

Compact Muon Solenoid
LHC, CERN
 Visit us: CMS Public Website, CMS Physics ;
Contact us: CMS Publications Committee
Visit us: CMS Public Website, CMS Physics ;
Contact us: CMS Publications Committee
| CMS-PAS-EXO-24-024 | ||
| Search for a right-handed W boson decaying into a tau-flavored heavy neutral lepton in proton-proton collisions at $ \sqrt{s} = $ 13 TeV | ||
| CMS Collaboration | ||
| 2026-07-31 | ||
| Abstract: A search is presented for a right-handed W boson ($ \mathrm{W}_\mathrm{R} $) and a heavy neutral lepton (N) in the decay chain $ \mathrm{W}_\mathrm{R}\to\tau\mathrm{N} $, followed by $ \mathrm{N}\to\tau\mathrm{qq} $. The $ \tau $ lepton originating from the N decay is assumed to decay leptonically, producing an electron or muon, while the other one is assumed to decay hadronically. The search explores two regions of parameter space: one where the decay products of the heavy neutral lepton are merged into a single large-radius jet, and the other where they are well separated in angular distance. The search is performed with the CMS experiment at the CERN LHC using the proton-proton collision data set collected during 2016-2018 at a center-of-mass energy of 13 TeV, which corresponds to an integrated luminosity of 138 fb$ ^{-1} $. No excess of events above the standard model expectation is observed. For an N mass of 0.1 TeV, $ \mathrm{W}_\mathrm{R} $ boson masses up to 3.07 TeV are excluded at 95% confidence level; assuming an N mass of half the $ \mathrm{W}_\mathrm{R} $ boson mass, $ \mathrm{W}_\mathrm{R} $ boson masses up to 3.47 TeV are excluded. | ||
| Links: CDS record (PDF) ; CADI line (restricted) ; | ||
| Figures | |
png pdf |
Figure 1:
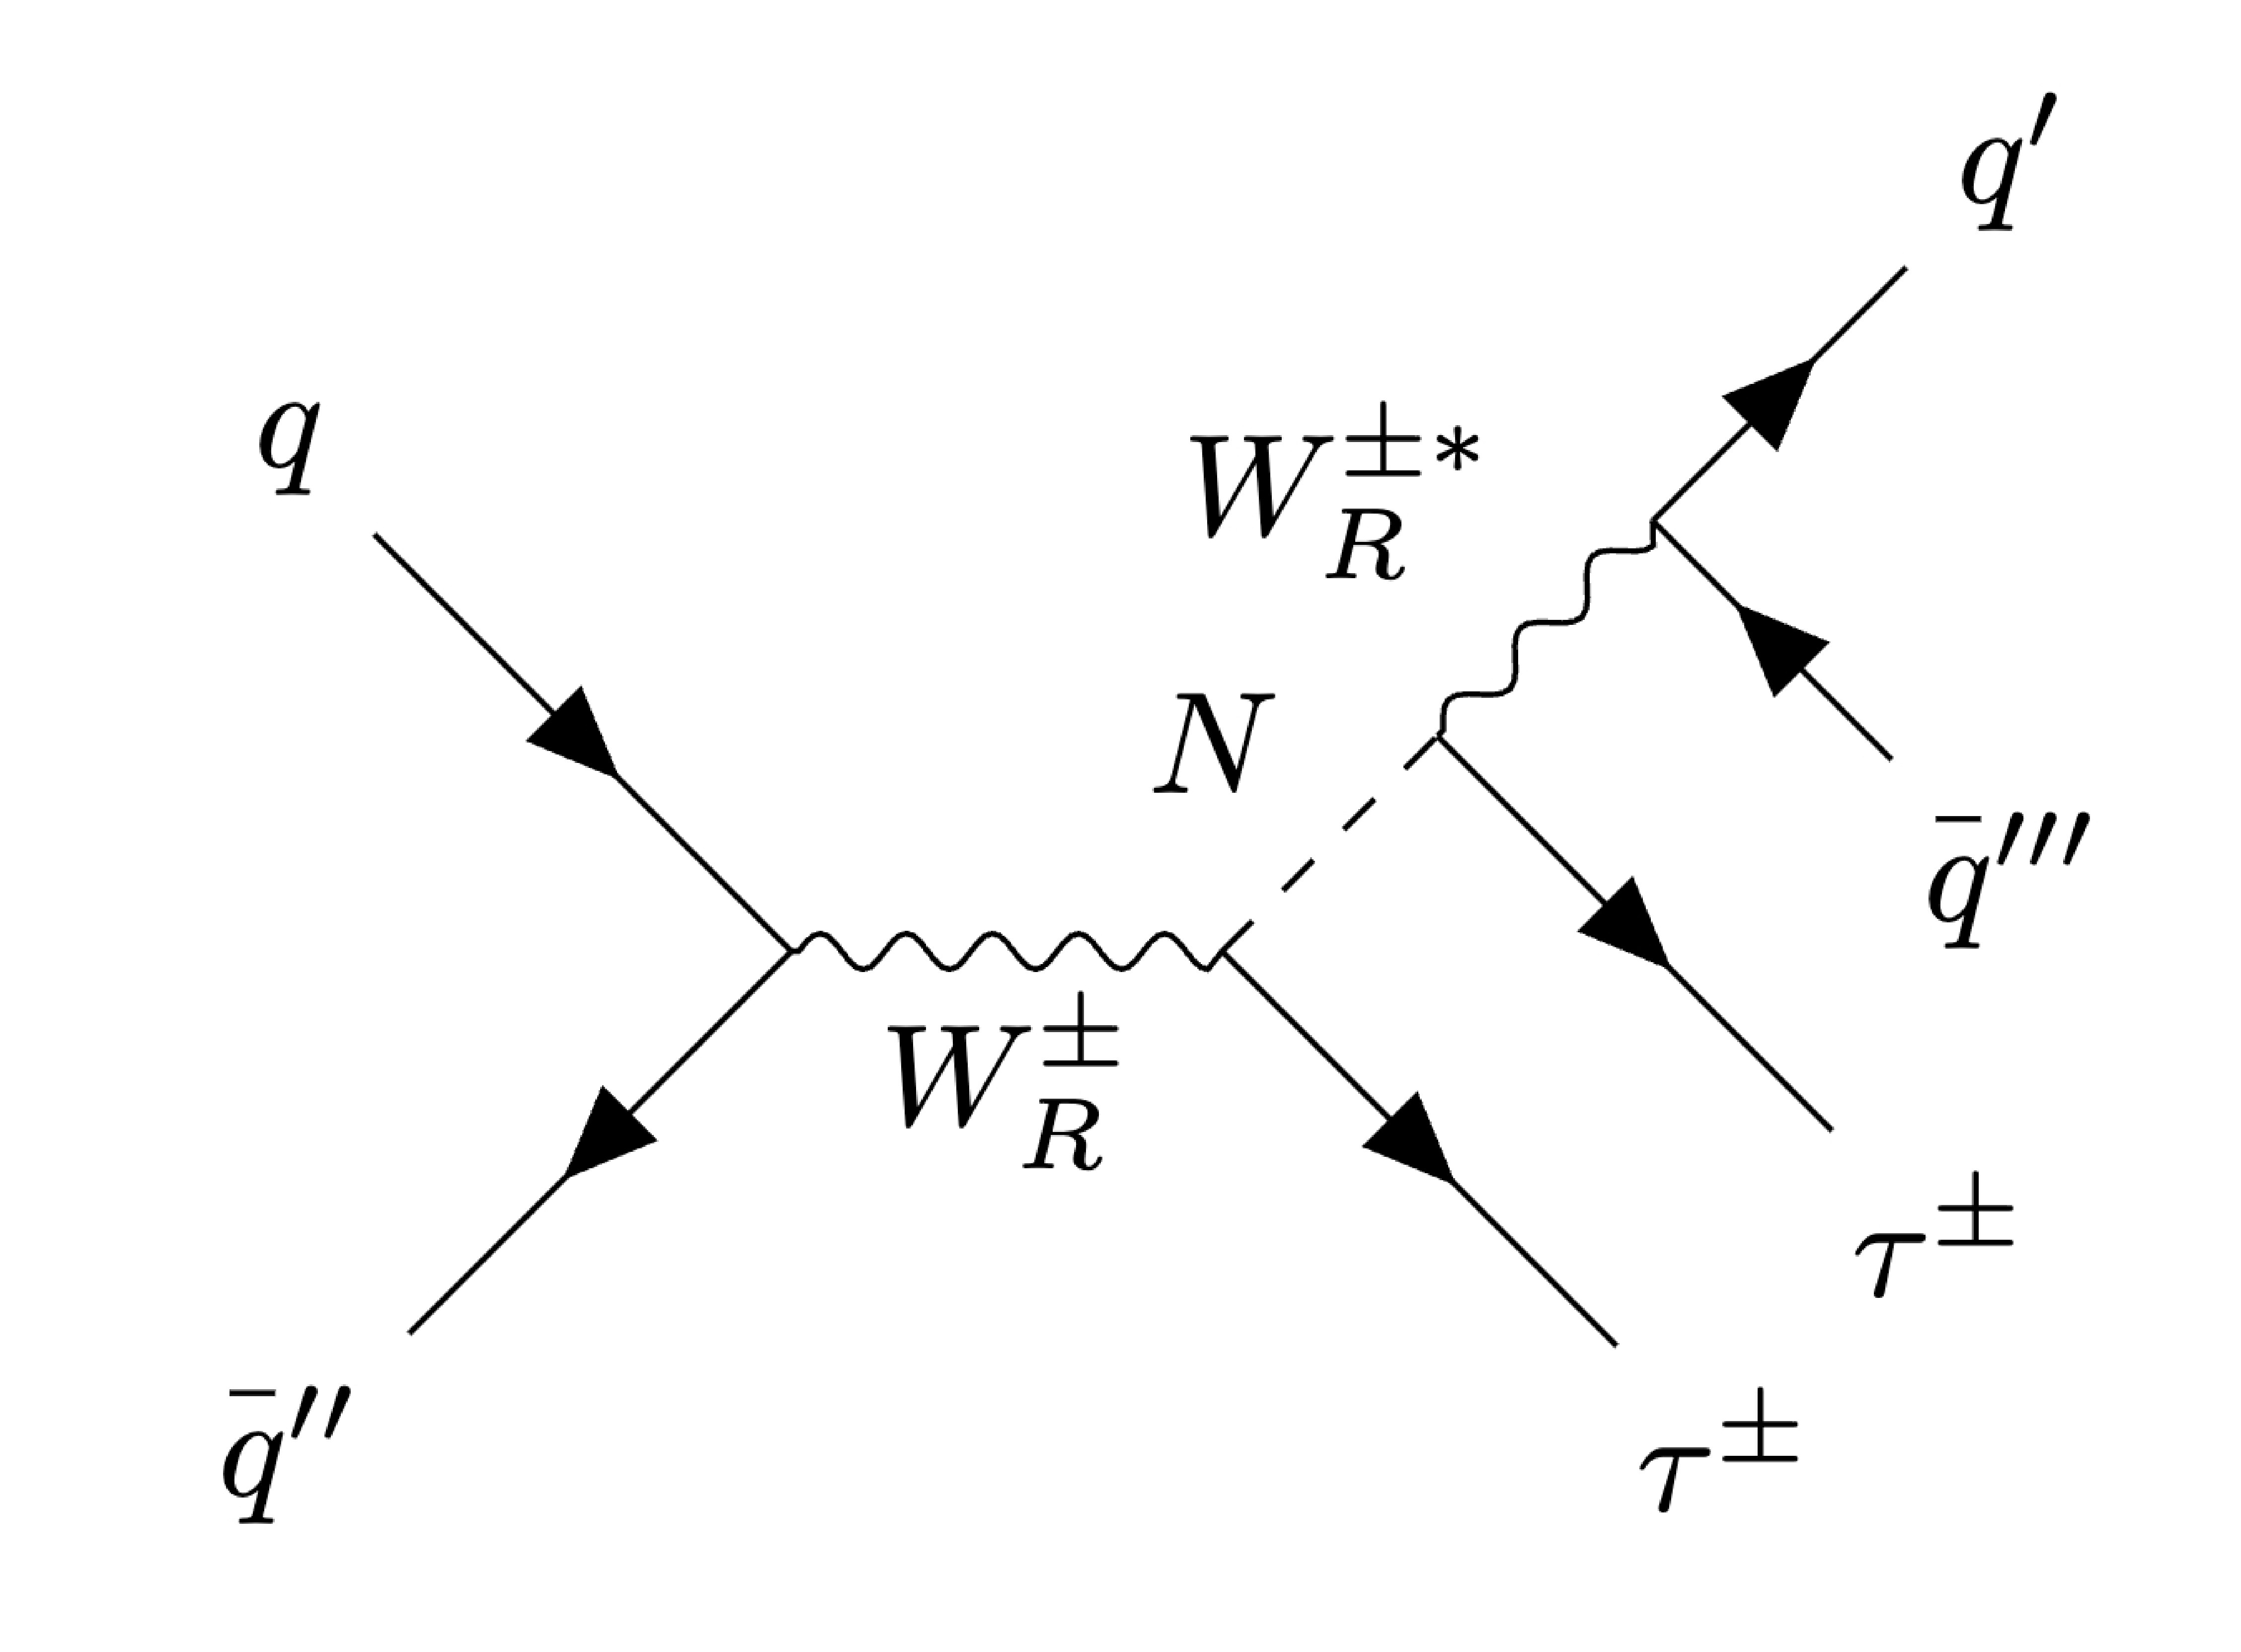
Feynman diagram for the production of a heavy neutral lepton via the decay of a $ \mathrm{W_R} $ boson. |
png pdf |
Figure 2:
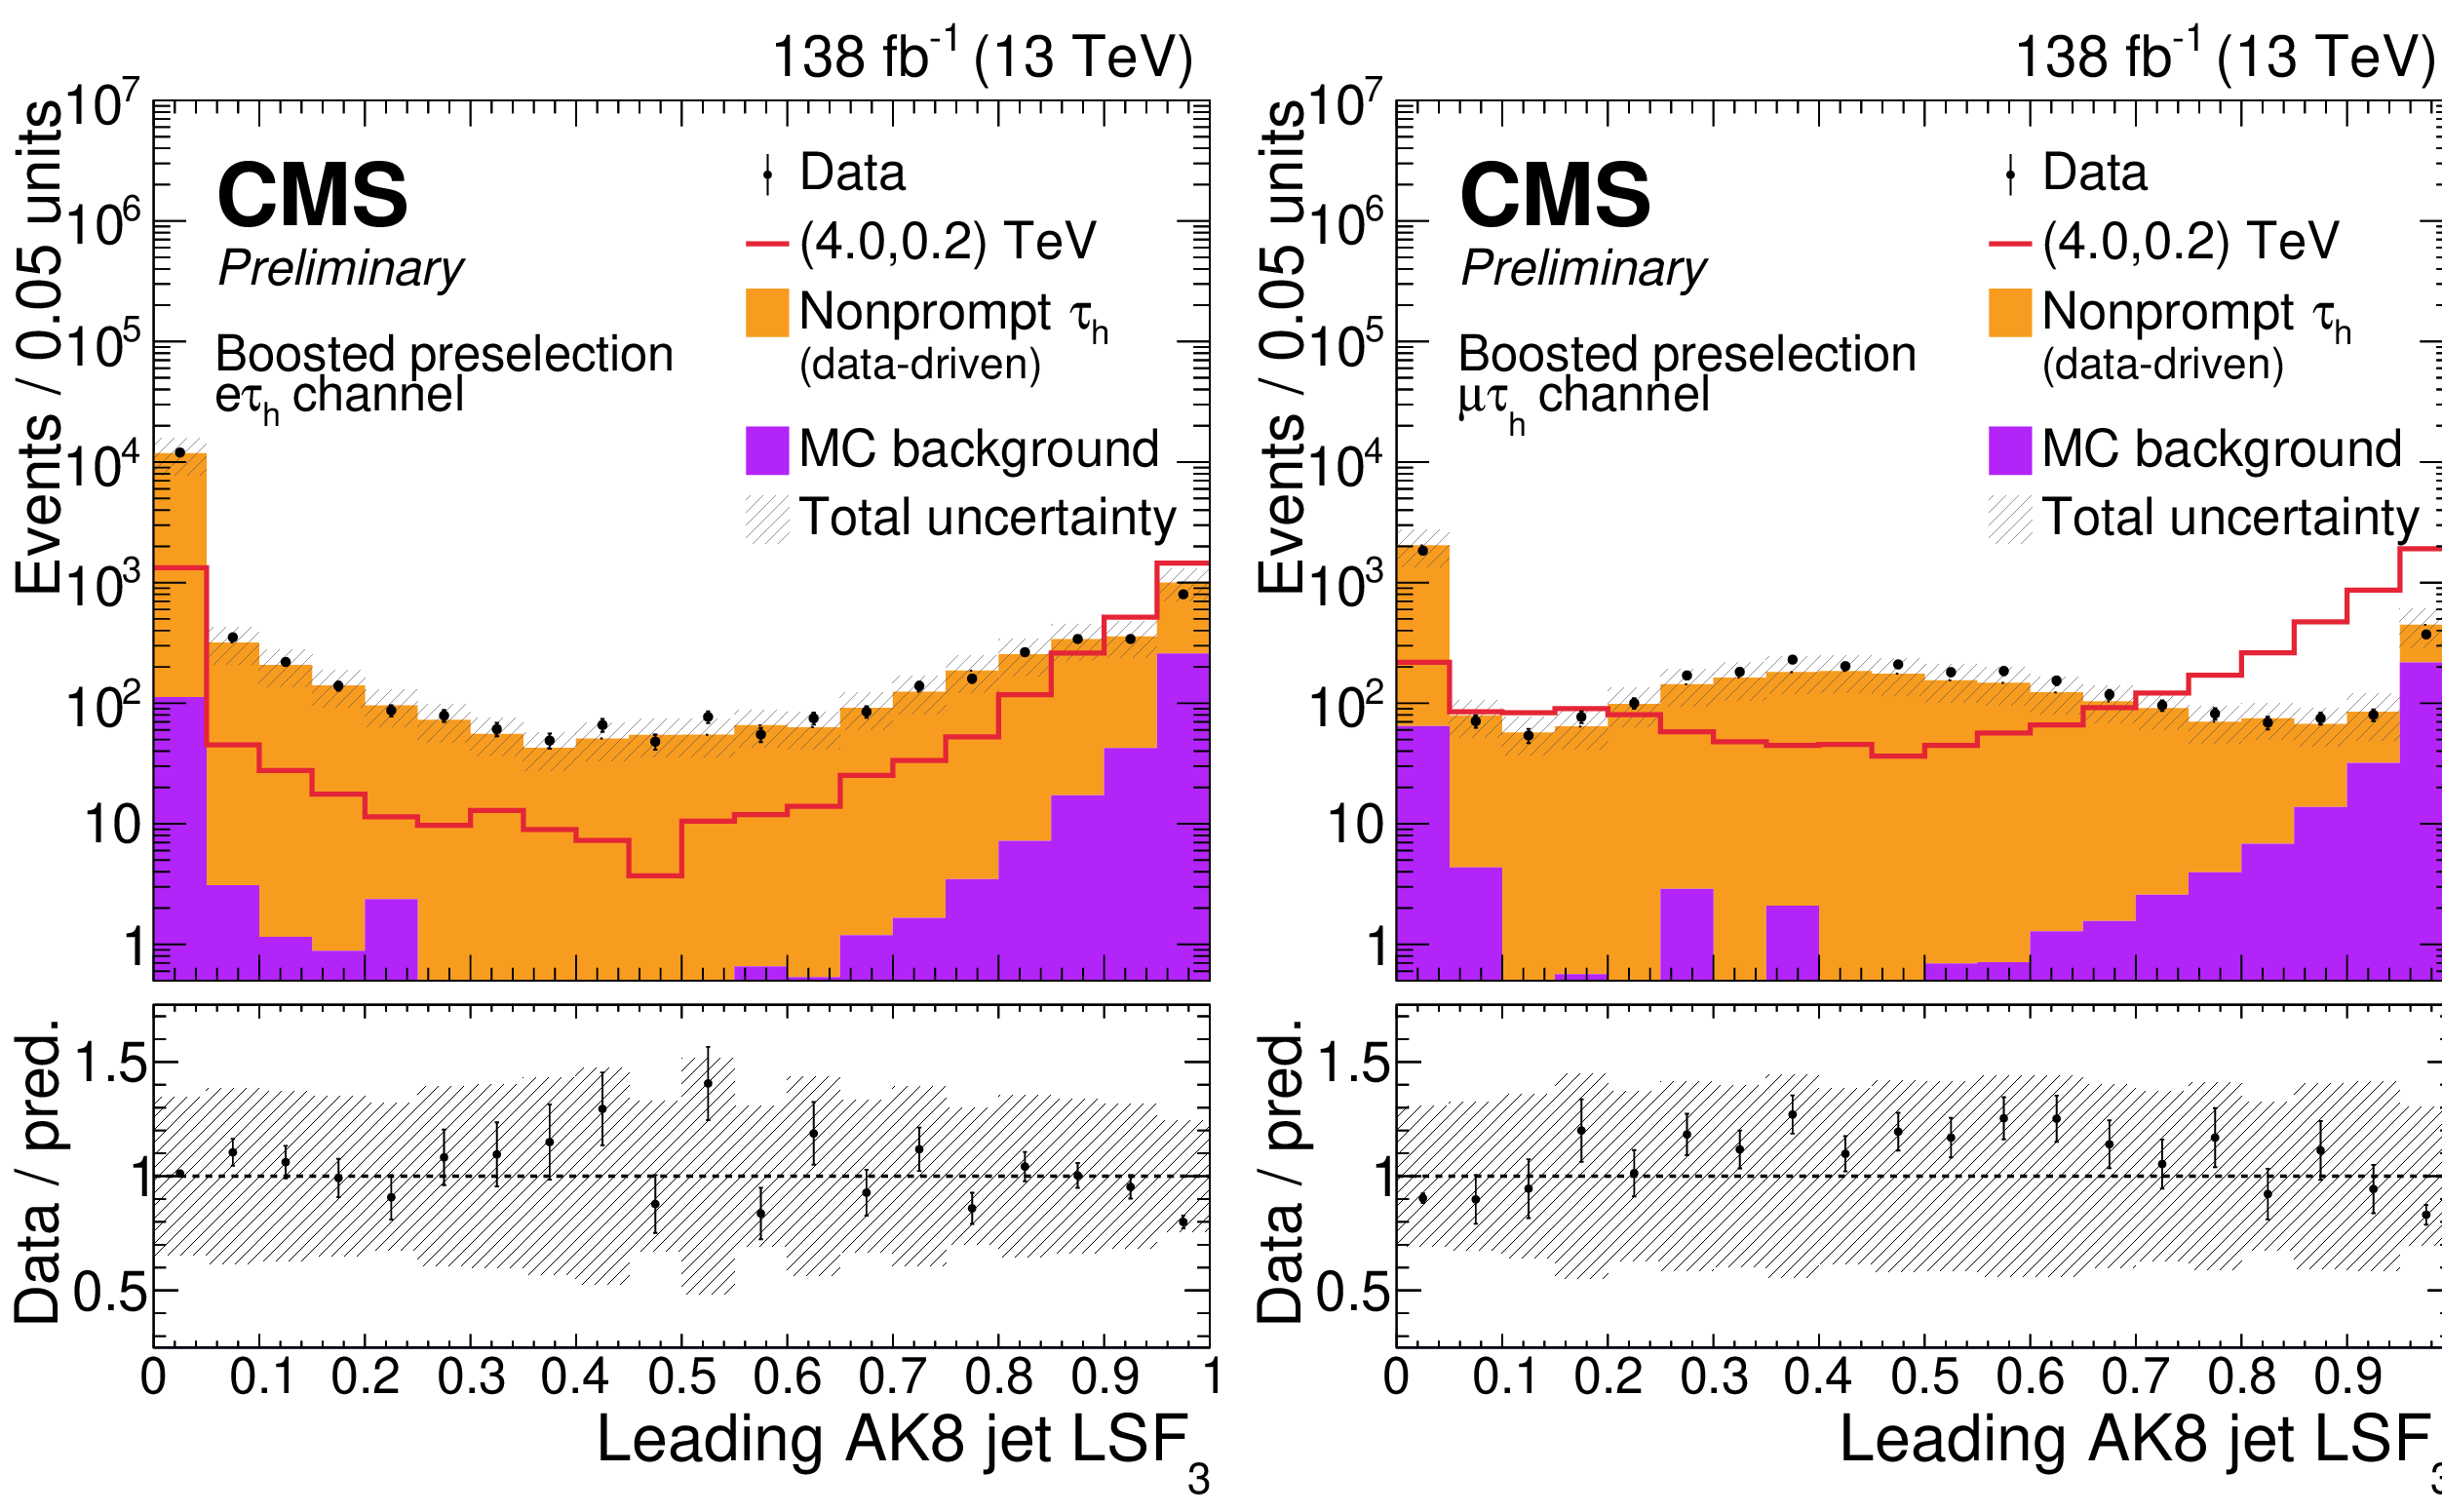
Prefit $ \text{LSF}_3 $ distributions of the leading AK8 jet for events passing the boosted preselection in the electron (left) and muon (right) channels. The stacked histograms show the prefit prediction, comprising the nonprompt $ \tau_\mathrm{h} $ background estimated from data and the remaining processes estimated from simulation (``MC background''). The data are shown as points and the hatched band represents the total prefit uncertainty. The lower panels show the ratio of the data to the total background prediction. The signal distribution for the mass point $ (m_{\mathrm{W_R}},m_{\mathrm{N}})=(4.0,0.2) \text{TeV} $, normalized to the nominal signal cross section of the model, is overlaid for comparison. Prediction is normalized to data. |
png pdf |
Figure 2-a:
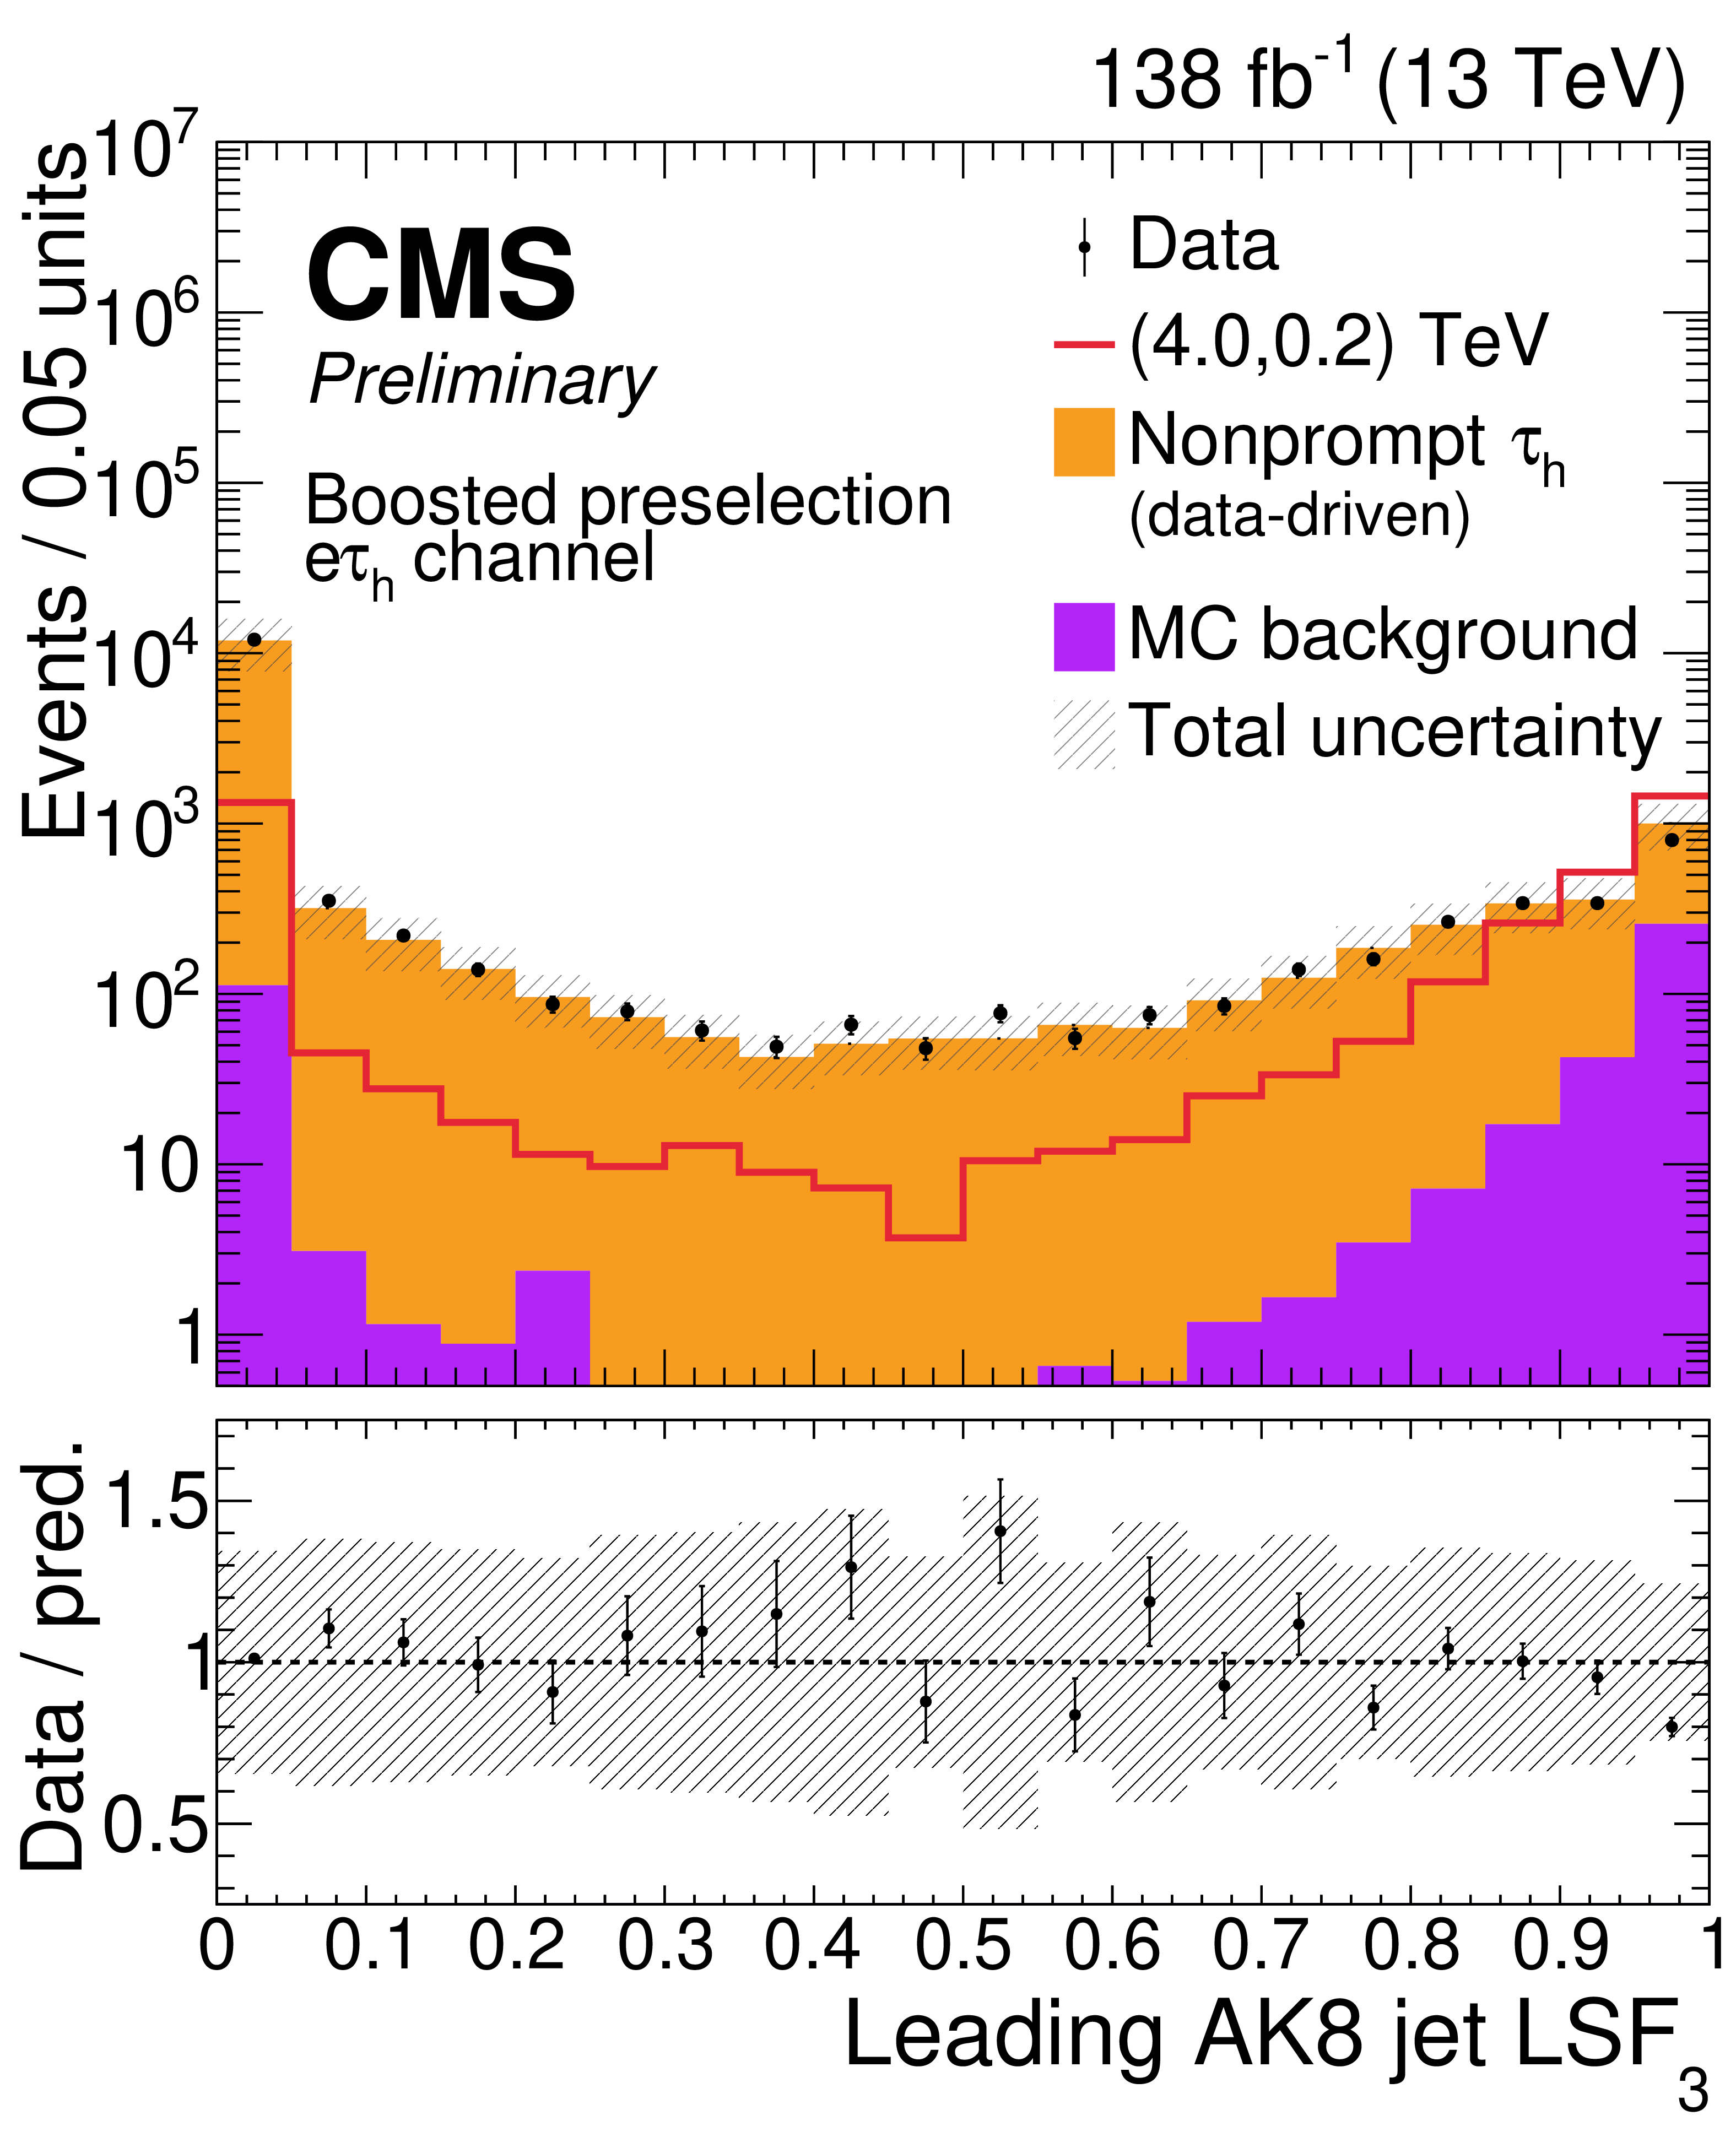
Prefit $ \text{LSF}_3 $ distributions of the leading AK8 jet for events passing the boosted preselection in the electron (left) and muon (right) channels. The stacked histograms show the prefit prediction, comprising the nonprompt $ \tau_\mathrm{h} $ background estimated from data and the remaining processes estimated from simulation (``MC background''). The data are shown as points and the hatched band represents the total prefit uncertainty. The lower panels show the ratio of the data to the total background prediction. The signal distribution for the mass point $ (m_{\mathrm{W_R}},m_{\mathrm{N}})=(4.0,0.2) \text{TeV} $, normalized to the nominal signal cross section of the model, is overlaid for comparison. Prediction is normalized to data. |
png pdf |
Figure 2-b:
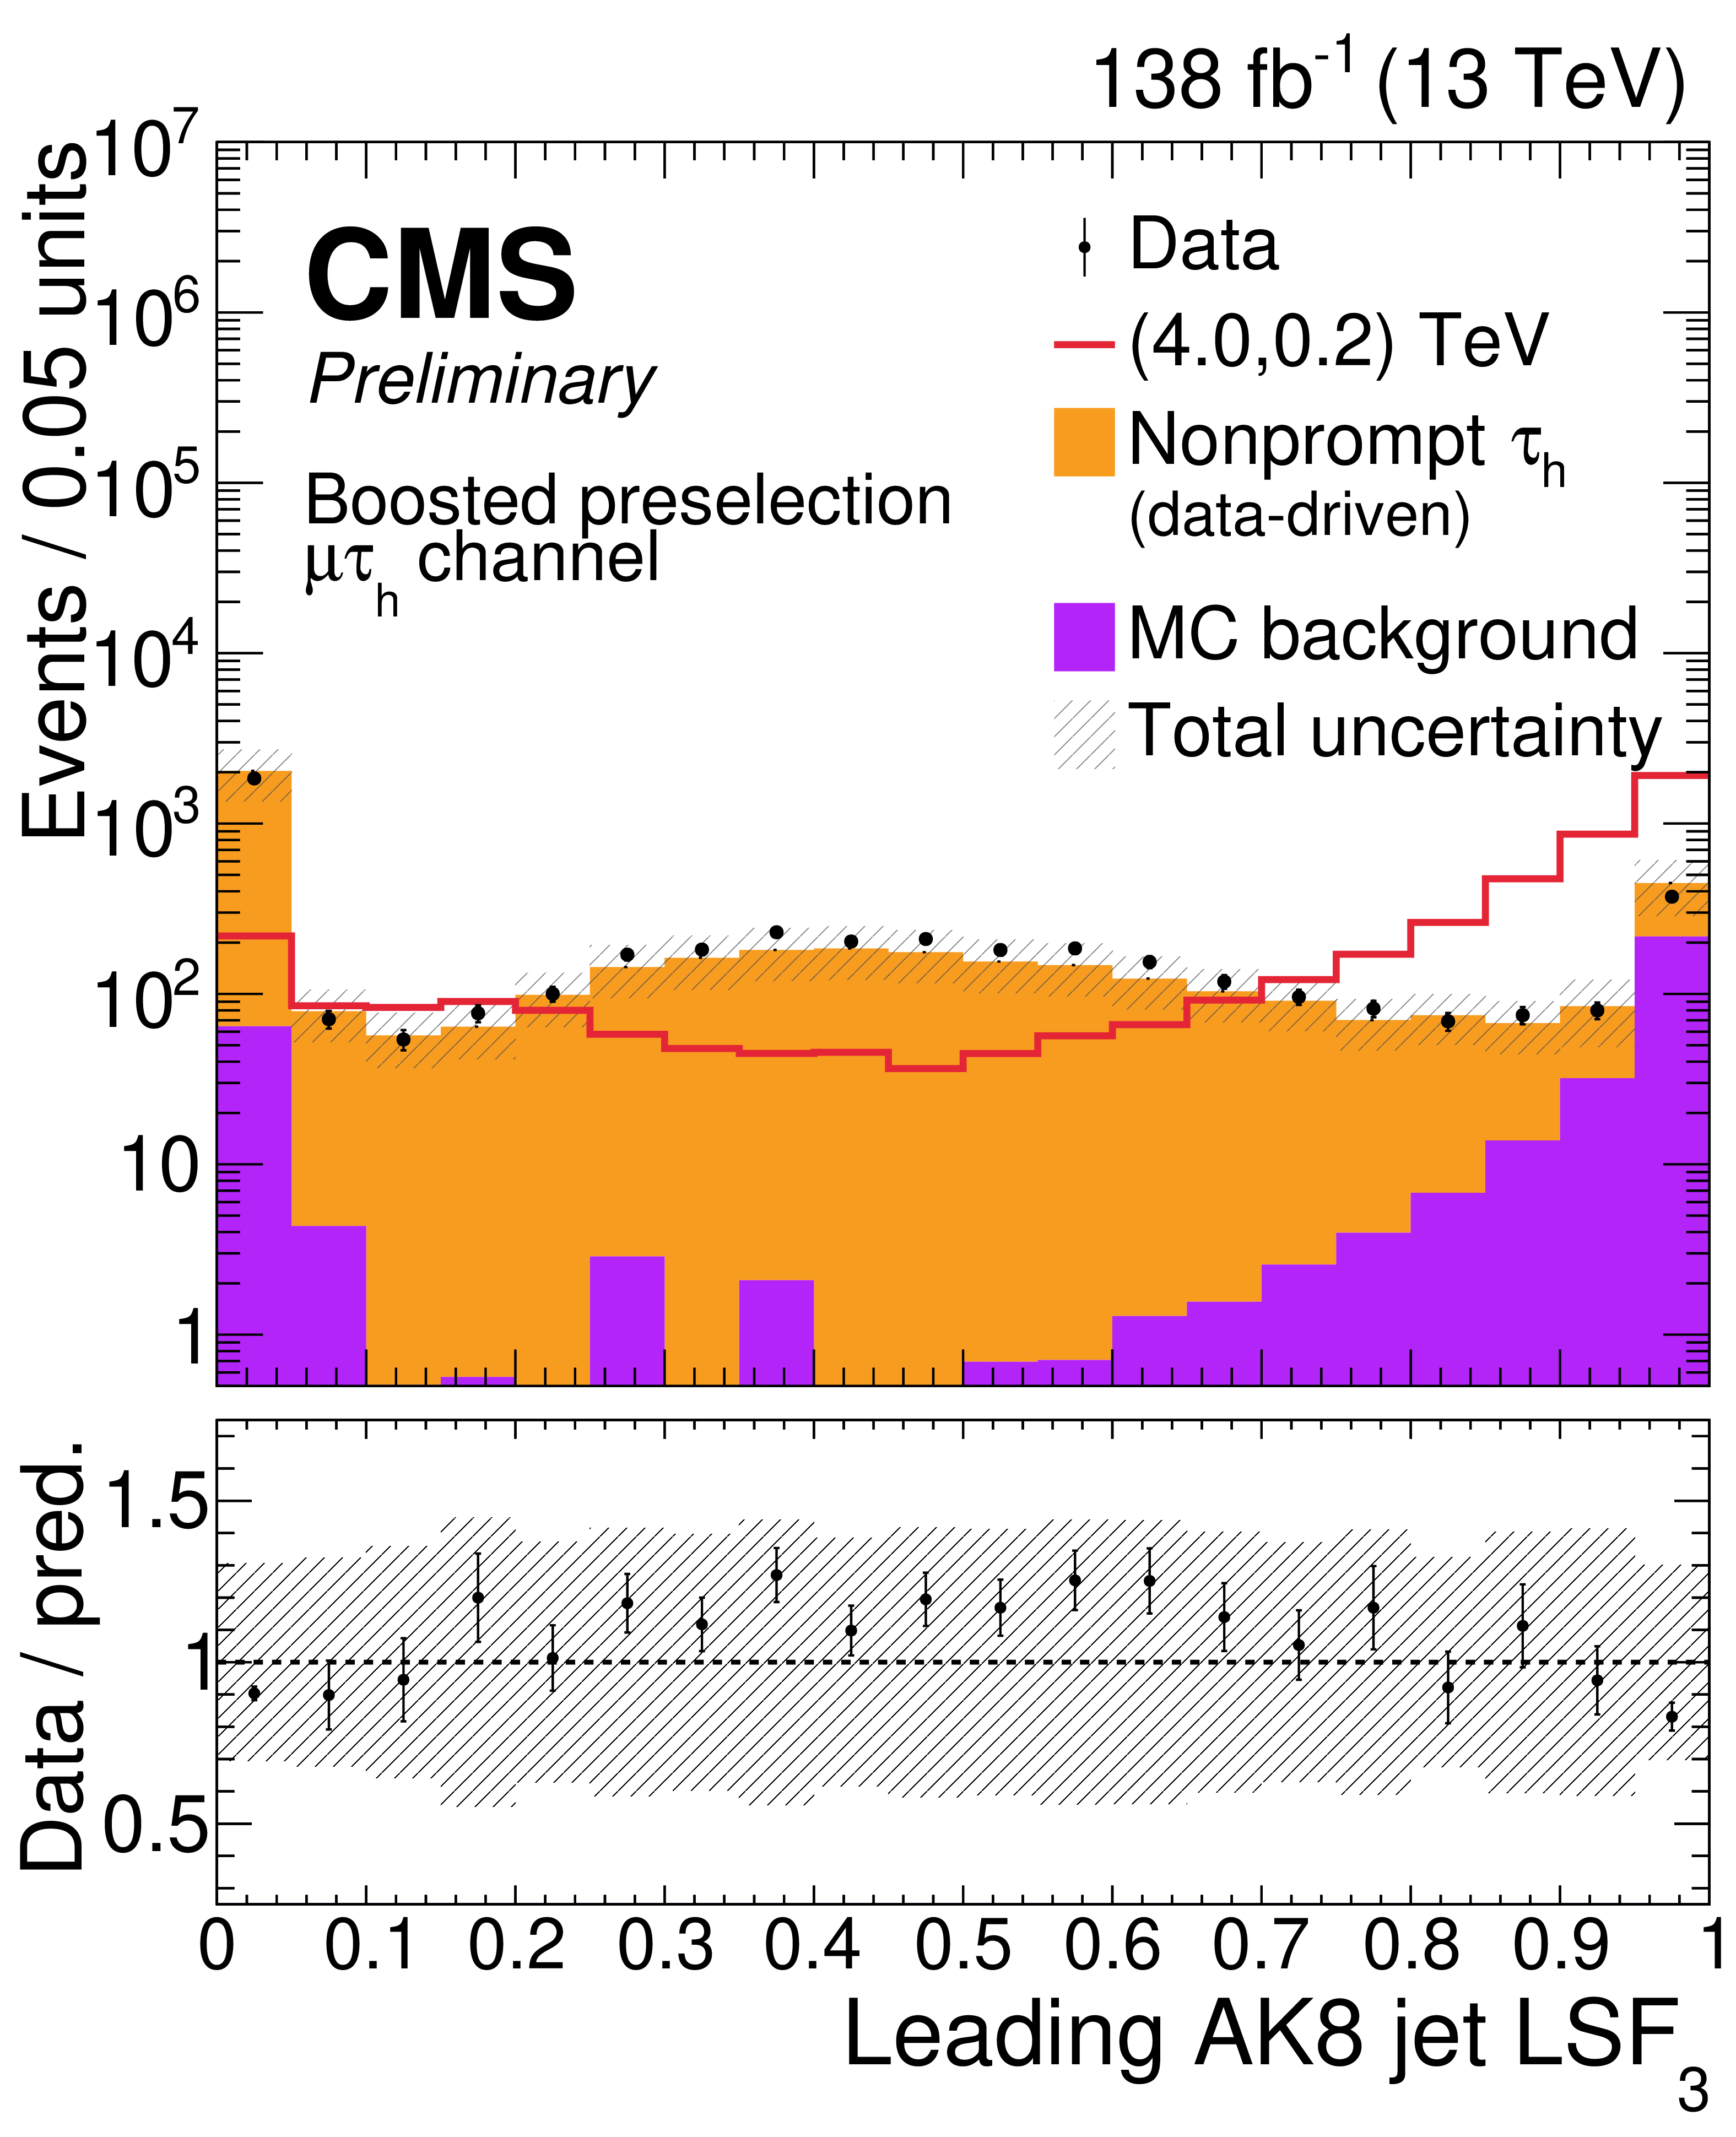
Prefit $ \text{LSF}_3 $ distributions of the leading AK8 jet for events passing the boosted preselection in the electron (left) and muon (right) channels. The stacked histograms show the prefit prediction, comprising the nonprompt $ \tau_\mathrm{h} $ background estimated from data and the remaining processes estimated from simulation (``MC background''). The data are shown as points and the hatched band represents the total prefit uncertainty. The lower panels show the ratio of the data to the total background prediction. The signal distribution for the mass point $ (m_{\mathrm{W_R}},m_{\mathrm{N}})=(4.0,0.2) \text{TeV} $, normalized to the nominal signal cross section of the model, is overlaid for comparison. Prediction is normalized to data. |
png pdf |
Figure 3:
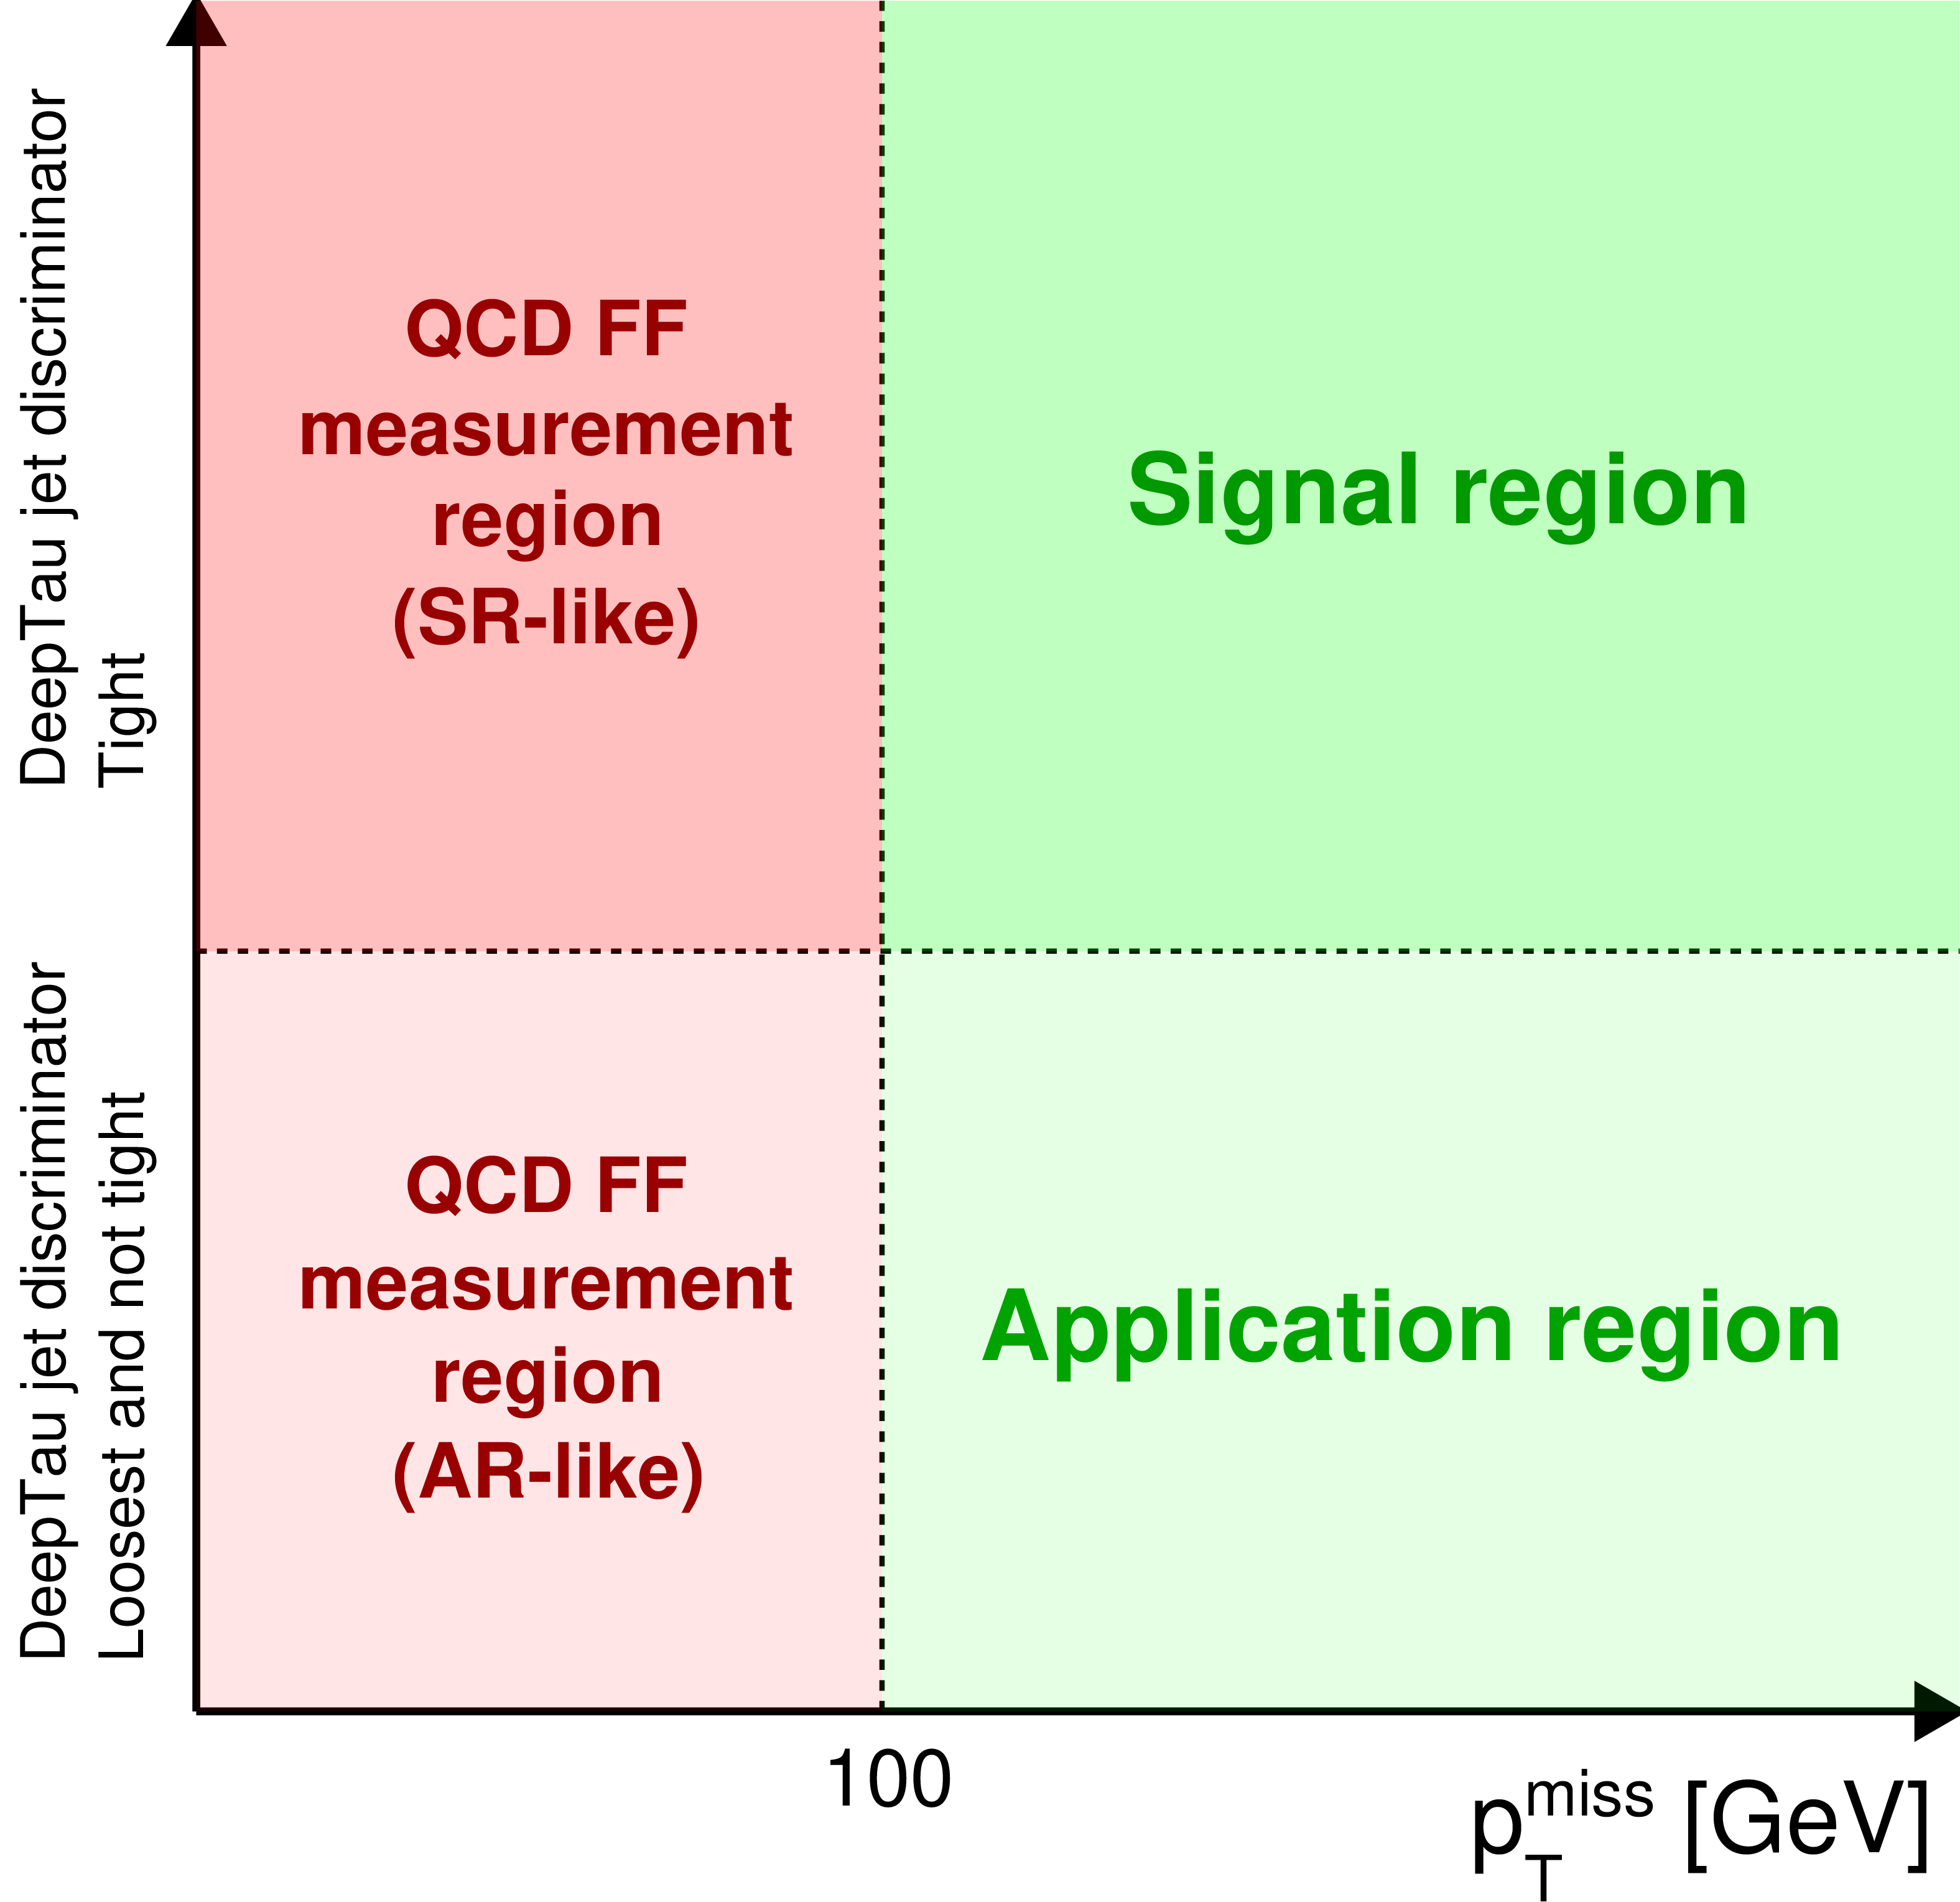
Schematic diagram showing the definition of the FF measurement and application regions with respect to the signal region. |
png pdf |
Figure 4:
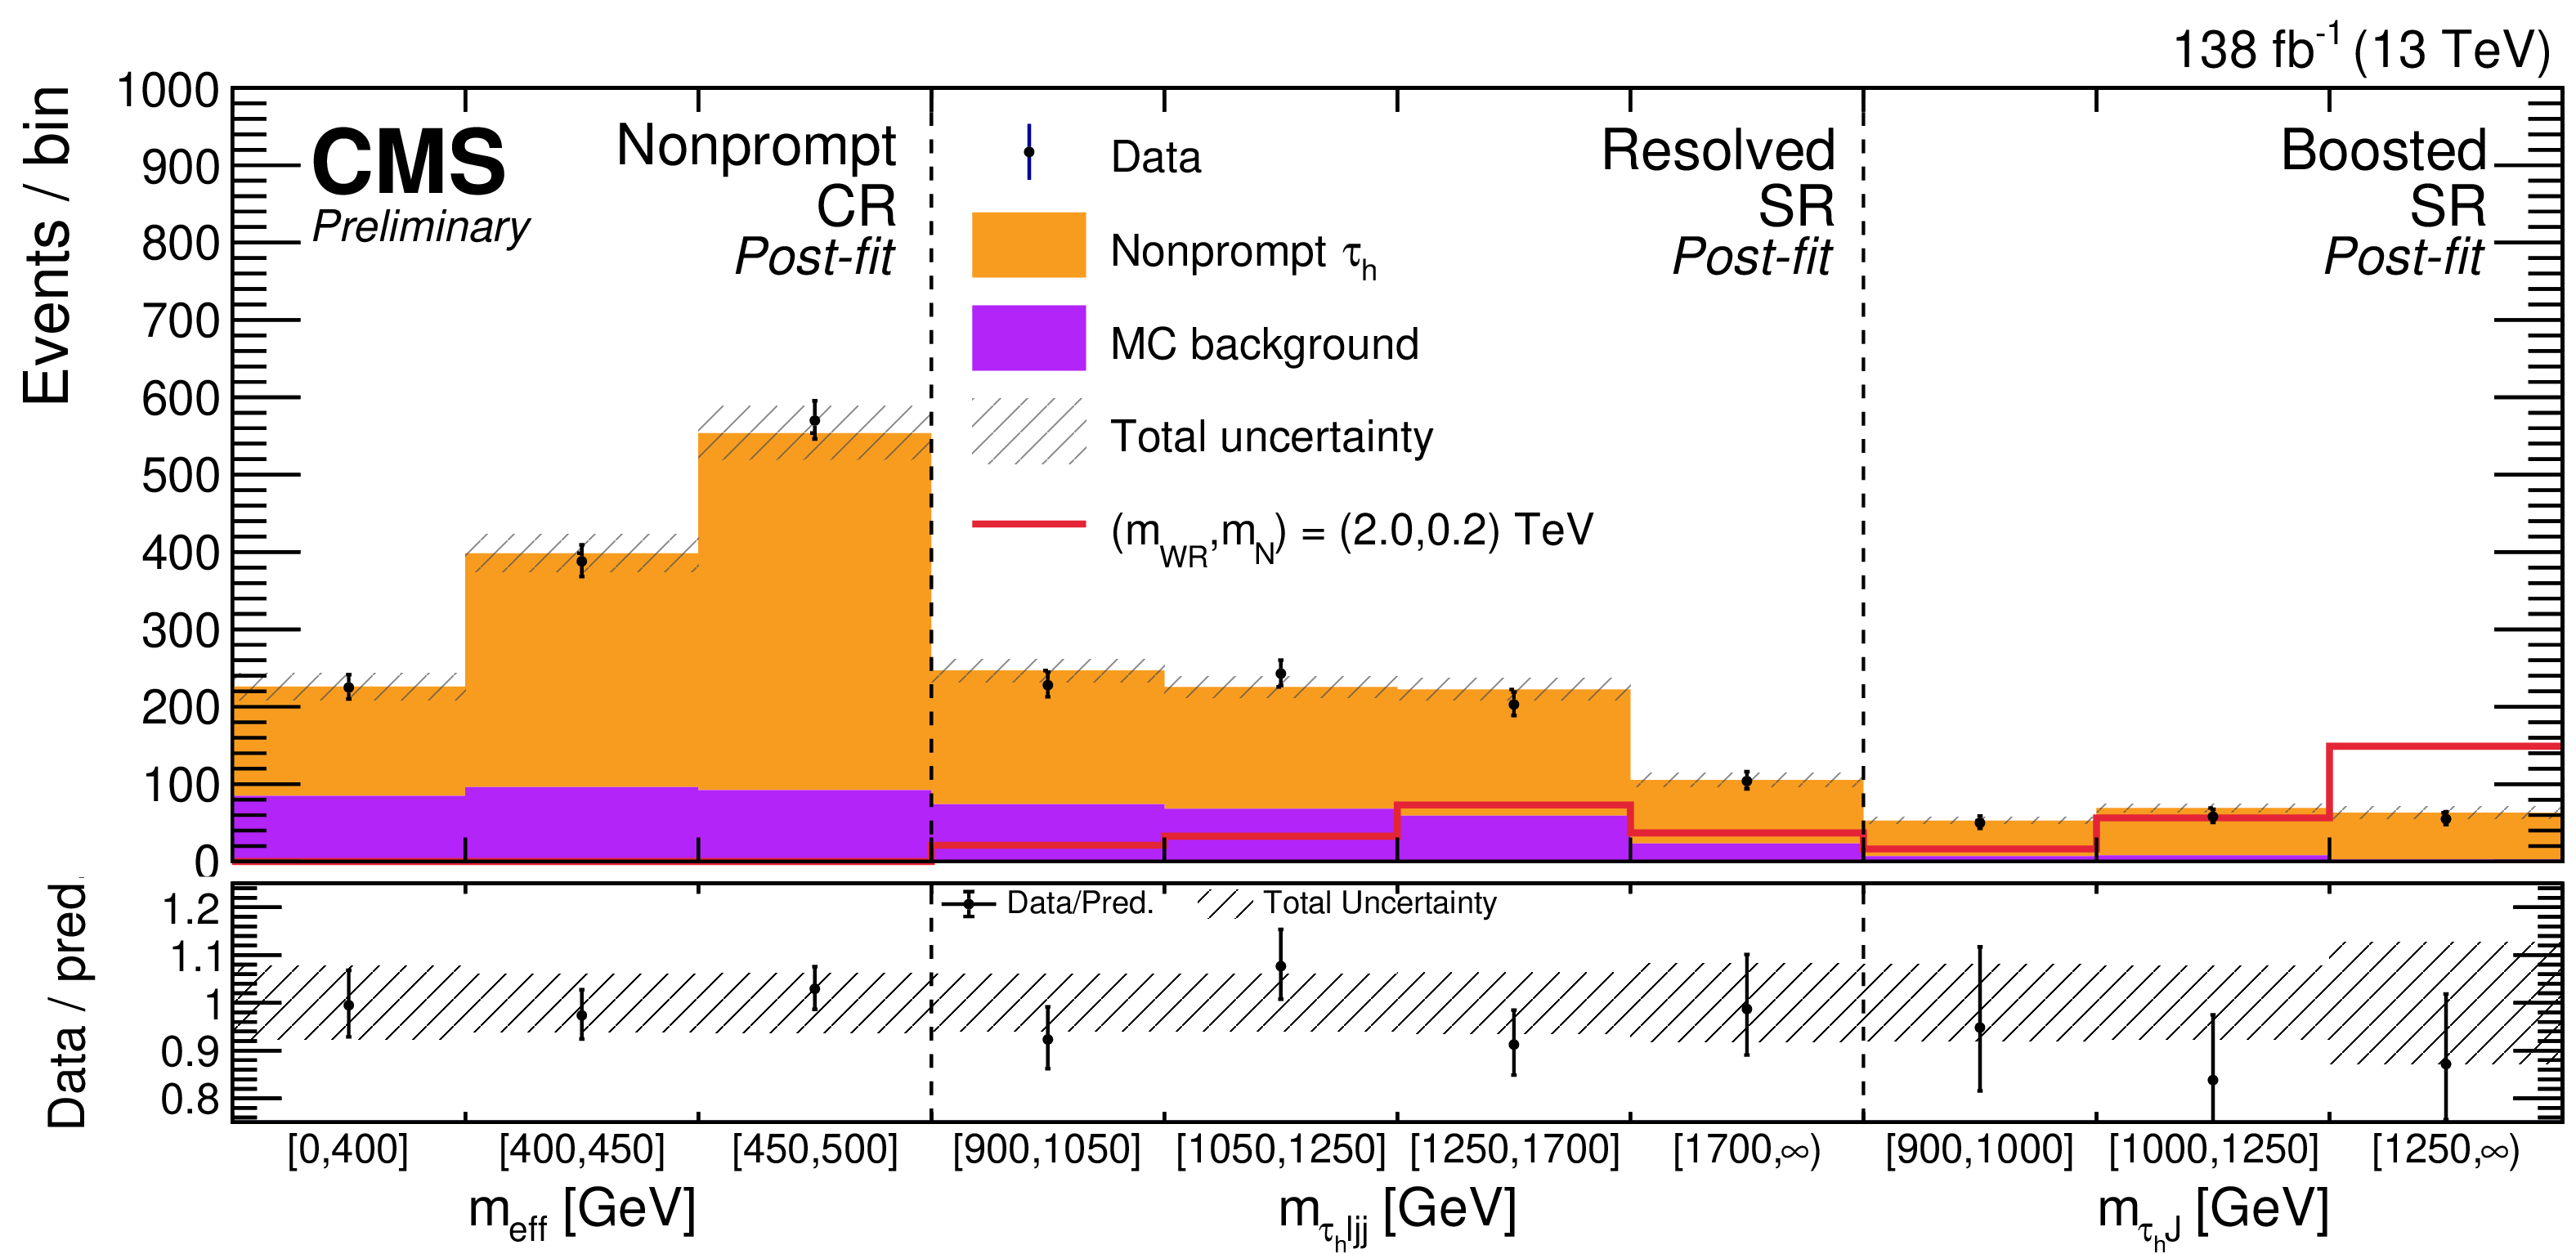
Postfit distributions of the fit observables in the nonprompt control region and the resolved and boosted signal regions, where $ m_\text{eff} $ is defined as $ m_{\tau\ell\text{jj}} $ ($ m_{\tau\text{J}} $) for events passing the resolved (boosted) preselection and the nonprompt CR selection. The stacked histograms show the postfit prediction, comprising the nonprompt $ \tau_\mathrm{h} $ background estimated from data and the remaining processes estimated from simulation (``MC background''). The data are shown as points and the hatched band represents the total postfit uncertainty. The lower panel shows the ratio of the data to the total background prediction. The signal distribution for the mass point $ (m_{\mathrm{W_R}},m_{\mathrm{N}})=(2.0,0.2) \text{TeV} $, normalized to the nominal signal cross section of the model, is overlaid for comparison. |
png pdf |
Figure 5:
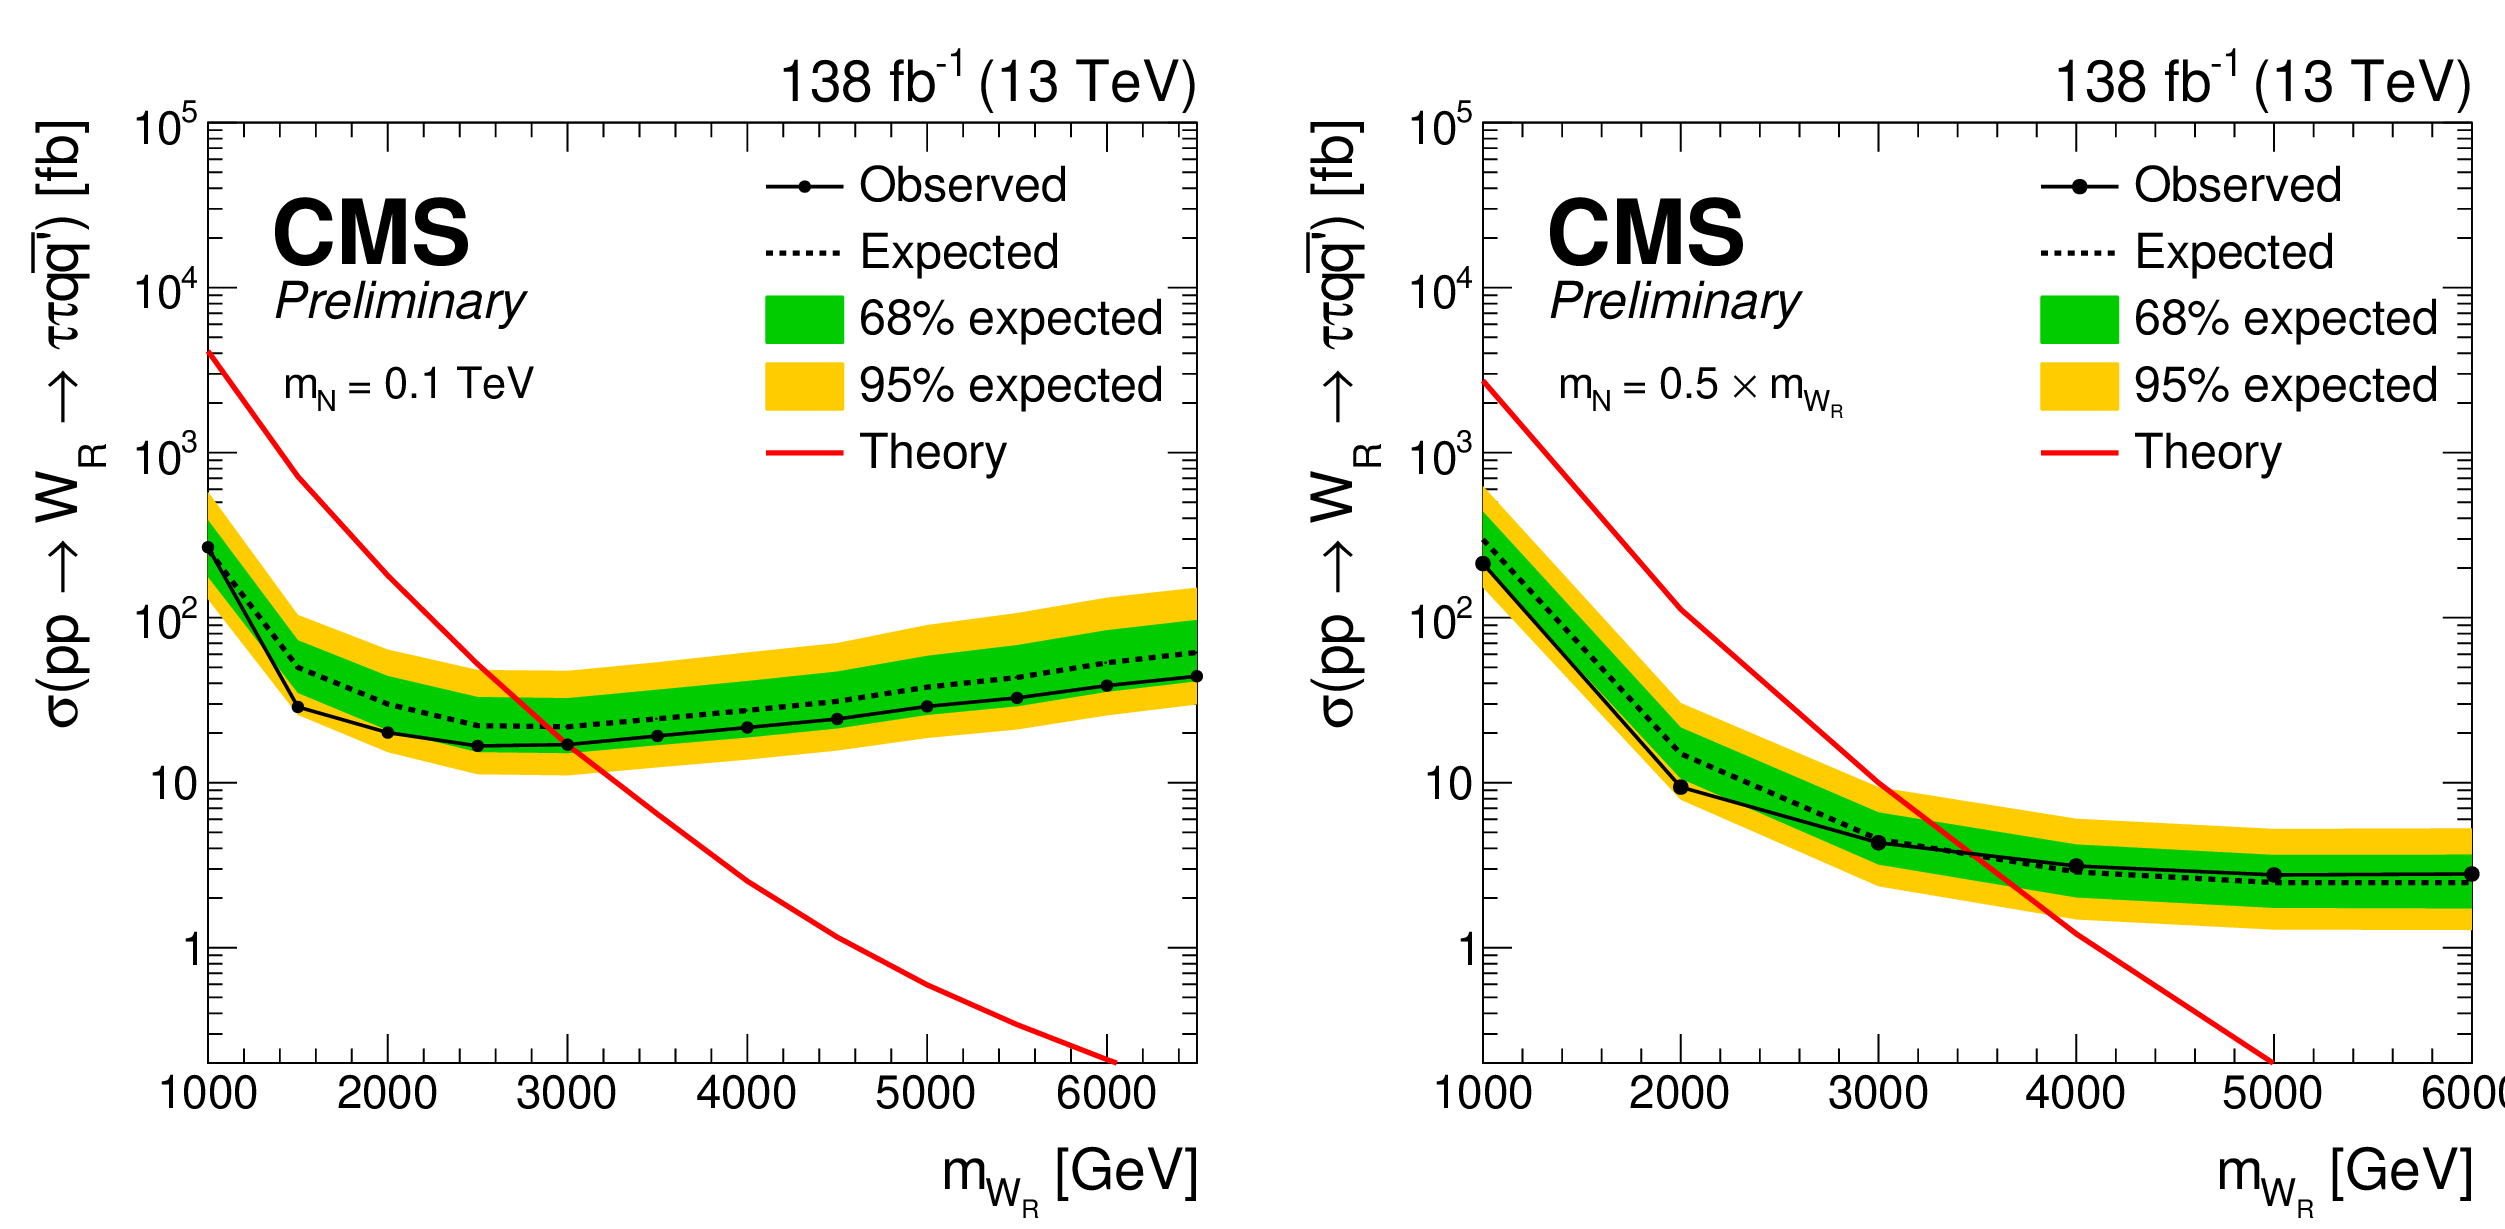
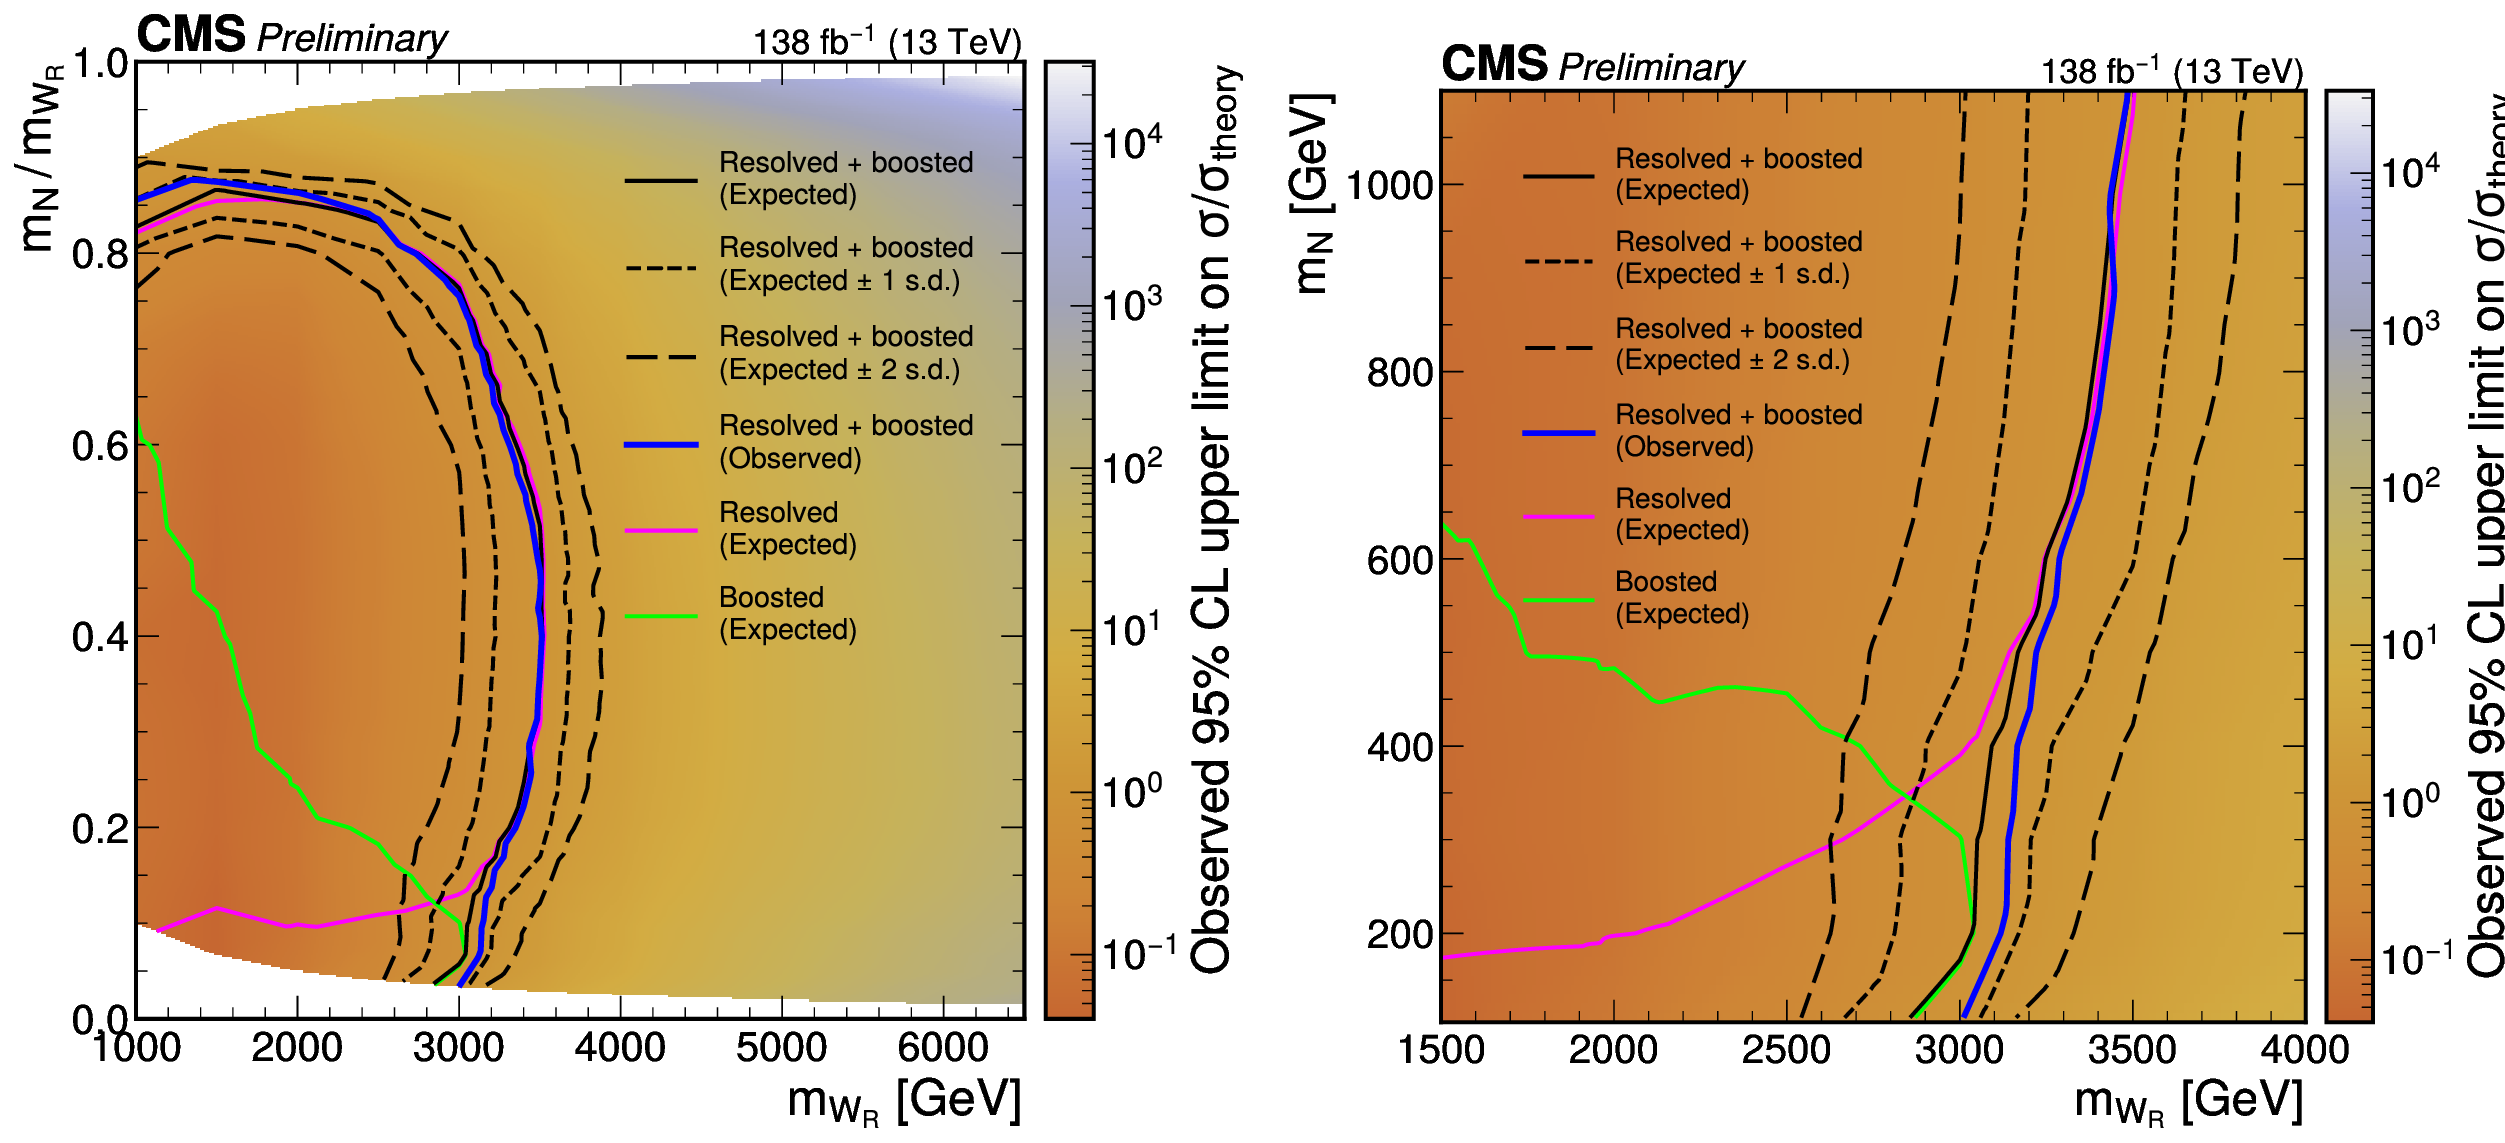
Upper limits at 95% CL on the product of the $ \mathrm{W_R} $ boson production cross section and the branching fraction, obtained by combining the resolved and boosted categories. The left (right) limit is the result for the $ m_{\mathrm{N}} = $ 0.1 TeV ($ m_{\mathrm{N}} = m_{\mathrm{W_R}}/ $ 2) mass point, which corresponds to the boosted (resolved) $ \mathrm{W_R} $ boson decay topology. The observed (median expected) limit is shown as the solid (dashed) black line, and the green (inner) and yellow (outer) bands indicate the 68 and 95% coverage of the expected limit. The red line represents the theory prediction. |
png pdf |
Figure 5-a:
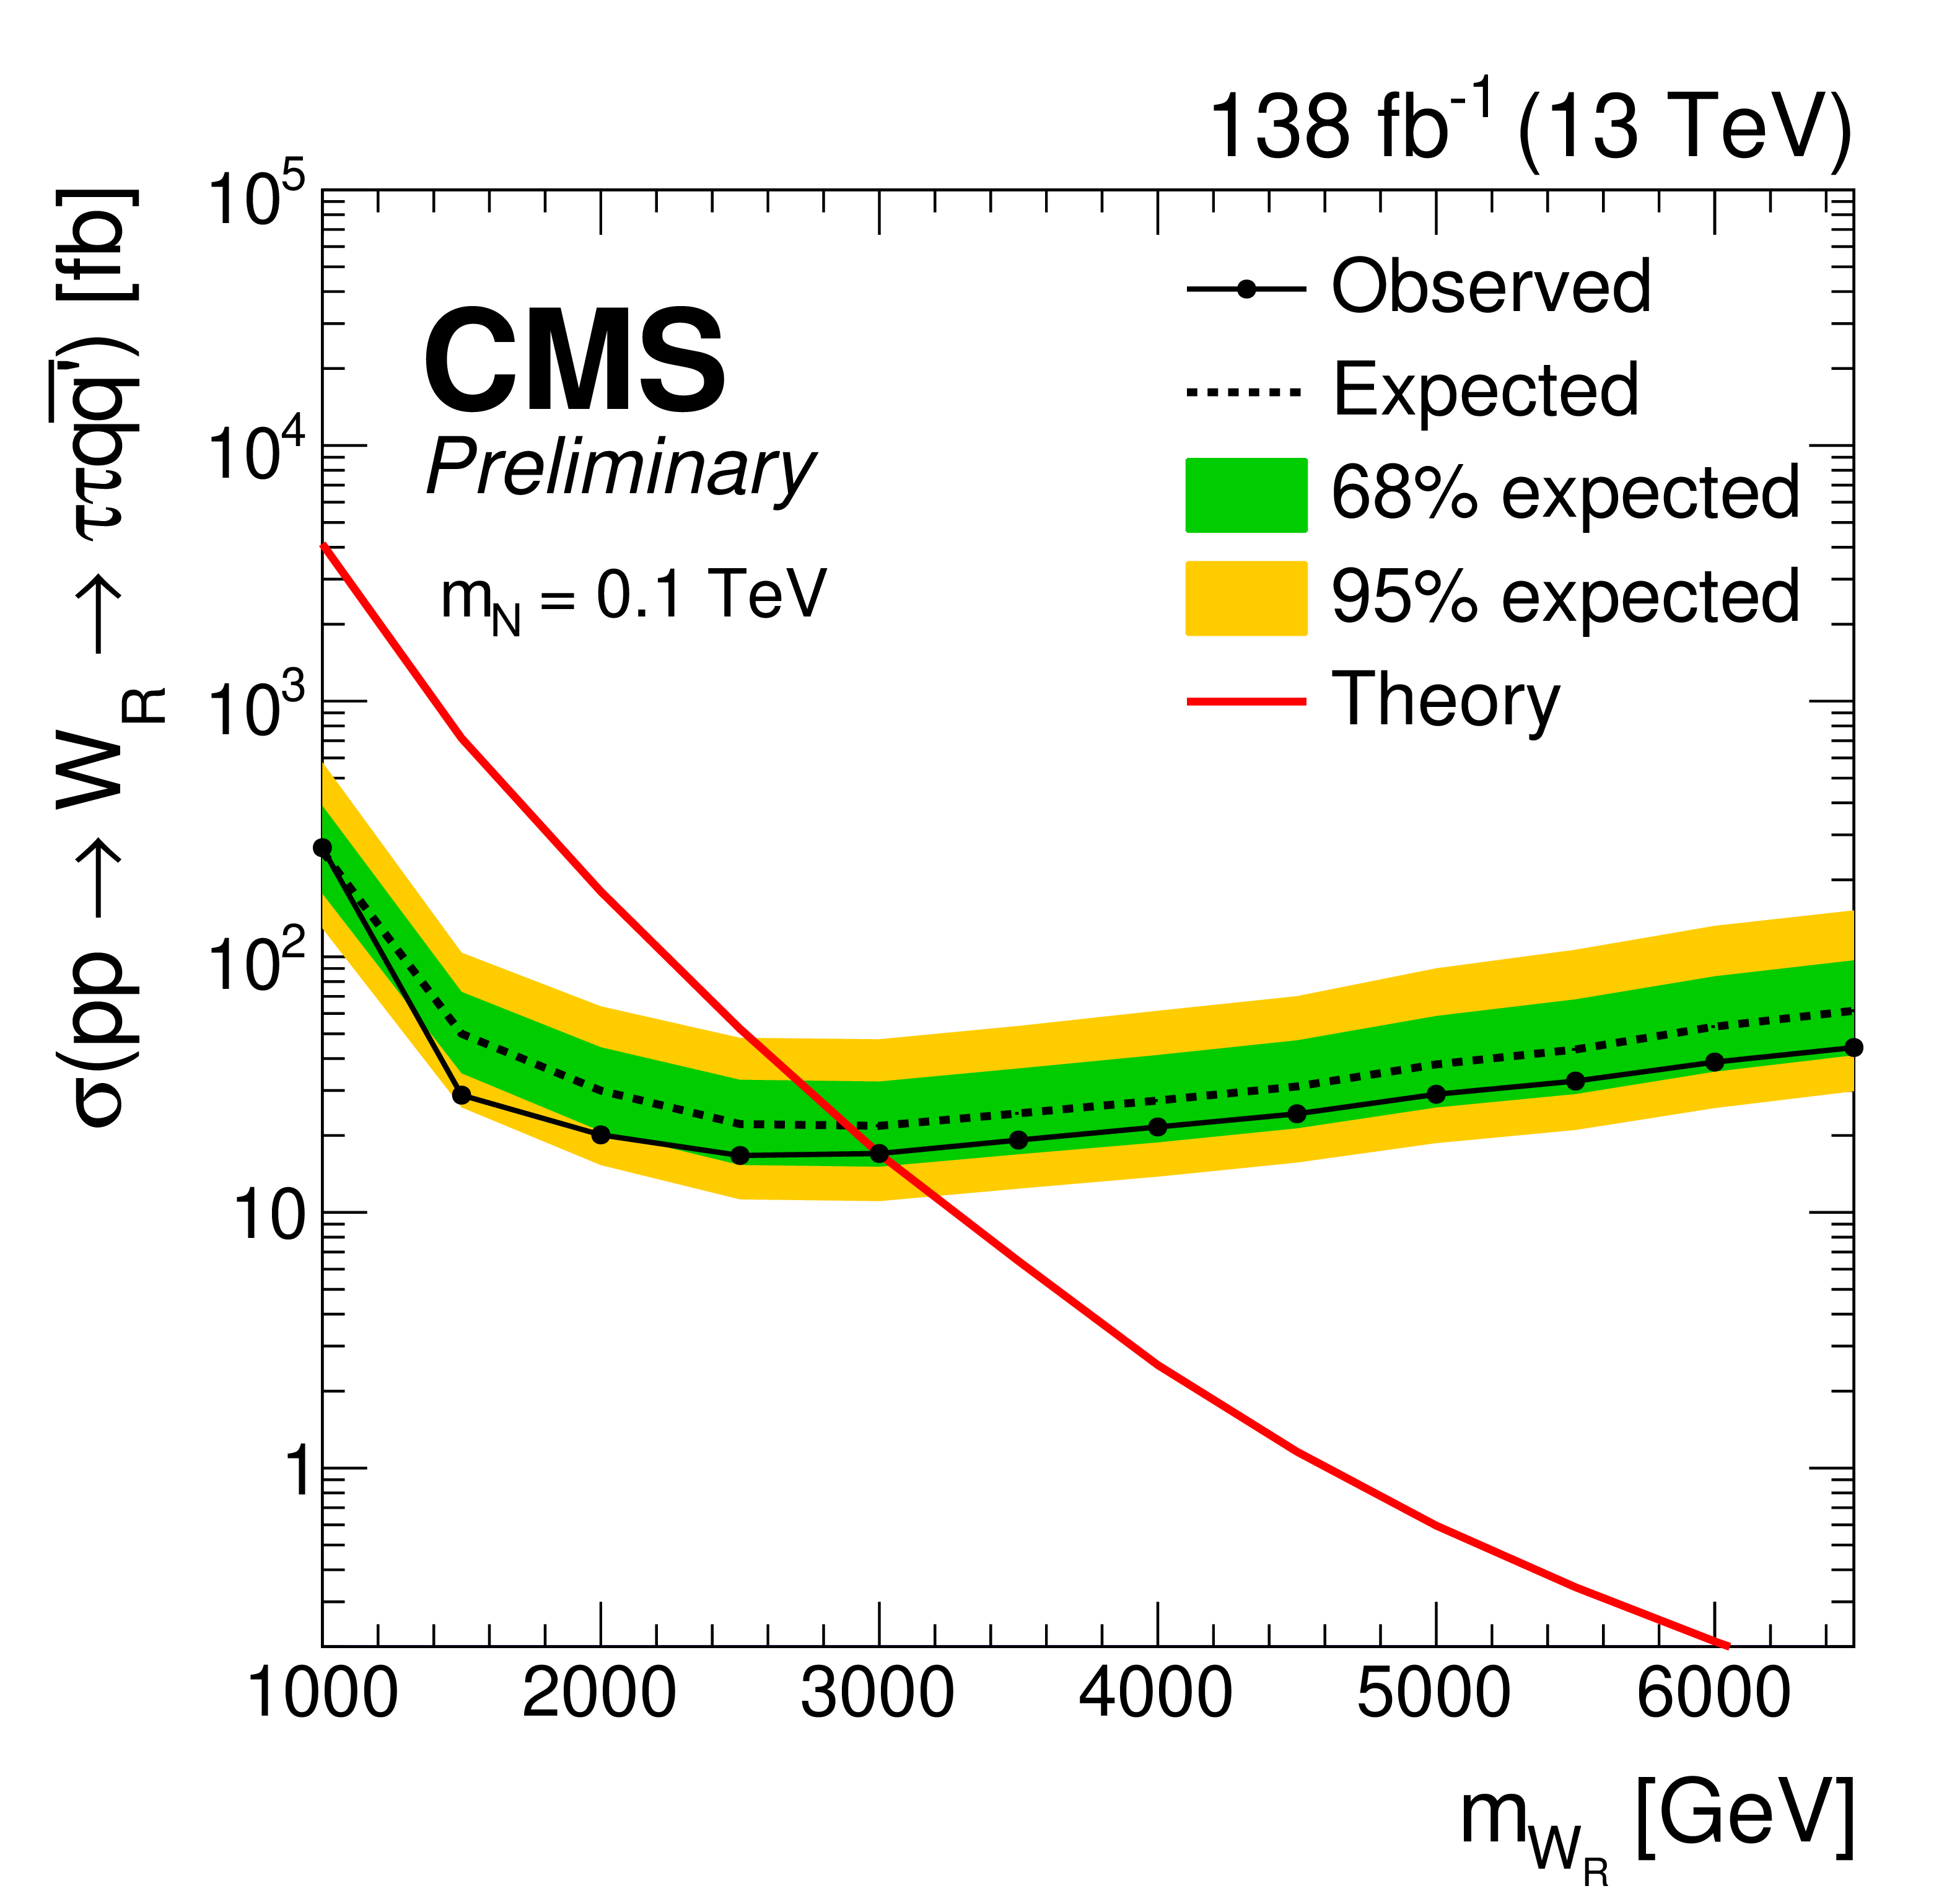
Upper limits at 95% CL on the product of the $ \mathrm{W_R} $ boson production cross section and the branching fraction, obtained by combining the resolved and boosted categories. The left (right) limit is the result for the $ m_{\mathrm{N}} = $ 0.1 TeV ($ m_{\mathrm{N}} = m_{\mathrm{W_R}}/ $ 2) mass point, which corresponds to the boosted (resolved) $ \mathrm{W_R} $ boson decay topology. The observed (median expected) limit is shown as the solid (dashed) black line, and the green (inner) and yellow (outer) bands indicate the 68 and 95% coverage of the expected limit. The red line represents the theory prediction. |
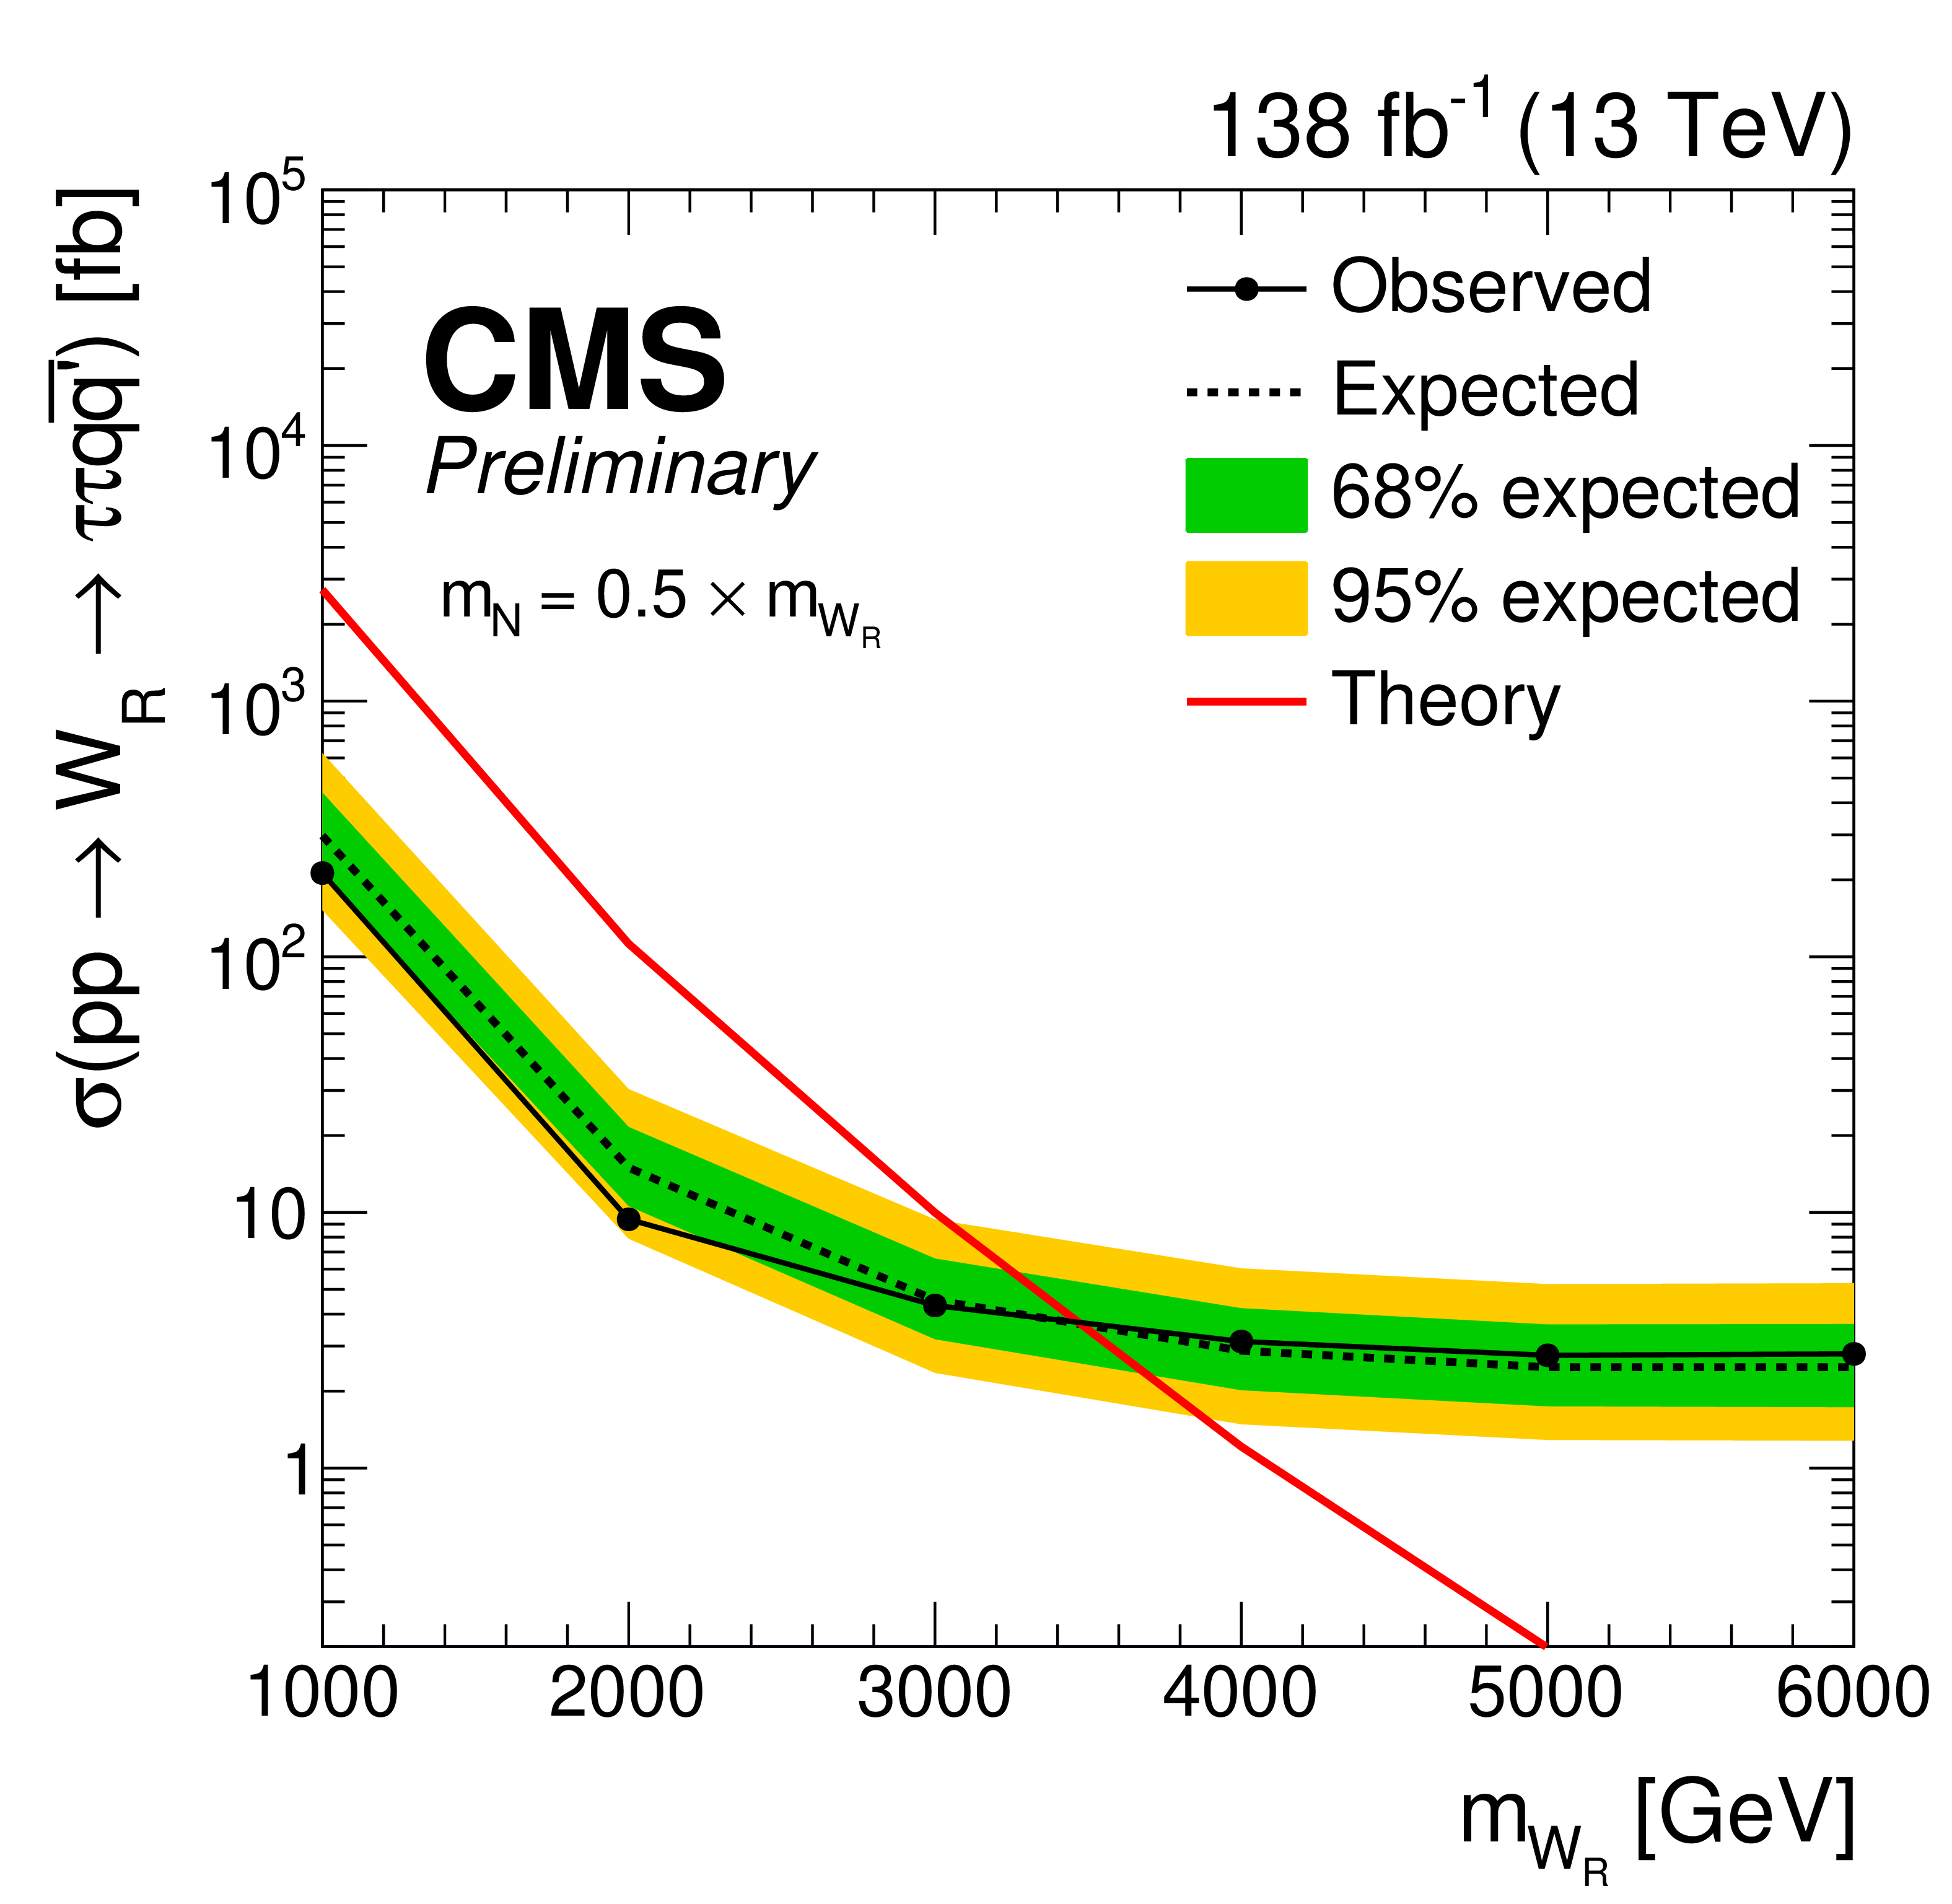
png pdf |
Figure 5-b:
Upper limits at 95% CL on the product of the $ \mathrm{W_R} $ boson production cross section and the branching fraction, obtained by combining the resolved and boosted categories. The left (right) limit is the result for the $ m_{\mathrm{N}} = $ 0.1 TeV ($ m_{\mathrm{N}} = m_{\mathrm{W_R}}/ $ 2) mass point, which corresponds to the boosted (resolved) $ \mathrm{W_R} $ boson decay topology. The observed (median expected) limit is shown as the solid (dashed) black line, and the green (inner) and yellow (outer) bands indicate the 68 and 95% coverage of the expected limit. The red line represents the theory prediction. |
png pdf |
Figure 6:
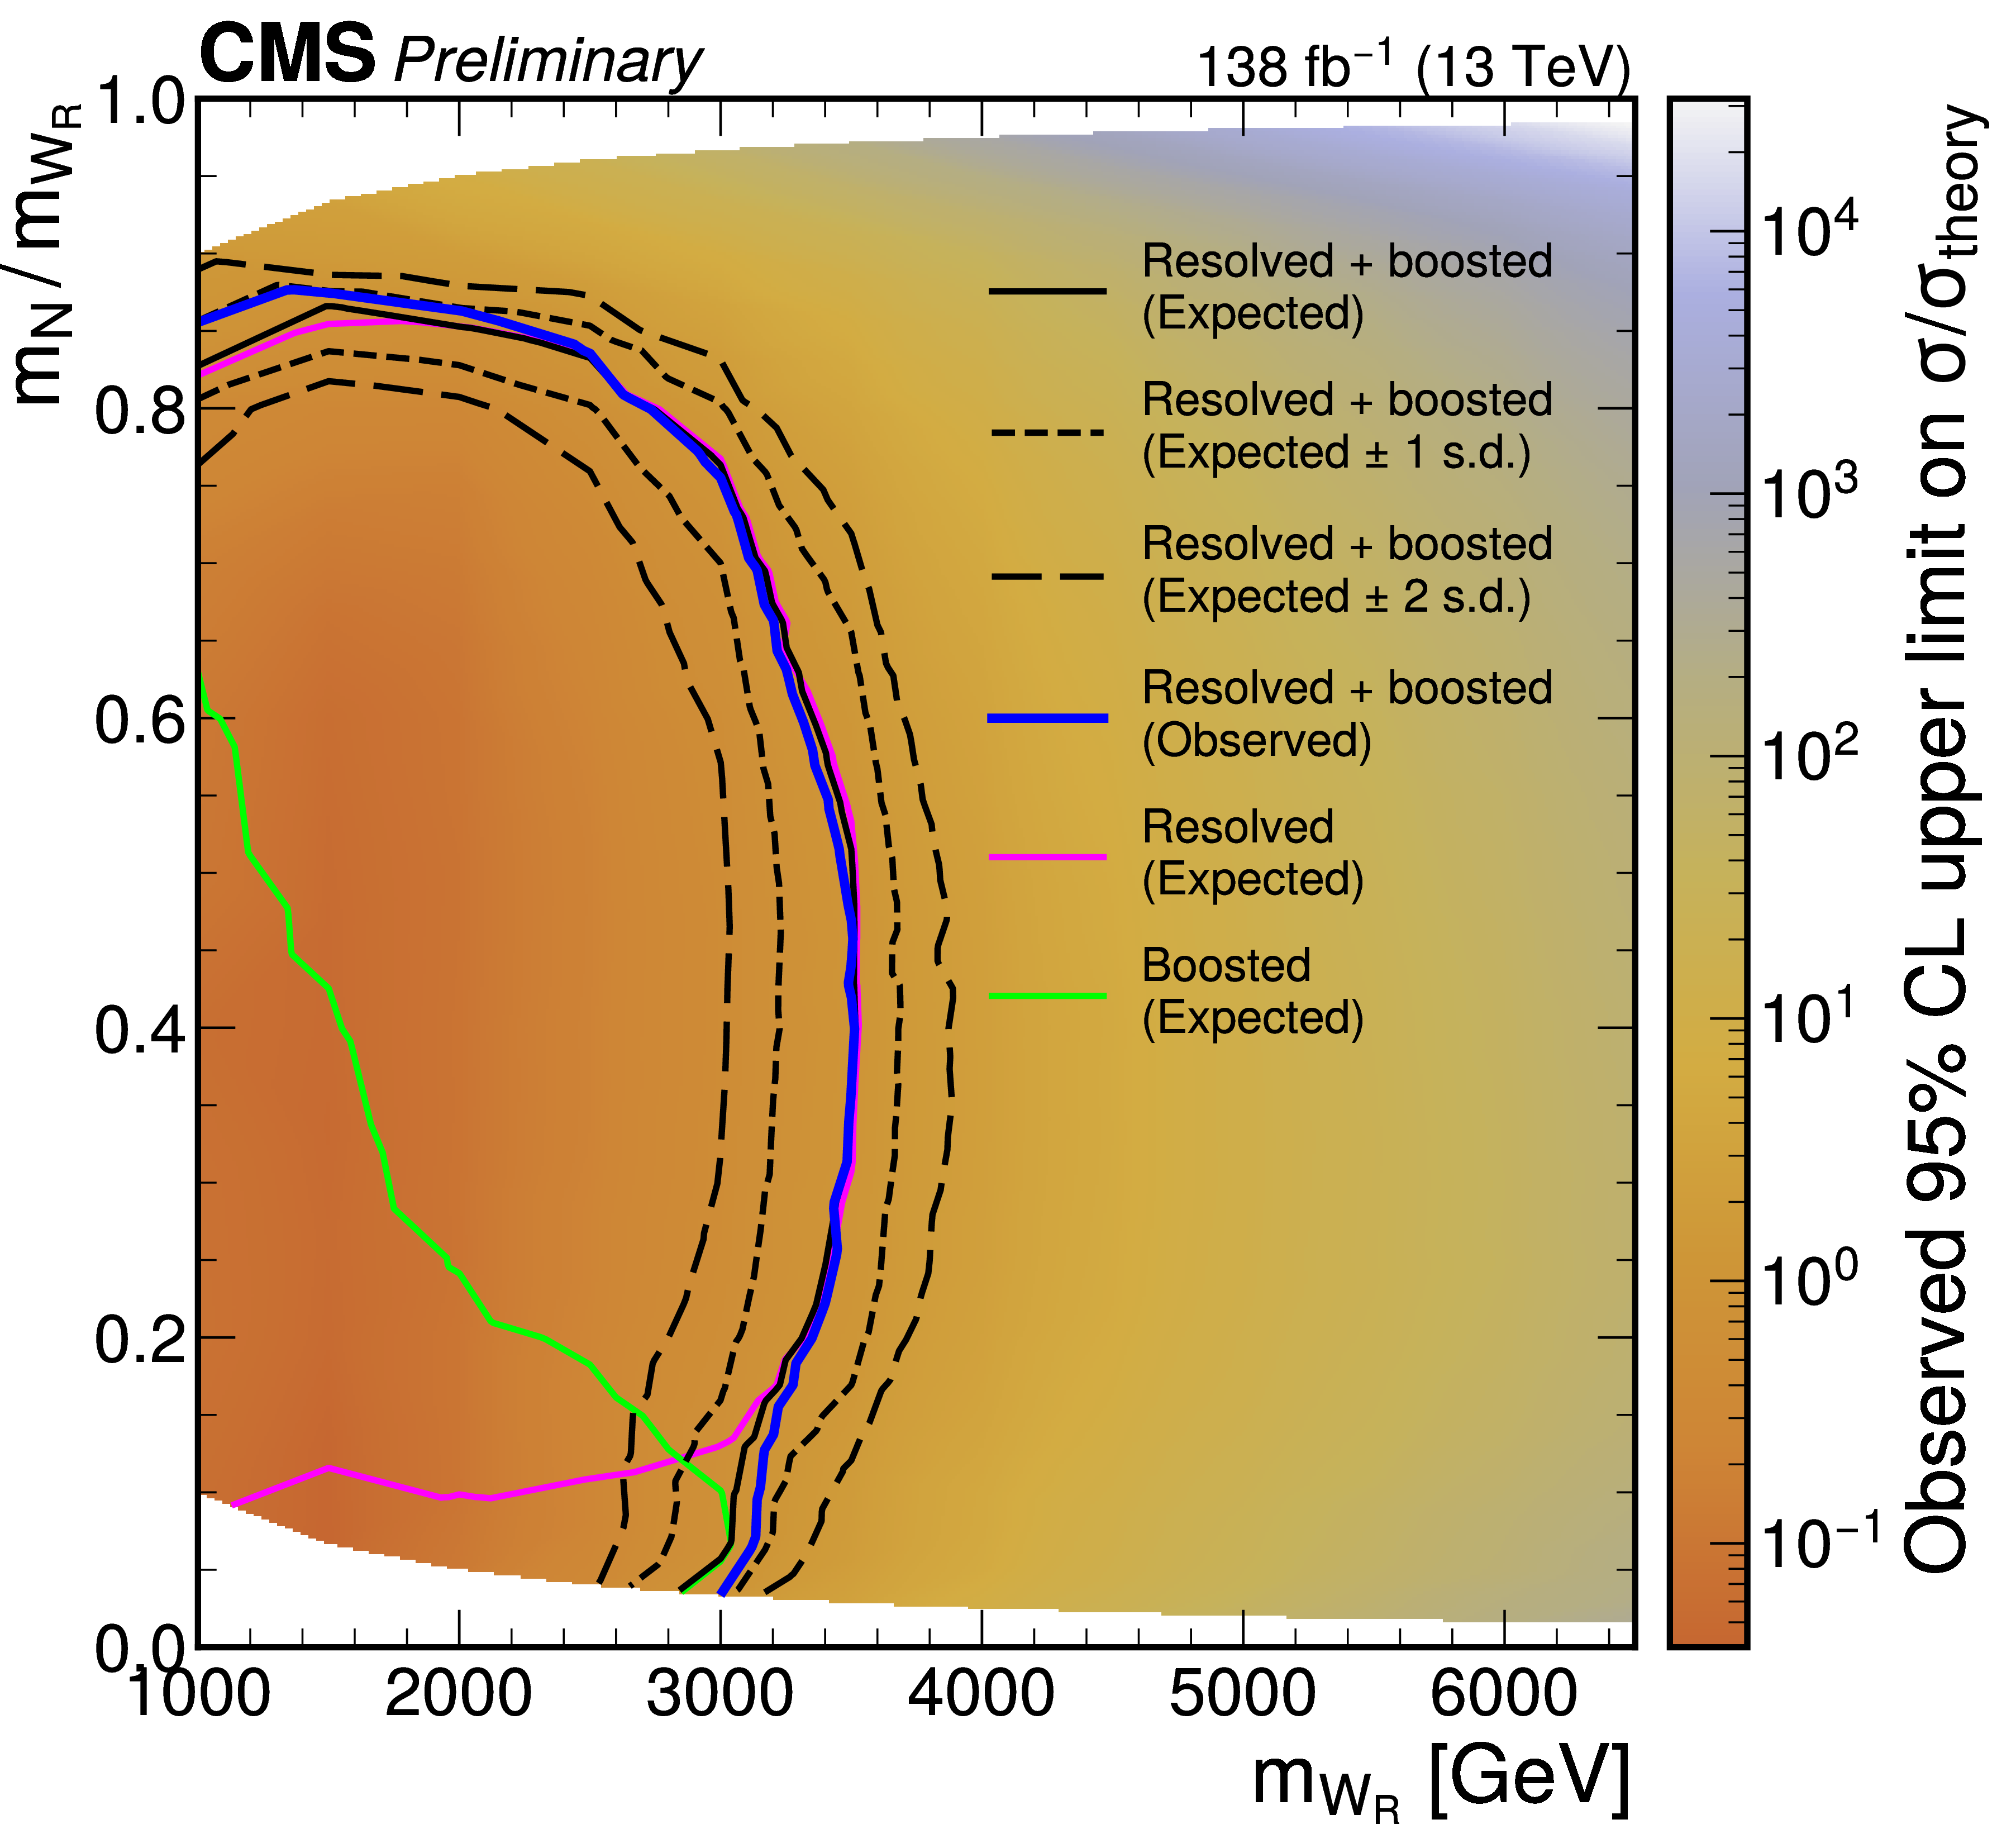
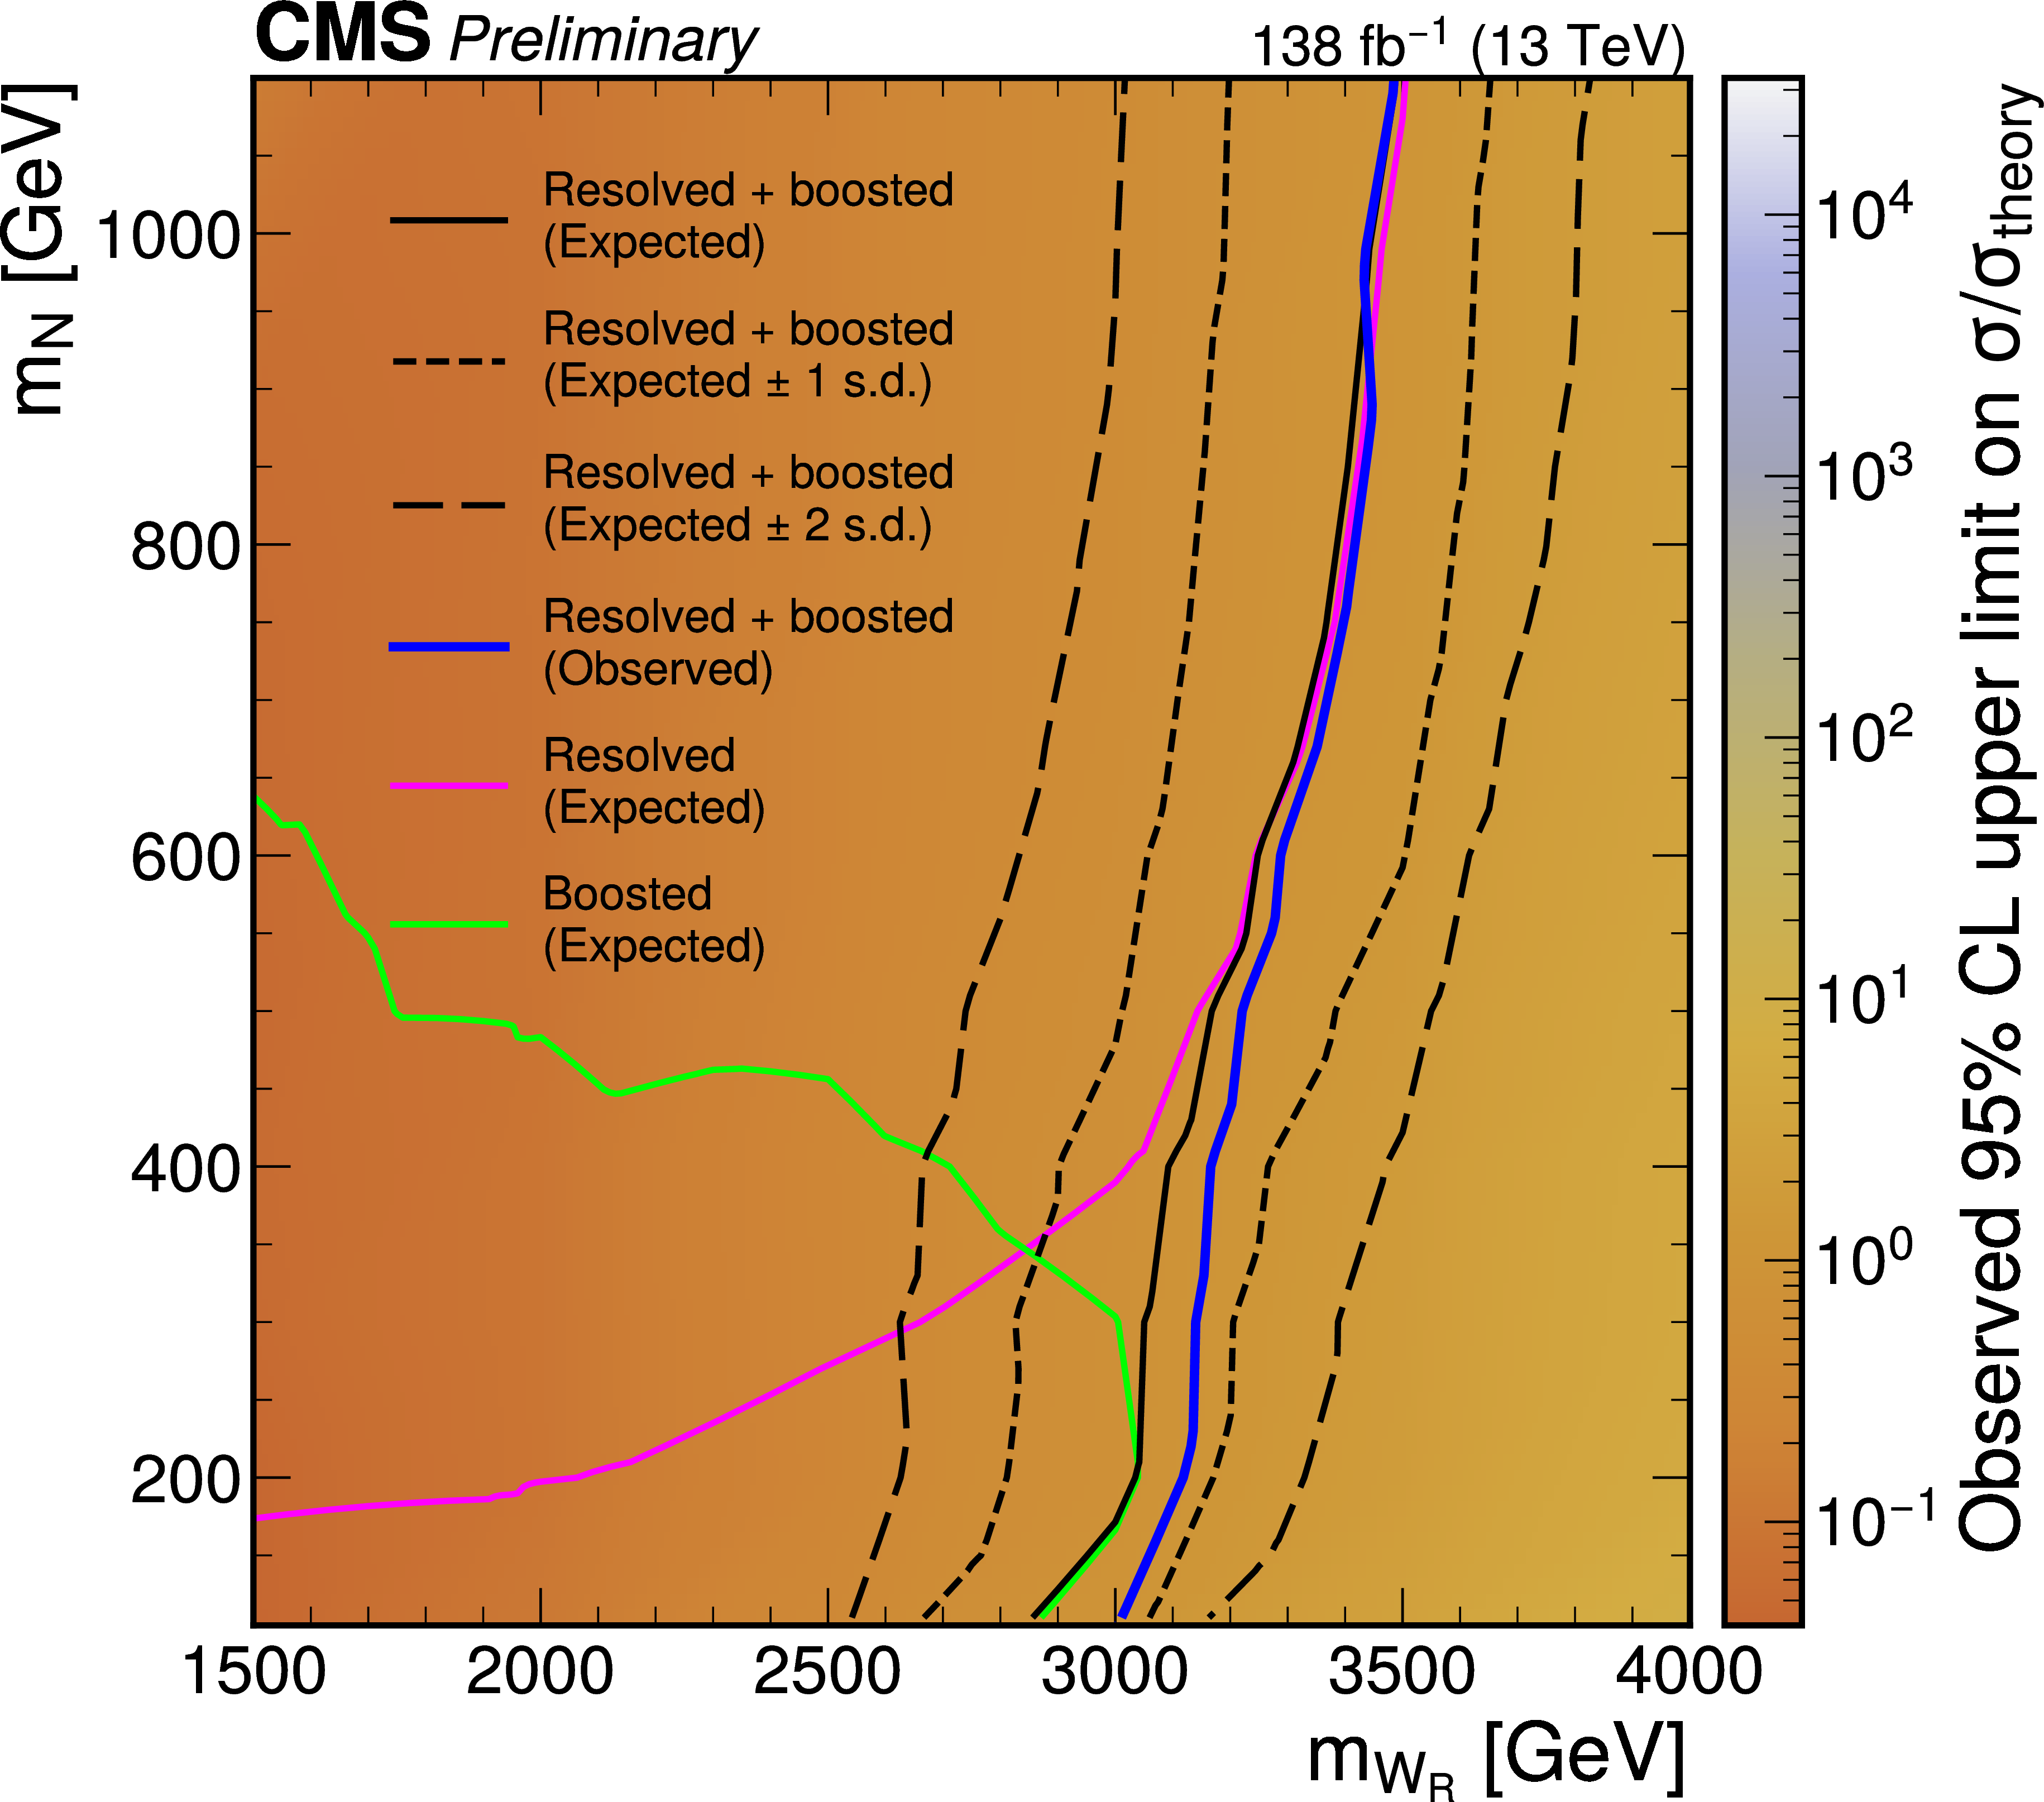
Upper limits at 95% CL on the product of the $ \mathrm{W_R} $ boson production cross section and the branching fraction, divided by the theory prediction (color scale), in the $ (m_{\mathrm{W_R}},m_{\mathrm{N}}/m_{\mathrm{W_R}}) $ plane (left) and in the $ (m_{\mathrm{W_R}},m_{\mathrm{N}}) $ plane with $ m_{\mathrm{N}} < $ 1 TeV (right) to emphasize the boosted regime. The observed exclusion contours are shown for the combined (blue) channel; the combined median expected contour is shown as the solid black line, with its 68 and 95% (${\pm}$1 and ${\pm}$2 standard deviations) bands depicted as dotted and dashed black lines, respectively. The median expected contours for the resolved and boosted categories are shown in magenta and green, respectively. The values at intermediate masses are obtained by linear interpolation between the simulated hypotheses using a Delaunay triangulation of the mass grid. |
png pdf |
Figure 6-a:
Upper limits at 95% CL on the product of the $ \mathrm{W_R} $ boson production cross section and the branching fraction, divided by the theory prediction (color scale), in the $ (m_{\mathrm{W_R}},m_{\mathrm{N}}/m_{\mathrm{W_R}}) $ plane (left) and in the $ (m_{\mathrm{W_R}},m_{\mathrm{N}}) $ plane with $ m_{\mathrm{N}} < $ 1 TeV (right) to emphasize the boosted regime. The observed exclusion contours are shown for the combined (blue) channel; the combined median expected contour is shown as the solid black line, with its 68 and 95% (${\pm}$1 and ${\pm}$2 standard deviations) bands depicted as dotted and dashed black lines, respectively. The median expected contours for the resolved and boosted categories are shown in magenta and green, respectively. The values at intermediate masses are obtained by linear interpolation between the simulated hypotheses using a Delaunay triangulation of the mass grid. |
png pdf |
Figure 6-b:
Upper limits at 95% CL on the product of the $ \mathrm{W_R} $ boson production cross section and the branching fraction, divided by the theory prediction (color scale), in the $ (m_{\mathrm{W_R}},m_{\mathrm{N}}/m_{\mathrm{W_R}}) $ plane (left) and in the $ (m_{\mathrm{W_R}},m_{\mathrm{N}}) $ plane with $ m_{\mathrm{N}} < $ 1 TeV (right) to emphasize the boosted regime. The observed exclusion contours are shown for the combined (blue) channel; the combined median expected contour is shown as the solid black line, with its 68 and 95% (${\pm}$1 and ${\pm}$2 standard deviations) bands depicted as dotted and dashed black lines, respectively. The median expected contours for the resolved and boosted categories are shown in magenta and green, respectively. The values at intermediate masses are obtained by linear interpolation between the simulated hypotheses using a Delaunay triangulation of the mass grid. |
| Tables | |
png pdf |
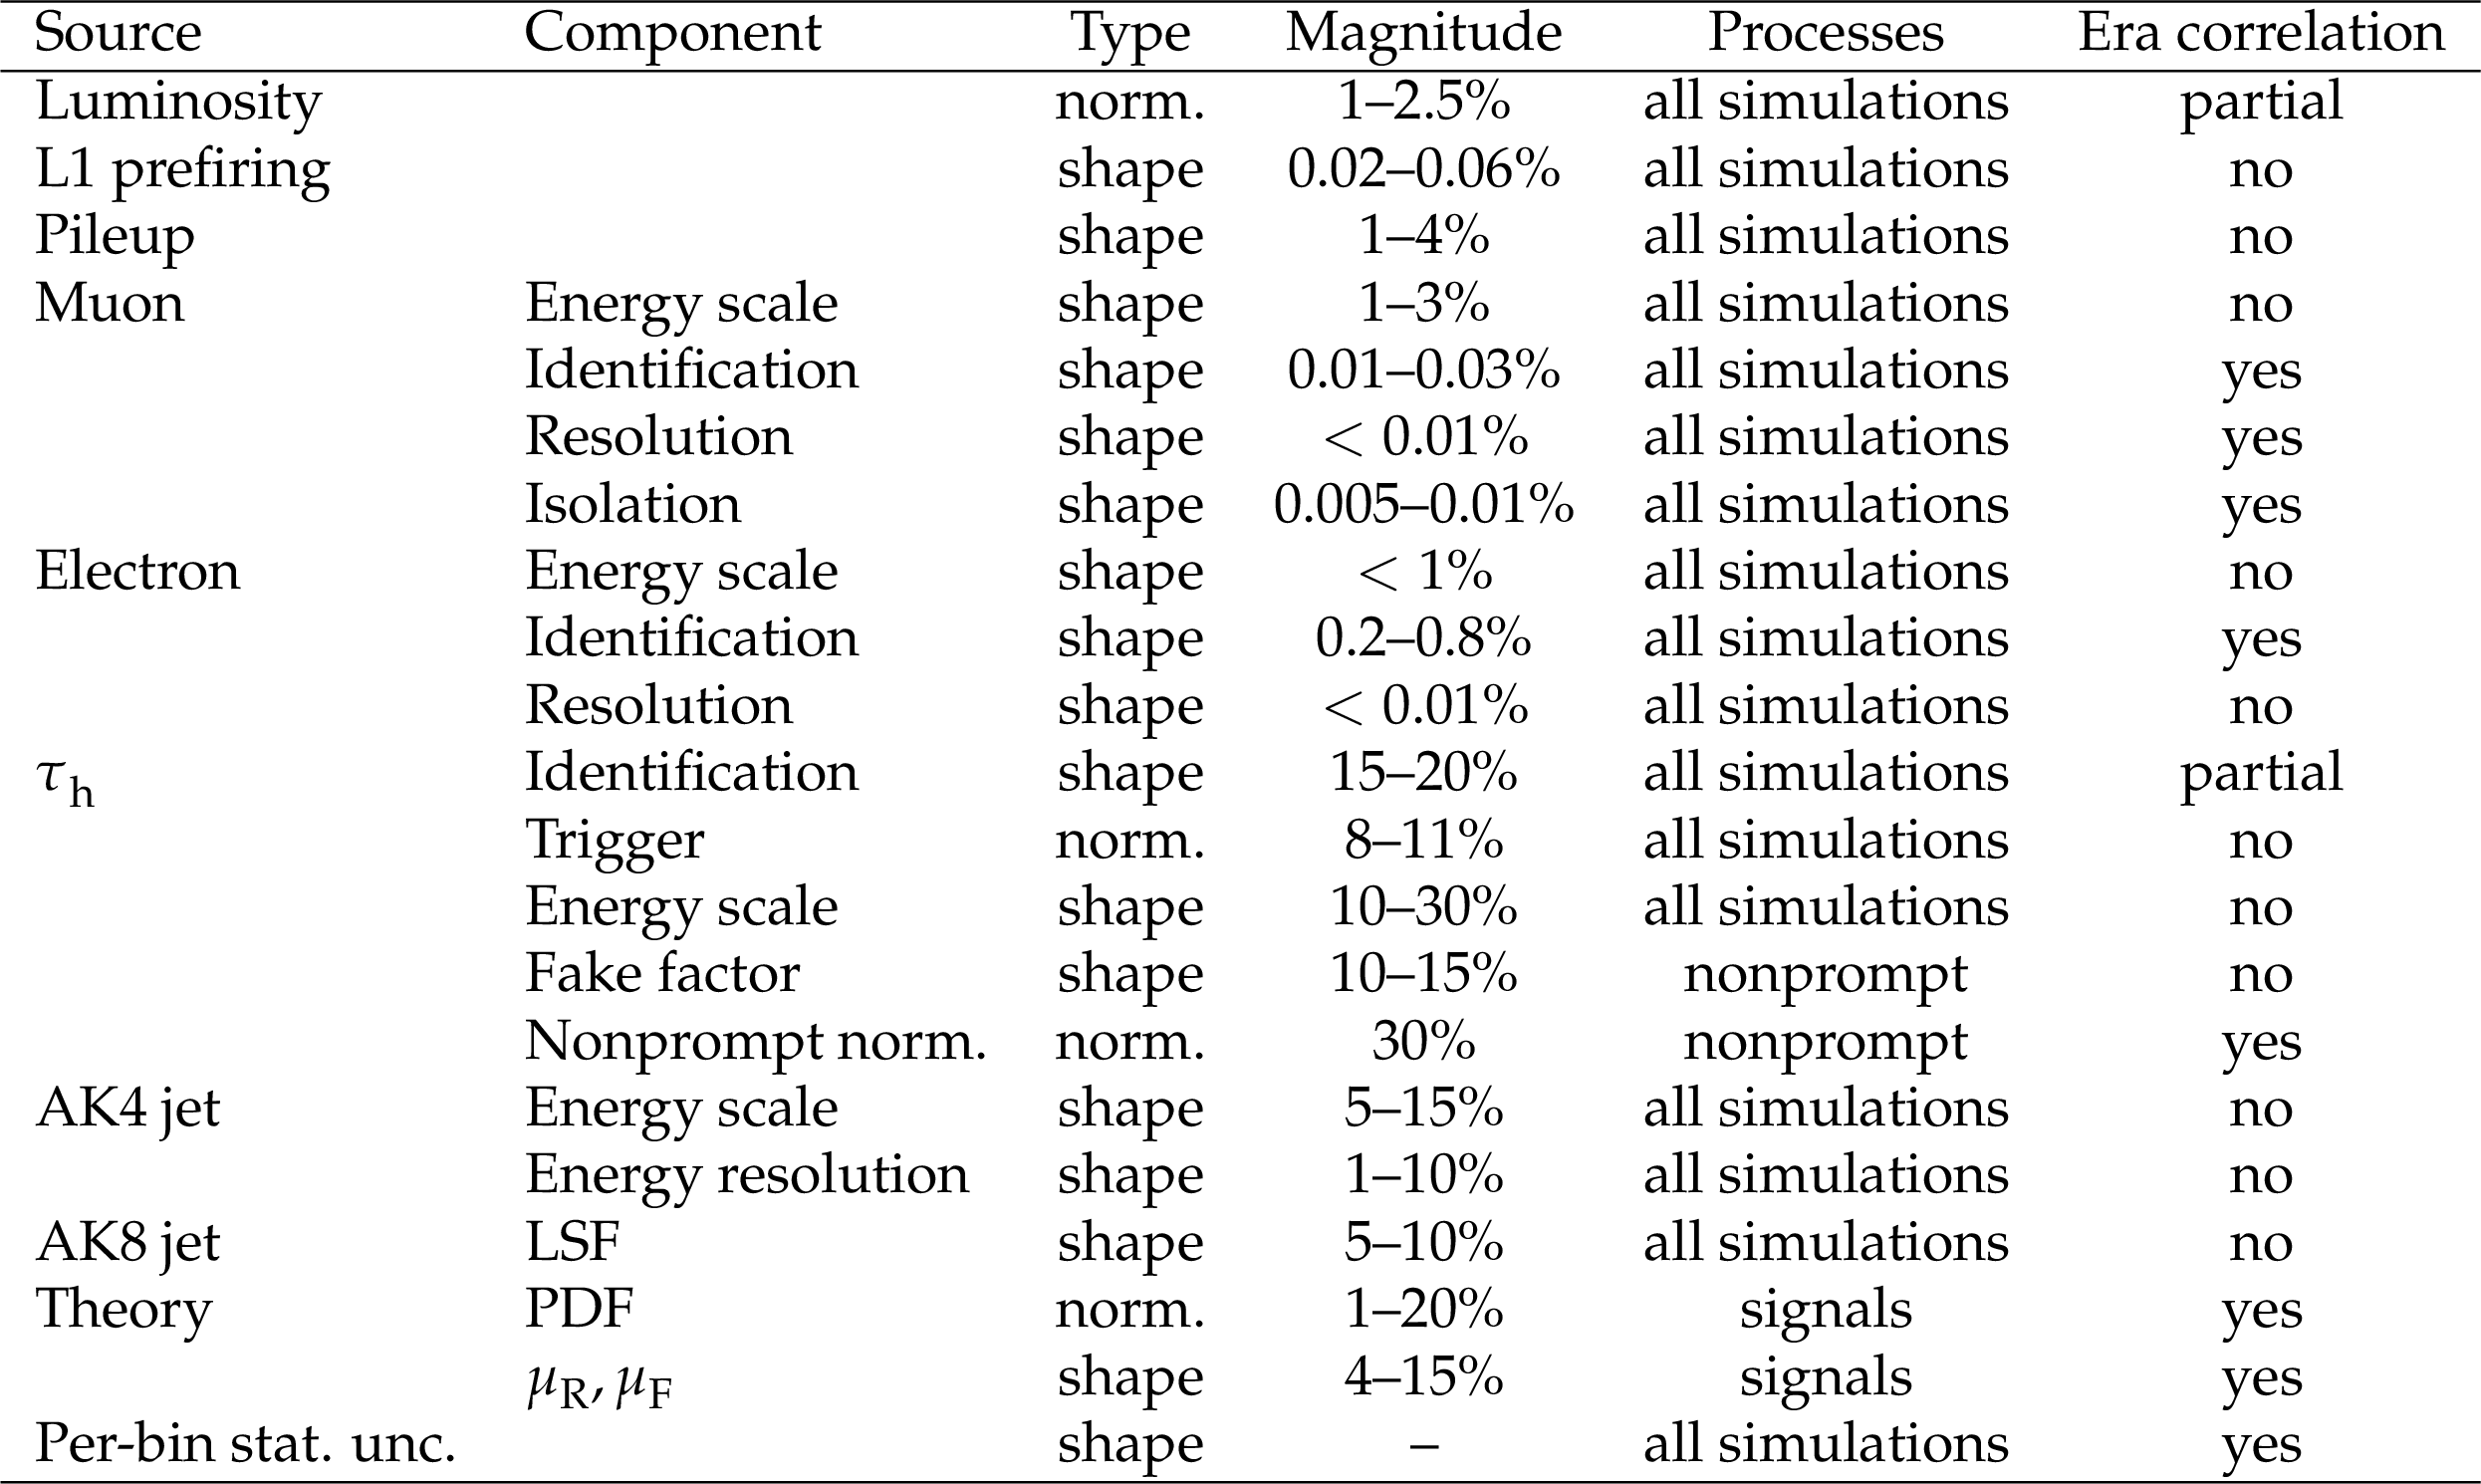
Table 1:
Summary of the systematic uncertainties considered in this analysis. For each source, the type, magnitude, affected processes, and correlation across data-taking eras are listed. The magnitude refers to the variation applied to each source. Sources of type ``norm.'' are included as a normalization-only effect on the signal and background yields, while those of type ``shape'' affect the bin-by-bin distribution of the final discriminant template used in the fit. |
| Summary |
| A search for right-handed W bosons ($ \mathrm{W_R} $) and heavy neutral leptons ($ \mathrm{N} $) in the left-right symmetric extension of the standard model has been presented. The analysis is based on proton-proton collision data collected at $ \sqrt{s} = $ 13 TeV with the CMS detector, corresponding to an integrated luminosity of 138 fb$ ^{-1} $. The final state of interest consists of two $ \tau $ leptons, one decaying hadronically and the other leptonically, and two quarks, and events are categorized into two regions: the resolved region, in which all four objects are well separated, and the boosted region, where the heavy neutral lepton decay is identified using jet substructure techniques applied to large-radius jets. The inclusion of the boosted region significantly enhances the search sensitivity for $ \mathrm{N} $ masses $ m_{\mathrm{N}} < $ 0.5 TeV. Upper limits are set on the product of the $ \mathrm{W_R} $ boson production cross section and the branching fraction for the decay chain into two $ \tau $ leptons and two quarks, assuming couplings identical to those in the standard model. For $ m_{\mathrm{N}} = m_{\mathrm{W_R}}/ $ 2, where $ m_{\mathrm{W_R}} $ is the $ \mathrm{W_R} $ boson mass, the observed (expected) lower limit on $ m_{\mathrm{W_R}} $ at 95% confidence level is 3.47 (3.48) TeV. By introducing a dedicated boosted category, this analysis sets the most stringent limits in the $ \tau $ channel at low $ m_{\mathrm{N}} $. For example, at $ m_{\mathrm{N}}=0.2 m_{\mathrm{W_R}} $ the observed lower limit on $ m_{\mathrm{W_R}} $ increases from 2.75 TeV, obtained by the previous CMS search in the fully hadronic final state with two hadronically decaying $ \tau $ leptons and two jets [9], to 3.35 TeV. For $ m_{\mathrm{N}} = $ 100 GeV, the corresponding observed (expected) limit is 3.07 (2.93) TeV, a region of parameter space for which no experimental limits had previously been set in the $ \tau $ channel. At larger $ m_{\mathrm{N}} $, the fully hadronic di-$ \tau $ search retains greater sensitivity, making the two $ \tau $-channel results complementary across the $ (m_{\mathrm{W_R}},m_{\mathrm{N}}) $ plane. These results are also complementary to the most stringent existing bounds on $ \mathrm{W_R} $ bosons, which come from CMS searches in the same-flavor dilepton channels using the same 138 fb$ ^{-1} $ data set, where $ m_{\mathrm{W_R}} $ is excluded up to 4.7 and 5.0 TeV in the electron and muon channels, respectively [57]. The $ \tau $ lepton channel probes a complementary and theoretically motivated region of the parameter space of the left-right symmetric model, given that right-handed neutrino masses and mixings are flavor dependent and constraints from the leptonic channels do not directly translate to the $ \tau $ lepton sector. No equivalent limits in the $ \tau $ lepton channel have been reported by the ATLAS Collaboration. Exploiting the full $ \sqrt{s}= $ 13 TeV data set of 138 fb$ ^{-1} $ in the final state with one electron or muon (\ell), one hadronically decaying $ \tau $ lepton, and two jets, and introducing a dedicated boosted signal region targeting $ \mathrm{W_R} $ boson decay topologies in which the $ \mathrm{N} $ decay products are reconstructed as a single large-radius jet, this analysis therefore provides the most stringent constraints to date on $ \mathrm{W_R} $ bosons decaying through $ \tau $-flavored heavy neutral leptons, and the first such limits at low $ m_{\mathrm{N}} $, where the boosted category contributes significantly to the sensitivity. \newpage |
| References | ||||
| 1 | Super-Kamiokande Collaboration | Evidence for oscillation of atmospheric neutrinos | PRL 81 (1998) 1562 | hep-ex/9807003 |
| 2 | SNO Collaboration | Direct evidence for neutrino flavor transformation from neutral-current interactions in SNO | AIP Conf. Proc. 646 (2002) 43 | |
| 3 | Particle Data Group Collaboration | Review of particle physics | PRD 110 (2024) 030001 | |
| 4 | KATRIN Collaboration | Direct neutrino mass measurement at the KATRIN experiment | PoS EPS-HEP 173, 2026 link |
|
| 5 | J. C. Pati and A. Salam | Lepton number as the fourth color | PRD 10 (1974) 275 | |
| 6 | R. N. Mohapatra and J. C. Pati | A natural left-right symmetry | PRD 11 (1975) 2558 | |
| 7 | P. Minkowski | $ \mu \to e\gamma $ at a rate of one out of $ 10^{9} $ muon decays? | PLB 67 (1977) 421 | |
| 8 | R. N. Mohapatra and G. Senjanovic | Neutrino mass and spontaneous parity nonconservation | PRL 44 (1980) 912 | |
| 9 | CMS Collaboration | Search for heavy neutrinos and third-generation leptoquarks in hadronic states of two $ \tau $ leptons and two jets in proton-proton collisions at $ \sqrt{s}= $ 13 TeV | JHEP 03 (2019) 170 | CMS-EXO-17-016 1811.00806 |
| 10 | CMS Collaboration | Search for third-generation scalar leptoquarks and heavy right-handed neutrinos in final states with two tau leptons and two jets in proton-proton collisions at $ \sqrt{s}= $ 13 TeV | JHEP 07 (2017) 121 | CMS-EXO-16-023 1703.03995 |
| 11 | C. Brust et al. | Identifying boosted new physics with non-isolated leptons | JHEP 04 (2015) 079 | 1410.0362 |
| 12 | CMS Collaboration | The CMS experiment at the CERN LHC | JINST 3 (2008) S08004 | |
| 13 | CMS Collaboration | Development of the CMS detector for the CERN LHC Run 3 | JINST 19 (2024) P05064 | CMS-PRF-21-001 2309.05466 |
| 14 | CMS Collaboration | Performance of the CMS Level-1 trigger in proton-proton collisions at $ \sqrt{s} = $ 13 TeV | JINST 15 (2020) P10017 | CMS-TRG-17-001 2006.10165 |
| 15 | CMS Collaboration | The CMS trigger system | JINST 12 (2017) P01020 | CMS-TRG-12-001 1609.02366 |
| 16 | CMS Collaboration | Performance of the CMS high-level trigger during LHC Run 2 | JINST 19 (2024) P11021 | CMS-TRG-19-001 2410.17038 |
| 17 | CMS Collaboration | Electron and photon reconstruction and identification with the CMS experiment at the CERN LHC | JINST 16 (2021) P05014 | CMS-EGM-17-001 2012.06888 |
| 18 | CMS Collaboration | Performance of the CMS muon detector and muon reconstruction with proton-proton collisions at $ \sqrt{s}= $ 13 TeV | JINST 13 (2018) P06015 | CMS-MUO-16-001 1804.04528 |
| 19 | CMS Collaboration | Description and performance of track and primary-vertex reconstruction with the CMS tracker | JINST 9 (2014) P10009 | CMS-TRK-11-001 1405.6569 |
| 20 | CMS Collaboration | Precision luminosity measurement in proton-proton collisions at $ \sqrt{s} = $ 13 TeV in 2015 and 2016 at CMS | EPJC 81 (2021) 800 | CMS-LUM-17-003 2104.01927 |
| 21 | CMS Collaboration | Precision luminosity measurement in proton-proton collisions at a center-of-mass energy of 13 TeV with the CMS detector at the Large Hadron Collider | CMS-LUM-20-001 2606.26832 |
|
| 22 | J. Alwall et al. | The automated computation of tree-level and next-to-leading order differential cross sections, and their matching to parton shower simulations | JHEP 07 (2014) 079 | 1405.0301 |
| 23 | M. Mitra, R. Ruiz, D. J. Scott, and M. Spannowsky | Neutrino jets from high-mass $ W_R $ gauge bosons in TeV-scale left-right symmetric models | PRD 94 (2016) 095016 | 1607.03504 |
| 24 | J. Alwall et al. | Comparative study of various algorithms for the merging of parton showers and matrix elements in hadronic collisions | EPJC 53 (2007) 473 | |
| 25 | P. Nason | A new method for combining NLO QCD with shower Monte Carlo algorithms | JHEP 11 (2004) 040 | hep-ph/0409146 |
| 26 | S. Frixione, P. Nason, and C. Oleari | Matching NLO QCD computations with parton shower simulations: The POWHEG method | JHEP 11 (2007) 070 | 0709.2092 |
| 27 | S. Alioli, P. Nason, C. Oleari, and E. Re | A general framework for implementing NLO calculations in shower Monte Carlo programs: The POWHEG BOX | JHEP 06 (2010) 043 | 1002.2581 |
| 28 | S. Frixione, P. Nason, and G. Ridolfi | A positive-weight next-to-leading-order Monte Carlo for heavy flavour hadroproduction | JHEP 09 (2007) 126 | 0707.3088 |
| 29 | J. M. Campbell, R. K. Ellis, P. Nason, and E. Re | Top-pair production and decay at NLO matched with parton showers | JHEP 04 (2015) 114 | 1412.1828 |
| 30 | S. Alioli, P. Nason, C. Oleari, and E. Re | NLO single-top production matched with shower in POWHEG: $ s $- and $ t $-channel contributions | JHEP 09 (2009) 111 | 0907.4076 |
| 31 | Y. Li and F. Petriello | Combining QCD and electroweak corrections to dilepton production in FEWZ | PRD 86 (2012) 094034 | 1208.5967 |
| 32 | M. Czakon and A. Mitov | Top++: A program for the calculation of the top-pair cross-section at hadron colliders | Comput. Phys. Commun. 185 (2014) 2930 | 1112.5675 |
| 33 | P. Kant et al. | HatHor for single top-quark production: Updated predictions and uncertainty estimates for single top-quark production in hadronic collisions | Comput. Phys. Commun. 191 (2015) 74 | 1406.4403 |
| 34 | F. Cascioli et al. | ZZ production at hadron colliders in NNLO QCD | PLB 735 (2014) 311 | 1405.2219 |
| 35 | CMS Collaboration | Extraction and validation of a new set of CMS PYTHIA8 tunes from underlying-event measurements | EPJC 80 (2020) 4 | CMS-GEN-17-001 1903.12179 |
| 36 | NNPDF Collaboration | Parton distributions from high-precision collider data | EPJC 77 (2017) 663 | 1706.00428 |
| 37 | GEANT4 Collaboration | GEANT4---a simulation toolkit | NIM A 506 (2003) 250 | |
| 38 | CMS Collaboration | Particle-flow reconstruction and global event description with the CMS detector | JINST 12 (2017) P10003 | CMS-PRF-14-001 1706.04965 |
| 39 | CMS Collaboration | Technical proposal for the Phase-II upgrade of the Compact Muon Solenoid | CMS Technical Proposal CERN-LHCC-2015-010, CMS-TDR-15-02, 2015 CDS |
|
| 40 | CMS Collaboration | Performance of reconstruction and identification of $ \tau $ leptons decaying to hadrons and $ \nu_\tau $ in pp collisions at $ \sqrt{s}= $ 13 TeV | JINST 13 (2018) P10005 | CMS-TAU-16-003 1809.02816 |
| 41 | CMS Collaboration | Identification of hadronic tau lepton decays using a deep neural network | JINST 17 (2022) P07023 | CMS-TAU-20-001 2201.08458 |
| 42 | M. Cacciari, G. P. Salam, and G. Soyez | The anti-$ k_{\mathrm{T}} $ jet clustering algorithm | JHEP 04 (2008) 063 | 0802.1189 |
| 43 | M. Cacciari, G. P. Salam, and G. Soyez | FastJet user manual | EPJC 72 (2012) 1896 | 1111.6097 |
| 44 | CMS Collaboration | Jet energy scale and resolution in the CMS experiment in pp collisions at 8 TeV | JINST 12 (2017) P02014 | CMS-JME-13-004 1607.03663 |
| 45 | CMS Collaboration | Pileup mitigation at CMS in 13 TeV data | JINST 15 (2020) P09018 | CMS-JME-18-001 2003.00503 |
| 46 | D. Bertolini, P. Harris, M. Low, and N. Tran | Pileup per particle identification | JHEP 10 (2014) 059 | 1407.6013 |
| 47 | CMS Collaboration | Search for additional neutral MSSM Higgs bosons in the $ \tau\tau $ final state in proton-proton collisions at $ \sqrt{s}= $ 13 TeV | JHEP 09 (2018) 007 | CMS-HIG-17-020 1803.06553 |
| 48 | CMS Collaboration | Measurement of the $ \mathrm{Z}\gamma^{*} \to \tau\tau $ cross section in pp collisions at $ \sqrt{s} = $ 13 TeV and validation of $ \tau $ lepton analysis techniques | EPJC 78 (2018) 708 | CMS-HIG-15-007 1801.03535 |
| 49 | CMS Collaboration | Performance of the CMS electromagnetic calorimeter in pp collisions at $ \sqrt{s}= $ 13 TeV | JINST 19 (2024) P09004 | CMS-EGM-18-002 2403.15518 |
| 50 | J. Butterworth et al. | PDF4LHC recommendations for LHC Run II | JPG 43 (2016) 023001 | 1510.03865 |
| 51 | R. J. Barlow and C. Beeston | Fitting using finite Monte Carlo samples | Comput. Phys. Commun. 77 (1993) 219 | |
| 52 | J. S. Conway | Incorporating nuisance parameters in likelihoods for multisource spectra | in, 2011 PHYSTAT 201 (2011) 115 |
1103.0354 |
| 53 | CMS Collaboration | The CMS statistical analysis and combination tool: Combine | Comput. Softw. Big Sci. 8 (2024) 19 | CMS-CAT-23-001 2404.06614 |
| 54 | G. Cowan, K. Cranmer, E. Gross, and O. Vitells | Asymptotic formulae for likelihood-based tests of new physics | EPJC 71 (2011) 1554 | 1007.1727 |
| 55 | T. Junk | Confidence level computation for combining searches with small statistics | NIM A 434 (1999) 435 | hep-ex/9902006 |
| 56 | A. L. Read | Presentation of search results: The $ CL_s $ technique | JPG 28 (2002) 2693 | |
| 57 | CMS Collaboration | Search for a right-handed W boson and a heavy neutrino in proton-proton collisions at $ \sqrt{s} = $ 13 TeV | JHEP 04 (2022) 047 | CMS-EXO-20-002 2112.03949 |
|
|
Compact Muon Solenoid LHC, CERN |

|

|

|

|

|

|