

Compact Muon Solenoid
LHC, CERN
| CMS-PAS-B2G-24-010 | ||
| Search for a new resonance decaying to a pair of Higgs bosons in the $ \mathrm{W}\mathrm{W}\gamma\gamma $ final state in proton-proton collisions at $ \sqrt{s} = 13 \text{TeV} $ | ||
| CMS Collaboration | ||
| 2025-10-24 | ||
| Abstract: A search for a new resonance in a $ \mathrm{W}\mathrm{W}\gamma\gamma $ final state is presented, using CERN LHC proton-proton collision data collected during 2016-2018 by the CMS detector at $ \sqrt{s}= $ 13 TeV, and corresponding to an integrated luminosity of 138 fb$ ^{-1} $. Both the fully hadronic ($ \mathrm{W}\mathrm{W}\to\mathrm{q}\mathrm{q}\mathrm{q}\mathrm{q} $) and semileptonic decay modes ($ \mathrm{W}\mathrm{W}\to\mathrm{q}\mathrm{q}\ell\nu $) of the WW pair are considered. A model-independent search is performed by placing upper limits on the production cross section times branching fraction for a narrow resonance with a mass in the range of 250 GeV to 3 TeV decaying into a pair of Higgs bosons, without assuming any specific scenario of physics beyond the standard model. In addition, the results are interpreted within the context of representative benchmark models, including spin-2 resonances and spin-0 resonances. The observed (expected) 95% confidence level upper limits on the product of the production cross section and branching fraction to Higgs boson pairs are in the range of 30-10700 fb (45-6060 fb) for spin-2 resonances, and 32-11600 fb (48-7220 fb) for spin-0 resonances, depending on the mass of the new resonance. | ||
| Links: CDS record (PDF) ; CADI line (restricted) ; | ||
| Figures | |
png pdf |
Figure 1:
Feynman diagram for BSM X resonance production at LHC via gluon-gluon fusion; X further decays to two SM Higgs bosons with a $ \mathrm{W}\mathrm{W}\gamma\gamma $ final state. |
png pdf |
Figure 2:
Distribution of the resolved PNN scores in the $ m_{\gamma\gamma} $ sideband region. The orange and blue histograms represent the data-driven and simulated diphoton+jets backgrounds, respectively. The filled black markers show the data in the sideband region, and the solid red line indicates the signal, scaled for visibility. |
png pdf |
Figure 3:
Distribution of the boosted PNN scores in the $ m_{\gamma\gamma} $ sideband region. The orange and blue histograms represent the data-driven and simulated diphoton+jets backgrounds, respectively. The filled black markers show the data in the sideband region, and the solid red line indicates the signal, scaled for visibility. |
png pdf |
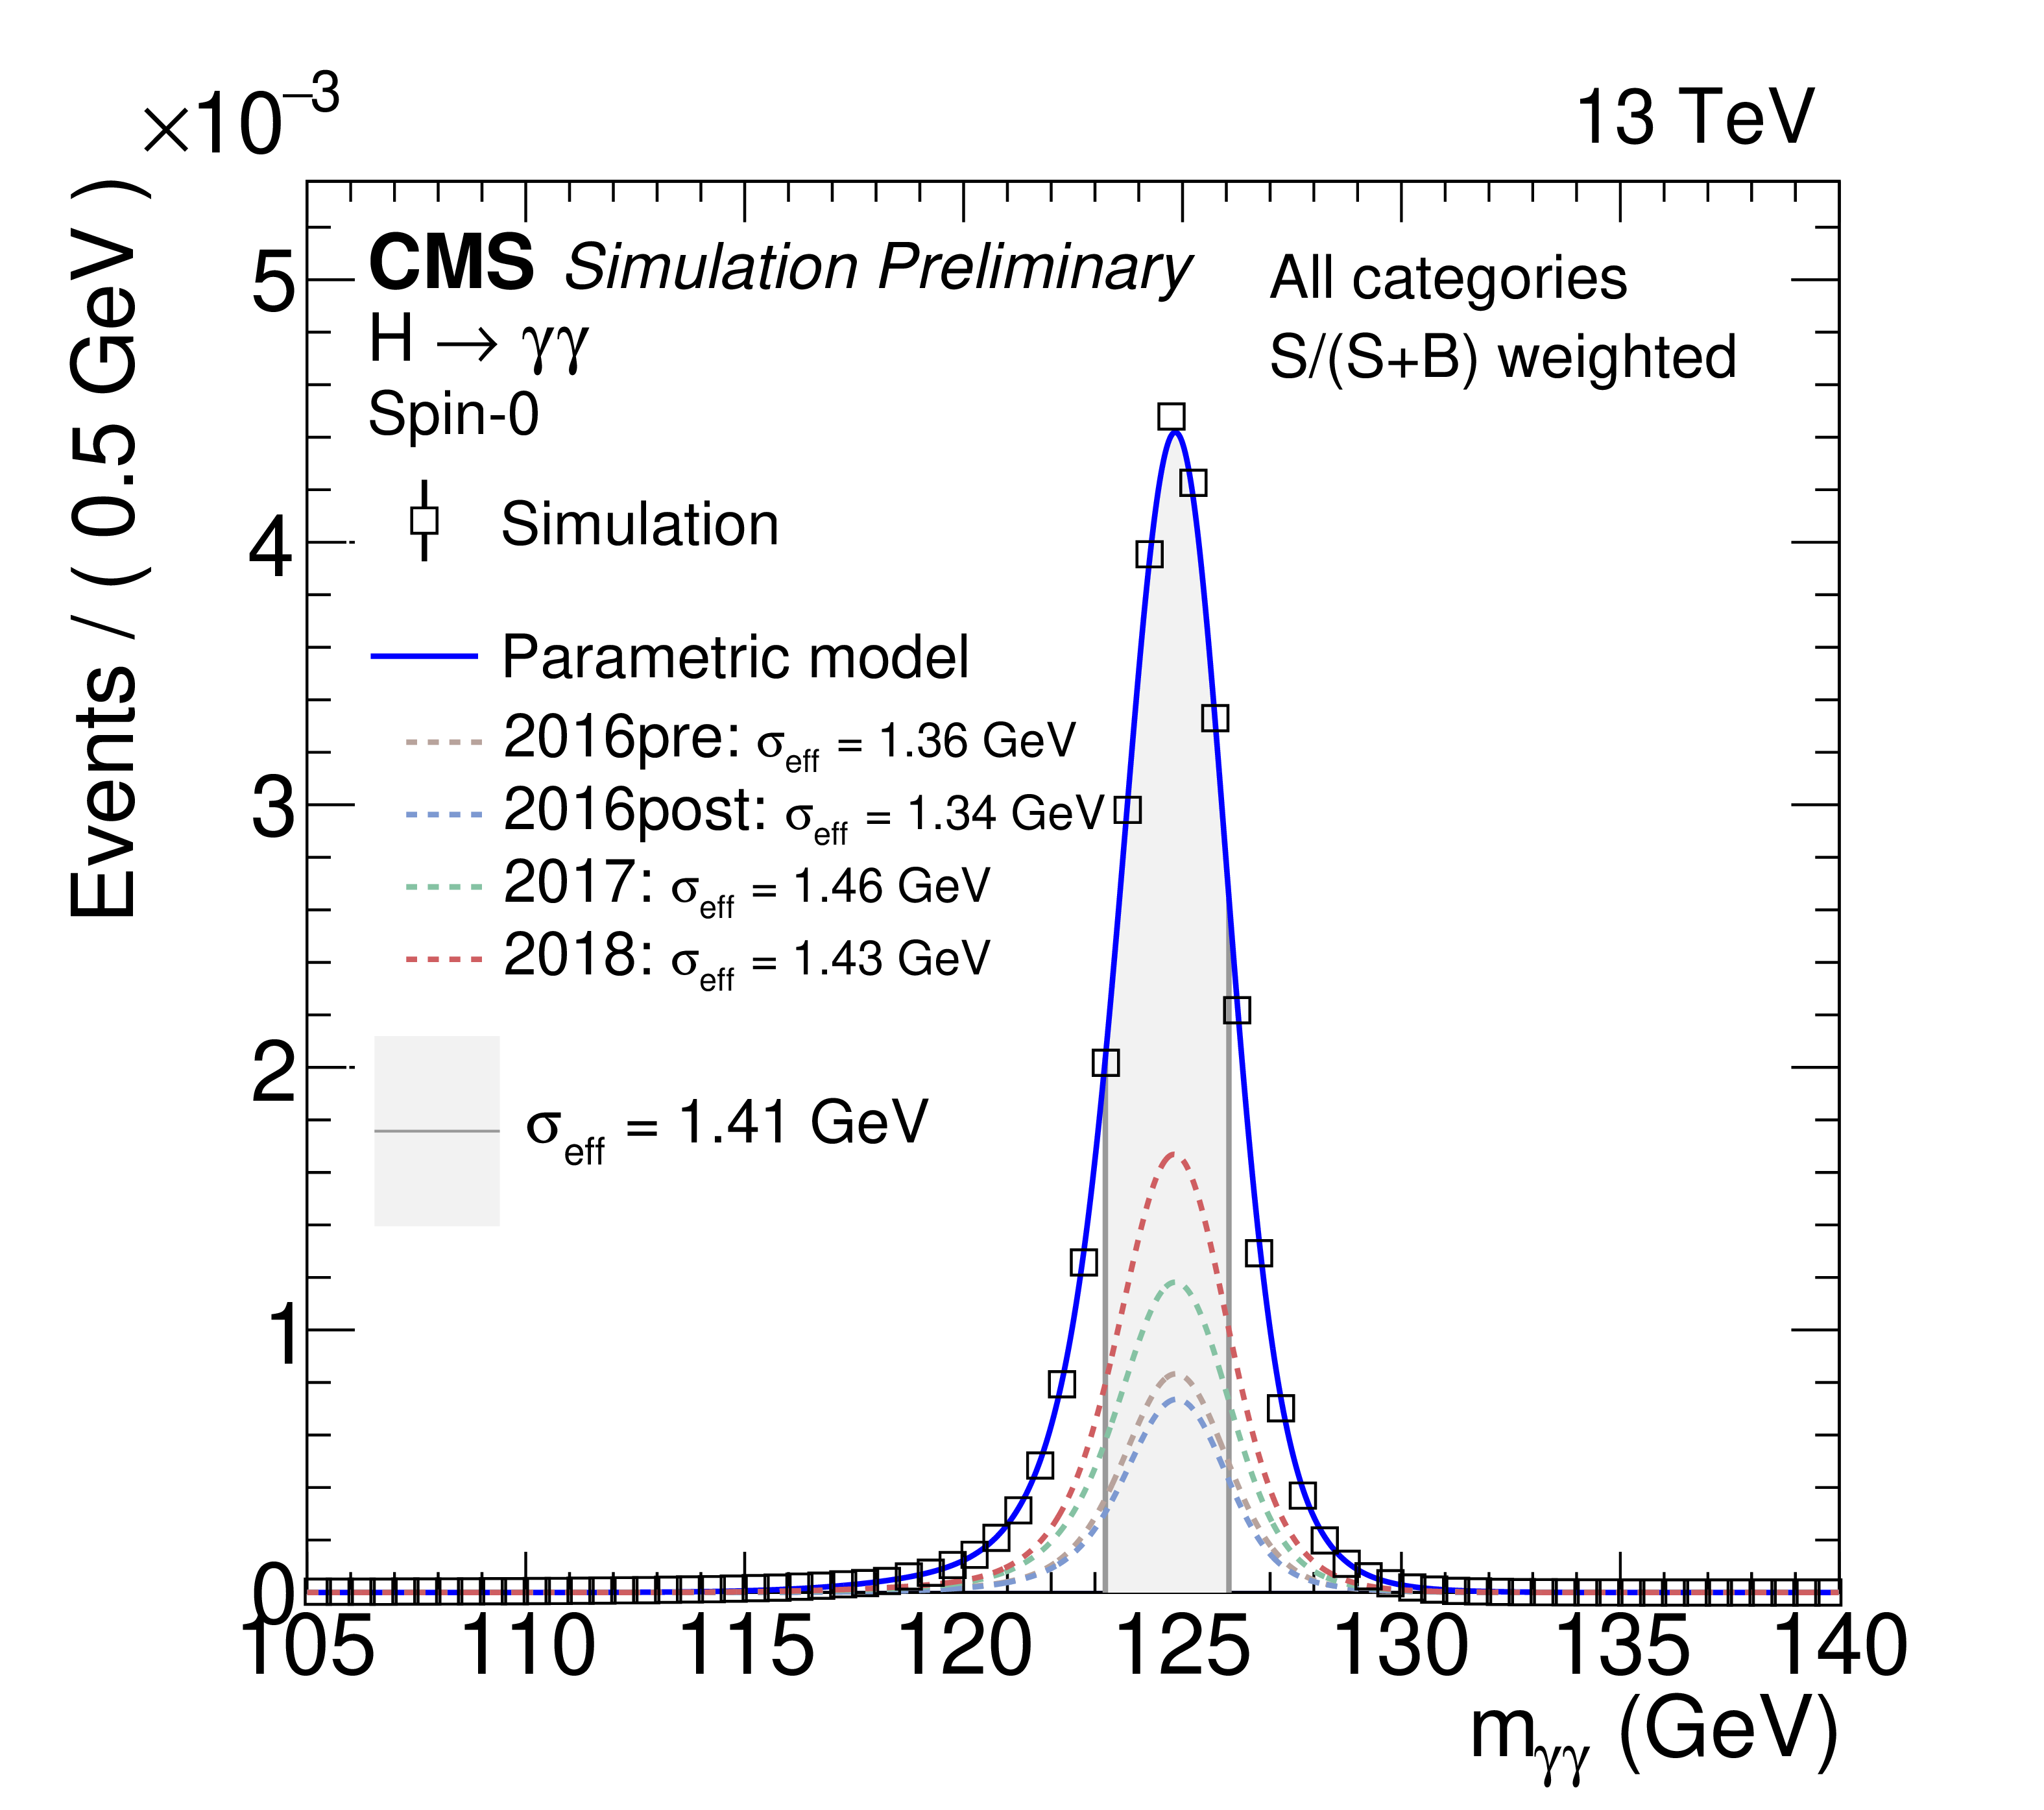
Figure 4:
The shape of the parametric signal model for each year of simulated data, and for the sum of all years together, is shown. The open squares represent weighted simulation events and the blue line the corresponding model. Also shown is the $ \sigma_{\text{eff}} $ value (half the width of the narrowest interval containing 68.3% of the $ m_{\gamma\gamma} $ distribution) in the grey shaded area. The contribution of the signal model from each year of data taking is illustrated with the dotted lines. The models are shown for the weighted sum of all analysis categories for spin-0 (left) and spin-2 (right) resonances with a mass of 1 TeV. |
png pdf |
Figure 4-a:
The shape of the parametric signal model for each year of simulated data, and for the sum of all years together, is shown. The open squares represent weighted simulation events and the blue line the corresponding model. Also shown is the $ \sigma_{\text{eff}} $ value (half the width of the narrowest interval containing 68.3% of the $ m_{\gamma\gamma} $ distribution) in the grey shaded area. The contribution of the signal model from each year of data taking is illustrated with the dotted lines. The models are shown for the weighted sum of all analysis categories for spin-0 (left) and spin-2 (right) resonances with a mass of 1 TeV. |
png pdf |
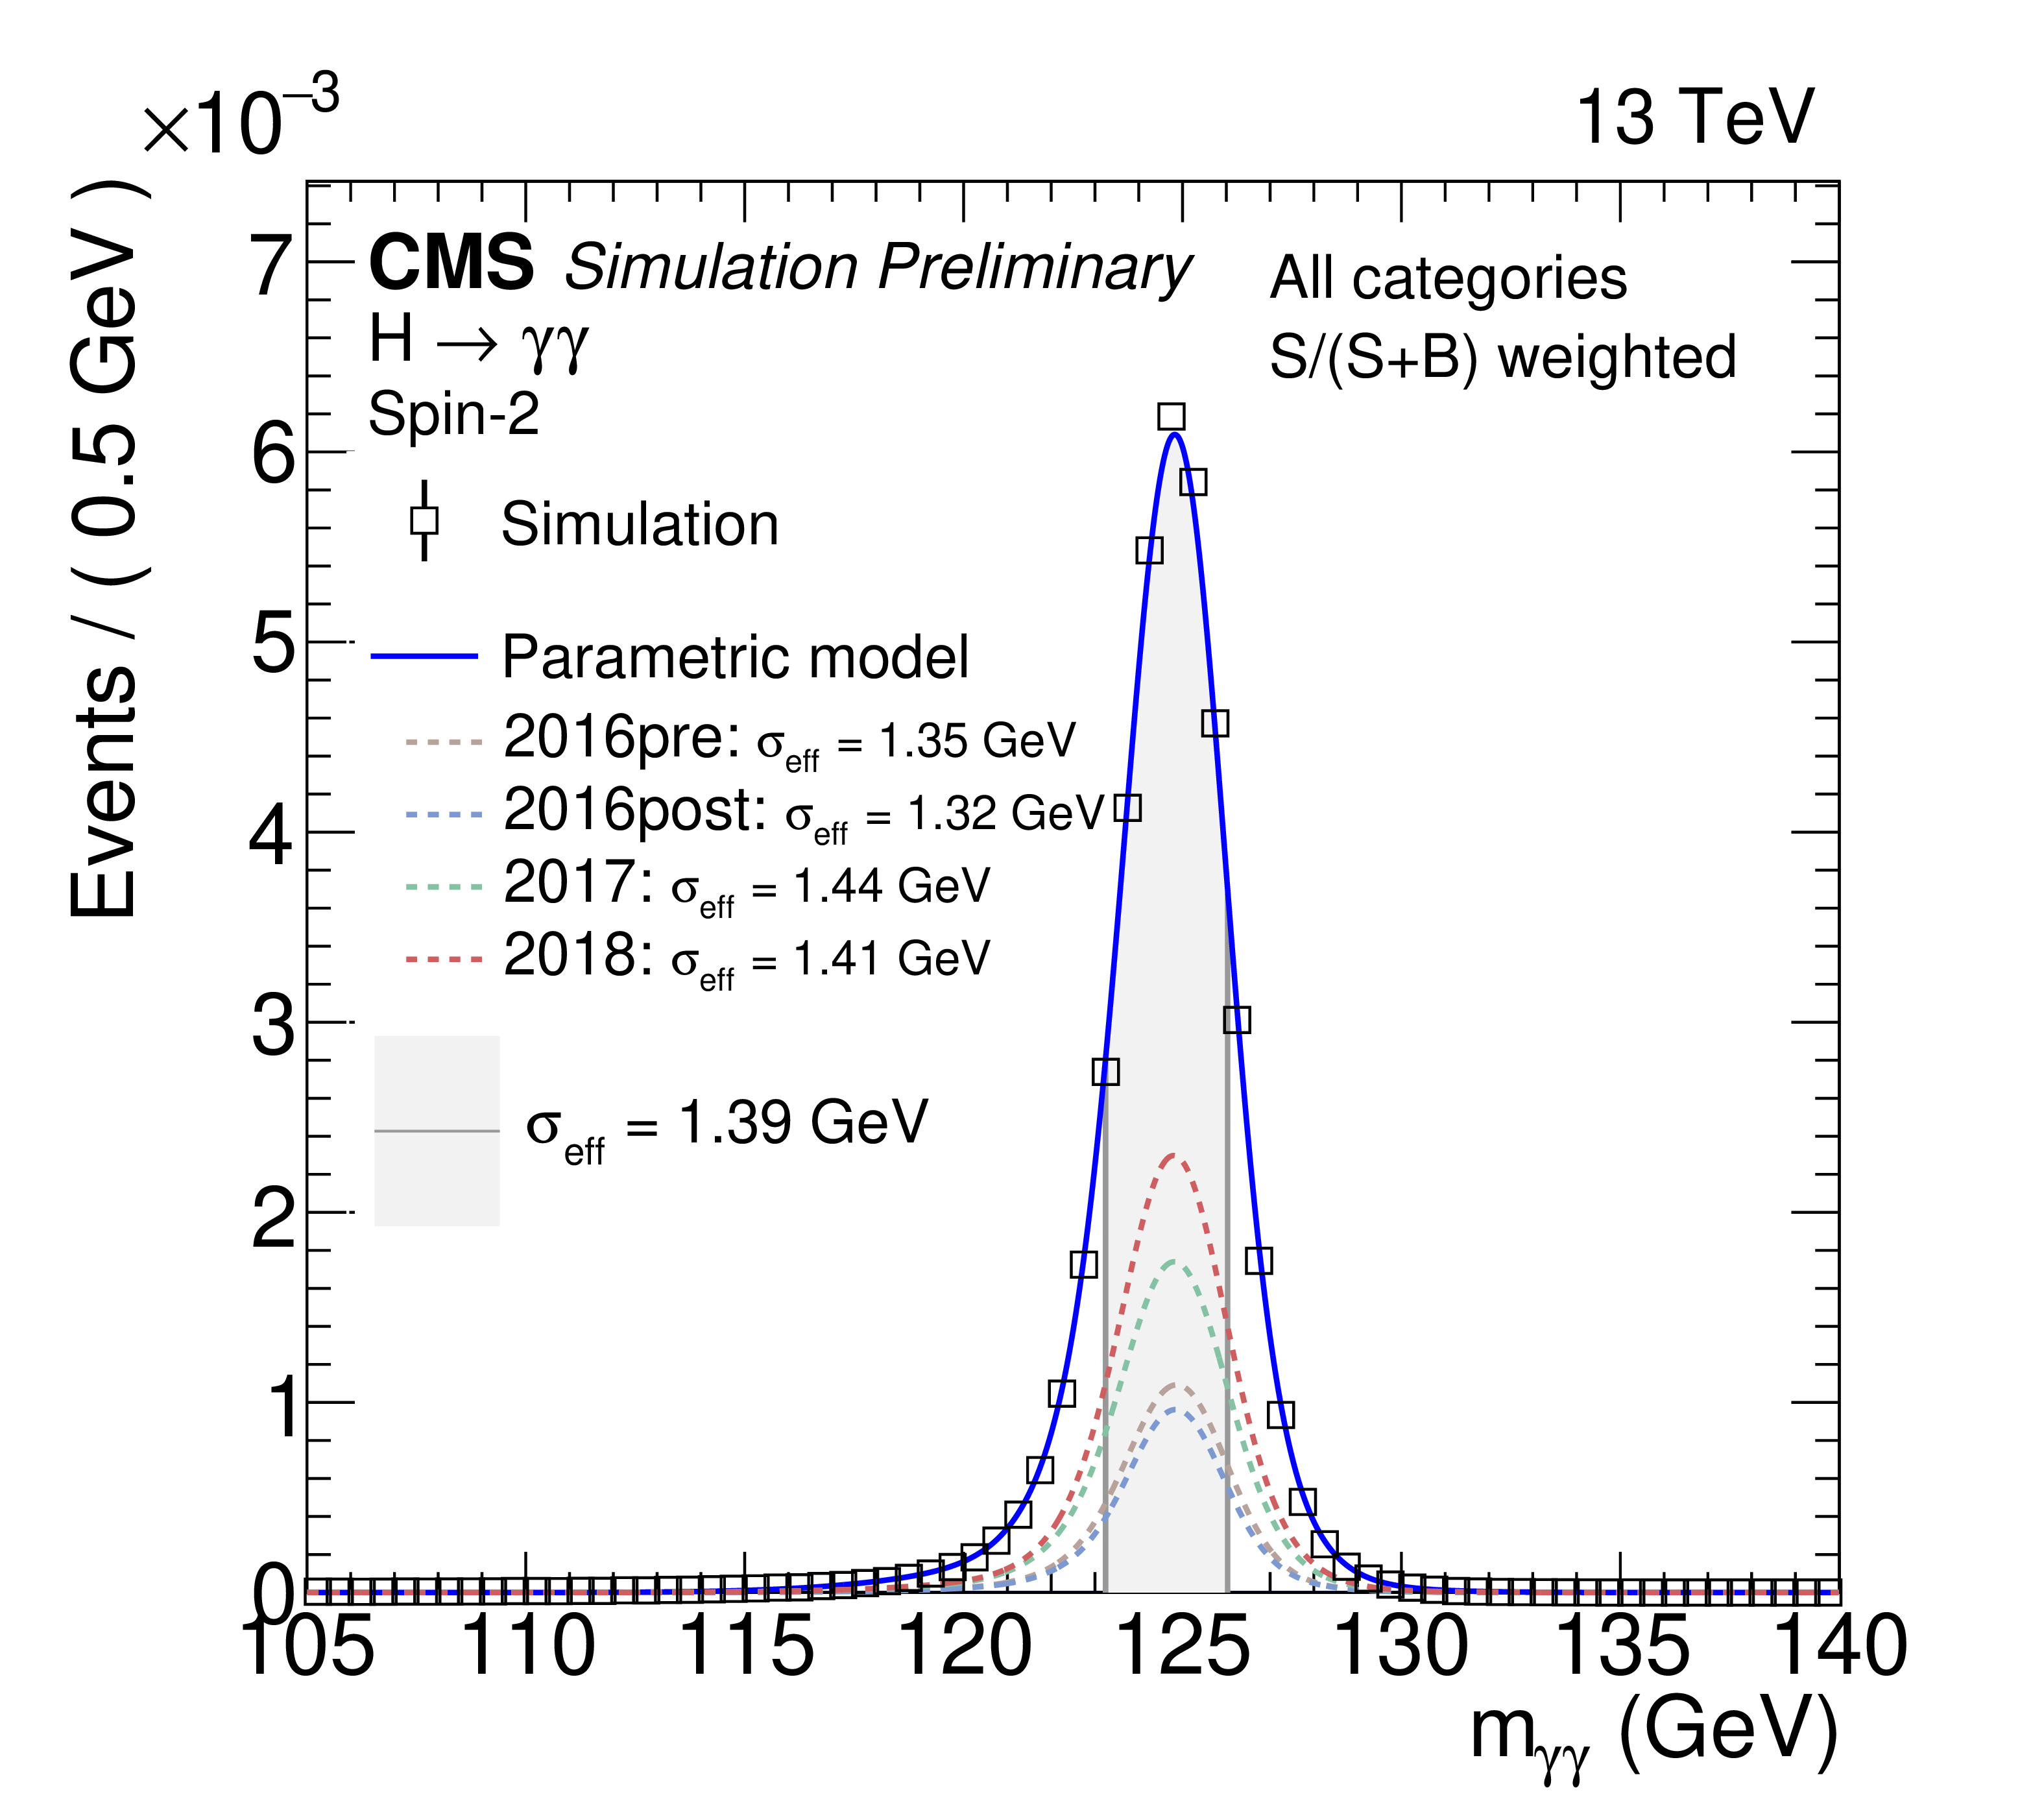
Figure 4-b:
The shape of the parametric signal model for each year of simulated data, and for the sum of all years together, is shown. The open squares represent weighted simulation events and the blue line the corresponding model. Also shown is the $ \sigma_{\text{eff}} $ value (half the width of the narrowest interval containing 68.3% of the $ m_{\gamma\gamma} $ distribution) in the grey shaded area. The contribution of the signal model from each year of data taking is illustrated with the dotted lines. The models are shown for the weighted sum of all analysis categories for spin-0 (left) and spin-2 (right) resonances with a mass of 1 TeV. |
png pdf |
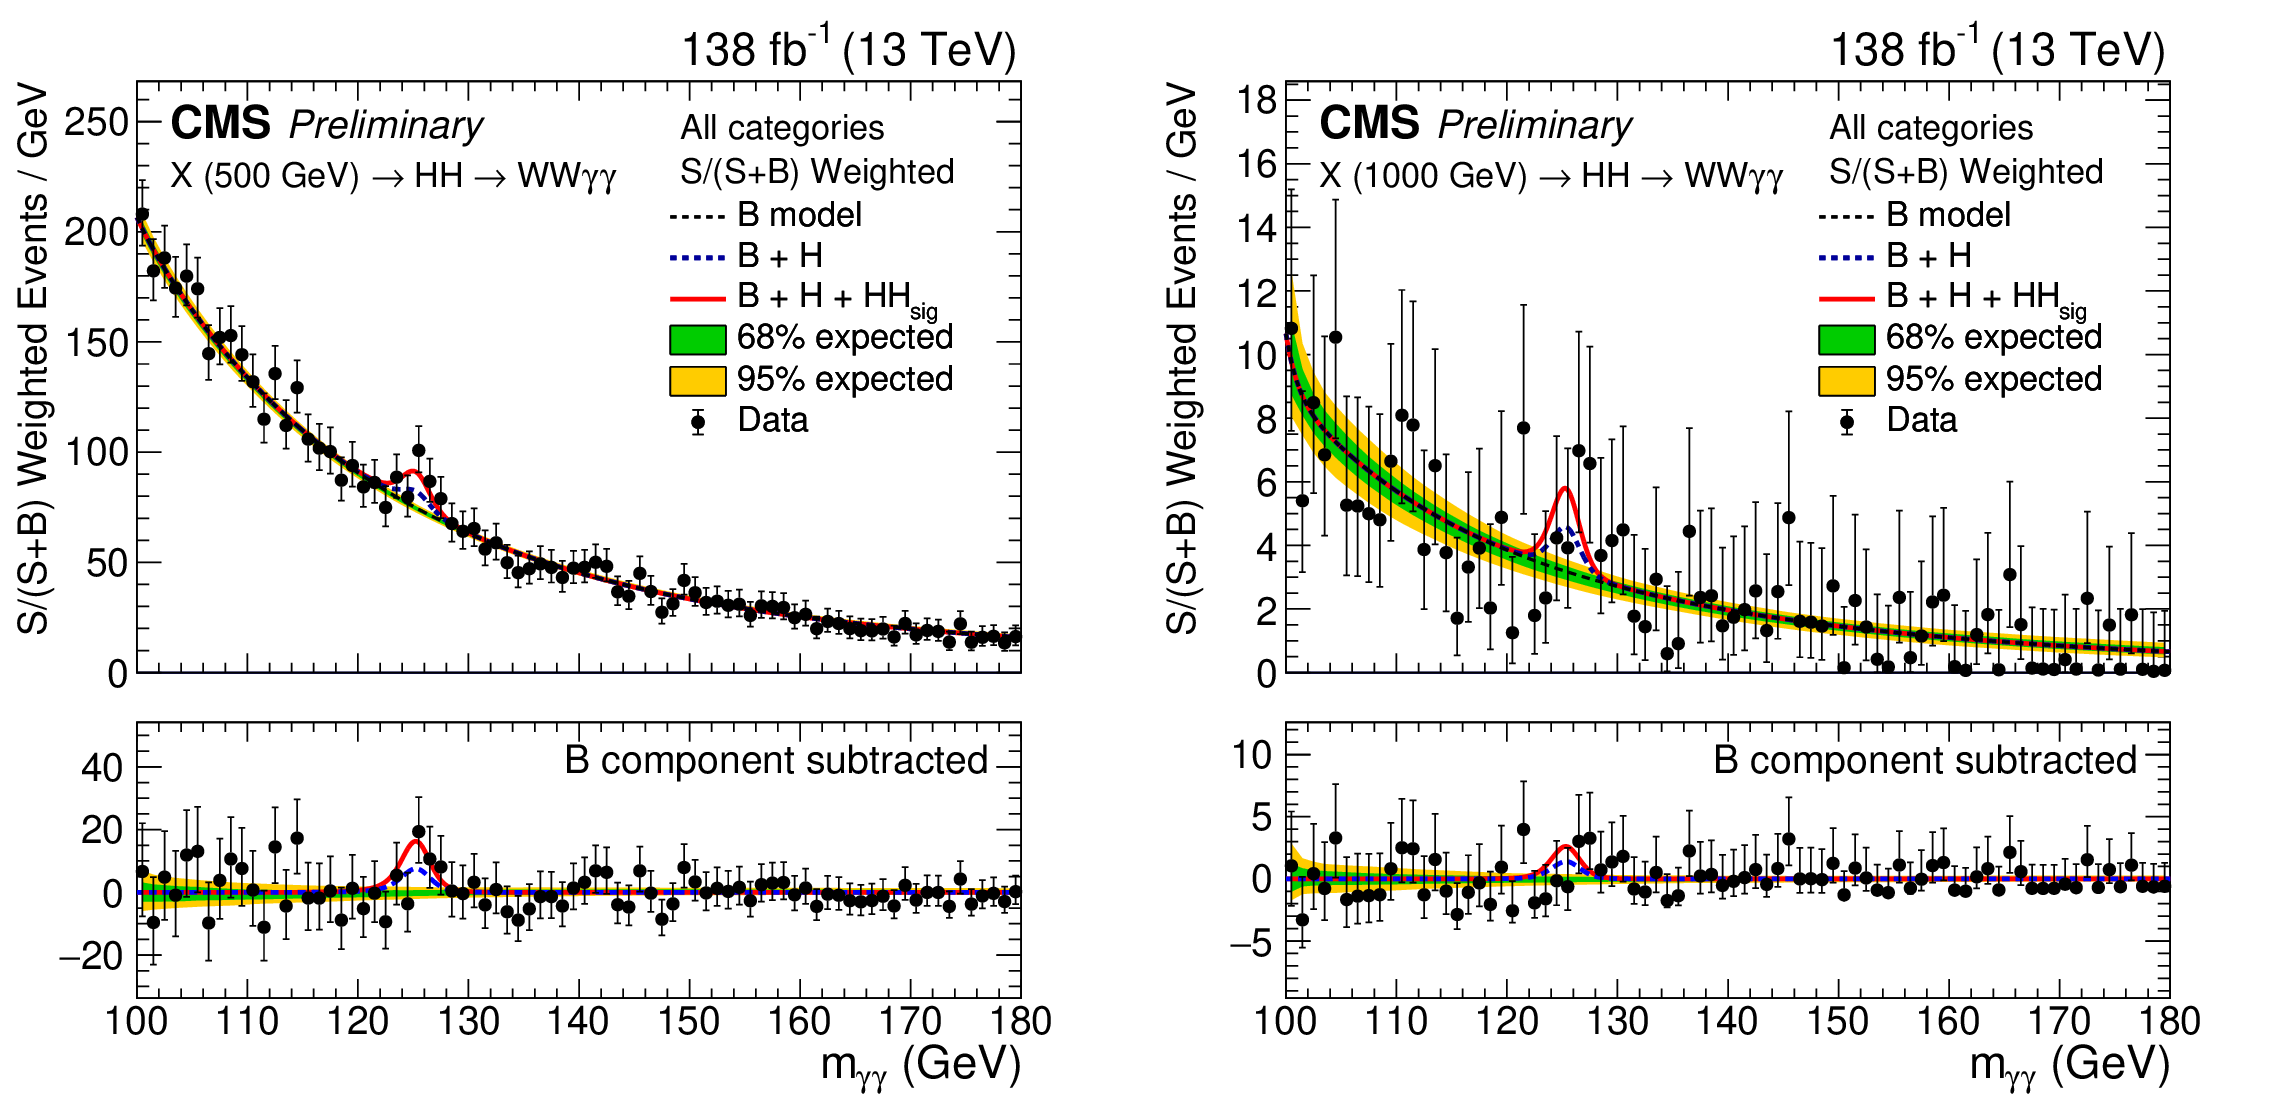
Figure 5:
Data points (black) and the signal-plus-background model fit for the sum of all analysis categories are shown. Each analysis category is weighted by S/(S+B), where S and B are the numbers of expected signal and background events, respectively, in a $ \pm $1$\sigma_\mathrm{eff} m_{\gamma\gamma} $ window centred on $ m_{\mathrm{H}} $. The one (green) standard deviation and two (yellow) standard deviation bands show the uncertainties in the background component of the fit. The solid red line shows the resonant HH signal combined with single Higgs and continuum backgrounds, the dashed blue line indicates the single Higgs plus continuum background, and the dashed black line represents the continuum background only. The lower panels show the residuals after subtraction of this background component. The left and right figure correspond to the results obtained when searching for a resonance of $ m_{\mathrm{X}} = $ 500 GeV and 1 TeV, respectively |

png pdf |
Figure 5-a:
Data points (black) and the signal-plus-background model fit for the sum of all analysis categories are shown. Each analysis category is weighted by S/(S+B), where S and B are the numbers of expected signal and background events, respectively, in a $ \pm $1$\sigma_\mathrm{eff} m_{\gamma\gamma} $ window centred on $ m_{\mathrm{H}} $. The one (green) standard deviation and two (yellow) standard deviation bands show the uncertainties in the background component of the fit. The solid red line shows the resonant HH signal combined with single Higgs and continuum backgrounds, the dashed blue line indicates the single Higgs plus continuum background, and the dashed black line represents the continuum background only. The lower panels show the residuals after subtraction of this background component. The left and right figure correspond to the results obtained when searching for a resonance of $ m_{\mathrm{X}} = $ 500 GeV and 1 TeV, respectively |

png pdf |
Figure 5-b:
Data points (black) and the signal-plus-background model fit for the sum of all analysis categories are shown. Each analysis category is weighted by S/(S+B), where S and B are the numbers of expected signal and background events, respectively, in a $ \pm $1$\sigma_\mathrm{eff} m_{\gamma\gamma} $ window centred on $ m_{\mathrm{H}} $. The one (green) standard deviation and two (yellow) standard deviation bands show the uncertainties in the background component of the fit. The solid red line shows the resonant HH signal combined with single Higgs and continuum backgrounds, the dashed blue line indicates the single Higgs plus continuum background, and the dashed black line represents the continuum background only. The lower panels show the residuals after subtraction of this background component. The left and right figure correspond to the results obtained when searching for a resonance of $ m_{\mathrm{X}} = $ 500 GeV and 1 TeV, respectively |
png pdf |
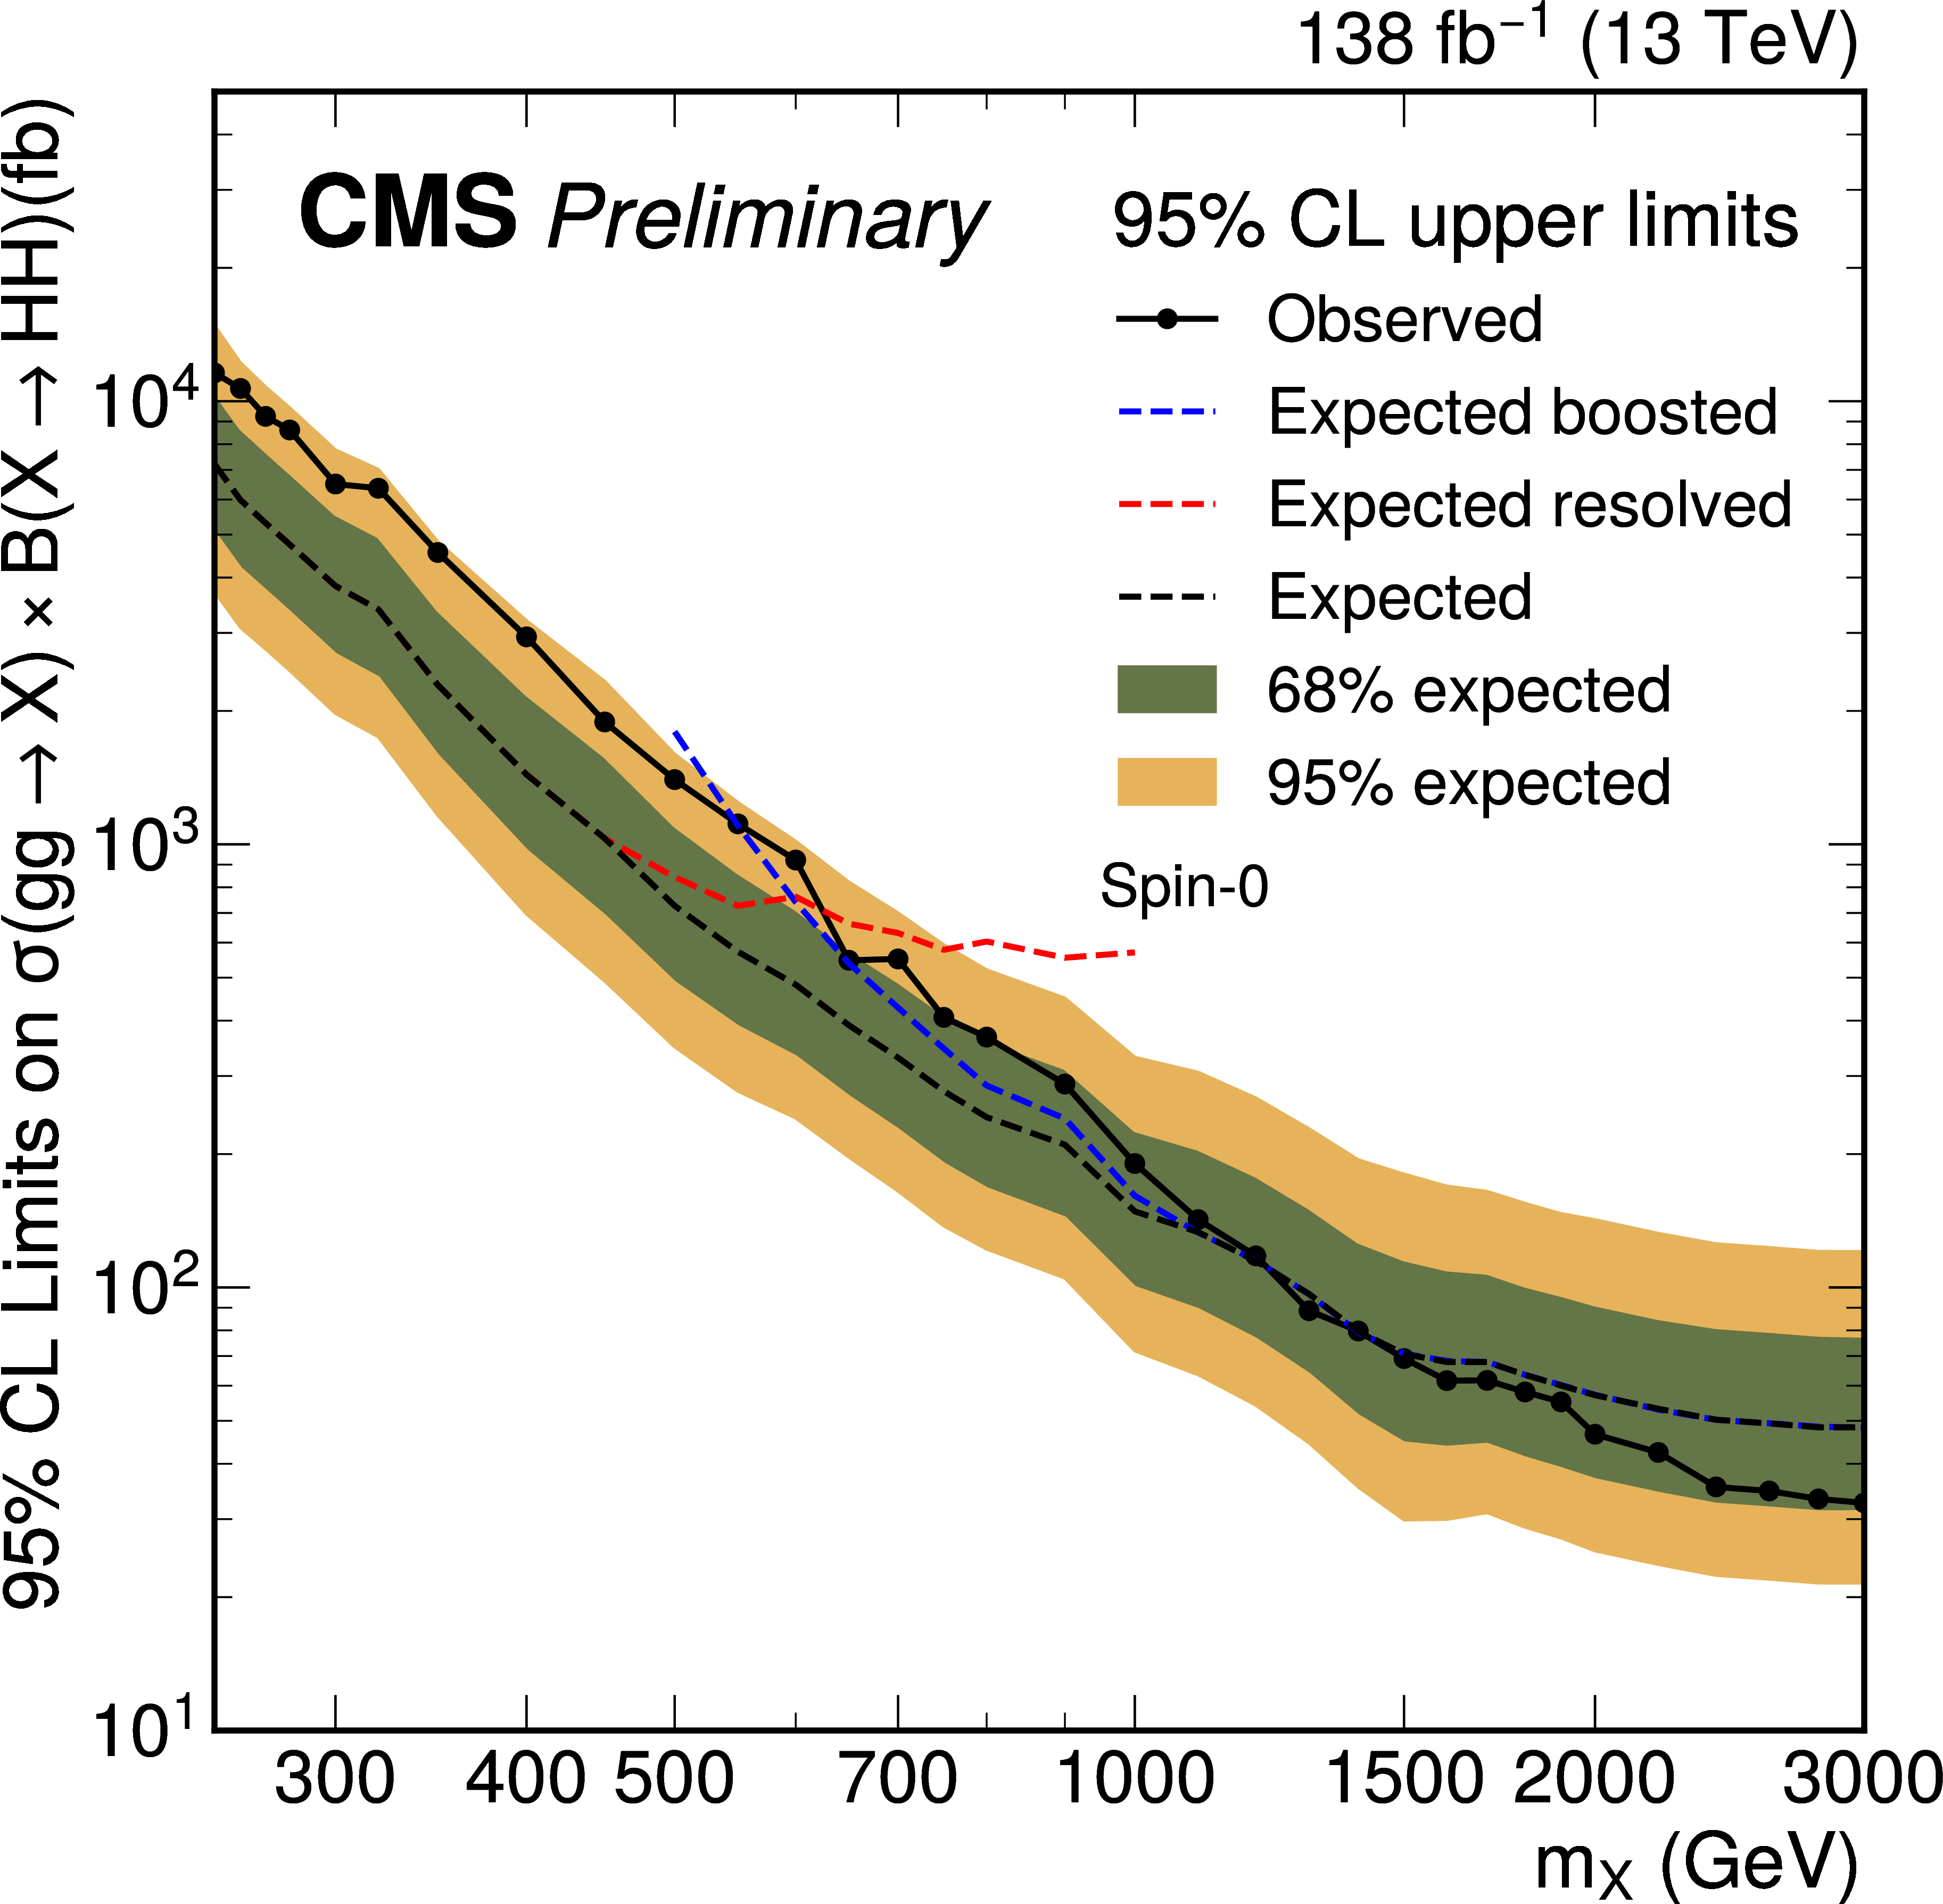
Figure 6:
Upper limits on the production cross section times branching fraction ($ \sigma \times \cal{B} $) for the resonant production of a spin-0 particle decaying into a pair of Higgs bosons, obtained from the analysis of $ \mathrm{g}\mathrm{g} \to \mathrm{X} \to \mathrm{H}\mathrm{H} \to \mathrm{W}\mathrm{W}\gamma\gamma $. Shown are the combined observed limits (solid black line with filled markers), combined expected limits (black dashed line), as well as the expected limits for the boosted category (blue dashed line) and the resolved category (red dashed line). |
png pdf |
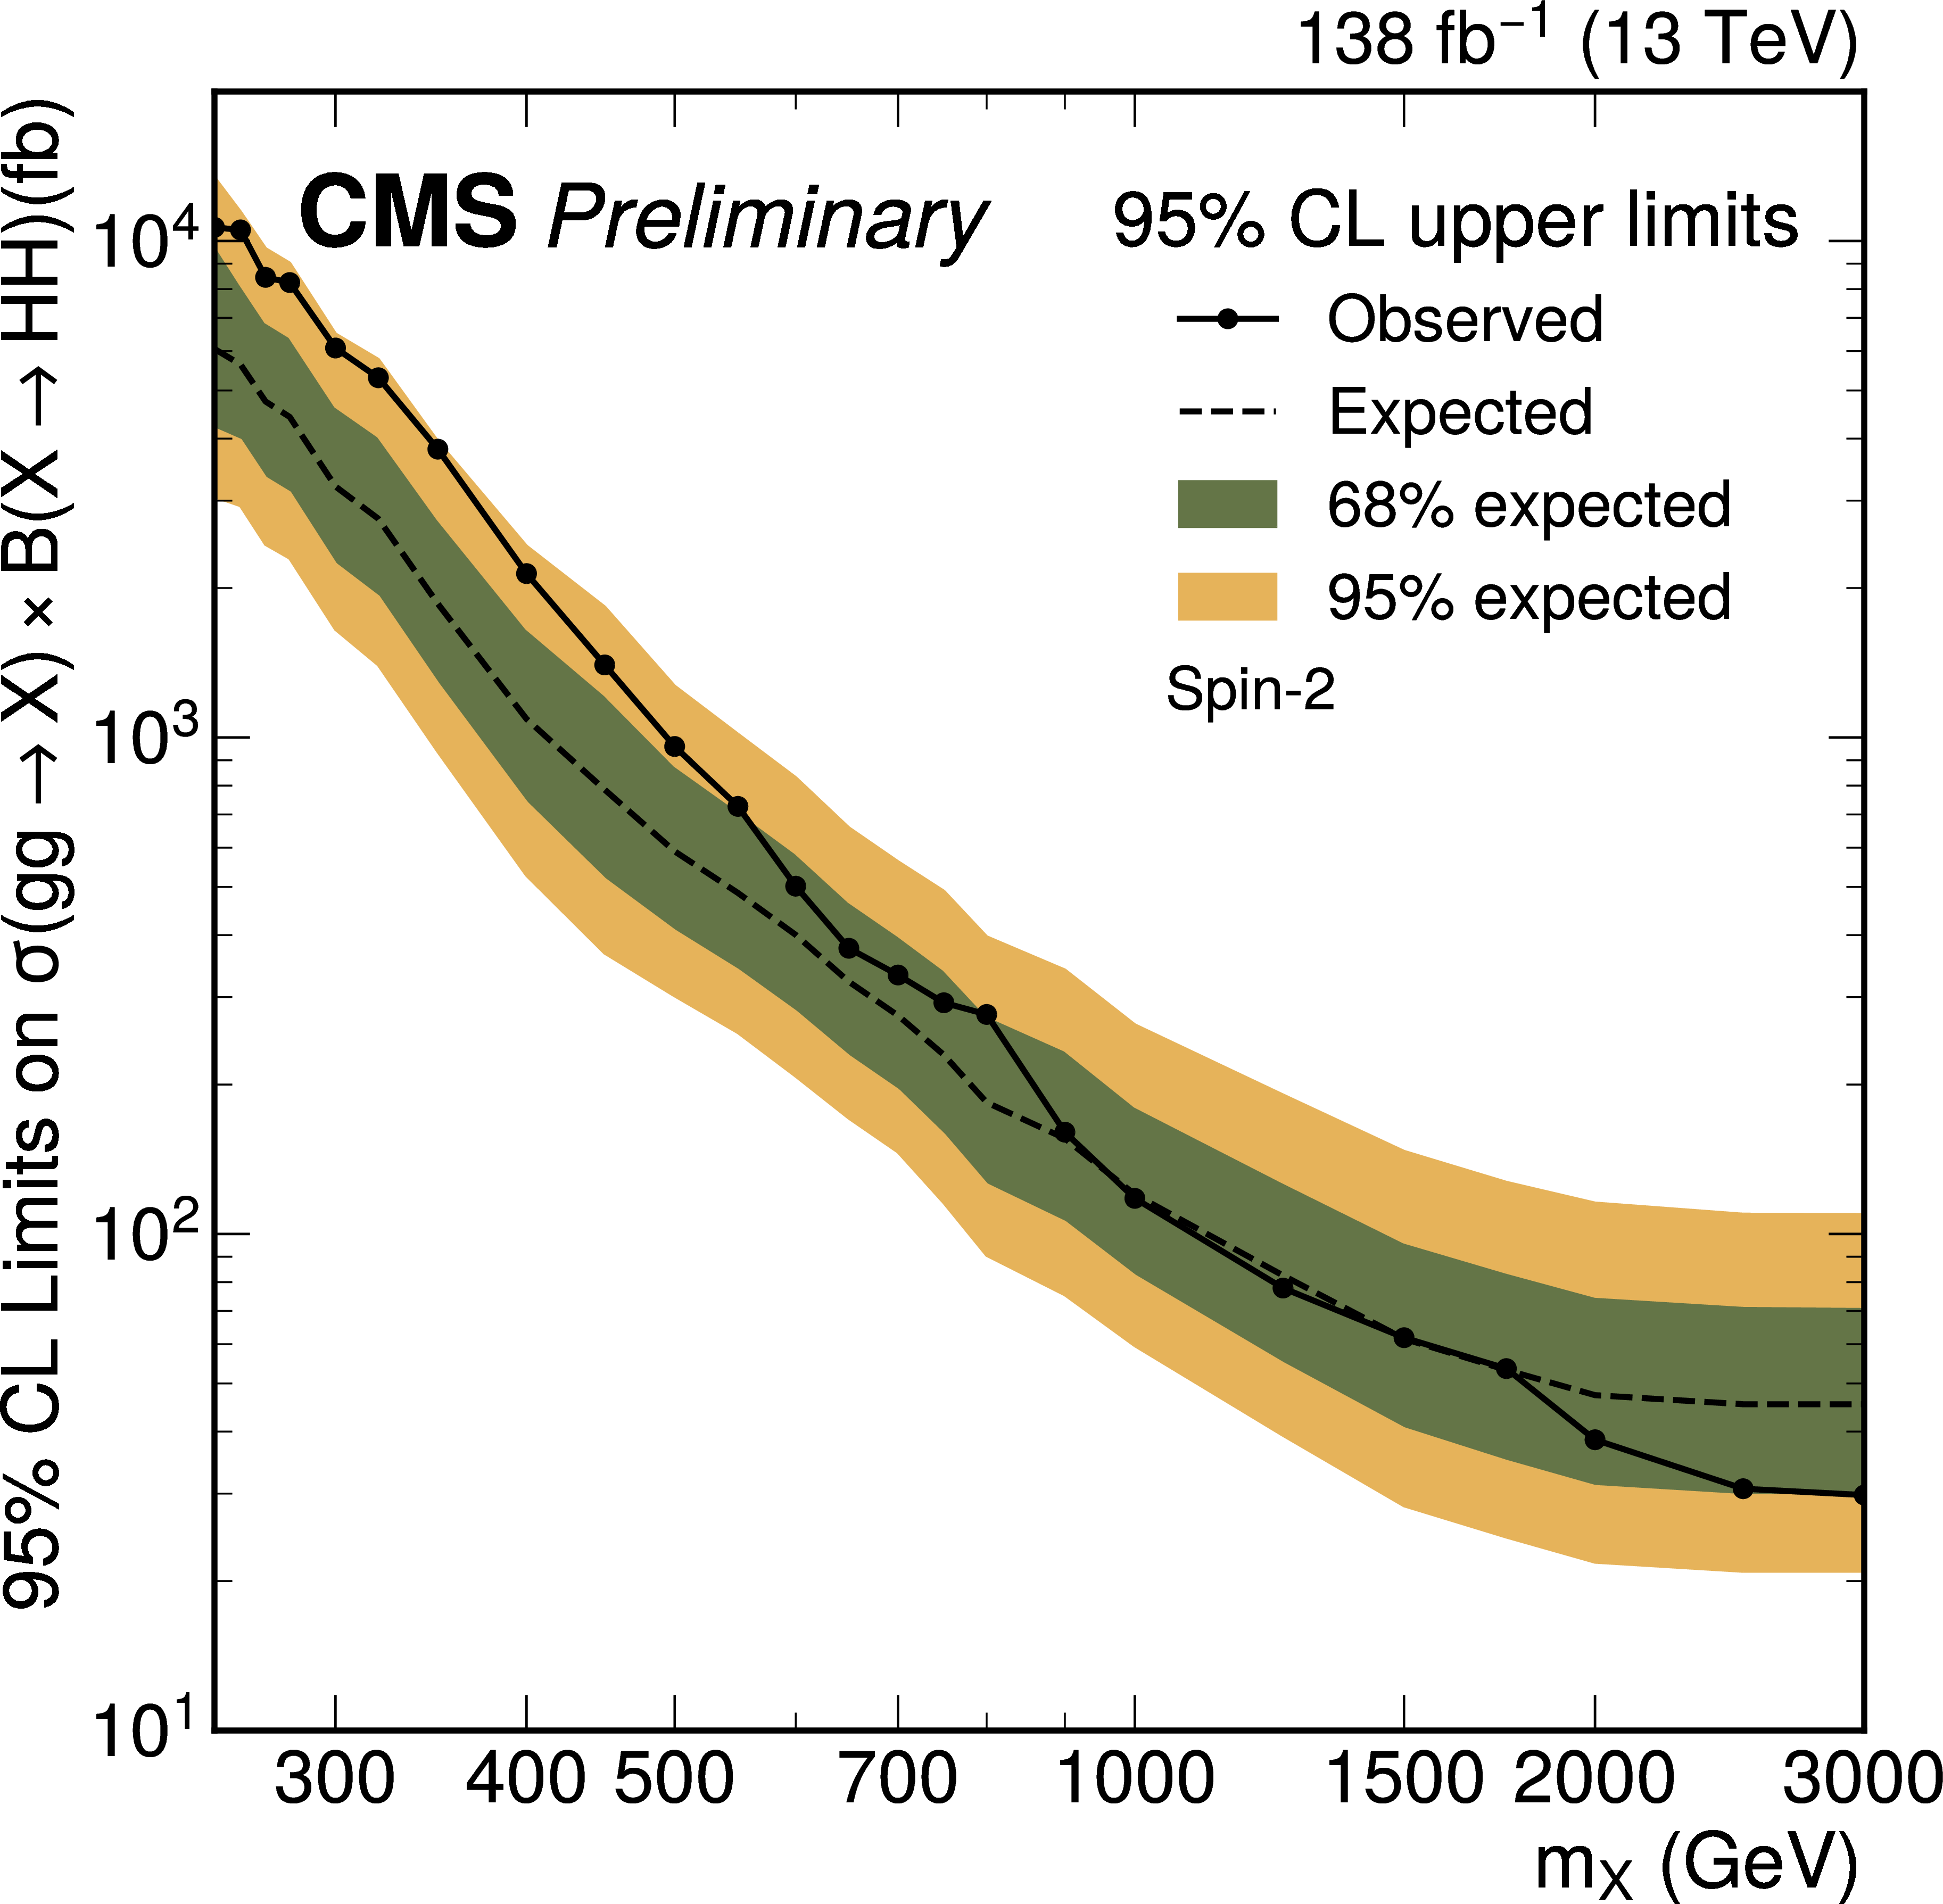
Figure 7:
Upper limits on the production cross section times branching fraction ($ \sigma \times \cal{B} $) for the resonant production of a spin-2 particle decaying into a pair of Higgs bosons, obtained from the analysis of $ \mathrm{g}\mathrm{g} \to \mathrm{X} \to \mathrm{H}\mathrm{H} \to \mathrm{W}\mathrm{W}\gamma\gamma $. Shown are the combined observed limits (solid black line with filled markers) and combined expected limits (black dashed line). |

png pdf |
Figure 8:
Upper limits on the production cross section times branching fraction ($ \sigma \times \cal{B} $) for resonant production of a spin-0 particle decaying into a pair of Higgs bosons. The results from this analysis of $ \mathrm{g}\mathrm{g} \to \mathrm{X} \to \mathrm{H}\mathrm{H} \to \mathrm{W}\mathrm{W}\gamma\gamma $ are shown alongside previously published CMS HH results in various final states. |
png pdf |
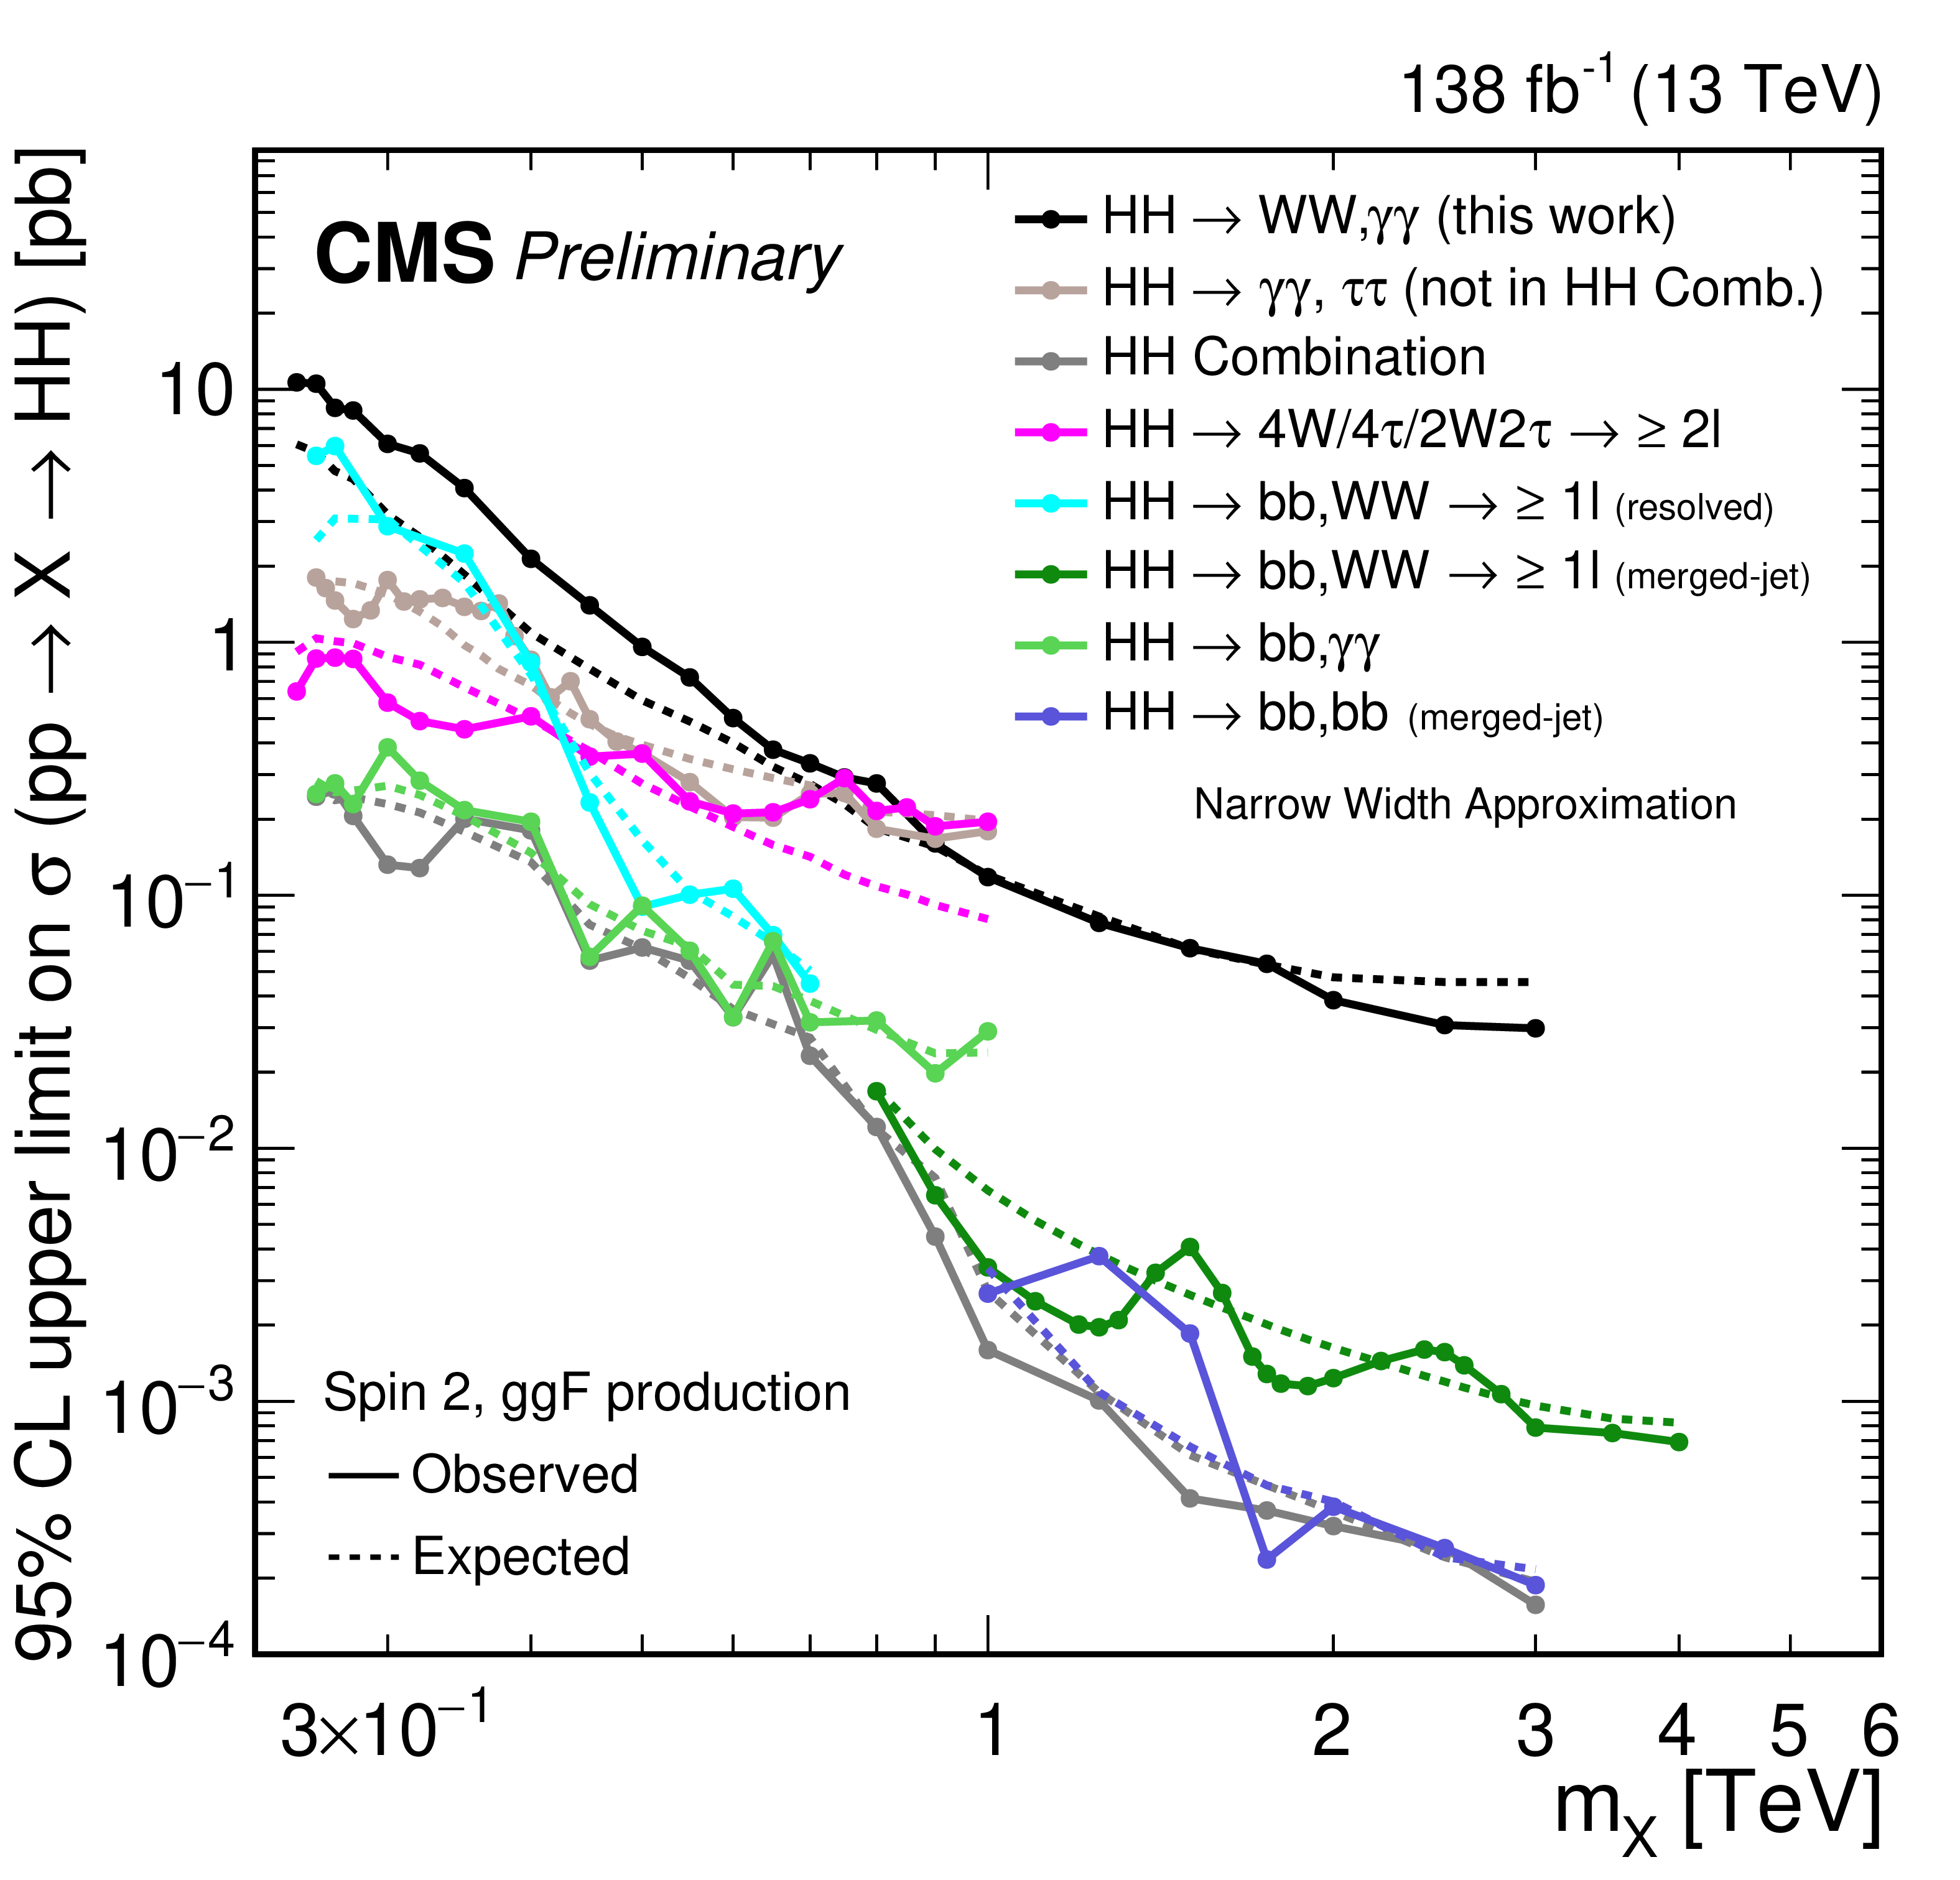
Figure 9:
Upper limits on the production cross section times branching fraction ($ \sigma \times \cal{B} $) for resonant production of a spin-2 particle decaying into a pair of Higgs bosons. The results from this analysis of $ \mathrm{g}\mathrm{g} \to \mathrm{X} \to \mathrm{H}\mathrm{H} \to \mathrm{W}\mathrm{W}\gamma\gamma $ are shown alongside previously published CMS HH results in various final states. |
| Tables | |
png pdf |
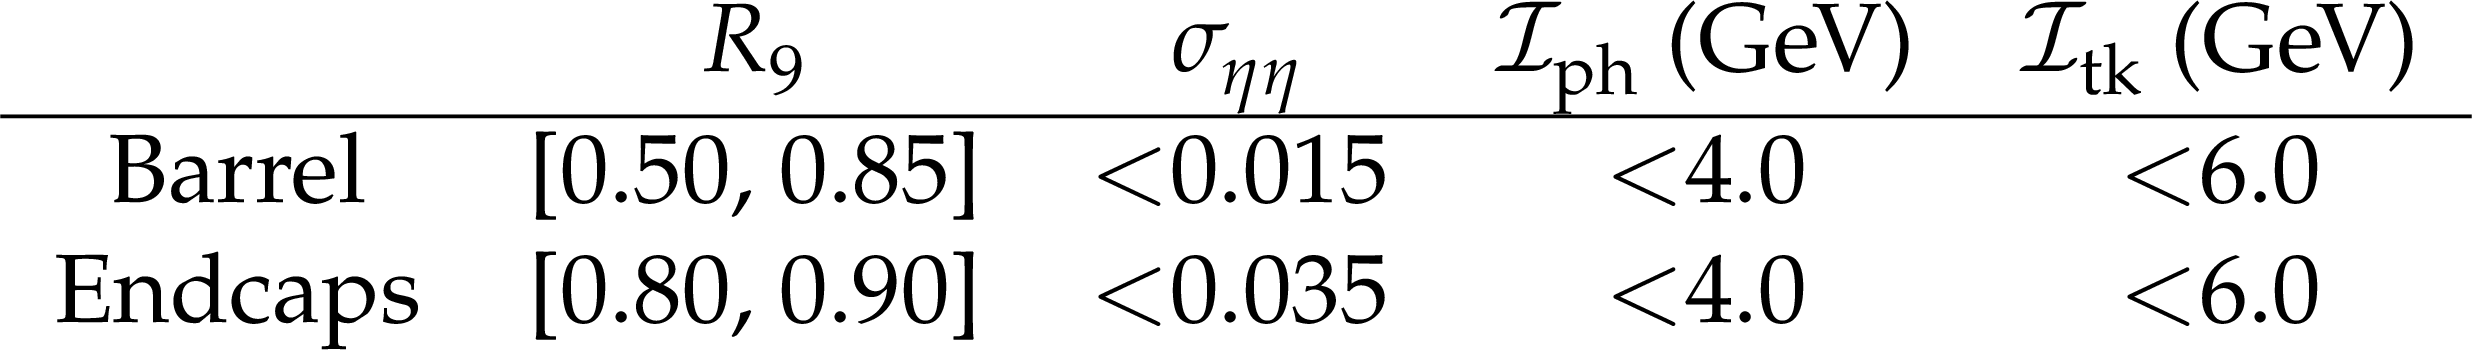
Table 1:
Additional photon requirements for barrel and endcap photons at different ranges of $ R_\mathrm{9} $, intended to mimic the HLT requirements. |
| Summary |
| This analysis presents the first search for resonant Higgs boson pair (HH) production in the $ \mathrm{W}\mathrm{W}\gamma\gamma $ final state at CMS. Using data corresponding to an integrated luminosity of 138 fb$ ^{-1} $ collected in pp collisions at a center-of-mass energy of 13 TeV in 2016--2018, we explore various final-state categories, including semileptonic and fully hadronic decay modes of the WW pair. This study extends the search for new resonances decaying into Higgs boson pairs across a wide mass range. The upper limits at 95% confidence level on the product of the production cross section of the spin-0 resonance and its decay branching fraction to HH are observed to be between 32 fb and 11.6 pb, and expected to be between 48 fb and 7220 fb, while for the spin-2 resonance and its decay branching fraction to HH, the limits are observed to be between 30 fb and 10.7 pb, and expected to be between 45 fb and 6060 fb, for a hypothetical resonance with a mass in the range 250--3000 GeV. When deriving the above limits, our signal processes are ($ \mathrm{W}\mathrm{W}\gamma\gamma + \mathrm{b}\overline{\mathrm{b}}\gamma\gamma + \mathrm{Z}\mathrm{Z}\gamma\gamma $), where the corresponding standard model (SM) branching fractions of the $ \mathrm{H} \to \gamma\gamma $ and $ \mathrm{H} \to \mathrm{W}\mathrm{W} $ ($ \mathrm{H} \to \mathrm{b}\overline{\mathrm{b}} $ or $ \mathrm{H} \to \mathrm{Z}\mathrm{Z} $) are assumed. The upper limits placed on the production cross sections of such resonant states provide valuable constraints on various beyond-SM (BSM) scenarios, including those with extended Higgs sectors. These results contribute to our understanding of the Higgs mechanism and the exploration of new physics beyond the SM. The search for BSM Higgs bosons remains a vibrant area of research, and this work lays the foundation for future studies aimed at exploring possible new resonances beyond the SM, including both scalar and spin-2 interpretations. |
| References | ||||
| 1 | CMS Collaboration | Observation of a new boson at a mass of 125 GeV with the CMS experiment at the LHC | PLB 716 (2012) | CMS-HIG-12-028 1207.7235 |
| 2 | ATLAS Collaboration | Observation of a new particle in the search for the Standard Model Higgs boson with the ATLAS detector at the LHC | PLB 716 (2012) | 1207.7214 |
| 3 | LHC Higgs Cross Section Working Group Collaboration | Handbook of LHC Higgs Cross Sections: 4. Deciphering the Nature of the Higgs Sector | technical report, 2017 link |
1610.07922 |
| 4 | M. Cacciari, G. P. Salam, and G. Soyez | The anti-$ k_{\mathrm{T}} $ jet clustering algorithm | JHEP 04 (2008) 063 | 0802.1189 |
| 5 | M. Cacciari, G. P. Salam, and G. Soyez | FastJet user manual | EPJC 72 (2012) 1896 | 1111.6097 |
| 6 | ATLAS Collaboration | Searches for Higgs boson pair production with ATLAS | technical report, CERN, Geneva, 2018 | 1809.08870 |
| 7 | CMS Collaboration | Search for the nonresonant and resonant production of a Higgs boson in association with an additional scalar boson in the $ \gamma\gamma\tau\tau $ final state | Submitted to JHEP, 2025 link |
CMS-HIG-22-012 2506.23012 |
| 8 | CMS Collaboration | Search for Higgs boson pairs decaying to WW*WW*, WW*$ \tau\tau $, and $ \tau\tau\tau\tau $ in proton-proton collisions at $ \sqrt{s} = $ 13 TeV | JHEP 07 (2023) 095 | CMS-HIG-21-002 2206.10268 |
| 9 | A. Carvalho | Gravity particles from Warped Extra Dimensions, predictions for LHC | link | 1404.0102 |
| 10 | G. Branco et al. | Theory and phenomenology of two-Higgs-doublet models | Phys. Rept. 516 (2012) 1 | 1106.0034 |
| 11 | U. Ellwanger, C. Hugonie, and A. M. Teixeira | The Next-to-Minimal Supersymmetric Standard Model | Phys. Rept. 496 (2010) 1 | 0910.1785 |
| 12 | K. Cheung | Phenomenology of the radion in the Randall-Sundrum scenario | PRD 63 (2001) 056007 | hep-ph/0009232 |
| 13 | CMS Collaboration | The CMS Experiment at the CERN LHC | JINST 3 (2008) S08004 | |
| 14 | CMS Collaboration | Performance of the CMS Level-1 trigger in proton-proton collisions at $ \sqrt{s} = $ 13 TeV | JINST 15 (2020) P10017 | CMS-TRG-17-001 2006.10165 |
| 15 | CMS Collaboration | Performance of the CMS high-level trigger during LHC Run 2 | JINST 19 (2024) P11021 | CMS-TRG-19-001 2410.17038 |
| 16 | CMS Collaboration | Performance of photon reconstruction and identification with the CMS detector in proton-proton collisions at sqrt(s) = 8 TeV | JINST 10 (2015) P08010 | CMS-EGM-14-001 1502.02702 |
| 17 | CMS Collaboration | A measurement of the Higgs boson mass in the diphoton decay channel | PLB 805 (2020) 135425 | CMS-HIG-19-004 2002.06398 |
| 18 | CMS Collaboration | Particle-flow reconstruction and global event description with the CMS detector | JINST 12 (2017) P10003 | CMS-PRF-14-001 1706.04965 |
| 19 | CMS Collaboration | Electron and photon reconstruction and identification with the CMS experiment at the CERN LHC | JINST 16 (2021) P05014 | CMS-EGM-17-001 2012.06888 |
| 20 | CMS Collaboration | Performance of missing transverse momentum reconstruction in proton-proton collisions at $ \sqrt{s} = $ 13 TeV using the CMS detector | JINST 14 (2019) P07004 | CMS-JME-17-001 1903.06078 |
| 21 | CMS Collaboration | Measurements of Higgs boson properties in the diphoton decay channel in proton-proton collisions at $ \sqrt{s} = $ 13 TeV | JHEP 11 (2018) 185 | CMS-HIG-16-040 1804.02716 |
| 22 | J. Alwall et al. | The automated computation of tree-level and next-to-leading order differential cross sections, and their matching to parton shower simulations | JHEP 07 (2014) 079 | 1405.0301 |
| 23 | P. Artoisenet, R. Frederix, O. Mattelaer, and R. Rietkerk | Automatic spin-entangled decays of heavy resonances in Monte Carlo simulations | JHEP 03 (2013) 015 | 1212.3460 |
| 24 | R. Frederix and S. Frixione | Merging meets matching in MC@NLO | JHEP 12 (2012) 061 | 1209.6215 |
| 25 | Sherpa Collaboration | Event Generation with Sherpa 2.2 | SciPost Phys. 7 (2019) 034 | 1905.09127 |
| 26 | T. Sjostrand et al. | An Introduction to PYTHIA 8.2 | Comput. Phys. Commun. 191 (2015) 159 | 1410.3012 |
| 27 | CMS Collaboration | Event generator tunes obtained from underlying event and multiparton scattering measurements | EPJC 76 (2016) 155 | CMS-GEN-14-001 1512.00815 |
| 28 | CMS Collaboration | Extraction and validation of a new set of CMS PYTHIA8 tunes from underlying-event measurements | EPJC 80 (2020) | CMS-GEN-17-001 1903.12179 |
| 29 | R. D. Ball et al. | Parton distributions from high-precision collider data | EPJC 77 (2017) 663 | 1706.00428 |
| 30 | GEANT4 Collaboration | GEANT4--a simulation toolkit | NIM A 506 (2003) 250 | |
| 31 | CMS Collaboration | Measurements of $ \mathrm{t\bar{t}}H $ production and the CP structure of the Yukawa interaction between the Higgs boson and top quark in the diphoton decay channel | PRL 125 (2020) 061801 | CMS-HIG-19-013 2003.10866 |
| 32 | CMS Collaboration | Performance of the CMS muon detector and muon reconstruction with proton-proton collisions at $ \sqrt{s}= $ 13 TeV | JINST 13 (2018) P06015 | CMS-MUO-16-001 1804.04528 |
| 33 | CMS Collaboration | Performance of the reconstruction and identification of high-momentum muons in proton-proton collisions at $ \sqrt{s}= $ 13 TeV | JINST 15 (2020) P02027 | CMS-MUO-17-001 1912.03516 |
| 34 | CMS Collaboration | Jet energy scale and resolution in the CMS experiment in pp collisions at 8 TeV | JINST 12 (2017) P02014 | CMS-JME-13-004 1607.03663 |
| 35 | D. Bertolini, P. Harris, M. Low, and N. Tran | Pileup Per Particle Identification | JHEP 10 (2014) 059 | 1407.6013 |
| 36 | CMS Collaboration | Pileup mitigation at CMS in 13 TeV data | JINST 15 (2020) P09018 | CMS-JME-18-001 2003.00503 |
| 37 | CMS Collaboration | Inclusive search for highly boosted Higgs bosons decaying to bottom quark-antiquark pairs in proton-proton collisions at $ \sqrt{s} = $ 13 TeV | JHEP 12 (2020) 085 | CMS-HIG-19-003 2006.13251 |
| 38 | H. Qu and L. Gouskos | Jet Tagging via Particle Clouds | PRD 101 (2020) 056019 | 1902.08570 |
| 39 | H. Qu, C. Li, and S. Qian | Particle transformer for jet tagging | in Proceedings of the 39th International Conference on Machine Learning, K. Chaudhuri et al., eds., volume 162 of Proceedings of Machine Learning Research, p. 18281. PMLR, 2022 link |
|
| 40 | E. A. Moreno et al. | JEDI-net: a jet identification algorithm based on interaction networks | link | 1908.05318 |
| 41 | E. A. Moreno et al. | Interaction networks for the identification of boosted $ \mathrm{H}\to\mathrm{b}\overline{\mathrm{b}} $ decays | (07, ) 01, 2020 PRD 10 (2020) 2 |
1909.12285 |
| 42 | et al. | Novel $ |V_{cb}| $ extraction method via boosted $ bc $-tagging with in-situ calibration | Y. . \url https://arxiv.org/abs/2503.00118 Zhao 202 (1900) 5 |
|
| 43 | CMS Collaboration | Search for highly energetic double Higgs boson production in the two bottom quark and two vector boson all-hadronic final state | CMS Physics Analysis Summary, 2024 CMS-PAS-HIG-23-012 |
CMS-PAS-HIG-23-012 |
| 44 | F. A. Dreyer, G. P. Salam, and G. Soyez | The Lund Jet Plane | JHEP 12 (2018) 064 | 1807.04758 |
| 45 | S. Catani, Y. L. Dokshitzer, M. H. Seymour, and B. R. Webber | Longitudinally invariant $ K_t $ clustering algorithms for hadron hadron collisions | NPB 406 (1993) 187 | |
| 46 | S. D. Ellis and D. E. Soper | Successive combination jet algorithm for hadron collisions | PRD 48 (1993) 3160 | hep-ph/9305266 |
| 47 | J. Mo \v c kus | On Bayesian Methods for Seeking the Extremum | p--404. Springer Berlin Heidelberg, Berlin, Heidelberg, 1975 link |
|
| 48 | CMS Collaboration | Measurements of Higgs boson production cross sections and couplings in the diphoton decay channel at $ \sqrt{\mathrm{s}} = $ 13 TeV | JHEP 07 (2021) 027 | CMS-HIG-19-015 2103.06956 |
| 49 | CMS Collaboration | Observation of the diphoton decay of the Higgs boson and measurement of its properties | EPJC 74 (2014) 3076 | CMS-HIG-13-001 1407.0558 |
| 50 | R. A. Fisher | On the interpretation of \ensuremath\chi^2 from contingency tables, and the calculation of \ensuremathP | Journal of the Royal Statistical Society 85 (1922) 87 | |
| 51 | The ATLAS, CMS, and LHC Higgs Combination Group Collaboration | Procedure for the LHC Higgs boson search combination in Summer 2011 | Technical Report CMS-NOTE-2011-005, ATL-PHYS-PUB-2011-11, 2011 | |
| 52 | P. D. Dauncey, M. Kenzie, N. Wardle, and G. J. Davies | Handling uncertainties in background shapes | JINST 10 (2015) P04015 | 1408.6865 |
| 53 | D. de Florian et al. | Handbook of LHC Higgs Cross Sections: 4. Deciphering the Nature of the Higgs Sector | LHC Higgs Cross Section Working Group Collaboration, 2017 link |
|
| 54 | CMS Collaboration | Performance of the CMS electromagnetic calorimeter in pp collisions at \ensuremath\sqrt$ _{s} = $ 13 TeV | JINST 19 (2024) P09004 | CMS-EGM-18-002 2403.15518 |
| 55 | T. Adams et al. | Beam test evaluation of electromagnetic calorimeter modules made from proton-damaged PbWO$ _4 $ crystals | JINST 11 (2016) P04012 | |
| 56 | F. Gentit | Litrani: A General purpose Monte Carlo program simulating light propagation in isotropic or anisotropic media | NIM A 486 (2002) 35 | |
| 57 | CMS Collaboration | Precision luminosity measurement in proton-proton collisions at $ \sqrt{s} = $ 13 TeV in 2015 and 2016 at CMS | EPJC 81 (2021) 800 | CMS-LUM-17-003 2104.01927 |
| 58 | CMS Collaboration | CMS luminosity measurement for the 2017 data-taking period at $ \sqrt{s} = $ 13 TeV | CMS Physics Analysis Summary, 2018 CMS-PAS-LUM-17-004 |
CMS-PAS-LUM-17-004 |
| 59 | CMS Collaboration | CMS luminosity measurement for the 2018 data-taking period at $ \sqrt{s} = $ 13 TeV | CMS Physics Analysis Summary, 2019 CMS-PAS-LUM-18-002 |
CMS-PAS-LUM-18-002 |
| 60 | CMS Collaboration | Measurement of the inclusive $ W $ and $ Z $ production cross sections in pp collisions at $ \sqrt{s}= $ 7 TeV | JHEP 10 (2011) 132 | CMS-EWK-10-005 1107.4789 |
| 61 | CMS Collaboration | Performance of electron reconstruction and selection with the CMS detector in proton-proton collisions at $ \sqrt{s} = $ 8 TeV | JINST 10 (2015) P06005 | CMS-EGM-13-001 1502.02701 |
| 62 | CMS Collaboration | Jet energy scale and resolution in the CMS experiment in pp collisions at 8 TeV | JINST 12 (2017) P02014 | CMS-JME-13-004 1607.03663 |
| 63 | CMS Collaboration | Performance of heavy-flavour jet identification in boosted topologies in proton-proton collisions at $ \sqrt{s} = $ 13 TeV | Technical Report, CERN, Geneva, 2023 CMS-PAS-BTV-22-001 |
CMS-PAS-BTV-22-001 |
| 64 | CMS Collaboration | The CMS Statistical Analysis and Combination Tool: Combine | Comput. Softw. Big Sci. 8 (2024) 19 | CMS-CAT-23-001 2404.06614 |
| 65 | A. L. Read | Presentation of search results: The $ CL_s $ technique | JPG 28 (2002) 2693 | |
|
|
Compact Muon Solenoid LHC, CERN |
|

|

|

|

|

|