

Compact Muon Solenoid
LHC, CERN
| CMS-PAS-HIG-20-001 | ||
| Simplified template cross section measurements of Higgs boson produced in association with vector bosons in the H $ \rightarrow \mathrm{b\bar{b}} $ decay channel in proton-proton collisions at $ \sqrt{s}= $ 13 TeV | ||
| CMS Collaboration | ||
| September 2022 | ||
| Abstract: Measurements of simplified template cross sections and inclusive signal strengths are presented for the production of a 125 GeV Higgs boson decaying into a pair of b quarks, produced in association with a vector boson. The analysis is based on the leptonic decays of the W and Z bosons, resulting in final states with 0, 1, or 2 electrons or muons. The Higgs boson candidate is reconstructed either from two resolved b-tagged jets or from a single large-radius jet containing the decay products of two b jets at large momenta. A sample of proton-proton collisions at $ \sqrt{s}= $ 13 TeV, collected by the CMS experiment between 2016 and 2018 and corresponding to a total integrated luminosity of 138 fb$ ^{-1} $, is analyzed. | ||
|
Links:
CDS record (PDF) ;
CADI line (restricted) ;
These preliminary results are superseded in this paper, Submitted to PRD. The superseded preliminary plots can be found here. |
||
| Figures | |
png pdf |
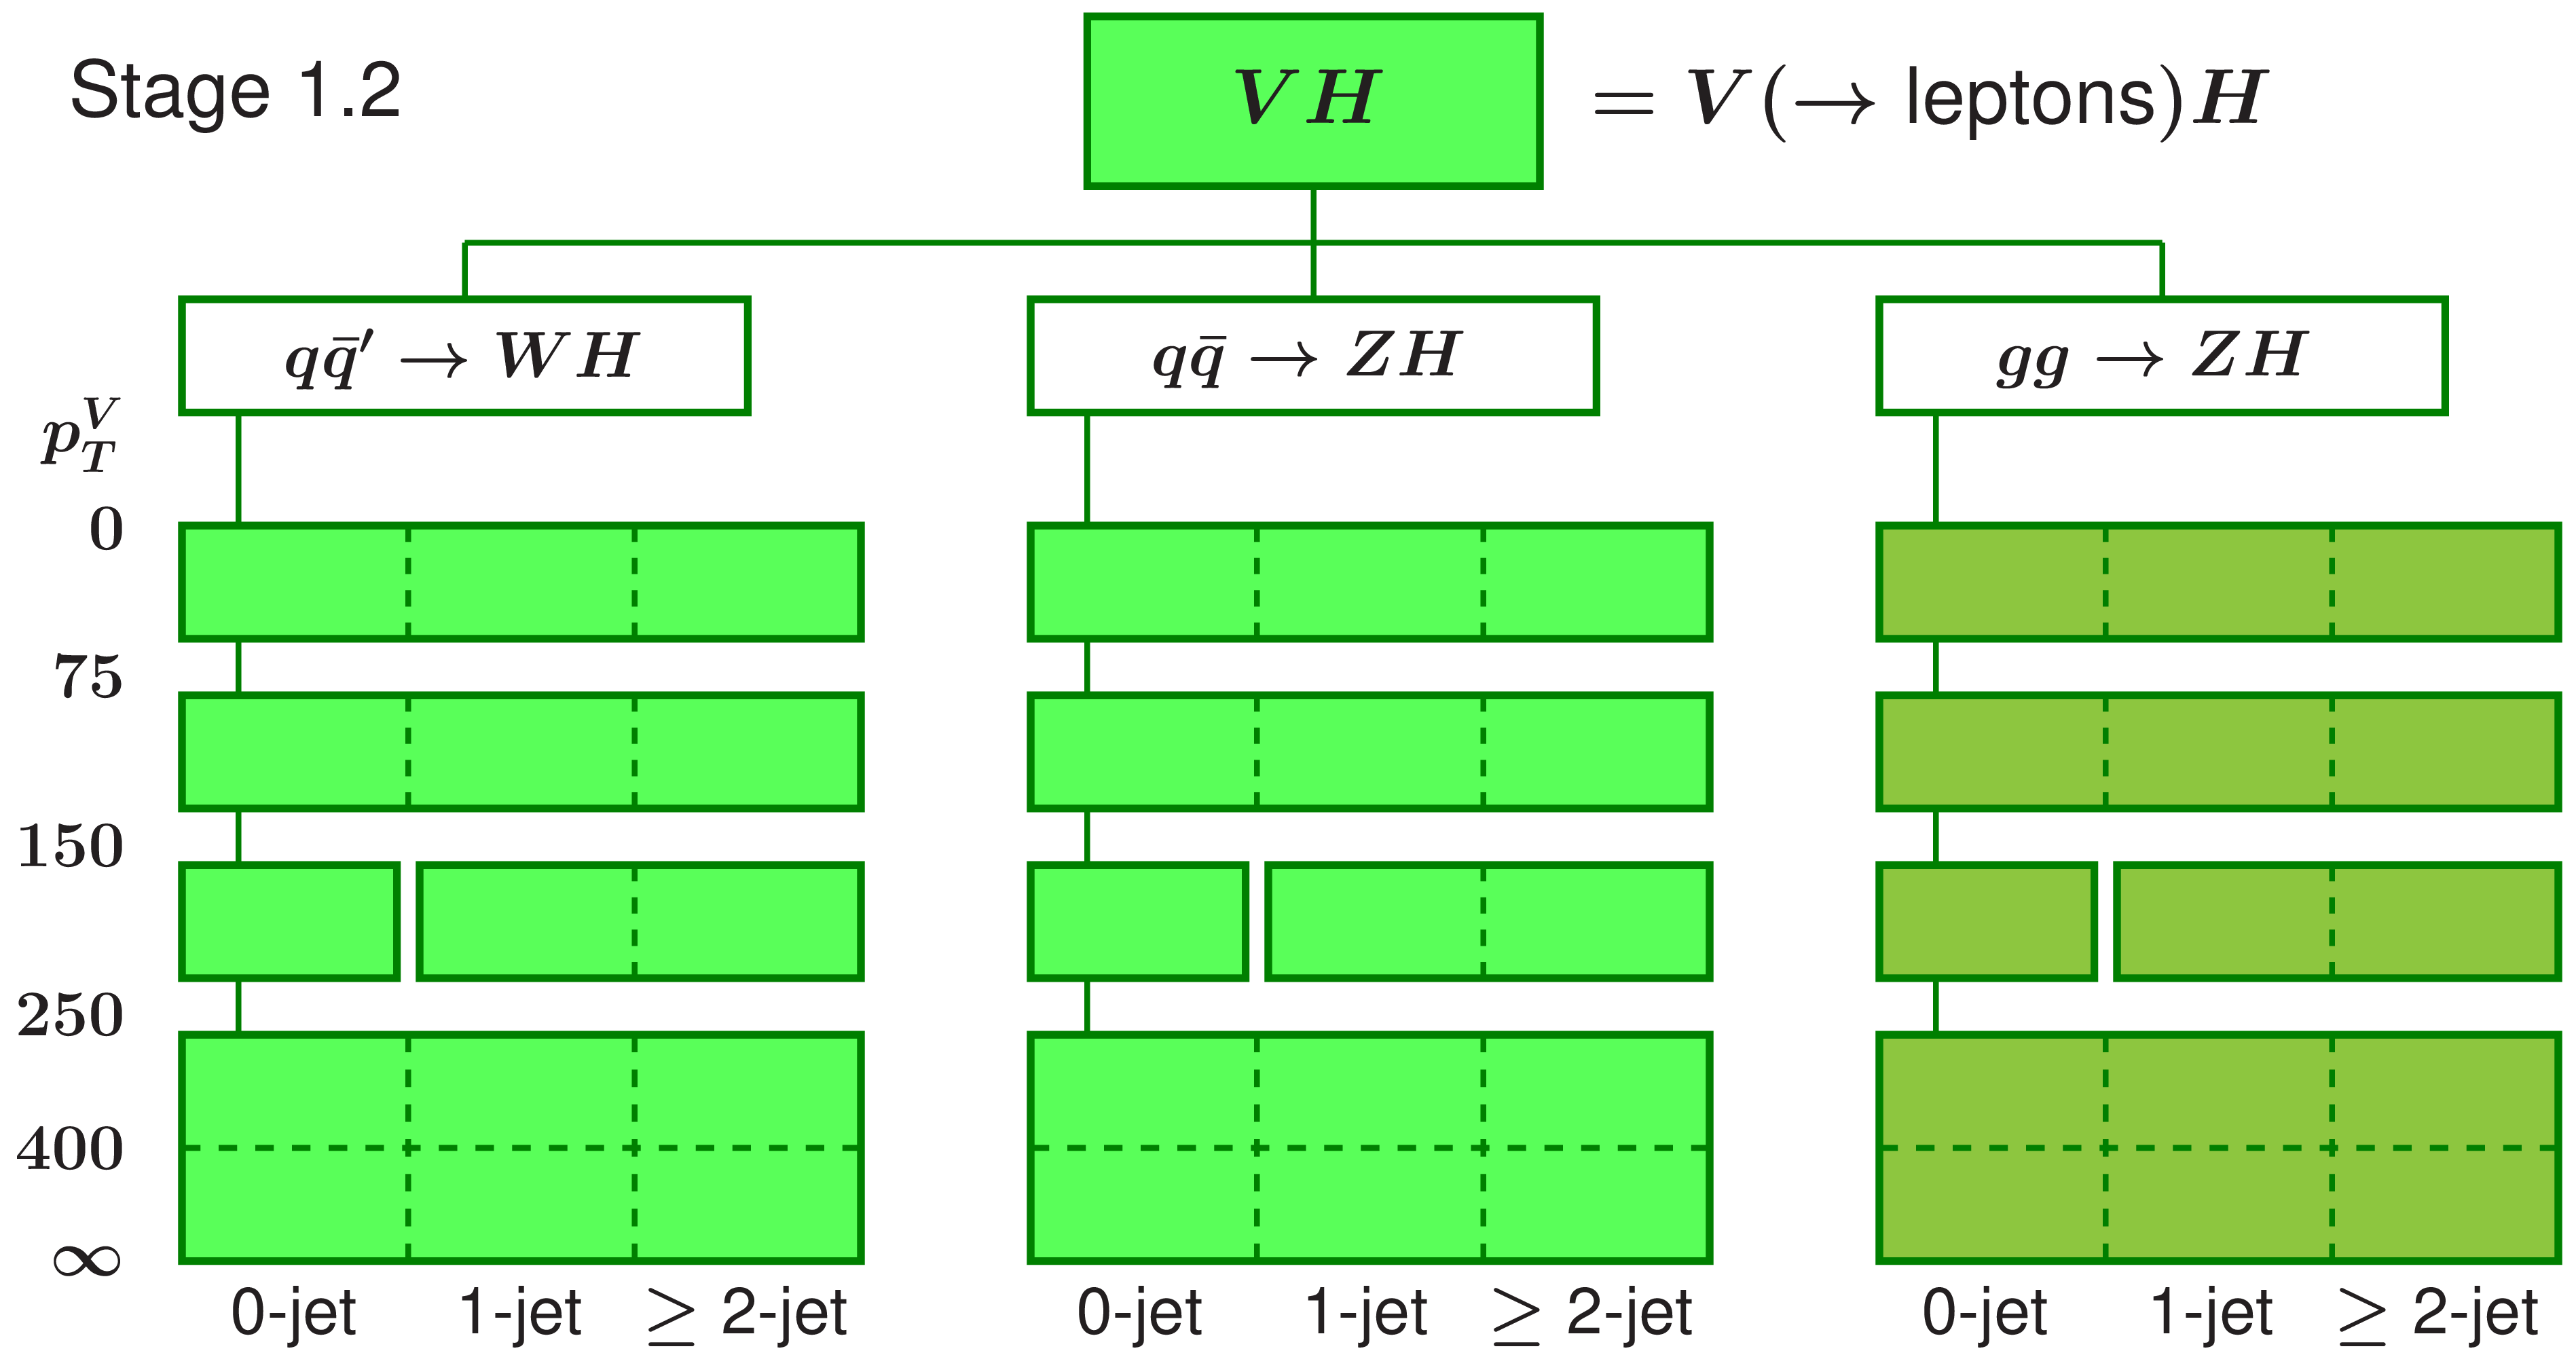
Figure 1:
Overview of the STXS bins for the three VH production modes. The vertical axis reflects the vector boson $ p_{\text{T}}(\text{V}) $ bin ranges and the horizontal axis the number of additional jets. The general bin definitions are indicated by the green boxes. No distinction is made between gluon and quark-induced production modes in the analysis. As mentioned in Section 5, some STXS bins are not explicitly targeted by the analysis: contributions from these bins in the analysis categories are fixed to their SM expectations. |
png pdf |
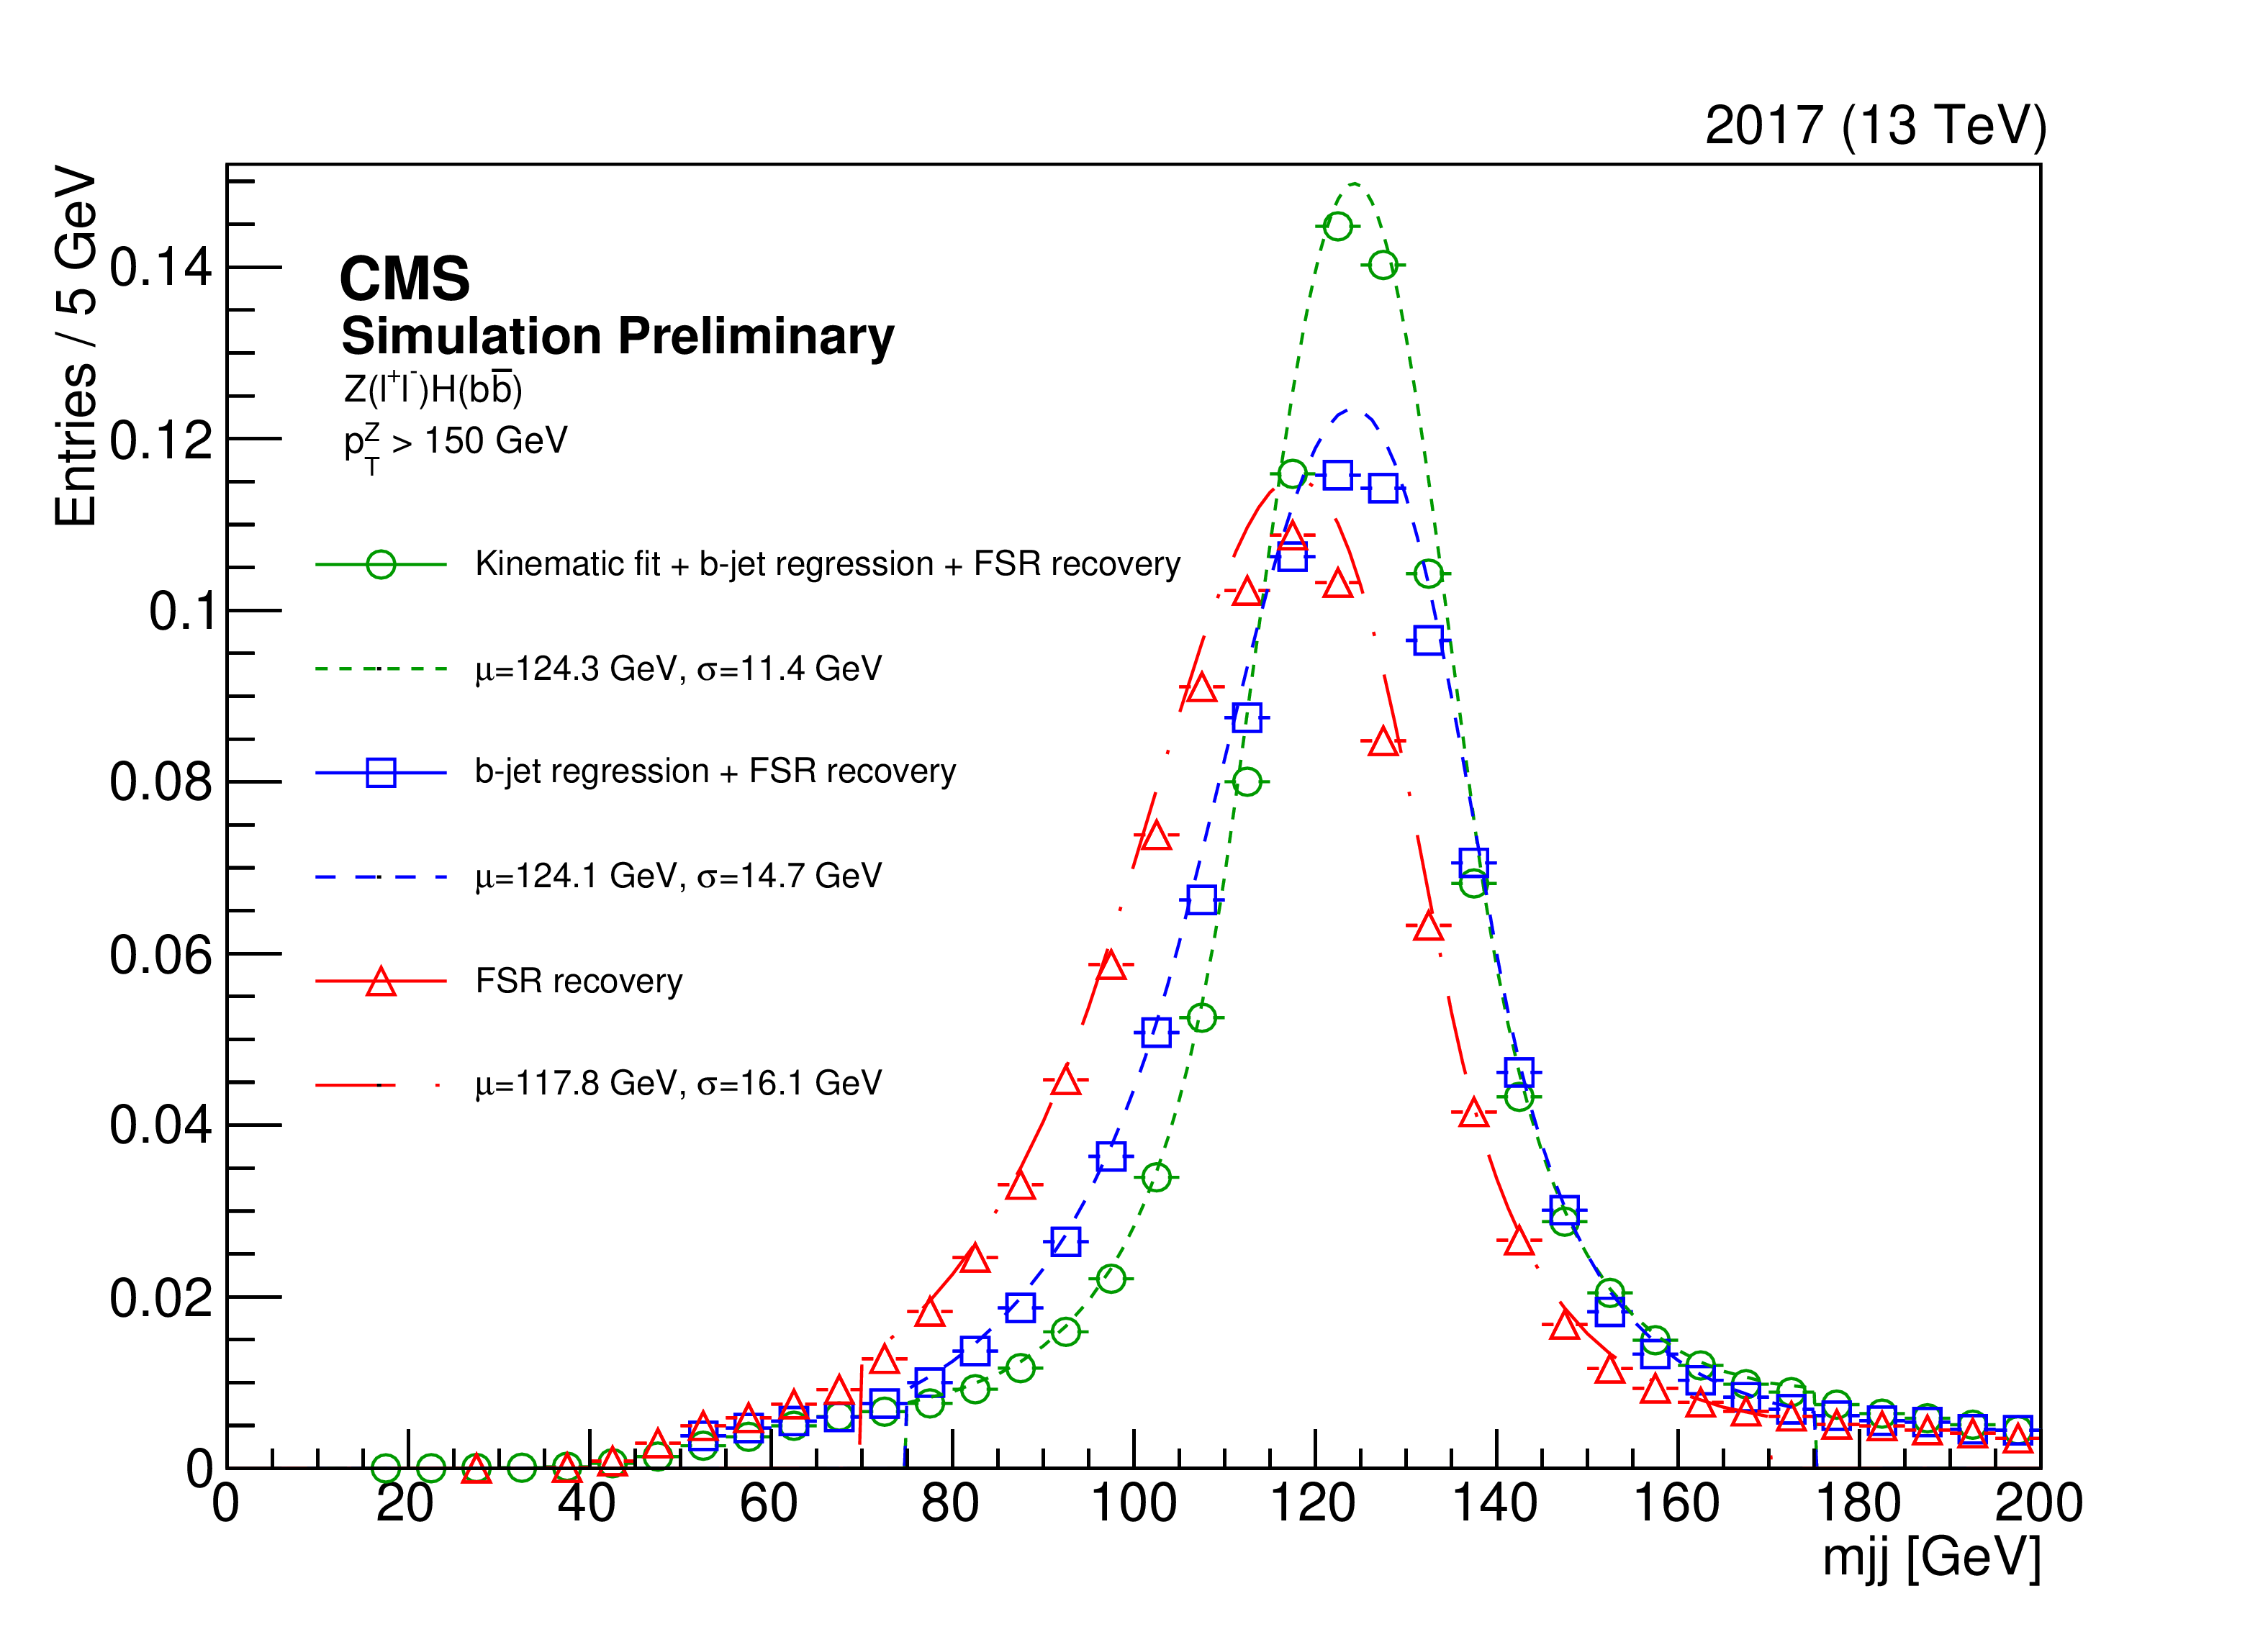
Figure 2:
Dijet invariant mass distributions in samples of simulated $ \text{VH}( \mathrm{b} \overline{\mathrm{b}} ) $ events passing the 2-lepton channel requirements without any additional recoiling jet. Distributions are shown before (red triangles) and after (blue squars) the energy corrections from the b jet regression are applied, and when a kinematic fit procedure (green circles) is used on top of them. The fitted mean and width of the core of the distribution, obtained by fitting a Bukin function, are displayed on the figure. |

png pdf |
Figure 3:
Distribution of the HFDNN scores in the 0-lepton (left) and 1-lepton (right) heavy-flavor control regions for the 2018 data set, after the fit to data. The output nodes target enrichment in the V+light-flavor (first bin), V+c (second bin), V+b (third bin), single-top (fourth bin), and $ { \mathrm{t} \overline{\mathrm{t}} } $ (fifth bin) backgrounds. |

png pdf |
Figure 3-a:
Distribution of the HFDNN scores in the 0-lepton (left) and 1-lepton (right) heavy-flavor control regions for the 2018 data set, after the fit to data. The output nodes target enrichment in the V+light-flavor (first bin), V+c (second bin), V+b (third bin), single-top (fourth bin), and $ { \mathrm{t} \overline{\mathrm{t}} } $ (fifth bin) backgrounds. |

png pdf |
Figure 3-b:
Distribution of the HFDNN scores in the 0-lepton (left) and 1-lepton (right) heavy-flavor control regions for the 2018 data set, after the fit to data. The output nodes target enrichment in the V+light-flavor (first bin), V+c (second bin), V+b (third bin), single-top (fourth bin), and $ { \mathrm{t} \overline{\mathrm{t}} } $ (fifth bin) backgrounds. |

png pdf |
Figure 4:
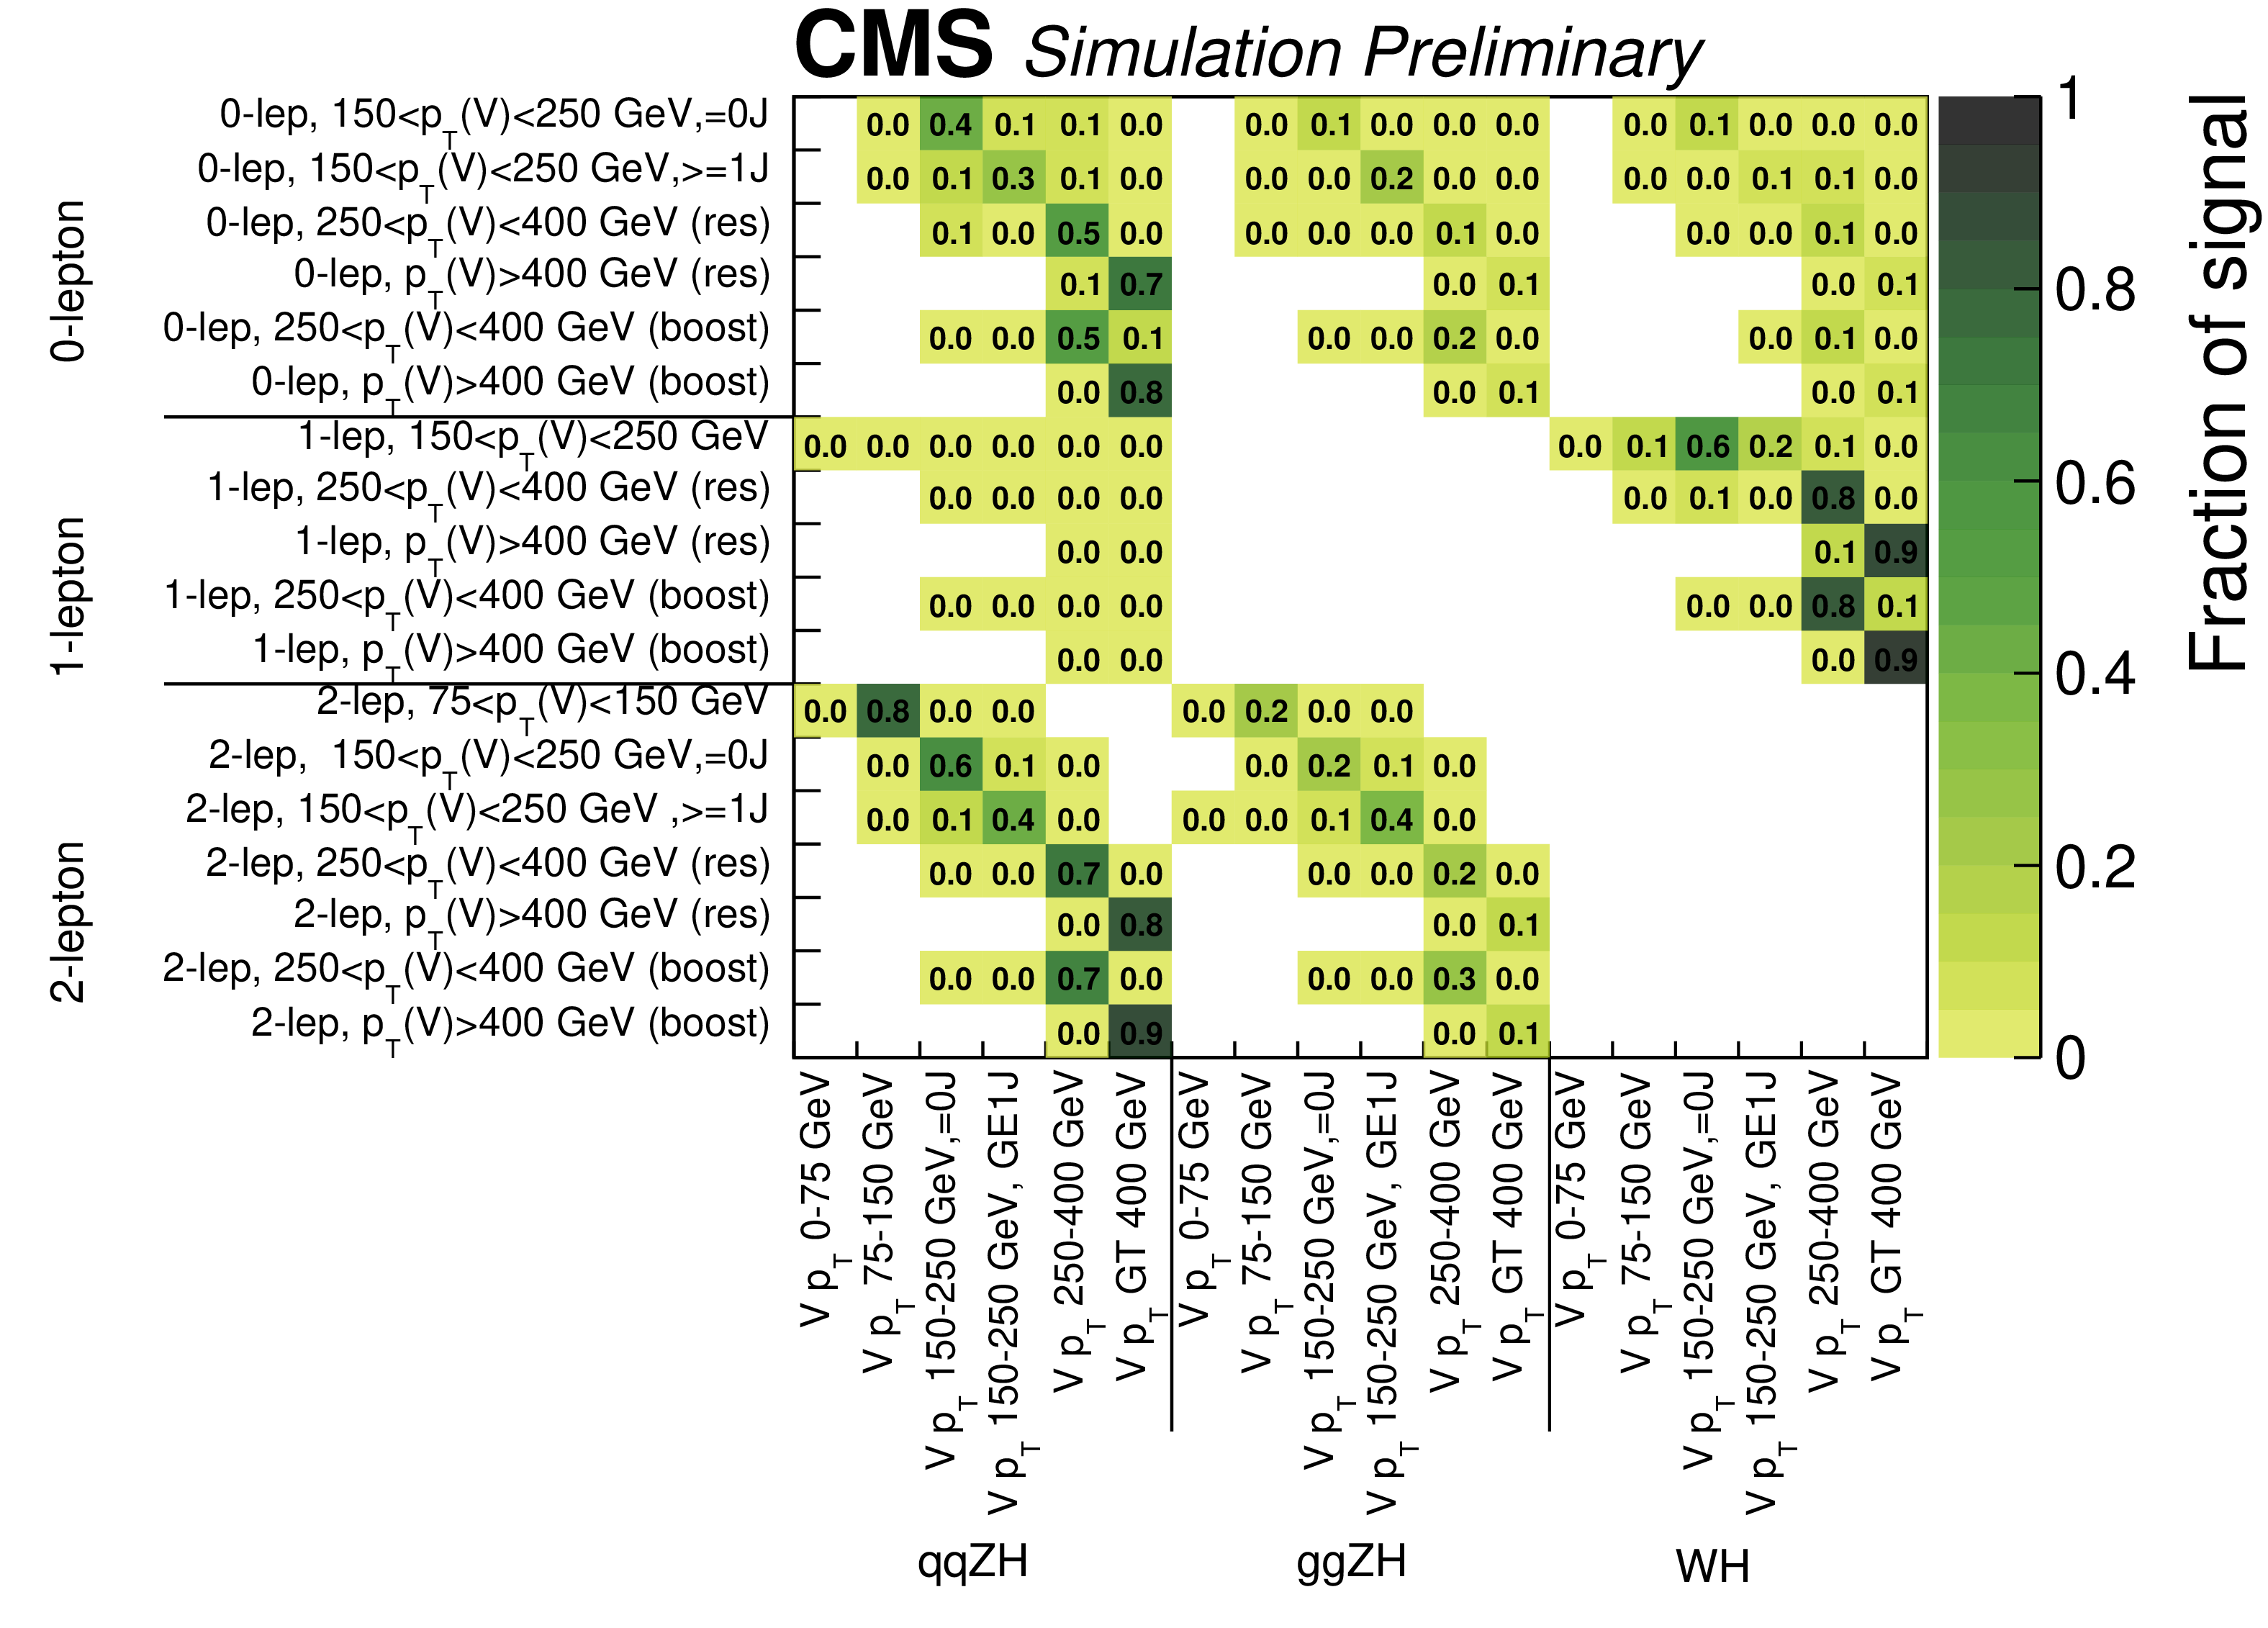
Contributions of the different STXS signal bins as a fraction of the total signal yield in each SR (upper). Correlation matrix of the parameters of interest in the STXS fit (lower). |
png pdf |
Figure 4-a:
Contributions of the different STXS signal bins as a fraction of the total signal yield in each SR (upper). Correlation matrix of the parameters of interest in the STXS fit (lower). |

png pdf |
Figure 4-b:
Contributions of the different STXS signal bins as a fraction of the total signal yield in each SR (upper). Correlation matrix of the parameters of interest in the STXS fit (lower). |

png pdf |
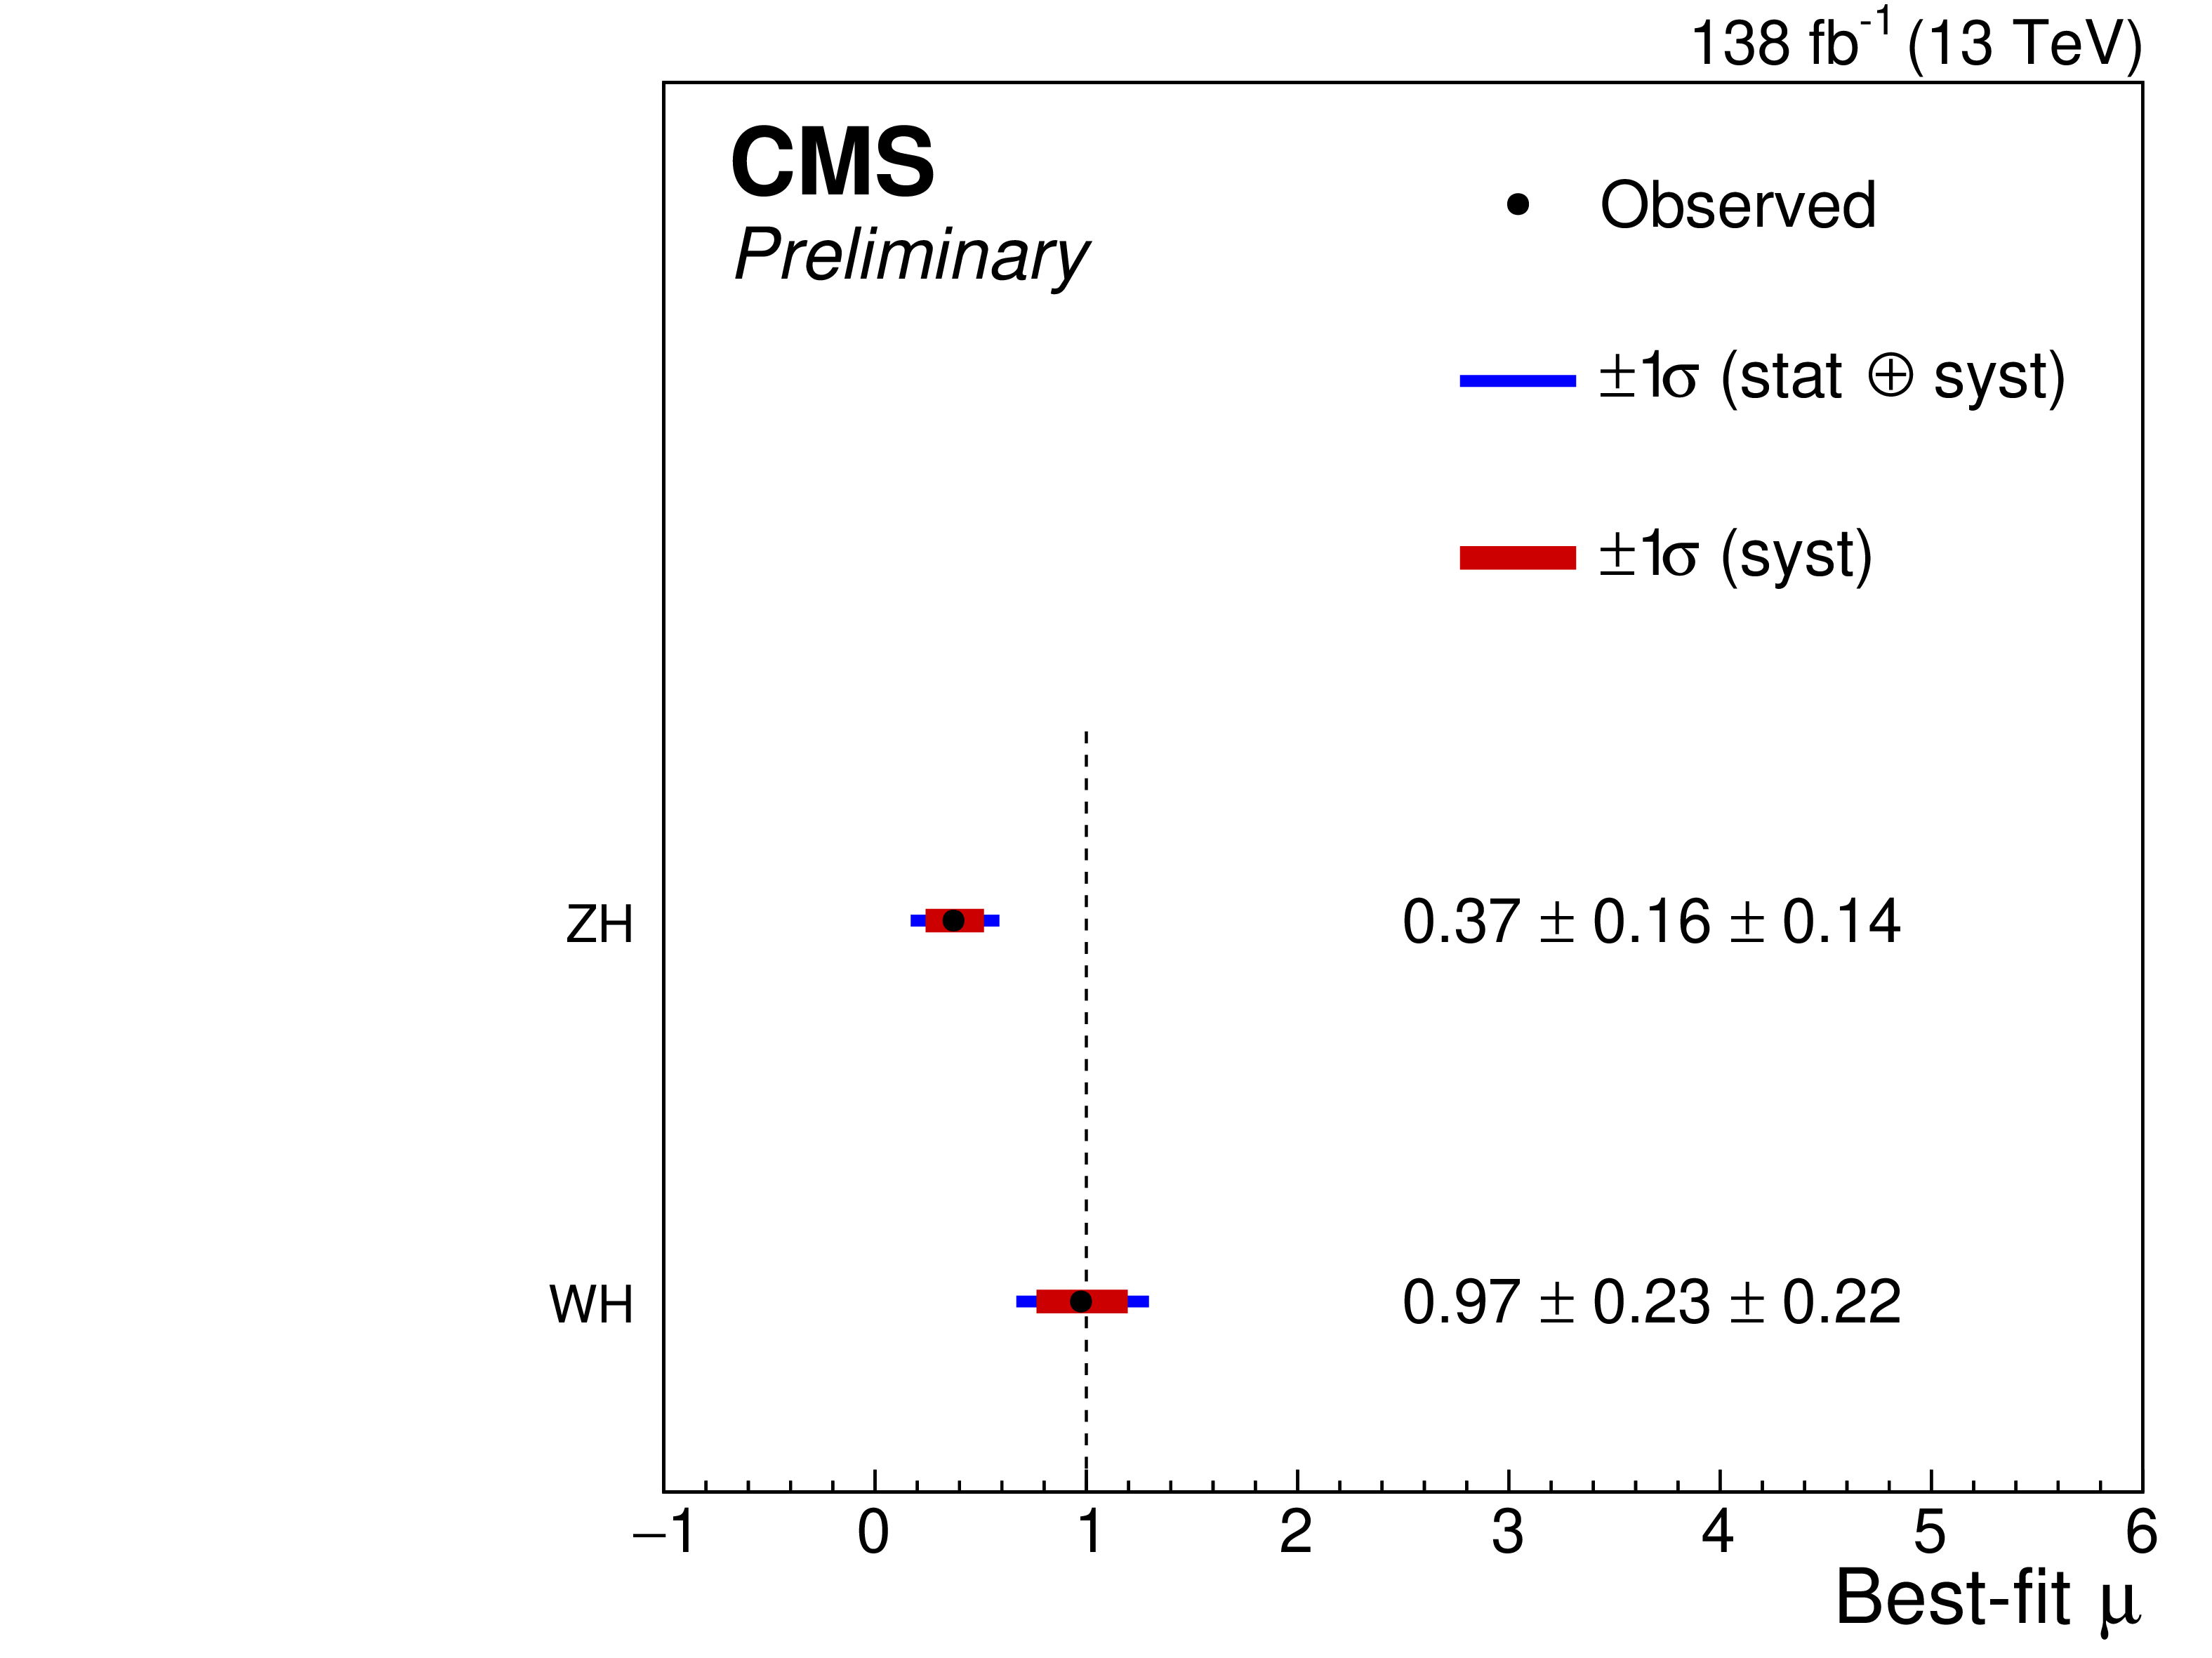
Figure 5:
Signal strengths for the 0-lepton, 1-lepton, and 2-lepton-lepton channels, as well as the combined signal strength (left). Signal strengths for the ZH and WH production modes (right). All results combine the 2016, 2017 and 2018 data. |

png pdf |
Figure 5-a:
Signal strengths for the 0-lepton, 1-lepton, and 2-lepton-lepton channels, as well as the combined signal strength (left). Signal strengths for the ZH and WH production modes (right). All results combine the 2016, 2017 and 2018 data. |
png pdf |
Figure 5-b:
Signal strengths for the 0-lepton, 1-lepton, and 2-lepton-lepton channels, as well as the combined signal strength (left). Signal strengths for the ZH and WH production modes (right). All results combine the 2016, 2017 and 2018 data. |

png pdf |
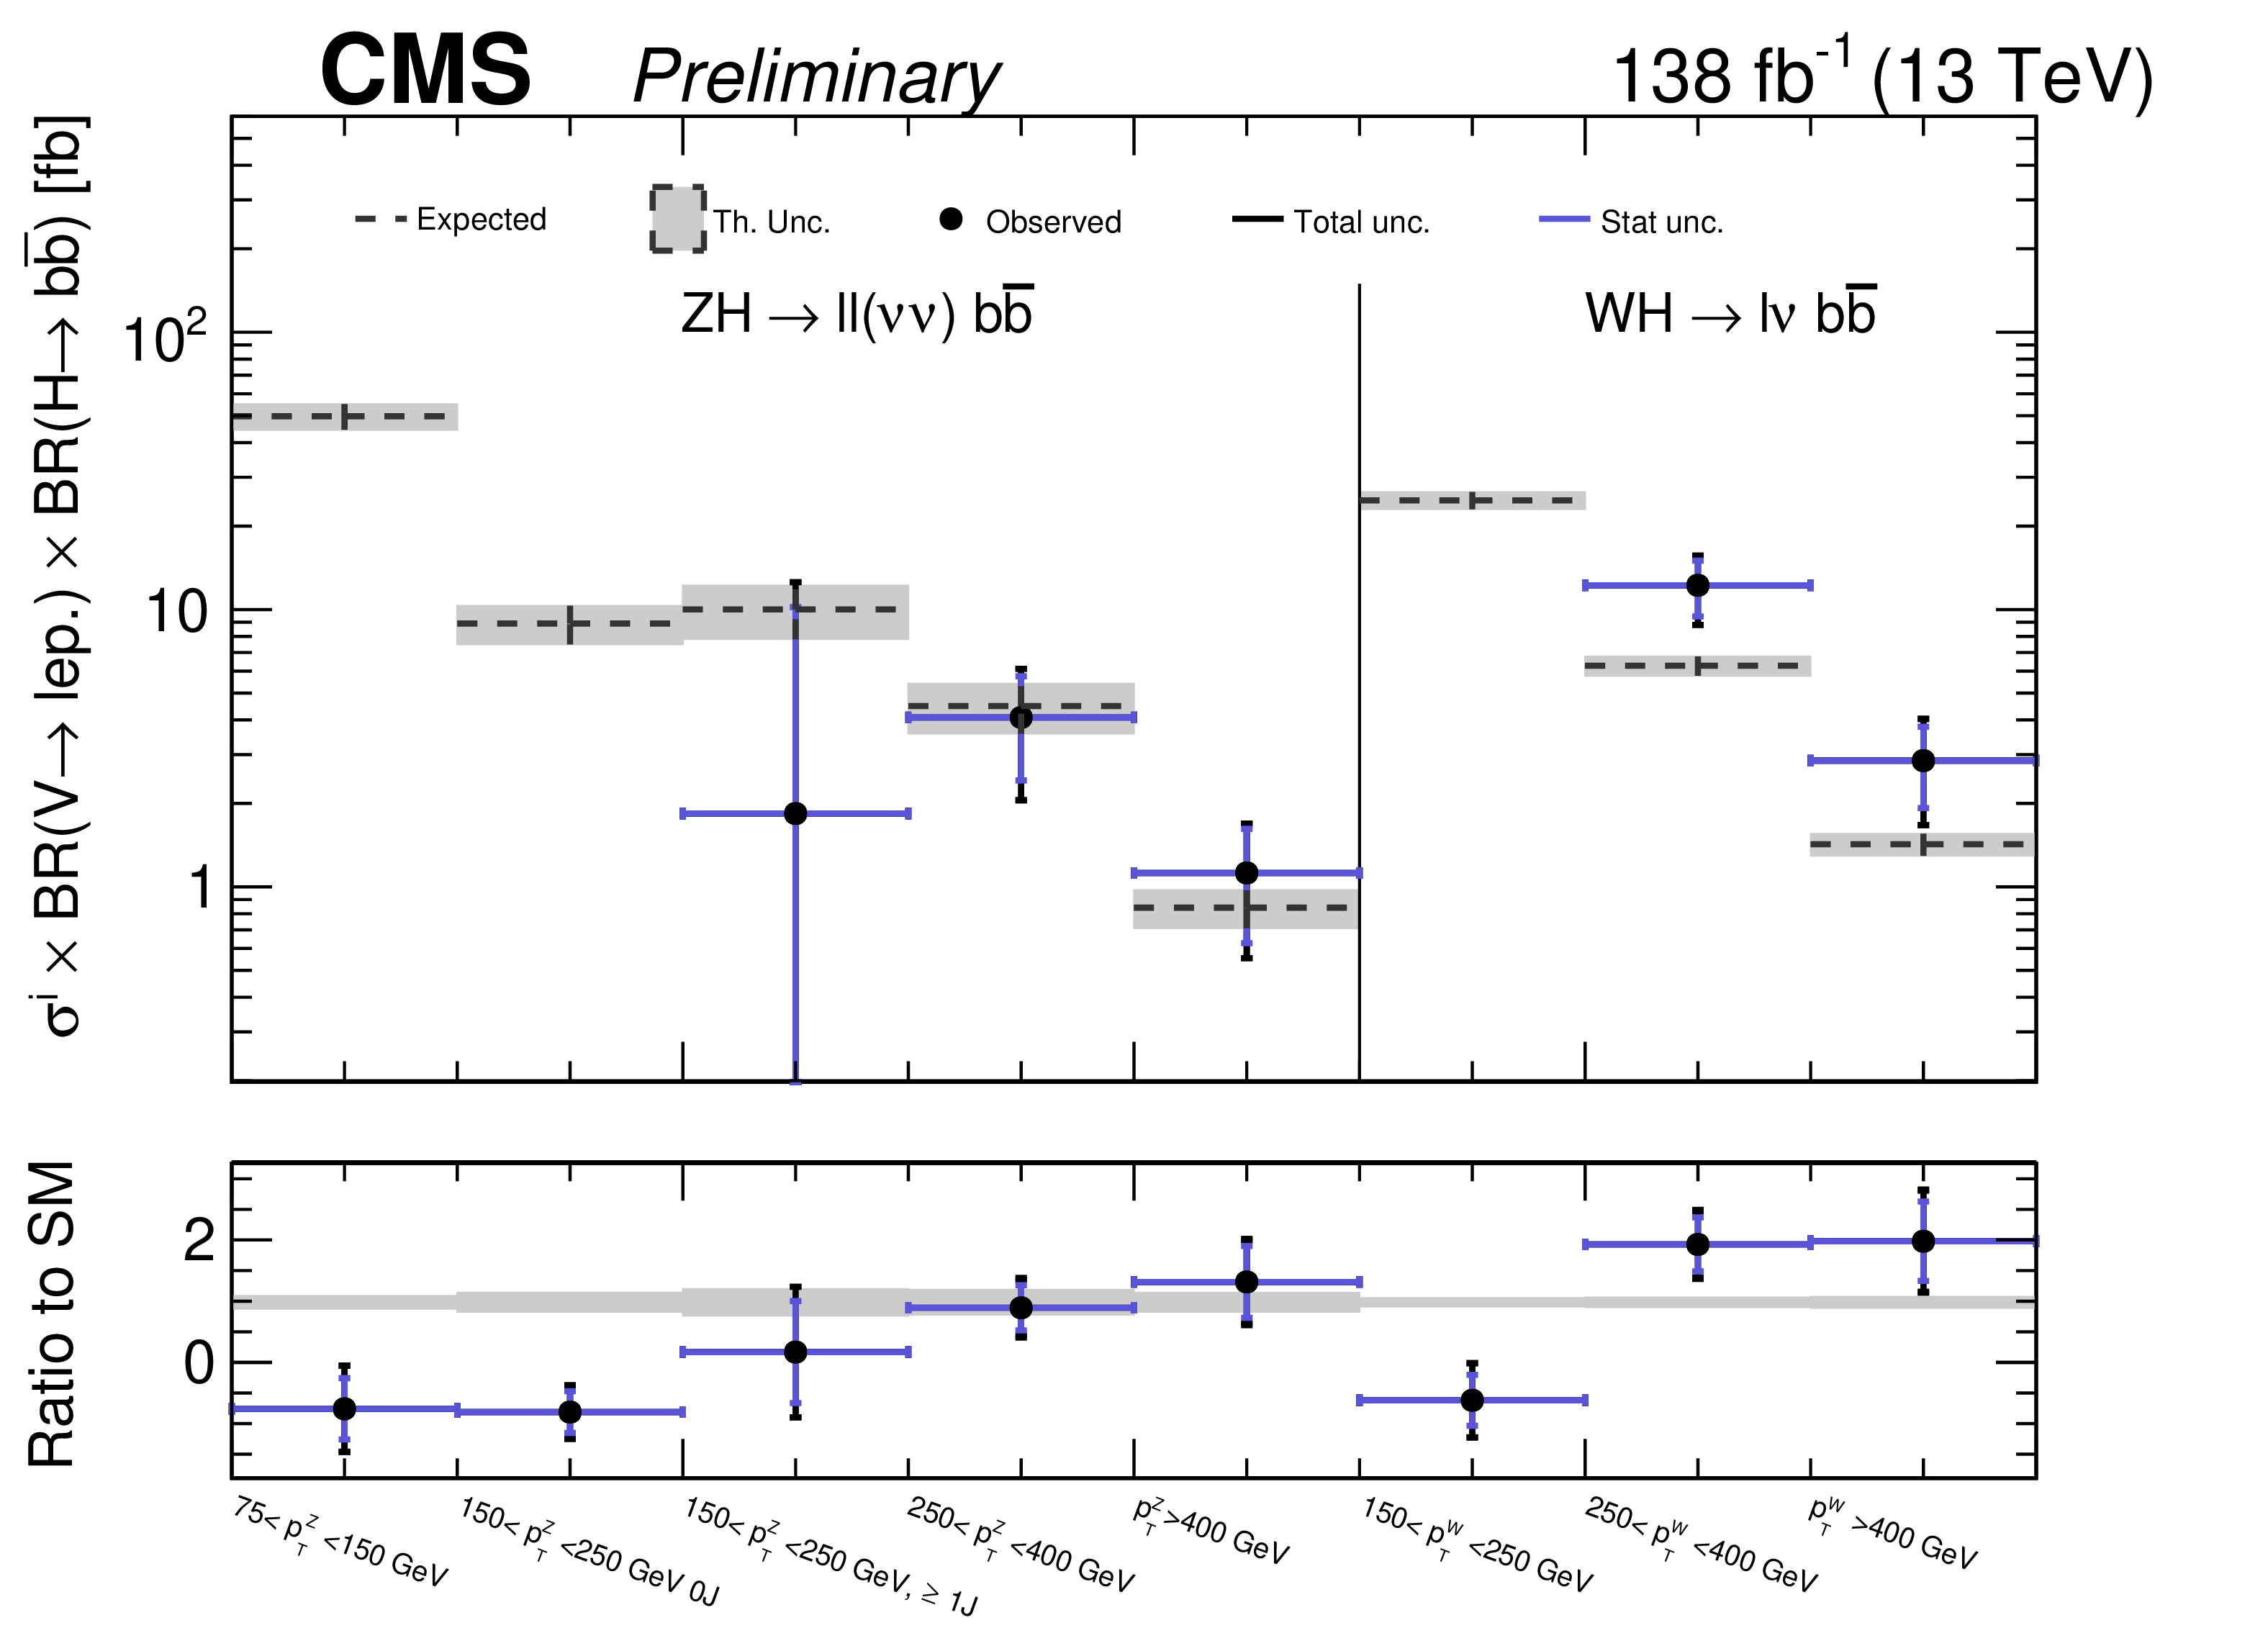
Figure 6:
STXS signal strengths from the analysis of the 2016--2018 data (left). Measured values of $ \sigma\mathcal{B} $ in the same STXS bins as for the signal strengths, combining all years (right). In the bottom panel, the ratio of the observed results with associated uncertainties to the SM expectations is shown. If the observed signal strength for a given STXS bin is negative, no value is quoted for $ \sigma\mathcal{B} $. |

png pdf |
Figure 6-a:
STXS signal strengths from the analysis of the 2016--2018 data (left). Measured values of $ \sigma\mathcal{B} $ in the same STXS bins as for the signal strengths, combining all years (right). In the bottom panel, the ratio of the observed results with associated uncertainties to the SM expectations is shown. If the observed signal strength for a given STXS bin is negative, no value is quoted for $ \sigma\mathcal{B} $. |
png pdf |
Figure 6-b:
STXS signal strengths from the analysis of the 2016--2018 data (left). Measured values of $ \sigma\mathcal{B} $ in the same STXS bins as for the signal strengths, combining all years (right). In the bottom panel, the ratio of the observed results with associated uncertainties to the SM expectations is shown. If the observed signal strength for a given STXS bin is negative, no value is quoted for $ \sigma\mathcal{B} $. |
png pdf |
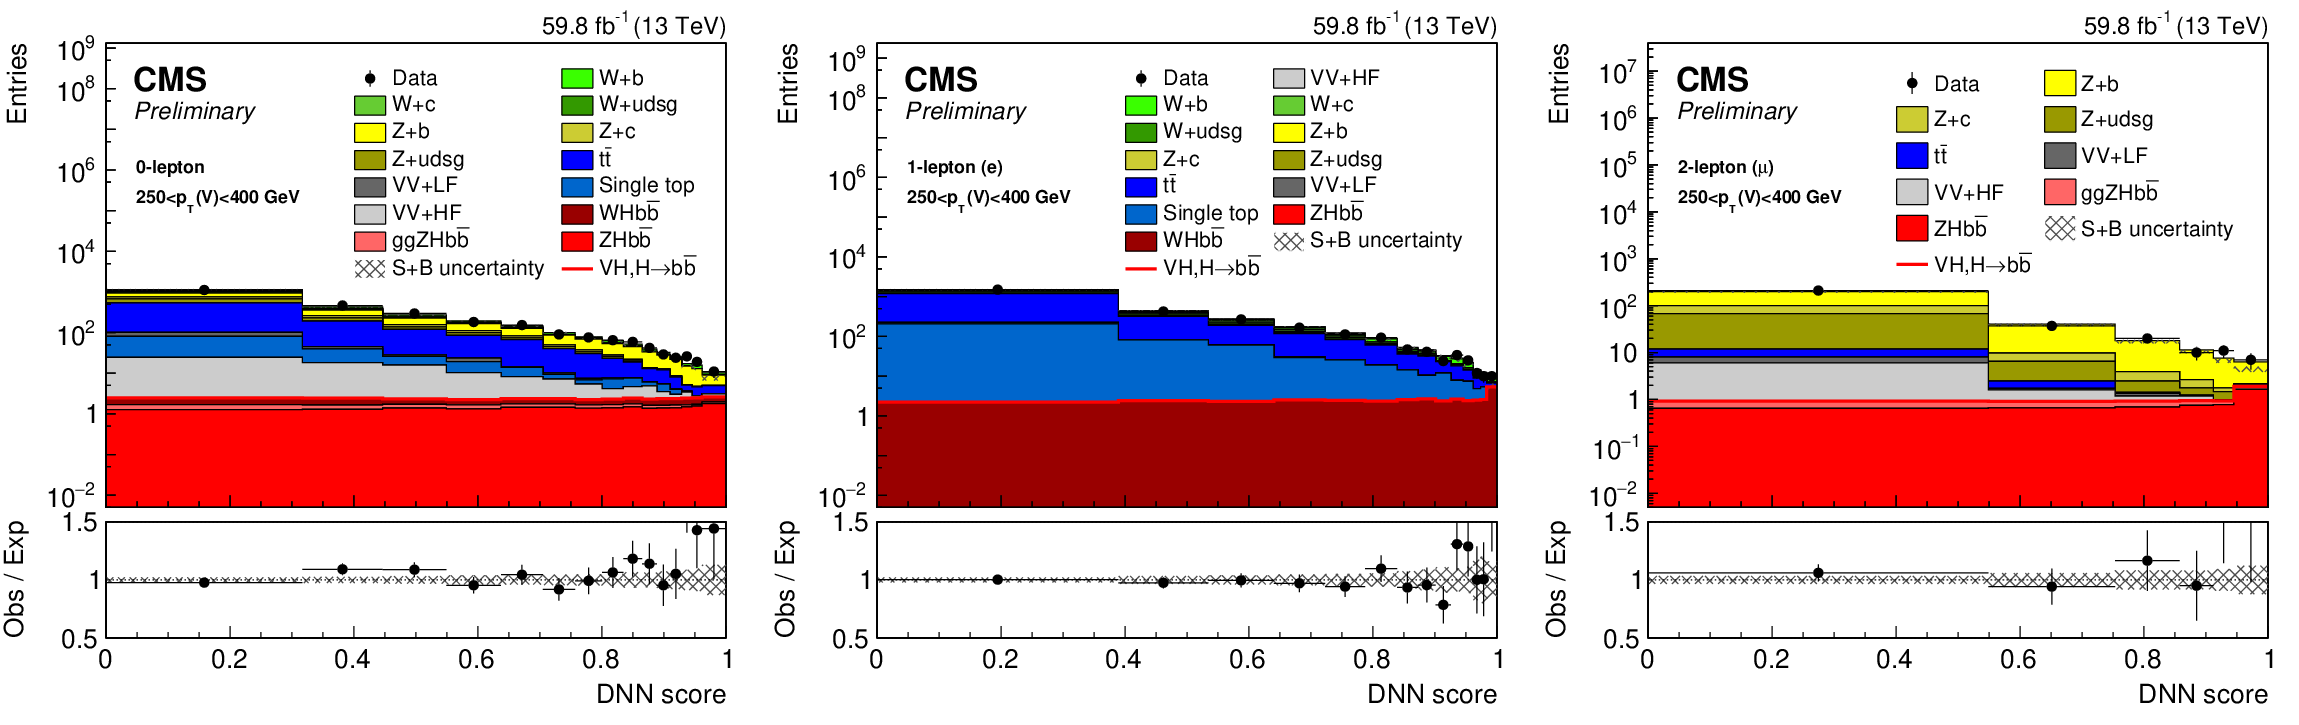
Figure 7:
Post-fit distributions of the DNN discriminant in the 250 $ < p_{\text{T}}(\text{V}) < $ 400 GeV category of the 0-lepton (left), 1-lepton (center), 2-lepton (right) channels using the 2018 data set. The background contributions after the global likelihood fit are shown as filled histograms. The Higgs boson signal is also shown as a filled histogram, and is normalized to the signal strength shown in Fig. 12. The hatched band indicates the combined statistical and systematic uncertainty in the sum of the signal and background templates. The ratio of the data to the sum of the fitted signal and background is shown in the lower panel. The distributions that enter the maximum-likelihood fit use the same binning as shown here. |
png pdf |
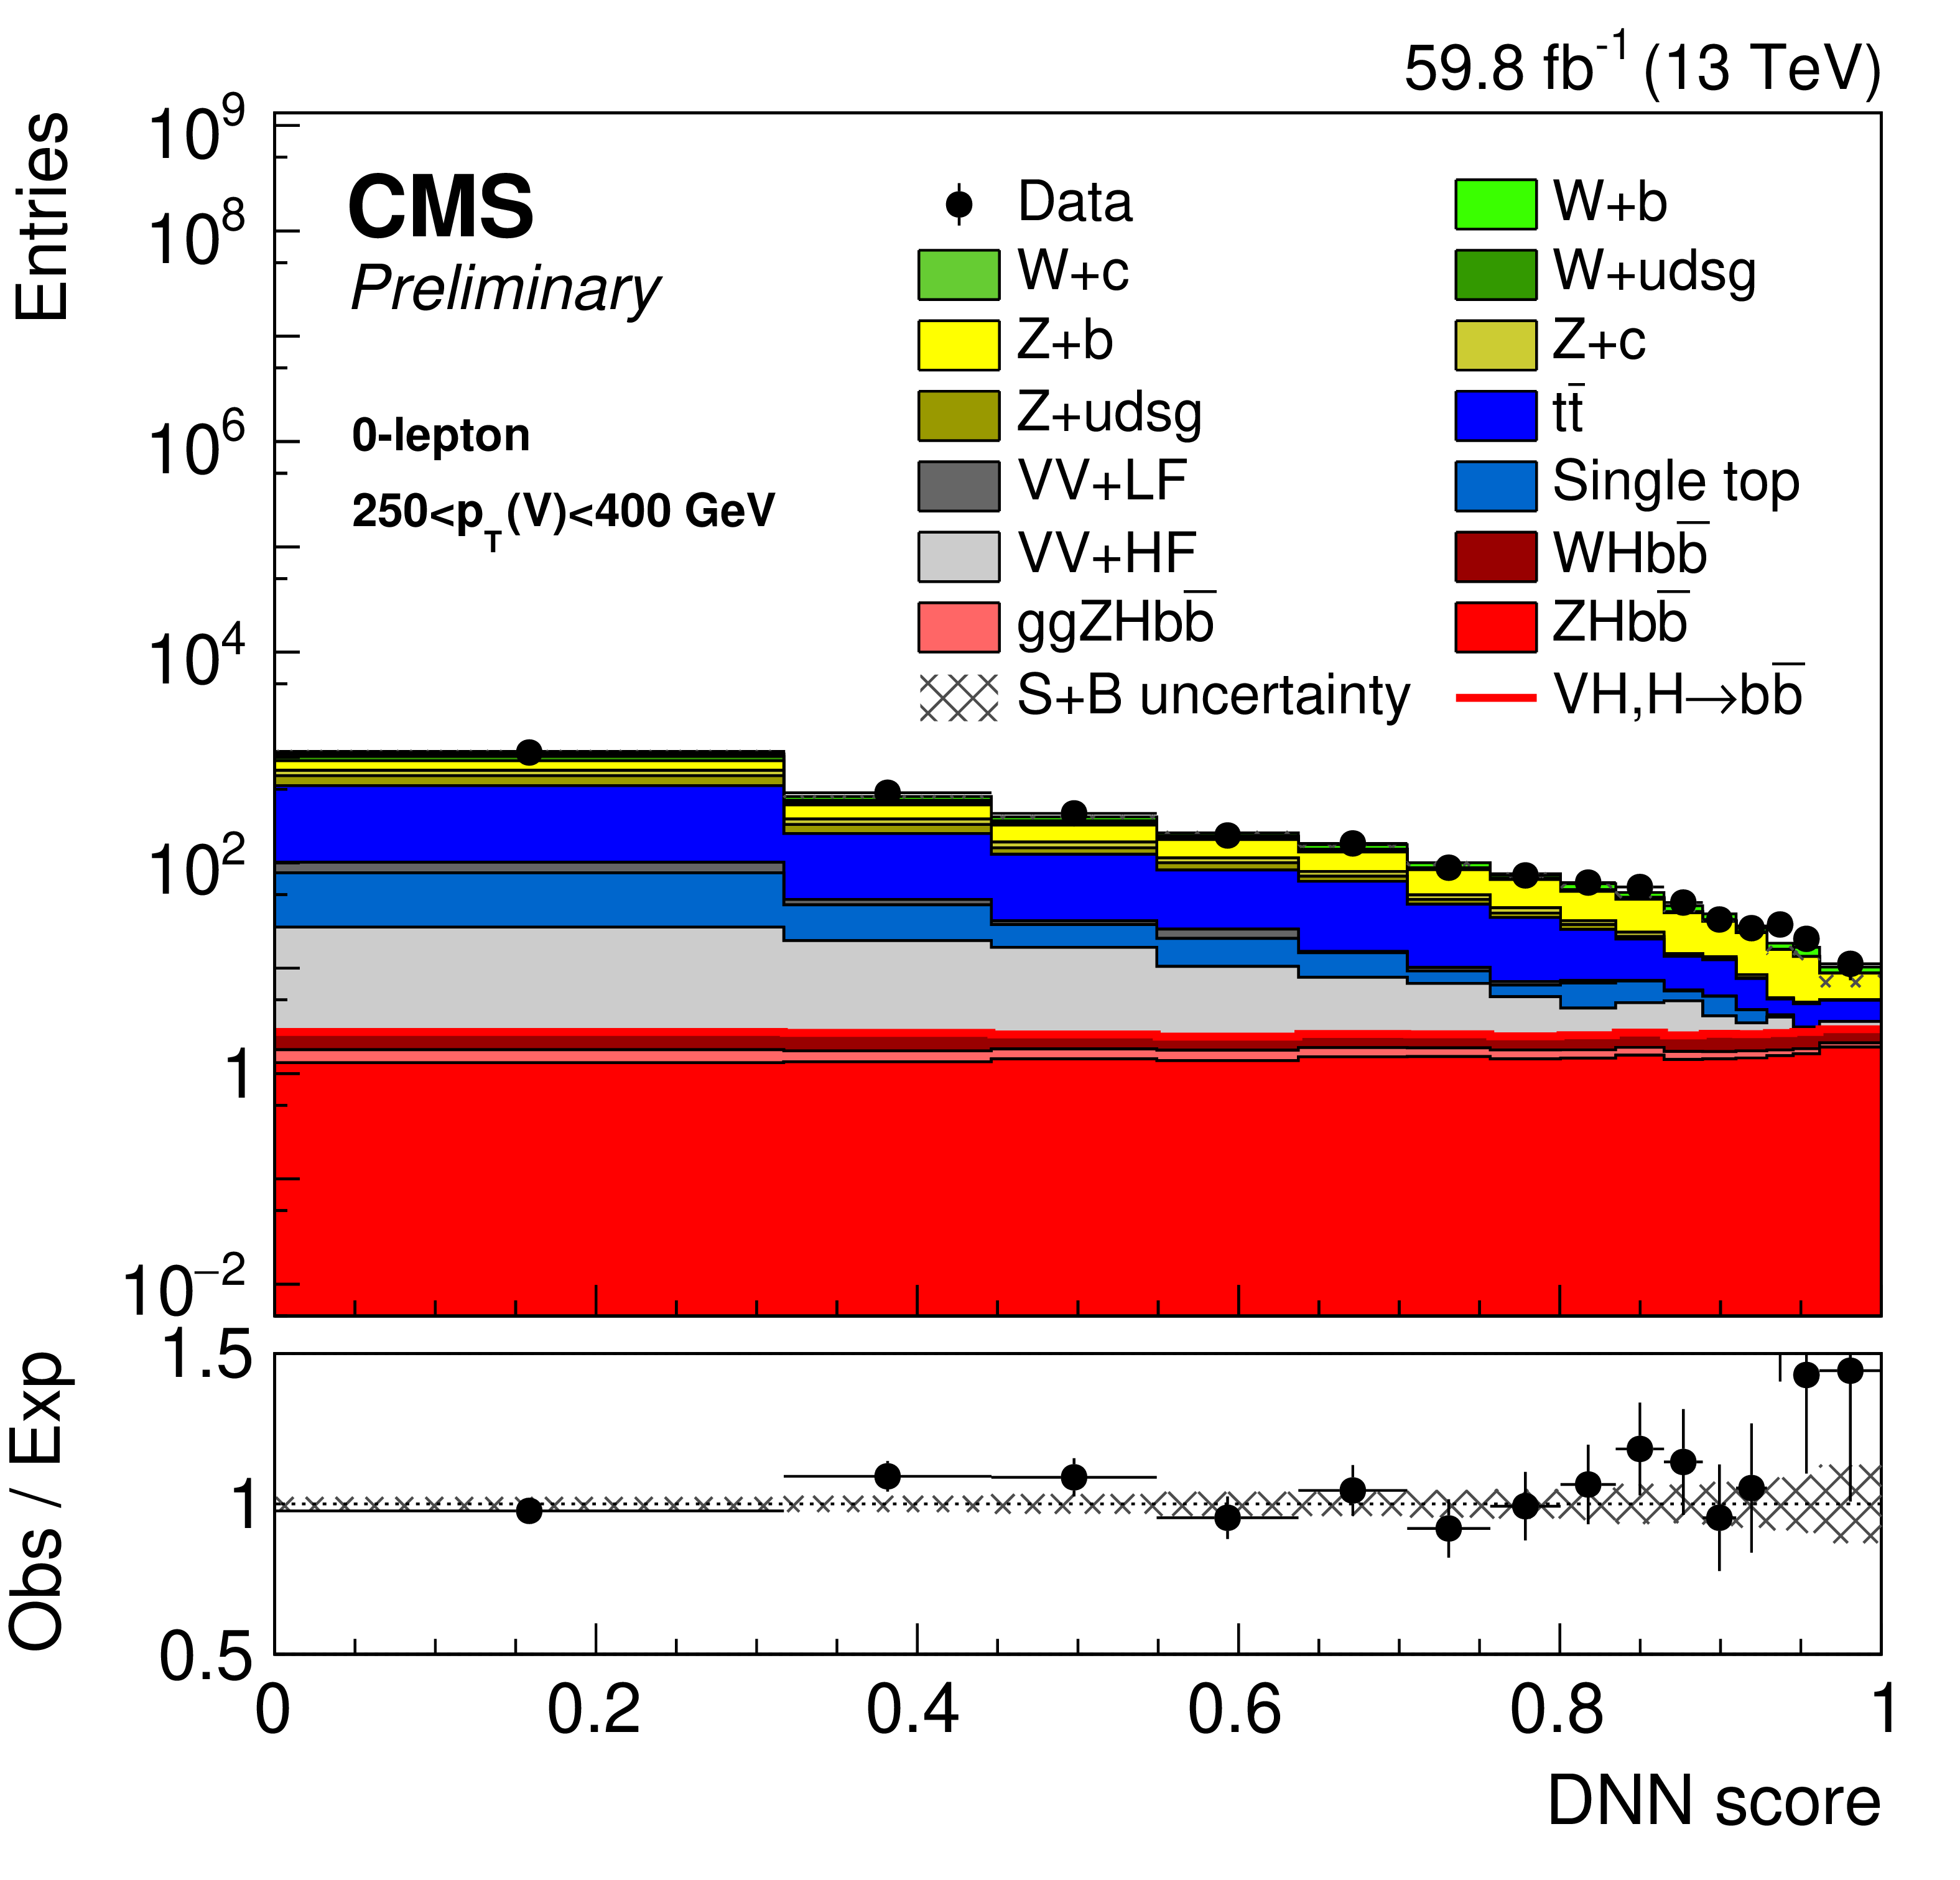
Figure 7-a:
Post-fit distributions of the DNN discriminant in the 250 $ < p_{\text{T}}(\text{V}) < $ 400 GeV category of the 0-lepton (left), 1-lepton (center), 2-lepton (right) channels using the 2018 data set. The background contributions after the global likelihood fit are shown as filled histograms. The Higgs boson signal is also shown as a filled histogram, and is normalized to the signal strength shown in Fig. 12. The hatched band indicates the combined statistical and systematic uncertainty in the sum of the signal and background templates. The ratio of the data to the sum of the fitted signal and background is shown in the lower panel. The distributions that enter the maximum-likelihood fit use the same binning as shown here. |
png pdf |
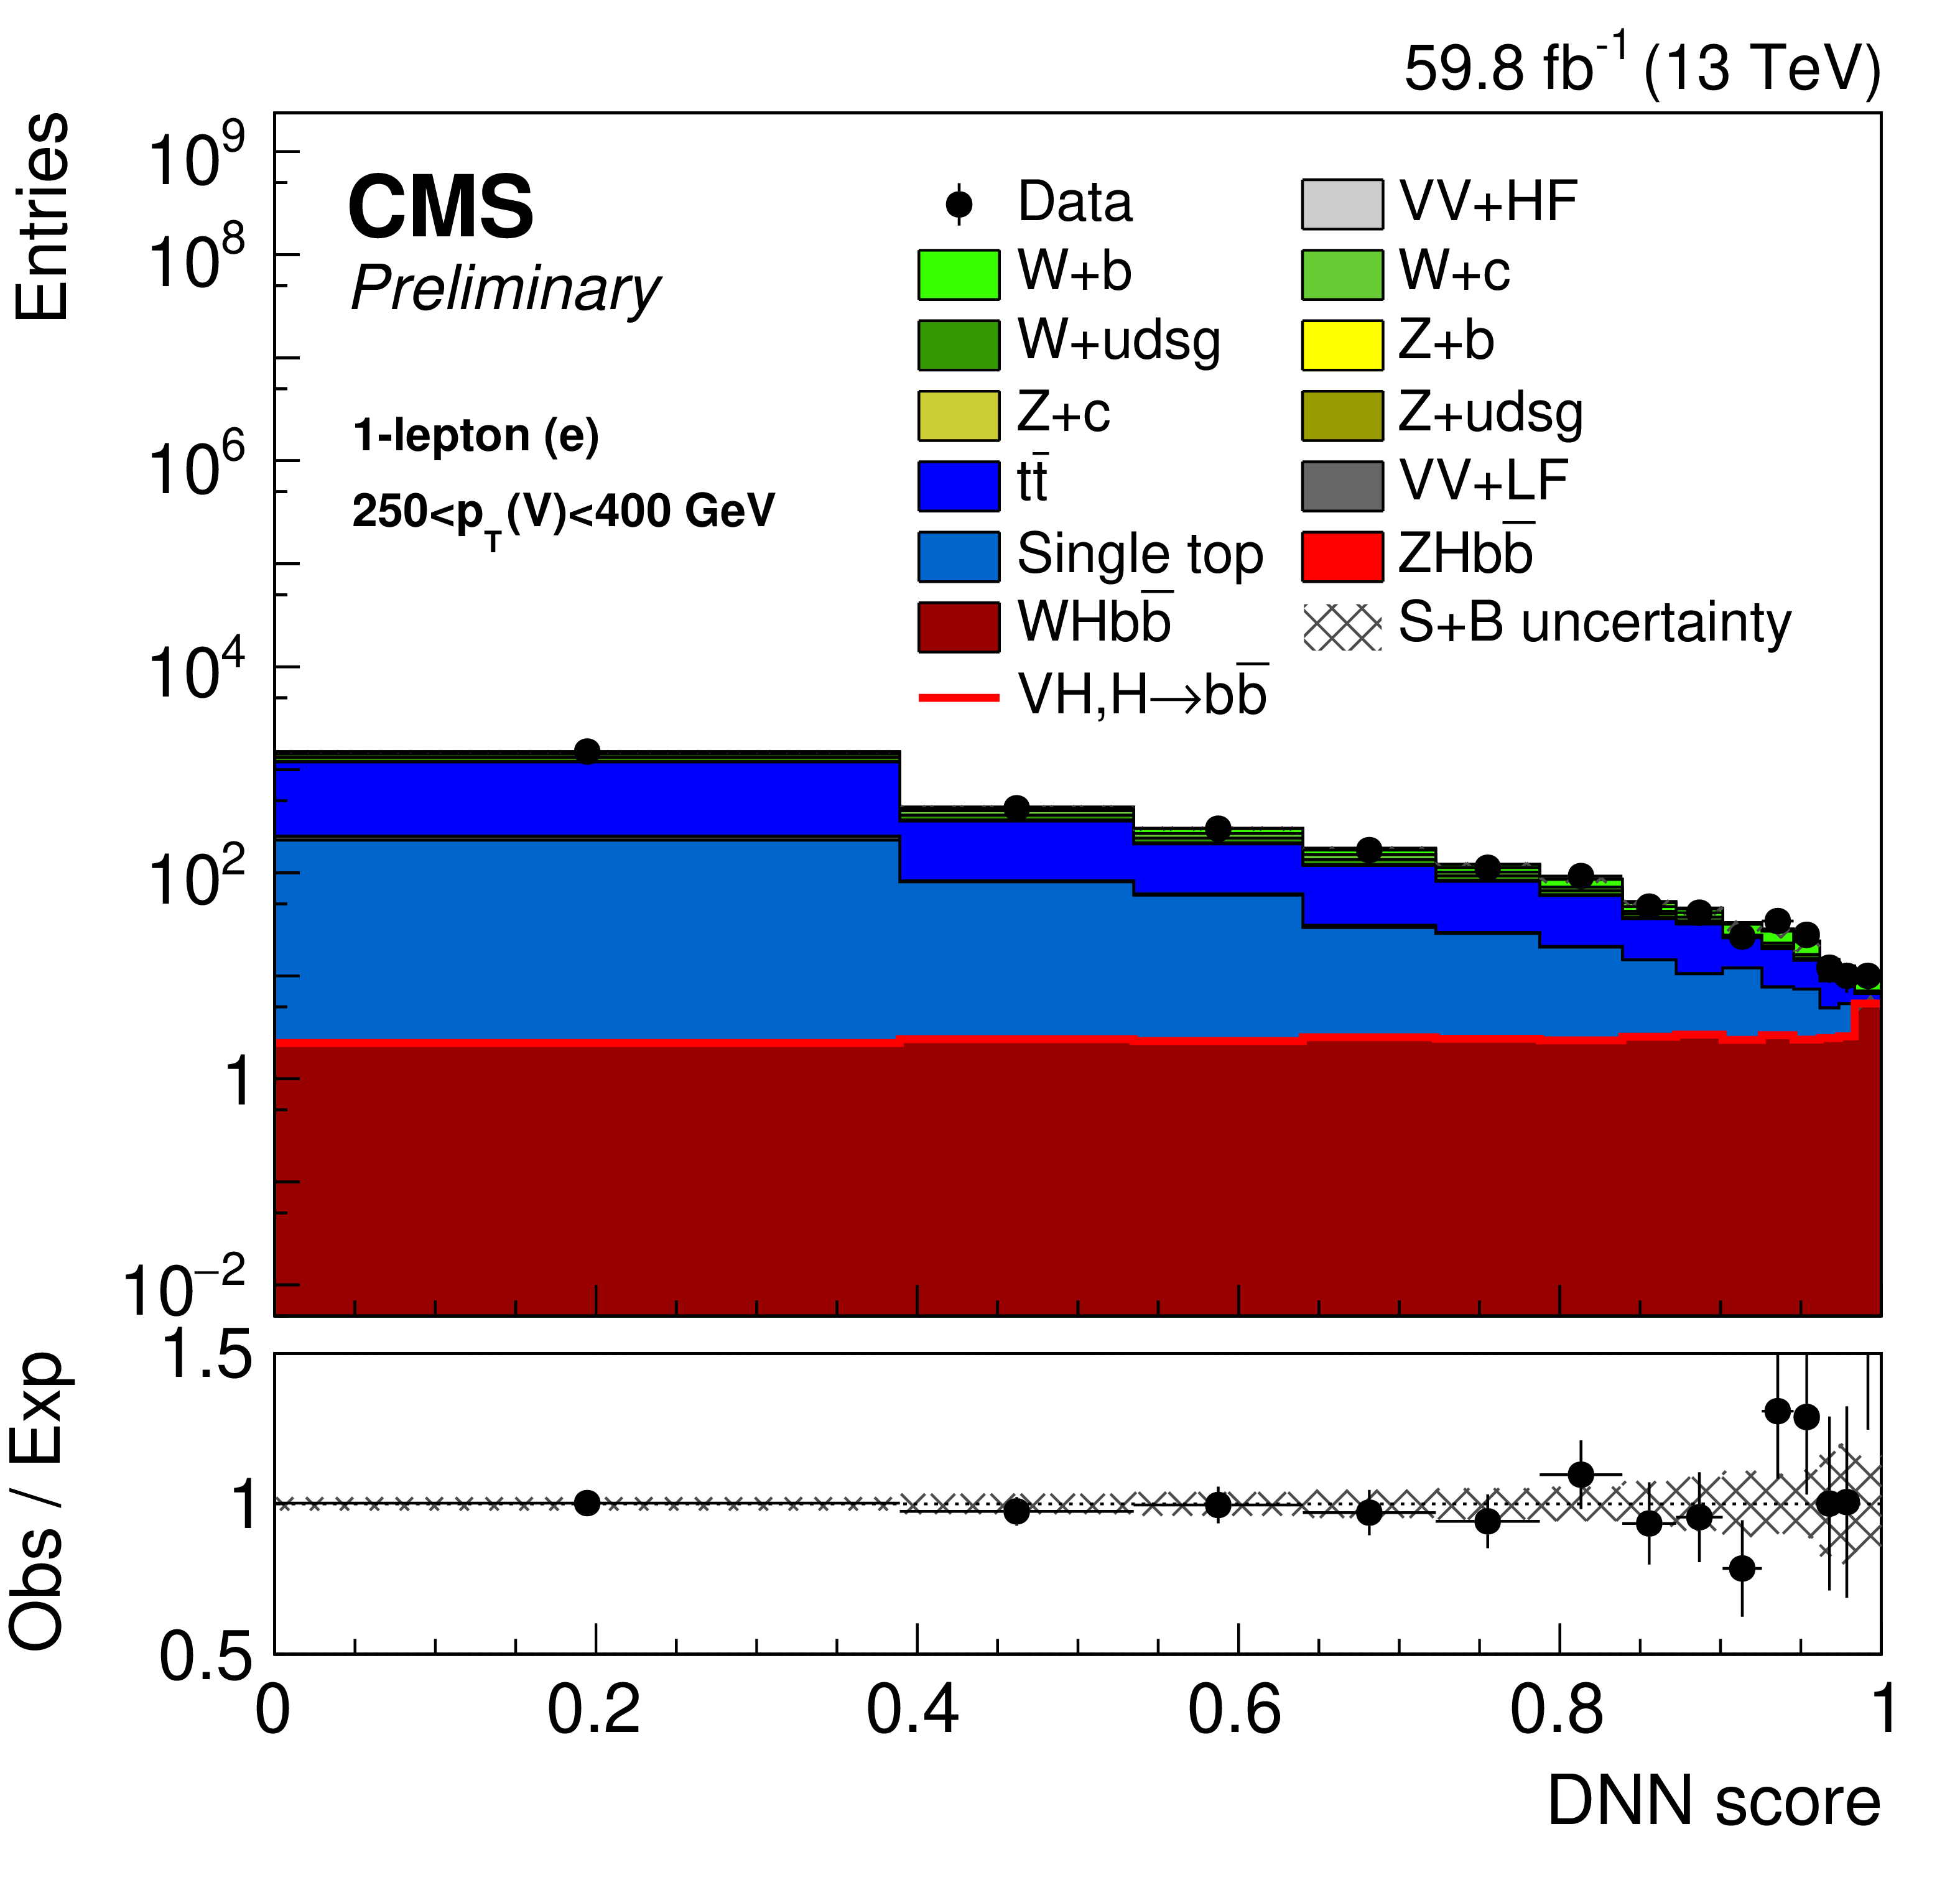
Figure 7-b:
Post-fit distributions of the DNN discriminant in the 250 $ < p_{\text{T}}(\text{V}) < $ 400 GeV category of the 0-lepton (left), 1-lepton (center), 2-lepton (right) channels using the 2018 data set. The background contributions after the global likelihood fit are shown as filled histograms. The Higgs boson signal is also shown as a filled histogram, and is normalized to the signal strength shown in Fig. 12. The hatched band indicates the combined statistical and systematic uncertainty in the sum of the signal and background templates. The ratio of the data to the sum of the fitted signal and background is shown in the lower panel. The distributions that enter the maximum-likelihood fit use the same binning as shown here. |

png pdf |
Figure 7-c:
Post-fit distributions of the DNN discriminant in the 250 $ < p_{\text{T}}(\text{V}) < $ 400 GeV category of the 0-lepton (left), 1-lepton (center), 2-lepton (right) channels using the 2018 data set. The background contributions after the global likelihood fit are shown as filled histograms. The Higgs boson signal is also shown as a filled histogram, and is normalized to the signal strength shown in Fig. 12. The hatched band indicates the combined statistical and systematic uncertainty in the sum of the signal and background templates. The ratio of the data to the sum of the fitted signal and background is shown in the lower panel. The distributions that enter the maximum-likelihood fit use the same binning as shown here. |

png pdf |
Figure 8:
Distributions of signal, background, and observed data event yields sorted into bins of similar signal-to-background ratio, as given by the result of the fit to the multivariate discriminants in the resolved and boosted categories. All events in the signal regions of the 2016-2018 data set are included. The red histogram indicates the Higgs boson signal assuming SM yields ($ \mu = $ 1) and the sum of all backgrounds is given by the gray histogram. The bottom panel shows the ratio of the observed data to the background, with the total uncertainty in the background indicated by the gray hatching. The red line indicates the sum of signal plus background contribution, divided by the background. |

png pdf |
Figure 9:
Results of the VZ, Z $ \rightarrow \mathrm{b\bar{b}} $ channel analysis using the full Run 2 dataset for both the WZ and ZZ production modes. |

png pdf |
Figure 10:
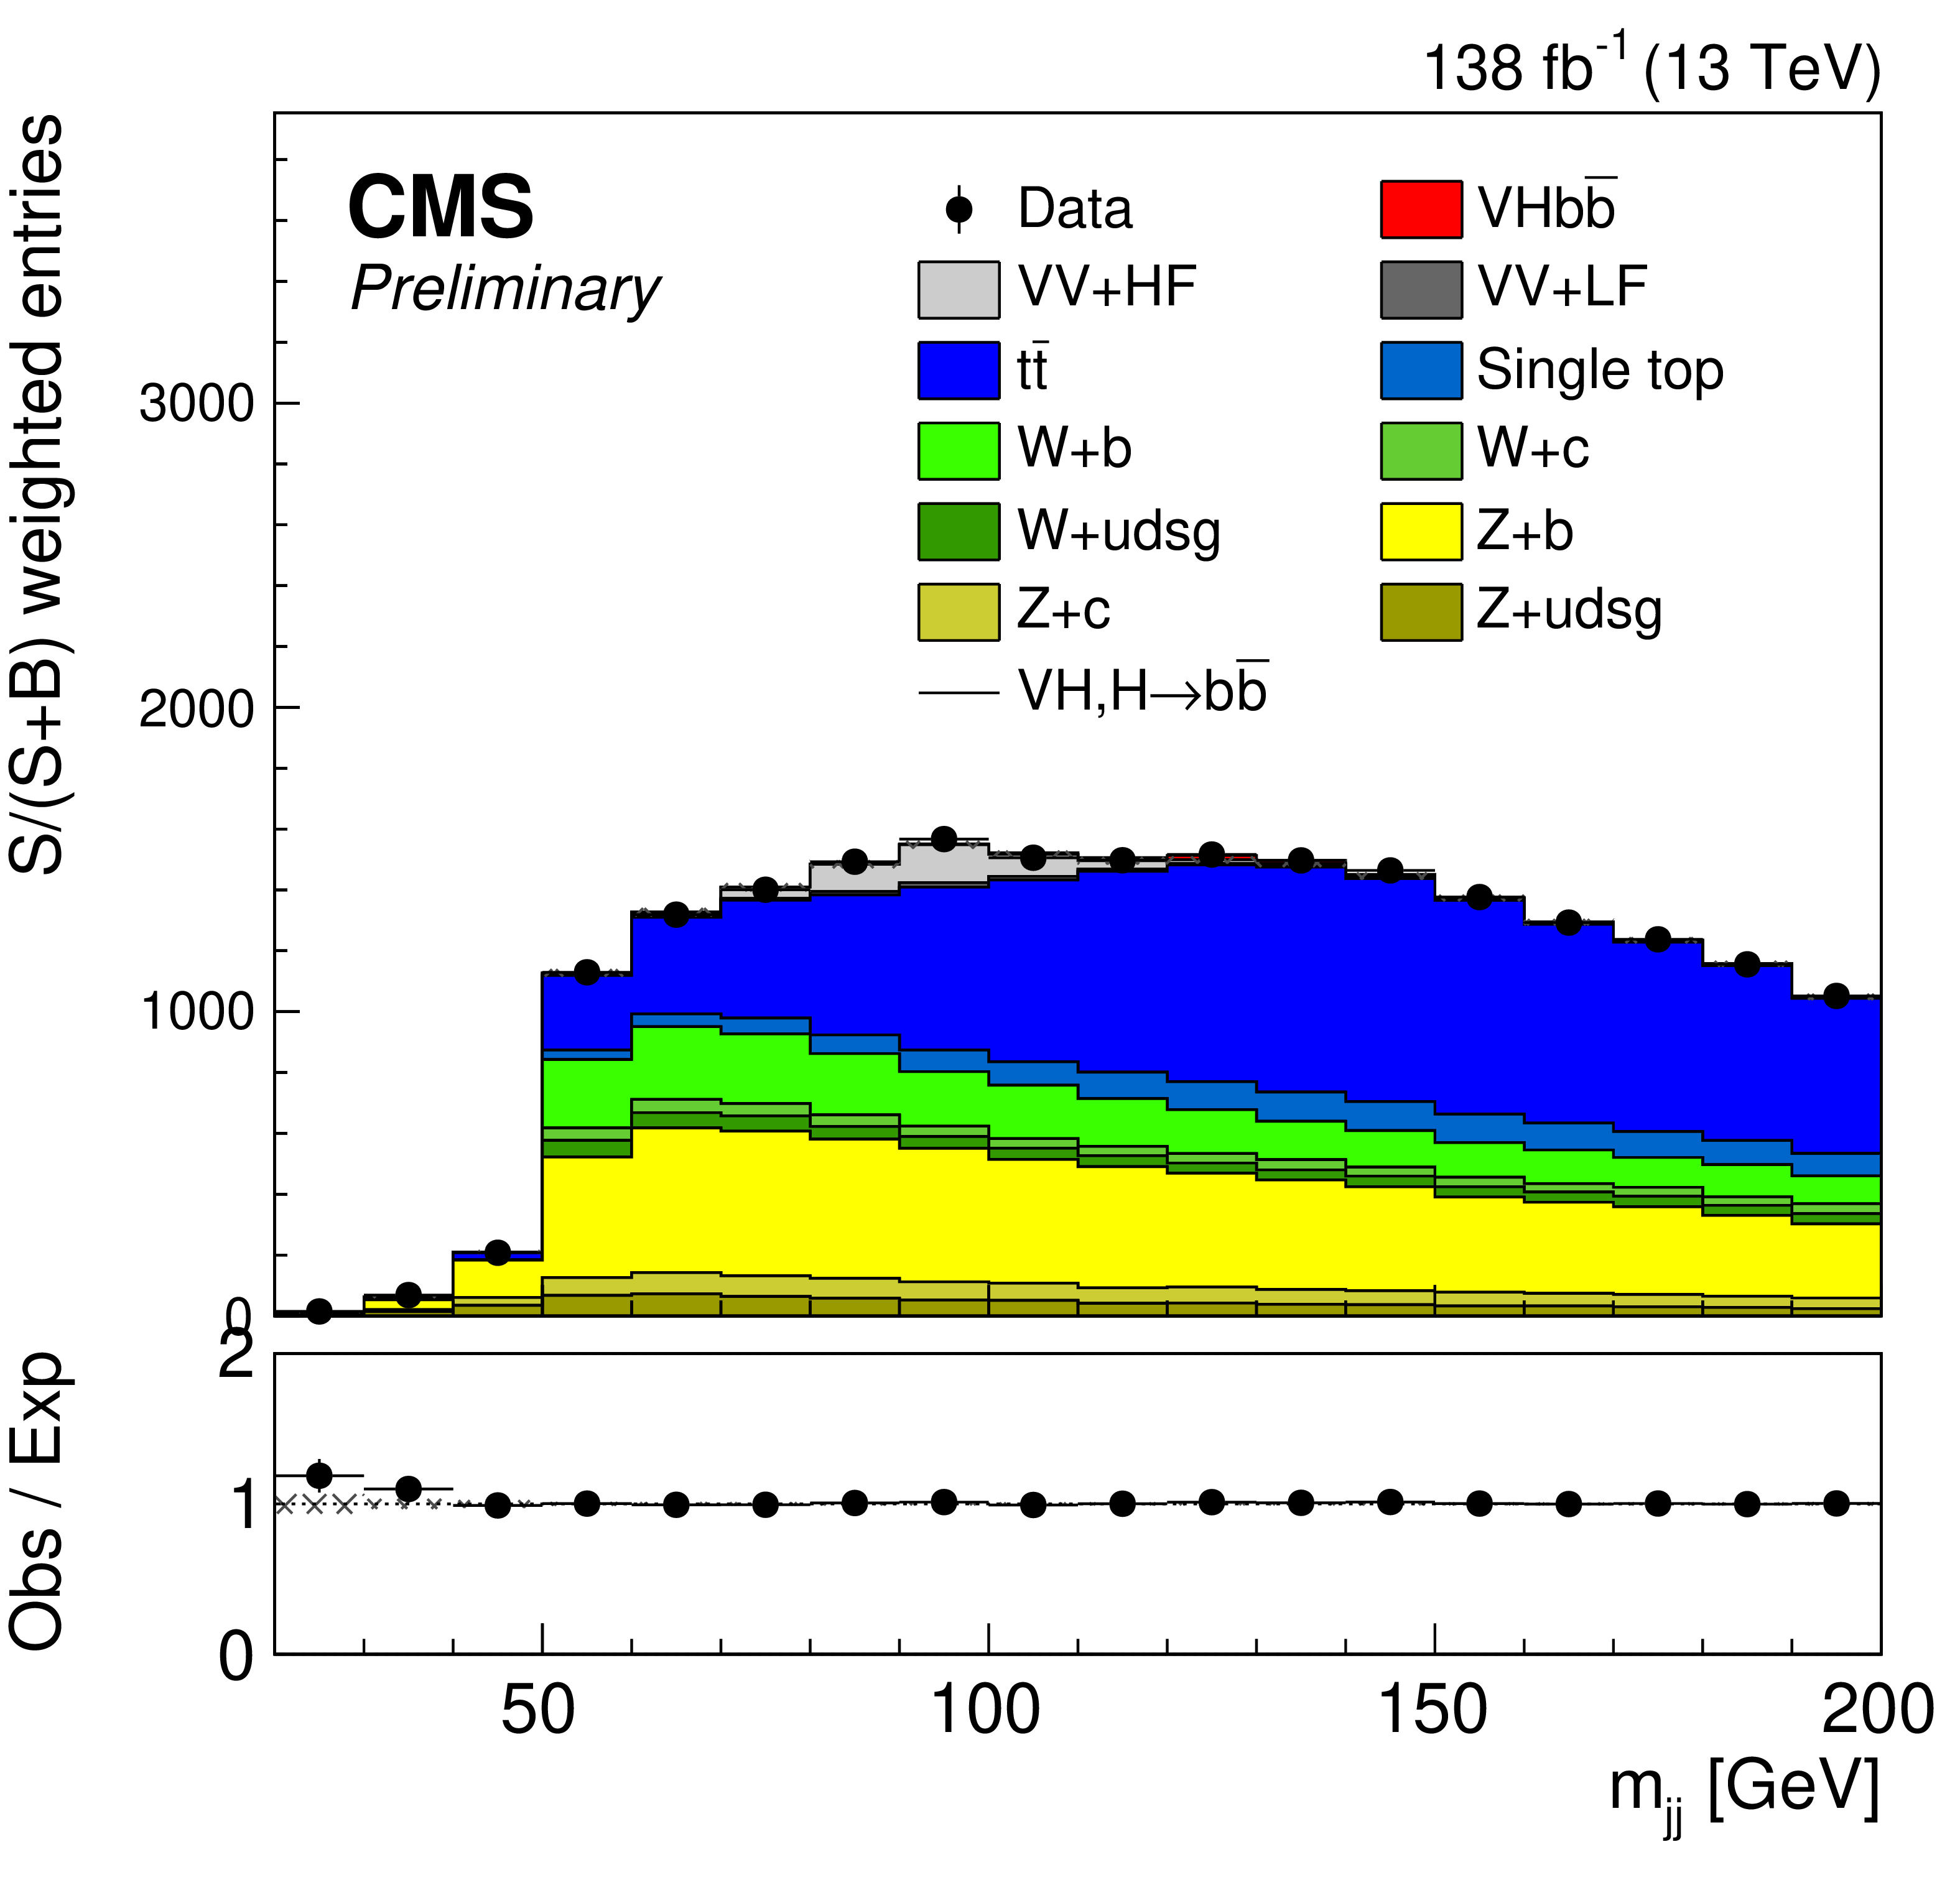
Dijet invariant mass distributions, where the events are weighted according to S/(S+B), combining all channels and data-taking years. The distributions are evaluated after the fit to data, and therefore the signal component is scaled by the fitted signal strength $ \mu=$ 0.34 $\pm $ 0.34. Apart from the VH and VZ contributions, all other background processes are also shown (left) or subtracted (right), to show the invariant mass peaks of the VZ, Z $ \rightarrow \mathrm{b\bar{b}} $ and VH, H $ \rightarrow \mathrm{b\bar{b}} $ resonances. |
png pdf |
Figure 10-a:
Dijet invariant mass distributions, where the events are weighted according to S/(S+B), combining all channels and data-taking years. The distributions are evaluated after the fit to data, and therefore the signal component is scaled by the fitted signal strength $ \mu=$ 0.34 $\pm $ 0.34. Apart from the VH and VZ contributions, all other background processes are also shown (left) or subtracted (right), to show the invariant mass peaks of the VZ, Z $ \rightarrow \mathrm{b\bar{b}} $ and VH, H $ \rightarrow \mathrm{b\bar{b}} $ resonances. |

png pdf |
Figure 10-b:
Dijet invariant mass distributions, where the events are weighted according to S/(S+B), combining all channels and data-taking years. The distributions are evaluated after the fit to data, and therefore the signal component is scaled by the fitted signal strength $ \mu=$ 0.34 $\pm $ 0.34. Apart from the VH and VZ contributions, all other background processes are also shown (left) or subtracted (right), to show the invariant mass peaks of the VZ, Z $ \rightarrow \mathrm{b\bar{b}} $ and VH, H $ \rightarrow \mathrm{b\bar{b}} $ resonances. |
| Tables | |

png pdf |
Table 1:
Definition of the SR and CRs for the resolved selection in the 0-lepton channel. The jet with the second largest b tagging score is required to pass the loose working point in all regions. |

png pdf |
Table 2:
Definition of the SR and CRs for the resolved selection of the 1-lepton channel. |
png pdf |
Table 3:
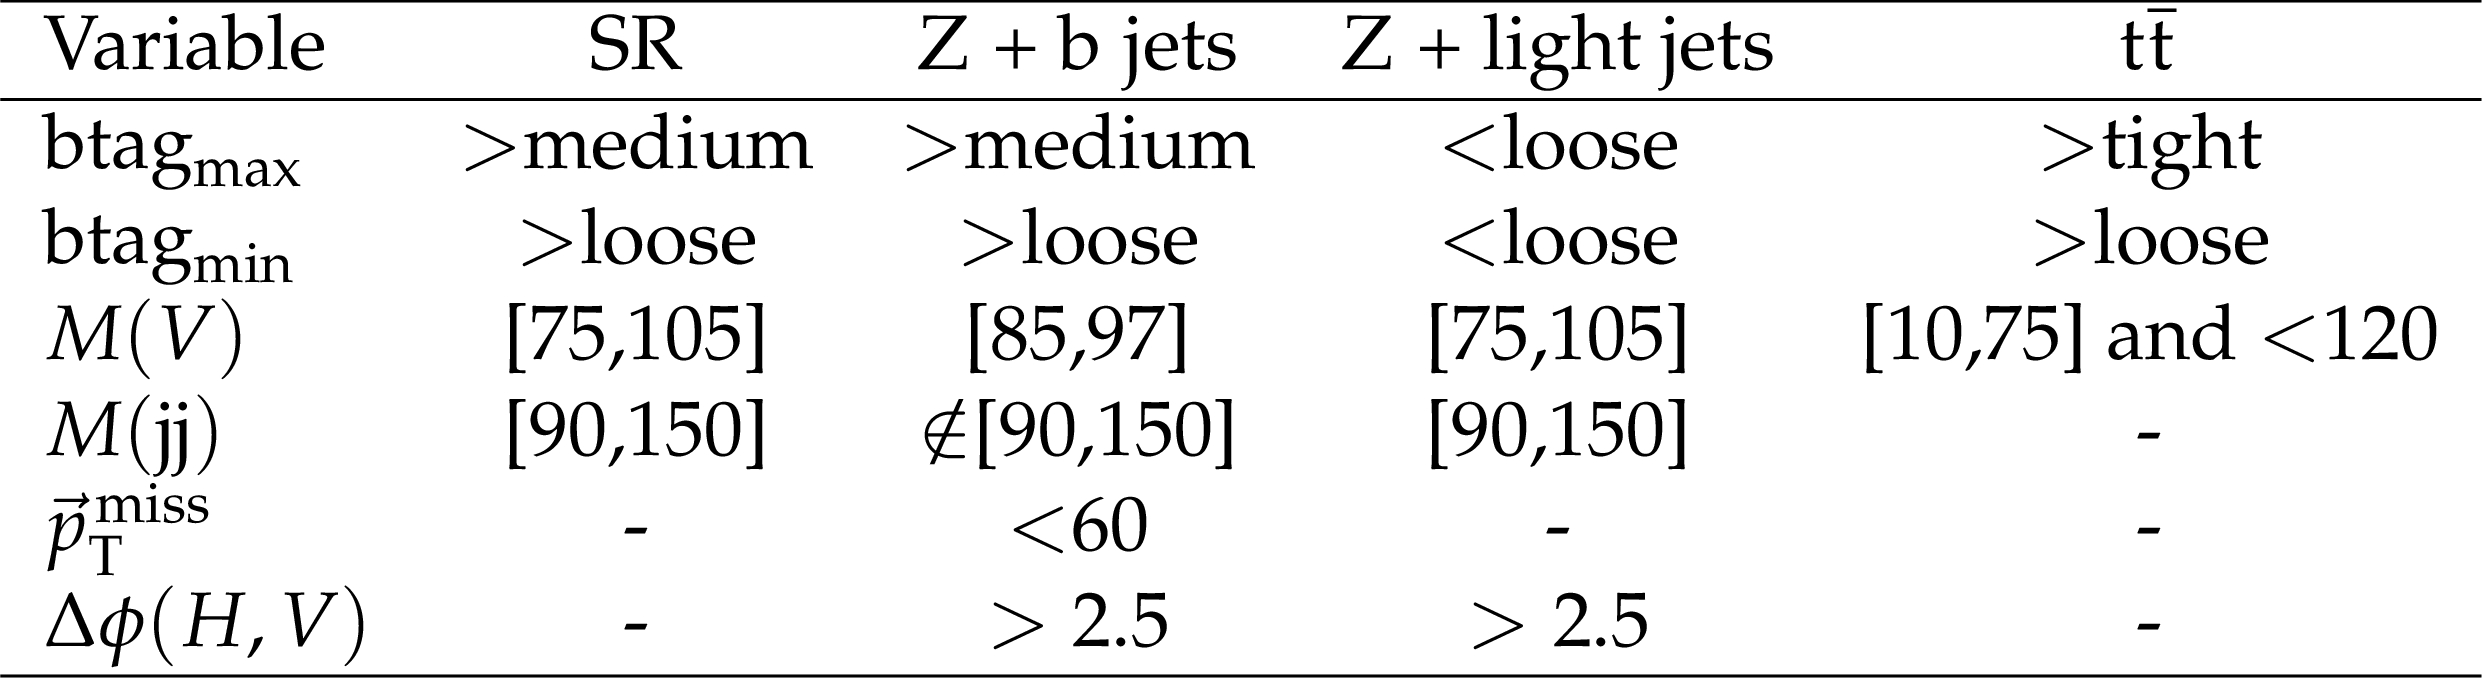
Definition of the SR and CRs for the resolved selection in the 2-lepton channel. |
png pdf |
Table 4:
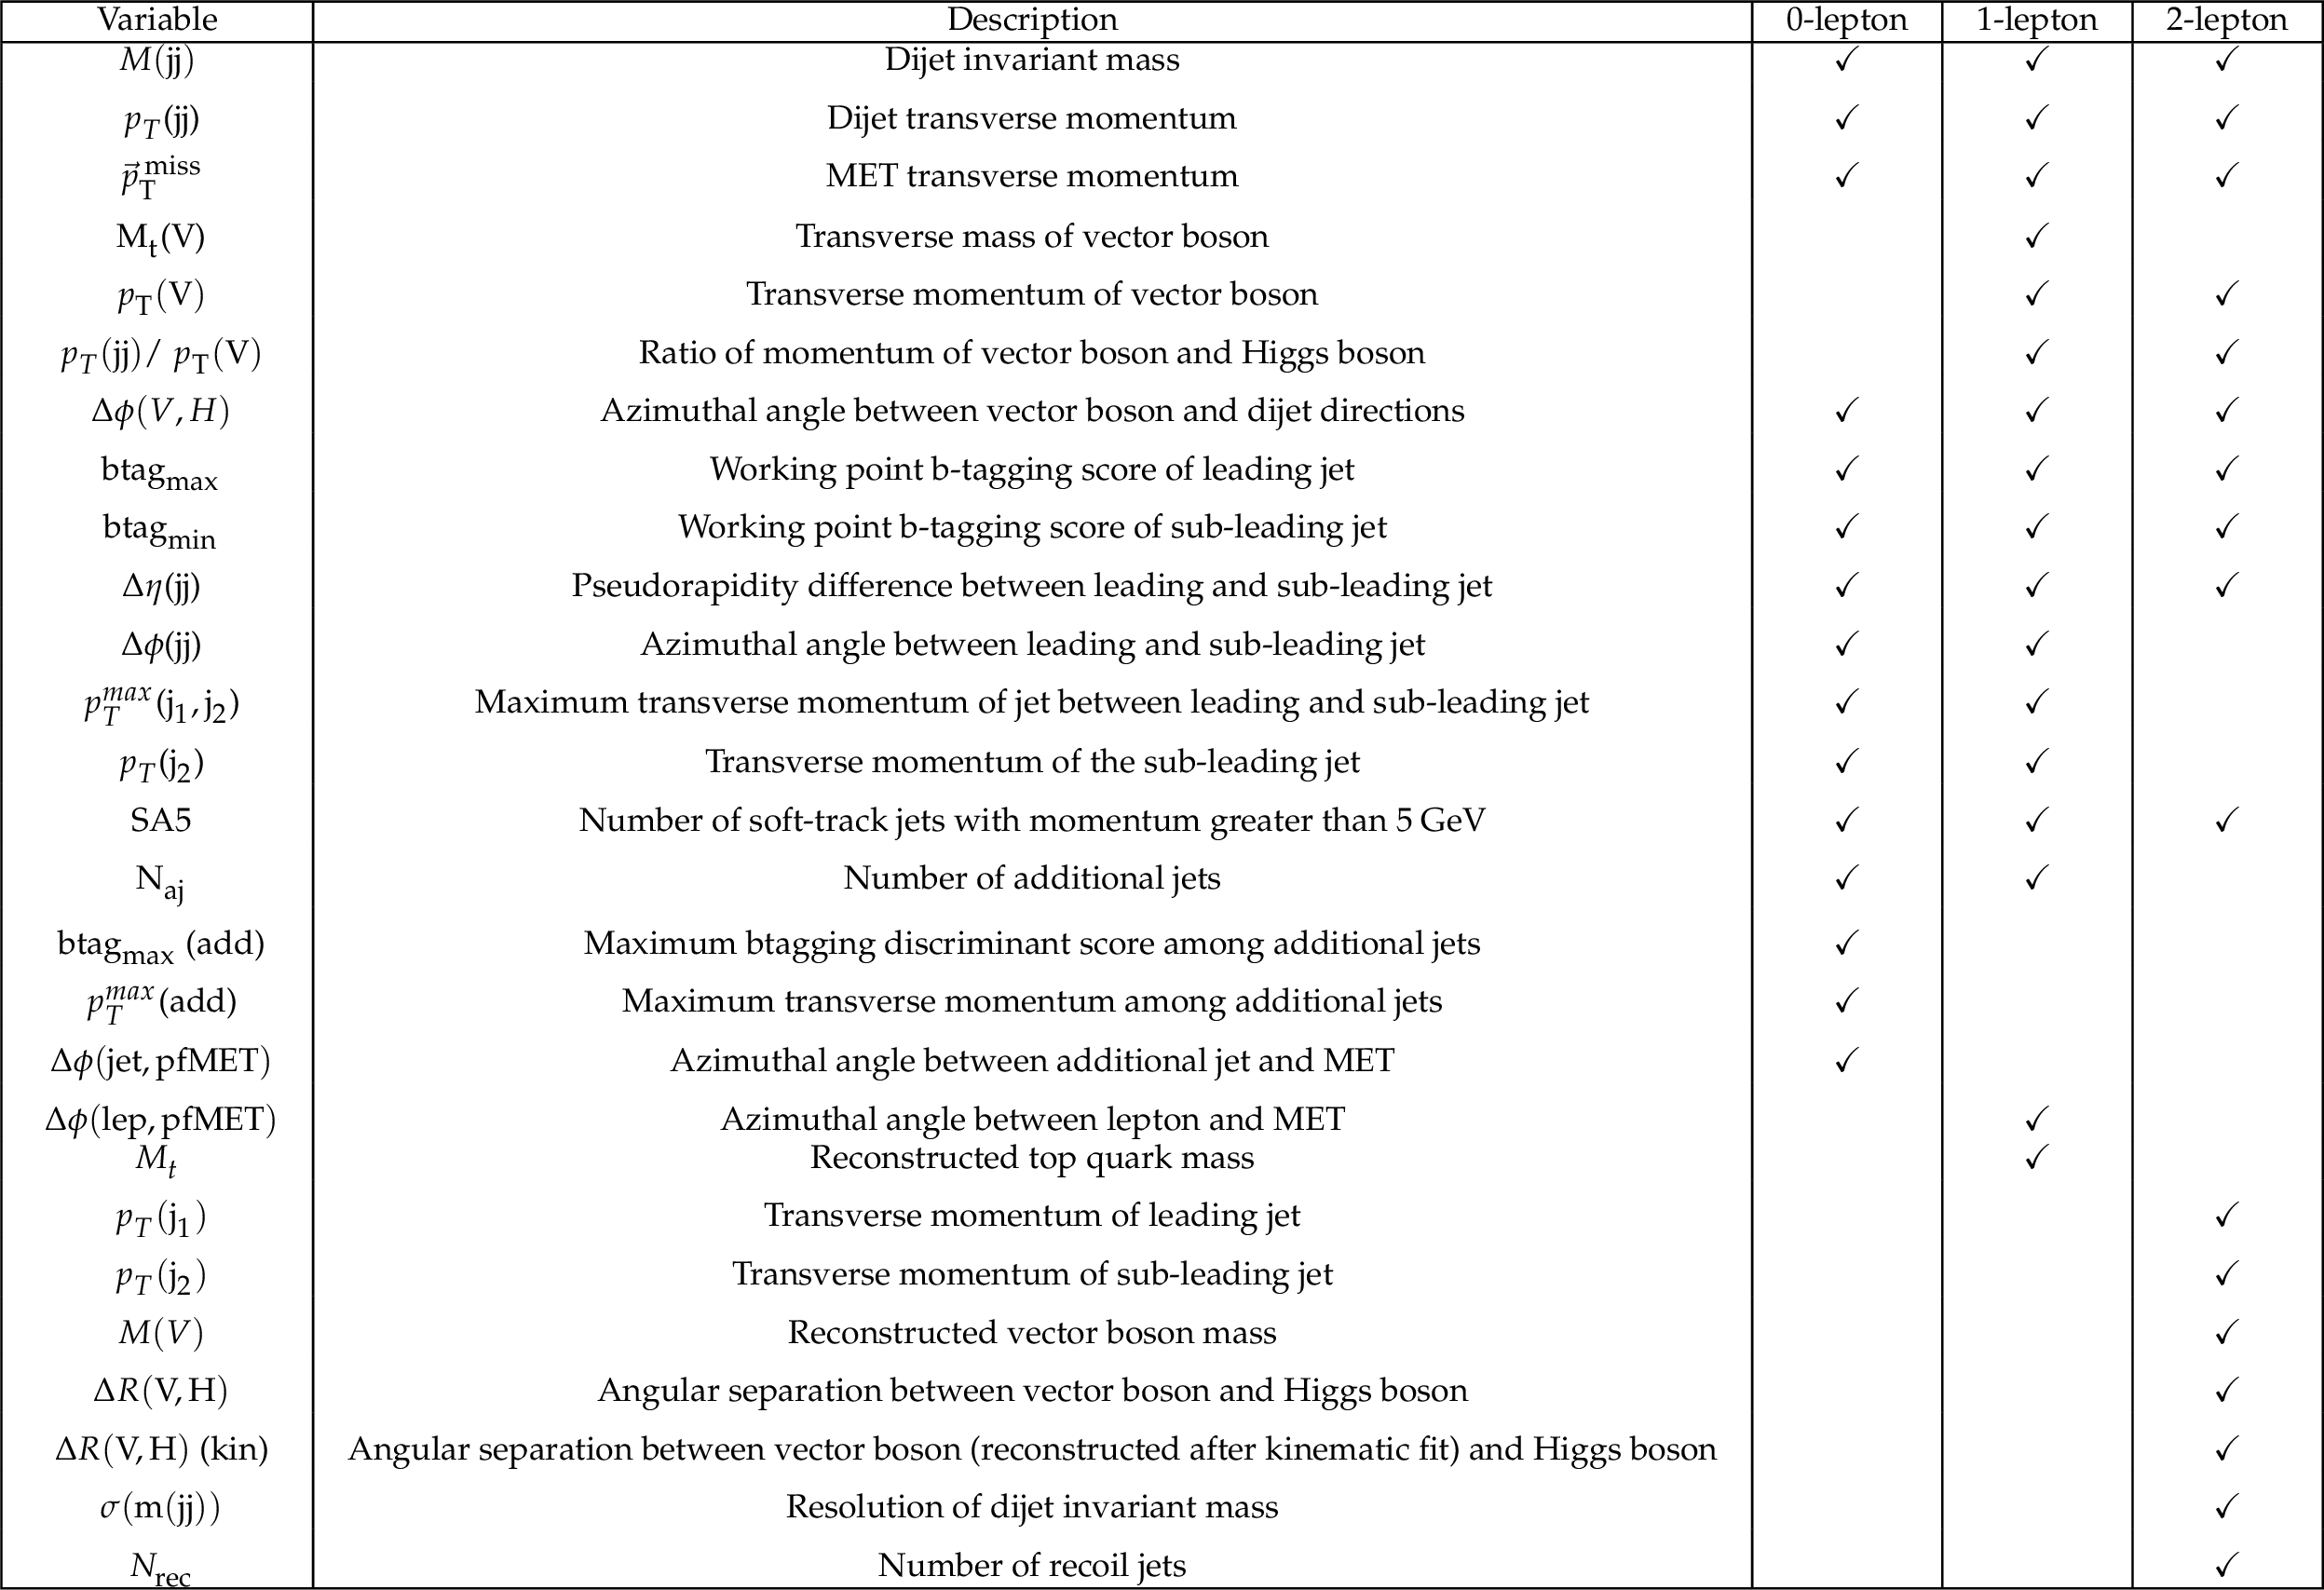
Input variables used for the DNN training in the resolved signal regions of the 0-lepton, 1-lepton, and 2-lepton channels. Reconstructed jets are classified as leading and sub-leading based on their b tag score. |
png pdf |
Table 5:
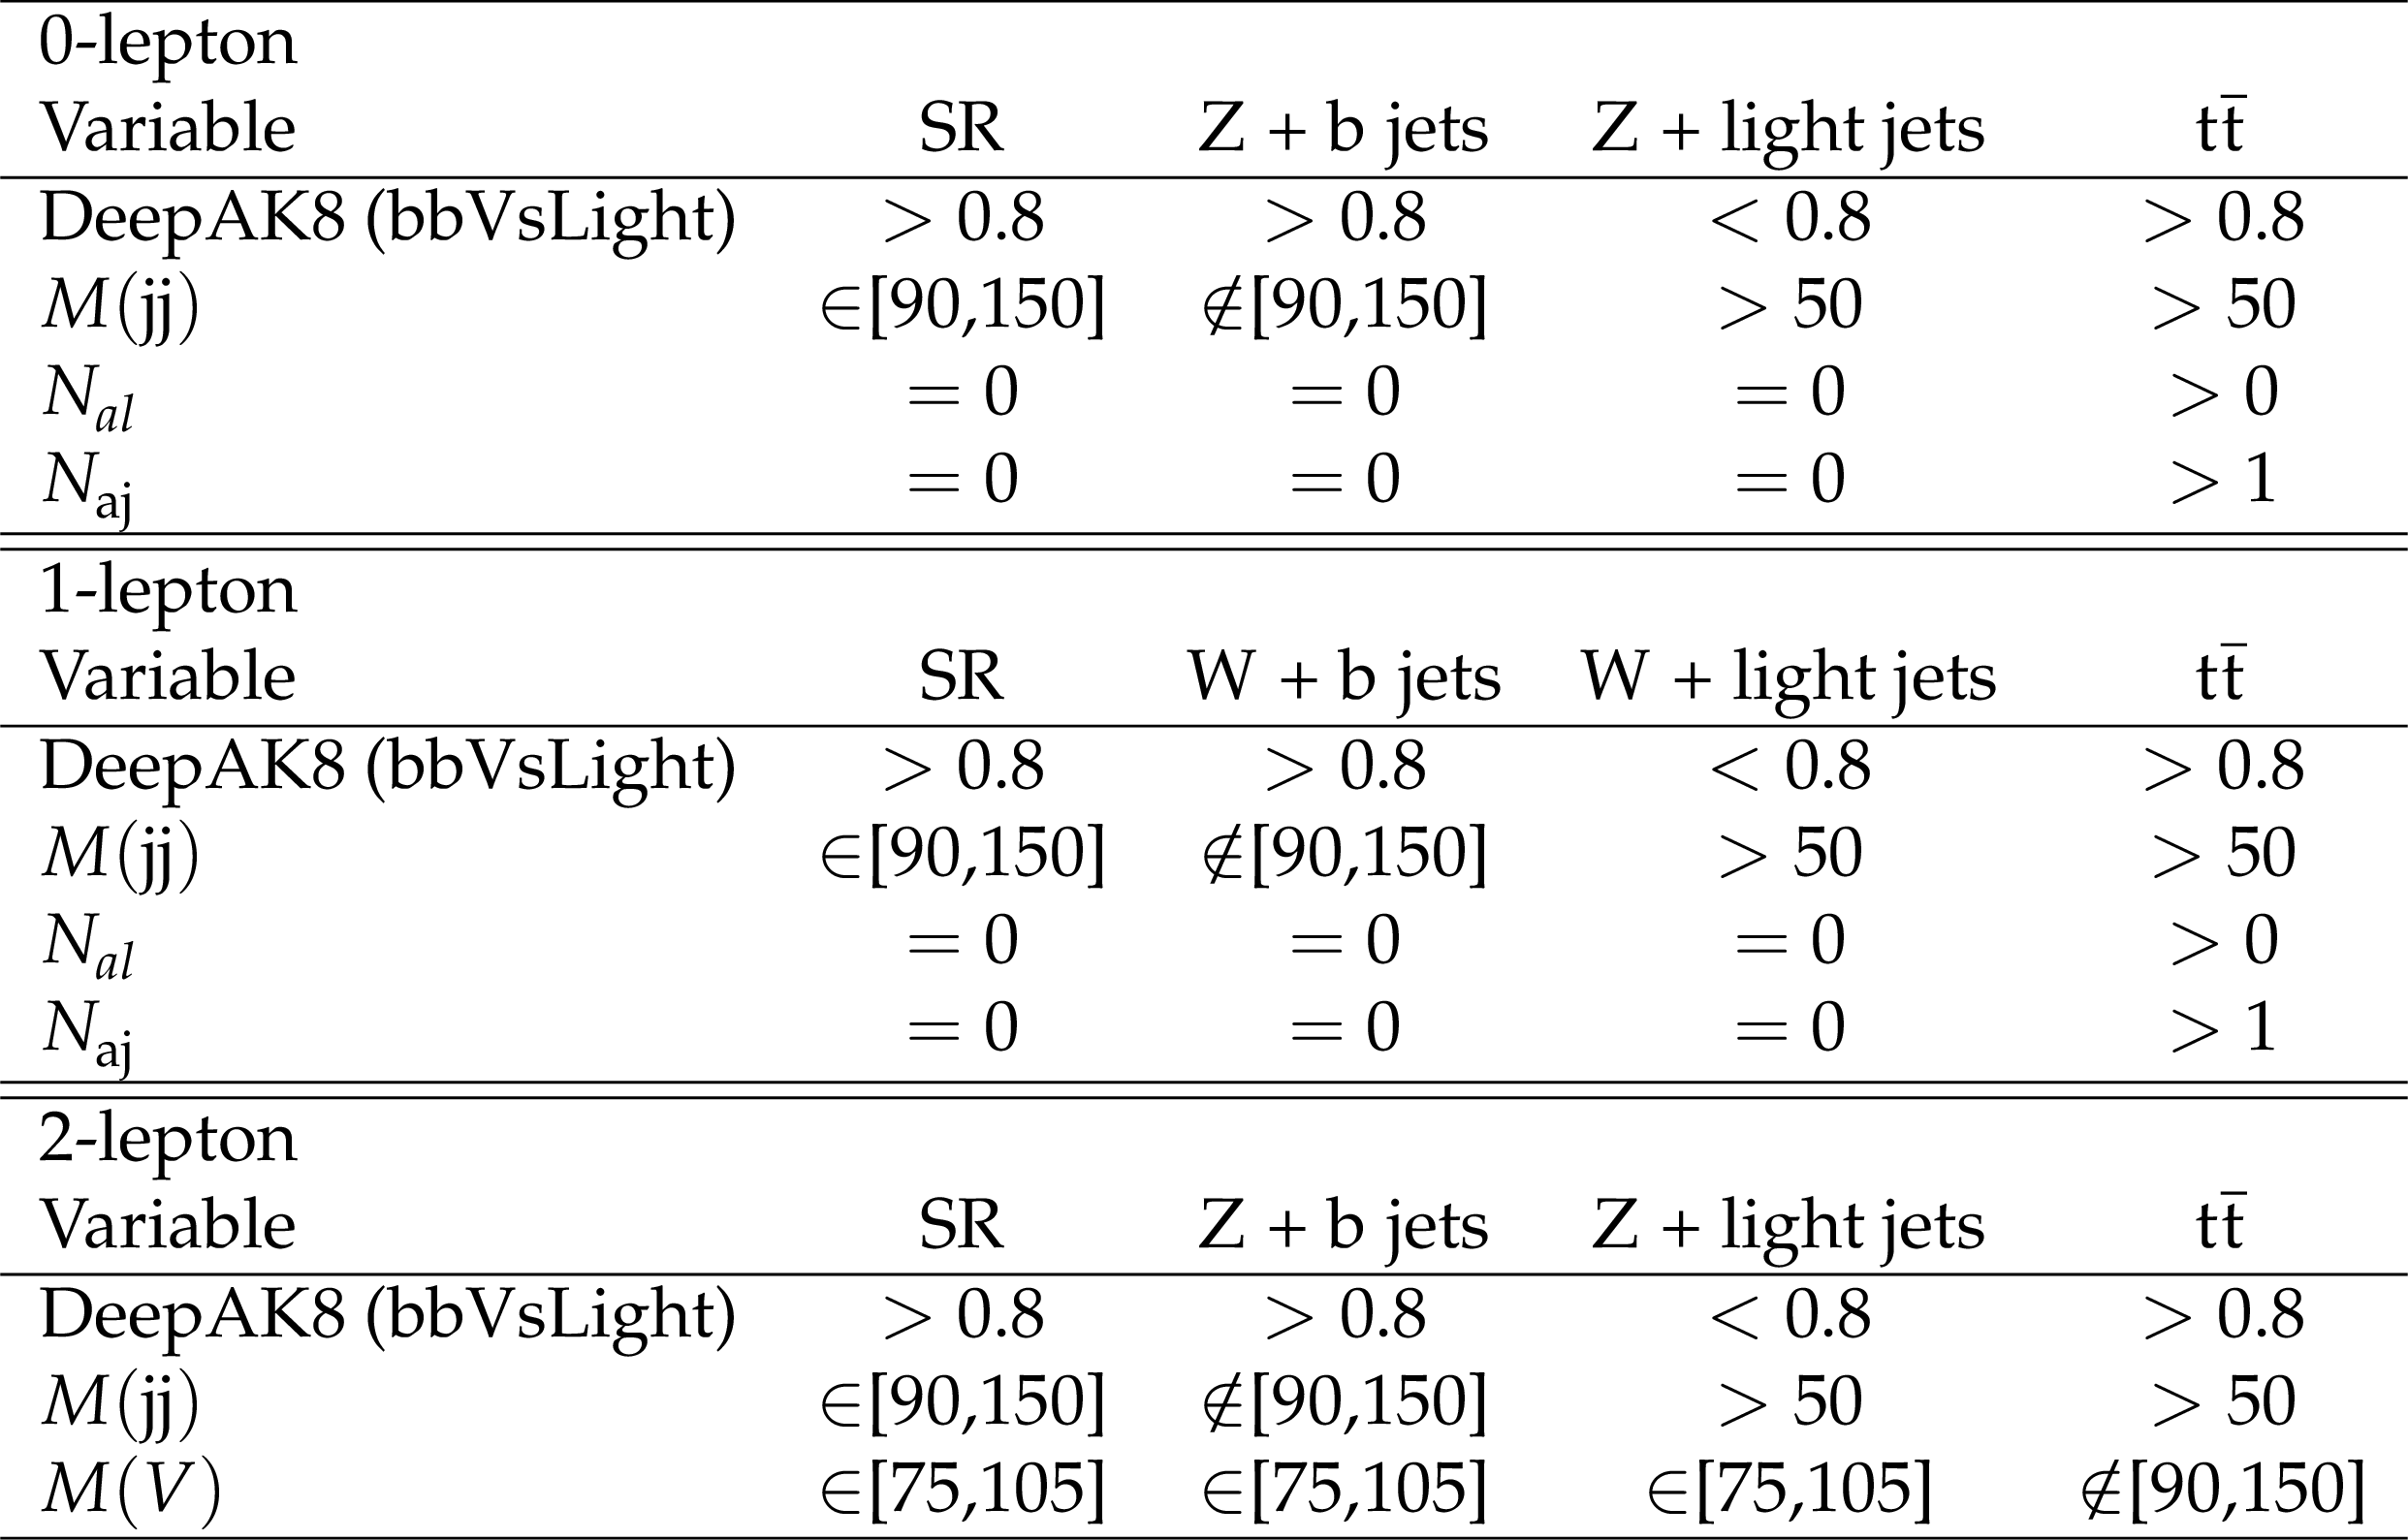
Selection criteria for the SR and CRs in the boosted topology, given separately for the three analysis channels. |
png pdf |
Table 6:
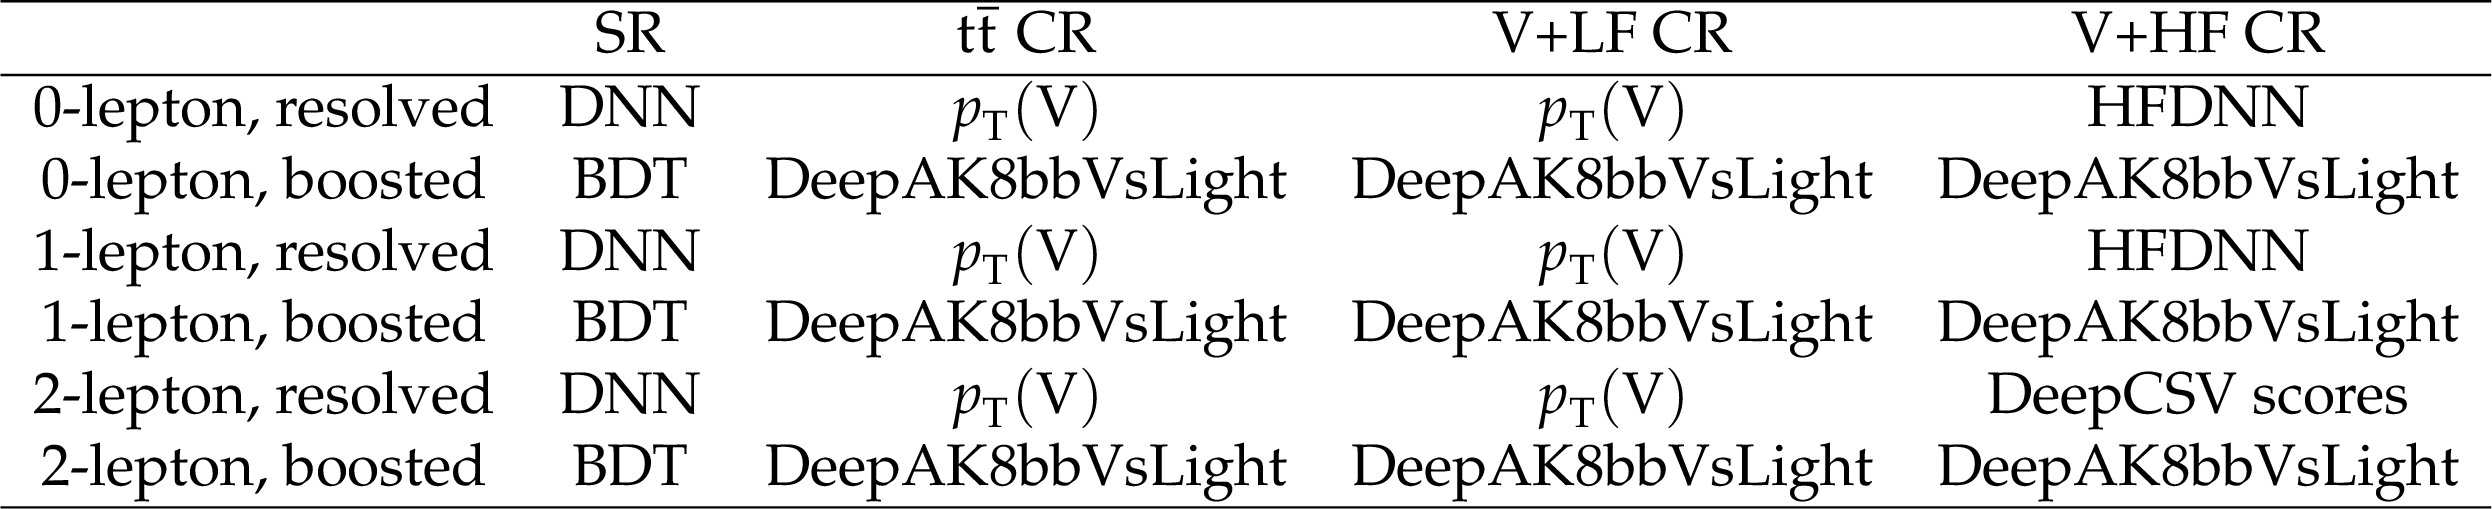
Discriminating variables fitted in each signal and control region. |
png pdf |
Table 7:
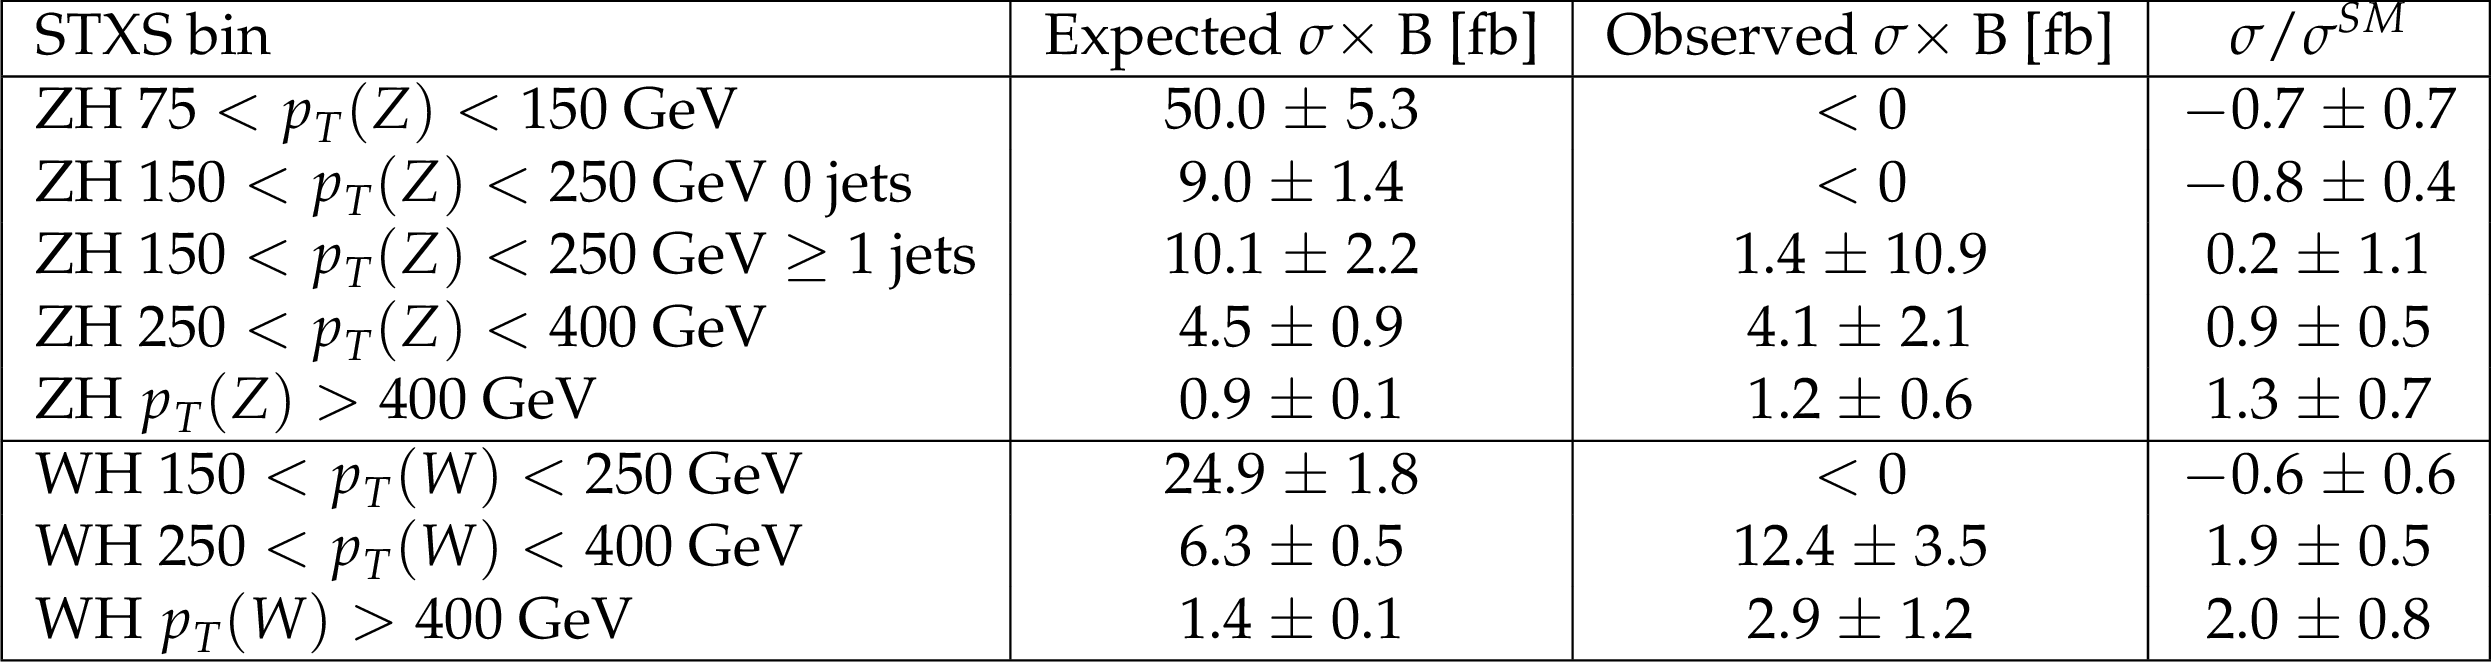
The cross section values for VH process in STXS 1.2 scheme multiplied by the branching fraction of V $ \to $ leptons and H $ \to \mathrm{b\bar{b}} $. The SM predictions for each bin are calculated using the inclusive values reported in YR4 [35]. |
png pdf |
Table 8:
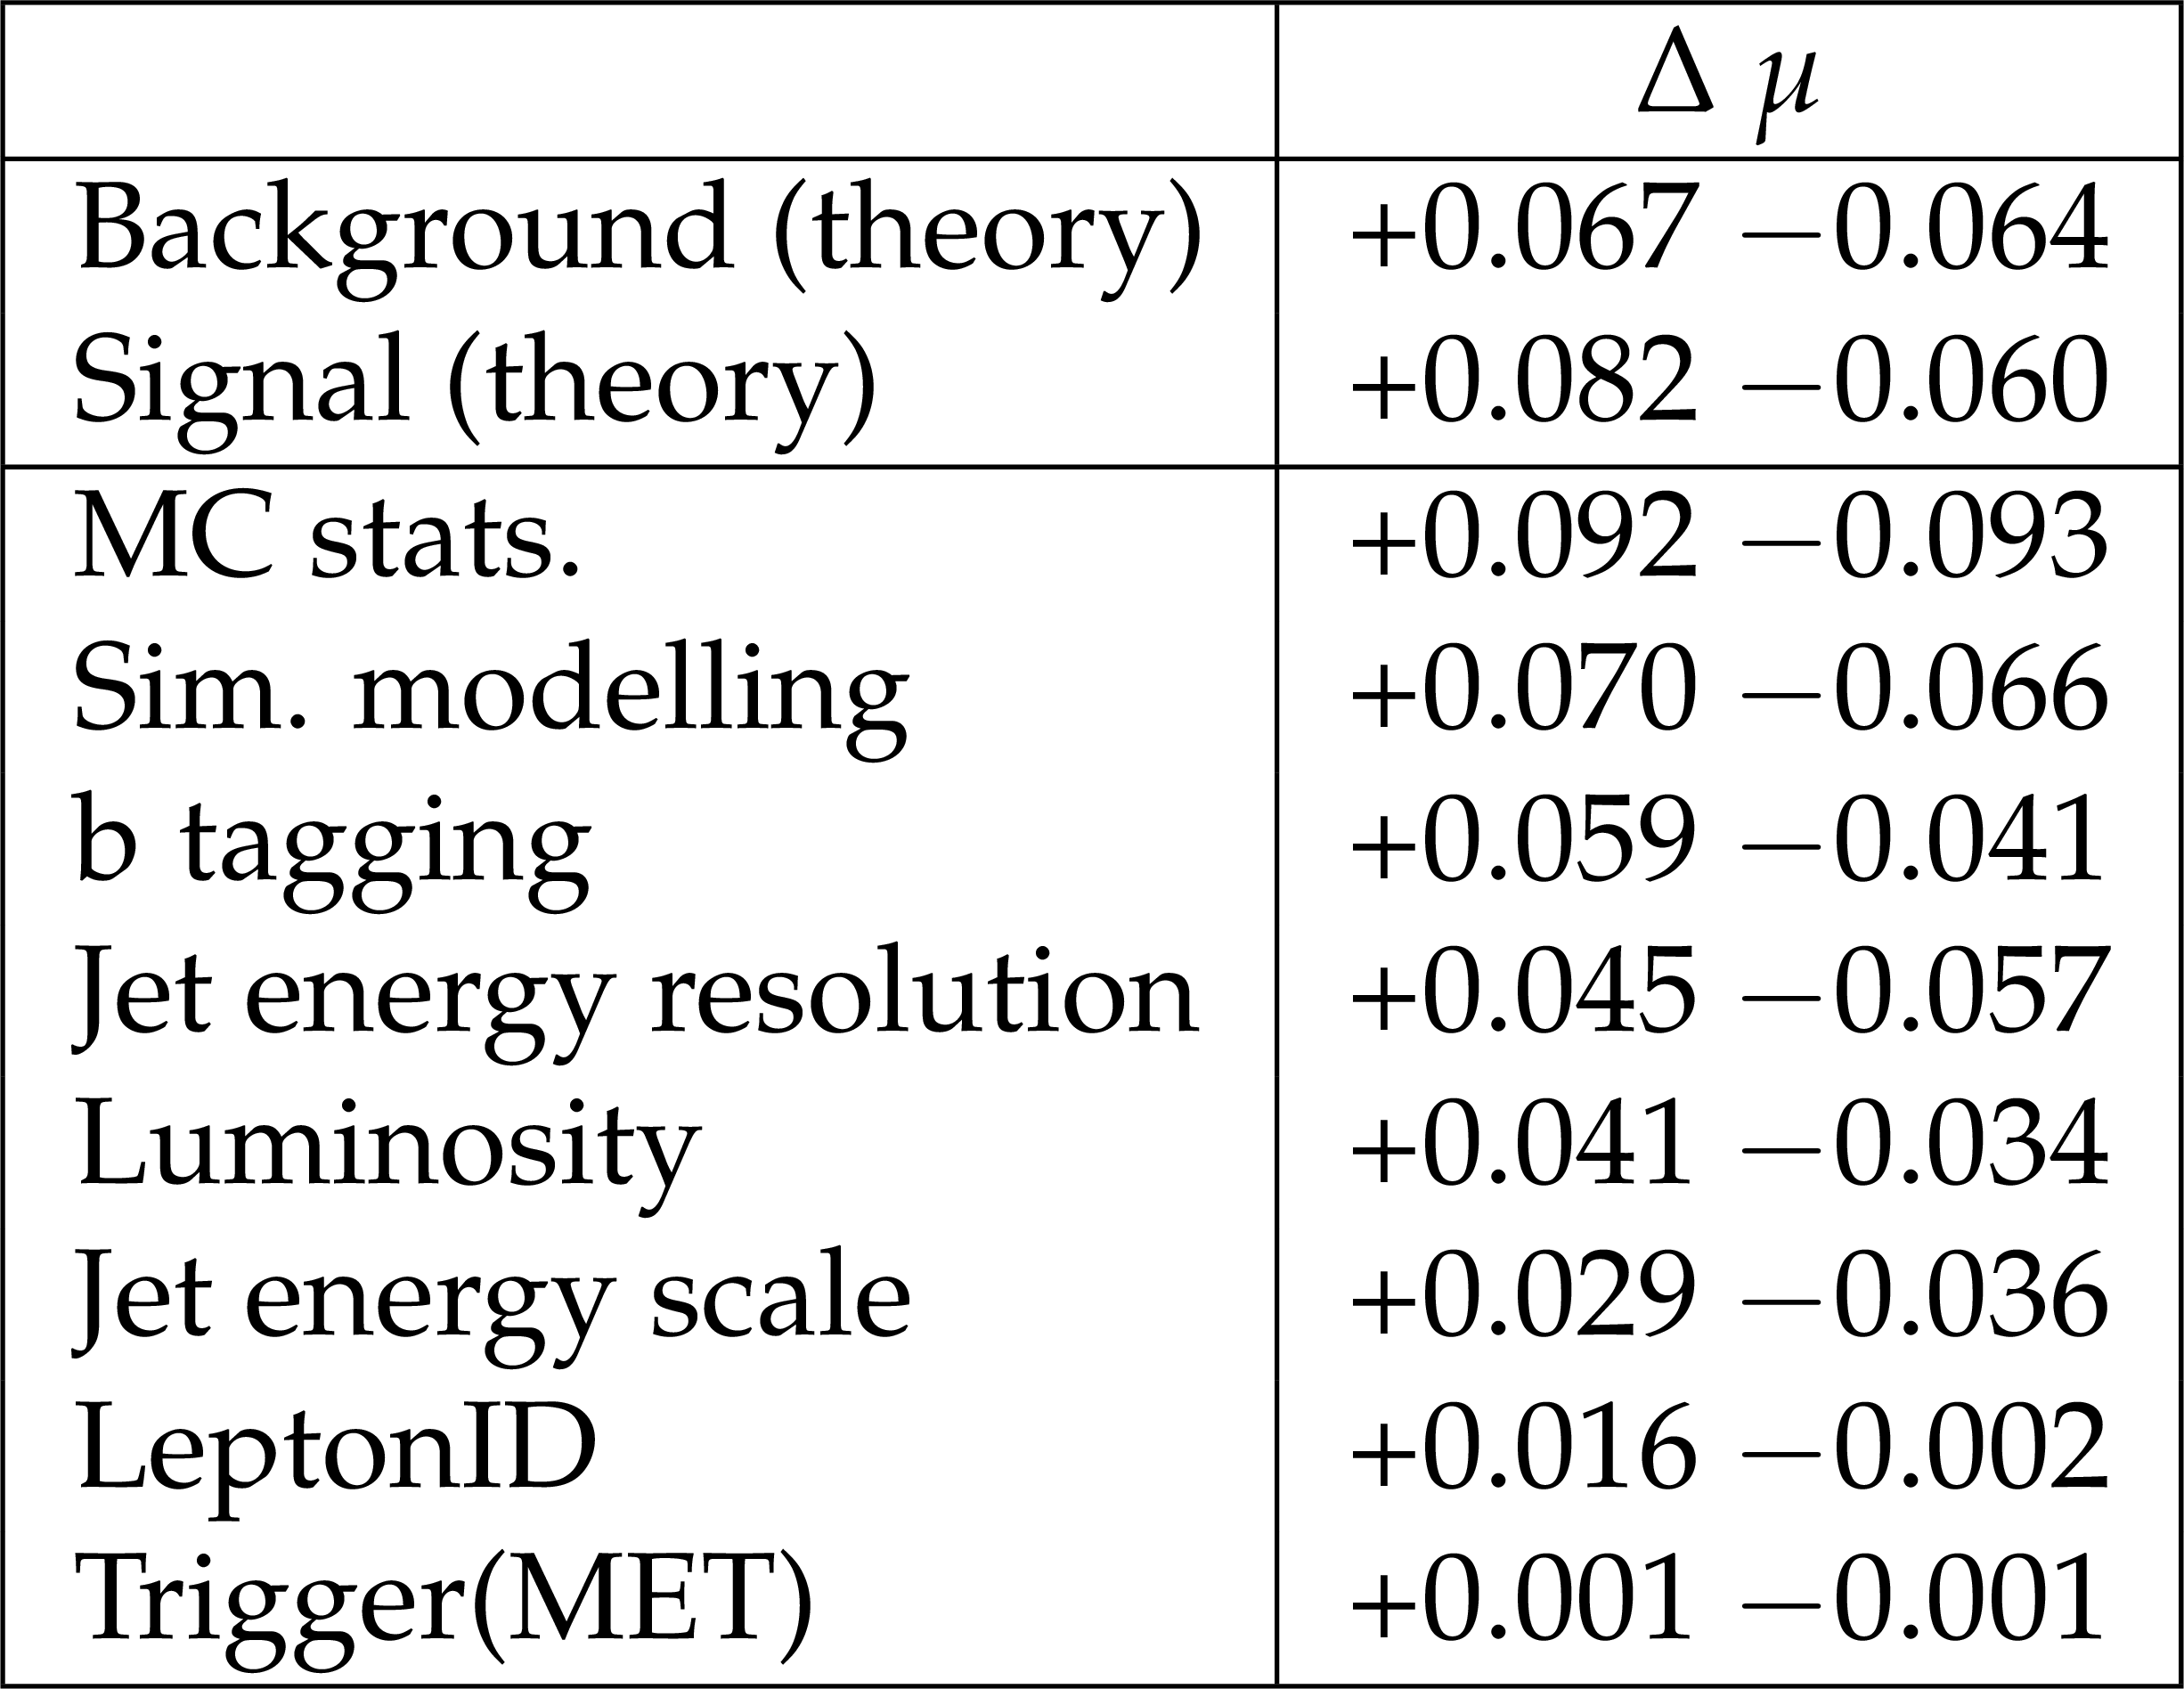
Impacts of different nuisance parameter groups on the inclusive $ \text{VH}( \mathrm{b} \overline{\mathrm{b}} ) $ signal strength. |
| Summary |
| Measurements of the SM Higgs boson production cross section have been presented, where the Higgs boson is produced in association with a vector boson and decays to bottom quark pairs, and where the vector bosons decay leptonically in either electron or muon channels. Proton-proton collision data collected by the CMS experiment during 2016, 2017, and 2018 at $ \sqrt{s}=$ 13 TeV are used, corresponding to an integrated luminosity of 138 fb$ ^{-1} $. Five decay modes have been analysed, and for each mode both a resolved and merged jet topologies are exploited. An additional subcategorization in the transverse momentum of the vector boson and the number of additional jets in the event is applied to maximize the sensitivity to the different simplified template cross section bins. The overall signal strength, combining all analysis categories, is found to be $ \mu =$ 0.58 $ \pm $ 0.18. This corresponds to an observed (expected) significance of 3.3 standard deviations (5.2 standard deviations). |
| References | ||||
| 1 | ATLAS Collaboration | Observation of a new particle in the search for the standard model Higgs boson with the ATLAS detector at the LHC | PLB 716 (2012) 1 | 1207.7214 |
| 2 | CMS Collaboration | Observation of a new boson at a mass of 125 GeV with the CMS experiment at the LHC | PLB 716 (2012) 30 | CMS-HIG-12-028 1207.7235 |
| 3 | CMS Collaboration | Observation of a new boson with mass near 125 GeV in pp collisions at $ \sqrt{s} $ = 7 and 8 TeV | JHEP 06 (2013) 081 | CMS-HIG-12-036 1303.4571 |
| 4 | F. Englert and R. Brout | Broken symmetry and the mass of gauge vector mesons | PRL 13 (1964) 321 | |
| 5 | P. W. Higgs | Broken symmetries, massless particles and gauge fields | PL 12 (1964) 132 | |
| 6 | P. W. Higgs | Broken symmetries and the masses of gauge bosons | PRL 13 (1964) 508 | |
| 7 | G. S. Guralnik, C. R. Hagen, and T. W. B. Kibble | Global conservation laws and massless particles | PRL 13 (1964) 585 | |
| 8 | P. W. Higgs | Spontaneous symmetry breakdown without massless bosons | PR 145 (1966) 1156 | |
| 9 | T. W. B. Kibble | Symmetry breaking in non-Abelian gauge theories | PR 155 (1967) 1554 | |
| 10 | ATLAS Collaboration | Measurement of Higgs boson production in the diphoton decay channel in pp collisions at center-of-mass energies of 7 and 8 TeV with the ATLAS detector | PRD 90 (2014) 112015 | 1408.7084 |
| 11 | CMS Collaboration | Observation of the diphoton decay of the Higgs boson and measurement of its properties | EPJC 74 (2014) 3076 | CMS-HIG-13-001 1407.0558 |
| 12 | ATLAS Collaboration | Measurements of Higgs boson production and couplings in the four-lepton channel in pp collisions at center-of-mass energies of 7 and 8 TeV with the ATLAS detector | PRD 91 (2015) 012006 | 1408.5191 |
| 13 | CMS Collaboration | Measurement of the properties of a Higgs boson in the four-lepton final state | PRD 89 (2014) 092007 | CMS-HIG-13-002 1312.5353 |
| 14 | ATLAS Collaboration | Observation and measurement of Higgs boson decays to WW$ ^* $ with the ATLAS detector | PRD 92 (2015) 012006 | 1412.2641 |
| 15 | ATLAS Collaboration | Study of (W/Z)H production and Higgs boson couplings using H $ \rightarrow $ WW$ ^{\ast} $ decays with the ATLAS detector | JHEP 08 (2015) 137 | 1506.06641 |
| 16 | CMS Collaboration | Measurement of Higgs boson production and properties in the WW decay channel with leptonic final states | JHEP 01 (2014) 096 | CMS-HIG-13-023 1312.1129 |
| 17 | ATLAS Collaboration | Evidence for the Higgs boson Yukawa coupling to tau leptons with the ATLAS detector | JHEP 04 (2015) 117 | 1501.04943 |
| 18 | CMS Collaboration | Evidence for the 125 GeV Higgs boson decaying to a pair of $ \tau $ leptons | JHEP 05 (2014) 104 | CMS-HIG-13-004 1401.5041 |
| 19 | CMS Collaboration | Observation of Higgs boson decays to a pair of tau leptons | PLB 779 (2017) 283 | CMS-HIG-16-043 1708.00373 |
| 20 | CMS Collaboration | Measurements of properties of the Higgs boson decaying to a W boson pair in pp collisions at $ \sqrt{s}= $ 13 TeV | PLB 791 (2019) 96 | CMS-HIG-16-042 1806.05246 |
| 21 | ATLAS Collaboration | Observation of $ H \rightarrow b\bar{b} $ decays and $ VH $ production with the ATLAS detector | PL 786 (2018) 59 | 1808.08238 |
| 22 | CMS Collaboration | Observation of $ \mathrm{t\overline{t}} $H production | PRL 120 (2018) 231801 | CMS-HIG-17-035 1804.02610 |
| 23 | ATLAS Collaboration | Observation of Higgs boson production in association with a top quark pair at the LHC with the ATLAS detector | PLB 784 (2018) 173 | 1806.00425 |
| 24 | ATLAS Collaboration | Measurements of the Higgs boson production and decay rates and coupling strengths using pp collision data at $ \sqrt{s}= $ 7 and 8 TeV in the ATLAS experiment | EPJC 76 (2016) 6 | 1507.04548 |
| 25 | CMS Collaboration | Precise determination of the mass of the Higgs boson and tests of compatibility of its couplings with the standard model predictions using proton collisions at 7 and 8 $ \,\text {TeV} $ | EPJC 75 (2015) 212 | CMS-HIG-14-009 1412.8662 |
| 26 | CMS Collaboration | Study of the mass and spin-parity of the Higgs boson candidate via its decays to Z boson pairs | PRL 110 (2013) 081803 | CMS-HIG-12-041 1212.6639 |
| 27 | ATLAS Collaboration | Evidence for the spin-0 nature of the Higgs boson using ATLAS data | PLB 726 (2013) 120 | 1307.1432 |
| 28 | ATLAS and CMS Collaborations | Measurements of the Higgs boson production and decay rates and constraints on its couplings from a combined ATLAS and CMS analysis of the LHC pp collision data at $ \sqrt{s}= $ 7 and 8 TeV | JHEP 08 (2016) 045 | 1606.02266 |
| 29 | ATLAS and CMS Collaborations | Combined measurement of the Higgs boson mass in pp collisions at $ \sqrt{s}= $ 7 and 8 TeV with the ATLAS and CMS experiments | PRL 114 (2015) 191803 | 1503.07589 |
| 30 | CMS Collaboration | Measurements of properties of the Higgs boson decaying into the four-lepton final state in pp collisions at $ \sqrt{s}= $ 13 TeV | JHEP 11 (2017) 047 | CMS-HIG-16-041 1706.09936 |
| 31 | ATLAS Collaboration | Combined measurement of differential and total cross sections in the $ H \rightarrow \gamma \gamma $ and the $ H \rightarrow ZZ^* \rightarrow 4\ell $ decay channels at $ \sqrt{s} = $ 13 TeV with the ATLAS detector | Phys. Lett. B 786 ), 2018 link |
1805.10197 |
| 32 | ATLAS Collaboration | Measurement of the Higgs boson mass in the $ H\rightarrow ZZ^* \rightarrow 4\ell $ and $ H \rightarrow \gamma\gamma $ channels with $ \sqrt{s}= $ 13 TeV $ pp $ collisions using the ATLAS detector | PLB 784 (2018) 345 | 1806.00242 |
| 33 | CMS Collaboration | Evidence for Higgs boson decay to a pair of muons | 74 ), 2021 JHEP 01 (2021) 148 |
CMS-HIG-19-006 2009.04363 |
| 34 | CMS Collaboration | Observation of Higgs boson decay to bottom quarks | PRL 121 (2018) 121801 | CMS-HIG-18-016 1808.08242 |
| 35 | LHC Higgs Cross Section Working Group Collaboration | Handbook of LHC Higgs Cross Sections: 4. Deciphering the Nature of the Higgs sector | technical report, 2016 link |
1610.07922 |
| 36 | J. R. Andersen et al. | Les Houches 2015: Physics at TeV Colliders Standard Model Working Group Report | in 9th Les Houches Workshop on Physics at TeV Colliders (PhysTeV) Les Houches, France, June 1-19,, 2015 link |
1605.04692 |
| 37 | ATLAS Collaboration | Measurement of VH, $ \mathrm{H}\to \mathrm{b}\overline{\mathrm{b}} $ production as a function of the vector-boson transverse momentum in 13 TeV pp collisions with the ATLAS detector | JHEP 05 (2019) 141 | 1903.04618 |
| 38 | ATLAS Collaboration | Measurements of $ WH $ and $ ZH $ production in the $ H \rightarrow b\bar{b} $ decay channel in $ pp $ collisions at 13 TeV with the ATLAS detector | EPJC 81 (2021) 178 | 2007.02873 |
| 39 | ATLAS Collaboration | Measurement of the associated production of a Higgs boson decaying into $ b $-quarks with a vector boson at high transverse momentum in $ pp $ collisions at $ \sqrt{s} = $ 13 TeV with the ATLAS detector | PLB 816 (2021) 136204 | 2008.02508 |
| 40 | CMS Collaboration | The CMS trigger system | JINST 12 (2017) P01020 | CMS-TRG-12-001 1609.02366 |
| 41 | CMS Collaboration | The CMS experiment at the CERN LHC | JINST 3 (2008) S08004 | |
| 42 | P. Nason | A new method for combining NLO QCD with shower Monte Carlo algorithms | JHEP 11 (2004) 040 | hep-ph/0409146 |
| 43 | S. Frixione, P. Nason, and C. Oleari | Matching NLO QCD computations with parton shower simulations: the POWHEG method | JHEP 11 (2007) 070 | 0709.2092 |
| 44 | S. Alioli, P. Nason, C. Oleari, and E. Re | A general framework for implementing NLO calculations in shower Monte Carlo programs: the POWHEG BOX | JHEP 06 (2010) 043 | 1002.2581 |
| 45 | K. Hamilton, P. Nason, and G. Zanderighi | MINLO: Multi-scale improved NLO | JHEP 10 (2012) 155 | 1206.3572 |
| 46 | G. Luisoni, P. Nason, C. Oleari, and F. Tramontano | $ HW^{\pm} $/HZ + 0 and 1 jet at NLO with the POWHEG BOX interfaced to GoSam and their merging within MiNLO | JHEP 10 (2013) 083 | 1306.2542 |
| 47 | J. Alwall et al. | The automated computation of tree-level and next-to-leading order differential cross sections, and their matching to parton shower simulations | JHEP 07 (2014) 079 | 1405.0301 |
| 48 | R. Frederix and S. Frixione | Merging meets matching in MC@NLO | JHEP 12 (2012) 061 | 1209.6215 |
| 49 | J. Alwall et al. | Comparative study of various algorithms for the merging of parton showers and matrix elements in hadronic collisions | EPJC 53 (2008) 473 | 0706.2569 |
| 50 | S. Kallweit et al. | NLO QCD+EW predictions for V + jets including off-shell vector-boson decays and multijet merging | JHEP 04 (2016) 021 | 1511.08692 |
| 51 | G. Ferrera, M. Grazzini, and F. Tramontano | Higher-order QCD effects for associated WH production and decay at the LHC | JHEP 04 (2014) 039 | 1312.1669 |
| 52 | G. Ferrera, M. Grazzini, and F. Tramontano | Associated ZH production at hadron colliders: the fully differential NNLO QCD calculation | PLB 740 (2015) 51 | 1407.4747 |
| 53 | O. Brein, R. V. Harlander, and T. J. E. Zirke | vh@nnlo - Higgs Strahlung at hadron colliders | Comput. Phys. Commun. 184 (2013) 998 | 1210.5347 |
| 54 | R. V. Harlander, S. Liebler, and T. Zirke | Higgs Strahlung at the Large Hadron Collider in the 2-Higgs-Doublet Model | JHEP 02 (2014) 023 | 1307.8122 |
| 55 | A. Denner, S. Dittmaier, S. Kallweit, and A. M\"uck | HAWK 2.0: A Monte Carlo program for Higgs production in vector-boson fusion and Higgs Strahlung at hadron colliders | Comput. Phys. Commun. 195 (2015) 161 | 1412.5390 |
| 56 | M. Czakon and A. Mitov | Top++: A program for the calculation of the top-pair cross-section at hadron colliders | Comput. Phys. Commun. 185 (2014) 2930 | 1112.5675 |
| 57 | NNPDF Collaboration | Parton distributions for the LHC Run II | JHEP 04 (2015) 040 | 1410.8849 |
| 58 | T. Sjostrand, S. Mrenna, and P. Z. Skands | A brief introduction to PYTHIA 8.1 | Comput. Phys. Commun. 178 (2008) 852 | 0710.3820 |
| 59 | CMS Collaboration | Event generator tunes obtained from underlying event and multiparton scattering measurements | EPJC 76 (2016) 155 | CMS-GEN-14-001 1512.00815 |
| 60 | P. Skands, S. Carrazza, and J. Rojo | Tuning PYTHIA 8.1: the Monash 2013 tune | EPJC 74 (2014) 3024 | 1404.5630 |
| 61 | GEANT4 Collaboration | GEANT4--a simulation toolkit | NIM A 506 (2003) 250 | |
| 62 | CMS Collaboration | Particle-flow reconstruction and global event description with the CMS detector | JINST 12 (2017) P10003 | CMS-PRF-14-001 1706.04965 |
| 63 | CMS Collaboration | Technical proposal for the Phase-II upgrade of the Compact Muon Solenoid | CMS Technical Proposal CERN-LHCC-2015-010, CMS-TDR-15-02, 2015 CDS |
|
| 64 | CMS Collaboration | Performance of electron reconstruction and selection with the CMS detector in proton-proton collisions at $ \sqrt{s} $=8 TeV | JINST P06005 ) 30, 2015 link |
CMS-EGM-13-001 1502.02701 |
| 65 | CMS Collaboration | Performance of the CMS muon detector and muon reconstruction with proton-proton collisions at $ \sqrt{s} $=13 TeV | JINST P06015 ) 30, 2018 link |
CMS-MUO-16-001 1804.04528 |
| 66 | CMS Collaboration | Jet energy scale and resolution in the CMS experiment in pp collisions at 8 TeV | JINST 12 (2017) P02014 | CMS-JME-13-004 1607.03663 |
| 67 | CMS Collaboration | Identification of heavy-flavour jets with the CMS detector in pp collisions at 13 TeV | JINST 13 ), 2018 link |
CMS-BTV-16-002 1712.07158 |
| 68 | CMS Collaboration | A deep neural network for simultaneous estimation of $ b $-jet energy and resolution | Computing and Software for Big Science 4 (2020) 10 | CMS-HIG-18-027 1912.06046 |
| 69 | M. Cacciari, G. P. Salam, and G. Soyez | The anti-$ k_{\mathrm{T}} $ jet clustering algorithm | %%CITATION = ARXIV:0802.1189, 2008 JHEP 04 (2008) 063 |
0802.1189 |
| 70 | CMS Collaboration | W and top tagging scale factors for Run 2 data | CMS Detector Performance Note CMS-DP-2020-025, 2020 CDS |
|
| 71 | CMS Collaboration | Performance of missing transverse momentum reconstruction in proton-proton collisions at $ \sqrt{s} = $ 13\,TeV using the CMS detector | JINST 14 (2019) P07004 | CMS-JME-17-001 1903.06078 |
| 72 | I. J. Goodfellow, Y. Bengio, and A. Courville | Deep Learning | MIT Press, Cambridge, MA, USA, 2016 link |
|
| 73 | CMS Collaboration | Precision luminosity measurement in proton-proton collisions at $ \sqrt{s} = $ 13 TeV in 2015 and 2016 at CMS | EPJC 81 (2021) 800 | CMS-LUM-17-003 2104.01927 |
| 74 | CMS Collaboration | CMS luminosity measurement for the 2017 data-taking period at $ \sqrt{s} = $ 13 TeV | CMS Physics Analysis Summary, 2018 CMS-PAS-LUM-17-004 |
CMS-PAS-LUM-17-004 |
| 75 | CMS Collaboration | CMS luminosity measurement for the 2018 data-taking period at $ \sqrt{s} = $ 13 TeV | CMS Physics Analysis Summary, 2019 CMS-PAS-LUM-18-002 |
CMS-PAS-LUM-18-002 |
| 76 | R. Barlow | Statistics: A Guide to the Use of Statistical Methods in the Physical Sciences | Manchester Physics Series,. ISBN~978-0-471-92295-7, 1989 | |
|
|
Compact Muon Solenoid LHC, CERN |
|

|

|

|

|

|