

Compact Muon Solenoid
LHC, CERN
| CMS-PAS-EXO-22-008 | ||
| Search for narrow trijet resonances in proton-proton collisions at $ \sqrt{s}= $ 13 TeV | ||
| CMS Collaboration | ||
| 21 May 2023 | ||
| Abstract: A search for narrow hadronic resonances decaying to three resolved jets is presented. The search uses 138 fb$^{-1}$ of proton-proton collision data with a collision center of mass energy of 13 TeV, collected by the CMS detector at the CERN LHC. The three-jet invariant mass spectrum is scrutinized for localized excesses compatible with new resonances with masses in the range of 1.75--9.00 TeV. The background from standard model processes is estimated by fitting the three-jet invariant mass spectrum with empirical functions, following techniques commonly used in dijet resonance searches. No significant deviations from the background expectations are observed. The results are interpreted in the context of several models predicting three-jet resonances, including a new right-handed boson $ \mathrm{Z}_{R} $ decaying to three gluons, a Kaluza-Klein gluon decaying via an intermediate radion to three gluons, and an excited quark decaying via a vector boson to three quarks. | ||
|
Links:
CDS record (PDF) ;
Physics Briefing ;
CADI line (restricted) ;
These preliminary results are superseded in this paper, Submitted to PRL. The superseded preliminary plots can be found here. |
||
| Figures | Summary | Additional Figures | References | CMS Publications |
|---|
| Figures | |
png pdf |
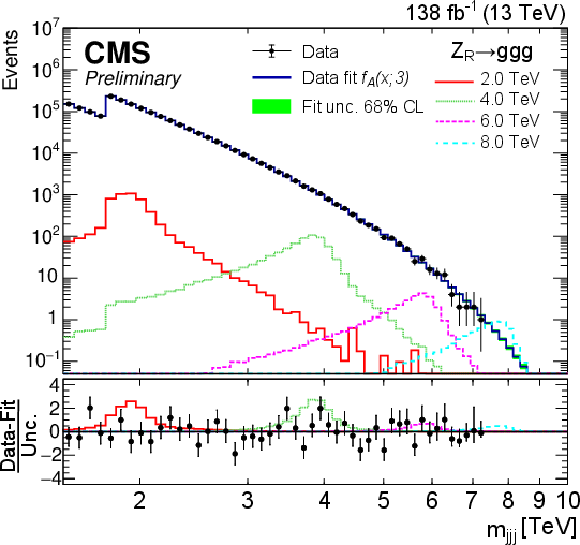
Figure 1:
The observed trijet invariant mass distribution and the background-only fit to the data using the $ f_A $ fit function. The expected $ m_{\mathrm{jjj}} $ distributions for $ \mathrm{Z}_{R} $ signal masses of 2, 4, 6, and 8 TeV with nominal width are also shown. The normalizations correspond to $ \sigma \times \mathcal{B} $ values of 200 fb, 50 fb, 20 fb, and 20 fb, respectively. Only 2016 data is shown for $ m_{\mathrm{jjj}} < $ 1.76 TeV because of the high trigger thresholds in 2017 and 2018. The bottom panel shows the difference between the observed data and the background prediction divided by the total uncertainty, along with expectations for the example $ \mathrm{Z}_{R} $ signal points. |
png pdf |
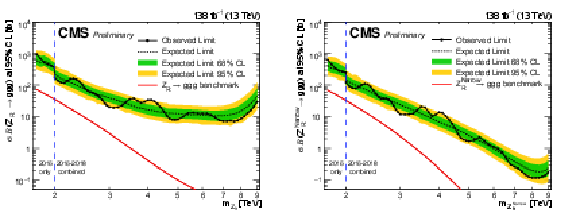
Figure 2:
Limits at 95% CL on $ \sigma \mathcal{B} (\mathrm{Z}_{R} \rightarrow 3\mathrm{g}) $ for the nominal (left) and narrow (right) width scenarios. Only 2016 data is used to derive limits below 2.0 TeV because of the higher trigger thresholds in 2017 and 2018. |
png pdf |
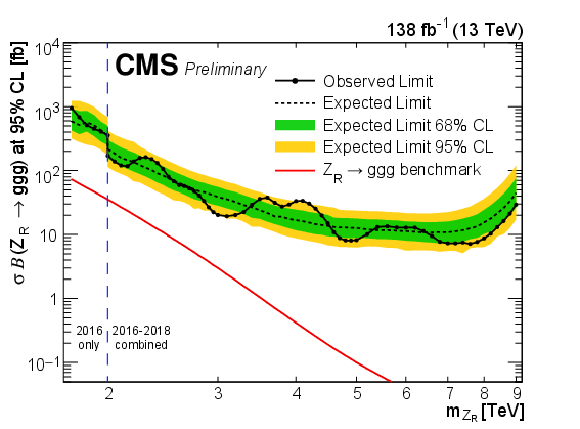
Figure 2-a:
Limits at 95% CL on $ \sigma \mathcal{B} (\mathrm{Z}_{R} \rightarrow 3\mathrm{g}) $ for the nominal (left) and narrow (right) width scenarios. Only 2016 data is used to derive limits below 2.0 TeV because of the higher trigger thresholds in 2017 and 2018. |
png pdf |
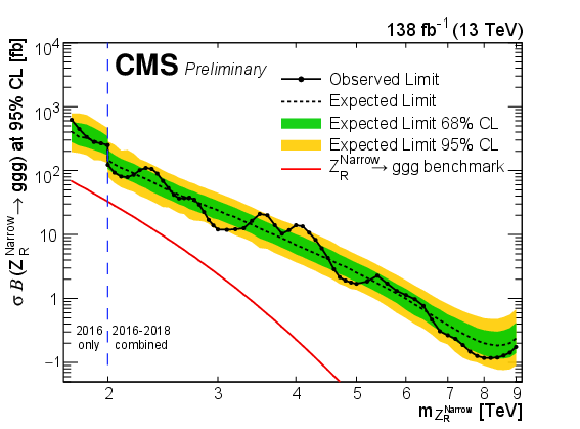
Figure 2-b:
Limits at 95% CL on $ \sigma \mathcal{B} (\mathrm{Z}_{R} \rightarrow 3\mathrm{g}) $ for the nominal (left) and narrow (right) width scenarios. Only 2016 data is used to derive limits below 2.0 TeV because of the higher trigger thresholds in 2017 and 2018. |
png pdf |
Figure 3:
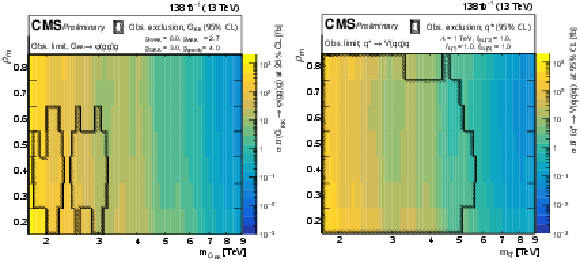
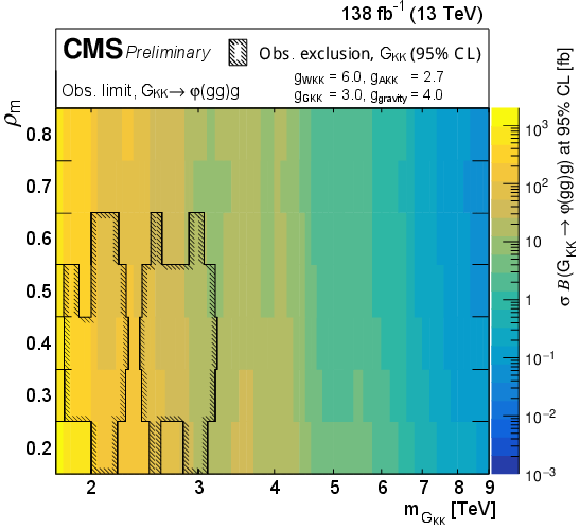
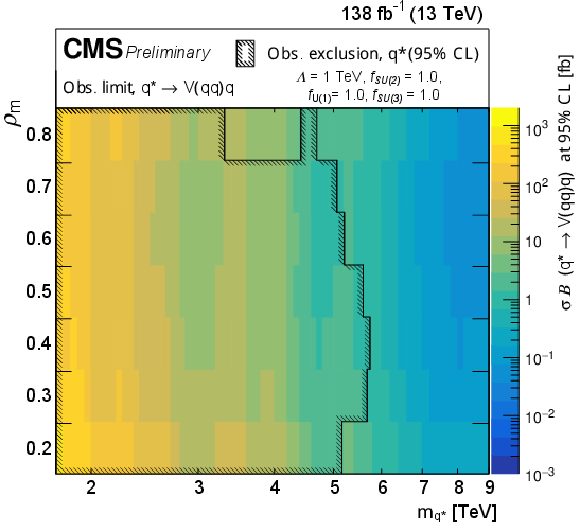
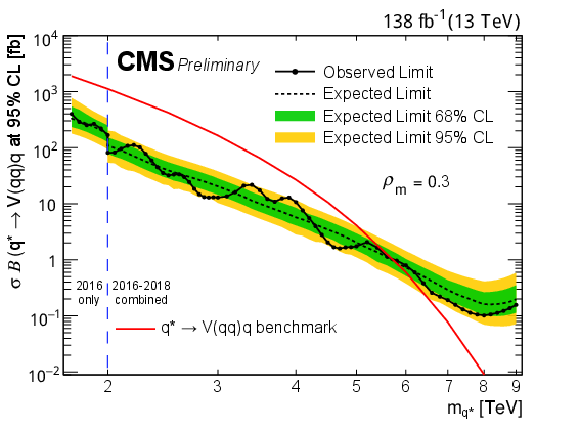
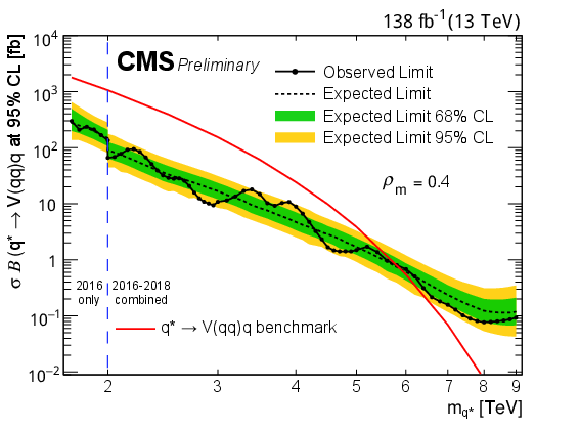
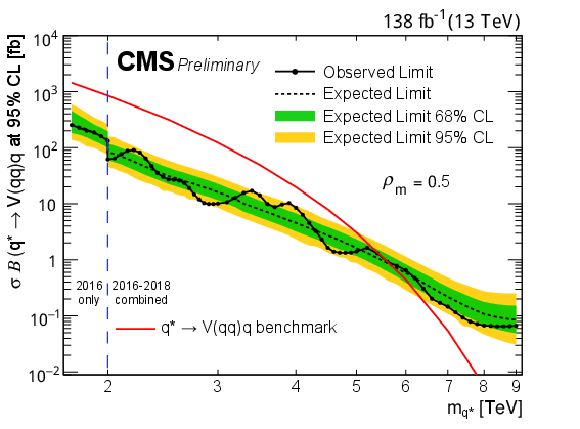
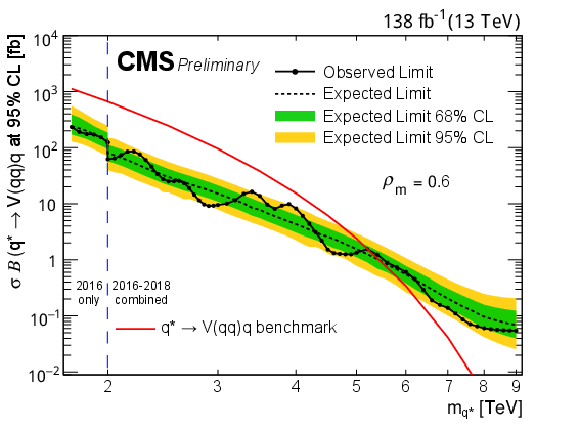
Limits at 95% CL as a function of $ m_{\mathrm{X}} $ and $ \rho_{m} $ on $ \sigma \mathcal{B} (\mathrm{X} \rightarrow \mathrm{Y}(\mathrm{g}\mathrm{g})\mathrm{g}) $ (left) and $ \sigma \mathcal{B} (\mathrm{X} \rightarrow \mathrm{Y}(\mathrm{q}\mathrm{q})\mathrm{q}) $ (right). Only 2016 data is used to derive limits below 2.0 TeV because of the higher trigger thresholds in 2017 and 2018. The mass exclusion ranges for the benchmark models are also shown. |
png pdf |
Figure 3-a:
Limits at 95% CL as a function of $ m_{\mathrm{X}} $ and $ \rho_{m} $ on $ \sigma \mathcal{B} (\mathrm{X} \rightarrow \mathrm{Y}(\mathrm{g}\mathrm{g})\mathrm{g}) $ (left) and $ \sigma \mathcal{B} (\mathrm{X} \rightarrow \mathrm{Y}(\mathrm{q}\mathrm{q})\mathrm{q}) $ (right). Only 2016 data is used to derive limits below 2.0 TeV because of the higher trigger thresholds in 2017 and 2018. The mass exclusion ranges for the benchmark models are also shown. |
png pdf |
Figure 3-b:
Limits at 95% CL as a function of $ m_{\mathrm{X}} $ and $ \rho_{m} $ on $ \sigma \mathcal{B} (\mathrm{X} \rightarrow \mathrm{Y}(\mathrm{g}\mathrm{g})\mathrm{g}) $ (left) and $ \sigma \mathcal{B} (\mathrm{X} \rightarrow \mathrm{Y}(\mathrm{q}\mathrm{q})\mathrm{q}) $ (right). Only 2016 data is used to derive limits below 2.0 TeV because of the higher trigger thresholds in 2017 and 2018. The mass exclusion ranges for the benchmark models are also shown. |
| Summary |
| In summary, the first generic search for new particles decaying to three hadronic jets has been presented. The search uses proton-proton collision data at $ \sqrt{s}= $ 13 TeV recorded by the CMS experiment from 2016--2018, corresponding to an integrated luminosity of 138 fb$^{-1}$. The signal is identified as a peak in the smoothly falling three-jet invariant mass spectrum. No significant excesses above the standard model background expectations are observed. Limits are set on the product of the production cross section and branching ratio to three resolved jets. The results are interpreted in the context of a new right-handed boson $ \mathrm{Z}_{R} $ decaying to three gluons, a Kaluza-Klein gluon G decaying via an intermediate radion to three gluons, and an excited quark decaying via a vector boson to three quarks. This is the first search for the three-body decay of high-mass resonances into three resolved jets at the LHC, and also the first search for high-mass resonances that decay into three resolved jets through an intermediate resonance with mass ratio $ \rho_{m} $ between 0.2 to 0.8, significantly extending the model parameter space explored by a previous search [51]. |
| Additional Figures | |
png pdf |
Additional Figure 1:
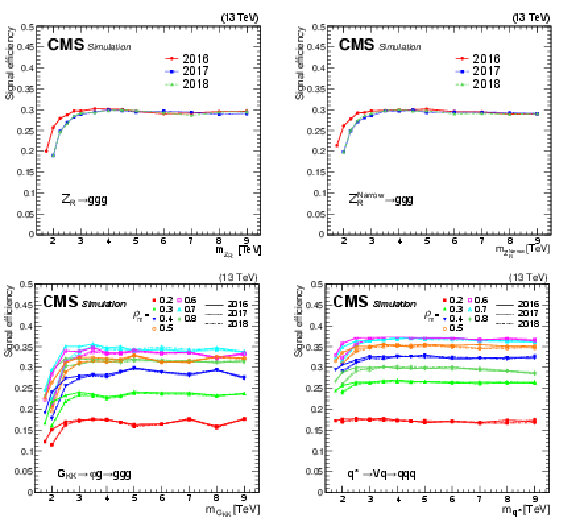
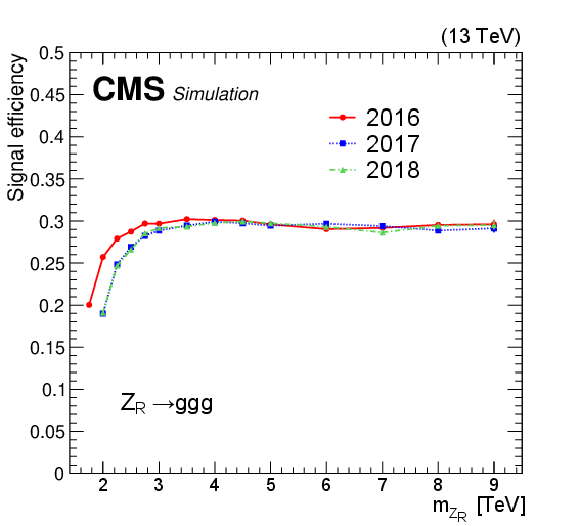
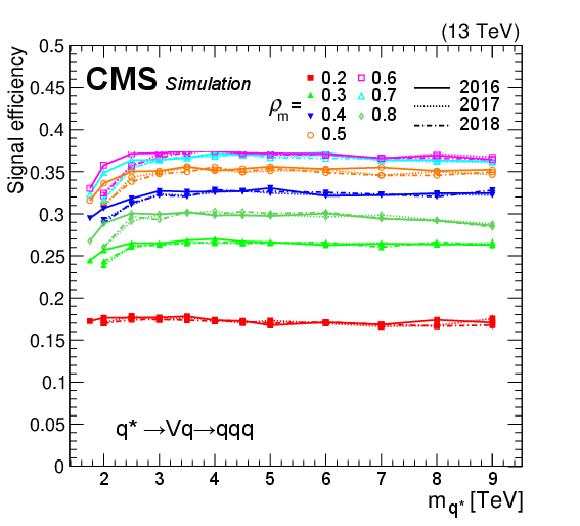
Efficiencies of the selection requirements on the benchmark signal processes: $ \mathrm{Z}_{R}\rightarrow \mathrm{g}\mathrm{g}\mathrm{g} $ with nominal width (top left), $ \mathrm{Z}_{R}\rightarrow \mathrm{g}\mathrm{g}\mathrm{g} $ with narrow width (top right), $ {\mathrm{G}_{\text{KK}}}\rightarrow \mathrm{g}\mathrm{g}\mathrm{g} $ (bottom left), and $ \mathrm{q}^{*}\rightarrow \mathrm{q}\mathrm{q}\mathrm{q} $. The efficiencies for 2016, 2017, and 2018 data-taking conditions are shown separately. The bottom two figures also show efficiencies for different $ \rho_{m} $ scenarios for cascade decays with intermediate resonances. |
png pdf |
Additional Figure 1-a:
Efficiencies of the selection requirements on the benchmark signal processes: $ \mathrm{Z}_{R}\rightarrow \mathrm{g}\mathrm{g}\mathrm{g} $ with nominal width (top left), $ \mathrm{Z}_{R}\rightarrow \mathrm{g}\mathrm{g}\mathrm{g} $ with narrow width (top right), $ {\mathrm{G}_{\text{KK}}}\rightarrow \mathrm{g}\mathrm{g}\mathrm{g} $ (bottom left), and $ \mathrm{q}^{*}\rightarrow \mathrm{q}\mathrm{q}\mathrm{q} $. The efficiencies for 2016, 2017, and 2018 data-taking conditions are shown separately. The bottom two figures also show efficiencies for different $ \rho_{m} $ scenarios for cascade decays with intermediate resonances. |

png pdf |
Additional Figure 1-b:
Efficiencies of the selection requirements on the benchmark signal processes: $ \mathrm{Z}_{R}\rightarrow \mathrm{g}\mathrm{g}\mathrm{g} $ with nominal width (top left), $ \mathrm{Z}_{R}\rightarrow \mathrm{g}\mathrm{g}\mathrm{g} $ with narrow width (top right), $ {\mathrm{G}_{\text{KK}}}\rightarrow \mathrm{g}\mathrm{g}\mathrm{g} $ (bottom left), and $ \mathrm{q}^{*}\rightarrow \mathrm{q}\mathrm{q}\mathrm{q} $. The efficiencies for 2016, 2017, and 2018 data-taking conditions are shown separately. The bottom two figures also show efficiencies for different $ \rho_{m} $ scenarios for cascade decays with intermediate resonances. |

png pdf |
Additional Figure 1-c:
Efficiencies of the selection requirements on the benchmark signal processes: $ \mathrm{Z}_{R}\rightarrow \mathrm{g}\mathrm{g}\mathrm{g} $ with nominal width (top left), $ \mathrm{Z}_{R}\rightarrow \mathrm{g}\mathrm{g}\mathrm{g} $ with narrow width (top right), $ {\mathrm{G}_{\text{KK}}}\rightarrow \mathrm{g}\mathrm{g}\mathrm{g} $ (bottom left), and $ \mathrm{q}^{*}\rightarrow \mathrm{q}\mathrm{q}\mathrm{q} $. The efficiencies for 2016, 2017, and 2018 data-taking conditions are shown separately. The bottom two figures also show efficiencies for different $ \rho_{m} $ scenarios for cascade decays with intermediate resonances. |
png pdf |
Additional Figure 1-d:
Efficiencies of the selection requirements on the benchmark signal processes: $ \mathrm{Z}_{R}\rightarrow \mathrm{g}\mathrm{g}\mathrm{g} $ with nominal width (top left), $ \mathrm{Z}_{R}\rightarrow \mathrm{g}\mathrm{g}\mathrm{g} $ with narrow width (top right), $ {\mathrm{G}_{\text{KK}}}\rightarrow \mathrm{g}\mathrm{g}\mathrm{g} $ (bottom left), and $ \mathrm{q}^{*}\rightarrow \mathrm{q}\mathrm{q}\mathrm{q} $. The efficiencies for 2016, 2017, and 2018 data-taking conditions are shown separately. The bottom two figures also show efficiencies for different $ \rho_{m} $ scenarios for cascade decays with intermediate resonances. |
png pdf |
Additional Figure 2:
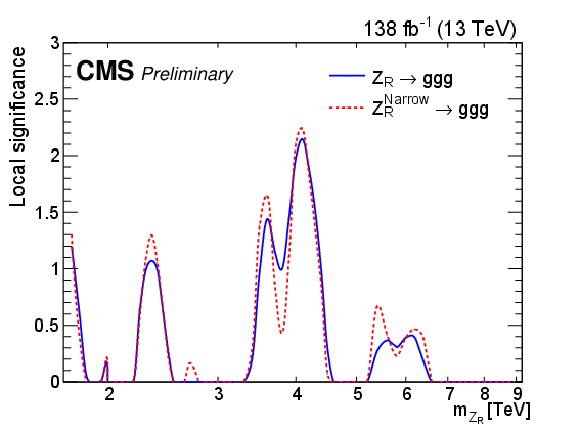
The observed local significance for a $ \mathrm{g}\mathrm{g}\mathrm{g} $ resonance versus $ \mathrm{Z}_{R} $ mass, shown for resonances with nominal width (blue) and narrow width (red). The most significant excesses correspond to 2.1 (2.2) standard deviations. |

png pdf |
Additional Figure 3:
The observed local significance versus $ m_{\mathrm{X}} $ and $ \rho_{m} $ for resonances decaying via a cascade. The largest deviations are observed at $ \rho_{m} = $ 0.3, $ m_{\mathrm{X}} = $ 4.1 TeV for $ \mathrm{X} \rightarrow \mathrm{Y}(\mathrm{g}\mathrm{g})\mathrm{g} $ and $ \rho_{m} = $ 0.7, $m_{\mathrm{X}} = $ 3.9 TeV for $ \mathrm{X} \rightarrow \mathrm{Y}(\mathrm{q}\mathrm{q})\mathrm{q} $. The corresponding local (global) significance values are 2.2 (0.36) and 2.1 (0.27) standard deviations, respectively. |

png pdf |
Additional Figure 3-a:
The observed local significance versus $ m_{\mathrm{X}} $ and $ \rho_{m} $ for resonances decaying via a cascade. The largest deviations are observed at $ \rho_{m} = $ 0.3, $ m_{\mathrm{X}} = $ 4.1 TeV for $ \mathrm{X} \rightarrow \mathrm{Y}(\mathrm{g}\mathrm{g})\mathrm{g} $ and $ \rho_{m} = $ 0.7, $m_{\mathrm{X}} = $ 3.9 TeV for $ \mathrm{X} \rightarrow \mathrm{Y}(\mathrm{q}\mathrm{q})\mathrm{q} $. The corresponding local (global) significance values are 2.2 (0.36) and 2.1 (0.27) standard deviations, respectively. |

png pdf |
Additional Figure 3-b:
The observed local significance versus $ m_{\mathrm{X}} $ and $ \rho_{m} $ for resonances decaying via a cascade. The largest deviations are observed at $ \rho_{m} = $ 0.3, $ m_{\mathrm{X}} = $ 4.1 TeV for $ \mathrm{X} \rightarrow \mathrm{Y}(\mathrm{g}\mathrm{g})\mathrm{g} $ and $ \rho_{m} = $ 0.7, $m_{\mathrm{X}} = $ 3.9 TeV for $ \mathrm{X} \rightarrow \mathrm{Y}(\mathrm{q}\mathrm{q})\mathrm{q} $. The corresponding local (global) significance values are 2.2 (0.36) and 2.1 (0.27) standard deviations, respectively. |
png pdf |
Additional Figure 4:
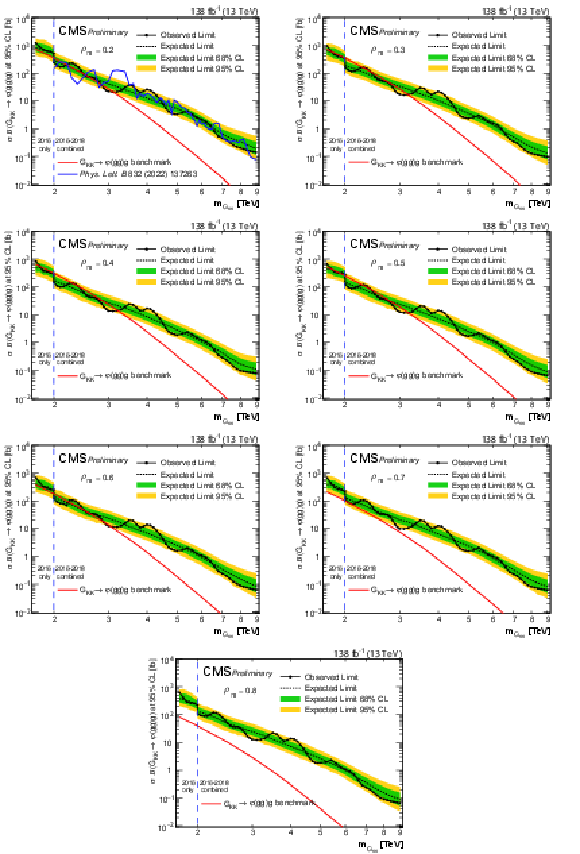
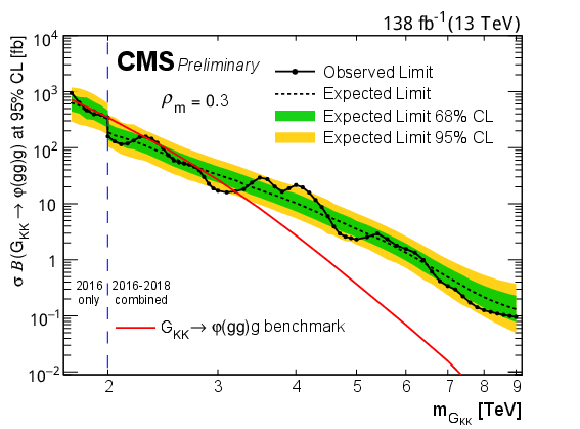
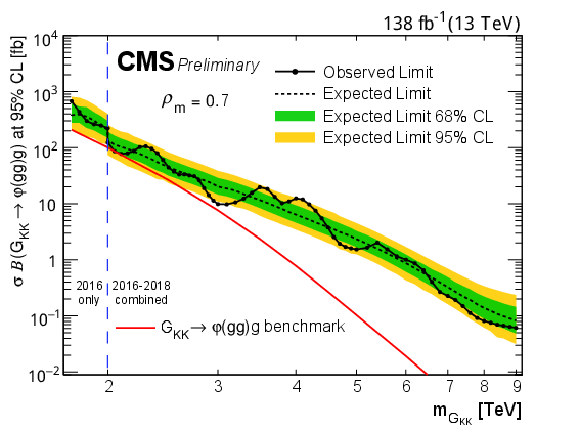
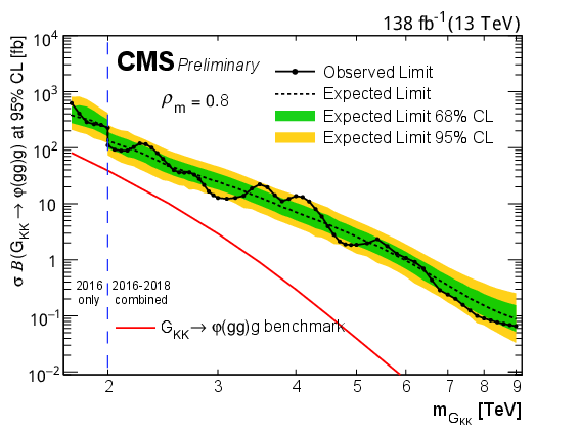
Limits at 95% CL on $ \sigma \mathcal{B} (\mathrm{X} \rightarrow \mathrm{Y}(\mathrm{g}\mathrm{g})\mathrm{g}) $ for different $ \rho_{m} $ scenarios. Only 2016 data is used to derive limits below 2.0 TeV because of the higher trigger thresholds in 2017 and 2018. Theoretical predictions are also shown for the benchmark $ {\mathrm{G}_{\text{KK}}} $ model. |

png pdf |
Additional Figure 4-a:
Limits at 95% CL on $ \sigma \mathcal{B} (\mathrm{X} \rightarrow \mathrm{Y}(\mathrm{g}\mathrm{g})\mathrm{g}) $ for different $ \rho_{m} $ scenarios. Only 2016 data is used to derive limits below 2.0 TeV because of the higher trigger thresholds in 2017 and 2018. Theoretical predictions are also shown for the benchmark $ {\mathrm{G}_{\text{KK}}} $ model. |
png pdf |
Additional Figure 4-b:
Limits at 95% CL on $ \sigma \mathcal{B} (\mathrm{X} \rightarrow \mathrm{Y}(\mathrm{g}\mathrm{g})\mathrm{g}) $ for different $ \rho_{m} $ scenarios. Only 2016 data is used to derive limits below 2.0 TeV because of the higher trigger thresholds in 2017 and 2018. Theoretical predictions are also shown for the benchmark $ {\mathrm{G}_{\text{KK}}} $ model. |

png pdf |
Additional Figure 4-c:
Limits at 95% CL on $ \sigma \mathcal{B} (\mathrm{X} \rightarrow \mathrm{Y}(\mathrm{g}\mathrm{g})\mathrm{g}) $ for different $ \rho_{m} $ scenarios. Only 2016 data is used to derive limits below 2.0 TeV because of the higher trigger thresholds in 2017 and 2018. Theoretical predictions are also shown for the benchmark $ {\mathrm{G}_{\text{KK}}} $ model. |

png pdf |
Additional Figure 4-d:
Limits at 95% CL on $ \sigma \mathcal{B} (\mathrm{X} \rightarrow \mathrm{Y}(\mathrm{g}\mathrm{g})\mathrm{g}) $ for different $ \rho_{m} $ scenarios. Only 2016 data is used to derive limits below 2.0 TeV because of the higher trigger thresholds in 2017 and 2018. Theoretical predictions are also shown for the benchmark $ {\mathrm{G}_{\text{KK}}} $ model. |

png pdf |
Additional Figure 4-e:
Limits at 95% CL on $ \sigma \mathcal{B} (\mathrm{X} \rightarrow \mathrm{Y}(\mathrm{g}\mathrm{g})\mathrm{g}) $ for different $ \rho_{m} $ scenarios. Only 2016 data is used to derive limits below 2.0 TeV because of the higher trigger thresholds in 2017 and 2018. Theoretical predictions are also shown for the benchmark $ {\mathrm{G}_{\text{KK}}} $ model. |
png pdf |
Additional Figure 4-f:
Limits at 95% CL on $ \sigma \mathcal{B} (\mathrm{X} \rightarrow \mathrm{Y}(\mathrm{g}\mathrm{g})\mathrm{g}) $ for different $ \rho_{m} $ scenarios. Only 2016 data is used to derive limits below 2.0 TeV because of the higher trigger thresholds in 2017 and 2018. Theoretical predictions are also shown for the benchmark $ {\mathrm{G}_{\text{KK}}} $ model. |
png pdf |
Additional Figure 4-g:
Limits at 95% CL on $ \sigma \mathcal{B} (\mathrm{X} \rightarrow \mathrm{Y}(\mathrm{g}\mathrm{g})\mathrm{g}) $ for different $ \rho_{m} $ scenarios. Only 2016 data is used to derive limits below 2.0 TeV because of the higher trigger thresholds in 2017 and 2018. Theoretical predictions are also shown for the benchmark $ {\mathrm{G}_{\text{KK}}} $ model. |

png pdf |
Additional Figure 5:
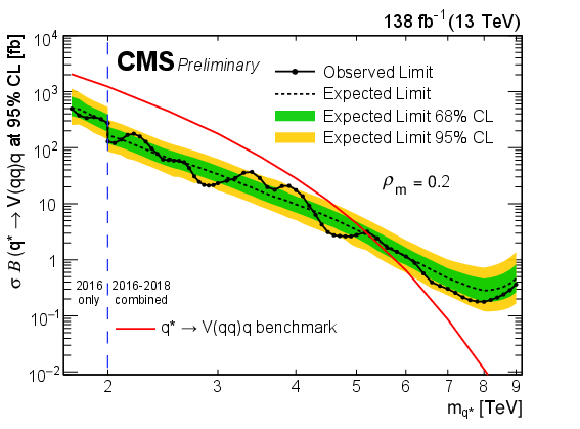
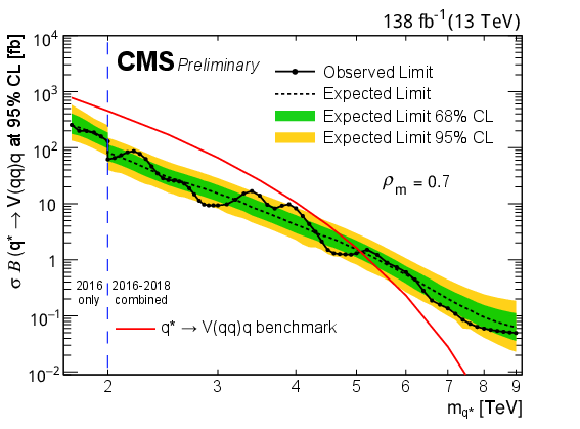
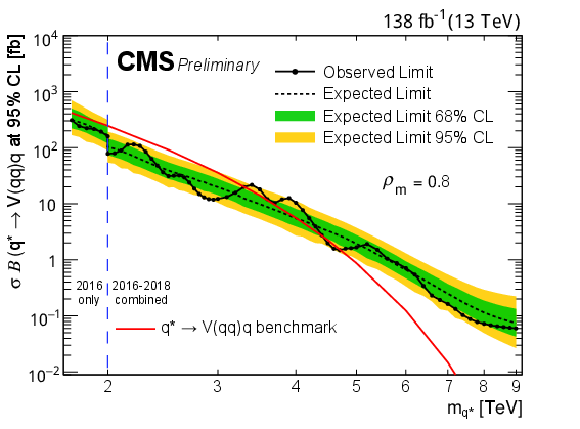
Limits at 95% CL on $ \sigma \mathcal{B} (\mathrm{X} \rightarrow \mathrm{Y}(\mathrm{q}\mathrm{q})\mathrm{q}) $ for resonances $ \mathrm{X} $ in different $ \rho_{m} $ scenarios. Only 2016 data is used to derive limits below 2.0 TeV because of the higher trigger thresholds in 2017 and 2018. Theoretical predictions are also shown for the benchmark $ \mathrm{q}^{*} $ model. |
png pdf |
Additional Figure 5-a:
Limits at 95% CL on $ \sigma \mathcal{B} (\mathrm{X} \rightarrow \mathrm{Y}(\mathrm{q}\mathrm{q})\mathrm{q}) $ for resonances $ \mathrm{X} $ in different $ \rho_{m} $ scenarios. Only 2016 data is used to derive limits below 2.0 TeV because of the higher trigger thresholds in 2017 and 2018. Theoretical predictions are also shown for the benchmark $ \mathrm{q}^{*} $ model. |
png pdf |
Additional Figure 5-b:
Limits at 95% CL on $ \sigma \mathcal{B} (\mathrm{X} \rightarrow \mathrm{Y}(\mathrm{q}\mathrm{q})\mathrm{q}) $ for resonances $ \mathrm{X} $ in different $ \rho_{m} $ scenarios. Only 2016 data is used to derive limits below 2.0 TeV because of the higher trigger thresholds in 2017 and 2018. Theoretical predictions are also shown for the benchmark $ \mathrm{q}^{*} $ model. |
png pdf |
Additional Figure 5-c:
Limits at 95% CL on $ \sigma \mathcal{B} (\mathrm{X} \rightarrow \mathrm{Y}(\mathrm{q}\mathrm{q})\mathrm{q}) $ for resonances $ \mathrm{X} $ in different $ \rho_{m} $ scenarios. Only 2016 data is used to derive limits below 2.0 TeV because of the higher trigger thresholds in 2017 and 2018. Theoretical predictions are also shown for the benchmark $ \mathrm{q}^{*} $ model. |
png pdf |
Additional Figure 5-d:
Limits at 95% CL on $ \sigma \mathcal{B} (\mathrm{X} \rightarrow \mathrm{Y}(\mathrm{q}\mathrm{q})\mathrm{q}) $ for resonances $ \mathrm{X} $ in different $ \rho_{m} $ scenarios. Only 2016 data is used to derive limits below 2.0 TeV because of the higher trigger thresholds in 2017 and 2018. Theoretical predictions are also shown for the benchmark $ \mathrm{q}^{*} $ model. |
png pdf |
Additional Figure 5-e:
Limits at 95% CL on $ \sigma \mathcal{B} (\mathrm{X} \rightarrow \mathrm{Y}(\mathrm{q}\mathrm{q})\mathrm{q}) $ for resonances $ \mathrm{X} $ in different $ \rho_{m} $ scenarios. Only 2016 data is used to derive limits below 2.0 TeV because of the higher trigger thresholds in 2017 and 2018. Theoretical predictions are also shown for the benchmark $ \mathrm{q}^{*} $ model. |
png pdf |
Additional Figure 5-f:
Limits at 95% CL on $ \sigma \mathcal{B} (\mathrm{X} \rightarrow \mathrm{Y}(\mathrm{q}\mathrm{q})\mathrm{q}) $ for resonances $ \mathrm{X} $ in different $ \rho_{m} $ scenarios. Only 2016 data is used to derive limits below 2.0 TeV because of the higher trigger thresholds in 2017 and 2018. Theoretical predictions are also shown for the benchmark $ \mathrm{q}^{*} $ model. |
png pdf |
Additional Figure 5-g:
Limits at 95% CL on $ \sigma \mathcal{B} (\mathrm{X} \rightarrow \mathrm{Y}(\mathrm{q}\mathrm{q})\mathrm{q}) $ for resonances $ \mathrm{X} $ in different $ \rho_{m} $ scenarios. Only 2016 data is used to derive limits below 2.0 TeV because of the higher trigger thresholds in 2017 and 2018. Theoretical predictions are also shown for the benchmark $ \mathrm{q}^{*} $ model. |
png pdf jpg |
Additional Figure 6:
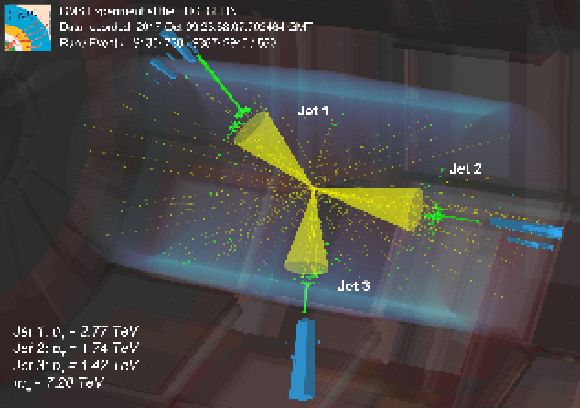
Three dimensional display of the event with the highest $ m_{\mathrm{jjj}} $ of 7.20 TeV. Energy deposited in the electromagnetic (green) and hadronic (blue) calorimeters and the reconstructed tracks of charged particles (yellow) are shown. Reconstructed three most energetic jets are represented by the yellow cones. |
| References | ||||
| 1 | UA1 Collaboration | Two-jet mass distributions at the CERN proton-antiproton collider | PLB 209 (1988) 127 | |
| 2 | UA2 Collaboration | A measurement of two-jet decays of the $ W $ and $ Z $ bosons at the CERN $ {\bar{p} p} $ collider | Z. Phys. C 49 (1991) 17 | |
| 3 | UA2 Collaboration | A search for new intermediate vector mesons and excited quarks decaying to two jets at the CERN $ {\rm \bar{p} p} $ collider | NPB 400 (1993) 3 | |
| 4 | CDF Collaboration | The two-jet invariant mass-distribution at $ \sqrt{s} = $ 1.8 TeV | PRD 41 (1990) 1722 | |
| 5 | CDF Collaboration | Search for quark compositeness, axigluons and heavy particles using the dijet invariant mass spectrum observed in $ {\rm \bar{p} p} $ collisions | PRL 71 (1993) 2542 | |
| 6 | CDF Collaboration | Search for new particles decaying to dijets in $ {\rm \bar{p} p} $ collisions at $ \sqrt{s} = $ 1.8 TeV | PRL 74 (1995) 3538 | hep-ex/9501001 |
| 7 | CDF Collaboration | Measurement of dijet angular distributions by the Collider Detector at Fermilab | PRL 77 (1996) 5336 | hep-ex/9609011 |
| 8 | CDF Collaboration | Search for new particles decaying to dijets at CDF | PRD 55 (1997) 5263 | hep-ex/9702004 |
| 9 | CDF Collaboration | Search for new particles decaying into dijets in proton-antiproton collisions at $ \sqrt{s} = $ 1.96 TeV | PRD 79 (2009) 112002 | 0812.4036 |
| 10 | D0 Collaboration | Measurement of dijet angular distributions and search for quark compositeness | PRL 80 (1998) 666 | hep-ex/9707016 |
| 11 | D0 Collaboration | The dijet mass spectrum and a search for quark compositeness in $ {\rm \bar{p} p} $ collisions at $ \sqrt{s} = $ 1.8 TeV | PRL 82 (1999) 2457 | hep-ex/9807014 |
| 12 | D0 Collaboration | Search for new particles in the two-jet decay channel with the D0 detector | PRD 69 (2004) 111101 | hep-ex/0308033 |
| 13 | ATLAS Collaboration | Search for new particles in two-jet final states in 7 TeV proton-proton collisions with the ATLAS detector at the LHC | PRL 105 (2010) 161801 | 1008.2461 |
| 14 | ATLAS Collaboration | Search for quark contact interactions in dijet angular distributions in pp collisions at $ \sqrt{s}= $ 7 TeV measured with the ATLAS detector | PLB 694 (2011) 327 | 1009.5069 |
| 15 | ATLAS Collaboration | A search for new physics in dijet mass and angular distributions in pp collisions at $ \sqrt{s} = $ 7 TeV measured with the ATLAS detector | New J. Phys. 13 (2011) 053044 | 1103.3864 |
| 16 | ATLAS Collaboration | Search for new physics in the dijet mass distribution using 1 fb$ ^{-1} $ of pp collision data at $ \sqrt{s}= $ 7 TeV collected by the ATLAS detector | PLB 708 (2012) 37 | 1108.6311 |
| 17 | ATLAS Collaboration | ATLAS search for new phenomena in dijet mass and angular distributions using pp collisions at $ \sqrt{s}= $ 7 TeV | JHEP 01 (2013) 029 | 1210.1718 |
| 18 | ATLAS Collaboration | Search for new phenomena in the dijet mass distribution using pp collision data at $ \sqrt{s}= $ 8 TeV with the ATLAS detector | PRD 91 (2015) 052007 | 1407.1376 |
| 19 | ATLAS Collaboration | Search for new phenomena in dijet angular distributions in proton-proton collisions at $ \sqrt{s} = $ 8 TeV measured with the ATLAS detector | PRL 114 (2015) 221802 | 1504.00357 |
| 20 | ATLAS Collaboration | Search for new phenomena in dijet mass and angular distributions from $ pp $ collisions at $ \sqrt{s} = $ 13 TeV with the ATLAS detector | PLB 754 (2016) 302 | 1512.01530 |
| 21 | ATLAS Collaboration | Search for resonances in the mass distribution of jet pairs with one or two jets identified as $ b $-jets in proton--proton collisions at $ \sqrt{s}= $ 13 TeV with the ATLAS detector | PLB 759 (2016) 229 | 1603.08791 |
| 22 | ATLAS Collaboration | Search for new phenomena in dijet events using 37 fb$ ^{-1} $ of $ pp $ collision data collected at $ \sqrt{s}= $ 13 TeV with the ATLAS detector | PRD 96 (2017) 052004 | 1703.09127 |
| 23 | CMS Collaboration | Search for dijet resonances in 7 TeV pp collisions at CMS | PRL 105 (2010) 211801 | CMS-EXO-10-010 1010.0203 |
| 24 | CMS Collaboration | Search for quark compositeness with the dijet centrality ratio in pp collisions at $ \sqrt{s}= $ 7 TeV | PRL 105 (2010) 262001 | CMS-EXO-10-002 1010.4439 |
| 25 | CMS Collaboration | Measurement of dijet angular distributions and search for quark compositeness in pp collisions at $ \sqrt{s} = $ 7 TeV | PRL 106 (2011) 201804 | CMS-EXO-10-009 1102.2020 |
| 26 | CMS Collaboration | Search for resonances in the dijet mass spectrum from 7 TeV pp collisions at CMS | PLB 704 (2011) 123 | CMS-EXO-11-015 1107.4771 |
| 27 | CMS Collaboration | Search for quark compositeness in dijet angular distributions from pp collisions at $ \sqrt{s}= $ 7 TeV | JHEP 05 (2012) 055 | CMS-EXO-11-017 1202.5535 |
| 28 | CMS Collaboration | Search for narrow resonances and quantum black holes in inclusive and b-tagged dijet mass spectra from pp collisions at $ \sqrt{s}= $ 7 TeV | JHEP 01 (2013) 013 | CMS-EXO-11-094 1210.2387 |
| 29 | CMS Collaboration | Search for narrow resonances using the dijet mass spectrum in pp collisions at $ \sqrt{s} = $ 8 TeV | PRD 87 (2013) 114015 | CMS-EXO-12-016 1302.4794 |
| 30 | CMS Collaboration | Search for quark contact interactions and extra spatial dimensions using dijet angular distributions in proton-proton collisions at $ \sqrt{s} = $ 8 TeV | PLB 746 (2015) 79 | CMS-EXO-12-050 1411.2646 |
| 31 | CMS Collaboration | Search for resonances and quantum black holes using dijet mass spectra in proton-proton collisions at $ \sqrt{s} = $ 8 TeV | PRD 91 (2015) 052009 | CMS-EXO-12-059 1501.04198 |
| 32 | CMS Collaboration | Search for narrow resonances decaying to dijets in proton-proton collisions at $ \sqrt{s} = $ 13 TeV | PRL 116 (2016) 071801 | CMS-EXO-15-001 1512.01224 |
| 33 | CMS Collaboration | Search for narrow resonances in dijet final states at $ \sqrt{s}= $ 8 TeV with the novel CMS technique of data scouting | PRL 117 (2016) 031802 | CMS-EXO-14-005 1604.08907 |
| 34 | CMS Collaboration | Search for dijet resonances in proton-proton collisions at $ \sqrt{s} $ = 13 TeV and constraints on dark matter and other models | PLB 769 (2017) 520 | CMS-EXO-16-032 1611.03568 |
| 35 | CMS Collaboration | Search for new physics with dijet angular distributions in proton-proton collisions at $ \sqrt{s}= $ 13 TeV | JHEP 07 (2017) 013 | CMS-EXO-15-009 1703.09986 |
| 36 | CMS Collaboration | Search for narrow resonances in the b-tagged dijet mass spectrum in proton-proton collisions at $ \sqrt{s} = $ 8 TeV | PRL 120 (2018) 201801 | CMS-EXO-16-057 1802.06149 |
| 37 | CMS Collaboration | Search for high mass dijet resonances with a new background prediction method in proton-proton collisions at $ \sqrt{s} = $ 13 TeV | JHEP 05 (2020) 033 | CMS-EXO-19-012 1911.03947 |
| 38 | CMS Collaboration | Search for narrow resonances in the b-tagged dijet mass spectrum in proton-proton collisions at $ \sqrt{s} $ = 13 TeV | Accepted by PRD | CMS-EXO-20-008 2205.01835 |
| 39 | CMS Collaboration | Search for low mass vector resonances decaying to quark-antiquark pairs in proton-proton collisions at $ \sqrt{s}= $ 13 TeV | PRL 119 (2017) 111802 | CMS-EXO-16-030 1705.10532 |
| 40 | CMS Collaboration | Search for low mass vector resonances decaying into quark-antiquark pairs in proton-proton collisions at $ \sqrt{s}= $ 13 TeV | JHEP 01 (2018) 097 | CMS-EXO-17-001 1710.00159 |
| 41 | CMS Collaboration | Search for low-mass resonances decaying into bottom quark-antiquark pairs in proton-proton collisions at $ \sqrt{s} = $ 13 TeV | PRD 99 (2019) 012005 | CMS-EXO-17-024 1810.11822 |
| 42 | CMS Collaboration | Search for Low-Mass Quark-Antiquark Resonances Produced in Association with a Photon at $ \sqrt {s} $ =13 TeV | PRL 123 (2019) 231803 | CMS-EXO-17-027 1905.10331 |
| 43 | CMS Collaboration | Search for low mass vector resonances decaying into quark-antiquark pairs in proton-proton collisions at $ \sqrt{s}= $ 13 TeV | PRD 100 (2019) 112007 | CMS-EXO-18-012 1909.04114 |
| 44 | CMS Collaboration | Search for dijet resonances using events with three jets in proton-proton collisions at $ \sqrt{s}= $ 13 TeV | PLB 805 (2020) 135448 | CMS-EXO-19-004 1911.03761 |
| 45 | ATLAS Collaboration | A search for pair-produced resonances in four-jet final states at $ \sqrt{s} = $ 13 TeV with the ATLAS detector | EPJC 78 (2018) 250 | 1710.07171 |
| 46 | CMS Collaboration | Search for pair-produced resonances decaying to quark pairs in proton-proton collisions at $ \sqrt{s}= $ 13 TeV | PRD 98 (2018) 112014 | CMS-EXO-17-021 1808.03124 |
| 47 | CMS Collaboration | Search for pair-produced resonances each decaying into at least four quarks in proton-proton collisions at $ \sqrt{s} = $ 13 TeV | PRL 121 (2018) 141802 | CMS-EXO-17-022 1806.01058 |
| 48 | ATLAS Collaboration | Search for R-parity-violating supersymmetric particles in multi-jet final states produced in $ p-p $ collisions at $ \sqrt{s} = $ 13 TeV using the ATLAS detector at the LHC | PLB 785 (2018) 136 | 1804.03568 |
| 49 | CMS Collaboration | Search for pair-produced three-jet resonances in proton-proton collisions at $ \sqrt{s} = $ 13 TeV | PRD 99 (2019) 012010 | CMS-EXO-17-030 1810.10092 |
| 50 | CMS Collaboration | Search for resonant and nonresonant production of pairs of dijet resonances in proton-proton collisions at $ \sqrt{s} $ = 13 TeV | Accepted by JHEP | CMS-EXO-21-010 2206.09997 |
| 51 | CMS Collaboration | Search for high-mass resonances decaying to a jet and a Lorentz-boosted resonance in proton-proton collisions at s=13TeV | PLB 832 (2022) 137263 | CMS-EXO-20-007 2201.02140 |
| 52 | K. Huitu, J. Maalampi, A. Pietila, and M. Raidal | Doubly charged Higgs at LHC | NPB 487 (1997) 27 | hep-ph/9606311 |
| 53 | K. S. Agashe et al. | LHC signals from cascade decays of warped vector resonances | Including private communications with authors, 2017 JHEP 05 (2017) 078 |
1612.00047 |
| 54 | K. Agashe, M. Ekhterachian, D. Kim, and D. Sathyan | LHC signals for KK graviton from an extended warped extra dimension | JHEP 11 (2020) 109 | 2008.06480 |
| 55 | U. Baur, M. Spira, and P. M. Zerwas | Excited-quark and -lepton production at hadron colliders | PRD 42 (1990) 815 | |
| 56 | CMS Collaboration | Performance of the CMS Level-1 trigger in proton-proton collisions at $ \sqrt{s} = $ 13\,TeV | JINST 15 (2020) P10017 | CMS-TRG-17-001 2006.10165 |
| 57 | CMS Collaboration | The CMS trigger system | JINST 12 (2017) P01020 | CMS-TRG-12-001 1609.02366 |
| 58 | M. Cacciari, G. P. Salam, and G. Soyez | The anti-$ k_t $ jet clustering algorithm | JHEP 04 (2008) 063 | 0802.1189 |
| 59 | M. Cacciari, G. P. Salam, and G. Soyez | FastJet user manual | EPJC 72 (2012) 1896 | 1111.6097 |
| 60 | CMS Collaboration | Pileup mitigation at CMS in 13 TeV data | JINST 15 (2020) P09018 | CMS-JME-18-001 2003.00503 |
| 61 | CMS Collaboration | Jet energy scale and resolution in the CMS experiment in pp collisions at 8 TeV | JINST 12 (2017) P02014 | CMS-JME-13-004 1607.03663 |
| 62 | CMS Collaboration | Jet algorithms performance in 13 TeV data | CMS Physics Analysis Summary, 2017 CMS-PAS-JME-16-003 |
CMS-PAS-JME-16-003 |
| 63 | T. Sjöstrand et al. | An introduction to PYTHIA 8.2 | Comput. Phys. Commun. 191 (2015) 159 | 1410.3012 |
| 64 | J. Alwall et al. | The automated computation of tree-level and next-to-leading order differential cross sections, and their matching to parton shower simulations | JHEP 07 (2014) 079 | 1405.0301 |
| 65 | NNPDF Collaboration | Parton distributions from high-precision collider data | EPJC 77 (2017) 10 | 1706.00428 |
| 66 | CMS Collaboration | Extraction and validation of a new set of CMS PYTHIA8 tunes from underlying-event measurements | EPJC 80 (2020) 4 | CMS-GEN-17-001 1903.12179 |
| 67 | GEANT4 Collaboration | GEANT 4---a simulation toolkit | NIM A 506 (2003) 250 | |
| 68 | R. A. Fisher | On the interpretation of $ \chi^{2} $ from contingency tables, and the calculation of P | J. R. Stat. Soc. 85 (1922) 87 | |
| 69 | ATLAS and CMS Collaborations, and LHC Higgs Combination Group | Procedure for the LHC Higgs boson search combination in Summer 2011 | Technical Report CMS-NOTE-2011-005, ATL-PHYS-PUB-2011-11, 2011 | |
| 70 | P. D. Dauncey, M. Kenzie, N. Wardle, and G. J. Davies | Handling uncertainties in background shapes: the discrete profiling method | JINST 10 (2015) P04015 | 1408.6865 |
| 71 | CMS Collaboration | Precision luminosity measurement in proton-proton collisions at $ \sqrt{s} = $ 13 TeV in 2015 and 2016 at CMS | EPJC 81 (2021) 800 | CMS-LUM-17-003 2104.01927 |
| 72 | CMS Collaboration | CMS luminosity measurement for the 2017 data-taking period at $ \sqrt{s} $ = 13 TeV | CMS Physics Analysis Summary, 2018 link |
CMS-PAS-LUM-17-004 |
| 73 | CMS Collaboration | CMS luminosity measurement for the 2018 data-taking period at $ \sqrt{s} $ = 13 TeV | CMS Physics Analysis Summary, 2019 link |
CMS-PAS-LUM-18-002 |
| 74 | E. Gross and O. Vitells | Trial factors for the look elsewhere effect in high energy physics | EPJC 70 (2010) 525 | 1005.1891 |
| 75 | A. L. Read | Presentation of search results: The CL$ _{\text{s}} $ technique | JPG 28 (2002) 2693 | |
| 76 | T. Junk | Confidence level computation for combining searches with small statistics | NIM A 434 (1999) 435 | hep-ex/9902006 |
| 77 | G. Cowan, K. Cranmer, E. Gross, and O. Vitells | Asymptotic formulae for likelihood-based tests of new physics | EPJC 71 (2011) 1554 | 1007.1727 |

|
Compact Muon Solenoid LHC, CERN |

|

|

|

|

|

|