

Compact Muon Solenoid
LHC, CERN
| CMS-HIN-24-007 ; CERN-EP-2025-089 | ||
| Exploring small-angle emissions in charm quark jets in proton-proton collisions at $ \sqrt{s} = $ 5.02 TeV | ||
| CMS Collaboration | ||
| 17 July 2025 | ||
| JHEP 05 (2026) 176 | ||
| Abstract: A measurement of the angular structure of jets containing a prompt $ \mathrm{D^0} $ meson and of inclusive jets in proton-proton collisions at the LHC at a center-of-mass energy of 5.02 TeV is presented. The data corresponding to an integrated luminosity of 301 pb$^{-1}$ were collected by the CMS experiment in 2017. Two jet grooming algorithms, late-$ k_{\mathrm{T}} $ and soft drop, are used to study the intrajet radiation pattern using iterative Cambridge-Aachen declustering. The splitting-angle distributions of jets with transverse momentum ($ p_{\mathrm{T}} $) of around 100 GeV, obtained with these two algorithms, show that there is a shift of the distribution for jets containing a prompt $ \mathrm{D^0} $ meson with respect to inclusive jets. The shift observed in the late-$ k_{\mathrm{T}} $ grooming approach is consistent with the dead-cone effect, whereas the shift for splittings selected with the soft-drop algorithm appears to be dominated by gluon splitting to charm quark-antiquark pairs. The measured distributions are corrected to the particle level and can be used to constrain model predictions for the substructure of high-$ p_{\mathrm{T}} $ charm quark jets. | ||
| Links: e-print arXiv:2507.13469 [hep-ex] (PDF) ; CDS record ; inSPIRE record ; HepData record ; CADI line (restricted) ; | ||
| Figures | |
png pdf |
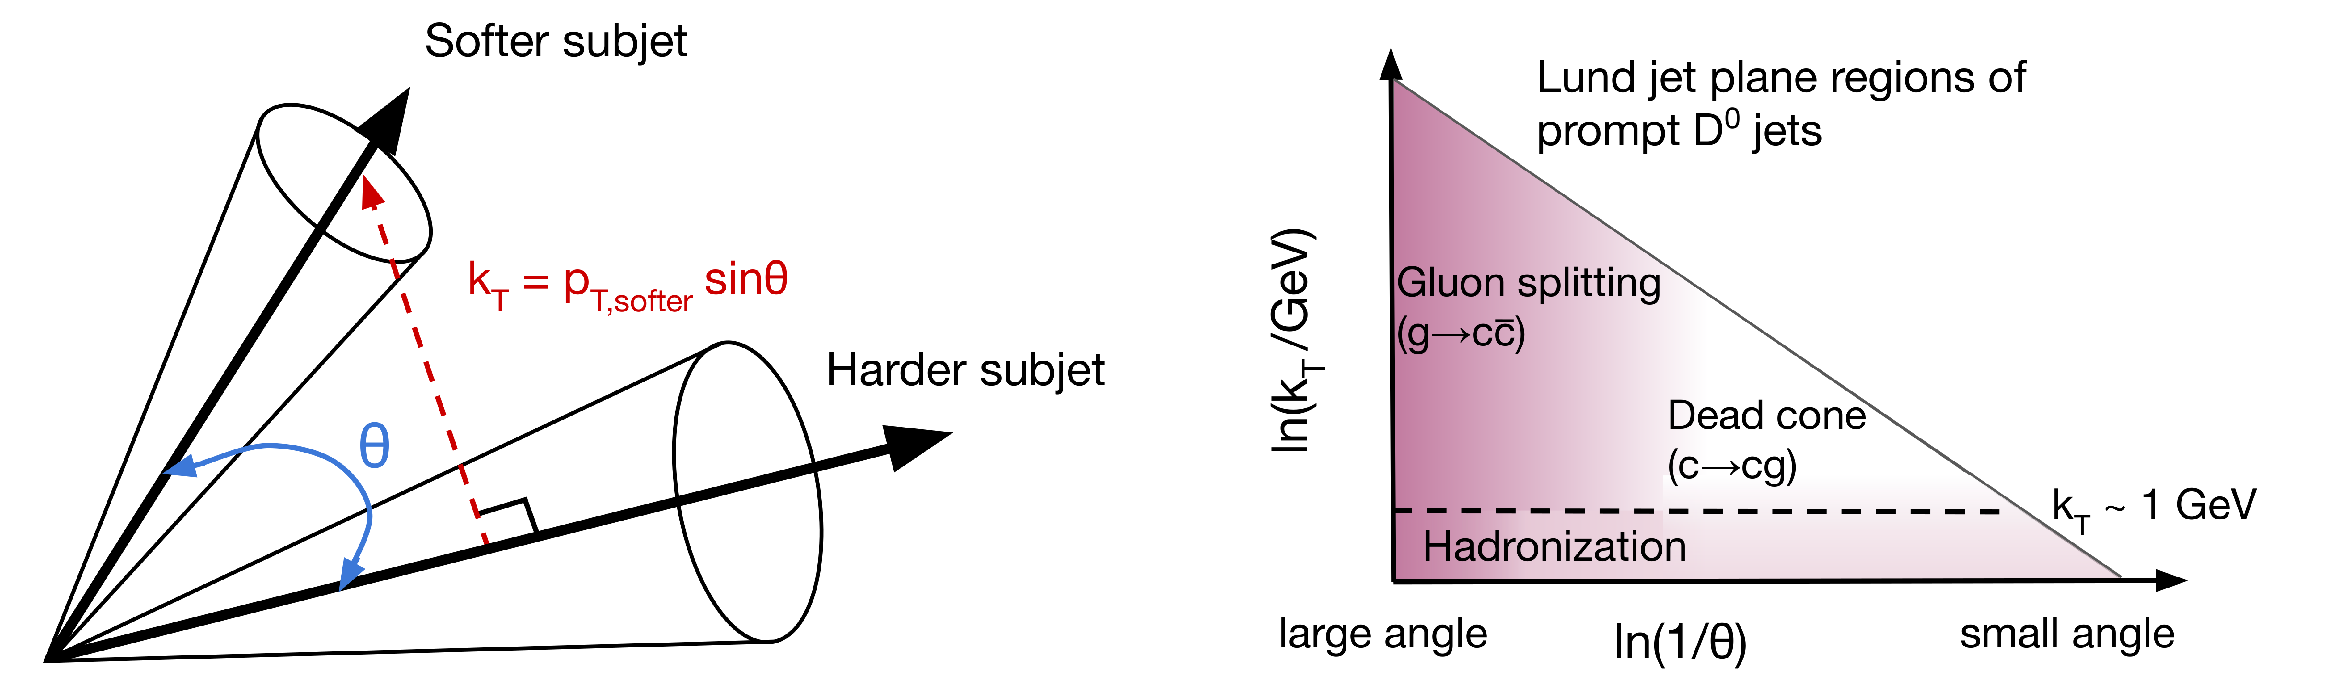
Figure 1:
Schematic diagram of two subjets, with their splitting angle $ \theta $ and the relative transverse momentum $ k_{\mathrm{T}} $ of the softer subjet with respect to the harder subjet (left). Different Lund jet plane regions for charm quark jet showers (right), where the vertical axis is the logarithm of the relative momentum $ k_{\mathrm{T}} $ of the emission and horizontal axis is the logarithm of the angle between the emission and the emitter $ \theta $. The shading represents the density of emissions in the primary Lund jet plane for c quark jets |
png pdf |
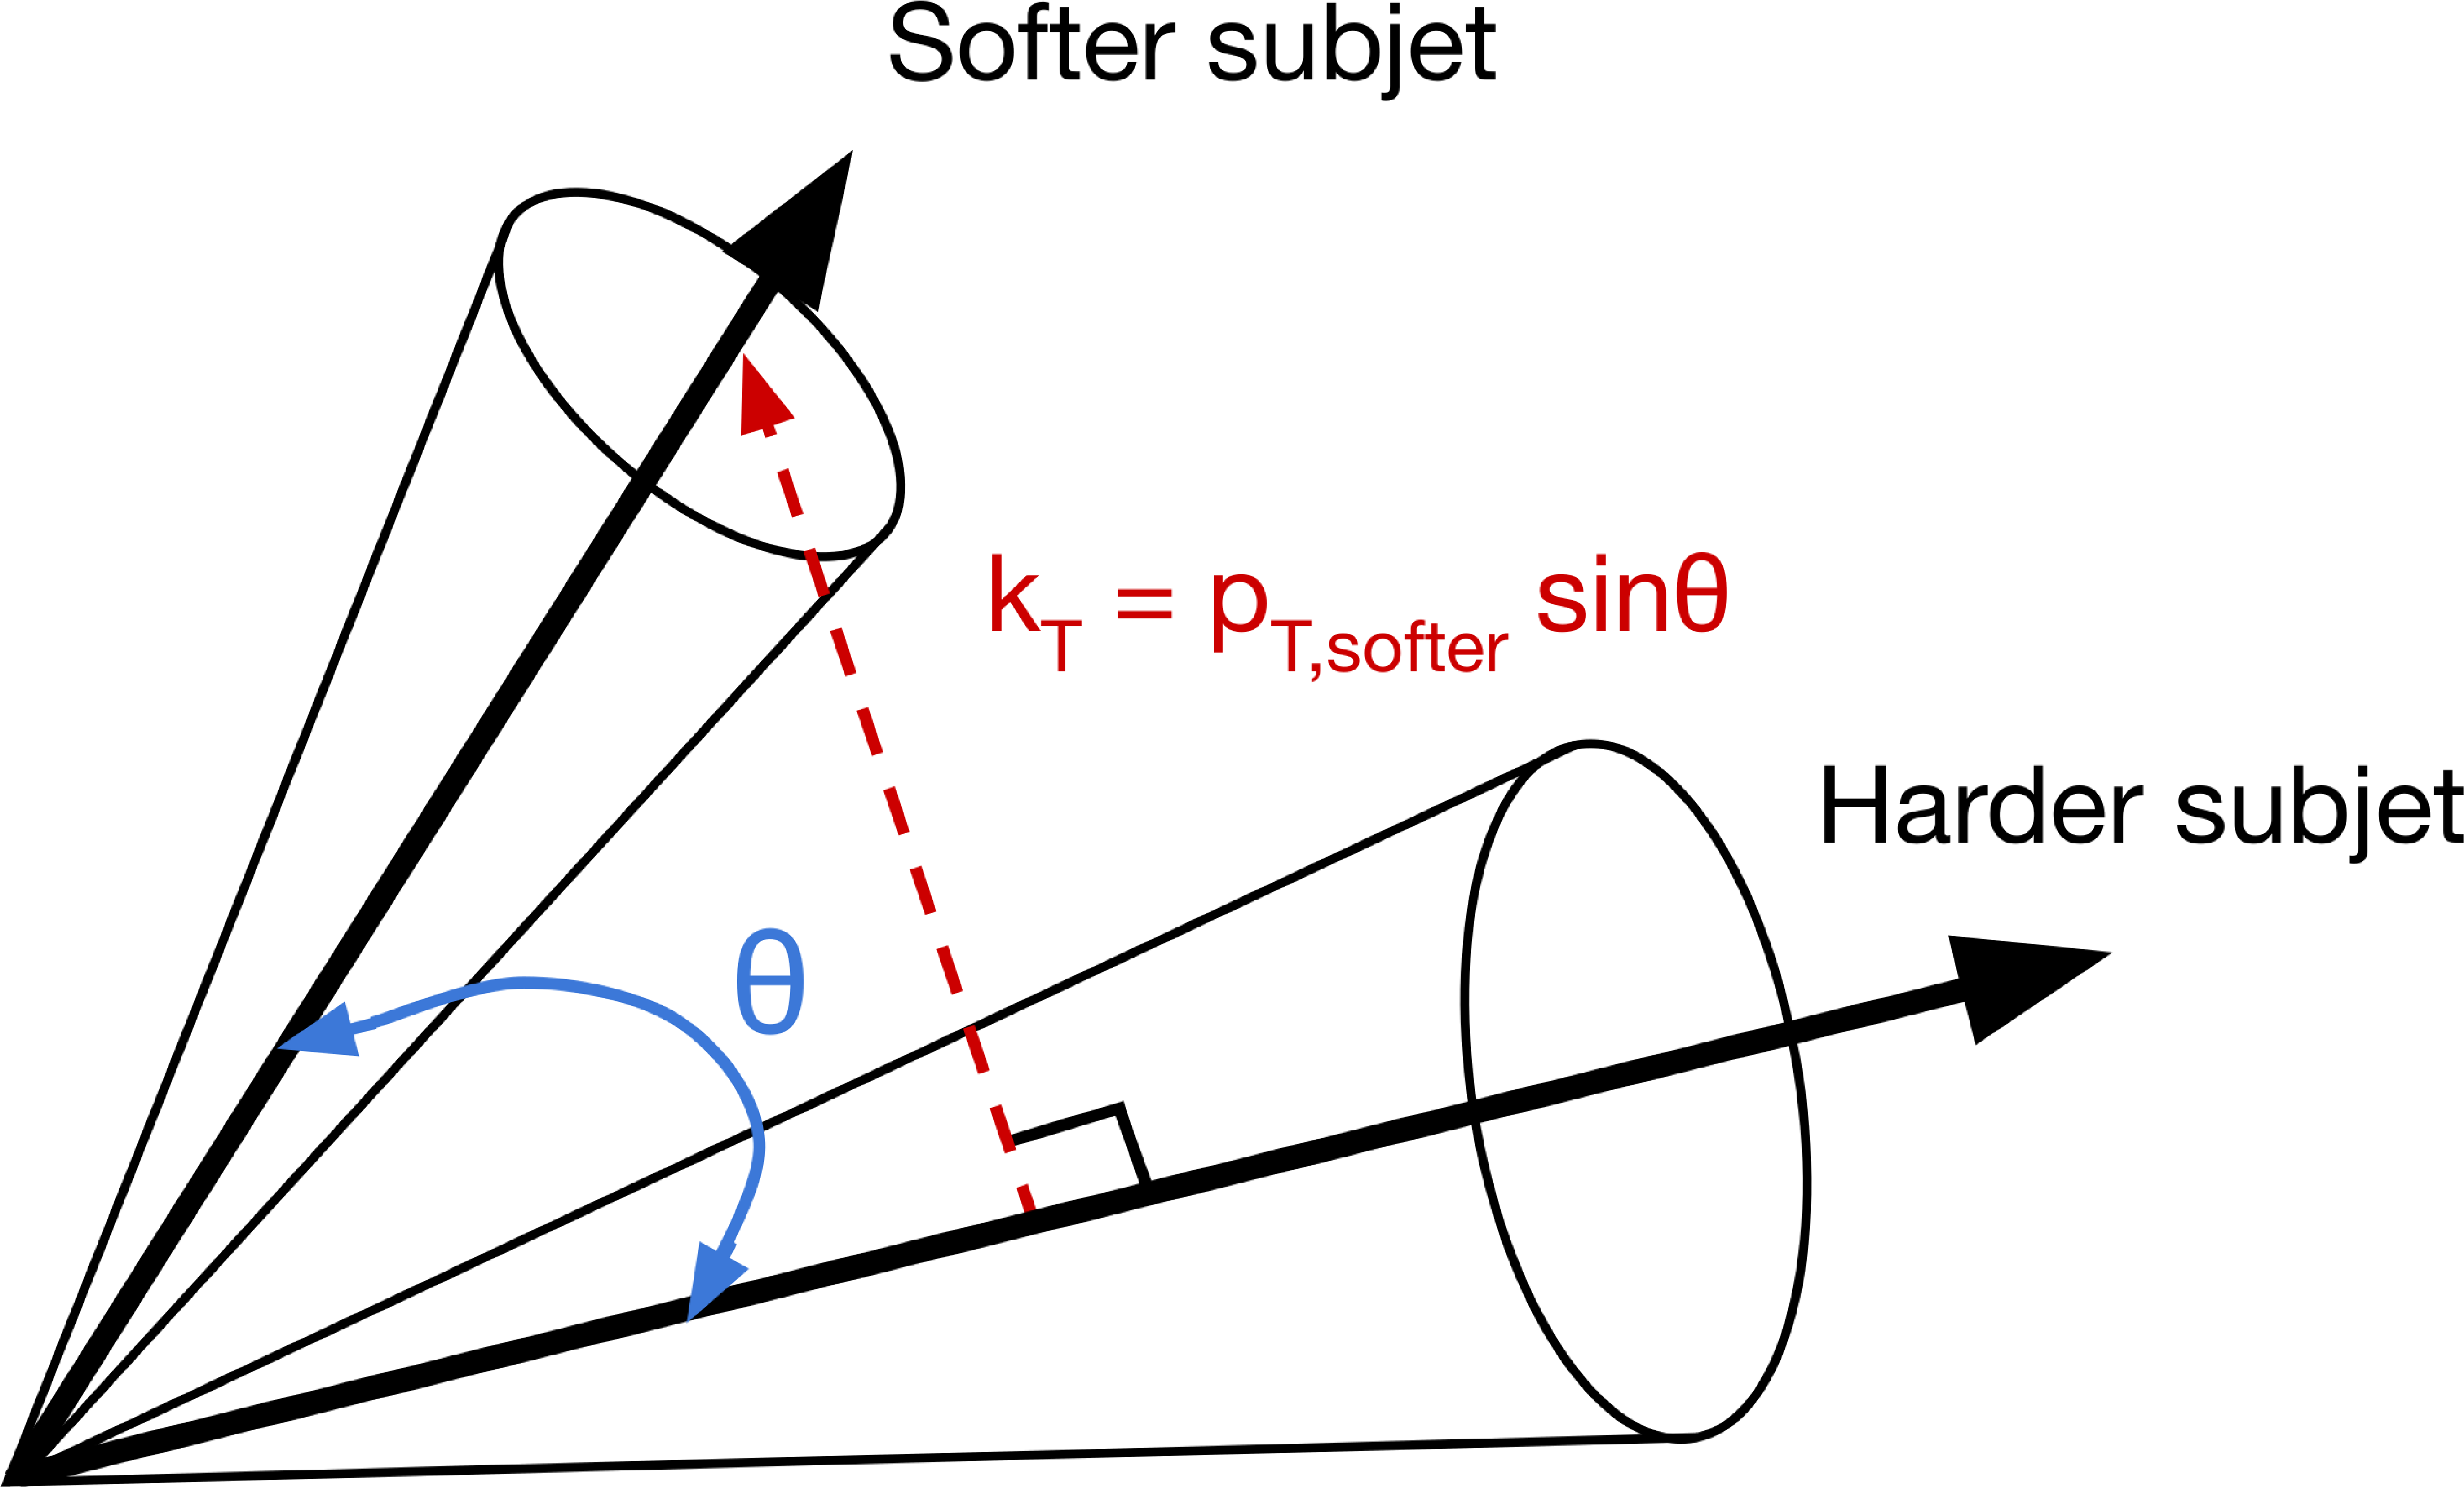
Figure 1-a:
Schematic diagram of two subjets, with their splitting angle $ \theta $ and the relative transverse momentum $ k_{\mathrm{T}} $ of the softer subjet with respect to the harder subjet (left). Different Lund jet plane regions for charm quark jet showers (right), where the vertical axis is the logarithm of the relative momentum $ k_{\mathrm{T}} $ of the emission and horizontal axis is the logarithm of the angle between the emission and the emitter $ \theta $. The shading represents the density of emissions in the primary Lund jet plane for c quark jets |
png pdf |
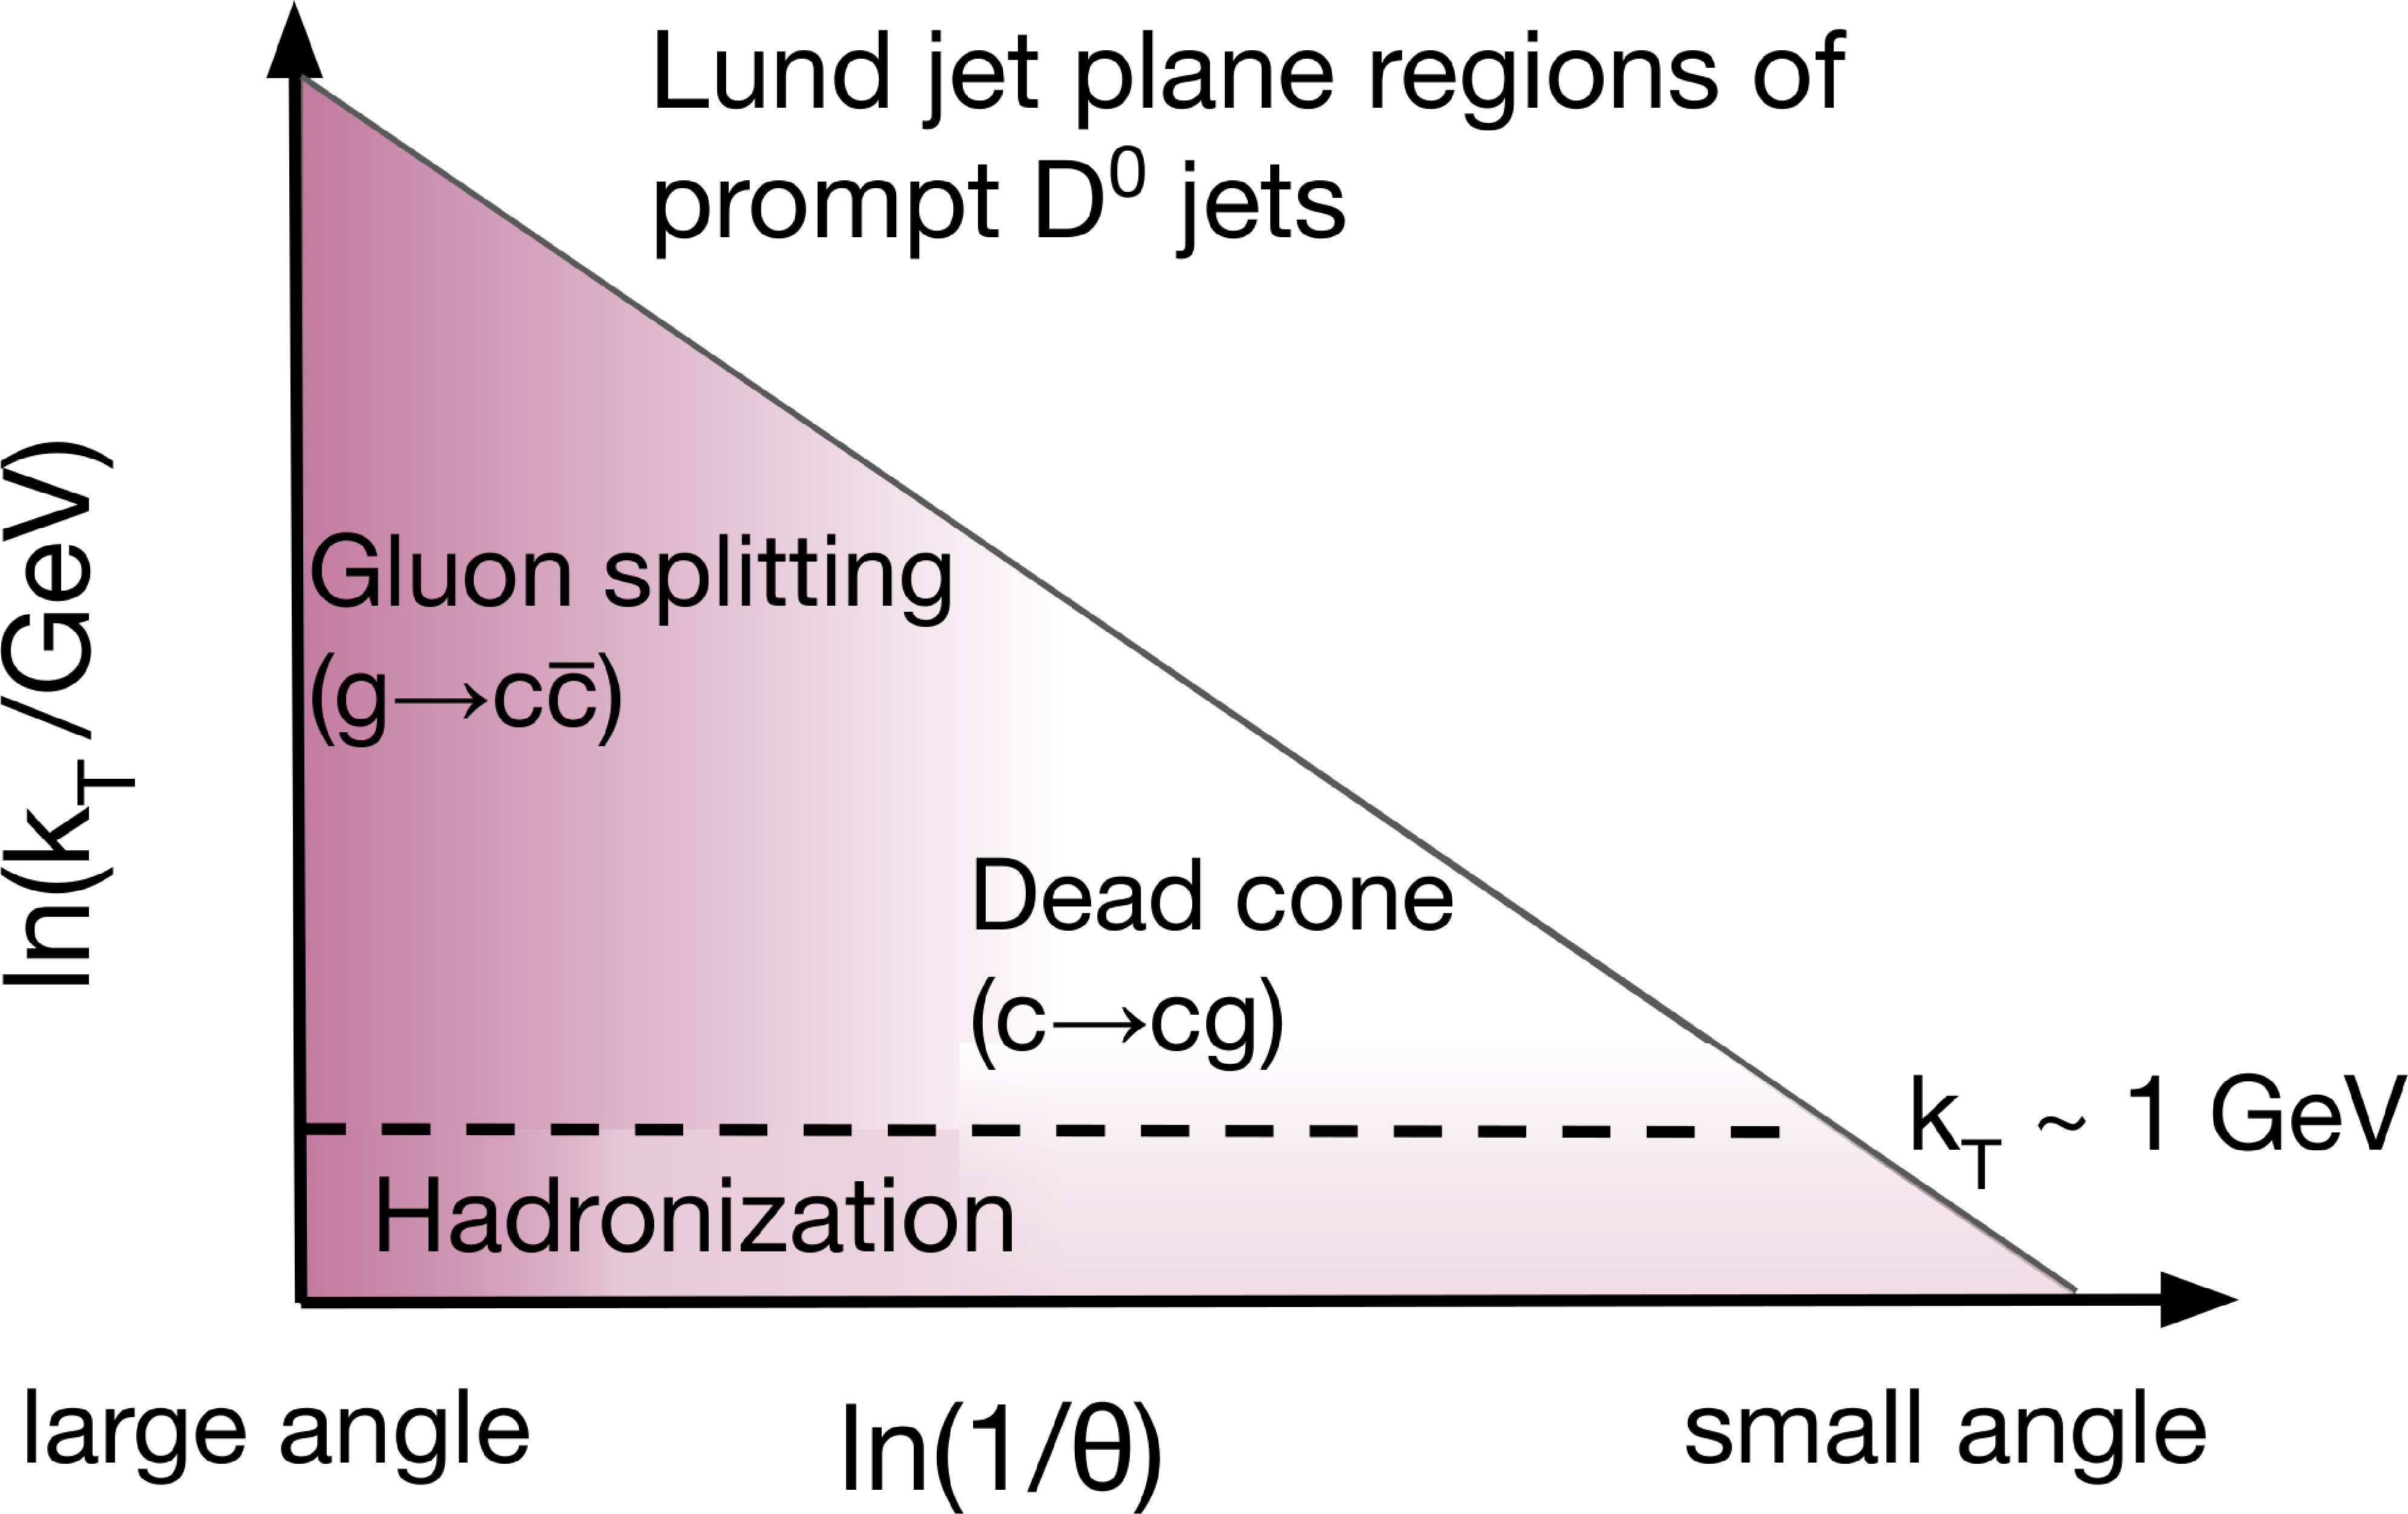
Figure 1-b:
Schematic diagram of two subjets, with their splitting angle $ \theta $ and the relative transverse momentum $ k_{\mathrm{T}} $ of the softer subjet with respect to the harder subjet (left). Different Lund jet plane regions for charm quark jet showers (right), where the vertical axis is the logarithm of the relative momentum $ k_{\mathrm{T}} $ of the emission and horizontal axis is the logarithm of the angle between the emission and the emitter $ \theta $. The shading represents the density of emissions in the primary Lund jet plane for c quark jets |
png pdf |
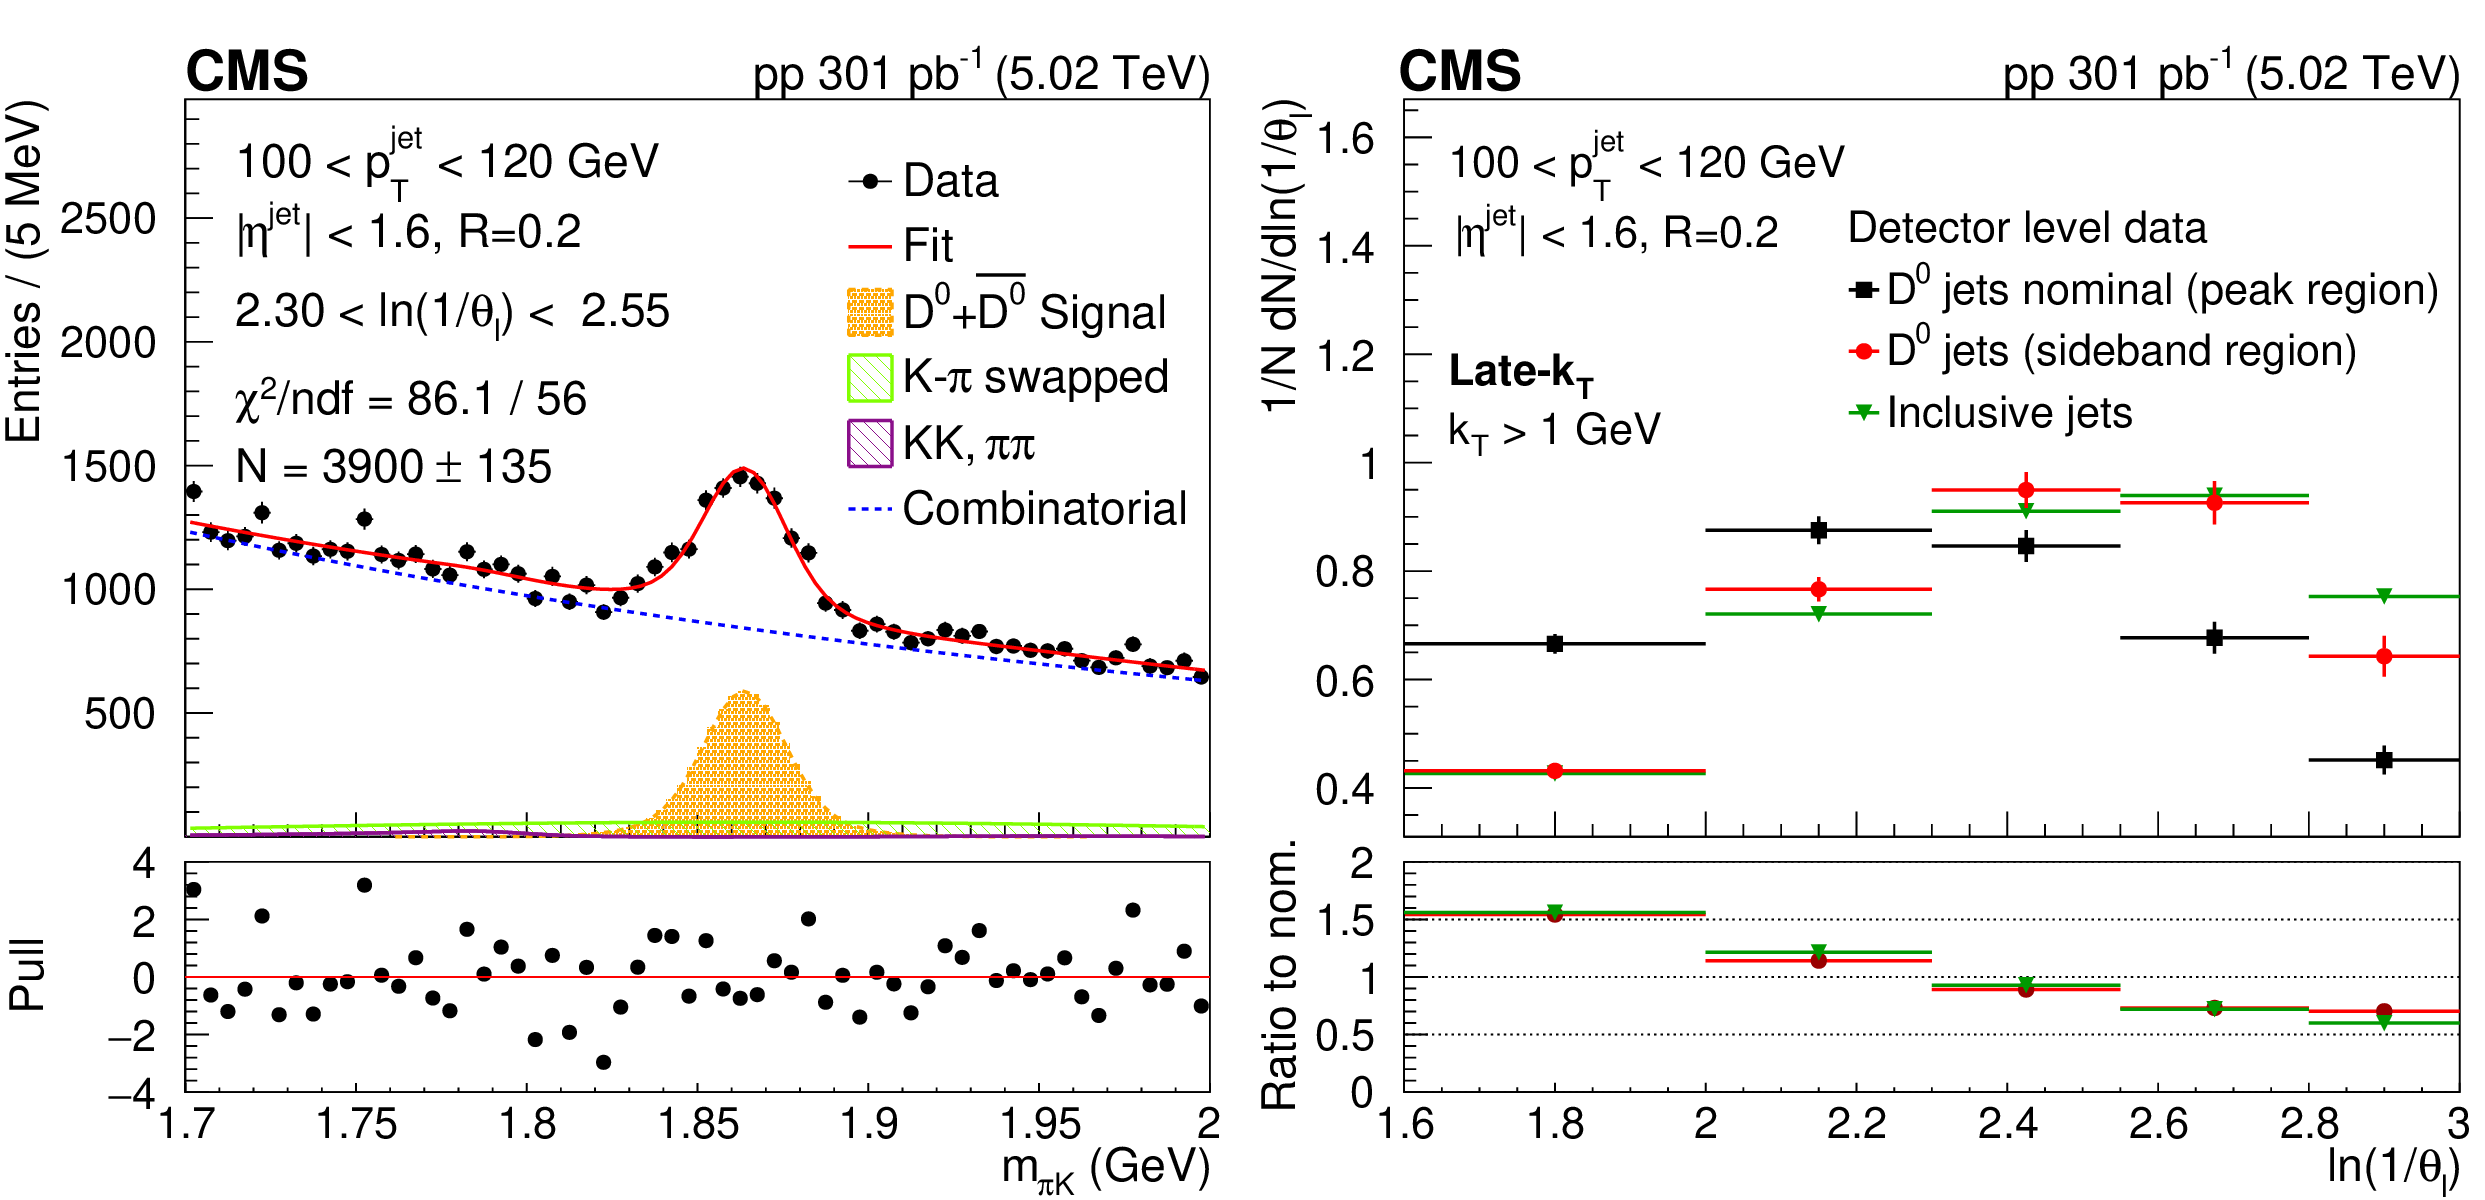
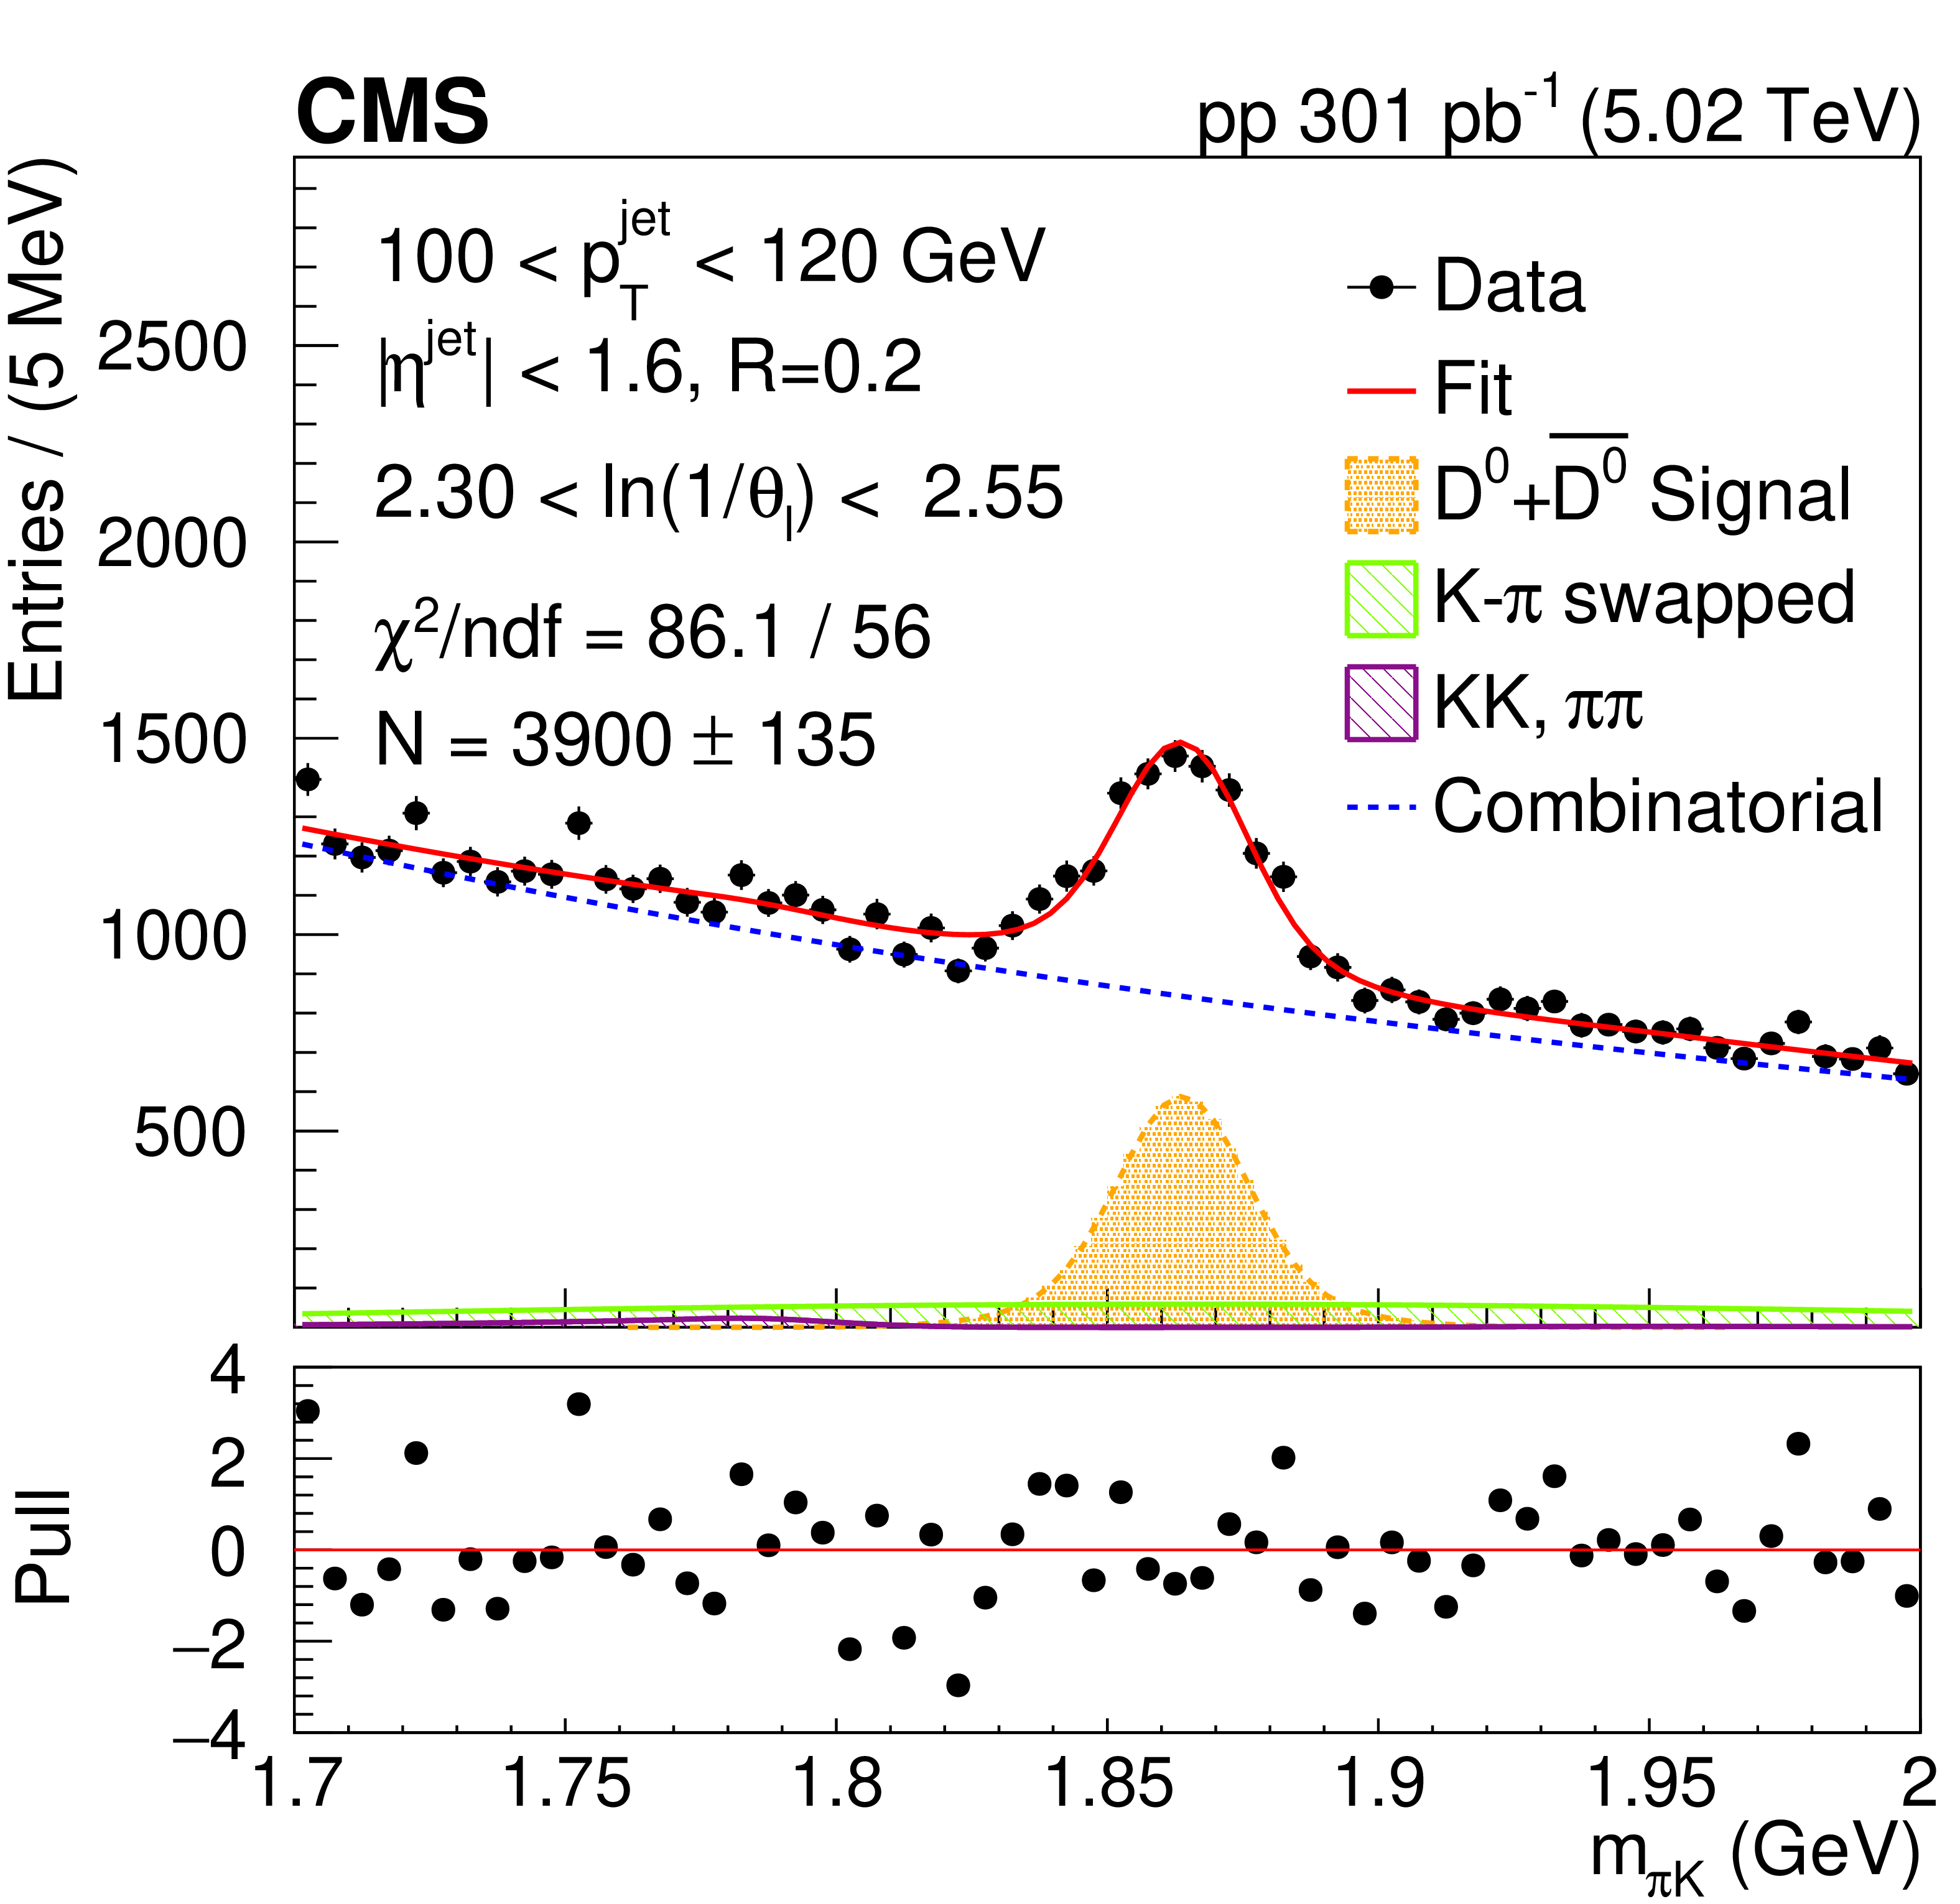
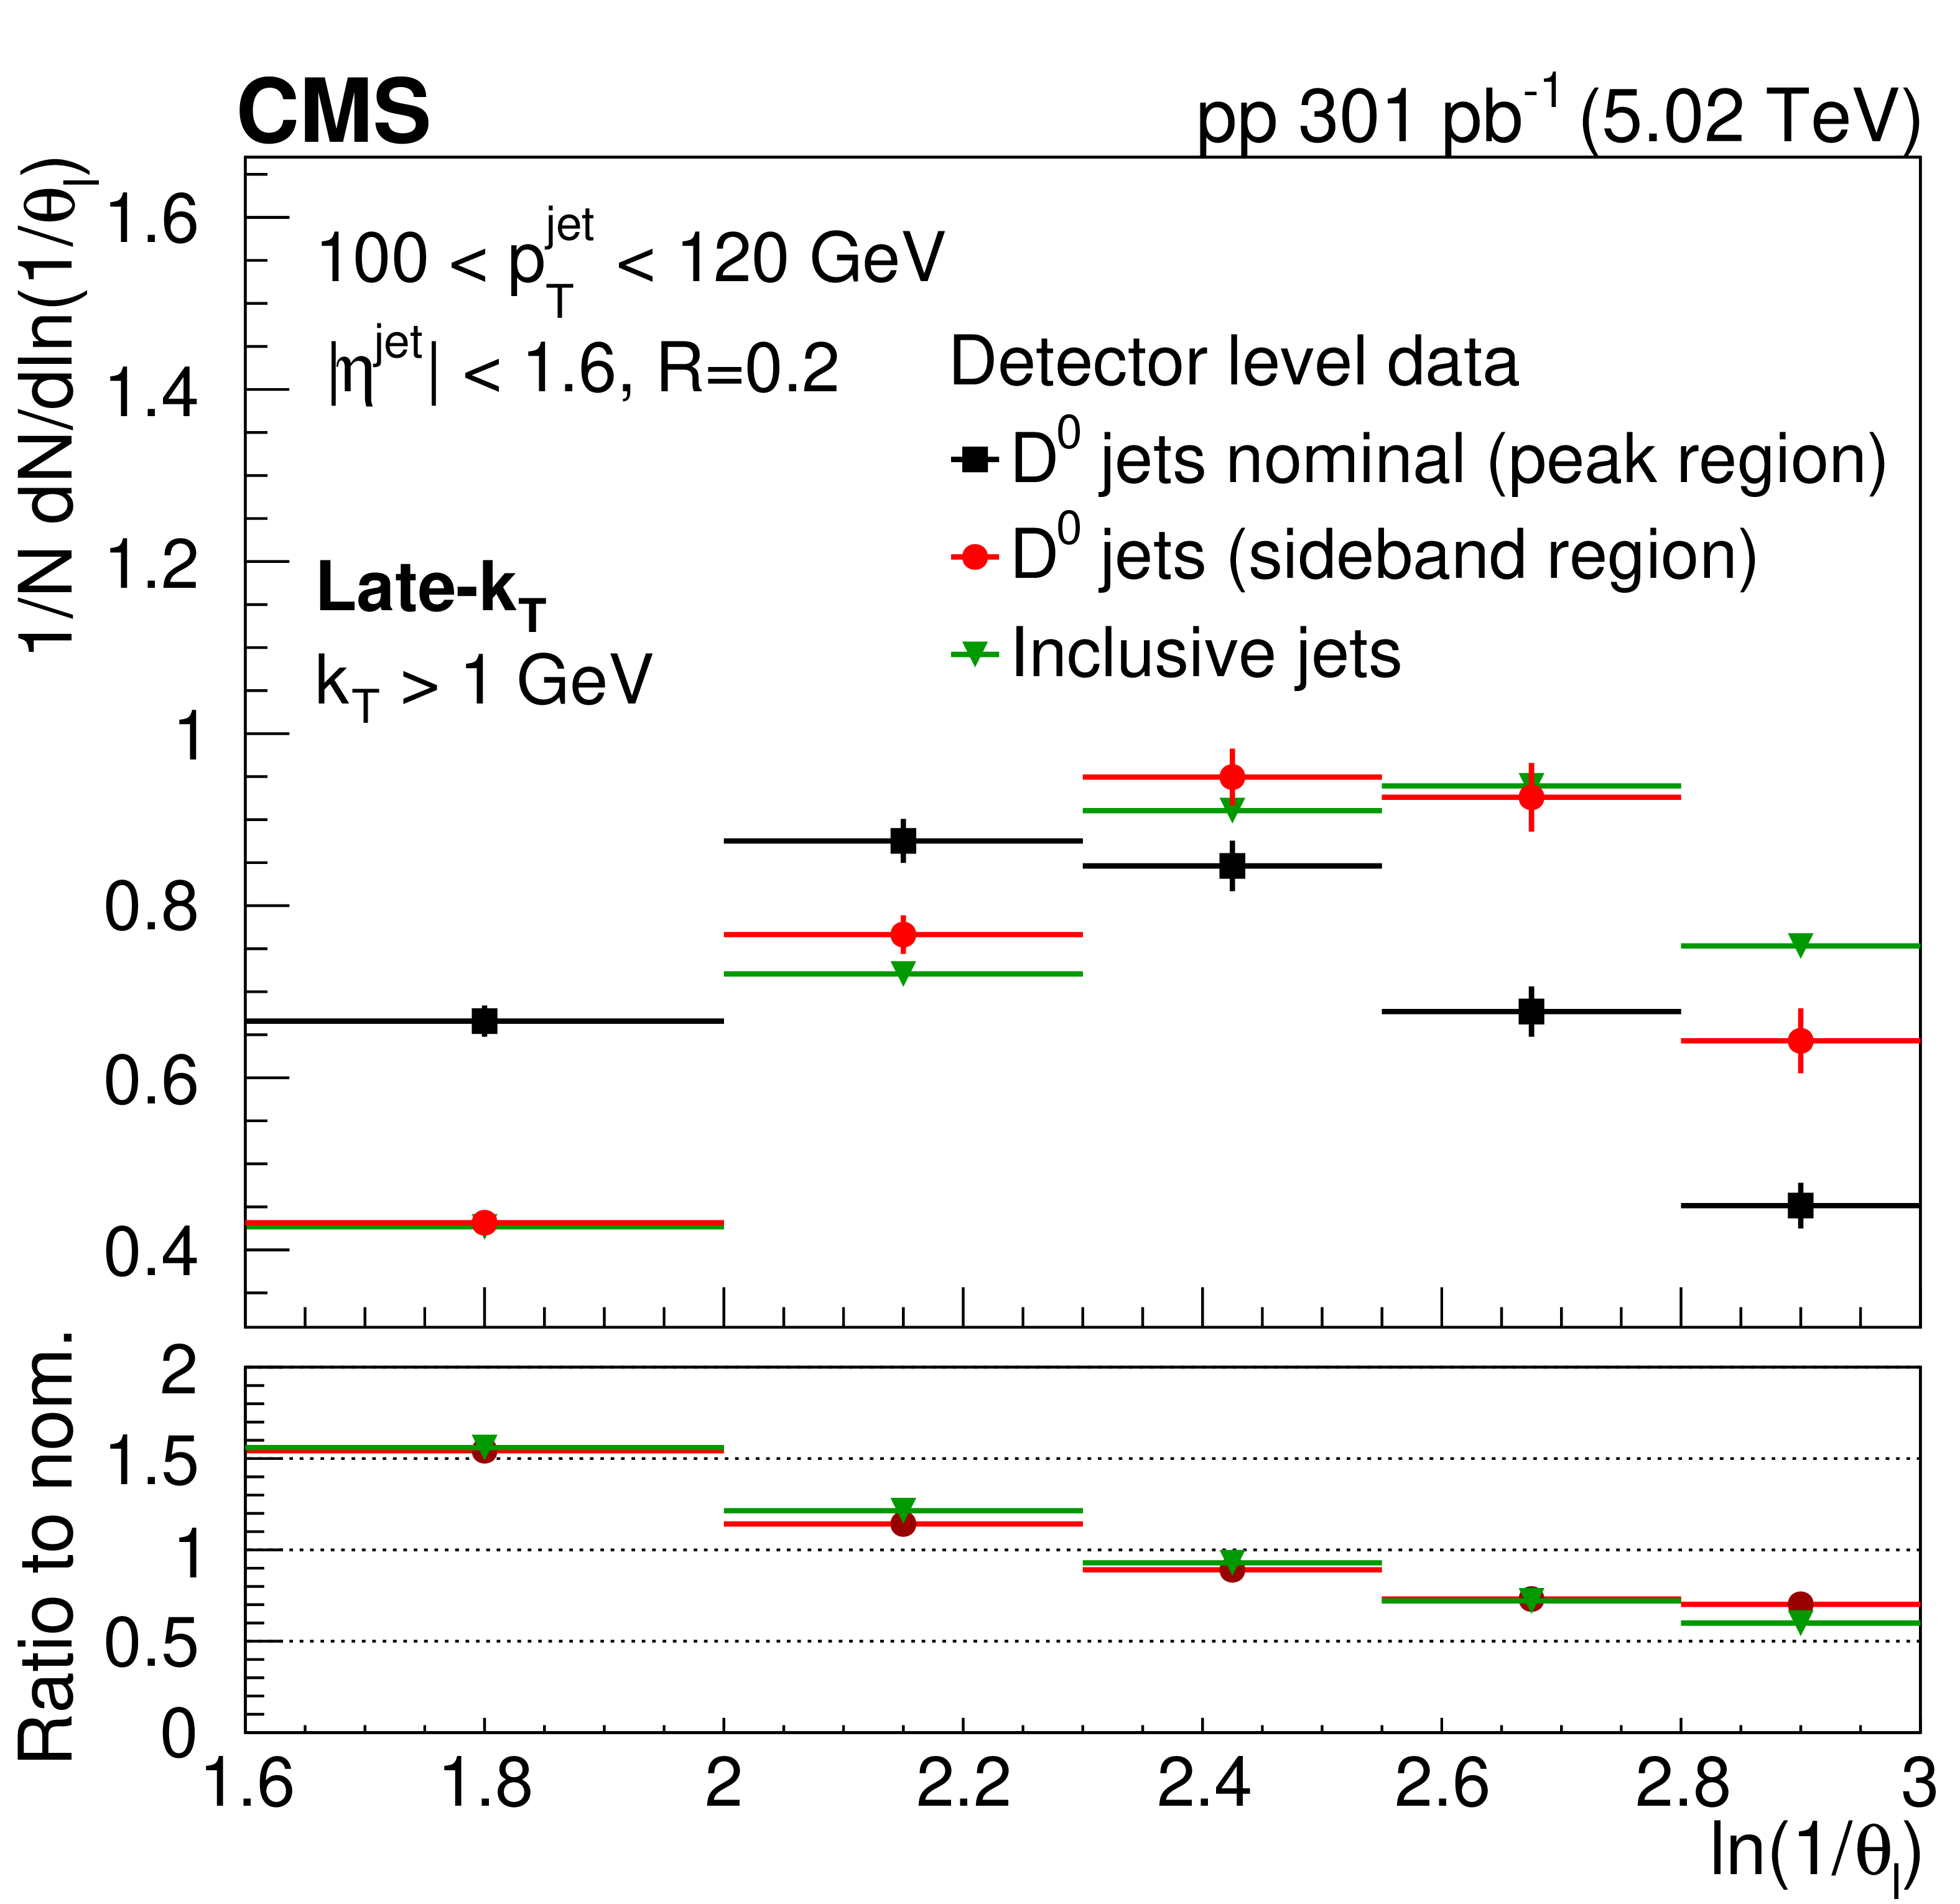
Figure 2:
Invariant mass distribution of particle pairs for $ \mathrm{D^0} $ jet candidates and fits for late-$ k_{\mathrm{T}} $ for splitting angle and jet momentum in the range: 2.3 $ < \theta_{\text{l}} < $ 2.55 and 100 $ < p_{\mathrm{T}}^{\text{jet}} < $ 120 GeV (left). Comparison of the ln(1/$ \theta_{\text{l}} $ ) distributions for invariant mass of the track pairs in the resonance region (black rectangles), in the mass sideband region 0.07 $ < |m_{\pi K} -m^D_{PDG}| < $ 0.12 GeV (red circles) and for inclusive jet data (green triangles)(right). In the lower panel, a ratio to nominal signal is shown. The error bands represent the statistical uncertainties. The ndf is number of degree of freedom. |
png pdf |
Figure 2-a:
Invariant mass distribution of particle pairs for $ \mathrm{D^0} $ jet candidates and fits for late-$ k_{\mathrm{T}} $ for splitting angle and jet momentum in the range: 2.3 $ < \theta_{\text{l}} < $ 2.55 and 100 $ < p_{\mathrm{T}}^{\text{jet}} < $ 120 GeV (left). Comparison of the ln(1/$ \theta_{\text{l}} $ ) distributions for invariant mass of the track pairs in the resonance region (black rectangles), in the mass sideband region 0.07 $ < |m_{\pi K} -m^D_{PDG}| < $ 0.12 GeV (red circles) and for inclusive jet data (green triangles)(right). In the lower panel, a ratio to nominal signal is shown. The error bands represent the statistical uncertainties. The ndf is number of degree of freedom. |
png pdf |
Figure 2-b:
Invariant mass distribution of particle pairs for $ \mathrm{D^0} $ jet candidates and fits for late-$ k_{\mathrm{T}} $ for splitting angle and jet momentum in the range: 2.3 $ < \theta_{\text{l}} < $ 2.55 and 100 $ < p_{\mathrm{T}}^{\text{jet}} < $ 120 GeV (left). Comparison of the ln(1/$ \theta_{\text{l}} $ ) distributions for invariant mass of the track pairs in the resonance region (black rectangles), in the mass sideband region 0.07 $ < |m_{\pi K} -m^D_{PDG}| < $ 0.12 GeV (red circles) and for inclusive jet data (green triangles)(right). In the lower panel, a ratio to nominal signal is shown. The error bands represent the statistical uncertainties. The ndf is number of degree of freedom. |
png pdf |
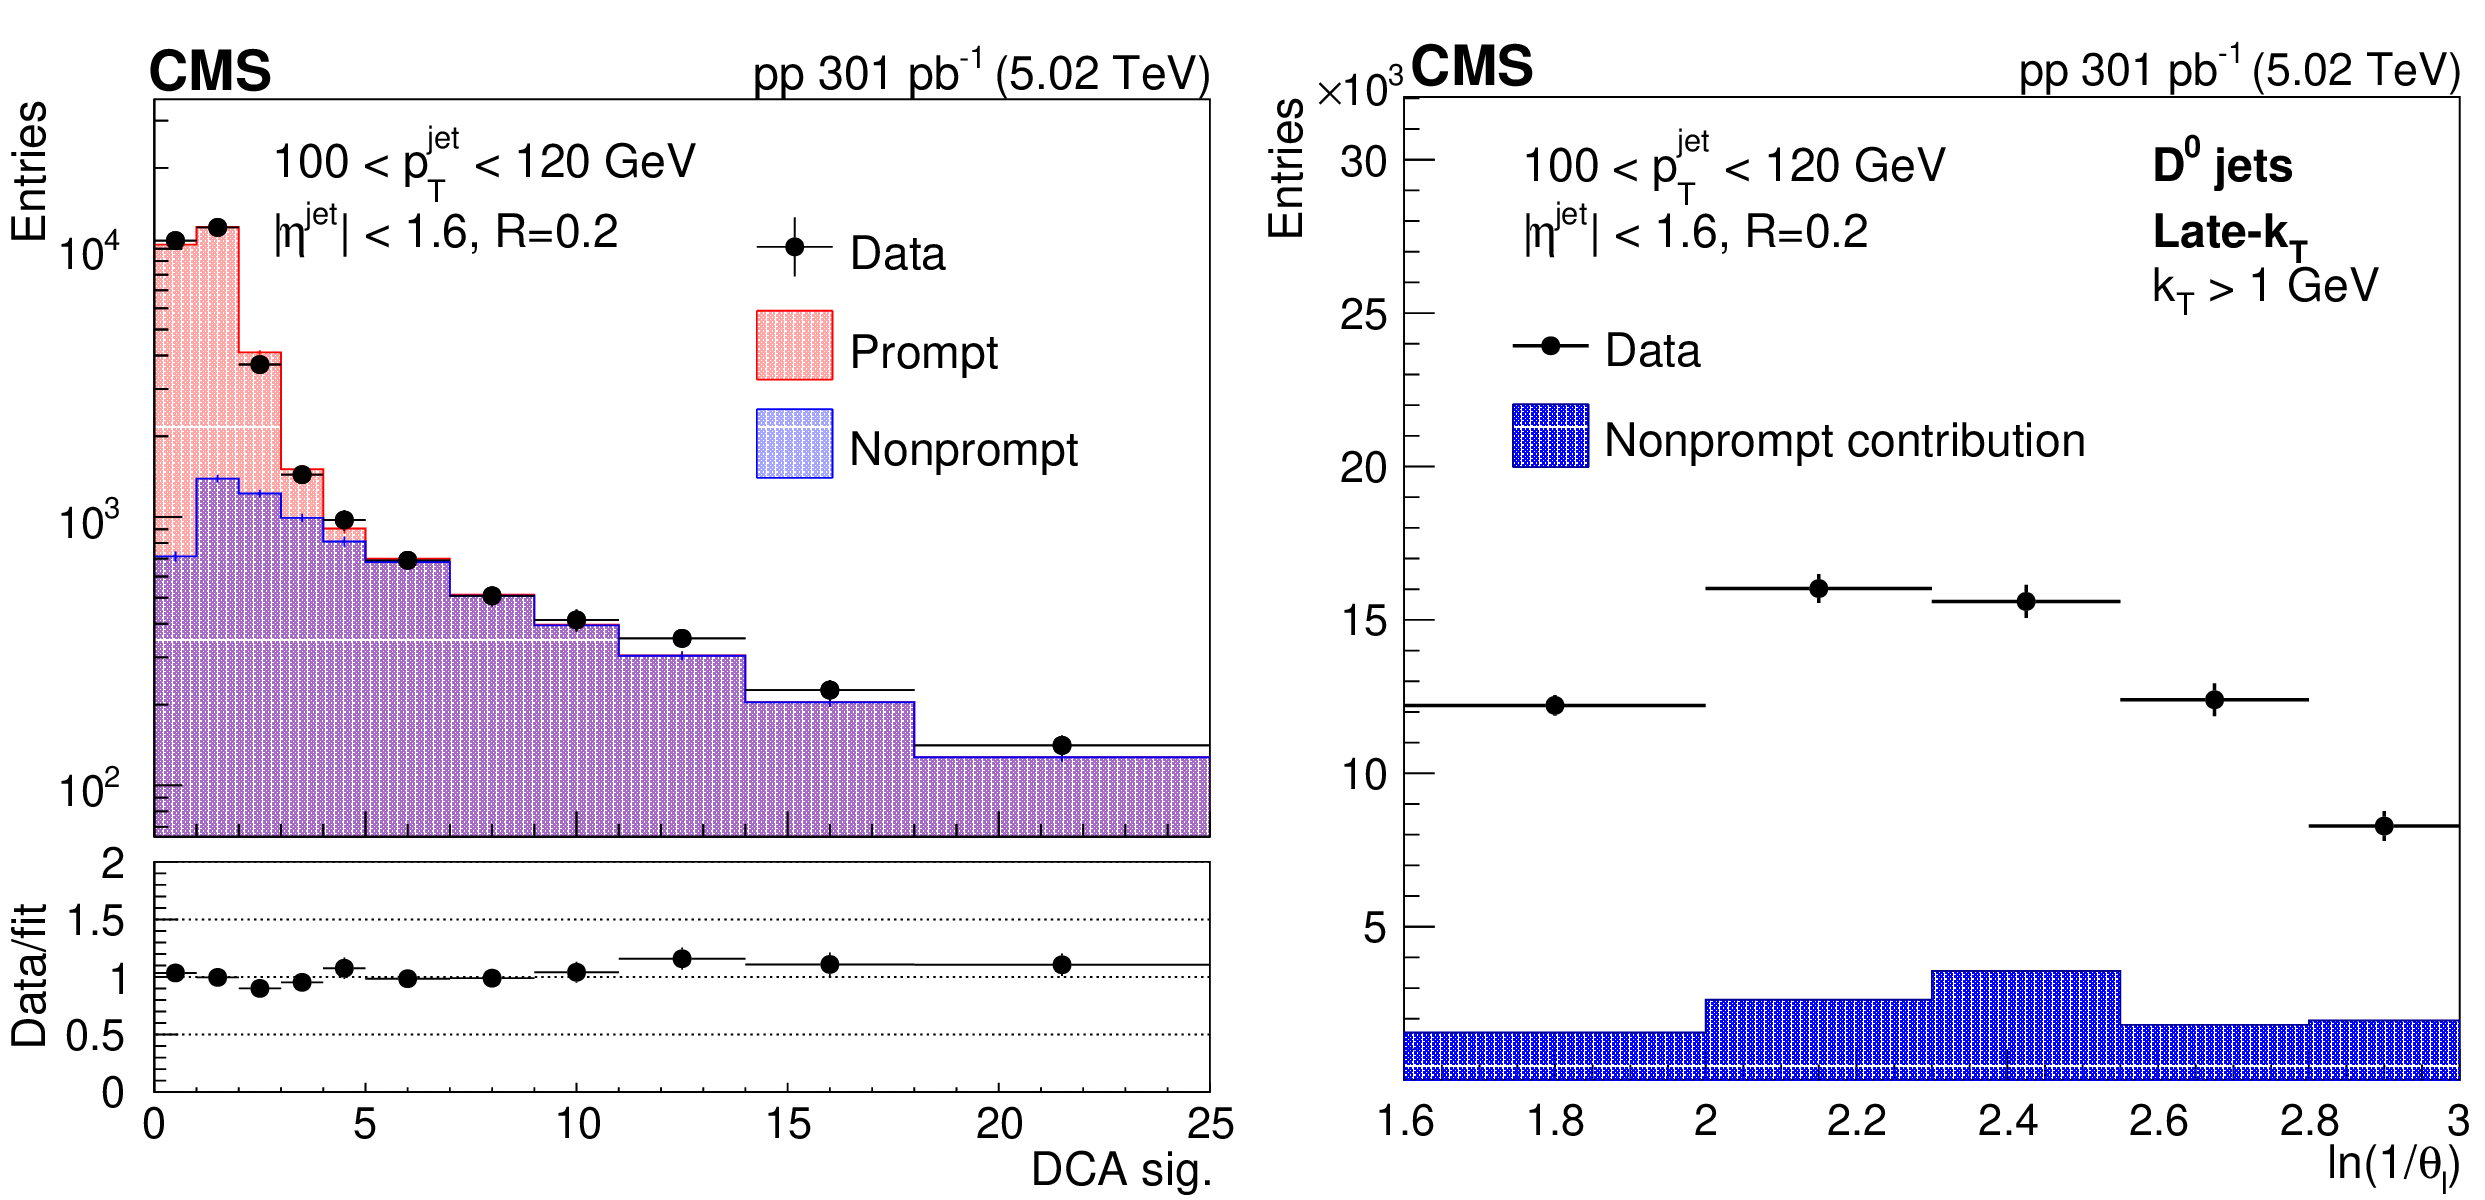
Figure 3:
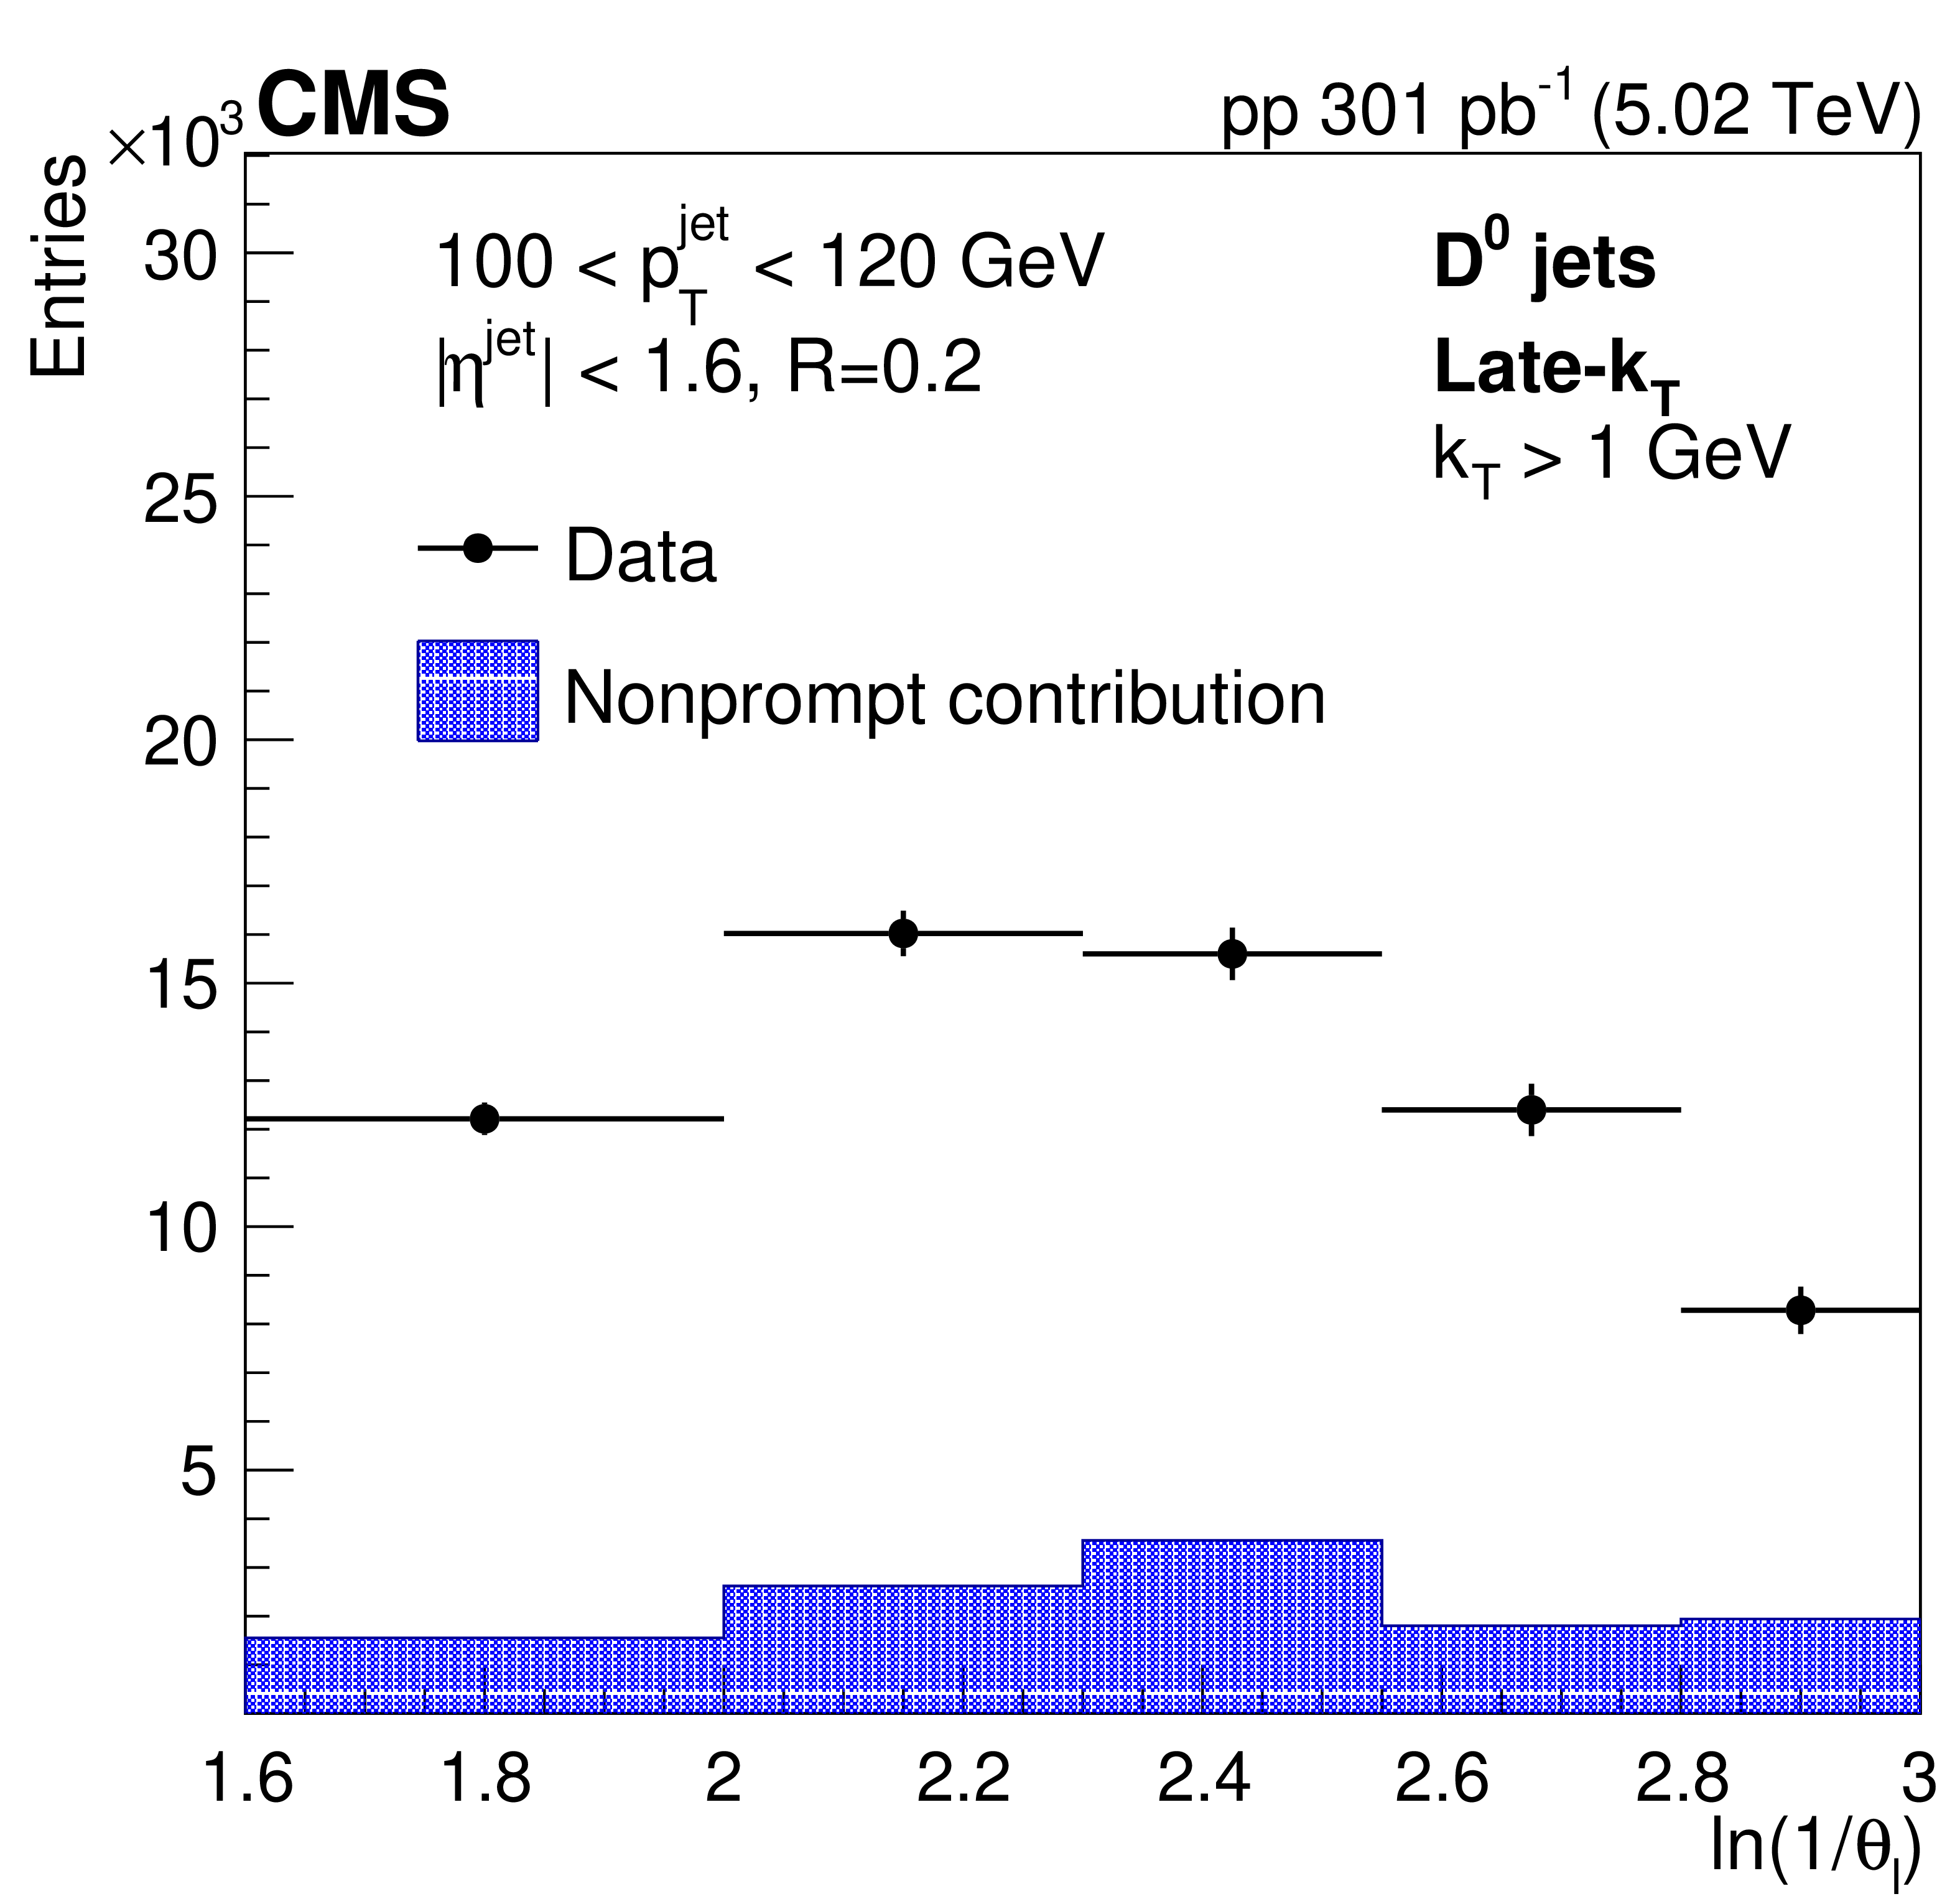
Detector-level DCA significance distribution in data fitted with PYTHIA8 CP5 templates for prompt and nonprompt $ \mathrm{D^0} $ mesons contained in jets (left). In the lower panel, the ratio between the data and the fit values is presented. Measured $ \mathrm{D^0} $ meson yield (black circles) and nonprompt $ \mathrm{D^0} $ meson contribution (filled histogram) as functions of the late-$ k_{\mathrm{T}} $ splitting angle $ \theta_{\text{l}} $ (right). |
png pdf |
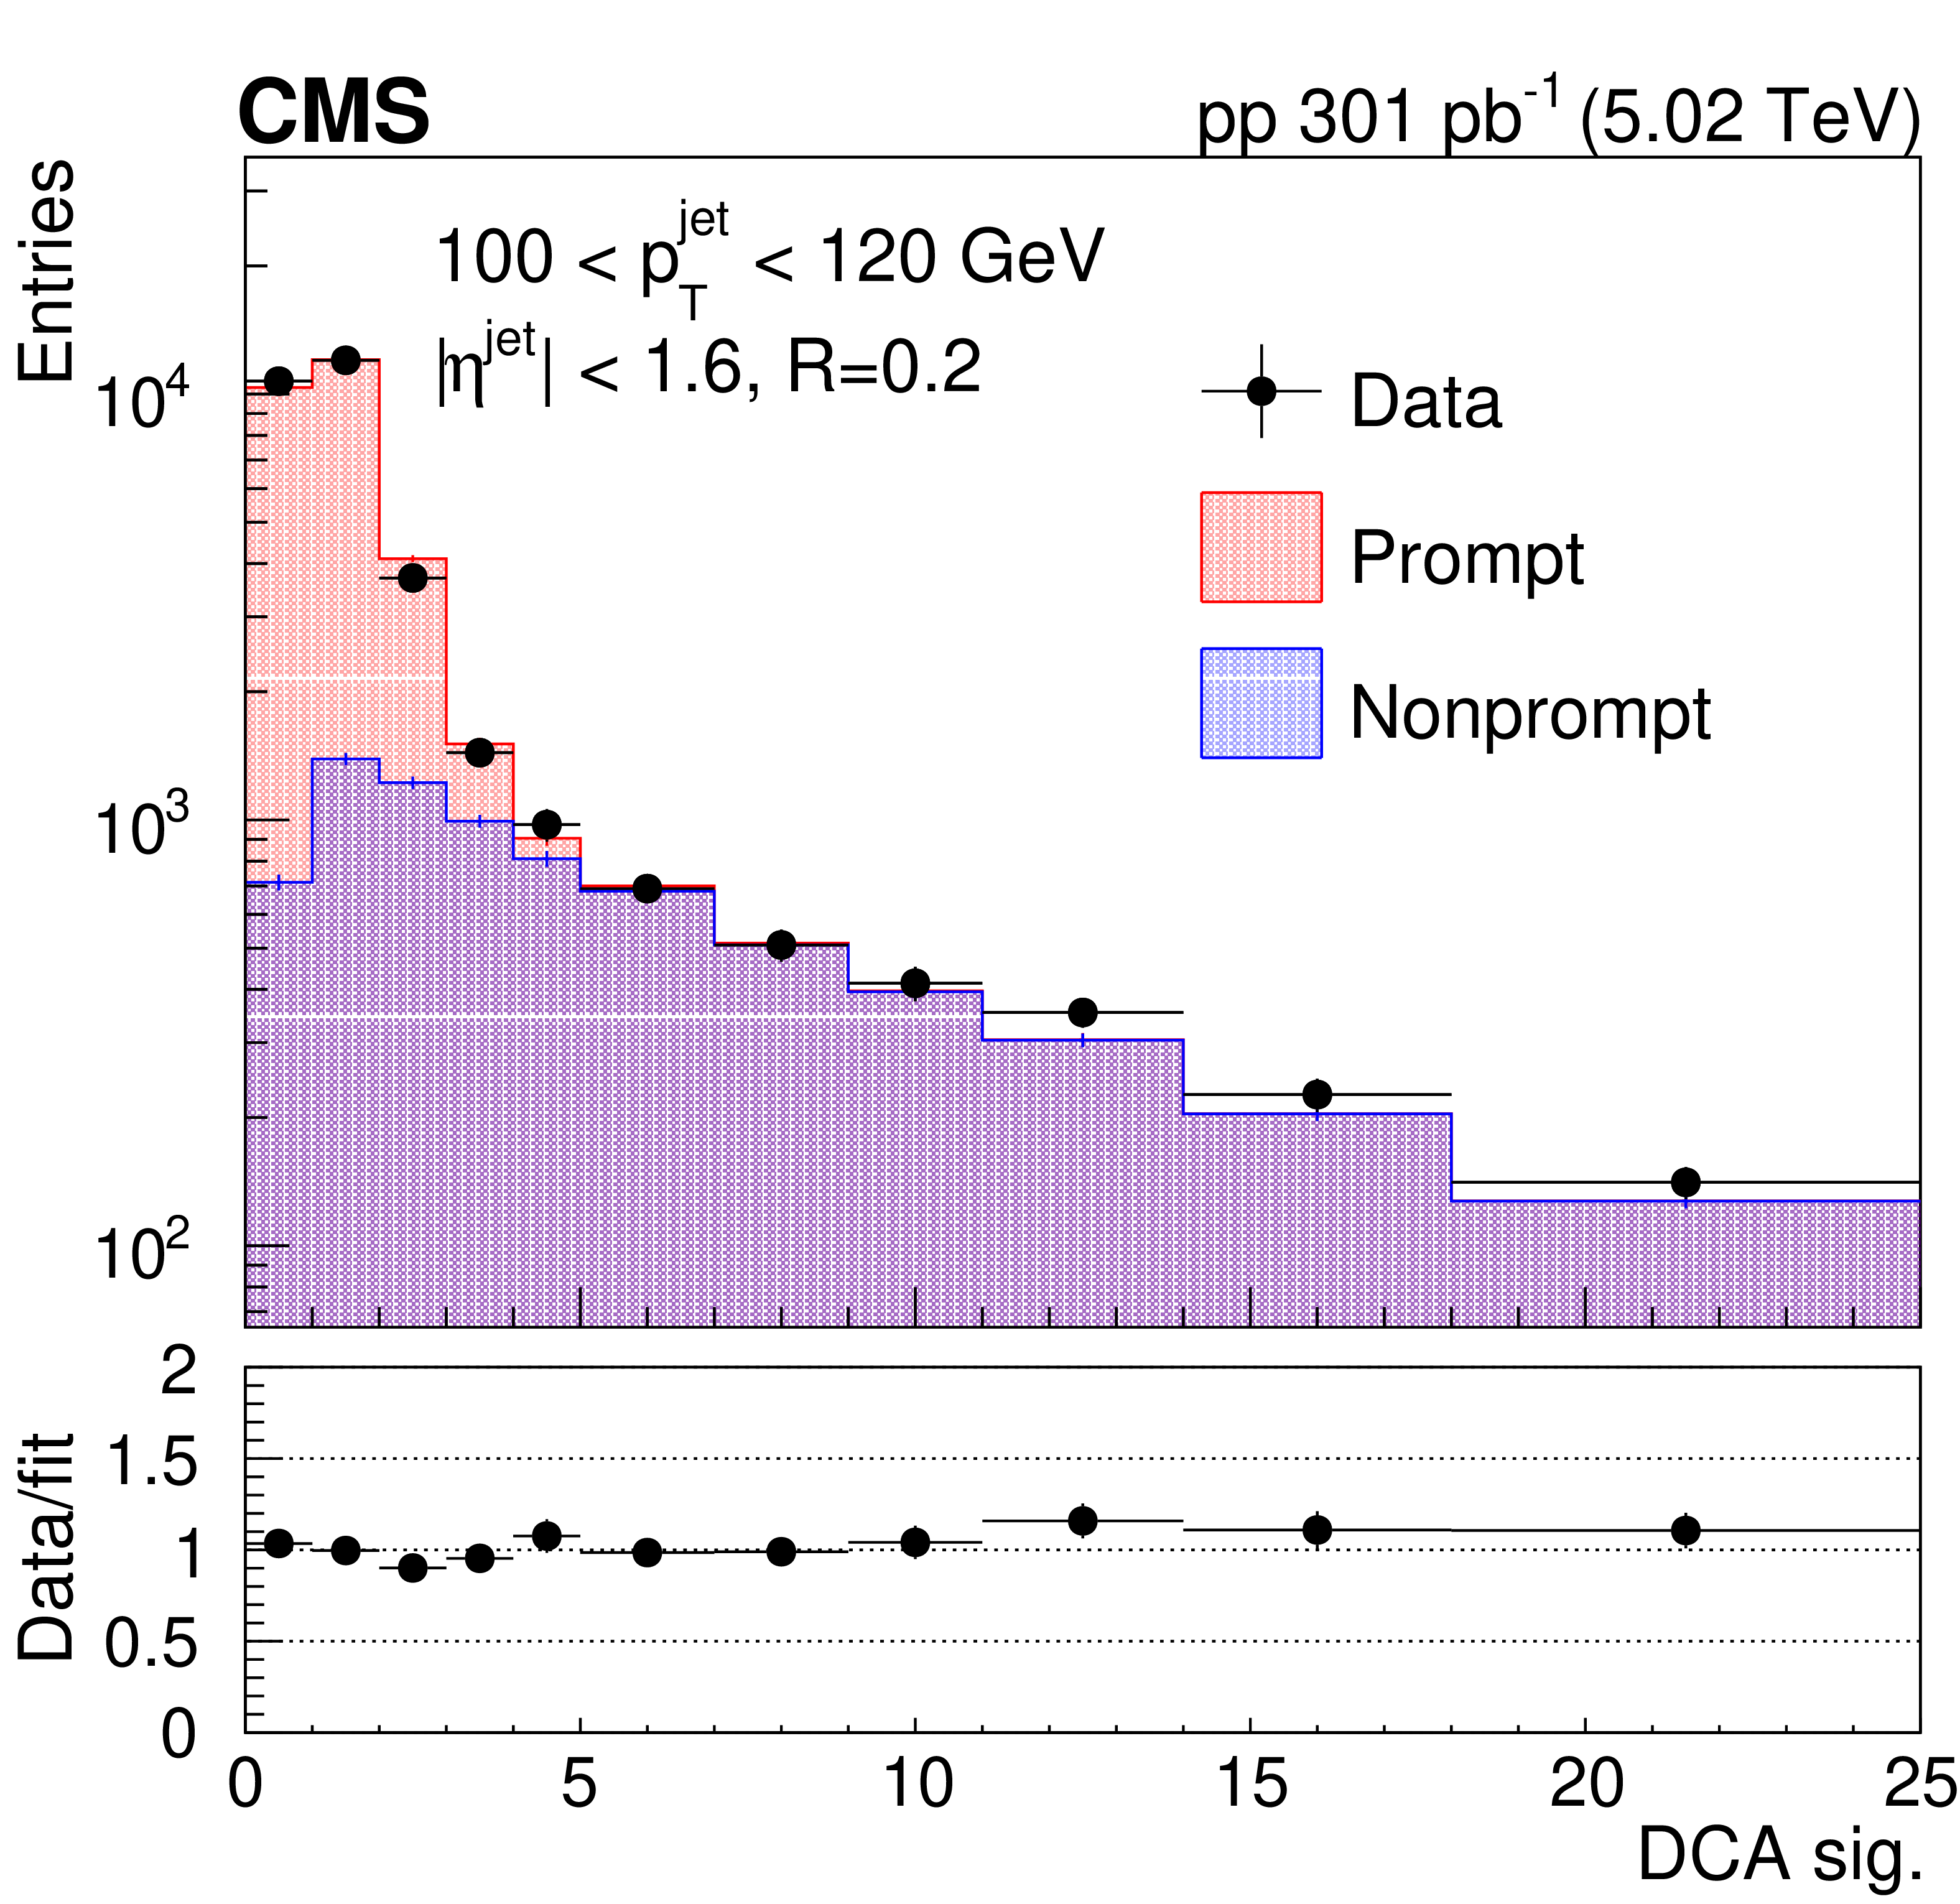
Figure 3-a:
Detector-level DCA significance distribution in data fitted with PYTHIA8 CP5 templates for prompt and nonprompt $ \mathrm{D^0} $ mesons contained in jets (left). In the lower panel, the ratio between the data and the fit values is presented. Measured $ \mathrm{D^0} $ meson yield (black circles) and nonprompt $ \mathrm{D^0} $ meson contribution (filled histogram) as functions of the late-$ k_{\mathrm{T}} $ splitting angle $ \theta_{\text{l}} $ (right). |
png pdf |
Figure 3-b:
Detector-level DCA significance distribution in data fitted with PYTHIA8 CP5 templates for prompt and nonprompt $ \mathrm{D^0} $ mesons contained in jets (left). In the lower panel, the ratio between the data and the fit values is presented. Measured $ \mathrm{D^0} $ meson yield (black circles) and nonprompt $ \mathrm{D^0} $ meson contribution (filled histogram) as functions of the late-$ k_{\mathrm{T}} $ splitting angle $ \theta_{\text{l}} $ (right). |
png pdf |
Figure 4:
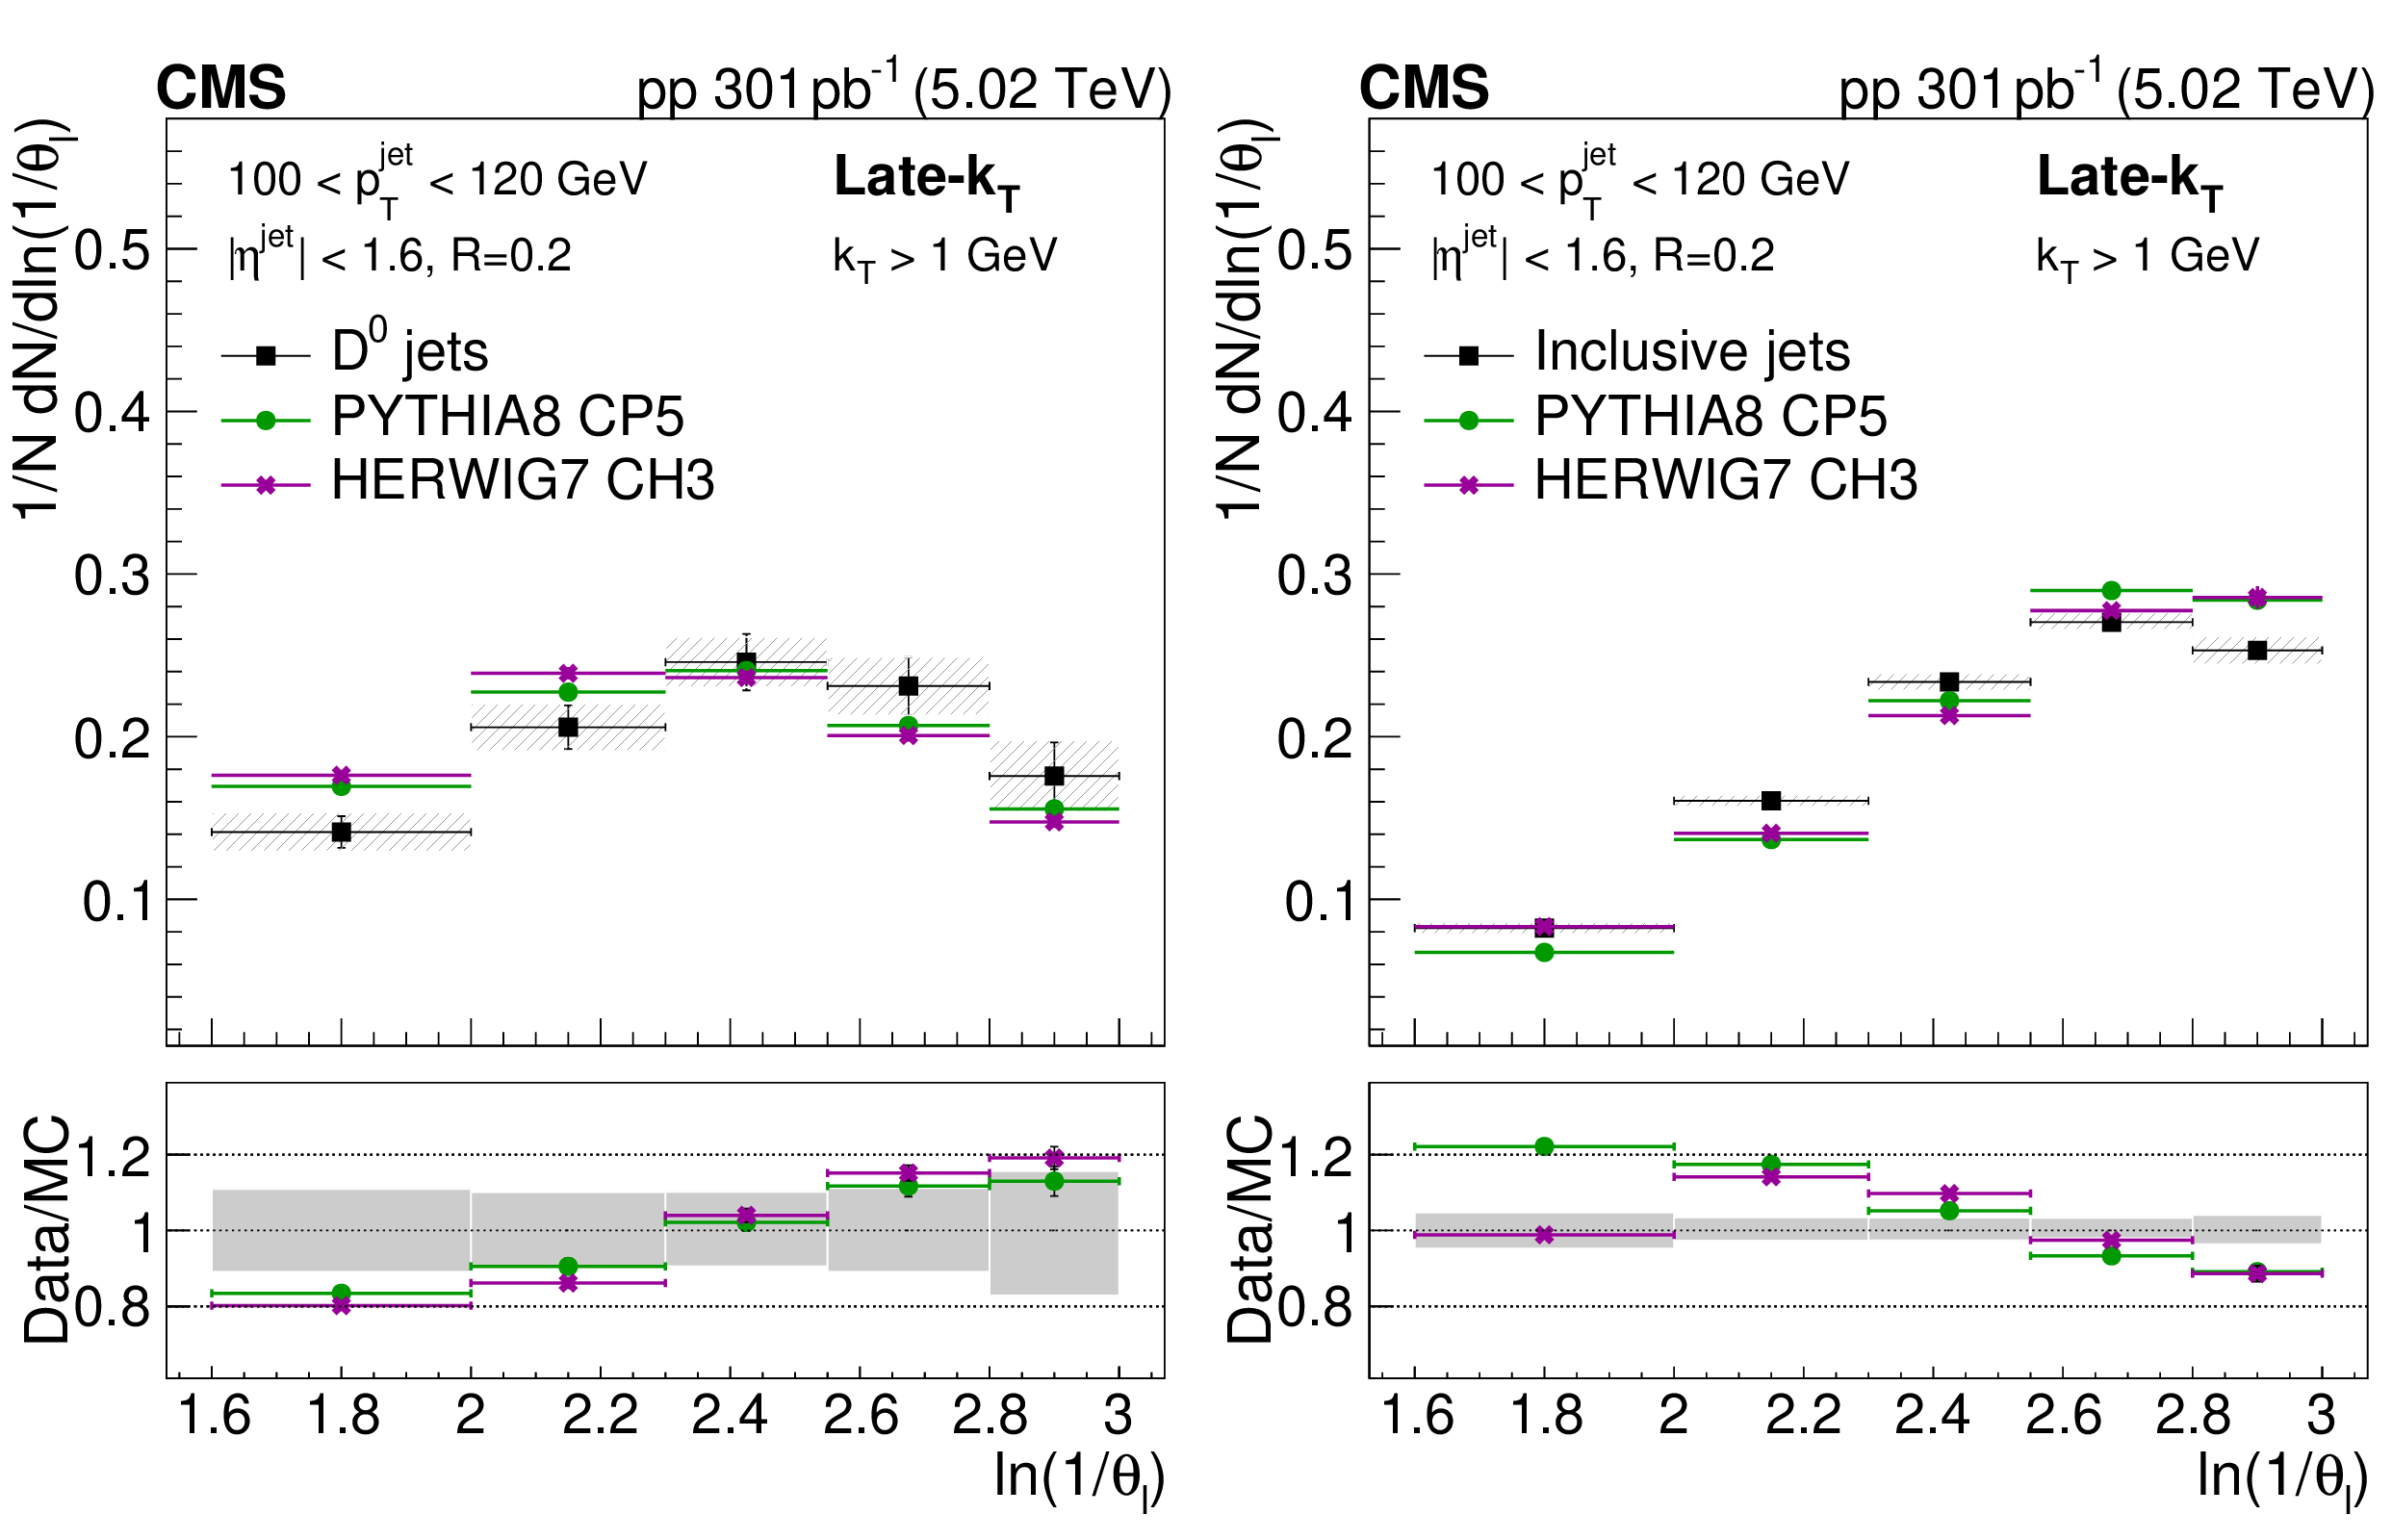
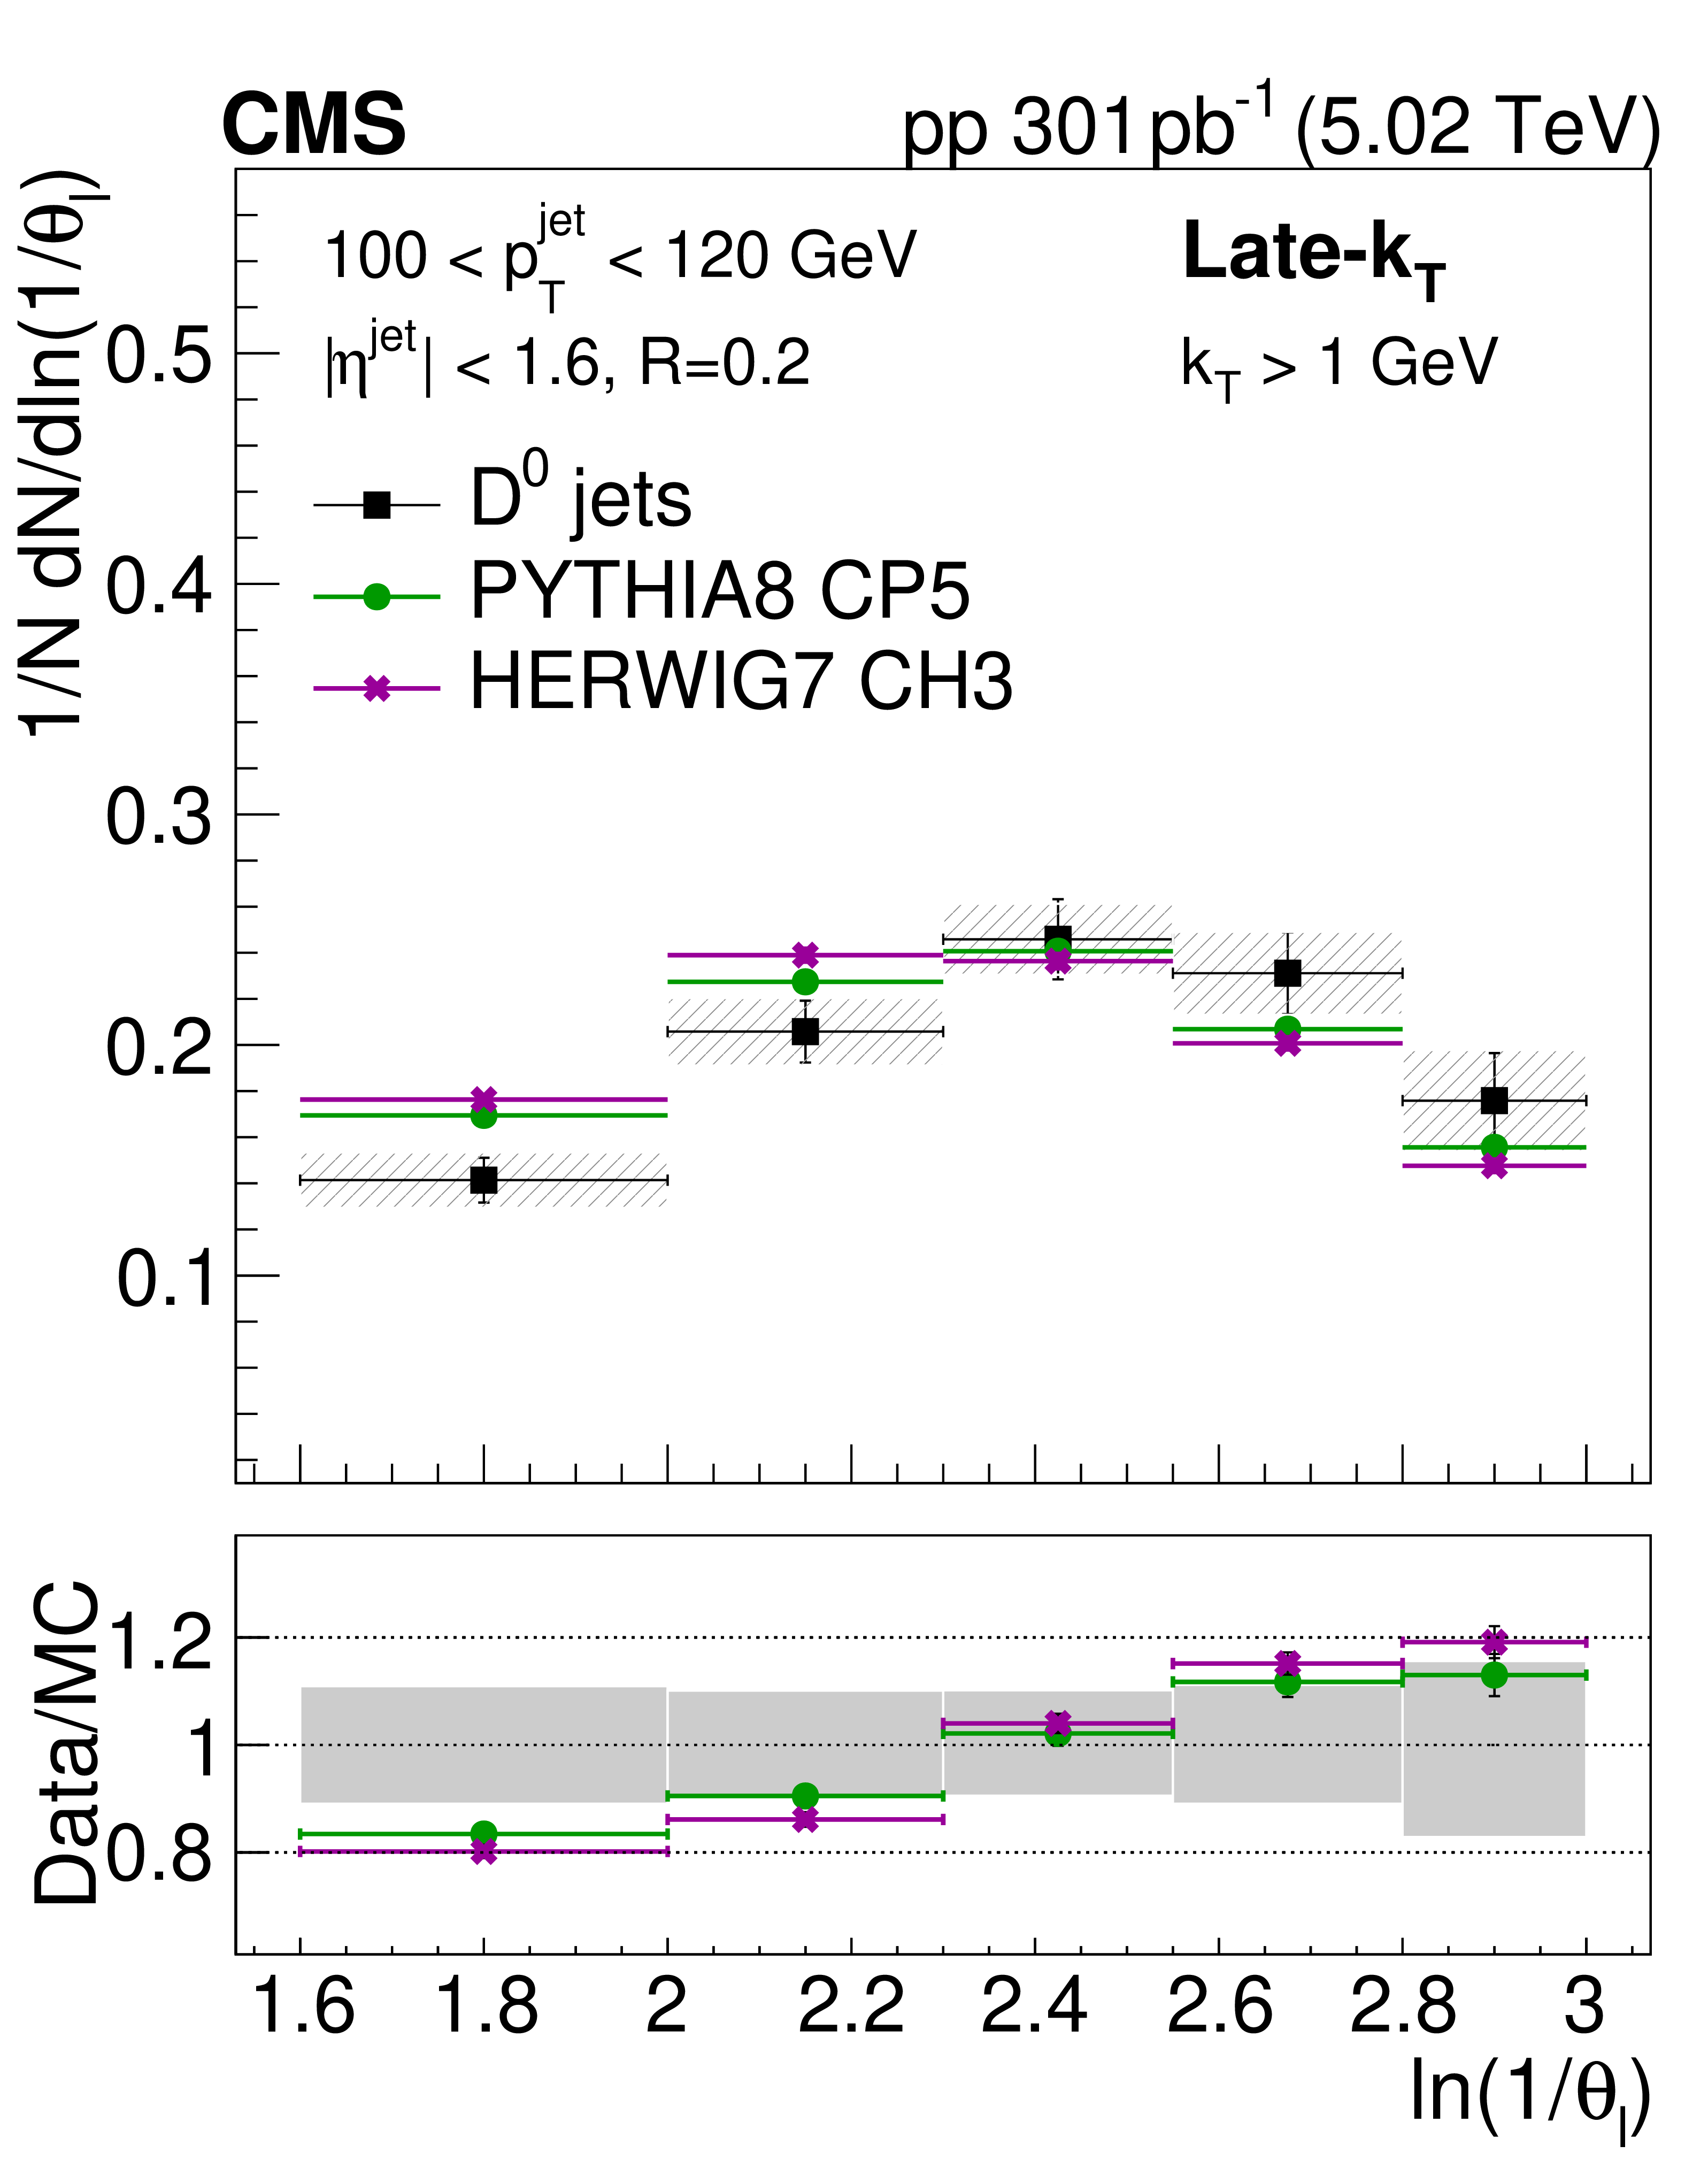
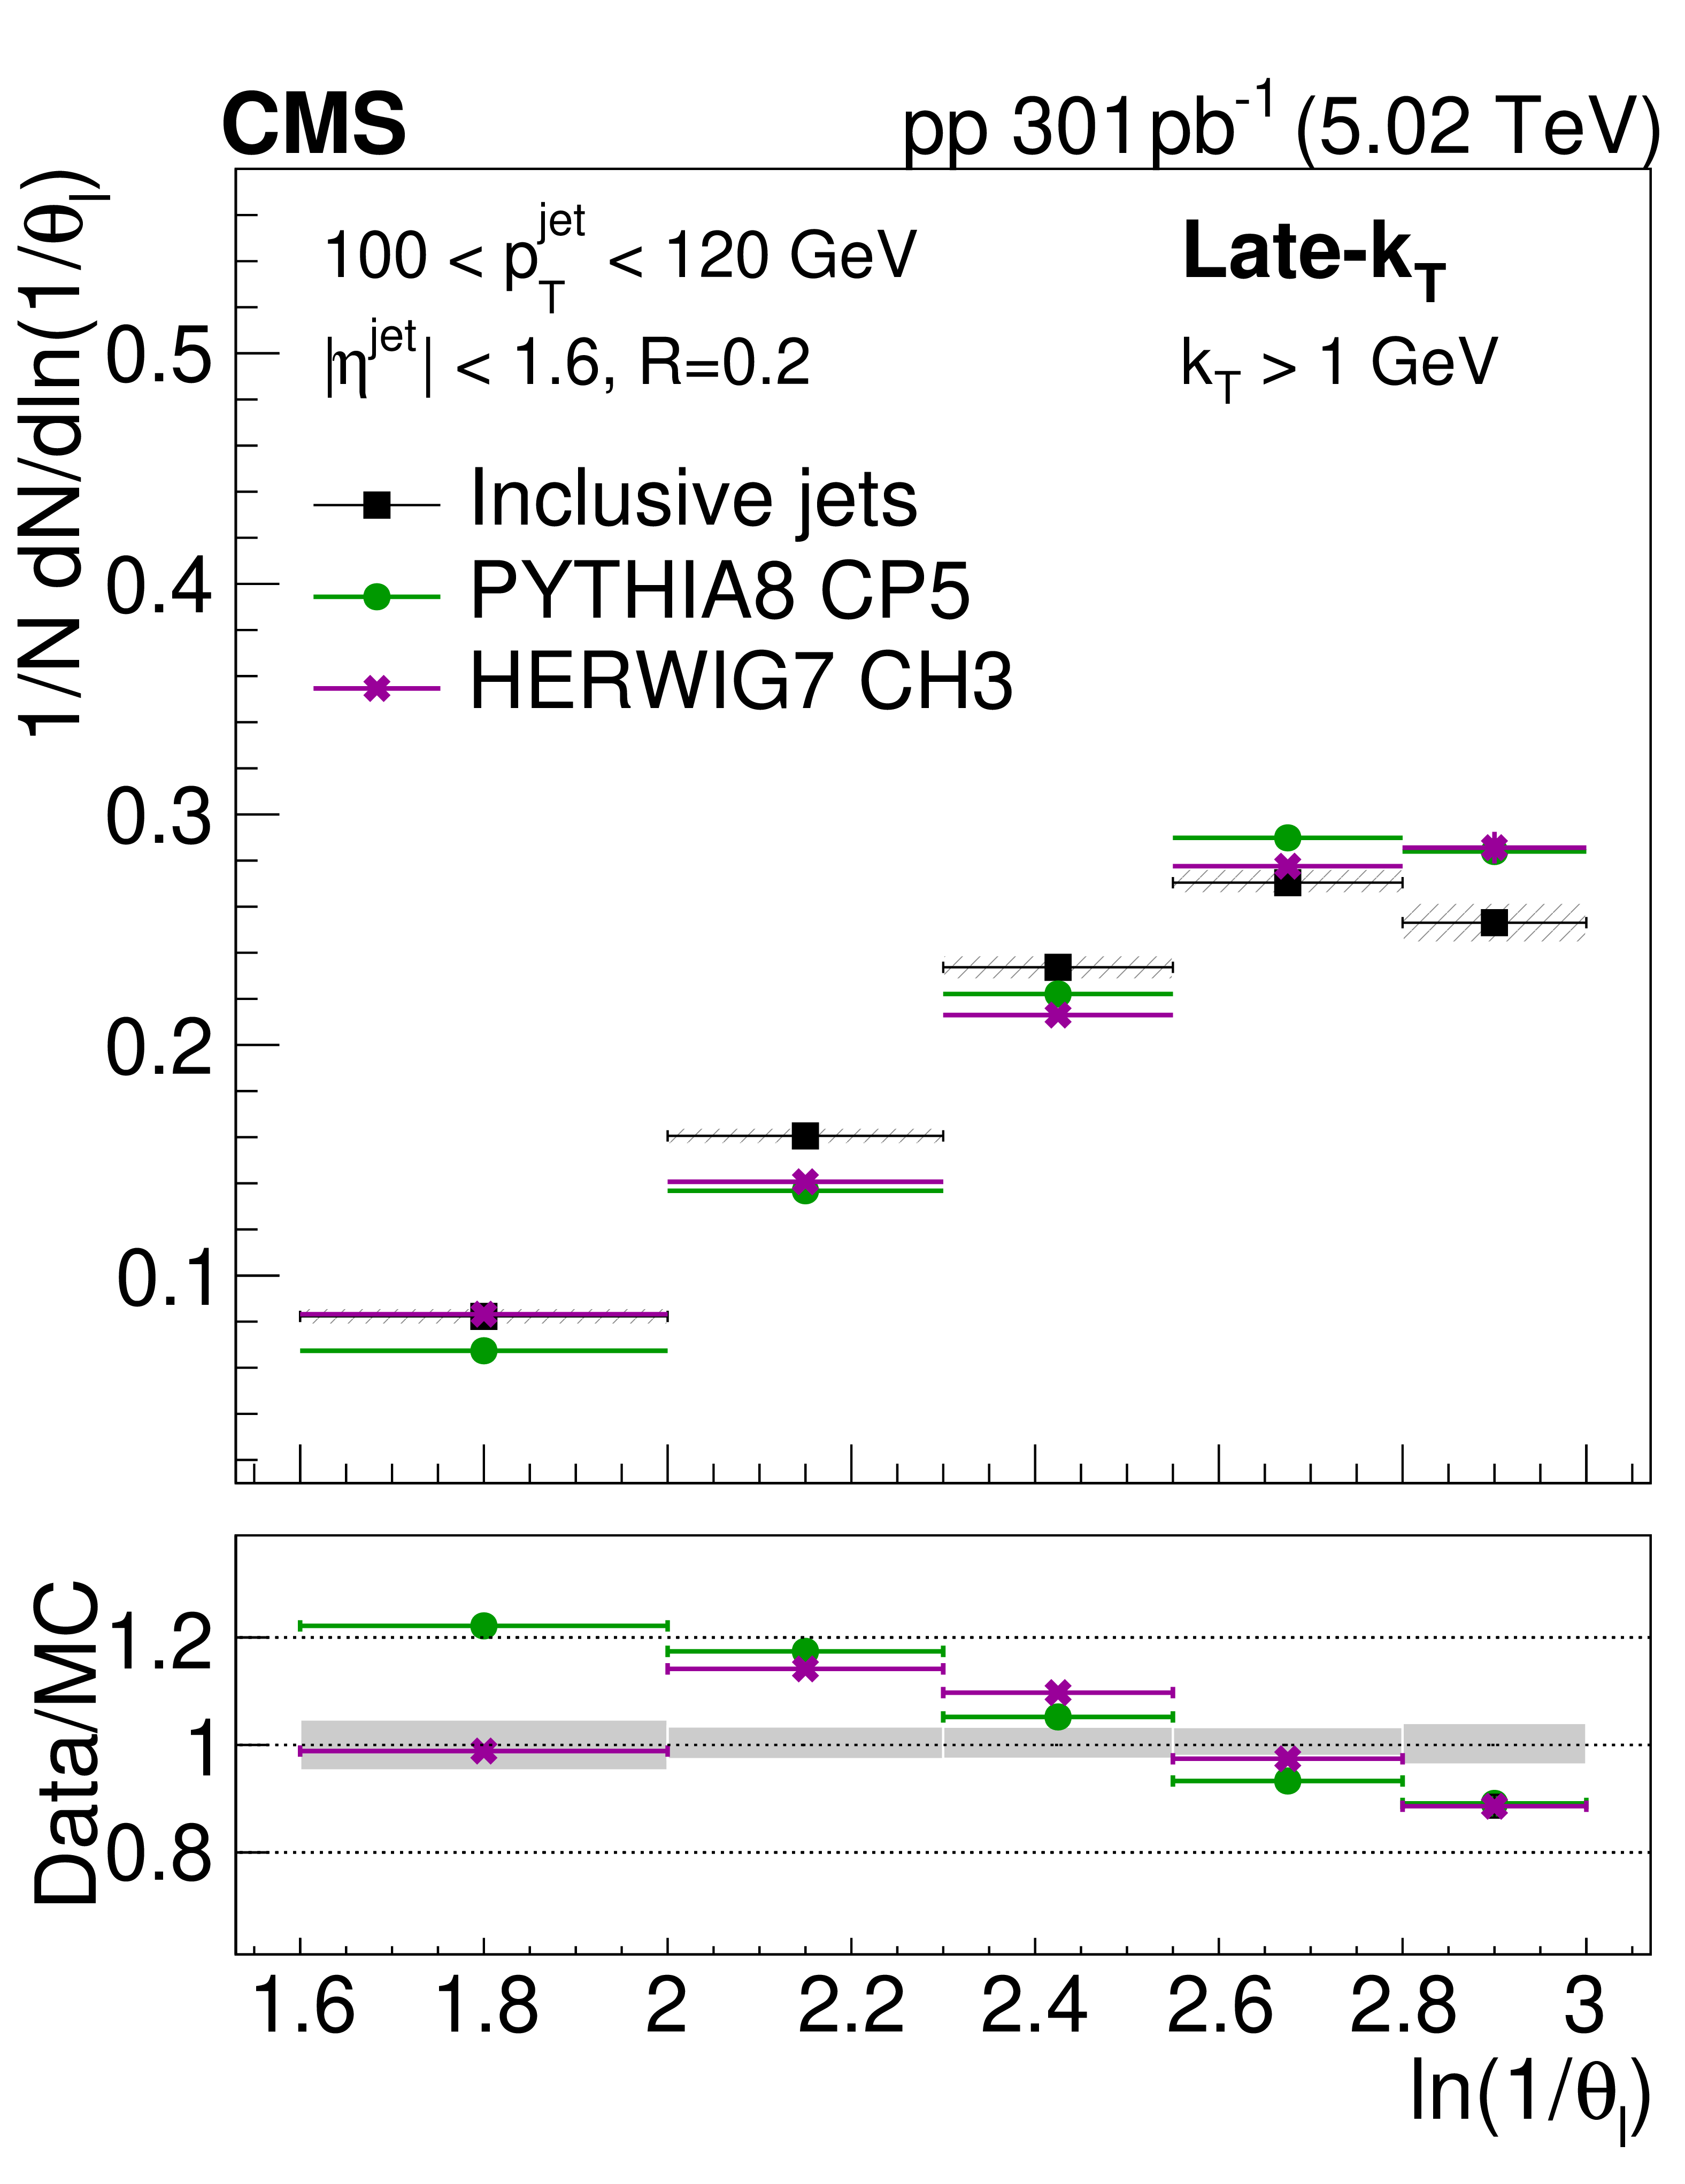
The unfolded late-$ k_{\mathrm{T}} $ angular distribution for prompt $ \mathrm{D^0} $ jets (left) and inclusive jets (right) compared to the predictions from PYTHIA8 CP5 and HERWIG 7 CH3. The error bands in the upper panel represent the total systematical uncertainty, whereas the vertical bars represent the statistical uncertainties. In the lower panel, the error band in the ratio plot represents the total experimental uncertainty in the measurement. |
png pdf |
Figure 4-a:
The unfolded late-$ k_{\mathrm{T}} $ angular distribution for prompt $ \mathrm{D^0} $ jets (left) and inclusive jets (right) compared to the predictions from PYTHIA8 CP5 and HERWIG 7 CH3. The error bands in the upper panel represent the total systematical uncertainty, whereas the vertical bars represent the statistical uncertainties. In the lower panel, the error band in the ratio plot represents the total experimental uncertainty in the measurement. |
png pdf |
Figure 4-b:
The unfolded late-$ k_{\mathrm{T}} $ angular distribution for prompt $ \mathrm{D^0} $ jets (left) and inclusive jets (right) compared to the predictions from PYTHIA8 CP5 and HERWIG 7 CH3. The error bands in the upper panel represent the total systematical uncertainty, whereas the vertical bars represent the statistical uncertainties. In the lower panel, the error band in the ratio plot represents the total experimental uncertainty in the measurement. |
png pdf |
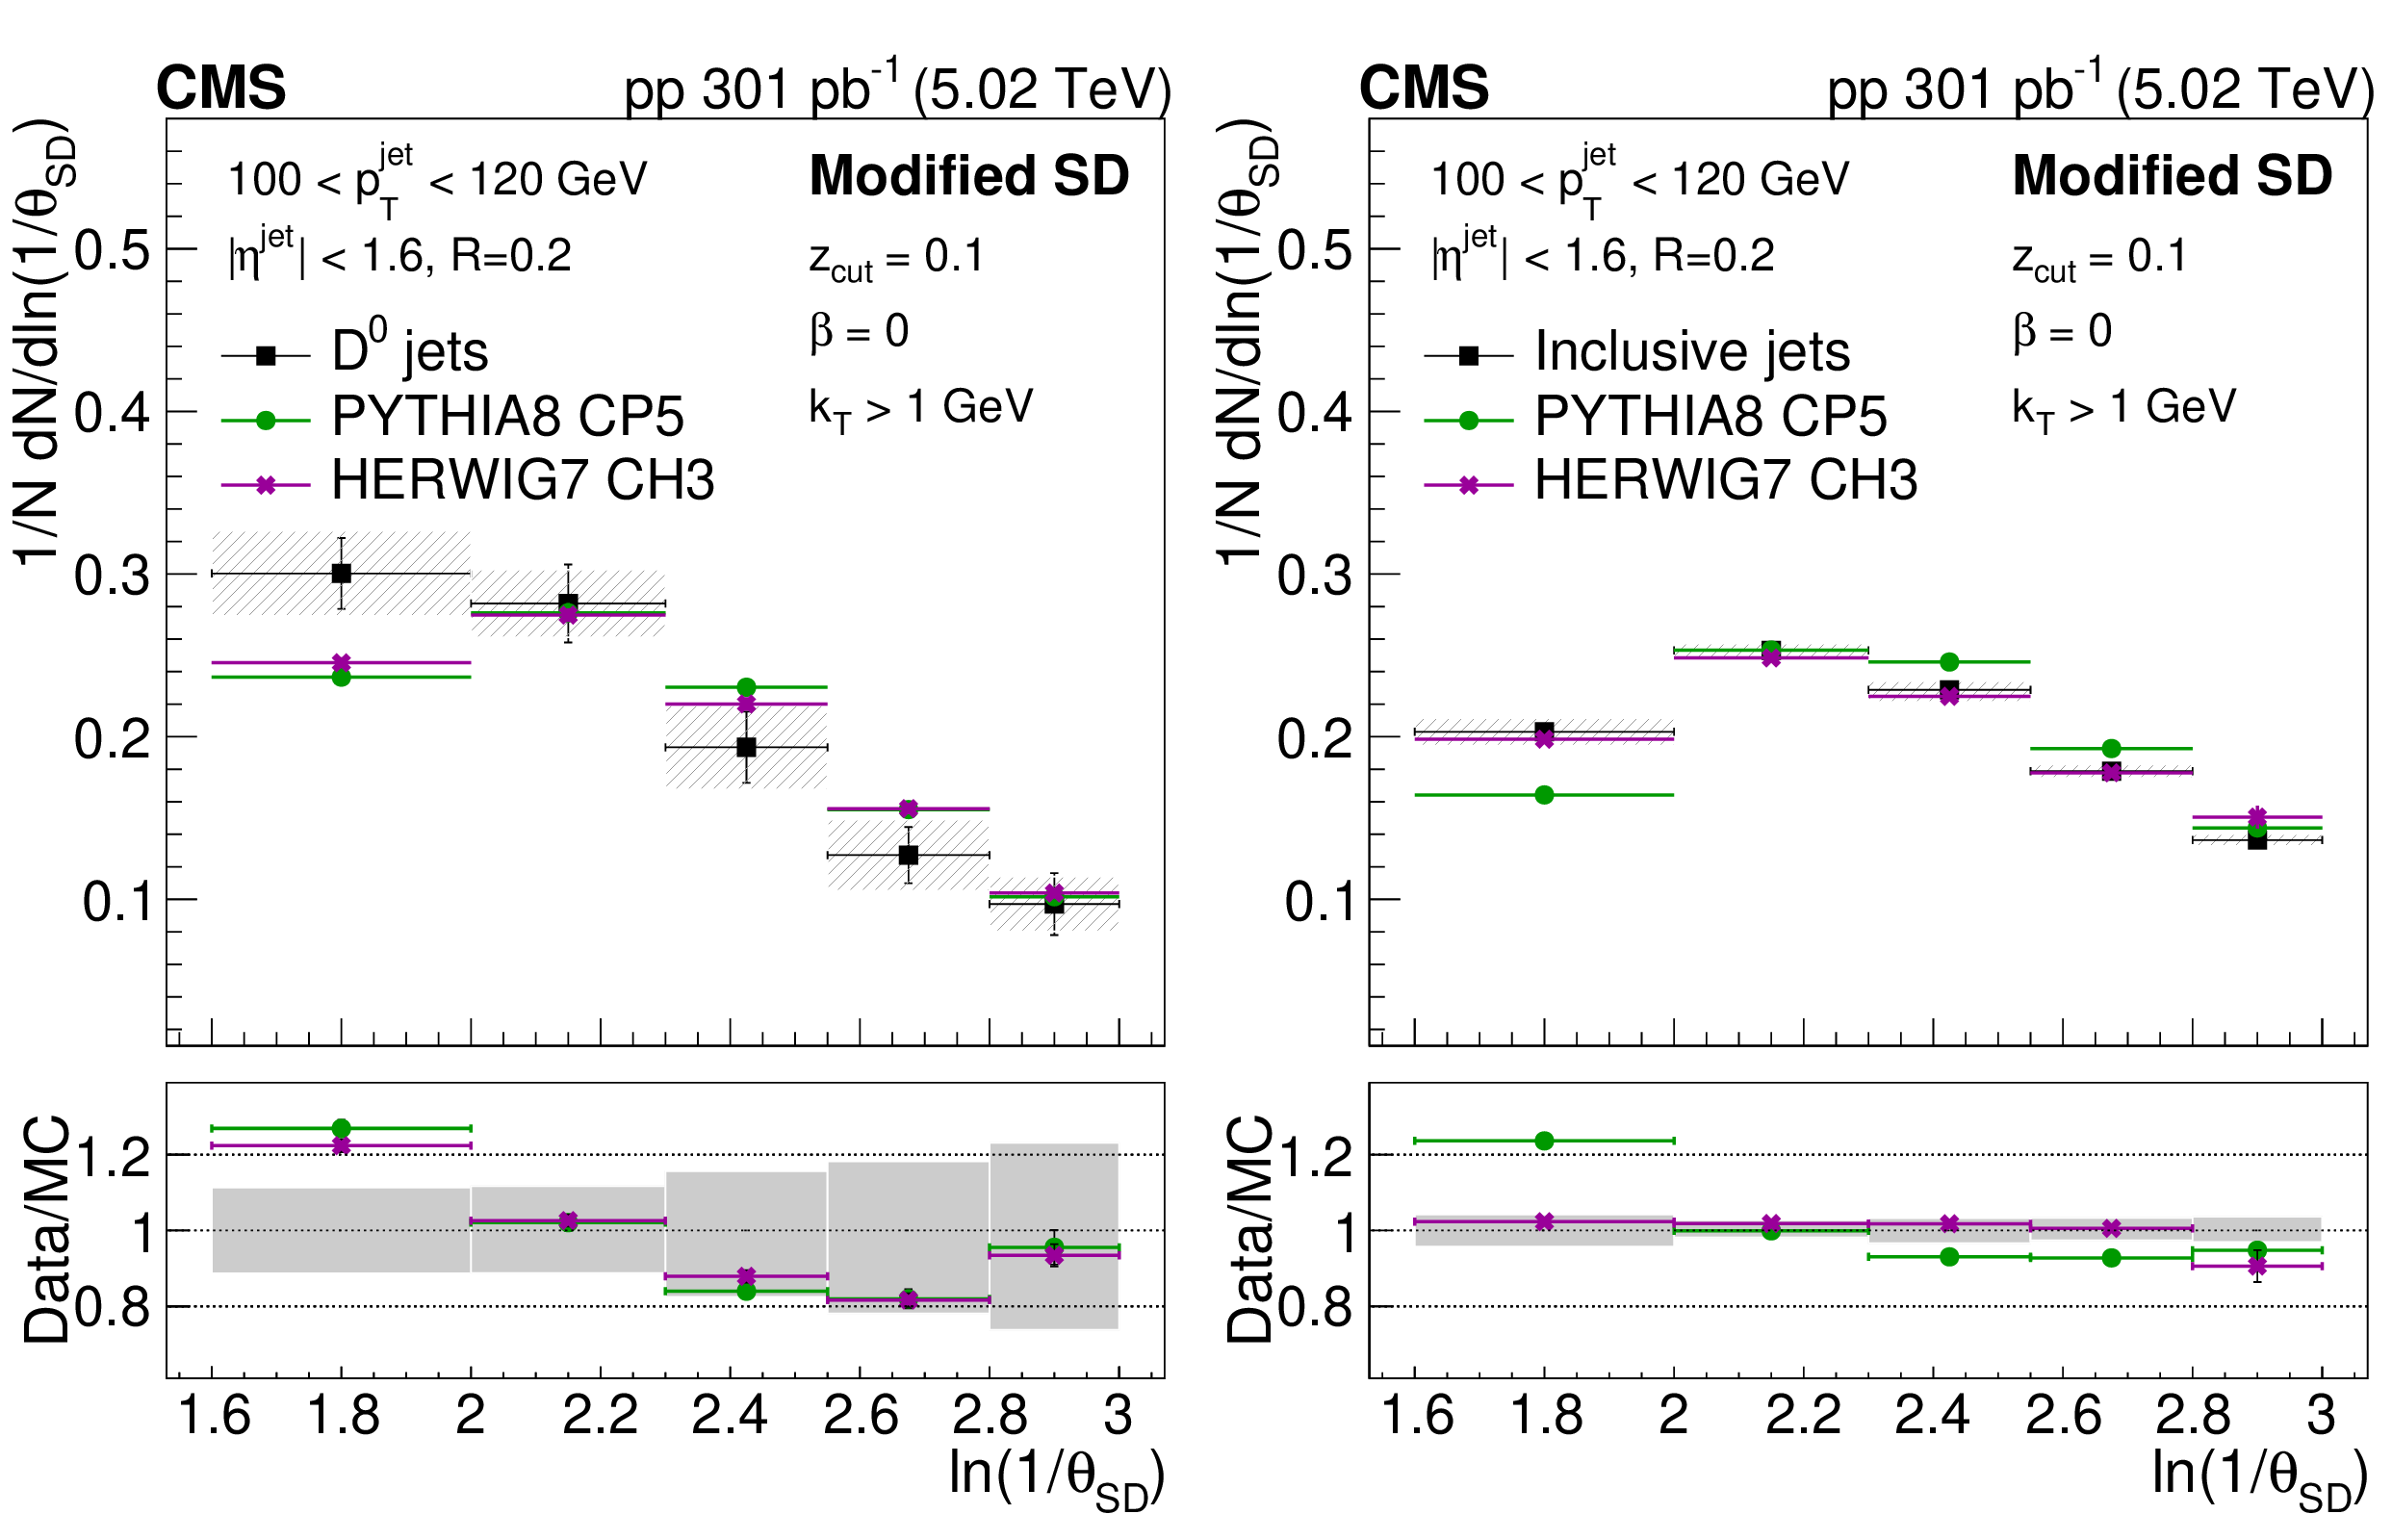
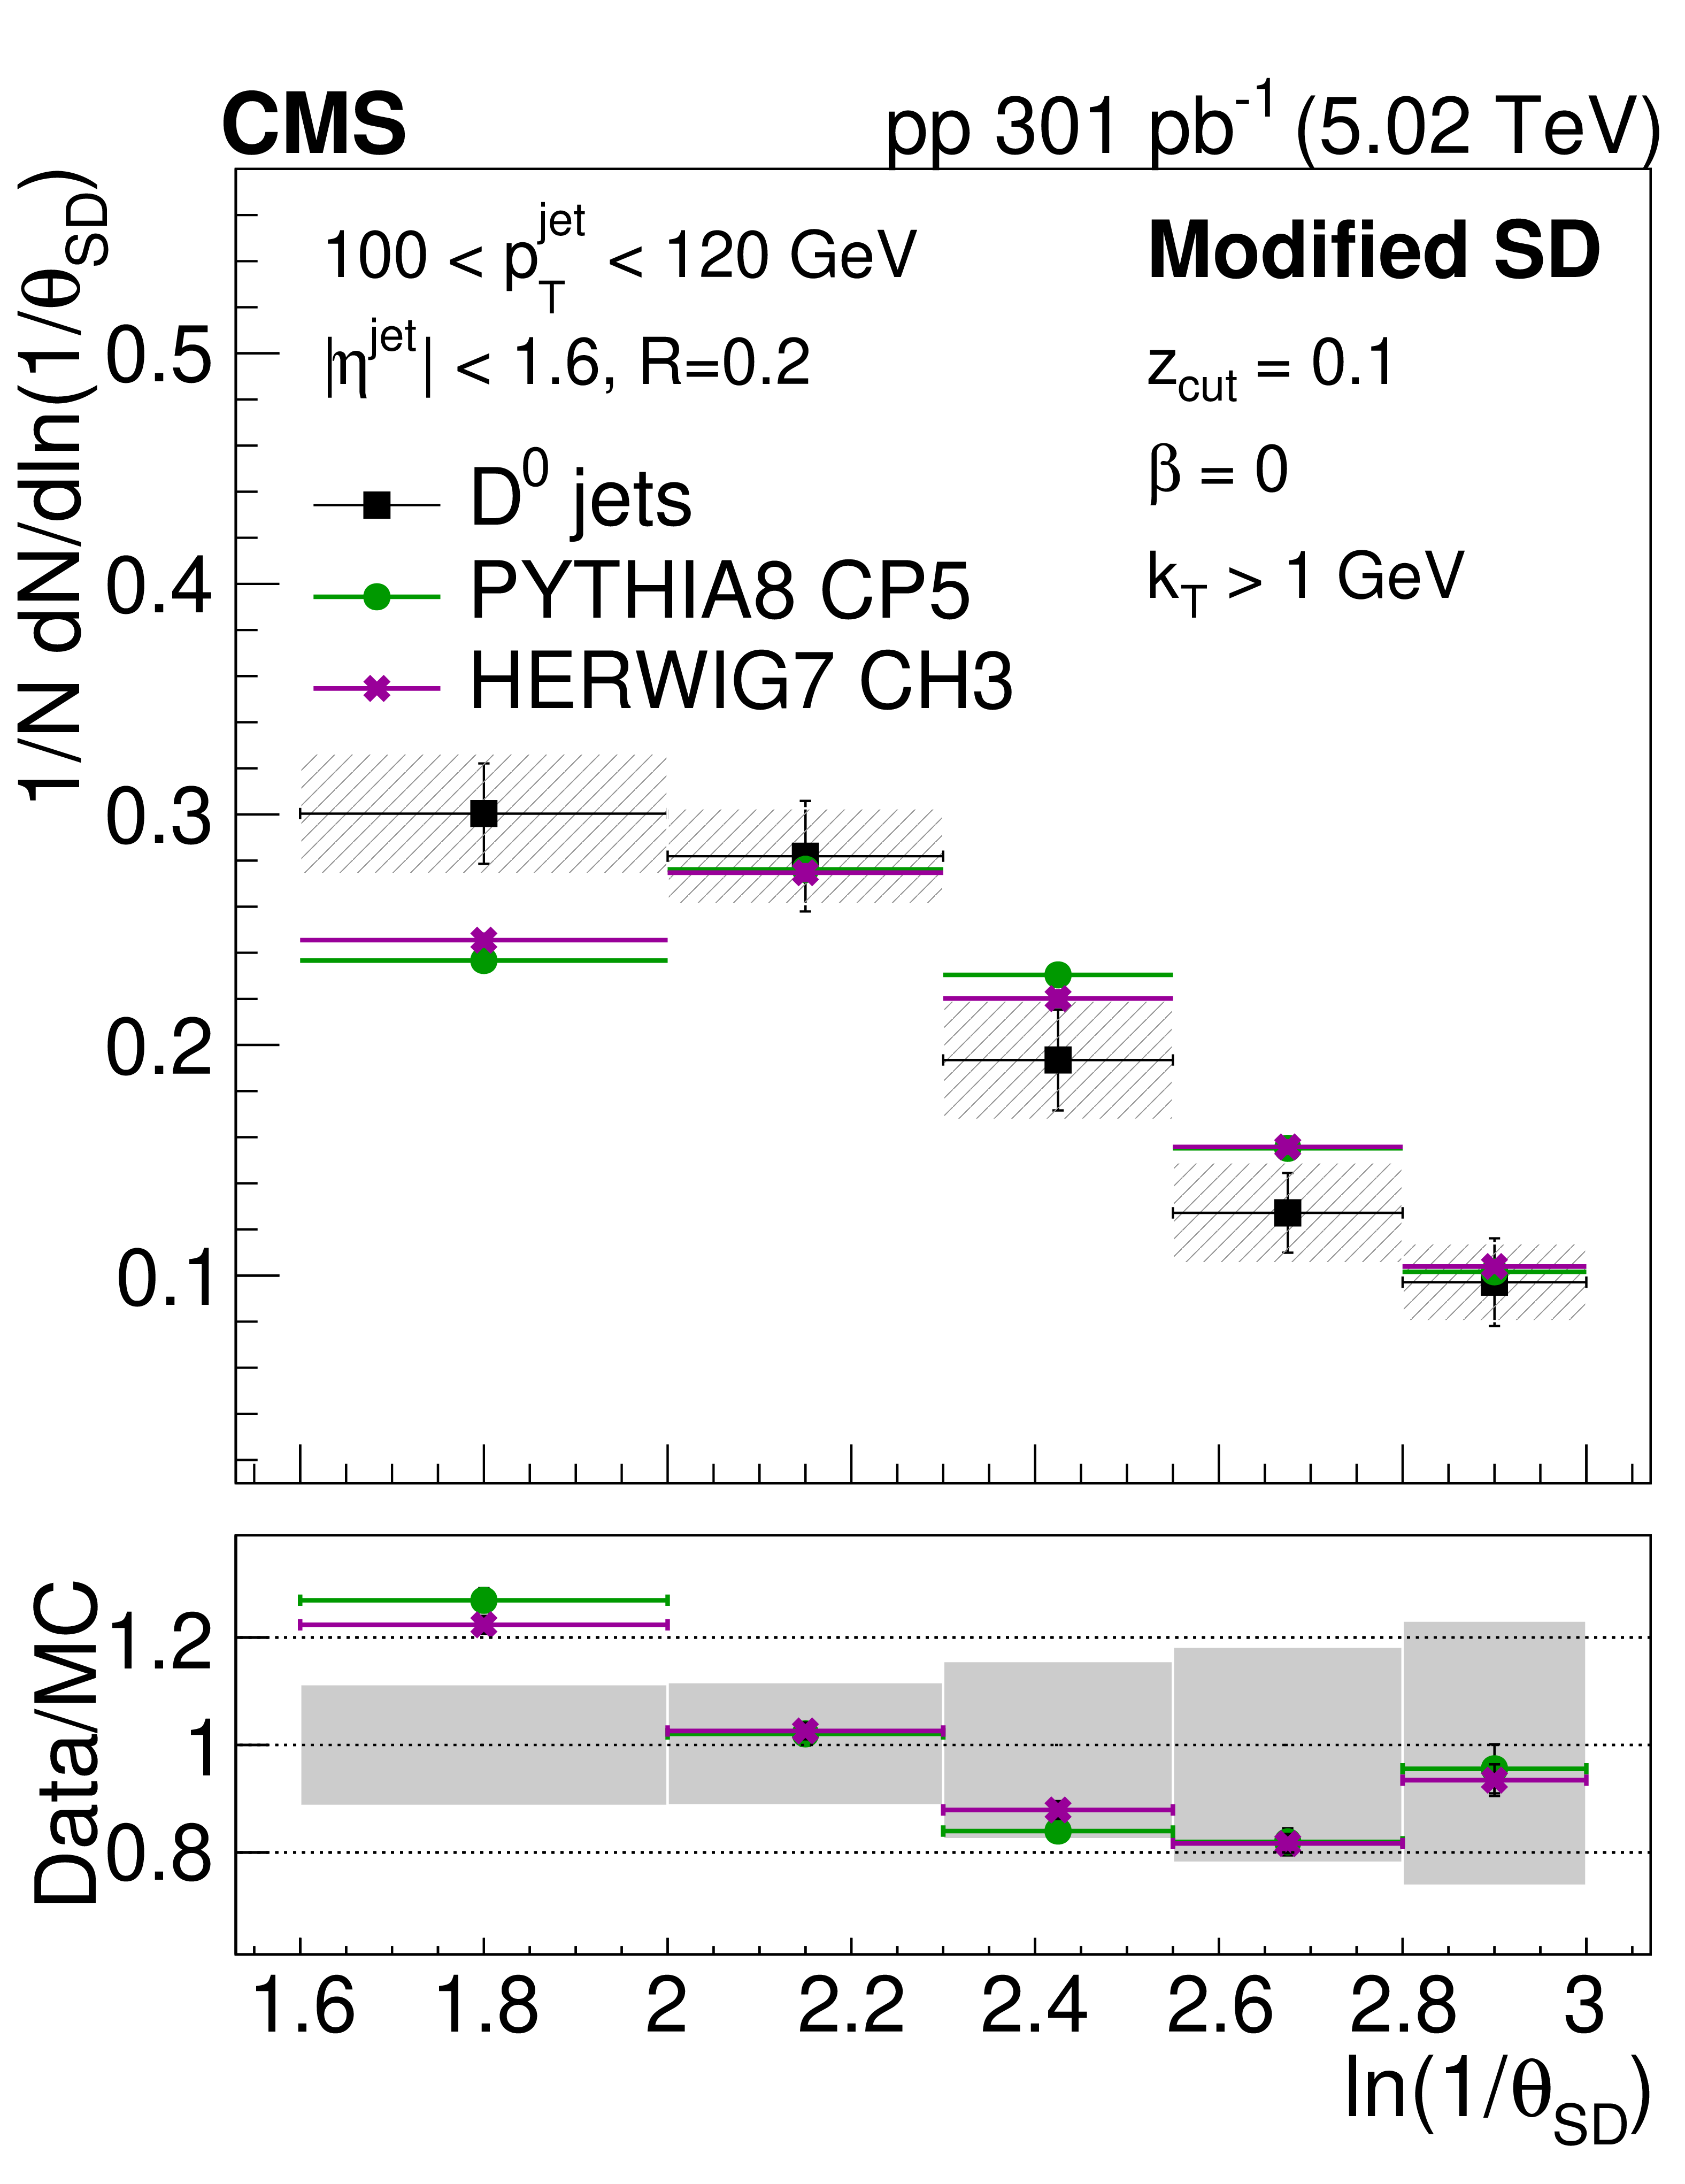
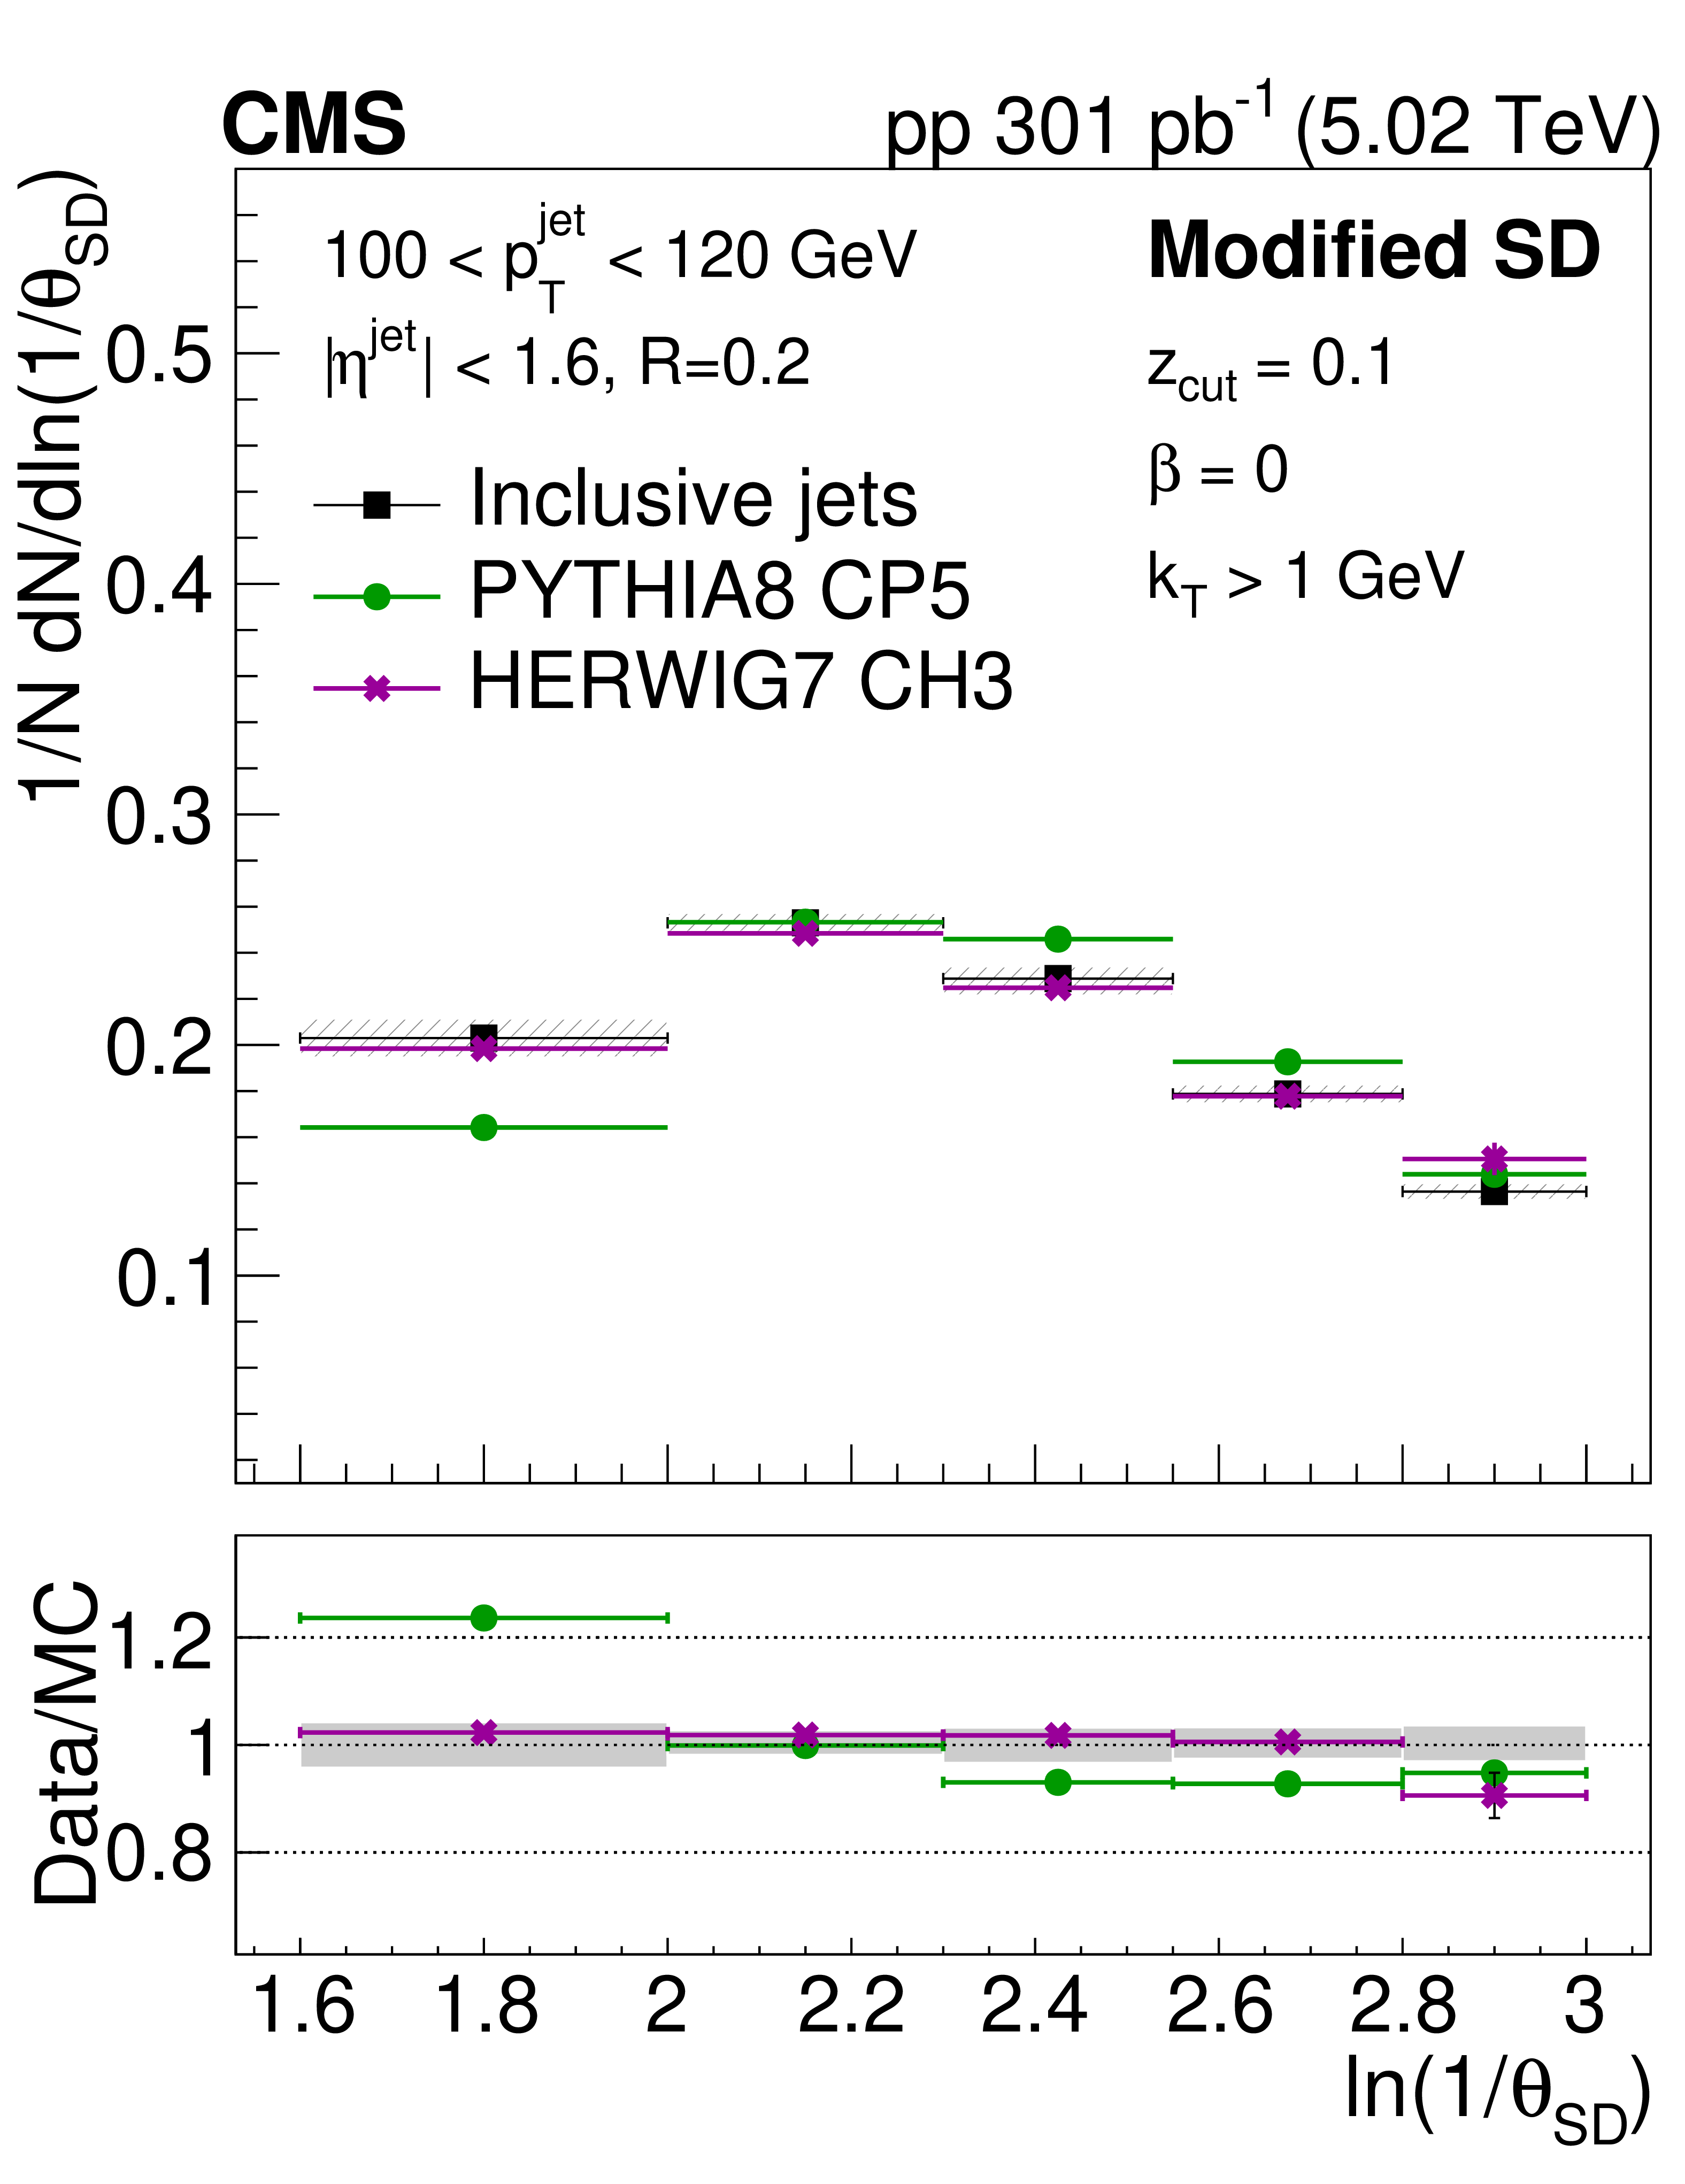
Figure 5:
The unfolded SD angular distribution for prompt $ \mathrm{D^0} $ jets (left) and inclusive jets (right) compared with predictions from PYTHIA8 CP5 and HERWIG 7 CH3. The error bands in the upper panel represent the total systematical uncertainty, whereas the vertical bars represent the statistical uncertainties. In the lower panel, the error band in the ratio plot represents the total experimental uncertainty in the measurement. |
png pdf |
Figure 5-a:
The unfolded SD angular distribution for prompt $ \mathrm{D^0} $ jets (left) and inclusive jets (right) compared with predictions from PYTHIA8 CP5 and HERWIG 7 CH3. The error bands in the upper panel represent the total systematical uncertainty, whereas the vertical bars represent the statistical uncertainties. In the lower panel, the error band in the ratio plot represents the total experimental uncertainty in the measurement. |
png pdf |
Figure 5-b:
The unfolded SD angular distribution for prompt $ \mathrm{D^0} $ jets (left) and inclusive jets (right) compared with predictions from PYTHIA8 CP5 and HERWIG 7 CH3. The error bands in the upper panel represent the total systematical uncertainty, whereas the vertical bars represent the statistical uncertainties. In the lower panel, the error band in the ratio plot represents the total experimental uncertainty in the measurement. |
png pdf |
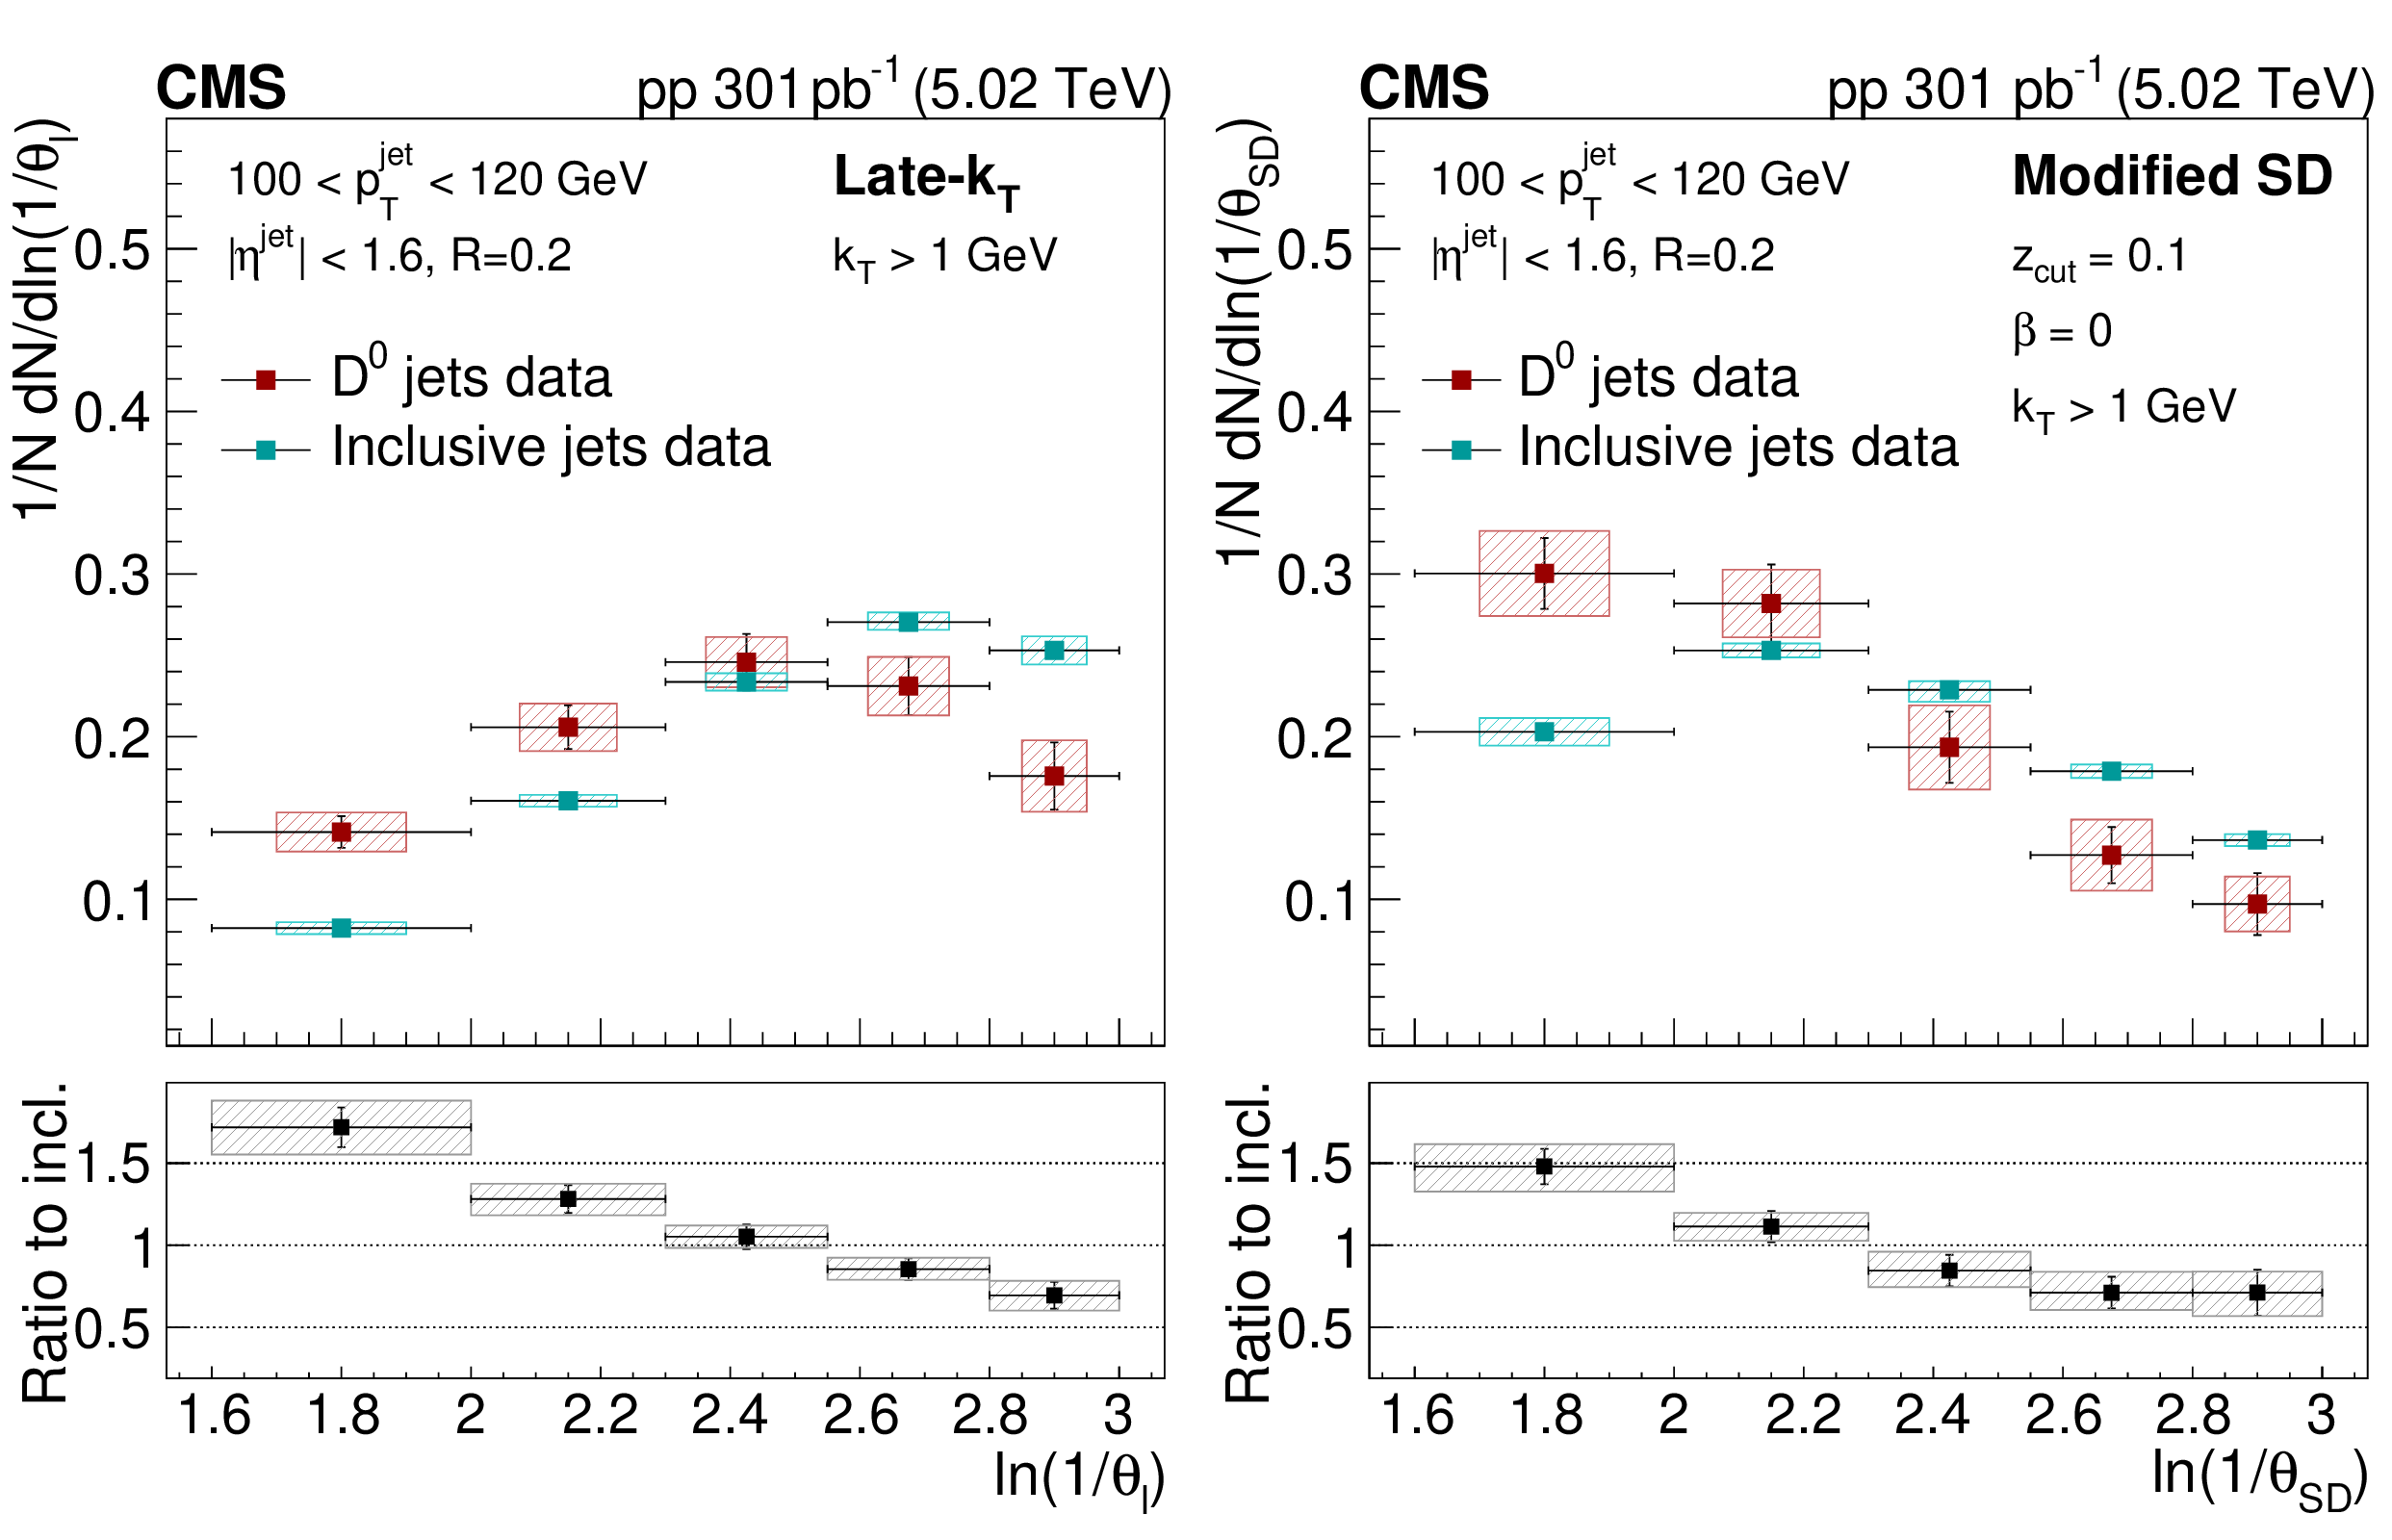
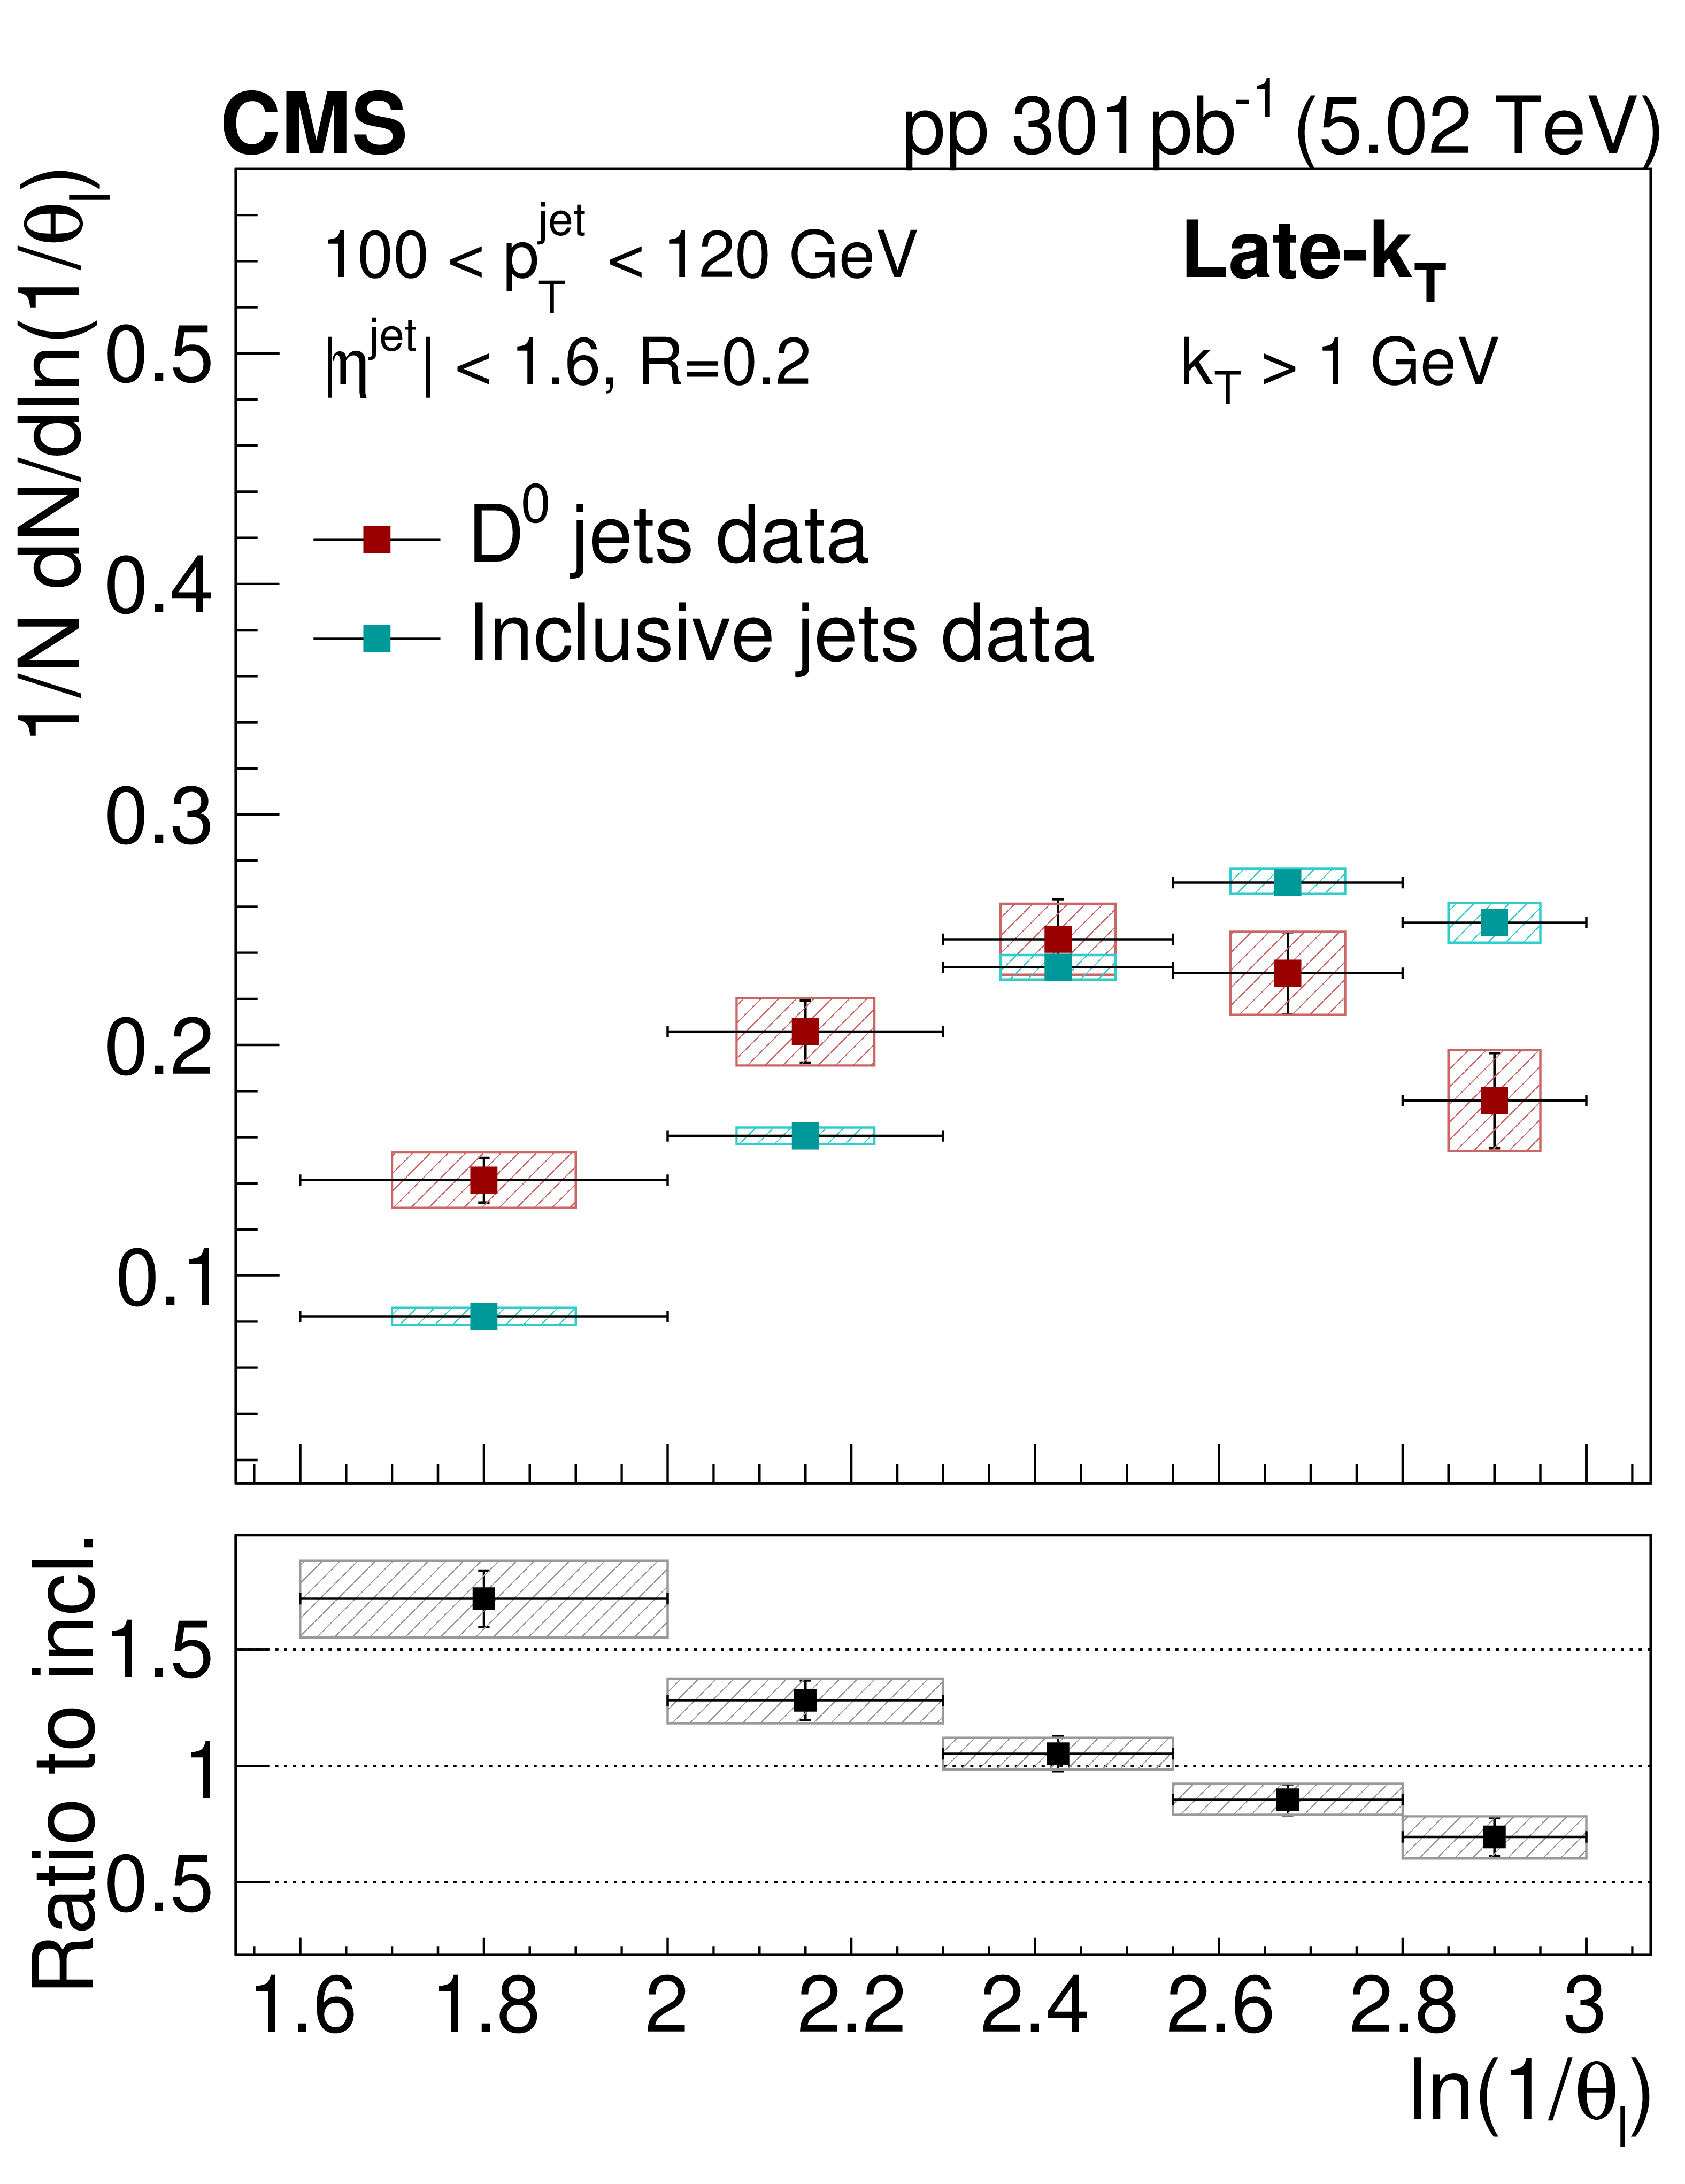
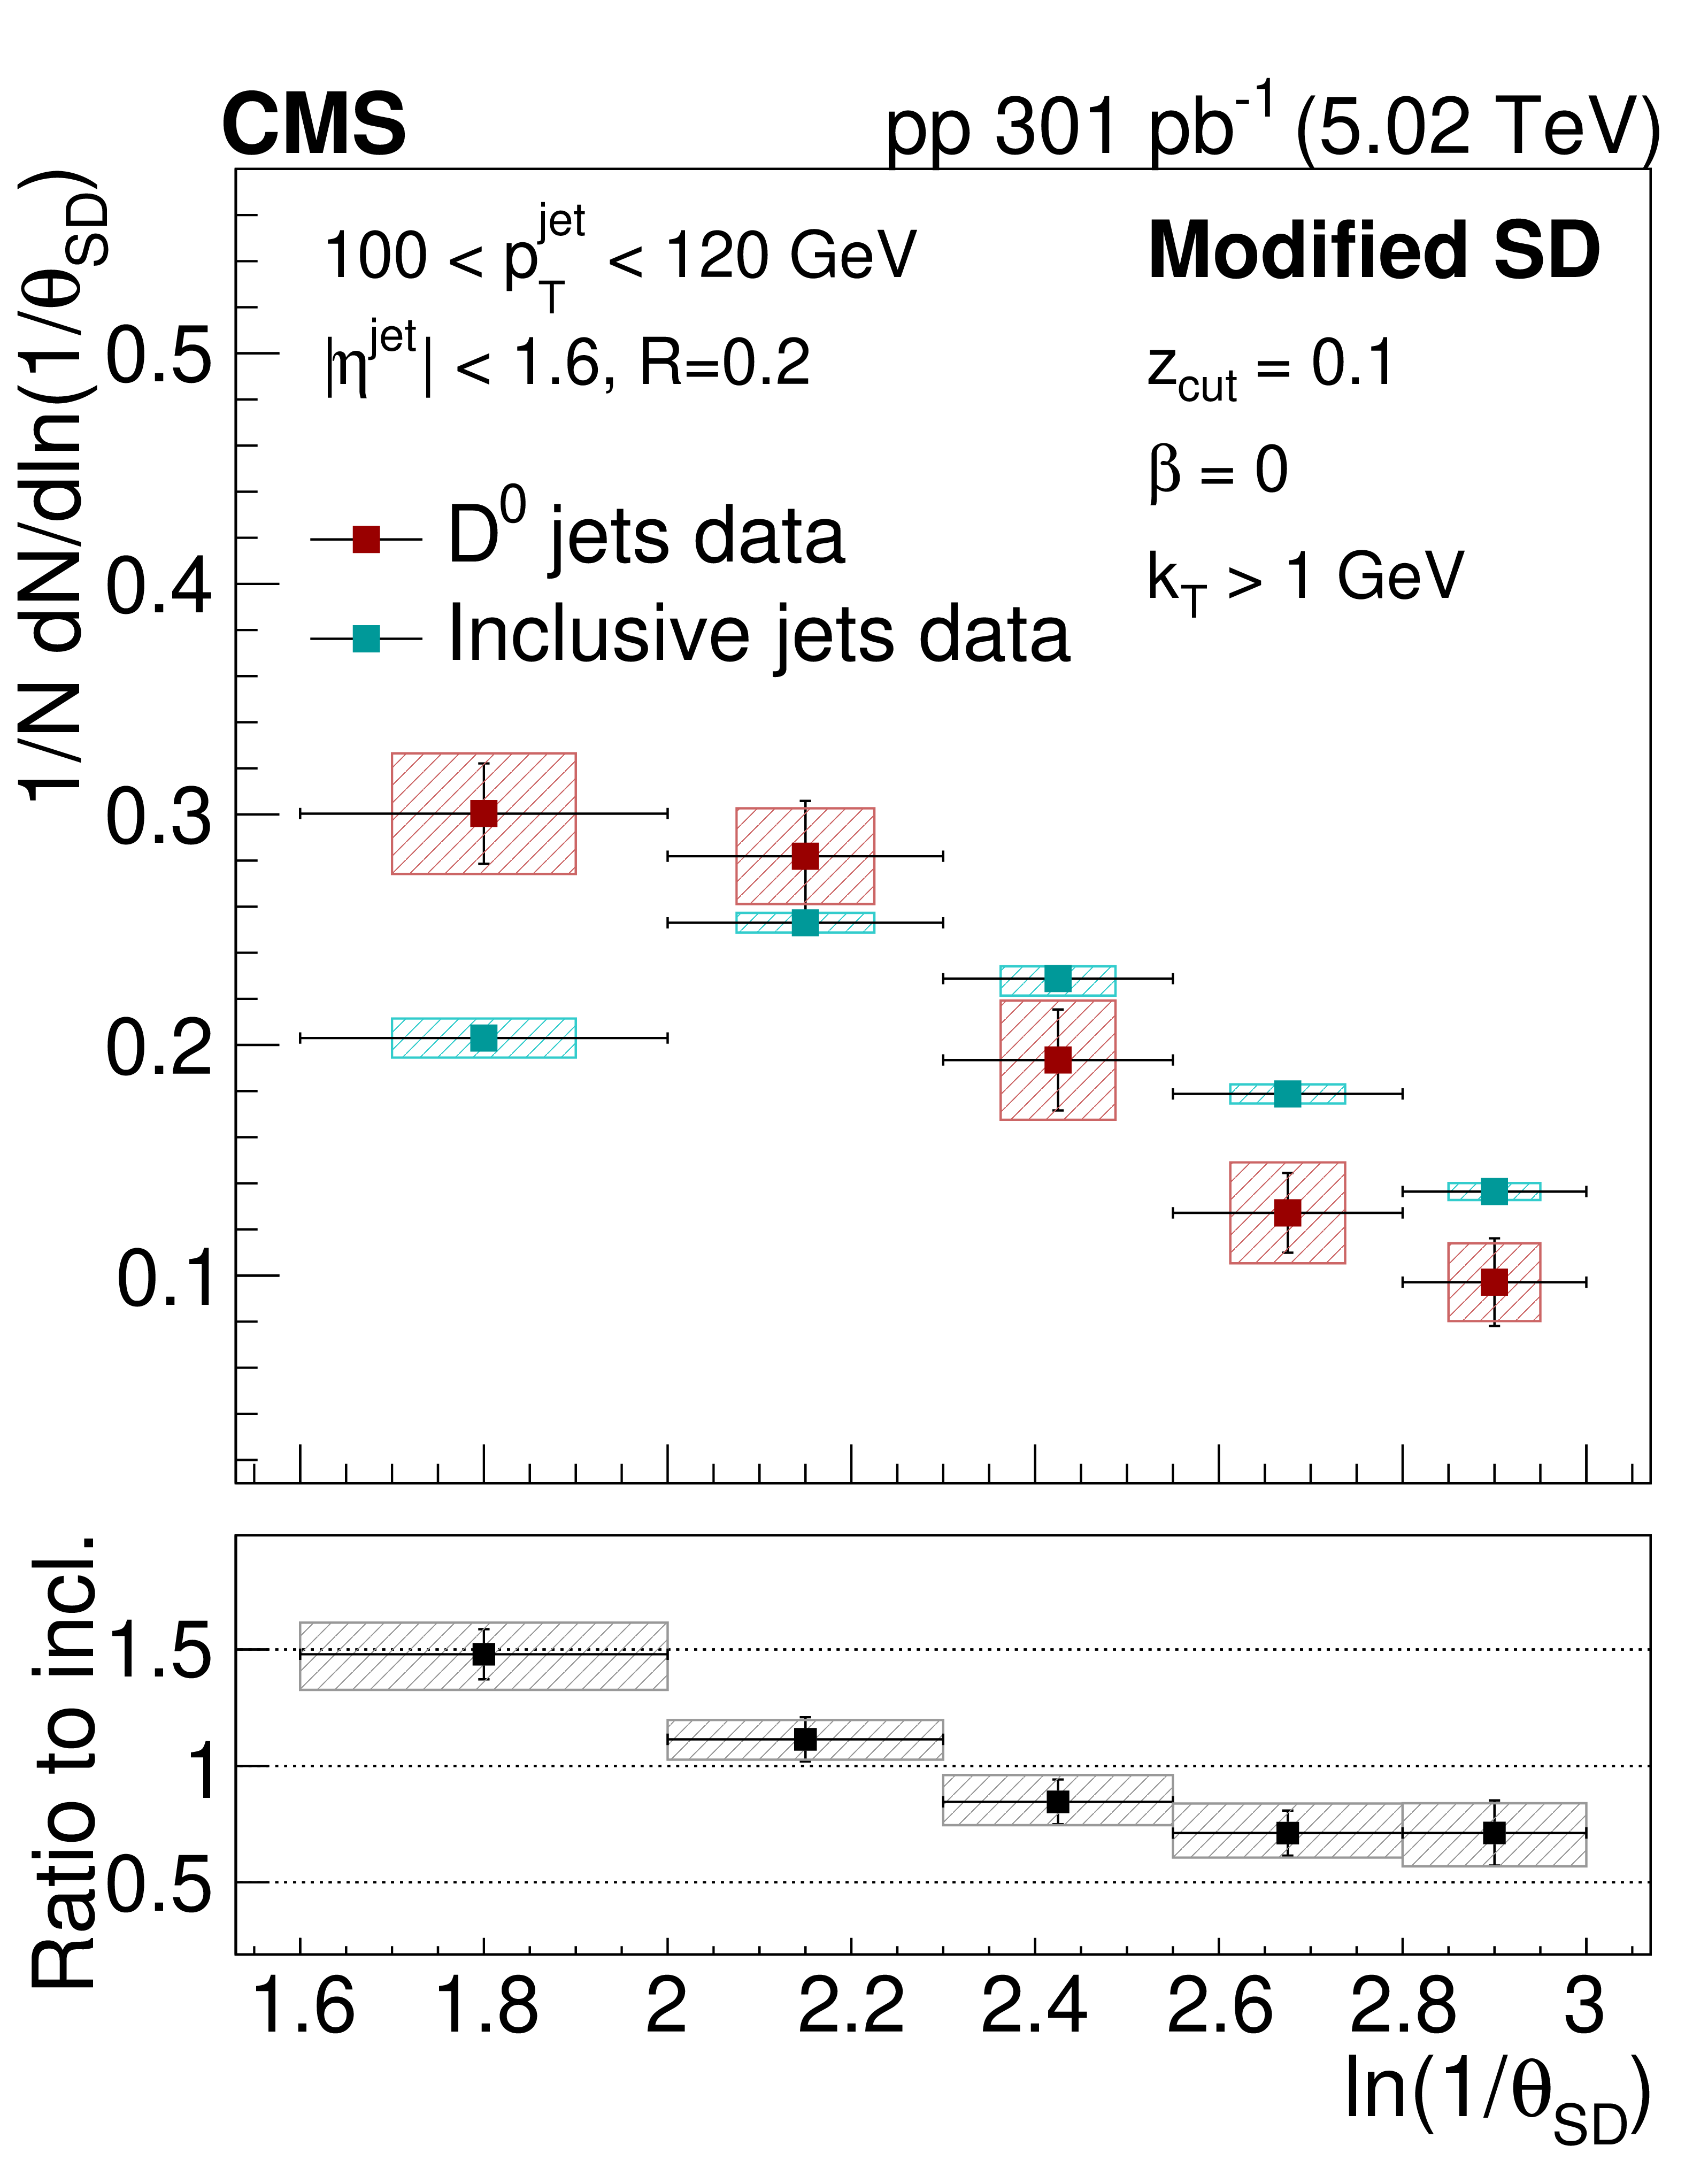
Figure 6:
The late-$ k_{\mathrm{T}} $ (left) and modified SD (right) angular distribution for prompt $ \mathrm{D^0} $ jets and inclusive jets. The ratio to the inclusive jets is shown in the lower panels. The error boxes represents the total systematic uncertainty, whereas the vertical bars represent the statistical uncertainties. |
png pdf |
Figure 6-a:
The late-$ k_{\mathrm{T}} $ (left) and modified SD (right) angular distribution for prompt $ \mathrm{D^0} $ jets and inclusive jets. The ratio to the inclusive jets is shown in the lower panels. The error boxes represents the total systematic uncertainty, whereas the vertical bars represent the statistical uncertainties. |
png pdf |
Figure 6-b:
The late-$ k_{\mathrm{T}} $ (left) and modified SD (right) angular distribution for prompt $ \mathrm{D^0} $ jets and inclusive jets. The ratio to the inclusive jets is shown in the lower panels. The error boxes represents the total systematic uncertainty, whereas the vertical bars represent the statistical uncertainties. |
png pdf |
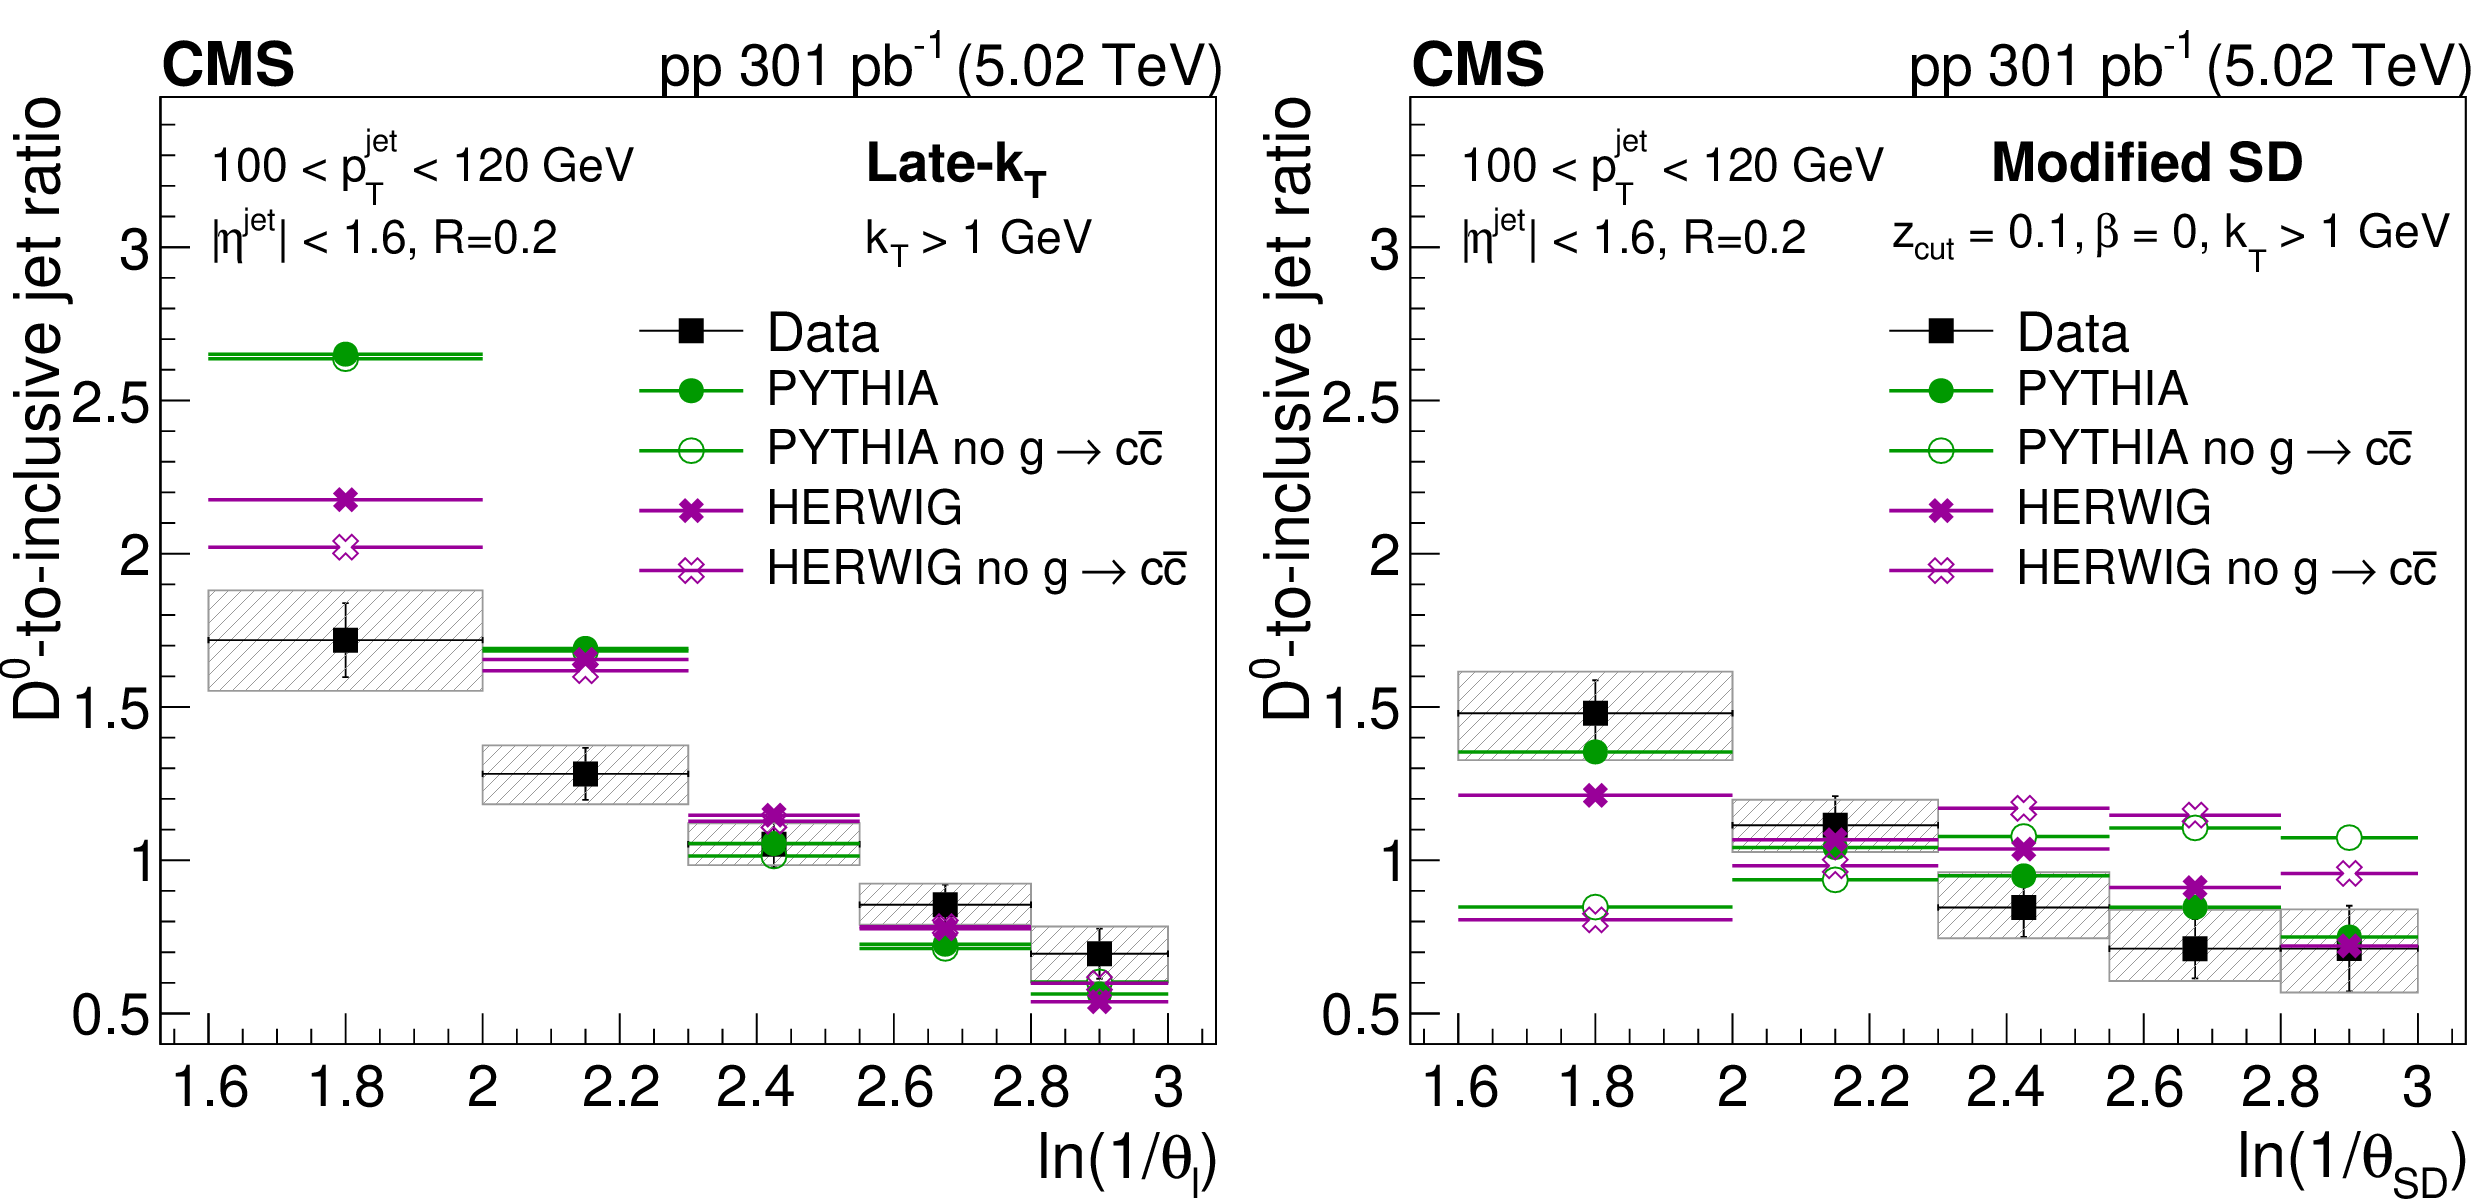
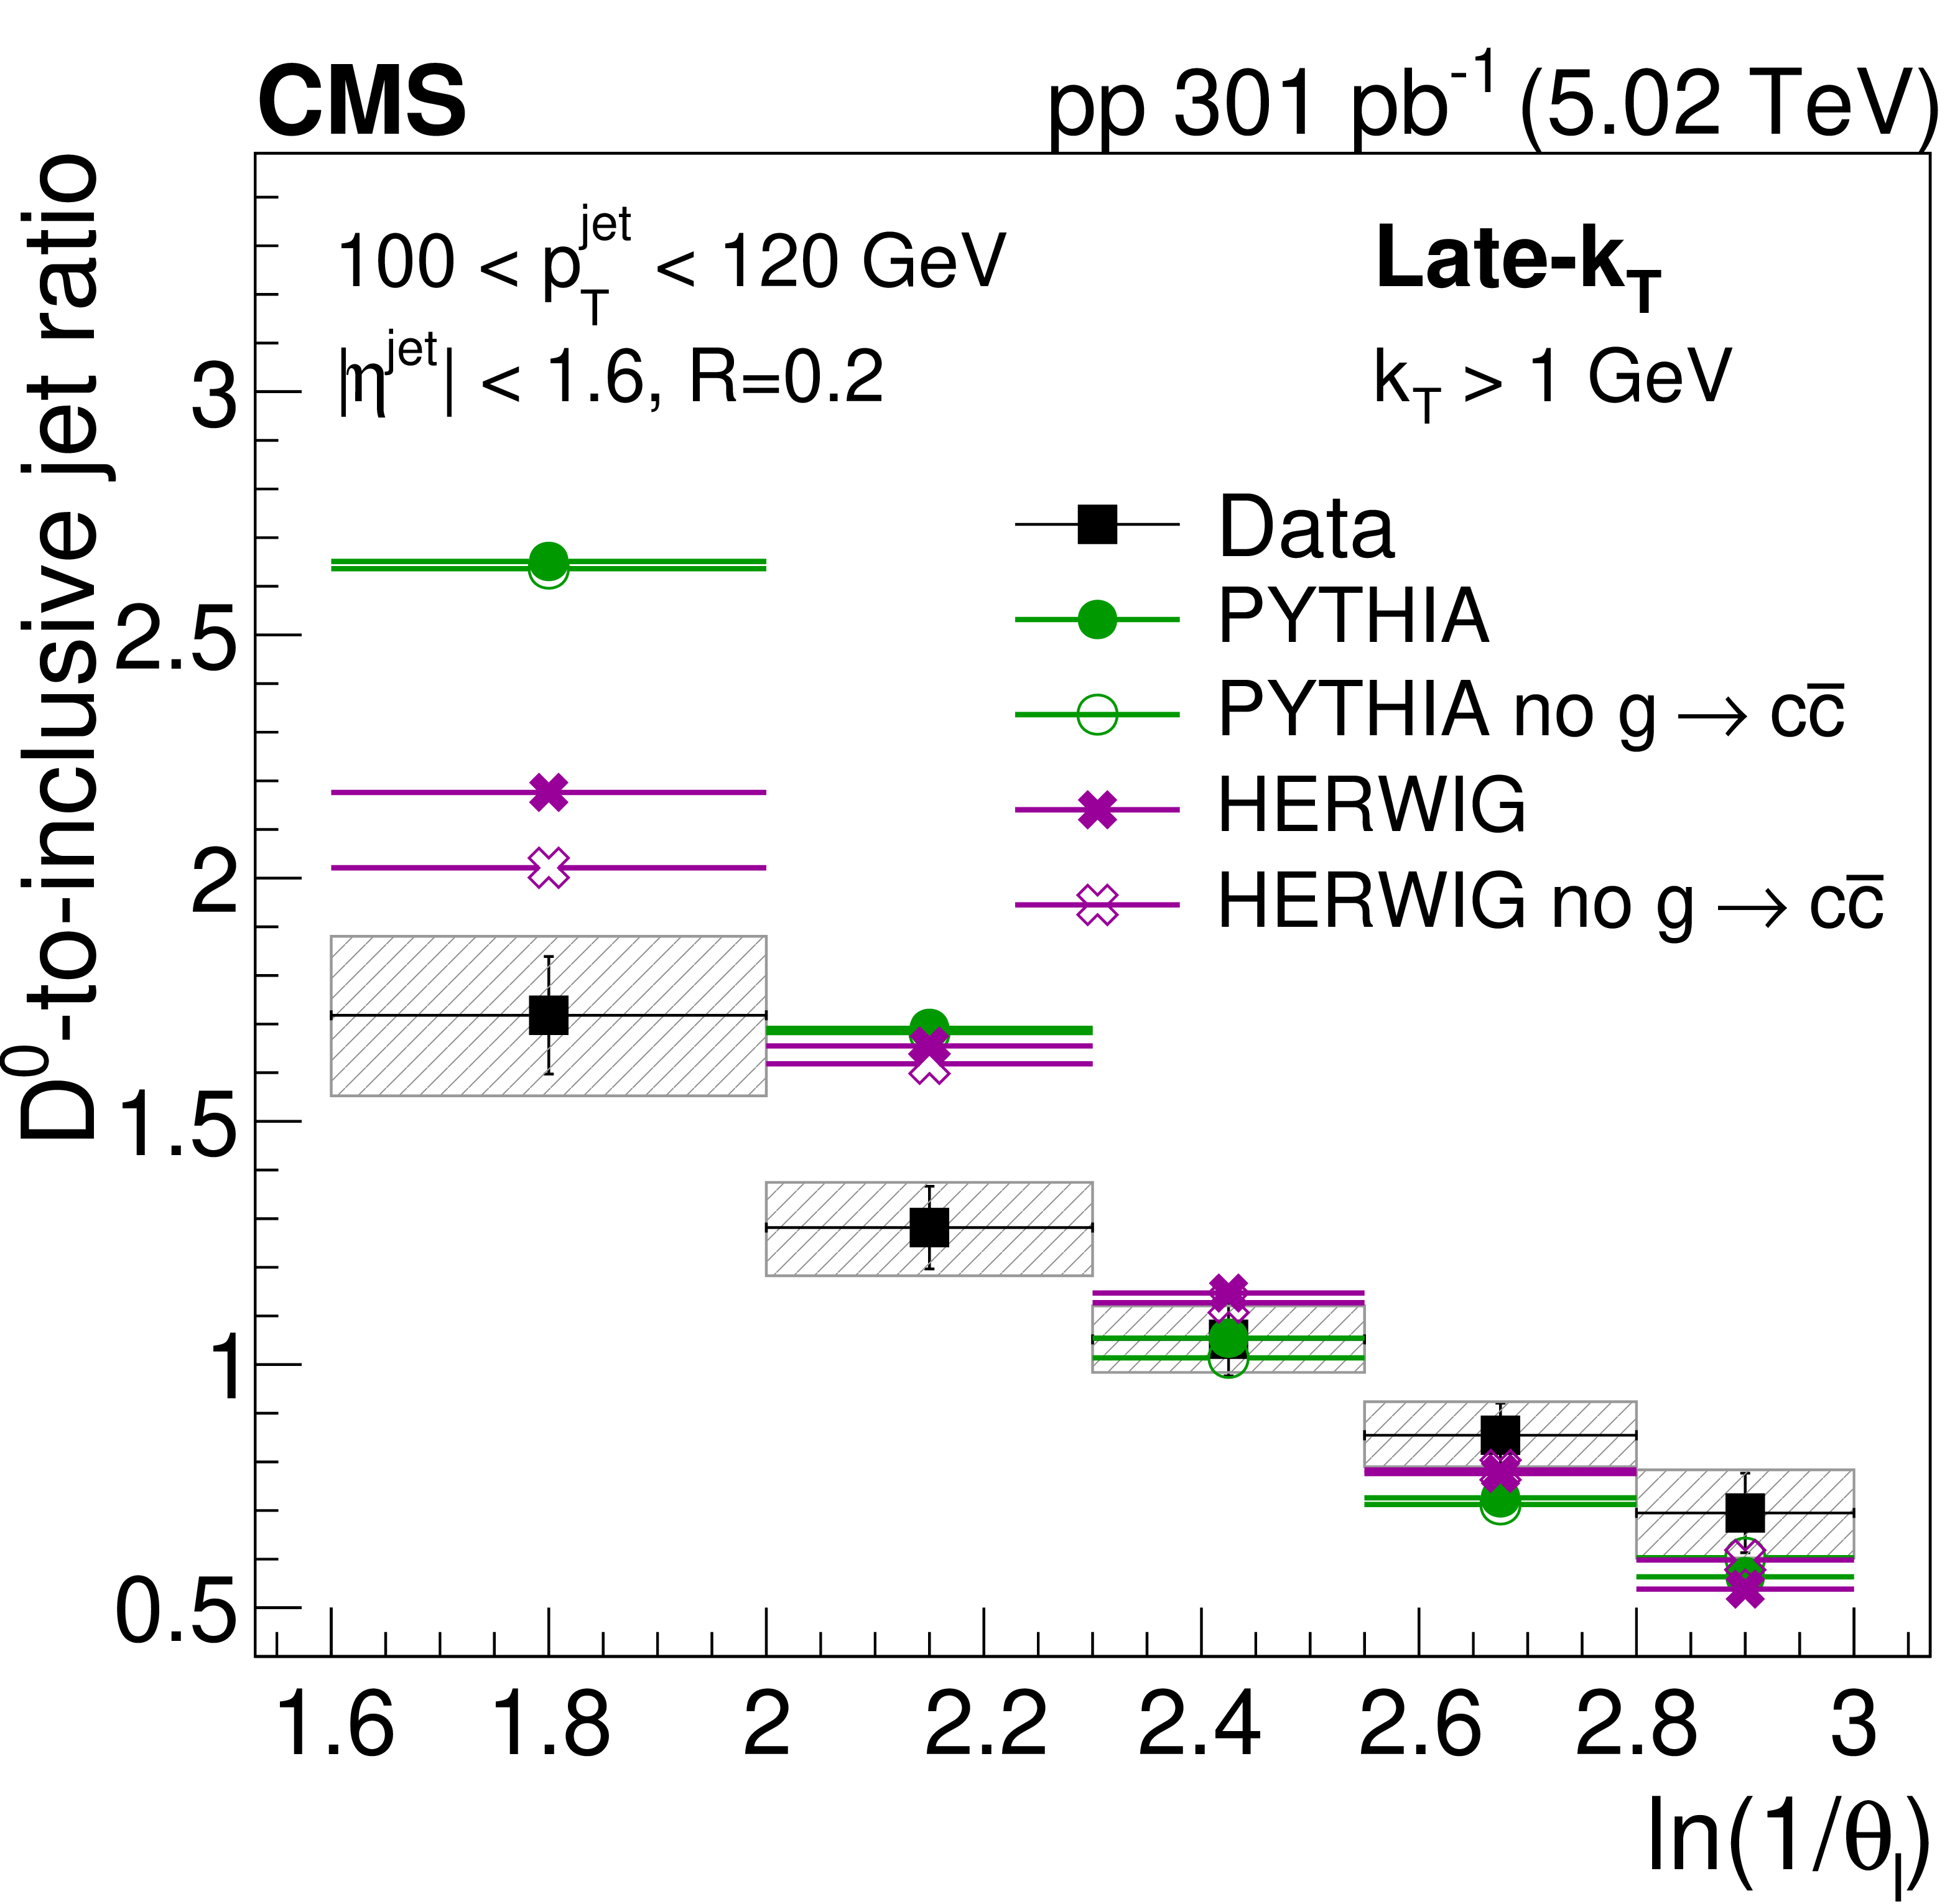
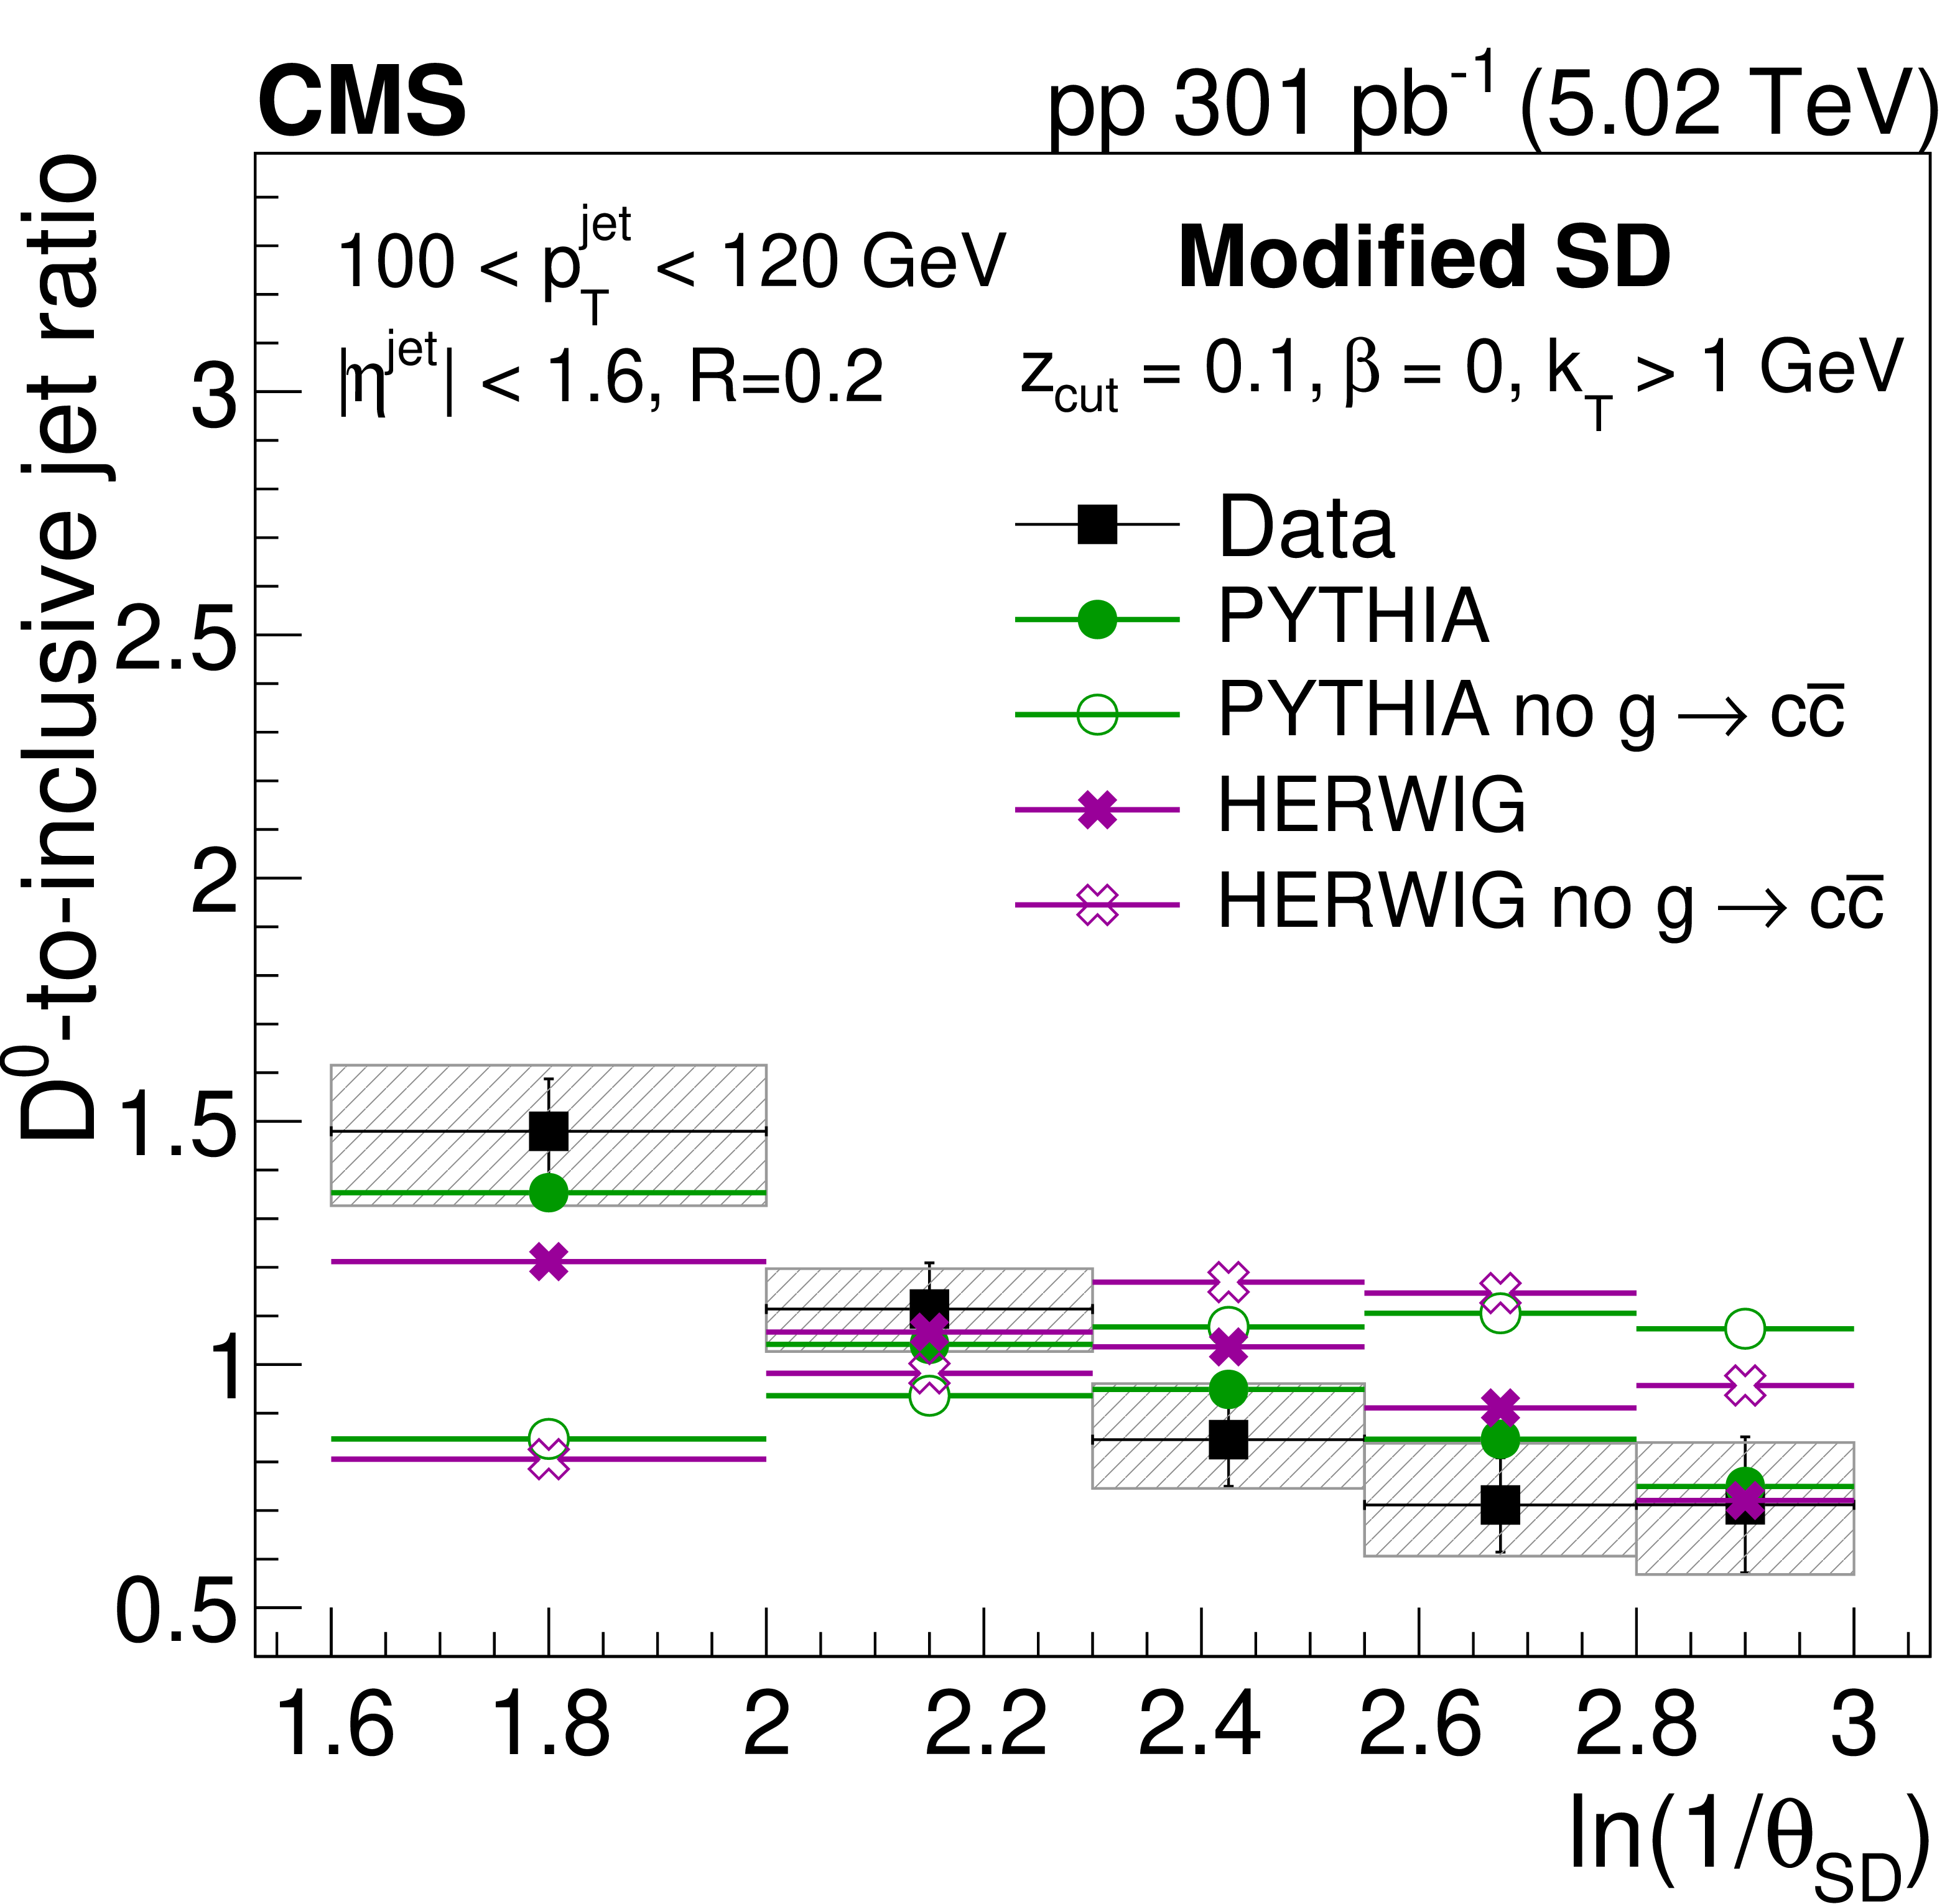
Figure 7:
The ratio of the late-$ k_{\mathrm{T}} $ (left) and SD (right) angle distributions for prompt $ \mathrm{D^0} $ jets to inclusive jets. The data are compared to PYTHIA8 CP5 and HERWIG 7 CH3 predictions with and without g$ \to \mathrm{c} \overline{\mathrm{c}} $. The error boxes represents the total systematic uncertainty, whereas the vertical bars represent the statistical uncertainties. |
png pdf |
Figure 7-a:
The ratio of the late-$ k_{\mathrm{T}} $ (left) and SD (right) angle distributions for prompt $ \mathrm{D^0} $ jets to inclusive jets. The data are compared to PYTHIA8 CP5 and HERWIG 7 CH3 predictions with and without g$ \to \mathrm{c} \overline{\mathrm{c}} $. The error boxes represents the total systematic uncertainty, whereas the vertical bars represent the statistical uncertainties. |
png pdf |
Figure 7-b:
The ratio of the late-$ k_{\mathrm{T}} $ (left) and SD (right) angle distributions for prompt $ \mathrm{D^0} $ jets to inclusive jets. The data are compared to PYTHIA8 CP5 and HERWIG 7 CH3 predictions with and without g$ \to \mathrm{c} \overline{\mathrm{c}} $. The error boxes represents the total systematic uncertainty, whereas the vertical bars represent the statistical uncertainties. |
| Tables | |
png pdf |
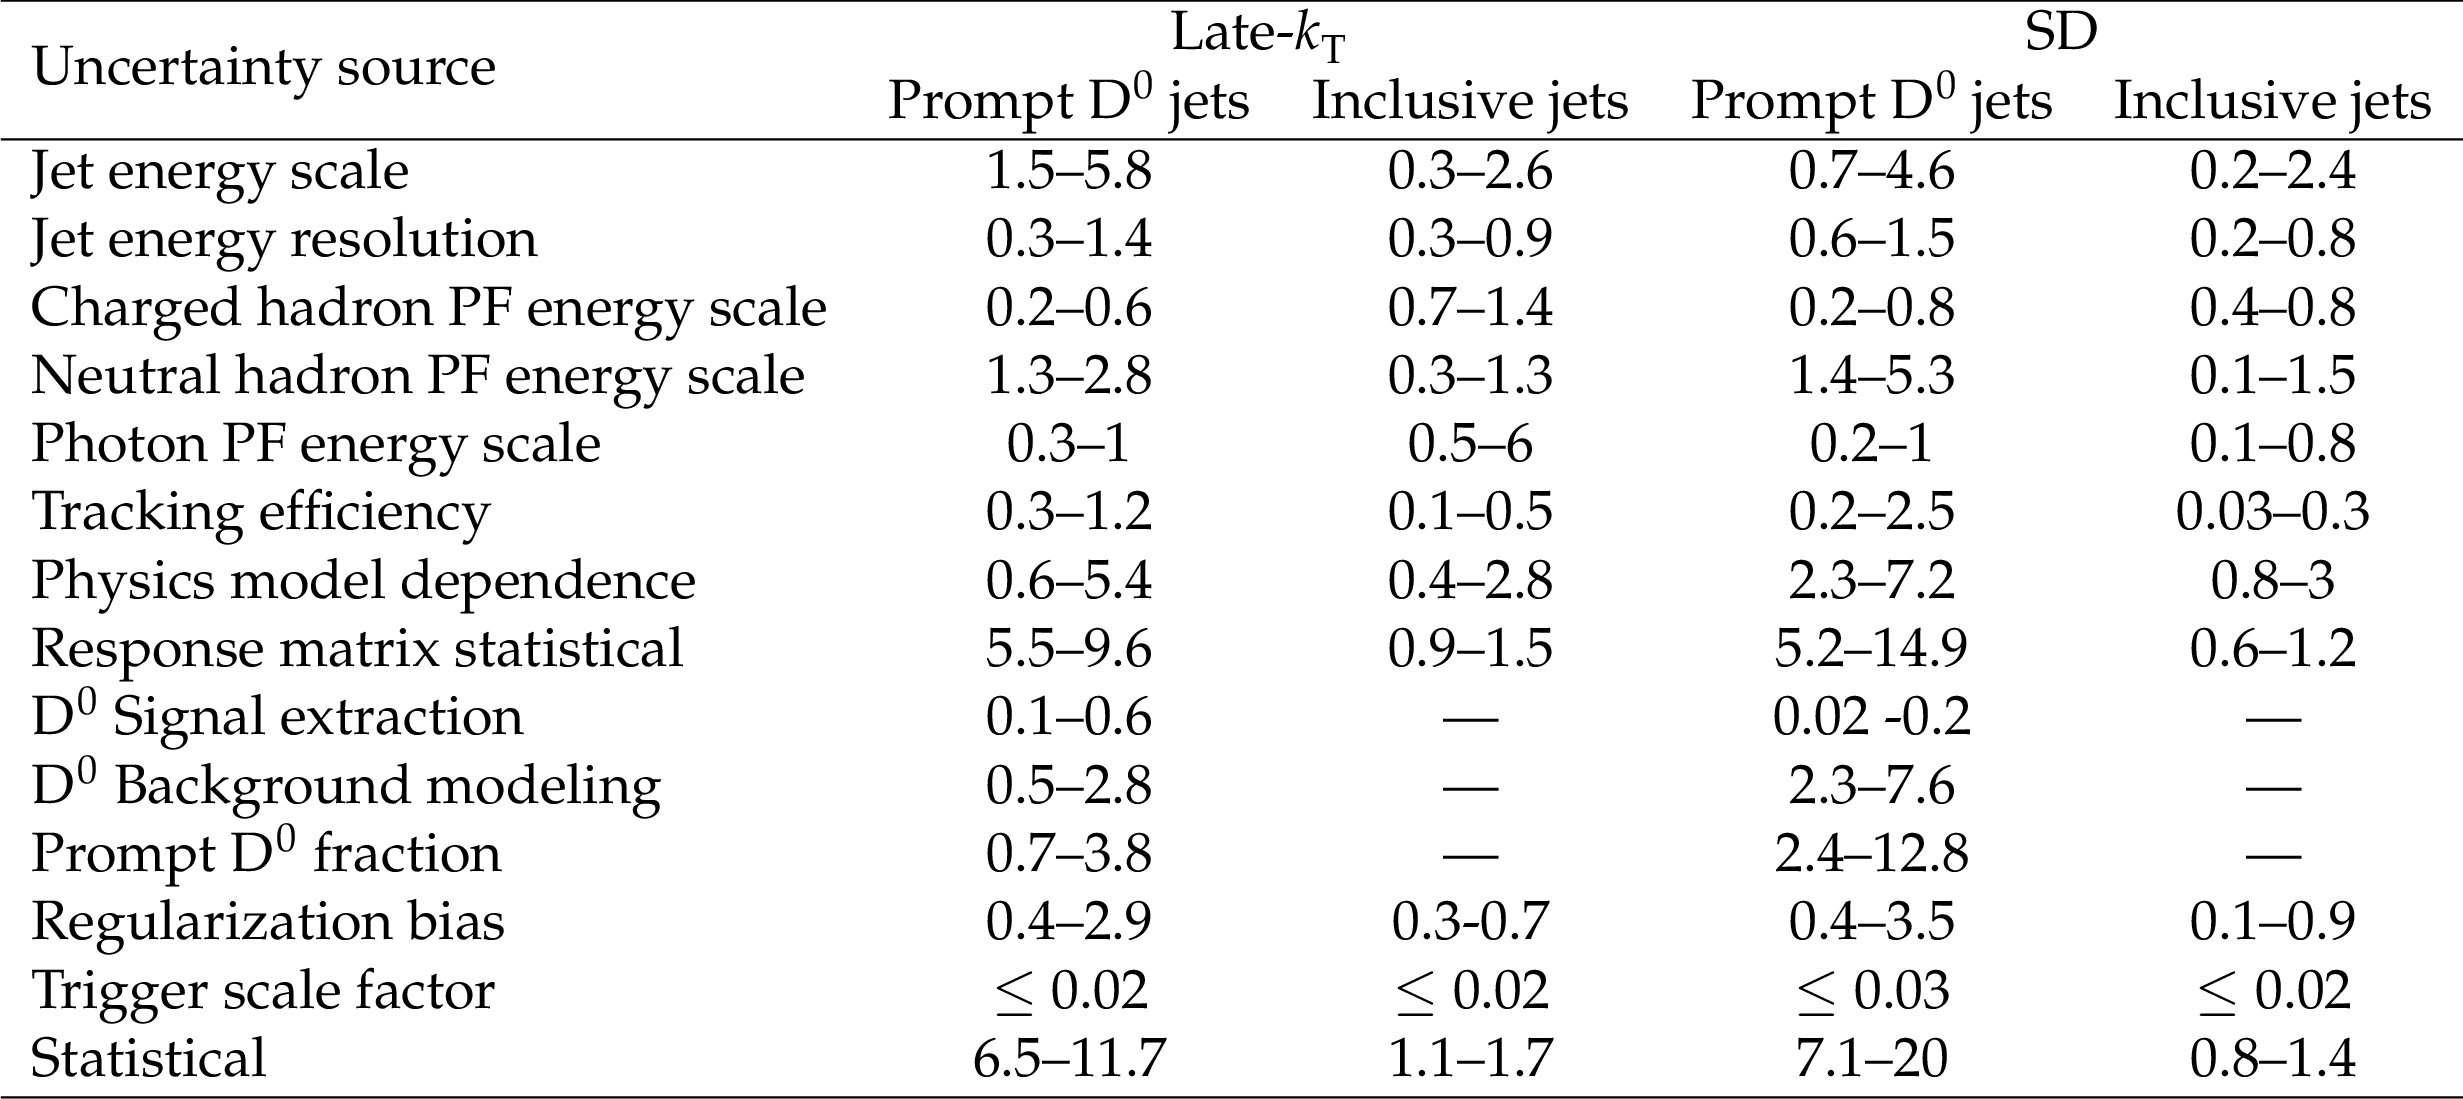
Table 1:
Summary of fractional uncertainties (%), with minimum and maximum uncertainty values indicated. |
| Summary |
| This paper presented measurements of the substructure of jets containing prompt $ \mathrm{D^0} $ mesons and of inclusive jets in proton-proton collisions at $ \sqrt{s} = $ 5.02 TeV, in a data sample corresponding to an integrated luminosity of 301 pb$^{-1}$, collected in 2017 with the CMS experiment. The analysis focuses on the substructure of jets with transverse momentum 100 $ < p_{\mathrm{T}}^\text{jet} < $ 120 GeV and pseudorapidity $ |\eta| < $ 1.6, initially clustered with the anti-$ k_{\mathrm{T}} $ algorithm and a distance parameter of $ R = $ 0.2. Both neutral and charged particles were used for the substructure of these jets. The $ \mathrm{D^0} $ mesons were identified via their two-pronged decays into a kaon and pion pair. In this analysis, the opening angle between the subjet pair found using two different grooming algorithms based on Cambridge-Aachen reclustering was measured. The late-$ k_{\mathrm{T}} $ algorithm consists of selecting the last splitting with a $ k_{\mathrm{T}} > $ 1 GeV in the Cambridge-Aachen tree and gives access to hard, collinear emissions in an algorithmic way. The angular separation between the two hard subjets found with the soft-drop grooming algorithm was also studied, using the parameters $ z_\text{cut} = $ 0.1 and $ \beta = $ 0, with the additional requirement that the emission has a minimum relative transverse momentum of $ k_{\mathrm{T}} > $ 1 GeV. Measured angular distributions were compared to PYTHIA8 CP5 and HERWIG 7 CH3 simulated events. HERWIG 7 CH3 prediction describes angular distribution of inclusive jets better than PYTHIA8 CP5, while in case of jets containing prompt $ \mathrm{D^0} $ mesons both predictions fail to reproduce data. Dedicated PYTHIA8 CP5 and HERWIG 7 CH3 predictions were produced to study impact of the gluon splitting to charm quark-antiquark pairs. The splitting angle distribution, in the case of soft-drop grooming algorithm, is sensitive to contributions from gluon splitting to charm quark-antiquark pairs at large angles. At the same time, the resulting angular distribution from late-$ k_{\mathrm{T}} $ grooming algorithm is less sensitive to gluon splitting and to soft- and wide-angle radiation, and is more sensitive to the dead-cone effect. Although $ p_{\mathrm{T}}^\text{jet} $ is much larger than the charm quark mass, it is possible to isolate hard collinear emissions and observe the suppression due to the charm quark mass in the hard and collinear region. This is the first measurement of charm quark jet substructure that probes the hard and collinear region of the jet shower, therefore minimizing the hadronization effect and enabling a more direct connection with expected parton shower. The jet $ p_{\mathrm{T}}^\text{jet} > $ 100 GeV selection, used for the first time for charm quark jet substructure, accesses the phase-space region which facilitates the interpretation of the jet substructure in terms of perturbative calculations. This measurement will serve as a reference for future studies in heavy ion collisions. In such interactions, the emissions induced by the strongly interacting quark-gluon plasma could be isolated in the region where vacuum emissions are vetoed by the dead cone. |
| References | ||||
| 1 | Y. L. Dokshitzer, V. A. Khoze, A. H. Mueller, and S. I. Troian | Basics of perturbative QCD | ||
| 2 | ALICE Collaboration | Direct observation of the dead cone effect in quantum chromodynamics | Nature 605 (2022) 440 | 2106.05713 |
| 3 | Y. L. Dokshitzer, V. A. Khoze, and S. I. Troian | On specific QCD properties of heavy quark fragmentation ('dead cone') | JPG 17 (1991) 1602 | |
| 4 | L. Cunqueiro, D. Napoletano, and A. Soto-Ontoso | Dead cone searches in heavy-ion collisions using the jet tree | PRD 107 (2023) 094008 | 2211.11789 |
| 5 | CMS Collaboration | Overview of high-density QCD studies with the CMS experiment at the LHC | Phys. Rept. 1115 (2025) 219 | CMS-HIN-23-011 2405.10785 |
| 6 | Y. L. Dokshitzer, G. D. Leder, S. Moretti, and B. R. Webber | Better jet clustering algorithms | JHEP 08 (1997) 001 | hep-ph/9707323 |
| 7 | F. A. Dreyer, G. P. Salam, and G. Soyez | The Lund Jet Plane | JHEP 12 (2018) 064 | 1807.04758 |
| 8 | L. Cunqueiro and M. Ploskoffń | Searching for the dead cone effects with iterative declustering of heavy-flavor jets | PRD 99 (2019) 074027 | 1812.00102 |
| 9 | A. J. Larkoski, S. Marzani, G. Soyez, and J. Thaler | Soft drop | JHEP 05 (2014) 146 | 1402.2657 |
| 10 | J. M. Butterworth, A. R. Davison, M. Rubin, and G. P. Salam | Jet substructure as a new Higgs search channel at the LHC | PRL 100 (2008) 242001 | 0802.2470 |
| 11 | ALICE Collaboration | Measurements of groomed jet substructure of charm jets tagged by $ \mathrm{D^0} $ mesons in proton-proton collisions at $ \sqrt{s}= $ 13 TeV | PRL 131 (2023) 192301 | 2208.04857 |
| 12 | CMS Collaboration | Luminosity measurement in proton-proton collisions at 5.02 TeV in 2017 at CMS | CMS Physics Analysis Summary CMS-PAS-LUM-19-001 |
CMS-PAS-LUM-19-001 |
| 13 | CMS Collaboration | HEPData record for this analysis | link | |
| 14 | CMS Collaboration | The CMS experiment at the CERN LHC | JINST 3 (2008) S08004 | |
| 15 | CMS Collaboration | Development of the CMS detector for the CERN LHC Run 3 | JINST 19 (2024) P05064 | CMS-PRF-21-001 2309.05466 |
| 16 | CMS Collaboration | Performance of the CMS Level-1 trigger in proton-proton collisions at $ \sqrt{s} = $ 13 TeV | JINST 15 (2020) P10017 | CMS-TRG-17-001 2006.10165 |
| 17 | CMS Collaboration | The CMS trigger system | JINST 12 (2017) P01020 | CMS-TRG-12-001 1609.02366 |
| 18 | CMS Collaboration | Electron and photon reconstruction and identification with the CMS experiment at the CERN LHC | JINST 16 (2021) P05014 | CMS-EGM-17-001 2012.06888 |
| 19 | CMS Collaboration | Performance of the CMS muon detector and muon reconstruction with proton-proton collisions at $ \sqrt{s}= $ 13 TeV | JINST 13 (2018) P06015 | CMS-MUO-16-001 1804.04528 |
| 20 | CMS Collaboration | Description and performance of track and primary-vertex reconstruction with the CMS tracker | JINST 9 (2014) P10009 | CMS-TRK-11-001 1405.6569 |
| 21 | CMS Collaboration | Particle-flow reconstruction and global event description with the CMS detector | JINST 12 (2017) P10003 | CMS-PRF-14-001 1706.04965 |
| 22 | CMS Collaboration | Performance of reconstruction and identification of $ \tau $ leptons decaying to hadrons and $ \nu_\tau $ in pp collisions at $ \sqrt{s}= $ 13 TeV | JINST 13 (2018) P10005 | CMS-TAU-16-003 1809.02816 |
| 23 | CMS Collaboration | Jet energy scale and resolution in the CMS experiment in pp collisions at 8 TeV | JINST 12 (2017) P02014 | CMS-JME-13-004 1607.03663 |
| 24 | CMS Collaboration | Performance of missing transverse momentum reconstruction in proton-proton collisions at $ \sqrt{s} = $ 13 TeV using the CMS detector | JINST 14 (2019) P07004 | CMS-JME-17-001 1903.06078 |
| 25 | T. Sj$\text ö $strand et al. | An introduction to PYTHIA8.2 | Comput. Phys. Commun. 191 (2015) 159 | 1410.3012 |
| 26 | CMS Collaboration | Extraction and validation of a new set of CMS PYTHIA8 tunes from underlying event measurements | EPJC 80 (2020) 4 | CMS-GEN-17-001 1903.12179 |
| 27 | S. Gieseke, P. Stephens, and B. Webber | New formalism for QCD parton showers | JHEP 12 (2003) 045 | hep-ph/0310083 |
| 28 | NNPDF Collaboration | Parton distributions for the LHC Run 2 | JHEP 04 (2015) 040 | 1410.8849 |
| 29 | B. R. Webber | A QCD model for jet fragmentation including soft gluon interference | NPB 238 (1984) 492 | |
| 30 | CMS Collaboration | Development and validation of HERWIG 7 tunes from CMS underlying event measurements | EPJC 81 (2021) 312 | CMS-GEN-19-001 2011.03422 |
| 31 | GEANT4 Collaboration | GEANT 4---a simulation toolkit | NIM A 506 (2003) 250 | |
| 32 | P. Skands, S. Carrazza, and J. Rojo | Tuning PYTHIA8.1: the Monash 2013 tune | EPJC 74 (2014) 3024 | 1404.5630 |
| 33 | CMS Collaboration | Event generator tunes obtained from underlying event and multiparton scattering measurements | EPJC 76 (2016) 155 | CMS-GEN-14-001 1512.00815 |
| 34 | M. Cacciari, G. P. Salam, and G. Soyez | The anti-$ k_{\mathrm{T}} $ jet clustering algorithm | JHEP 04 (2008) 063 | 0802.1189 |
| 35 | M. Cacciari, G. P. Salam, and G. Soyez | FastJet user manual | EPJC 72 (2012) 1896 | 1111.6097 |
| 36 | H. A. Andrews et al. | Novel tools and observables for jet physics in heavy-ion collisions | JPG 47 (2020) 065102 | 1808.03689 |
| 37 | CMS Collaboration | Determination of jet energy calibration and transverse momentum resolution in CMS | JINST 6 (2011) P11002 | CMS-JME-10-011 1107.4277 |
| 38 | Particle Data Group , S. Navas et al. | Review of particle physics | PRD 110 (2024) 030001 | |
| 39 | H. Voss, A. Höcker, J. Stelzer, and F. Tegenfeldt | TMVA, the toolkit for multivariate data analysis with ROOT | in Proc. XIth International Workshop on Advanced Computing and Analysis Techniques in Physics Research (ACAT), 2007 link |
physics/0703039 |
| 40 | CMS Collaboration | Studies of charm quark diffusion inside jets using PbPb and pp collisions at $ \sqrt {\smash [b]{s_{_{\mathrm {NN}}}}} = $ 5.02 TeV | PRL 125 (2020) 102001 | CMS-HIN-18-007 1911.01461 |
| 41 | M. Wobisch and T. Wengler | Hadronization corrections to jet cross sections in deep inelastic scattering | in Proc. Workshop on Monte Carlo generators for HERA physics, 1998 link |
hep-ph/9907280 |
| 42 | S. Caletti, A. Ghira, and S. Marzani | On heavy-flavor jets with soft drop | EPJC 84 (2024) 212 | 2312.11623 |
| 43 | G. D'Agostini | A multidimensional unfolding method based on Bayes' theorem | NIM A 362 (1995) 487 | |
| 44 | T. Adye | Unfolding algorithms and tests using RooUnfold | in Proc. PHYSTAT 2011 Workshop on Statistical Issues Related to Discovery Claims in Search Experiments and Unfolding, H. Prosper and L. Lyons, eds., Geneva, 2011 link |
1105.1160 |
| 45 | CMS Collaboration | Single-particle response in the CMS calorimeters | CMS Physics Analysis Summary, 2010 link |
|
| 46 | CMS Collaboration | Measurements of azimuthal anisotropy of nonprompt $ \mathrm{D^0} $ mesons in PbPb collisions at 5.02TeV | PLB 850 (2024) 138389 | CMS-HIN-21-003 2212.01636 |
| 47 | CMS Collaboration | Study of quark and gluon jet substructure in Z+jet and dijet events from pp collisions | JHEP 01 (2022) 188 | CMS-SMP-20-010 2109.03340 |
| 48 | CMS Collaboration | Measurement of the primary Lund jet plane density in proton-proton collisions at $ \sqrt{\textrm{s}} = $ 13 TeV | JHEP 05 (2024) 116 | CMS-SMP-22-007 2312.16343 |
|
|
Compact Muon Solenoid LHC, CERN |
|

|

|

|

|

|