

Compact Muon Solenoid
LHC, CERN
| CMS-HIG-16-044 ; CERN-EP-2017-233 | ||
| Evidence for the Higgs boson decay to a bottom quark-antiquark pair | ||
| CMS Collaboration | ||
| 21 September 2017 | ||
| Phys. Lett. B 780 (2018) 501 | ||
| Abstract: A search for the standard model (SM) Higgs boson (H) decaying to $\mathrm{b\bar{b}}$ when produced in association with an electroweak vector boson is reported for the following processes: $\mathrm{Z}(\nu\nu)\mathrm{H}$, $\mathrm{W}(\mu\nu)\mathrm{H}$, $\mathrm{W}(\mathrm{e}\nu)\mathrm{H}$, $\mathrm{Z}(\mu\mu)\mathrm{H}$, and $\mathrm{Z}(\mathrm{e}\mathrm{e})\mathrm{H}$. The search is performed in data samples corresponding to an integrated luminosity of 35.9 fb$^{-1}$ at $\sqrt{s} = $ 13 TeV recorded by the CMS experiment at the LHC during Run 2 in 2016. An excess of events is observed in data compared to the expectation in the absence of a ${\mathrm{H}\to\mathrm{b\bar{b}}} $ signal. The significance of this excess is 3.3 standard deviations, where the expectation from SM Higgs boson production is 2.8. The signal strength corresponding to this excess, relative to that of the SM Higgs boson production, is 1.2 $\pm$ 0.4. When combined with the Run 1 measurement of the same processes, the signal significance is 3.8 standard deviations with 3.8 expected. The corresponding signal strength, relative to that of the SM Higgs boson, is 1.06$^{+0.31}_{-0.29}$. | ||
| Links: e-print arXiv:1709.07497 [hep-ex] (PDF) ; CDS record ; inSPIRE record ; CADI line (restricted) ; | ||
| Figures | |
png pdf |
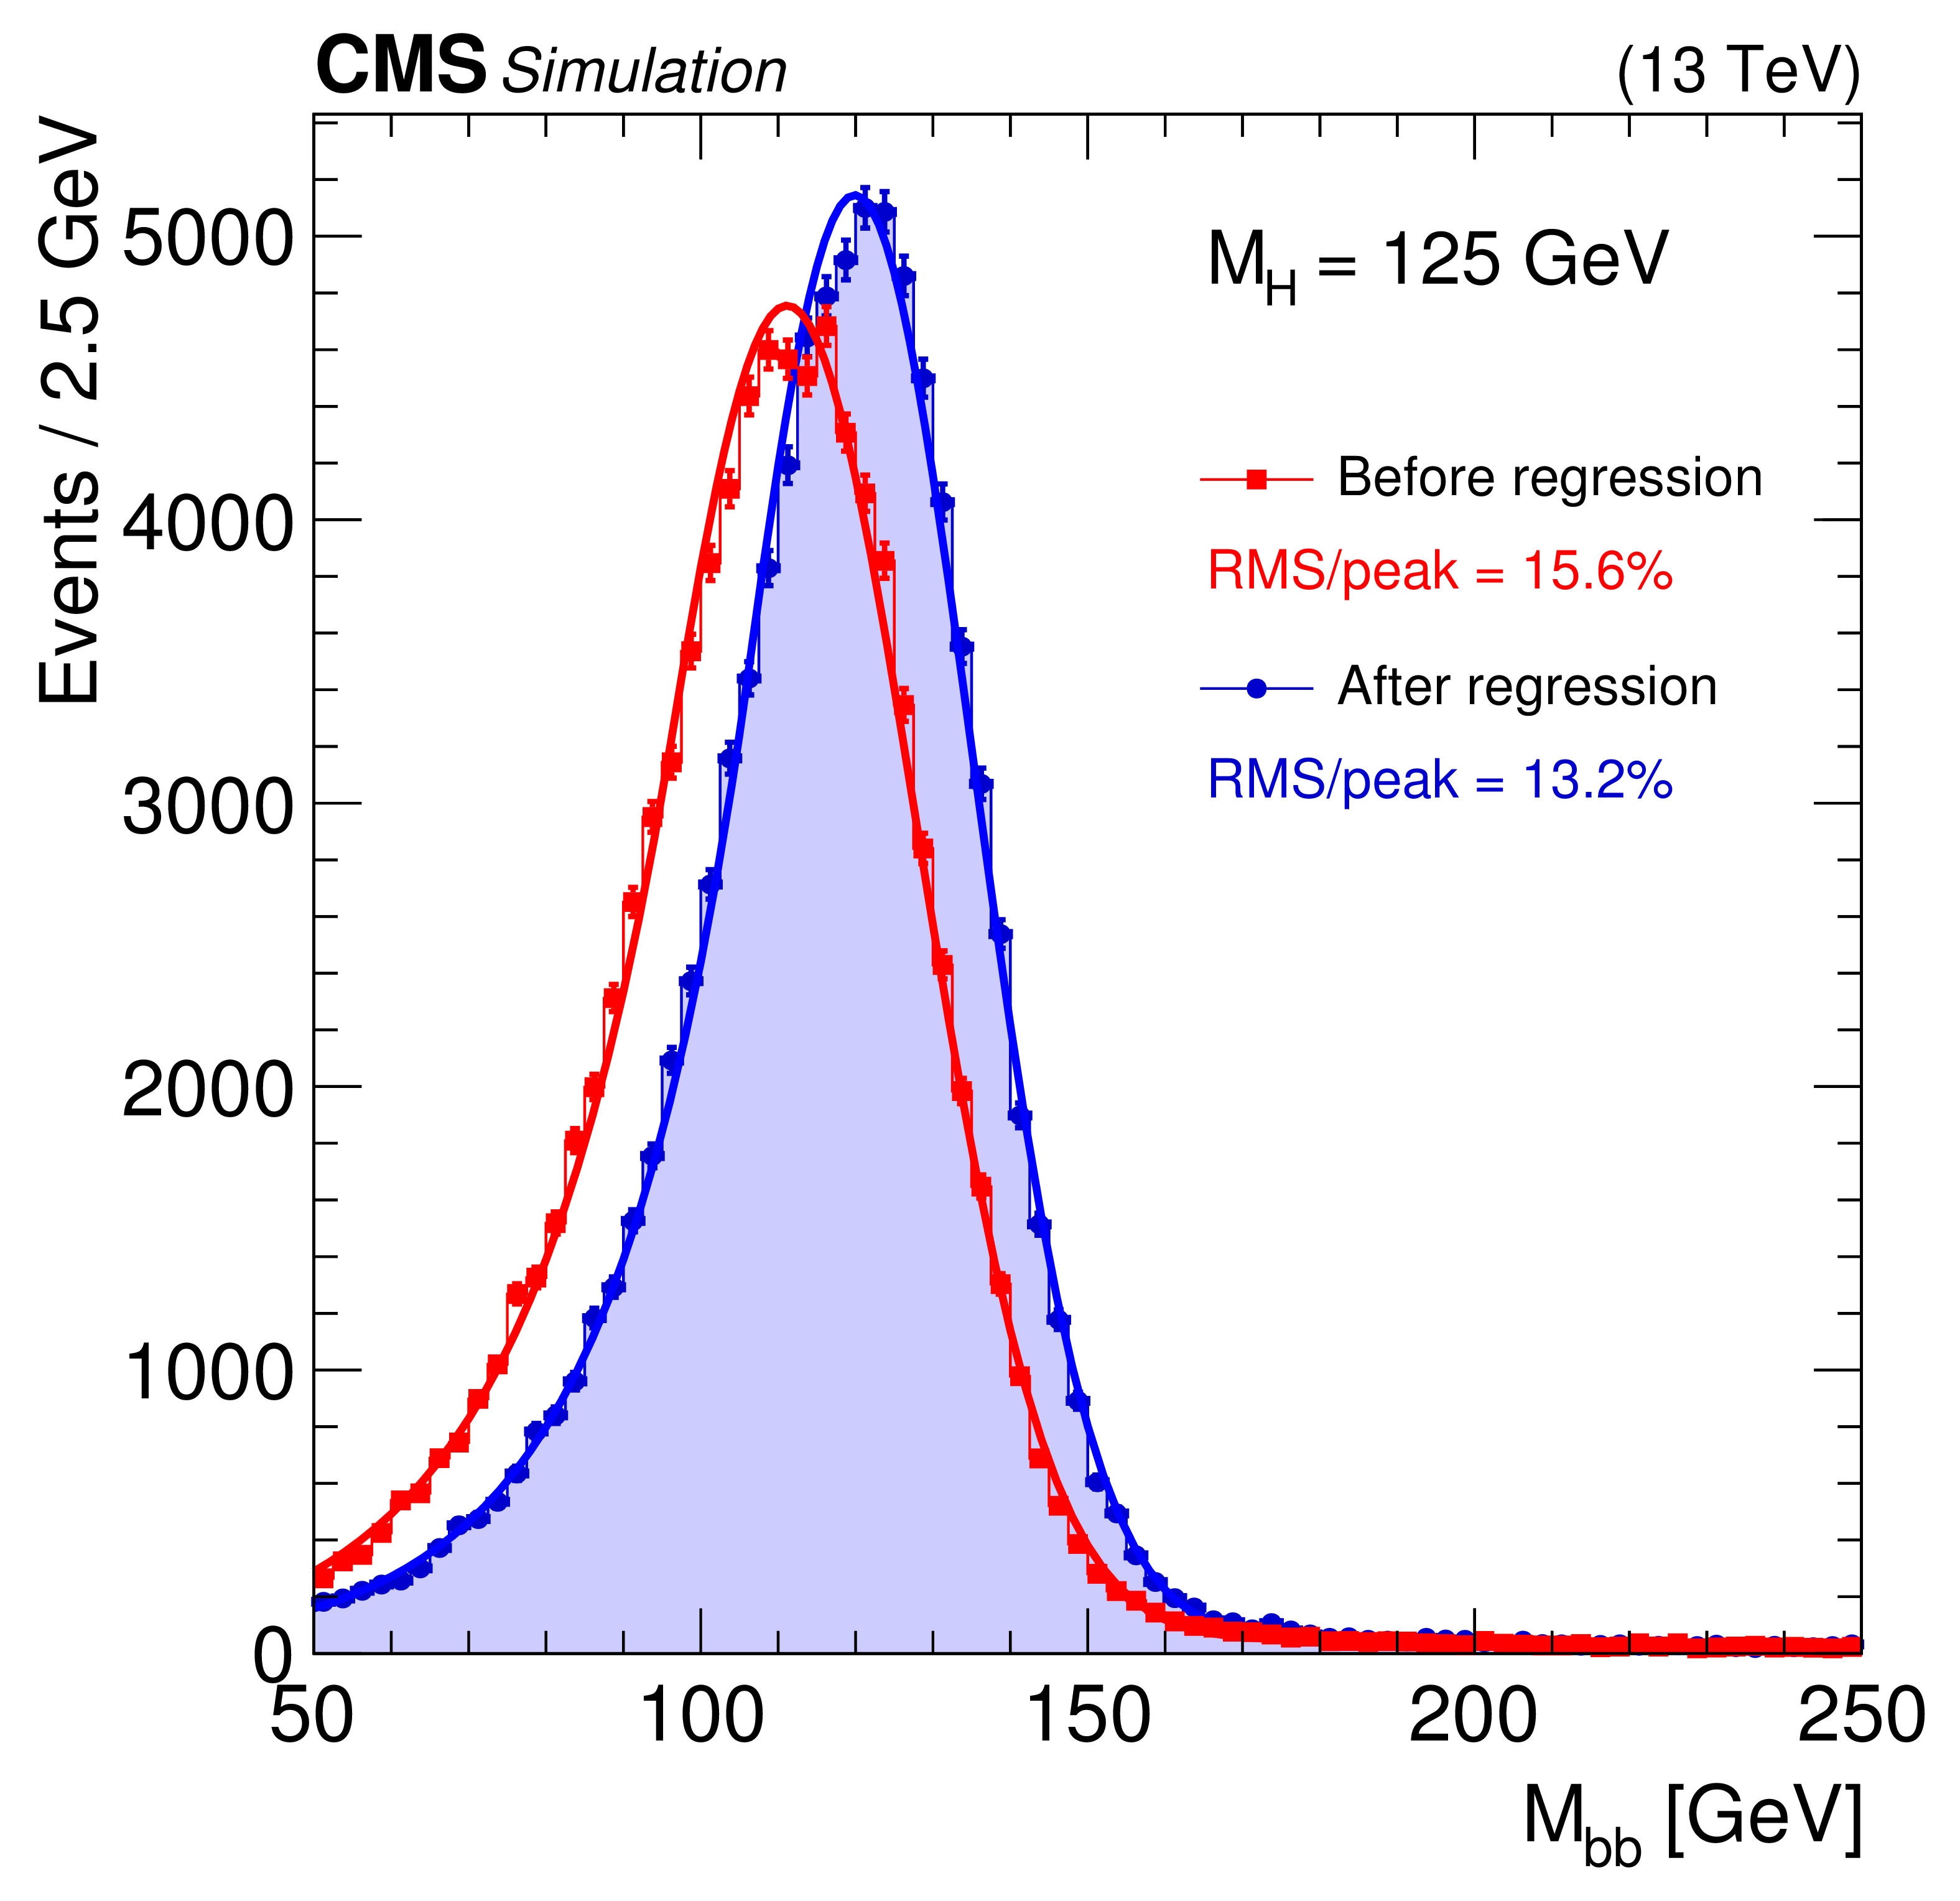
Figure 1:
Dijet invariant mass distributions for simulated samples of ${\mathrm{Z} (\ell \ell)\mathrm{H} (\mathrm{b} \mathrm{b})}$ events ($m_{\mathrm{H}} = $ 125 GeV), before (red) and after (blue) the energy correction from the regression procedure is applied. A sum of a Bernstein polynomial and a Crystal Ball function is used to fit the distribution. The displayed resolutions are derived from the peak and RMS of the Gaussian core of the Crystal Ball function. |

png pdf |
Figure 2:
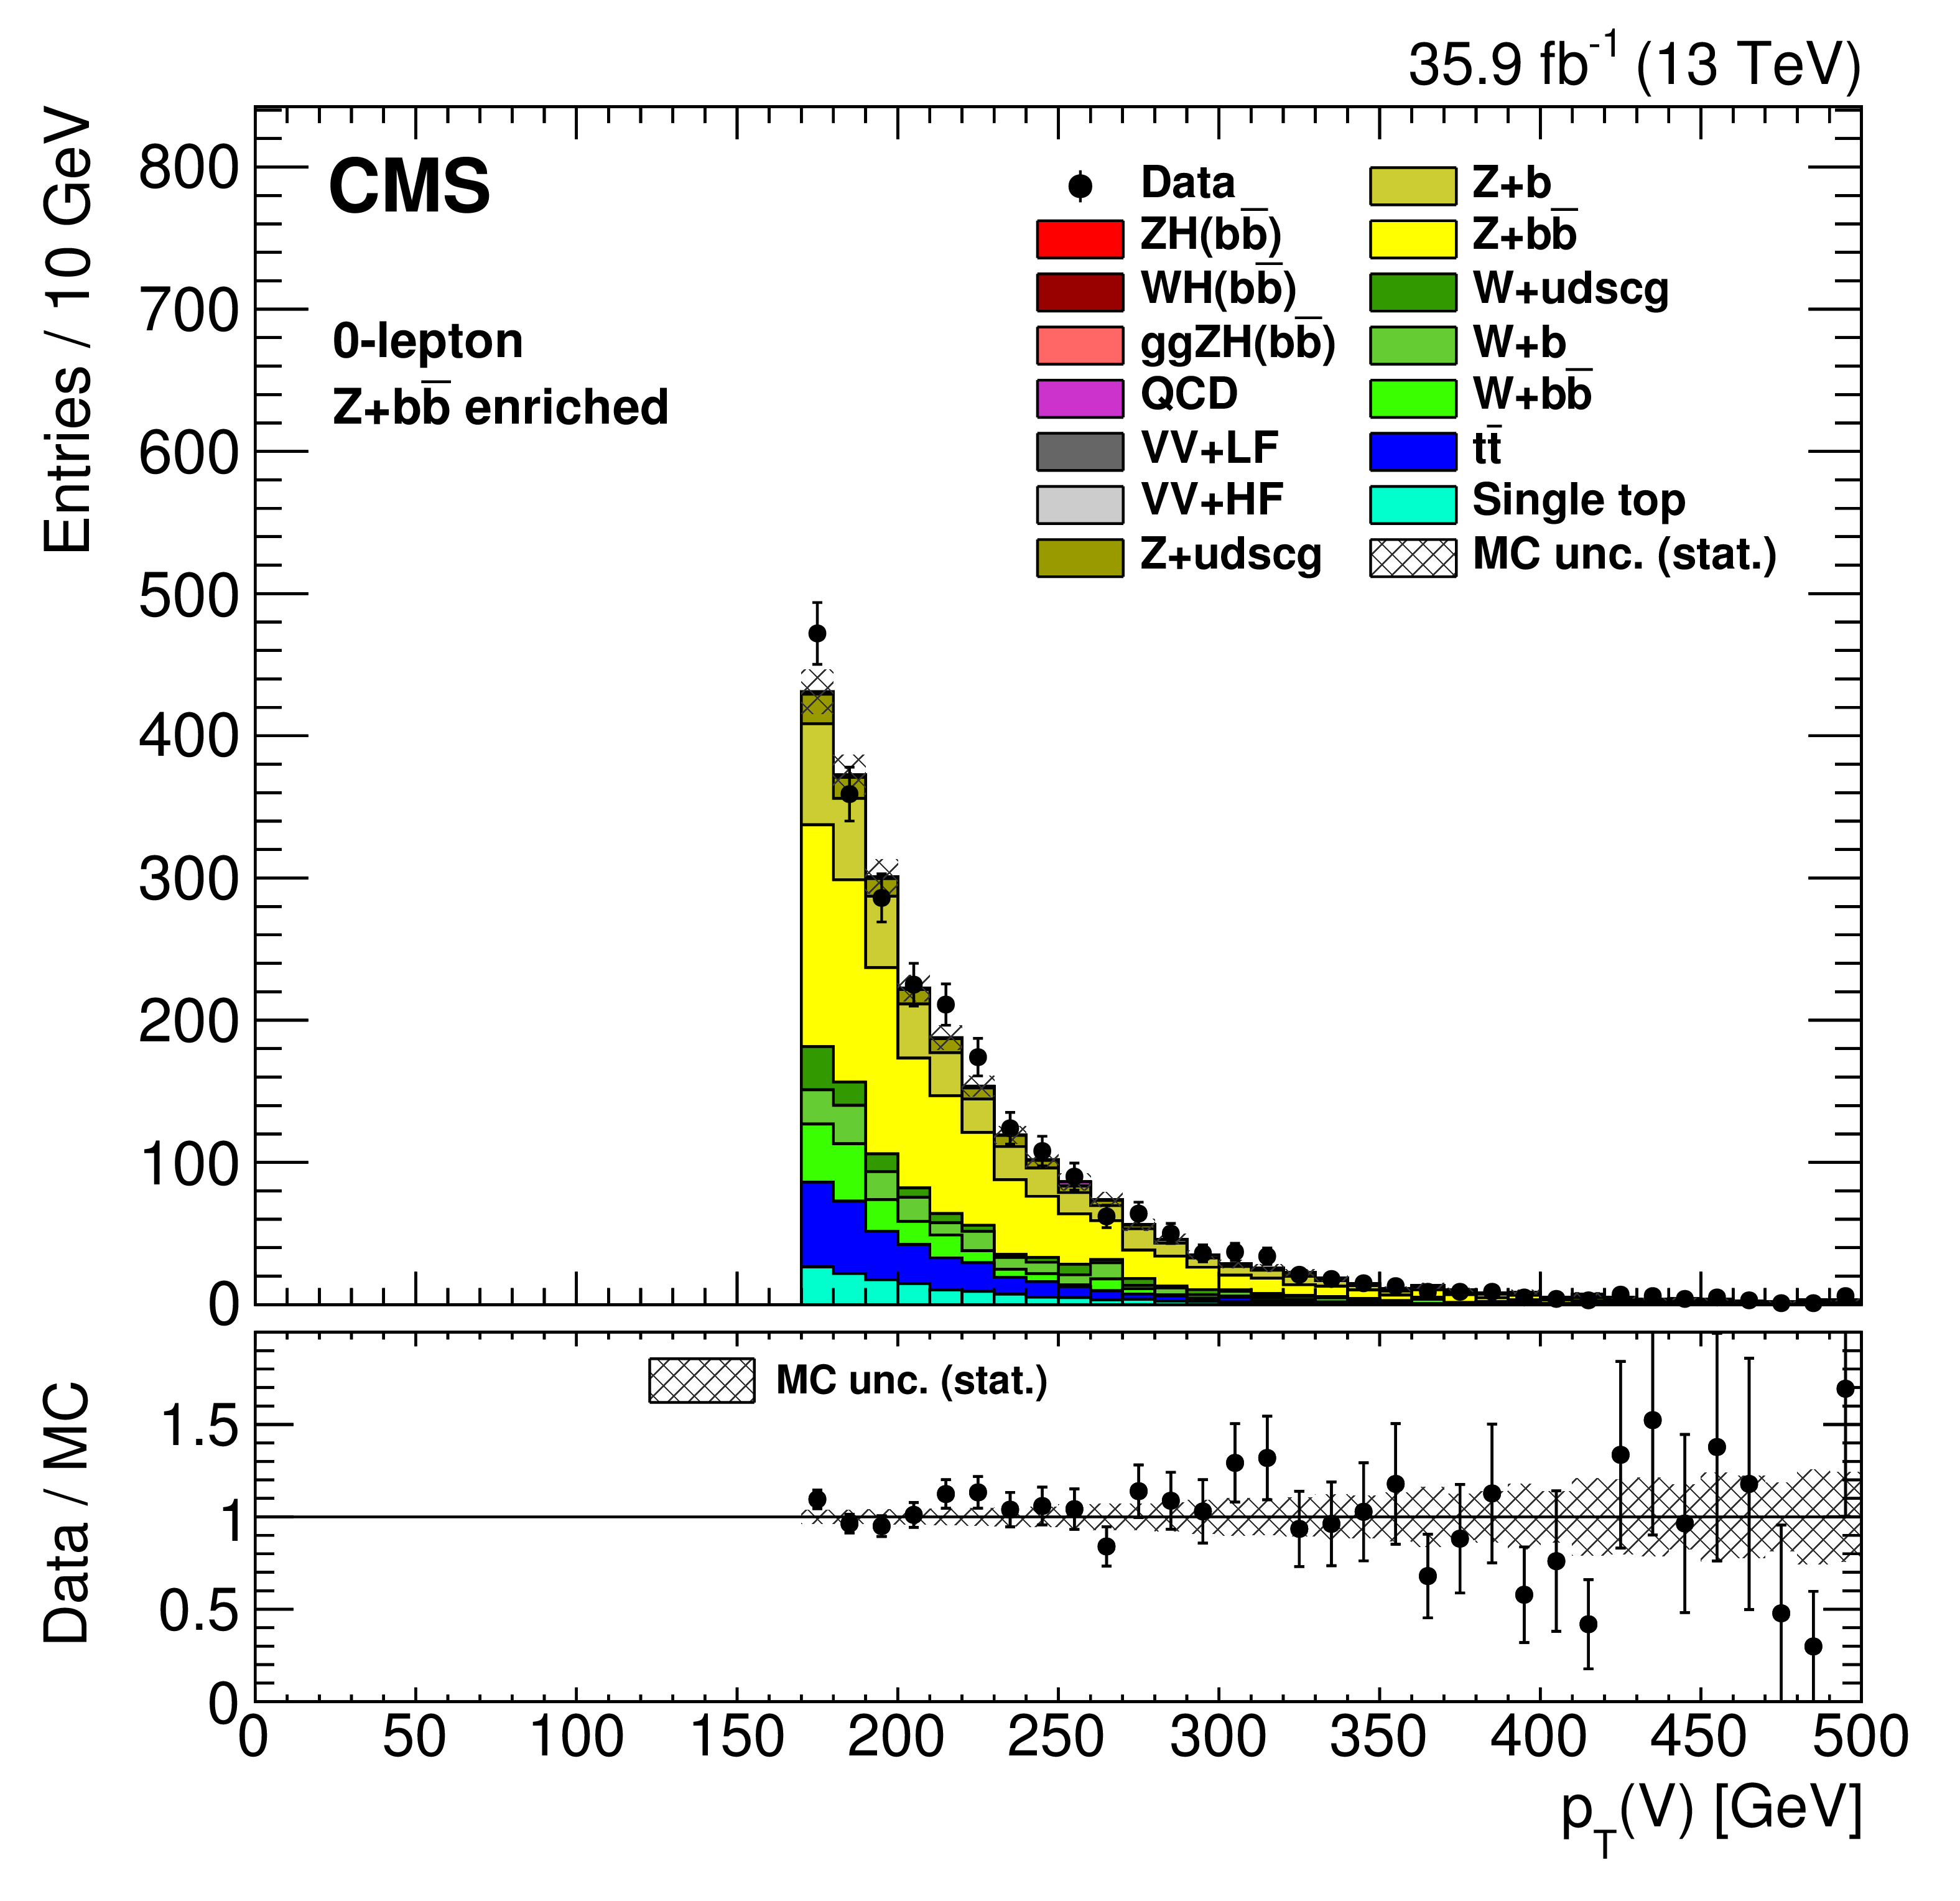
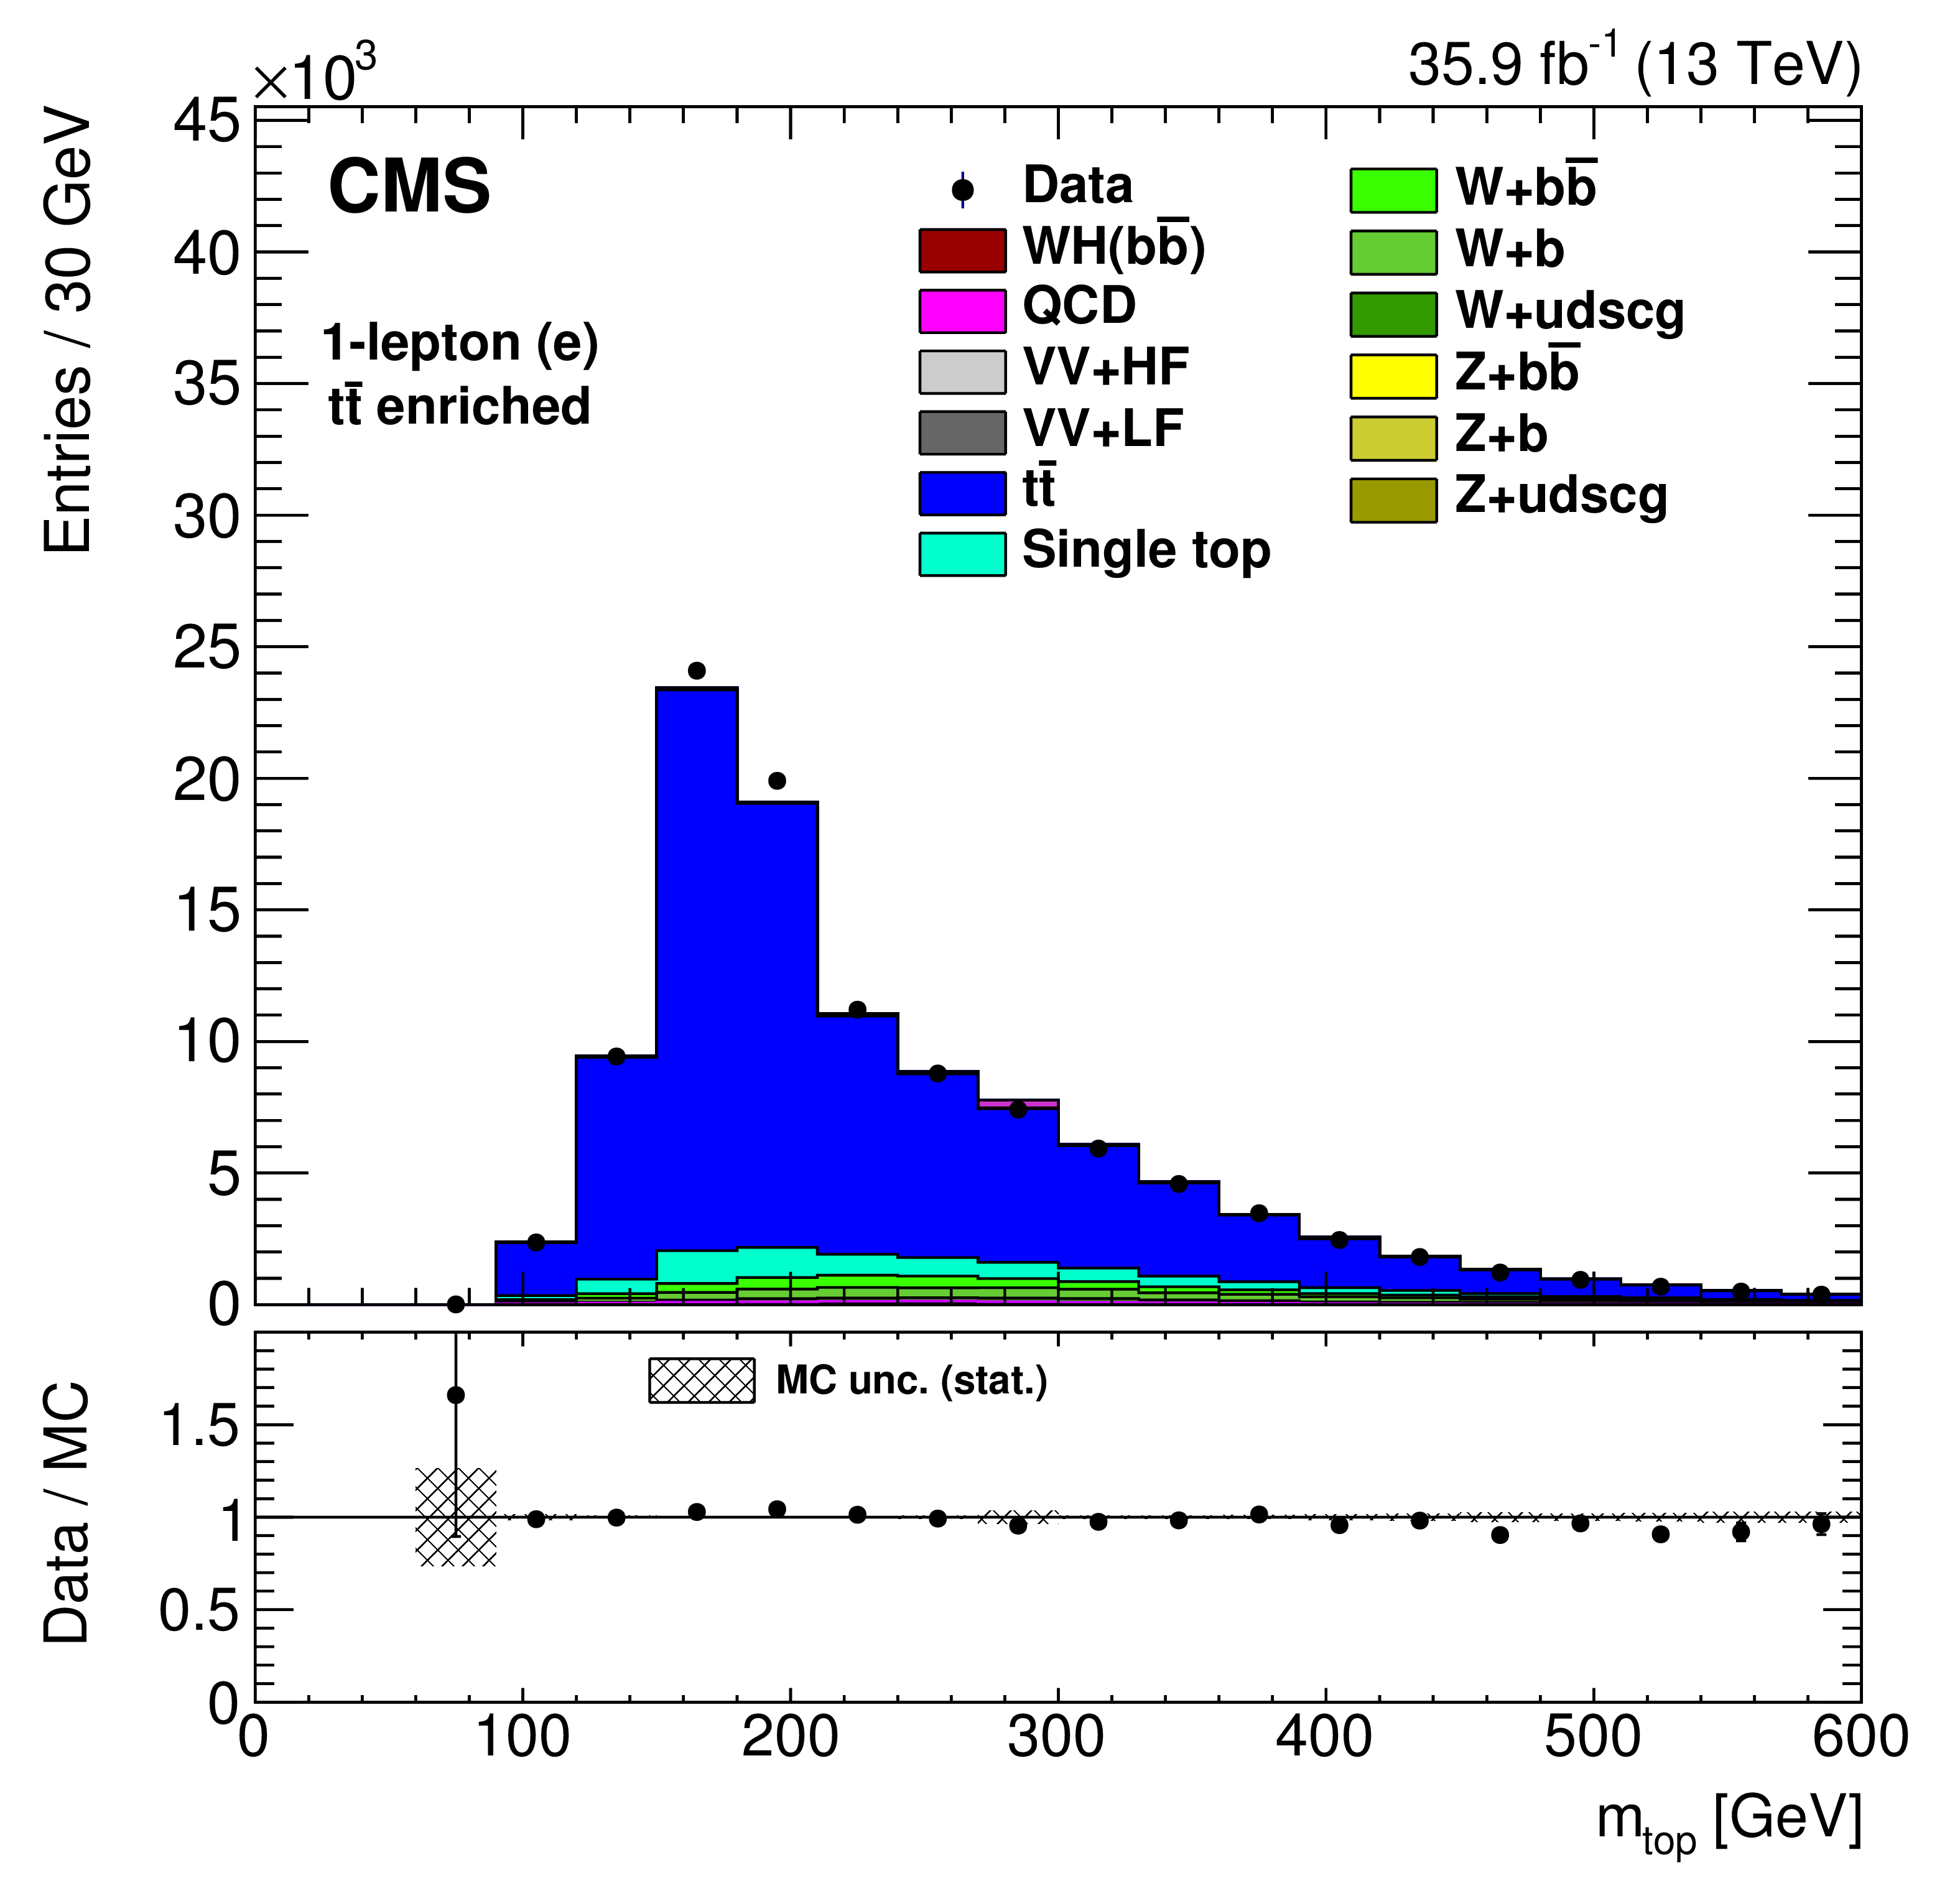
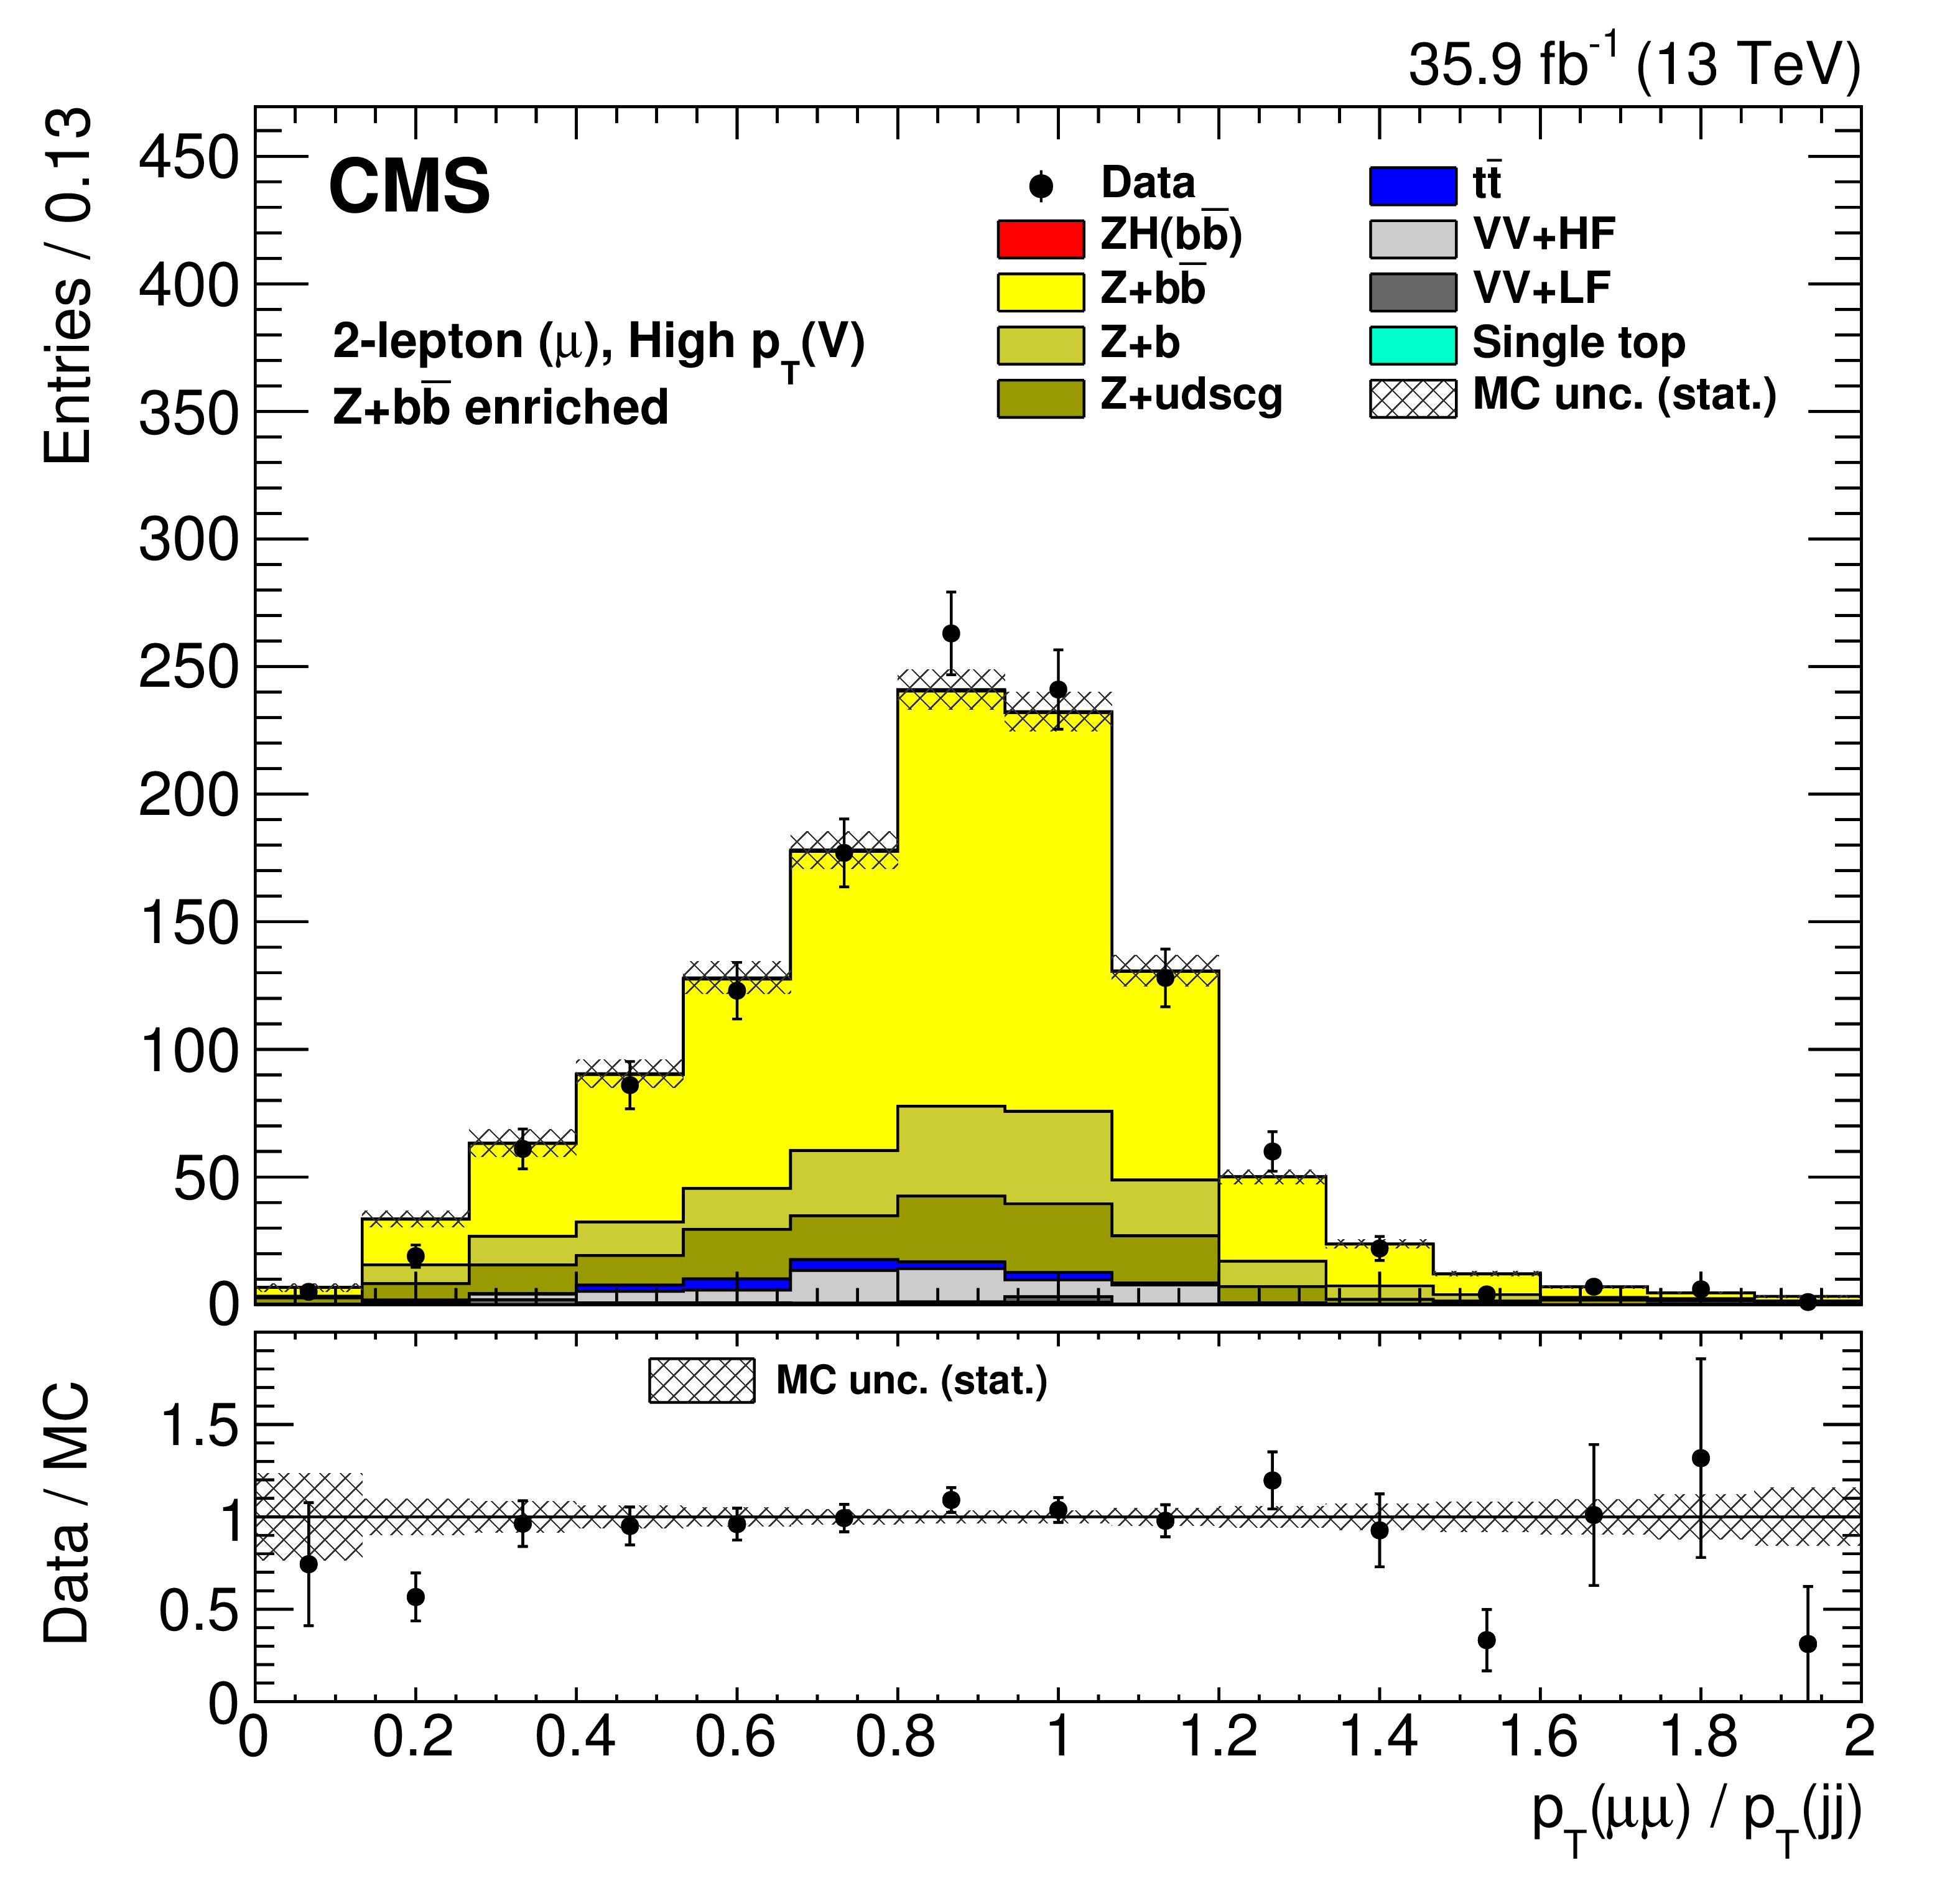
Examples of distributions for variables in the simulated samples and in data for different control regions and for different channels after applying the data/MC scale factors in Table 6. The top row of plots is from the 0-lepton Z+HF control region. The middle row shows variables in the 1-lepton ${\mathrm{t} {}\mathrm{\bar{t}}} $ control region. The bottom row shows variables in the 2-lepton Z+HF control region. The plots on the left are always ${{p_{\mathrm {T}}} ({\mathrm {V}})}$. Plots on the right show a key variable that is validated in that control region. These variables are, from top to bottom, the azimuthal angle between the two jets that comprise the Higgs boson, the reconstructed top quark mass, and the ratio of ${{p_{\mathrm {T}}} ({\mathrm {V}})}$ and ${{{p_{\mathrm {T}}} \mathrm {(jj)}}}$. |
png pdf |
Figure 2-a:
Distribution of ${{p_{\mathrm {T}}} ({\mathrm {V}})}$ in the simulated samples and in data for |
png pdf |
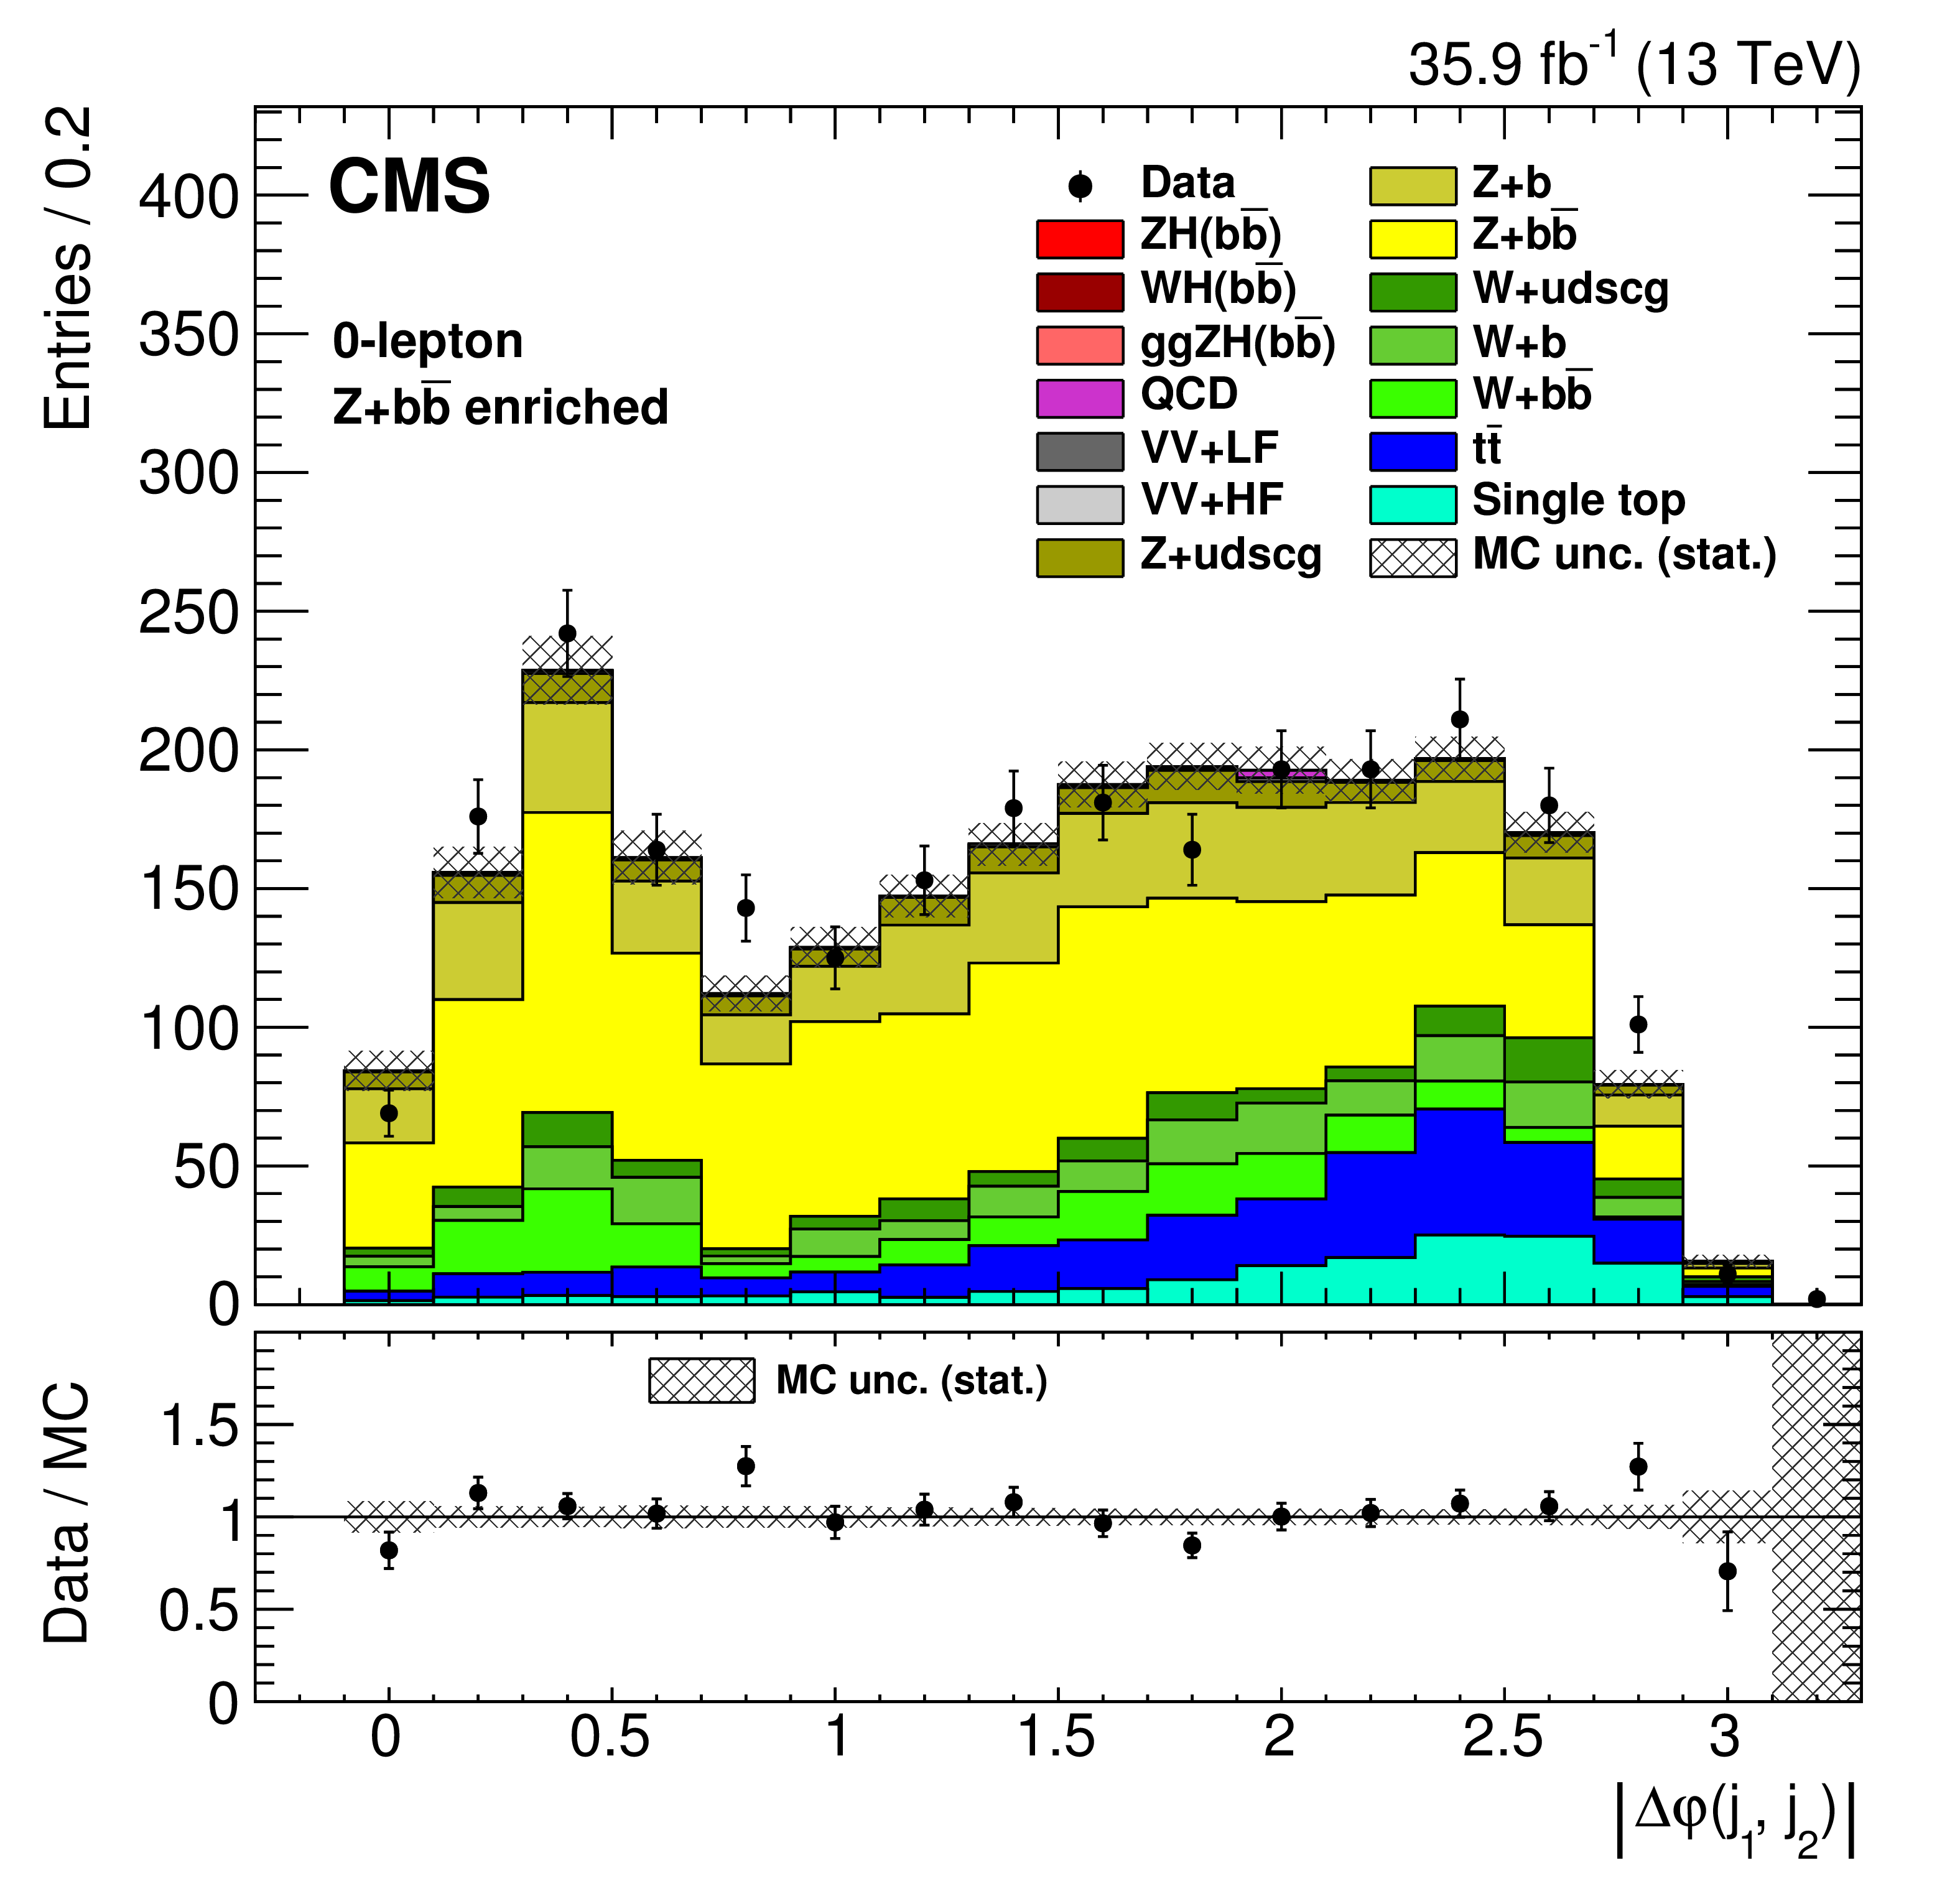
Figure 2-b:
Distribution of the azimuthal angle between the two jets that comprise the Higgs boson in the simulated samples and in data for the 0-lepton Z+HF control region, after applying the data/MC scale factors in Table 6. |
png pdf |
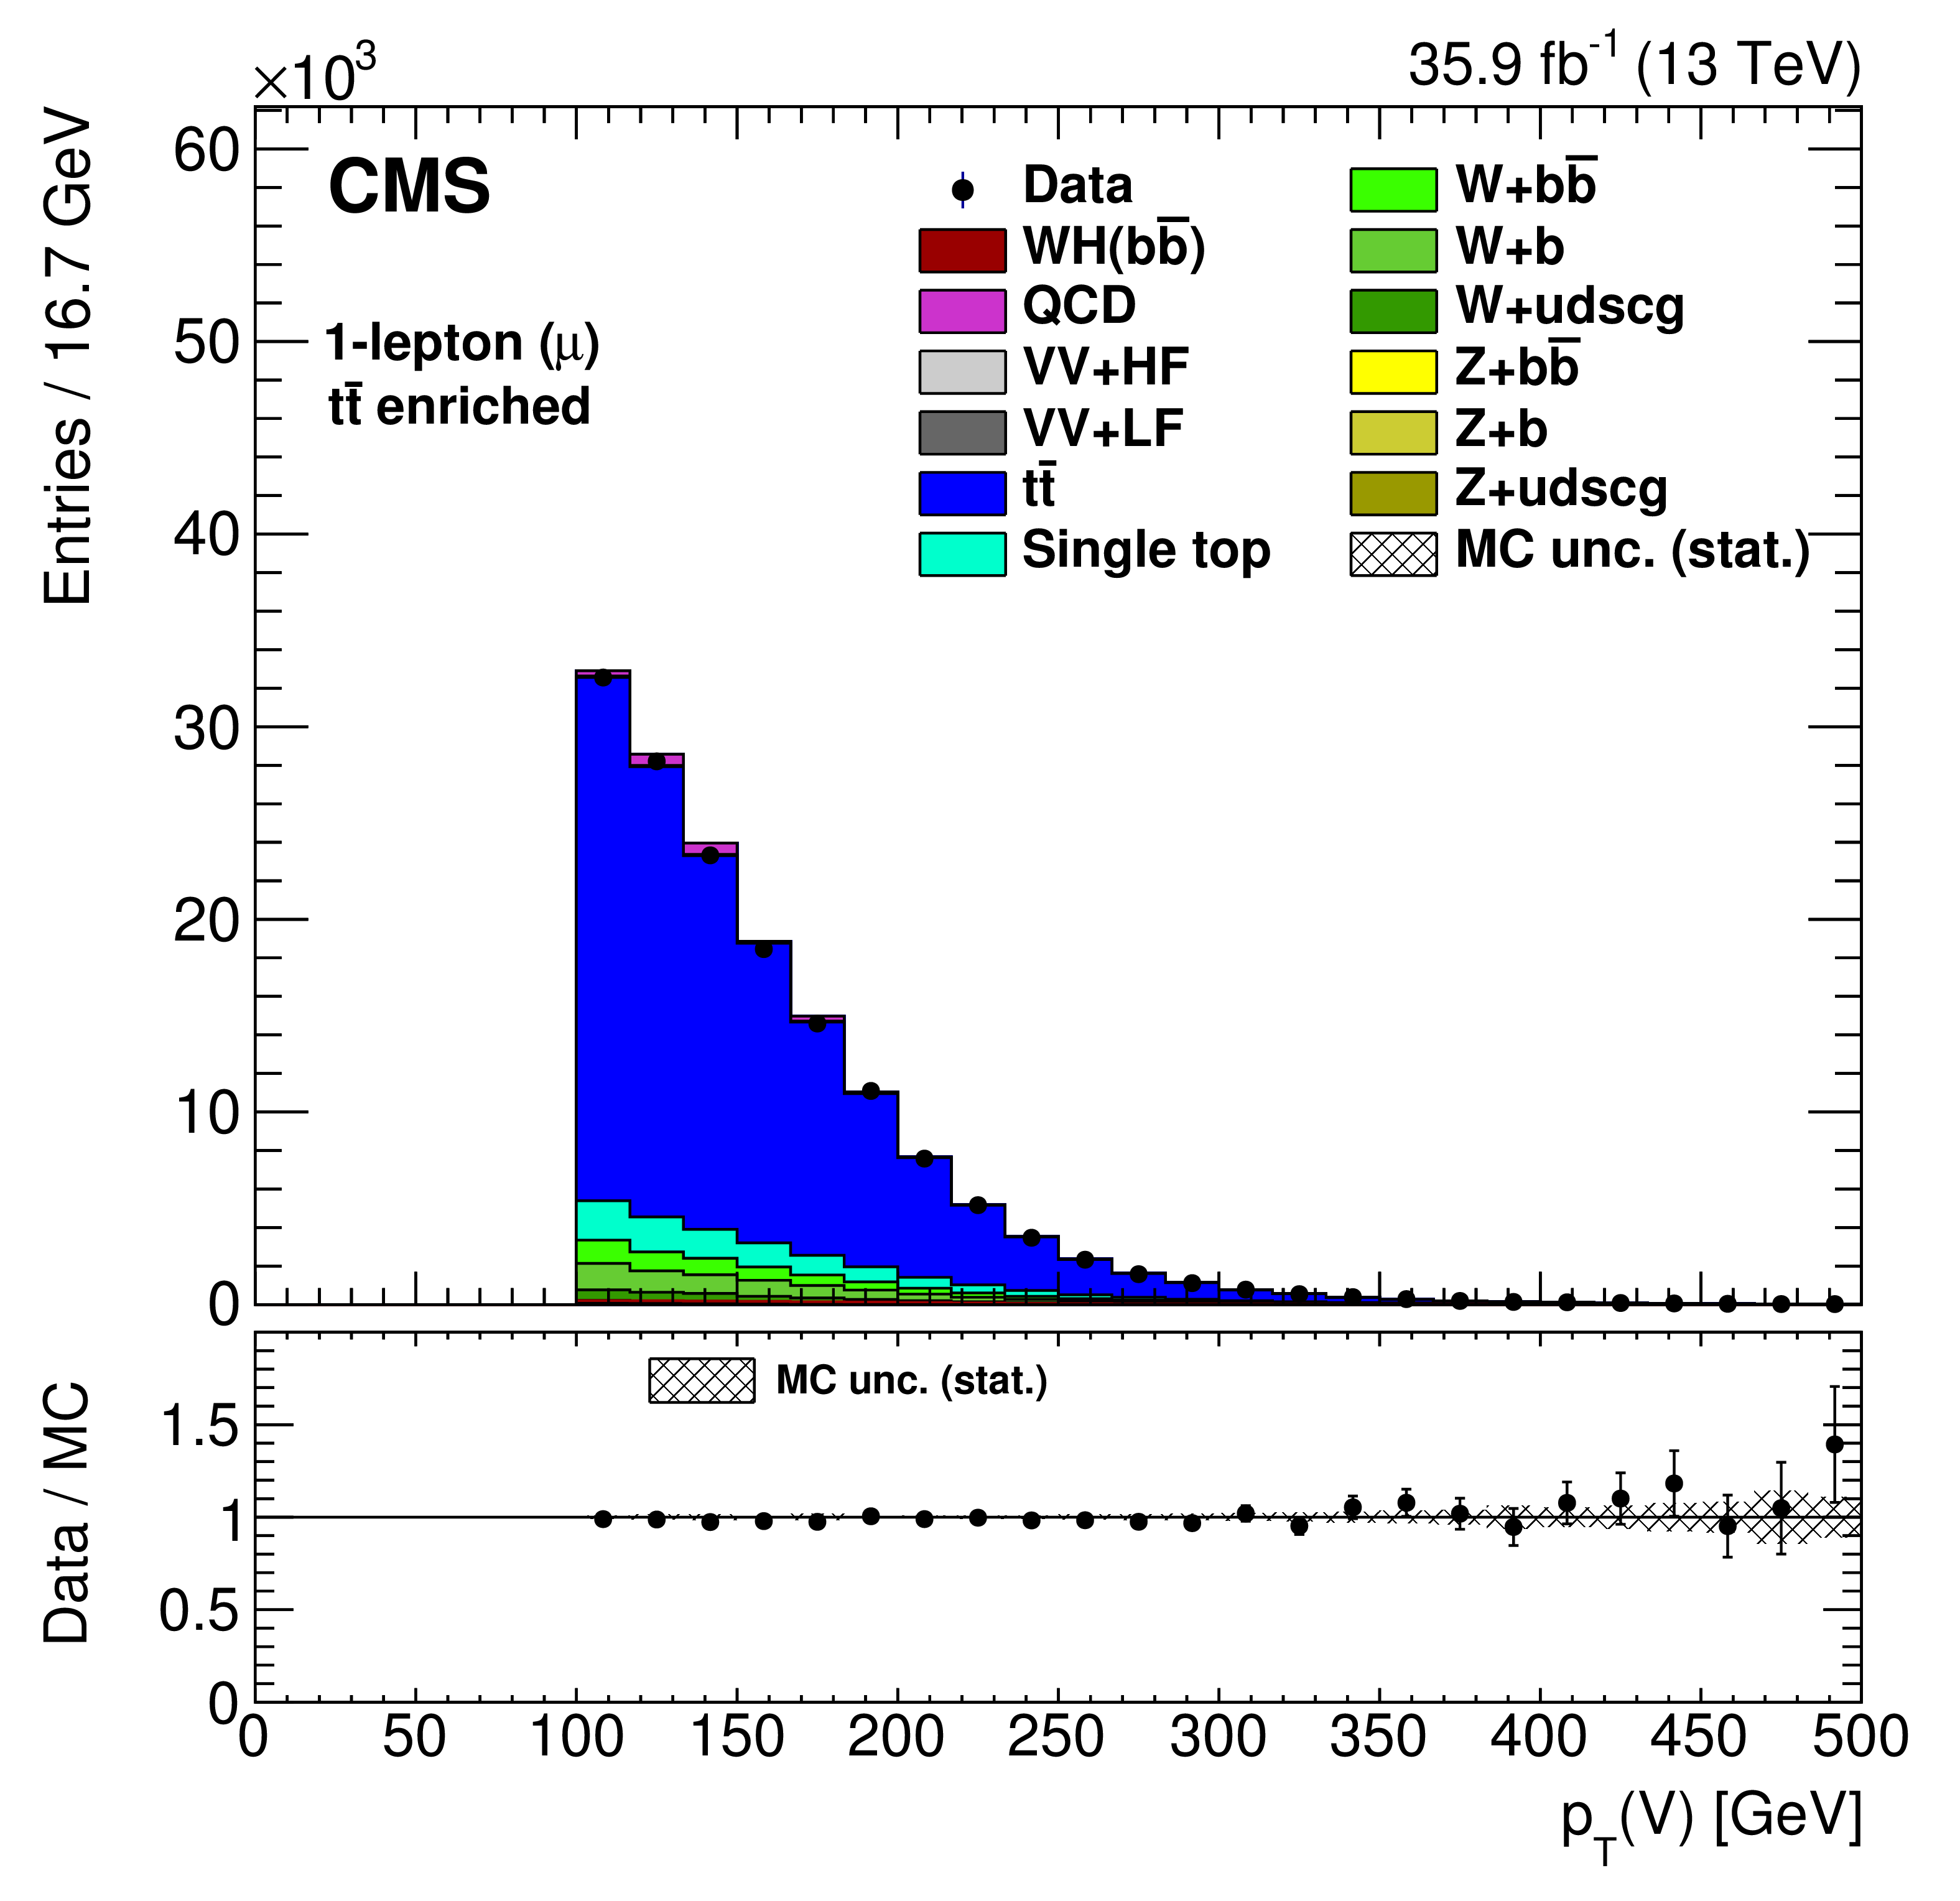
Figure 2-c:
Distribution of ${{p_{\mathrm {T}}} ({\mathrm {V}})}$ in the simulated samples and in data for the 1-lepton ${\mathrm{t} {}\mathrm{\bar{t}}} $ control region, after applying the data/MC scale factors in Table 6. |
png pdf |
Figure 2-d:
Distribution of the reconstructed top quark mass in the simulated samples and in data for the 1-lepton ${\mathrm{t} {}\mathrm{\bar{t}}} $ control region, after applying the data/MC scale factors in Table 6. |

png pdf |
Figure 2-e:
Distribution of ${{p_{\mathrm {T}}} ({\mathrm {V}})}$ in the simulated samples and in data for the 2-lepton Z+HF control region, after applying the data/MC scale factors in Table 6. |
png pdf |
Figure 2-f:
Distribution of the ratio of ${{p_{\mathrm {T}}} ({\mathrm {V}})}$ and ${{{p_{\mathrm {T}}} \mathrm {(jj)}}}$ in the simulated samples and in data for the 2-lepton Z+HF control region, after applying the data/MC scale factors in Table 6. |

png pdf |
Figure 3:
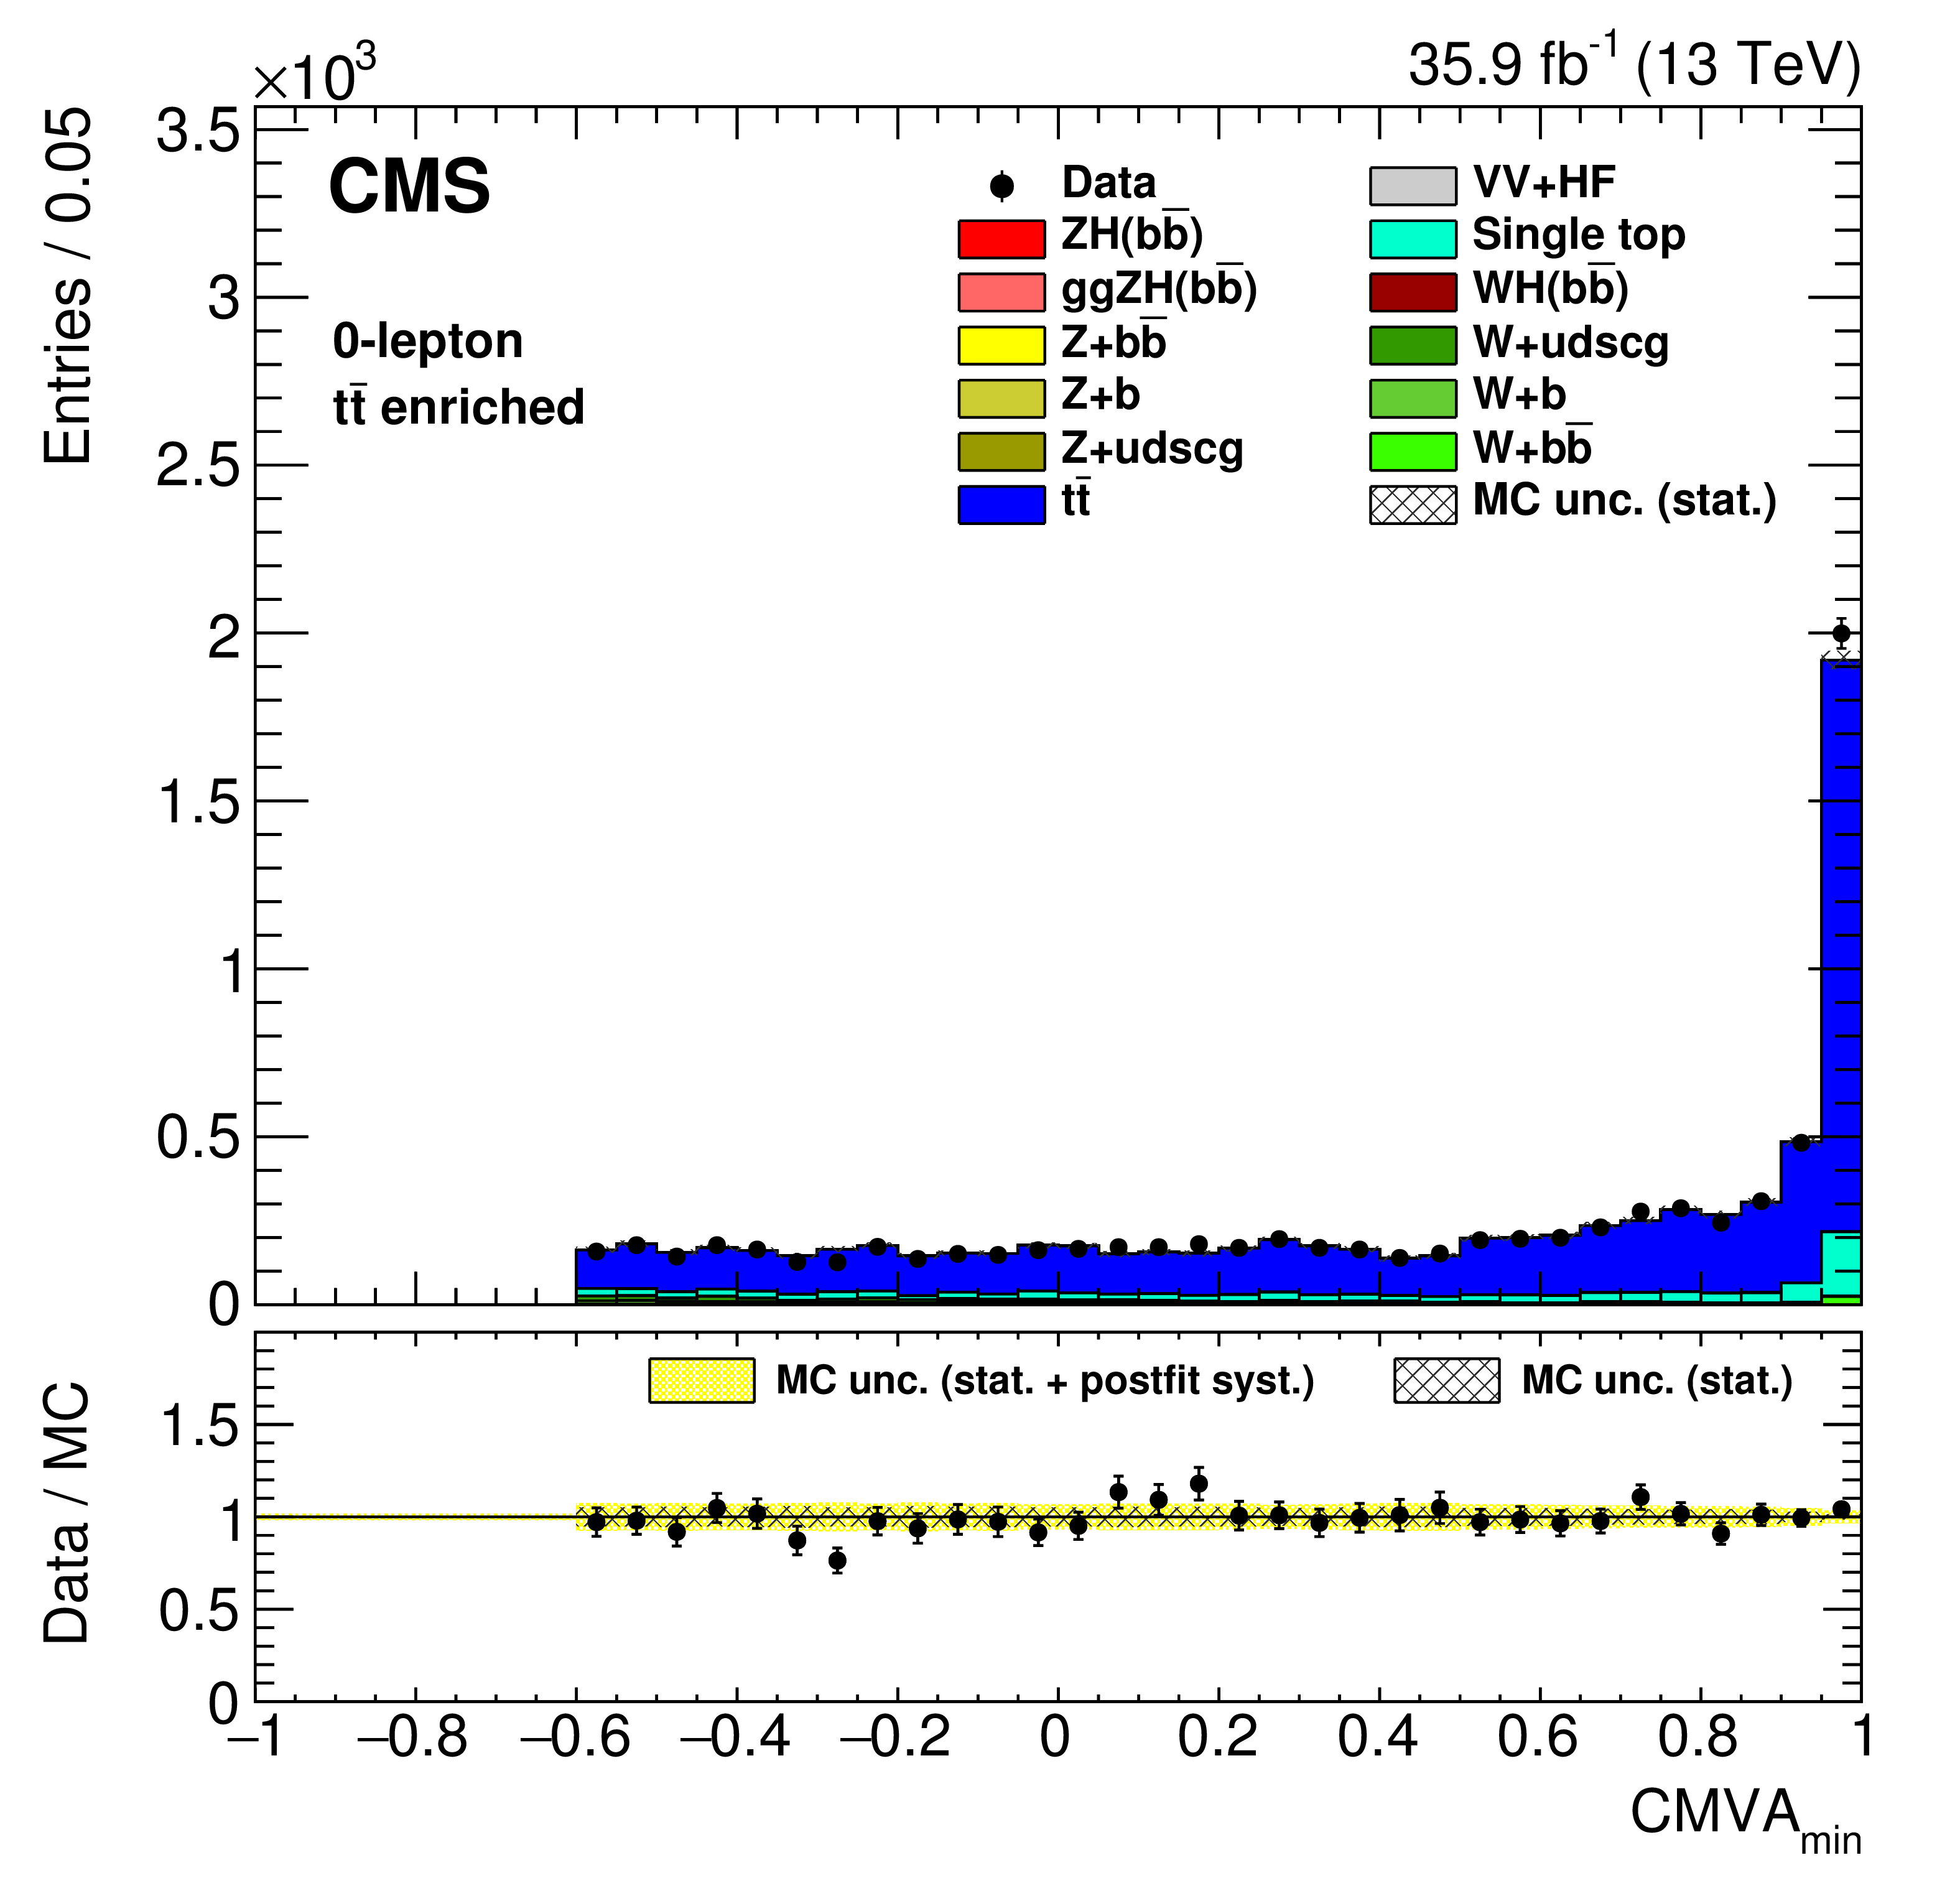
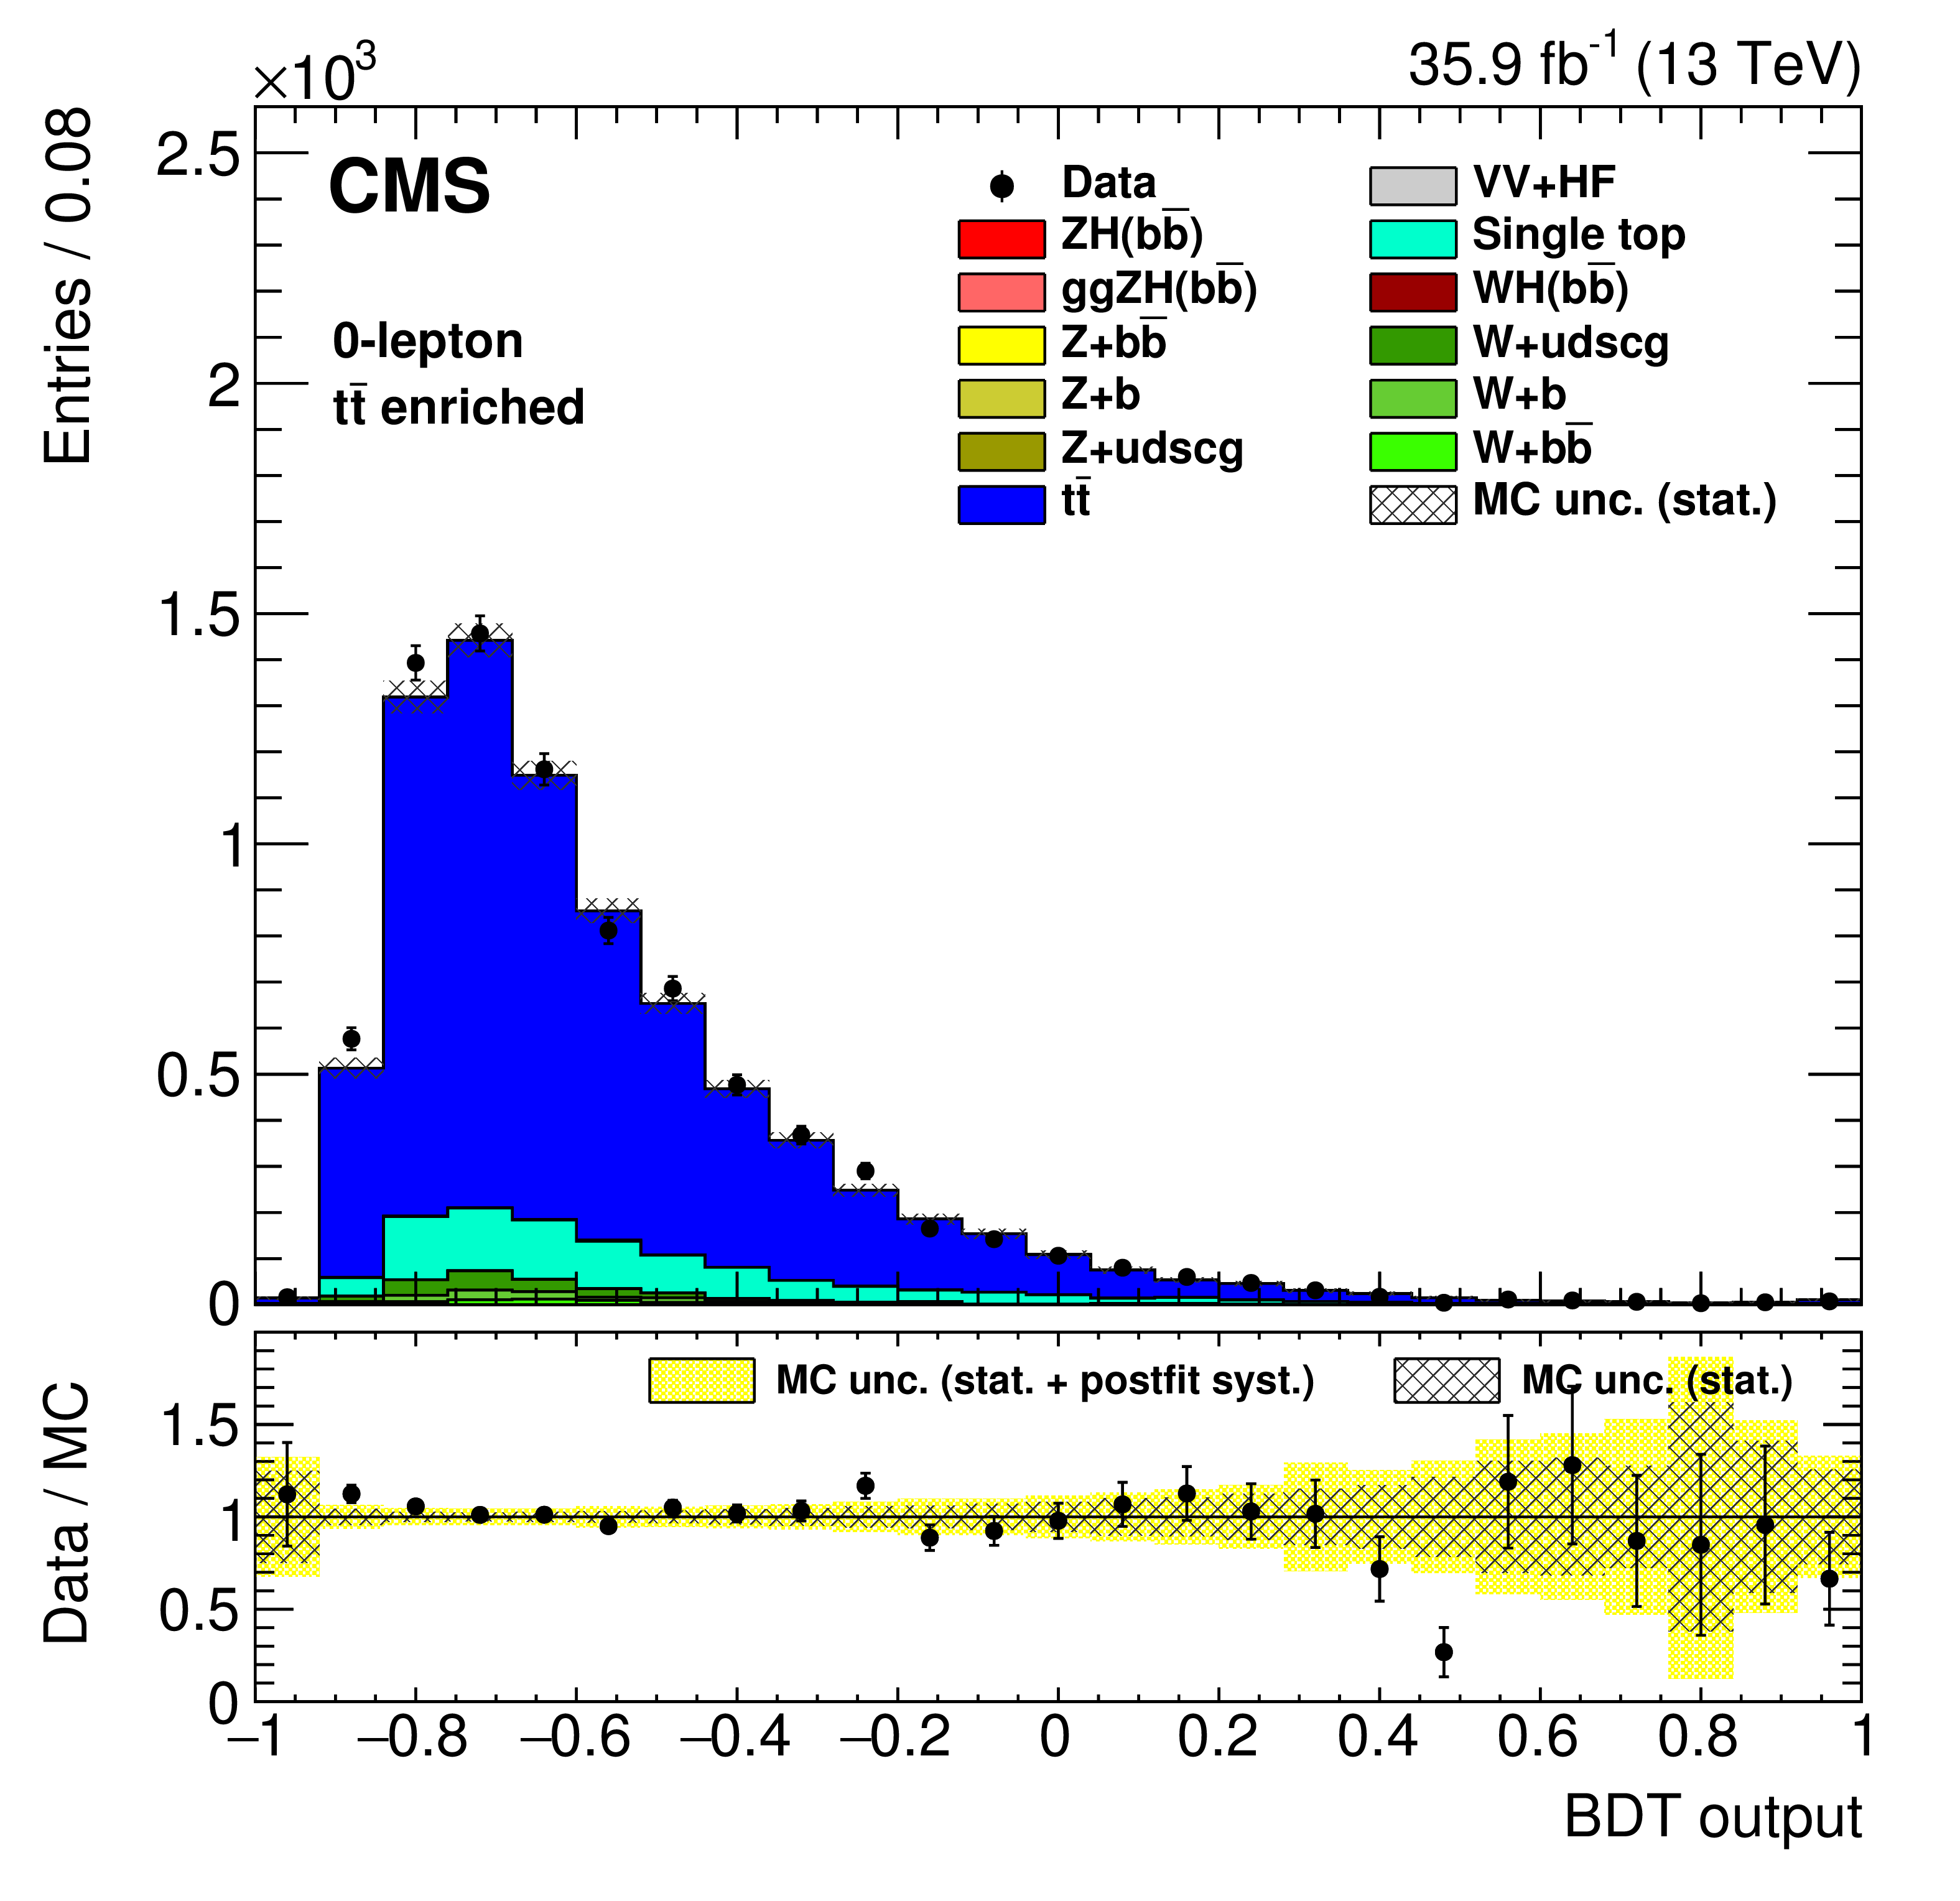
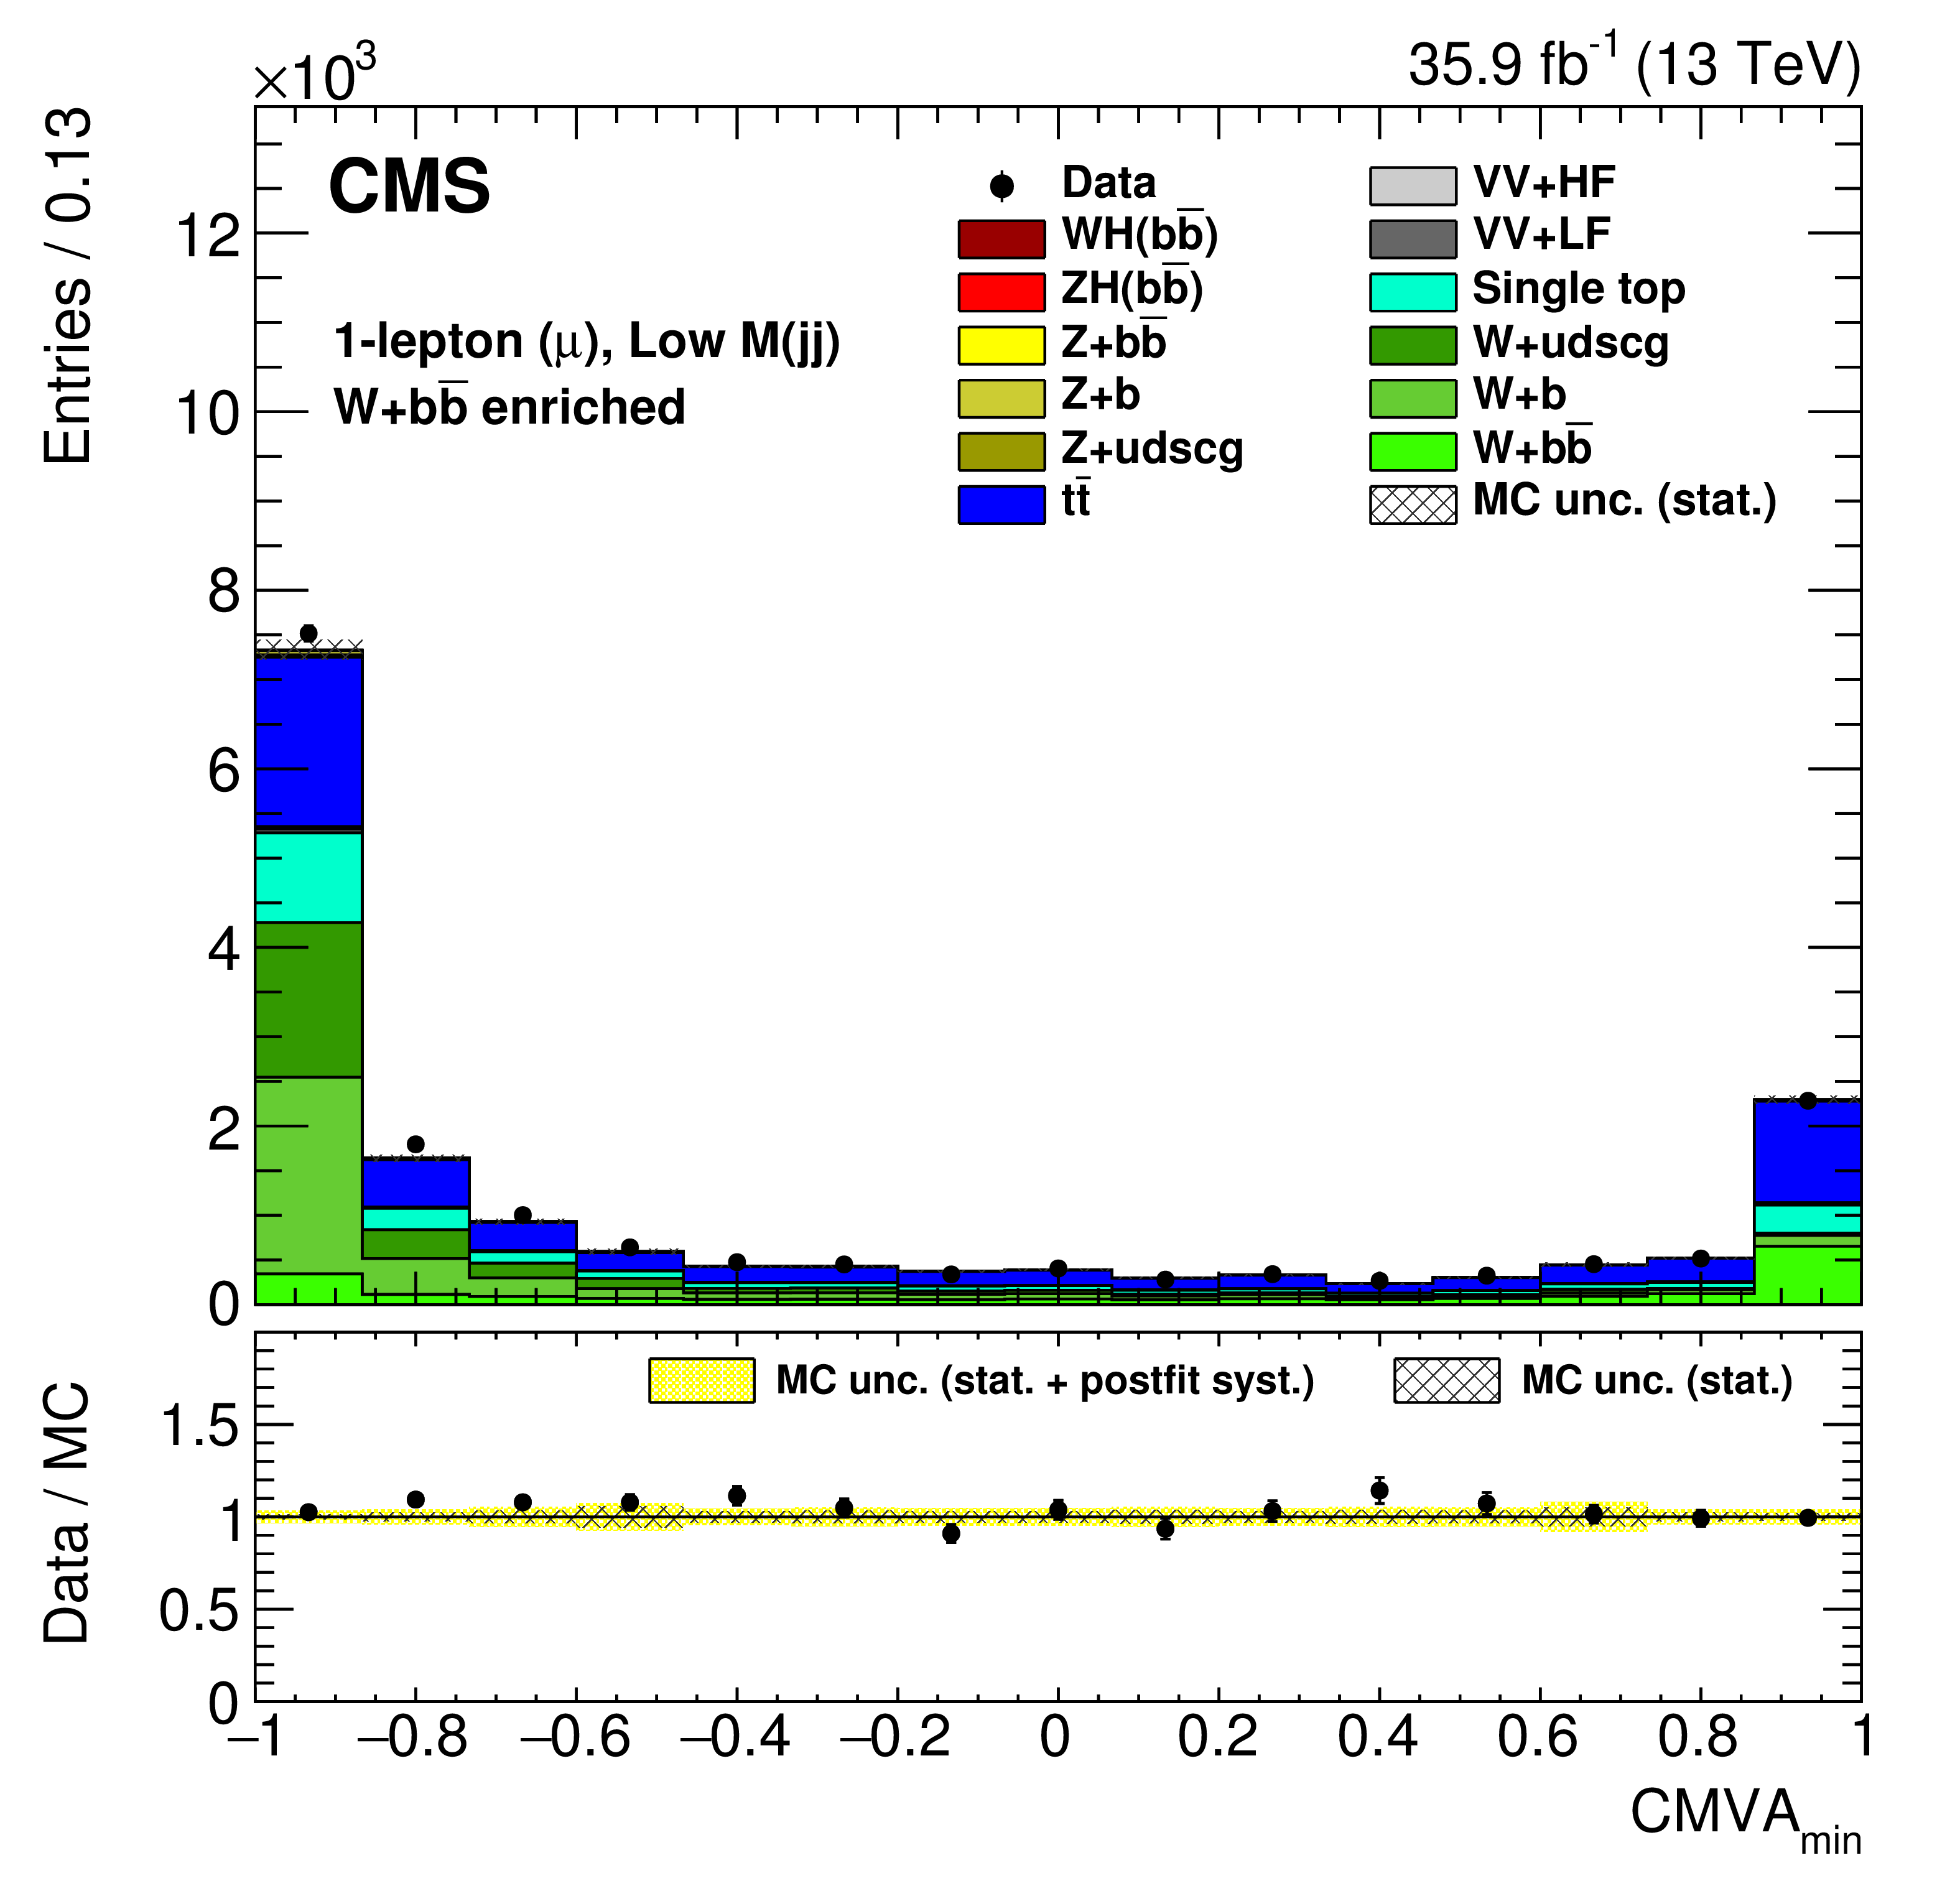
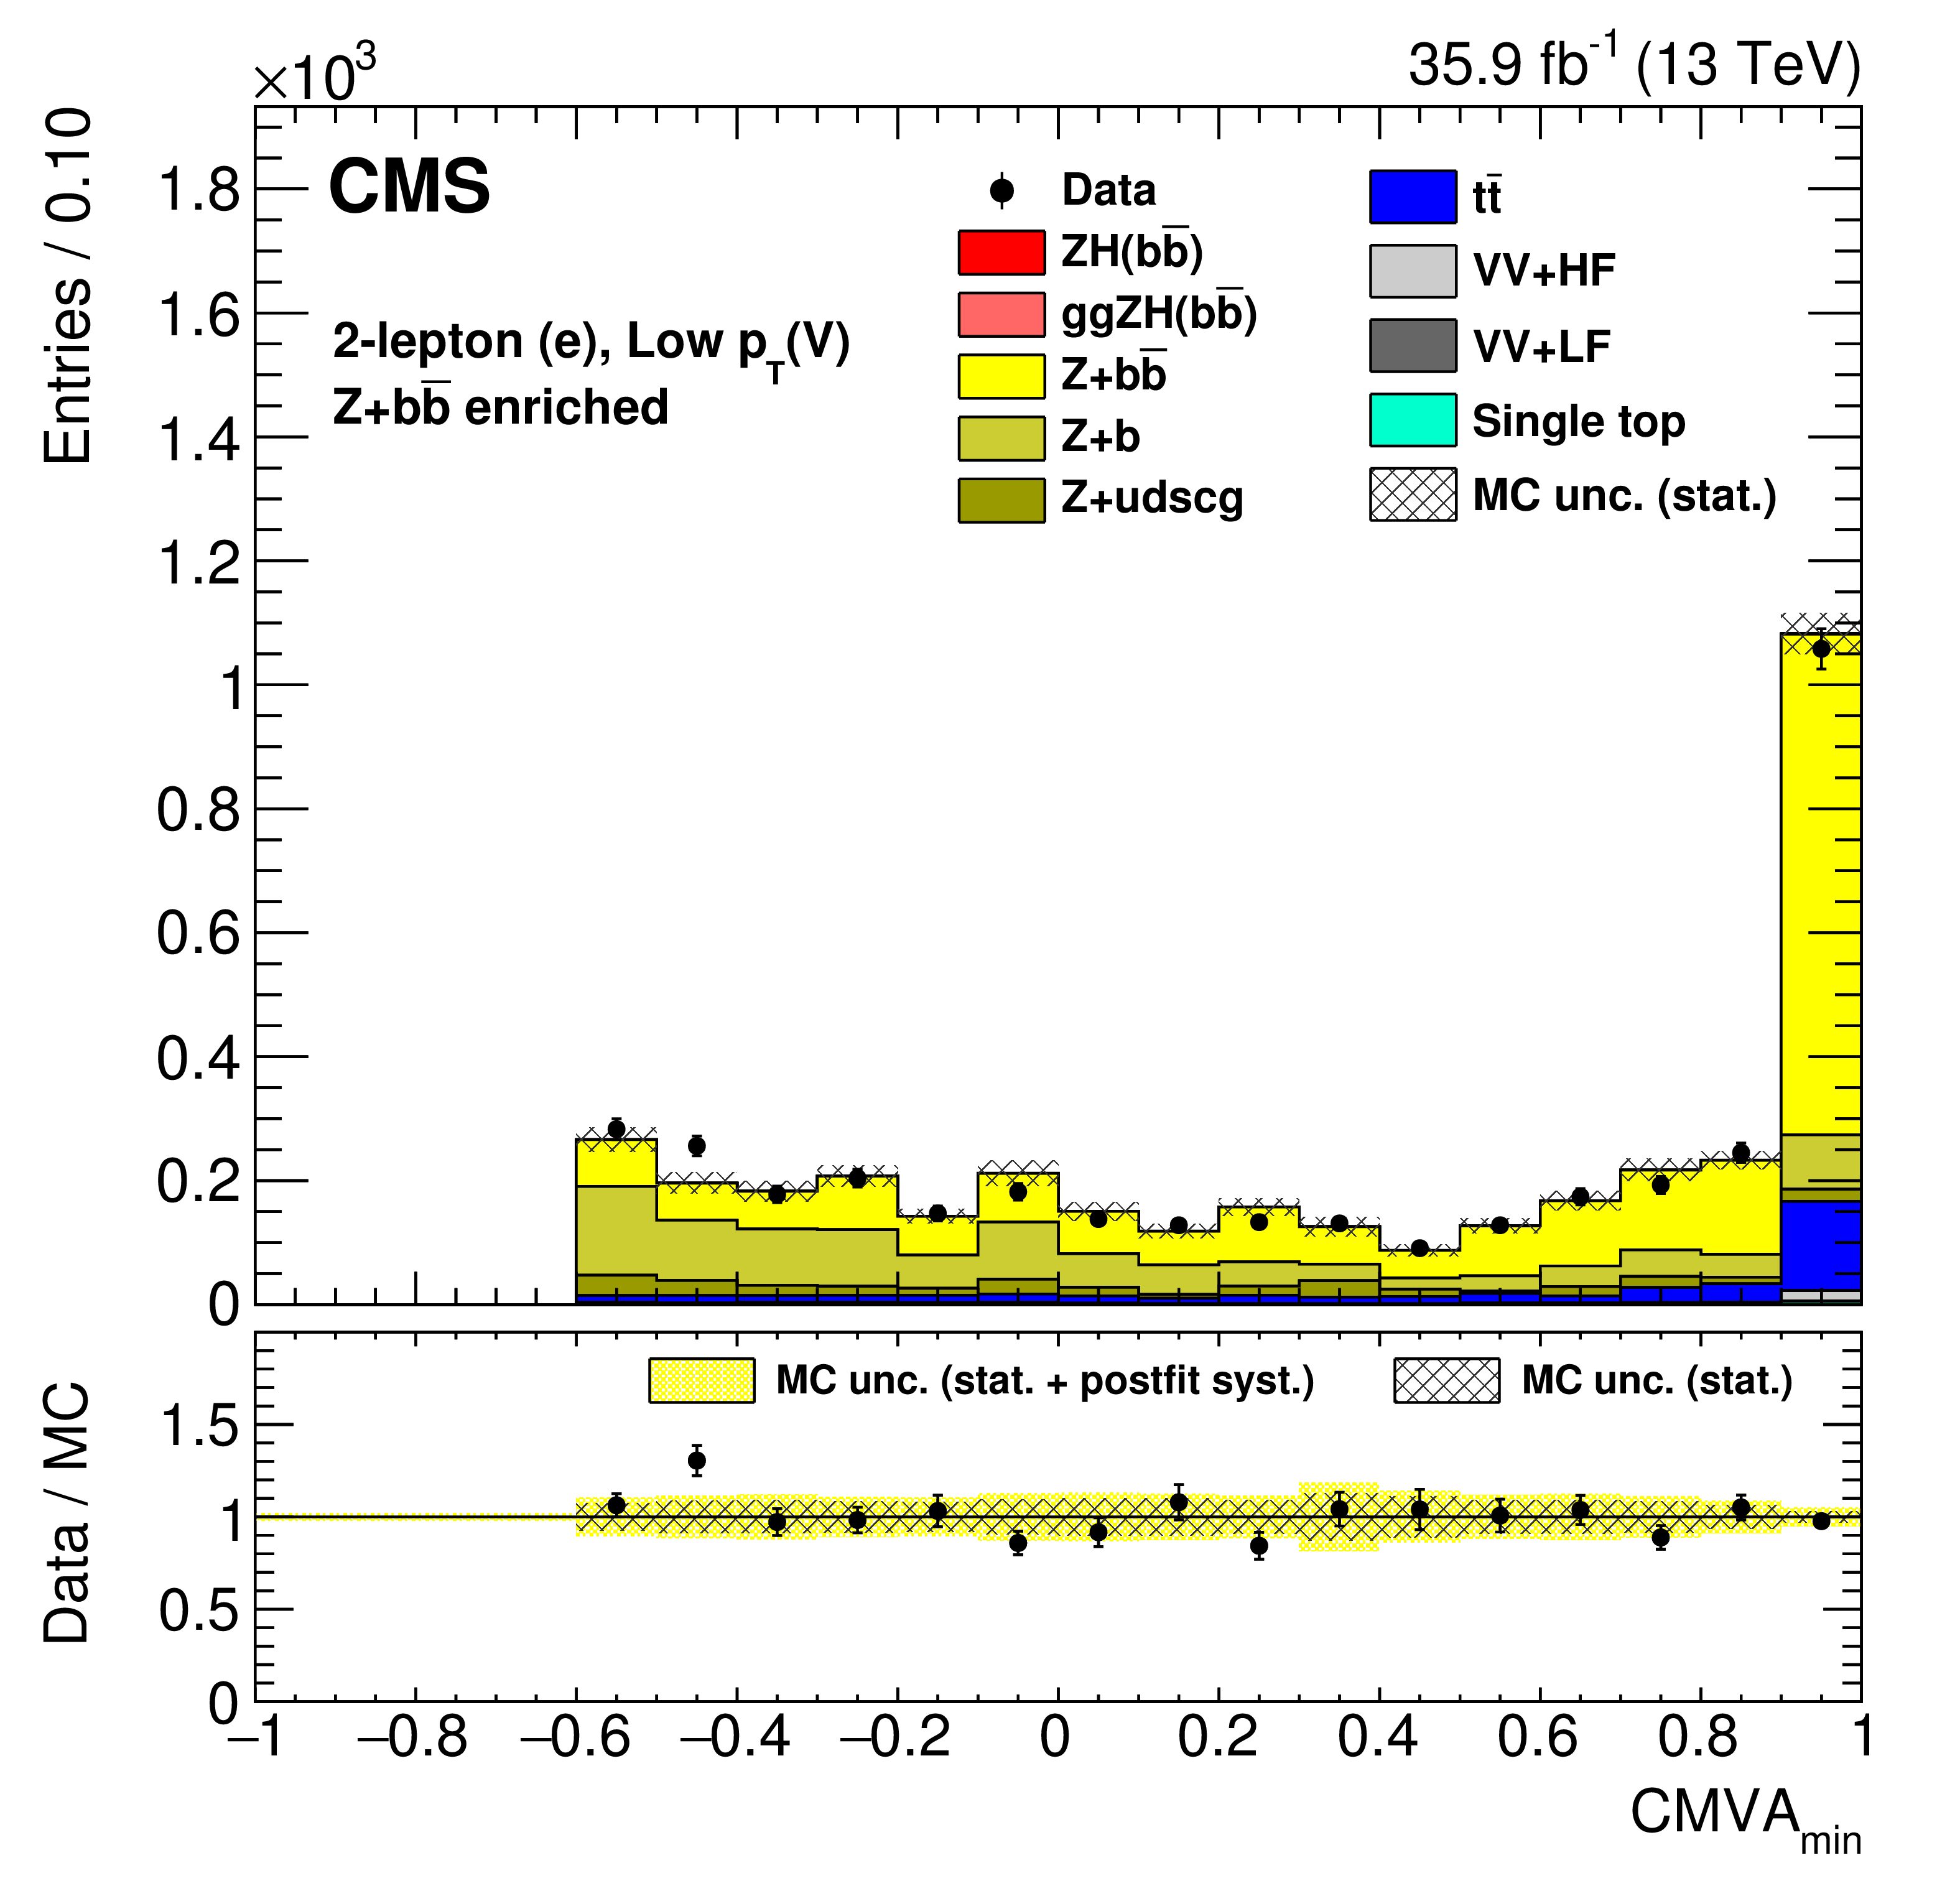
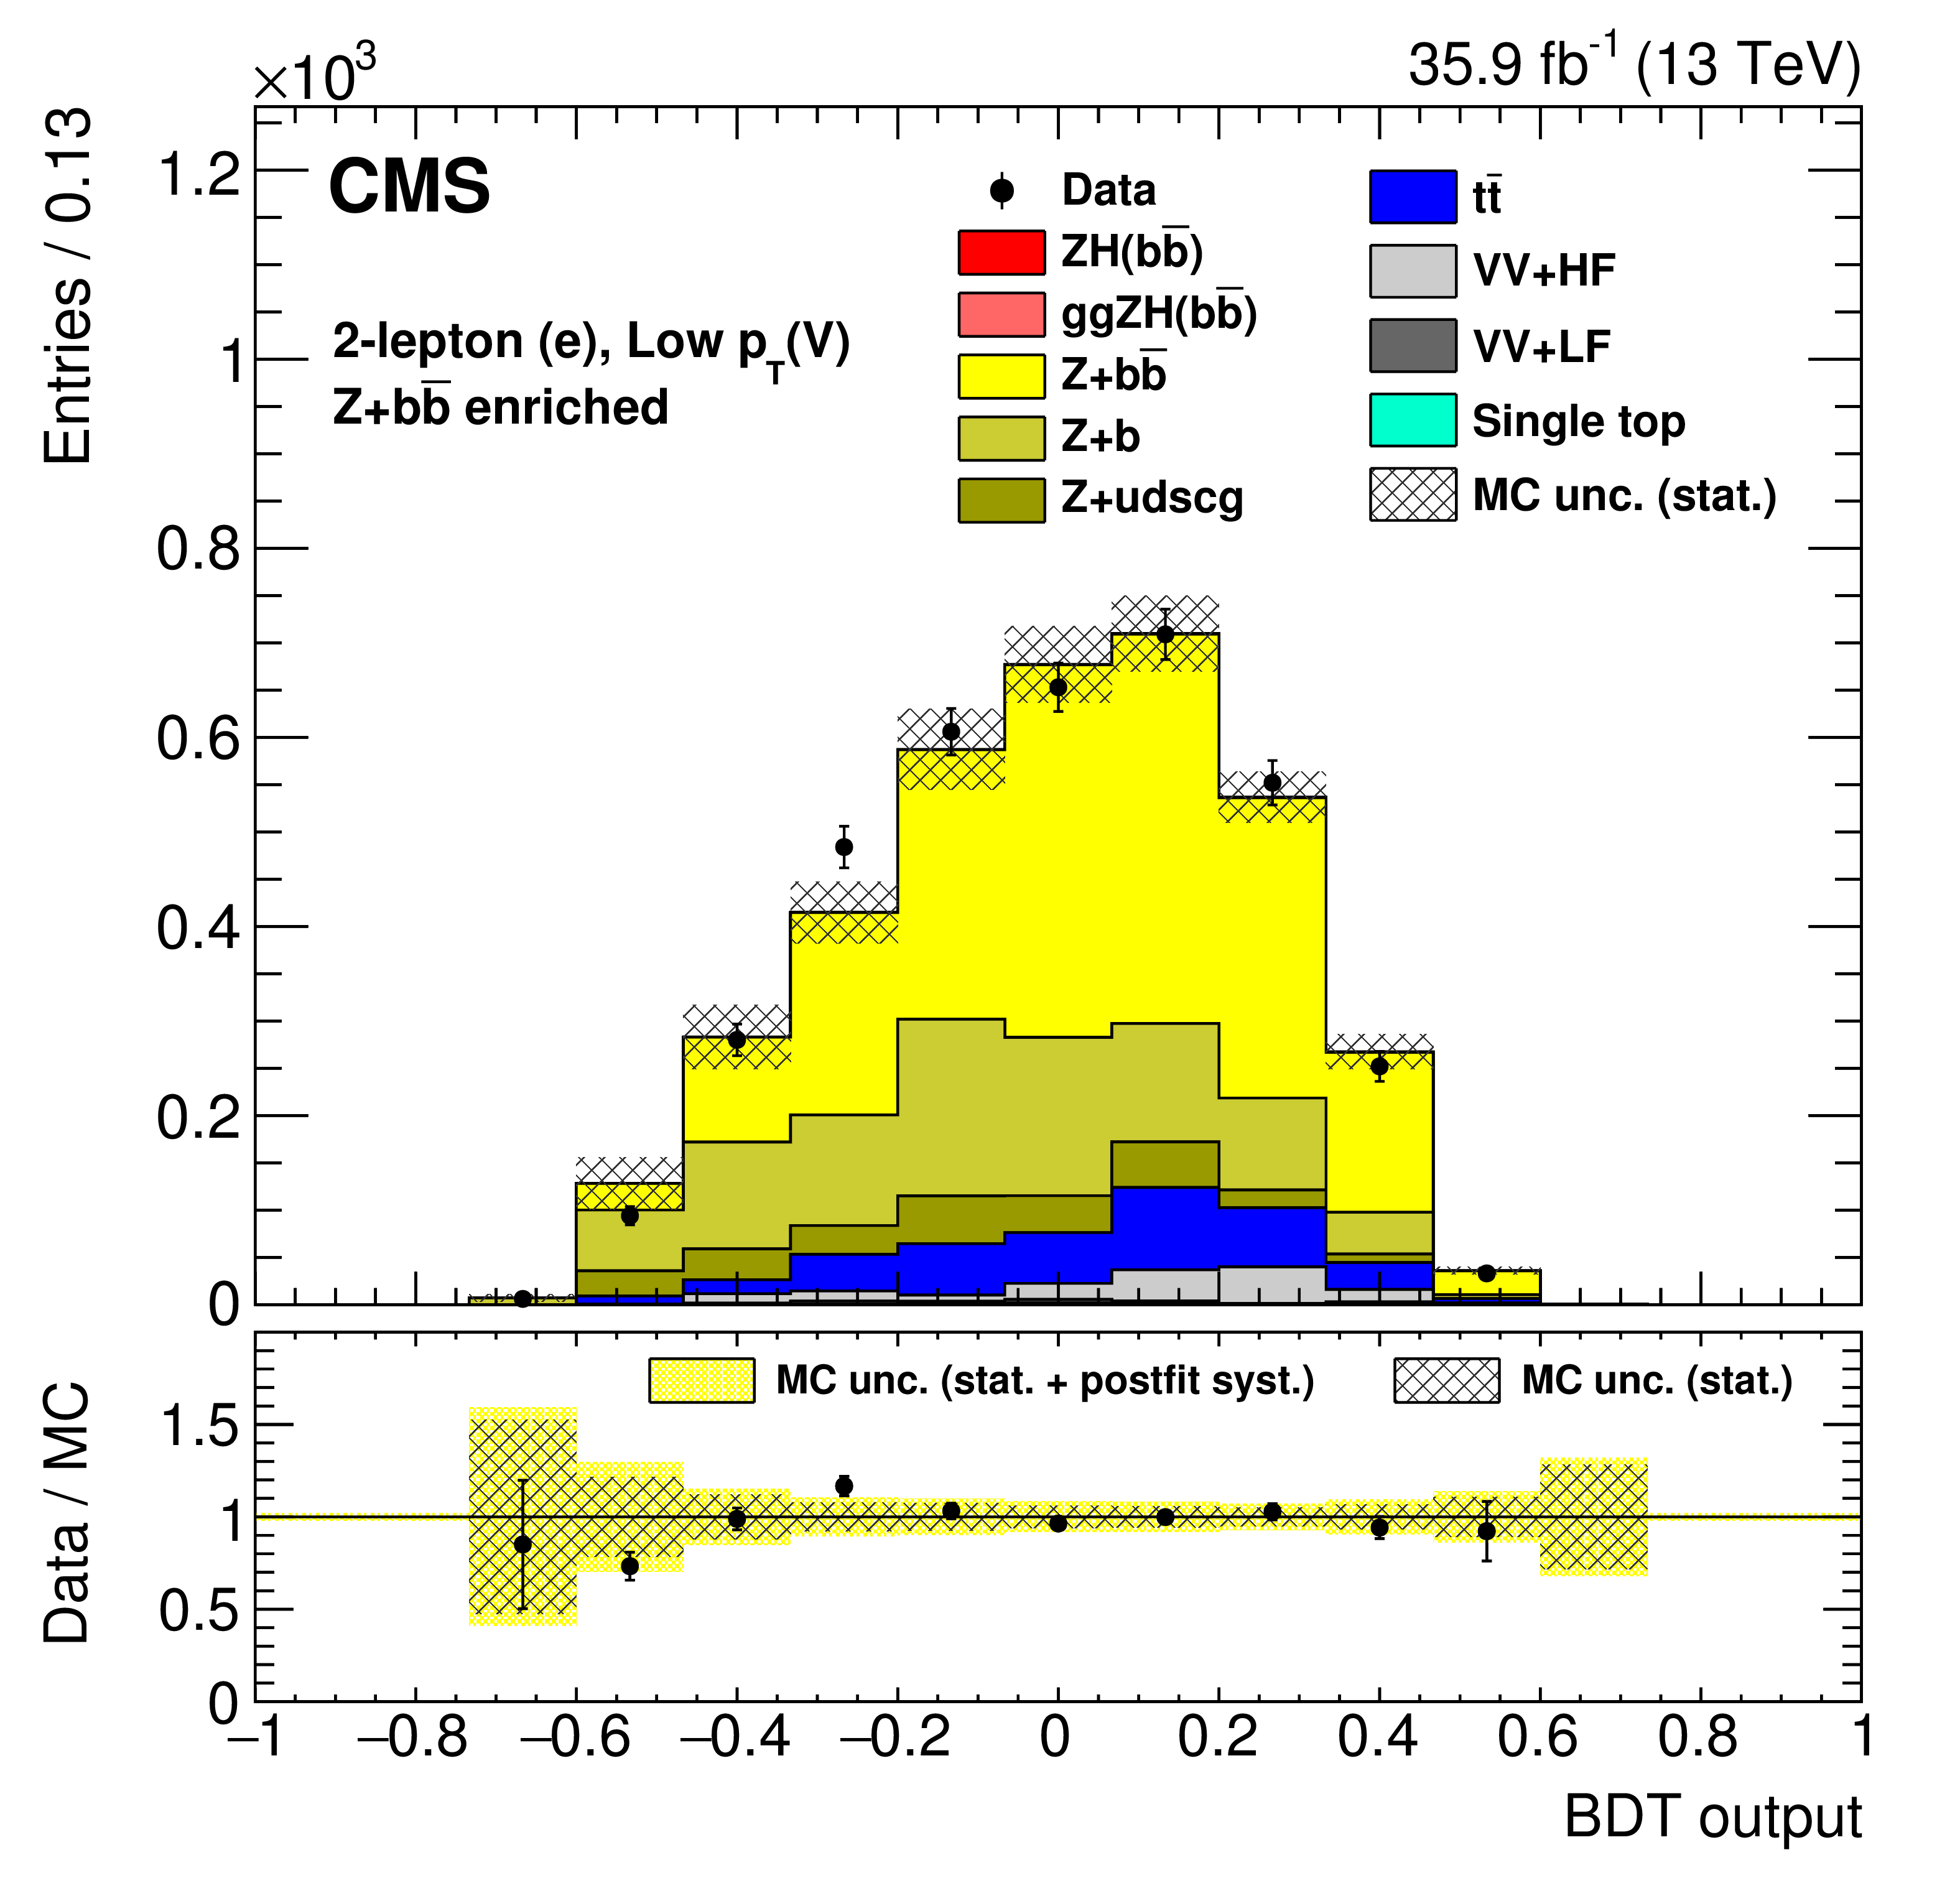
Distributions in control regions after simulated samples are fit to the data in the signal extraction fit. On the left are examples of ${\mathrm {CMVA_{min}}}$ distributions, while on the right are corresponding event BDT distributions of the same control regions as the plots on the left. Note that these BDT distributions are not part of the fit and are primarily for validation. The control regions shown from top to bottom are: ${\mathrm{t} {}\mathrm{\bar{t}}}$ for the 0-lepton channel, low-mass HF for the single-muon channel, and HF for the dielectron channel. |
png pdf |
Figure 3-a:
Distribution of ${\mathrm {CMVA_{min}}}$ in the ${\mathrm{t} {}\mathrm{\bar{t}}}$ control region for the 0-lepton channel, after simulated samples are fit to the data in the signal extraction fit. |
png pdf |
Figure 3-b:
Distribution of the event BDT in the ${\mathrm{t} {}\mathrm{\bar{t}}}$ control region for the 0-lepton channel, after simulated samples are fit to the data in the signal extraction fit. (This BDT distribution is primarily for validation.) |
png pdf |
Figure 3-c:
Distribution of ${\mathrm {CMVA_{min}}}$ in the low-mass HF control region for the single-muon channel, after simulated samples are fit to the data in the signal extraction fit. |

png pdf |
Figure 3-d:
Distribution of the event BDT in the low-mass HF control region for the single-muon channel, after simulated samples are fit to the data in the signal extraction fit. (This BDT distribution is primarily for validation.) |
png pdf |
Figure 3-e:
Distribution of ${\mathrm {CMVA_{min}}}$ in the HF control region for the dielectron channel, after simulated samples are fit to the data in the signal extraction fit. |
png pdf |
Figure 3-f:
Distribution of ${\mathrm {CMVA_{min}}}$ in the HF control region for the dielectron channel, after simulated samples are fit to the data in the signal extraction fit. (This BDT distribution is primarily for validation.) |
png pdf |
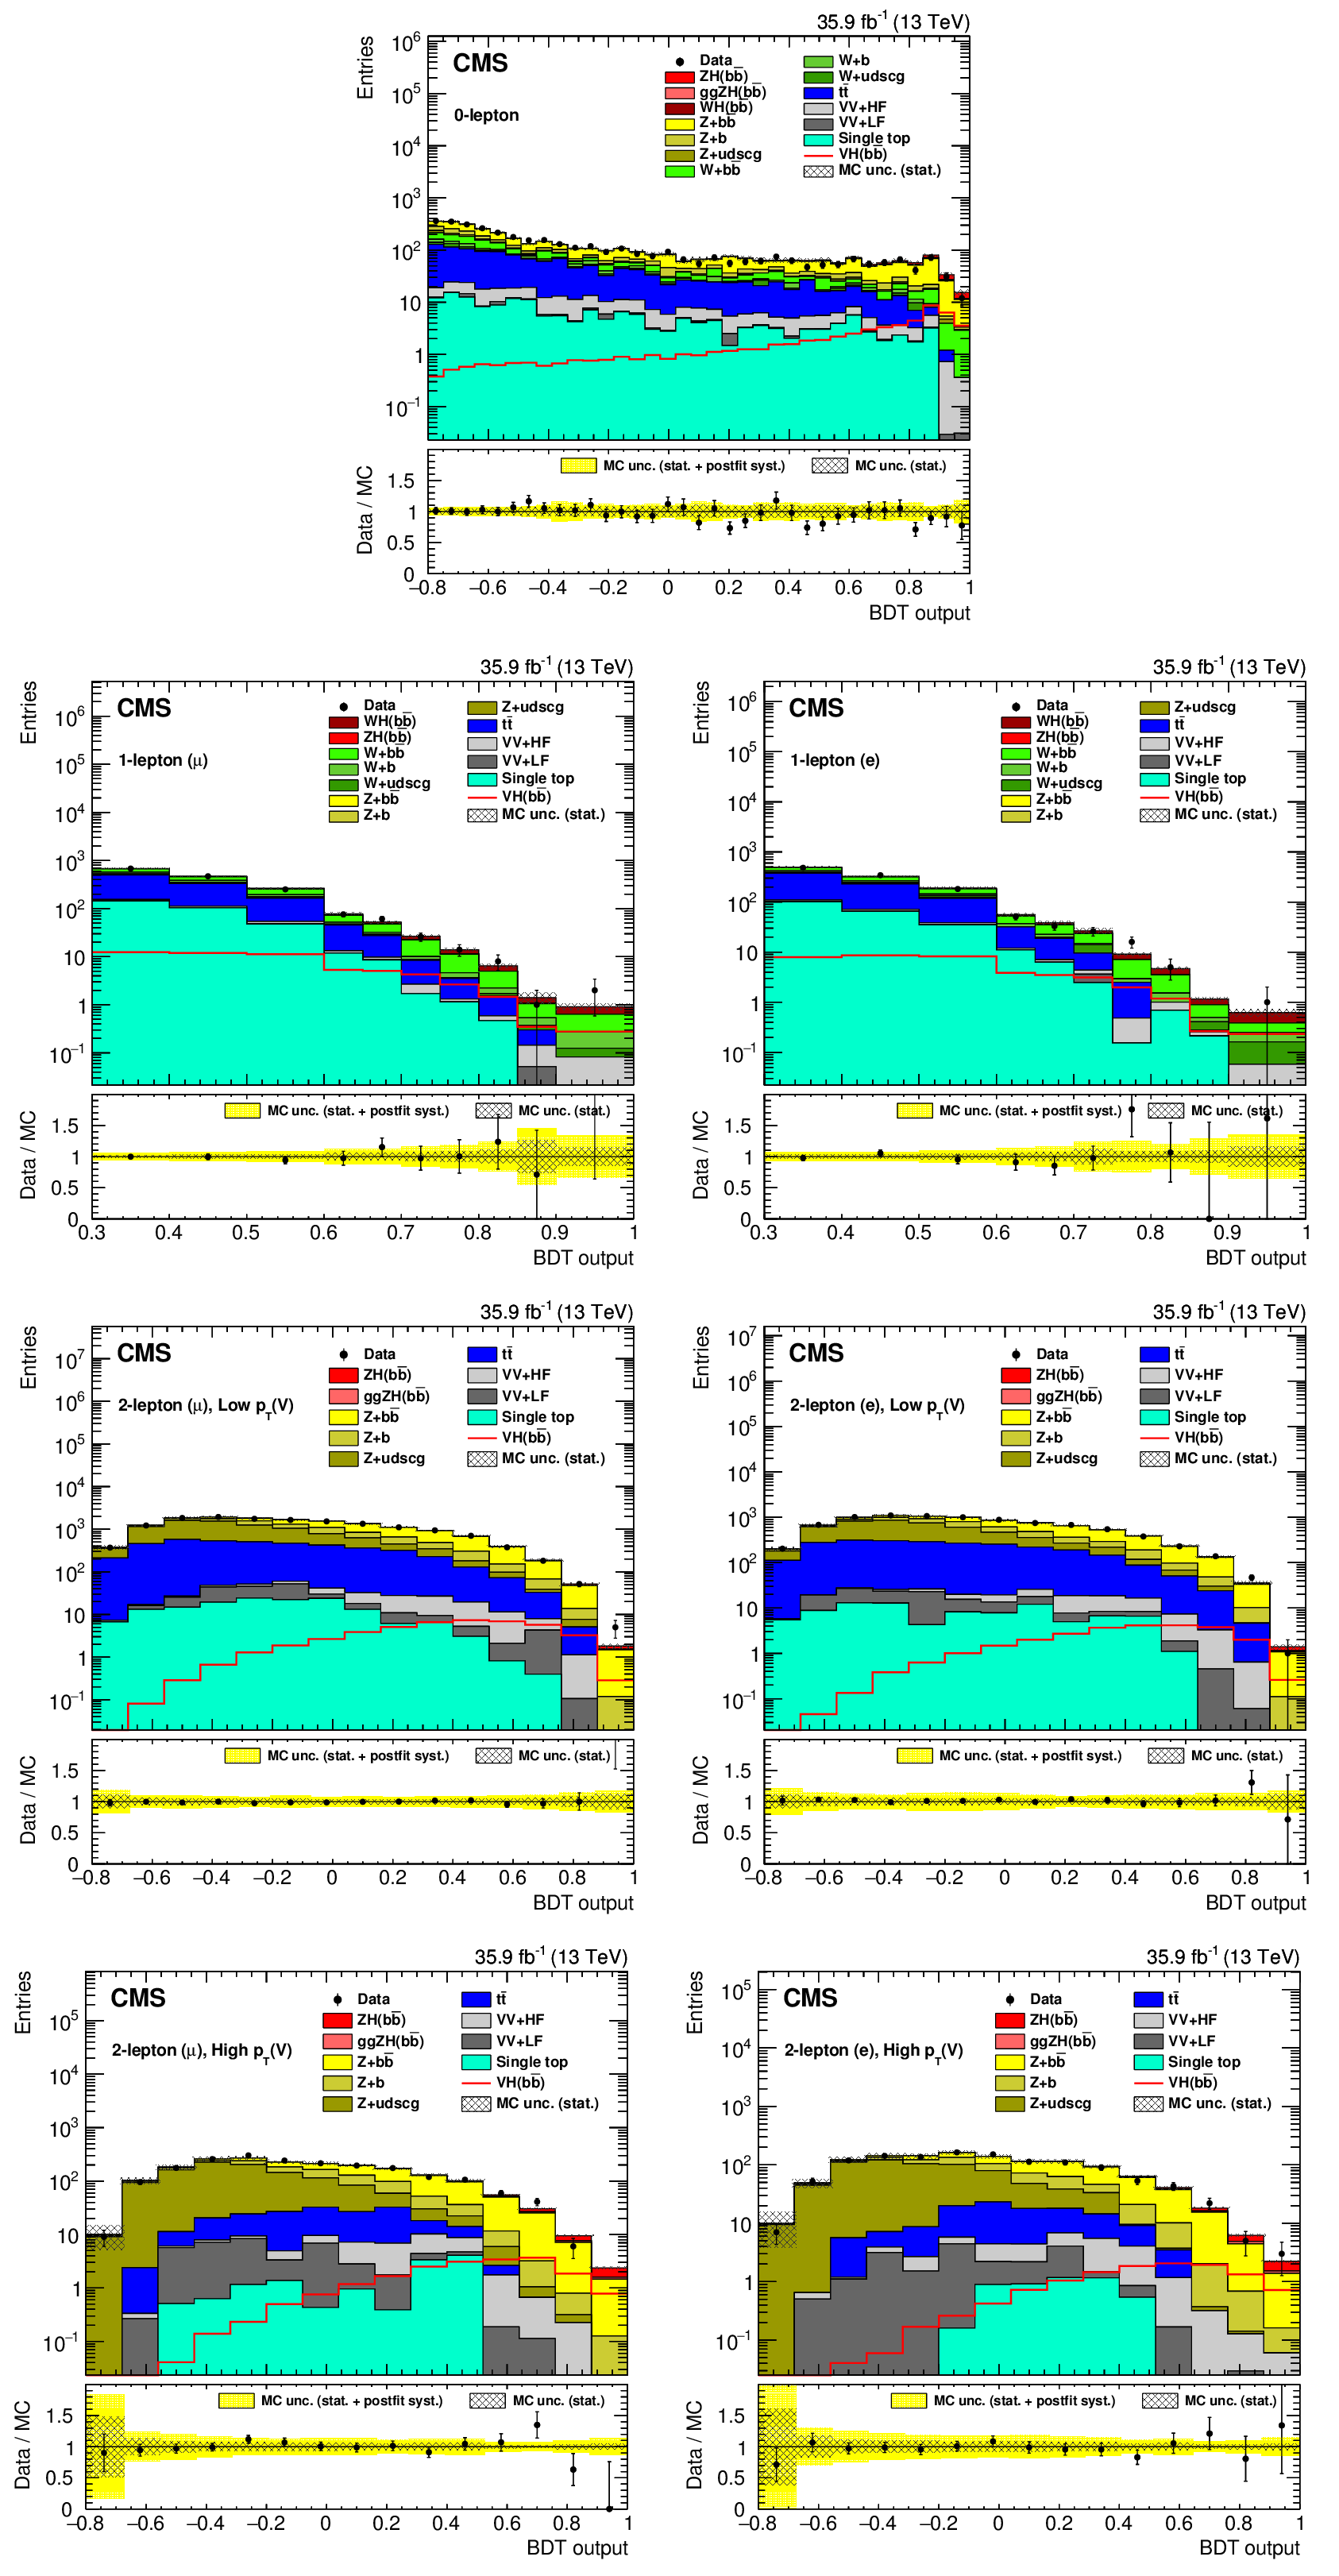
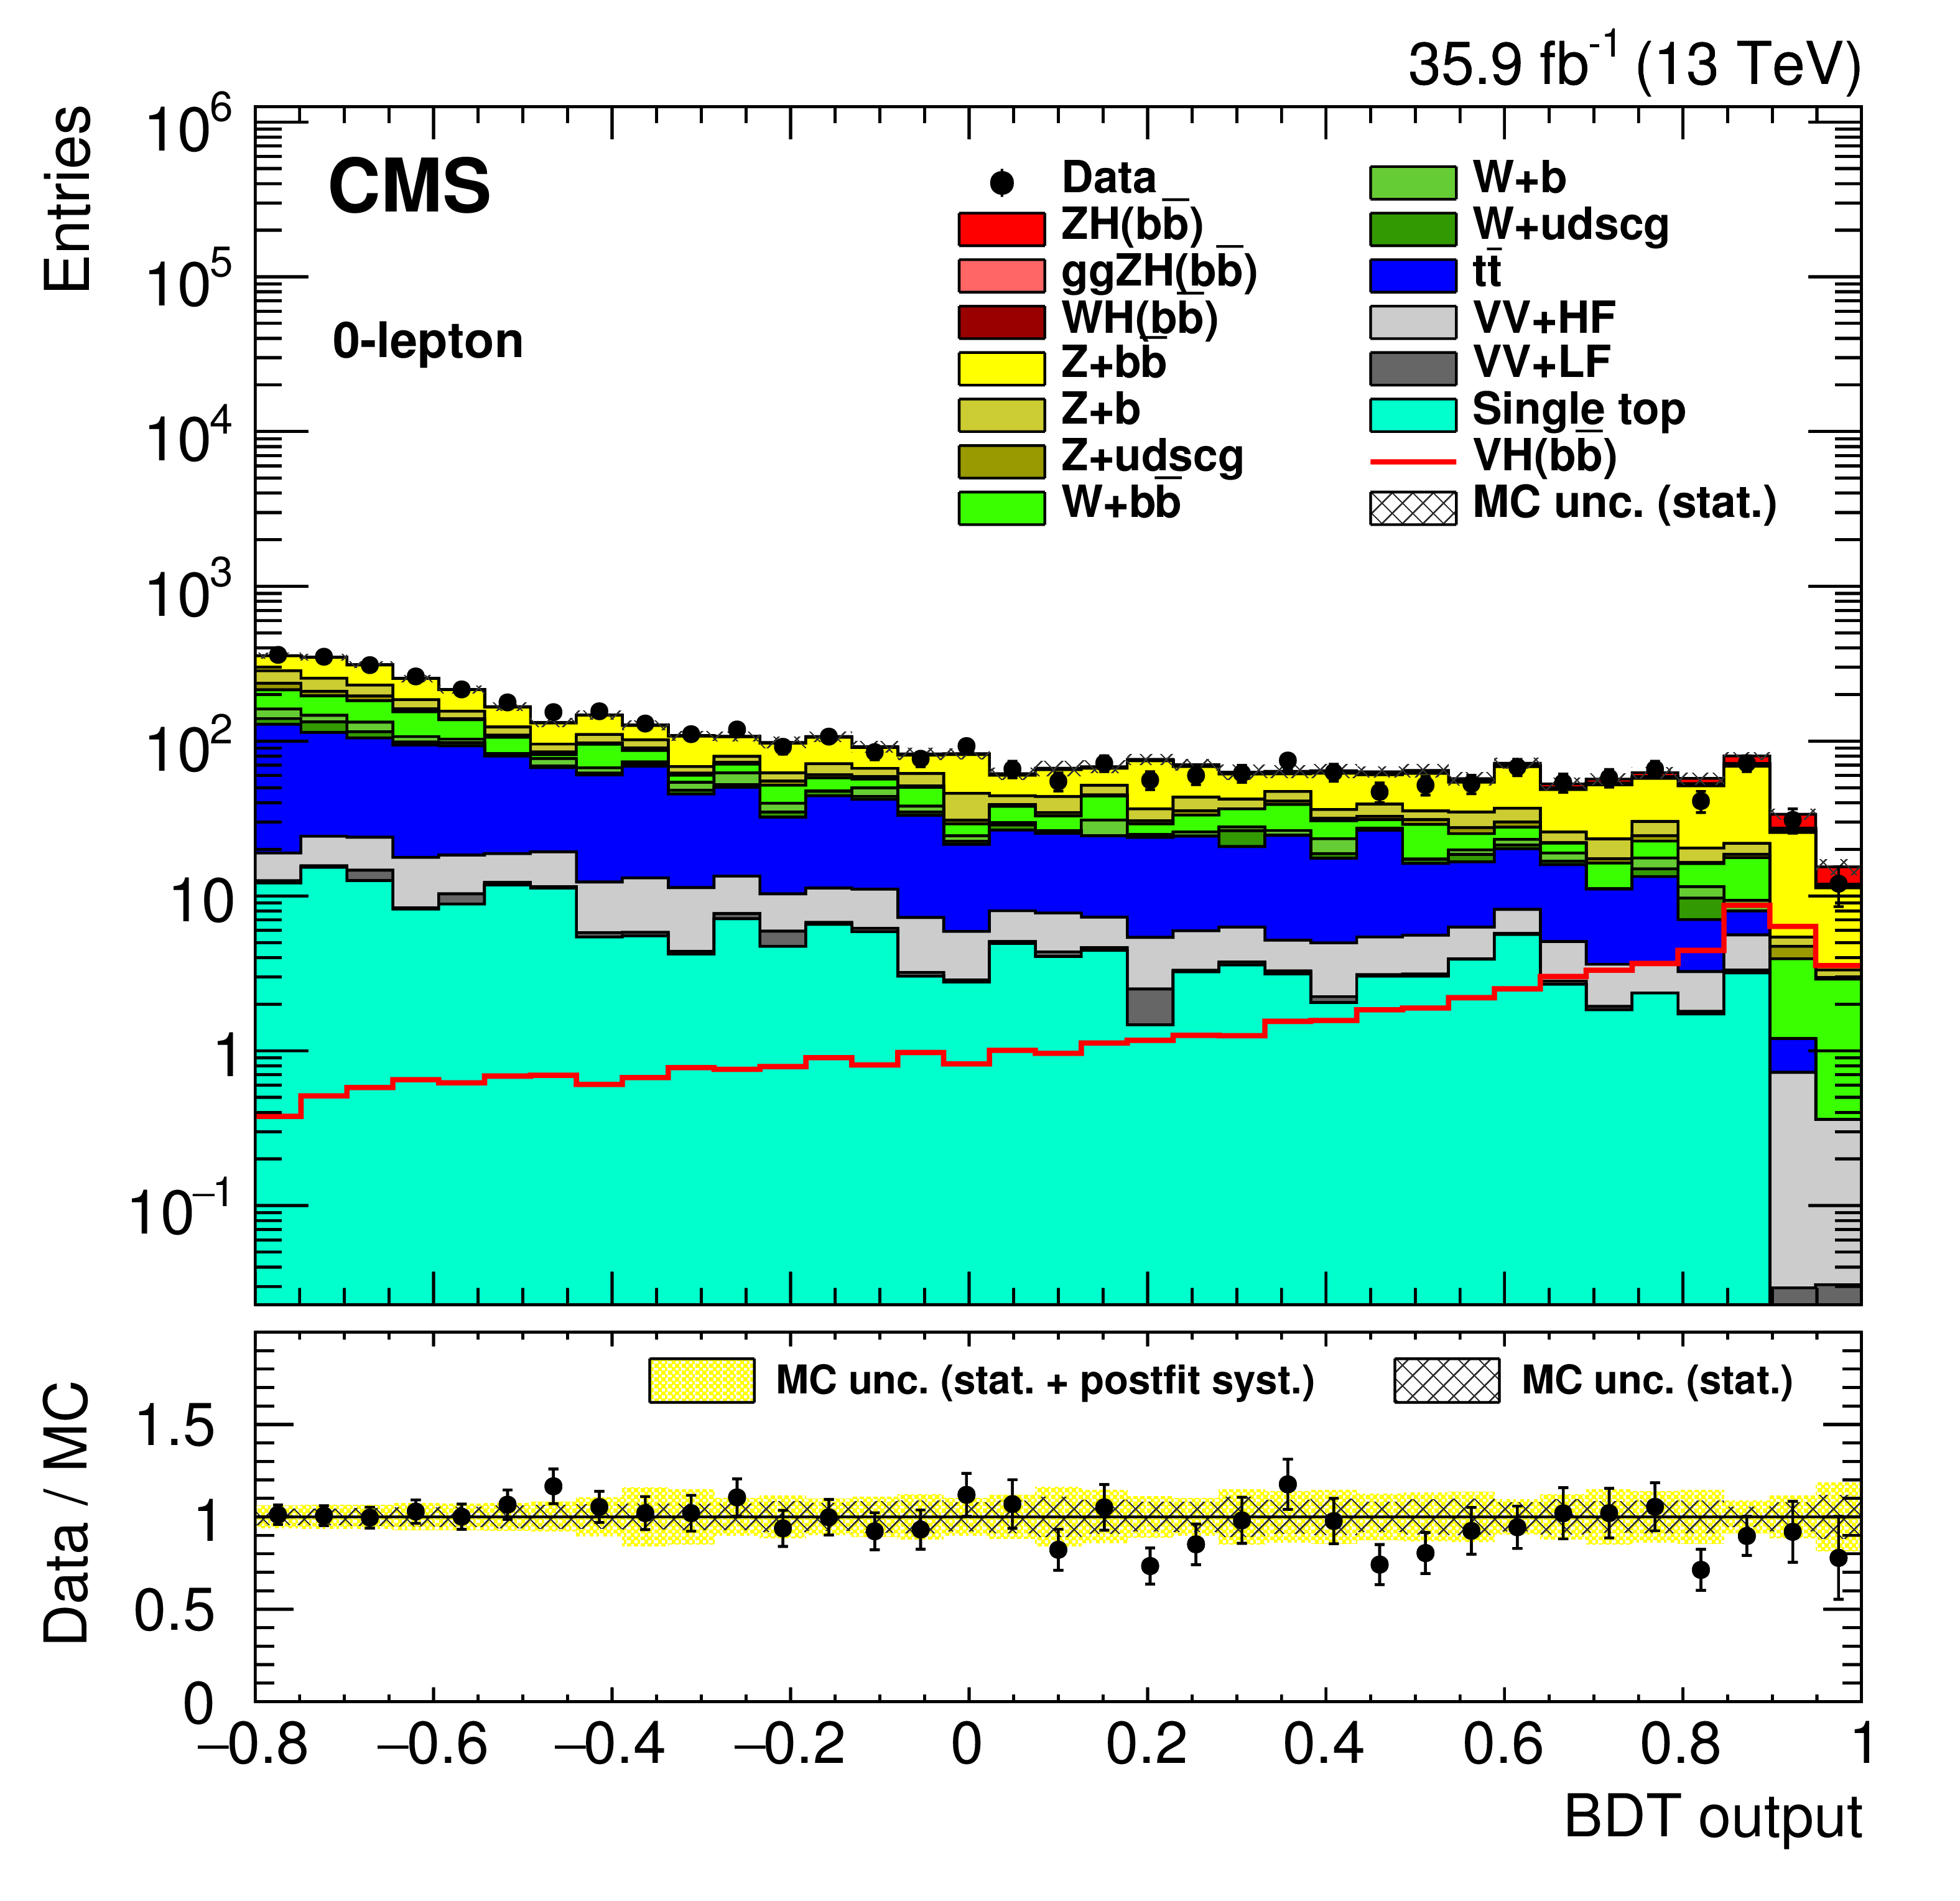
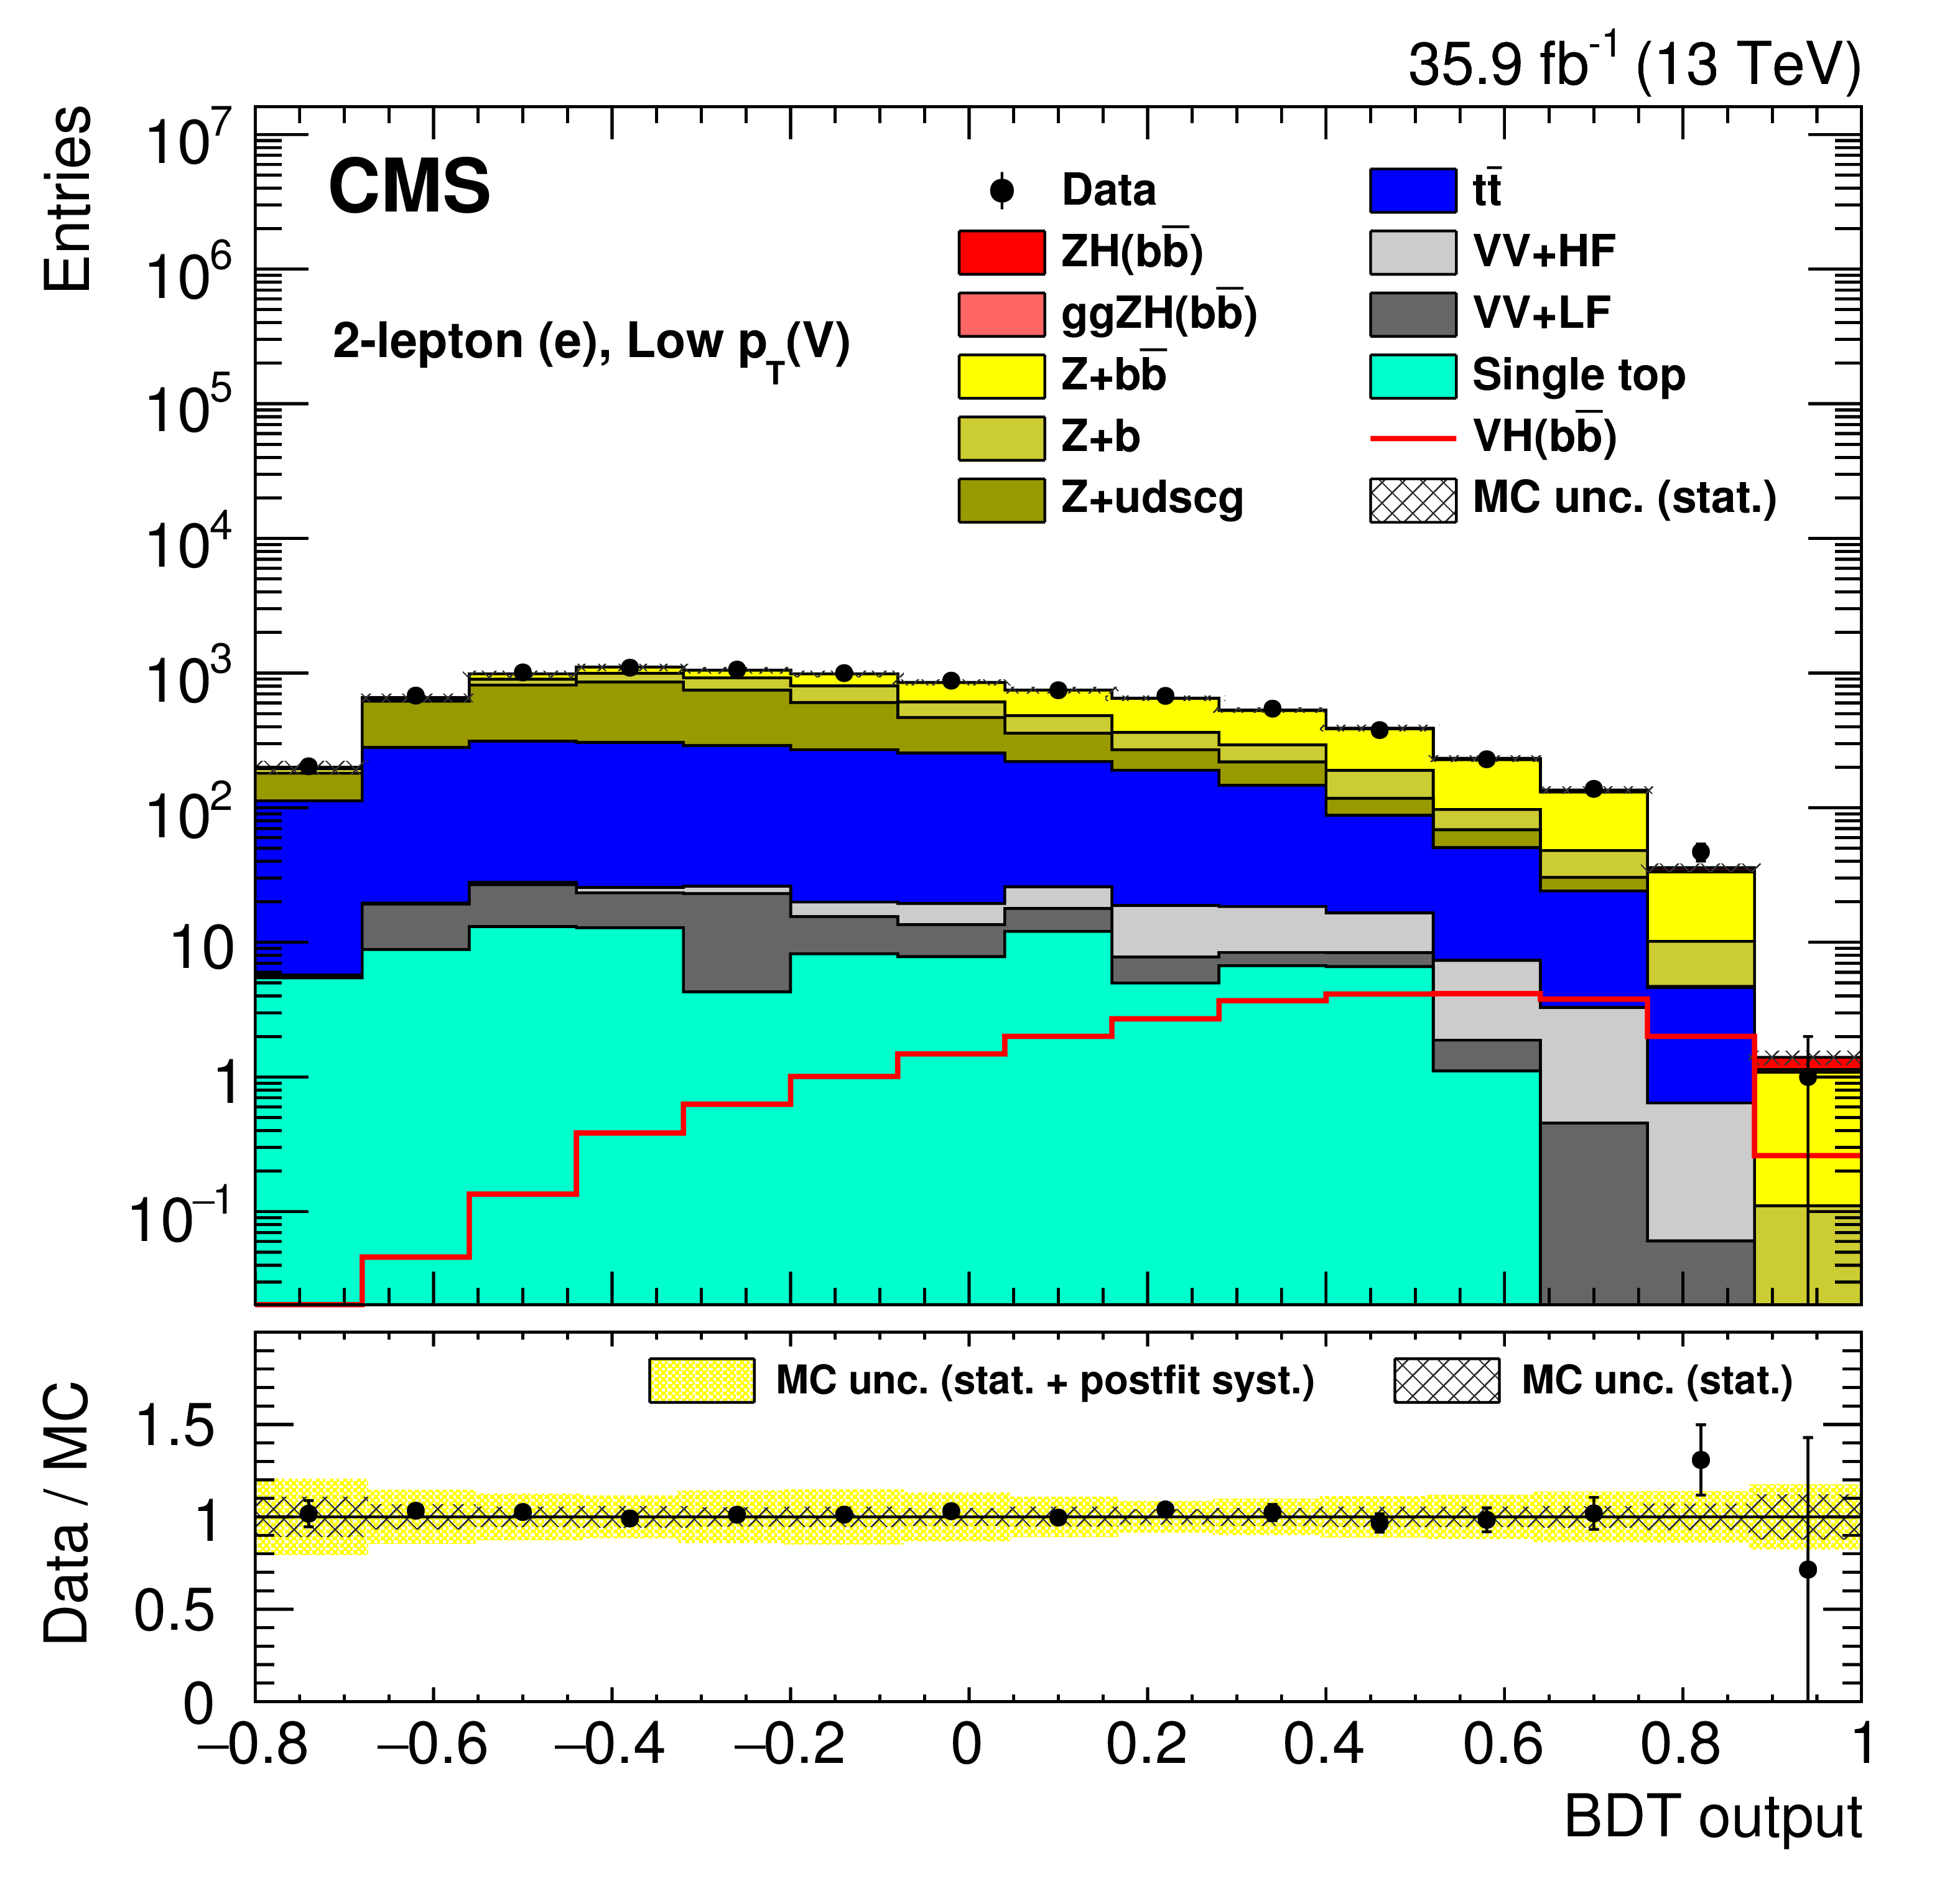
Figure 4:
Post-fit event BDT output distributions for the 13 TeV data (points with error bars), for the 0-lepton channel (top), for the 1-lepton channels (middle), and for the 2-lepton low-$ {{p_{\mathrm {T}}} ({\mathrm {V}})}$ and high-$ {{p_{\mathrm {T}}} ({\mathrm {V}})}$ regions (bottom). The bottom inset shows the ratio of the number of events observed in data to that of the prediction from simulated samples for the SM Higgs boson signal and for backgrounds. |
png pdf |
Figure 4-a:
Post-fit event BDT output distributions for the 13 TeV data (points with error bars), for the 0-lepton channel. The bottom inset shows the ratio of the number of events observed in data to that of the prediction from simulated samples for the SM Higgs boson signal and for backgrounds. |
png pdf |
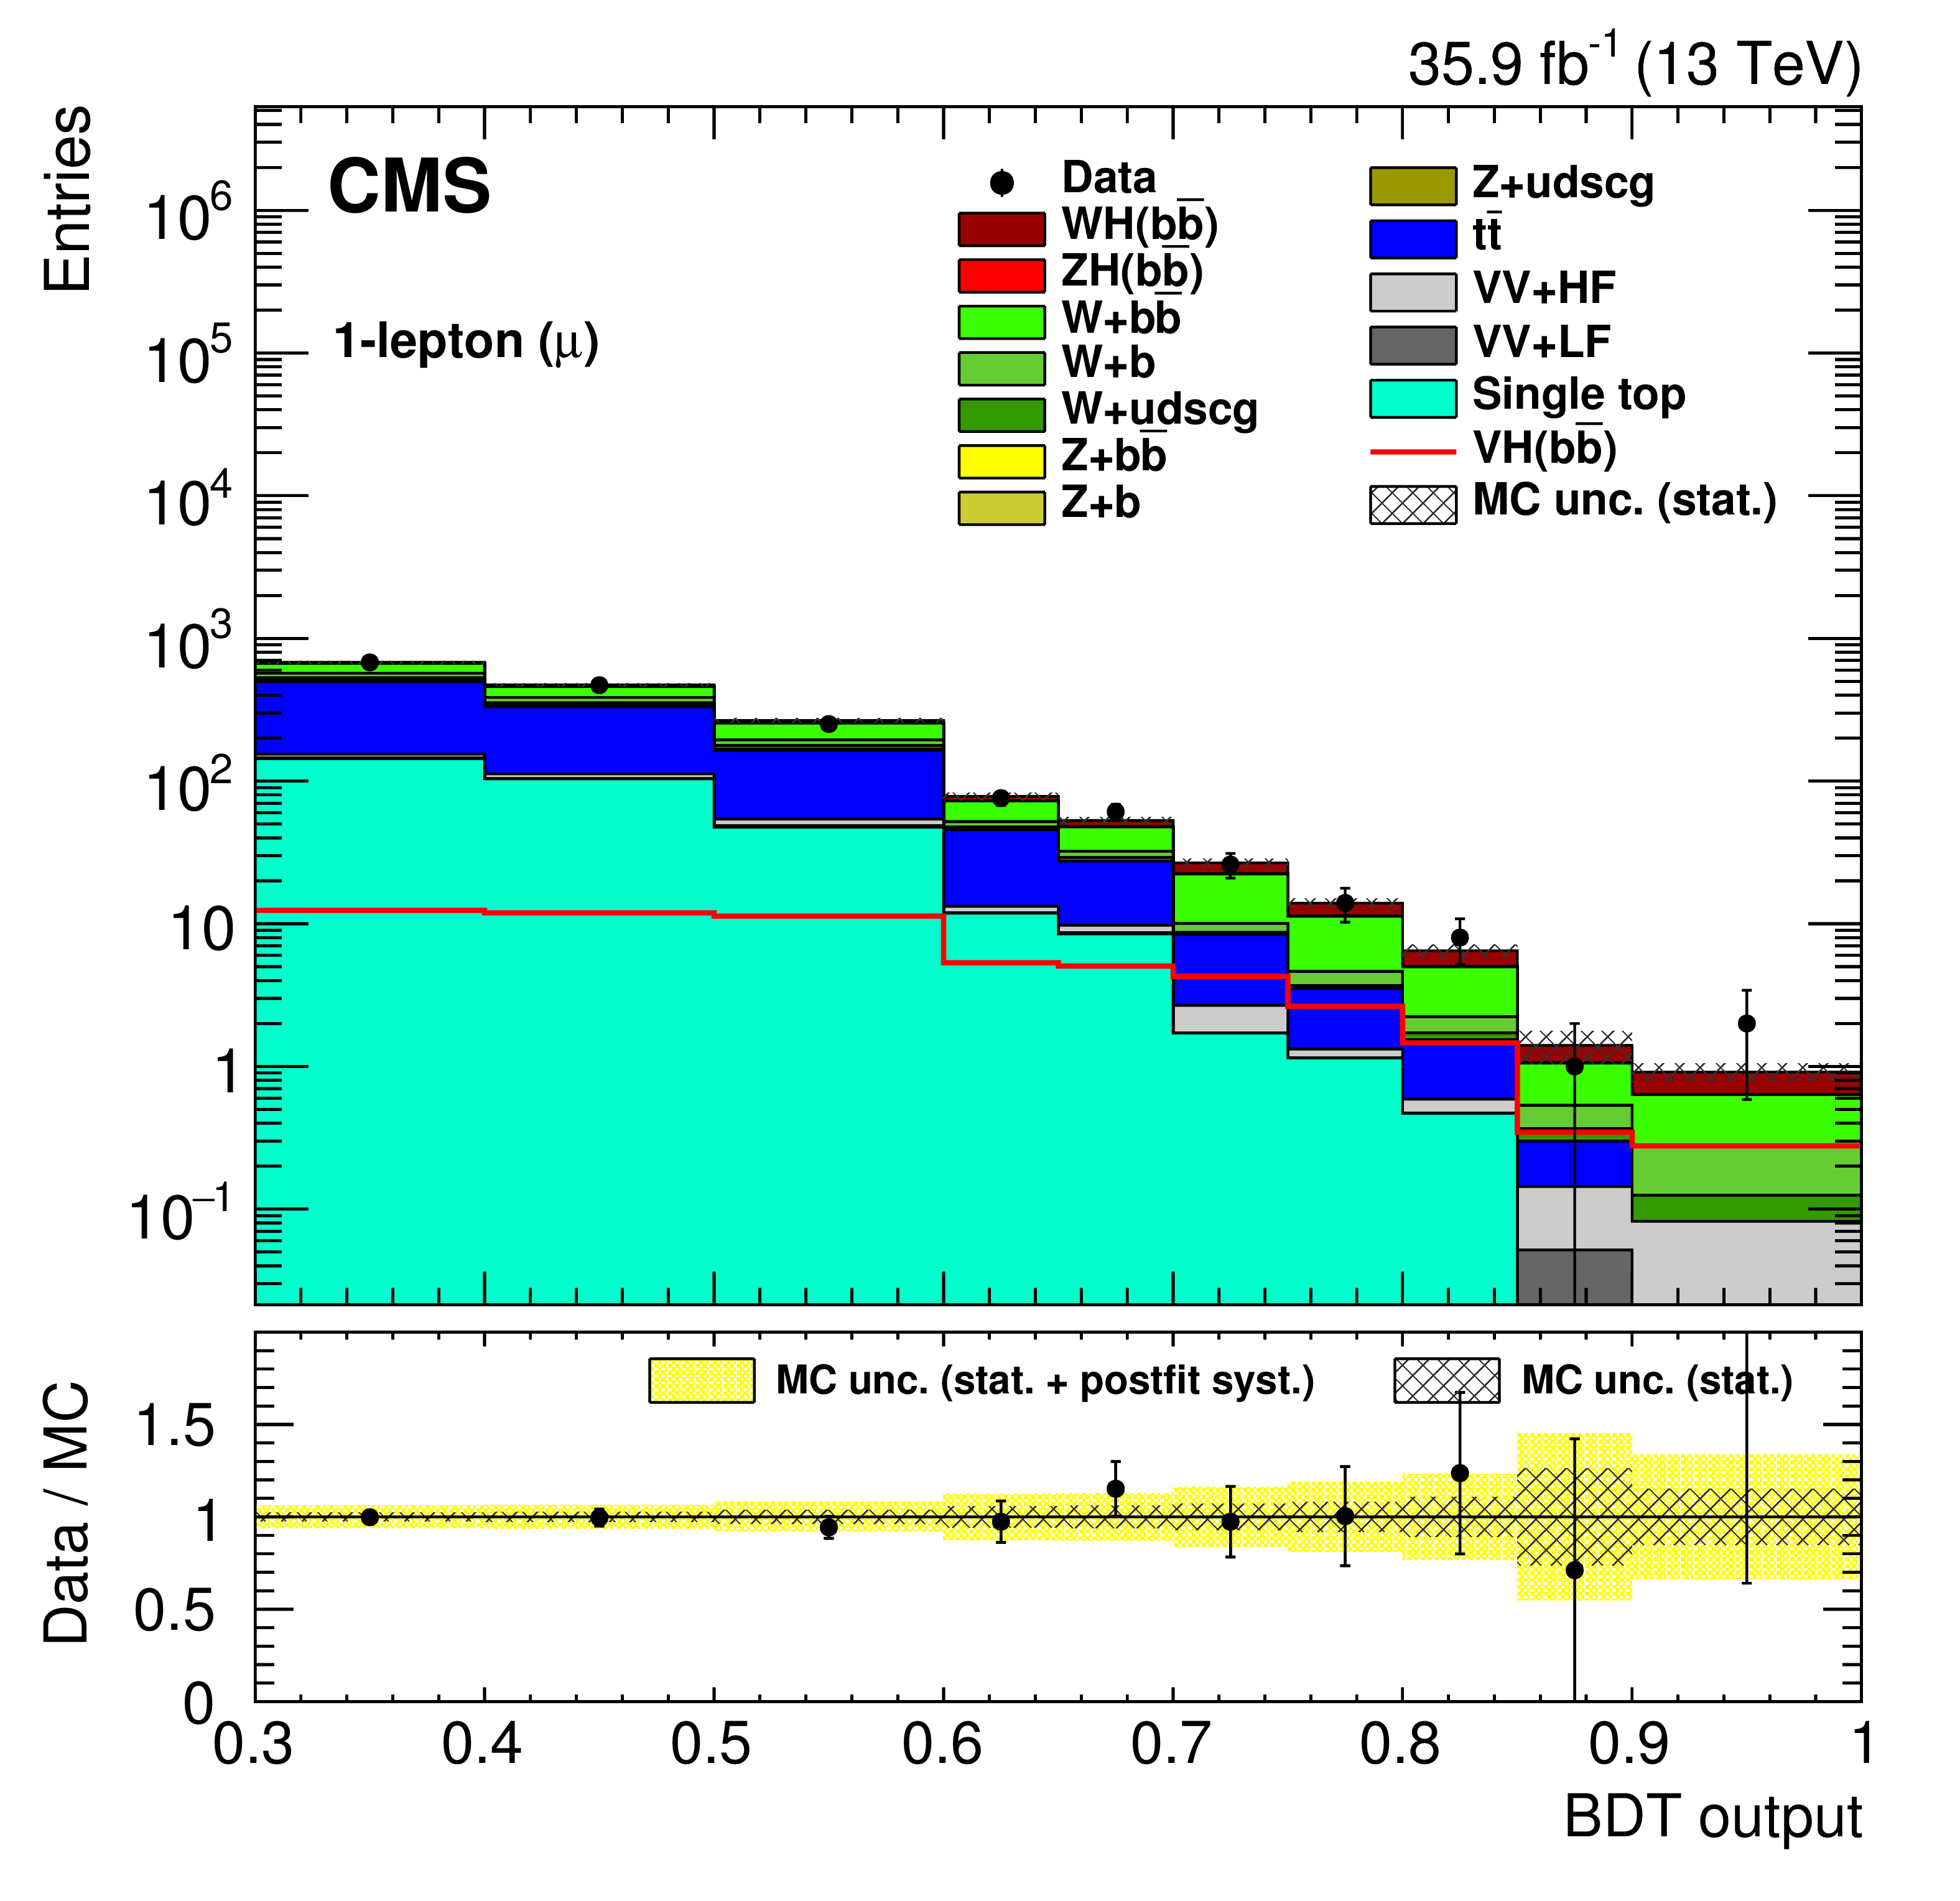
Figure 4-b:
Post-fit event BDT output distributions for the 13 TeV data (points with error bars), for the 1-muon channel. The bottom inset shows the ratio of the number of events observed in data to that of the prediction from simulated samples for the SM Higgs boson signal and for backgrounds. |
png pdf |
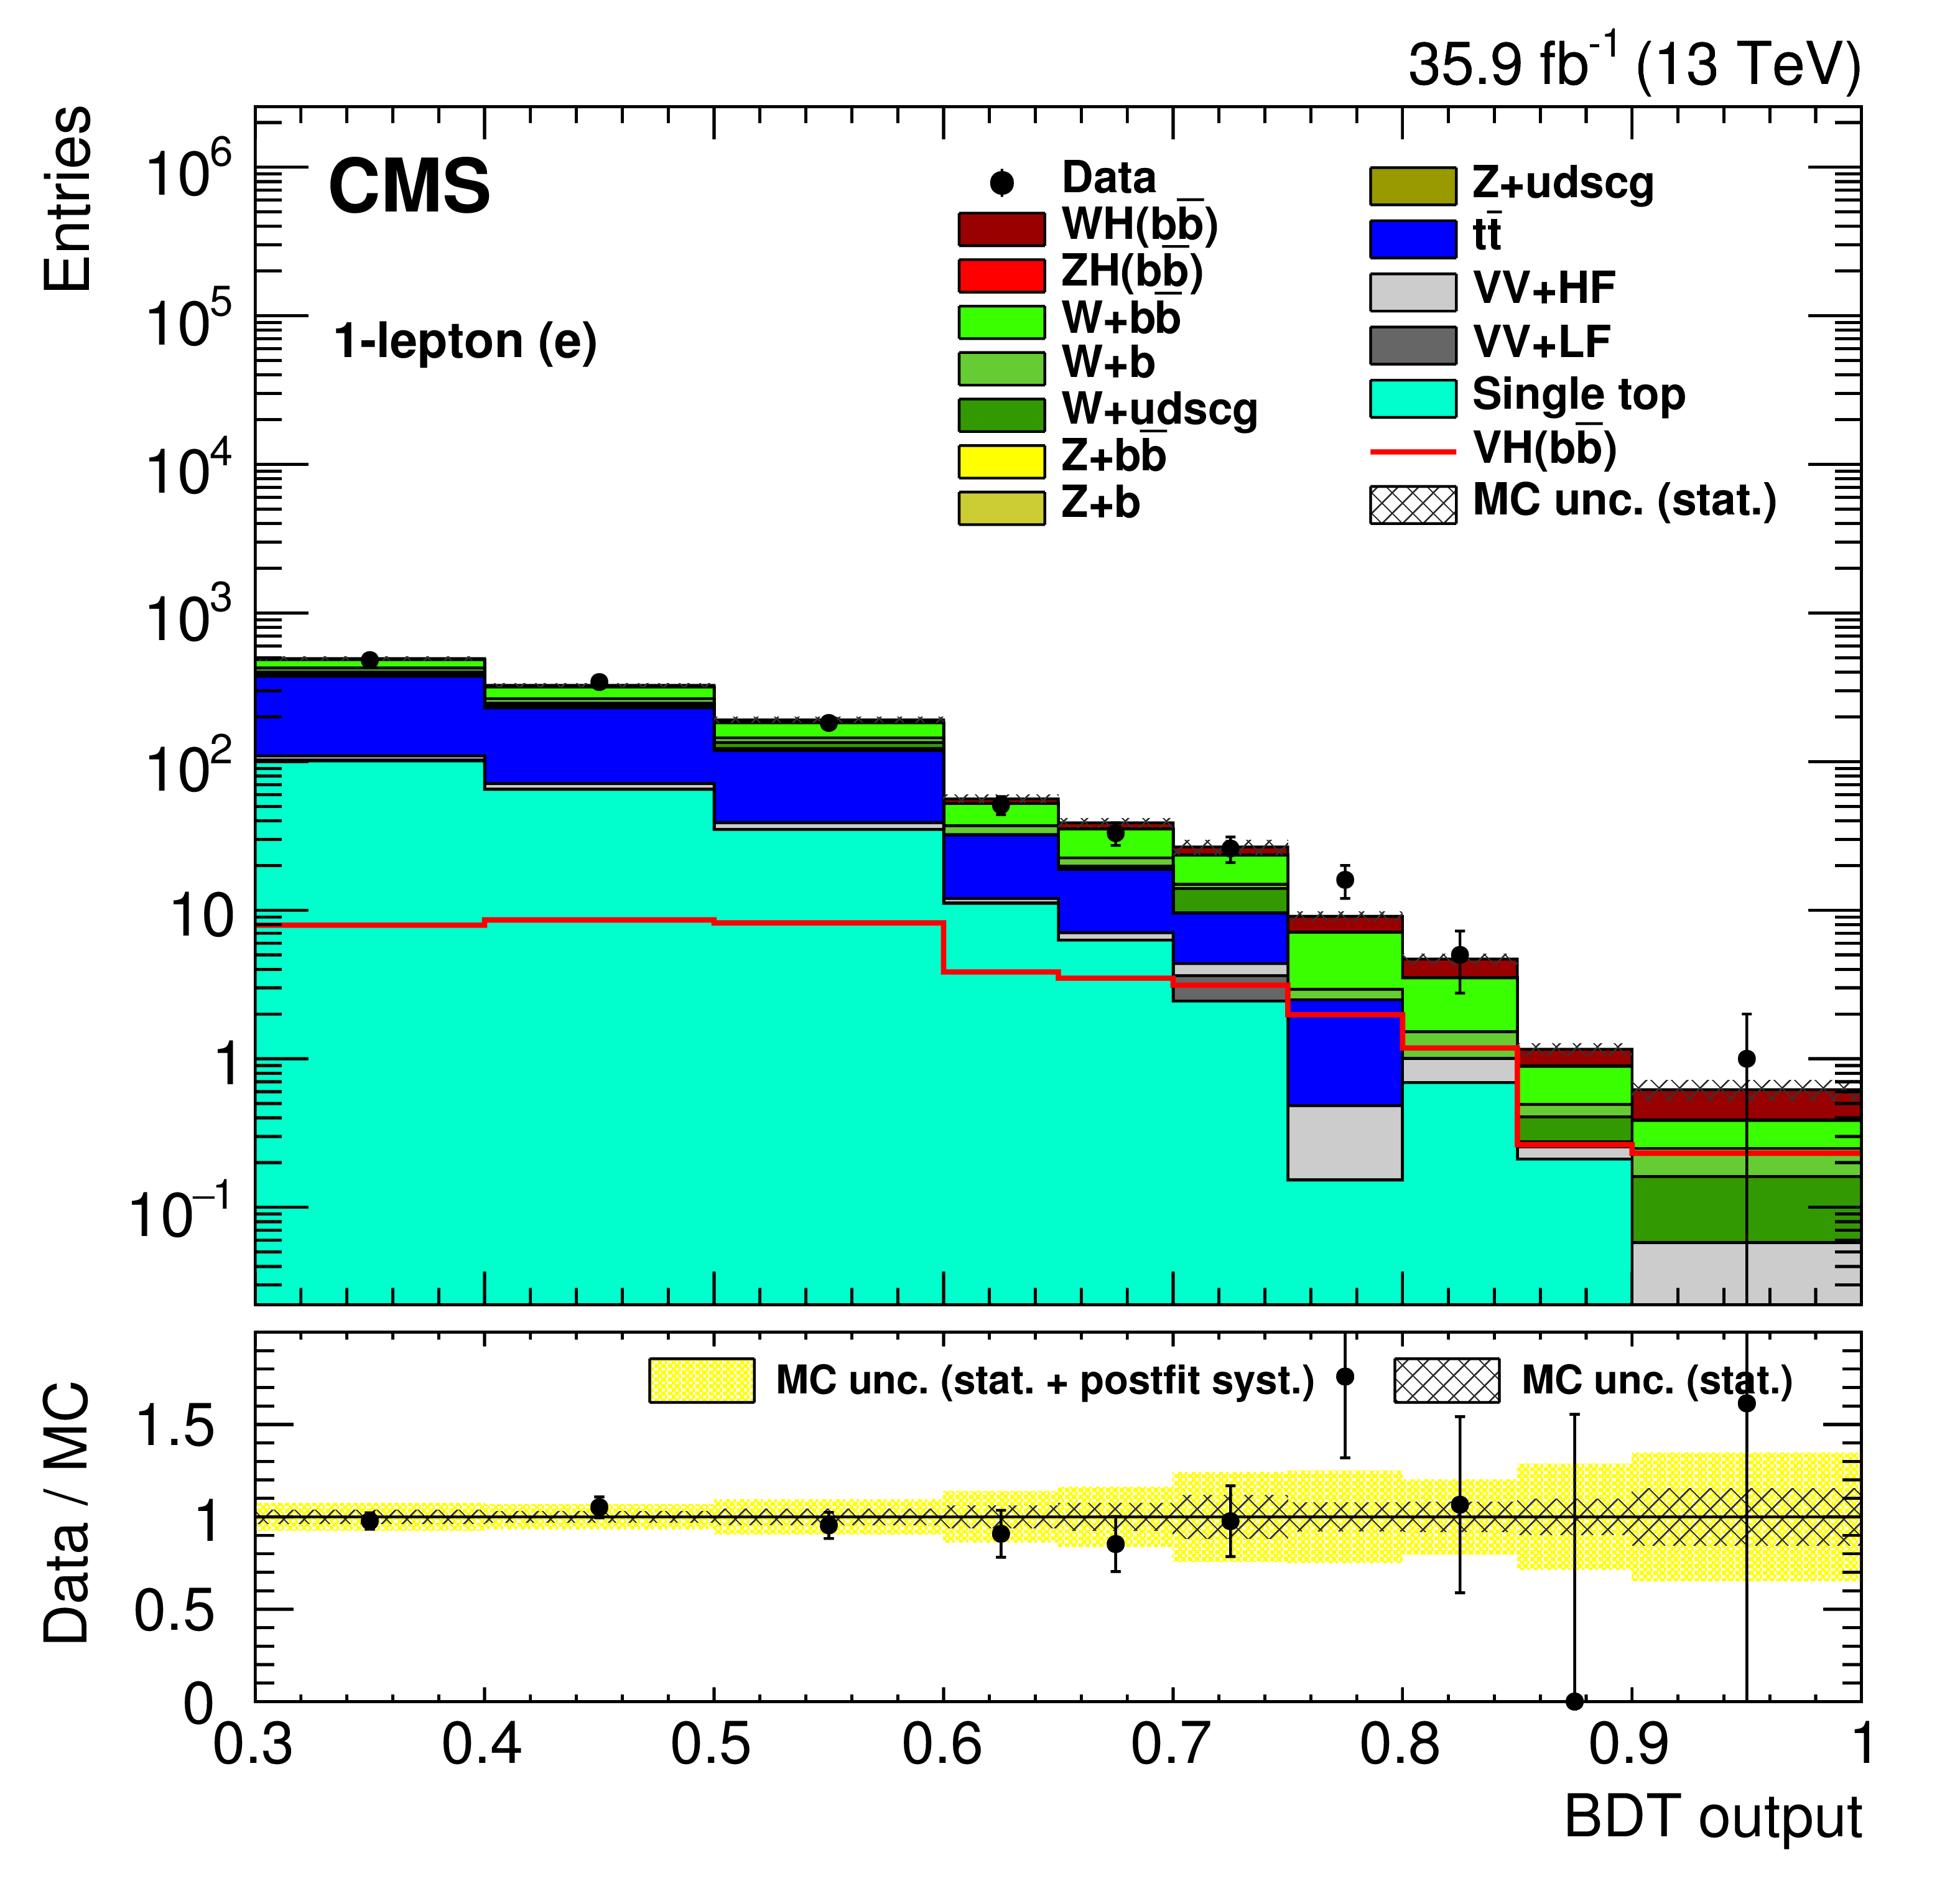
Figure 4-c:
Post-fit event BDT output distributions for the 13 TeV data (points with error bars), for the 1-electron channel. The bottom inset shows the ratio of the number of events observed in data to that of the prediction from simulated samples for the SM Higgs boson signal and for backgrounds. |
png pdf |
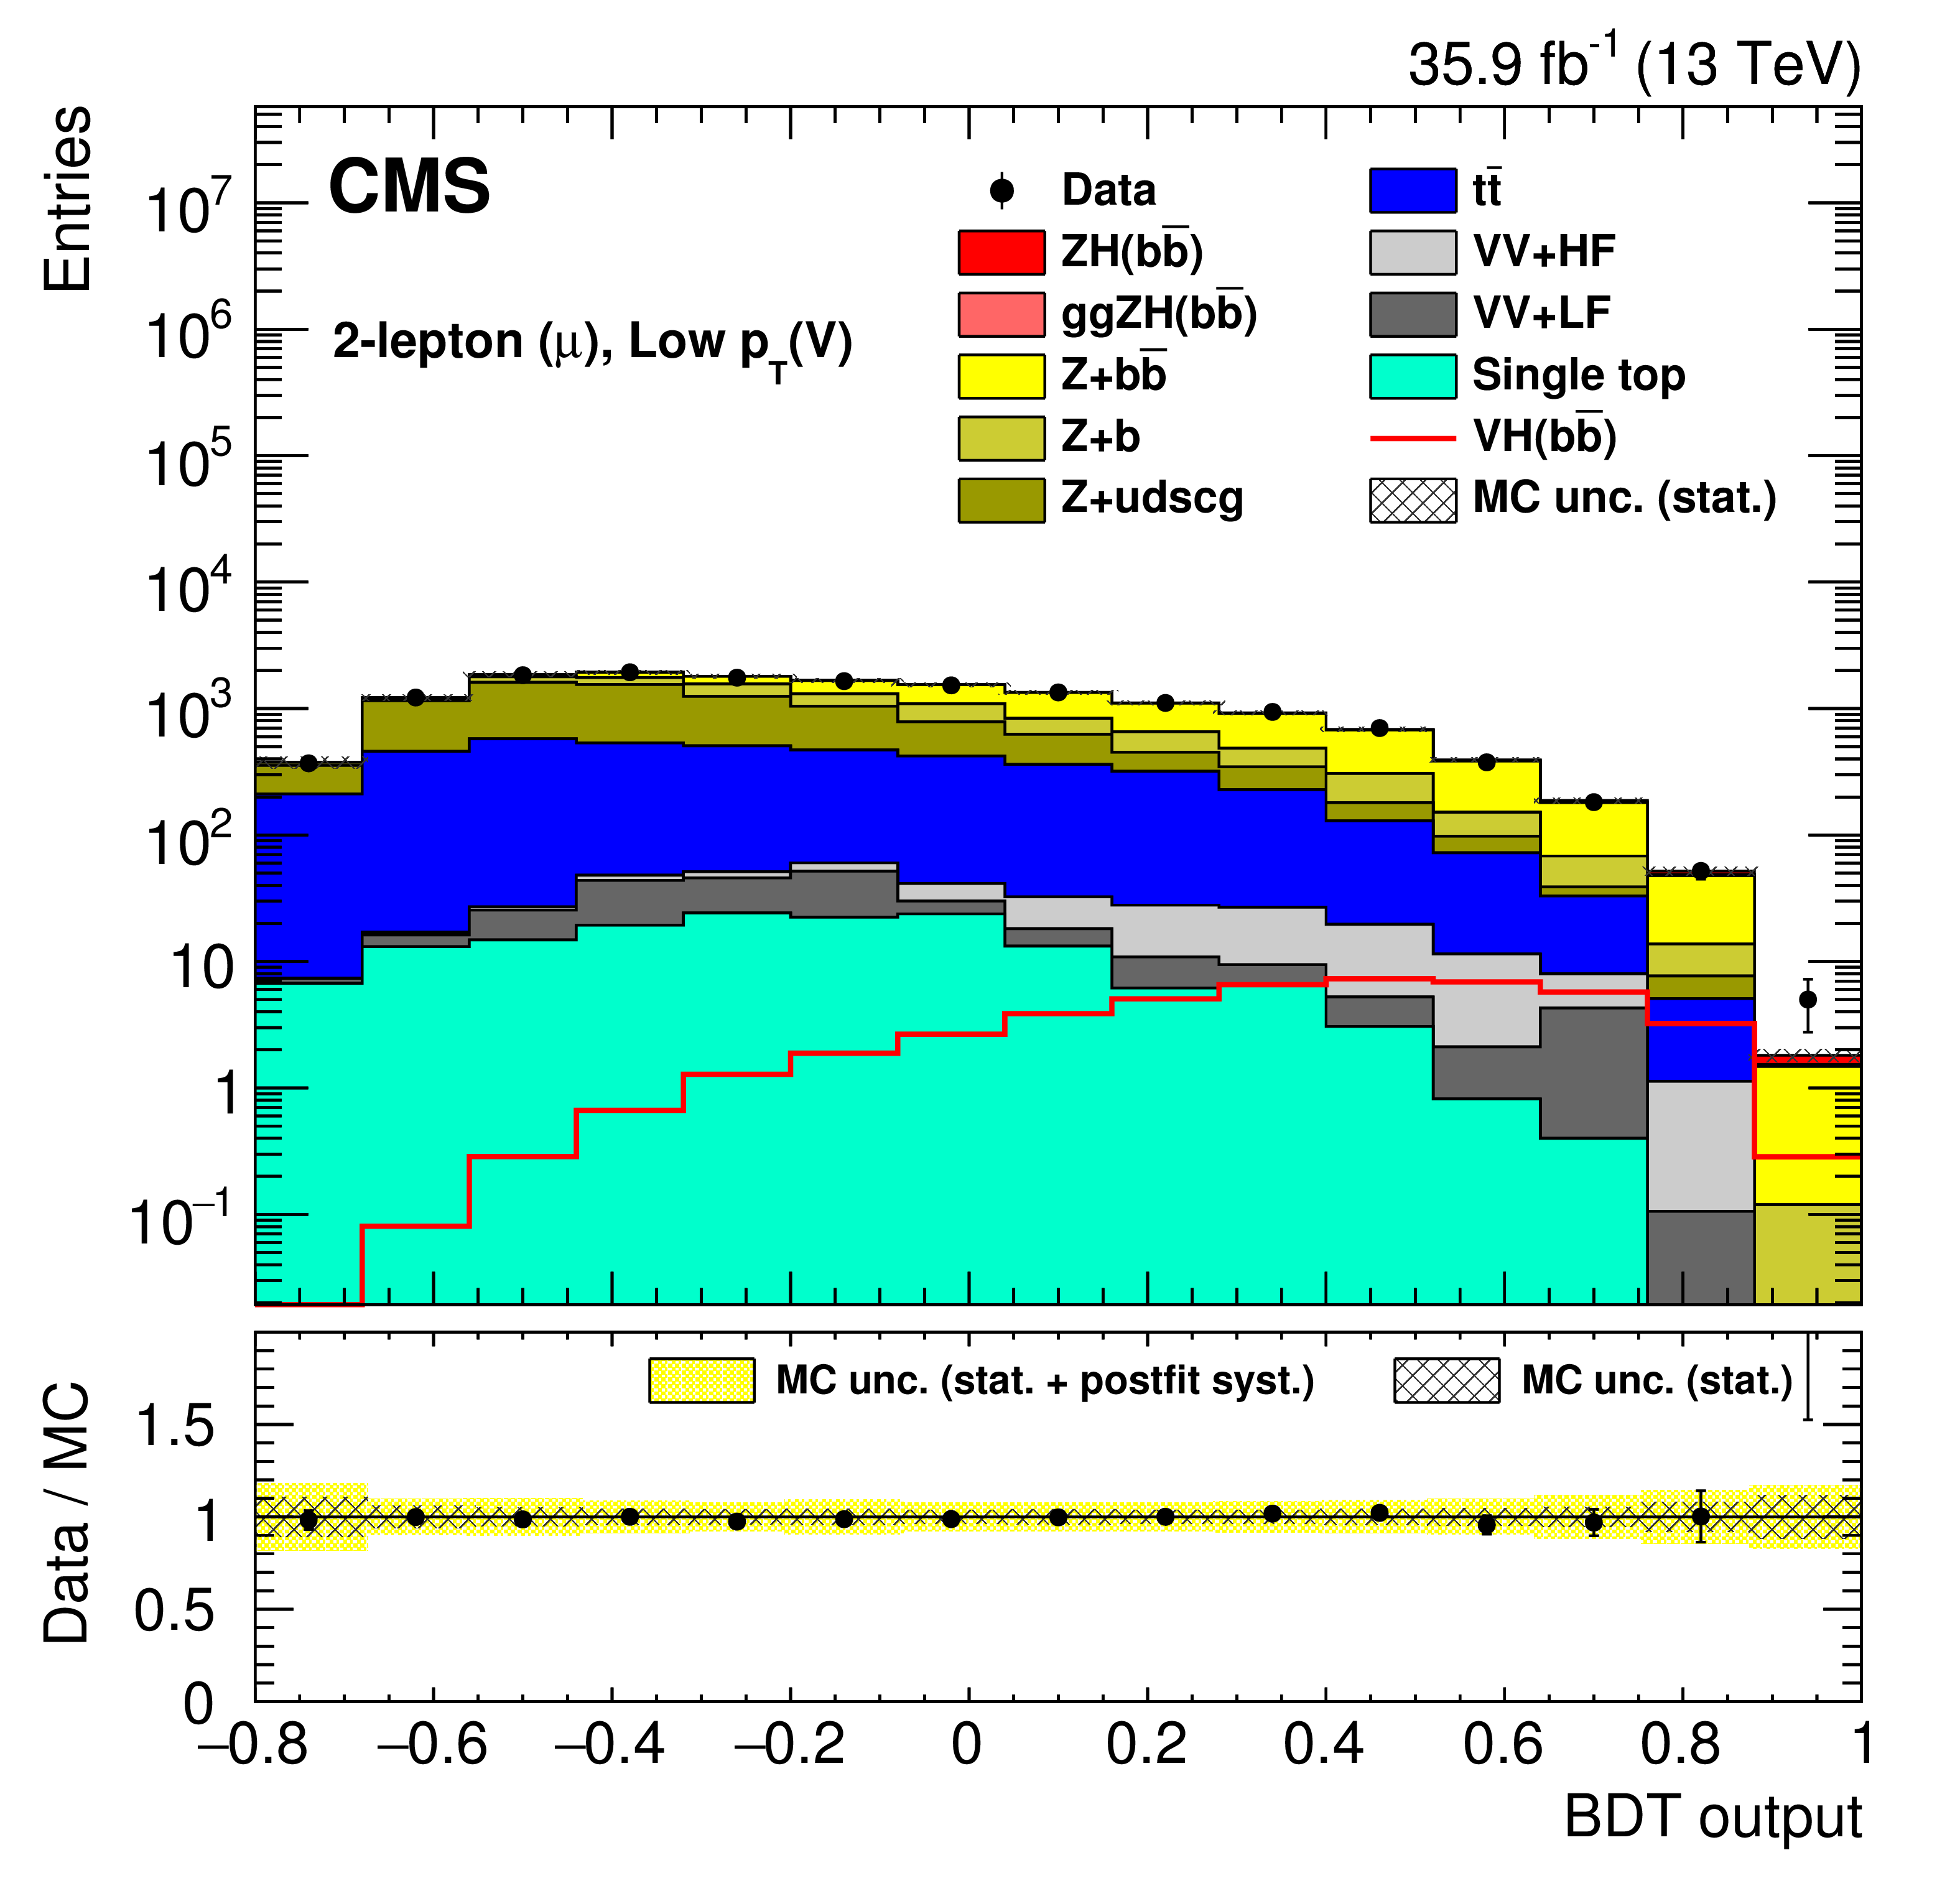
Figure 4-d:
Post-fit event BDT output distributions for the 13 TeV data (points with error bars), for the 2-muon low-$ {{p_{\mathrm {T}}} ({\mathrm {V}})}$ region. The bottom inset shows the ratio of the number of events observed in data to that of the prediction from simulated samples for the SM Higgs boson signal and for backgrounds. |
png pdf |
Figure 4-e:
Post-fit event BDT output distributions for the 13 TeV data (points with error bars), for the 2-electron low-$. The bottom inset shows the ratio of the number of events observed in data to that of the prediction from simulated samples for the SM Higgs boson signal and for backgrounds. |
png pdf |
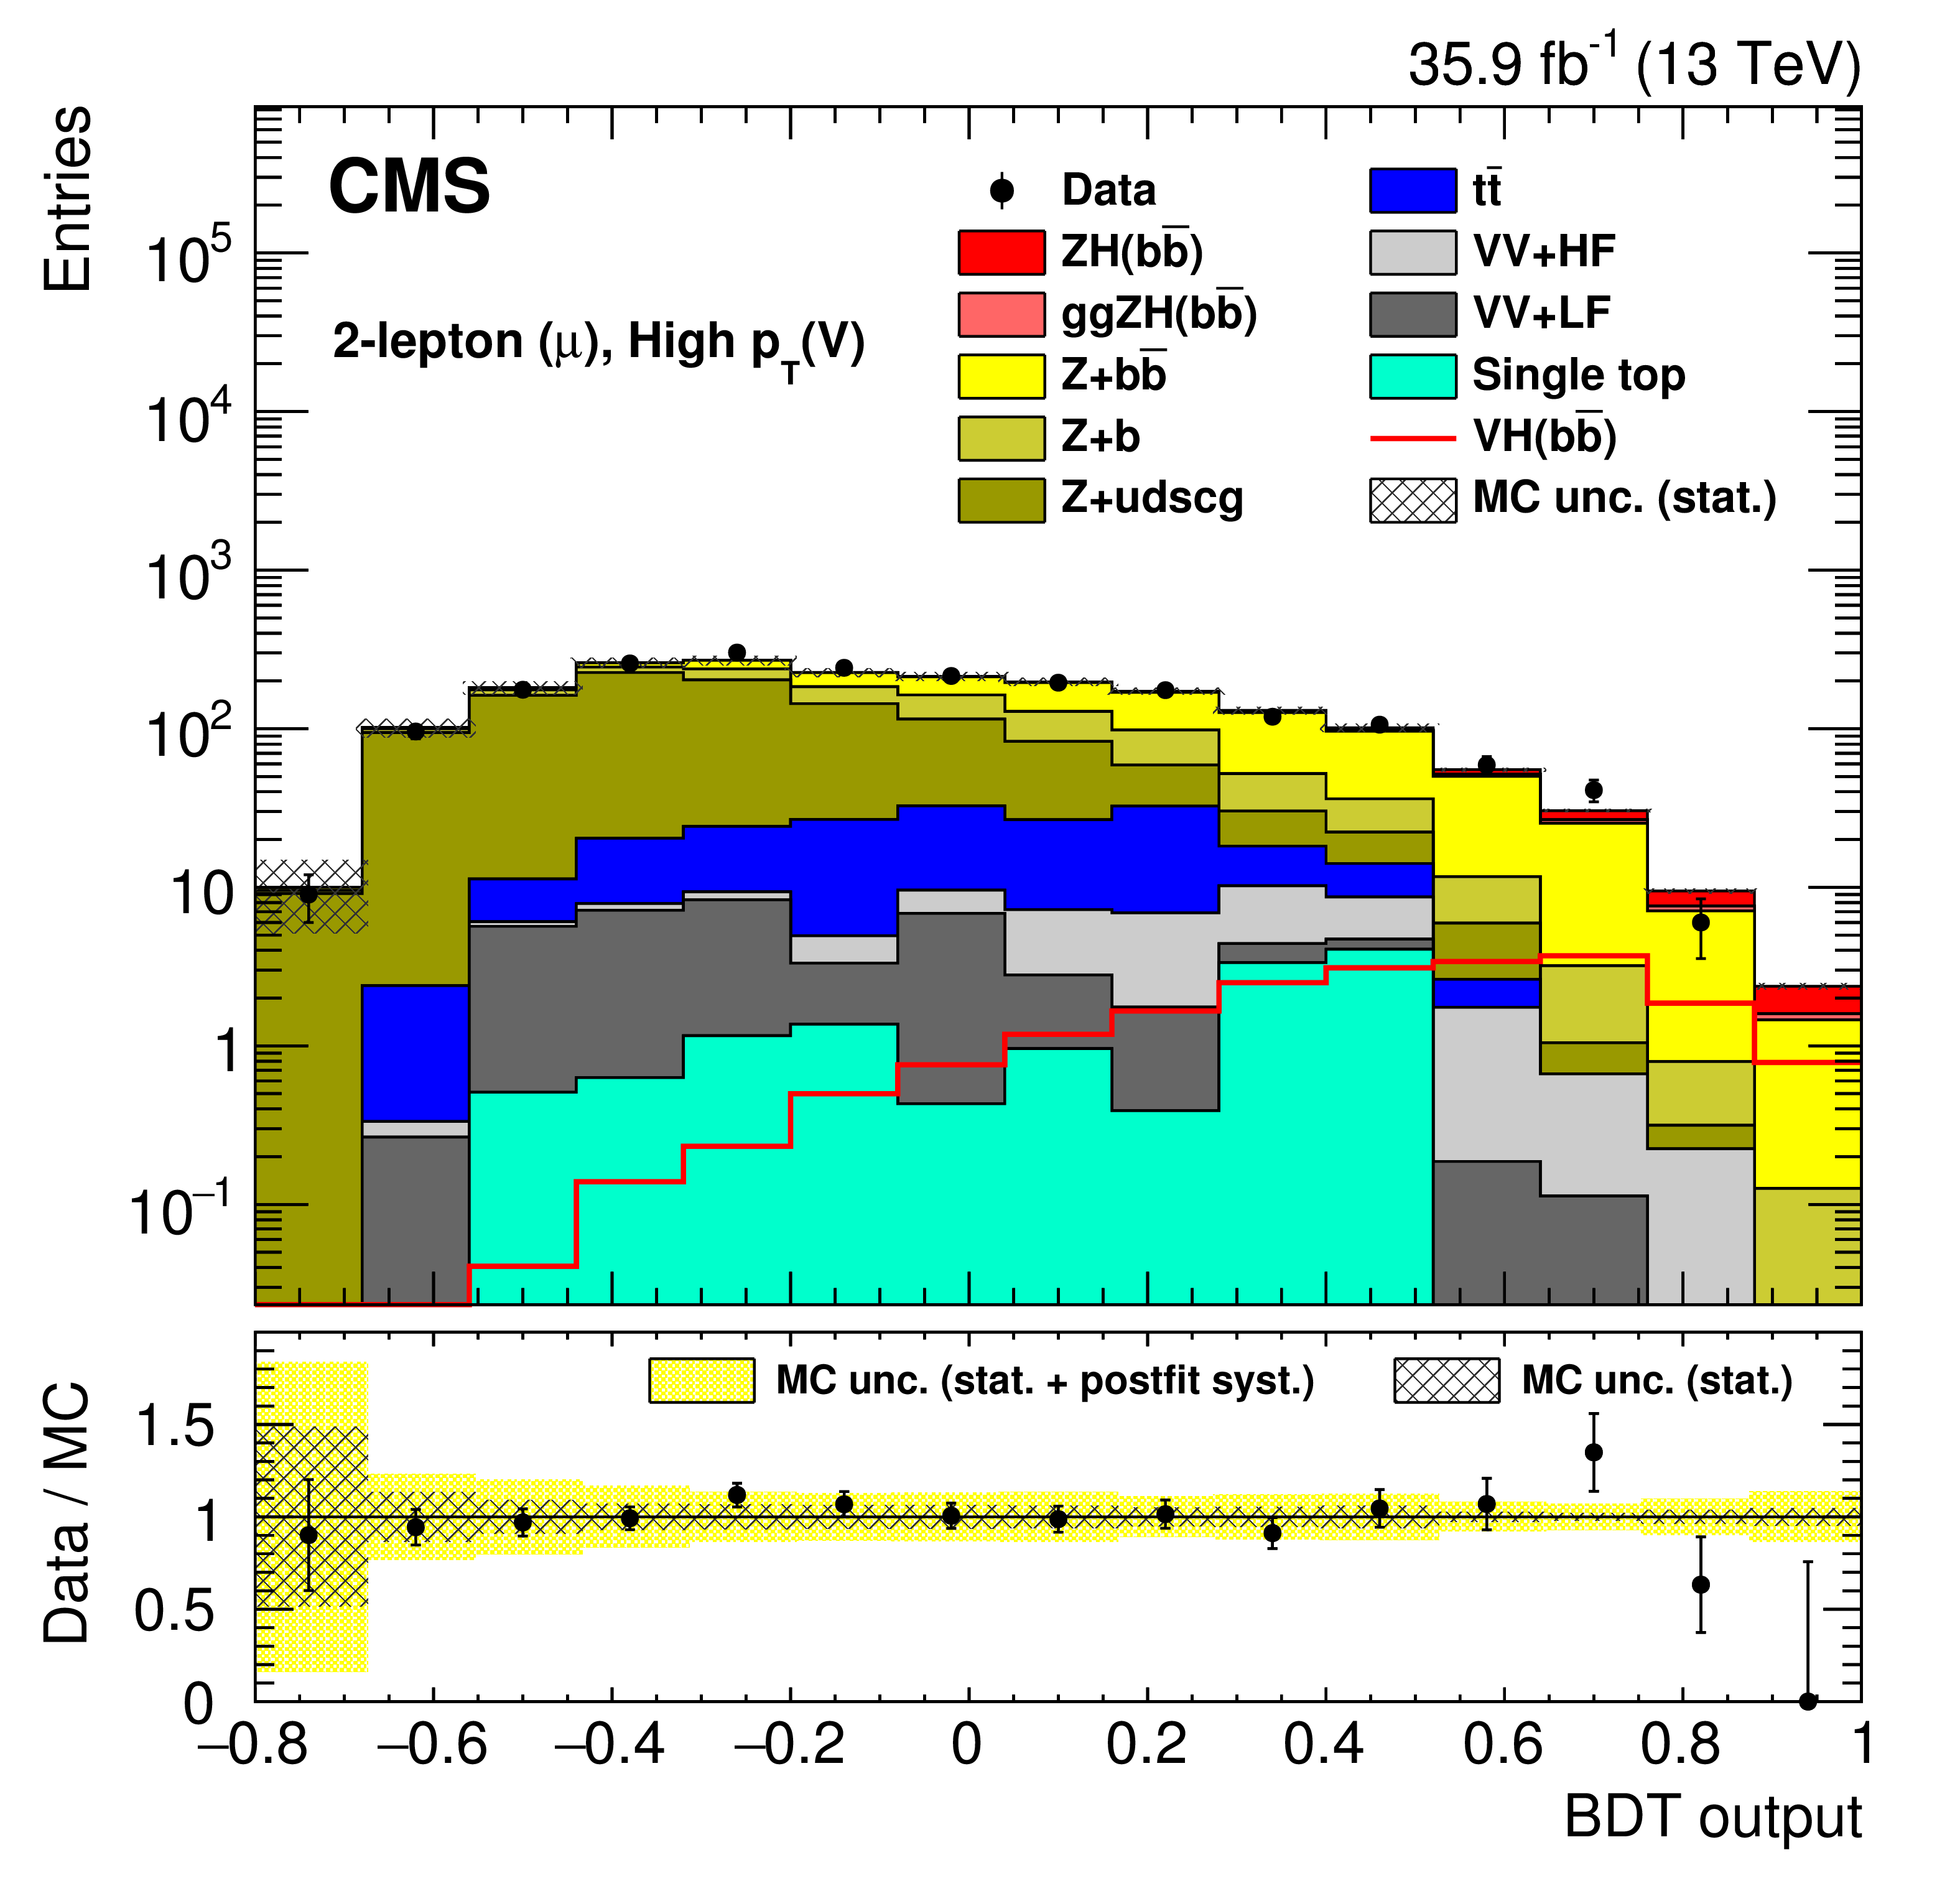
Figure 4-f:
Post-fit event BDT output distributions for the 13 TeV data (points with error bars), for the 2-muon high-$ {{p_{\mathrm {T}}} ({\mathrm {V}})}$ region. The bottom inset shows the ratio of the number of events observed in data to that of the prediction from simulated samples for the SM Higgs boson signal and for backgrounds. |
png pdf |
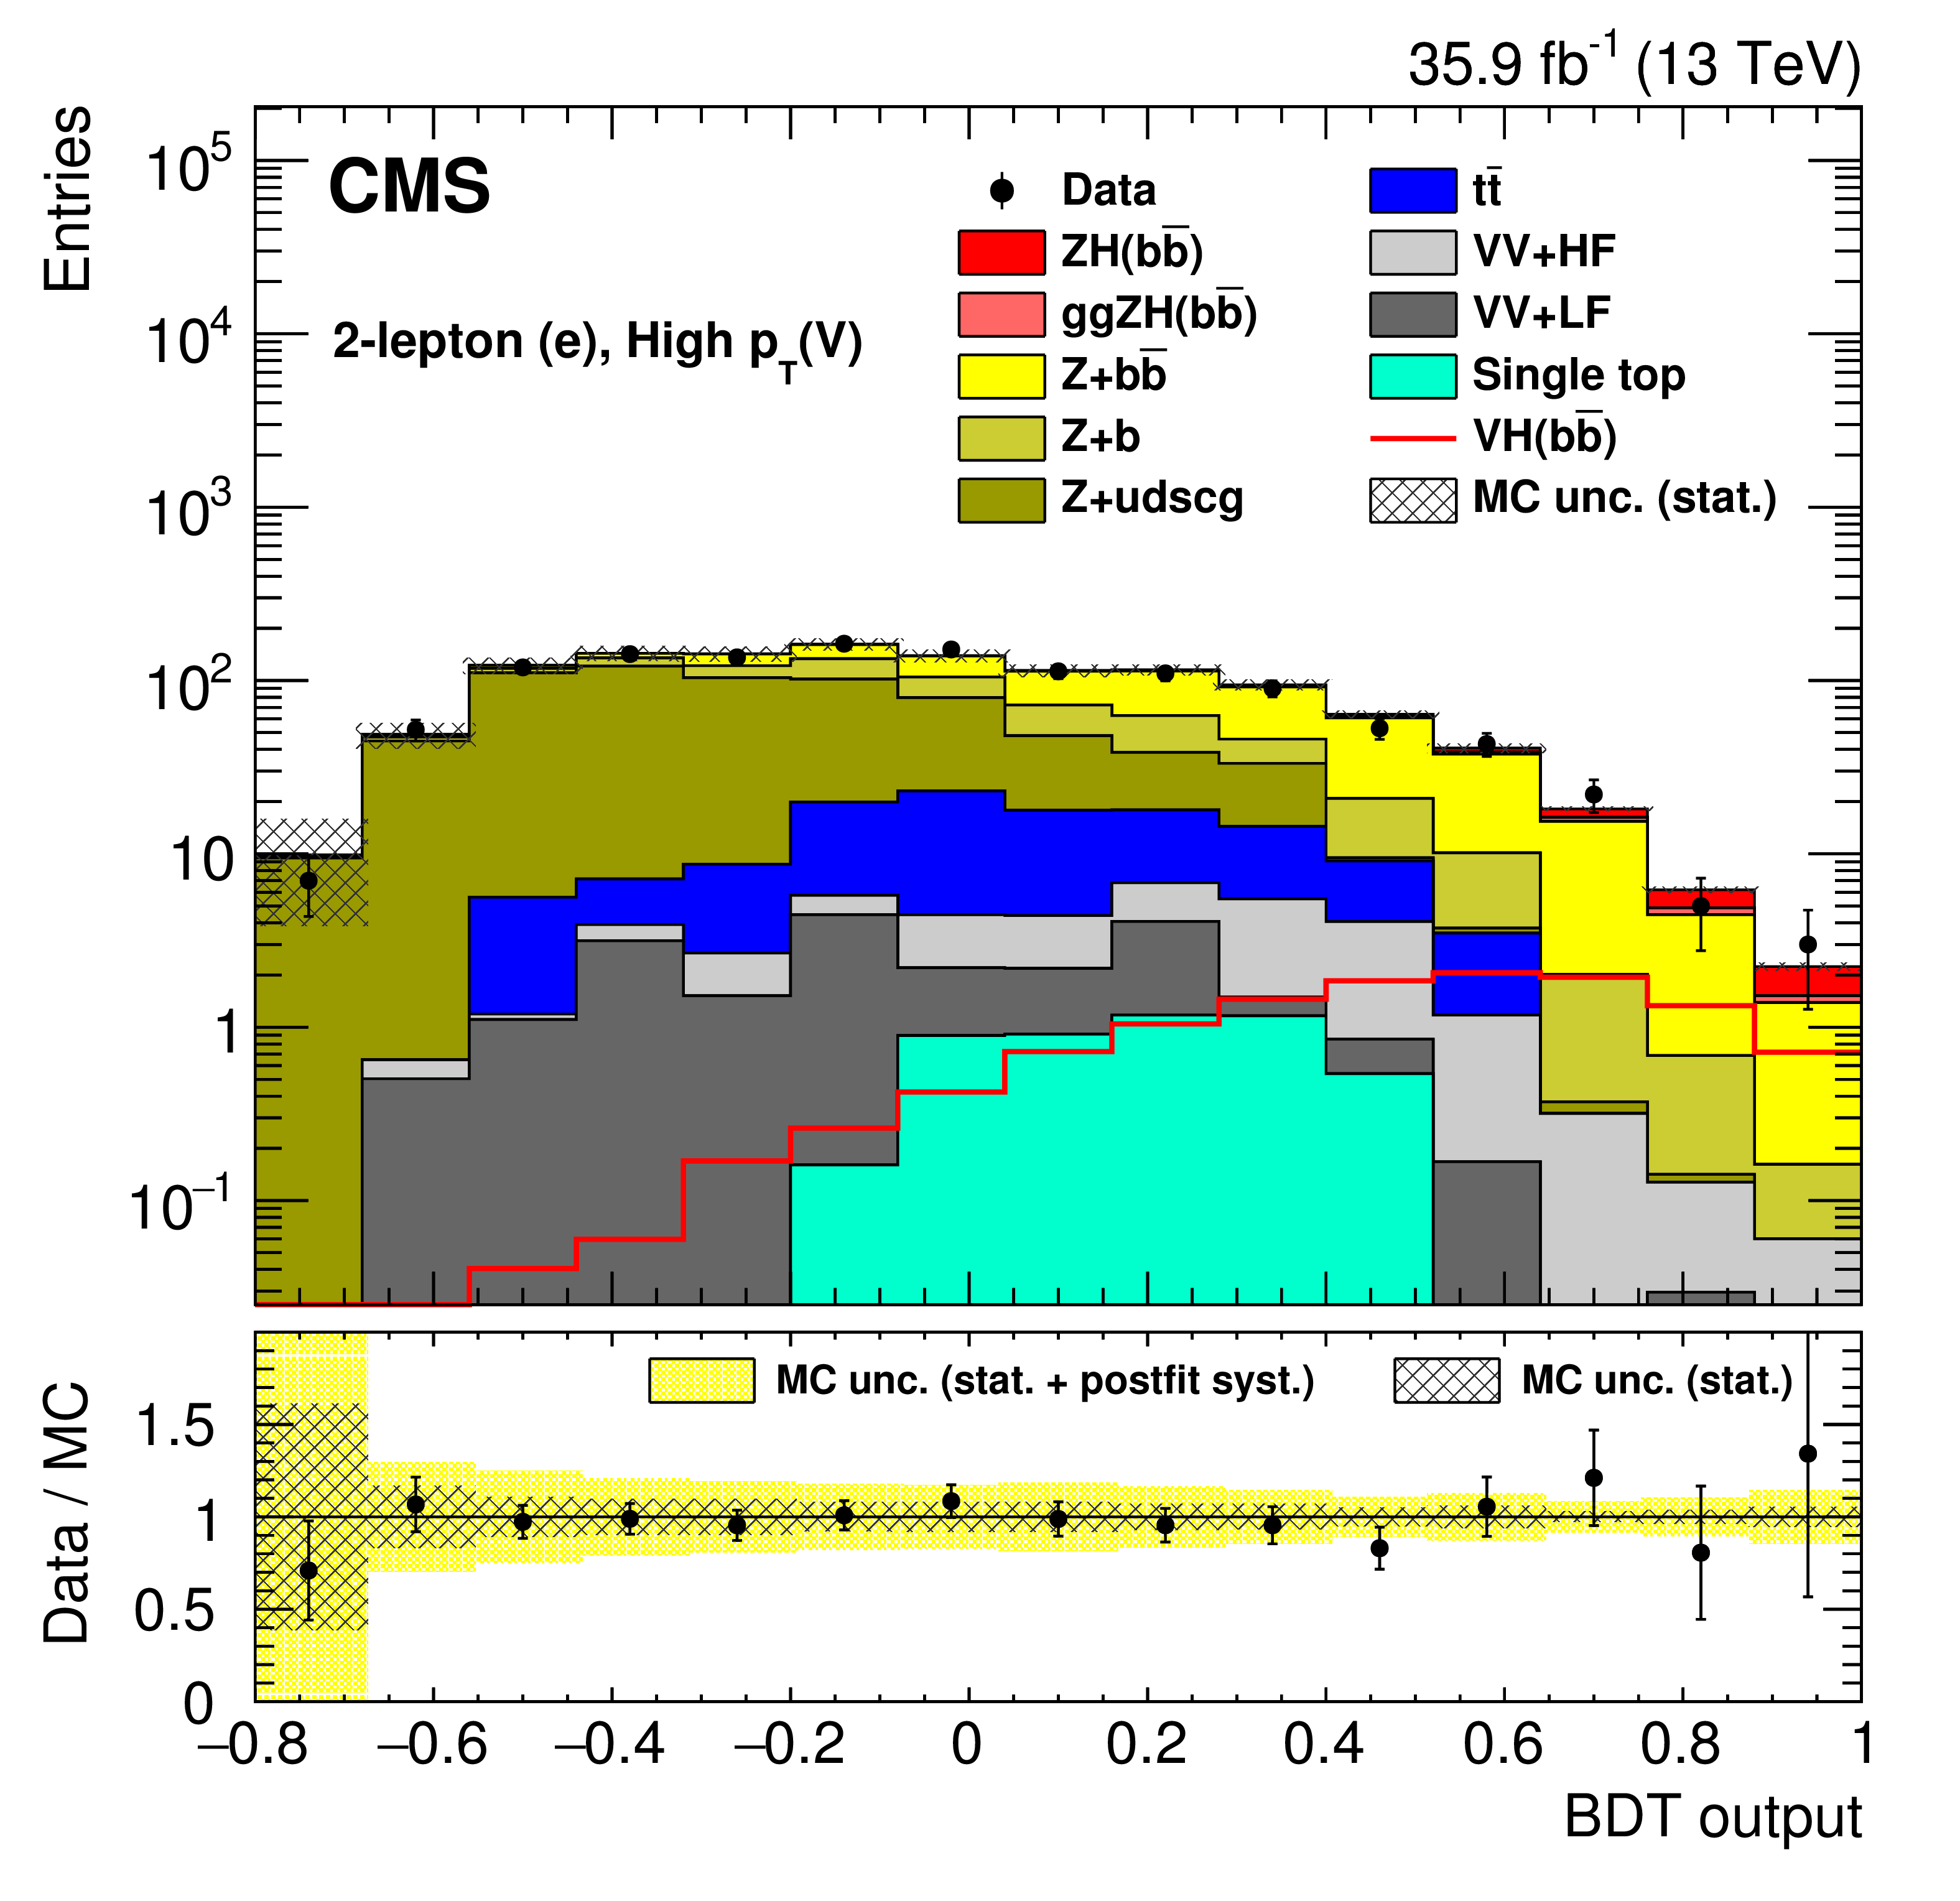
Figure 4-g:
Post-fit event BDT output distributions for the 13 TeV data (points with error bars), for the 2-electron high-$ {{p_{\mathrm {T}}} ({\mathrm {V}})}$ region. The bottom inset shows the ratio of the number of events observed in data to that of the prediction from simulated samples for the SM Higgs boson signal and for backgrounds. |
png pdf |
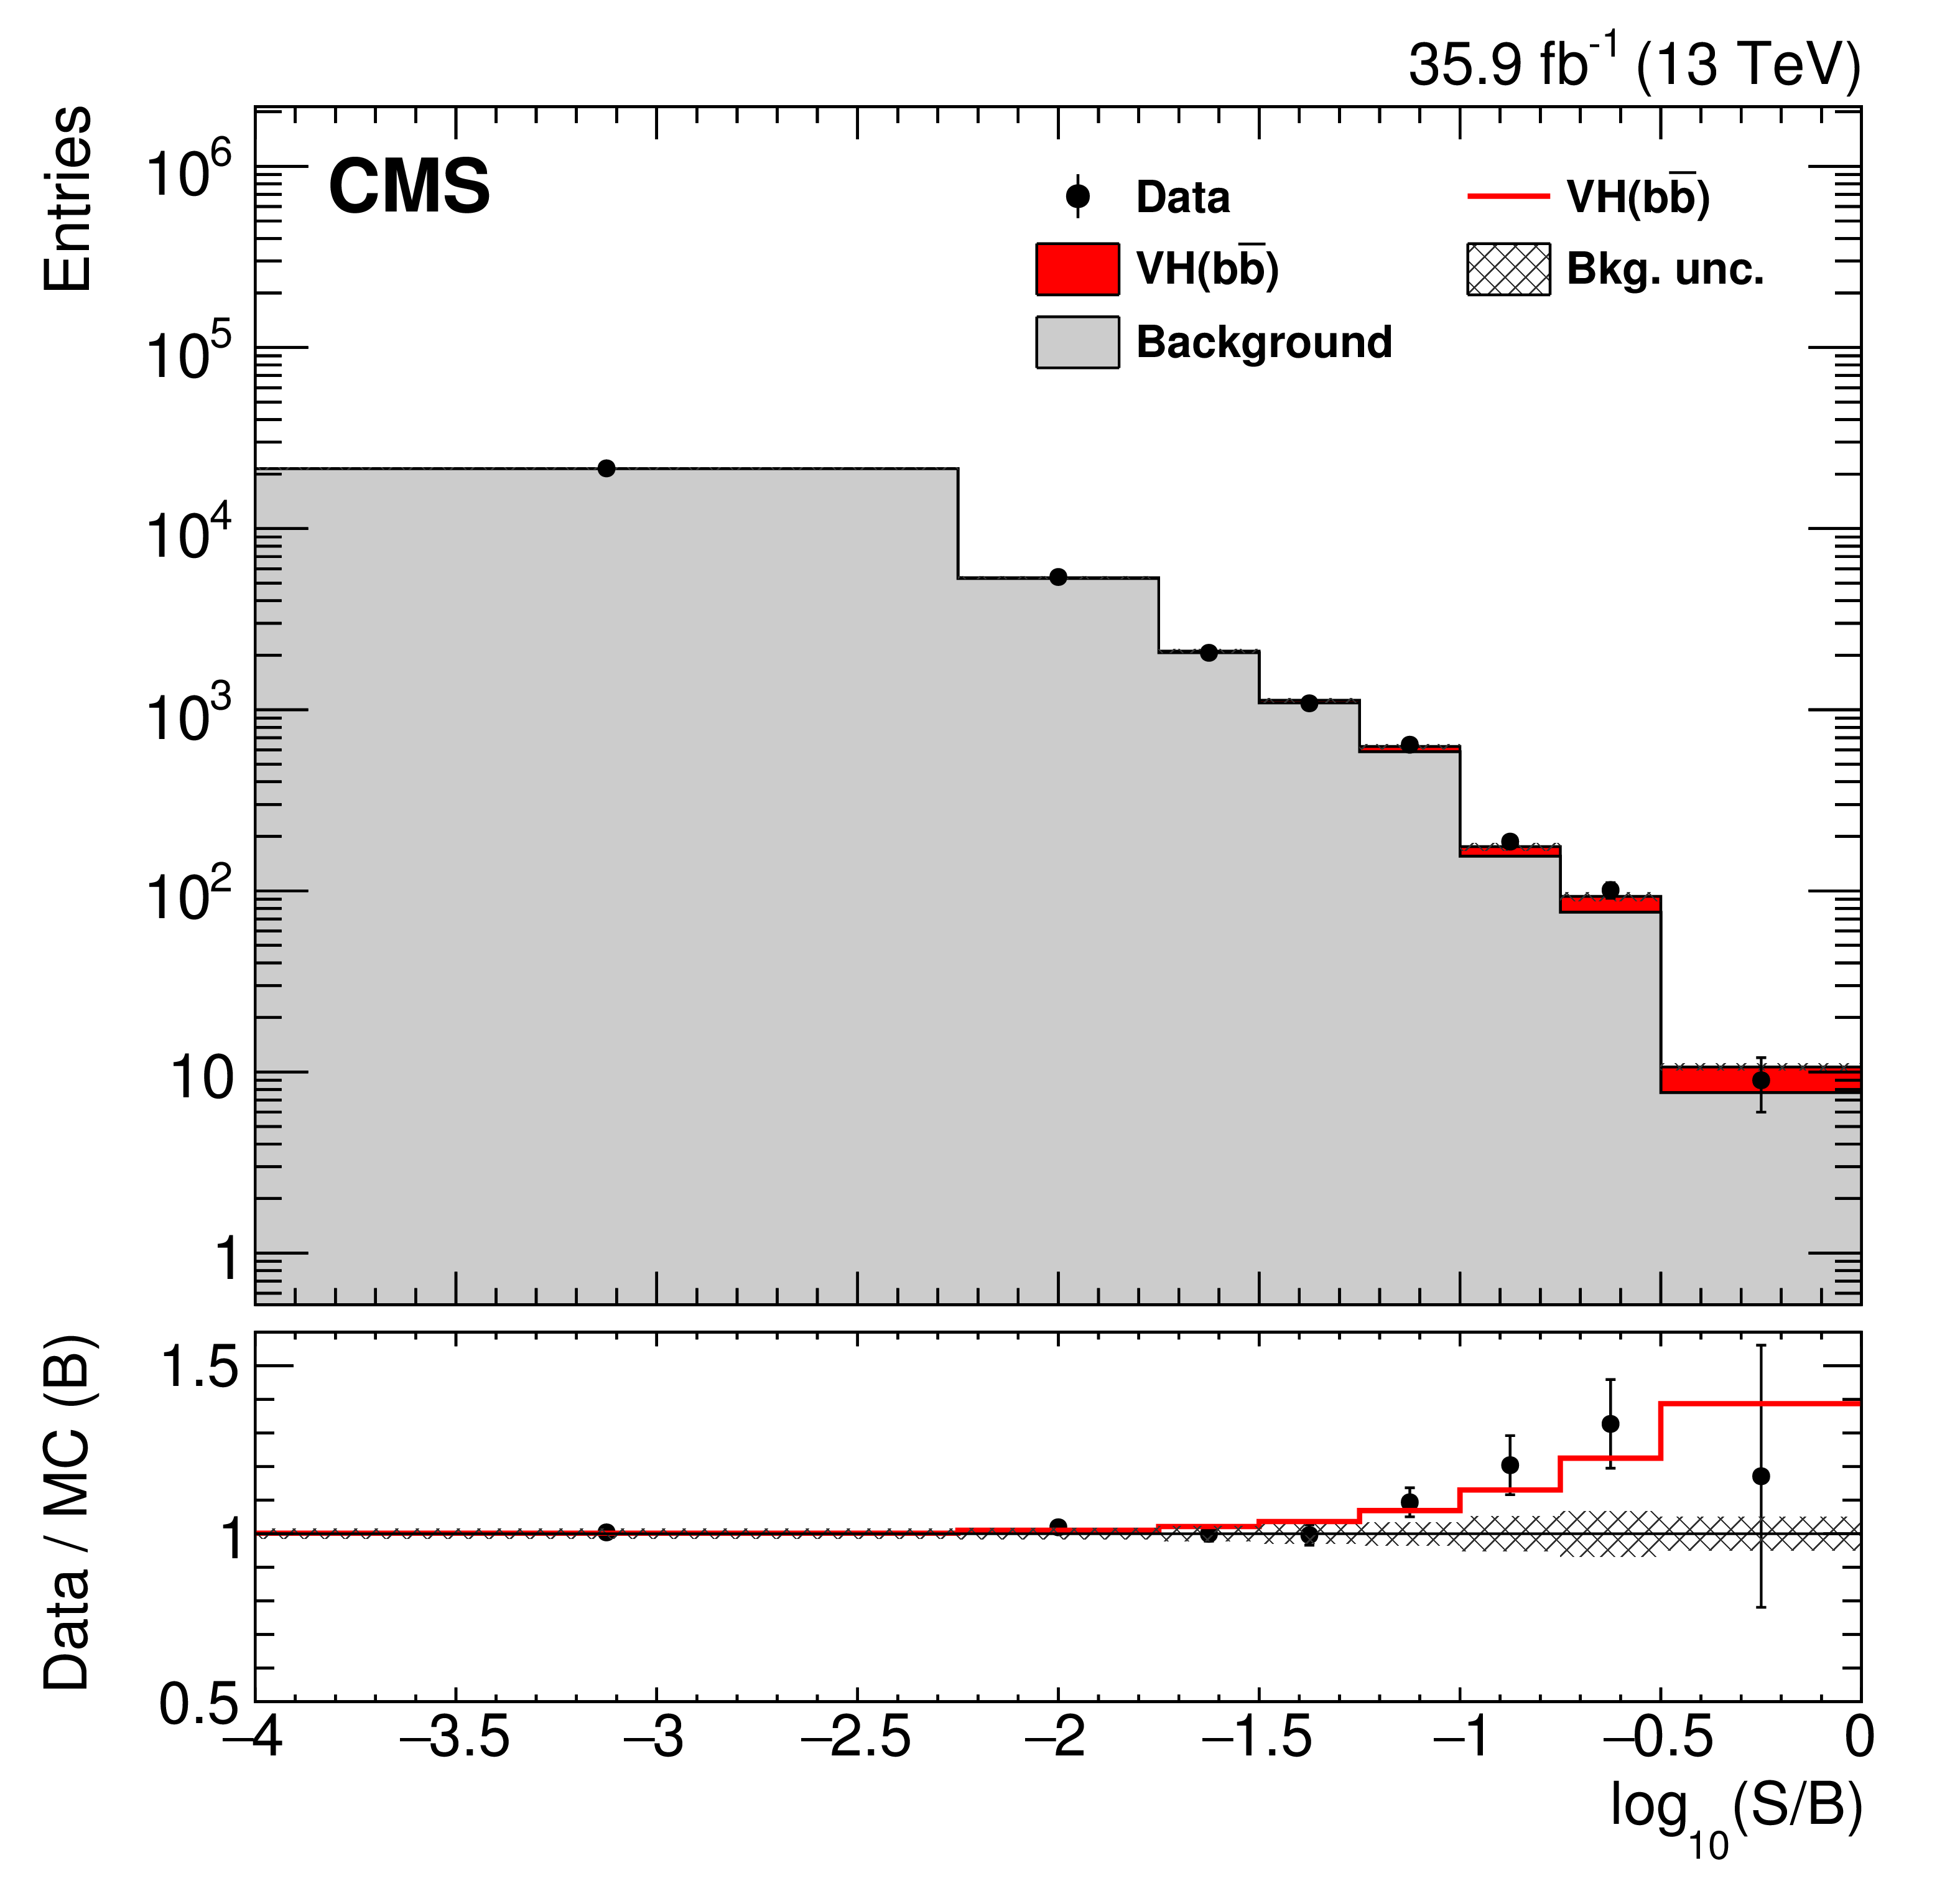
Figure 5:
Combination of all channels into a single event BDT distribution. Events are sorted in bins of similar expected signal-to-background ratio, as given by the value of the output of their corresponding BDT discriminant (trained with a Higgs boson mass hypothesis of 125 GeV). The bottom plots show the ratio of the data to the background-only prediction. |
png pdf |
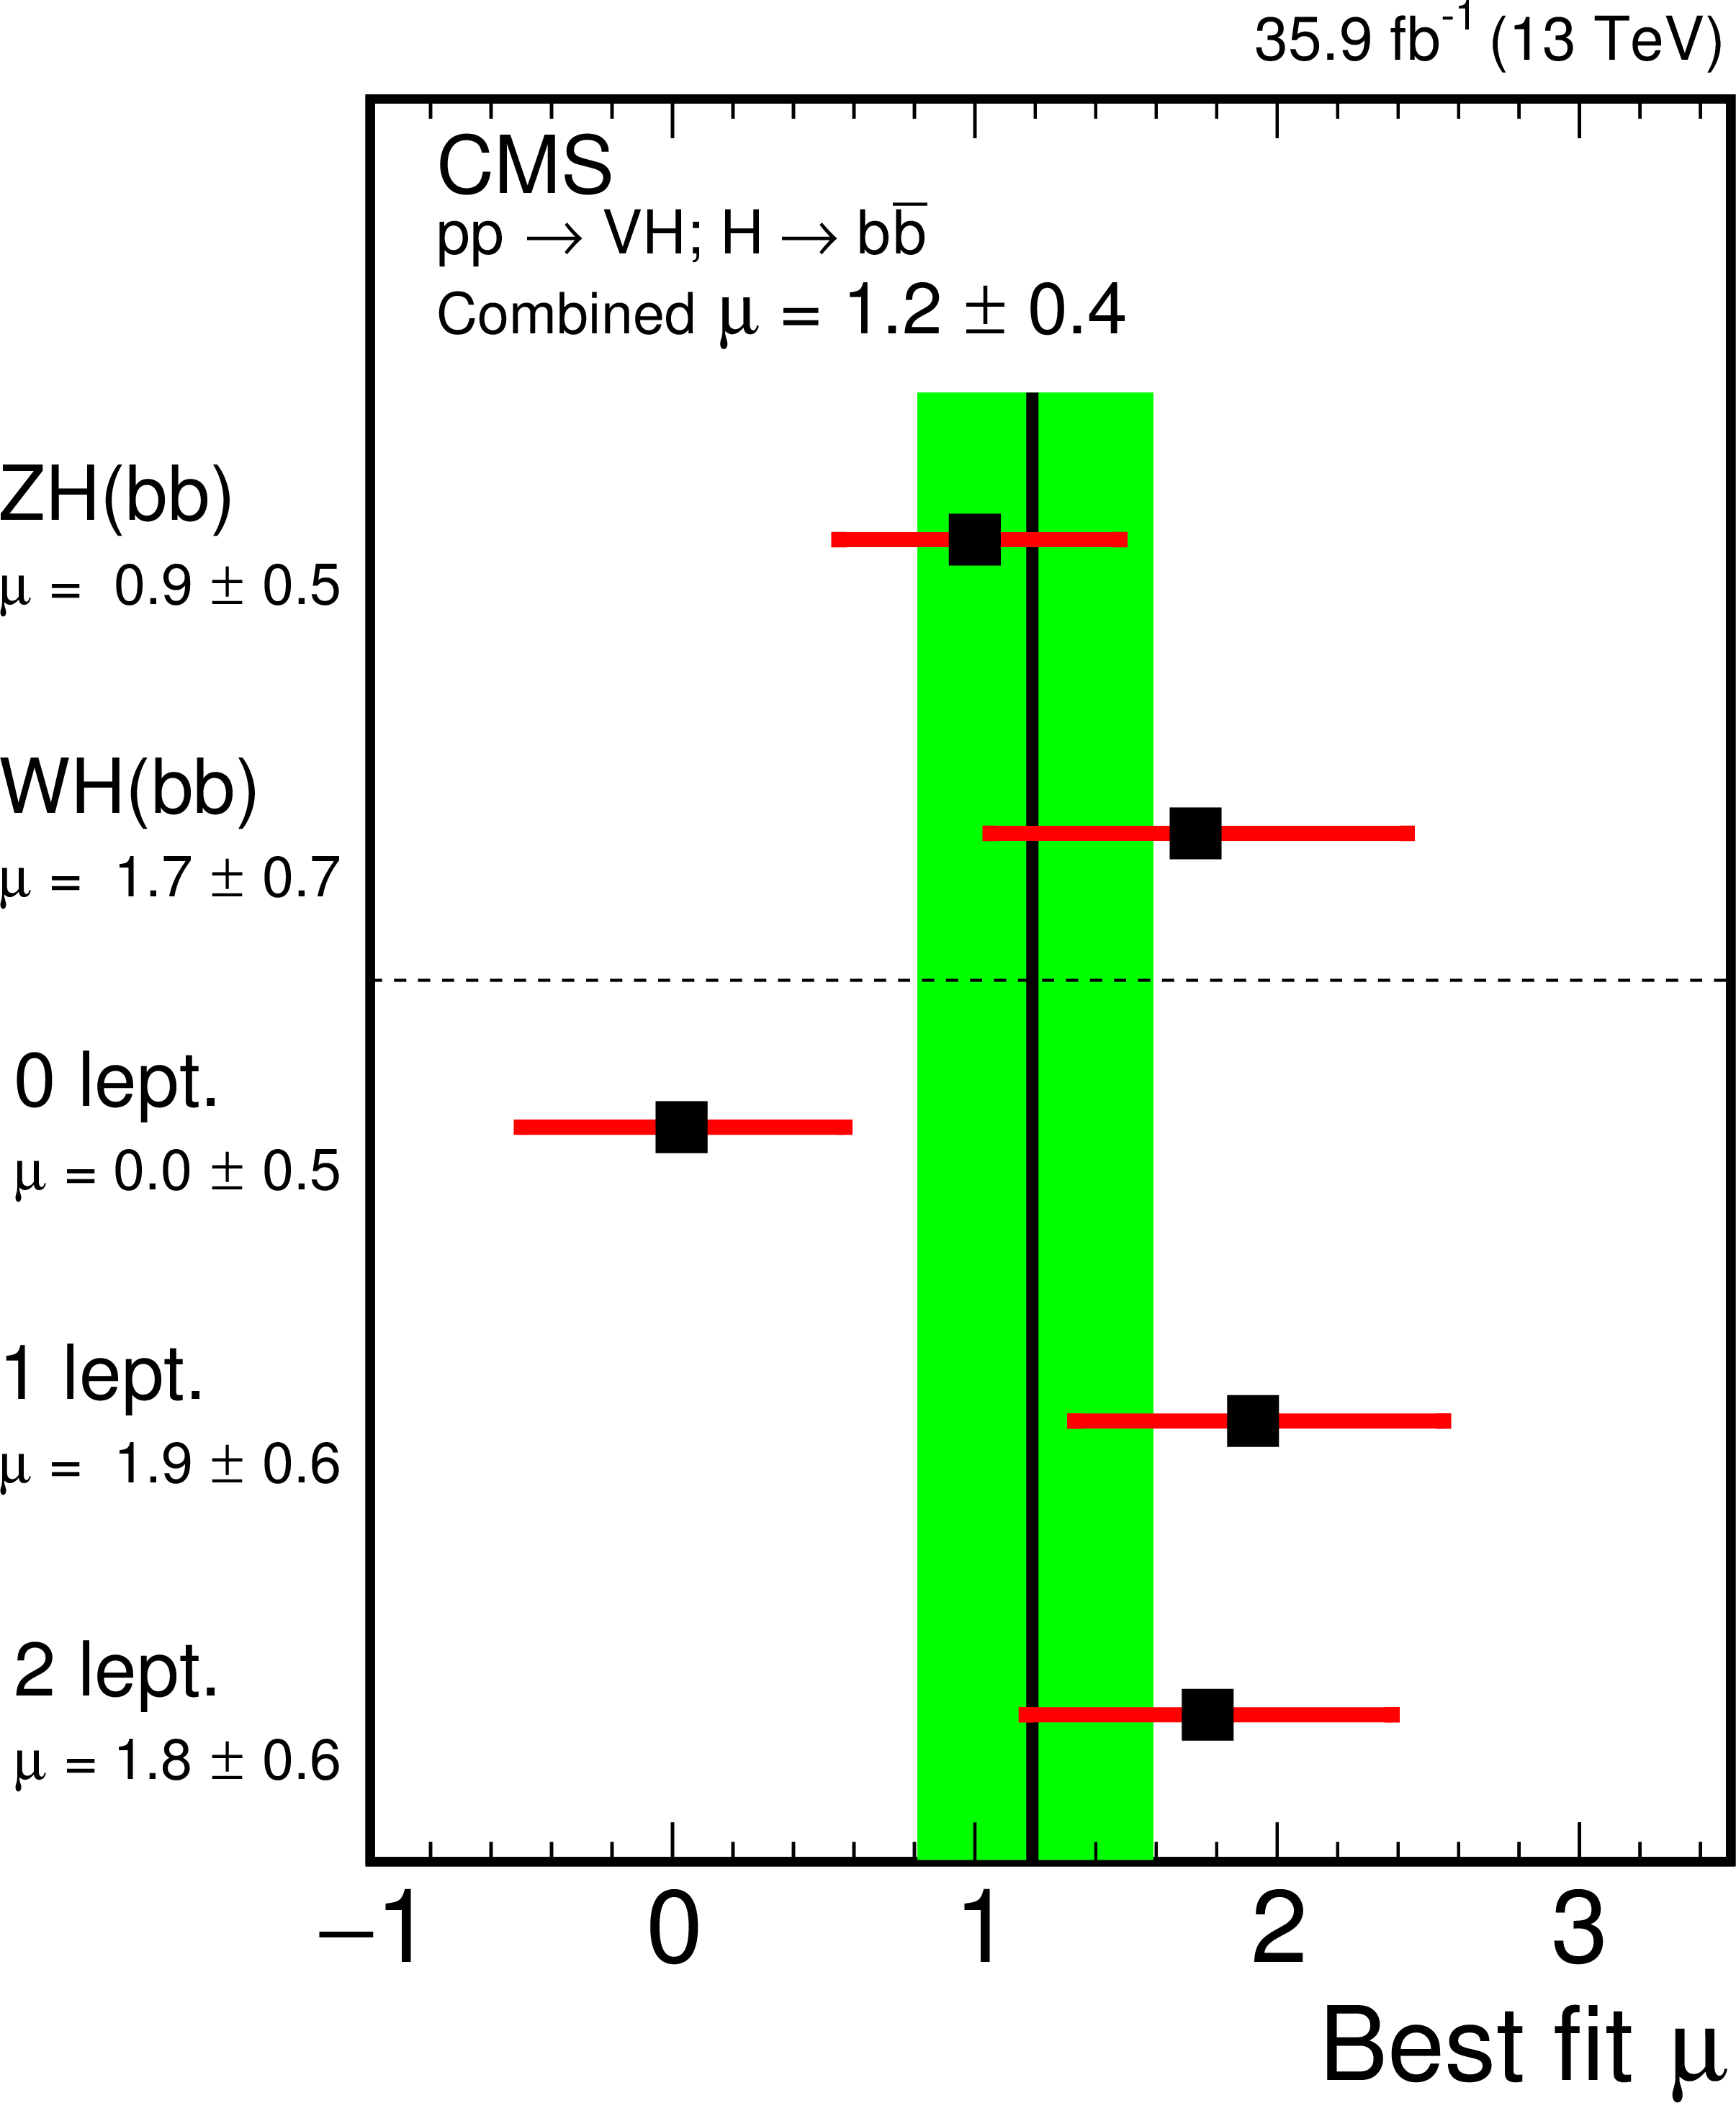
Figure 6:
The best fit value of the signal strength $\mu $, at $ {m_\mathrm{H}} = $ 125.09 GeV, is shown in black with a green uncertainty band. Also shown are the results of a separate fit where each channel is assigned an independent signal strength parameter. Above the dashed line are the ${\mathrm{W} \mathrm{H}} $ and ${\mathrm{Z} \mathrm{H}} $ signal strengths derived from a fit where each production mode is assigned an independent signal strength parameter. |
png pdf |
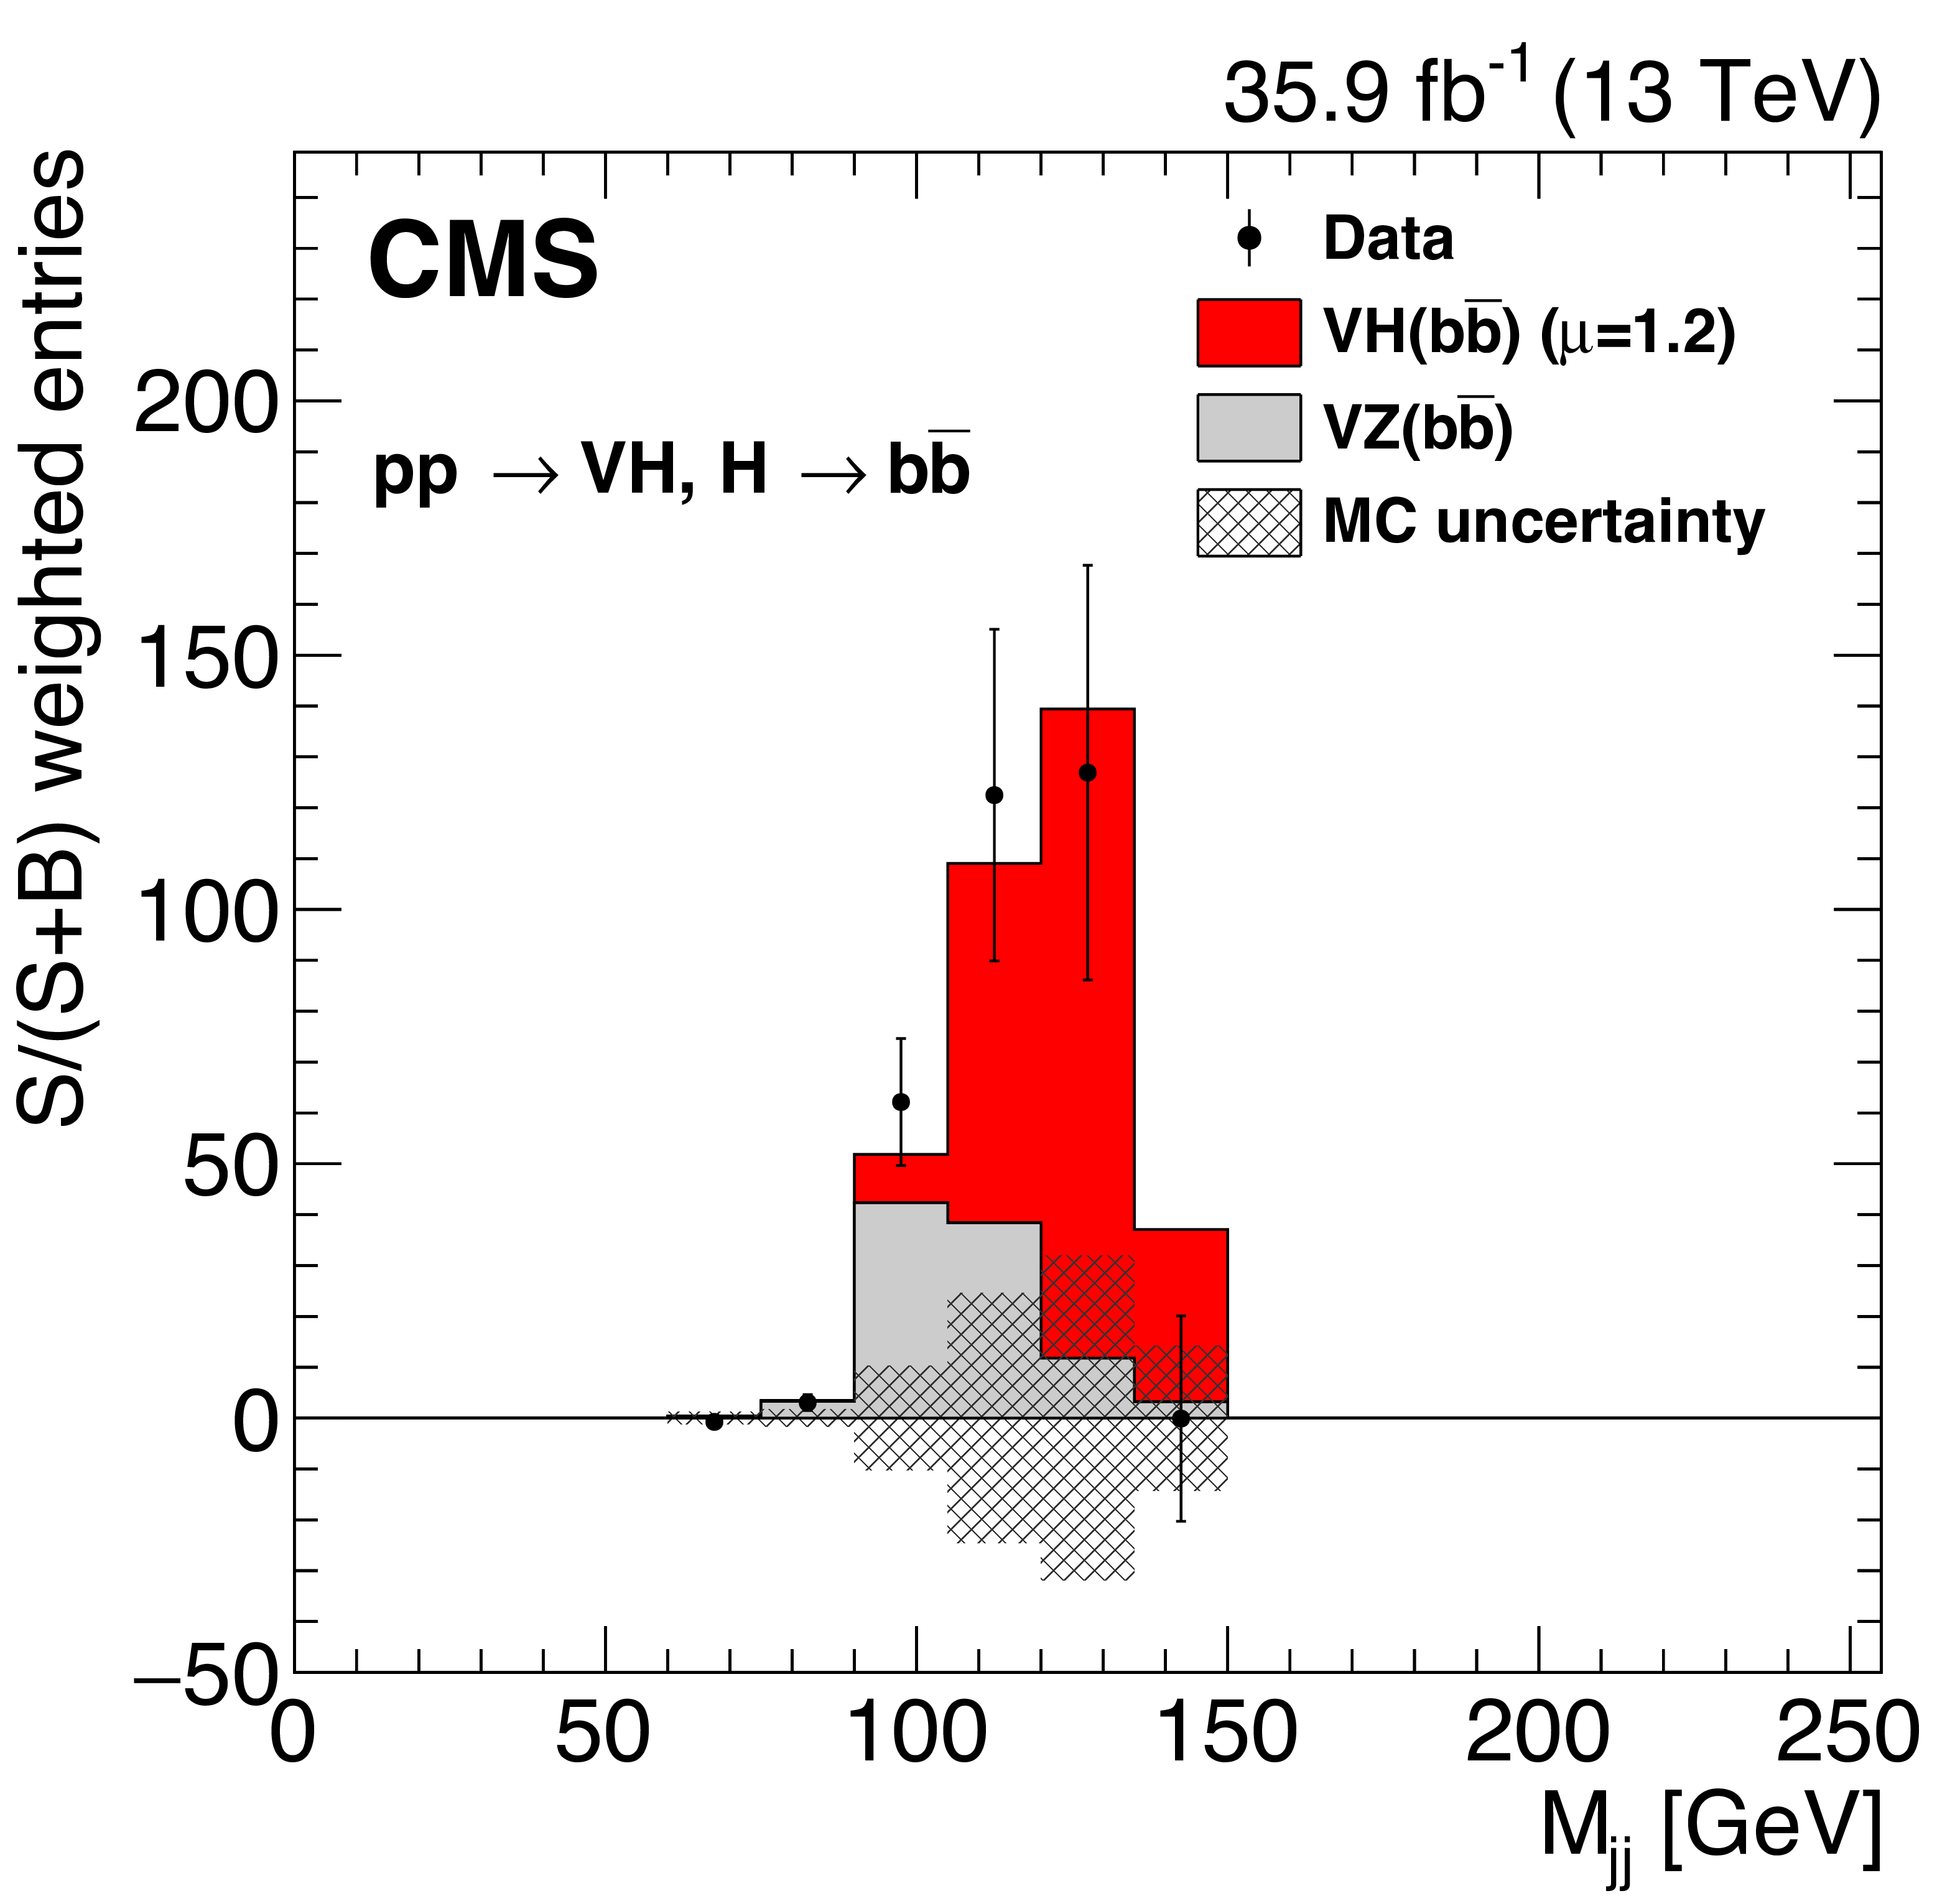
Figure 7:
Weighted dijet invariant mass distribution for events in all channels combined. Shown are data and the ${{{\mathrm {V}}}\mathrm{H}} $ and ${{{\mathrm {V}}}\mathrm{Z}} $ processes with all other background processes subtracted. Weights are derived from the event BDT output distribution as described in the text. |
png pdf |
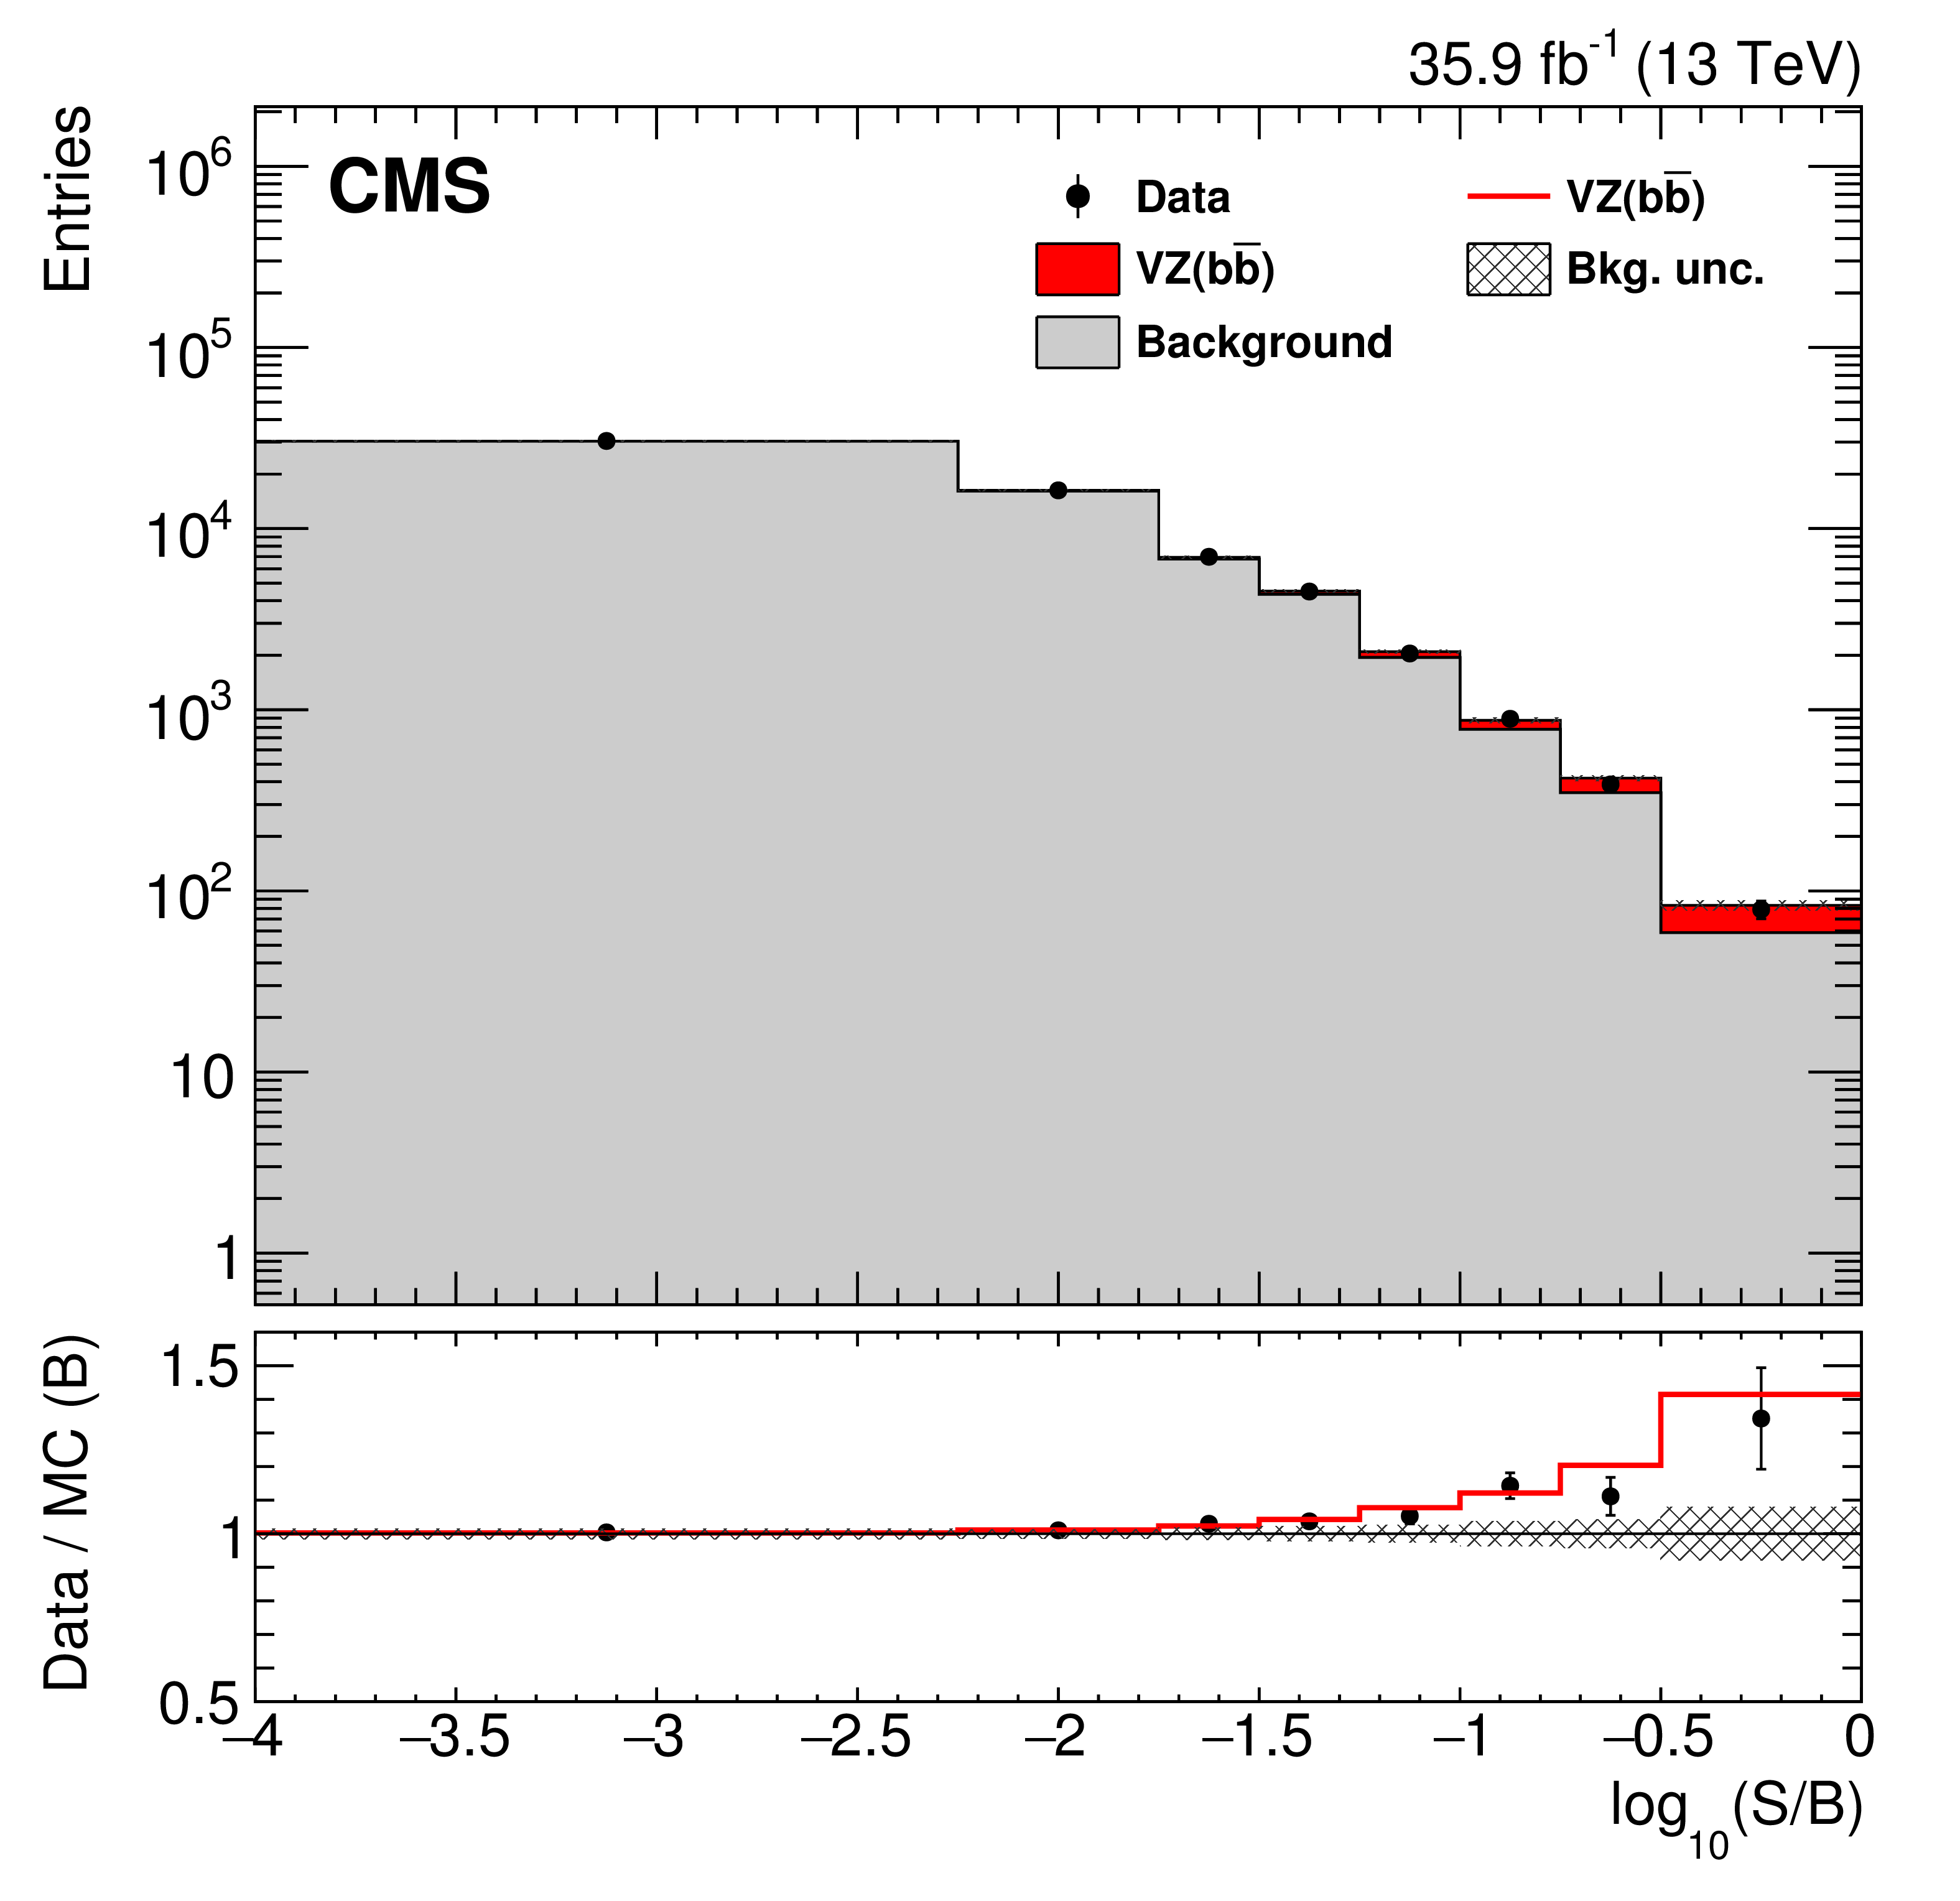
Figure 8:
Combination of all channels in the ${{{\mathrm {V}}}\mathrm{Z}} $ search, with ${\mathrm{Z} \to {\mathrm{b} \mathrm{\bar{b}}}}$ into a single event BDT distribution. Events are sorted in bins of similar expected signal-to-background ratio, as given by the value of the output of their corresponding BDT discriminant. The bottom inset shows the ratio of the data to the predicted background, with a red line overlaying the expected SM contribution from ${{{\mathrm {V}}}\mathrm{Z}} $ with ${\mathrm{Z} \to {\mathrm{b} \mathrm{\bar{b}}}}$. |
| Tables | |

png pdf |
Table 1:
Selection criteria that define the signal region. Entries marked with "--'' indicate that the variable is not used in the given channel. Where selections differ for different $ {{p_{\mathrm {T}}} ({\mathrm {V}})} $ regions, there are comma separated entries of thresholds or square brackets with a range that indicate each region's selection as defined in the first row of the table. The values listed for kinematic variables are in units of GeV, and for angles in units of radians. Where selection differs between lepton flavors, the selection is listed as (muon, electron). |
png pdf |
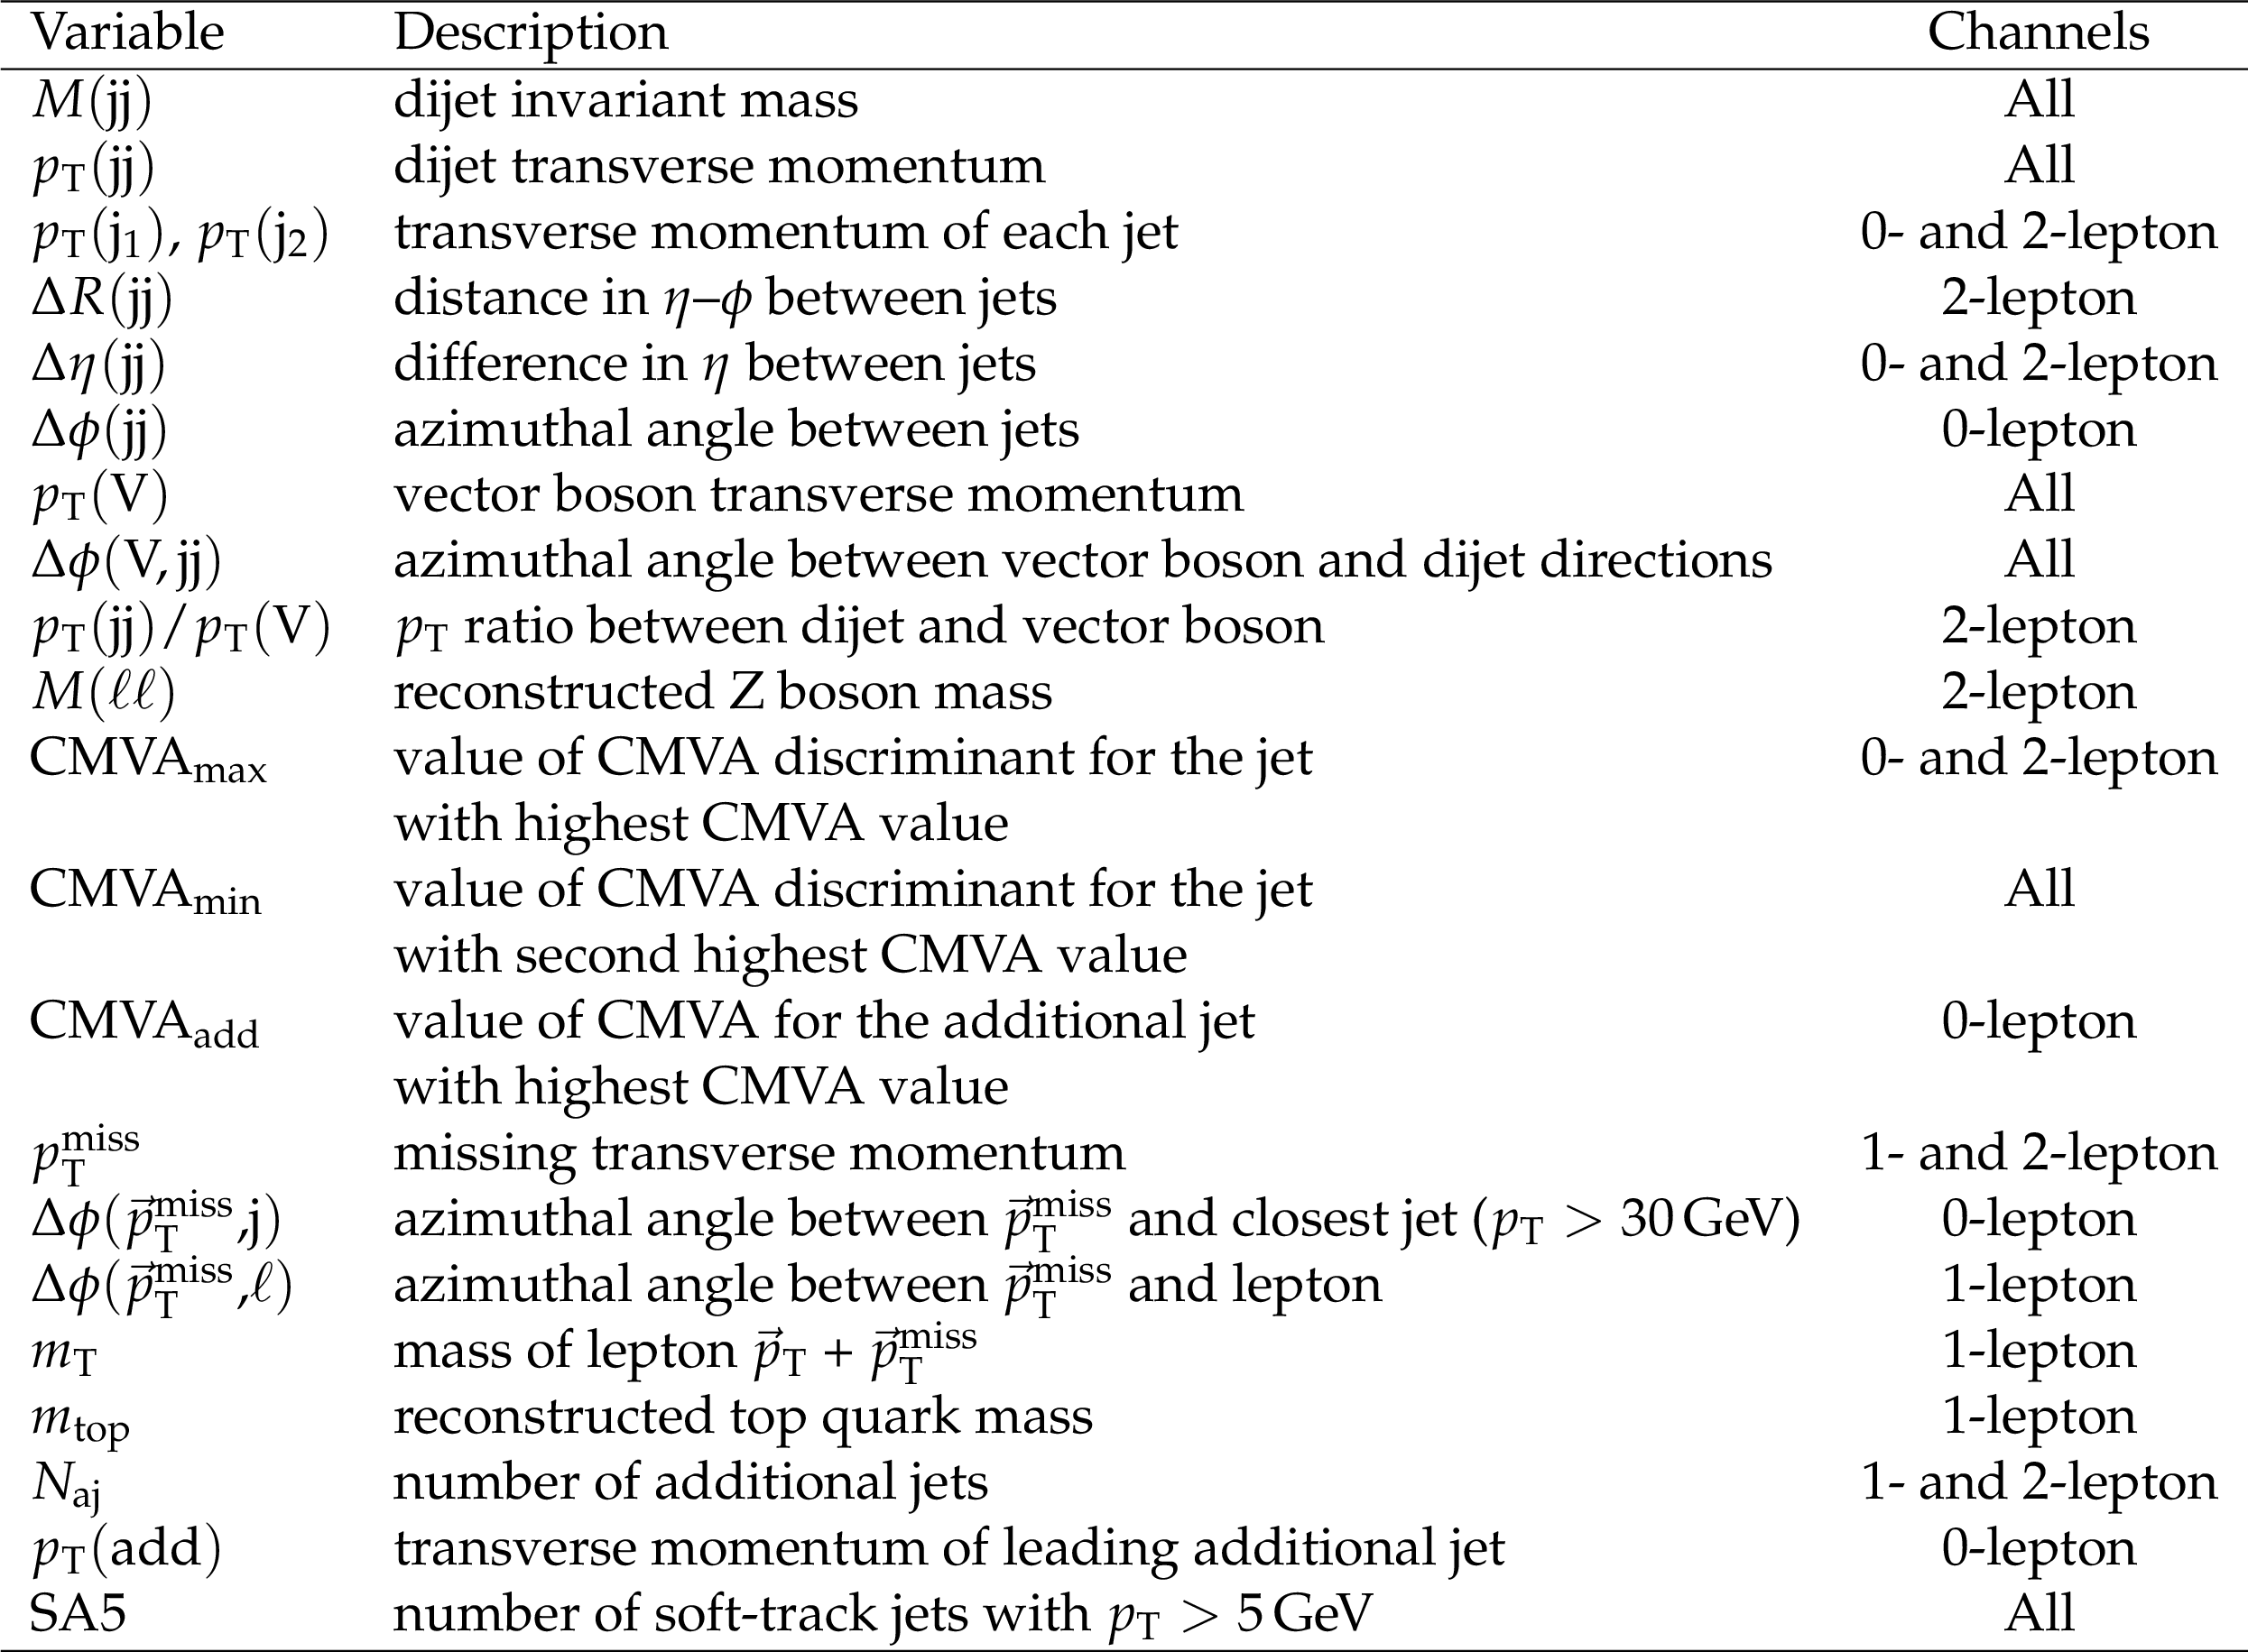
Table 2:
Variables used in the training of the event BDT discriminant for the different channels. Jets are counted as additional jets to those selected to reconstruct the ${\mathrm{H} \to {\mathrm{b} \mathrm{\bar{b}}}}$ decay if they satisfy the following: $ {p_{\mathrm {T}}} > $ 30 GeV and $ | \eta | < $ 2.4 for the 0- and 2-lepton channels, and $ {p_{\mathrm {T}}} > $ 25 GeV and $ | \eta | < $ 2.9 for the 1-lepton channel. |
png pdf |
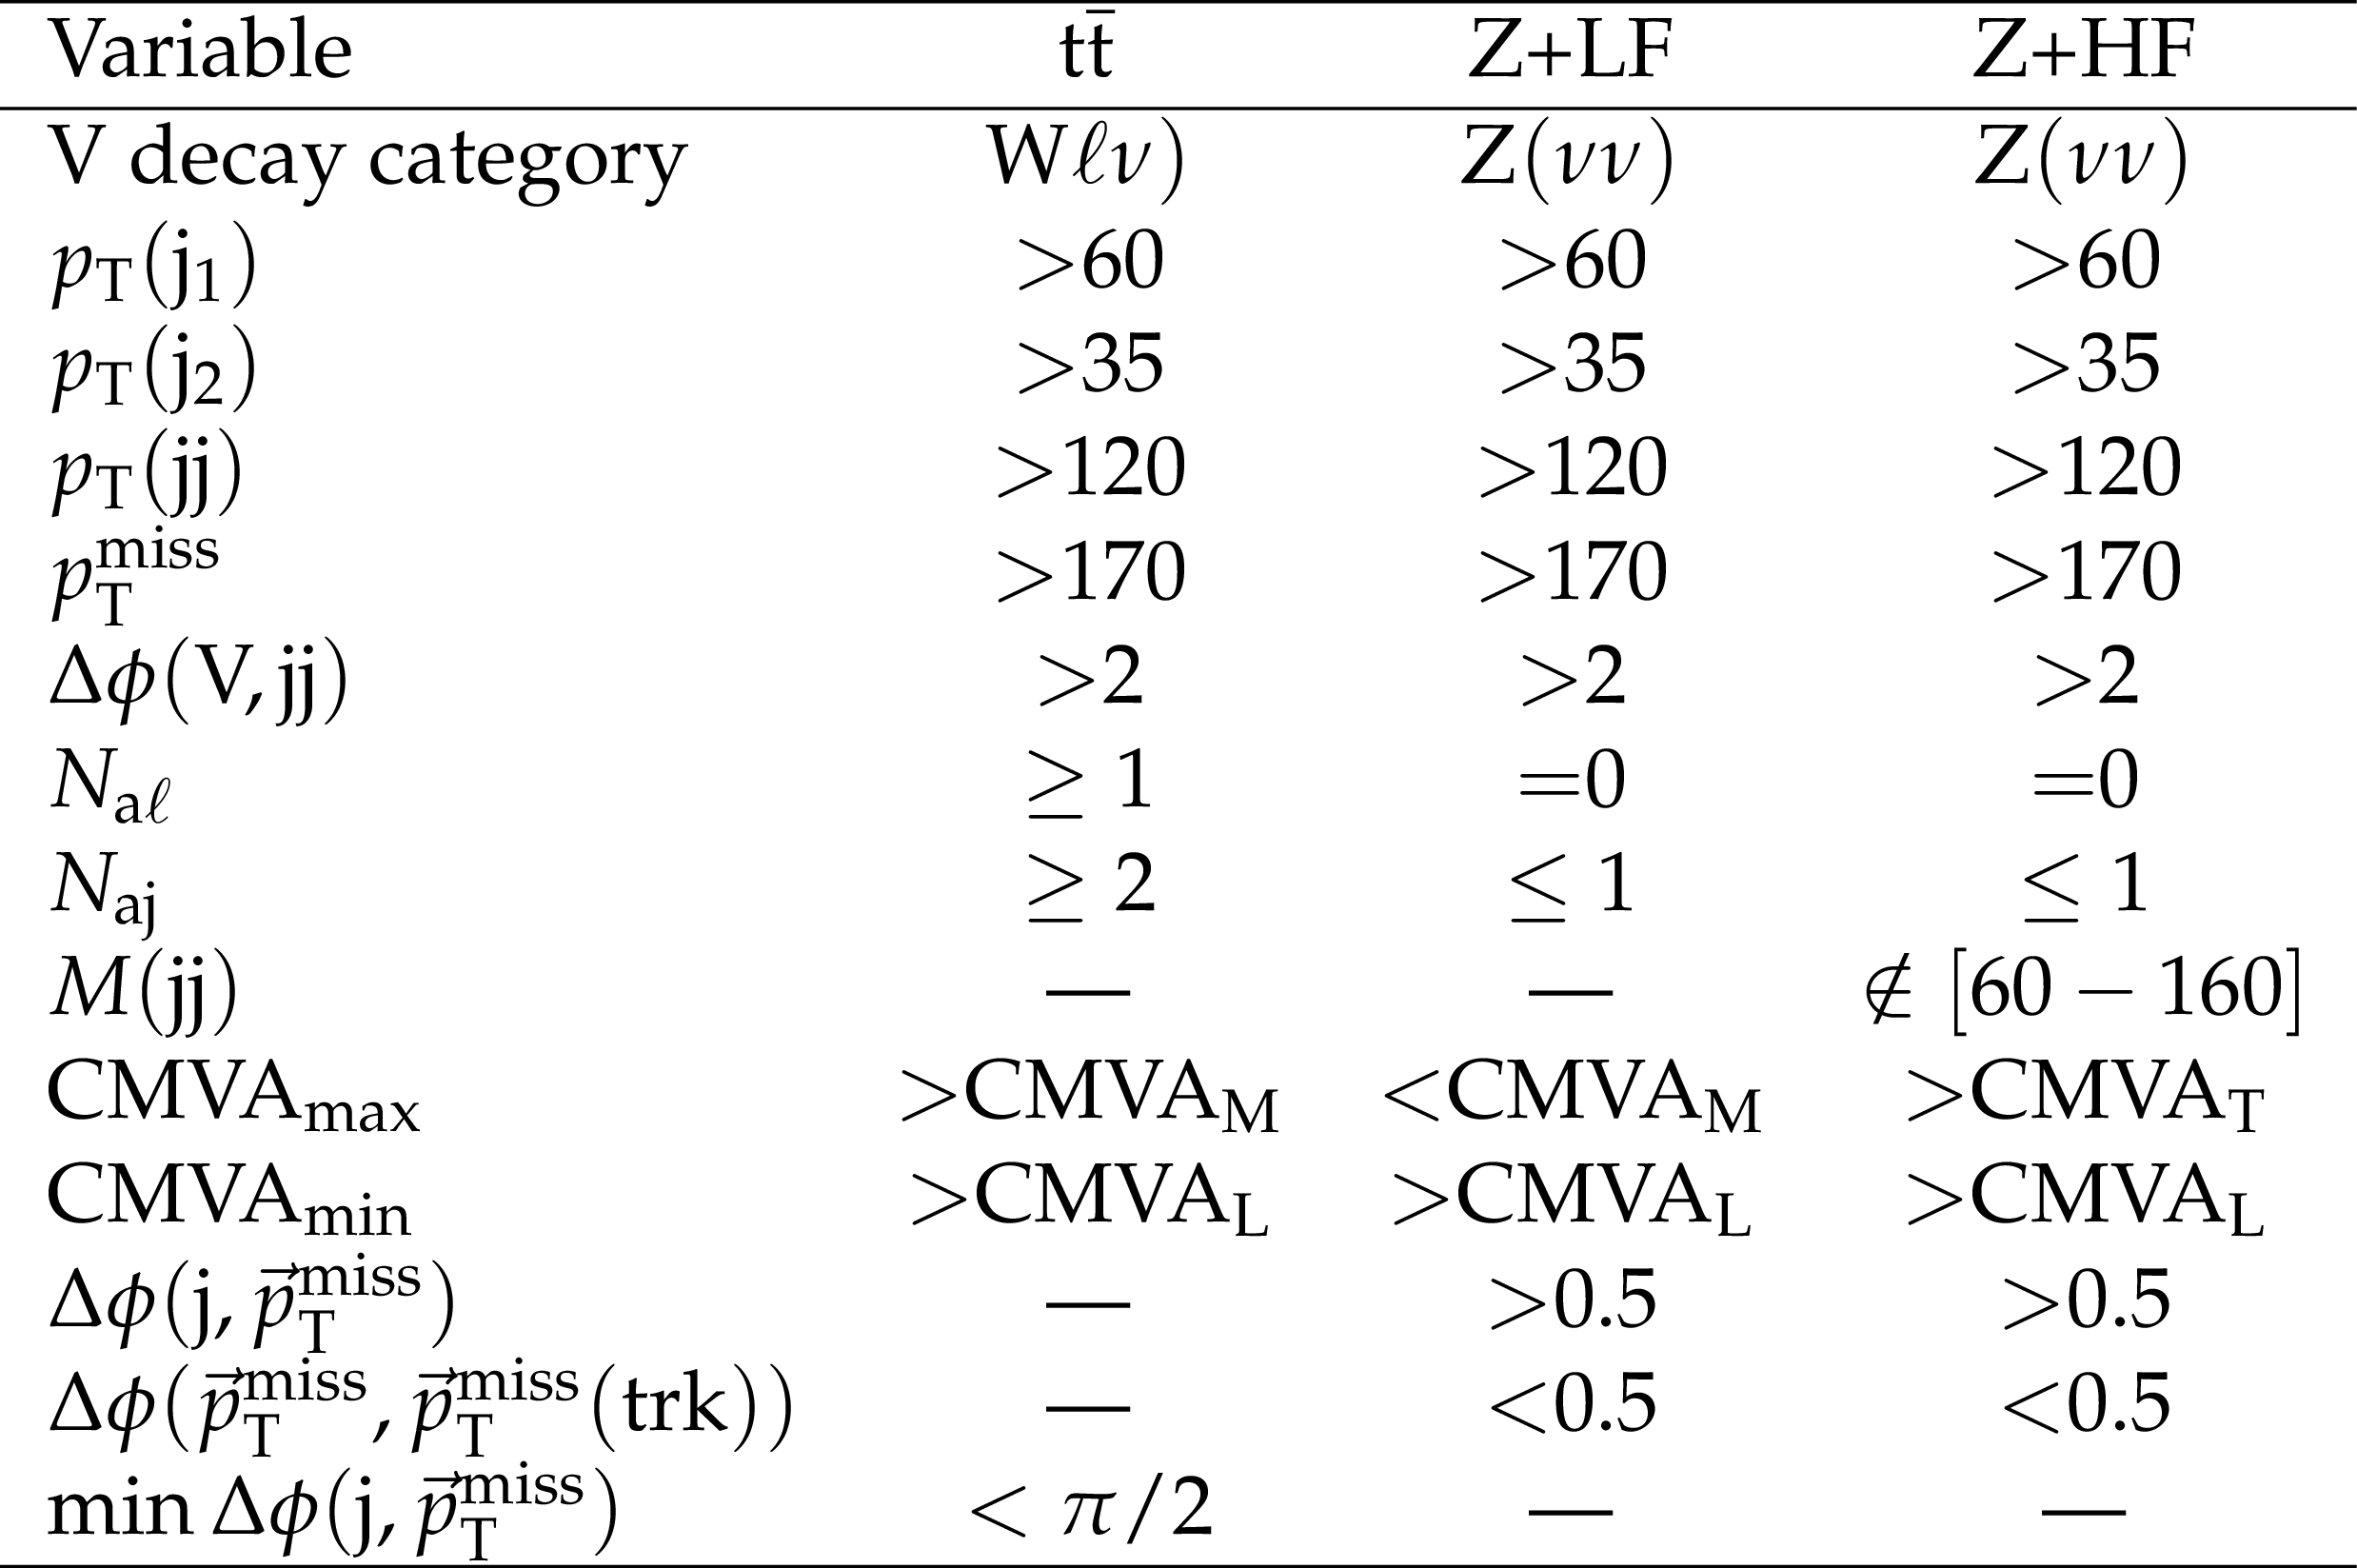
Table 3:
Definition of the control regions for the 0-lepton channel. LF and HF refer to light- and heavy-flavor jets. The values listed for kinematic variables are in units of GeV, and for angles in units of radians. Entries marked with "--'' indicate that the variable is not used in that region. |
png pdf |
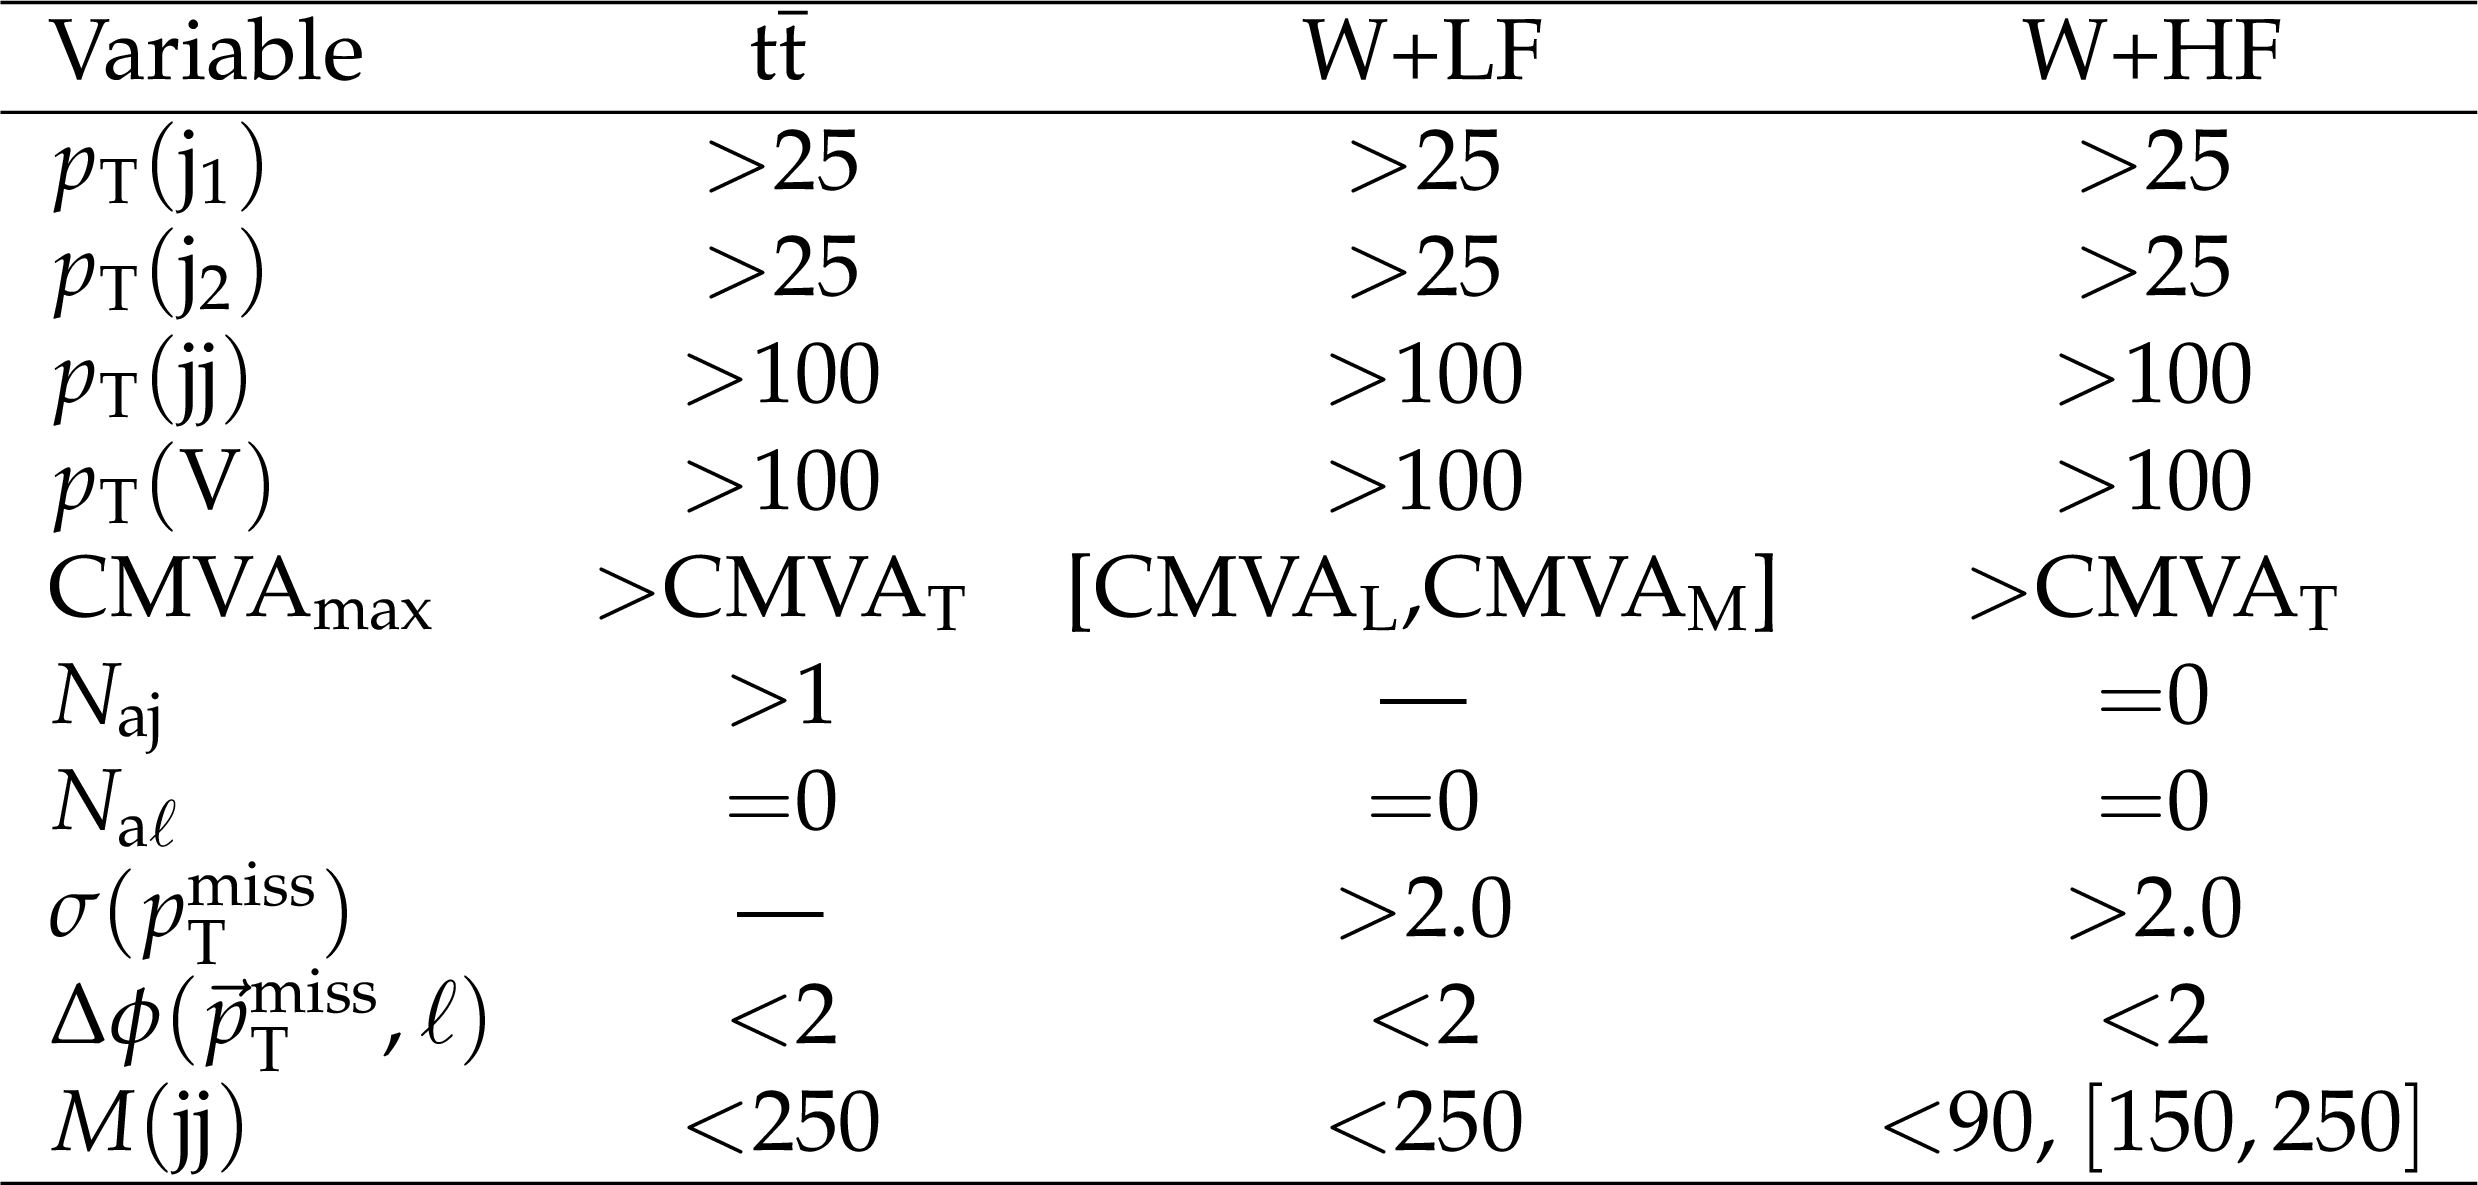
Table 4:
Definition of the control regions for the 1-lepton channels. The HF control region is divided into low and high mass ranges as shown in the table. The significance of ${{p}_{\mathrm {T}}^{\text {miss}}}$, ${\sigma ({{p}_{\mathrm {T}}^{\text {miss}}})}$, is ${{p}_{\mathrm {T}}^{\text {miss}}}$ divided by the square root of the scalar sum of jet ${p_{\mathrm {T}}}$ where jet $ {p_{\mathrm {T}}} > $ 30 GeV. The values listed for kinematic variables are in units of GeV, except for ${\sigma ({{p}_{\mathrm {T}}^{\text {miss}}})}$ whose units are $\sqrt{\mathrm{GeV}}$. For angles units are radians. Entries marked with " --'' indicate that the variable is not used in that region. |
png pdf |
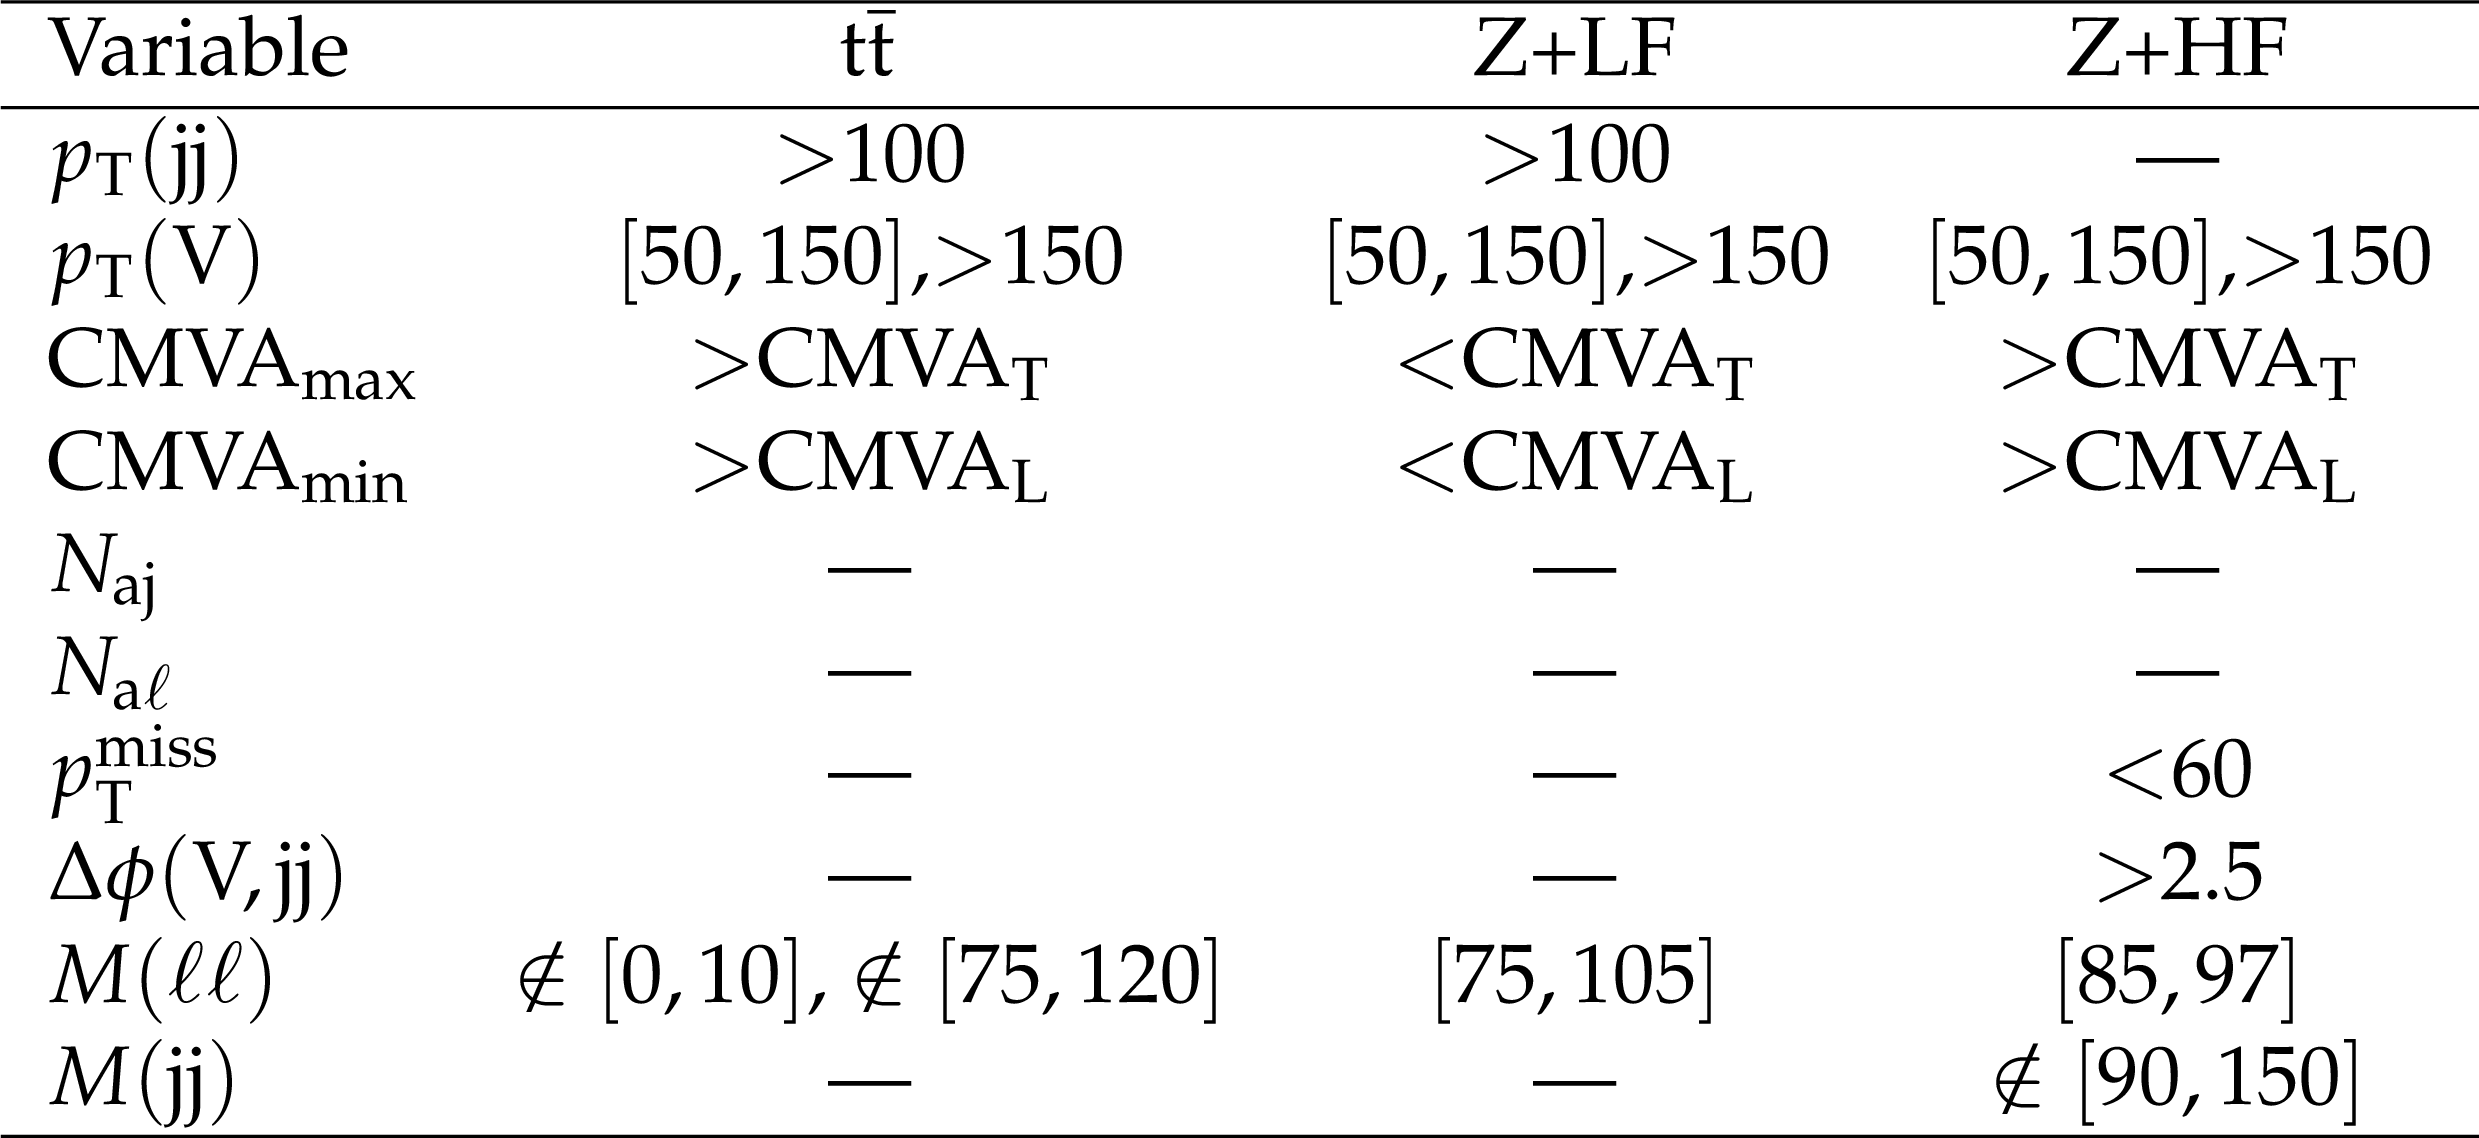
Table 5:
Definition of the control regions for the 2-lepton channels. The same selection is used for both the low- and high-$ {{p_{\mathrm {T}}} ({\mathrm {V}})}$ regions. The values listed for kinematic variables are in units of GeV and for angles in units of radians. Entries marked with "--'' indicate that the variable is not used in that region. |
png pdf |
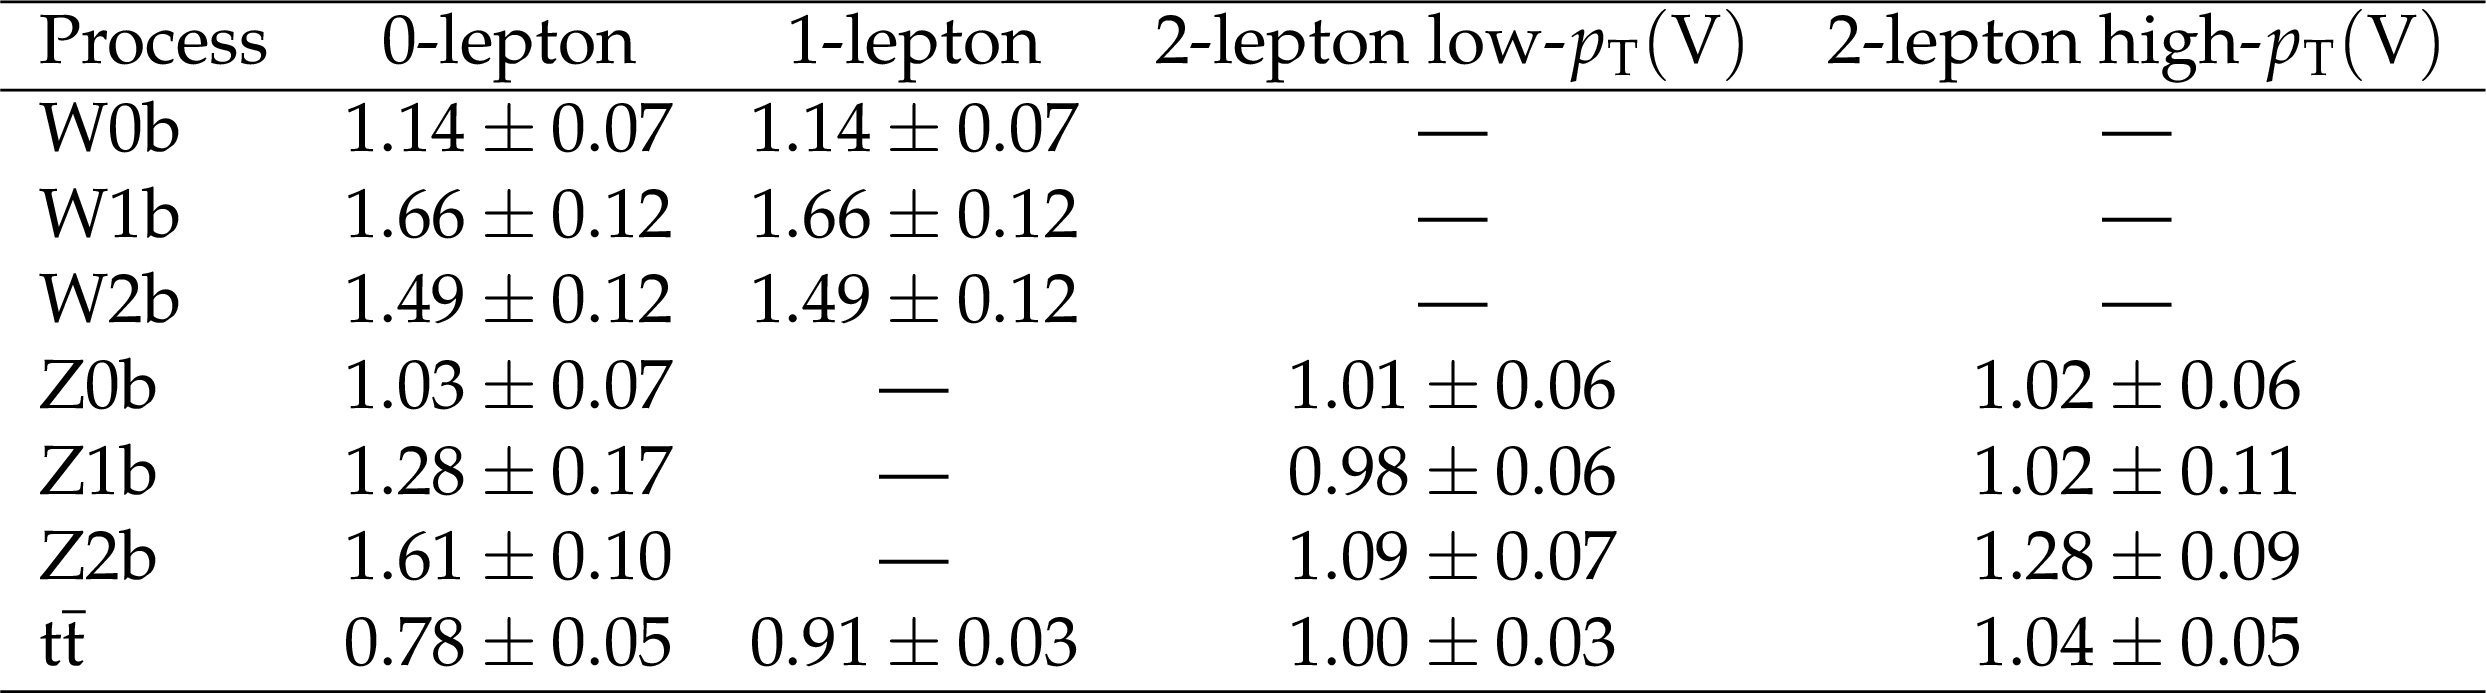
Table 6:
Data/MC scale factors for each of the main background processes in each channel, as obtained from the combined signal-extraction fit to control and signal region distributions described in Section 7. Electron and muon samples in the 1- and 2-lepton channels are fit simultaneously to determine average scale factors. The same scale factors for W+jets processes are used for the 0- and 1-lepton channels. |
png pdf |
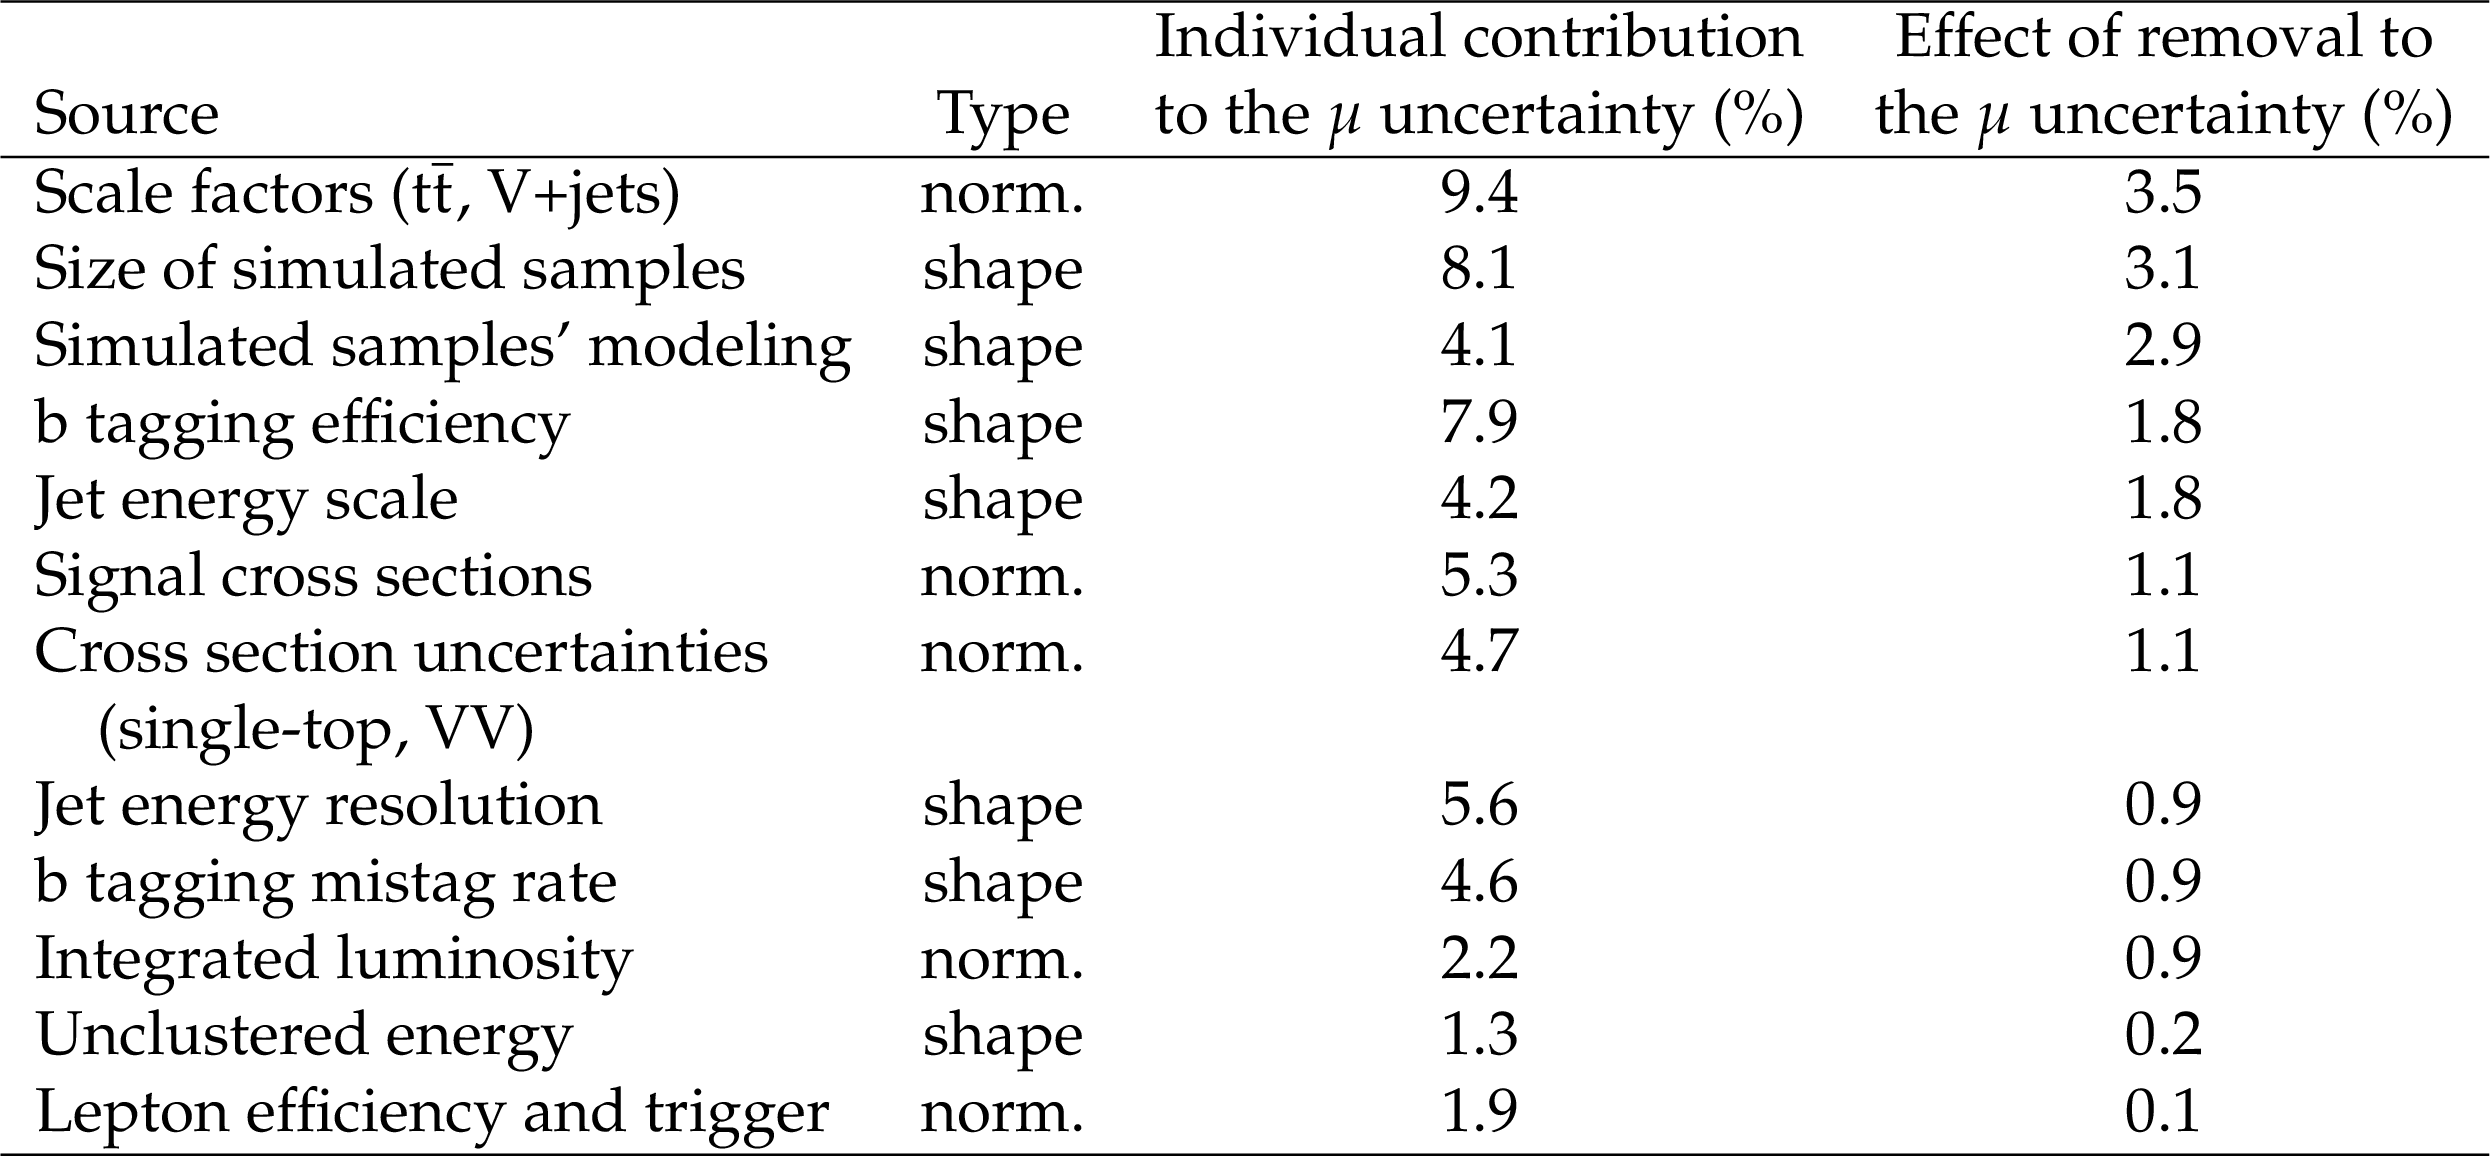
Table 7:
Effect of each source of systematic uncertainty in the expected signal strength $\mu $. The third column shows the uncertainty in $\mu $ from each source when only that particular source is considered. The last column shows the percentage decrease in the uncertainty when removing that specific source of uncertainty while applying all other systematic uncertainties. Due to correlations, the total systematic uncertainty is less than the sum in quadrature of the individual uncertainties. The second column shows whether the source affects only the normalization or both the shape and normalization of the event BDT output distribution. See text for details. |
png pdf |
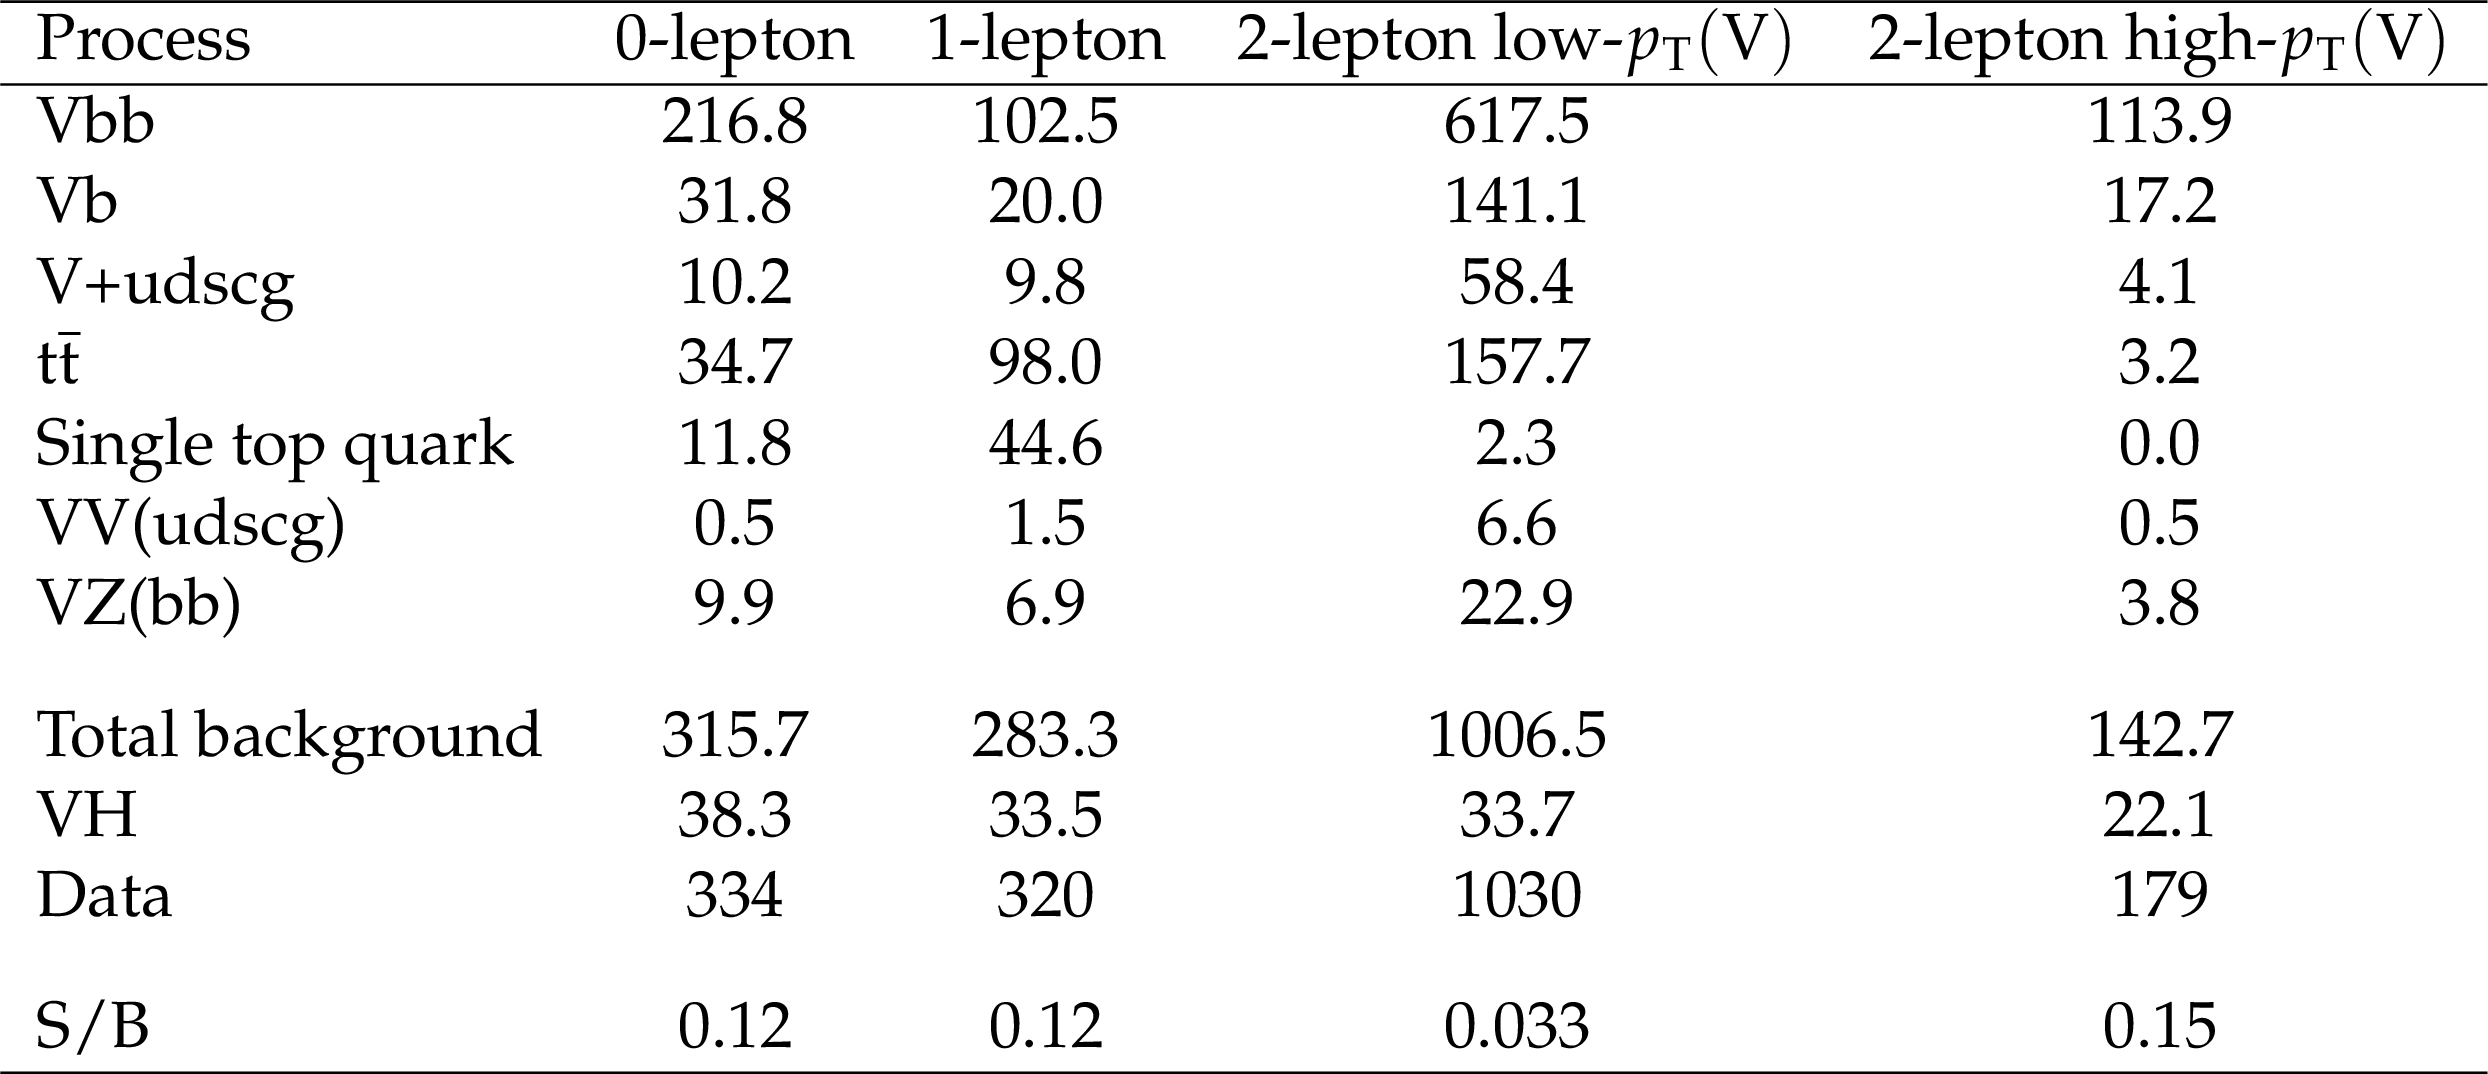
Table 8:
The total numbers of events in each channel, for the 20% most sensitive region of the event BDT output distribution is shown for all background processes, for the SM Higgs boson ${{{\mathrm {V}}}\mathrm{H}} $ signal, and for data. The yields from simulated samples are computed with adjustments to the shapes and normalizations of the BDT distributions given by the signal extraction fit. The signal-to-background ratio (S/B) is also shown. |
png pdf |
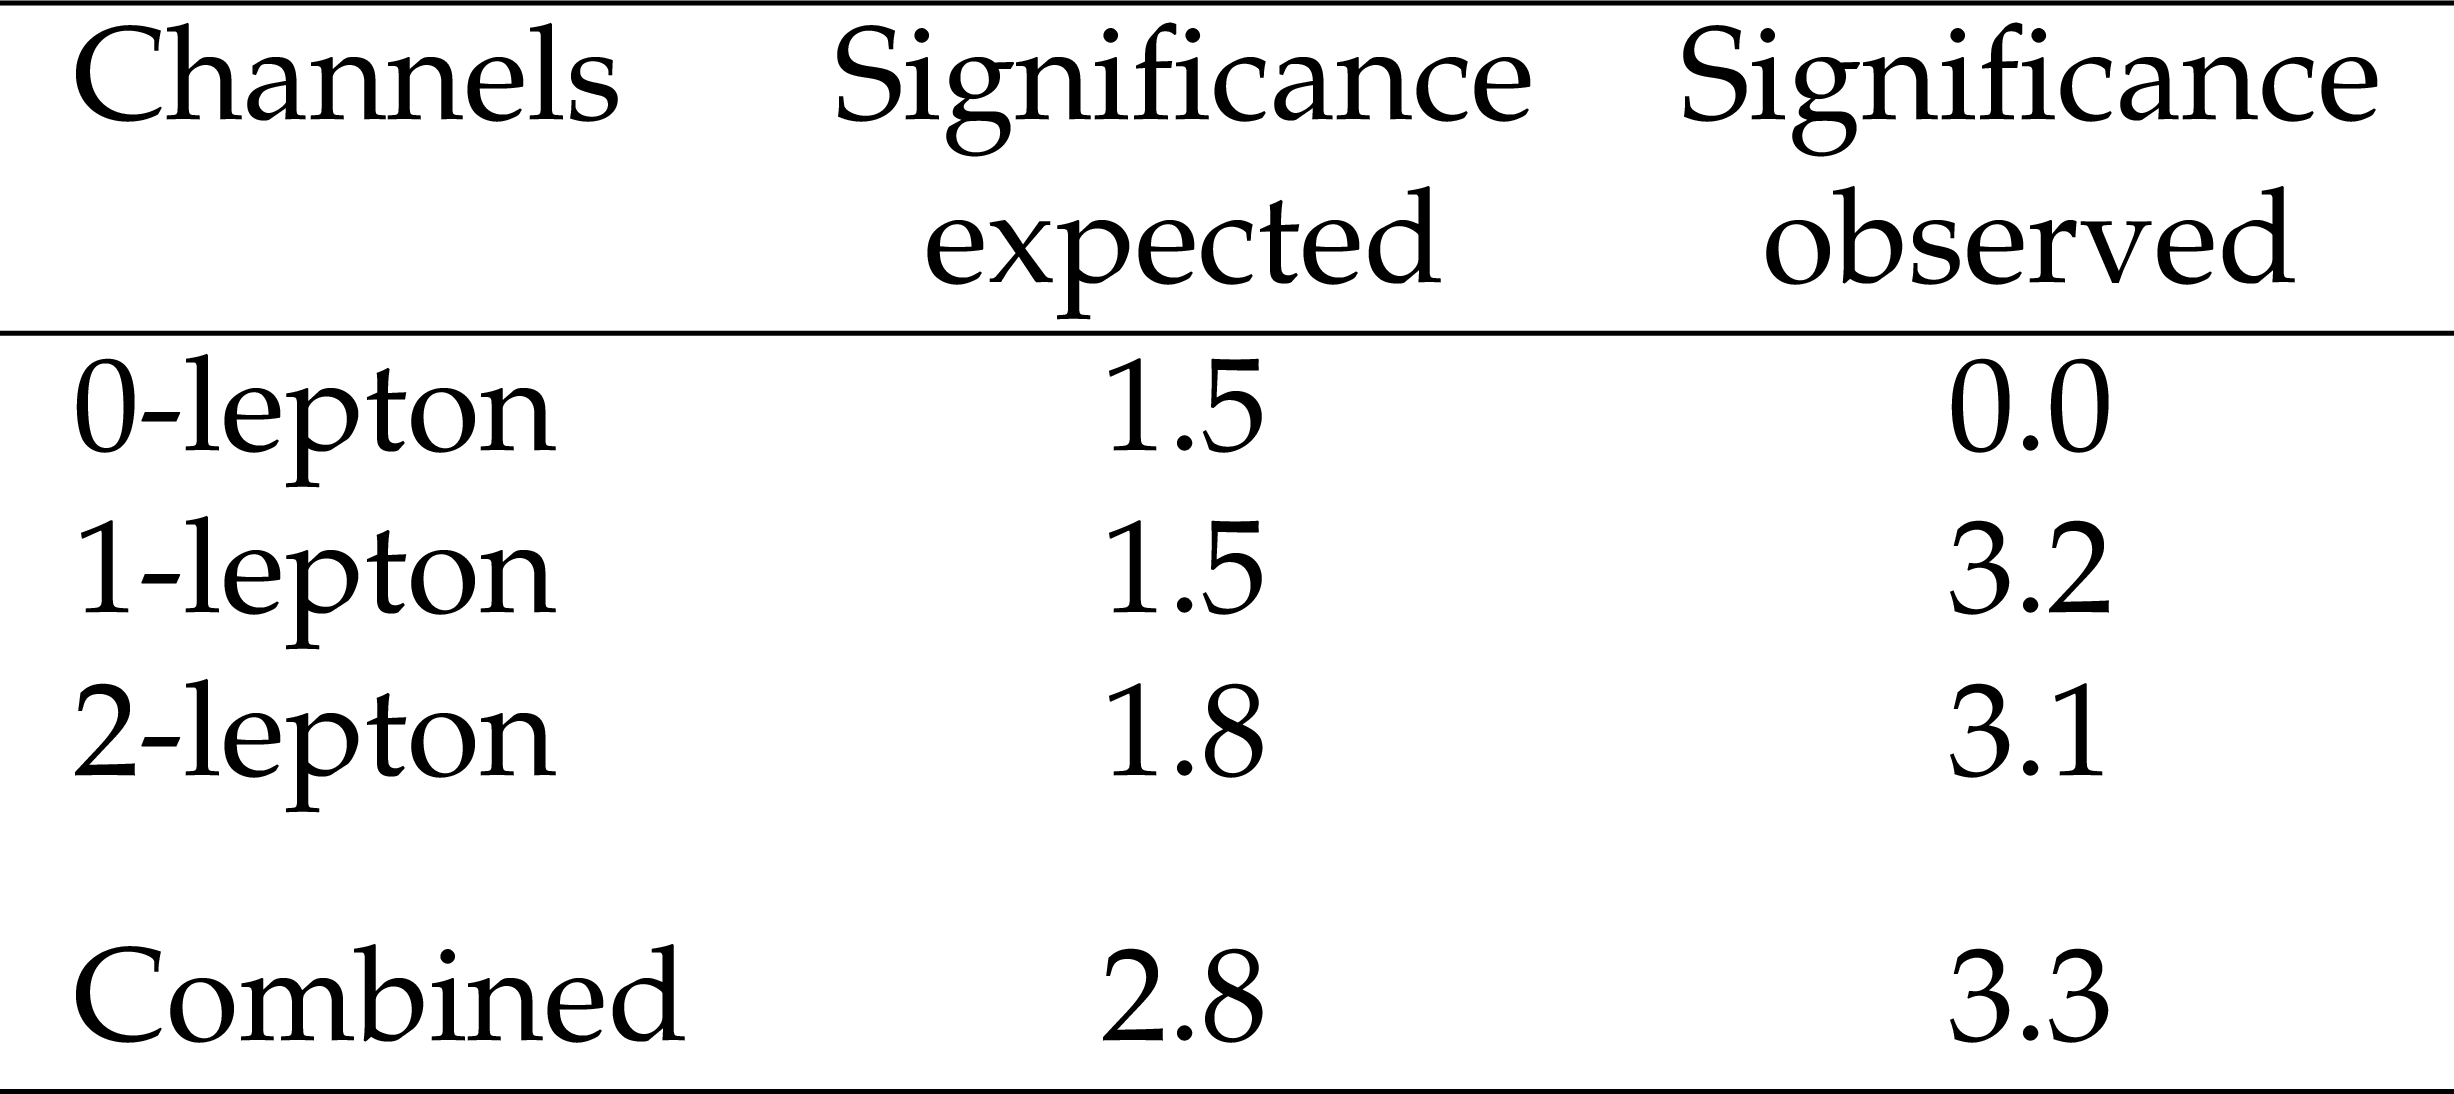
Table 9:
The expected and observed significances for ${{{\mathrm {V}}}\mathrm{H}} $ production with ${\mathrm{H} \to {\mathrm{b} \mathrm{\bar{b}}}}$ are shown, for $ {m_\mathrm{H}} = $ 125.09 GeV, for each channel fit individually as well as for the combination of all three channels. |
png pdf |
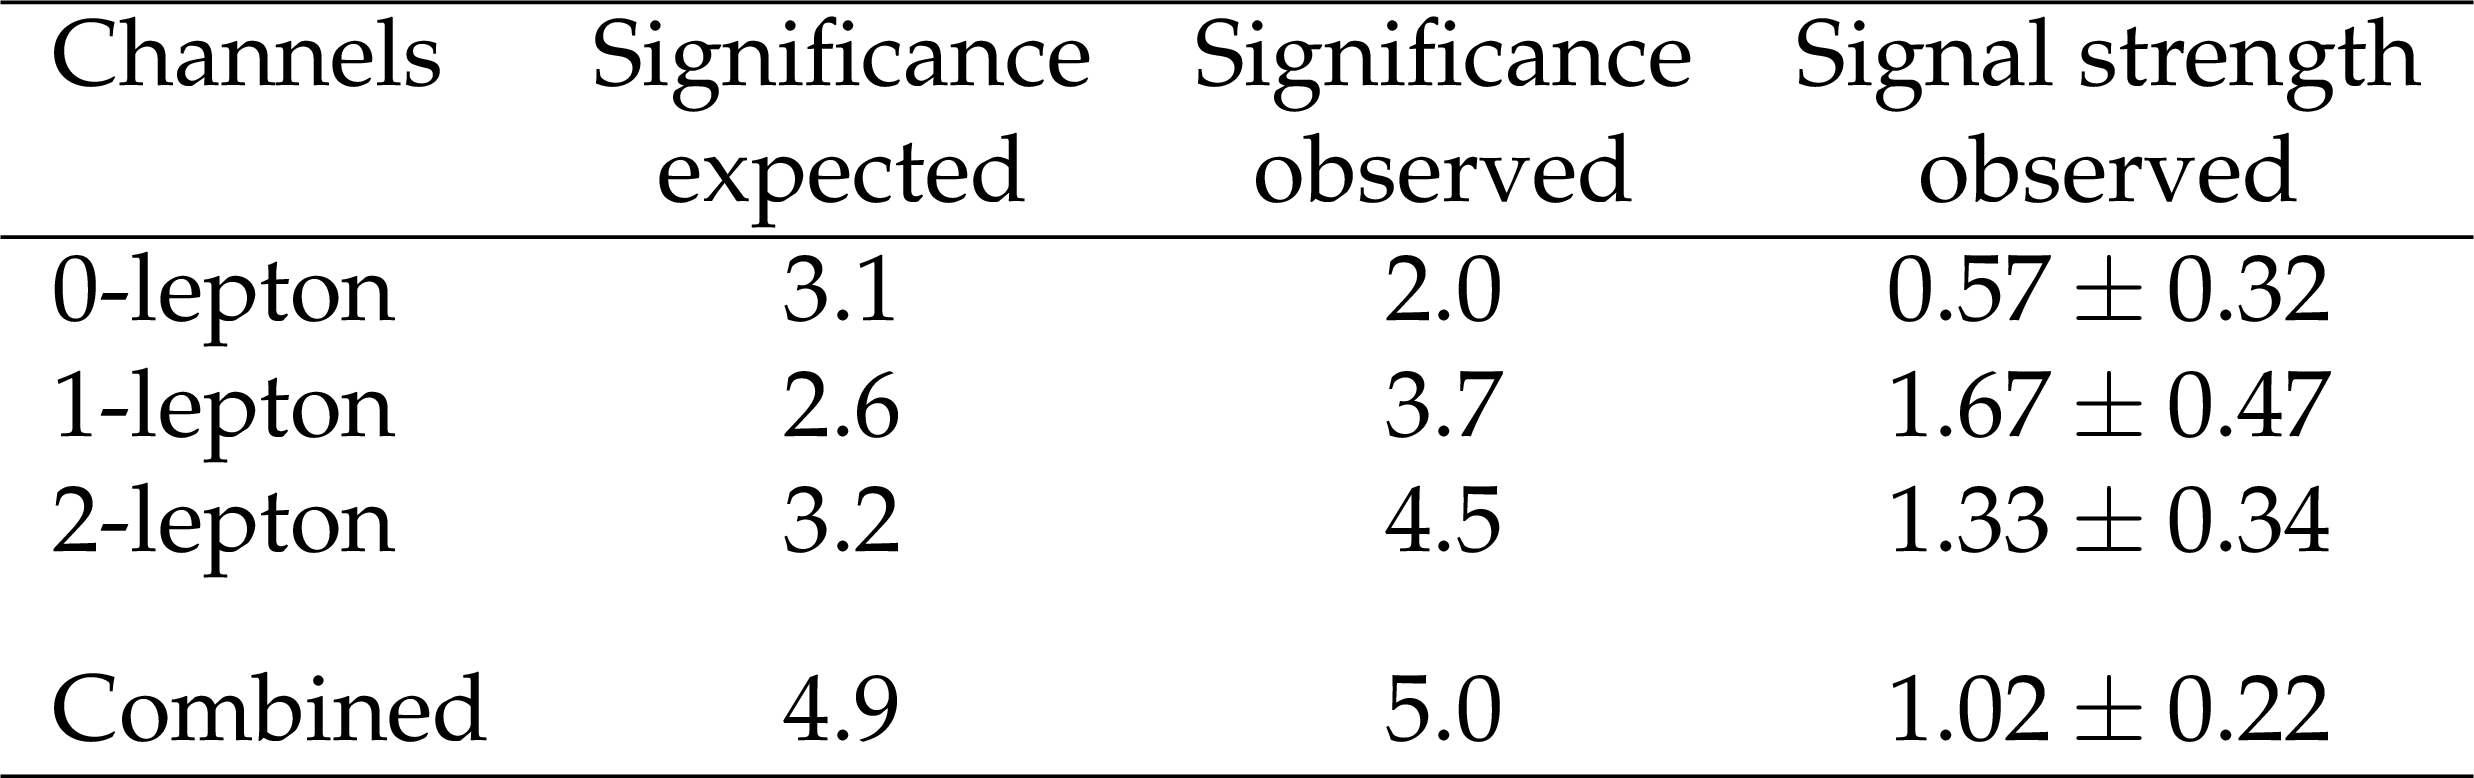
Table 10:
Validation results for ${{{\mathrm {V}}}\mathrm{Z}} $ production with ${\mathrm{Z} \to {\mathrm{b} \mathrm{\bar{b}}}}$. Expected and observed significances, and the observed signal strengths. Significance values are given in numbers of standard deviations. |
png pdf |
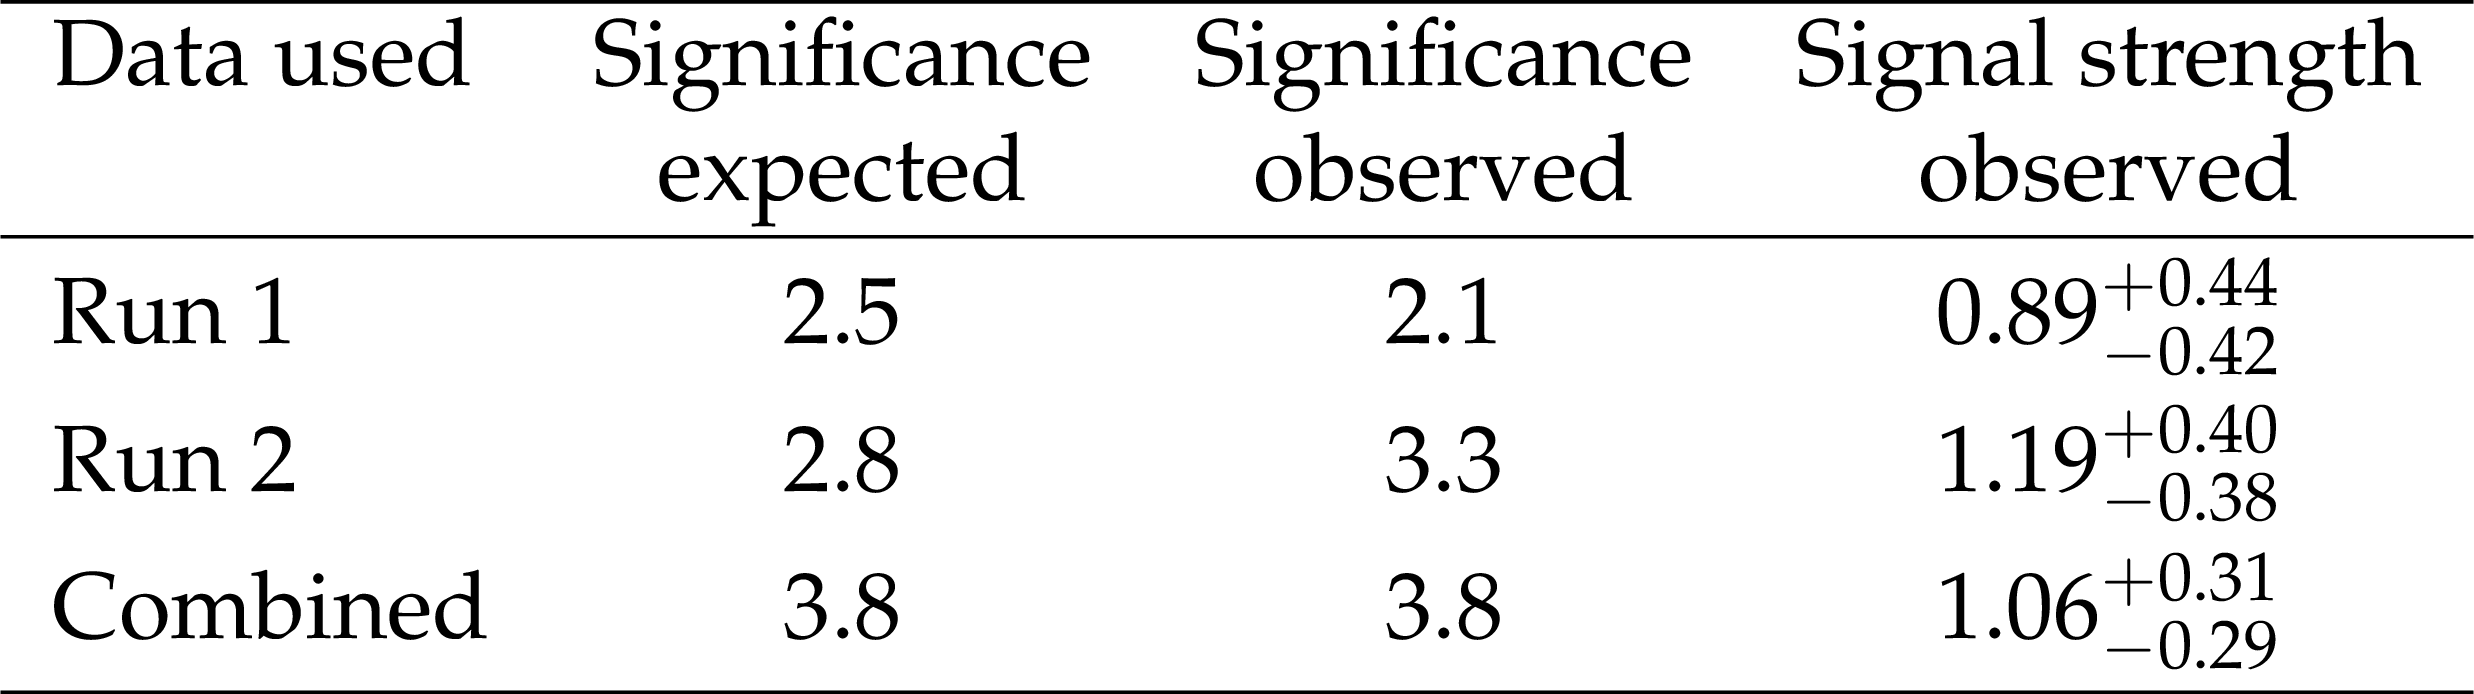
Table 11:
The expected and observed significances and the observed signal strengths for ${{{\mathrm {V}}}\mathrm{H}} $ production with ${\mathrm{H} \to {\mathrm{b} \mathrm{\bar{b}}}}$ for Run1 data[18], Run2 (2016) data, and for the combination of the two. Significance values are given in numbers of standard deviations. |
| Summary |
|
A search for the standard model (SM) Higgs boson (H) when produced in association with an electroweak vector boson and decaying to a $\mathrm{b\bar{b}}$ pair is reported for the $\mathrm{Z}(\nu\nu)\mathrm{H}$, $\mathrm{W}(\mu\nu)\mathrm{H}$, $\mathrm{W}(\mathrm{e}\nu)\mathrm{H}$, $\mathrm{Z}(\mu\mu)\mathrm{H}$, and $\mathrm{Z}(\mathrm{e}\mathrm{e})\mathrm{H}$ processes. The search is performed in data samples corresponding to an integrated luminosity of 35.9 fb$^{-1}$ at $\sqrt{s} = $ 13 TeV, recorded by the CMS experiment at the LHC. The observed signal significance, for ${m_\mathrm{H}} =125.09$ GeV, is 3.3 standard deviations, where the expectation from the SM Higgs boson production is 2.8. The corresponding signal strength is $\mu= $ 1.2 $\pm$ 0.4. The combination of this result with the one from the same measurement performed by the CMS Collaboration in Run 1 of the LHC using proton-proton collisions at $\sqrt{s}= $ 7 and 8 TeV with data samples corresponding to integrated luminosities of up to 5.1 and 18.9 fb$^{-1}$, respectively, yields an observed signal significance of 3.8 standard deviations, where 3.8 are expected from the SM signal. The corresponding signal strength is $\mu= $ 1.06$^{+0.31}_{-0.29}$. The result presented in this article provides evidence for the decay of the Higgs boson into a pair of b quarks with a rate consistent with the SM expectation. |
| References | ||||
| 1 | ATLAS Collaboration | Observation of a new particle in the search for the Standard Model Higgs boson with the ATLAS detector at the LHC | PLB 716 (2012) 1 | 1207.7214 |
| 2 | CMS Collaboration | Observation of a new boson at a mass of 125 GeV with the CMS experiment at the LHC | PLB 716 (2012) 30 | CMS-HIG-12-028 1207.7235 |
| 3 | CMS Collaboration | Observation of a new boson with mass near 125 GeV in pp collisions at $ \sqrt{s} = $ 7 and 8 TeV | JHEP 06 (2013) 081 | CMS-HIG-12-036 1303.4571 |
| 4 | ATLAS Collaboration | Measurement of Higgs boson production in the diphoton decay channel in pp collisions at center-of-mass energies of 7 and 8 TeV with the ATLAS detector | PRD 90 (2014) 112015 | 1408.7084 |
| 5 | CMS Collaboration | Observation of the diphoton decay of the Higgs boson and measurement of its properties | EPJC 74 (2014) 3076 | CMS-HIG-13-001 1407.0558 |
| 6 | ATLAS Collaboration | Measurements of Higgs boson production and couplings in the four-lepton channel in pp collisions at center-of-mass energies of 7 and 8 TeV with the ATLAS detector | PRD 91 (2015) 012006 | 1408.5191 |
| 7 | CMS Collaboration | Measurement of the properties of a Higgs boson in the four-lepton final state | PRD 89 (2014) 092007 | CMS-HIG-13-002 1312.5353 |
| 8 | ATLAS Collaboration | Observation and measurement of Higgs boson decays to WW$ ^* $ with the ATLAS detector | PRD 92 (2015) 012006 | 1412.2641 |
| 9 | ATLAS Collaboration | Study of (W/Z)H production and Higgs boson couplings using H $ \rightarrow $ WW$ ^{\ast} $ decays with the ATLAS detector | JHEP 08 (2015) 137 | 1506.06641 |
| 10 | CMS Collaboration | Measurement of Higgs boson production and properties in the WW decay channel with leptonic final states | JHEP 01 (2014) 096 | CMS-HIG-13-023 1312.1129 |
| 11 | ATLAS Collaboration | Evidence for the Higgs-boson Yukawa coupling to tau leptons with the ATLAS detector | JHEP 04 (2015) 117 | 1501.04943 |
| 12 | CMS Collaboration | Evidence for the 125 GeV Higgs boson decaying to a pair of $ \tau $ leptons | JHEP 05 (2014) 104 | CMS-HIG-13-004 1401.5041 |
| 13 | CMS Collaboration | Observation of Higgs boson decays to a pair of tau leptons | Submitted to PLB | CMS-HIG-16-043 1708.00373 |
| 14 | ATLAS Collaboration | Measurements of the Higgs boson production and decay rates and coupling strengths using pp collision data at $ \sqrt{s}= $ 7 and 8 TeV in the ATLAS experiment | EPJC 76 (2016) 6 | 1507.04548 |
| 15 | CMS Collaboration | Precise determination of the mass of the Higgs boson and tests of compatibility of its couplings with the standard model predictions using proton collisions at 7 and 8 TeV | EPJC 75 (2015) 212 | CMS-HIG-14-009 1412.8662 |
| 16 | CMS Collaboration | Study of the mass and spin-parity of the Higgs boson candidate via its decays to Z boson pairs | PRL 110 (2013) 081803 | CMS-HIG-12-041 1212.6639 |
| 17 | ATLAS Collaboration | Evidence for the spin-0 nature of the Higgs boson using ATLAS data | PLB 726 (2013) 120 | 1307.1432 |
| 18 | ATLAS and CMS Collaborations | Measurements of the Higgs boson production and decay rates and constraints on its couplings from a combined ATLAS and CMS analysis of the LHC pp collision data at $ \sqrt{s}= $ 7 and 8 TeV | JHEP 08 (2016) 045 | 1606.02266 |
| 19 | ATLAS and CMS Collaborations | Combined measurement of the Higgs boson mass in pp collisions at $ \sqrt{s}= $ 7 and 8 TeV with the ATLAS and CMS experiments | PRL 114 (2015) 191803 | 1503.07589 |
| 20 | CMS Collaboration | Measurements of properties of the Higgs boson decaying into the four-lepton final state in pp collisions at $ \sqrt{s} = $ 13 TeV | Submitted to JHEP | CMS-HIG-16-041 1706.09936 |
| 21 | F. Englert and R. Brout | Broken symmetry and the mass of gauge vector mesons | PRL 13 (1964) 321 | |
| 22 | P. W. Higgs | Broken symmetries, massless particles and gauge fields | PL12 (1964) 132 | |
| 23 | P. W. Higgs | Broken symmetries and the masses of gauge bosons | PRL 13 (1964) 508 | |
| 24 | G. S. Guralnik, C. R. Hagen, and T. W. B. Kibble | Global conservation laws and massless particles | PRL 13 (1964) 585 | |
| 25 | P. W. Higgs | Spontaneous symmetry breakdown without massless bosons | PR145 (1966) 1156 | |
| 26 | T. W. B. Kibble | Symmetry breaking in non-Abelian gauge theories | PR155 (1967) 1554 | |
| 27 | S. Heinmeyer et al. | Handbook of LHC Higgs Cross Sections: 3. Higgs Properties | CERN-2013-004 | 1307.1347 |
| 28 | S. Weinberg | A model of leptons | PRL 19 (1967) 1264 | |
| 29 | Y. Nambu and G. Jona-Lasinio | Dynamical model of elementary particles based on an analogy with superconductivity. I | PR122 (1961) 345 | |
| 30 | CDF and D0 Collaborations | Evidence for a particle produced in association with weak bosons and decaying to a bottom-antibottom quark pair in Higgs boson searches at the Tevatron | PRL 109 (2012) 071804 | 1207.6436 |
| 31 | ATLAS Collaboration | Search for the Standard Model Higgs boson produced in association with top quarks and decaying into $ \mathrm{b}\overline{\mathrm{b}} $ in pp collisions at $ \sqrt{s} = $ 8 TeV with the ATLAS detector | EPJC 75 (2015) 349 | 1503.05066 |
| 32 | ATLAS Collaboration | Search for the Standard Model Higgs boson decaying into $ \mathrm{b}\overline{\mathrm{b}} $ produced in association with top quarks decaying hadronically in pp collisions at $ \sqrt{s}= $ 8 TeV with the ATLAS detector | JHEP 05 (2016) 160 | 1604.03812 |
| 33 | CMS Collaboration | Search for the standard model Higgs boson produced in association with a top-quark pair in pp collisions at the LHC | JHEP 05 (2013) 145 | CMS-HIG-12-035 1303.0763 |
| 34 | CMS Collaboration | Search for the associated production of the Higgs boson with a top-quark pair | JHEP 09 (2014) 087 | CMS-HIG-13-029 1408.1682 |
| 35 | ATLAS Collaboration | Search for the Standard Model Higgs boson produced by vector-boson fusion and decaying to bottom quarks in $ \sqrt{s}= $ 8 TeV pp collisions with the ATLAS detector | JHEP 11 (2016) 112 | 1606.02181 |
| 36 | CMS Collaboration | Search for the standard model Higgs boson produced through vector boson fusion and decaying to $ \mathrm{b}\overline{\mathrm{b}} $ | PRD 92 (2015) 032008 | CMS-HIG-14-004 1506.01010 |
| 37 | ATLAS Collaboration | Search for the $ \mathrm{b}\overline{\mathrm{b}} $ decay of the Standard Model Higgs boson in associated (W/Z)H production with the ATLAS detector | JHEP 01 (2015) 069 | 1409.6212 |
| 38 | CMS Collaboration | Search for the standard model Higgs boson produced in association with a W or a Z boson and decaying to bottom quarks | PRD 89 (2014) 012003 | CMS-HIG-13-012 1310.3687 |
| 39 | CMS Collaboration | Inclusive search for a highly boosted Higgs boson decaying to a bottom quark-antiquark pair | Submitted to PRL | CMS-HIG-17-010 1709.05543 |
| 40 | ATLAS Collaboration | Evidence for the $ H\rightarrow {b\bar{\mathrm{b}}} $ decay with the ATLAS detector | Submitted to JHEP | 1708.03299 |
| 41 | B. P. Roe et al. | Boosted decision trees, an alternative to artificial neural networks | NIMA 543 (2005) 577 | physics/0408124 |
| 42 | H. Voss, A. Hocker, J. Stelzer, and F. Tegenfeldt | TMVA, the toolkit for multivariate data analysis with ROOT | in XIth International Workshop on Advanced Computing and Analysis Techniques in Physics Research (ACAT), p. 40 2007 | physics/0703039 |
| 43 | CMS Collaboration | The CMS experiment at the CERN LHC | JINST 3 (2008) S08004 | CMS-00-001 |
| 44 | GEANT4 Collaboration | GEANT4 --- a simulation toolkit | NIMA 506 (2003) 250 | |
| 45 | P. Nason | A new method for combining NLO QCD with shower Monte Carlo algorithms | JHEP 11 (2004) 040 | hep-ph/0409146 |
| 46 | S. Frixione, P. Nason, and C. Oleari | Matching NLO QCD computations with parton shower simulations: the POWHEG method | JHEP 11 (2007) 070 | 0709.2092 |
| 47 | S. Alioli, P. Nason, C. Oleari, and E. Re | A general framework for implementing NLO calculations in shower Monte Carlo programs: the POWHEG BOX | JHEP 06 (2010) 043 | 1002.2581 |
| 48 | K. Hamilton, P. Nason, and G. Zanderighi | MINLO: Multi-Scale Improved NLO | JHEP 10 (2012) 155 | 1206.3572 |
| 49 | G. Luisoni, P. Nason, C. Oleari, and F. Tramontano | HW$ ^{\pm} $/HZ + 0 and 1 jet at NLO with the POWHEG BOX interfaced to GoSam and their merging within MiNLO | JHEP 10 (2013) 083 | 1306.2542 |
| 50 | J. Alwall et al. | The automated computation of tree-level and next-to-leading order differential cross sections, and their matching to parton shower simulations | JHEP 07 (2014) 079 | 1405.0301 |
| 51 | R. Frederix and S. Frixione | Merging meets matching in MC@NLO | JHEP 12 (2012) 061 | 1209.6215 |
| 52 | J. Alwall et al. | Comparative study of various algorithms for the merging of parton showers and matrix elements in hadronic collisions | EPJC 53 (2008) 473 | 0706.2569 |
| 53 | S. Frixione, P. Nason, and G. Ridolfi | A positive-weight next-to-leading-order Monte Carlo for heavy flavour hadroproduction | JHEP 09 (2007) 126 | 0707.3088 |
| 54 | R. Frederix, E. Re, and P. Torrielli | Single-top $ t $-channel hadroproduction in the four-flavour scheme with POWHEG and aMC@NLO | JHEP 09 (2012) 130 | 1207.5391 |
| 55 | E. Re | Single-top Wt-channel production matched with parton showers using the POWHEG method | EPJC 71 (2011) 1547 | 1009.2450 |
| 56 | S. Alioli, P. Nason, C. Oleari, and E. Re | NLO single-top production matched with shower in POWHEG: $ s $- and $ t $-channel contributions | JHEP 09 (2009) 111 | 0907.4076 |
| 57 | G. Ferrera, M. Grazzini, and F. Tramontano | Higher-order QCD effects for associated WH production and decay at the LHC | JHEP 04 (2014) 039 | 1312.1669 |
| 58 | G. Ferrera, M. Grazzini, and F. Tramontano | Associated ZH production at hadron colliders: the fully differential NNLO QCD calculation | PLB 740 (2015) 51 | 1407.4747 |
| 59 | G. Ferrera, M. Grazzini, and F. Tramontano | Associated WH production at hadron colliders: a fully exclusive QCD calculation at NNLO | PRL 107 (2011) 152003 | 1107.1164 |
| 60 | O. Brein, R. V. Harlander, and T. J. E. Zirke | vh@nnlo --- Higgs Strahlung at hadron colliders | CPC 184 (2013) 998 | 1210.5347 |
| 61 | R. V. Harlander, S. Liebler, and T. Zirke | Higgs Strahlung at the Large Hadron Collider in the 2-Higgs-Doublet Model | JHEP 02 (2014) 023 | 1307.8122 |
| 62 | A. Denner, S. Dittmaier, S. Kallweit, and A. Muck | HAWK 2.0: A Monte Carlo program for Higgs production in vector-boson fusion and Higgs strahlung at hadron colliders | CPC 195 (2015) 161 | 1412.5390 |
| 63 | LHC Higgs Cross Section Working Group | Handbook of LHC Higgs Cross Sections: 4. Deciphering the Nature of the Higgs Sector | 1610.07922 | |
| 64 | M. Czakon and A. Mitov | Top++: A Program for the Calculation of the Top-Pair Cross-Section at Hadron Colliders | CPC 185 (2014) 2930 | 1112.5675 |
| 65 | NNPDF Collaboration | Parton distributions for the LHC Run II | JHEP 04 (2015) 040 | 1410.8849 |
| 66 | T. Sjostrand, S. Mrenna, and P. Skands | A brief introduction to PYTHIA 8.1 | CPC 178 (2008) 852 | 0710.3820 |
| 67 | CMS Collaboration | Event generator tunes obtained from underlying event and multiparton scattering measurements | EPJC 76 (2016) 155 | CMS-GEN-14-001 1512.00815 |
| 68 | P. Skands, S. Carrazza, and J. Rojo | Tuning PYTHIA 8.1: the Monash 2013 tune | EPJC 74 (2014) 3024 | 1404.5630 |
| 69 | CMS Collaboration | Particle-flow reconstruction and global event description with the CMS detector | Submitted to JINST | CMS-PRF-14-001 1706.04965 |
| 70 | M. Cacciari, G. P. Salam, and G. Soyez | The anti-$ k_{t} $ jet clustering algorithm | JHEP 04 (2008) 063 | 0802.1189 |
| 71 | M. Cacciari, G. P. Salam, and G. Soyez | FastJet User Manual | EPJC 72 (2012) 1896 | 1111.6097 |
| 72 | M. Cacciari and G. P. Salam | Pileup subtraction using jet areas | PLB 659 (2008) 119 | 0707.1378 |
| 73 | CMS Collaboration | Performance of CMS muon reconstruction in pp collision events at $ \sqrt{s}= $ 7 ~ TeV | JINST 7 (2012) P10002 | CMS-MUO-10-004 1206.4071 |
| 74 | CMS Collaboration | Performance of electron reconstruction and selection with the CMS detector in proton-proton collisions at $ \sqrt{s} = $ 8 TeV | JINST 10 (2015) P06005 | CMS-EGM-13-001 1502.02701 |
| 75 | M. Cacciari and G. P. Salam | Dispelling the $ N^{3} $ myth for the $ k_t $ jet-finder | PLB 641 (2006) 57 | hep-ph/0512210 |
| 76 | CMS Collaboration | Determination of jet energy calibration and transverse momentum resolution in CMS | JINST 6 (2011) P11002 | CMS-JME-10-011 1107.4277 |
| 77 | CMS Collaboration | Performance of missing energy reconstruction in 13 TeV pp collision data using the CMS detector | CMS-PAS-JME-16-004 | CMS-PAS-JME-16-004 |
| 78 | CMS Collaboration | Identification of b-quark jets with the CMS experiment | JINST 8 (2013) P04013 | |
| 79 | CMS Collaboration | Identification of b quark jets at the CMS Experiment in the LHC Run 2 | CMS-PAS-BTV-15-001 | CMS-PAS-BTV-15-001 |
| 80 | CMS Collaboration | Description and performance of track and primary-vertex reconstruction with the CMS tracker | JINST 9 (2014) P10009 | CMS-TRK-11-001 1405.6569 |
| 81 | CMS Collaboration | Commissioning of trackjets in pp collisions at $ \sqrt{s} = $ 7 TeV | CMS-PAS-JME-10-006 | |
| 82 | CMS Collaboration | Performance of jet reconstruction with charged tracks only | CMS-PAS-JME-08-001 | |
| 83 | CMS Collaboration | Measurement of the hadronic activity in events with a Z and two jets and extraction of the cross section for the electroweak production of a Z with two jets in pp collisions at $ \sqrt{s} = $ 7 TeV | JHEP 10 (2013) 062 | CMS-FSQ-12-019 1305.7389 |
| 84 | CMS Collaboration | Measurement of electroweak production of two jets in association with a Z boson in proton-proton collisions at $ \sqrt{s}= $ 8 TeV | EPJC 75 (2015) 66 | CMS-FSQ-12-035 1410.3153 |
| 85 | CMS Collaboration | Jet algorithms performance in 13 TeV data | CMS-PAS-JME-16-003 | CMS-PAS-JME-16-003 |
| 86 | Particle Data Group, C. Patrignani et al. | Review of Particle Physics | CPC 40 (2016), no. 10, 100001 | |
| 87 | J. M. Butterworth, A. R. Davison, M. Rubin, and G. P. Salam | Jet substructure as a new Higgs search channel at the LHC | PRL 100 (2008) 242001 | 0802.2470 |
| 88 | T. Aaltonen et al. | Improved b-jet Energy Correction for H $ \to \mathrm{b}\bar{\mathrm{b}} $ Searches at CDF | 1107.3026 | |
| 89 | S. Kallweit et al. | NLO QCD+EW predictions for V+jets including off-shell vector-boson decays and multijet merging | JHEP 04 (2016) 021 | 1511.08692 |
| 90 | CMS Collaboration | Measurement of differential cross sections for top quark pair production using the $ \text{lepton}{+}\text{jets} $ final state in proton-proton collisions at 13 TeV | PRD 95 (2017) 092001 | |
| 91 | S. Frixione and B. R. Webber | Matching NLO QCD computations and parton shower simulations | JHEP 06 (2002) 029 | hep-ph/0204244 |
| 92 | CMS Collaboration | Jet energy scale and resolution in the CMS experiment in pp collisions at 8 TeV | JINST 12 (2017) P02014 | CMS-JME-13-004 1607.03663 |
| 93 | CMS Collaboration | Cross section measurement of $ t $-channel single top quark production in pp collisions at $ \sqrt{s}= $ 13 TeV | PLB 772 (2017) 752 | CMS-TOP-16-003 1610.00678 |
| 94 | CMS Collaboration | Measurement of the WZ production cross section in pp collisions at $ \sqrt{s} = $ 13 TeV | PLB 766 (2017) 268 | CMS-SMP-16-002 1607.06943 |
| 95 | CMS Collaboration | Measurement of the ZZ production cross section and Z $ \to \ell^+\ell^-\ell'^+\ell'^- $ branching fraction in pp collisions at $ \sqrt{s} = $ 13 TeV | PLB 763 (2016) 280 | CMS-SMP-16-001 1607.08834 |
| 96 | CMS Collaboration | CMS luminosity measurements for the 2016 data taking period | CMS-PAS-LUM-17-001 | CMS-PAS-LUM-17-001 |
| 97 | T. Junk | Confidence level computation for combining searches with small statistics | NIMA 434 (1999) 435 | |
| 98 | A. L. Read | Presentation of search results: The $ CL_s $ technique | JPG 28 (2002) 2693 | |
| 99 | ATLAS and CMS Collaborations, LHC Higgs Combination Group | Procedure for the LHC Higgs boson search combination in Summer 2011 | ATL-PHYS-PUB 011-11/CMS NOTE 2011-005 | |
| 100 | G. Cowan, K. Cranmer, E. Gross, and O. Vitells | Asymptotic formulae for likelihood-based tests of new physics | EPJC 71 (2011) 1554 | 1007.1727 |
|
|
Compact Muon Solenoid LHC, CERN |
|

|

|

|

|

|