

Compact Muon Solenoid
LHC, CERN
| CMS-EXO-24-028 ; CERN-EP-2026-048 | ||
| A search for microscopic black holes, string balls, and sphalerons in proton-proton collisions at $ \sqrt{s} = $ 13 TeV | ||
| CMS Collaboration | ||
| 12 April 2026 | ||
| Accepted for publication in the Journal of High Energy Physics | ||
| Abstract: A search for microscopic black holes, string balls, and electroweak sphalerons using proton-proton collisions at $ \sqrt{s} = $ 13 TeV recorded with the CMS detector at the CERN LHC during the 2016--2018 data taking, and corresponding to an integrated luminosity of 138 fb$ ^{-1} $, is presented. Two search strategies based on control samples in data are used. Model-independent limits on the cross section of physics phenomena with multiple energetic jets, leptons, and photons are set using a method that relies on the shape invariance of the scalar sum of the transverse momenta of all objects in the event. Model-dependent limits on black hole and sphaleron production are set using a newly introduced method that has been developed for the identification of collider events with distinct kinematic features by separating them into classes based on phase space proximity. In the context of models with large extra dimensions, semiclassical black holes and string balls with masses below 8.4--11.4 TeV and 9.0--10.7 TeV, respectively, are excluded at 95% confidence level, significantly extending the reach beyond previous searches. Results of a dedicated search for electroweak sphalerons are used to derive an upper limit of 0.0034 at 95% confidence level on the fraction of quark-quark interactions above the nominal sphaleron transition energy threshold of 9 TeV. | ||
| Links: e-print arXiv:2604.10732 [hep-ex] (PDF) ; CDS record ; inSPIRE record ; HepData record ; Physics Briefing ; CADI line (restricted) ; | ||
| Figures & Tables | Summary | Additional Figures | References | CMS Publications |
|---|
| Figures | |
png pdf |
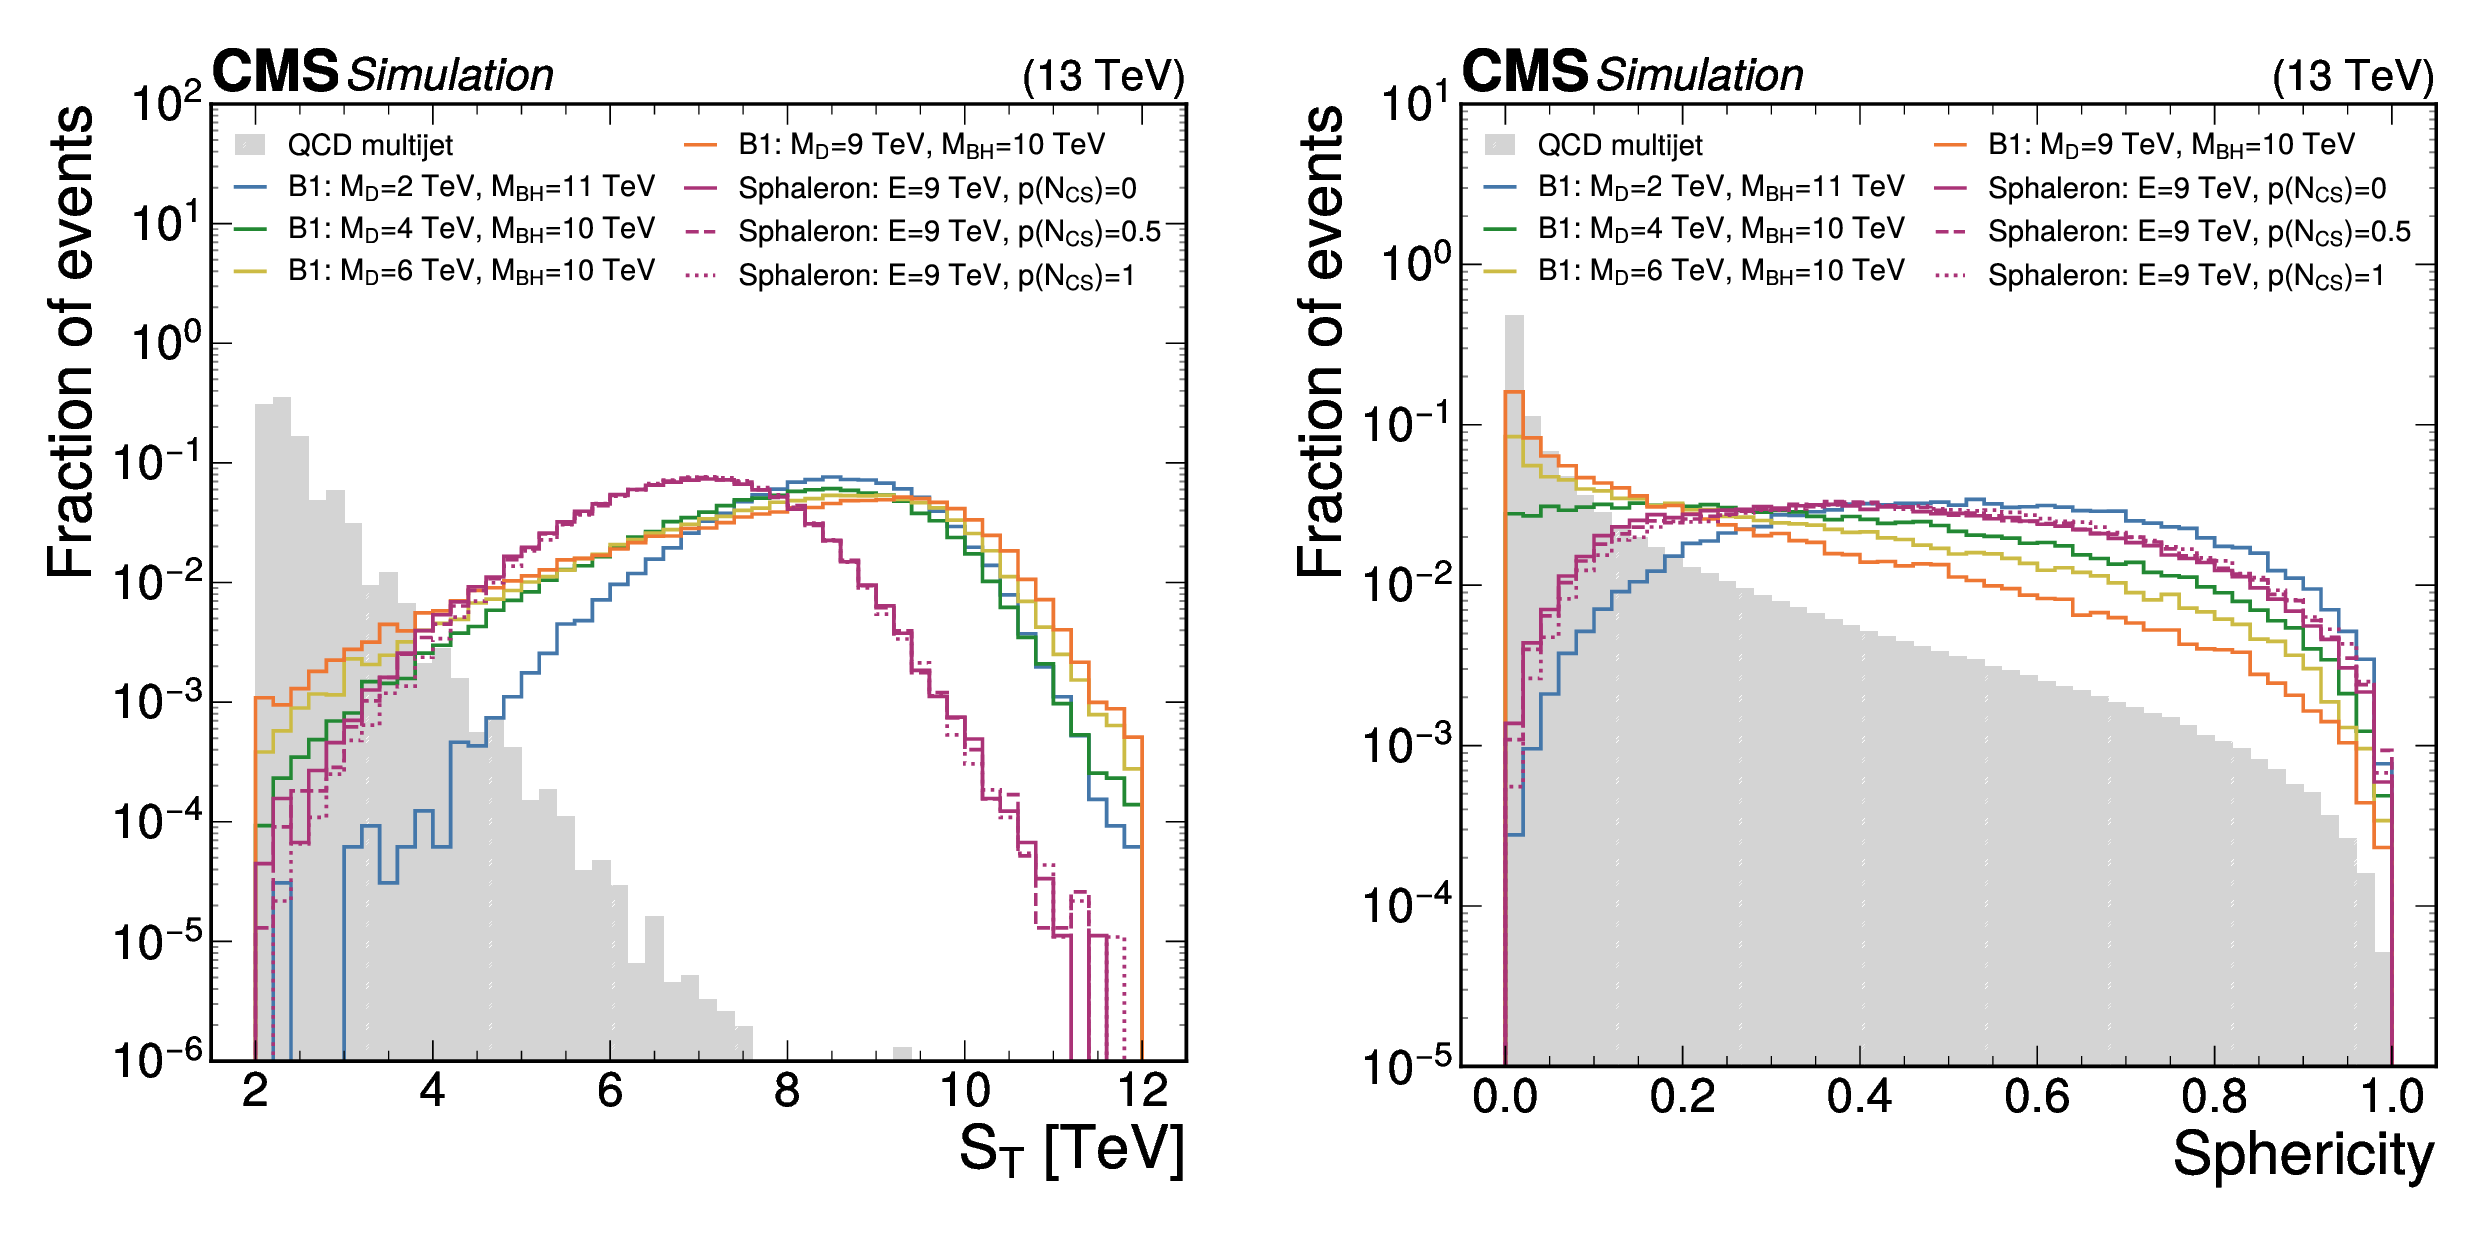
Figure 1:
The $ S_\text{T} $ (left) and sphericity (right) distributions for various BH (with $ n = $ 2) and sphaleron signal models are plotted along with the corresponding distributions for simulated QCD multijet background events. The distributions are normalized to unit area. |
png pdf |
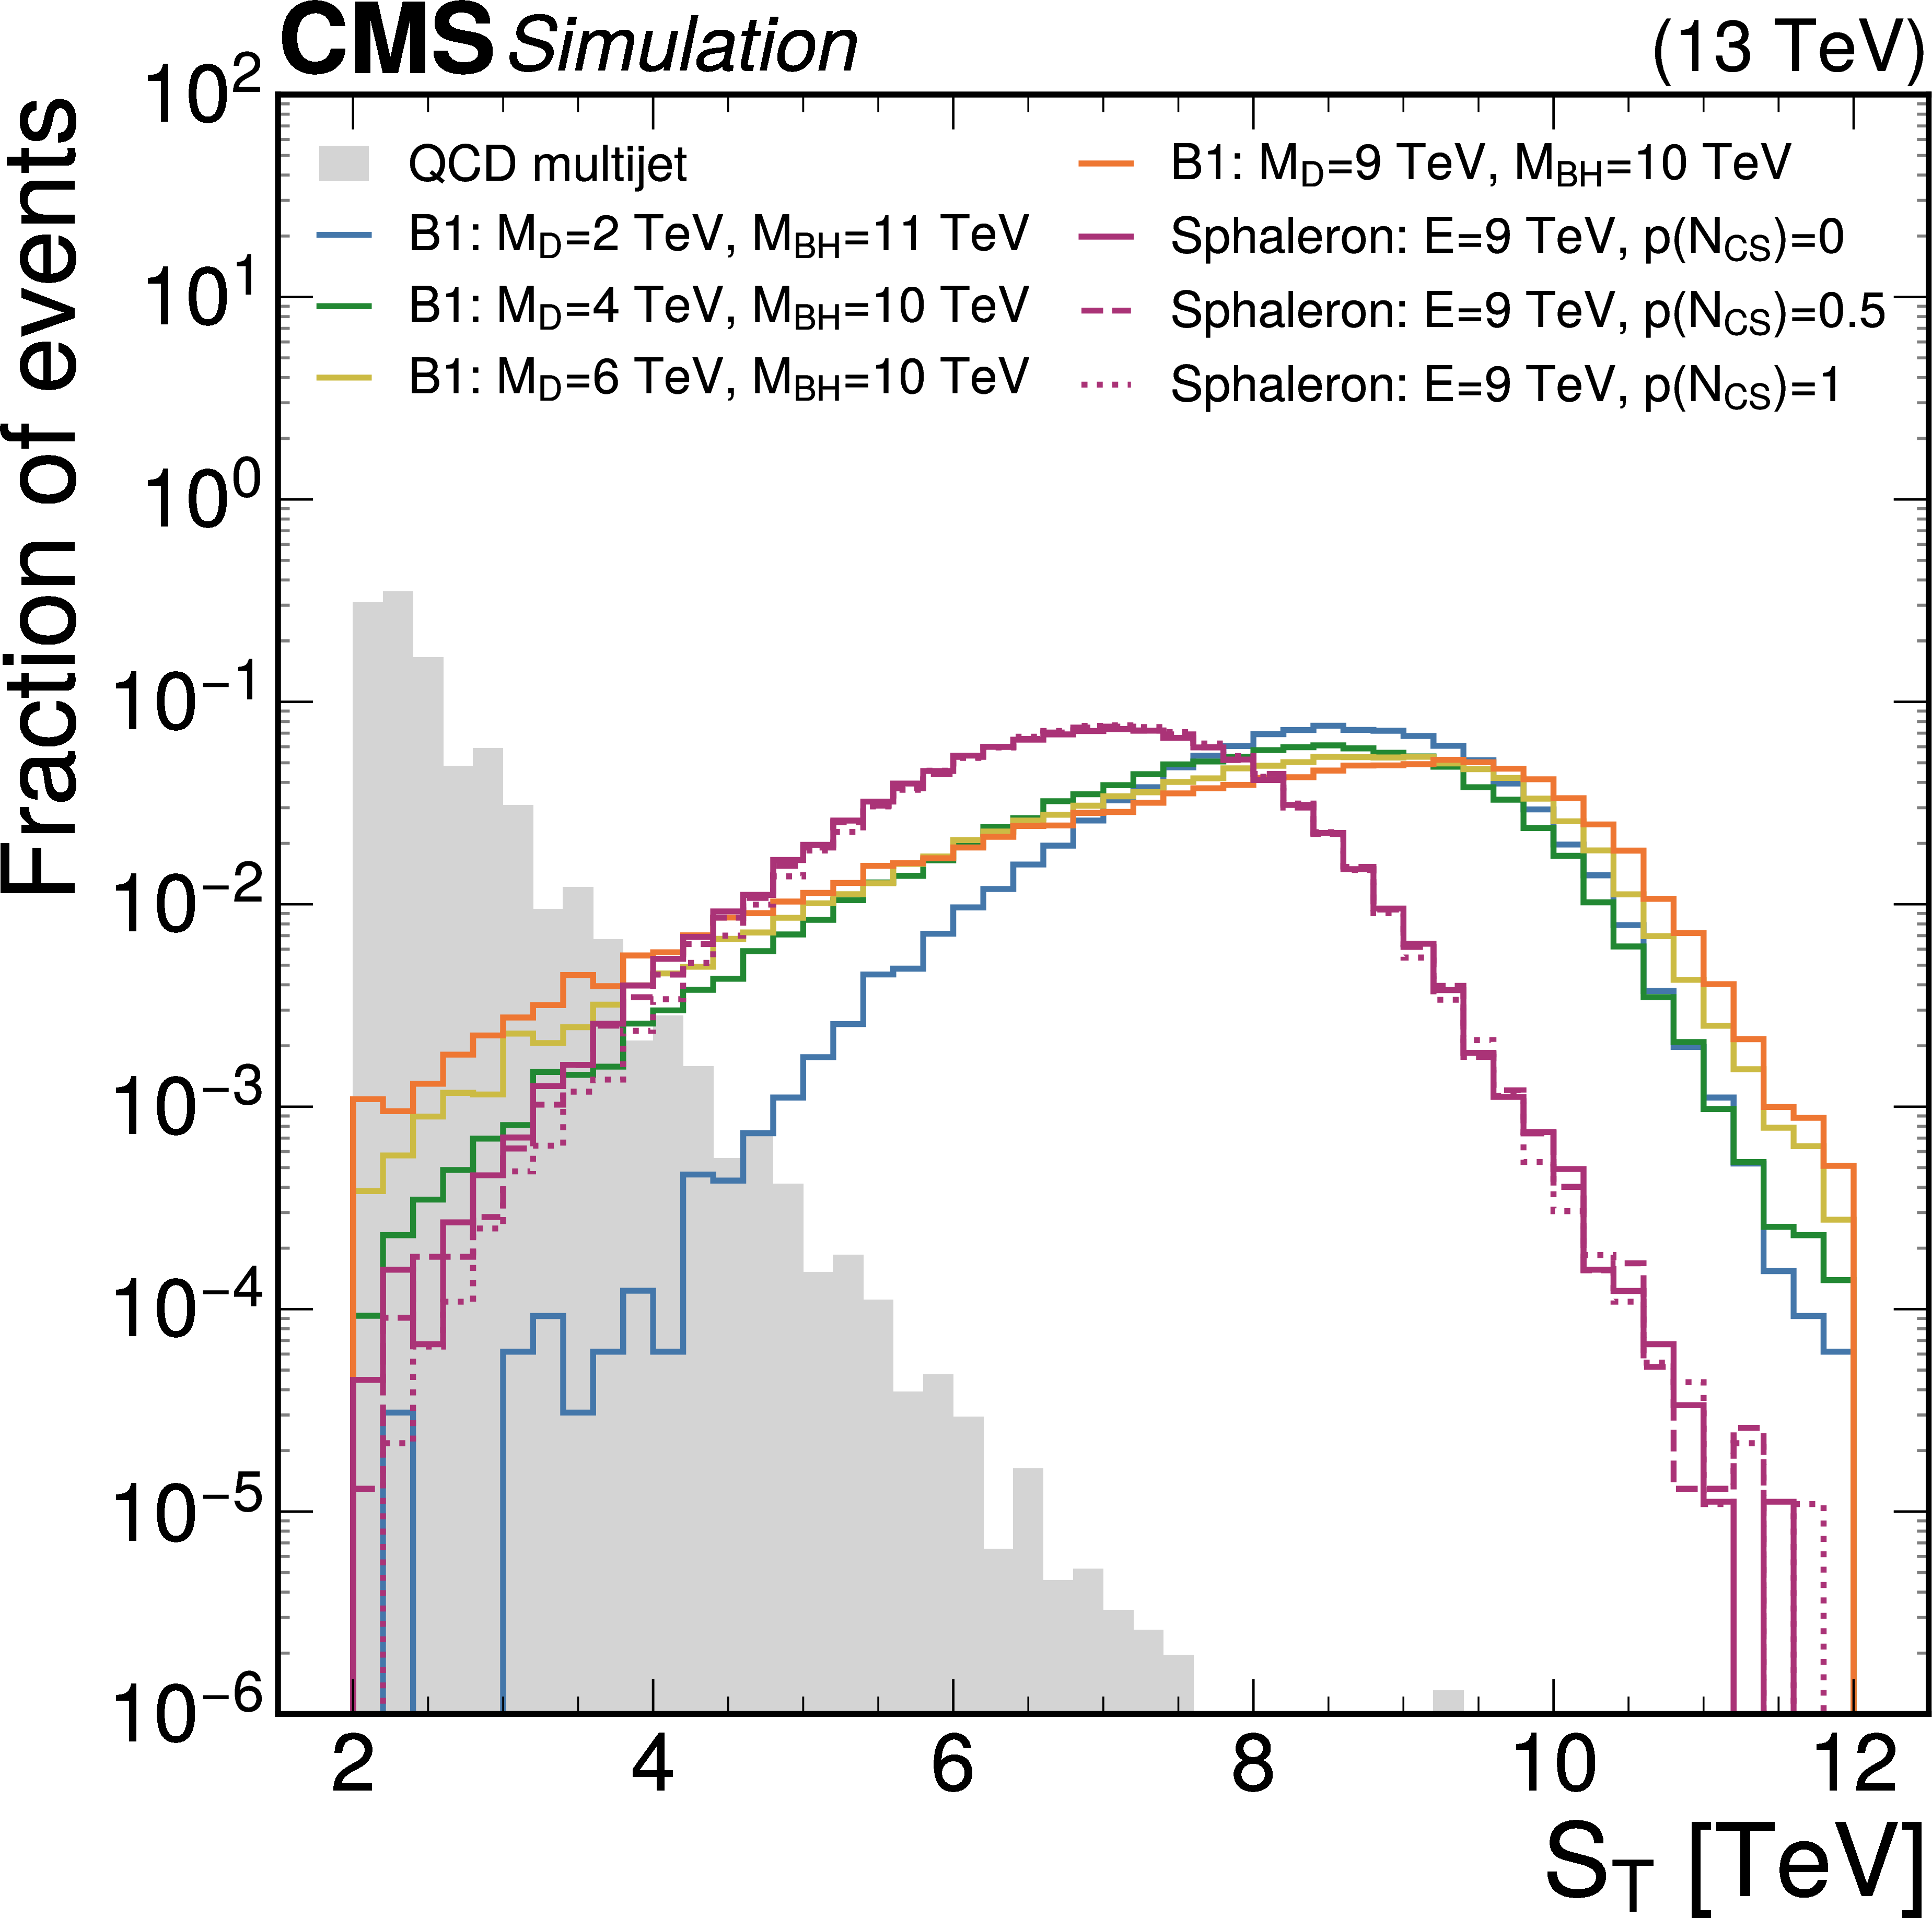
Figure 1-a:
The $ S_\text{T} $ (left) and sphericity (right) distributions for various BH (with $ n = $ 2) and sphaleron signal models are plotted along with the corresponding distributions for simulated QCD multijet background events. The distributions are normalized to unit area. |
png pdf |
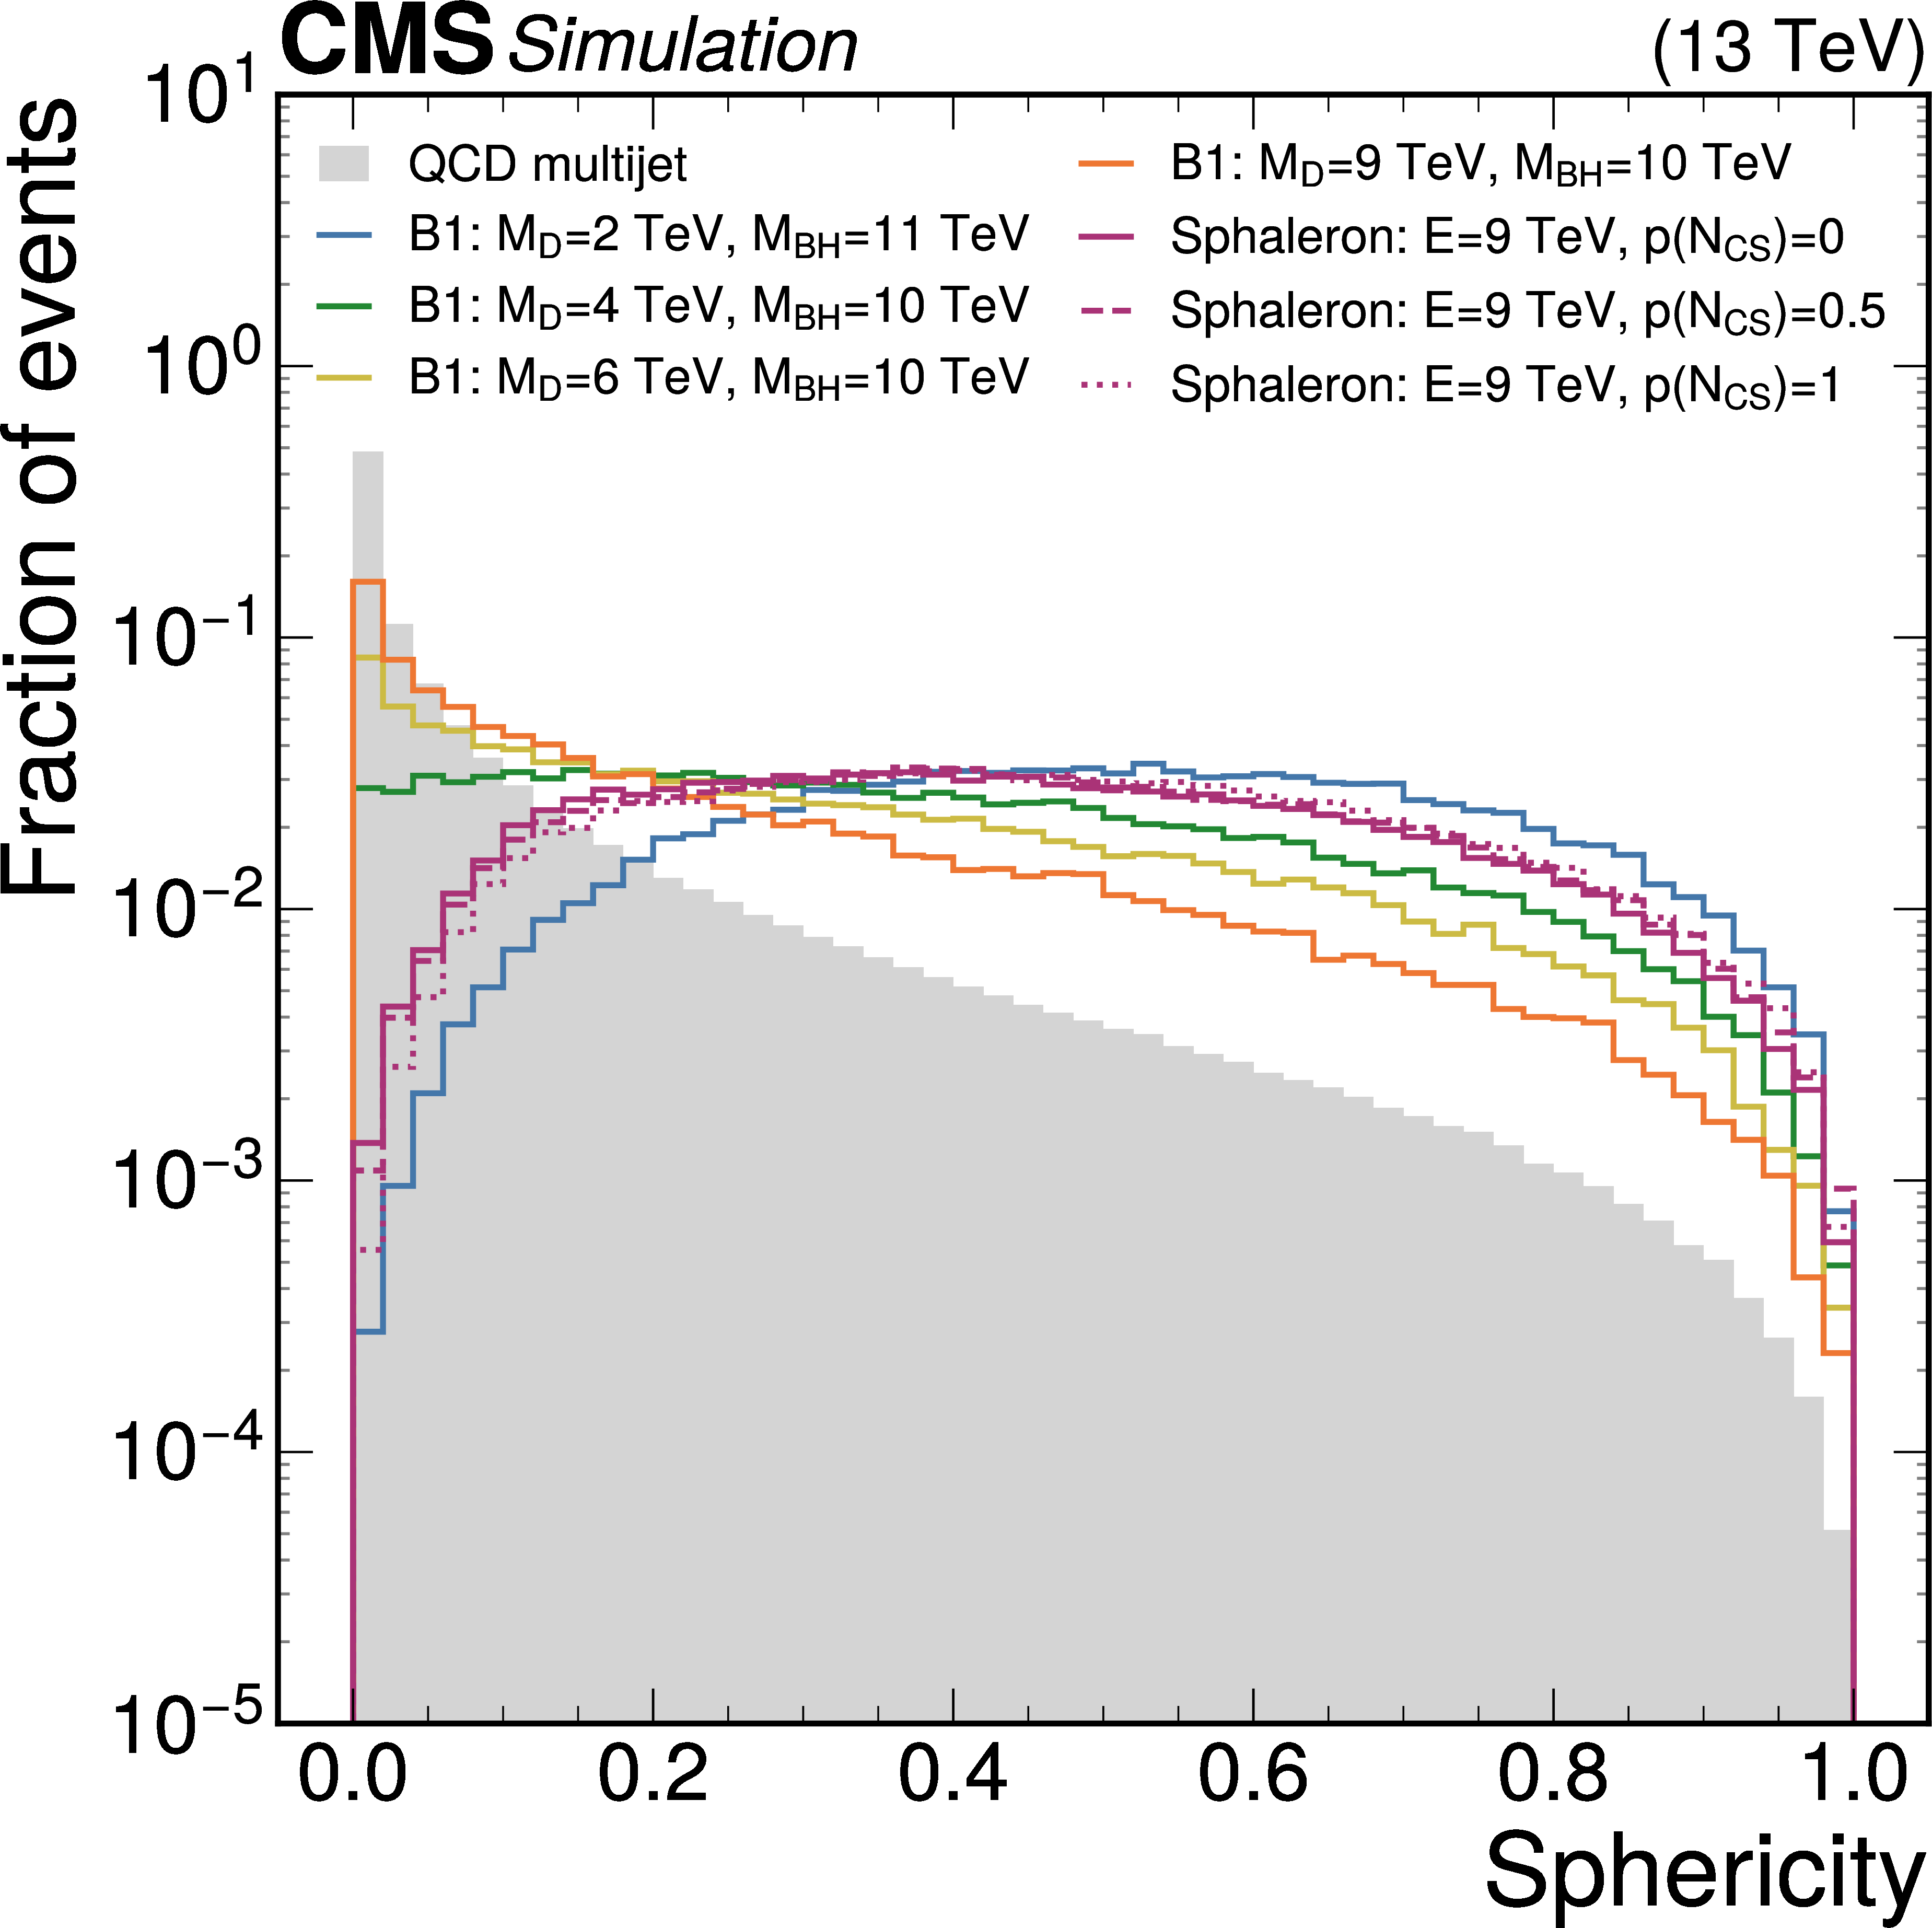
Figure 1-b:
The $ S_\text{T} $ (left) and sphericity (right) distributions for various BH (with $ n = $ 2) and sphaleron signal models are plotted along with the corresponding distributions for simulated QCD multijet background events. The distributions are normalized to unit area. |
png pdf |
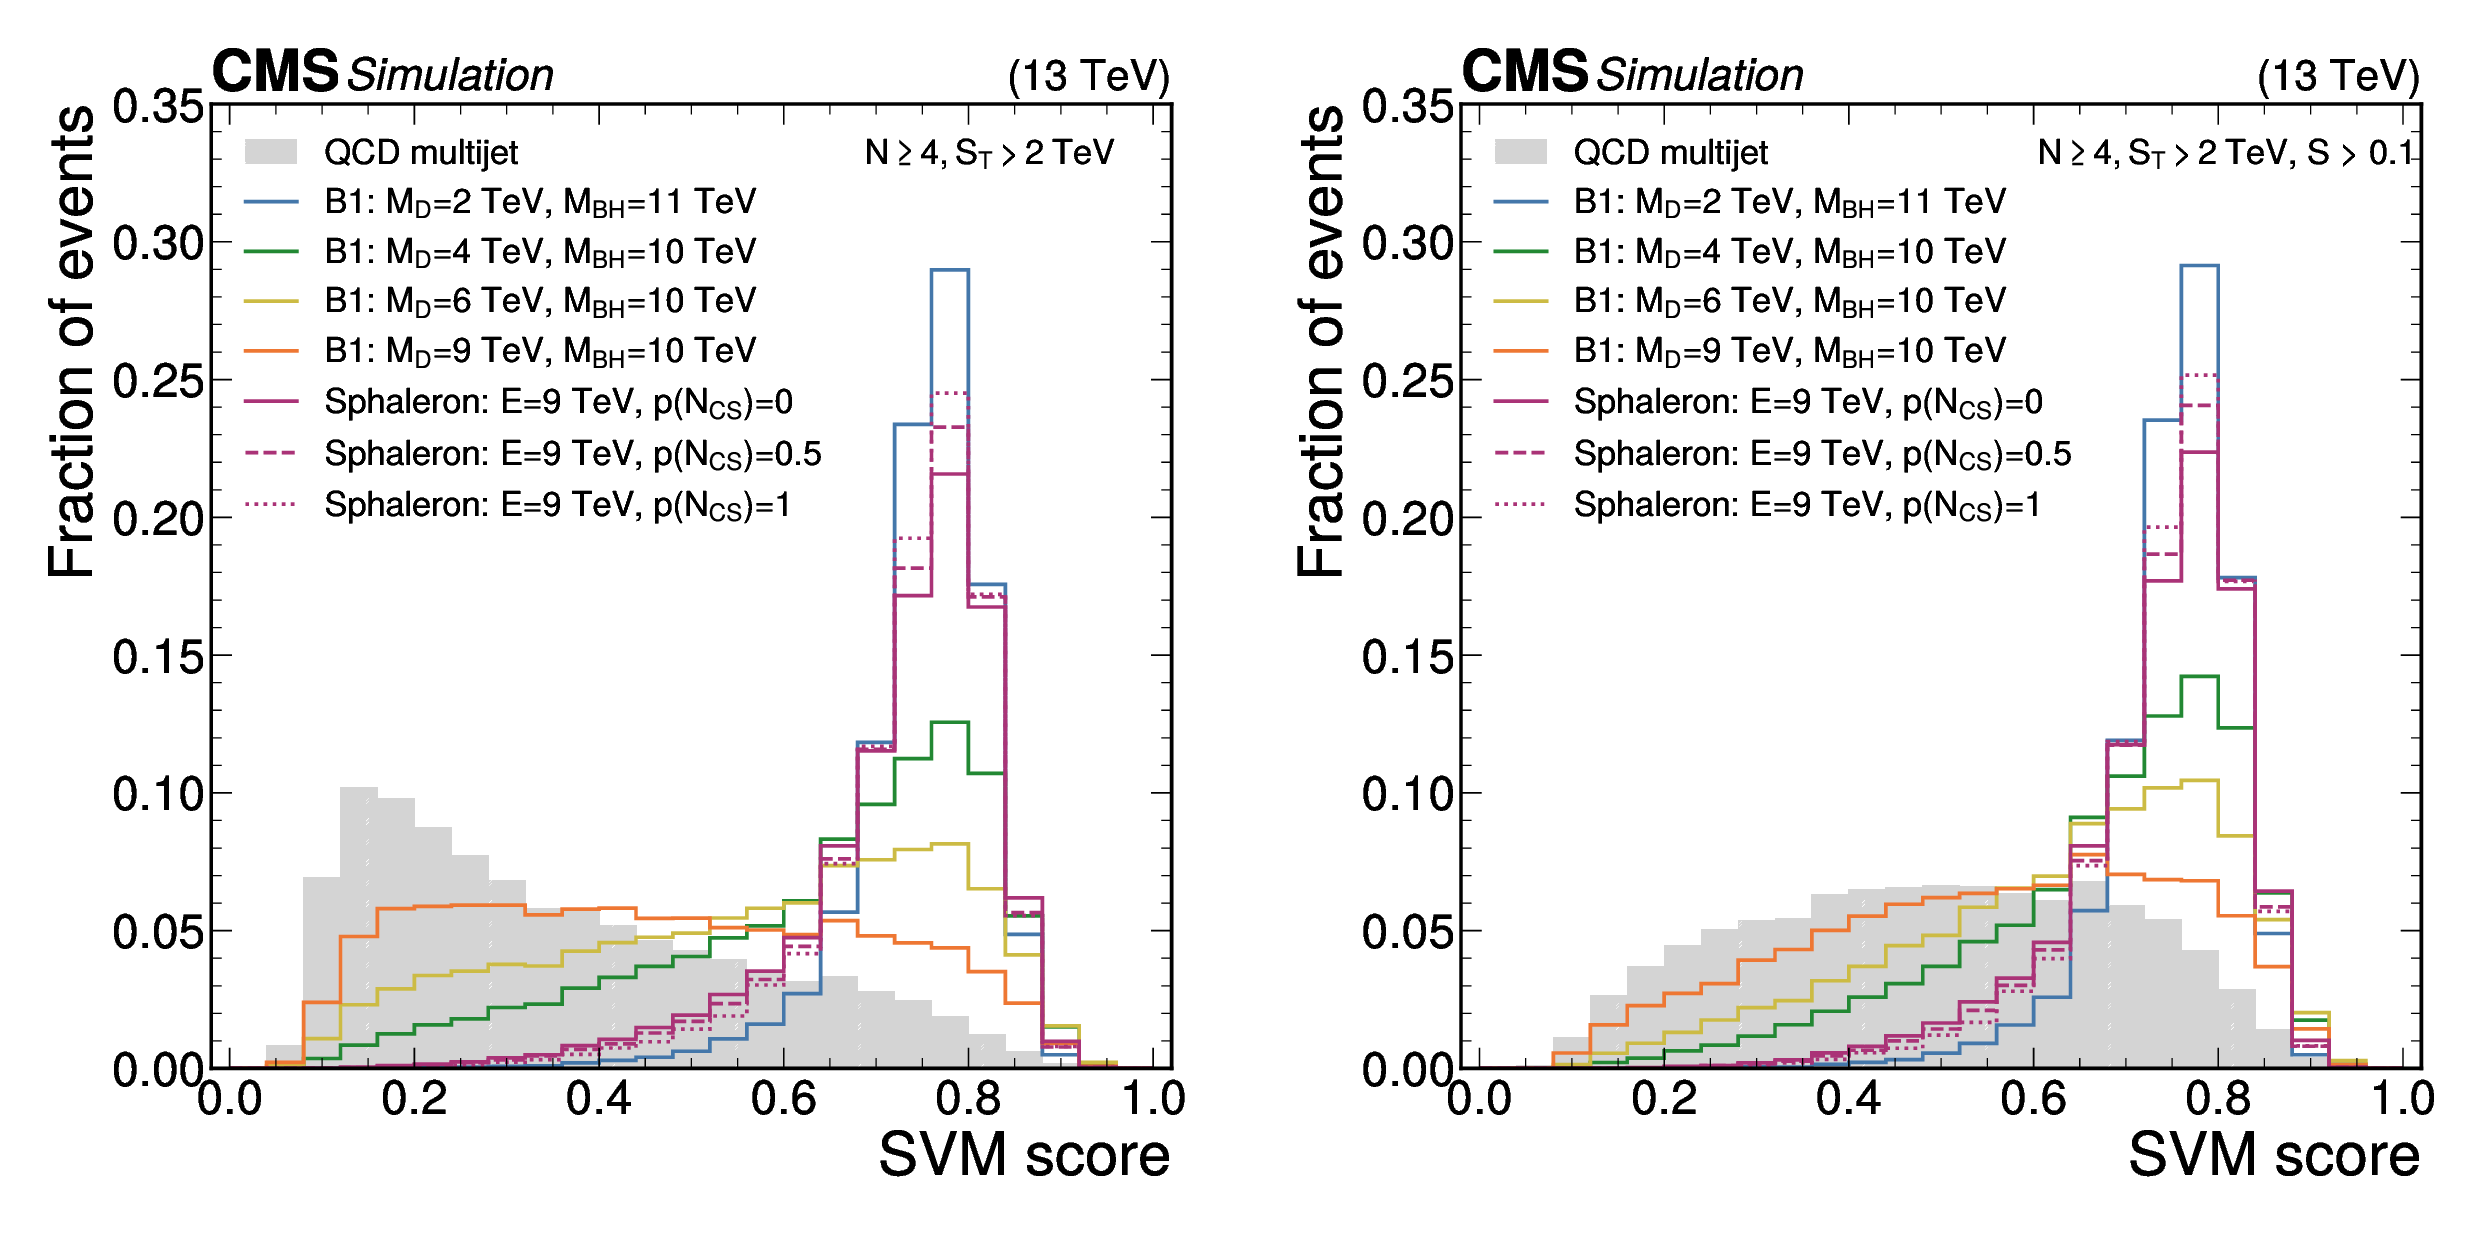
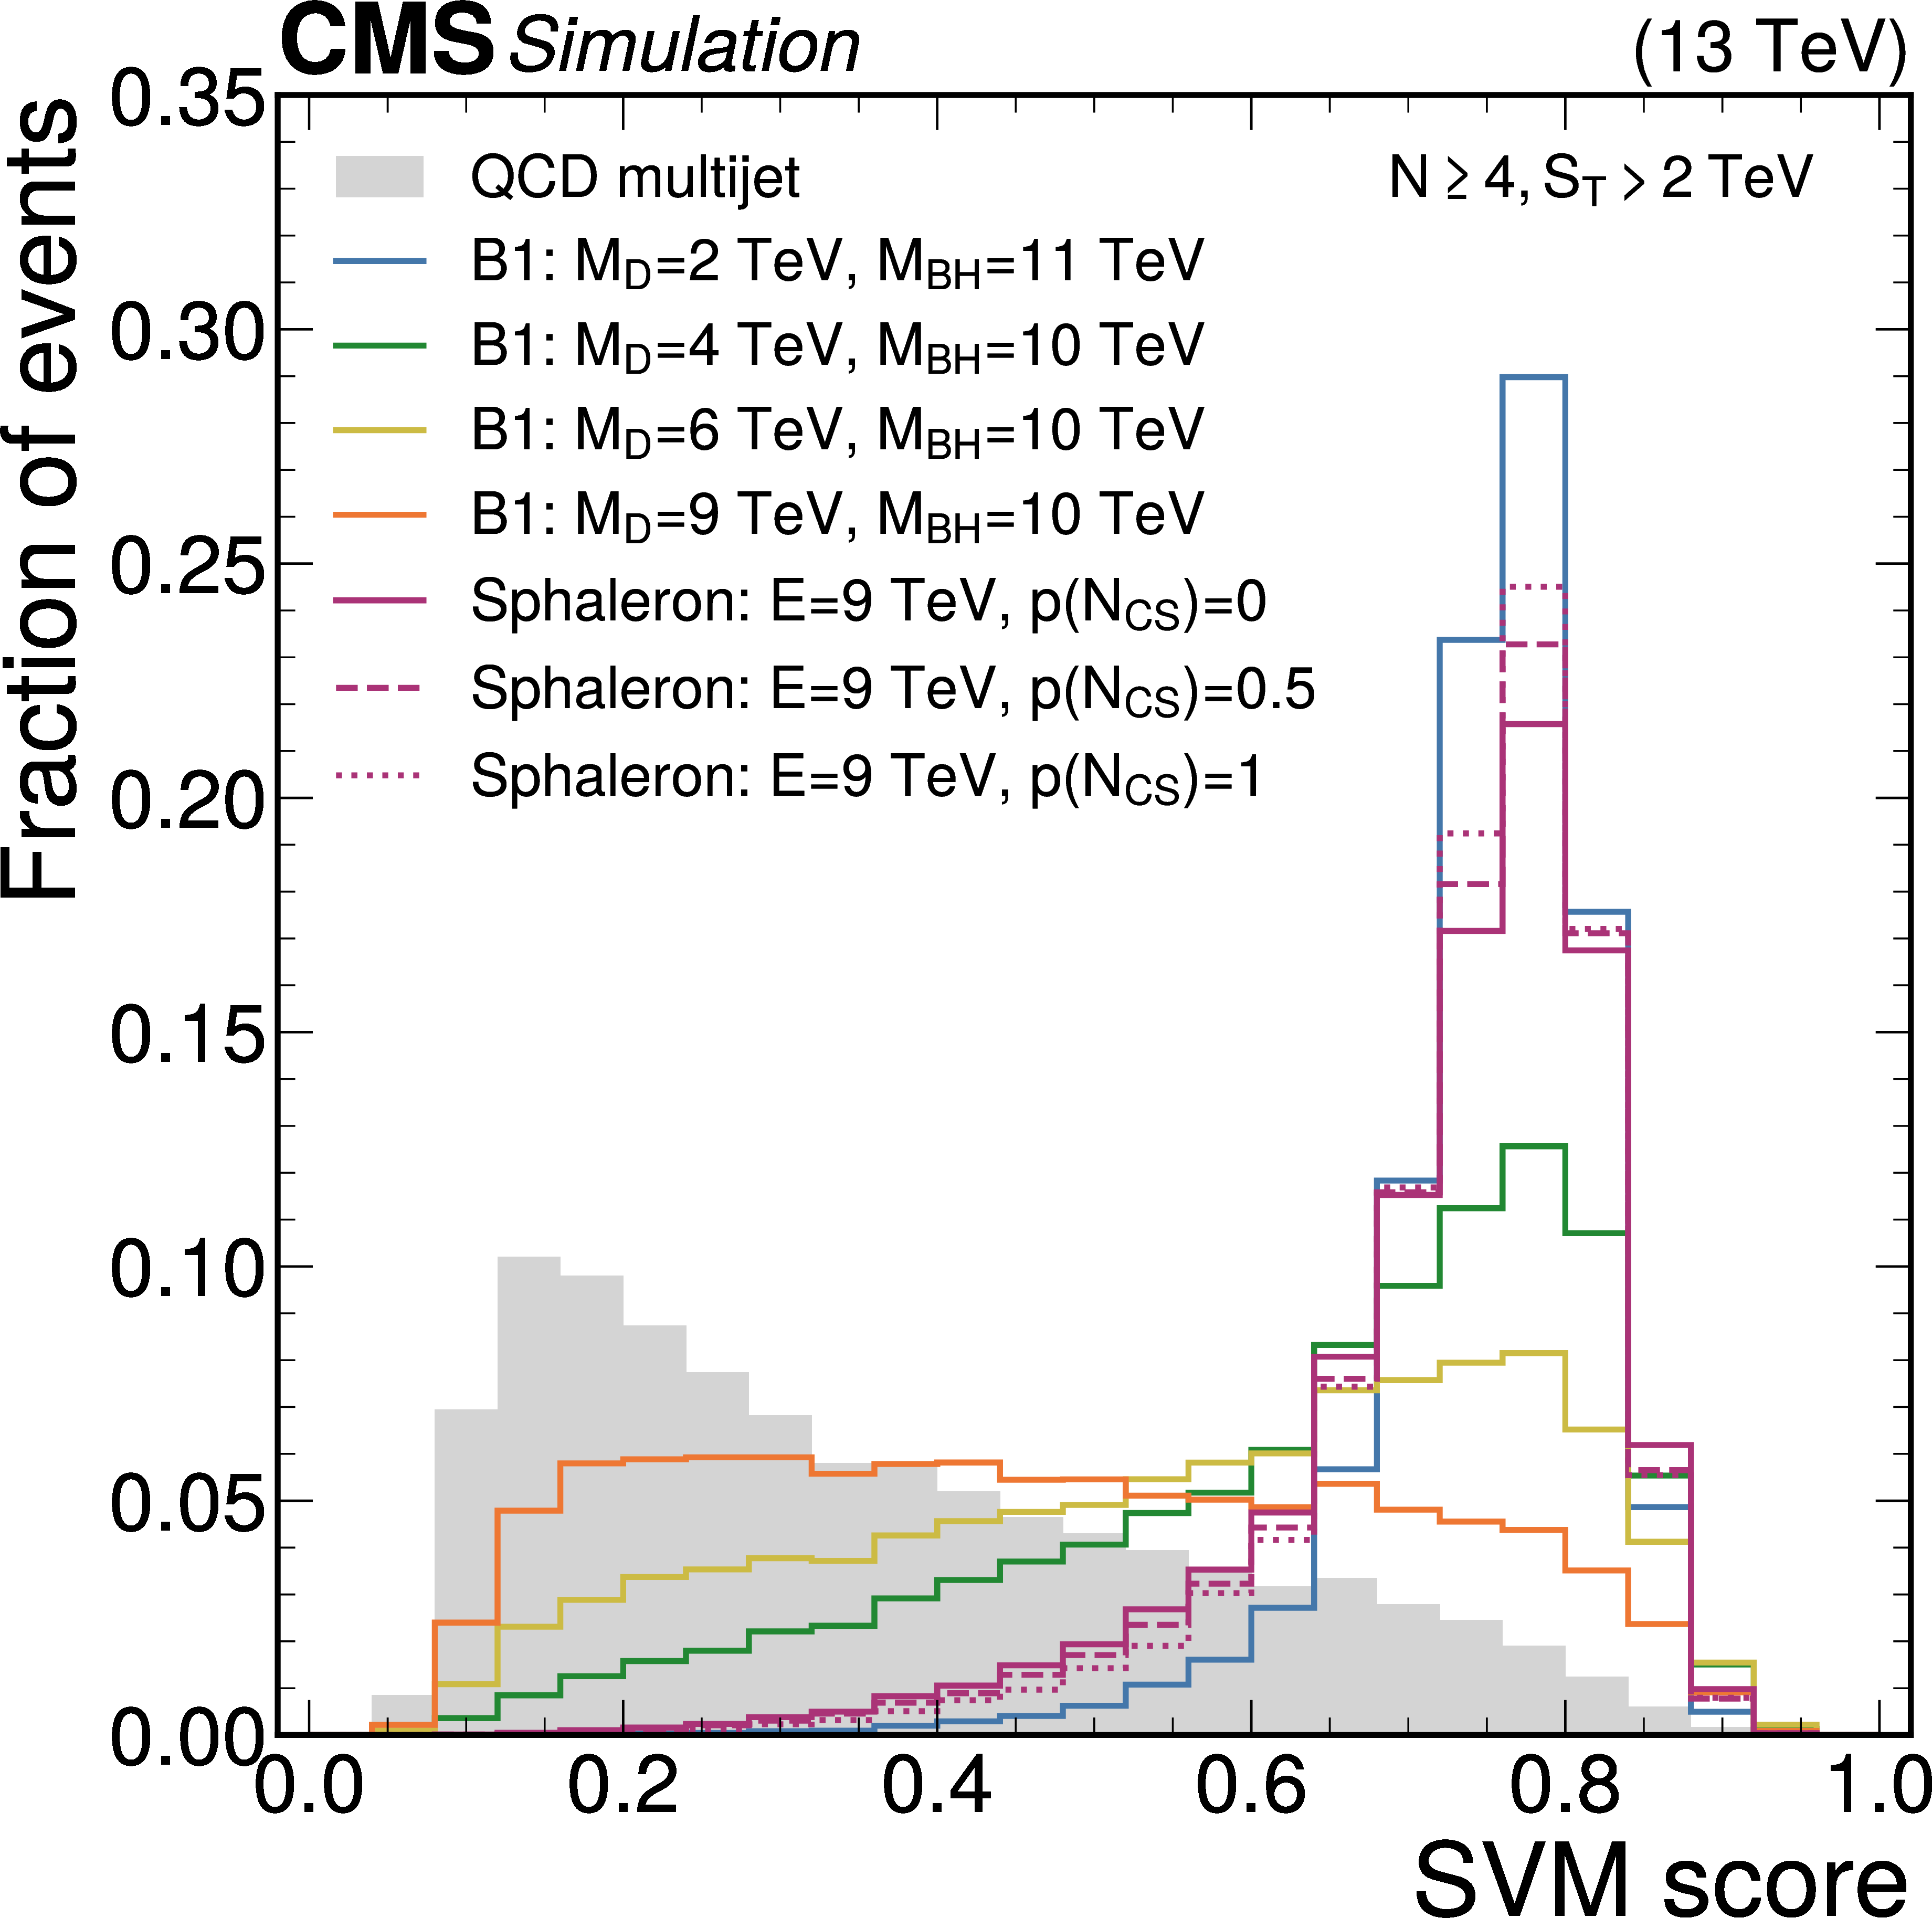
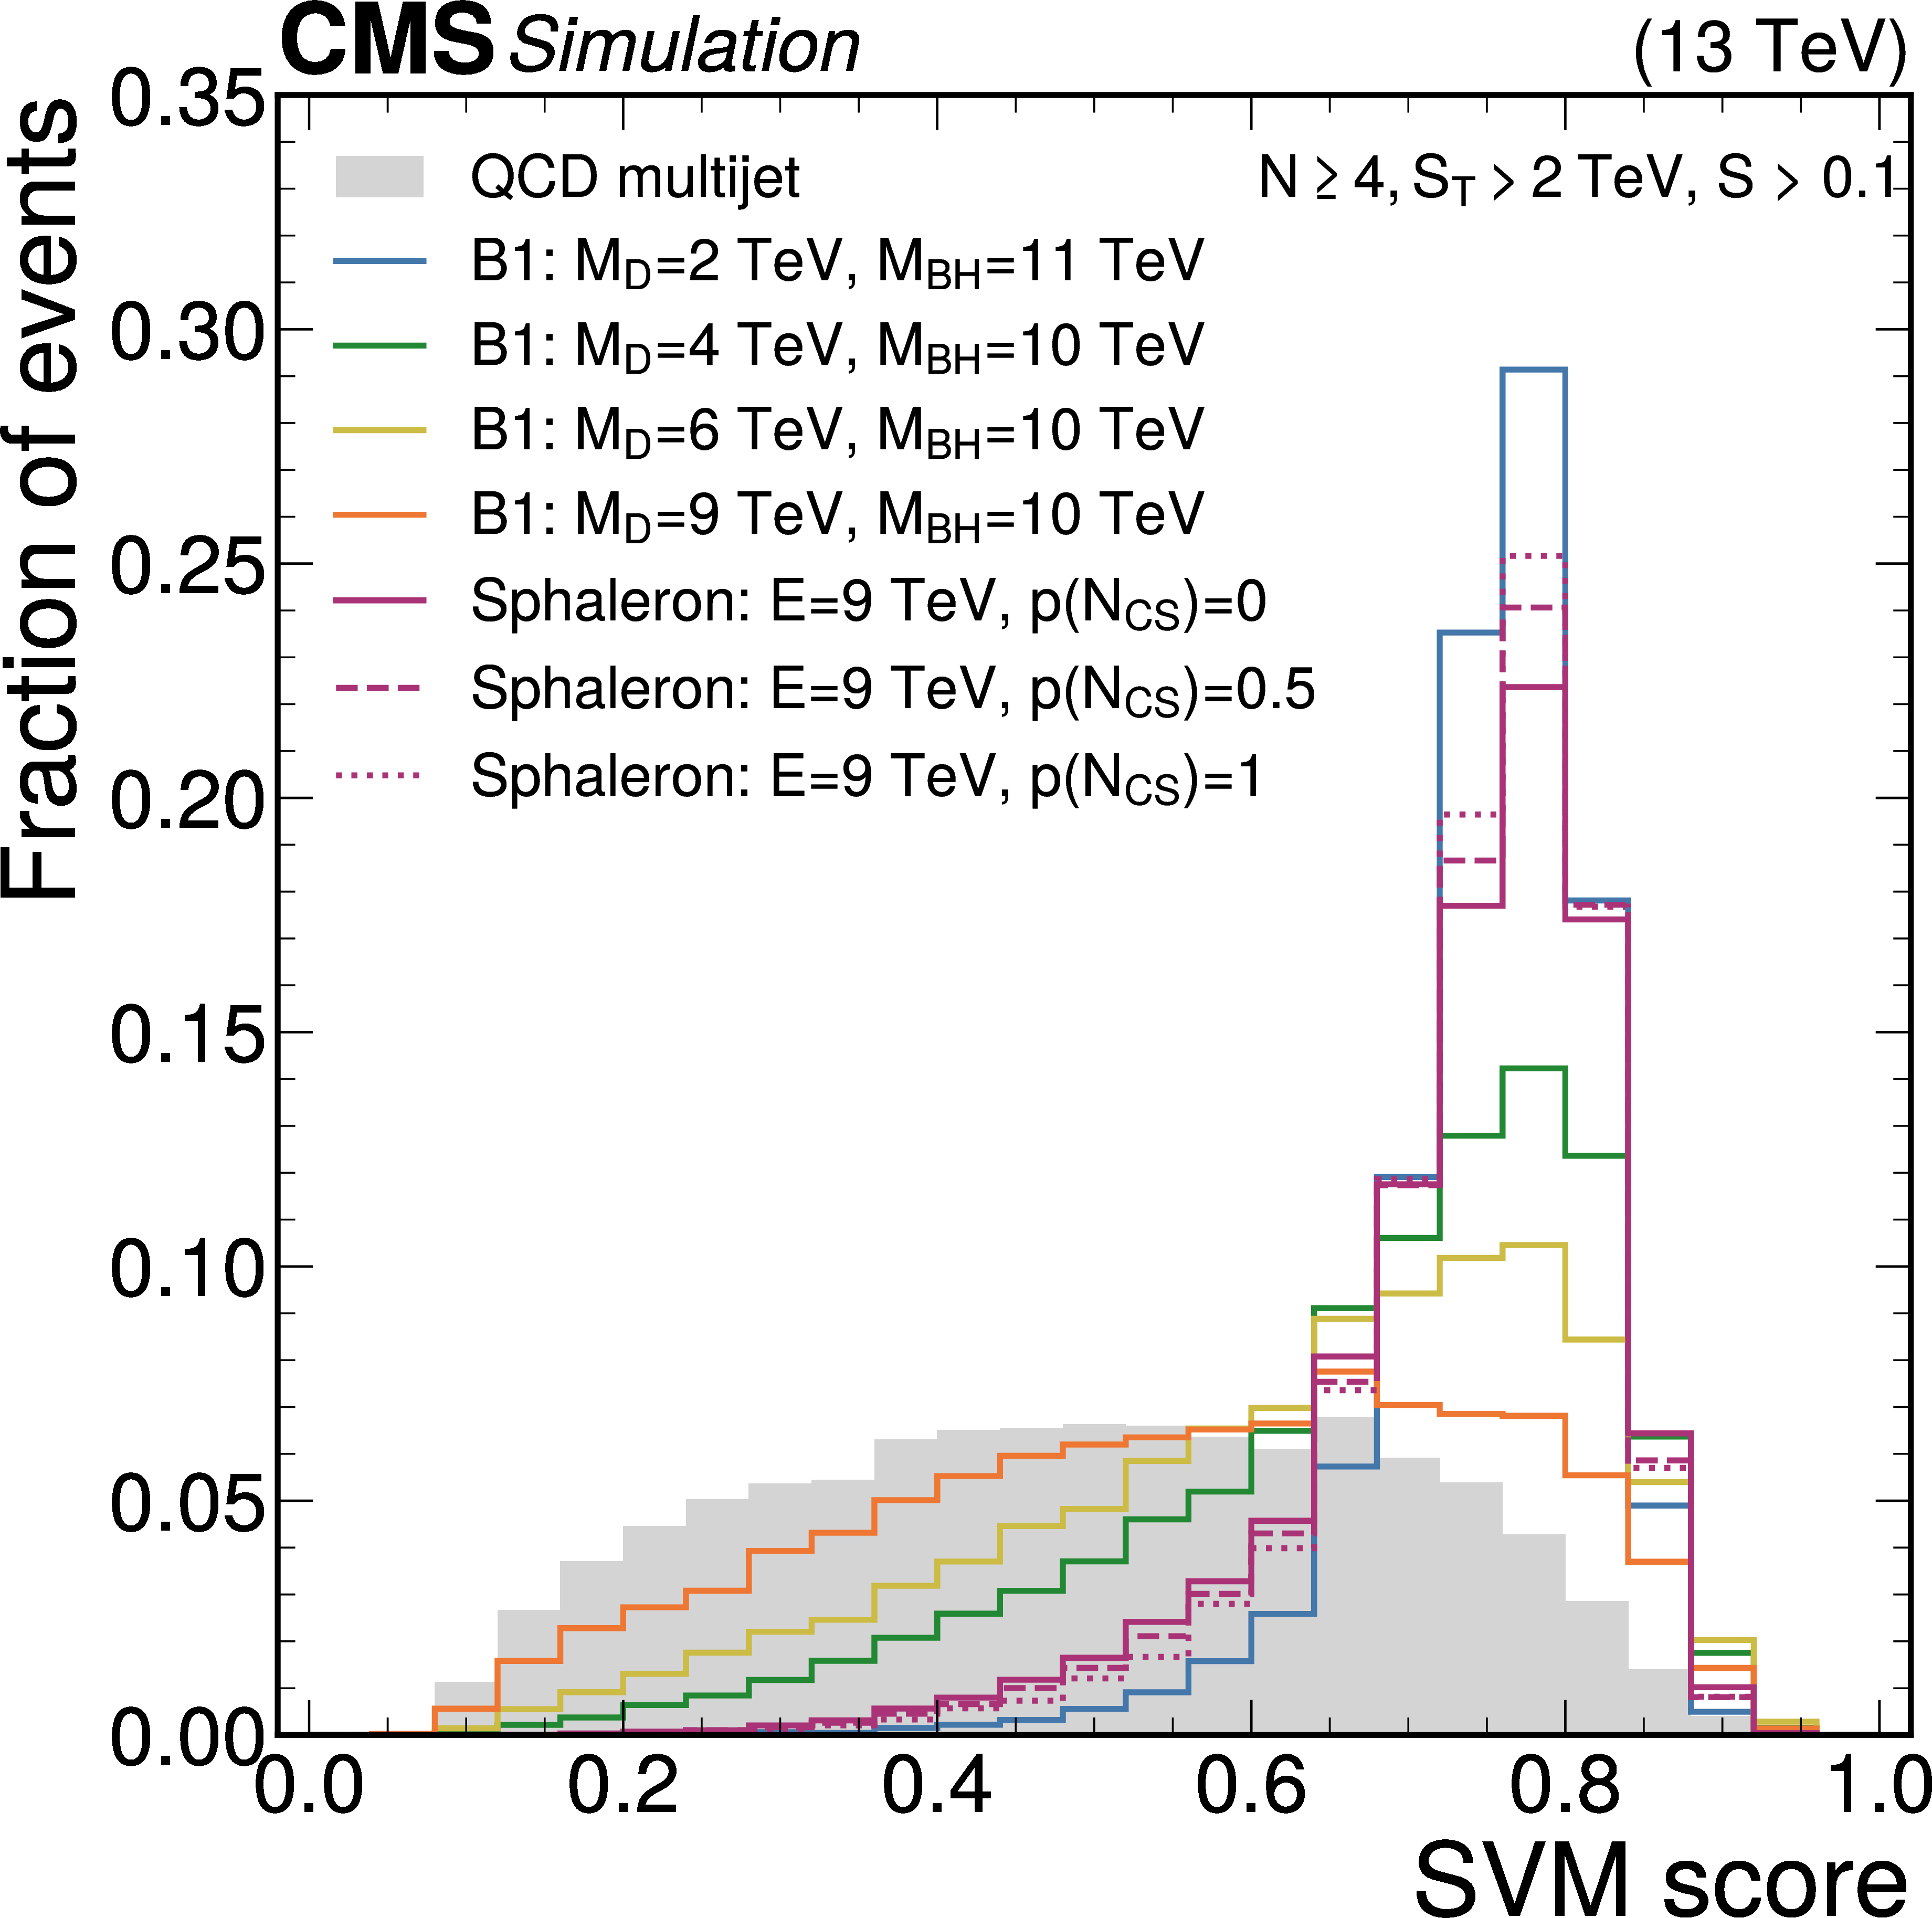
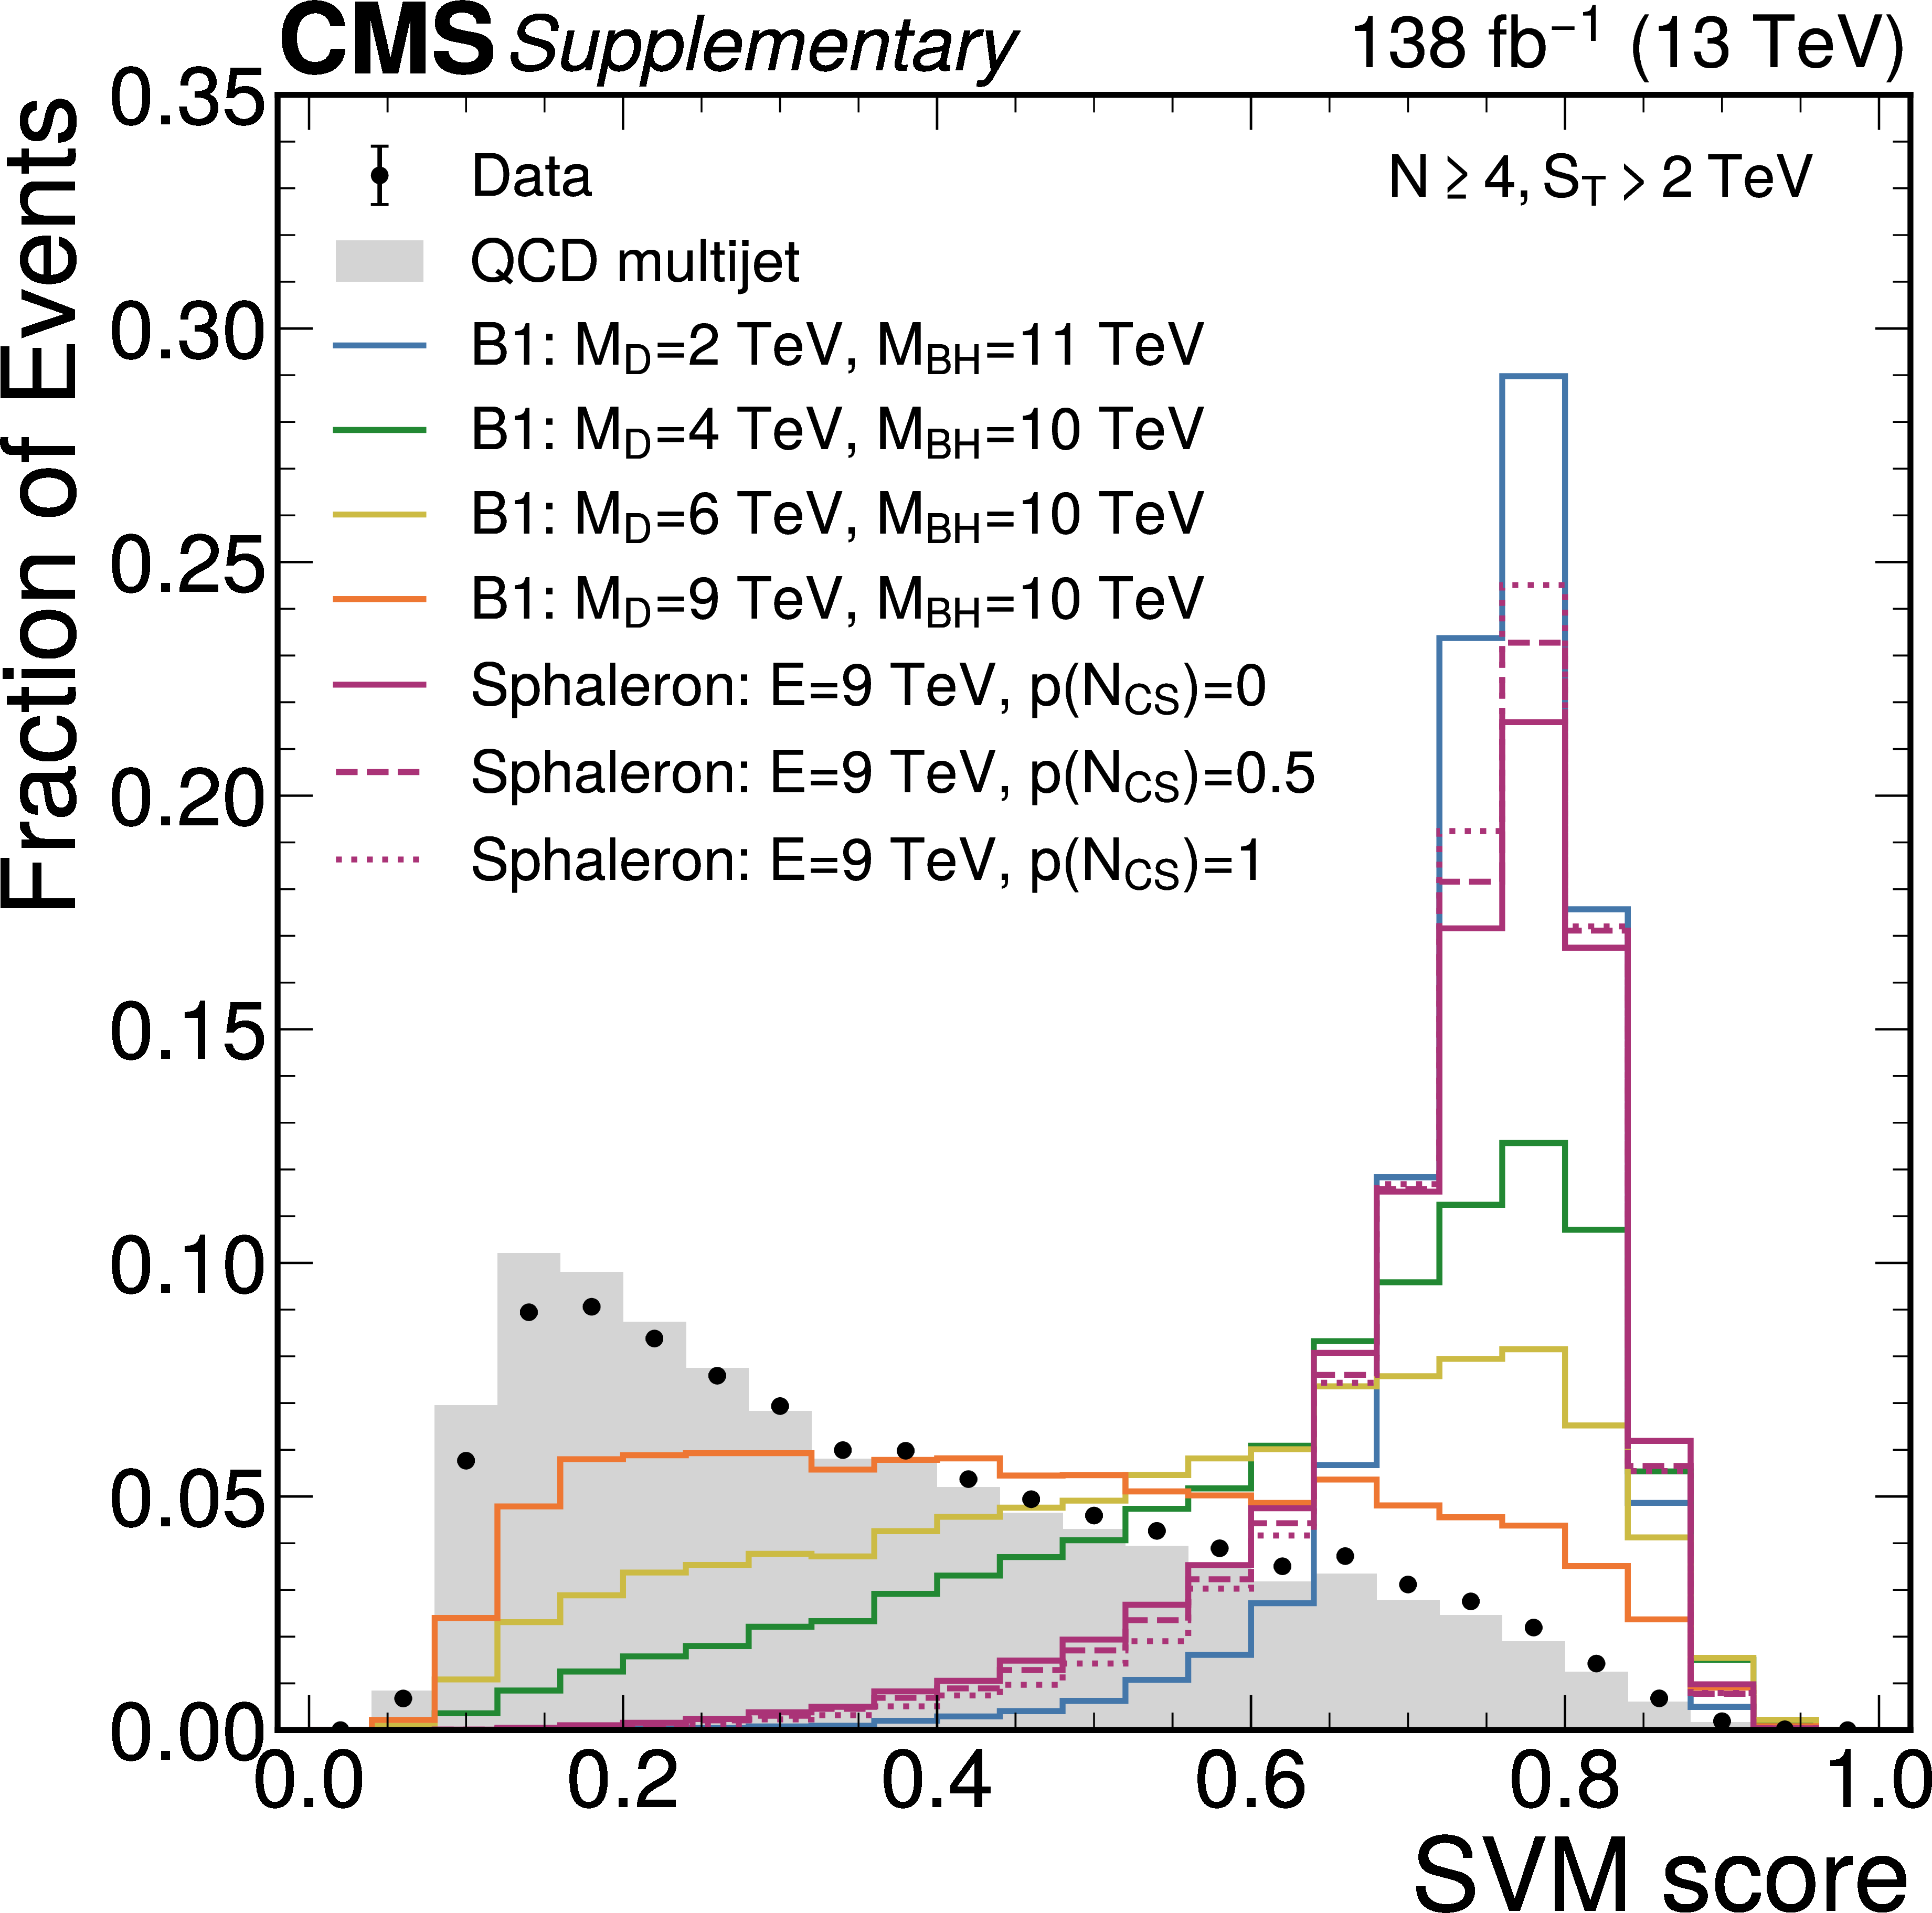
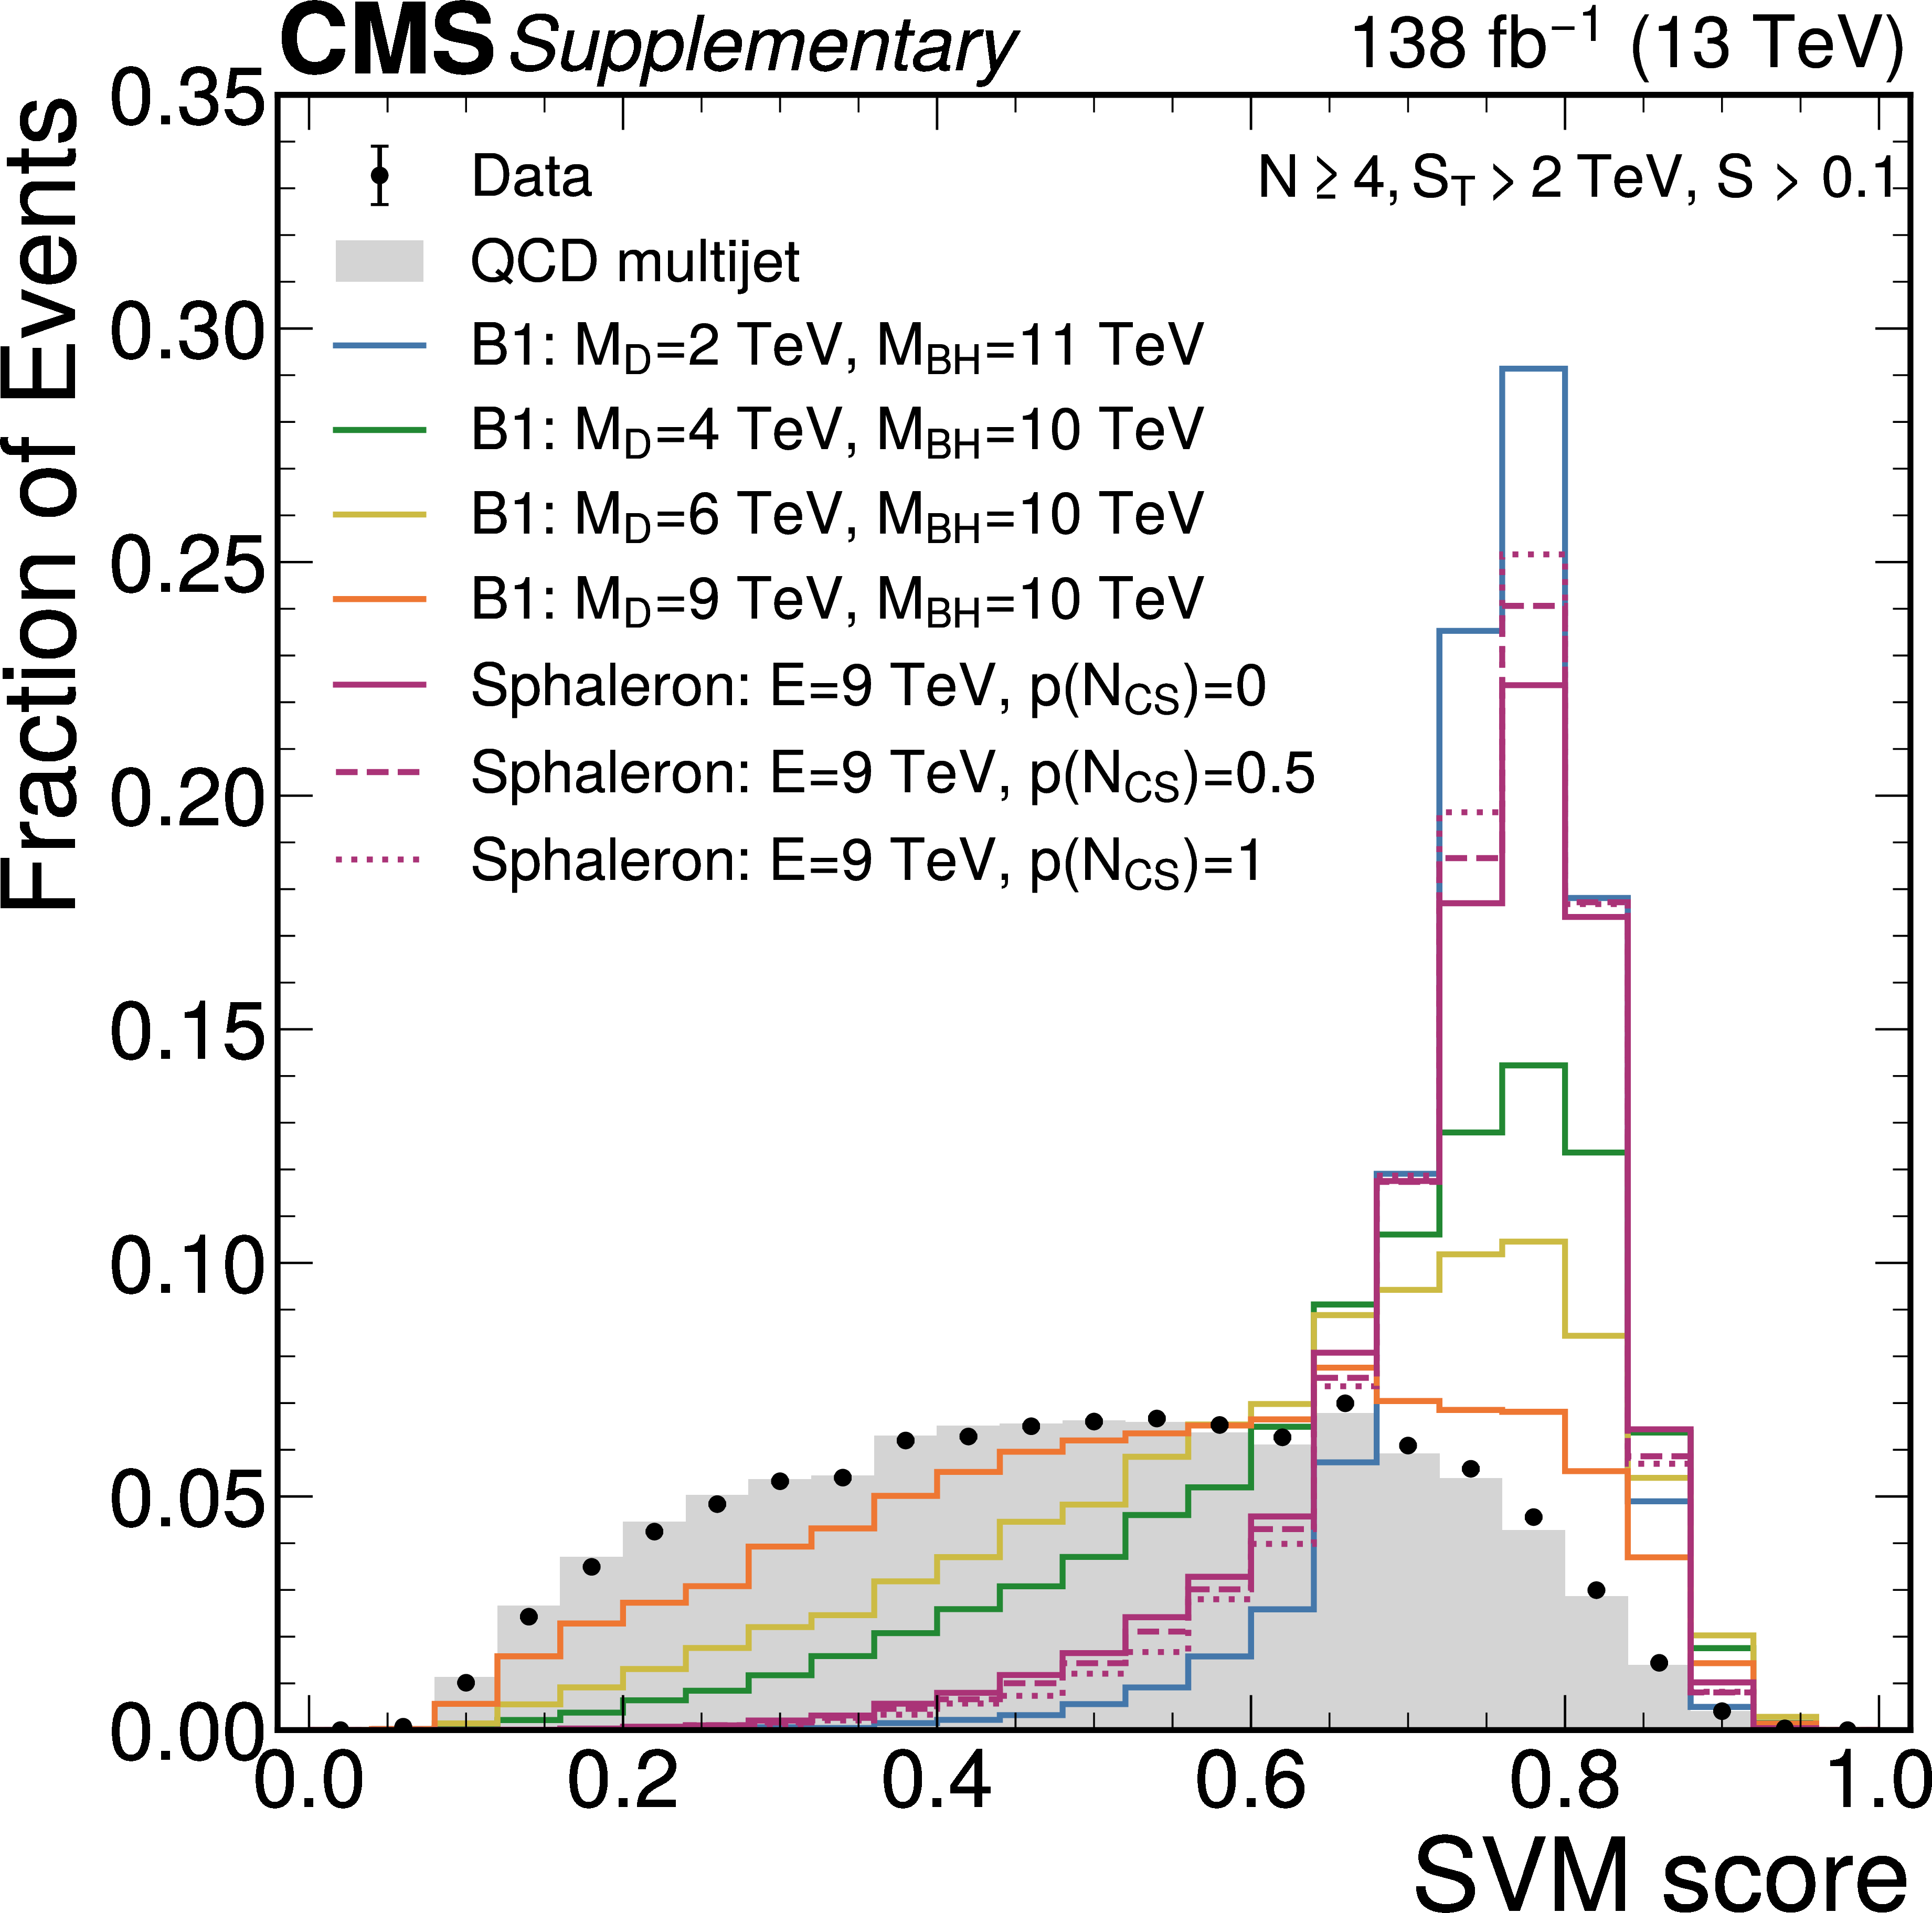
Figure 2:
The SVM score distributions for simulated QCD multijets, and selected BH (with $ n = $ 2) and sphaleron models, before (left) and after (right) the sphericity requirement. The distributions are normalized to unit area. |
png pdf |
Figure 2-a:
The SVM score distributions for simulated QCD multijets, and selected BH (with $ n = $ 2) and sphaleron models, before (left) and after (right) the sphericity requirement. The distributions are normalized to unit area. |
png pdf |
Figure 2-b:
The SVM score distributions for simulated QCD multijets, and selected BH (with $ n = $ 2) and sphaleron models, before (left) and after (right) the sphericity requirement. The distributions are normalized to unit area. |
png pdf |
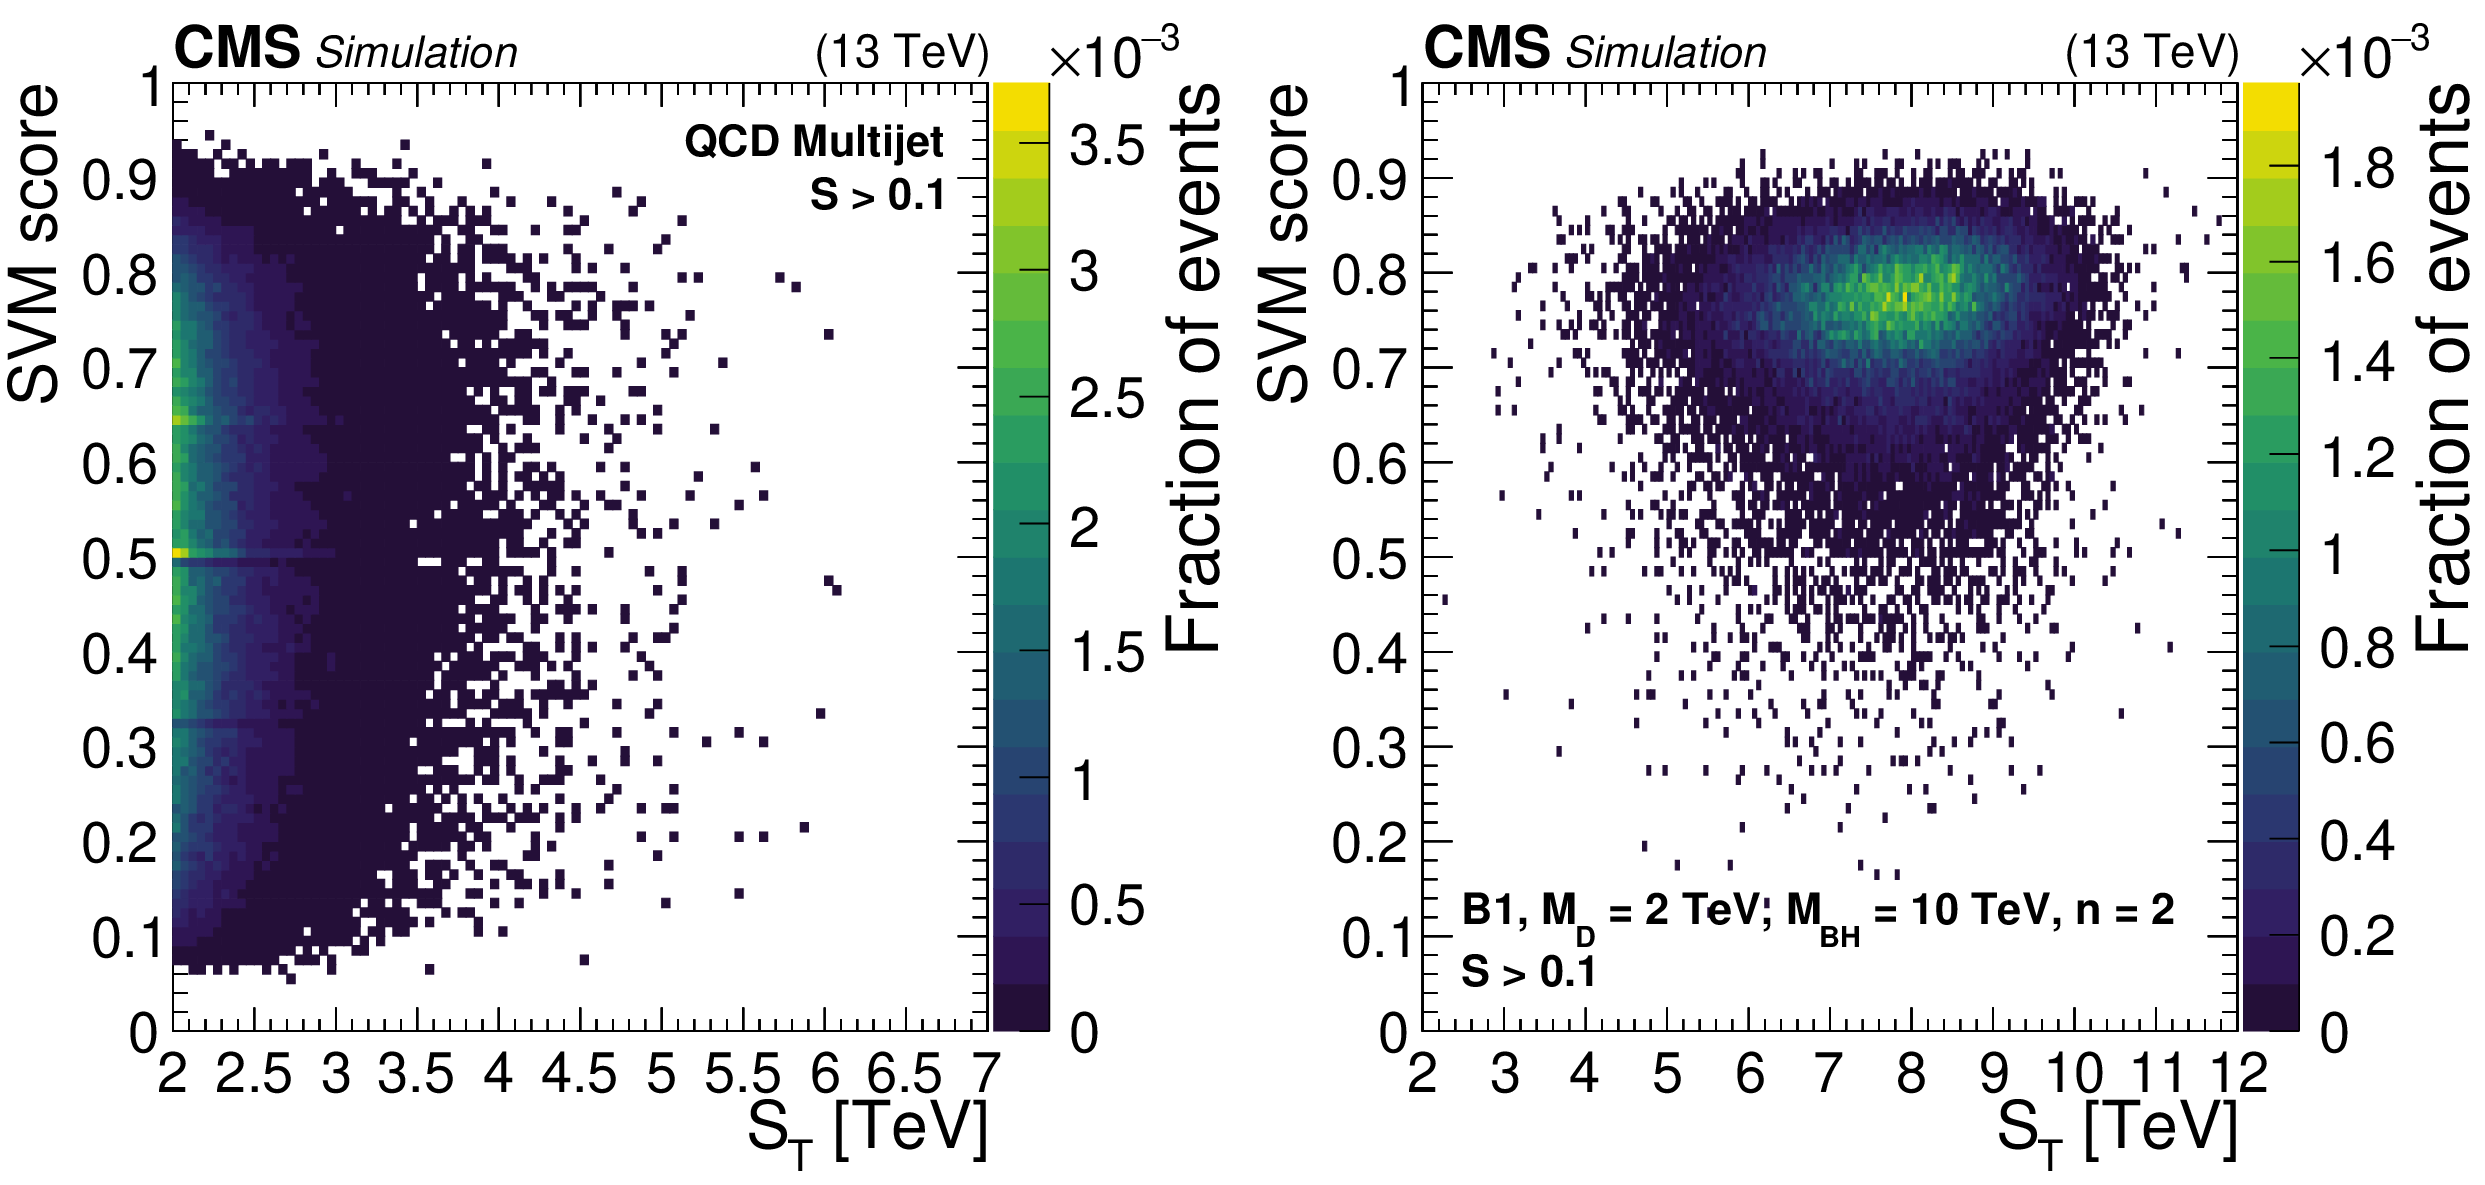
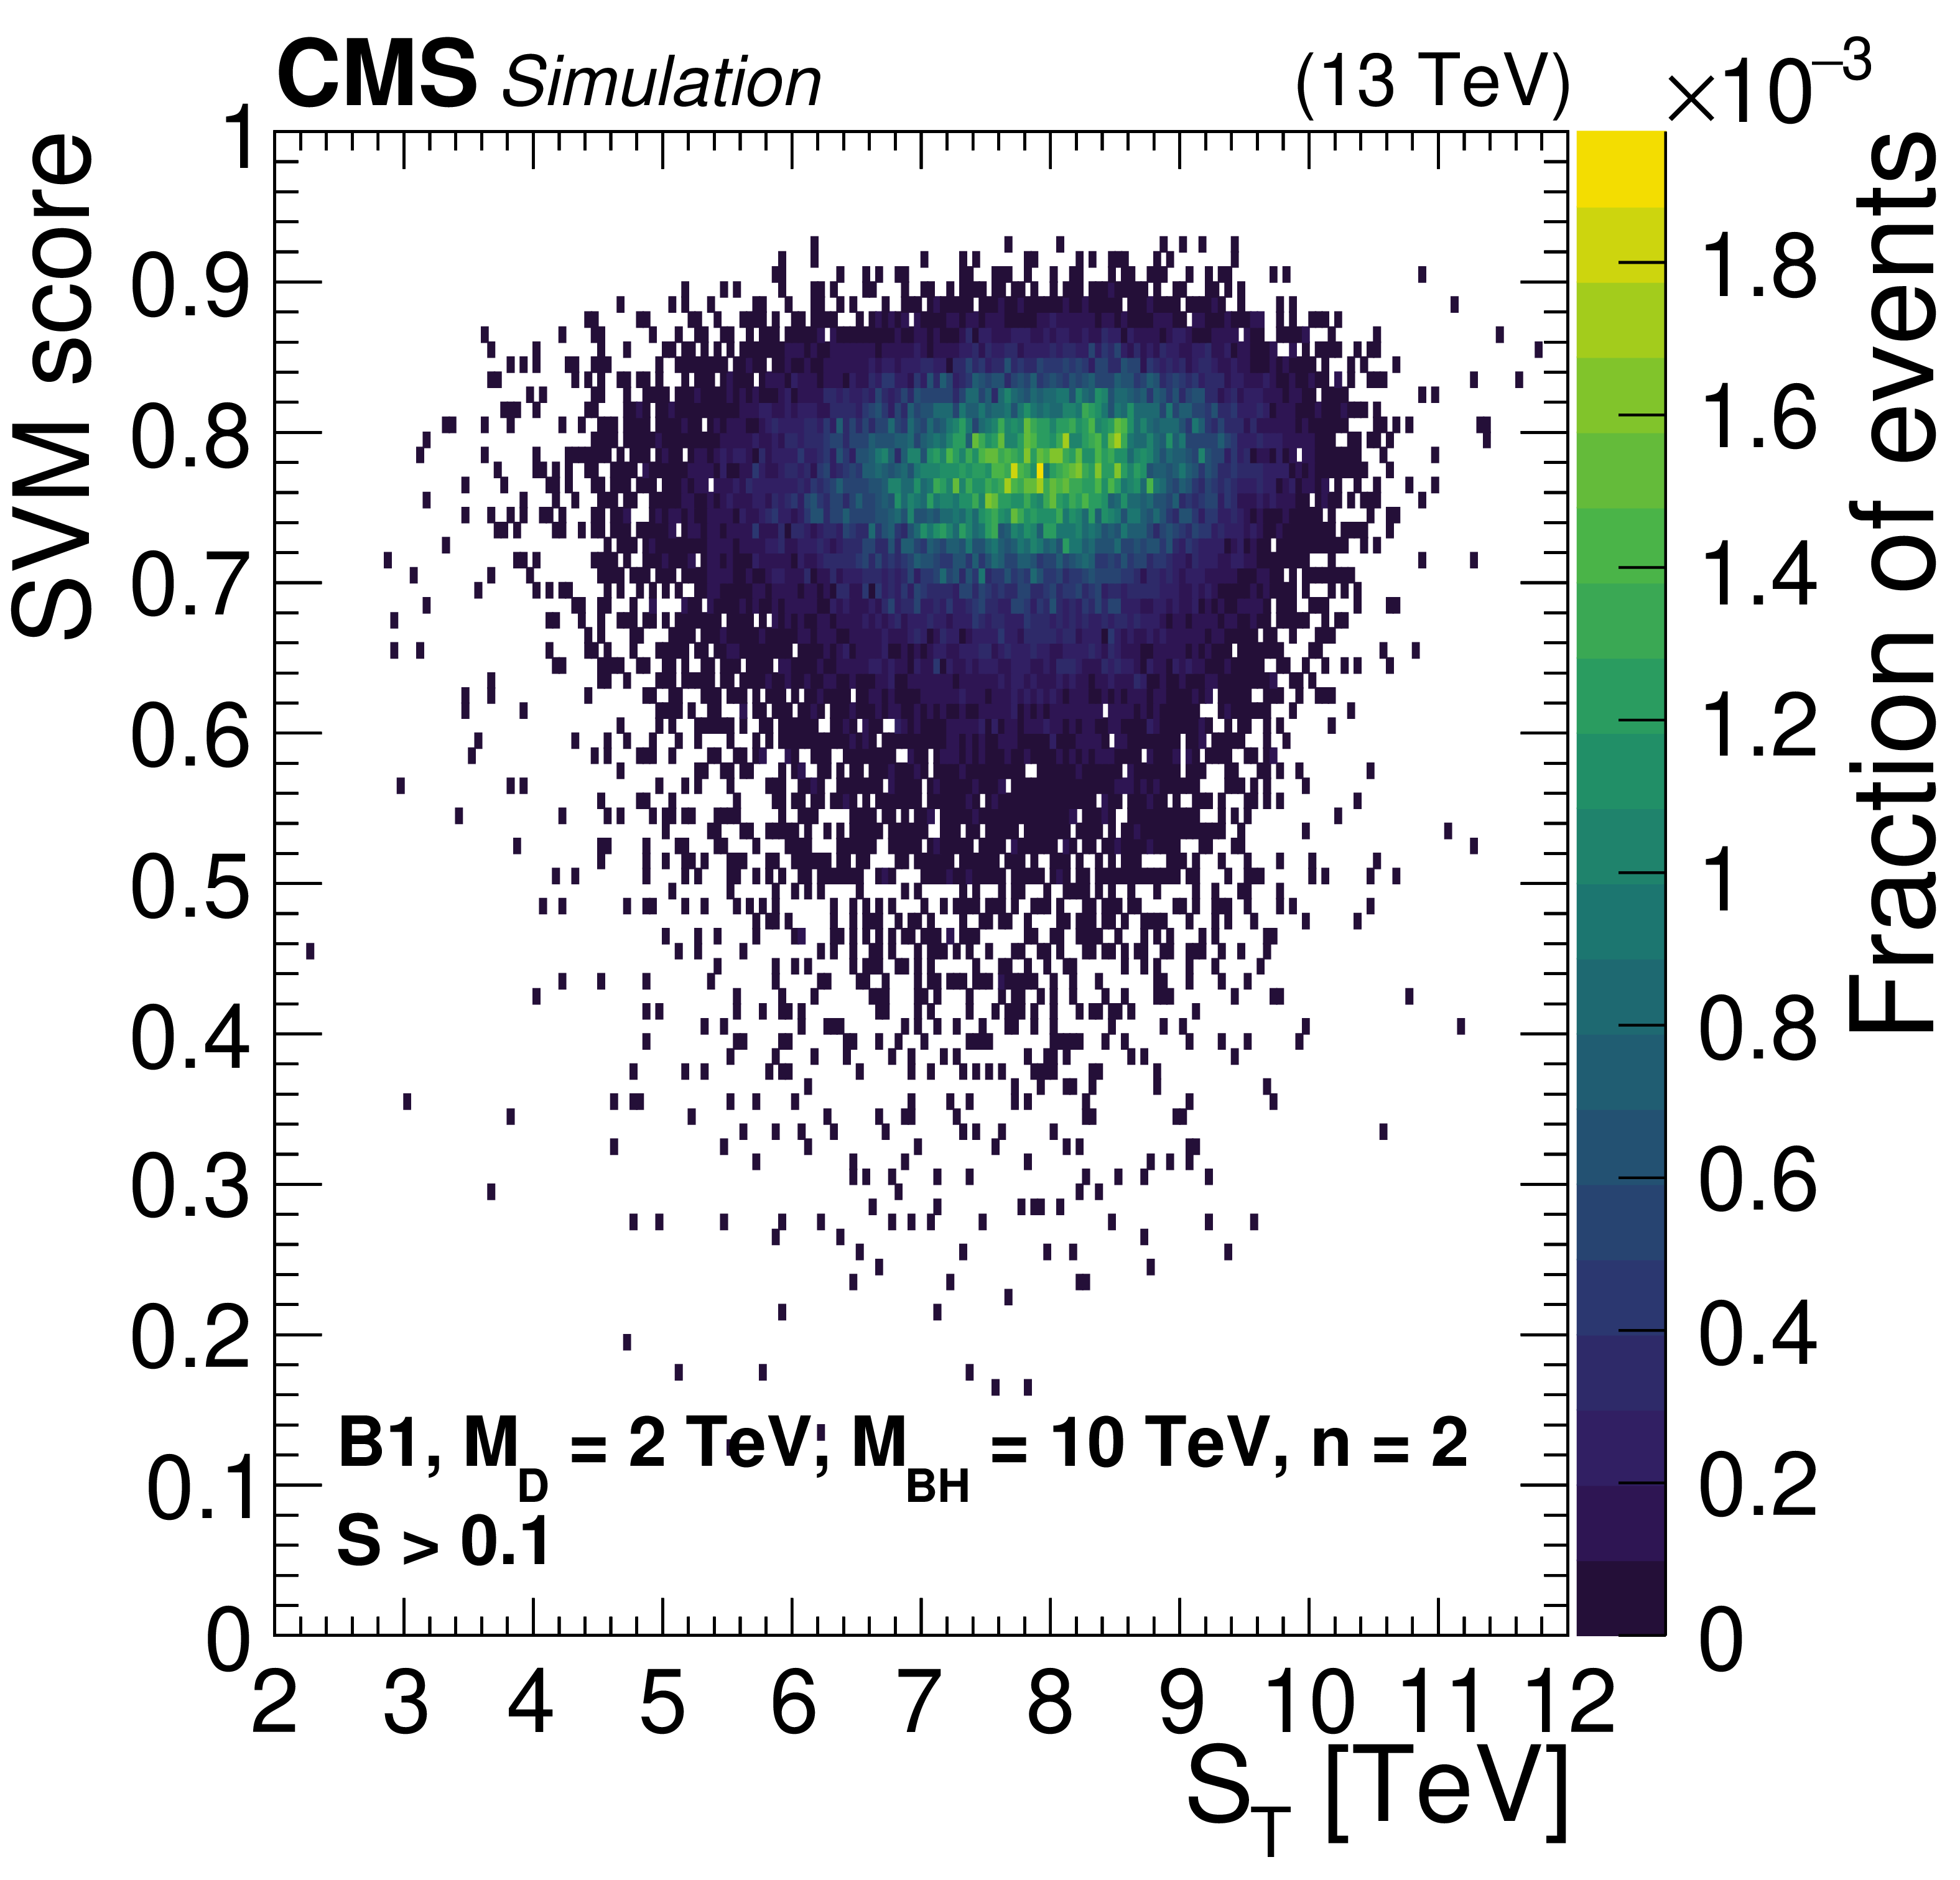
Figure 3:
The SVM score vs. the $ S_\text{T} $ distributions for simulated QCD multijet background (left) and the BH signal model B1 with $ M_\text{D} = $ 2 TeV, $ M_\text{BH} = $ 10 TeV, and $ n = $ 2 (right), after the $ S > $ 0.1 selection. |
png pdf |
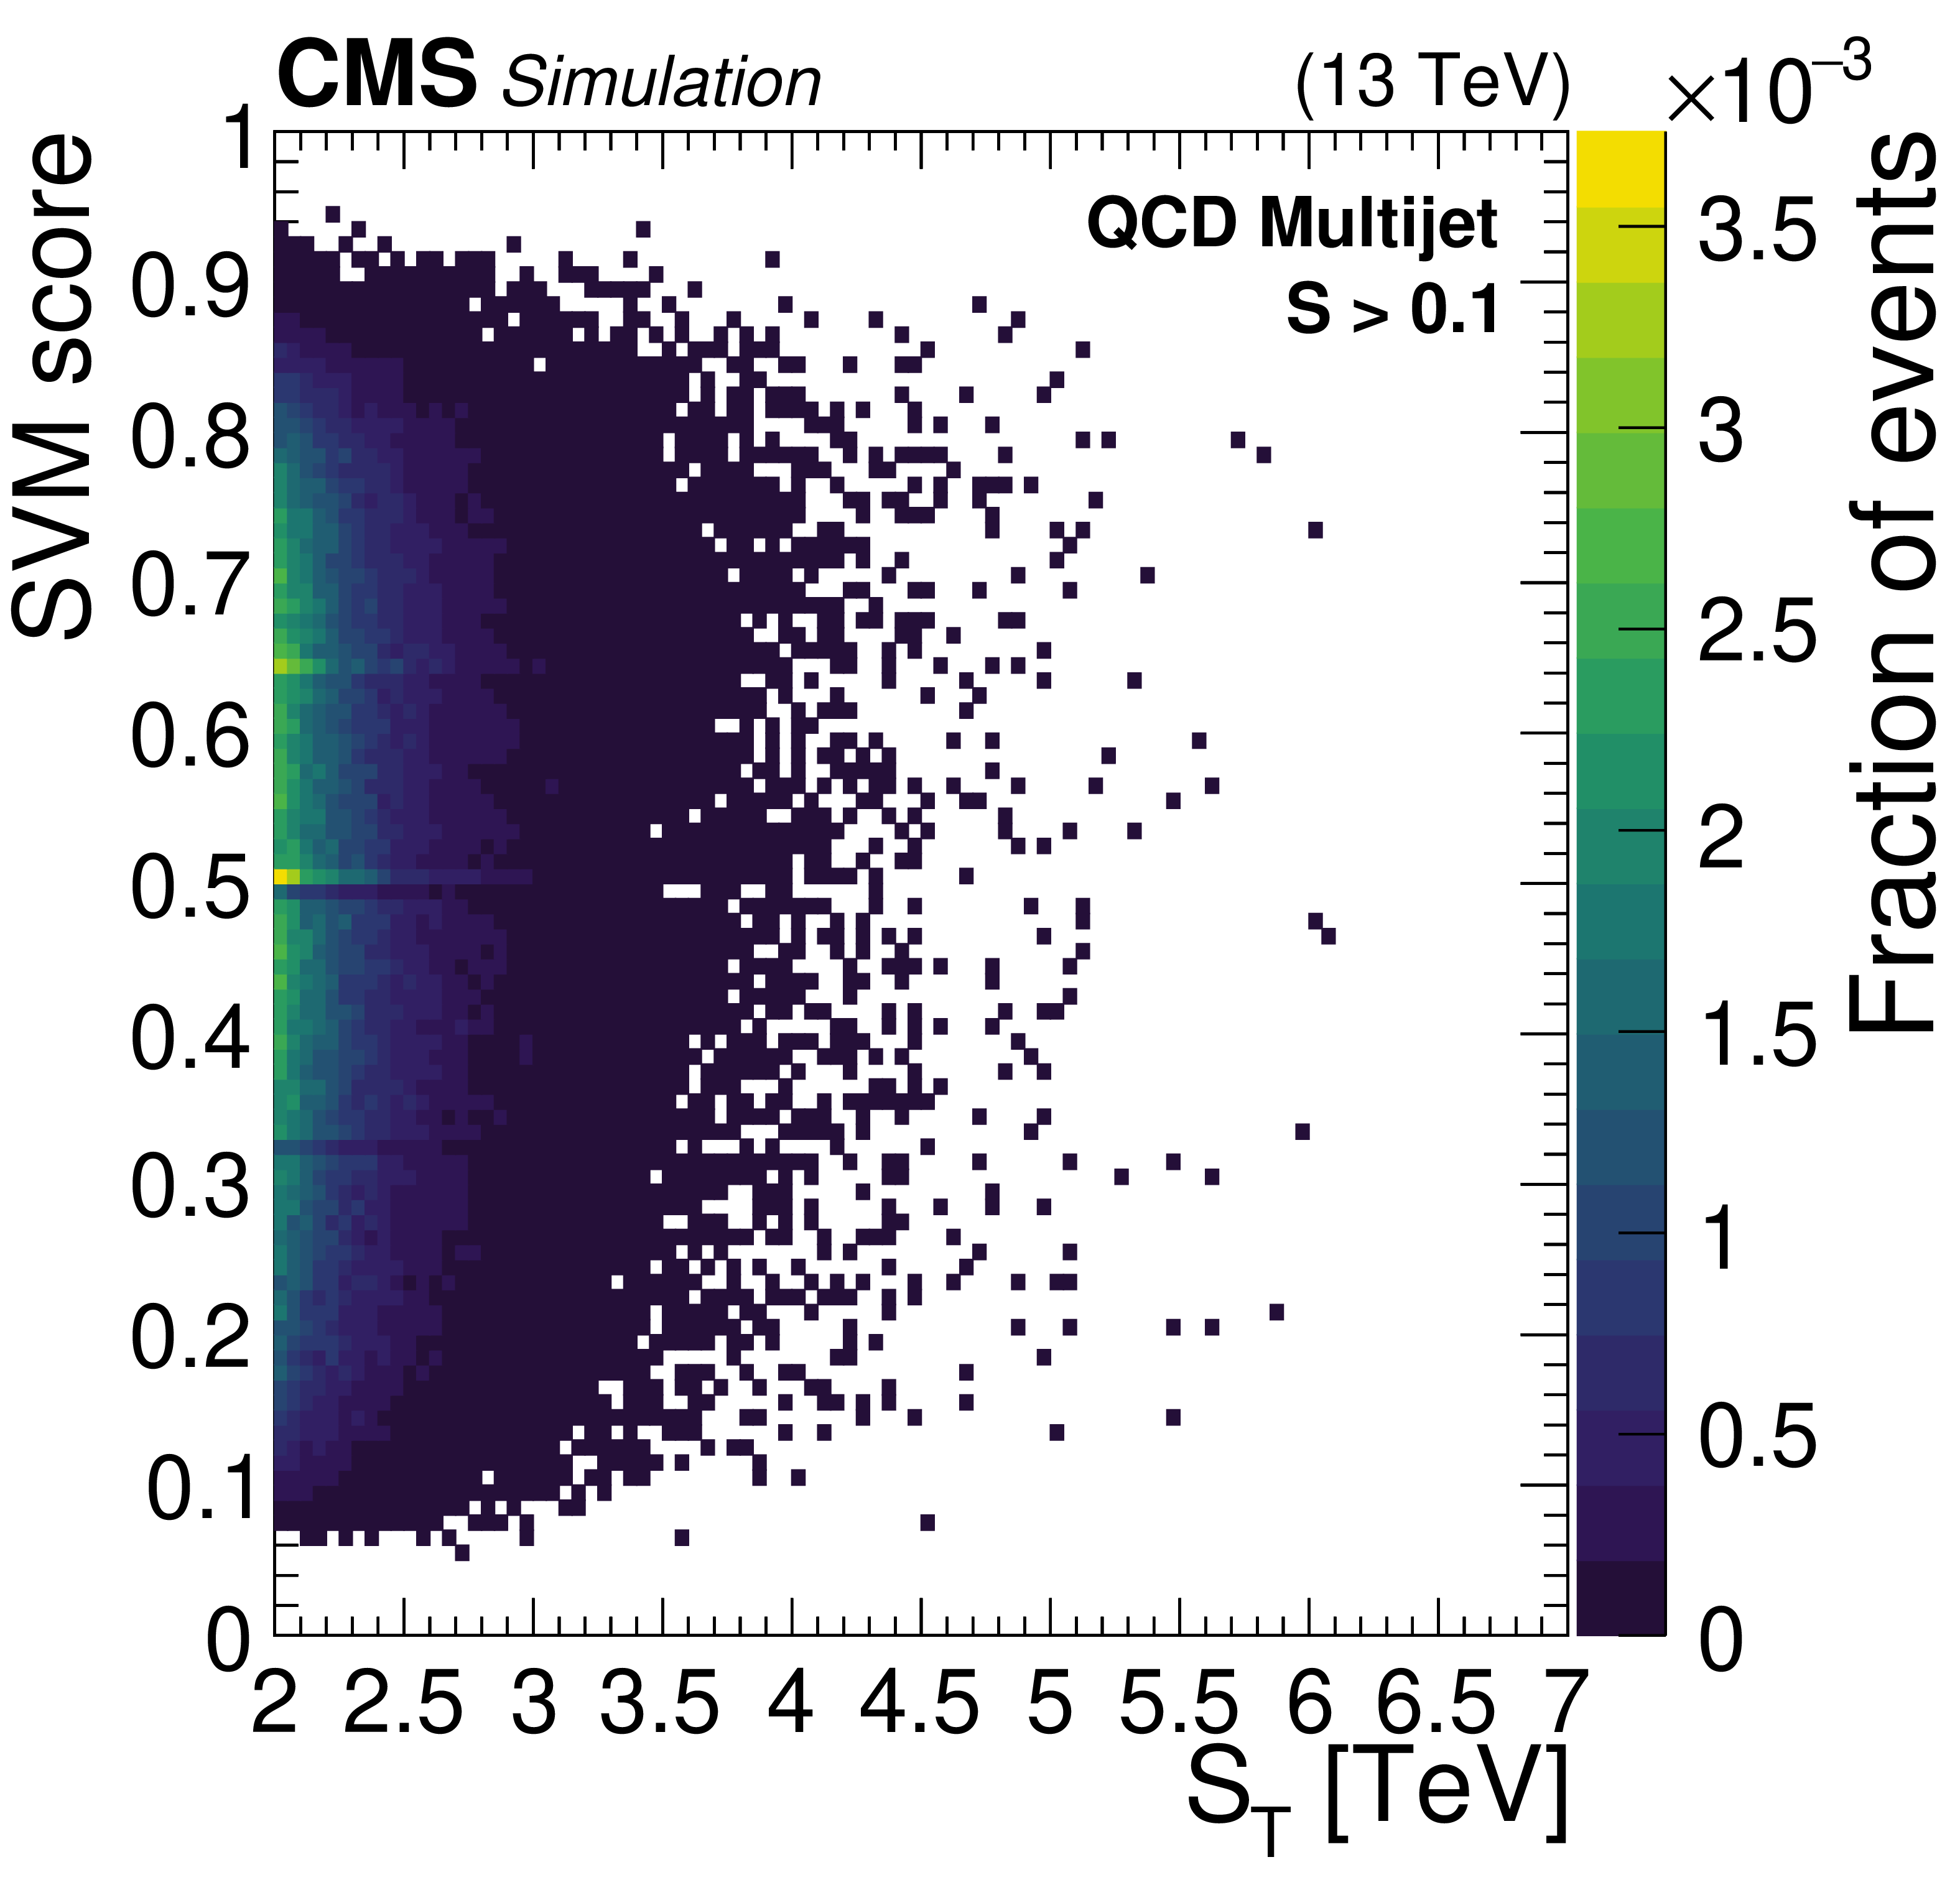
Figure 3-a:
The SVM score vs. the $ S_\text{T} $ distributions for simulated QCD multijet background (left) and the BH signal model B1 with $ M_\text{D} = $ 2 TeV, $ M_\text{BH} = $ 10 TeV, and $ n = $ 2 (right), after the $ S > $ 0.1 selection. |
png pdf |
Figure 3-b:
The SVM score vs. the $ S_\text{T} $ distributions for simulated QCD multijet background (left) and the BH signal model B1 with $ M_\text{D} = $ 2 TeV, $ M_\text{BH} = $ 10 TeV, and $ n = $ 2 (right), after the $ S > $ 0.1 selection. |
png pdf |
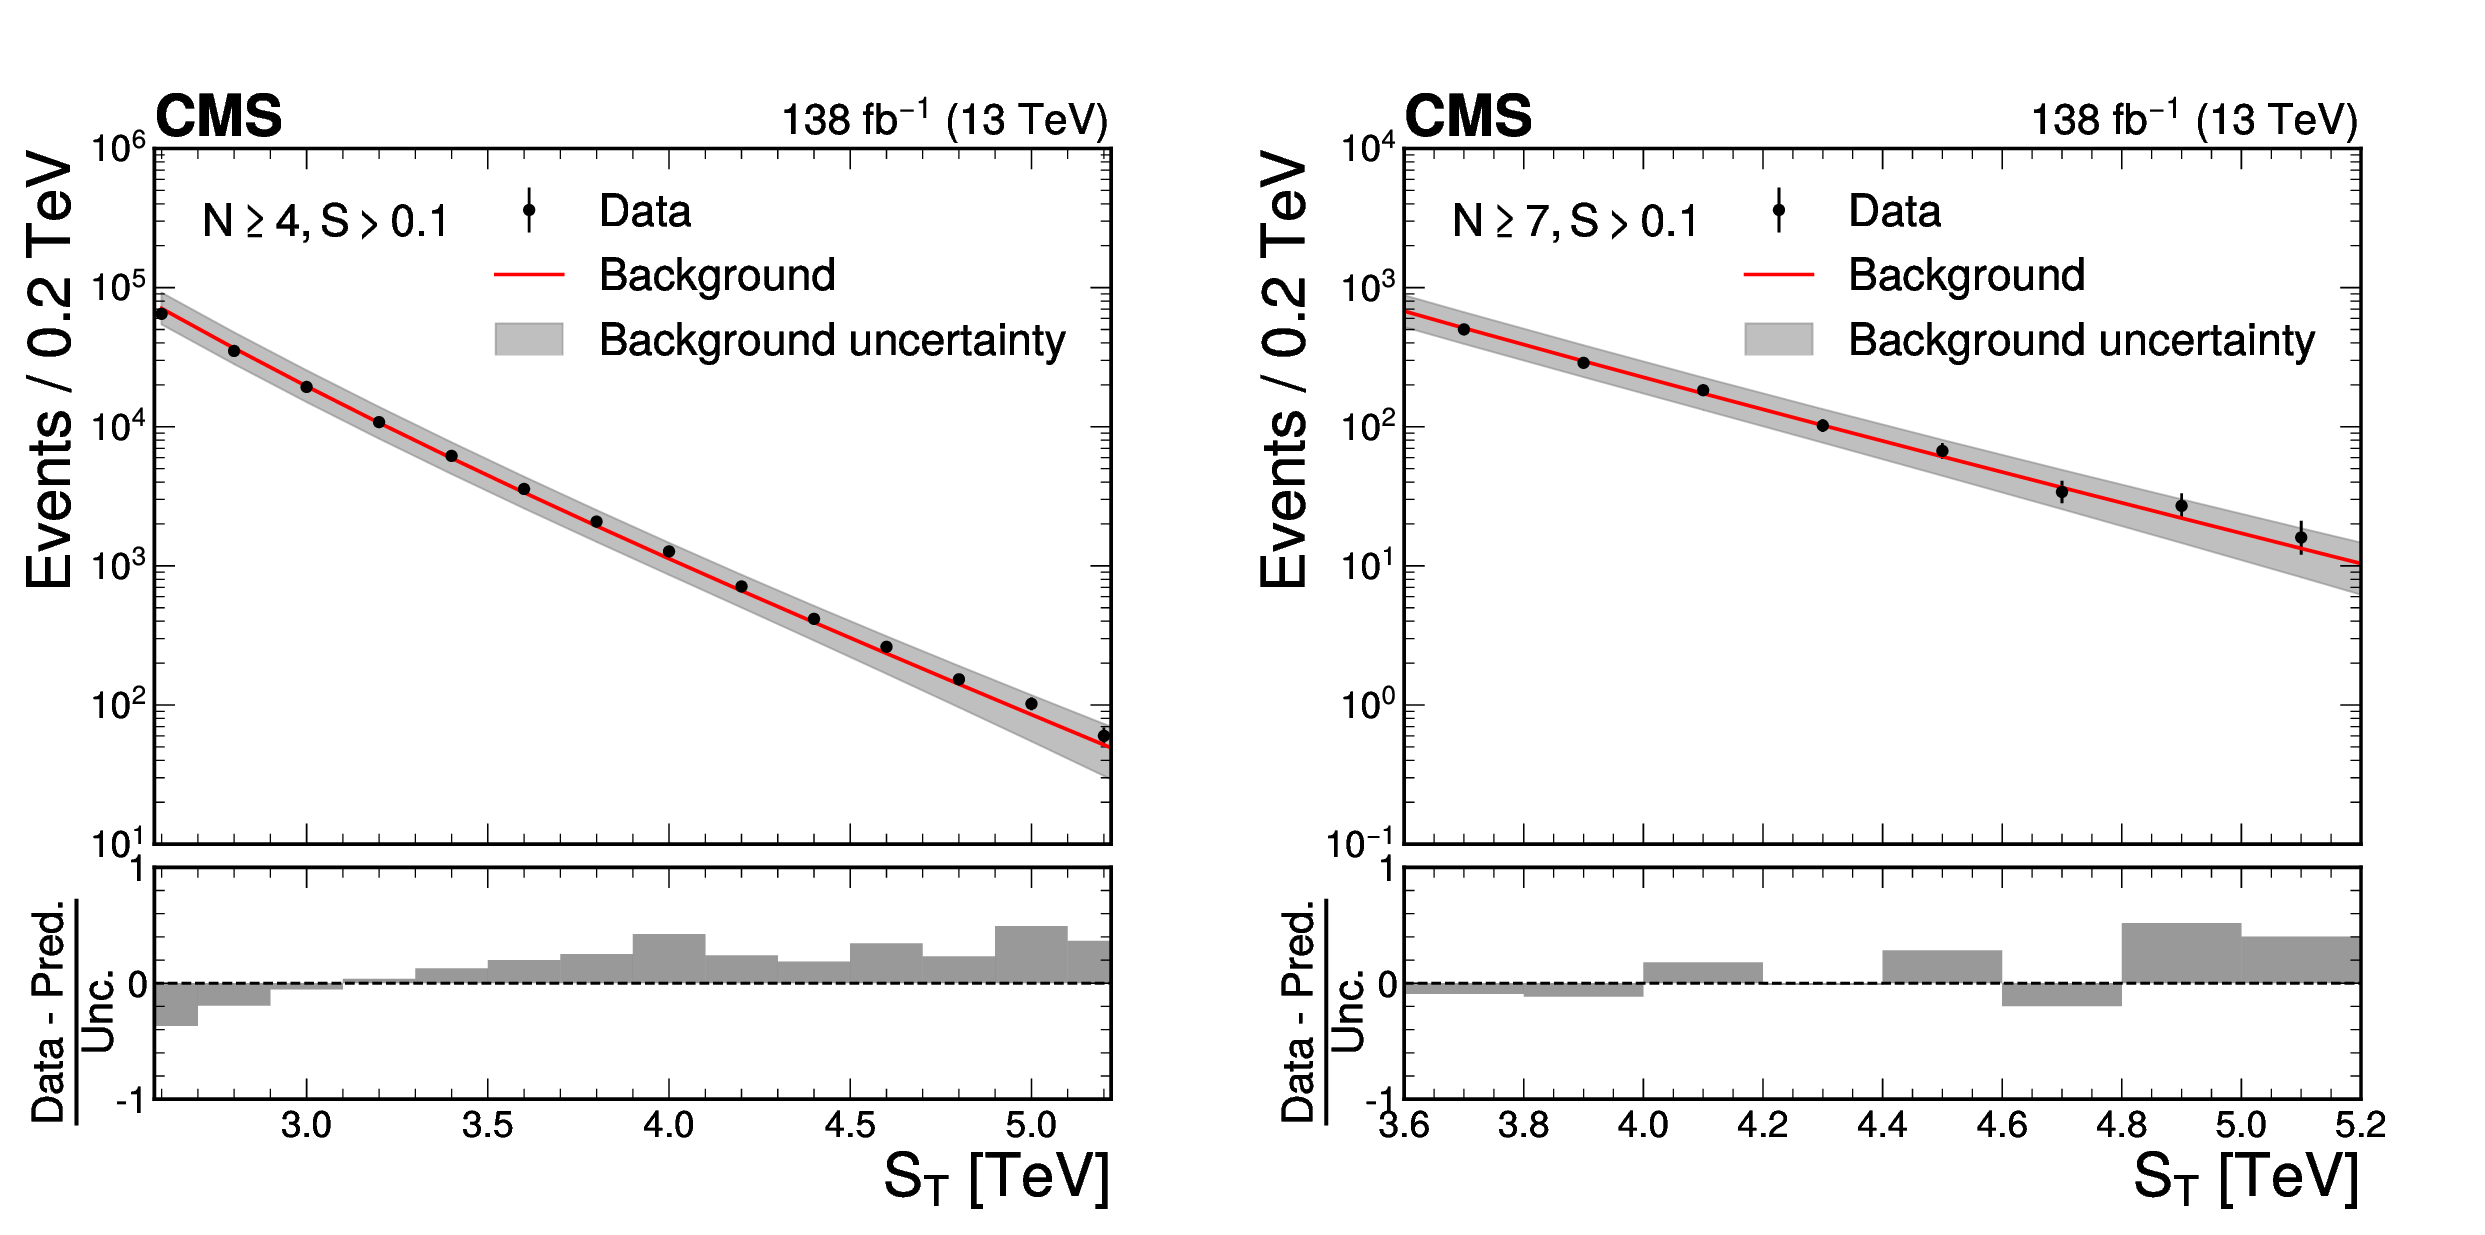
Figure 4:
The $ S_\text{T} $ distribution in the $ N \geq $ 4 (left) and $ N \geq $ 7 (right) in the SI-VR in data is indicated by the black dots. The background prediction is represented by the red line, and the gray band corresponds to the background modeling uncertainty. The lower panels show the difference between observed data and the background prediction, normalized by the total uncertainty. |
png pdf |
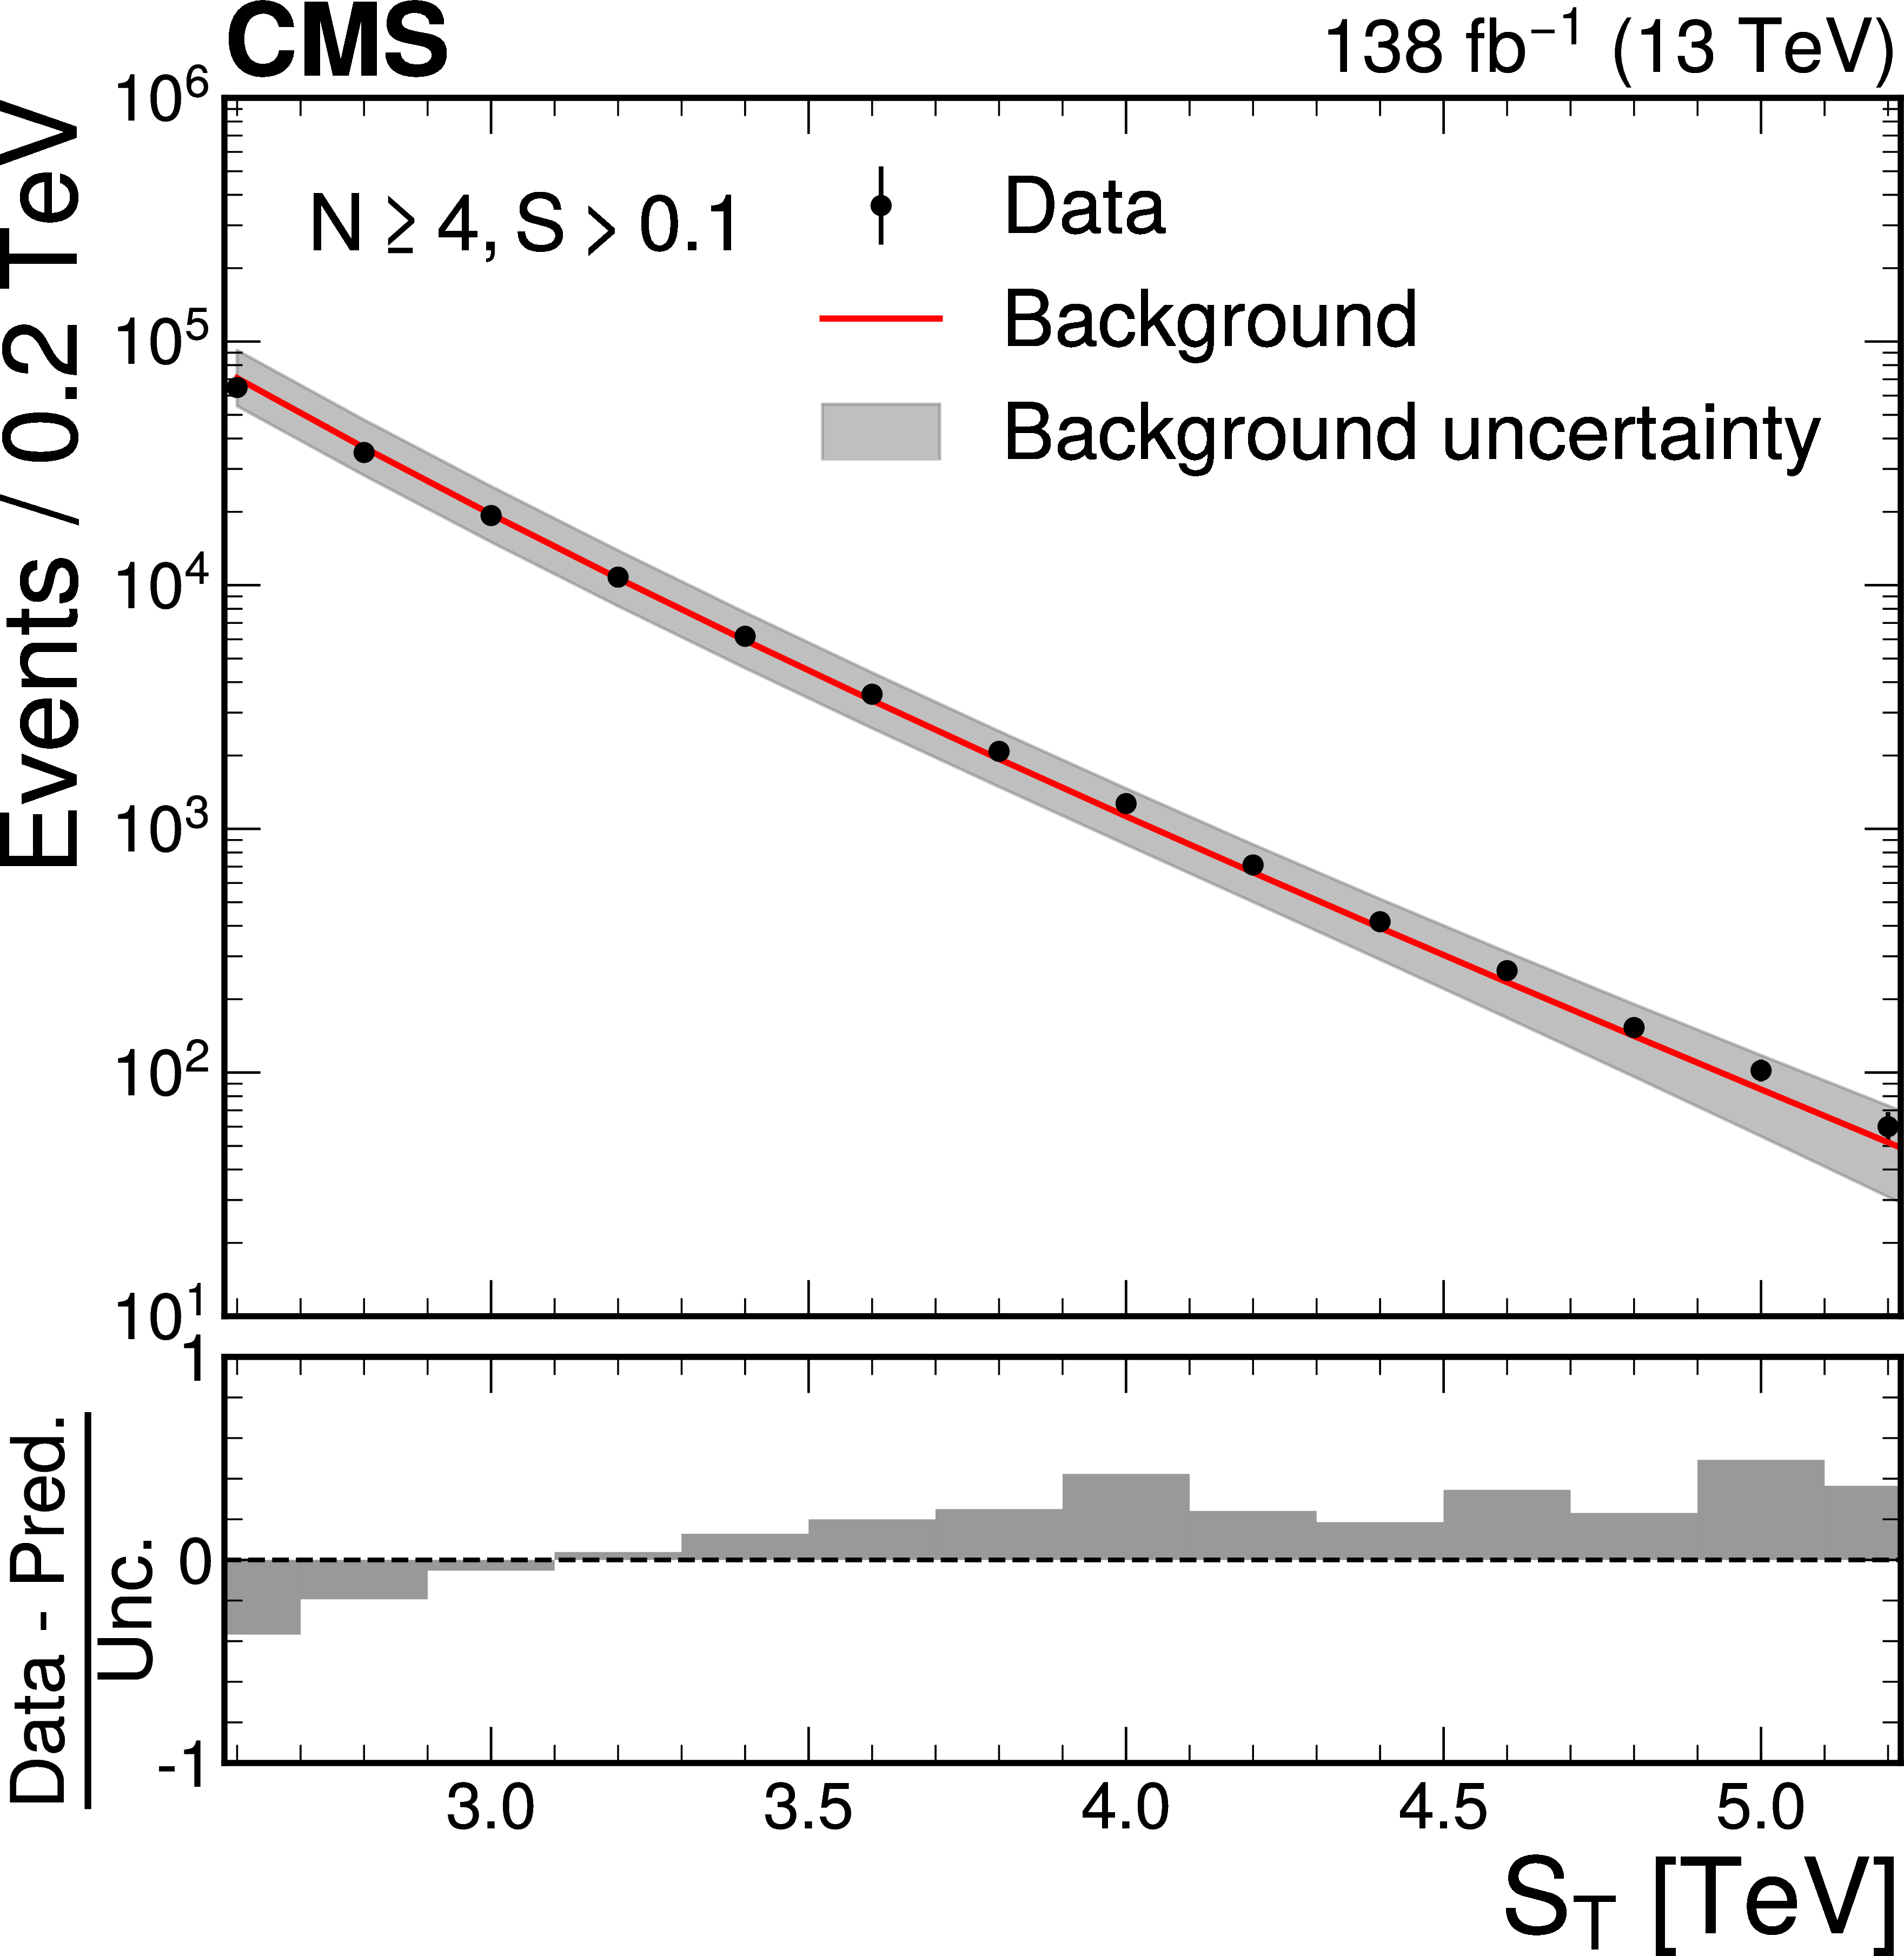
Figure 4-a:
The $ S_\text{T} $ distribution in the $ N \geq $ 4 (left) and $ N \geq $ 7 (right) in the SI-VR in data is indicated by the black dots. The background prediction is represented by the red line, and the gray band corresponds to the background modeling uncertainty. The lower panels show the difference between observed data and the background prediction, normalized by the total uncertainty. |
png pdf |
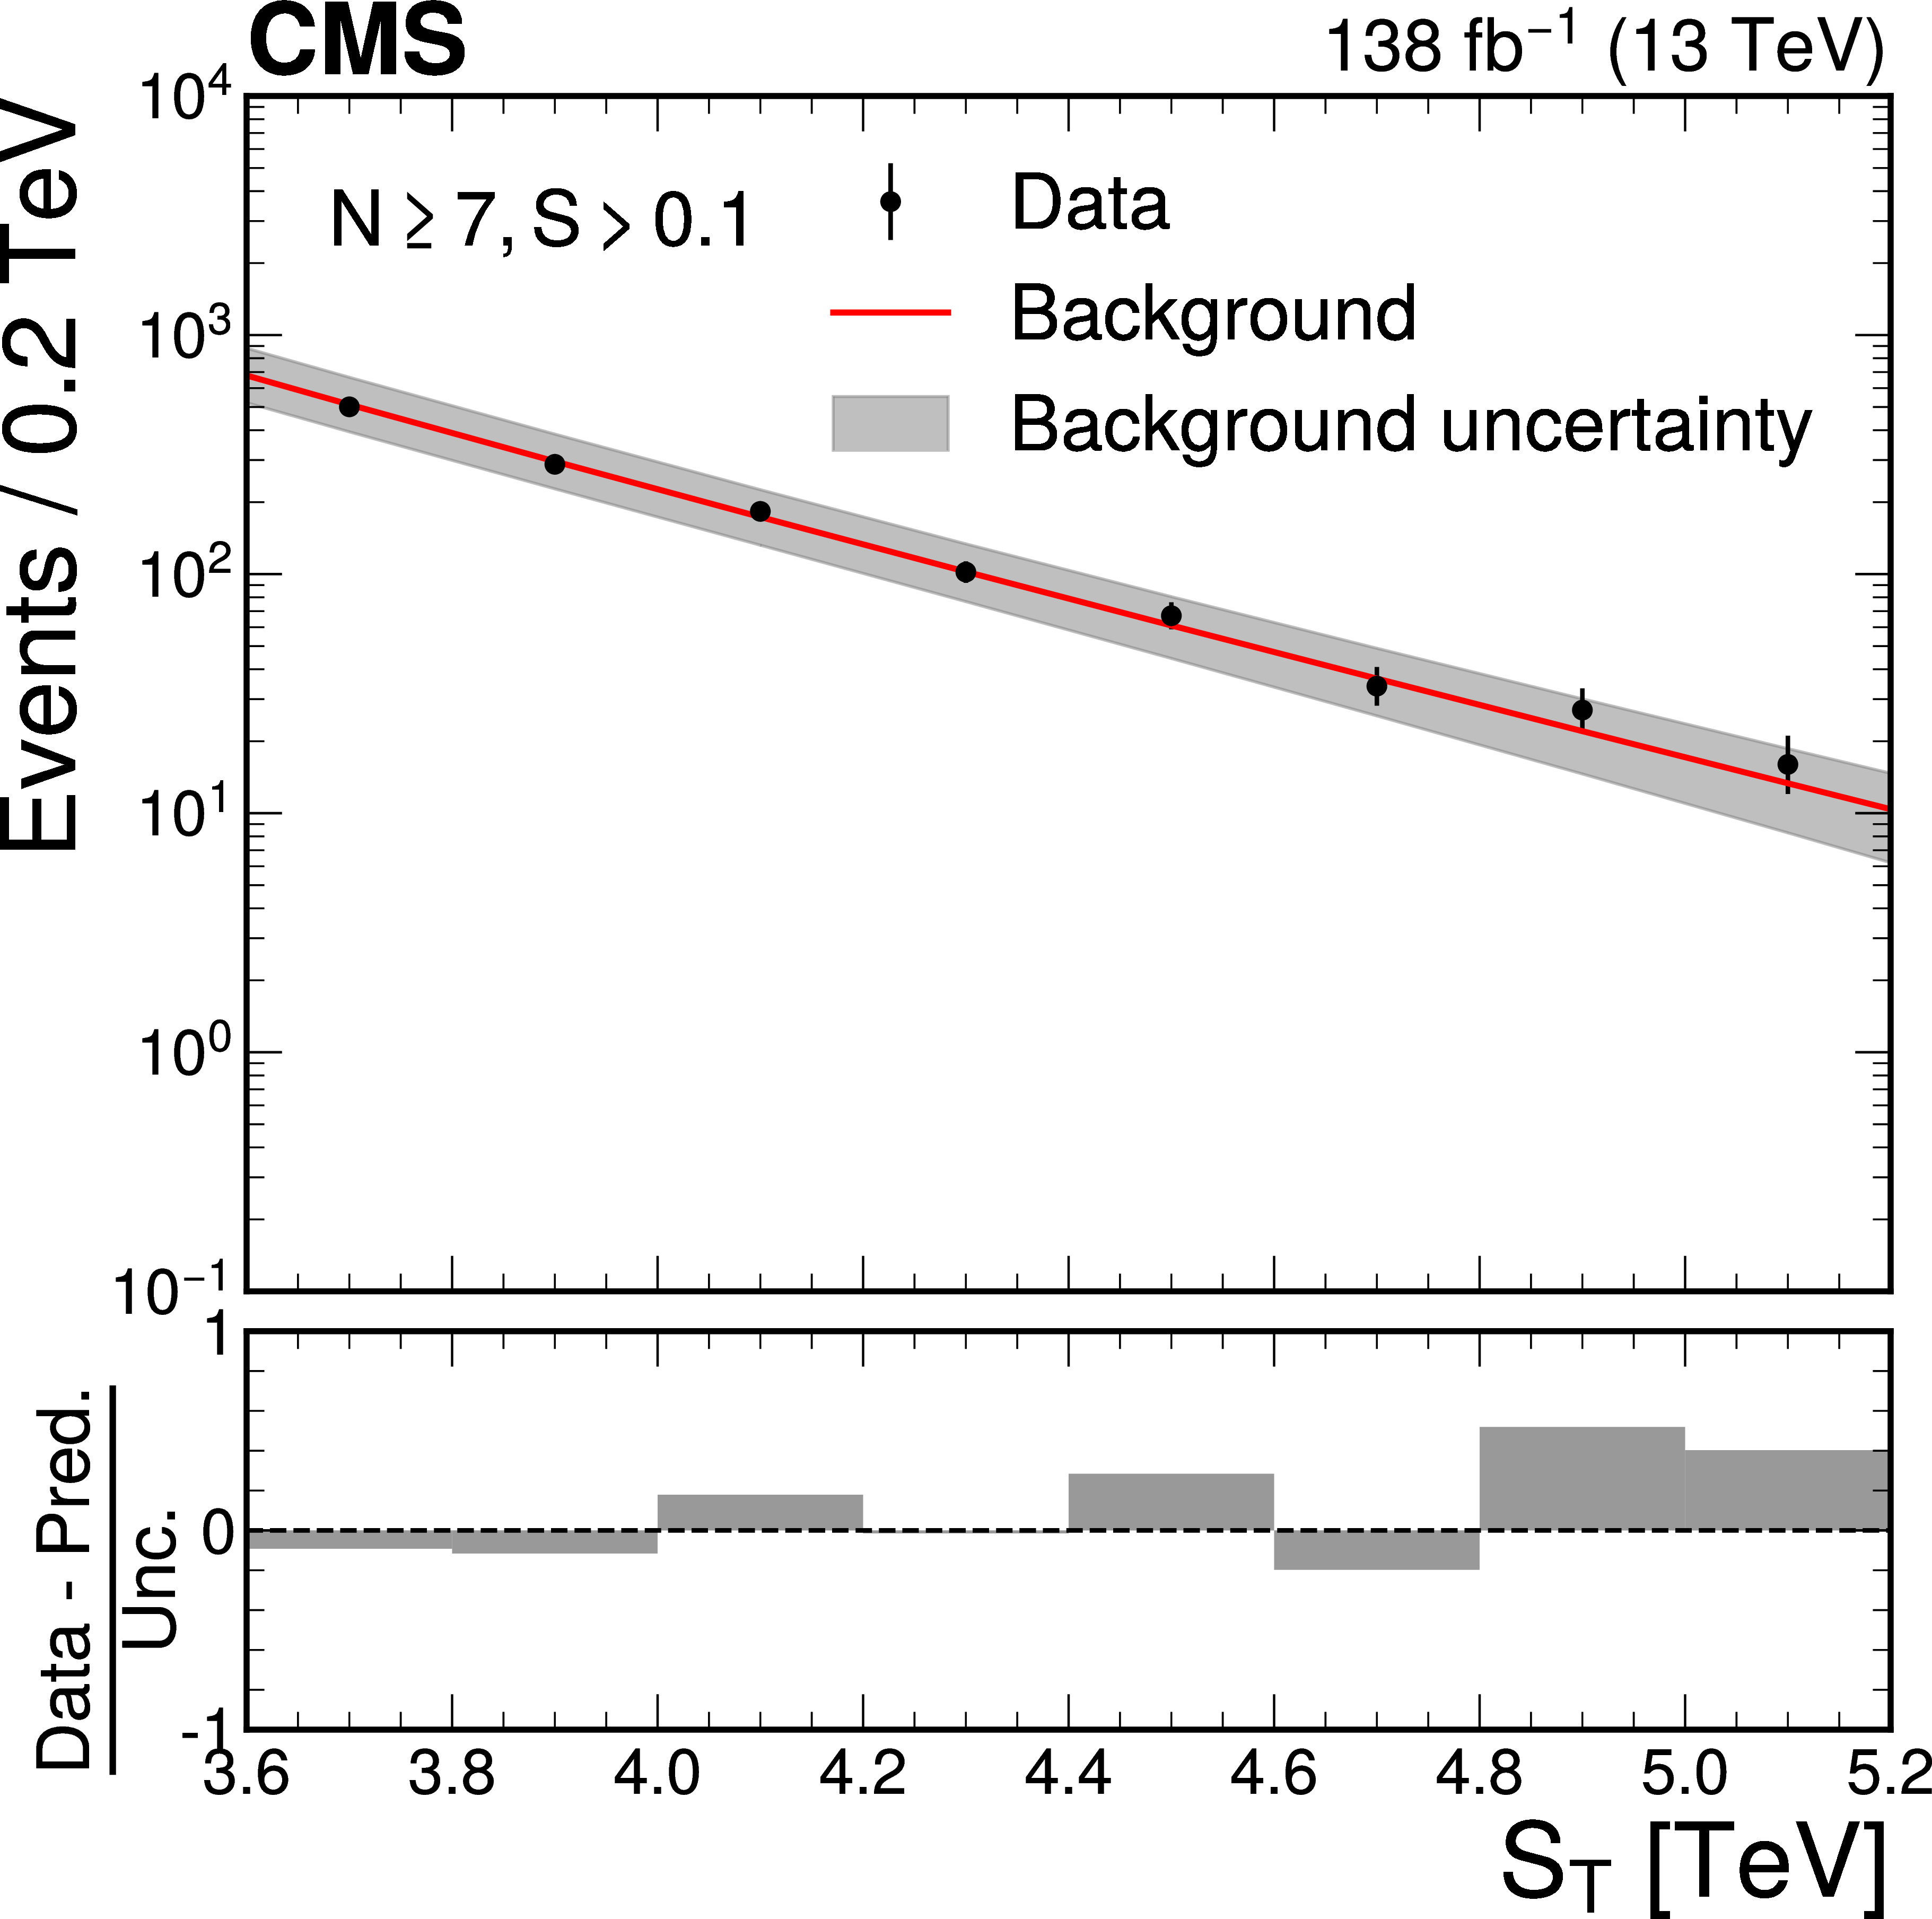
Figure 4-b:
The $ S_\text{T} $ distribution in the $ N \geq $ 4 (left) and $ N \geq $ 7 (right) in the SI-VR in data is indicated by the black dots. The background prediction is represented by the red line, and the gray band corresponds to the background modeling uncertainty. The lower panels show the difference between observed data and the background prediction, normalized by the total uncertainty. |
png pdf |
Figure 5:
Post-fit $ S_\text{T} $ distributions in VR-FAIL (left) and VR-PASS (right) regions in data. The gray hatched areas include both statistical and systematic uncertainties in the background prediction (yellow histogram). The red line corresponds to the signal model B1, with $ M_\text{D} = $ 2 TeV, $ M_\text{BH} = $ 10 TeV, and $ n = $ 2. The lower panels show the difference between observed data and the background prediction, normalized by the total uncertainty. |
png pdf |
Figure 6:
The $ S_\text{T} $ distribution in the $ N \geq $ 4 (left) and $ N \geq $ 7 (right) SI-SR in data, indicated by the black dots, along with the background prediction and its uncertainty represented by the red line and gray band, respectively. Lower panel as in Fig. 4. |
png pdf |
Figure 6-a:
The $ S_\text{T} $ distribution in the $ N \geq $ 4 (left) and $ N \geq $ 7 (right) SI-SR in data, indicated by the black dots, along with the background prediction and its uncertainty represented by the red line and gray band, respectively. Lower panel as in Fig. 4. |
png pdf |
Figure 6-b:
The $ S_\text{T} $ distribution in the $ N \geq $ 4 (left) and $ N \geq $ 7 (right) SI-SR in data, indicated by the black dots, along with the background prediction and its uncertainty represented by the red line and gray band, respectively. Lower panel as in Fig. 4. |
png pdf |
Figure 7:
Expected and observed model-independent 95% CL upper limits on the cross section times acceptance for multiplicity $ N \geq $ 4, where the inner (outer) band represents the 68% (95%) quantile of the expected limit (left), and the observed limits with different minimum object multiplicity requirements (right). |
png pdf |
Figure 7-a:
Expected and observed model-independent 95% CL upper limits on the cross section times acceptance for multiplicity $ N \geq $ 4, where the inner (outer) band represents the 68% (95%) quantile of the expected limit (left), and the observed limits with different minimum object multiplicity requirements (right). |
png pdf |
Figure 7-b:
Expected and observed model-independent 95% CL upper limits on the cross section times acceptance for multiplicity $ N \geq $ 4, where the inner (outer) band represents the 68% (95%) quantile of the expected limit (left), and the observed limits with different minimum object multiplicity requirements (right). |
png pdf |
Figure 8:
Post-fit $ S_\text{T} $ distributions in the FAIL (left) and PASS (right) regions in data. The gray shaded area includes both statistical and systematic uncertainties in the background prediction (yellow histogram) while the red and blue lines are B1 signal examples, as noted in the legends. Lower panel as in Fig. 5. |
png pdf |
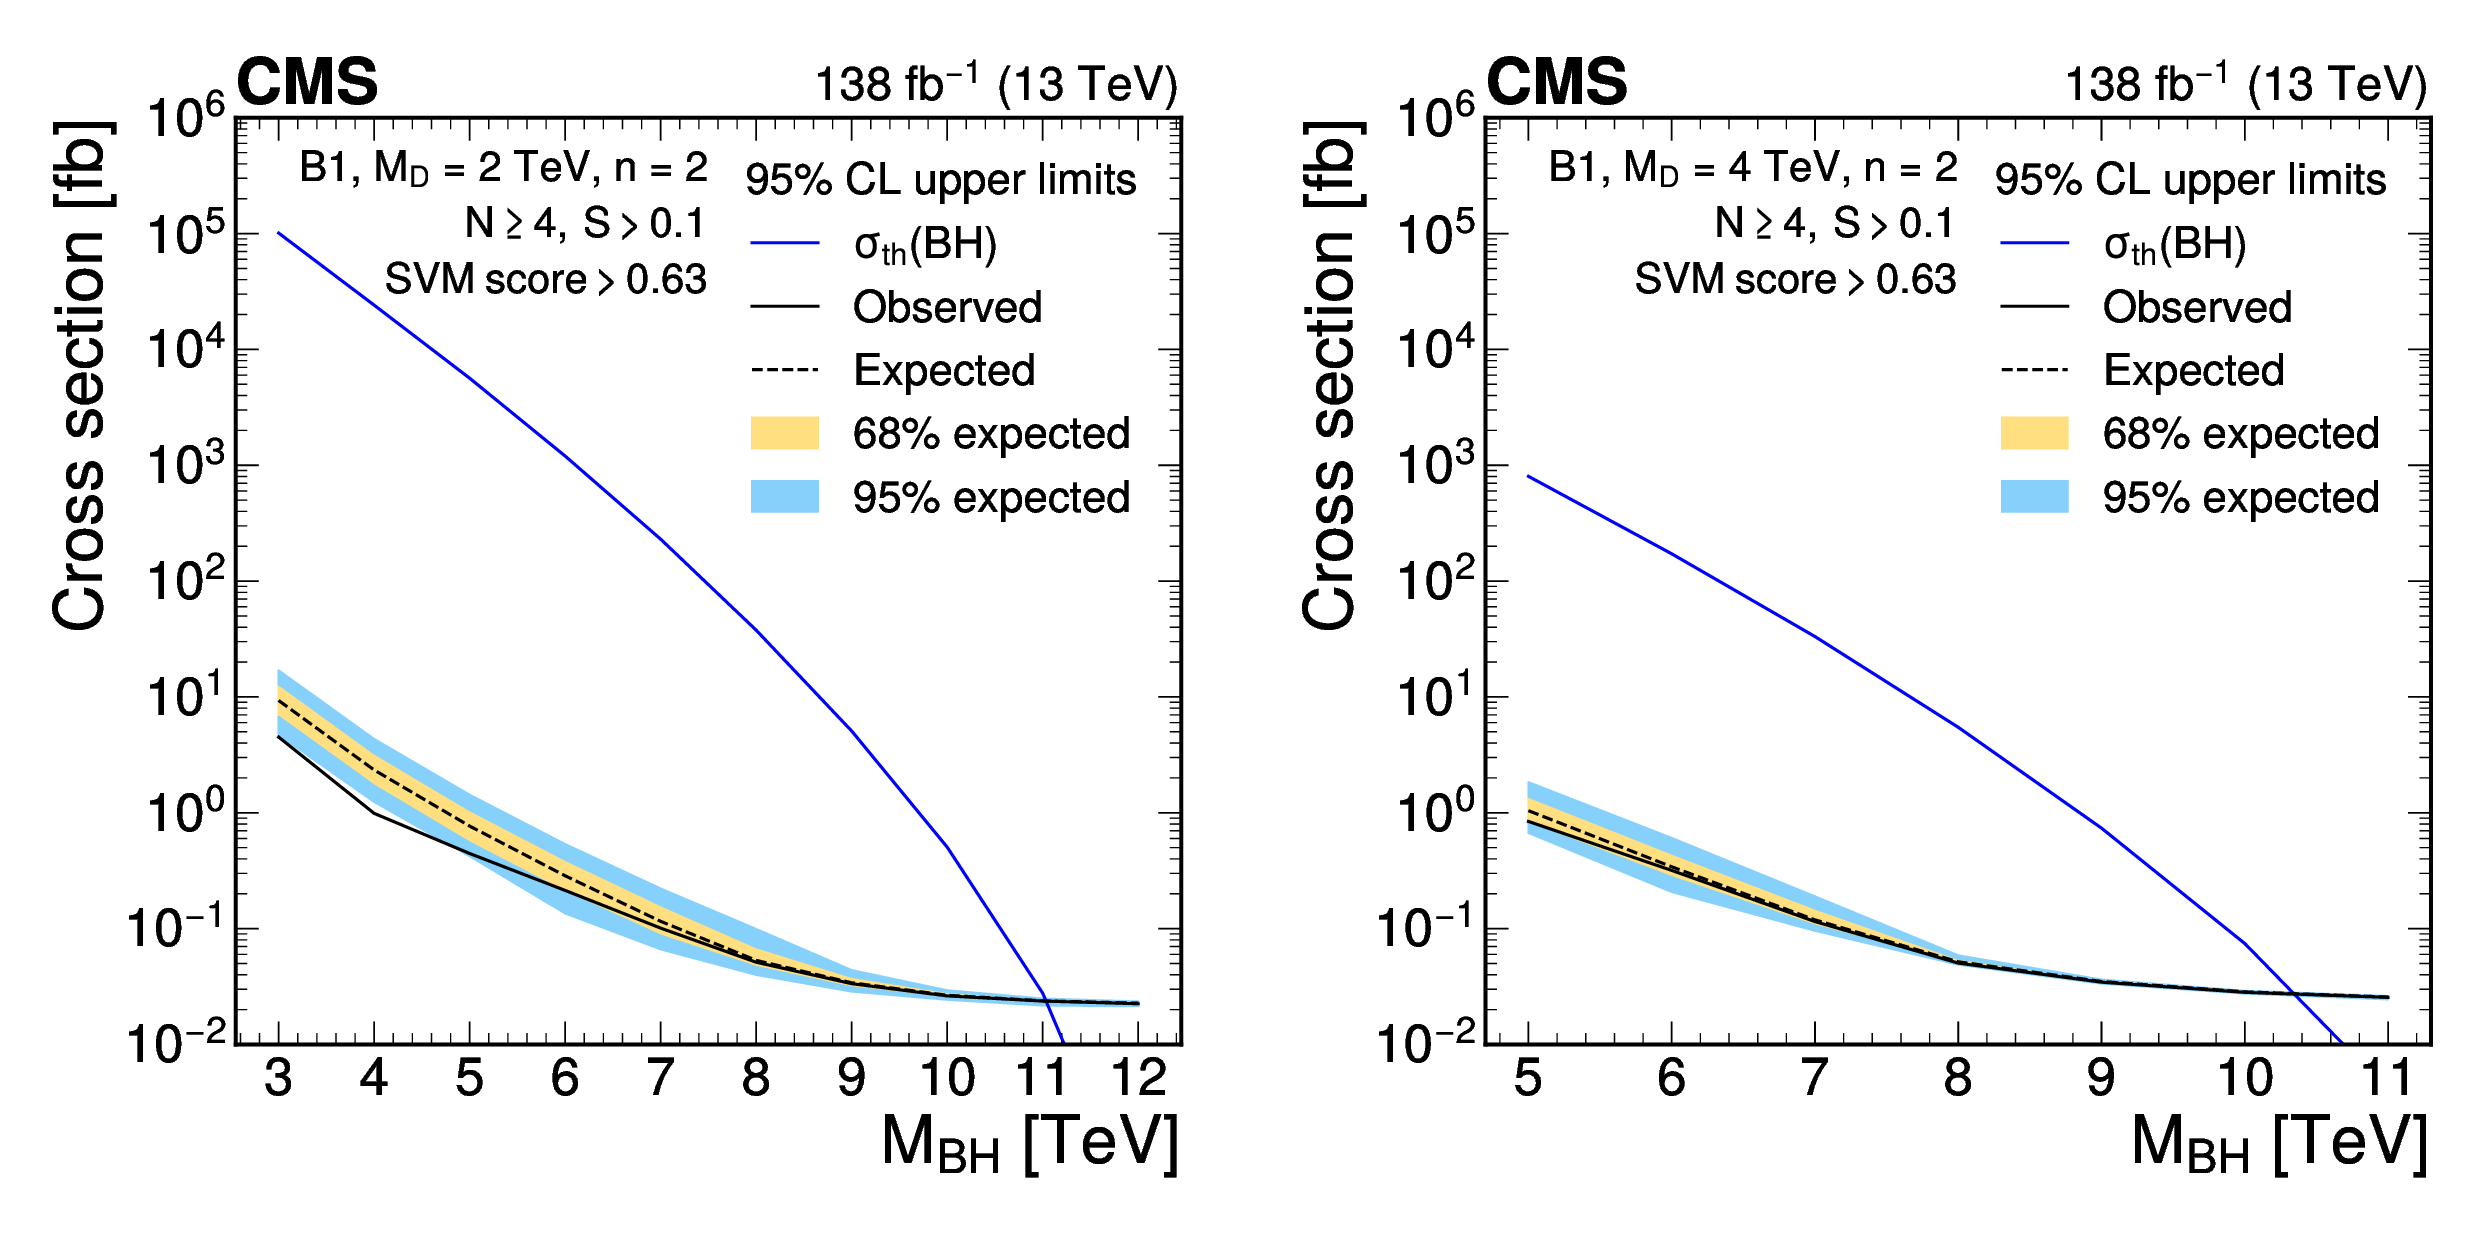
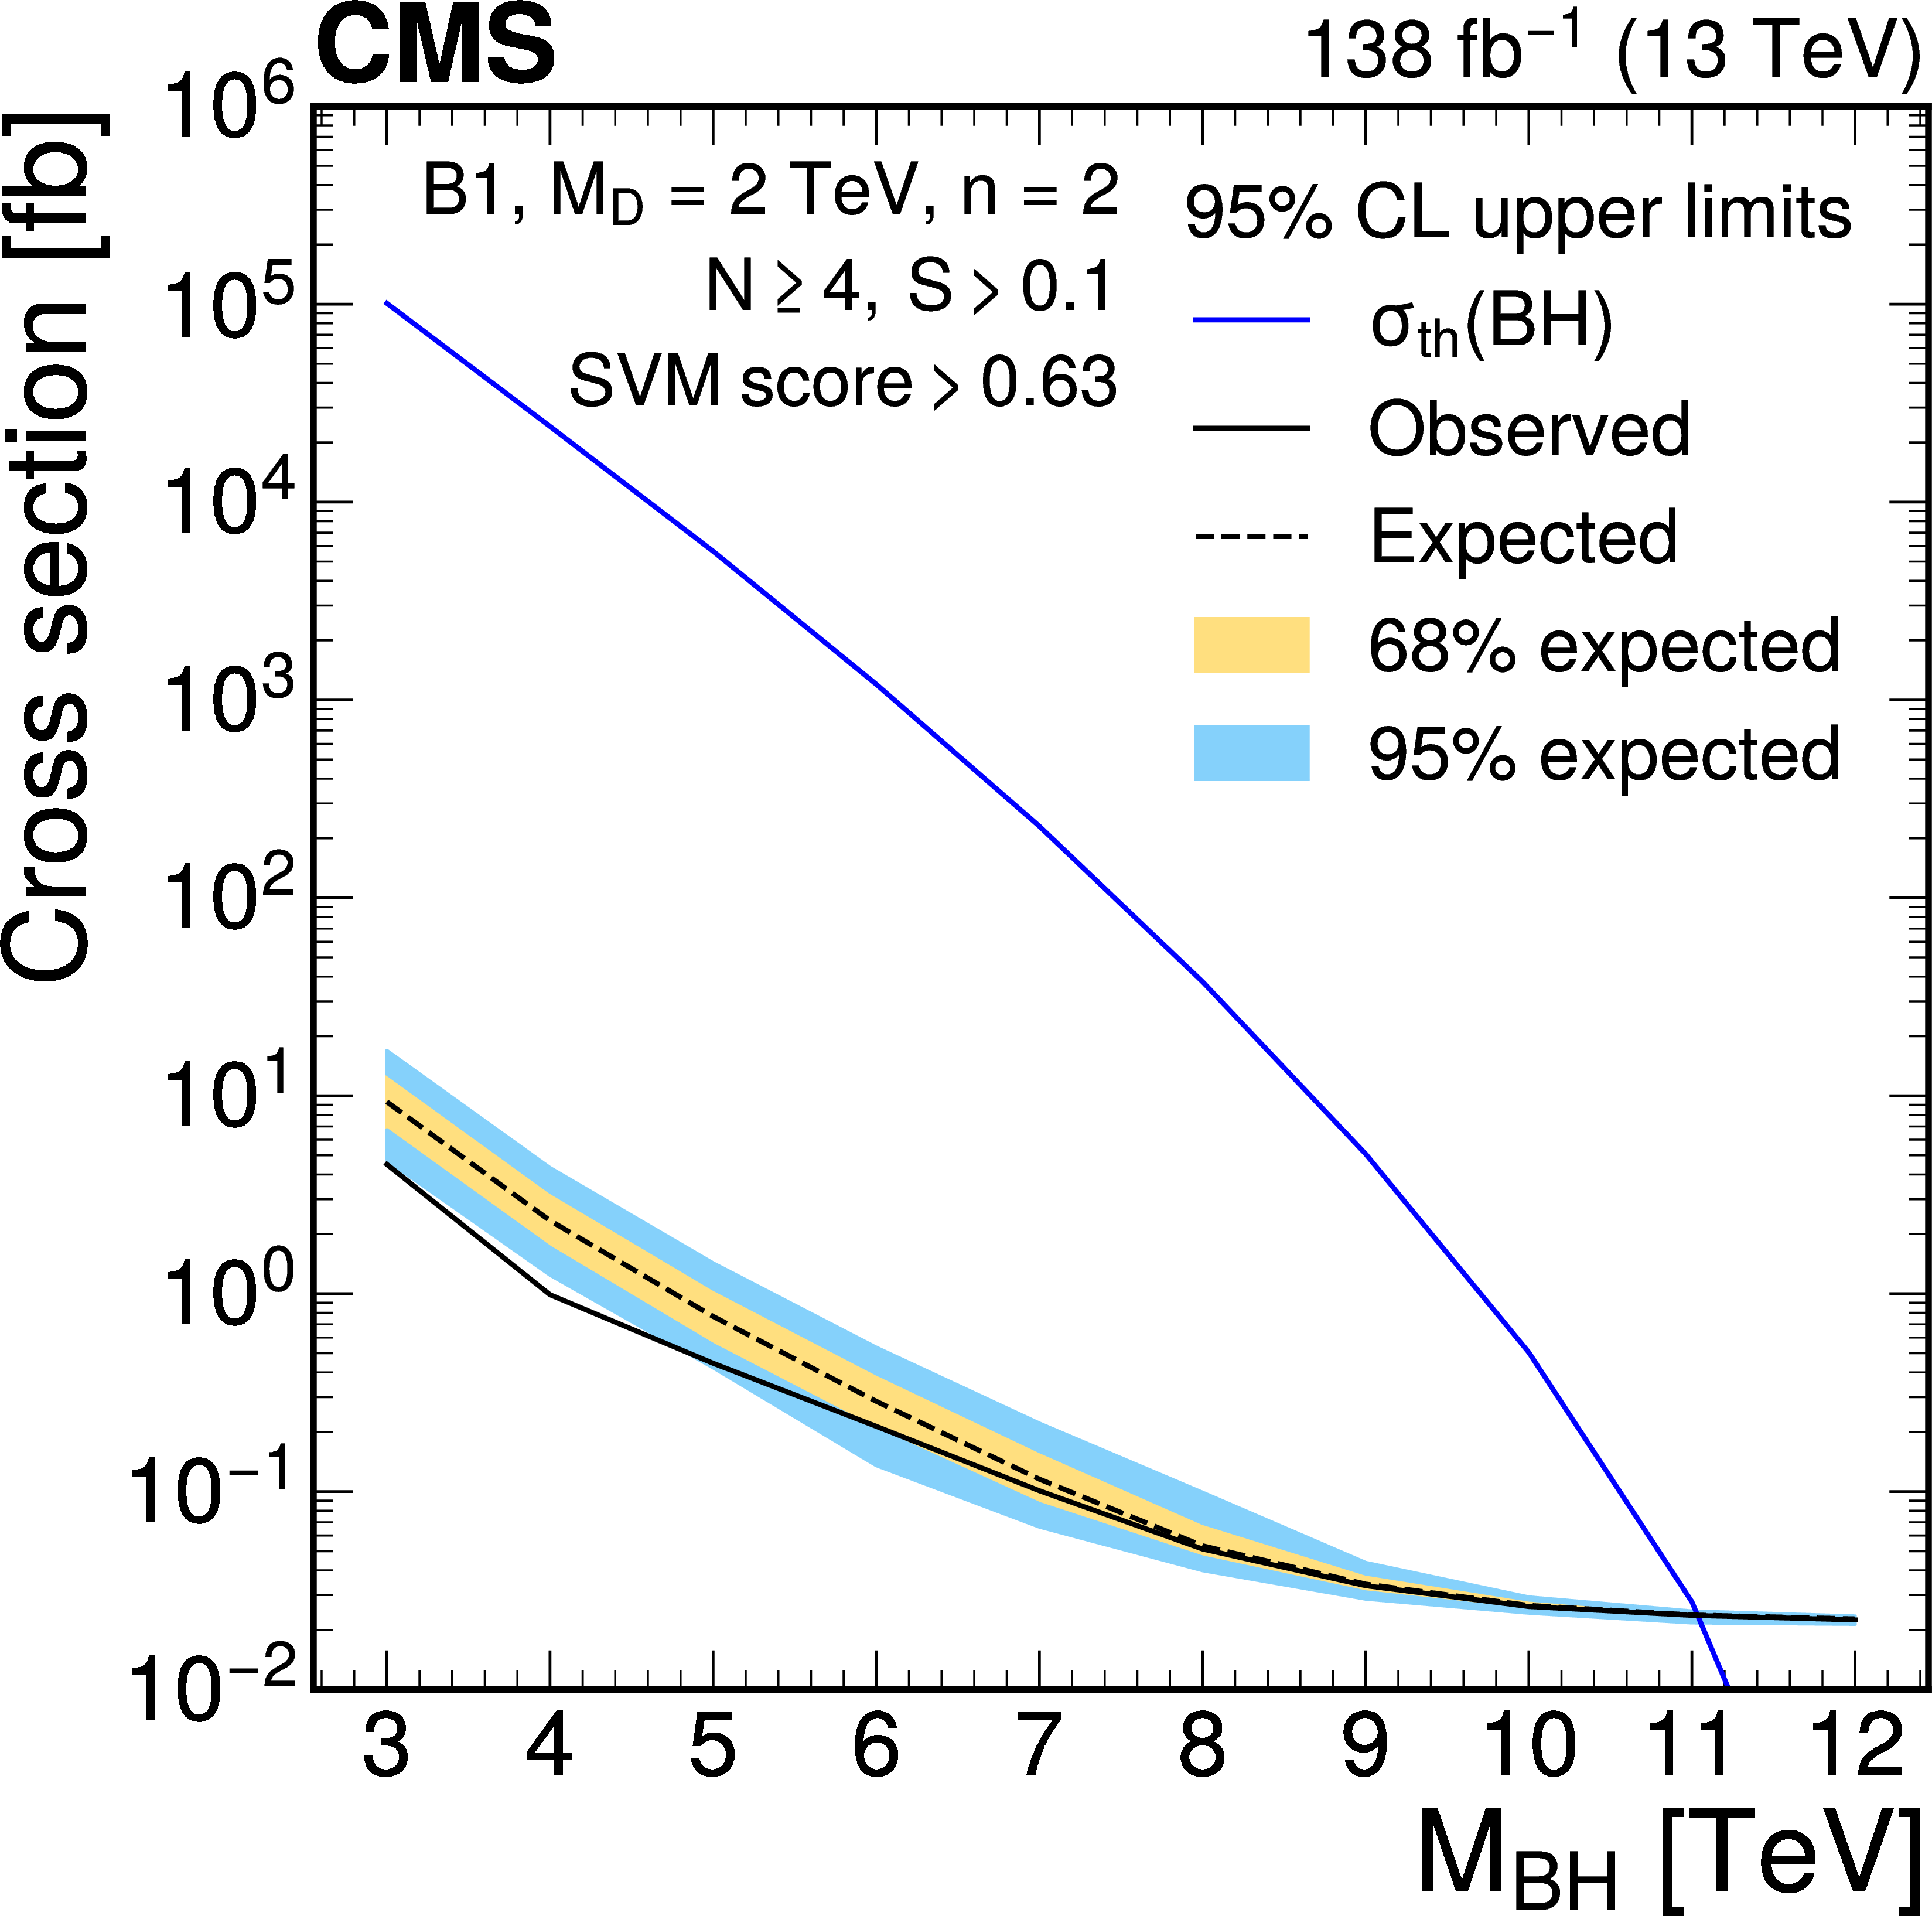
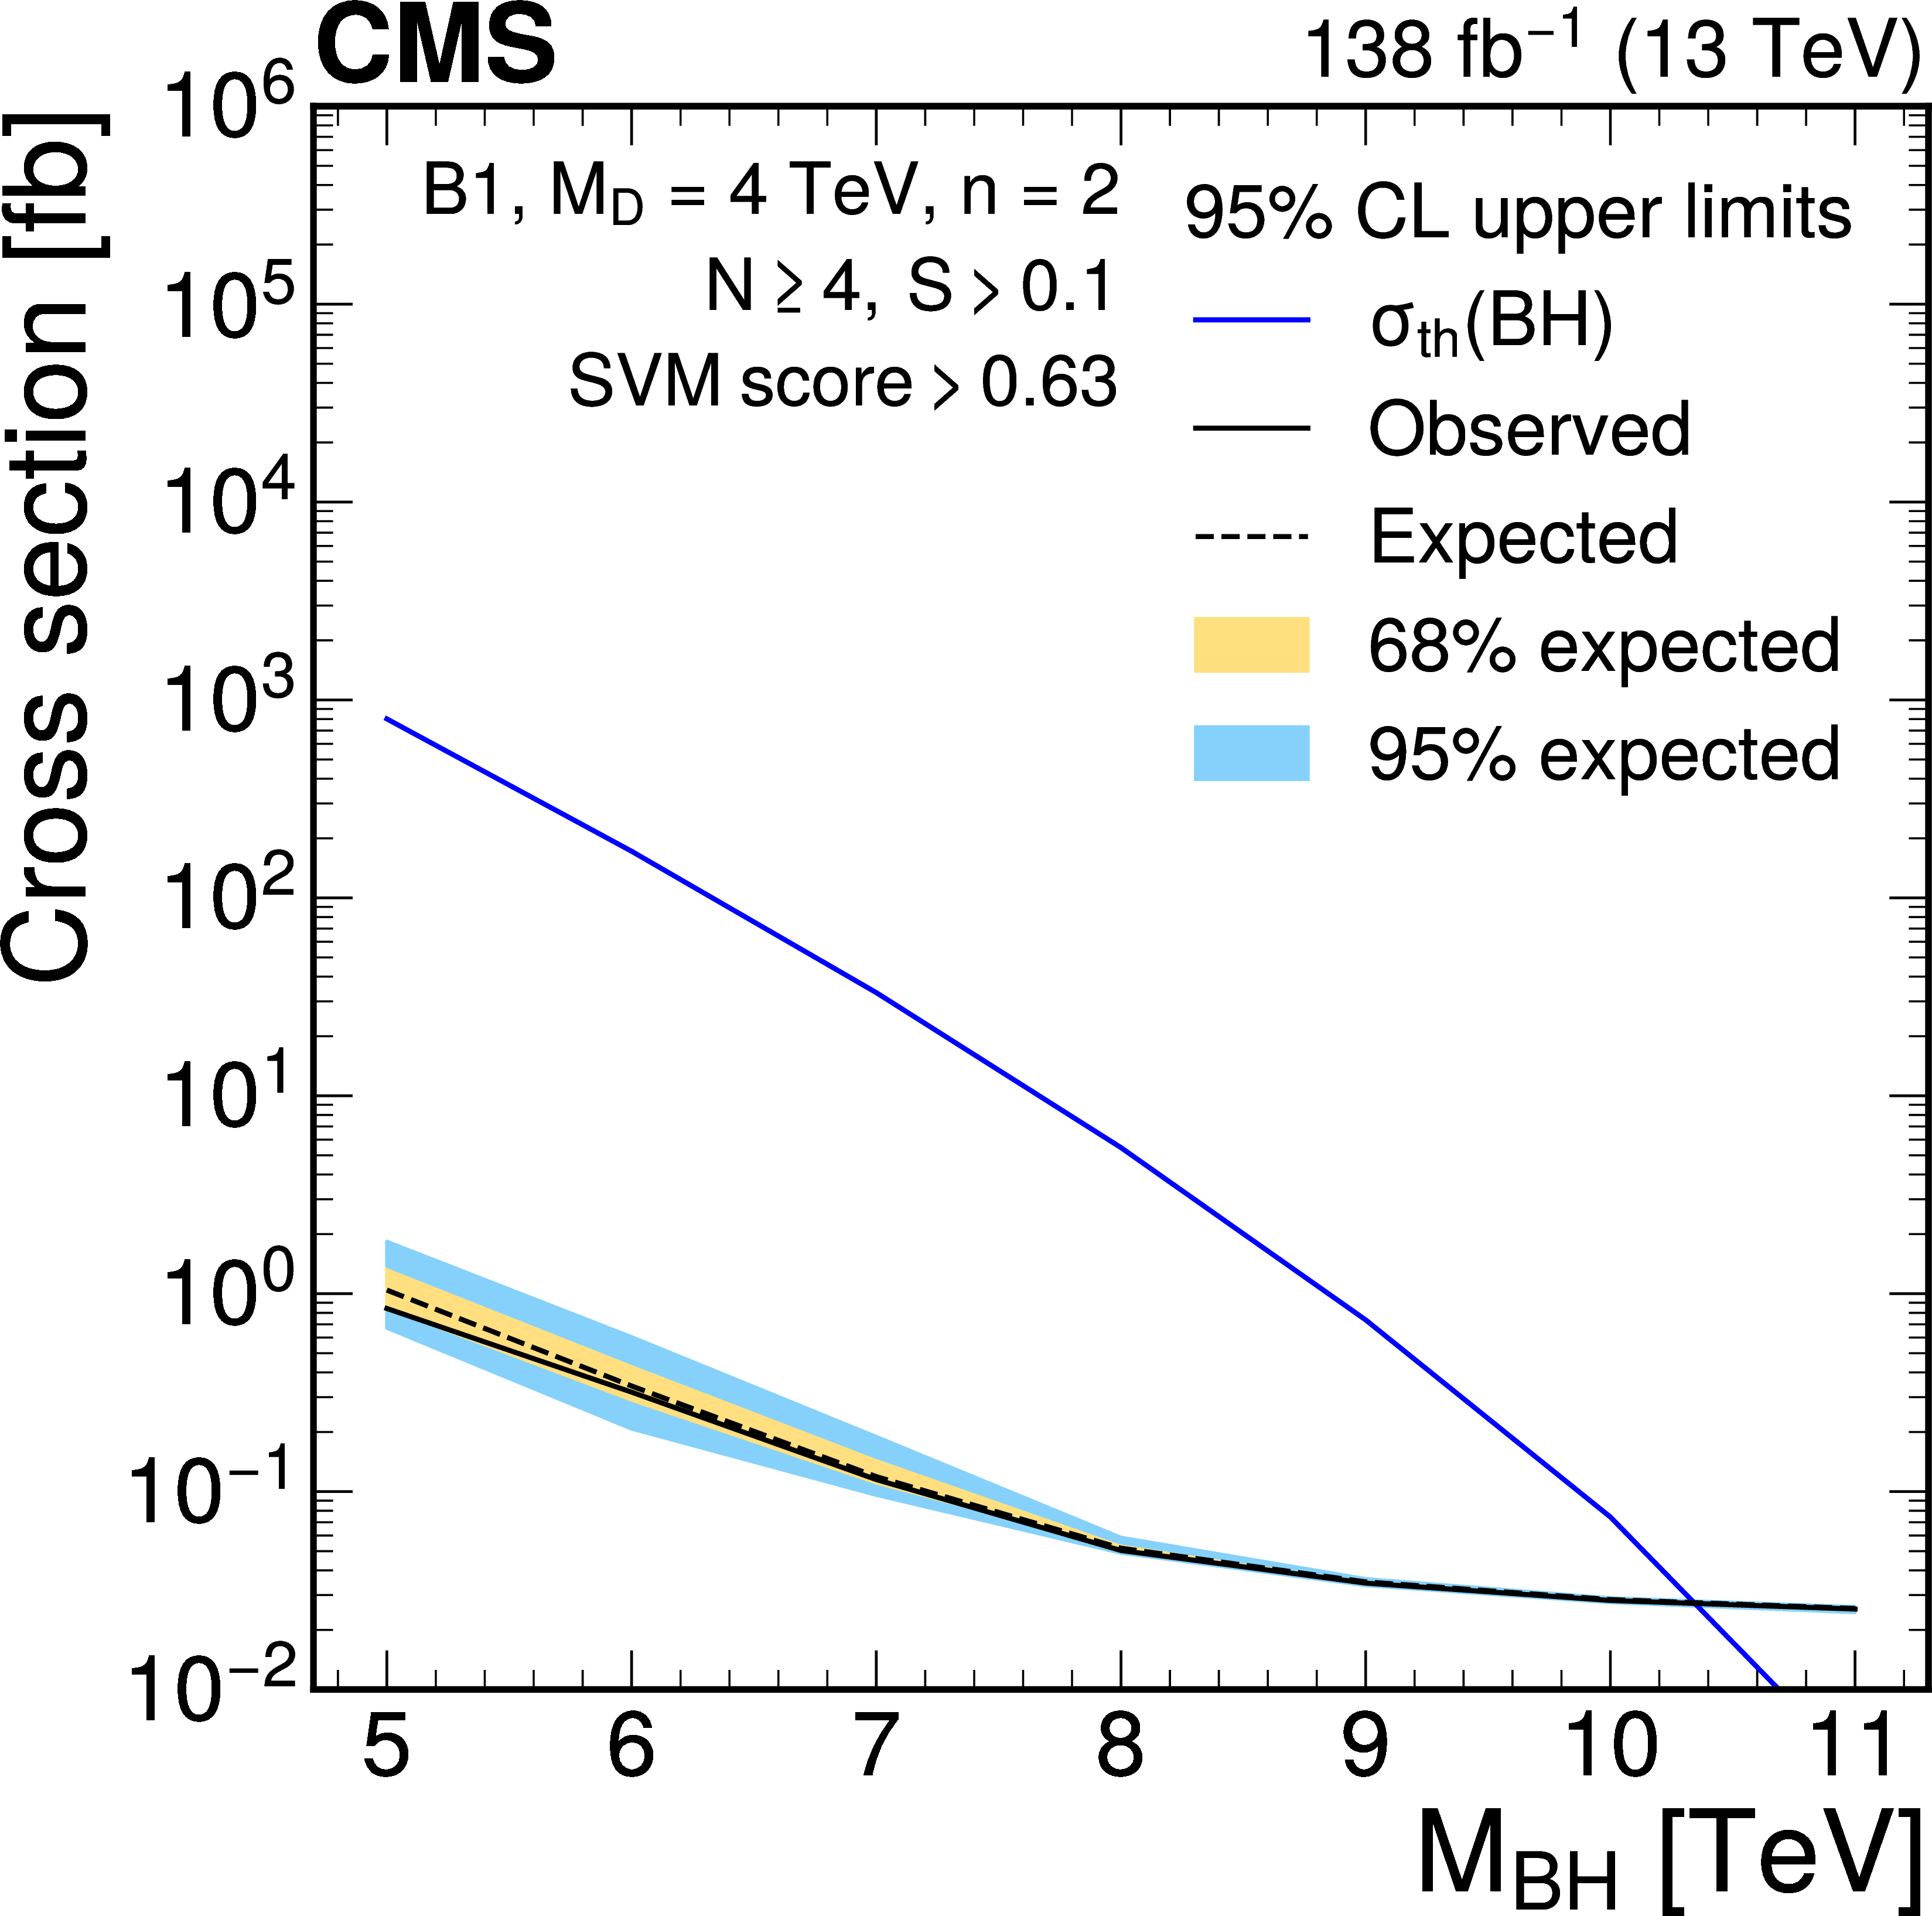
Figure 9:
Expected and observed 95% CL upper limits on the cross section for a semiclassical nonrotating BH model (B1) with $ n = $ 2 and $ M_\text{D} = $ 2 TeV (left) or $ M_\text{D} = $ 4 TeV (right), as a function of $ M_\text{BH} $. The blue curves represent the theoretical cross section values. The inner (outer) band represents the 68% (95%) quantile of the expected limit. |
png pdf |
Figure 9-a:
Expected and observed 95% CL upper limits on the cross section for a semiclassical nonrotating BH model (B1) with $ n = $ 2 and $ M_\text{D} = $ 2 TeV (left) or $ M_\text{D} = $ 4 TeV (right), as a function of $ M_\text{BH} $. The blue curves represent the theoretical cross section values. The inner (outer) band represents the 68% (95%) quantile of the expected limit. |
png pdf |
Figure 9-b:
Expected and observed 95% CL upper limits on the cross section for a semiclassical nonrotating BH model (B1) with $ n = $ 2 and $ M_\text{D} = $ 2 TeV (left) or $ M_\text{D} = $ 4 TeV (right), as a function of $ M_\text{BH} $. The blue curves represent the theoretical cross section values. The inner (outer) band represents the 68% (95%) quantile of the expected limit. |
png pdf |
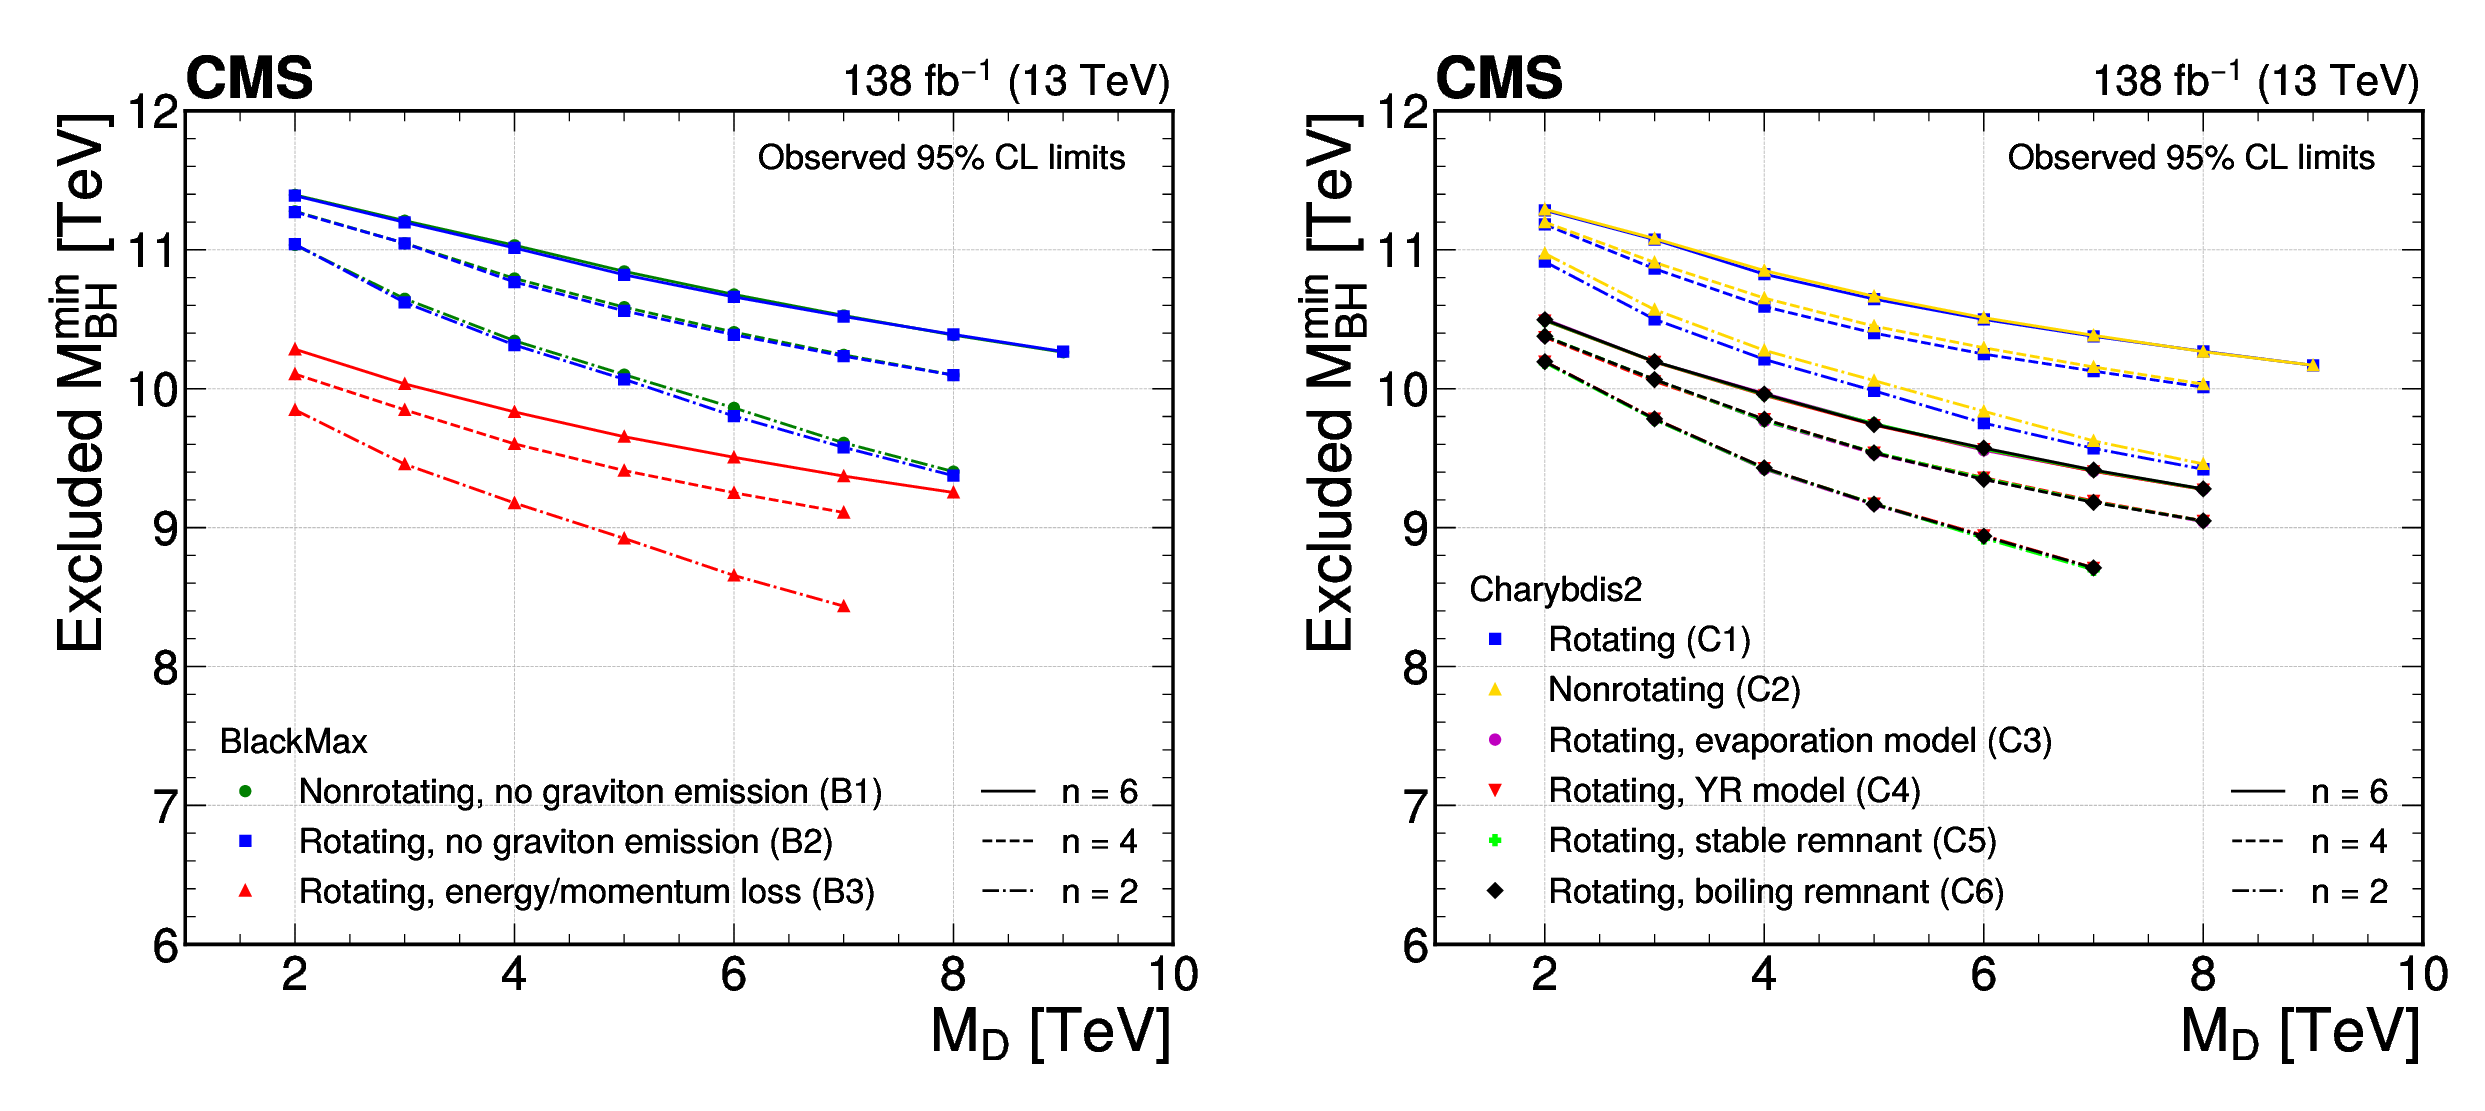
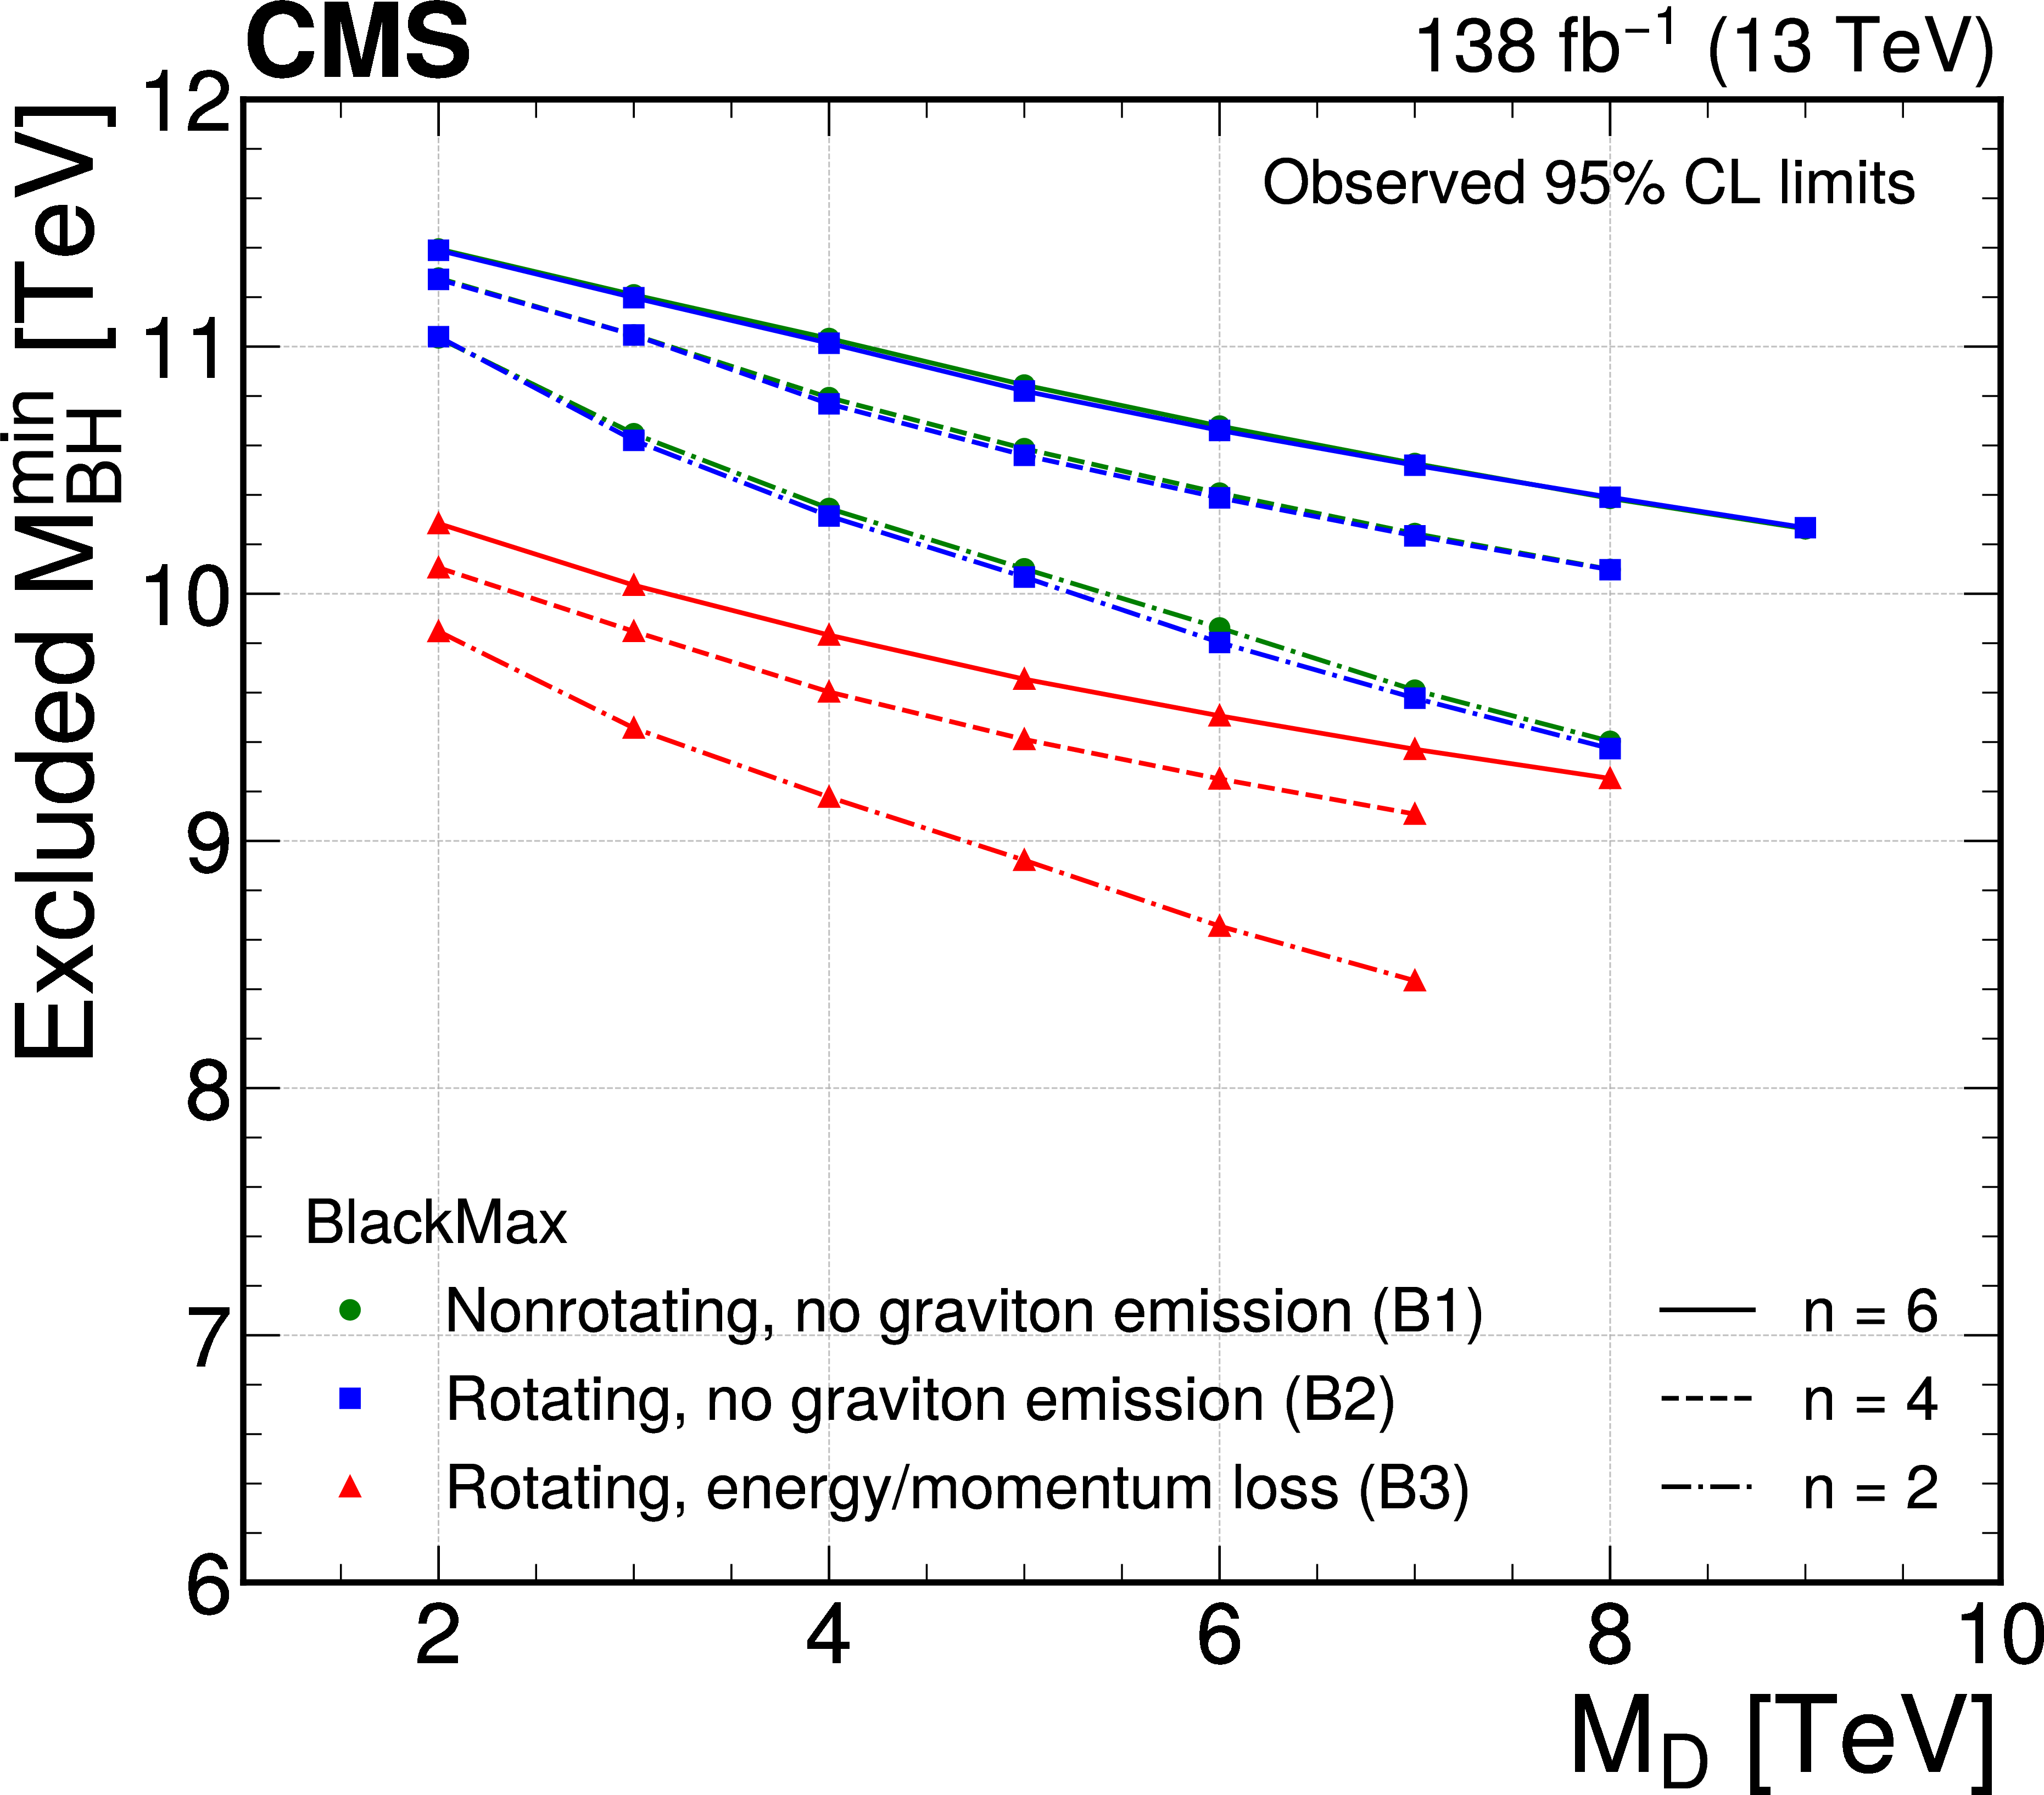
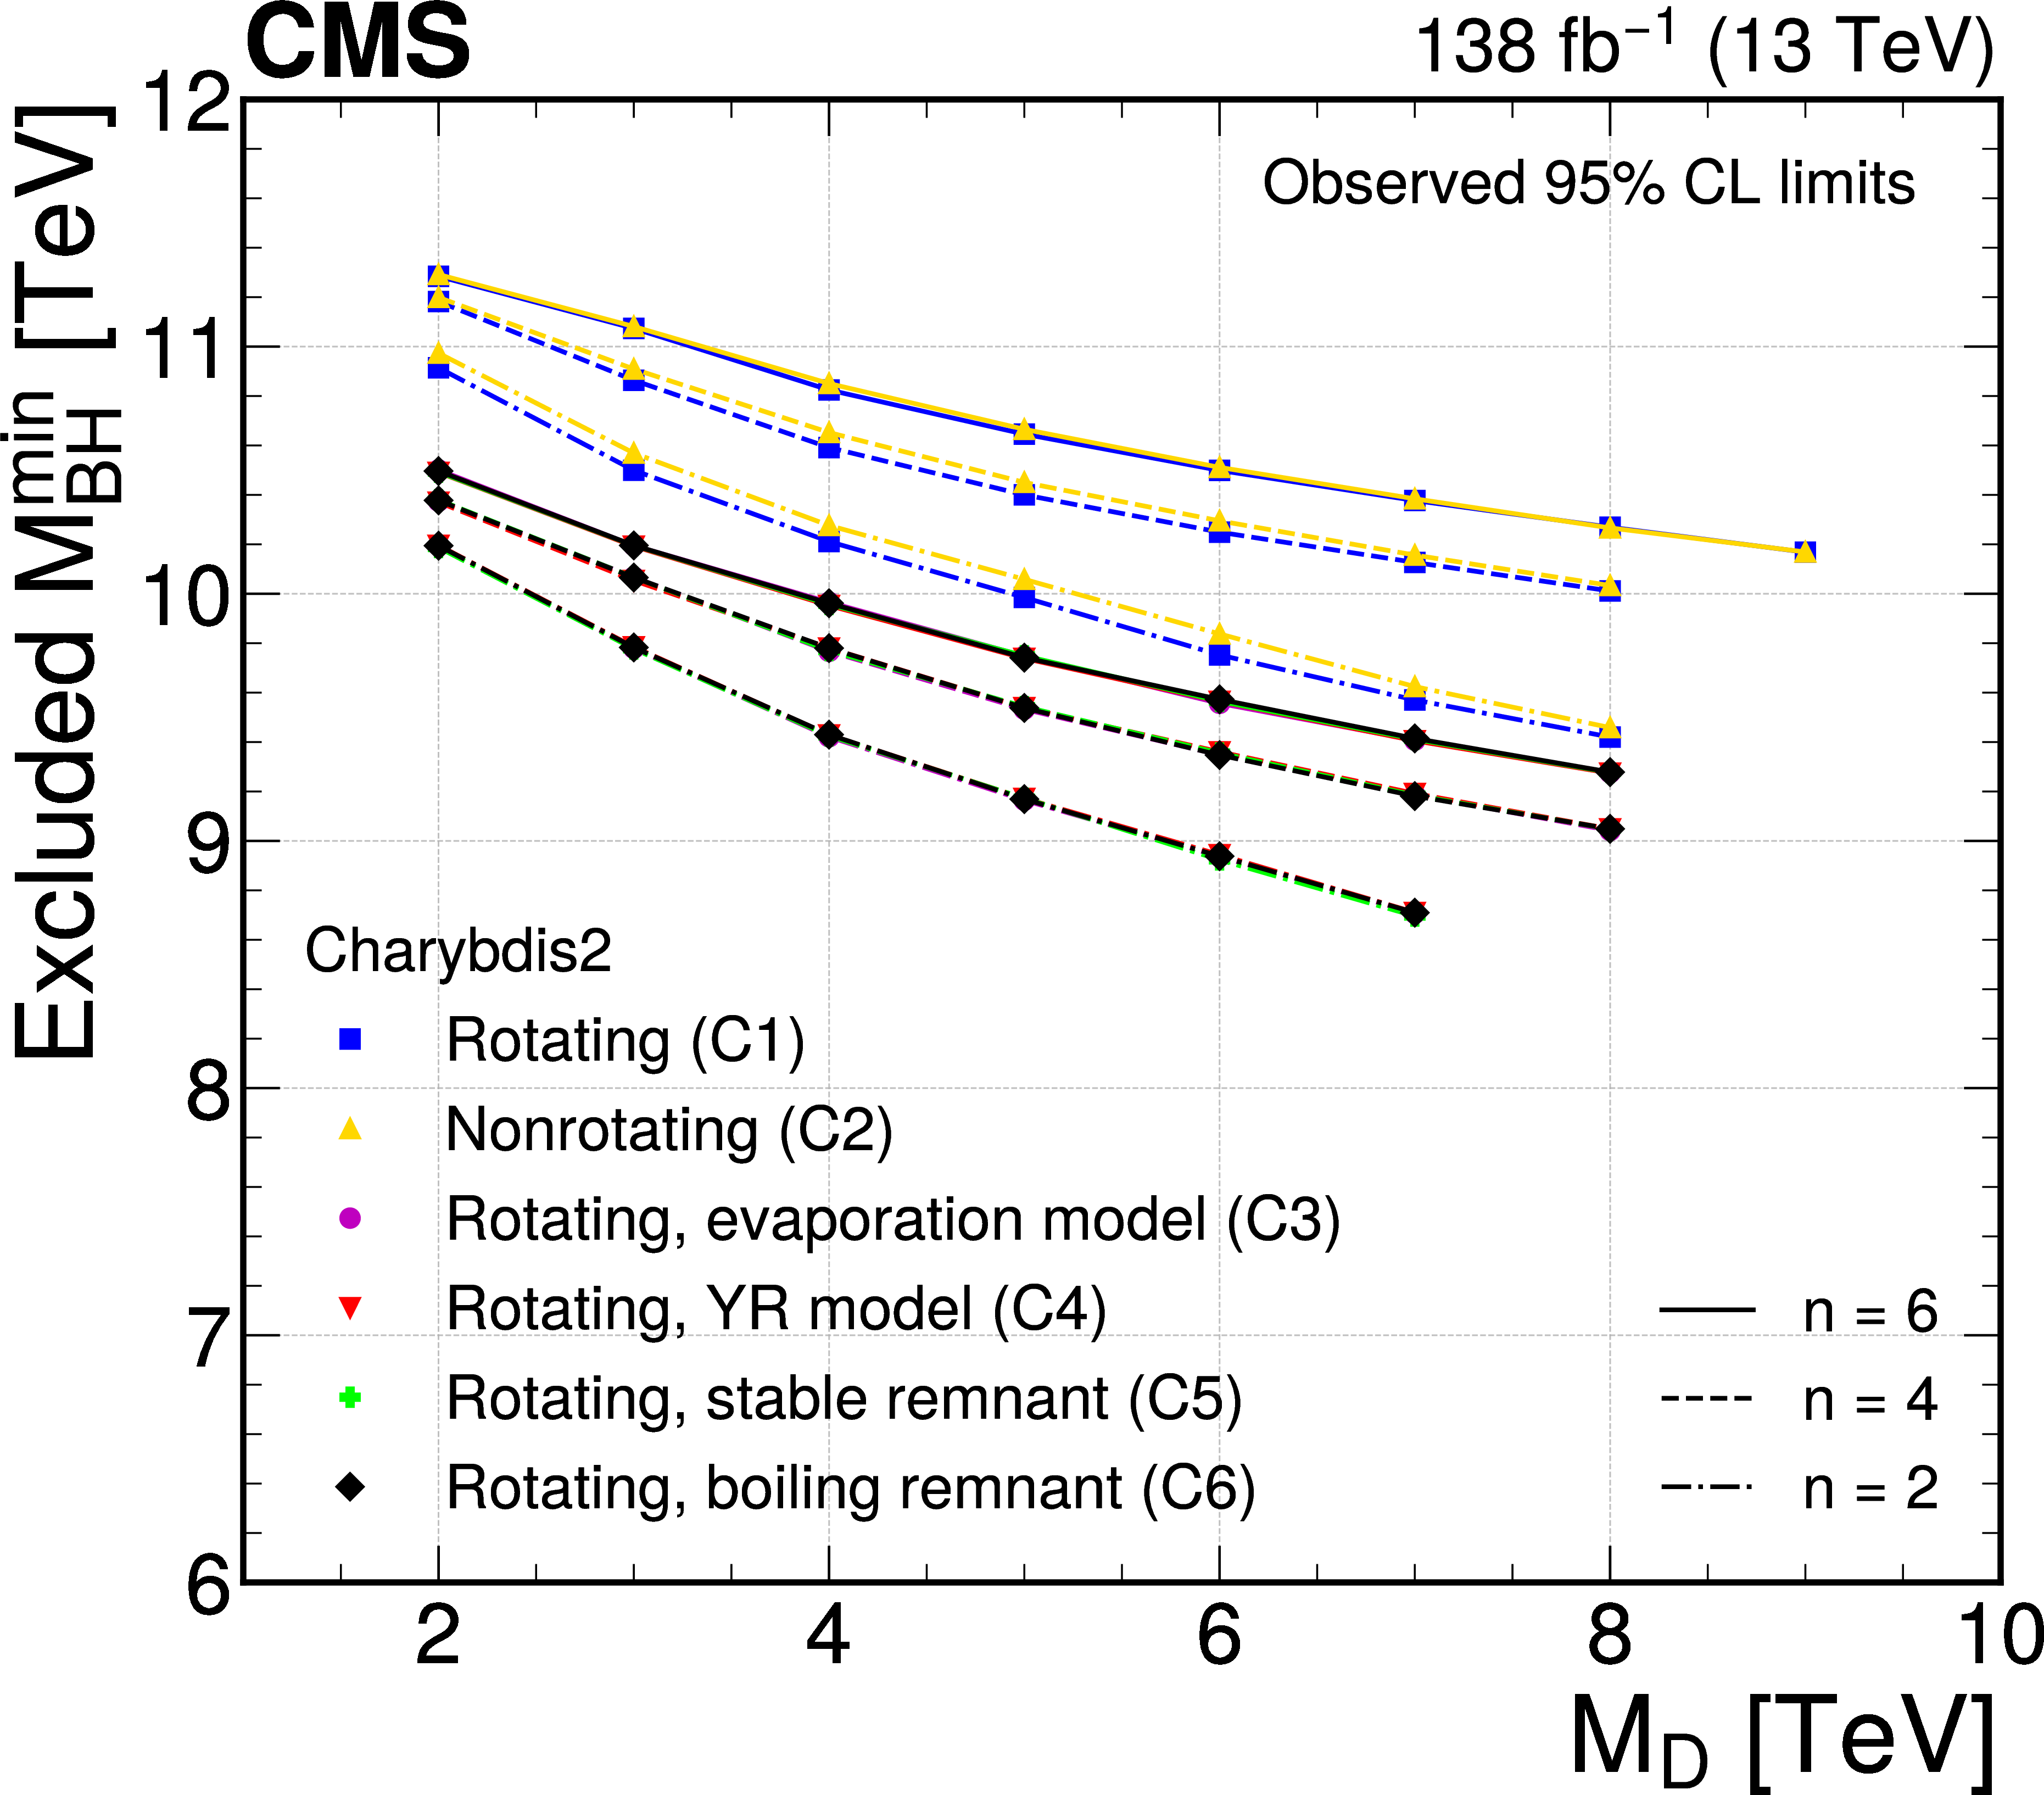
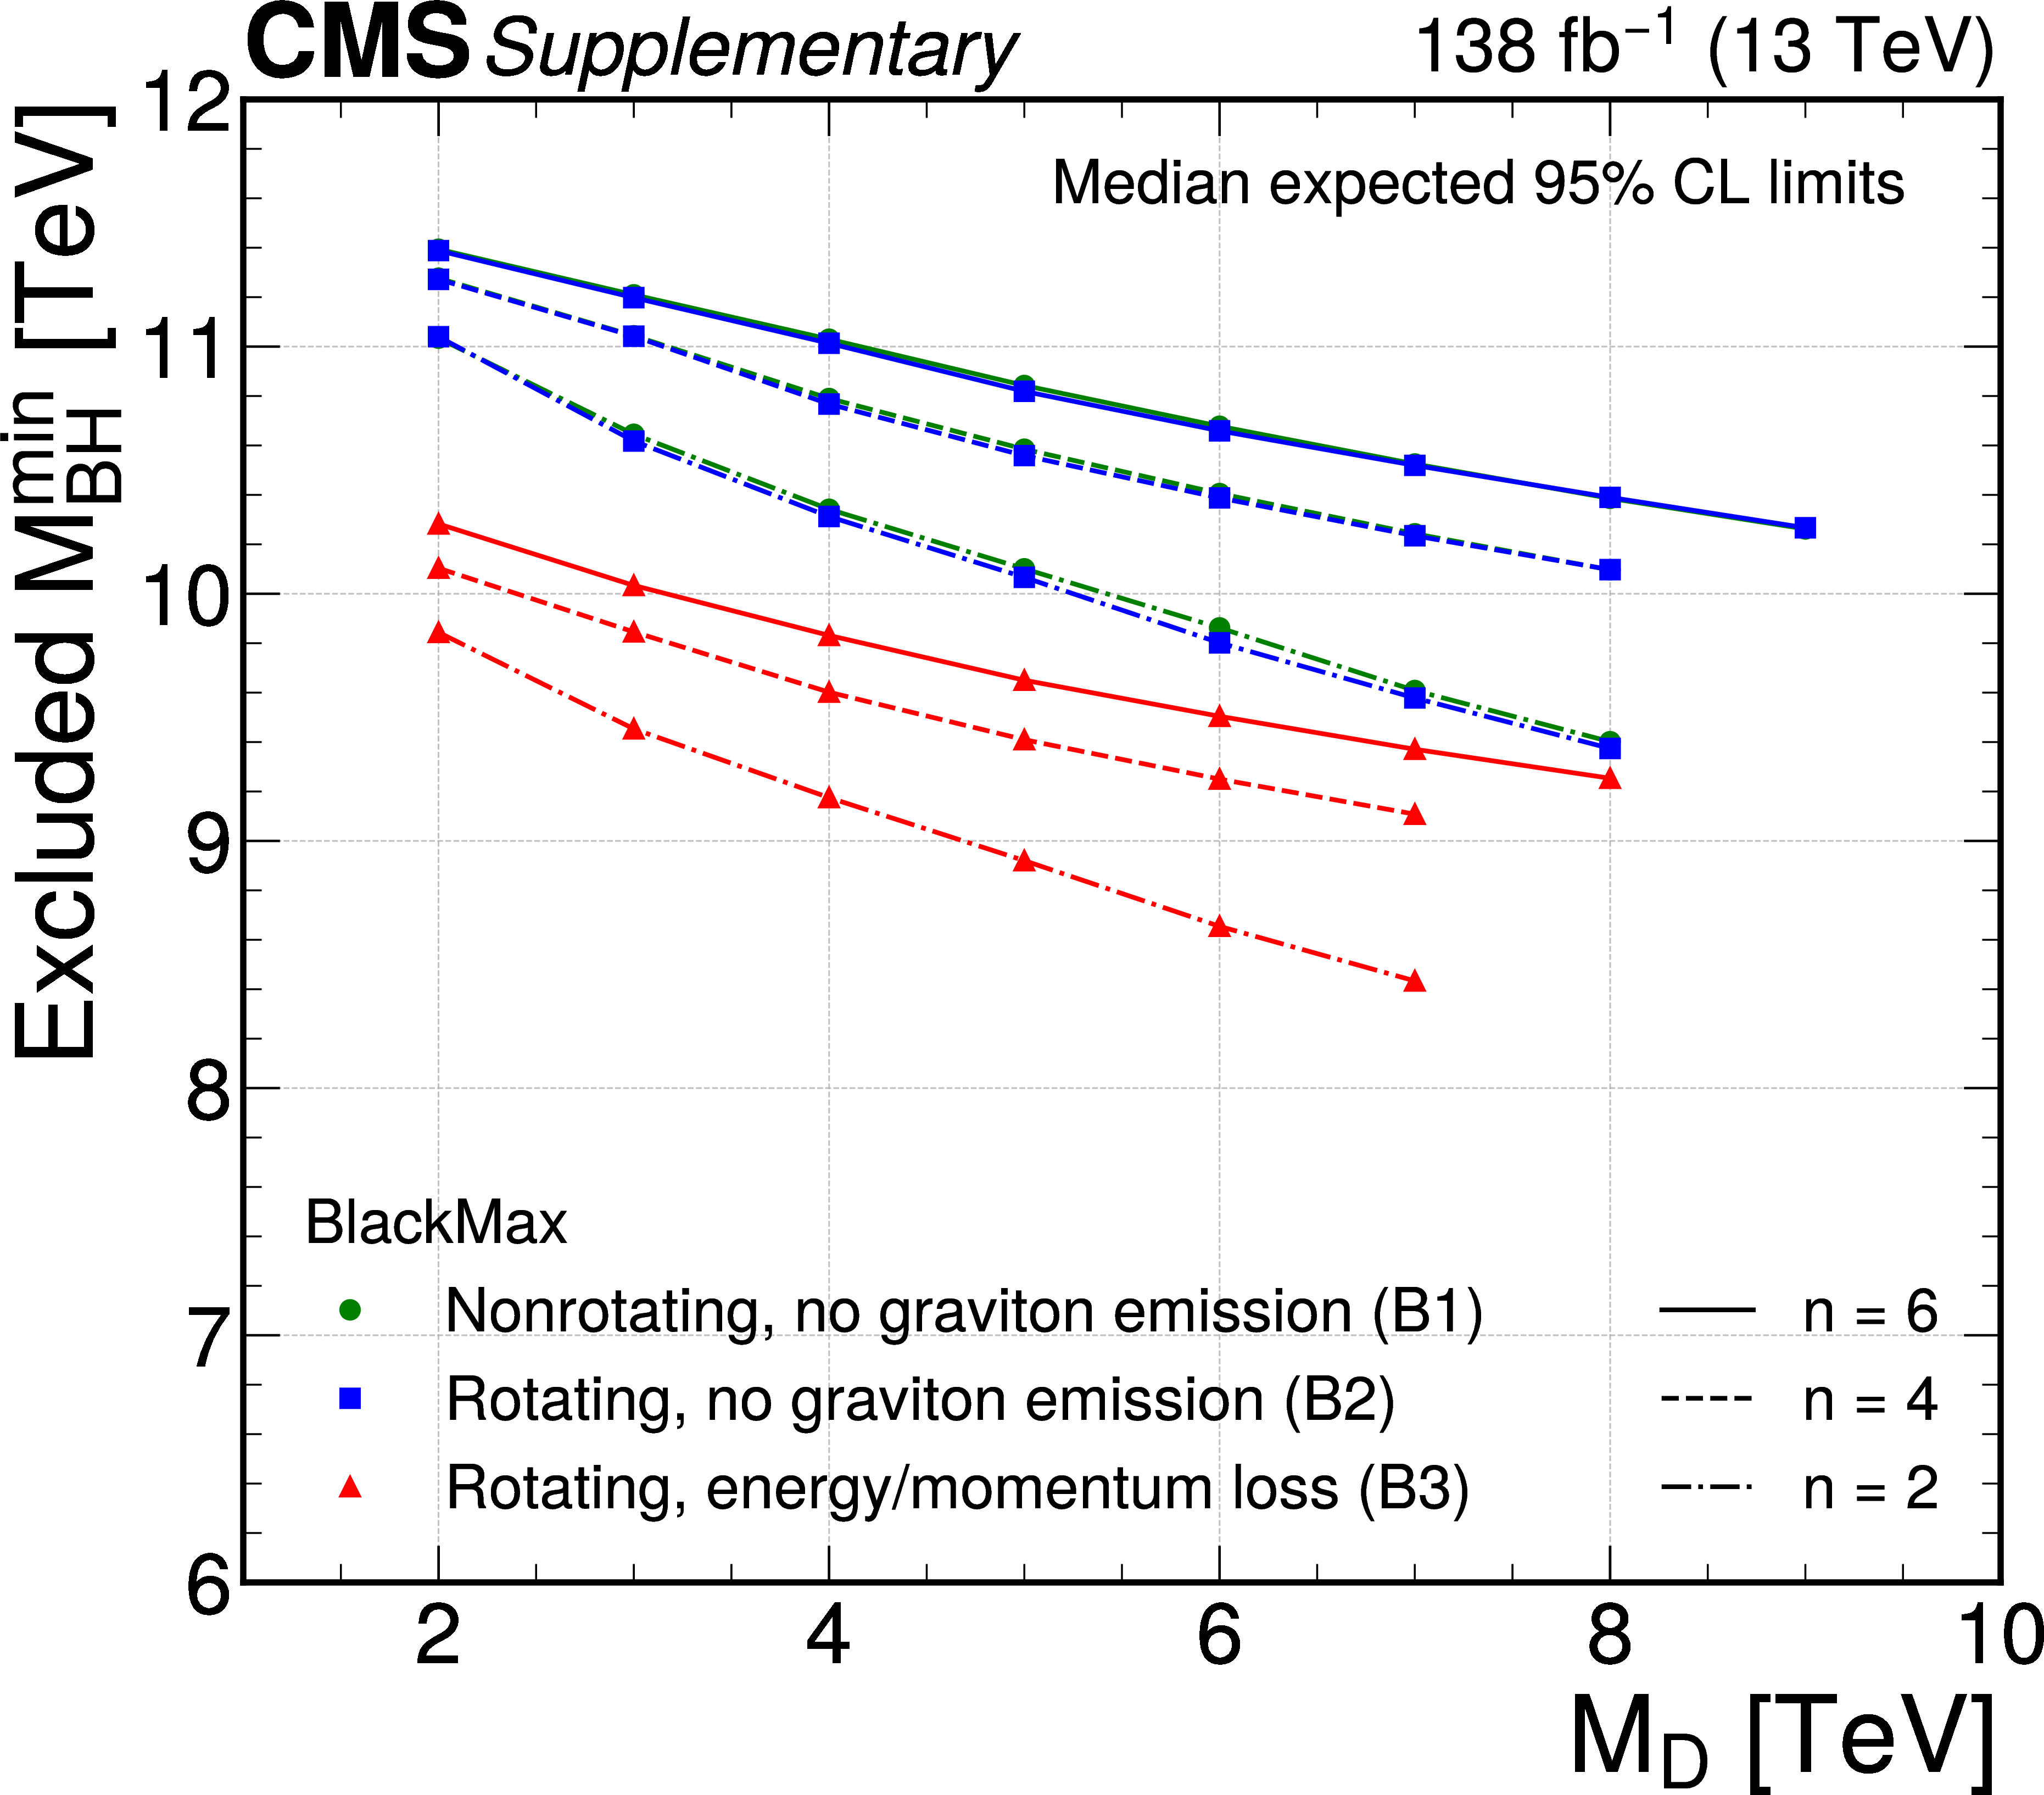
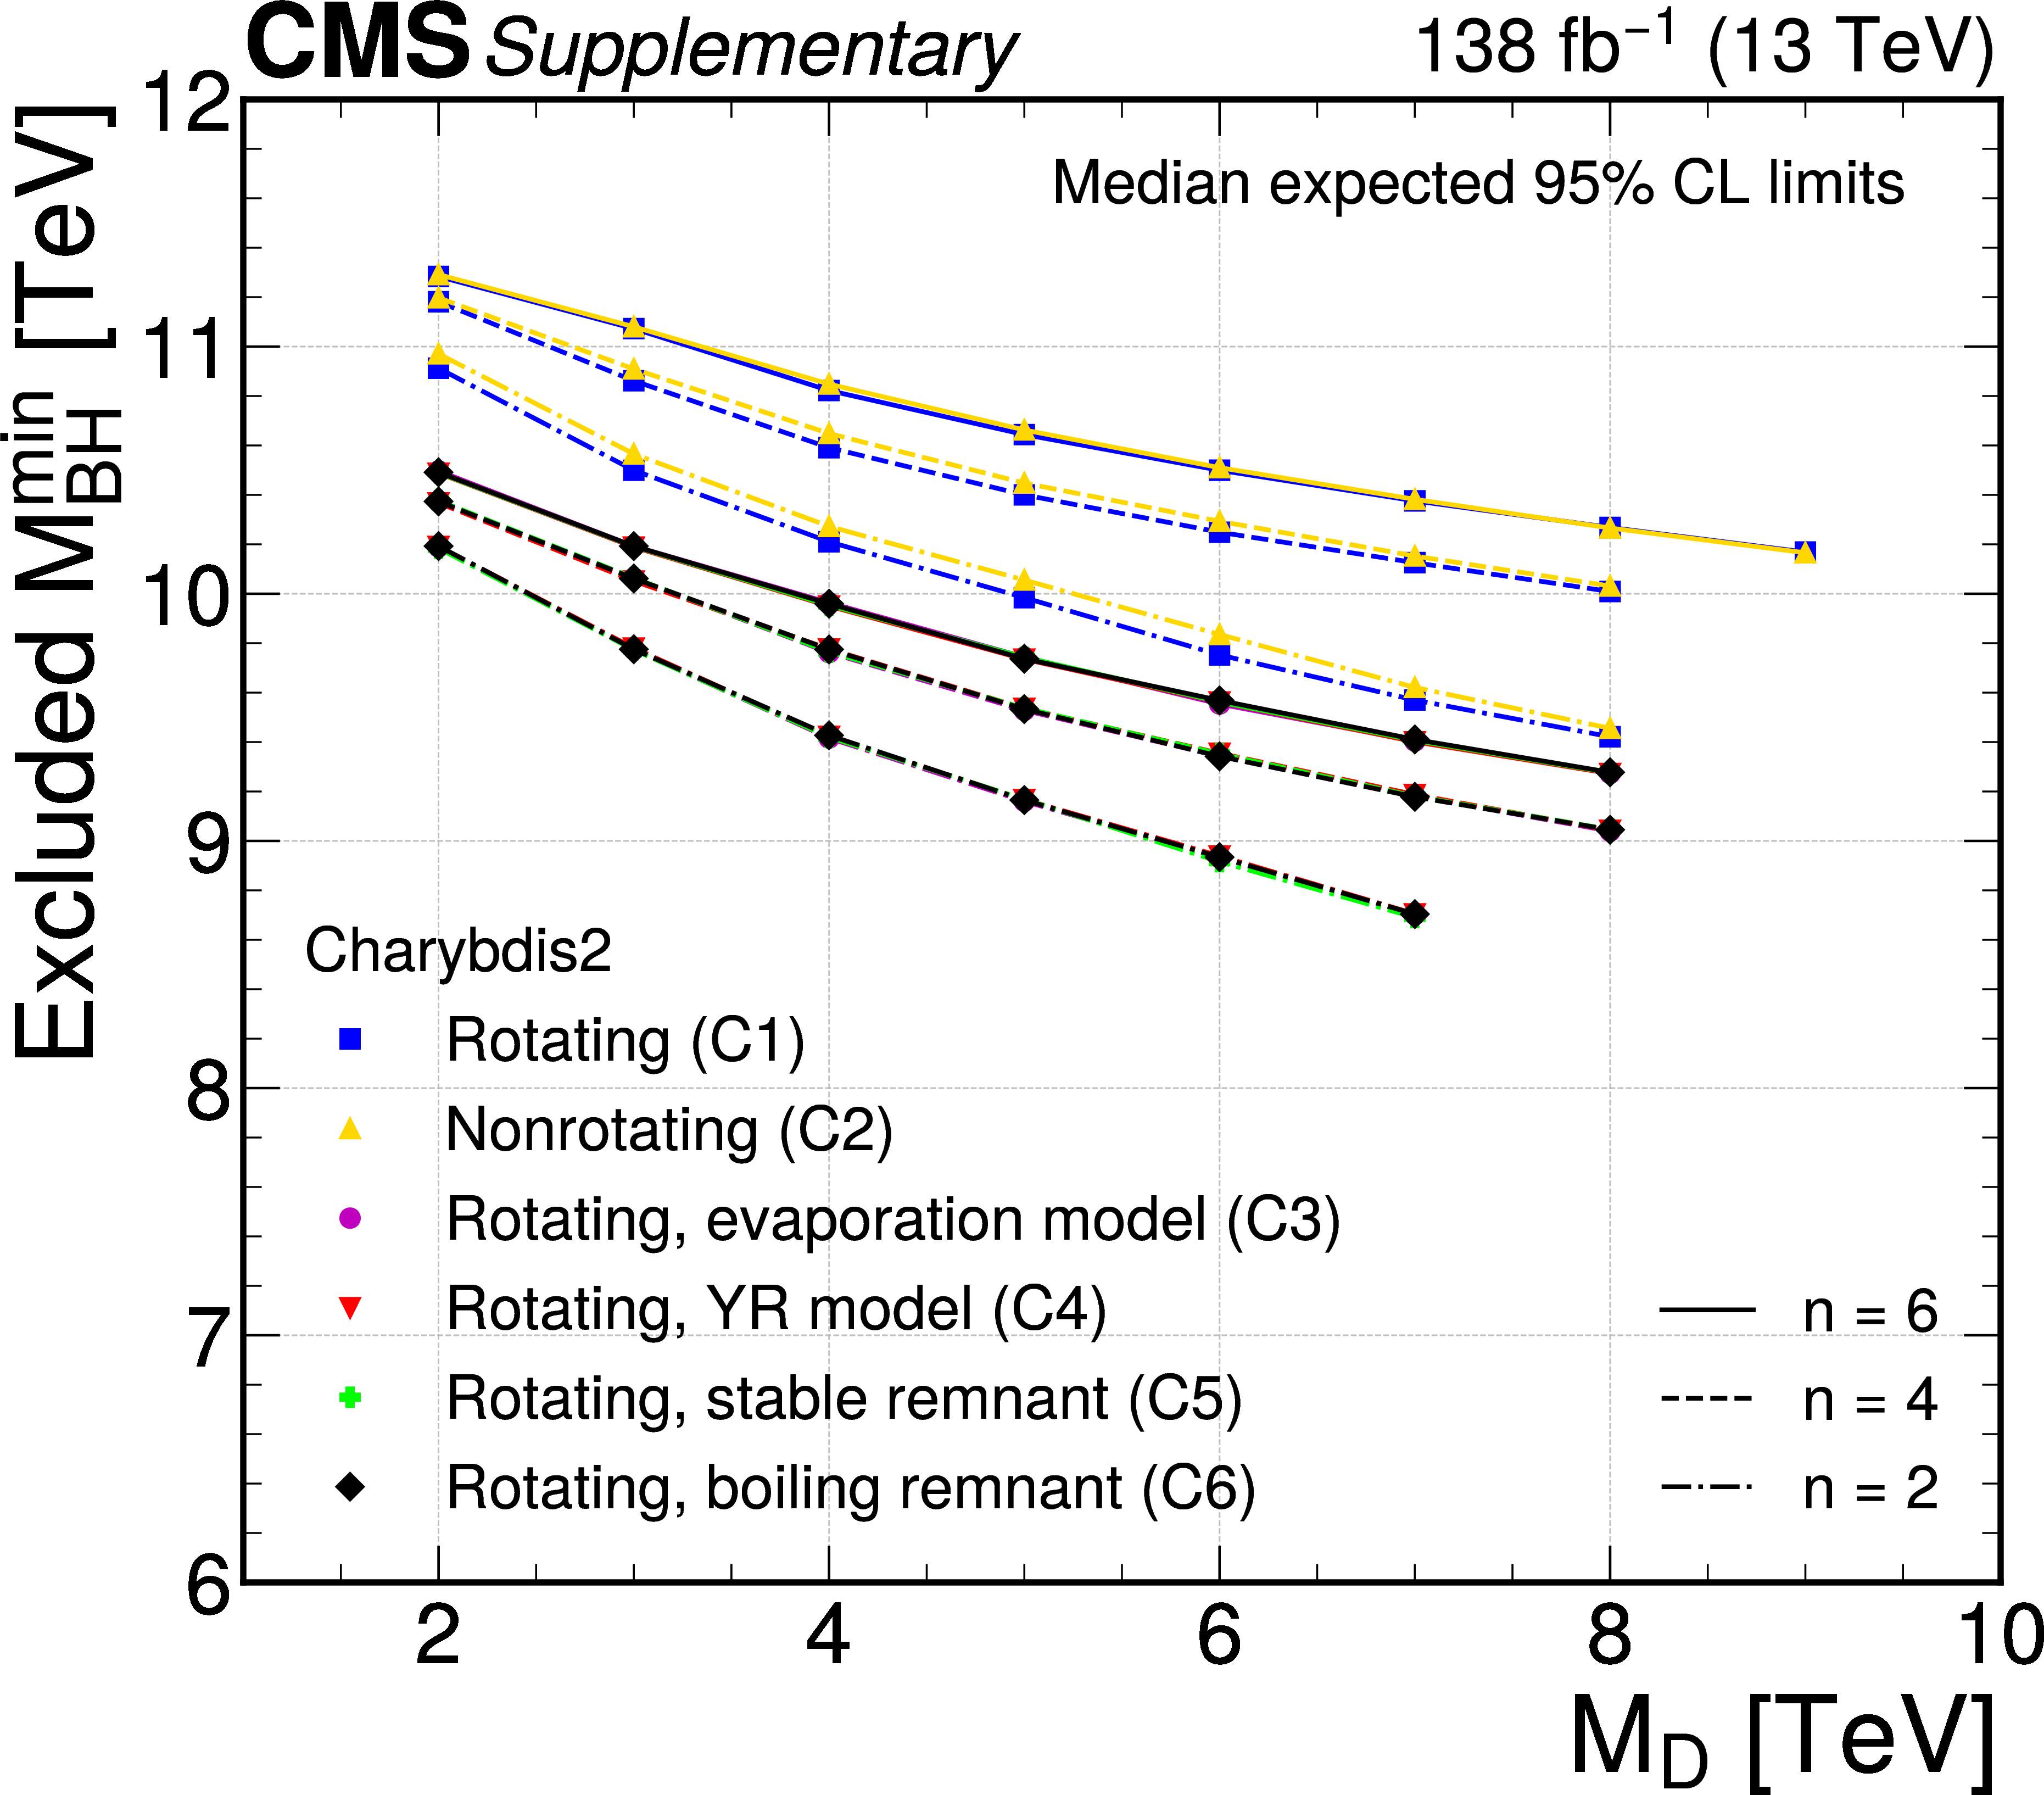
Figure 10:
Excluded $ M_{\text{BH}}^{\text{min}} $ values as functions of $ M_\text{D} $ and $ n $ for a variety of BLACKMAX (left) and CHARYBDIS2 (right) BH models. |
png pdf |
Figure 10-a:
Excluded $ M_{\text{BH}}^{\text{min}} $ values as functions of $ M_\text{D} $ and $ n $ for a variety of BLACKMAX (left) and CHARYBDIS2 (right) BH models. |
png pdf |
Figure 10-b:
Excluded $ M_{\text{BH}}^{\text{min}} $ values as functions of $ M_\text{D} $ and $ n $ for a variety of BLACKMAX (left) and CHARYBDIS2 (right) BH models. |
png pdf |
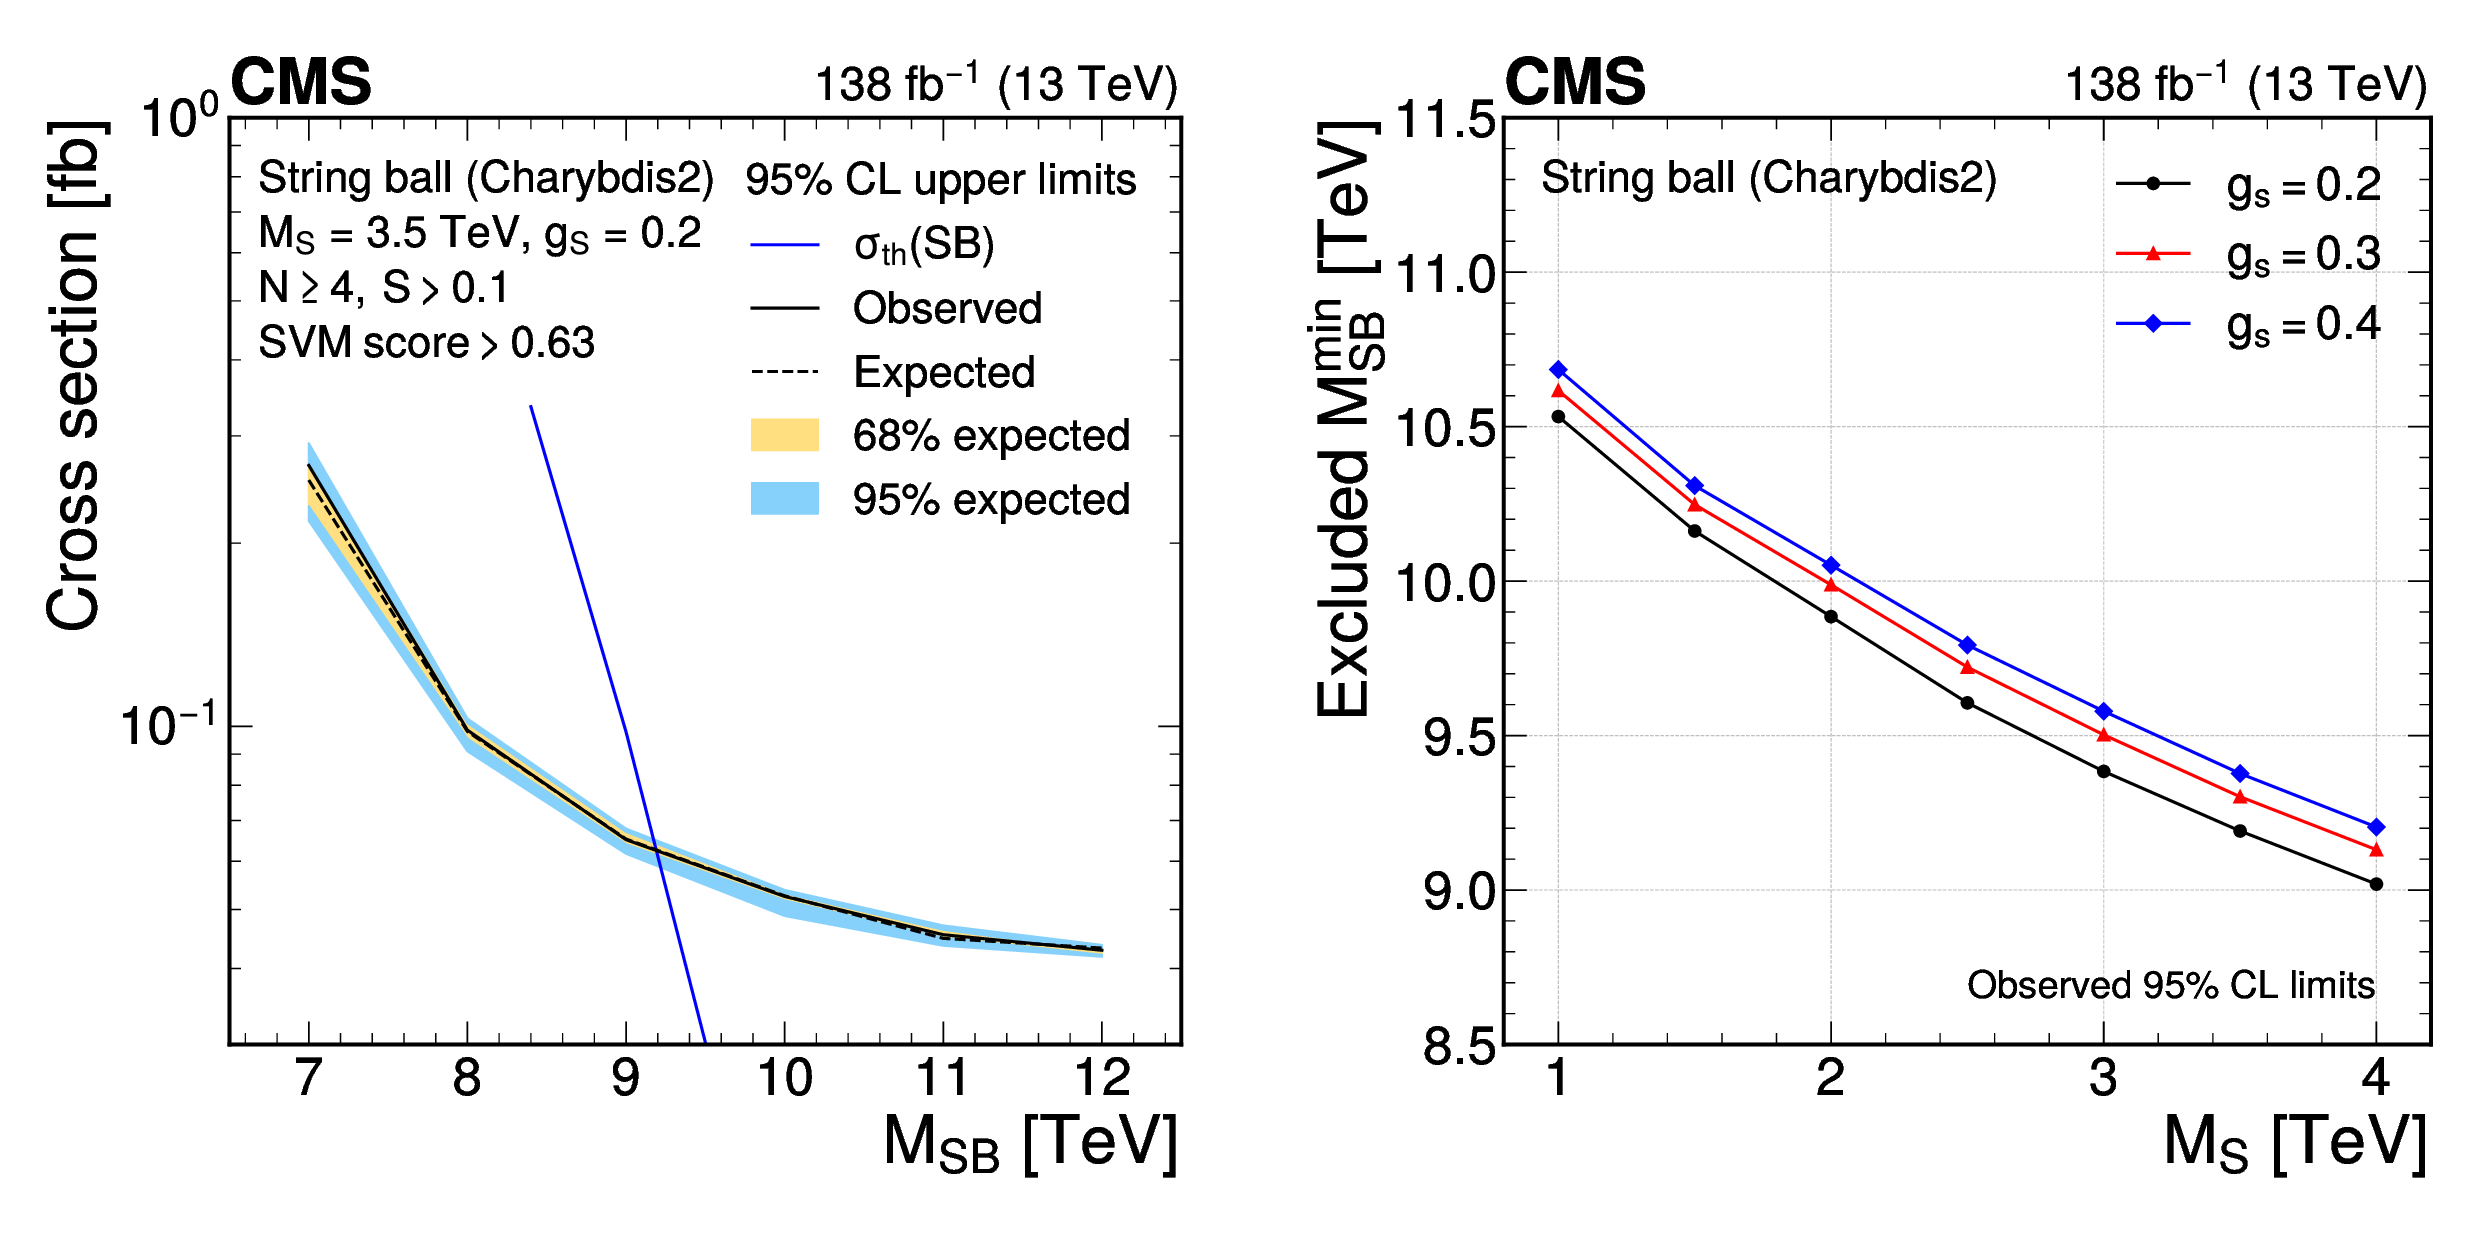
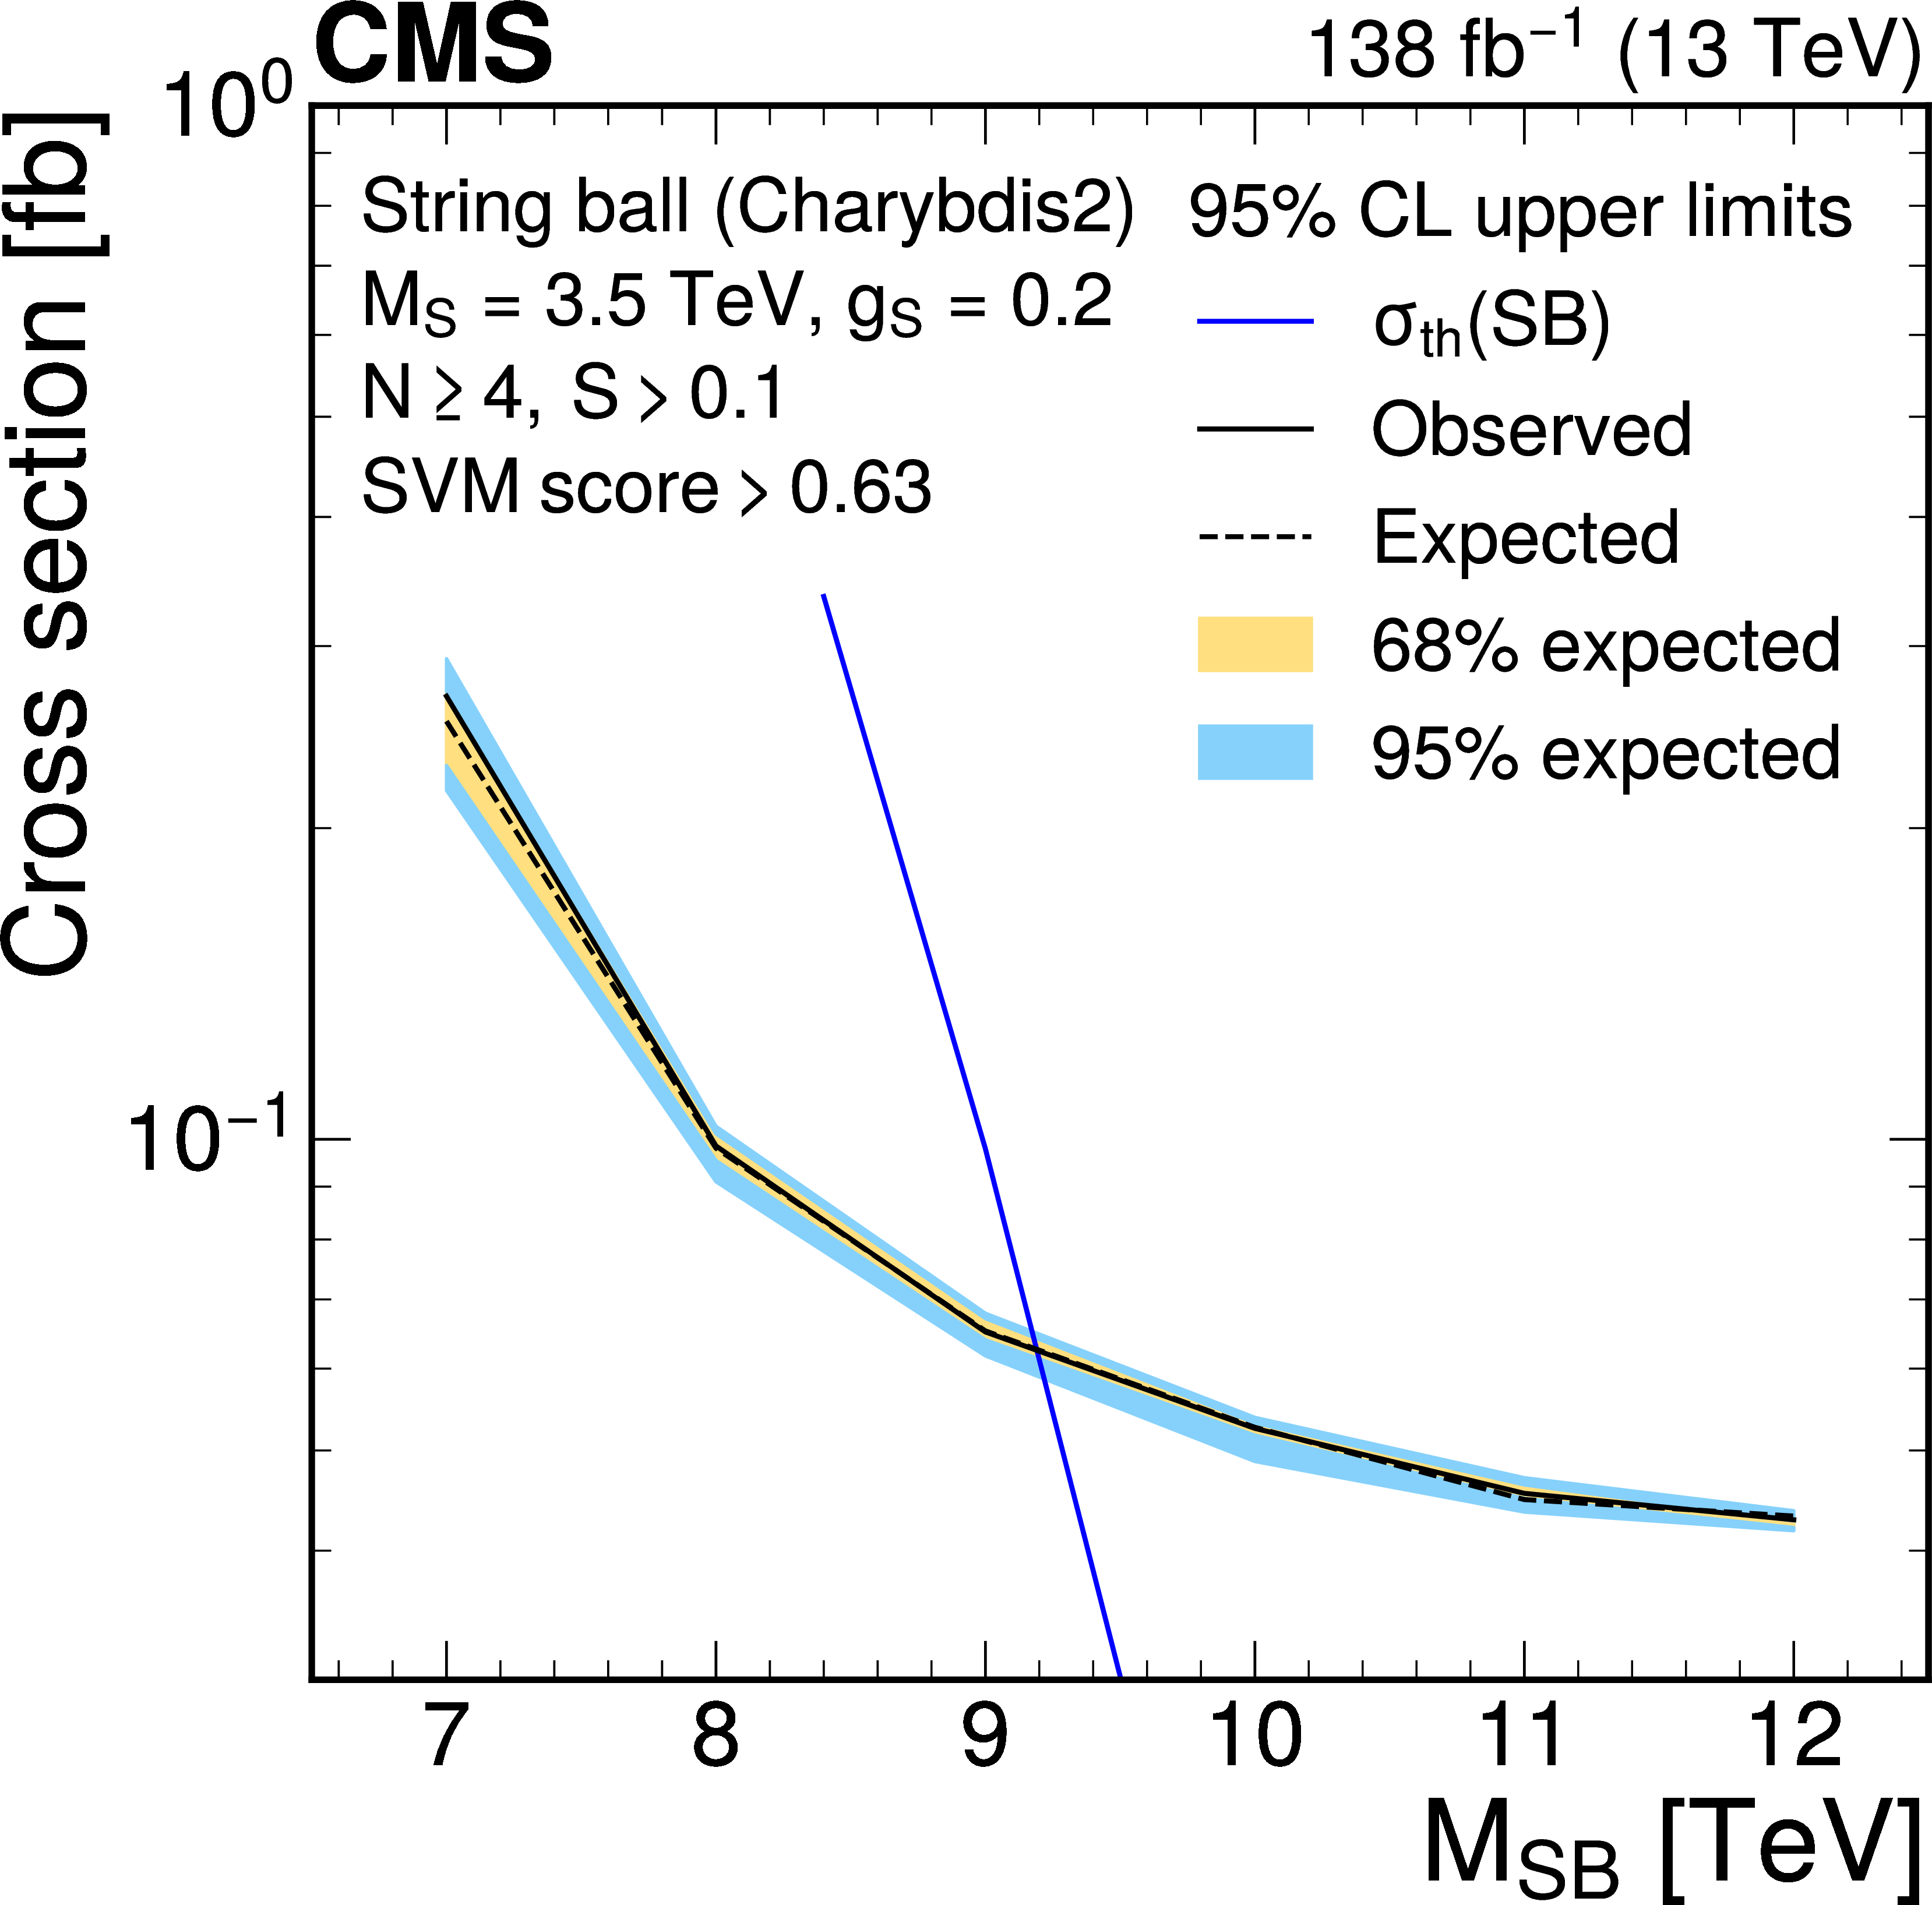
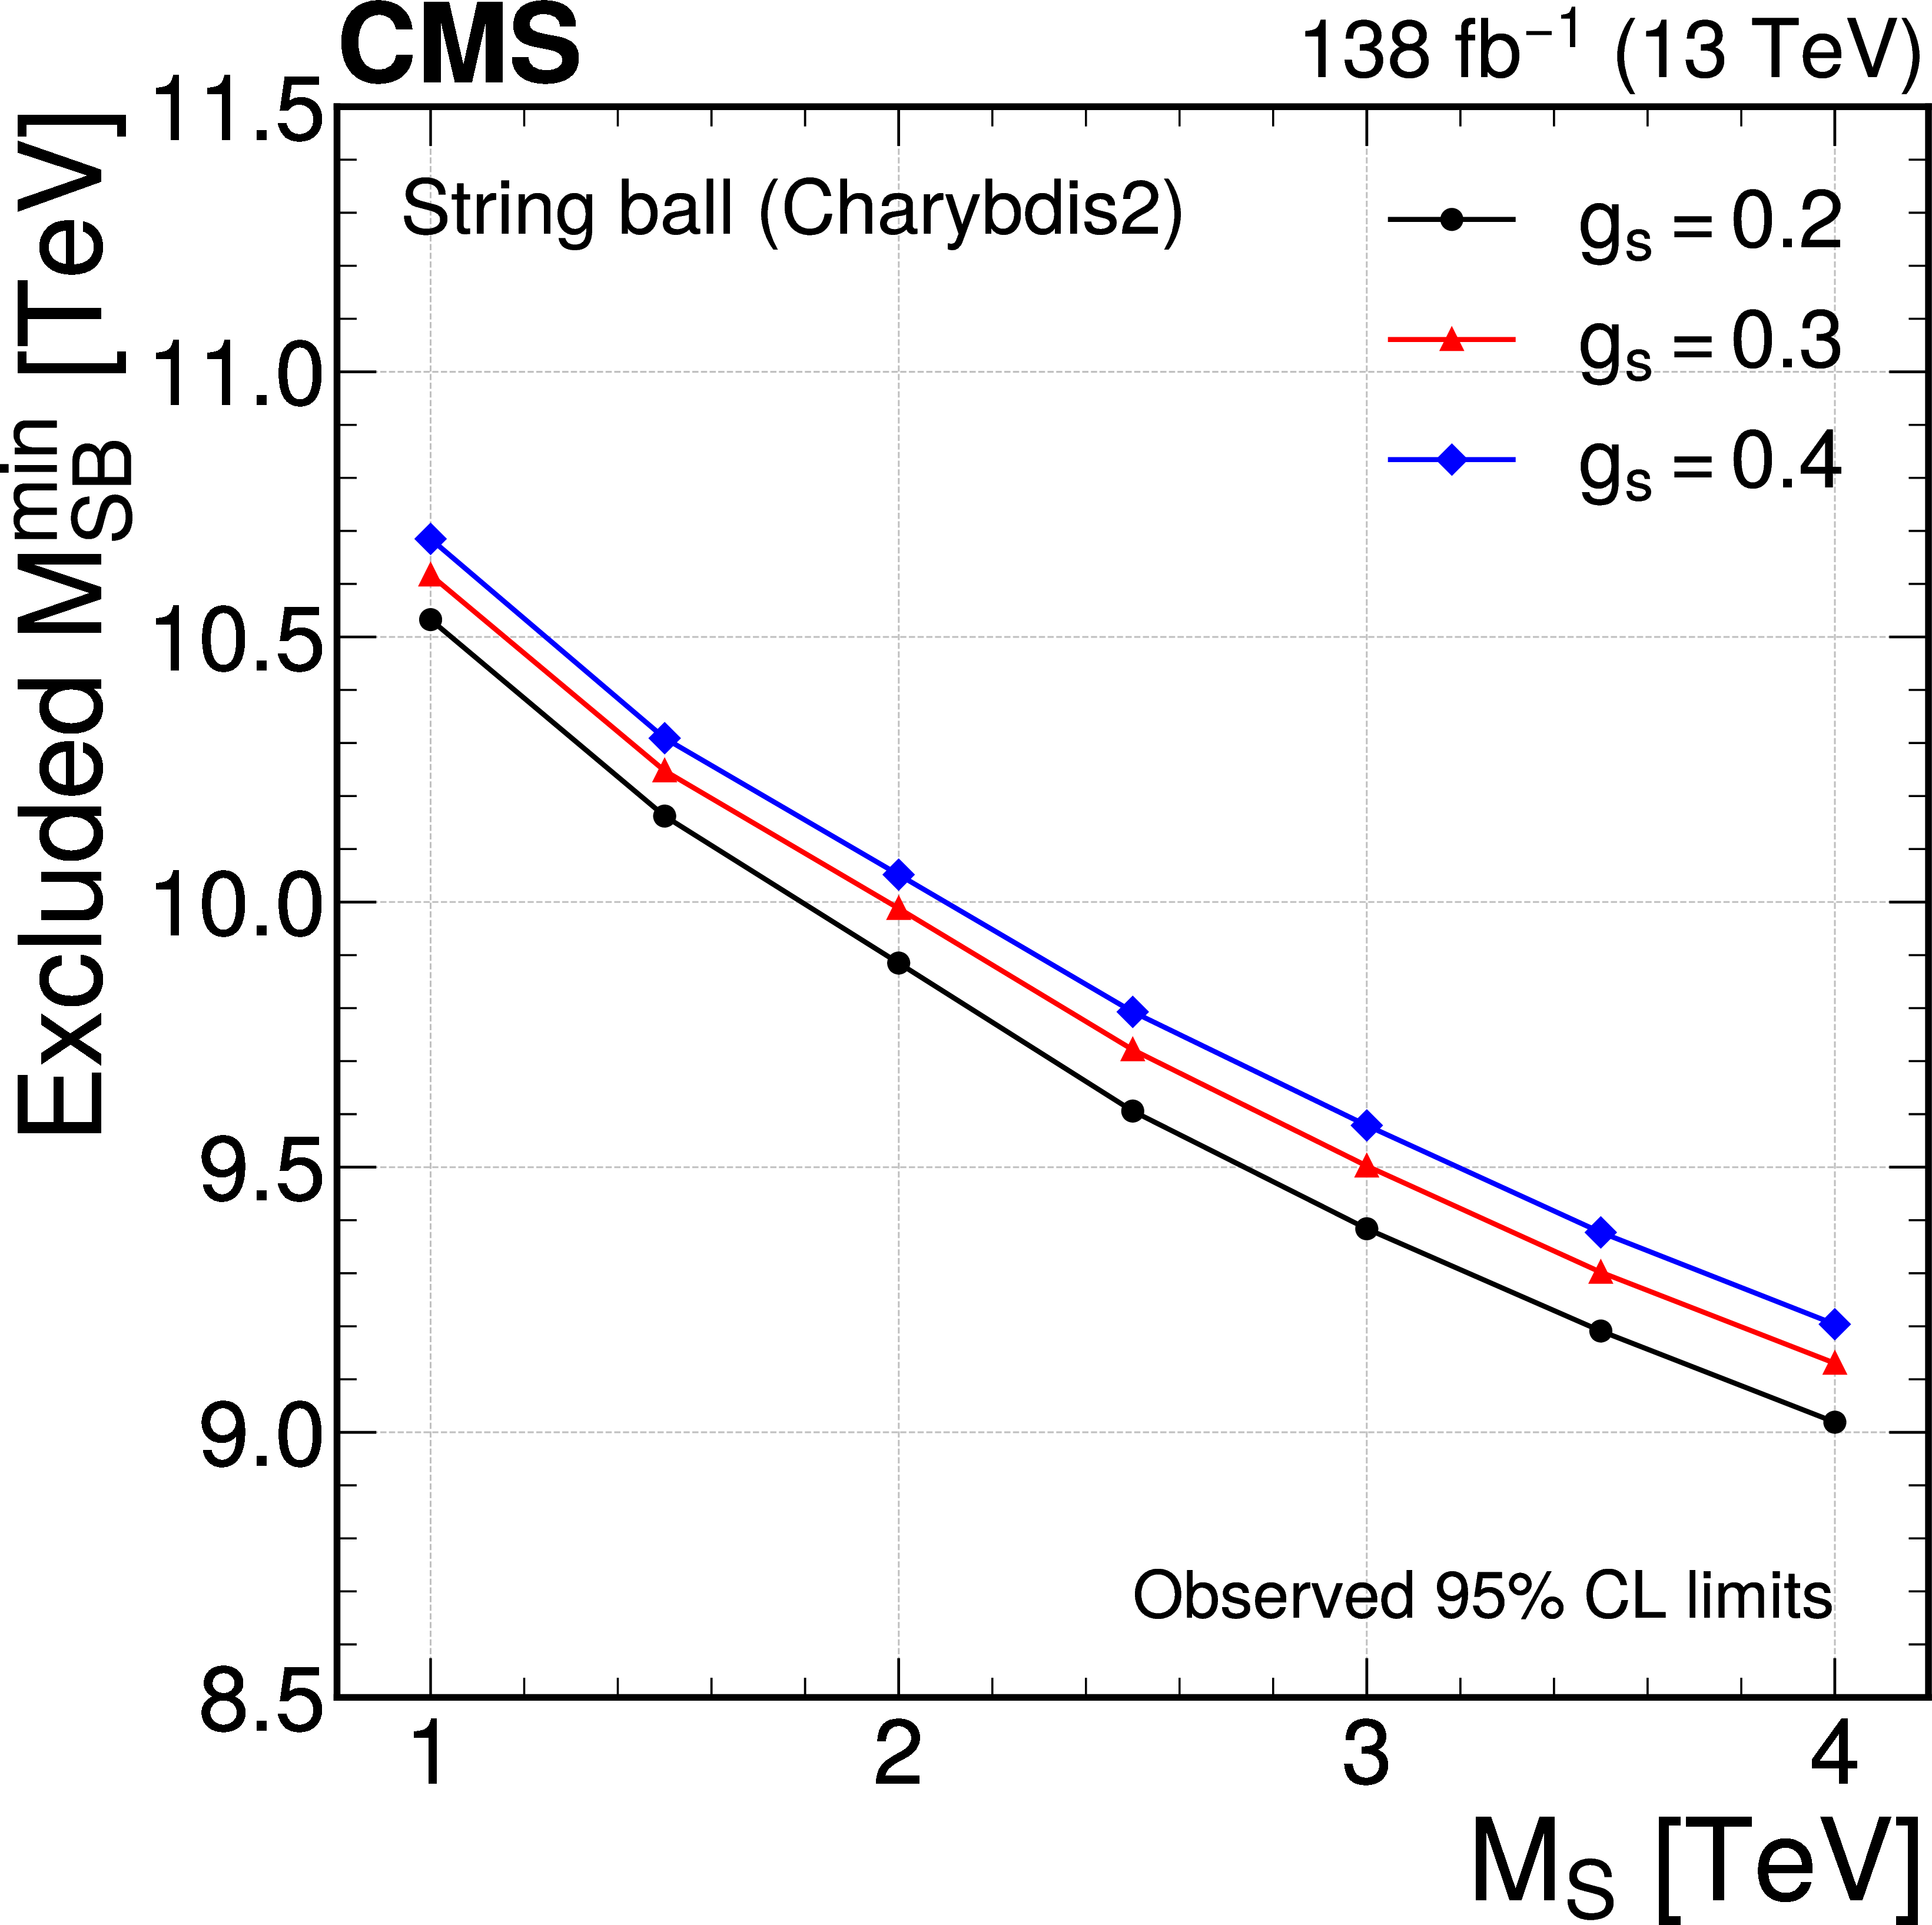
Figure 11:
Expected and observed 95% CL upper limits for SB models with $ M_{\text{S}} = $ 3.5 TeV and $ g_{\text{S}} = $ 0.2 (left) and excluded SB mass values as functions of $ M_{\text{S}} $ at $ g_{\text{S}}=0.2, $ 0.3, and 0.4 (right). The inner (outer) band represents the 68% (95%) quantile of the expected limit. |
png pdf |
Figure 11-a:
Expected and observed 95% CL upper limits for SB models with $ M_{\text{S}} = $ 3.5 TeV and $ g_{\text{S}} = $ 0.2 (left) and excluded SB mass values as functions of $ M_{\text{S}} $ at $ g_{\text{S}}=0.2, $ 0.3, and 0.4 (right). The inner (outer) band represents the 68% (95%) quantile of the expected limit. |
png pdf |
Figure 11-b:
Expected and observed 95% CL upper limits for SB models with $ M_{\text{S}} = $ 3.5 TeV and $ g_{\text{S}} = $ 0.2 (left) and excluded SB mass values as functions of $ M_{\text{S}} $ at $ g_{\text{S}}=0.2, $ 0.3, and 0.4 (right). The inner (outer) band represents the 68% (95%) quantile of the expected limit. |
png pdf |
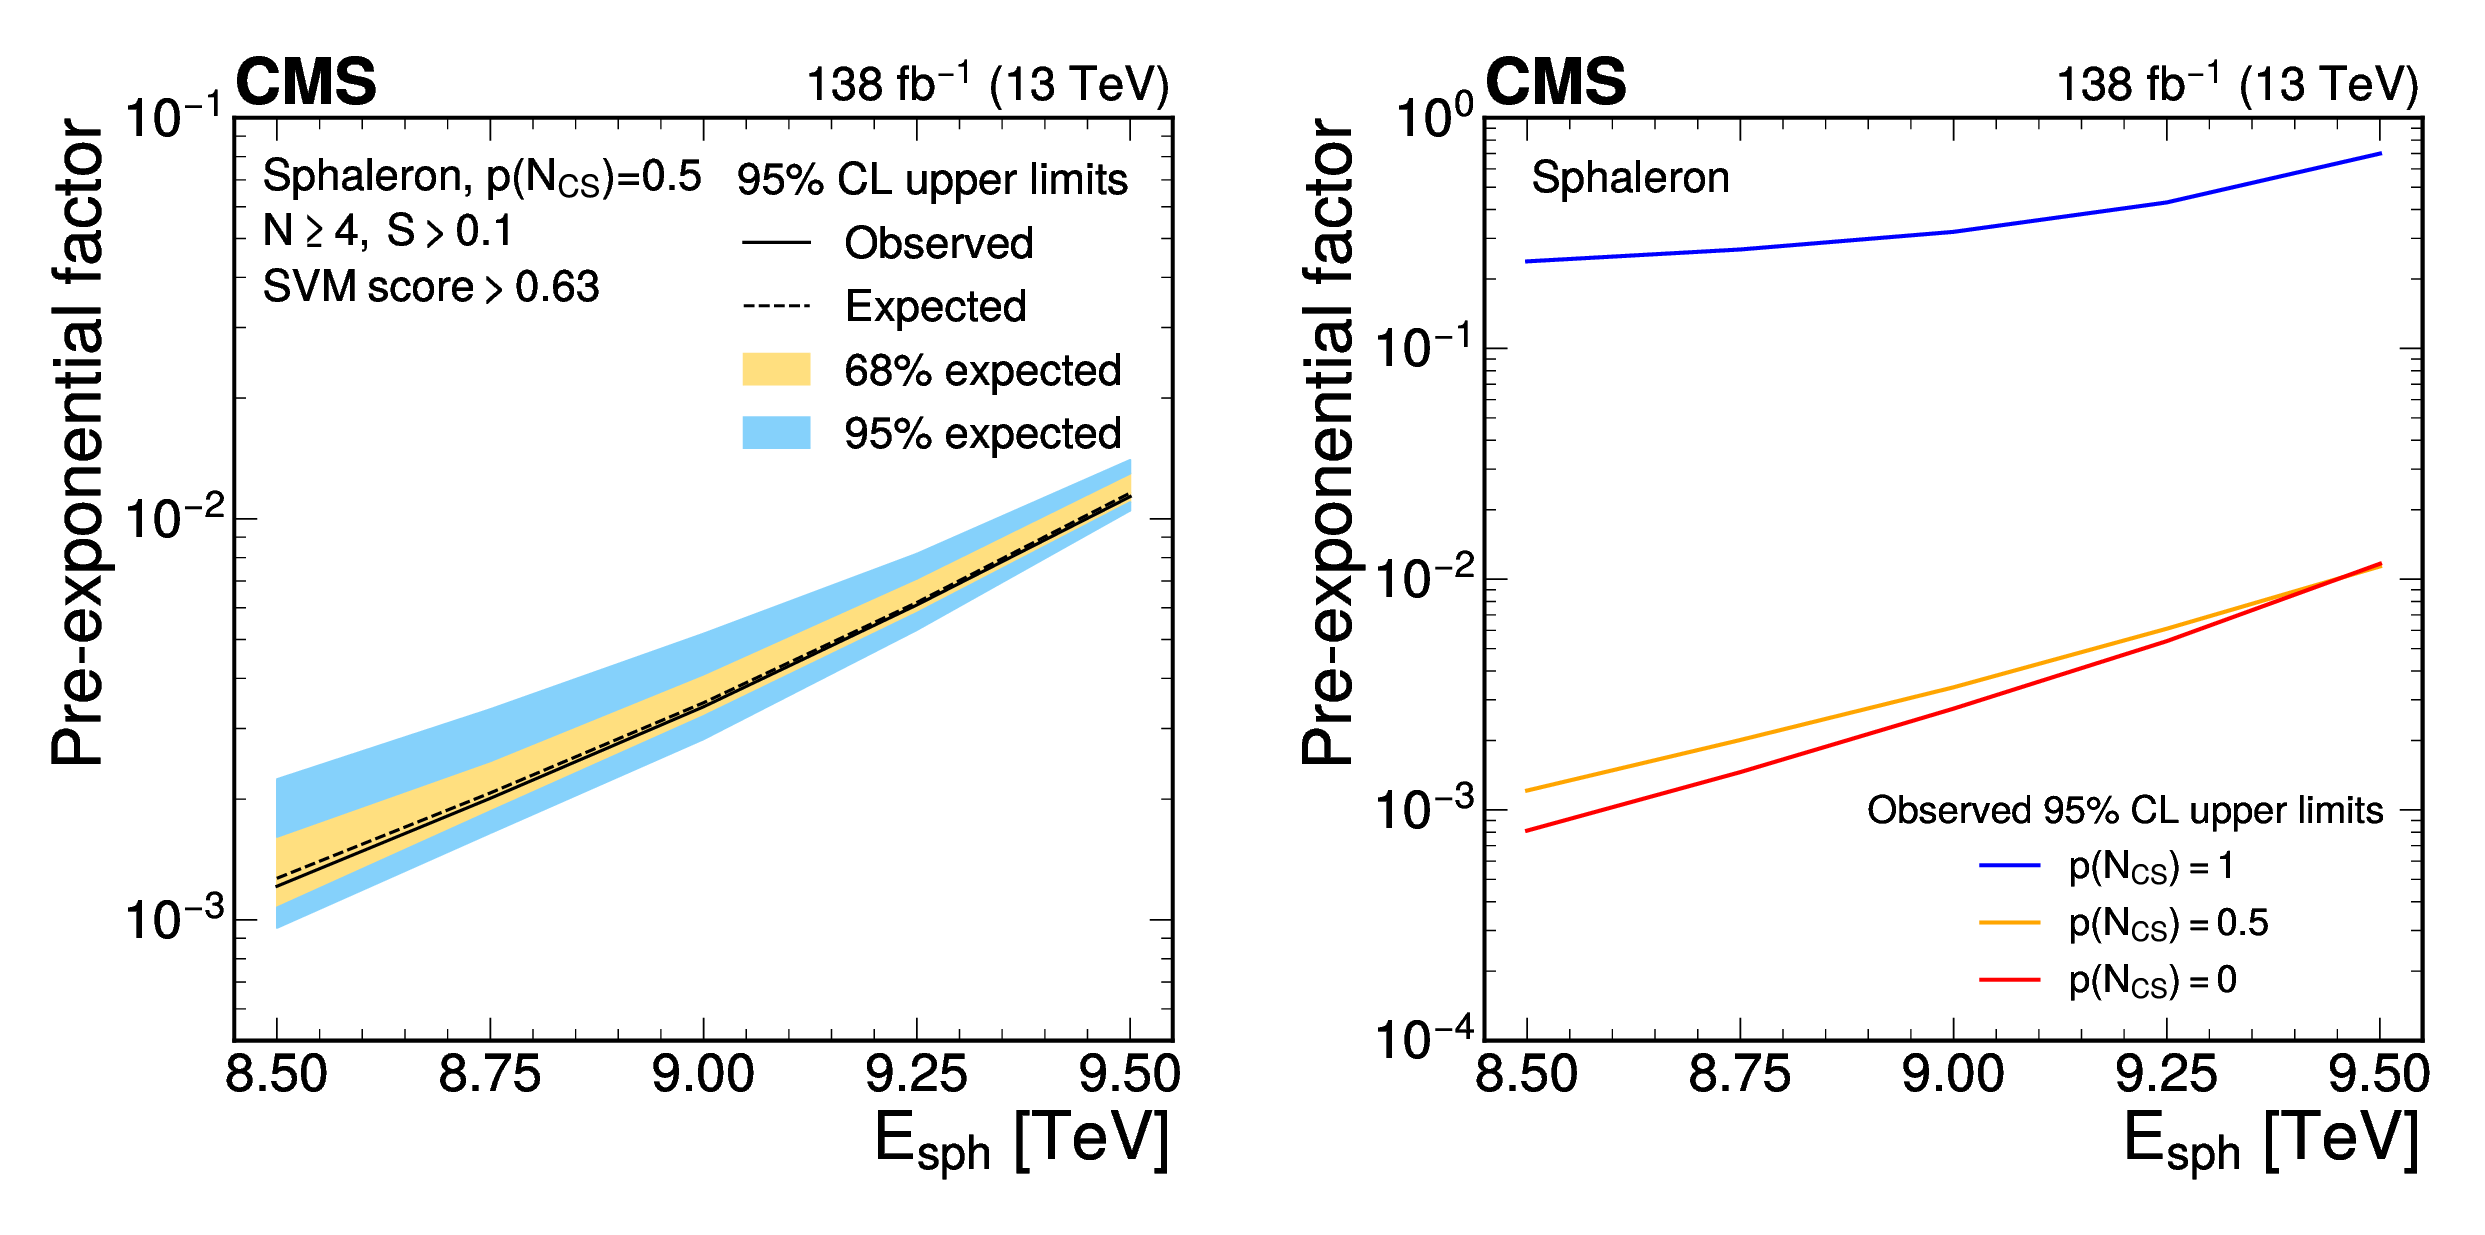
Figure 12:
Expected and observed 95% CL upper limits on the pre-exponential factor for the sphaleron model with $ p({N_\text{CS}})= $ 0.5 (left), and observed limits with $ p({N_\text{CS}})= $ 0, 0.5, and 1 (right). The inner (outer) band (left) represents the 68% (95%) quantiles of the expected limit. |
png pdf |
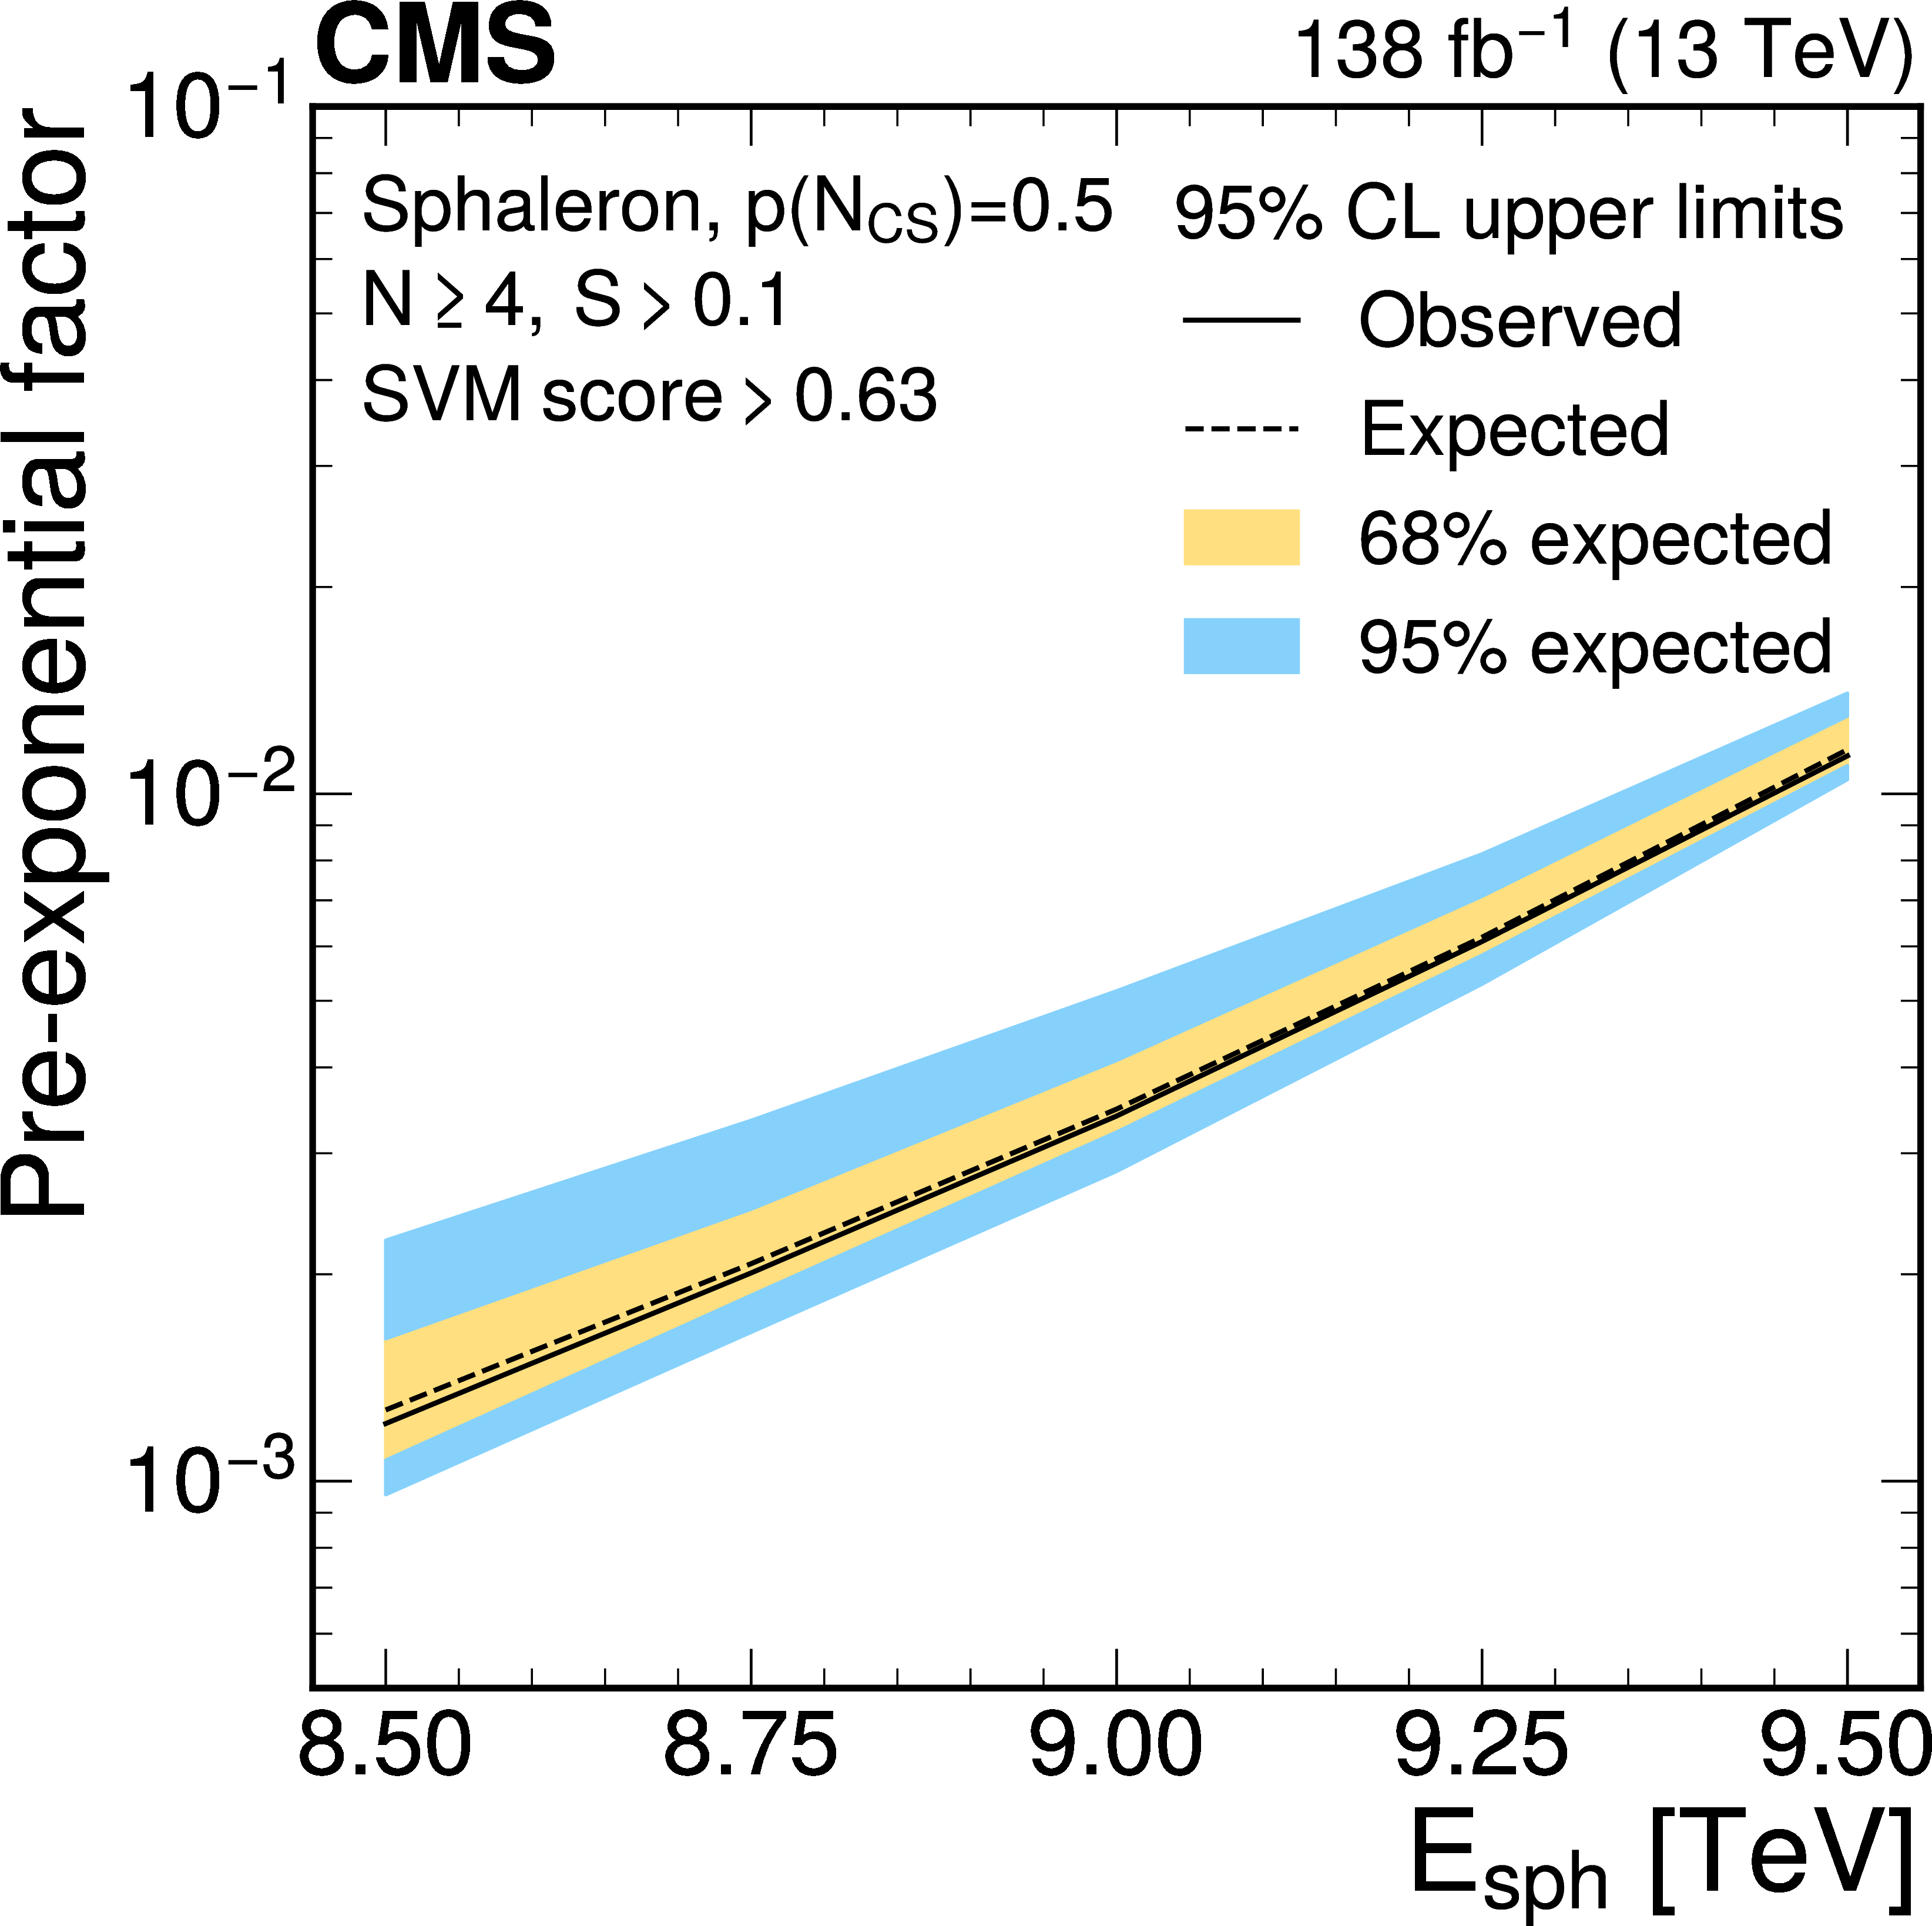
Figure 12-a:
Expected and observed 95% CL upper limits on the pre-exponential factor for the sphaleron model with $ p({N_\text{CS}})= $ 0.5 (left), and observed limits with $ p({N_\text{CS}})= $ 0, 0.5, and 1 (right). The inner (outer) band (left) represents the 68% (95%) quantiles of the expected limit. |
png pdf |
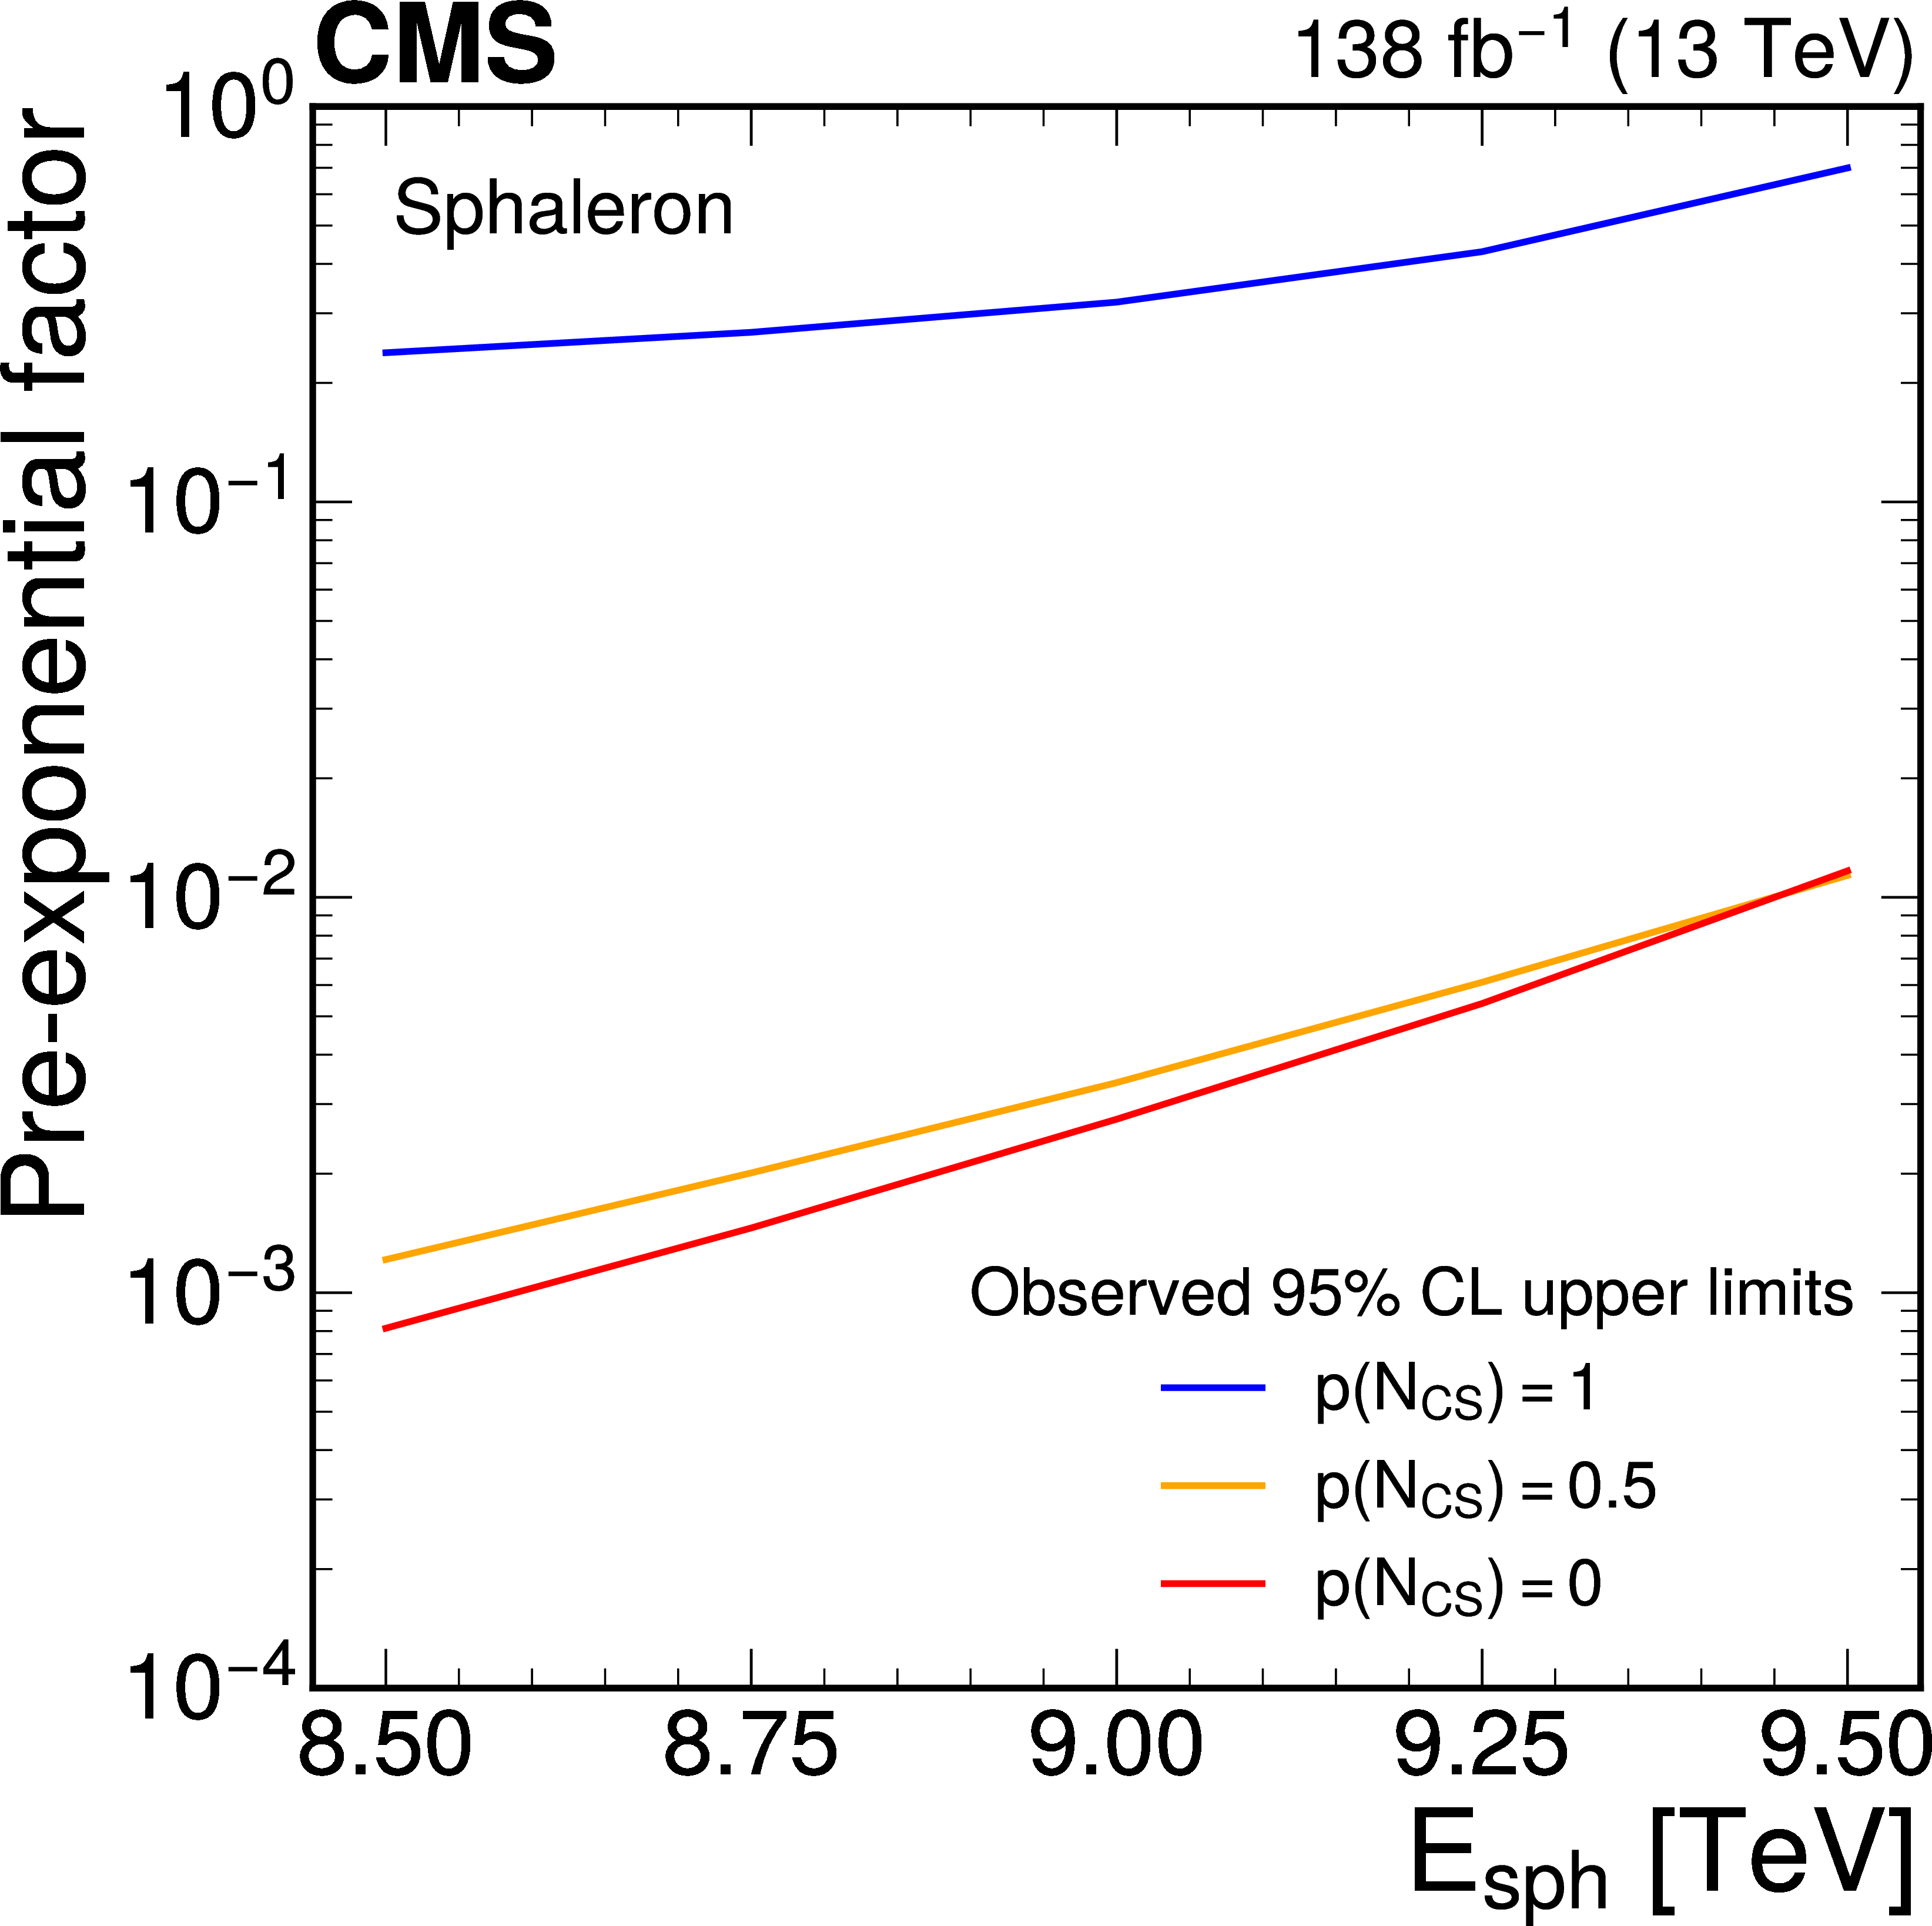
Figure 12-b:
Expected and observed 95% CL upper limits on the pre-exponential factor for the sphaleron model with $ p({N_\text{CS}})= $ 0.5 (left), and observed limits with $ p({N_\text{CS}})= $ 0, 0.5, and 1 (right). The inner (outer) band (left) represents the 68% (95%) quantiles of the expected limit. |
| Tables | |
png pdf |
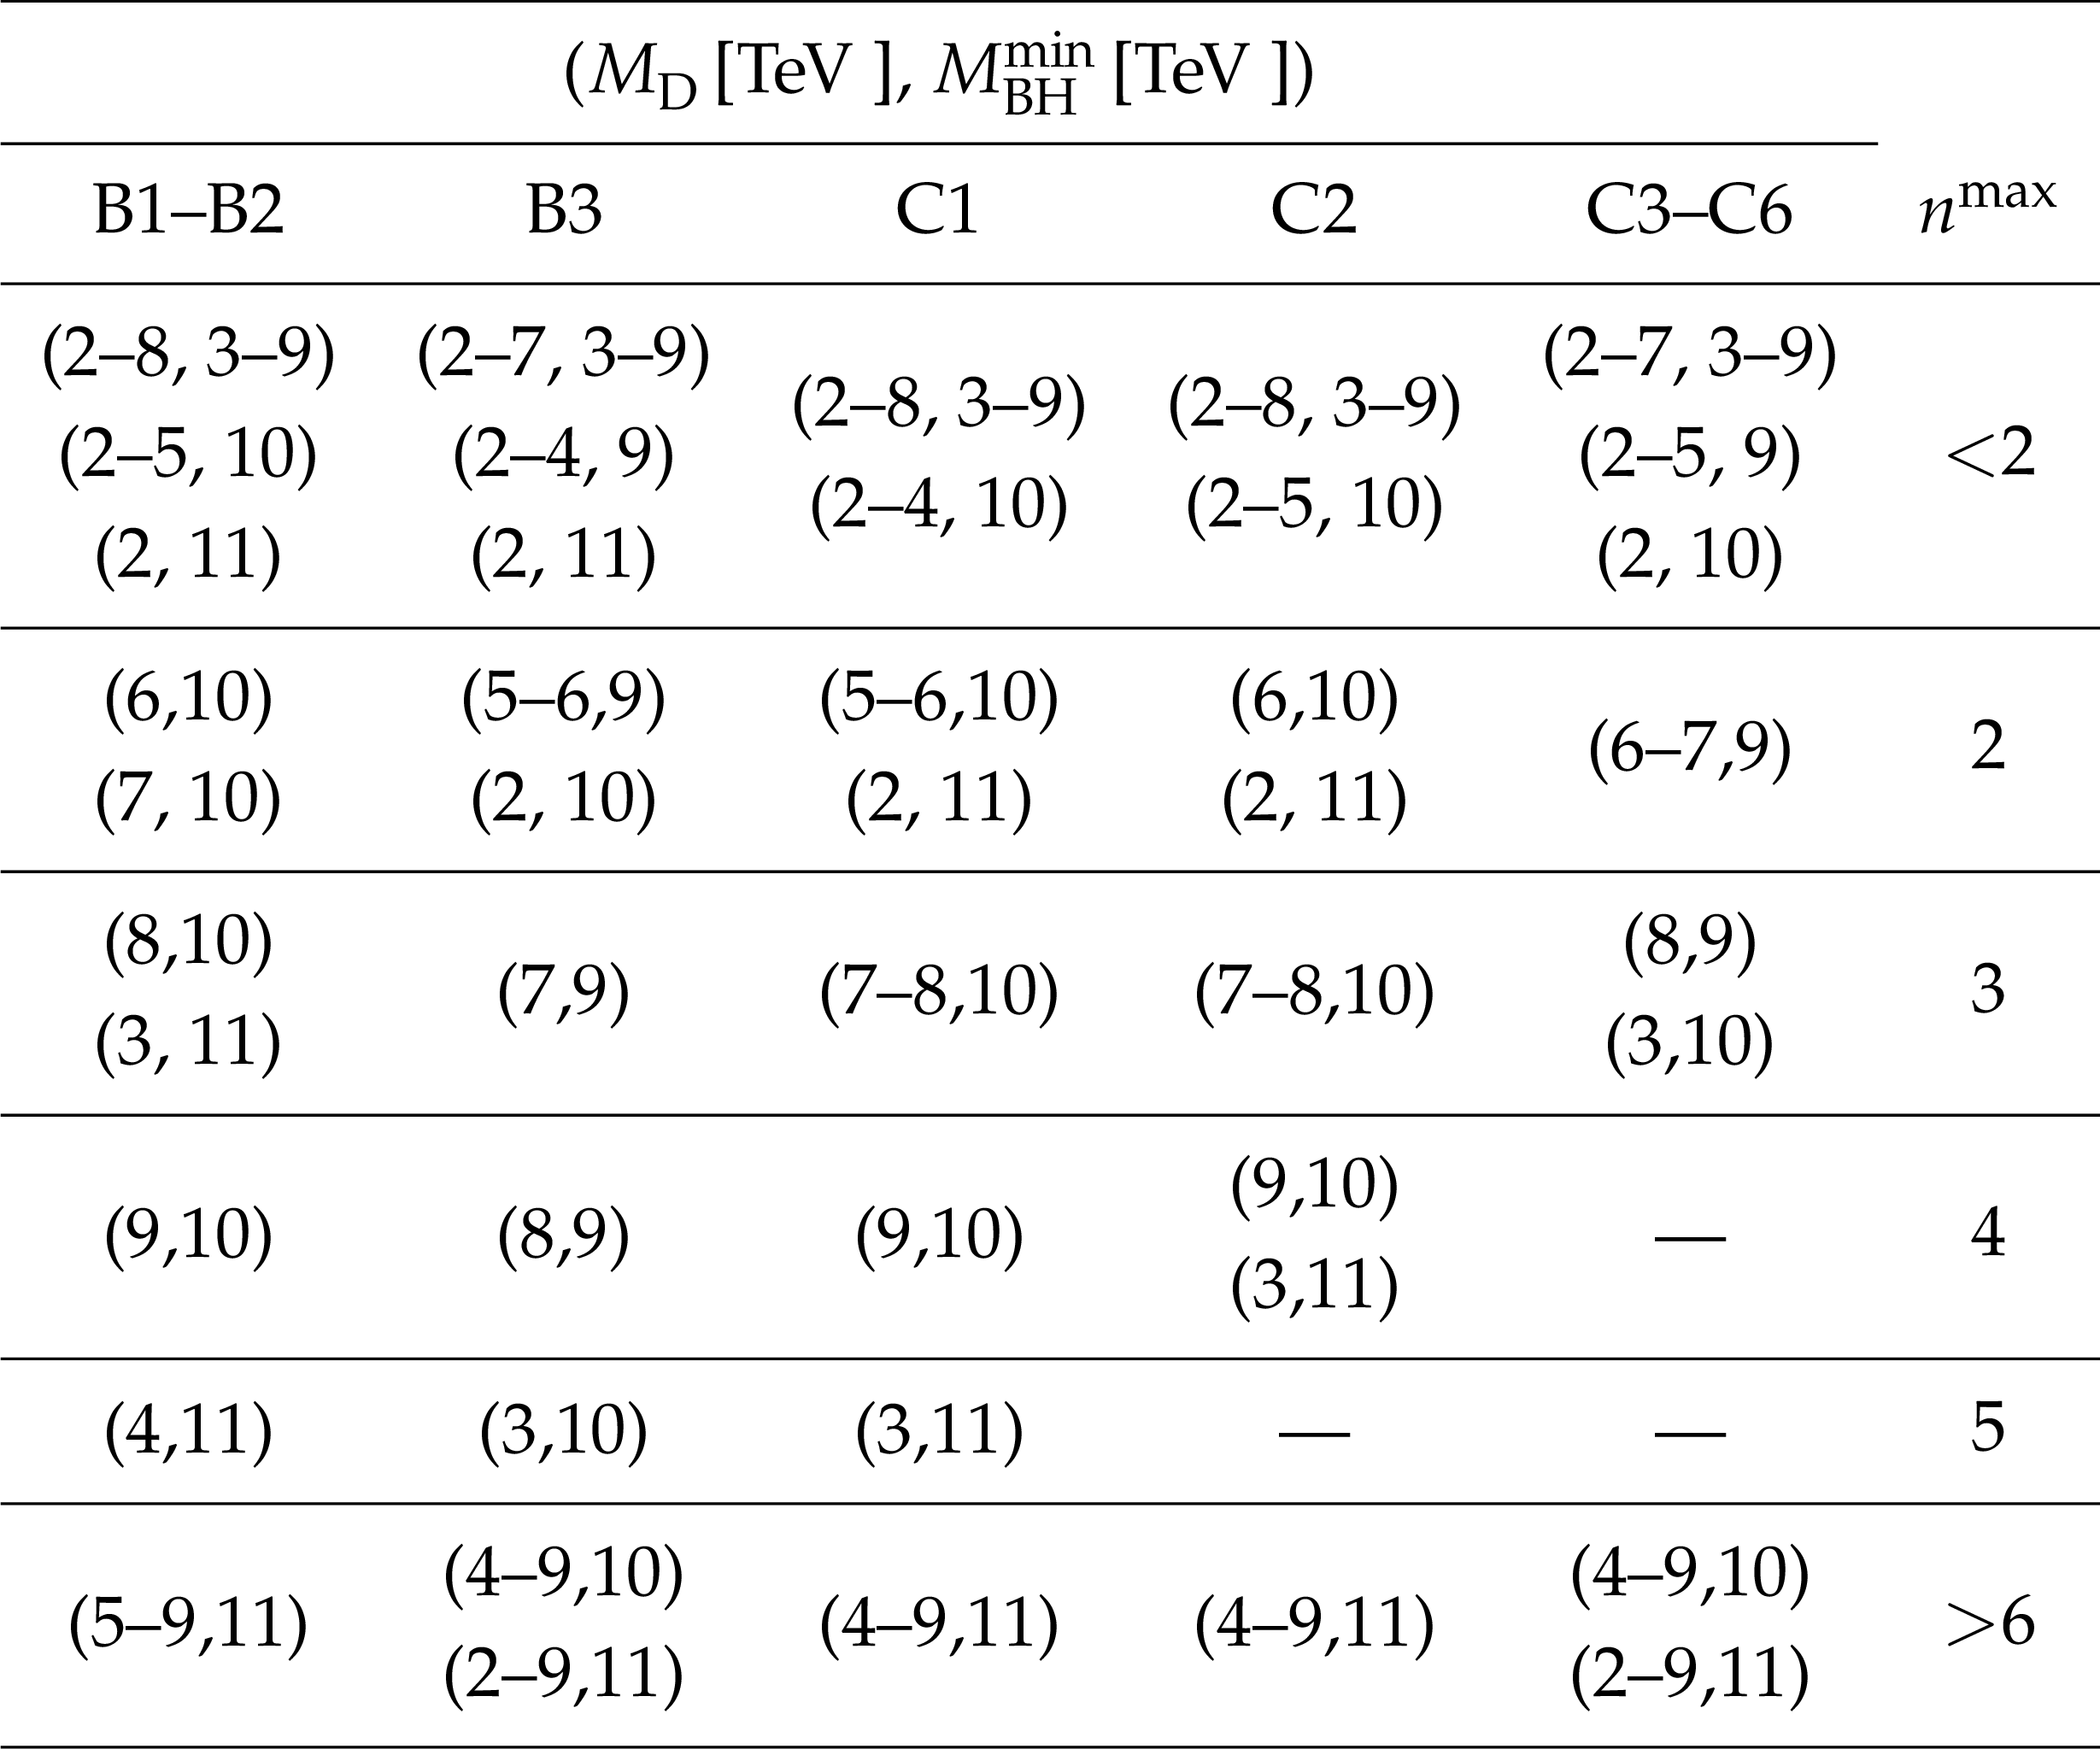
Table 1:
Parameter combinations of the fundamental Planck scale $ M_\text{D} $ and minimum black hole mass $ M_{\text{BH}}^{\text{min}} $ (both in TeV) that exclude a given number of extra dimensions $ n^{\text{max}} $, for BH models generated with BLACKMAX and CHARYBDIS2. Each row collects all ($ M_\text{D} $, $ M_{\text{BH}}^{\text{min}} $) pairs yielding the same exclusion level. Combinations with $ M_{\text{BH}}^{\text{min}} < M_\text{D} $ are unphysical and not considered. The first row indicates the pairs that are excluded for any number of extra dimensions in the ADD model, while the last row shows the parameters where no exclusion could be made in this analysis. |
| Summary |
| A dedicated search for black holes, string balls, and sphalerons produced in proton-proton collisions at $ \sqrt{s} = $ 13 TeV using data collected with the CMS detector has been presented. No excesses above the standard model background predictions are observed. We set 95% confidence level (CL) model-independent limits on cross section of hypothetical signals characterized by a large multiplicity of energetic jets, leptons, and photons. The model-independent results demonstrate approximately a factor of four improvement in the cross section limit compared to the previous CMS analysis. The model-dependent results exclude at 95% CL semiclassical black holes and string balls with masses below 8.4--11.4 TeV and 9.0--10.7 TeV, respectively, depending on the model and the number of extra dimensions. This extends the exclusion reach by 1--1.6 TeV and 1.3--1.9 TeV, respectively. The observed (expected) upper limit on the sphaleron pre-exponential factor for the nominal electroweak sphaleron transition energy of 9 TeV is 0.0034 (0.0035) at 95% CL, which is strengthened by a factor of 6.2 (3.4) compared to the previous best limit of 0.021 (0.012) from CMS [21]. These are the most stringent limits on the sphaleron pre-exponential factor to date. A significant improvement in the model-dependent study over previous results comes from an improved understanding of parton distribution functions. Additional significant gains can be traced to both the increased integrated luminosity, and the enhanced background rejection provided by the sphericity and phase space distance event selection requirements. |
| Additional Figures | |
png pdf |
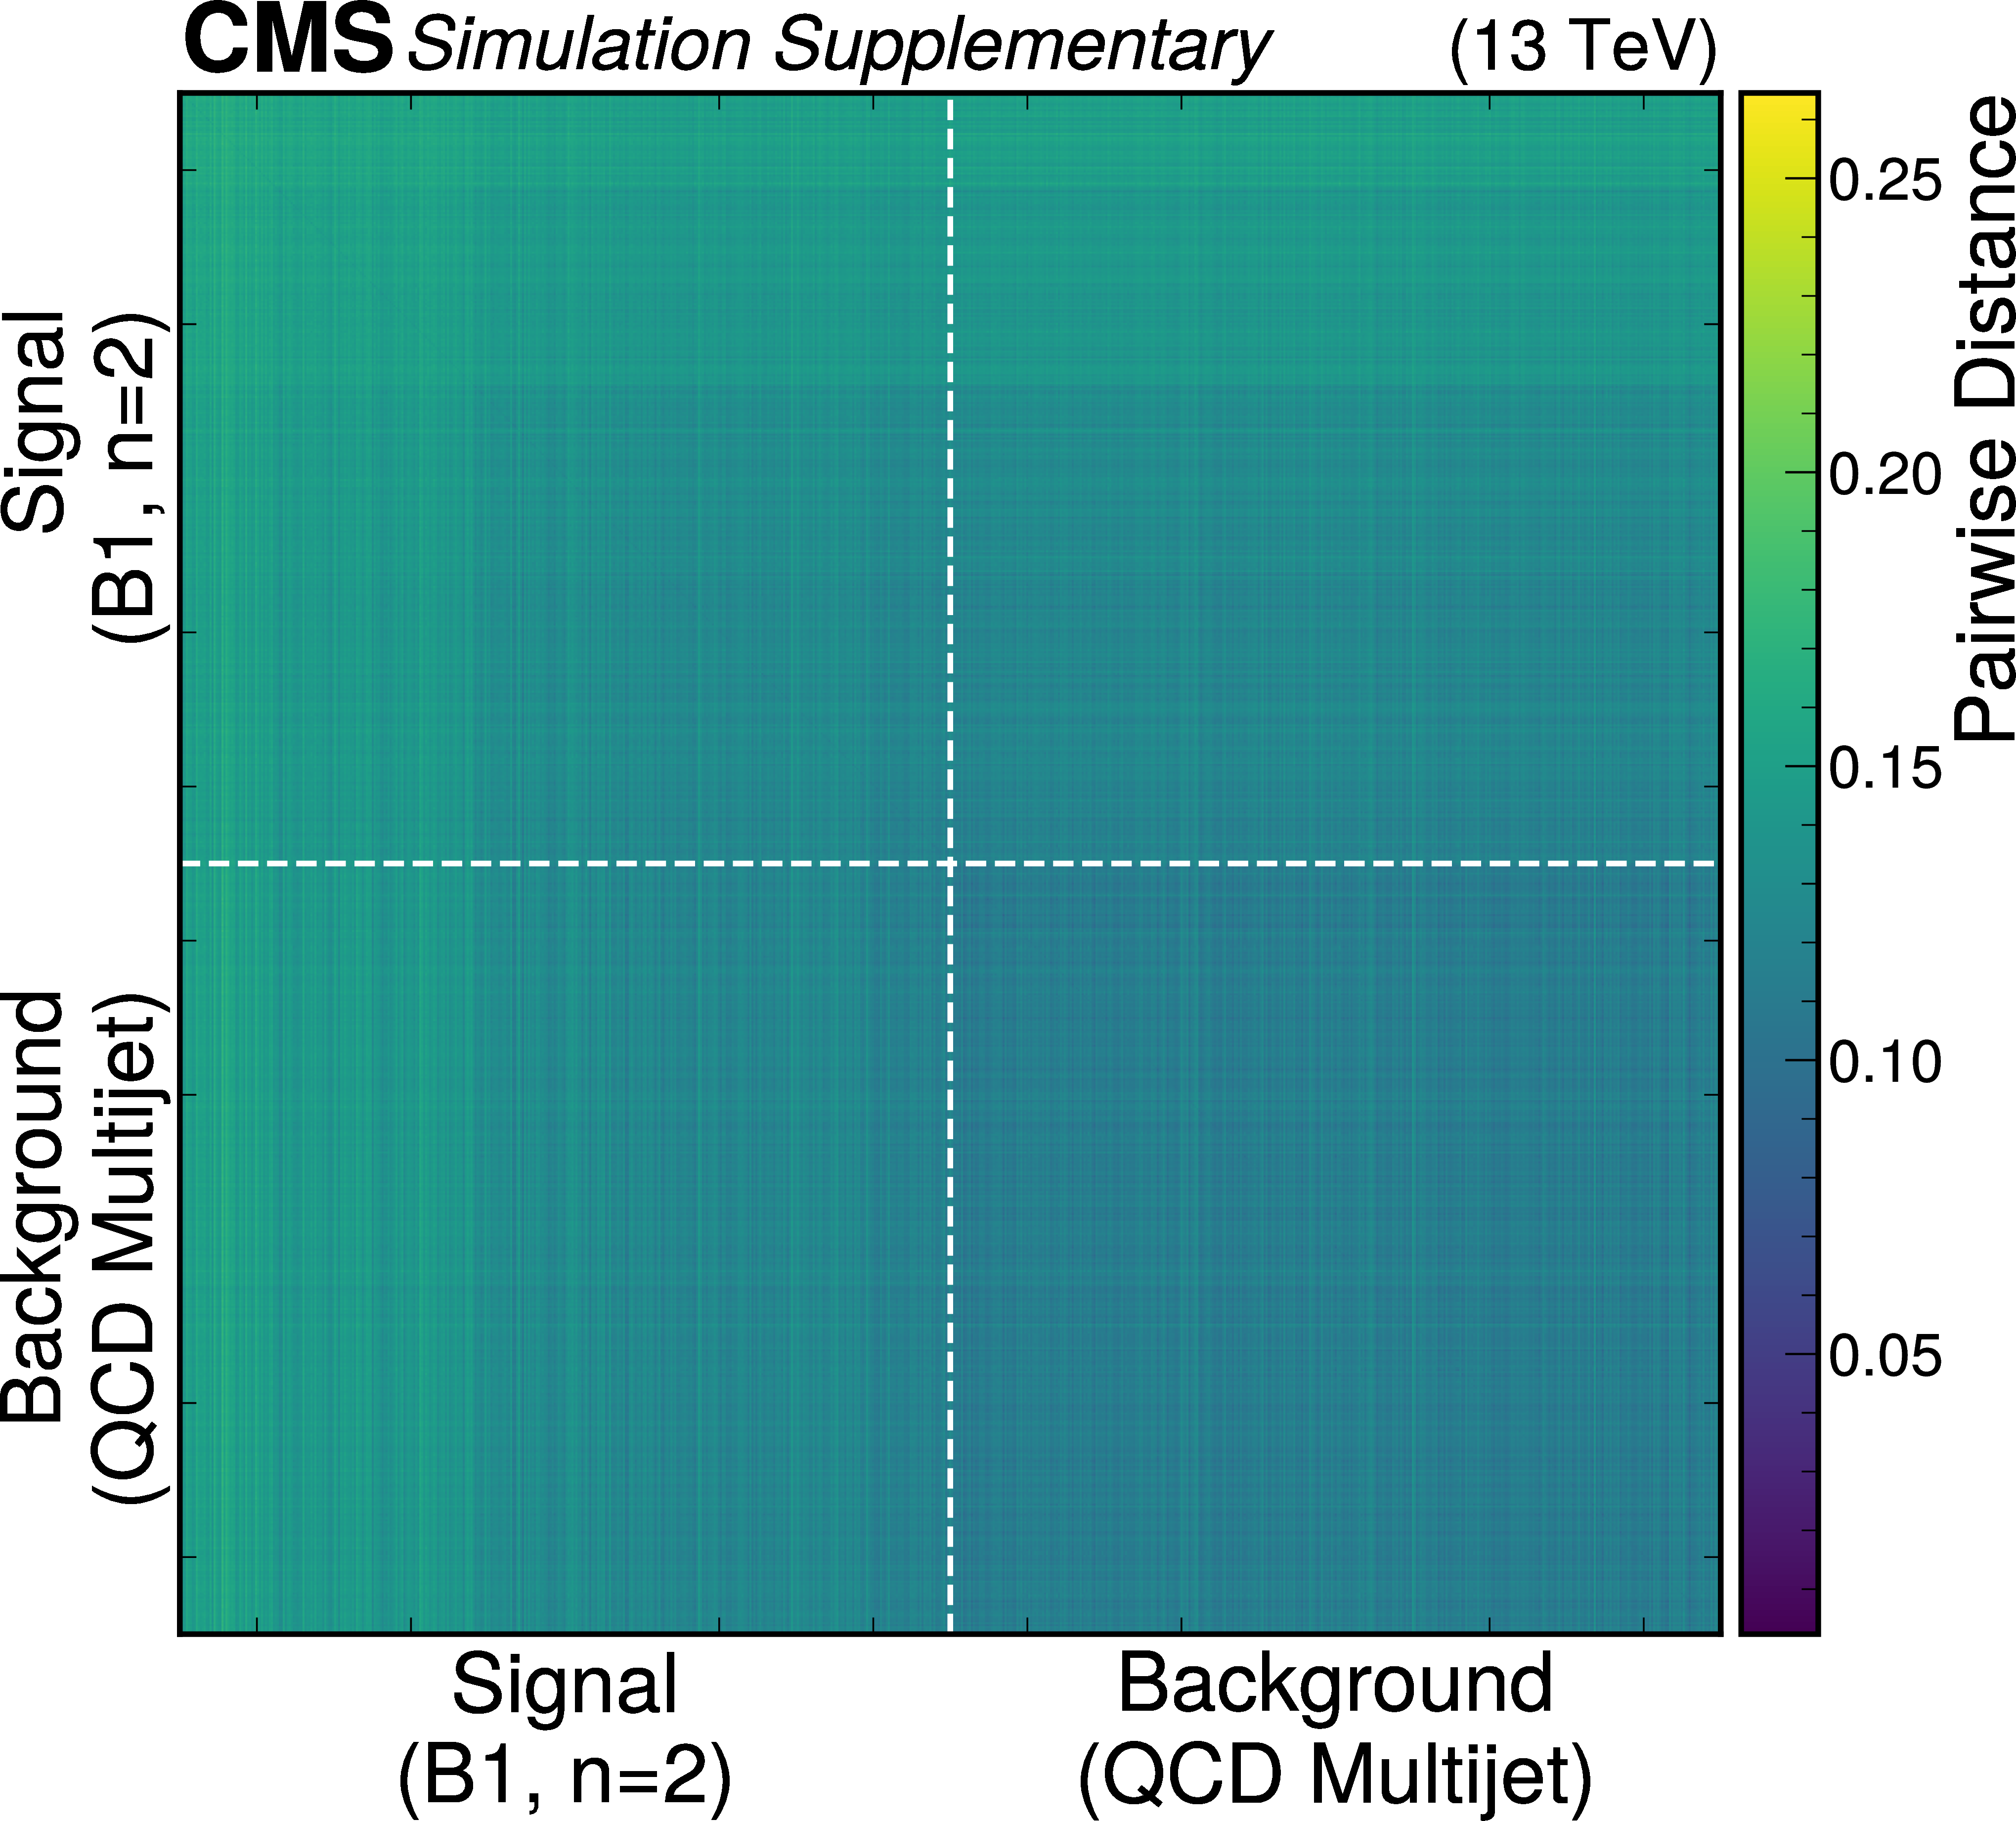
Additional Figure 1:
Pairwise phase space distance of 10,000 background vs 10,000 signal events. The signal event contains a mix of differennt $M_\text{BH}$ values. The X and Y axis are the event indices from 1 to 20,000. |
png pdf |
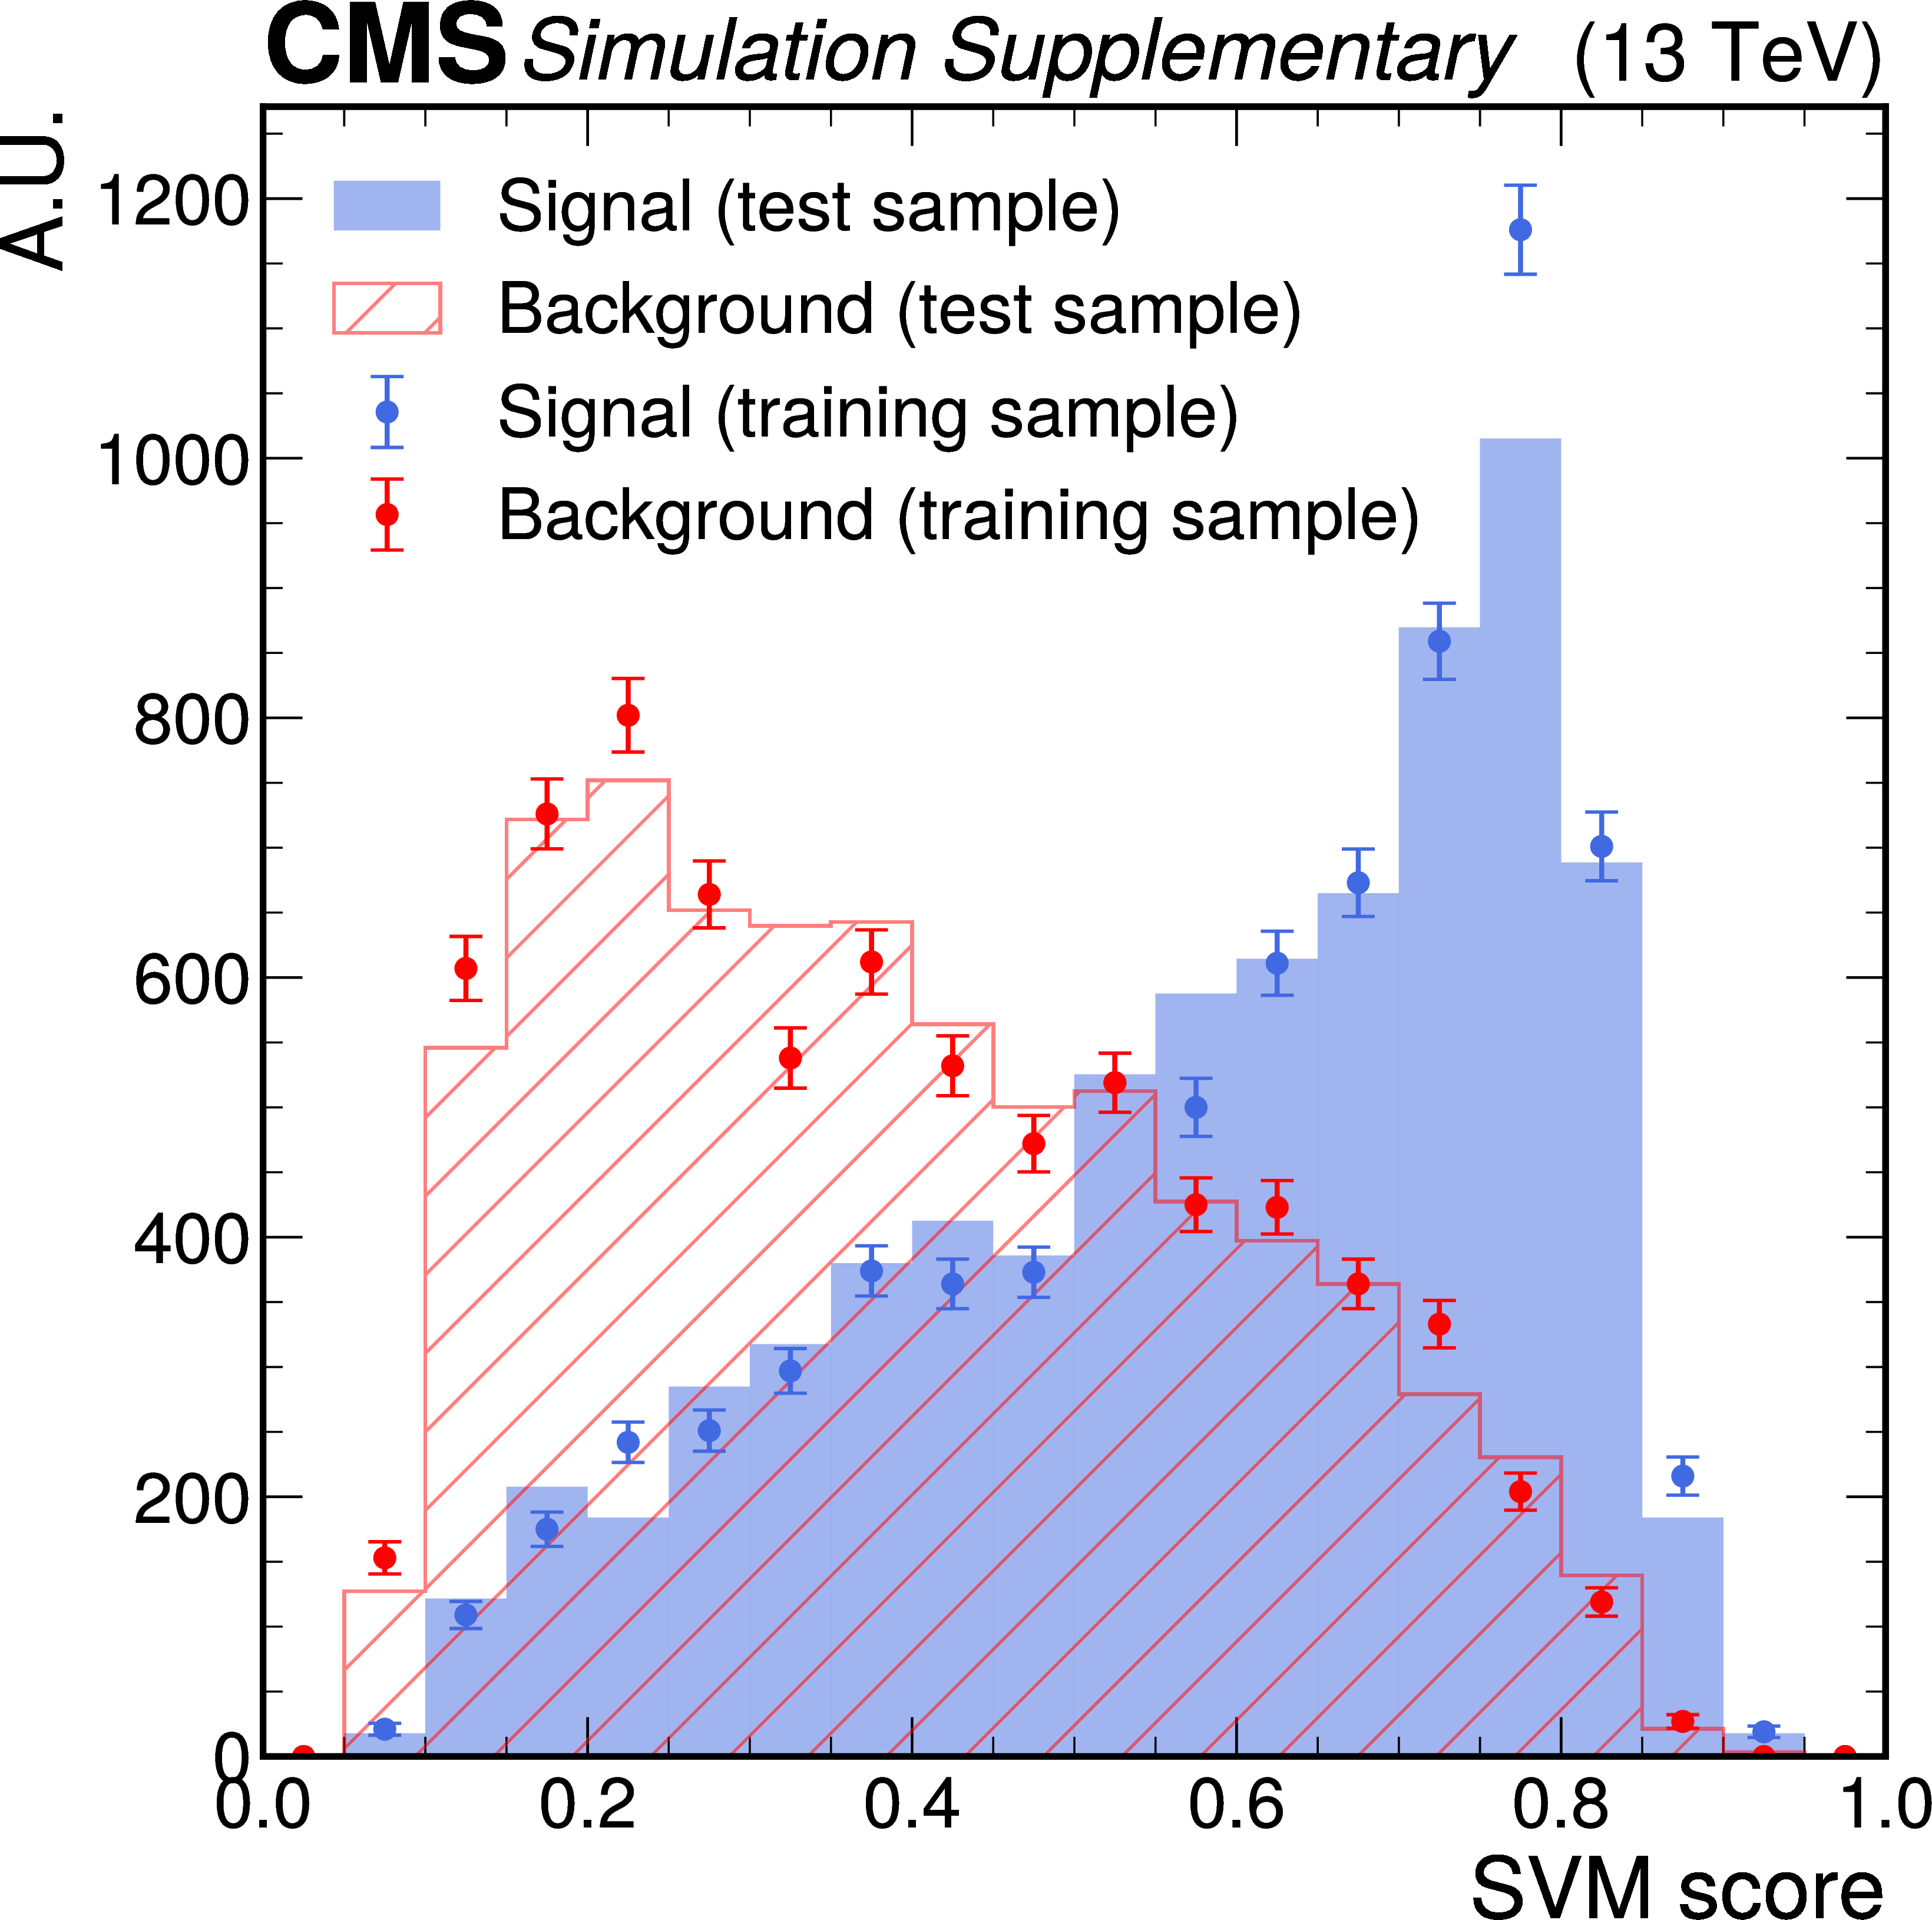
Additional Figure 2:
The SVM score distribution in the training and test datasets. |
png pdf |
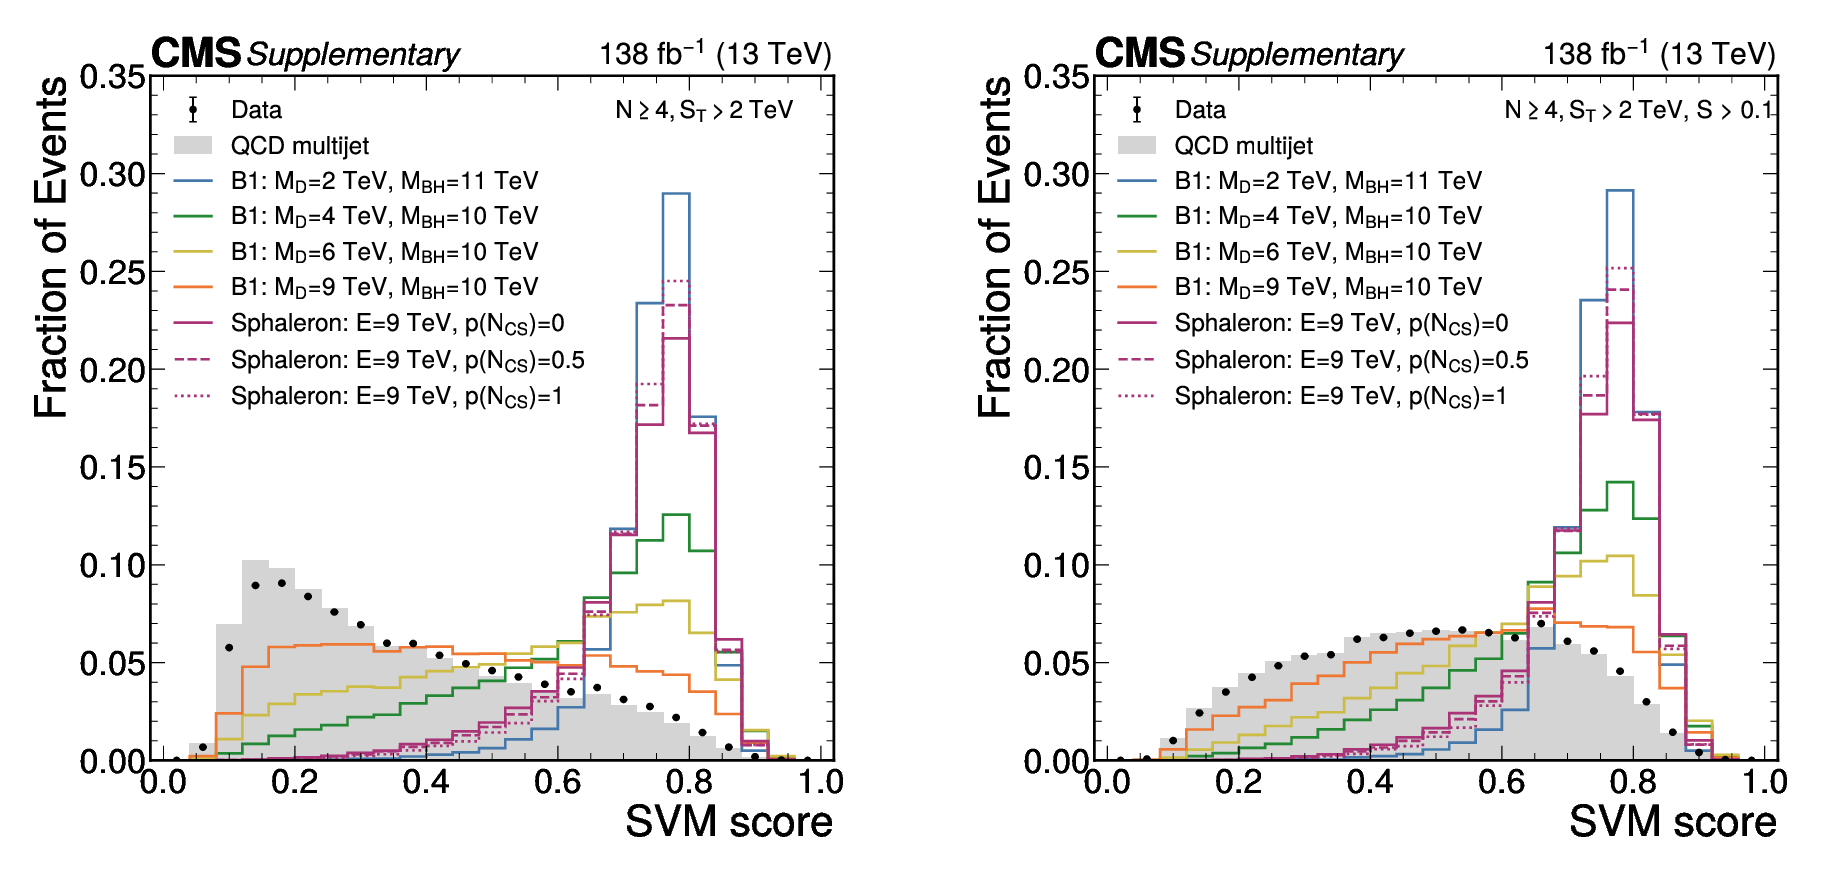
Additional Figure 3:
The SVM score distributions for various $M_\text{BH}$ mass points from B1, n=2 and sphaleron $E_{sph}=9$ TeV signal models without (left) and with (right) the sphericity cut. |
png pdf |
Additional Figure 3-a:
The SVM score distributions for various $M_\text{BH}$ mass points from B1, n=2 and sphaleron $E_{sph}=9$ TeV signal models without (left) and with (right) the sphericity cut. |
png pdf |
Additional Figure 3-b:
The SVM score distributions for various $M_\text{BH}$ mass points from B1, n=2 and sphaleron $E_{sph}=9$ TeV signal models without (left) and with (right) the sphericity cut. |
png pdf |
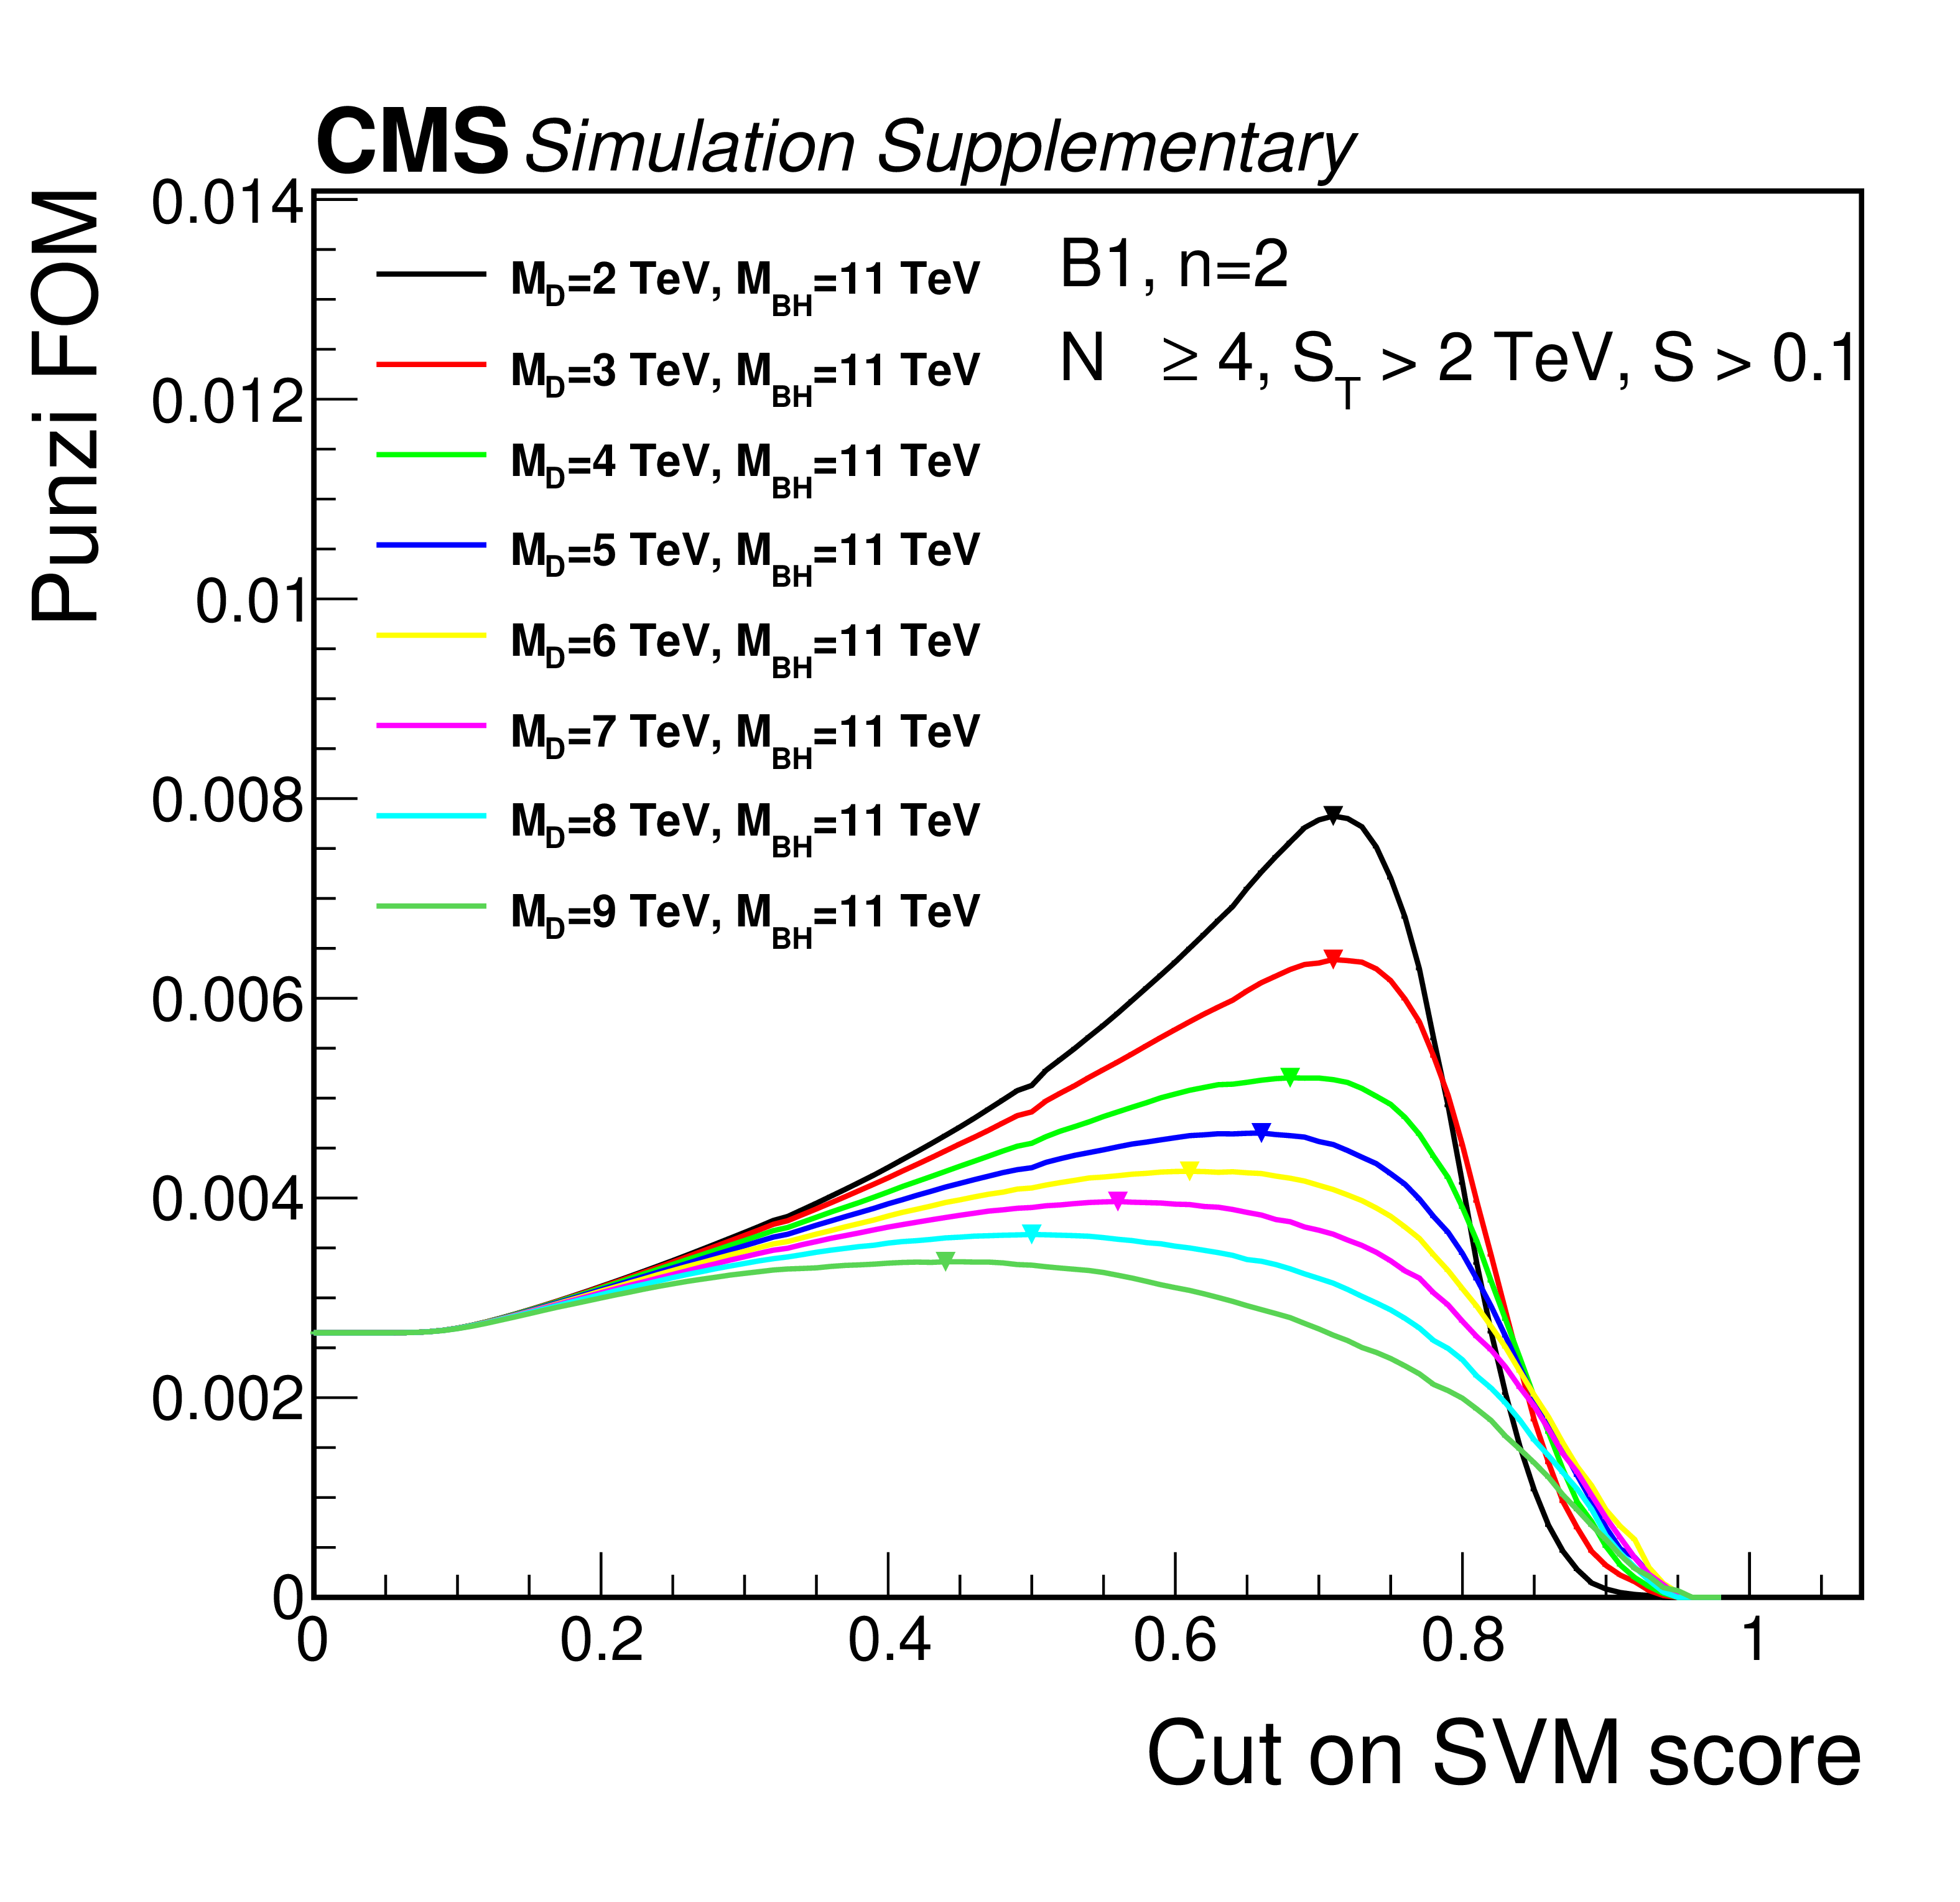
Additional Figure 4:
The Punzi figure of merit as a function of the SVM score cut for the different $M_D$ values in the B1, n=2, $M_\text{BH}$ =11 TeV signal model. |
png pdf |
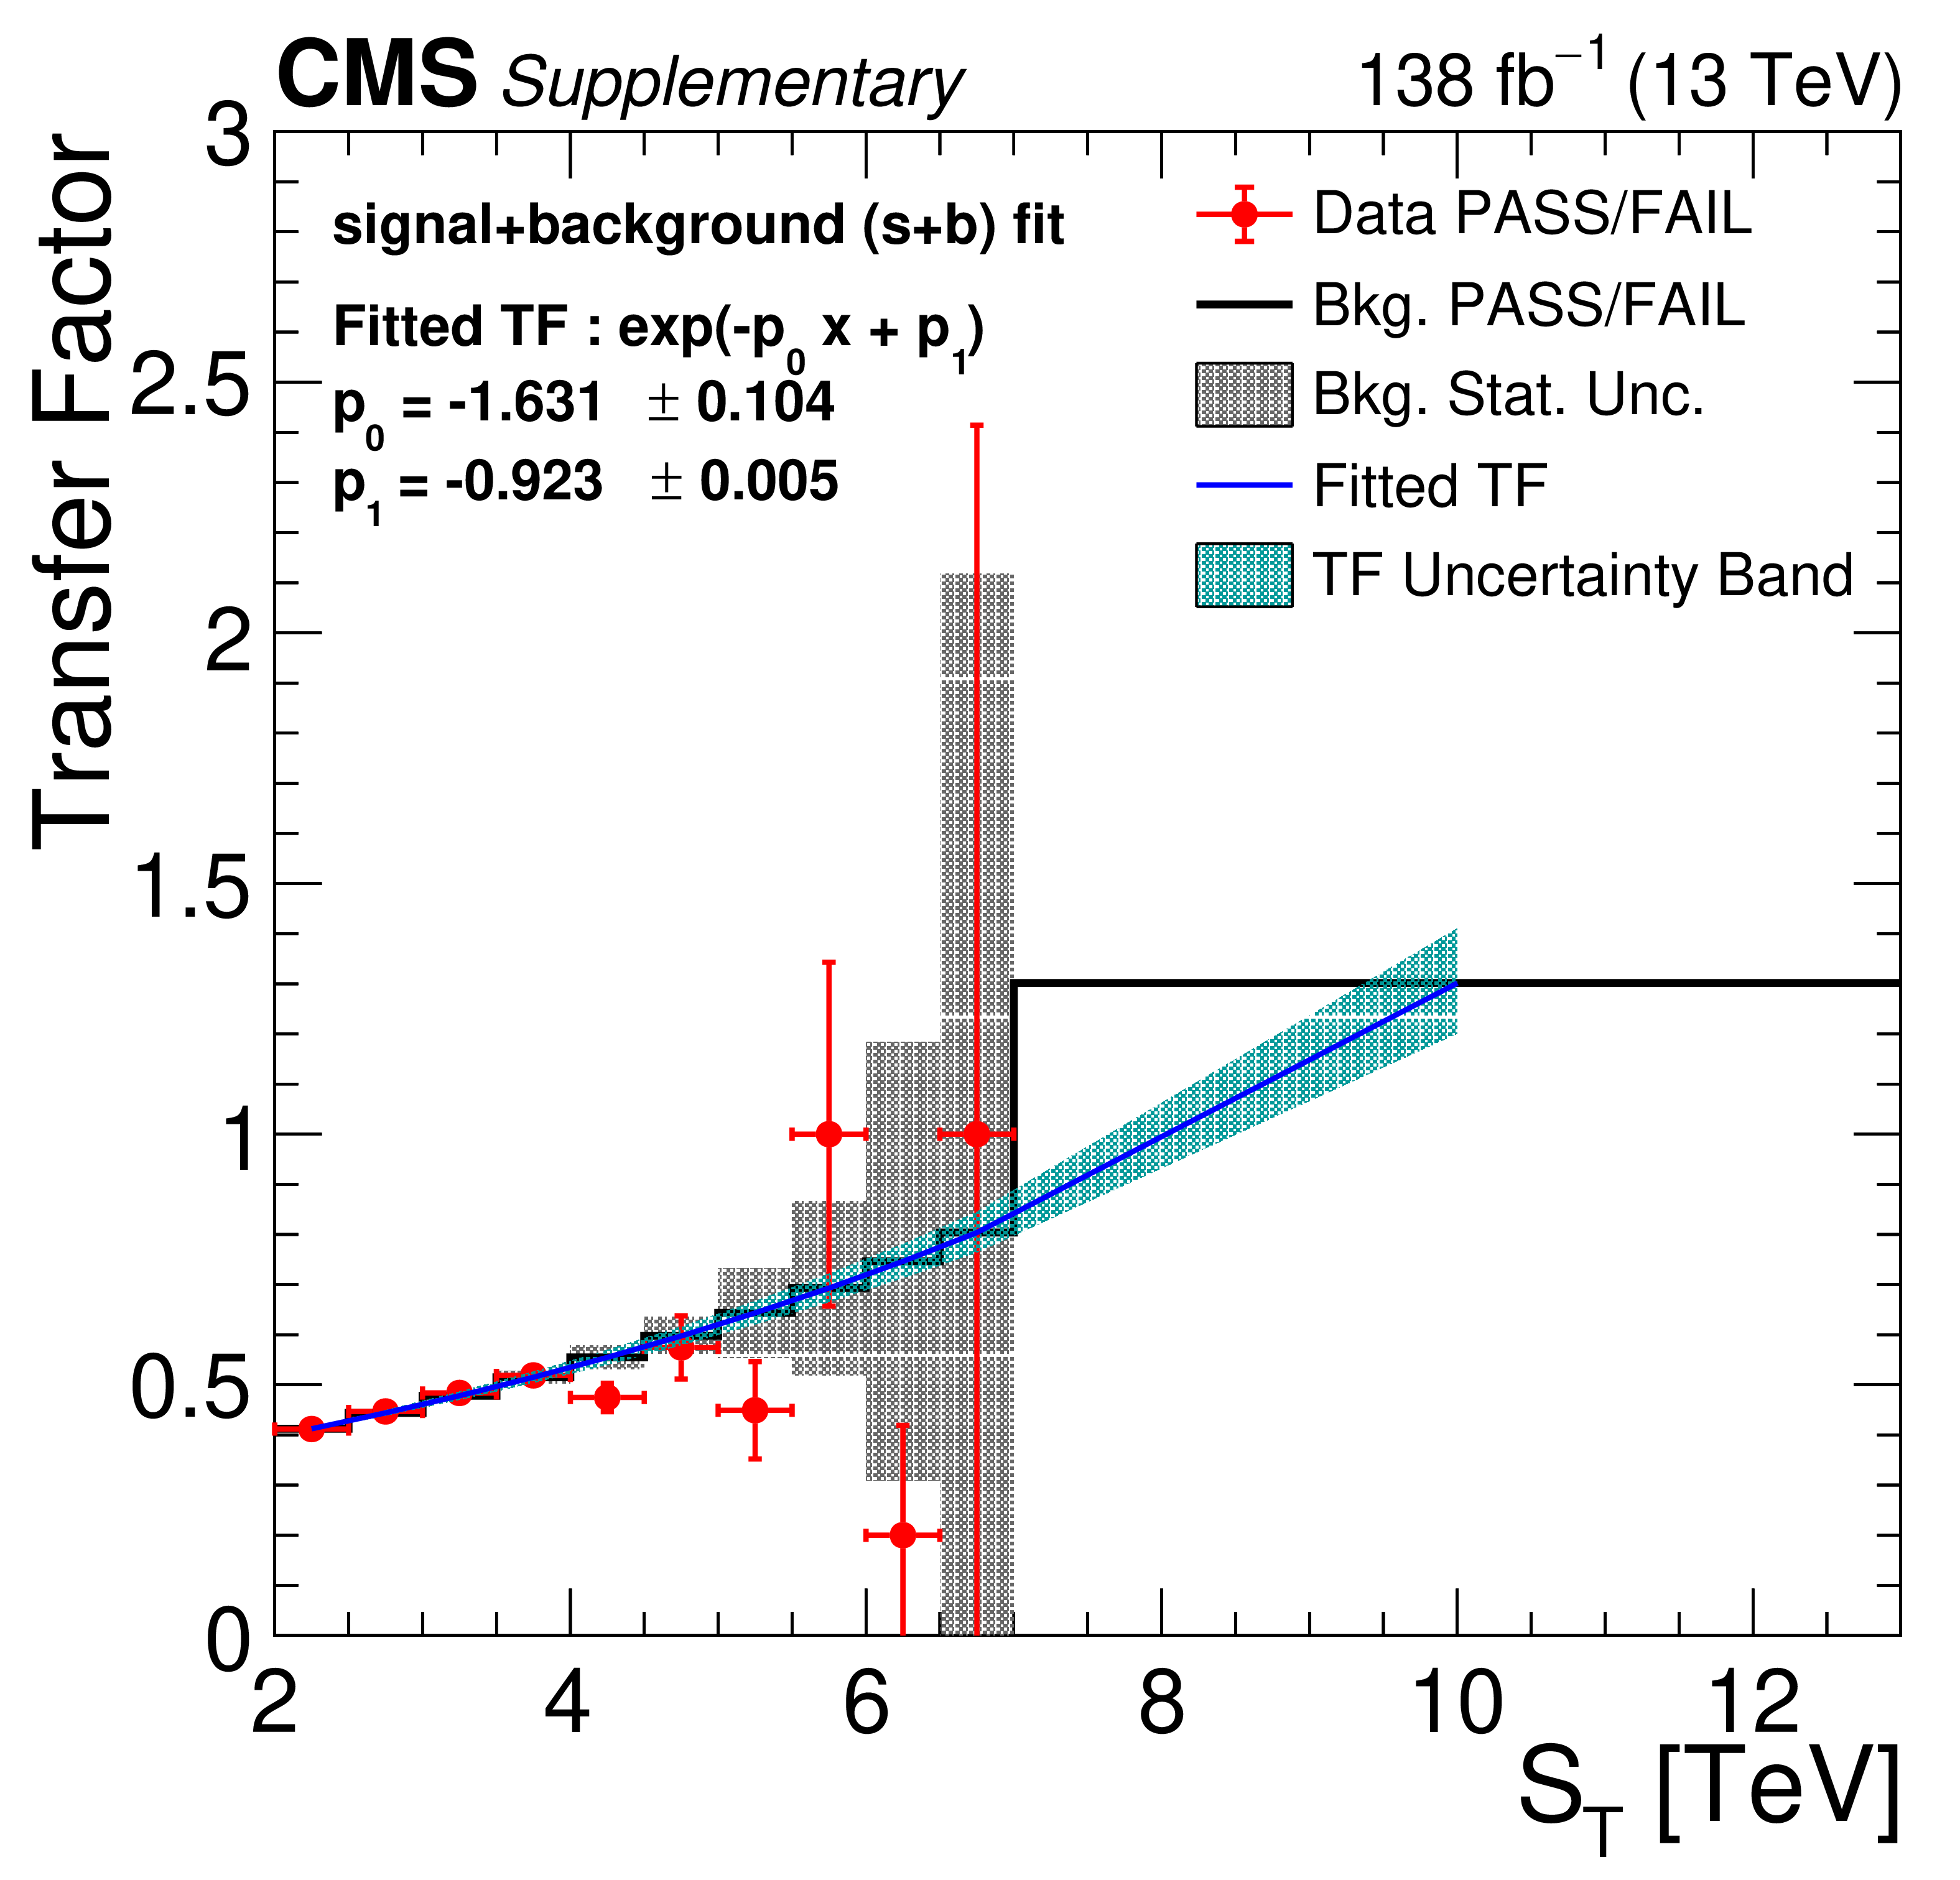
Additional Figure 5:
Post-fit PASS/FAIL as a function of $S_T$ of the predicted background, fitted transfer function, and data with statistical errors for the signal+background fit. |
png pdf |
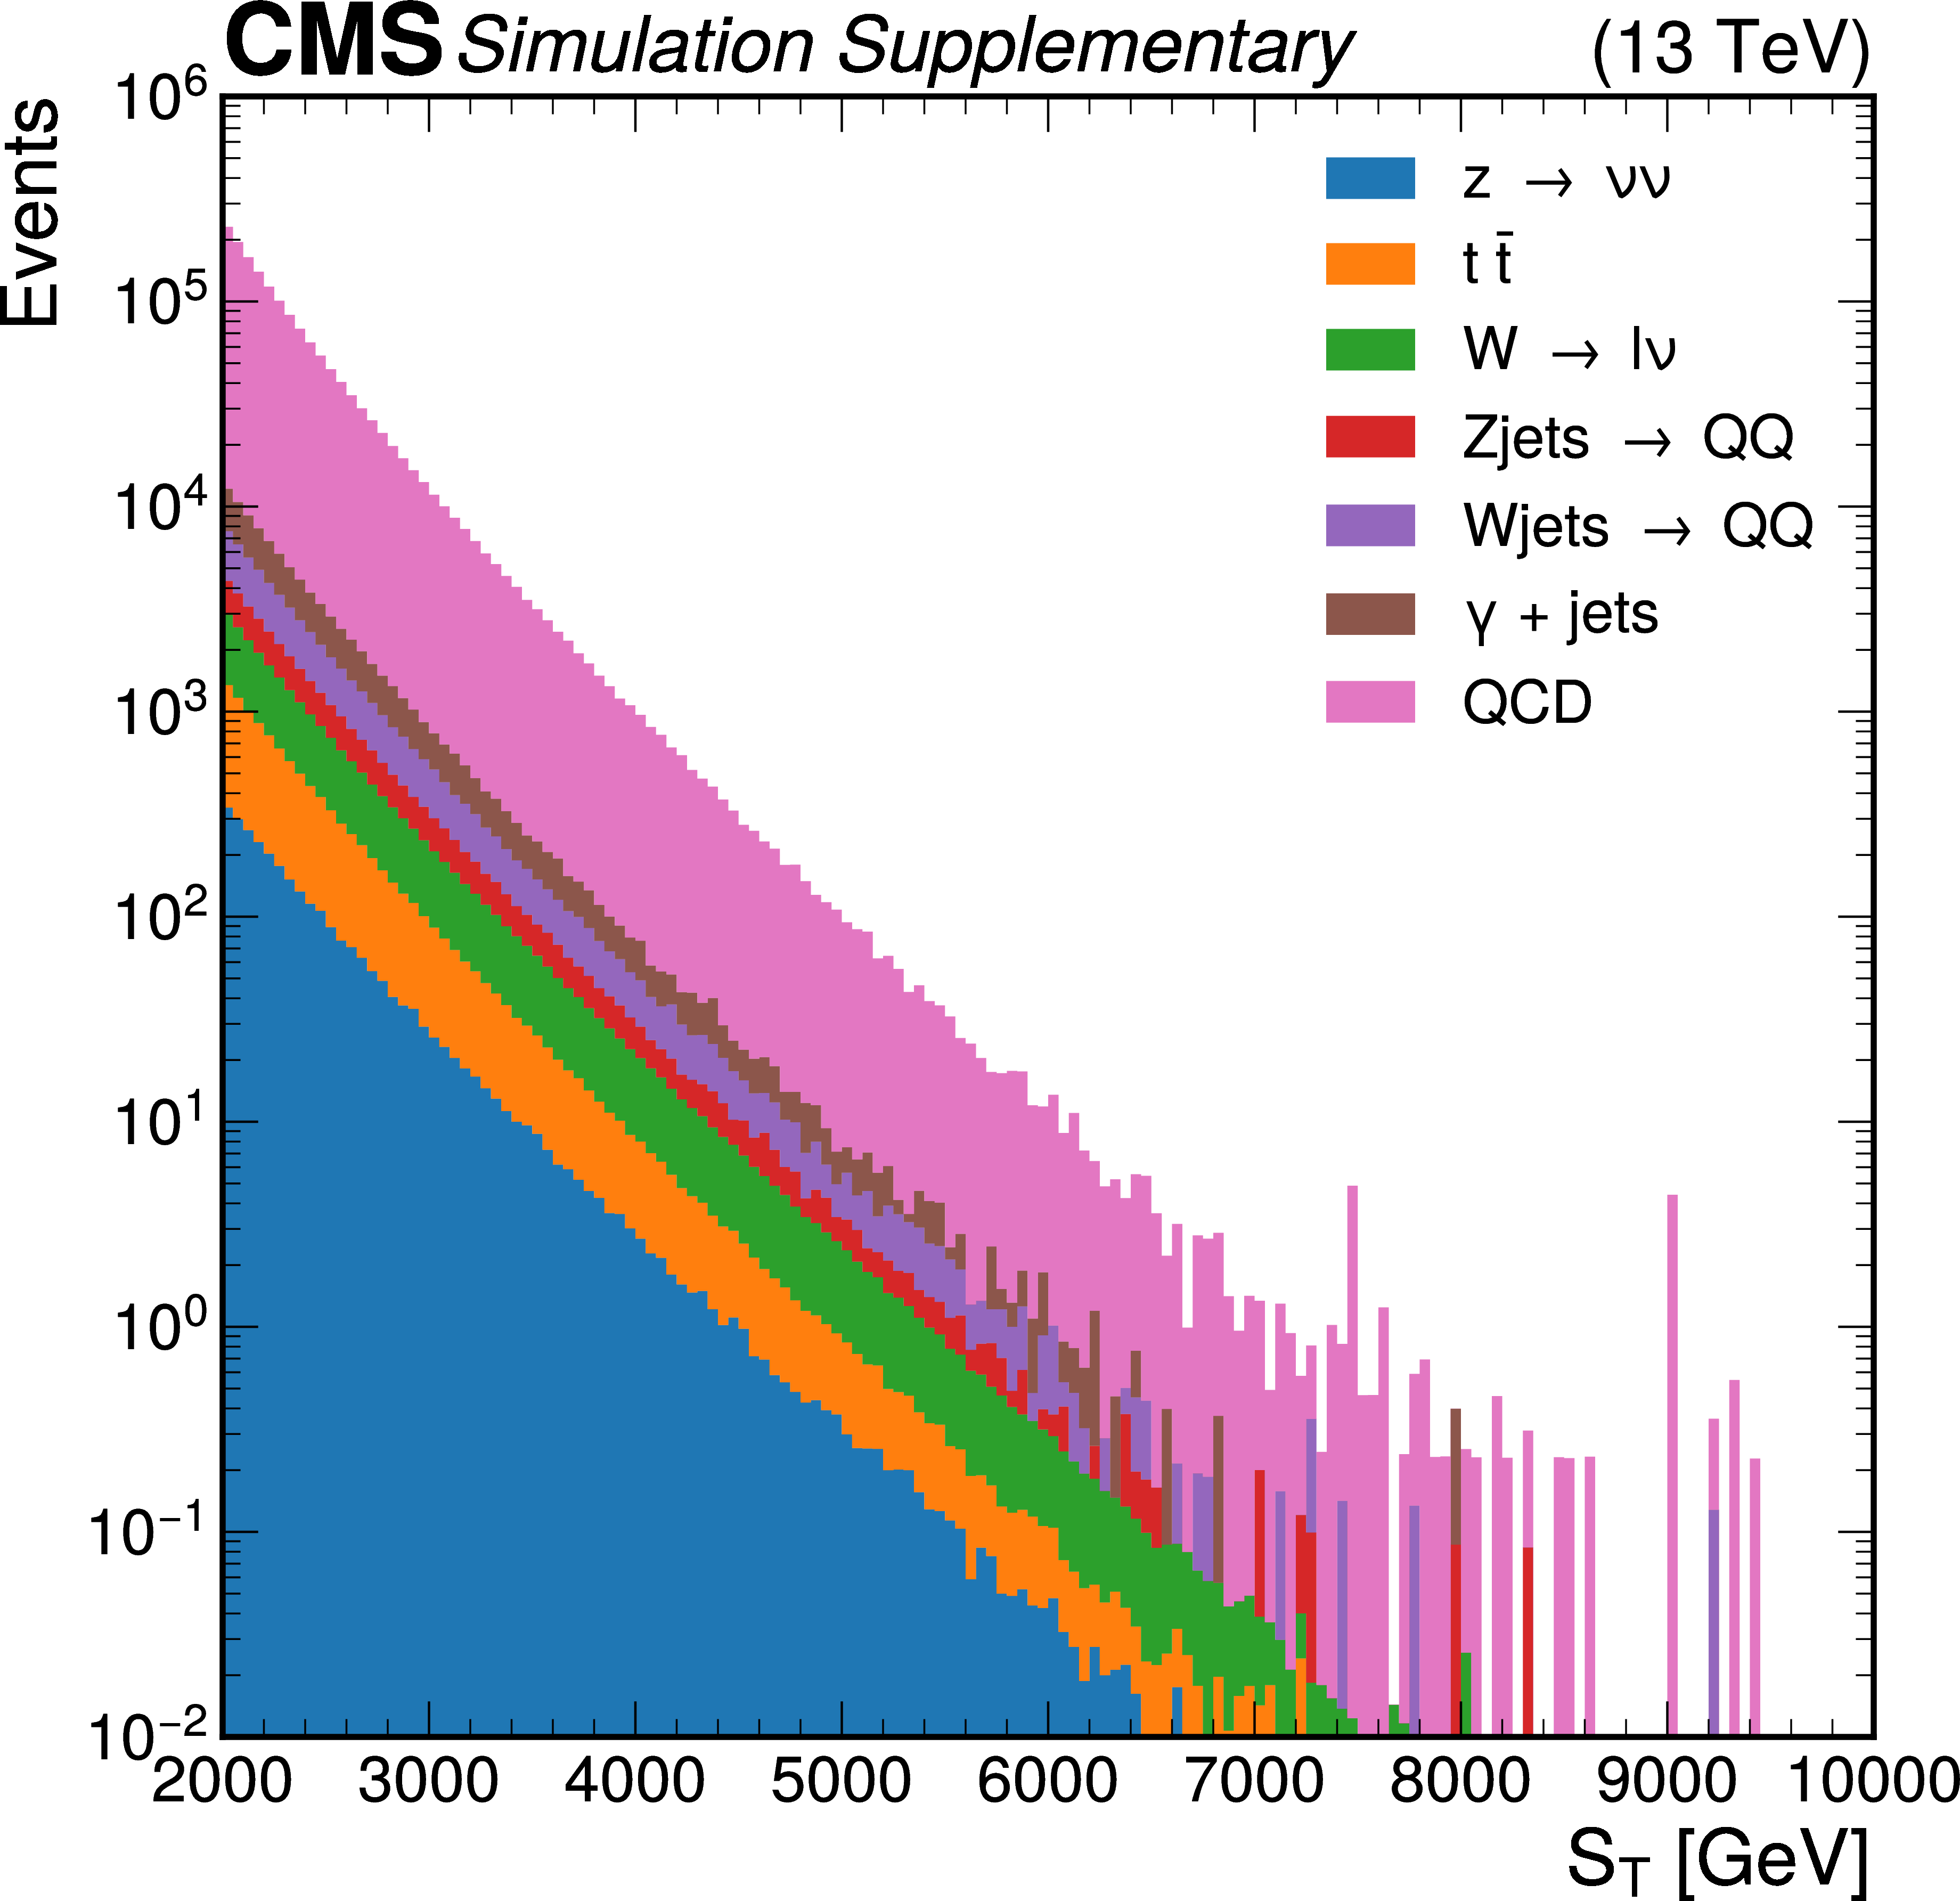
Additional Figure 6:
Simulation based background $S_T$ distribution after event selections. The stacked histograms show the expected yields for $Z\to\nu\nu$, $t\bar{t}$, $W\to\ell\nu$, $Z{+}$jets, $W{+}$jets, $\gamma{+}$jets, and QCD multijet events. The main background is the QCD multijet production. |
png pdf |
Additional Figure 7:
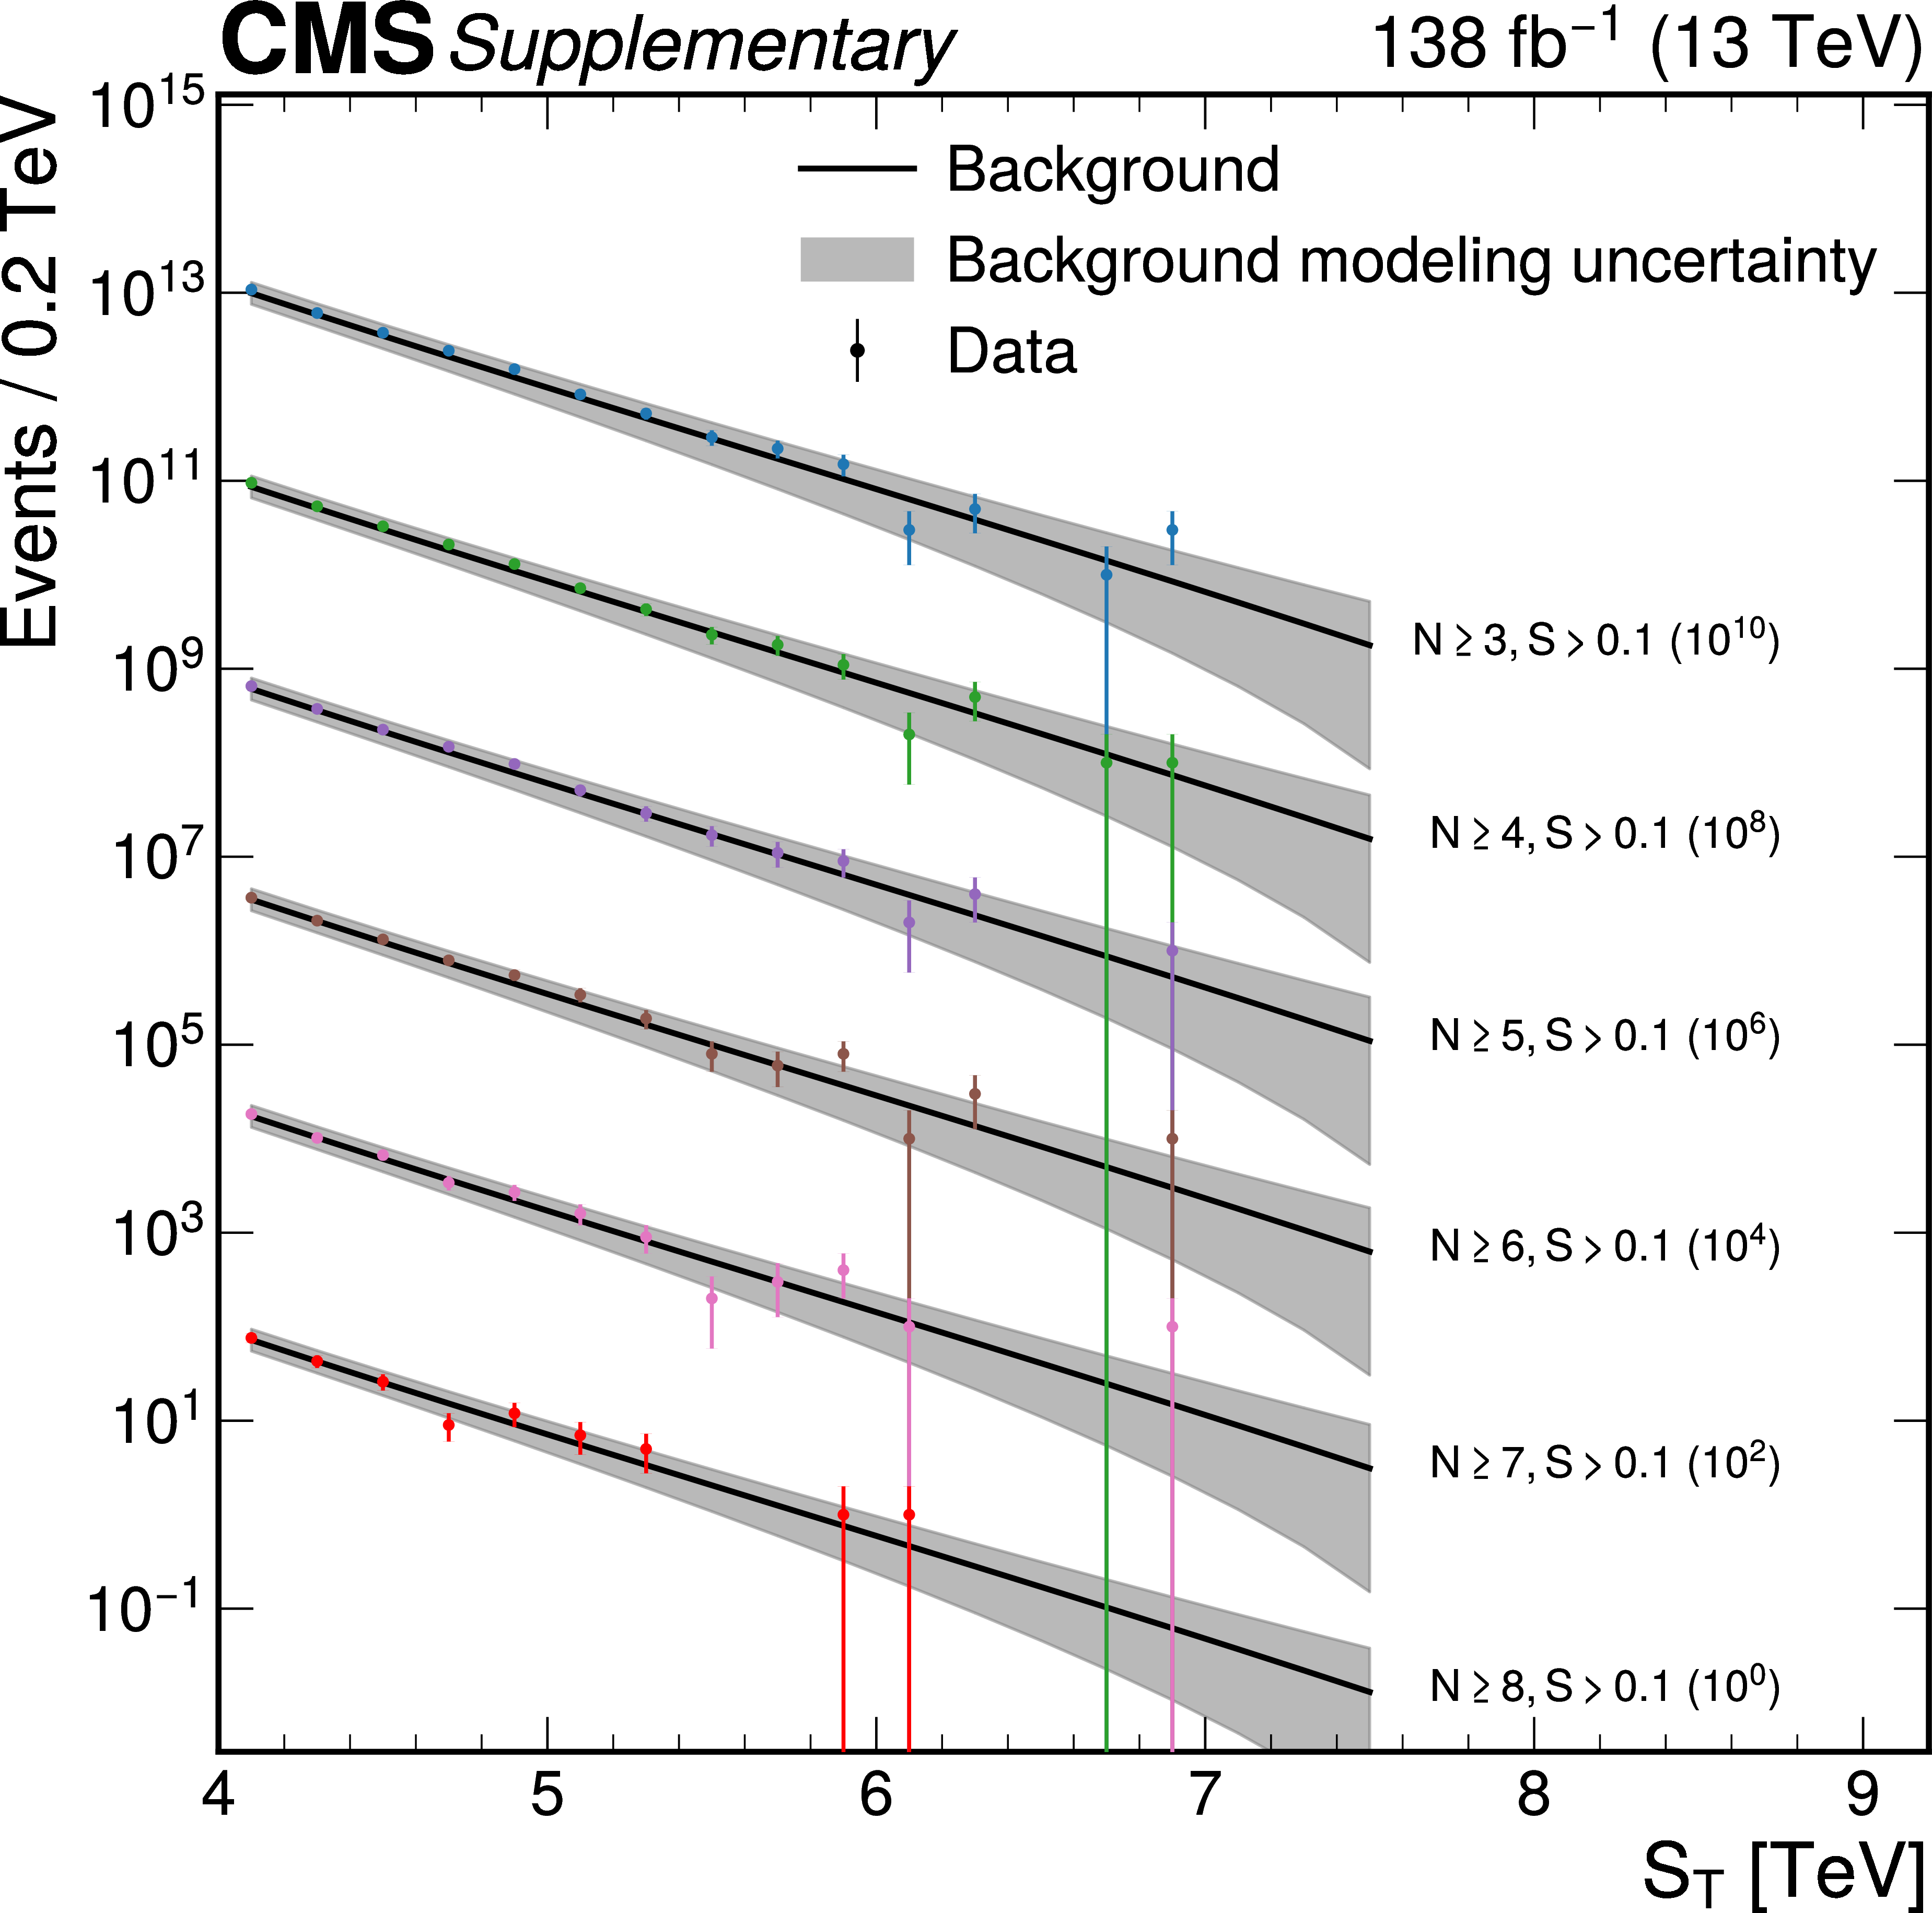
Demonstration of $S_T$-invariance across event multiplicities. The shown figure is the $S_T$ spectra for $N\!\geq\!3$–$8$ after the sphericity requirement $S>0.1$, each multiplied by the factor indicated to separate the curves. The solid line is the background prediction; the gray band shows the background modeling uncertainty. Points are data with statistical uncertainties. All the curves are aligned with the actual data within uncertainties. |
png pdf |
Additional Figure 8:
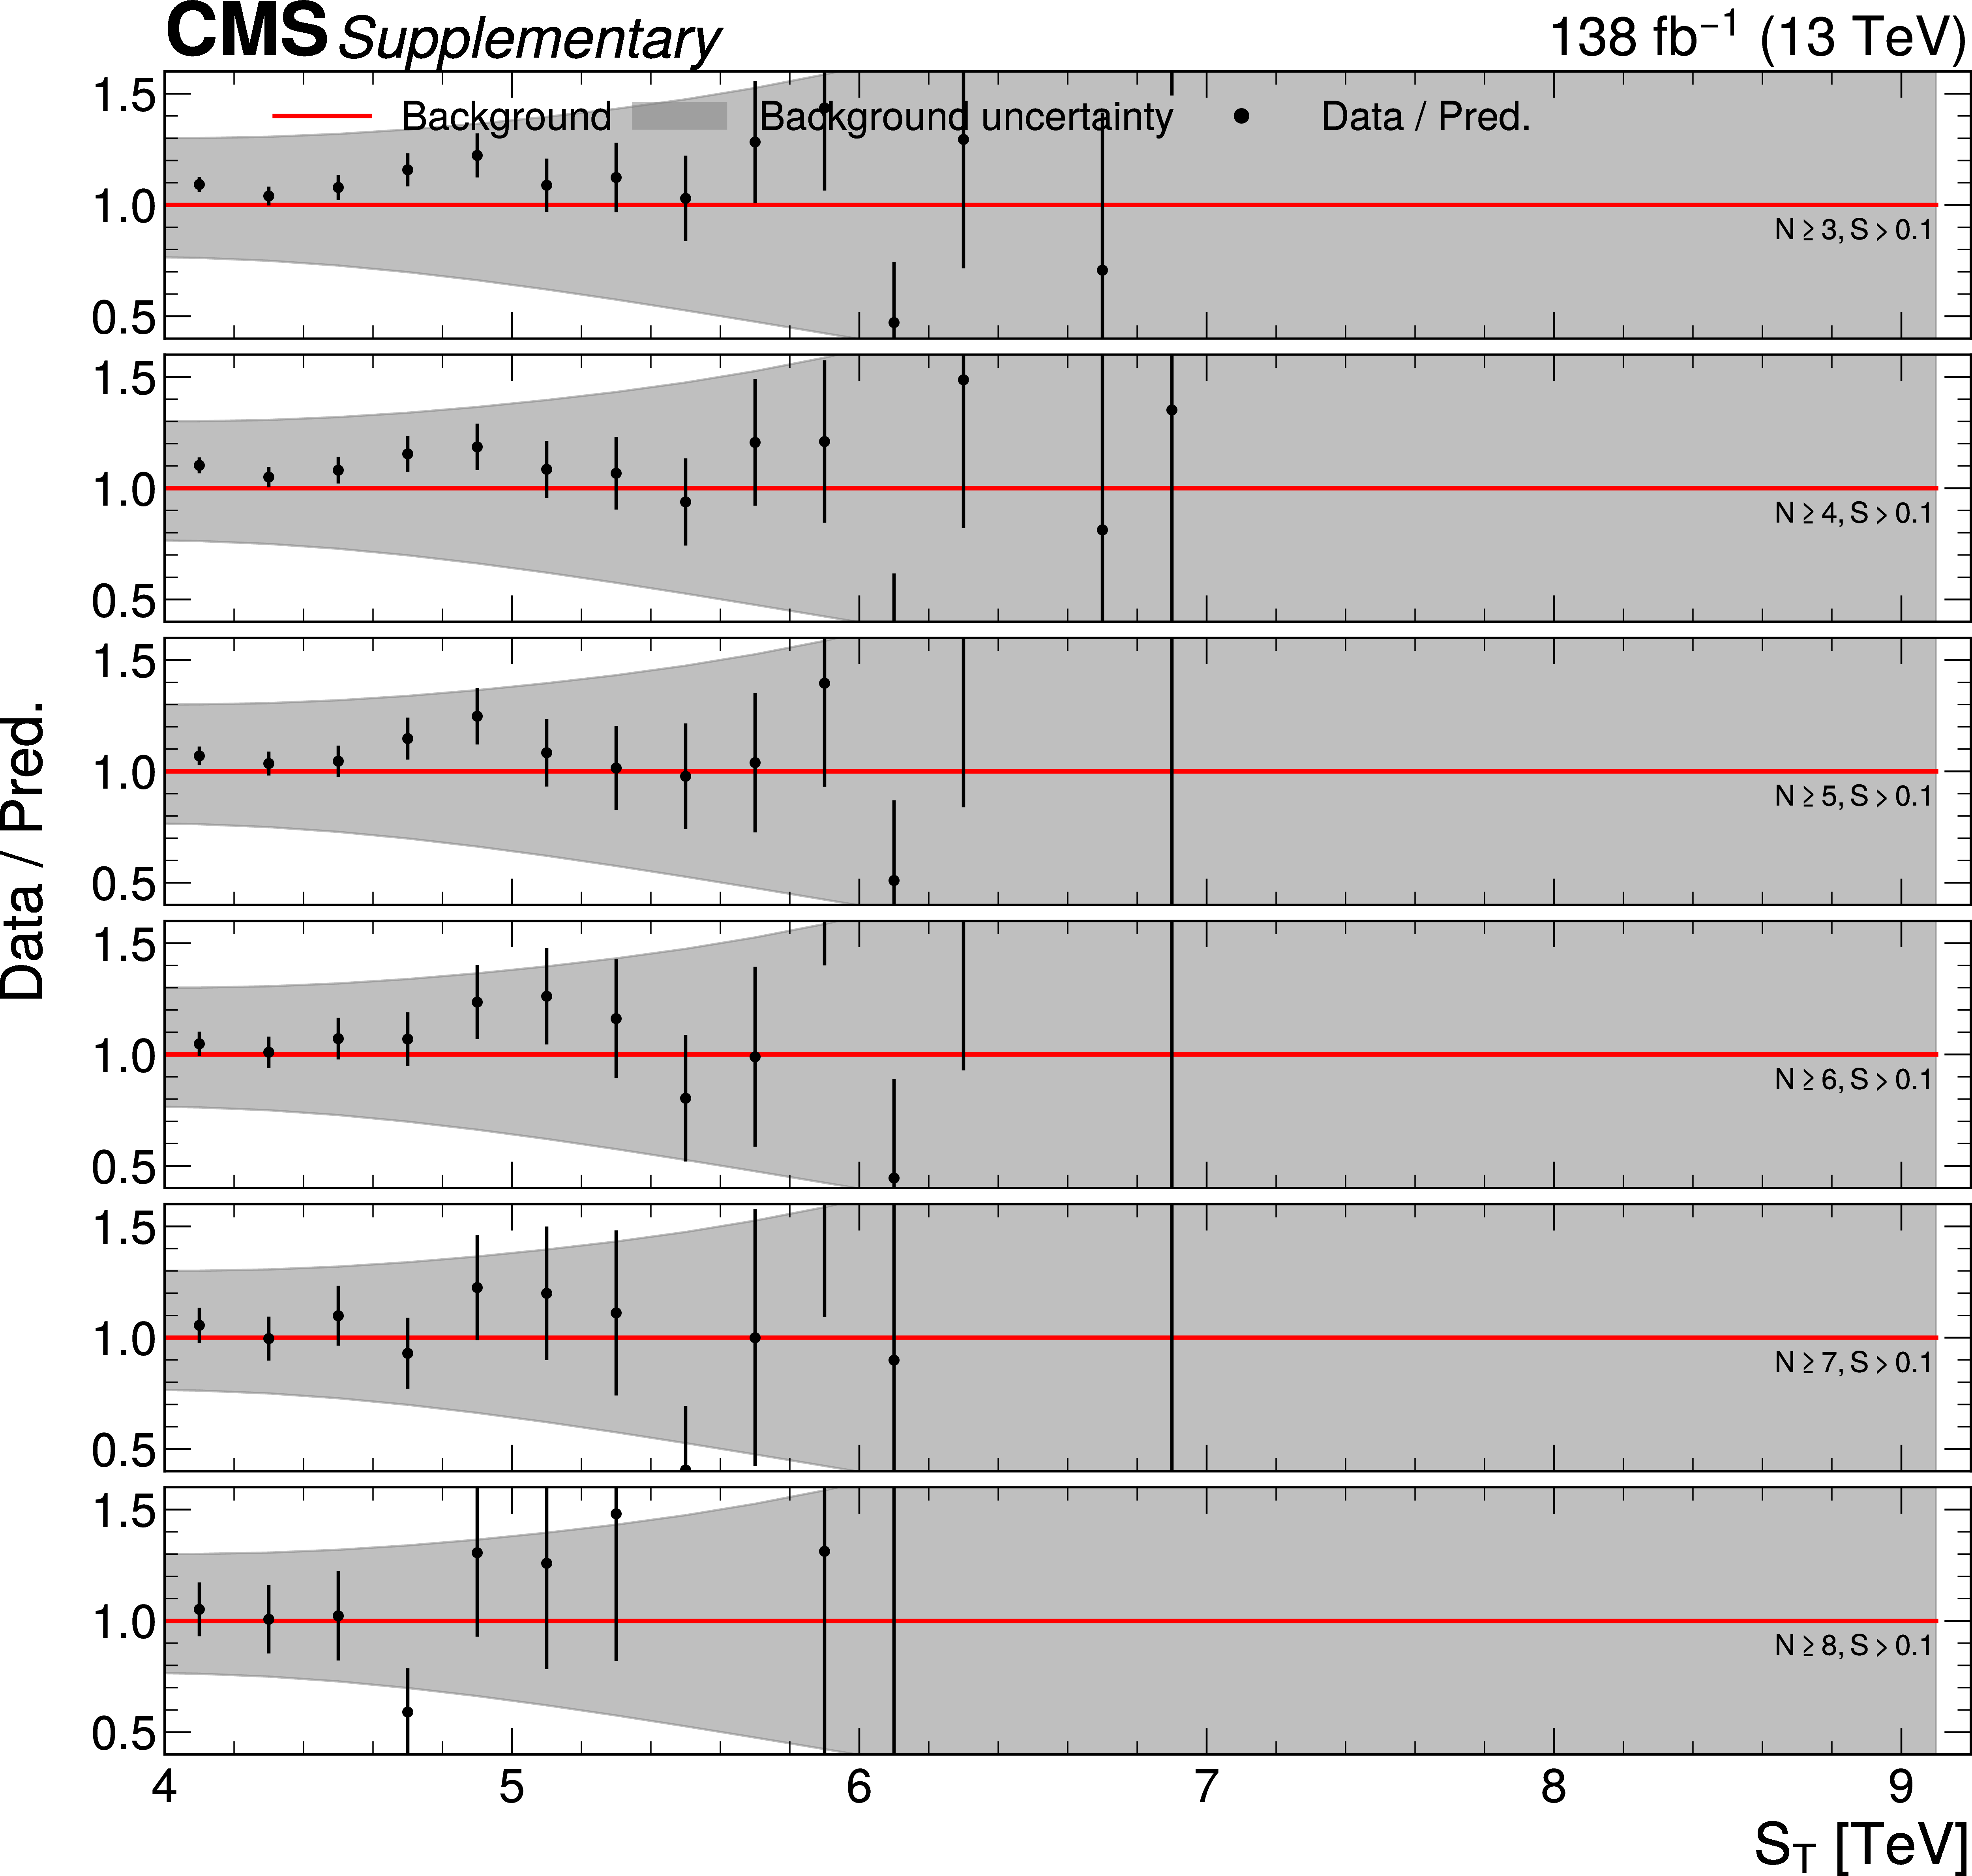
Data to prediction ratios of the $S_T$ spectra for multiplicities $N\!\ge\!3$--$8$ after the sphericity requirement $S>0.1$. The red horizontal line at 1 represents the background prediction, and the gray band shows the corresponding background modeling uncertainty. Points are data with statistical uncertainties. Across all multiplicities the ratios are consistent with unity, and the propagated shapes are aligned with the actual data within uncertainties. Hence, the $S_T$-invariance holds. |
png pdf |
Additional Figure 9:
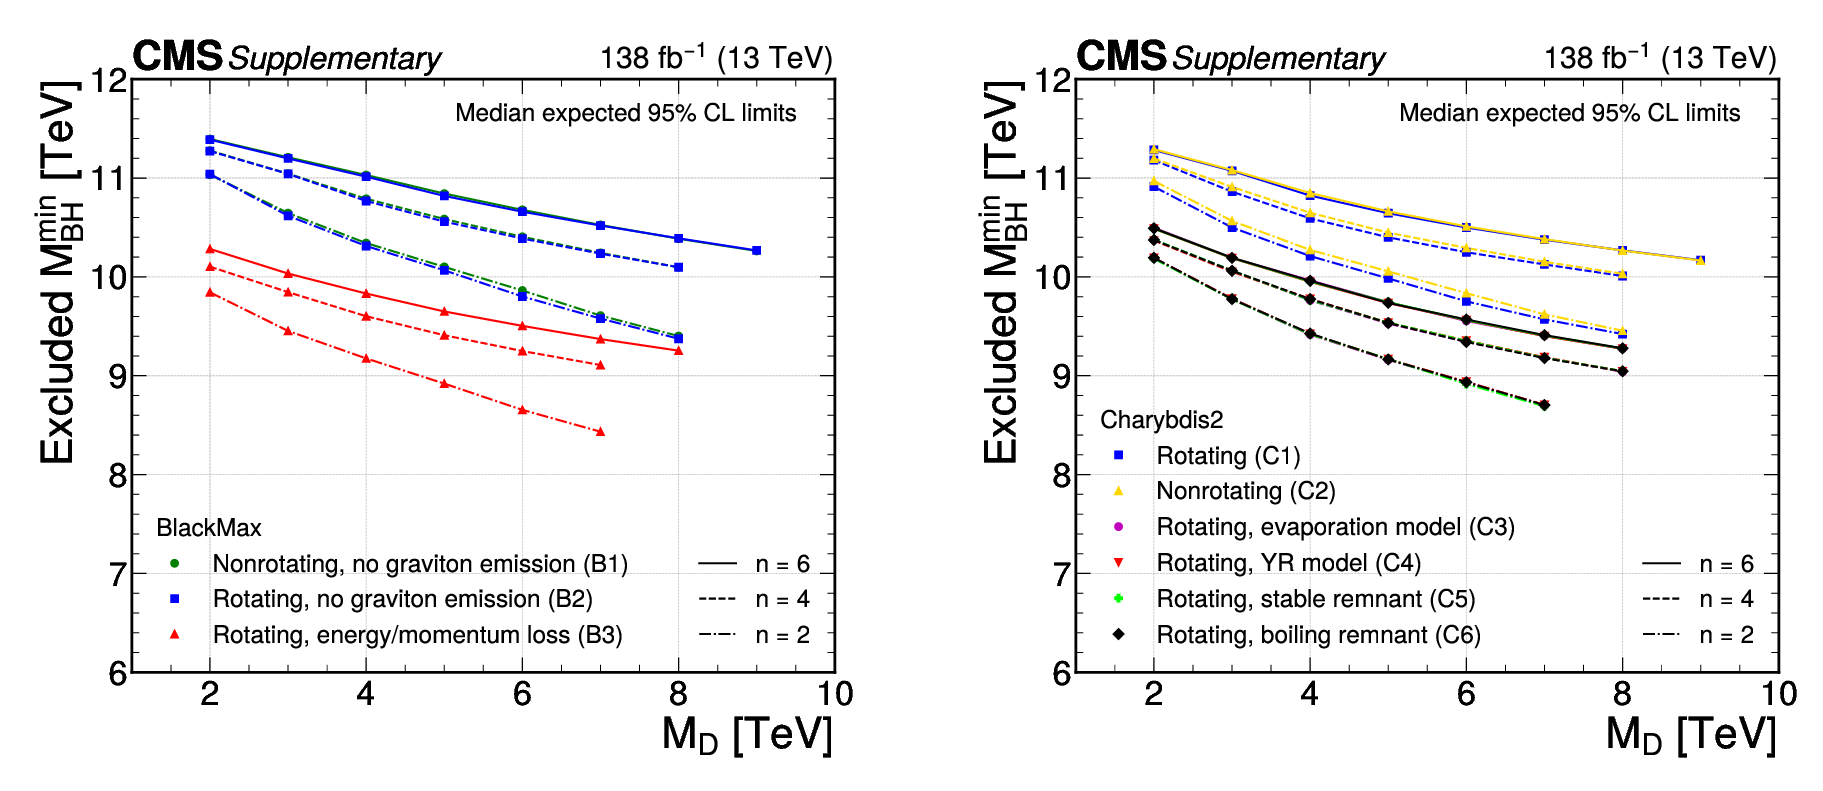
Median expected excluded $M_\text{BH}$ values as a function of $M_\text{D}$ and $n$ for a variety of \textsc{BlackMax} (left) and \textsc{Charybdis2} (right) BH models. |
png pdf |
Additional Figure 9-a:
Median expected excluded $M_\text{BH}$ values as a function of $M_\text{D}$ and $n$ for a variety of \textsc{BlackMax} (left) and \textsc{Charybdis2} (right) BH models. |
png pdf |
Additional Figure 9-b:
Median expected excluded $M_\text{BH}$ values as a function of $M_\text{D}$ and $n$ for a variety of \textsc{BlackMax} (left) and \textsc{Charybdis2} (right) BH models. |
png pdf |
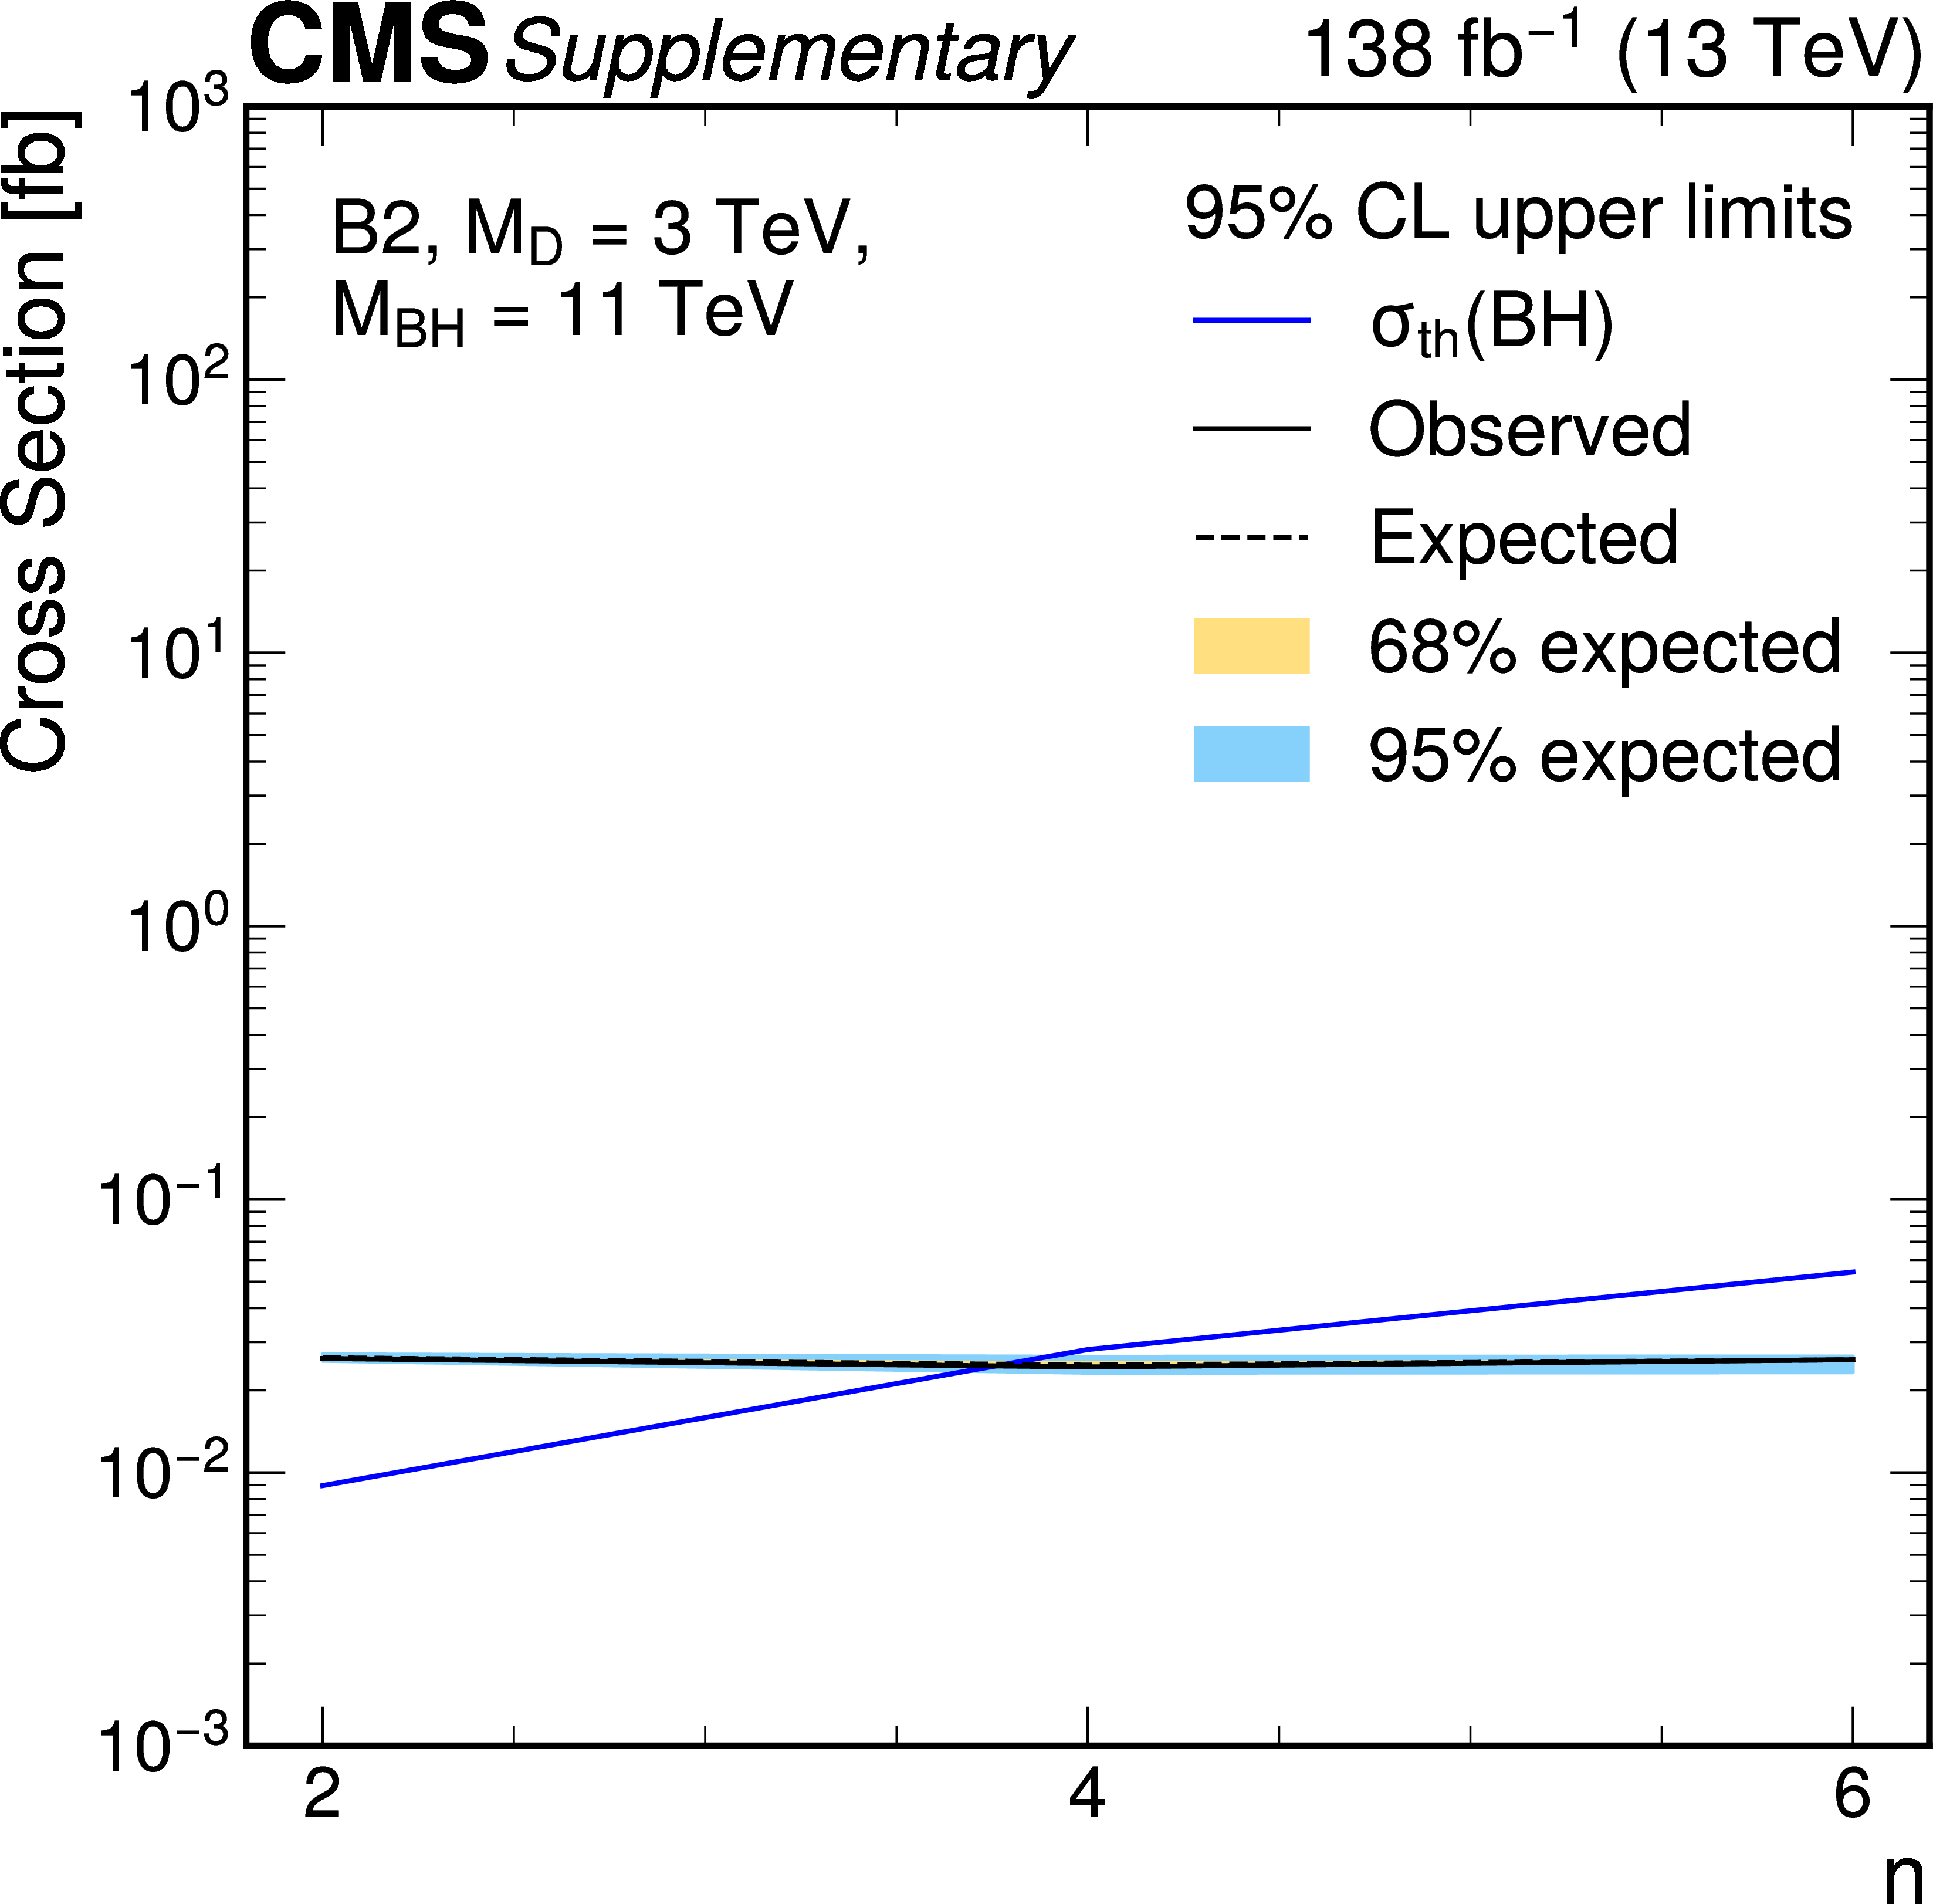
Additional Figure 10:
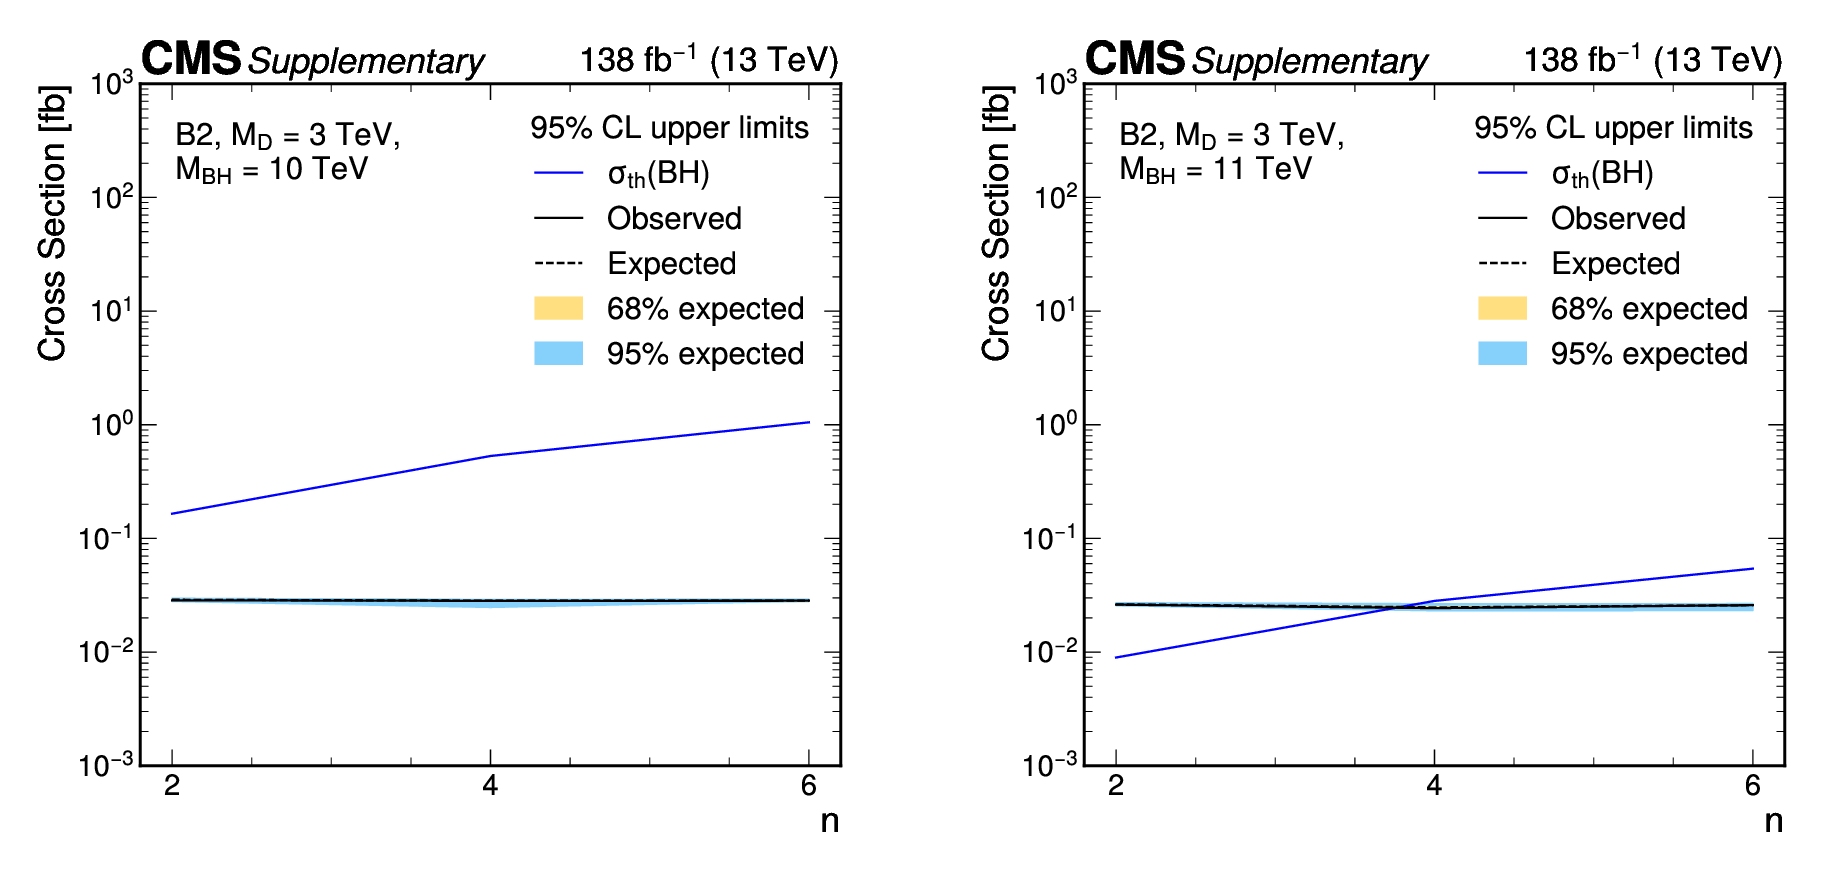
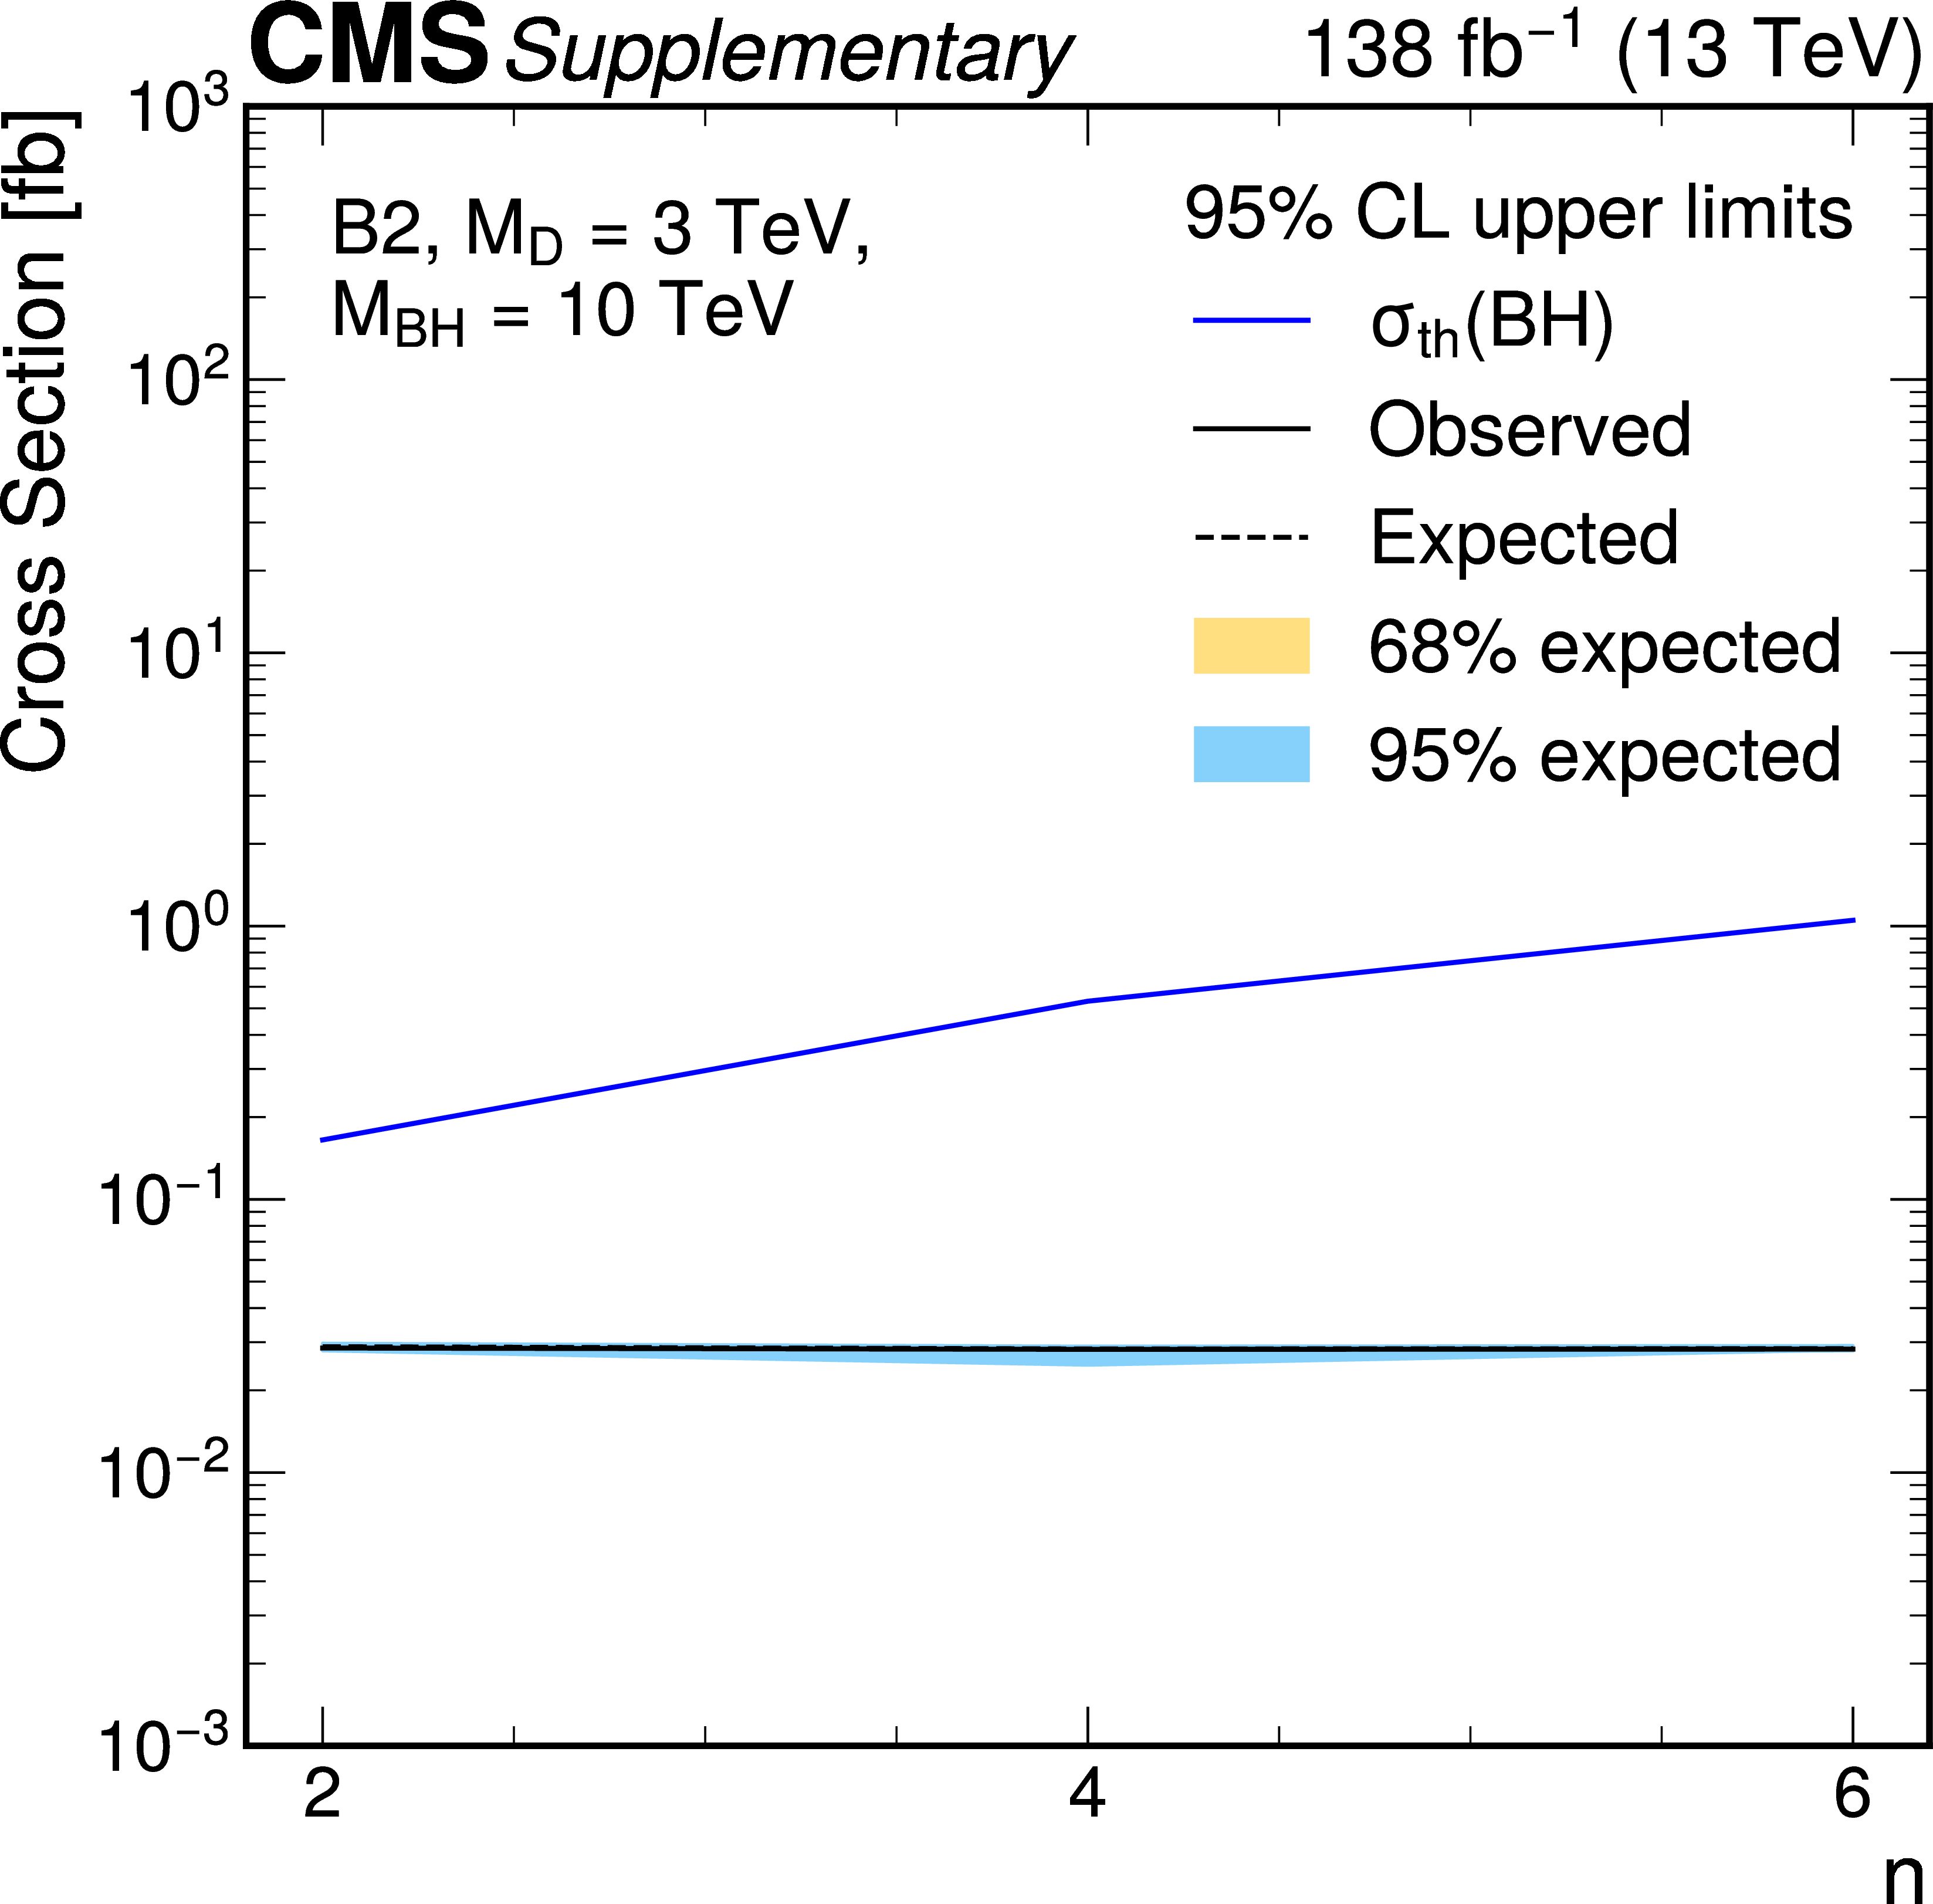
Expected and observed 95% CL upper limits on the cross section of the BH production as a function of the number of extra dimensions for the signal model B2 with $M_\text{D} = 3 $ TeV and $M_\text{BH} = 10 $ TeV (left), and for $M_\text{BH} = 11 $ TeV (right). |
png pdf |
Additional Figure 10-a:
Expected and observed 95% CL upper limits on the cross section of the BH production as a function of the number of extra dimensions for the signal model B2 with $M_\text{D} = 3 $ TeV and $M_\text{BH} = 10 $ TeV (left), and for $M_\text{BH} = 11 $ TeV (right). |
png pdf |
Additional Figure 10-b:
Expected and observed 95% CL upper limits on the cross section of the BH production as a function of the number of extra dimensions for the signal model B2 with $M_\text{D} = 3 $ TeV and $M_\text{BH} = 10 $ TeV (left), and for $M_\text{BH} = 11 $ TeV (right). |
png pdf |
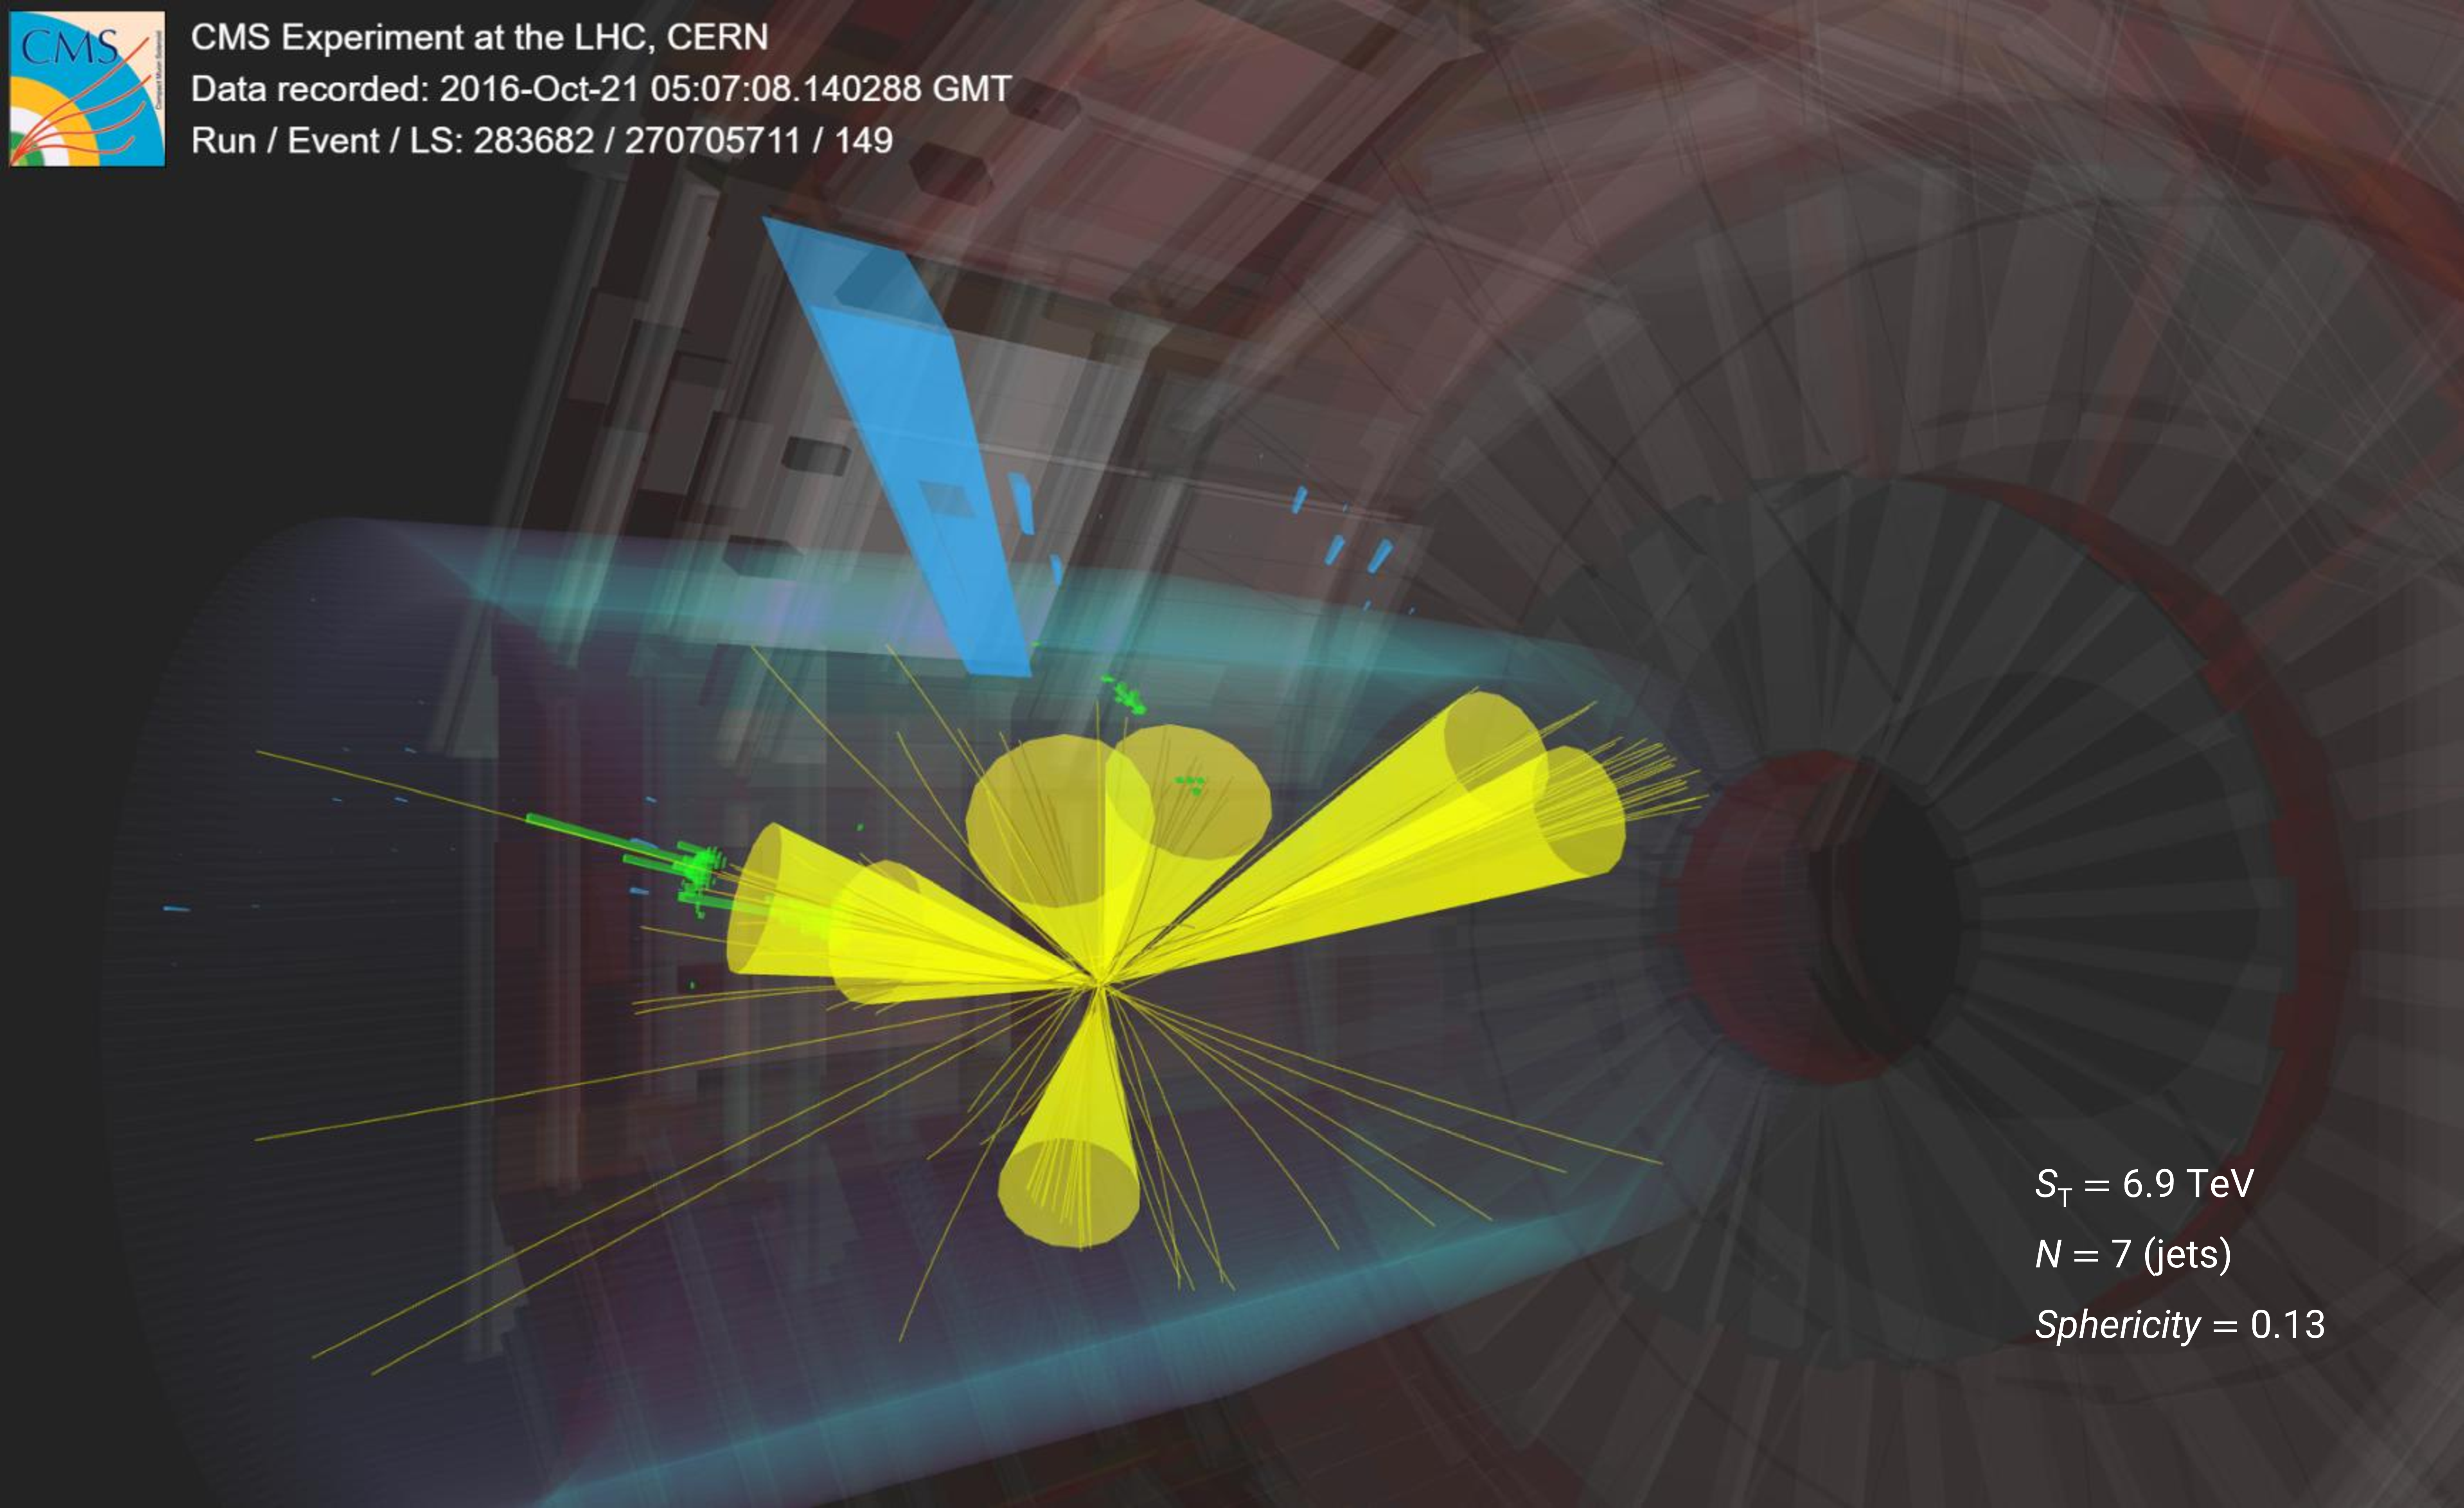
Additional Figure 11:
An event display of the largest-$S_\text{T}$ (6.9 TeV) signal candidate event seen in data. The event contains 7 jets, represented by the yellow cones. |
png pdf |
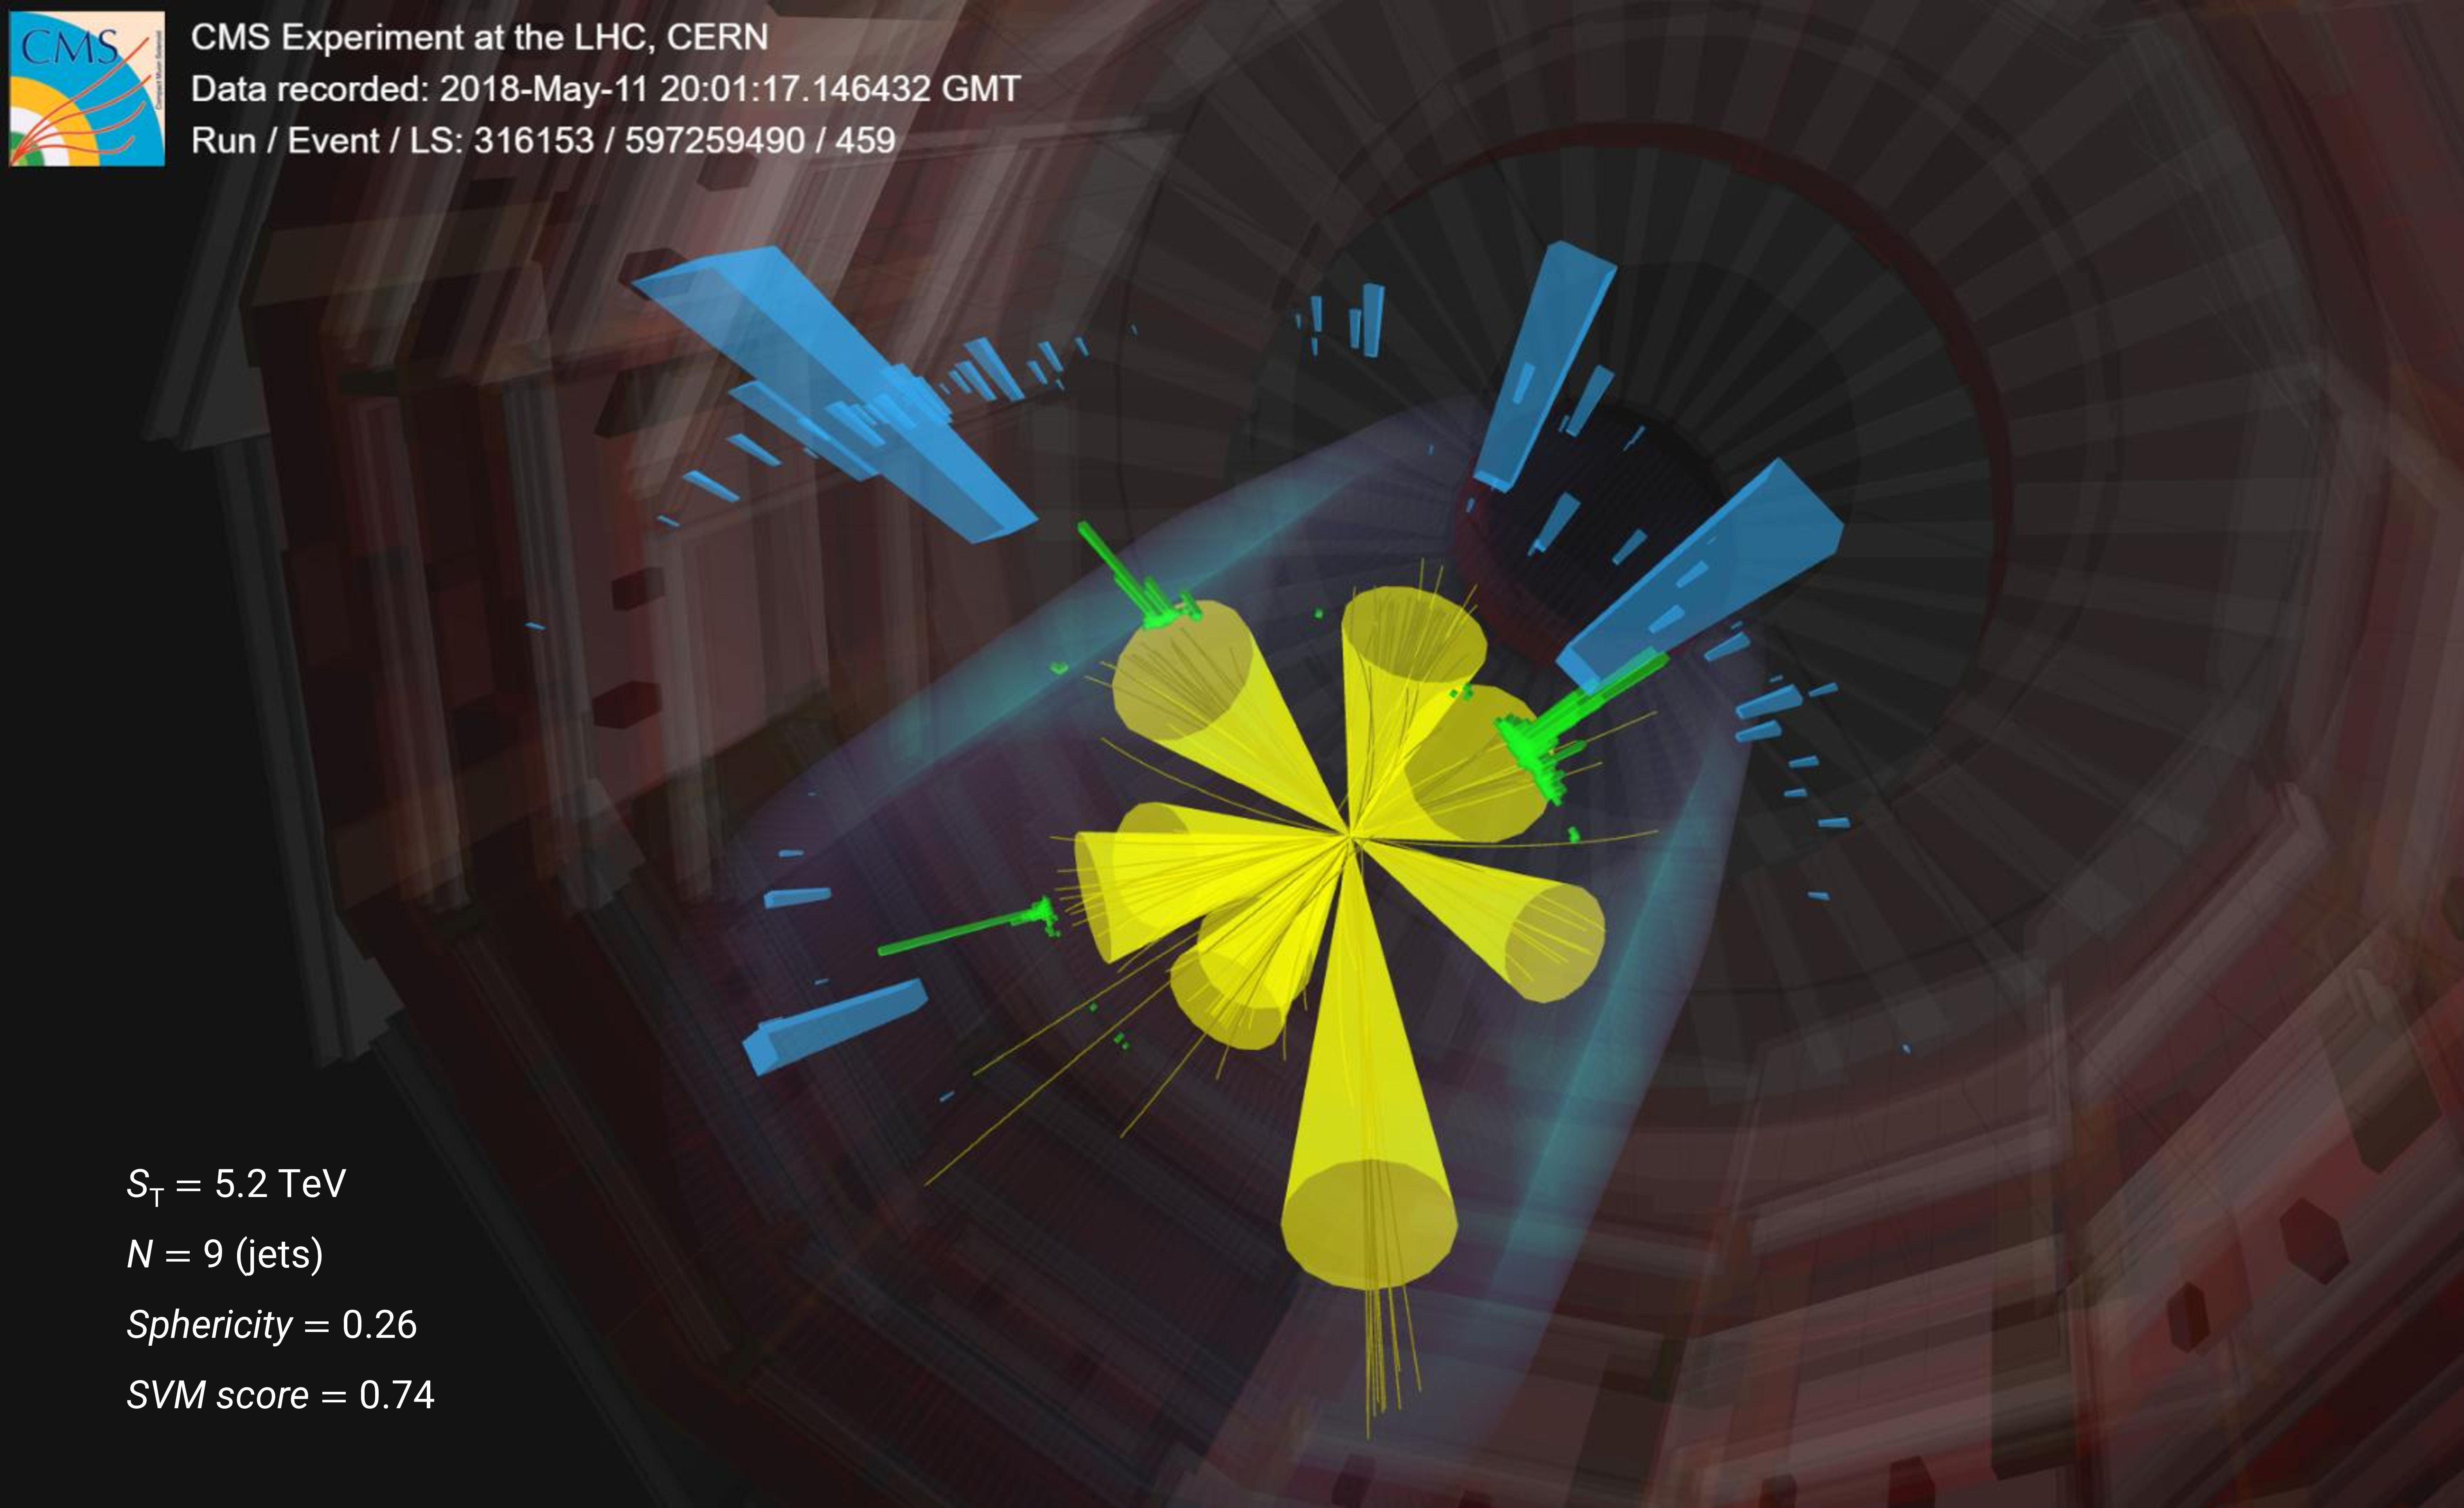
Additional Figure 12:
An event display of the highest-multiplicity ($N =$ 9) signal candidate event seen in data. The event contains 9 jets, represented by the yellow cones. |
png pdf |
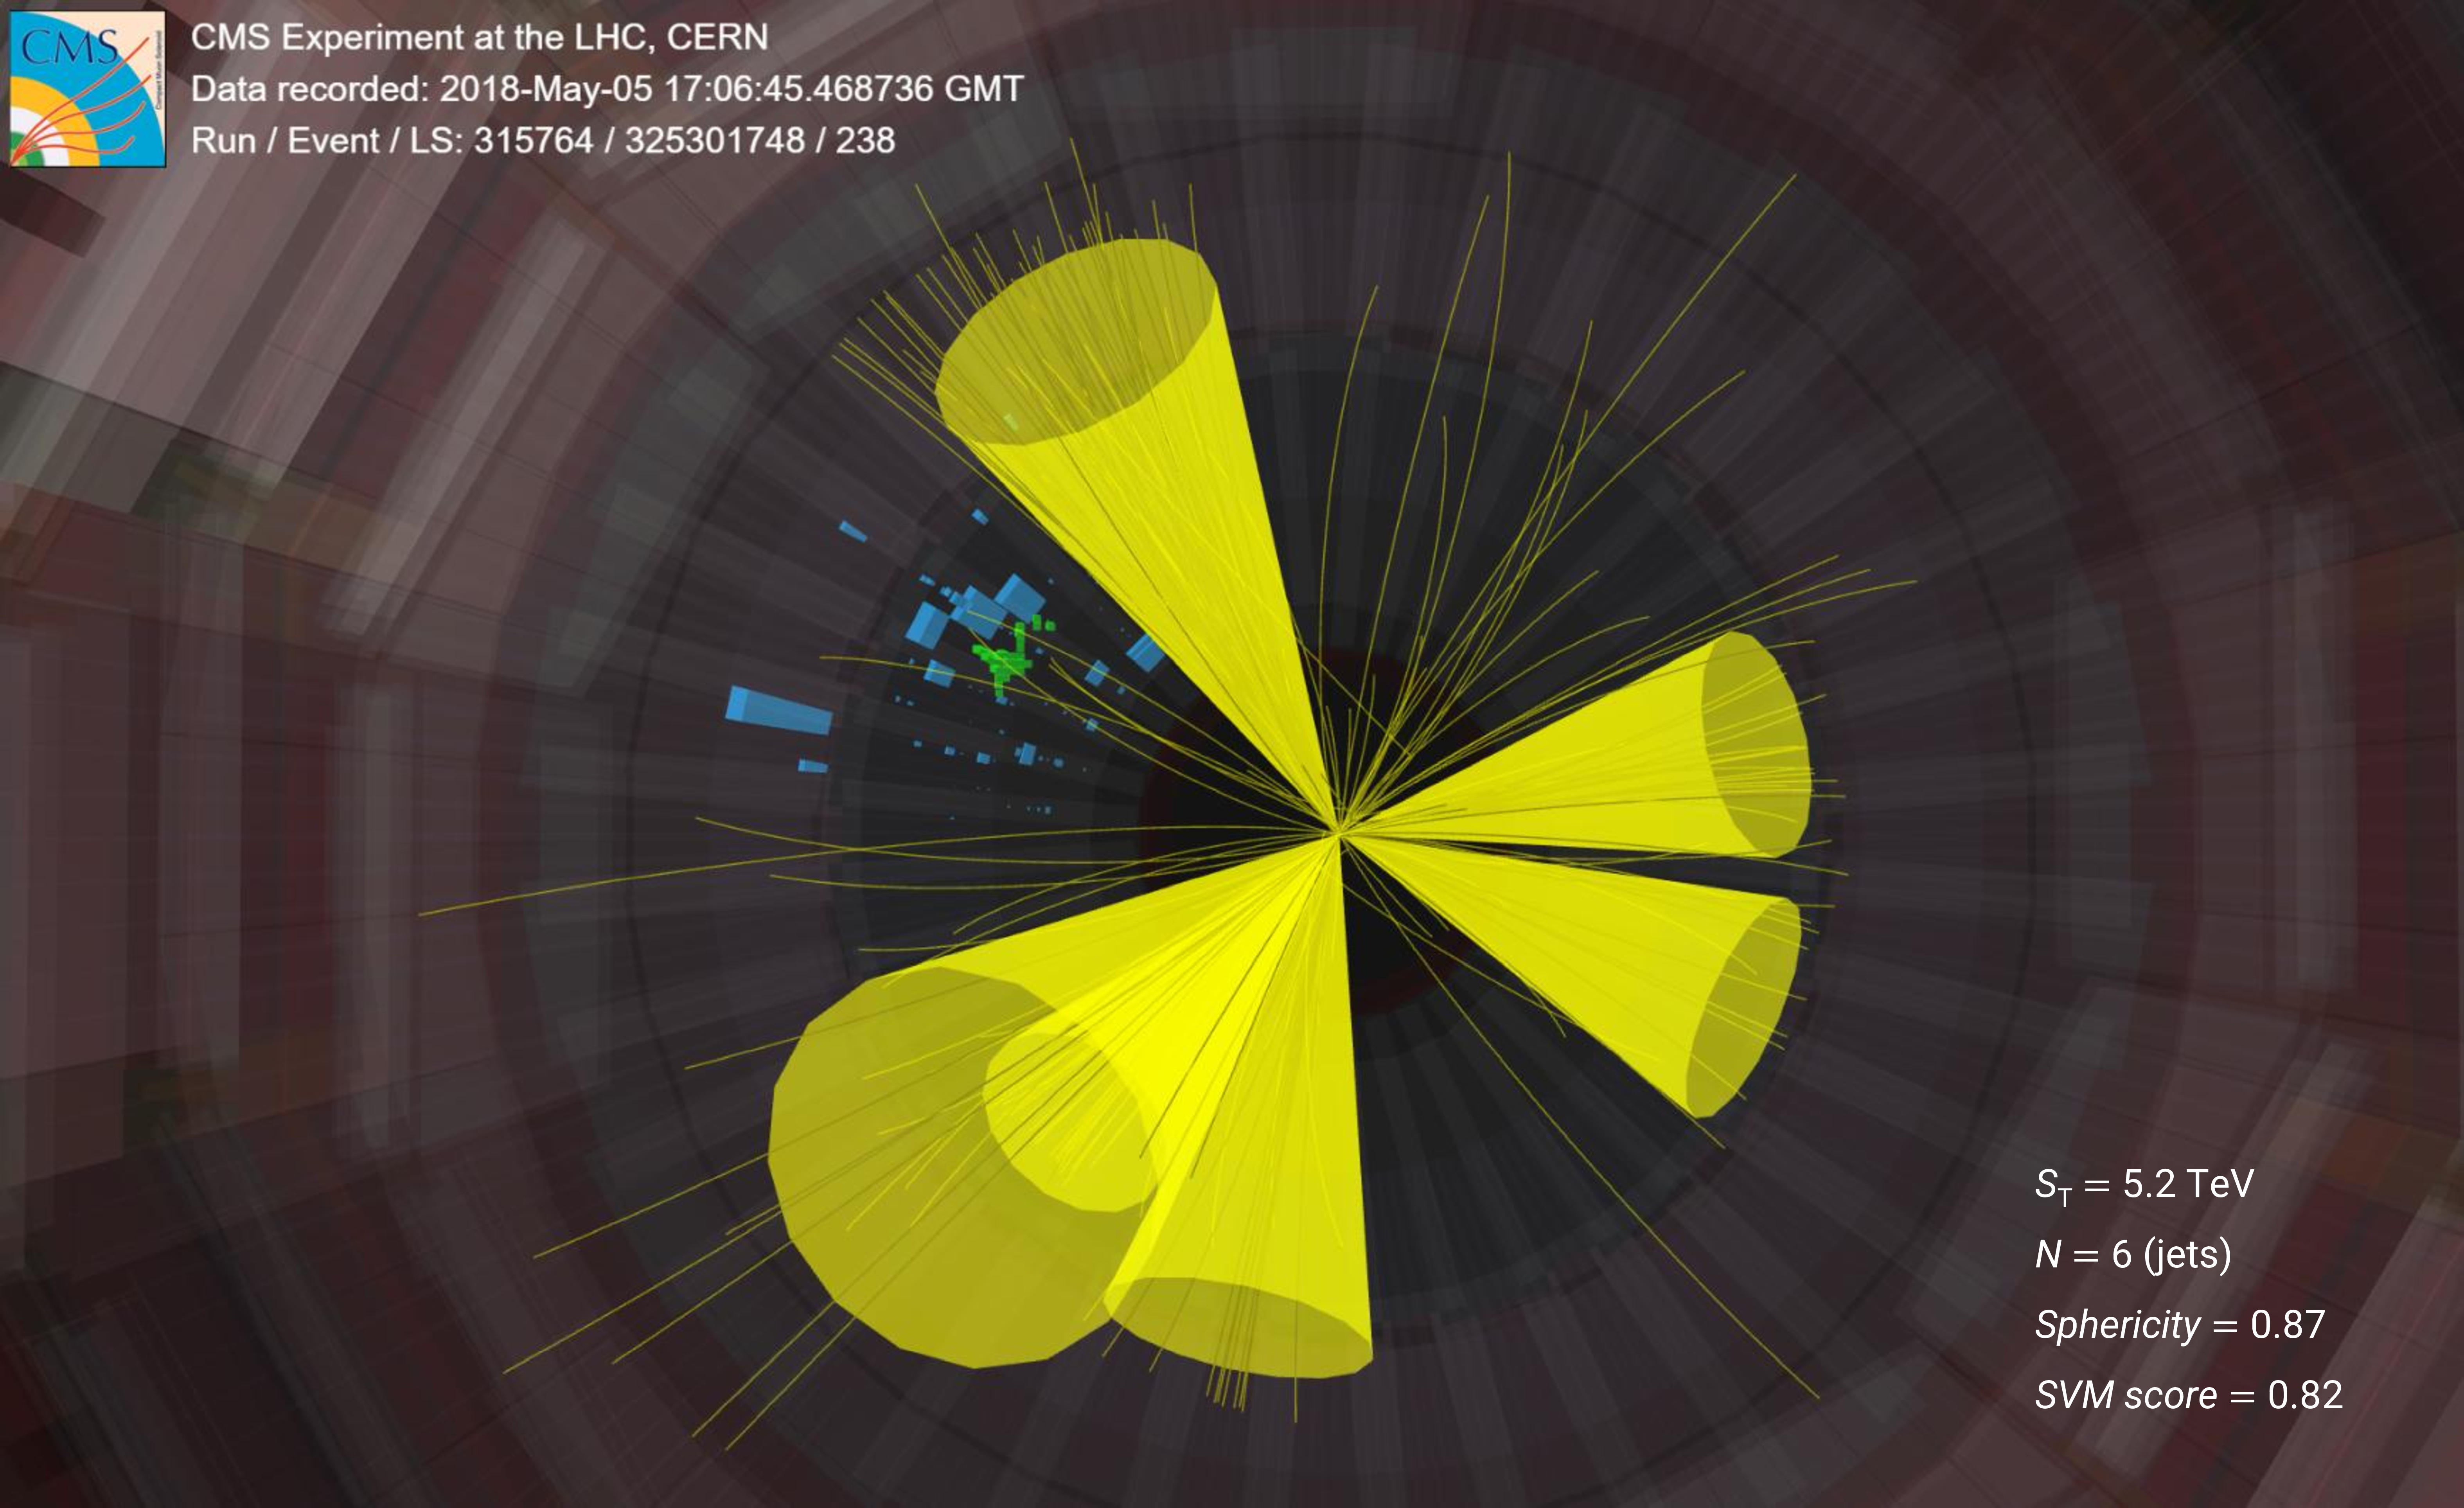
Additional Figure 13:
An event display of the most-spherical (sphericity = 0.87) signal candidate event seen in data. The event contains 6 jets, represented by the yellow cones. |
png pdf |
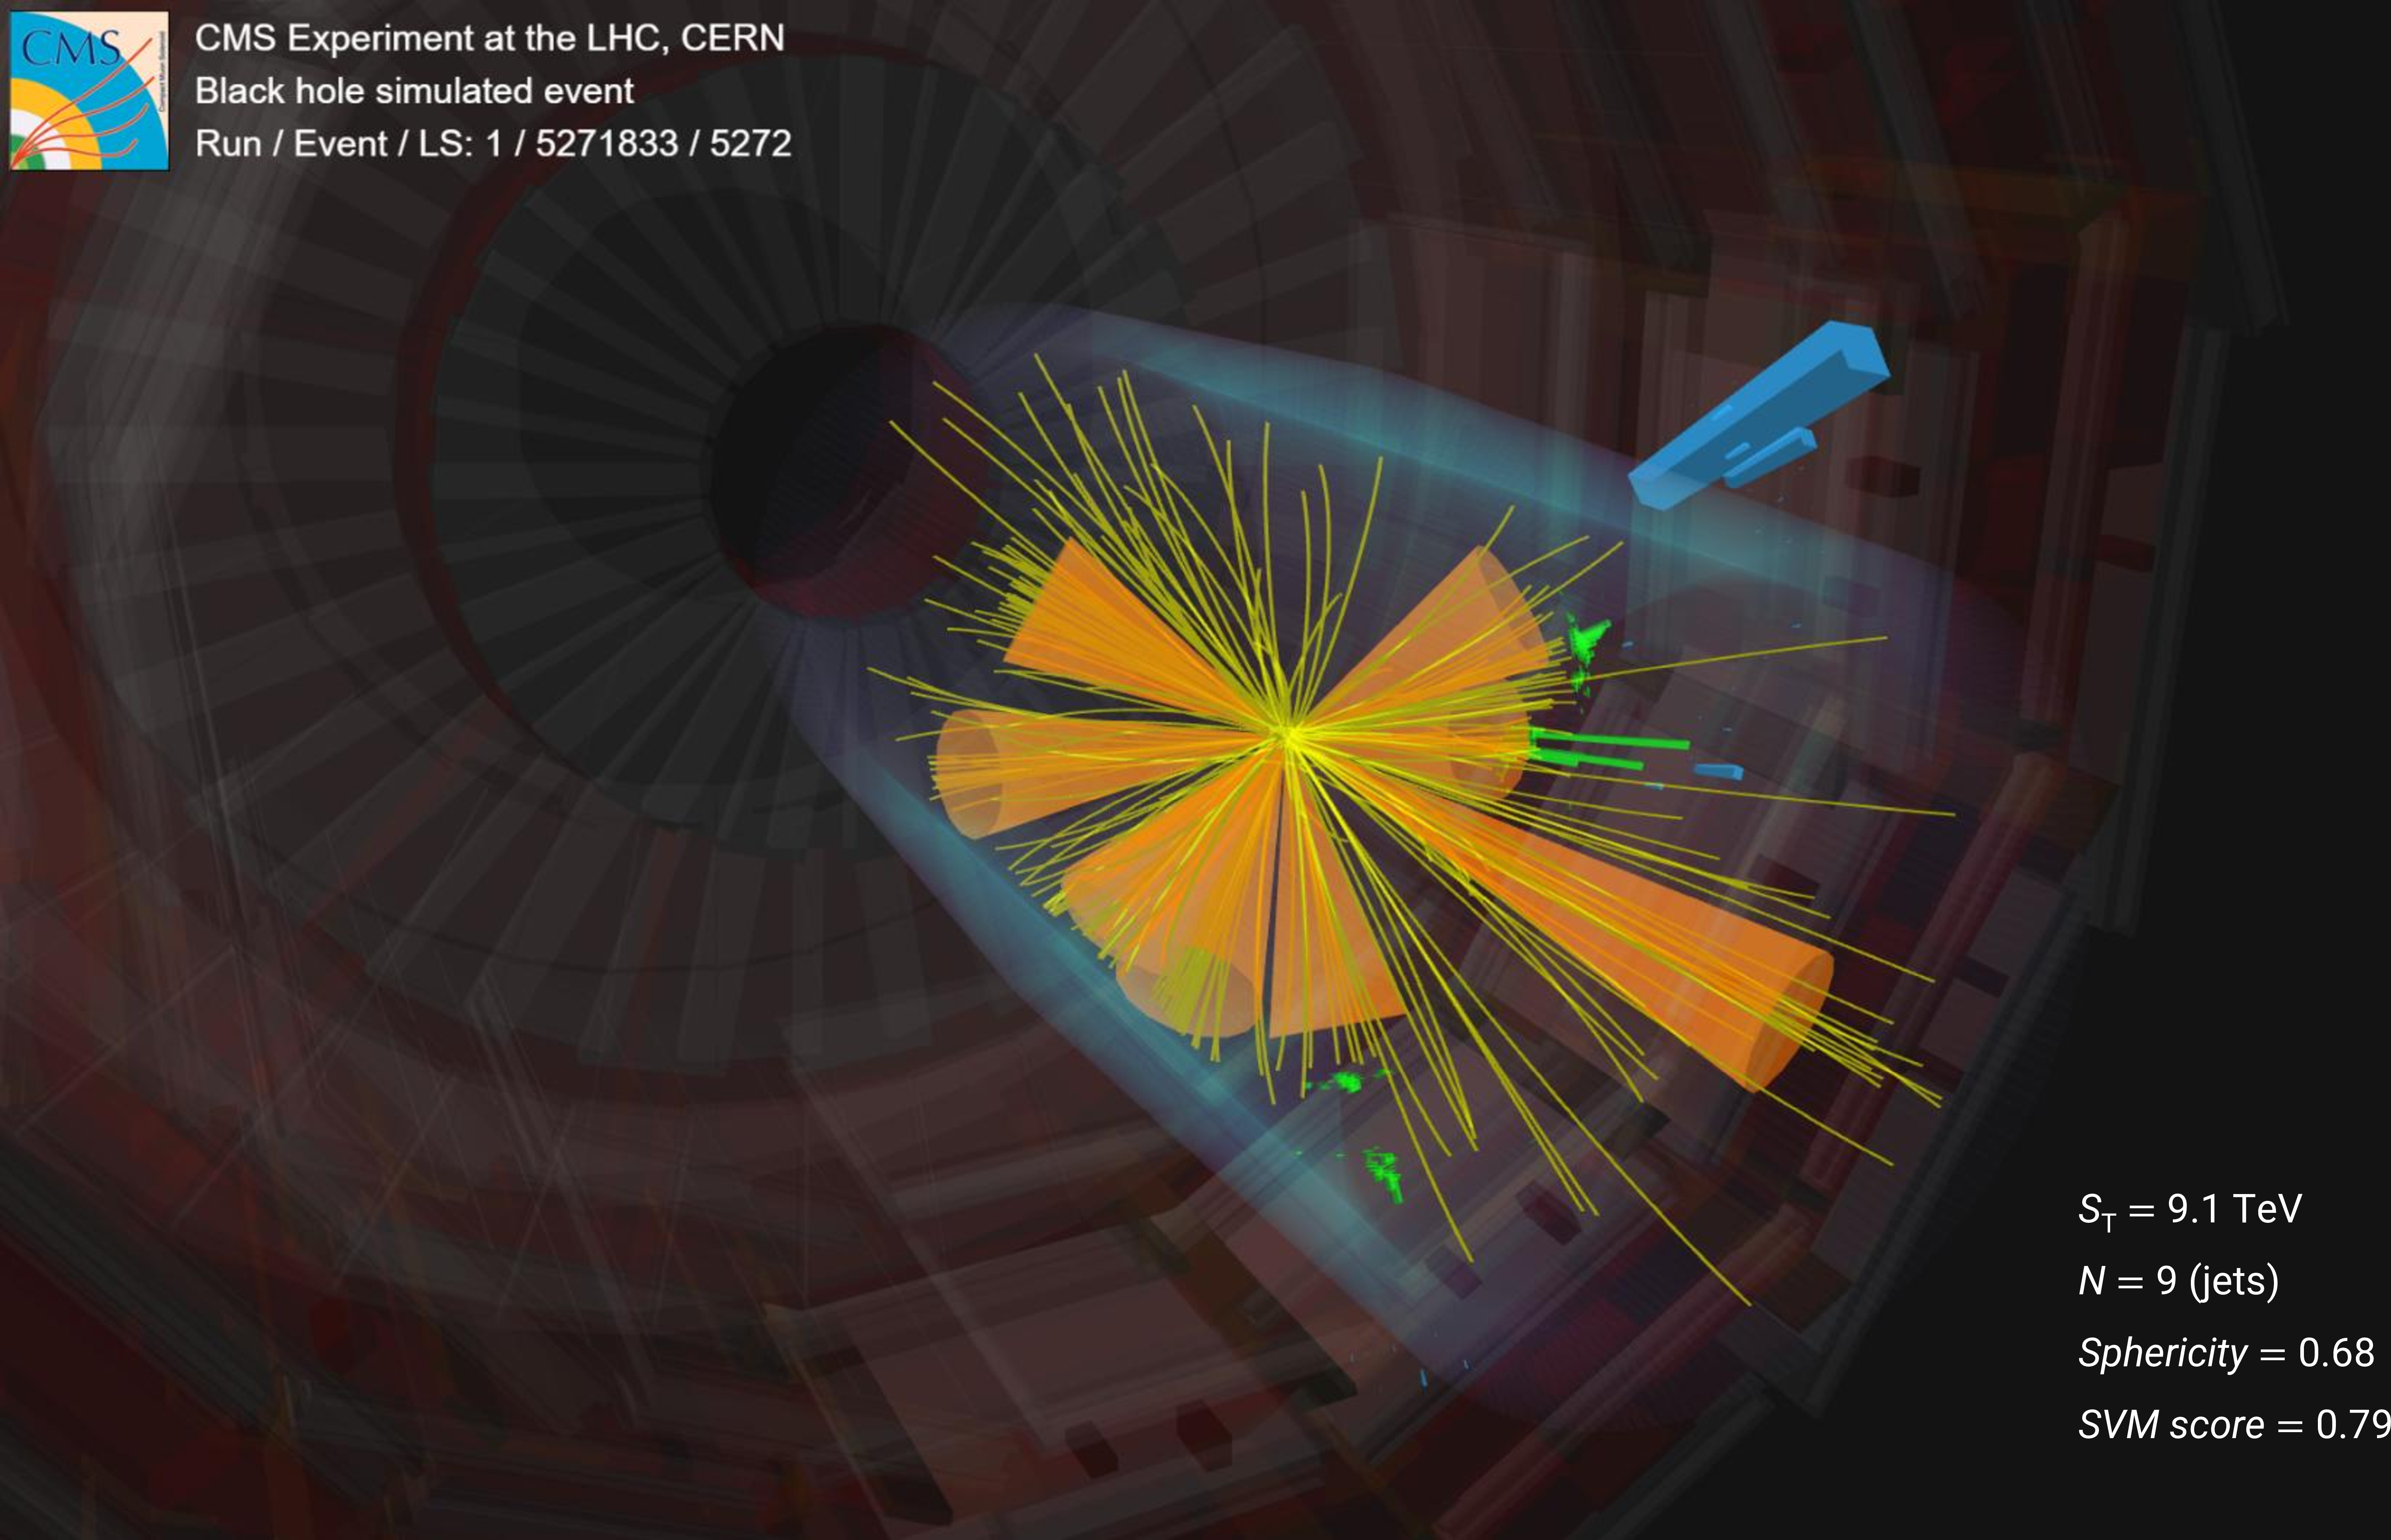
Additional Figure 14:
An event display of a simulated black hole event. The event contains 9 jets, represented by the orange cones. |
png pdf |
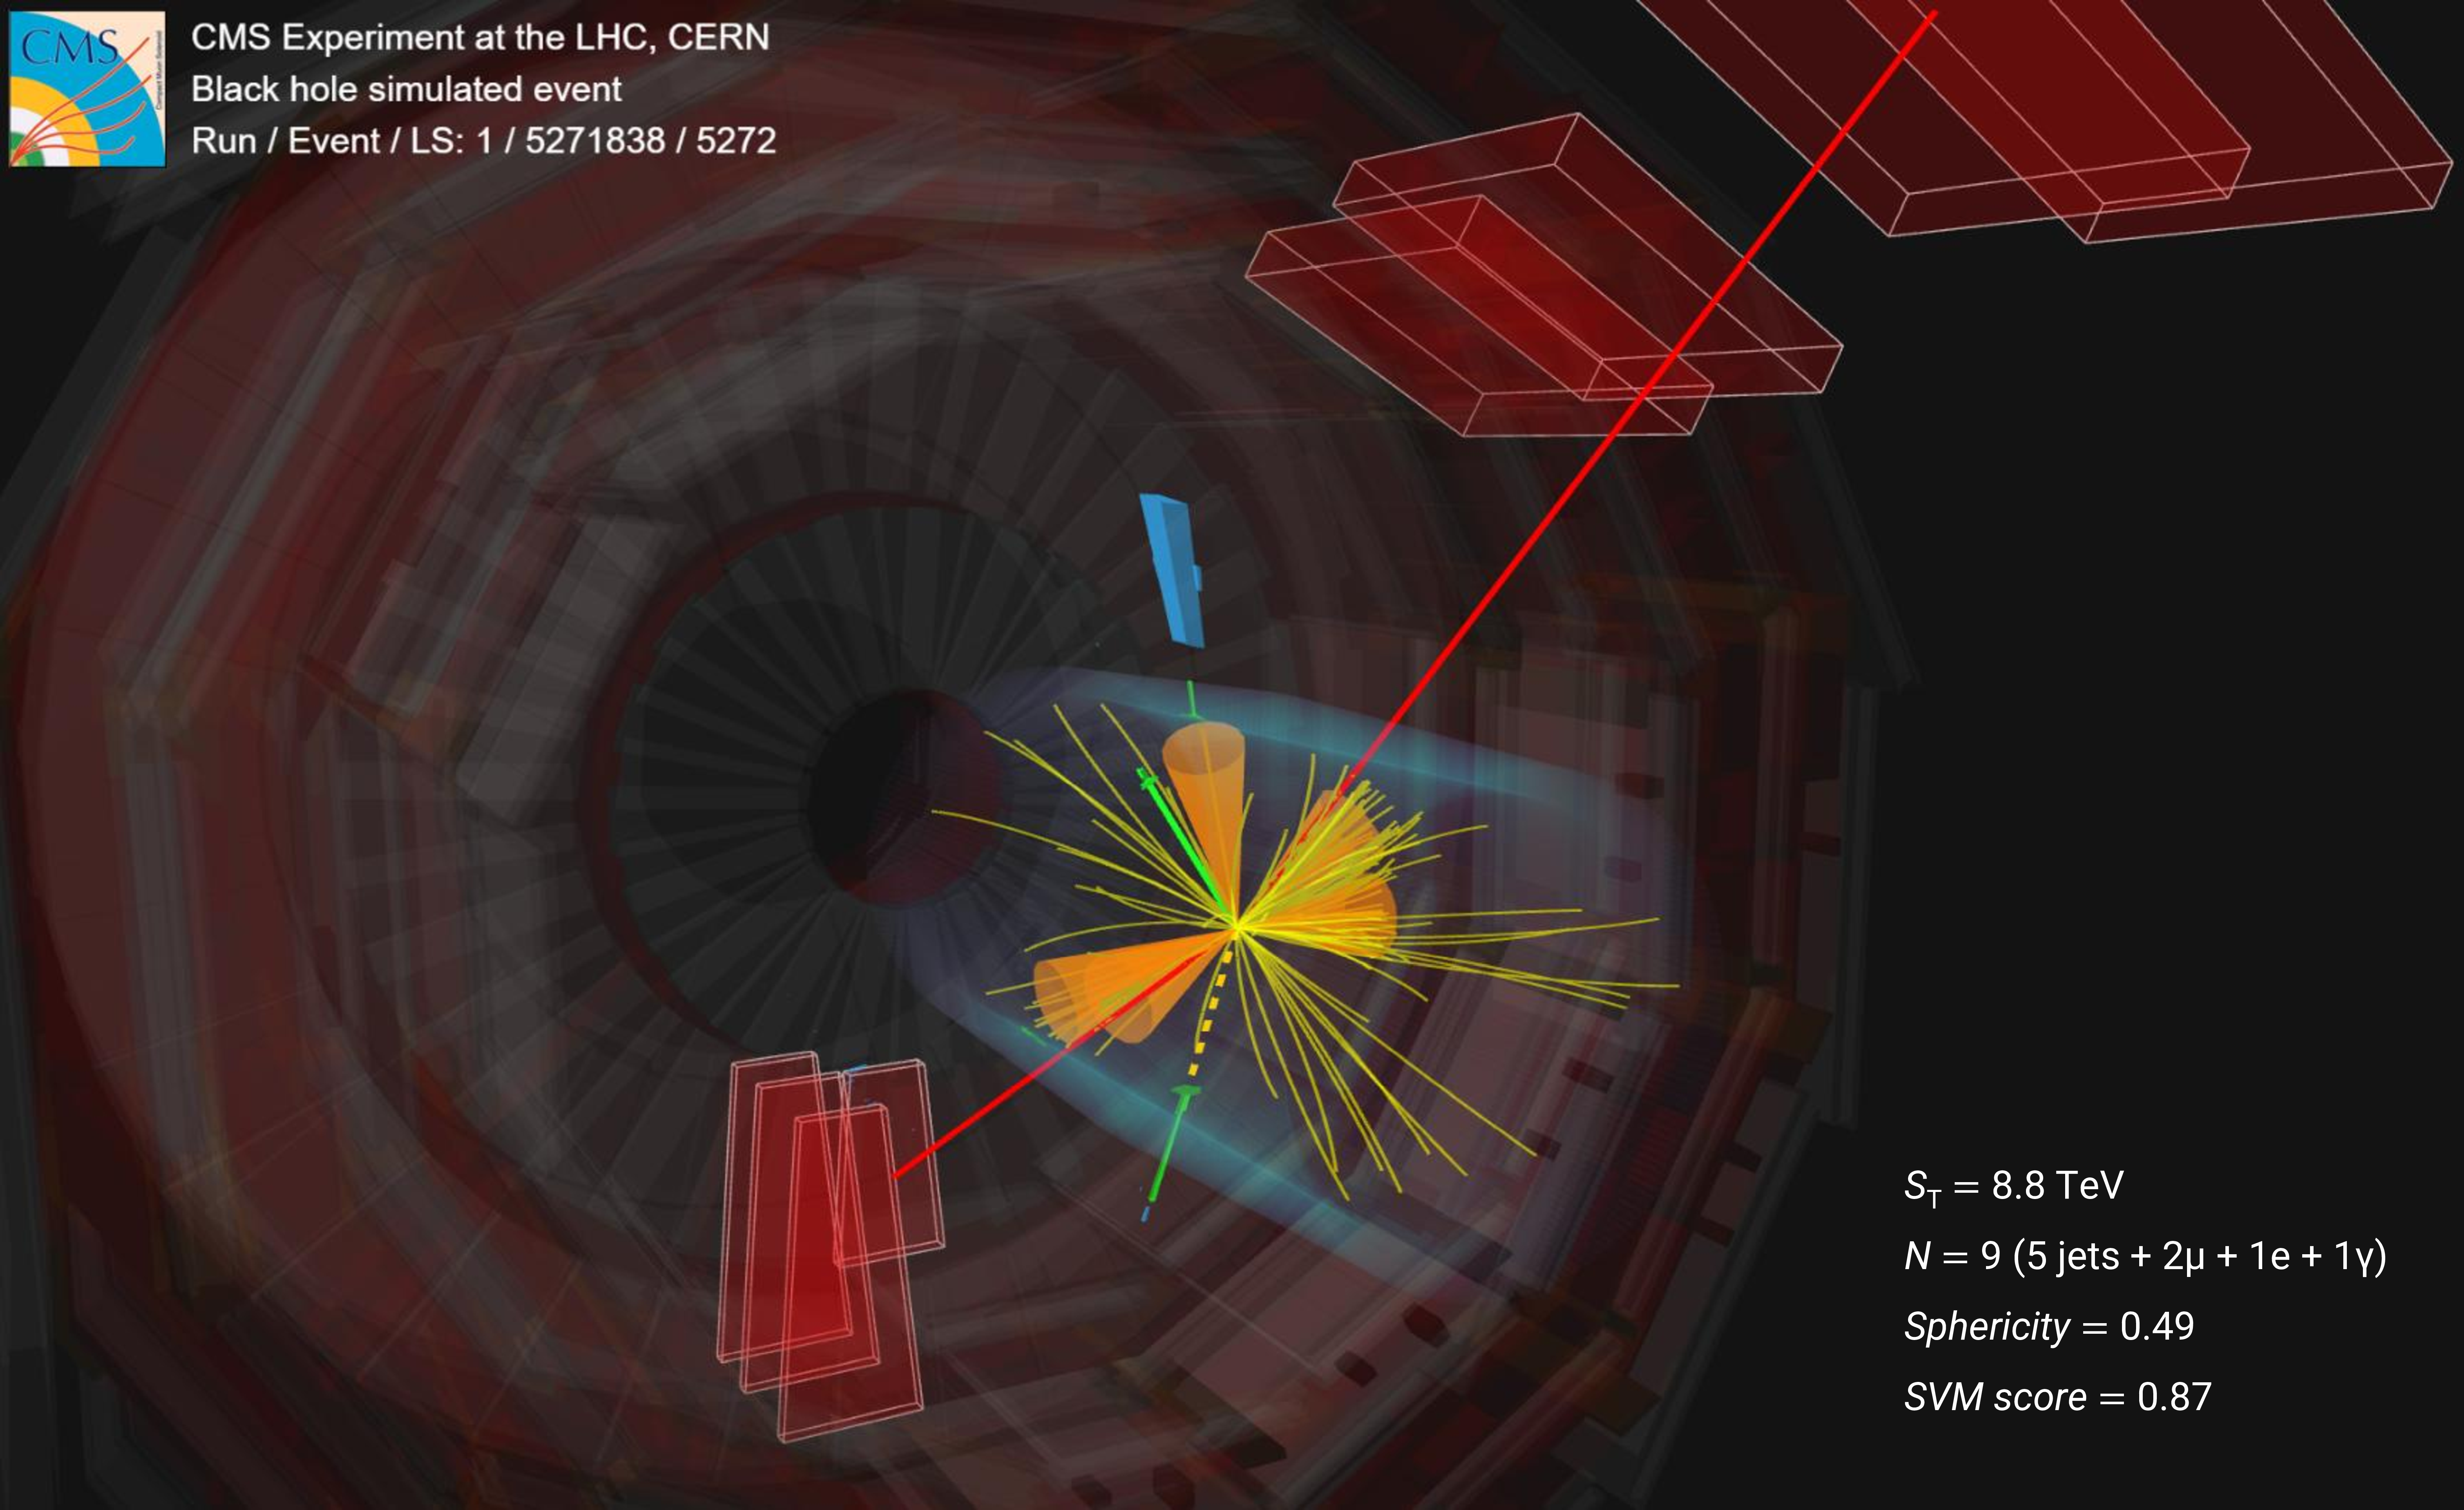
Additional Figure 15:
An event display of a simulated black hole event. The event contains: 5 jets, represented by the orange cones; 2 muons, respresented by the red trajectories; 1 electron, shown by the solid green line; and one photon, indicated by the dashed yellow line. |
png pdf |
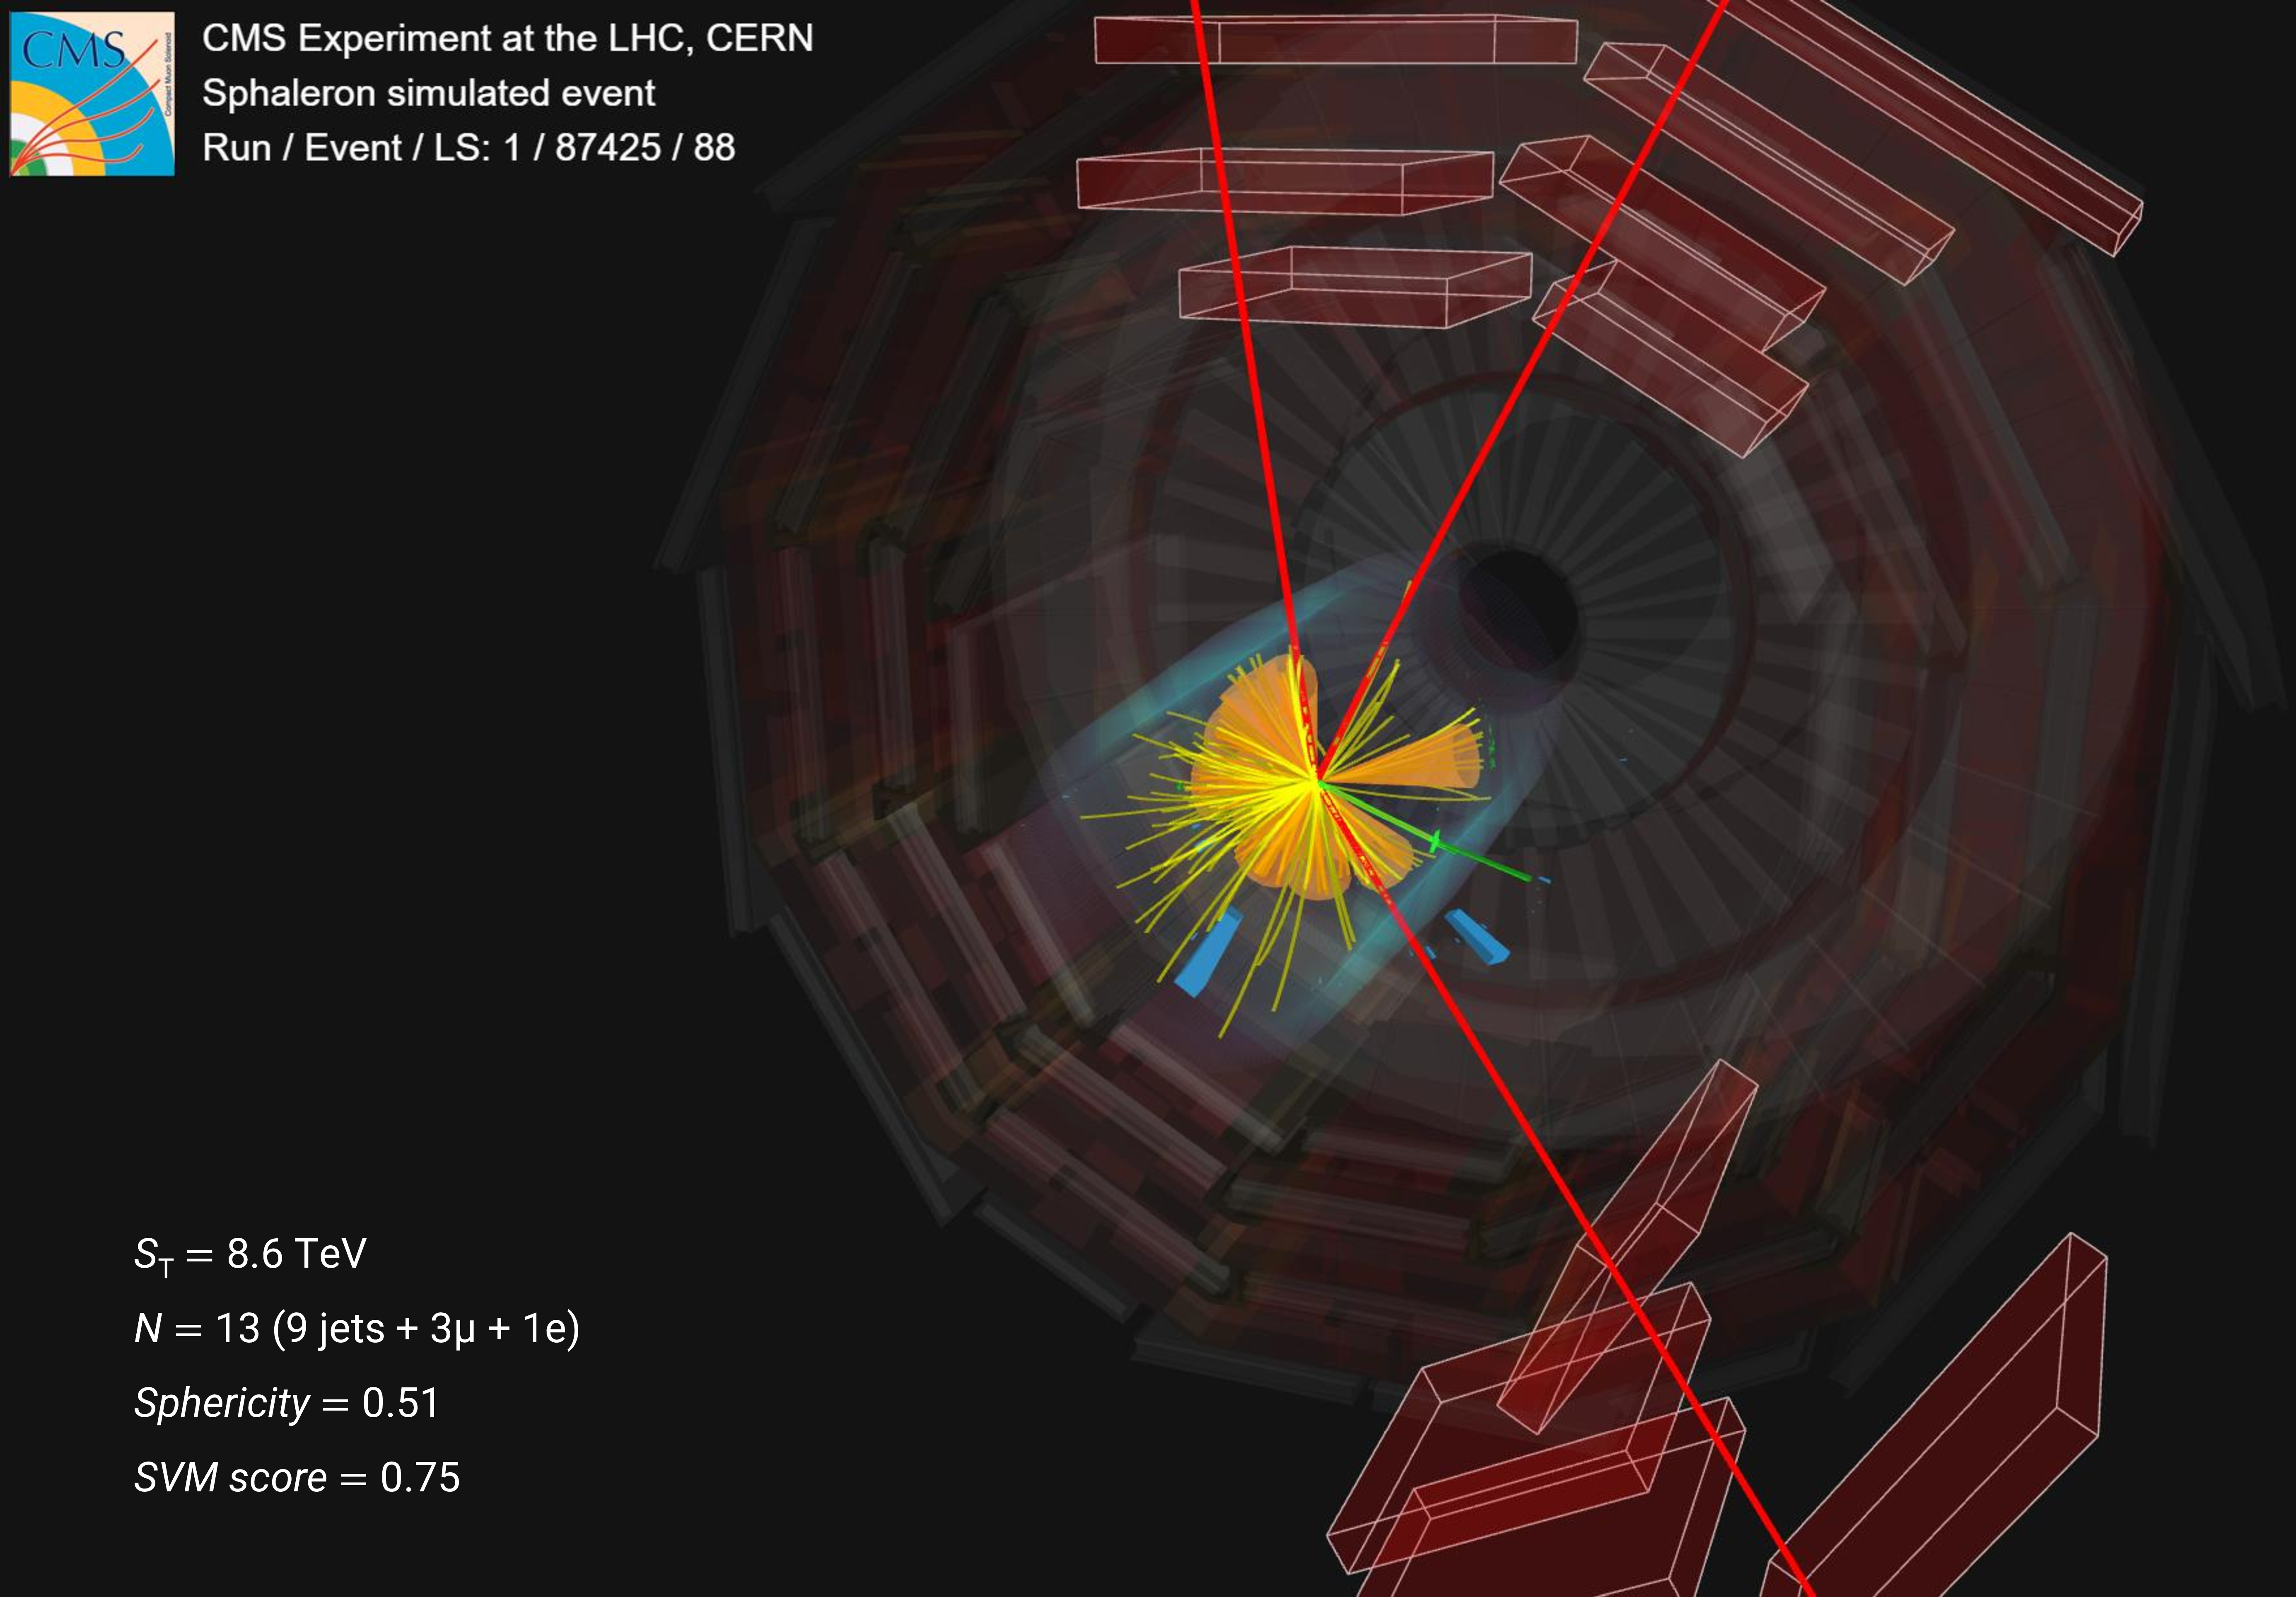
Additional Figure 16:
An event display of a simulated sphaleron event. The event contains 9 jets, 3 muons, and 1 electon, represented by the orange cones, red trajectories, and the solid green line, respectively. |
| References | ||||
| 1 | I. Antoniadis, N. Arkani-Hamed, S. Dimopoulos, and G. R. Dvali | New dimensions at a millimeter to a fermi and superstrings at a TeV | PLB 436 (1998) 257 | hep-ph/9804398 |
| 2 | N. Arkani-Hamed, S. Dimopoulos, and G. R. Dvali | The hierarchy problem and new dimensions at a millimeter | PLB 429 (1998) 263 | hep-ph/9803315 |
| 3 | N. Arkani-Hamed, S. Dimopoulos, and G. R. Dvali | Phenomenology, astrophysics and cosmology of theories with submillimeter dimensions and TeV scale quantum gravity | PRD 59 (1999) 086004 | hep-ph/9807344 |
| 4 | L. Randall and R. Sundrum | An alternative to compactification | PRL 83 (1999) 4690 | hep-th/9906064 |
| 5 | L. Randall and R. Sundrum | A large mass hierarchy from a small extra dimension | PRL 83 (1999) 3370 | hep-ph/9905221 |
| 6 | S. Dimopoulos and G. L. Landsberg | Black holes at the LHC | PRL 87 (2001) 161602 | hep-ph/0106295 |
| 7 | P. C. Argyres, S. Dimopoulos, and J. March-Russell | Black holes and submillimeter dimensions | PLB 441 (1998) 96 | hep-th/9808138 |
| 8 | S. B. Giddings and S. D. Thomas | High-energy colliders as black hole factories: The end of short distance physics | PRD 65 (2002) 056010 | hep-ph/0106219 |
| 9 | S. W. Hawking | Particle creation by black holes | [Erratum: doi:10./BF01608497, 1975] Commun. Math. Phys. 43 (1975) 199 |
|
| 10 | P. Meade and L. Randall | Black holes and quantum gravity at the LHC | JHEP 05 (2008) 003 | 0708.3017 |
| 11 | D. M. Gingrich | Quantum black holes with charge, colour, and spin at the LHC | JPG 37 (2010) 105008 | 0912.0826 |
| 12 | X. Calmet, W. Gong, and S. D. H. Hsu | Colorful quantum black holes at the LHC | PLB 668 (2008) 20 | 0806.4605 |
| 13 | S. Dimopoulos and R. Emparan | String balls at the LHC and beyond | PLB 526 (2002) 393 | hep-ph/0108060 |
| 14 | G. 't Hooft | Symmetry breaking through Bell-Jackiw anomalies | PRL 37 (1976) 8 | |
| 15 | F. R. Klinkhamer and N. S. Manton | A saddle point solution in the Weinberg-Salam theory | PRD 30 (1984) 2212 | |
| 16 | S. H. H. Tye and S. S. C. Wong | Bloch wave function for the periodic sphaleron potential and unsuppressed baryon and lepton number violating processes | PRD 92 (2015) 045005 | 1505.03690 |
| 17 | J. Ellis and K. Sakurai | Search for sphalerons in proton-proton collisions | JHEP 04 (2016) 086 | 1601.03654 |
| 18 | A. Papaefstathiou, S. Pl ä tzer, and K. Sakurai | On the phenomenology of sphaleron-induced processes at the LHC and beyond | JHEP 12 (2019) 017 | 1910.04761 |
| 19 | ATLAS Collaboration | Search for strong gravity in multijet final states produced in pp collisions at $ \sqrt{s} = $ 13 TeV using the ATLAS detector at the LHC | JHEP 03 (2016) 026 | 1512.02586 |
| 20 | ATLAS Collaboration | Search for quantum black hole production in lepton+jet final states using proton-proton collisions at $ \sqrt{s}= $ 13 TeV with the ATLAS detector | PRD 109 (2024) 032010 | 2307.14967 |
| 21 | CMS Collaboration | Search for black holes and sphalerons in high-multiplicity final states in proton-proton collisions at $ \sqrt{s}= $ 13 TeV | JHEP 11 (2018) 042 | CMS-EXO-17-023 1805.06013 |
| 22 | CMS Collaboration | Search for microscopic black hole signatures at the Large Hadron Collider | PLB 697 (2011) 434 | CMS-EXO-10-017 1012.3375 |
| 23 | CMS Collaboration | Search for microscopic black holes in $ pp $ collisions at $ \sqrt{s}= $ 7 TeV | JHEP 04 (2012) 061 | CMS-EXO-11-071 1202.6396 |
| 24 | CMS Collaboration | Search for microscopic black holes in $ pp $ collisions at $ \sqrt{s} = $ 8 TeV | JHEP 07 (2013) 178 | CMS-EXO-12-009 1303.5338 |
| 25 | CMS Collaboration | Search for black holes in high-multiplicity final states in proton-proton collisions at $ \sqrt{s}= $13 TeV | PLB 774 (2017) 279 | CMS-EXO-15-007 1705.01403 |
| 26 | CMS Collaboration | HEPData record for this analysis | link | |
| 27 | CMS Collaboration | The CMS experiment at the CERN LHC | JINST 3 (2008) S08004 | 1003.4038 |
| 28 | CMS Collaboration | Development of the CMS detector for the CERN LHC Run 3 | JINST 19 (2024) P05064 | CMS-PRF-21-001 2309.05466 |
| 29 | CMS Collaboration | Description and performance of track and primary-vertex reconstruction with the CMS tracker | JINST 9 (2014) P10009 | CMS-TRK-11-001 1405.6569 |
| 30 | Tracker Group of the CMS Collaboration | The CMS phase-1 pixel detector upgrade | JINST 16 (2021) P02027 | 2012.14304 |
| 31 | CMS Collaboration | Track impact parameter resolution for the full pseudo rapidity coverage in the 2017 dataset with the CMS Phase-1 pixel detector | CMS Detector Performance Summary CMS-DP-2020-049, 2020 CDS |
|
| 32 | CMS Collaboration | 2017 tracking performance plots | CMS Detector Performance Summary CMS-DP-2017-015, 2017 CDS |
|
| 33 | CMS Collaboration | Performance of the CMS level-1 trigger in proton-proton collisions at $ \sqrt{s} = $ 13 TeV | JINST 15 (2020) P10017 | CMS-TRG-17-001 2006.10165 |
| 34 | CMS Collaboration | The CMS trigger system | JINST 12 (2017) P01020 | CMS-TRG-12-001 1609.02366 |
| 35 | CMS Collaboration | Performance of the CMS high-level trigger during LHC Run 2 | JINST 19 (2024) P11021 | CMS-TRG-19-001 2410.17038 |
| 36 | D.-C. Dai et al. | BlackMax: A black-hole event generator with rotation, recoil, split branes, and brane tension | PRD 77 (2008) 076007 | 0711.3012 |
| 37 | C. M. Harris, P. Richardson, and B. R. Webber | CHARYBDIS: A black hole event generator | JHEP 08 (2003) 033 | hep-ph/0307305 |
| 38 | J. A. Frost et al. | Phenomenology of production and decay of spinning extra-dimensional black holes at hadron colliders | JHEP 10 (2009) 014 | 0904.0979 |
| 39 | C. Bravo and J. Hauser | BaryoGEN, a Monte Carlo generator for sphaleron-like transitions in proton-proton collisions | JHEP 11 (2018) 041 | 1805.02786 |
| 40 | R. Frederix et al. | The automation of next-to-leading order electroweak calculations | [Erratum: doi: 10./JHEP11()085, 2018] JHEP 07 (2018) 185 |
1804.10017 |
| 41 | J. Alwall et al. | Comparative study of various algorithms for the merging of parton showers and matrix elements in hadronic collisions | EPJC 53 (2008) 473 | 0706.2569 |
| 42 | S. Creek, O. Efthimiou, P. Kanti, and K. Tamvakis | Greybody factors for brane scalar fields in a rotating black-hole background | PRD 75 (2007) 084043 | hep-th/0701288 |
| 43 | S. Creek, O. Efthimiou, P. Kanti, and K. Tamvakis | Scalar emission in the bulk in a rotating black hole background | PLB 656 (2007) 102 | 0709.0241 |
| 44 | H. Yoshino and V. S. Rychkov | Improved analysis of black hole formation in high-energy particle collisions | [Erratum: doi:10.1103/PhysRevD.77.089905, 2005] PRD 71 (2005) 104028 |
hep-th/0503171 |
| 45 | B. Koch, M. Bleicher, and S. Hossenfelder | Black hole remnants at the LHC | JHEP 10 (2005) 053 | hep-ph/0507138 |
| 46 | H. Stoecker | Stable TeV - black hole remnants at the LHC: Discovery through di-jet suppression, mono-jet emission and a supersonic boom in the quark-gluon plasma | Int. J. Mod. Phys. D 16 (2007) 185 | hep-ph/0605062 |
| 47 | F. Scardigli | Glimpses on the micro black hole Planck phase | Symmetry 12 (2020) 1519 | 0809.1832 |
| 48 | D. M. Gingrich and K. Martell | Study of highly-excited string states at the Large Hadron Collider | PRD 78 (2008) 115009 | 0808.2512 |
| 49 | CMS Collaboration | Extraction and validation of a new set of CMS PYTHIA8 tunes from underlying-event measurements | EPJC 80 (2020) 4 | CMS-GEN-17-001 1903.12179 |
| 50 | NNPDF Collaboration | Parton distributions from high-precision collider data | EPJC 77 (2017) 663 | 1706.00428 |
| 51 | CMS Collaboration | Upgrades for the CMS simulation | J. Phys. Conf. Ser. 608 (2015) 012056 | |
| 52 | CMS Collaboration | Particle-flow reconstruction and global event description with the CMS detector | JINST 12 (2017) P10003 | CMS-PRF-14-001 1706.04965 |
| 53 | CMS Collaboration | Technical proposal for the Phase-II upgrade of the Compact Muon Solenoid | CMS Technical Proposal CERN-LHCC-2015-010, CMS-TDR-15-02, CMS, 2015 CDS |
|
| 54 | CMS Collaboration | Jet energy scale and resolution in the CMS experiment in pp collisions at 8 TeV | no. 02, P0, 2017 JINST 12 (2017) |
CMS-JME-13-004 1607.03663 |
| 55 | CMS Collaboration | Pileup removal algorithms | CMS Physics Analysis Summary, CMS, 2014 CMS-PAS-JME-14-001 |
CMS-PAS-JME-14-001 |
| 56 | CMS Collaboration | Jet algorithms performance in 13 TeV data | CMS Physics Analysis Summary, CMS, 2017 link |
CMS-PAS-JME-16-003 |
| 57 | CMS Collaboration | Performance of electron reconstruction and selection with the CMS detector in proton-proton collisions at $\sqrt{s}$ = 8 TeV | JINST 10 (2015) P06005 | CMS-EGM-13-001 1502.02701 |
| 58 | CMS Collaboration | Electron and photon reconstruction and identification with the CMS experiment at the CERN LHC | JINST 16 (2021) P05014 | CMS-EGM-17-001 2012.06888 |
| 59 | CMS Collaboration | Performance of CMS muon reconstruction in pp collision events at $ \sqrt{s}= $ 7 TeV | JINST 7 (2012) P10002 | CMS-MUO-10-004 1206.4071 |
| 60 | CMS Collaboration | Performance of the CMS muon detector and muon reconstruction with proton-proton collisions at $ \sqrt{s}= $ 13 TeV | JINST 13 (2018) P06015 | CMS-MUO-16-001 1804.04528 |
| 61 | CMS Collaboration | Performance of missing transverse momentum reconstruction in proton-proton collisions at $ \sqrt{s} = $ 13 TeV using the CMS detector | JINST 14 (2019) P07004 | CMS-JME-17-001 1903.06078 |
| 62 | ALEPH Collaboration | Studies of quantum chromodynamics with the ALEPH detector | Phys. Rept. 294 (1998) 1 | |
| 63 | ATLAS Collaboration | Measurement of event shapes at large momentum transfer with the ATLAS detector in pp collisions at $ \sqrt{s}= $ 7 TeV | EPJC 72 (2012) 2211 | 1206.2135 |
| 64 | ALICE Collaboration | Transverse sphericity of primary charged particles in minimum bias proton-proton collisions at $ \sqrt{s}= $ 0.9, 2.76 and 7 TeV | EPJC 72 (2012) 2124 | 1205.3963 |
| 65 | P. T. Komiske, E. M. Metodiev, and J. Thaler | Metric space of collider events | PRL 123 (2019) 041801 | 1902.02346 |
| 66 | P. T. Komiske, E. M. Metodiev, and J. Thaler | The hidden geometry of particle collisions | JHEP 07 (2020) 006 | 2004.04159 |
| 67 | T. Cai, J. Cheng, K. Craig, and N. Craig | Which metric on the space of collider events? | PRD 105 (2022) 076003 | 2111.03670 |
| 68 | P. T. Komiske et al. | Exploring the space of jets with CMS open data | PRD 101 (2020) 034009 | 1908.08542 |
| 69 | C. Cesarotti and J. Thaler | A robust measure of event isotropy at colliders | JHEP 08 (2020) 084 | 2004.06125 |
| 70 | C. Cesarotti, M. Reece, and M. J. Strassler | The efficacy of event isotropy as an event shape observable | JHEP 07 (2021) 215 | 2011.06599 |
| 71 | L. Gouskos et al. | Optimal transport for a novel event description at hadron colliders | PRD 108 (2023) 096003 | 2211.02029 |
| 72 | ATLAS Collaboration | Measurements of multijet event isotropies using optimal transport with the ATLAS detector | JHEP 10 (2023) 060 | 2305.16930 |
| 73 | A. J. Larkoski and T. Melia | Covariantizing phase space | PRD 102 (2020) 094014 | 2008.06508 |
| 74 | T. Cai et al. | The phase space distance between collider events | JHEP 09 (2024) 054 | 2405.16698 |
| 75 | C. Cortes and V. Vapnik | Support-vector networks | Mach. Learn. 20 (1995) 273 | |
| 76 | G. Punzi | Sensitivity of searches for new signals and its optimization | Conf 030908 (2003) MODT002 | physics/0308063 |
| 77 | L. Corcodilos | The 2D Alphabet background modeling method and its use in the search for an excited bottom quark | PhD thesis, Johns Hopkins University, 2021 link |
|
| 78 | R. A. Fisher | On the interpretation of $ \chi^2 $ from contingency tables, and the calculation of p | J. Roy. Stat. Soc. 85 (1922) 87 | |
| 79 | S. Baker and R. D. Cousins | Clarification of the use of chi-square and likelihood functions in fits to histograms | NIM 221 (1984) 437 | |
| 80 | CMS Collaboration | Precision luminosity measurement in proton-proton collisions at $ \sqrt{s} = $ 13 TeV with the CMS detector | CMS-PAS-LUM-20-001 | CMS-PAS-LUM-20-001 |
| 81 | CMS Collaboration | Measurement of the inelastic proton-proton cross section at $ \sqrt{s}= $ 13 TeV | JHEP 07 (2018) 161 | CMS-FSQ-15-005 1802.02613 |
| 82 | CMS Collaboration | Identification of heavy, energetic, hadronically decaying particles using machine-learning techniques | JINST 15 (2020) P06005 | CMS-JME-18-002 2004.08262 |
| 83 | CMS Collaboration | Pileup mitigation at CMS in 13 TeV data | JINST 15 (2020) P09018 | CMS-JME-18-001 2003.00503 |
| 84 | CMS Collaboration | The CMS statistical analysis and combination tool: Combine | Comput. Softw. Big Sci. 8 (2024) 19 | CMS-CAT-23-001 2404.06614 |
| 85 | W. Verkerke and D. Kirkby | The RooFit toolkit for data modeling | in the Int. Conf. on Computing in High Energy and Nuclear Physics (CHEP ): La Jolla CA, United States, March 24--28,, 2003 Proc. 1 (2003) 3 |
physics/0306116 |
| 86 | L. Moneta et al. | The RooStats project | in the Int. Workshop on Advanced Computing and Analysis Techniques in Physics Research (ACAT ): Jaipur, India, February 22--27,, 2010 Proc. 1 (2010) 3 |
1009.1003 |
| 87 | T. Junk | Confidence level computation for combining searches with small statistics | NIM A 434 (1999) 435 | hep-ex/9902006 |
| 88 | A. L. Read | Presentation of search results: The $ CL_s $ technique | JPG 28 (2002) 2693 | |
| 89 | ATLAS, CMS, LHC Higgs Combination Group Collaboration | Procedure for the LHC Higgs boson search combination in Summer 2011 | Technical Report CMS-NOTE-2011-005, ATL-PHYS-PUB-2011-11, CERN, 2011 | |
| 90 | G. Cowan, K. Cranmer, E. Gross, and O. Vitells | Asymptotic formulae for likelihood-based tests of new physics | [Erratum: doi:10.1140/epjc/s2-013-2501-z, 2011] EPJC 71 (2011) 1554 |
1007.1727 |
|
|
Compact Muon Solenoid LHC, CERN |
|

|

|

|

|

|