

Compact Muon Solenoid
LHC, CERN
| CMS-EXO-24-011 ; CERN-EP-2026-057 | ||
| Measurement of dijet angular distributions and search for beyond the standard model physics in proton-proton collisions at $ \sqrt{s} = $ 13 TeV | ||
| CMS Collaboration | ||
| 26 March 2026 | ||
| Submitted to Physics Letters B | ||
| Abstract: A measurement is presented of dijet angular distributions in proton-proton collisions at $ \sqrt{s} = $ 13 TeV, using data collected with the CMS detector at the CERN LHC and corresponding to an integrated luminosity of 138 fb$ ^{-1} $. For the first time, the dijet angular distributions, corrected for detector effects, are compared with the predictions of perturbative quantum chromodynamics at next-to-next-to-leading order, including next-to-leading-order electroweak corrections. While data are generally found to be in agreement with predictions, a small difference in shape of the normalized distributions is seen for dijet masses ranging from 2.4 to 4.8 TeV and above 6 TeV. The distributions are used to search for proposed signatures of quark compositeness, extra spatial dimensions, quantum black holes, dark-matter mediators, axion-like particles, and anomalous gluon couplings. The most stringent limits to date are set for most of these scenarios. Quark contact interactions are excluded at 95% confidence level (CL) up to a scale of 17 (37) TeV for destructive (constructive) interference in a benchmark scenario, valid to next-to-leading order in quantum chromodynamics, and in which only left-handed quarks participate. The coupling of axion-like particles to the gluon, $ c_{\text{g}}/f_{\text{a}} $, is constrained to be lower than 0.42$ \text{TeV}^{-1} $ at 95% CL. The anomalous triple-gluon coupling, $ C_{\text{G}}/\Lambda^2 $, in a standard model effective field theory is constrained to be lower than 0.0076$ \text{TeV}^{-2} $ at 95% CL. | ||
| Links: e-print arXiv:2603.25458 [hep-ex] (PDF) ; CDS record ; inSPIRE record ; HepData record ; Physics Briefing ; CADI line (restricted) ; | ||
| Figures | |
png pdf |
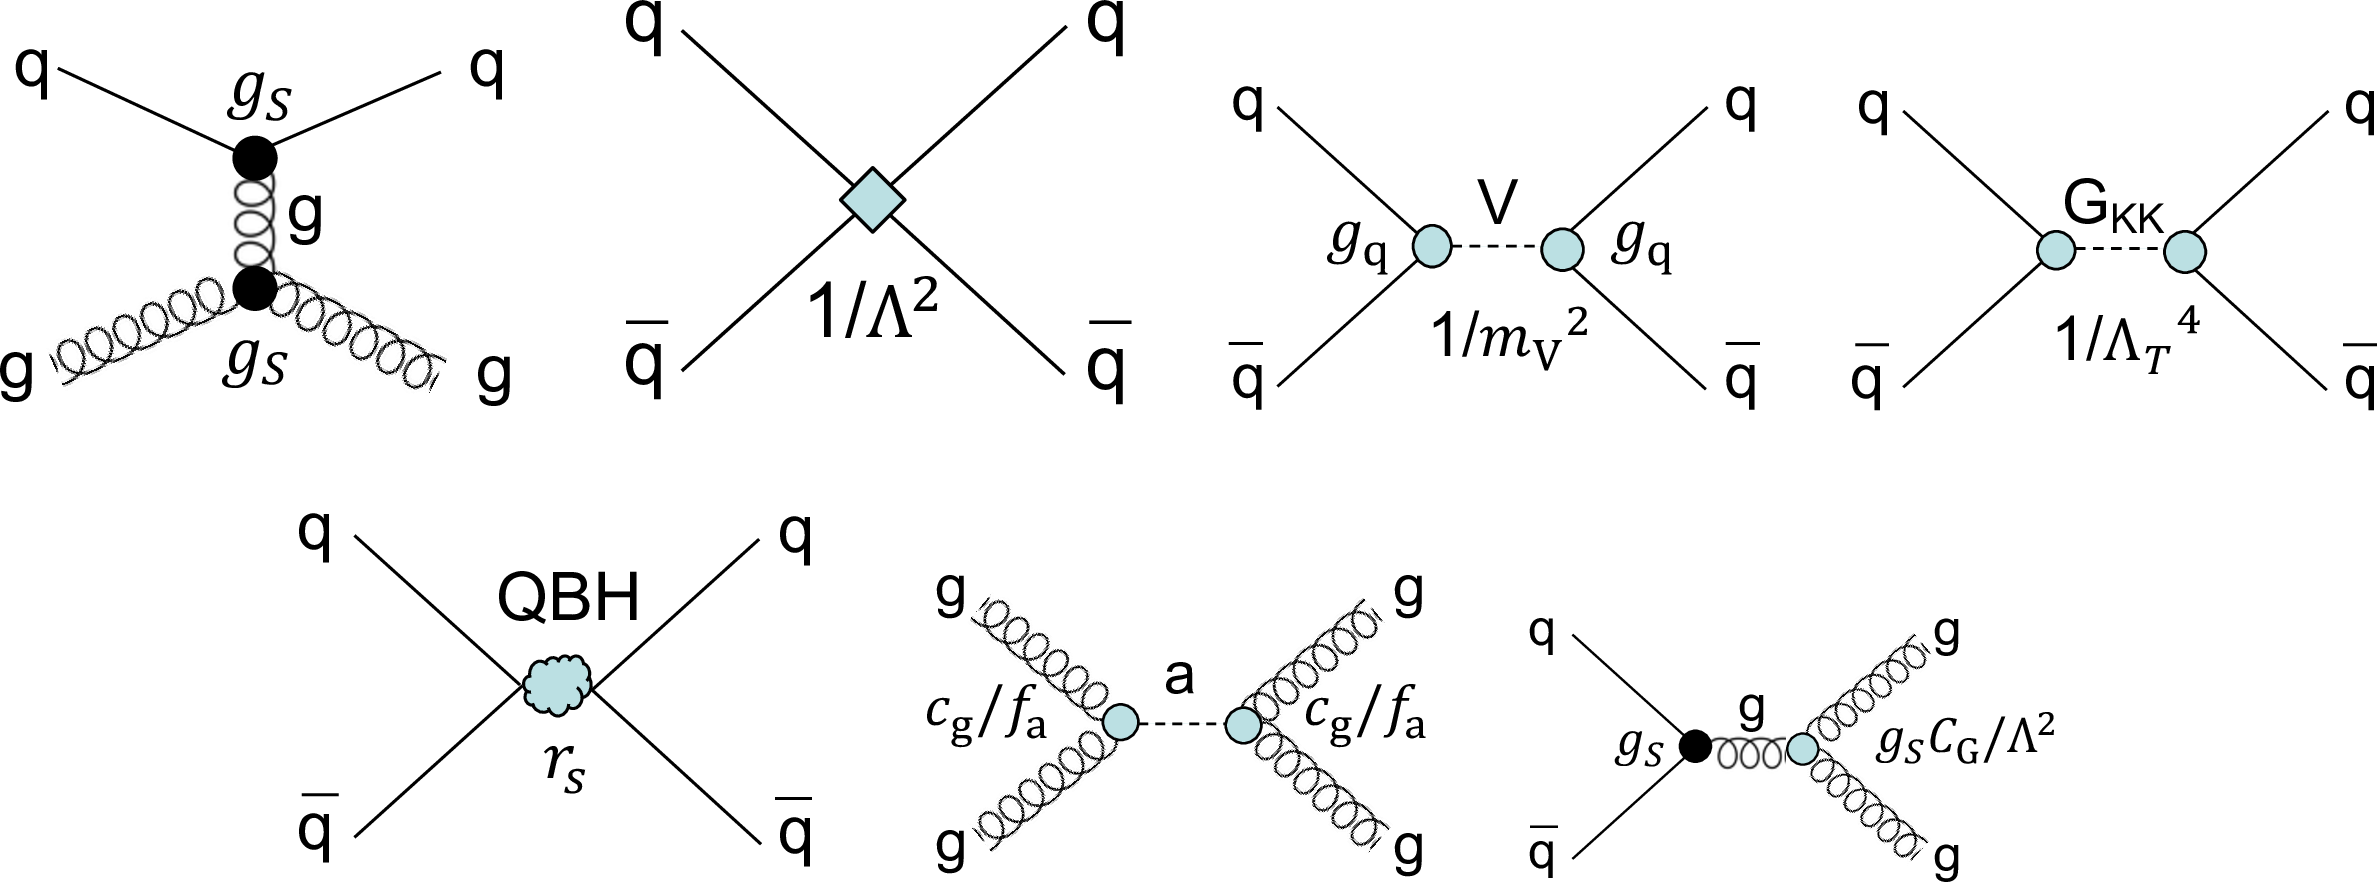
Figure 1:
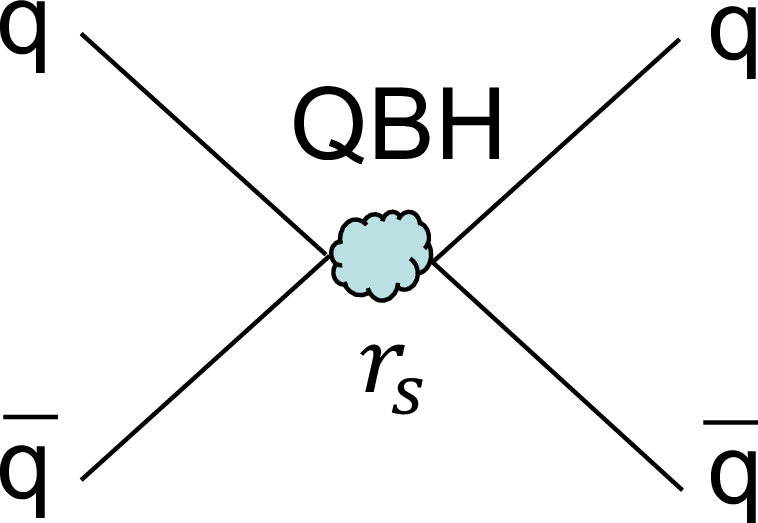
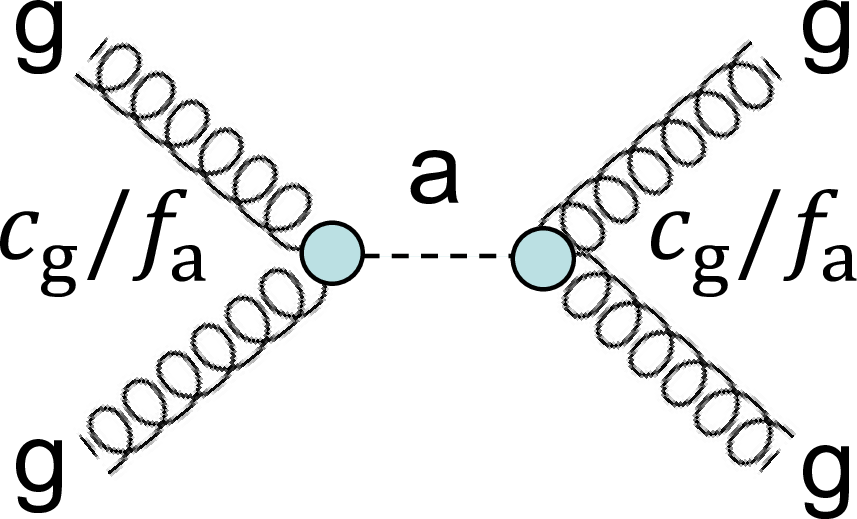
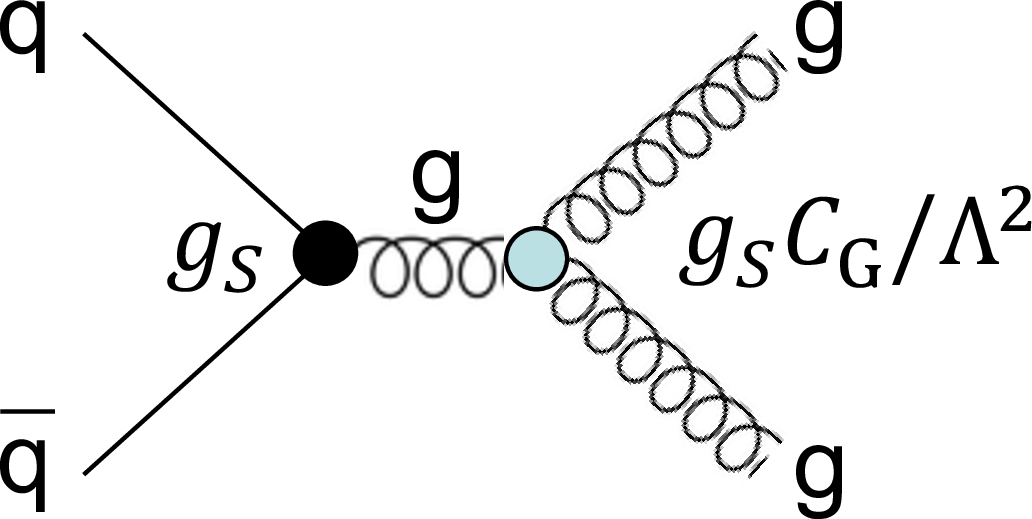
Example diagrams of dijet production processes in QCD and BSM physics. Upper row: $ t $-channel quark-gluon scattering in QCD (left), quark-quark scattering via a BSM contact interaction (center left), quark pair production through an $ s $-channel BSM resonance (center right), and quark pair production through gravitons in models with extra spatial dimensions (right). Lower row: quark pair production through a quantum black hole (left), gluon pair production through an axion-like particle (center), and gluon pair production with a dimension-6 effective field theory anomalous gluon coupling operator (right). A description of the symbols in the diagrams is given in Section 5. |

png pdf |
Figure 1-a:
Example diagrams of dijet production processes in QCD and BSM physics. Upper row: $ t $-channel quark-gluon scattering in QCD (left), quark-quark scattering via a BSM contact interaction (center left), quark pair production through an $ s $-channel BSM resonance (center right), and quark pair production through gravitons in models with extra spatial dimensions (right). Lower row: quark pair production through a quantum black hole (left), gluon pair production through an axion-like particle (center), and gluon pair production with a dimension-6 effective field theory anomalous gluon coupling operator (right). A description of the symbols in the diagrams is given in Section 5. |
png pdf |
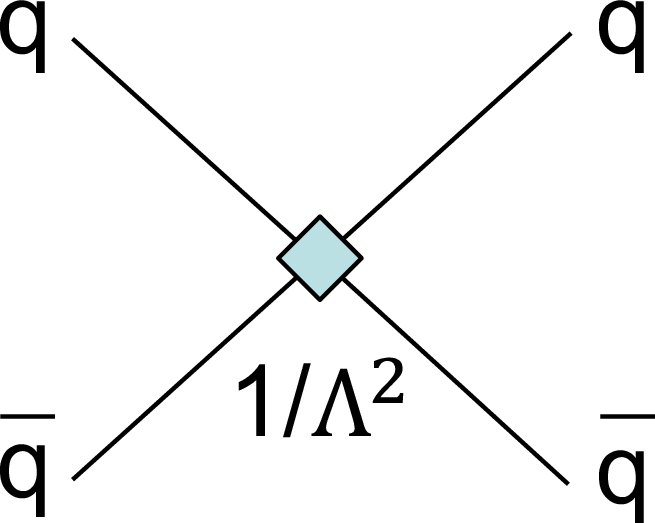
Figure 1-b:
Example diagrams of dijet production processes in QCD and BSM physics. Upper row: $ t $-channel quark-gluon scattering in QCD (left), quark-quark scattering via a BSM contact interaction (center left), quark pair production through an $ s $-channel BSM resonance (center right), and quark pair production through gravitons in models with extra spatial dimensions (right). Lower row: quark pair production through a quantum black hole (left), gluon pair production through an axion-like particle (center), and gluon pair production with a dimension-6 effective field theory anomalous gluon coupling operator (right). A description of the symbols in the diagrams is given in Section 5. |
png pdf |
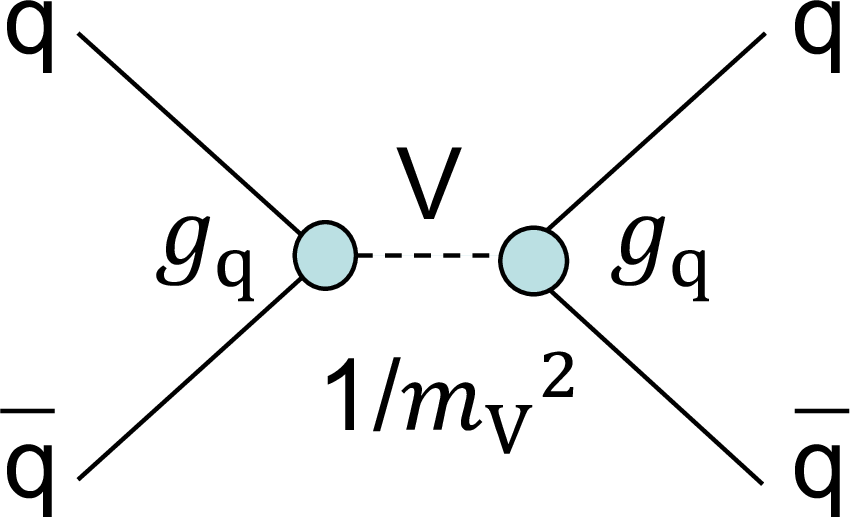
Figure 1-c:
Example diagrams of dijet production processes in QCD and BSM physics. Upper row: $ t $-channel quark-gluon scattering in QCD (left), quark-quark scattering via a BSM contact interaction (center left), quark pair production through an $ s $-channel BSM resonance (center right), and quark pair production through gravitons in models with extra spatial dimensions (right). Lower row: quark pair production through a quantum black hole (left), gluon pair production through an axion-like particle (center), and gluon pair production with a dimension-6 effective field theory anomalous gluon coupling operator (right). A description of the symbols in the diagrams is given in Section 5. |
png pdf |
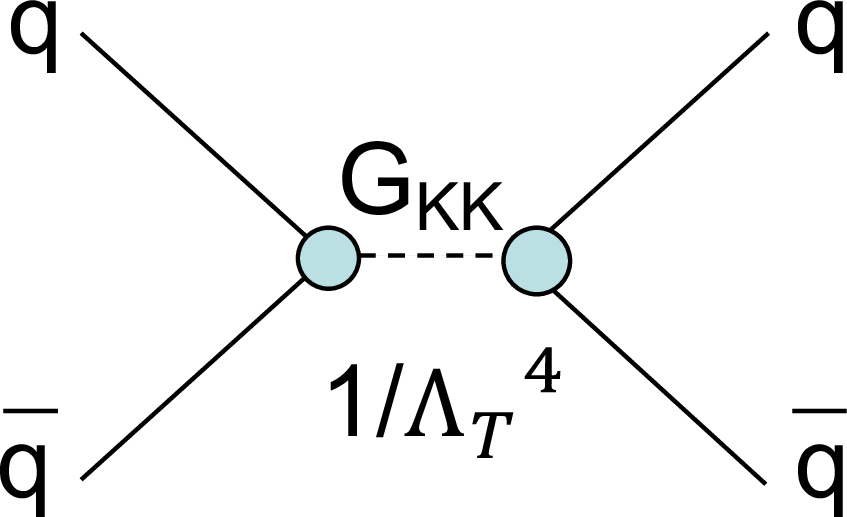
Figure 1-d:
Example diagrams of dijet production processes in QCD and BSM physics. Upper row: $ t $-channel quark-gluon scattering in QCD (left), quark-quark scattering via a BSM contact interaction (center left), quark pair production through an $ s $-channel BSM resonance (center right), and quark pair production through gravitons in models with extra spatial dimensions (right). Lower row: quark pair production through a quantum black hole (left), gluon pair production through an axion-like particle (center), and gluon pair production with a dimension-6 effective field theory anomalous gluon coupling operator (right). A description of the symbols in the diagrams is given in Section 5. |
png pdf |
Figure 1-e:
Example diagrams of dijet production processes in QCD and BSM physics. Upper row: $ t $-channel quark-gluon scattering in QCD (left), quark-quark scattering via a BSM contact interaction (center left), quark pair production through an $ s $-channel BSM resonance (center right), and quark pair production through gravitons in models with extra spatial dimensions (right). Lower row: quark pair production through a quantum black hole (left), gluon pair production through an axion-like particle (center), and gluon pair production with a dimension-6 effective field theory anomalous gluon coupling operator (right). A description of the symbols in the diagrams is given in Section 5. |
png pdf |
Figure 1-f:
Example diagrams of dijet production processes in QCD and BSM physics. Upper row: $ t $-channel quark-gluon scattering in QCD (left), quark-quark scattering via a BSM contact interaction (center left), quark pair production through an $ s $-channel BSM resonance (center right), and quark pair production through gravitons in models with extra spatial dimensions (right). Lower row: quark pair production through a quantum black hole (left), gluon pair production through an axion-like particle (center), and gluon pair production with a dimension-6 effective field theory anomalous gluon coupling operator (right). A description of the symbols in the diagrams is given in Section 5. |
png pdf |
Figure 1-g:
Example diagrams of dijet production processes in QCD and BSM physics. Upper row: $ t $-channel quark-gluon scattering in QCD (left), quark-quark scattering via a BSM contact interaction (center left), quark pair production through an $ s $-channel BSM resonance (center right), and quark pair production through gravitons in models with extra spatial dimensions (right). Lower row: quark pair production through a quantum black hole (left), gluon pair production through an axion-like particle (center), and gluon pair production with a dimension-6 effective field theory anomalous gluon coupling operator (right). A description of the symbols in the diagrams is given in Section 5. |
png pdf |
Figure 2:
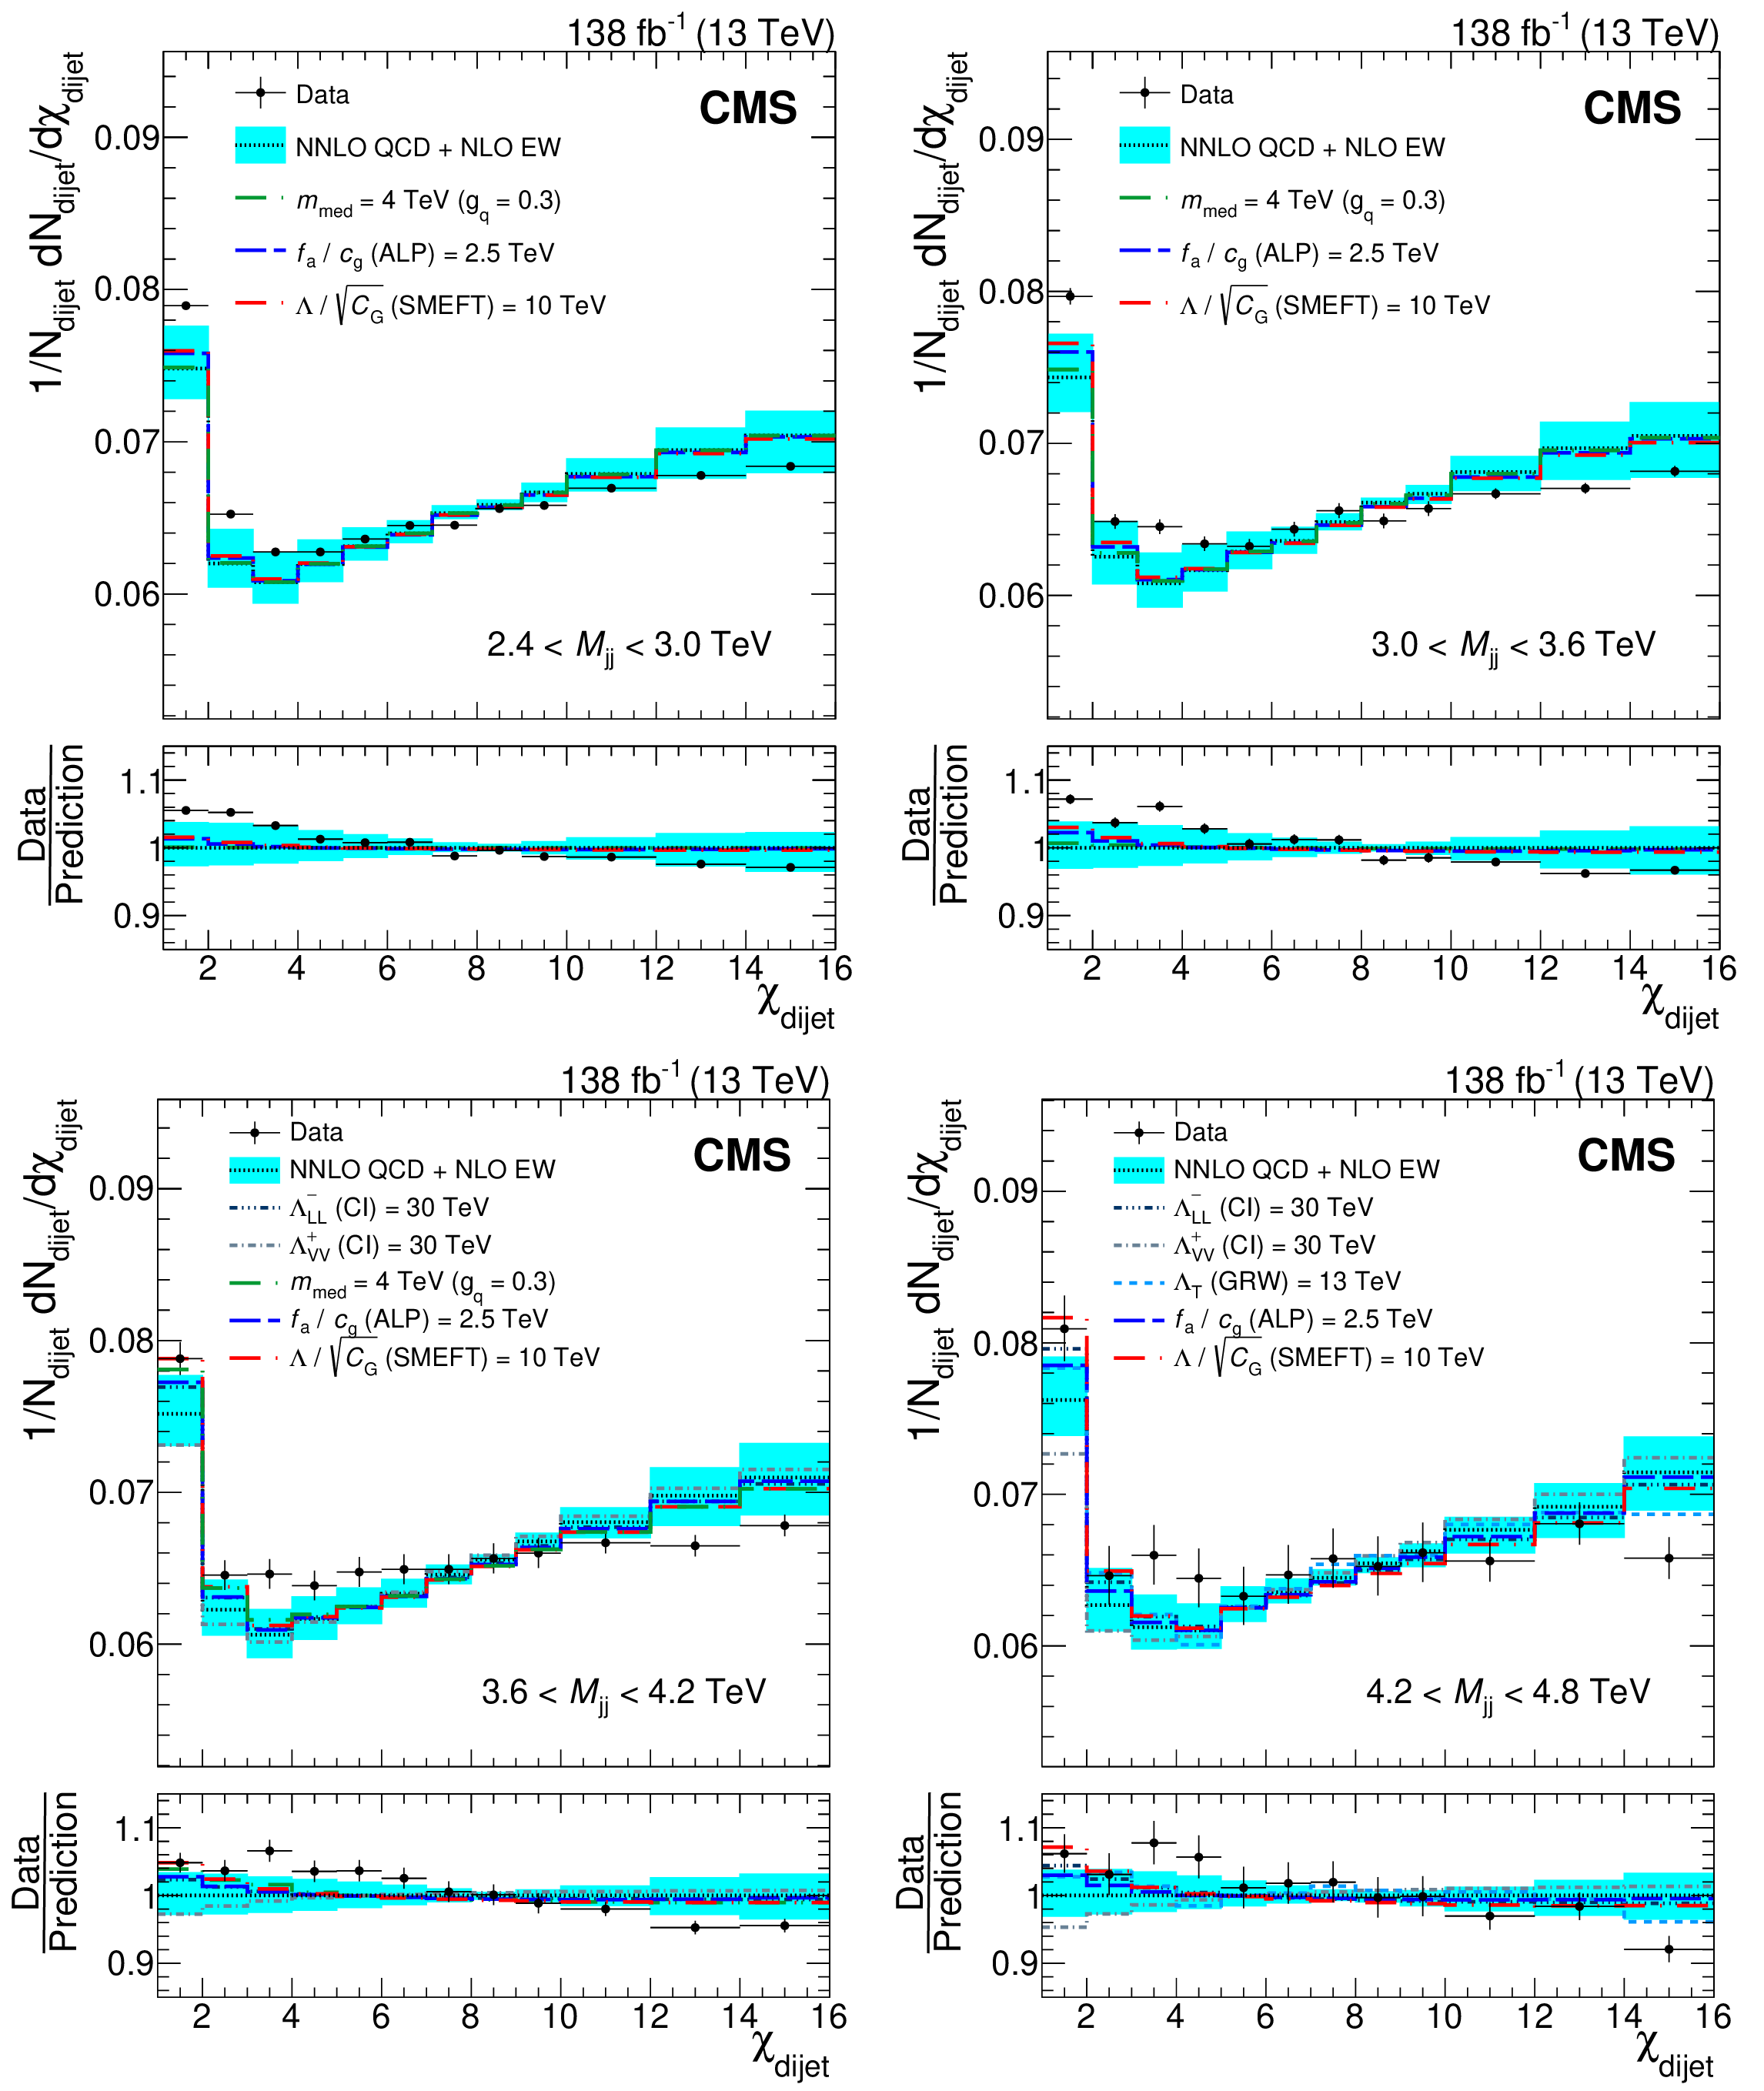
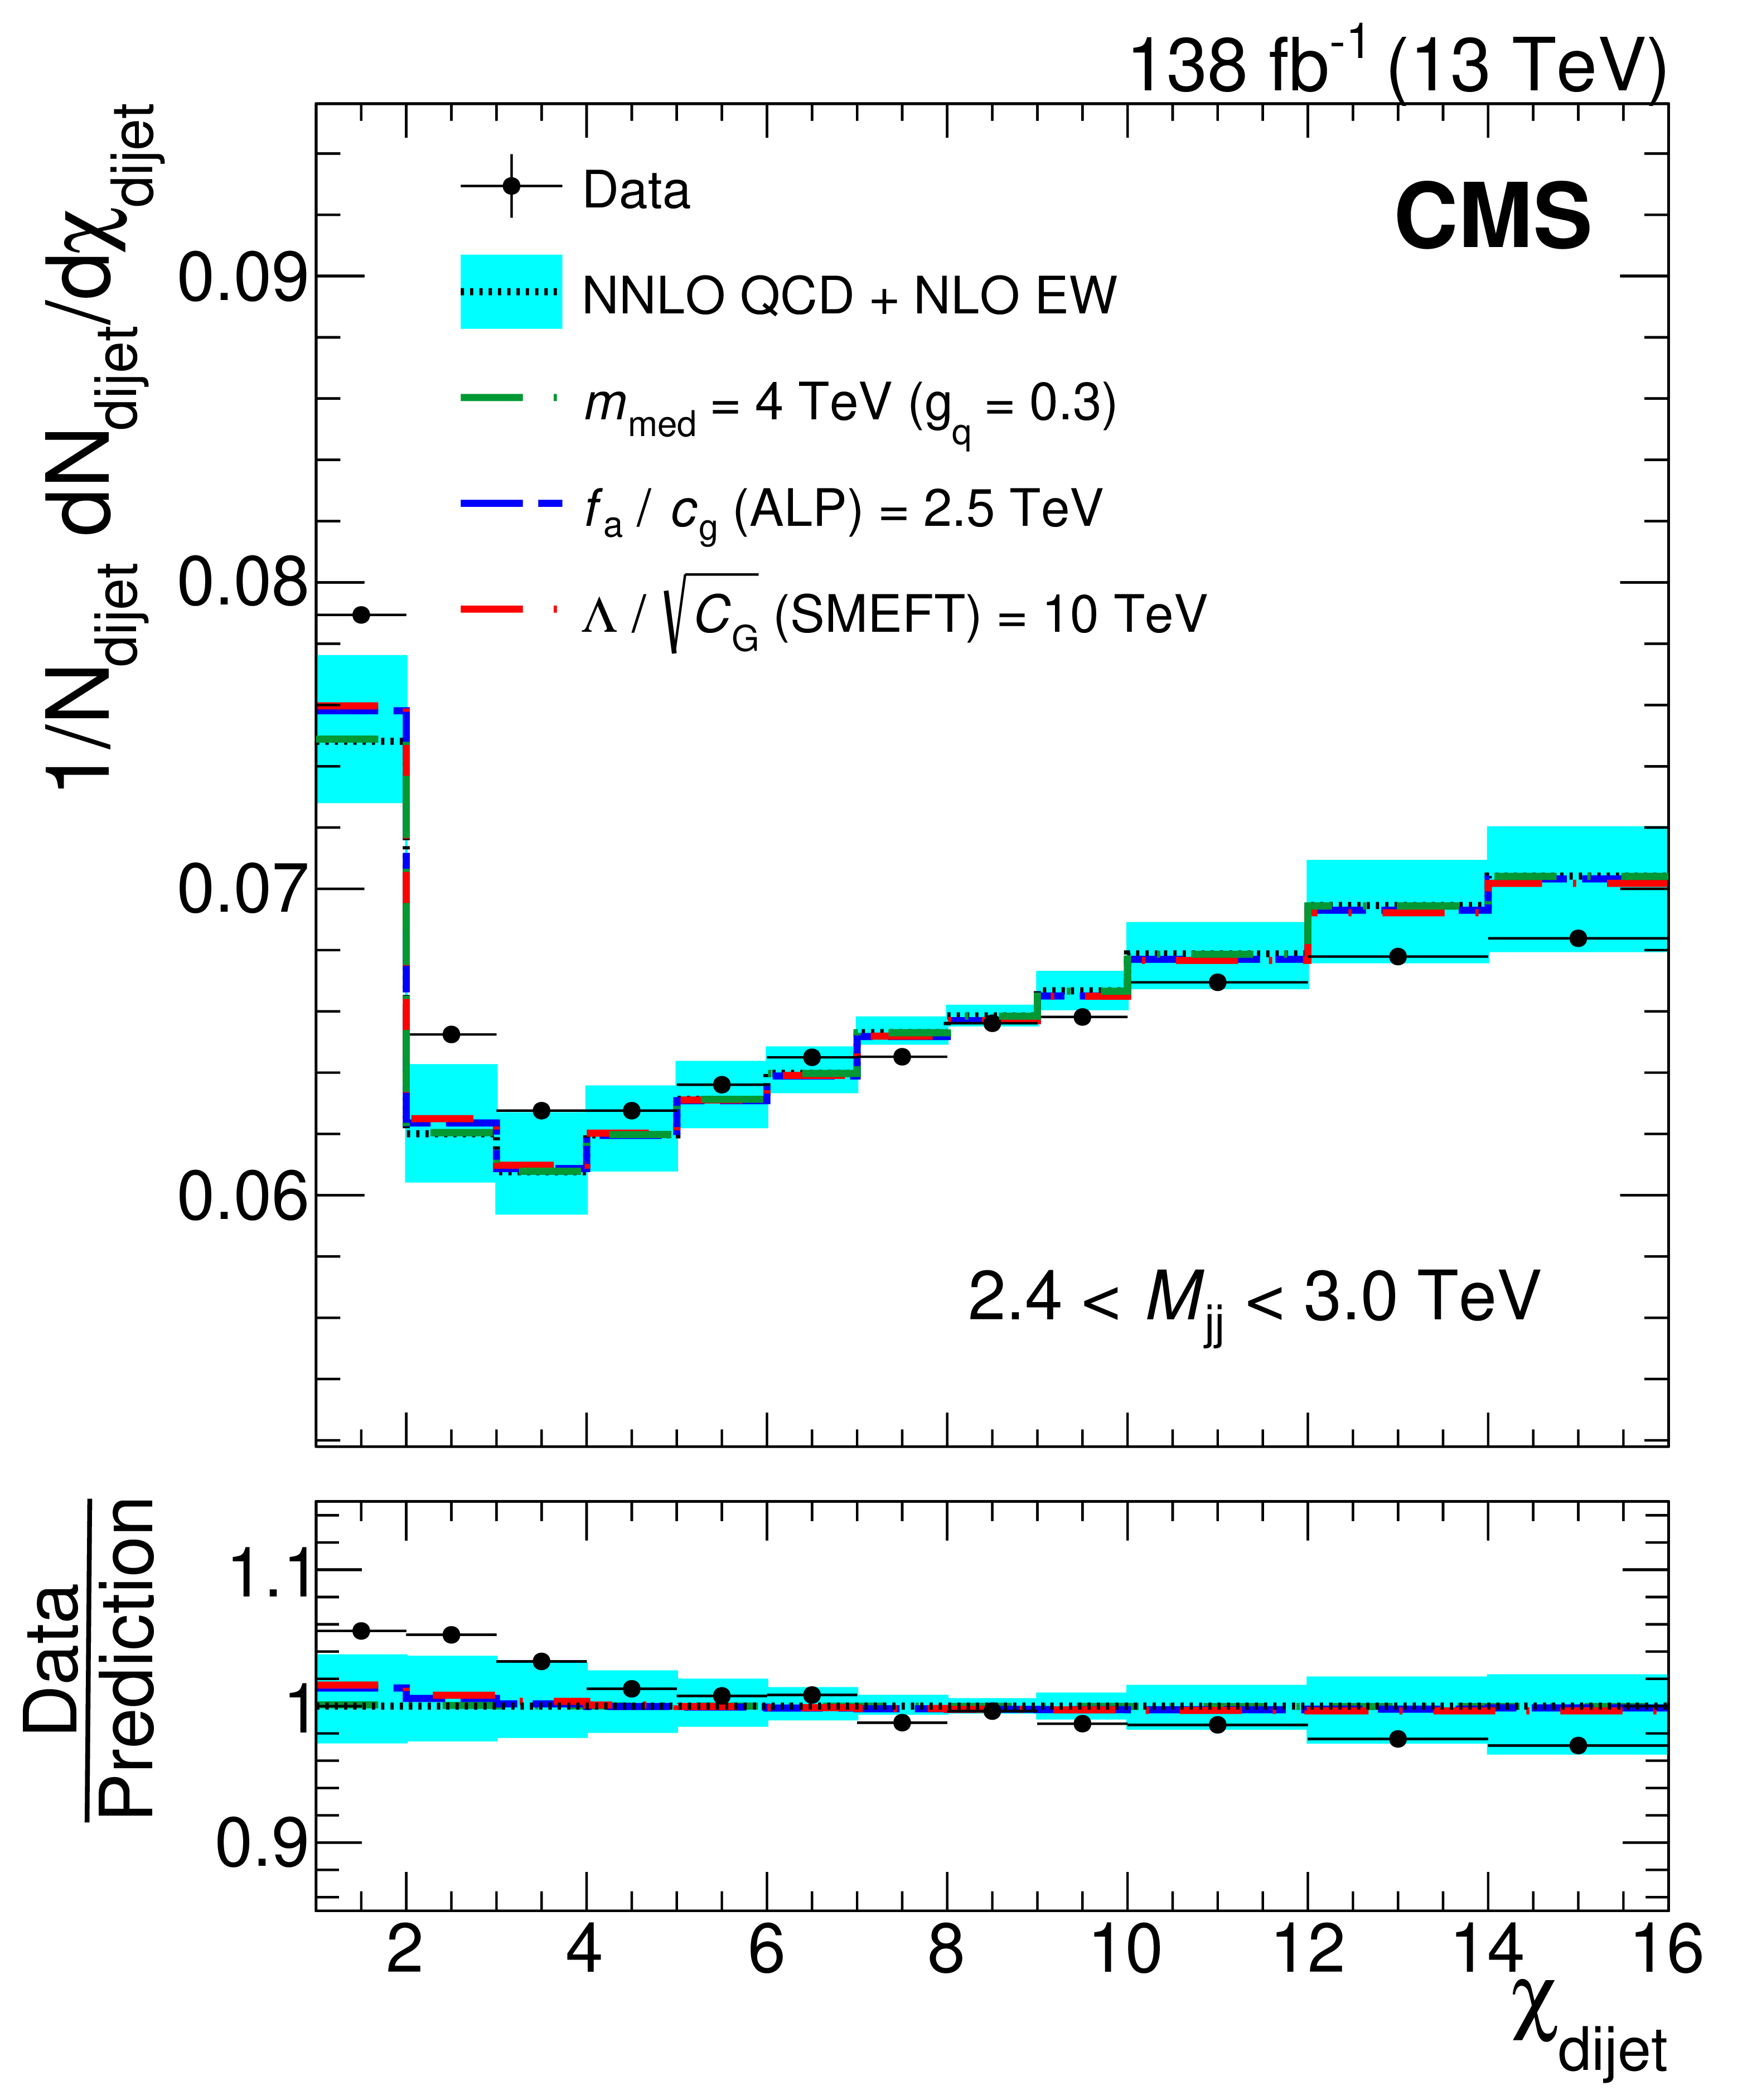
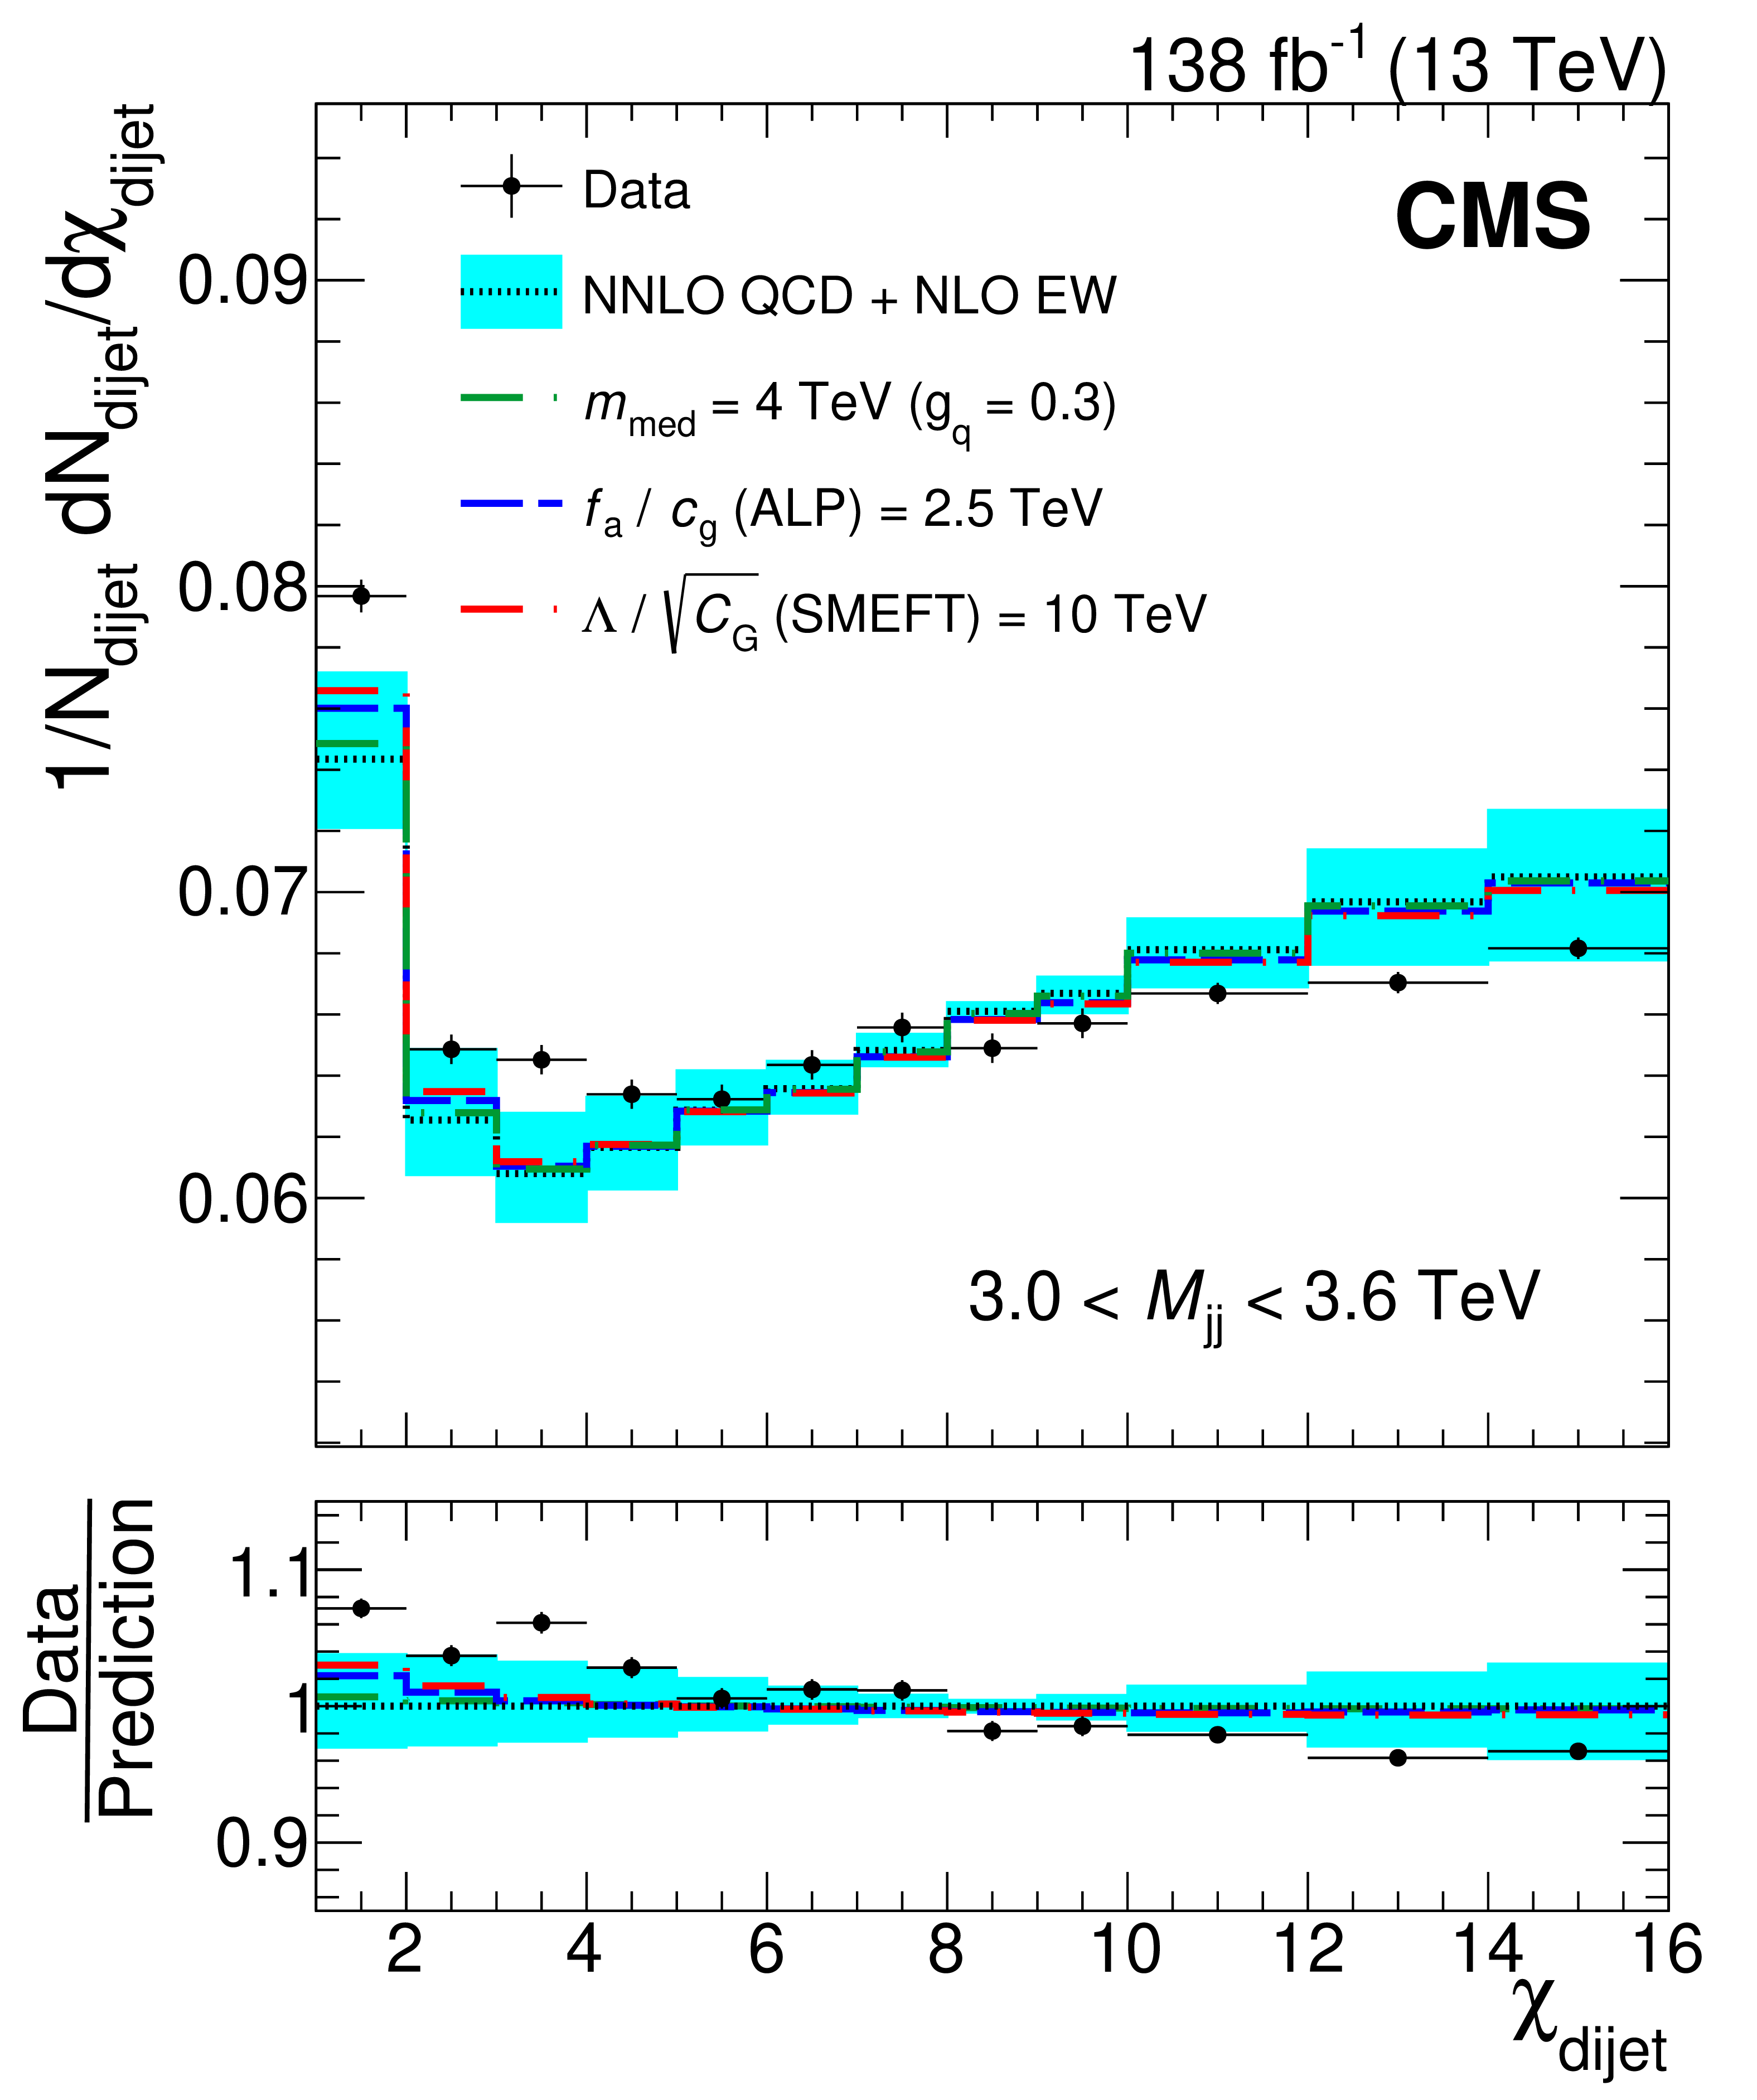
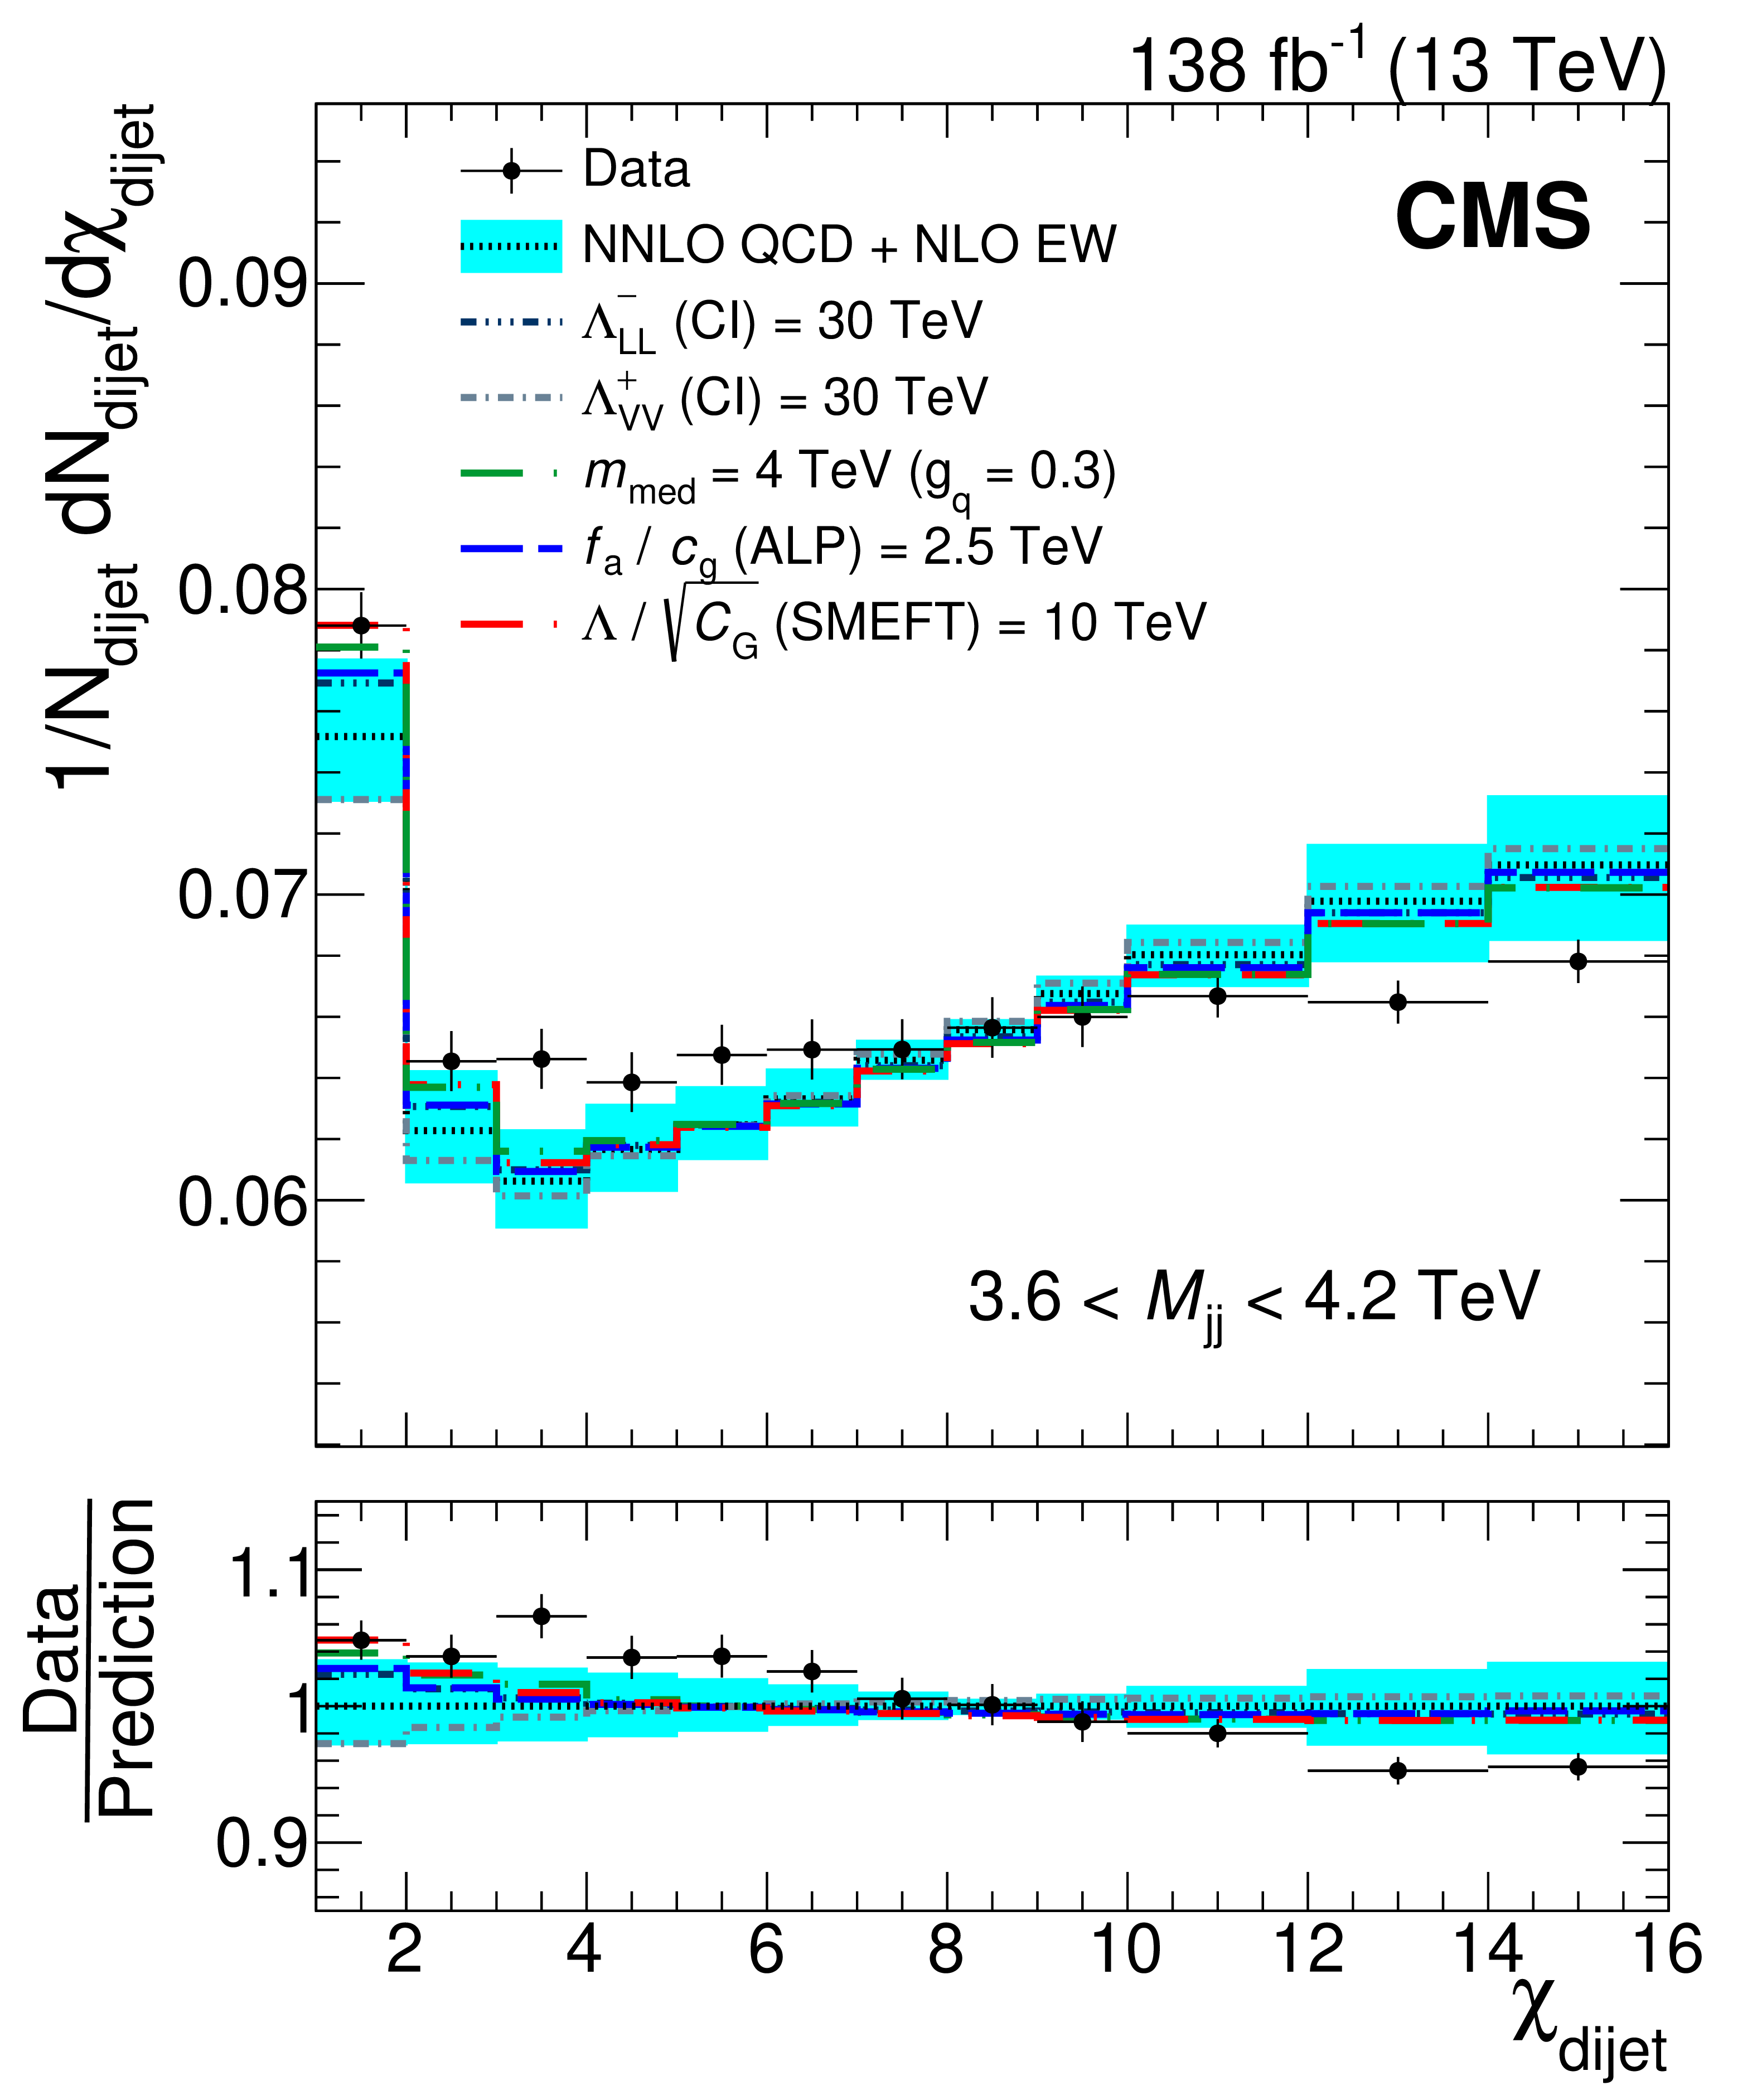
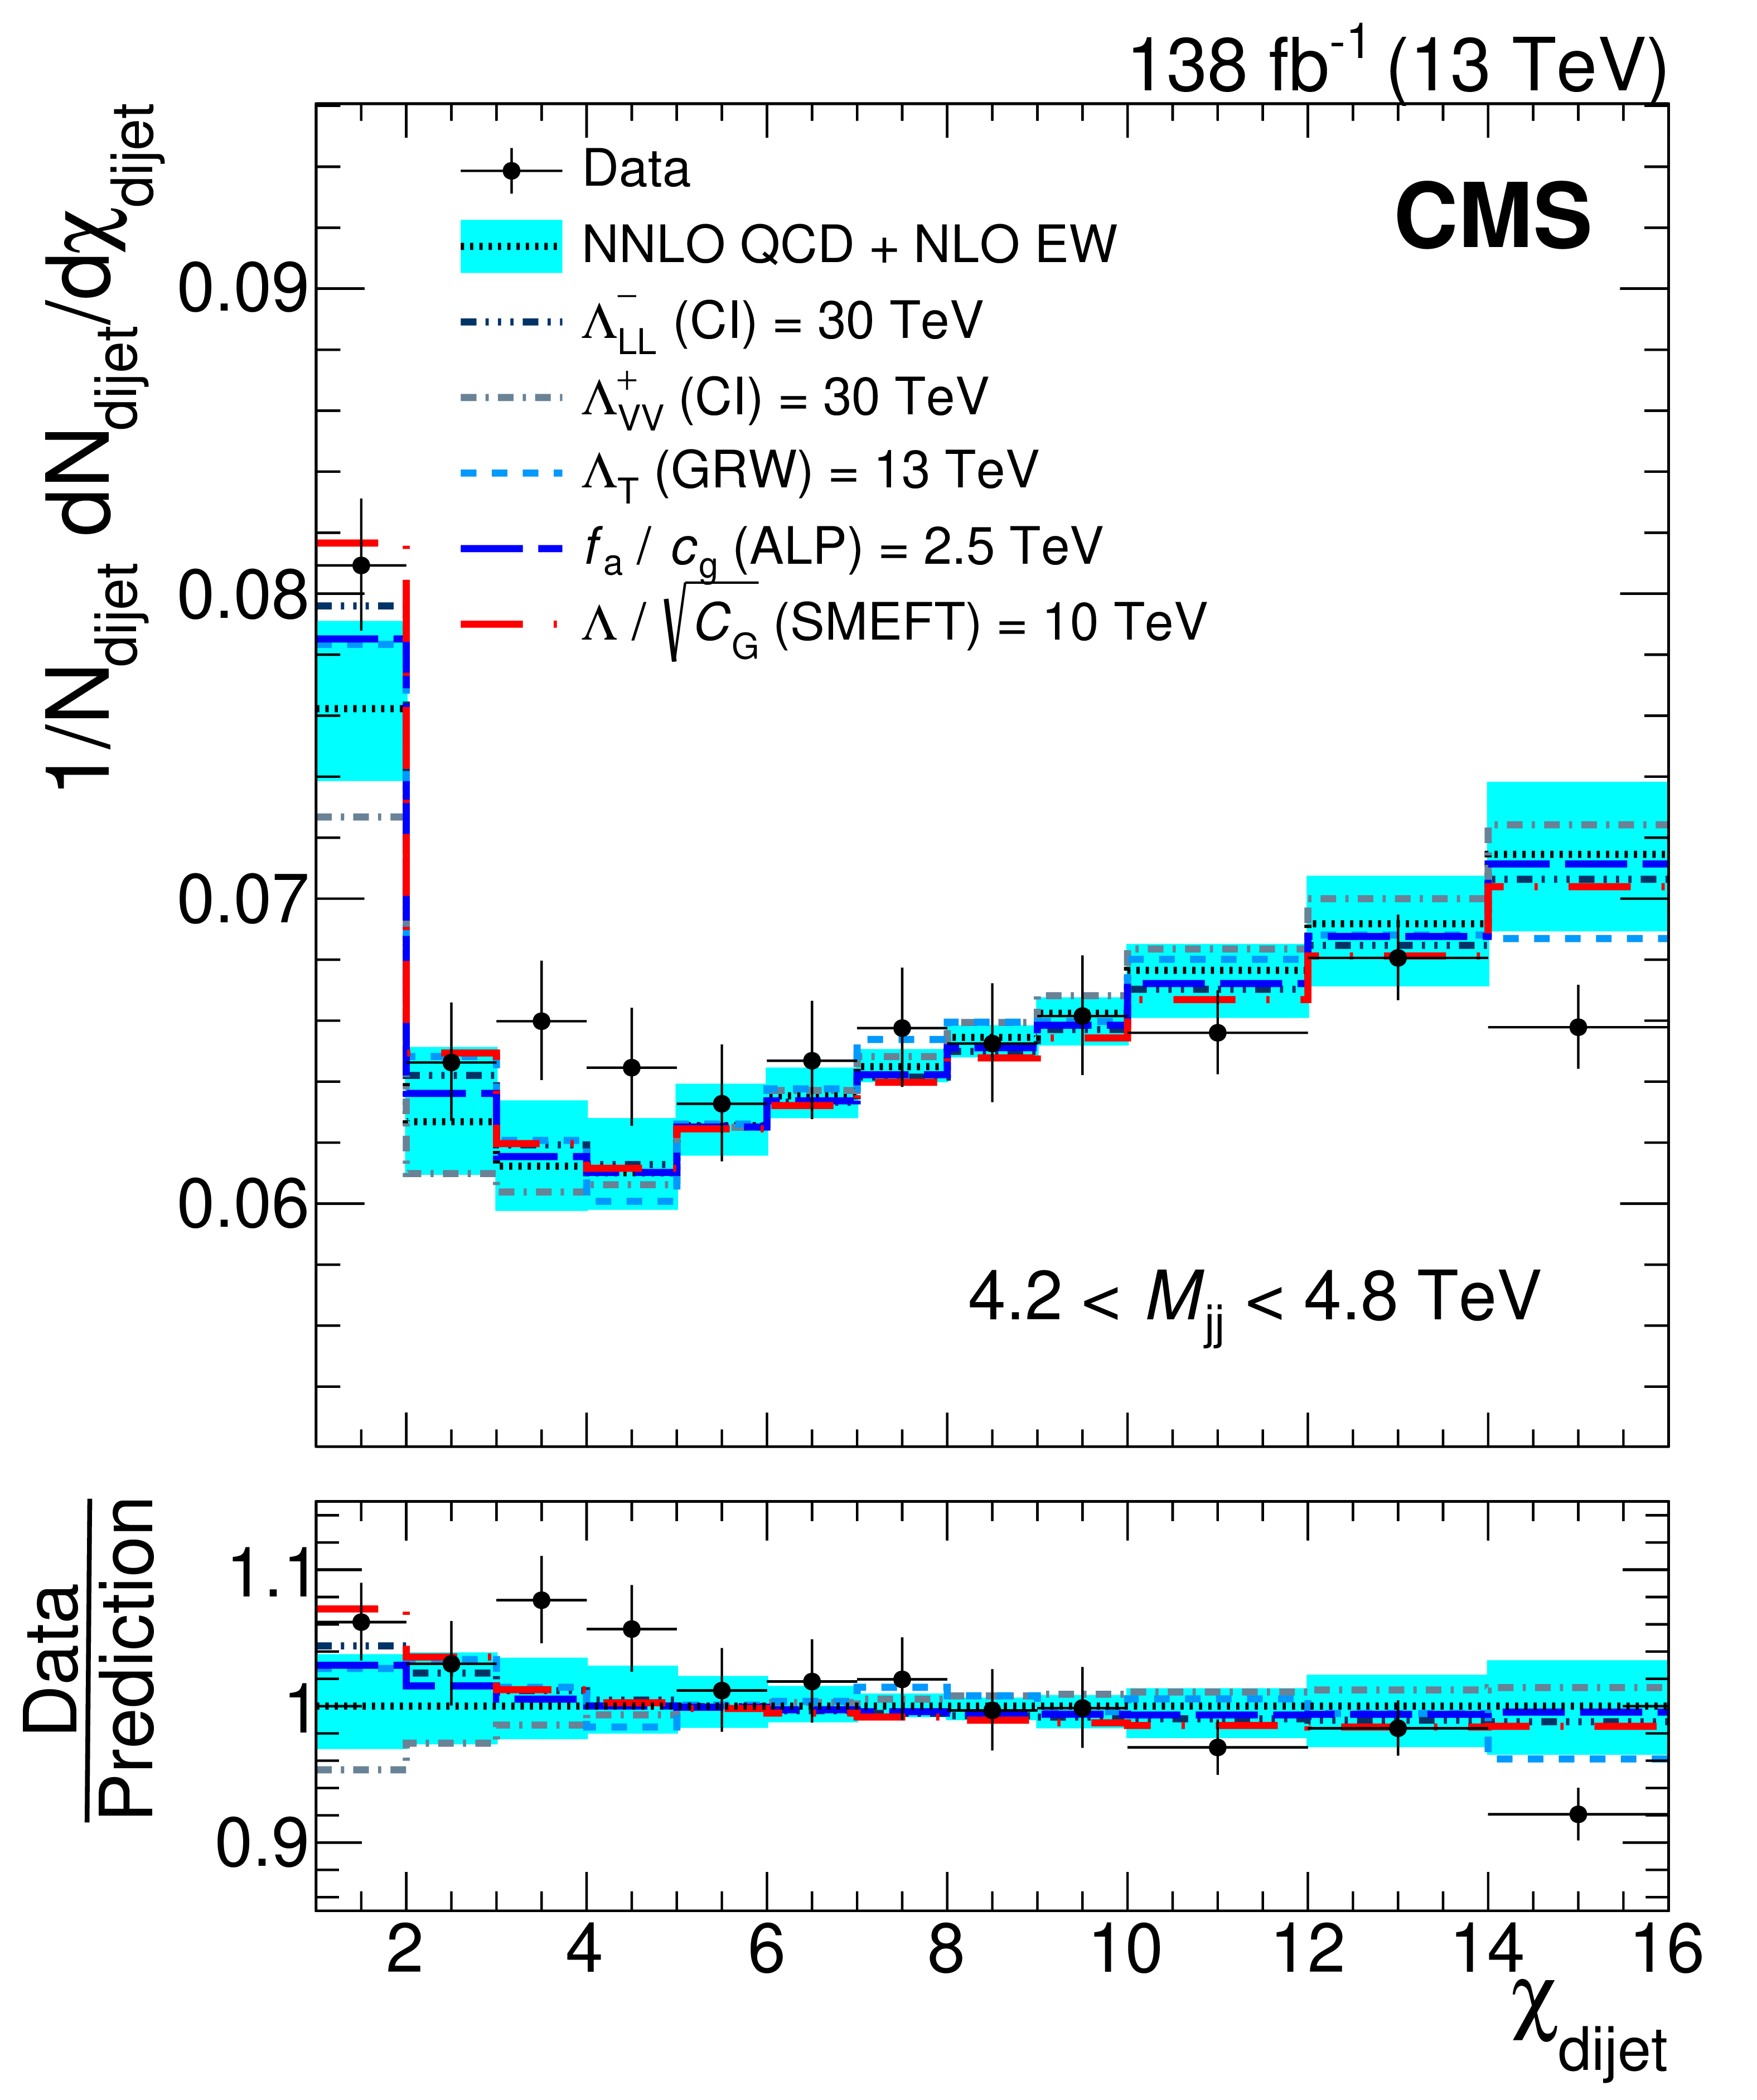
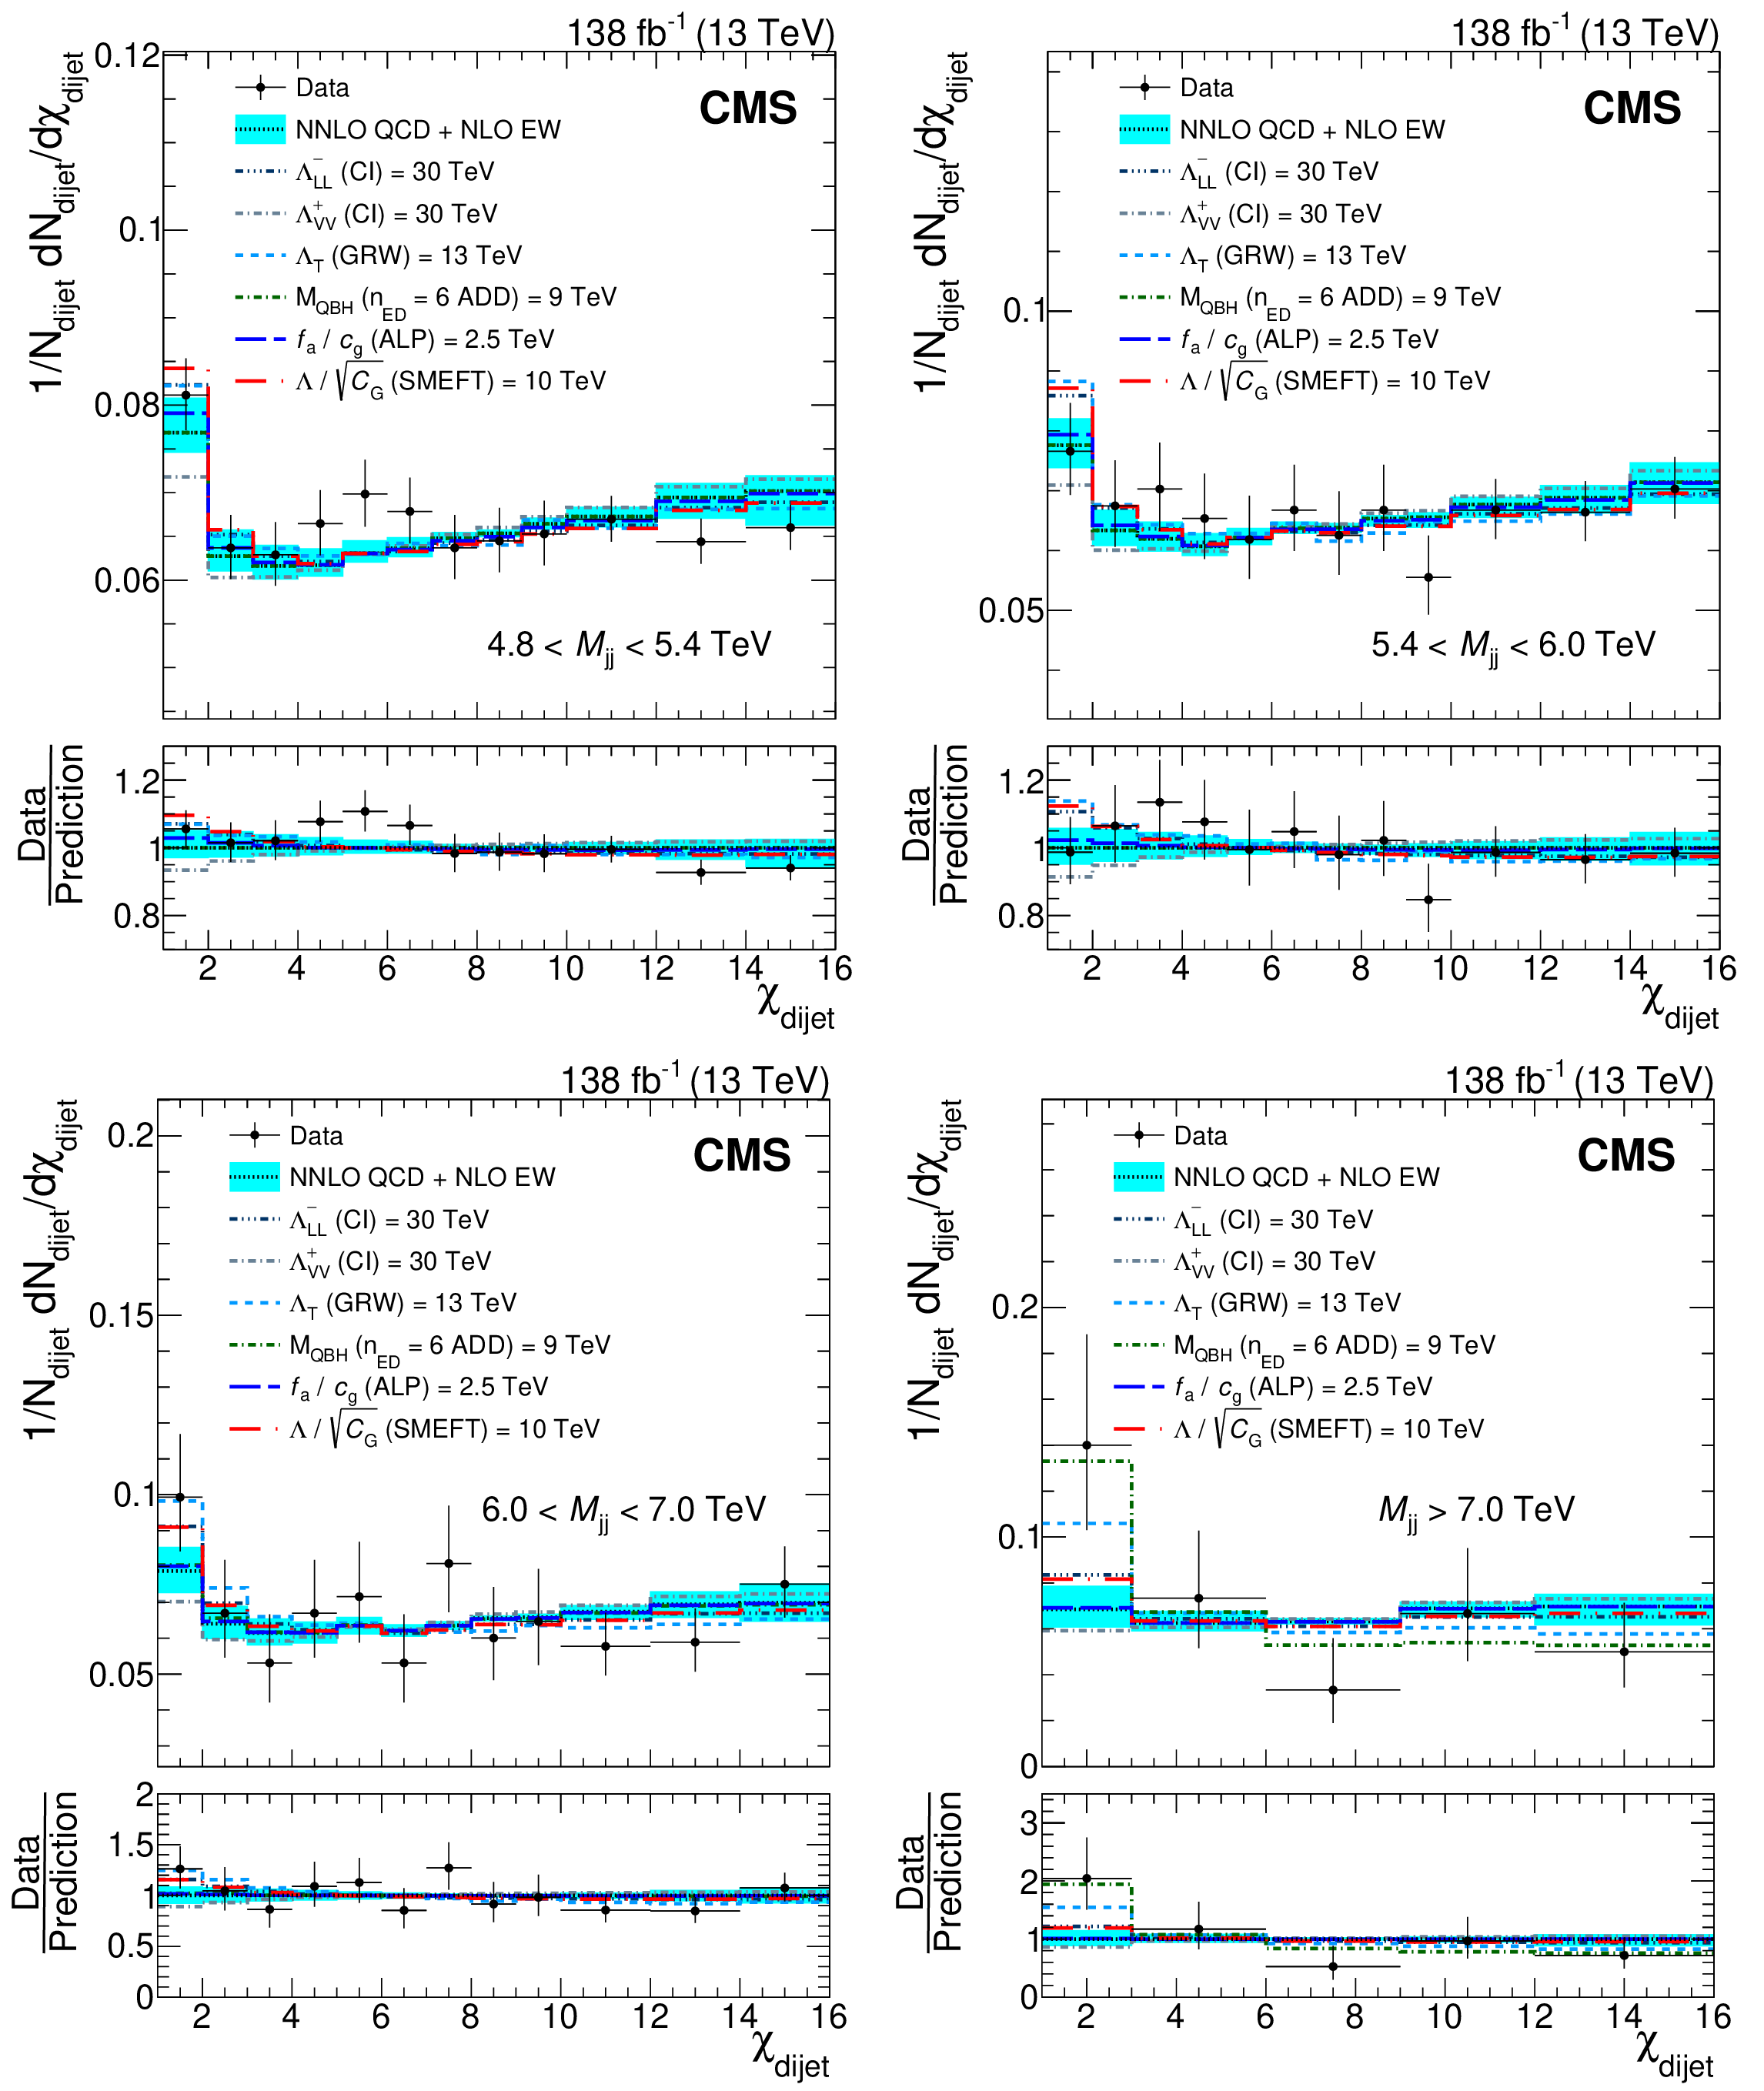
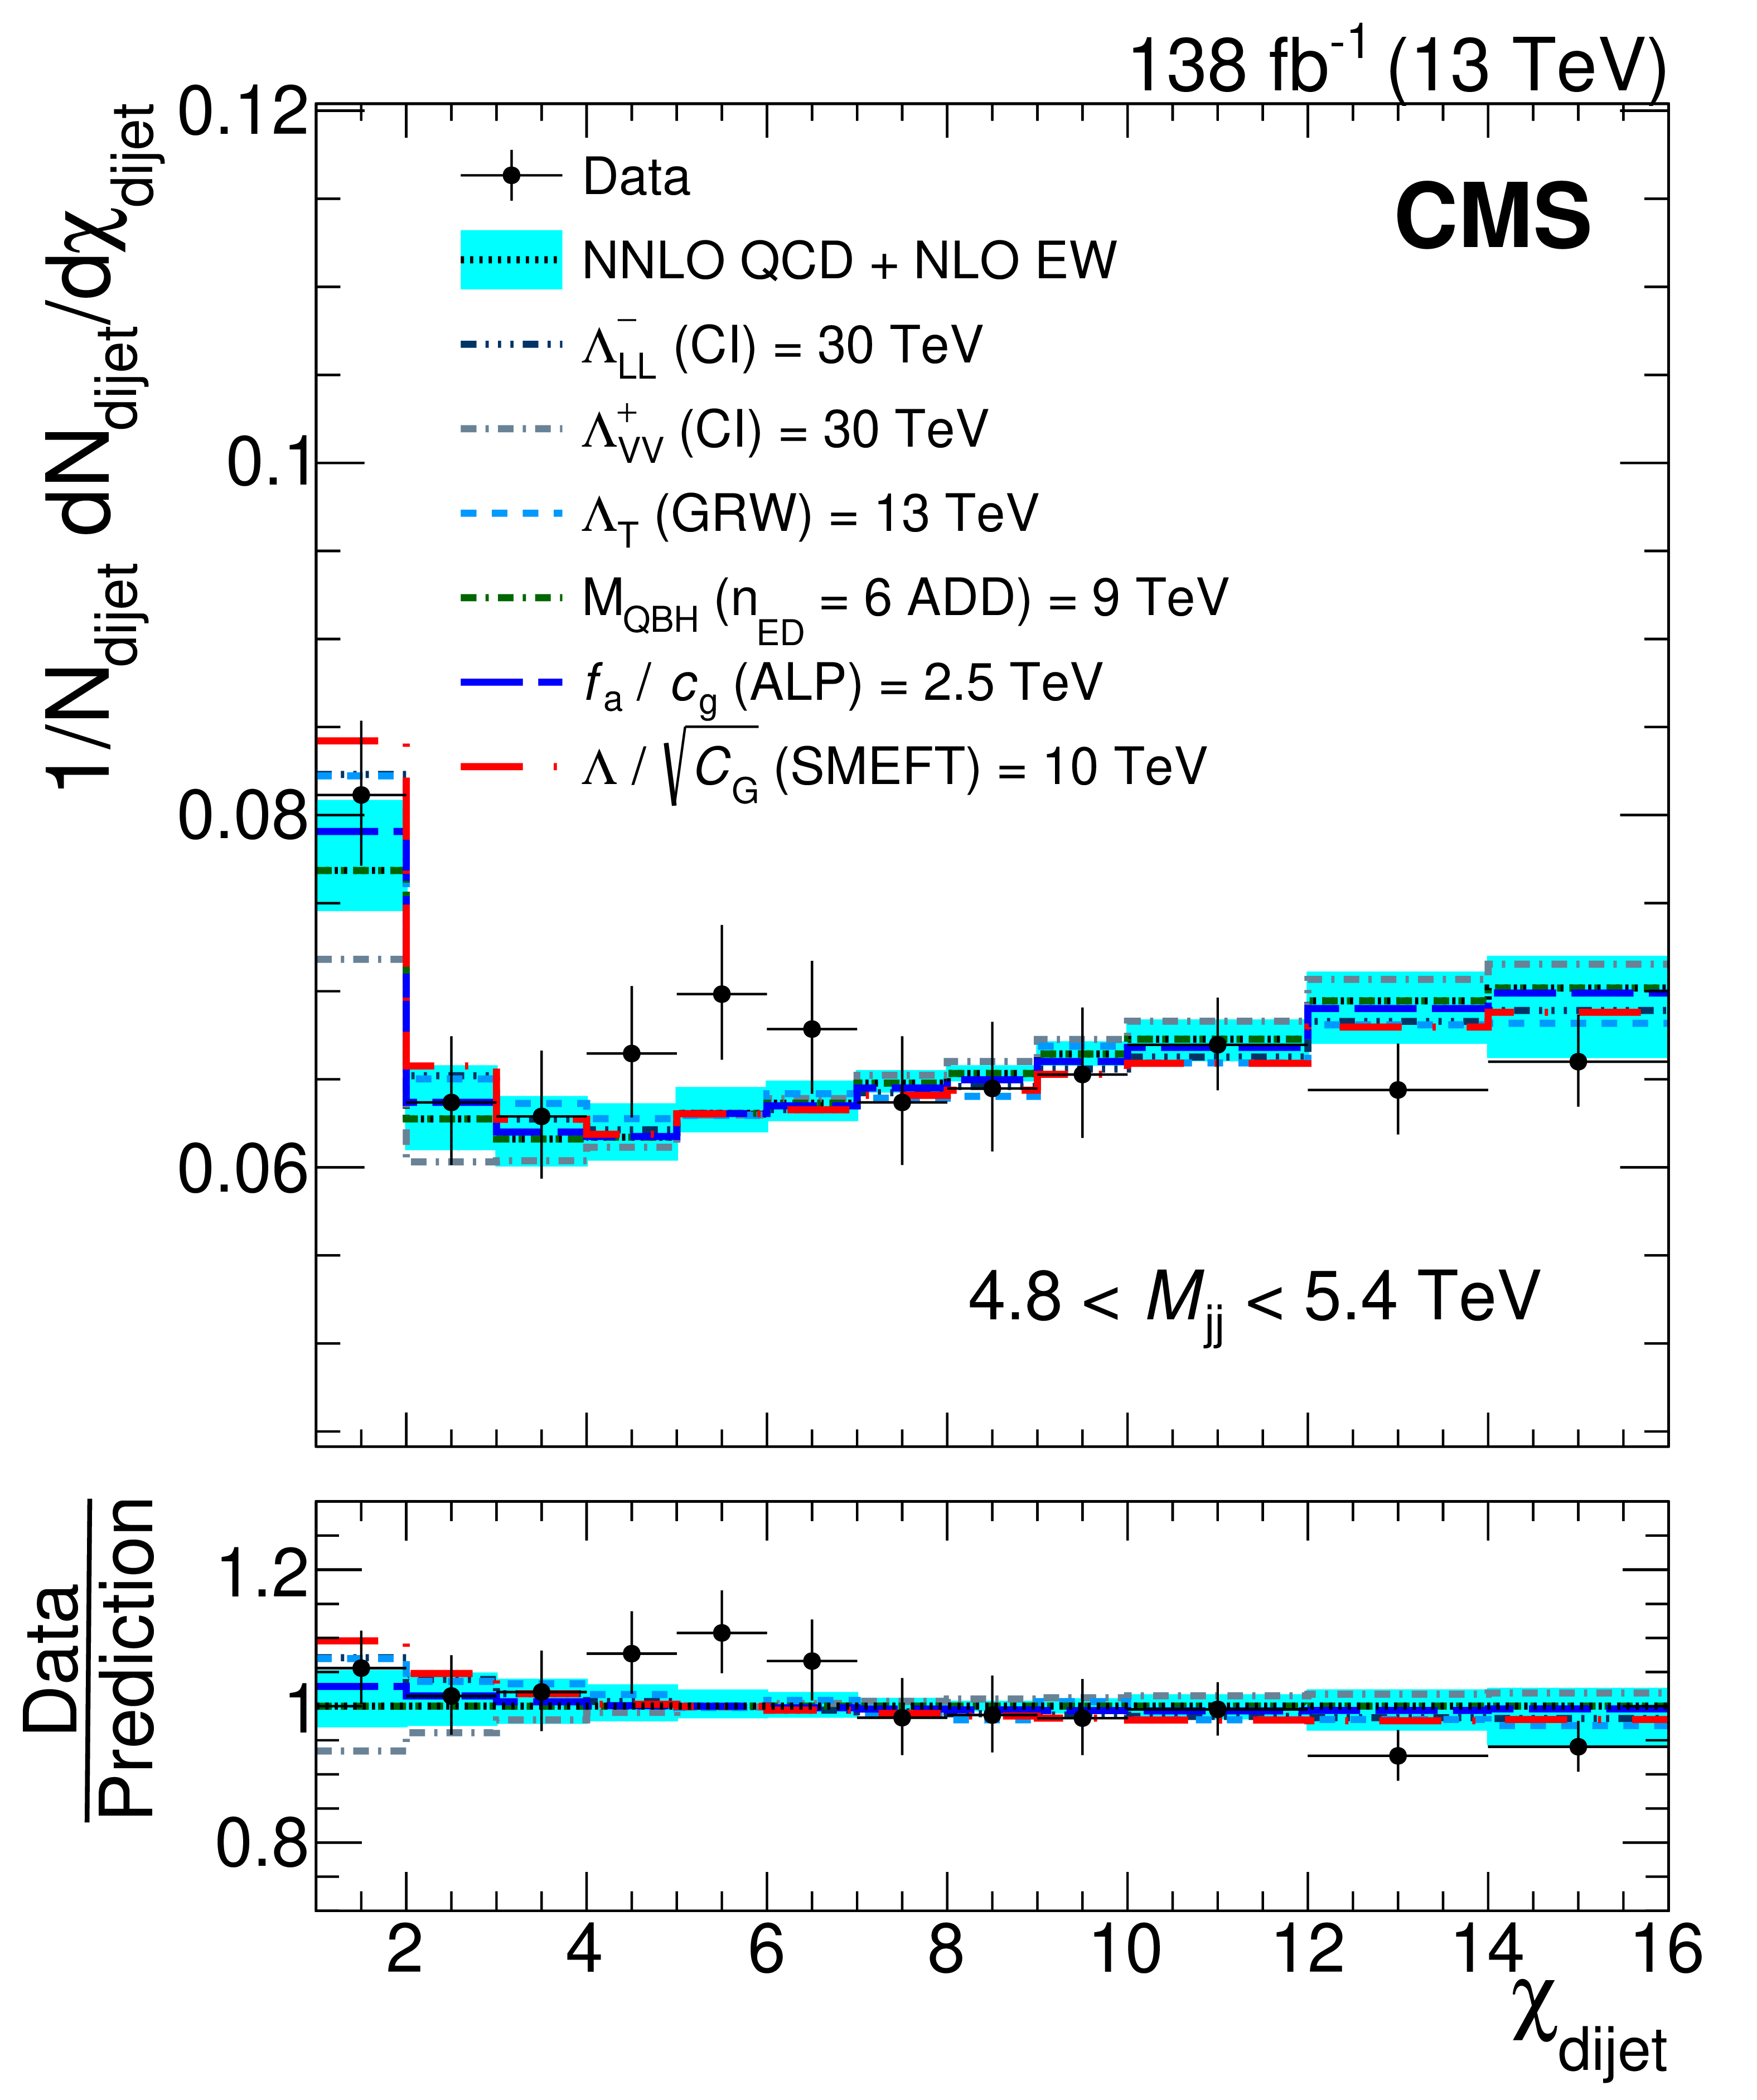
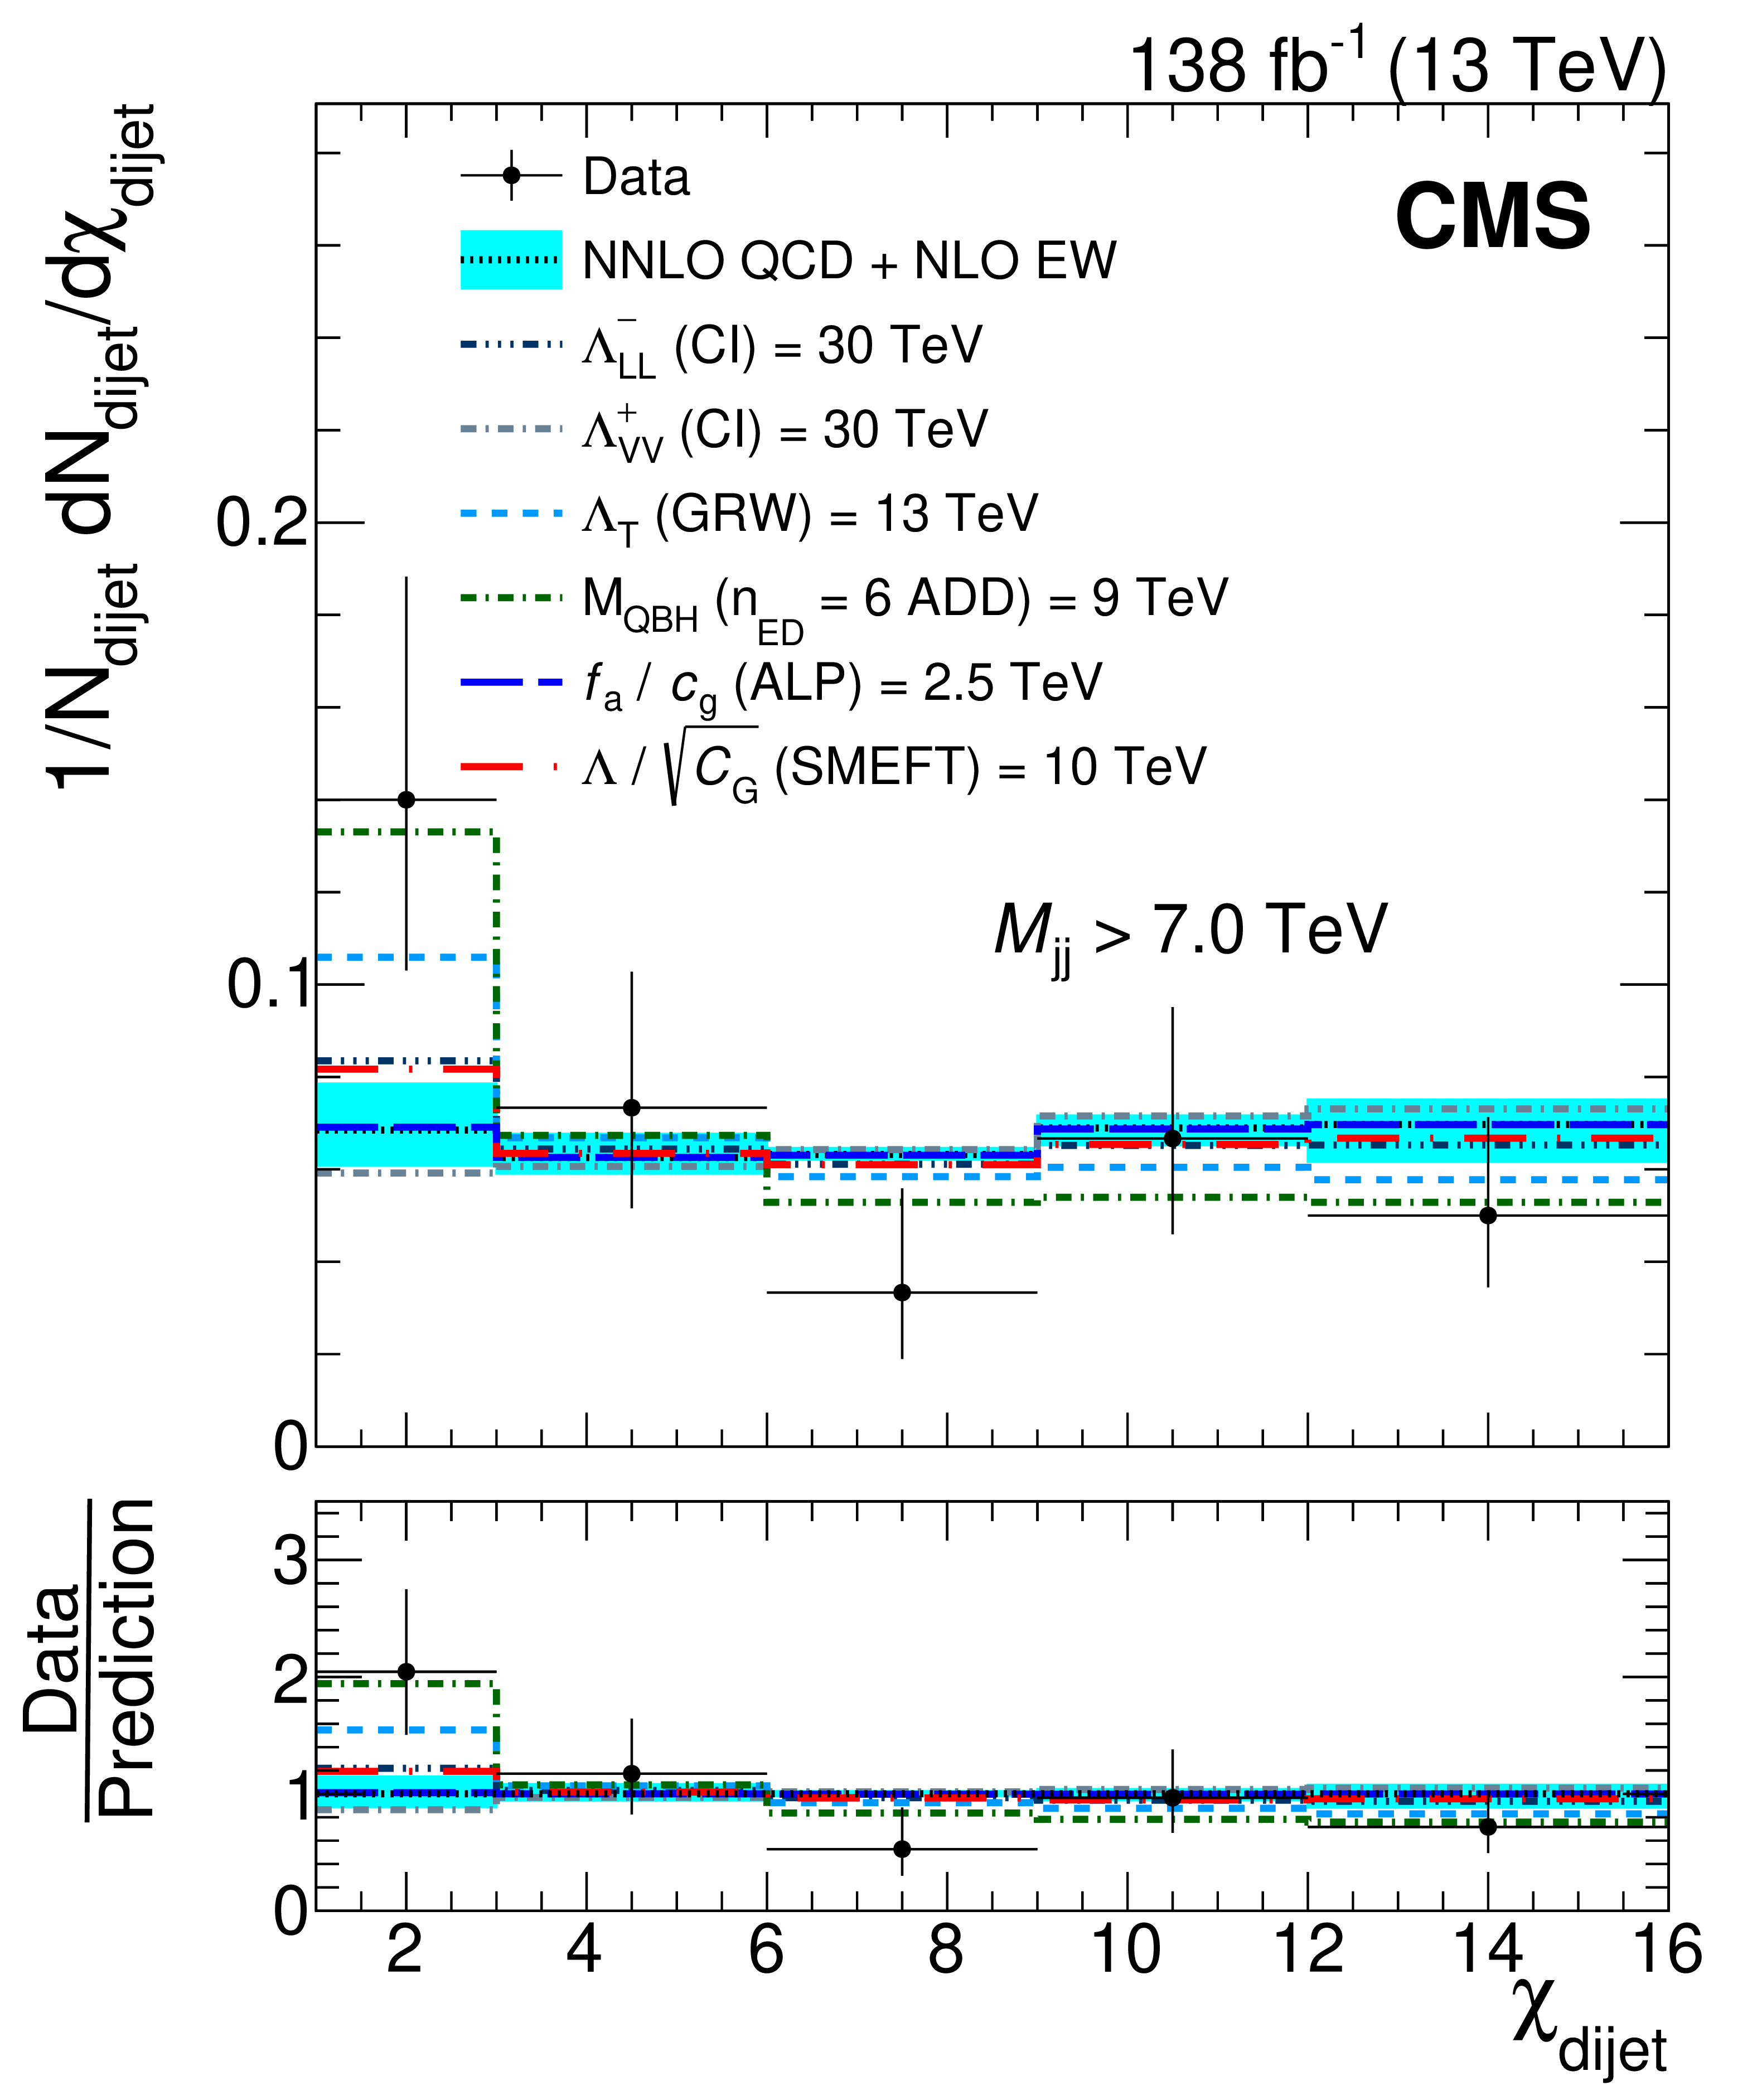
Normalized $ \chi_{\text{dijet}} $ distributions for the $ M_{\mathrm{jj}} $ bins up to 4.8 TeV. The data distributions at the detector level (points) are compared to NNLO predictions, corrected for the detector response (black dotted lines). The vertical bars on the points represent statistical and experimental systematic uncertainties combined in quadrature. The horizontal bars show the bin widths. Theoretical uncertainties are indicated with the blue bands. The prediction from various BSM scenarios, with parameter values given in the legend, are shown by the different dot-dashed lines. The lower plots display the ratio of the data to the NNLO QCD + NLO EW predictions. |
png pdf |
Figure 2-a:
Normalized $ \chi_{\text{dijet}} $ distributions for the $ M_{\mathrm{jj}} $ bins up to 4.8 TeV. The data distributions at the detector level (points) are compared to NNLO predictions, corrected for the detector response (black dotted lines). The vertical bars on the points represent statistical and experimental systematic uncertainties combined in quadrature. The horizontal bars show the bin widths. Theoretical uncertainties are indicated with the blue bands. The prediction from various BSM scenarios, with parameter values given in the legend, are shown by the different dot-dashed lines. The lower plots display the ratio of the data to the NNLO QCD + NLO EW predictions. |
png pdf |
Figure 2-b:
Normalized $ \chi_{\text{dijet}} $ distributions for the $ M_{\mathrm{jj}} $ bins up to 4.8 TeV. The data distributions at the detector level (points) are compared to NNLO predictions, corrected for the detector response (black dotted lines). The vertical bars on the points represent statistical and experimental systematic uncertainties combined in quadrature. The horizontal bars show the bin widths. Theoretical uncertainties are indicated with the blue bands. The prediction from various BSM scenarios, with parameter values given in the legend, are shown by the different dot-dashed lines. The lower plots display the ratio of the data to the NNLO QCD + NLO EW predictions. |
png pdf |
Figure 2-c:
Normalized $ \chi_{\text{dijet}} $ distributions for the $ M_{\mathrm{jj}} $ bins up to 4.8 TeV. The data distributions at the detector level (points) are compared to NNLO predictions, corrected for the detector response (black dotted lines). The vertical bars on the points represent statistical and experimental systematic uncertainties combined in quadrature. The horizontal bars show the bin widths. Theoretical uncertainties are indicated with the blue bands. The prediction from various BSM scenarios, with parameter values given in the legend, are shown by the different dot-dashed lines. The lower plots display the ratio of the data to the NNLO QCD + NLO EW predictions. |
png pdf |
Figure 2-d:
Normalized $ \chi_{\text{dijet}} $ distributions for the $ M_{\mathrm{jj}} $ bins up to 4.8 TeV. The data distributions at the detector level (points) are compared to NNLO predictions, corrected for the detector response (black dotted lines). The vertical bars on the points represent statistical and experimental systematic uncertainties combined in quadrature. The horizontal bars show the bin widths. Theoretical uncertainties are indicated with the blue bands. The prediction from various BSM scenarios, with parameter values given in the legend, are shown by the different dot-dashed lines. The lower plots display the ratio of the data to the NNLO QCD + NLO EW predictions. |
png pdf |
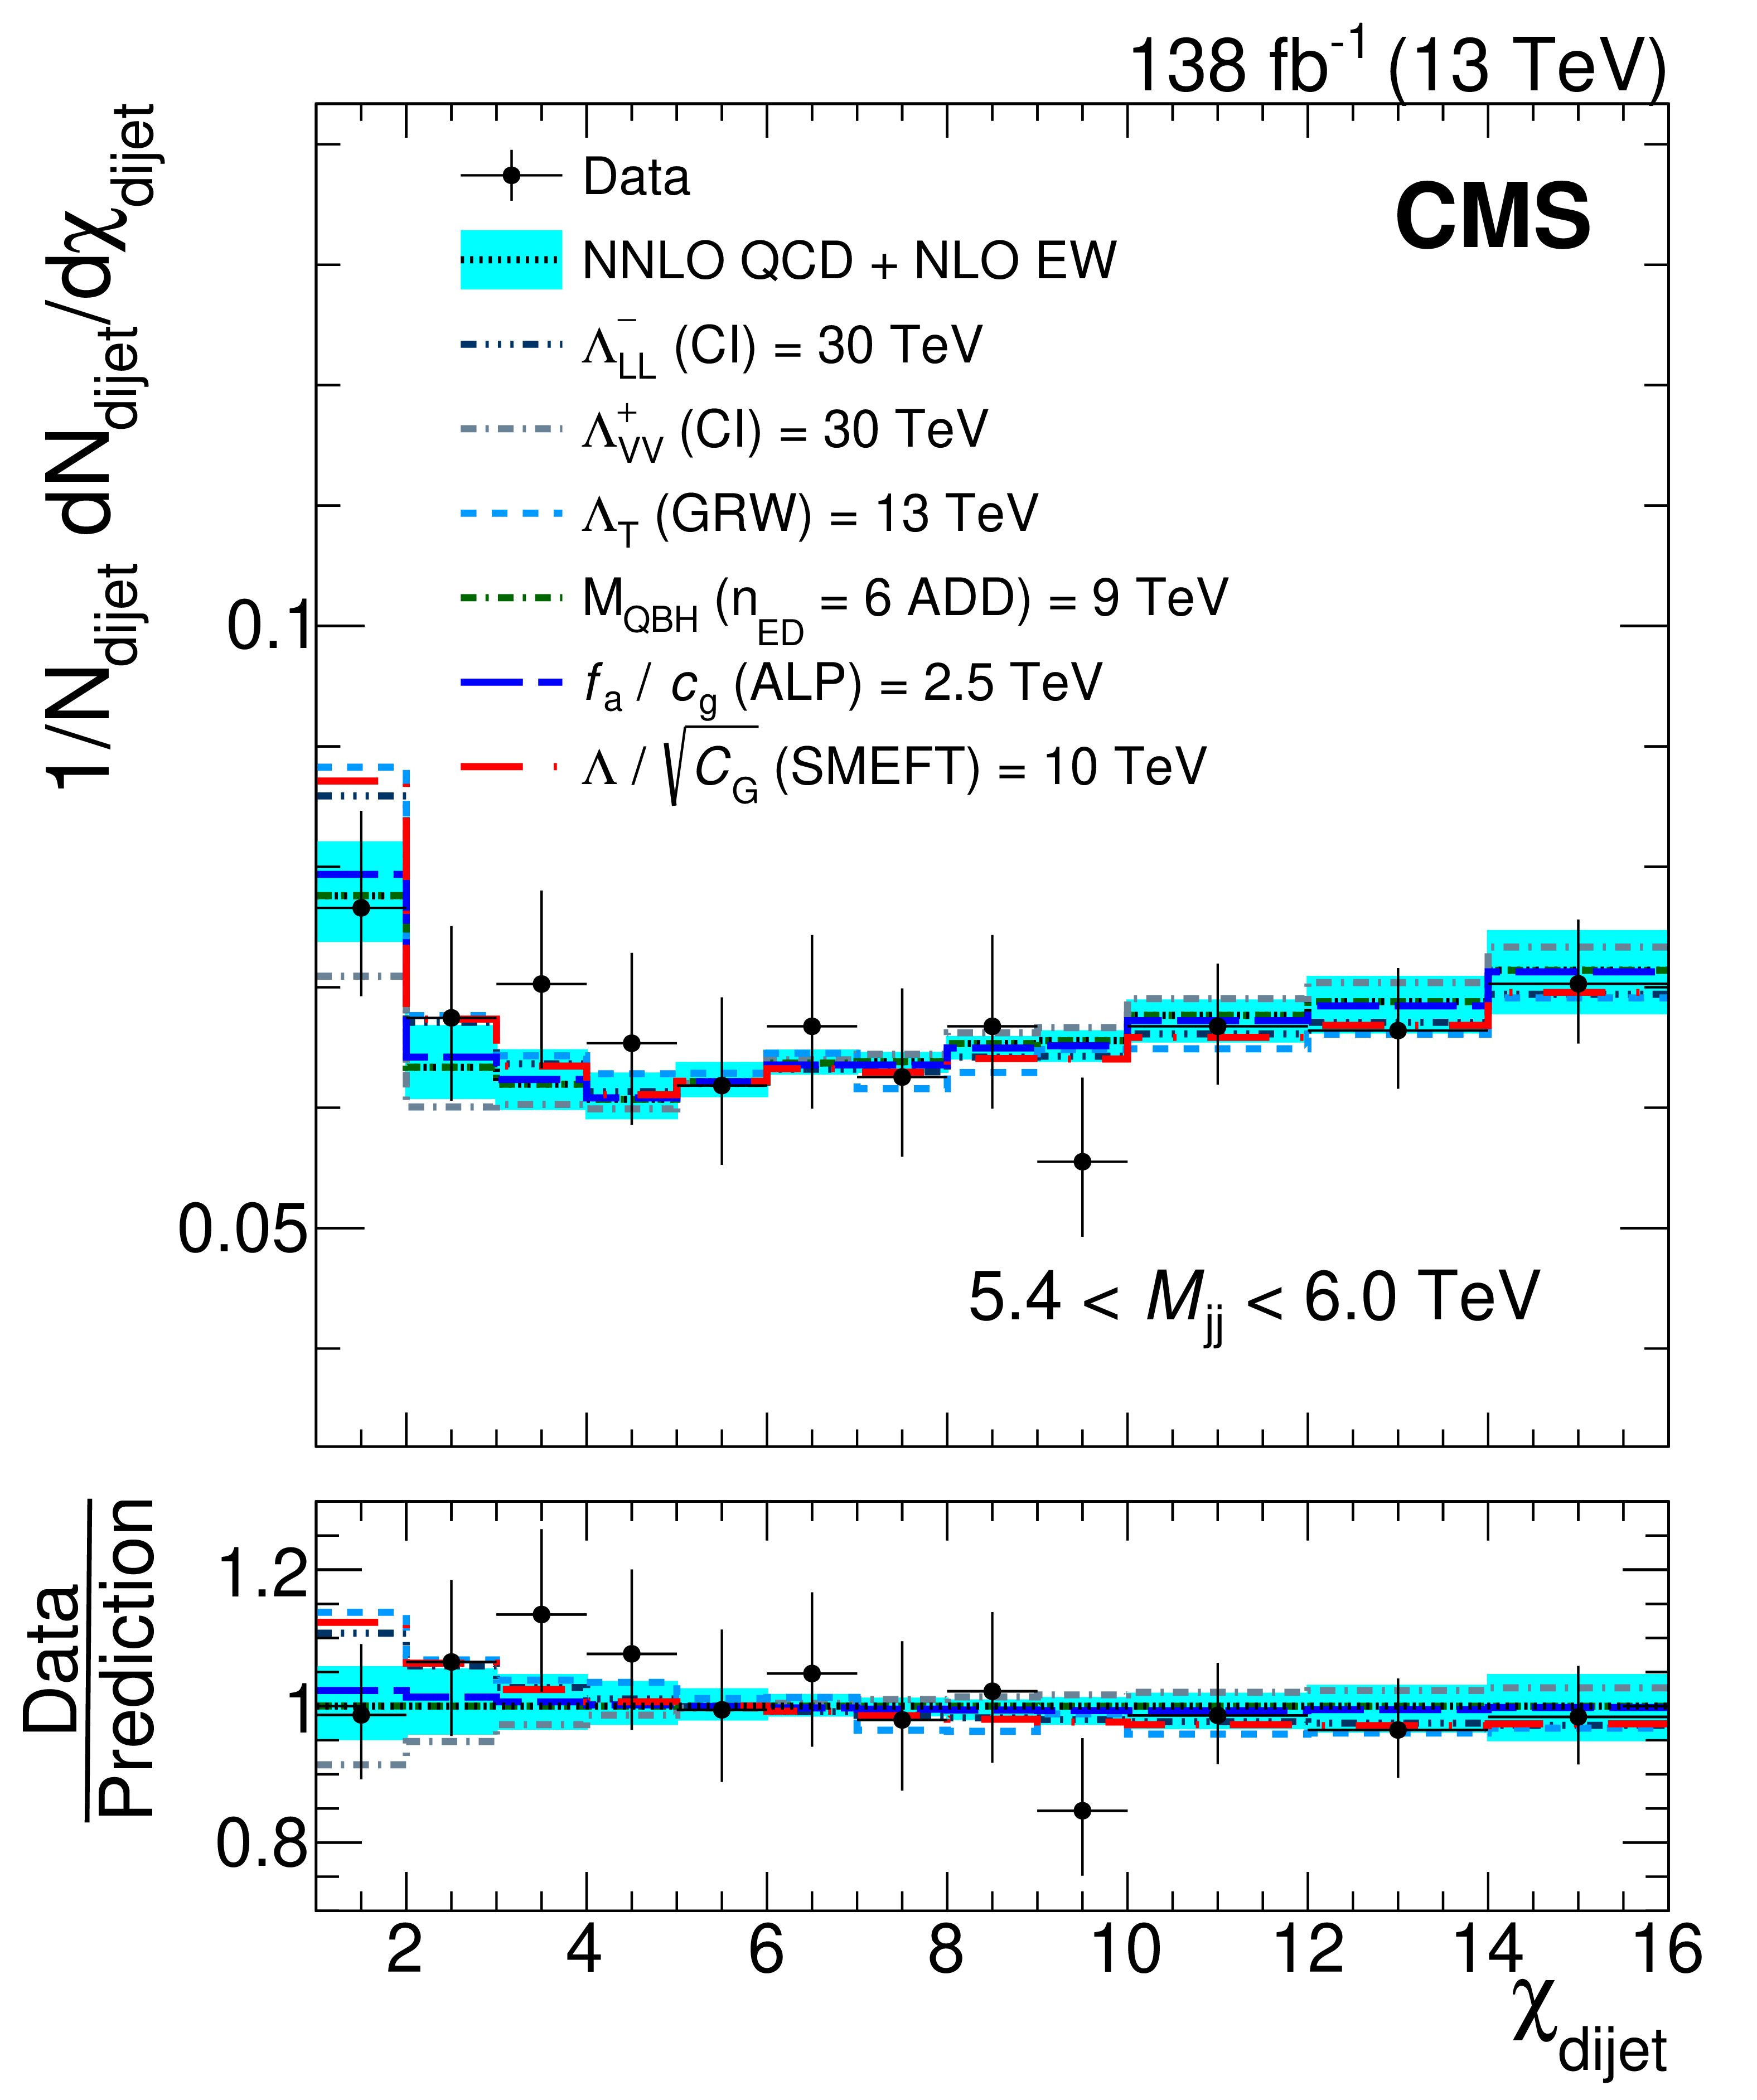
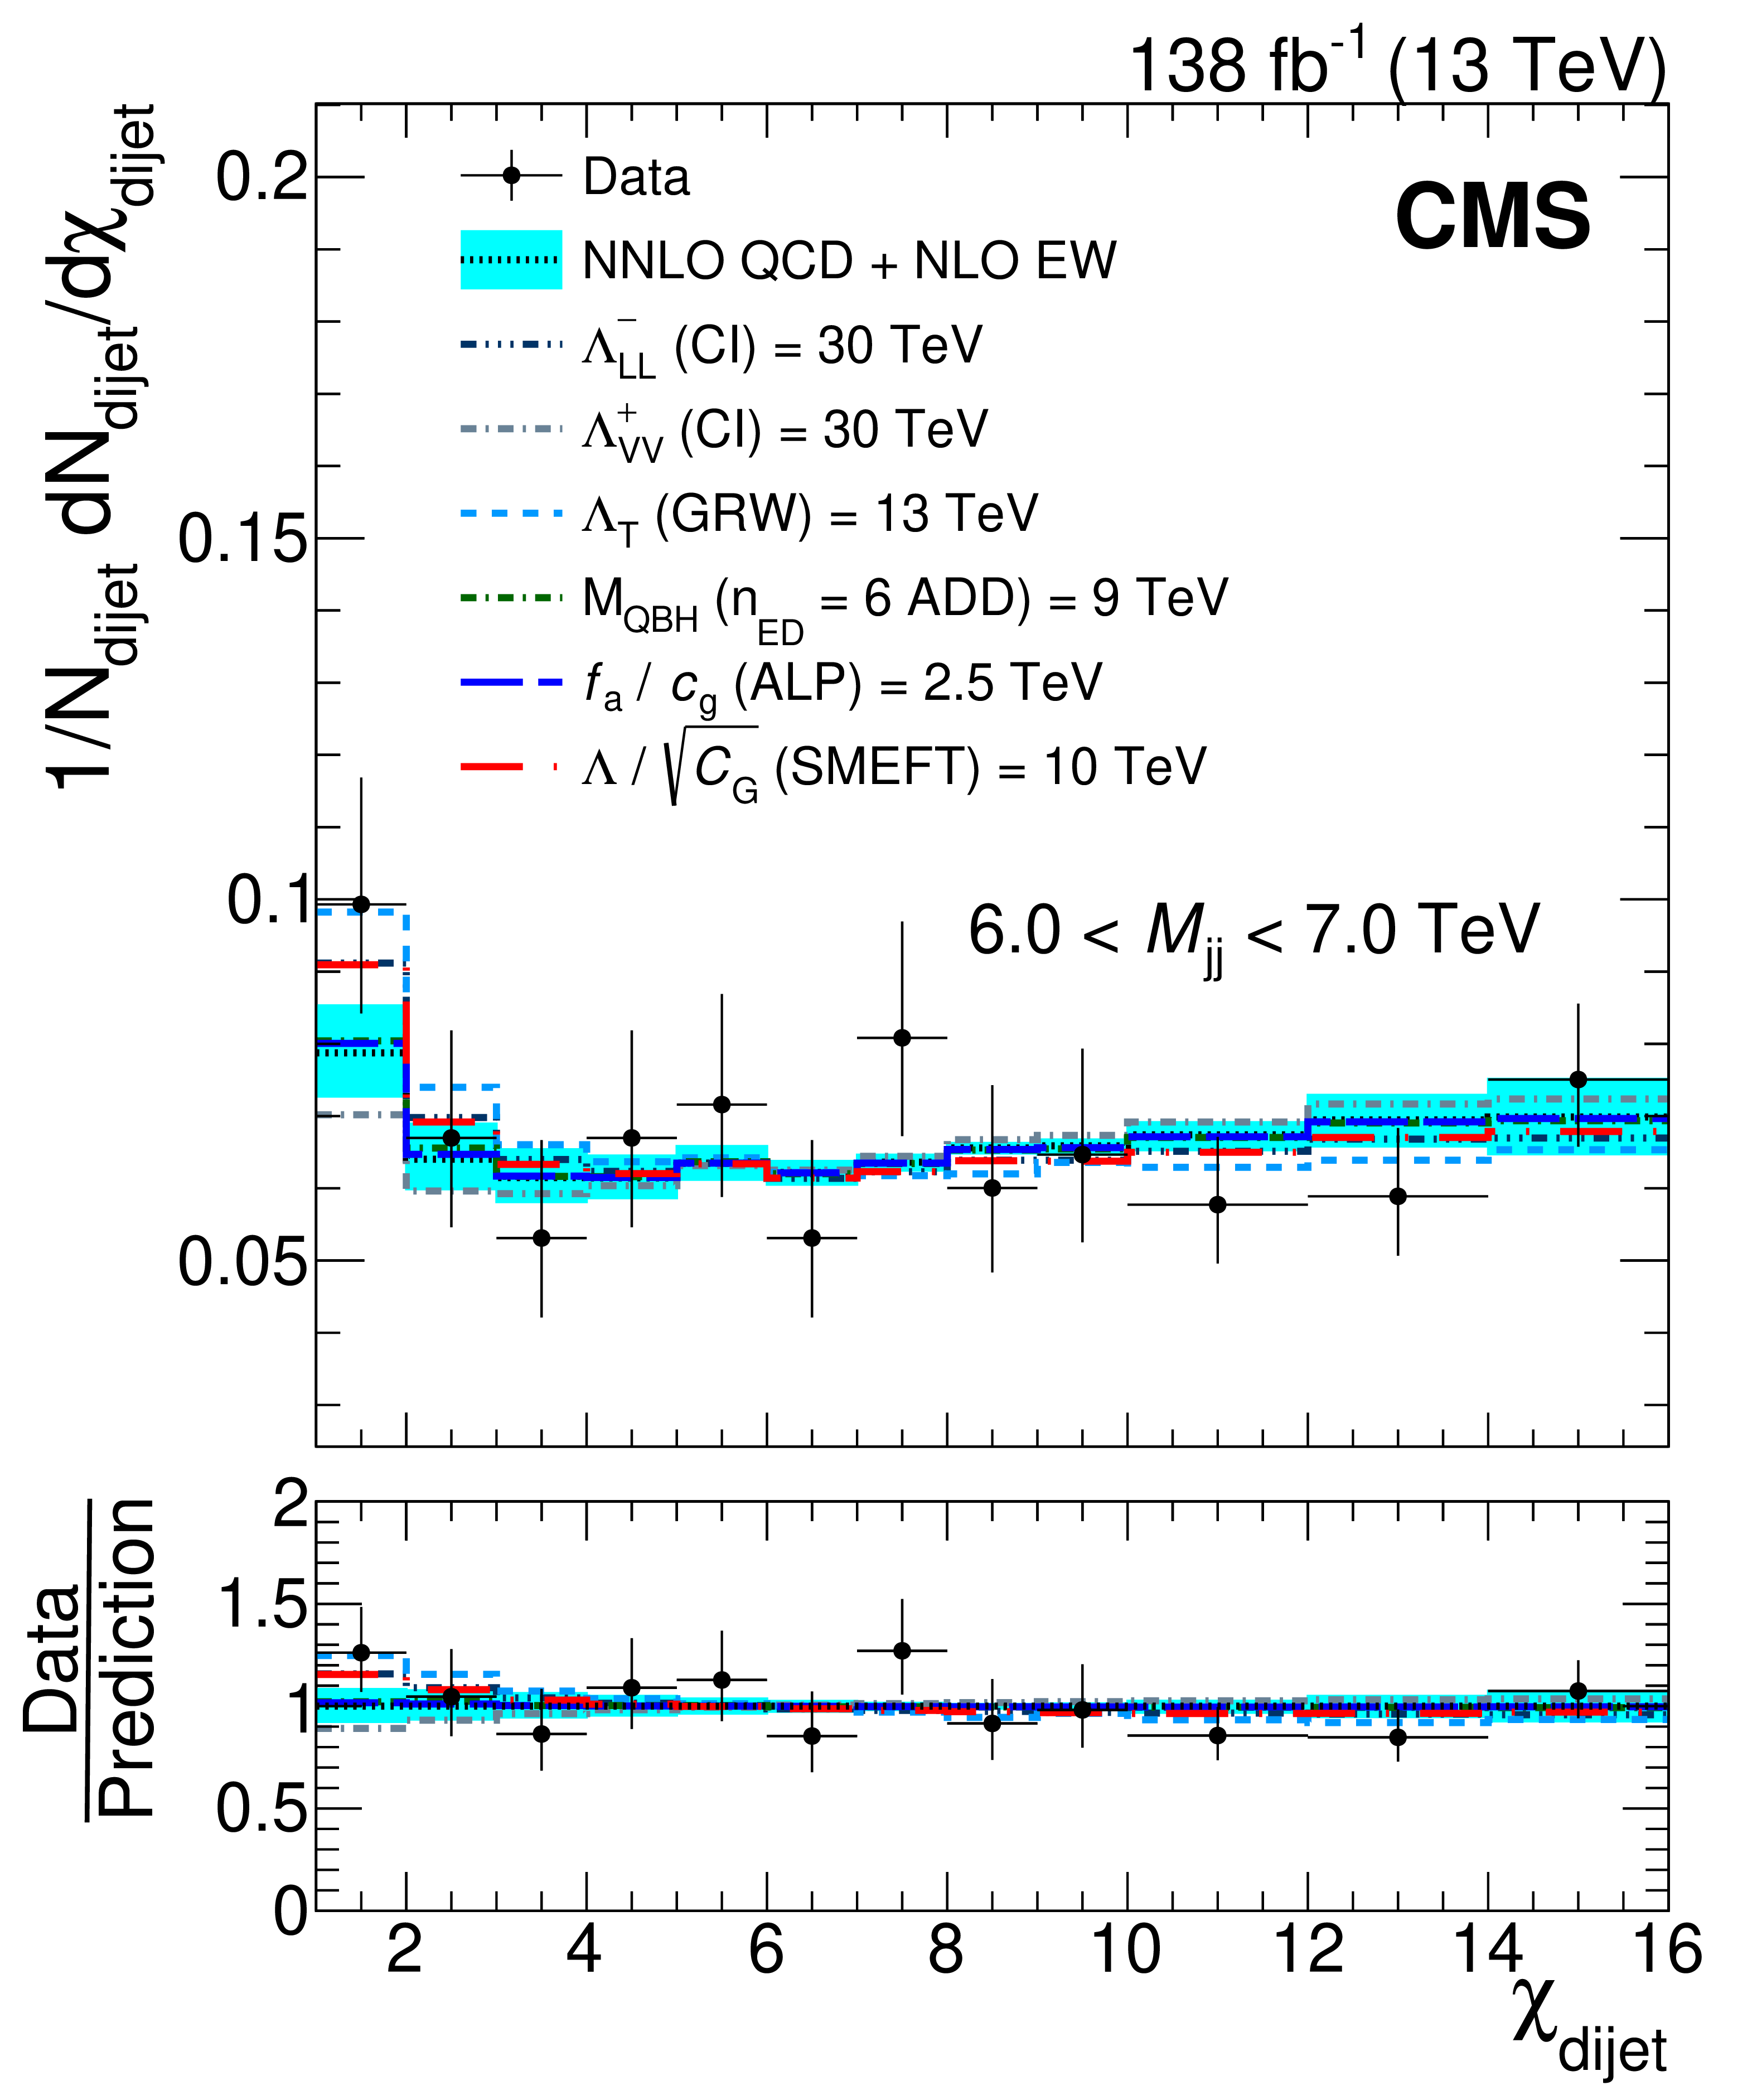
Figure 3:
Normalized $ \chi_{\text{dijet}} $ distributions for the $ M_{\mathrm{jj}} $ bins above 4.8 TeV. Notations as in Fig. 2. |
png pdf |
Figure 3-a:
Normalized $ \chi_{\text{dijet}} $ distributions for the $ M_{\mathrm{jj}} $ bins above 4.8 TeV. Notations as in Fig. 2. |
png pdf |
Figure 3-b:
Normalized $ \chi_{\text{dijet}} $ distributions for the $ M_{\mathrm{jj}} $ bins above 4.8 TeV. Notations as in Fig. 2. |
png pdf |
Figure 3-c:
Normalized $ \chi_{\text{dijet}} $ distributions for the $ M_{\mathrm{jj}} $ bins above 4.8 TeV. Notations as in Fig. 2. |
png pdf |
Figure 3-d:
Normalized $ \chi_{\text{dijet}} $ distributions for the $ M_{\mathrm{jj}} $ bins above 4.8 TeV. Notations as in Fig. 2. |
png pdf |
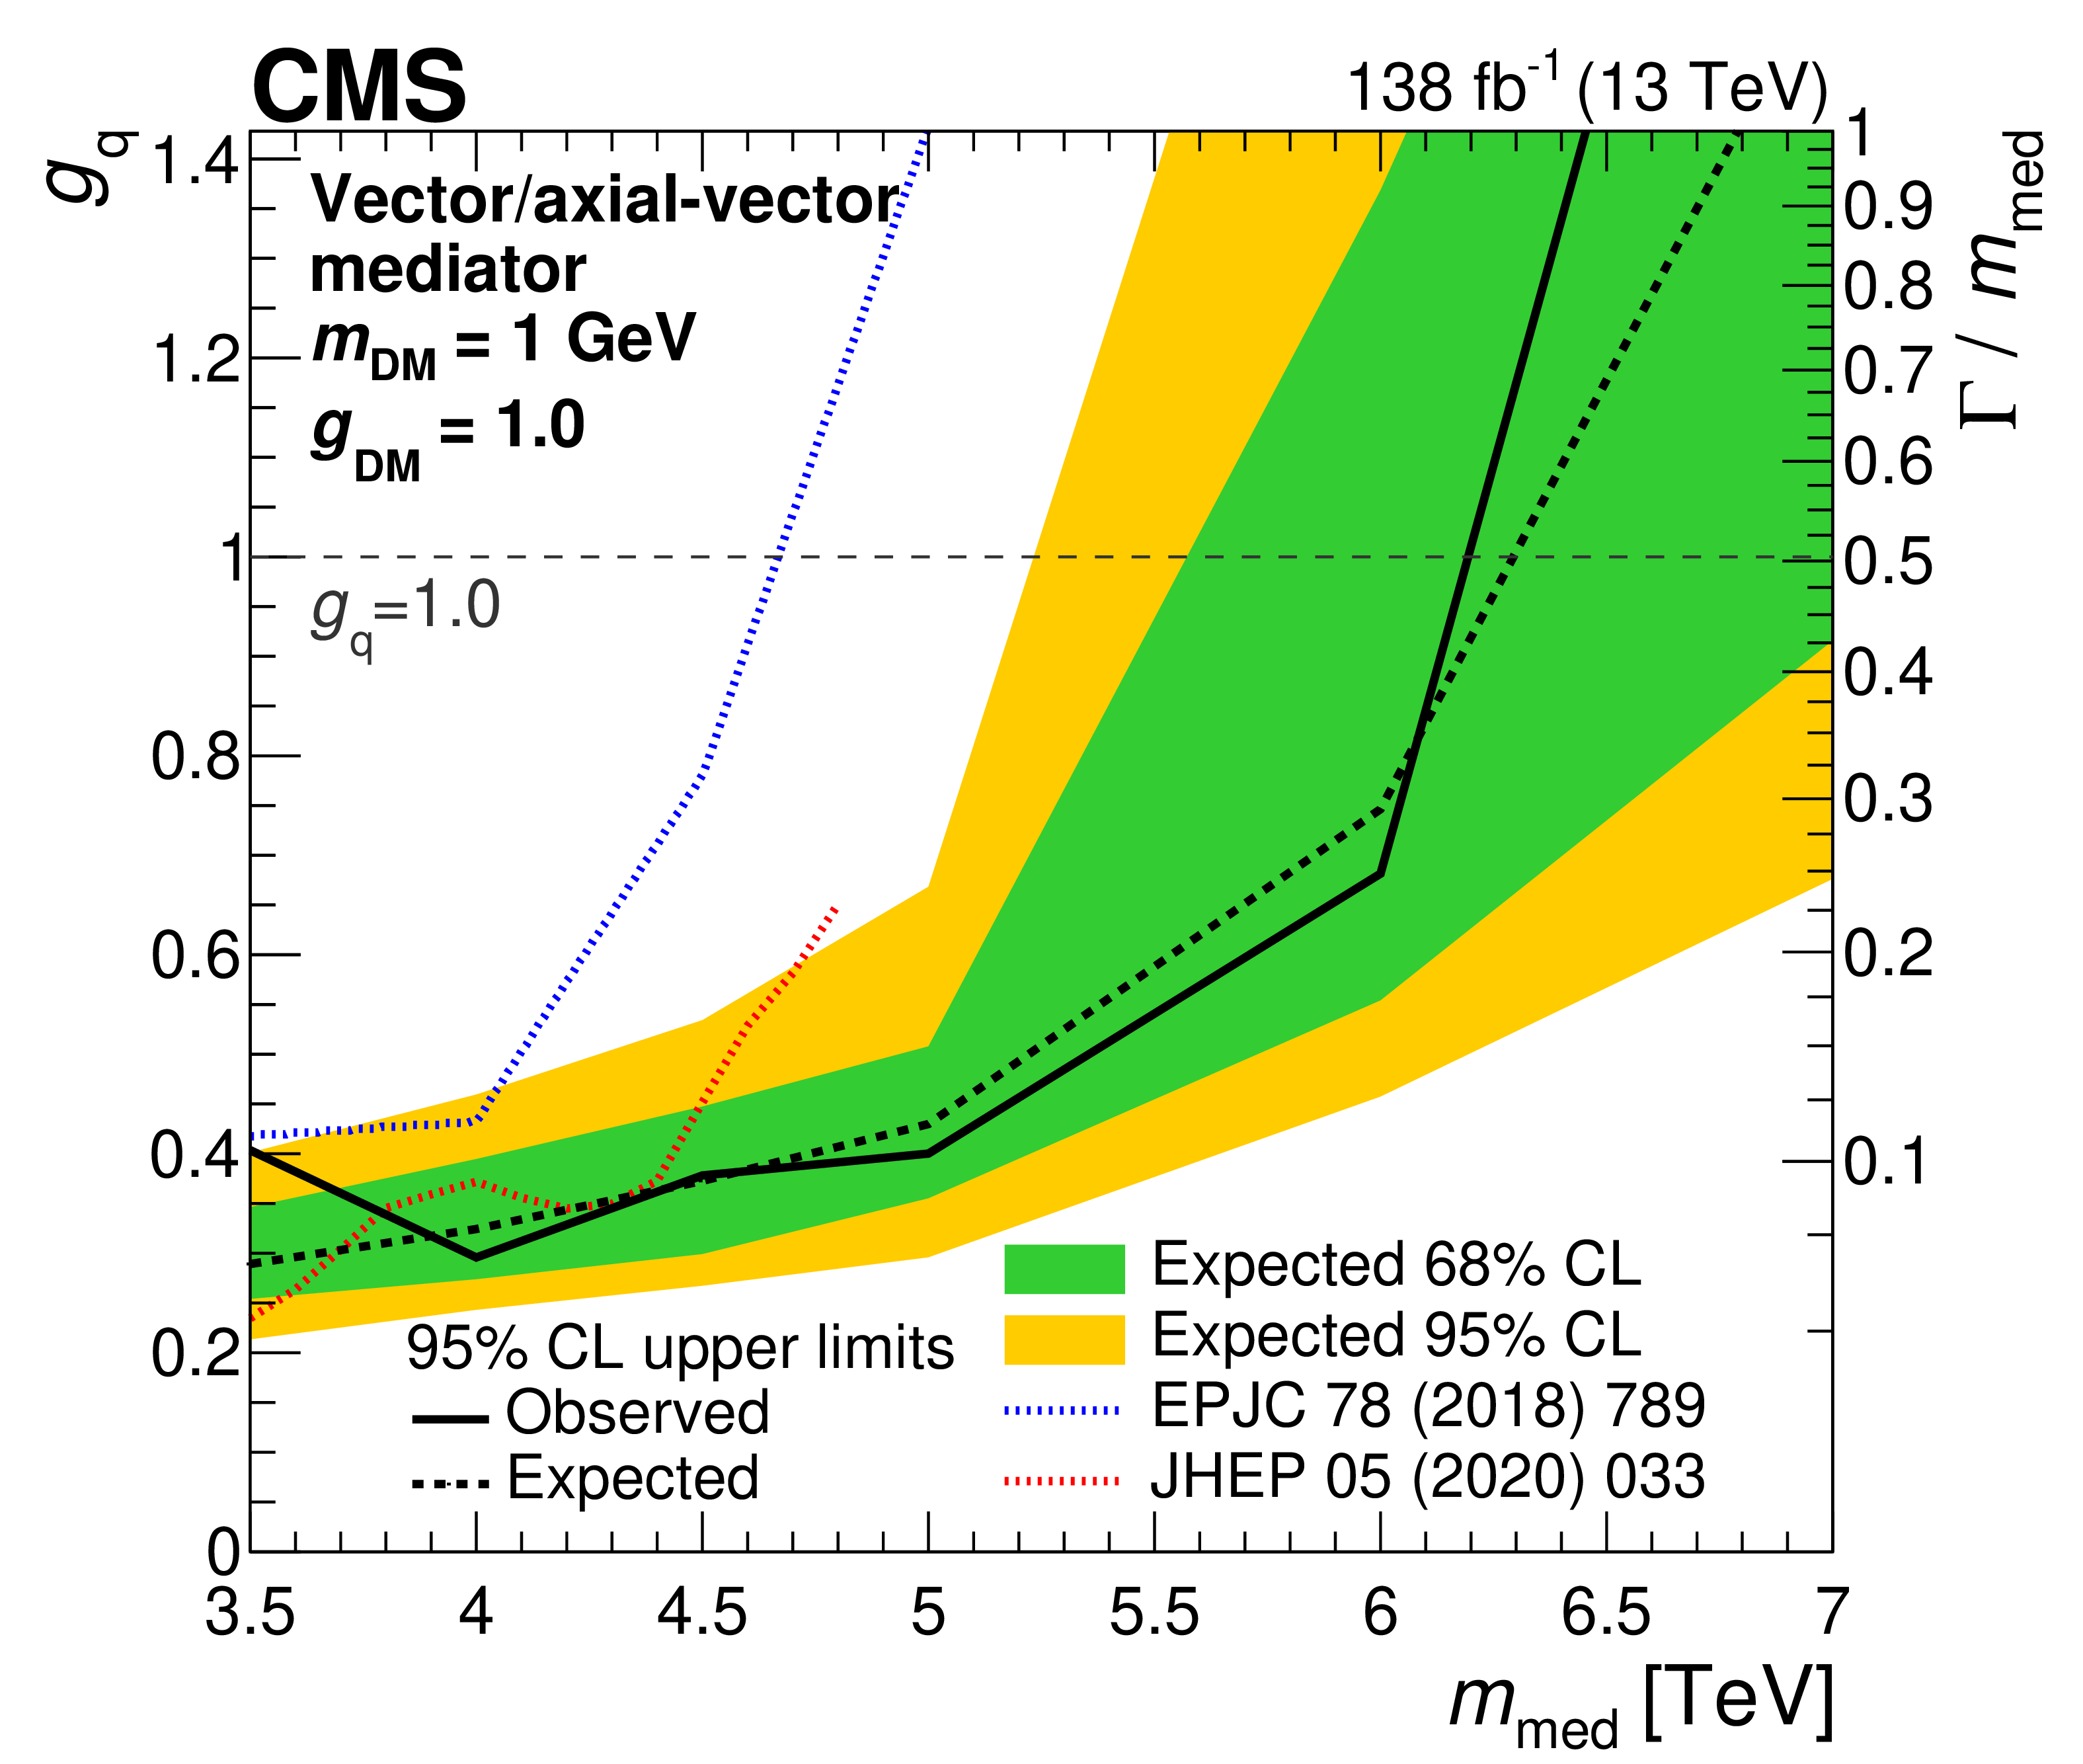
Figure 4:
The 95% CL upper limits on the universal quark coupling $ g_{\text{q}} $ as functions of a vector or axial-vector mediator mass, with $ g_{\text{DM}}= $ 1.0 and $ m_{\text{DM}}= $ 1 GeV. The observed (solid line) and expected (dashed line) limits and their 68% and 95% confidence intervals (shaded bands) are shown. A dashed horizontal line shows the coupling strength for a benchmark DM mediator with $ g_{\text{q}}= $ 1. Results are compared to the previous searches using dijet angular [23] (blue dotted line) and dijet mass [21] (red dotted line) distributions. The vertical scale on the right axis gives the corresponding values of $ \Gamma/m_{\text{med}} $. |
png pdf |
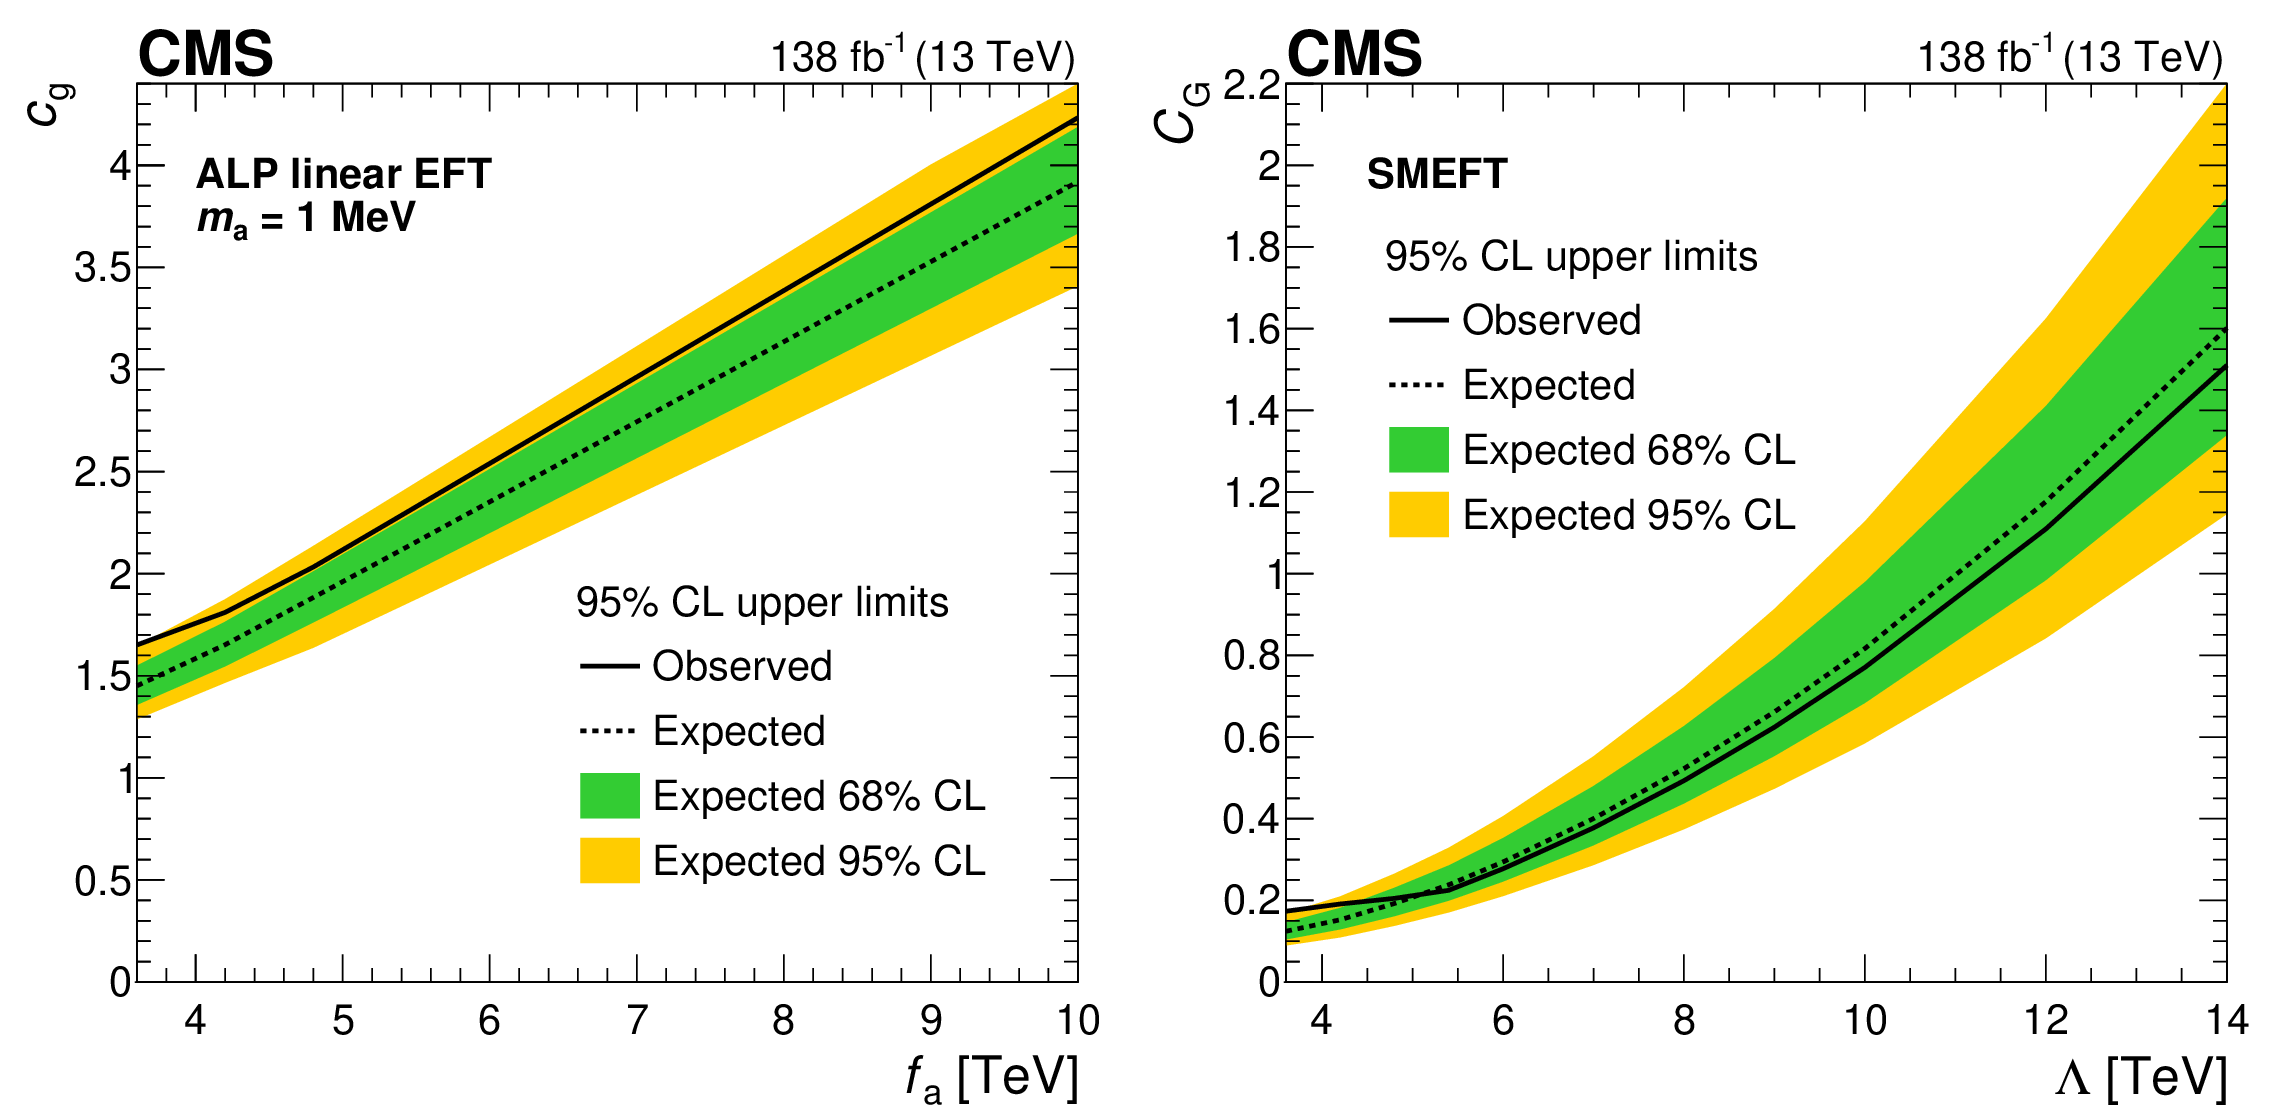
Figure 5:
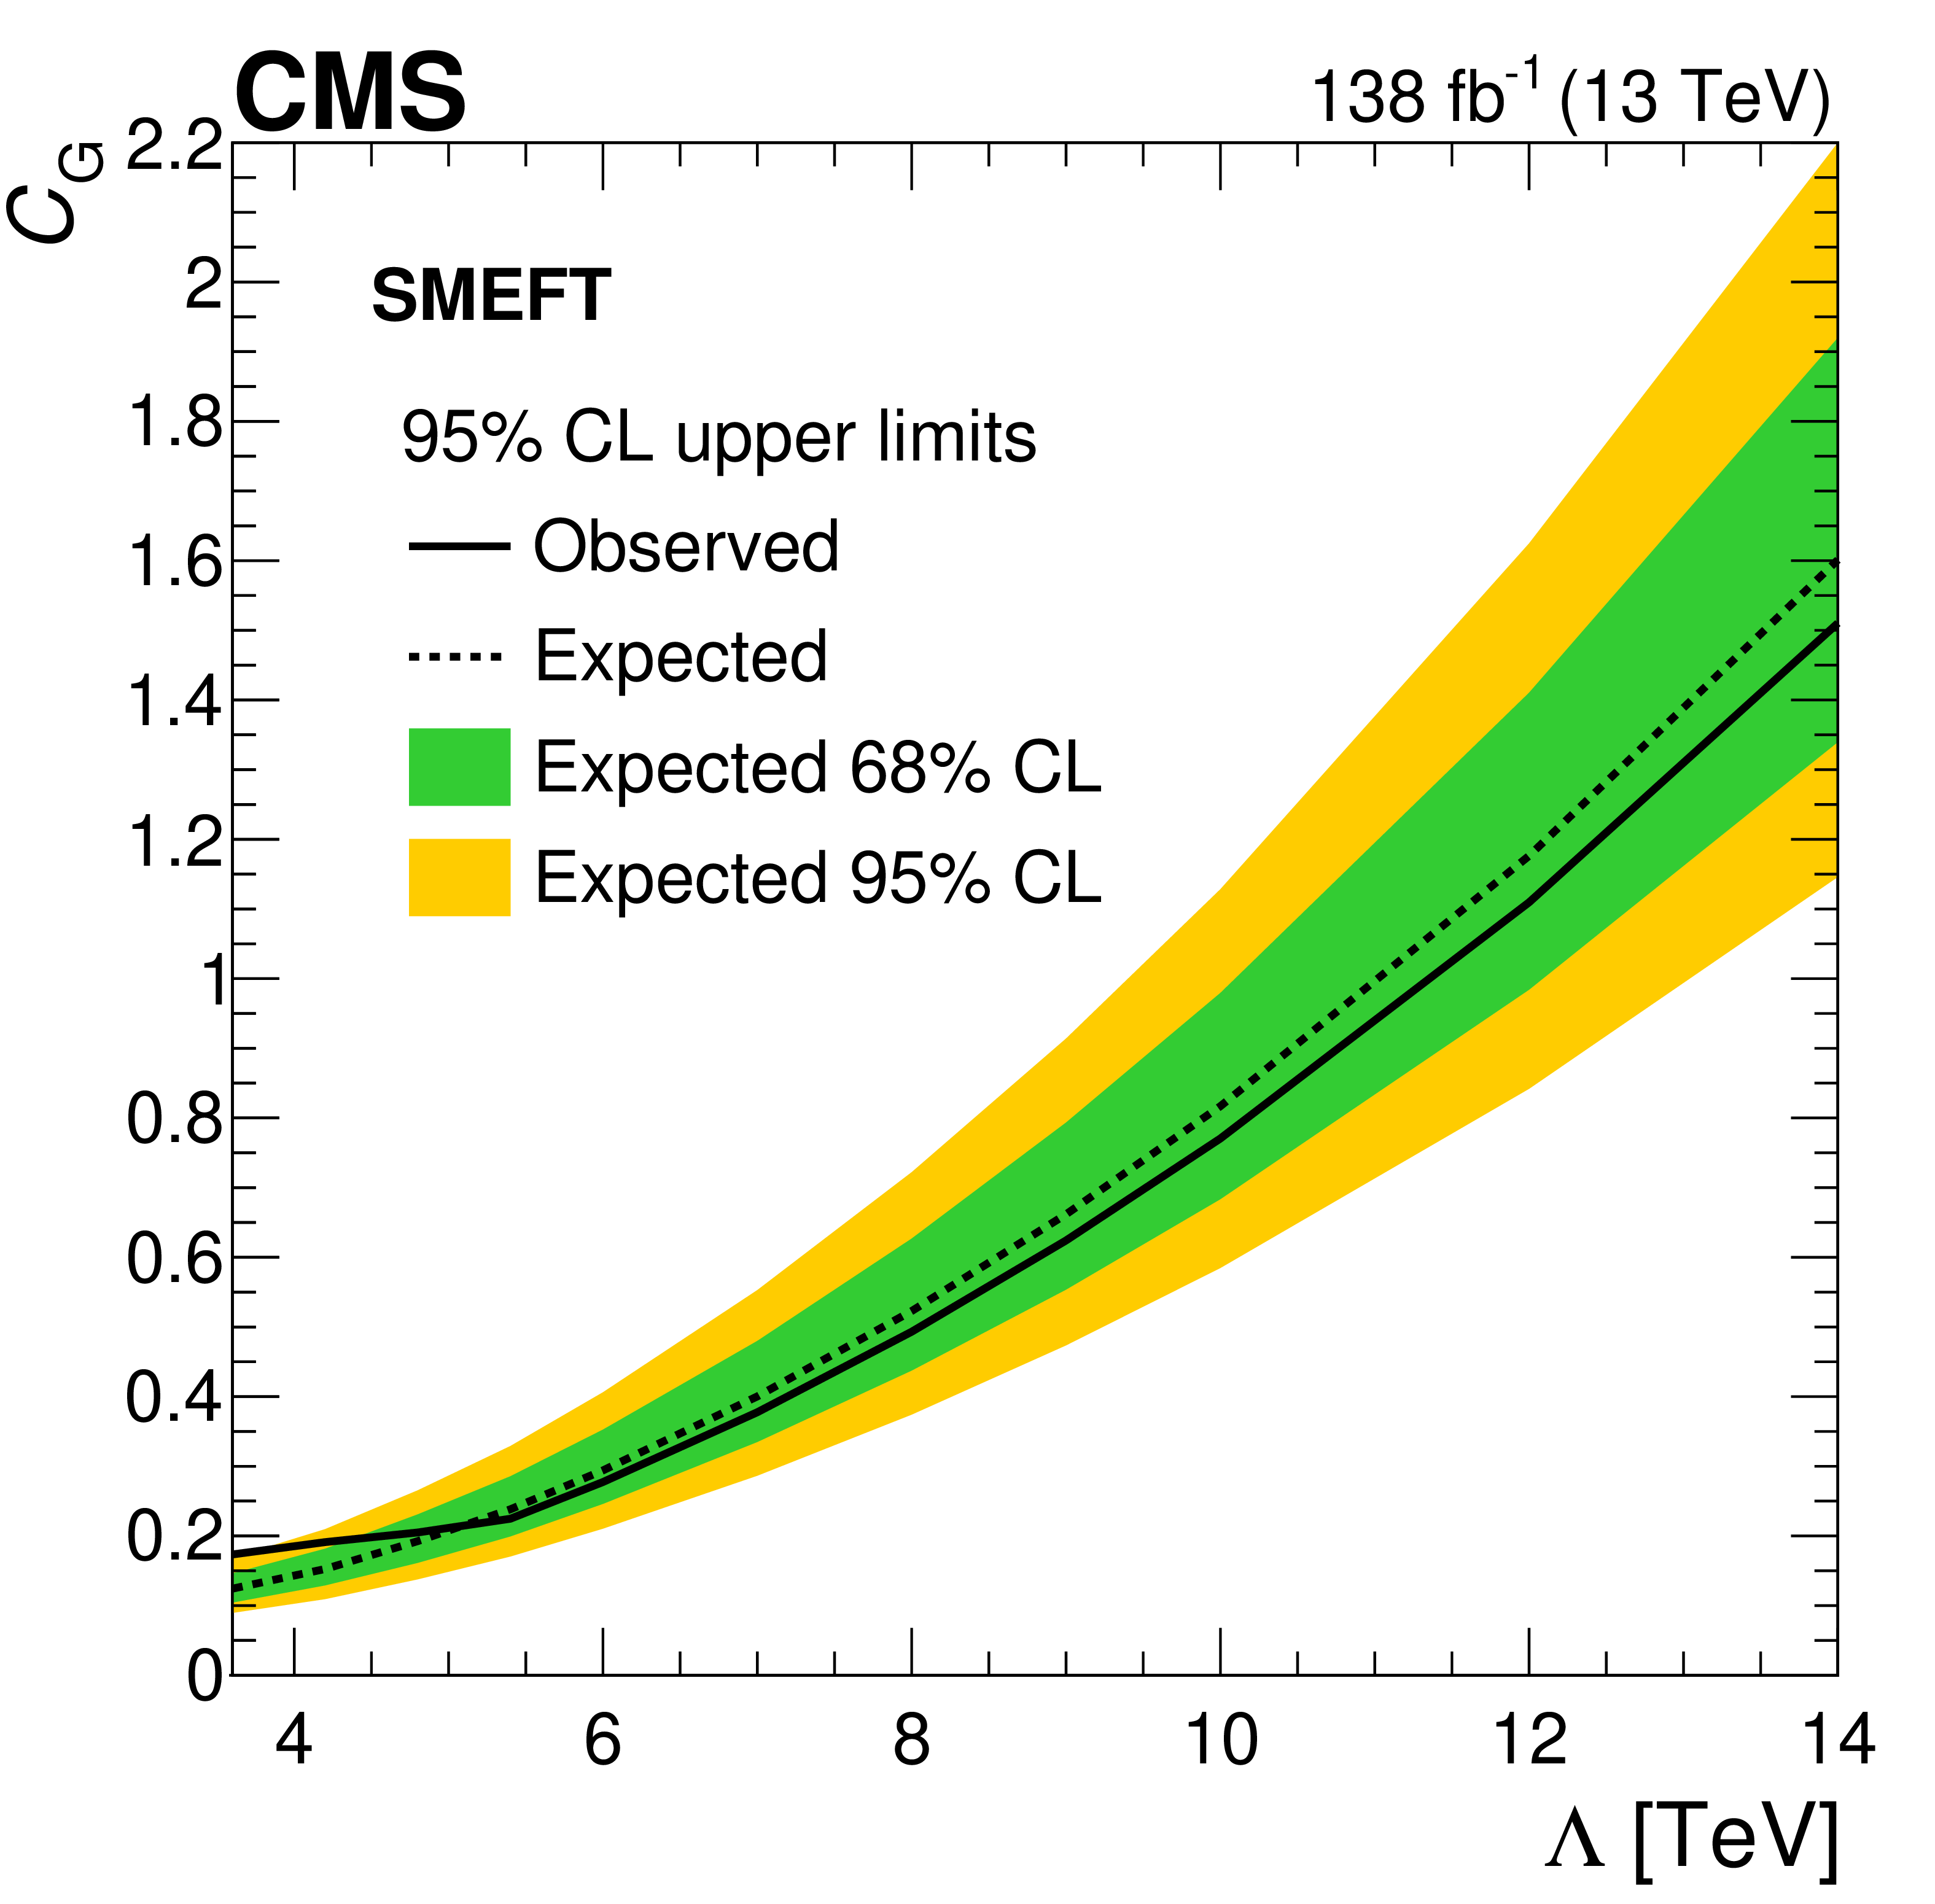
The 95% CL upper limits on the ALP gluon coupling (left) in linear EFT, $ c_\text{g} $, as functions of the characteristic energy scale, $ f_\text{a} $, assuming $ m_\text{a}= $ 1 MeV. Only $ \chi_{\text{dijet}} $ distributions with $ M_{\mathrm{jj}} < f_\text{a} $ are used to obtain the limits on $ c_\text{g} $. The 95% CL upper limits on the anomalous triple-gluon coupling (right), $ C_\text{G} $, in SMEFT as functions of the BSM physics energy scale, $ \Lambda $. Only $ \chi_{\text{dijet}} $ distributions with $ M_{\mathrm{jj}} < \Lambda $ are used to obtain the limits on $ C_\text{G} $. The observed limits (solid lines), expected limits (dashed lines), and their 68% and 95% confidence intervals (shaded bands) are shown. |
png pdf |
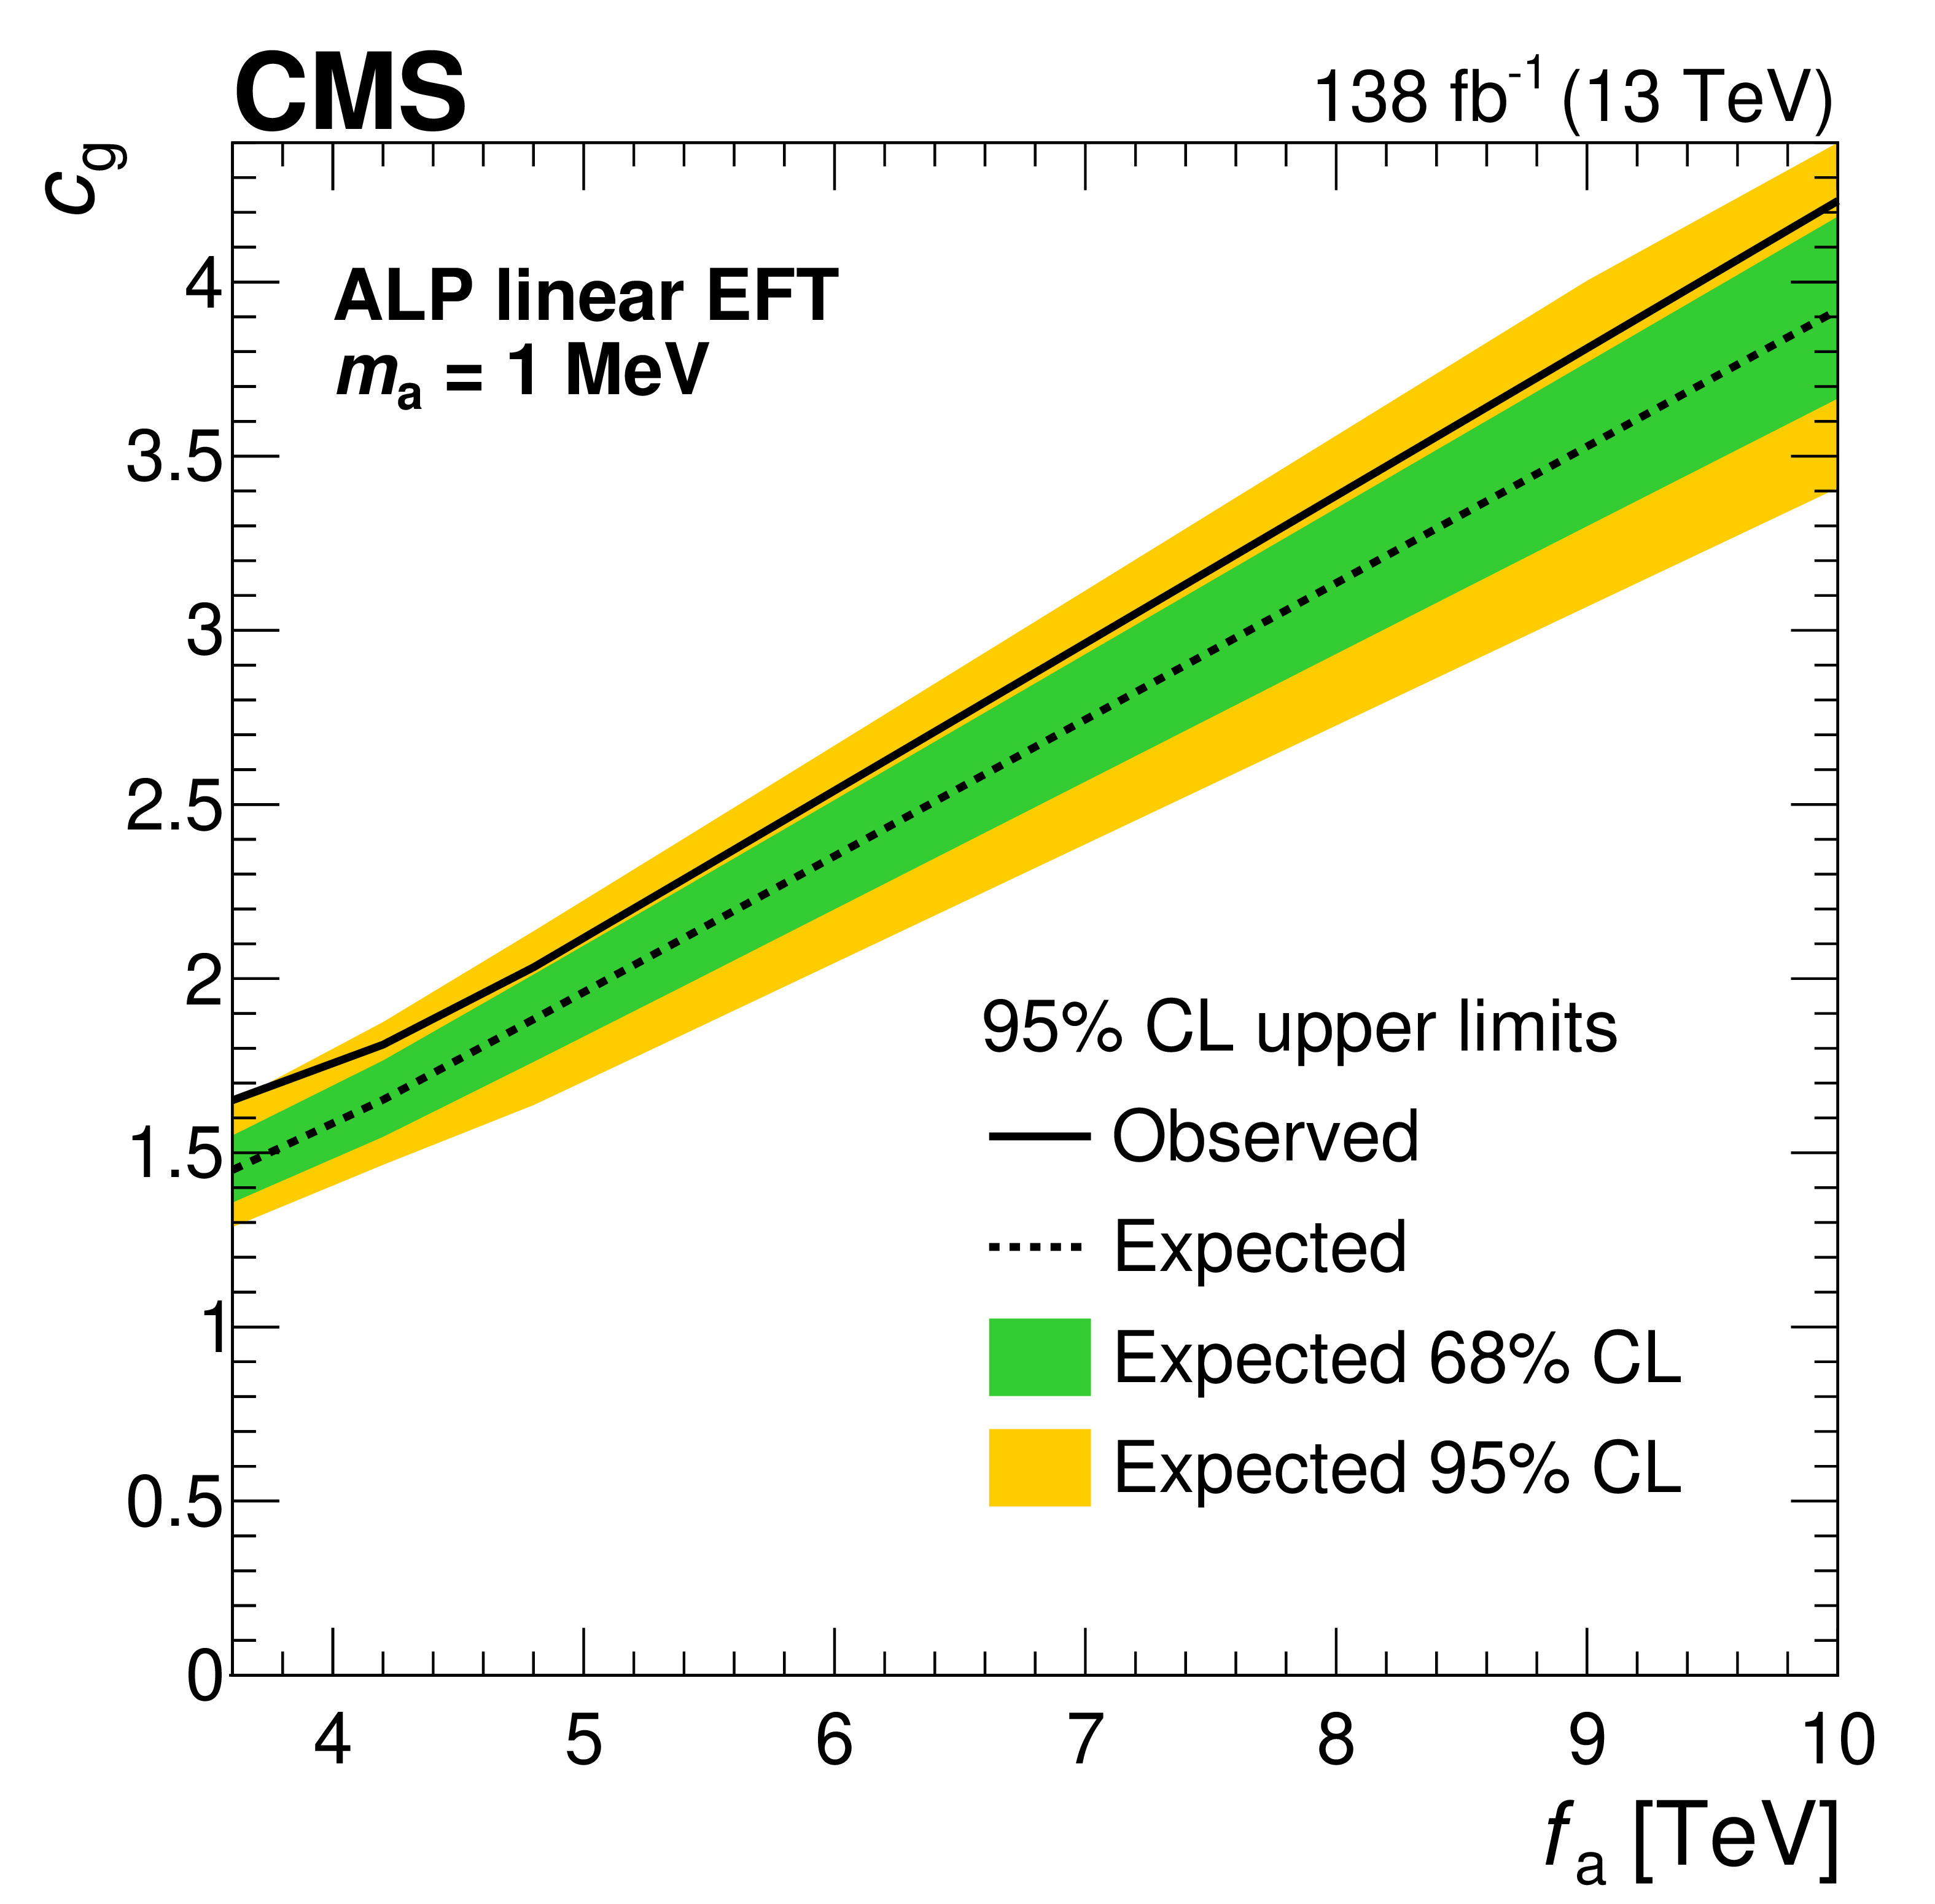
Figure 5-a:
The 95% CL upper limits on the ALP gluon coupling (left) in linear EFT, $ c_\text{g} $, as functions of the characteristic energy scale, $ f_\text{a} $, assuming $ m_\text{a}= $ 1 MeV. Only $ \chi_{\text{dijet}} $ distributions with $ M_{\mathrm{jj}} < f_\text{a} $ are used to obtain the limits on $ c_\text{g} $. The 95% CL upper limits on the anomalous triple-gluon coupling (right), $ C_\text{G} $, in SMEFT as functions of the BSM physics energy scale, $ \Lambda $. Only $ \chi_{\text{dijet}} $ distributions with $ M_{\mathrm{jj}} < \Lambda $ are used to obtain the limits on $ C_\text{G} $. The observed limits (solid lines), expected limits (dashed lines), and their 68% and 95% confidence intervals (shaded bands) are shown. |
png pdf |
Figure 5-b:
The 95% CL upper limits on the ALP gluon coupling (left) in linear EFT, $ c_\text{g} $, as functions of the characteristic energy scale, $ f_\text{a} $, assuming $ m_\text{a}= $ 1 MeV. Only $ \chi_{\text{dijet}} $ distributions with $ M_{\mathrm{jj}} < f_\text{a} $ are used to obtain the limits on $ c_\text{g} $. The 95% CL upper limits on the anomalous triple-gluon coupling (right), $ C_\text{G} $, in SMEFT as functions of the BSM physics energy scale, $ \Lambda $. Only $ \chi_{\text{dijet}} $ distributions with $ M_{\mathrm{jj}} < \Lambda $ are used to obtain the limits on $ C_\text{G} $. The observed limits (solid lines), expected limits (dashed lines), and their 68% and 95% confidence intervals (shaded bands) are shown. |
png pdf |
Figure 6:
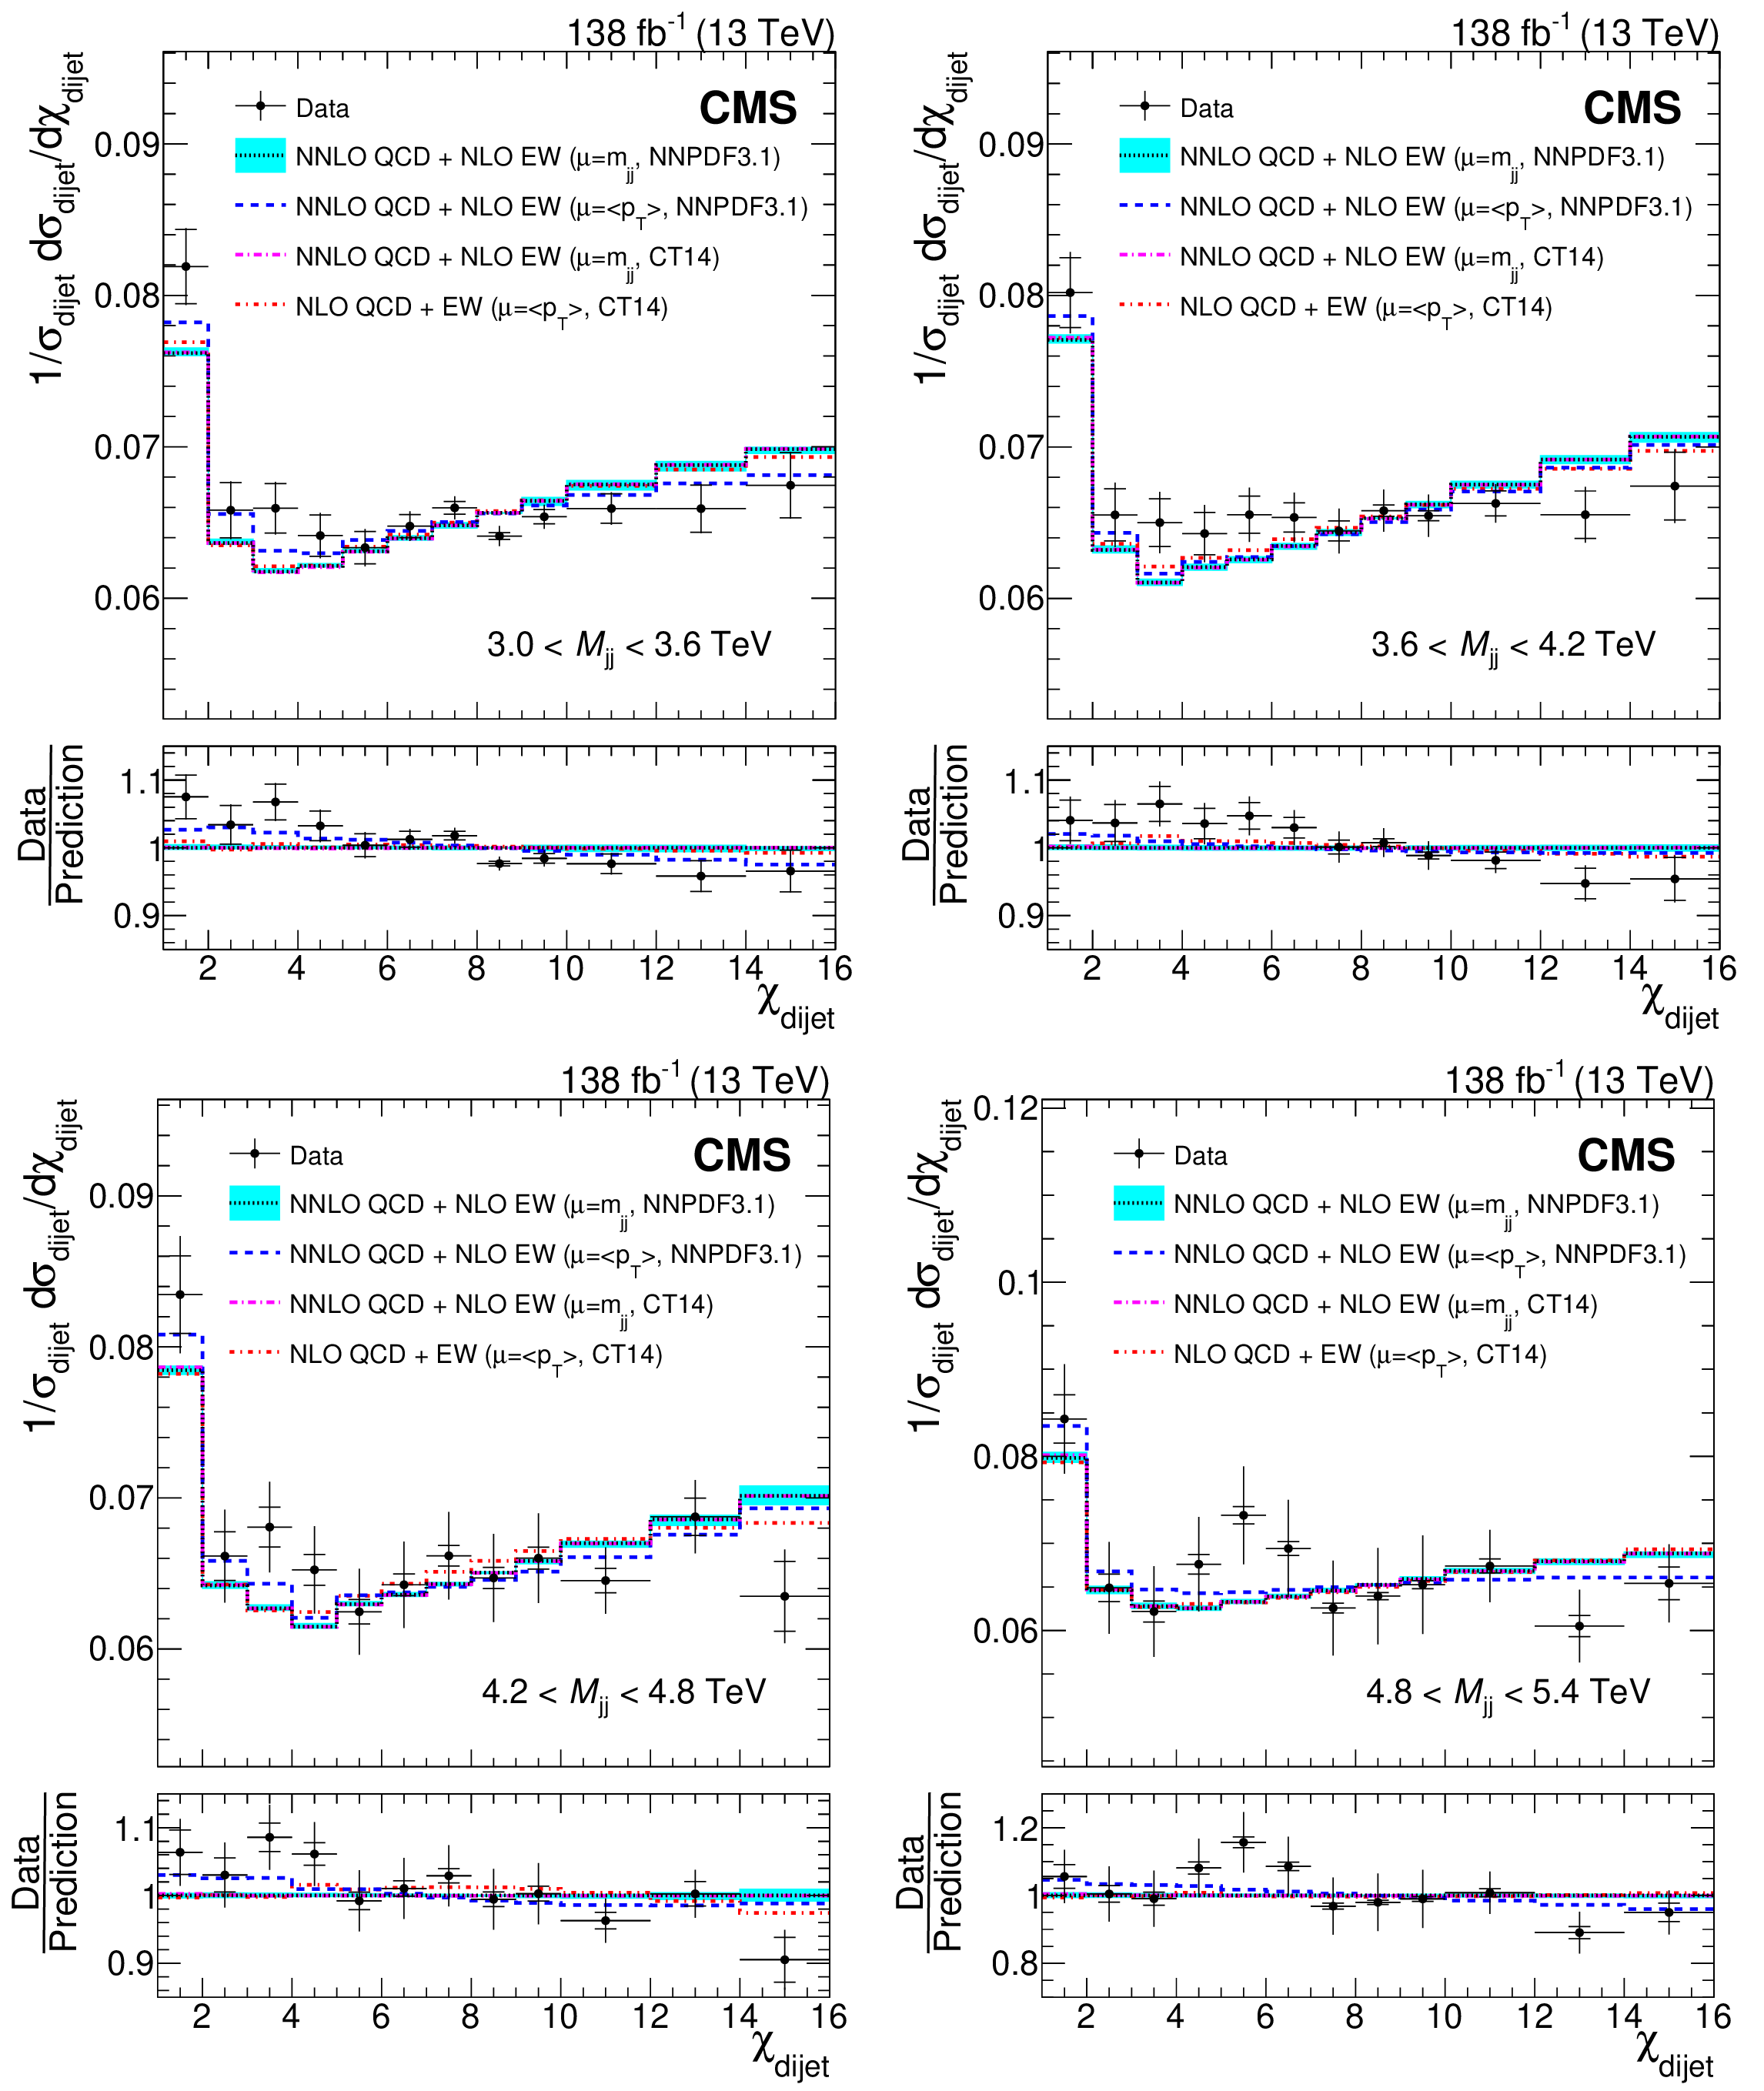
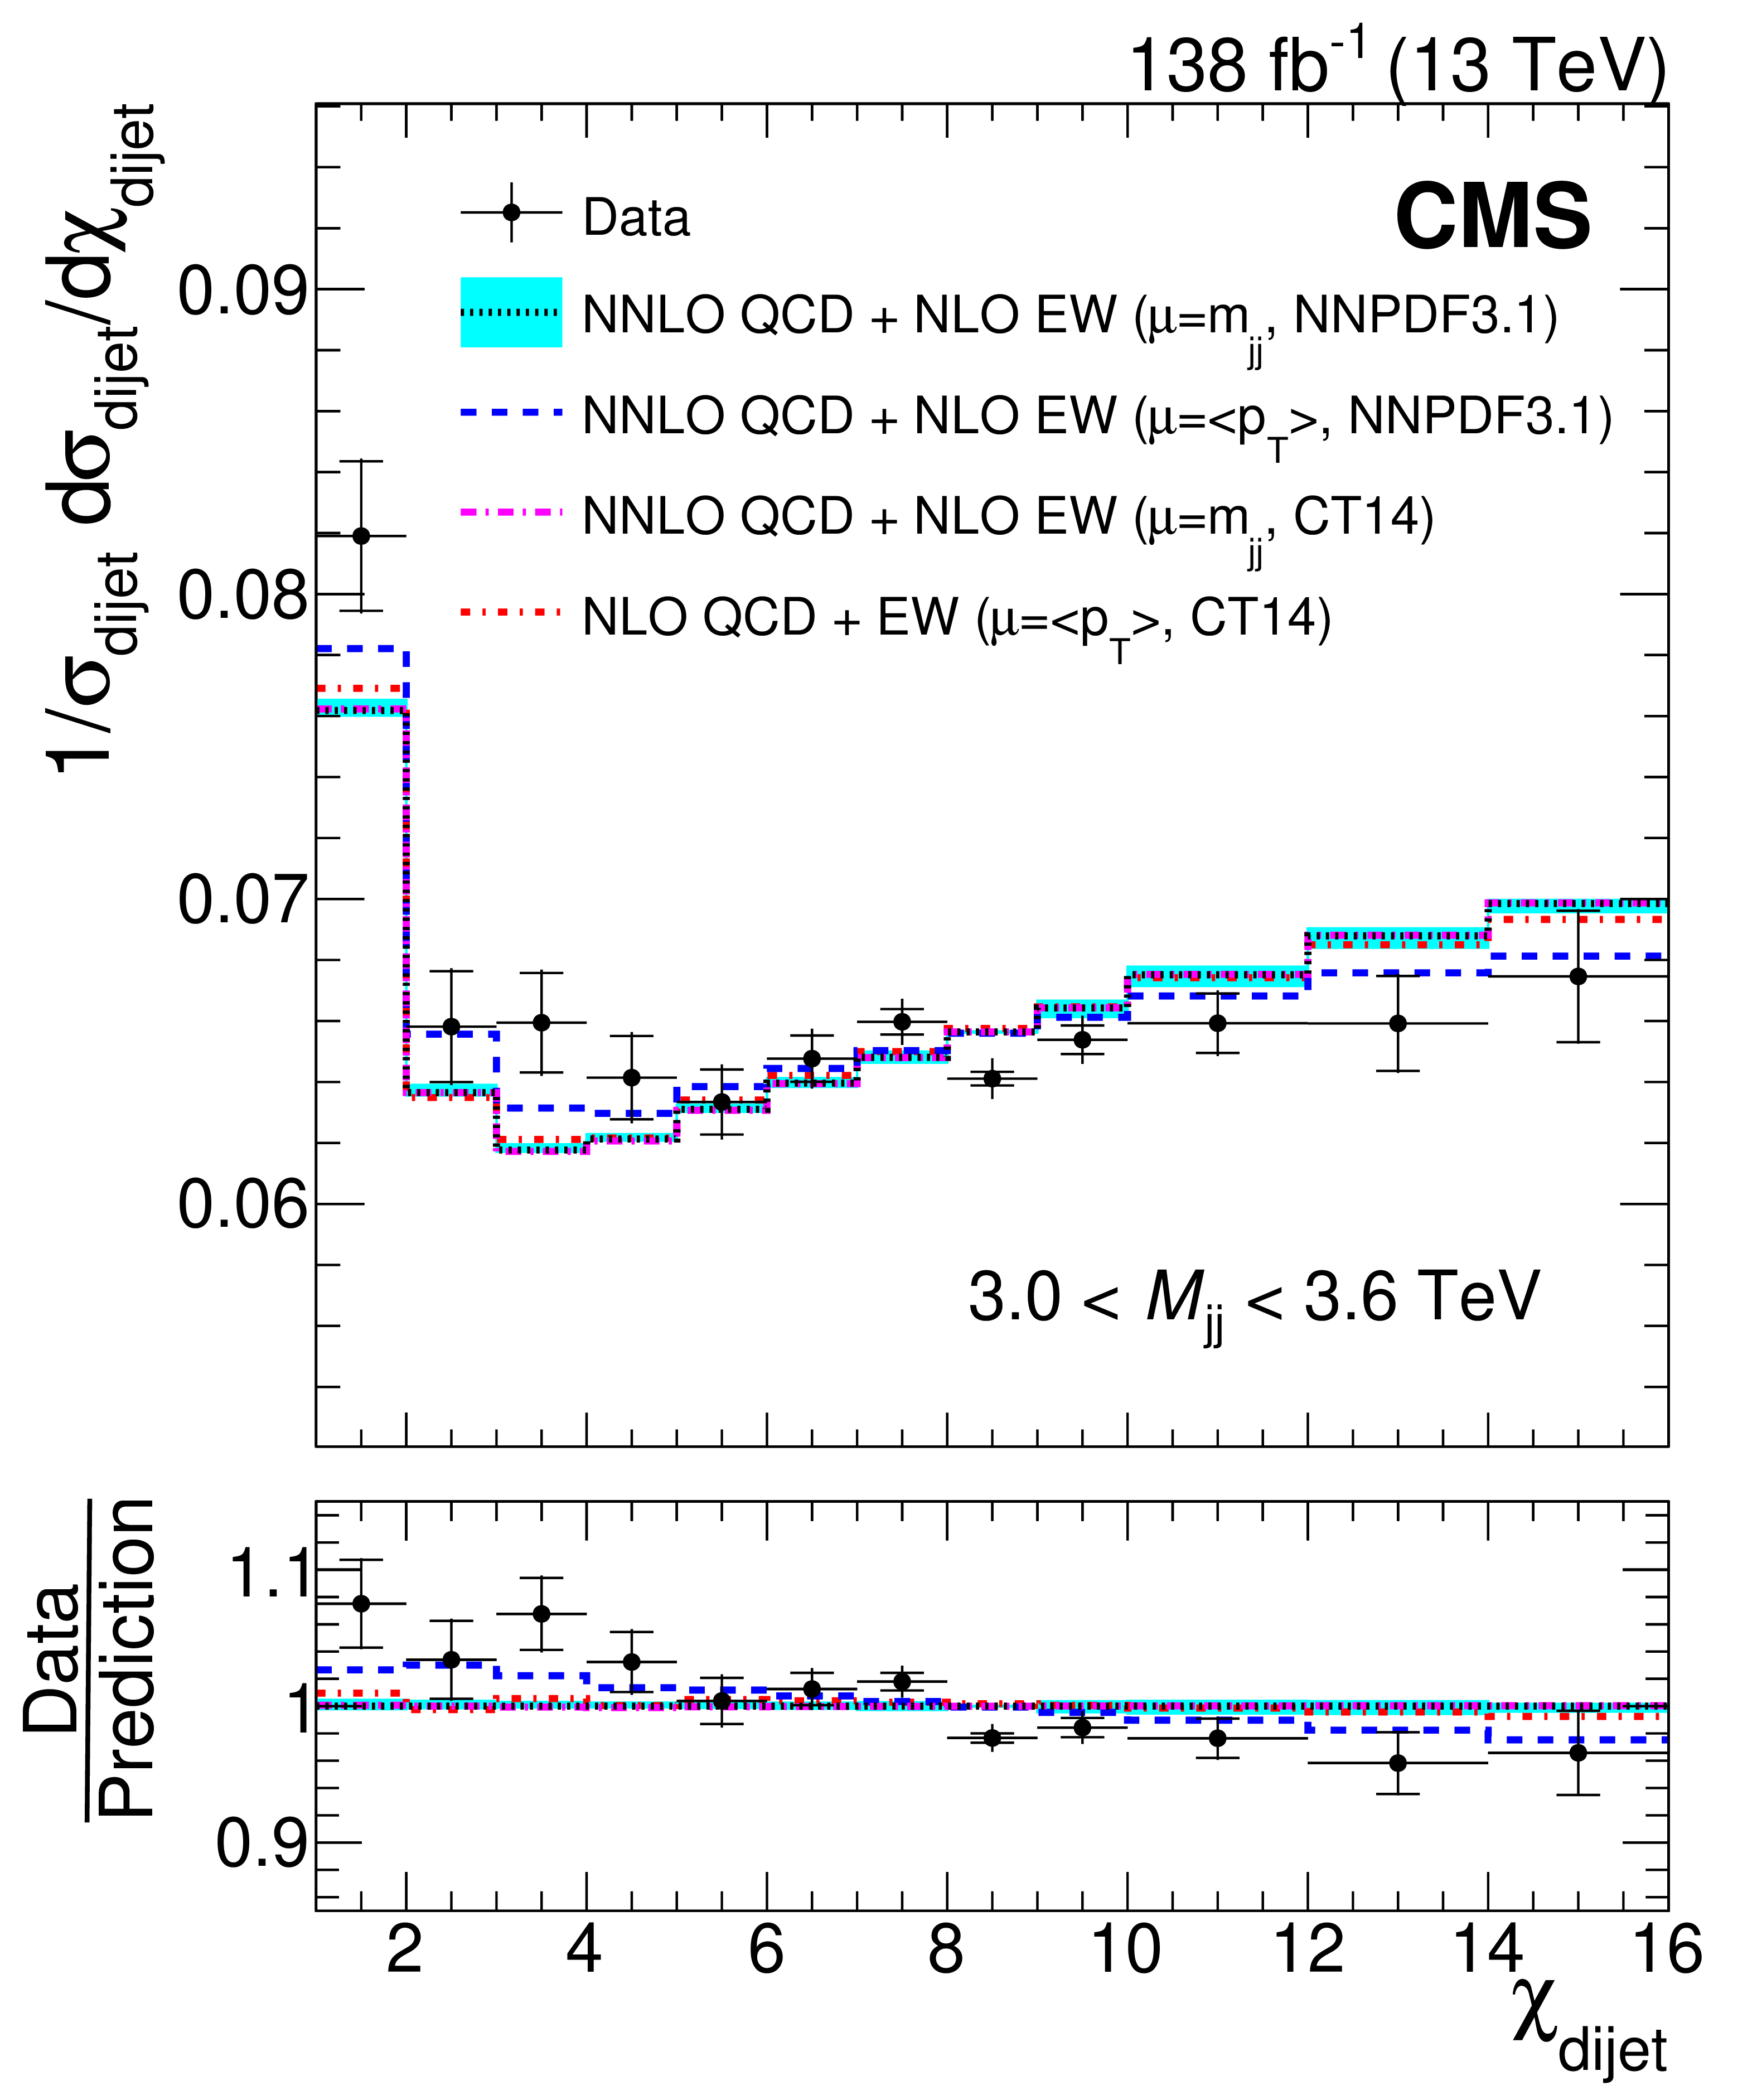
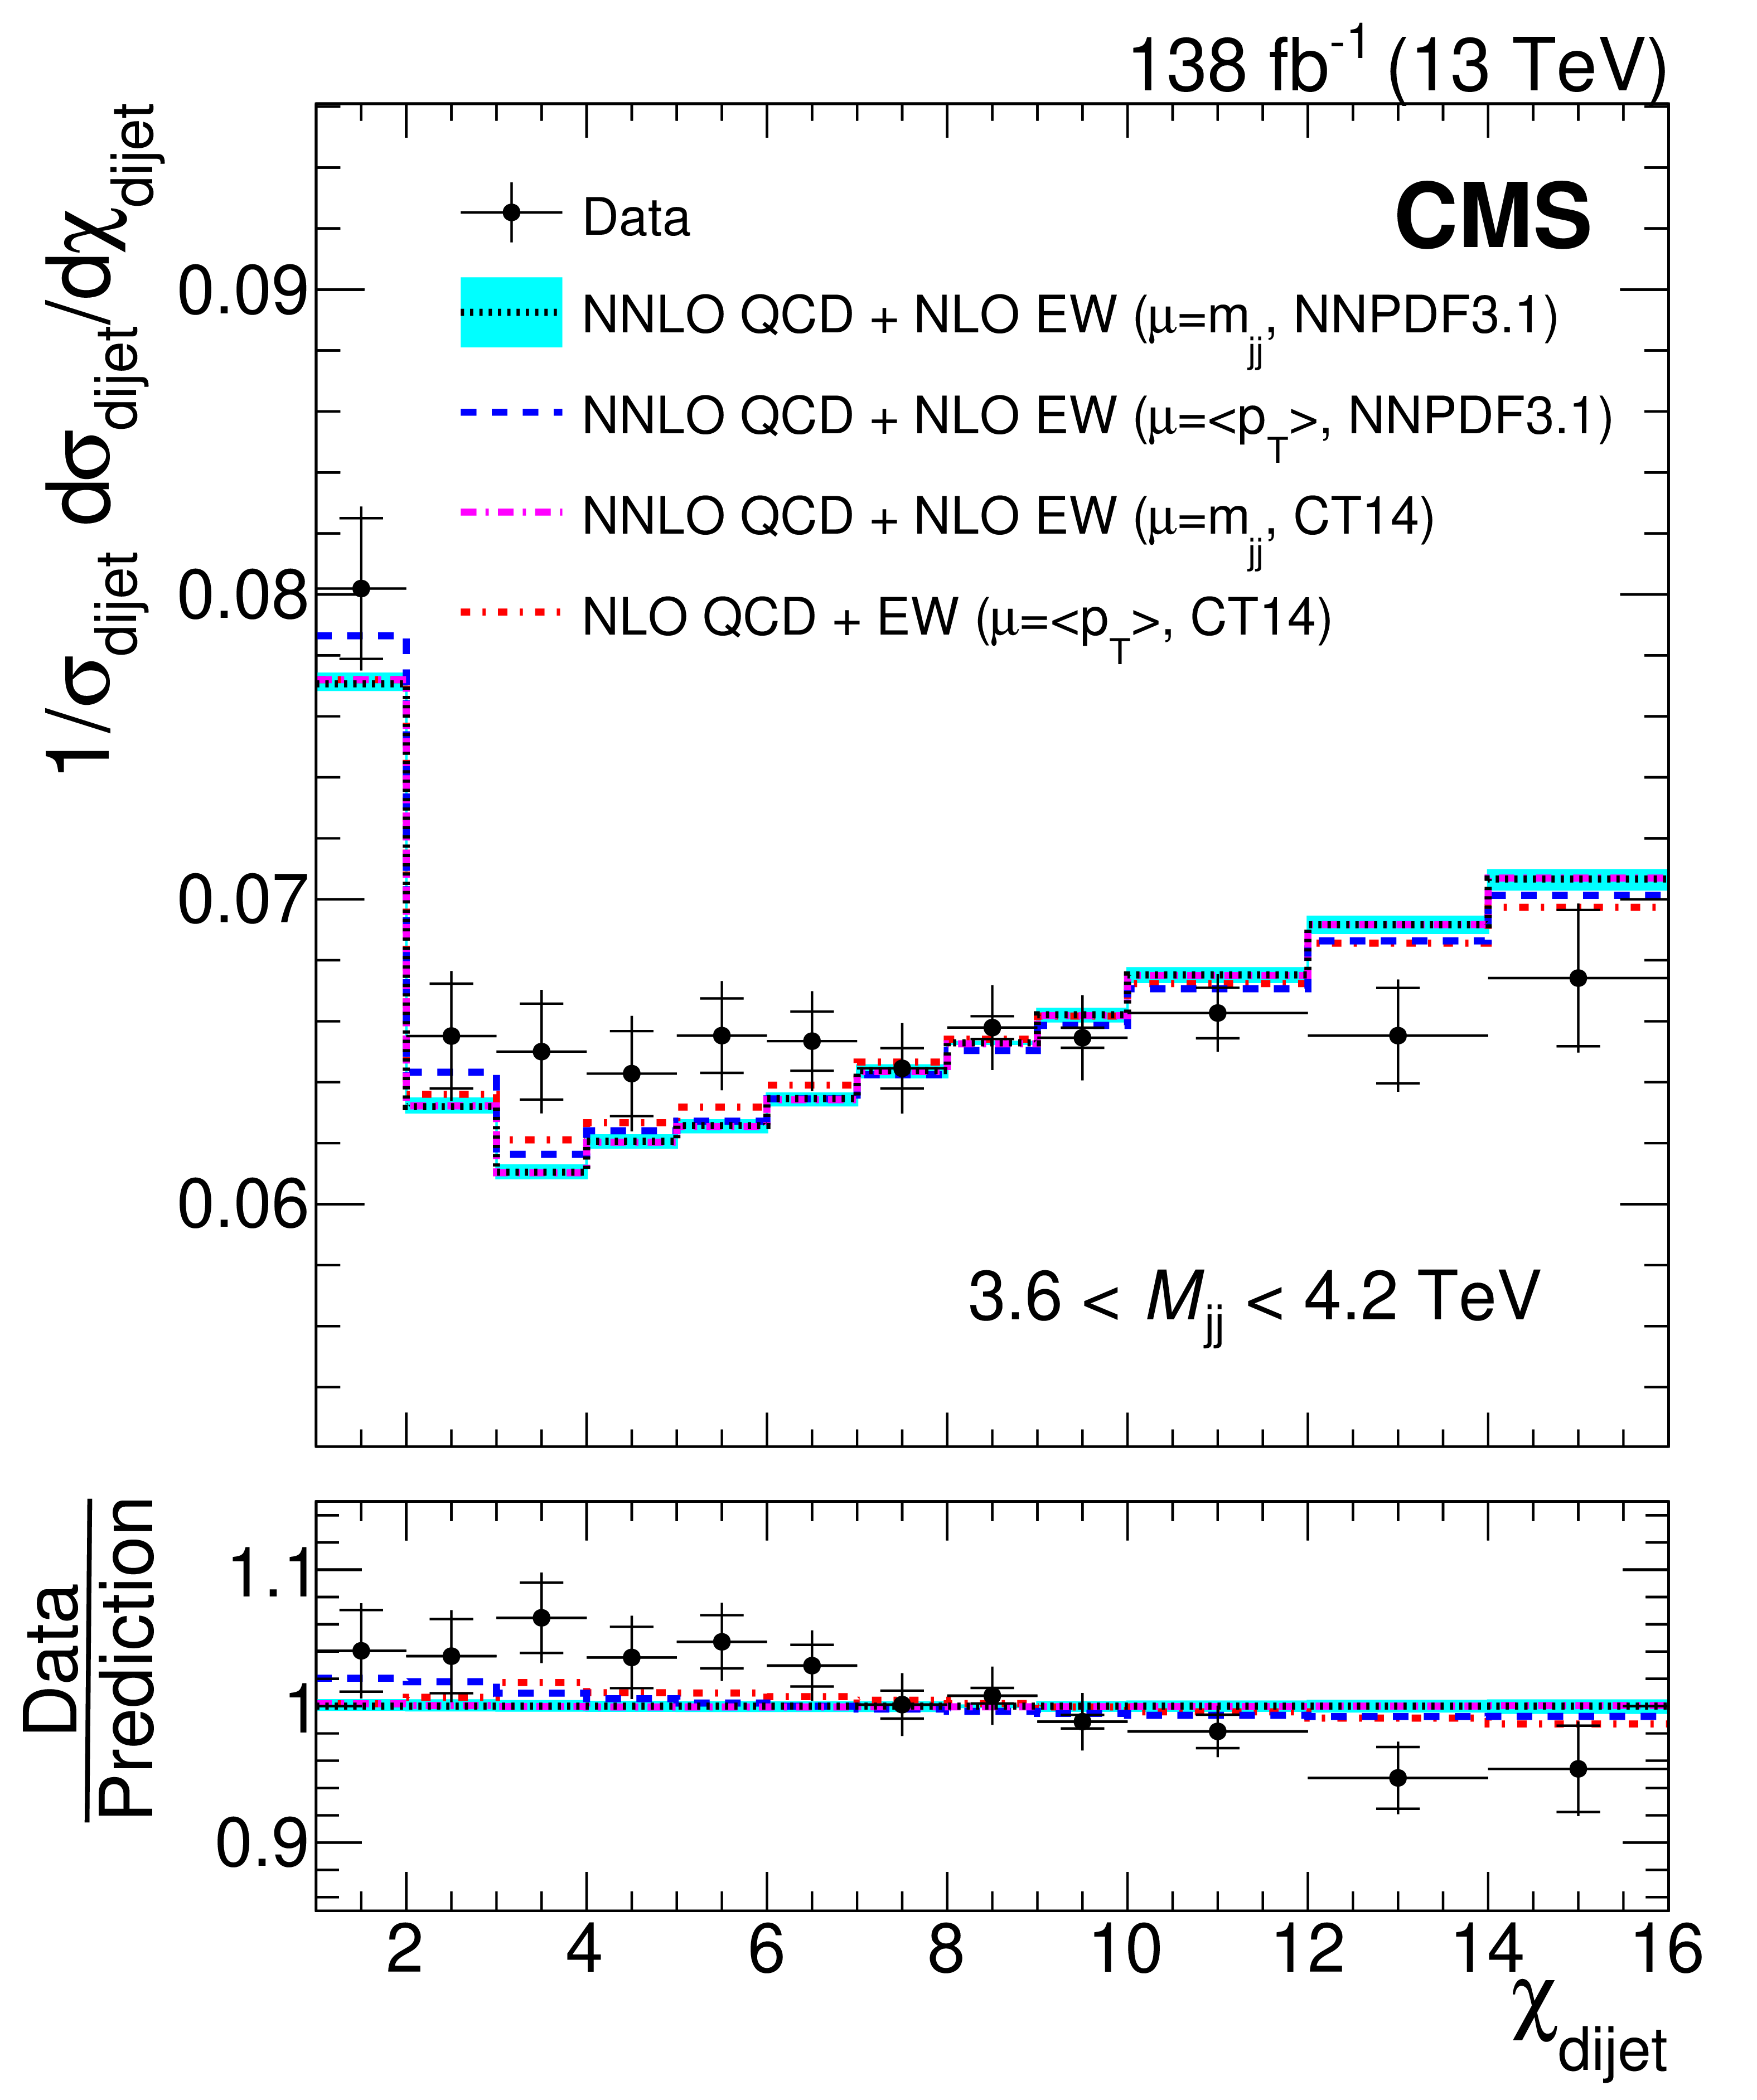
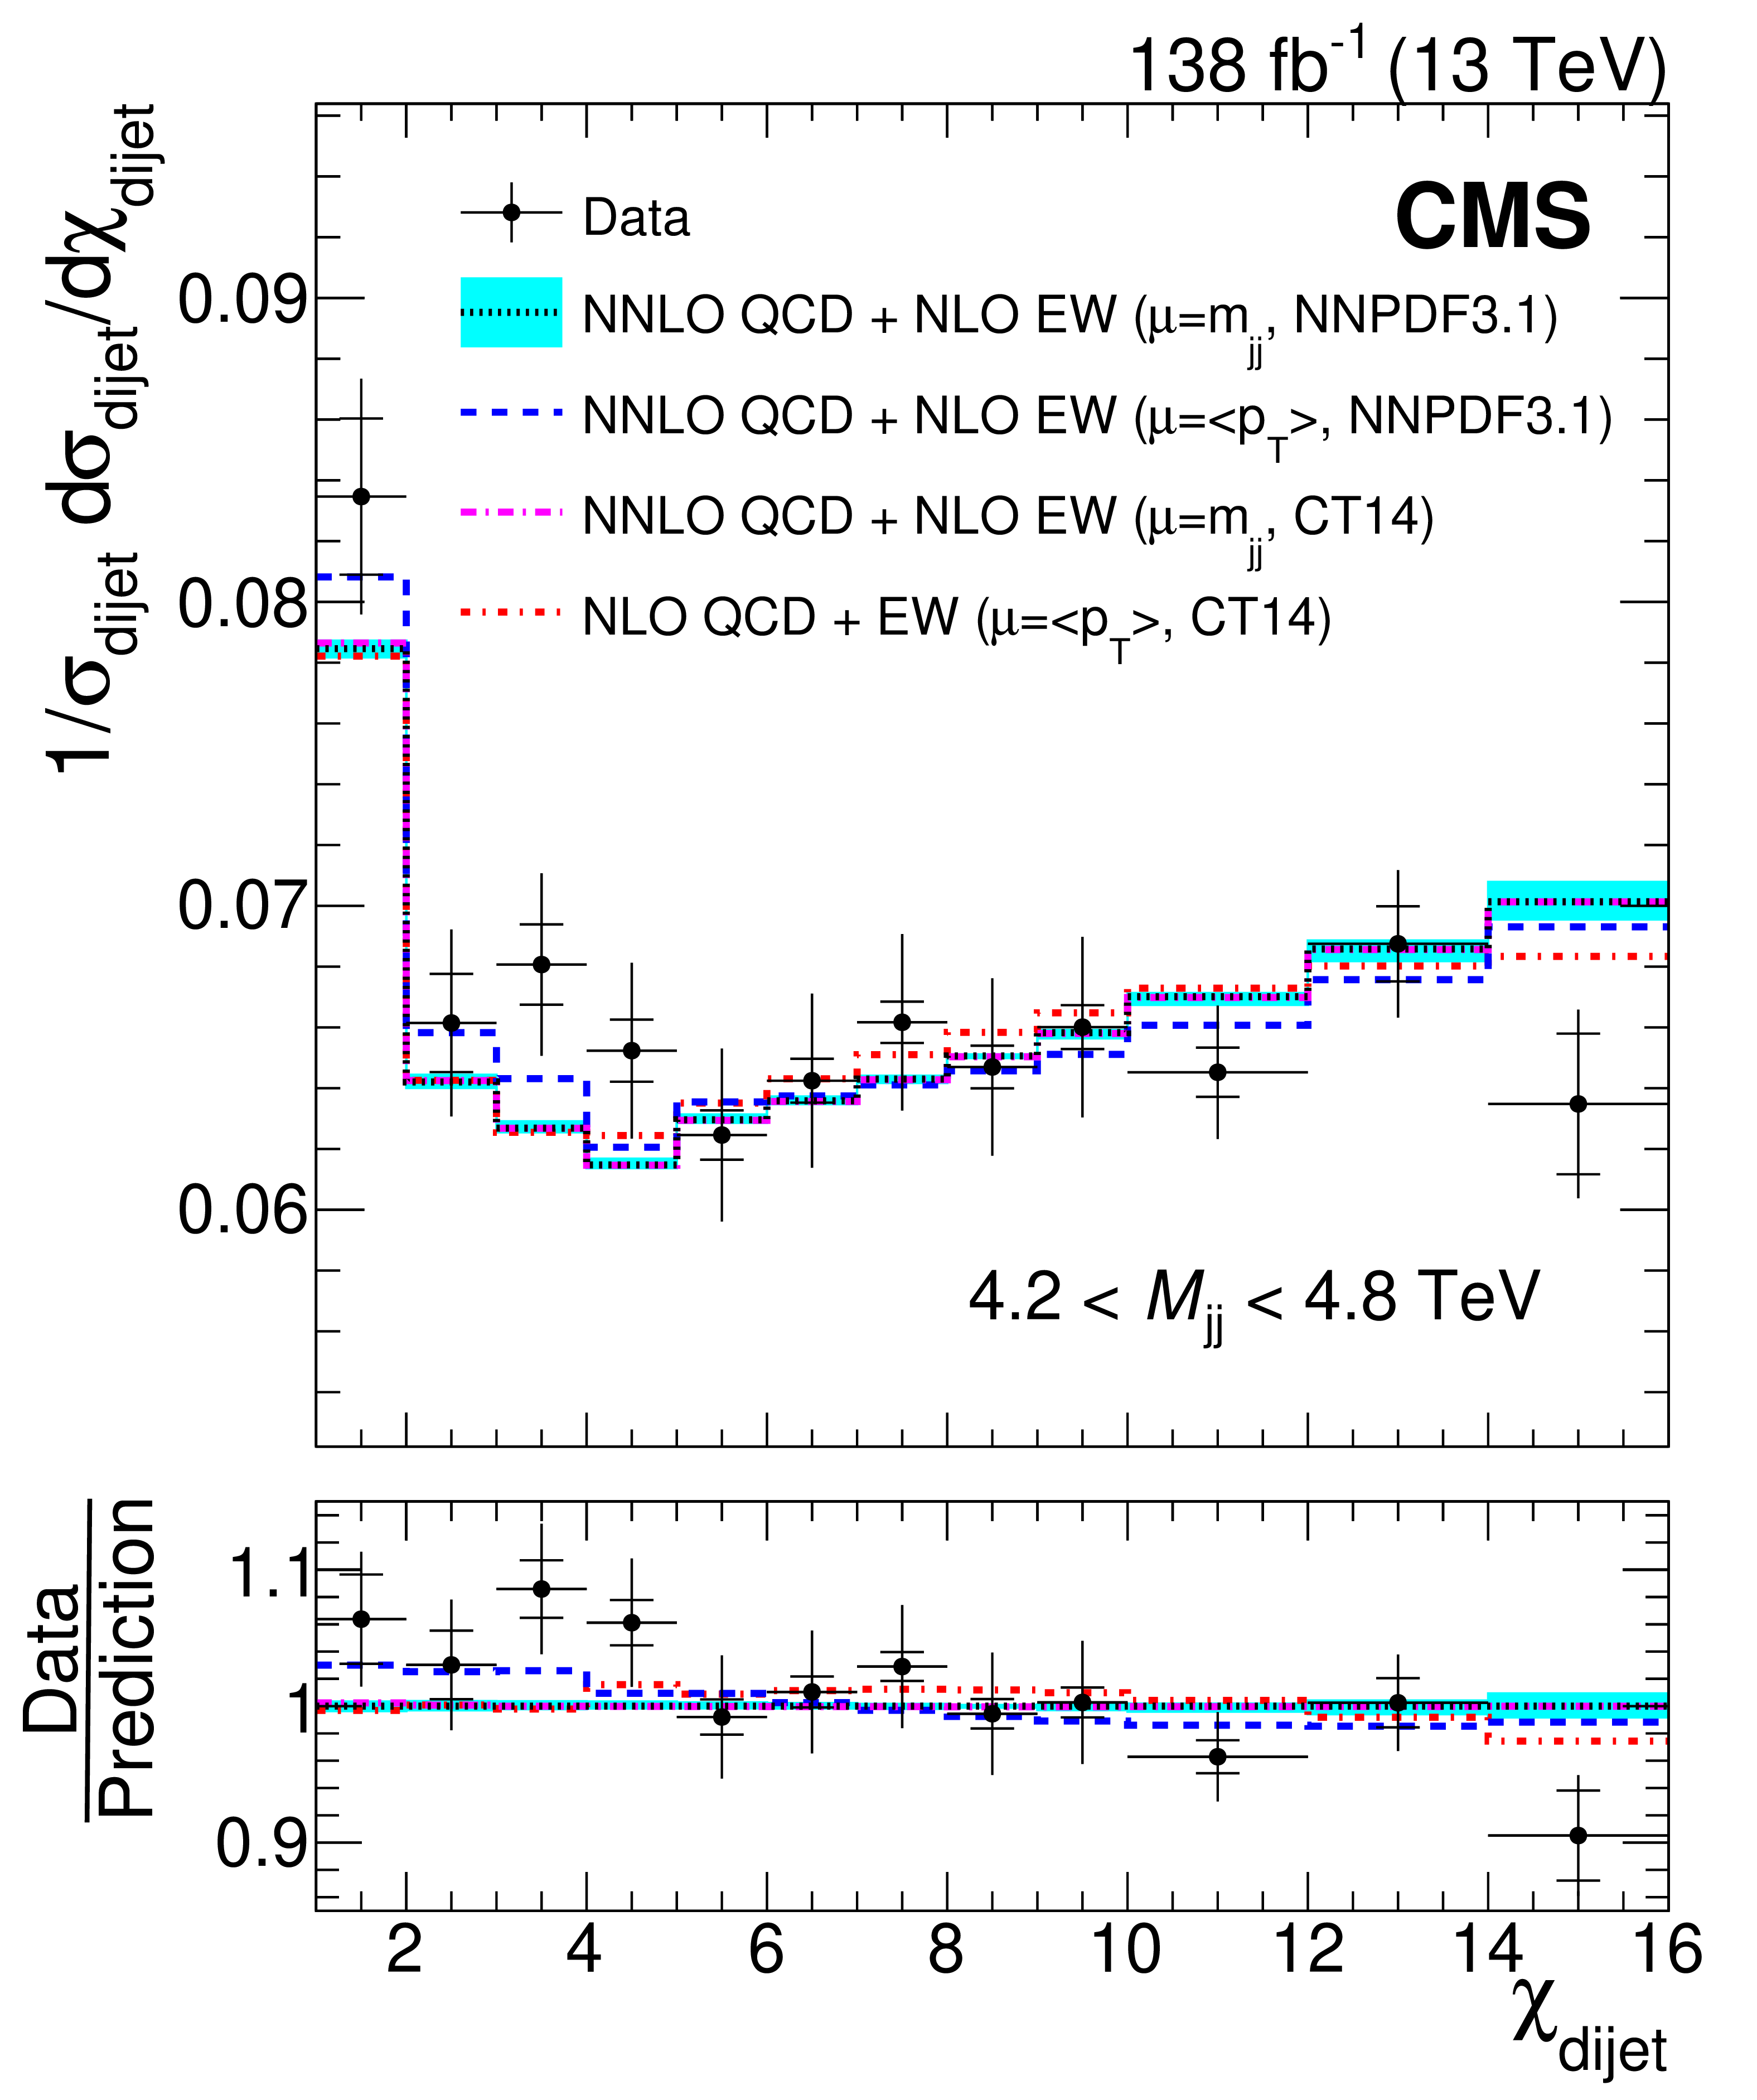
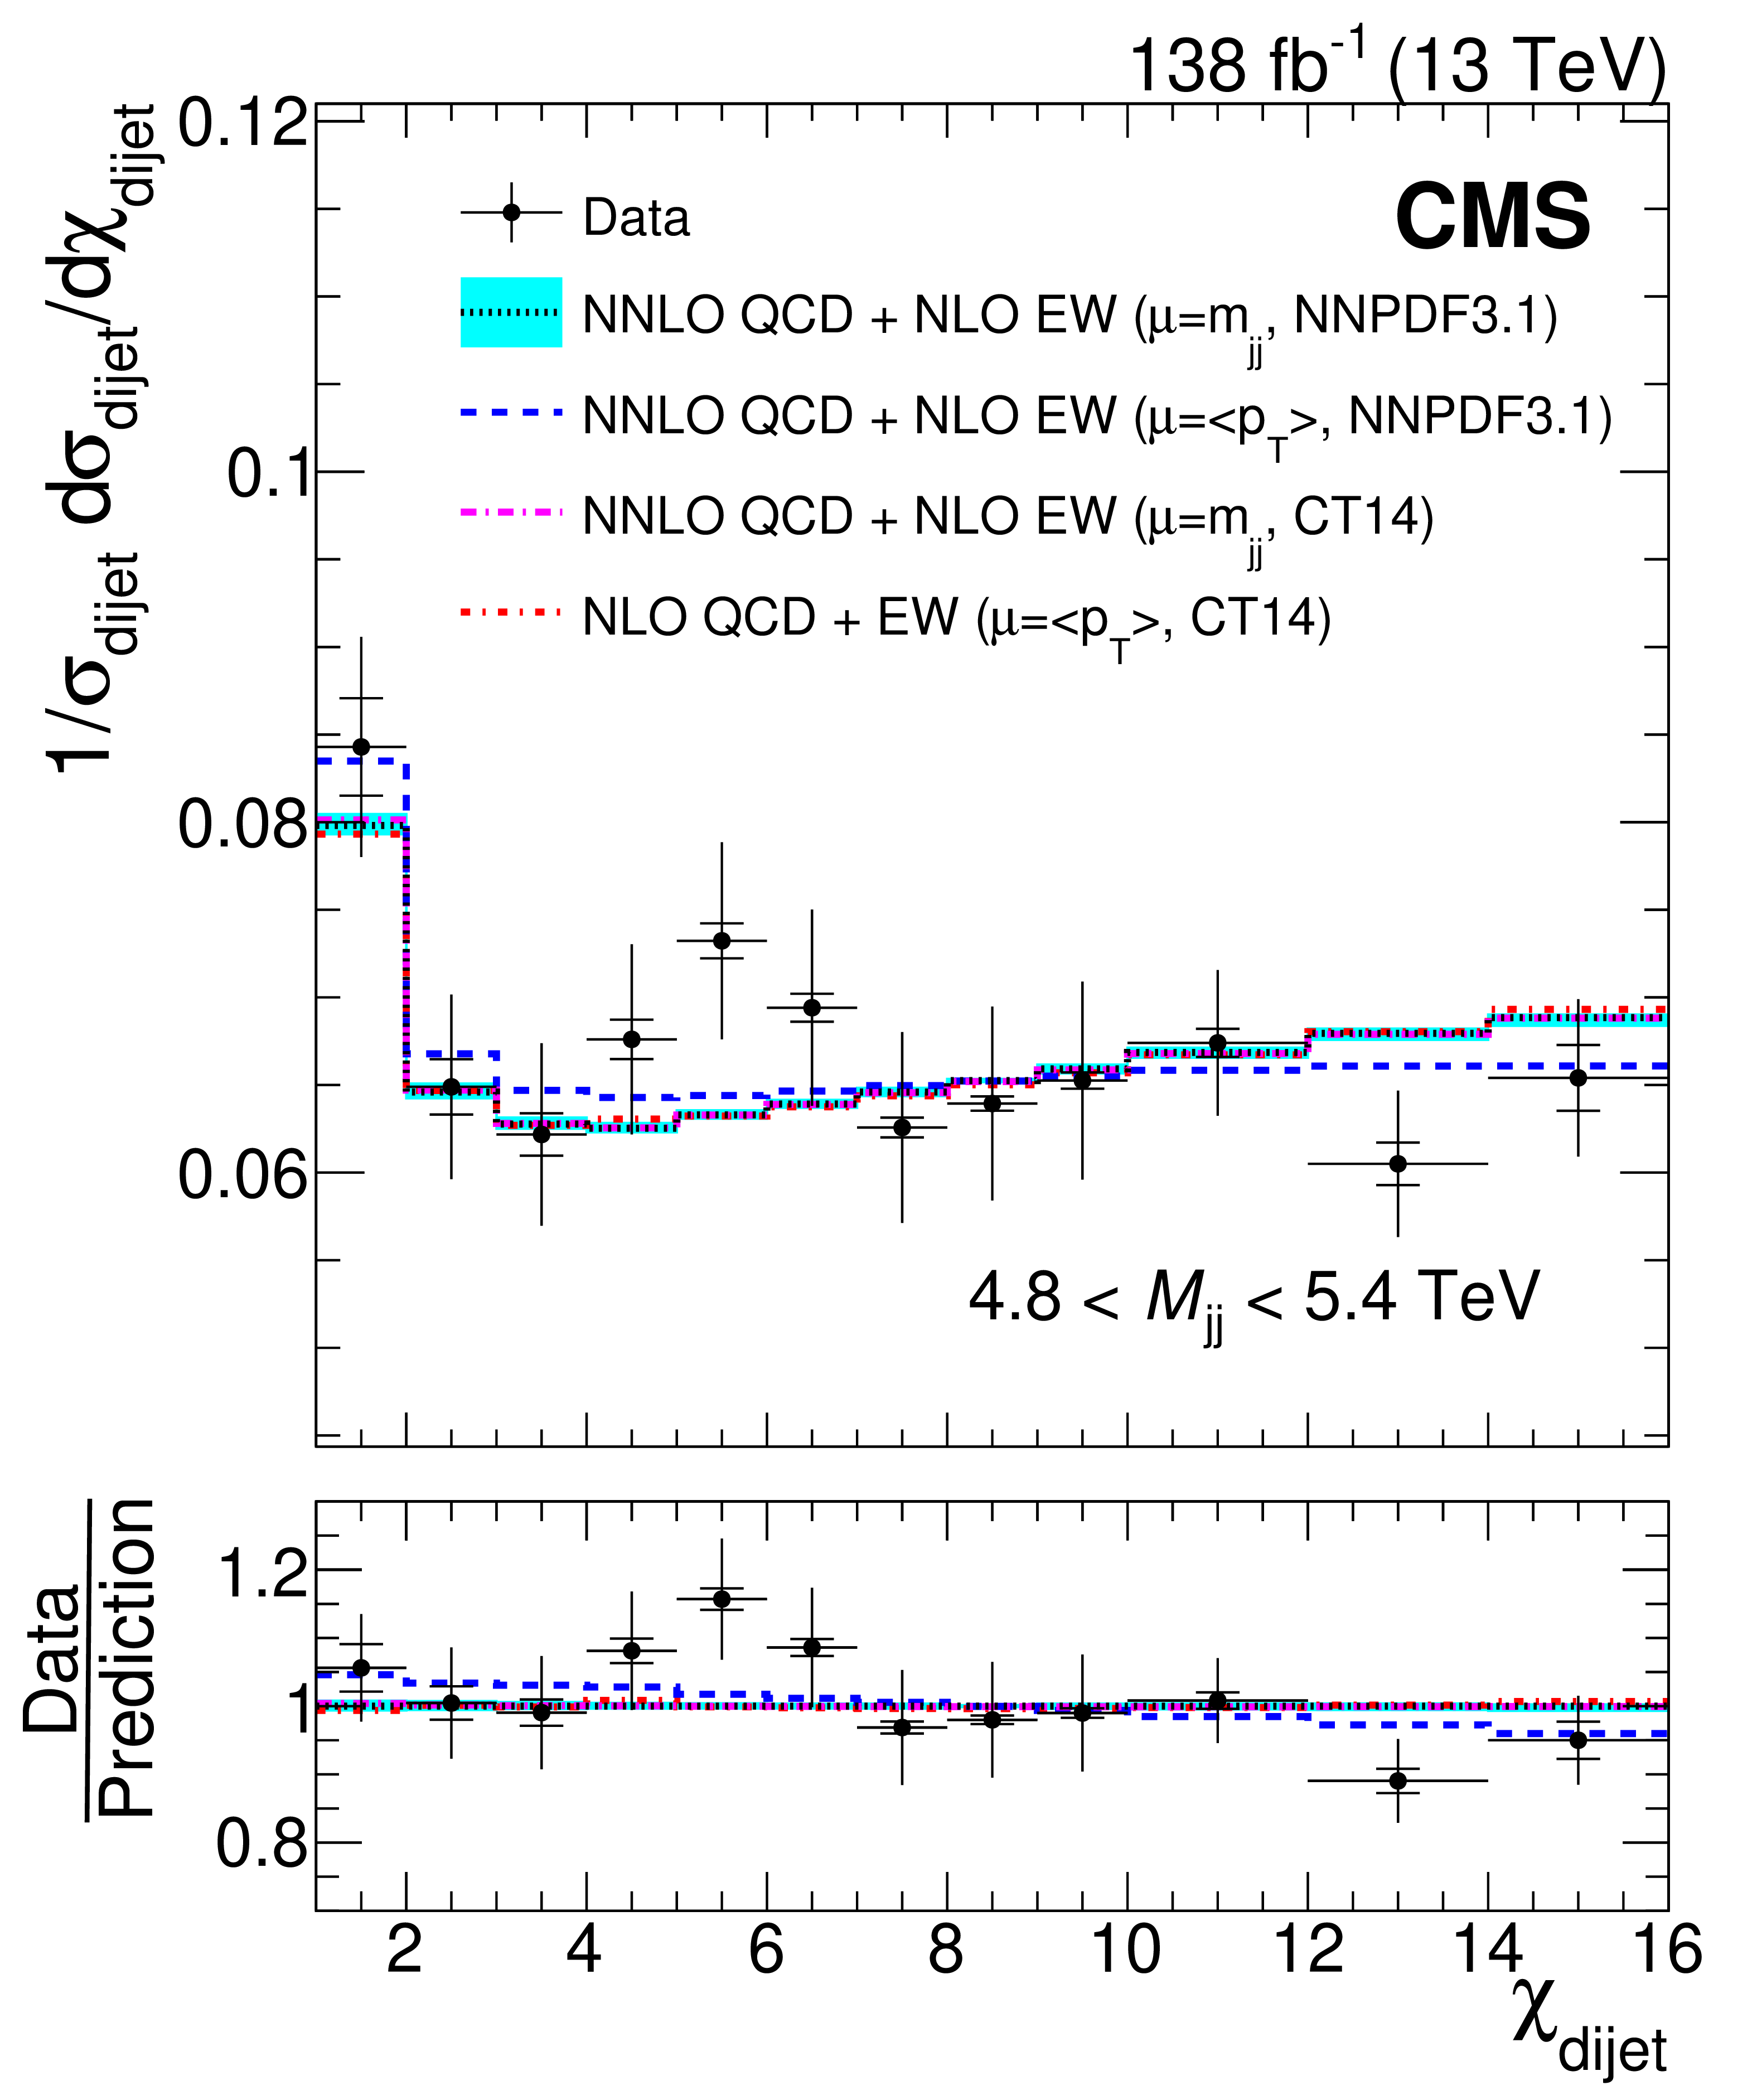
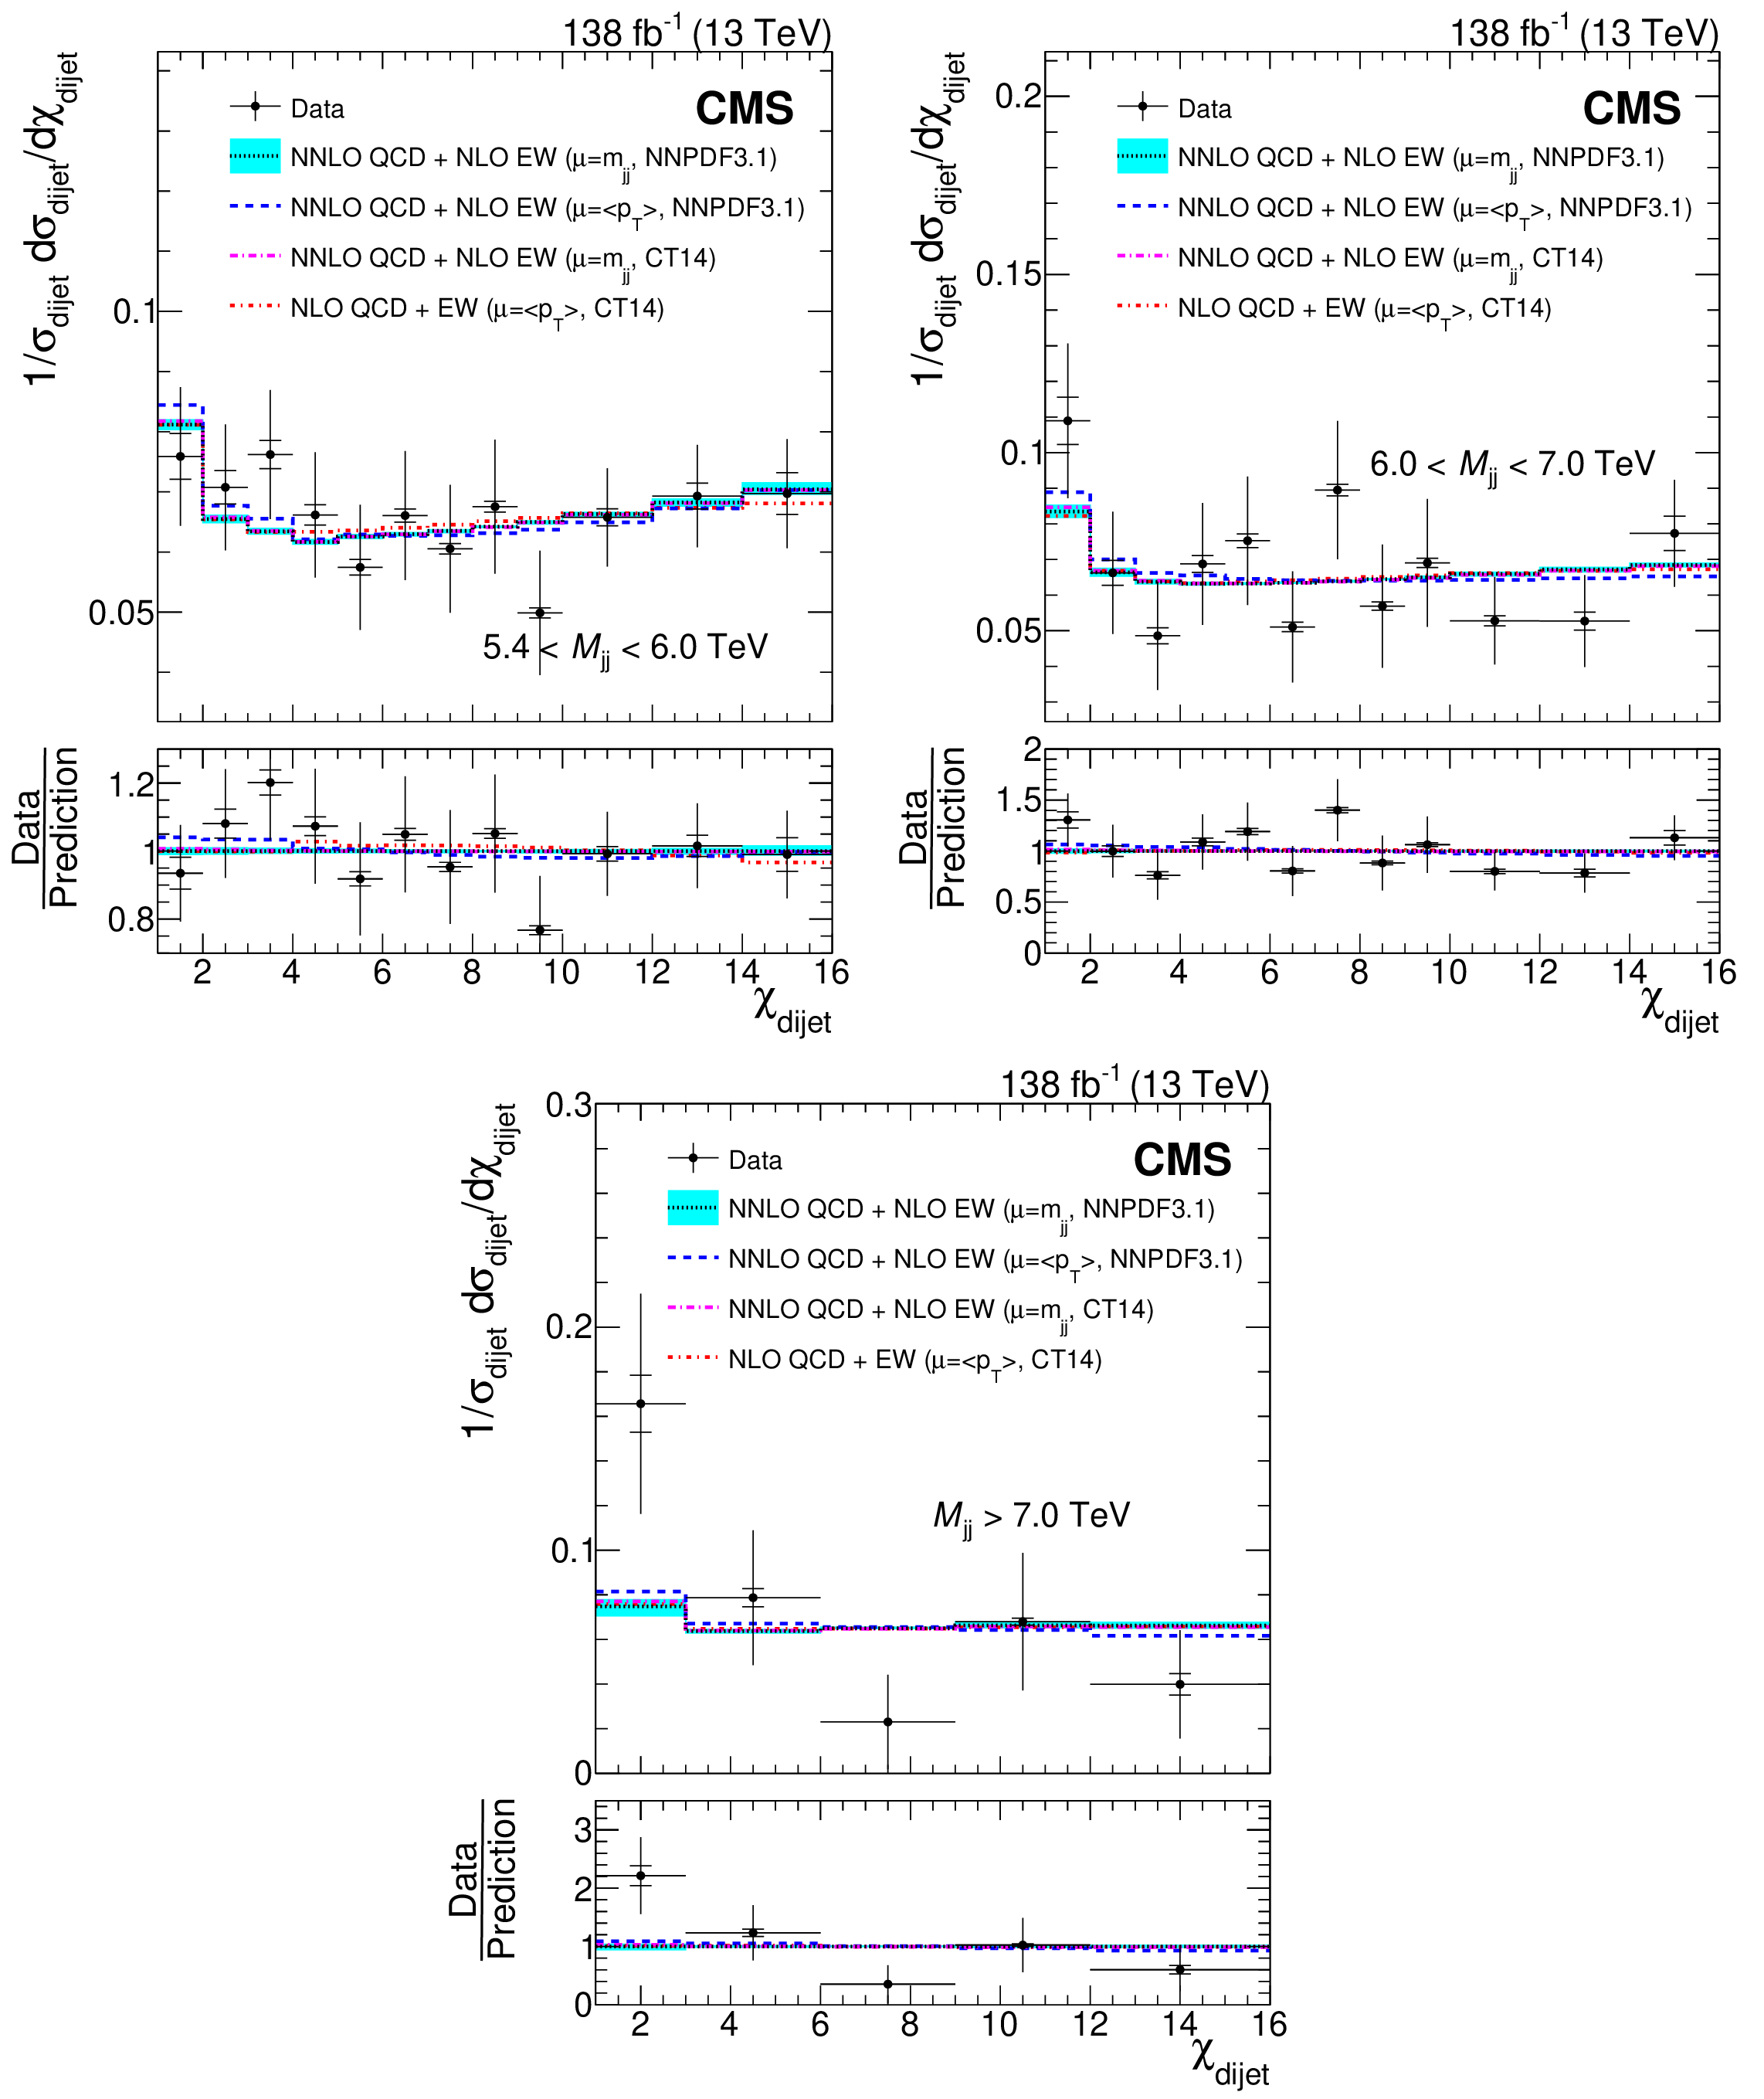
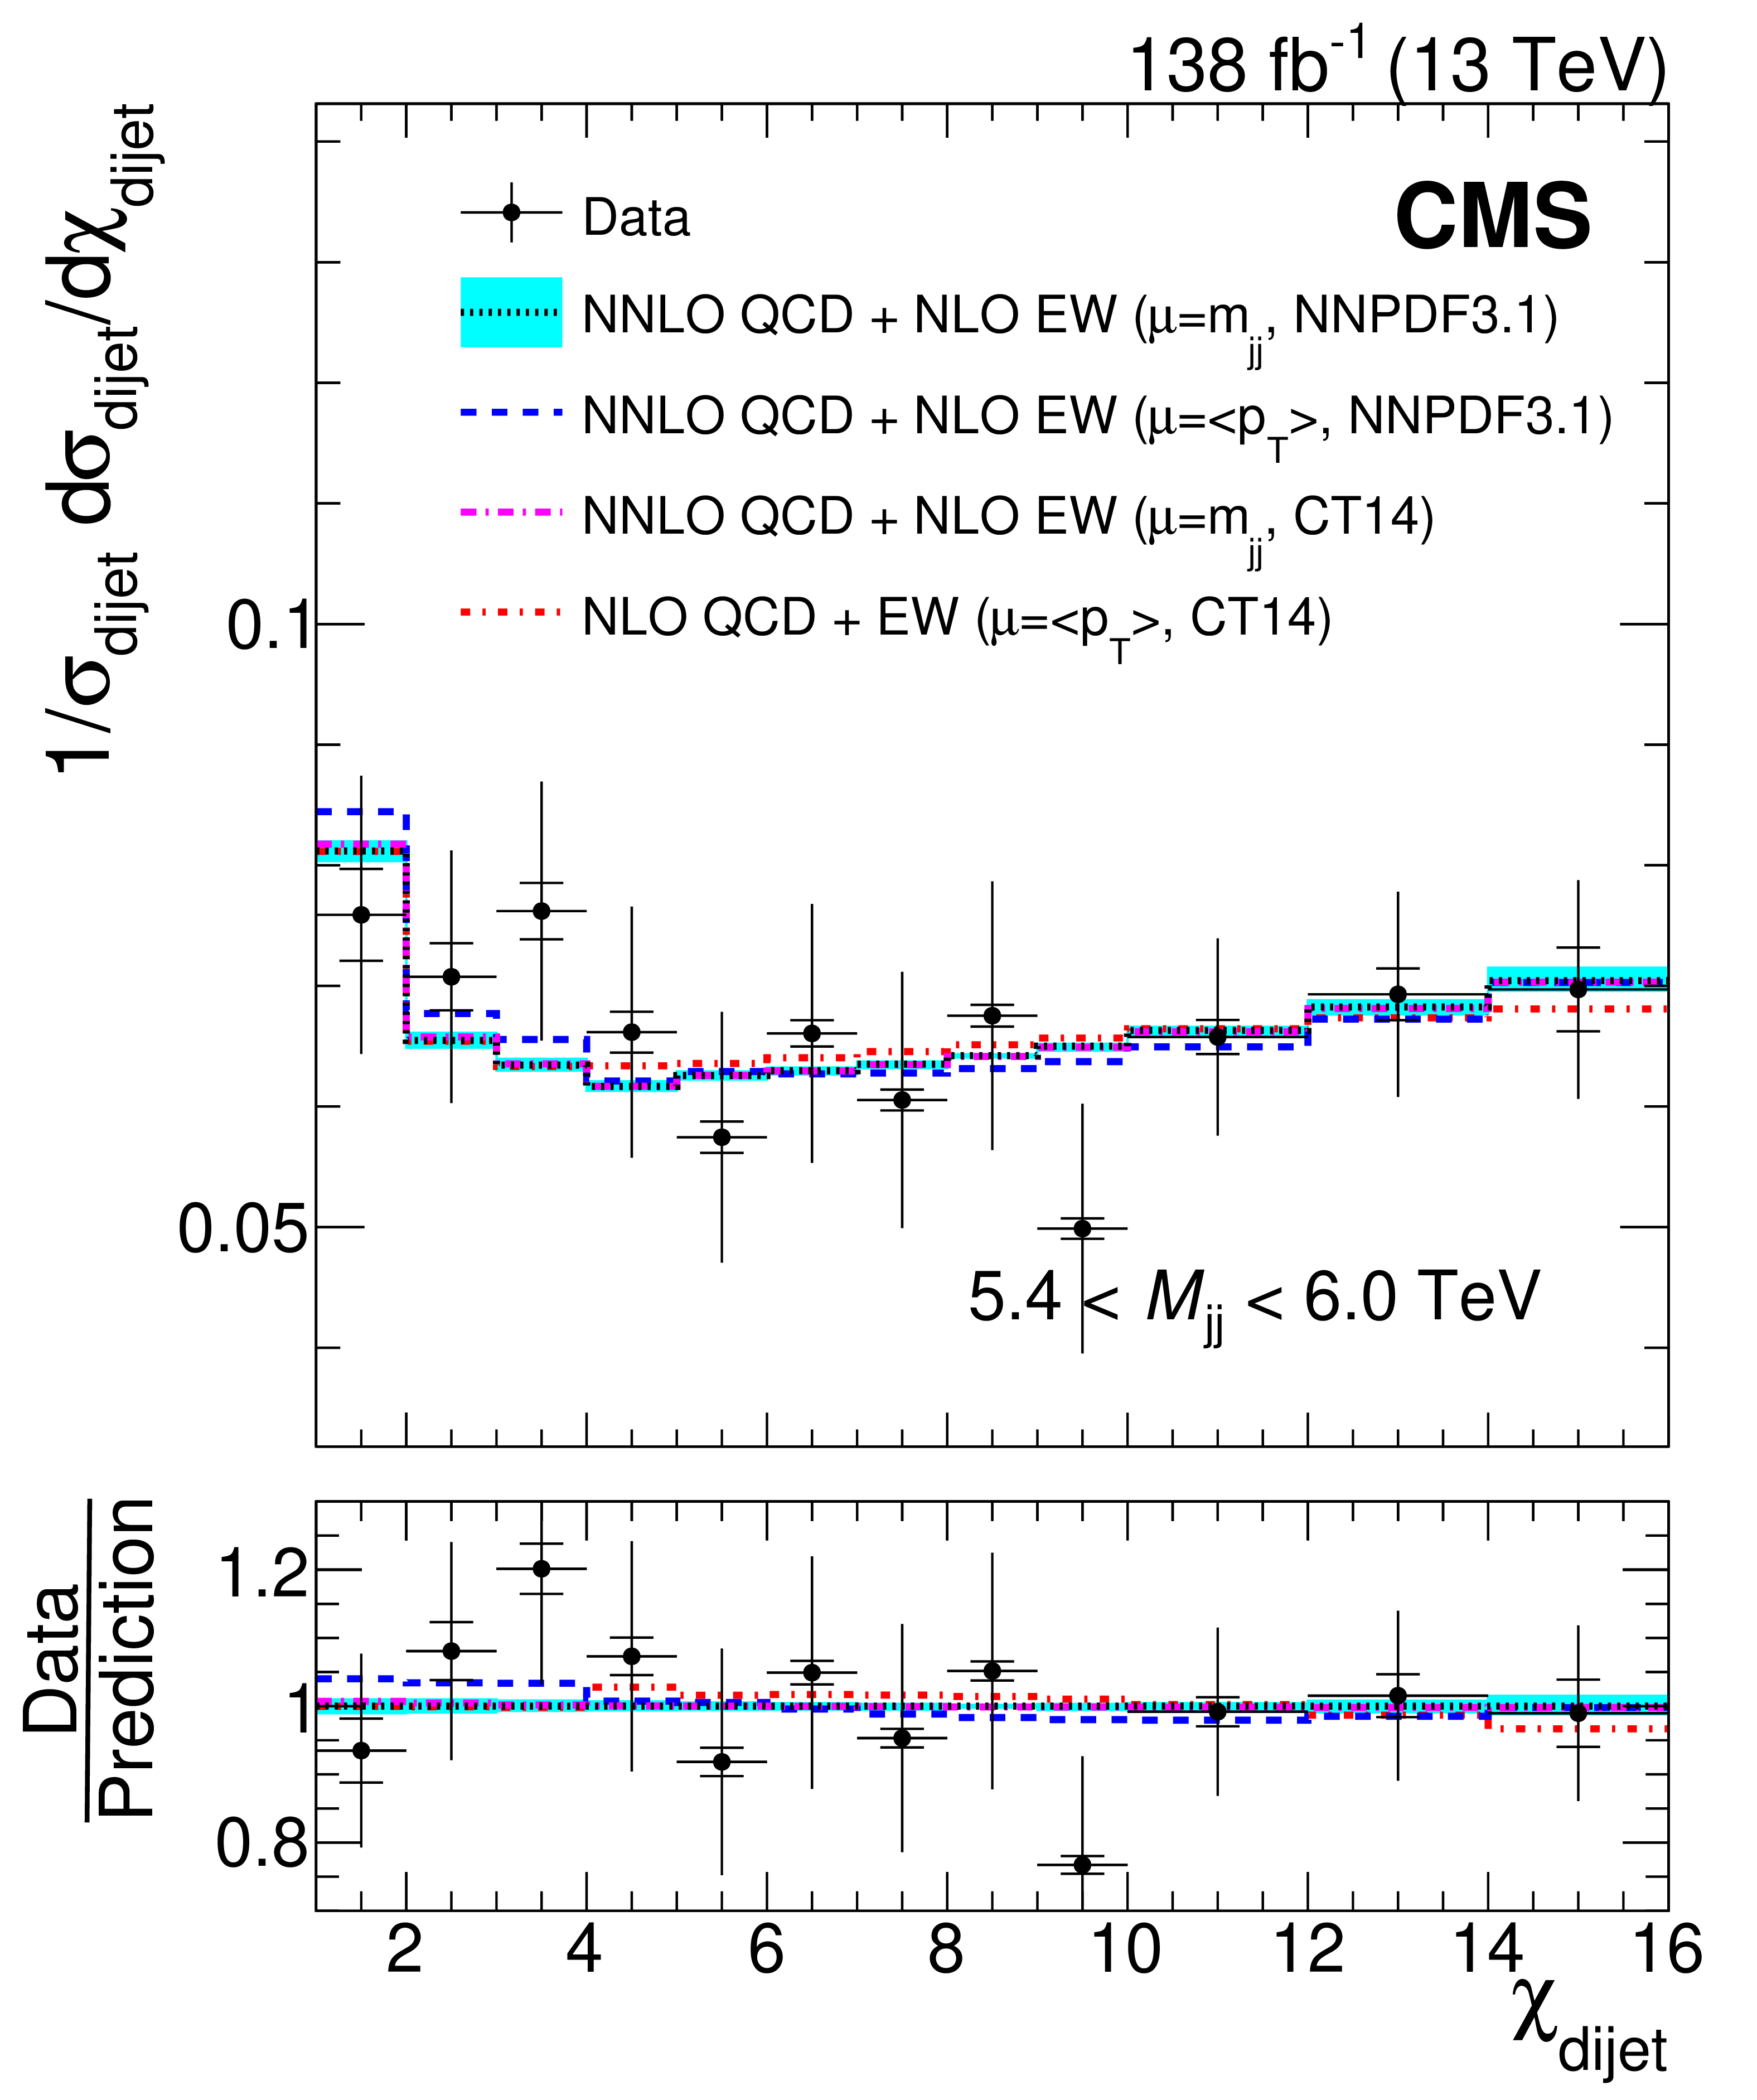
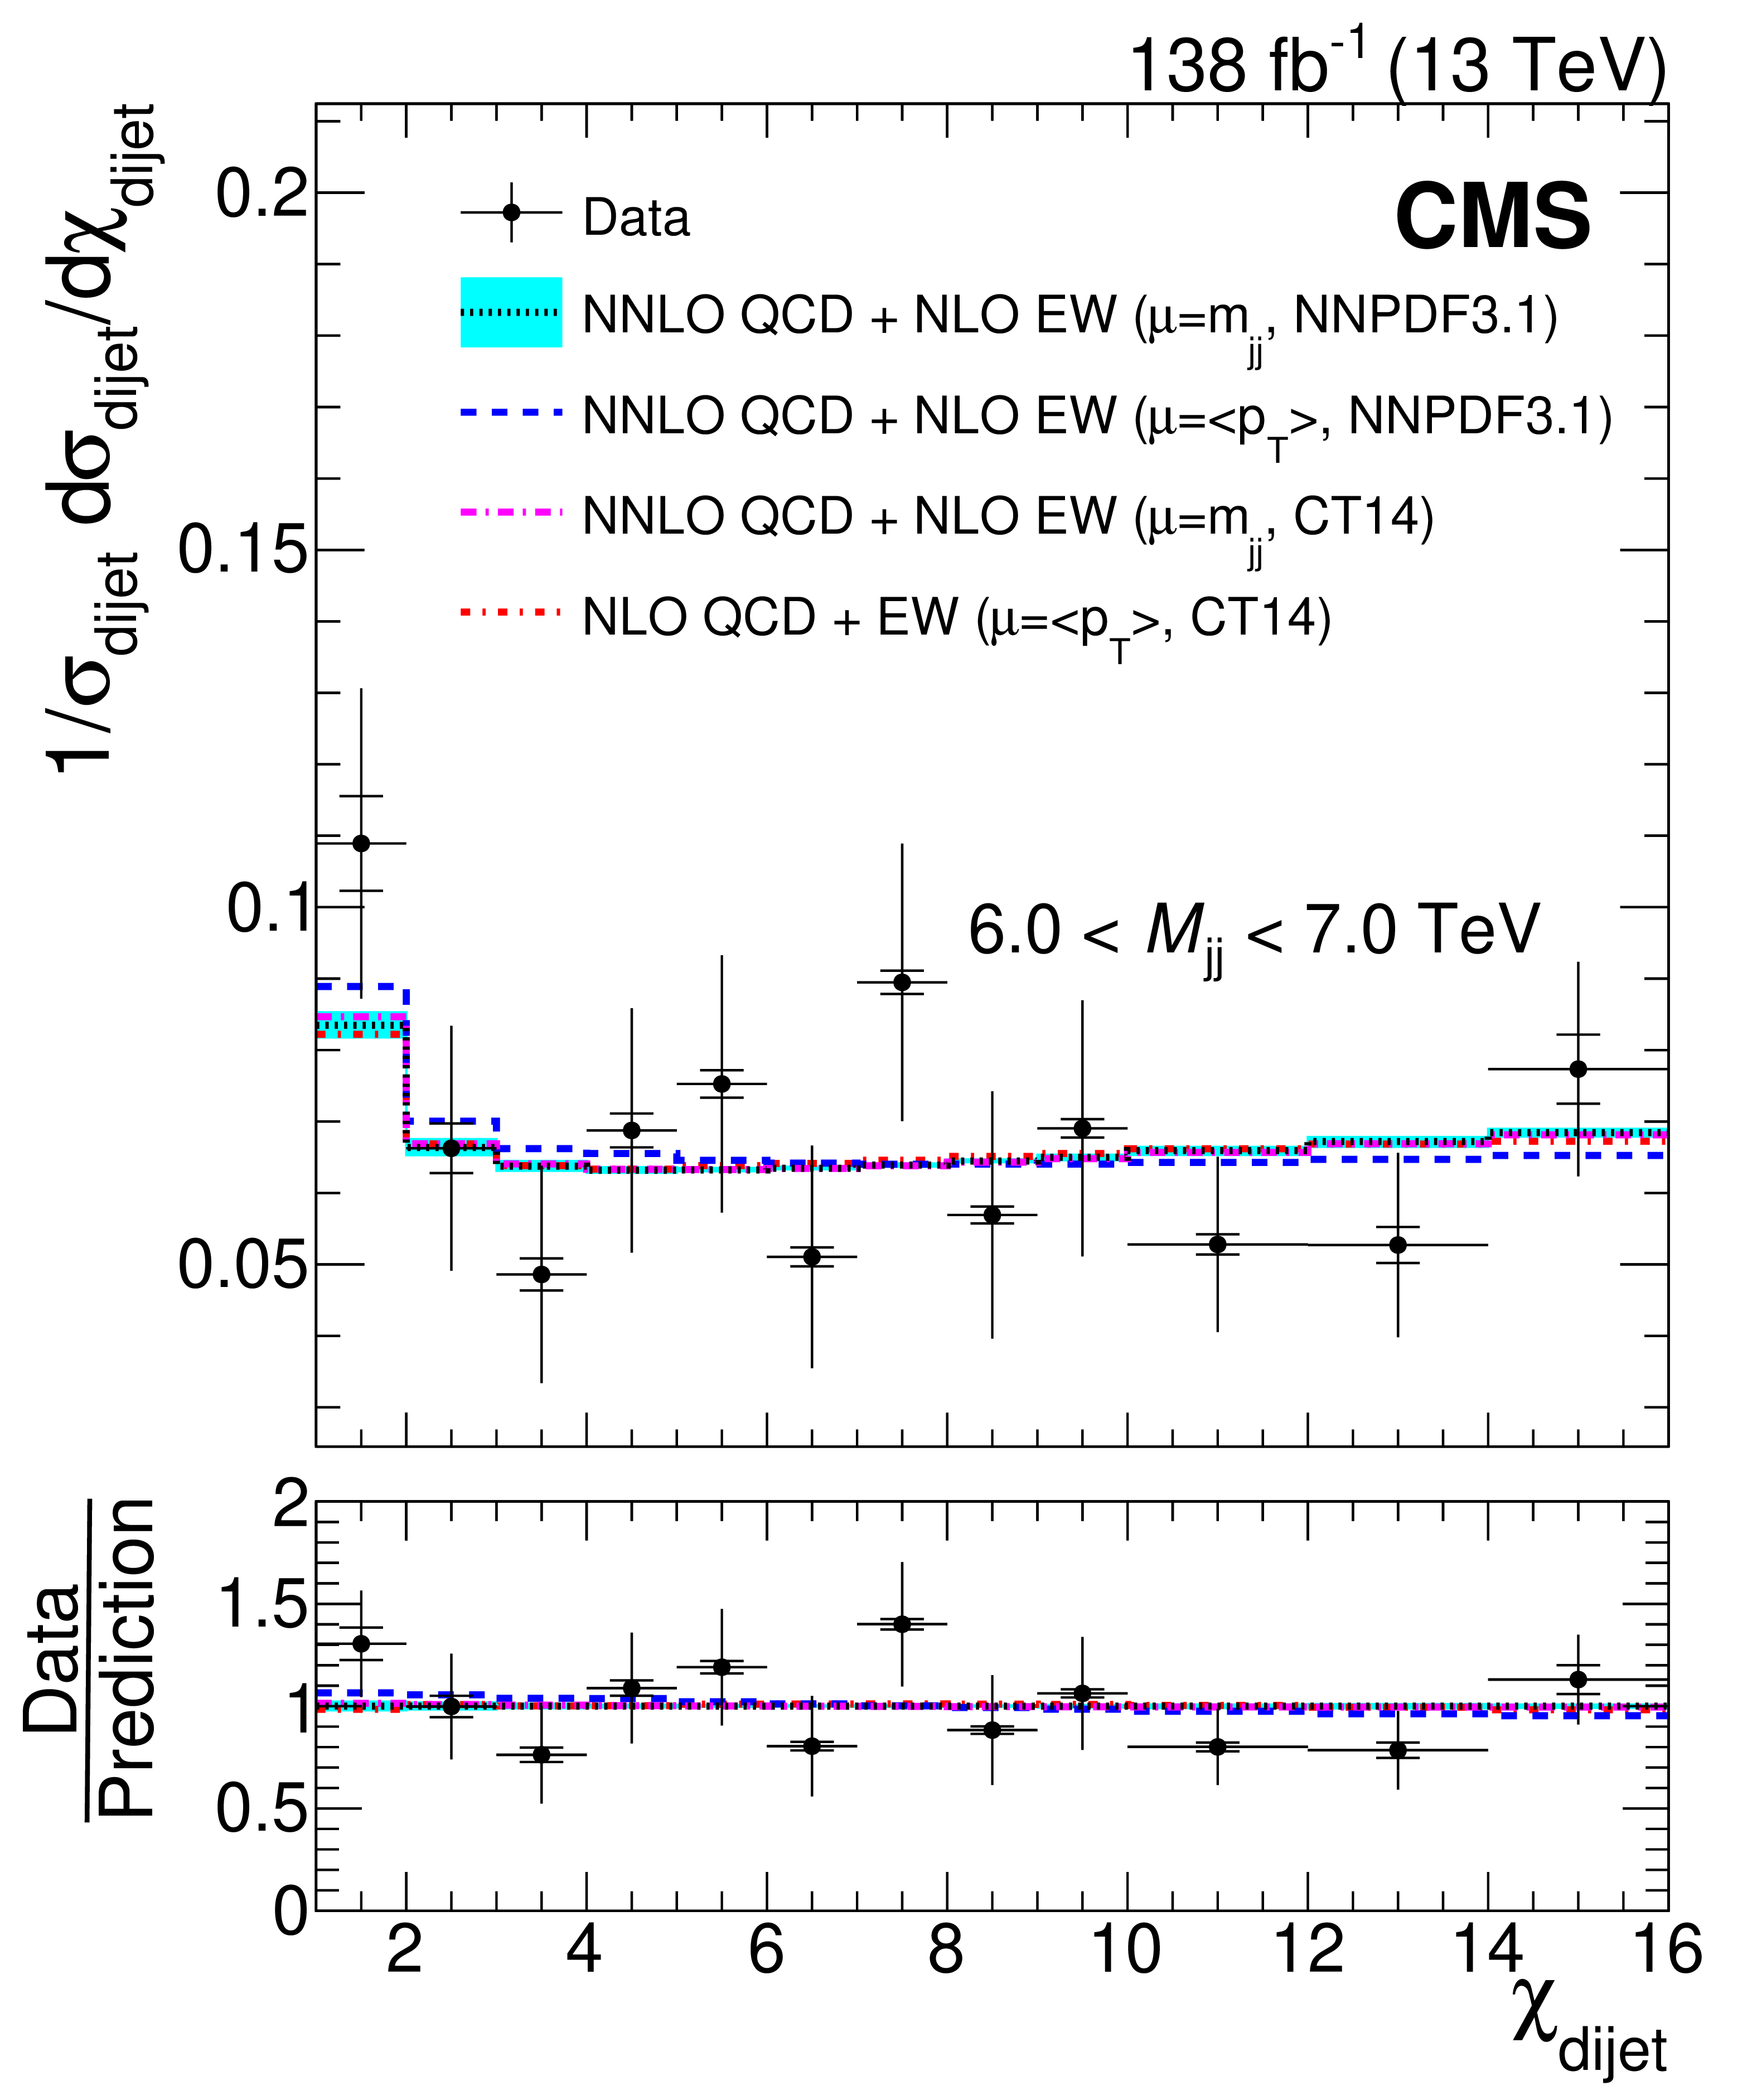
Normalized $ \chi_{\text{dijet}} $ distributions from data (points) corrected for detector effects for four different ranges of $ M_{\mathrm{jj}} $. The inner vertical bars on the points correspond to the systematic uncertainties in the data, and the outer ones to the total uncertainties. The horizontal bars give the bin widths. Theoretical NNLO QCD + NLO EW predictions are shown for central scale choices $ \mu_{\mathrm{F}} = \mu_{\mathrm{R}} = M_{\mathrm{jj}} $ (black dotted line) and $ \mu_{\mathrm{F}} = \mu_{\mathrm{R}} = \langle p_{\mathrm{T}} \rangle $ (blue dashed line), both using the NNPDF3.1 PDF set. Prediction using the alternative CT14 PDF set (purple long-dashed-dotted line), and the NLO predictions from a previous CMS publication [22] (red short-dashed-dotted lines) are also plotted. Theoretical uncertainties with the central scale $ \mu_{\mathrm{F}} = \mu_{\mathrm{R}} = M_{\mathrm{jj}} $ and using NNPDF3.1 are indicated with the gray bands. The lower plots display the ratio of the data to the NNLO QCD + NLO EW predictions. |
png pdf |
Figure 6-a:
Normalized $ \chi_{\text{dijet}} $ distributions from data (points) corrected for detector effects for four different ranges of $ M_{\mathrm{jj}} $. The inner vertical bars on the points correspond to the systematic uncertainties in the data, and the outer ones to the total uncertainties. The horizontal bars give the bin widths. Theoretical NNLO QCD + NLO EW predictions are shown for central scale choices $ \mu_{\mathrm{F}} = \mu_{\mathrm{R}} = M_{\mathrm{jj}} $ (black dotted line) and $ \mu_{\mathrm{F}} = \mu_{\mathrm{R}} = \langle p_{\mathrm{T}} \rangle $ (blue dashed line), both using the NNPDF3.1 PDF set. Prediction using the alternative CT14 PDF set (purple long-dashed-dotted line), and the NLO predictions from a previous CMS publication [22] (red short-dashed-dotted lines) are also plotted. Theoretical uncertainties with the central scale $ \mu_{\mathrm{F}} = \mu_{\mathrm{R}} = M_{\mathrm{jj}} $ and using NNPDF3.1 are indicated with the gray bands. The lower plots display the ratio of the data to the NNLO QCD + NLO EW predictions. |
png pdf |
Figure 6-b:
Normalized $ \chi_{\text{dijet}} $ distributions from data (points) corrected for detector effects for four different ranges of $ M_{\mathrm{jj}} $. The inner vertical bars on the points correspond to the systematic uncertainties in the data, and the outer ones to the total uncertainties. The horizontal bars give the bin widths. Theoretical NNLO QCD + NLO EW predictions are shown for central scale choices $ \mu_{\mathrm{F}} = \mu_{\mathrm{R}} = M_{\mathrm{jj}} $ (black dotted line) and $ \mu_{\mathrm{F}} = \mu_{\mathrm{R}} = \langle p_{\mathrm{T}} \rangle $ (blue dashed line), both using the NNPDF3.1 PDF set. Prediction using the alternative CT14 PDF set (purple long-dashed-dotted line), and the NLO predictions from a previous CMS publication [22] (red short-dashed-dotted lines) are also plotted. Theoretical uncertainties with the central scale $ \mu_{\mathrm{F}} = \mu_{\mathrm{R}} = M_{\mathrm{jj}} $ and using NNPDF3.1 are indicated with the gray bands. The lower plots display the ratio of the data to the NNLO QCD + NLO EW predictions. |
png pdf |
Figure 6-c:
Normalized $ \chi_{\text{dijet}} $ distributions from data (points) corrected for detector effects for four different ranges of $ M_{\mathrm{jj}} $. The inner vertical bars on the points correspond to the systematic uncertainties in the data, and the outer ones to the total uncertainties. The horizontal bars give the bin widths. Theoretical NNLO QCD + NLO EW predictions are shown for central scale choices $ \mu_{\mathrm{F}} = \mu_{\mathrm{R}} = M_{\mathrm{jj}} $ (black dotted line) and $ \mu_{\mathrm{F}} = \mu_{\mathrm{R}} = \langle p_{\mathrm{T}} \rangle $ (blue dashed line), both using the NNPDF3.1 PDF set. Prediction using the alternative CT14 PDF set (purple long-dashed-dotted line), and the NLO predictions from a previous CMS publication [22] (red short-dashed-dotted lines) are also plotted. Theoretical uncertainties with the central scale $ \mu_{\mathrm{F}} = \mu_{\mathrm{R}} = M_{\mathrm{jj}} $ and using NNPDF3.1 are indicated with the gray bands. The lower plots display the ratio of the data to the NNLO QCD + NLO EW predictions. |
png pdf |
Figure 6-d:
Normalized $ \chi_{\text{dijet}} $ distributions from data (points) corrected for detector effects for four different ranges of $ M_{\mathrm{jj}} $. The inner vertical bars on the points correspond to the systematic uncertainties in the data, and the outer ones to the total uncertainties. The horizontal bars give the bin widths. Theoretical NNLO QCD + NLO EW predictions are shown for central scale choices $ \mu_{\mathrm{F}} = \mu_{\mathrm{R}} = M_{\mathrm{jj}} $ (black dotted line) and $ \mu_{\mathrm{F}} = \mu_{\mathrm{R}} = \langle p_{\mathrm{T}} \rangle $ (blue dashed line), both using the NNPDF3.1 PDF set. Prediction using the alternative CT14 PDF set (purple long-dashed-dotted line), and the NLO predictions from a previous CMS publication [22] (red short-dashed-dotted lines) are also plotted. Theoretical uncertainties with the central scale $ \mu_{\mathrm{F}} = \mu_{\mathrm{R}} = M_{\mathrm{jj}} $ and using NNPDF3.1 are indicated with the gray bands. The lower plots display the ratio of the data to the NNLO QCD + NLO EW predictions. |
png pdf |
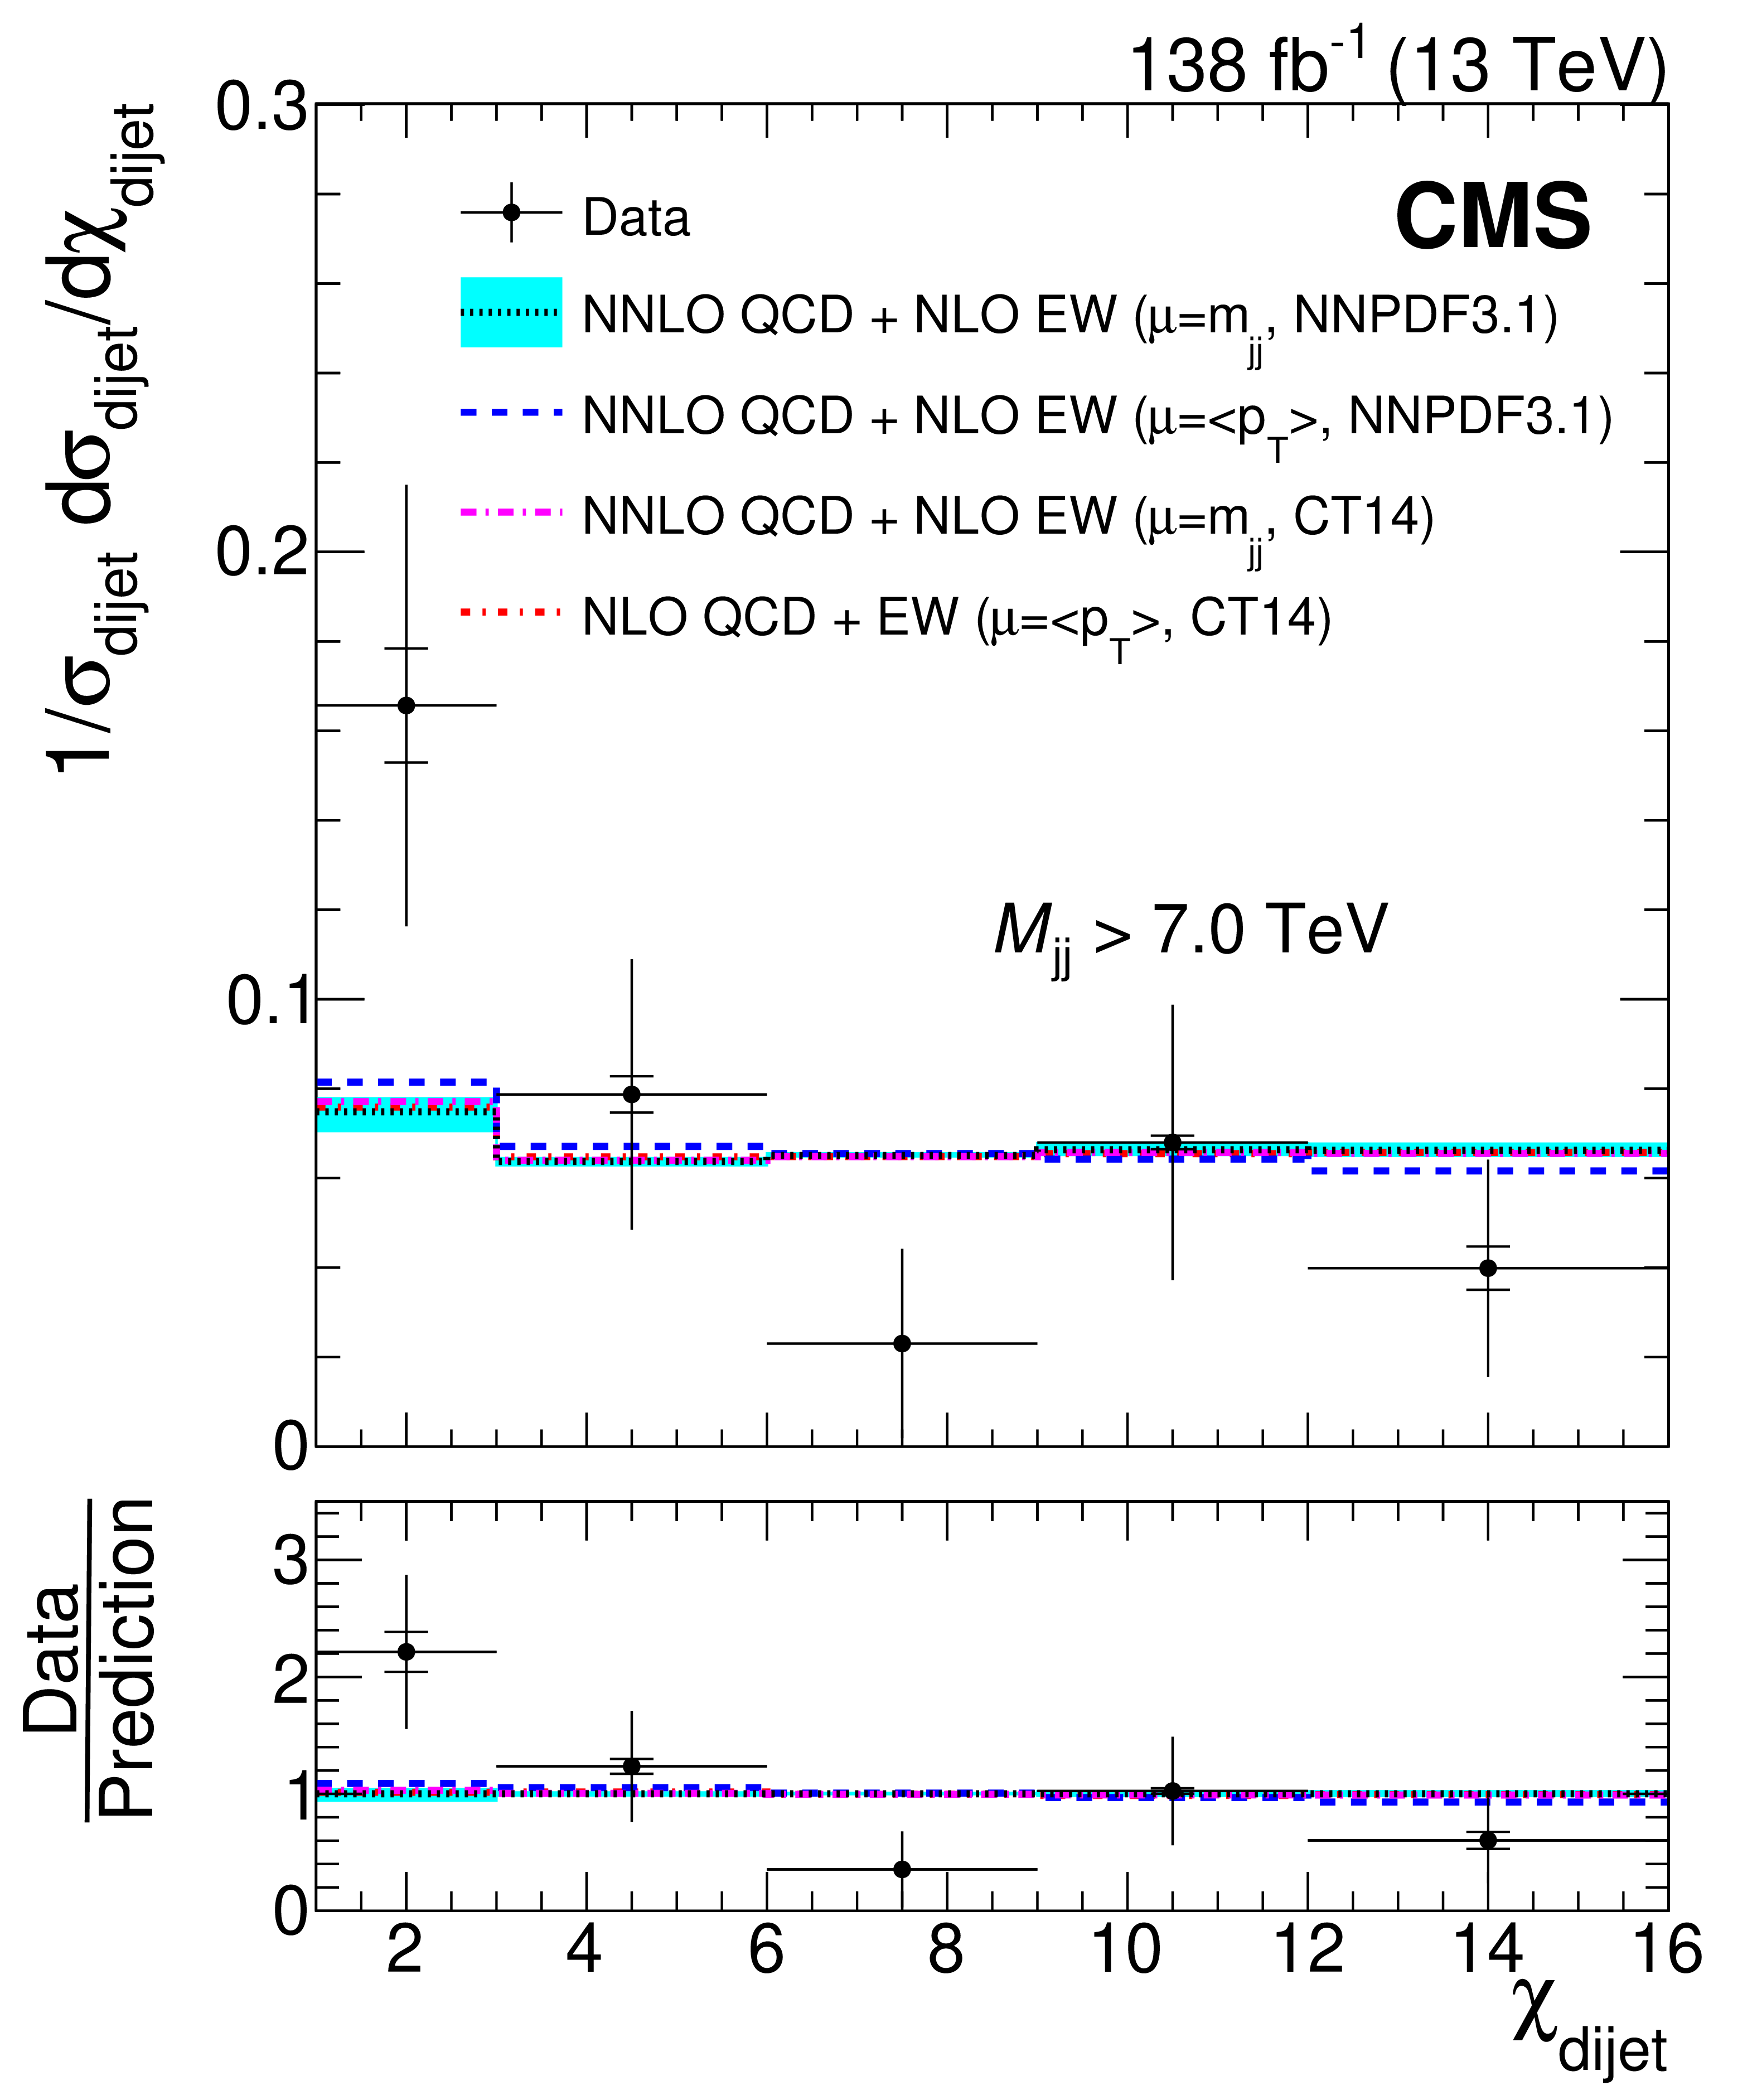
Figure 7:
Normalized $ \chi_{\text{dijet}} $ distributions corrected for detector effects for three different ranges of $ M_{\mathrm{jj}} $. Notations as in Fig. 6. |
png pdf |
Figure 7-a:
Normalized $ \chi_{\text{dijet}} $ distributions corrected for detector effects for three different ranges of $ M_{\mathrm{jj}} $. Notations as in Fig. 6. |
png pdf |
Figure 7-b:
Normalized $ \chi_{\text{dijet}} $ distributions corrected for detector effects for three different ranges of $ M_{\mathrm{jj}} $. Notations as in Fig. 6. |
png pdf |
Figure 7-c:
Normalized $ \chi_{\text{dijet}} $ distributions corrected for detector effects for three different ranges of $ M_{\mathrm{jj}} $. Notations as in Fig. 6. |
png pdf |
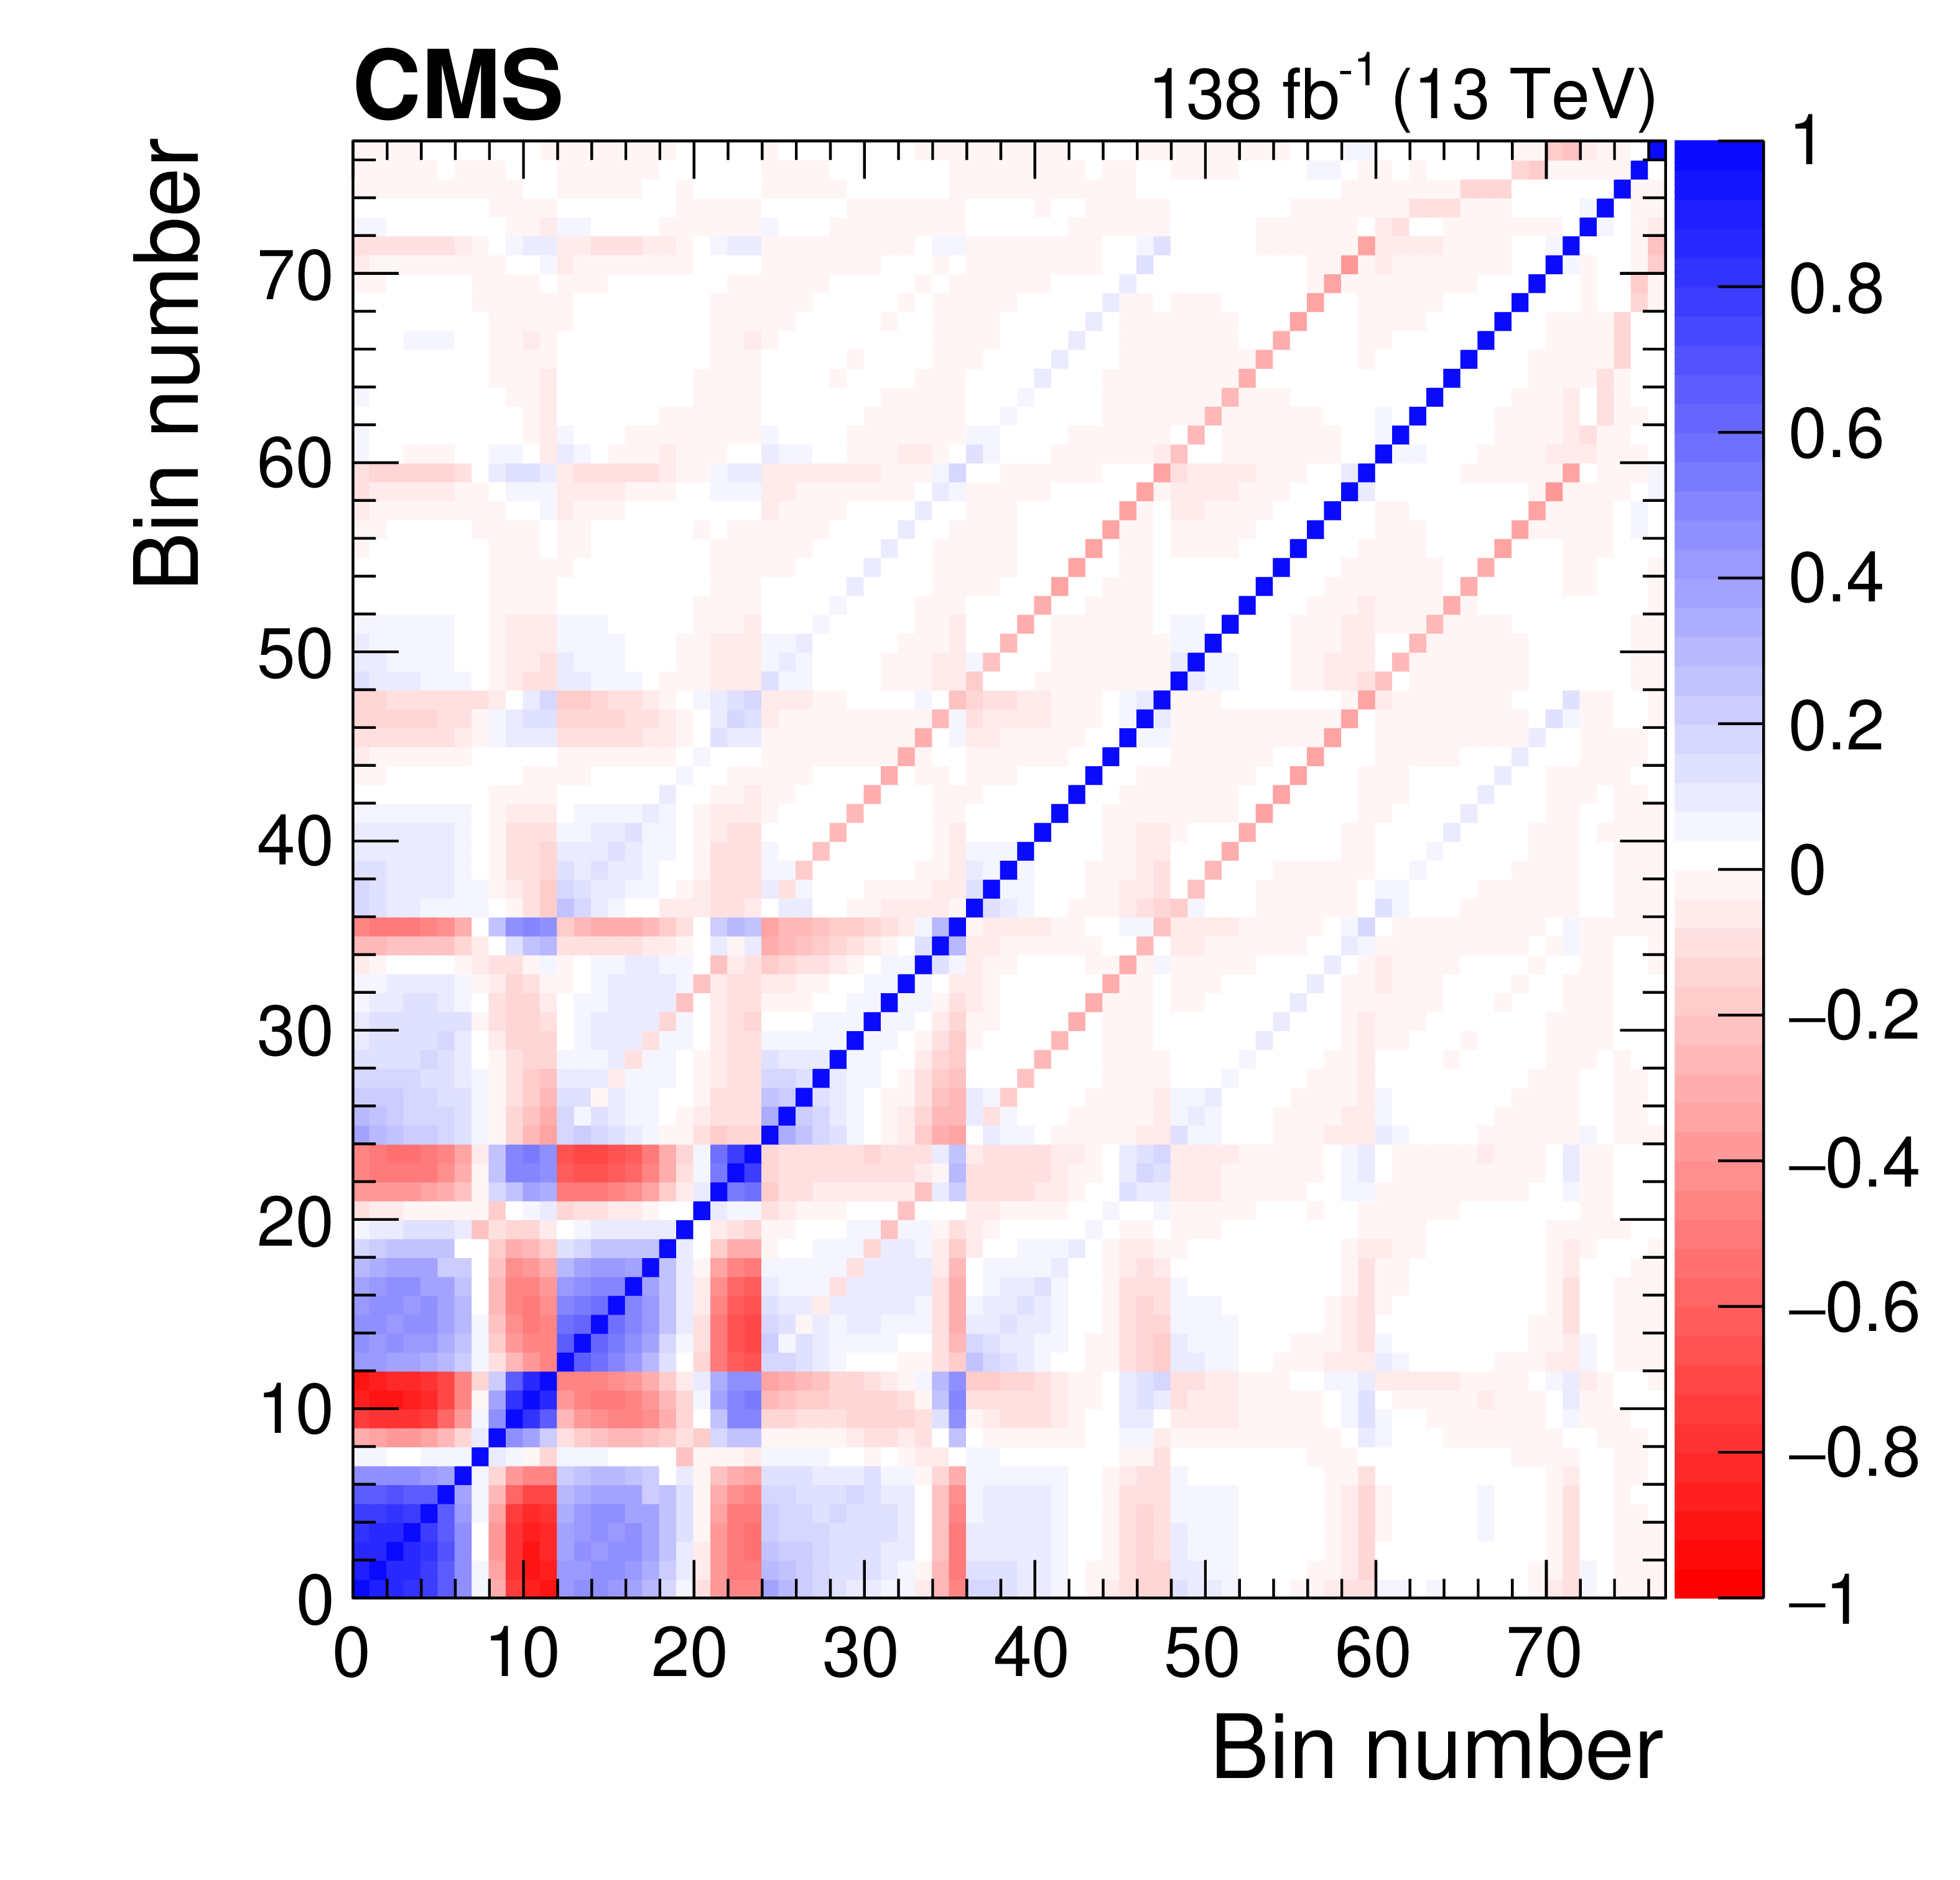
Figure 8:
The correlation matrix of the maximum likelihood estimators of the signal strength modifiers. The matrix is obtained after the fit to data. The bin numbers correspond to 11 times the index (starting at 0) of the $ M_{\mathrm{jj}} $ bin (3.0, 3.6, 4.2, 4.8, 5.4, 6.0, 7.0) GeV plus the index (starting at 0) of the $ \chi_{\text{dijet}} $ bin (1, 2, 3, 4, 5, 6, 7, 8, 9, 10, 12, 14). |
| Tables | |
png pdf |
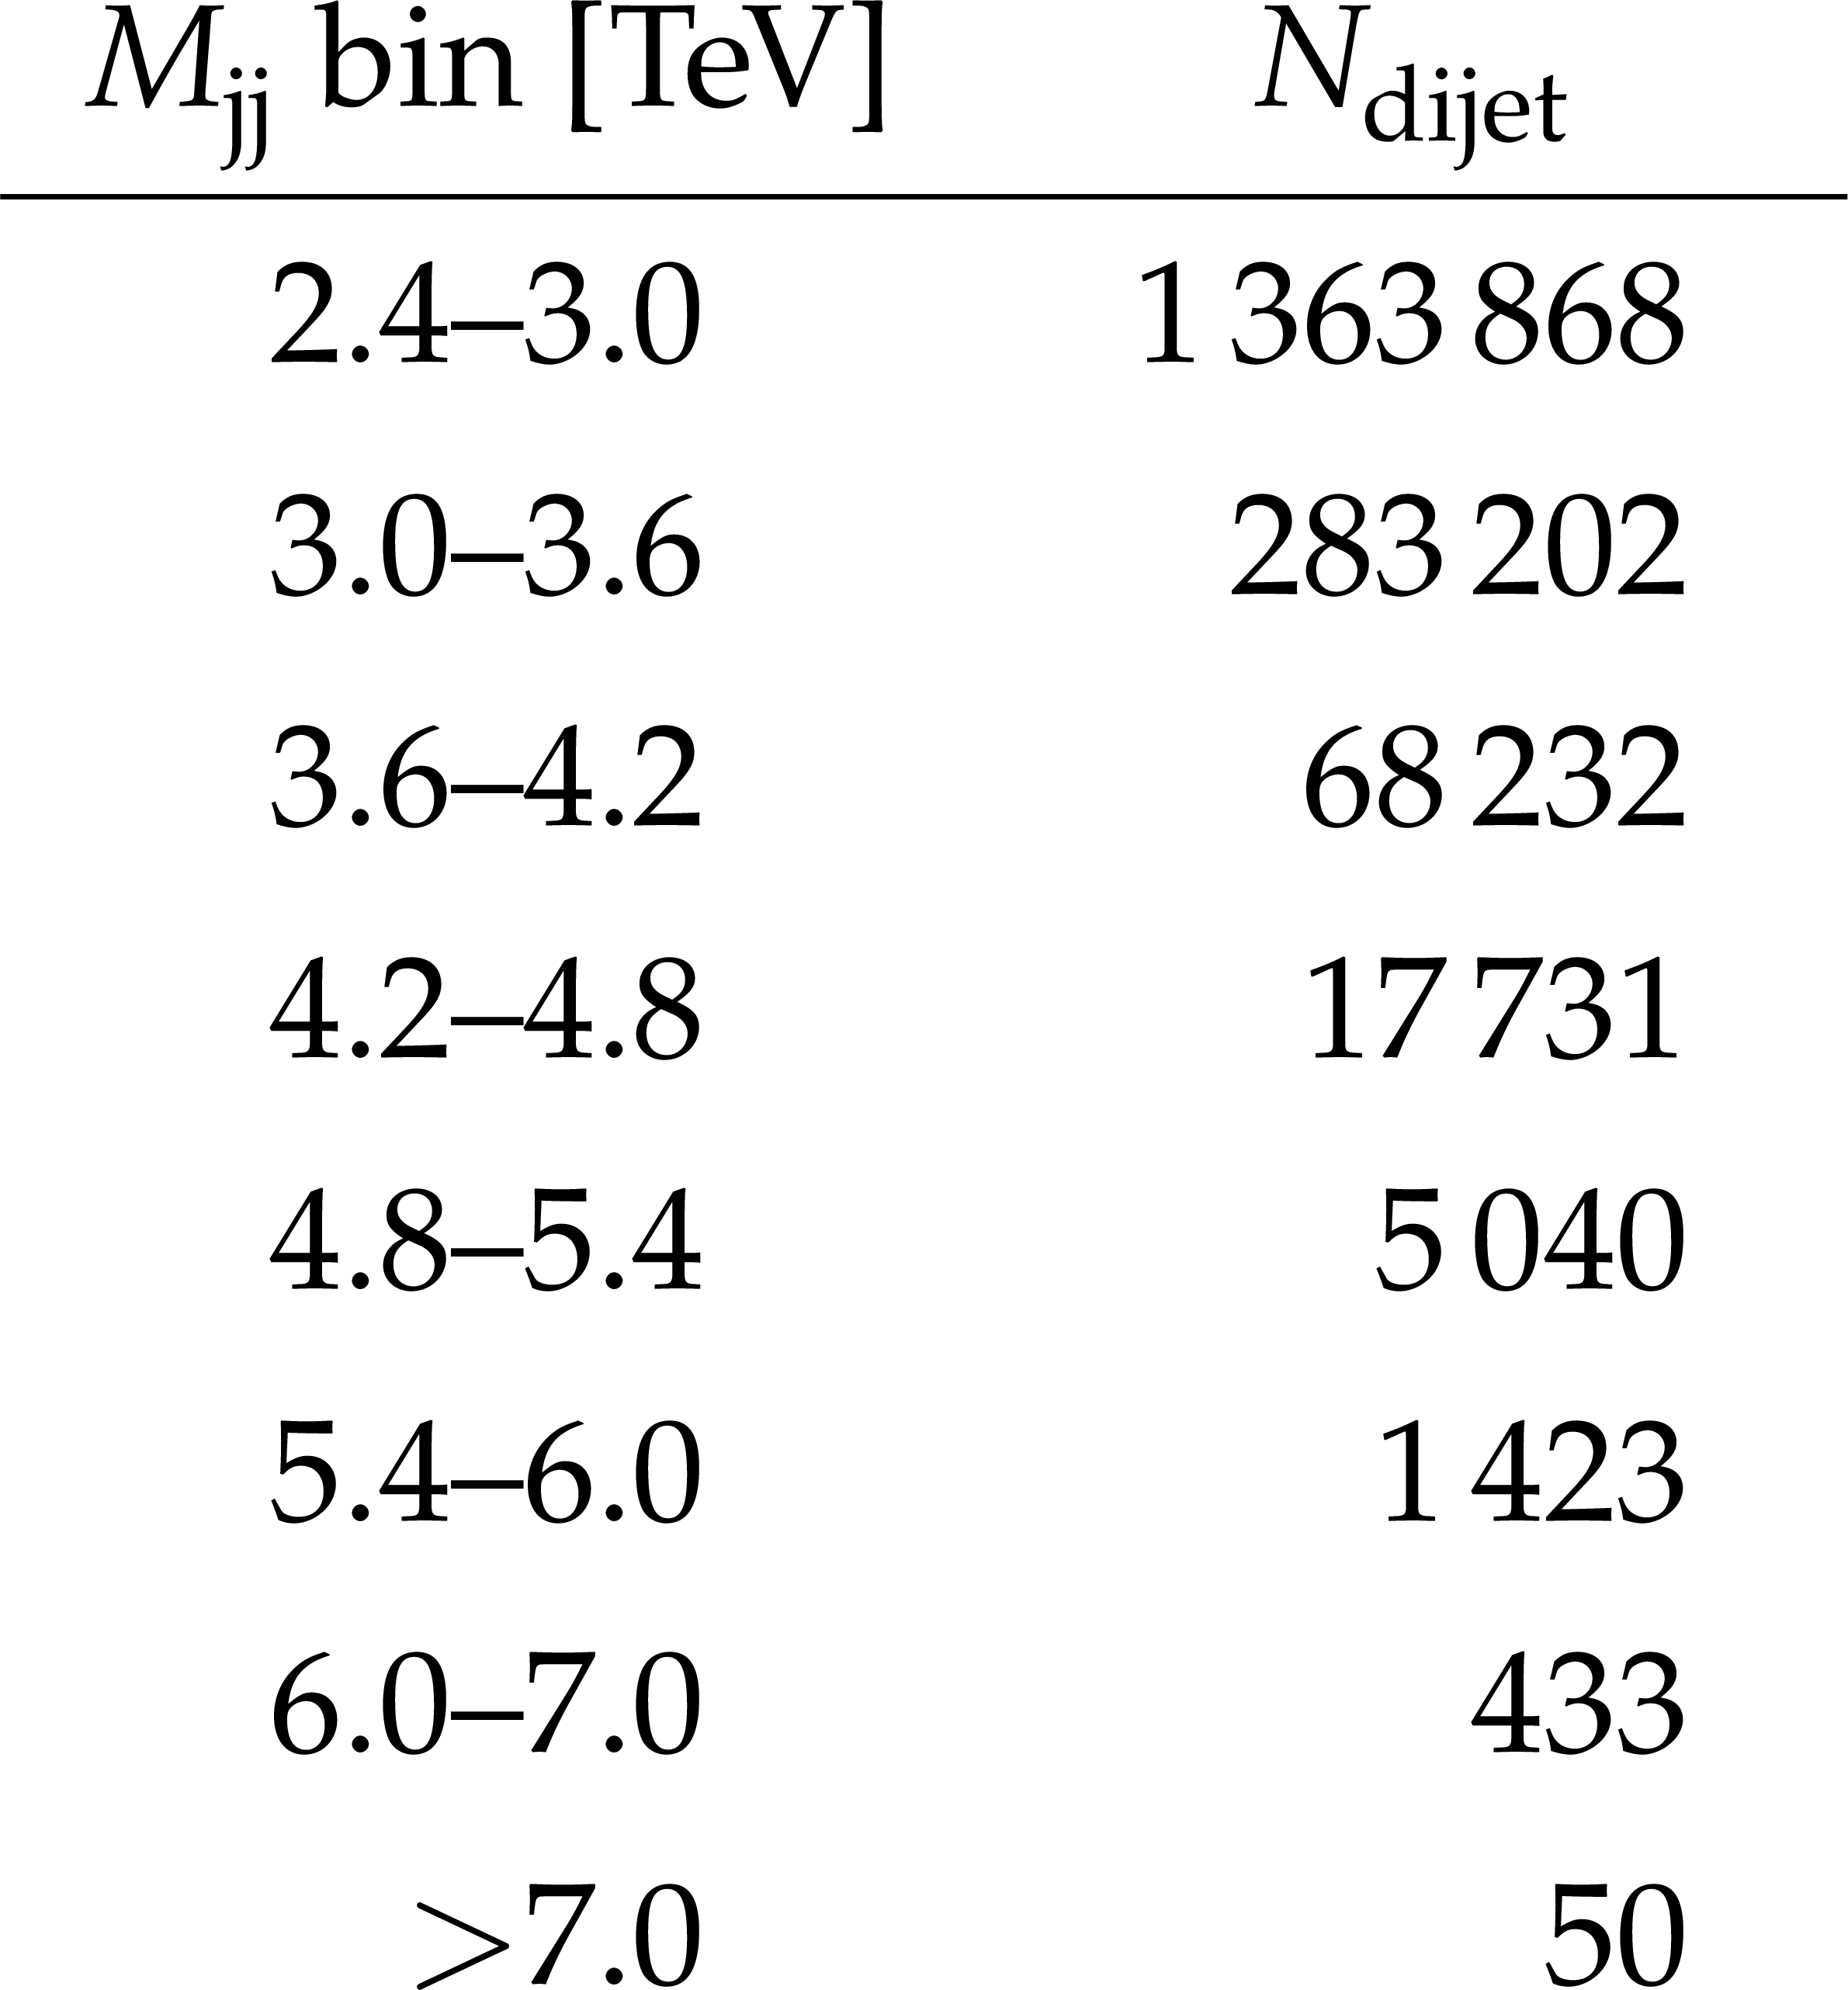
Table 1:
Observed number of events, $ N_{\text{dijet}} $, after selection in each $ M_{\text{jj}} $ bin. |
png pdf |
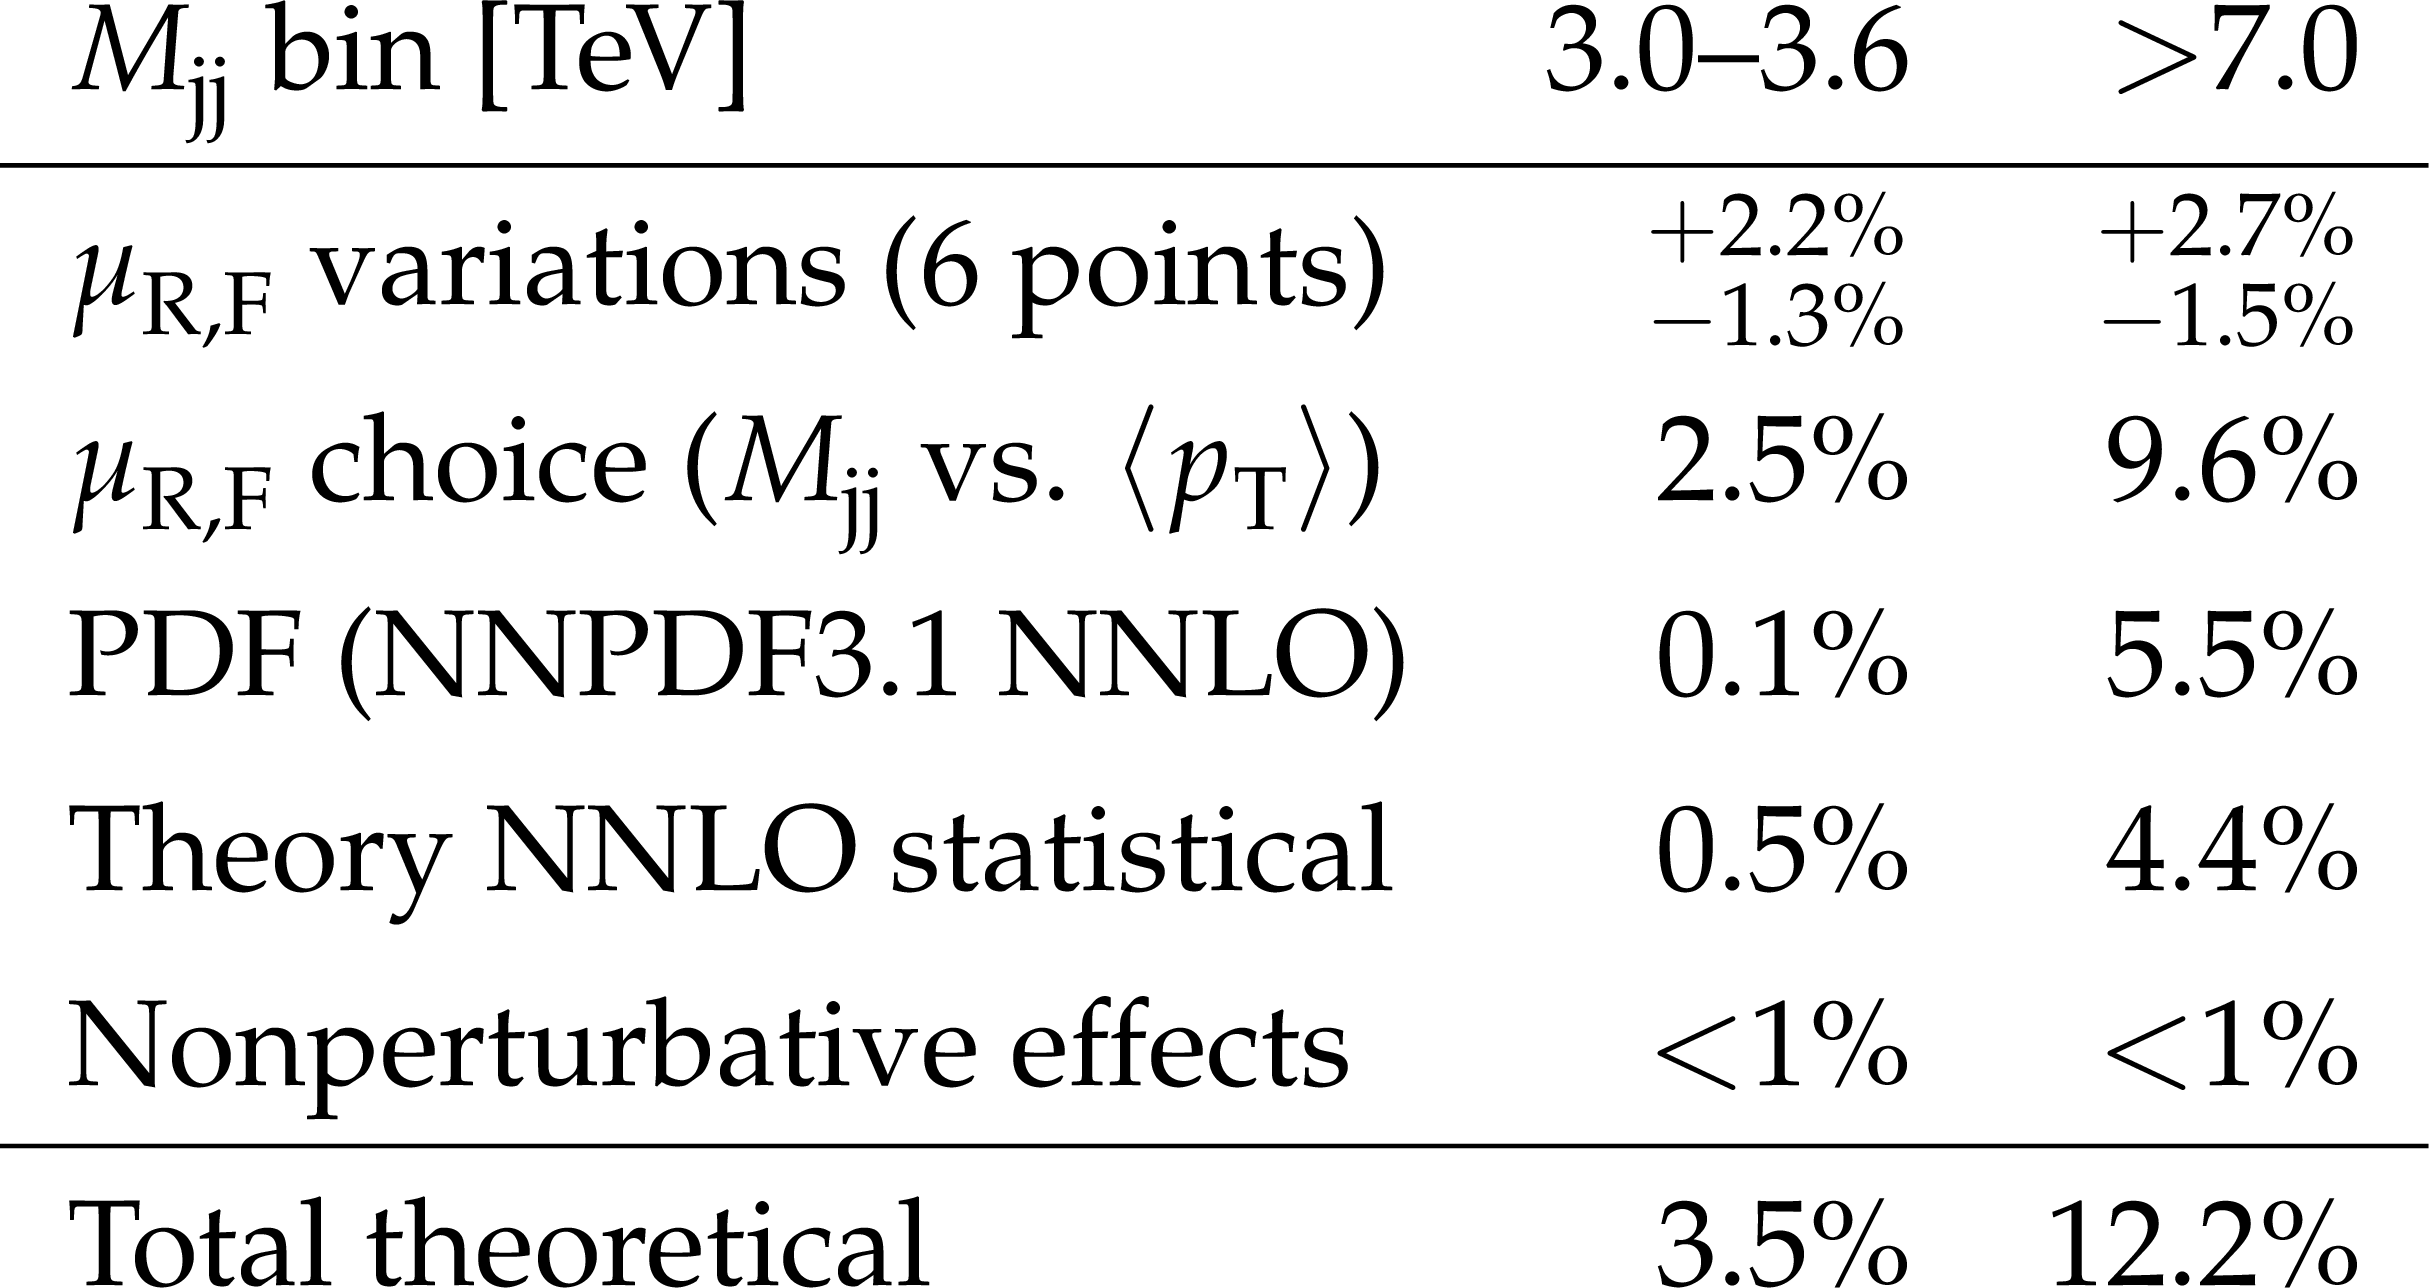
Table 2:
Summary of the leading theoretical uncertainties in the normalized $ \chi_{\text{dijet}} $ distributions. The full analysis takes into account correlations between $ \chi_{\text{dijet}} $ bins; however, this table shows the contributions in the lowest $ \chi_{\text{dijet}} $ bin for two representative $ M_{\text{jj}} $ bins. This illustrates the magnitude of the contributions for these $ M_{\text{jj}} $ bins. |
png pdf |
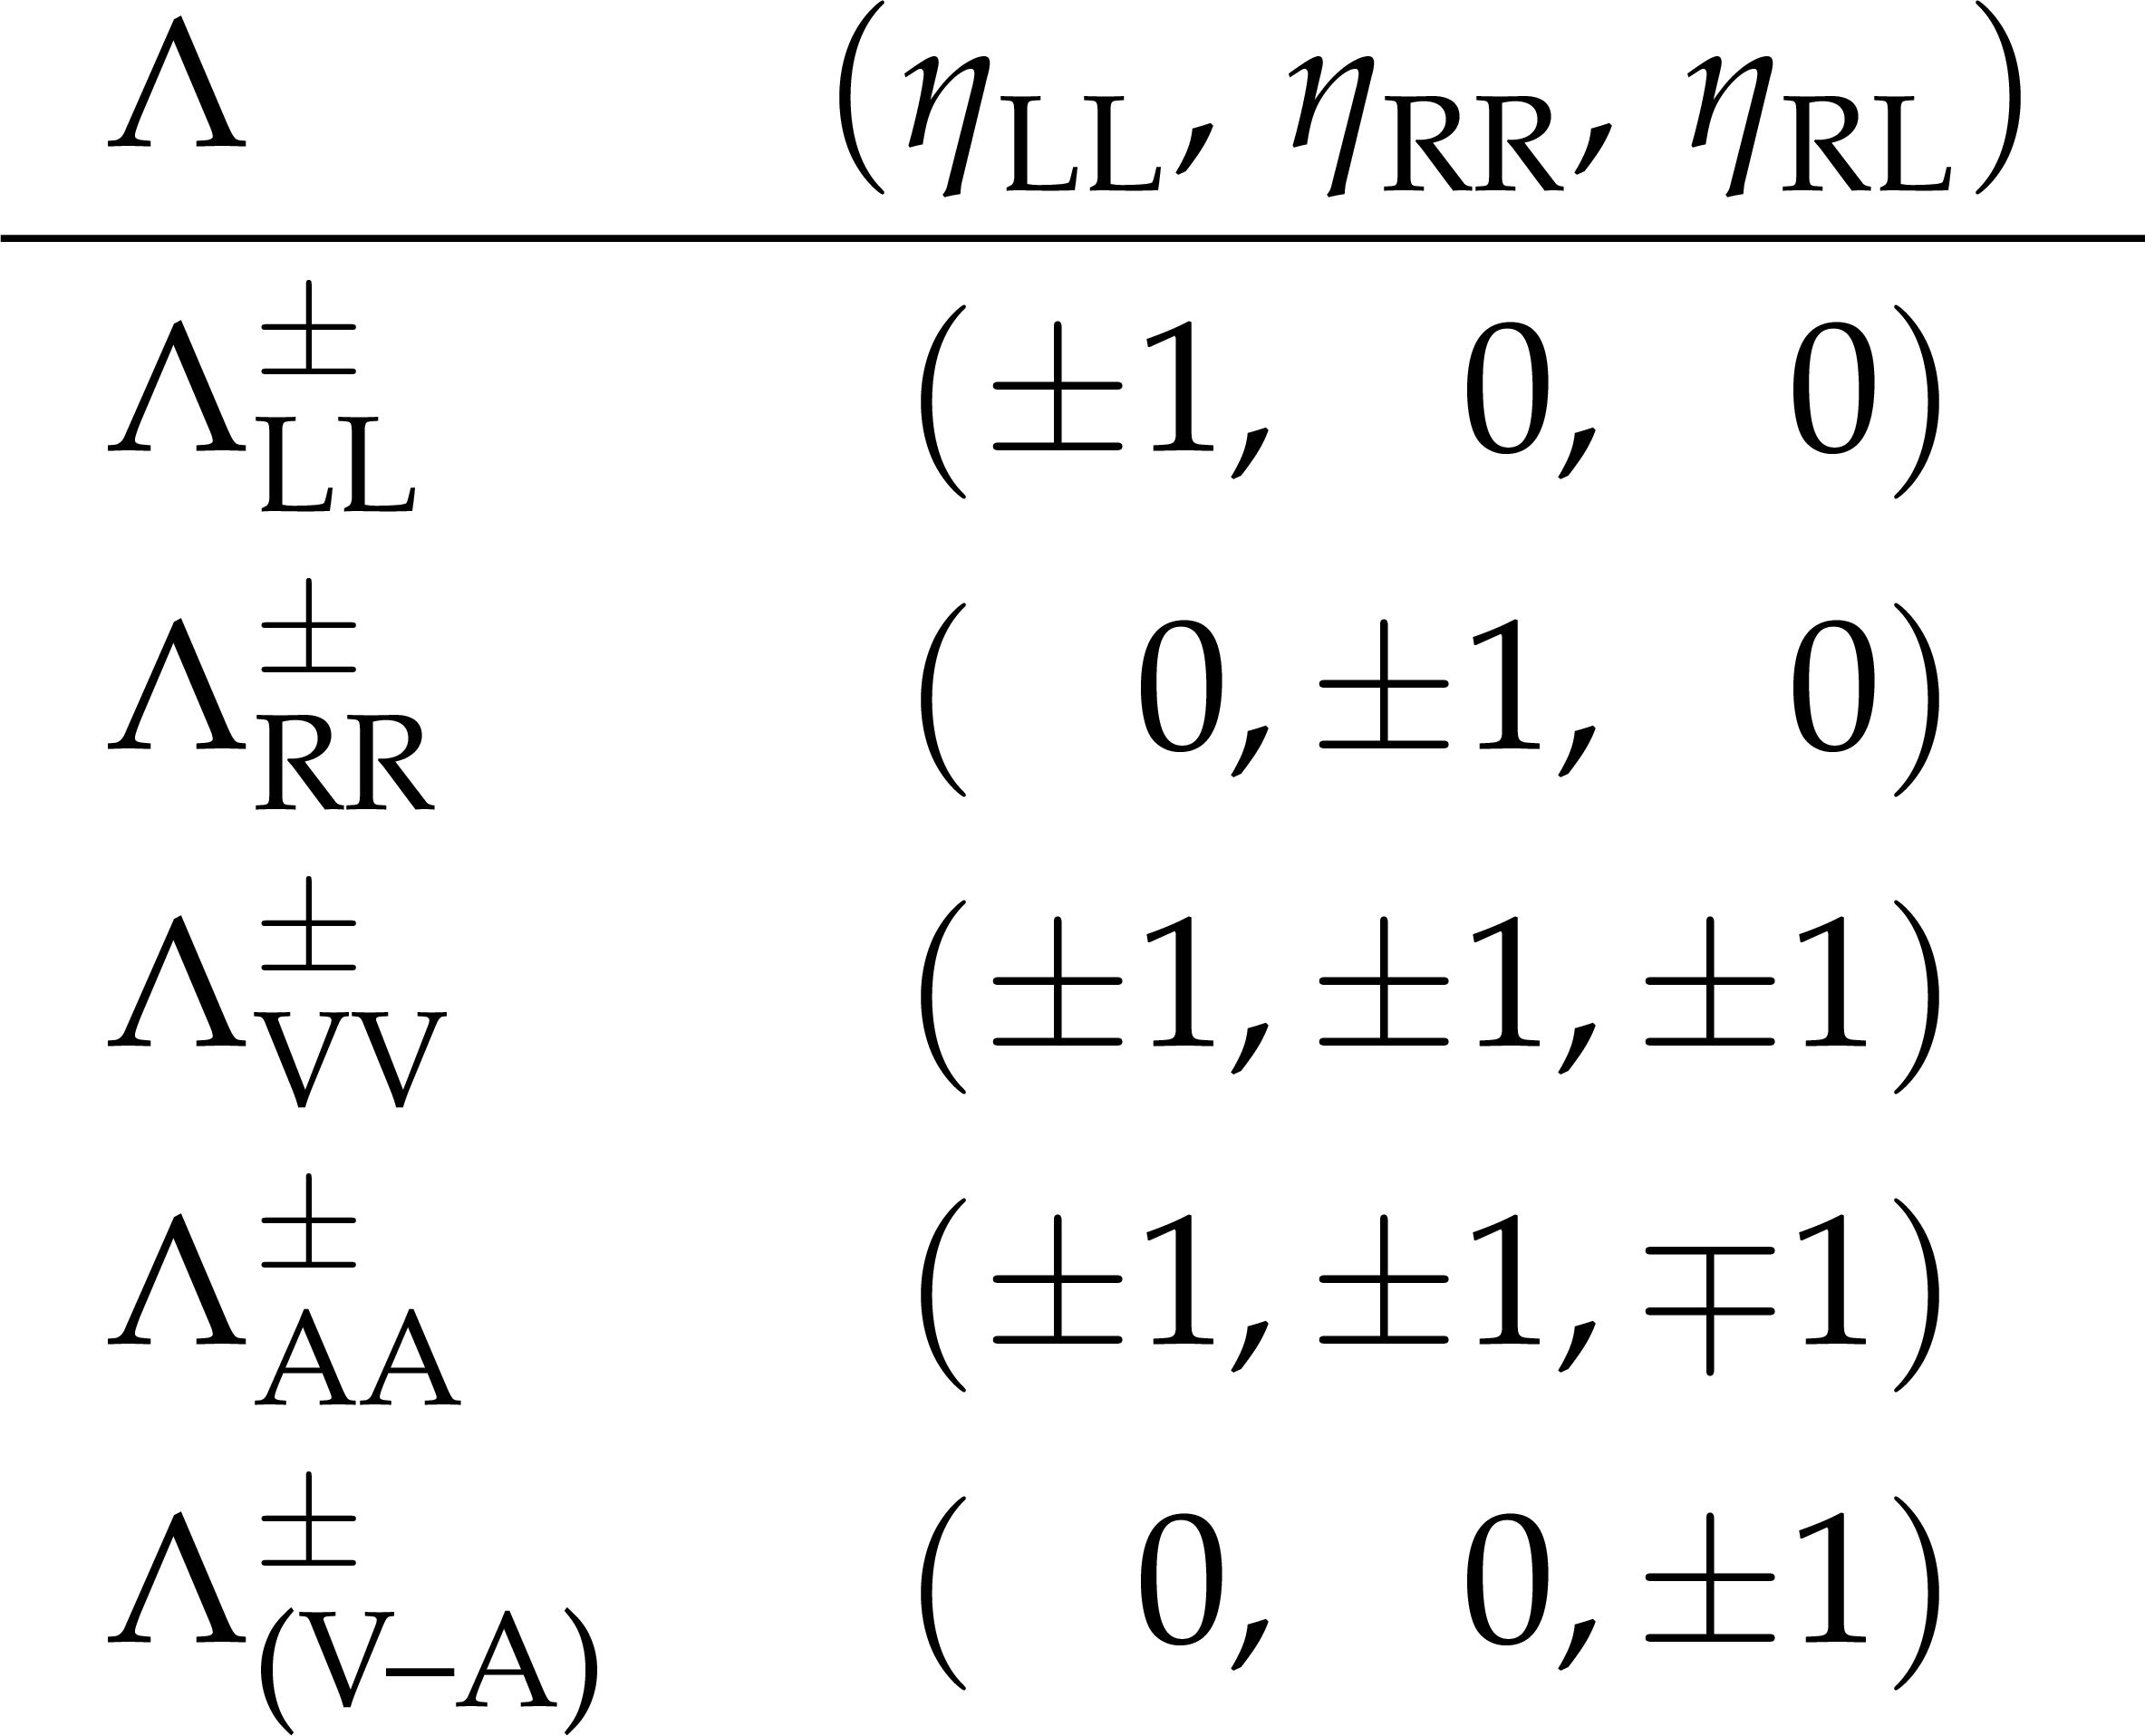
Table 3:
The different combinations of $ (\eta_{\text{LL}}, \eta_{\text{RR}}, \eta_{\text{RL}}) $ used in the search for CIs between quarks and the corresponding mass scale name. |
png pdf |
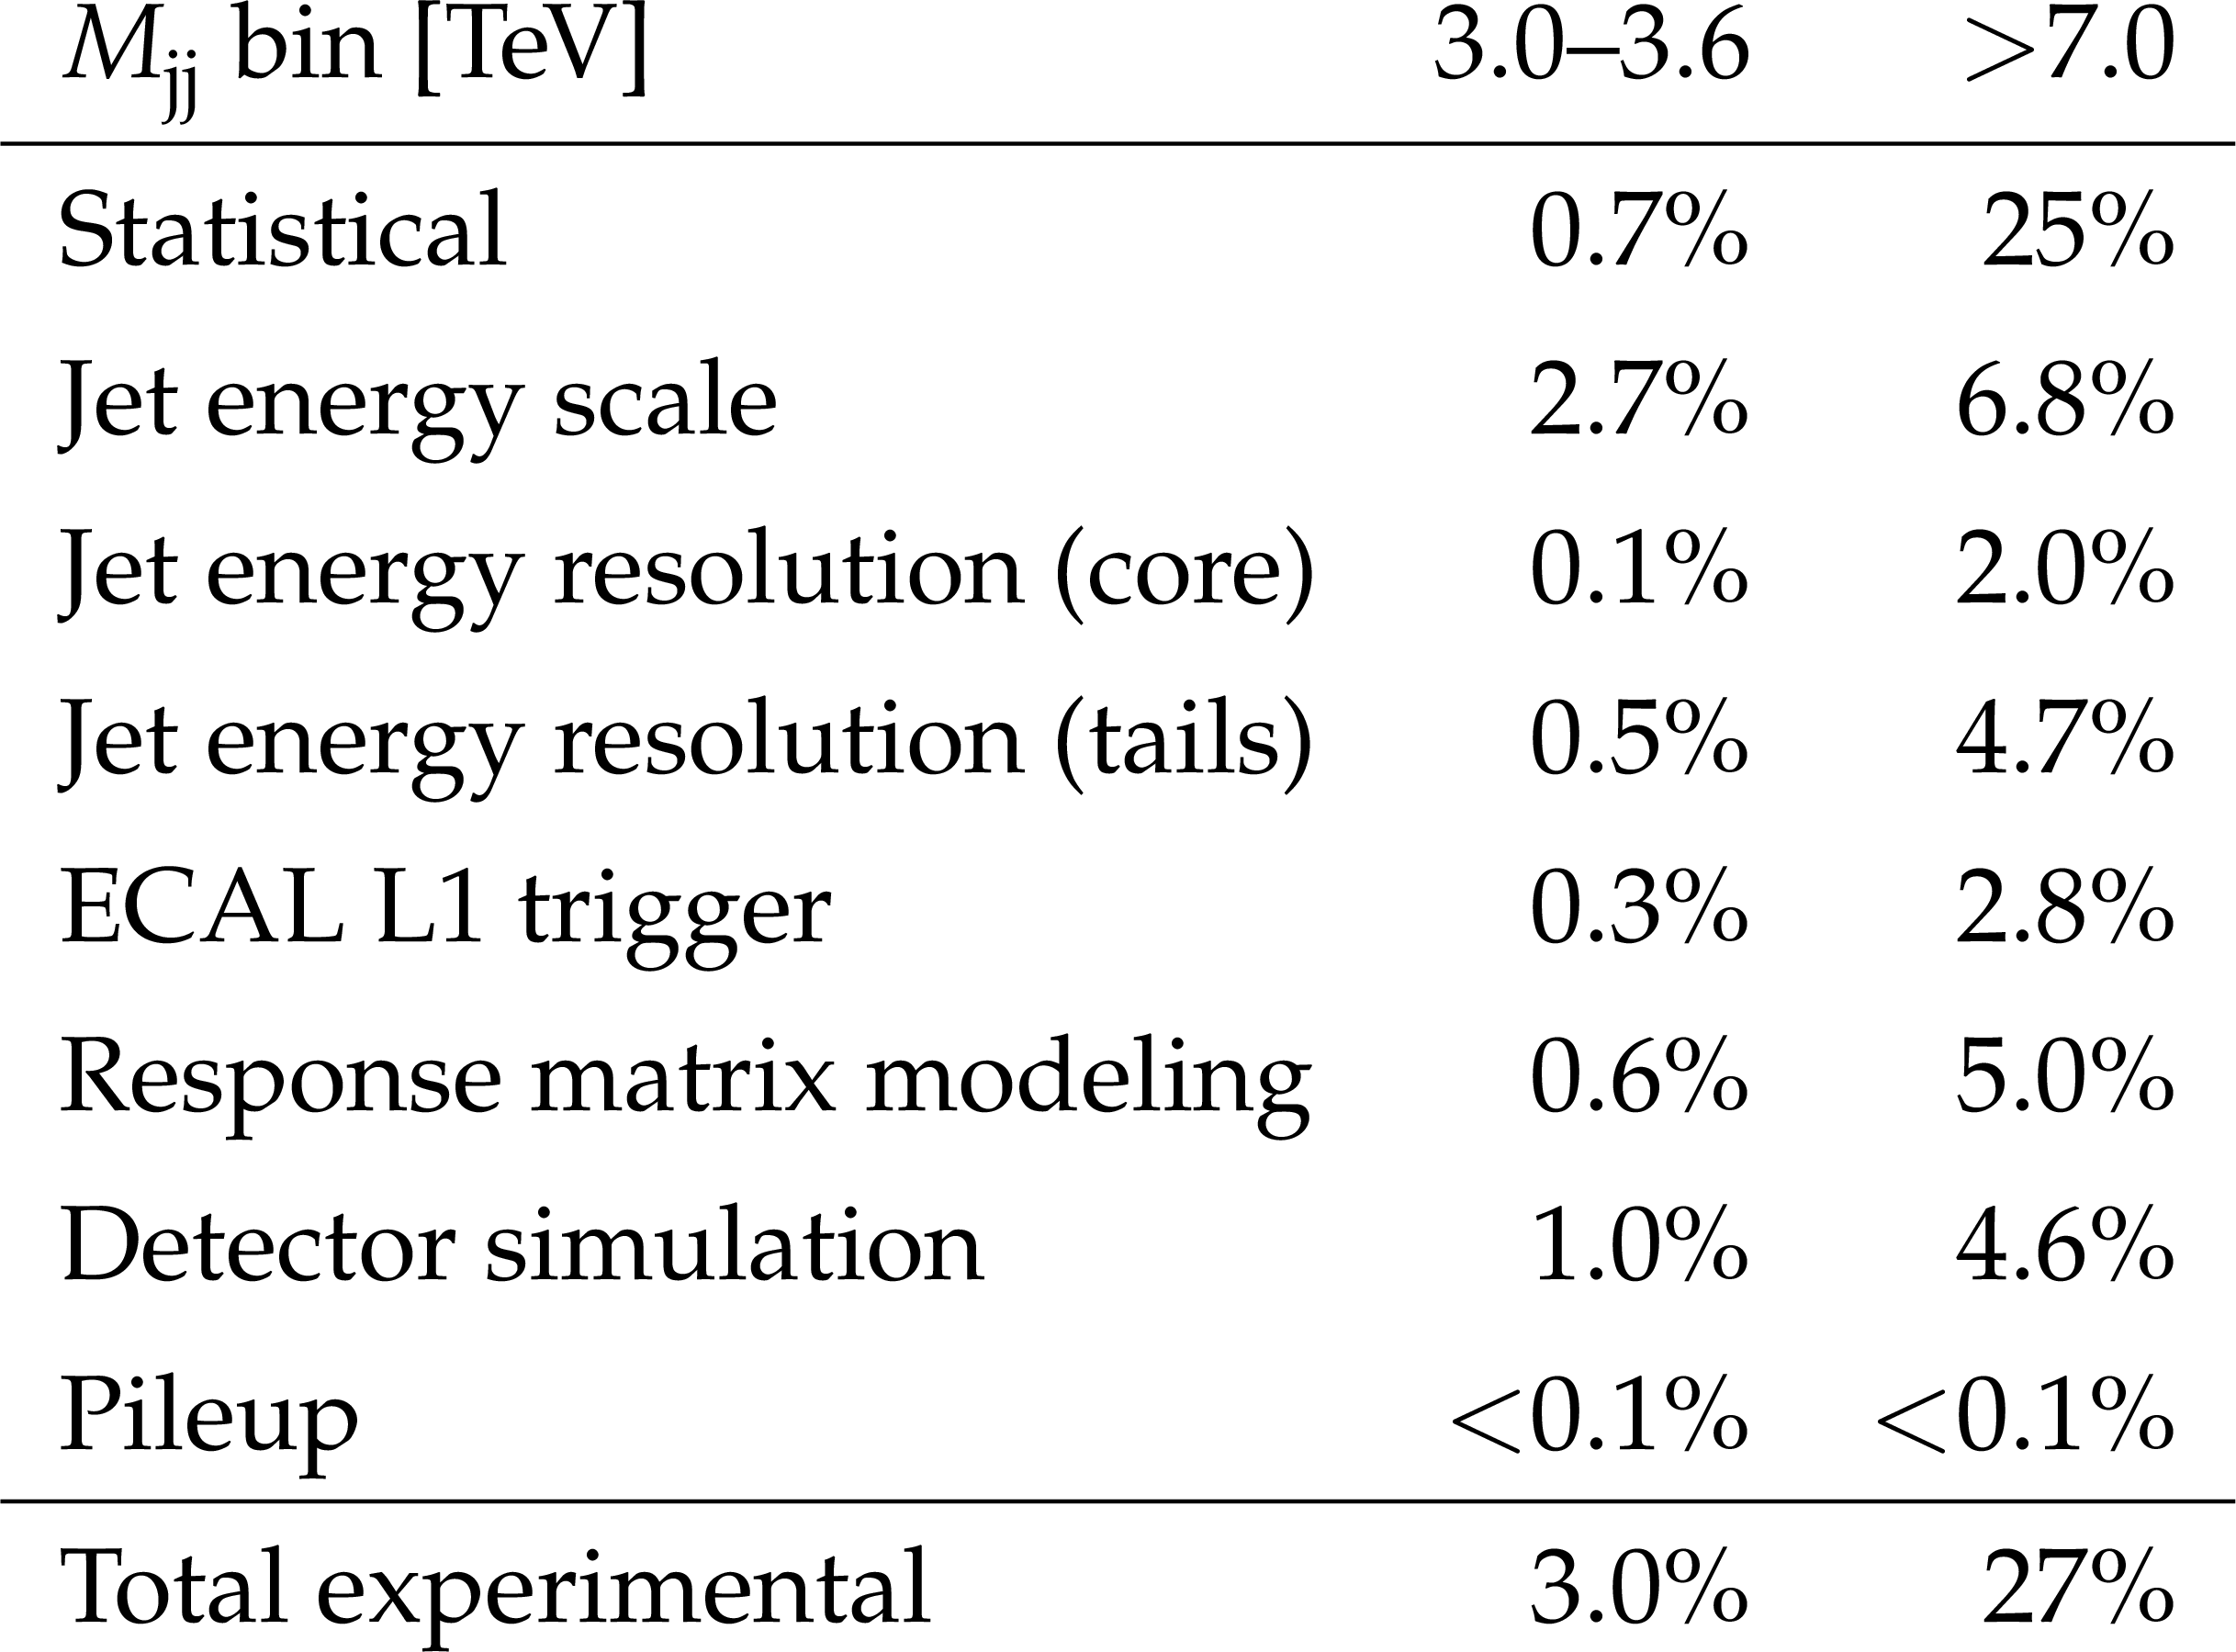
Table 4:
Leading experimental uncertainties in the normalized $ \chi_{\text{dijet}} $ distributions. The uncertainties in the lowest $ \chi_{\text{dijet}} $ bin for two $ M_{\text{jj}} $ bins are shown as representative examples. |
png pdf |
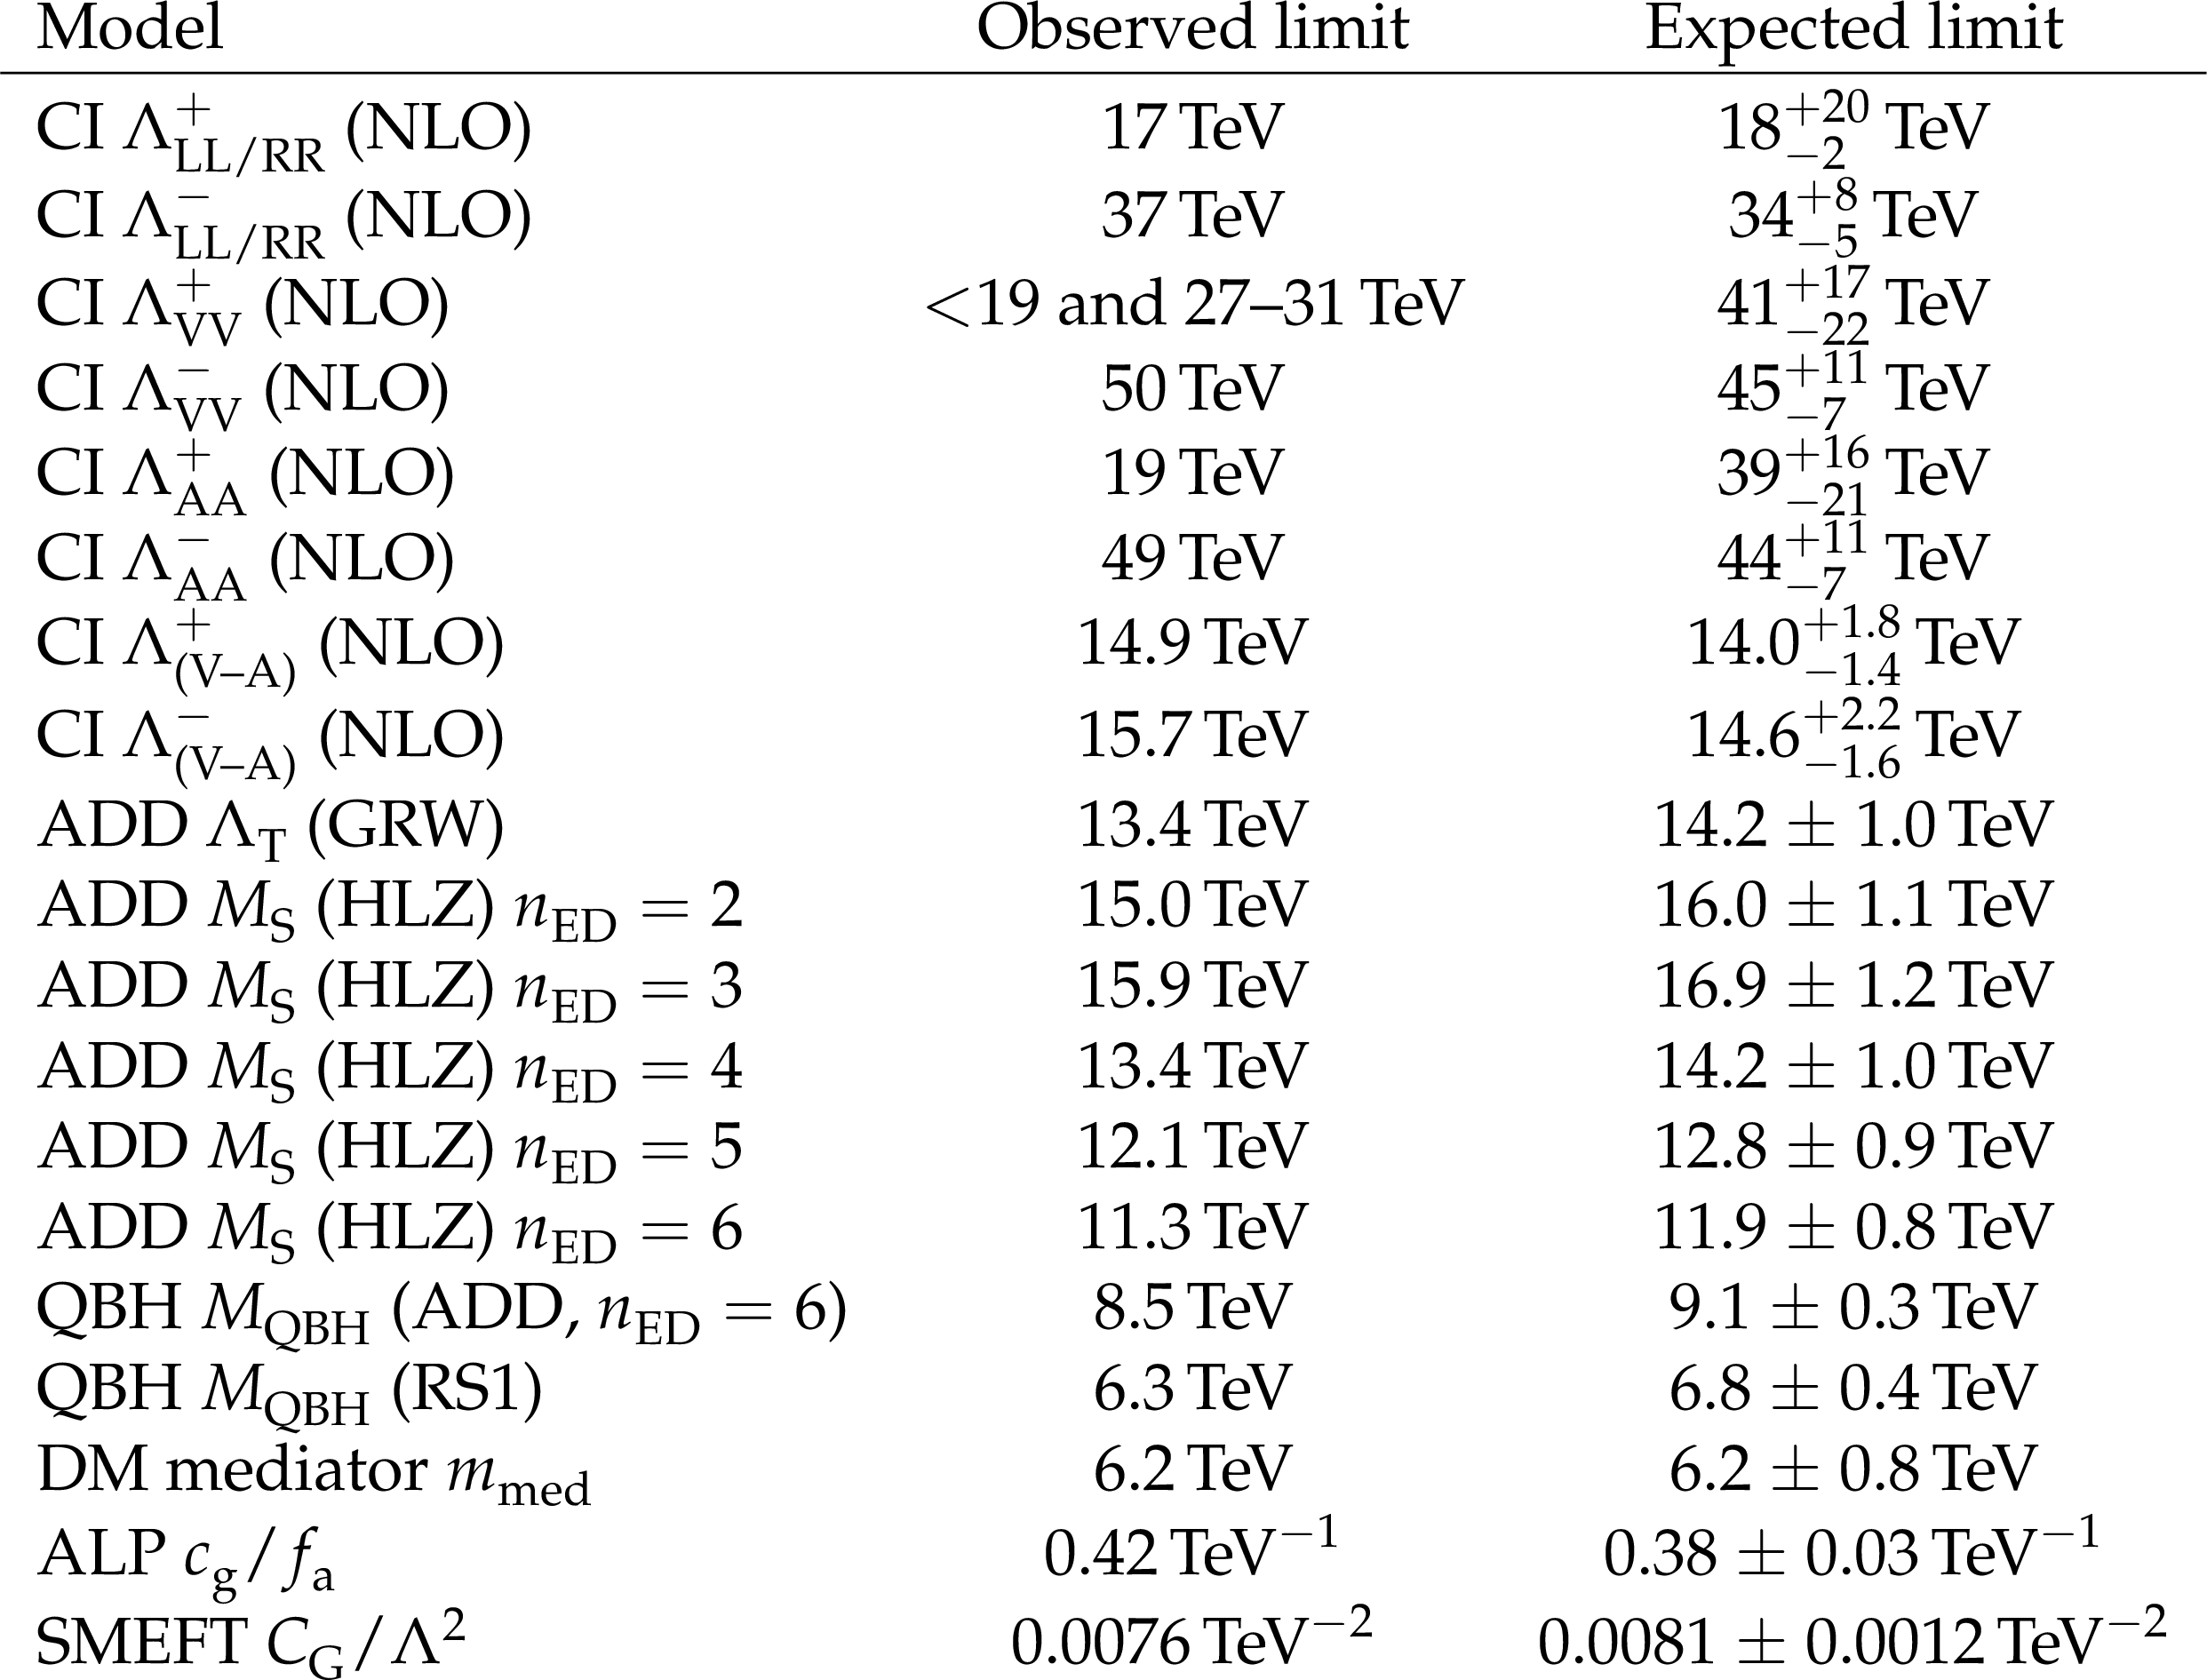
Table 5:
Observed and expected exclusion limits at 95% CL for various BSM models. The $ \pm $ 1 standard deviation values for the expected limits are quoted, as shown in the last column. |
| Summary |
| Normalized dijet angular distributions have been measured with the CMS detector over a wide range of dijet invariant masses, using proton-proton collisions at the LHC, corresponding to an integrated luminosity of 138 fb$ ^{-1} $. For the first time, the dijet angular distributions corrected for detector effects have been compared with predictions of perturbative quantum chromodynamics at next-to-next-to-leading order. Predictions assuming two different choices for the factorization and renormalization scales, $ \mu_{\mathrm{F}} = \mu_{\mathrm{R}} = M_{\mathrm{jj}} $ or $ \langle p_{\mathrm{T}} \rangle $, are found to differ by more than the six variations of scales commonly used to quantify the uncertainty in the predictions. While data are generally found to be in agreement with the standard model predictions, a small difference in the shape of the normalized distributions is seen for dijet masses below 4.8 TeV and above 6.0 TeV. The distributions are used to set lower limits on beyond the standard model theories, including quark contact interaction models with next-to-leading-order quantum chromodynamic corrections, extra dimension models, quantum black hole production, dark-matter mediators, axion-like particles, and standard model effective field theory. The most stringent lower limits to date are set on the scale of graviton exchange. In the Giudice--Rattazzi--Wells convention, virtual graviton exchange is excluded up to a scale of 13.4 TeV at 95% confidence level (CL). The production of quantum black holes is excluded for masses below 8.5 and 6.3 TeV at 95% CL, depending on the scenario. Limits for different contact interaction models are obtained. In the benchmark scenario, valid to next-to-leading order in quantum chromodynamics and in which only left-handed quarks participate, quark contact interactions are excluded to a scale of 17 (37) TeV at 95% CL for destructive (constructive) interference. Mediators in a simplified model of interactions between quarks and dark matter with masses between 4 and 6.2 TeV are excluded at 95% CL for vector and axial-vector mediators. The ratio of the gluon operator coefficient $ c_{\text{g}} $ to the characteristic high-energy scale $ f_{\text{a}} $, $ c_{\text{g}}/f_{\text{a}} $, is determined to have a 95% CL upper limit of 0.42 $ \text{TeV}^{-1} $. The anomalous triple-gluon coupling, $ C_{\text{G}}/\Lambda^2 $, in a standard model effective field theory is constrained to be lower than 0.0076 $ \text{TeV}^{-2} $ at 95% CL. |
| References | ||||
| 1 | CMS Collaboration | Measurements of differential jet cross sections in proton-proton collisions at $ \sqrt{s}= $ 7 TeV with the CMS detector | [Erratum: doi:10.1103/PhysRevD.87.12], 2013 PRD 87 (2013) 112002 |
CMS-QCD-11-004 1212.6660 |
| 2 | ATLAS Collaboration | Measurement of dijet cross sections in $ pp $ collisions at 7 TeV centre-of-mass energy using the ATLAS detector | JHEP 05 (2014) 059 | 1312.3524 |
| 3 | CMS Collaboration | Measurement of the triple-differential dijet cross section in proton-proton collisions at $ \sqrt{s}= $ 8 TeV and constraints on parton distribution functions | EPJC 77 (2017) 746 | CMS-SMP-16-011 1705.02628 |
| 4 | ATLAS Collaboration | Measurement of inclusive jet and dijet cross-sections in proton-proton collisions at $ \sqrt{s}= $ 13 TeV with the ATLAS detector | JHEP 05 (2018) 195 | 1711.02692 |
| 5 | CMS Collaboration | Measurement of multidifferential cross sections for dijet production in proton-proton collisions at $ \sqrt{s} = 13 \text {Te}\hspace{-.08em}\text {V} $ | EPJC 85 (2025) 72 | CMS-SMP-21-008 2312.16669 |
| 6 | H. Terazawa | Subquark model of leptons and quarks | PRD 22 (1980) 184 | |
| 7 | E. Eichten, K. Lane, and M. Peskin | New tests for quark and lepton substructure | PRL 50 (1983) 811 | |
| 8 | E. Eichten, I. Hinchliffe, K. Lane, and C. Quigg | Supercollider physics | Rev. Mod. Phys. 56 (1984) 579 | |
| 9 | N. Arkani-Hamed, S. Dimopoulos, and G. Dvali | The hierarchy problem and new dimensions at a millimeter | PLB 429 (1998) 263 | hep-ph/9803315 |
| 10 | N. Arkani-Hamed, S. Dimopoulos, and G. Dvali | Phenomenology, astrophysics and cosmology of theories with sub-millimeter dimensions and TeV scale quantum gravity | PRD 59 (1999) 086004 | hep-ph/9807344 |
| 11 | P. C. Argyres, S. Dimopoulos and J. March-Russell | Black holes and sub-millimeter dimensions | PLB 441 (1998) 96 | hep-th/9808138 |
| 12 | T. Banks and W. Fischler | A model for high-energy scattering in quantum gravity | hep-th/9906038 | |
| 13 | R. Emparan, G. T. Horowitz, and R. C. Myers | Black holes radiate mainly on the brane | PRL 85 (2000) 499 | hep-th/0003118 |
| 14 | S. Dimopoulos and G. L. Landsberg | Black holes at the LHC | PRL 87 (2001) 161602 | hep-ph/0106295 |
| 15 | S. B. Giddings and S. D. Thomas | High energy colliders as black hole factories: the end of short distance physics | PRD 65 (2002) 056010 | hep-ph/0106219 |
| 16 | J. Abdallah et al. | Simplified models for dark matter searches at the LHC | Phys. Dark Univ. 9-10 8, 2015 link |
1506.03116 |
| 17 | A. Boveia et al. | Recommendations on presenting LHC searches for missing transverse energy signals using simplified $ s $-channel models of dark matter | Phys. Dark Univ. 27 (2020) 100365 | 1603.04156 |
| 18 | M. B. Gavela, J. M. No, V. Sanz, and J. F. de Troc \'o niz | Nonresonant searches for axionlike particles at the LHC | PRL 124 (2020) 051802 | 1905.12953 |
| 19 | W. Buchmuller and D. Wyler | Effective lagrangian analysis of new interactions and flavor conservation | NPB 268 (1986) 621 | |
| 20 | ATLAS Collaboration | Search for new resonances in mass distributions of jet pairs using 139 fb$ ^{-1} $ of $ pp $ collisions at $ \sqrt{s}= $ 13 TeV with the ATLAS detector | JHEP 03 (2020) 145 | 1910.08447 |
| 21 | CMS Collaboration | Search for high mass dijet resonances with a new background prediction method in proton-proton collisions at $ \sqrt{s} = $ 13 TeV | JHEP 05 (2020) 033 | CMS-EXO-19-012 1911.03947 |
| 22 | CMS Collaboration | Measurement and QCD analysis of double-differential inclusive jet cross sections in proton-proton collisions at $ \sqrt{s} = $ 13 TeV | [Addendum: \doi10./JHEP12()035], 2022 JHEP 02 (2022) 142 |
CMS-SMP-20-011 2111.10431 |
| 23 | CMS Collaboration | Search for new physics in dijet angular distributions using proton-proton collisions at $ \sqrt{s}= $ 13 TeV and constraints on dark matter and other models | [Erratum: doi:10.1140/epjc/s2-022-10278-0], 2018 EPJC 78 (2018) 789 |
CMS-EXO-16-046 1803.08030 |
| 24 | ATLAS Collaboration | Search for new phenomena in dijet events using 37 fb$ ^{-1} $ of $ pp $ collision data collected at $ \sqrt{s}= $13 TeV with the ATLAS detector | PRD 96 (2017) 052004 | 1703.09127 |
| 25 | B. L. Combridge and C. J. Maxwell | Untangling large $ p_{\text{t}} $ hadronic reactions | NPB 239 (1984) 429 | |
| 26 | CMS Collaboration | Precision luminosity measurement in proton-proton collisions at $ \sqrt{s} = $ 13 TeV in 2015 and 2016 at CMS | EPJC 81 (2021) 800 | CMS-LUM-17-003 2104.01927 |
| 27 | CMS Collaboration | CMS luminosity measurement for the 2017 data-taking period at $ \sqrt{s} = $ 13 TeV | CMS Physics Analysis Summary, 2018 CMS-PAS-LUM-17-004 |
CMS-PAS-LUM-17-004 |
| 28 | CMS Collaboration | CMS luminosity measurement for the 2018 data-taking period at $ \sqrt{s} = $ 13 TeV | CMS Physics Analysis Summary, 2019 CMS-PAS-LUM-18-002 |
CMS-PAS-LUM-18-002 |
| 29 | R. Goldouzian and M. D. Hildreth | LHC dijet angular distributions as a probe for the dimension-six triple gluon vertex | PLB 811 (2020) 135889 | 2001.02736 |
| 30 | J. Currie et al. | Precise predictions for dijet production at the LHC | PRL 119 (2017) 152001 | 1705.10271 |
| 31 | CMS Collaboration | HEPData record for this analysis | link | |
| 32 | CMS Collaboration | The CMS experiment at the CERN LHC | JINST 3 (2008) S08004 | |
| 33 | CMS Collaboration | Development of the CMS detector for the CERN LHC Run 3 | JINST 19 (2024) P05064 | CMS-PRF-21-001 2309.05466 |
| 34 | CMS Collaboration | Performance of the CMS Level-1 trigger in proton-proton collisions at $ \sqrt{s} = $ 13 TeV | JINST 15 (2020) P10017 | CMS-TRG-17-001 2006.10165 |
| 35 | CMS Collaboration | The CMS trigger system | JINST 12 (2017) P01020 | CMS-TRG-12-001 1609.02366 |
| 36 | CMS Collaboration | Performance of the CMS high-level trigger during LHC Run 2 | JINST 19 (2024) P11021 | CMS-TRG-19-001 2410.17038 |
| 37 | CMS Collaboration | Electron and photon reconstruction and identification with the CMS experiment at the CERN LHC | JINST 16 (2021) P05014 | CMS-EGM-17-001 2012.06888 |
| 38 | CMS Collaboration | Performance of the CMS muon detector and muon reconstruction with proton-proton collisions at $ \sqrt{s}= $ 13 TeV | JINST 13 (2018) P06015 | CMS-MUO-16-001 1804.04528 |
| 39 | CMS Collaboration | Description and performance of track and primary-vertex reconstruction with the CMS tracker | JINST 9 (2014) P10009 | CMS-TRK-11-001 1405.6569 |
| 40 | CMS Collaboration | Particle-flow reconstruction and global event description with the CMS detector | JINST 12 (2017) P10003 | CMS-PRF-14-001 1706.04965 |
| 41 | M. Cacciari, G. P. Salam, and G. Soyez | The anti-kt jet clustering algorithm | JHEP 04 (2008) 063 | 0802.1189 |
| 42 | M. Cacciari, G. P. Salam, and G. Soyez | FASTJET user manual | EPJC 72 (2012) 1896 | 1111.6097 |
| 43 | CMS Collaboration | Jet energy scale and resolution in the CMS experiment in pp collisions at 8 TeV | JINST 12 (2017) P02014 | CMS-JME-13-004 1607.03663 |
| 44 | CMS Collaboration | Jet algorithms performance in 13 TeV data | CMS Physics Analysis Summary, 2016 CMS-PAS-JME-16-003 |
CMS-PAS-JME-16-003 |
| 45 | CMS Collaboration | Performance of missing transverse momentum reconstruction in proton-proton collisions at $ \sqrt{s} = $ 13 TeV using the CMS detector | JINST 14 (2019) P07004 | CMS-JME-17-001 1903.06078 |
| 46 | CMS Collaboration | Technical proposal for the Phase-II upgrade of the Compact Muon Solenoid | CMS Technical Proposal CERN-LHCC-2015-010, CMS-TDR-15-02, 2015 CDS |
|
| 47 | T. Kluge, K. Rabbertz, and M. Wobisch | Fast pQCD calculations for PDF fits | in, Tsukuba, Japan, 2006 Proc. Int. Conf. DIS 200 (2006) 483 |
hep-ph/0609285 |
| 48 | A. Gehrmann-De Ridder et al. | Triple differential dijet cross section at the LHC | PRL 123 (2019) 102001 | 1905.09047 |
| 49 | NNPDF Collaboration | Parton distributions from high-precision collider data | EPJC 77 (2017) 663 | 1706.00428 |
| 50 | S. Dulat et al. | New parton distribution functions from a global analysis of quantum chromodynamics | PRD 93 (2016) 033006 | 1506.07443 |
| 51 | S. Dittmaier, A. Huss, and C. Speckner | Weak radiative corrections to dijet production at hadron colliders | JHEP 11 (2012) 095 | 1210.0438 |
| 52 | P. Skands, S. Carrazza, and J. Rojo | Tuning PYTHIA 8.1: the Monash 2013 tune | EPJC 74 (2014) 3024 | 1404.5630 |
| 53 | CMS Collaboration | Event generator tunes obtained from underlying event and multiparton scattering measurements | EPJC 76 (2016) 155 | CMS-GEN-14-001 1512.00815 |
| 54 | M. Bahr et al. | Herwig++ physics and manual | EPJC 58 (2008) 639 | 0803.0883 |
| 55 | M. H. Seymour and A. Siodmok | Constraining MPI models using $ \sigma_{eff} $ and recent Tevatron and LHC Underlying Event data | JHEP 10 (2013) 113 | 1307.5015 |
| 56 | M. Cacciari et al. | The $ t \bar{t} $ cross-section at 1.8 TeV and 1.96 TeV: A study of the systematics due to parton densities and scale dependence | JHEP 04 (2004) 068 | hep-ph/0303085 |
| 57 | A. Banfi, G. P. Salam, and G. Zanderighi | Phenomenology of event shapes at hadron colliders | JHEP 06 (2010) 038 | 1001.4082 |
| 58 | NNPDF Collaboration | Parton distributions for the LHC Run II | JHEP 04 (2015) 040 | 1410.8849 |
| 59 | GEANT4 Collaboration | GEANT4---a simulation toolkit | NIM A 506 (2003) 250 | |
| 60 | T. Sjöstrand et al. | An introduction to PYTHIA 8.2 | Comput. Phys. Commun. 191 (2015) 159 | 1410.3012 |
| 61 | CMS Collaboration | Extraction and validation of a new set of CMS PYTHIA8 tunes from underlying-event measurements | EPJC 80 (2020) 4 | CMS-GEN-17-001 1903.12179 |
| 62 | J. Alwall et al. | The automated computation of tree-level and next-to-leading order differential cross sections, and their matching to parton shower simulations | JHEP 07 (2014) 079 | 1405.0301 |
| 63 | J. Alwall et al. | Comparative study of various algorithms for the merging of parton showers and matrix elements in hadronic collisions | EPJC 53 (2008) 473 | 0706.2569 |
| 64 | J. Bellm et al. | Herwig 7.0/Herwig++ 3.0 release note | EPJC 76 (2016) 196 | 1512.01178 |
| 65 | M. Oreglia | A study of the reactions $ \psi^\prime \to \gamma \gamma \psi $ | PhD thesis, SLAC, 1980 link |
|
| 66 | E. Gaiser | Charmonium spectroscopy from radiative decays of the $ J/\psi $ and $ \psi^\prime $ | PhD thesis, Stanford U, 1982 | |
| 67 | J. Gao et al. | Next-to-leading QCD effect to the quark compositeness search at the LHC | PRL 106 (2011) 142001 | 1101.4611 |
| 68 | M. Backovic , K. Kong, and M. McCaskey | MadDM v.1.0: Computation of dark matter relic abundance using MadGraph5 | Phys. Dark Univ. 5-6 18, 2014 link |
1308.4955 |
| 69 | M. Backovic et al. | Direct detection of dark matter with MadDM v.2.0 | Phys. Dark Univ. 9-10 37, 2015 link |
1505.04190 |
| 70 | G. F. Giudice, R. Rattazzi, and J. D. Wells | Quantum gravity and extra dimensions at high-energy colliders | NPB 544 (1999) 3 | hep-ph/9811291 |
| 71 | T. Han, J. D. Lykken, and R. Zhang | On Kaluza--Klein states from large extra dimensions | PRD 59 (1999) 105006 | hep-ph/9811350 |
| 72 | K. Cheung and G. Landsberg | Drell--Yan and diphoton production at hadron colliders and low scale gravity model | PRD 62 (2000) 076003 | hep-ph/9909218 |
| 73 | X. Calmet, W. Gong, and S. D. H. Hsu | Colorful quantum black holes at the LHC | PLB 668 (2008) 20 | 0806.4605 |
| 74 | P. Meade, L. Randall | Black holes and quantum gravity at the LHC | JHEP 05 (2008) 003 | 0708.3017 |
| 75 | D. M. Gingrich | Quantum black holes with charge, colour, and spin at the LHC | JPG 37 (2010) 105008 | 0912.0826 |
| 76 | P. Kanti and J. March-Russell | Calculable corrections to brane black hole decay. 2. greybody factors for spin 1/2 and 1 | PRD 67 (2003) 104019 | hep-ph/0212199 |
| 77 | L. Randall, R. Sundrum | Large mass hierarchy from a small extra dimension | PRL 83 (1999) 3370 | hep-ph/9905221 |
| 78 | L. Randall, R. Sundrum | An alternative to compactification | PRL 83 (1999) 4690 | hep-th/9906064 |
| 79 | D. M. Gingrich | Monte Carlo event generator for black hole production and decay in proton-proton collisions | Comput. Phys. Commun. 181 (2010) 1917 | 0911.5370 |
| 80 | H. Georgi, D. B. Kaplan, and L. Randall | Manifesting the invisible axion at low-energies | PLB 169 (1986) 73 | |
| 81 | K. Choi, K. Kang, and J. E. Kim | Effects of $ \eta^\prime $ in low-energy axion physics | PLB 181 (1986) 145 | |
| 82 | R. D. Peccei and H. R. Quinn | CP conservation in the presence of instantons | PRL 38 (1977) 1440 | |
| 83 | I. Brivio et al. | ALPs effective field theory and collider signatures | EPJC 77 (2017) 572 | 1701.05379 |
| 84 | C. Zhang and S. Willenbrock | Effective-field-theory approach to top-quark production and decay | PRD 83 (2011) 034006 | 1008.3869 |
| 85 | V. Hirschi, F. Maltoni, I. Tsinikos, and E. Vryonidou | Constraining anomalous gluon self-interactions at the LHC: a reappraisal | JHEP 07 (2018) 093 | 1806.04696 |
| 86 | CMS Collaboration | Jet energy scale and resolution performances with 13 TeV data | CMS Detector Performance Summary CERN-CMS-DP-2016-020, 2016 CDS |
|
| 87 | G. Cowan, K. Cranmer, E. Gross, and O. Vitells | Asymptotic formulae for likelihood-based tests of new physics | EPJC 71 (2011) 1554 | 1007.1727 |
| 88 | ATLAS and CMS Collaborations, and the LHC Higgs Combination Group | Procedure for the LHC Higgs boson search combination in summer 2011 | Technical Report CMS-NOTE-2011-005, ATL-PHYS-PUB-2011-11, 2011 | |
| 89 | T. Junk | Confidence level computation for combining searches with small statistics | NIM A 434 (1999) 435 | hep-ex/9902006 |
| 90 | A. L. Read | Presentation of search results: The $ {CL}_{s} $ technique | JPG 28 (2002) 2693 | |
| 91 | CMS Collaboration | The CMS statistical analysis and combination tool: Combine | Comput. Softw. Big Sci. 8 (2024) 19 | CMS-CAT-23-001 2404.06614 |
| 92 | F. Krauss, S. Kuttimalai, and T. Plehn | LHC multijet events as a probe for anomalous dimension-six gluon interactions | PRD 95 (2017) 035024 | 1611.00767 |
| 93 | J. Ellis et al. | Top, Higgs, diboson and electroweak fit to the standard model effective field theory | JHEP 04 (2021) 279 | 2012.02779 |
| 94 | S. Schmitt | TUnfold, an algorithm for correcting migration effects in high energy physics | JINST 7 (2012) T10003 | 1205.6201 |
|
|
Compact Muon Solenoid LHC, CERN |
|

|

|

|

|

|