

Compact Muon Solenoid
LHC, CERN
| CMS-SMP-16-011 ; CERN-EP-2017-061 | ||
| Measurement of the triple-differential dijet cross section in proton-proton collisions at $ \sqrt{s} = $ 8 TeV and constraints on parton distribution functions | ||
| CMS Collaboration | ||
| 7 May 2017 | ||
| Eur. Phys. J. C 77 (2017) 746 | ||
| Abstract: A measurement is presented of the triple-differential dijet cross section at a centre-of-mass energy of 8 TeV using 19.7 fb$^{-1}$ of data collected with the CMS detector in proton-proton collisions at the LHC. The cross section is measured as a function of the average transverse momentum, half the rapidity separation, and the boost of the two leading jets in the event. The cross section is corrected for detector effects and compared to calculations in perturbative quantum chromodynamics at next-to-leading order accuracy, complemented with electroweak and nonperturbative corrections. New constraints on parton distribution functions are obtained and the inferred value of the strong coupling constant is $\alpha_S(M_\text{Z}) = $ 0.1199 $\pm$ 0.0015 (exp) $_{-0.0020}^{+0.0031}$ (theo), where $M_\text{Z}$ is the mass of the Z boson. | ||
| Links: e-print arXiv:1705.02628 [hep-ex] (PDF) ; CDS record ; inSPIRE record ; HepData record ; CADI line (restricted) ; | ||
| Figures | |
png pdf |
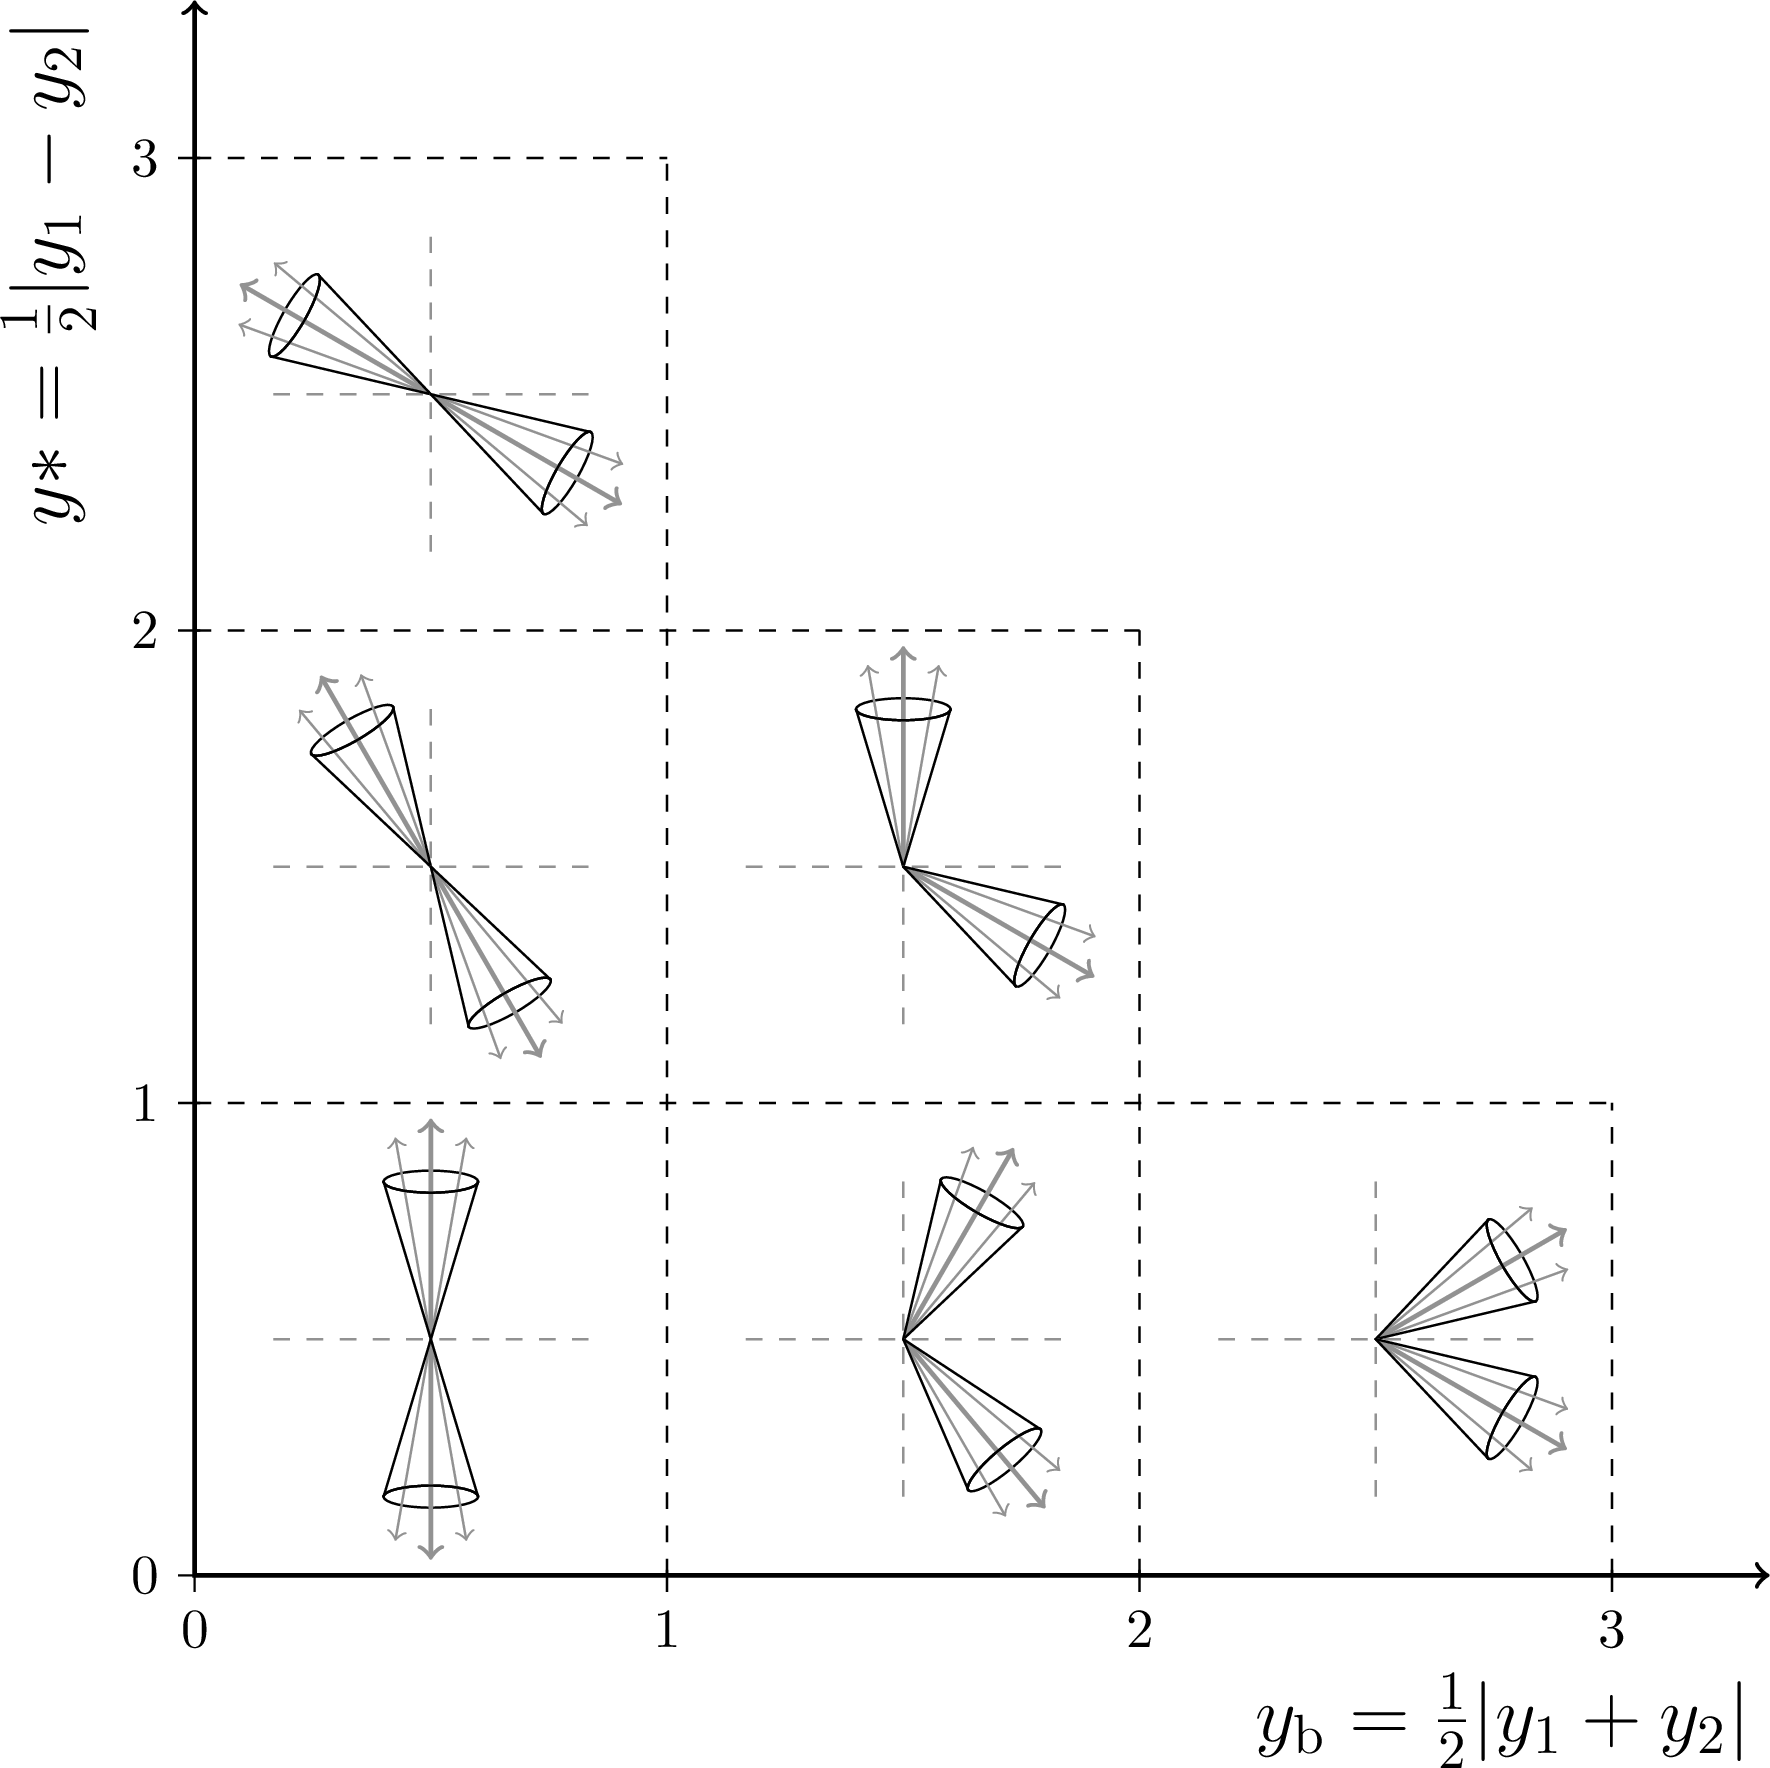
Figure 1:
Illustration of the dijet event topologies in the ${y^{*}}$ and ${y_{\mathrm {b}}}$ kinematic plane. The dijet system can be classified as a same-side or opposite-side jet event according to the boost of the two leading jets, thereby providing insight into the parton kinematics. |
png pdf |
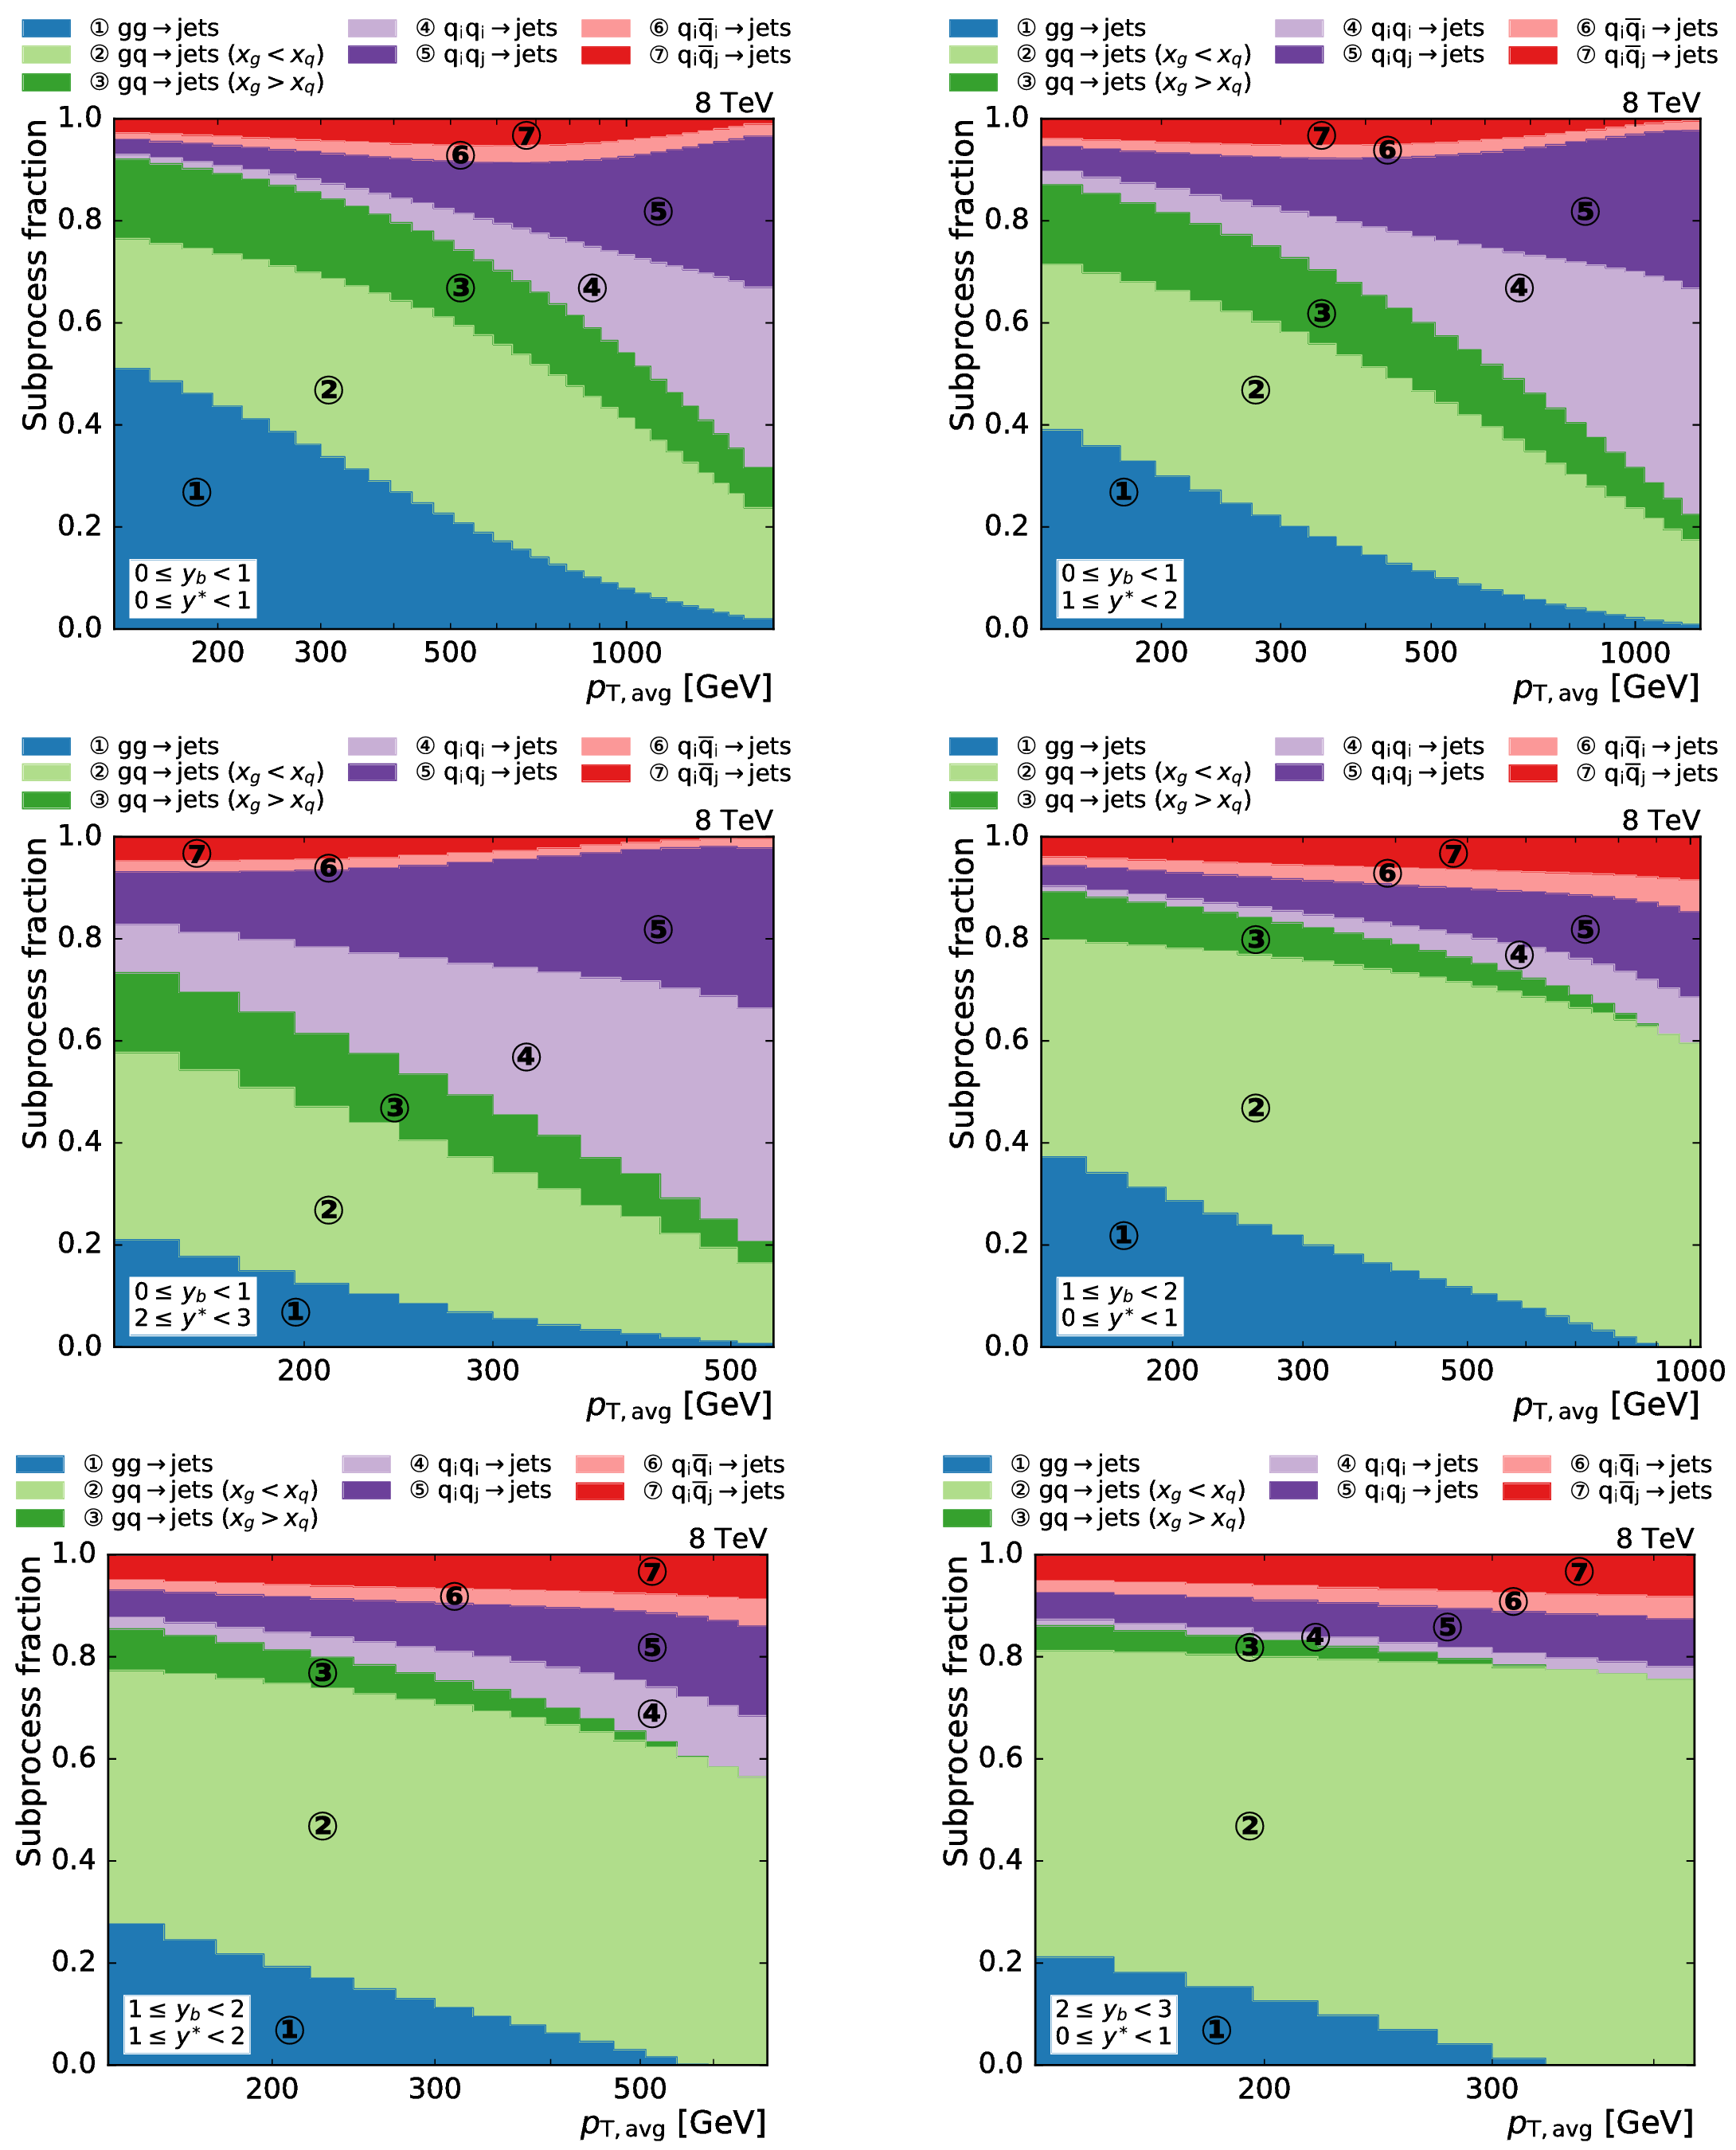
Figure 2:
Relative contributions of all subprocesses to the total cross section at NLO as a function of $ {p_{\mathrm {T,avg}}} $ in the various ${y^{*}}$ and $ {y_{\mathrm {b}}} $ bins. The subprocess contributions are grouped into seven categories according to the type of the incoming partons. The calculations have been performed with NLOJet++. The notation implies the sum over initial-state parton flavors as well as interchanged quarks and antiquarks. |

png pdf |
Figure 2-a:
Relative contributions of all subprocesses to the total cross section at NLO as a function of $ {p_{\mathrm {T,avg}}} $ in the (0 $ \leq {{y_{\mathrm {b}}}} < $ 1, 0 $ \leq {y^{*}} < $ 1) bin. The subprocess contributions are grouped into seven categories according to the type of the incoming partons. The calculations have been performed with NLOJet++. The notation implies the sum over initial-state parton flavors as well as interchanged quarks and antiquarks. |

png pdf |
Figure 2-b:
Relative contributions of all subprocesses to the total cross section at NLO as a function of $ {p_{\mathrm {T,avg}}} $ in the (0 $ \leq {{y_{\mathrm {b}}}} < $ 1, 1 $ \leq {y^{*}} < $ 2) bin. The subprocess contributions are grouped into seven categories according to the type of the incoming partons. The calculations have been performed with NLOJet++. The notation implies the sum over initial-state parton flavors as well as interchanged quarks and antiquarks. |
png pdf |
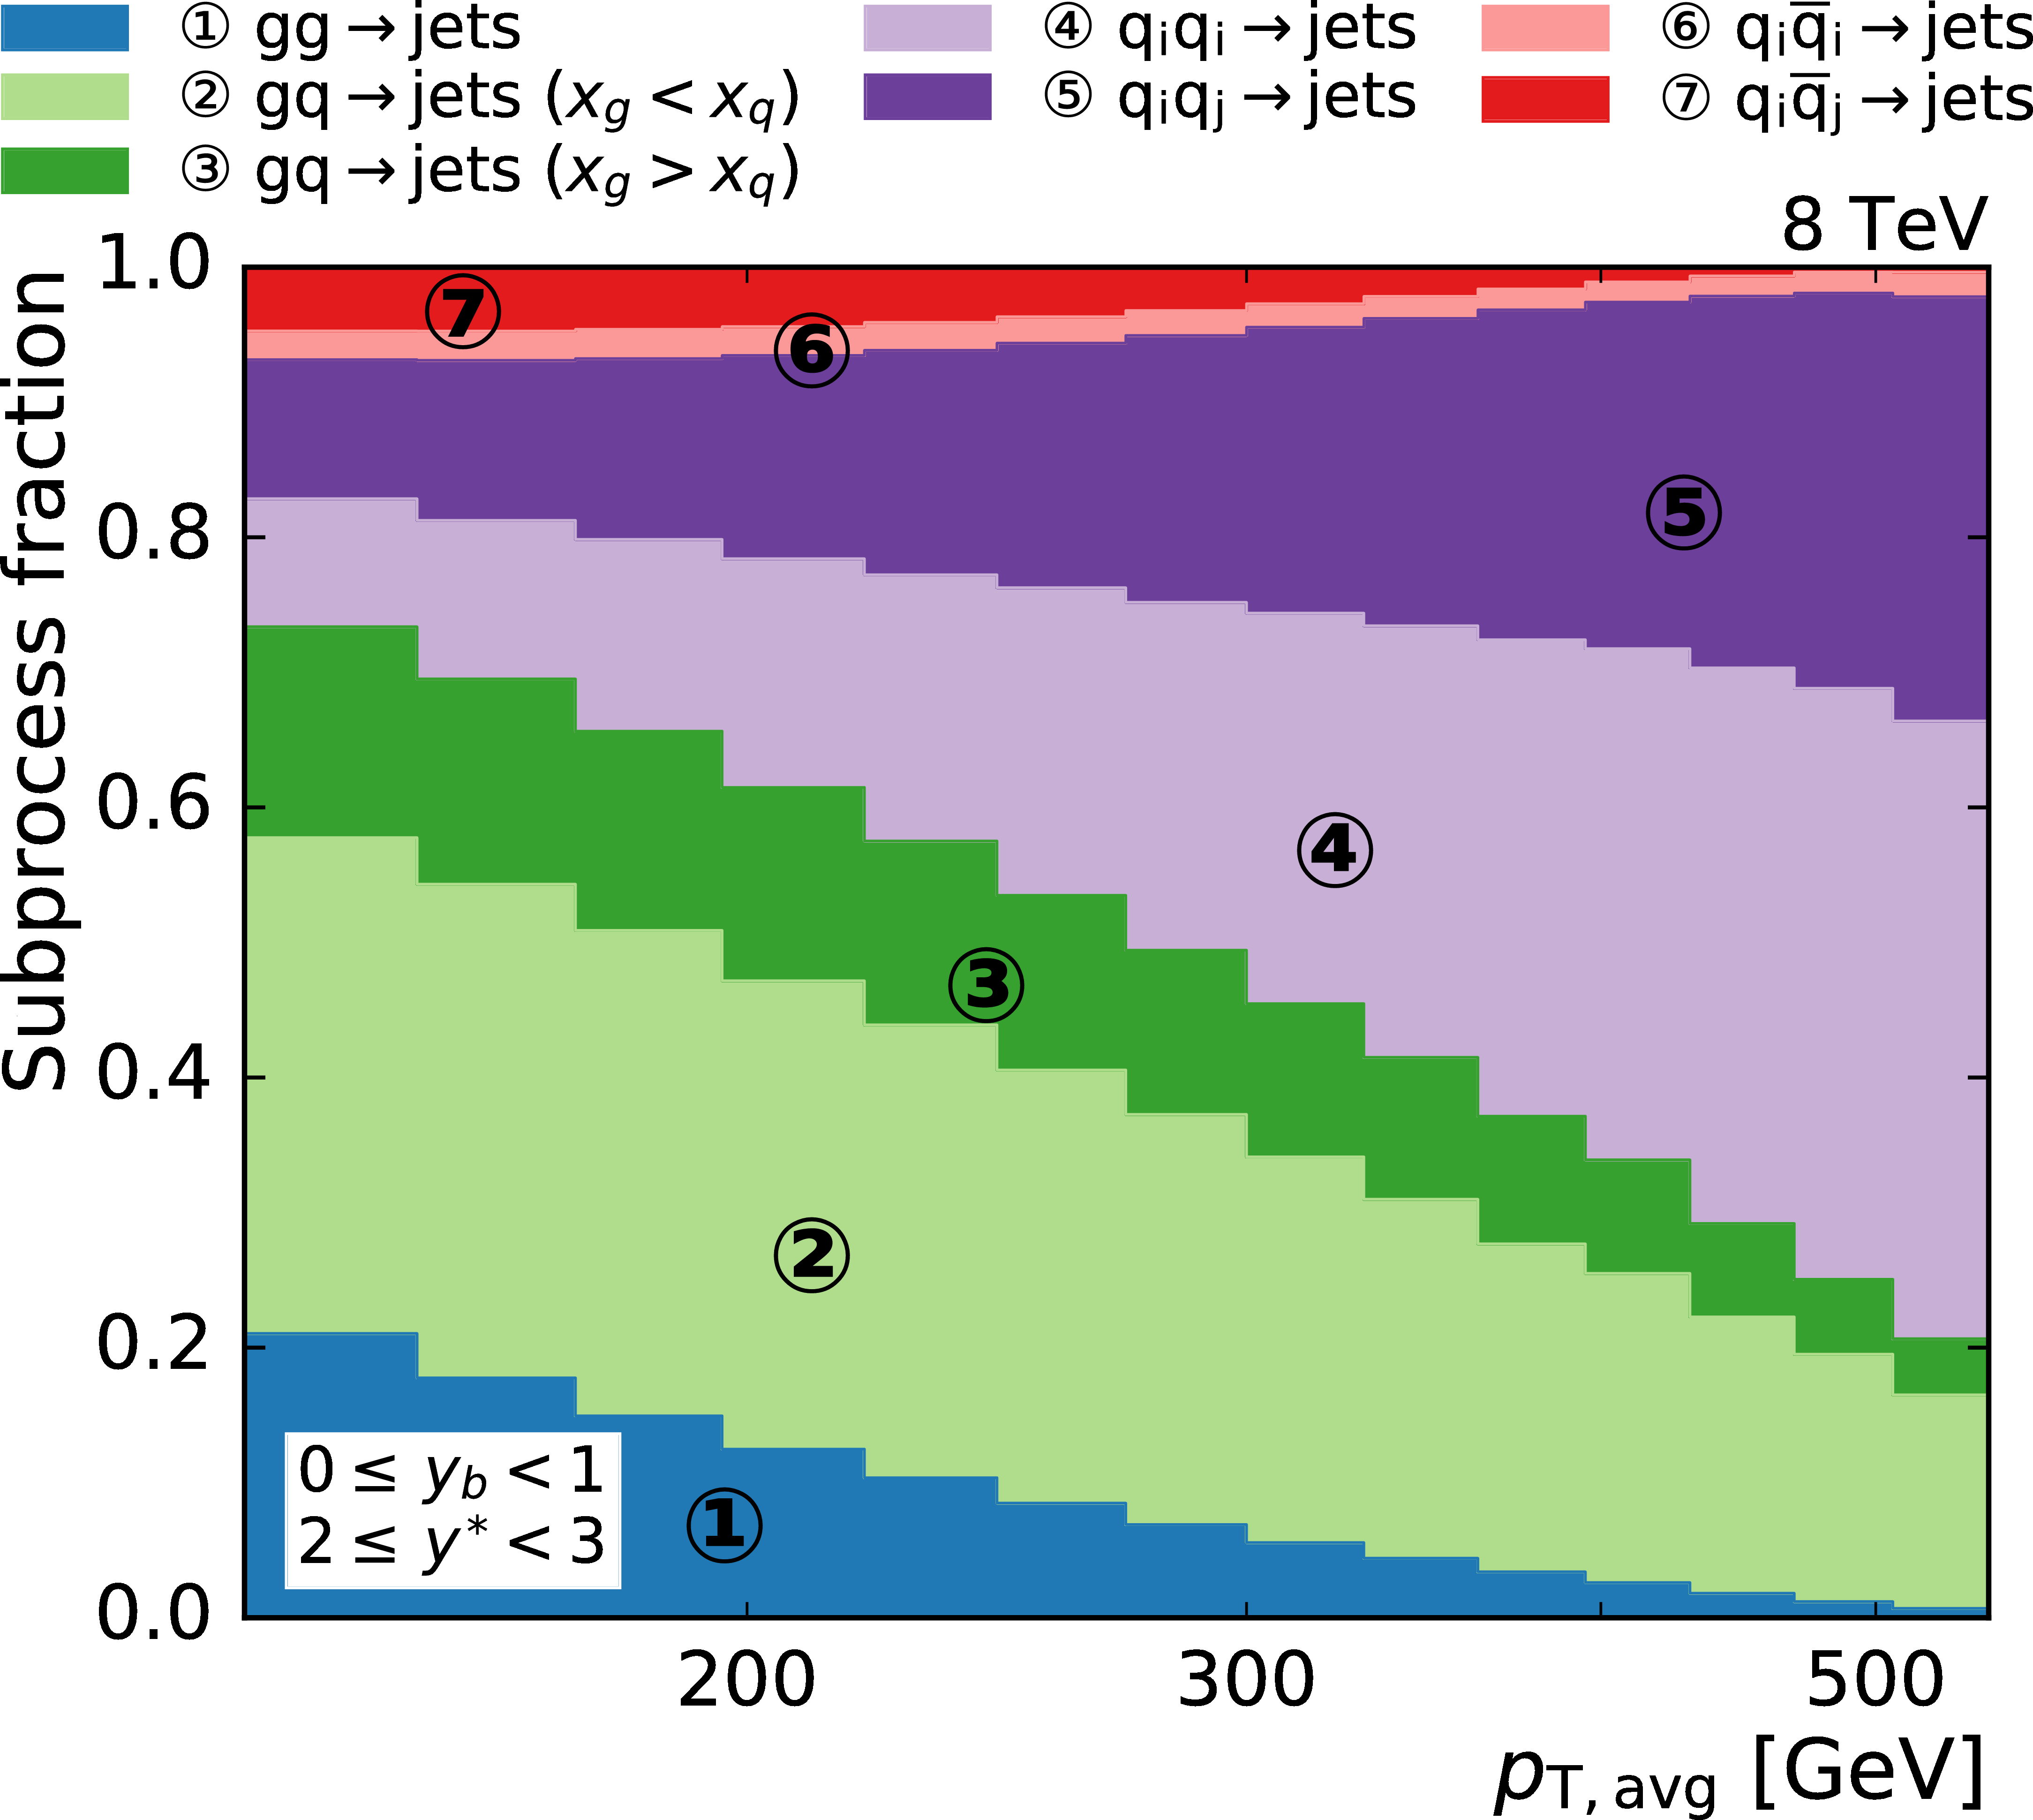
Figure 2-c:
Relative contributions of all subprocesses to the total cross section at NLO as a function of $ {p_{\mathrm {T,avg}}} $ in the (0 $ \leq {{y_{\mathrm {b}}}} < $ 1, 2 $ \leq {y^{*}} < $ 3) bin. The subprocess contributions are grouped into seven categories according to the type of the incoming partons. The calculations have been performed with NLOJet++. The notation implies the sum over initial-state parton flavors as well as interchanged quarks and antiquarks. |

png pdf |
Figure 2-d:
Relative contributions of all subprocesses to the total cross section at NLO as a function of $ {p_{\mathrm {T,avg}}} $ in the (1 $ \leq {{y_{\mathrm {b}}}} < $ 2, 0 $ \leq {y^{*}} < $ 1) bin. The subprocess contributions are grouped into seven categories according to the type of the incoming partons. The calculations have been performed with NLOJet++. The notation implies the sum over initial-state parton flavors as well as interchanged quarks and antiquarks. |
png pdf |
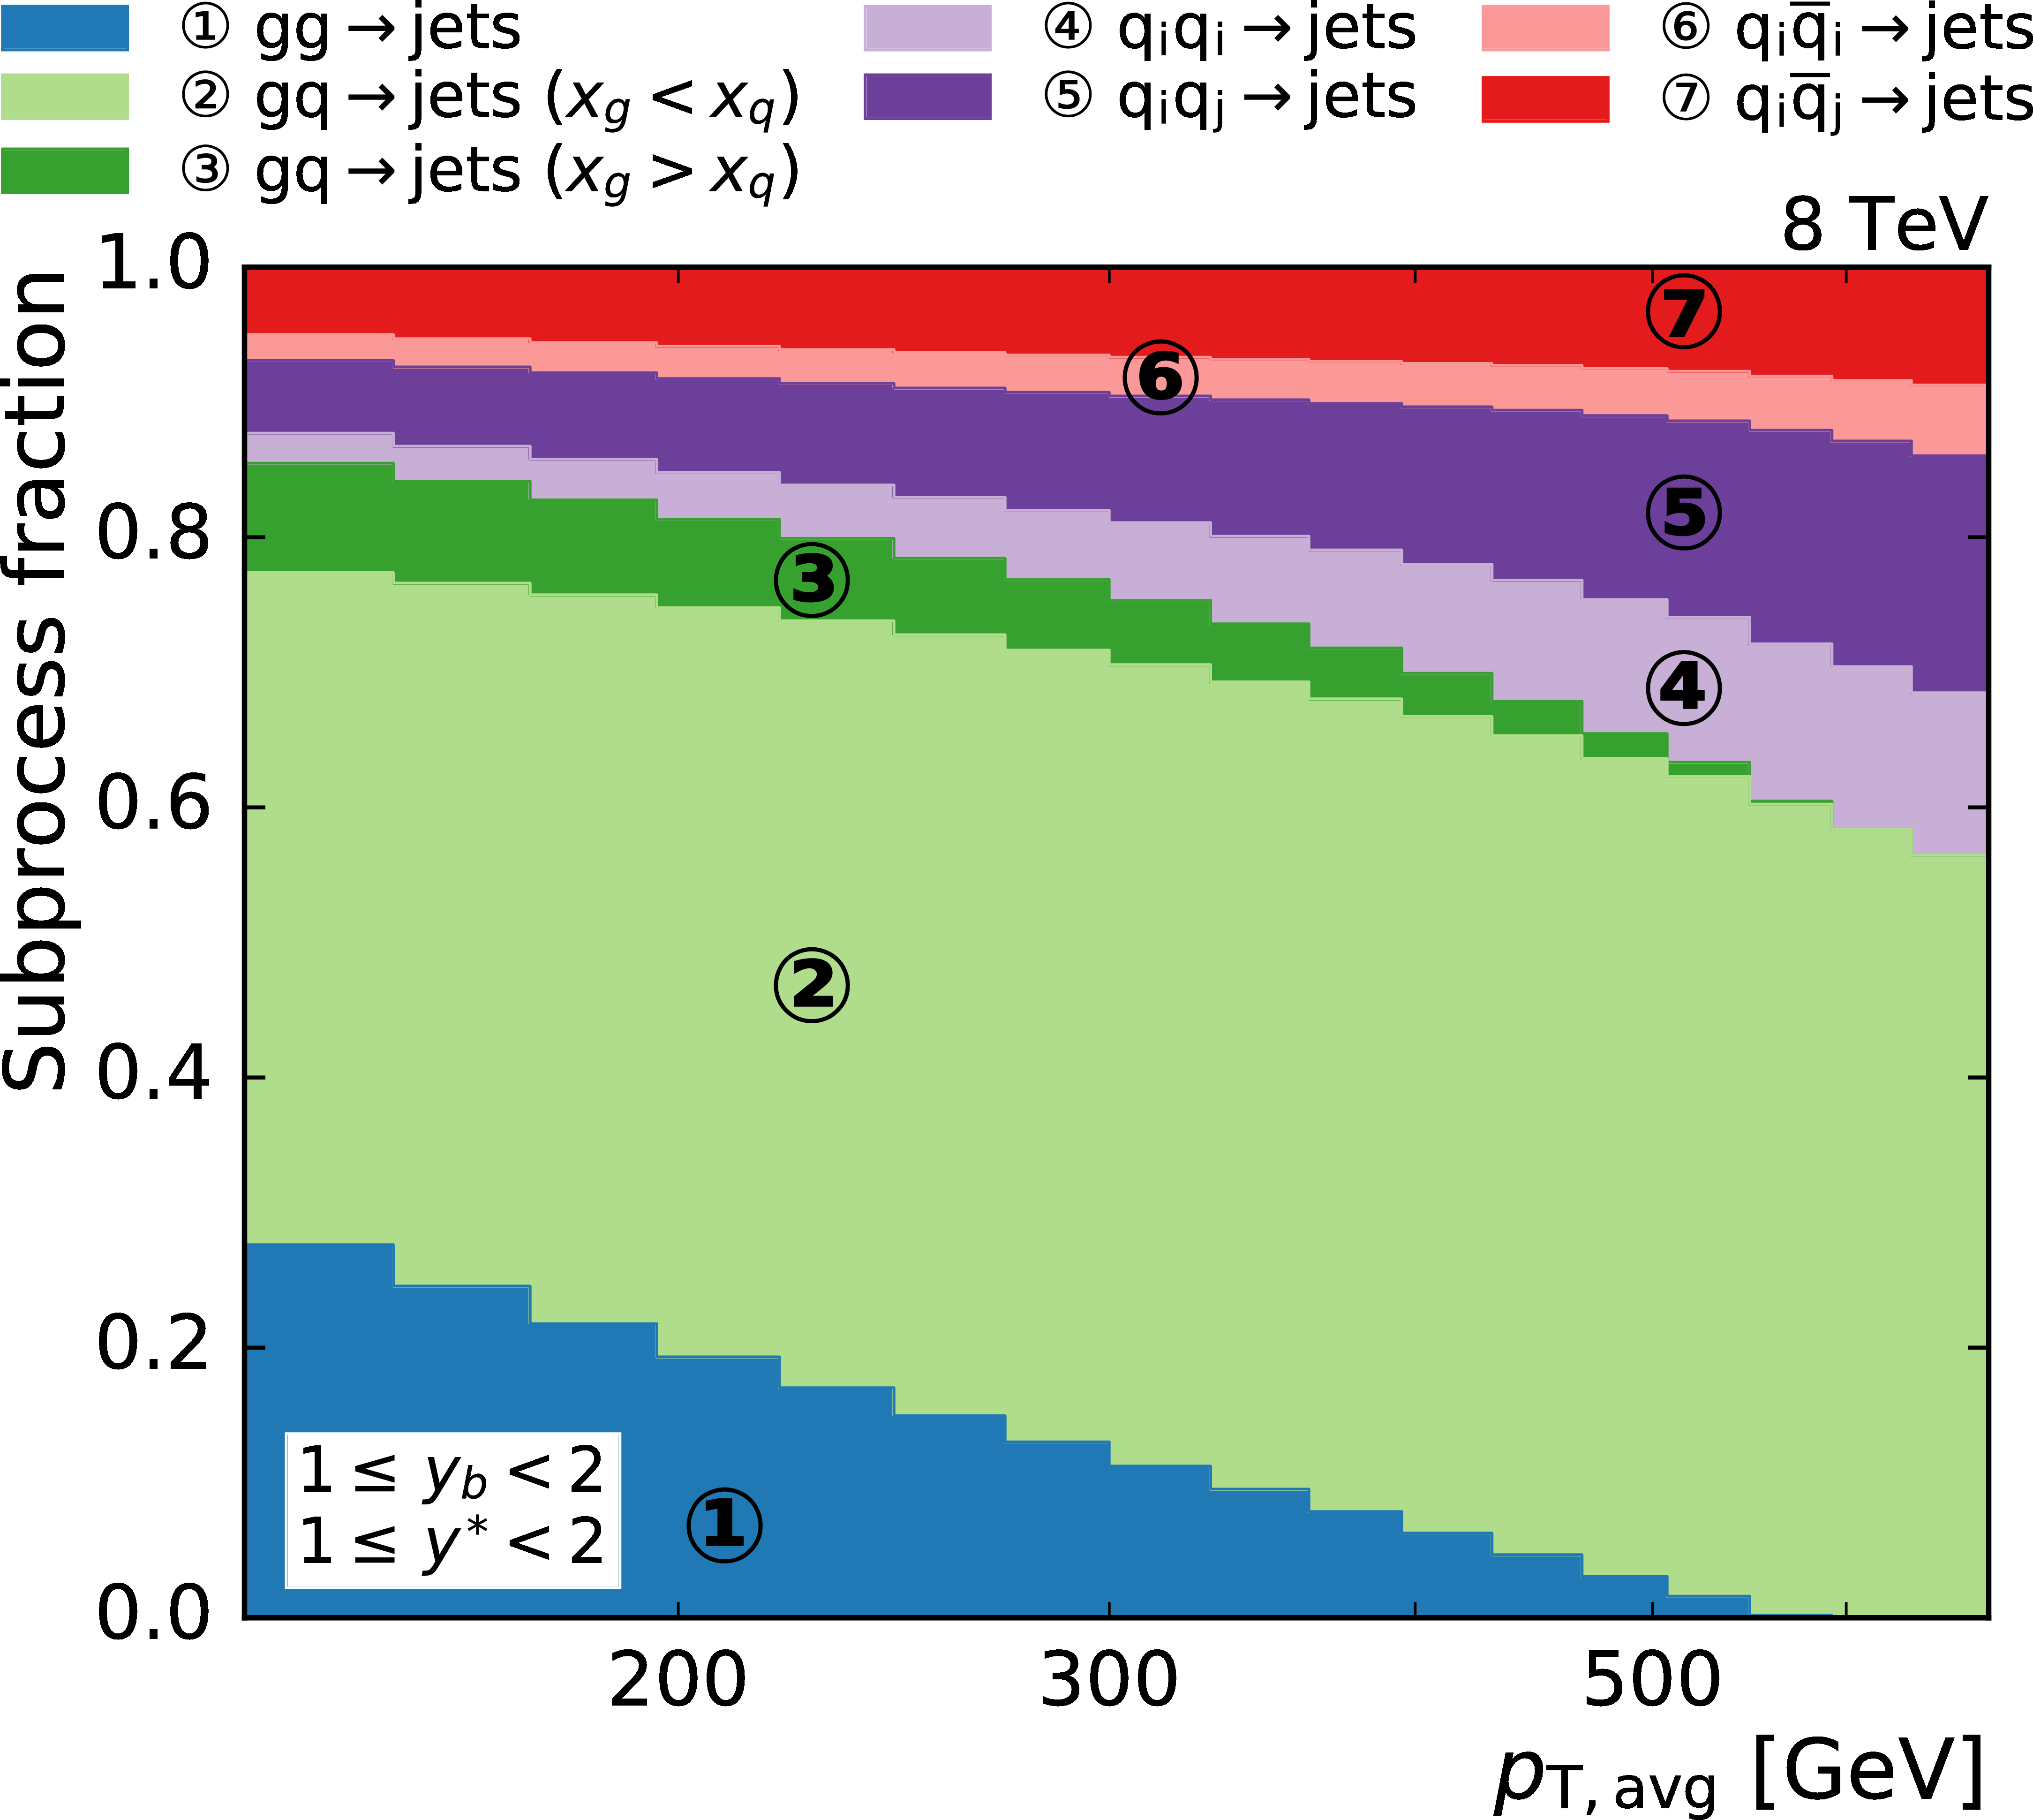
Figure 2-e:
Relative contributions of all subprocesses to the total cross section at NLO as a function of $ {p_{\mathrm {T,avg}}} $ in the (1 $ \leq {{y_{\mathrm {b}}}} < $ 2, 1 $ \leq {y^{*}} < $ 2) bin. The subprocess contributions are grouped into seven categories according to the type of the incoming partons. The calculations have been performed with NLOJet++. The notation implies the sum over initial-state parton flavors as well as interchanged quarks and antiquarks. |

png pdf |
Figure 2-f:
Relative contributions of all subprocesses to the total cross section at NLO as a function of $ {p_{\mathrm {T,avg}}} $ in the (2 $ \leq {{y_{\mathrm {b}}}} < $ 3, 0 $ \leq {y^{*}} < $ 1) bin. The subprocess contributions are grouped into seven categories according to the type of the incoming partons. The calculations have been performed with NLOJet++. The notation implies the sum over initial-state parton flavors as well as interchanged quarks and antiquarks. |
png pdf |
Figure 3:
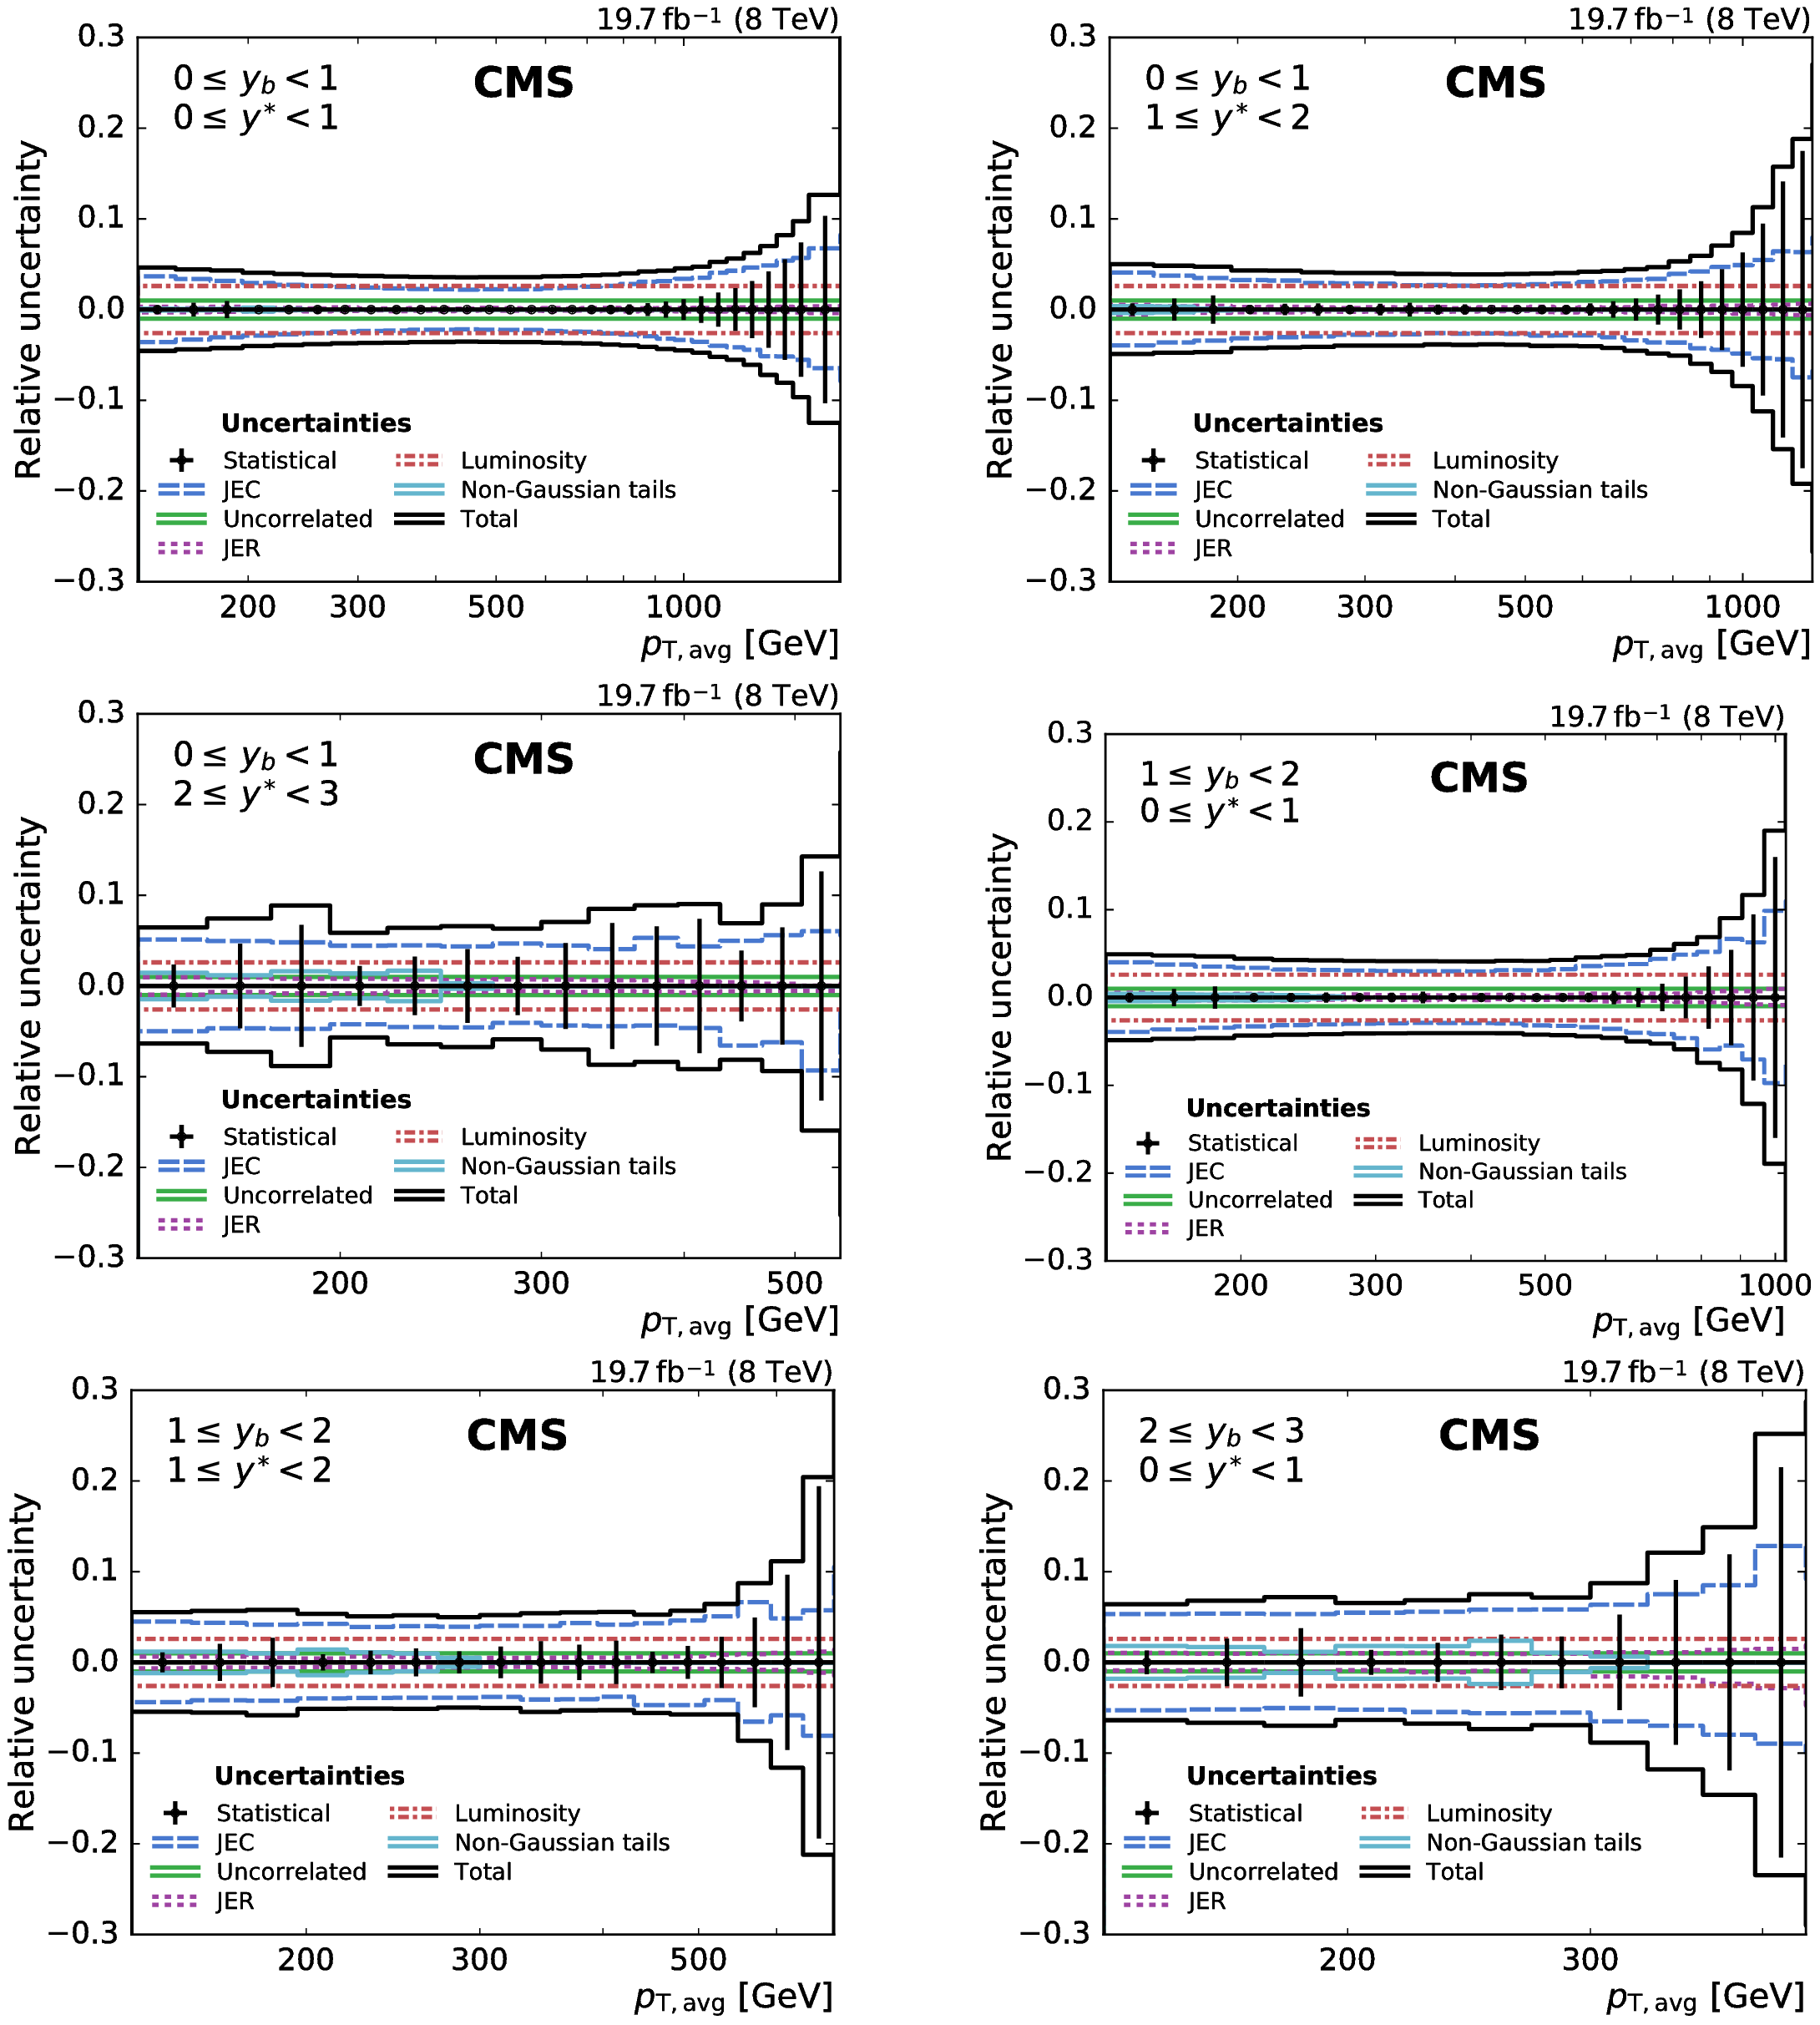
Overview of all experimental uncertainties affecting the cross section measurement in six bins of $ {y_{\mathrm {b}}} $ and ${y^{*}}$. The error bars indicate the statistical uncertainty after unfolding. The different lines show the uncertainties resulting from jet energy corrections, jet energy resolution, integrated luminosity, non-Gaussian tails in the resolution, and from residual effects included in the uncorrelated uncertainty. The total uncertainty is obtained by adding all uncertainties in quadrature. |

png pdf |
Figure 3-a:
Overview of all experimental uncertainties affecting the cross section measurement in the (0 $ \leq {{y_{\mathrm {b}}}} < $ 1, 0 $ \leq {y^{*}} < $ 1) bin. The error bars indicate the statistical uncertainty after unfolding. The different lines show the uncertainties resulting from jet energy corrections, jet energy resolution, integrated luminosity, non-Gaussian tails in the resolution, and from residual effects included in the uncorrelated uncertainty. The total uncertainty is obtained by adding all uncertainties in quadrature. |
png pdf |
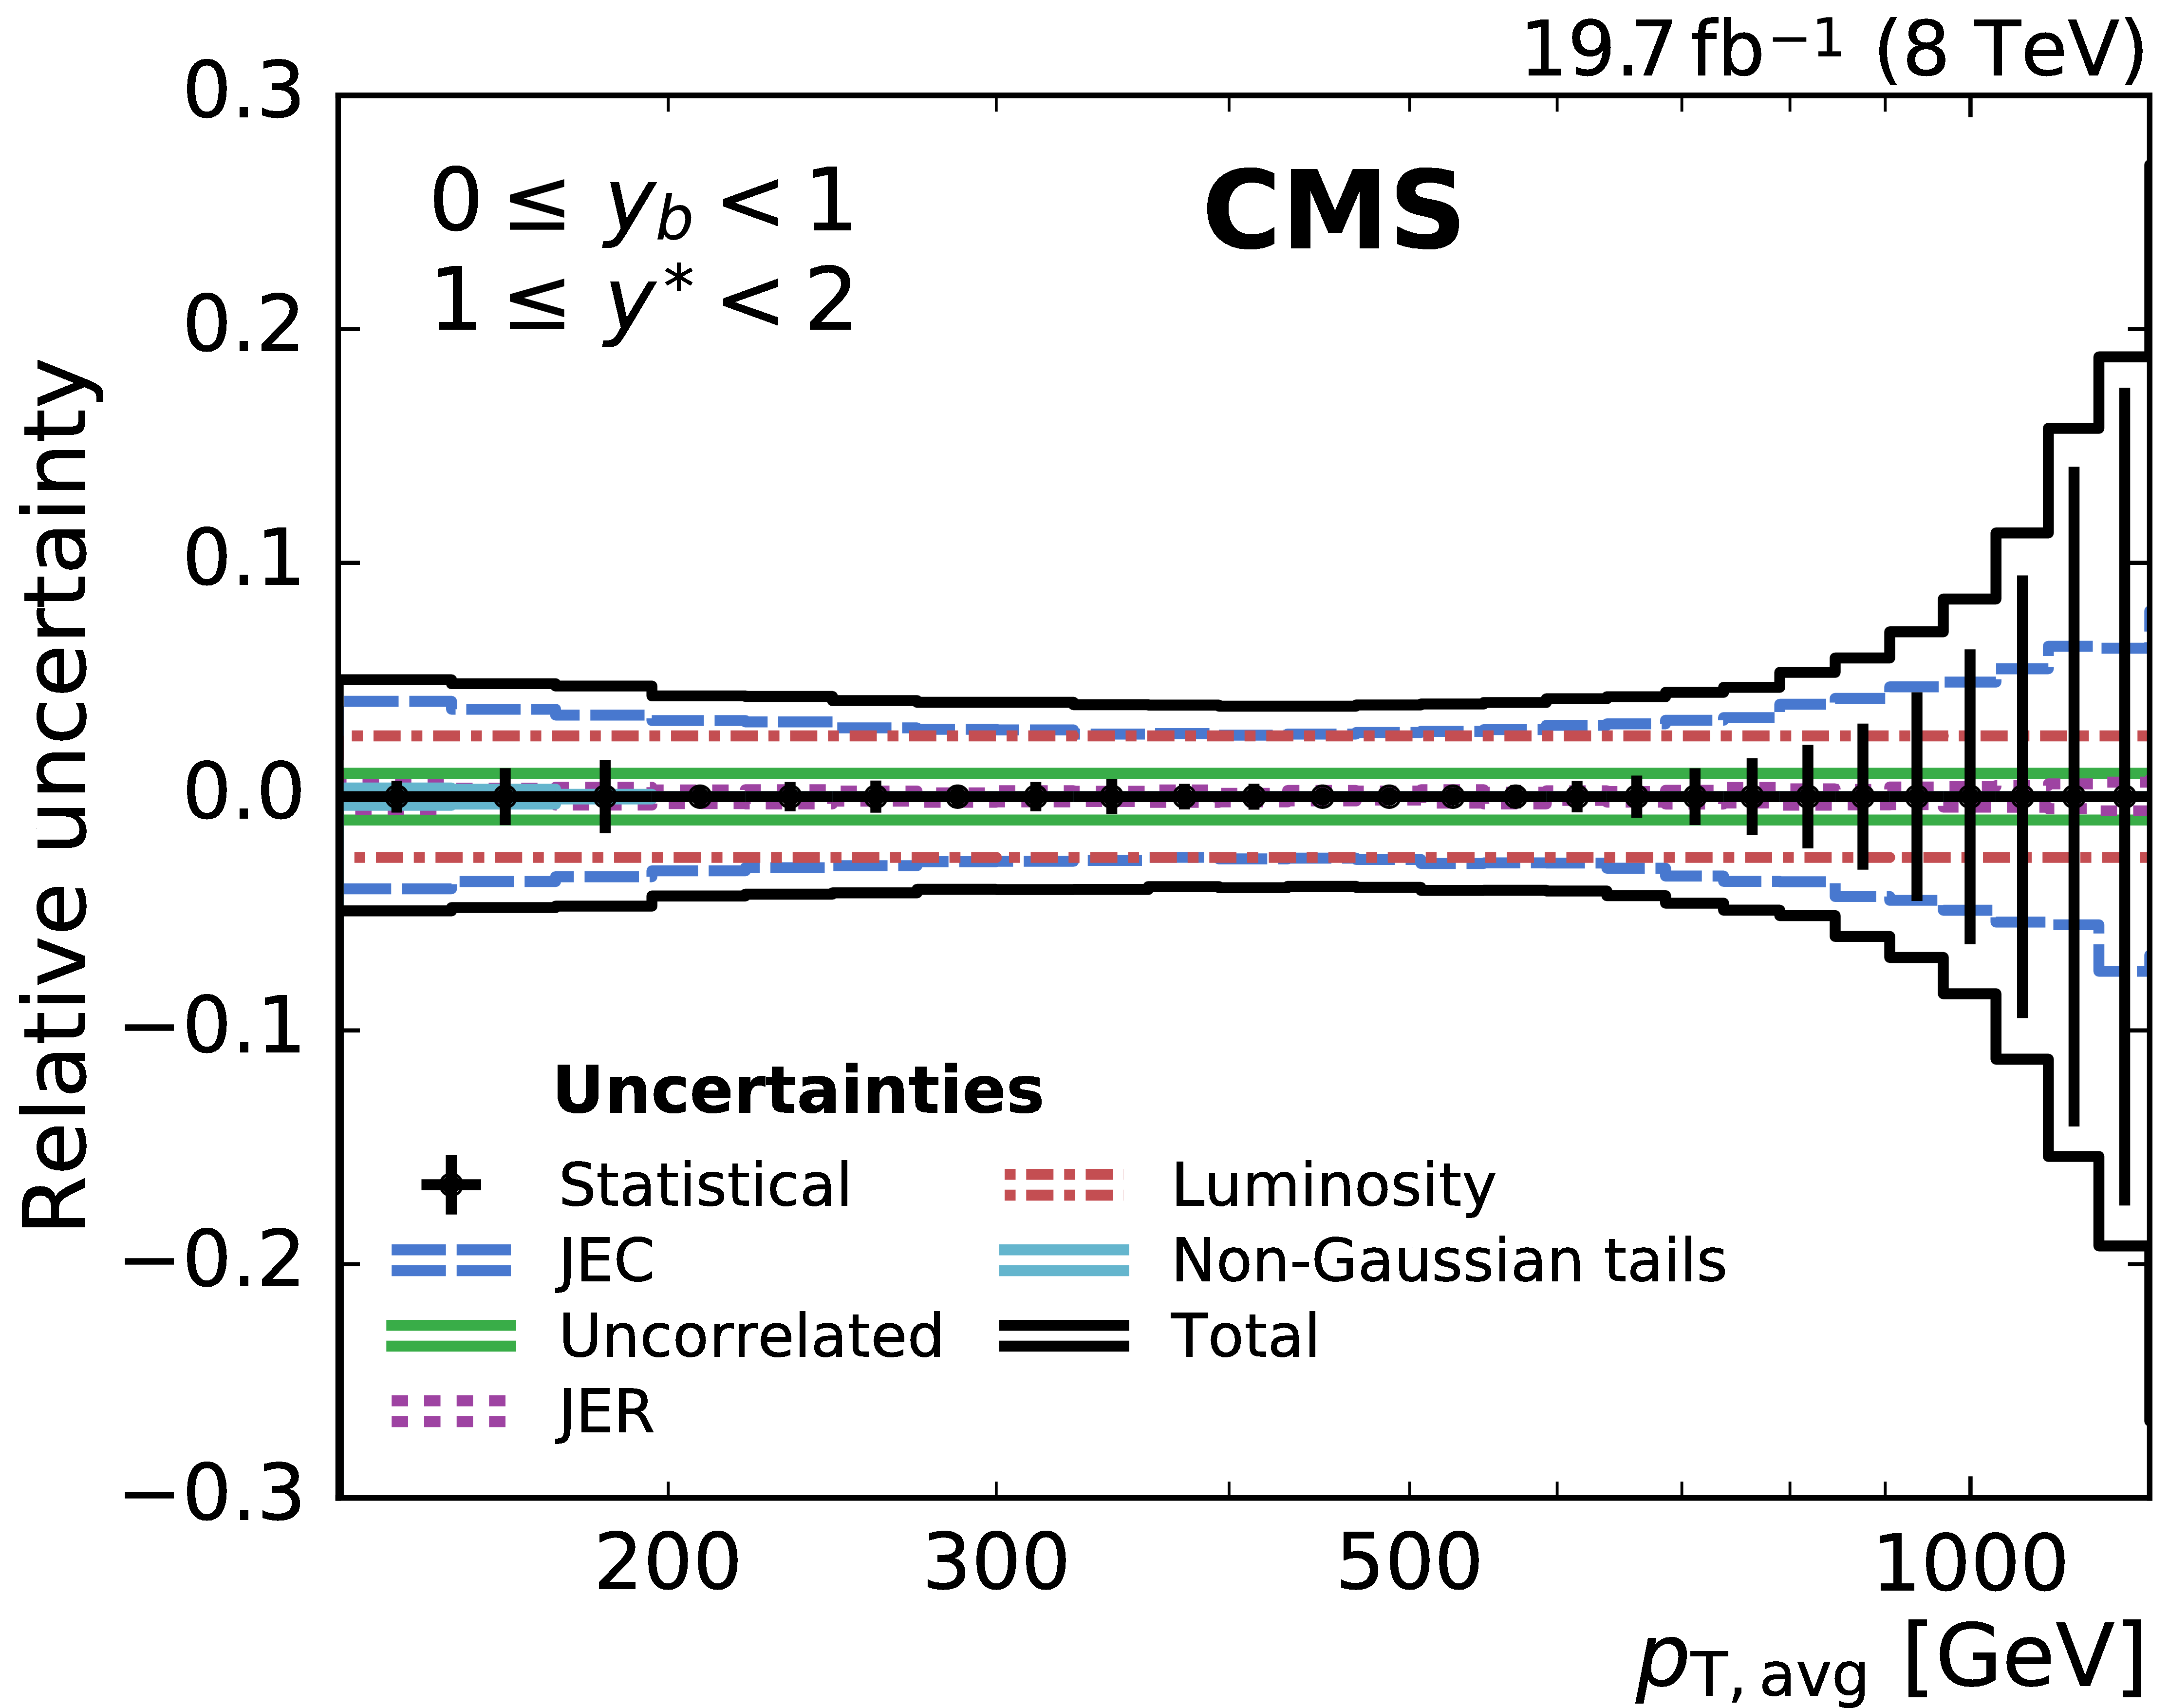
Figure 3-b:
Overview of all experimental uncertainties affecting the cross section measurement in the (0 $ \leq {{y_{\mathrm {b}}}} < $ 1, 1 $ \leq {y^{*}} < $ 2) bin. The error bars indicate the statistical uncertainty after unfolding. The different lines show the uncertainties resulting from jet energy corrections, jet energy resolution, integrated luminosity, non-Gaussian tails in the resolution, and from residual effects included in the uncorrelated uncertainty. The total uncertainty is obtained by adding all uncertainties in quadrature. |

png pdf |
Figure 3-c:
Overview of all experimental uncertainties affecting the cross section measurement in the (0 $ \leq {{y_{\mathrm {b}}}} < $ 1, 2 $ \leq {y^{*}} < $ 3) bin. The error bars indicate the statistical uncertainty after unfolding. The different lines show the uncertainties resulting from jet energy corrections, jet energy resolution, integrated luminosity, non-Gaussian tails in the resolution, and from residual effects included in the uncorrelated uncertainty. The total uncertainty is obtained by adding all uncertainties in quadrature. |

png pdf |
Figure 3-d:
Overview of all experimental uncertainties affecting the cross section measurement in the (1 $ \leq {{y_{\mathrm {b}}}} < $ 2, 0 $ \leq {y^{*}} < $ 1) bin. The error bars indicate the statistical uncertainty after unfolding. The different lines show the uncertainties resulting from jet energy corrections, jet energy resolution, integrated luminosity, non-Gaussian tails in the resolution, and from residual effects included in the uncorrelated uncertainty. The total uncertainty is obtained by adding all uncertainties in quadrature. |
png pdf |
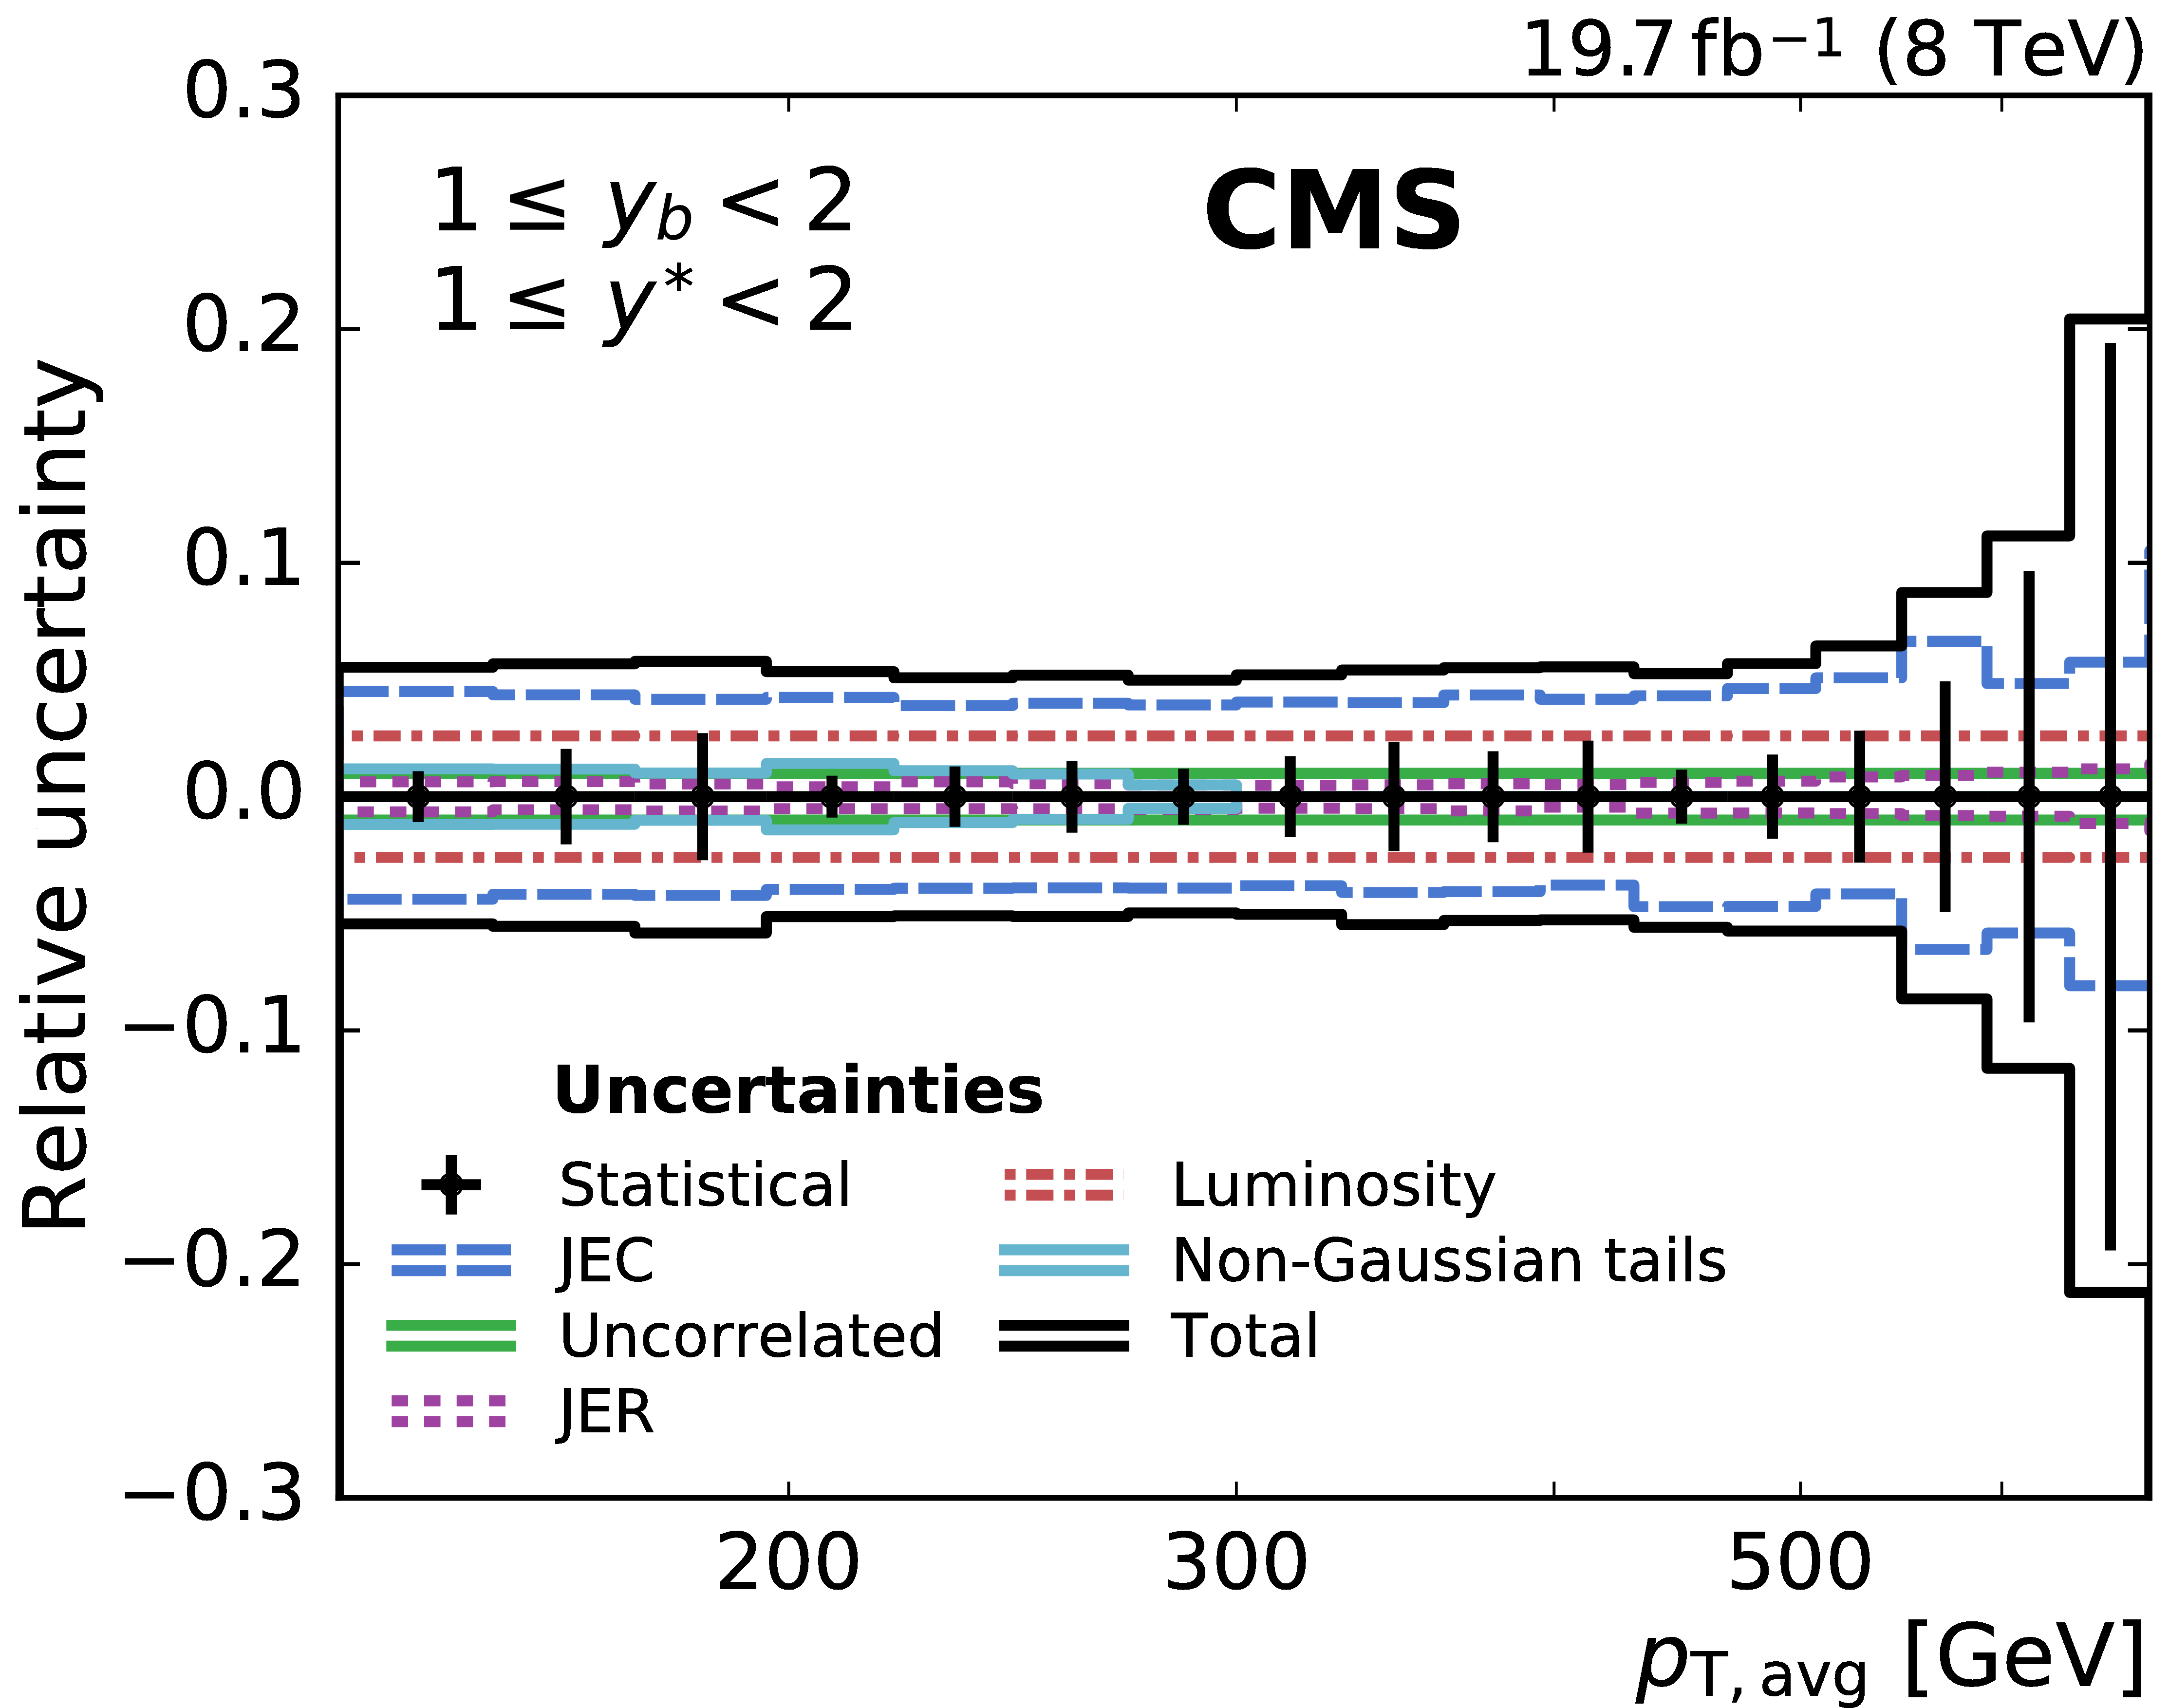
Figure 3-e:
Overview of all experimental uncertainties affecting the cross section measurement in the (1 $ \leq {{y_{\mathrm {b}}}} < $ 2, 1 $ \leq {y^{*}} < $ 2) bin. The error bars indicate the statistical uncertainty after unfolding. The different lines show the uncertainties resulting from jet energy corrections, jet energy resolution, integrated luminosity, non-Gaussian tails in the resolution, and from residual effects included in the uncorrelated uncertainty. The total uncertainty is obtained by adding all uncertainties in quadrature. |

png pdf |
Figure 3-f:
Overview of all experimental uncertainties affecting the cross section measurement in the (2 $ \leq {{y_{\mathrm {b}}}} < $ 3, 0 $ \leq {y^{*}} < $ 1) bin. The error bars indicate the statistical uncertainty after unfolding. The different lines show the uncertainties resulting from jet energy corrections, jet energy resolution, integrated luminosity, non-Gaussian tails in the resolution, and from residual effects included in the uncorrelated uncertainty. The total uncertainty is obtained by adding all uncertainties in quadrature. |

png pdf |
Figure 4:
Overview of the theoretical correction factors. For each of the six analysis bins the NLO QCD (top left), the electroweak (top right), and the NP correction factor (bottom) are shown as a function of $ {p_{\mathrm {T,avg}}} $. The NLO QCD correction has been derived with the same NLO PDF in numerator and denominator and is included in the NLO prediction by NLOJet++. |

png pdf |
Figure 4-a:
Overview of the theoretical correction factors. For each of the six analysis bins the NLO QCD correction factor is shown as a function of $ {p_{\mathrm {T,avg}}} $. The NLO QCD correction has been derived with the same NLO PDF in numerator and denominator and is included in the NLO prediction by NLOJet++. |
png pdf |
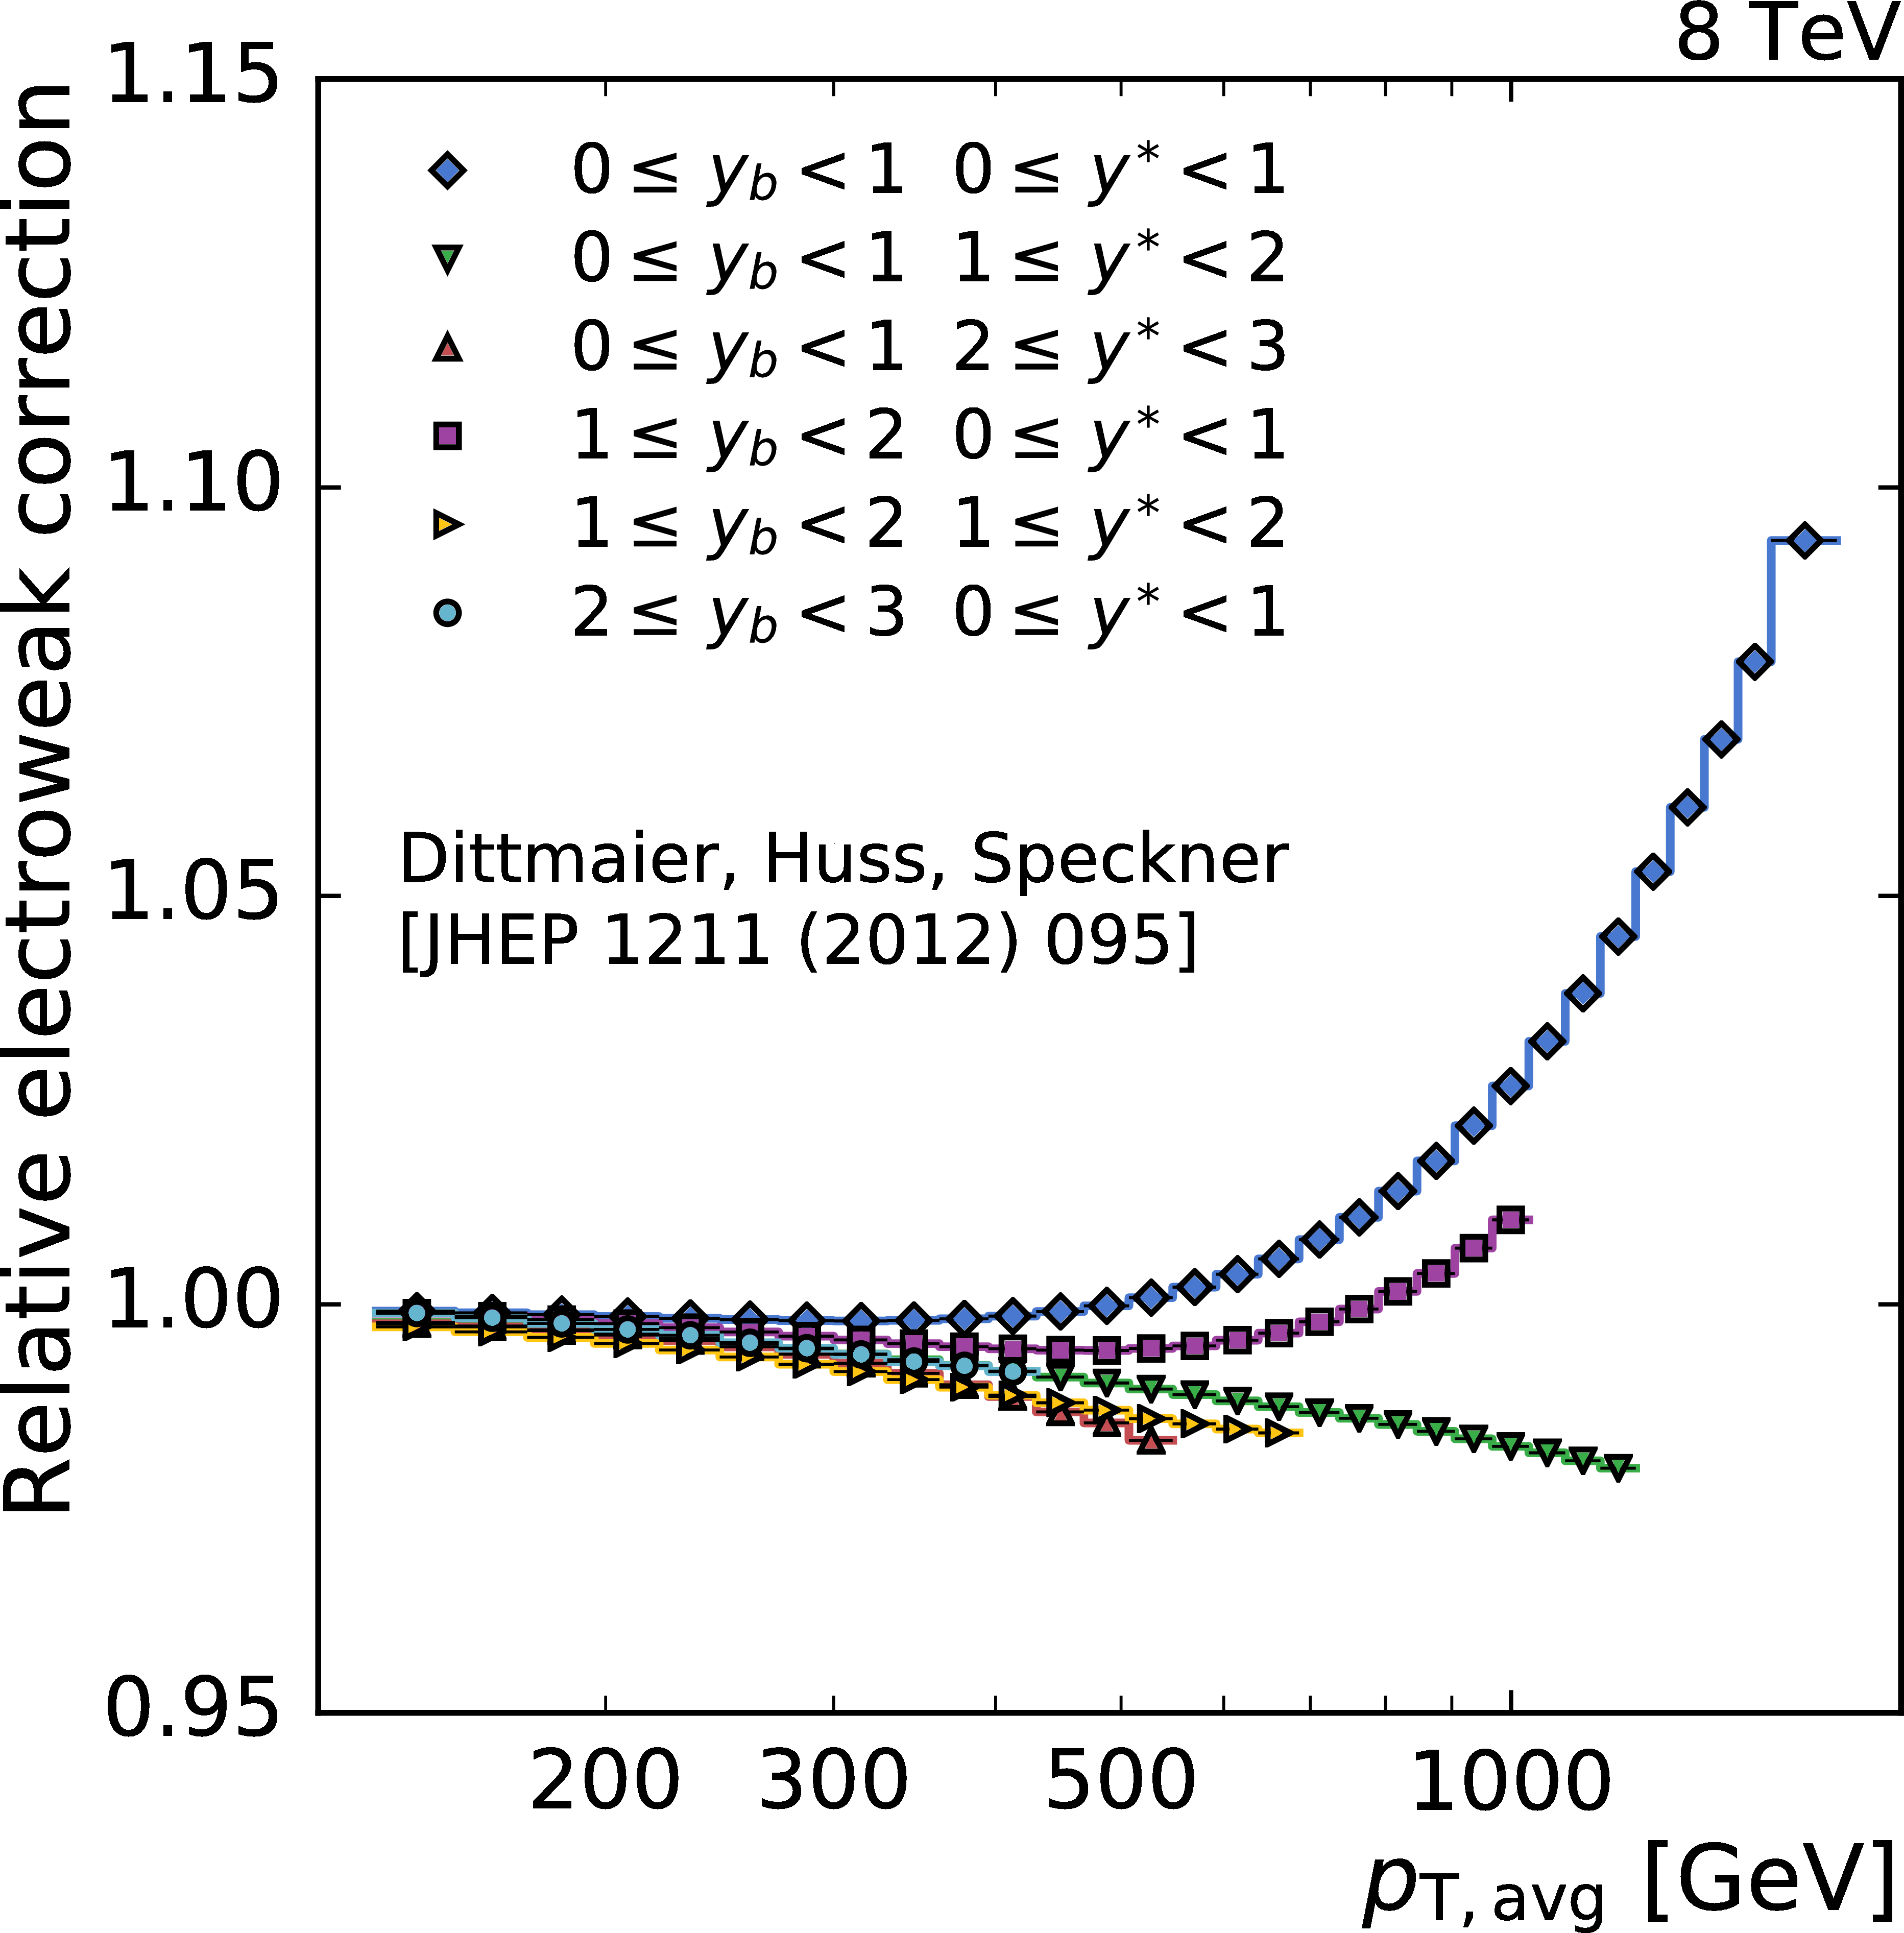
Figure 4-b:
Overview of the theoretical correction factors. For each of the six analysis bins the electroweak correction factor is shown as a function of $ {p_{\mathrm {T,avg}}} $. The NLO QCD correction has been derived with the same NLO PDF in numerator and denominator and is included in the NLO prediction by NLOJet++. |

png pdf |
Figure 4-c:
Overview of the theoretical correction factors. For each of the six analysis bins the NP correction factor is shown as a function of $ {p_{\mathrm {T,avg}}} $. The NLO QCD correction has been derived with the same NLO PDF in numerator and denominator and is included in the NLO prediction by NLOJet++. |

png pdf |
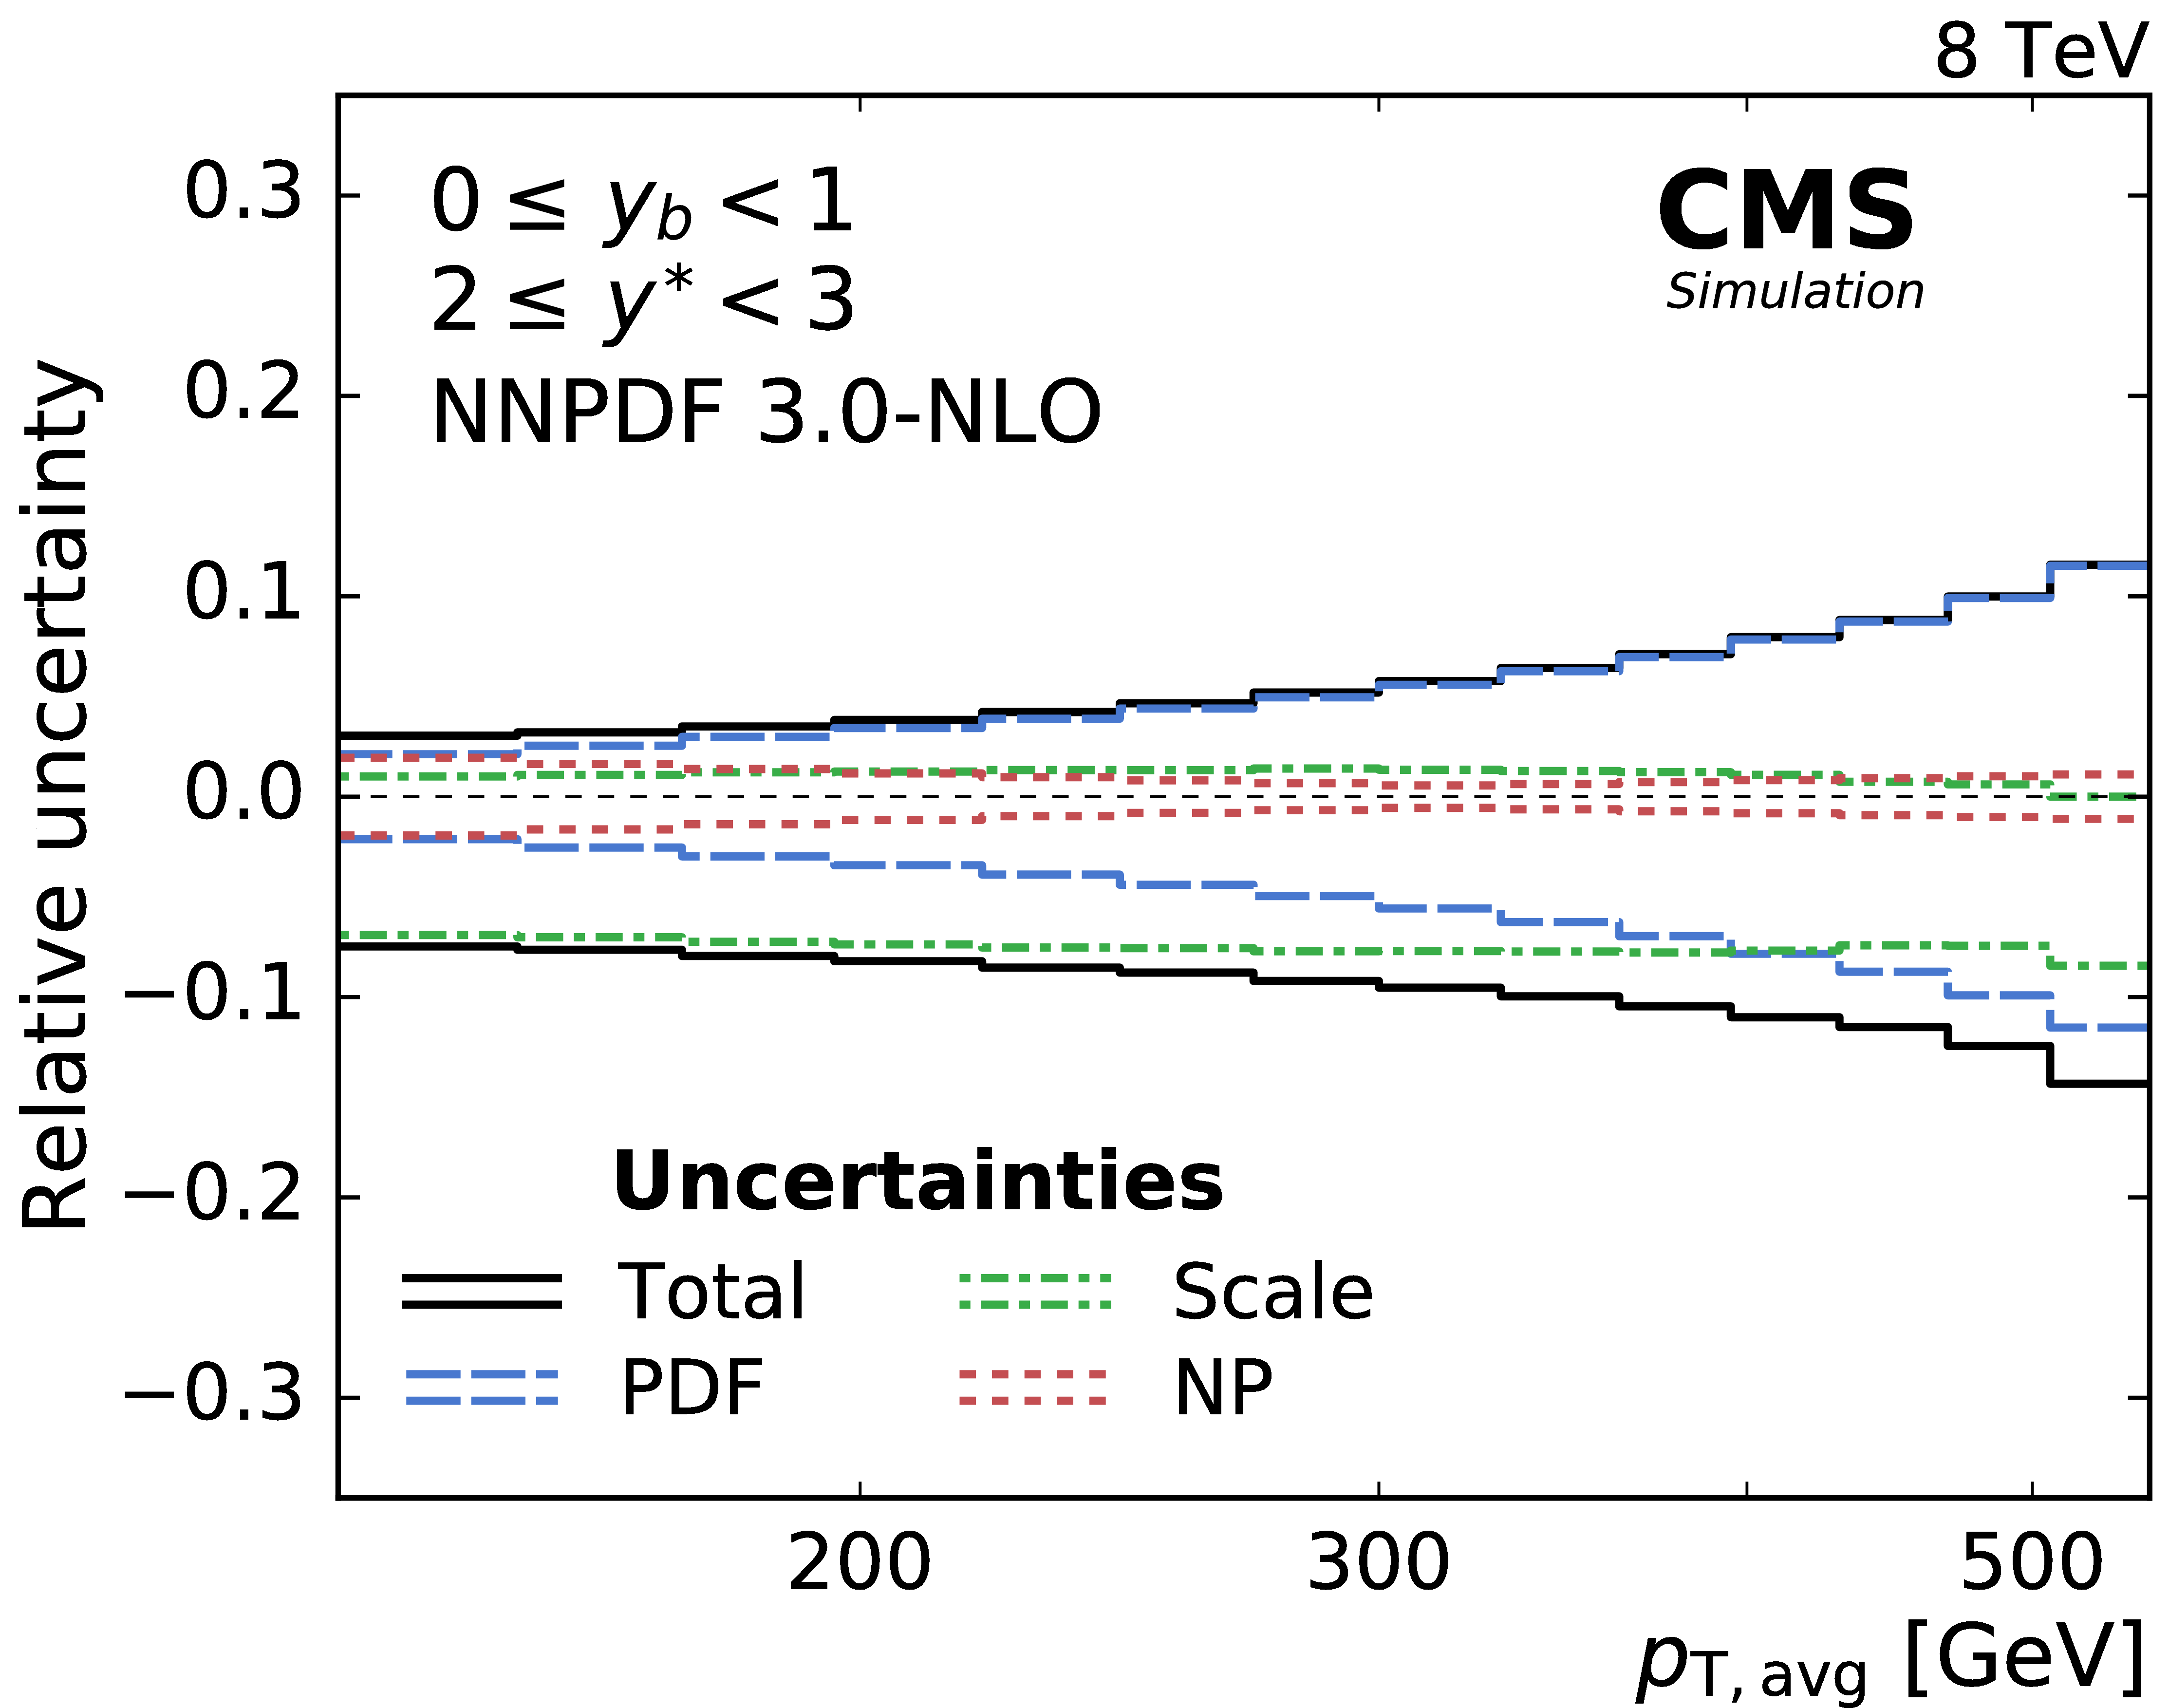
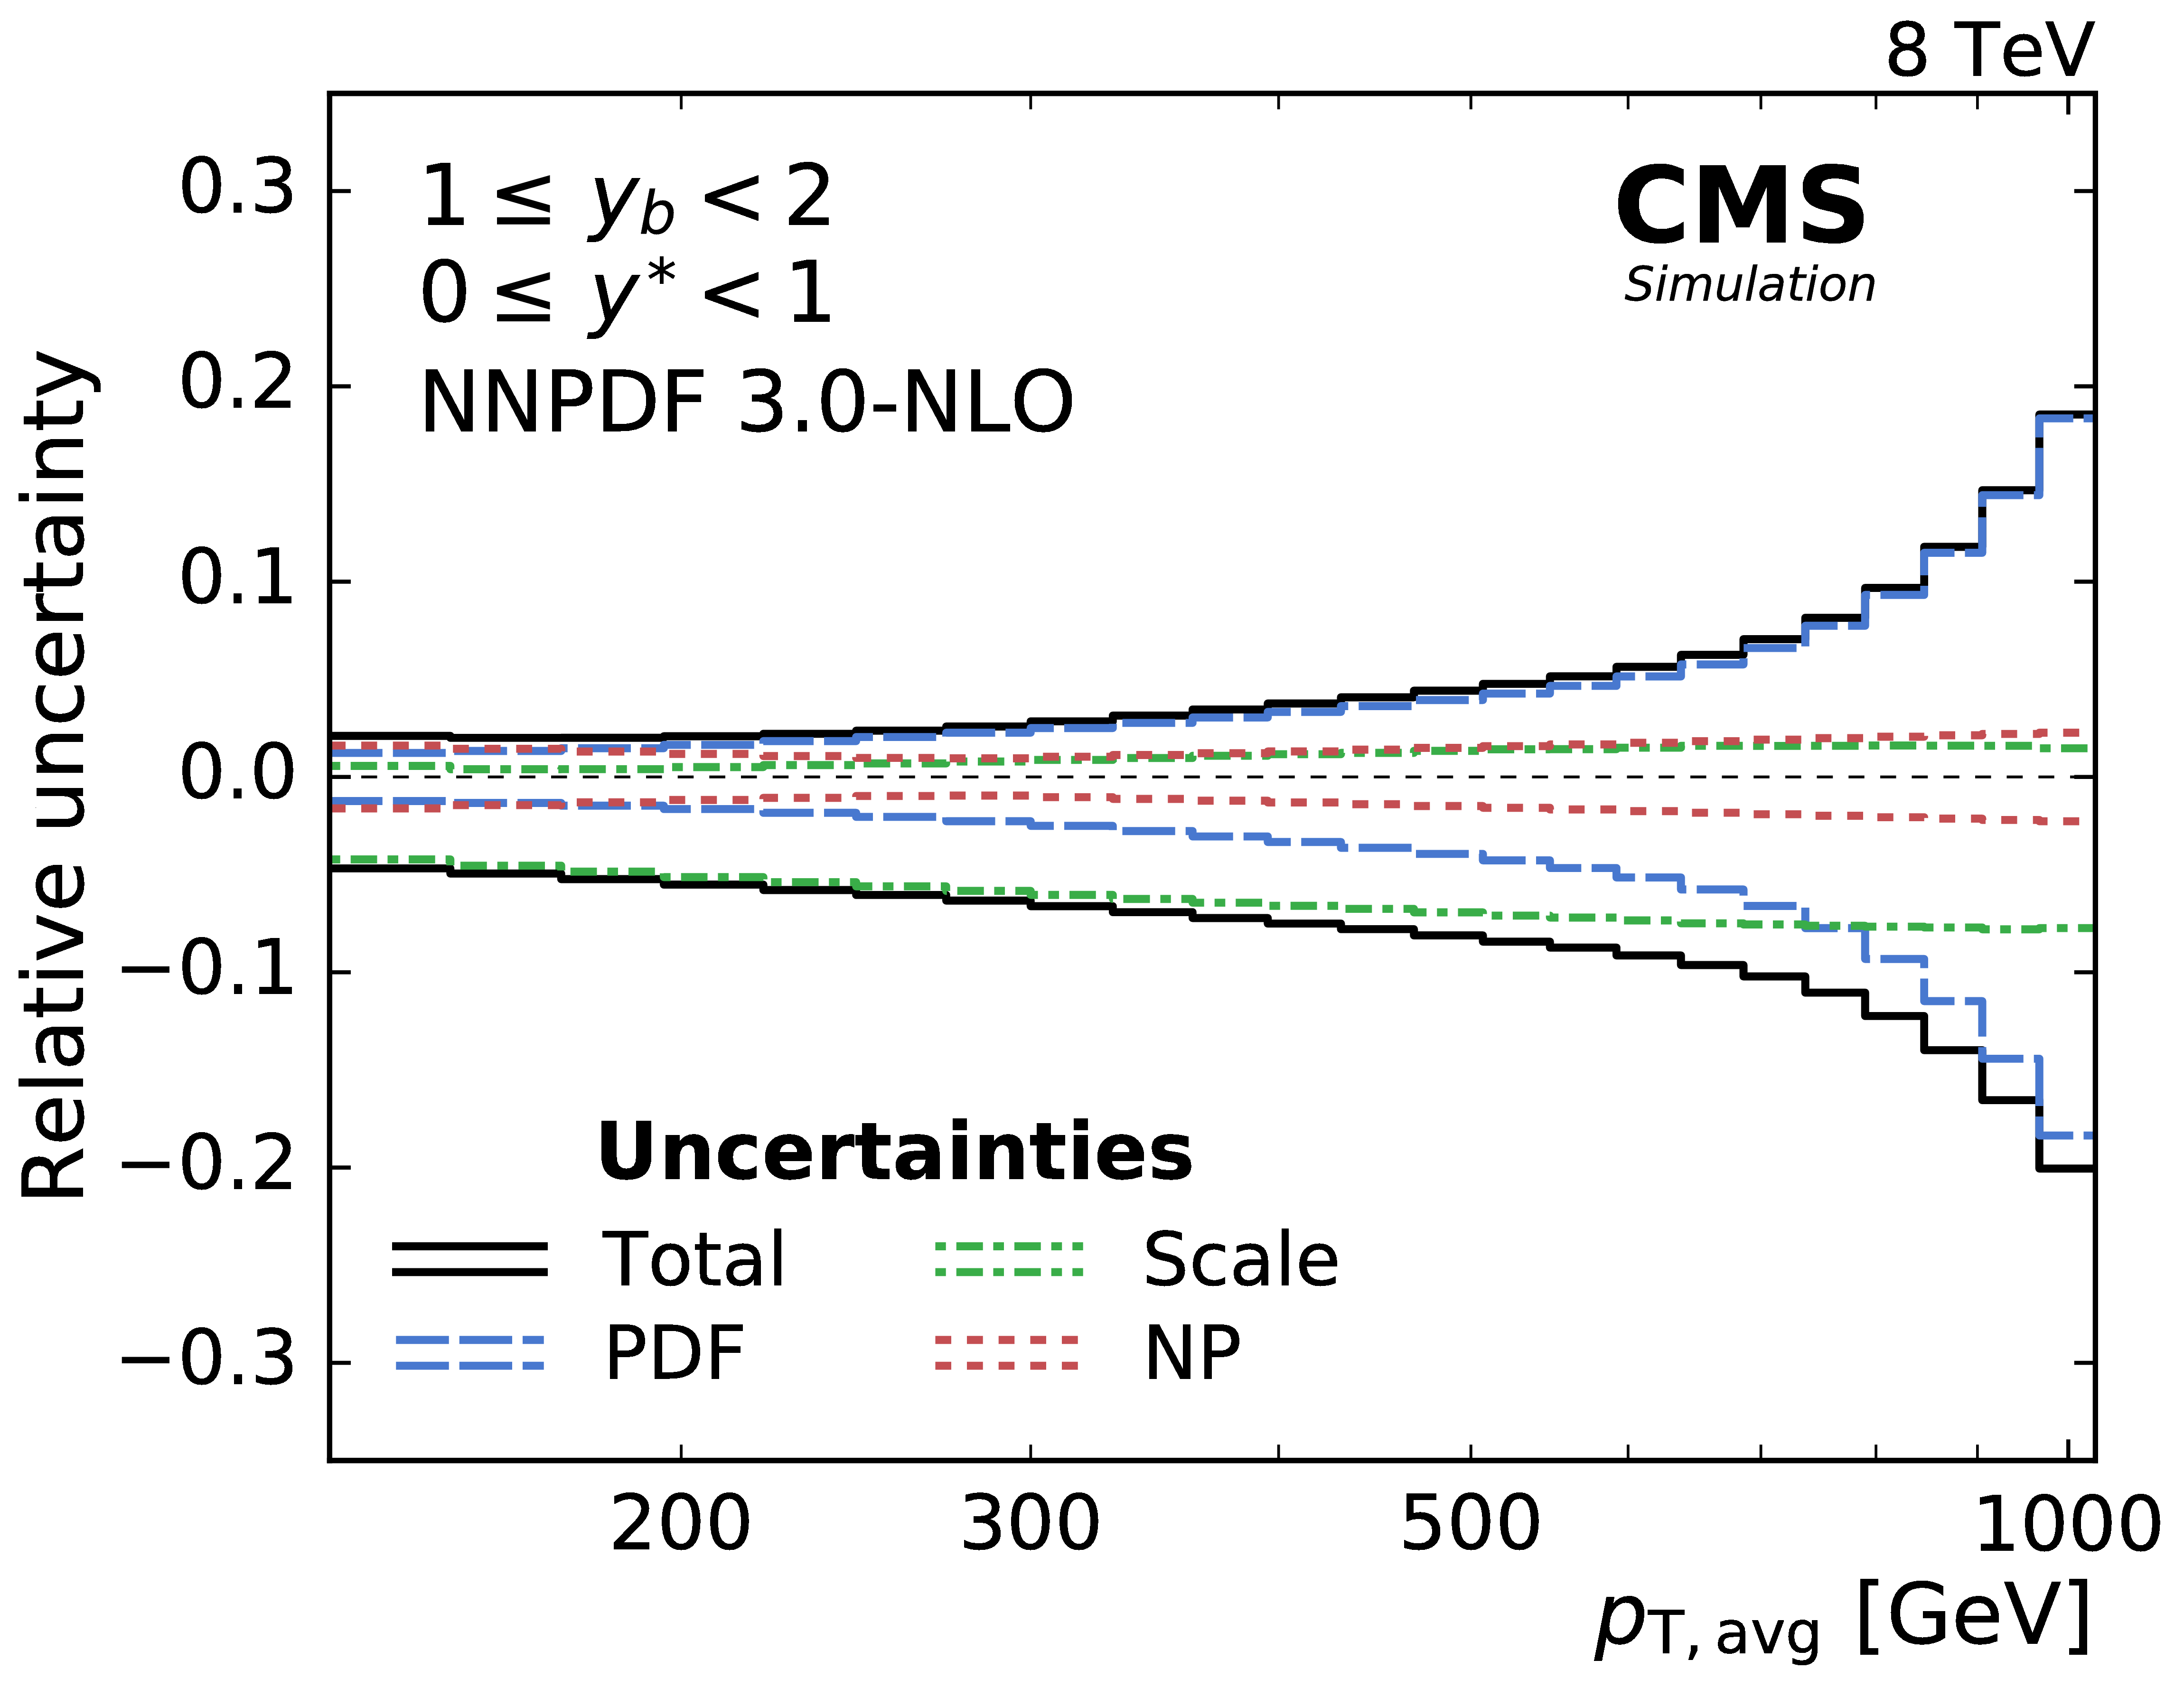
Figure 5:
Overview of the theoretical uncertainties. The scale uncertainty dominates in the low- $ {p_{\mathrm {T,avg}}} $ region. At high $ {p_{\mathrm {T,avg}}} $, and especially in the boosted region, the PDFs become the dominant source of uncertainty. |

png pdf |
Figure 5-a:
Overview of the theoretical uncertainties in the (0 $ \leq {{y_{\mathrm {b}}}} < $ 1, 0 $ \leq {y^{*}} < $ 1) bin. The scale uncertainty dominates in the low- $ {p_{\mathrm {T,avg}}} $ region. At high $ {p_{\mathrm {T,avg}}} $, and especially in the boosted region, the PDFs become the dominant source of uncertainty. |

png pdf |
Figure 5-b:
Overview of the theoretical uncertainties in the (0 $ \leq {{y_{\mathrm {b}}}} < $ 1, 1 $ \leq {y^{*}} < $ 2) bin. The scale uncertainty dominates in the low- $ {p_{\mathrm {T,avg}}} $ region. At high $ {p_{\mathrm {T,avg}}} $, and especially in the boosted region, the PDFs become the dominant source of uncertainty. |
png pdf |
Figure 5-c:
Overview of the theoretical uncertainties in the (0 $ \leq {{y_{\mathrm {b}}}} < $ 1, 2 $ \leq {y^{*}} < $ 3) bin. The scale uncertainty dominates in the low- $ {p_{\mathrm {T,avg}}} $ region. At high $ {p_{\mathrm {T,avg}}} $, and especially in the boosted region, the PDFs become the dominant source of uncertainty. |
png pdf |
Figure 5-d:
Overview of the theoretical uncertainties in the (1 $ \leq {{y_{\mathrm {b}}}} < $ 2, 0 $ \leq {y^{*}} < $ 1) bin. The scale uncertainty dominates in the low- $ {p_{\mathrm {T,avg}}} $ region. At high $ {p_{\mathrm {T,avg}}} $, and especially in the boosted region, the PDFs become the dominant source of uncertainty. |

png pdf |
Figure 5-e:
Overview of the theoretical uncertainties in the (1 $ \leq {{y_{\mathrm {b}}}} < $ 2, 1 $ \leq {y^{*}} < $ 2) bin. The scale uncertainty dominates in the low- $ {p_{\mathrm {T,avg}}} $ region. At high $ {p_{\mathrm {T,avg}}} $, and especially in the boosted region, the PDFs become the dominant source of uncertainty. |

png pdf |
Figure 5-f:
Overview of the theoretical uncertainties in the (2 $ \leq {{y_{\mathrm {b}}}} < $ 3, 0 $ \leq {y^{*}} < $ 1) bin. The scale uncertainty dominates in the low- $ {p_{\mathrm {T,avg}}} $ region. At high $ {p_{\mathrm {T,avg}}} $, and especially in the boosted region, the PDFs become the dominant source of uncertainty. |

png pdf |
Figure 6:
The triple-differential dijet cross section in six bins of ${y^{*}}$ and $ {y_{\mathrm {b}}} $. The data are indicated by different markers for each bin. The theoretical predictions, obtained with NLOJet++ and NNPDF3.0, and complemented with EW and NP corrections, are depicted by solid lines. Apart from the boosted region, the data are well described by the predictions at NLO accuracy over many orders of magnitude. |
png pdf |
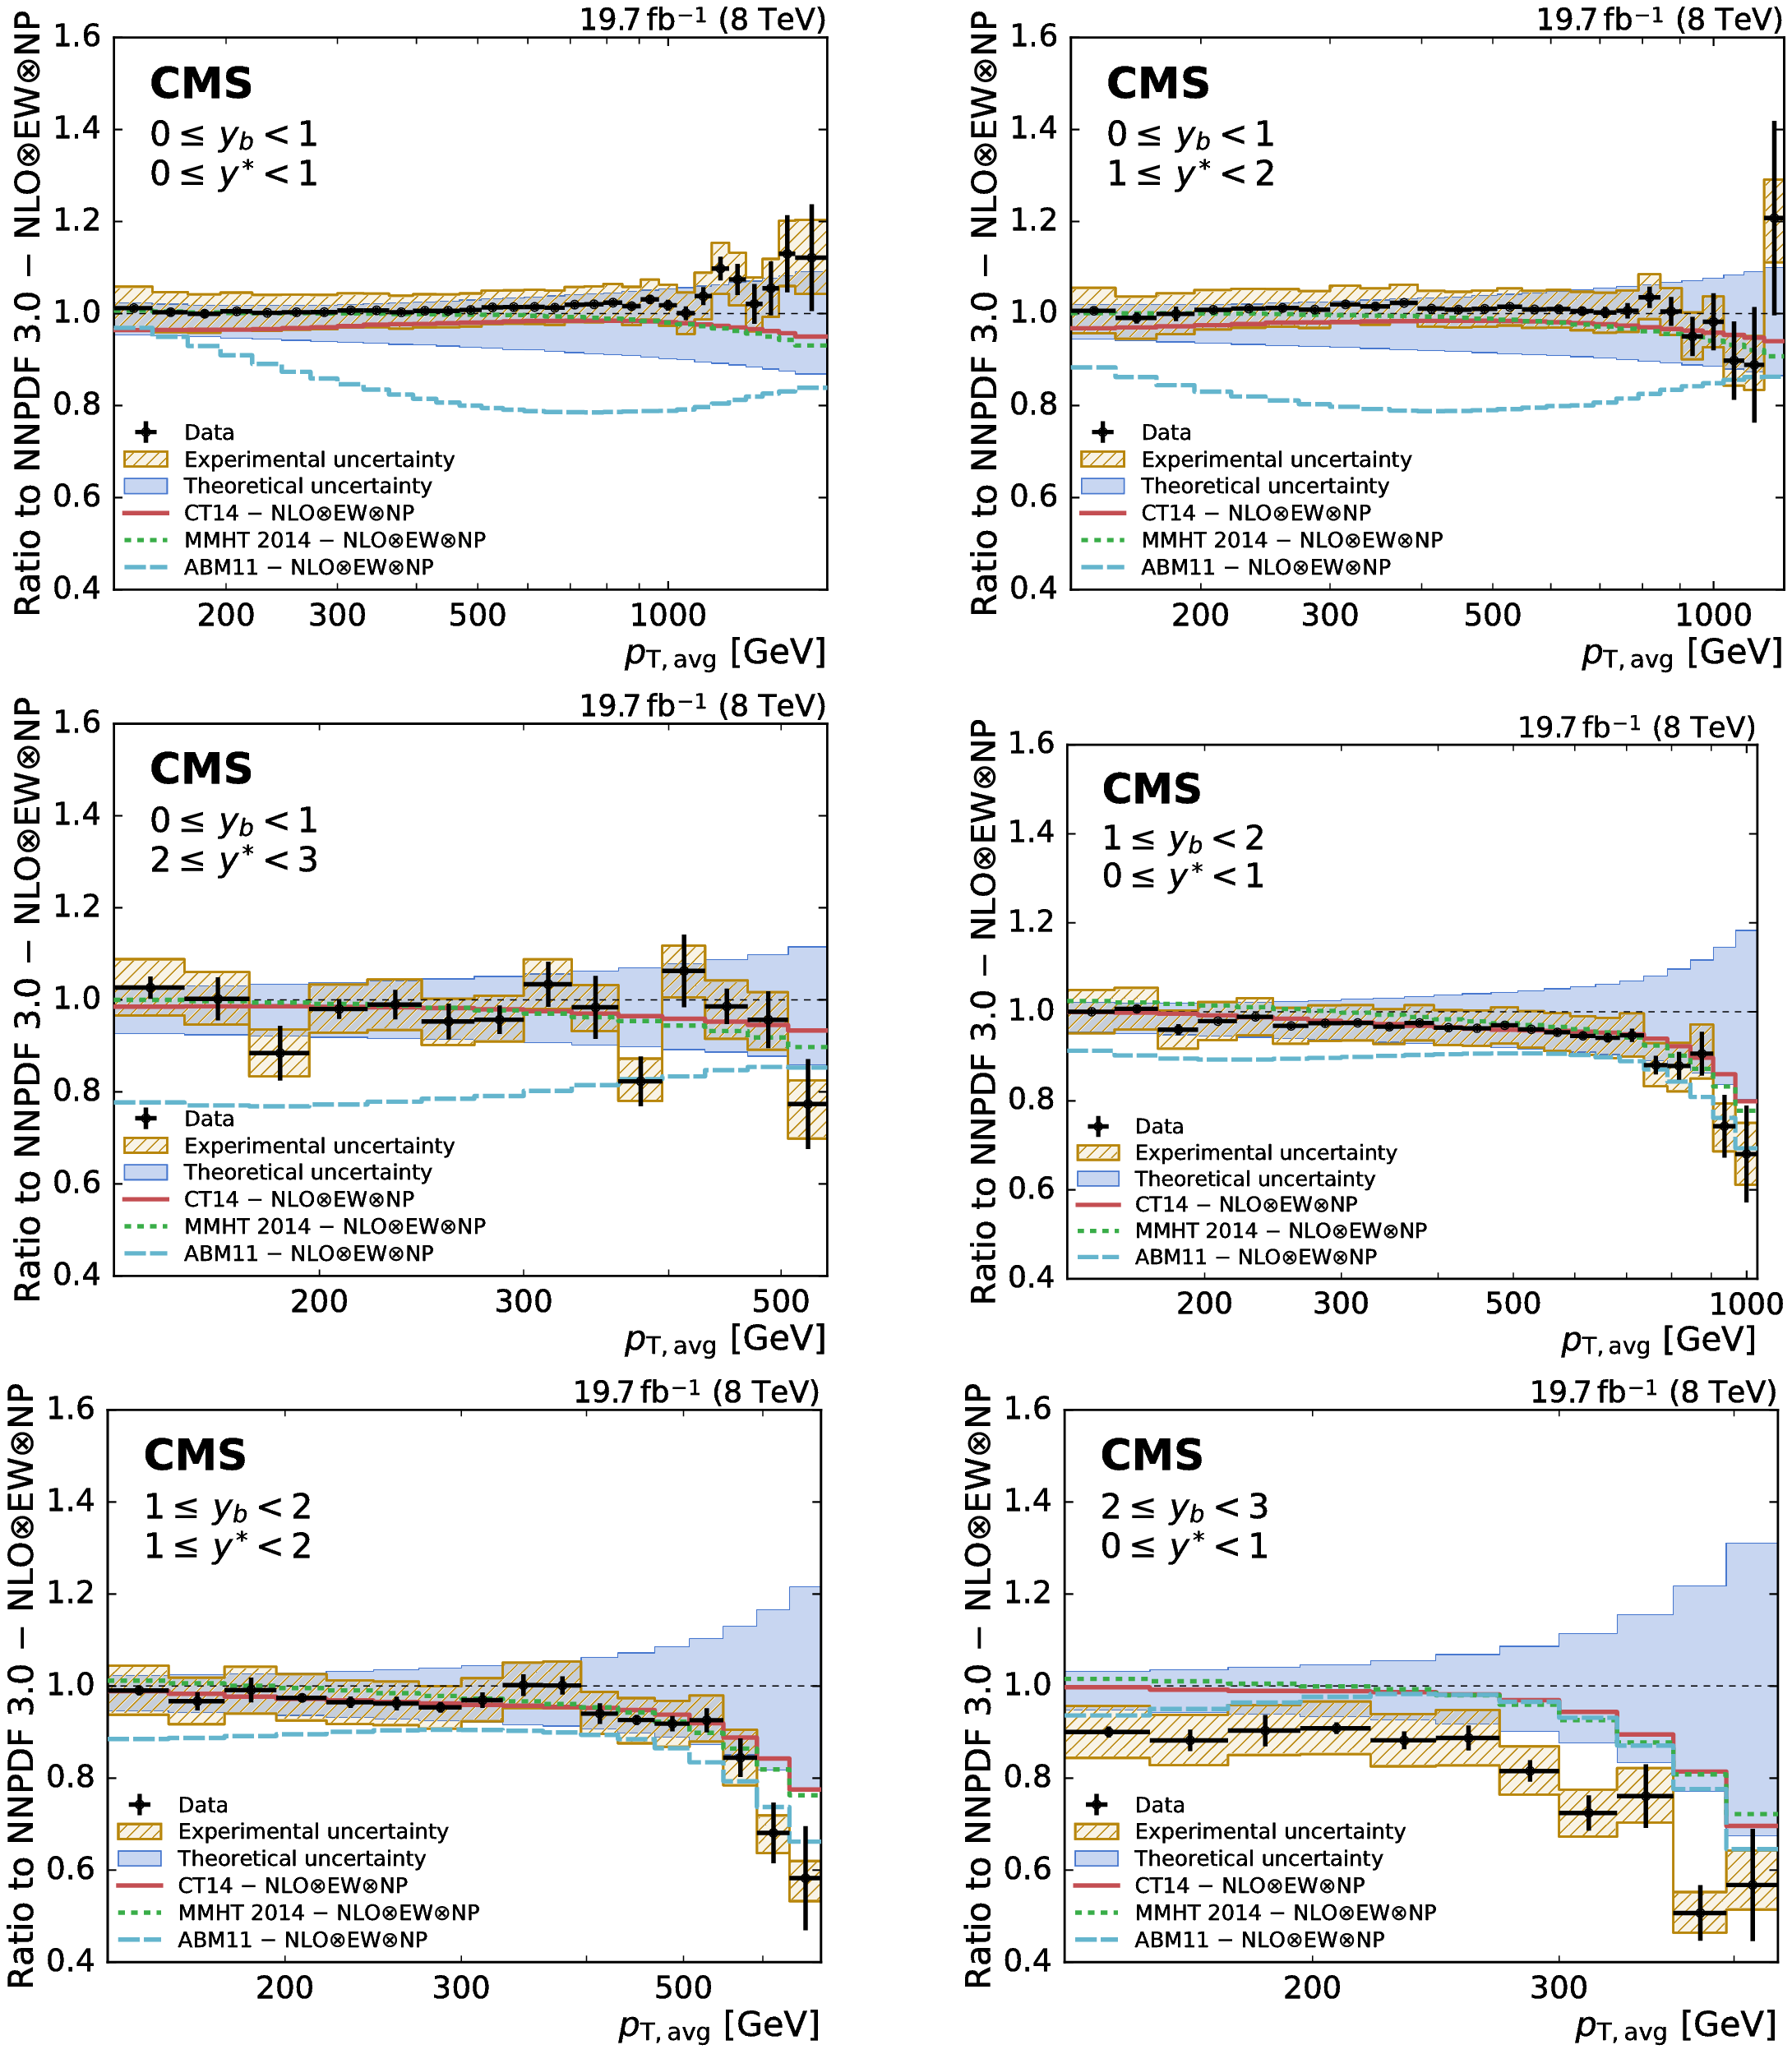
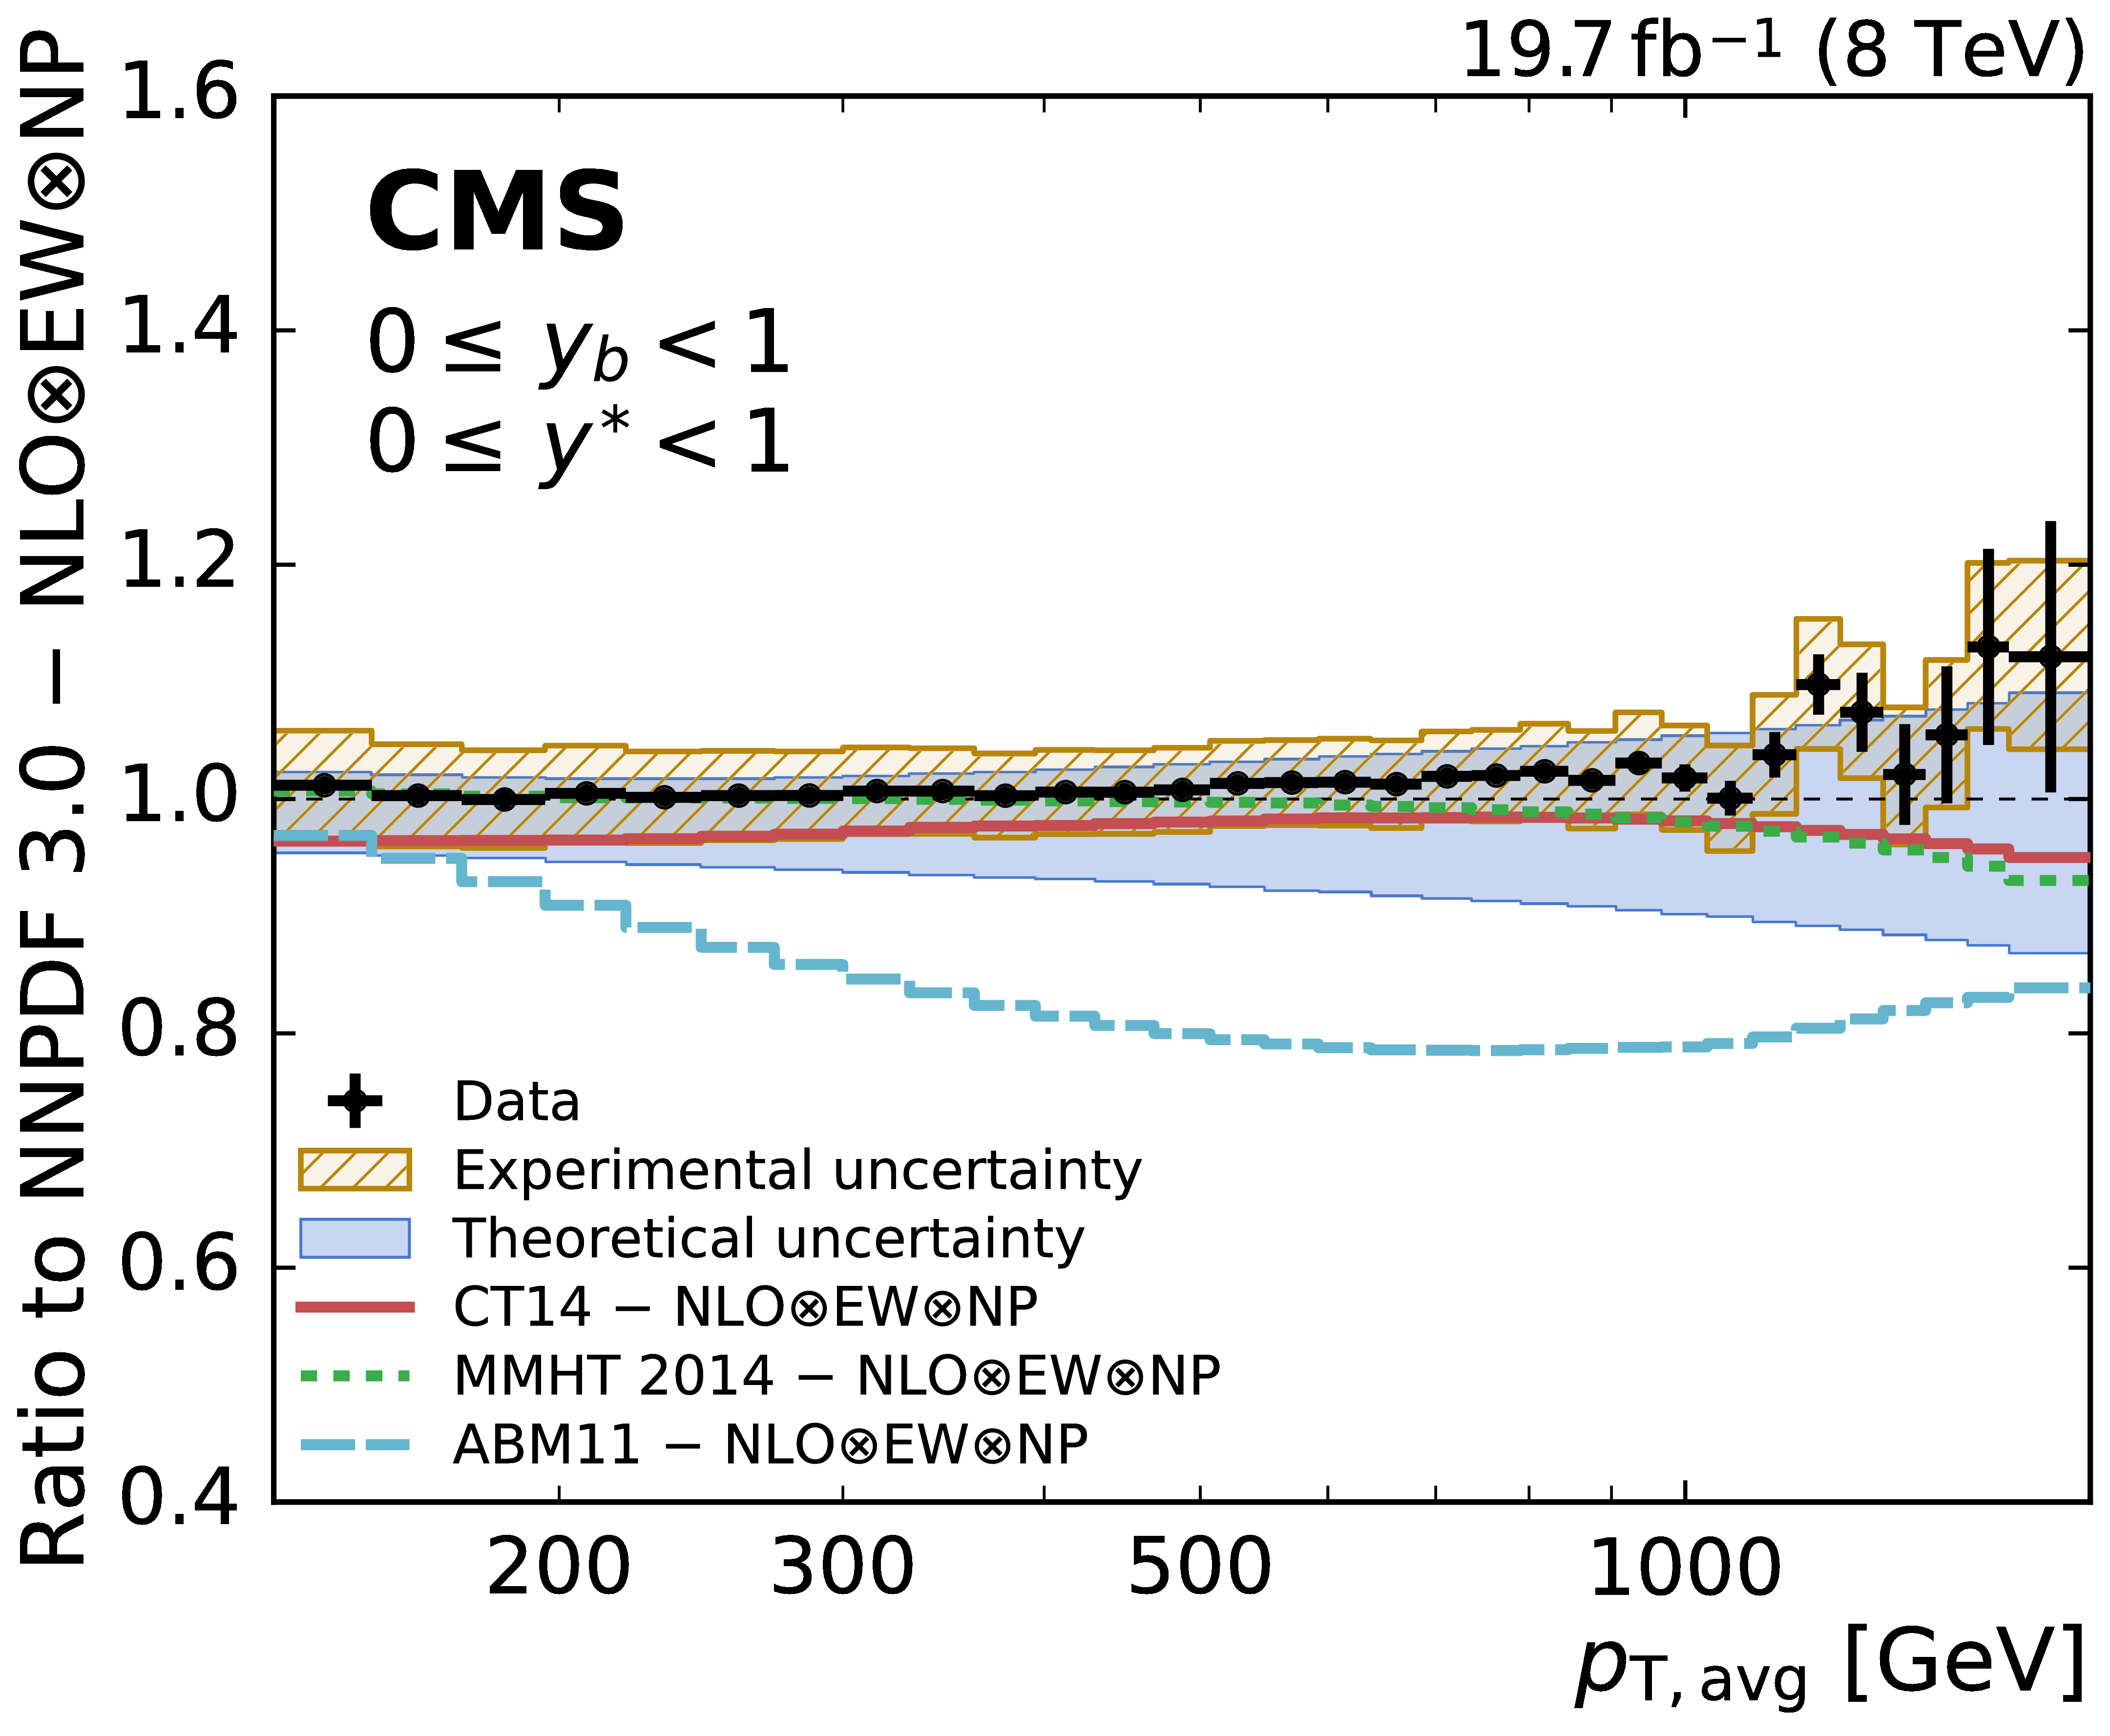
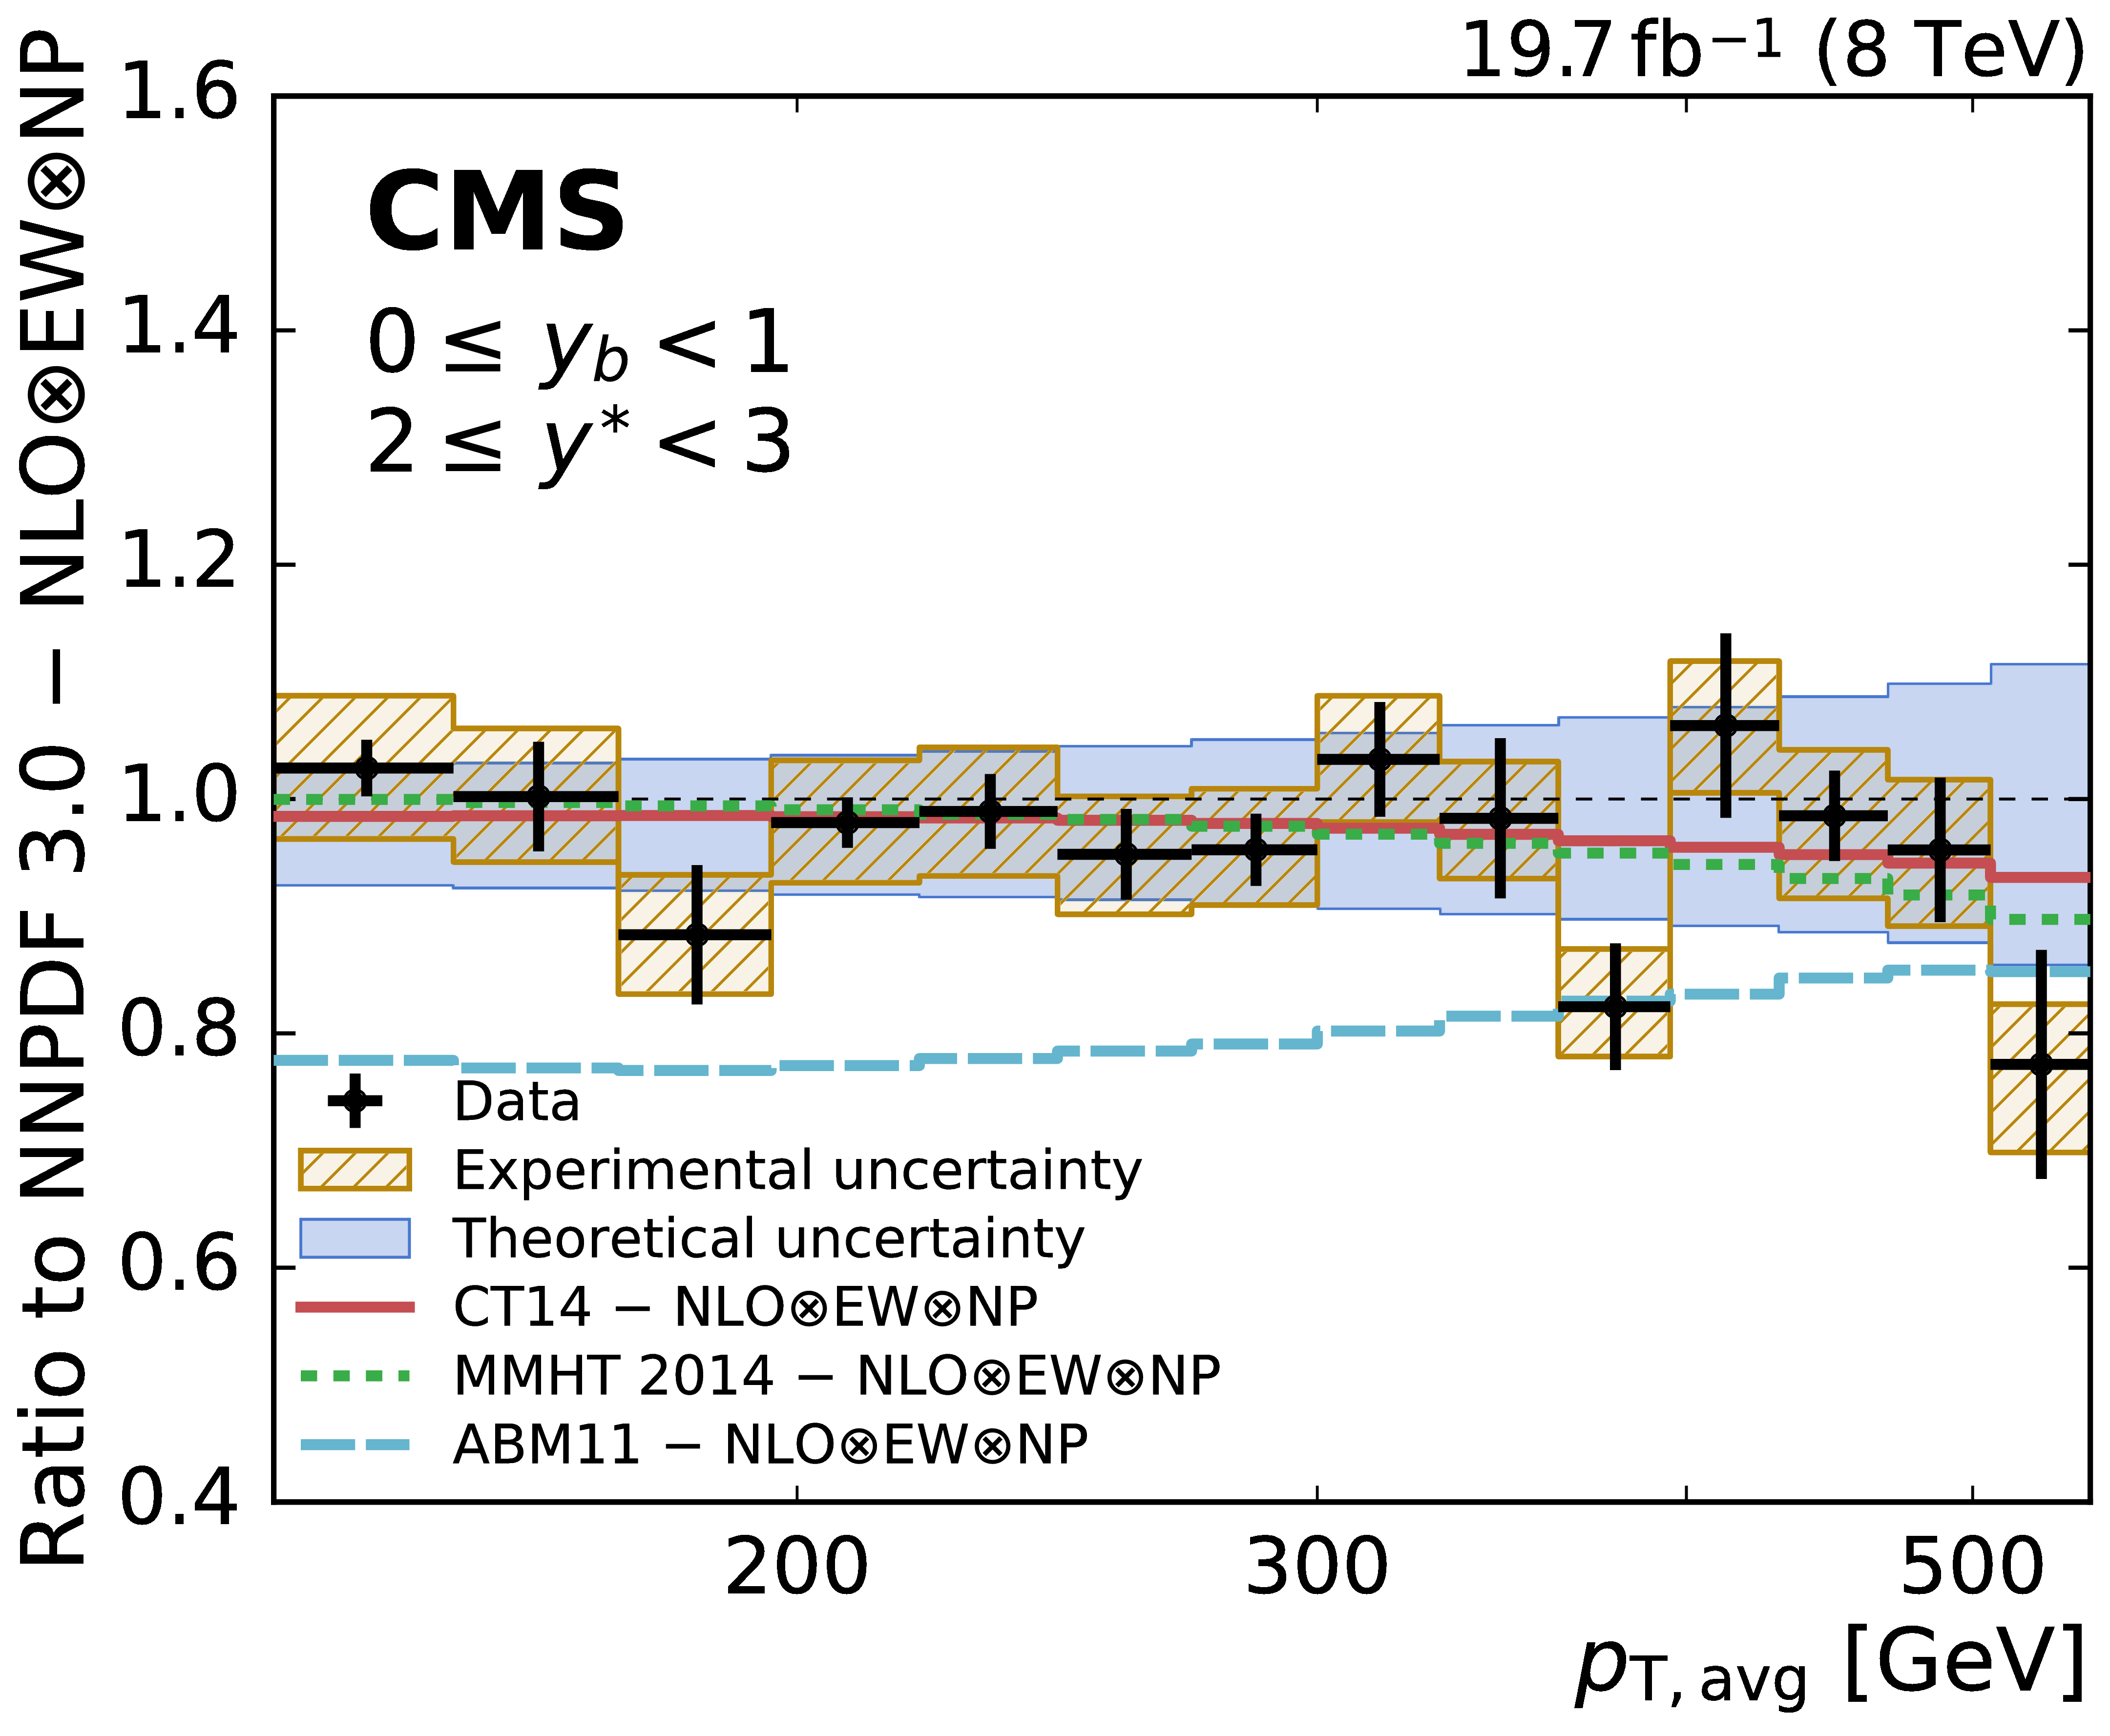
Figure 7:
Ratio of the triple-differential dijet cross section to the NLOJet++ prediction using the NNPDF3.0 set. The data points including statistical uncertainties are indicated by markers, the systematic experimental uncertainty is represented by the hatched band. The solid band shows the PDF, scale, and NP uncertainties quadratically added; the solid and dashed lines give the ratios calculated with the predictions for different PDF sets. |
png pdf |
Figure 7-a:
Ratio of the triple-differential dijet cross section to the NLOJet++ prediction using the NNPDF3.0 set in the (0 $ \leq {{y_{\mathrm {b}}}} < $ 1, 0 $ \leq {y^{*}} < $ 1) bin. The data points including statistical uncertainties are indicated by markers, the systematic experimental uncertainty is represented by the hatched band. The solid band shows the PDF, scale, and NP uncertainties quadratically added; the solid and dashed lines give the ratios calculated with the predictions for different PDF sets. |

png pdf |
Figure 7-b:
Ratio of the triple-differential dijet cross section to the NLOJet++ prediction using the NNPDF3.0 set in the (0 $ \leq {{y_{\mathrm {b}}}} < $ 1, 1 $ \leq {y^{*}} < $ 2) bin. The data points including statistical uncertainties are indicated by markers, the systematic experimental uncertainty is represented by the hatched band. The solid band shows the PDF, scale, and NP uncertainties quadratically added; the solid and dashed lines give the ratios calculated with the predictions for different PDF sets. |
png pdf |
Figure 7-c:
Ratio of the triple-differential dijet cross section to the NLOJet++ prediction using the NNPDF3.0 set in the (0 $ \leq {{y_{\mathrm {b}}}} < $ 1, 2 $ \leq {y^{*}} < $ 3) bin. The data points including statistical uncertainties are indicated by markers, the systematic experimental uncertainty is represented by the hatched band. The solid band shows the PDF, scale, and NP uncertainties quadratically added; the solid and dashed lines give the ratios calculated with the predictions for different PDF sets. |

png pdf |
Figure 7-d:
Ratio of the triple-differential dijet cross section to the NLOJet++ prediction using the NNPDF3.0 set in the (1 $ \leq {{y_{\mathrm {b}}}} < $ 2, 0 $ \leq {y^{*}} < $ 1) bin. The data points including statistical uncertainties are indicated by markers, the systematic experimental uncertainty is represented by the hatched band. The solid band shows the PDF, scale, and NP uncertainties quadratically added; the solid and dashed lines give the ratios calculated with the predictions for different PDF sets. |

png pdf |
Figure 7-e:
Ratio of the triple-differential dijet cross section to the NLOJet++ prediction using the NNPDF3.0 set in the (1 $ \leq {{y_{\mathrm {b}}}} < $ 2, 1 $ \leq {y^{*}} < $ 2) bin. The data points including statistical uncertainties are indicated by markers, the systematic experimental uncertainty is represented by the hatched band. The solid band shows the PDF, scale, and NP uncertainties quadratically added; the solid and dashed lines give the ratios calculated with the predictions for different PDF sets. |

png pdf |
Figure 7-f:
Ratio of the triple-differential dijet cross section to the NLOJet++ prediction using the NNPDF3.0 set in the (2 $ \leq {{y_{\mathrm {b}}}} < $ 3, 0 $ \leq {y^{*}} < $ 1) bin. The data points including statistical uncertainties are indicated by markers, the systematic experimental uncertainty is represented by the hatched band. The solid band shows the PDF, scale, and NP uncertainties quadratically added; the solid and dashed lines give the ratios calculated with the predictions for different PDF sets. |
png pdf |
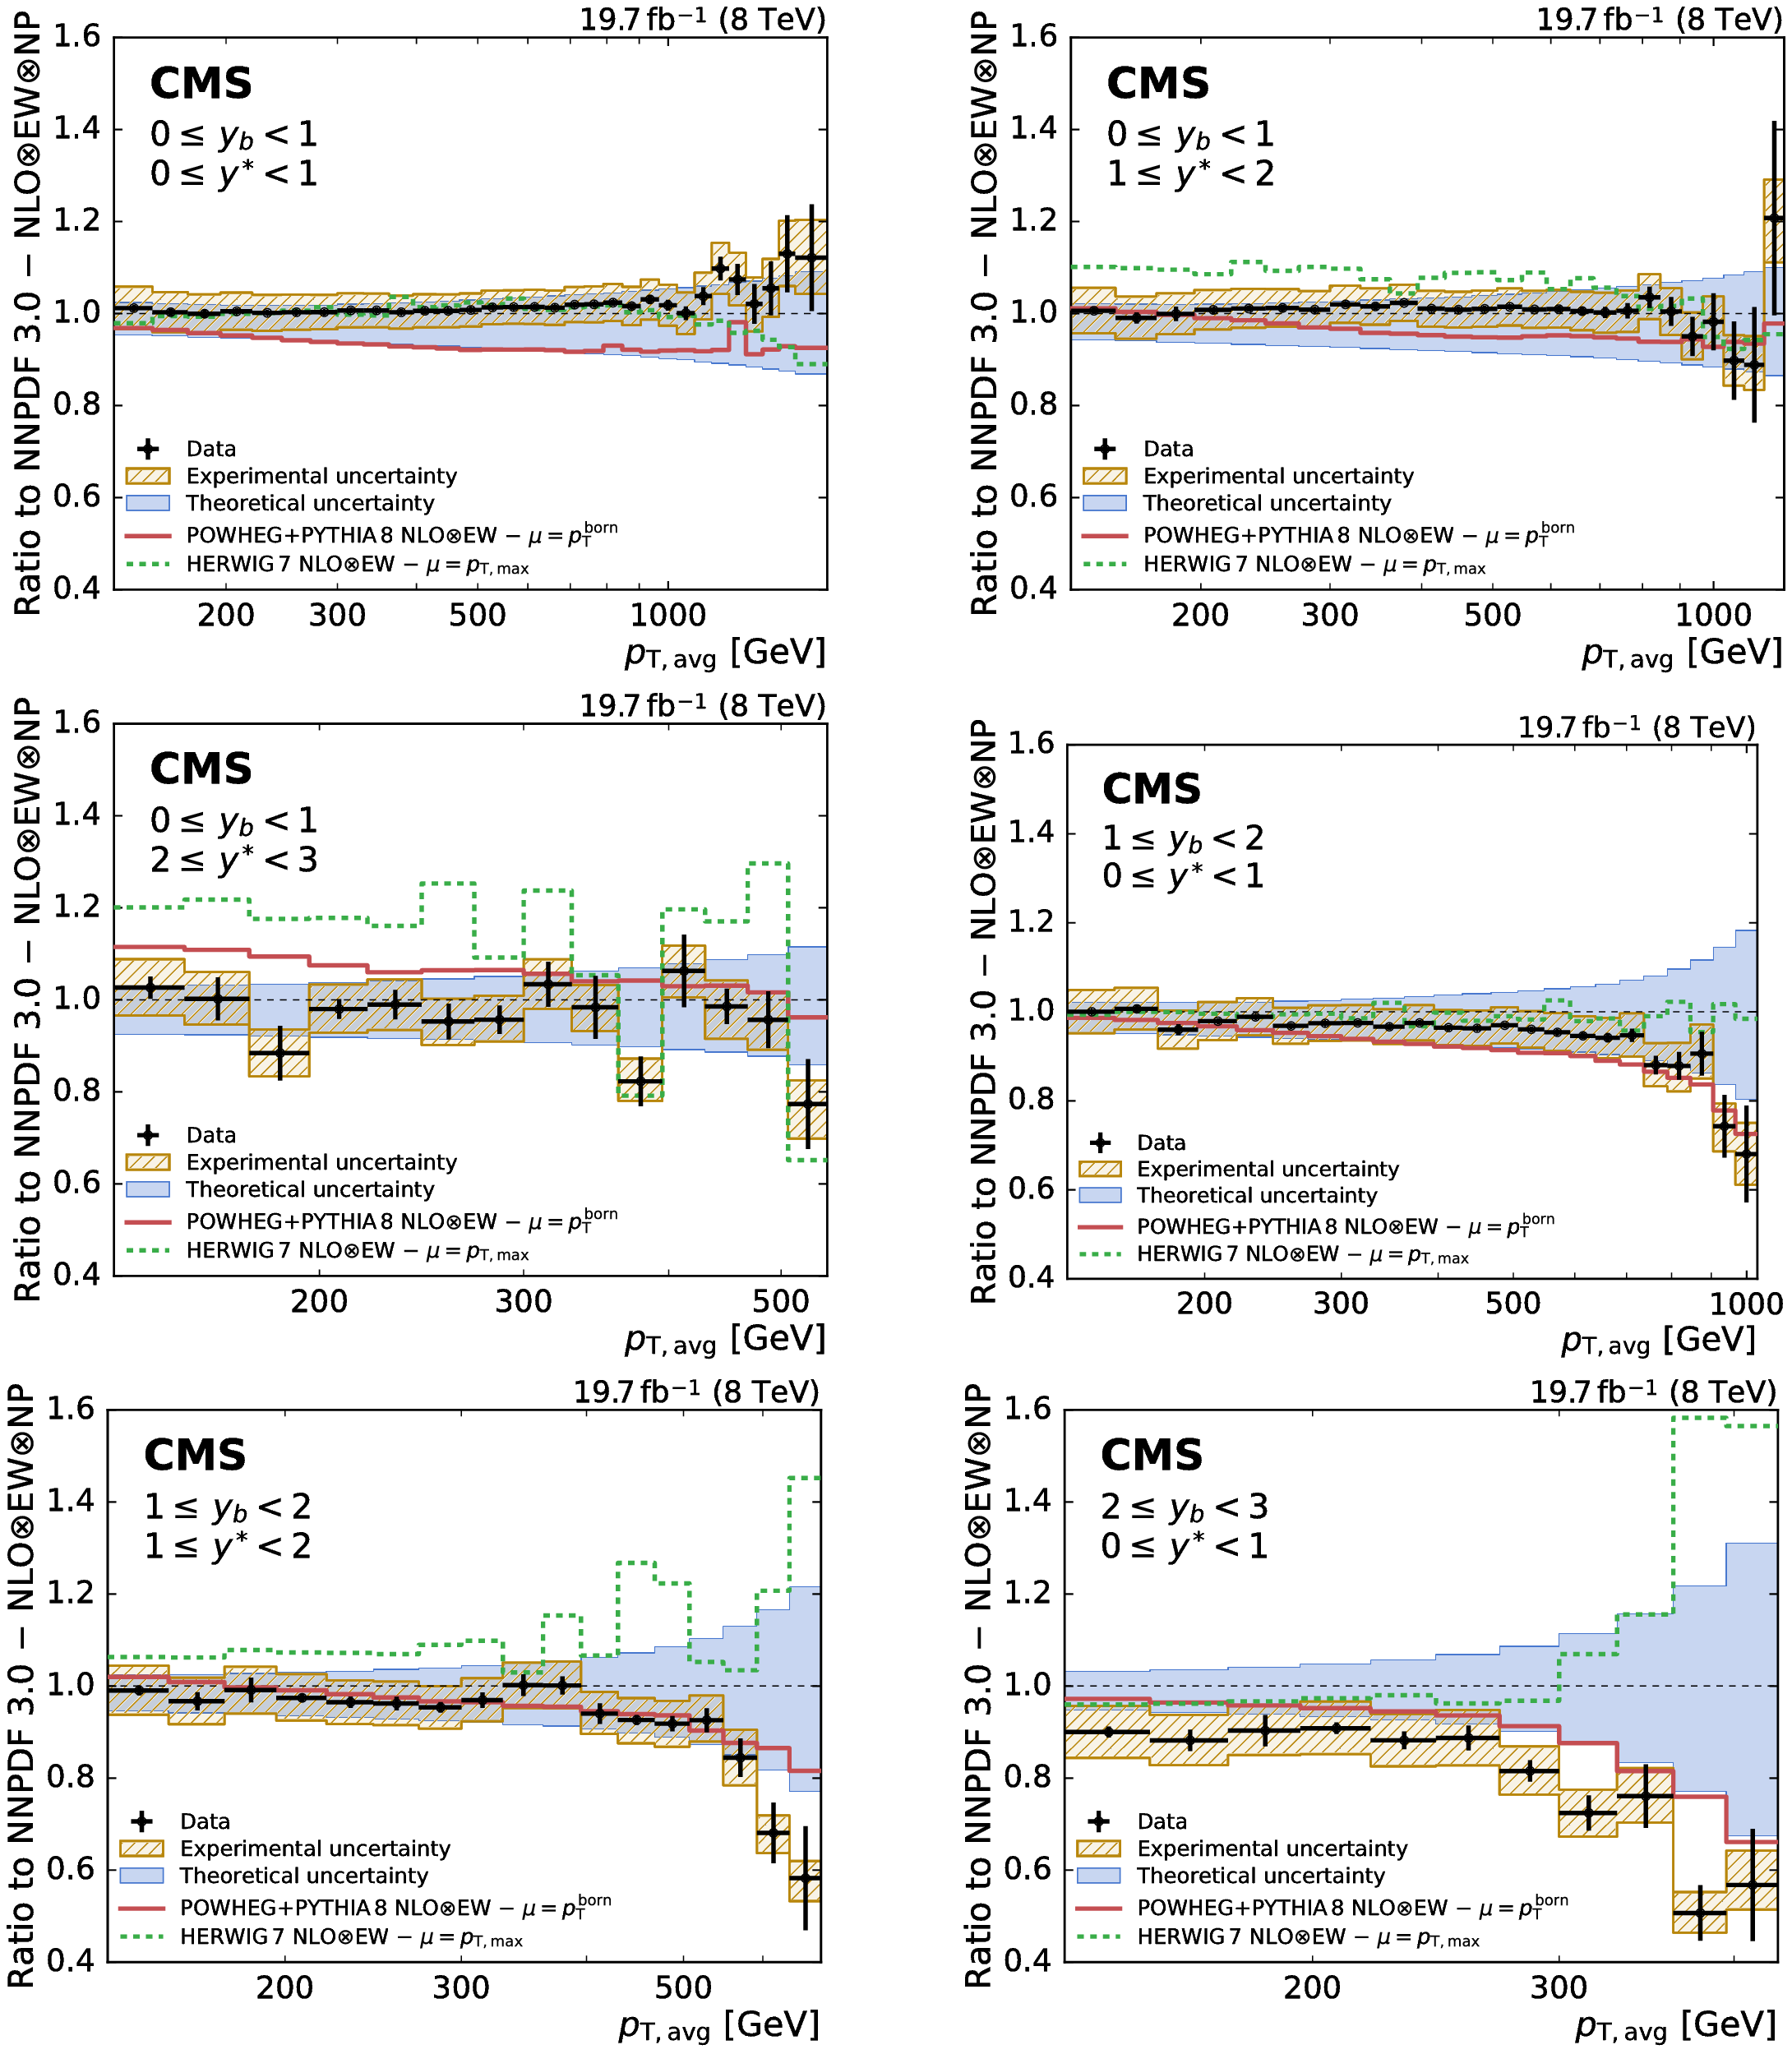
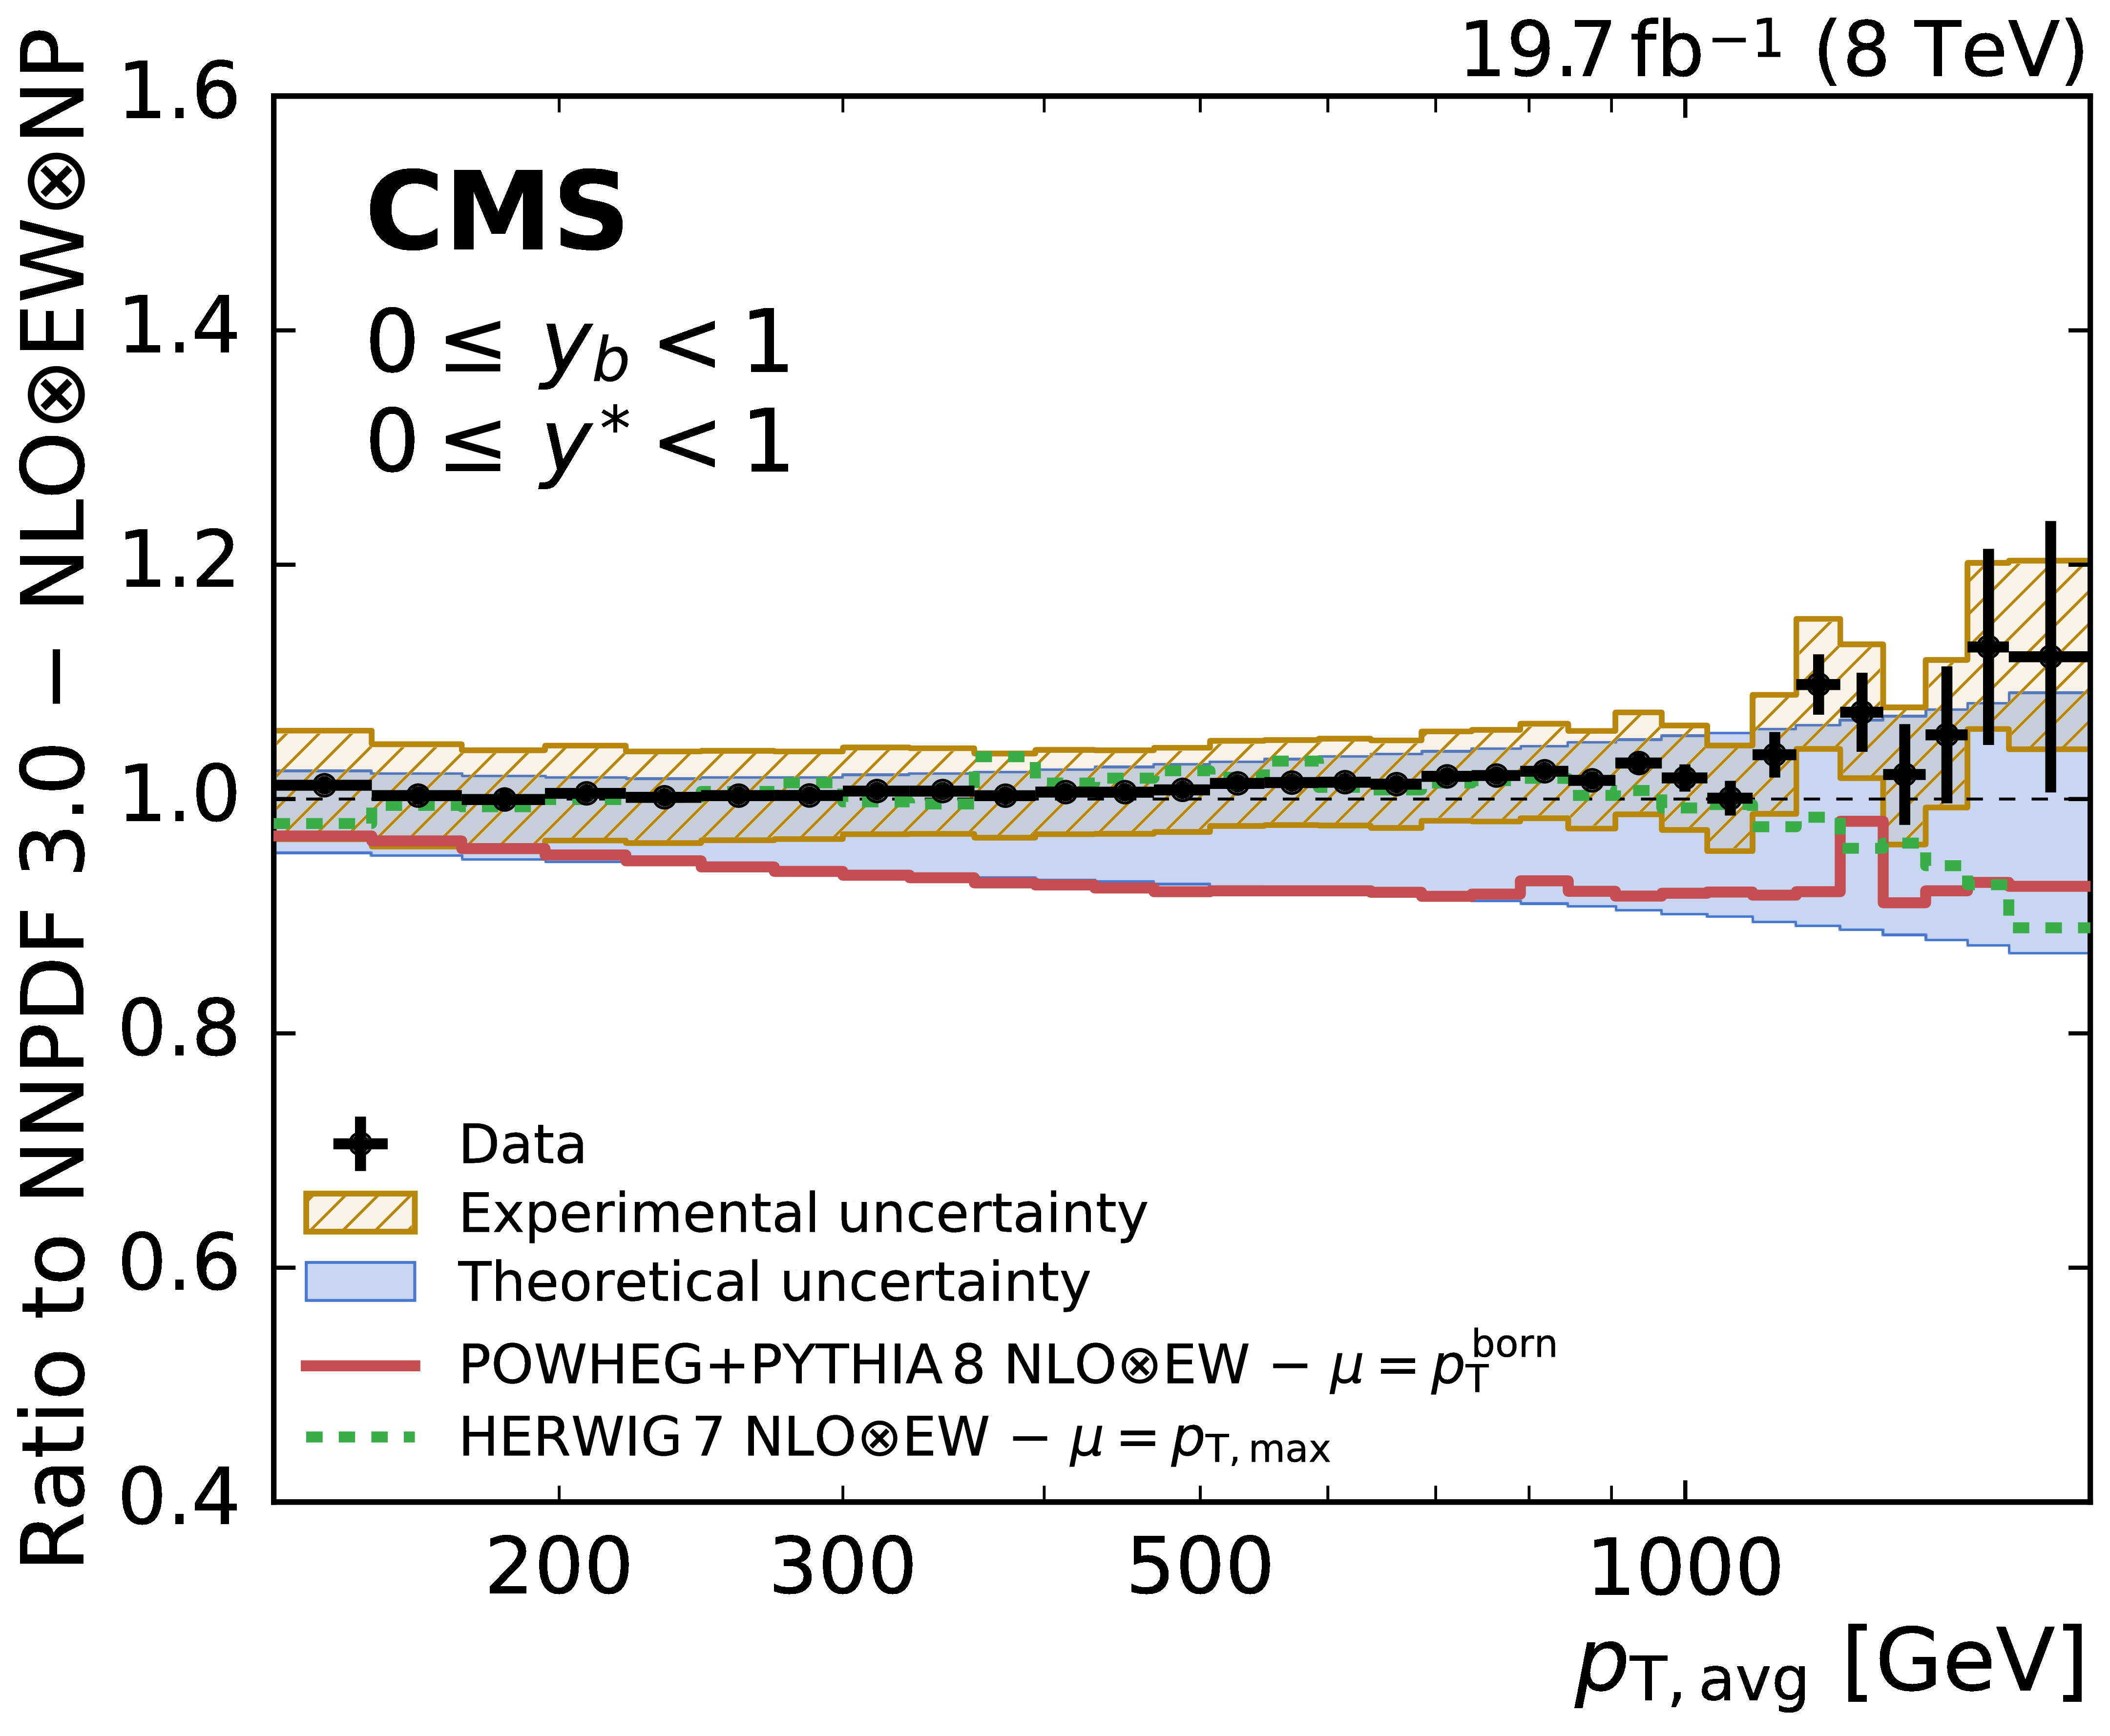
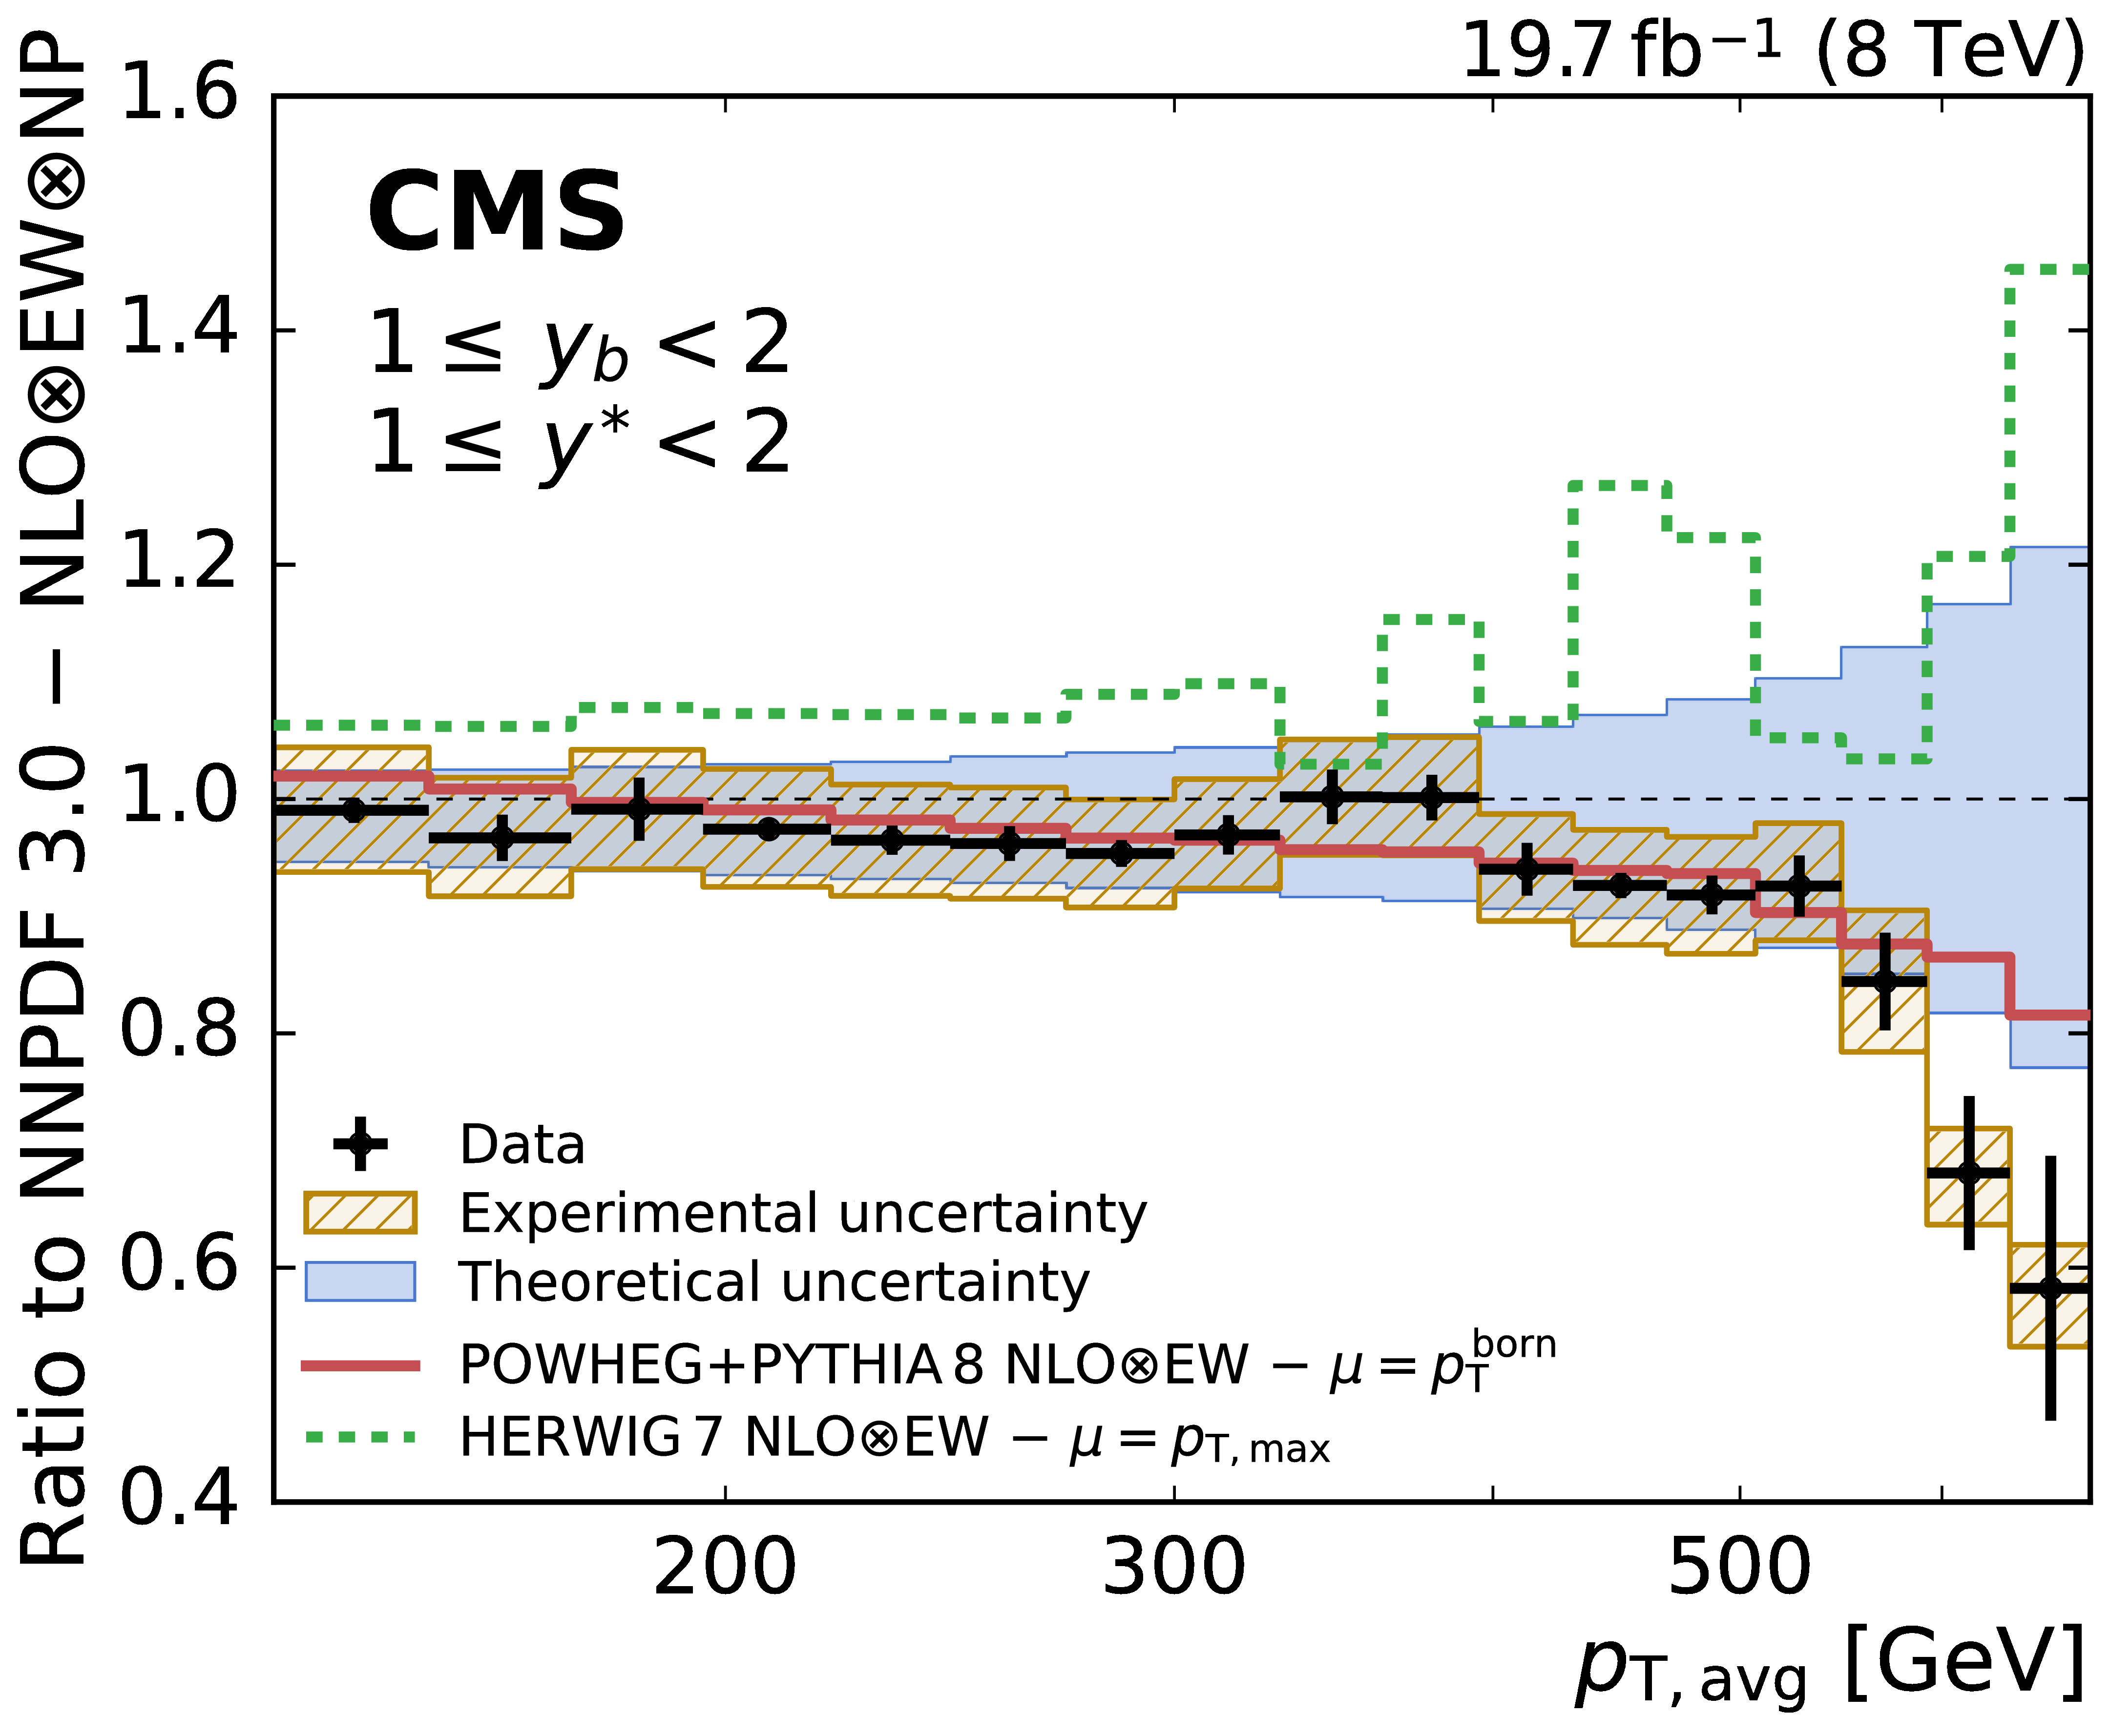
Figure 8:
Ratio of the triple-differential dijet cross section to the NLOJet++ prediction using the NNPDF3.0 set. The data points including statistical uncertainties are indicated by markers, the systematic experimental uncertainty is represented by the hatched band. The solid band shows the PDF, scale, and NP uncertainties quadratically added. The predictions of the NLO MC event generators POWHEG+PYTHIA-8 and HERWIG-7 are depicted by solid and dashed lines, respectively. |
png pdf |
Figure 8-a:
Ratio of the triple-differential dijet cross section to the NLOJet++ prediction using the NNPDF3.0 set in the (0 $ \leq {{y_{\mathrm {b}}}} < $ 1, 0 $ \leq {y^{*}} < $ 1) bin. The data points including statistical uncertainties are indicated by markers, the systematic experimental uncertainty is represented by the hatched band. The solid band shows the PDF, scale, and NP uncertainties quadratically added. The predictions of the NLO MC event generators POWHEG+PYTHIA-8 and HERWIG-7 are depicted by solid and dashed lines, respectively. |

png pdf |
Figure 8-b:
Ratio of the triple-differential dijet cross section to the NLOJet++ prediction using the NNPDF3.0 set in the (0 $ \leq {{y_{\mathrm {b}}}} < $ 1, 1 $ \leq {y^{*}} < $ 2) bin. The data points including statistical uncertainties are indicated by markers, the systematic experimental uncertainty is represented by the hatched band. The solid band shows the PDF, scale, and NP uncertainties quadratically added. The predictions of the NLO MC event generators POWHEG+PYTHIA-8 and HERWIG-7 are depicted by solid and dashed lines, respectively. |

png pdf |
Figure 8-c:
Ratio of the triple-differential dijet cross section to the NLOJet++ prediction using the NNPDF3.0 set in the (0 $ \leq {{y_{\mathrm {b}}}} < $ 1, 2 $ \leq {y^{*}} < $ 3) bin. The data points including statistical uncertainties are indicated by markers, the systematic experimental uncertainty is represented by the hatched band. The solid band shows the PDF, scale, and NP uncertainties quadratically added. The predictions of the NLO MC event generators POWHEG+PYTHIA-8 and HERWIG-7 are depicted by solid and dashed lines, respectively. |

png pdf |
Figure 8-d:
Ratio of the triple-differential dijet cross section to the NLOJet++ prediction using the NNPDF3.0 set in the (1 $ \leq {{y_{\mathrm {b}}}} < $ 2, 0 $ \leq {y^{*}} < $ 1) bin. The data points including statistical uncertainties are indicated by markers, the systematic experimental uncertainty is represented by the hatched band. The solid band shows the PDF, scale, and NP uncertainties quadratically added. The predictions of the NLO MC event generators POWHEG+PYTHIA-8 and HERWIG-7 are depicted by solid and dashed lines, respectively. |
png pdf |
Figure 8-e:
Ratio of the triple-differential dijet cross section to the NLOJet++ prediction using the NNPDF3.0 set in the (1 $ \leq {{y_{\mathrm {b}}}} < $ 2, 1 $ \leq {y^{*}} < $ 2) bin. The data points including statistical uncertainties are indicated by markers, the systematic experimental uncertainty is represented by the hatched band. The solid band shows the PDF, scale, and NP uncertainties quadratically added. The predictions of the NLO MC event generators POWHEG+PYTHIA-8 and HERWIG-7 are depicted by solid and dashed lines, respectively. |

png pdf |
Figure 8-f:
Ratio of the triple-differential dijet cross section to the NLOJet++ prediction using the NNPDF3.0 set in the (2 $ \leq {{y_{\mathrm {b}}}} < $ 3, 0 $ \leq {y^{*}} < $ 1) bin. The data points including statistical uncertainties are indicated by markers, the systematic experimental uncertainty is represented by the hatched band. The solid band shows the PDF, scale, and NP uncertainties quadratically added. The predictions of the NLO MC event generators POWHEG+PYTHIA-8 and HERWIG-7 are depicted by solid and dashed lines, respectively. |

png pdf |
Figure 9:
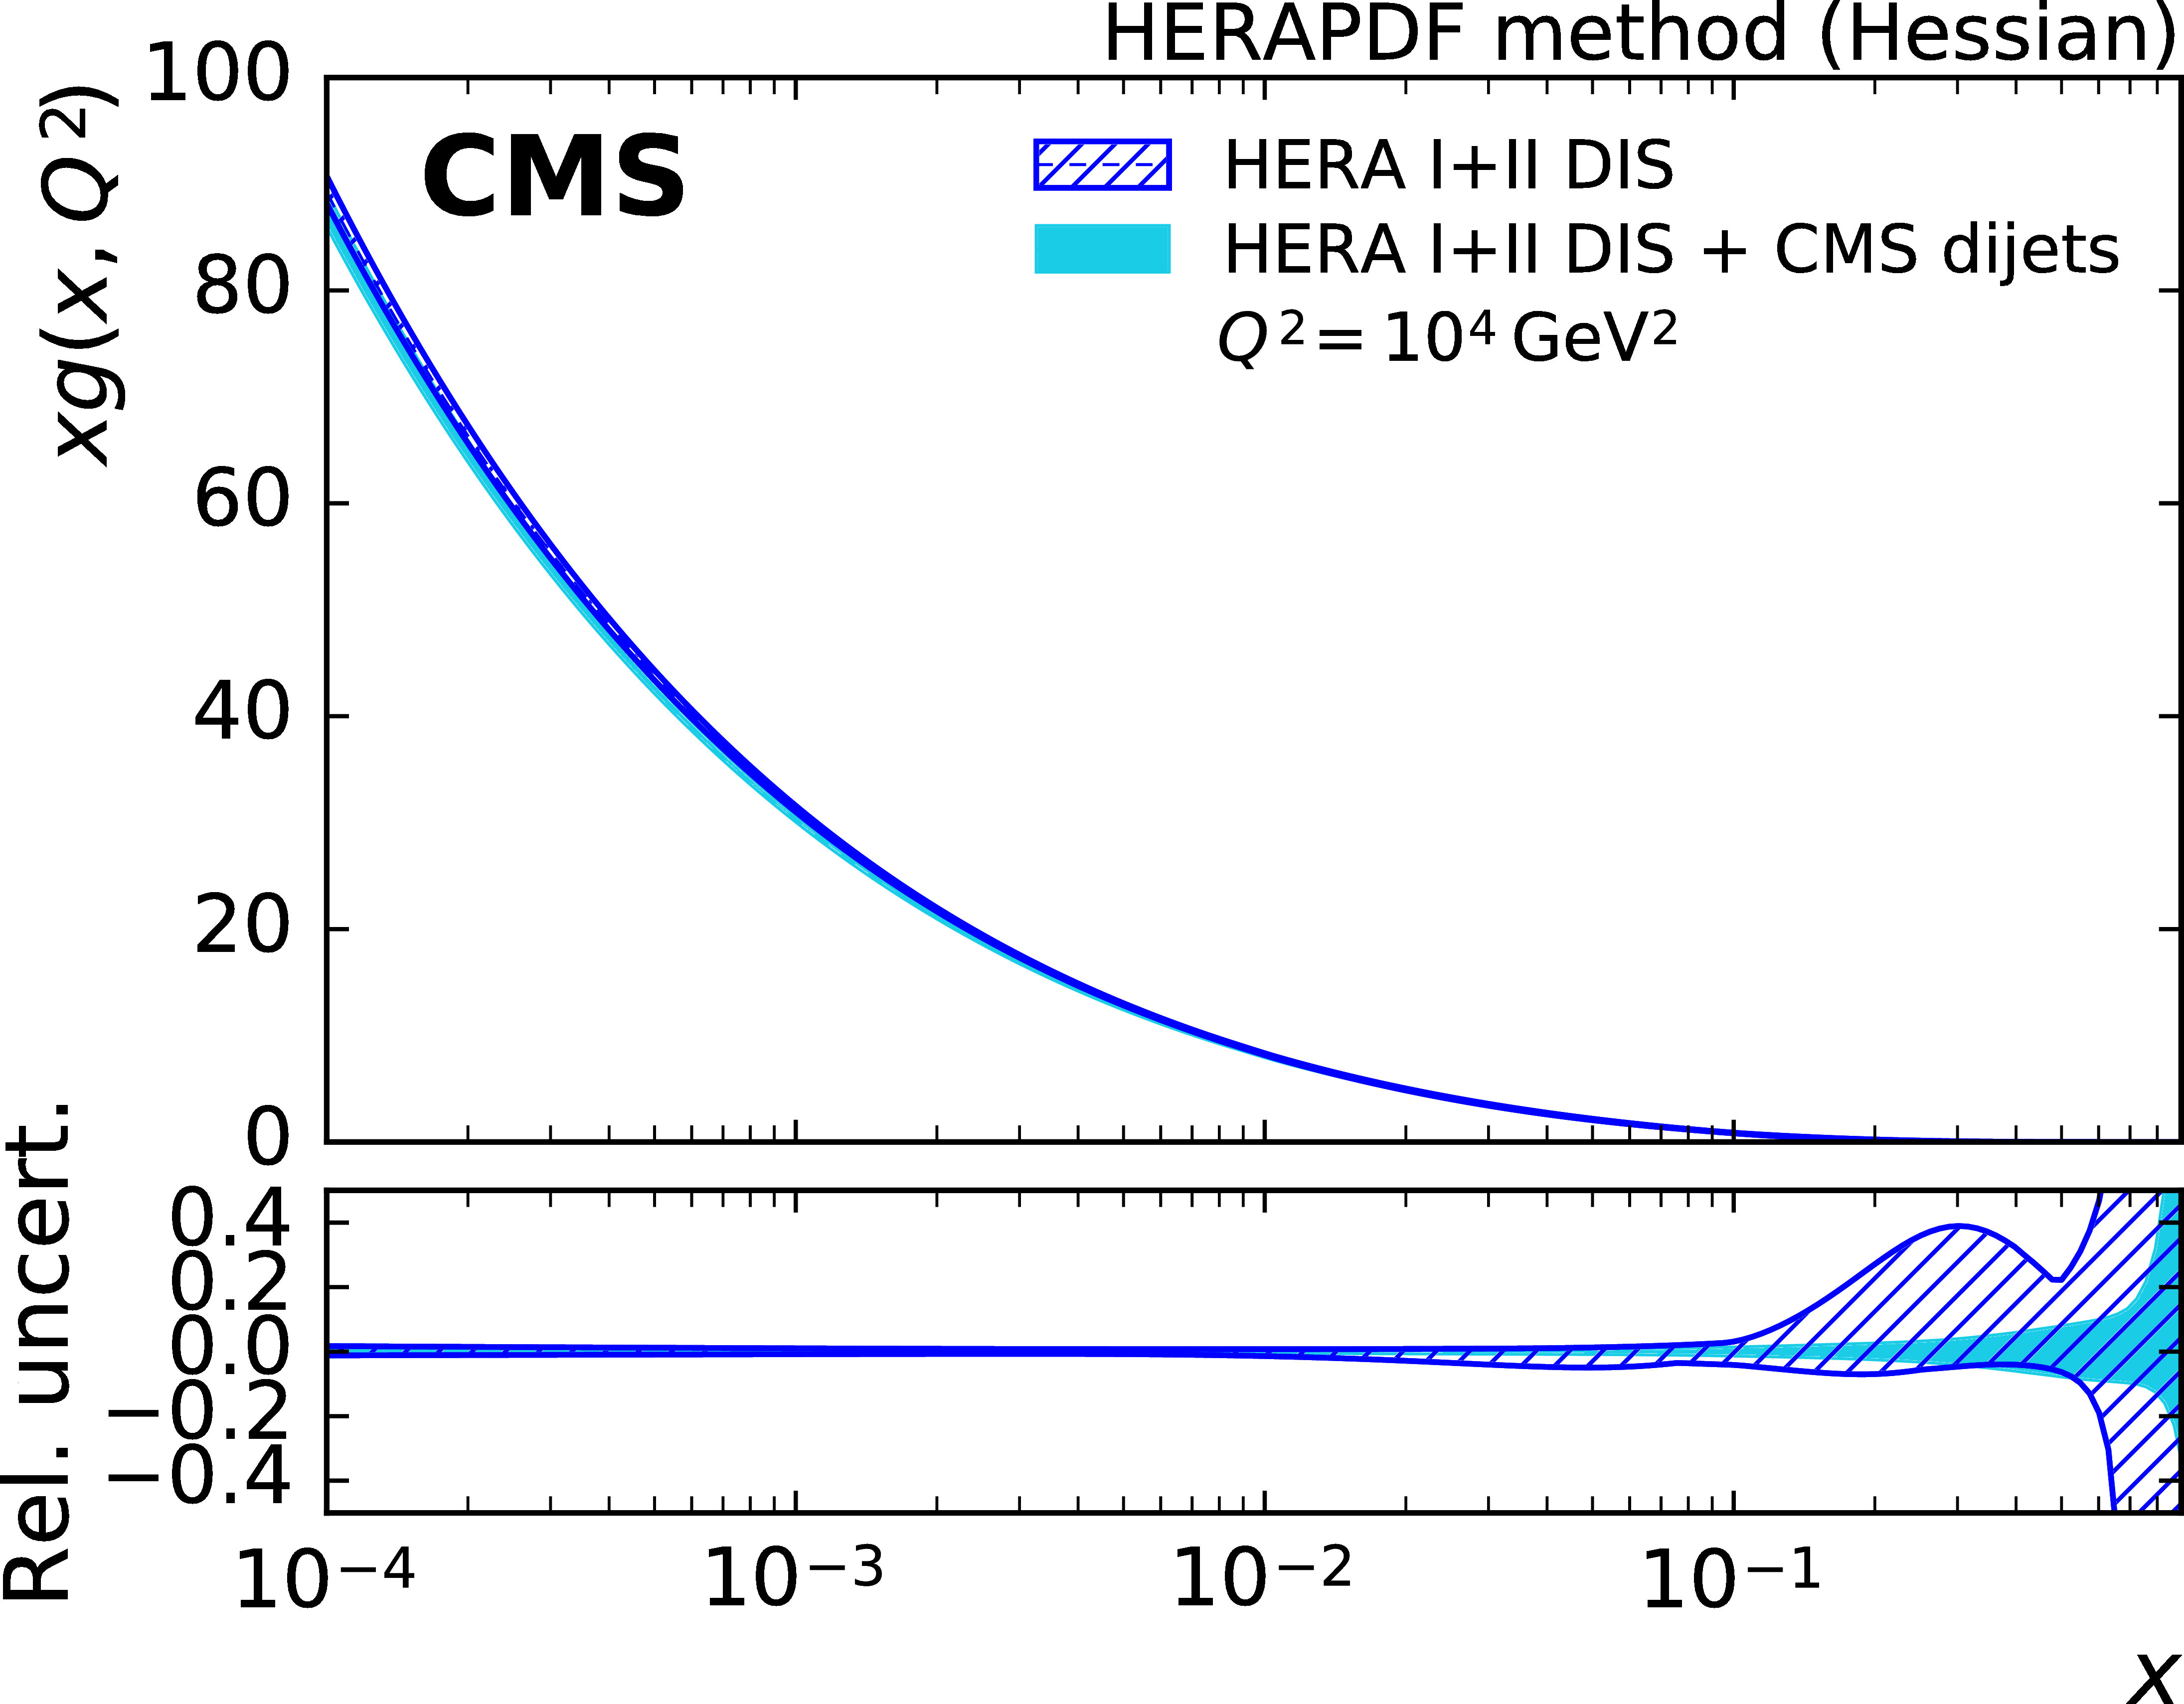
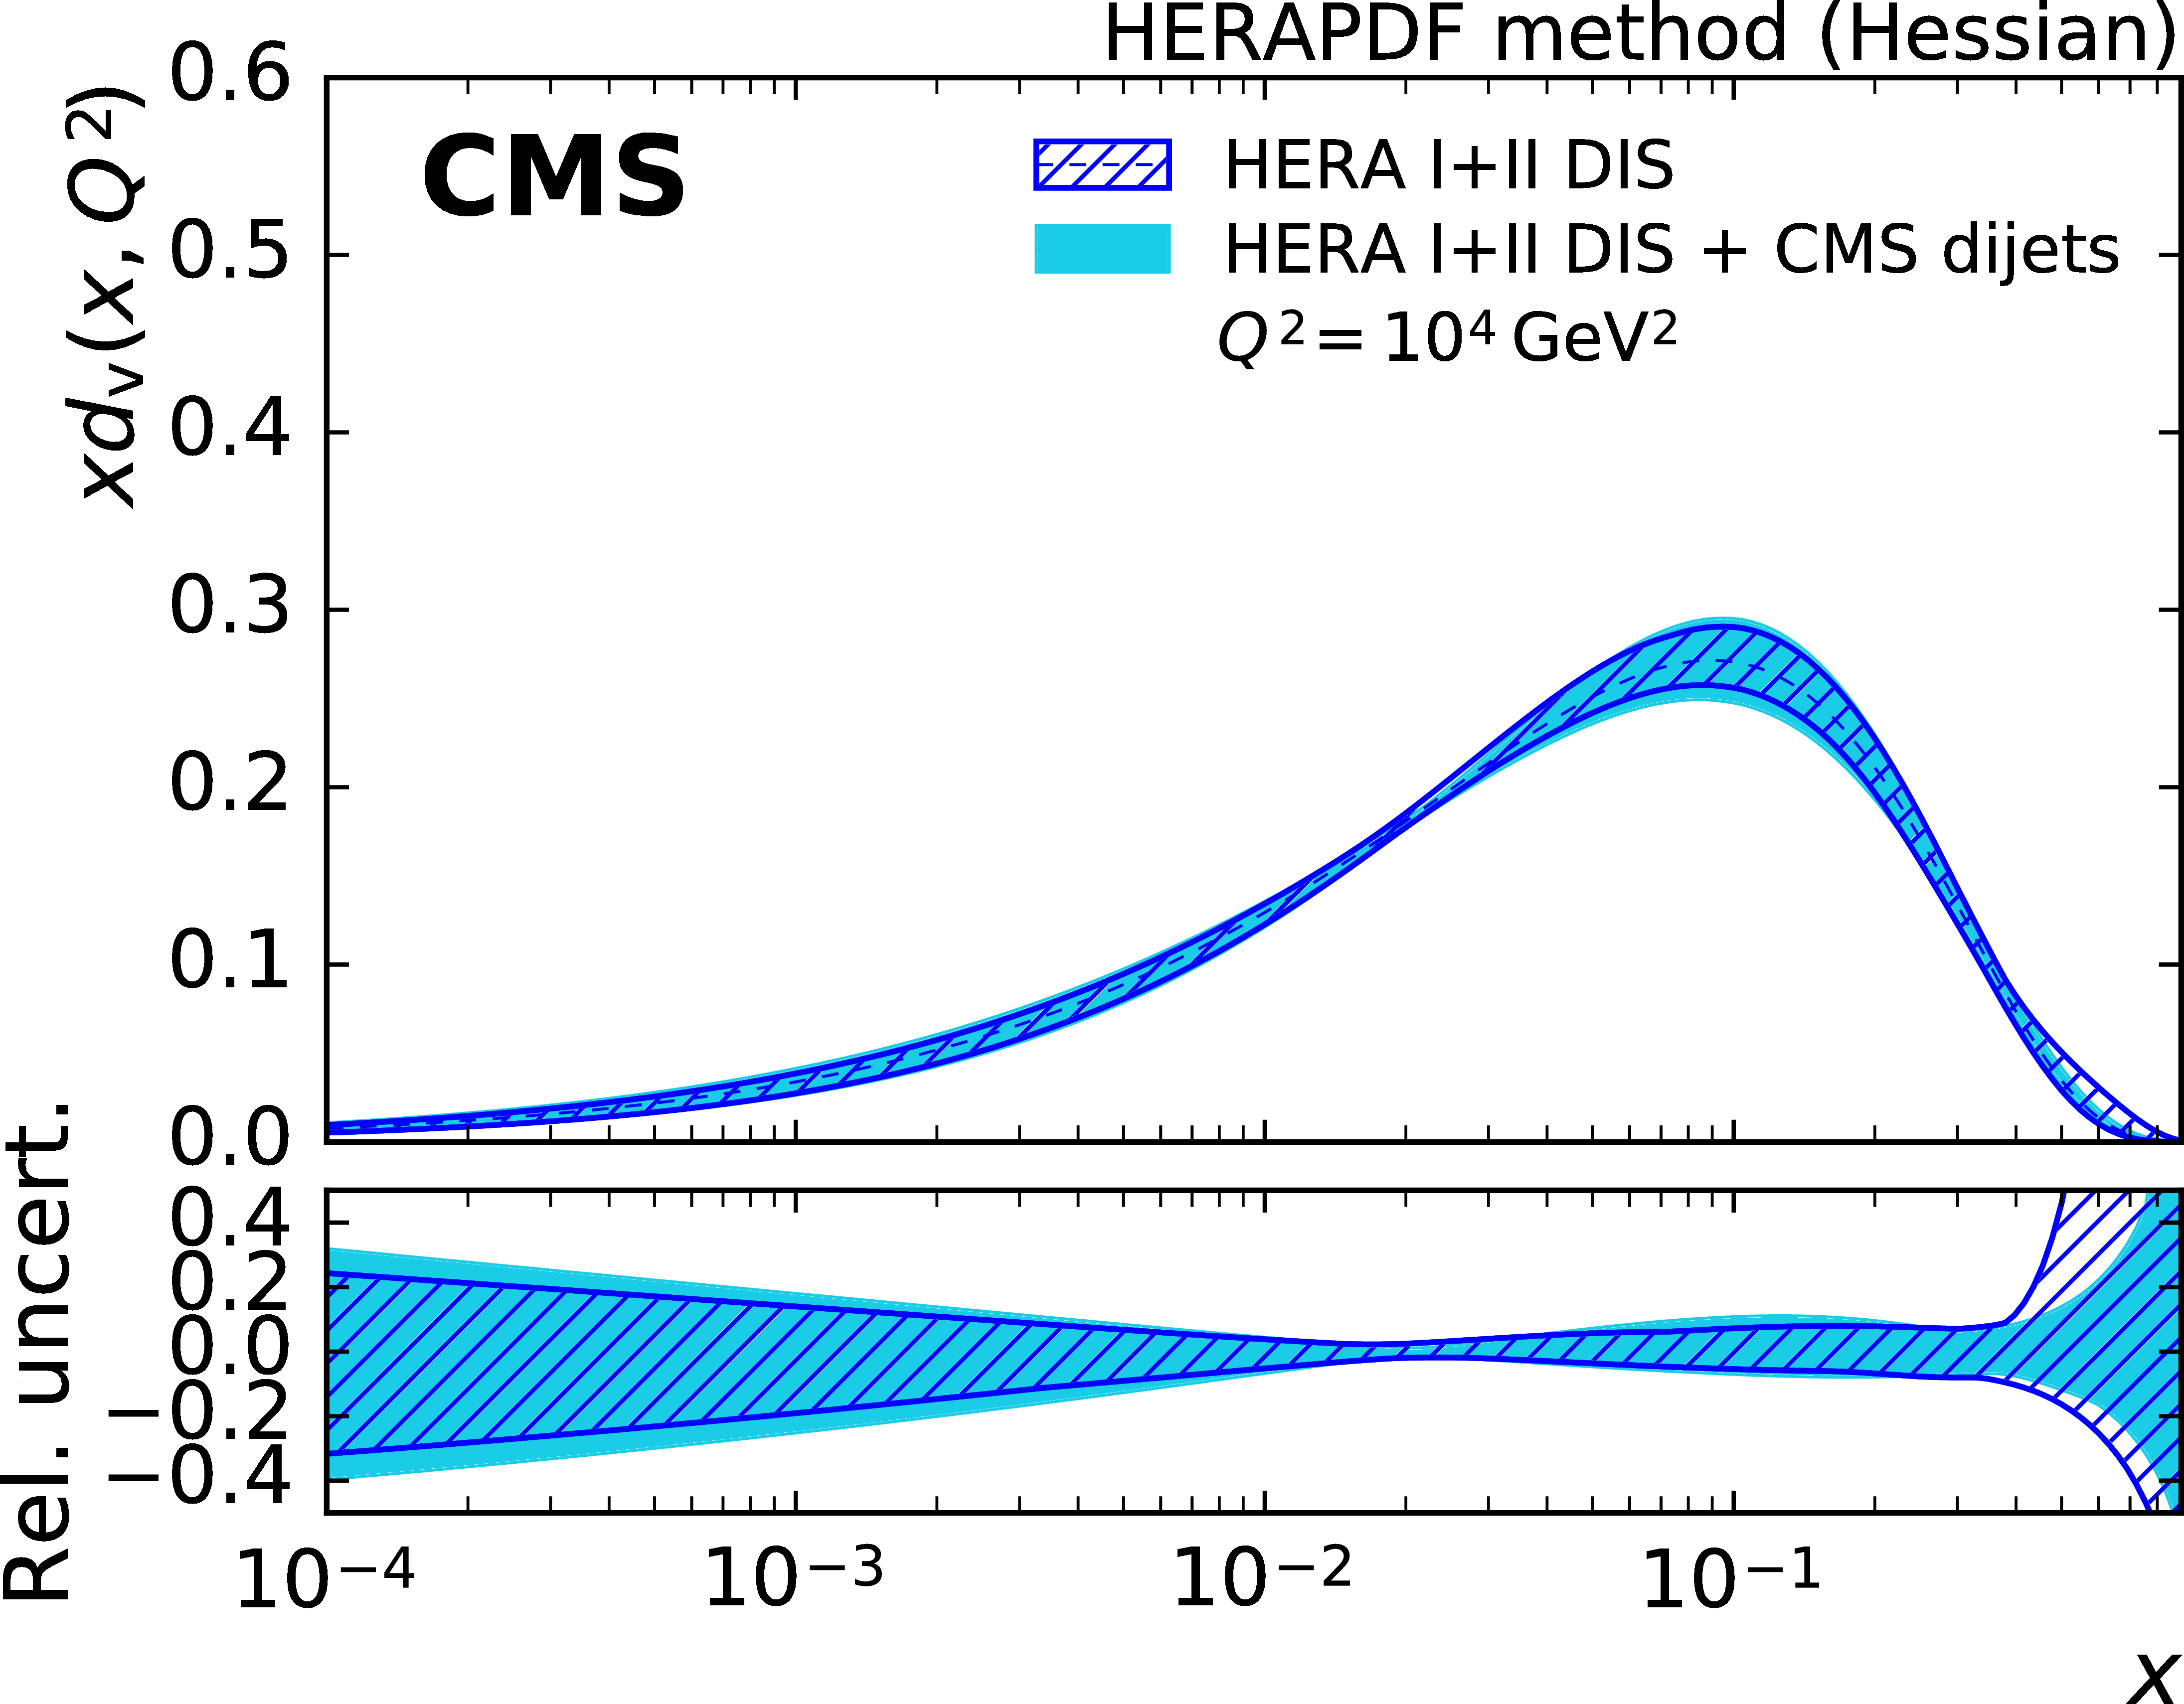
The gluon (top left), sea quark (top right), dvalence quark (bottom left), and uvalence quark (bottom right) PDFs as a function of $x$ as derived from HERA inclusive DIS data alone (hatched band) and in combination with CMS dijet data (solid band). The PDFs are shown at the scale $Q^2 = 10^{4}$ GeV$ ^2 $ with their total uncertainties. |
png pdf |
Figure 9-a:
The gluon PDF as a function of $x$ as derived from HERA inclusive DIS data alone (hatched band) and in combination with CMS dijet data (solid band). The PDFs are shown at the scale $Q^2 = 10^{4} $ GeV$ ^2$ with their total uncertainties. |

png pdf |
Figure 9-b:
The sea quark PDFs as a function of $x$ as derived from HERA inclusive DIS data alone (hatched band) and in combination with CMS dijet data (solid band). The PDFs are shown at the scale $Q^2 = 10^{4} $ GeV$ ^2$ with their total uncertainties. |
png pdf |
Figure 9-c:
The d-valence quark PDF as a function of $x$ as derived from HERA inclusive DIS data alone (hatched band) and in combination with CMS dijet data (solid band). The PDFs are shown at the scale $Q^2 = 10^{4} $ GeV$ ^2$ with their total uncertainties. |

png pdf |
Figure 9-d:
The u-valence quark PDF as a function of $x$ as derived from HERA inclusive DIS data alone (hatched band) and in combination with CMS dijet data (solid band). The PDFs are shown at the scale $Q^2 = 10^{4} $ GeV$ ^2$ with their total uncertainties. |

png pdf |
Figure 10:
The gluon PDF as a function of $x$ as derived from HERA inclusive DIS data alone (hatched band) and in combination with CMS dijet data (solid band). The PDF and its total uncertainty are shown at the starting scale $Q^2 = $ 1.9 GeV$^2$ of the PDF evolution. |

png pdf |
Figure 11:
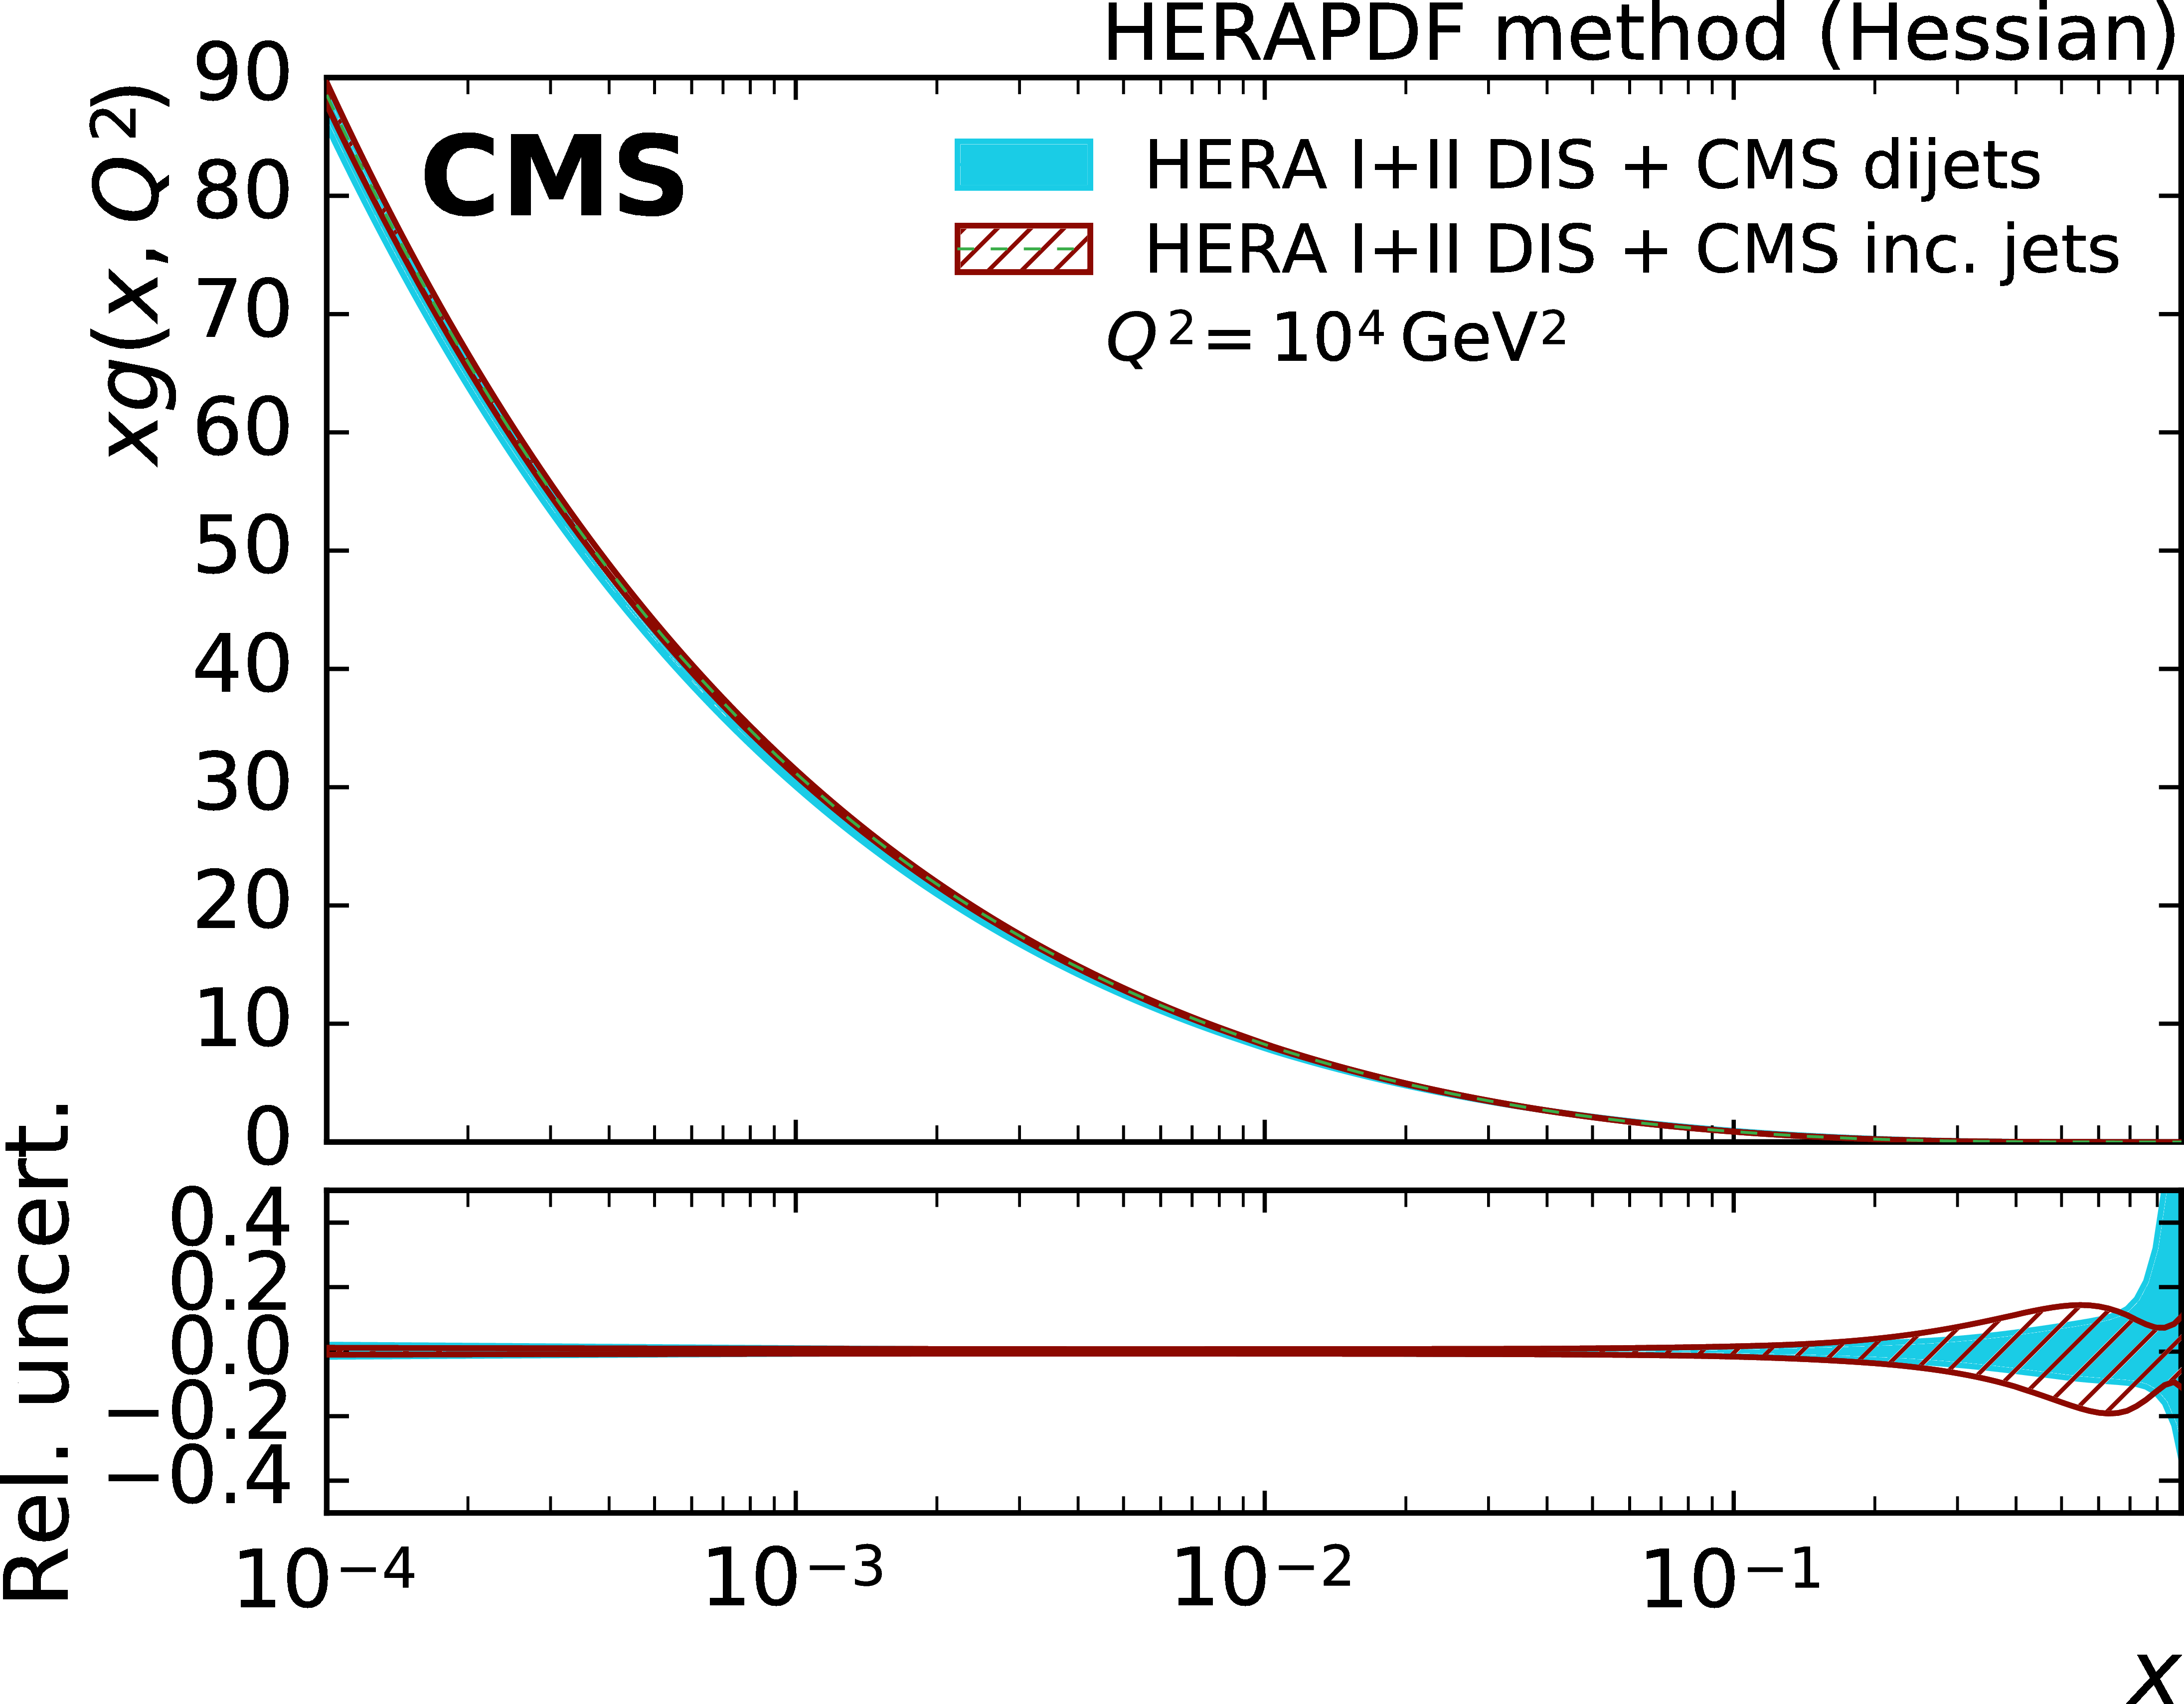
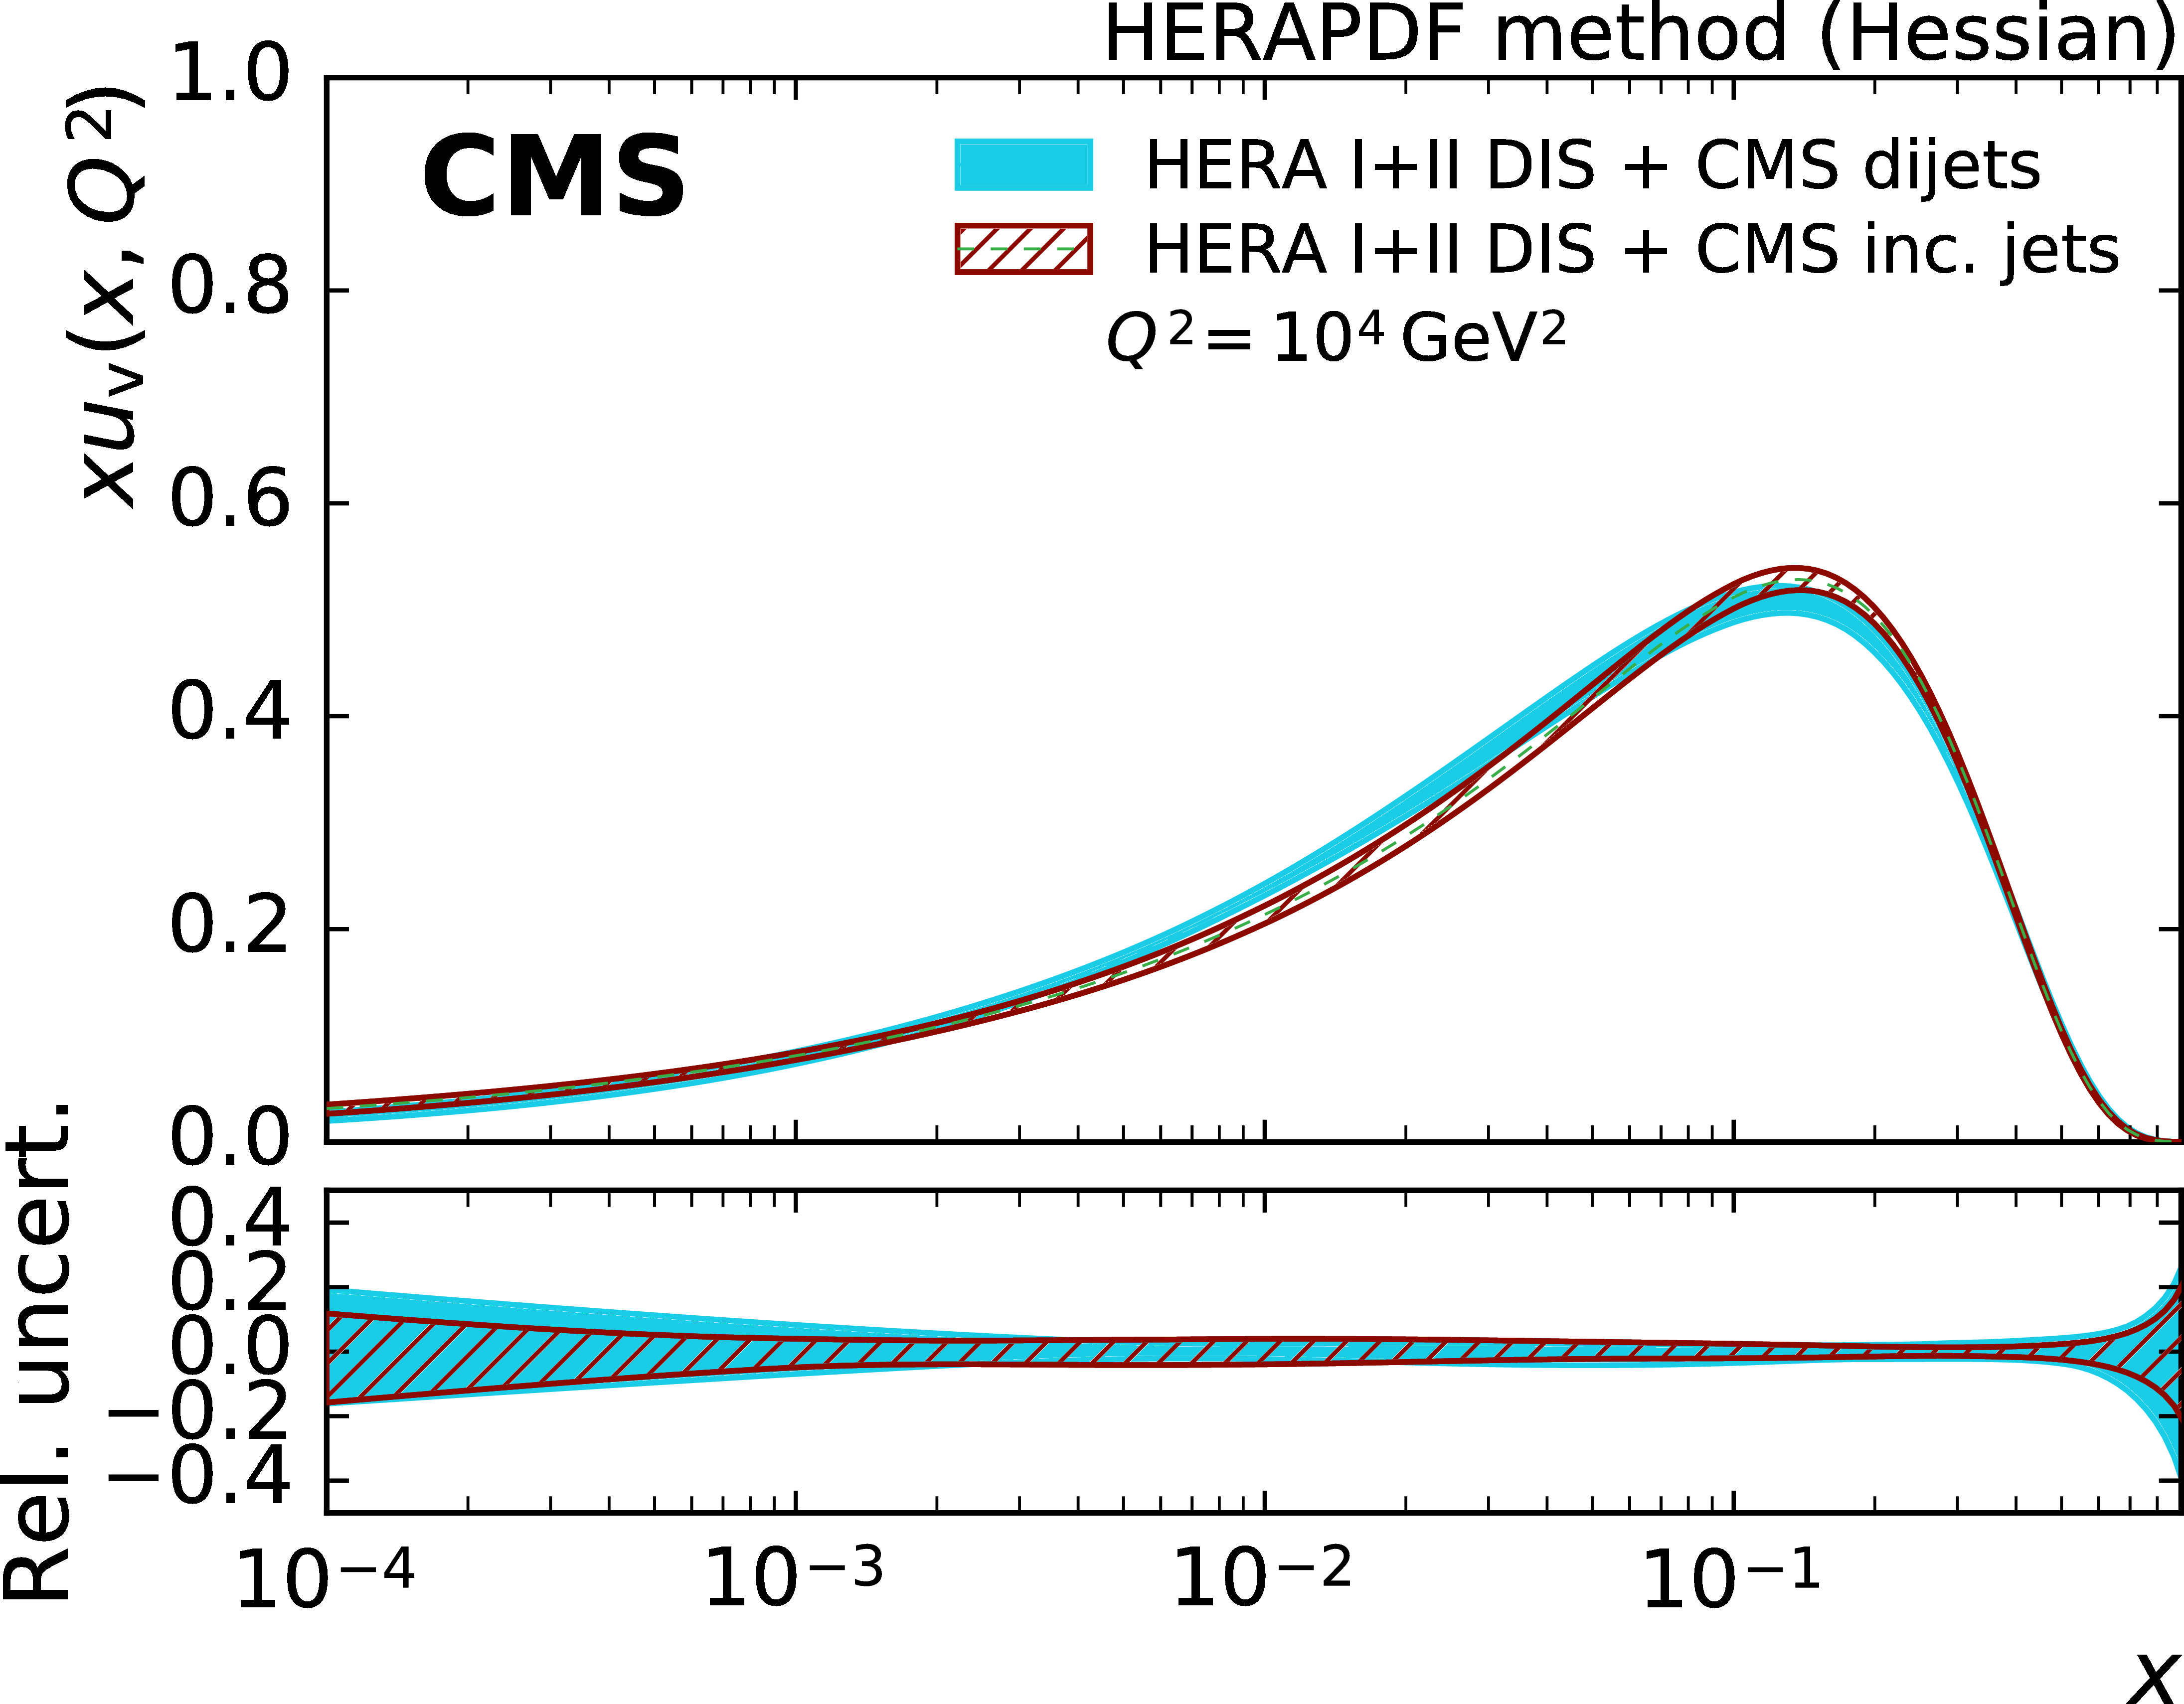
The gluon (top left), sea quark (top right), dvalence quark (bottom left), and uvalence quark (bottom right) PDFs as a function of $x$ as derived from a fit of HERA inclusive DIS data in combination with CMS inclusive jet data (solid band) and CMS dijet data (hatched band) at 8 TeV. The PDFs are shown at the scale $Q^2 = 10^{4} $ GeV$^2$ with their total uncertainties. |
png pdf |
Figure 11-a:
The gluon PDF as a function of $x$ as derived from a fit of HERA inclusive DIS data in combination with CMS inclusive jet data (solid band) and CMS dijet data (hatched band) at 8 TeV. The PDFs are shown at the scale $Q^2 = 10^{4} $ GeV$^2$ with their total uncertainties. |

png pdf |
Figure 11-b:
The sea quark PDF as a function of $x$ as derived from a fit of HERA inclusive DIS data in combination with CMS inclusive jet data (solid band) and CMS dijet data (hatched band) at 8 TeV. The PDFs are shown at the scale $Q^2 = 10^{4} $ GeV$^2$ with their total uncertainties. |

png pdf |
Figure 11-c:
The d-valence quark PDF as a function of $x$ as derived from a fit of HERA inclusive DIS data in combination with CMS inclusive jet data (solid band) and CMS dijet data (hatched band) at 8 TeV. The PDFs are shown at the scale $Q^2 = 10^{4} $ GeV$^2$ with their total uncertainties. |
png pdf |
Figure 11-d:
The u-valence quark PDF as a function of $x$ as derived from a fit of HERA inclusive DIS data in combination with CMS inclusive jet data (solid band) and CMS dijet data (hatched band) at 8 TeV. The PDFs are shown at the scale $Q^2 = 10^{4} $ GeV$^2$ with their total uncertainties. |
| Tables | |

png pdf |
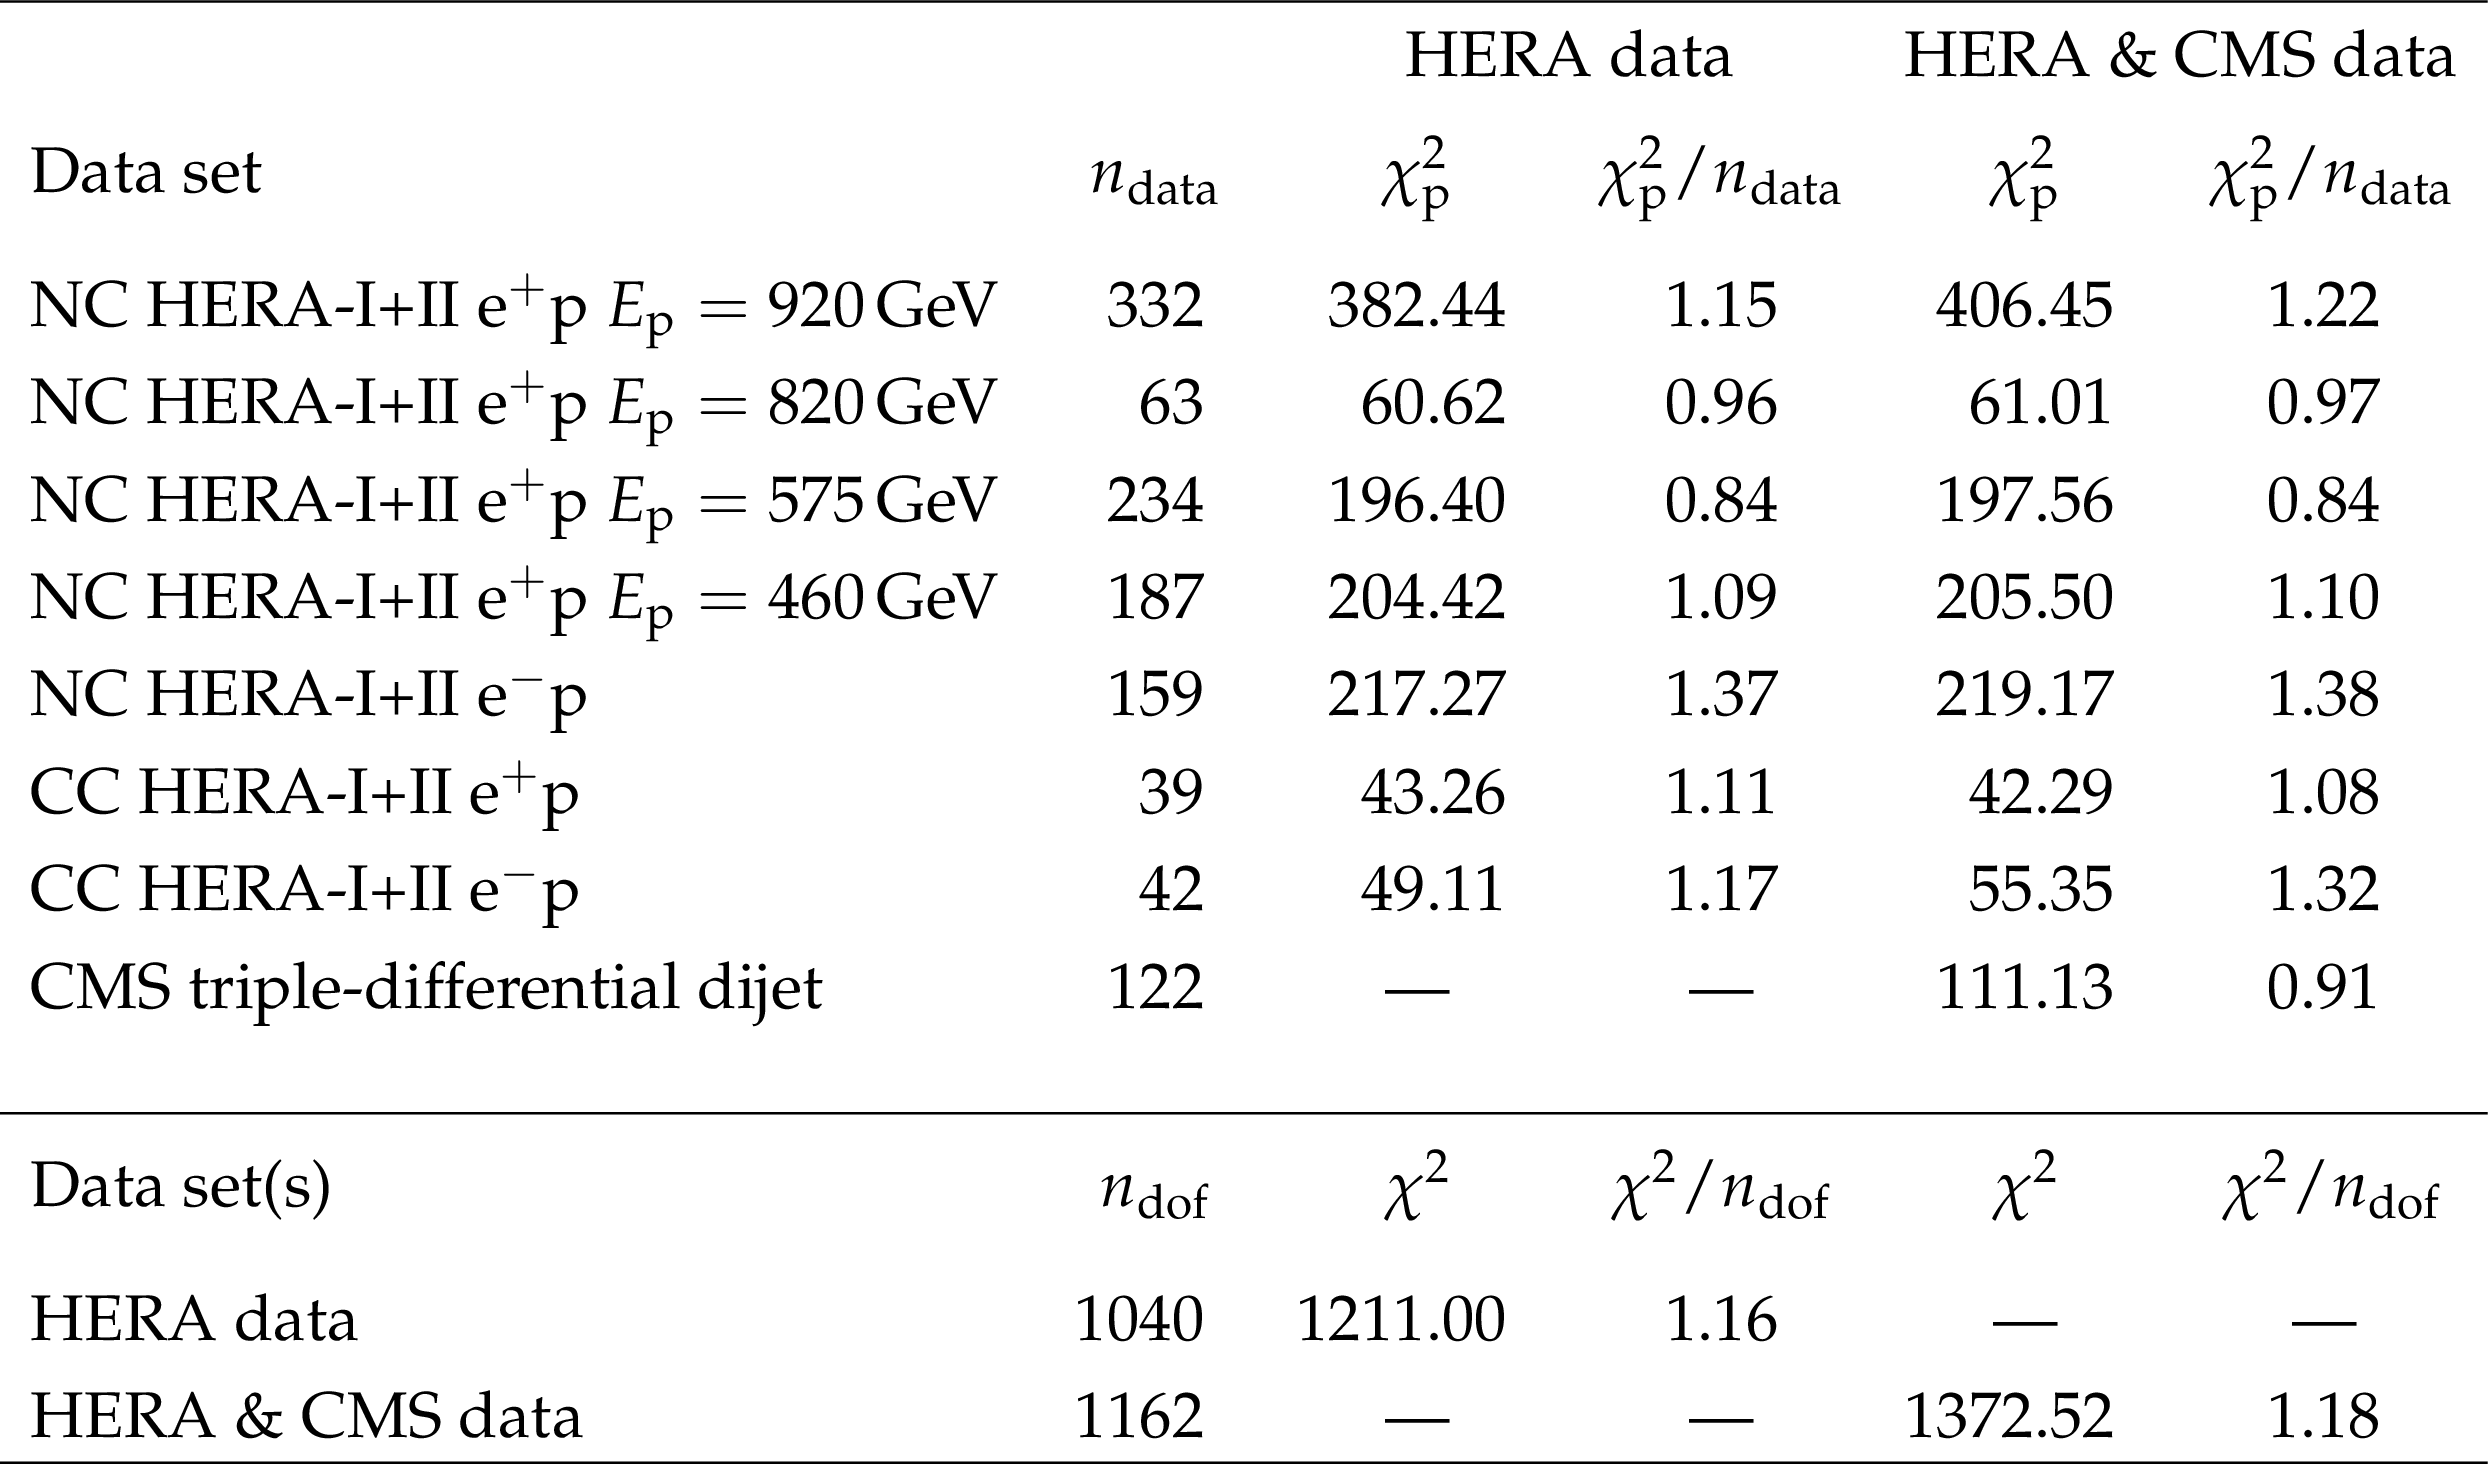
Table 1:
List of single-jet trigger thresholds used in the analysis. |
png pdf |
Table 2:
The partial ${\chi ^2}$ ($ {\chi ^2_\text {p}} $) for each data set in the HERA DIS (middle section) or the combined fit including the CMS triple-differential dijet data (right section) are shown. The bottom two lines show the total ${\chi ^2}$ and ${\chi ^2/n_\text {dof}} $. The difference between the sum of all ${\chi ^2_\text {p}}$ and the total ${\chi ^2}$ for the combined fit is attributed to the nuisance parameters. |
| Summary |
|
A measurement of the triple-differential dijet cross section is presented for $ \sqrt{s} = $ 8 TeV. The data are found to be well described by NLO predictions corrected for nonperturbative and electroweak effects, except for highly boosted event topologies that suffer from large uncertainties in parton distribution functions (PDFs). The precise data constrain the PDFs, especially in the highly boosted regime that probes the highest fractions $x$ of the proton momentum carried by a parton. The impact of the data on the PDFs is demonstrated by performing a simultaneous fit to cross sections of deep-inelastic scattering obtained by the HERA experiments and the dijet cross section measured in this analysis. When including the dijet data, an increased gluon PDF at high $x$ is obtained and the overall uncertainties of the PDFs, especially those of the gluon distribution, are significantly reduced. In contrast to a fit that uses inclusive jet data, this measurement carries more information on the valence-quark content of the proton such that a more flexible parameterisation is needed to describe the low-$x$ behaviour of the u and d valence quark PDFs. This higher sensitivity is accompanied by slightly larger uncertainties in the valence quark distributions as a consequence of the greater flexibility in the parameterisation of the PDFs. In a simultaneous fit the strong coupling constant $\alpha_S(M_\text{Z})$ is extracted together with the PDFs. The value obtained at the mass of the Z boson is and is in agreement with previous measurements at the LHC by CMS [54, 62, 70-72] and ATLAS [73], and with the world average value of $\alpha_S(M_\text{Z}) = $ 0.1181 $\pm$ 0.0011 [74]. The dominant uncertainty is theoretical in nature and is expected to be reduced significantly in the future using pQCD predictions at next-to-next-to-leading order [75]. |
| References | ||||
| 1 | UA2 Collaboration | Observation of very large transverse momentum jets at the CERN $ \bar{p}p $ collider | PLB 118 (1982) 203 | |
| 2 | AFS Collaboration | Dijet production cross-section and fragmentation of jets produced in $ p p $ collisions at $ \sqrt{s} = $ 63 GeV | Z. Phys. C 30 (1986) 27 | |
| 3 | CDF Collaboration | A measurement of the differential dijet mass cross section in $ p\bar{p} $ collisions at $ \sqrt{s} = $ 1.8 TeV | PRD 61 (2000) 091101 | hep-ex/9912022 |
| 4 | CDF Collaboration | Measurement of the dijet mass distribution in $ p\bar{p} $ collisions at $ \sqrt{s} = $ 1.8 TeV | PRD 48 (1993) 998 | |
| 5 | CDF Collaboration | Two-jet invariant-mass distribution at $ \sqrt{s} = $ 1.8 TeV | PRD 41 (1990) 1722 | |
| 6 | D0 Collaboration | Dijet Mass Spectrum and a Search for Quark Compositeness in $ \bar{p}p $ Collisions at $ \sqrt{s} = $ 1.8 TeV | PRL 82 (1999) 2457 | hep-ex/9807014 |
| 7 | ATLAS Collaboration | Measurement of inclusive jet and dijet cross sections in proton-proton collisions at 7 TeV centre-of-mass energy with the ATLAS detector | EPJC 71 (2011) 1512 | 1009.5908 |
| 8 | CMS Collaboration | Measurement of the differential dijet production cross section in proton-proton collisions at $ \sqrt{s} = $ 7 TeV | PLB 700 (2011) 187 | CMS-QCD-10-025 1104.1693 |
| 9 | ATLAS Collaboration | Measurement of inclusive jet and dijet production in $ pp $ collisions at $ \sqrt{s} = $ 7 TeV using the ATLAS detector | PRD 86 (2012) 014022 | 1112.6297 |
| 10 | ATLAS Collaboration | Measurement of dijet cross sections in $ pp $ collisions at 7 TeV centre-of-mass energy using the ATLAS detector | JHEP 05 (2014) 059 | 1312.3524 |
| 11 | CMS Collaboration | Measurements of differential jet cross sections in proton-proton collisions at $ \sqrt{s} = $ 7 TeV with the CMS detector | PRD 87 (2013) 112002 | CMS-QCD-11-004 1212.6660 |
| 12 | CDF Collaboration | Two-Jet Differential Cross-Section in $ \bar{p}p $ Collisions at $ \sqrt{s} = $ 1.8 TeV | PRL 64 (1990) 157 | |
| 13 | CDF Collaboration | Measurement of the two-jet differential cross section in $ p\bar{p} $ collisions at $ \sqrt{s} = $ 1800 GeV | PRD 64 (2001) 012001 | hep-ex/0012013 |
| 14 | Z. Nagy | Three Jet Cross-Sections in Hadron Hadron Collisions at Next-To-Leading Order | PRL 88 (2002) 122003 | hep-ph/0110315 |
| 15 | Z. Nagy | Next-to-leading order calculation of three-jet observables in hadron hadron collisions | PRD 68 (2003) 094002 | hep-ph/0307268 |
| 16 | CMS Collaboration | The CMS experiment at the CERN LHC | JINST 3 (2008) S08004 | CMS-00-001 |
| 17 | CMS Collaboration | The CMS high level trigger | EPJC 46 (2006) 605 | hep-ex/0512077 |
| 18 | CMS Collaboration | The CMS trigger system | JINST 12 (2017) P01020 | CMS-TRG-12-001 1609.02366 |
| 19 | CMS Collaboration | Particle-Flow Event Reconstruction in CMS and Performance for Jets, Taus, and MET | CDS | |
| 20 | CMS Collaboration | Commissioning of the Particle-flow Event Reconstruction with the first LHC collisions recorded in the CMS detector | CDS | |
| 21 | CMS Collaboration | Pileup Removal Algorithms | CMS-PAS-JME-14-001 | CMS-PAS-JME-14-001 |
| 22 | M. Cacciari, G. P. Salam, and G. Soyez | The anti-$ k_t $ jet clustering algorithm | JHEP 04 (2008) 063 | 0802.1189 |
| 23 | CMS Collaboration | Determination of jet energy calibration and transverse momentum resolution in CMS | JINST 6 (2011) P11002 | CMS-JME-10-011 1107.4277 |
| 24 | CMS Collaboration | Jet energy scale and resolution in the CMS experiment in pp collisions at 8 TeV | JINST 12 (2017) P02014 | CMS-JME-13-004 1607.03663 |
| 25 | G. D'Agostini | A multidimensional unfolding method based on Bayes' theorem | NIMA 362 (1995) 487 | |
| 26 | L. B. Lucy | An iterative technique for the rectification of observed distributions | Astron. J. 79 (1974) 745 | |
| 27 | W. H. Richardson | Bayesian-Based Iterative Method of Image Restoration | J. Opt. Soc. Am. 62 (1972) 55 | |
| 28 | T. Adye | Unfolding algorithms and tests using RooUnfold | in Proceedings, PHYSTAT 2011 Workshop on Statistical Issues Related to Discovery Claims in Search Experiments and Unfolding, Geneva | 1105.1160 |
| 29 | S. Dulat et al. | New parton distribution functions from a global analysis of quantum chromodynamics | PRD 93 (2016) 033006 | 1506.07443 |
| 30 | S. Agostinelli et al. | GEANT4---a simulation toolkit | NIMA 506 (2003) 250 | |
| 31 | T. Sjostrand, S. Mrenna, and P. Z. Skands | PYTHIA 6.4 physics and manual | JHEP 05 (2006) 026 | hep-ph/0603175 |
| 32 | E. Veklerov and J. Llacer | Stopping Rule for the MLE Algorithm Based on Statistical Hypothesis Testing | IEEE Transactions on Medical Imaging MI-6 (1987) 313 | |
| 33 | CMS Collaboration | CMS Luminosity Based on Pixel Cluster Counting - Summer 2013 Update | CMS-PAS-LUM-13-001 | CMS-PAS-LUM-13-001 |
| 34 | T. Kluge, K. Rabbertz, and M. Wobisch | fastNLO: fast pQCD calculations for PDF fits | in 14th International Workshop on Deep Inelastic Scattering (DIS 2006), Tsukuba | hep-ph/0609285 |
| 35 | D. Britzger, K. Rabbertz, F. Stober, and M. Wobisch | New features in version 2 of the fastNLO project | in Proceedings, XX.\ International Workshop on Deep-Inelastic Scattering and Related Subjects (DIS 2012), Bonn | 1208.3641 |
| 36 | S. D. Ellis, Z. Kunszt, and D. E. Soper | Two-Jet Production in Hadron Collisions at Order $ \alpha_s^3 $ in QCD | PRL 69 (1992) 1496 | |
| 37 | S. Alekhin, J. Blumlein, and S. Moch | Parton distribution functions and benchmark cross sections at NNLO | PRD 86 (2012) 054009 | 1202.2281 |
| 38 | L. A. Harland-Lang, A. D. Martin, P. Motylinski, and R. S. Thorne | Parton distributions in the LHC era: MMHT 2014 PDFs | EPJC 75 (2015) 204 | 1412.3989 |
| 39 | NNPDF Collaboration | Parton distributions for the LHC Run II | JHEP 04 (2015) 040 | 1410.8849 |
| 40 | M. R. Whalley, D. Bourilkov, and R. C. Group | The Les Houches Accord PDFs (LHAPDF) and LHAGLUE | in Proceedings, HERA and the LHC: A Workshop on the implications of HERA for LHC physics: Vol. B Geneva and Hamburg, 2004 | hep-ph/0508110 |
| 41 | A. Buckley et al. | LHAPDF6: parton density access in the LHC precision era | EPJC 75 (2015) 132 | 1412.7420 |
| 42 | T. Sjostrand, S. Mrenna, and P. Z. Skands | A brief introduction to PYTHIA 8.1 | CPC 178 (2008) 852 | 0710.3820 |
| 43 | M. Bahr et al. | Herwig++ physics and manual | EPJC 58 (2008) 639 | 0803.0883 |
| 44 | CMS Collaboration | Event generator tunes obtained from underlying event and multiparton scattering measurements | EPJC 76 (2015) 155 | CMS-GEN-14-001 1512.00815 |
| 45 | M. H. Seymour and A. Siodmok | Constraining MPI models using $ \sigma_\text{eff} $ and recent Tevatron and LHC underlying event data | JHEP 10 (2013) 113 | 1307.5015 |
| 46 | P. Nason | A new method for combining NLO QCD with shower Monte Carlo algorithms | JHEP 11 (2004) 040 | hep-ph/0409146 |
| 47 | S. Frixione, P. Nason, and C. Oleari | Matching NLO QCD computations with Parton Shower simulations: the POWHEG method | JHEP 11 (2007) 070 | 0709.2092 |
| 48 | S. Alioli, P. Nason, C. Oleari, and E. Re | A general framework for implementing NLO calculations in shower Monte Carlo programs: the POWHEG BOX | JHEP 06 (2010) 043 | 1002.2581 |
| 49 | S. Alioli et al. | Jet pair production in POWHEG | JHEP 04 (2011) 081 | 1012.3380 |
| 50 | S. Dittmaier, A. Huss, and C. Speckner | Weak radiative corrections to dijet production at hadron colliders | JHEP 11 (2012) 095 | 1210.0438 |
| 51 | R. Frederix et al. | The complete NLO corrections to dijet hadroproduction | 1612.06548 | |
| 52 | M. Cacciari et al. | The t anti-t cross-section at 1.8 TeV and 1.96 TeV: a study of the systematics due to parton densities and scale dependence | JHEP 04 (2004) 068 | hep-ph/0303085 |
| 53 | A. Banfi, G. P. Salam, and G. Zanderighi | Phenomenology of event shapes at hadron colliders | JHEP 06 (2010) 038 | 1001.4082 |
| 54 | CMS Collaboration | Constraints on parton distribution functions and extraction of the strong coupling constant from the inclusive jet cross section in pp collisions at $ \sqrt{s} = $ 7 TeV | EPJC 75 (2015) 288 | CMS-SMP-12-028 1410.6765 |
| 55 | J. Bellm et al. | Herwig 7.0/Herwig++ 3.0 release note | EPJC 76 (2016) 196 | 1512.01178 |
| 56 | H1 and ZEUS Collaborations | Combination of measurements of inclusive deep inelastic $ {e^{\pm }p} $ scattering cross sections and QCD analysis of HERA data | EPJC 75 (2015) 580 | 1506.06042 |
| 57 | S. Alekhin et al. | HERAFitter | EPJC 75 (2015) 304 | 1410.4412 |
| 58 | V. N. Gribov and L. N. Lipatov | Deep inelastic ep scattering in perturbation theory | Sov. J. Nucl. Phys. 15 (1972)438 | |
| 59 | G. Altarelli and G. Parisi | Asymptotic freedom in parton language | Nucl. Phys. B 126 (1977) 298 | |
| 60 | Y. L. Dokshitzer | Calculation of the Structure Functions for Deep Inelastic Scattering and $ e^+e^- $ Annihilation by Perturbation Theory in Quantum Chromodynamics. | Sov. Phys. JETP 46 (1977)641 | |
| 61 | M. Botje | QCDNUM: fast QCD evolution and convolution | CPC 182 (2011) 490 | 1005.1481 |
| 62 | CMS Collaboration | Measurement and QCD analysis of double-differential inclusive jet cross-sections in pp collisions at $ \sqrt{s} = $ 8 TeV and ratios to 2.76 and 7 TeV | JHEP 03 (2017) 156 | CMS-SMP-14-001 1609.05331 |
| 63 | R. S. Thorne and R. G. Roberts | An ordered analysis of heavy flavor production in deep inelastic scattering | PRD 57 (1998) 6871 | hep-ph/9709442 |
| 64 | R. S. Thorne | Variable-flavor number scheme for next-to-next-to-leading order | PRD 73 (2006) 054019 | hep-ph/0601245 |
| 65 | CMS Collaboration | Measurement of the differential cross section and charge asymmetry for inclusive $ \mathrm {p}\mathrm {p}\rightarrow \mathrm {W}^{\pm }+X $ production at $ {\sqrt{s}} = $ 8 TeV | EPJC 76 (2016) 469 | CMS-SMP-14-022 1603.01803 |
| 66 | J. Pumplin et al. | Uncertainties of predictions from parton distribution functions. 2. The Hessian method | PRD 65 (2001) 014013 | hep-ph/0101032 |
| 67 | W. T. Giele and S. Keller | Implications of hadron collider observables on parton distribution function uncertainties | PRD 58 (1998) 094023 | hep-ph/9803393 |
| 68 | CMS Collaboration | Measurement of the muon charge asymmetry in inclusive $ pp \to W+X $ production at $ \sqrt{s} = $ 7 TeV and an improved determination of light parton distribution functions | PRD 90 (2014) 032004 | CMS-SMP-12-021 1312.6283 |
| 69 | B. J. A. Watt, P. Motylinski, and R. S. Thorne | The effect of LHC jet data on MSTW PDFs | EPJC 74 (2014) 2934 | 1311.5703 |
| 70 | CMS Collaboration | Measurement of the ratio of the inclusive 3-jet cross section to the inclusive 2-jet cross section in pp collisions at $ \sqrt{s} = $ 7 TeV and first determination of the strong coupling constant in the TeV range | EPJC 73 (2013) 2604 | CMS-QCD-11-003 1304.7498 |
| 71 | CMS Collaboration | Measurement of the inclusive 3-jet production differential cross section in proton-proton collisions at 7 TeV and determination of the strong coupling constant in the TeV range | EPJC 75 (2015) 186 | CMS-SMP-12-027 1412.1633 |
| 72 | CMS Collaboration | Determination of the top-quark pole mass and strong coupling constant from the $ \mathrm{t}\bar{\mathrm{t}} $ production cross section in pp collisions at $ \sqrt{s} = $ 7 TeV | PLB 728 (2014) 496 | CMS-TOP-12-022 1307.1907 |
| 73 | ATLAS Collaboration | Measurement of transverse energy-energy correlations in multi-jet events in $ pp $ collisions at $ \sqrt{s} = $ 7 TeV using the ATLAS detector and determination of the strong coupling constant $ \alpha_{\mathrm{s}}(m_Z) $ | PLB 750 (2015) 427 | 1508.01579 |
| 74 | C. Patrignani and others (Particle Data Group) | Review of Particle Physics | CPC 40 (2016) 100001 | |
| 75 | J. Currie, E. W. N. Glover, and J. Pires | Next-to-Next-to Leading Order QCD Predictions for Single Jet Inclusive Production at the LHC | PRL 118 (2017) 072002 | 1611.01460 |
|
|
Compact Muon Solenoid LHC, CERN |
|

|

|

|

|

|