

Compact Muon Solenoid
LHC, CERN
| CMS-B2G-23-003 ; CERN-EP-2026-081 | ||
| Search for light charged Higgs bosons decaying to charm and strange quarks in $ \mathrm{t} \overline{\mathrm{t}} $ events in proton-proton collisions at $ \sqrt{s}= $ 13 TeV | ||
| CMS Collaboration | ||
| 1 May 2026 | ||
| Submitted to the Journal of High Energy Physics | ||
| Abstract: A search is presented for a light charged Higgs boson $ \mathrm{{H}^{\pm}} $ in top quark pair production ( $ \mathrm{t} \overline{\mathrm{t}} $), where one of the top quarks decays to an $ \mathrm{{H}^{\pm}} $ and a bottom quark, while the other decays to a $ \mathrm{W}^{\mp} $ boson and a bottom quark. The $ \mathrm{{H}^{\pm}} $ is assumed to decay into a charm and a strange quark, whereas the $ \mathrm{W}^{\mp} $ boson decays into a charged lepton (electron or muon) and a neutrino. Results are reported based on proton-proton collision data at $ \sqrt{s} = $ 13 TeV, corresponding to an integrated luminosity of 138 fb$ ^{-1} $. The analysis probes $ \mathrm{{H}^{\pm}} $ masses in the range 40 to 160 GeV using the invariant mass spectrum of the two light jets, where light jets are defined as jets that do not satisfy the bottom quark tagging requirement. The observed yield is found to be consistent with standard model predictions. Upper limits are set on the branching fraction $ \mathcal{B}(\mathrm{t} \to \mathrm{{H}^{\pm}} \mathrm{b}) $, with values in the range of 0.07--1.12% at 95% confidence level, under the assumption that $ \mathcal{B}(\mathrm{{H}^{\pm}} \to \mathrm{c}\mathrm{s}) = 100% $. These are the first direct limits on charged Higgs bosons produced in top quark decays for masses between 40 and 50 GeV, and the most stringent limits to date in the 70--110 GeV range. | ||
| Links: e-print arXiv:2604.27795 [hep-ex] (PDF) ; CDS record ; inSPIRE record ; HepData record ; CADI line (restricted) ; | ||
| Figures | |
png pdf |
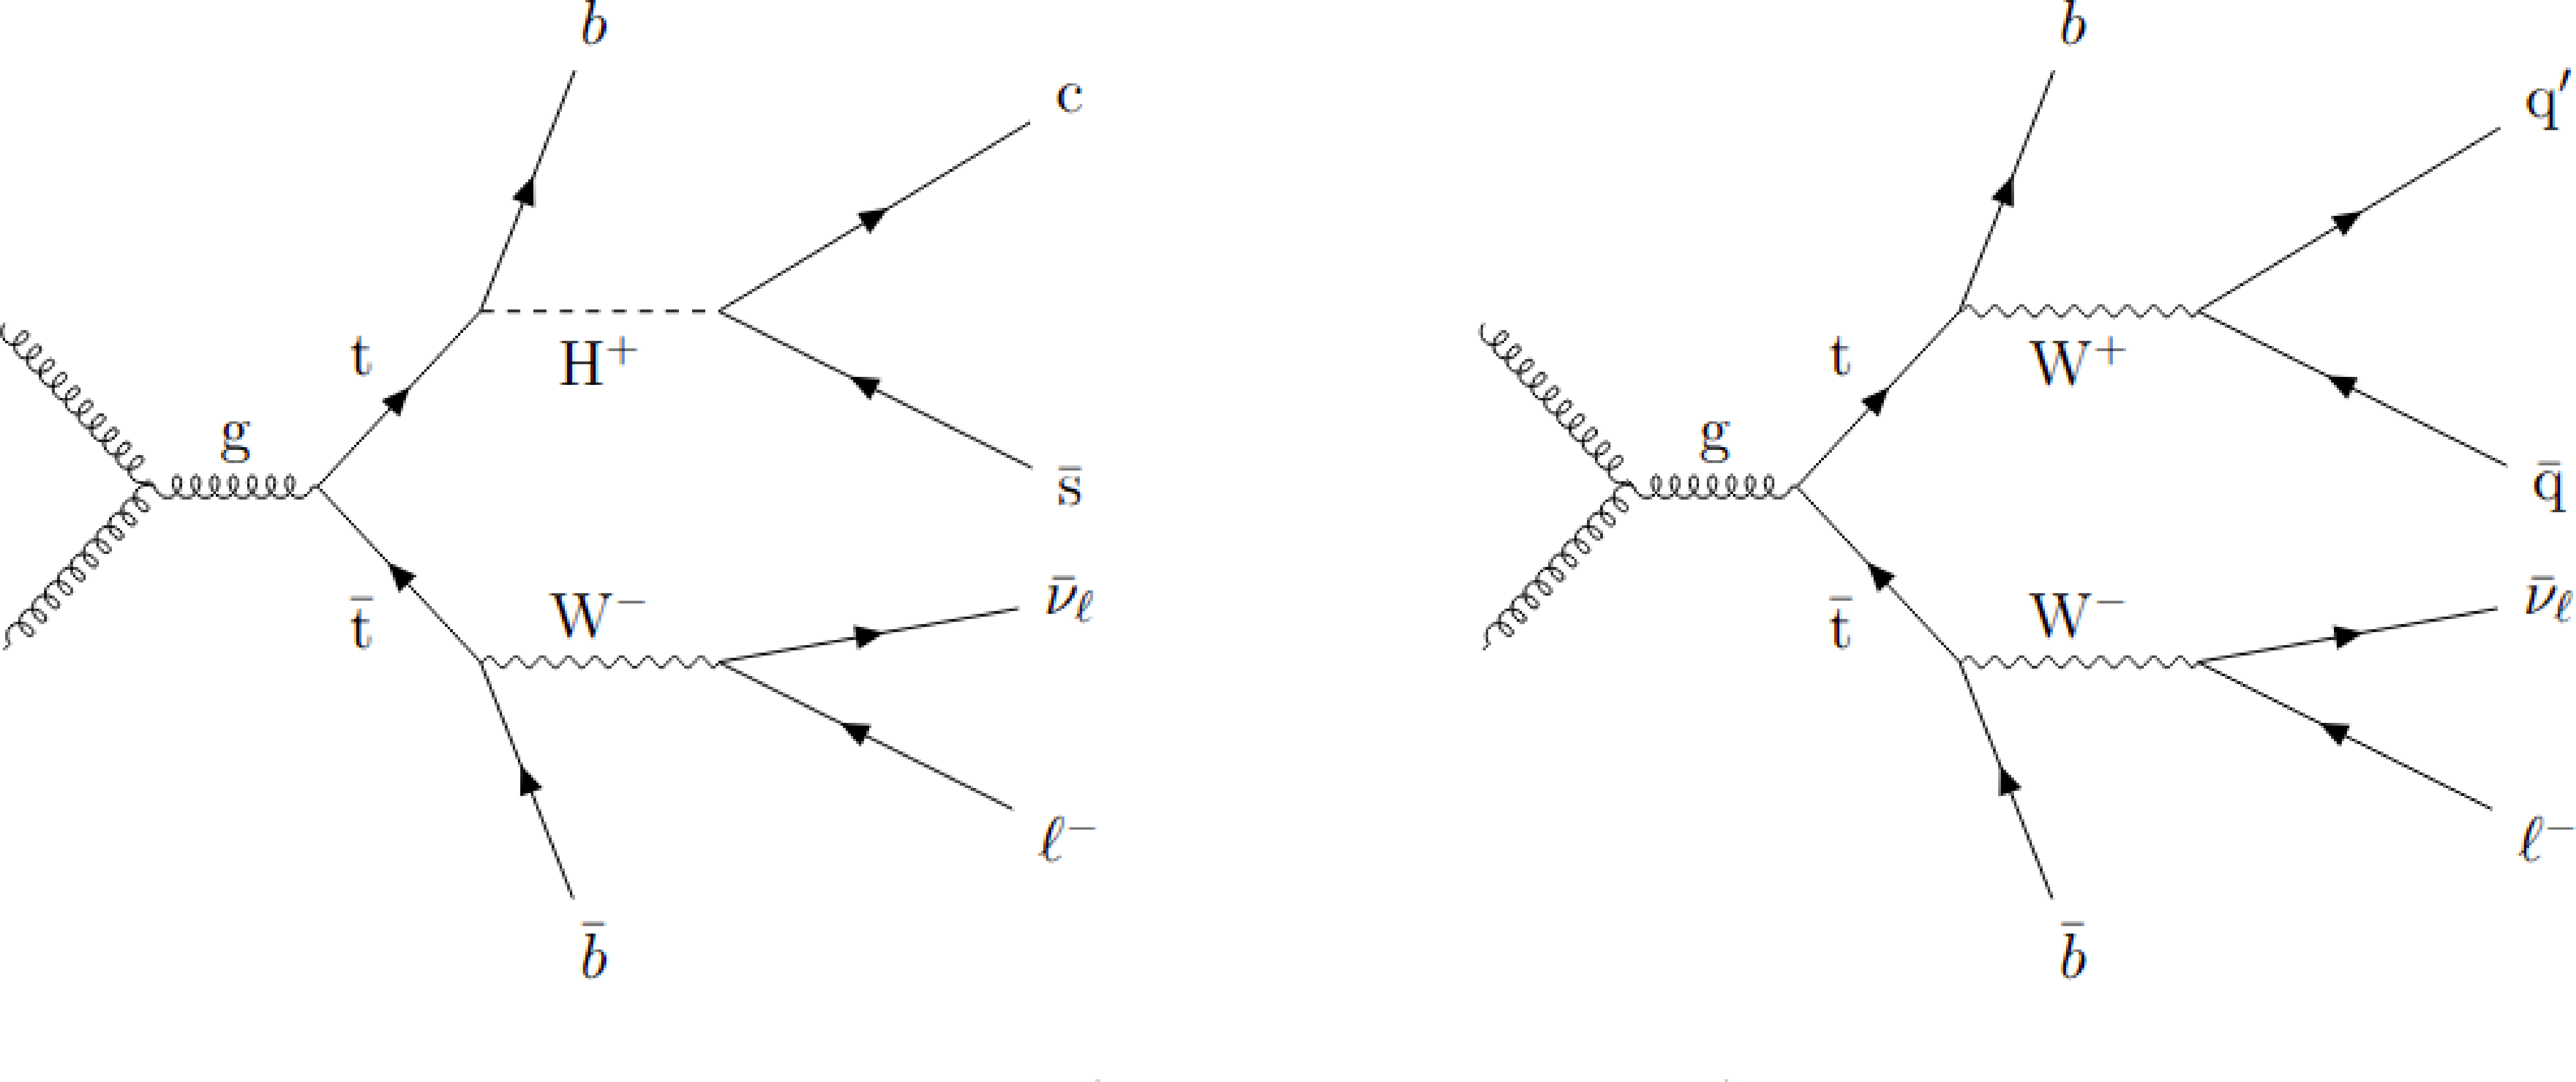
Figure 1:
Leading-order Feynman diagrams of $ \mathrm{t} \overline{\mathrm{t}} $ production in gluon-gluon fusion process. One possible production of $ \mathrm{{H}^{\pm}} $ signal from t quark decay is shown in the left plot. The decay products of $ \mathrm{{H}^{\pm}} $ are c and s quarks. The diagram on right side shows the $ \mathrm{t} \overline{\mathrm{t}} $ process in the lepton+jets channels, an irreducible SM background. |
png pdf |
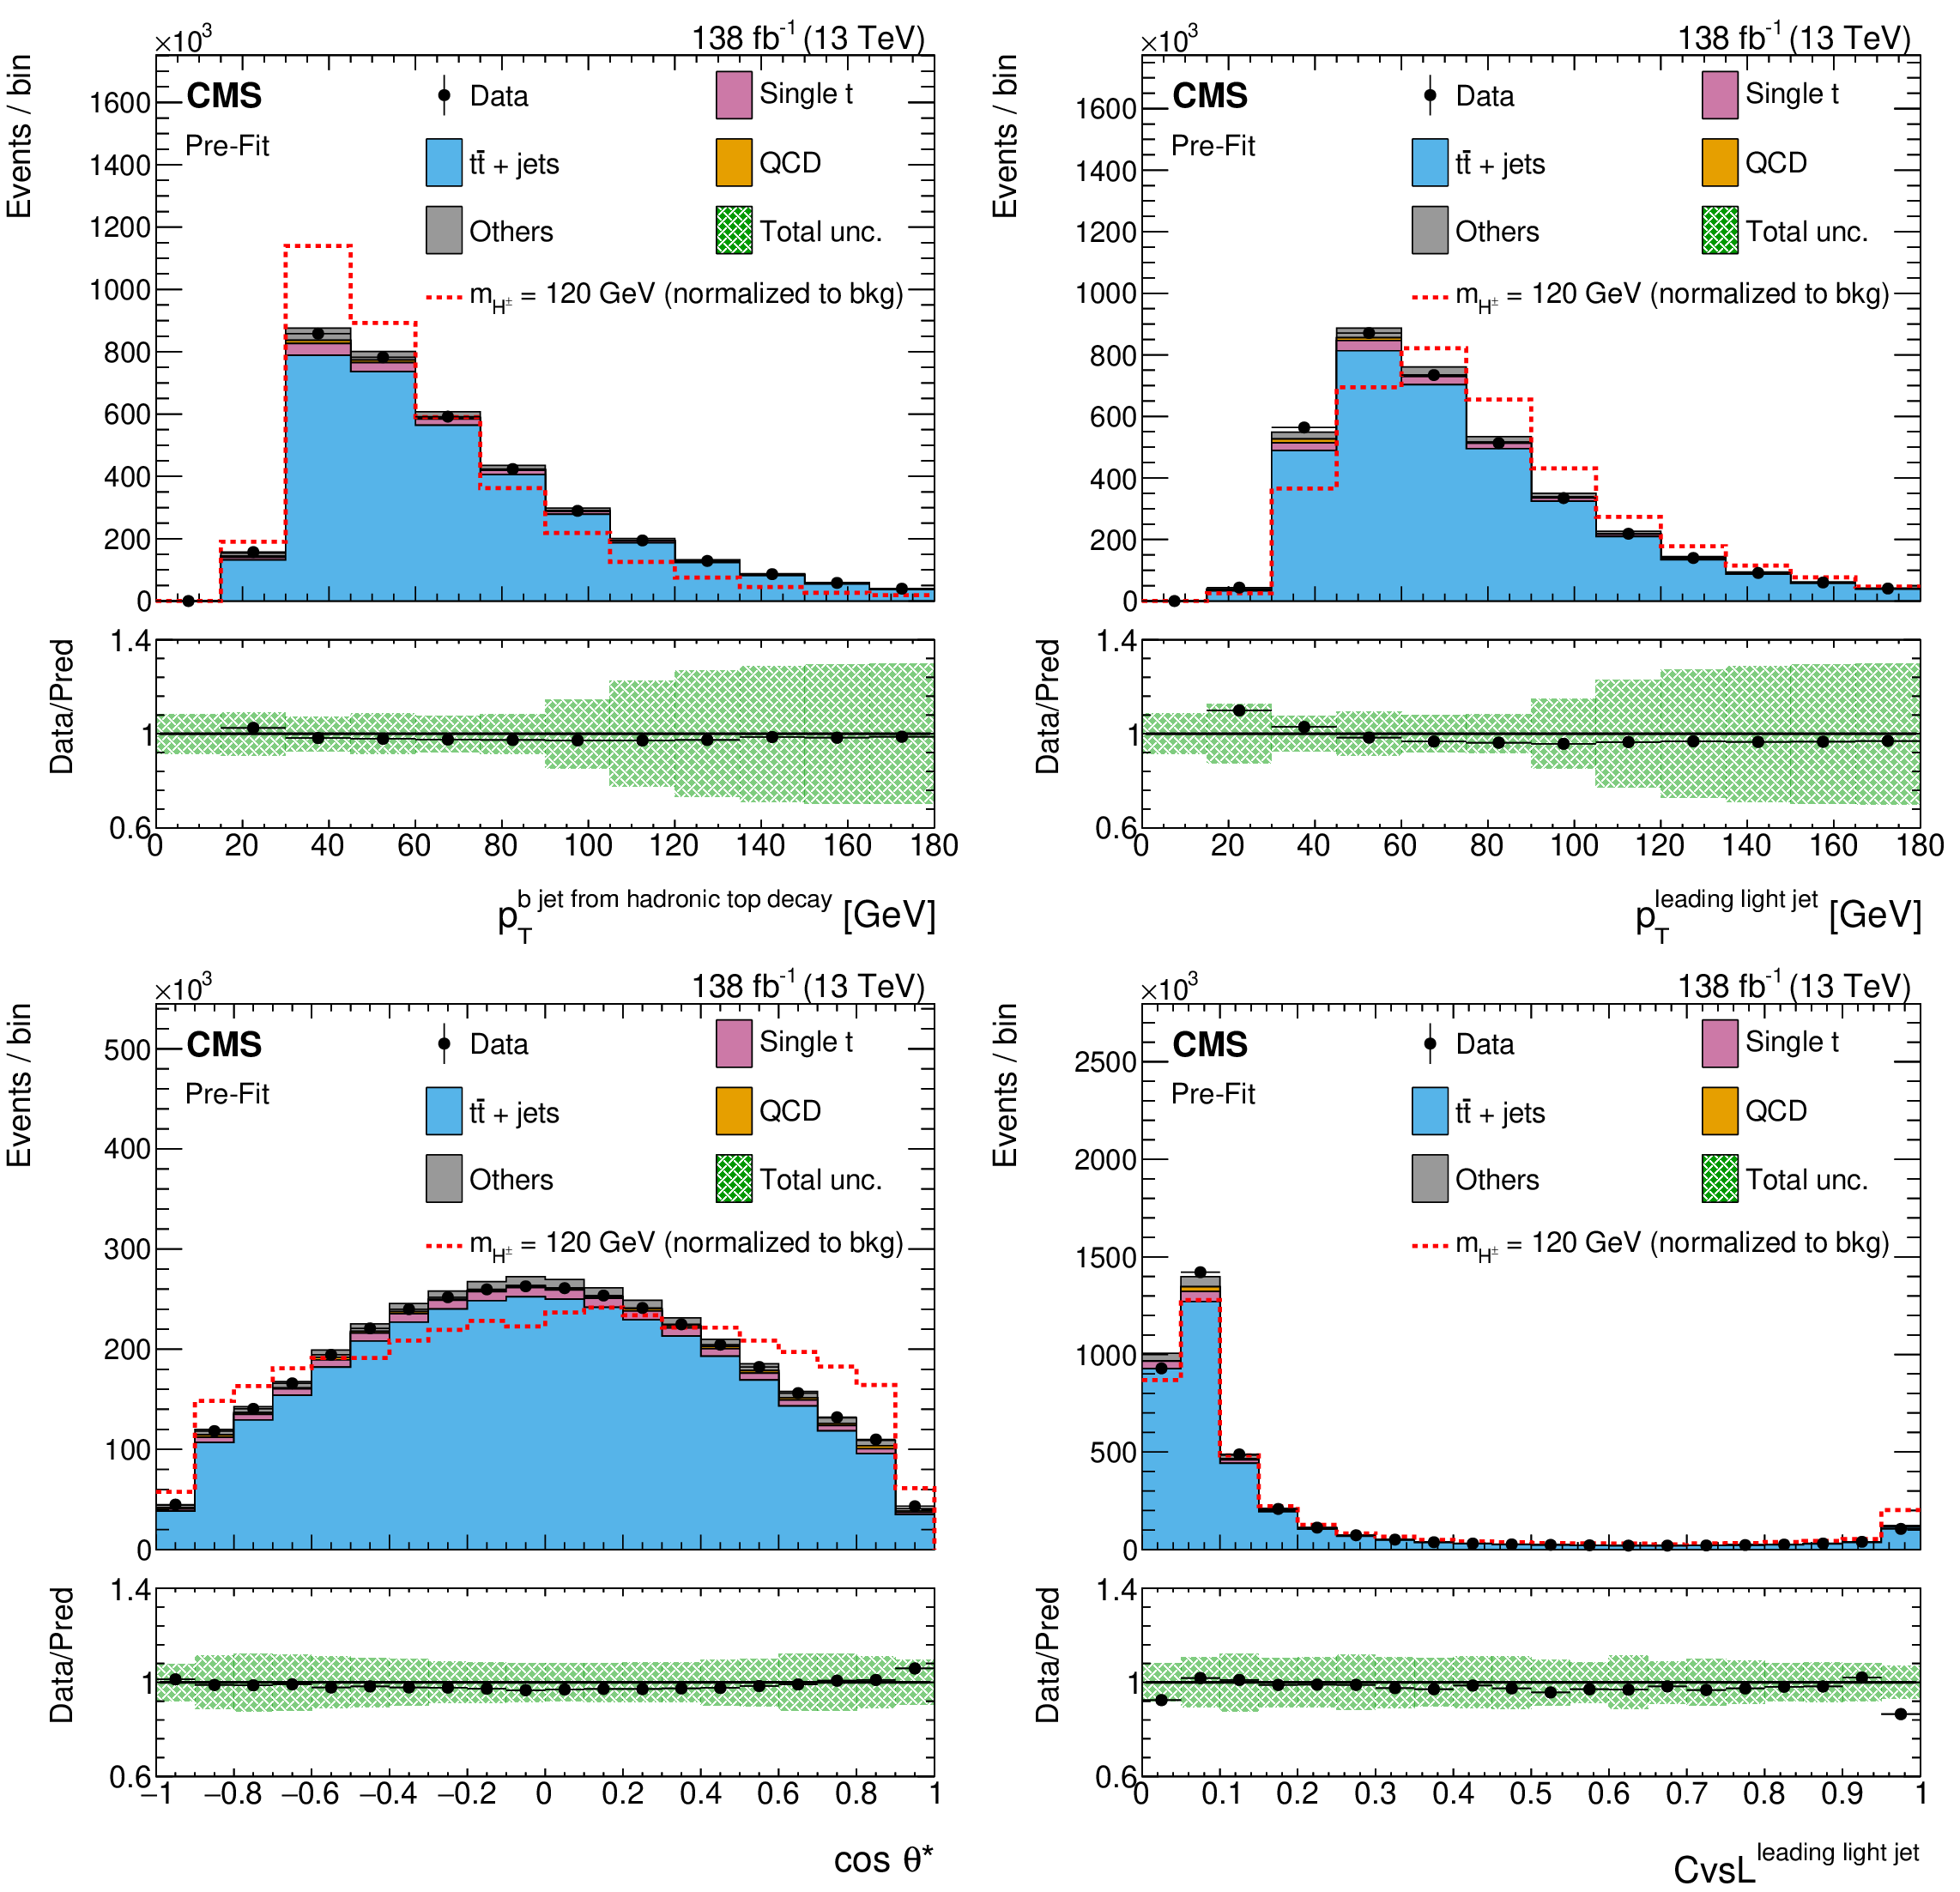
Figure 2:
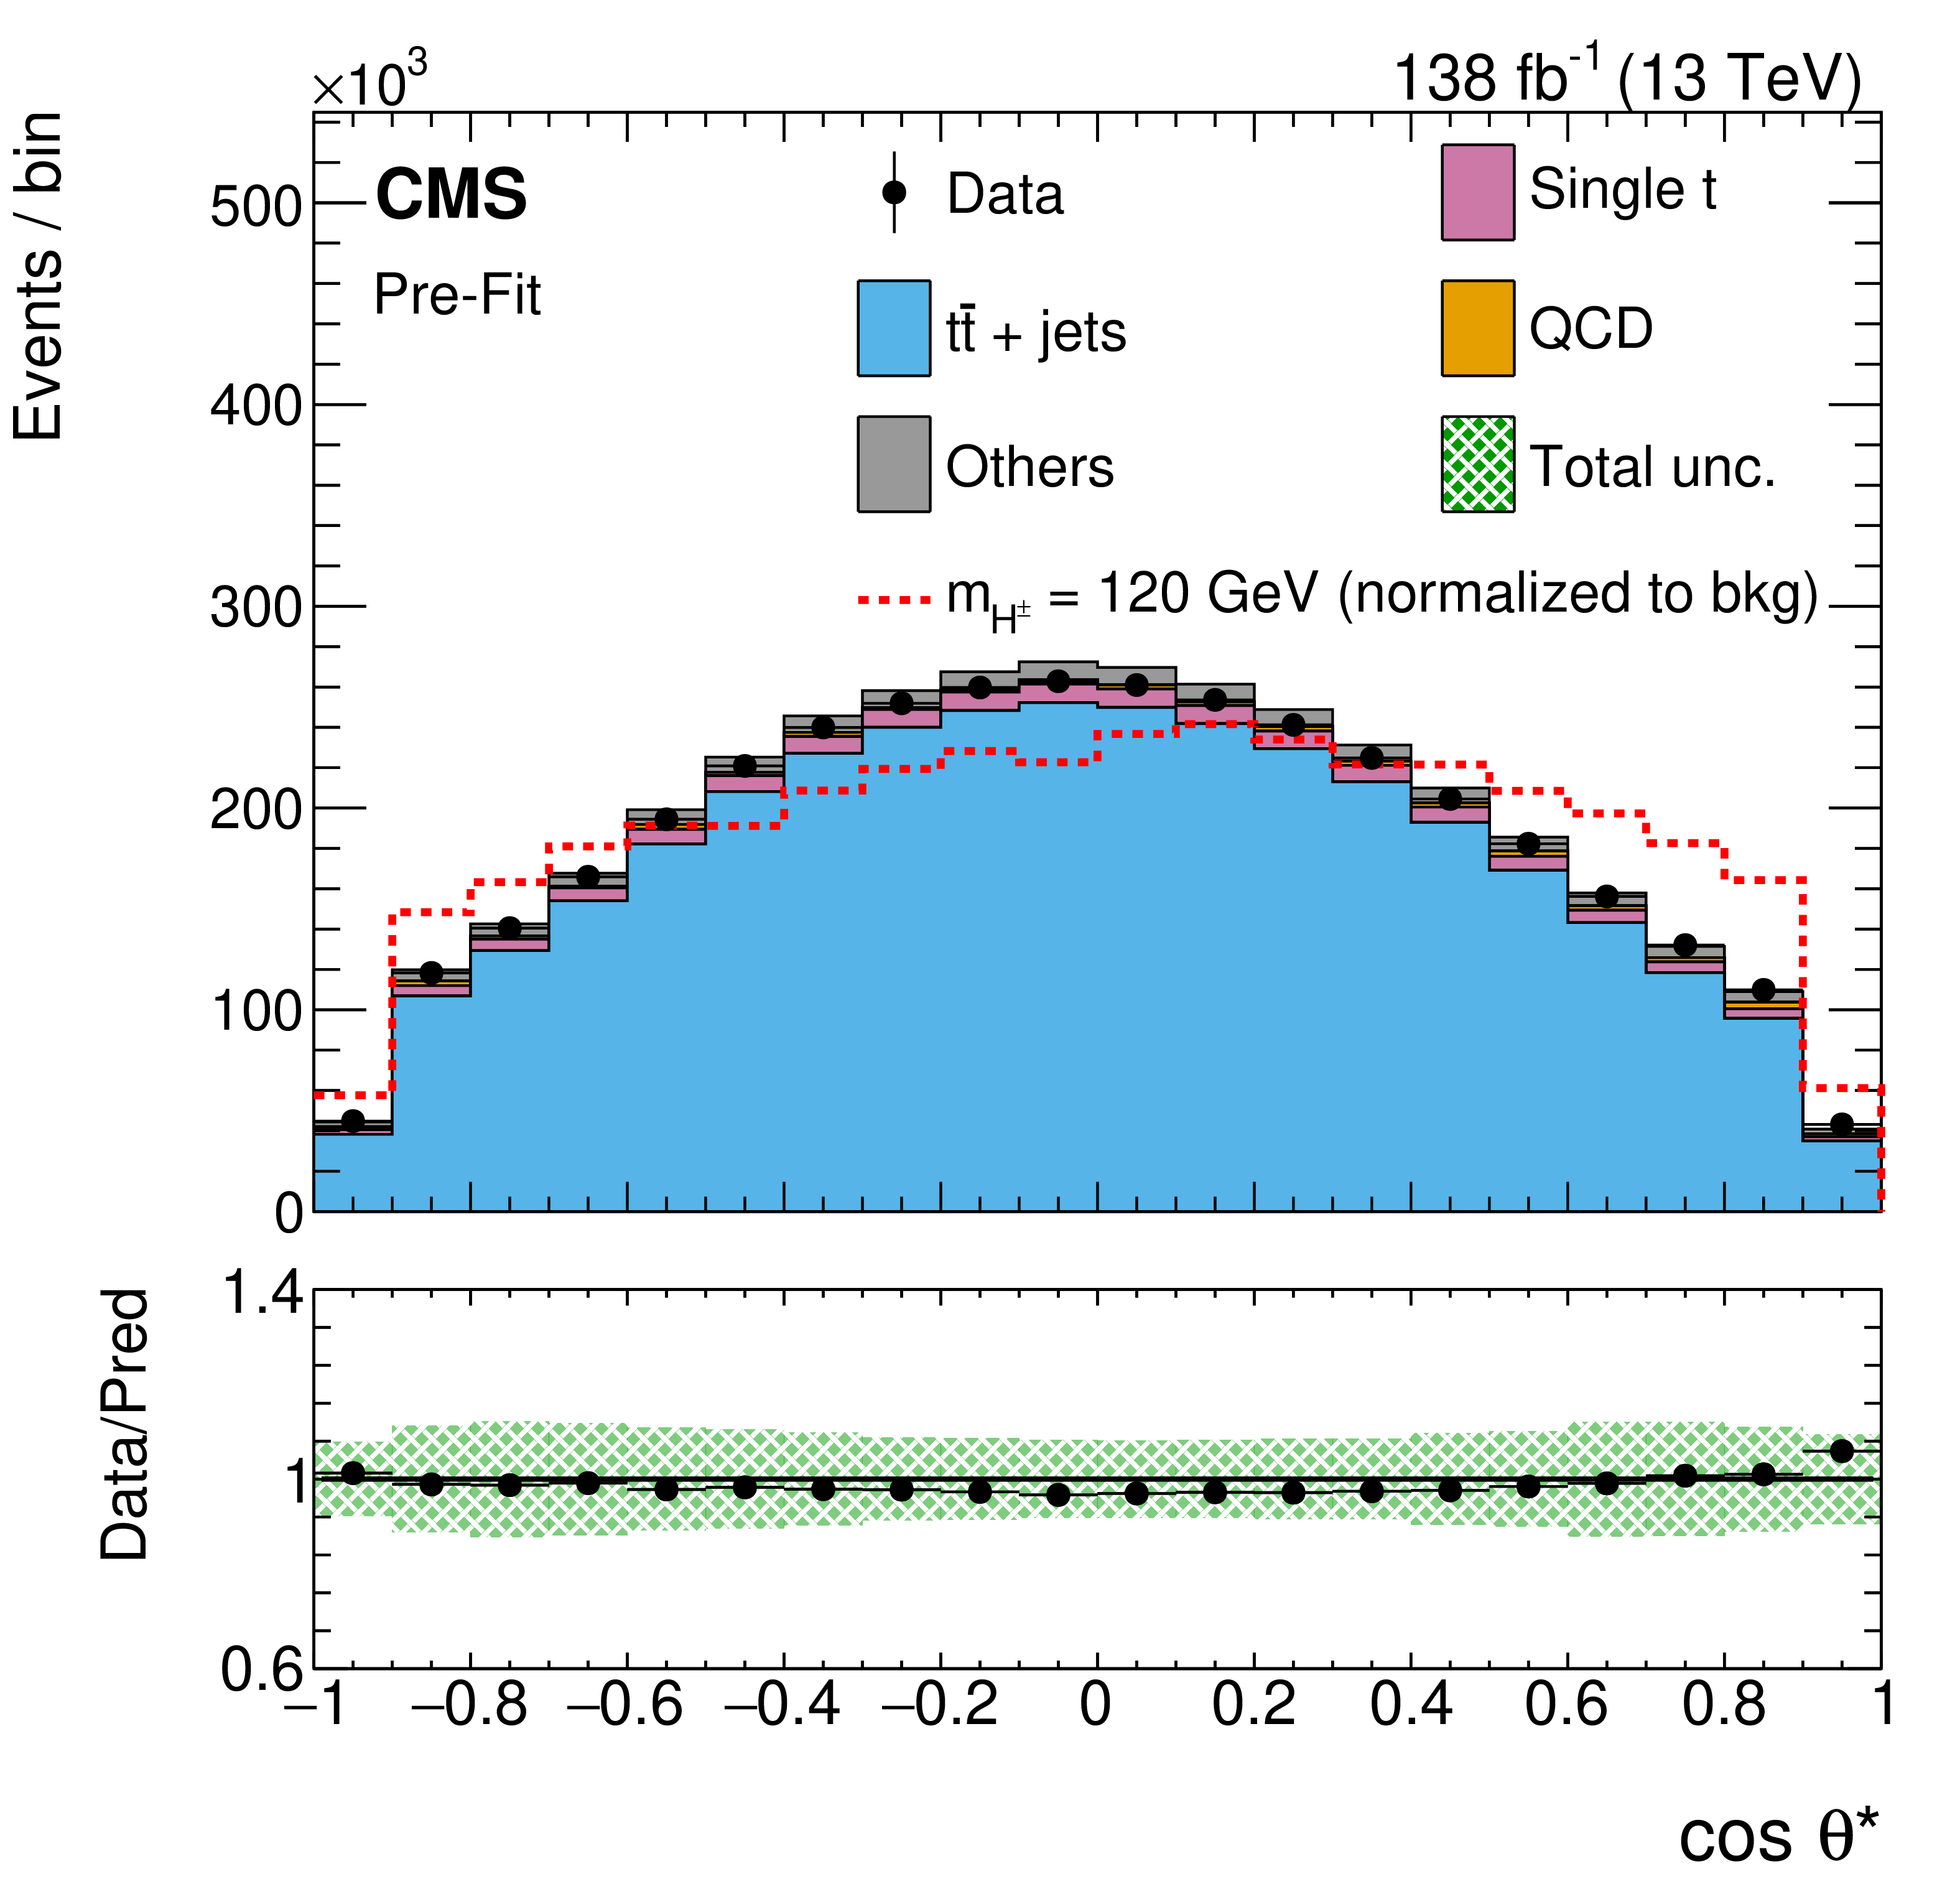
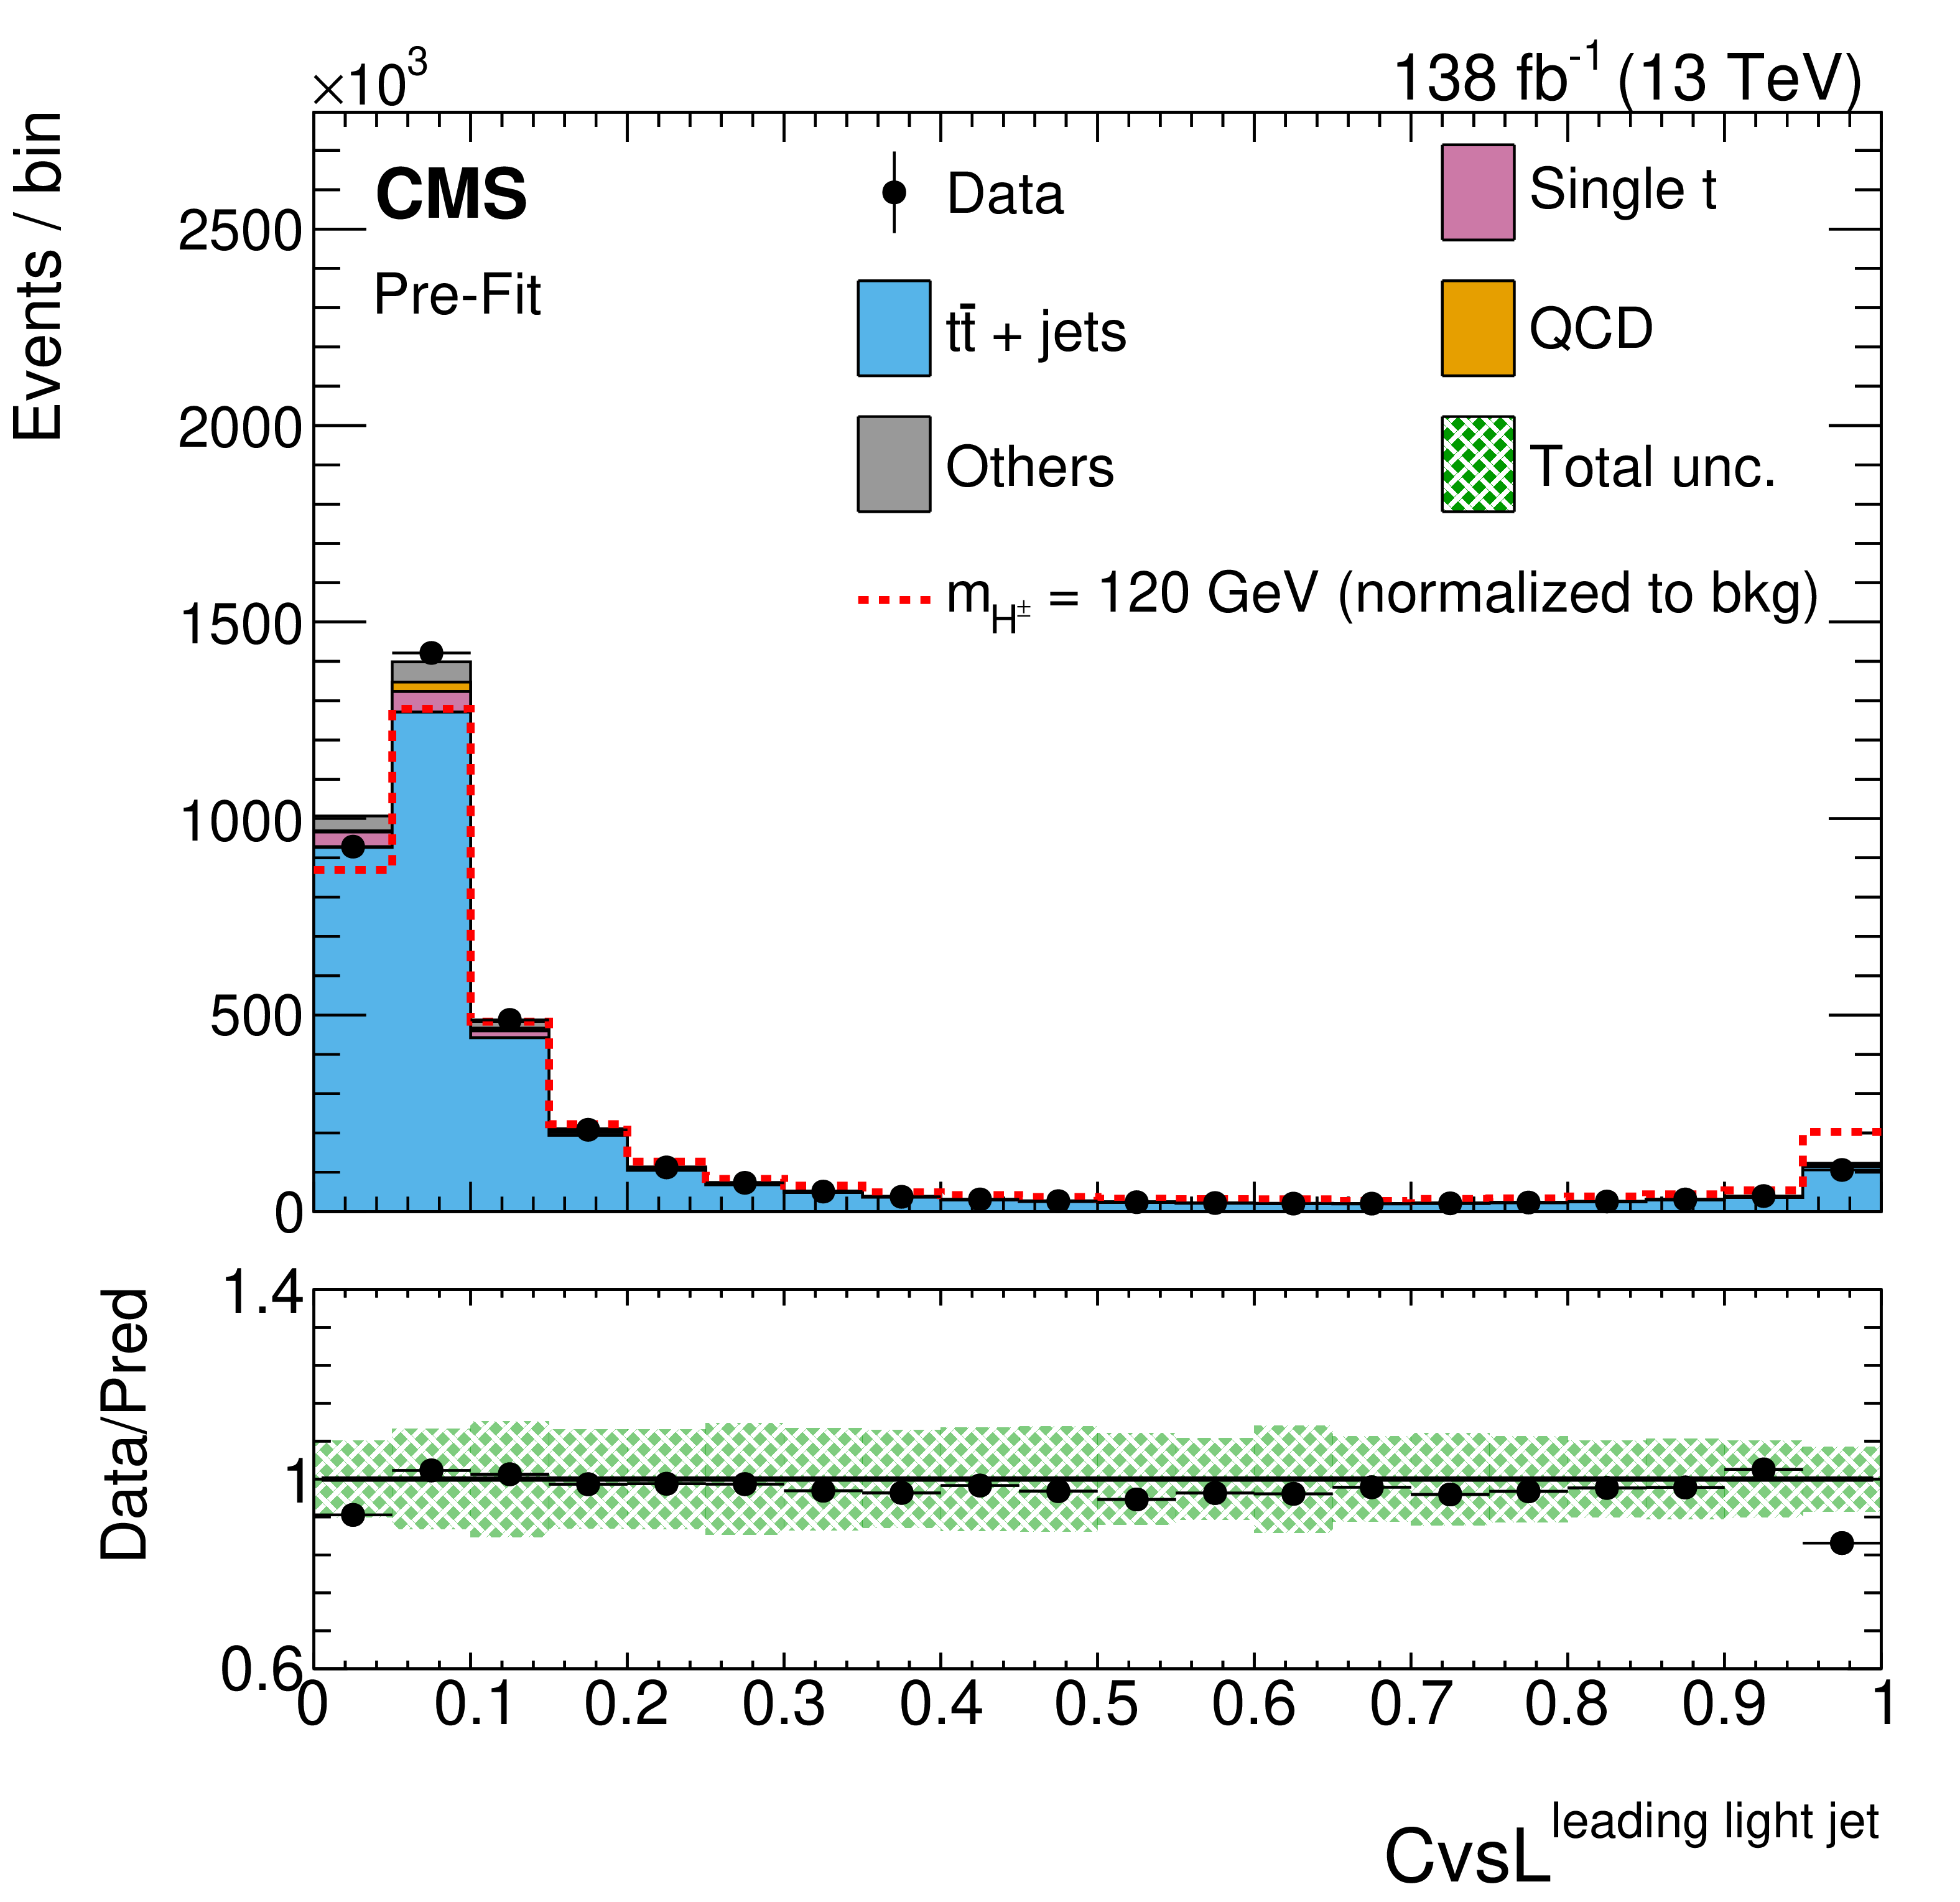
Distributions of selected input variables used in the BDT training for the combined data set. Shown are the pre-fit distributions of the $ p_{\mathrm{T}} $ of the b-tagged jet from the hadronic top quark decay (upper left), the $ p_{\mathrm{T}} $ of the leading light jet (upper right), the $ \cos\theta^\ast $ discriminant variable (lower left), and the CvsL discriminator value of the leading light jet (lower right). The lower panels display the ratio of data to the predicted background, with the shaded band representing the total uncertainty in the prediction. The potential signal distribution is normalized to the background yield. |
png pdf |
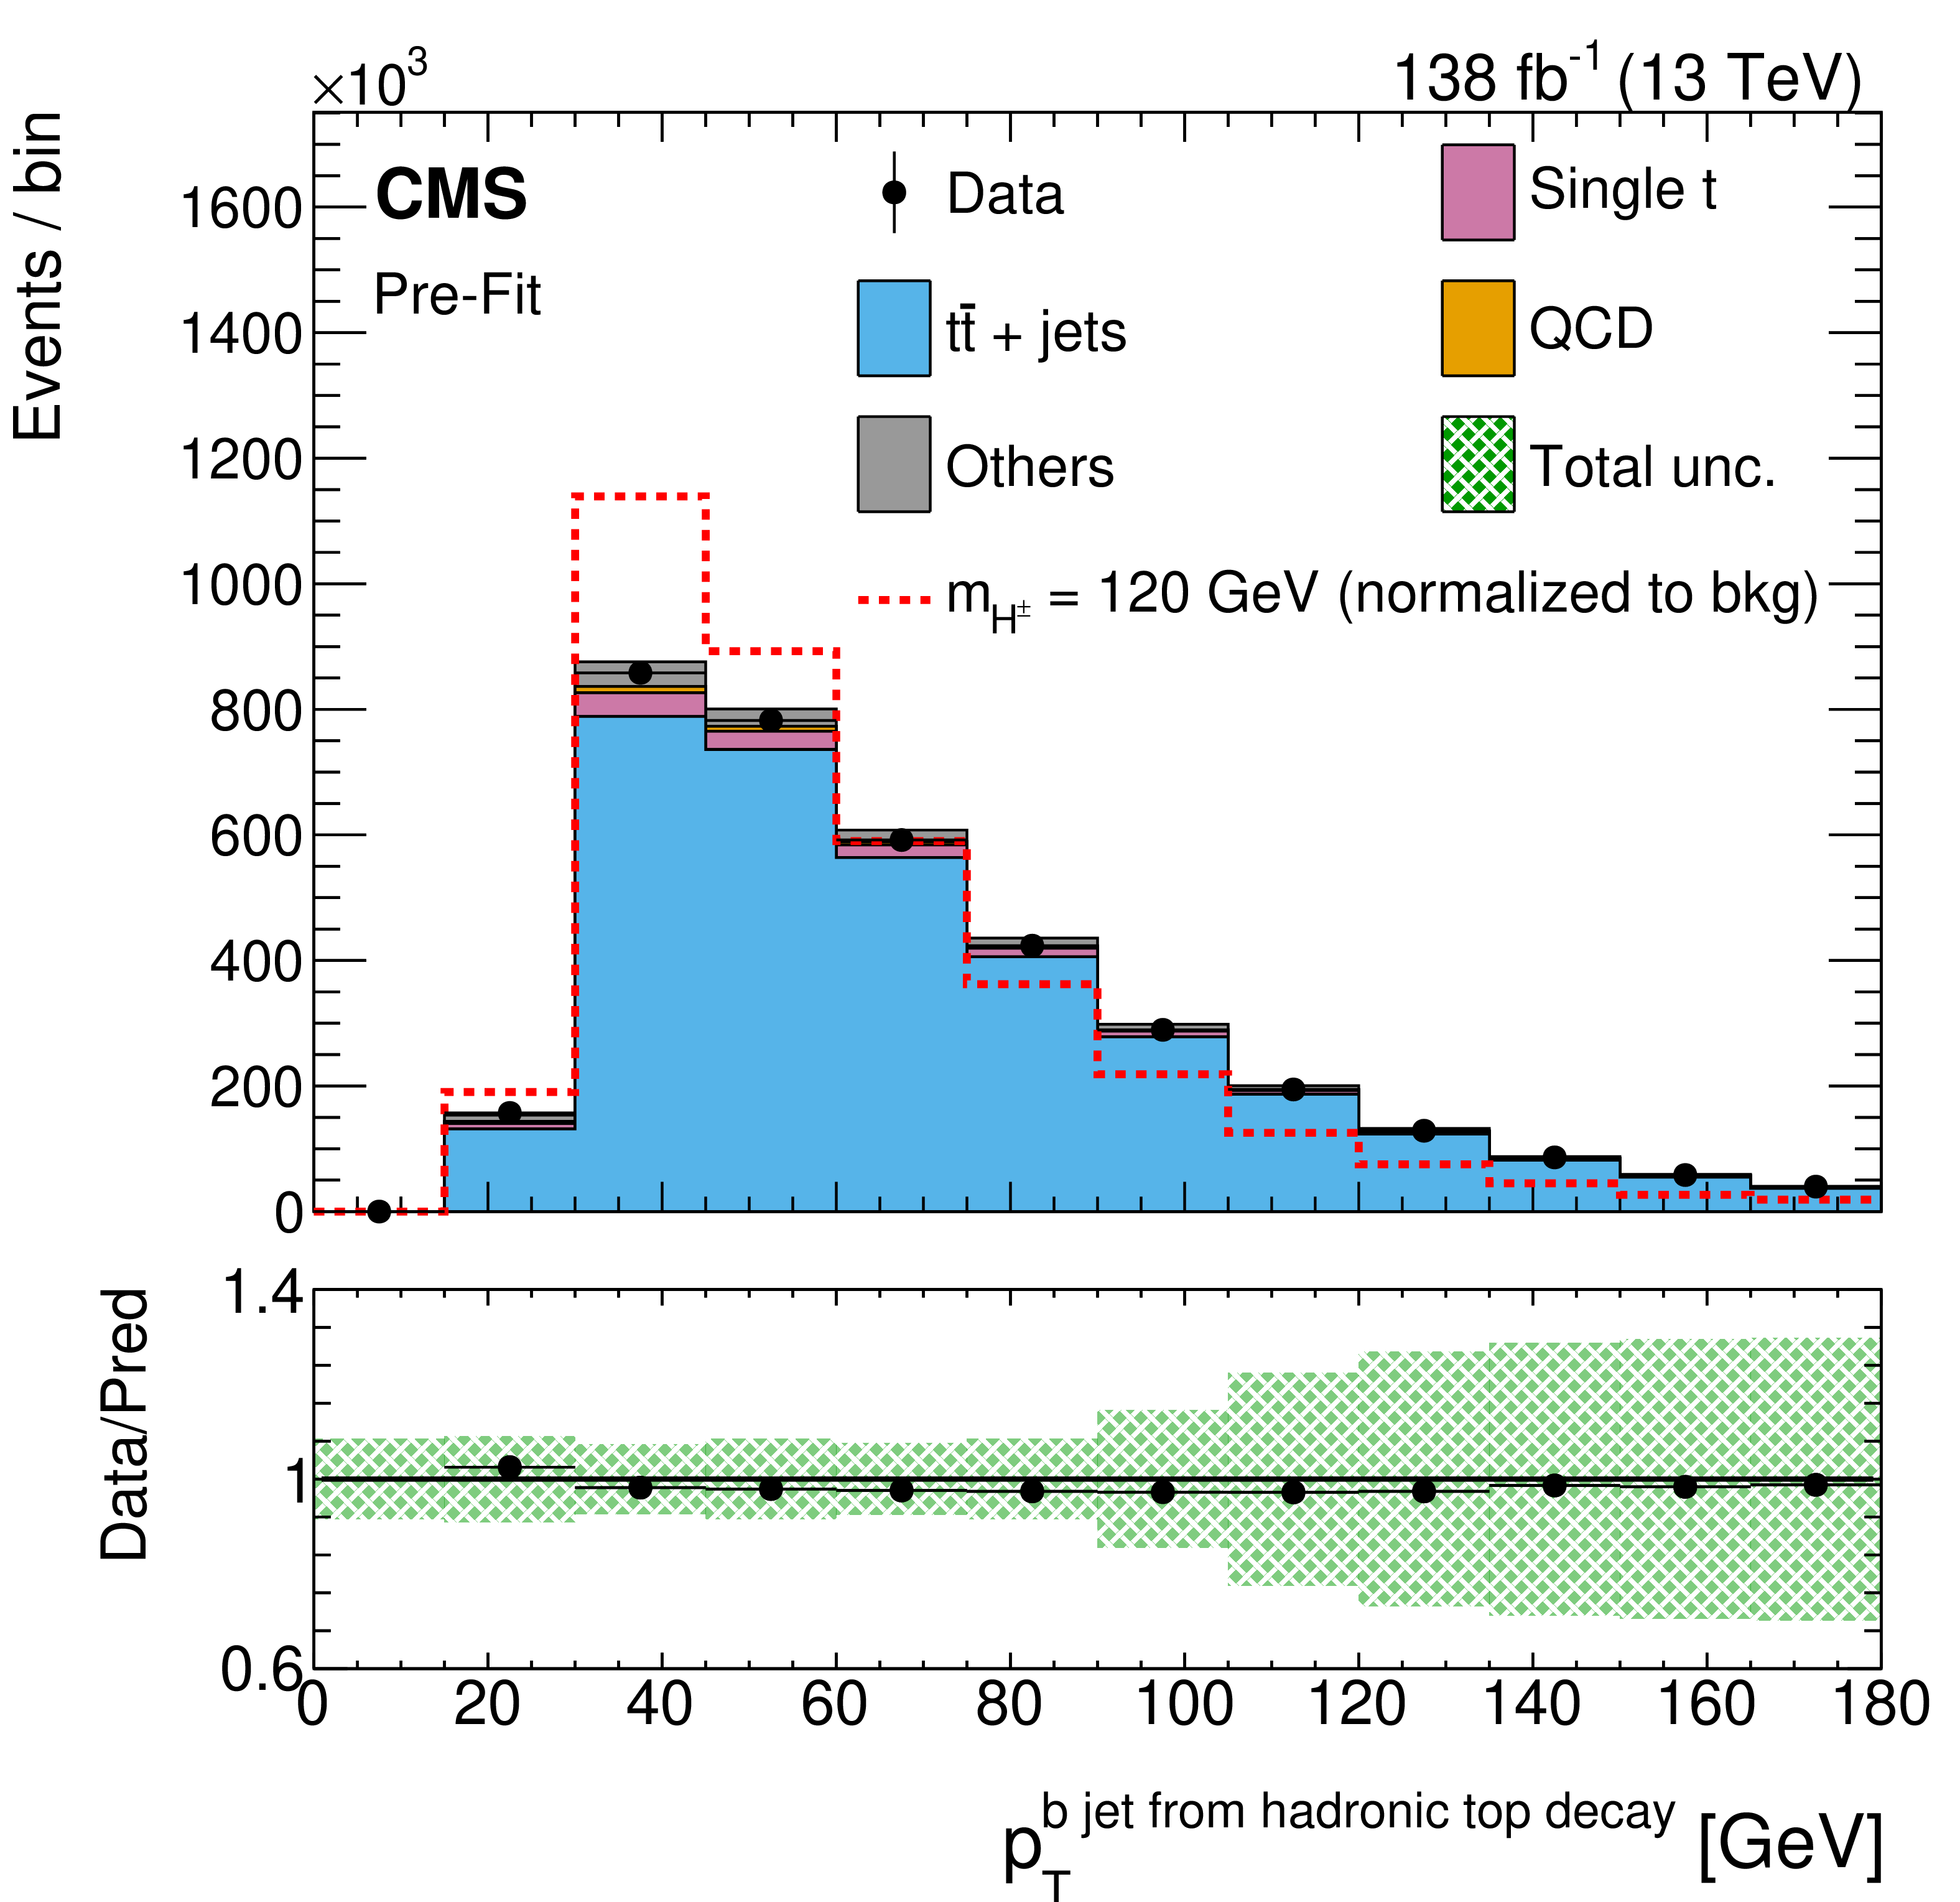
Figure 2-a:
Distributions of selected input variables used in the BDT training for the combined data set. Shown are the pre-fit distributions of the $ p_{\mathrm{T}} $ of the b-tagged jet from the hadronic top quark decay (upper left), the $ p_{\mathrm{T}} $ of the leading light jet (upper right), the $ \cos\theta^\ast $ discriminant variable (lower left), and the CvsL discriminator value of the leading light jet (lower right). The lower panels display the ratio of data to the predicted background, with the shaded band representing the total uncertainty in the prediction. The potential signal distribution is normalized to the background yield. |
png pdf |
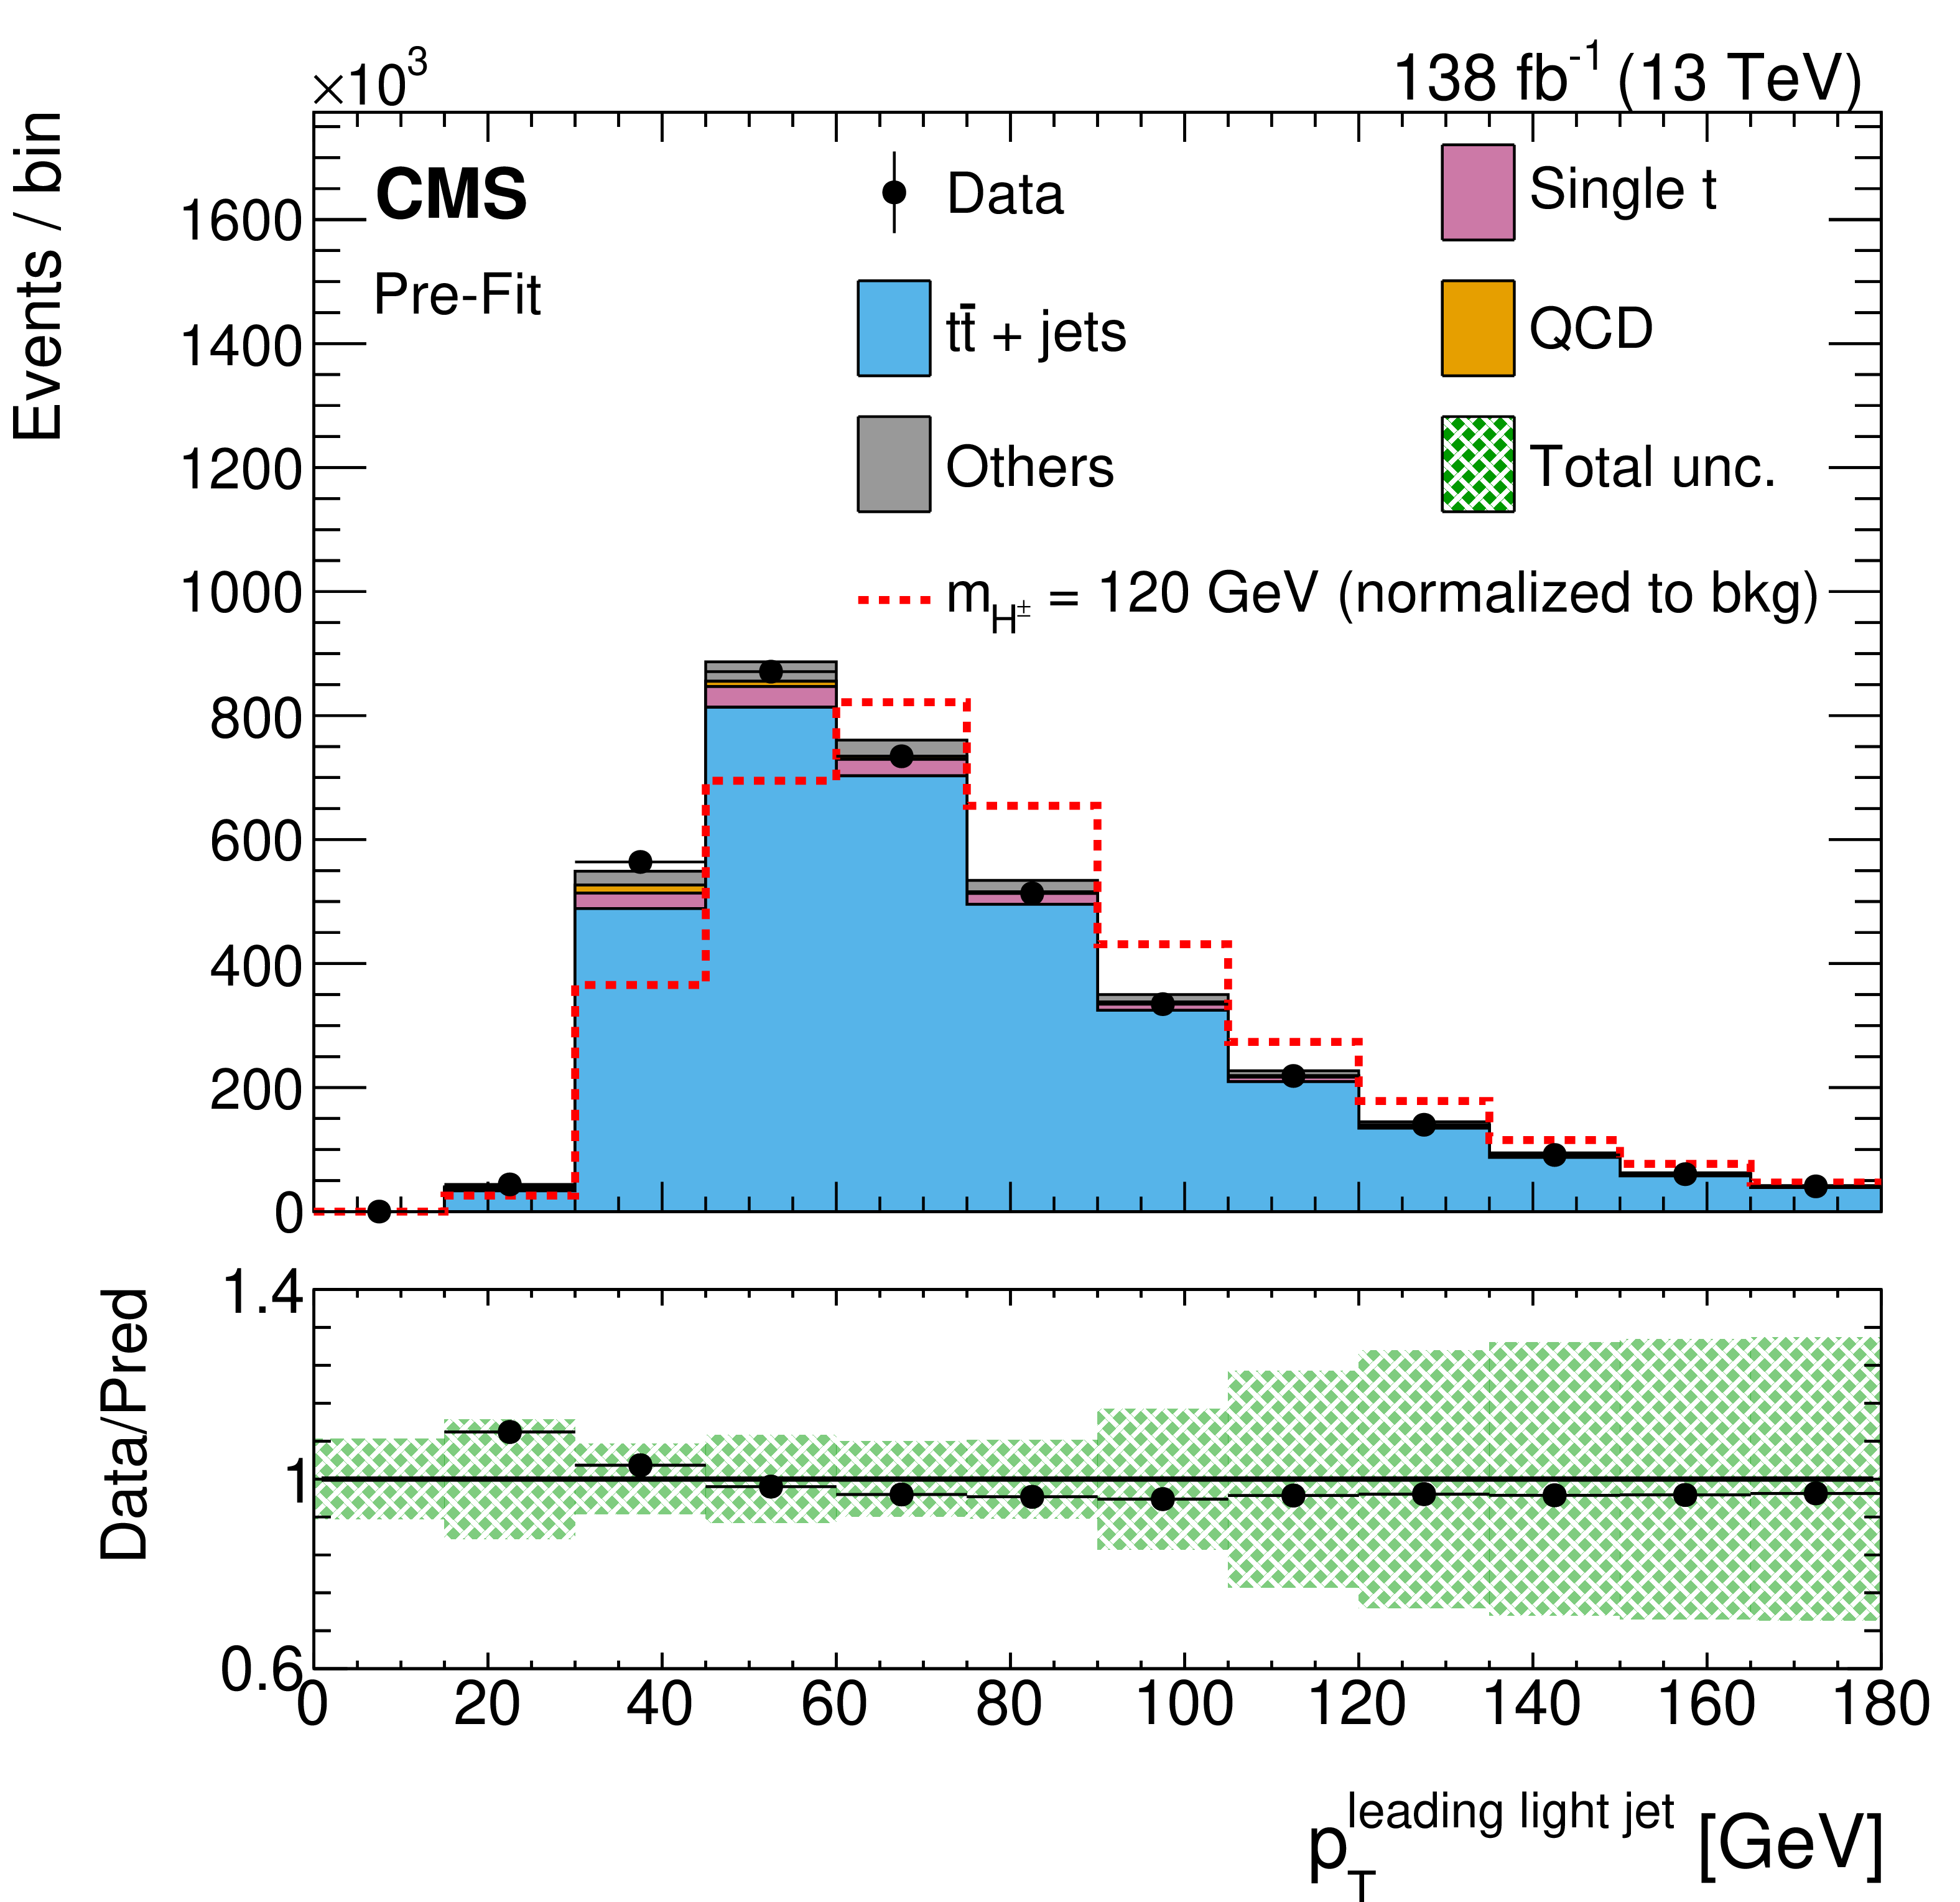
Figure 2-b:
Distributions of selected input variables used in the BDT training for the combined data set. Shown are the pre-fit distributions of the $ p_{\mathrm{T}} $ of the b-tagged jet from the hadronic top quark decay (upper left), the $ p_{\mathrm{T}} $ of the leading light jet (upper right), the $ \cos\theta^\ast $ discriminant variable (lower left), and the CvsL discriminator value of the leading light jet (lower right). The lower panels display the ratio of data to the predicted background, with the shaded band representing the total uncertainty in the prediction. The potential signal distribution is normalized to the background yield. |
png pdf |
Figure 2-c:
Distributions of selected input variables used in the BDT training for the combined data set. Shown are the pre-fit distributions of the $ p_{\mathrm{T}} $ of the b-tagged jet from the hadronic top quark decay (upper left), the $ p_{\mathrm{T}} $ of the leading light jet (upper right), the $ \cos\theta^\ast $ discriminant variable (lower left), and the CvsL discriminator value of the leading light jet (lower right). The lower panels display the ratio of data to the predicted background, with the shaded band representing the total uncertainty in the prediction. The potential signal distribution is normalized to the background yield. |
png pdf |
Figure 2-d:
Distributions of selected input variables used in the BDT training for the combined data set. Shown are the pre-fit distributions of the $ p_{\mathrm{T}} $ of the b-tagged jet from the hadronic top quark decay (upper left), the $ p_{\mathrm{T}} $ of the leading light jet (upper right), the $ \cos\theta^\ast $ discriminant variable (lower left), and the CvsL discriminator value of the leading light jet (lower right). The lower panels display the ratio of data to the predicted background, with the shaded band representing the total uncertainty in the prediction. The potential signal distribution is normalized to the background yield. |
png pdf |
Figure 3:
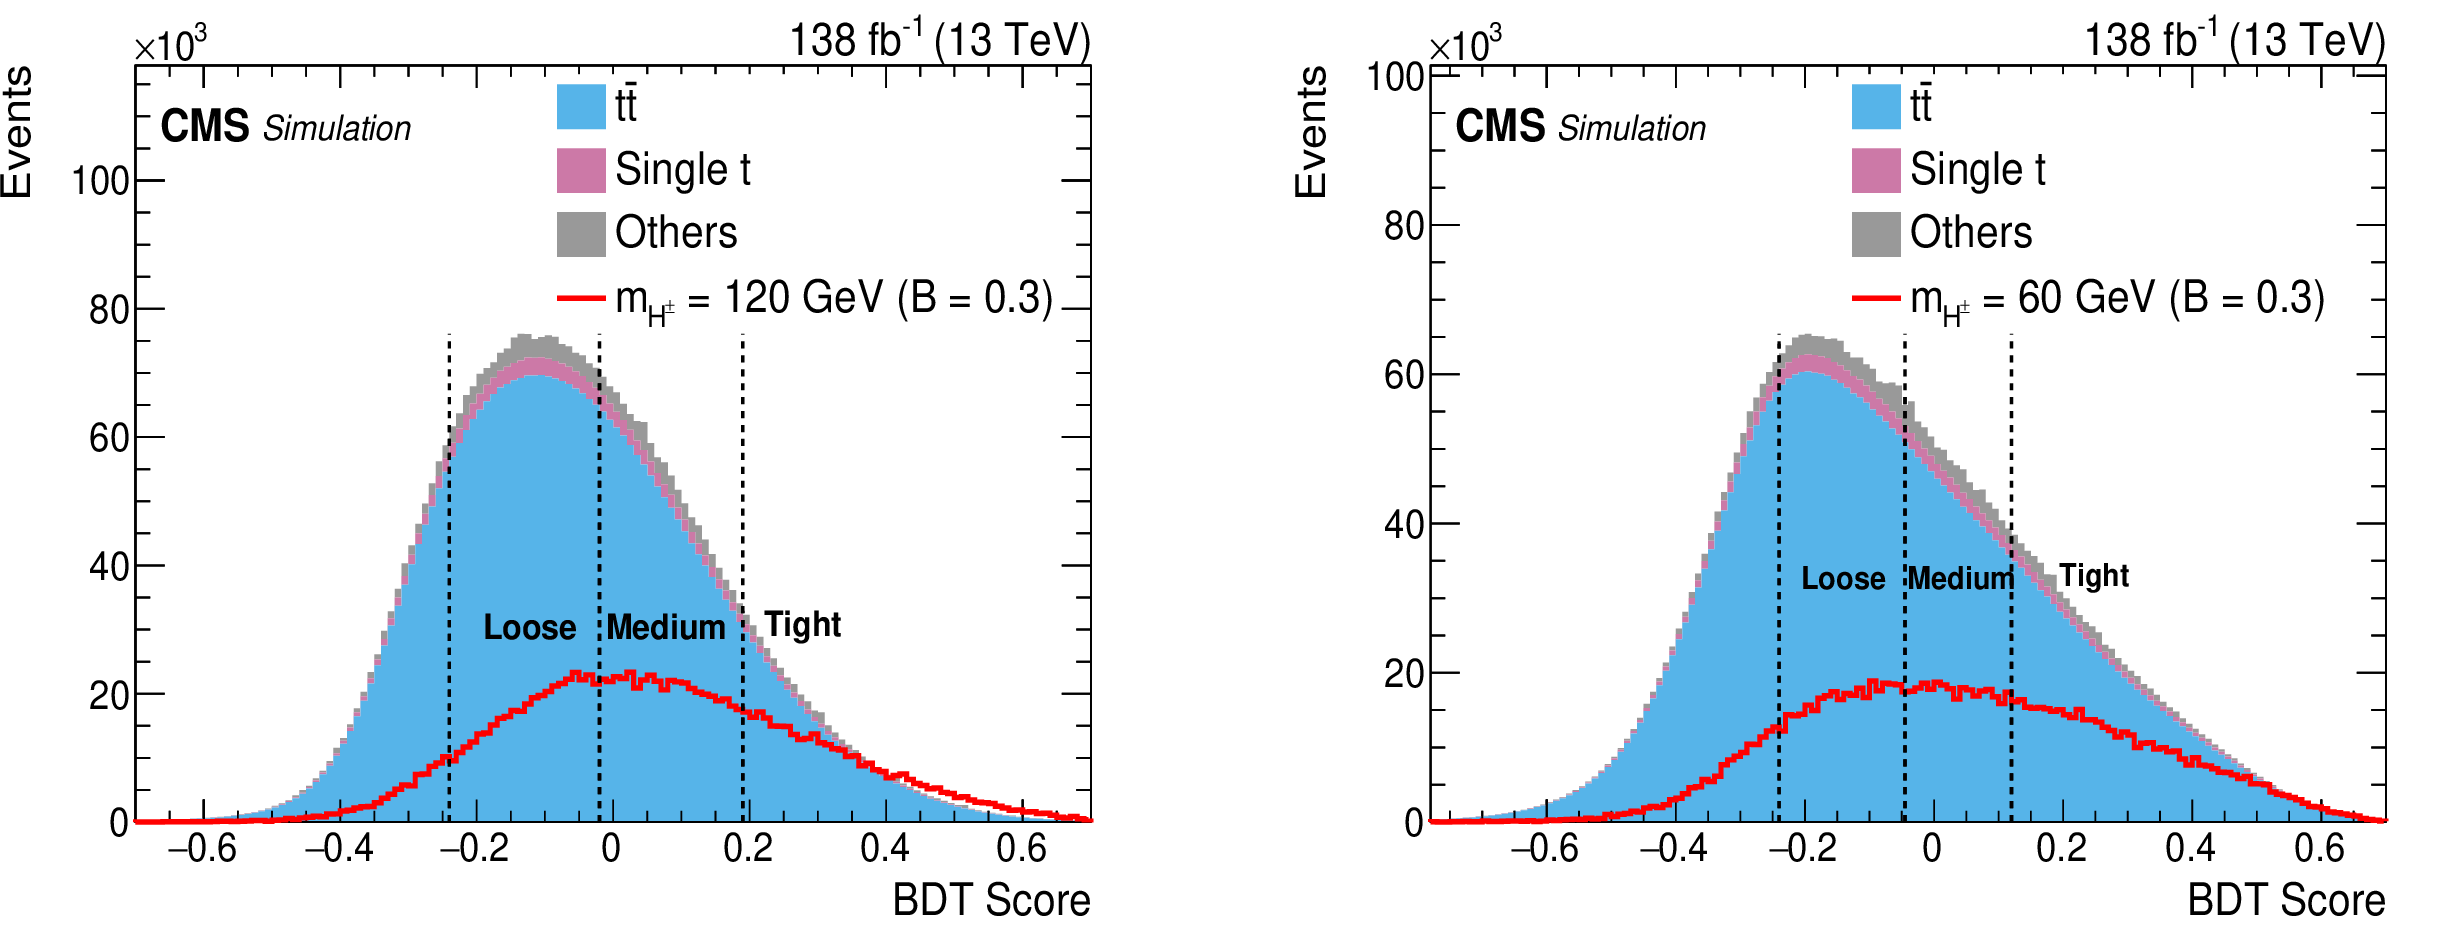
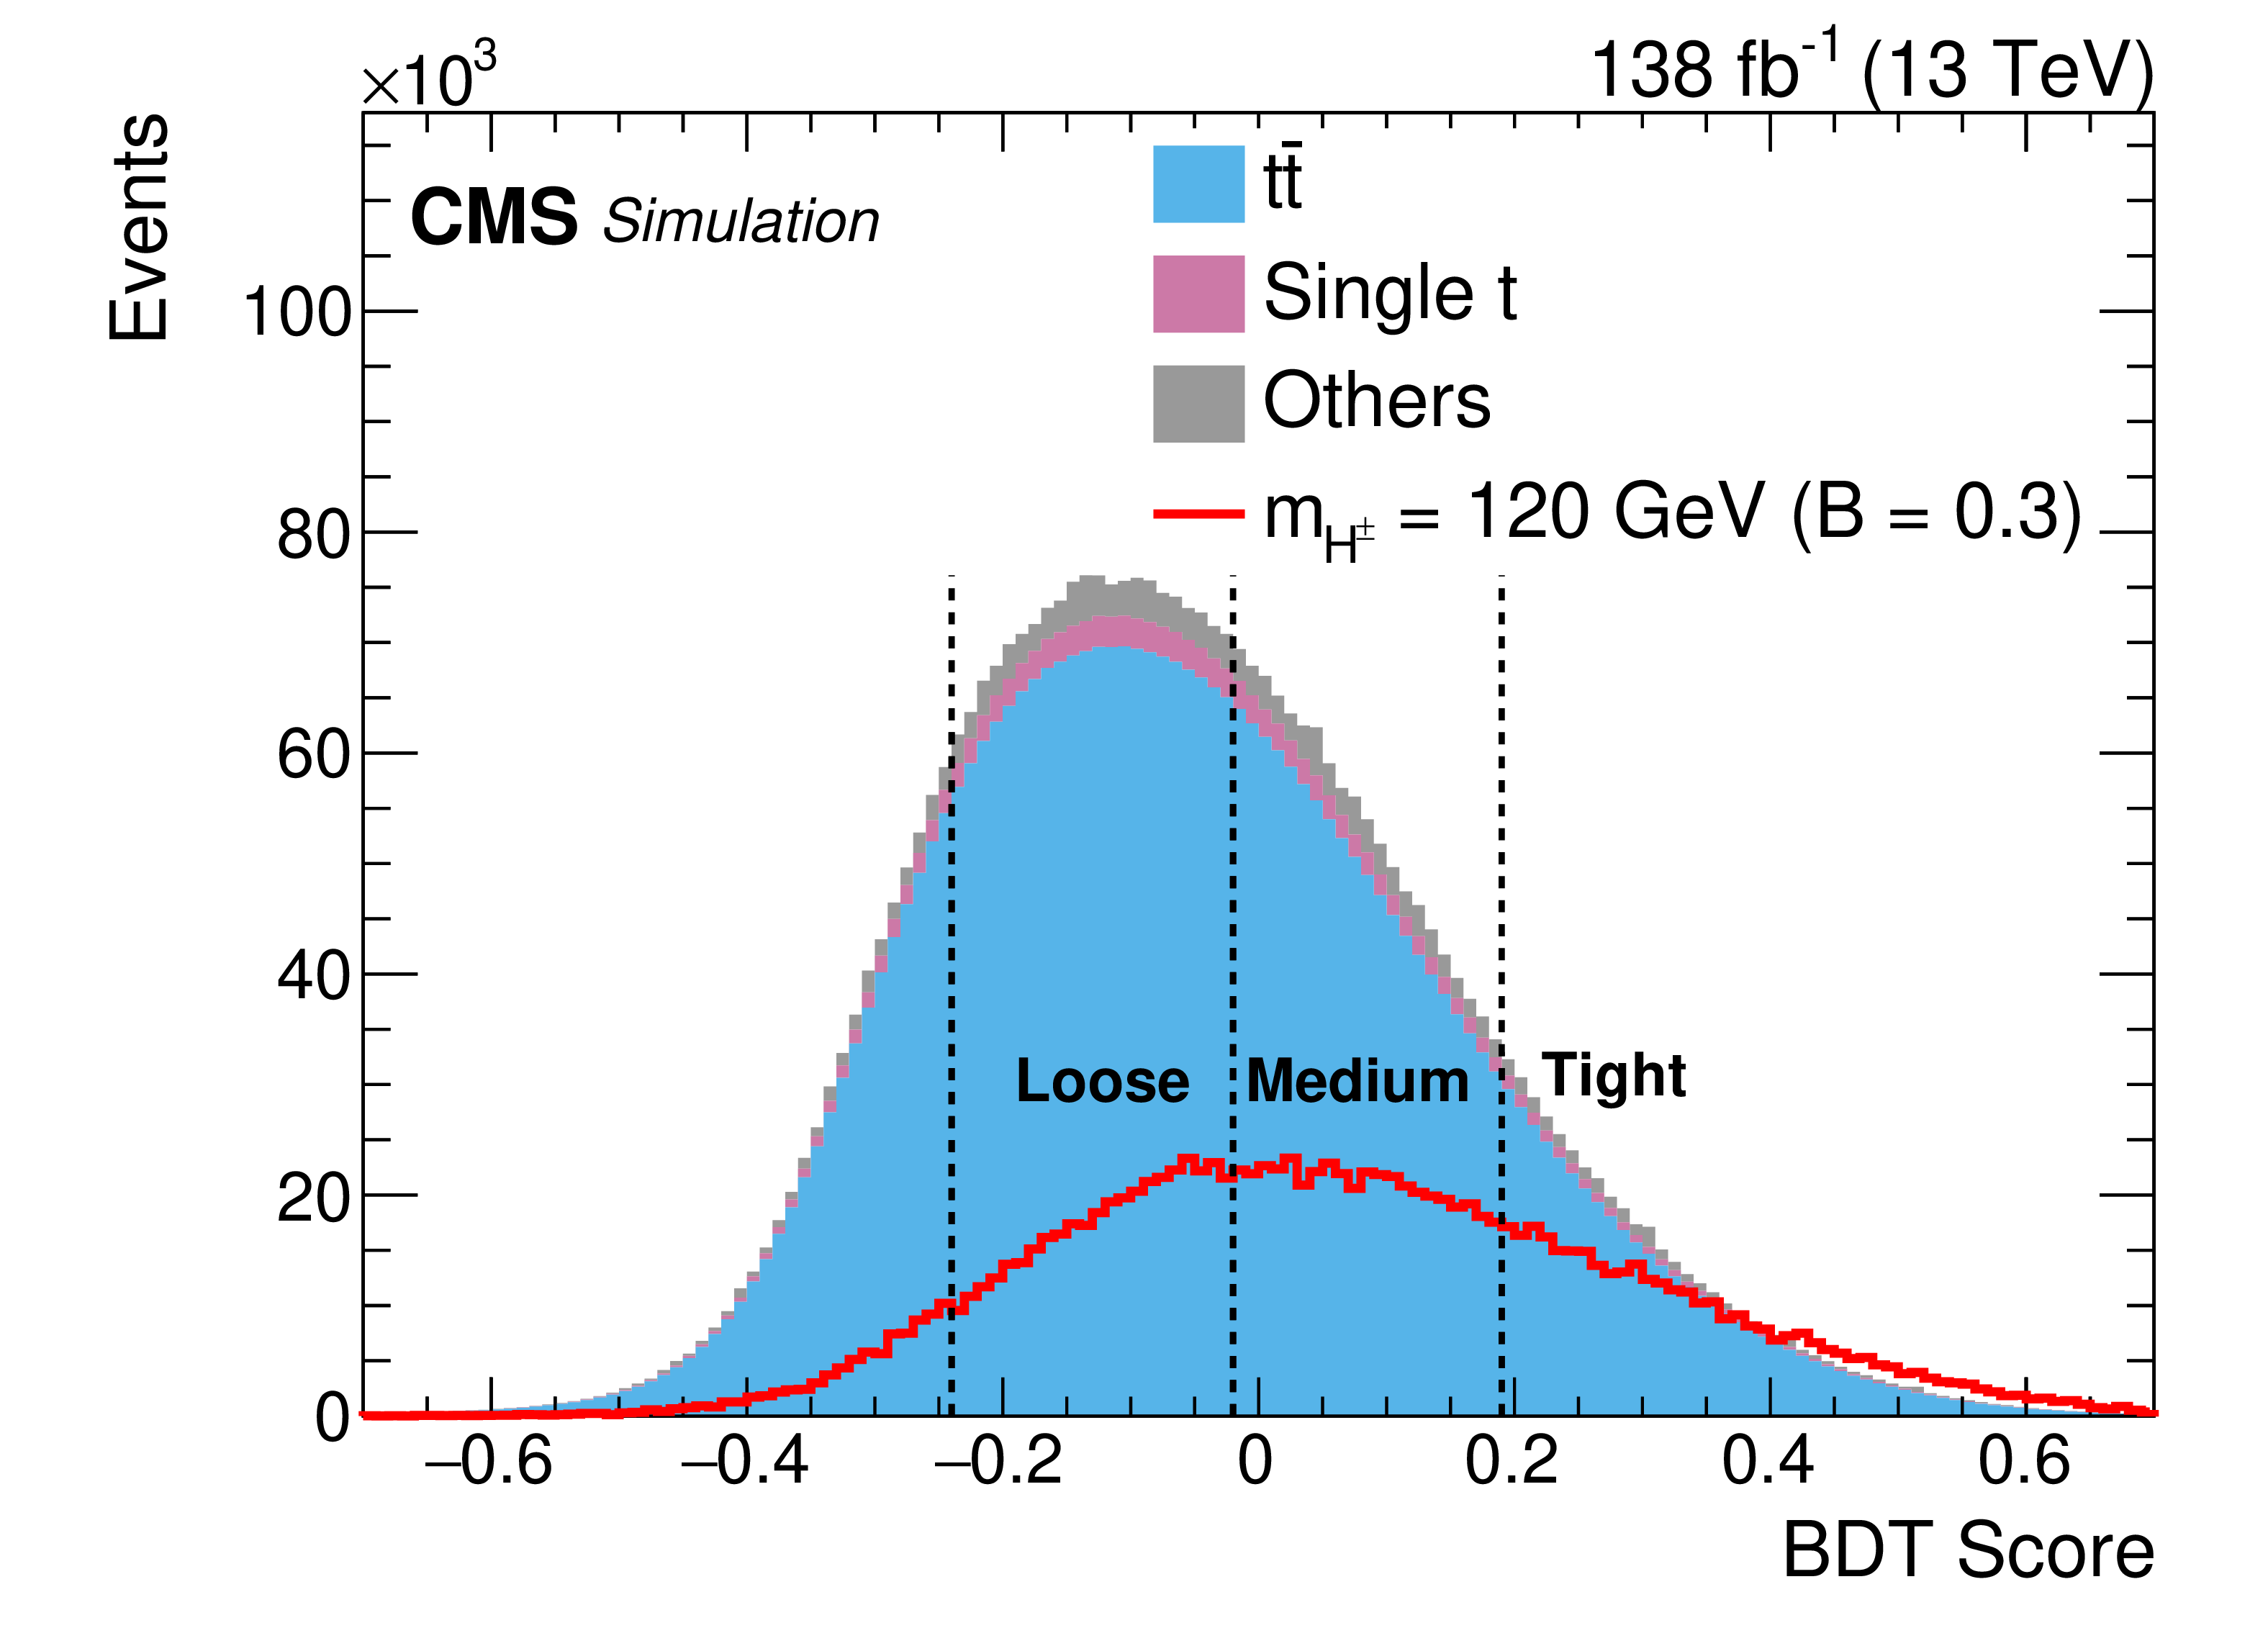
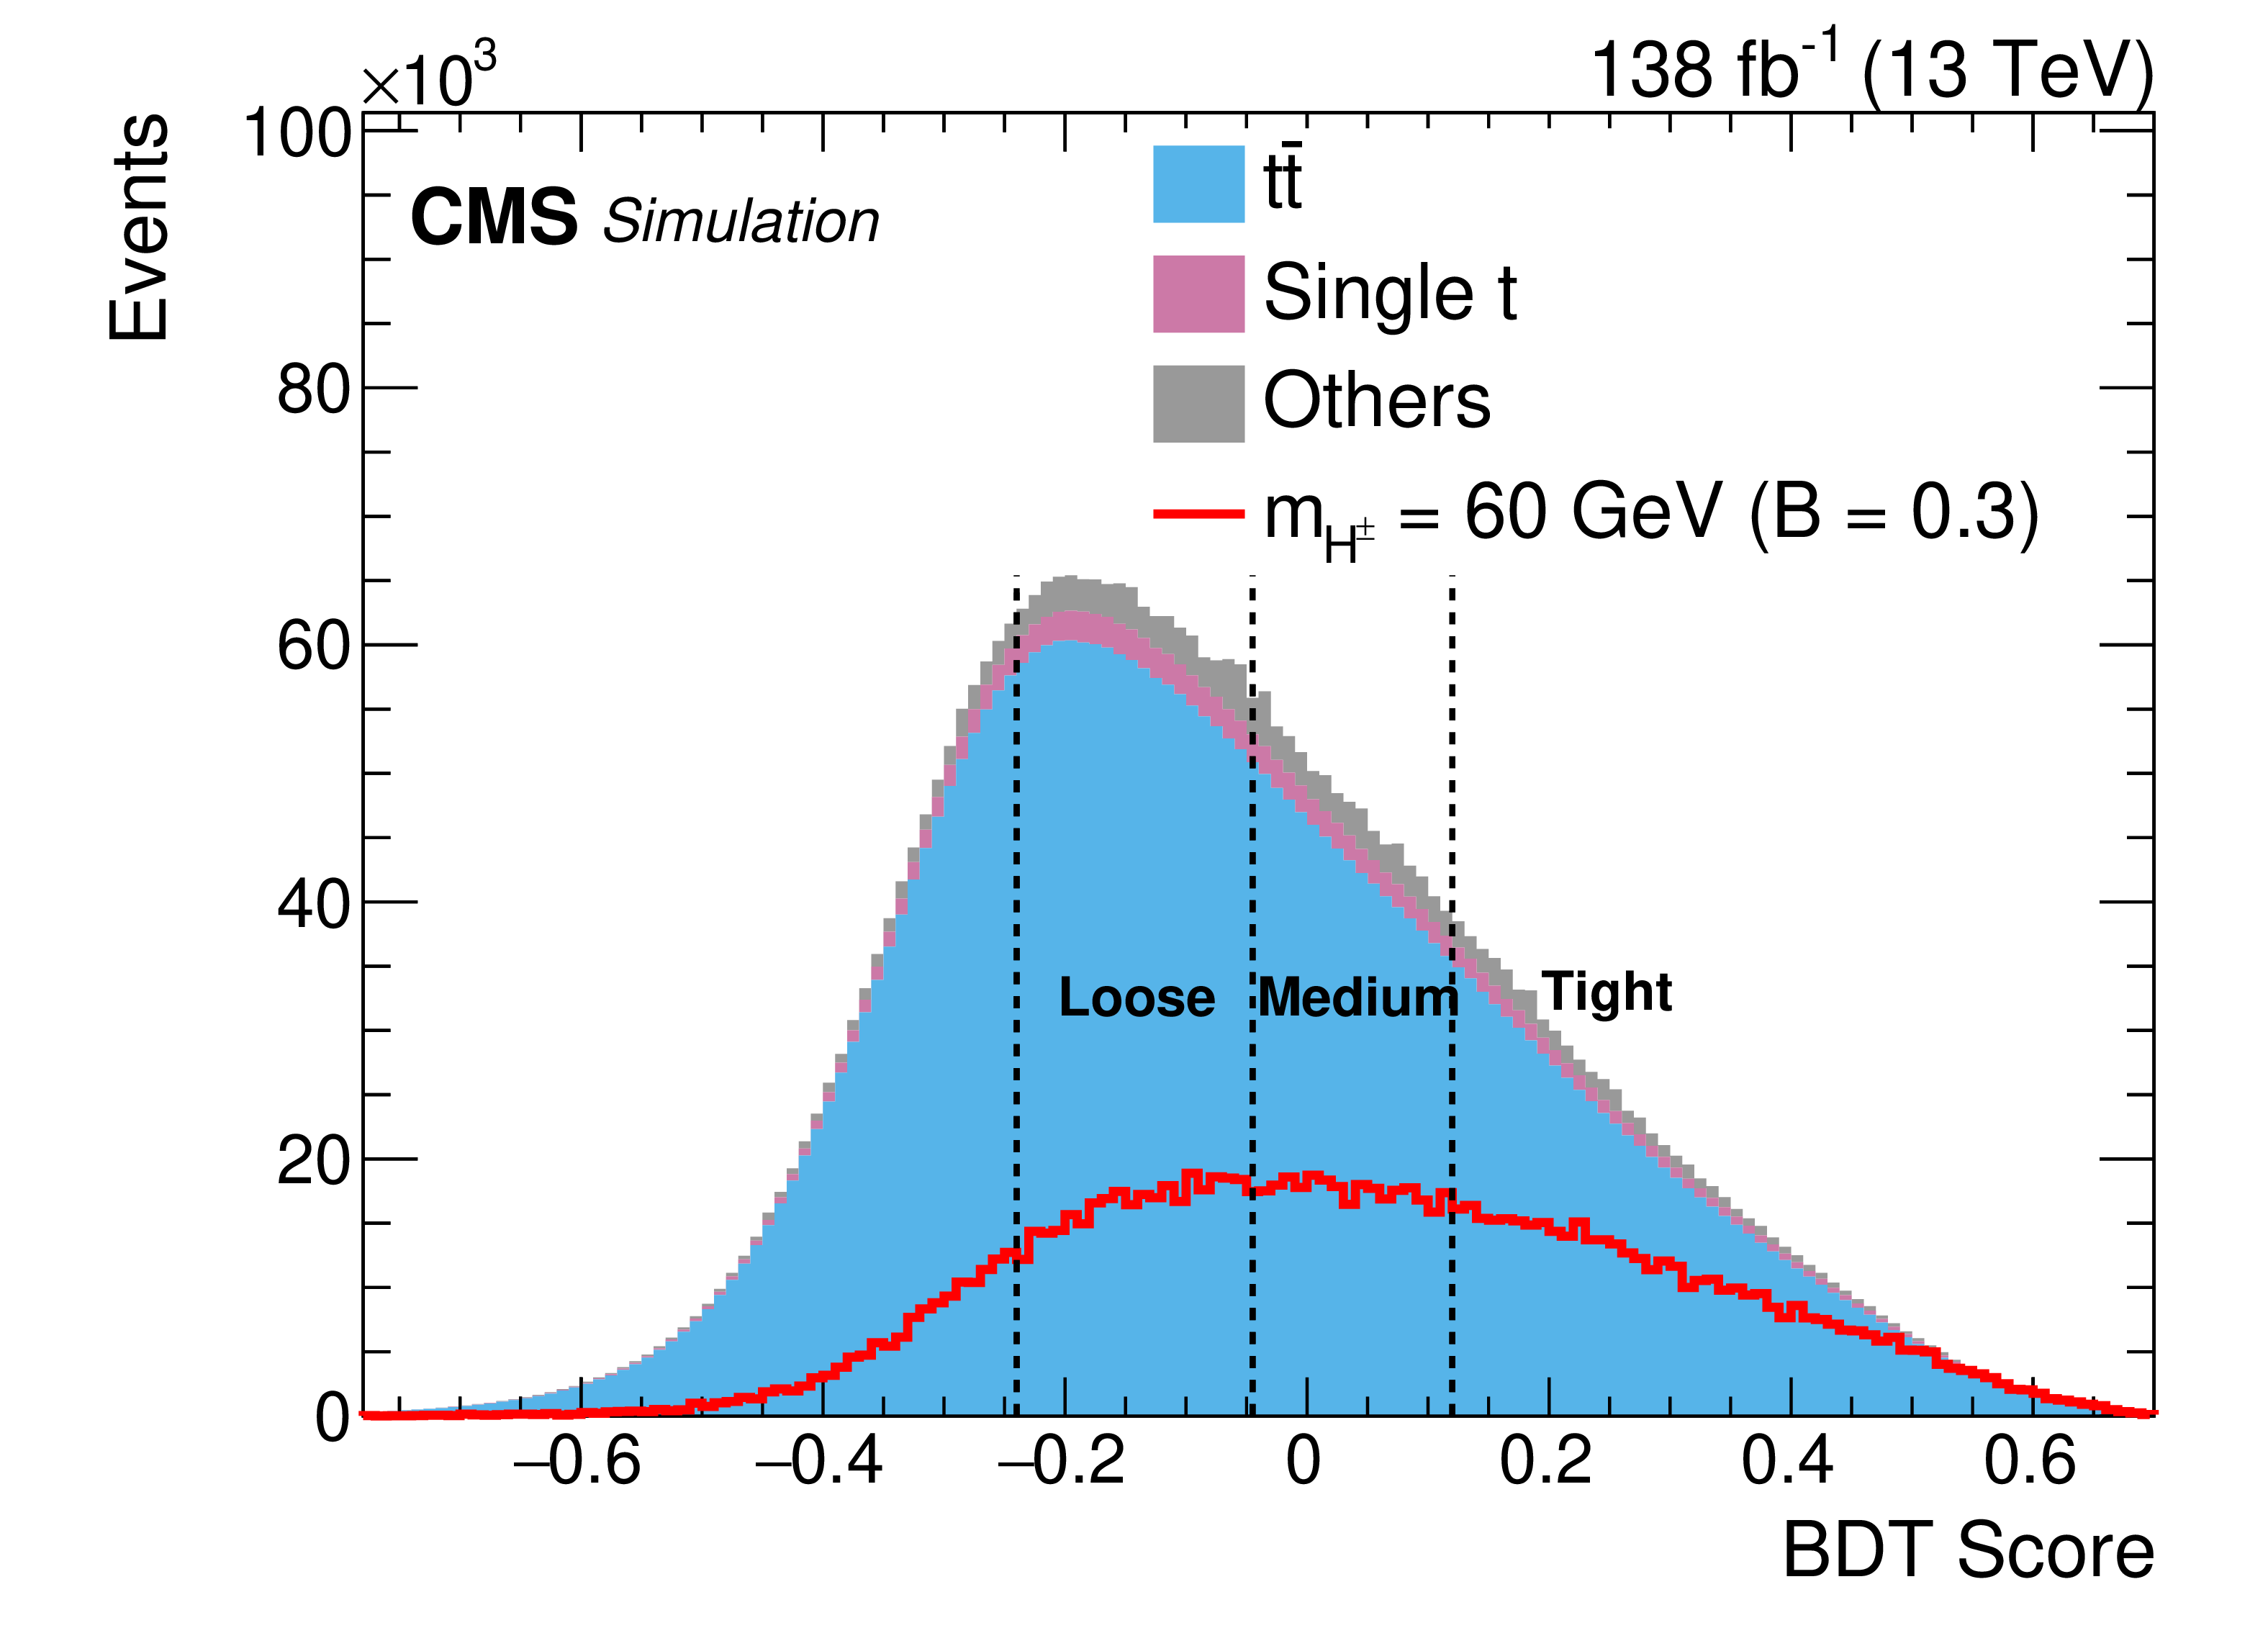
BDT output score distribution for the backgrounds and signal processes for the (left) high-mass and (right) low-mass models. The vertical lines correspond to the working points used for categorization. The signal distribution is normalized to $ \mathcal{B}(\mathrm{t} \to \mathrm{{H}^{\pm}} \mathrm{b}) = 30% $ for visualization purposes. |
png pdf |
Figure 3-a:
BDT output score distribution for the backgrounds and signal processes for the (left) high-mass and (right) low-mass models. The vertical lines correspond to the working points used for categorization. The signal distribution is normalized to $ \mathcal{B}(\mathrm{t} \to \mathrm{{H}^{\pm}} \mathrm{b}) = 30% $ for visualization purposes. |
png pdf |
Figure 3-b:
BDT output score distribution for the backgrounds and signal processes for the (left) high-mass and (right) low-mass models. The vertical lines correspond to the working points used for categorization. The signal distribution is normalized to $ \mathcal{B}(\mathrm{t} \to \mathrm{{H}^{\pm}} \mathrm{b}) = 30% $ for visualization purposes. |
png pdf |
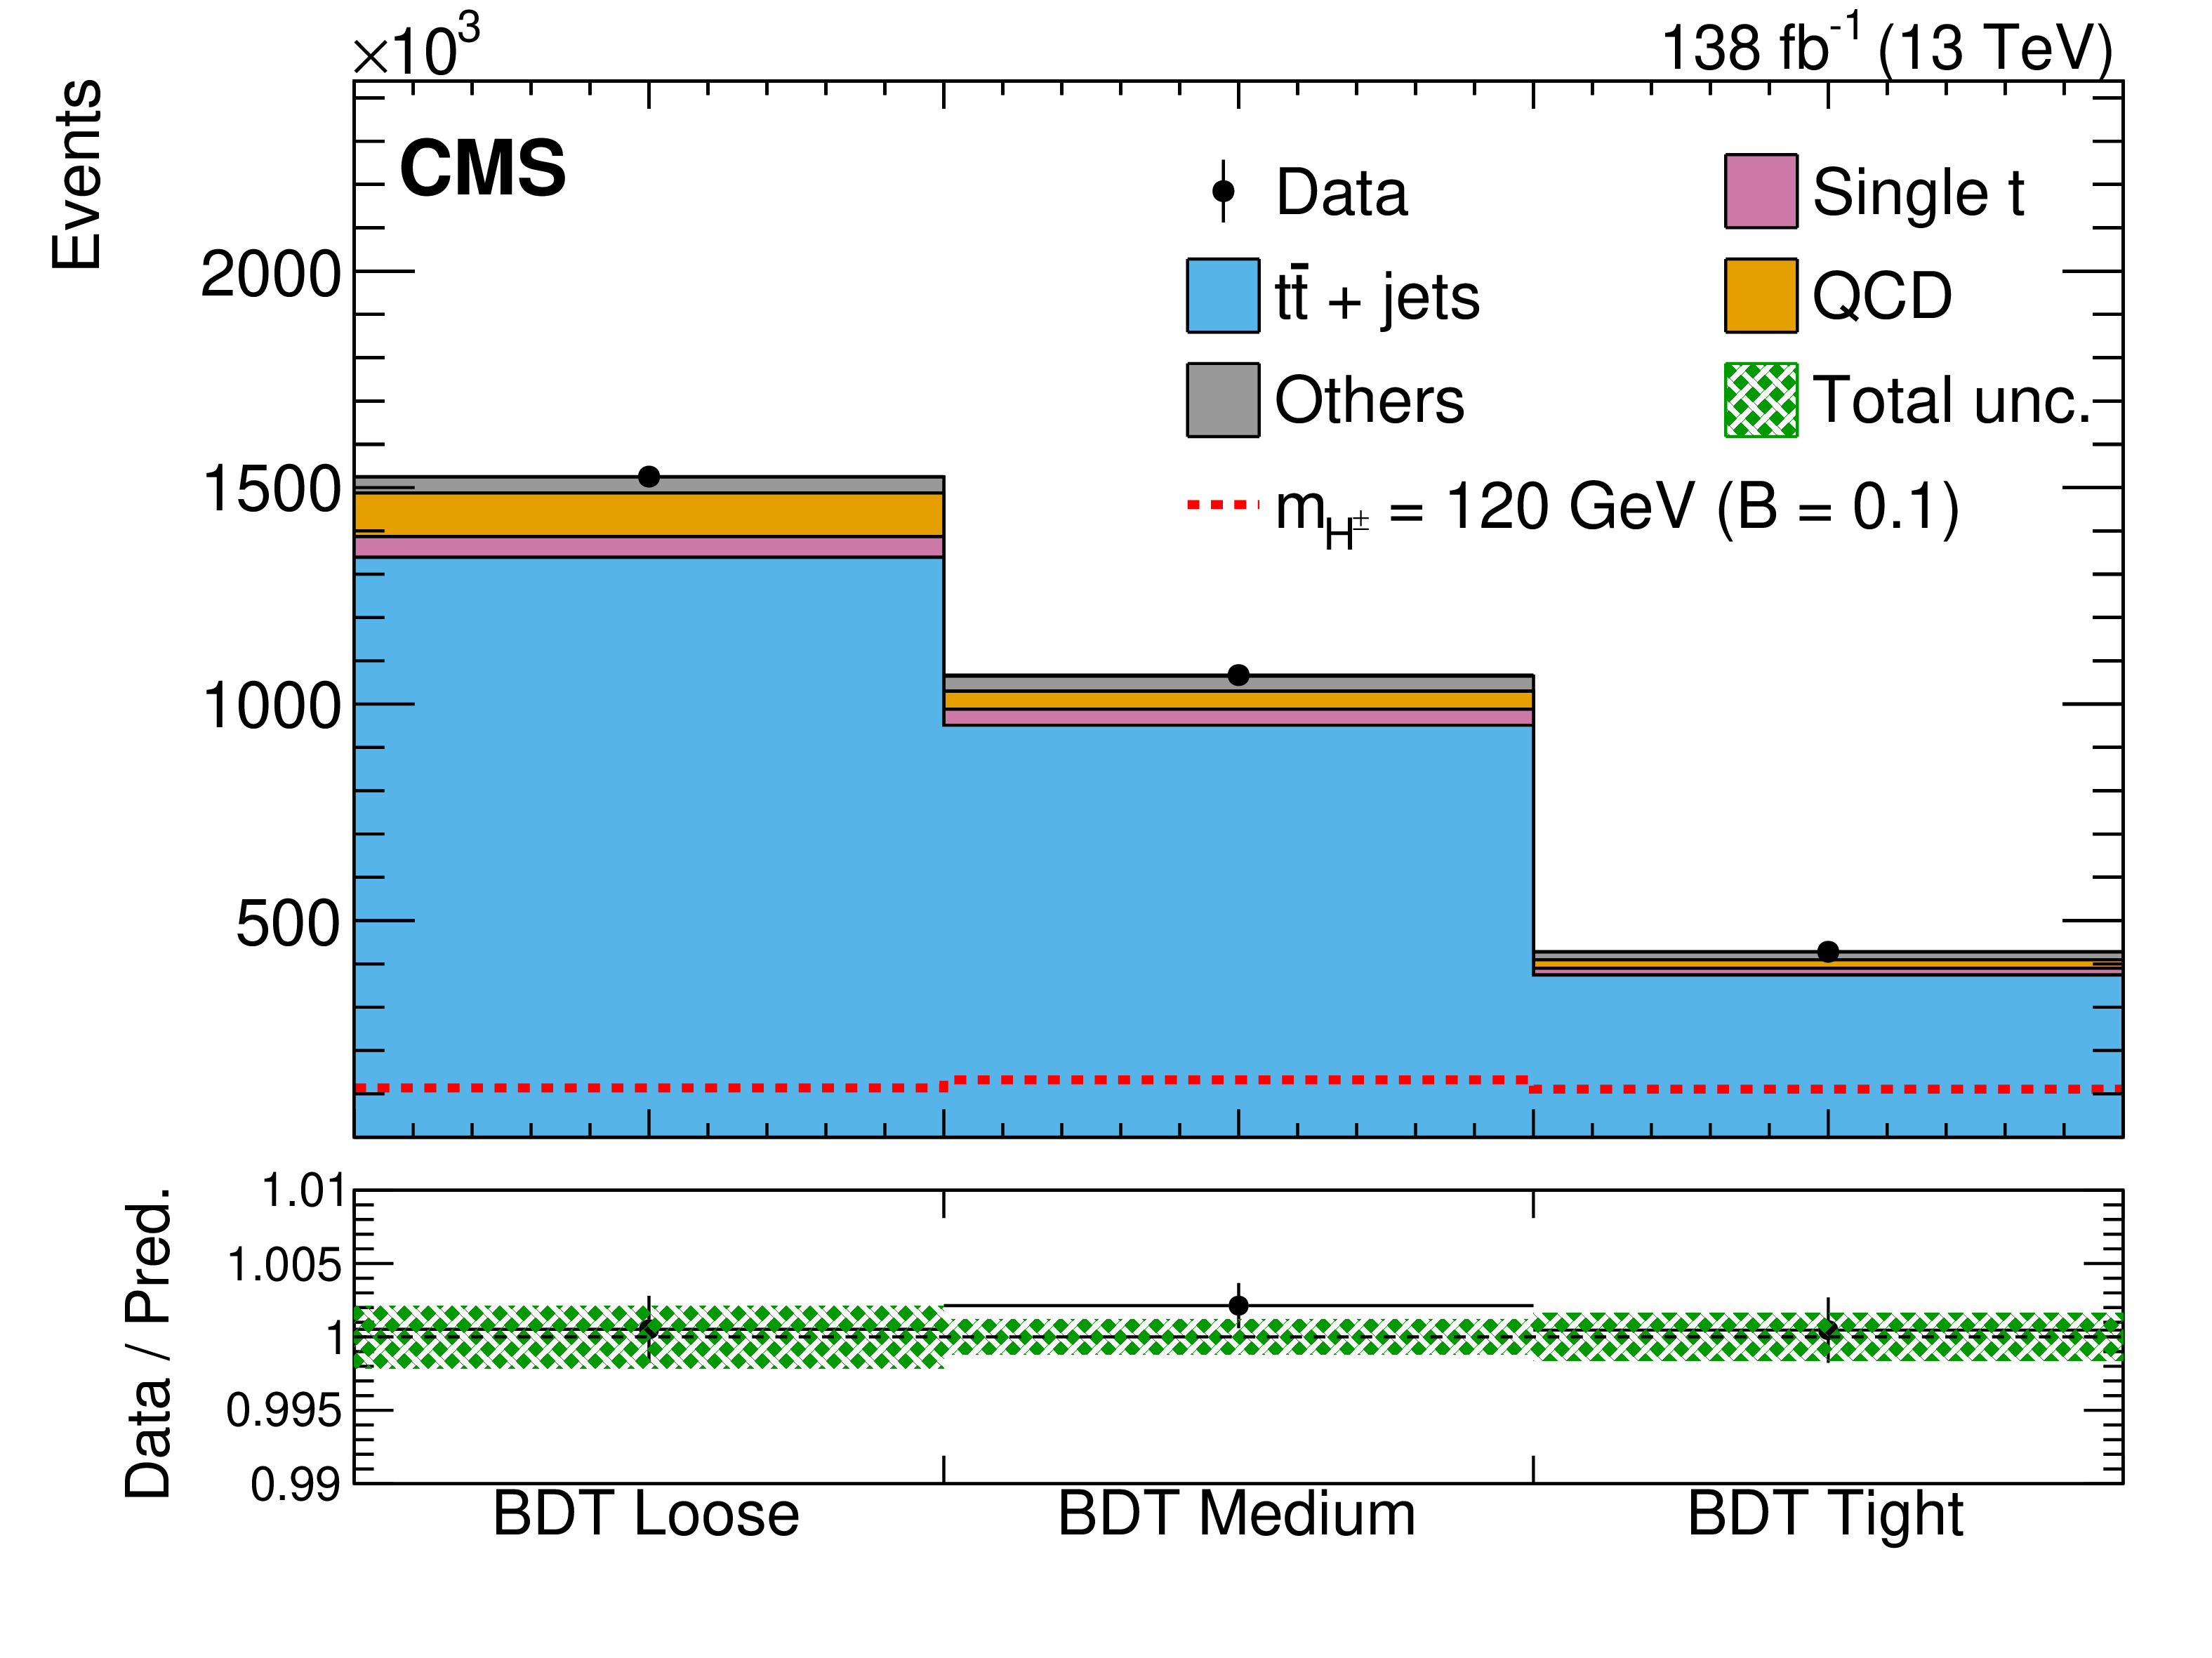
Figure 4:
Post-fit event yields of the BDT categories after the background-only fit. The lower panel shows the ratio of data to the predicted background, with the shaded band indicating the total uncertainty in the prediction, including both statistical and systematic contributions. For comparison, the potential signal yield with $ \mathcal{B}(\mathrm{t} \to \mathrm{{H}^{\pm}} \mathrm{b})=10% $ is shown. |
png pdf |
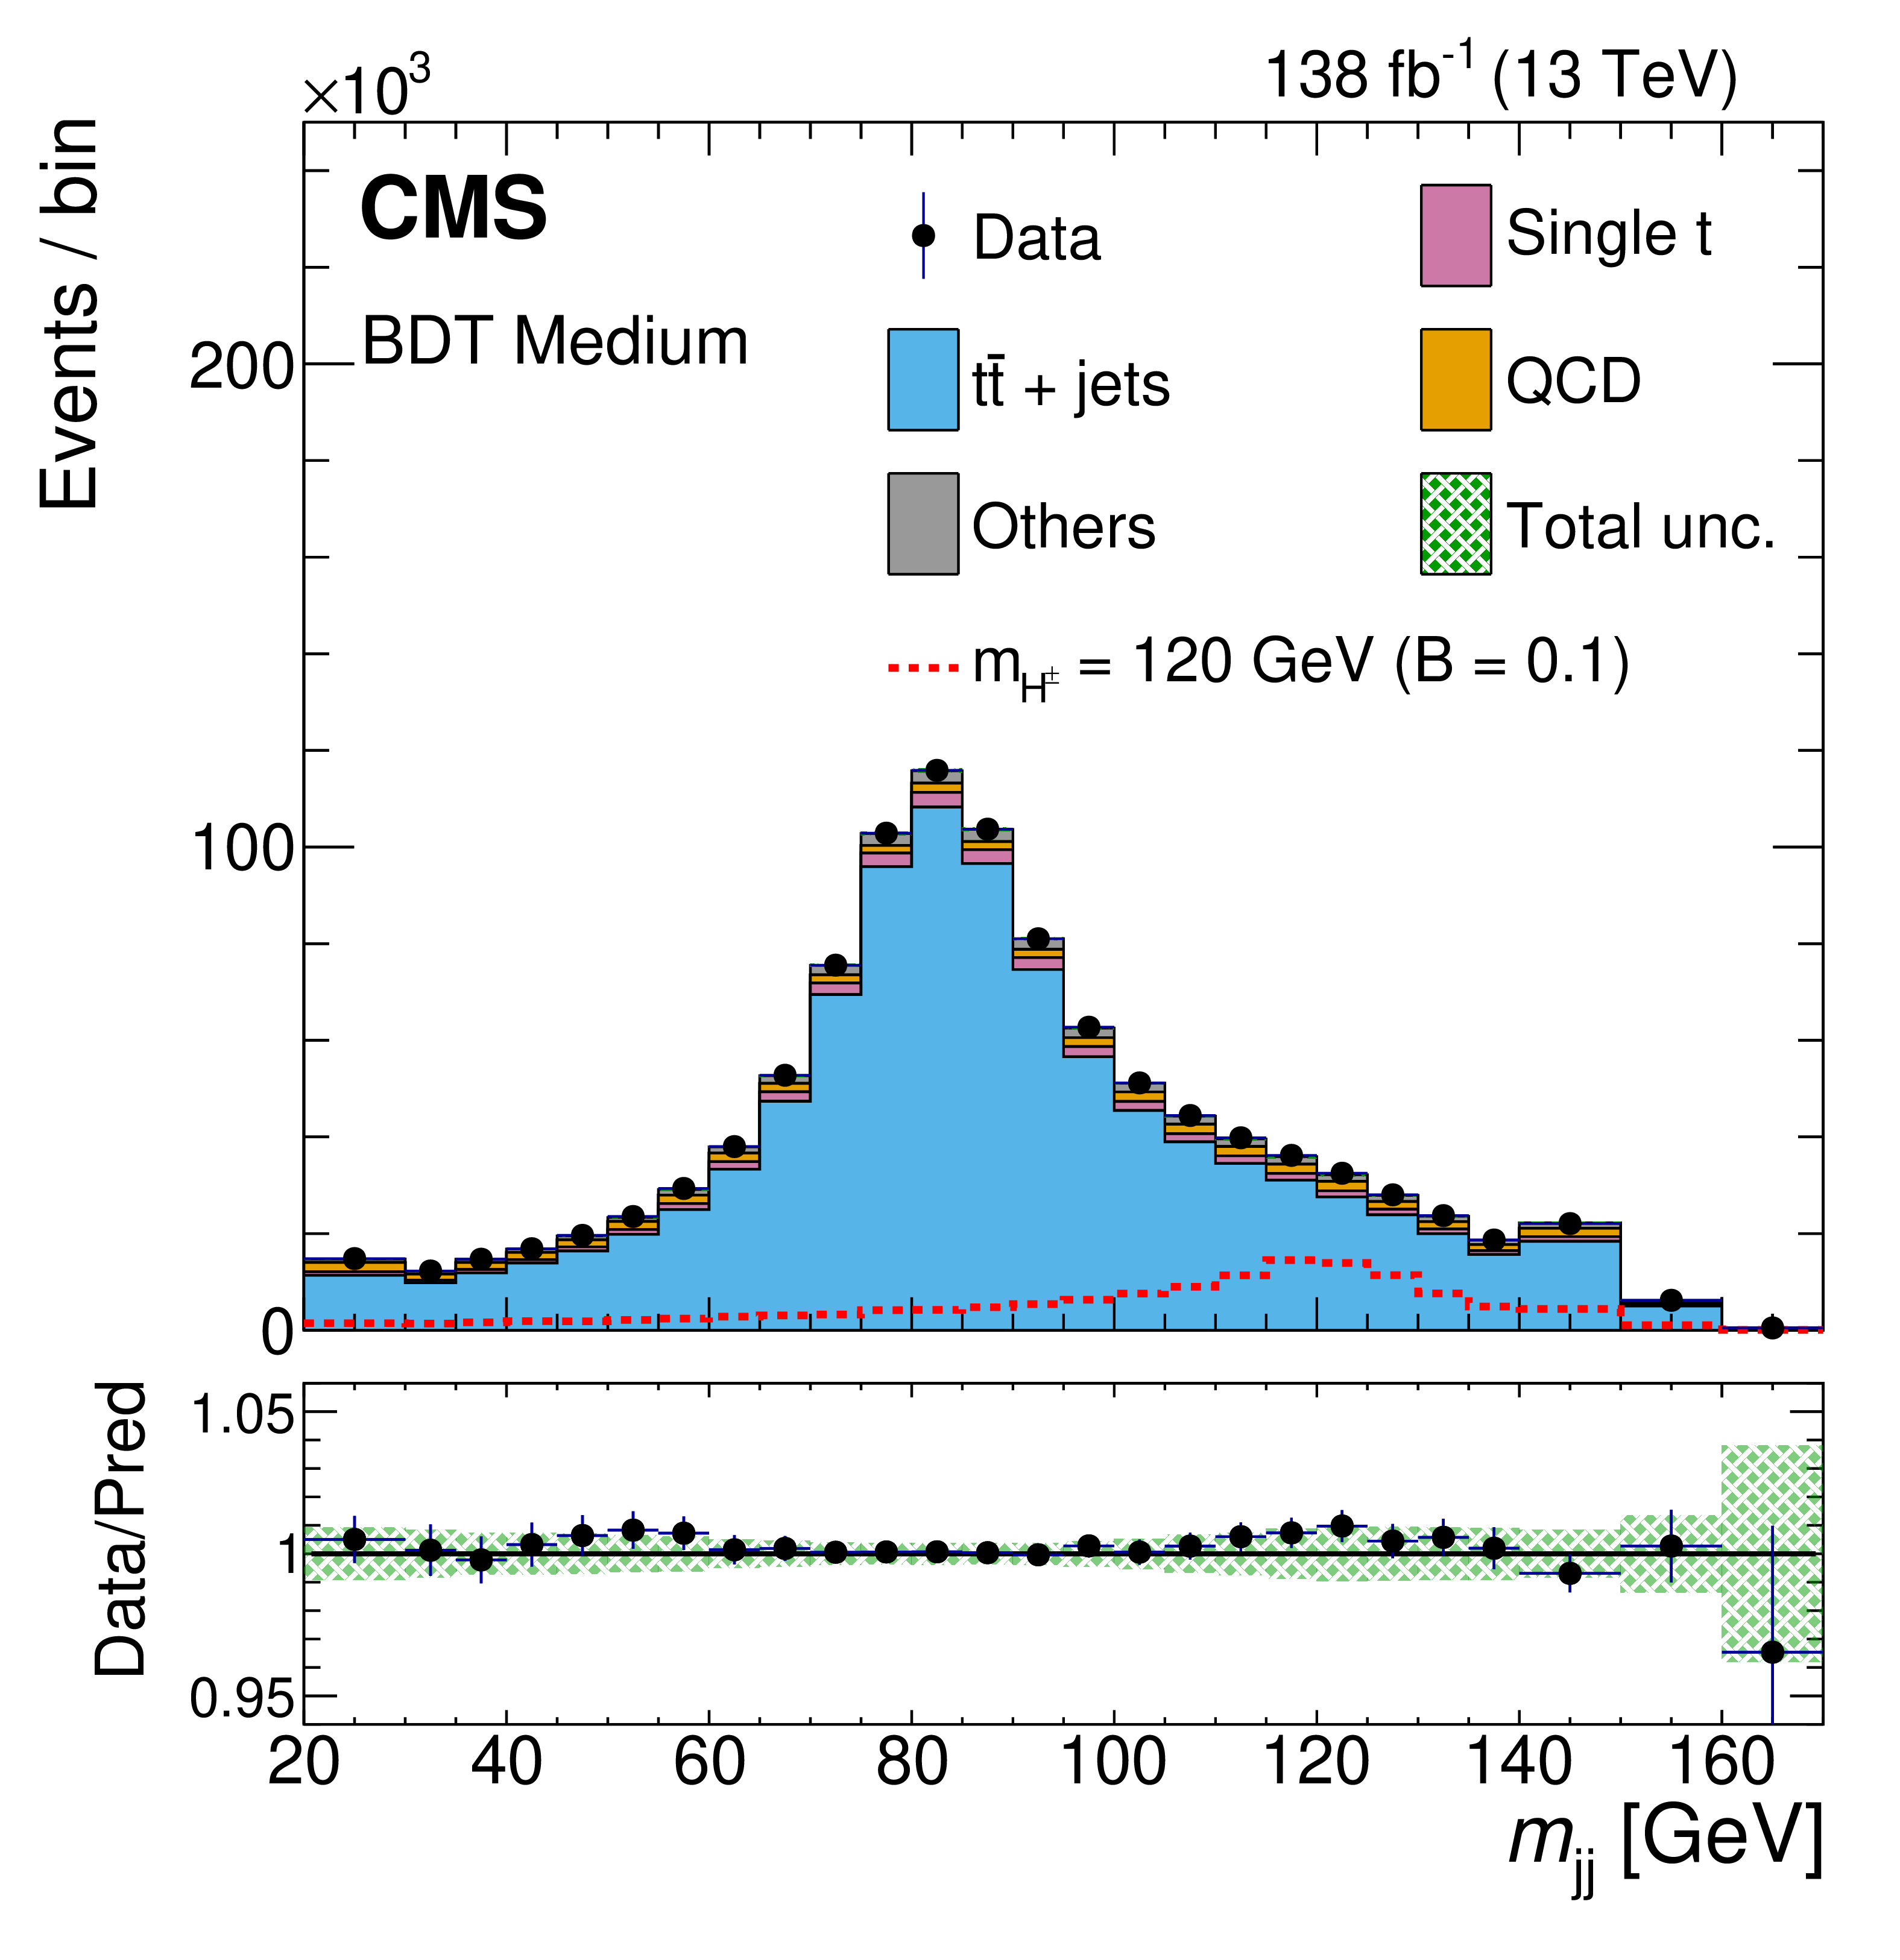
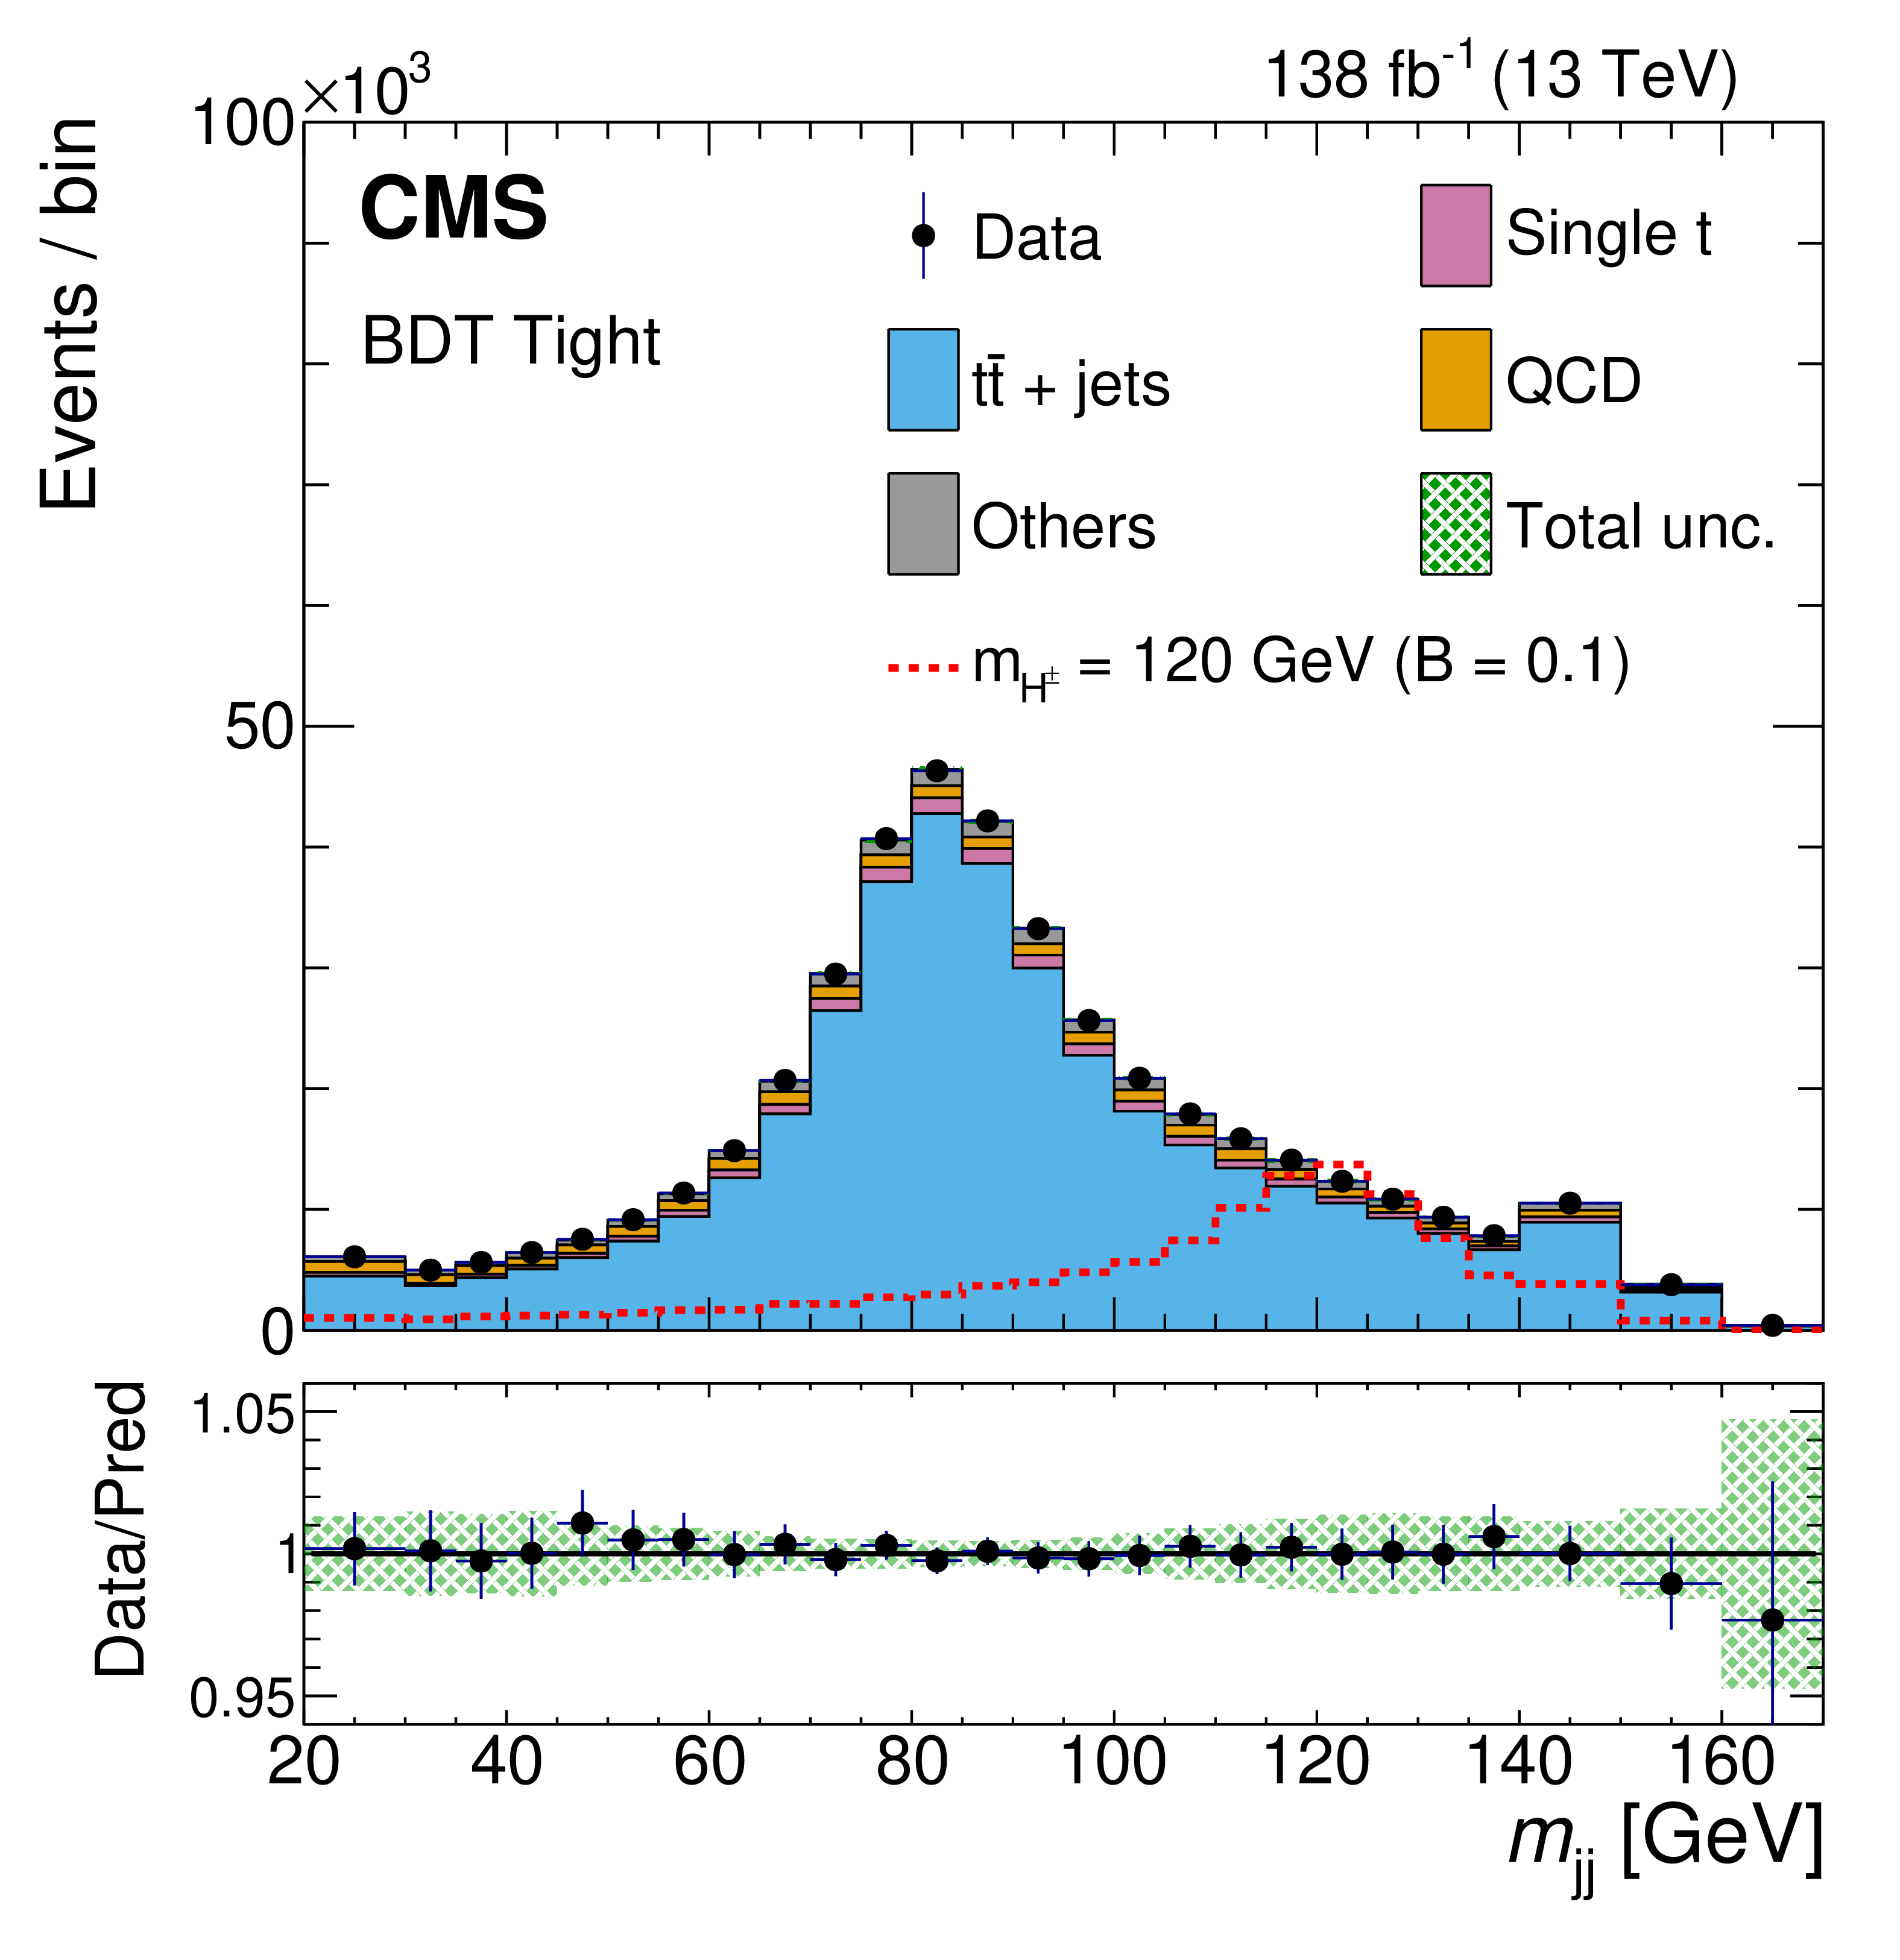
Figure 5:
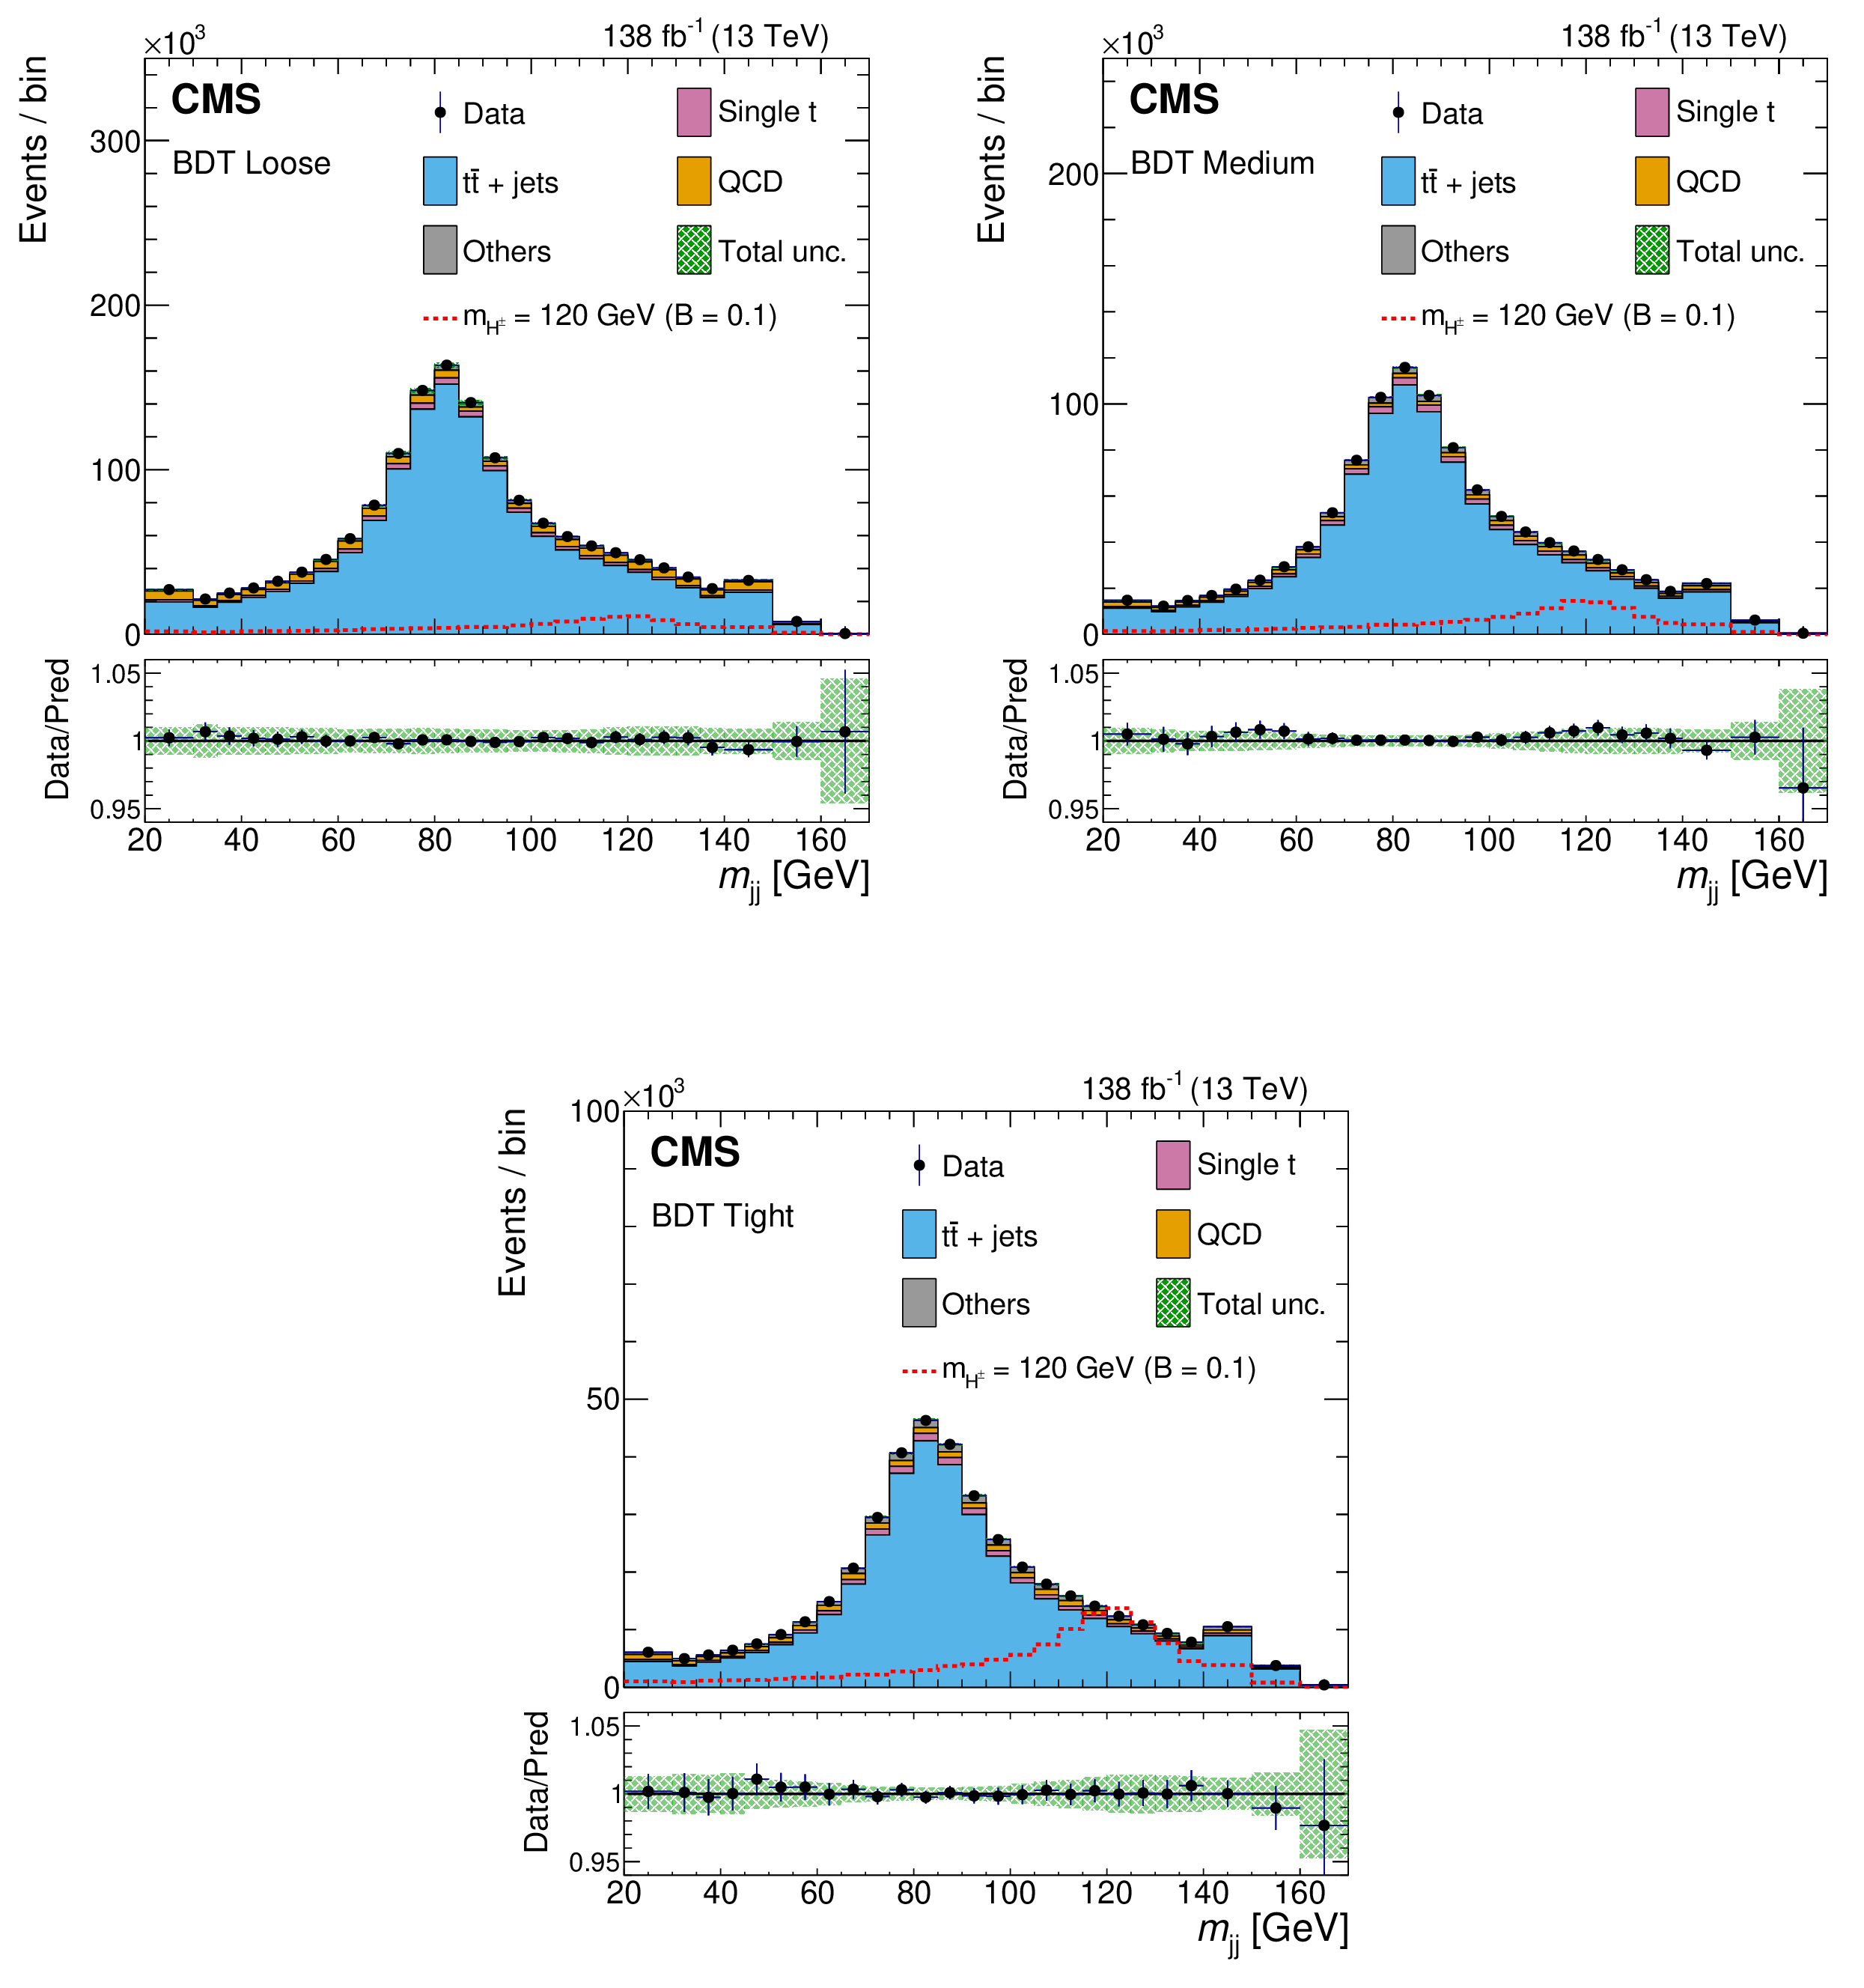
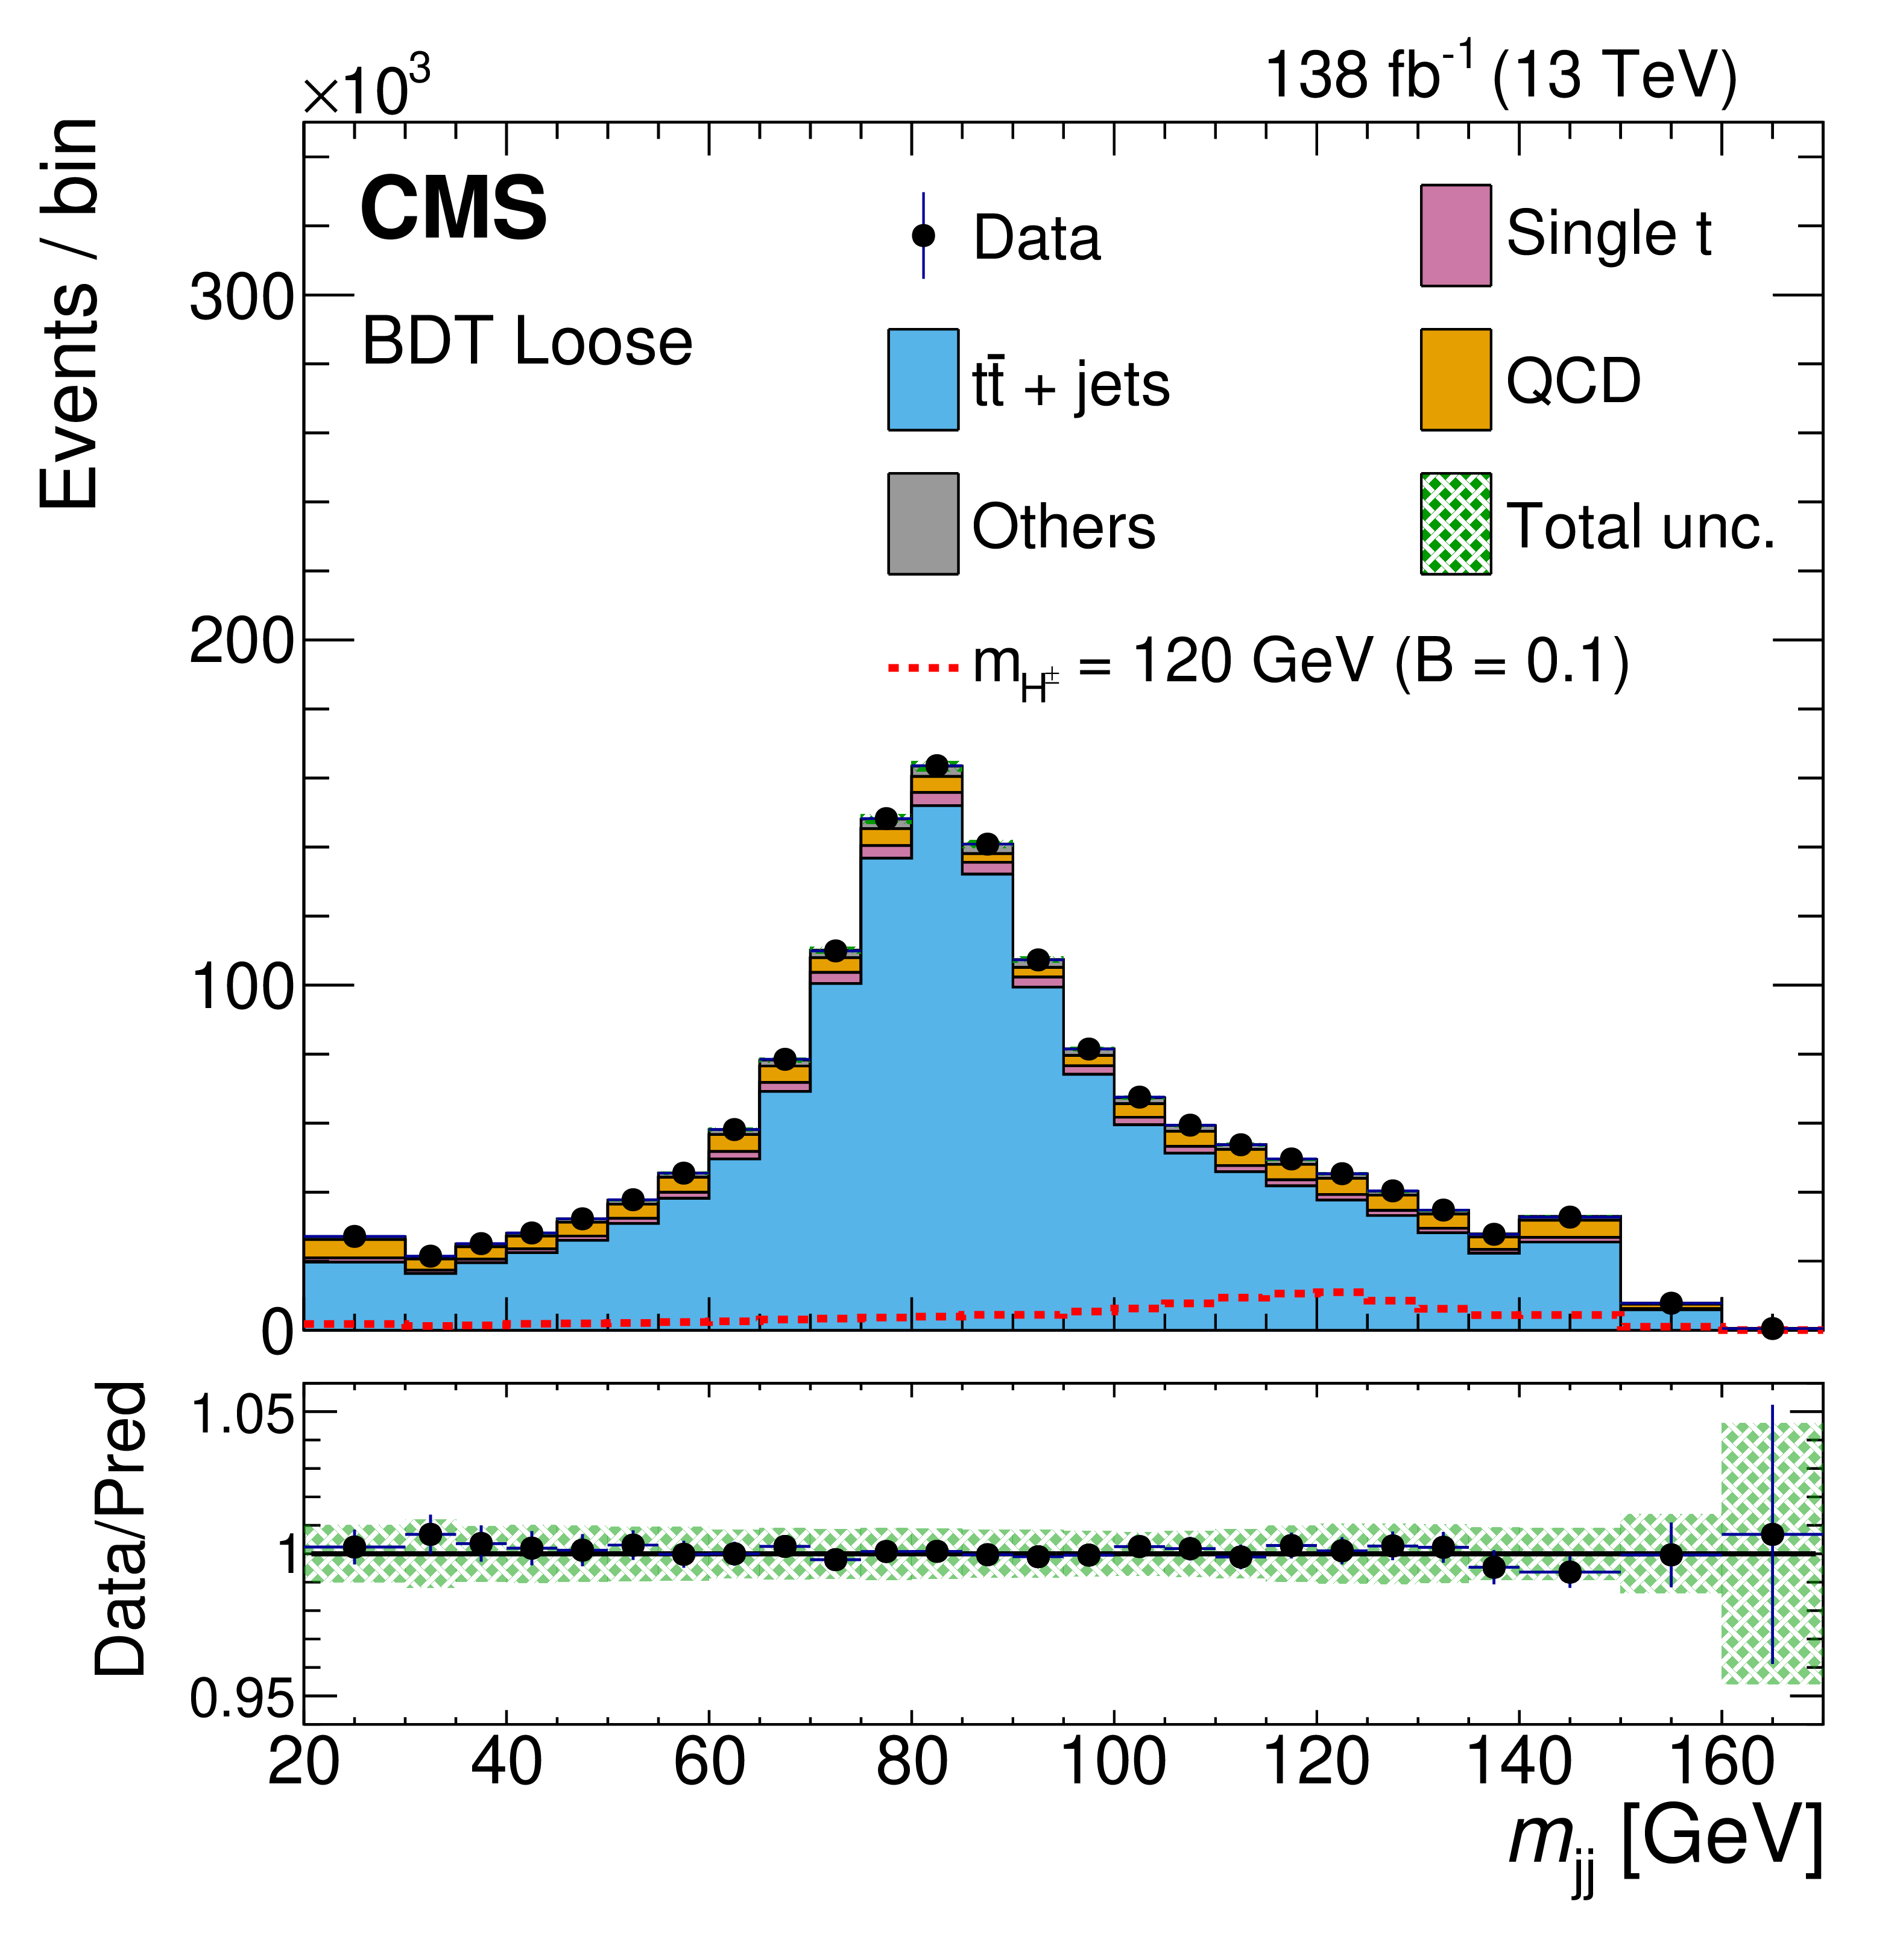
The post-fit $ m_\text{jj} $ distributions for data and background processes in loose, medium and tight BDT categories are shown for combined data set. The $ m_\text{jj} $ variable is defined as the invariant mass of the two light jets associated with the $ \mathrm{W}/\mathrm{{H}^{\pm}} $ candidate. The potential signal distribution normalized to $ \mathcal{B}(\mathrm{t} \to \mathrm{{H}^{\pm}} \mathrm{b})=10% $ is also overlaid for comparison. The lower panels display the ratio of data to the predicted background, with the shaded band indicating the total uncertainty in the prediction, including both statistical and systematic components. Upper row: loose (left) and medium (right) BDT categories. Bottom row: tight BDT category. |
png pdf |
Figure 5-a:
The post-fit $ m_\text{jj} $ distributions for data and background processes in loose, medium and tight BDT categories are shown for combined data set. The $ m_\text{jj} $ variable is defined as the invariant mass of the two light jets associated with the $ \mathrm{W}/\mathrm{{H}^{\pm}} $ candidate. The potential signal distribution normalized to $ \mathcal{B}(\mathrm{t} \to \mathrm{{H}^{\pm}} \mathrm{b})=10% $ is also overlaid for comparison. The lower panels display the ratio of data to the predicted background, with the shaded band indicating the total uncertainty in the prediction, including both statistical and systematic components. Upper row: loose (left) and medium (right) BDT categories. Bottom row: tight BDT category. |
png pdf |
Figure 5-b:
The post-fit $ m_\text{jj} $ distributions for data and background processes in loose, medium and tight BDT categories are shown for combined data set. The $ m_\text{jj} $ variable is defined as the invariant mass of the two light jets associated with the $ \mathrm{W}/\mathrm{{H}^{\pm}} $ candidate. The potential signal distribution normalized to $ \mathcal{B}(\mathrm{t} \to \mathrm{{H}^{\pm}} \mathrm{b})=10% $ is also overlaid for comparison. The lower panels display the ratio of data to the predicted background, with the shaded band indicating the total uncertainty in the prediction, including both statistical and systematic components. Upper row: loose (left) and medium (right) BDT categories. Bottom row: tight BDT category. |
png pdf |
Figure 5-c:
The post-fit $ m_\text{jj} $ distributions for data and background processes in loose, medium and tight BDT categories are shown for combined data set. The $ m_\text{jj} $ variable is defined as the invariant mass of the two light jets associated with the $ \mathrm{W}/\mathrm{{H}^{\pm}} $ candidate. The potential signal distribution normalized to $ \mathcal{B}(\mathrm{t} \to \mathrm{{H}^{\pm}} \mathrm{b})=10% $ is also overlaid for comparison. The lower panels display the ratio of data to the predicted background, with the shaded band indicating the total uncertainty in the prediction, including both statistical and systematic components. Upper row: loose (left) and medium (right) BDT categories. Bottom row: tight BDT category. |
png pdf |
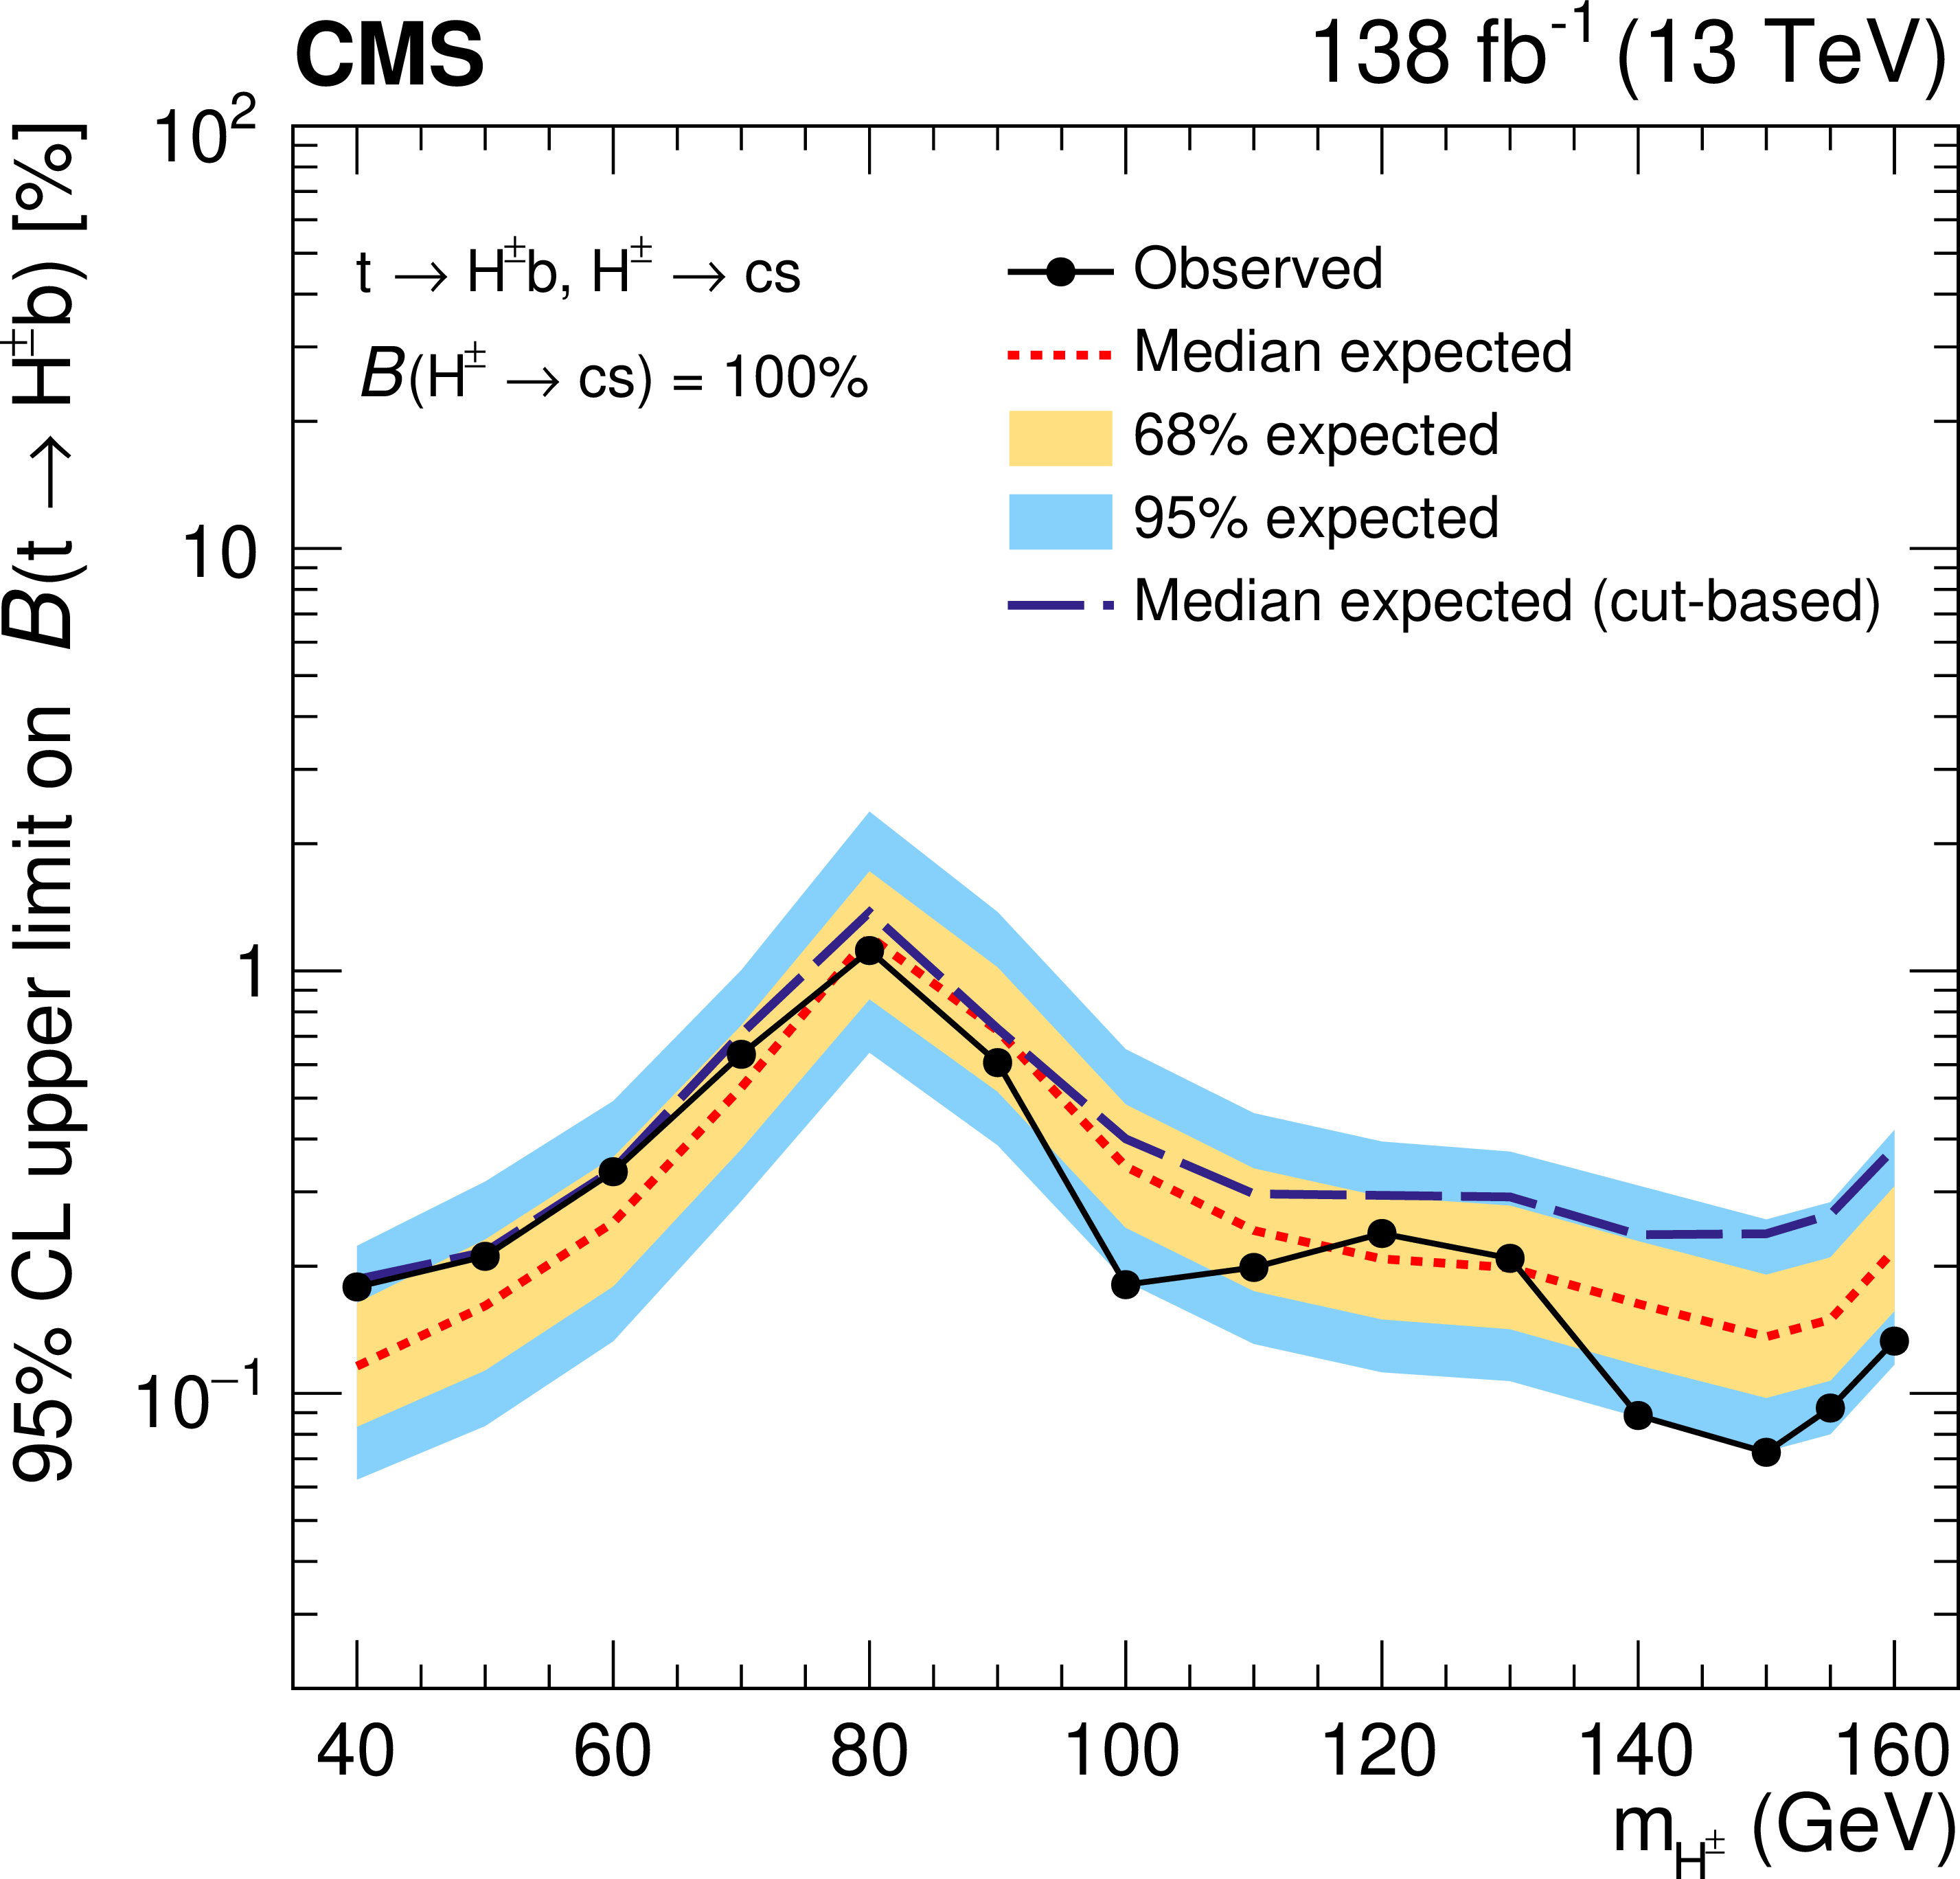
Figure 6:
Expected and observed upper limits at 95% CL on the branching fraction $ \mathcal{B}(\mathrm{t} \to \mathrm{{H}^{\pm}} \mathrm{b}) $ obtained using the BDT-based analysis in the combined lepton category ($ \mu\! $+jets and $ \mathrm{e}\! $+jets channels). For comparison, the expected limits from the cut-based analysis are also shown. |
| Tables | |
png pdf |
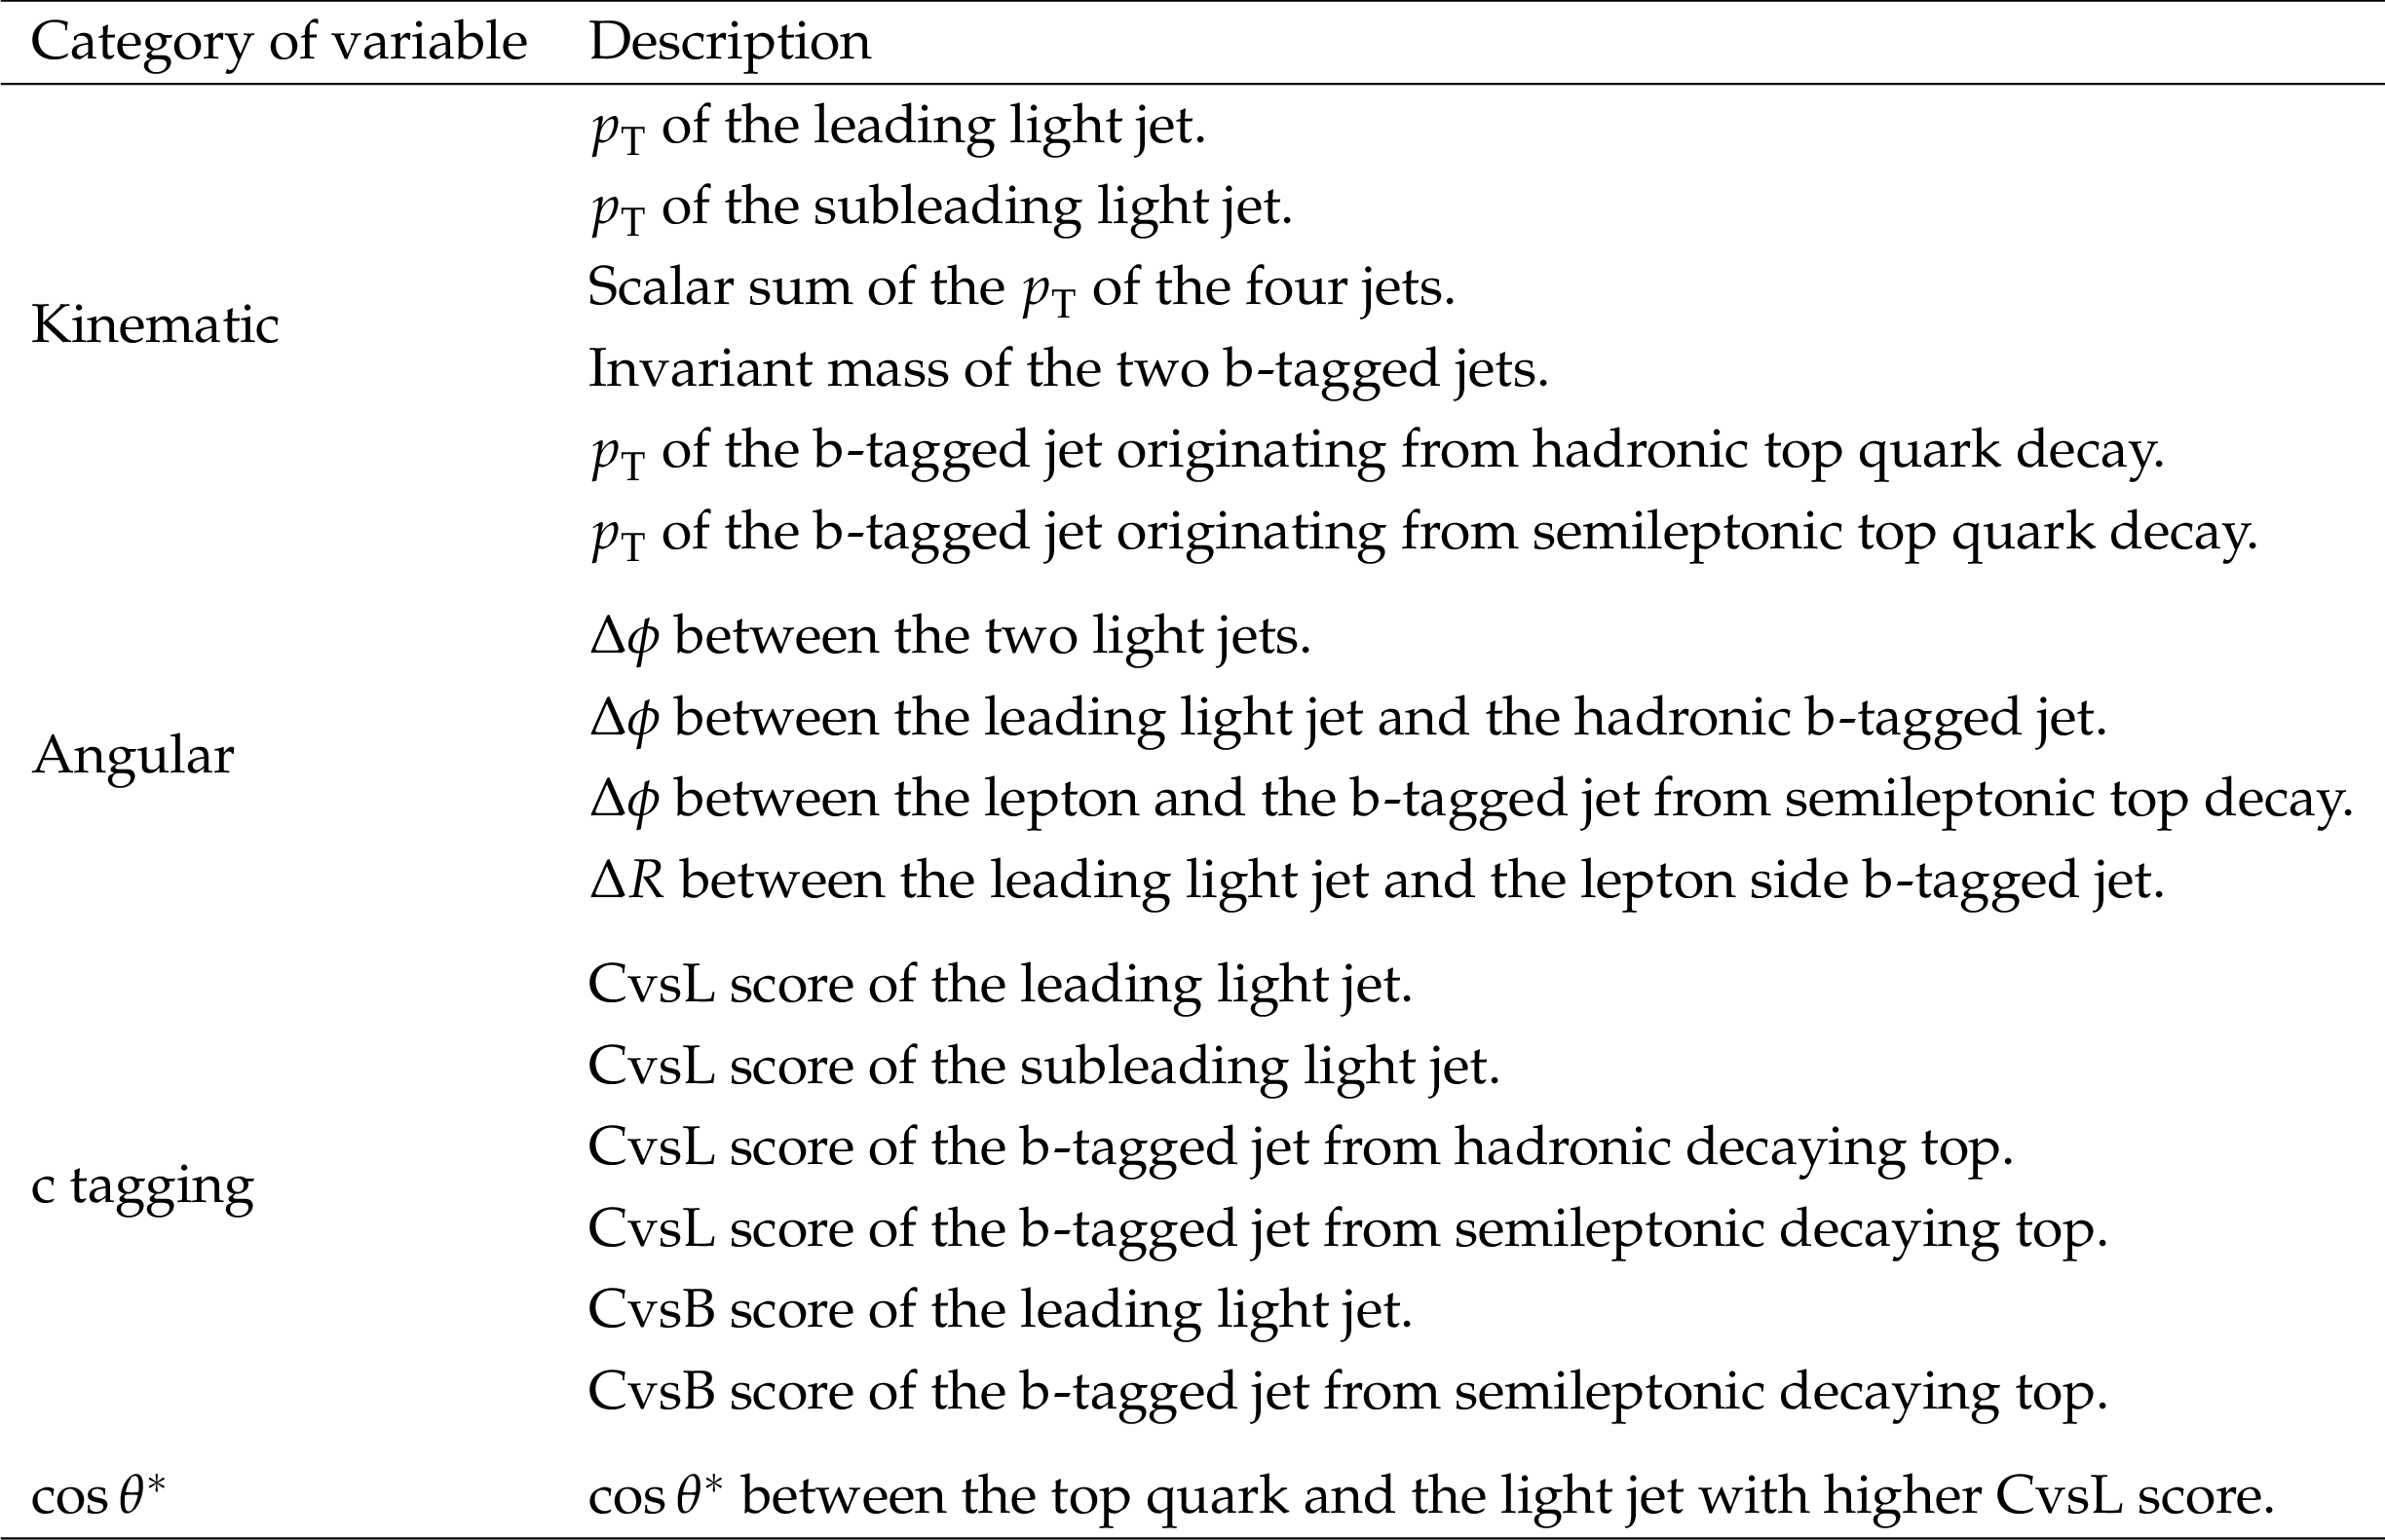
Table 1:
The input variables used for event categorization in the BDT |
png pdf |
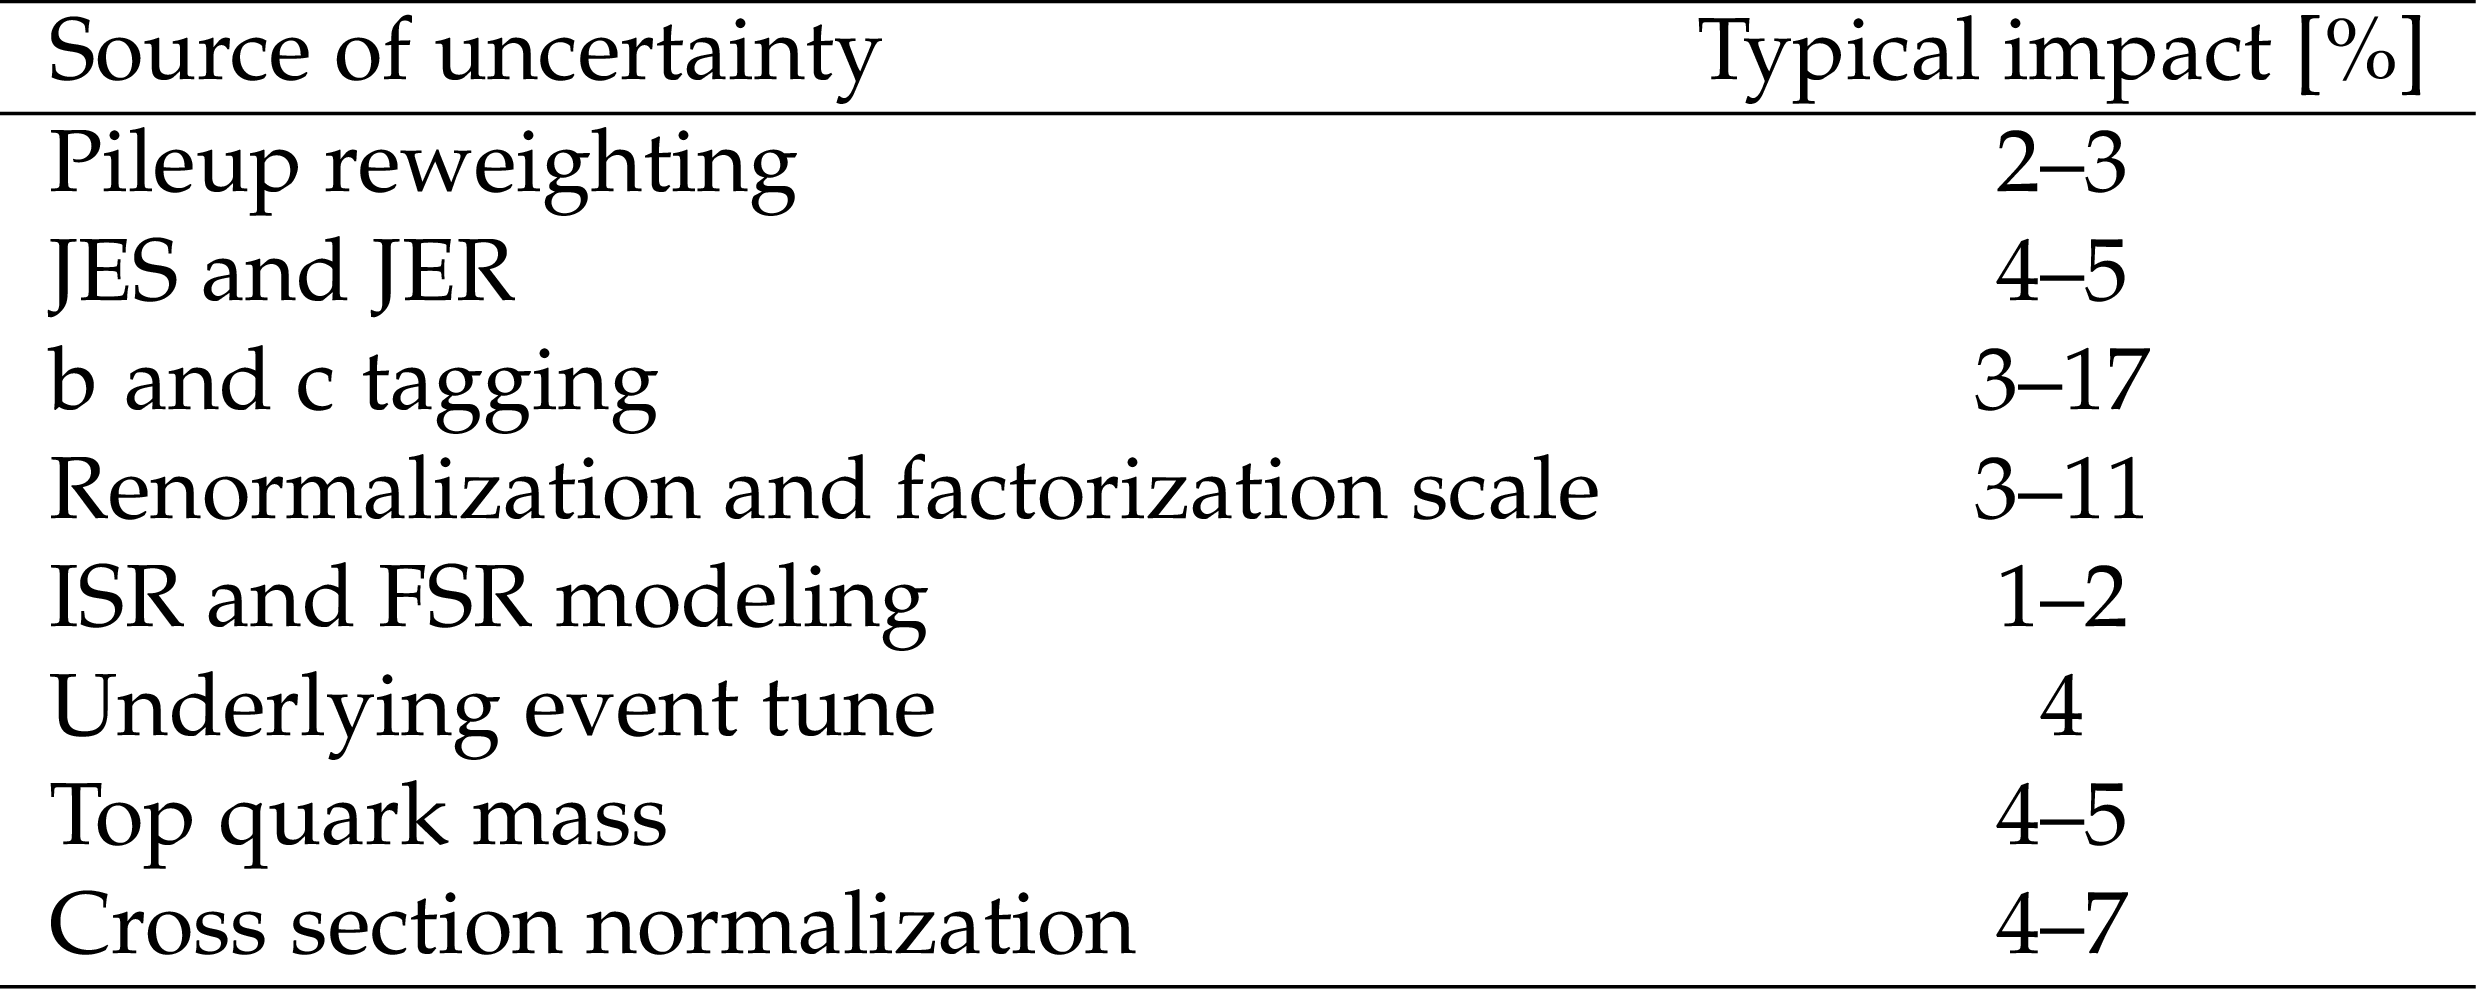
Table 2:
Summary of the main sources of systematic uncertainties and their typical impact on the $ m_\text{jj} $ distribution. The ranges reflect variations across different data-taking years and event categories. |
png pdf |
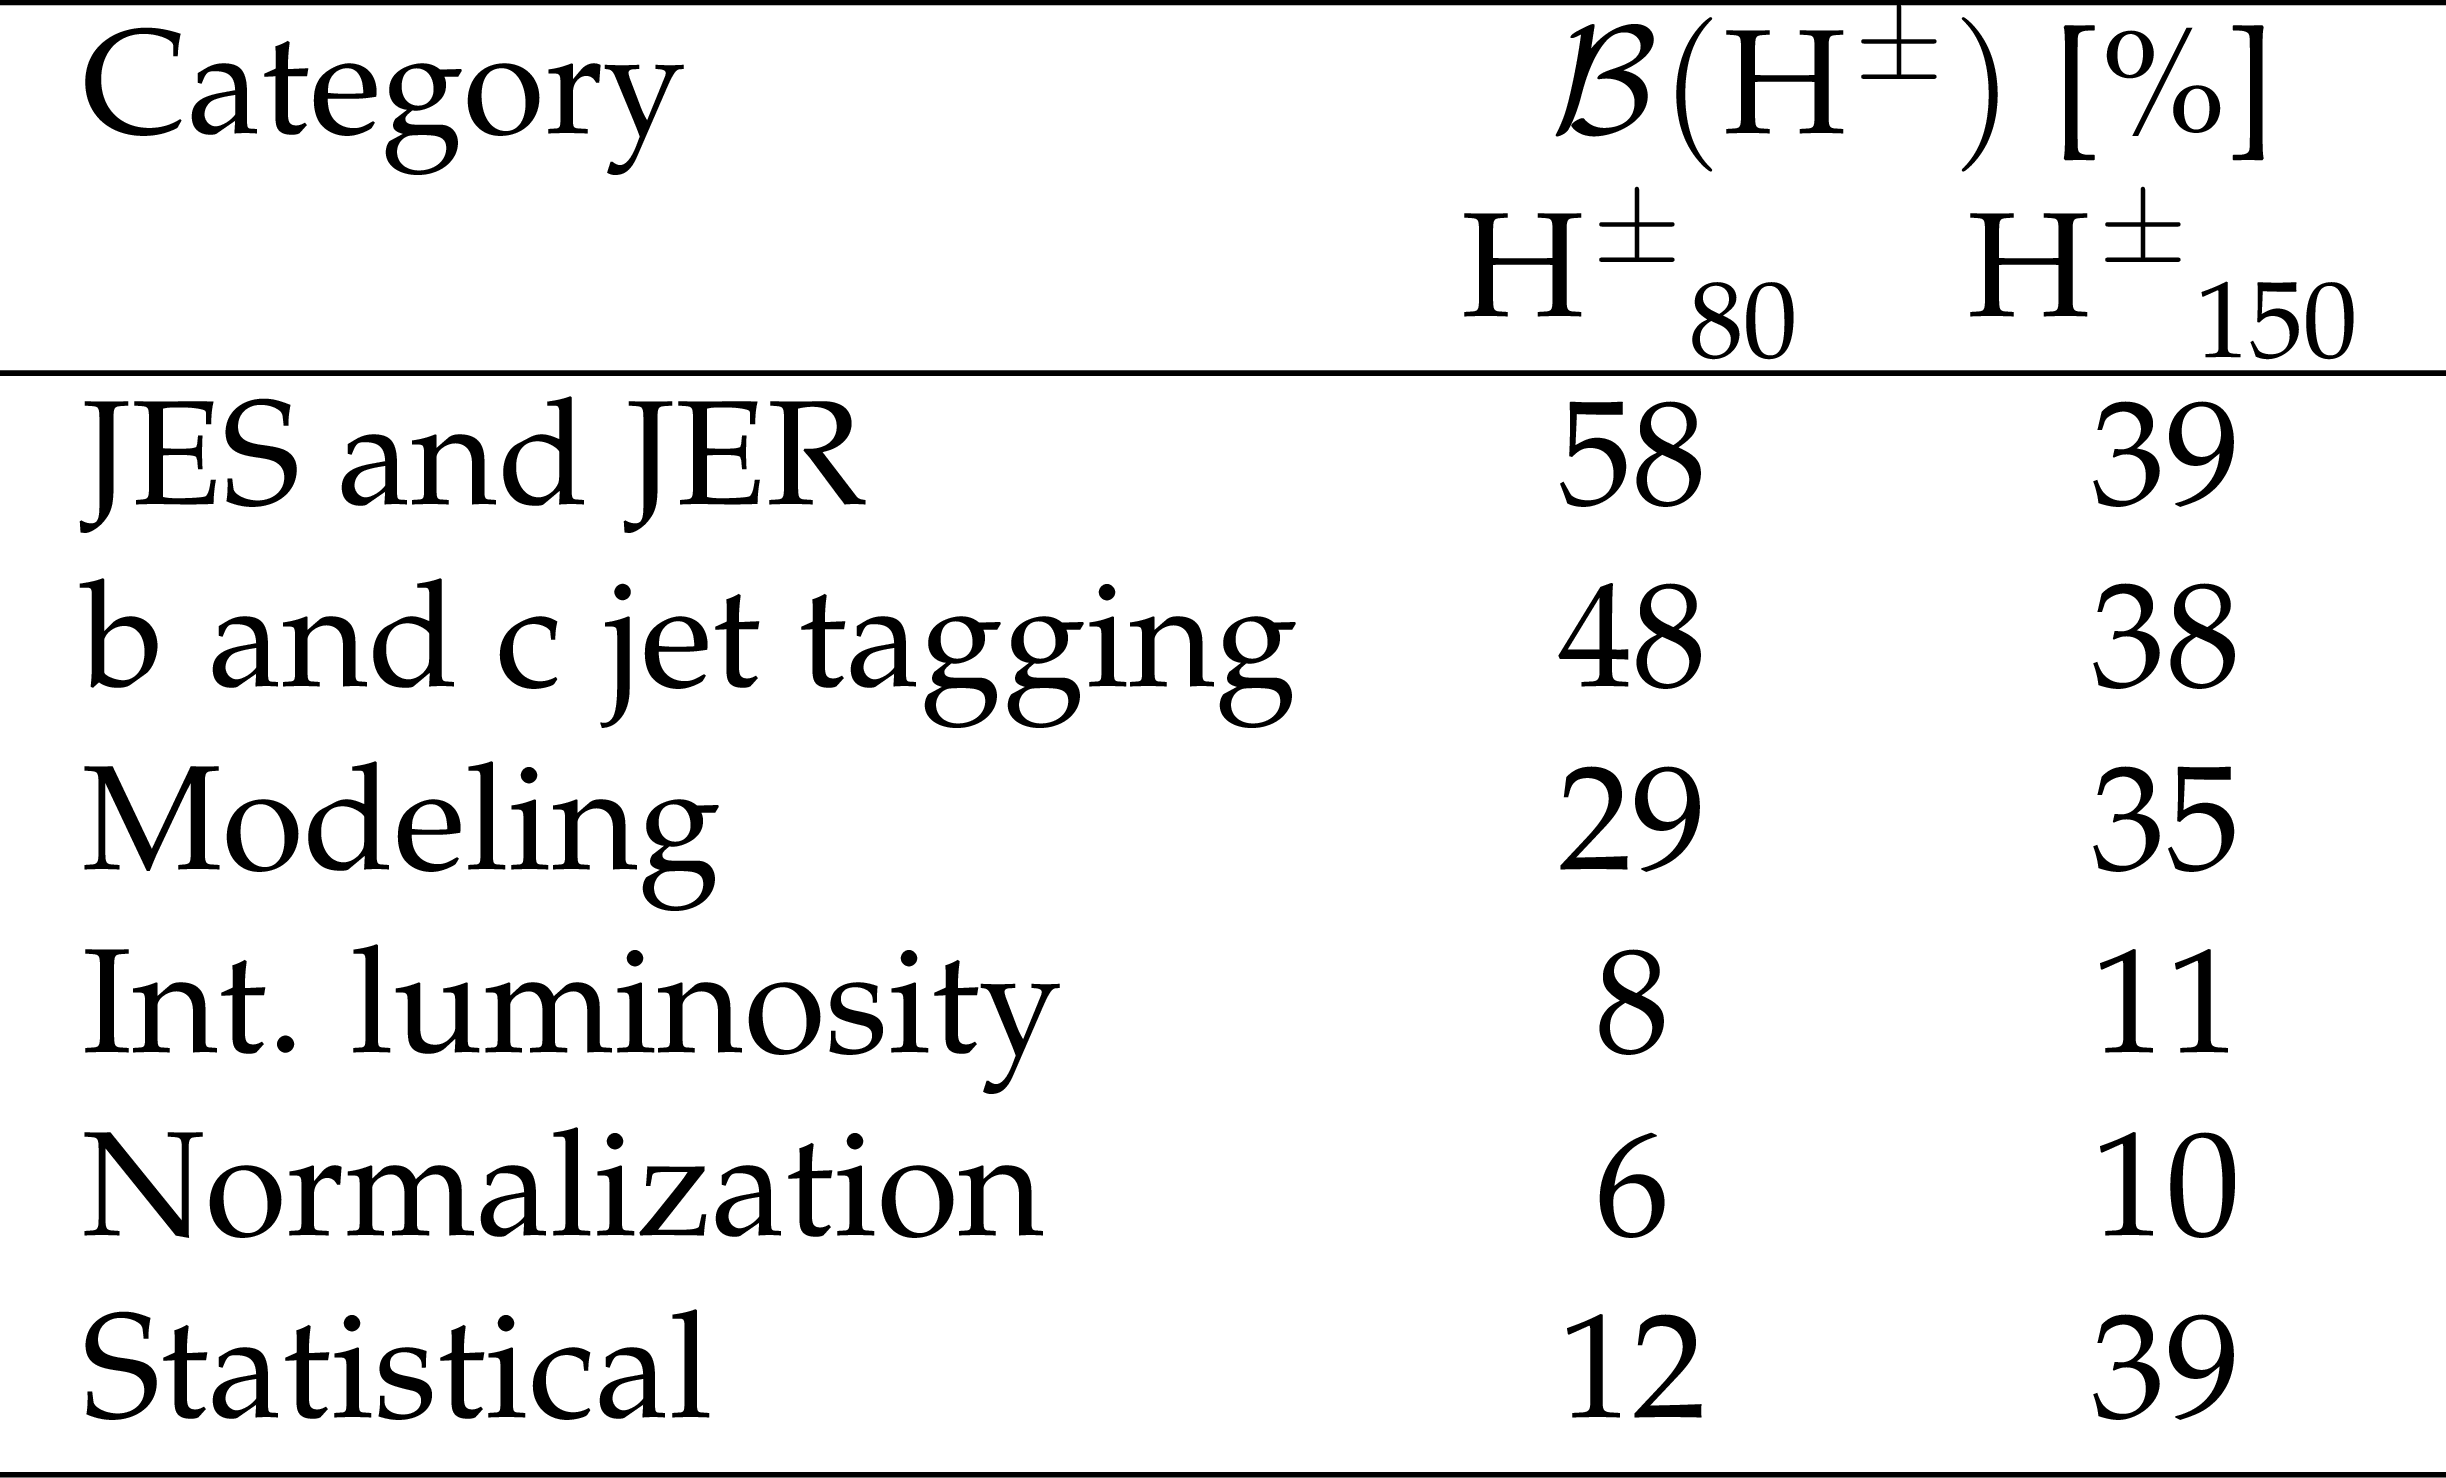
Table 3:
Breakdown of systematic and statistical uncertainties in the extracted $ \mathcal{B}_{\mathrm{{H}^{\pm}}} $ for two signal mass points. Each percentage represents the contribution of the corresponding nuisance parameter group relative to the total uncertainty when all sources are combined in quadrature. |
| Summary |
| A search has been presented for a light charged Higgs boson ($ \mathrm{{H}^{\pm}} $) produced in top quark decays in $ \mathrm{t} \overline{\mathrm{t}} $ events and decaying to charm and strange quarks using 2016--2018 data recorded by the CMS experiment at the LHC. Upper limits on $ \mathcal{B}(\mathrm{t} \to \mathrm{{H}^{\pm}} \mathrm{b}) $ are computed at the 95% confidence level, under the assumption of $ \mathcal{B}(\mathrm{{H}^{\pm}} \to \mathrm{c}\mathrm{s}) = 100% $, with the observed upper limit on $ \mathcal{B}(\mathrm{t} \to \mathrm{{H}^{\pm}} \mathrm{b}) $ below 1.1% for all assumed $ \mathrm{{H}^{\pm}} $ masses between 40 and 160 GeV. These are the first direct limits on charged Higgs bosons produced in top quark decays for masses between 40 and 50 GeV, and the most stringent limits to date in the 70--110 GeV range. |
| References | ||||
| 1 | ATLAS Collaboration | Observation of a new particle in the search for the standard model Higgs boson with the ATLAS detector at the LHC | PLB 716 (2012) 1 | 1207.7214 |
| 2 | CMS Collaboration | Observation of a new boson at a mass of 125 GeV with the CMS experiment at the LHC | PLB 716 (2012) 30 | CMS-HIG-12-028 1207.7235 |
| 3 | ATLAS and CMS Collaborations | Measurements of the Higgs boson production and decay rates and constraints on its couplings from a combined ATLAS and CMS analysis of the LHC pp collision data at $ \sqrt{s}= $ 7 and 8 TeV | JHEP 08 (2016) 045 | 1606.02266 |
| 4 | T. D. Lee | A Theory of Spontaneous T Violation | PRD 8 (1973) 1226 | |
| 5 | M. Aoki, S. Kanemura, K. Tsumura, and K. Yagyu | Models of Yukawa interaction in the two Higgs doublet model, and their collider phenomenology | PRD 80 (2009) 015017 | 0902.4665 |
| 6 | W. Altmannshofer et al. | Collider signatures of flavorful Higgs bosons | PRD 94 (2016) 115032 | 1610.02398 |
| 7 | LEP Working Group for Higgs boson searches, ALEPH, DELPHI, L3 and OPAL Collaborations | Search for the standard model Higgs boson at LEP | PLB 565 (2003) 61 | hep-ex/0306033 |
| 8 | ALEPH Collaboration | Search for charged Higgs bosons in $ \mathrm{e}^{+}\mathrm{e}^{-} $ collisions at energies up to $ \sqrt{s} = $ 209 GeV | PLB 543 (2002) 1 | hep-ex/0207054 |
| 9 | L3 Collaboration | Search for charged Higgs bosons at LEP | PLB 575 (2003) 208 | hep-ex/0309056 |
| 10 | DELPHI Collaboration | Search for charged Higgs bosons at LEP in general two Higgs doublet models | EPJC 34 (2004) 399 | hep-ex/0404012 |
| 11 | OPAL Collaboration | Search for charged Higgs bosons in $ \mathrm{e}^{+}\mathrm{e}^{-} $ collisions at $ \sqrt{s} = 189- $ 209 GeV | EPJC 72 (2012) 2076 | 0812.0267 |
| 12 | ALEPH, DELPHI, L3, and OPAL Collaborations and LEP working group on Higgs boson searches | Search for charged Higgs bosons: Combined results using LEP data | EPJC 73 (2013) 2463 | 1301.6065 |
| 13 | D0 Collaboration | Search for charged Higgs bosons in top quark decays | PLB 682 (2009) 278 | 0908.1811 |
| 14 | CDF Collaboration | Search for charged Higgs bosons in decays of top quarks in $ \mathrm{p}\overline{\mathrm{p}} $ collisions at $ \sqrt{s} = $ 1.96 TeV | PRL 103 (2009) 101803 | 0907.1269 |
| 15 | LHC Higgs Cross Section Working Group Collaboration | Handbook of LHC Higgs Cross Sections: 4. Deciphering the Nature of the Higgs Sector | link | 1610.07922 |
| 16 | ATLAS Collaboration | Search for a light charged Higgs boson in the decay channel $ \mathrm{H}^{+} \to \mathrm{c}\overline{\mathrm{s}} $ in $ \mathrm{t}\overline{\mathrm{t}} $ events using pp collisions at $ \sqrt{s} = 7 $ TeVwith the ATLAS detector | EPJC 73 (2013) 2465 | 1302.3694 |
| 17 | ATLAS Collaboration | Search for charged Higgs bosons decaying via $ H^{\pm} \rightarrow \tau^{\pm}\nu $ in fully hadronic final states using pp collision data at $ \sqrt{s} = $ 8 TeV with the ATLAS detector | JHEP 03 (2015) 088 | 1412.6663 |
| 18 | CMS Collaboration | Search for a light charged Higgs boson decaying to $ \mathrm{c}\overline{\mathrm{s}} $ in pp collisions at $ \sqrt{s}= $ 8 TeV | JHEP 12 (2015) 178 | CMS-HIG-13-035 1510.04252 |
| 19 | CMS Collaboration | Search for a light charged Higgs boson in the H$ ^\pm \to $ cs channel in proton-proton collisions at $ \sqrt{s} = $ 13 TeV | PRD 102 (2020) 072001 | CMS-HIG-18-021 2005.08900 |
| 20 | ATLAS Collaboration | Search for a light charged Higgs boson in $ \text{t} \to \text{H}^{\pm}\text{b} $ decays, with $ \text{H}^{\pm} \to \text{cs} $, in $ \text{pp} $ collisions at $ \sqrt{s} = $ 13 \textTeV with the ATLAS detector | EPJC 85 (2025) 112 | 2407.10096 |
| 21 | CMS Collaboration | HEPData record for this analysis | link | |
| 22 | CMS Collaboration | The CMS experiment at the CERN LHC | JINST 3 (2003) S08004 | 0803.2024 |
| 23 | CMS Collaboration | Development of the CMS detector for the CERN LHC Run 3 | JINST 19 (2024) P05064 | |
| 24 | CMS Collaboration | Performance of the CMS Level-1 trigger in proton-proton collisions at $ \sqrt{s} = $ 13 TeV | JINST 15 (2020) P10017 | CMS-TRG-17-001 2006.10165 |
| 25 | CMS Collaboration | The CMS trigger system | JINST 12 (2017) P01020 | CMS-TRG-12-001 1609.02366 |
| 26 | CMS Collaboration | Performance of the CMS high-level trigger during LHC Run 2 | JINST 19 (2024) P11021 | CMS-TRG-19-001 2410.17038 |
| 27 | CMS Collaboration | Electron and photon reconstruction and identification with the CMS experiment at the CERN LHC | JINST 16 (2021) P05014 | CMS-EGM-17-001 2012.06888 |
| 28 | CMS Collaboration | Performance of the CMS muon detector and muon reconstruction with proton-proton collisions at $ \sqrt{s}= $ 13 TeV | JINST 13 (2018) P06015 | CMS-MUO-16-001 1804.04528 |
| 29 | CMS Collaboration | Description and performance of track and primary-vertex reconstruction with the CMS tracker | JINST 9 (2014) P10009 | CMS-TRK-11-001 1405.6569 |
| 30 | J. Alwall et al. | The automated computation of tree-level and next-to-leading order differential cross sections, and their matching to parton shower simulations | JHEP 07 (2014) 079 | 1405.0301 |
| 31 | Particle Data Group Collaboration | Review of Particle Physics | PTEP 2024 (2024) 083C01 | |
| 32 | S. Frixione, P. Nason, and C. Oleari | Matching NLO QCD computations with parton shower simulations: the POWHEG method | JHEP 11 (2007) 070 | 0709.2092 |
| 33 | S. Alioli, P. Nason, C. Oleari, and E. Re | A general framework for implementing NLO calculations in shower Monte Carlo programs: the POWHEG BOX | JHEP 06 (2010) 043 | 1002.2581 |
| 34 | P. Nason | A new method for combining NLO QCD with shower Monte Carlo algorithms | JHEP 11 (2004) 040 | hep-ph/0409146 |
| 35 | CMS Collaboration | Measurement of the inclusive and differential $ {\mathrm{t}\overline{\mathrm{t}}} \gamma $ cross sections in the single-lepton channel and EFT interpretation at $ \sqrt{s}= $ 13 TeV | JHEP 12 (2021) 180 | CMS-TOP-18-010 2107.01508 |
| 36 | T. Sjöstrand et al. | An introduction to PYTHIA 8.2 | Comput. Phys. Commun. 191 (2015) 159 | 1410.3012 |
| 37 | CMS Collaboration | Extraction and validation of a new set of CMS PYTHIA8 tunes from underlying-event measurements | EPJC 80 (2020) 4 | CMS-GEN-17-001 1903.12179 |
| 38 | M. L. Mangano, M. Moretti, F. Piccinini, and M. Treccani | Matching matrix elements and shower evolution for top-quark production in hadronic collisions | JHEP 01 (2007) 013 | hep-ph/0611129 |
| 39 | R. Frederix and S. Frixione | Merging meets matching in MC@NLO | JHEP 12 (2012) 061 | 1209.6215 |
| 40 | NNPDF Collaboration | Parton distributions from high-precision collider data | EPJC 77 (2017) 663 | 1706.00428 |
| 41 | GEANT4 Collaboration | GEANT4—a simulation toolkit | NIM A 506 (2003) 250 | |
| 42 | CMS Collaboration | Measurement of the inelastic proton-proton cross section at $ \sqrt{s}= $ 13 TeV | JHEP 07 (2018) 161 | CMS-FSQ-15-005 1802.02613 |
| 43 | CMS Collaboration | Technical proposal for the Phase-II upgrade of the Compact Muon Solenoid | CMS Technical Proposal CERN-LHCC-2015-010, CMS-TDR-15-02, 2015 CDS |
|
| 44 | CMS Collaboration | Particle-flow reconstruction and global event description with the CMS detector | JINST 12 (2017) P10003 | CMS-PRF-14-001 1706.04965 |
| 45 | W. Adam, R. Fr \"u hwirth, A. Strandlie, and T. Todorov | Reconstruction of Electrons with the Gaussian-Sum Filter in the CMS Tracker at the LHC | JPG 31 (2005) N9 | physics/0301087 |
| 46 | M. Cacciari, G. P. Salam, and G. Soyez | The anti-$ k_{\mathrm{T}} $ jet clustering algorithm | JHEP 04 (2008) 063 | 0802.1189 |
| 47 | M. Cacciari, G. P. Salam, and G. Soyez | FastJet user manual | EPJC 72 (2012) 1896 | 1111.6097 |
| 48 | CMS Collaboration | Pileup mitigation at CMS in 13 TeV data | JINST 15 (2020) P09018 | CMS-JME-18-001 2003.00503 |
| 49 | CMS Collaboration | Jet energy scale and resolution in the CMS experiment in pp collisions at 8 TeV | JINST 12 (2017) P02014 | CMS-JME-13-004 1607.03663 |
| 50 | CMS Collaboration | Performance of missing transverse momentum reconstruction in proton-proton collisions at $ \sqrt{s} = $ 13 TeV using the CMS detector | JINST 14 (2019) P07004 | CMS-JME-17-001 1903.06078 |
| 51 | E. Bols et al. | Jet flavour classification using DeepJet | JINST 15 (2020) P12012 | 2008.10519 |
| 52 | CMS Collaboration | A new calibration method for charm jet identification validated with proton-proton collision events at $ \sqrt{s} = $ 13 TeV | JINST 17 (2022) P03014 | CMS-BTV-20-001 2111.03027 |
| 53 | CMS Collaboration | Muon Reconstruction and Identification Performance with Run-2 data | CMS Detector Performance Summary CMS-DP-2020-040, 2020 CDS |
|
| 54 | CMS Collaboration | The CMS statistical analysis and combination tool: COMBINE | Comput. Softw. Big Sci. 8 (2024) 19 | CMS-CAT-23-001 2404.06614 |
| 55 | BaBar Collaboration | Measurement of the inclusive charmless semileptonic branching ratio of $ B $ mesons and determination of $ |V_{ub}| $ | PRL 92 (2004) 071802 | hep-ex/0307062 |
| 56 | BaBar Collaboration | Determination of the branching fraction for $ B \to X_{\mathrm{c}} \ell \nu $ decays and of $ |V_{cb}| $ from hadronic mass and lepton energy moments | PRL 93 (2004) 011803 | hep-ex/0404017 |
| 57 | J. D'Hondt et al. | Fitting of event topologies with external kinematic constraints in CMS | CMS Note 200 (2006) 6 | |
| 58 | F. Pedregosa et al. | Scikit-learn: Machine Learning in Python | J. Machine Learning Res. 12 (2011) 2825 | 1201.0490 |
| 59 | R. Kohavi | A Study of Cross-Validation and Bootstrap for Accuracy Estimation and Model Selection | in the International Joint Conference on Artificial Intelligence, 1995 Proceedings of the 1 (1995) 1137 |
|
| 60 | CMS Collaboration | Precision luminosity measurement in proton-proton collisions at $ \sqrt{s} = $ 13 TeV in 2015 and 2016 at CMS | EPJC 81 (2021) 800 | CMS-LUM-17-003 2104.01927 |
| 61 | CMS Collaboration | CMS luminosity measurement for the 2017 data-taking period at $ \sqrt{s} = $ 13 TeV | CMS Physics Analysis Summary, 2018 link |
CMS-PAS-LUM-17-004 |
| 62 | CMS Collaboration | CMS luminosity measurement for the 2018 data-taking period at $ \sqrt{s} = $ 13 TeV | CMS Physics Analysis Summary, 2019 link |
CMS-PAS-LUM-18-002 |
| 63 | J. Butterworth et al. | PDF4LHC recommendations for LHC Run II | JPG 43 (2016) 023001 | 1510.03865 |
| 64 | P. Skands, S. Carrazza, and J. Rojo | Tuning PYTHIA 8.1: the Monash 2013 Tune | EPJC 74 (2014) 3024 | 1404.5630 |
| 65 | CMS Collaboration | Investigations of the impact of the parton shower tuning in PYTHIA 8 in the modelling of \ensuremath\mathrmt\overline\mathrmt at $ \sqrt{s} = $ 8 and 13 $ \text{TeV} $ | CMS Physics Analysis Summary, 2016 CMS-PAS-TOP-16-021 |
CMS-PAS-TOP-16-021 |
| 66 | R. J. Barlow and C. Beeston | Fitting using finite Monte Carlo samples | Comput. Phys. Commun. 77 (1993) 219 | |
| 67 | T. Junk | Confidence level computation for combining searches with small statistics | NIM A 434 (1999) 435 | hep-ex/9902006 |
| 68 | A. L. Read | Presentation of search results: The $ \textit{CL}_{\text{s}} $ technique | JPG 28 (2002) 2693 | |
| 69 | G. Cowan, K. Cranmer, E. Gross, and O. Vitells | Asymptotic formulae for likelihood-based tests of new physics | EPJC 71 (2011) 1554 | 1007.1727 |
| 70 | ATLAS and CMS Collaborations | Procedure for the LHC Higgs boson search combination in Summer 2011 | Technical Report ATL-PHYS-PUB-2011-011, /005, 2011 CMS NOTE 201 (2011) 1 |
|
| 71 | J. S. Conway | Incorporating Nuisance Parameters in Likelihoods for Multisource Spectra | Proceedings of the PHYSTAT 2011 (2011) 115 | 1103.0354 |
|
|
Compact Muon Solenoid LHC, CERN |
|

|

|

|

|

|