

Compact Muon Solenoid
LHC, CERN
| CMS-HIG-18-021 ; CERN-EP-2020-057 | ||
| Search for a light charged Higgs boson in the $ \mathrm{H}^{\pm} \to \mathrm{c}\mathrm{s}$ channel in proton-proton collisions at $\sqrt{s} = $ 13 TeV | ||
| CMS Collaboration | ||
| 18 May 2020 | ||
| Phys. Rev. D 102 (2020) 072001 | ||
| Abstract: A search is conducted for a low-mass charged Higgs boson produced in a top quark decay and subsequently decaying into a charm and a strange quark. The data sample was recorded in proton-proton collisions at $\sqrt{s} = $ 13 TeV by the CMS experiment at the LHC and corresponds to an integrated luminosity of 35.9 fb$^{-1}$. The search is performed in the process of top quark pair production, where one top quark decays to a bottom quark and a charged Higgs boson, and the other to a bottom quark and a W boson. With the W boson decaying to a charged lepton (electron or muon) and a neutrino, the final state comprises an isolated lepton, missing transverse momentum, and at least four jets, of which two are tagged as b jets. To enhance the search sensitivity, one of the jets originating from the charged Higgs boson is required to satisfy a charm tagging selection. No significant excess beyond standard model predictions is found in the dijet invariant mass distribution. An upper limit in the range 1.68-0.25% is set on the branching fraction of the top quark decay to the charged Higgs boson and bottom quark for a charged Higgs boson mass between 80 and 160 GeV. | ||
| Links: e-print arXiv:2005.08900 [hep-ex] (PDF) ; CDS record ; inSPIRE record ; HepData record ; CADI line (restricted) ; | ||
| Figures | |
png pdf |
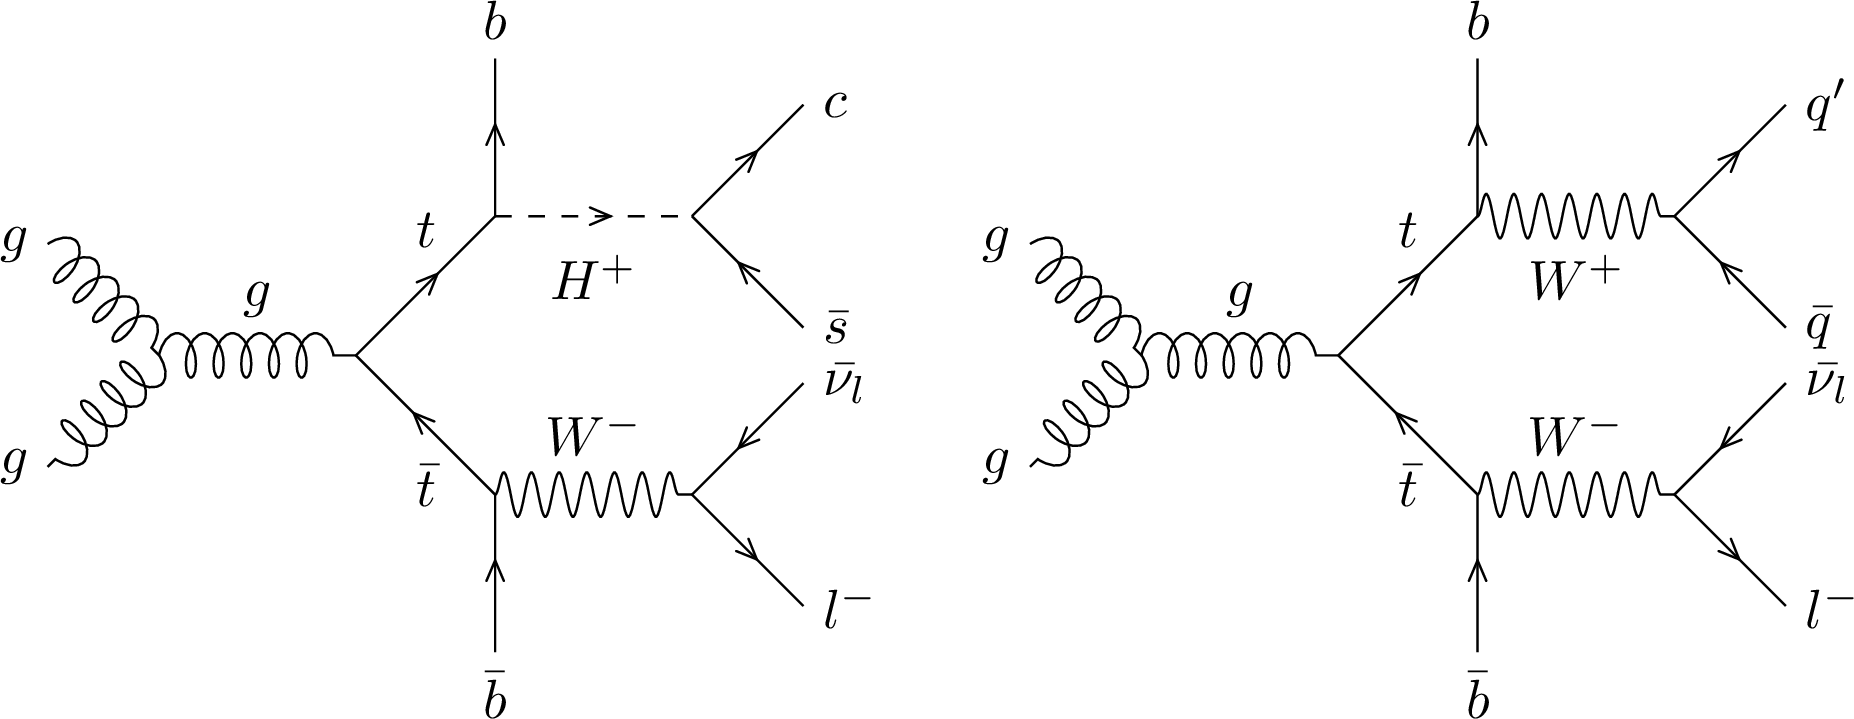
Figure 1:
Sample diagrams of ${\mathrm{t} \mathrm{\bar{t}}}$ production via gluon-gluon scattering. The left plot shows the signal process in which the ${\mathrm{t} \mathrm{\bar{t}}}$ pair decay products include a charged Higgs boson. The right plot shows the SM decay of a ${\mathrm{t} \mathrm{\bar{t}}}$ pair in the semileptonic decay channel. |
png pdf |
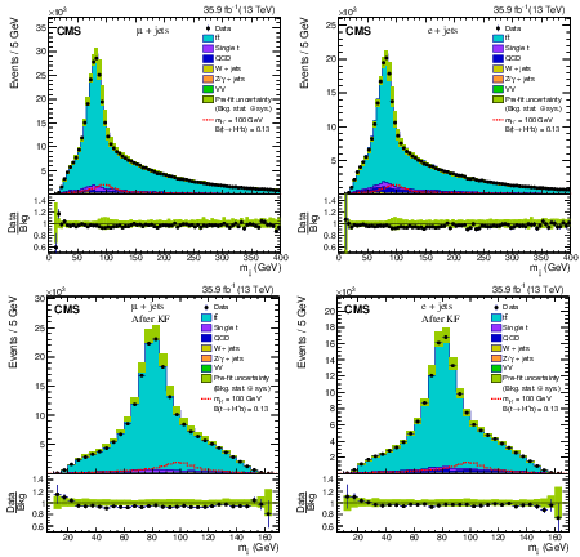
Figure 2:
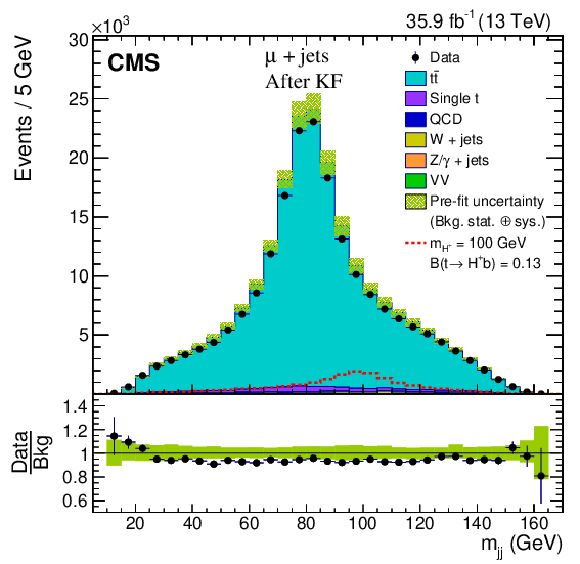
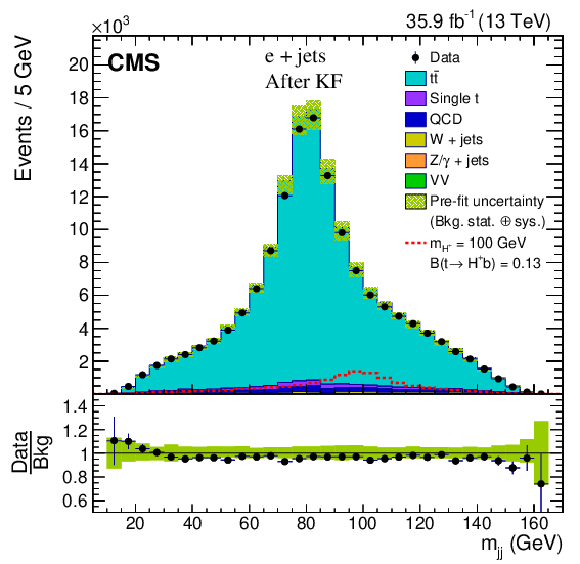
Distributions of ${m_\text {jj}}$, prior to the fit to data, of the two highest ${p_{\mathrm {T}}}$ non-b jets for the muon+jets channel (left column) and the electron+jets channel (right column). The two distributions in the upper row are obtained using reconstructed jets. The distributions in the lower row are calculated using jets after the kinematic fit. The uncertainty band (showing the absolute uncertainty in the upper panels, and the relative uncertainty in the lower panels) includes both statistical and systematic components. The signal events are scaled by twice the maximum observed upper limit on ${\mathcal {B}(\mathrm{t} \to \mathrm{H}^{+} \mathrm{b})}$ obtained at 8 TeV [23]. |
png pdf |
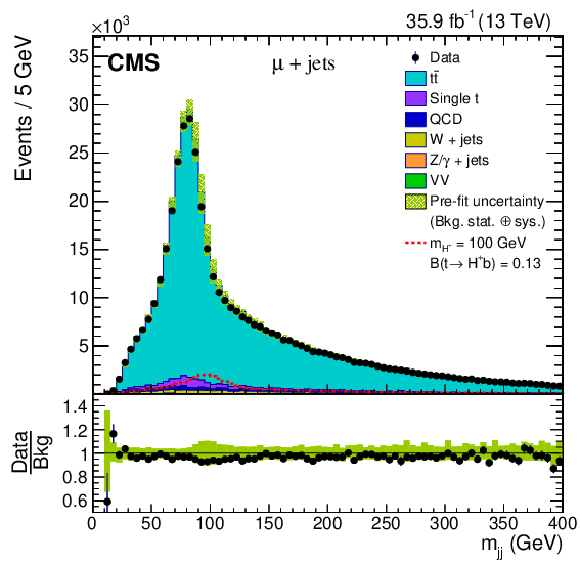
Figure 2-a:
Distributions of ${m_\text {jj}}$, prior to the fit to data, of the two highest ${p_{\mathrm {T}}}$ non-b jets for the muon+jets channel. The distribution is obtained using reconstructed jets. The uncertainty band (showing the absolute uncertainty in the upper panel, and the relative uncertainty in the lower panel) includes both statistical and systematic components. The signal events are scaled by twice the maximum observed upper limit on ${\mathcal {B}(\mathrm{t} \to \mathrm{H}^{+} \mathrm{b})}$ obtained at 8 TeV [23]. |
png pdf |
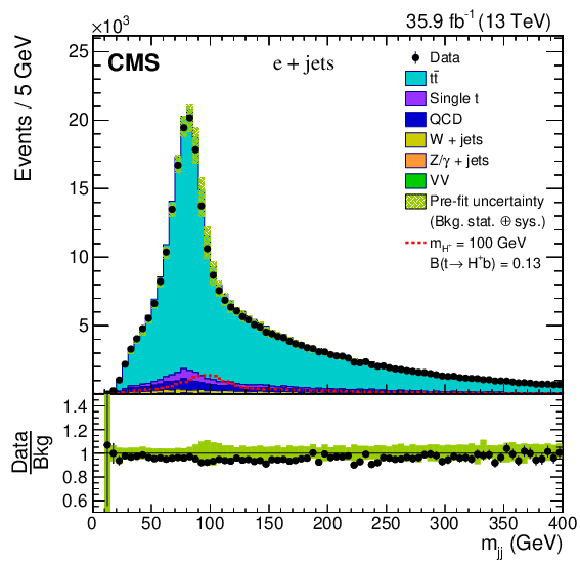
Figure 2-b:
Distributions of ${m_\text {jj}}$, prior to the fit to data, of the two highest ${p_{\mathrm {T}}}$ non-b jets for the electron+jets channel. The distribution is obtained using reconstructed jets. The uncertainty band (showing the absolute uncertainty in the upper panel, and the relative uncertainty in the lower panel) includes both statistical and systematic components. The signal events are scaled by twice the maximum observed upper limit on ${\mathcal {B}(\mathrm{t} \to \mathrm{H}^{+} \mathrm{b})}$ obtained at 8 TeV [23]. |
png pdf |
Figure 2-c:
Distributions of ${m_\text {jj}}$, prior to the fit to data, of the two highest ${p_{\mathrm {T}}}$ non-b jets for the muon+jets channel. The distribution is calculated using jets after the kinematic fit. The uncertainty band (showing the absolute uncertainty in the upper panel, and the relative uncertainty in the lower panel) includes both statistical and systematic components. The signal events are scaled by twice the maximum observed upper limit on ${\mathcal {B}(\mathrm{t} \to \mathrm{H}^{+} \mathrm{b})}$ obtained at 8 TeV [23]. |
png pdf |
Figure 2-d:
Distributions of ${m_\text {jj}}$, prior to the fit to data, of the two highest ${p_{\mathrm {T}}}$ non-b jets for the electron+jets channel. The distribution is calculated using jets after the kinematic fit. The uncertainty band (showing the absolute uncertainty in the upper panel, and the relative uncertainty in the lower panel) includes both statistical and systematic components. The signal events are scaled by twice the maximum observed upper limit on ${\mathcal {B}(\mathrm{t} \to \mathrm{H}^{+} \mathrm{b})}$ obtained at 8 TeV [23]. |
png pdf |
Figure 3:
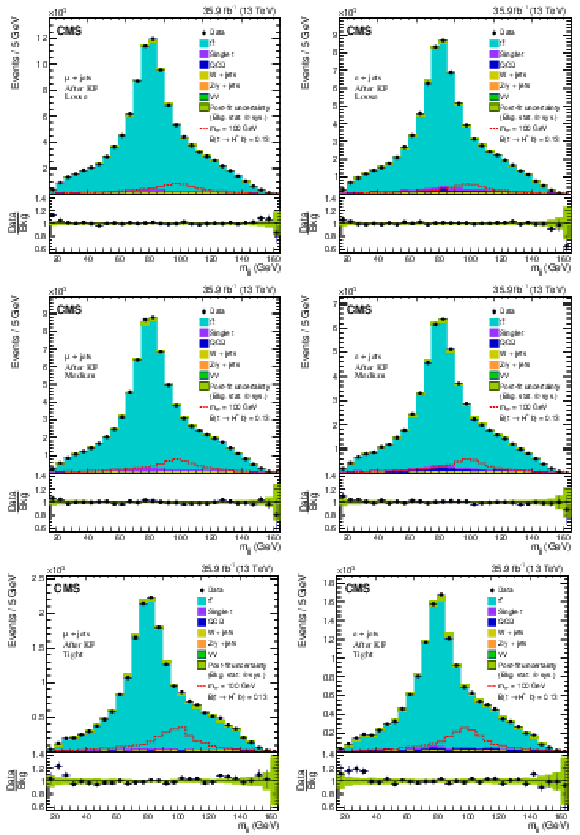
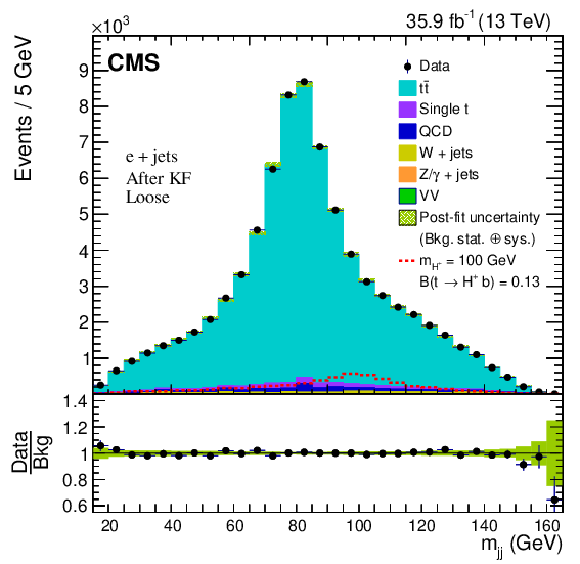
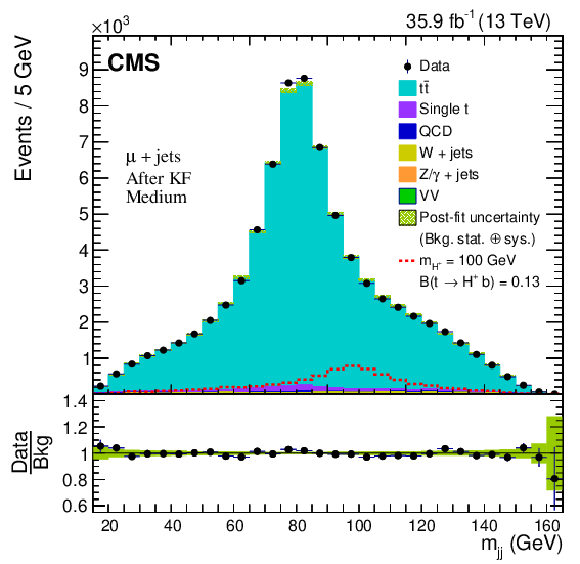
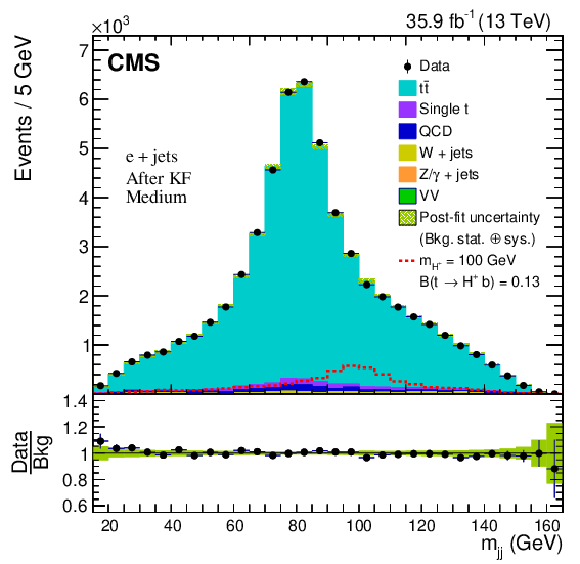
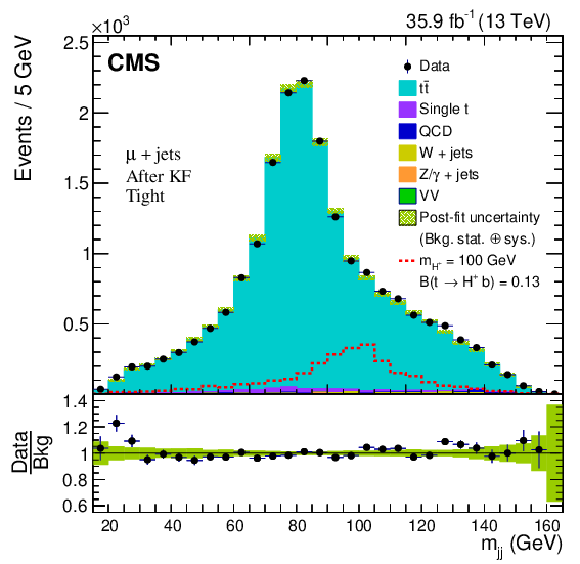
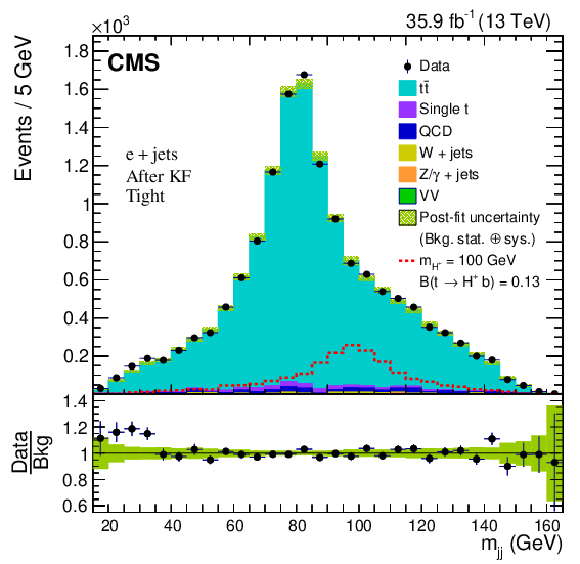
Distributions of ${m_\text {jj}}$, after a background-only fit to the data, in the exclusive charm tagging categories for the muon+jets (left column) and electron+jets (right column) channels. The upper row shows the exclusive loose category, the middle row shows the exclusive medium category, and the lower row shows the exclusive tight category. The expected signal significance (prior to the fit) can be observed to vary across the different categories. The uncertainty band (showing the absolute uncertainty in the upper panels, and the relative uncertainty in the lower panels) includes both statistical and systematic components after the background-only fit. The signal distributions are scaled by twice the maximum observed upper limit on ${\mathcal {B}(\mathrm{t} \to \mathrm{H}^{+} \mathrm{b})}$ obtained at 8 TeV [23]. |
png pdf |
Figure 3-a:
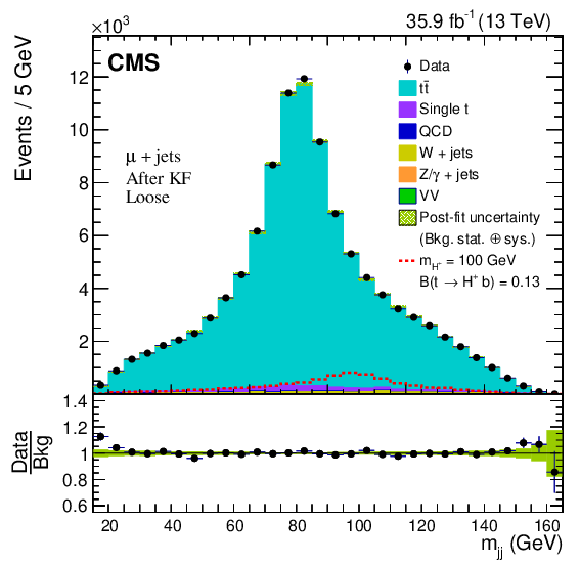
Distribution of ${m_\text {jj}}$, after a background-only fit to the data, for the muon+jets channel in the exclusive loose charm tagging category. The expected signal significance (prior to the fit) can be observed to vary across the different categories. The uncertainty band (showing the absolute uncertainty in the upper panels, and the relative uncertainty in the lower panels) includes both statistical and systematic components after the background-only fit. The signal distributions are scaled by twice the maximum observed upper limit on ${\mathcal {B}(\mathrm{t} \to \mathrm{H}^{+} \mathrm{b})}$ obtained at 8 TeV [23]. |
png pdf |
Figure 3-b:
Distribution of ${m_\text {jj}}$, after a background-only fit to the data, for the electron+jets channel in the exclusive loose charm tagging category. The expected signal significance (prior to the fit) can be observed to vary across the different categories. The uncertainty band (showing the absolute uncertainty in the upper panels, and the relative uncertainty in the lower panels) includes both statistical and systematic components after the background-only fit. The signal distributions are scaled by twice the maximum observed upper limit on ${\mathcal {B}(\mathrm{t} \to \mathrm{H}^{+} \mathrm{b})}$ obtained at 8 TeV [23]. |
png pdf |
Figure 3-c:
Distribution of ${m_\text {jj}}$, after a background-only fit to the data, for the muon+jets channel in the exclusive medium charm tagging category. The expected signal significance (prior to the fit) can be observed to vary across the different categories. The uncertainty band (showing the absolute uncertainty in the upper panels, and the relative uncertainty in the lower panels) includes both statistical and systematic components after the background-only fit. The signal distributions are scaled by twice the maximum observed upper limit on ${\mathcal {B}(\mathrm{t} \to \mathrm{H}^{+} \mathrm{b})}$ obtained at 8 TeV [23]. |
png pdf |
Figure 3-d:
Distribution of ${m_\text {jj}}$, after a background-only fit to the data, for the electron+jets channel in the exclusive medium charm tagging category. The expected signal significance (prior to the fit) can be observed to vary across the different categories. The uncertainty band (showing the absolute uncertainty in the upper panels, and the relative uncertainty in the lower panels) includes both statistical and systematic components after the background-only fit. The signal distributions are scaled by twice the maximum observed upper limit on ${\mathcal {B}(\mathrm{t} \to \mathrm{H}^{+} \mathrm{b})}$ obtained at 8 TeV [23]. |
png pdf |
Figure 3-e:
Distribution of ${m_\text {jj}}$, after a background-only fit to the data, for the muon+jets channel in the exclusive tight charm tagging category. The expected signal significance (prior to the fit) can be observed to vary across the different categories. The uncertainty band (showing the absolute uncertainty in the upper panels, and the relative uncertainty in the lower panels) includes both statistical and systematic components after the background-only fit. The signal distributions are scaled by twice the maximum observed upper limit on ${\mathcal {B}(\mathrm{t} \to \mathrm{H}^{+} \mathrm{b})}$ obtained at 8 TeV [23]. |
png pdf |
Figure 3-f:
Distribution of ${m_\text {jj}}$, after a background-only fit to the data, for the electron+jets channel in the exclusive tight charm tagging category. The expected signal significance (prior to the fit) can be observed to vary across the different categories. The uncertainty band (showing the absolute uncertainty in the upper panels, and the relative uncertainty in the lower panels) includes both statistical and systematic components after the background-only fit. The signal distributions are scaled by twice the maximum observed upper limit on ${\mathcal {B}(\mathrm{t} \to \mathrm{H}^{+} \mathrm{b})}$ obtained at 8 TeV [23]. |
png pdf |
Figure 4:
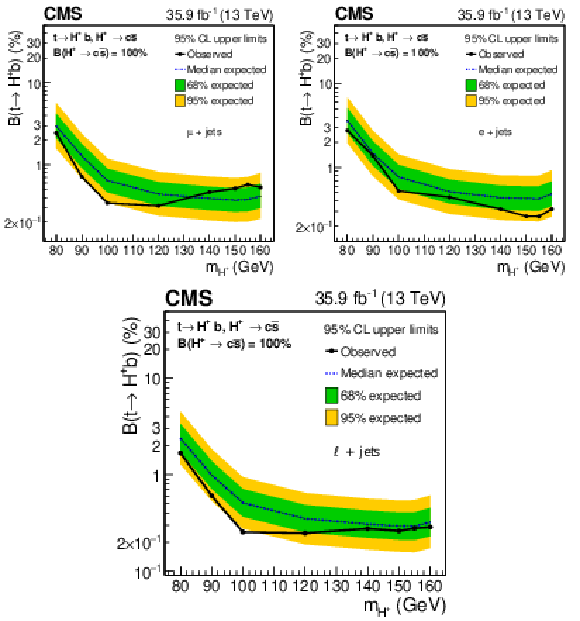
The expected and observed upper limit in % on ${\mathcal {B}(\mathrm{t} \to \mathrm{H}^{+} \mathrm{b})}$ as a function of $ {m_{\mathrm{H}^{+}}} $ using ${m_\text {jj}}$ after the individual charm tagging categories have been combined, for the muon+jets (upper left) and electron+jets (upper right) channels, and their combination (lower). |
png pdf |
Figure 4-a:
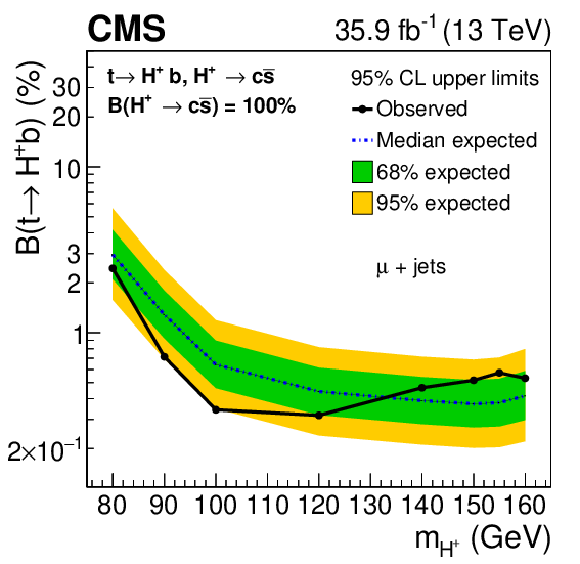
The expected and observed upper limit in % on ${\mathcal {B}(\mathrm{t} \to \mathrm{H}^{+} \mathrm{b})}$ as a function of $ {m_{\mathrm{H}^{+}}} $ using ${m_\text {jj}}$ after the individual charm tagging categories have been combined, for the muon+jets channel. |
png pdf |
Figure 4-b:
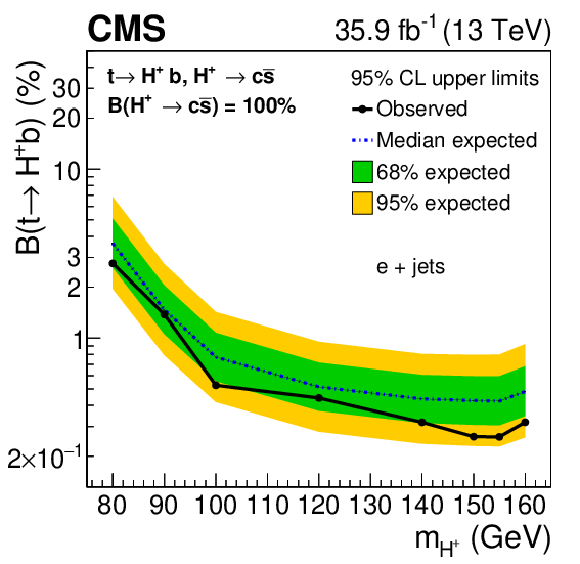
The expected and observed upper limit in % on ${\mathcal {B}(\mathrm{t} \to \mathrm{H}^{+} \mathrm{b})}$ as a function of $ {m_{\mathrm{H}^{+}}} $ using ${m_\text {jj}}$ after the individual charm tagging categories have been combined, for the electron+jets channel. |

png pdf |
Figure 4-c:
The expected and observed upper limit in % on ${\mathcal {B}(\mathrm{t} \to \mathrm{H}^{+} \mathrm{b})}$ as a function of $ {m_{\mathrm{H}^{+}}} $ using ${m_\text {jj}}$ after the individual charm tagging categories have been combined, for the combination of muon+jets and electron+jets channels. |
| Tables | |

png pdf |
Table 1:
The efficiency of the c jet tagger to tag a jet from a c quark ($\epsilon ^{\mathrm{c}}$), a b quark ($\epsilon ^{\mathrm{b}}$), or light flavor ($\epsilon ^{\mathrm{u} \mathrm{d} \mathrm{s} \mathrm{g}}$) at different working points, as determined from simulation [54]. |

png pdf |
Table 2:
Expected event yields for different signal mass scenarios and backgrounds in each of the channels and event categories. The number of events is shown along with its uncertainty, including statistical and systematic effects. The yields of the background processes are obtained after a background-only fit to the data. The total uncertainty in the background process is calculated by taking into account all the positive as well as negative correlations among the fit parameters. The signal event yields are scaled by twice the maximum observed upper limit on ${\mathcal {B}(\mathrm{t} \to \mathrm{H}^{+} \mathrm{b})}$ obtained at 8 TeV [23]. |

png pdf |
Table 3:
Systematic and statistical uncertainties in the event yield for the different processes in %, prior to the fit to data, for the exclusive charm categories in the muon (electron) channel. The "---'' indicates that the corresponding uncertainties are either not considered for the given process, or too small to be measured. |

png pdf |
Table 4:
Expected and observed 95% CL exclusion limits in % on ${\mathcal {B}(\mathrm{t} \to \mathrm{H}^{+} \mathrm{b})}$ in the muon+jets (electron+jets) channel, after the individual charm tagging categories have been combined. |
png pdf |
Table 5:
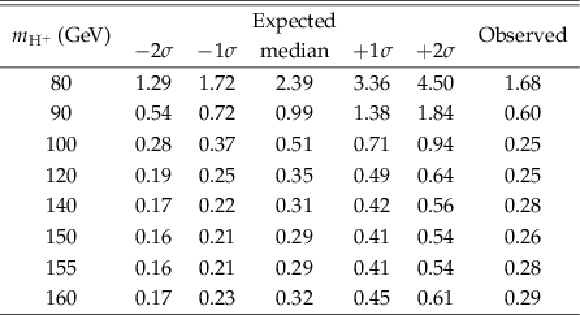
Expected and observed 95% CL exclusion limits in % on ${\mathcal {B}(\mathrm{t} \to \mathrm{H}^{+} \mathrm{b})}$, after the individual charm tagging categories and the muon and electron channels have been combined. |
| Summary |
| A search for a light charged Higgs boson produced by top quark decay has been performed in the muon+jets and electron+jets channels at $\sqrt{s} = $ 13 TeV, using a data sample corresponding to an integrated luminosity of 35.9 fb$^{-1}$. The observed and predicted number of events from standard model processes are in agreement within the uncertainties. An exclusion limit at 95% confidence level on the branching fraction ${\mathcal{B}(\mathrm{t} \to \mathrm{H}^{+}\mathrm{b})}$ has been computed by assuming ${\mathcal{B}(\mathrm{H}^{+} \to \mathrm{c}\mathrm{\bar{s}})} = $ 100%. The observed exclusion limits are in the range, for a charged Higgs boson mass between 80 and 160 GeV, 2.44-0.32, 2.77-0.26, and 1.68-0.25% for the muon+jets, electron+jets, and the combination of the two channels, respectively. These are the first results from the LHC at $\sqrt{s} = $ 13 TeV for the above final states, and represent an improvement by a factor of approximately 4 over the previous results at $\sqrt{s} = $ 8 TeV. |
| References | ||||
| 1 | ATLAS Collaboration | Observation of a new particle in the search for the standard model Higgs boson with the ATLAS detector at the LHC | PLB 716 (2012) 1 | 1207.7214 |
| 2 | CMS Collaboration | Observation of a new boson at a mass of 125 GeV with the CMS experiment at the LHC | PLB 716 (2012) 30 | CMS-HIG-12-028 1207.7235 |
| 3 | CMS Collaboration | Observation of a new boson with mass near 125 GeV in pp collisions at $ \sqrt{s} = $ 7 and 8 TeV | JHEP 06 (2013) 081 | CMS-HIG-12-036 1303.4571 |
| 4 | G. C. Branco et al. | Theory and phenomenology of two-Higgs-doublet models | PR 516 (2012) 1 | 1106.0034 |
| 5 | S. P. Martin | A supersymmetry primer | in Perspectives on Supersymmetry, p. 1 1997 | hep-ph/9709356 |
| 6 | \relax Yu. A. Golfand and E. P. Likhtman | Extension of the algebra of Poincaré group generators and violation of P invariance | JEPTL 13 (1971) 323 | |
| 7 | J. Wess and B. Zumino | Supergauge transformations in four dimensions | NP 70 (1974) 39 | |
| 8 | Planck Collaboration | Planck 2013 results. XVI. Cosmological parameters | Astron. Astrophys. 571 (2014) A16 | 1303.5076 |
| 9 | Planck Collaboration | Planck 2013 results. I. Overview of products and scientific results | Astron. Astrophys. 571 (2014) A1 | 1303.5062 |
| 10 | N. Arkani-Hamed, S. Dimopoulos, and G. R. Dvali | The hierarchy problem and new dimensions at a millimeter | PLB 429 (1998) 263 | hep-ph/9803315 |
| 11 | M. Aoki, S. Kanemura, K. Tsumura, and K. Yagyu | Models of Yukawa interaction in the two Higgs doublet model, and their collider phenomenology | PRD 80 (2009) 015017 | 0902.4665 |
| 12 | E. Ma, D. P. Roy, and J. Wudka | Enhanced three-body decay of the charged Higgs boson | PRL 80 (1998) 1162 | hep-ph/9710447 |
| 13 | L3 Collaboration | Search for charged Higgs bosons at LEP | PLB 575 (2003) 208 | hep-ex/0309056 |
| 14 | ALEPH Collaboration | Search for charged Higgs bosons in $ e^{+} e^{-} $ collisions at energies up to $ \sqrt{s} = $ 209 GeV | PLB 543 (2002) 1 | hep-ex/0207054 |
| 15 | DELPHI Collaboration | Search for charged Higgs bosons at LEP in general two Higgs doublet models | EPJC 34 (2004) 399 | hep-ex/0404012 |
| 16 | ALEPH, DELPHI, L3, and OPAL Collaborations and LEP working group on Higgs boson searches | Search for charged Higgs bosons: Combined results using LEP data | EPJC 73 (2013) 2463 | 1301.6065 |
| 17 | OPAL Collaboration | Search for charged Higgs bosons in $ e^+e^- $ collisions at $ \sqrt{s} = $ 189-209 GeV | EPJC 72 (2012) 2076 | 0812.0267 |
| 18 | CDF Collaboration | Search for charged Higgs bosons in decays of top quarks in $ {\mathrm{p}}\mathrm{\bar{p}} $ collisions at $ \sqrt{s} = $ 1.96 TeV | PRL 103 (2009) 101803 | 0907.1269 |
| 19 | D0 Collaboration | Search for charged Higgs bosons in top quark decays | PLB 682 (2009) 278 | 0908.1811 |
| 20 | ATLAS Collaboration | Search for charged Higgs bosons decaying via $ H^{\pm} \rightarrow \tau^{\pm}\nu $ in fully hadronic final states using pp collision data at $ \sqrt{s} = $ 8 TeV with the ATLAS detector | JHEP 03 (2015) 088 | 1412.6663 |
| 21 | CMS Collaboration | Search for a charged Higgs boson in pp collisions at $ \sqrt{s}= $ 8 TeV | JHEP 11 (2015) 018 | CMS-HIG-14-023 1508.07774 |
| 22 | ATLAS Collaboration | Search for a light charged Higgs boson in the decay channel $ H^+ \to c\bar{s} $ in $ t\bar{t} $ events using pp collisions at $ \sqrt{s} = $ 7 TeV with the ATLAS detector | EPJC 73 (2013) 2465 | 1302.3694 |
| 23 | CMS Collaboration | Search for a light charged Higgs boson decaying to $ \mathrm{c}\overline{\mathrm{s}} $ in pp collisions at $ \sqrt{s}= $ 8 TeV | JHEP 12 (2015) 178 | CMS-HIG-13-035 1510.04252 |
| 24 | CMS Collaboration | Search for a charged Higgs boson decaying to charm and bottom quarks in proton-proton collisions at $ \sqrt{s}= $ 8 TeV | JHEP 11 (2018) 115 | CMS-HIG-16-030 1808.06575 |
| 25 | ATLAS Collaboration | Search for charged Higgs bosons produced in association with a top quark and decaying via $ H^{\pm} \rightarrow \tau\nu $ using $ pp $ collision data recorded at $ \sqrt{s} = $ 13 TeV by the ATLAS detector | PLB 759 (2016) 555 | 1603.09203 |
| 26 | ATLAS Collaboration | Search for charged Higgs bosons decaying via $ H^{\pm} \to \tau^{\pm}\nu_{\tau} $ in the $ \tau $+jets and $ \tau $+lepton final states with 36 fb$ ^{-1} $ of $ pp $ collision data recorded at $ \sqrt{s} = $ 13 TeV with the ATLAS experiment | JHEP 09 (2018) 139 | 1807.07915 |
| 27 | ATLAS Collaboration | Search for charged Higgs bosons decaying into top and bottom quarks at $ \sqrt{s} = $ 13 TeV with the ATLAS detector | JHEP 11 (2018) 085 | 1808.03599 |
| 28 | CMS Collaboration | Search for a light charged Higgs boson decaying to a W boson and a CP-odd Higgs boson in final states with e$ \mu\mu $ or $ \mu\mu\mu $ in proton-proton collisions at $ \sqrt{s} = $ 13 TeV | PRL 123 (2019) 131802 | CMS-HIG-18-020 1905.07453 |
| 29 | CMS Collaboration | Search for charged Higgs bosons produced via vector boson fusion and decaying into a pair of $ W $ and $ Z $ bosons using pp collisions at $ \sqrt{s}= $ 13 TeV | PRL 119 (2017) 141802 | CMS-HIG-16-027 1705.02942 |
| 30 | CMS Collaboration | Search for charged Higgs bosons in the H$ ^{\pm} \to \tau^{\pm}\nu_\tau $ decay channel in proton-proton collisions at $ \sqrt{s} = $ 13 TeV | JHEP 07 (2019) 142 | CMS-HIG-18-014 1903.04560 |
| 31 | CMS Collaboration | The CMS trigger system | JINST 12 (2017) P01020 | CMS-TRG-12-001 1609.02366 |
| 32 | CMS Collaboration | The CMS experiment at the CERN LHC | JINST 3 (2008) S08004 | CMS-00-001 |
| 33 | J. Alwall et al. | The automated computation of tree-level and next-to-leading order differential cross sections, and their matching to parton shower simulations | JHEP 07 (2014) 079 | 1405.0301 |
| 34 | S. Frixione, P. Nason, and C. Oleari | Matching NLO QCD computations with parton shower simulations: the POWHEG method | JHEP 11 (2007) 070 | 0709.2092 |
| 35 | P. Nason | A new method for combining NLO QCD with shower Monte Carlo algorithms | JHEP 11 (2004) 040 | hep-ph/0409146 |
| 36 | S. Alioli, P. Nason, C. Oleari, and E. Re | A general framework for implementing NLO calculations in shower Monte Carlo programs: the POWHEG BOX | JHEP 06 (2010) 043 | 1002.2581 |
| 37 | NNPDF Collaboration | Parton distributions from high-precision collider data | EPJC 77 (2017) 663 | 1706.00428 |
| 38 | T. Sjostrand et al. | An introduction to PYTHIA 8.2 | CPC 191 (2015) 159 | 1410.3012 |
| 39 | CMS Collaboration | Event generator tunes obtained from underlying event and multiparton scattering measurements | EPJC 76 (2016) 155 | CMS-GEN-14-001 1512.00815 |
| 40 | GEANT4 Collaboration | GEANT4--a simulation toolkit | NIMA 506 (2003) 250 | |
| 41 | M. Beneke, P. Falgari, S. Klein, and C. Schwinn | Hadronic top-quark pair production with NNLL threshold resummation | NPB 855 (2012) 695 | 1109.1536 |
| 42 | Particle Data Group, M. Tanabashi et al. | Review of particle physics | PRD 98 (2018) 030001 | |
| 43 | S. Alioli, P. Nason, C. Oleari, and E. Re | NLO single-top production matched with shower in POWHEG: $ s $- and $ t $-channel contributions | JHEP 09 (2009) 111 | 0907.4076 |
| 44 | E. Re | Single-top Wt-channel production matched with parton showers using the POWHEG method | EPJC 71 (2011) 1547 | 1009.2450 |
| 45 | J. Alwall et al. | Comparative study of various algorithms for the merging of parton showers and matrix elements in hadronic collisions | EPJC 53 (2008) 473 | 0706.2569 |
| 46 | CMS Collaboration | Particle-flow reconstruction and global event description with the CMS detector | JINST 12 (2017) P10003 | CMS-PRF-14-001 1706.04965 |
| 47 | CMS Collaboration | Description and performance of track and primary-vertex reconstruction with the CMS tracker | JINST 9 (2014) P10009 | CMS-TRK-11-001 1405.6569 |
| 48 | M. Cacciari, G. P. Salam, and G. Soyez | The anti-$ {k_{\mathrm{T}}} $ jet clustering algorithm | JHEP 04 (2008) 063 | 0802.1189 |
| 49 | M. Cacciari, G. P. Salam, and G. Soyez | FastJet user manual | EPJC 72 (2012) 1896 | 1111.6097 |
| 50 | CMS Collaboration | Performance of the CMS muon detector and muon reconstruction with proton-proton collisions at $ \sqrt{s}= $ 13 TeV | JINST 13 (2018) P06015 | CMS-MUO-16-001 1804.04528 |
| 51 | CMS Collaboration | Performance of electron reconstruction and selection with the CMS detector in proton-proton collisions at $ \sqrt{s} = $ 8 TeV | JINST 10 (2015) P06005 | CMS-EGM-13-001 1502.02701 |
| 52 | A. M. Polyakov | Quark confinement and topology of gauge groups | NPB 120 (1977) 429 | |
| 53 | CMS Collaboration | Jet energy scale and resolution in the CMS experiment in pp collisions at 8 TeV | JINST 12 (2017) P02014 | CMS-JME-13-004 1607.03663 |
| 54 | CMS Collaboration | Identification of heavy-flavour jets with the CMS detector in pp collisions at 13 TeV | JINST 13 (2018) P05011 | CMS-BTV-16-002 1712.07158 |
| 55 | M. Cacciari and G. P. Salam | Pileup subtraction using jet areas | PLB 659 (2008) 119 | 0707.1378 |
| 56 | J. D'Hondt et al. | Fitting of event topologies with external kinematic constraints in CMS | CMS Note 2006/023 | |
| 57 | CMS Collaboration | CMS luminosity measurements for the 2016 data taking period | CMS-PAS-LUM-17-001 | CMS-PAS-LUM-17-001 |
| 58 | CMS Collaboration | Measurement of the inelastic proton-proton cross section at $ \sqrt{s}= $ 13 TeV | JHEP 07 (2018) 161 | CMS-FSQ-15-005 1802.02613 |
| 59 | CMS Collaboration | Measurement of differential cross sections for top quark pair production using the lepton+jets final state in proton-proton collisions at 13 TeV | PRD 95 (2017) 092001 | CMS-TOP-16-008 1610.04191 |
| 60 | CMS Collaboration | Measurements of $ \mathrm{t\overline{t}} $ differential cross sections in proton-proton collisions at $ \sqrt{s}= $ 13 tev using events containing two leptons | JHEP 02 (2019) 149 | CMS-TOP-17-014 1811.06625 |
| 61 | CMS Collaboration | Investigations of the impact of the parton shower tuning in Pythia 8 in the modelling of $ \mathrm{t\overline{t}} $ at $ \sqrt{s}= $ 8 and 13 TeV | CMS-PAS-TOP-16-021 | CMS-PAS-TOP-16-021 |
| 62 | J. Butterworth et al. | PDF4LHC recommendations for LHC Run II | JPG 43 (2016) 023001 | 1510.03865 |
| 63 | R. J. Barlow and C. Beeston | Fitting using finite Monte Carlo samples | CPC 77 (1993) 219 | |
| 64 | T. Junk | Confidence level computation for combining searches with small statistics | NIMA 434 (1999) 435 | hep-ex/9902006 |
| 65 | A. L. Read | Presentation of search results: The CL$ _{\text{s}} $ technique | JPG 28 (2002) 2693 | |
| 66 | G. Cowan, K. Cranmer, E. Gross, and O. Vitells | Asymptotic formulae for likelihood-based tests of new physics | EPJC 71 (2011) 1554 | 1007.1727 |

|
Compact Muon Solenoid LHC, CERN |

|

|

|

|

|

|