
Compact Muon Solenoid
LHC, CERN
 Visit us: CMS Public Website, CMS Physics ;
Contact us: CMS Publications Committee
| CMS-PAS-TOP-25-018 | ||
| Measurement of the single top $ t $-channel production cross section at a center-of-mass energy of 13.6 TeV | ||
| CMS Collaboration | ||
| 2026-10-06 | ||
| Abstract: This note presents measurements of the single top $ t $-channel production cross section in proton-proton collisions at a center-of-mass energy of 13.6 TeV. The analysis uses 62.5 fb$ ^{-1} $ of data collected during 2022 and 2023 with the CMS detector at the CERN LHC. Events with exactly one isolated charged lepton (electron or muon) and two jets, one of which is identified as originating from a bottom quark, are selected. A multivariate discriminant is employed to enhance the separation between signal and background processes. The signal cross section is extracted from a maximum likelihood fit to the discriminant distribution. The inclusive single top $ t $-channel production cross section is measured to be $ \sigma(\mathrm{tq}+\mathrm{\bar{t}q})=223.1 ^{+9.3}_{-9.1} \mathrm{(syst)}\pm1.2 \mathrm{(stat)} $ pb. The individual top quark and antiquark cross sections are also measured to be $ \sigma(\mathrm{tq})=139.9 ^{+5.4}_{-5.1} \mathrm{(syst)}\pm0.9 \mathrm{(stat)} $ pb and $ \sigma(\mathrm{\bar{t}q})=83.8 ^{+3.9}_{-3.7} \mathrm{(syst)}\pm0.7 \mathrm{(stat)} $ pb, respectively. The ratio of the two individual cross sections is measured, yielding a value of $ \mathcal{R}_{\mathrm{t-ch}}= $ 1.67 $ \pm $ 0.04 $ \mathrm{(syst)}\pm0.02 \mathrm{(stat)} $. This ratio and the inclusive cross section are also compared with predictions obtained using different PDF sets. From the inclusive cross section result, the product $ |f_{\mathrm{LV}}V_{\mathrm{tb}}| $ is computed as $ |f_{\mathrm{LV}}V_{\mathrm{tb}}|= $ 0.980 $ \pm $ 0.021 $ \mathrm{(exp)}\pm0.009 \mathrm{(theo)} $. All measurements are in agreement with the standard model prediction. | ||
| Links: CDS record (PDF) ; CADI line (restricted) ; | ||
| Figures | |
png pdf |
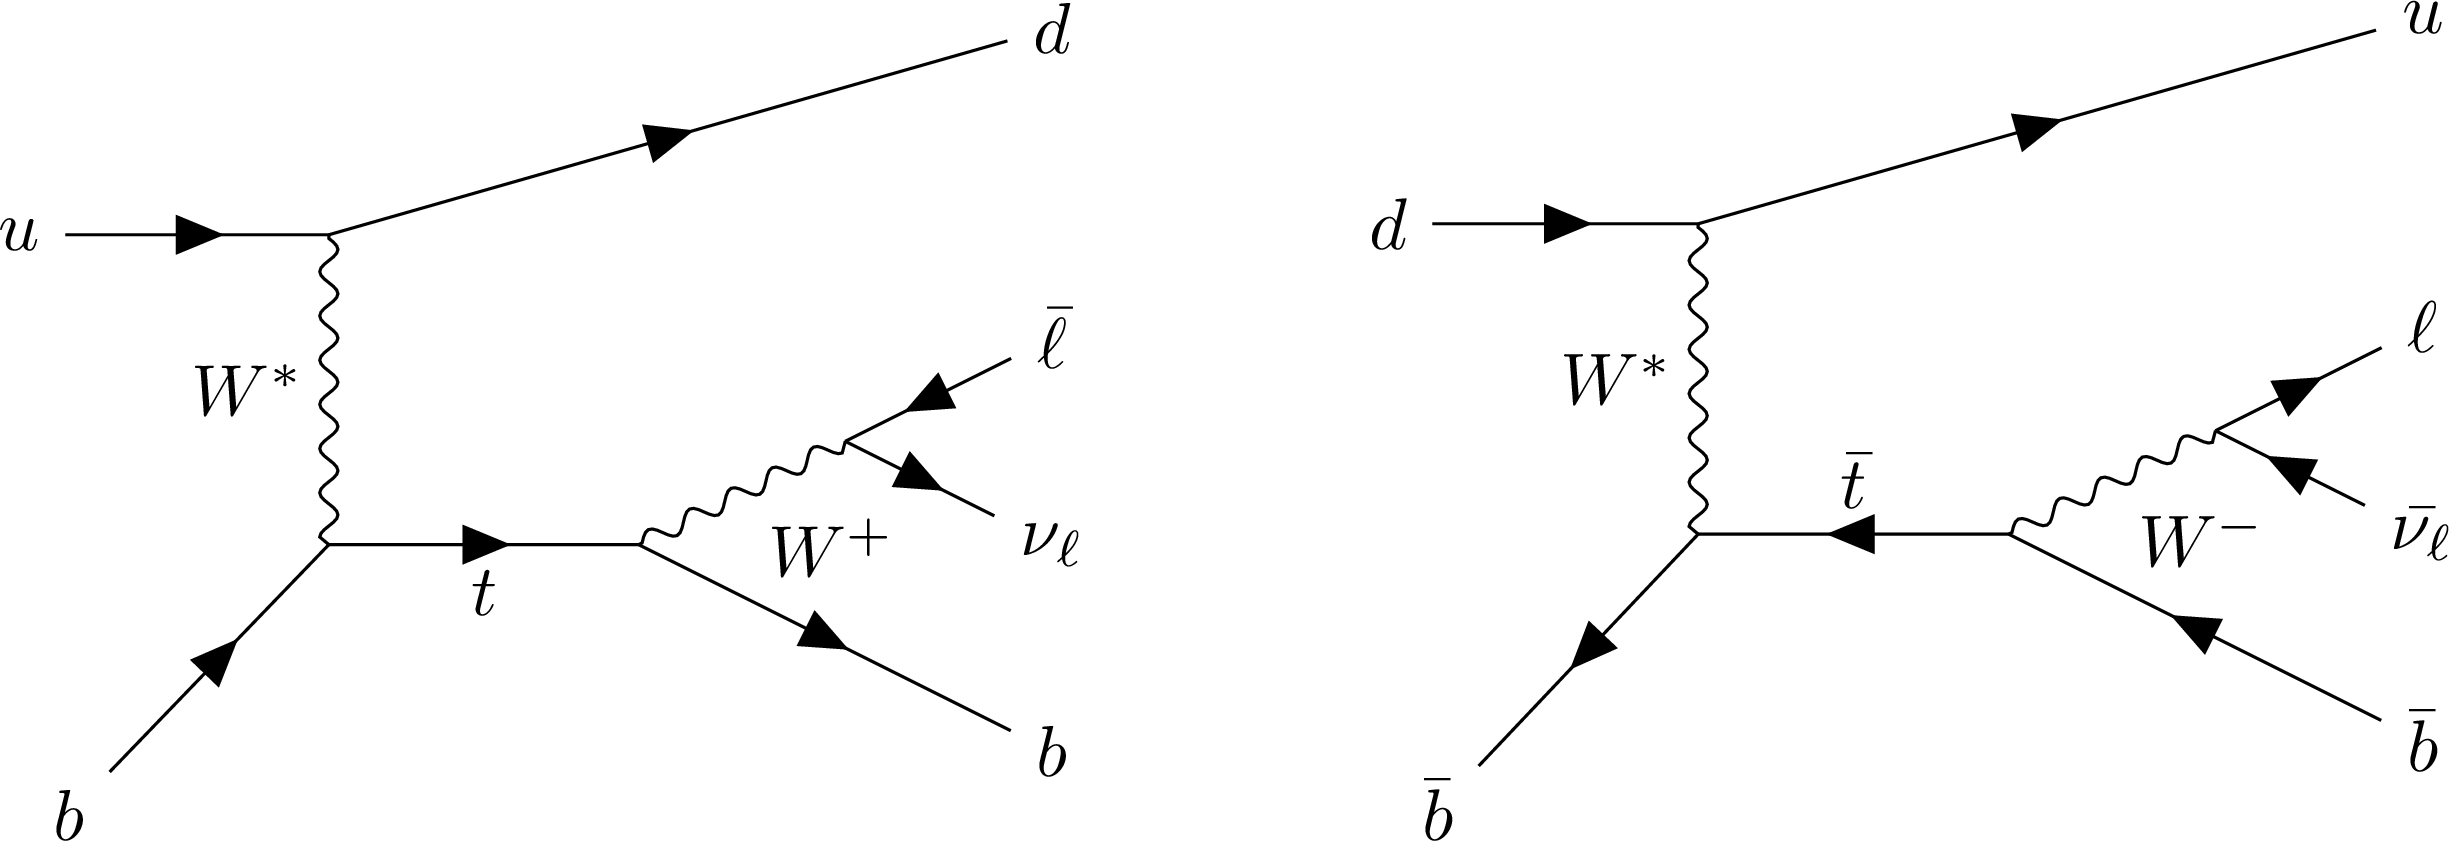
Figure 1:
Representative leading order Feynman diagrams for single top quark (left) and single top antiquark (right) production via the $ t $ channel. |
png pdf |
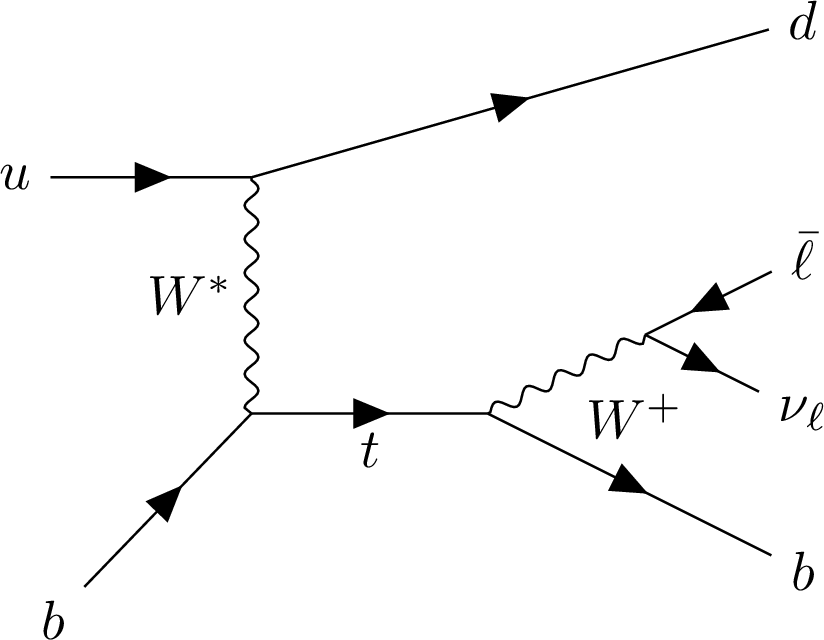
Figure 1-a:
Representative leading order Feynman diagrams for single top quark (left) and single top antiquark (right) production via the $ t $ channel. |
png pdf |
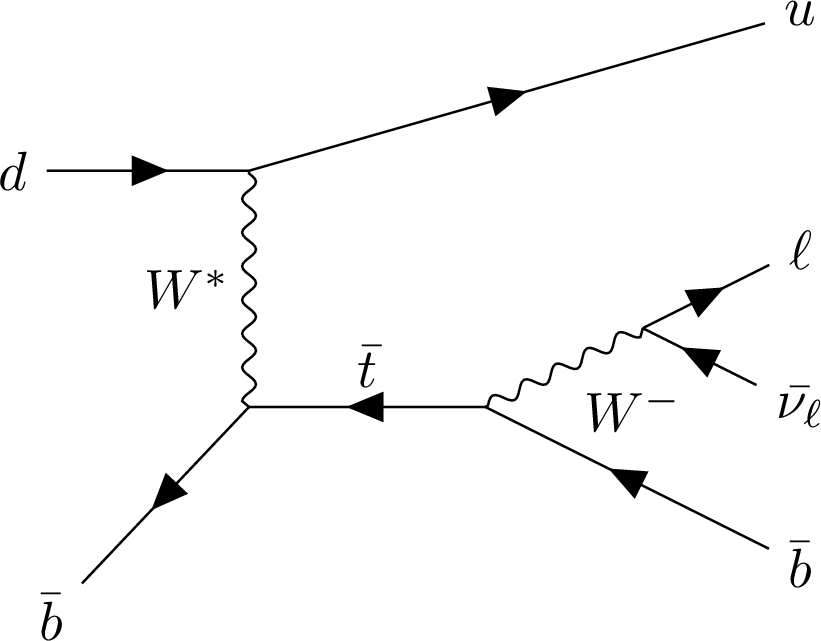
Figure 1-b:
Representative leading order Feynman diagrams for single top quark (left) and single top antiquark (right) production via the $ t $ channel. |
png pdf |
Figure 2:
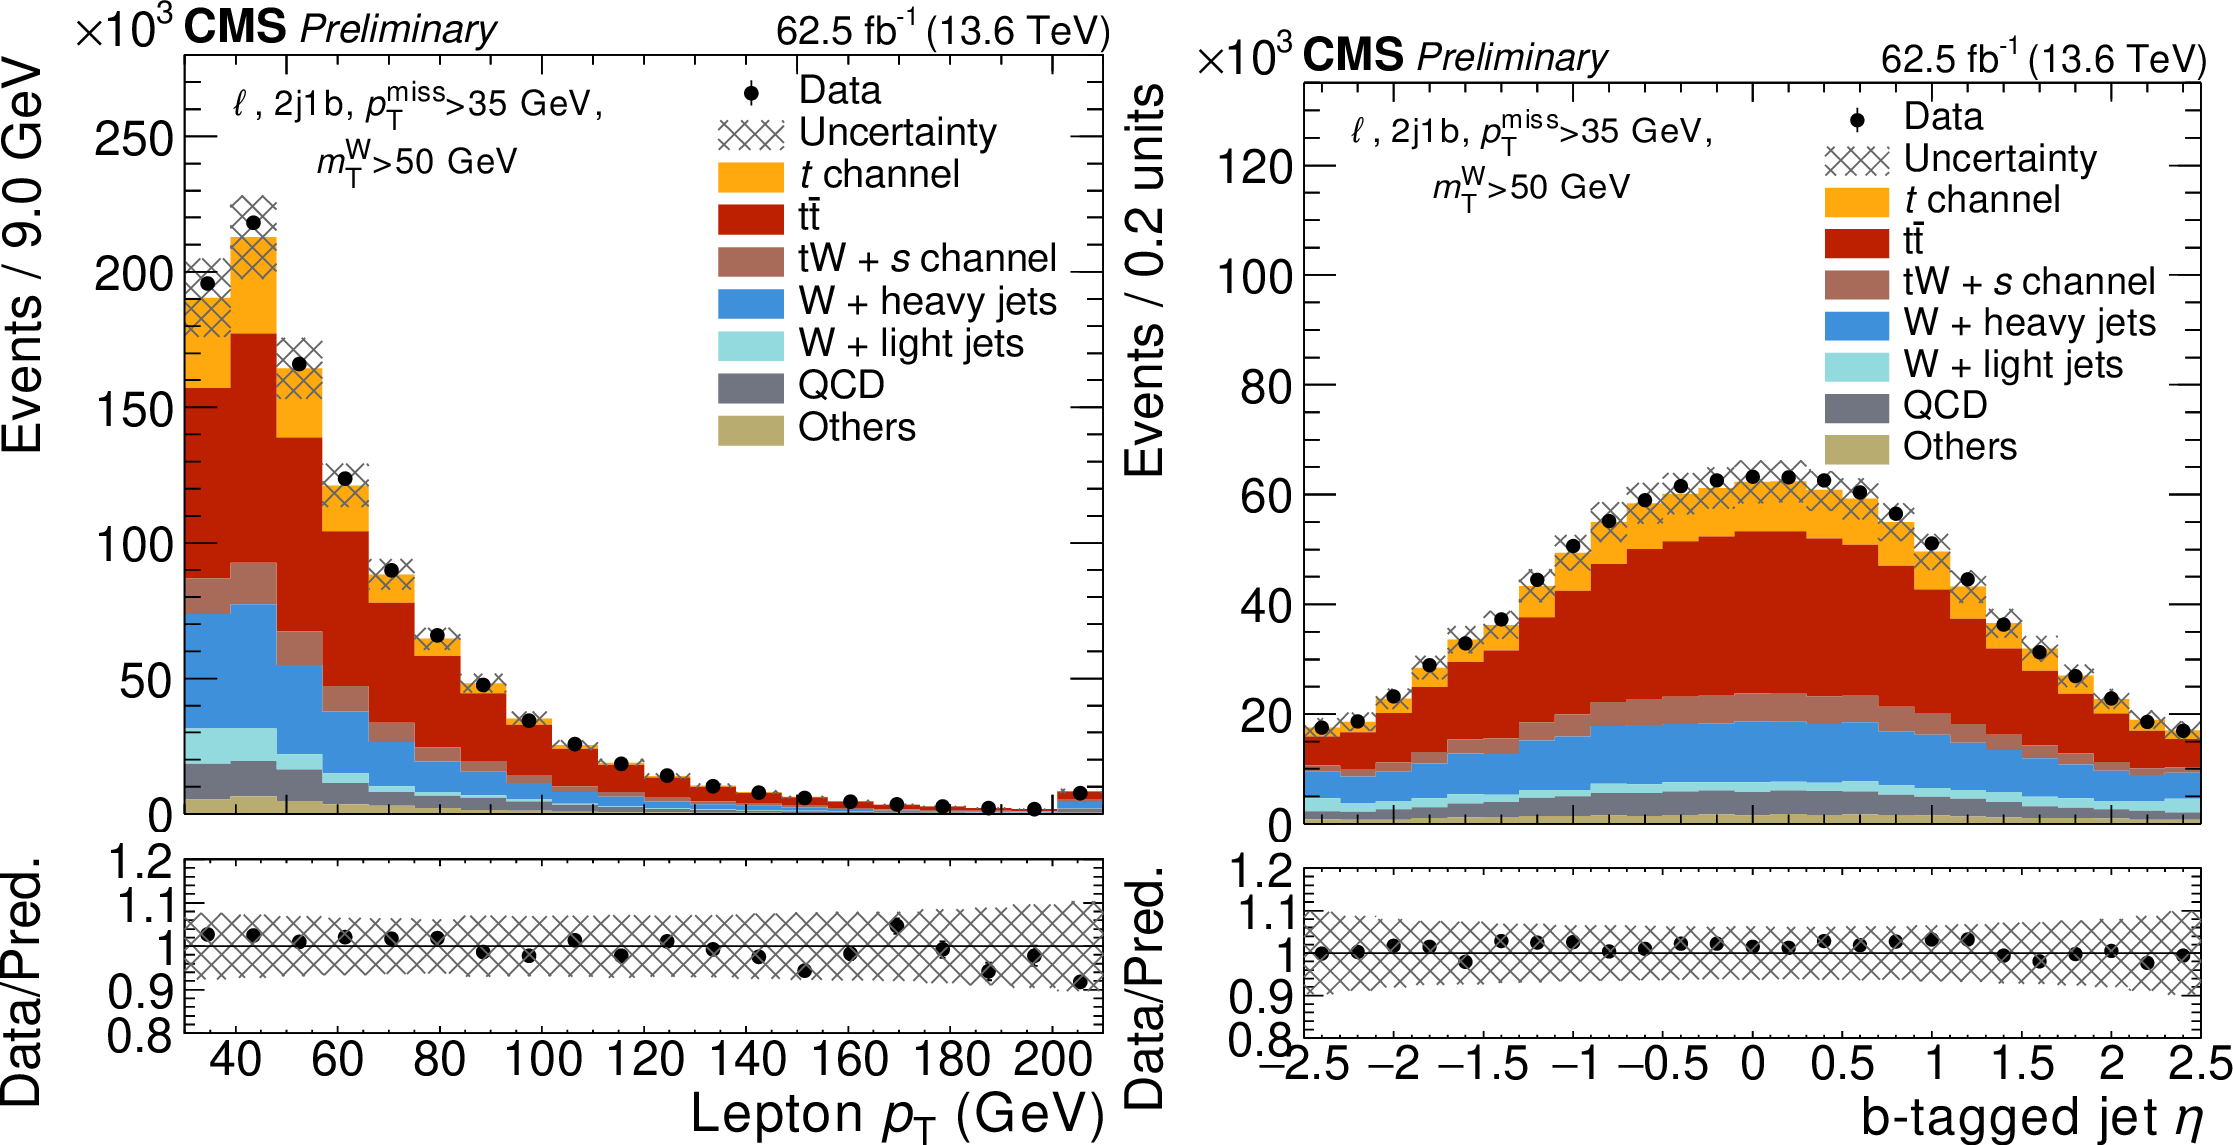
Distributions of the $ p_{\mathrm{T}} $ of the lepton (left) and the $ \eta $ of the b-tagged jet (right) for events in the signal region described in Section 5. The shaded bands represent the uncertainties in the prediction while the vertical bars on the data points represent the statistical uncertainties. The subdominant contribution of the $ \mathrm{Z}/\gamma^\star $, VV, VVV and ttX processes is included in "Others". The last bin of the lepton $ p_{\mathrm{T}} $ includes the overflow events. |
png pdf |
Figure 2-a:
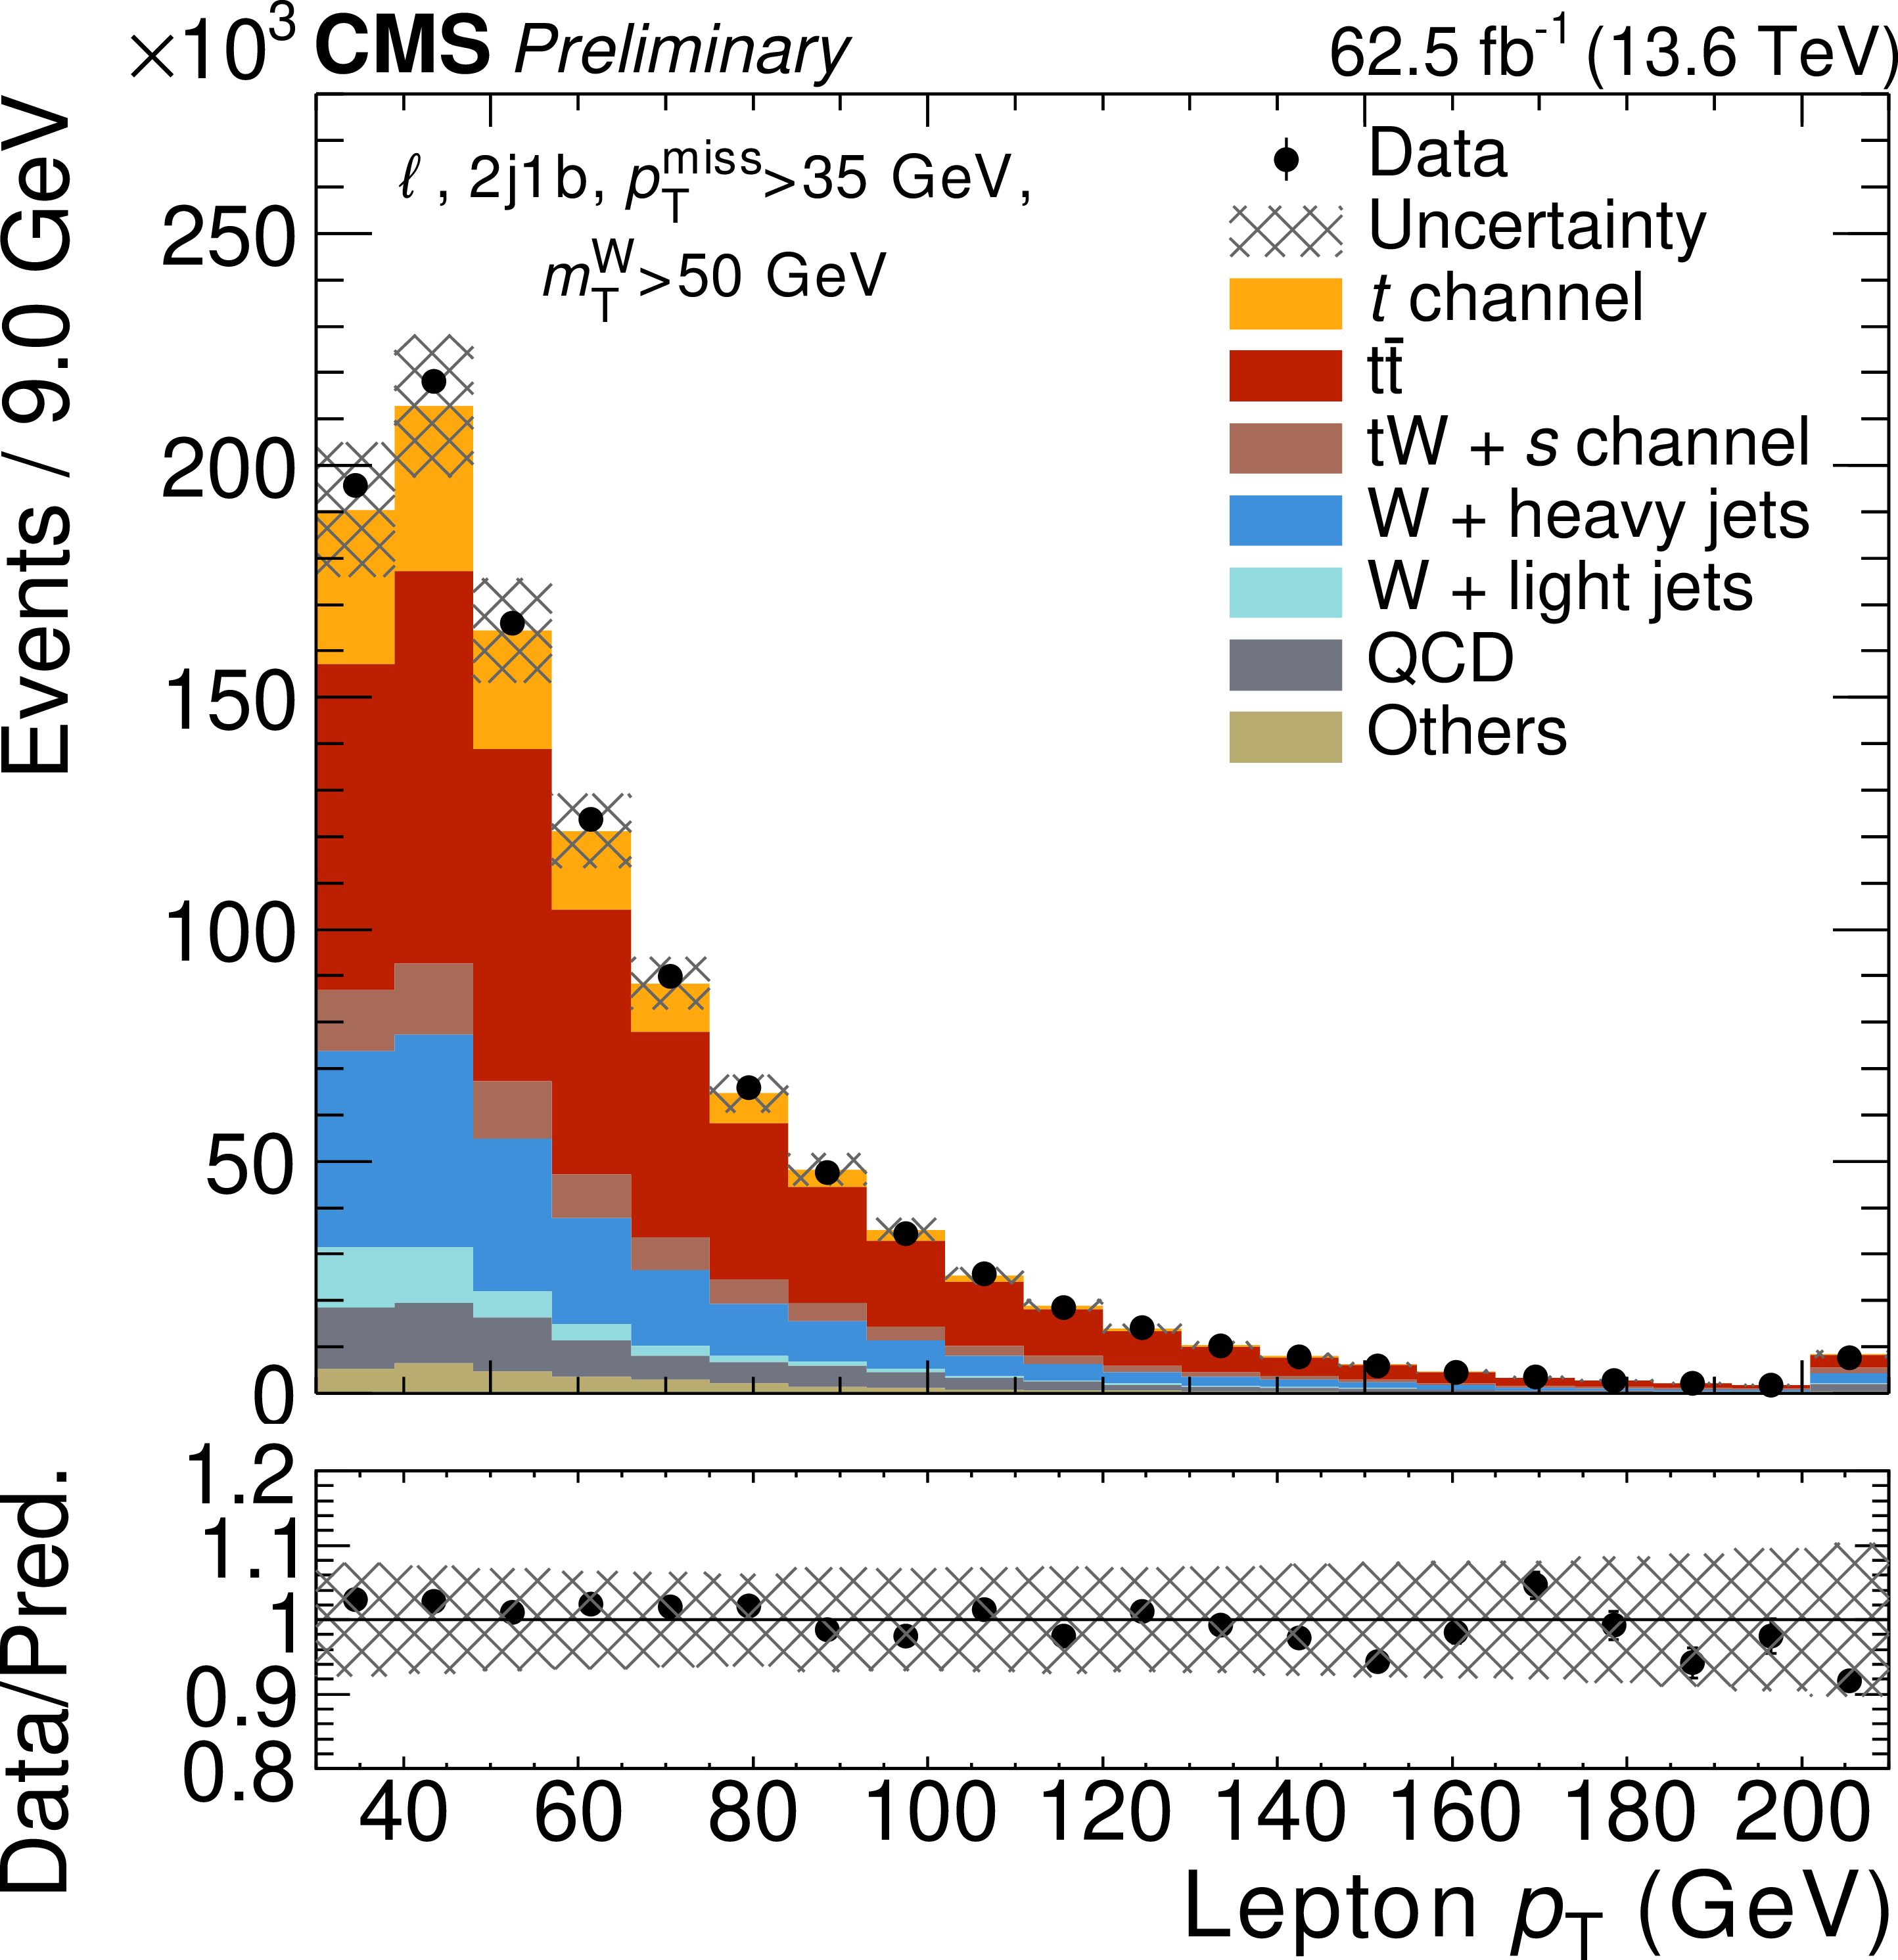
Distributions of the $ p_{\mathrm{T}} $ of the lepton (left) and the $ \eta $ of the b-tagged jet (right) for events in the signal region described in Section 5. The shaded bands represent the uncertainties in the prediction while the vertical bars on the data points represent the statistical uncertainties. The subdominant contribution of the $ \mathrm{Z}/\gamma^\star $, VV, VVV and ttX processes is included in "Others". The last bin of the lepton $ p_{\mathrm{T}} $ includes the overflow events. |
png pdf |
Figure 2-b:
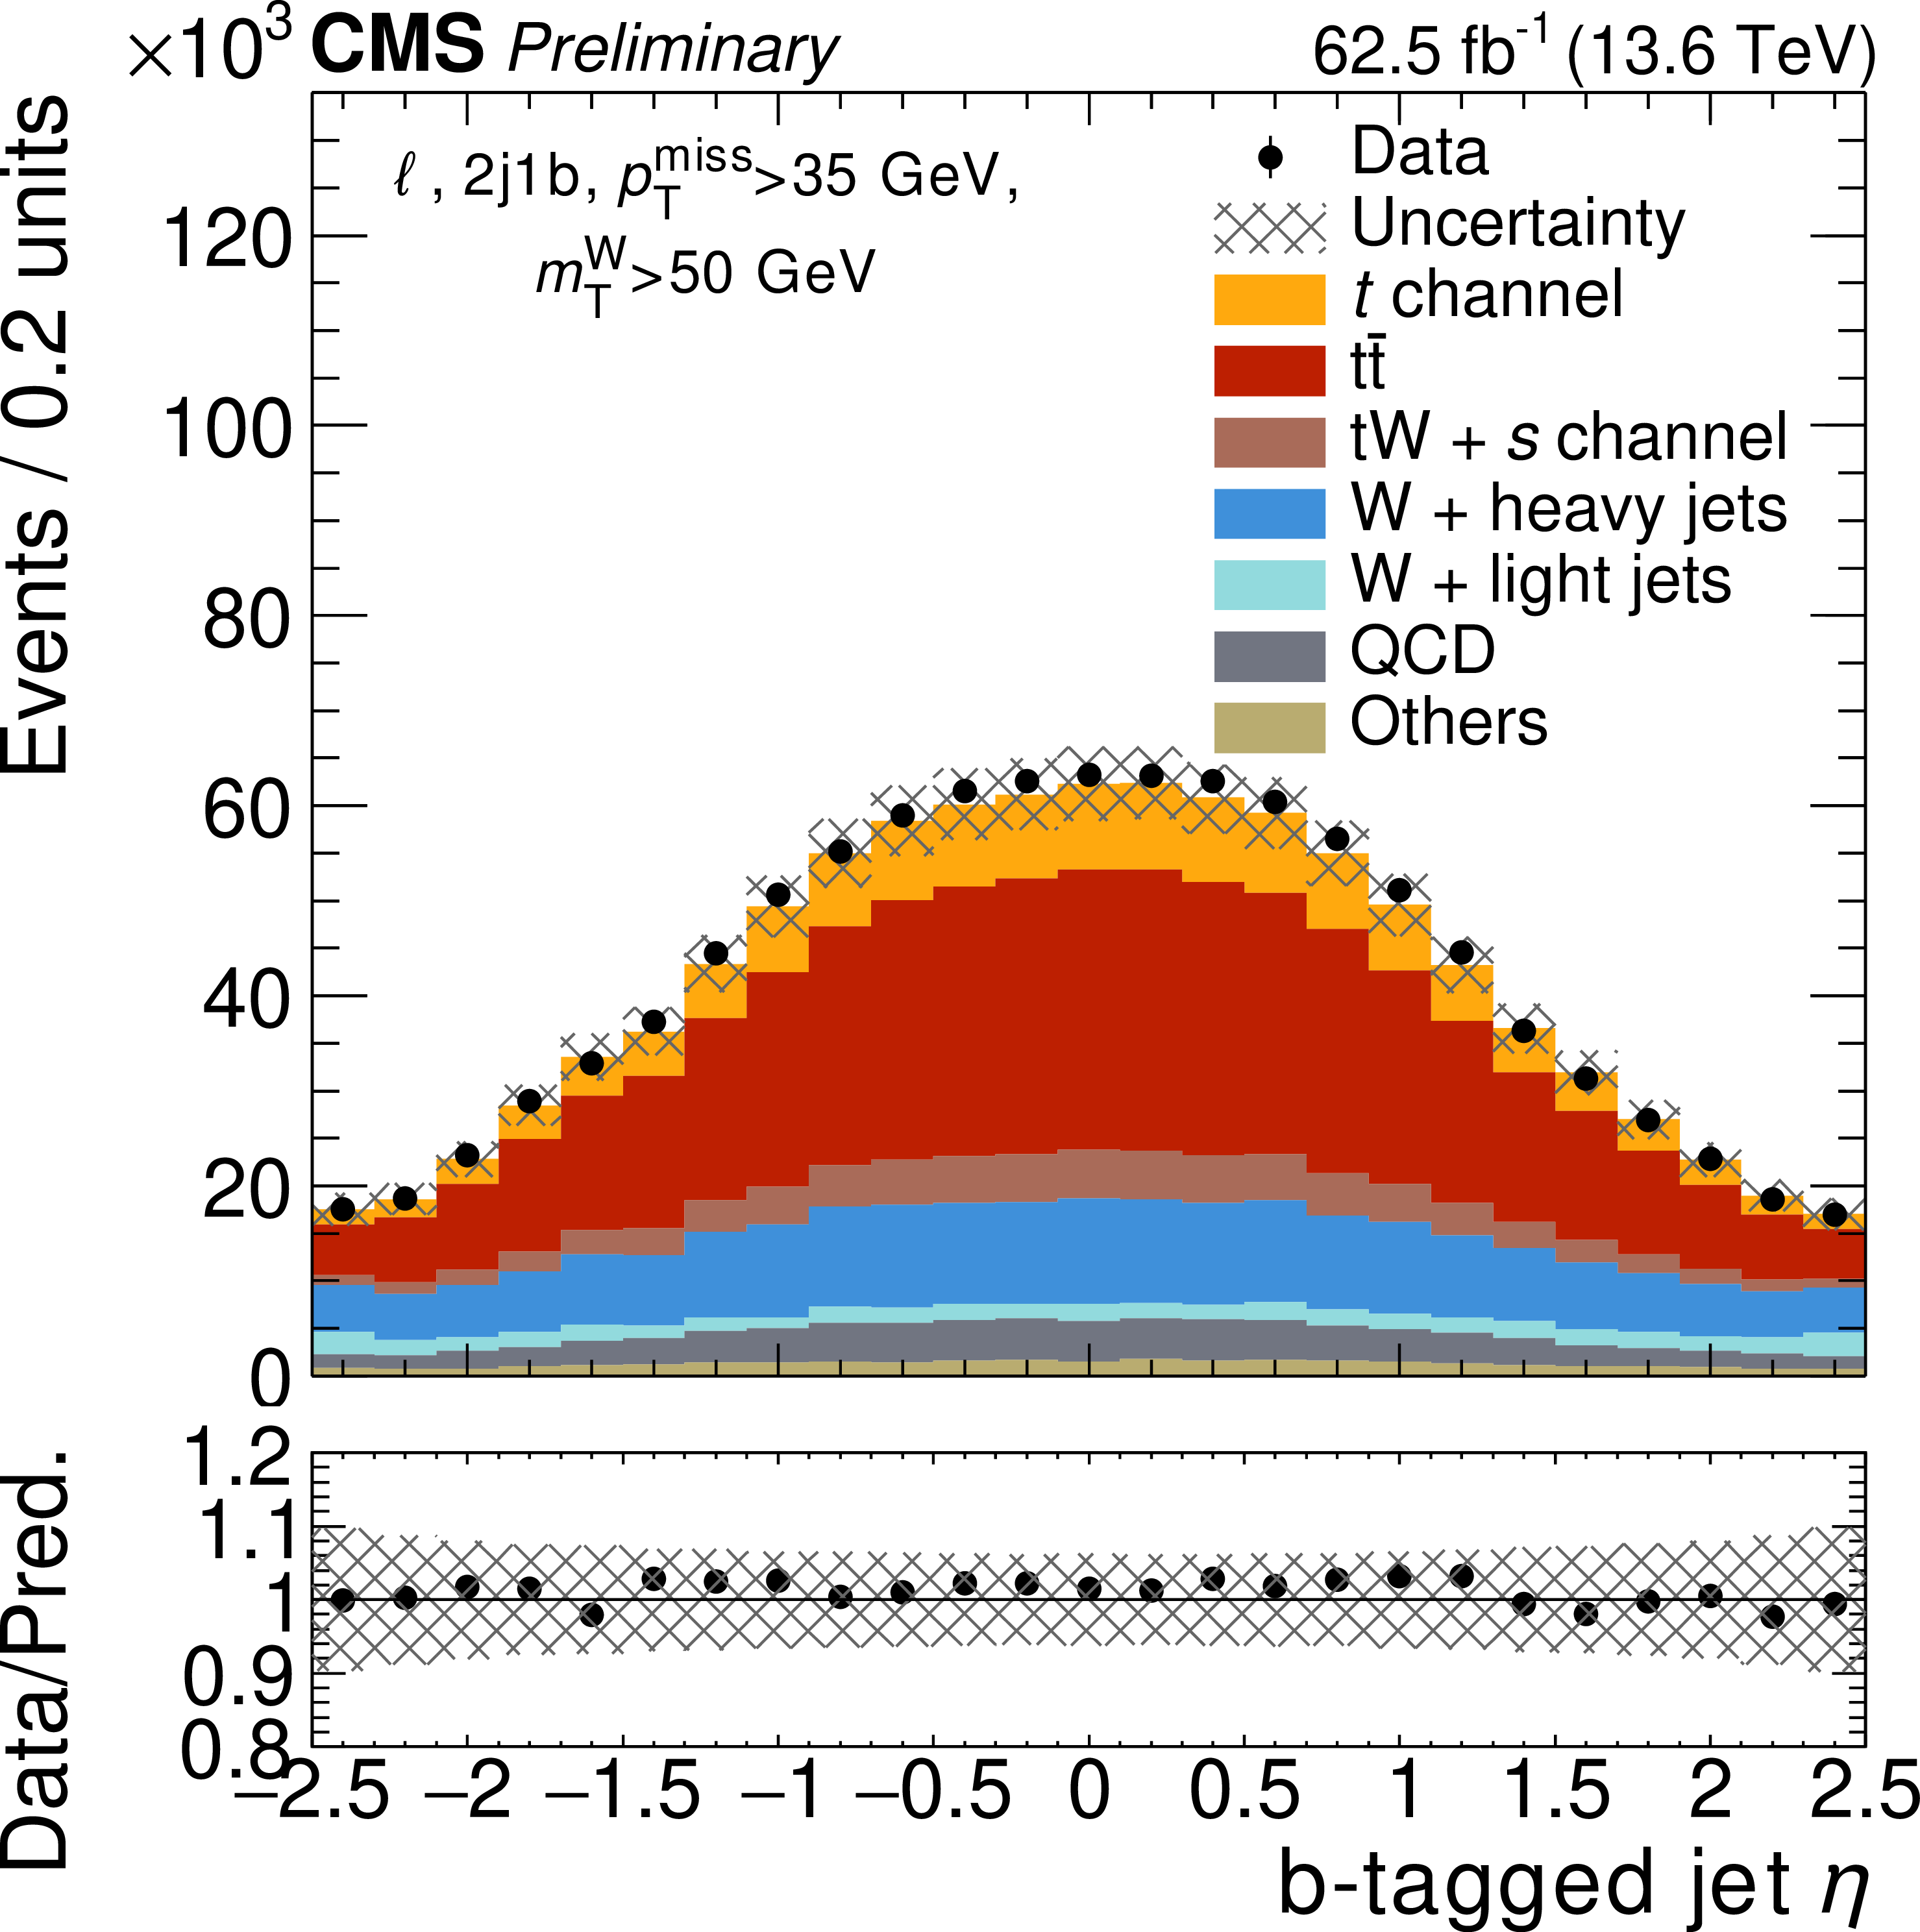
Distributions of the $ p_{\mathrm{T}} $ of the lepton (left) and the $ \eta $ of the b-tagged jet (right) for events in the signal region described in Section 5. The shaded bands represent the uncertainties in the prediction while the vertical bars on the data points represent the statistical uncertainties. The subdominant contribution of the $ \mathrm{Z}/\gamma^\star $, VV, VVV and ttX processes is included in "Others". The last bin of the lepton $ p_{\mathrm{T}} $ includes the overflow events. |
png pdf |
Figure 3:
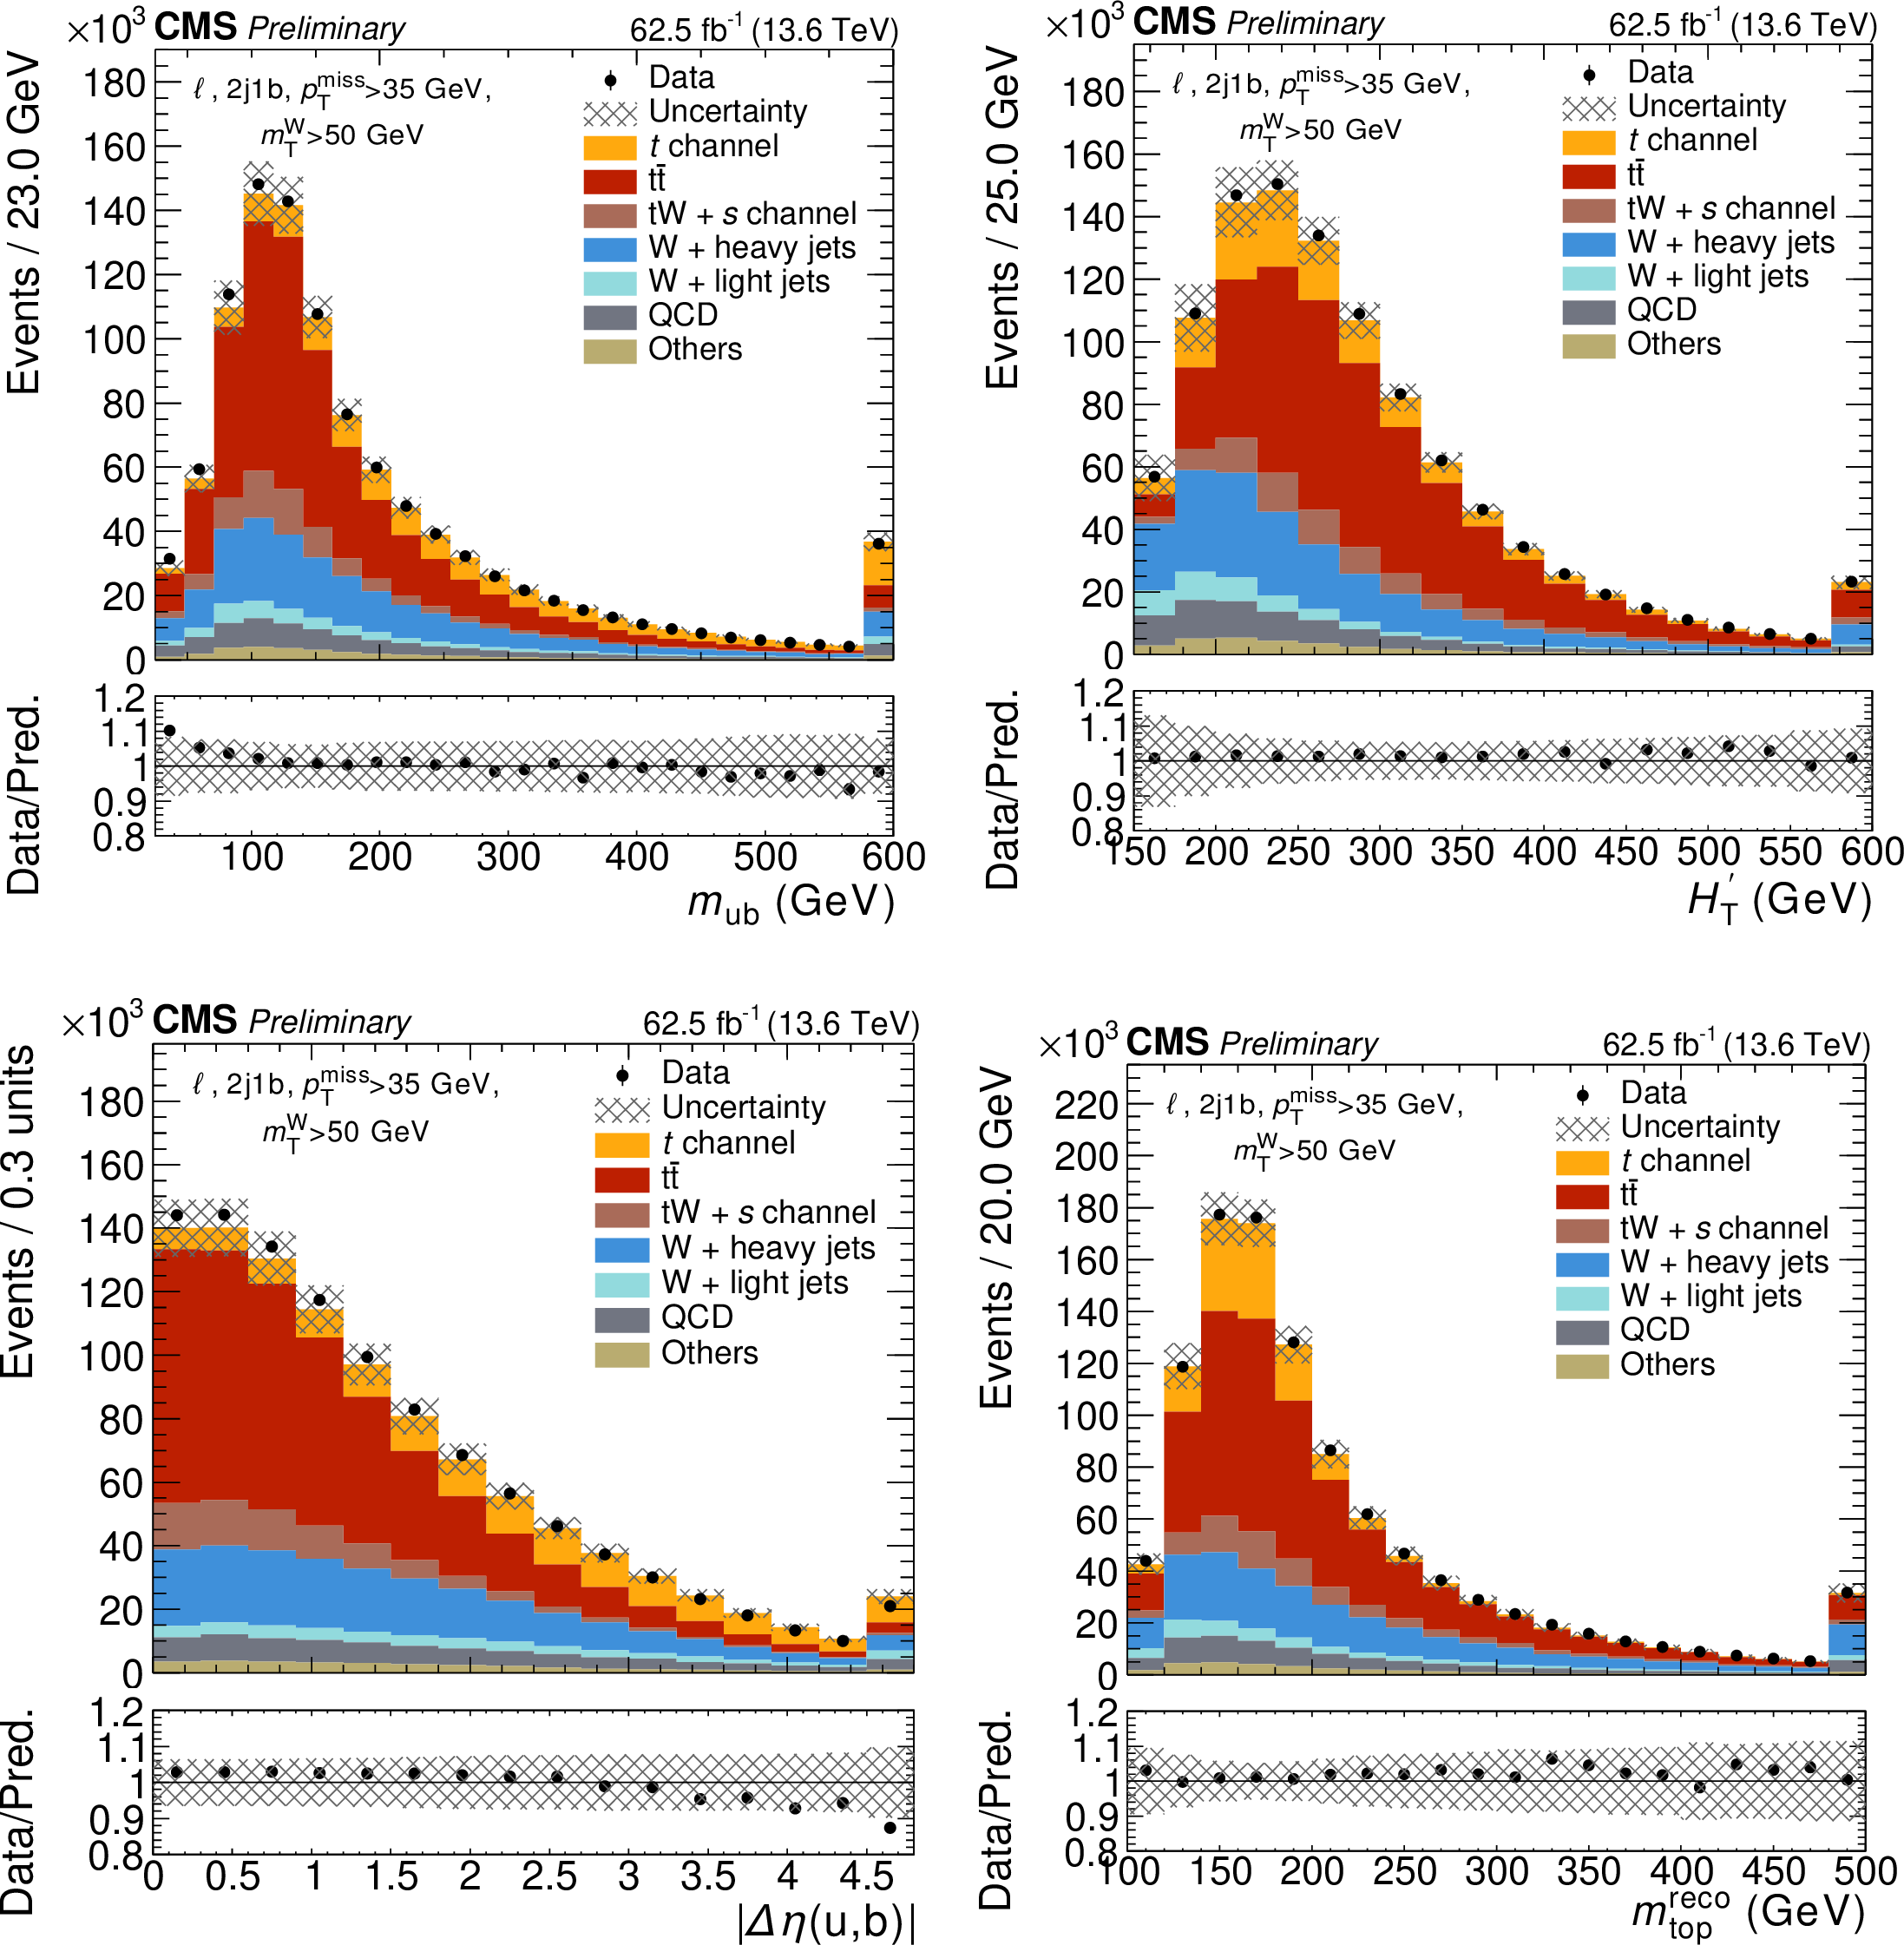
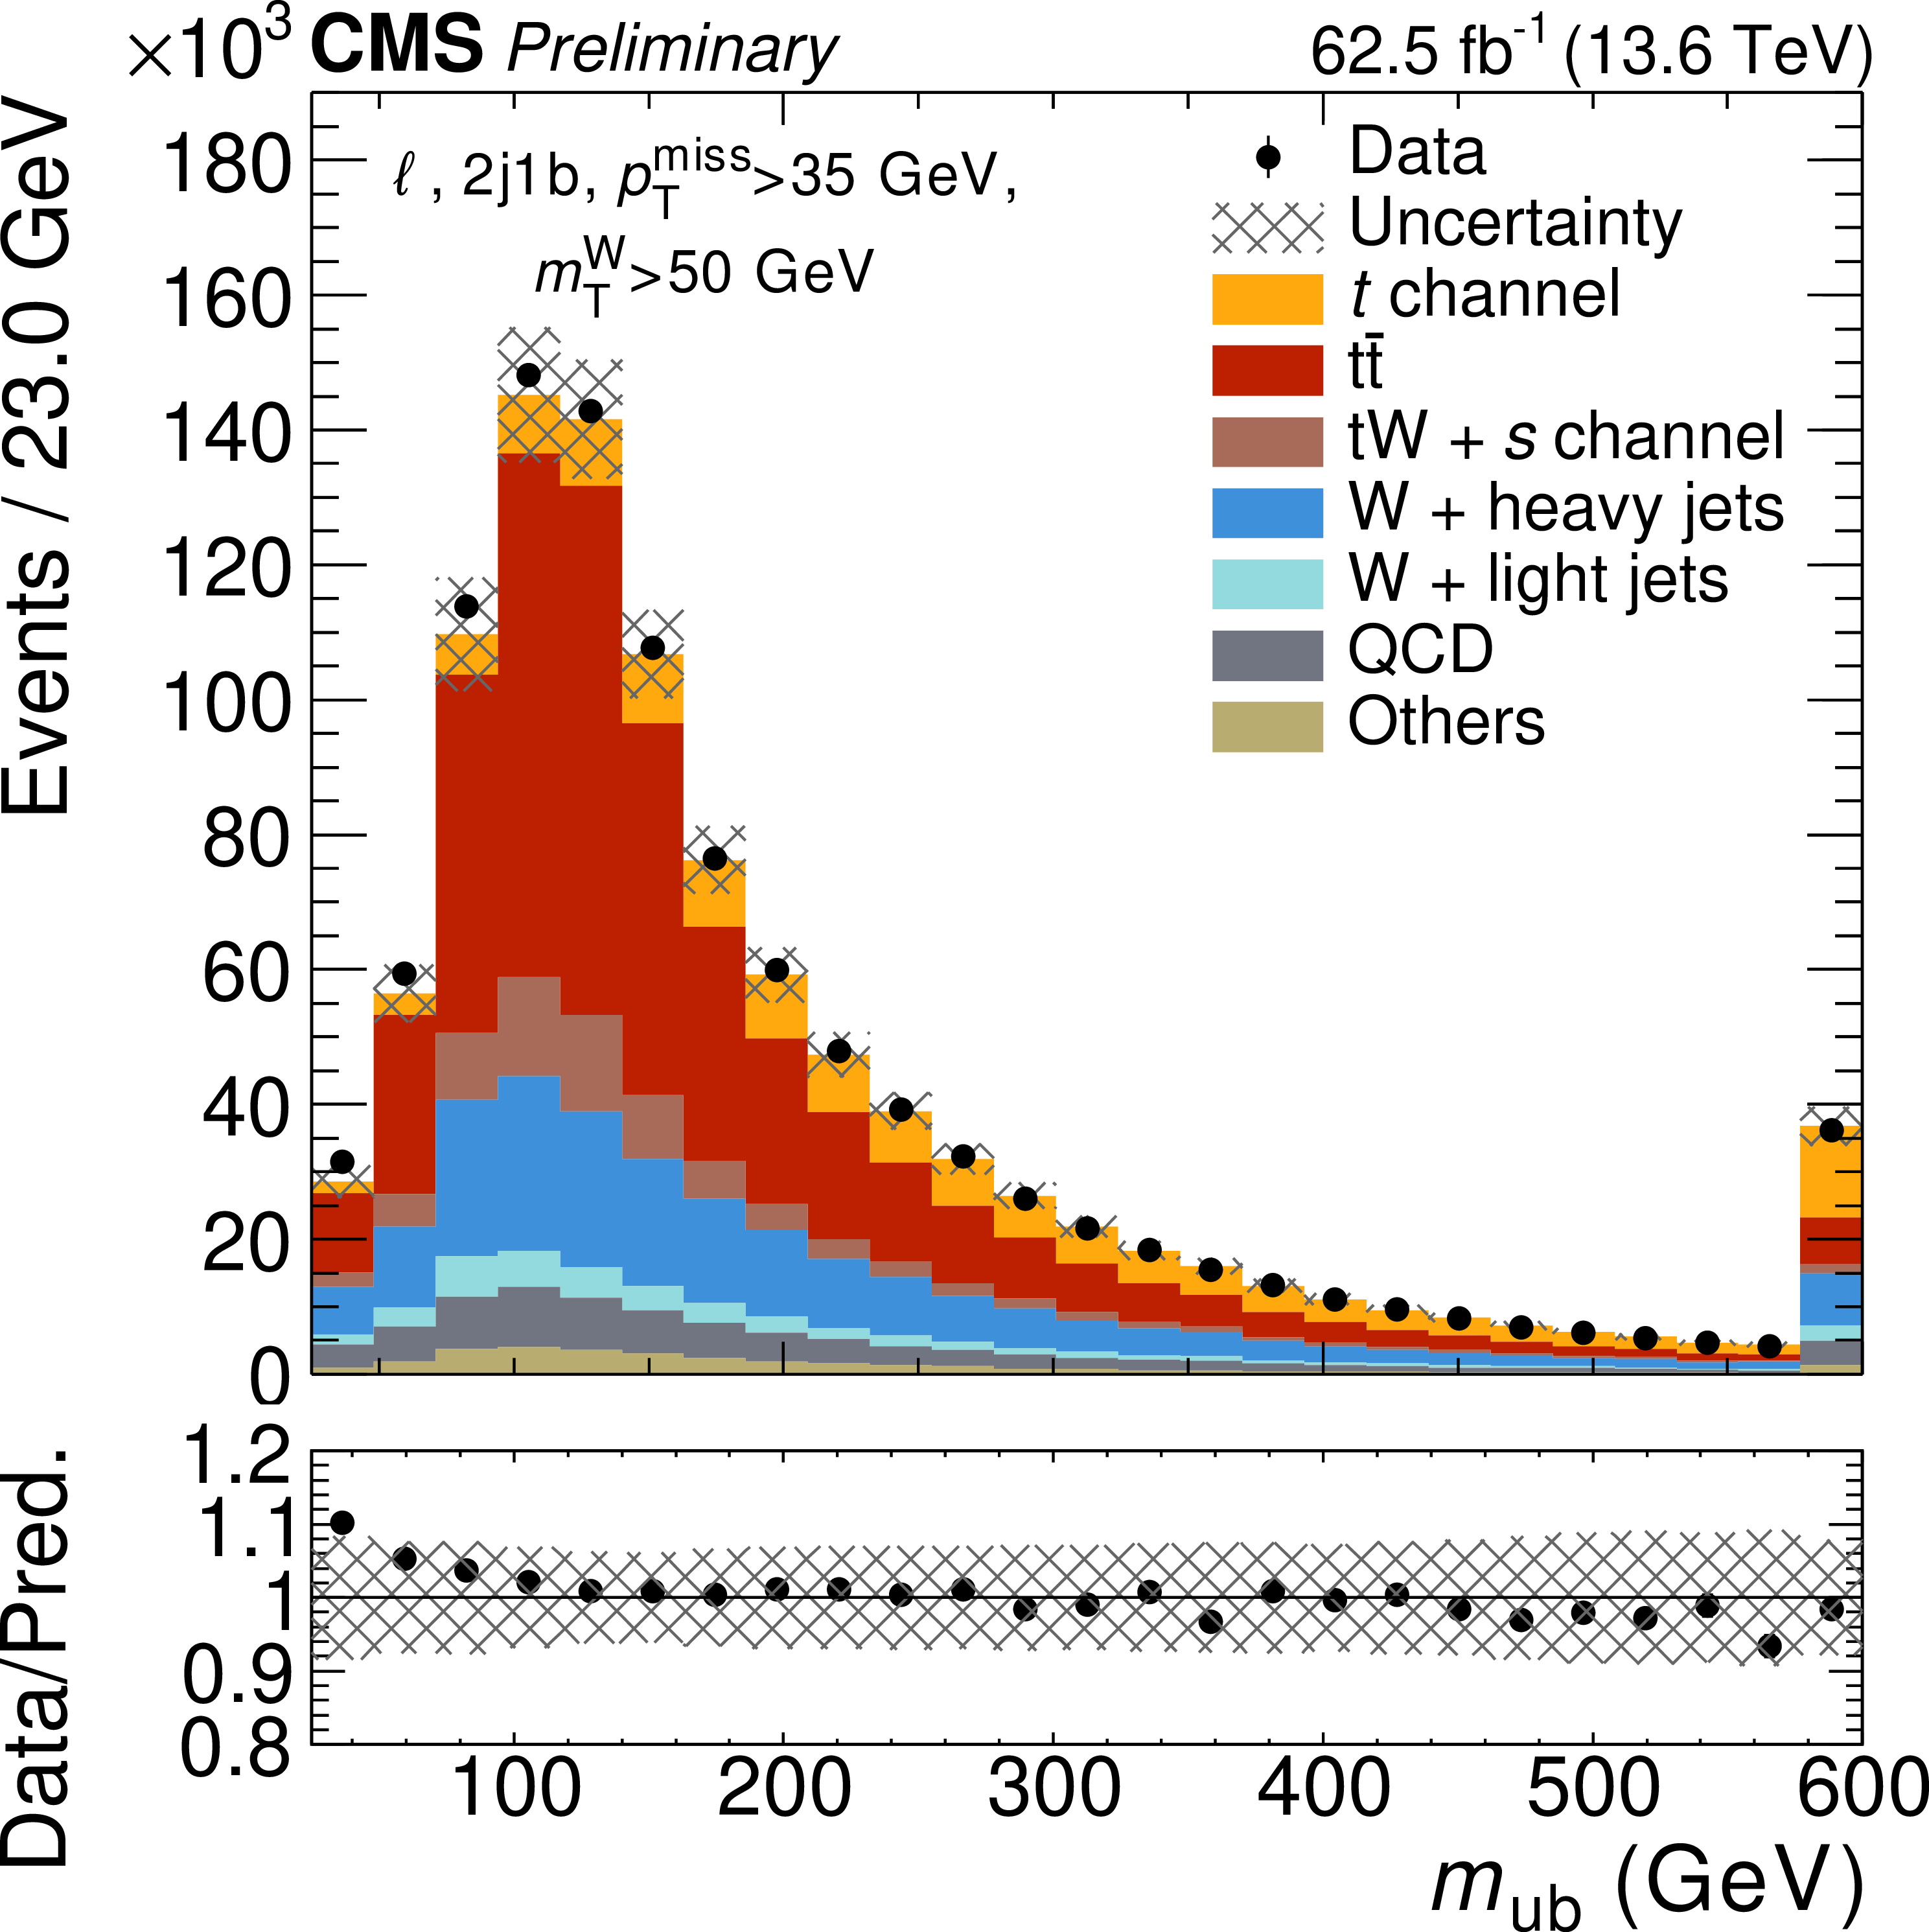
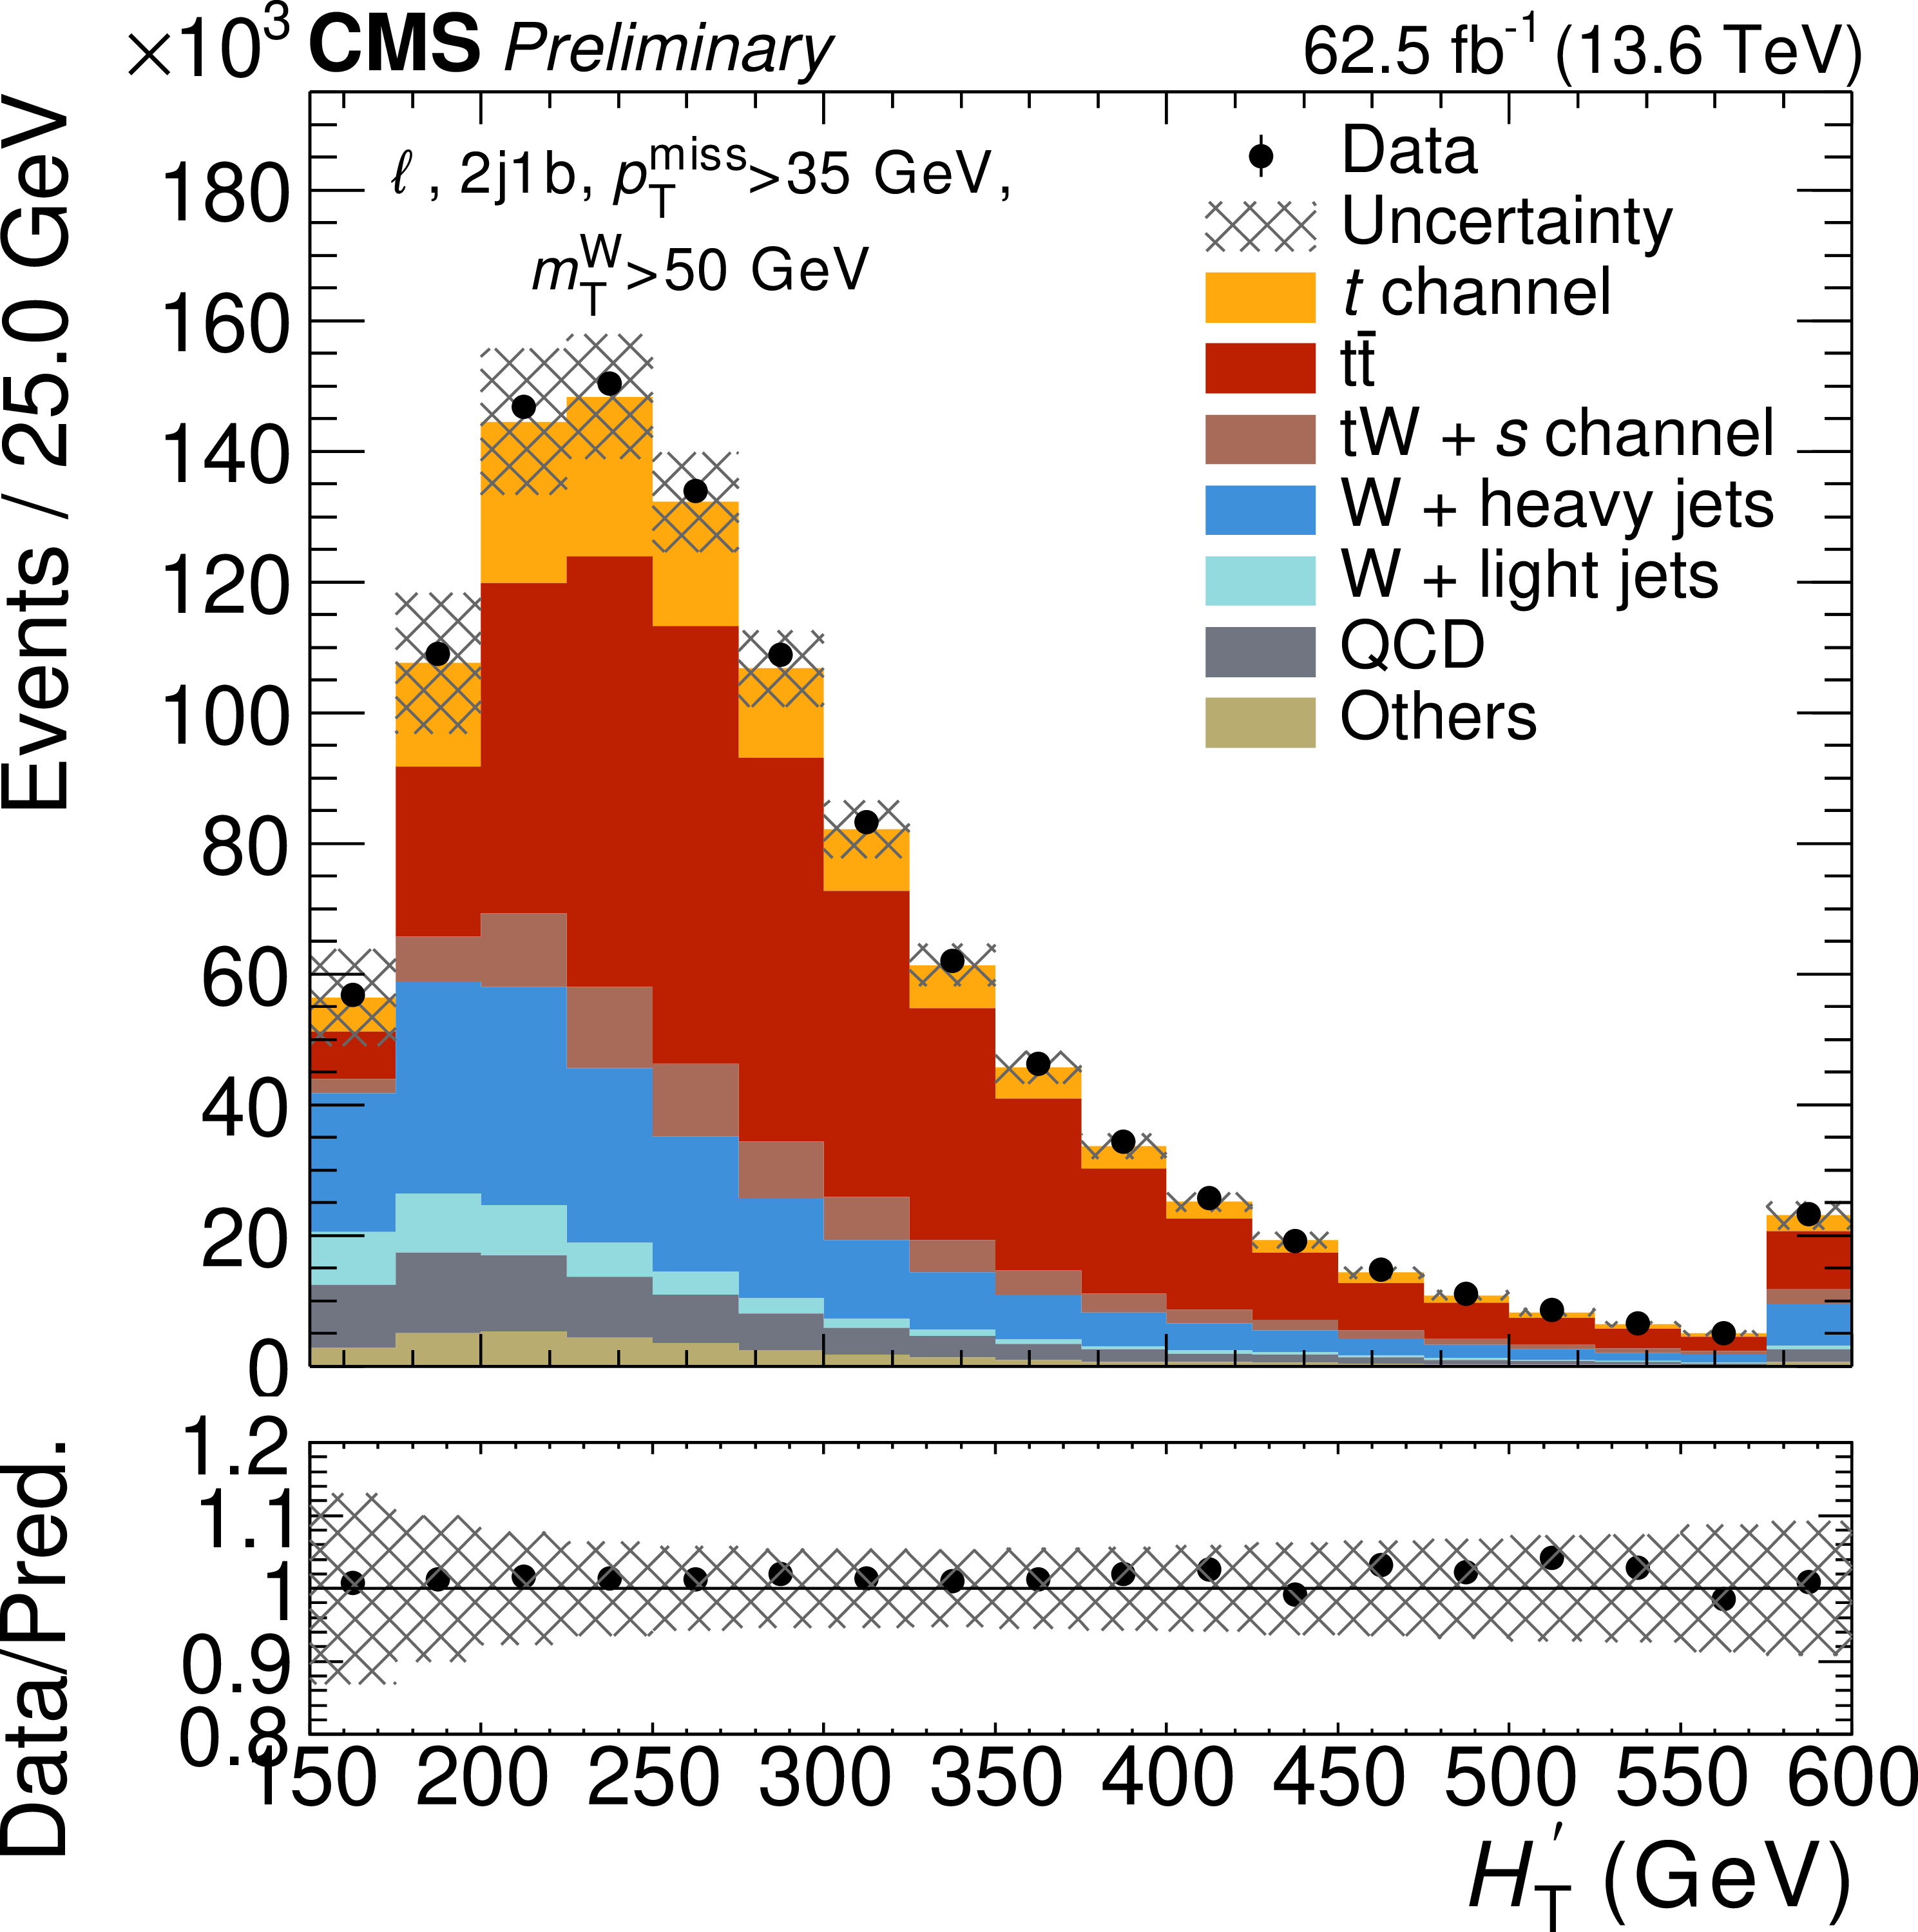
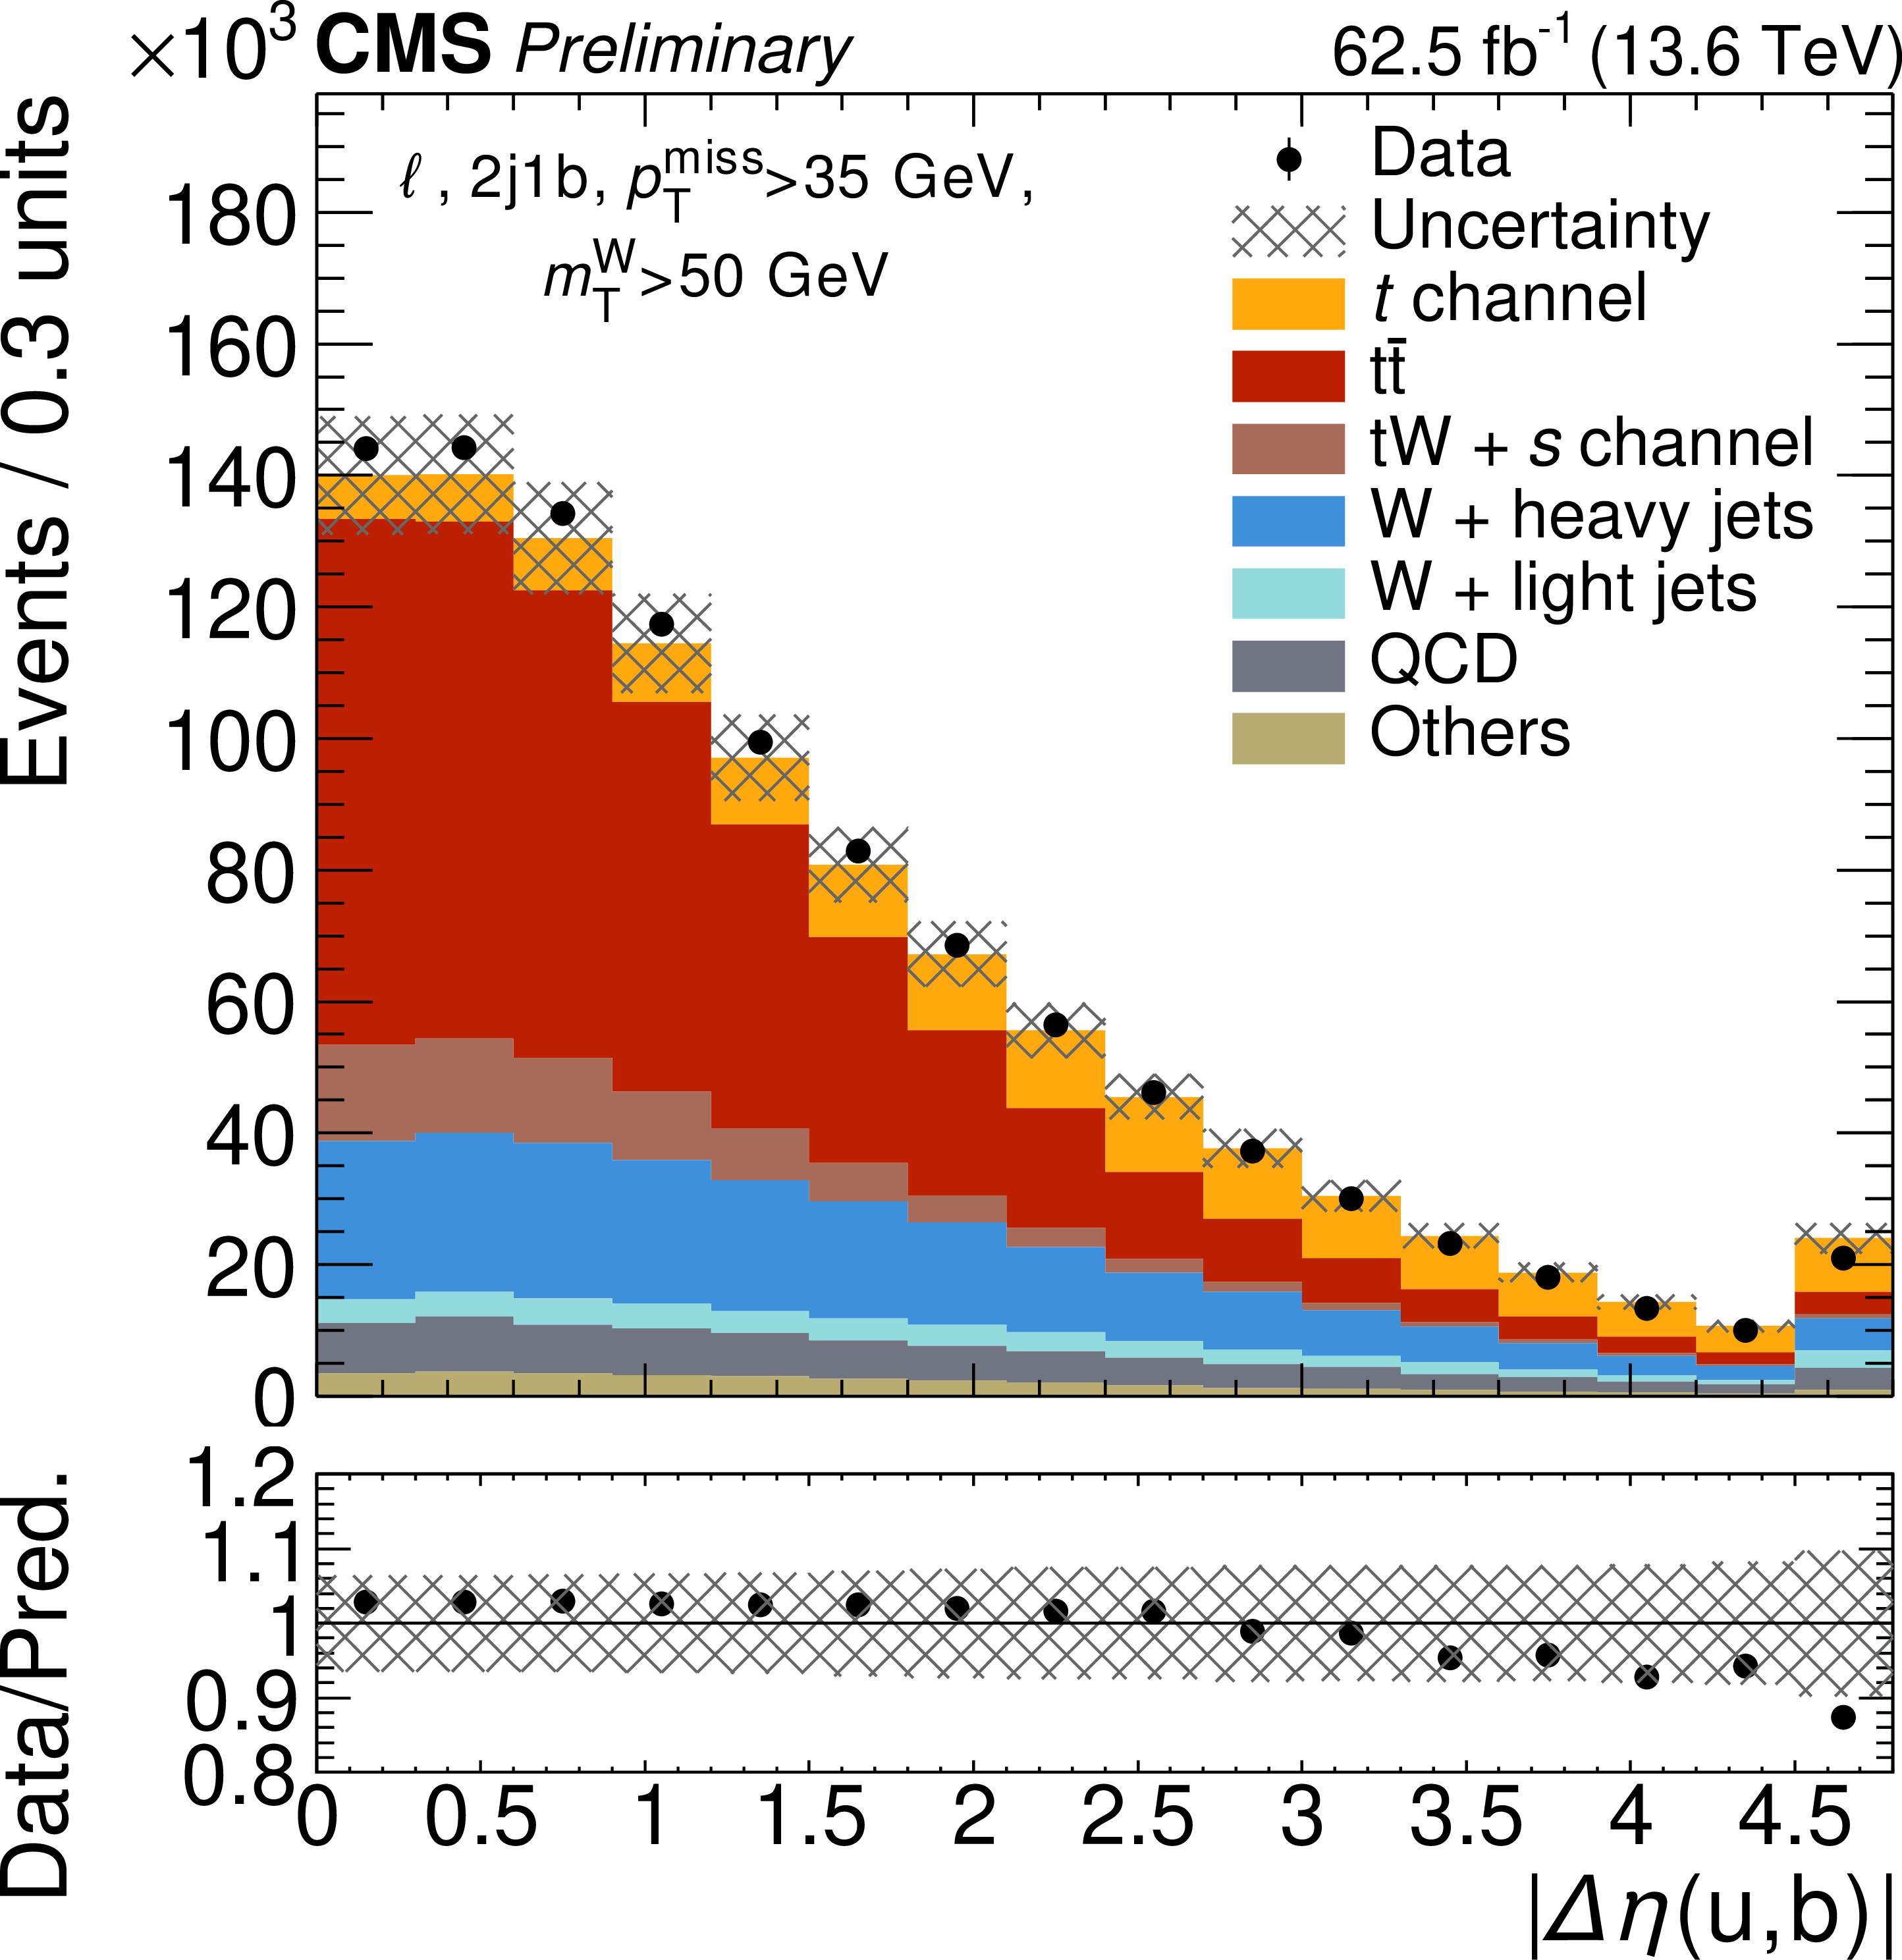
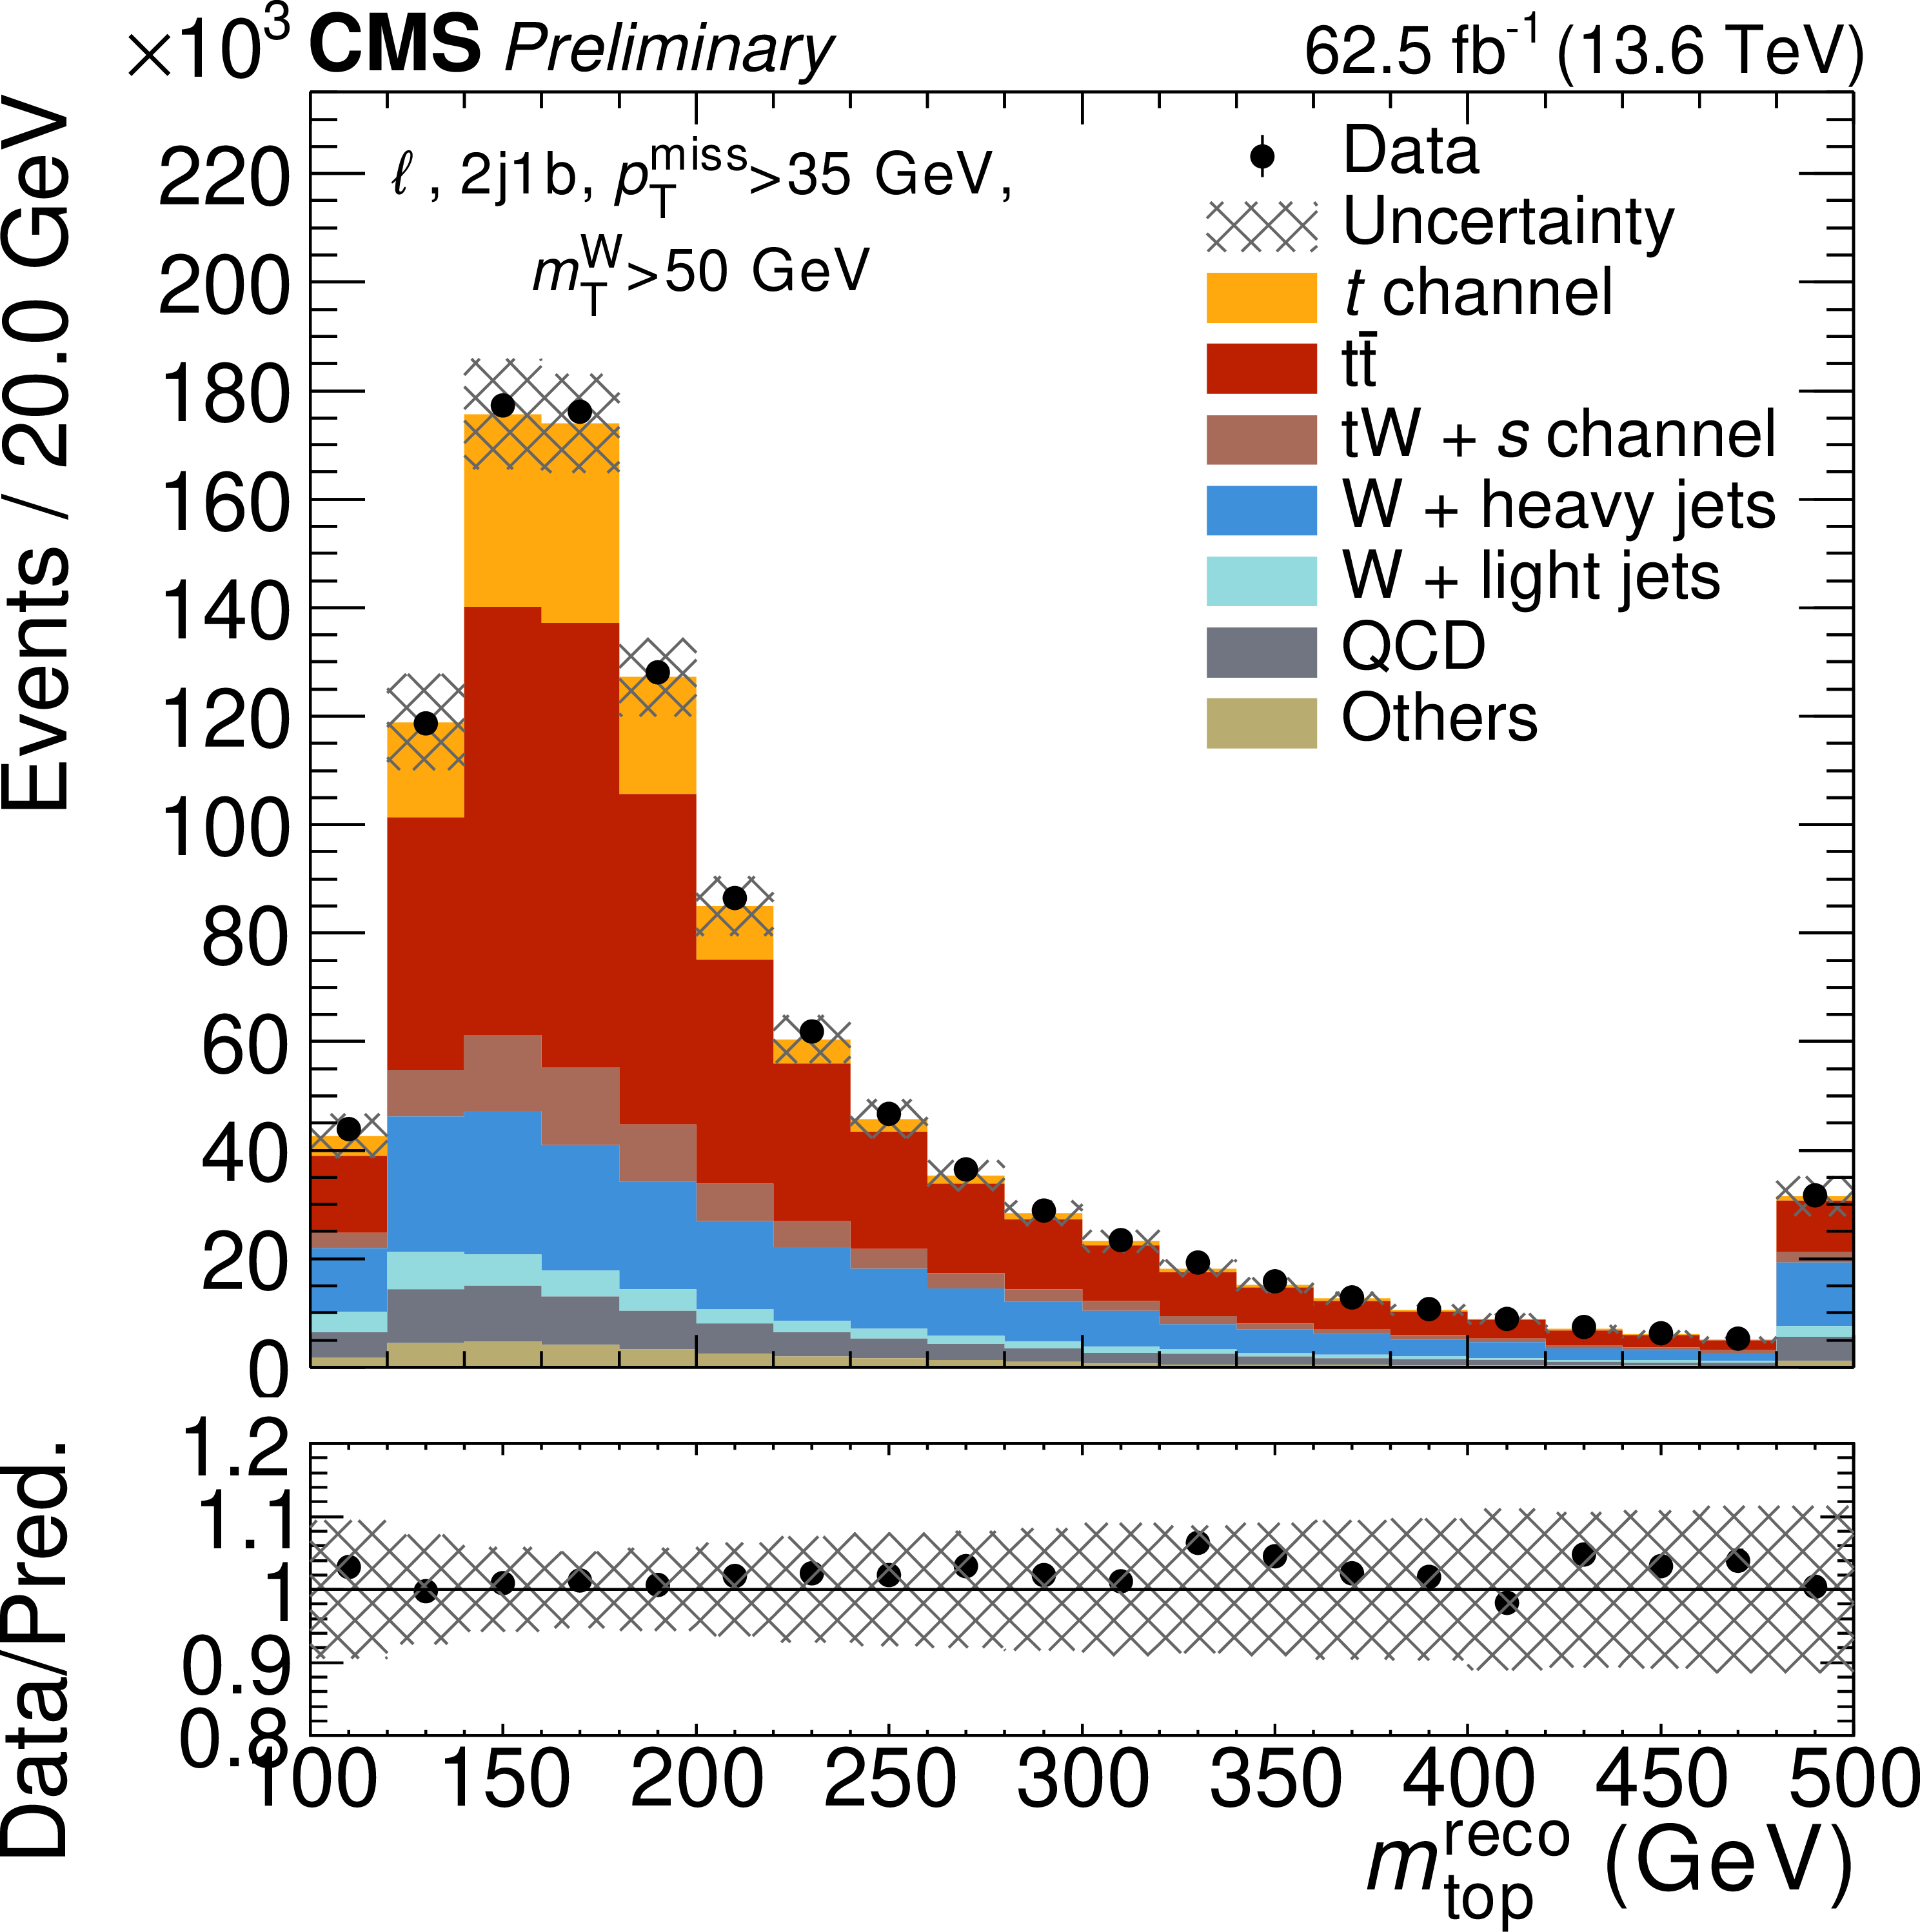
Distributions of the most discriminating input variables used in the DNN training for events in the signal region described in Section 5. From top left to bottom right, the distributions show the invariant mass of the light and b-tagged jet, $ m_{\text{ub}} $; the sum of the $ p_{\mathrm{T}} $ of the jets, $ p_{\mathrm{T}}^\text{miss} $ and the lepton, $ H_{\text{T}}' $; the difference of $ \eta $ between the light jet and the b-tagged jet, $ |\Delta \eta_{\text{ub}}| $, and the reconstructed mass of the top quark, $ m_{\mathrm{top}}^{\mathrm{reco}} $. The shaded bands represent the uncertainties in the predictions while the vertical bars on the data points represent the statistical uncertainties. The subdominant contribution of the $ \mathrm{Z}/\gamma^\star $, VV, VVV and ttX processes is included in "Others". The last bin of each distribution includes overflow events. |
png pdf |
Figure 3-a:
Distributions of the most discriminating input variables used in the DNN training for events in the signal region described in Section 5. From top left to bottom right, the distributions show the invariant mass of the light and b-tagged jet, $ m_{\text{ub}} $; the sum of the $ p_{\mathrm{T}} $ of the jets, $ p_{\mathrm{T}}^\text{miss} $ and the lepton, $ H_{\text{T}}' $; the difference of $ \eta $ between the light jet and the b-tagged jet, $ |\Delta \eta_{\text{ub}}| $, and the reconstructed mass of the top quark, $ m_{\mathrm{top}}^{\mathrm{reco}} $. The shaded bands represent the uncertainties in the predictions while the vertical bars on the data points represent the statistical uncertainties. The subdominant contribution of the $ \mathrm{Z}/\gamma^\star $, VV, VVV and ttX processes is included in "Others". The last bin of each distribution includes overflow events. |
png pdf |
Figure 3-b:
Distributions of the most discriminating input variables used in the DNN training for events in the signal region described in Section 5. From top left to bottom right, the distributions show the invariant mass of the light and b-tagged jet, $ m_{\text{ub}} $; the sum of the $ p_{\mathrm{T}} $ of the jets, $ p_{\mathrm{T}}^\text{miss} $ and the lepton, $ H_{\text{T}}' $; the difference of $ \eta $ between the light jet and the b-tagged jet, $ |\Delta \eta_{\text{ub}}| $, and the reconstructed mass of the top quark, $ m_{\mathrm{top}}^{\mathrm{reco}} $. The shaded bands represent the uncertainties in the predictions while the vertical bars on the data points represent the statistical uncertainties. The subdominant contribution of the $ \mathrm{Z}/\gamma^\star $, VV, VVV and ttX processes is included in "Others". The last bin of each distribution includes overflow events. |
png pdf |
Figure 3-c:
Distributions of the most discriminating input variables used in the DNN training for events in the signal region described in Section 5. From top left to bottom right, the distributions show the invariant mass of the light and b-tagged jet, $ m_{\text{ub}} $; the sum of the $ p_{\mathrm{T}} $ of the jets, $ p_{\mathrm{T}}^\text{miss} $ and the lepton, $ H_{\text{T}}' $; the difference of $ \eta $ between the light jet and the b-tagged jet, $ |\Delta \eta_{\text{ub}}| $, and the reconstructed mass of the top quark, $ m_{\mathrm{top}}^{\mathrm{reco}} $. The shaded bands represent the uncertainties in the predictions while the vertical bars on the data points represent the statistical uncertainties. The subdominant contribution of the $ \mathrm{Z}/\gamma^\star $, VV, VVV and ttX processes is included in "Others". The last bin of each distribution includes overflow events. |
png pdf |
Figure 3-d:
Distributions of the most discriminating input variables used in the DNN training for events in the signal region described in Section 5. From top left to bottom right, the distributions show the invariant mass of the light and b-tagged jet, $ m_{\text{ub}} $; the sum of the $ p_{\mathrm{T}} $ of the jets, $ p_{\mathrm{T}}^\text{miss} $ and the lepton, $ H_{\text{T}}' $; the difference of $ \eta $ between the light jet and the b-tagged jet, $ |\Delta \eta_{\text{ub}}| $, and the reconstructed mass of the top quark, $ m_{\mathrm{top}}^{\mathrm{reco}} $. The shaded bands represent the uncertainties in the predictions while the vertical bars on the data points represent the statistical uncertainties. The subdominant contribution of the $ \mathrm{Z}/\gamma^\star $, VV, VVV and ttX processes is included in "Others". The last bin of each distribution includes overflow events. |
png pdf |
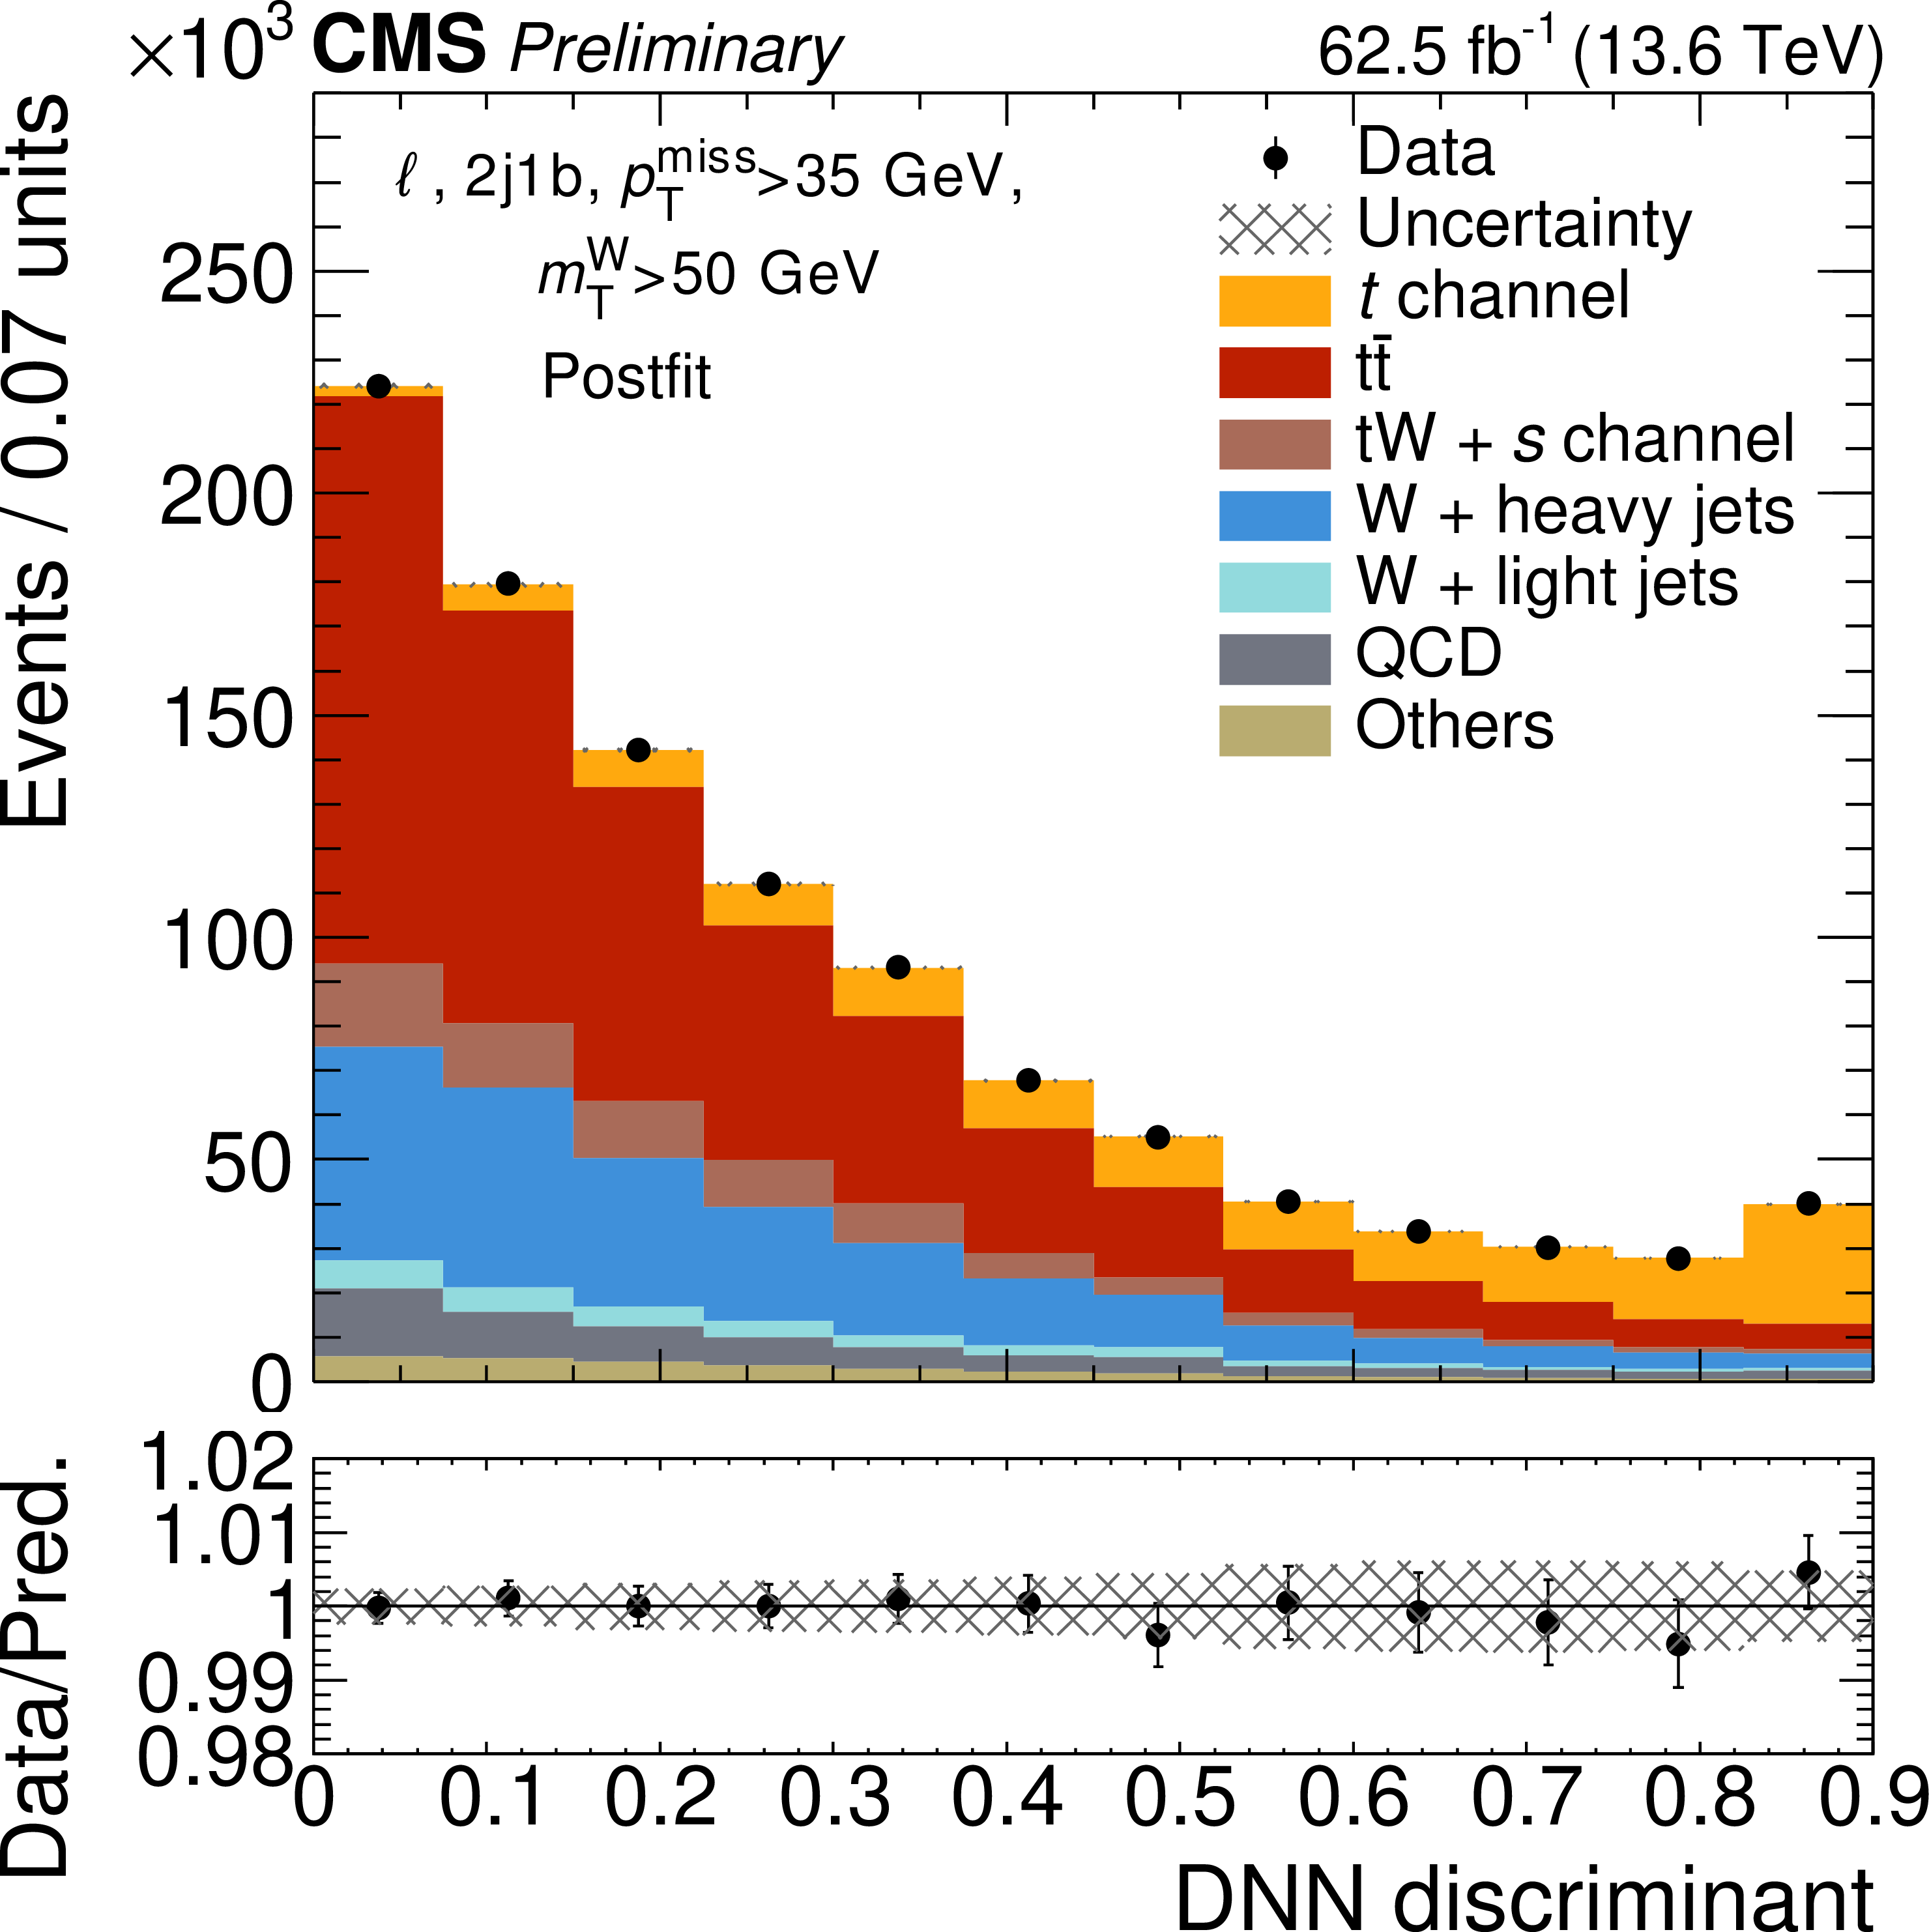
Figure 4:
Postfit DNN distribution for the combined 2022 and 2023 datasets. The shaded band represents the uncertainties in the predictions while the vertical bars on the data points represent the statistical uncertainties. The subdominant contribution of the $ \mathrm{Z}/\gamma^\star $, VV, VVV and ttX processes is included in "Others". The last bin includes overflow events. |
png pdf |
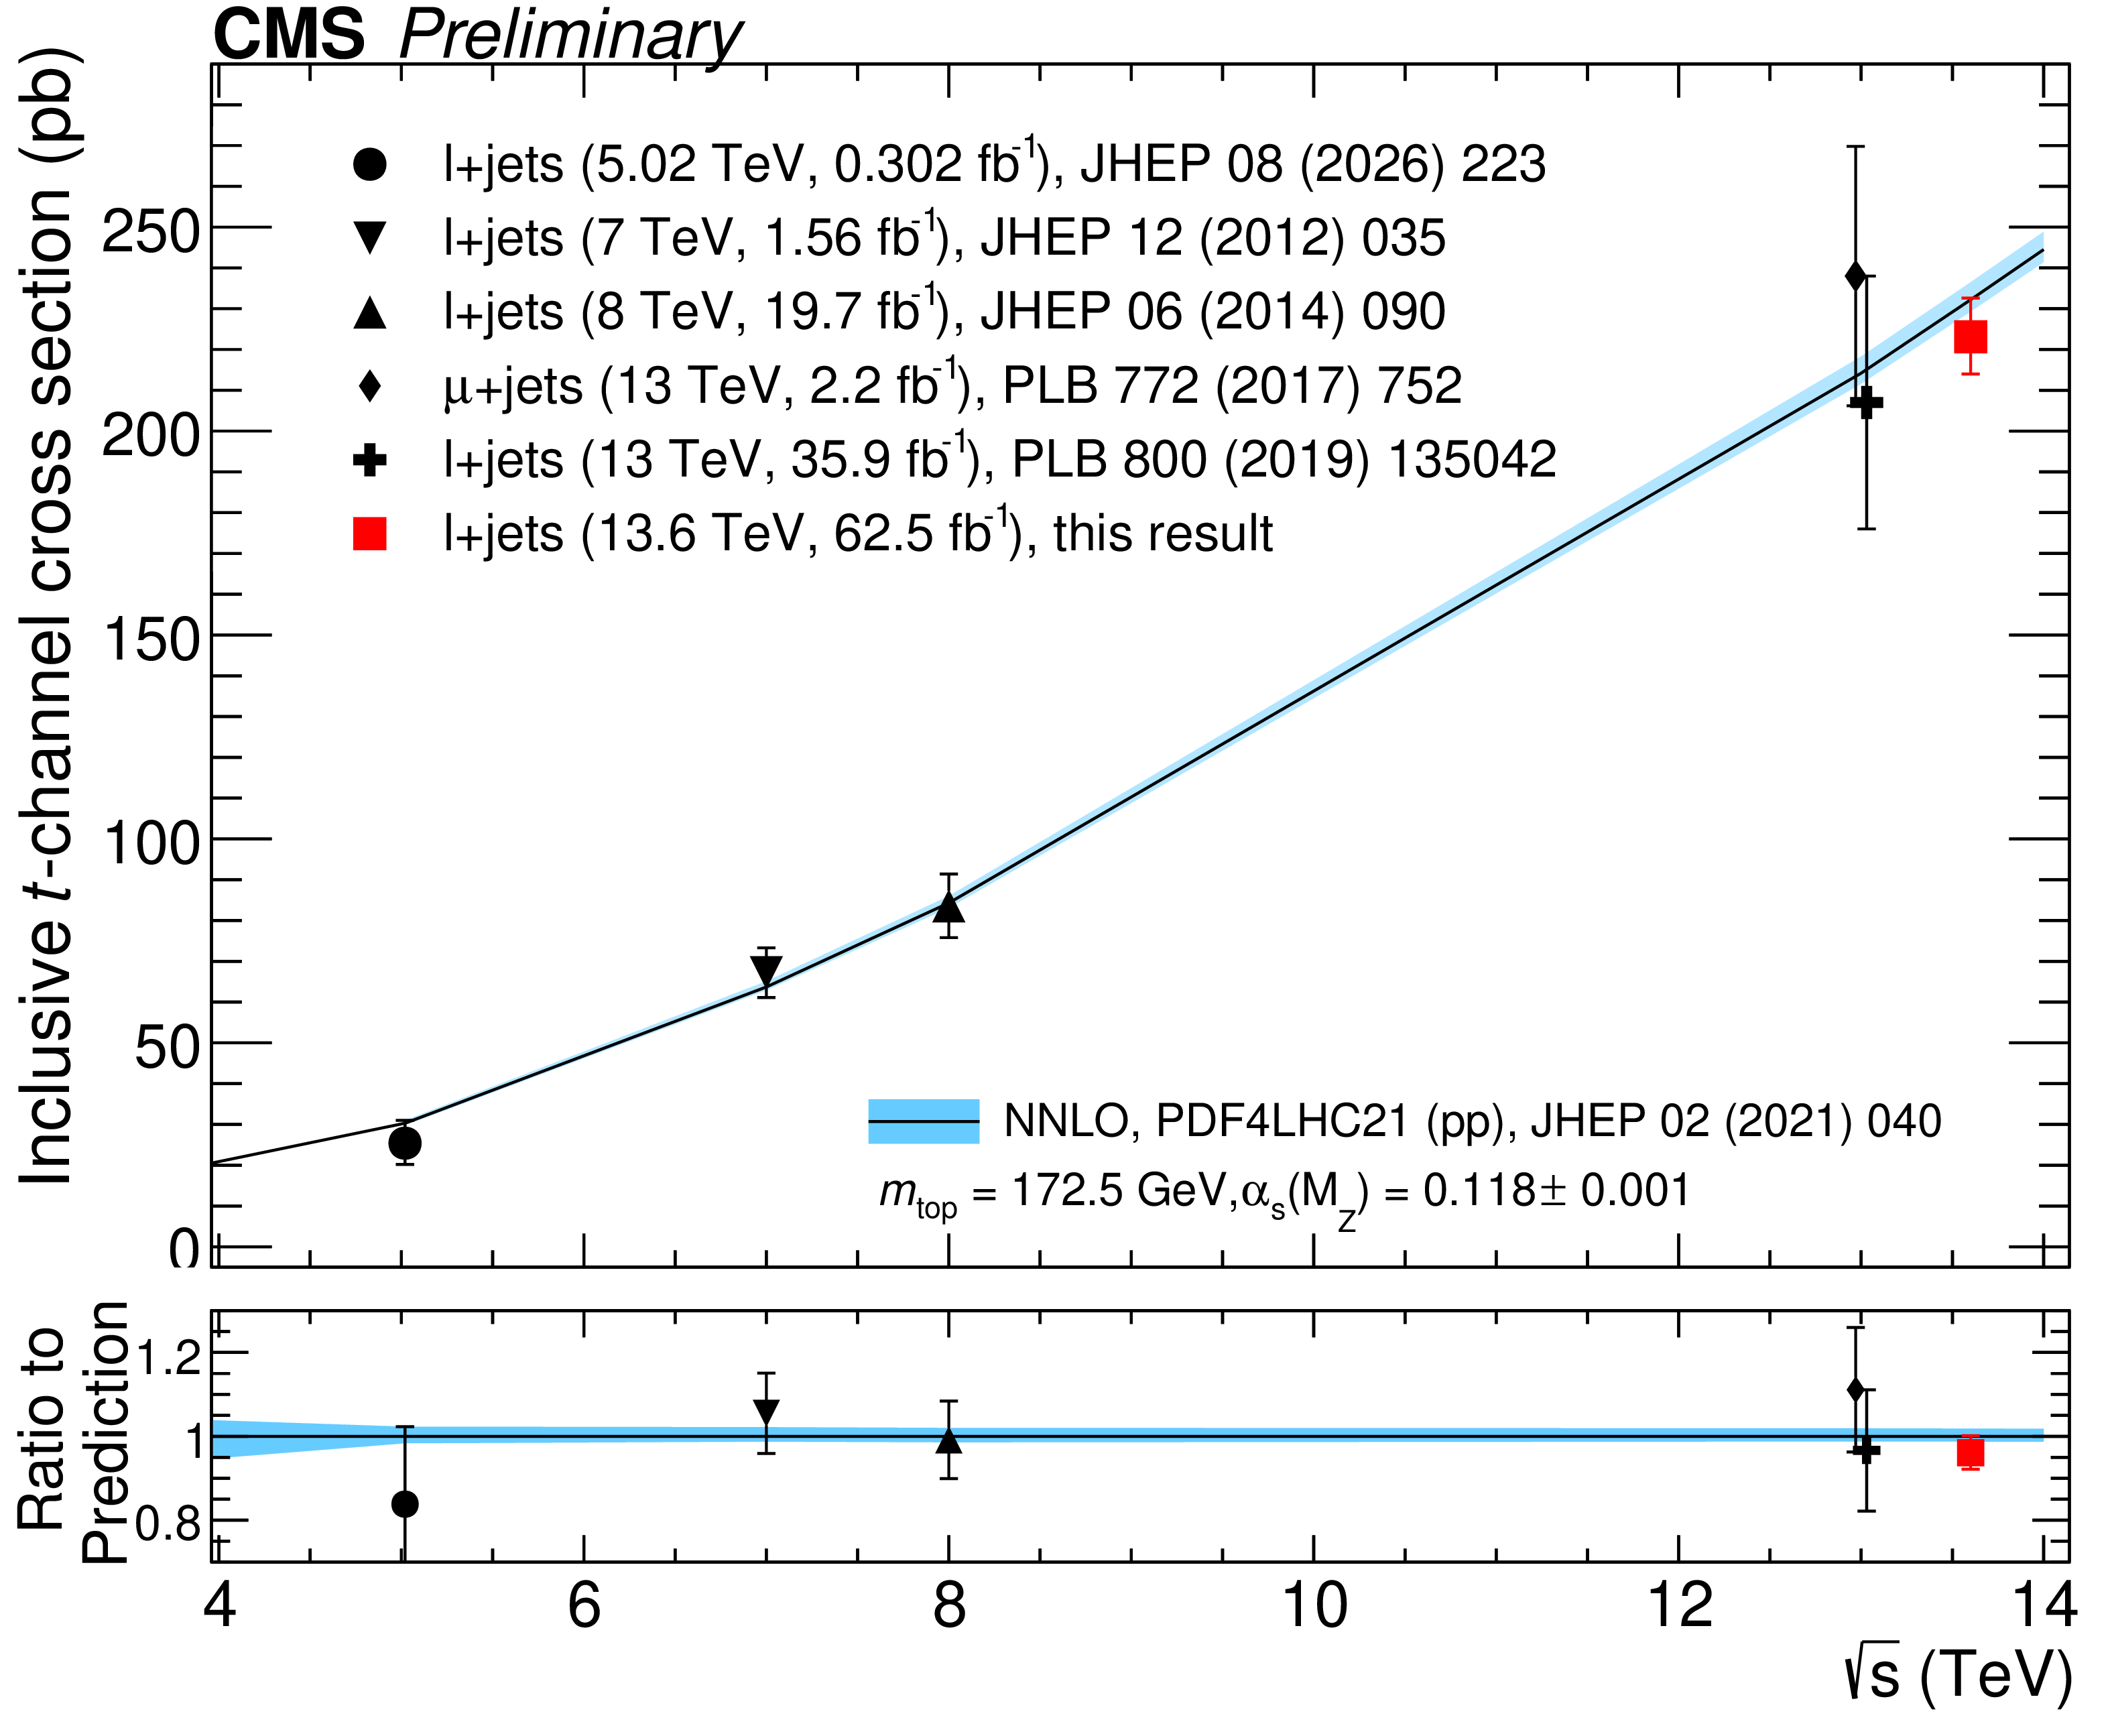
Figure 6:
Inclusive $ t $-channel production cross section as a function of center-of-mass energy, comparing CMS measurements with theoretical predictions [7,9,11,12,15,2]. |
png pdf |
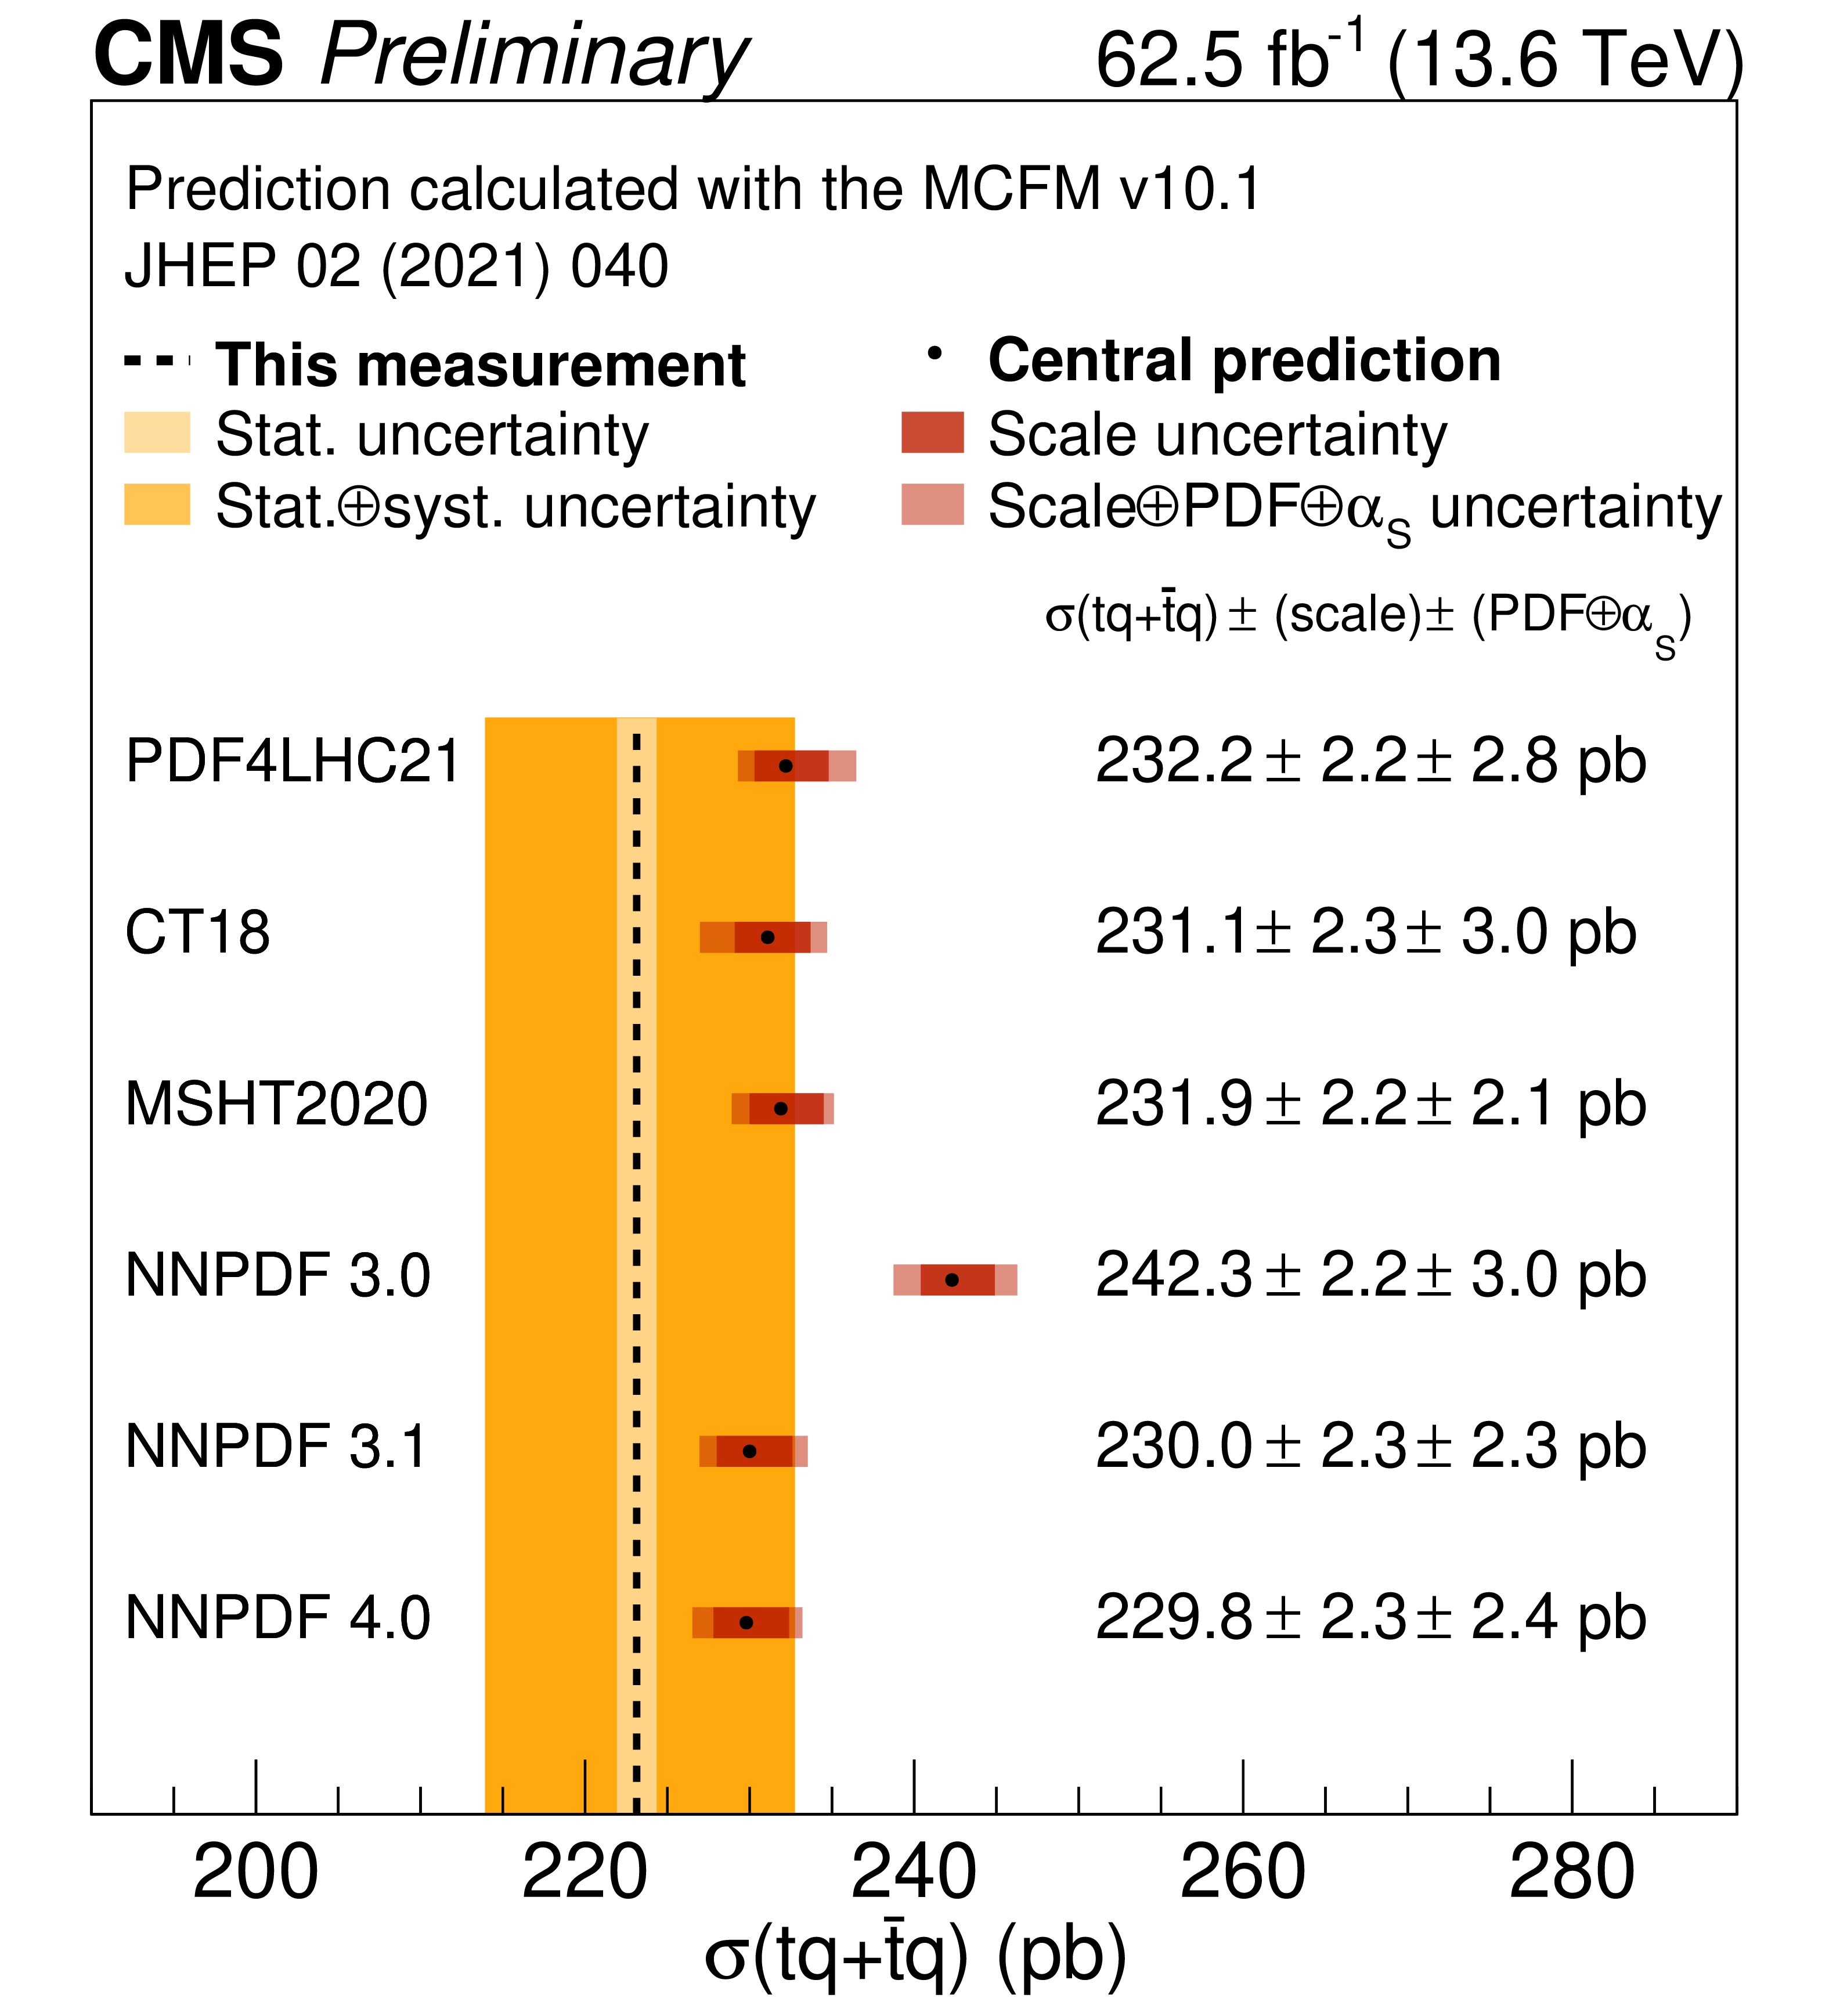
Figure 7:
Comparison of the measured inclusive cross section at $ \sqrt{s}= $ 13.6 TeV with predictions using different PDF sets [1]. |
png pdf |
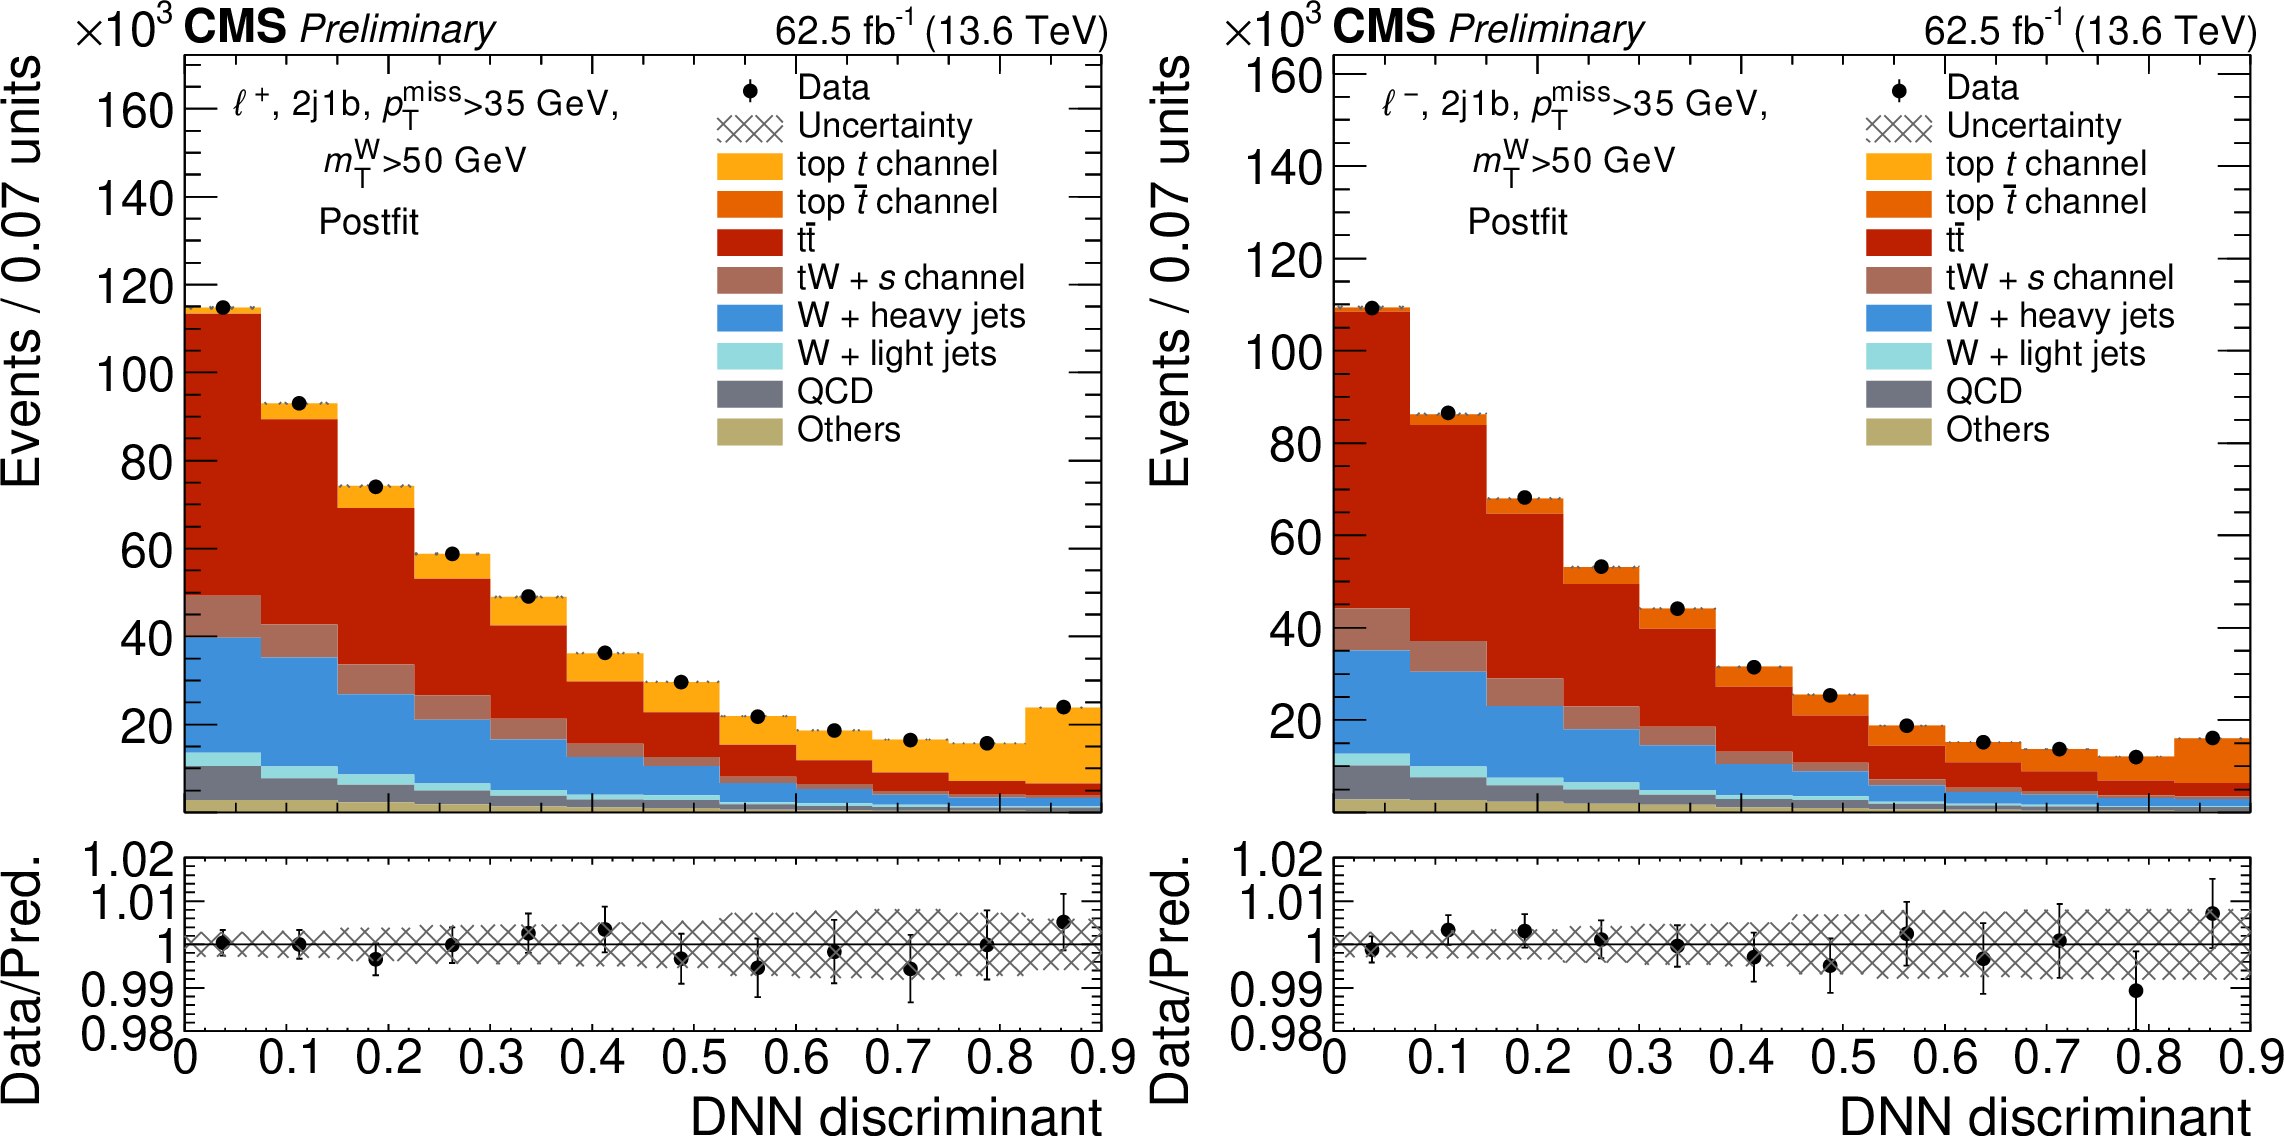
Figure 8:
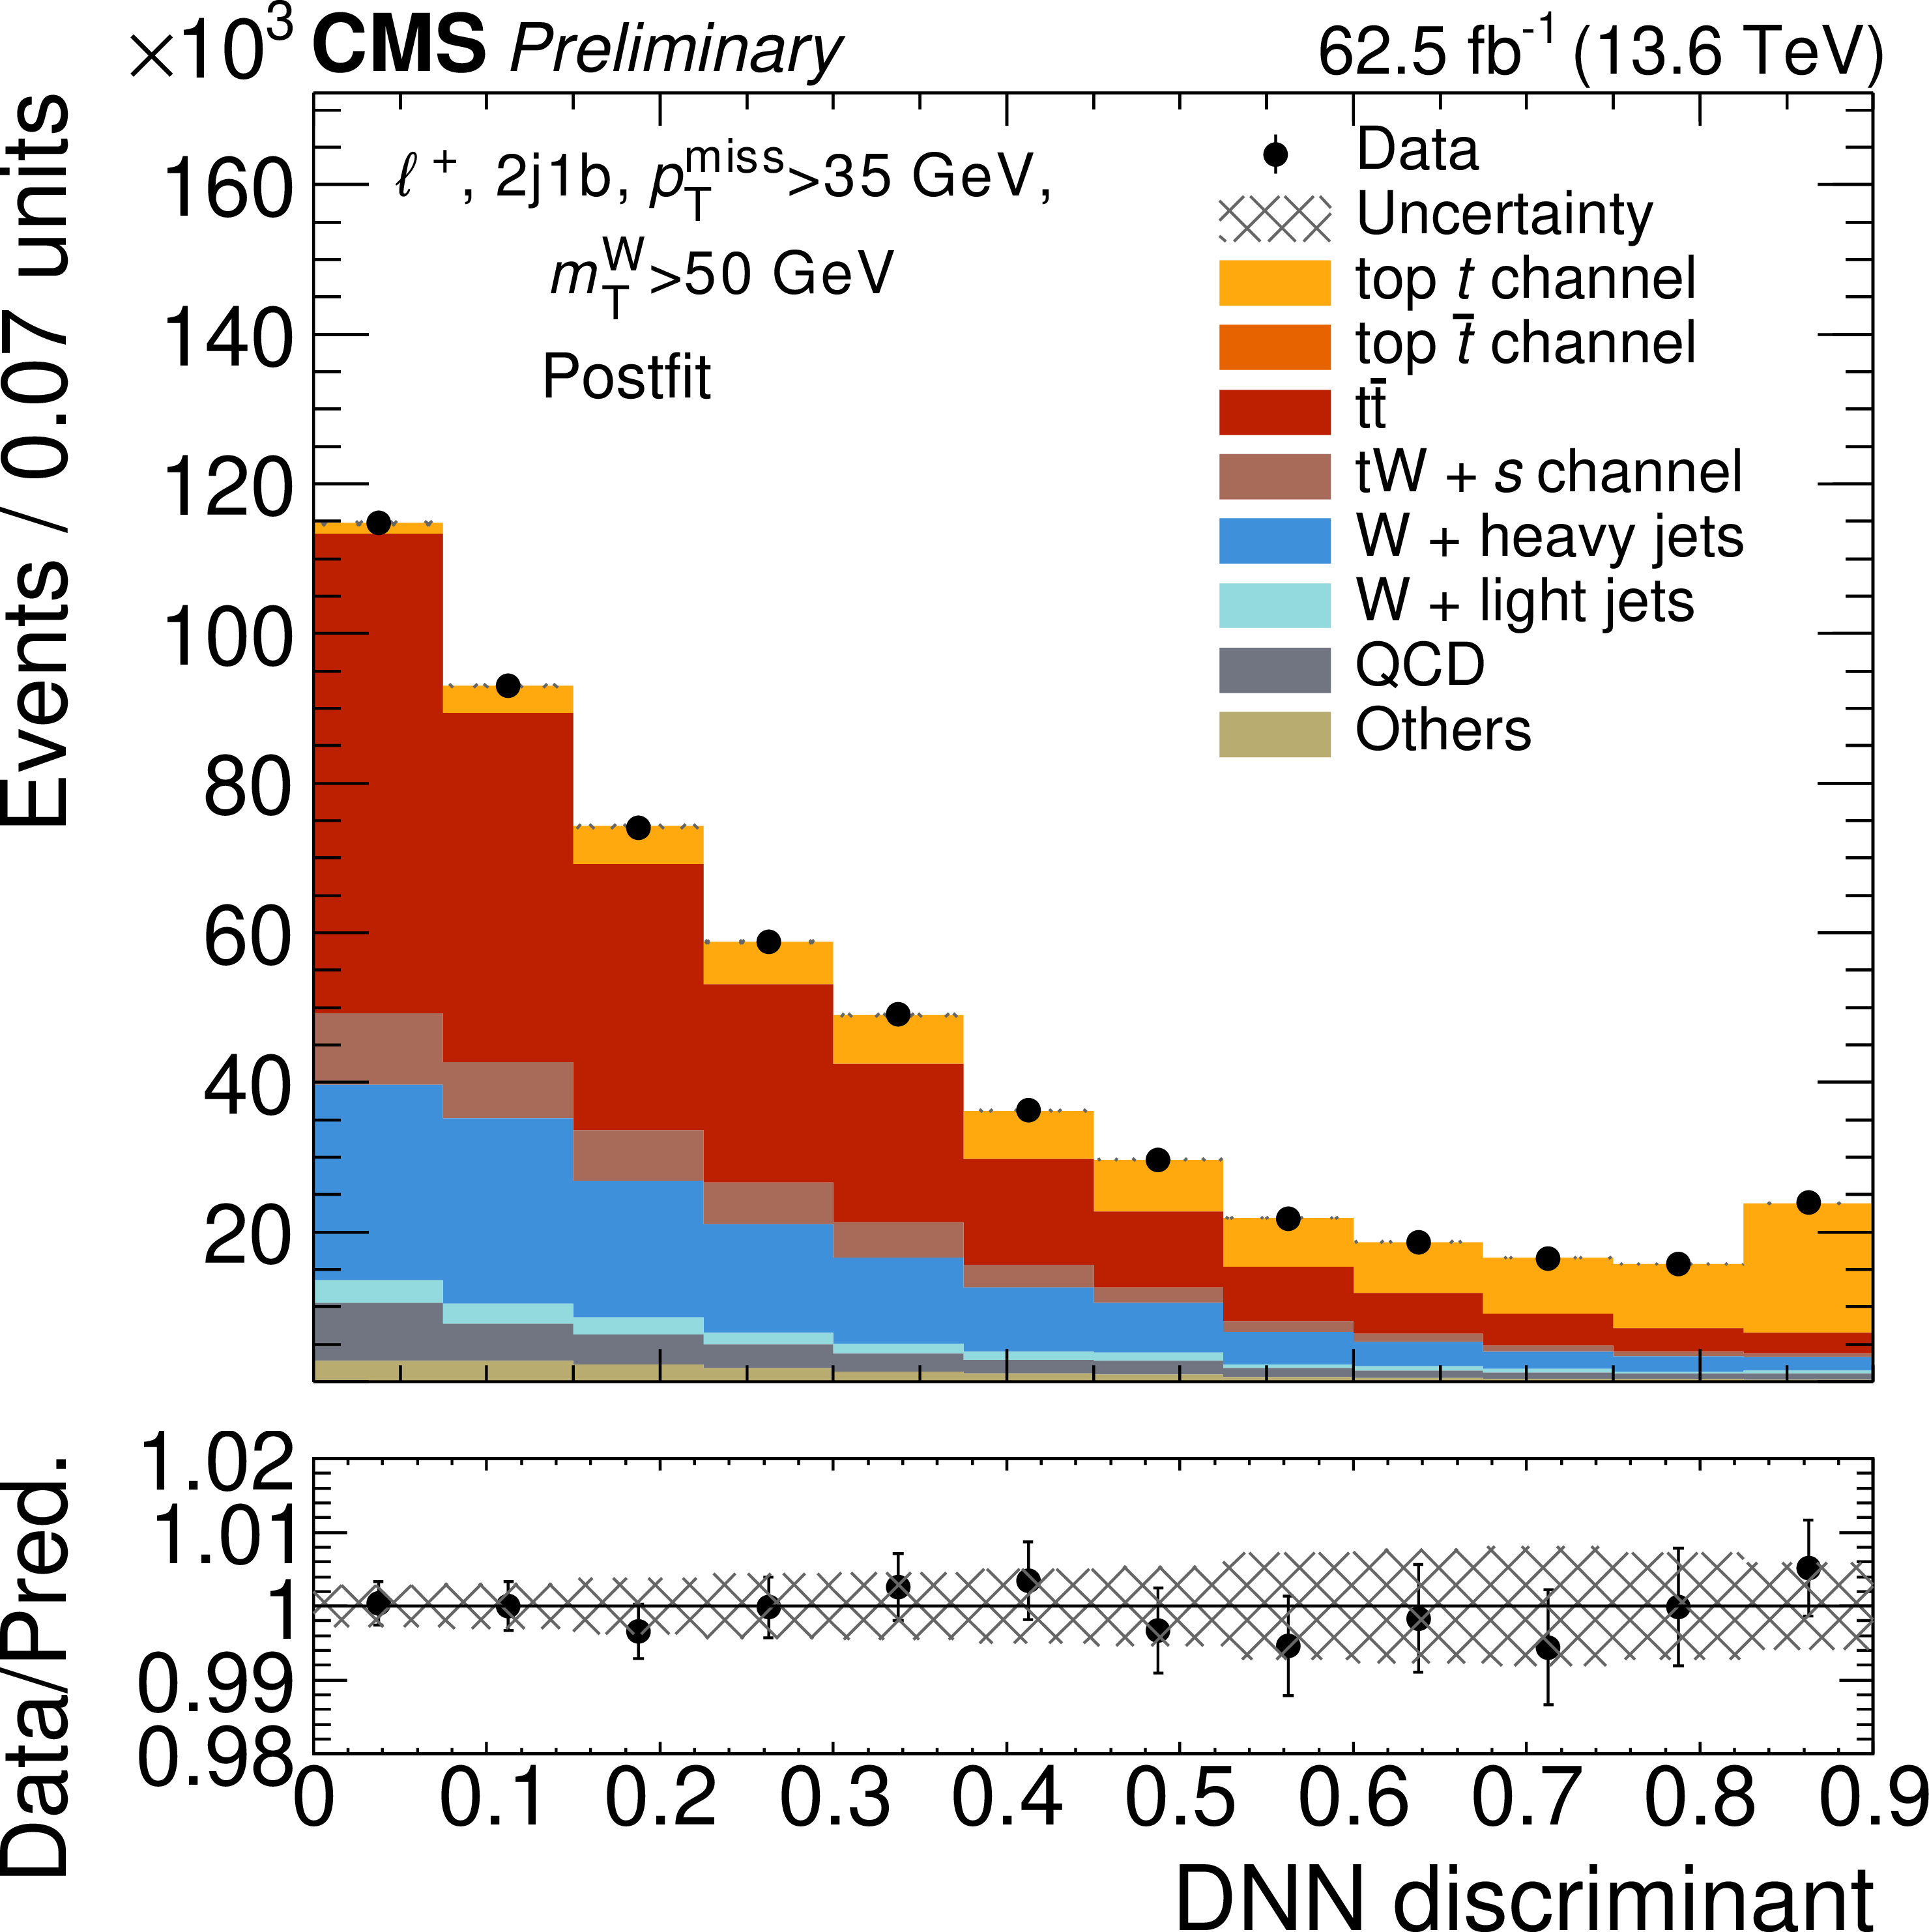
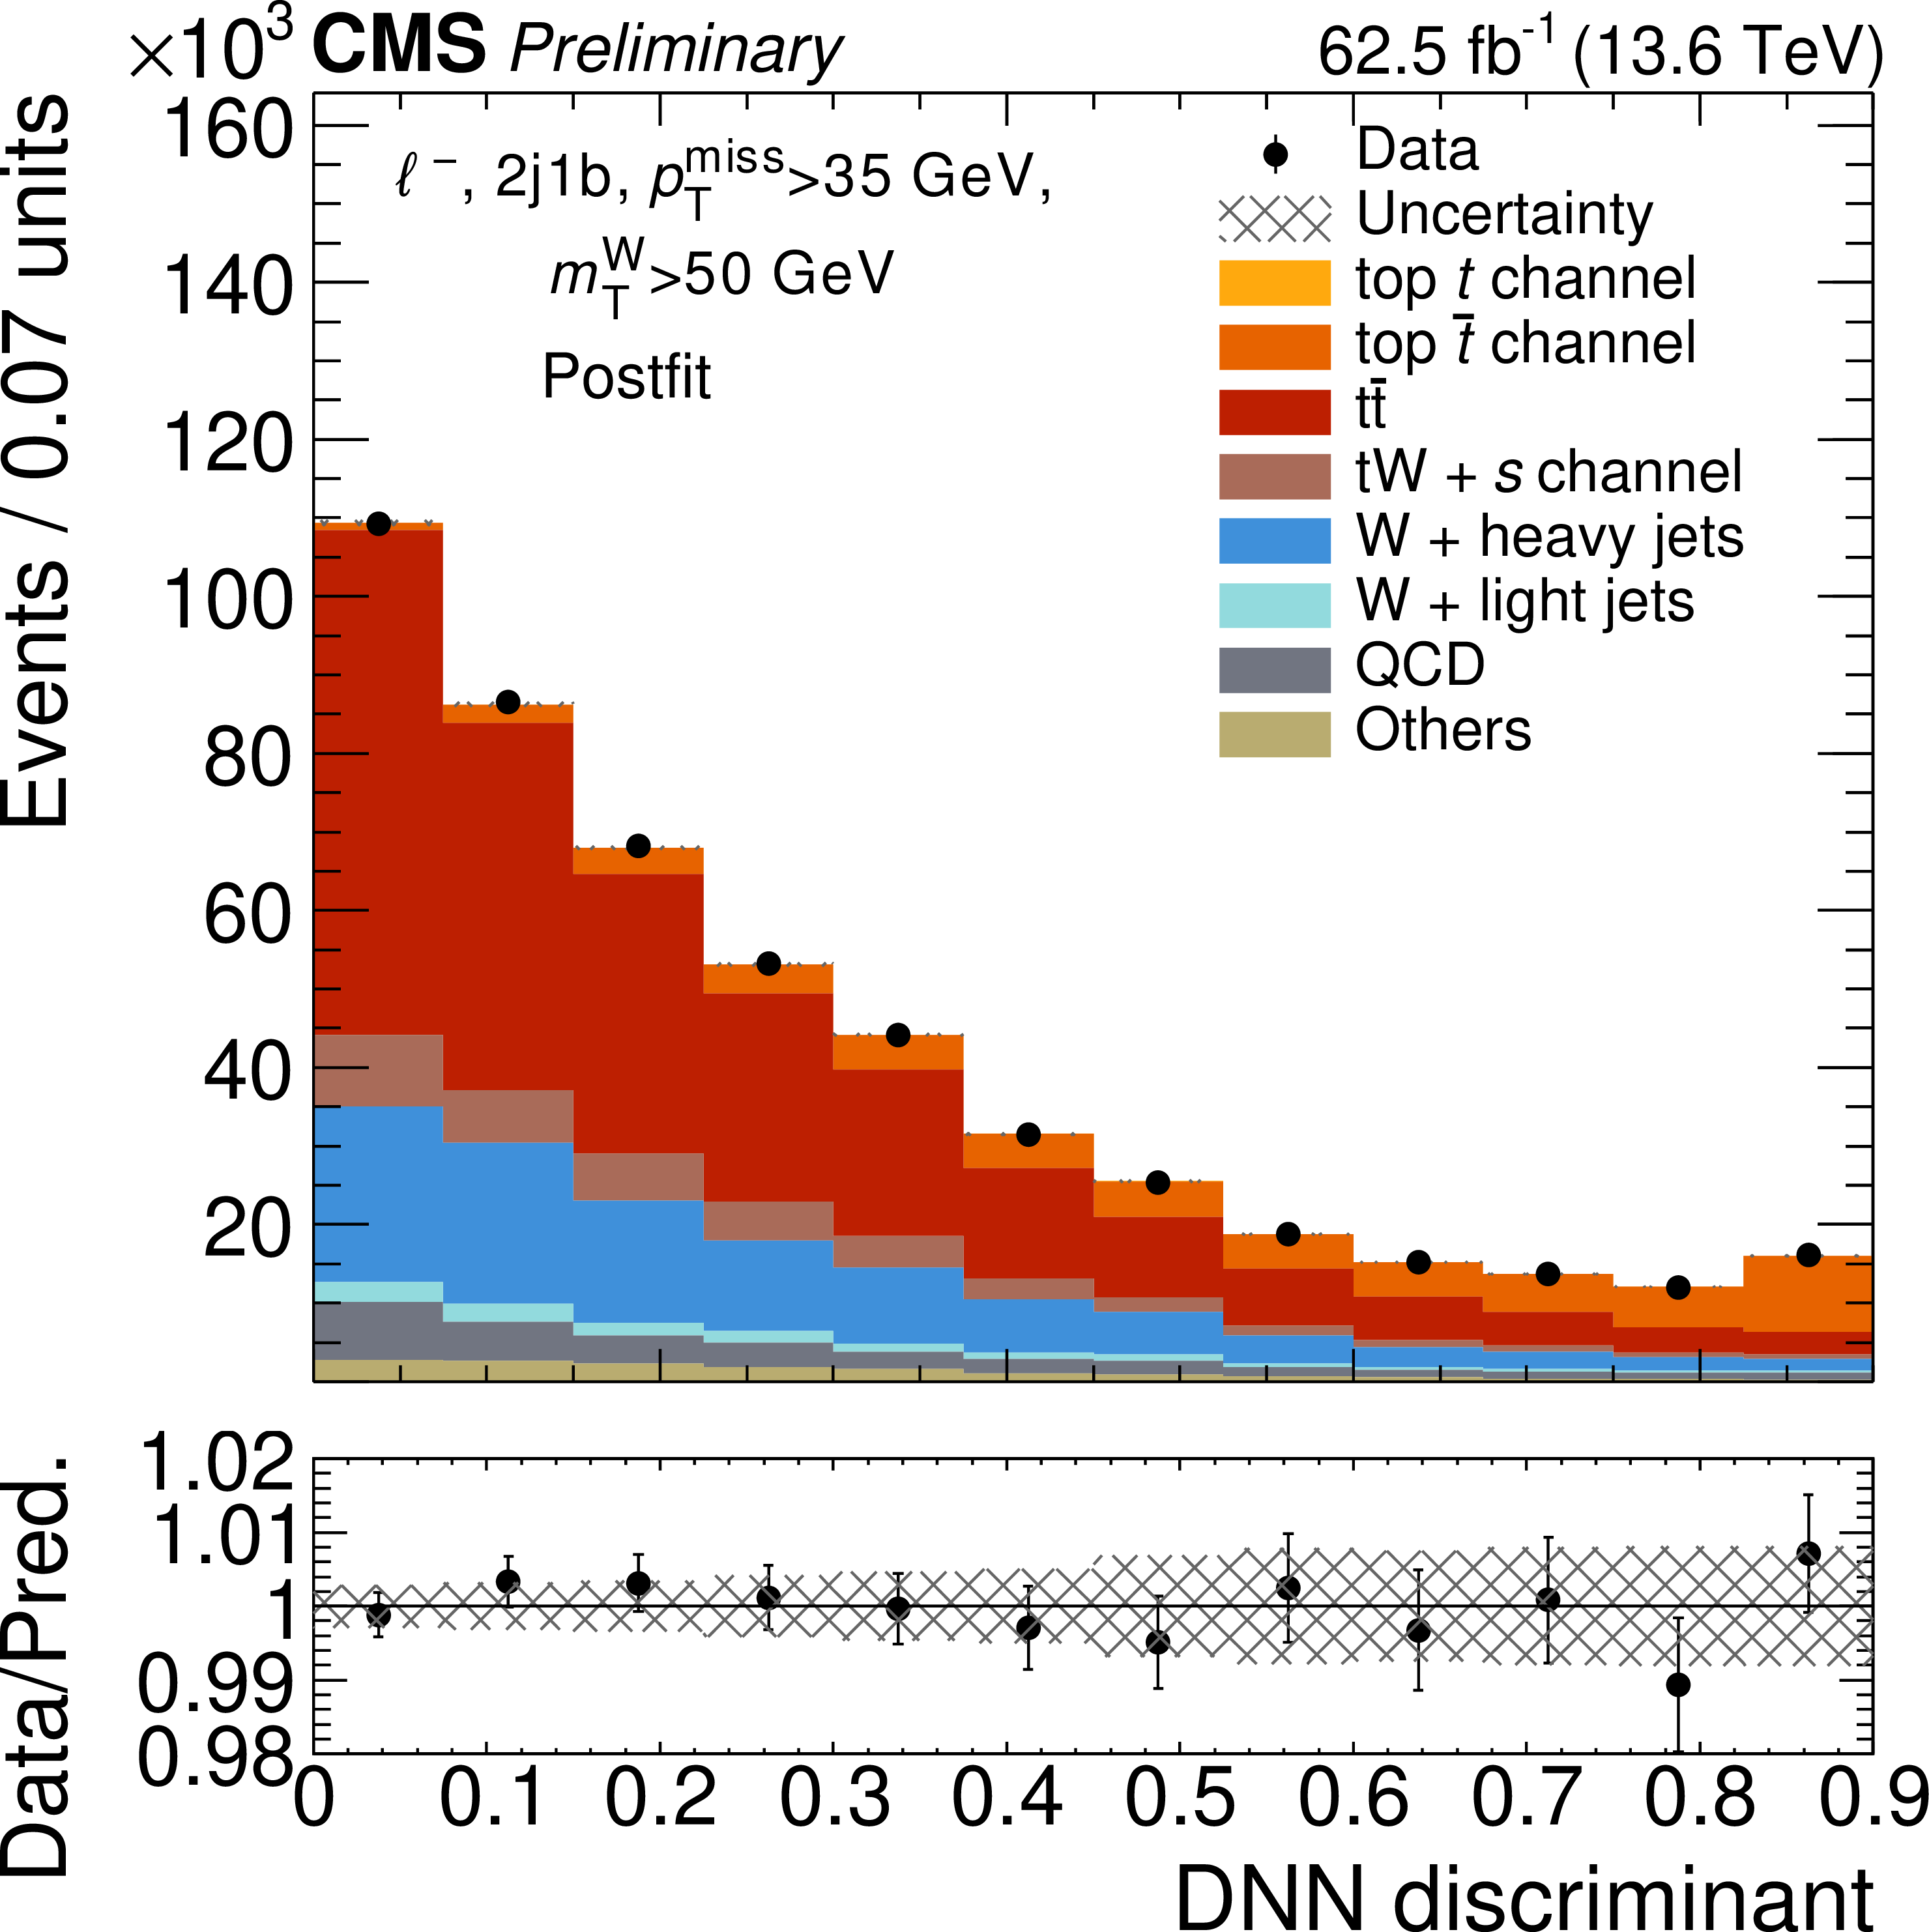
Postfit DNN distributions for the combined 2022 and 2023 datasets for events where the lepton has positive (negative) electric charge on the left (right). The shaded bands represent the uncertainties in the predictions while the vertical bars on the data points represent the statistical uncertainties. The subdominant contribution of the $ \mathrm{Z}/\gamma^\star $, VV, VVV and ttX processes is included in "Others". The last bin includes overflow events. |
png pdf |
Figure 8-a:
Postfit DNN distributions for the combined 2022 and 2023 datasets for events where the lepton has positive (negative) electric charge on the left (right). The shaded bands represent the uncertainties in the predictions while the vertical bars on the data points represent the statistical uncertainties. The subdominant contribution of the $ \mathrm{Z}/\gamma^\star $, VV, VVV and ttX processes is included in "Others". The last bin includes overflow events. |
png pdf |
Figure 8-b:
Postfit DNN distributions for the combined 2022 and 2023 datasets for events where the lepton has positive (negative) electric charge on the left (right). The shaded bands represent the uncertainties in the predictions while the vertical bars on the data points represent the statistical uncertainties. The subdominant contribution of the $ \mathrm{Z}/\gamma^\star $, VV, VVV and ttX processes is included in "Others". The last bin includes overflow events. |
png pdf |
Figure 9:
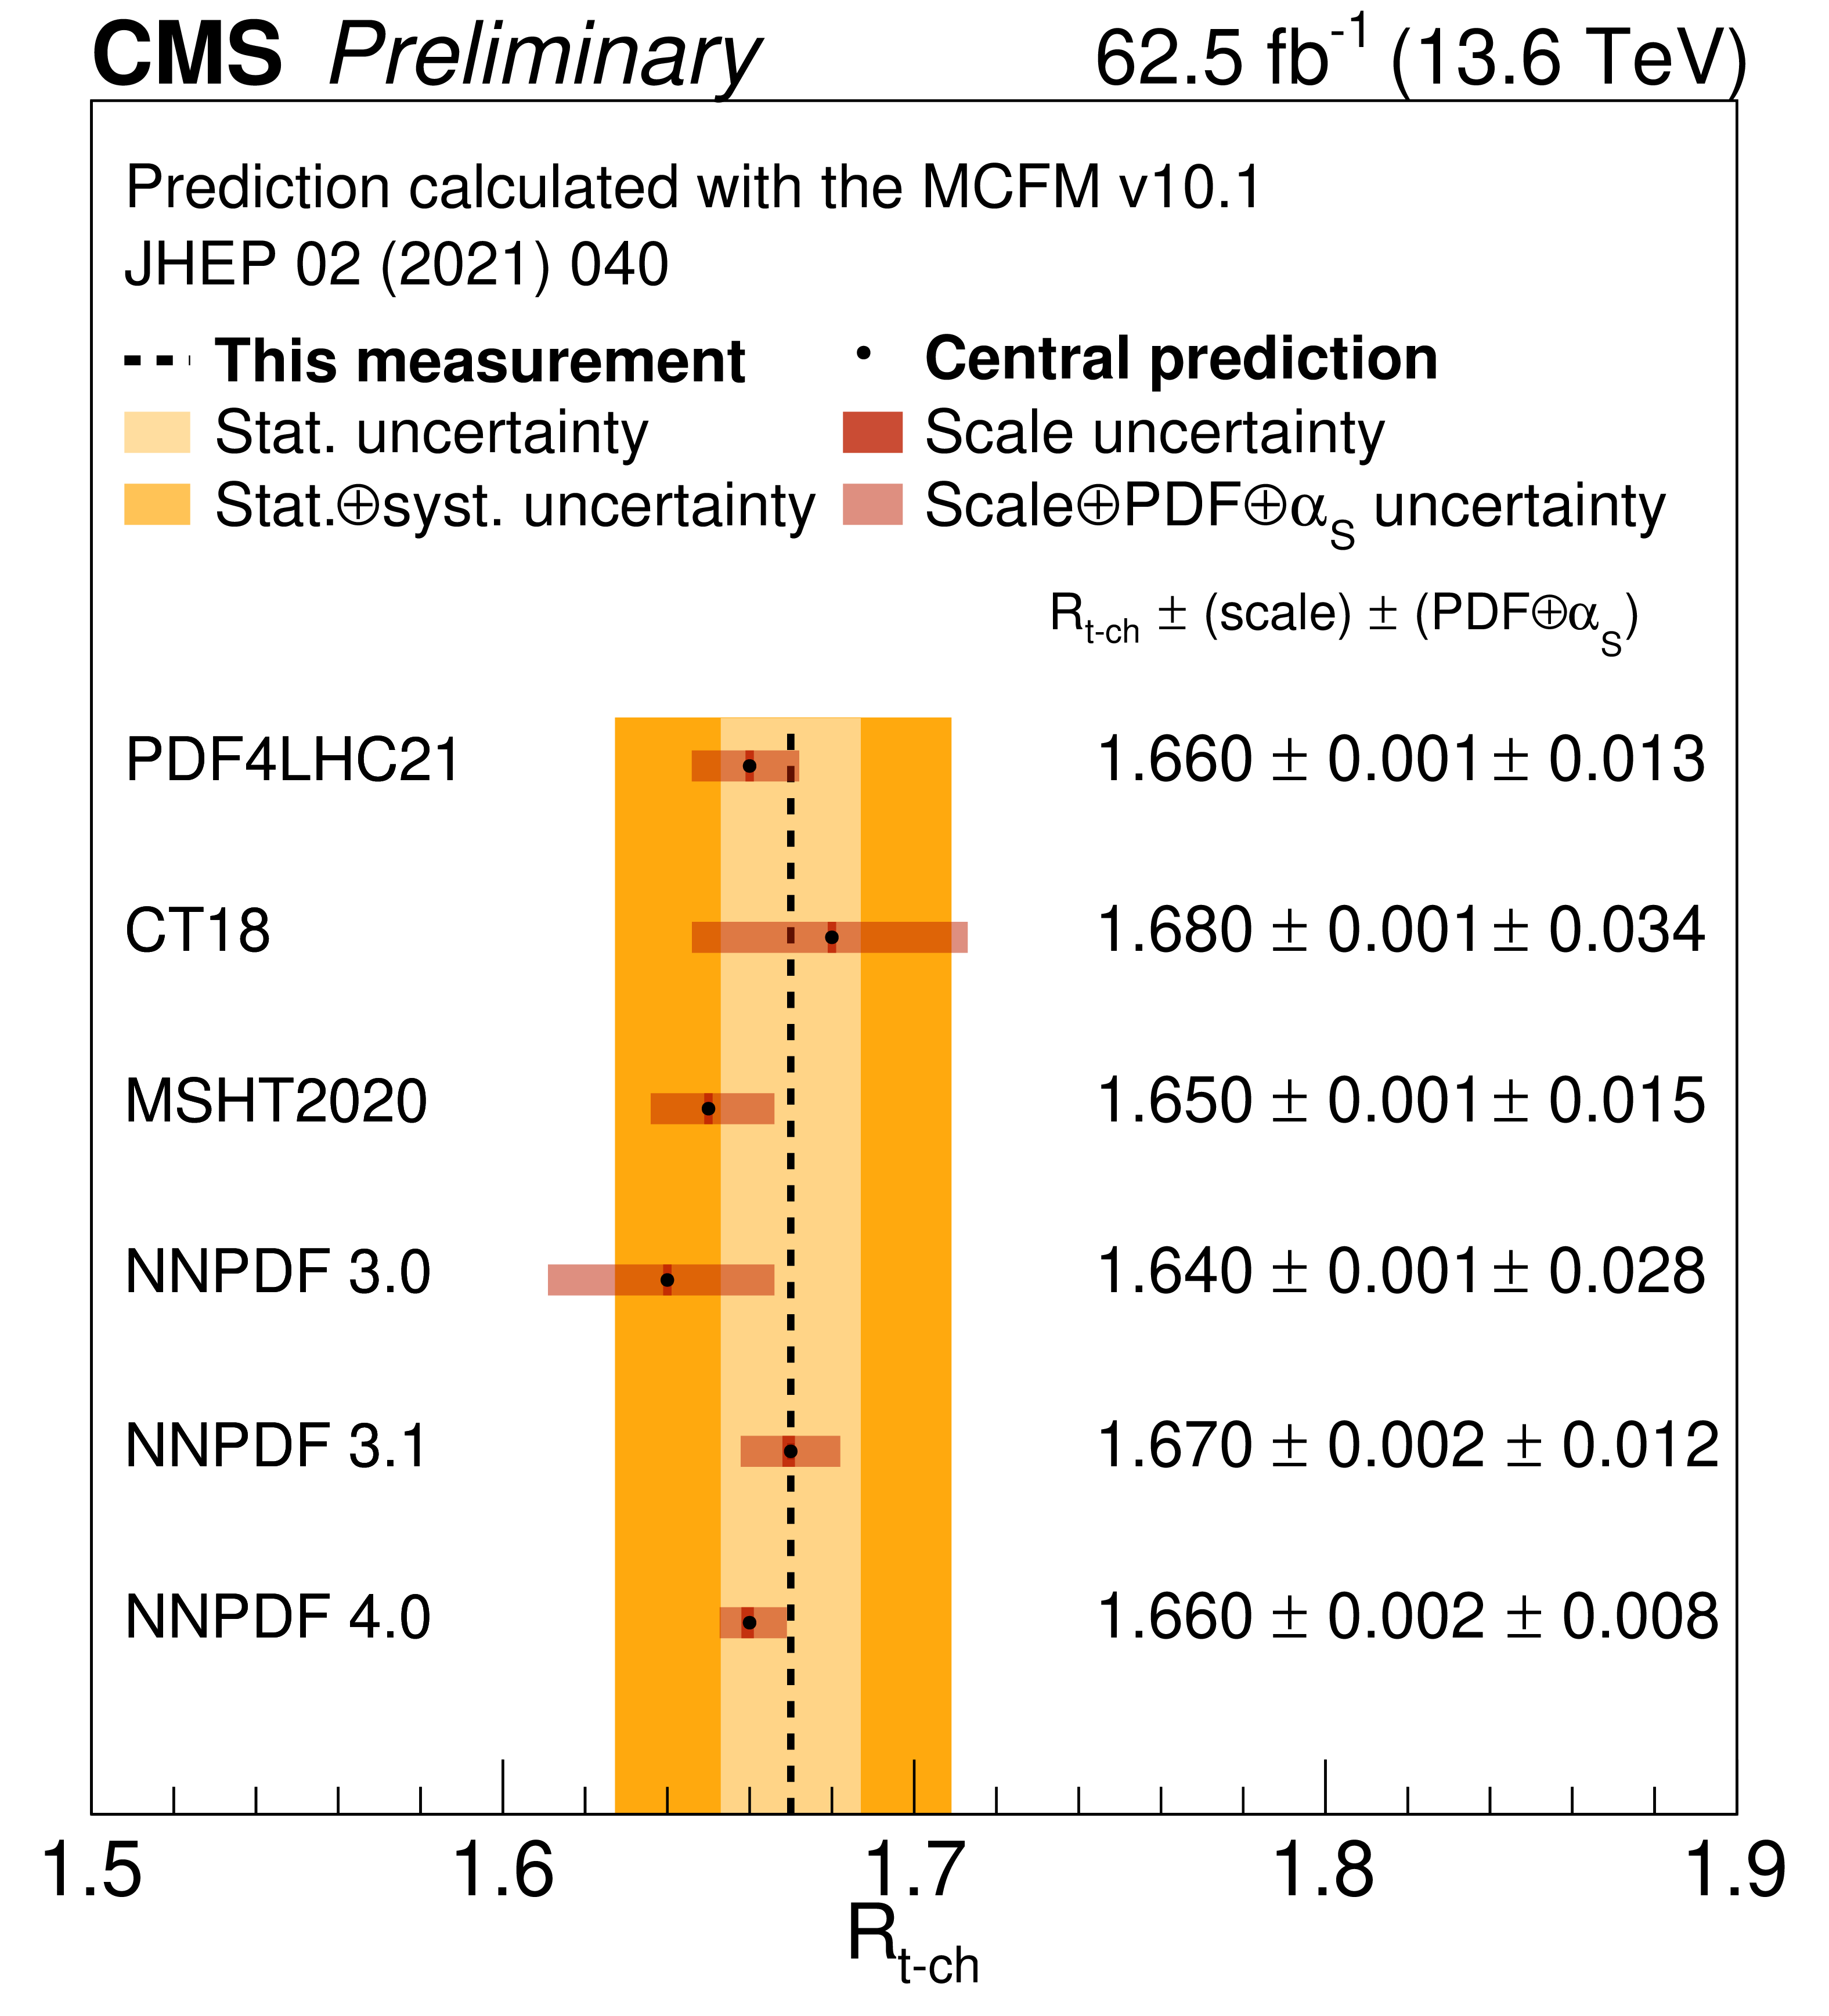
Comparison of the measured value of the ratio of $ \sigma (\mathrm{t}\mathrm{q}) $ and $ \sigma (\overline{\mathrm{t}}\mathrm{q}) $ at $ \sqrt{s}= $ 13.6 TeV with predictions using different PDF sets [1]. |
| Tables | |
png pdf |
Table 1:
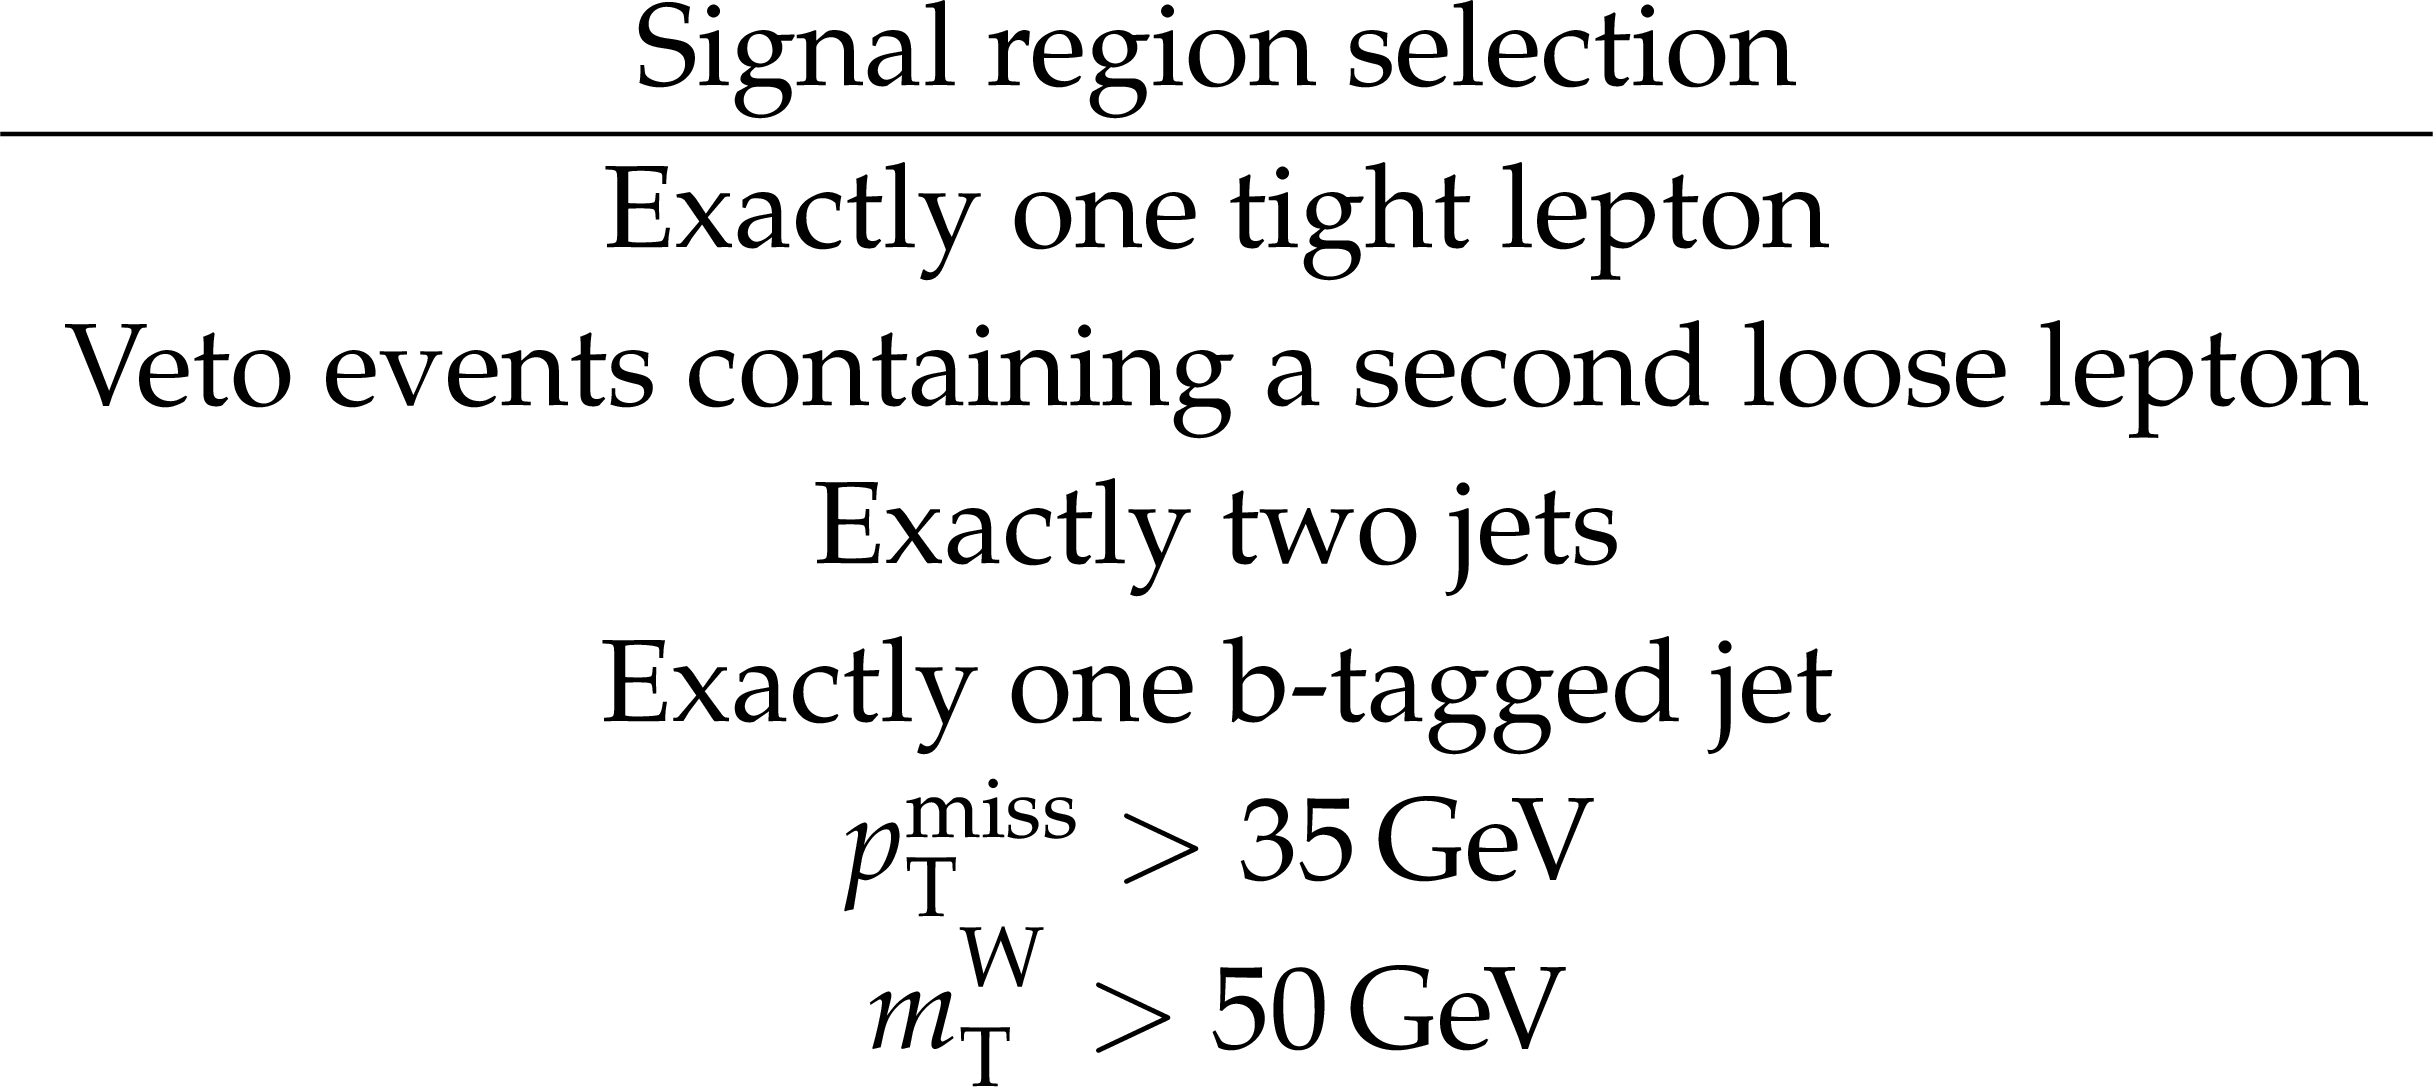
Summary of the event selection used to define the signal region. |
png pdf |
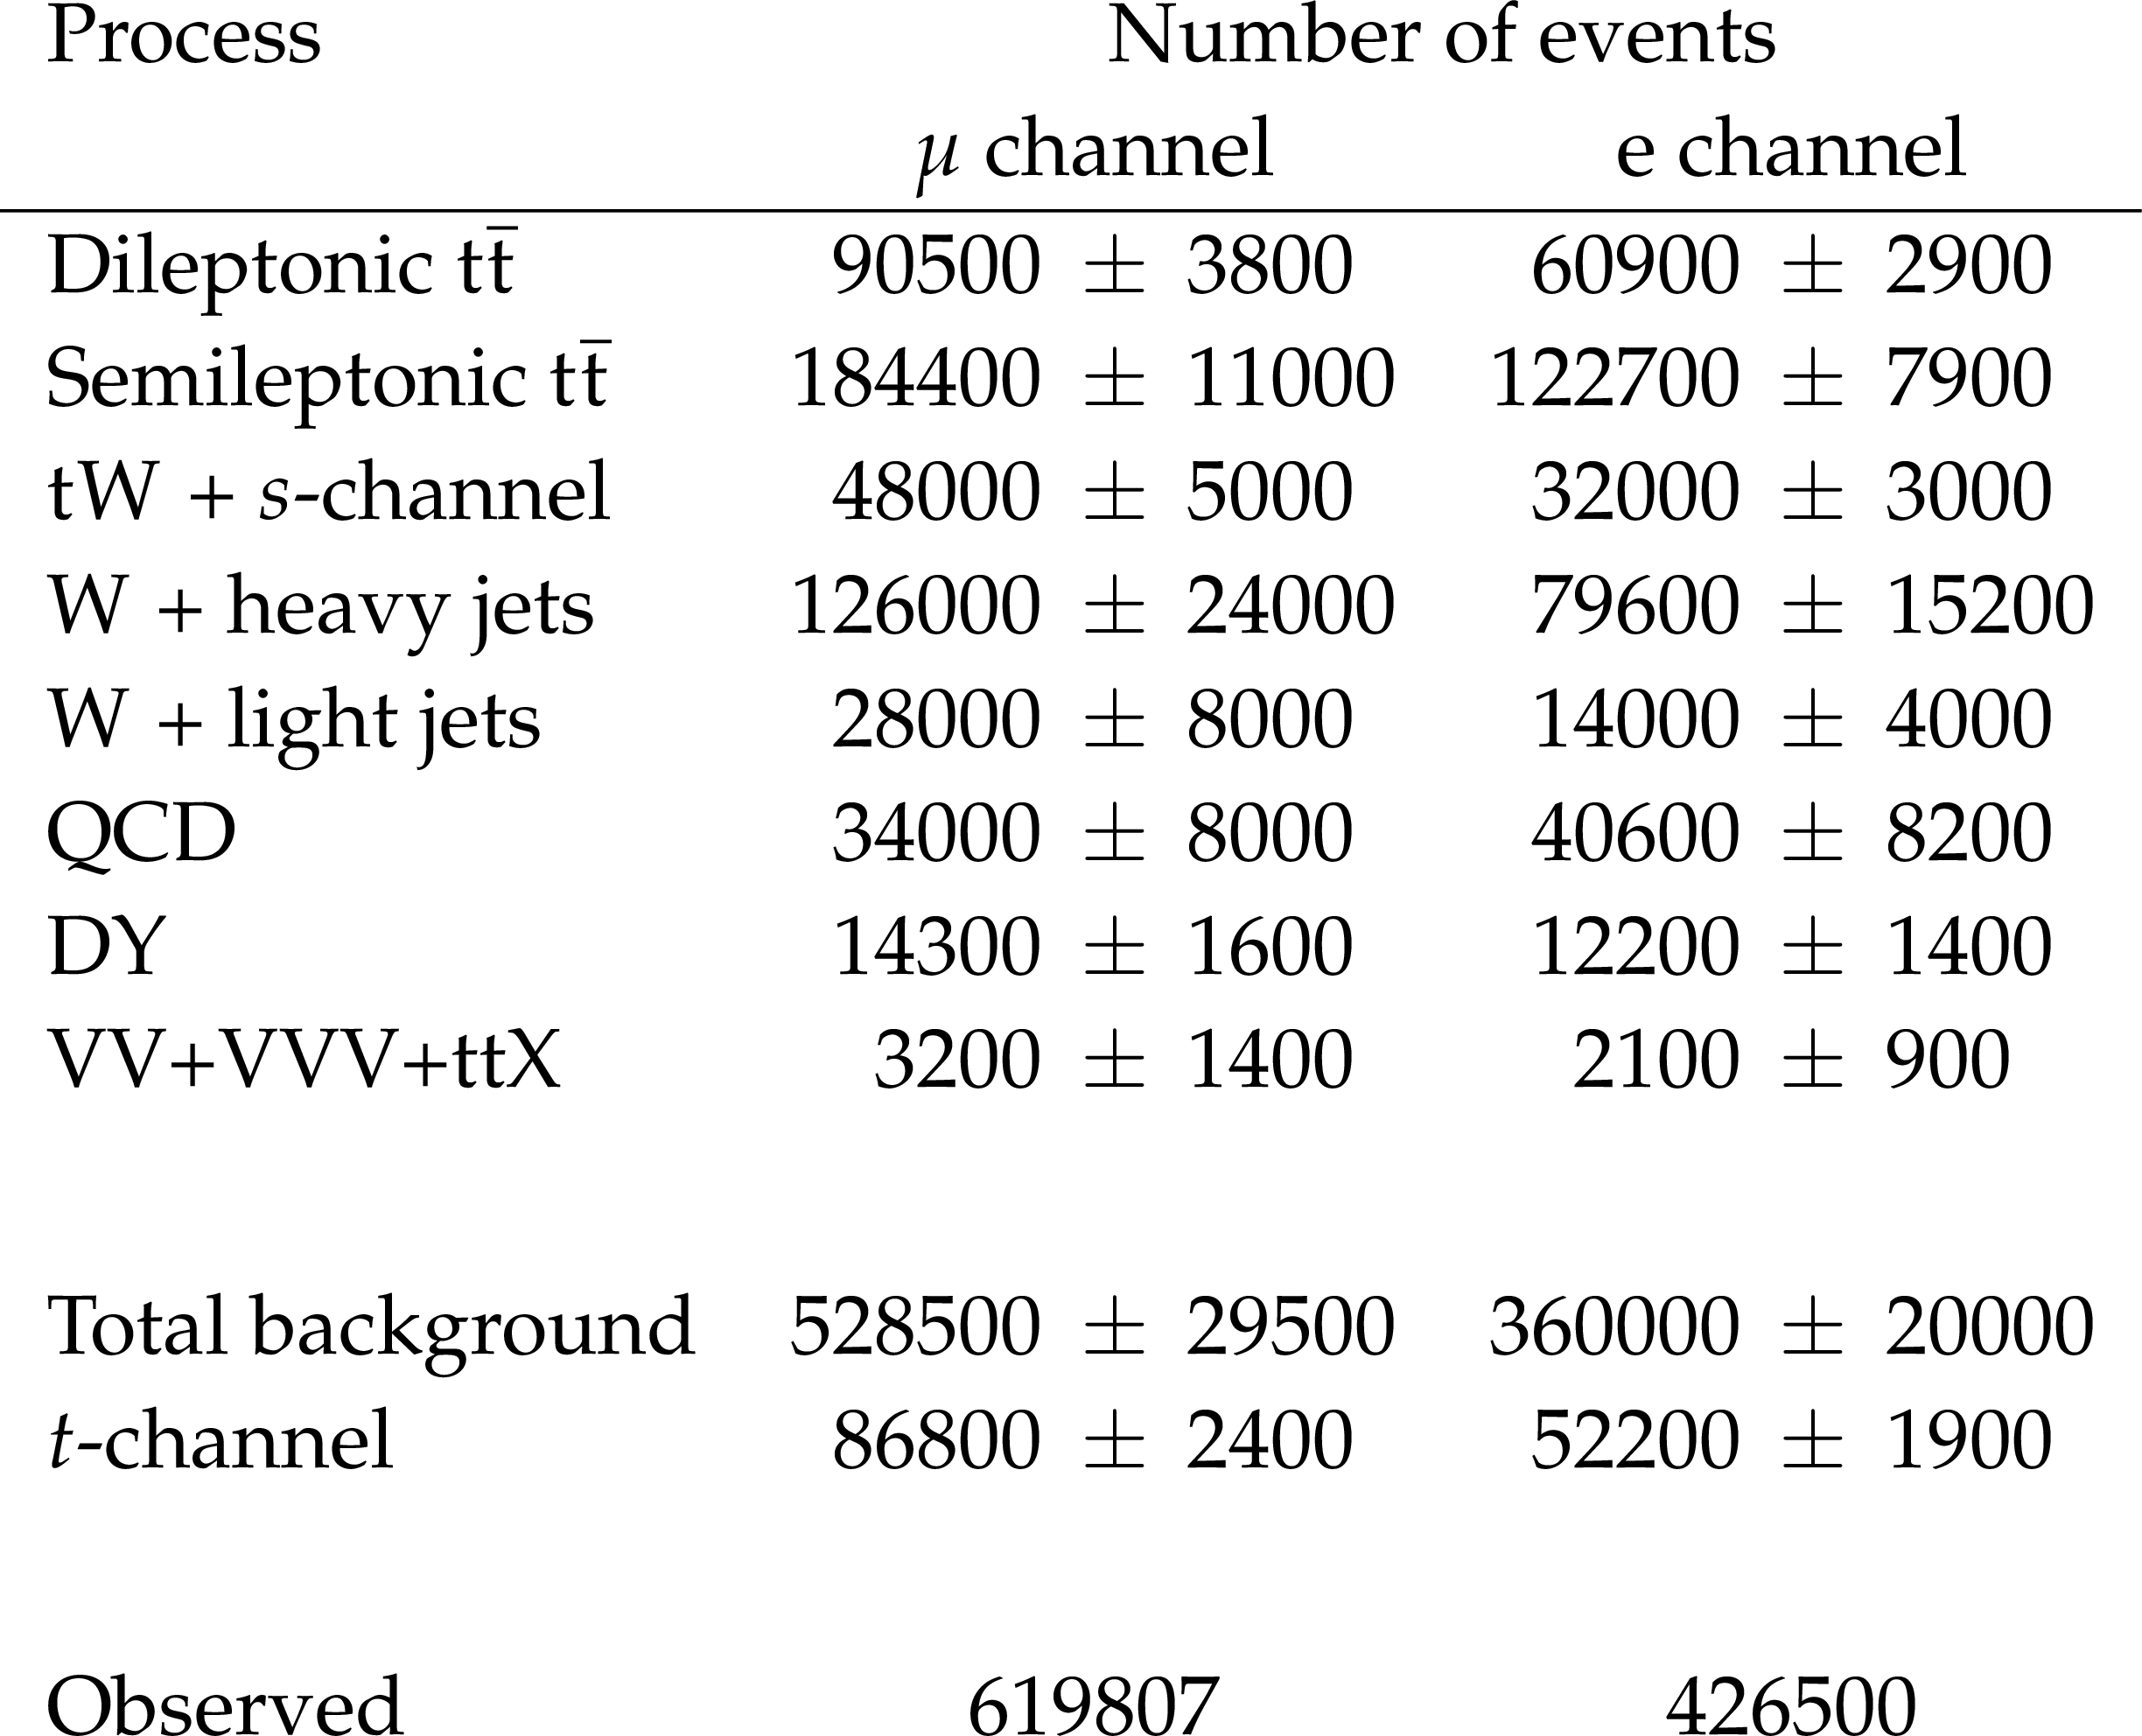
Table 2:
Event yields for events in the signal region described in Section 5 and before the fit, shown separately for the muon and electron channels for the observed data and each of the predicted processes. The quoted uncertainties are the total uncertainties. |
png pdf |
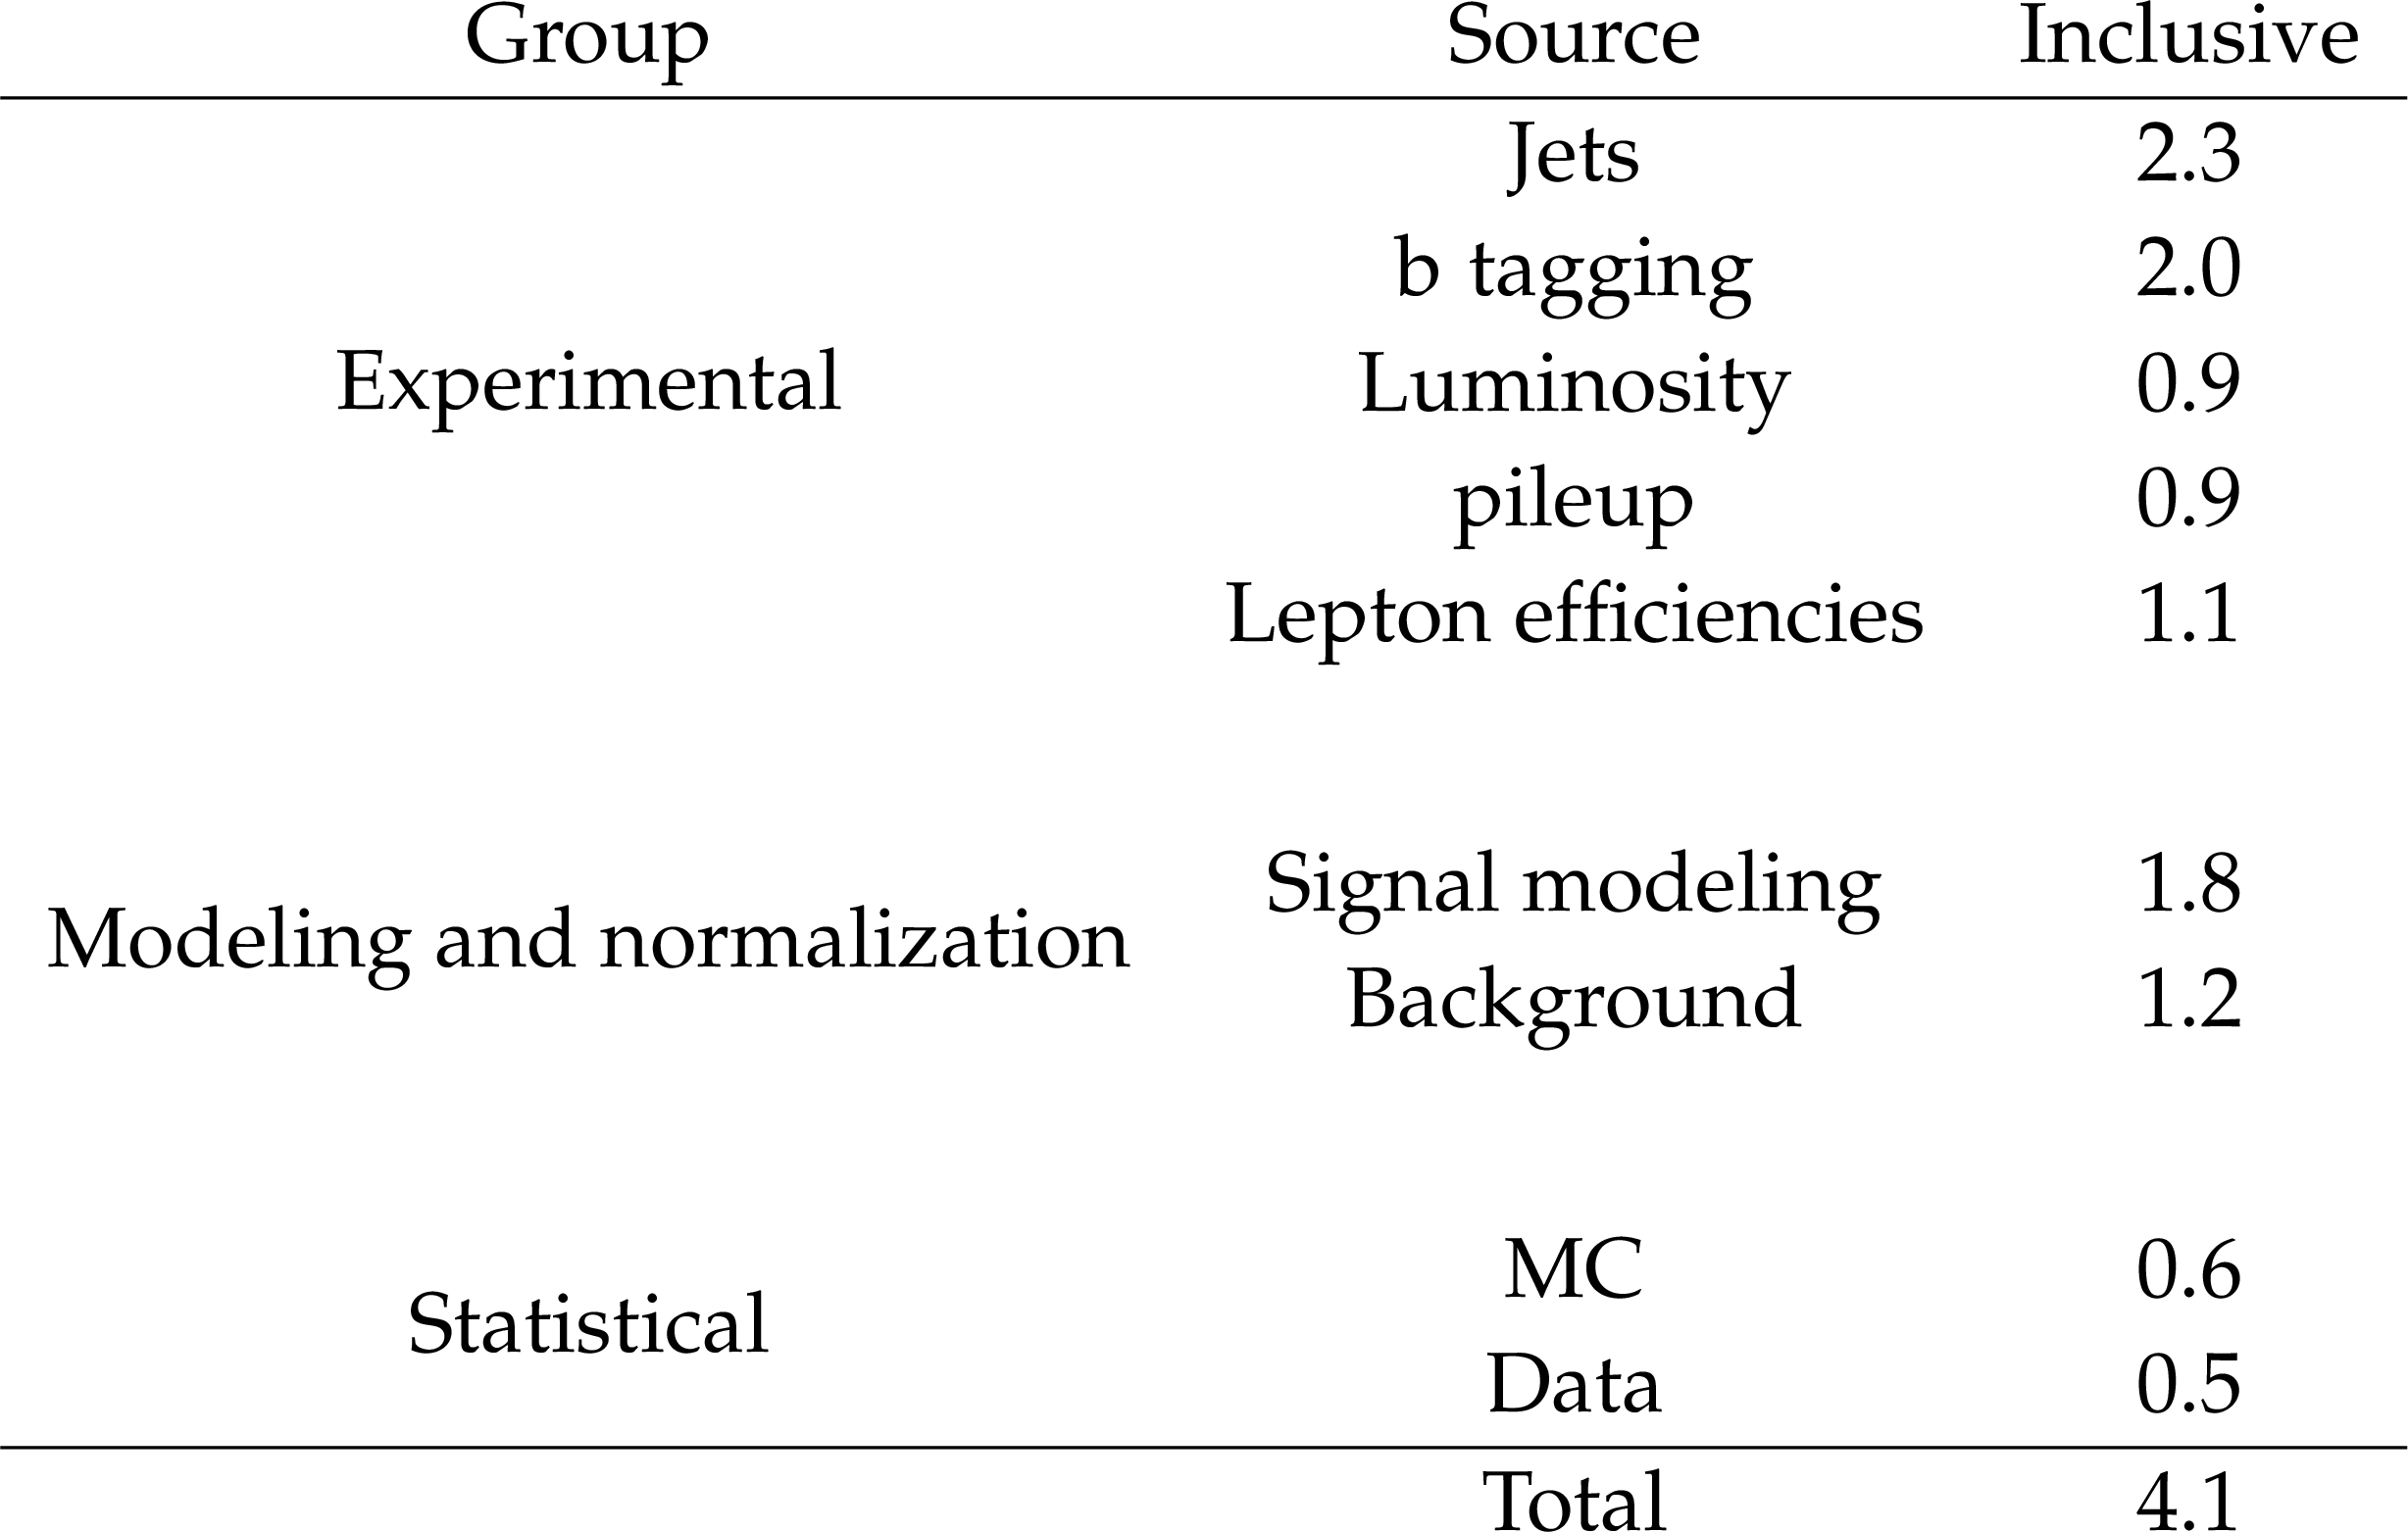
Table 3:
Breakdown of the uncertainty sources and their relative impacts on the measurement, evaluated by progressively freezing groups of nuisance parameters, given in %. In the experimental group, the jet sources include the JES and JER, and the lepton efficiencies include the trigger, muon and electron efficiencies. The signal modeling includes all the modeling uncertainties affecting the signal including the correlated ones (UE, FSR and PDFs), and background includes all the background normalization uncertainties (QCD shape included) and the modeling uncertainties affecting only $ \mathrm{t} \overline{\mathrm{t}} $. |
| Summary |
| Measurements of the single top $ t $-channel production cross section are presented. The analysis uses proton-proton collision data collected by CMS in 2022 and 2023 at a center-of-mass energy of 13.6 TeV, corresponding to an integrated luminosity of 62.5 fb$ ^{-1} $. This is the first measurement of this process at this collision energy. The events selected contain exactly one isolated charged lepton and two jets, one of which is b-tagged. The cross section is measured using a maximum-likelihood fit to a DNN discriminant that separates the signal from the backgrounds. The measured value of the inclusive $ t $-channel production cross section is $ \sigma(\mathrm{t}\mathrm{q} + \overline{\mathrm{t}}\mathrm{q})= $ 223.1 $ ^{+9.3}_{-9.1} $ (syst) \pm 1.2 (stat) $ \mathrm{pb} $. The top quark cross section is $ \sigma (\mathrm{t}\mathrm{q}) = $ 139.9 $ ^{+5.4}_{-5.1} $ (syst) \pm 0.9 (stat) $ \mathrm{pb} $ and the top antiquark cross section $ \sigma (\overline{\mathrm{t}}\mathrm{q}) = $ 83.8 $ ^{+3.9}_{-3.7} $ (syst) \pm 0.7 (stat) $ \mathrm{pb} $. The ratio of the two individual cross sections is measured, yielding a value of $ \mathcal{R}_{\mathrm{t-ch}} = $ 1.67 $ \pm $ 0.04 (syst) $ \pm $ 0.02 (stat). The measured inclusive cross section and the ratio are compared with predictions obtained using different PDF sets and are found to be in agreement. The inclusive cross section is also used to extract the product $ |f_{\text{LV}}V_{\mathrm{\mathrm{t}\mathrm{b}}}| $ with a value of $ |f_{\text{LV}}V_{\mathrm{\mathrm{t}\mathrm{b}}}|= $ 0.980 $ \pm $ 0.021 (exp) $ \pm $ 0.009 (theo). All measurements are in agreement with the standard model prediction. |
| References | ||||
| 1 | ATLAS and CMS Collaborations | Reference single top-quark cross-sections for ATLAS and CMS analyses | ATLAS PUB Note ATL-PHYS-PUB-2025-035, 2025 | |
| 2 | J. Campbell, T. Neumann, and Z. Sullivan | Single-top-quark production in the $ t $-channel at NNLO | JHEP 02 (2021) 040 | 2012.01574 |
| 3 | PDF4LHC Working Group , R. D. Ball et al. | The PDF4LHC21 combination of global PDF fits for the LHC \mboxRun 3 | JPG 49 (2022) 080501 | 2203.05506 |
| 4 | CDF Collaboration | Observation of electroweak single top-quark production | PRL 103 (2009) 092002 | 0903.0885 |
| 5 | \DZERO Collaboration | Observation of single top-quark production | PRL 103 (2009) 092001 | 0903.0850 |
| 6 | CMS Collaboration | Measurement of the $ t $-channel single top quark production cross section in $ {\mathrm{p}\mathrm{p}} $ collisions at $ \sqrt{s}= $ 7 TeV | PRL 107 (2011) 091802 | CMS-TOP-10-008 1106.3052 |
| 7 | CMS Collaboration | Measurement of the single-top-quark $ t $-channel cross section in $ {\mathrm{p}\mathrm{p}} $ collisions at $ \sqrt{s}= $ 7 TeV | JHEP 12 (2012) 035 | CMS-TOP-11-021 1209.4533 |
| 8 | ATLAS Collaboration | Comprehensive measurements of $ t $-channel single top-quark production cross sections at $ \sqrt{s}= $ 7 TeV with the ATLAS detector | PRD 90 (2014) 112006 | 1406.7844 |
| 9 | CMS Collaboration | Measurement of the $ t $-channel single-top-quark production cross section and of the $ |V_{\mathrm{t}\mathrm{b}}| $ CKM matrix element in $ {\mathrm{p}\mathrm{p}} $ collisions at $ \sqrt{s}= $ 8 TeV | JHEP 06 (2014) 090 | CMS-TOP-12-038 1403.7366 |
| 10 | ATLAS Collaboration | Fiducial, total and differential cross-section measurements of $ t $-channel single top-quark production in $ {\mathrm{p}\mathrm{p}} $ collisions at 8 TeV using data collected by the ATLAS detector | EPJC 77 (2017) 531 | 1702.02859 |
| 11 | CMS Collaboration | Cross section measurement of $ t $-channel single top quark production in $ {\mathrm{p}\mathrm{p}} $ collisions at $ \sqrt{s}= $ 13 TeV | PLB 772 (2017) 752 | CMS-TOP-16-003 1610.00678 |
| 12 | CMS Collaboration | Measurement of the single top quark and antiquark production cross sections in the $ t $ channel and their ratio in proton-proton collisions at $ \sqrt{s}= $ 13 TeV | PLB 800 (2020) 135042 | CMS-TOP-17-011 1812.10514 |
| 13 | ATLAS Collaboration | Measurement of $ t $-channel production of single top quarks and antiquarks in $ {\mathrm{p}\mathrm{p}} $ collisions at 13 TeV using the full ATLAS \mboxRun 2 data sample | JHEP 05 (2024) 305 | 2403.02126 |
| 14 | ATLAS Collaboration | Measurement of $ t $-channel single-top-quark production in $ {\mathrm{p}\mathrm{p}} $ collisions at $ \sqrt{s}= $ 5.02 TeV with the ATLAS detector | PLB 854 (2024) 138726 | 2310.01518 |
| 15 | CMS Collaboration | Measurement of the $ t $-channel single top quark cross section in proton-proton collisions at $ \sqrt{s}= $ 5.02 TeV | JHEP 08 (2026) 223 | CMS-TOP-24-011 2603.13592 |
| 16 | J. Alwall et al. | Is $ {V}_{\mathrm{t}\mathrm{b}}\simeq $ 1? | EPJC 49 (2007) 791 | hep-ph/0607115 |
| 17 | CMS Collaboration | The CMS experiment at the CERN LHC | JINST 3 (2008) S08004 | |
| 18 | CMS Collaboration | Development of the CMS detector for the CERN LHC \mboxRun 3 | JINST 19 (2024) P05064 | CMS-PRF-21-001 2309.05466 |
| 19 | CMS Collaboration | Performance of the CMS Level-1 trigger in proton-proton collisions at $ \sqrt{s}= $ 13 TeV | JINST 15 (2020) P10017 | CMS-TRG-17-001 2006.10165 |
| 20 | CMS Collaboration | The CMS trigger system | JINST 12 (2017) P01020 | CMS-TRG-12-001 1609.02366 |
| 21 | CMS Collaboration | Performance of the CMS high-level trigger during LHC \mboxRun 2 | JINST 19 (2024) P11021 | CMS-TRG-19-001 2410.17038 |
| 22 | CMS Collaboration | Electron and photon reconstruction and identification with the CMS experiment at the CERN LHC | JINST 16 (2021) P05014 | CMS-EGM-17-001 2012.06888 |
| 23 | CMS Collaboration | Performance of the CMS muon detector and muon reconstruction with proton-proton collisions at $ \sqrt{s}= $ 13 TeV | JINST 13 (2018) P06015 | CMS-MUO-16-001 1804.04528 |
| 24 | CMS Collaboration | Description and performance of track and primary-vertex reconstruction with the CMS tracker | JINST 9 (2014) P10009 | CMS-TRK-11-001 1405.6569 |
| 25 | CMS Collaboration | Performance of muon reconstruction in the CMS high level trigger using $ {\mathrm{p}\mathrm{p}} $ collision data at $ \sqrt{s}= $ 13.6 TeV in 2023 | CMS Detector Performance Note CMS-DP-2024-005, 2024 CDS |
|
| 26 | S. Alioli, P. Nason, C. Oleari, and E. Re | A general framework for implementing NLO calculations in shower Monte Carlo programs: the POWHEG box | JHEP 06 (2010) 043 | 1002.2581 |
| 27 | S. Frixione, P. Nason, and C. Oleari | Matching NLO QCD computations with parton shower simulations: the POWHEG method | JHEP 11 (2007) 070 | 0709.2092 |
| 28 | P. Nason | A new method for combining NLO QCD with shower Monte Carlo algorithms | JHEP 11 (2004) 040 | hep-ph/0409146 |
| 29 | J. Alwall et al. | The automated computation of tree-level and next-to-leading order differential cross sections, and their matching to parton shower simulations | JHEP 07 (2014) 079 | 1405.0301 |
| 30 | NNPDF Collaboration | Parton distributions from high-precision collider data | EPJC 77 (2017) 663 | 1706.00428 |
| 31 | T. Sjöstrand et al. | An introduction to PYTHIA8.2 | Comput. Phys. Commun. 191 (2015) 159 | 1410.3012 |
| 32 | CMS Collaboration | Extraction and validation of a new set of CMS PYTHIA8 tunes from underlying-event measurements | EPJC 80 (2020) 4 | CMS-GEN-17-001 1903.12179 |
| 33 | GEANT4 Collaboration | GEANT 4---a simulation toolkit | NIM A 506 (2003) 250 | |
| 34 | Y. Li and F. Petriello | Combining QCD and electroweak corrections to dilepton production in FEWZ | PRD 86 (2012) 094034 | 1208.5967 |
| 35 | N. Kidonakis and N. Yamanaka | Higher-order corrections for $ {\mathrm{t}\mathrm{W}} $ production at high-energy hadron colliders | JHEP 05 (2021) 278 | 2102.11300 |
| 36 | J. M. Campbell, R. K. Ellis, and C. Williams | Vector boson pair production at the LHC | JHEP 07 (2011) 018 | 1105.0020 |
| 37 | M. Czakon, P. Fiedler, and A. Mitov | Total top-quark pair-production cross section at hadron colliders through $ \mathcal{O}({\alpha_\mathrm{S}}^4) $ | PRL 110 (2013) 252004 | 1303.6254 |
| 38 | M. Czakon and A. Mitov | top++: a program for the calculation of the top-pair cross-section at hadron colliders | Comput. Phys. Commun. 185 (2014) 2930 | 1112.5675 |
| 39 | CMS Collaboration | Measurements of the inclusive W and Z boson production cross sections and their ratios in proton-proton collisions at $ \sqrt{s}= $ 13.6 TeV | JHEP 01 (2026) 047 | CMS-SMP-22-017 2503.09742 |
| 40 | CMS Collaboration | Particle-flow reconstruction and global event description with the CMS detector | JINST 12 (2017) P10003 | CMS-PRF-14-001 1706.04965 |
| 41 | CMS Collaboration | Technical proposal for the Phase-II upgrade of the Compact Muon Solenoid | CMS Technical Proposal CERN-LHCC-2015-010, CMS-TDR-15-02, 2015 link |
|
| 42 | CMS Collaboration | Muon identification using multivariate techniques in the CMS experiment in proton-proton collisions at $ \sqrt{s}= $ 13 TeV | JINST 19 (2024) P02031 | CMS-MUO-22-001 2310.03844 |
| 43 | CMS Collaboration | Measurement of the inclusive $ {\mathrm{W}\mathrm{Z}} $ production cross section in $ {\mathrm{p}\mathrm{p}} $ collisions at $ \sqrt{s}= $ 13.6 TeV | JHEP 04 (2025) 115 | CMS-SMP-24-005 2412.02477 |
| 44 | M. Cacciari, G. P. Salam, and G. Soyez | The anti-$ k_{\mathrm{T}} $ jet clustering algorithm | JHEP 04 (2008) 063 | 0802.1189 |
| 45 | M. Cacciari, G. P. Salam, and G. Soyez | FASTJET user manual | EPJC 72 (2012) 1896 | 1111.6097 |
| 46 | CMS Collaboration | Pileup mitigation at CMS in 13 TeV data | JINST 15 (2020) P09018 | CMS-JME-18-001 2003.00503 |
| 47 | D. Bertolini, P. Harris, M. Low, and N. Tran | Pileup per particle identification | JHEP 10 (2014) 059 | 1407.6013 |
| 48 | CMS Collaboration | Jet energy scale and resolution in the CMS experiment in $ {\mathrm{p}\mathrm{p}} $ collisions at 8 TeV | JINST 12 (2017) P02014 | CMS-JME-13-004 1607.03663 |
| 49 | H. Qu, C. Li, and S. Qian | Particle transformer for jet tagging | in Proc. 39th International Conference on Machine Learning (ICML ): Baltimore MD, USA, July 17--23,.. [], 2022 PMLR 162 (2022) 18281 |
2202.03772 |
| 50 | CMS Collaboration | Transformer models for heavy flavor jet identification | CMS Detector Performance Note CMS-DP-2022-050, 2022 CDS |
|
| 51 | CMS Collaboration | Adversarial training for b-tagging algorithms in CMS | CMS Detector Performance Note CMS-DP-2022-049, 2022 CDS |
|
| 52 | CMS Collaboration | \mboxRun 3 commissioning results of heavy-flavor jet tagging at $ \sqrt{s}= $ 13.6 TeV with CMS data using a modern framework for data processing | CMS Detector Performance Note CMS-DP-2024-024, 2024 CDS |
|
| 53 | CMS Collaboration | Performance of missing transverse momentum reconstruction in proton-proton collisions at $ \sqrt{s}= $ 13 TeV using the CMS detector | JINST 14 (2019) P07004 | CMS-JME-17-001 1903.06078 |
| 54 | CMS Collaboration | Measurement of the inclusive $ \mathrm{t} \overline{\mathrm{t}} $ cross section in final states with at least one lepton and additional jets with 302$ \text{pb}^{-1}$ of $ {\mathrm{p}\mathrm{p}} $ collisions at $ \sqrt{s}= $ 5.02 TeV | JHEP 04 (2025) 099 | CMS-TOP-23-005 2410.21631 |
| 55 | F. Chollet et al. | keras | Software available from \urlhttps://keras.io, 2015 | |
| 56 | R. Cousins | Generalization of chisquare goodness-of-fit test for binned data using saturated models, with application to histograms | link | |
| 57 | E. Gross and O. Vitells | Trial factors for the look elsewhere effect in high energy physics | EPJC 70 (2010) 525 | 1005.1891 |
| 58 | J. S. Conway | Incorporating nuisance parameters in likelihoods for multisource spectra | in orkshop on Statistical Issues Related to Discovery Claims in Search Experiments and Unfolding (PHYSTAT ): Geneva, Switzerland, January 17--20,, 2011 Proc. 2011 (2011) W |
1103.0354 |
| 59 | CMS Collaboration | Performance of photon reconstruction and identification with the CMS detector in proton-proton collisions at $ \sqrt{s}= $ 8 TeV | JINST 10 (2015) P08010 | CMS-EGM-14-001 1502.02702 |
| 60 | C. J. Clopper and E. S. Pearson | The use of confidence or fiducial limits illustrated in the case of the binomial | Biometrika 26 (1934) 404 | |
| 61 | CMS Collaboration | Luminosity measurement in proton-proton collisions at 13.6 TeV in 2022 at CMS | CMS Physics Analysis Summary, 2024 CMS-PAS-LUM-22-001 |
CMS-PAS-LUM-22-001 |
| 62 | CMS Collaboration | Measurement of the offline integrated luminosity for the CMS proton-proton collision dataset recorded in 2023 | CMS Detector Performance Note CMS-DP-2024-068, 2024 CDS |
|
| 63 | P. Skands, S. Carrazza, and J. Rojo | Tuning PYTHIA8.1: the Monash 2013 tune | EPJC 74 (2014) 3024 | 1404.5630 |
| 64 | W. S. Cleveland | Robust locally weighted regression and smoothing scatterplots | J. Am. Stat. Assoc. 74 (1979) 829 | |
| 65 | ATLAS and CMS Collaborations | Improved common $ \mathrm{t} \overline{\mathrm{t}} $ Monte Carlo settings for ATLAS and CMS | Technical Report CMS-NOTE-2023-004, ATL-PHYS-PUB-2023-016, 2023 | |
| 66 | CMS Collaboration | Measurement of differential cross sections for top quark pair production using the lepton+jets final state in proton-proton collisions at 13 TeV | PRD 95 (2017) 092001 | CMS-TOP-16-008 1610.04191 |
| 67 | CMS Collaboration | Measurement of the differential cross section for top quark pair production in $ {\mathrm{p}\mathrm{p}} $ collisions at $ \sqrt{s} = $ 8 TeV | EPJC 75 (2015) 542 | CMS-TOP-12-028 1505.04480 |
| 68 | CMS Collaboration | Measurement of the $ \mathrm{t} \overline{\mathrm{t}} $ production cross section in the all-jets final state in $ {\mathrm{p}\mathrm{p}} $ collisions at $ \sqrt{s}= $ 8 TeV | EPJC 76 (2016) 128 | CMS-TOP-14-018 1509.06076 |
| 69 | M. Czakon et al. | Top-pair production at the LHC through NNLO QCD and NLO EW | JHEP 10 (2017) 186 | 1705.04105 |
| 70 | CMS Collaboration | Measurement of inclusive and differential cross sections of single top quark production in association with a W boson in proton-proton collisions at $ \sqrt{s}= $ 13.6 TeV | JHEP 01 (2025) 107 | CMS-TOP-23-008 2409.06444 |
| 71 | CMS Collaboration | First measurement of the top quark pair production cross section in proton-proton collisions at $ \sqrt{s}= $ 13.6 TeV | JHEP 08 (2023) 204 | CMS-TOP-22-012 2303.10680 |
| 72 | CMS Collaboration | The CMS statistical analysis and combination tool: combine | Comput. Softw. Big Sci. 8 (2024) 19 | CMS-CAT-23-001 2404.06614 |
| 73 | Particle Data Group , F. Takahashi et al. | Review of particle physics | Int. J. Mod. Phys. A 41 (2026) 2630011 | |
|
|
Compact Muon Solenoid LHC, CERN |

|
|
|
|
|
|