

Compact Muon Solenoid
LHC, CERN
| CMS-PAS-HIG-18-029 | ||
| Measurements of Higgs boson production via gluon fusion and vector boson fusion in the diphoton decay channel at $\sqrt{s} = $ 13 TeV | ||
| CMS Collaboration | ||
| March 2019 | ||
| Abstract: Measurements of the Higgs boson production cross sections with the Higgs boson decaying into a pair of photons are reported. Events with two photons are selected from a sample of proton-proton collisions at a center-of-mass energy $\sqrt{s}= $ 13 TeV collected by the CMS detector at the LHC in 2016 and 2017, corresponding to an integrated luminosity of 77.4 fb$^{-1}$. Cross sections for gluon fusion and vector boson fusion production, normalized to the corresponding standard model predictions, are measured to be 1.15$_{-0.15}^{+0.15}$ and 0.8$_{-0.3}^{+0.4}$, respectively. These production modes are further measured in kinematic regions within the simplified template cross section framework. All results are found to be in agreement with the standard model expectations. | ||
| Links: CDS record (PDF) ; inSPIRE record ; CADI line (restricted) ; | ||
| Figures | |
png pdf |
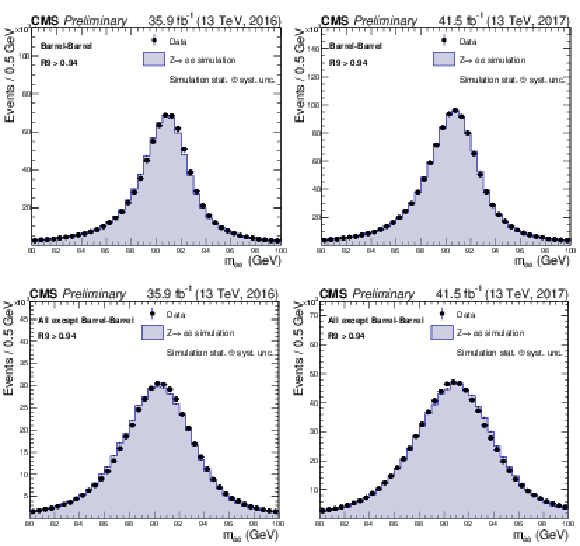
Figure 1:
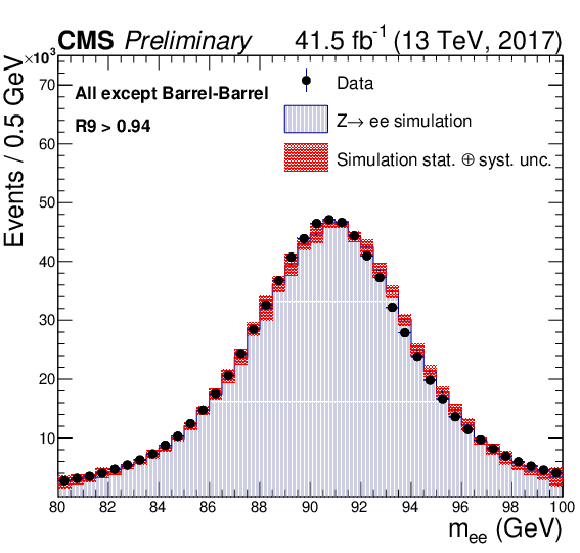
Comparison of the dielectron invariant mass spectra in data and simulation, after applying energy scale corrections to data and energy smearing to the simulation, for ${Z \rightarrow e^+e^-}$ events with electrons reconstructed as photons. The comparison is shown for events where both electrons are in the ECAL barrel (top), and at least one electron is not in the ECAL barrel (bottom). Electrons are required to satisfy $ {R_\mathrm {9}} > $ 0.94. The plots on the left show data and simulation from 2016, with 2017 data and simulation shown in the plots on the right. |
png pdf |
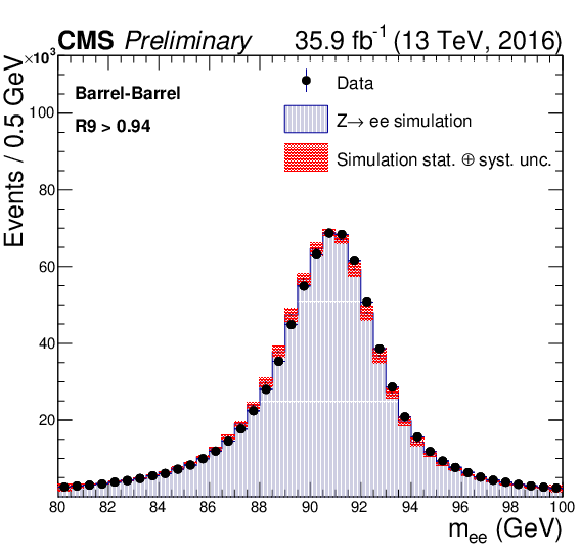
Figure 1-a:
Comparison of the dielectron invariant mass spectra in data and simulation, after applying energy scale corrections to data and energy smearing to the simulation, for ${Z \rightarrow e^+e^-}$ events with electrons reconstructed as photons. The comparison is shown for events where both electrons are in the ECAL barrel. Electrons are required to satisfy $ {R_\mathrm {9}} > $ 0.94. The plots show data and simulation from 2016. |
png pdf |
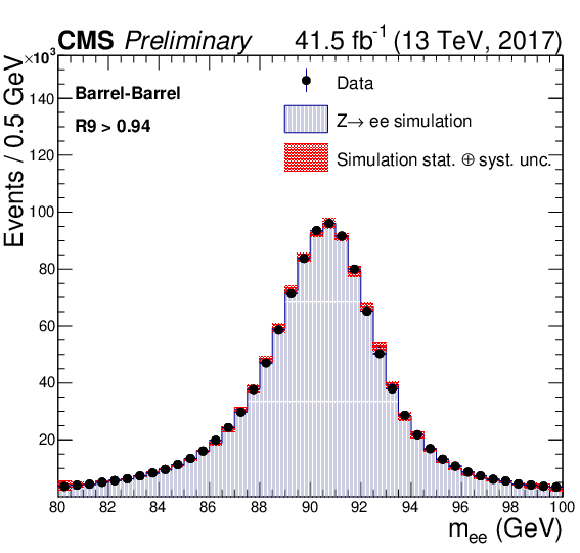
Figure 1-b:
Comparison of the dielectron invariant mass spectra in data and simulation, after applying energy scale corrections to data and energy smearing to the simulation, for ${Z \rightarrow e^+e^-}$ events with electrons reconstructed as photons. The comparison is shown for events where both electrons are in the ECAL barrel. Electrons are required to satisfy $ {R_\mathrm {9}} > $ 0.94. The plots show data and simulation from 2017. |
png pdf |
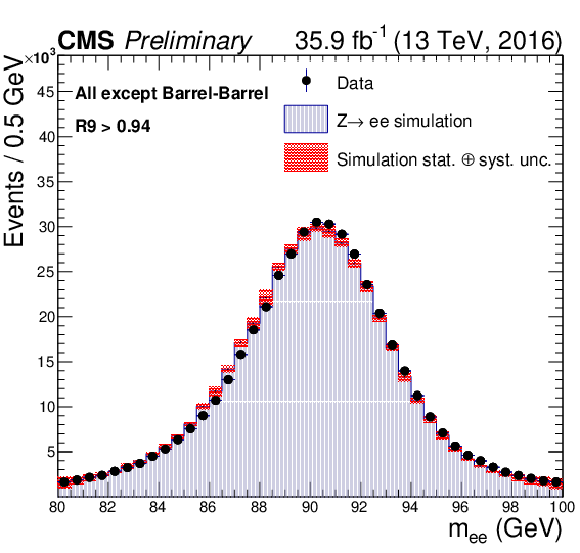
Figure 1-c:
Comparison of the dielectron invariant mass spectra in data and simulation, after applying energy scale corrections to data and energy smearing to the simulation, for ${Z \rightarrow e^+e^-}$ events with electrons reconstructed as photons. The comparison is shown for events where at least one electron is not in the ECAL barrel. Electrons are required to satisfy $ {R_\mathrm {9}} > $ 0.94. The plots show data and simulation from 2016. |
png pdf |
Figure 1-d:
Comparison of the dielectron invariant mass spectra in data and simulation, after applying energy scale corrections to data and energy smearing to the simulation, for ${Z \rightarrow e^+e^-}$ events with electrons reconstructed as photons. The comparison is shown for events where at least one electron is not in the ECAL barrel. Electrons are required to satisfy $ {R_\mathrm {9}} > $ 0.94. The plots show data and simulation from 2017. |
png pdf |
Figure 2:
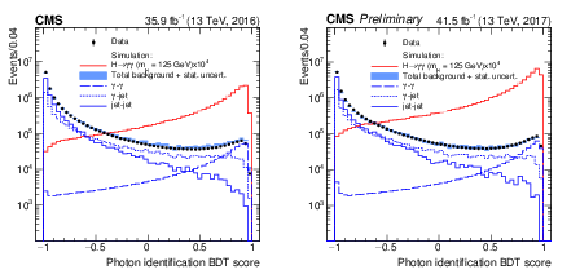
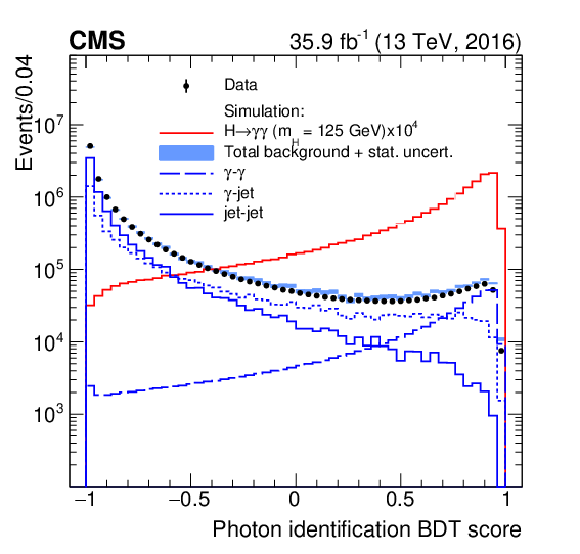
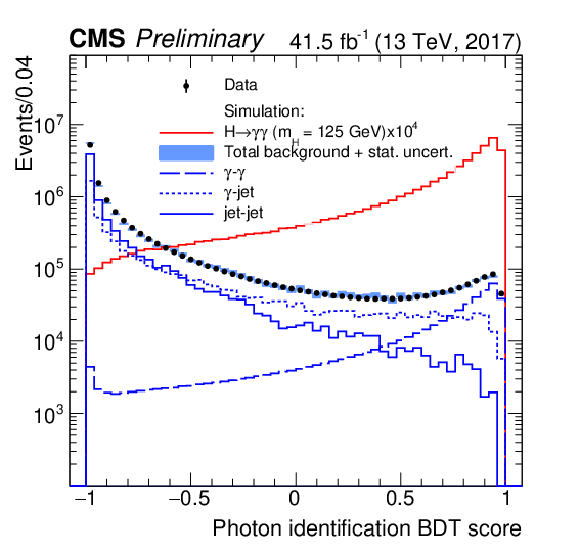
Distribution of the photon identification BDT score of the lowest scoring photon of diphoton pairs with an invariant mass in the range 100 $ < {m_{\gamma \gamma}} < $ 180 GeV, for data events passing the preselection (black points), and for simulated background events (blue histogram). Histograms are also shown for different components of the simulated background. The sum of all background distributions is scaled up to data. The red histogram corresponds to simulated Higgs boson signal events. The left figure shows 2016 data and simulation as presented in Ref. [10], with 2017 data and simulation shown on the right. |
png pdf |
Figure 2-a:
Distribution of the photon identification BDT score of the lowest scoring photon of diphoton pairs with an invariant mass in the range 100 $ < {m_{\gamma \gamma}} < $ 180 GeV, for data events passing the preselection (black points), and for simulated background events (blue histogram). Histograms are also shown for different components of the simulated background. The sum of all background distributions is scaled up to data. The red histogram corresponds to simulated Higgs boson signal events. The figure shows 2016 data and simulation as presented in Ref. [10]. |
png pdf |
Figure 2-b:
Distribution of the photon identification BDT score of the lowest scoring photon of diphoton pairs with an invariant mass in the range 100 $ < {m_{\gamma \gamma}} < $ 180 GeV, for data events passing the preselection (black points), and for simulated background events (blue histogram). Histograms are also shown for different components of the simulated background. The sum of all background distributions is scaled up to data. The red histogram corresponds to simulated Higgs boson signal events. The figure shows 2017 data and simulation. |
png pdf |
Figure 3:
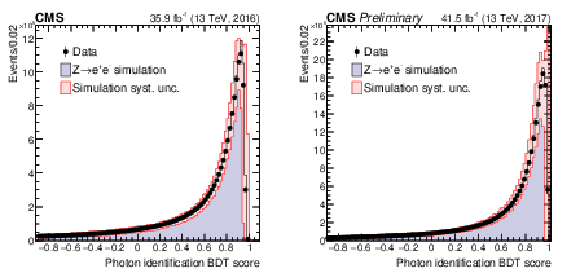
Distribution of the photon identification BDT for ${Z \rightarrow e^+e^-}$ events in data and simulation, where the electrons are reconstructed as photons. The systematic uncertainty applied to the shape from simulation (hashed region) is also shown. The left figure shows 2016 data and simulation as presented in Ref. [10], with 2017 data and simulation shown on the right. |
png pdf |
Figure 3-a:
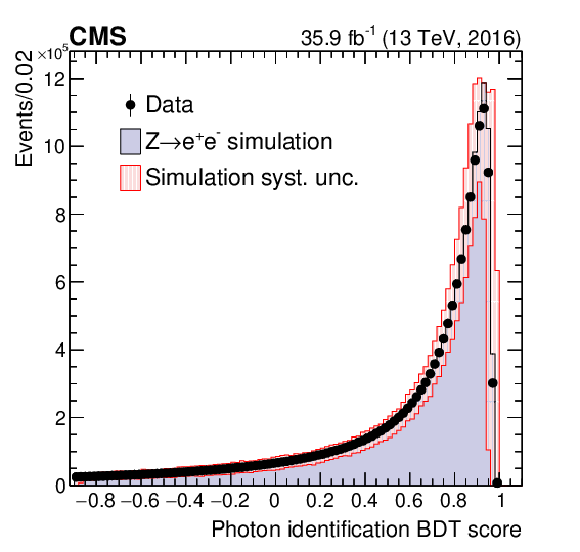
Distribution of the photon identification BDT for ${Z \rightarrow e^+e^-}$ events in data and simulation, where the electrons are reconstructed as photons. The systematic uncertainty applied to the shape from simulation (hashed region) is also shown. The figure shows 2016 data and simulation as presented in Ref. [10]. |

png pdf |
Figure 3-b:
Distribution of the photon identification BDT for ${Z \rightarrow e^+e^-}$ events in data and simulation, where the electrons are reconstructed as photons. The systematic uncertainty applied to the shape from simulation (hashed region) is also shown. The figure shows 2017 data and simulation. |
png pdf |
Figure 4:
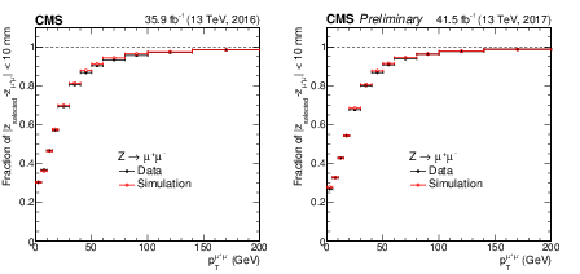
Validation of the ${H\rightarrow \gamma \gamma}$ vertex identification algorithm on ${Z\rightarrow \mu \mu}$ events omitting the muon tracks. Simulated events are weighted to match the distributions of pileup and location of primary vertices in data. The left figure shows 2016 data and simulation as presented in Ref. [10], with 2017 data and simulation shown on the right. |
png pdf |
Figure 4-a:
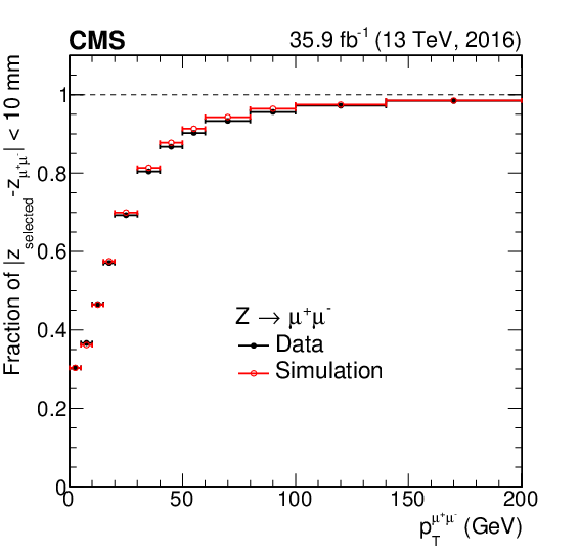
Validation of the ${H\rightarrow \gamma \gamma}$ vertex identification algorithm on ${Z\rightarrow \mu \mu}$ events omitting the muon tracks. Simulated events are weighted to match the distributions of pileup and location of primary vertices in data. The figure shows 2016 data and simulation as presented in Ref. [10]. |

png pdf |
Figure 4-b:
Validation of the ${H\rightarrow \gamma \gamma}$ vertex identification algorithm on ${Z\rightarrow \mu \mu}$ events omitting the muon tracks. Simulated events are weighted to match the distributions of pileup and location of primary vertices in data. The figure shows 2017 data and simulation. |
png pdf |
Figure 5:
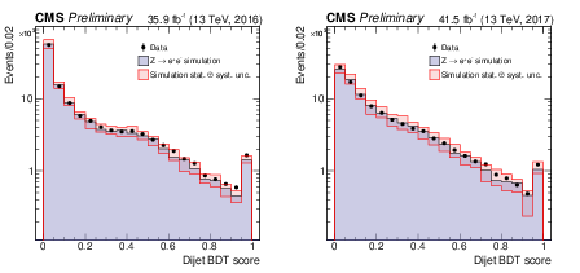
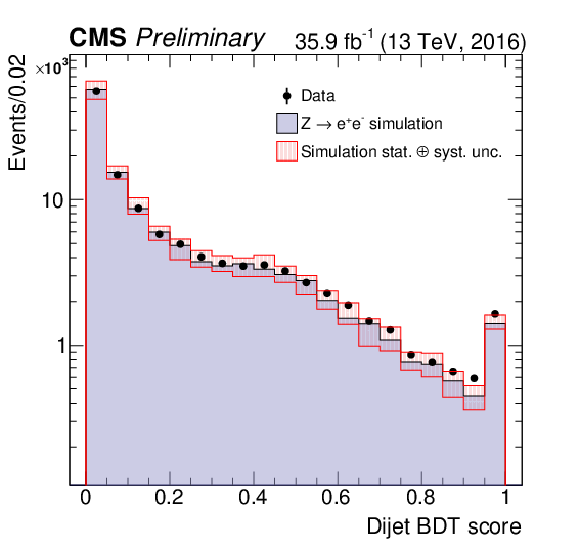
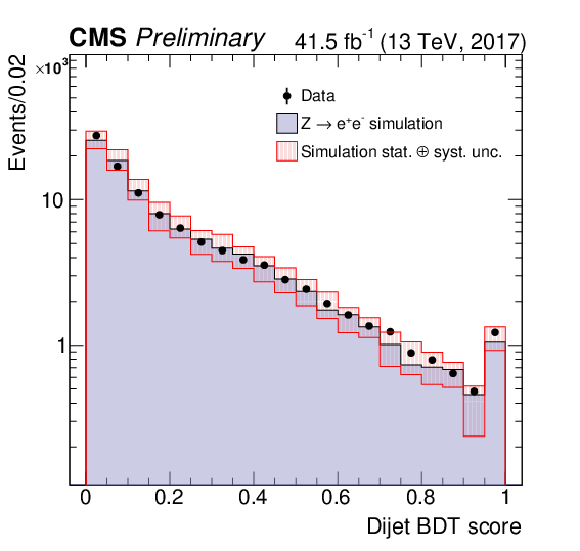
Score of the dijet BDT in $\mathrm{Z} \to \mathrm{e^{+}} \mathrm{e^{-}} $ events where the electrons are reconstructed as photons. The points show the score for data, the histogram shows the score for simulated Drell-Yan events, including statistical and systematic uncertainties (pink band). The left plot shows 2016 data and MC, with 2017 data and MC on the right. |
png pdf |
Figure 5-a:
Score of the dijet BDT in $\mathrm{Z} \to \mathrm{e^{+}} \mathrm{e^{-}} $ events where the electrons are reconstructed as photons. The points show the score for data, the histogram shows the score for simulated Drell-Yan events, including statistical and systematic uncertainties (pink band). The plot shows 2016 data and MC. |
png pdf |
Figure 5-b:
Score of the dijet BDT in $\mathrm{Z} \to \mathrm{e^{+}} \mathrm{e^{-}} $ events where the electrons are reconstructed as photons. The points show the score for data, the histogram shows the score for simulated Drell-Yan events, including statistical and systematic uncertainties (pink band). The plot shows 2017 data and MC. |
png pdf |
Figure 6:
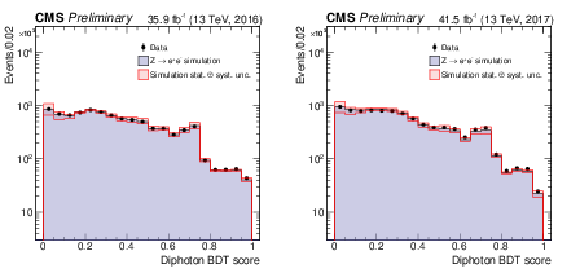
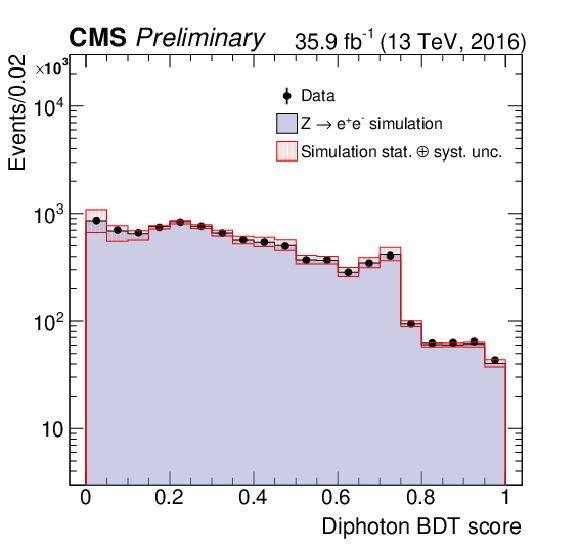
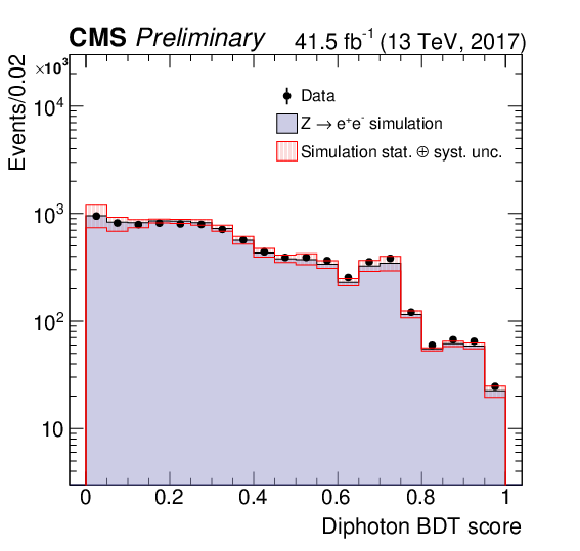
Score of the diphoton multivariate classifier in $\mathrm{Z} \to \mathrm{e^{+}} \mathrm{e^{-}} $ events where the electrons are reconstructed as photons. The points show the score for data, the histogram shows the score for simulated Drell-Yan events, including statistical and systematic uncertainties (pink band). The left plot shows 2016 data and MC, with 2017 data and MC on the right. |
png pdf |
Figure 6-a:
Score of the diphoton multivariate classifier in $\mathrm{Z} \to \mathrm{e^{+}} \mathrm{e^{-}} $ events where the electrons are reconstructed as photons. The points show the score for data, the histogram shows the score for simulated Drell-Yan events, including statistical and systematic uncertainties (pink band). The plot shows 2016 data and MC. |
png pdf |
Figure 6-b:
Score of the diphoton multivariate classifier in $\mathrm{Z} \to \mathrm{e^{+}} \mathrm{e^{-}} $ events where the electrons are reconstructed as photons. The points show the score for data, the histogram shows the score for simulated Drell-Yan events, including statistical and systematic uncertainties (pink band). The plot shows 2017 data and MC. |
png pdf |
Figure 7:
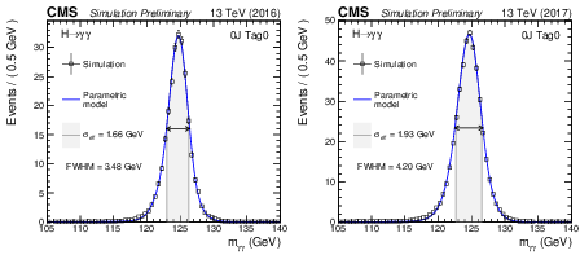
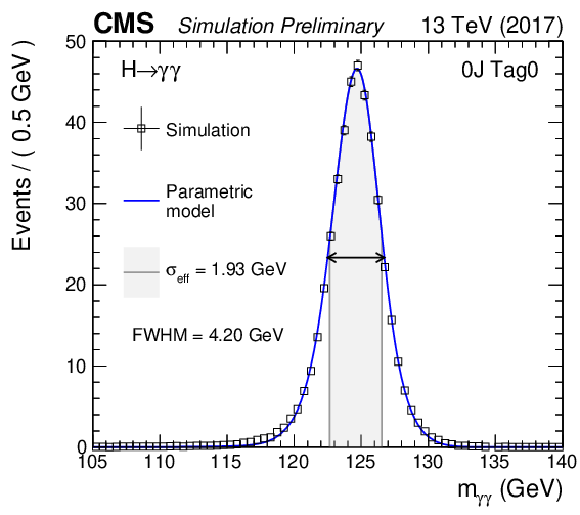
Parametrized signal shape for the highest resolution analysis category targeting ggH 0J production. The open squares represent weighted simulation events and the blue line the corresponding model. Also shown is the $\sigma _{\text {eff}}$ value (half the width of the narrowest interval containing 68.3% of the invariant mass distribution) and the full width at half of the maximum (FWHM). The left plot shows the 2016 simulation, with the 2017 on the right. |

png pdf |
Figure 7-a:
Parametrized signal shape for the highest resolution analysis category targeting ggH 0J production. The open squares represent weighted simulation events and the blue line the corresponding model. Also shown is the $\sigma _{\text {eff}}$ value (half the width of the narrowest interval containing 68.3% of the invariant mass distribution) and the full width at half of the maximum (FWHM). The plot shows the 2016 simulation. |
png pdf |
Figure 7-b:
Parametrized signal shape for the highest resolution analysis category targeting ggH 0J production. The open squares represent weighted simulation events and the blue line the corresponding model. Also shown is the $\sigma _{\text {eff}}$ value (half the width of the narrowest interval containing 68.3% of the invariant mass distribution) and the full width at half of the maximum (FWHM). The plot shows the 2017 simulation. |
png pdf |
Figure 8:
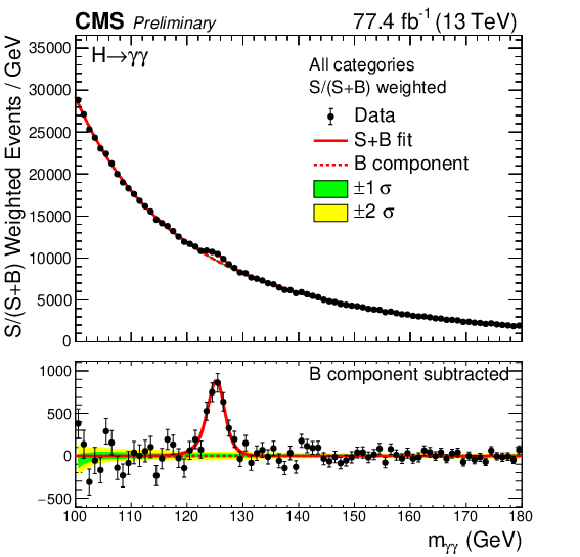
Data points (black) and signal plus background model fit for the sum of all categories is shown. Each category is weighted by S/(S + B), where S and B are the numbers of expected signal and background events, respectively, in a $ \pm 1 \sigma _{eff}$ mass window centered on $m_{\textrm {H}}$. The one standard deviation (green) and two standard deviation (yellow) bands include the uncertainties in the background component of the fit. The solid red line shows the contribution from the total signal, plus the background contribution. The dashed red line shows the contribution from the background component of the fit. The bottom plot shows the residuals after subtraction of this background component. |
png pdf |
Figure 9:
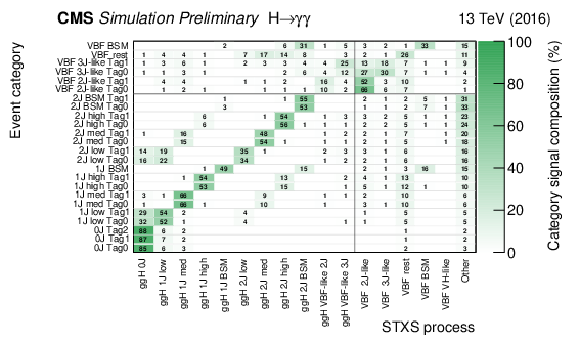
The composition of each analysis category in terms of stage 1 bins is shown. The colour scale corresponds to the fraction of each category (rows) accounted for by each stage 1 process (columns). Each row therefore sums to 100%. Entries with values less than 0.5% are not shown. Simulation corresponding to 2016 conditions is shown. |
png pdf |
Figure 10:
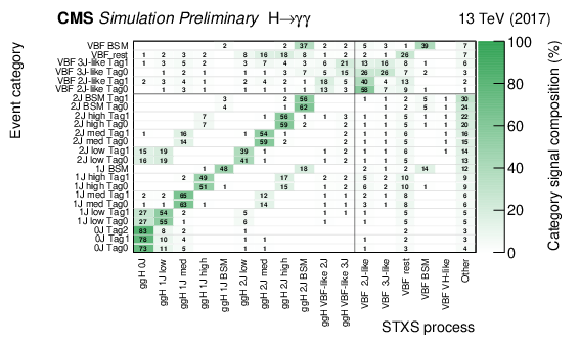
The composition of each analysis category in terms of stage 1 bins is shown. The colour scale corresponds to the fraction of each category (rows) accounted for by each stage 1 process (columns). Each row therefore sums to 100%. Entries with values less than 0.5% are not shown. Simulation corresponding to 2017 conditions is shown. |
png pdf |
Figure 11:
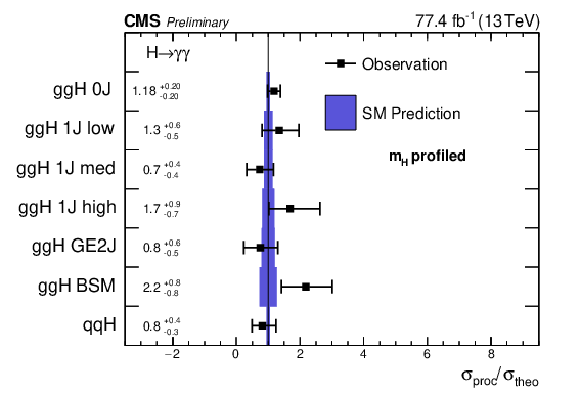
The results of a seven-parameter fit in the STXS framework. The ggH 1J and 2J BSM bins are grouped together in the fit; the remaining four ggH bins with two or more jets are also grouped. All five VBF bins are grouped together. The ggH parameters include bbH components, while the qqH parameter includes the hadronic VH contribution. The ttH, tH and VH leptonic processes are constrained to the SM prediction. Cross section ratios are shown with approximate 68% CL intervals (black points), and compared to the SM expectations and their uncertainties (blue bands). |
png pdf |
Figure 12:
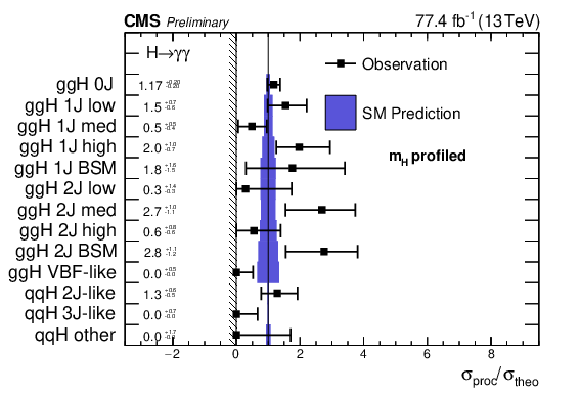
The results of a thirteen-parameter fit in the STXS framework. The two VBF-like ggH bins are grouped to form one parameter, as are the VBF BSM-like, VH-like and Rest bins. No further merging is performed. The ggH parameters include bbH components, while the qqH parameters include the hadronic VH contribution. The ttH, tH and VH leptonic processes are constrained to the SM prediction. Cross section ratios are shown with approximate 68% CL intervals (black points) and compared to the SM expectations and their uncertainties (blue bands). The cross section ratios are constrained to be non-negative, as indicated by the vertical line and hashed pattern. The parameters whose best-fit values are at zero are known to have 68% CL intervals which slightly under-cover; this is checked using pseudo-experiments. The compatibility of this fit with the SM prediction, expressed as a $p$-value with respect to the SM, is approximately 18%. |
png pdf |
Figure 13:
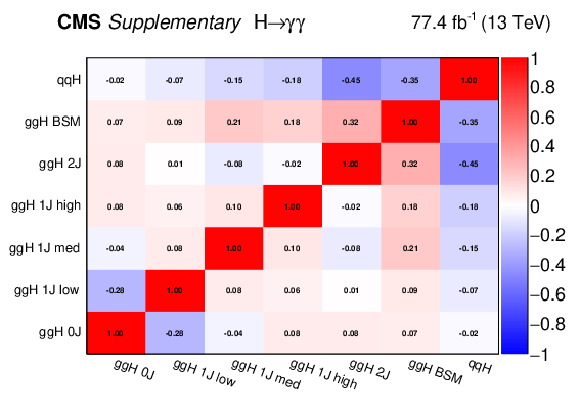
The results of a seven-parameter fit in the STXS framework. The ggH 1J and 2J BSM bins are grouped together in the fit; the remaining four ggH bins with two or more jets are also grouped. All five VBF bins are grouped together. The ggH parameters include bbH components, while the qqH parameter includes the hadronic VH contribution. The ttH, tH and VH leptonic processes are constrained to the SM prediction. The size of the correlation is indicated by the colour scale. |
png pdf |
Figure 14:
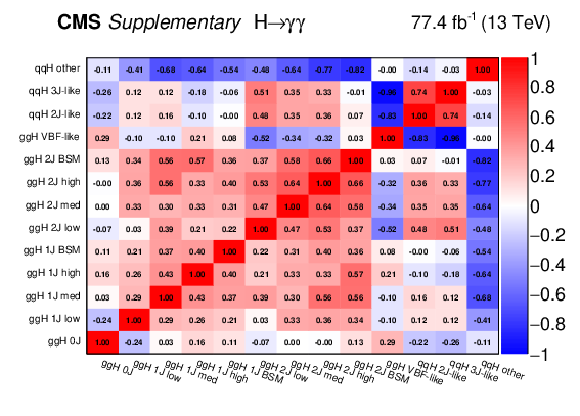
Observed correlations in a thirteen-parameter fit in the STXS framework The two VBF-like ggH bins are grouped to form one parameter, as are the VBF BSM-like, VH-like and Rest bins. No further merging is performed. The ggH parameters include bbH components, while the qqH parameters include the hadronic VH contribution. The ttH, tH and VH leptonic processes are constrained to the SM prediction. The size of the correlation is indicated by the colour scale. |
| Tables | |
png pdf |
Table 1:
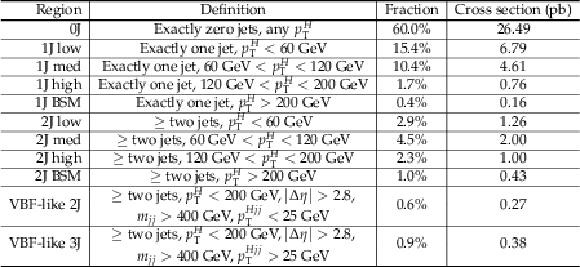
The particle level definition of each ggH stage 1 bin and the corresponding fractional and absolute cross sections. The fractions are estimated from simulated ggH ${H \rightarrow \gamma \gamma}$ events within the region $|y_H| < $ 2.5. Details of the simulated samples can be found in Section 3. Each bin is exclusive; events passing the VBF-like selection are not included in the other ggH 2J bins. |

png pdf |
Table 2:
The particle level definition of each VBF stage 1 bin and the corresponding fractional and absolute cross sections. The fractions reported are normalized relative to inclusive VBF or VH hadronic production, whilst the cross sections are the sum of the VBF and VH hadronic values. The fractions are estimated from simulated VBF and hadronic VH ${H \rightarrow \gamma \gamma}$ events within the region $|y_H| < $ 2.5. Details of the simulated samples can be found in Section 3. Each bin is exclusive; all bins except the BSM bin are required to have the leading jet $ {p_{\mathrm {T}}} < $ 200 GeV. |

png pdf |
Table 3:
Schema of the photon preselection requirements. |
png pdf |
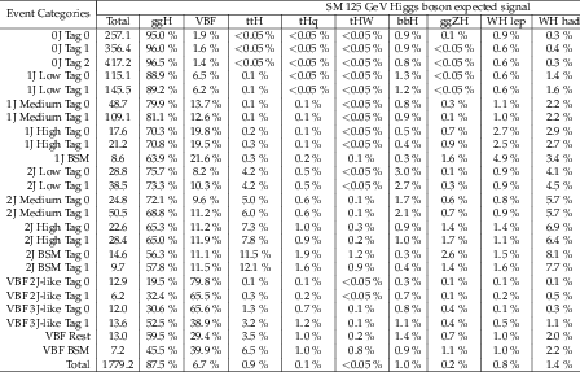
Table 4:
The expected number of signal events per category and the percentage breakdown per production mode in that category. The $\sigma _{eff}$, computed as the smallest interval containing 68.3% of the invariant mass distribution, and $\sigma _{HM}$, computed as the FWHM divided by 2.35, are also shown as an estimate of the $m_{\gamma \gamma}$ resolution in that category. The expected number of background events per GeV around 125 GeV is listed. The expected ratio of signal to signal plus background events, S/(S + B), is also shown, where S and B are the numbers of expected signal and background events, respectively, in a $ \pm 1 \sigma _{eff}$ mass window centered on $m_{\textrm {H}}$. Data and simulation from 2016 is shown. |
png pdf |
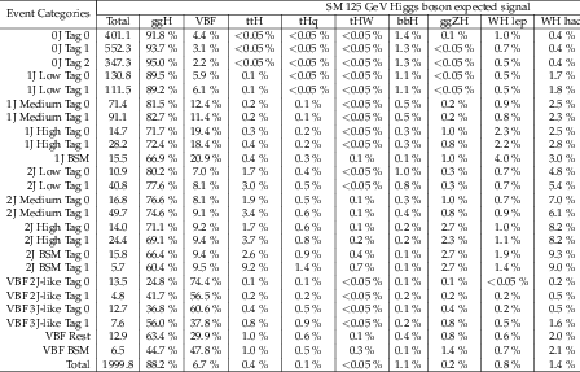
Table 5:
The expected number of signal events per category and the percentage breakdown per production mode in that category. The $\sigma _{eff}$, computed as the smallest interval containing 68.3% of the invariant mass distribution, and $\sigma _{HM}$, computed as the FWHM divided by 2.35, are also shown as an estimate of the $m_{\gamma \gamma}$ resolution in that category. The expected number of background events per GeV around 125 GeV is listed. The expected ratio of signal to signal plus background events, S/(S + B), is also shown, where S and B are the numbers of expected signal and background events, respectively, in a $ \pm 1 \sigma _{eff}$ mass window centered on $m_{\textrm {H}}$. Data and simulation from 2017 is shown. |

png pdf |
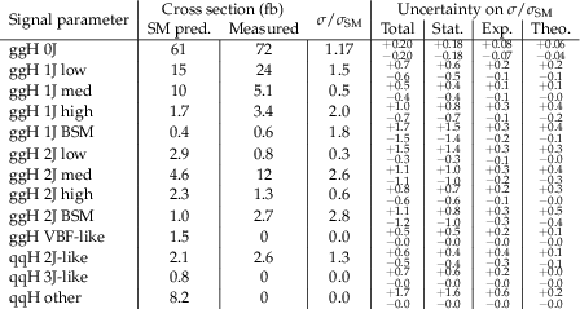
Table 6:
The results of a seven-parameter fit in the STXS framework. The ggH 1J and 2J BSM bins are grouped together in the fit; the remaining four ggH bins with two or more jets are also grouped. All five VBF bins are grouped together. The ggH parameters include bbH components, while the qqH parameter includes the hadronic VH contribution. The ttH, tH and VH leptonic processes are constrained to the SM prediction. Both the measured value and the standard model prediction for the product of the cross section and branching ratio are shown. The ratio of the measured cross section to the SM prediction is also shown, together with its uncertainty. In addition, the statistical, experimental, and theoretical components of the uncertainty on each parameter are reported. |
png pdf |
Table 7:
The results of a thirteen-parameter fit in the STXS framework. The two VBF-like ggH bins are grouped to form one parameter, as are the VBF BSM-like, VH-like and Rest bins. No further merging is performed. The ggH parameters include bbH components, while the qqH parameters include the hadronic VH contribution. The ttH, tH and VH leptonic processes are constrained to the SM prediction. Both the measured value and the standard model prediction for the product of the cross section and branching ratio are shown. The ratio of the measured cross section to the SM prediction is also shown, together with its uncertainty. In addition, the statistical, experimental, and theoretical components of the uncertainty on each parameter are reported. |
| Summary |
| Measurements of the Higgs boson production cross sections with the Higgs boson decaying into a pair of photons are reported. Events with two photons are selected from a sample of proton-proton collisions at a center-of-mass energy $\sqrt{s}= $ 13 TeV collected by the CMS detector at the LHC in 2016 and 2017, corresponding to an integrated luminosity of 77.4 fb$^{-1}$. Cross sections for gluon fusion and vector boson fusion production, normalized to the corresponding standard model predictions, are measured to be 1.15$_{-0.15}^{+0.15}$ and 0.8$_{-0.3}^{+0.4}$, respectively. These production modes are further measured in kinematic regions within the simplified template cross section framework. All results are found to be in agreement with the standard model expectations. |
| References | ||||
| 1 | ATLAS Collaboration | Observation of a new particle in the search for the Standard Model Higgs boson with the detector at the LHC | PLB 716 (2012) 1 | 1207.7214 |
| 2 | CMS Collaboration | Observation of a new boson at a mass of 125 GeV with the CMS experiment at the LHC | PLB 716 (2012) 30 | CMS-HIG-12-028 1207.7235 |
| 3 | CMS Collaboration | Observation of a new boson with mass near 125 GeV in pp collisions at $ \sqrt{s} = $ 7 and 8 TeV | JHEP 06 (2013) 081 | CMS-HIG-12-036 1303.4571 |
| 4 | CMS Collaboration | Observation of $ \mathrm{t\overline{t}} $H production | PRL 120 (2018) 231801 | CMS-HIG-17-035 1804.02610 |
| 5 | ATLAS Collaboration | Observation of Higgs boson production in association with a top quark pair at the LHC with the ATLAS detector | PLB 784 (2018) 173 | 1806.00425 |
| 6 | CMS Collaboration | Observation of Higgs boson decay to bottom quarks | PRL 121 (2018) 121801 | CMS-HIG-18-016 1808.08242 |
| 7 | ATLAS Collaboration | Observation of $ H \rightarrow b\bar{b} $ decays and $ VH $ production with the ATLAS detector | PLB 786 (2018) 59 | 1808.08238 |
| 8 | CMS Collaboration | Combined measurements of Higgs boson couplings in proton-proton collisions at $ \sqrt{s}= $ 13 TeV | Submitted to: EPJC (2018) | CMS-HIG-17-031 1809.10733 |
| 9 | ATLAS Collaboration | Combined measurements of Higgs boson production and decay using up to 80 fb$ ^{-1} $ of proton--proton collision data at $ \sqrt{s}= $ 13 TeV collected with the ATLAS experiment | ATLAS-CONF-2018-031 | |
| 10 | CMS Collaboration | Measurements of Higgs boson properties in the diphoton decay channel in proton-proton collisions at $ \sqrt{s} = $ 13 TeV | JHEP 11 (2018) 185 | CMS-HIG-16-040 1804.02716 |
| 11 | LHC Higgs Cross Section Working Group Collaboration | Handbook of LHC Higgs Cross Sections: 4. Deciphering the Nature of the Higgs Sector | 1610.07922 | |
| 12 | CMS Collaboration | Measurement of the associated production of a Higgs boson and a pair of top-antitop quarks with the Higgs boson decaying to two photons in proton-proton collisions at $ \sqrt{s}= $ 13 TeV | CMS-PAS-HIG-18-018 | |
| 13 | ATLAS Collaboration | Measurements of Higgs boson properties in the diphoton decay channel with 36 fb$ ^{-1} $ of $ pp $ collision data at $ \sqrt{s} = $ 13 TeV with the ATLAS detector | PRD 98 (2018) 052005 | 1802.04146 |
| 14 | ATLAS Collaboration | Measurements of Higgs boson properties in the diphoton decay channel using 80 fb$ ^{-1} $ of $ pp $ collision data at $ \sqrt s = $ 13 TeV with the ATLAS detector | ATLAS-CONF-2018-028 | |
| 15 | ATLAS Collaboration | Measurements of the Higgs boson production, fiducial and differential cross sections in the $ 4\ell $ decay channel at $ \sqrt{s}=13 {TeV} $ with the ATLAS detector | ATLAS-CONF-2018-018 | |
| 16 | ATLAS Collaboration | Measurement of gluon fusion and vector boson fusion Higgs boson production cross-sections in the $ H \to WW^{*} \to e\nu\mu\nu $ decay channel in pp collisions at $ \sqrt{s} = $ 13 TeV with the ATLAS detector | ATLAS-CONF-2018-004 | |
| 17 | ATLAS Collaboration | Cross-section measurements of the Higgs boson decaying to a pair of tau leptons in proton--proton collisions at $ \sqrt{s}= $ 13 TeV with the ATLAS detector | ATLAS-CONF-2018-021 | |
| 18 | CMS Collaboration | Measurements of properties of the Higgs boson decaying into the four-lepton final state in pp collisions at $ \sqrt{s}= $ 13 TeV | JHEP 11 (2017) 047 | CMS-HIG-16-041 1706.09936 |
| 19 | CMS Collaboration | Measurements of properties of the Higgs boson in the four-lepton final state at $ \sqrt{s}= $ 13 TeV | CMS-PAS-HIG-18-001 | CMS-PAS-HIG-18-001 |
| 20 | CMS Collaboration | Measurements of properties of the Higgs boson decaying to a W boson pair in pp collisions at $ \sqrt{s}= $ 13 TeV | Submitted to: PLB (2018) | CMS-HIG-16-042 1806.05246 |
| 21 | CMS Collaboration | Observation of the Higgs boson decay to a pair of $ \tau $ leptons with the CMS detector | PLB 779 (2018) 283 | CMS-HIG-16-043 1708.00373 |
| 22 | M. Cacciari, G. P. Salam, and G. Soyez | The Anti-k(t) jet clustering algorithm | JHEP 04 (2008) 063 | 0802.1189 |
| 23 | M. Cacciari, G. P. Salam, and G. Soyez | FastJet user manual | EPJC 72 (2012) 1896 | 1111.6097 |
| 24 | C. Anastasiou et al. | Higgs boson gluon-fusion production in QCD at three loops | PRL 114 (2015) 212001 | 1503.06056 |
| 25 | C. Anastasiou et al. | High precision determination of the gluon fusion Higgs boson cross-section at the LHC | JHEP 05 (2016) 058 | 1602.00695 |
| 26 | CMS Collaboration | Particle-flow reconstruction and global event description with the cms detector | JINST 12 (2017) P10003 | CMS-PRF-14-001 1706.04965 |
| 27 | CMS Collaboration | The CMS experiment at the CERN LHC | JINST 3 (2008) S08004 | CMS-00-001 |
| 28 | CMS Collaboration | Measurement of the Inclusive $ W $ and $ Z $ Production Cross Sections in $ pp $ Collisions at $ \sqrt{s}= $ 7 TeV | JHEP 10 (2011) 132 | CMS-EWK-10-005 1107.4789 |
| 29 | J. Alwall et al. | The automated computation of tree-level and next-to-leading order differential cross sections, and their matching to parton shower simulations | JHEP 07 (2014) 079 | 1405.0301 |
| 30 | K. Hamilton, P. Nason, E. Re, and G. Zanderighi | NNLOPS simulation of Higgs boson production | JHEP 10 (2013) 222 | 1309.0017 |
| 31 | T. Sjostrand et al. | An introduction to PYTHIA 8.2 | CPC 191 (2015) 159 | 1410.3012 |
| 32 | P. Nason | A New method for combining NLO QCD with shower Monte Carlo algorithms | JHEP 11 (2004) 040 | hep-ph/0409146 |
| 33 | S. Frixione, P. Nason, and C. Oleari | Matching NLO QCD computations with Parton Shower simulations: the POWHEG method | JHEP 11 (2007) 070 | 0709.2092 |
| 34 | S. Alioli, P. Nason, C. Oleari, and E. Re | A general framework for implementing NLO calculations in shower Monte Carlo programs: the POWHEG BOX | JHEP 06 (2010) 043 | 1002.2581 |
| 35 | H. B. Hartanto, B. Jager, L. Reina, and D. Wackeroth | Higgs boson production in association with top quarks in the POWHEG BOX | PRD 91 (2015) 094003 | 1501.04498 |
| 36 | T. Gleisberg et al. | Event generation with SHERPA 1.1 | JHEP 02 (2009) 007 | 0811.4622 |
| 37 | GEANT4 Collaboration | GEANT4: A simulation toolkit | NIMA506 (2003) 250 | |
| 38 | CMS Collaboration | Energy calibration and resolution of the CMS electromagnetic calorimeter in $ pp $ collisions at $ \sqrt{s} = $ 7 TeV | JINST 8 (2013) P09009 | CMS-EGM-11-001 1306.2016 |
| 39 | CMS Collaboration | Performance of photon reconstruction and identification with the CMS Detector in proton-proton collisions at sqrt(s) = 8 TeV | JINST 10 (2015) P08010 | CMS-EGM-14-001 1502.02702 |
| 40 | P. D. Dauncey, M. Kenzie, N. Wardle, and G. J. Davies | Handling uncertainties in background shapes: the discrete profiling method | JINST 10 (2015) P04015 | 1408.6865 |
| 41 | CMS Collaboration | Observation of the diphoton decay of the Higgs boson and measurement of its properties | EPJC 74 (2014) 3076 | CMS-HIG-13-001 1407.0558 |
| 42 | R. A. Fisher | Handling uncertainties in background shapes | Journal of the Royal Statistical Society 85 (1922) | |
| 43 | J. Butterworth et al. | PDF4LHC recommendations for LHC Run II | JPG43 (2016) 023001 | 1510.03865 |
| 44 | LHC Higgs Cross Section Working Group Collaboration | Handbook of LHC Higgs cross sections: 3. Higgs Properties | 1307.1347 | |
| 45 | NNPDF Collaboration | Parton distributions for the LHC Run II | JHEP 04 (2015) 040 | 1410.8849 |
| 46 | S. Carrazza et al. | An unbiased hessian representation for Monte Carlo PDFs | EPJC 75 (2015) 369 | 1505.06736 |
| 47 | CMS Collaboration | Jet algorithms performance in 13 TeV data | CMS-PAS-JME-16-003 | CMS-PAS-JME-16-003 |
| 48 | CMS Collaboration | CMS Luminosity Measurements for the 2016 Data Taking Period | CMS-PAS-LUM-17-001 | CMS-PAS-LUM-17-001 |
| 49 | CMS Collaboration | CMS luminosity measurement for the 2017 data-taking period at $ \sqrt{s} = $ 13 TeV | CMS-PAS-LUM-17-004 | CMS-PAS-LUM-17-004 |
| 50 | CMS Collaboration | Precise determination of the mass of the Higgs boson and tests of compatibility of its couplings with the standard model predictions using proton collisions at 7 and 8 TeV | EPJC 75 (2015) 212 | CMS-HIG-14-009 1412.8662 |

|
Compact Muon Solenoid LHC, CERN |

|

|

|

|

|

|