

Compact Muon Solenoid
LHC, CERN
| CMS-PAS-HIG-16-036 | ||
| A search for doubly-charged Higgs boson production in three and four lepton final states at $\sqrt{s}= $ 13 TeV | ||
| CMS Collaboration | ||
| January 2017 | ||
| Abstract: A search for a doubly-charged Higgs boson, $\Phi^{\pm\pm}$, in proton-proton collisions at $\sqrt{s} = $ 13 TeV with the CMS experiment at the LHC using a data sample corresponding to an integrated luminosity of 12.9 fb$^{-1}$ is presented. The search considers final states with three lepton final states coming from the associated production of $\Phi^{\pm\pm}\Phi^{\mp}$ and the four lepton final states coming from the pair production of $\Phi^{++}\Phi^{-}$. Lower bounds on the doubly-charged Higgs boson mass are reported for a variety of assumptions on its branching ratio to charged lepton pairs. | ||
| Links: CDS record (PDF) ; inSPIRE record ; CADI line (restricted) ; | ||
| Figures | |
png pdf |
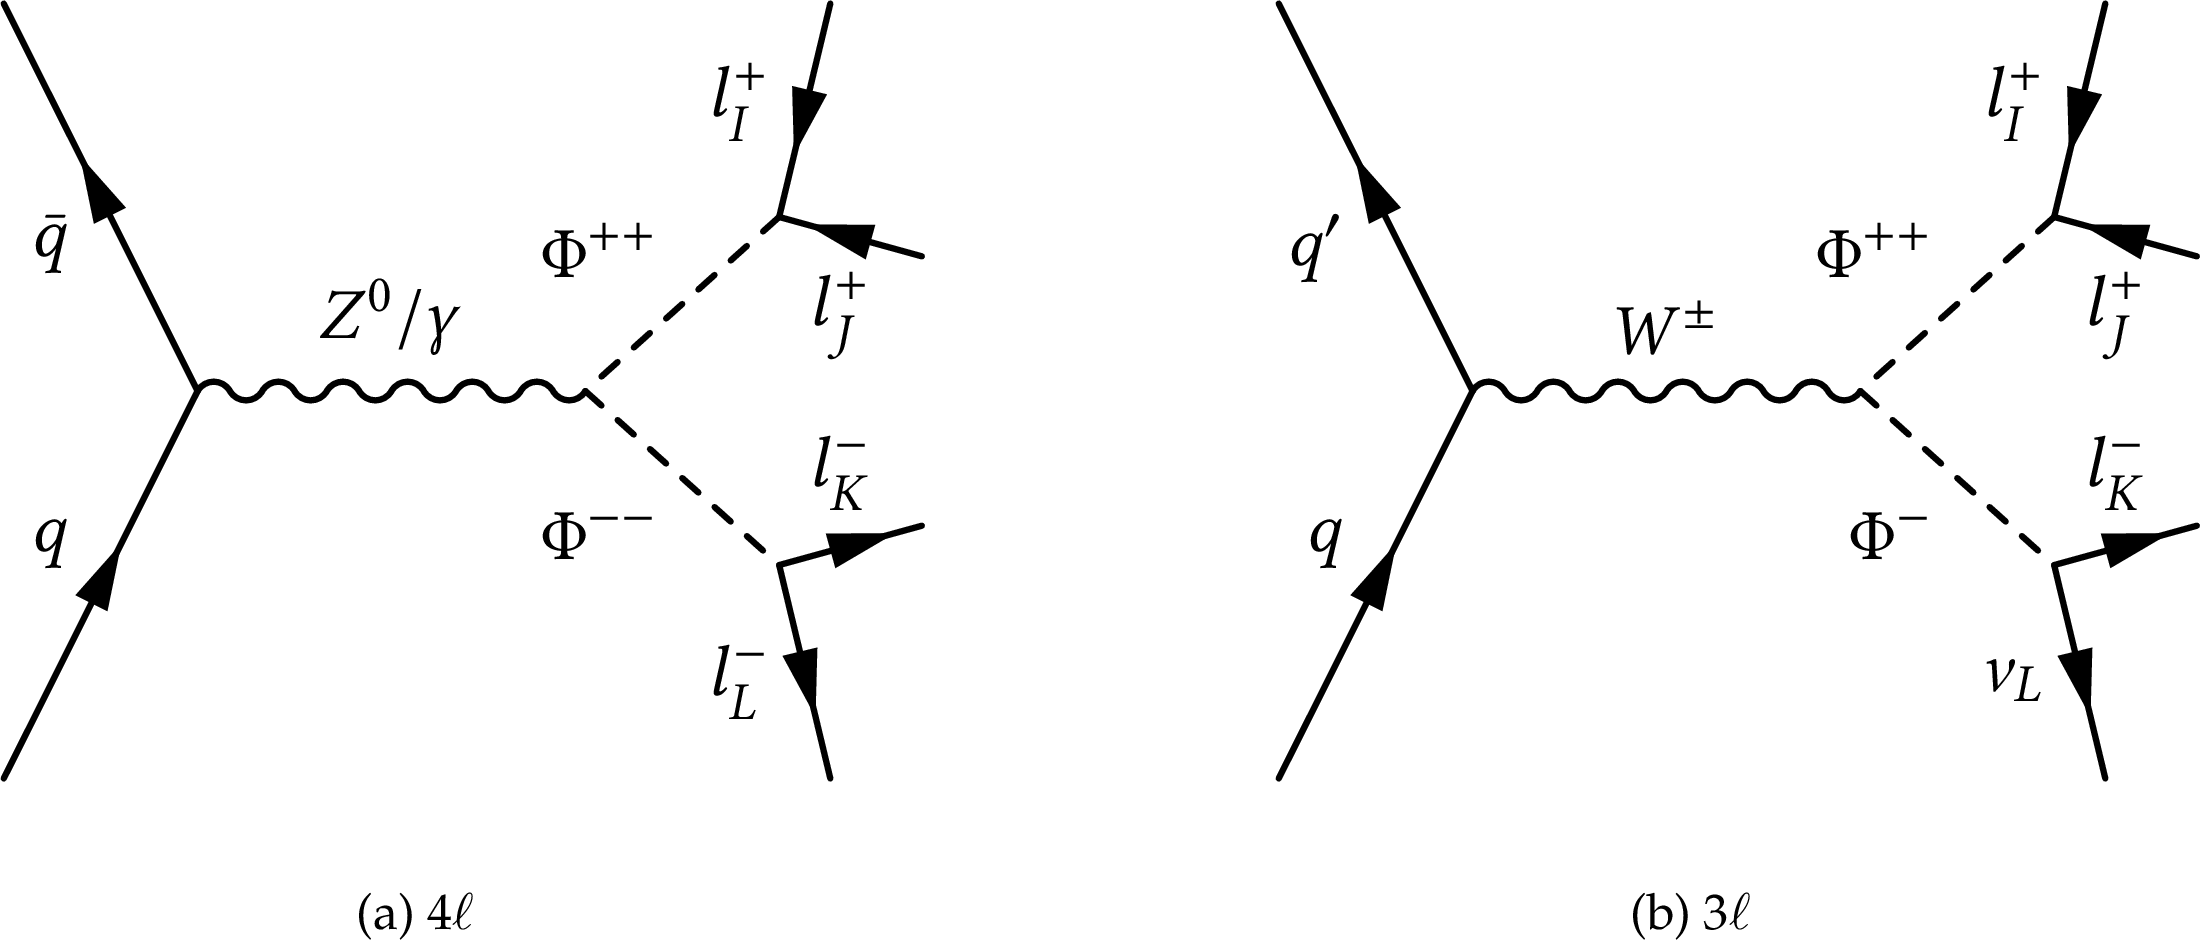
Figure 1:
Feynman diagrams for the four (a) and three (b) lepton final states |

png pdf |
Figure 1-a:
Feynman diagram for the four lepton final states |

png pdf |
Figure 1-b:
Feynman diagram for the three lepton final states |
png pdf |
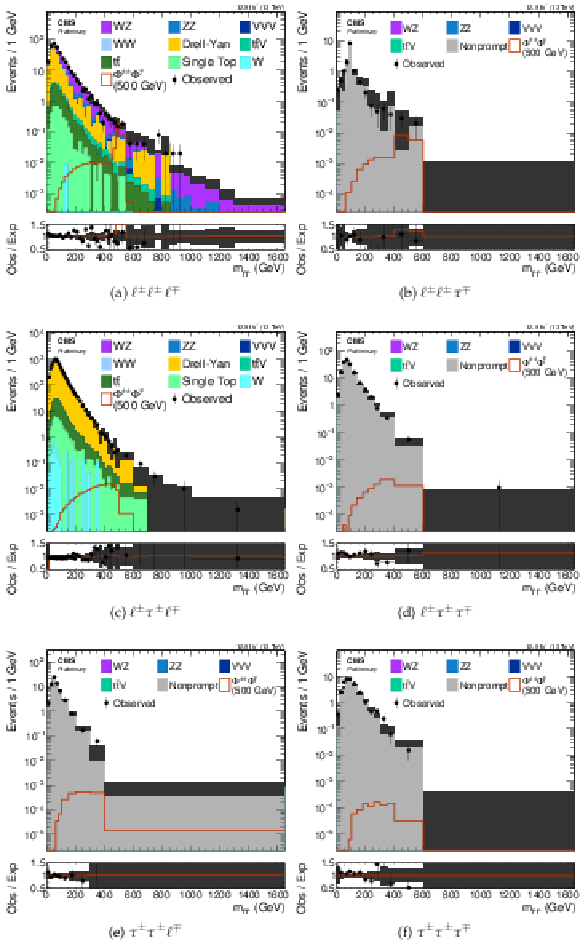
Figure 2:
Same sign dilepton mass distributions for each three lepton final state category. The solid symbols represent the data with Poisson statistical uncertainties, while the filled histograms represent the background expectation from simulation or data as described in the text. The shaded bands represent the statistical uncertainty in the background estimation. A sample signal distribution for the associated production mode with $ {m_{ {\Phi ^{\pm \pm }} }} = $ 500 GeV is overlaid. Only samples with nonzero expectation are shown. The ratio of the observed (Obs) and expected (Exp) distributions is also included. |

png pdf |
Figure 2-a:
Same sign dilepton mass distribution for the $\ell^{\pm}\ell^{\pm}\ell^{\mp}$ three lepton final state category. The solid symbols represent the data with Poisson statistical uncertainties, while the filled histograms represent the background expectation from simulation or data as described in the text. The shaded bands represent the statistical uncertainty in the background estimation. A sample signal distribution for the associated production mode with $ {m_{ {\Phi ^{\pm \pm }} }} = $ 500 GeV is overlaid. Only samples with nonzero expectation are shown. The ratio of the observed (Obs) and expected (Exp) distributions is also included. |

png pdf |
Figure 2-b:
Same sign dilepton mass distribution for the $\ell^{\pm}\ell^{\pm}\tau^{\mp}$ three lepton final state category. The solid symbols represent the data with Poisson statistical uncertainties, while the filled histograms represent the background expectation from simulation or data as described in the text. The shaded bands represent the statistical uncertainty in the background estimation. A sample signal distribution for the associated production mode with $ {m_{ {\Phi ^{\pm \pm }} }} = $ 500 GeV is overlaid. Only samples with nonzero expectation are shown. The ratio of the observed (Obs) and expected (Exp) distributions is also included. |

png pdf |
Figure 2-c:
Same sign dilepton mass distribution for the $\ell^{\pm}\tau^{\pm}\ell^{\mp}$ three lepton final state category. The solid symbols represent the data with Poisson statistical uncertainties, while the filled histograms represent the background expectation from simulation or data as described in the text. The shaded bands represent the statistical uncertainty in the background estimation. A sample signal distribution for the associated production mode with $ {m_{ {\Phi ^{\pm \pm }} }} = $ 500 GeV is overlaid. Only samples with nonzero expectation are shown. The ratio of the observed (Obs) and expected (Exp) distributions is also included. |
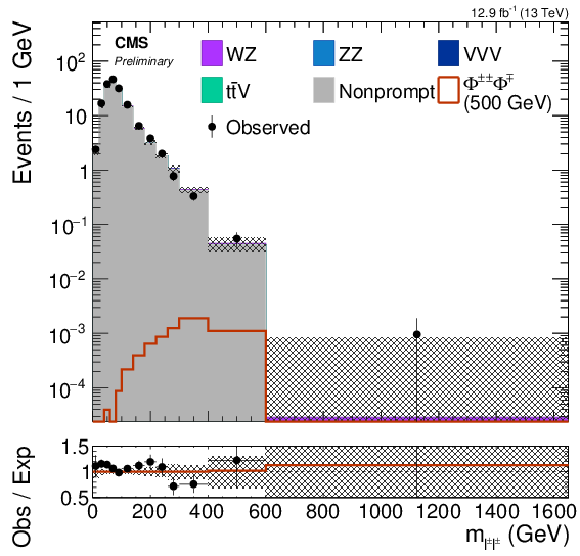
png pdf |
Figure 2-d:
Same sign dilepton mass distribution for the $\ell^{\pm}\tau^{\pm}\tau^{\mp}$ three lepton final state category. The solid symbols represent the data with Poisson statistical uncertainties, while the filled histograms represent the background expectation from simulation or data as described in the text. The shaded bands represent the statistical uncertainty in the background estimation. A sample signal distribution for the associated production mode with $ {m_{ {\Phi ^{\pm \pm }} }} = $ 500 GeV is overlaid. Only samples with nonzero expectation are shown. The ratio of the observed (Obs) and expected (Exp) distributions is also included. |

png pdf |
Figure 2-e:
Same sign dilepton mass distribution for the $\tau^{\pm}\tau^{\pm}\ell^{\mp}$ three lepton final state category. The solid symbols represent the data with Poisson statistical uncertainties, while the filled histograms represent the background expectation from simulation or data as described in the text. The shaded bands represent the statistical uncertainty in the background estimation. A sample signal distribution for the associated production mode with $ {m_{ {\Phi ^{\pm \pm }} }} = $ 500 GeV is overlaid. Only samples with nonzero expectation are shown. The ratio of the observed (Obs) and expected (Exp) distributions is also included. |
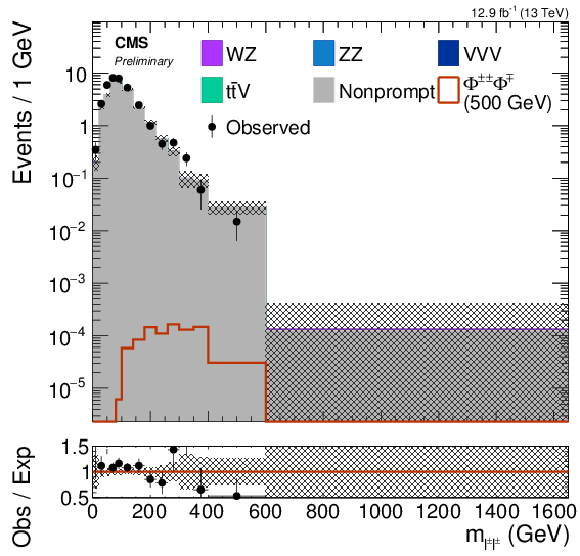
png pdf |
Figure 2-f:
Same sign dilepton mass distribution for the $\tau^{\pm}\tau^{\pm}\tau^{\mp}$ three lepton final state category. The solid symbols represent the data with Poisson statistical uncertainties, while the filled histograms represent the background expectation from simulation or data as described in the text. The shaded bands represent the statistical uncertainty in the background estimation. A sample signal distribution for the associated production mode with $ {m_{ {\Phi ^{\pm \pm }} }} = $ 500 GeV is overlaid. Only samples with nonzero expectation are shown. The ratio of the observed (Obs) and expected (Exp) distributions is also included. |

png pdf |
Figure 3:
Same sign dilepton mass distributions for each four lepton final state category. The solid symbols represent the data with Poisson statistical uncertainties, while the histograms represent the background expectation from simulation or data as described in the text. The shaded bands represent the statistical uncertainty in the background estimation. A sample signal distribution for the pair production mode with $ {m_{ {\Phi ^{\pm \pm }} }} = $ 500 GeV is overlaid. Only samples with nonzero expectation are shown. The ratio of the observed (Obs) and expected (Exp) distributions is also included. |
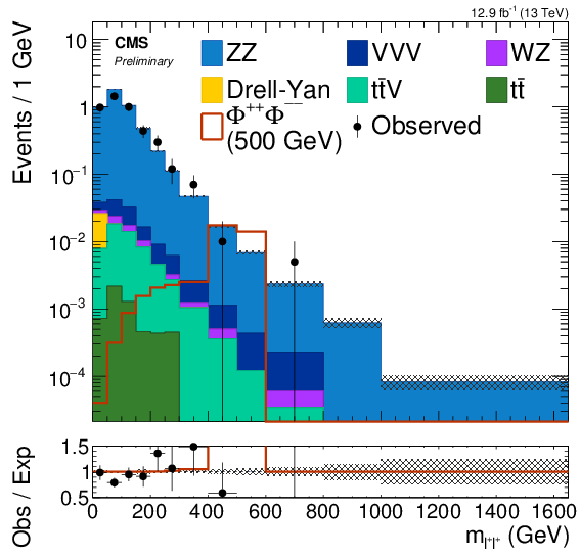
png pdf |
Figure 3-a:
Same sign dilepton mass distribution for the $\ell^{+}\ell^{+}\ell^{-}\ell^{-}$ four lepton final state category. The solid symbols represent the data with Poisson statistical uncertainties, while the histograms represent the background expectation from simulation or data as described in the text. The shaded bands represent the statistical uncertainty in the background estimation. A sample signal distribution for the pair production mode with $ {m_{ {\Phi ^{\pm \pm }} }} = $ 500 GeV is overlaid. Only samples with nonzero expectation are shown. The ratio of the observed (Obs) and expected (Exp) distributions is also included. |
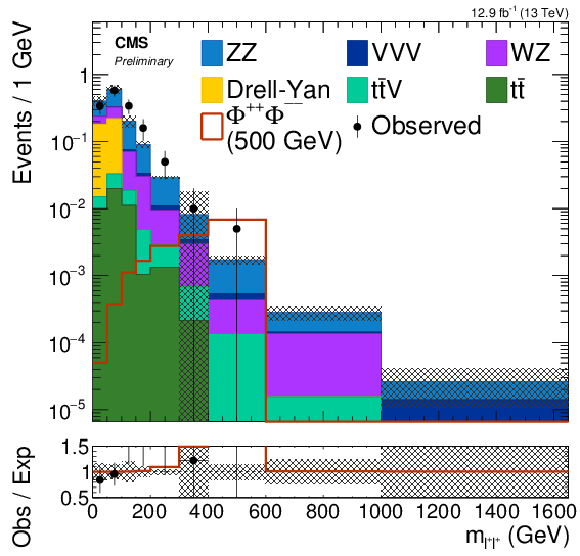
png pdf |
Figure 3-b:
Same sign dilepton mass distribution for the $\ell^{\pm}\ell^{\pm}\ell^{\mp}\tau^{\mp}$ four lepton final state category. The solid symbols represent the data with Poisson statistical uncertainties, while the histograms represent the background expectation from simulation or data as described in the text. The shaded bands represent the statistical uncertainty in the background estimation. A sample signal distribution for the pair production mode with $ {m_{ {\Phi ^{\pm \pm }} }} = $ 500 GeV is overlaid. Only samples with nonzero expectation are shown. The ratio of the observed (Obs) and expected (Exp) distributions is also included. |

png pdf |
Figure 3-c:
Same sign dilepton mass distribution for the $\ell^{\pm}\ell^{\pm}\tau^{\mp}\tau^{\mp}$ four lepton final state category. The solid symbols represent the data with Poisson statistical uncertainties, while the histograms represent the background expectation from simulation or data as described in the text. The shaded bands represent the statistical uncertainty in the background estimation. A sample signal distribution for the pair production mode with $ {m_{ {\Phi ^{\pm \pm }} }} = $ 500 GeV is overlaid. Only samples with nonzero expectation are shown. The ratio of the observed (Obs) and expected (Exp) distributions is also included. |

png pdf |
Figure 3-d:
Same sign dilepton mass distribution for the $\ell^{+}\tau^{+}\ell^{-}\tau^{-}$ four lepton final state category. The solid symbols represent the data with Poisson statistical uncertainties, while the histograms represent the background expectation from simulation or data as described in the text. The shaded bands represent the statistical uncertainty in the background estimation. A sample signal distribution for the pair production mode with $ {m_{ {\Phi ^{\pm \pm }} }} = $ 500 GeV is overlaid. Only samples with nonzero expectation are shown. The ratio of the observed (Obs) and expected (Exp) distributions is also included. |

png pdf |
Figure 3-e:
Same sign dilepton mass distribution for the $\ell^{\pm}\tau^{\pm}\tau^{\mp}\tau^{\mp}$ four lepton final state category. The solid symbols represent the data with Poisson statistical uncertainties, while the histograms represent the background expectation from simulation or data as described in the text. The shaded bands represent the statistical uncertainty in the background estimation. A sample signal distribution for the pair production mode with $ {m_{ {\Phi ^{\pm \pm }} }} = $ 500 GeV is overlaid. Only samples with nonzero expectation are shown. The ratio of the observed (Obs) and expected (Exp) distributions is also included. |

png pdf |
Figure 3-f:
Same sign dilepton mass distribution for the $\tau^{+}\tau^{+}\tau^{-}\tau^{-}$ four lepton final state category. The solid symbols represent the data with Poisson statistical uncertainties, while the histograms represent the background expectation from simulation or data as described in the text. The shaded bands represent the statistical uncertainty in the background estimation. A sample signal distribution for the pair production mode with $ {m_{ {\Phi ^{\pm \pm }} }} = $ 500 GeV is overlaid. Only samples with nonzero expectation are shown. The ratio of the observed (Obs) and expected (Exp) distributions is also included. |
png pdf |
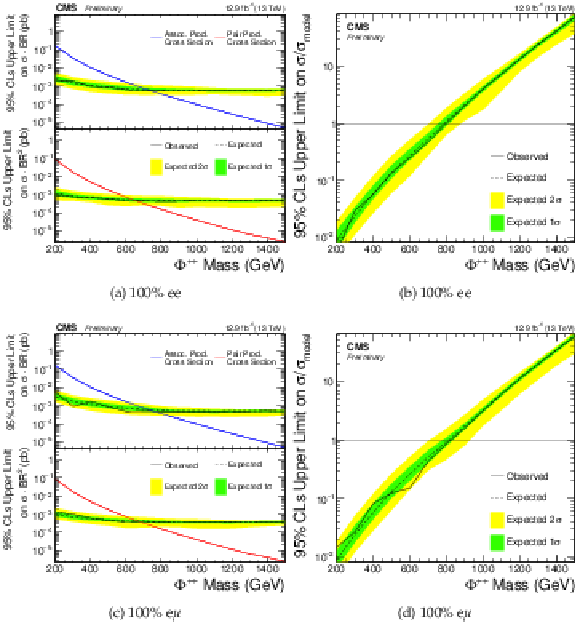
Figure 4:
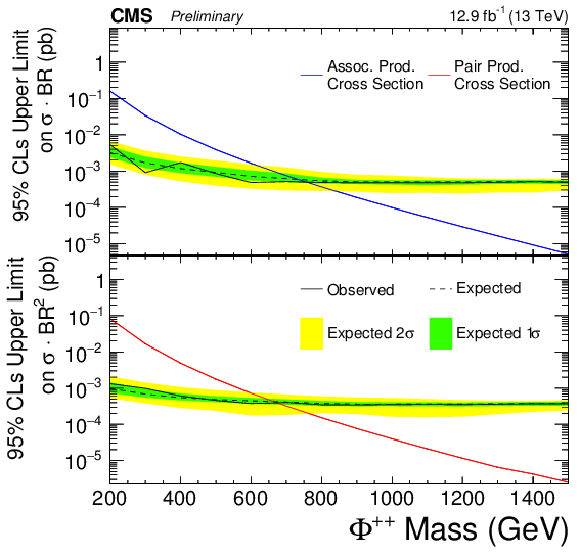
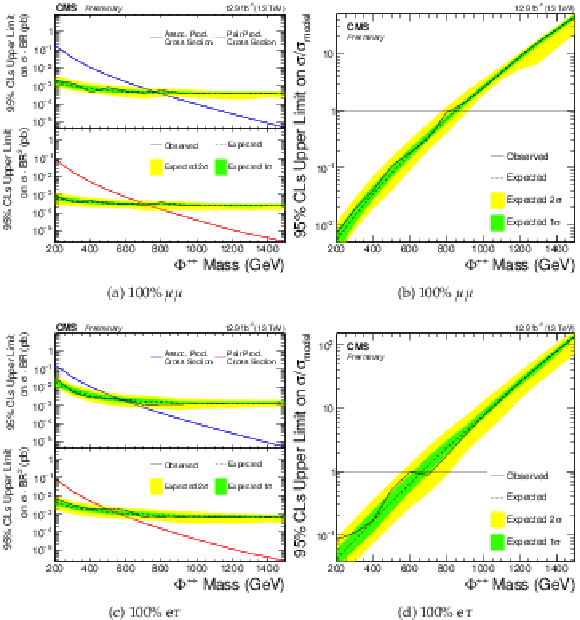
Limits on associated and pair production for each 100% branching fraction to $\mathrm{ e } \mathrm{ e } $ and $\mathrm{ e } \mu $, as well as the combined limit. |

png pdf |
Figure 4-a:
Limits on associated and pair production for 100% branching fraction to $\mathrm{ e } \mathrm{ e } $ . |
png pdf |
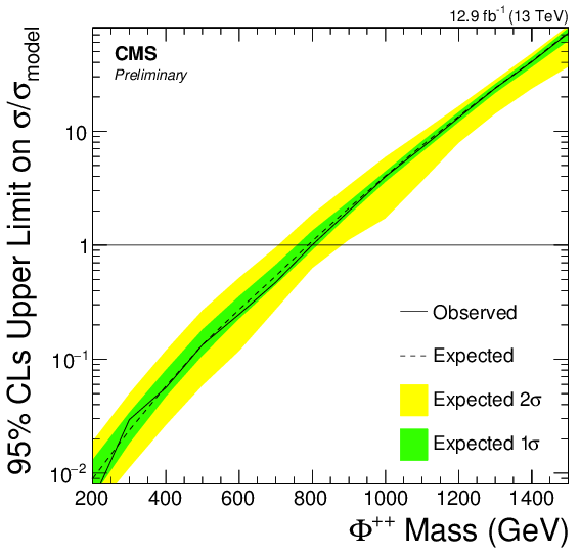
Figure 4-b:
Combined limit for 100% branching fraction to $\mathrm{ e } \mathrm{ e } $. |
png pdf |
Figure 4-c:
Limits on associated and pair production for 100% branching fraction to $\mathrm{ e } \mu $. |

png pdf |
Figure 4-d:
Combined limit for 100% branching fraction to $\mathrm{ e } \mu $. |
png pdf |
Figure 5:
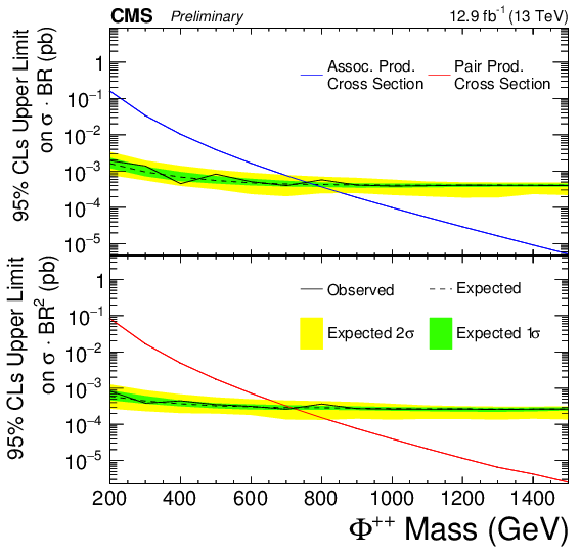
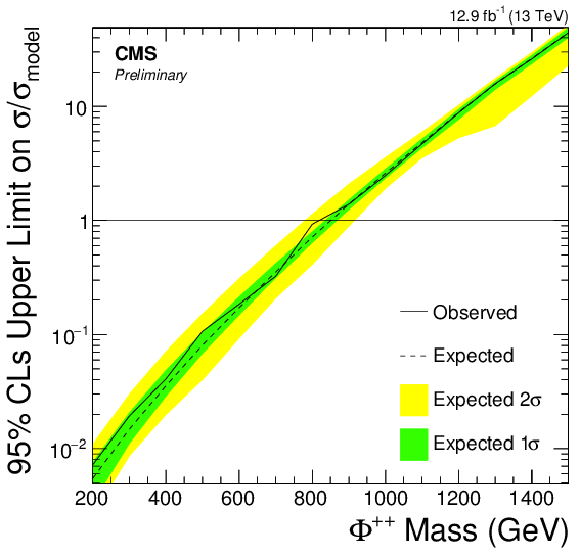
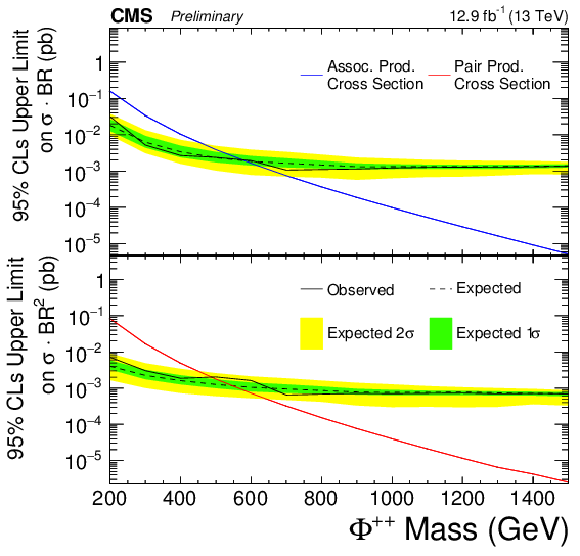
Limits on associated and pair production for each 100% branching fraction to $\mu \mu $ and $\mathrm{ e } \tau $, as well as the combined limit. |
png pdf |
Figure 5-a:
Limits on associated and pair production for 100% branching fraction to $\mu \mu $. |
png pdf |
Figure 5-b:
Combined limit for 100% branching fraction to $\mu \mu $. |
png pdf |
Figure 5-c:
Limits on associated and pair production for 100% branching fraction to $\mathrm{ e } \tau $. |

png pdf |
Figure 5-d:
Combined limit for 100% branching fraction to $\mathrm{ e } \tau $. |

png pdf |
Figure 6:
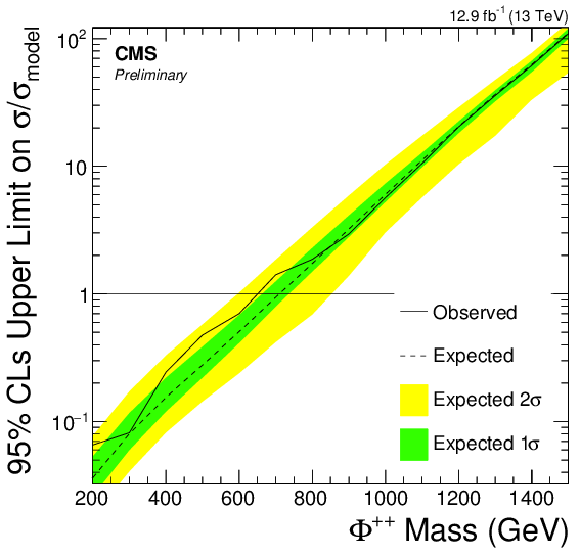
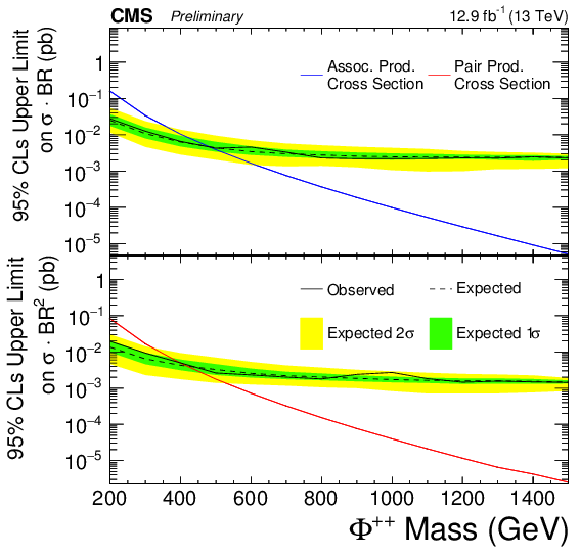
Limits on associated and pair production for each 100% branching fraction to $\mu \tau $ and $\tau \tau $, as well as the combined limit. |

png pdf |
Figure 6-a:
Limits on associated and pair production for each 100% branching fraction to $\mu \tau $. |
png pdf |
Figure 6-b:
Combined limit for each 100% branching fraction to $\mu \tau $. |
png pdf |
Figure 6-c:
Limits on associated and pair production for each 100% branching fraction to $\tau \tau $. |

png pdf |
Figure 6-d:
Combined limit for each 100% branching fraction to $\tau \tau $. |

png pdf |
Figure 7:
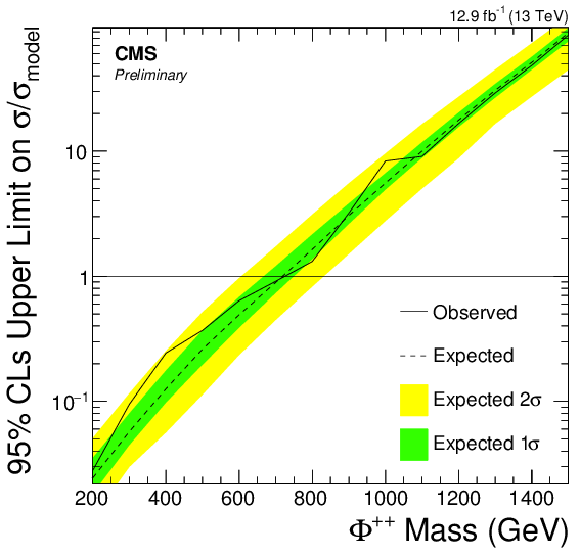
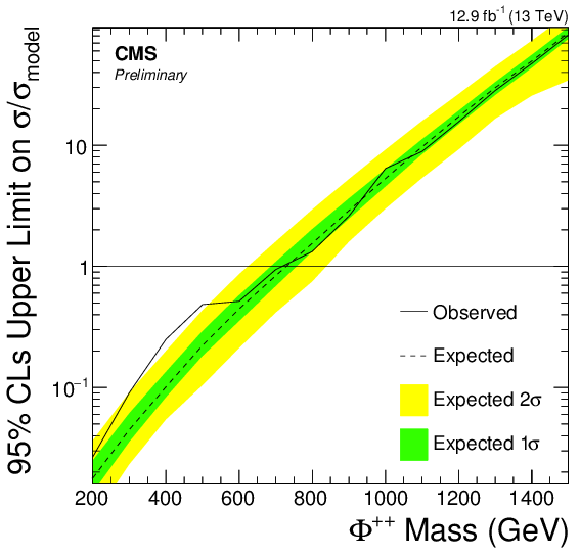
Limits on associated and pair production for Benchmark 1 and Benchmark 2, as well as the combined limit. |

png pdf |
Figure 7-a:
Limits on associated and pair production for Benchmark 1. |
png pdf |
Figure 7-b:
Combined limit for Benchmark 1. |

png pdf |
Figure 7-c:
Limits on associated and pair production for Benchmark 2. |
png pdf |
Figure 7-d:
Combined limit for Benchmark 2. |
png pdf |
Figure 8:
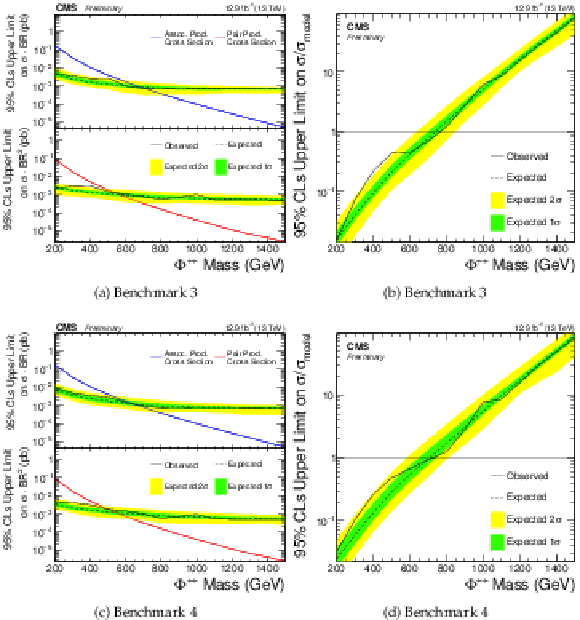
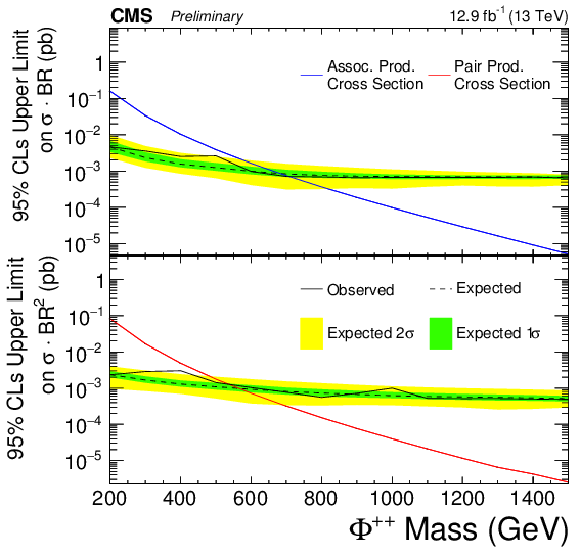
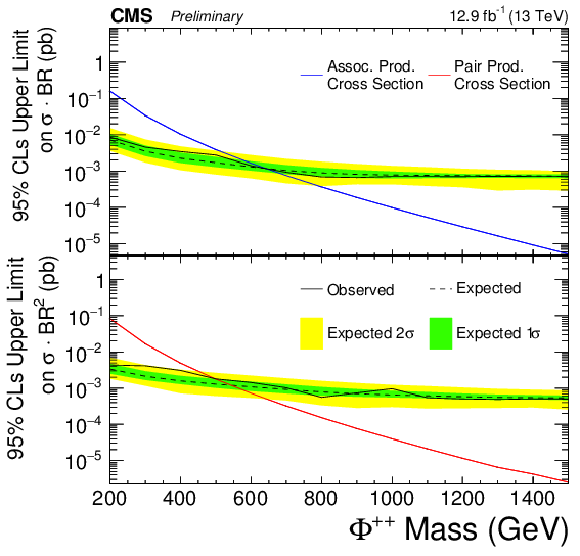
Limits on associated and pair production for Benchmark 3 and Benchmark 4, as well as the combined limit. |
png pdf |
Figure 8-a:
Limits on associated and pair production for Benchmark 3. |

png pdf |
Figure 8-b:
Combined limit for Benchmark 3. |
png pdf |
Figure 8-c:
Limits on associated and pair production for Benchmark 4. |

png pdf |
Figure 8-d:
Combined limit for Benchmark 4. |

png pdf |
Figure 9:
Summary of expected and observed limits for each production mode and the combined limit. The shaded region represents the excluded mass points and the thick solid line represents the expected exclusion with the hashed region indicating the direction. |
| Tables | |

png pdf |
Table 1:
Branching fraction scenarios for the decays of $\Phi ^{\pm \pm }$. |

png pdf |
Table 2:
Selections made on three lepton final states to define the final signal region. |

png pdf |
Table 3:
Selections made on four lepton final states to define the final signal region. |
png pdf |
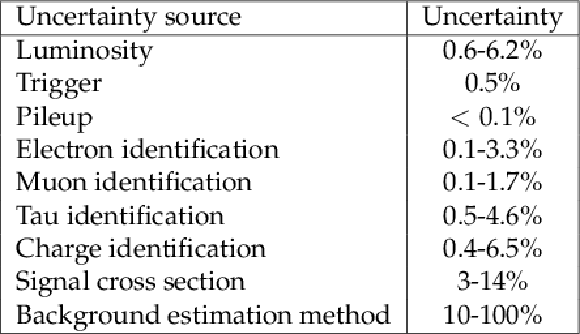
Table 4:
The effect of each uncertainty in the signal region expected value. These uncertainties vary for each final state and mass hypothesis. |
png pdf |
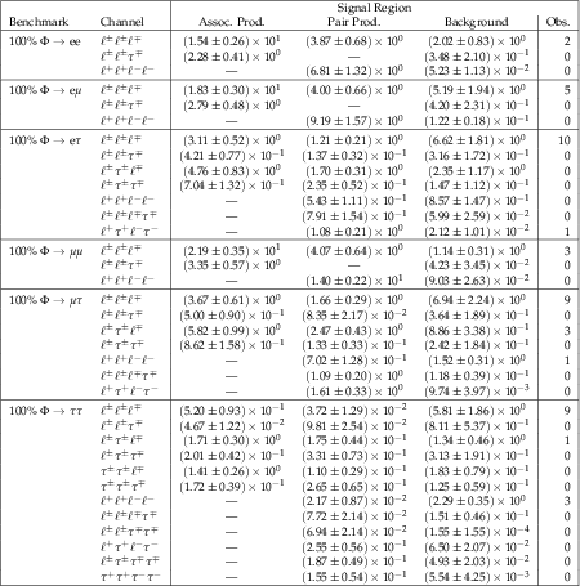
Table 5:
Yields for the signal region for a mass hypothesis of 500 GeV. The uncertainties shown are combined statistical and systematic. |

png pdf |
Table 6:
Observed (expected) 95% CL limits for associated (AP) and pair production (PP) and the combined limit. |
| Summary |
| A search for a doubly-charged Higgs boson utilizing $ \sqrt{s} = $ 13 TeV LHC proton-proton collisions is presented. The data correspond to an integrated luminosity of 12.9 fb$^{-1}$ collected by the CMS experiment. No significant excess over standard model background expectations is observed, and lower bounds on the $\Phi^{\pm\pm}$ mass are extended to between 800 GeV and 820 GeV for final states with 100% decays to $\mathrm{ ee }$, $\mathrm{ e }\mu$, and $\mu\mu$, and to 714 GeV and 643 GeV for final states with 100% decays to $e\tau$ and $\mu\tau$, respectively. Final states with 100% decays to $\tau\tau$ are excluded up to 535 GeV. In addition, benchmark points of the type II see-saw model targeting four possible neutrino mass hypotheses are also probed, with lower bounds between 716 GeV and 761 GeV. |
| References | ||||
| 1 | Particle Data Group, K. A. Olive et al. | Review of particle physics | CPC 38 (2014) 090001 | |
| 2 | M. Raidal et al. | Flavour physics of leptons and dipole moments | EPJC 57 (2008) 13 | 0801.1826 |
| 3 | M. Magg and C. Wetterich | Neutrino mass problem and gauge hierarchy | PLB 94 (1980) 61 | |
| 4 | J. Schechter and J. W. F. Valle | Neutrino masses in SU(2) x U(1) theories | PRD 22 (1980) 2227 | |
| 5 | G. Lazarides, Q. Shafi, and C. Wetterich | Proton lifetime and fermion masses in an SO(10) model | Nucl. Phys. B 181 (1981) 287 | |
| 6 | R. N. Mohapatra and G. Senjanovic | Neutrino masses and mixings in gauge models with spontaneous parity violation | PRD 23 (1981) 165 | |
| 7 | CMS Collaboration | A search for a doubly-charged Higgs boson in $ pp $ collisions at $ \sqrt{s}=7 $ TeV | EPJC 72 (2012) 2189 | CMS-HIG-12-005 1207.2666 |
| 8 | K. Huitu et al. | Doubly charged Higgs at LHC | Nucl. Phys. B 487 (1997) 27 | hep-ph/9606311 |
| 9 | M. Muhlleitner and M. Spira | A Note on doubly charged Higgs pair production at hadron colliders | PRD 68 (2003) 117701 | hep-ph/0305288 |
| 10 | A. G. Akeroyd, C.-W. Chiang, and N. Gaur | Leptonic signatures of doubly charged Higgs boson production at the LHC | JHEP 11 (2010) 005 | 1009.2780 |
| 11 | M. Kadastik, M. Raidal, and L. Rebane | Direct determination of neutrino mass parameters at future colliders | PRD 77 (2008) 115023 | 0712.3912 |
| 12 | A. Hektor et al. | Testing neutrino masses in little Higgs models via discovery of doubly charged Higgs at LHC | Nucl. Phys. B 787 (2007) 198 | 0705.1495 |
| 13 | J. Garayoa and T. Schwetz | Neutrino mass hierarchy and Majorana CP phases within the Higgs triplet model at the LHC | JHEP 03 (2008) 009 | 0712.1453 |
| 14 | A. G. Akeroyd, M. Aoki, and H. Sugiyama | Probing Majorana phases and the neutrino mass spectrum in the Higgs triplet model at the CERN LHC | PRD 77 (Apr, 2008) 075010 | |
| 15 | J. Lesgourgues and S. Pastor | Massive neutrinos and cosmology | PR 429 (2006) 307--379 | astro-ph/0603494 |
| 16 | M. L. Swartz | Limits on doubly charged Higgs boson and lepton flavor violation | PRD 40 (1989) 1521, .Revised version, May 1989 | |
| 17 | TASSO Collaboration | An improved measurement of electroweak couplings from $ e^+e^- \rightarrow e^+ e^- $ and $ e^+ e^- \rightarrow \mu^+ \mu^- $ | Z. Phys. C 22 (1984) 13 | |
| 18 | PLUTO Collaboration | Tests of the Standard Model with lepton pair production in $ e^+e^- $ reactions | Z. Phys. C 27 (1985) 341 | |
| 19 | M. Derrick et al. | New results from Bhabha scattering at 29~GeV | PLB 166 (1986) 463 | |
| 20 | M. Derrick et al. | Experimental study of the reactions $ e^+ e^- \rightarrow e^+ e^- $ and $ e+ e- \rightarrow \gamma\gamma $ at 29~GeV | PRD 34 (1986) 3286 | |
| 21 | E. Fernandez et al. | Electroweak effects in $ e^+e^-\rightarrow e^+e^- $ at $ \sqrt{s} $ = 29~GeV | PRD 35 (1987) 10 | |
| 22 | M. L. Swartz et al. | A search for doubly charged Higgs scalars in $ Z $ decay | PRL 64 (1990) 2877 | |
| 23 | H1 Collaboration | Search for doubly-charged Higgs boson production at HERA | PLB 638 (2006) 432 | hep-ex/0604027 |
| 24 | L3 Collaboration | Search for doubly charged Higgs bosons at LEP | PLB 576 (2003) 18 | hep-ex/0309076 |
| 25 | DELPHI Collaboration | Search for doubly charged Higgs bosons at LEP-2 | PLB 552 (2003) 127 | hep-ex/0303026 |
| 26 | OPAL Collaboration | Search for the single production of doubly charged Higgs bosons and constraints on their couplings from Bhabha scattering | PLB 577 (2003) 93 | hep-ex/0308052 |
| 27 | OPAL Collaboration | Search for doubly charged Higgs bosons with the OPAL detector at LEP | PLB 526 (2002) 221 | hep-ex/0111059 |
| 28 | CDF Collaboration | Search for Doubly Charged Higgs Bosons with Lepton-Flavor-Violating Decays involving Tau Leptons | PRL 101 (2008) 121801 | 0808.2161 |
| 29 | CDF Collaboration | Search for doubly-charged Higgs bosons decaying to dileptons in $ p\bar{p} $ collisions at $ \sqrt{s} = 1.96 $ TeV | PRL 93 (2004) 221802 | hep-ex/0406073 |
| 30 | D0 Collaboration | Search for pair production of doubly-charged Higgs bosons in the $ H^{++} H^{-} \to \mu^{+} \mu^{+} \mu^{-} \mu^{-} $ final state at D0 | PRL 101 (2008) 071803 | 0803.1534 |
| 31 | ATLAS Collaboration | Search for doubly-charged Higgs bosons in like-sign dilepton final states at $ \sqrt{s}=7 $ TeV with the ATLAS detector | EPJC 72 (2012) 2244 | 1210.5070 |
| 32 | ATLAS Collaboration | Search for anomalous production of prompt same-sign lepton pairs and pair-produced doubly charged Higgs bosons with $ \sqrt{s}=8 $ TeV pp collisions using the ATLAS detector | JHEP 03 (2015) 041 | 1412.0237 |
| 33 | CMS Collaboration | Search for a doubly-charged Higgs boson with $ \sqrt{s}= $ 8 TeV pp collisions at the CMS experiment | CMS-PAS-HIG-14-039 | CMS-PAS-HIG-14-039 |
| 34 | CMS Collaboration | The CMS experiment at the CERN LHC | JINST 3 (2008) S08004 | CMS-00-001 |
| 35 | T. Sj\"ostrand et al. | An Introduction to PYTHIA 8.2 | CPC 191 (2015) 159 | 1410.3012 |
| 36 | A. Belyaev, N. D. Christensen, and A. Pukhov | CalcHEP 3.4 for collider physics within and beyond the Standard Model | CPC 184 (2013) 1729 | 1207.6082 |
| 37 | T. Melia, P. Nason, R. Rontsch, and G. Zanderighi | $ \text{W}^{+}\text{W}^{-} $, WZ and ZZ production in the POWHEG BOX | JHEP 11 (2011) 078 | 1107.5051 |
| 38 | P. Nason | A new method for combining NLO QCD with shower Monte Carlo algorithms | JHEP 11 (2004) 040 | hep-ph/0409146 |
| 39 | S. Frixione, P. Nason, and C. Oleari | Matching NLO QCD computations with parton shower simulations: the POWHEG method | JHEP 11 (2007) 070 | 0709.2092 |
| 40 | S. Alioli, P. Nason, C. Oleari, and E. Re | A General Framework for Implementing NLO Calculations in Shower Monte Carlo Programs: the POWHEG BOX | JHEP 06 (2010) 043 | 1002.2581 |
| 41 | J. M. Campbell and R. K. Ellis | MCFM for the Tevatron and the LHC | NPPS 205 (2010) 10 | 1007.3492 |
| 42 | J. Alwall et al. | The automated computation of tree-level and next-to-leading order differential cross sections, and their matching to parton shower simulations | JHEP 07 (2014) 079 | 1405.0301 |
| 43 | F. Caola, K. Melnikov, R. R\"ontsch, and L. Tancredi | QCD corrections to ZZ production in gluon fusion at the LHC | PRD 92 (2015) 094028 | 1509.06734 |
| 44 | M. Grazzini, S. Kallweit, and D. Rathlev | ZZ production at the LHC: fiducial cross sections and distributions in NNLO QCD | PLB 750 (2015) 407 | 1507.06257 |
| 45 | CMS Collaboration | Event generator tunes obtained from underlying event and multiparton scattering measurements | The European Physical Journal C 76 (2016) 1 | CMS-GEN-14-001 1512.00815 |
| 46 | NNPDF Collaboration | Parton distributions for the LHC Run II | JHEP 04 (2015) 040 | 1410.8849 |
| 47 | GEANT4 Collaboration | GEANT4: A simulation toolkit | NIMA 506 (2003) 250 | |
| 48 | CMS Collaboration | Particle-flow event reconstruction in CMS and performance for jets, taus, and $ E_{\mathrm{T}}^{\text{miss}} $ | CDS | |
| 49 | CMS Collaboration | Commissioning of the particle-flow event reconstruction with the first LHC collisions recorded in the CMS detector | CDS | |
| 50 | CMS Collaboration | Performance of electron reconstruction and selection with the CMS detector in proton-proton collisions at $ \sqrt{s} = 8 $$ TeV $ | JINST 10 (2015) P06005 | CMS-EGM-13-001 1502.02701 |
| 51 | CMS Collaboration | Performance of CMS muon reconstruction in pp collision events at $ \sqrt{s} = 7 $$ TeV $ | JINST 7 (2012) P10002 | CMS-MUO-10-004 1206.4071 |
| 52 | CMS Collaboration | Performance of reconstruction and identification of tau leptons in their decays to hadrons and tau neutrino in LHC Run-2 | CMS-PAS-TAU-16-002 | CMS-PAS-TAU-16-002 |
| 53 | M. Cacciari, G. P. Salam, and G. Soyez | The anti-$ k_{\rm{t}} $ jet clustering algorithm | JHEP 04 (2008) 063 | 0802.1189 |
| 54 | CMS Collaboration | Determination of jet energy calibration and transverse momentum resolution in CMS | JINST 6 (2011) P11002 | CMS-JME-10-011 1107.4277 |
| 55 | CMS Collaboration | Pileup Jet Identification | CMS-PAS-JME-13-005 | CMS-PAS-JME-13-005 |
| 56 | M. Cacciari and G. P. Salam | Pileup subtraction using jet areas | PLB 659 (2008) 119 | 0707.1378 |
| 57 | T. Junk | Confidence level computation for combining searches with small statistics | NIMA 434 (1999) 435 | hep-ex/9902006 |
| 58 | A. L. Read | Presentation of search results: The CL(s) technique | JPG 28 (2002) 2693 | |

|
Compact Muon Solenoid LHC, CERN |

|

|

|

|

|

|