

Compact Muon Solenoid
LHC, CERN
| CMS-PAS-TOP-23-005 | ||
| Measurement of the inclusive $ \mathrm{t\bar{t}} $ cross section in final states with one lepton and additional jets at 5.02 TeV with 2017 data | ||
| CMS Collaboration | ||
| 11 April 2024 | ||
| Abstract: A measurement of the top quark pair production cross section in proton-proton collisions at a centre-of-mass energy of 5.02 TeV is presented. The data were collected in a low-energy and low-intensity LHC run in autumn 2017, and correspond to an integrated luminosity of 302 pb$^{-1}$. The measurement is performed using events with one electron or muon, and multiple jets. Events are classified based on the number of all reconstructed jets and of the b-tagged jets; the signal selection includes the usage of multivariate analysis techniques. The measured cross section is 61.4 $ \pm $ 1.6 (stat) $^{+2.7}_{-2.6}$ (syst) $\pm$ 1.2 (lumi) pb. A combination with the result in the dilepton channel based on the same data set results in a value of 61.2 $ ^{+1.6}_{-1.5} $ (stat) $^{+2.6}_{-2.3}$ (syst) $\pm$ 1.2 (lumi) pb, in agreement with the standard model prediction of 69.5 $ ^{+2.9}_{-3.1} $ pb (at next-to-next-to-leading-order in QCD). | ||
|
Links:
CDS record (PDF) ;
Physics Briefing ;
CADI line (restricted) ;
These preliminary results are superseded in this paper, Submitted to JHEP. The superseded preliminary plots can be found here. |
||
| Figures | |

png pdf |
Figure 1:
Ranking of the input variables of the random forest. Importance in the horizontal axis is computed as the mean of accumulation of the impurity decrease within each tree [51]. |

png pdf |
Figure 2:
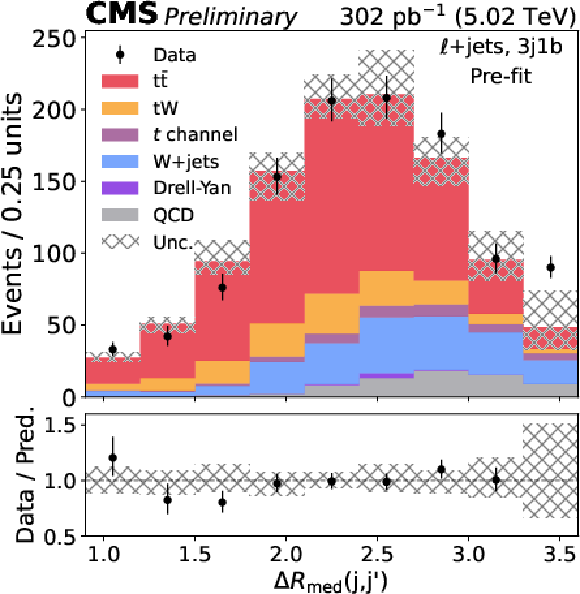
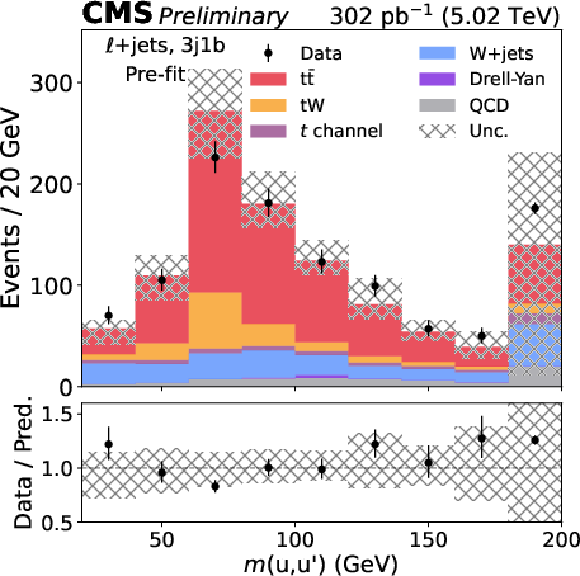
Distributions for data and expected signal and background contributions of the most discriminating input variables used for the random forest training, $ \Delta R_\mathrm{med}(\mathrm{j,j')} $ (left) and $ \mathit{m}(\mathrm{u},\mathrm{u'}) $ (right), in the 3j1b category, before the maximum likelihood fit. The vertical error bars represent the statistical uncertainty in the data, and the shaded band the experimental uncertainty in the prediction (not including MC statistics). The lower panels show the data-to-prediction ratio. The first and last bins in each distribution include underflow and overflow events, respectively. |
png pdf |
Figure 2-a:
Distributions for data and expected signal and background contributions of the most discriminating input variables used for the random forest training, $ \Delta R_\mathrm{med}(\mathrm{j,j')} $ (left) and $ \mathit{m}(\mathrm{u},\mathrm{u'}) $ (right), in the 3j1b category, before the maximum likelihood fit. The vertical error bars represent the statistical uncertainty in the data, and the shaded band the experimental uncertainty in the prediction (not including MC statistics). The lower panels show the data-to-prediction ratio. The first and last bins in each distribution include underflow and overflow events, respectively. |
png pdf |
Figure 2-b:
Distributions for data and expected signal and background contributions of the most discriminating input variables used for the random forest training, $ \Delta R_\mathrm{med}(\mathrm{j,j')} $ (left) and $ \mathit{m}(\mathrm{u},\mathrm{u'}) $ (right), in the 3j1b category, before the maximum likelihood fit. The vertical error bars represent the statistical uncertainty in the data, and the shaded band the experimental uncertainty in the prediction (not including MC statistics). The lower panels show the data-to-prediction ratio. The first and last bins in each distribution include underflow and overflow events, respectively. |
png pdf |
Figure 3:
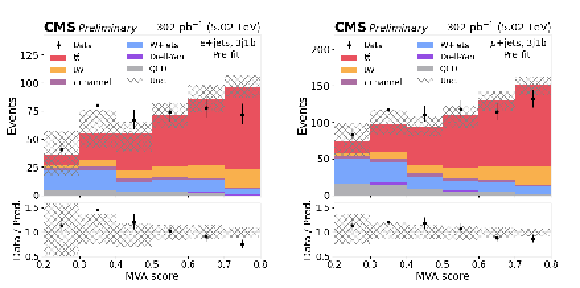
Distributions for data and expected signal and background contributions of the MVA score for the $ e $+jets (left) and $ \mu $+jets (right) channels in the 3j1b category, before the maximum likelihood fit. The vertical error bars represent the statistical uncertainty in the data, and the shaded band the experimental uncertainty in the prediction (not including MC statistics). The lower panels show the data-to-prediction ratio. The first and last bins in each distribution include underflow and overflow events, respectively. |

png |
Figure 3-a:
Distributions for data and expected signal and background contributions of the MVA score for the $ e $+jets (left) and $ \mu $+jets (right) channels in the 3j1b category, before the maximum likelihood fit. The vertical error bars represent the statistical uncertainty in the data, and the shaded band the experimental uncertainty in the prediction (not including MC statistics). The lower panels show the data-to-prediction ratio. The first and last bins in each distribution include underflow and overflow events, respectively. |

png |
Figure 3-b:
Distributions for data and expected signal and background contributions of the MVA score for the $ e $+jets (left) and $ \mu $+jets (right) channels in the 3j1b category, before the maximum likelihood fit. The vertical error bars represent the statistical uncertainty in the data, and the shaded band the experimental uncertainty in the prediction (not including MC statistics). The lower panels show the data-to-prediction ratio. The first and last bins in each distribution include underflow and overflow events, respectively. |
png pdf |
Figure 4:
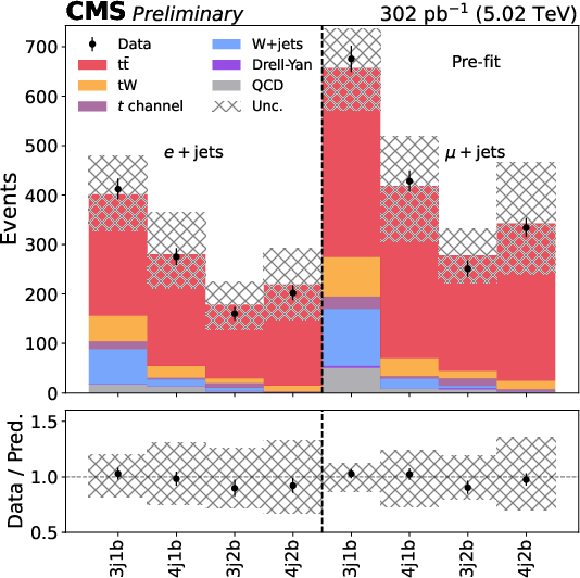
Observed and predicted number of events in each of the eight categories of the signal region, before the maximum likelihood fit. The vertical error bars represent the statistical uncertainty in the data, and the shaded band the experimental and theoretical uncertainty in the prediction. The lower panels show the data-to-prediction ratio. |
png pdf |
Figure 5:
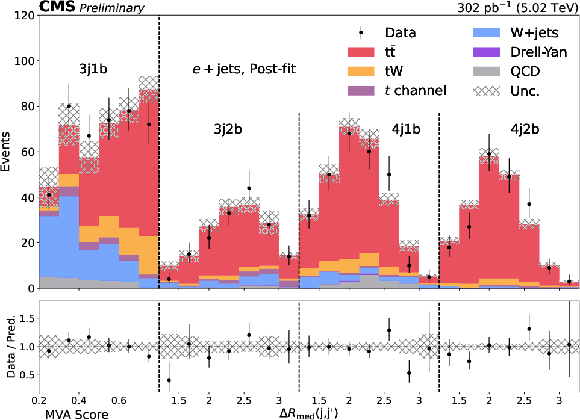
Distributions for the $ e $+jets final state after the maximum likelihood fit: MVA score bins for the 3j1b category and $ \Delta R_\mathrm{med}(\mathrm{j,j')} $ bins for the other categories. The vertical error bars represent the statistical uncertainty in the data, and the shaded band the uncertainty in the prediction. All uncertainties considered in the analysis are included in the uncertainty band. The lower panels show the data-to-prediction ratio. The first and last bins in each distribution include underflow and overflow events, respectively. |
png pdf |
Figure 6:
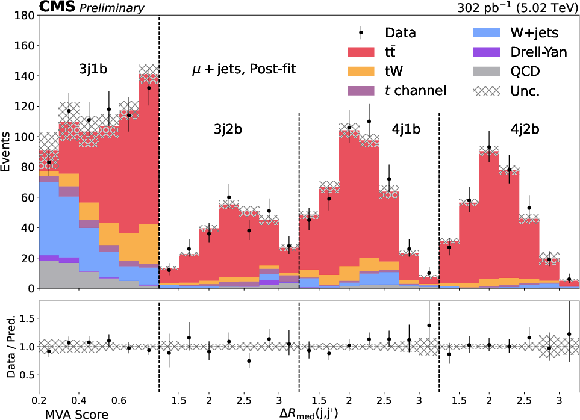
Distributions for the $ \mu $+jets final state after the maximum likelihood fit: MVA score bins for the 3j1b category and $ \Delta R_\mathrm{med}(\mathrm{j,j')} $ bins for the other categories. The vertical error bars represent the statistical uncertainty in the data, and the shaded band the uncertainty in the prediction. All uncertainties considered in the analysis are included in the uncertainty band. The lower panels show the data-to-prediction ratio. The first and last bins in each distribution include underflow and overflow events, respectively. |
png pdf |
Figure 9:
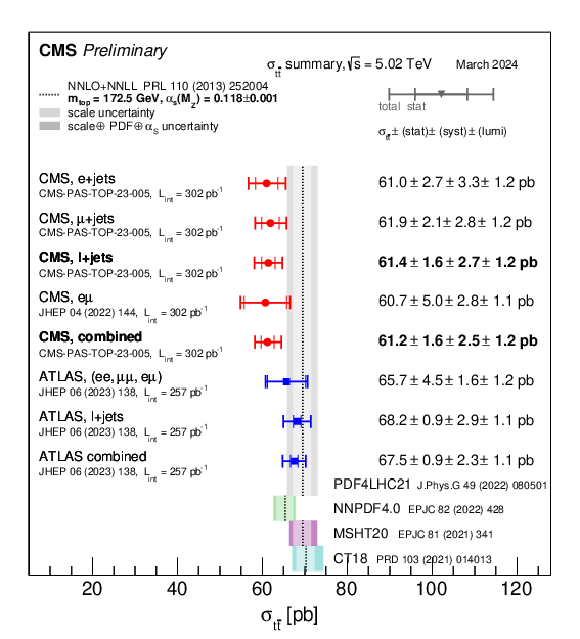
Summary of the most recent measurements from the ATLAS [3] and CMS Collaborations using data collected at 5 TeV. |
| Tables | |

png pdf |
Table 1:
Summary of MC samples used to model the signal and background processes. The last column corresponds to the QCD or electroweak (EW) precision used to normalize the distributions provided by the generators. The predictions for $ \mathrm{t} \overline{\mathrm{t}} $, $ t $ channel and $ \mathrm{t}\mathrm{W} $ are calculated using the PDF4LHC prescription [31]. |

png pdf |
Table 2:
Summary of the variables used for the MVA training. |
| Summary |
| A measurement of the top quark pair production cross section in proton-proton collisions at a centre-of-mass energy of 5.02 TeV is performed for events with one electron or one muon and multiple jets using data collected by the CMS experiment in 2017, corresponding to an integrated luminosity of 302 pb$^{-1}$. The dominant background sources in the analysis are W+jets and tW processes for which MC simulations are used to estimate their contribution. In addition, the contribution from QCD multijet events is estimated from data. The measurement is done via a maximum likelihood fit to eight event categories defined in terms of the number of jets and b-tagged jets. The cross section is found to be 61.4 $ \pm $ 1.6 (stat) $ ^{+2.7}_{-2.6} $ (syst) $ \pm $ 1.2 (lumi) pb. This measurement is combined with the result obtained in the dilepton channel, based on the same data set, resulting in a value of 61.2 $ ^{+1.6}_{-1.5} $ (stat) $ ^{+2.6}_{-2.3} $ (syst) $ \pm $ 1.2 (lumi) pb. In both cases, the dominant uncertainties are those associated with the luminosity and with the b tagging scale factors for heavy flavours. This result is in agreement with the standard model prediction and with previous measurements from CMS and ATLAS. A summary plot of previous CMS and ATLAS measurements, together with the ones presented in this analysis (as well as those for the $ e $+jets and $ \mu $+jets channels separately) can be seen in Fig. 9. |
| References | ||||
| 1 | CMS Collaboration | Measurement of the inclusive $ \mathrm{t} \overline{\mathrm{t}} $ cross section in pp collisions at $ \sqrt{s}= $ 5.02 TeV using final states with at least one charged lepton | JHEP 03 (2018) 115 | CMS-TOP-16-023 1711.03143 |
| 2 | CMS Collaboration | Measurement of the inclusive $ \mathrm{t}\overline{\mathrm{t}} $ production cross section in proton-proton collisions at $ \sqrt{s} = $ 5.02 TeV | JHEP 04 (2022) 144 | CMS-TOP-20-004 2112.09114 |
| 3 | ATLAS Collaboration | Measurement of the $ t\overline{t} $ production cross-section in pp collisions at $ \sqrt{s} = $ 5.02 TeV with the ATLAS detector | JHEP 06 (2023) 138 | 2207.01354 |
| 4 | CMS and ATLAS Collaborations | Combination of inclusive top-quark pair production cross-section measurements using ATLAS and CMS data at $ \sqrt{s} = $ 7 and 8 TeV | JHEP 07 (2023) 213 | 2205.13830 |
| 5 | ATLAS Collaboration | Measurement of the $ \mathrm{t} \overline{\mathrm{t}} $ production cross-section and lepton differential distributions in $ e\mu $ dilepton events from pp collisions at $ \sqrt{s}= $ 13 TeV with the ATLAS detector | EPJC 80 (2020) 528 | 1910.08819 |
| 6 | CMS Collaboration | Measurement of the top quark pair production cross section in proton-proton collisions at $ \sqrt{s}= $ 13 TeV | PRL 116 (2016) 052002 | CMS-TOP-15-003 1510.05302 |
| 7 | CMS Collaboration | Measurement of the $ \mathrm{t} \overline{\mathrm{t}} $ production cross section using events in the $ \mathrm{e}\mu $ final state in pp collisions at $ \sqrt{s}= $ 13 TeV | EPJC 77 (2017) 172 | CMS-TOP-16-005 1611.04040 |
| 8 | CMS Collaboration | Measurement of differential $ \mathrm{t} \overline{\mathrm{t}} $ production cross sections in the full kinematic range using lepton+jets events from proton-proton collisions at $ \sqrt{s}= $ 13 TeV | PRD 104 (2021) 092013 | CMS-TOP-20-001 2108.02803 |
| 9 | LHCb Collaboration | Measurement of forward top pair production in the dilepton channel in pp collisions at $ \sqrt{s}= $ 13 TeV | JHEP 08 (2018) 174 | 1803.05188 |
| 10 | CMS Collaboration | First measurement of the top quark pair production cross section in proton-proton collisions at $ \sqrt{s} = $ 13.6 TeV | JHEP 08 (2023) 204 | CMS-TOP-22-012 2303.10680 |
| 11 | ATLAS Collaboration | Measurement of the $ \mathrm{t}\overline{\mathrm{t}} $ cross section and its ratio to the Z production cross section using pp collisions at $ \sqrt{s} = $ 13.6 TeV with the ATLAS detector | PLB 848 (2024) 138376 | 2308.09529 |
| 12 | CMS Collaboration | Observation of top quark production in proton-nucleus collisions | PRL 119 (2017) 242001 | CMS-HIN-17-002 1709.07411 |
| 13 | CMS Collaboration | Evidence for top quark production in nucleus-nucleus collisions | PRL 125 (2020) 222001 | CMS-HIN-19-001 2006.11110 |
| 14 | CMS Collaboration | Measurement of double-differential cross sections for top quark pair production in pp collisions at $ \sqrt{s} = $ 8 TeV and impact on parton distribution functions | EPJC 77 (2017) 459 | CMS-TOP-14-013 1703.01630 |
| 15 | CMS Collaboration | The CMS experiment at the CERN LHC | JINST 3 (2008) S08004 | |
| 16 | CMS Collaboration | Development of the CMS detector for the CERN LHC Run 3 | Accepted by \itJINST | CMS-PRF-21-001 2309.05466 |
| 17 | CMS Collaboration | The CMS trigger system | JINST 12 (2017) P01020 | CMS-TRG-12-001 1609.02366 |
| 18 | CMS Collaboration | Performance of the CMS Level-1 trigger in proton-proton collisions at $ \sqrt{s}= $ 13 TeV | JINST 15 (2020) P10017 | CMS-TRG-17-001 2006.10165 |
| 19 | GEANT4 Collaboration | GEANT 4---a simulation toolkit | NIM A 506 (2003) 250 | |
| 20 | S. Frixione, P. Nason, and C. Oleari | Matching NLO QCD computations with parton shower simulations: the POWHEG method | JHEP 11 (2007) 070 | 0709.2092 |
| 21 | S. Alioli, P. Nason, C. Oleari, and E. Re | A general framework for implementing NLO calculations in shower Monte Carlo programs: the POWHEG BOX | JHEP 06 (2010) 043 | 1002.2581 |
| 22 | S. Frixione, P. Nason, and G. Ridolfi | A positive-weight next-to-leading-order Monte Carlo for heavy flavor hadroproduction | JHEP 09 (2007) 126 | 0707.3088 |
| 23 | T. Sjöstrand et al. | An introduction to PYTHIA8.2 | Comput. Phys. Commun. 191 (2015) 159 | 1410.3012 |
| 24 | CMS Collaboration | Extraction and validation of a new set of CMS PYTHIA8 tunes from underlying-event measurements | EPJC 80 (2020) 4 | CMS-GEN-17-001 1903.12179 |
| 25 | NNPDF Collaboration | Parton distributions from high-precision collider data | EPJC 77 (2017) 663 | 1706.00428 |
| 26 | J. Alwall et al. | The automated computation of tree-level and next-to-leading order differential cross sections, and their matching to parton shower simulations | JHEP 07 (2014) 079 | 1405.0301 |
| 27 | R. Frederix and S. Frixione | Merging meets matching in MC@NLO | JHEP 12 (2012) 061 | 1209.6215 |
| 28 | M. Czakon and A. Mitov | TOP++: a program for the calculation of the top-pair cross-section at hadron colliders | Comput. Phys. Commun. 185 (2014) 2930 | 1112.5675 |
| 29 | M. Czakon, P. Fiedler, and A. Mitov | Total top quark pair production cross section at hadron colliders through O($ \alpha_\mathrm{S}^4 $) | PRL 110 (2013) 252004 | 1303.6254 |
| 30 | Particle Data Group Collaboration | Review of Particle Physics | PTEP 2020 (2020) 083C01 | |
| 31 | M. Botje et al. | The PDF4LHC Working Group Interim Recommendations | 1101.0538 | |
| 32 | A. D. Martin, W. J. Stirling, R. S. Thorne, and G. Watt | Parton distributions for the LHC | EPJC 63 (2009) 189 | 0901.0002 |
| 33 | A. D. Martin, W. J. Stirling, R. S. Thorne, and G. Watt | Uncertainties on $ \alpha_{S} $ in global PDF analyses and implications for predicted hadronic cross sections | EPJC 64 (2009) 653 | 0905.3531 |
| 34 | H.-L. Lai et al. | New parton distributions for collider physics | PRD 82 (2010) 074024 | 1007.2241 |
| 35 | J. Gao et al. | CT10 next-to-next-to-leading order global analysis of QCD | PRD 89 (2014) 033009 | 1302.6246 |
| 36 | R. D. Ball et al. | Parton distributions with LHC data | Nuclear Physics B 867 (2013) 244 | 1207.1303 |
| 37 | J. Campbell, T. Neumann, and Z. Sullivan | Single-top-quark production in the $ t $-channel at NNLO | JHEP 02 (2021) 040 | 2012.01574 |
| 38 | N. Kidonakis and N. Yamanaka | Higher-order corrections for $ tW $ production at high-energy hadron colliders | JHEP 05 (2021) 278 | 2102.11300 |
| 39 | K. Melnikov and F. Petriello | Electroweak gauge boson production at hadron colliders through $ O(\alpha_\mathrm{S}^2) $ | PRD 74 (2006) 114017 | hep-ph/0609070 |
| 40 | CMS Collaboration | Particle-flow reconstruction and global event description with the CMS detector | JINST 12 (2017) P10003 | CMS-PRF-14-001 1706.04965 |
| 41 | M. Cacciari, G. P. Salam, and G. Soyez | The anti-$ k_{\mathrm{T}} $ jet clustering algorithm | JHEP 04 (2008) 063 | 0802.1189 |
| 42 | M. Cacciari, G. P. Salam, and G. Soyez | FASTJET user manual | EPJC 72 (2012) 1896 | 1111.6097 |
| 43 | CMS Collaboration | Jet energy scale and resolution in the CMS experiment in pp collisions at 8 TeV | JINST 12 (2017) P02014 | CMS-JME-13-004 1607.03663 |
| 44 | CMS Collaboration | Jet algorithms performance in 13 TeV data | CMS Physics Analysis Summary, 2017 CMS-PAS-JME-16-003 |
CMS-PAS-JME-16-003 |
| 45 | CMS Collaboration | Identification of heavy-flavour jets with the CMS detector in pp collisions at 13 TeV | JINST 13 (2018) P05011 | CMS-BTV-16-002 1712.07158 |
| 46 | CMS Collaboration | Electron and photon reconstruction and identification with the CMS experiment at the CERN LHC | JINST 16 (2021) P05014 | CMS-EGM-17-001 2012.06888 |
| 47 | CMS Collaboration | Performance of the CMS muon detector and muon reconstruction with proton-proton collisions at $ \sqrt{s}= $ 13 TeV | JINST 13 (2018) P06015 | CMS-MUO-16-001 1804.04528 |
| 48 | CMS Collaboration | Technical proposal for the Phase-II upgrade of the Compact Muon Solenoid | CMS Technical Proposal CERN-LHCC-2015-010, CMS-TDR-15-02, 2015 CDS |
|
| 49 | CMS Collaboration | Measurement of the Higgs boson production rate in association with top quarks in final states with electrons, muons, and hadronically decaying tau leptons at $ \sqrt{s}= $ 13 TeV | EPJC 81 (2021) 378 | CMS-HIG-19-008 2011.03652 |
| 50 | CMS Collaboration | Performance of missing transverse momentum reconstruction in proton-proton collisions at $ \sqrt{s} = $ 13 TeV using the CMS detector | JINST 14 (2019) P07004 | CMS-JME-17-001 1903.06078 |
| 51 | F. Pedregosa et al. | Scikit-learn: Machine learning in python | Journal of Machine Learning Research 12 (2011) 2825 | |
| 52 | J. Butterworth et al. | PDF4LHC recommendations for LHC Run II | JPG 43 (2016) 023001 | 1510.03865 |
| 53 | CMS Collaboration | Luminosity calibration for the pp reference run at $ \sqrt{s}= $ 5.02 TeV in 2017 | CMS Physics Analysis Summary, 2019 CMS-PAS-LUM-19-001 |
CMS-PAS-LUM-19-001 |
| 54 | J. S. Conway | Incorporating nuisance parameters in likelihoods for multisource spectra | in Proc. 2011 Workshop on Statistical Issues Related to Discovery Claims in Search Experiments and Unfolding (PHYSTAT ): Geneva, 2011 link |
1103.0354 |

|
Compact Muon Solenoid LHC, CERN |

|

|

|

|

|

|