

Compact Muon Solenoid
LHC, CERN
| CMS-PAS-TOP-21-005 | ||
| Evidence for the simultaneous production of four top quarks in proton-proton collisions at $ \sqrt{s} = $ 13 TeV | ||
| CMS Collaboration | ||
| 20 September 2022 | ||
| Abstract: The production of four top quarks ($ \mathrm{t\bar{t}t\bar{t}} $) is studied in up to 138 fb$ ^{-1} $ of LHC proton-proton collision data at a center-of-mass energy of 13 TeV. Events that have zero, one, or two opposite-sign charged electrons or muons are considered. This is the first $ \mathrm{t\bar{t}t\bar{t}} $ result that includes the all-hadronic final state. The observed significance of the $ \mathrm{t\bar{t}t\bar{t}} $ signal in these final states is 3.7 standard deviations (1.5 expected). The measured cross section is 38 $ ^{+13}_{-11} $ fb. Combining this result with published CMS results in other final states, we obtain a significance of 3.9 standard deviations (3.2 expected), which corresponds to an observed cross section of 17 $ ^{+5}_{-5} $ fb. | ||
|
Links:
CDS record (PDF) ;
CADI line (restricted) ;
These preliminary results are superseded in this paper, PLB 844 (2023) 138076. The superseded preliminary plots can be found here. |
||
| Figures & Tables | Summary | Additional Figures & Tables | References | CMS Publications |
|---|
| Figures | |

png pdf |
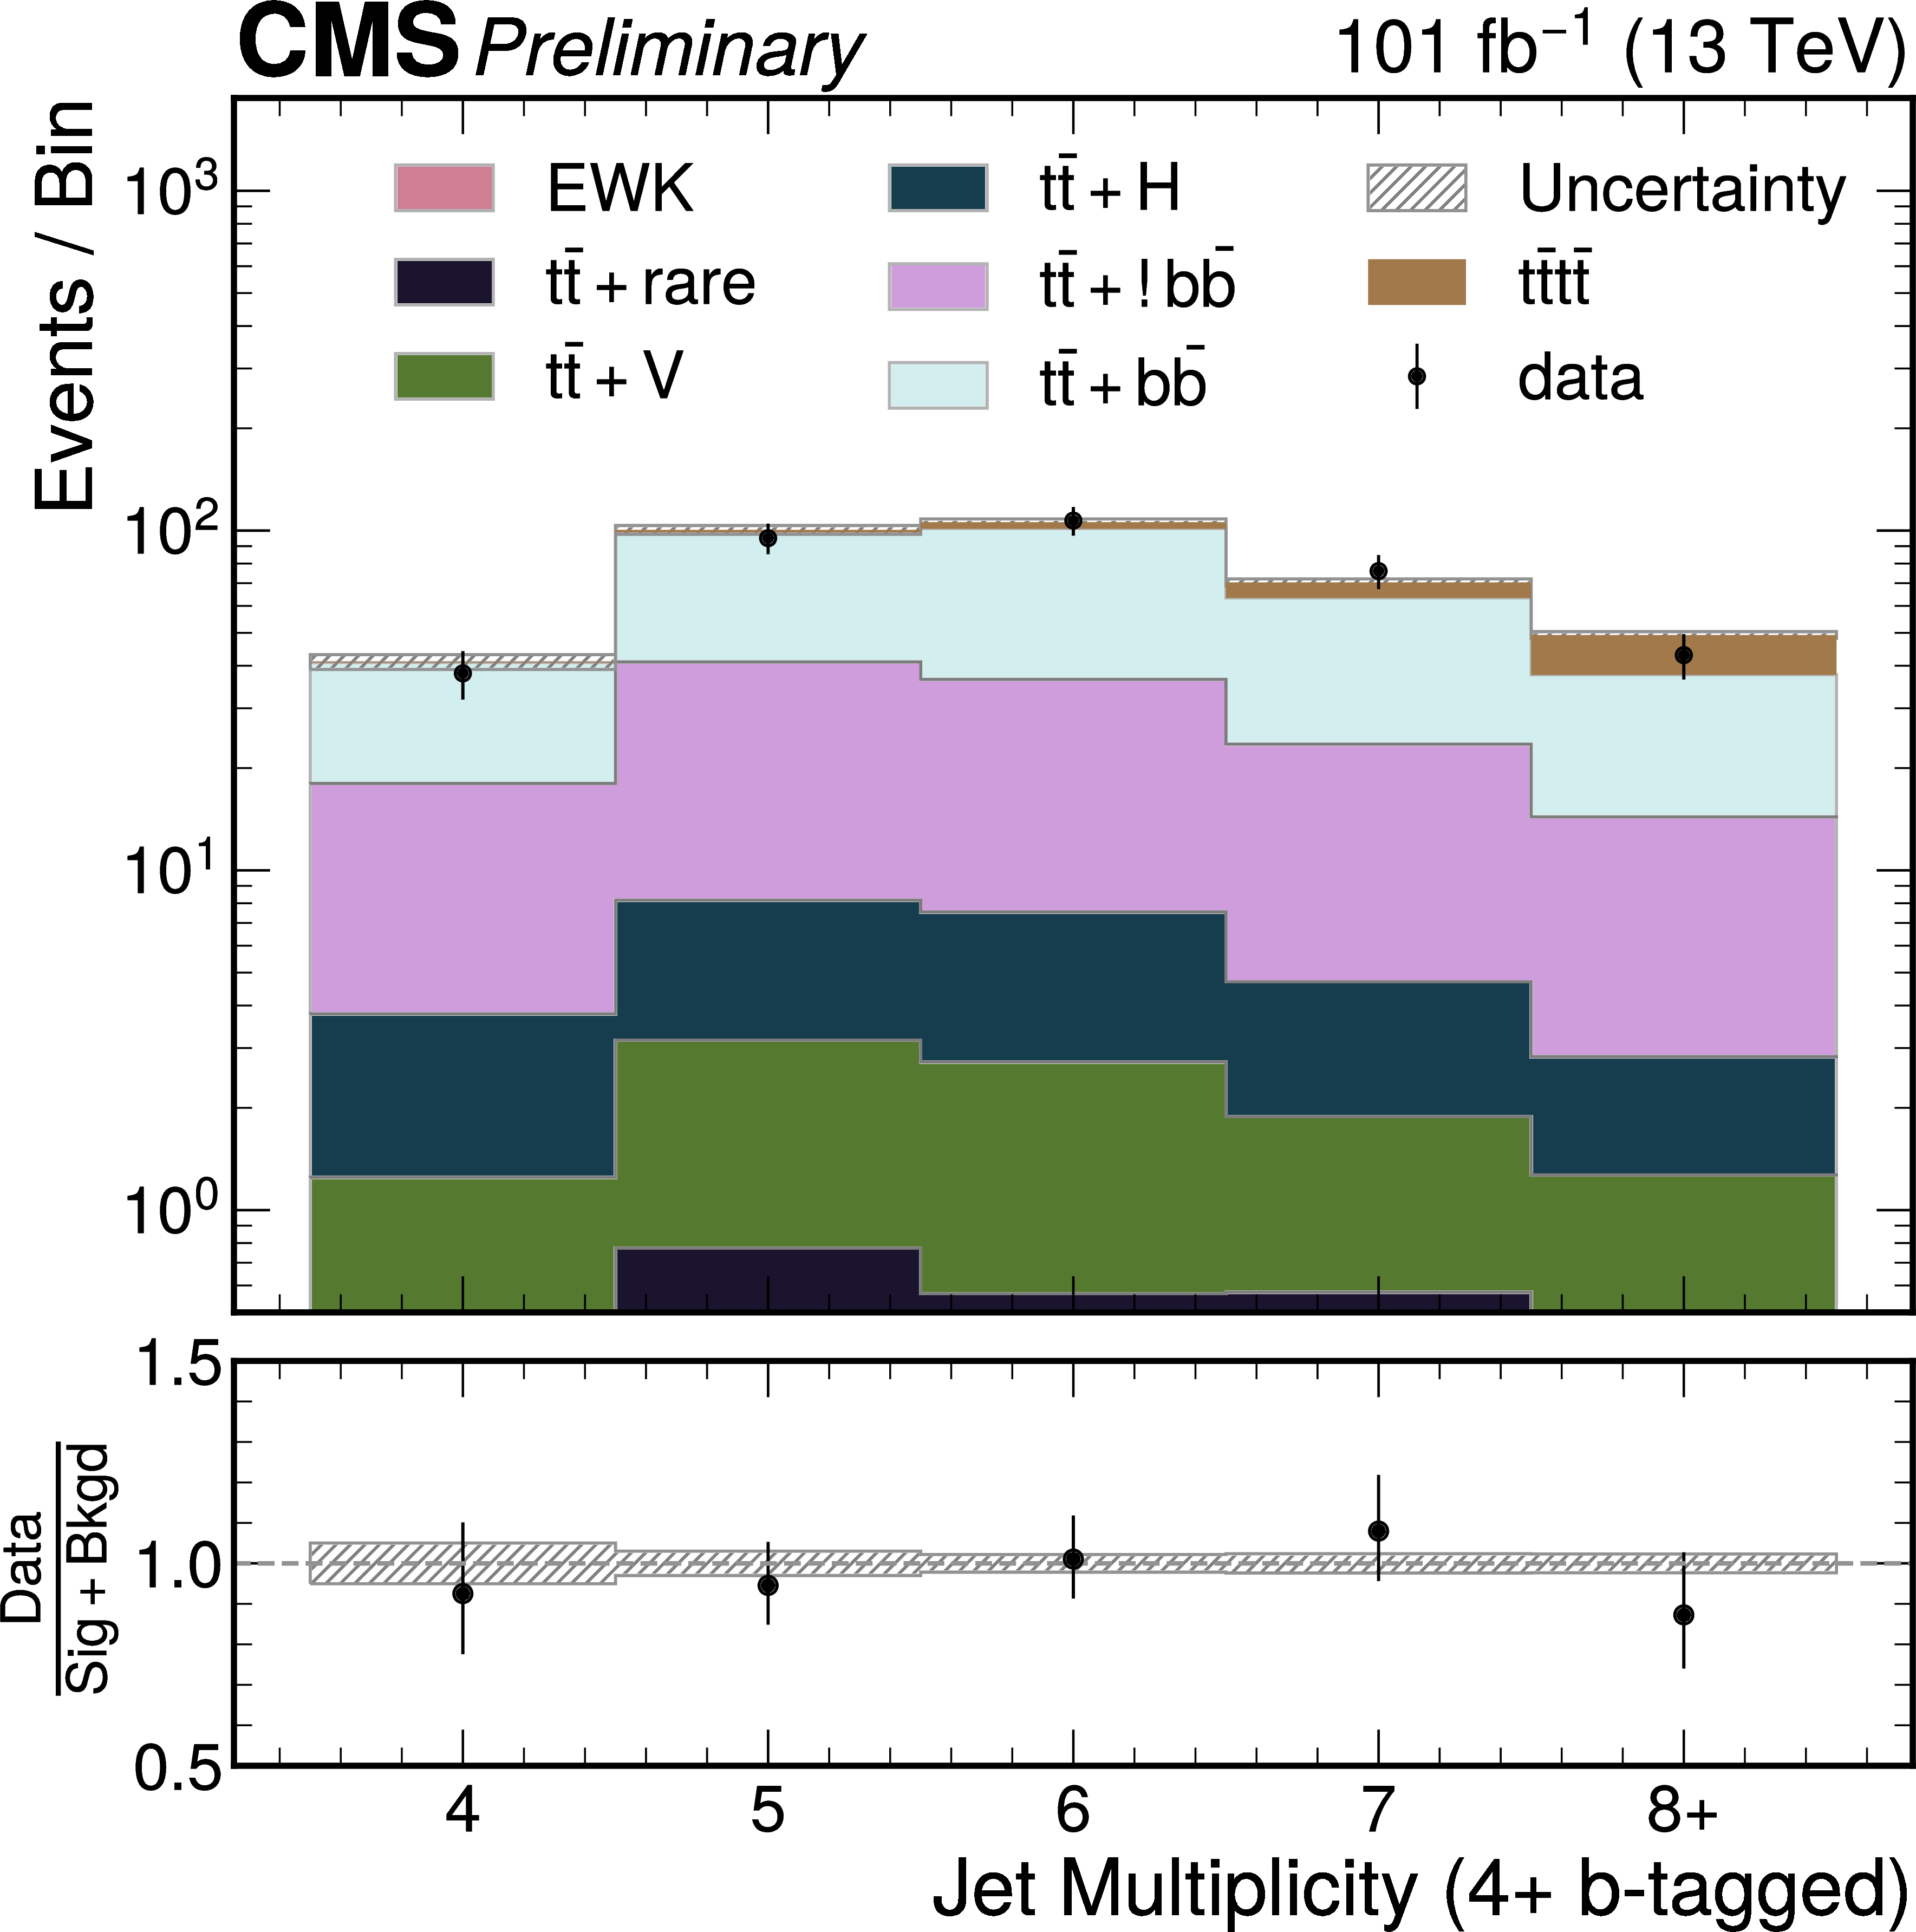
Figure 1:
The jet multiplicity for $ N_\text{b}\ge $ 4 in the opposite-sign dilepton channel for the combined 2017 and 2018 data with dilepton decay categories combined (left), and the distribution of the BDT discriminants for three different categories in the combined single-electron and muon channels (right). The background is shown as a stacked histogram and the post-fit $\mathrm{t\bar{t}t\bar{t}}$yield is shown on top (bottom) of all other backgrounds for the distributions on the left (right). The gray and black bands correspond to the estimated total uncertainty after the fit. |
png pdf |
Figure 1-a:
The jet multiplicity for $ N_\text{b}\ge $ 4 in the opposite-sign dilepton channel for the combined 2017 and 2018 data with dilepton decay categories combined. The background is shown as a stacked histogram and the post-fit $\mathrm{t\bar{t}t\bar{t}}$yield is shown on top of all other backgrounds for the distributions. The gray and black bands correspond to the estimated total uncertainty after the fit. |

png pdf |
Figure 1-b:
The distribution of the BDT discriminants for three different categories in the combined single-electron and muon channels. The background is shown as a stacked histogram and the post-fit $\mathrm{t\bar{t}t\bar{t}}$yield is shown on bottom of all other backgrounds for the distributions. The gray and black bands correspond to the estimated total uncertainty after the fit. |

png pdf |
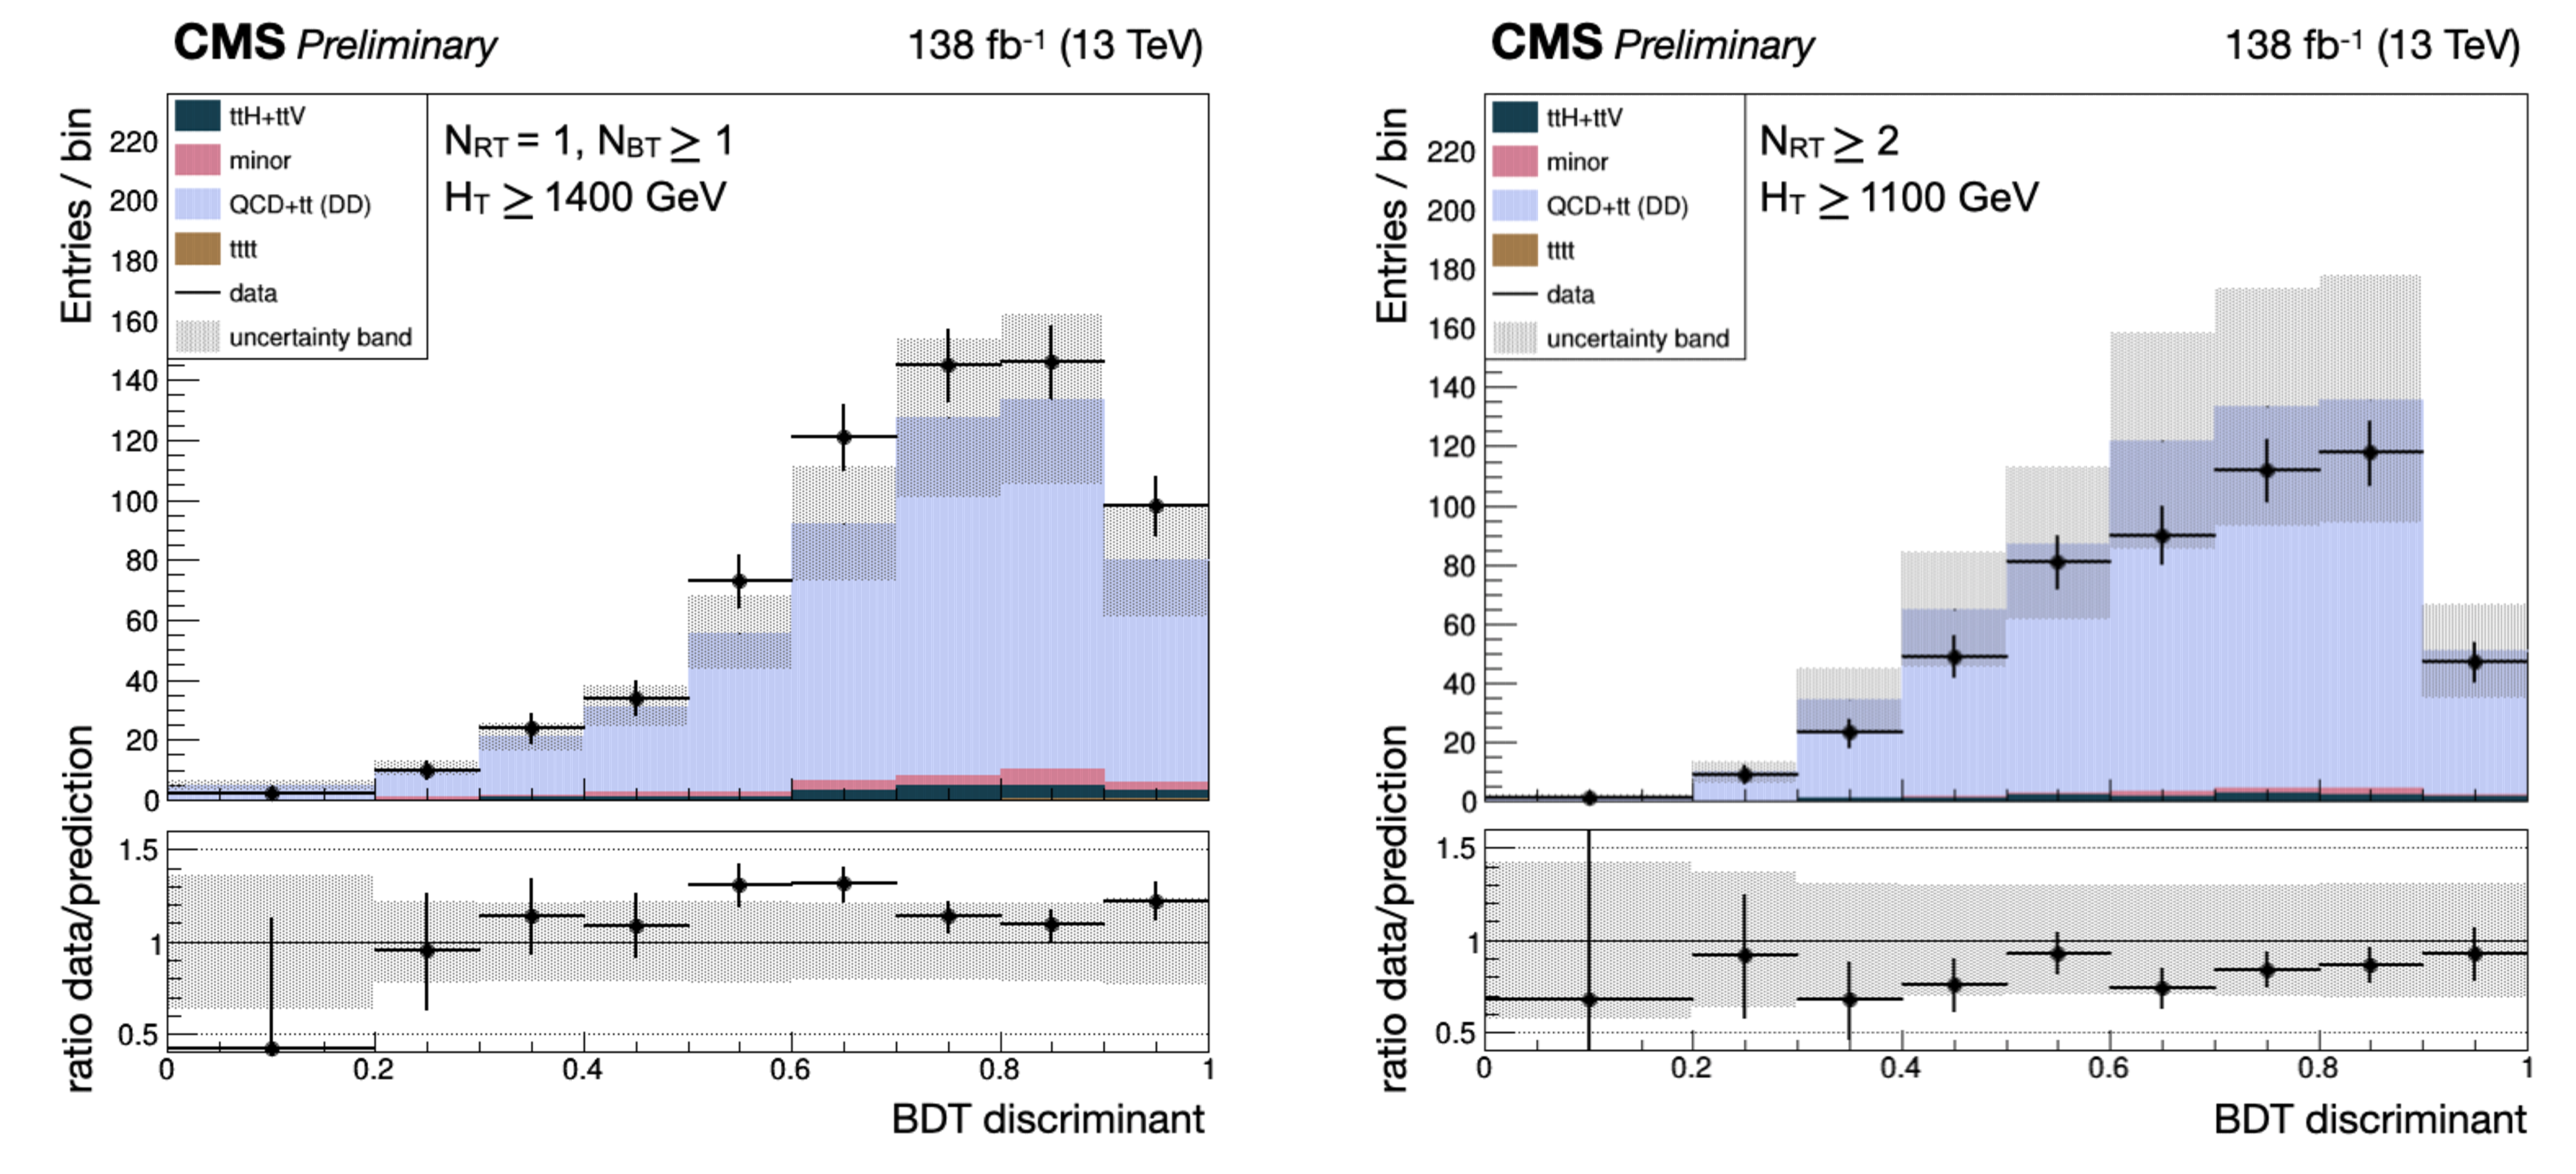
Figure 2:
Post-fit signal+background predictions for the full Run II all-hadronic channel BDT output distributions for the two most sensitive SR categories, defined by $ N_\text{RT}= $ 1, $ N_\text{BT}\ge $ 1, $ H_{\mathrm{T}} > $ 1400 GeV (left), and $ N_\text{BT}\ge $ 2, $ H_{\mathrm{T}} > $ 1100 GeV (right). Estimates for the $\mathrm{t\bar{t}t\bar{t}}$signal and other minor backgrounds are shown using simulated samples. The postfit error bands shown include all systematic uncertainties. |

png pdf |
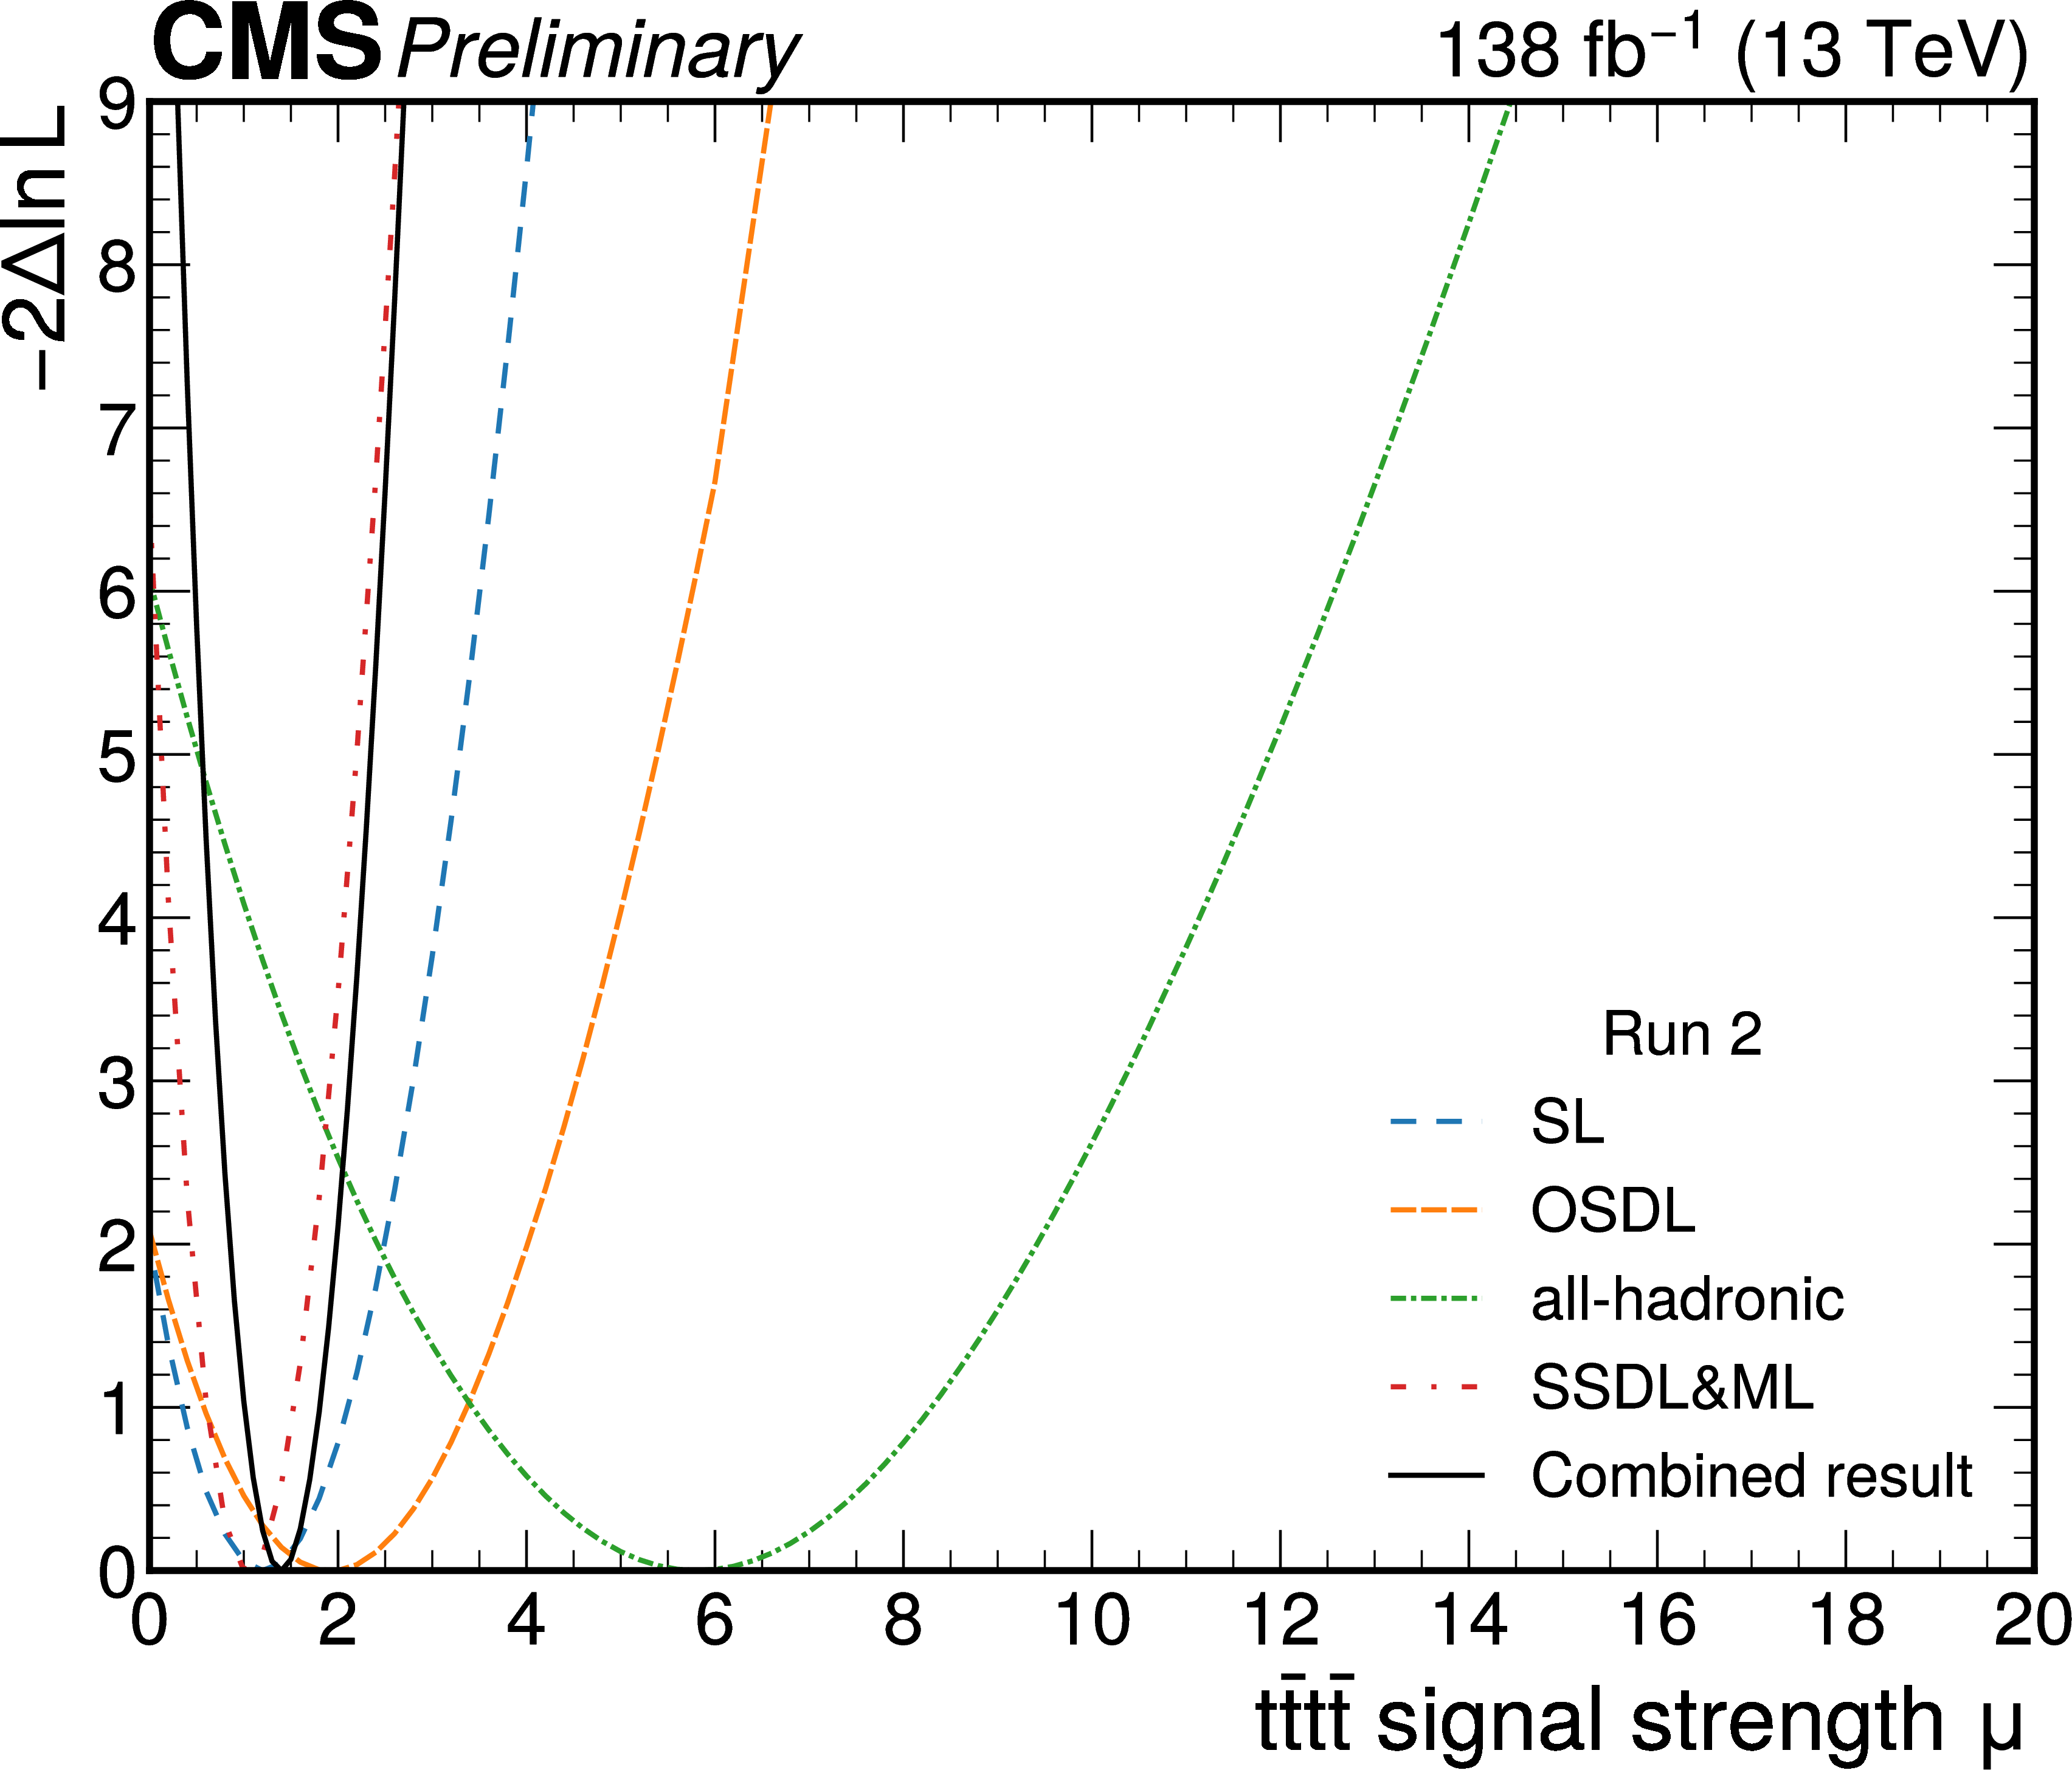
Figure 3:
Expected and observed significance (in standard deviations) for $\mathrm{t\bar{t}t\bar{t}}$production from each of the decay channels and their combination. |
| Tables | |

png pdf |
Table 1:
Best fit values of signal strength and the resulting significance (in standard deviations) for $\mathrm{t\bar{t}t\bar{t}}$-production for each of the decay channels and for the full Run 2 dataset. |
| Summary |
| In summary, we have measured the cross section for the simultaneous production of four top quarks ($\mathrm{t\bar{t}t\bar{t}}$) in pp\ collisions. The data were collected by the CMS experiment at the LHC between 2016 and 2018, and correspond to an integrated luminosity of up to 138 fb$ ^{-1} $ at a center-of-mass energy of 13 TeV. Decay modes with zero, one, or two opposite-sign charged leptons (electrons and muons), were considered. The all-hadronic final state was studied for the first time in a $\mathrm{t\bar{t}t\bar{t}}$-production analysis. The observed and expected significances of the new analyses described here are 3.7 and 1.5 standard deviations, respectively. The measured cross section is 38 $ ^{+13}_{-11} $ fb. When combined with previously published CMS results in other final states, the significances increase to 3.9 (observed) and 3.2 standard deviations (expected), and corresponds to an observed $\mathrm{t\bar{t}t\bar{t}}$ cross section of 17 $ ^{+5}_{-5} $ fb. The results are compatible with measurements by ATLAS Collaboration [28]. |
| Additional Figures | |

png pdf |
Additional Figure 1:
Fraction of background processes in each analysis tagging categories in combined single-electron and muon channels. |

png pdf |
Additional Figure 2:
Number of event in each tagging category in combined single-electron and muon channels before fit to data. Background uncertainties include all statistical and systematic components added in quadrature. |
png pdf |
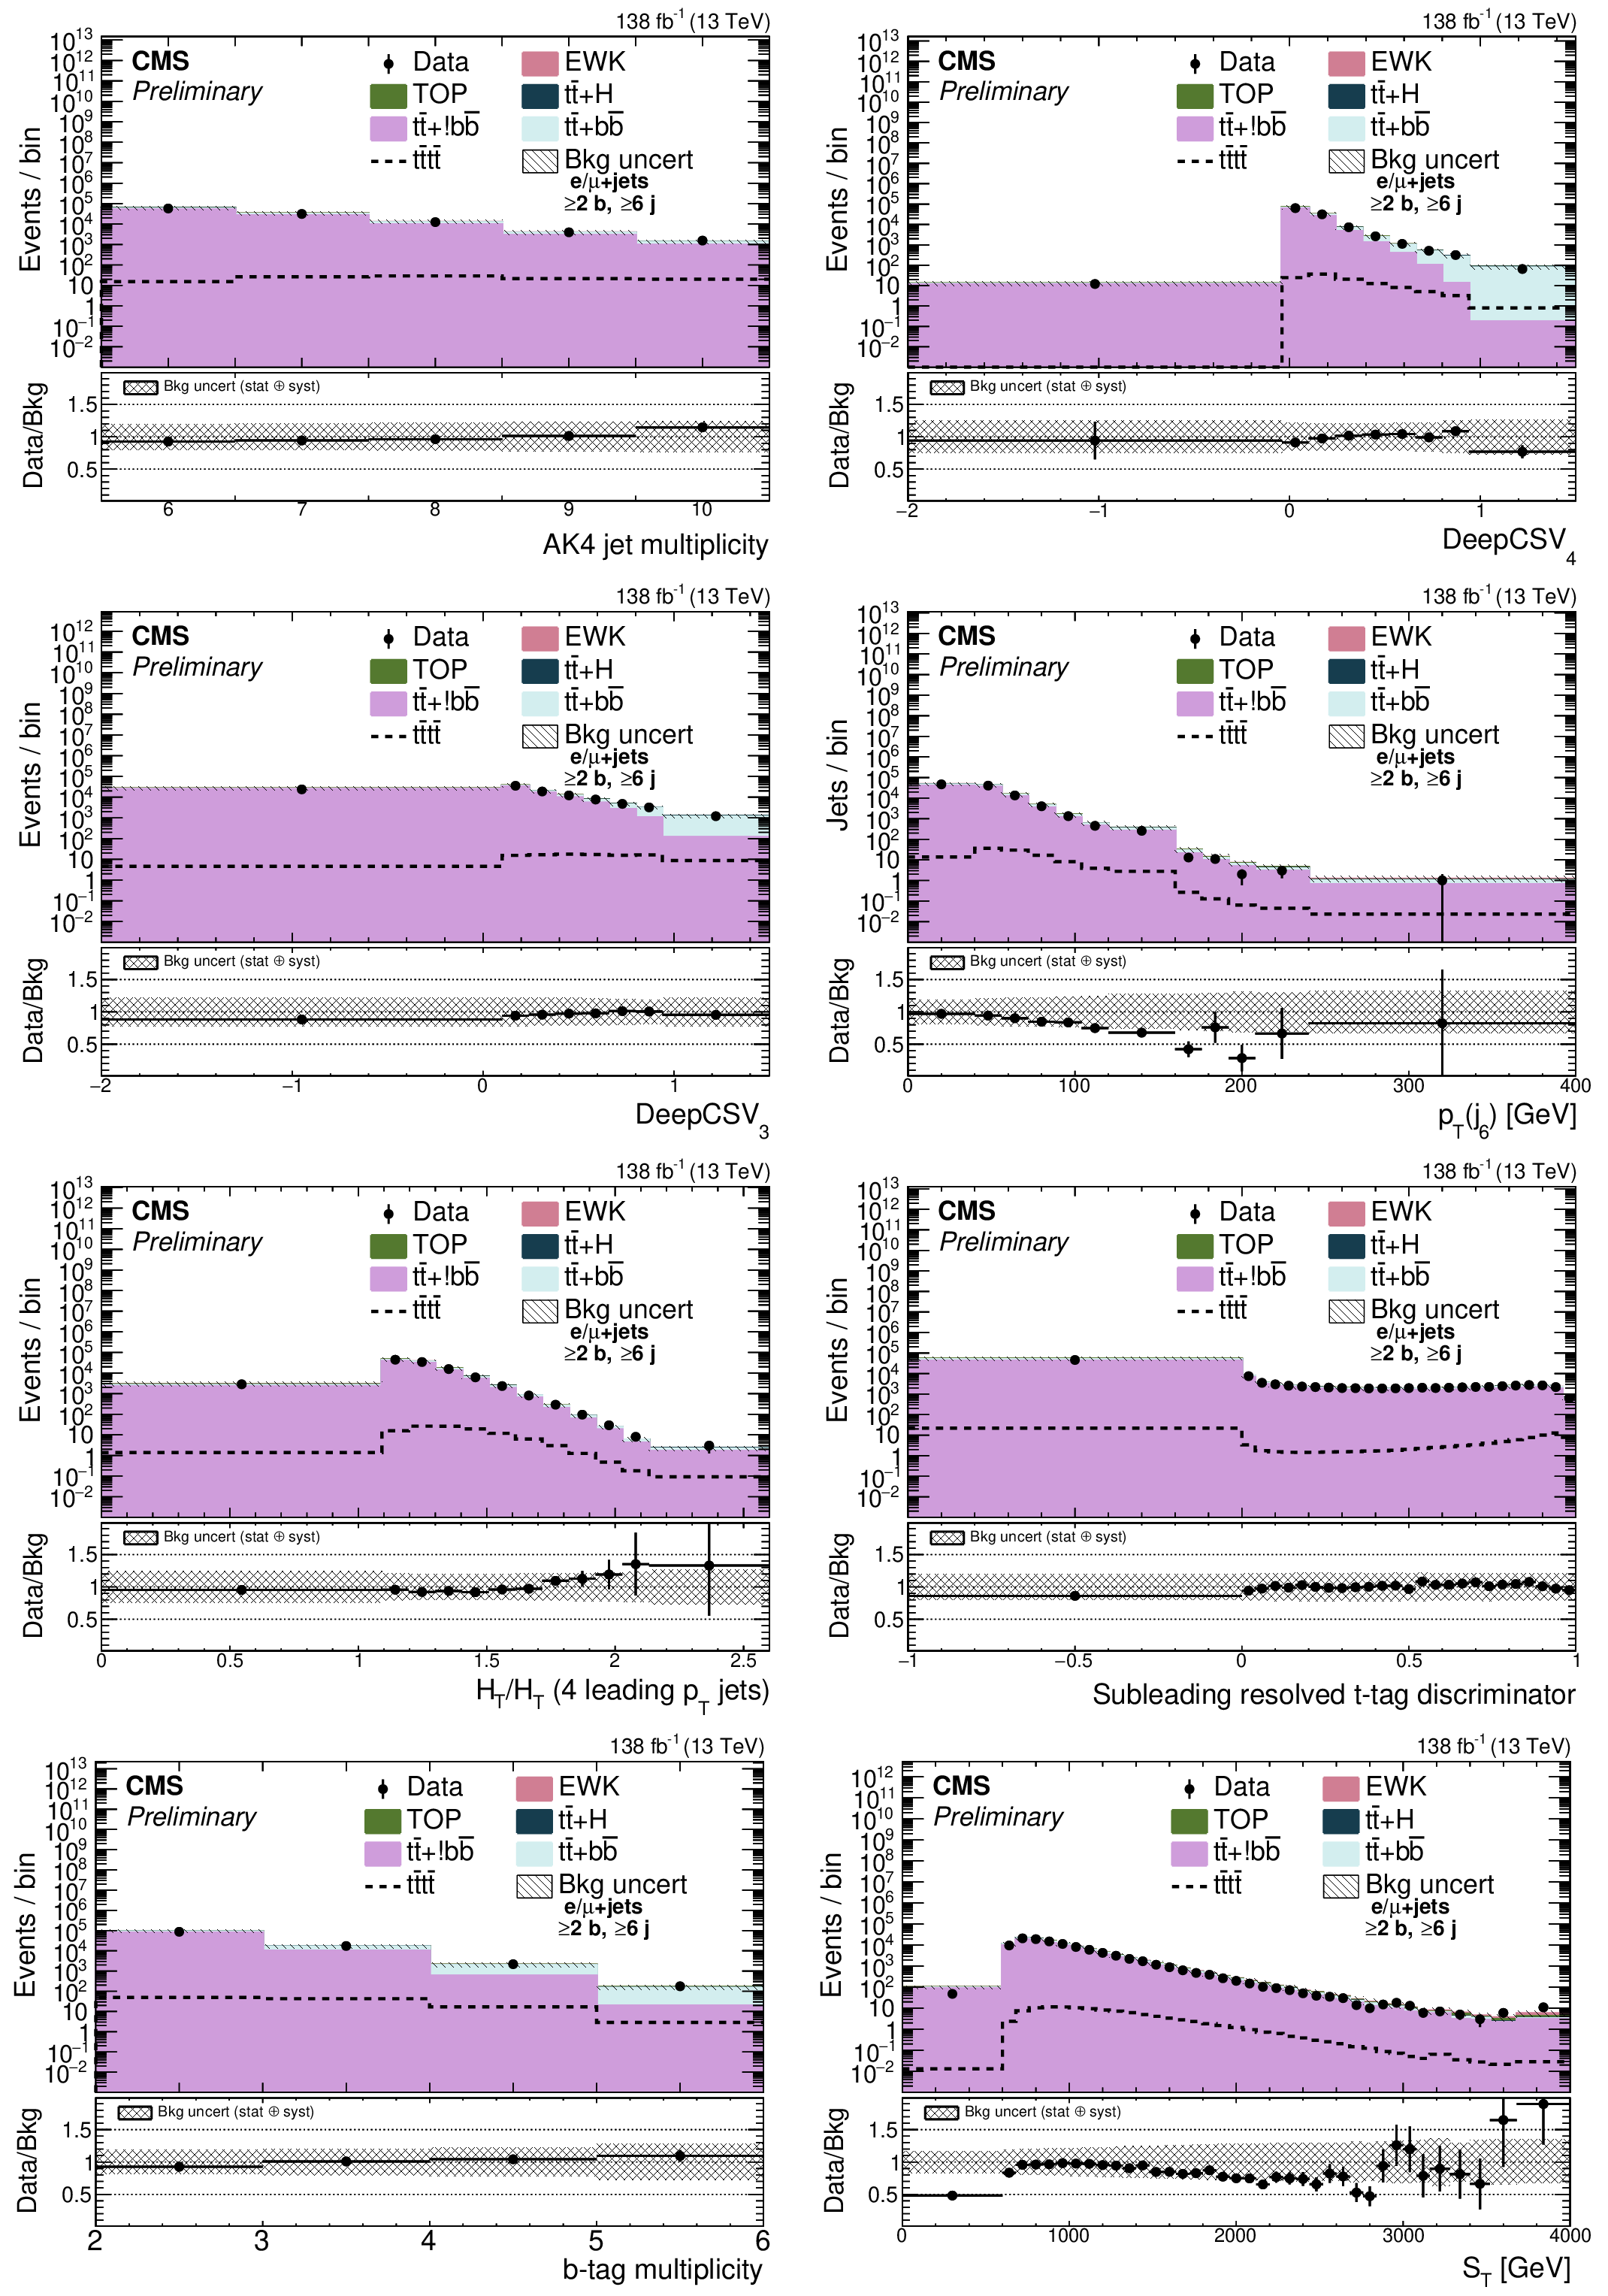
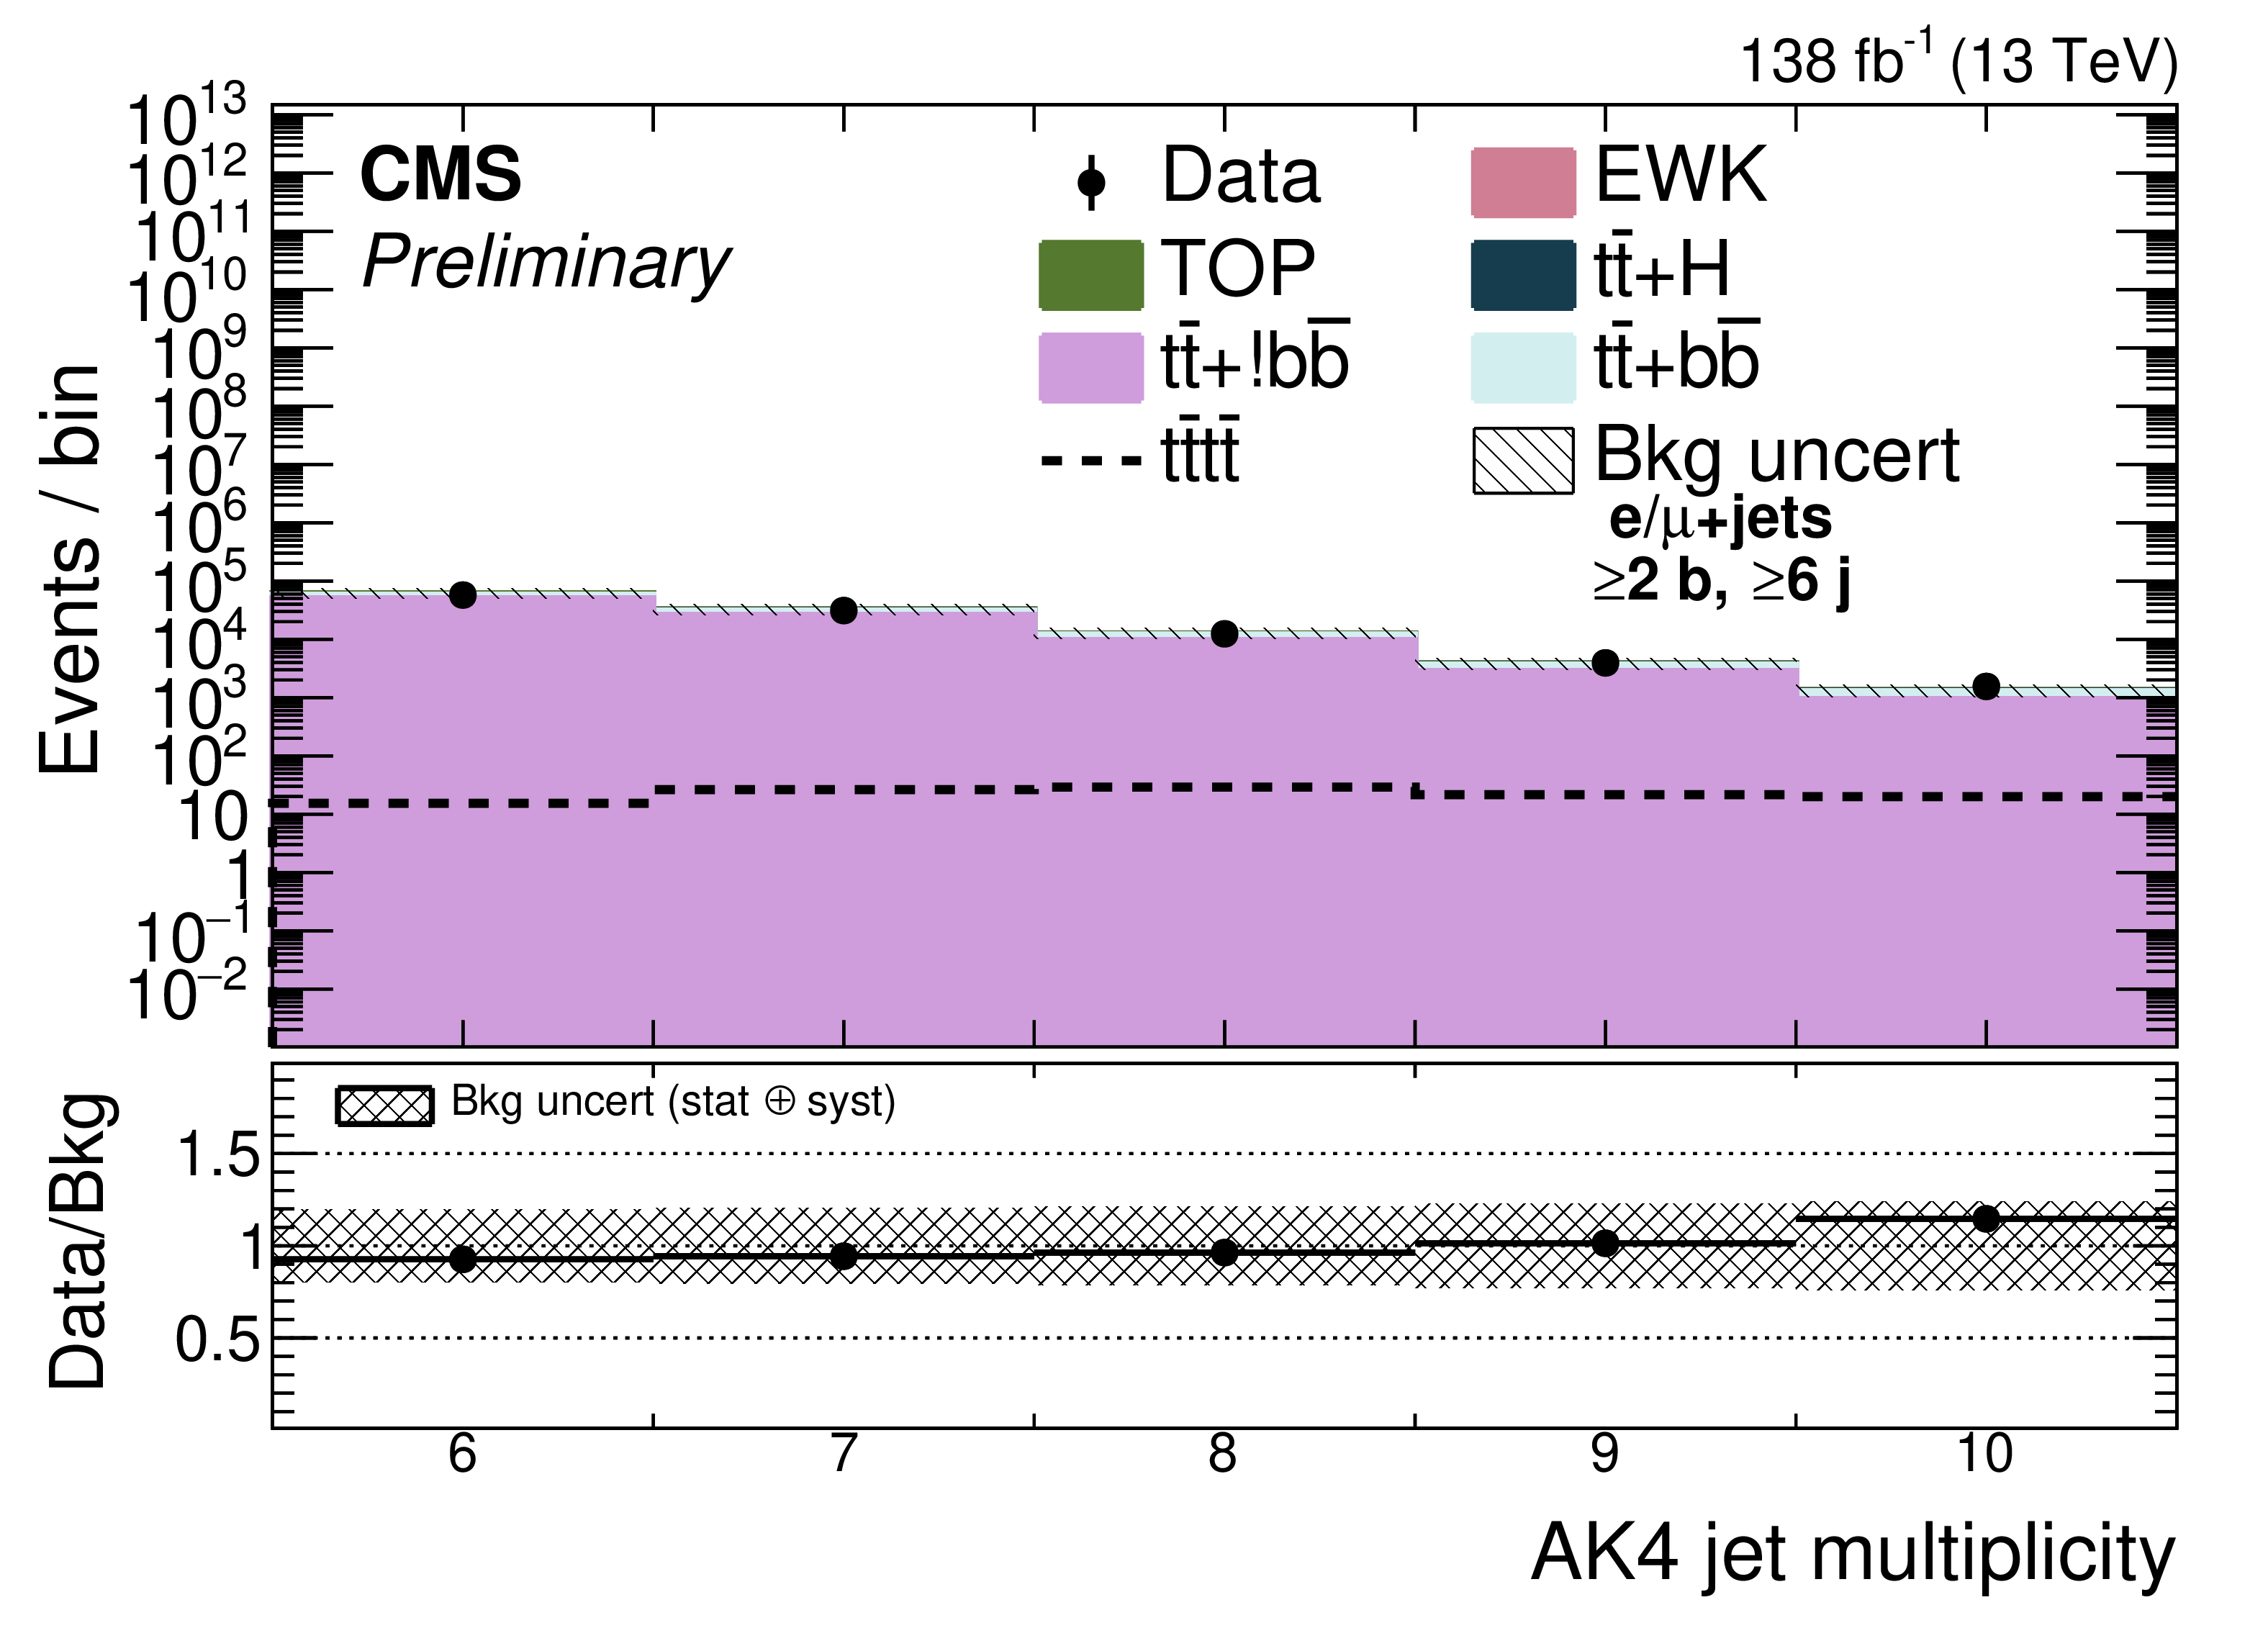
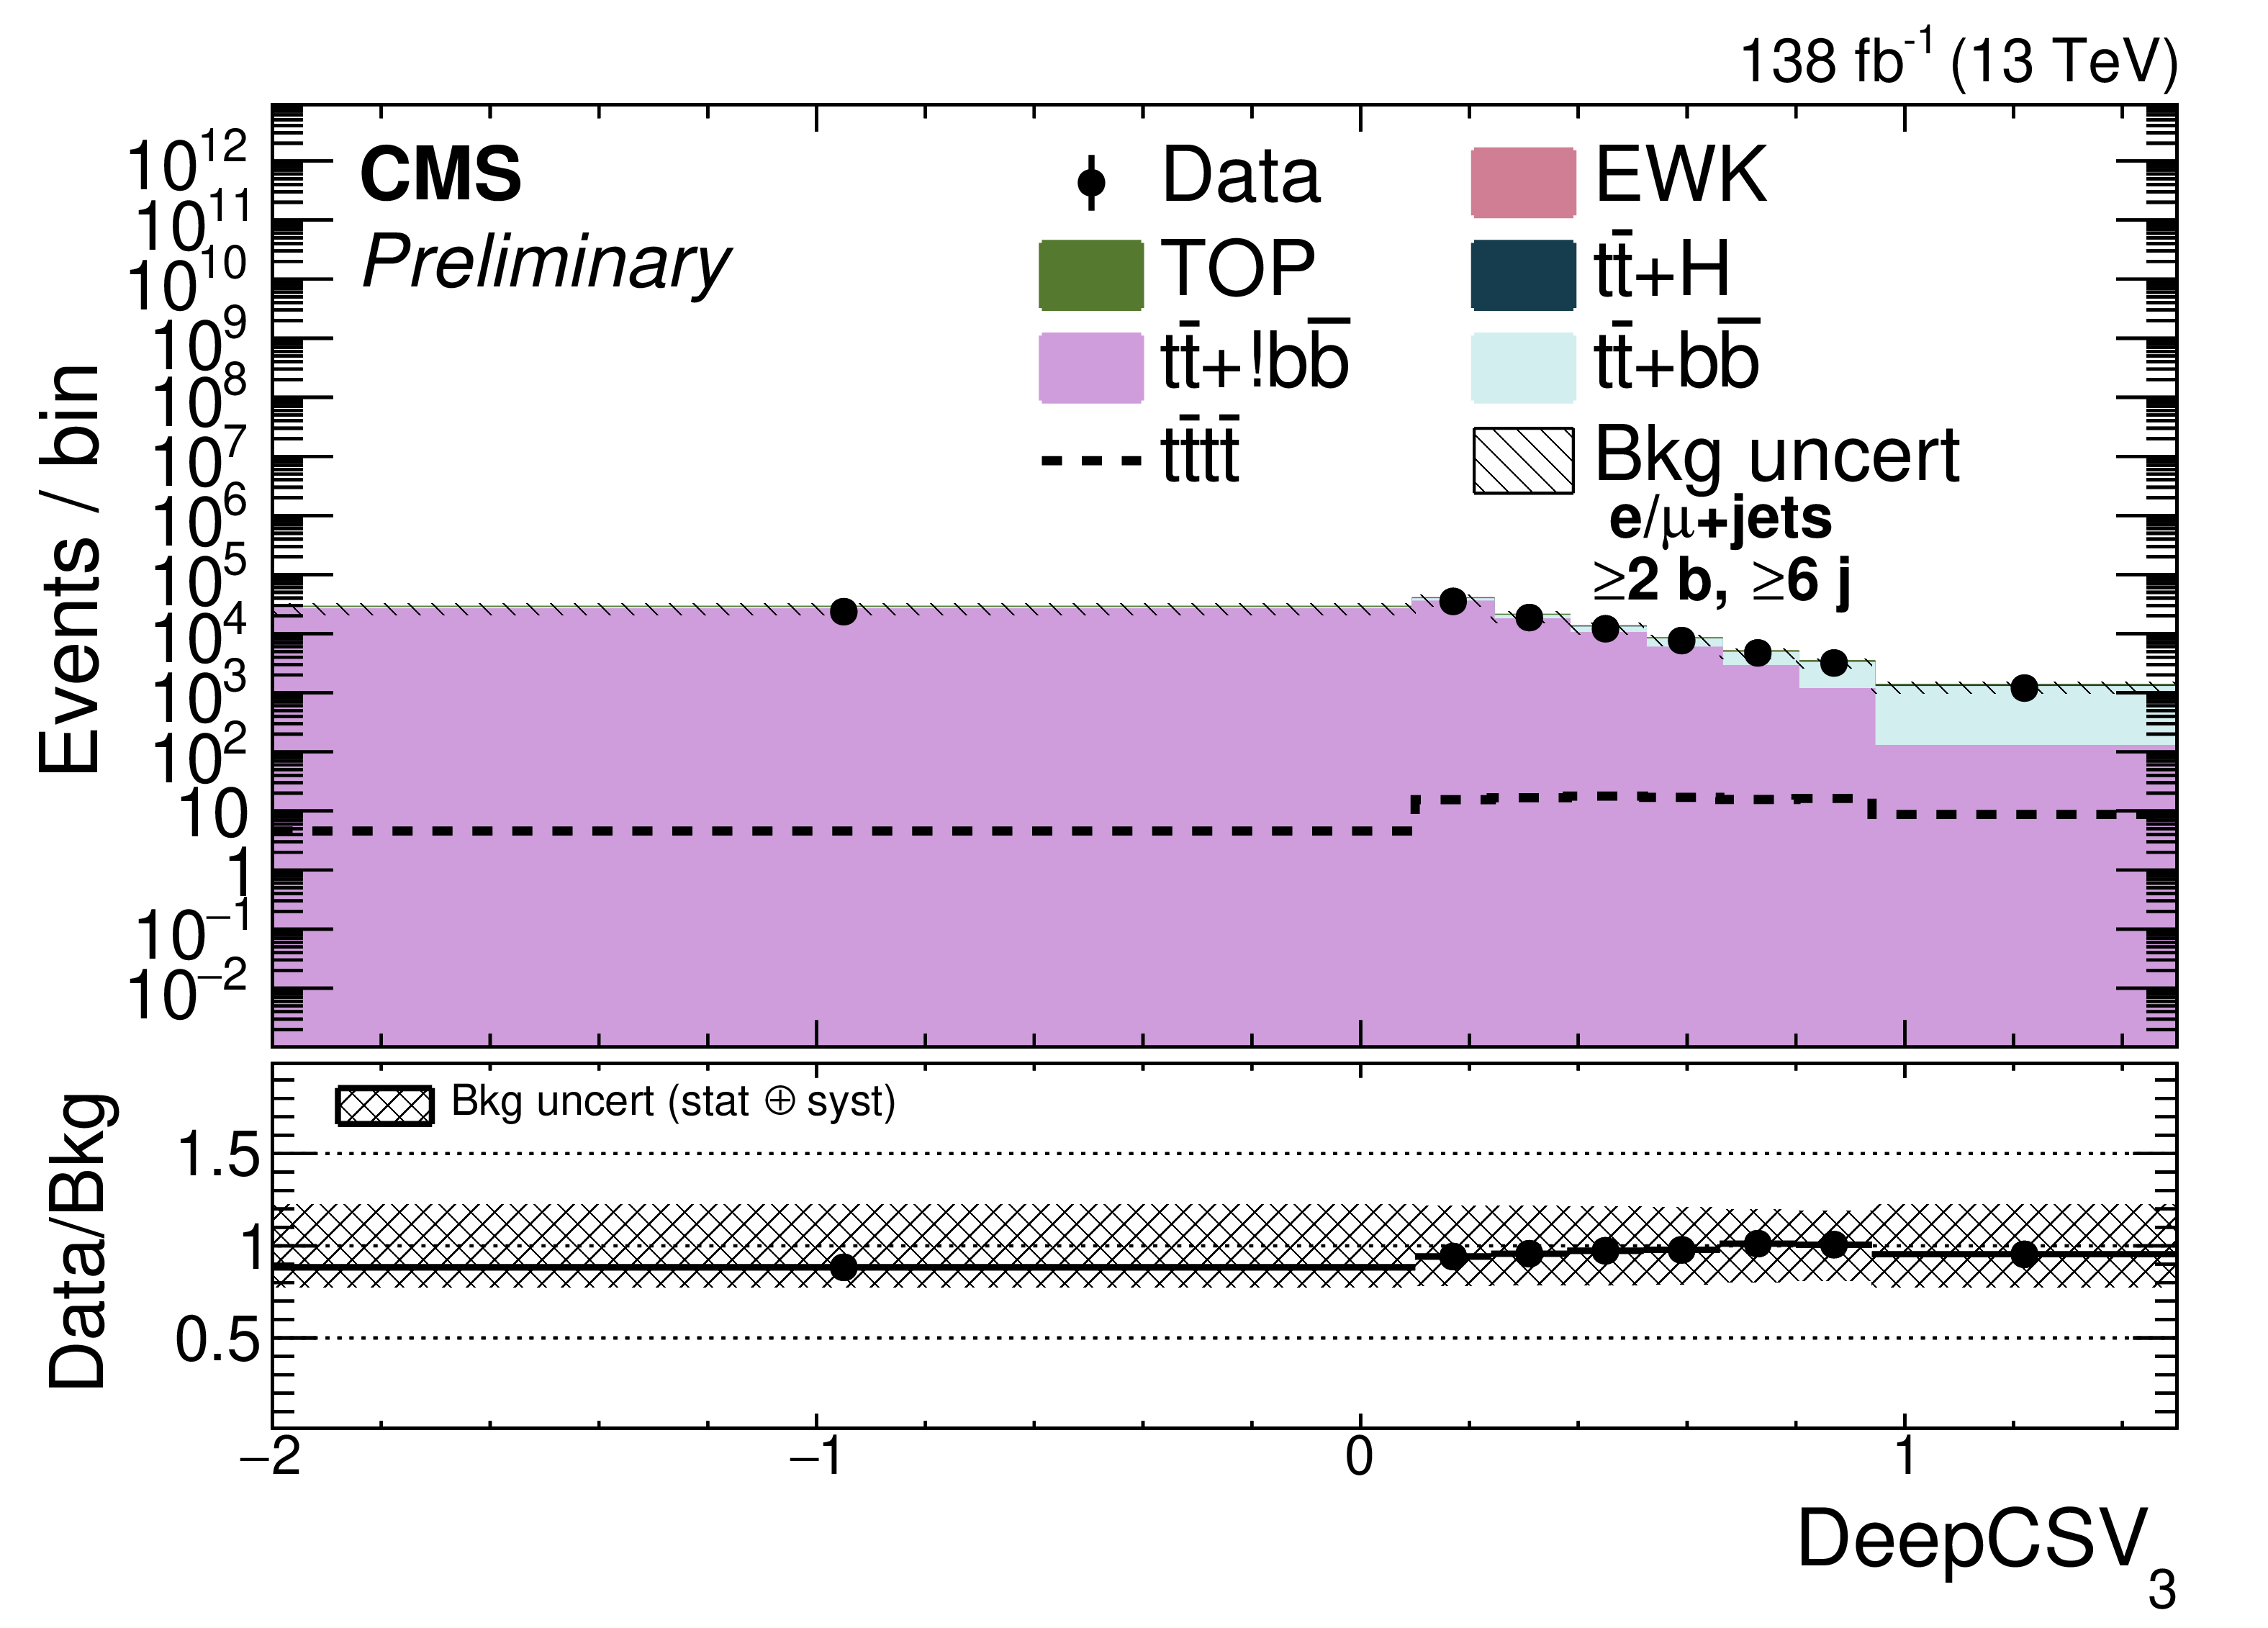
Additional Figure 3:
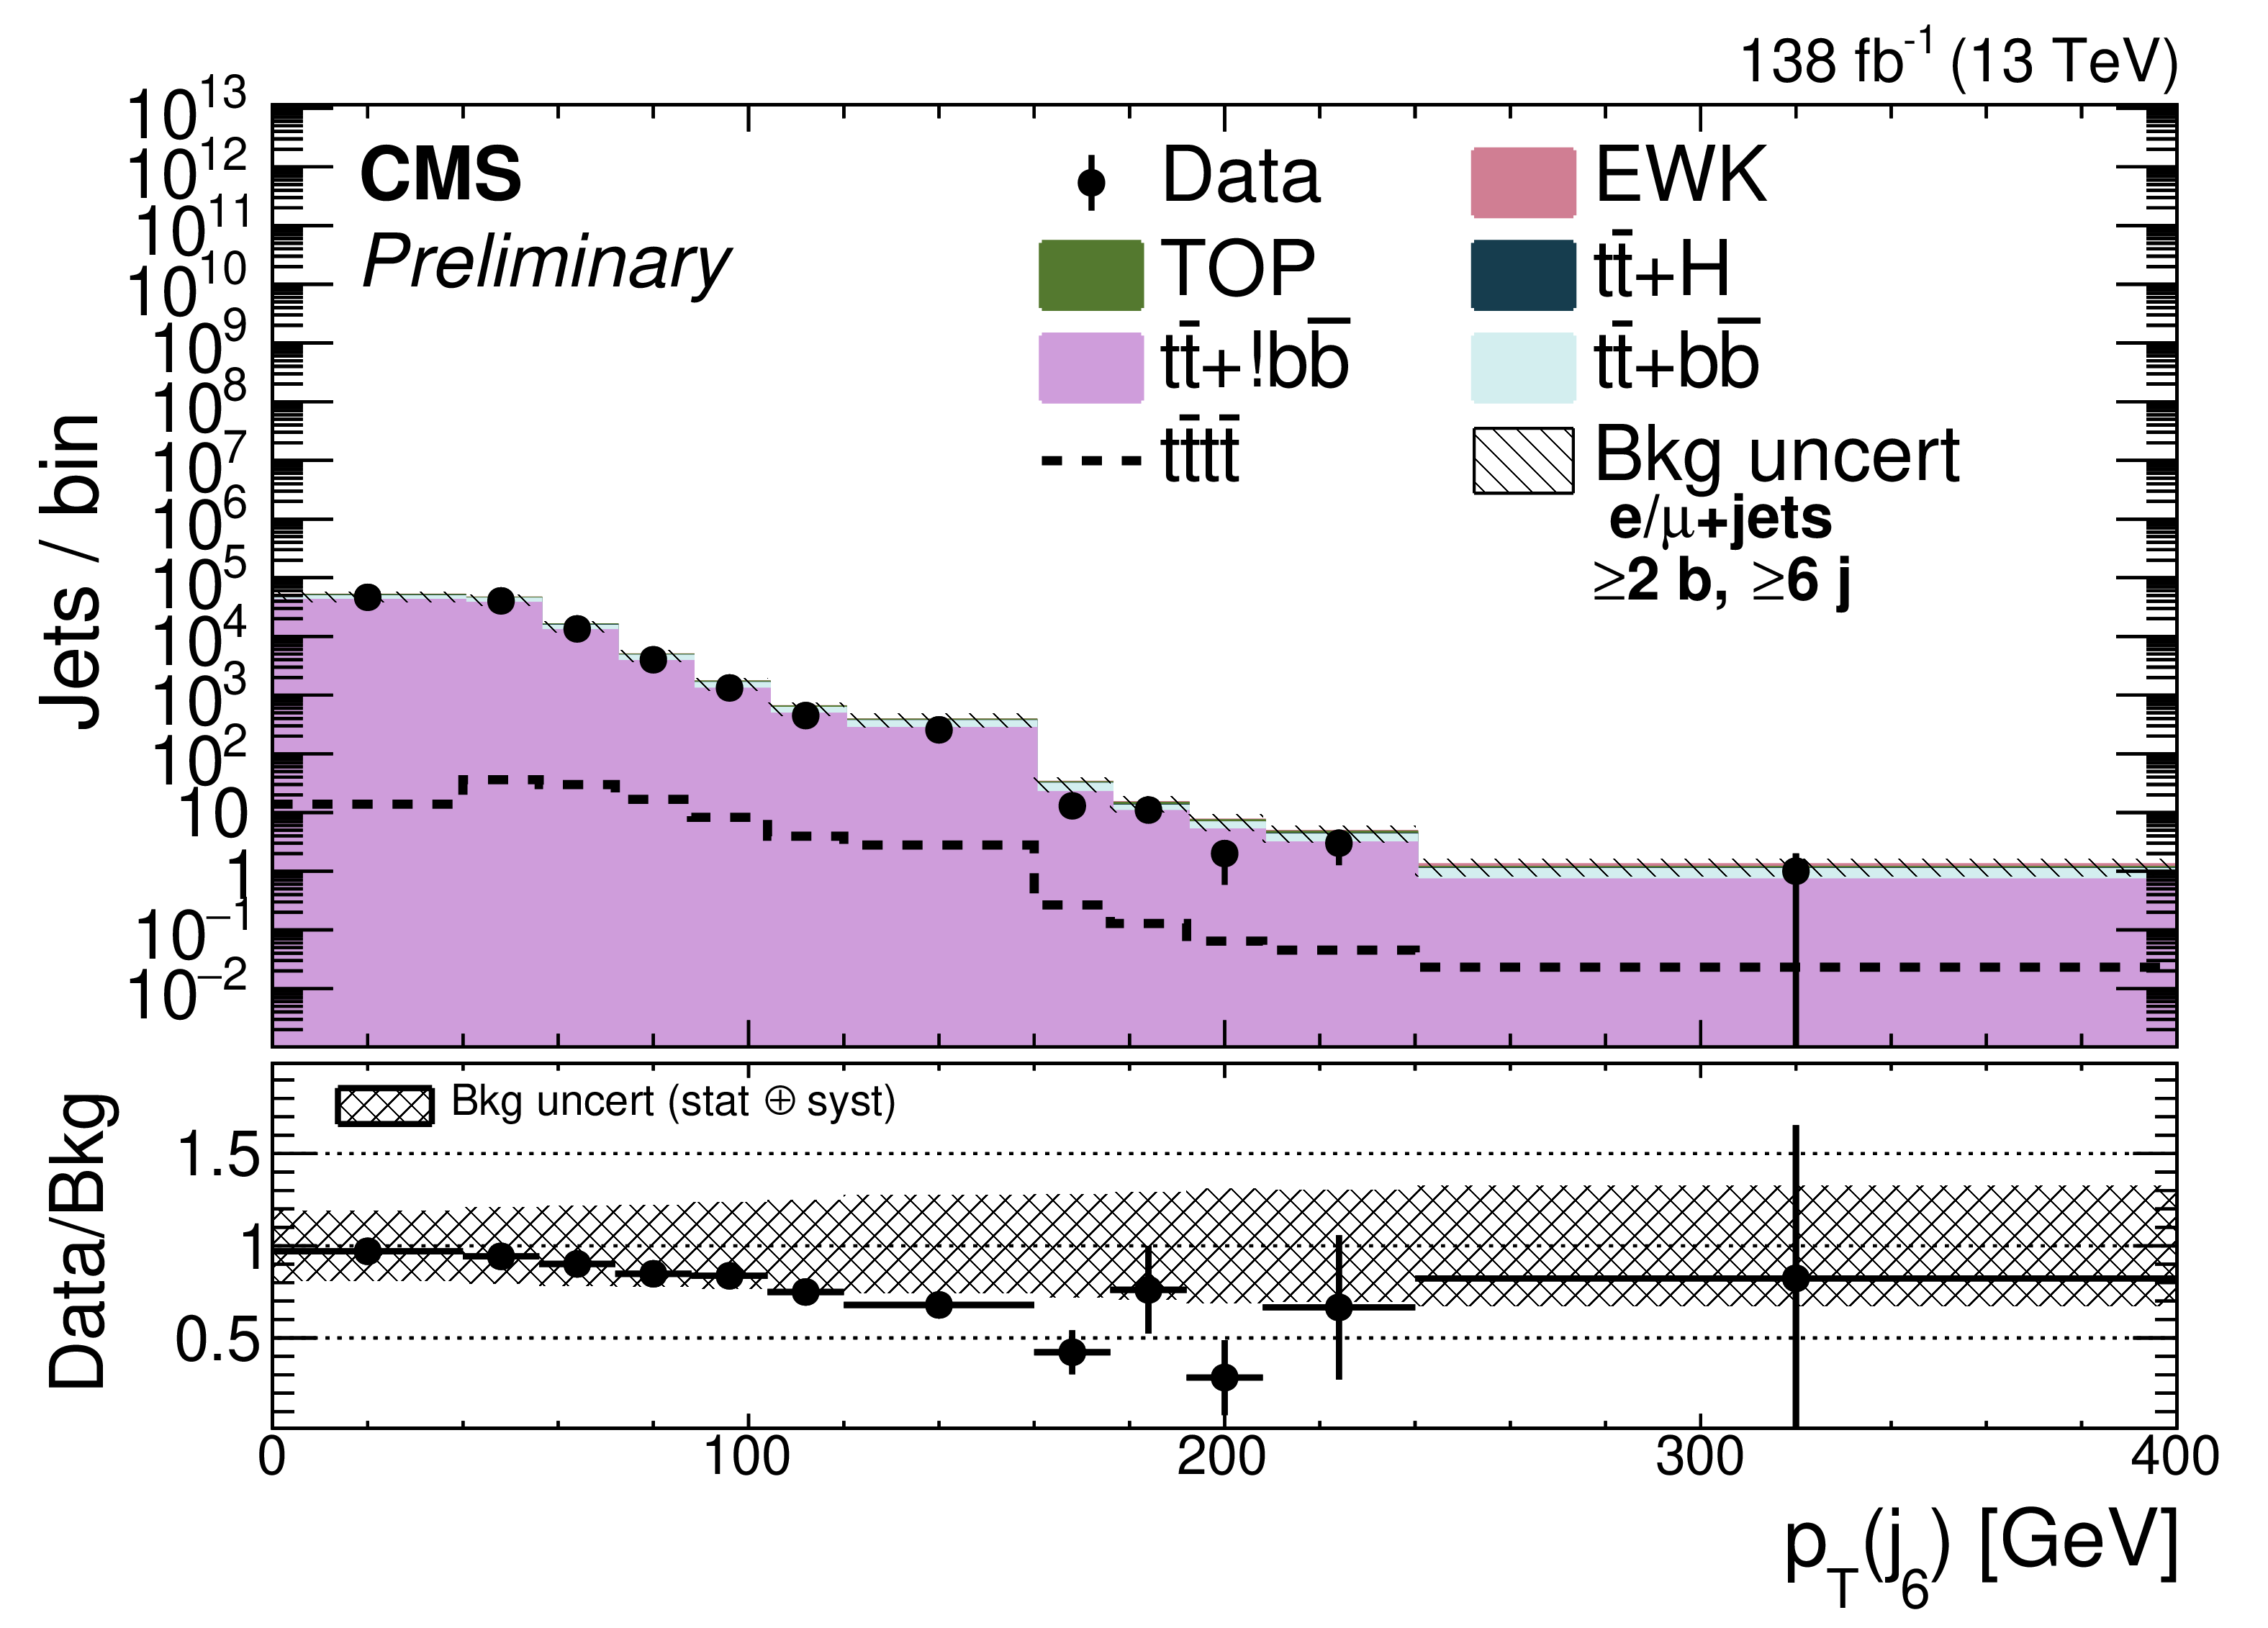
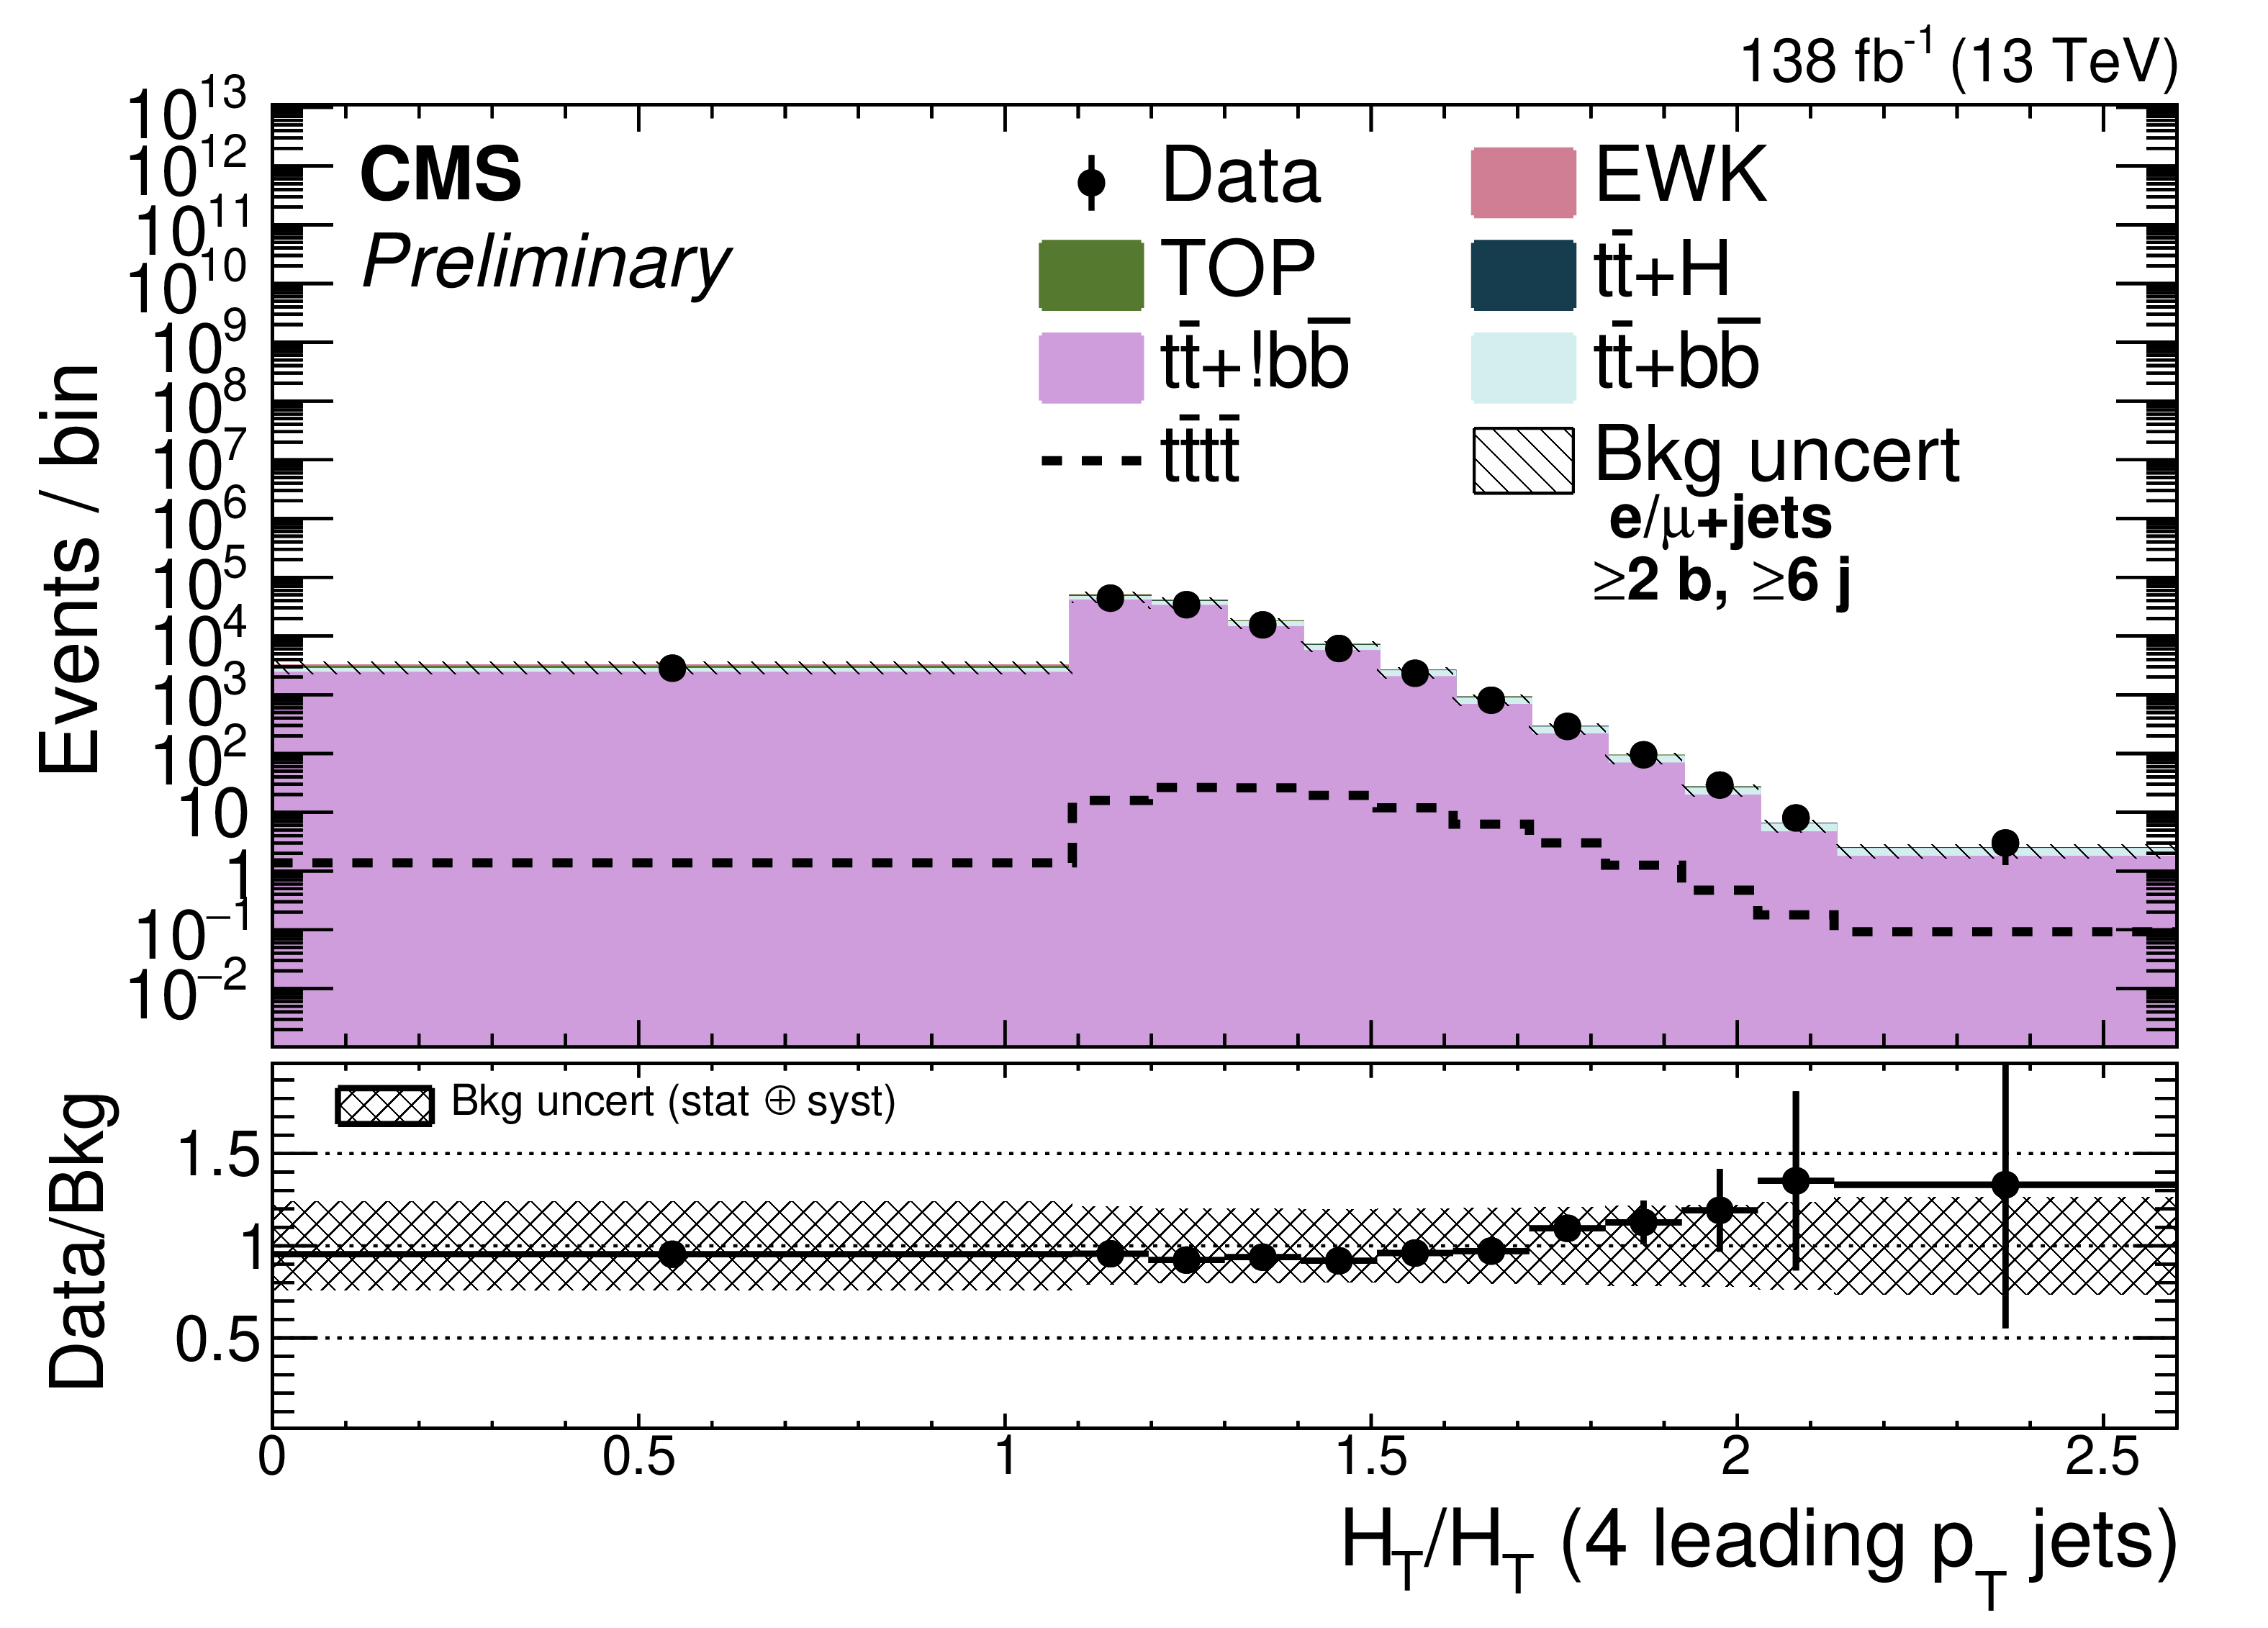
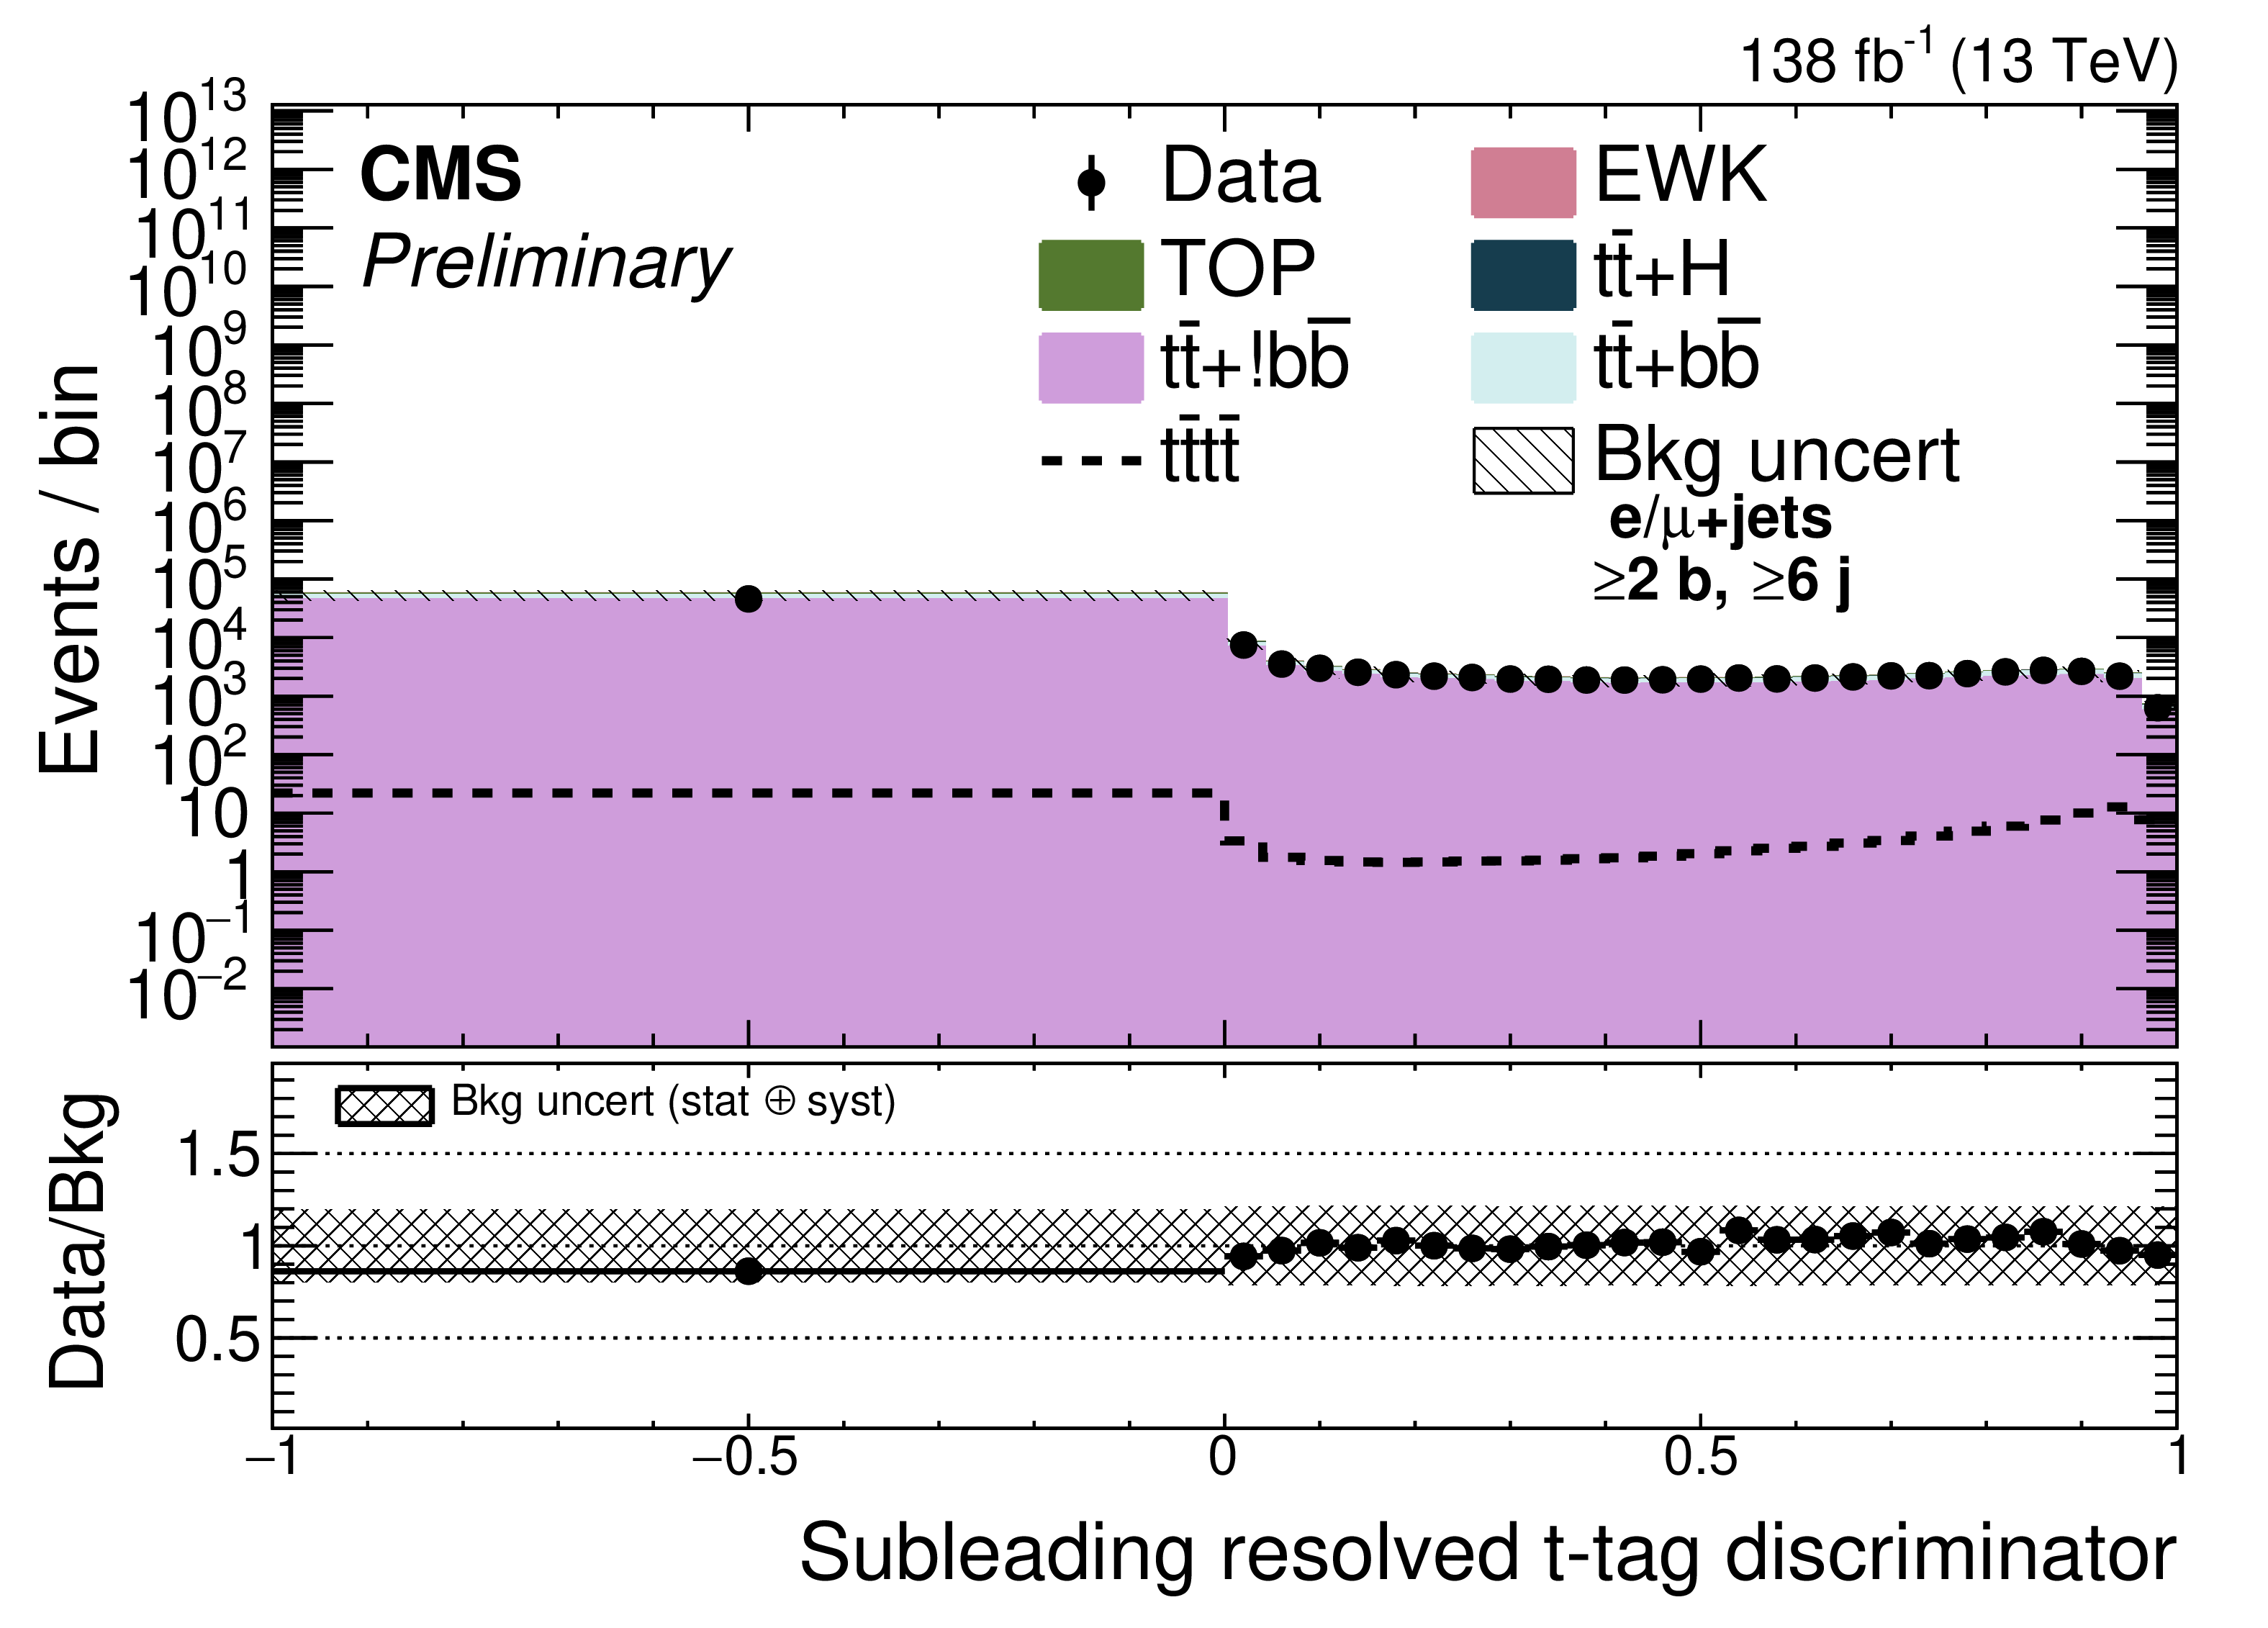
Distributions of (from upper left to lower right) AK4 jet multiplicity, DeepCSV value of fourth and third leading jets, sixth leading jet $ p_{\mathrm{T}} $, ratio of $ H_{\mathrm{T}} $ over $ H_{\mathrm{T}} $ of the four leading $ p_{\mathrm{T}} $ jets, subleading resolved top tagger discriminator value, b-tag multiplicity, and $ S_T $ (scalar sum lepton $ p_{\mathrm{T}} $, $ p_{\mathrm{T}}^\text{miss} $, and $ H_{\mathrm{T}} $) in combined single-electron and muon channels before fit to data, requiring $ \geq $ 6 AK4 jets and $ \geq $ 2 b-tags. Background uncertainties include all statistical and systematic components added in quadrature. |
png pdf |
Additional Figure 3-a:
Distributions of (from upper left to lower right) AK4 jet multiplicity, DeepCSV value of fourth and third leading jets, sixth leading jet $ p_{\mathrm{T}} $, ratio of $ H_{\mathrm{T}} $ over $ H_{\mathrm{T}} $ of the four leading $ p_{\mathrm{T}} $ jets, subleading resolved top tagger discriminator value, b-tag multiplicity, and $ S_T $ (scalar sum lepton $ p_{\mathrm{T}} $, $ p_{\mathrm{T}}^\text{miss} $, and $ H_{\mathrm{T}} $) in combined single-electron and muon channels before fit to data, requiring $ \geq $ 6 AK4 jets and $ \geq $ 2 b-tags. Background uncertainties include all statistical and systematic components added in quadrature. |

png pdf |
Additional Figure 3-b:
Distributions of (from upper left to lower right) AK4 jet multiplicity, DeepCSV value of fourth and third leading jets, sixth leading jet $ p_{\mathrm{T}} $, ratio of $ H_{\mathrm{T}} $ over $ H_{\mathrm{T}} $ of the four leading $ p_{\mathrm{T}} $ jets, subleading resolved top tagger discriminator value, b-tag multiplicity, and $ S_T $ (scalar sum lepton $ p_{\mathrm{T}} $, $ p_{\mathrm{T}}^\text{miss} $, and $ H_{\mathrm{T}} $) in combined single-electron and muon channels before fit to data, requiring $ \geq $ 6 AK4 jets and $ \geq $ 2 b-tags. Background uncertainties include all statistical and systematic components added in quadrature. |
png pdf |
Additional Figure 3-c:
Distributions of (from upper left to lower right) AK4 jet multiplicity, DeepCSV value of fourth and third leading jets, sixth leading jet $ p_{\mathrm{T}} $, ratio of $ H_{\mathrm{T}} $ over $ H_{\mathrm{T}} $ of the four leading $ p_{\mathrm{T}} $ jets, subleading resolved top tagger discriminator value, b-tag multiplicity, and $ S_T $ (scalar sum lepton $ p_{\mathrm{T}} $, $ p_{\mathrm{T}}^\text{miss} $, and $ H_{\mathrm{T}} $) in combined single-electron and muon channels before fit to data, requiring $ \geq $ 6 AK4 jets and $ \geq $ 2 b-tags. Background uncertainties include all statistical and systematic components added in quadrature. |
png pdf |
Additional Figure 3-d:
Distributions of (from upper left to lower right) AK4 jet multiplicity, DeepCSV value of fourth and third leading jets, sixth leading jet $ p_{\mathrm{T}} $, ratio of $ H_{\mathrm{T}} $ over $ H_{\mathrm{T}} $ of the four leading $ p_{\mathrm{T}} $ jets, subleading resolved top tagger discriminator value, b-tag multiplicity, and $ S_T $ (scalar sum lepton $ p_{\mathrm{T}} $, $ p_{\mathrm{T}}^\text{miss} $, and $ H_{\mathrm{T}} $) in combined single-electron and muon channels before fit to data, requiring $ \geq $ 6 AK4 jets and $ \geq $ 2 b-tags. Background uncertainties include all statistical and systematic components added in quadrature. |
png pdf |
Additional Figure 3-e:
Distributions of (from upper left to lower right) AK4 jet multiplicity, DeepCSV value of fourth and third leading jets, sixth leading jet $ p_{\mathrm{T}} $, ratio of $ H_{\mathrm{T}} $ over $ H_{\mathrm{T}} $ of the four leading $ p_{\mathrm{T}} $ jets, subleading resolved top tagger discriminator value, b-tag multiplicity, and $ S_T $ (scalar sum lepton $ p_{\mathrm{T}} $, $ p_{\mathrm{T}}^\text{miss} $, and $ H_{\mathrm{T}} $) in combined single-electron and muon channels before fit to data, requiring $ \geq $ 6 AK4 jets and $ \geq $ 2 b-tags. Background uncertainties include all statistical and systematic components added in quadrature. |
png pdf |
Additional Figure 3-f:
Distributions of (from upper left to lower right) AK4 jet multiplicity, DeepCSV value of fourth and third leading jets, sixth leading jet $ p_{\mathrm{T}} $, ratio of $ H_{\mathrm{T}} $ over $ H_{\mathrm{T}} $ of the four leading $ p_{\mathrm{T}} $ jets, subleading resolved top tagger discriminator value, b-tag multiplicity, and $ S_T $ (scalar sum lepton $ p_{\mathrm{T}} $, $ p_{\mathrm{T}}^\text{miss} $, and $ H_{\mathrm{T}} $) in combined single-electron and muon channels before fit to data, requiring $ \geq $ 6 AK4 jets and $ \geq $ 2 b-tags. Background uncertainties include all statistical and systematic components added in quadrature. |

png pdf |
Additional Figure 3-g:
Distributions of (from upper left to lower right) AK4 jet multiplicity, DeepCSV value of fourth and third leading jets, sixth leading jet $ p_{\mathrm{T}} $, ratio of $ H_{\mathrm{T}} $ over $ H_{\mathrm{T}} $ of the four leading $ p_{\mathrm{T}} $ jets, subleading resolved top tagger discriminator value, b-tag multiplicity, and $ S_T $ (scalar sum lepton $ p_{\mathrm{T}} $, $ p_{\mathrm{T}}^\text{miss} $, and $ H_{\mathrm{T}} $) in combined single-electron and muon channels before fit to data, requiring $ \geq $ 6 AK4 jets and $ \geq $ 2 b-tags. Background uncertainties include all statistical and systematic components added in quadrature. |

png pdf |
Additional Figure 3-h:
Distributions of (from upper left to lower right) AK4 jet multiplicity, DeepCSV value of fourth and third leading jets, sixth leading jet $ p_{\mathrm{T}} $, ratio of $ H_{\mathrm{T}} $ over $ H_{\mathrm{T}} $ of the four leading $ p_{\mathrm{T}} $ jets, subleading resolved top tagger discriminator value, b-tag multiplicity, and $ S_T $ (scalar sum lepton $ p_{\mathrm{T}} $, $ p_{\mathrm{T}}^\text{miss} $, and $ H_{\mathrm{T}} $) in combined single-electron and muon channels before fit to data, requiring $ \geq $ 6 AK4 jets and $ \geq $ 2 b-tags. Background uncertainties include all statistical and systematic components added in quadrature. |

png pdf |
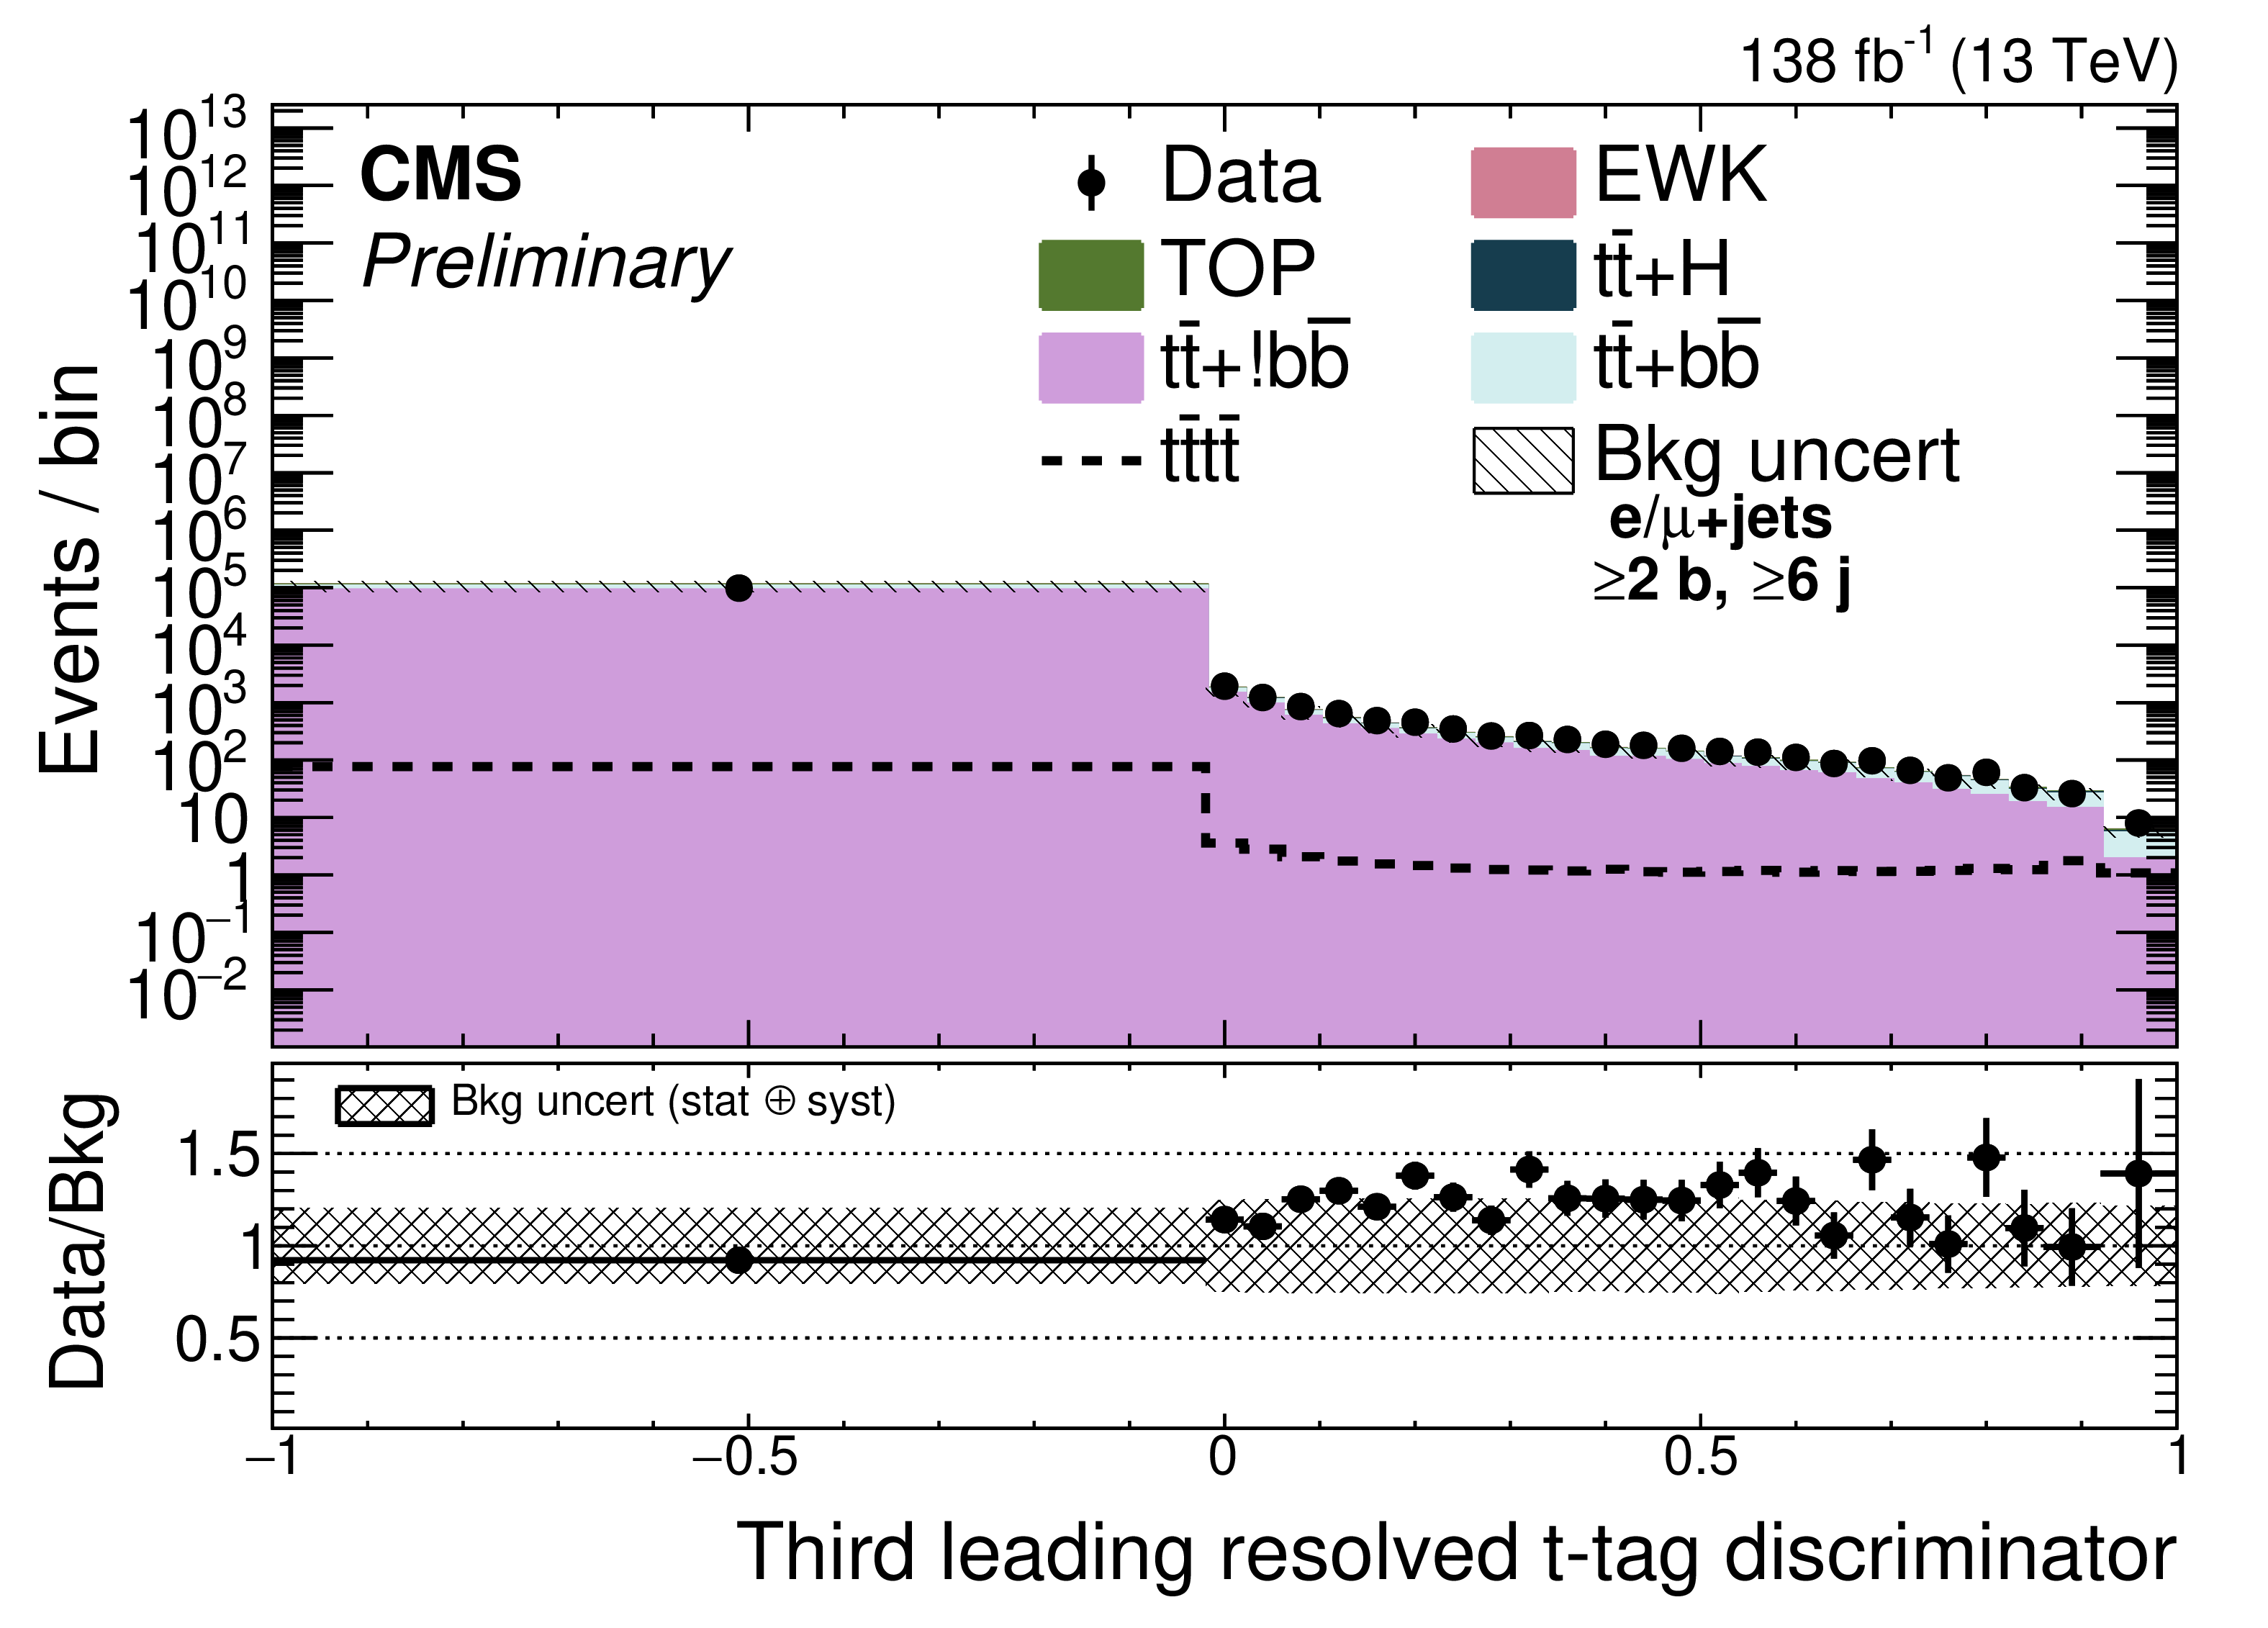
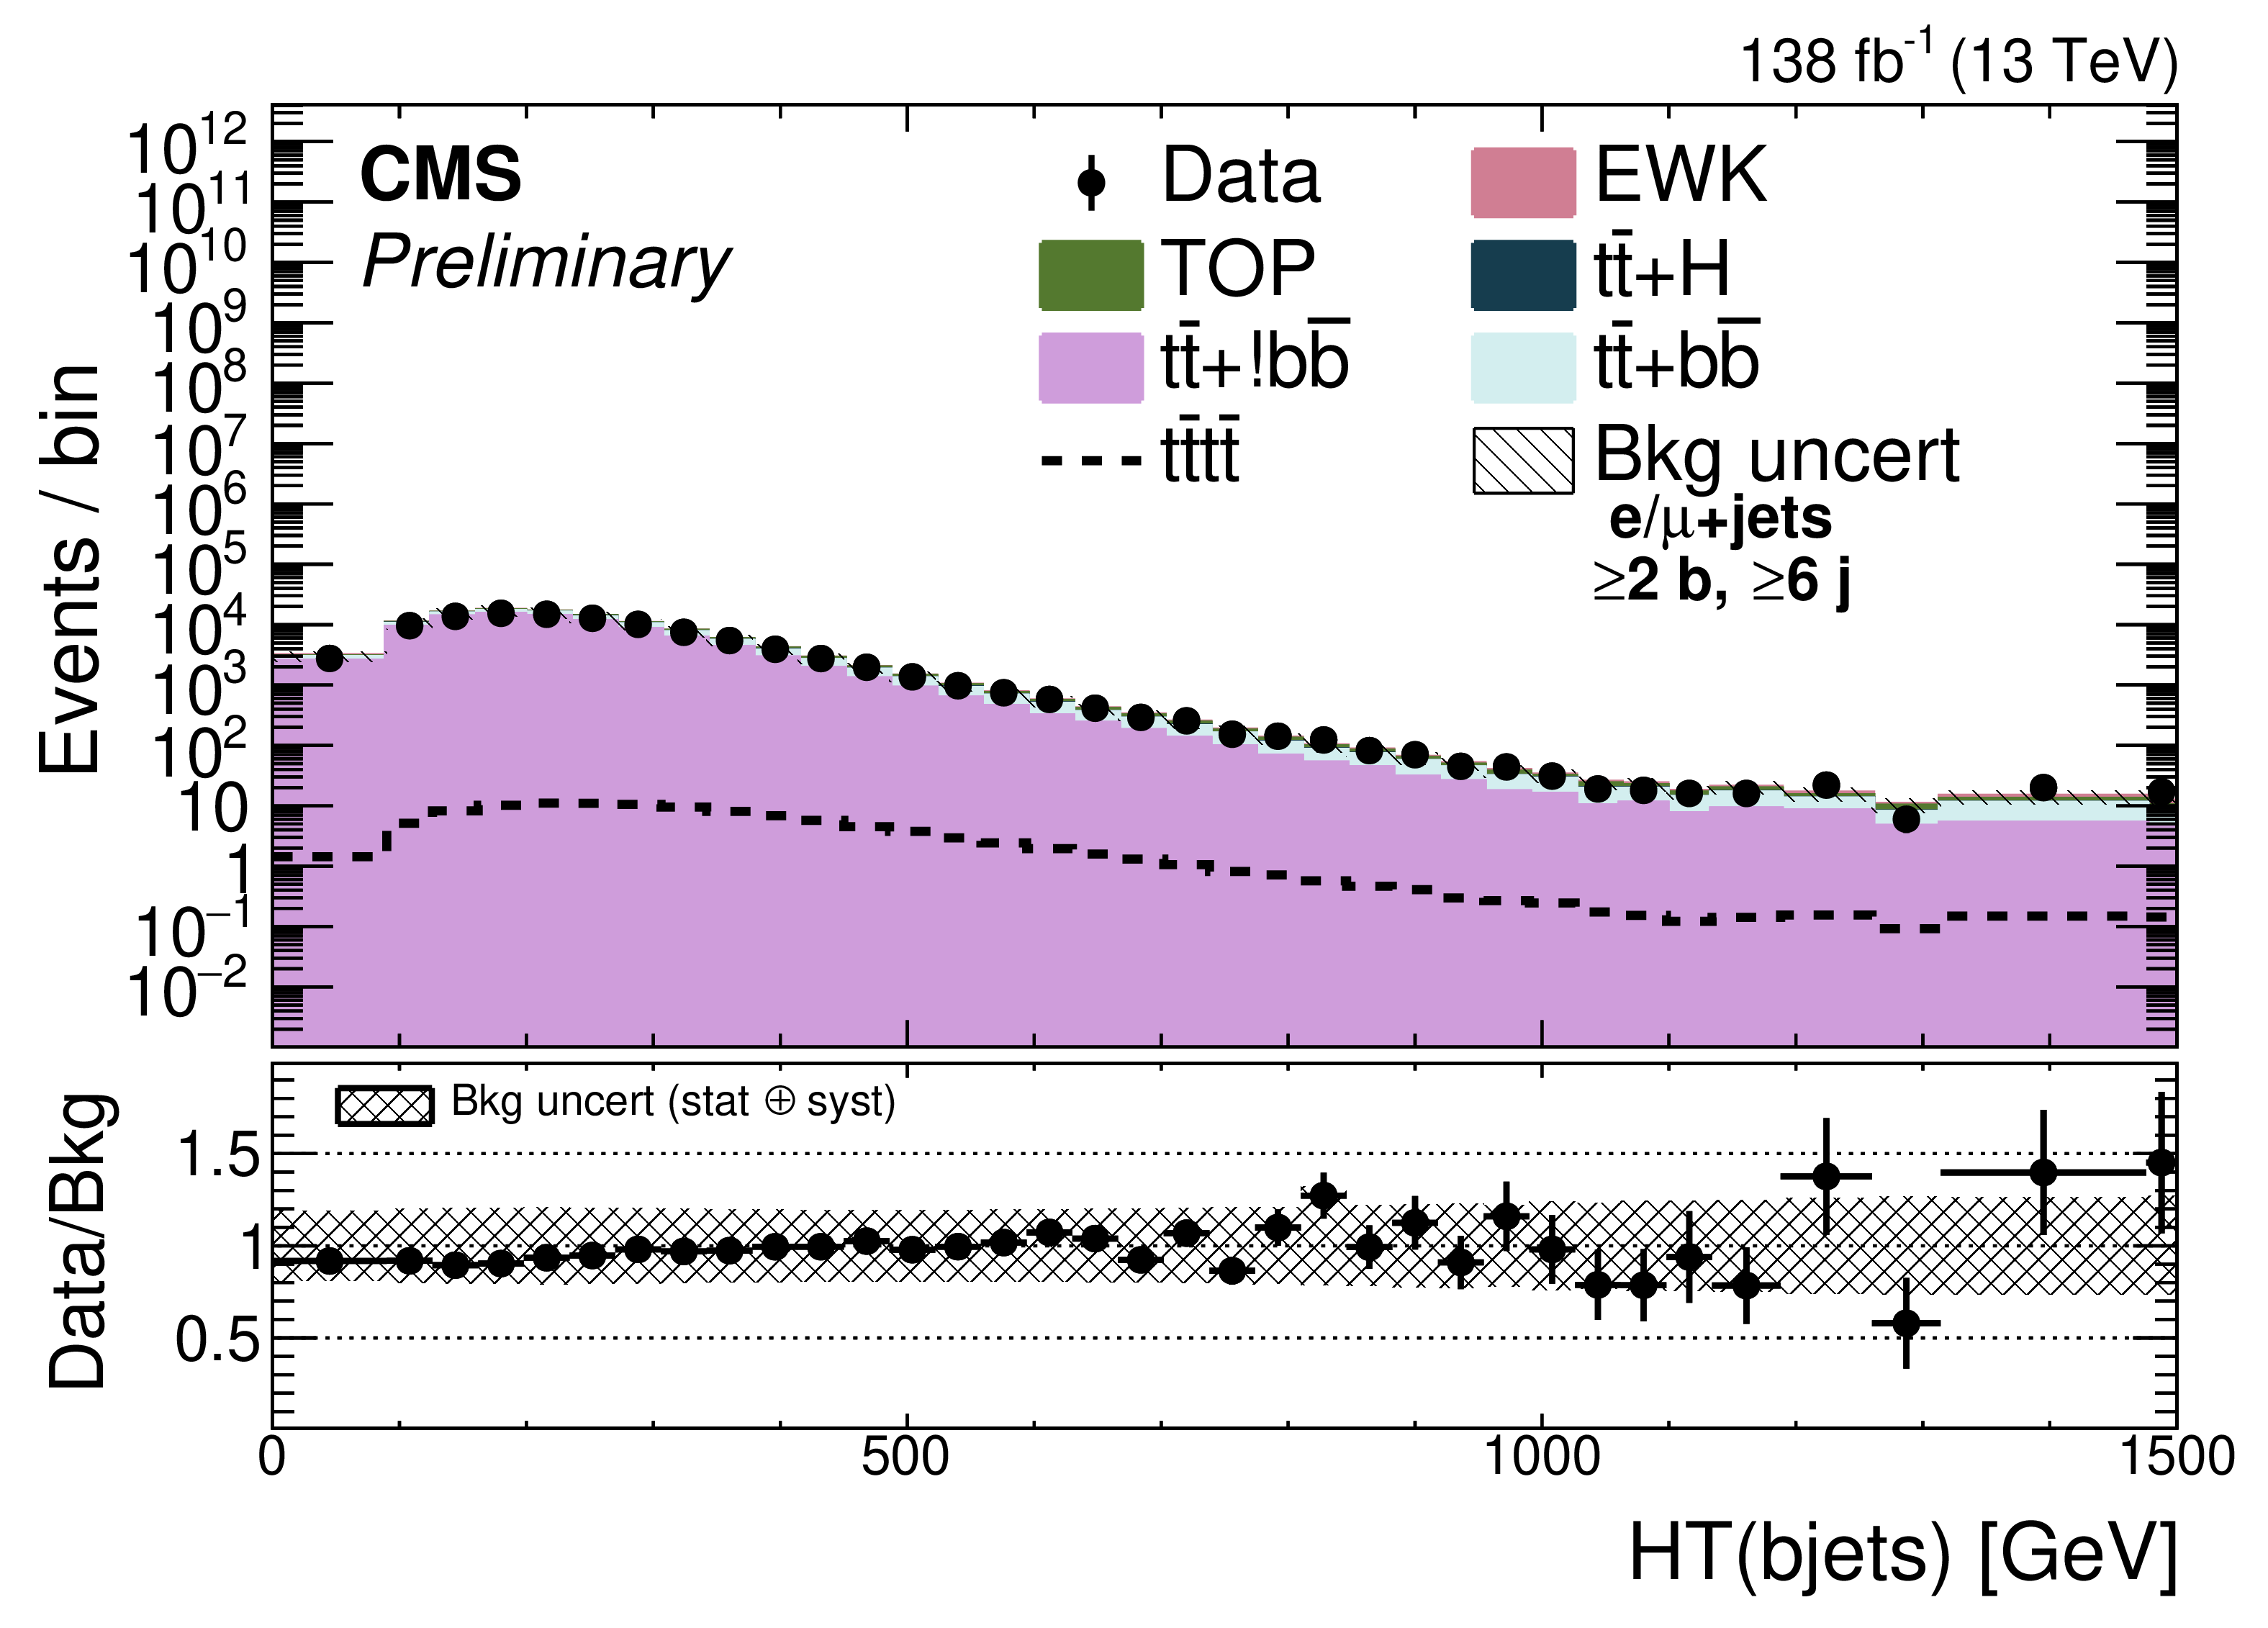
Additional Figure 4:
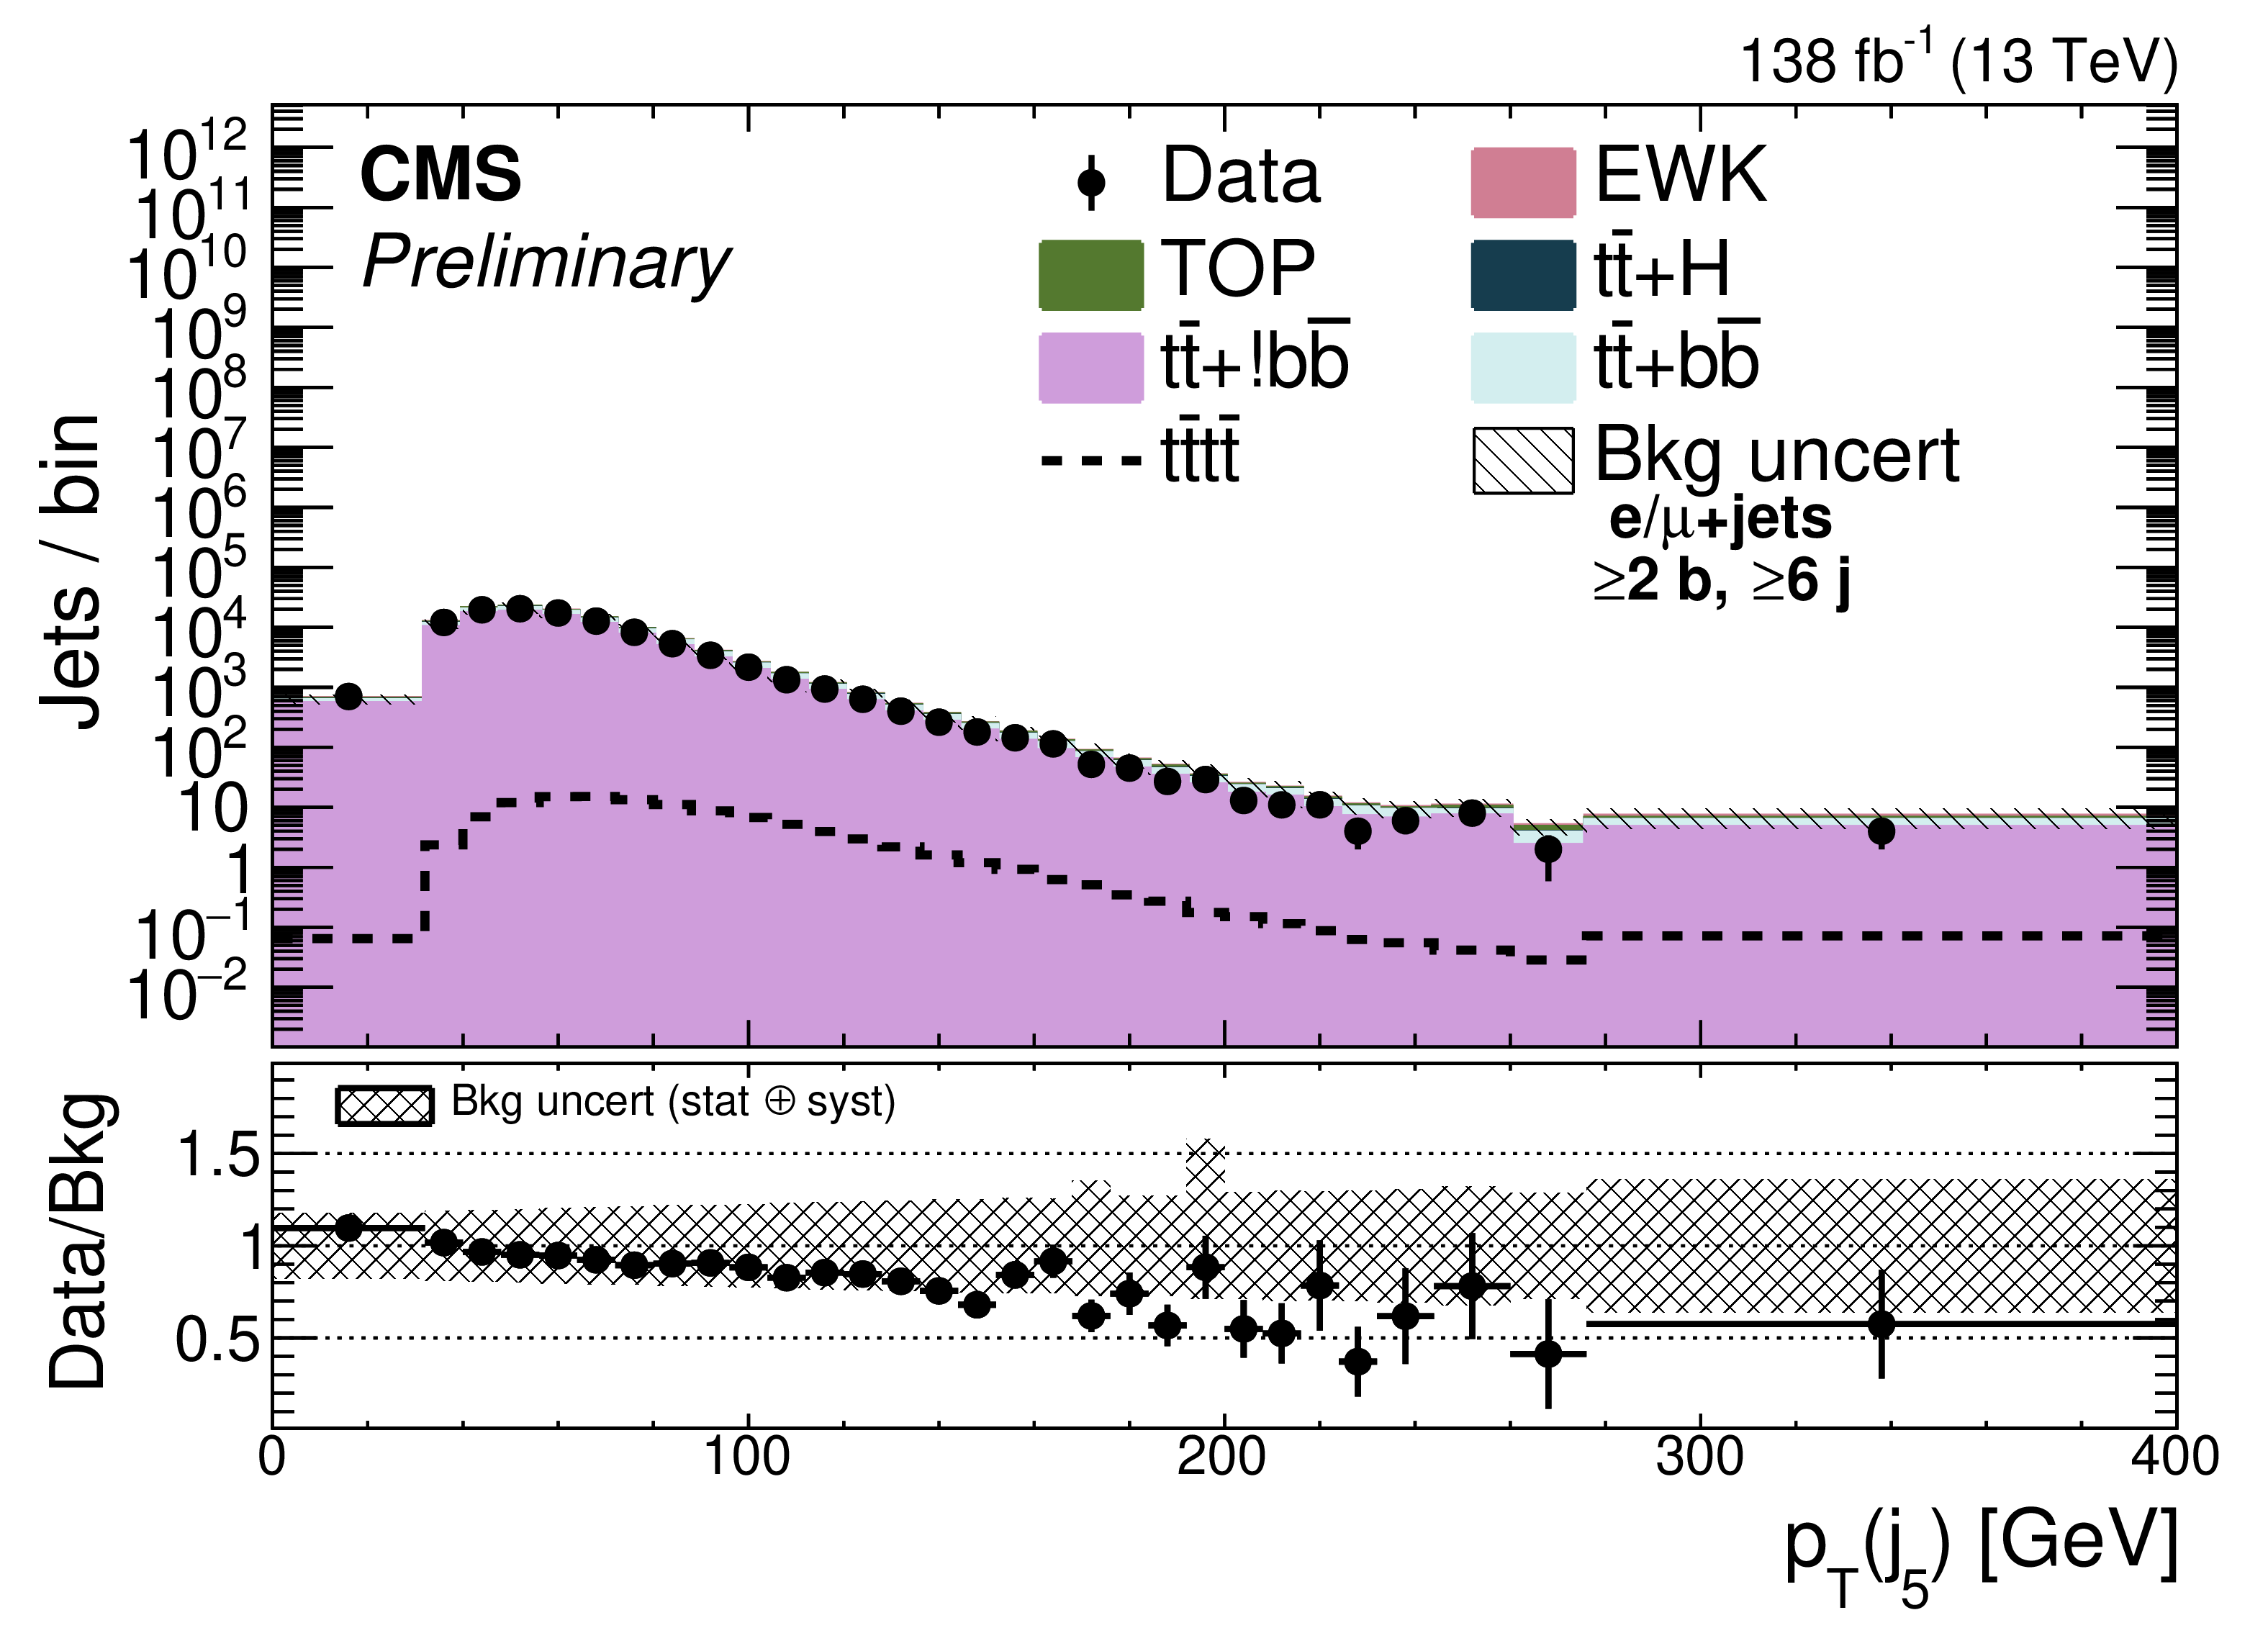
Distributions of (from upper left to lower right) fifth leading jet $ p_{\mathrm{T}} $, $ H_{\mathrm{T}} $, fifth jet $ p_{\mathrm{T}} $, where b-tagged jets ordered by $ p_{\mathrm{T}} $ first, hemiout, third leading resolved top tagger discriminator value, $ H_{\mathrm{T}} $ without leading and subleading b-tagged jets, $ H_{\mathrm{T}} $ of b-tagged jets, and mass of all jets and leptonically decaying W system in combined single-electron and muon channels before fit to data, requiring $ \geq $ 6 AK4 jets and $ \geq $ 2 b-tags. Background uncertainties include all statistical and systematic components added in quadrature. |
png pdf |
Additional Figure 4-a:
Distributions of (from upper left to lower right) fifth leading jet $ p_{\mathrm{T}} $, $ H_{\mathrm{T}} $, fifth jet $ p_{\mathrm{T}} $, where b-tagged jets ordered by $ p_{\mathrm{T}} $ first, hemiout, third leading resolved top tagger discriminator value, $ H_{\mathrm{T}} $ without leading and subleading b-tagged jets, $ H_{\mathrm{T}} $ of b-tagged jets, and mass of all jets and leptonically decaying W system in combined single-electron and muon channels before fit to data, requiring $ \geq $ 6 AK4 jets and $ \geq $ 2 b-tags. Background uncertainties include all statistical and systematic components added in quadrature. |

png pdf |
Additional Figure 4-b:
Distributions of (from upper left to lower right) fifth leading jet $ p_{\mathrm{T}} $, $ H_{\mathrm{T}} $, fifth jet $ p_{\mathrm{T}} $, where b-tagged jets ordered by $ p_{\mathrm{T}} $ first, hemiout, third leading resolved top tagger discriminator value, $ H_{\mathrm{T}} $ without leading and subleading b-tagged jets, $ H_{\mathrm{T}} $ of b-tagged jets, and mass of all jets and leptonically decaying W system in combined single-electron and muon channels before fit to data, requiring $ \geq $ 6 AK4 jets and $ \geq $ 2 b-tags. Background uncertainties include all statistical and systematic components added in quadrature. |

png pdf |
Additional Figure 4-c:
Distributions of (from upper left to lower right) fifth leading jet $ p_{\mathrm{T}} $, $ H_{\mathrm{T}} $, fifth jet $ p_{\mathrm{T}} $, where b-tagged jets ordered by $ p_{\mathrm{T}} $ first, hemiout, third leading resolved top tagger discriminator value, $ H_{\mathrm{T}} $ without leading and subleading b-tagged jets, $ H_{\mathrm{T}} $ of b-tagged jets, and mass of all jets and leptonically decaying W system in combined single-electron and muon channels before fit to data, requiring $ \geq $ 6 AK4 jets and $ \geq $ 2 b-tags. Background uncertainties include all statistical and systematic components added in quadrature. |

png pdf |
Additional Figure 4-d:
Distributions of (from upper left to lower right) fifth leading jet $ p_{\mathrm{T}} $, $ H_{\mathrm{T}} $, fifth jet $ p_{\mathrm{T}} $, where b-tagged jets ordered by $ p_{\mathrm{T}} $ first, hemiout, third leading resolved top tagger discriminator value, $ H_{\mathrm{T}} $ without leading and subleading b-tagged jets, $ H_{\mathrm{T}} $ of b-tagged jets, and mass of all jets and leptonically decaying W system in combined single-electron and muon channels before fit to data, requiring $ \geq $ 6 AK4 jets and $ \geq $ 2 b-tags. Background uncertainties include all statistical and systematic components added in quadrature. |
png pdf |
Additional Figure 4-e:
Distributions of (from upper left to lower right) fifth leading jet $ p_{\mathrm{T}} $, $ H_{\mathrm{T}} $, fifth jet $ p_{\mathrm{T}} $, where b-tagged jets ordered by $ p_{\mathrm{T}} $ first, hemiout, third leading resolved top tagger discriminator value, $ H_{\mathrm{T}} $ without leading and subleading b-tagged jets, $ H_{\mathrm{T}} $ of b-tagged jets, and mass of all jets and leptonically decaying W system in combined single-electron and muon channels before fit to data, requiring $ \geq $ 6 AK4 jets and $ \geq $ 2 b-tags. Background uncertainties include all statistical and systematic components added in quadrature. |

png pdf |
Additional Figure 4-f:
Distributions of (from upper left to lower right) fifth leading jet $ p_{\mathrm{T}} $, $ H_{\mathrm{T}} $, fifth jet $ p_{\mathrm{T}} $, where b-tagged jets ordered by $ p_{\mathrm{T}} $ first, hemiout, third leading resolved top tagger discriminator value, $ H_{\mathrm{T}} $ without leading and subleading b-tagged jets, $ H_{\mathrm{T}} $ of b-tagged jets, and mass of all jets and leptonically decaying W system in combined single-electron and muon channels before fit to data, requiring $ \geq $ 6 AK4 jets and $ \geq $ 2 b-tags. Background uncertainties include all statistical and systematic components added in quadrature. |
png pdf |
Additional Figure 4-g:
Distributions of (from upper left to lower right) fifth leading jet $ p_{\mathrm{T}} $, $ H_{\mathrm{T}} $, fifth jet $ p_{\mathrm{T}} $, where b-tagged jets ordered by $ p_{\mathrm{T}} $ first, hemiout, third leading resolved top tagger discriminator value, $ H_{\mathrm{T}} $ without leading and subleading b-tagged jets, $ H_{\mathrm{T}} $ of b-tagged jets, and mass of all jets and leptonically decaying W system in combined single-electron and muon channels before fit to data, requiring $ \geq $ 6 AK4 jets and $ \geq $ 2 b-tags. Background uncertainties include all statistical and systematic components added in quadrature. |

png pdf |
Additional Figure 4-h:
Distributions of (from upper left to lower right) fifth leading jet $ p_{\mathrm{T}} $, $ H_{\mathrm{T}} $, fifth jet $ p_{\mathrm{T}} $, where b-tagged jets ordered by $ p_{\mathrm{T}} $ first, hemiout, third leading resolved top tagger discriminator value, $ H_{\mathrm{T}} $ without leading and subleading b-tagged jets, $ H_{\mathrm{T}} $ of b-tagged jets, and mass of all jets and leptonically decaying W system in combined single-electron and muon channels before fit to data, requiring $ \geq $ 6 AK4 jets and $ \geq $ 2 b-tags. Background uncertainties include all statistical and systematic components added in quadrature. |
png pdf |
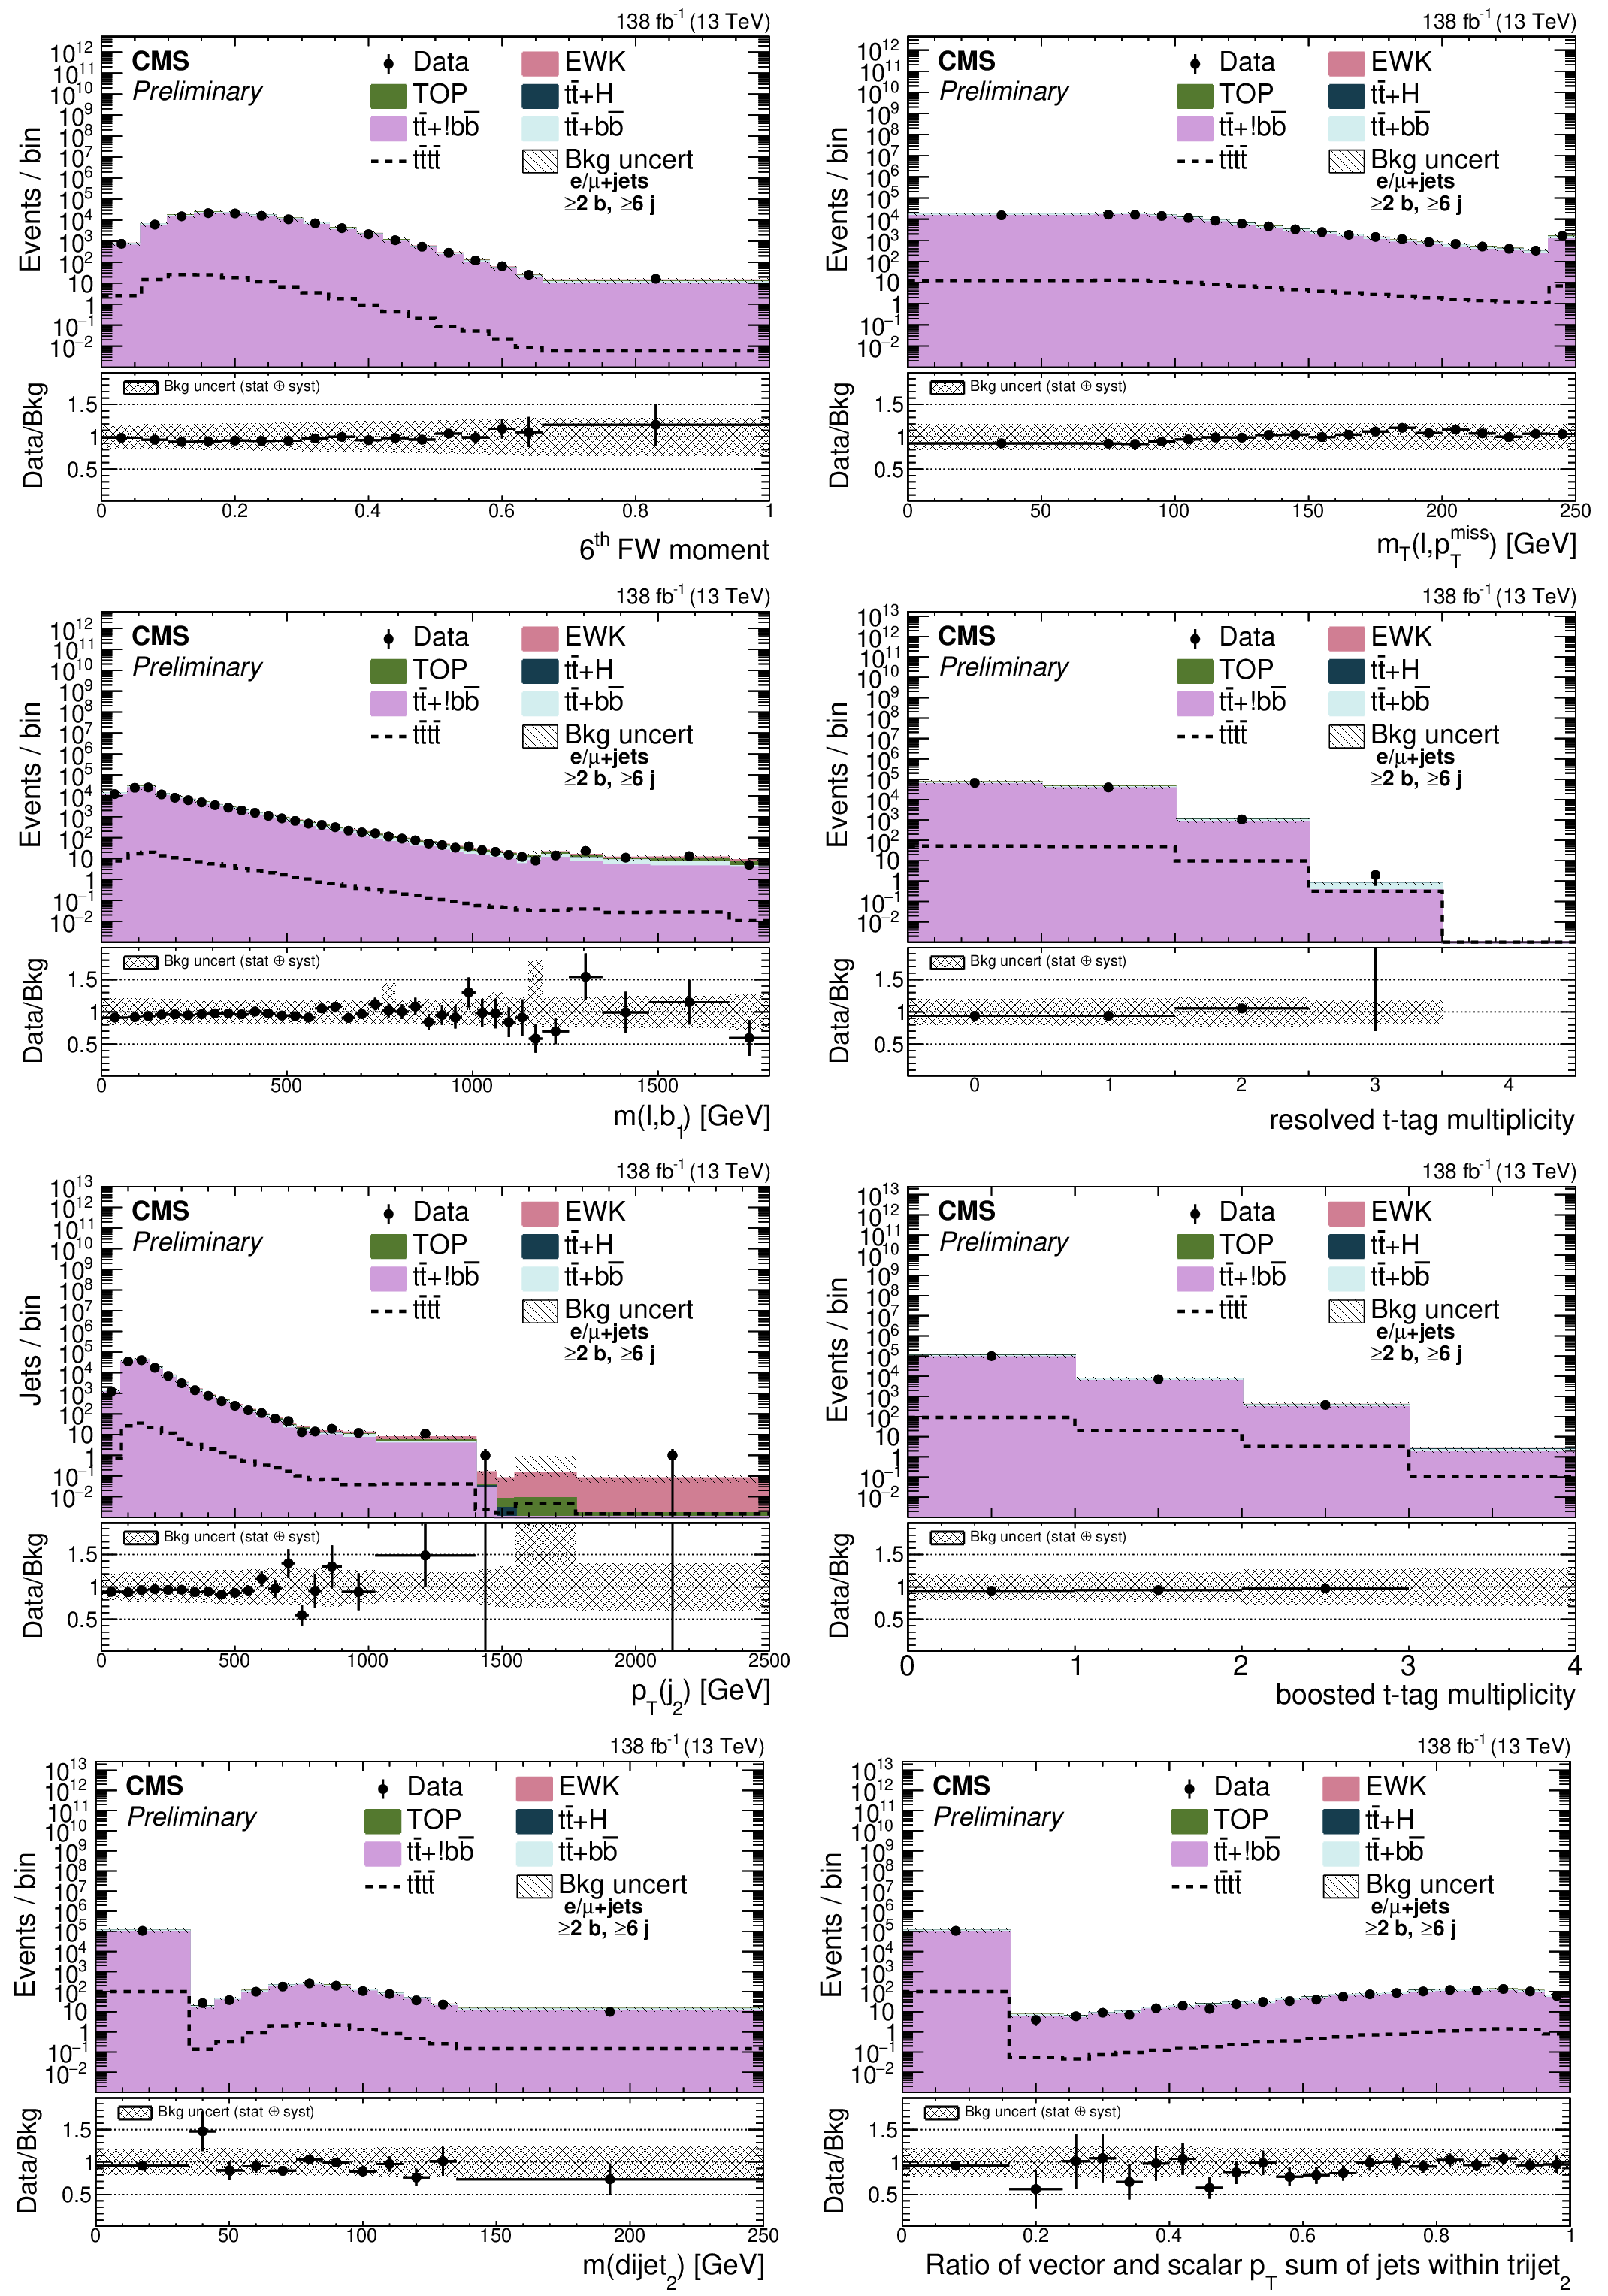
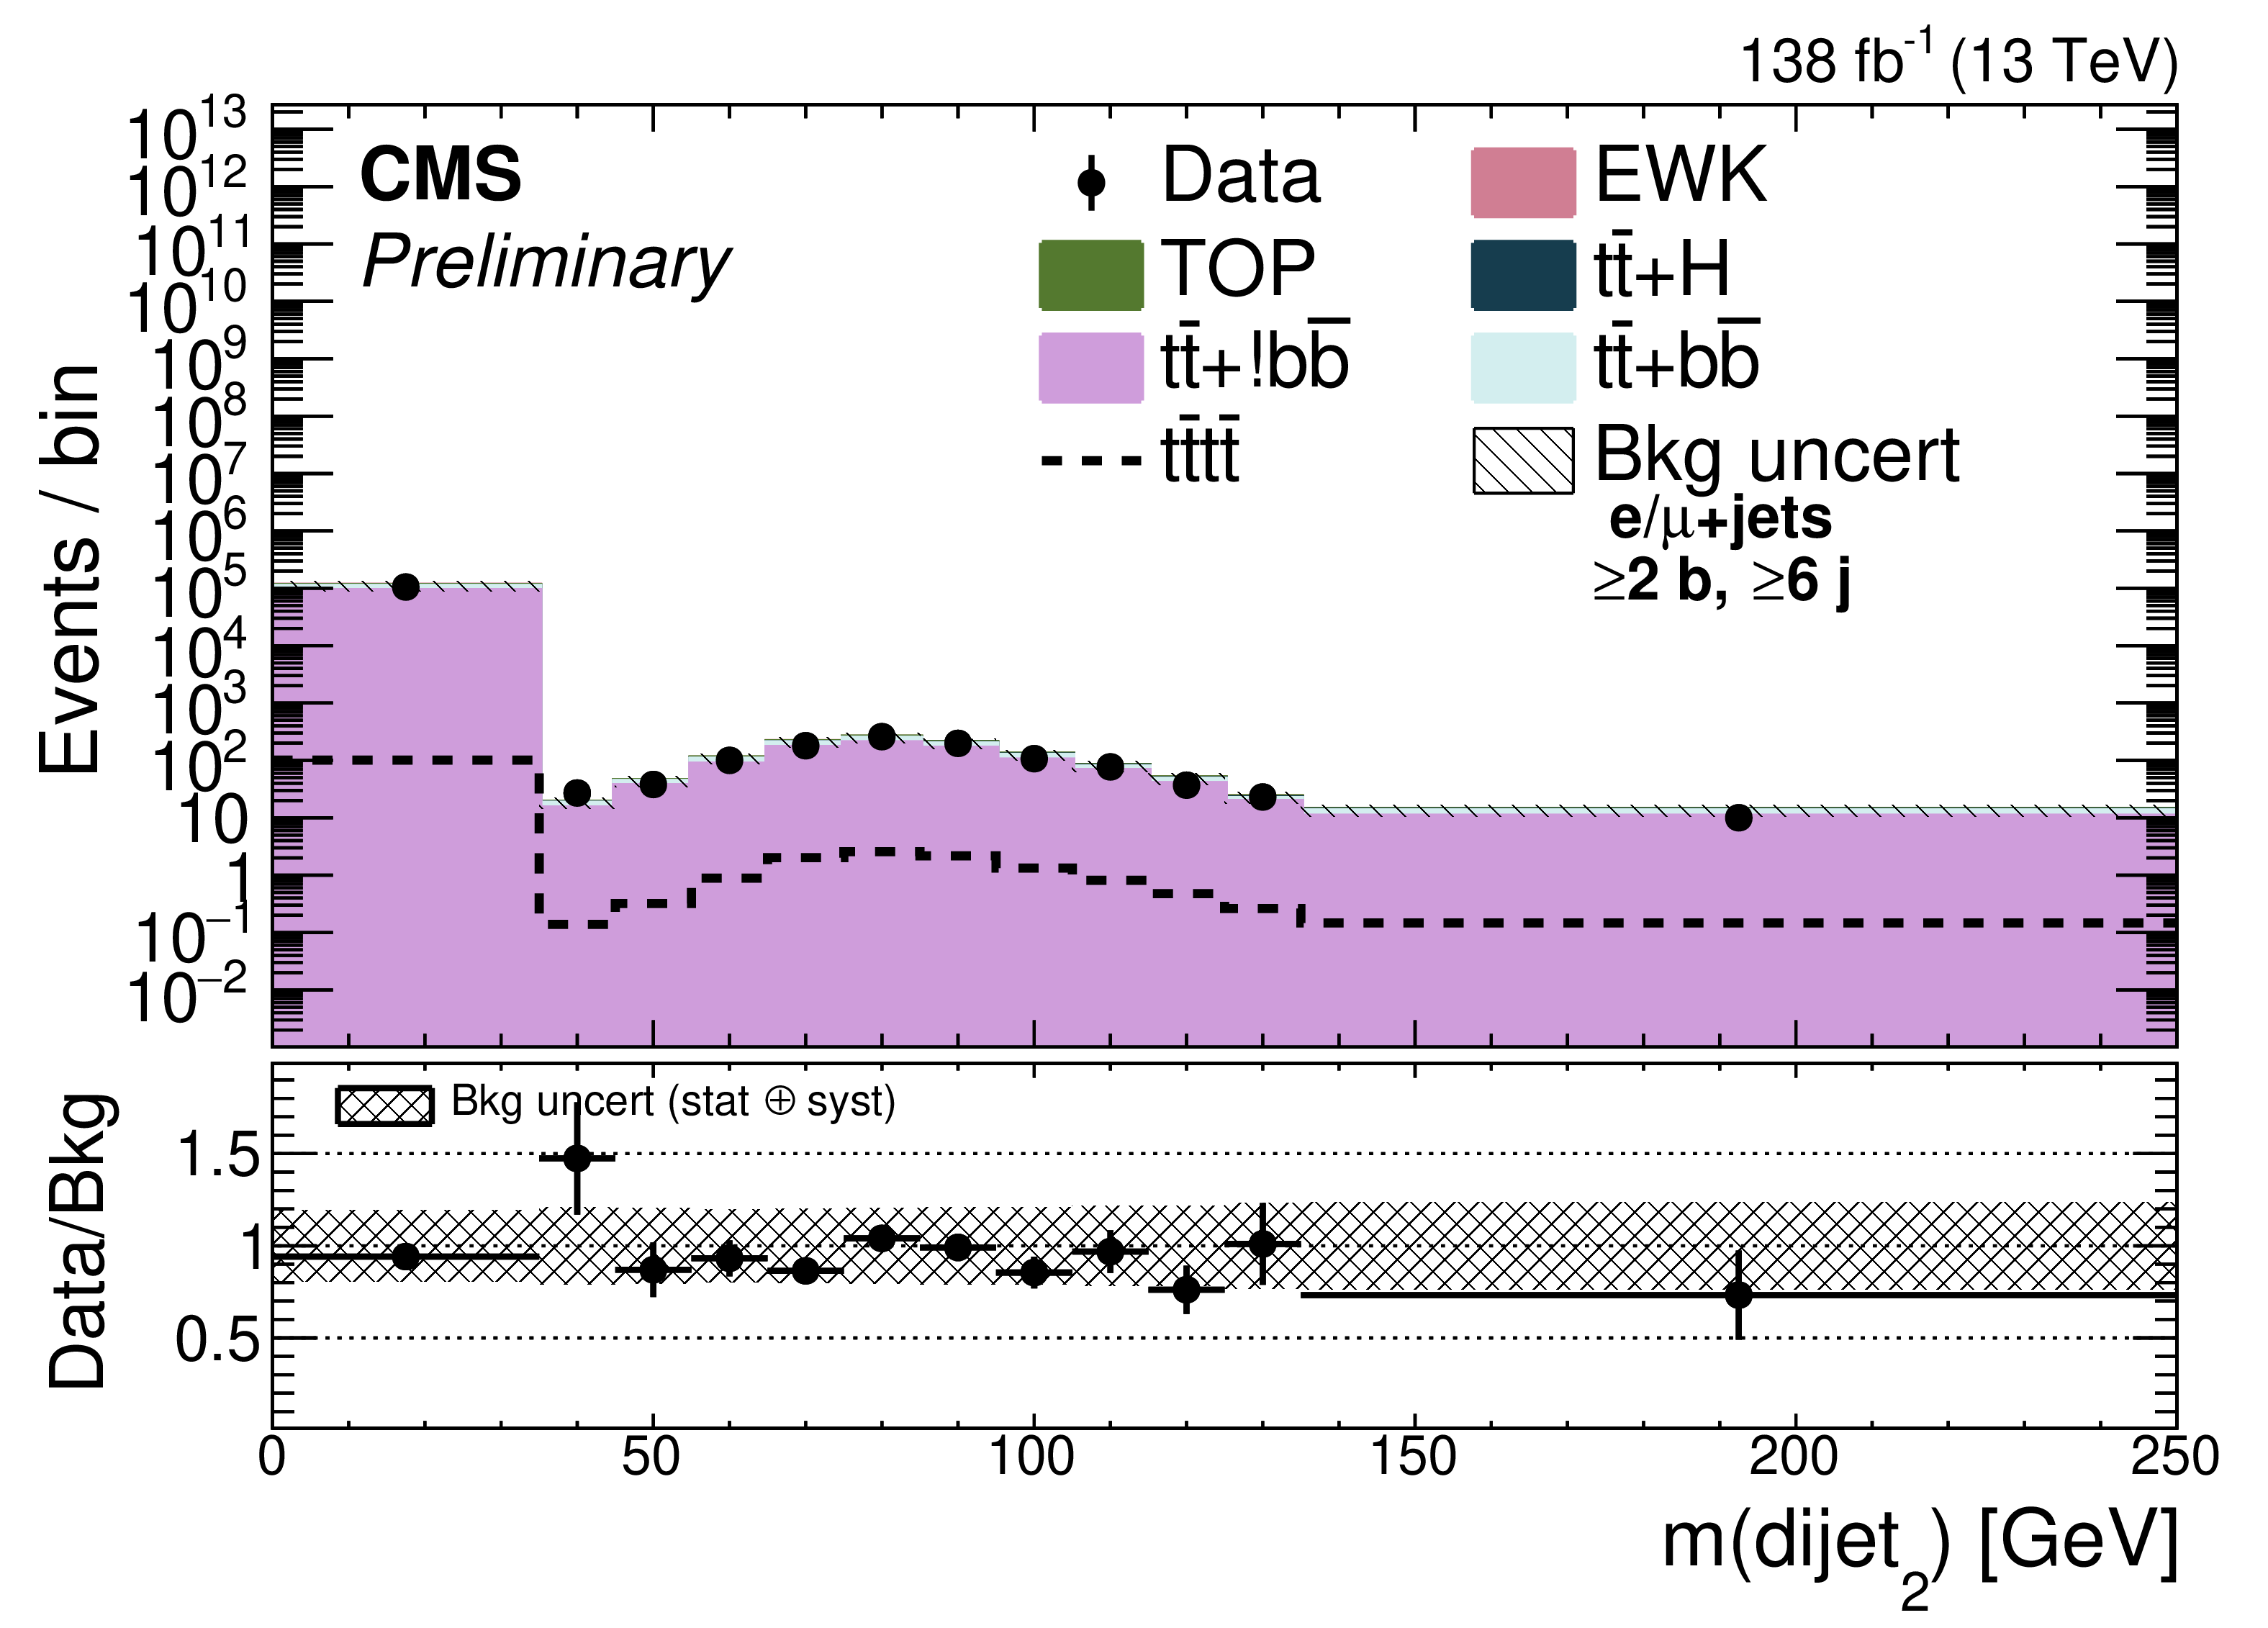
Additional Figure 5:
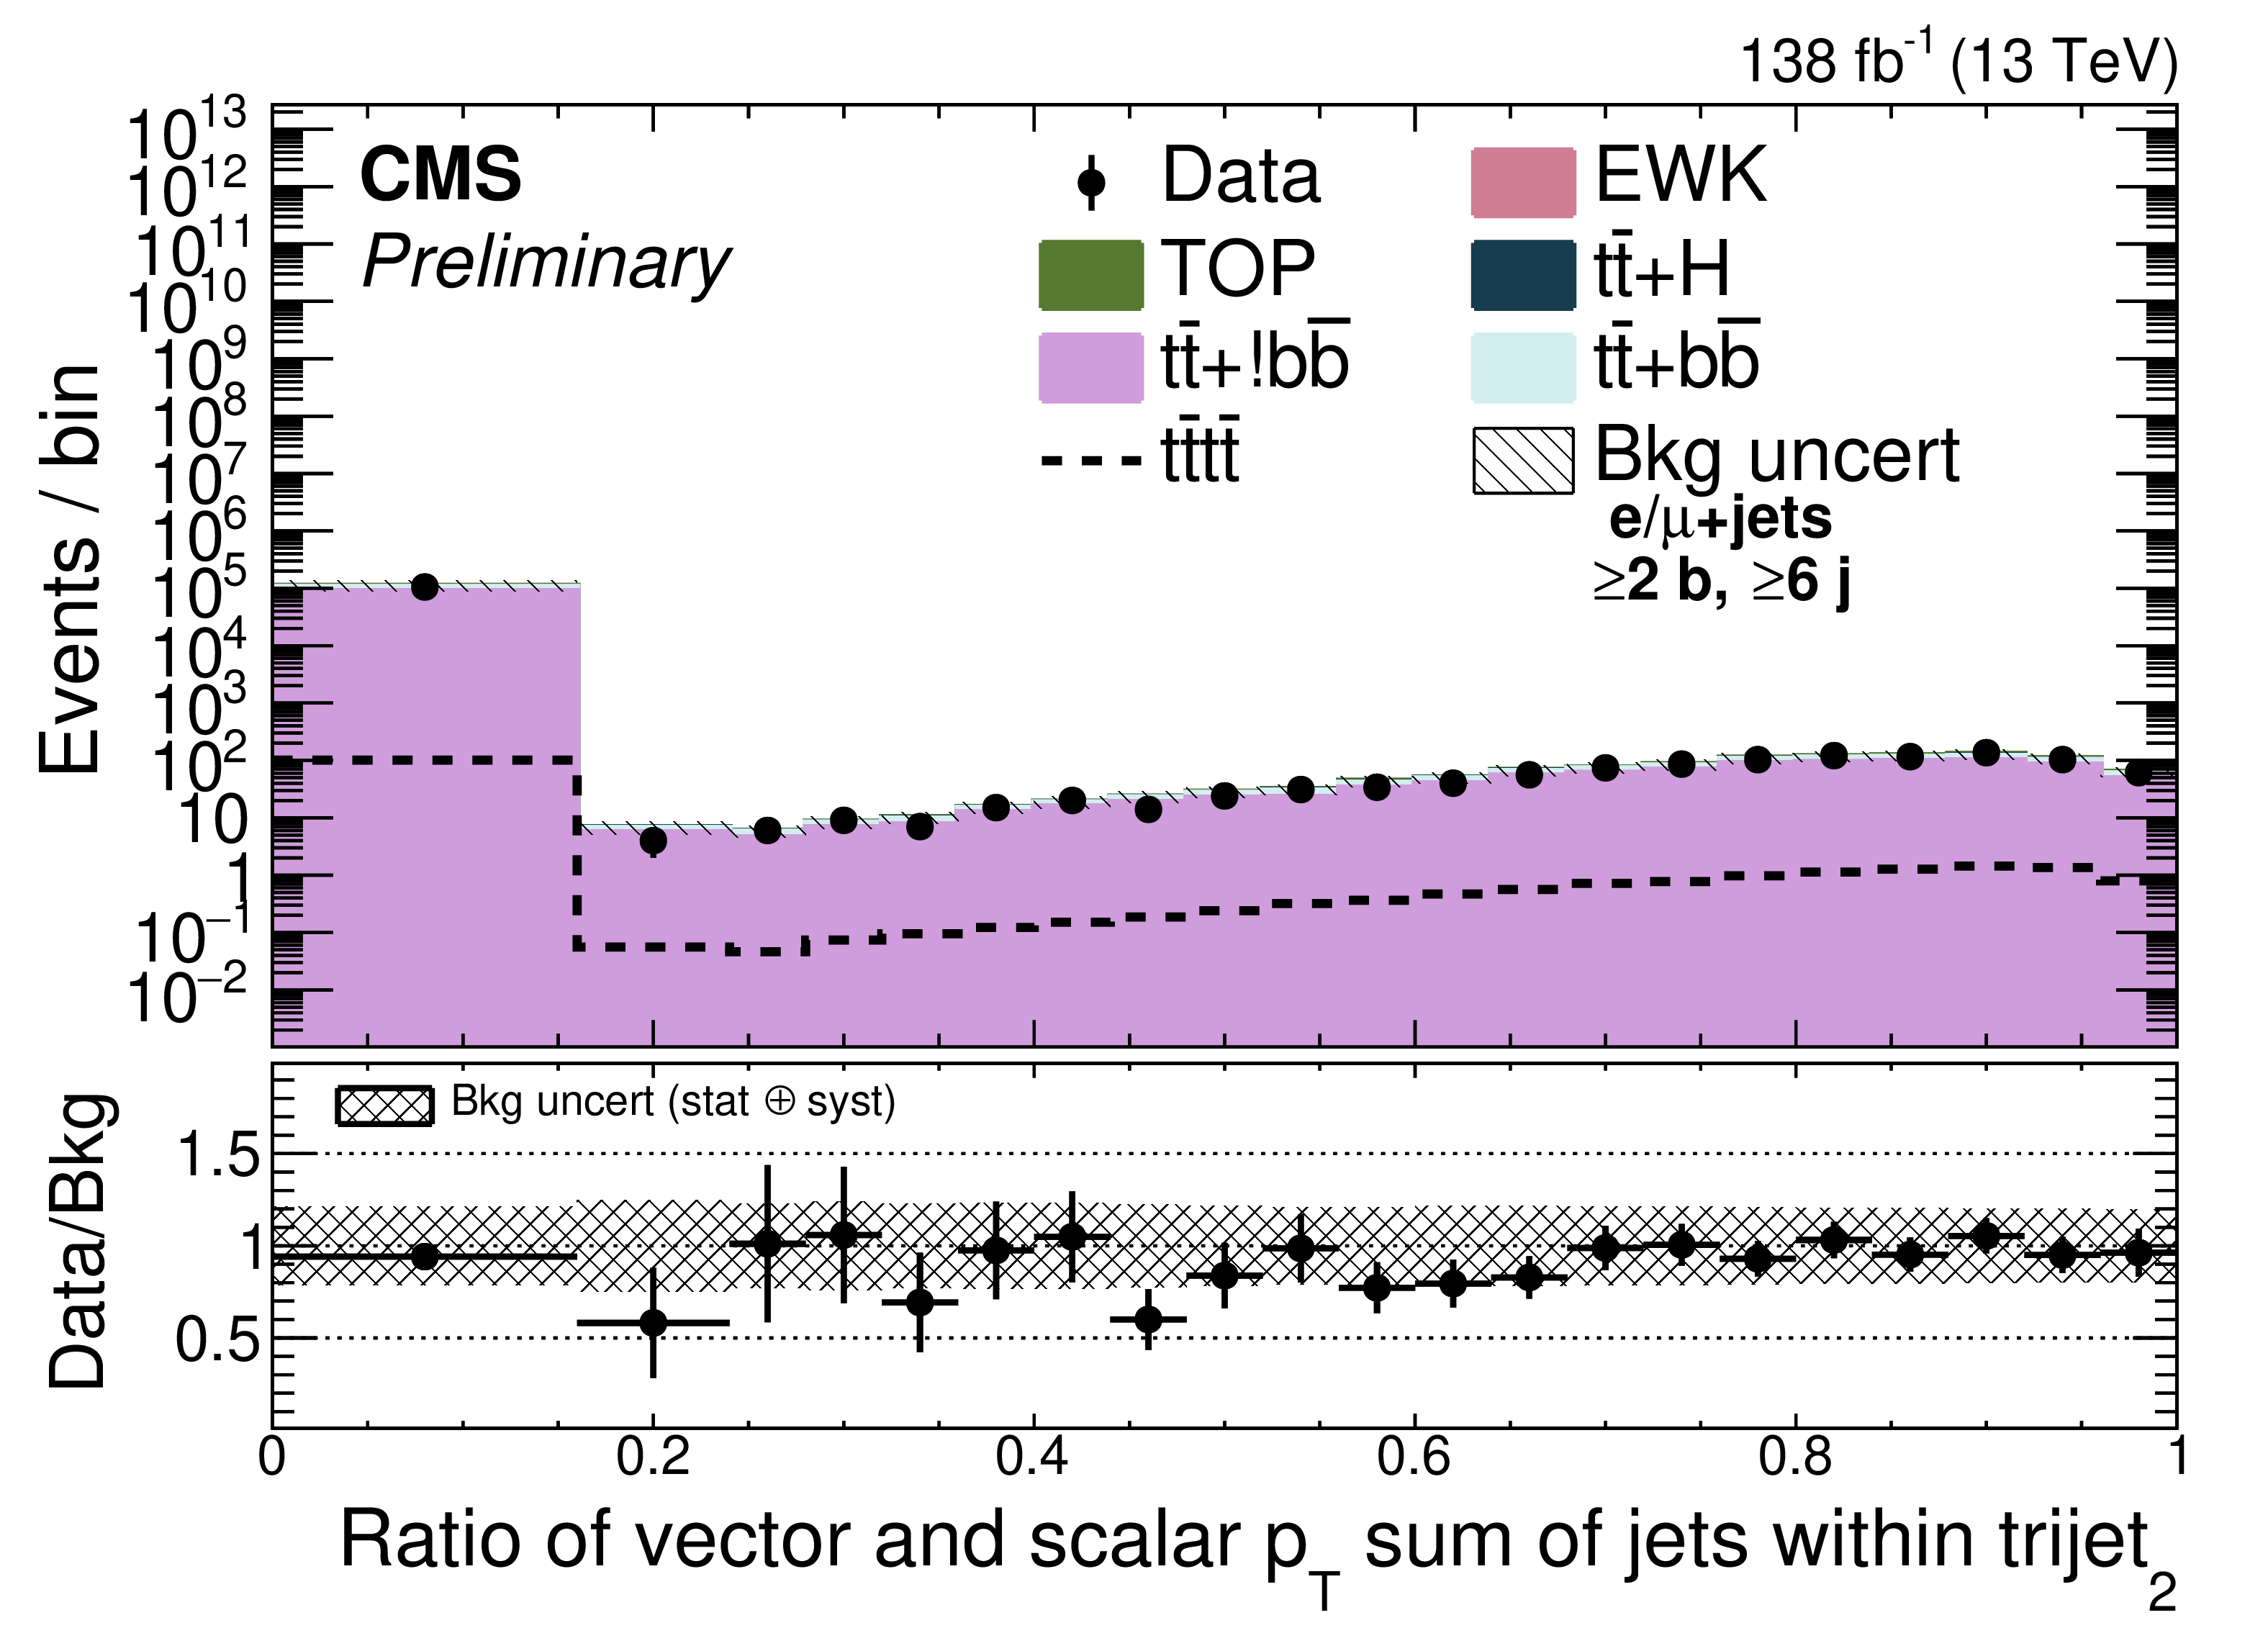
Distributions of (from upper left to lower right) sixth Fox-Wolfram (FW) moment, transverse mass of the lepton and $ p_{\mathrm{T}}^\text{miss} $, mass of the lepton and leading b-tagged jet, resolved top tag multiplicity, subleading jet $ p_{\mathrm{T}} $, boosted top tag multiplicity, mass of dijet with minimum separation among the three daughters of resolved t-tagged trijet with second highest discriminator value, and ratio of vector and scalar sum $ p_{\mathrm{T}} $ of three daughters of resolved t-tagged trijet with second highest discriminator value in combined single-electron and muon channels before fit to data, requiring $ \geq $ 6 AK4 jets and $ \geq $ 2 b-tags. Background uncertainties include all statistical and systematic components added in quadrature. |

png pdf |
Additional Figure 5-a:
Distributions of (from upper left to lower right) sixth Fox-Wolfram (FW) moment, transverse mass of the lepton and $ p_{\mathrm{T}}^\text{miss} $, mass of the lepton and leading b-tagged jet, resolved top tag multiplicity, subleading jet $ p_{\mathrm{T}} $, boosted top tag multiplicity, mass of dijet with minimum separation among the three daughters of resolved t-tagged trijet with second highest discriminator value, and ratio of vector and scalar sum $ p_{\mathrm{T}} $ of three daughters of resolved t-tagged trijet with second highest discriminator value in combined single-electron and muon channels before fit to data, requiring $ \geq $ 6 AK4 jets and $ \geq $ 2 b-tags. Background uncertainties include all statistical and systematic components added in quadrature. |

png pdf |
Additional Figure 5-b:
Distributions of (from upper left to lower right) sixth Fox-Wolfram (FW) moment, transverse mass of the lepton and $ p_{\mathrm{T}}^\text{miss} $, mass of the lepton and leading b-tagged jet, resolved top tag multiplicity, subleading jet $ p_{\mathrm{T}} $, boosted top tag multiplicity, mass of dijet with minimum separation among the three daughters of resolved t-tagged trijet with second highest discriminator value, and ratio of vector and scalar sum $ p_{\mathrm{T}} $ of three daughters of resolved t-tagged trijet with second highest discriminator value in combined single-electron and muon channels before fit to data, requiring $ \geq $ 6 AK4 jets and $ \geq $ 2 b-tags. Background uncertainties include all statistical and systematic components added in quadrature. |

png pdf |
Additional Figure 5-c:
Distributions of (from upper left to lower right) sixth Fox-Wolfram (FW) moment, transverse mass of the lepton and $ p_{\mathrm{T}}^\text{miss} $, mass of the lepton and leading b-tagged jet, resolved top tag multiplicity, subleading jet $ p_{\mathrm{T}} $, boosted top tag multiplicity, mass of dijet with minimum separation among the three daughters of resolved t-tagged trijet with second highest discriminator value, and ratio of vector and scalar sum $ p_{\mathrm{T}} $ of three daughters of resolved t-tagged trijet with second highest discriminator value in combined single-electron and muon channels before fit to data, requiring $ \geq $ 6 AK4 jets and $ \geq $ 2 b-tags. Background uncertainties include all statistical and systematic components added in quadrature. |

png pdf |
Additional Figure 5-d:
Distributions of (from upper left to lower right) sixth Fox-Wolfram (FW) moment, transverse mass of the lepton and $ p_{\mathrm{T}}^\text{miss} $, mass of the lepton and leading b-tagged jet, resolved top tag multiplicity, subleading jet $ p_{\mathrm{T}} $, boosted top tag multiplicity, mass of dijet with minimum separation among the three daughters of resolved t-tagged trijet with second highest discriminator value, and ratio of vector and scalar sum $ p_{\mathrm{T}} $ of three daughters of resolved t-tagged trijet with second highest discriminator value in combined single-electron and muon channels before fit to data, requiring $ \geq $ 6 AK4 jets and $ \geq $ 2 b-tags. Background uncertainties include all statistical and systematic components added in quadrature. |

png pdf |
Additional Figure 5-e:
Distributions of (from upper left to lower right) sixth Fox-Wolfram (FW) moment, transverse mass of the lepton and $ p_{\mathrm{T}}^\text{miss} $, mass of the lepton and leading b-tagged jet, resolved top tag multiplicity, subleading jet $ p_{\mathrm{T}} $, boosted top tag multiplicity, mass of dijet with minimum separation among the three daughters of resolved t-tagged trijet with second highest discriminator value, and ratio of vector and scalar sum $ p_{\mathrm{T}} $ of three daughters of resolved t-tagged trijet with second highest discriminator value in combined single-electron and muon channels before fit to data, requiring $ \geq $ 6 AK4 jets and $ \geq $ 2 b-tags. Background uncertainties include all statistical and systematic components added in quadrature. |

png pdf |
Additional Figure 5-f:
Distributions of (from upper left to lower right) sixth Fox-Wolfram (FW) moment, transverse mass of the lepton and $ p_{\mathrm{T}}^\text{miss} $, mass of the lepton and leading b-tagged jet, resolved top tag multiplicity, subleading jet $ p_{\mathrm{T}} $, boosted top tag multiplicity, mass of dijet with minimum separation among the three daughters of resolved t-tagged trijet with second highest discriminator value, and ratio of vector and scalar sum $ p_{\mathrm{T}} $ of three daughters of resolved t-tagged trijet with second highest discriminator value in combined single-electron and muon channels before fit to data, requiring $ \geq $ 6 AK4 jets and $ \geq $ 2 b-tags. Background uncertainties include all statistical and systematic components added in quadrature. |
png pdf |
Additional Figure 5-g:
Distributions of (from upper left to lower right) sixth Fox-Wolfram (FW) moment, transverse mass of the lepton and $ p_{\mathrm{T}}^\text{miss} $, mass of the lepton and leading b-tagged jet, resolved top tag multiplicity, subleading jet $ p_{\mathrm{T}} $, boosted top tag multiplicity, mass of dijet with minimum separation among the three daughters of resolved t-tagged trijet with second highest discriminator value, and ratio of vector and scalar sum $ p_{\mathrm{T}} $ of three daughters of resolved t-tagged trijet with second highest discriminator value in combined single-electron and muon channels before fit to data, requiring $ \geq $ 6 AK4 jets and $ \geq $ 2 b-tags. Background uncertainties include all statistical and systematic components added in quadrature. |
png pdf |
Additional Figure 5-h:
Distributions of (from upper left to lower right) sixth Fox-Wolfram (FW) moment, transverse mass of the lepton and $ p_{\mathrm{T}}^\text{miss} $, mass of the lepton and leading b-tagged jet, resolved top tag multiplicity, subleading jet $ p_{\mathrm{T}} $, boosted top tag multiplicity, mass of dijet with minimum separation among the three daughters of resolved t-tagged trijet with second highest discriminator value, and ratio of vector and scalar sum $ p_{\mathrm{T}} $ of three daughters of resolved t-tagged trijet with second highest discriminator value in combined single-electron and muon channels before fit to data, requiring $ \geq $ 6 AK4 jets and $ \geq $ 2 b-tags. Background uncertainties include all statistical and systematic components added in quadrature. |

png pdf |
Additional Figure 6:
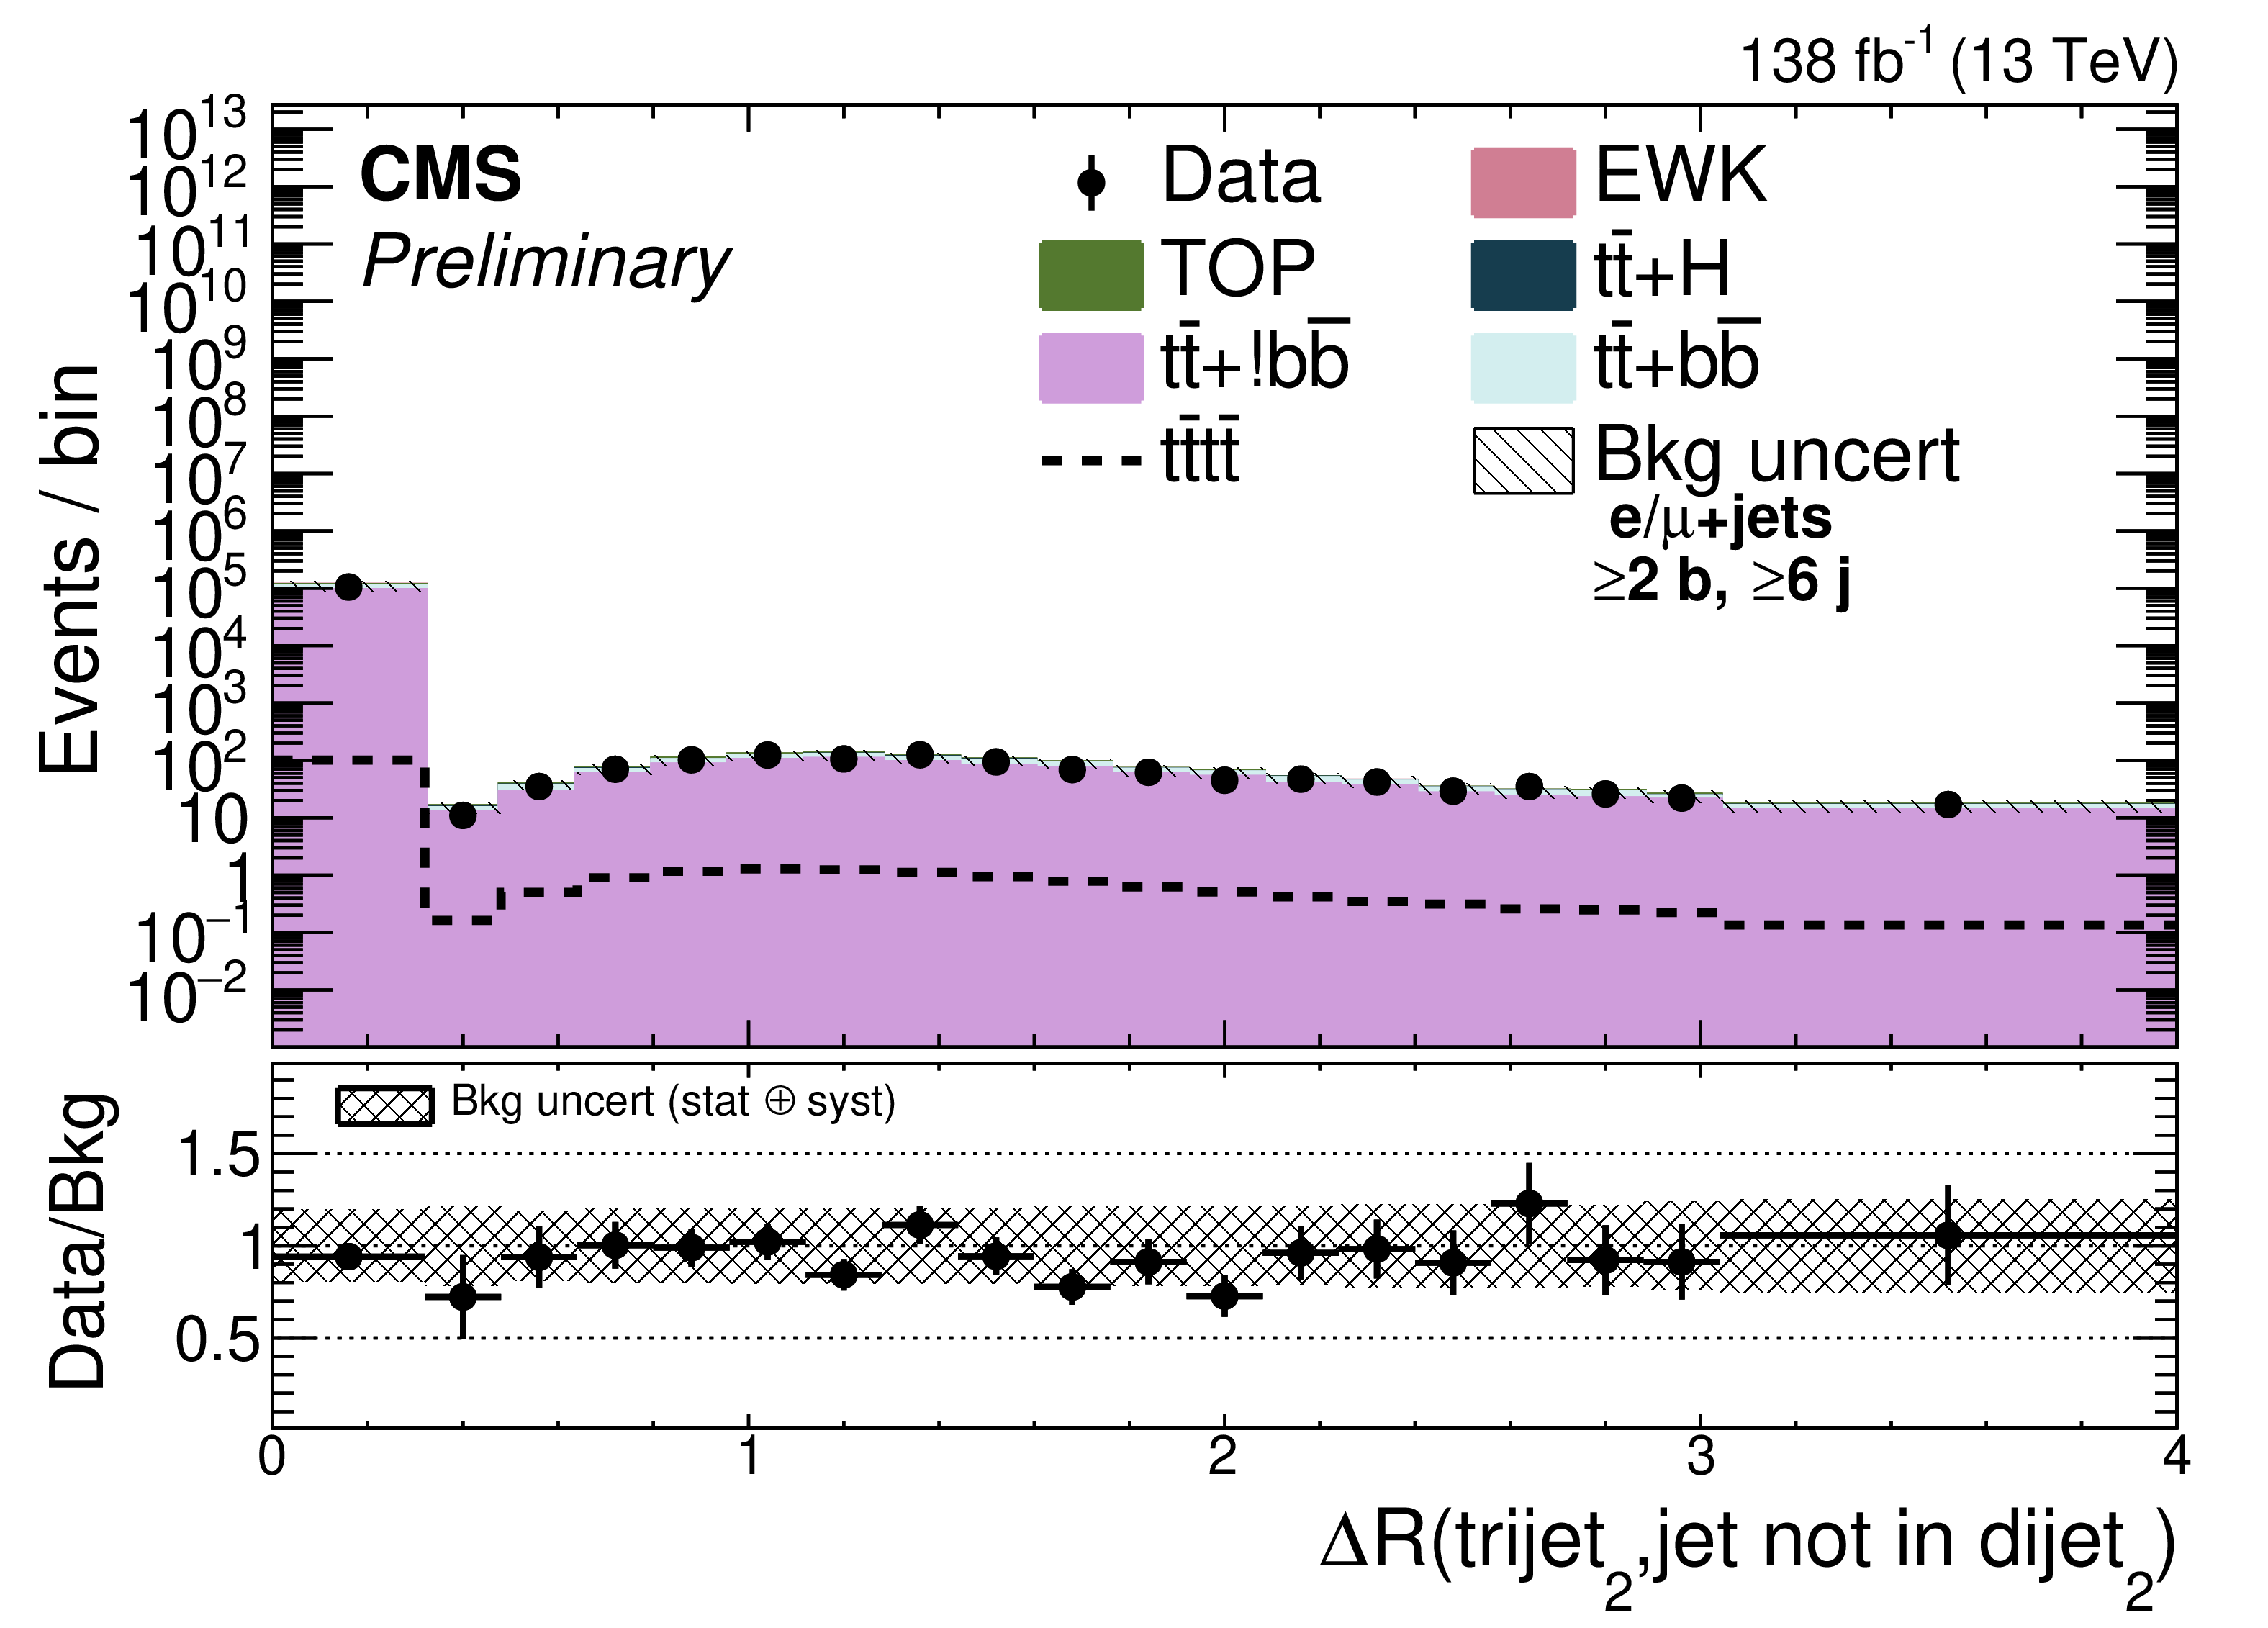
Distributions of (from upper left to lower right) $ \Delta R $ separation between resolved t-tagged trijet with second highest discriminator and the jet that is not in dijet with minimum separation, mass of resolved t-tagged trijet with second highest discriminator value, aplanarity, minimum separation between b-jet pairs, $ \Delta R $ separation between resolved t-tagged trijet with second highest discriminator and dijet with minimum separation, leading resolved top tagger discriminator value, maximum mass of b-jet pair, and leading b-jet $ p_{\mathrm{T}} $ in combined single-electron and muon channels before fit to data, requiring $ \geq $ 6 AK4 jets and $ \geq $ 2 b-tags. Background uncertainties include all statistical and systematic components added in quadrature. |
png pdf |
Additional Figure 6-a:
Distributions of (from upper left to lower right) $ \Delta R $ separation between resolved t-tagged trijet with second highest discriminator and the jet that is not in dijet with minimum separation, mass of resolved t-tagged trijet with second highest discriminator value, aplanarity, minimum separation between b-jet pairs, $ \Delta R $ separation between resolved t-tagged trijet with second highest discriminator and dijet with minimum separation, leading resolved top tagger discriminator value, maximum mass of b-jet pair, and leading b-jet $ p_{\mathrm{T}} $ in combined single-electron and muon channels before fit to data, requiring $ \geq $ 6 AK4 jets and $ \geq $ 2 b-tags. Background uncertainties include all statistical and systematic components added in quadrature. |

png pdf |
Additional Figure 6-b:
Distributions of (from upper left to lower right) $ \Delta R $ separation between resolved t-tagged trijet with second highest discriminator and the jet that is not in dijet with minimum separation, mass of resolved t-tagged trijet with second highest discriminator value, aplanarity, minimum separation between b-jet pairs, $ \Delta R $ separation between resolved t-tagged trijet with second highest discriminator and dijet with minimum separation, leading resolved top tagger discriminator value, maximum mass of b-jet pair, and leading b-jet $ p_{\mathrm{T}} $ in combined single-electron and muon channels before fit to data, requiring $ \geq $ 6 AK4 jets and $ \geq $ 2 b-tags. Background uncertainties include all statistical and systematic components added in quadrature. |

png pdf |
Additional Figure 6-c:
Distributions of (from upper left to lower right) $ \Delta R $ separation between resolved t-tagged trijet with second highest discriminator and the jet that is not in dijet with minimum separation, mass of resolved t-tagged trijet with second highest discriminator value, aplanarity, minimum separation between b-jet pairs, $ \Delta R $ separation between resolved t-tagged trijet with second highest discriminator and dijet with minimum separation, leading resolved top tagger discriminator value, maximum mass of b-jet pair, and leading b-jet $ p_{\mathrm{T}} $ in combined single-electron and muon channels before fit to data, requiring $ \geq $ 6 AK4 jets and $ \geq $ 2 b-tags. Background uncertainties include all statistical and systematic components added in quadrature. |

png pdf |
Additional Figure 6-d:
Distributions of (from upper left to lower right) $ \Delta R $ separation between resolved t-tagged trijet with second highest discriminator and the jet that is not in dijet with minimum separation, mass of resolved t-tagged trijet with second highest discriminator value, aplanarity, minimum separation between b-jet pairs, $ \Delta R $ separation between resolved t-tagged trijet with second highest discriminator and dijet with minimum separation, leading resolved top tagger discriminator value, maximum mass of b-jet pair, and leading b-jet $ p_{\mathrm{T}} $ in combined single-electron and muon channels before fit to data, requiring $ \geq $ 6 AK4 jets and $ \geq $ 2 b-tags. Background uncertainties include all statistical and systematic components added in quadrature. |

png pdf |
Additional Figure 6-e:
Distributions of (from upper left to lower right) $ \Delta R $ separation between resolved t-tagged trijet with second highest discriminator and the jet that is not in dijet with minimum separation, mass of resolved t-tagged trijet with second highest discriminator value, aplanarity, minimum separation between b-jet pairs, $ \Delta R $ separation between resolved t-tagged trijet with second highest discriminator and dijet with minimum separation, leading resolved top tagger discriminator value, maximum mass of b-jet pair, and leading b-jet $ p_{\mathrm{T}} $ in combined single-electron and muon channels before fit to data, requiring $ \geq $ 6 AK4 jets and $ \geq $ 2 b-tags. Background uncertainties include all statistical and systematic components added in quadrature. |

png pdf |
Additional Figure 6-f:
Distributions of (from upper left to lower right) $ \Delta R $ separation between resolved t-tagged trijet with second highest discriminator and the jet that is not in dijet with minimum separation, mass of resolved t-tagged trijet with second highest discriminator value, aplanarity, minimum separation between b-jet pairs, $ \Delta R $ separation between resolved t-tagged trijet with second highest discriminator and dijet with minimum separation, leading resolved top tagger discriminator value, maximum mass of b-jet pair, and leading b-jet $ p_{\mathrm{T}} $ in combined single-electron and muon channels before fit to data, requiring $ \geq $ 6 AK4 jets and $ \geq $ 2 b-tags. Background uncertainties include all statistical and systematic components added in quadrature. |

png pdf |
Additional Figure 6-g:
Distributions of (from upper left to lower right) $ \Delta R $ separation between resolved t-tagged trijet with second highest discriminator and the jet that is not in dijet with minimum separation, mass of resolved t-tagged trijet with second highest discriminator value, aplanarity, minimum separation between b-jet pairs, $ \Delta R $ separation between resolved t-tagged trijet with second highest discriminator and dijet with minimum separation, leading resolved top tagger discriminator value, maximum mass of b-jet pair, and leading b-jet $ p_{\mathrm{T}} $ in combined single-electron and muon channels before fit to data, requiring $ \geq $ 6 AK4 jets and $ \geq $ 2 b-tags. Background uncertainties include all statistical and systematic components added in quadrature. |

png pdf |
Additional Figure 6-h:
Distributions of (from upper left to lower right) $ \Delta R $ separation between resolved t-tagged trijet with second highest discriminator and the jet that is not in dijet with minimum separation, mass of resolved t-tagged trijet with second highest discriminator value, aplanarity, minimum separation between b-jet pairs, $ \Delta R $ separation between resolved t-tagged trijet with second highest discriminator and dijet with minimum separation, leading resolved top tagger discriminator value, maximum mass of b-jet pair, and leading b-jet $ p_{\mathrm{T}} $ in combined single-electron and muon channels before fit to data, requiring $ \geq $ 6 AK4 jets and $ \geq $ 2 b-tags. Background uncertainties include all statistical and systematic components added in quadrature. |

png pdf |
Additional Figure 7:
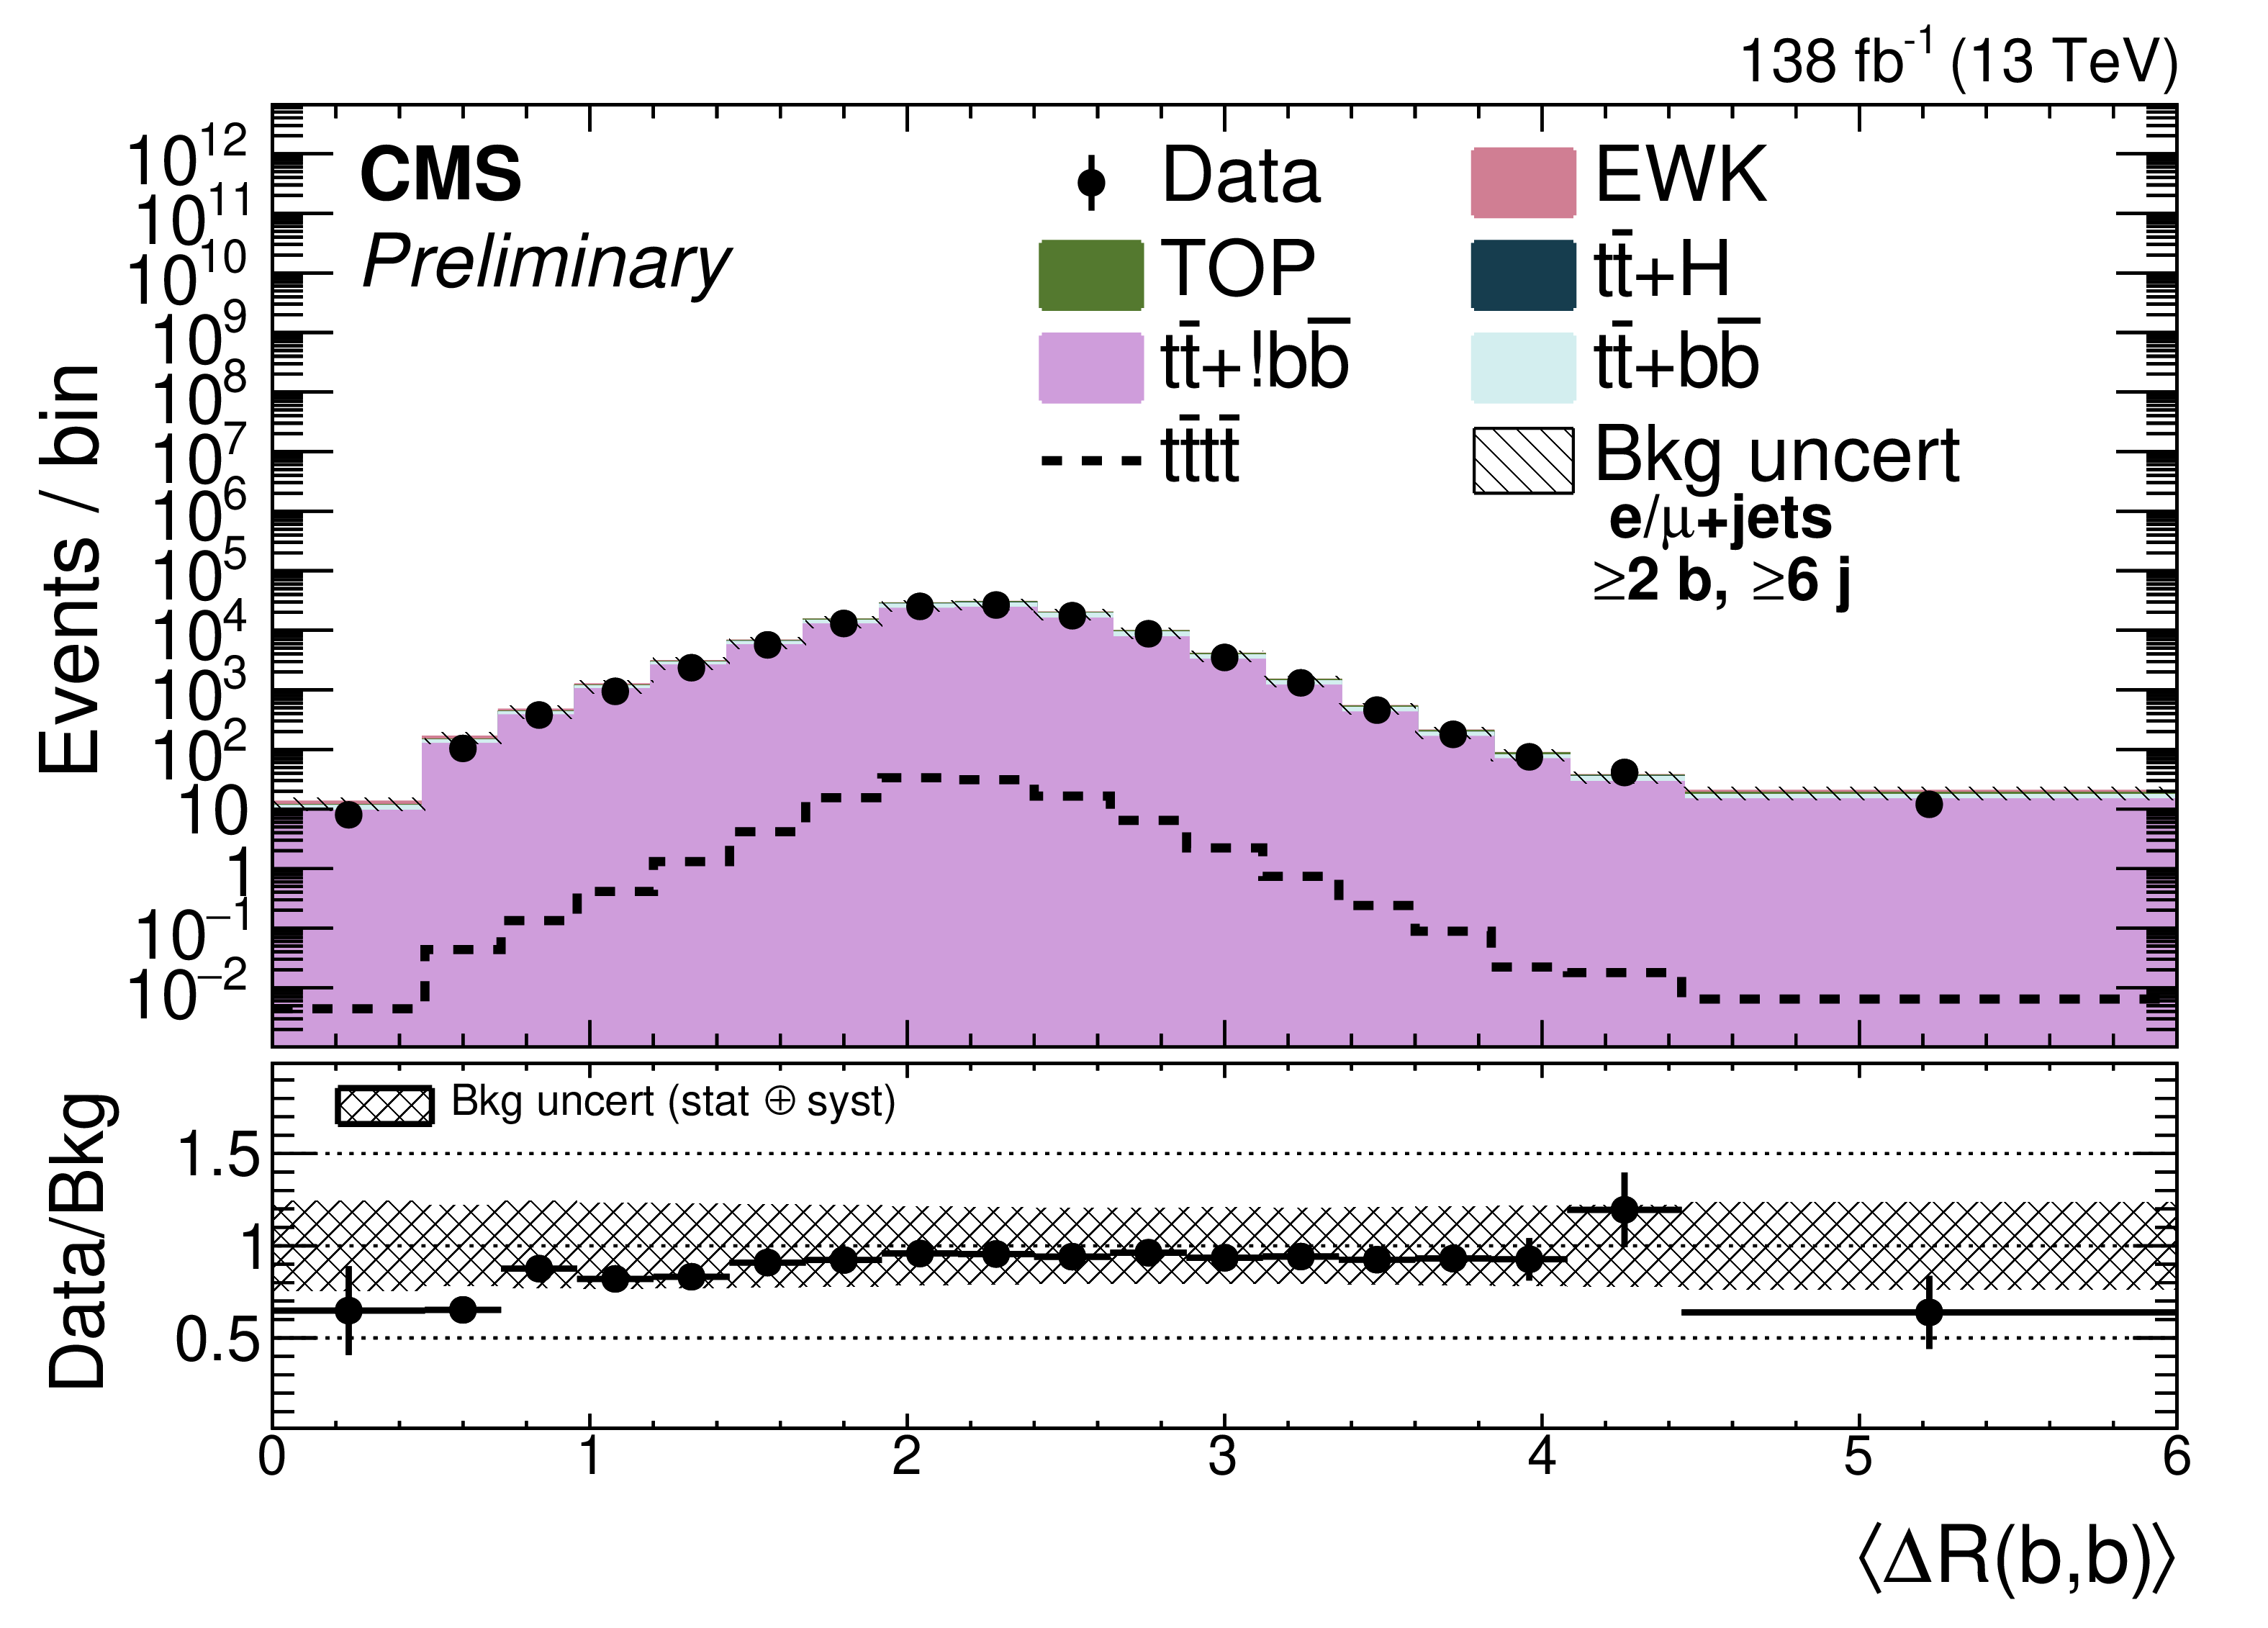
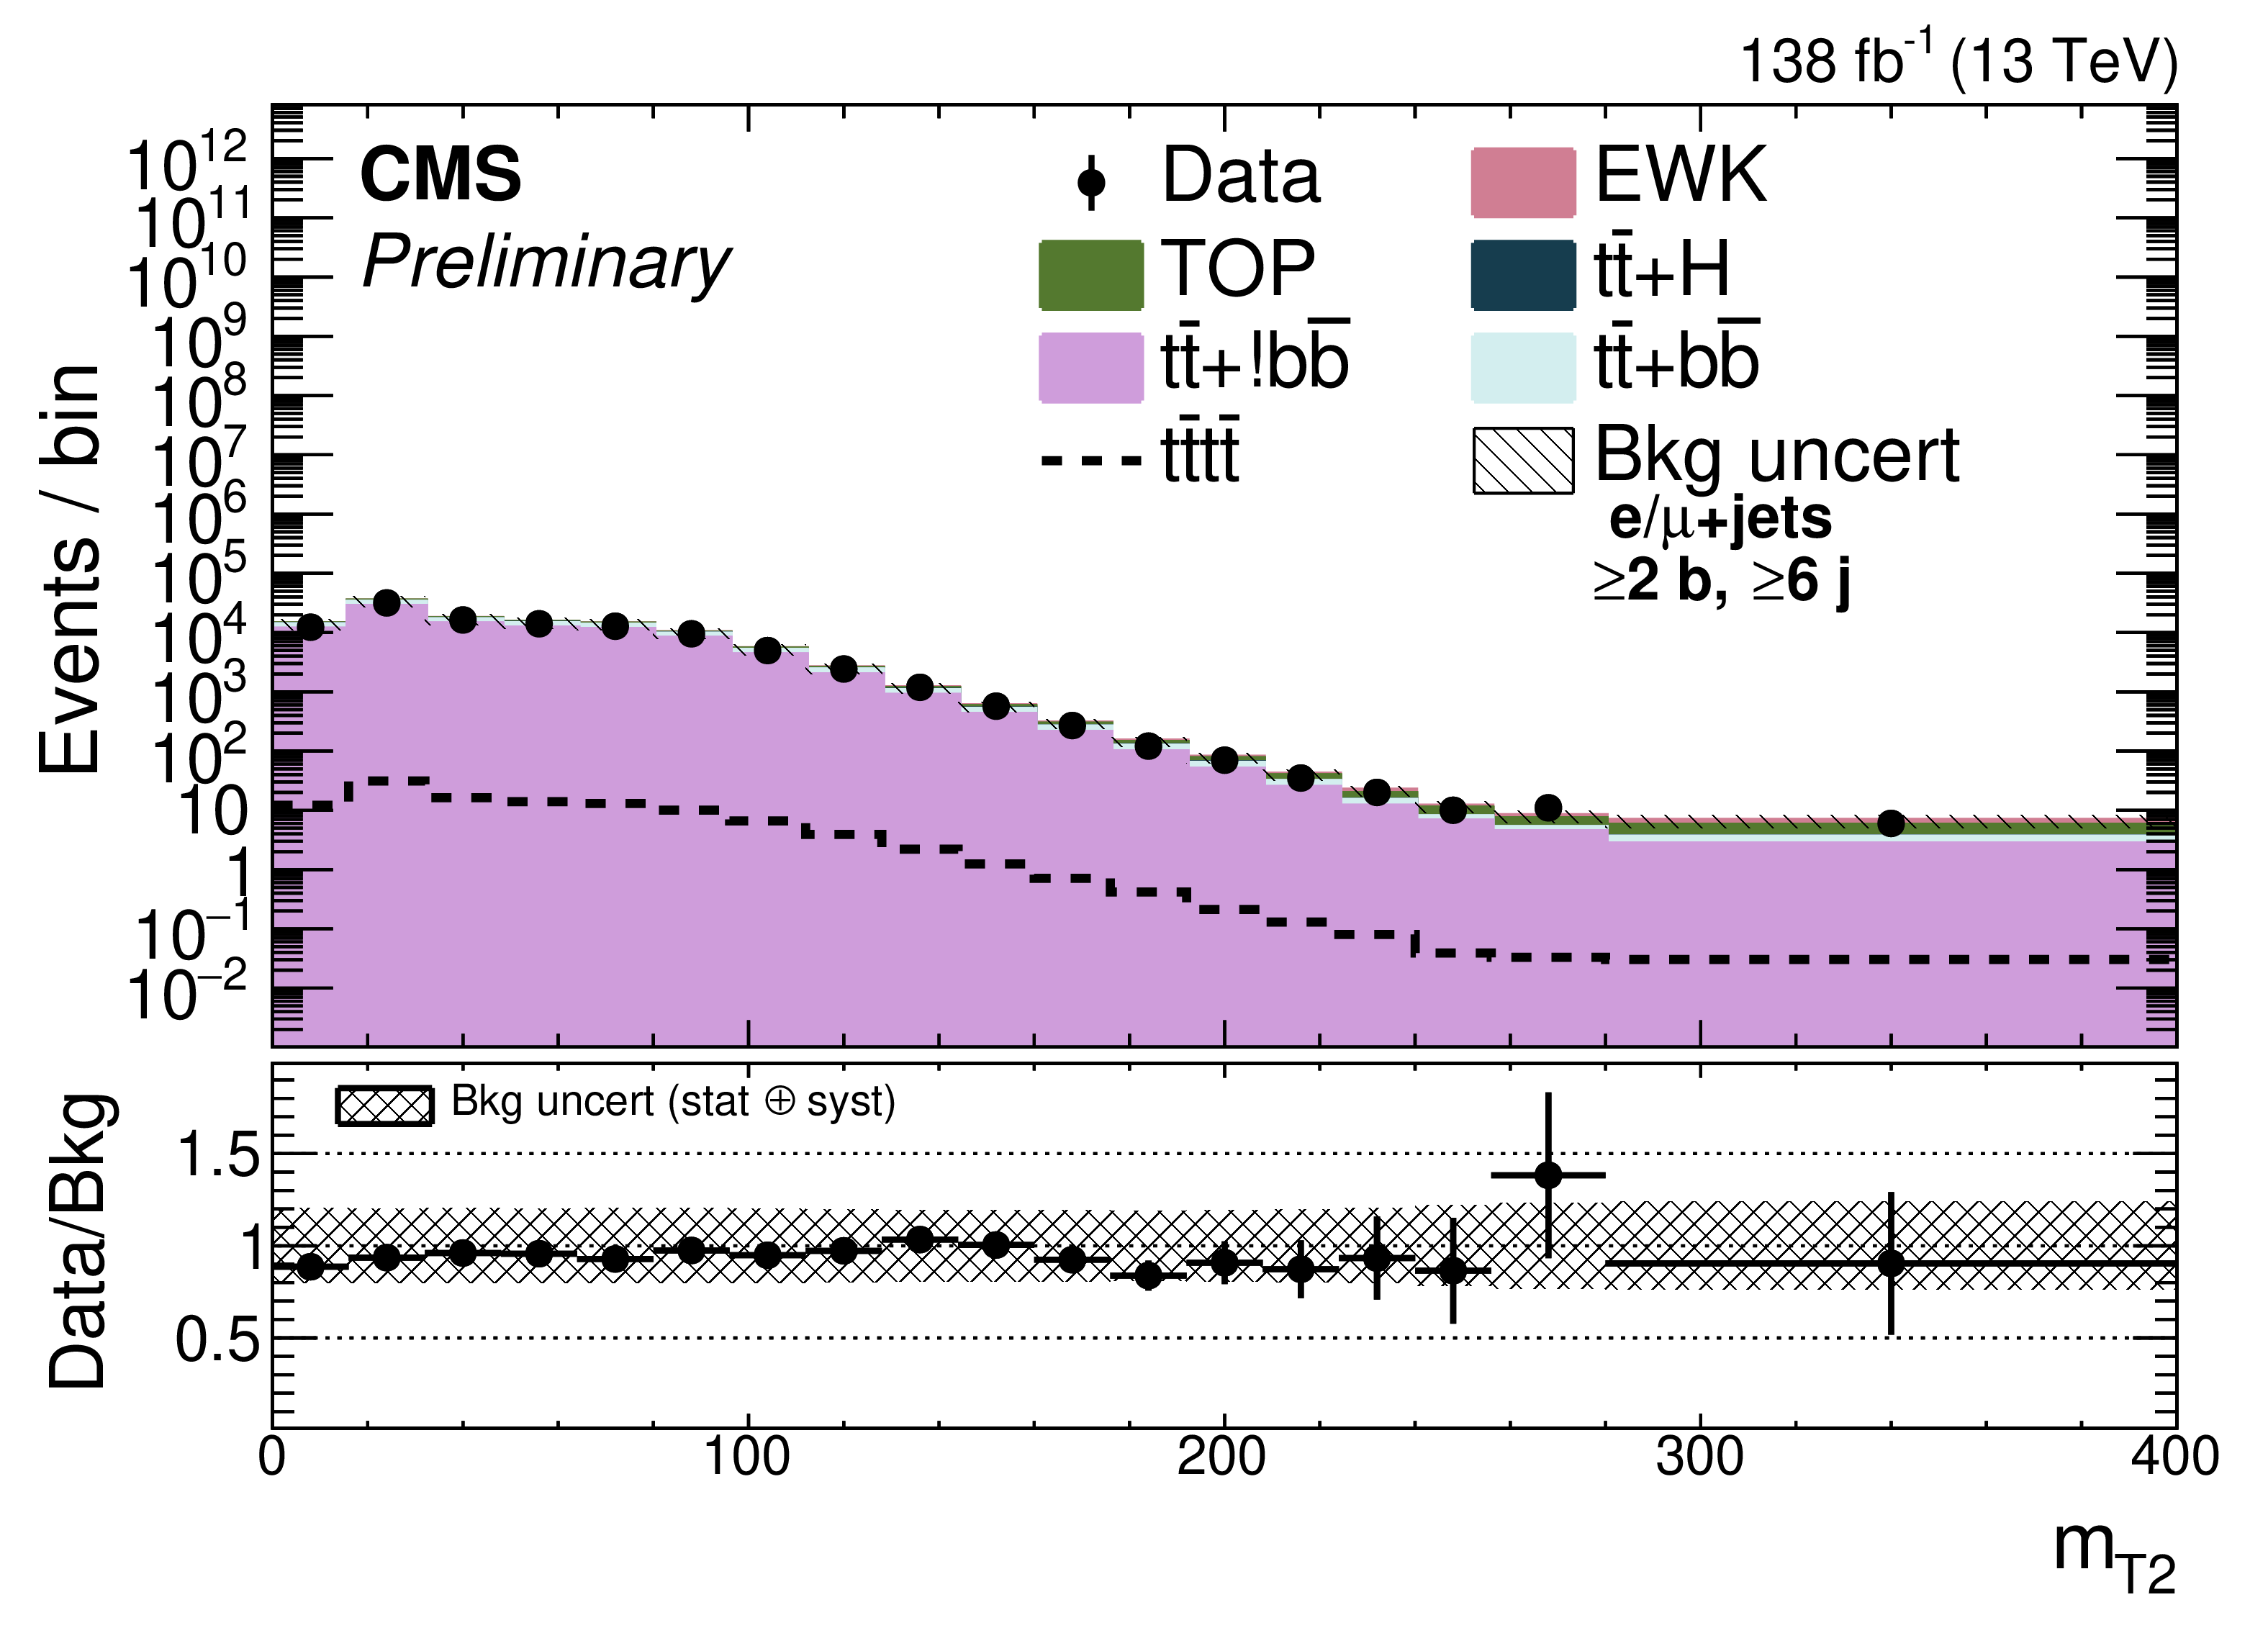
Distributions of (from upper left to lower right) DeepCSV discriminator value of the jet that is not in dijet with minimum separation, where dijet is from resolved t-tagged trijet with second highest discriminator, mass of lepton and b-jet system with minimum separation between lepton and b-jet, $ p_{\mathrm{T}}^\text{miss} $, sphericity, average separation between b-jet pairs, centrality, maximum $ \eta $ separation between b-jet pairs, and $ m_{T2} $ in combined single-electron and muon channels before fit to data, requiring $ \geq $ 6 AK4 jets and $ \geq $ 2 b-tags. Background uncertainties include all statistical and systematic components added in quadrature. |

png pdf |
Additional Figure 7-a:
Distributions of (from upper left to lower right) DeepCSV discriminator value of the jet that is not in dijet with minimum separation, where dijet is from resolved t-tagged trijet with second highest discriminator, mass of lepton and b-jet system with minimum separation between lepton and b-jet, $ p_{\mathrm{T}}^\text{miss} $, sphericity, average separation between b-jet pairs, centrality, maximum $ \eta $ separation between b-jet pairs, and $ m_{T2} $ in combined single-electron and muon channels before fit to data, requiring $ \geq $ 6 AK4 jets and $ \geq $ 2 b-tags. Background uncertainties include all statistical and systematic components added in quadrature. |

png pdf |
Additional Figure 7-b:
Distributions of (from upper left to lower right) DeepCSV discriminator value of the jet that is not in dijet with minimum separation, where dijet is from resolved t-tagged trijet with second highest discriminator, mass of lepton and b-jet system with minimum separation between lepton and b-jet, $ p_{\mathrm{T}}^\text{miss} $, sphericity, average separation between b-jet pairs, centrality, maximum $ \eta $ separation between b-jet pairs, and $ m_{T2} $ in combined single-electron and muon channels before fit to data, requiring $ \geq $ 6 AK4 jets and $ \geq $ 2 b-tags. Background uncertainties include all statistical and systematic components added in quadrature. |

png pdf |
Additional Figure 7-c:
Distributions of (from upper left to lower right) DeepCSV discriminator value of the jet that is not in dijet with minimum separation, where dijet is from resolved t-tagged trijet with second highest discriminator, mass of lepton and b-jet system with minimum separation between lepton and b-jet, $ p_{\mathrm{T}}^\text{miss} $, sphericity, average separation between b-jet pairs, centrality, maximum $ \eta $ separation between b-jet pairs, and $ m_{T2} $ in combined single-electron and muon channels before fit to data, requiring $ \geq $ 6 AK4 jets and $ \geq $ 2 b-tags. Background uncertainties include all statistical and systematic components added in quadrature. |

png pdf |
Additional Figure 7-d:
Distributions of (from upper left to lower right) DeepCSV discriminator value of the jet that is not in dijet with minimum separation, where dijet is from resolved t-tagged trijet with second highest discriminator, mass of lepton and b-jet system with minimum separation between lepton and b-jet, $ p_{\mathrm{T}}^\text{miss} $, sphericity, average separation between b-jet pairs, centrality, maximum $ \eta $ separation between b-jet pairs, and $ m_{T2} $ in combined single-electron and muon channels before fit to data, requiring $ \geq $ 6 AK4 jets and $ \geq $ 2 b-tags. Background uncertainties include all statistical and systematic components added in quadrature. |
png pdf |
Additional Figure 7-e:
Distributions of (from upper left to lower right) DeepCSV discriminator value of the jet that is not in dijet with minimum separation, where dijet is from resolved t-tagged trijet with second highest discriminator, mass of lepton and b-jet system with minimum separation between lepton and b-jet, $ p_{\mathrm{T}}^\text{miss} $, sphericity, average separation between b-jet pairs, centrality, maximum $ \eta $ separation between b-jet pairs, and $ m_{T2} $ in combined single-electron and muon channels before fit to data, requiring $ \geq $ 6 AK4 jets and $ \geq $ 2 b-tags. Background uncertainties include all statistical and systematic components added in quadrature. |

png pdf |
Additional Figure 7-f:
Distributions of (from upper left to lower right) DeepCSV discriminator value of the jet that is not in dijet with minimum separation, where dijet is from resolved t-tagged trijet with second highest discriminator, mass of lepton and b-jet system with minimum separation between lepton and b-jet, $ p_{\mathrm{T}}^\text{miss} $, sphericity, average separation between b-jet pairs, centrality, maximum $ \eta $ separation between b-jet pairs, and $ m_{T2} $ in combined single-electron and muon channels before fit to data, requiring $ \geq $ 6 AK4 jets and $ \geq $ 2 b-tags. Background uncertainties include all statistical and systematic components added in quadrature. |

png pdf |
Additional Figure 7-g:
Distributions of (from upper left to lower right) DeepCSV discriminator value of the jet that is not in dijet with minimum separation, where dijet is from resolved t-tagged trijet with second highest discriminator, mass of lepton and b-jet system with minimum separation between lepton and b-jet, $ p_{\mathrm{T}}^\text{miss} $, sphericity, average separation between b-jet pairs, centrality, maximum $ \eta $ separation between b-jet pairs, and $ m_{T2} $ in combined single-electron and muon channels before fit to data, requiring $ \geq $ 6 AK4 jets and $ \geq $ 2 b-tags. Background uncertainties include all statistical and systematic components added in quadrature. |
png pdf |
Additional Figure 7-h:
Distributions of (from upper left to lower right) DeepCSV discriminator value of the jet that is not in dijet with minimum separation, where dijet is from resolved t-tagged trijet with second highest discriminator, mass of lepton and b-jet system with minimum separation between lepton and b-jet, $ p_{\mathrm{T}}^\text{miss} $, sphericity, average separation between b-jet pairs, centrality, maximum $ \eta $ separation between b-jet pairs, and $ m_{T2} $ in combined single-electron and muon channels before fit to data, requiring $ \geq $ 6 AK4 jets and $ \geq $ 2 b-tags. Background uncertainties include all statistical and systematic components added in quadrature. |
png pdf |
Additional Figure 8:
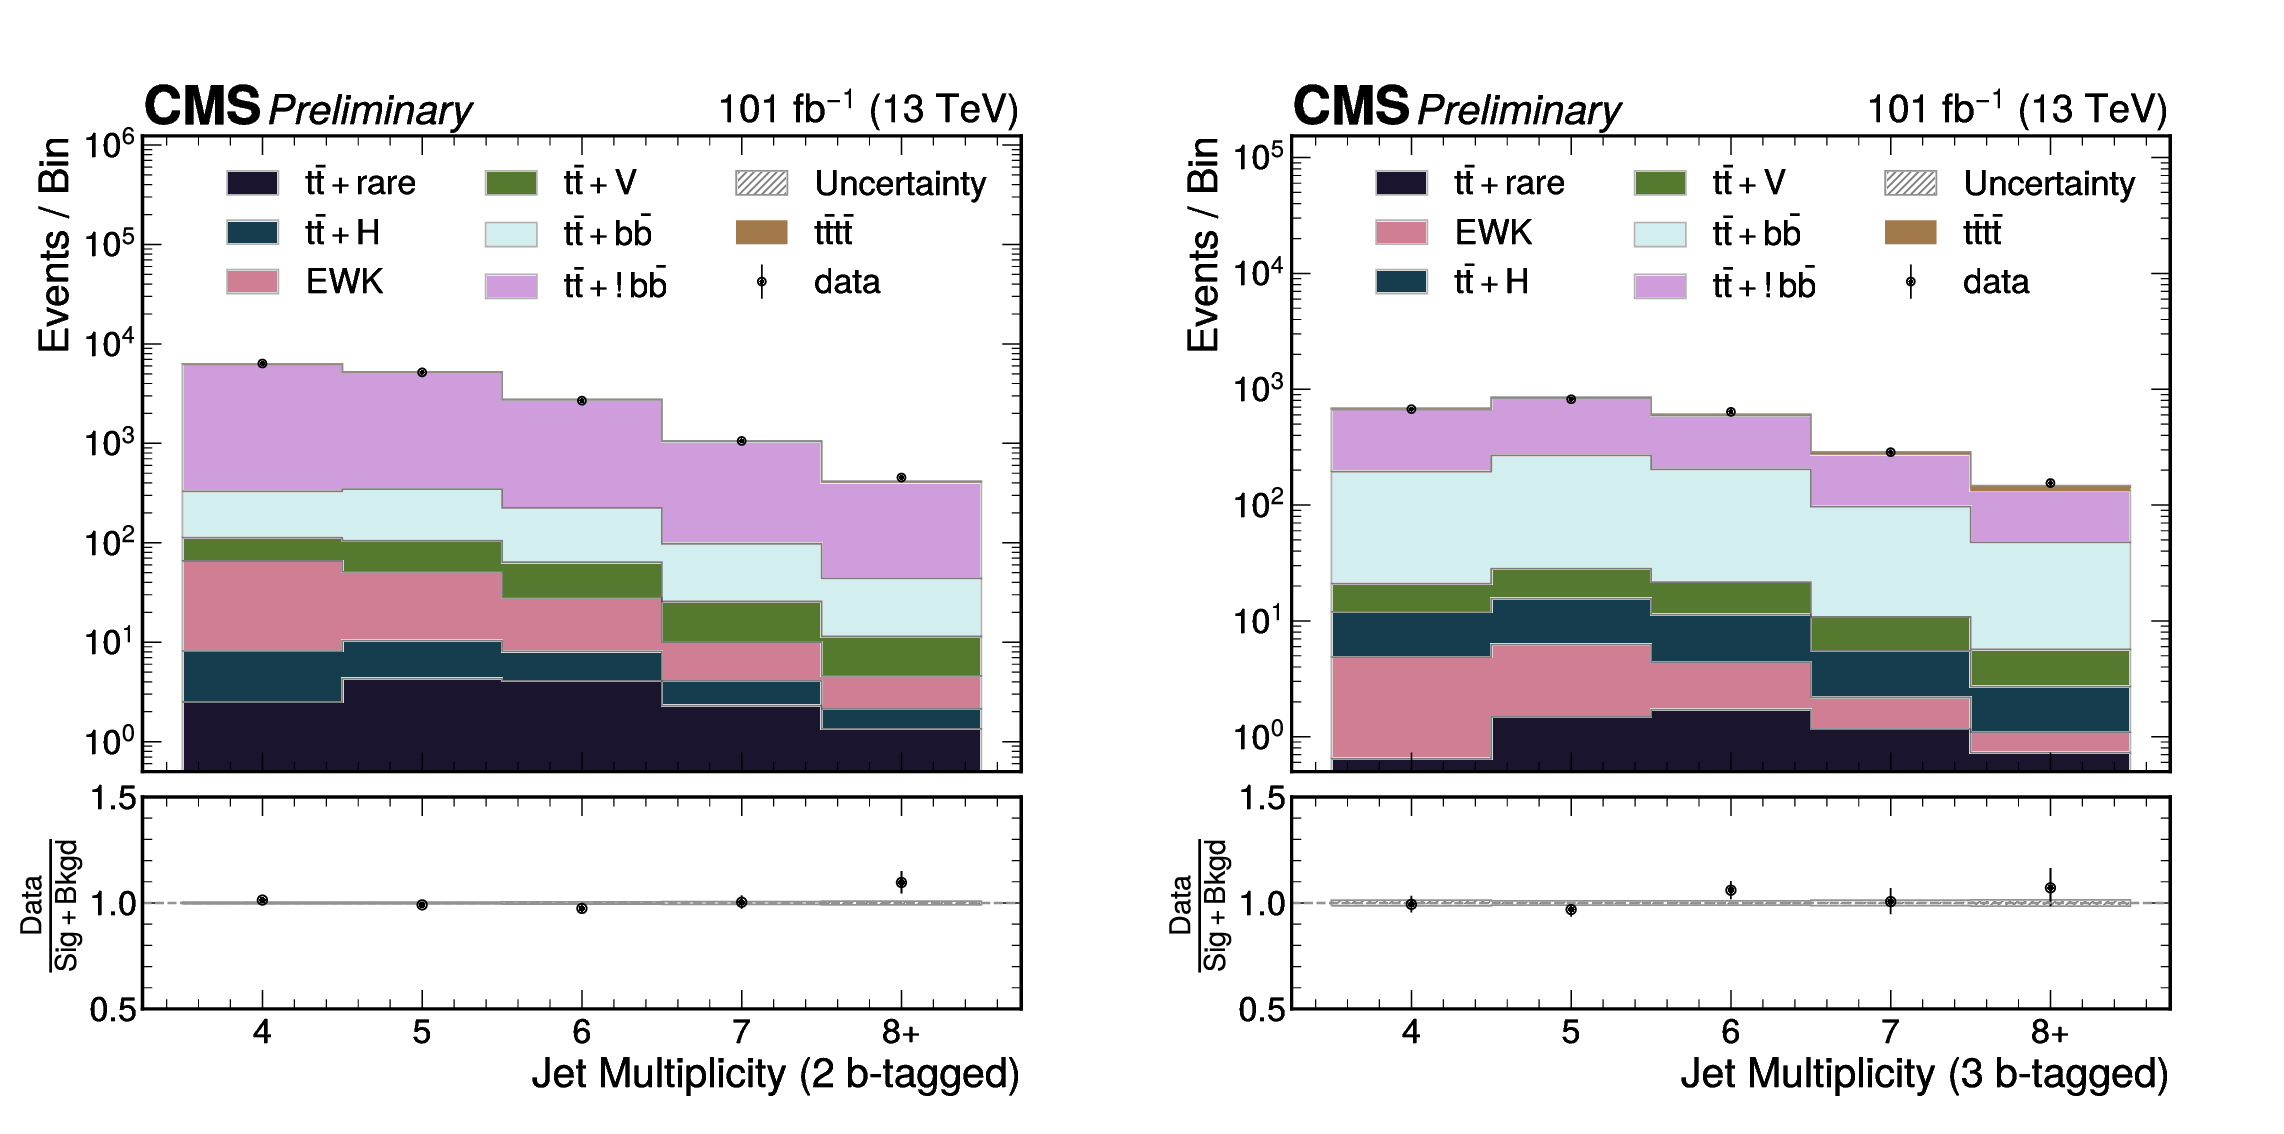
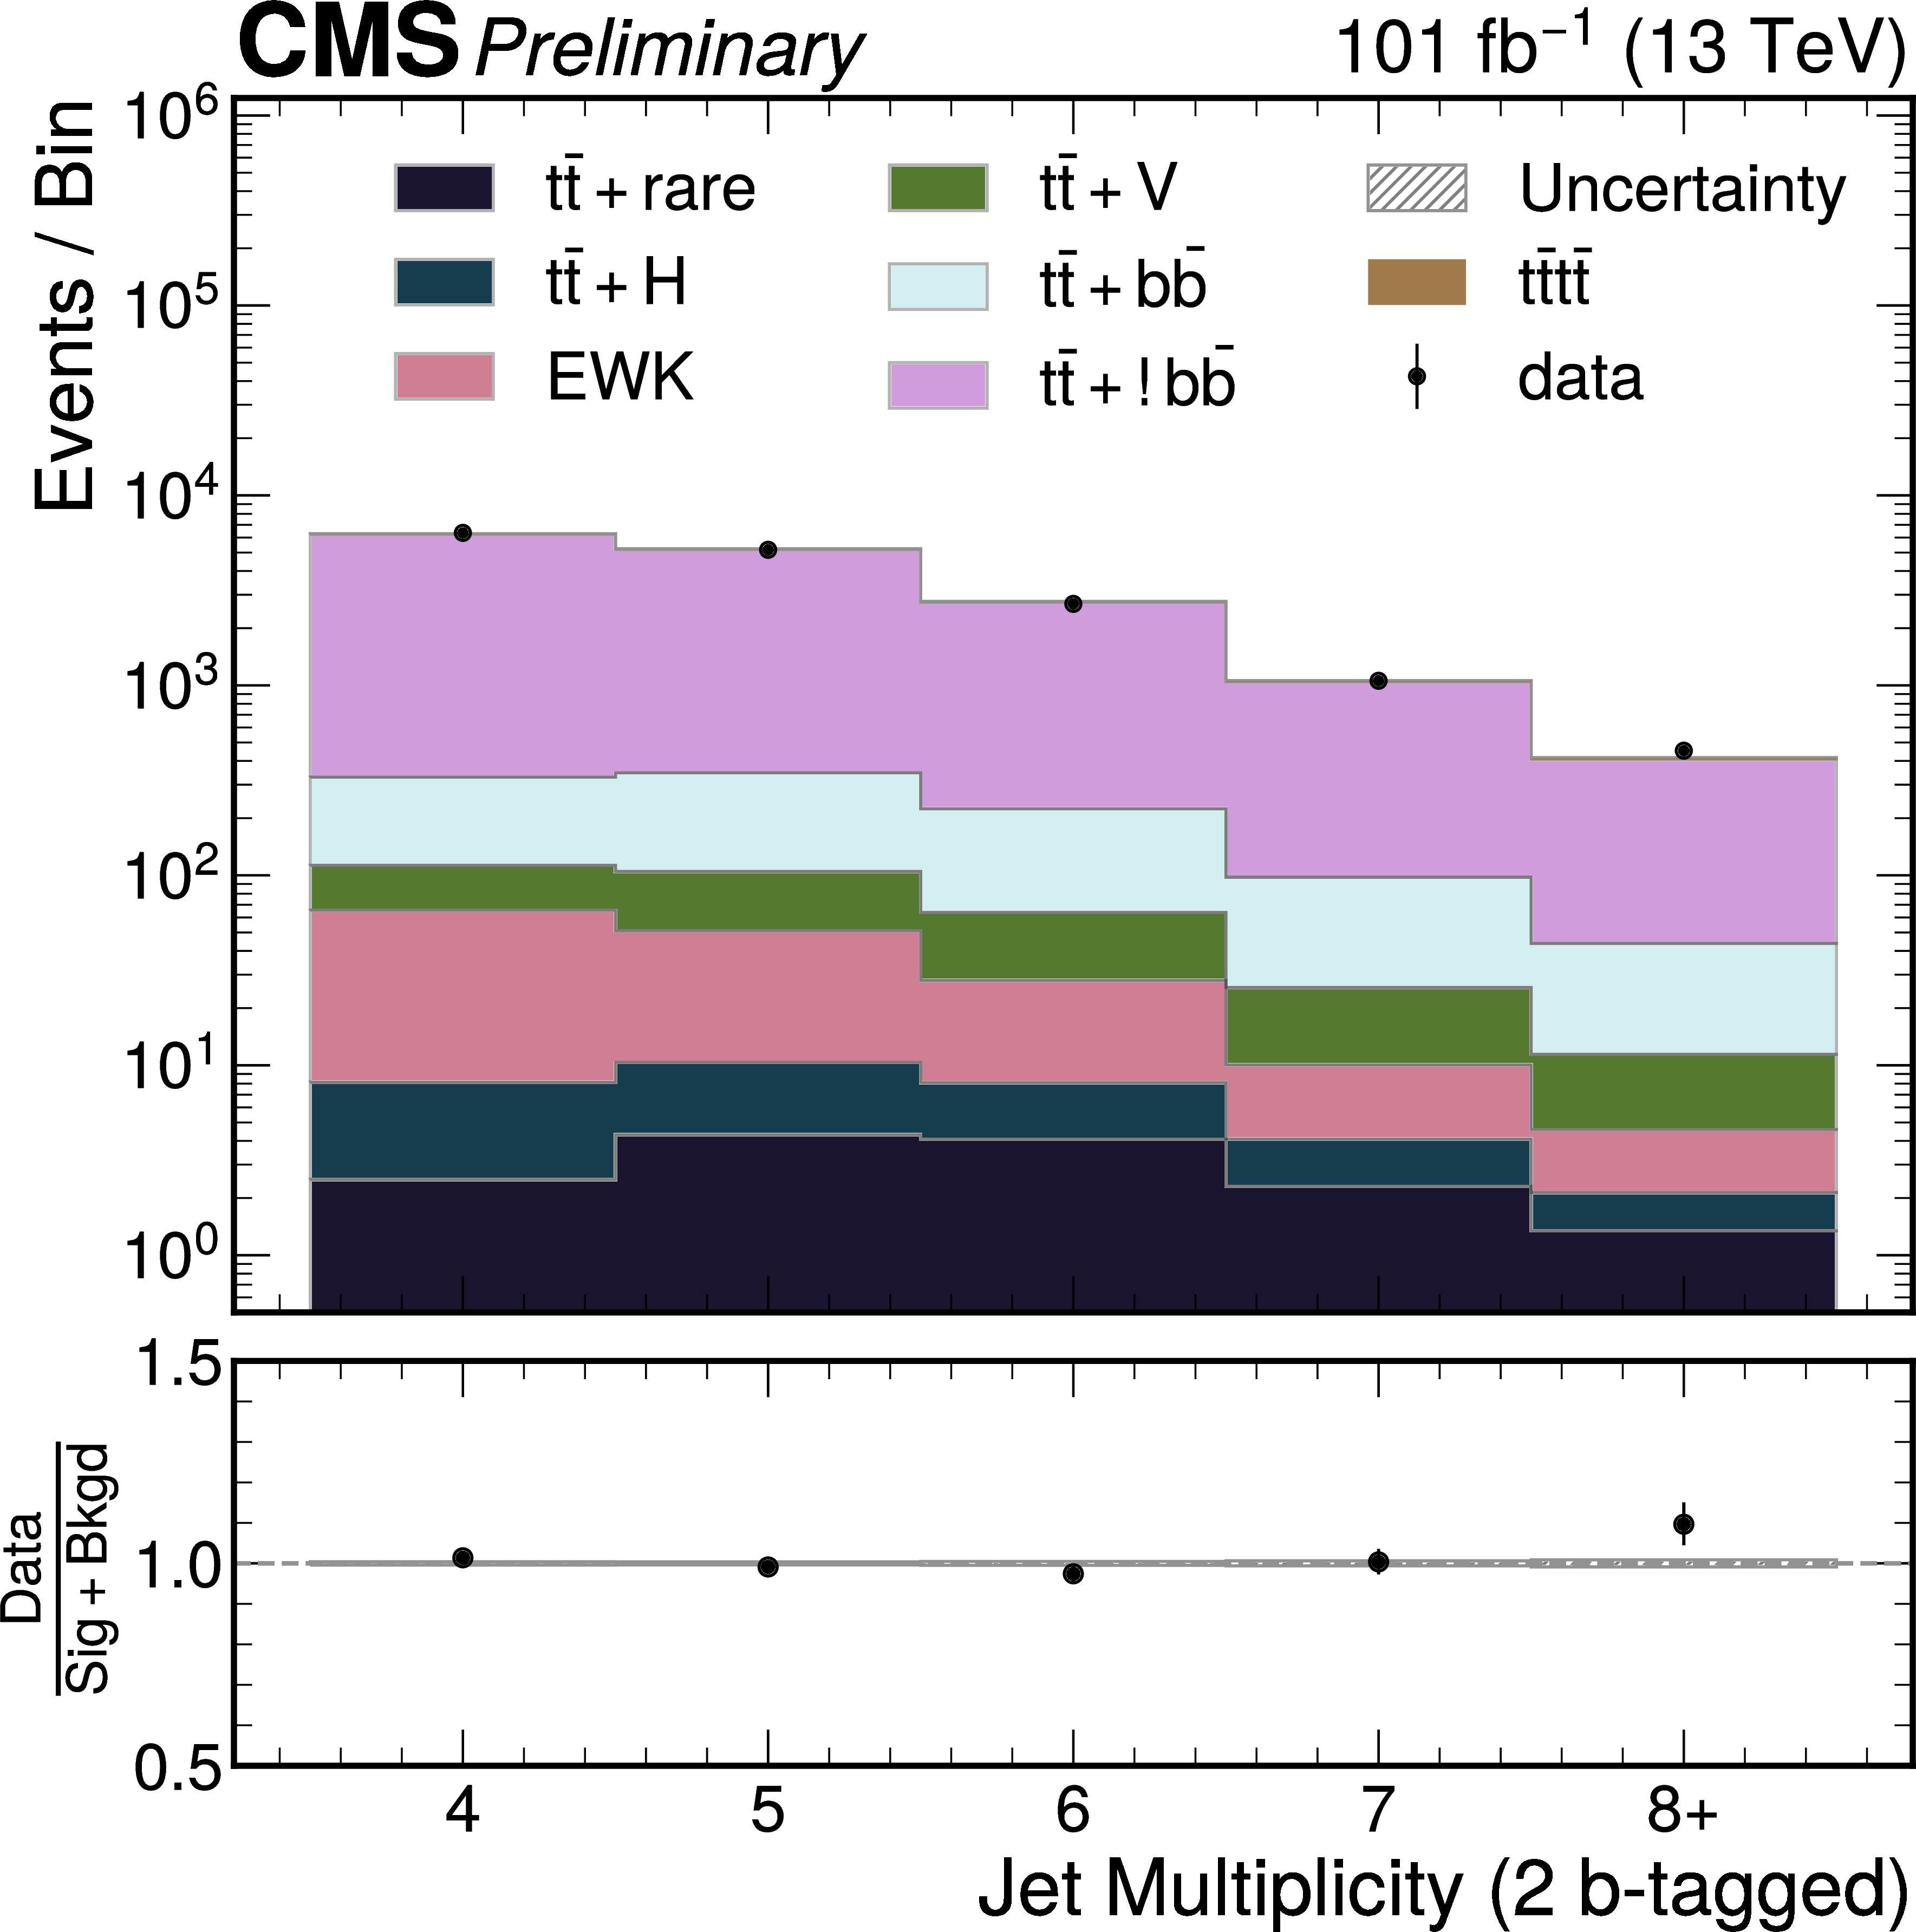
The jet multiplicity for 2 $ N_\text{b} $ (left) and 3 $ N_\text{b} $ (right) categories in the opposite-sign dilepton channel for the combined 2017 and 2018 data. The data from the three dilepton decay channels are combined. The background is shown as a stacked histogram and the post-fit $ {\mathrm{t}\overline{\mathrm{t}}} {\mathrm{t}\overline{\mathrm{t}}} $ yield is shown on top of all other backgrounds. The gray and black bands correspond to the estimated total uncertainty after the fit. |
png pdf |
Additional Figure 8-a:
The jet multiplicity for 2 $ N_\text{b} $ (left) and 3 $ N_\text{b} $ (right) categories in the opposite-sign dilepton channel for the combined 2017 and 2018 data. The data from the three dilepton decay channels are combined. The background is shown as a stacked histogram and the post-fit $ {\mathrm{t}\overline{\mathrm{t}}} {\mathrm{t}\overline{\mathrm{t}}} $ yield is shown on top of all other backgrounds. The gray and black bands correspond to the estimated total uncertainty after the fit. |

png pdf |
Additional Figure 8-b:
The jet multiplicity for 2 $ N_\text{b} $ (left) and 3 $ N_\text{b} $ (right) categories in the opposite-sign dilepton channel for the combined 2017 and 2018 data. The data from the three dilepton decay channels are combined. The background is shown as a stacked histogram and the post-fit $ {\mathrm{t}\overline{\mathrm{t}}} {\mathrm{t}\overline{\mathrm{t}}} $ yield is shown on top of all other backgrounds. The gray and black bands correspond to the estimated total uncertainty after the fit. |
png pdf |
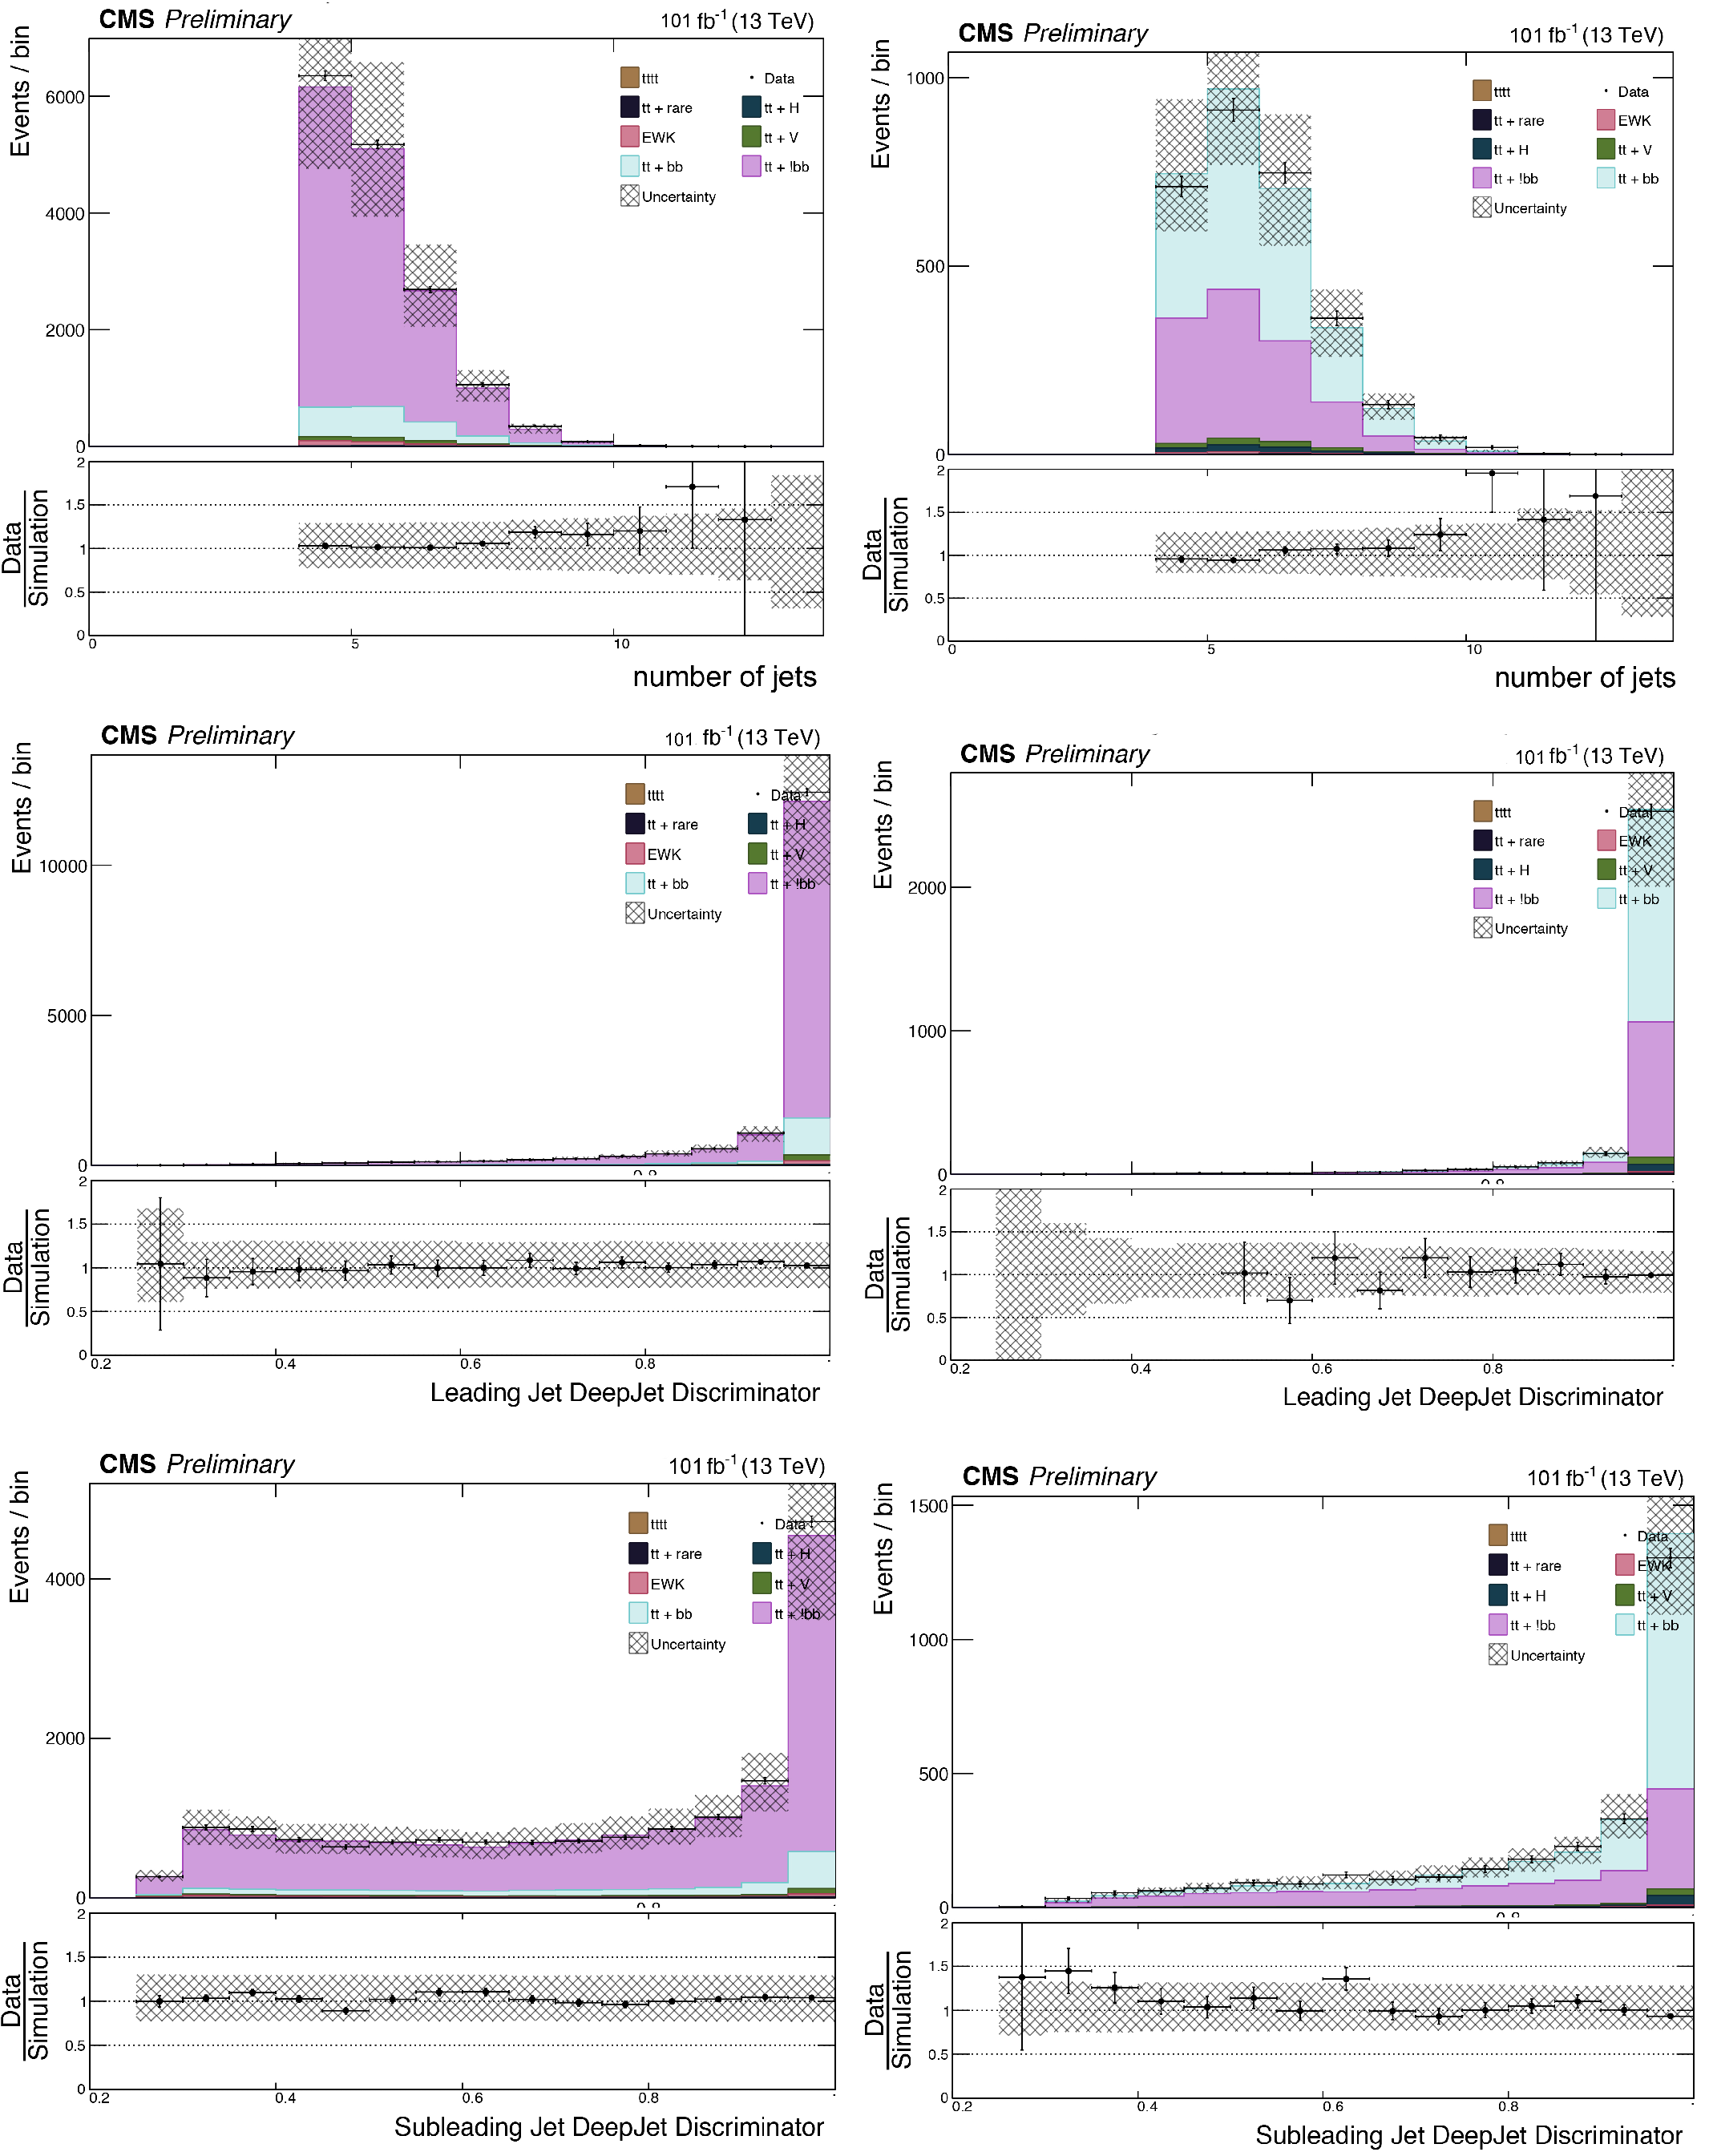
Additional Figure 9:
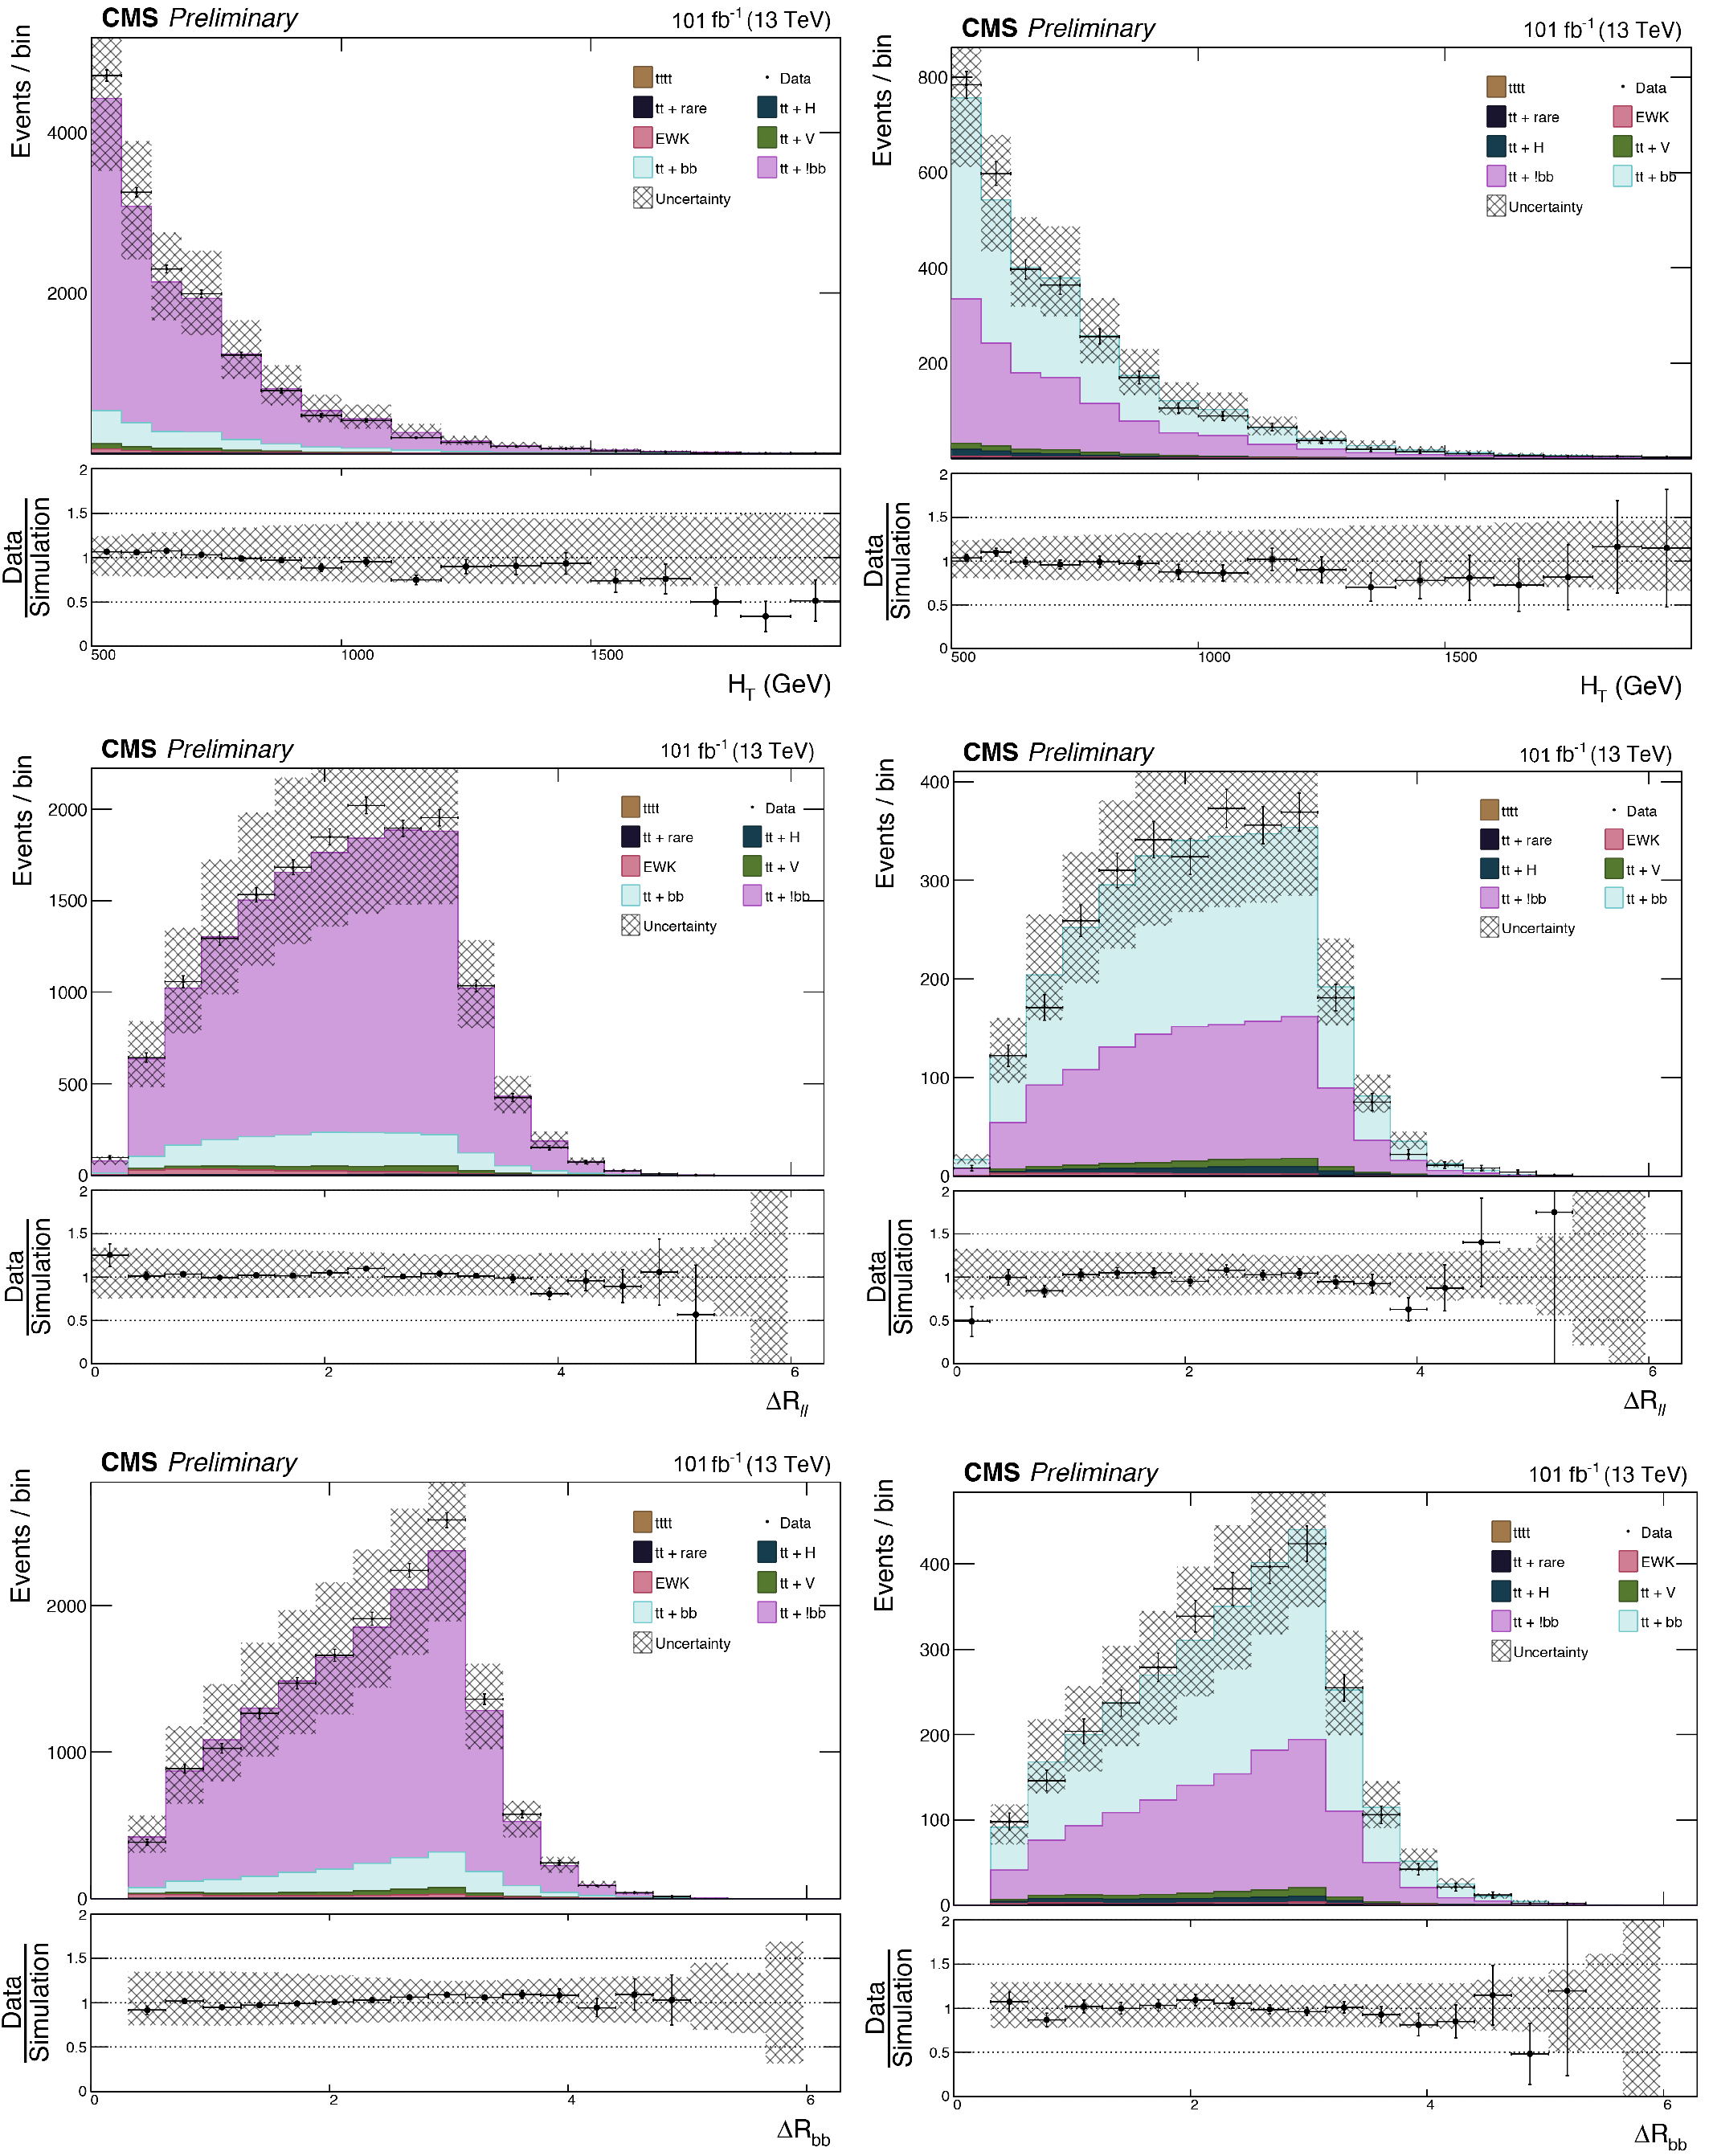
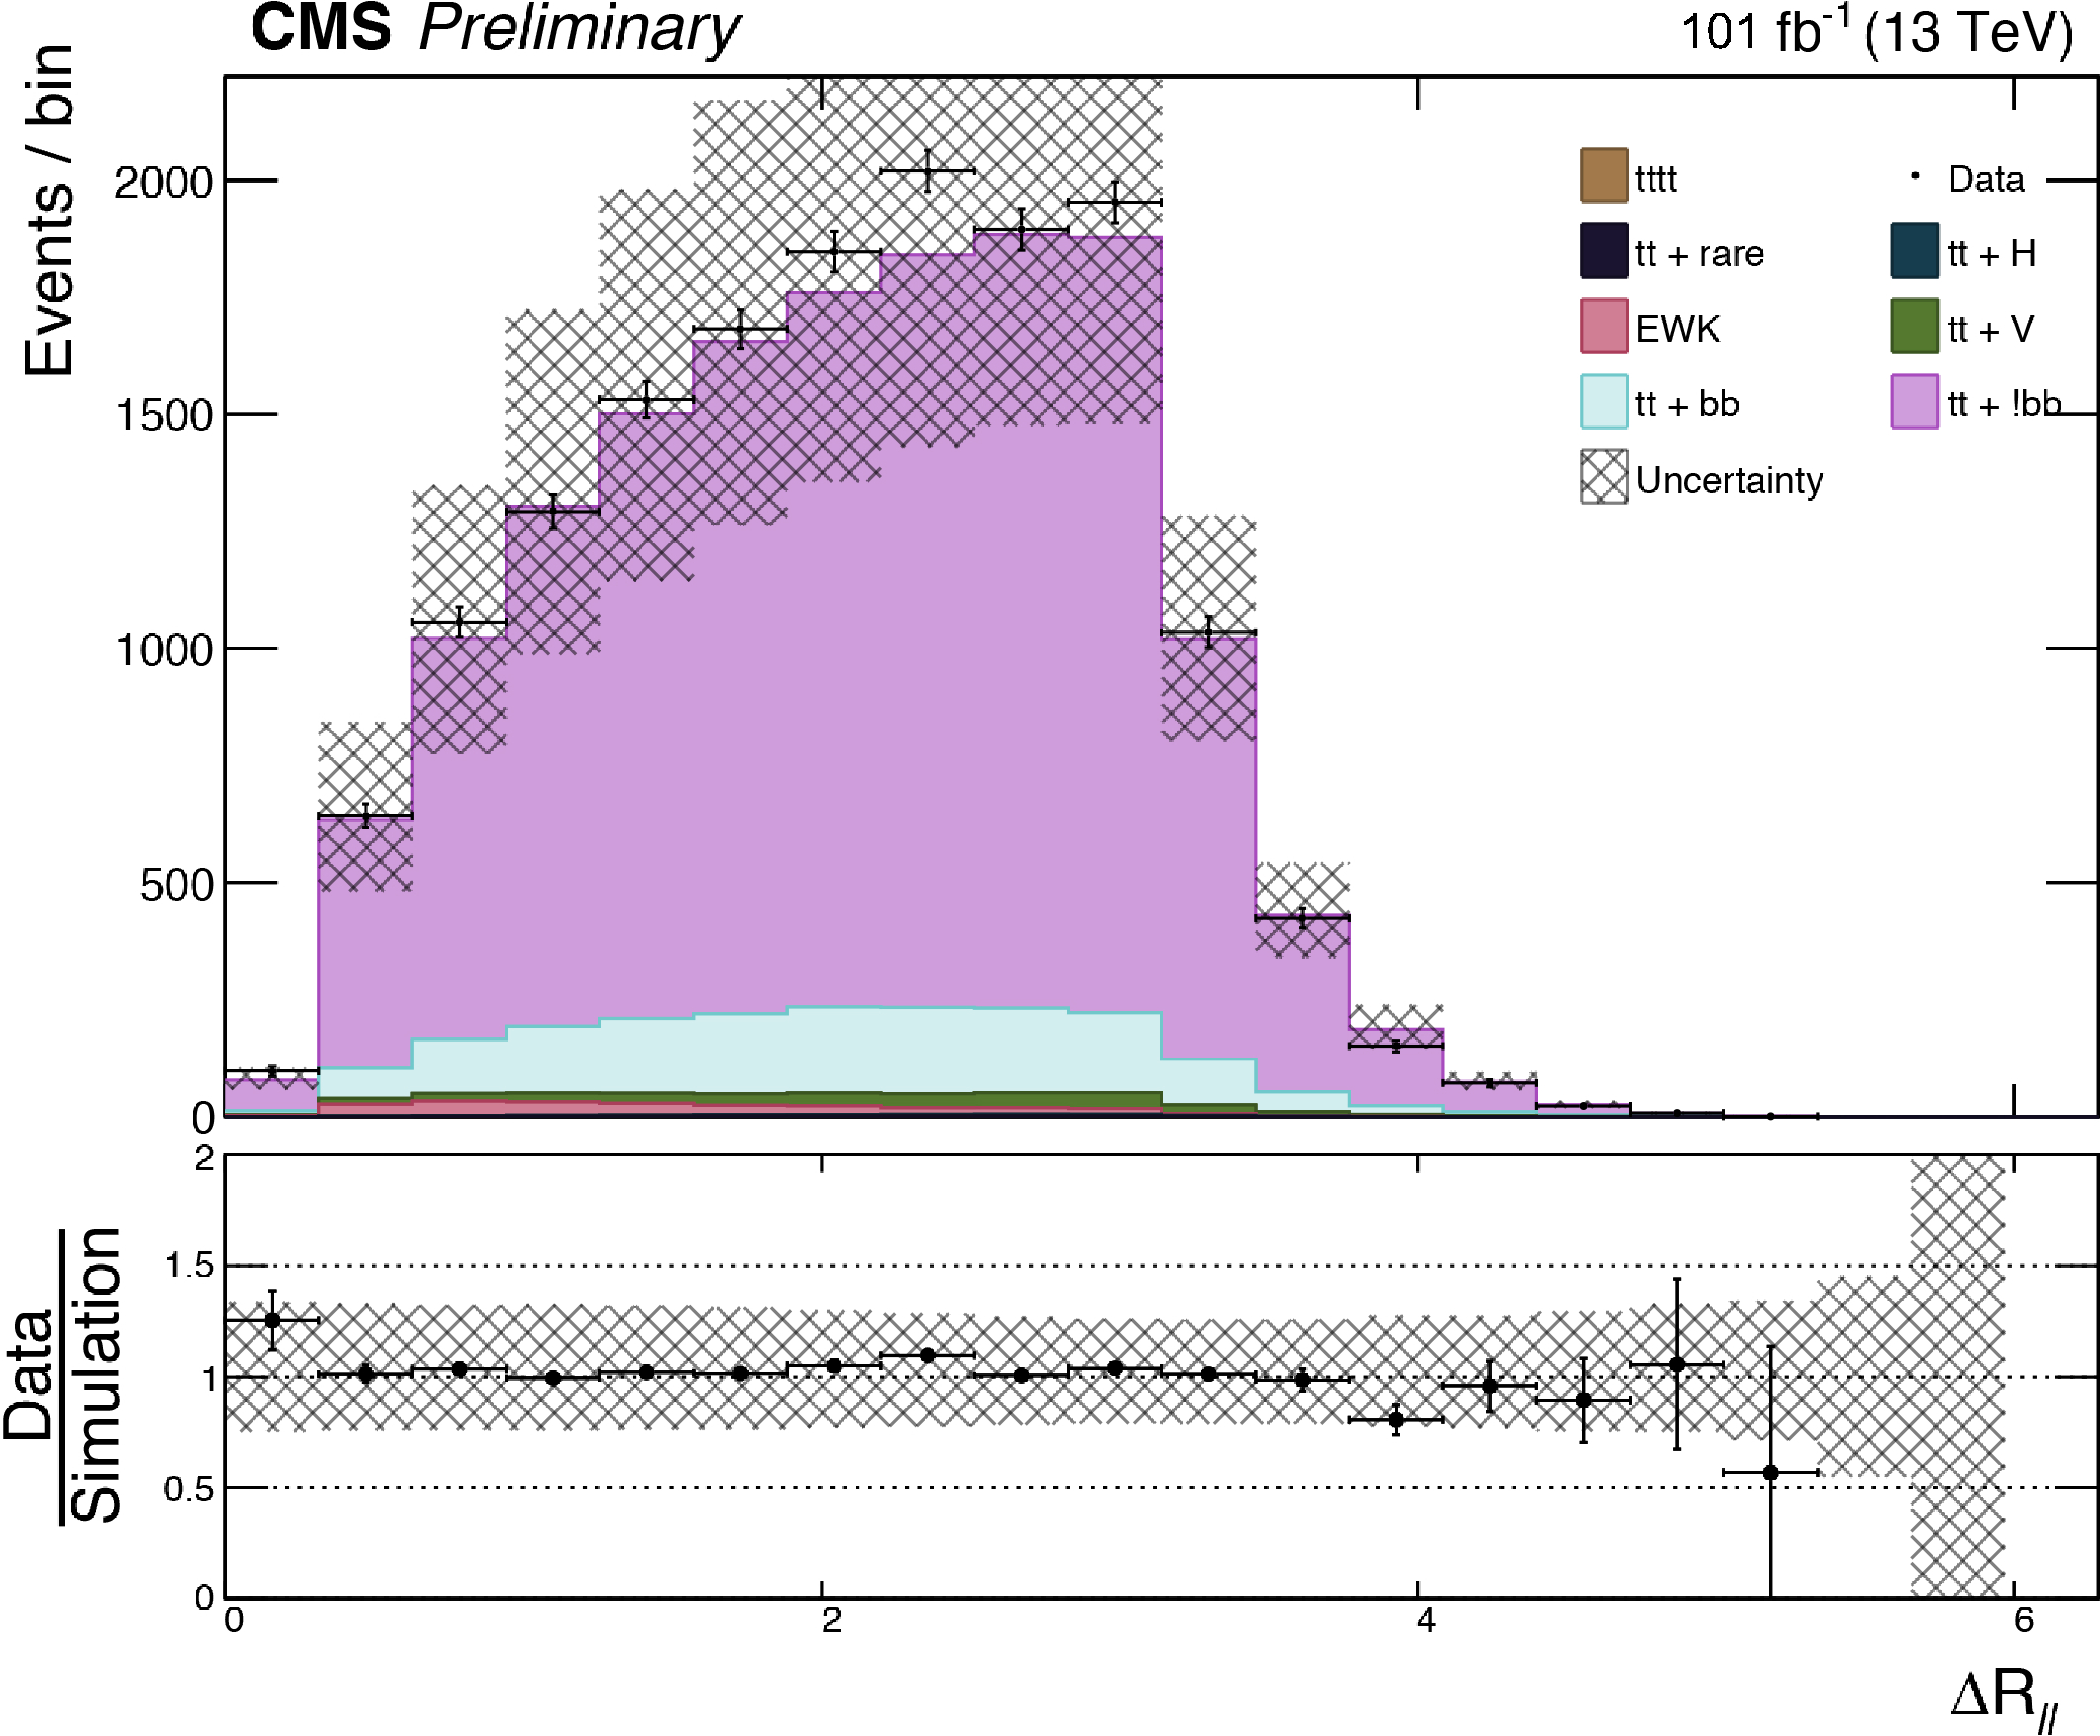
Opposite-sign dilepton channel prefit control plots for events with 2 $ N_\text{b} $ (left) and 3 $ N_\text{b} $ tagged jets (right). Where appropriate the data from the three dilepton decay categories are combined. The distributions shown are the $ H_{\mathrm{T}} $, and $ \Delta R $ separation between the two leptons ($ \Delta R_{\ell\ell} $) and the two leading b-quarks ($ \Delta R_{\mathrm{b}\mathrm{b}} $). The background is shown as a stacked histogram and the pre-fit $ {\mathrm{t}\overline{\mathrm{t}}} {\mathrm{t}\overline{\mathrm{t}}} $ yield is shown on top of all other backgrounds. The gray and black bands correspond to the estimated total uncertainty before the fit. |

png pdf |
Additional Figure 9-a:
Opposite-sign dilepton channel prefit control plots for events with 2 $ N_\text{b} $ (left) and 3 $ N_\text{b} $ tagged jets (right). Where appropriate the data from the three dilepton decay categories are combined. The distributions shown are the $ H_{\mathrm{T}} $, and $ \Delta R $ separation between the two leptons ($ \Delta R_{\ell\ell} $) and the two leading b-quarks ($ \Delta R_{\mathrm{b}\mathrm{b}} $). The background is shown as a stacked histogram and the pre-fit $ {\mathrm{t}\overline{\mathrm{t}}} {\mathrm{t}\overline{\mathrm{t}}} $ yield is shown on top of all other backgrounds. The gray and black bands correspond to the estimated total uncertainty before the fit. |

png pdf |
Additional Figure 9-b:
Opposite-sign dilepton channel prefit control plots for events with 2 $ N_\text{b} $ (left) and 3 $ N_\text{b} $ tagged jets (right). Where appropriate the data from the three dilepton decay categories are combined. The distributions shown are the $ H_{\mathrm{T}} $, and $ \Delta R $ separation between the two leptons ($ \Delta R_{\ell\ell} $) and the two leading b-quarks ($ \Delta R_{\mathrm{b}\mathrm{b}} $). The background is shown as a stacked histogram and the pre-fit $ {\mathrm{t}\overline{\mathrm{t}}} {\mathrm{t}\overline{\mathrm{t}}} $ yield is shown on top of all other backgrounds. The gray and black bands correspond to the estimated total uncertainty before the fit. |
png pdf |
Additional Figure 9-c:
Opposite-sign dilepton channel prefit control plots for events with 2 $ N_\text{b} $ (left) and 3 $ N_\text{b} $ tagged jets (right). Where appropriate the data from the three dilepton decay categories are combined. The distributions shown are the $ H_{\mathrm{T}} $, and $ \Delta R $ separation between the two leptons ($ \Delta R_{\ell\ell} $) and the two leading b-quarks ($ \Delta R_{\mathrm{b}\mathrm{b}} $). The background is shown as a stacked histogram and the pre-fit $ {\mathrm{t}\overline{\mathrm{t}}} {\mathrm{t}\overline{\mathrm{t}}} $ yield is shown on top of all other backgrounds. The gray and black bands correspond to the estimated total uncertainty before the fit. |

png pdf |
Additional Figure 9-d:
Opposite-sign dilepton channel prefit control plots for events with 2 $ N_\text{b} $ (left) and 3 $ N_\text{b} $ tagged jets (right). Where appropriate the data from the three dilepton decay categories are combined. The distributions shown are the $ H_{\mathrm{T}} $, and $ \Delta R $ separation between the two leptons ($ \Delta R_{\ell\ell} $) and the two leading b-quarks ($ \Delta R_{\mathrm{b}\mathrm{b}} $). The background is shown as a stacked histogram and the pre-fit $ {\mathrm{t}\overline{\mathrm{t}}} {\mathrm{t}\overline{\mathrm{t}}} $ yield is shown on top of all other backgrounds. The gray and black bands correspond to the estimated total uncertainty before the fit. |

png pdf |
Additional Figure 9-e:
Opposite-sign dilepton channel prefit control plots for events with 2 $ N_\text{b} $ (left) and 3 $ N_\text{b} $ tagged jets (right). Where appropriate the data from the three dilepton decay categories are combined. The distributions shown are the $ H_{\mathrm{T}} $, and $ \Delta R $ separation between the two leptons ($ \Delta R_{\ell\ell} $) and the two leading b-quarks ($ \Delta R_{\mathrm{b}\mathrm{b}} $). The background is shown as a stacked histogram and the pre-fit $ {\mathrm{t}\overline{\mathrm{t}}} {\mathrm{t}\overline{\mathrm{t}}} $ yield is shown on top of all other backgrounds. The gray and black bands correspond to the estimated total uncertainty before the fit. |

png pdf |
Additional Figure 9-f:
Opposite-sign dilepton channel prefit control plots for events with 2 $ N_\text{b} $ (left) and 3 $ N_\text{b} $ tagged jets (right). Where appropriate the data from the three dilepton decay categories are combined. The distributions shown are the $ H_{\mathrm{T}} $, and $ \Delta R $ separation between the two leptons ($ \Delta R_{\ell\ell} $) and the two leading b-quarks ($ \Delta R_{\mathrm{b}\mathrm{b}} $). The background is shown as a stacked histogram and the pre-fit $ {\mathrm{t}\overline{\mathrm{t}}} {\mathrm{t}\overline{\mathrm{t}}} $ yield is shown on top of all other backgrounds. The gray and black bands correspond to the estimated total uncertainty before the fit. |
png pdf |
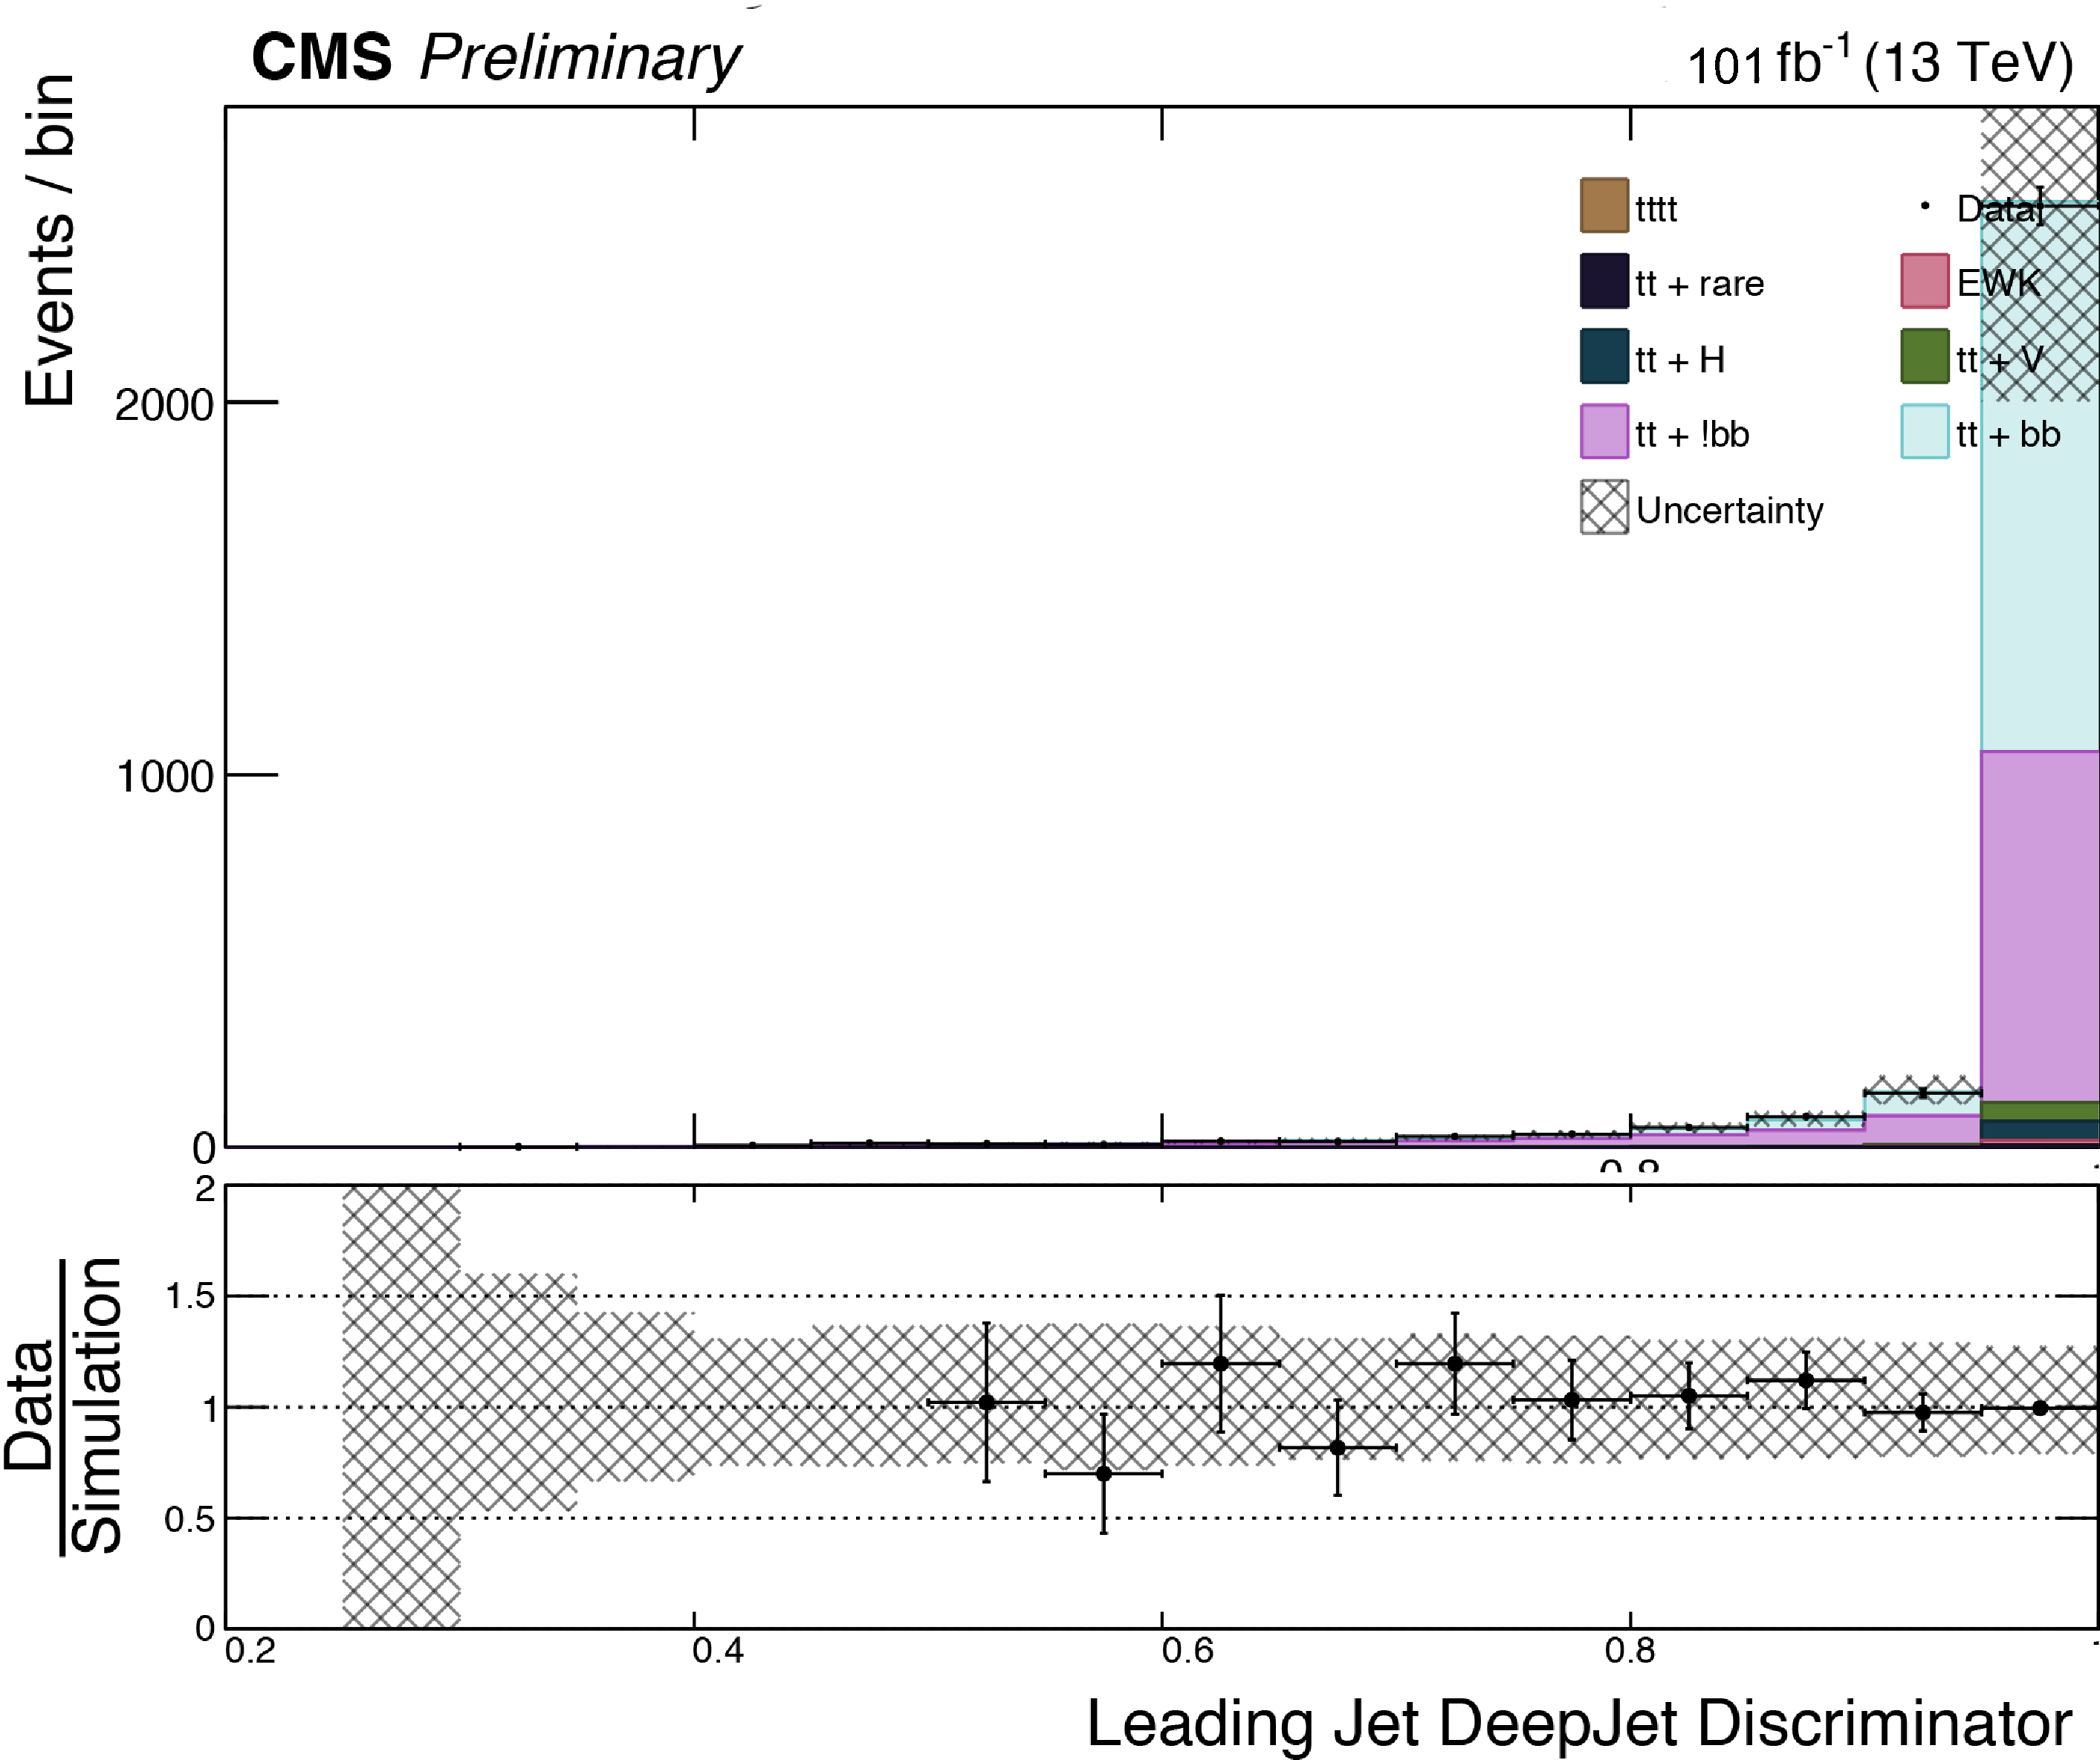
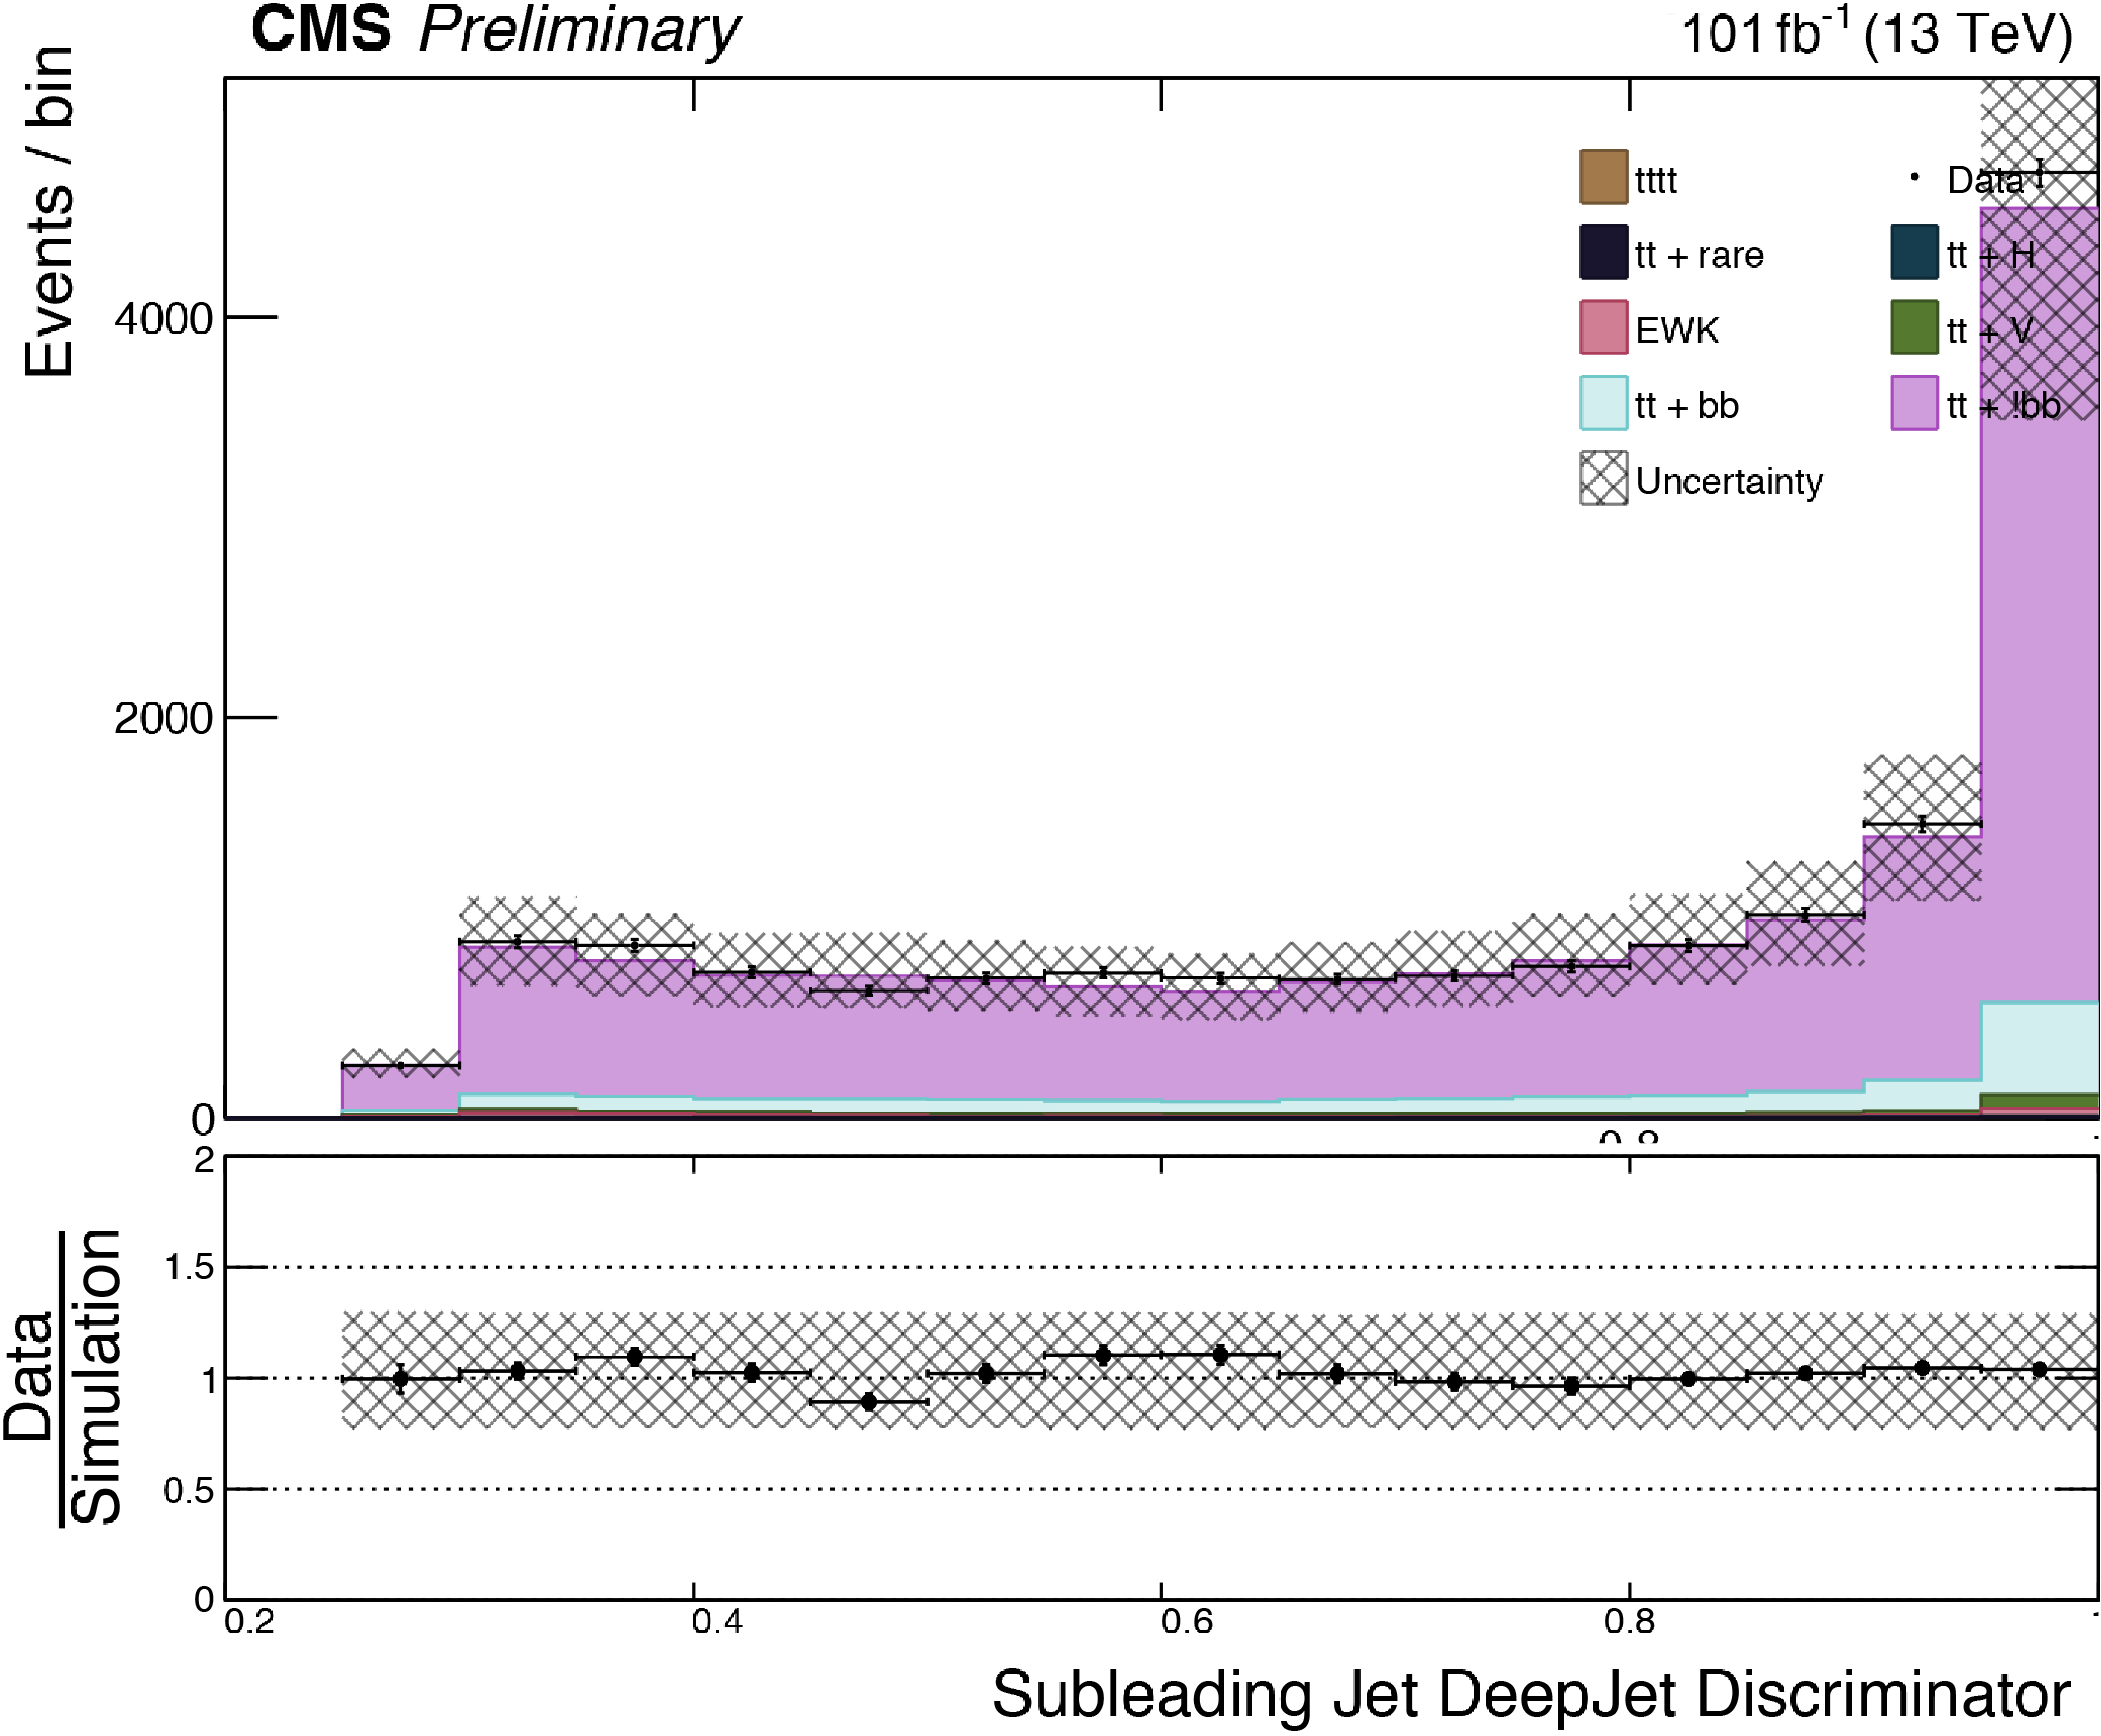
Additional Figure 10:
Opposite-sign dilepton channel prefit control plots for events with 2 $ N_\text{b} $ (left) and 3 $ N_\text{b} $ tagged jets (right). Where appropriate the data from the three dilepton decay categories are combined. The distributions shown are the number of jets, and the b-tag discriminant for two leading b-jets. The background is shown as a stacked histogram and the pre-fit $ {\mathrm{t}\overline{\mathrm{t}}} {\mathrm{t}\overline{\mathrm{t}}} $ yield is shown on top of all other backgrounds. The gray and black bands correspond to the estimated total uncertainty before the fit. |

png pdf |
Additional Figure 10-a:
Opposite-sign dilepton channel prefit control plots for events with 2 $ N_\text{b} $ (left) and 3 $ N_\text{b} $ tagged jets (right). Where appropriate the data from the three dilepton decay categories are combined. The distributions shown are the number of jets, and the b-tag discriminant for two leading b-jets. The background is shown as a stacked histogram and the pre-fit $ {\mathrm{t}\overline{\mathrm{t}}} {\mathrm{t}\overline{\mathrm{t}}} $ yield is shown on top of all other backgrounds. The gray and black bands correspond to the estimated total uncertainty before the fit. |

png pdf |
Additional Figure 10-b:
Opposite-sign dilepton channel prefit control plots for events with 2 $ N_\text{b} $ (left) and 3 $ N_\text{b} $ tagged jets (right). Where appropriate the data from the three dilepton decay categories are combined. The distributions shown are the number of jets, and the b-tag discriminant for two leading b-jets. The background is shown as a stacked histogram and the pre-fit $ {\mathrm{t}\overline{\mathrm{t}}} {\mathrm{t}\overline{\mathrm{t}}} $ yield is shown on top of all other backgrounds. The gray and black bands correspond to the estimated total uncertainty before the fit. |

png pdf |
Additional Figure 10-c:
Opposite-sign dilepton channel prefit control plots for events with 2 $ N_\text{b} $ (left) and 3 $ N_\text{b} $ tagged jets (right). Where appropriate the data from the three dilepton decay categories are combined. The distributions shown are the number of jets, and the b-tag discriminant for two leading b-jets. The background is shown as a stacked histogram and the pre-fit $ {\mathrm{t}\overline{\mathrm{t}}} {\mathrm{t}\overline{\mathrm{t}}} $ yield is shown on top of all other backgrounds. The gray and black bands correspond to the estimated total uncertainty before the fit. |
png pdf |
Additional Figure 10-d:
Opposite-sign dilepton channel prefit control plots for events with 2 $ N_\text{b} $ (left) and 3 $ N_\text{b} $ tagged jets (right). Where appropriate the data from the three dilepton decay categories are combined. The distributions shown are the number of jets, and the b-tag discriminant for two leading b-jets. The background is shown as a stacked histogram and the pre-fit $ {\mathrm{t}\overline{\mathrm{t}}} {\mathrm{t}\overline{\mathrm{t}}} $ yield is shown on top of all other backgrounds. The gray and black bands correspond to the estimated total uncertainty before the fit. |
png pdf |
Additional Figure 10-e:
Opposite-sign dilepton channel prefit control plots for events with 2 $ N_\text{b} $ (left) and 3 $ N_\text{b} $ tagged jets (right). Where appropriate the data from the three dilepton decay categories are combined. The distributions shown are the number of jets, and the b-tag discriminant for two leading b-jets. The background is shown as a stacked histogram and the pre-fit $ {\mathrm{t}\overline{\mathrm{t}}} {\mathrm{t}\overline{\mathrm{t}}} $ yield is shown on top of all other backgrounds. The gray and black bands correspond to the estimated total uncertainty before the fit. |

png pdf |
Additional Figure 10-f:
Opposite-sign dilepton channel prefit control plots for events with 2 $ N_\text{b} $ (left) and 3 $ N_\text{b} $ tagged jets (right). Where appropriate the data from the three dilepton decay categories are combined. The distributions shown are the number of jets, and the b-tag discriminant for two leading b-jets. The background is shown as a stacked histogram and the pre-fit $ {\mathrm{t}\overline{\mathrm{t}}} {\mathrm{t}\overline{\mathrm{t}}} $ yield is shown on top of all other backgrounds. The gray and black bands correspond to the estimated total uncertainty before the fit. |

png pdf |
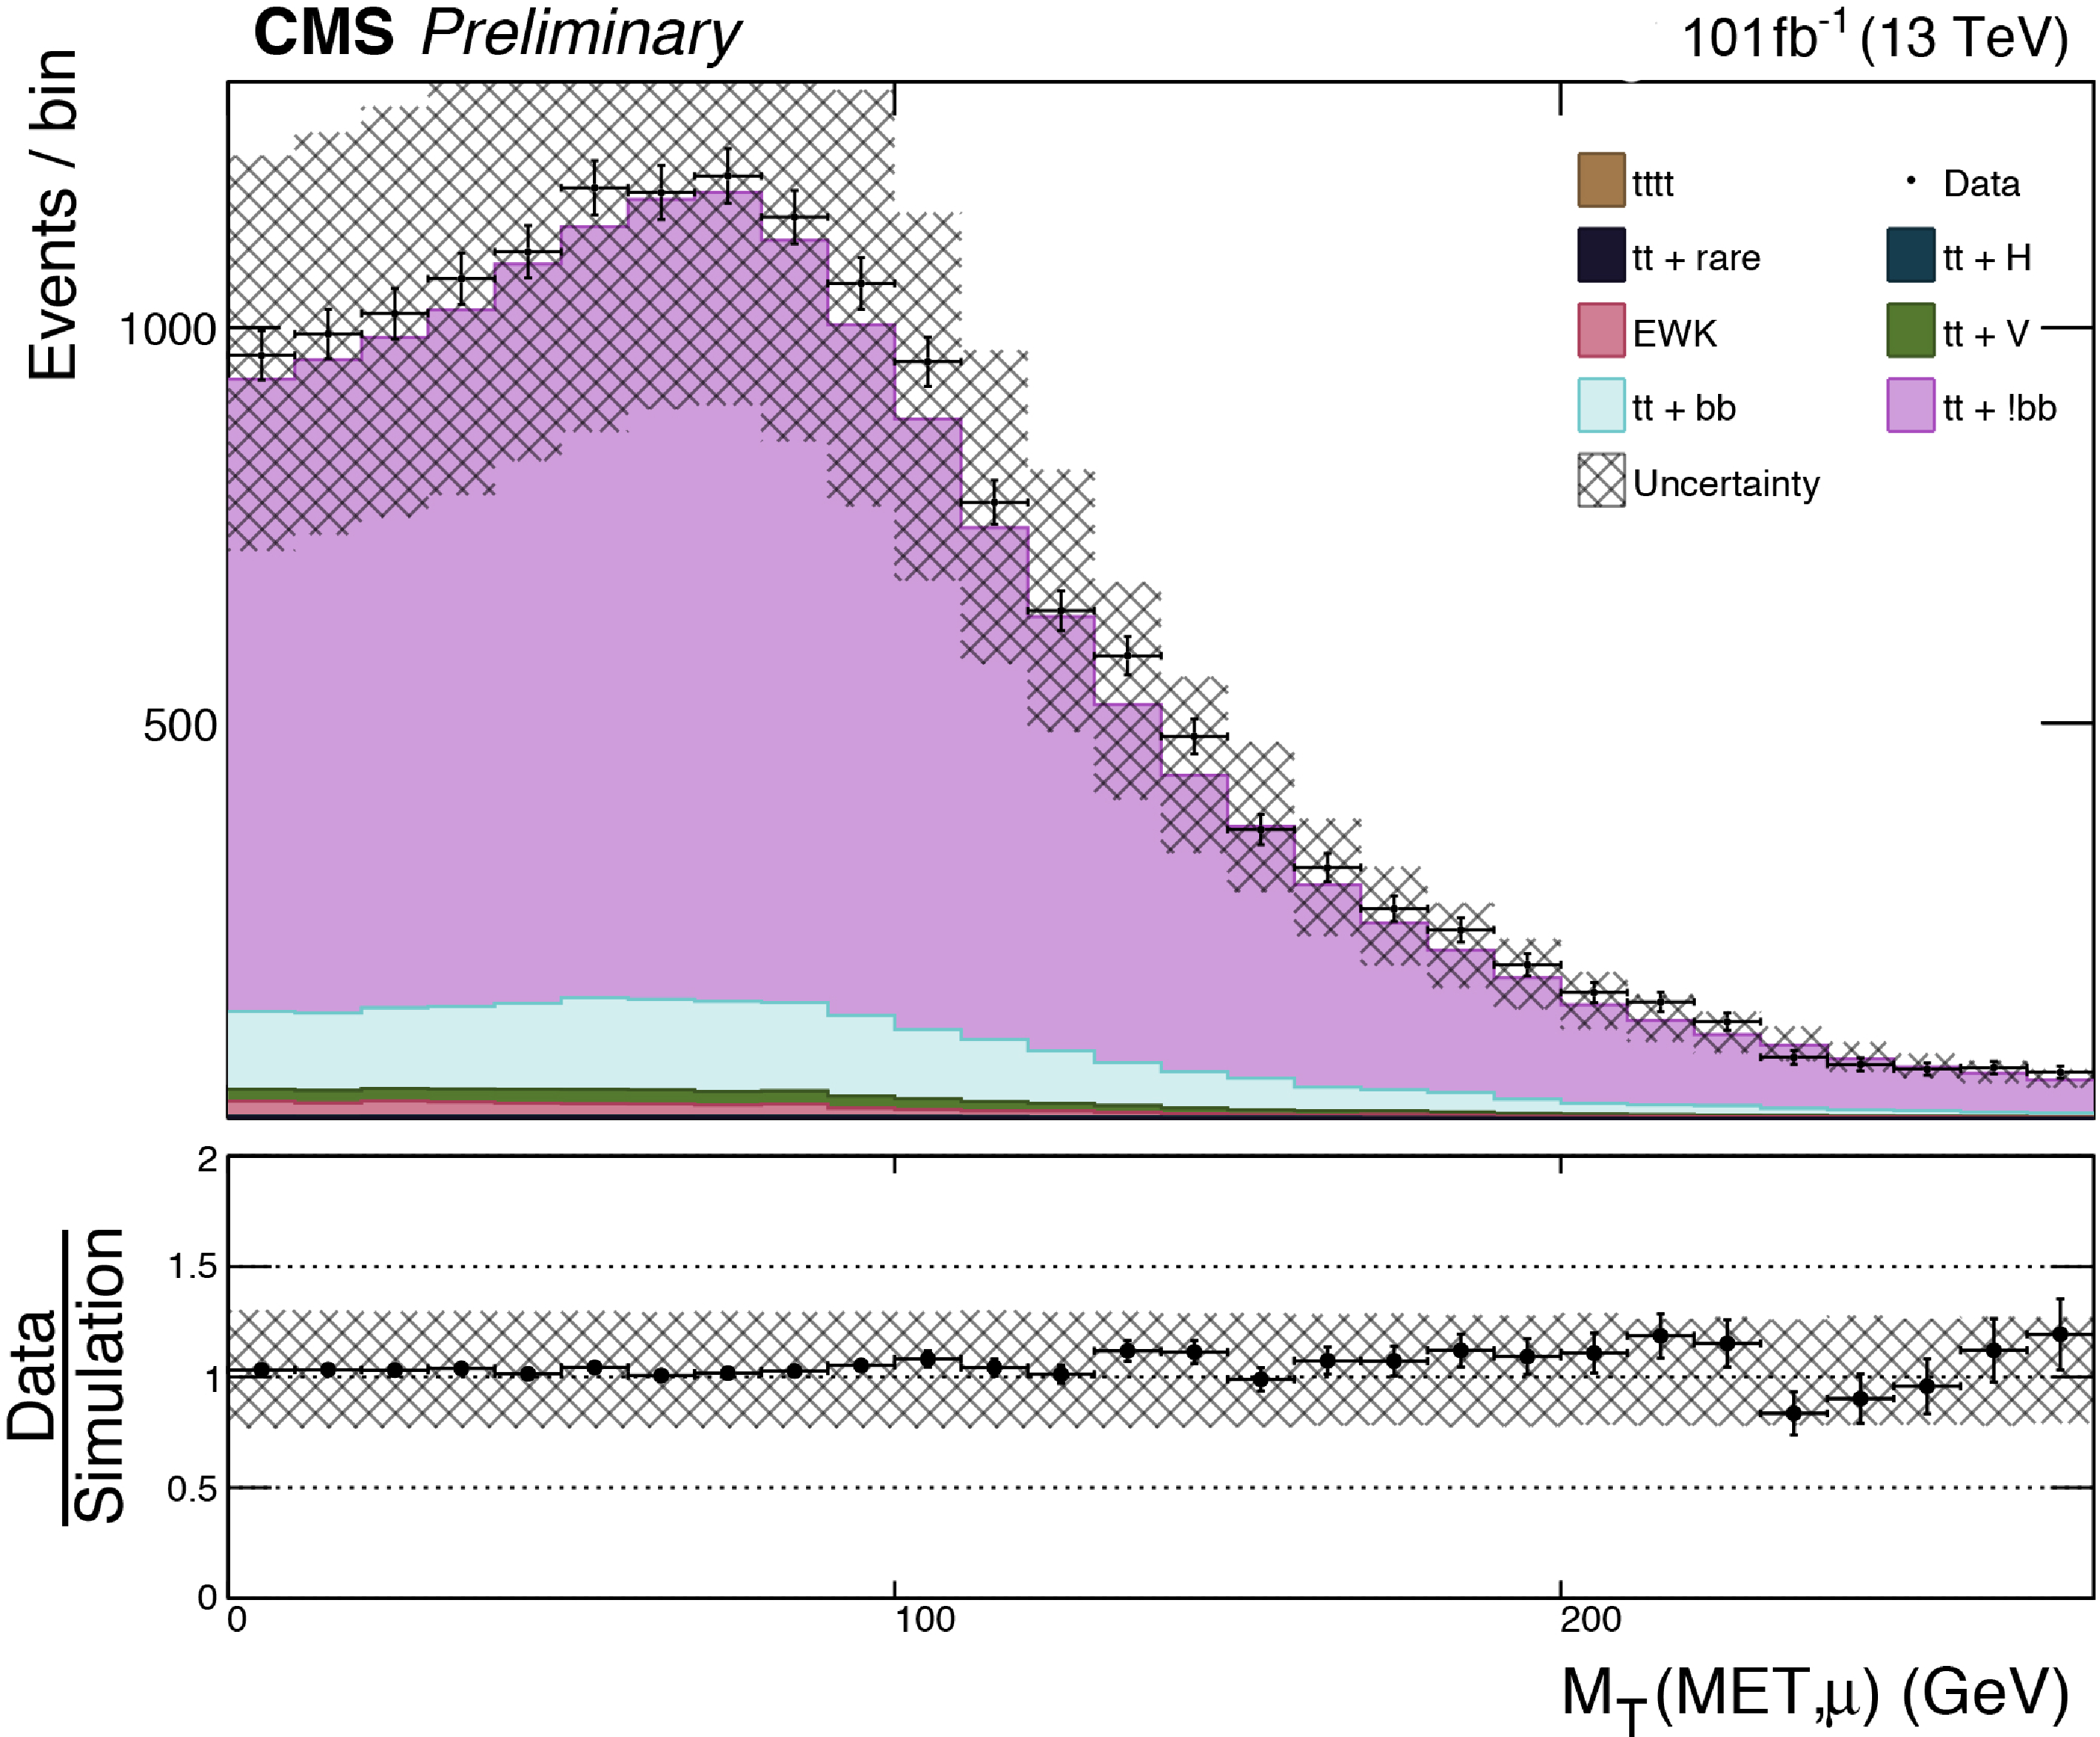
Additional Figure 11:
Opposite-sign dilepton channel prefit control plots for events with 2 $ N_\text{b} $ (left) and 3 $ N_\text{b} $-tagged jets (right). Where appropriate the data from the three dilepton decay categories are combined. The distributions shown are the transverse mass ($ M_{\rm{T}}(p_{\mathrm{T}}^\text{miss},\ell) $), computed using the missing transverse momentum and the leading muon (upper) or electron (lower). The background is shown as a stacked histogram and the pre-fit $ {\mathrm{t}\overline{\mathrm{t}}} {\mathrm{t}\overline{\mathrm{t}}} $ yield is shown on top of all other backgrounds. The gray and black bands correspond to the estimated total uncertainty before the fit. |
png pdf |
Additional Figure 11-a:
Opposite-sign dilepton channel prefit control plots for events with 2 $ N_\text{b} $ (left) and 3 $ N_\text{b} $-tagged jets (right). Where appropriate the data from the three dilepton decay categories are combined. The distributions shown are the transverse mass ($ M_{\rm{T}}(p_{\mathrm{T}}^\text{miss},\ell) $), computed using the missing transverse momentum and the leading muon (upper) or electron (lower). The background is shown as a stacked histogram and the pre-fit $ {\mathrm{t}\overline{\mathrm{t}}} {\mathrm{t}\overline{\mathrm{t}}} $ yield is shown on top of all other backgrounds. The gray and black bands correspond to the estimated total uncertainty before the fit. |

png pdf |
Additional Figure 11-b:
Opposite-sign dilepton channel prefit control plots for events with 2 $ N_\text{b} $ (left) and 3 $ N_\text{b} $-tagged jets (right). Where appropriate the data from the three dilepton decay categories are combined. The distributions shown are the transverse mass ($ M_{\rm{T}}(p_{\mathrm{T}}^\text{miss},\ell) $), computed using the missing transverse momentum and the leading muon (upper) or electron (lower). The background is shown as a stacked histogram and the pre-fit $ {\mathrm{t}\overline{\mathrm{t}}} {\mathrm{t}\overline{\mathrm{t}}} $ yield is shown on top of all other backgrounds. The gray and black bands correspond to the estimated total uncertainty before the fit. |

png pdf |
Additional Figure 11-c:
Opposite-sign dilepton channel prefit control plots for events with 2 $ N_\text{b} $ (left) and 3 $ N_\text{b} $-tagged jets (right). Where appropriate the data from the three dilepton decay categories are combined. The distributions shown are the transverse mass ($ M_{\rm{T}}(p_{\mathrm{T}}^\text{miss},\ell) $), computed using the missing transverse momentum and the leading muon (upper) or electron (lower). The background is shown as a stacked histogram and the pre-fit $ {\mathrm{t}\overline{\mathrm{t}}} {\mathrm{t}\overline{\mathrm{t}}} $ yield is shown on top of all other backgrounds. The gray and black bands correspond to the estimated total uncertainty before the fit. |

png pdf |
Additional Figure 11-d:
Opposite-sign dilepton channel prefit control plots for events with 2 $ N_\text{b} $ (left) and 3 $ N_\text{b} $-tagged jets (right). Where appropriate the data from the three dilepton decay categories are combined. The distributions shown are the transverse mass ($ M_{\rm{T}}(p_{\mathrm{T}}^\text{miss},\ell) $), computed using the missing transverse momentum and the leading muon (upper) or electron (lower). The background is shown as a stacked histogram and the pre-fit $ {\mathrm{t}\overline{\mathrm{t}}} {\mathrm{t}\overline{\mathrm{t}}} $ yield is shown on top of all other backgrounds. The gray and black bands correspond to the estimated total uncertainty before the fit. |
png pdf |
Additional Figure 12:
2016-2018 dataset BDT shape predictions vs data in the all-hadronic channel corresponding to the SR bins defined by $ N_\text{RT} $, $ N_\text{BT} $, and $ H_{\mathrm{T}} $, for the 8-jet validation region for the two most sensitive SR categories, defined by $ N_\text{RT}= $ 1, $ N_\text{BT}\ge $ 1, $ H_{\mathrm{T}} > $ 1400 GeV (left), and $ N_\text{BT}\ge $ 2, $ H_{\mathrm{T}} > $ 1100 GeV (right). The $ \mathrm{t} \overline{\mathrm{t}} $ and QCD multijet background BDT discriminant shape is predicted by the ABCDnn and normalized to the yields predicted by the extended ABCD method. Estimates for $ {\mathrm{t}\overline{\mathrm{t}}} {\mathrm{t}\overline{\mathrm{t}}} $ signal and other minor backgrounds are shown using simulated samples. The error bands shown include statistical uncertainties as well as the normalization uncertainties to account for discrepancies between the data and the data-driven background estimate observed in the VRs. |

png pdf |
Additional Figure 13:
Post-fit signal+background predictions for the 2016-2018 dataset in the all-hadronic channel BDT output distributions for the two most sensitive SR categories, defined by $ N_\text{RT}= $ 1, $ N_\text{BT}\ge $ 1, $ H_{\mathrm{T}} > $ 1400 GeV (left), and $ N_\text{BT}\ge $ 2, $ H_{\mathrm{T}} > $ 1100 GeV (right). The $ \mathrm{t} \overline{\mathrm{t}} $ and QCD multijet background BDT discriminant shape is predicted by the ABCDnn and normalized to the yields predicted by the extended ABCD method. Estimates for $ {\mathrm{t}\overline{\mathrm{t}}} {\mathrm{t}\overline{\mathrm{t}}} $ signal and other minor backgrounds are shown using simulated samples. The error bands shown include statistical uncertainties as well as the normalization uncertainties to account for discrepancies between the data and the data-driven background estimate observed in the VRs. |
png pdf |
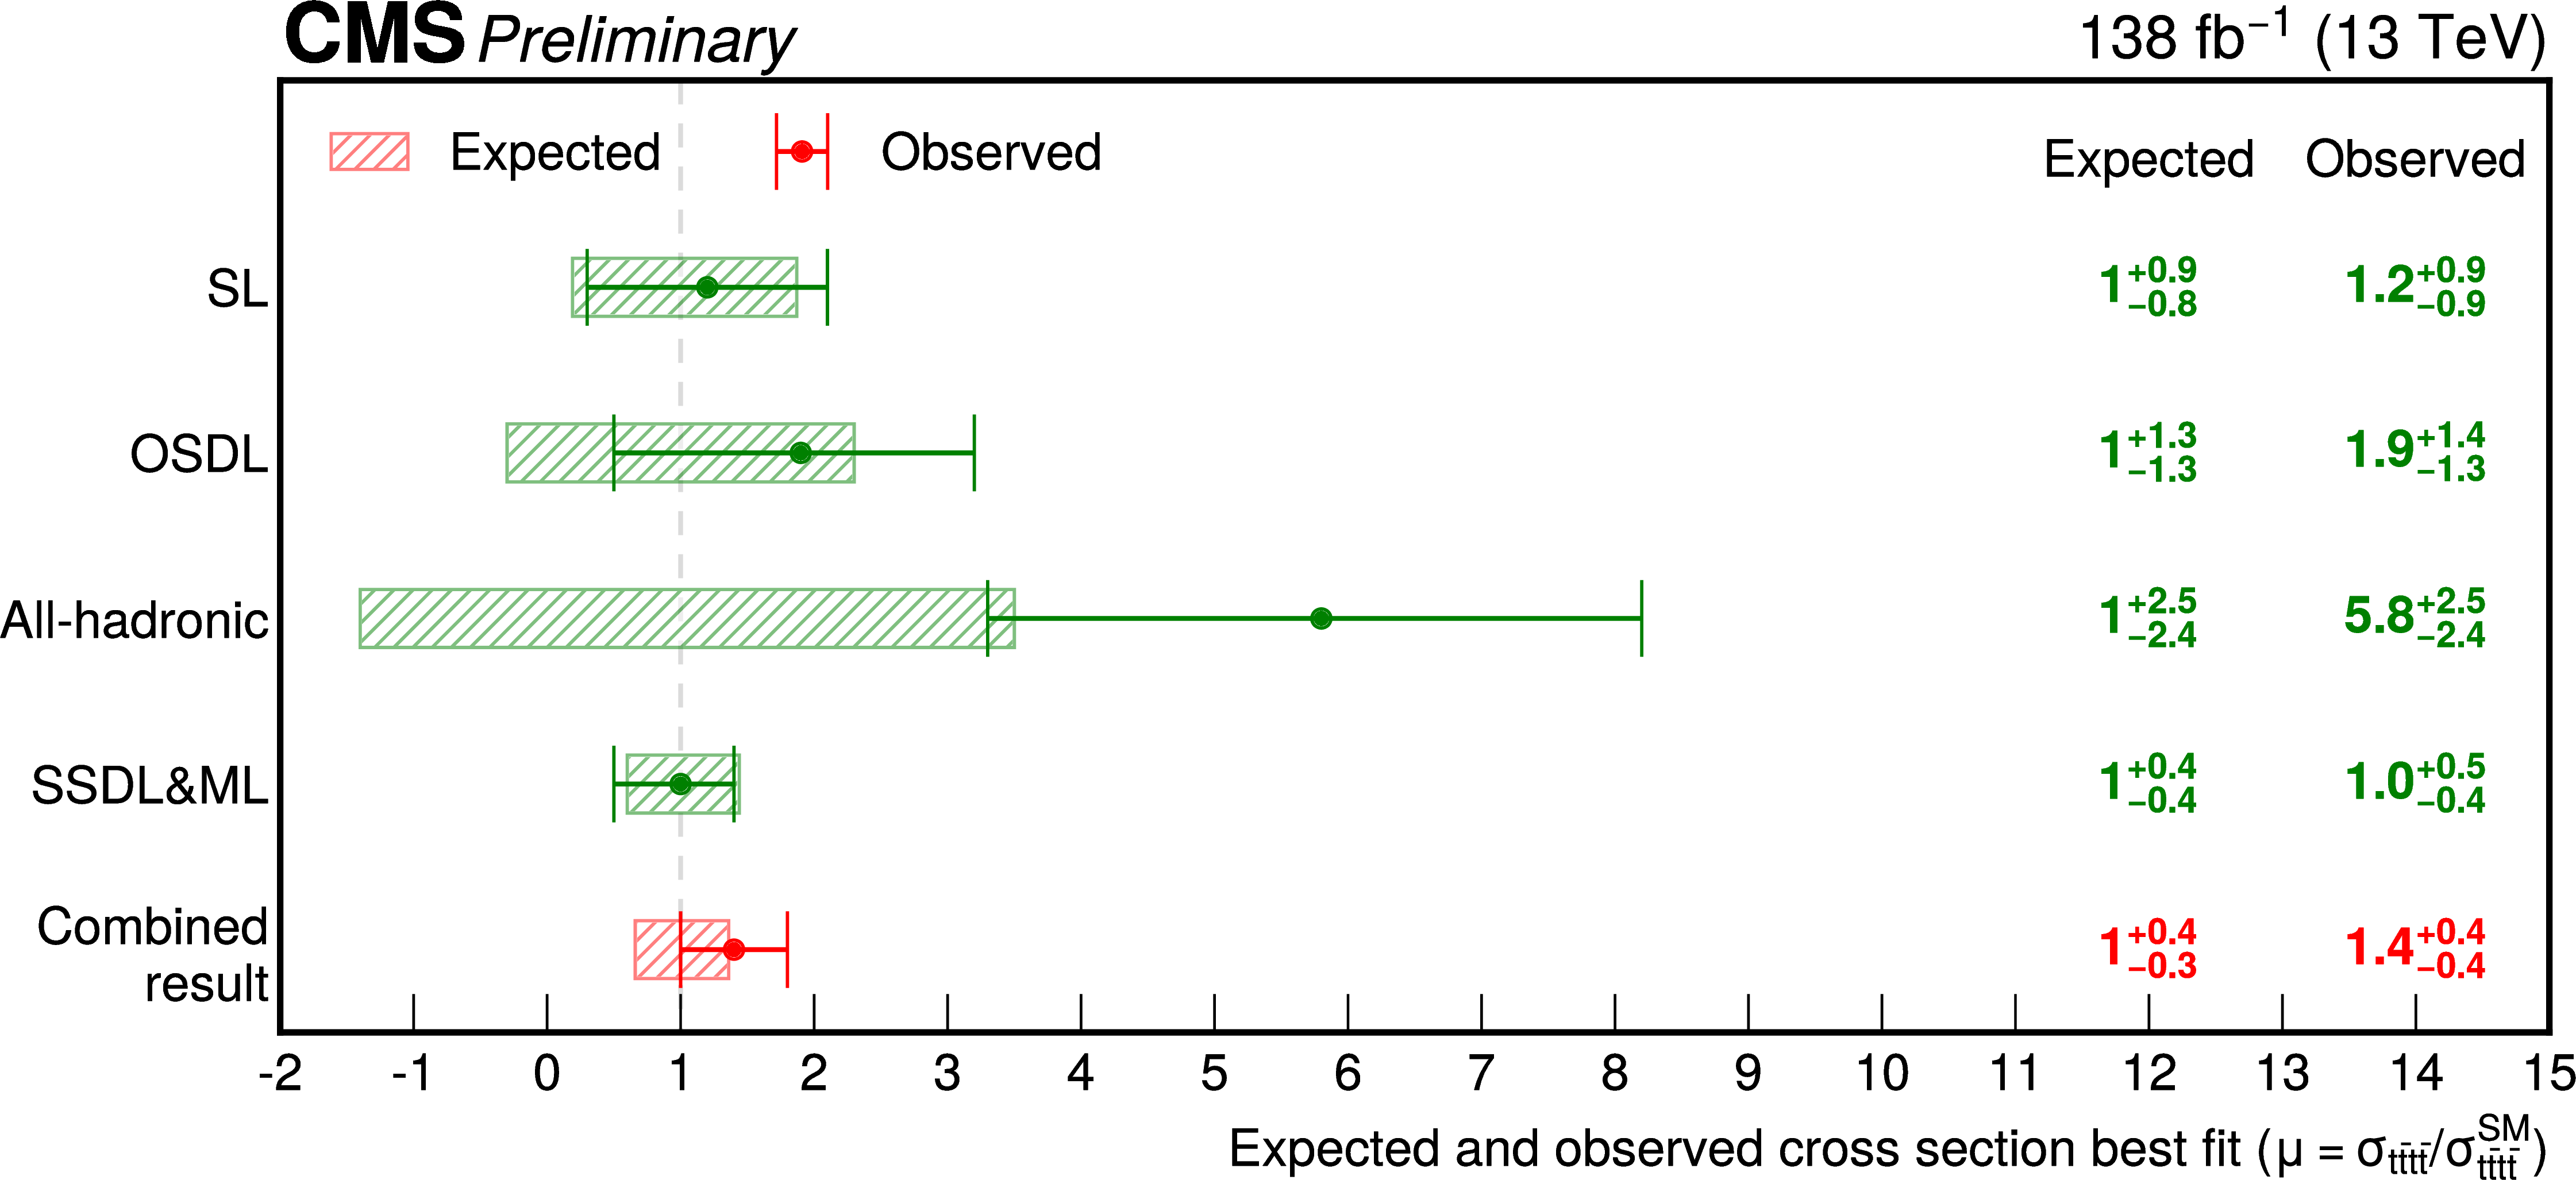
Additional Figure 14:
The expected and observed signal strength from each final state, and for the combination for the full Run II dataset. |
png pdf |
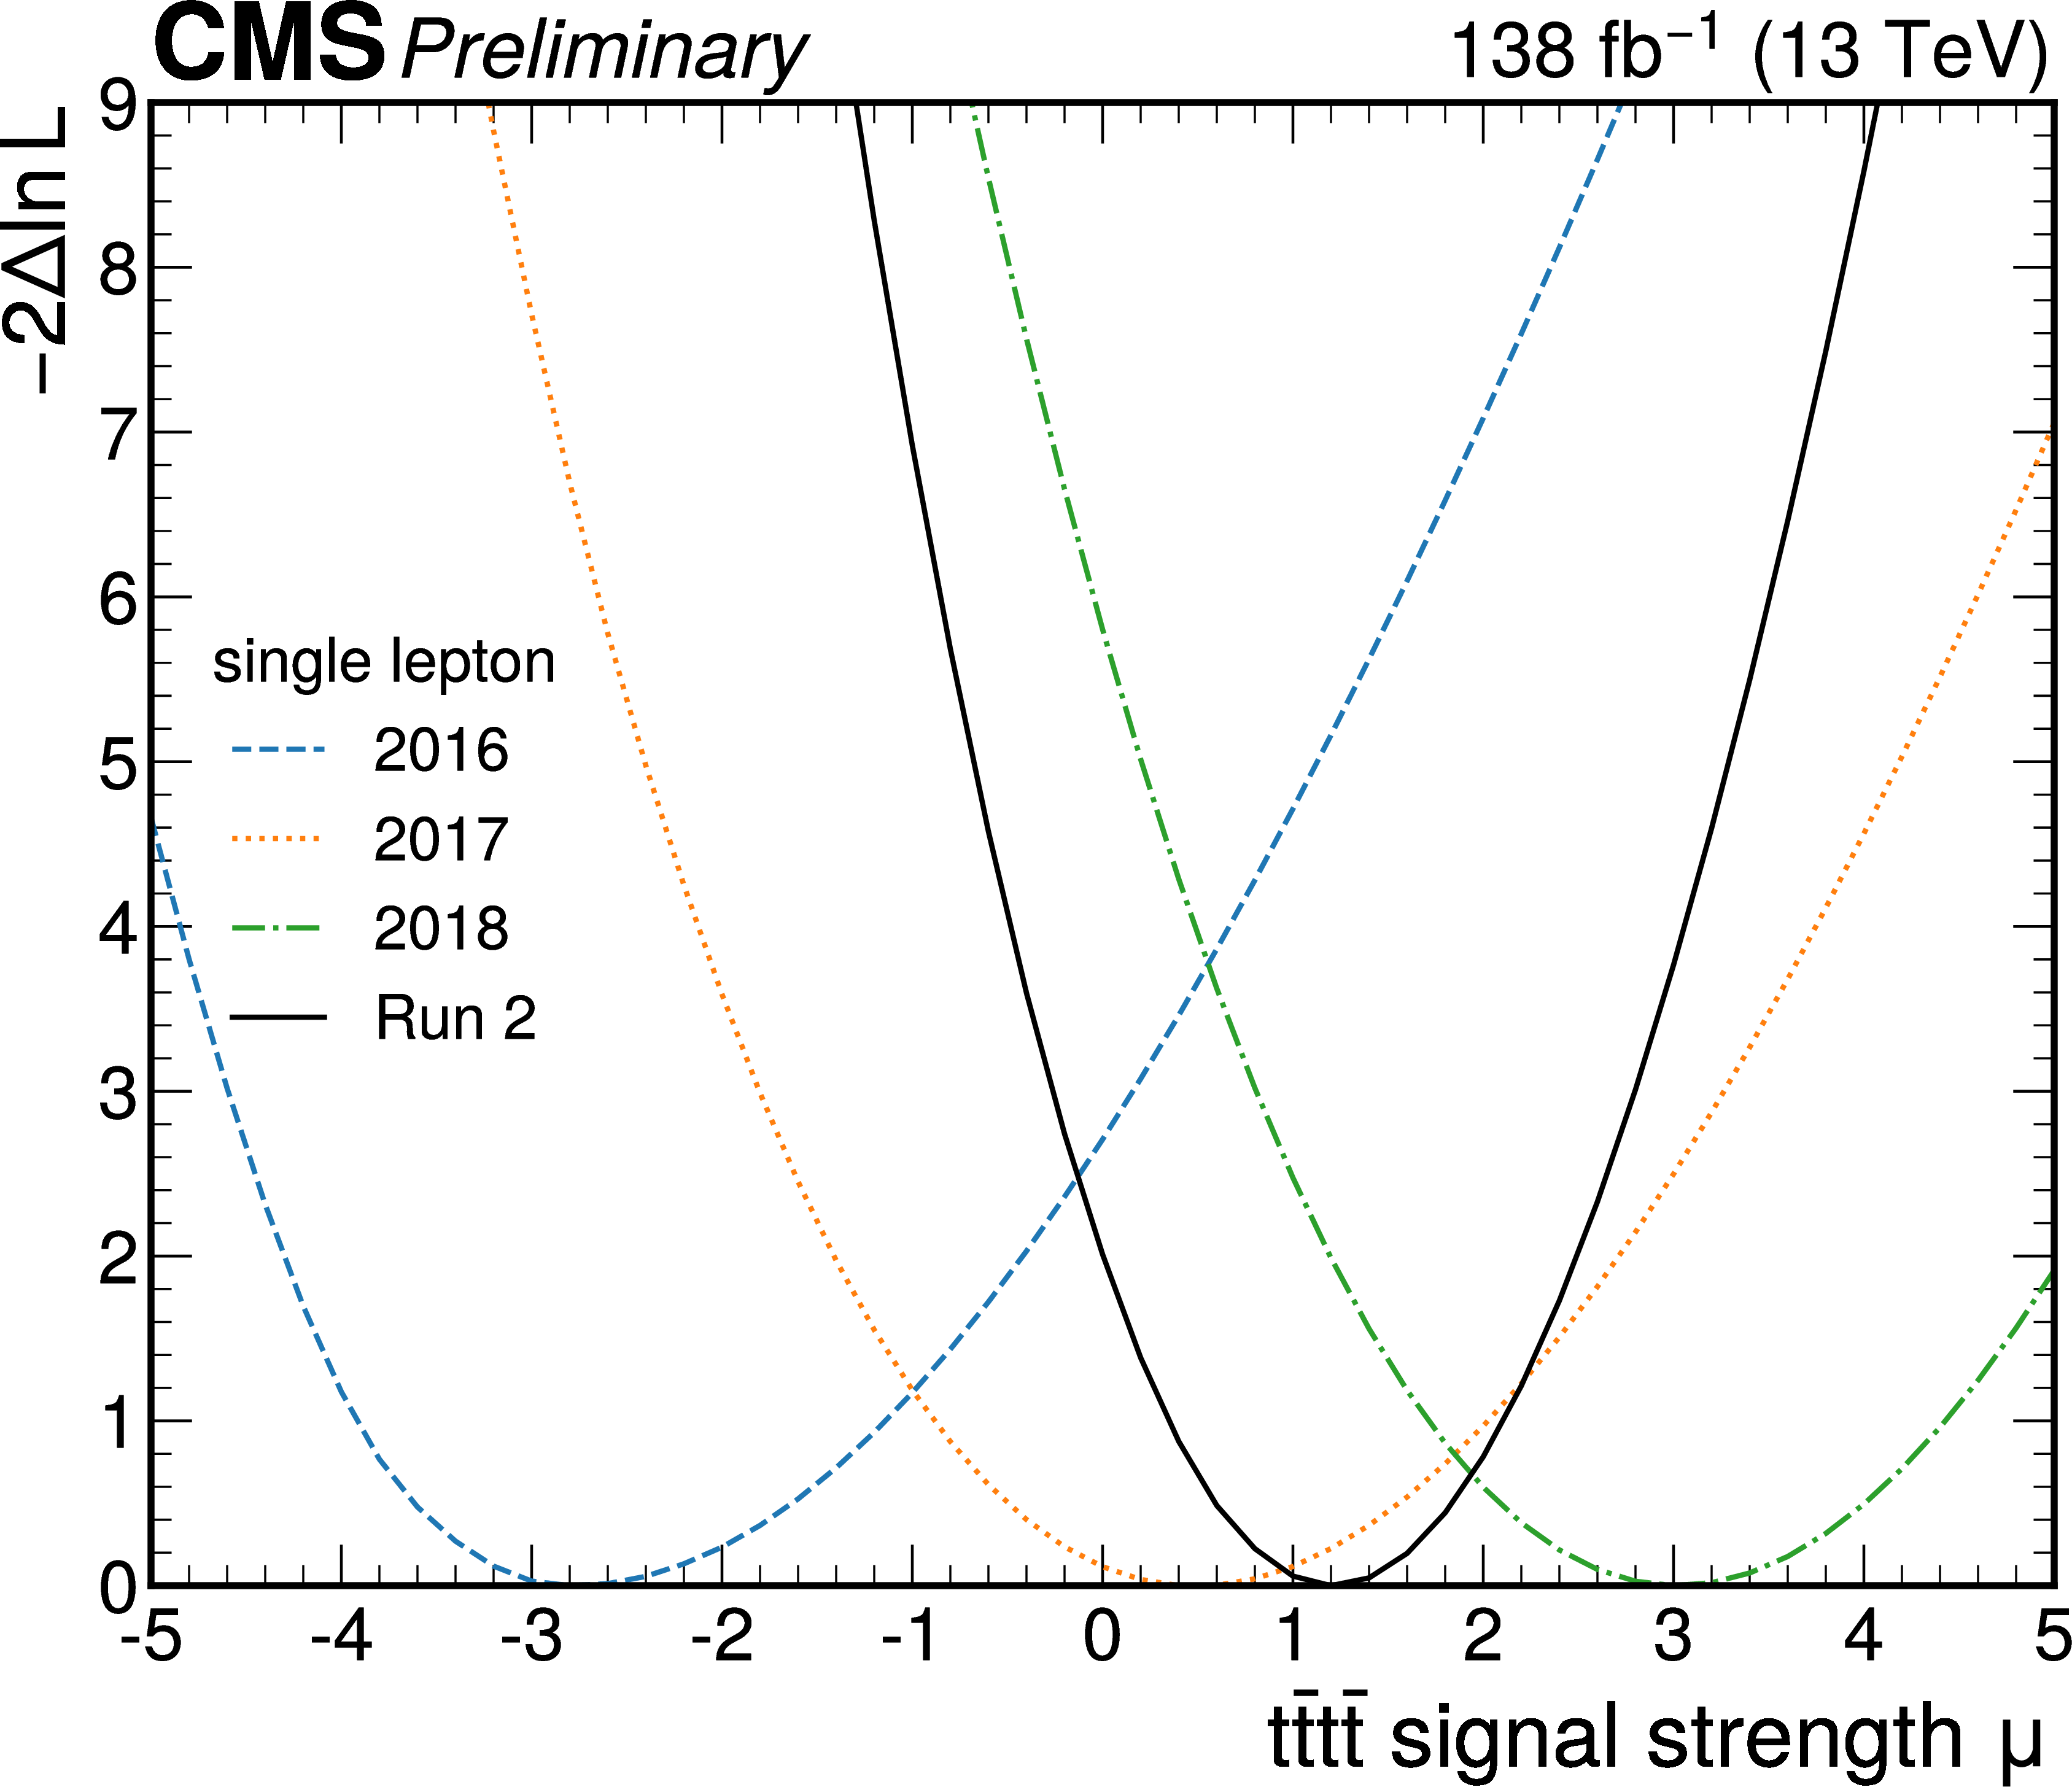
Additional Figure 15:
The post-fit negative log-likelihood scan for the single lepton final state, separated per year and combined for all years. |
png pdf |
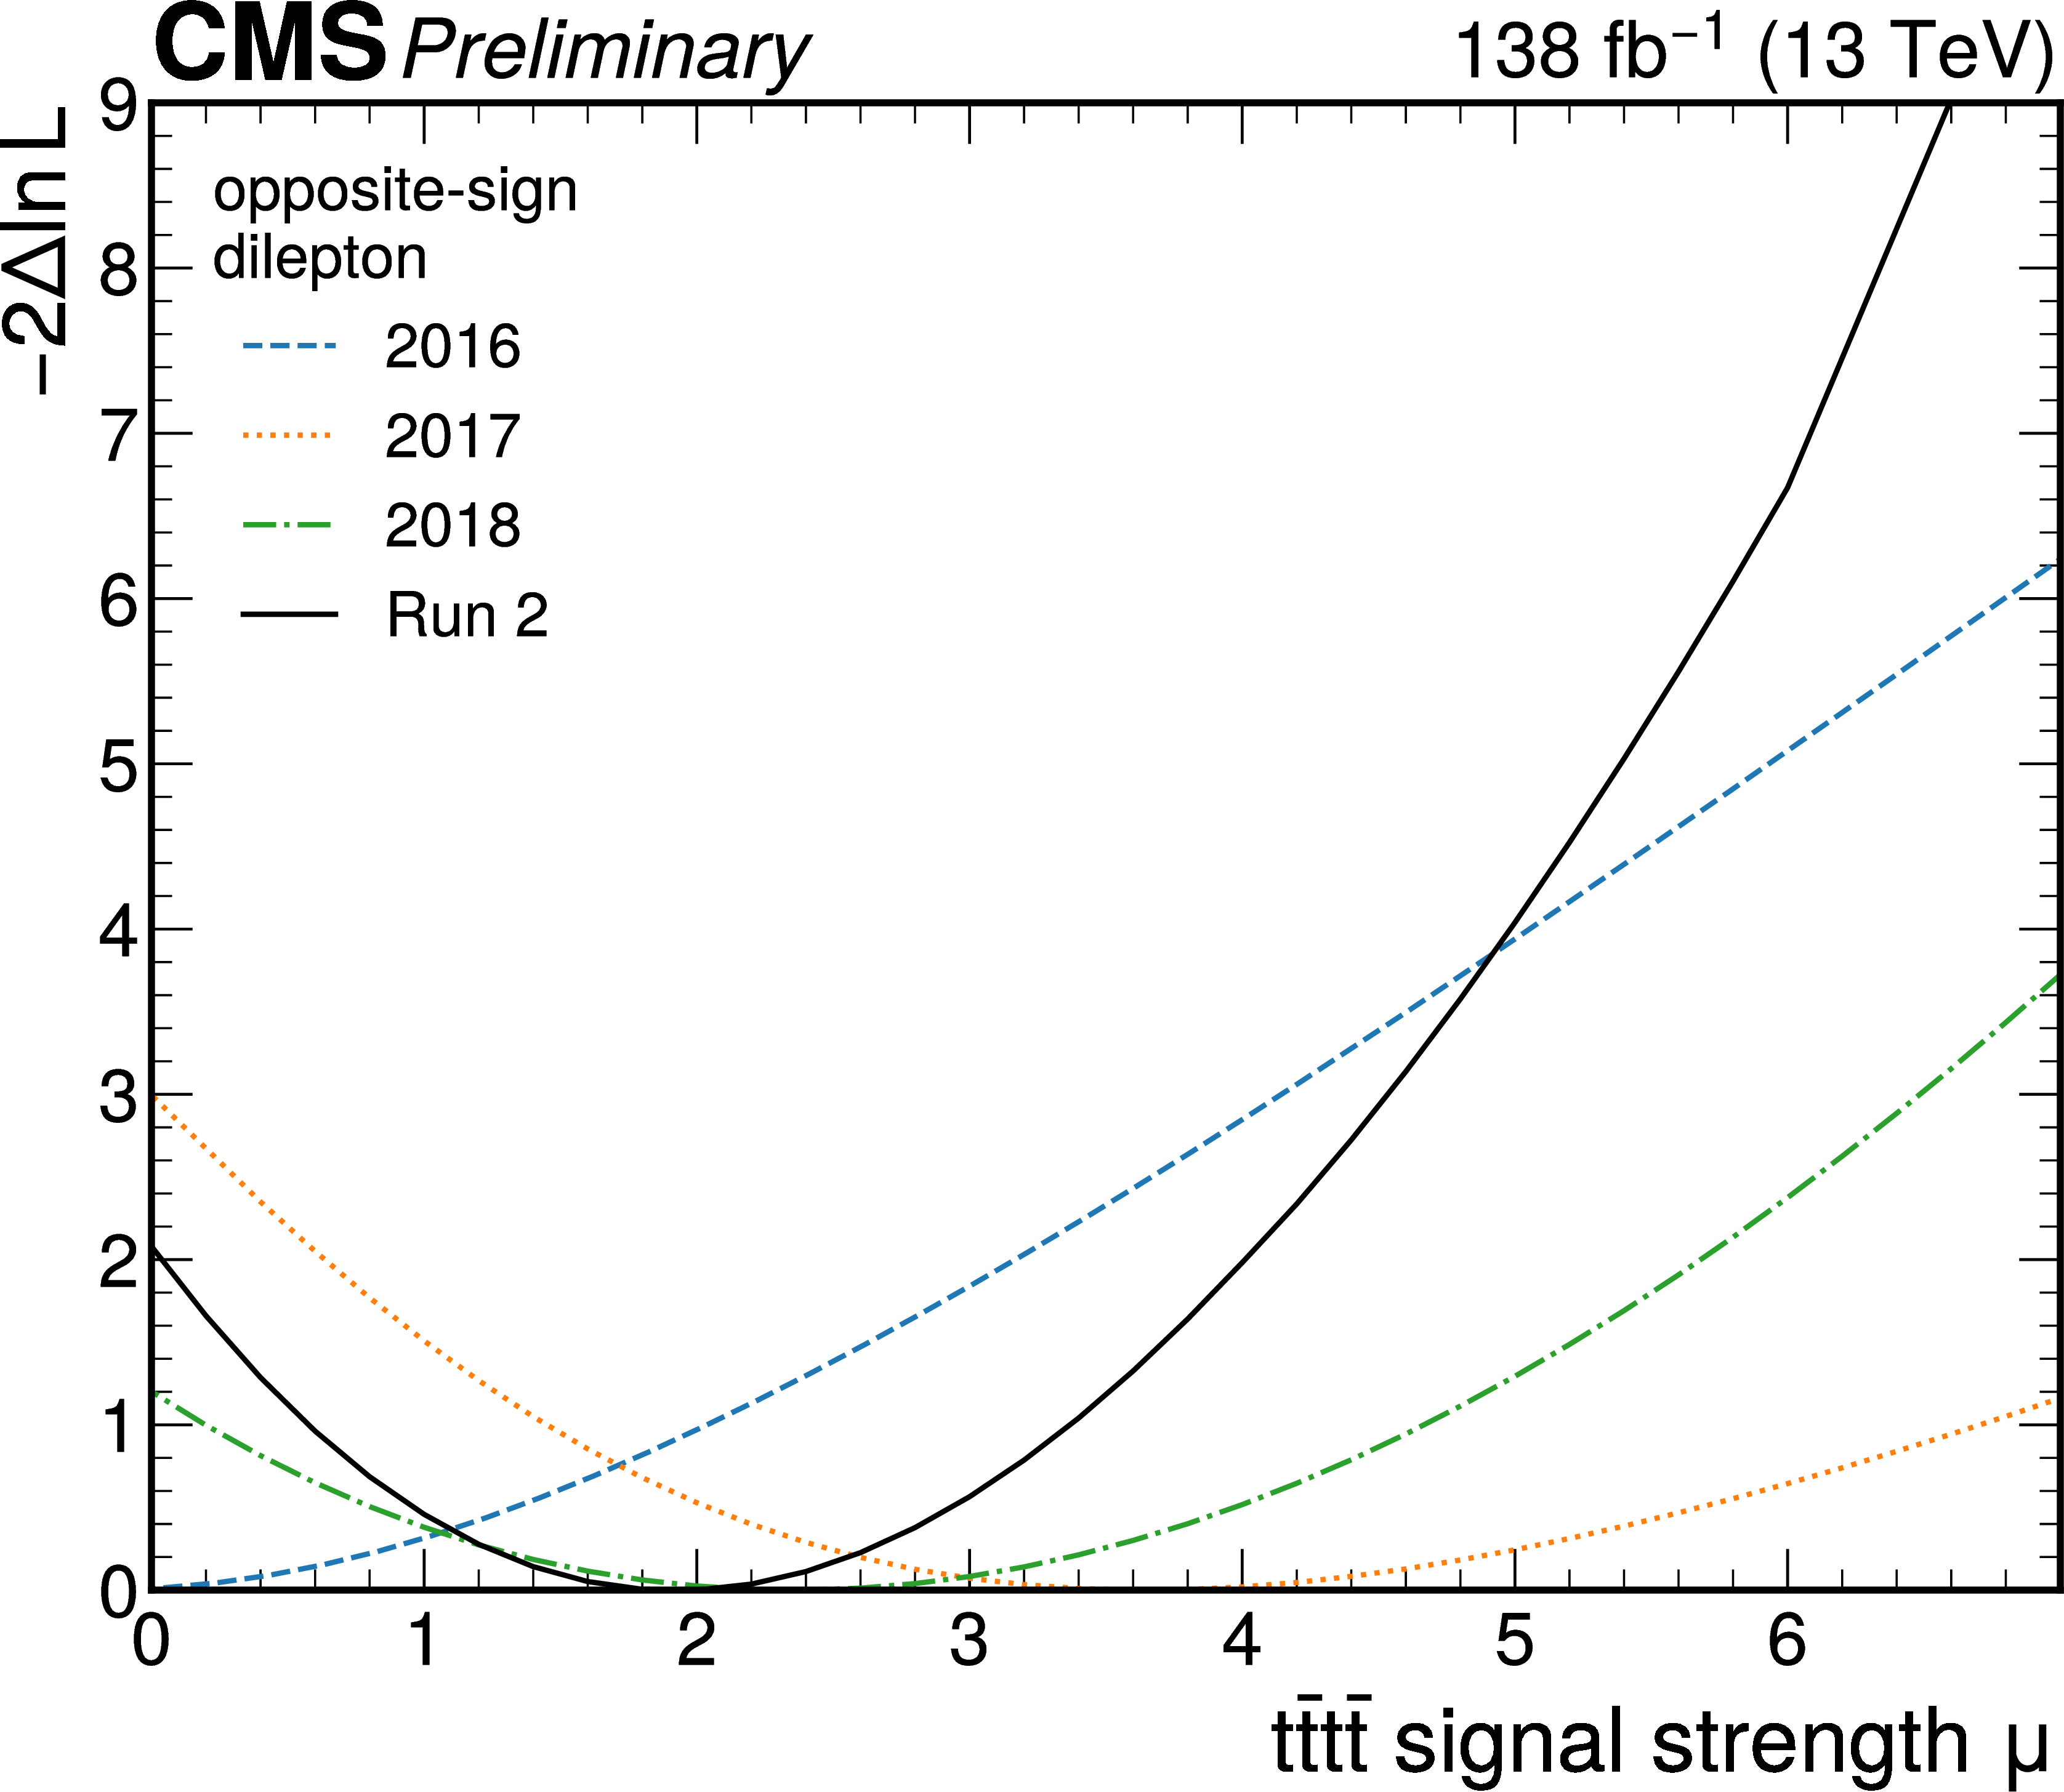
Additional Figure 16:
The post-fit negative log-likelihood scan for opposite-sign dilepton final state, separated per year and combined for all years. |

png pdf |
Additional Figure 17:
The post-fit negative log-likelihood scan for all-hadronic final state, separated per year and combined for all years. |
png pdf |
Additional Figure 18:
The post-fit negative log-likelihood scan for all final states and the combination of all final states. |

png pdf |
Additional Figure 19:
Comparison of the four top quark production cross section as a function of top Yukawa coupling value, compared with the observed cross section value and observed upper limit. |
| Additional Tables | |

png pdf |
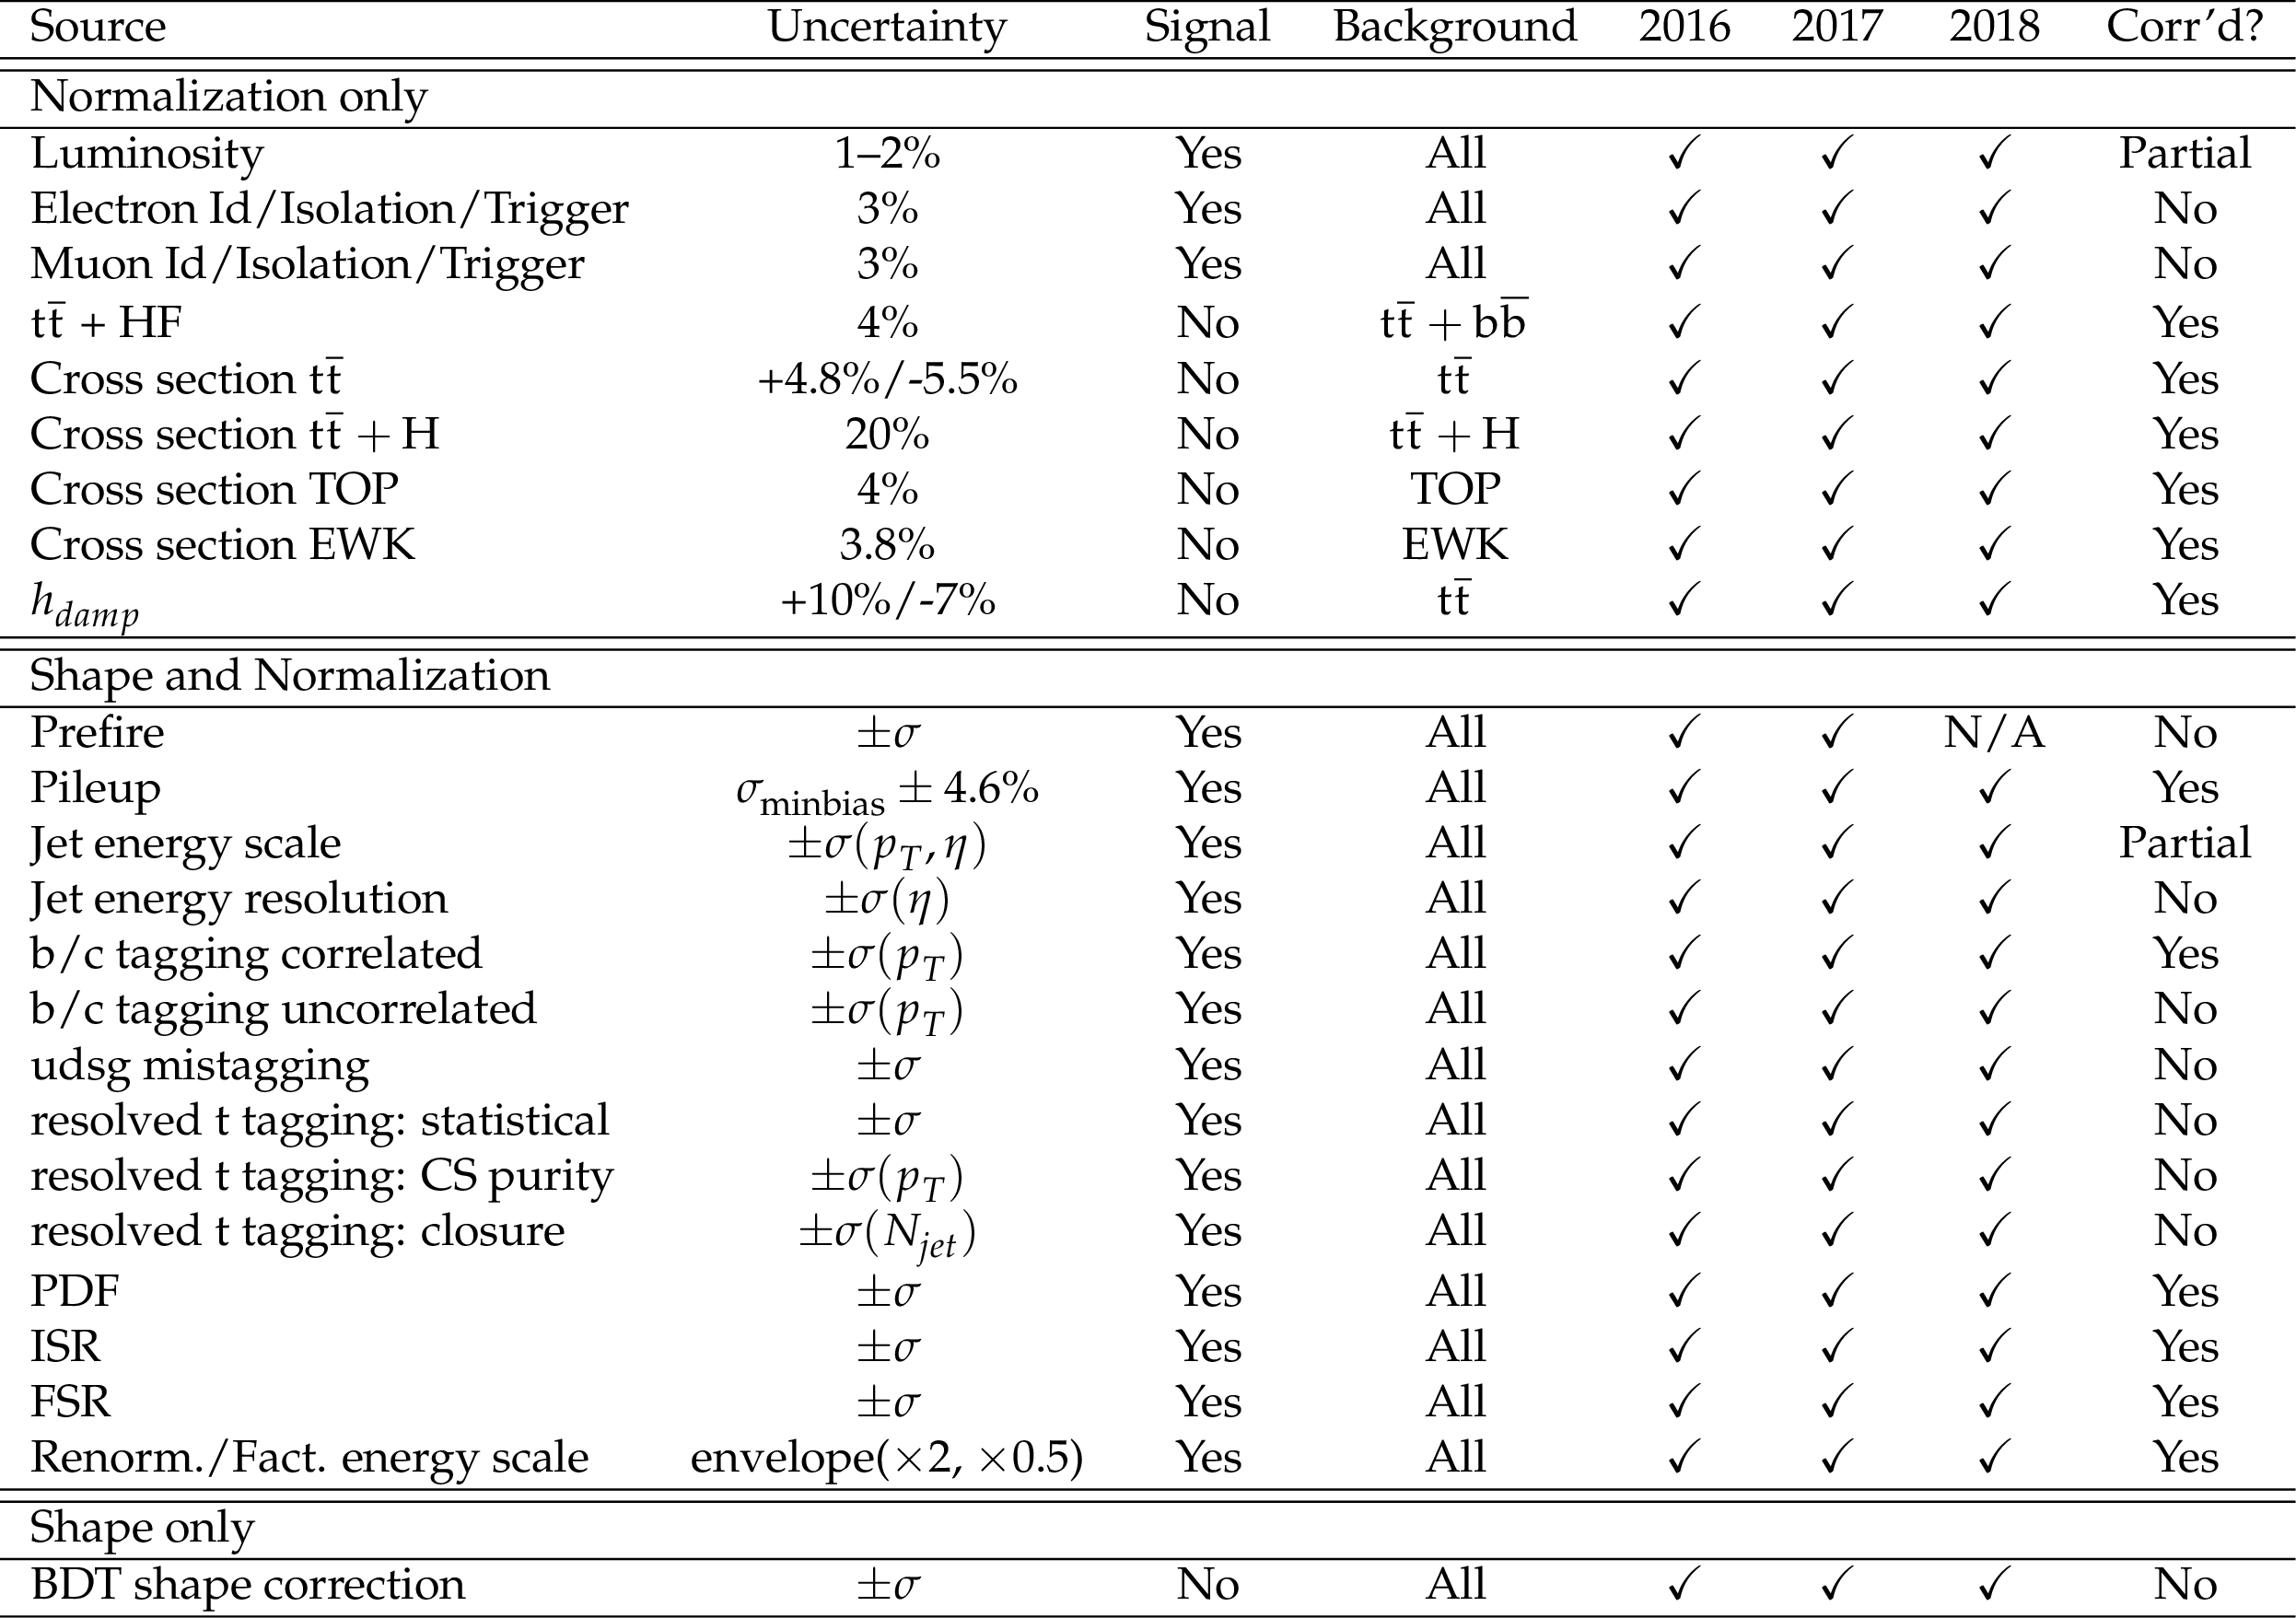
Additional Table 1:
Summary of systematic uncertainties. |
png pdf |
Additional Table 2:
Summary of all systematic uncertainties considered in the single-lepton final state and correlations across different data-taking periods. |

png pdf |
Additional Table 3:
BDT input variable ranking by separation in single-lepton final state, corresponding to training with 2017 MC samples and number of jets $ \geq $ 6. Trijet_2 corresponds to the second (ordered by their discriminator value) resolved t-tagged jet and dijet_2 corresponds to the jet pair within trijet_2 with minimum $ \Delta R $ separation. |

png pdf |
Additional Table 4:
Summary of systematic uncertainties and the ranges of their effects on signal and background yields in the all-hadronic channel. The uncertainty type (shape vs normalization only), affected processes, correlations (between processes and/or years), and effects on signal and background yields as percentages are shown. Systematic uncertainties are considered for all years unless otherwise indicated. ''ttX'' refers to $ \mathrm{t} \overline{\mathrm{t}} $ production in association with single bosons (H, W, Z). |
| References | ||||
| 1 | CDF Collaboration | Observation of top quark production in $ \bar{p}p $ collisions | PRL 74 (1995) 2626 | hep-ex/9503002 |
| 2 | D0 Collaboration | Observation of the top quark | PRL 74 (1995) 2632 | hep-ex/9503003 |
| 3 | CDF Collaboration | Observation of electroweak single top-quark production | PRL 103 (2009) 092002 | |
| 4 | D0 Collaboration | Observation of Single Top Quark Production | PRL 103 (2009) 092001 | 0903.0850 |
| 5 | CMS Collaboration | First Measurement of the Cross Section for Top-Quark Pair Production in Proton-Proton Collisions at $ \sqrt{s}= $ 7 TeV | PLB 695 (2011) 424 | CMS-TOP-10-001 1010.5994 |
| 6 | ATLAS Collaboration | Measurement of the top quark-pair production cross section with ATLAS in pp collisions at $ \sqrt{s}= $ 7 TeV | EPJC 71 (2011) 1577 | 1012.1792 |
| 7 | CMS Collaboration | Measurement of the $ t $-channel single top quark production cross section in pp collisions at $ \sqrt{s}= $ 7 TeV | PRL 107 (2011) 091802 | CMS-TOP-10-008 1106.3052 |
| 8 | ATLAS Collaboration | Measurement of the $ t $-channel single top-quark production cross section in pp collisions at $ \sqrt{s}= $ 7 TeV with the ATLAS detector | PLB 717 (2012) 330 | 1205.3130 |
| 9 | CMS Collaboration | Observation of the associated production of a single top quark and a W boson in pp collisions at $ \sqrt s = $8 TeV | PRL 112 (2014) 231802 | CMS-TOP-12-040 1401.2942 |
| 10 | ATLAS Collaboration | Measurement of the production cross-section of a single top quark in association with a W boson at 8 TeV with the ATLAS experiment | JHEP 01 (2016) 064 | 1510.03752 |
| 11 | R. Frederix, D. Pagani, and M. Zaro | Large NLO corrections in $ t\bar{t}W^{\pm} $ and $ t\bar{t}t\bar{t} $ hadroproduction from supposedly subleading EW contributions | JHEP 02 (2018) 031 | 1711.02116 |
| 12 | H. P. Nilles | Supersymmetry, Supergravity and Particle Physics | Phys. Rept. 110 (1984) 1 | |
| 13 | S. P. Martin | A Supersymmetry primer | Advanced Series on Directions in High Energy Physics 18 (1998) 1 | hep-ph/9709356 |
| 14 | G. Cacciapaglia et al. | Composite scalars at the LHC: the Higgs, the sextet and the octet | JHEP 11 (2015) 201 | 1507.02283 |
| 15 | K. Kumar, T. M. P. Tait, and R. Vega-Morales | Manifestations of top compositeness at colliders | JHEP 05 (2009) 022 | 0901.3808 |
| 16 | D. Dicus, A. Stange, and S. Willenbrock | Higgs decay to top quarks at hadron colliders | PLB 333 (1994) 126 | hep-ph/9404359 |
| 17 | N. Craig et al. | The hunt for the rest of the Higgs bosons | JHEP 06 (2015) 137 | 1504.04630 |
| 18 | N. Craig et al. | Heavy Higgs bosons at low $ \tan \beta $: from the LHC to 100 TeV | JHEP 01 (2017) 018 | 1605.08744 |
| 19 | G. Cacciapaglia, A. Deandrea, and J. Llodra-Perez | A dark matter candidate from Lorentz invariance in 6D | JHEP 03 (2010) 083 | 0907.4993 |
| 20 | O. Ducu, L. Heurtier, and J. Maurer | LHC signatures of a Z' mediator between dark matter and the SU(3) sector | JHEP 03 (2016) 006 | 1509.05615 |
| 21 | C. Degrande et al. | Non-resonant new physics in top pair production at hadron colliders | JHEP 03 (2011) 125 | 1010.6304 |
| 22 | ATLAS Collaboration | Search for four-top-quark production in the single-lepton and opposite-sign dilepton final states in pp collisions at $ \sqrt{s} $ = 13 TeV with the ATLAS detector | PRD 99 (2019) 052009 | 1811.02305 |
| 23 | ATLAS Collaboration | Search for new phenomena in events with same-charge leptons and b-jets in pp collisions at $ \sqrt{s}= $ 13 TeV with the ATLAS detector | JHEP 12 (2018) 039 | 1807.11883 |
| 24 | CMS Collaboration | Search for physics beyond the standard model in events with two leptons of same sign, missing transverse momentum, and jets in proton-proton collisions at $ \sqrt{s}= $ 13 TeV | EPJC 77 (2017) 578 | CMS-SUS-16-035 1704.07323 |
| 25 | CMS Collaboration | Search for standard model production of four top quarks with same-sign and multilepton final states in proton-proton collisions at $ \sqrt{s} = $ 13 TeV | EPJC 78 (2018) 140 | CMS-TOP-17-009 1710.10614 |
| 26 | CMS Collaboration | Search for production of four top quarks in final states with same-sign or multiple leptons in proton-proton collisions at $ \sqrt{s}= $ 13 TeV | EPJC 80 (2020) 75 | CMS-TOP-18-003 1908.06463 |
| 27 | CMS Collaboration | Search for the production of four top quarks in the single-lepton and opposite-sign dilepton final states in proton-proton collisions at $ \sqrt{s} $ = 13 TeV | JHEP 11 (2019) 082 | CMS-TOP-17-019 1906.02805 |
| 28 | ATLAS Collaboration | Evidence for $ t\bar{t}t\bar{t} $ production in the multilepton final state in proton-proton collisions at $ \sqrt{s}= $ 13 TeV with the ATLAS detector | EPJC 80 (2020) 1085 | 2007.14858 |
| 29 | J. Alwall et al. | The automated computation of tree-level and next-to-leading order differential cross sections, and their matching to parton shower simulations | JHEP 07 (2014) 079 | 1405.0301 |
| 30 | P. Nason | A New method for combining NLO QCD with shower Monte Carlo algorithms | JHEP 11 (2004) 040 | hep-ph/0409146 |
| 31 | S. Frixione, P. Nason, and C. Oleari | Matching NLO QCD computations with Parton Shower simulations: the POWHEG method | JHEP 11 (2007) 070 | 0709.2092 |
| 32 | S. Alioli, P. Nason, C. Oleari, and E. Re | A general framework for implementing NLO calculations in shower Monte Carlo programs: the POWHEG BOX | JHEP 06 (2010) 043 | 1002.2581 |
| 33 | T. Sjöstrand et al. | An Introduction to PYTHIA 8.2 | Comput. Phys. Commun. 191 (2015) 159 | 1410.3012 |
| 34 | J. Alwall et al. | Comparative study of various algorithms for the merging of parton showers and matrix elements in hadronic collisions | EPJC 53 (2008) 473 | 0706.2569 |
| 35 | R. Frederix and S. Frixione | Merging meets matching in MC@NLO | JHEP 12 (2012) 061 | 1209.6215 |
| 36 | CMS Collaboration | Extraction and validation of a new set of CMS PYTHIA8 tunes from underlying-event measurements | EPJC 80 (2020) 4 | CMS-GEN-17-001 1903.12179 |
| 37 | NNPDF Collaboration | Parton distributions from high-precision collider data | EPJC 77 (2017) 663 | 1706.00428 |
| 38 | GEANT4 Collaboration | GEANT4--a simulation toolkit | NIM A 506 (2003) 250 | |
| 39 | CMS Collaboration | Measurement of the cross section for $ \text{t}\bar{\text{t}} $ production with additional jets and b jets in pp collisions at $ \sqrt{s}= $ 13 TeV | JHEP 07 (2020) 125 | CMS-TOP-18-002 2003.06467 |
| 40 | CMS Collaboration | Particle-flow reconstruction and global event description with the CMS detector | JINST 12 (2017) P10003 | CMS-PRF-14-001 1706.04965 |
| 41 | M. Cacciari, G. P. Salam, and G. Soyez | The anti-$ k_{\mathrm{T}} $ jet clustering algorithm | JHEP 04 (2008) 063 | 0802.1189 |
| 42 | M. Cacciari, G. P. Salam, and G. Soyez | FastJet User Manual | EPJC 72 (2012) 1896 | 1111.6097 |
| 43 | CMS Collaboration | Jet energy scale and resolution in the CMS experiment in pp collisions at 8 TeV | JINST 12 (2017) P02014 | CMS-JME-13-004 1607.03663 |
| 44 | CMS Collaboration | Performance of missing transverse momentum reconstruction in proton-proton collisions at $ \sqrt{s} = $ 13 TeV using the CMS detector | JINST 14 (2019) P07004 | CMS-JME-17-001 1903.06078 |
| 45 | E. Bols et al. | Jet Flavour Classification Using DeepJet | JINST 15 (2020) P12012 | 2008.10519 |
| 46 | CMS Collaboration | Performance of the DeepJet b tagging algorithm using 41.9/fb of data from proton-proton collisions at 13 TeV with Phase 1 CMS detector | CMS Detector Performance Note CMS-DP-2018-058, 2018 CDS |
|
| 47 | CMS Collaboration | Search for direct top squark pair production in events with one lepton, jets, and missing transverse momentum at 13 TeV with the CMS experiment | JHEP 05 (2020) 032 | CMS-SUS-19-009 1912.08887 |
| 48 | CMS Collaboration | Search for top squark production in fully-hadronic final states in proton-proton collisions at $ \sqrt{s} = $ 13 TeV | PRD 104 (2021) 052001 | CMS-SUS-19-010 2103.01290 |
| 49 | CMS Collaboration | Search for direct production of supersymmetric partners of the top quark in the all-jets final state in proton-proton collisions at $ \sqrt{s}= $ 13 TeV | JHEP 10 (2017) 005 | CMS-SUS-16-049 1707.03316 |
| 50 | T. Hastie, R. Tibshirani, and J. Friedman | The elements of statistical learning | Springer-Verlag, second edition, 2013 link |
|
| 51 | L. Breiman, J. Friedman, R. Olshen, and C. Stone | Classification and regression trees | Wadsworth, 1984 | |
| 52 | CMS Collaboration | Machine learning-based identification of highly Lorentz-boosted hadronically decaying particles at the CMS experiment | CMS Physics Analysis Summary, 2019 CMS-PAS-JME-18-002 |
CMS-PAS-JME-18-002 |
| 53 | CMS Collaboration | Performance of the CMS Level-1 trigger in proton-proton collisions at $ \sqrt{s} = $ 13 TeV | JINST 15 (2020) P10017 | CMS-TRG-17-001 2006.10165 |
| 54 | CMS Collaboration | The CMS trigger system | JINST 12 (2017) P01020 | CMS-TRG-12-001 1609.02366 |
| 55 | H. Voss, A. Höcker, J. Stelzer, and F. Tegenfeldt | TMVA, the toolkit for multivariate data analysis with ROOT | in XIth International Workshop on Advanced Computing and Analysis Techniques in Physics Research (ACAT), 2007 link |
physics/0703039 |
| 56 | G. C. Fox and S. Wolfram | Observables for the Analysis of Event Shapes in $ {e}^{+}{e}^{-} $ Annihilation and Other Processes | PRL 41 (1978) 1581 | |
| 57 | J. L. S. Choi and H. Oh | Data-driven Estimation of Background Distribution through Neural Autoregressive Flows | 2008.03636 | |
| 58 | ATLAS and CMS Collaborations, and LHC Higgs Combination Group | Procedure for the LHC Higgs boson search combination in Summer 2011 | Technical Report CMS-NOTE-2011-005, ATL-PHYS-PUB-2011-11, 2011 | |
| 59 | G. Cowan, K. Cranmer, E. Gross, and O. Vitells | Asymptotic formulae for likelihood-based tests of new physics | EPJC 71 (2011) 1554 | 1007.1727 |
| 60 | CMS Collaboration | Precision luminosity measurement in proton-proton collisions at $ \sqrt{s} = $ 13 TeV in 2015 and 2016 at CMS | EPJC 81 (2021) 800 | CMS-LUM-17-003 2104.01927 |
| 61 | CMS Collaboration | CMS luminosity measurement for the 2017 data-taking period at $ \sqrt{s} = $ 13 TeV | CMS Physics Analysis Summary, 2018 CMS-PAS-LUM-17-004 |
CMS-PAS-LUM-17-004 |
| 62 | CMS Collaboration | CMS luminosity measurement for the 2018 data-taking period at $ \sqrt{s} = $ 13 TeV | CMS Physics Analysis Summary, 2019 CMS-PAS-LUM-18-002 |
CMS-PAS-LUM-18-002 |
|
|
Compact Muon Solenoid LHC, CERN |
|

|

|

|

|

|