

Compact Muon Solenoid
LHC, CERN
| CMS-PAS-TOP-17-012 | ||
| Extraction of CKM matrix elements in single top quark $t$-channel events in proton-proton collisions at $\sqrt{s} = $ 13 TeV | ||
| CMS Collaboration | ||
| November 2019 | ||
| Abstract: This note presents a model-independent extraction of the modulus of the Cabibbo Kobayashi Maskawa matrix elements $\mathrm{V_{\mathrm{tb}}}$, $\mathrm{V_{\mathrm{td}}}$, and $\mathrm{V_{\mathrm{ts}}}$ using an event sample enriched in single top quark $t$-channel events. The analysis uses proton-proton collisions data from the LHC collected during 2016 by the CMS experiment at a centre-of-mass energy of 13 TeV, corresponding to an integrated luminosity of 35.9 fb$^{-1}$. Processes directly sensitive to the matrix elements $\mathrm{V_{\mathrm{tb}}}$, $\mathrm{V_{\mathrm{td}}}$, and $\mathrm{V_{\mathrm{ts}}}$ are considered in both the production and decay vertices of the top quark in single top quark $t$-channel production, as well as in the background processes containing top quarks. Final states are investigated where a muon or electron stems from the leptonic decay chain of the top quark, and two or three jets are selected, one or two of which are identified as coming from the hadronisation of a b quark. The event sample is divided into categories according to the number of jets. Multivariate classifier variables are built in each category in order to discriminate between signal and other standard model processes, and a simultaneous maximum-likelihood fit to data is performed on all categories. The measured value of $\mathrm{|V_{\mathrm{tb}}|}$ is 1.00 $\pm$ 0.03, where the uncertainty includes both statistical and systematic uncertainties, and the upper limit derived on $\mathrm{|V_{\mathrm{ts}}|^2}+\mathrm{|V_{\mathrm{td}}|^2}$ is 0.17 at 95% confidence level. | ||
|
Links:
CDS record (PDF) ;
CADI line (restricted) ;
These preliminary results are superseded in this paper, PLB 808 (2020) 135609. The superseded preliminary plots can be found here. |
||
| Figures | |
png pdf |
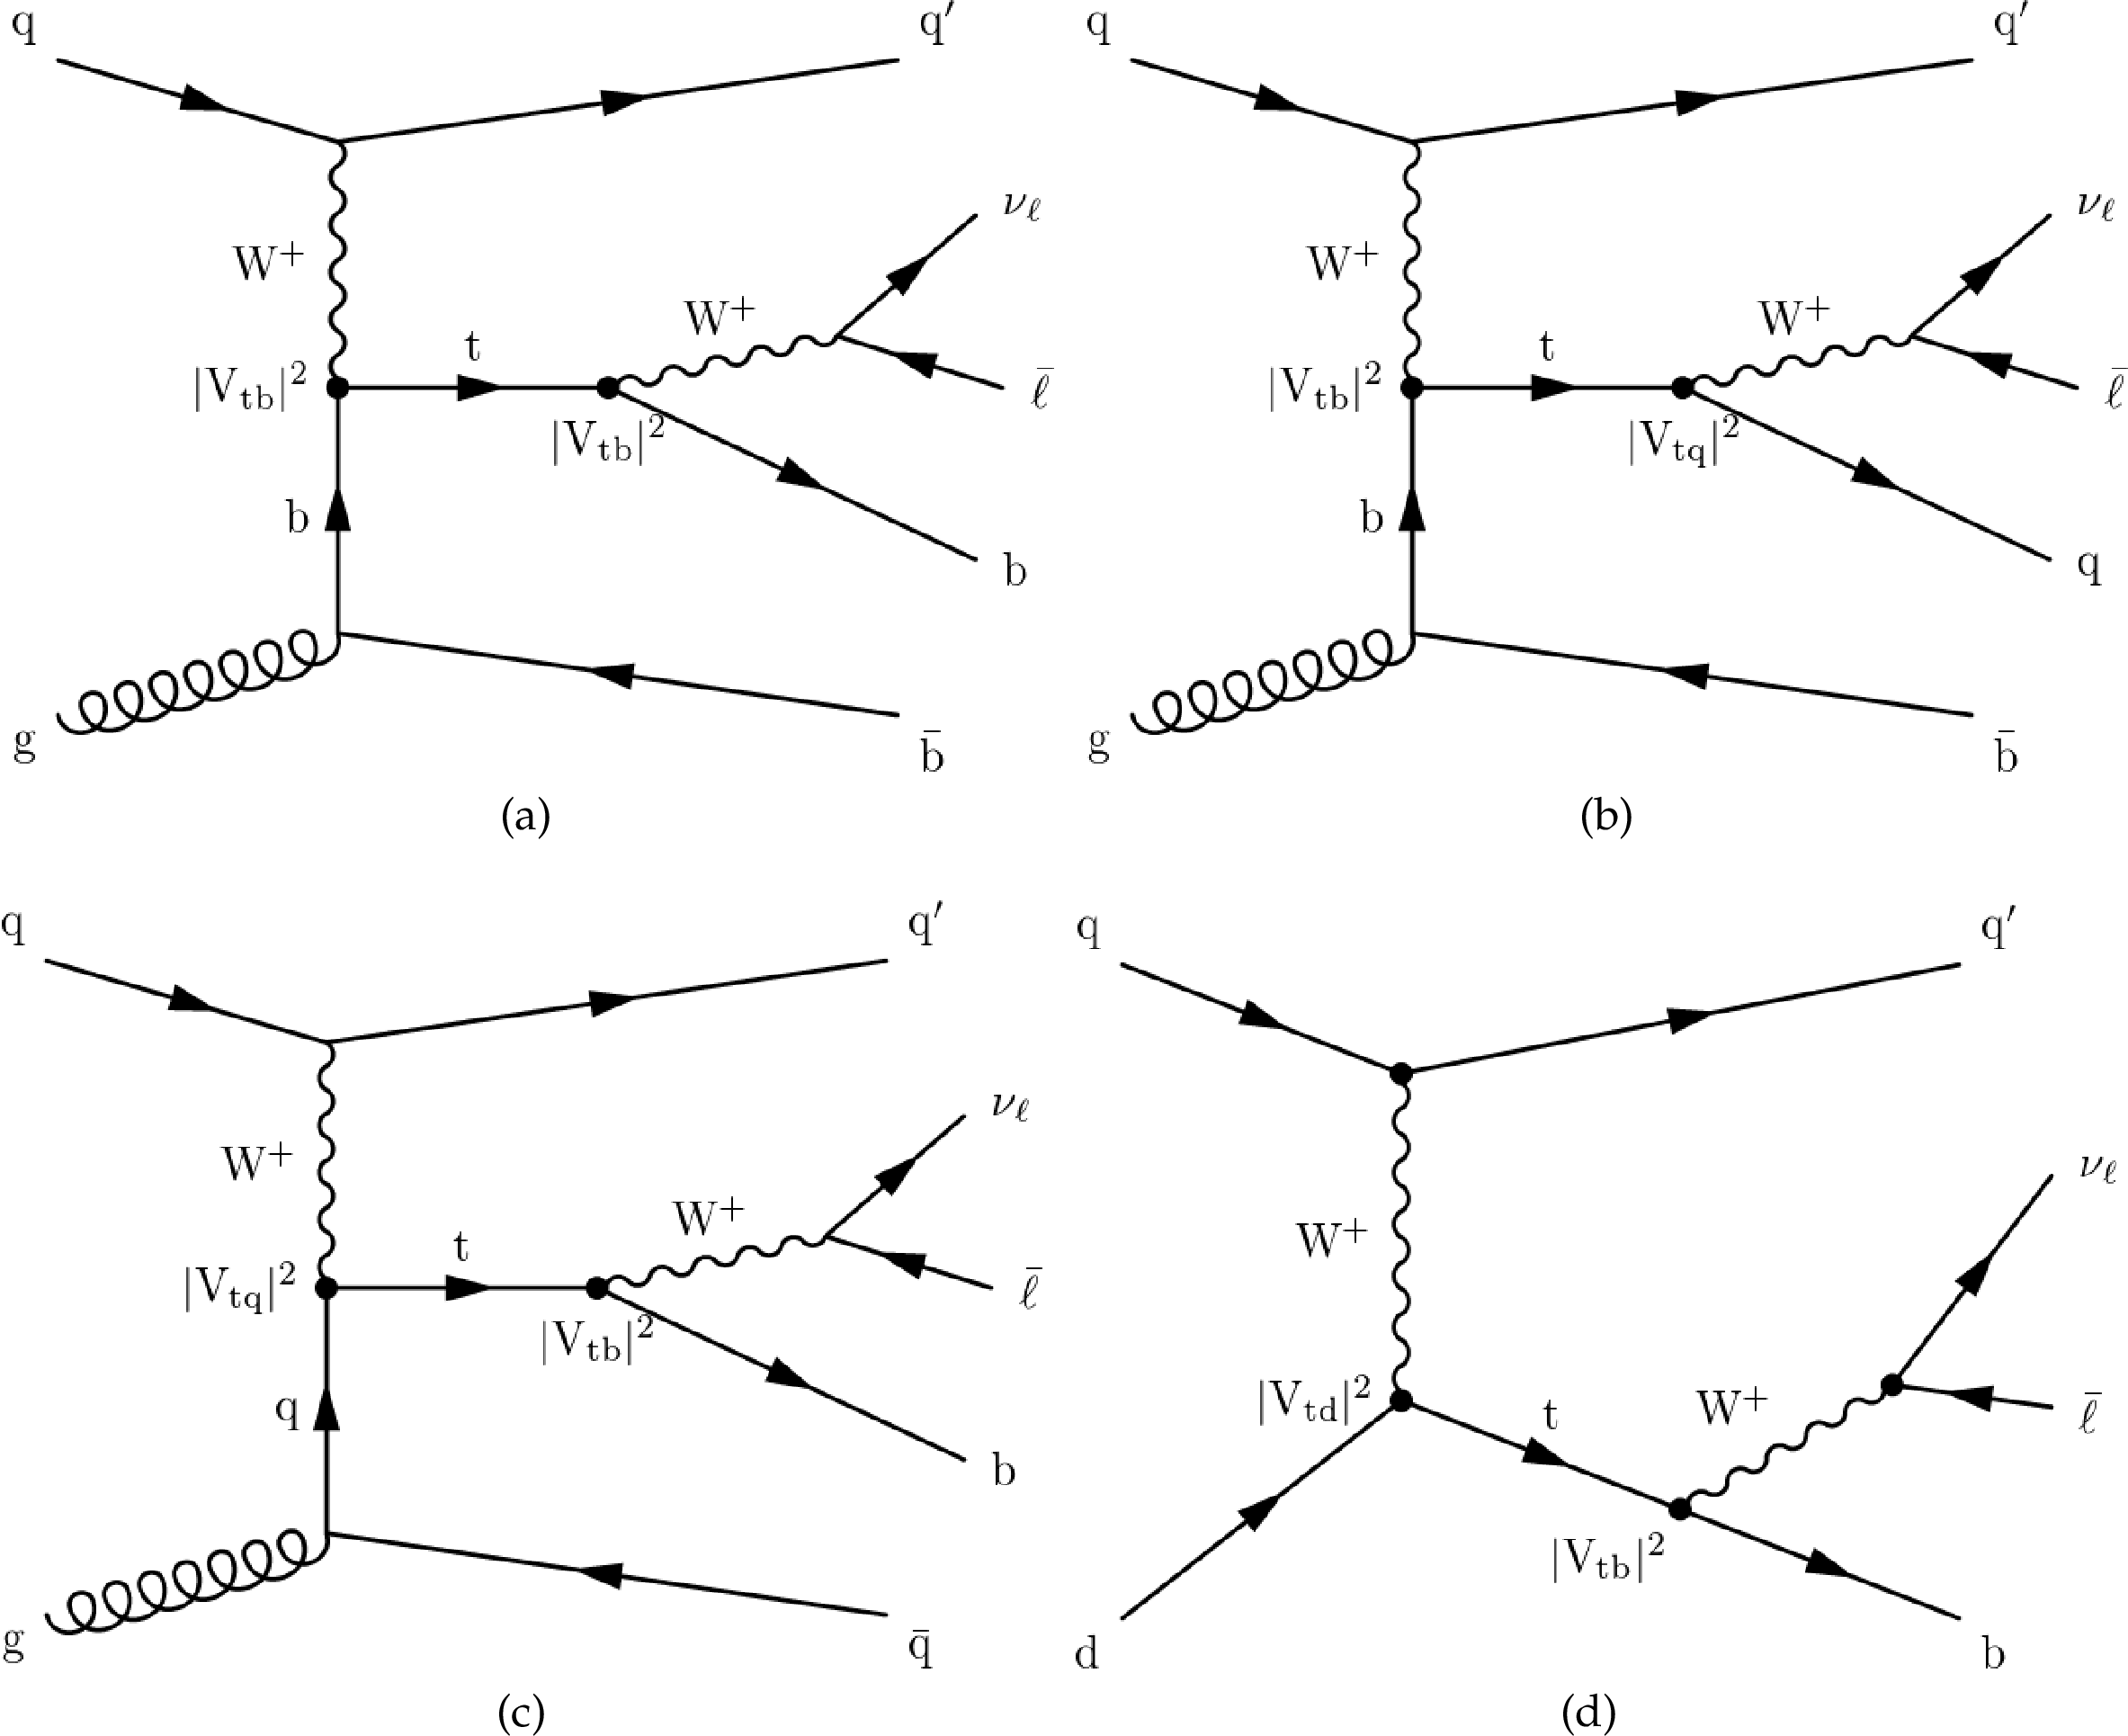
Figure 1:
Leading-order Feynman diagrams for single top quark production via the $t$-channel featuring: (a) a tWb vertex in production and decay, (b) a tWb vertex in production and a tWq in decay, with q being a s or d quark, (c) a tWq vertex in production and a tWb in decay, and (d) a d quark-initiated process, enhanced thanks to contributions from valence d quarks. |
png pdf |
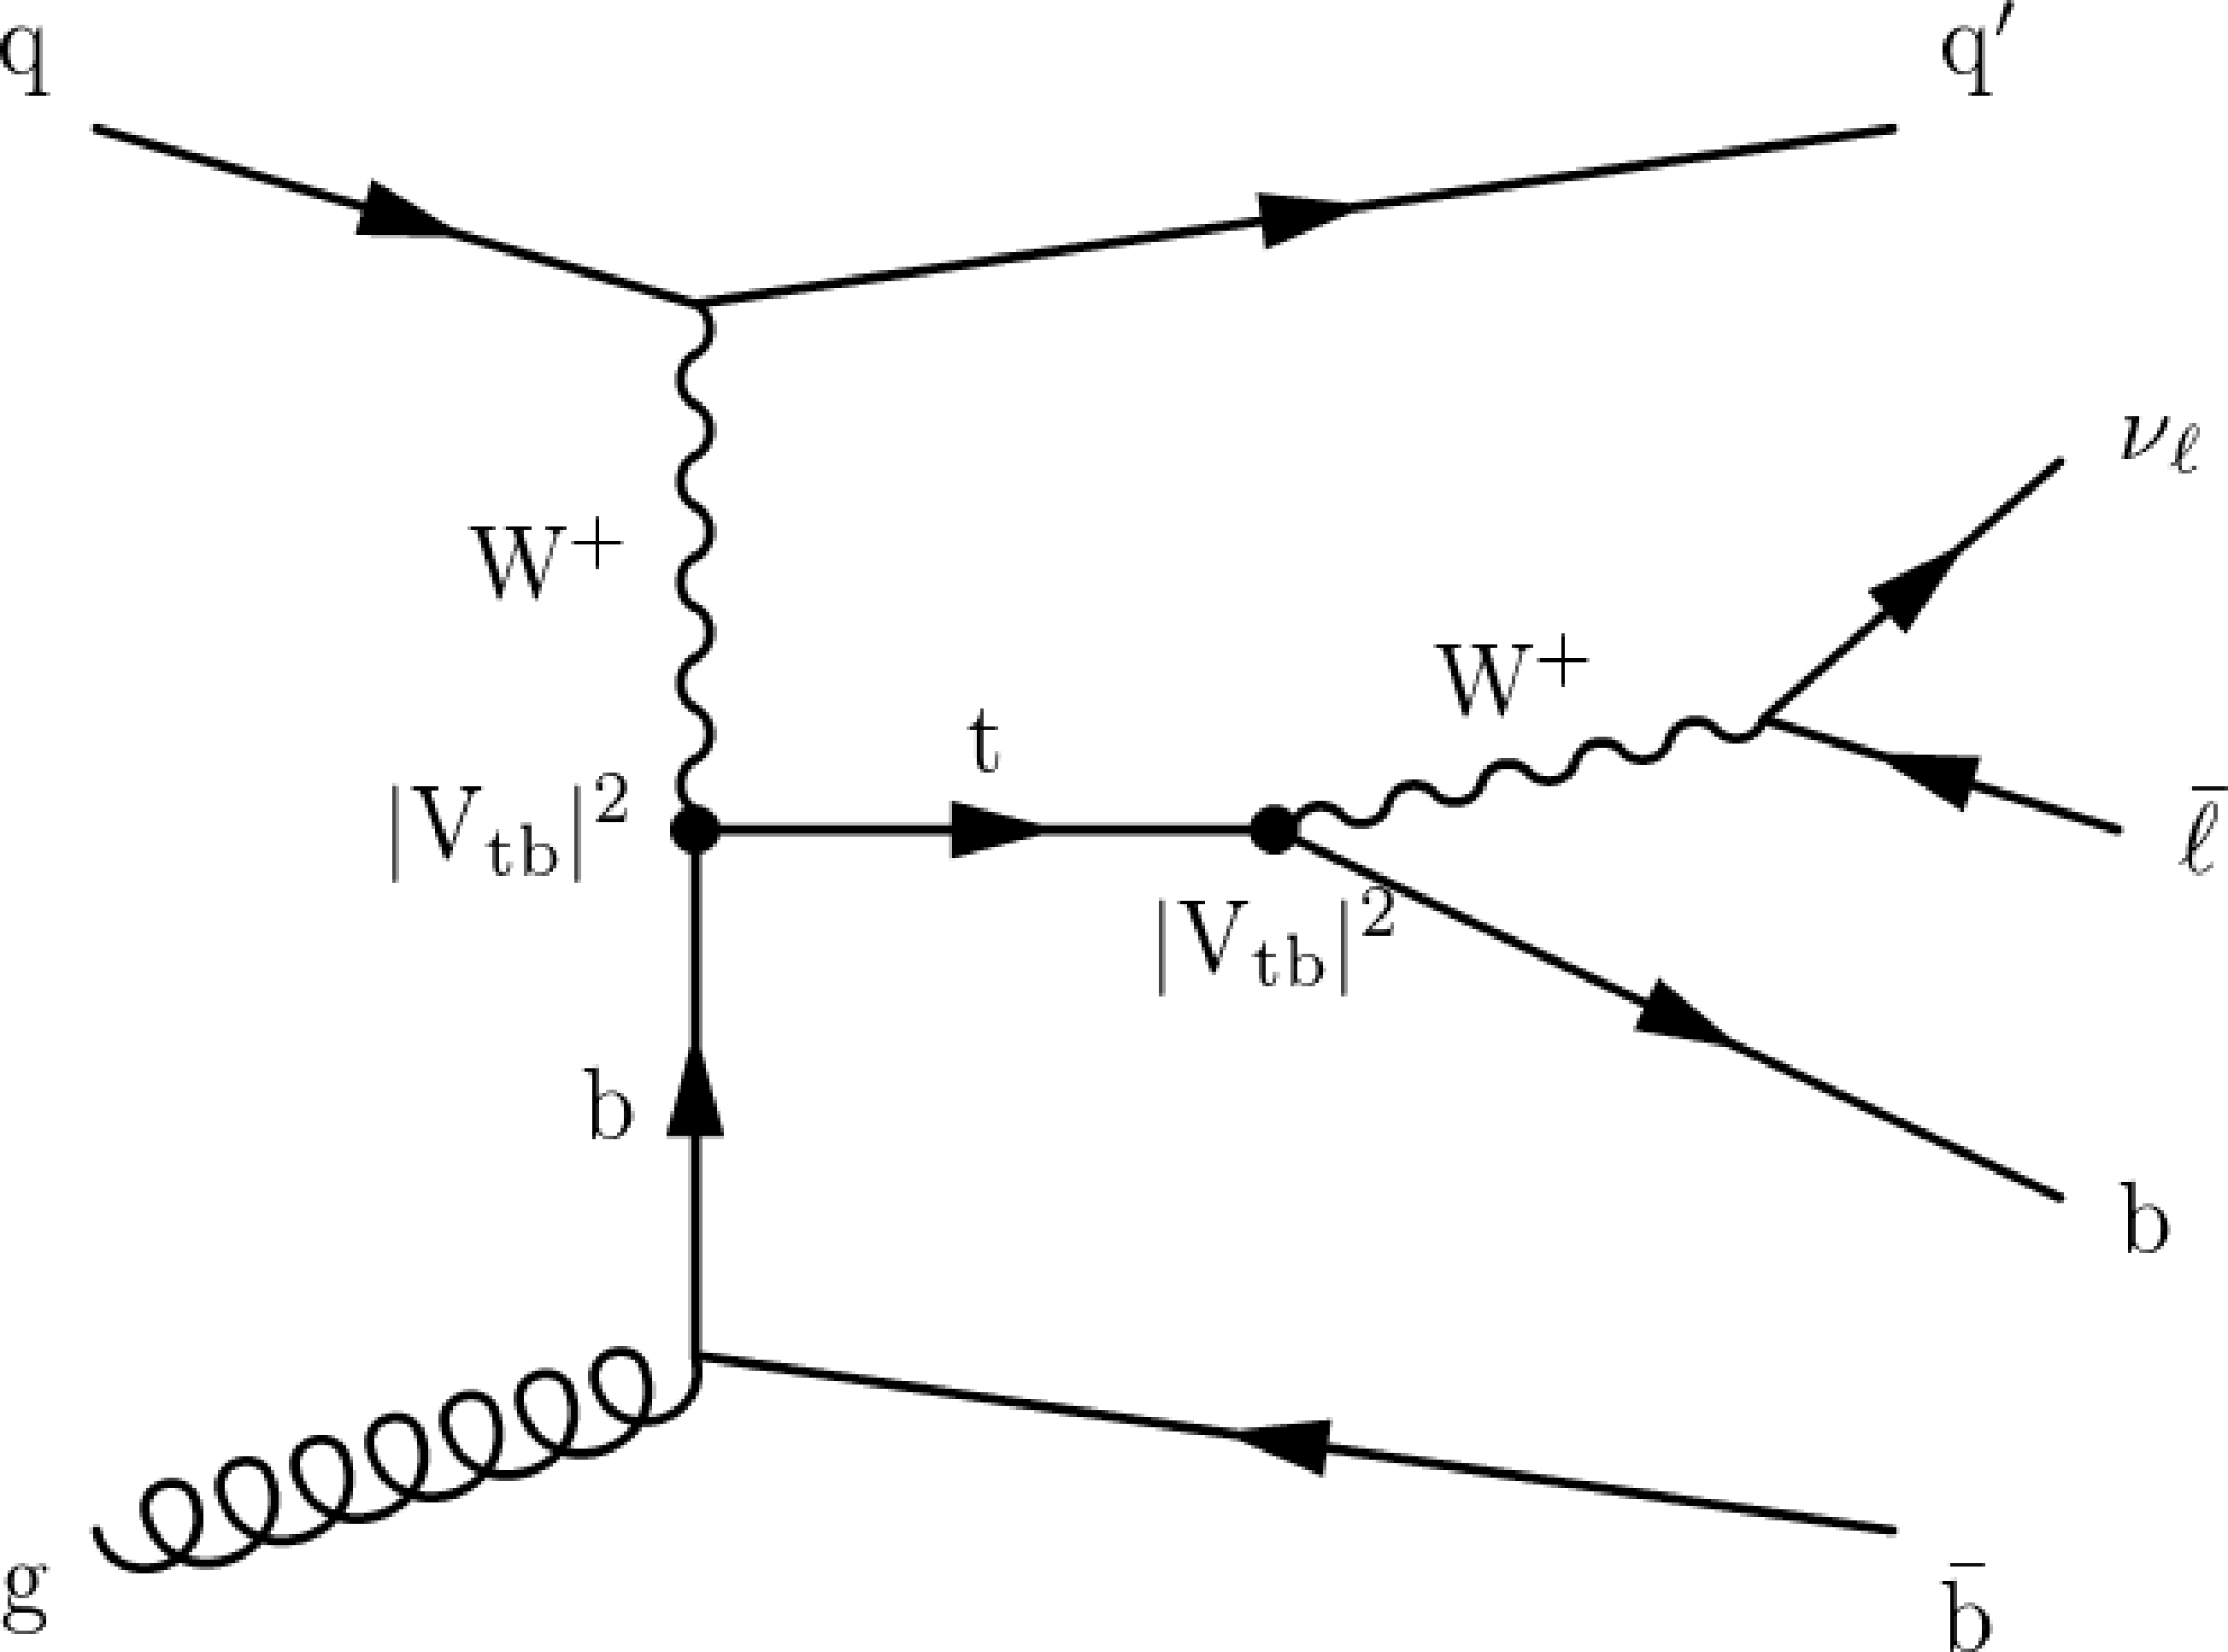
Figure 1-a:
Leading-order Feynman diagram for single top quark production via the $t$-channel featuring a tWb vertex in production and decay. |

png pdf |
Figure 1-b:
Leading-order Feynman diagram for single top quark production via the $t$-channel featuring a tWb vertex in production and a tWq in decay, with q being a s or d quark. |
png pdf |
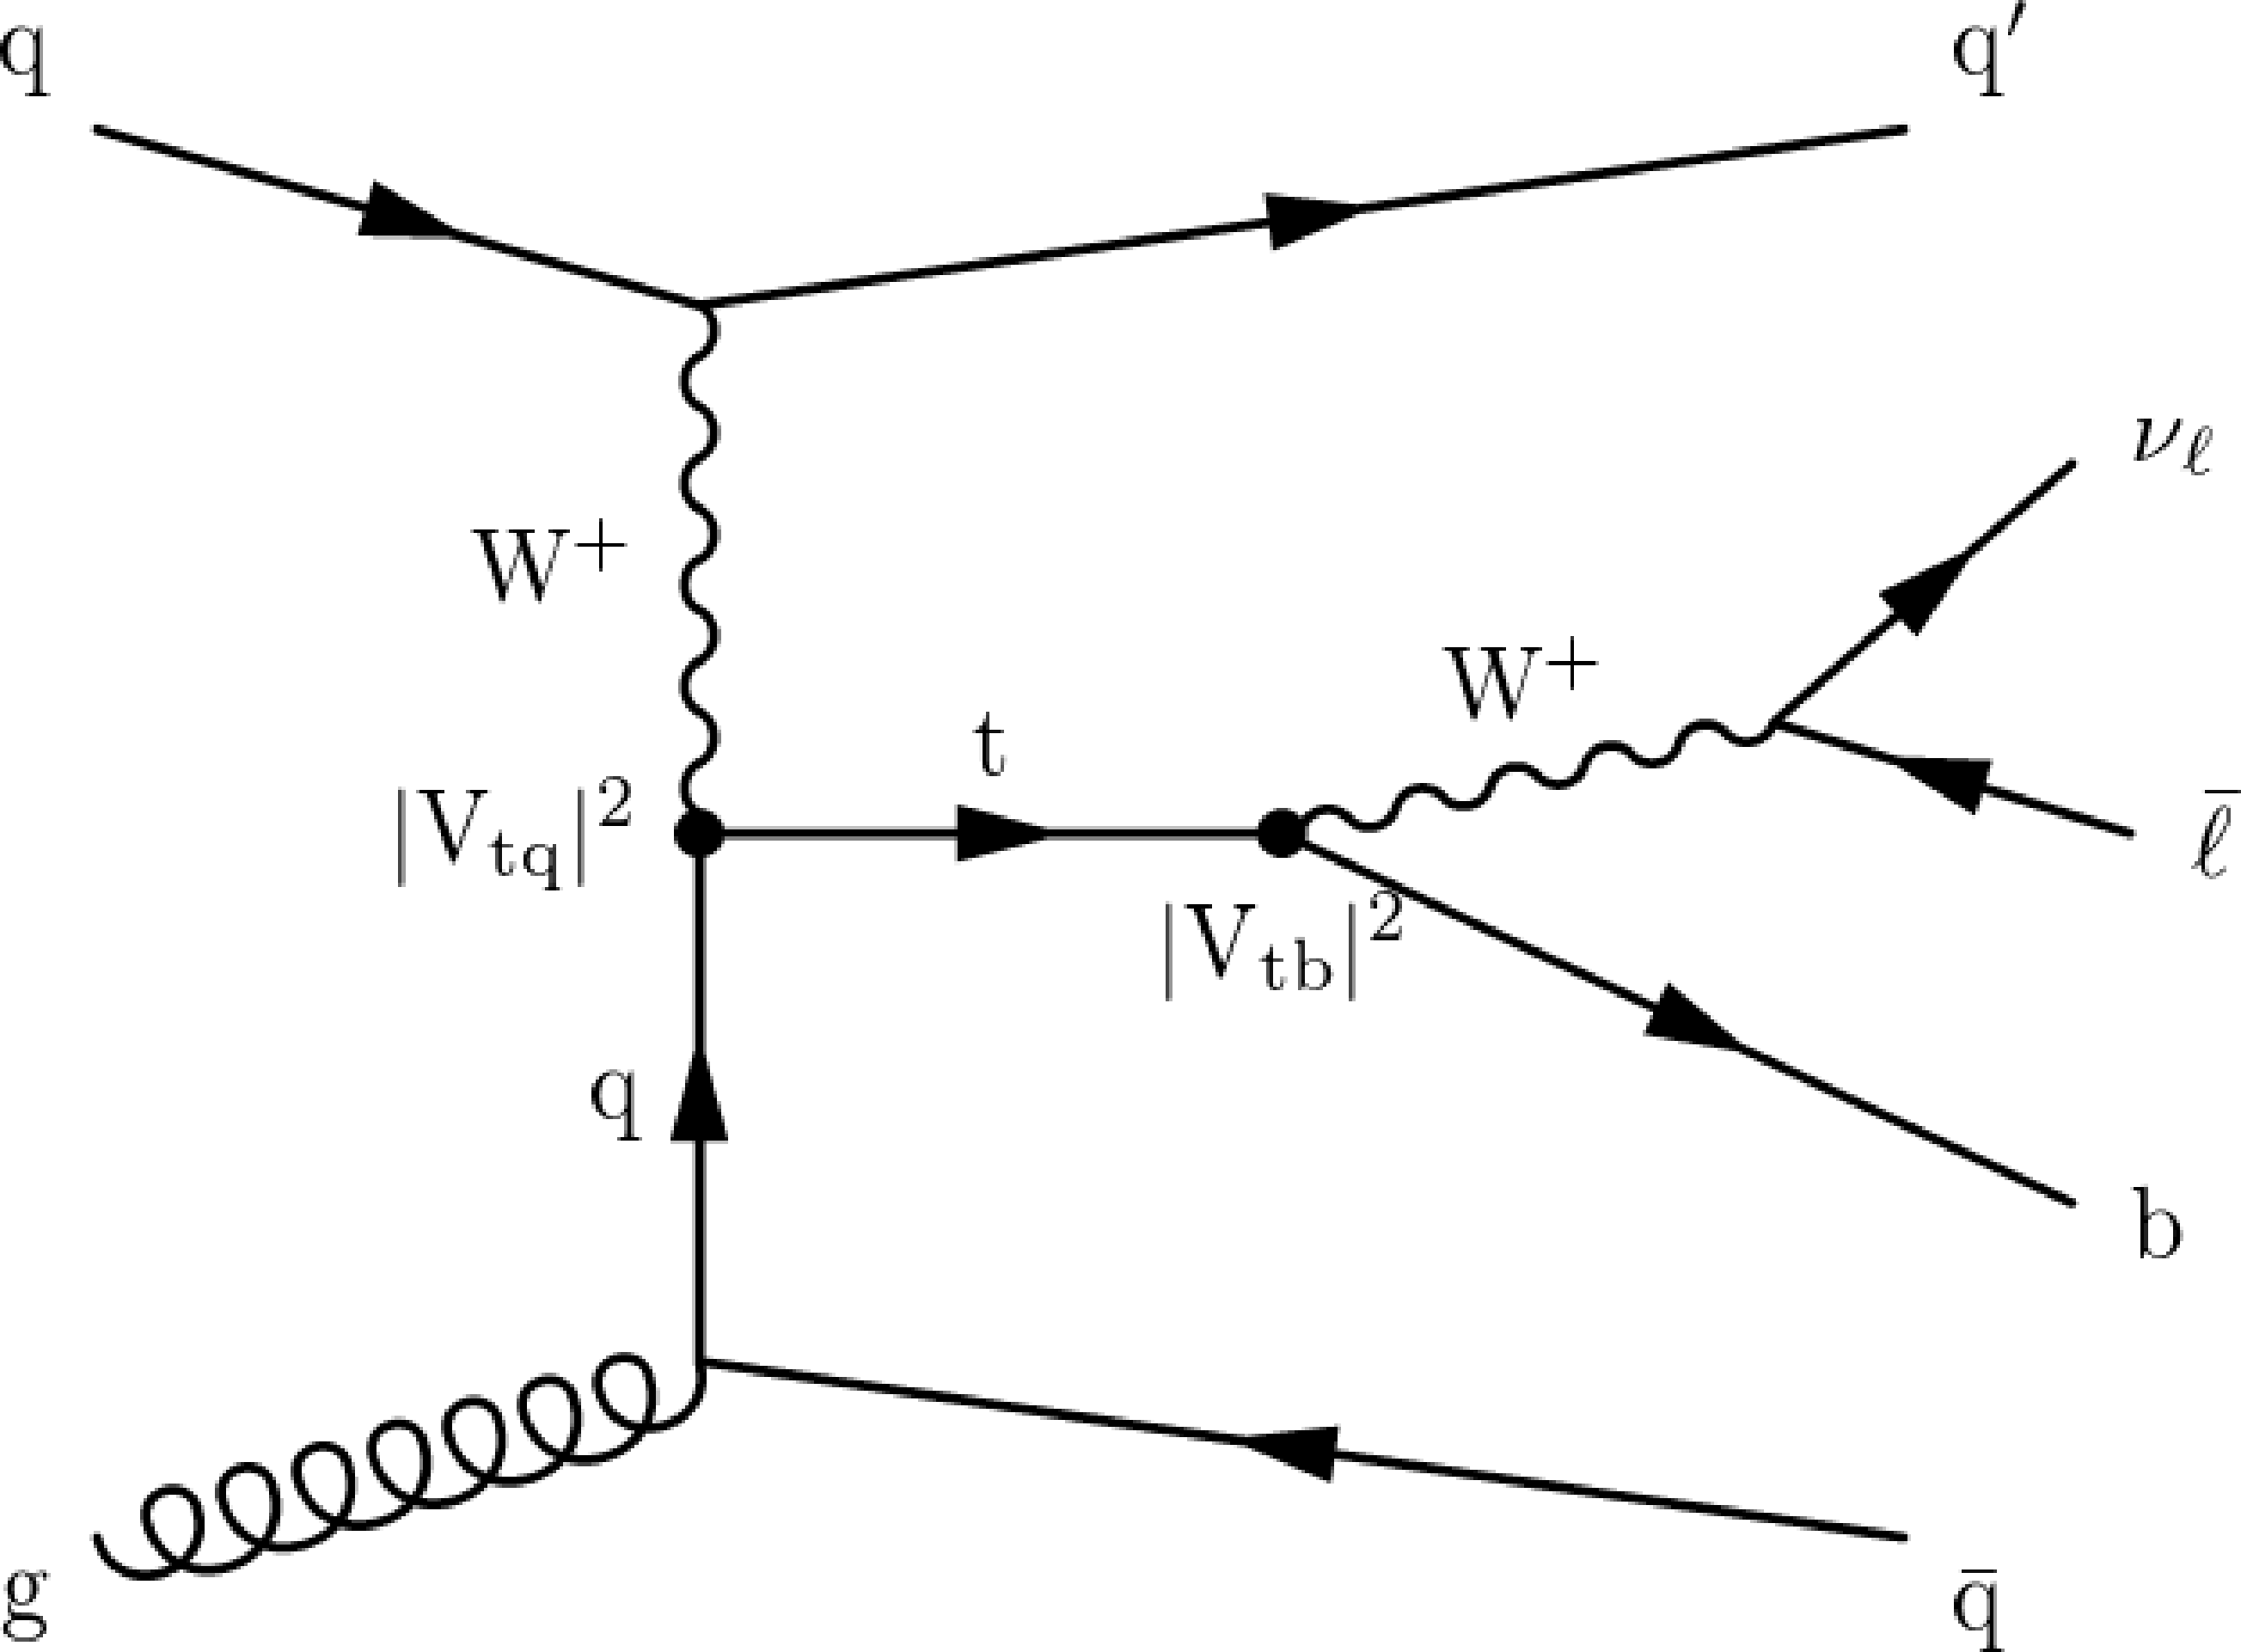
Figure 1-c:
Leading-order Feynman diagram for single top quark production via the $t$-channel featuring a tWq vertex in production and a tWb in decay. |

png pdf |
Figure 1-d:
Leading-order Feynman diagram for single top quark production via the $t$-channel featuring a d quark-initiated process, enhanced thanks to contributions from valence d quarks. |
png pdf |
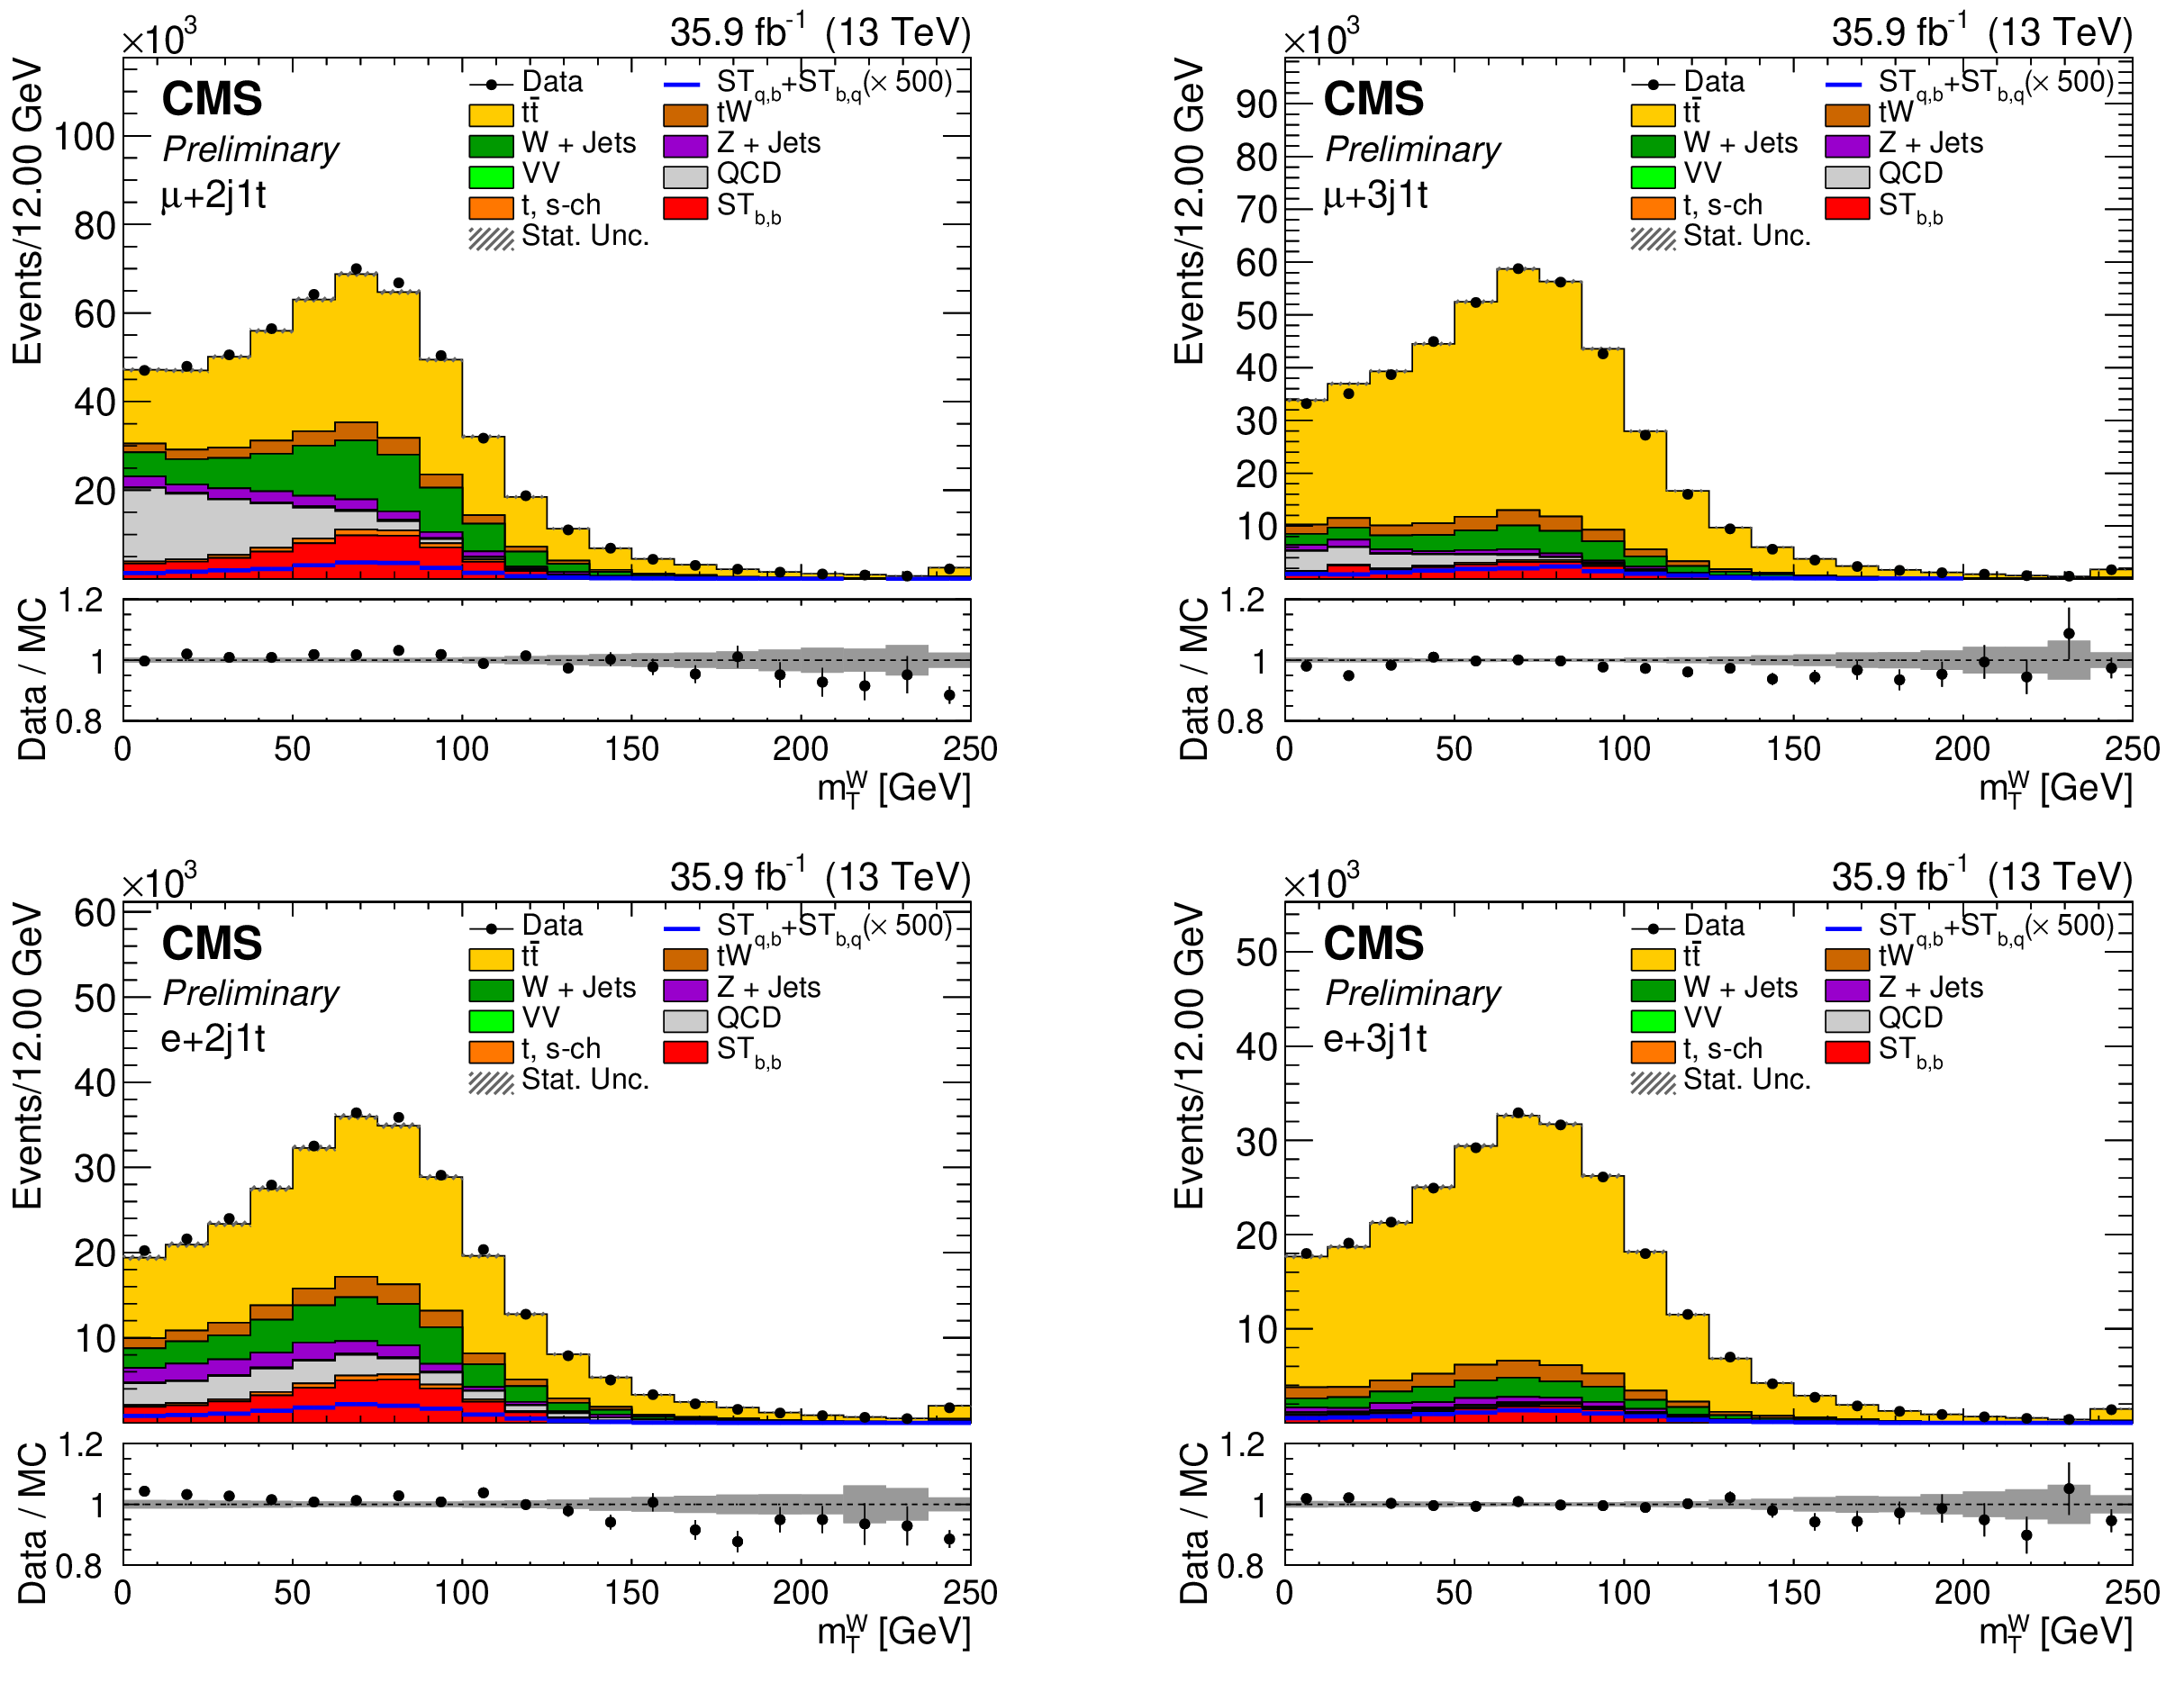
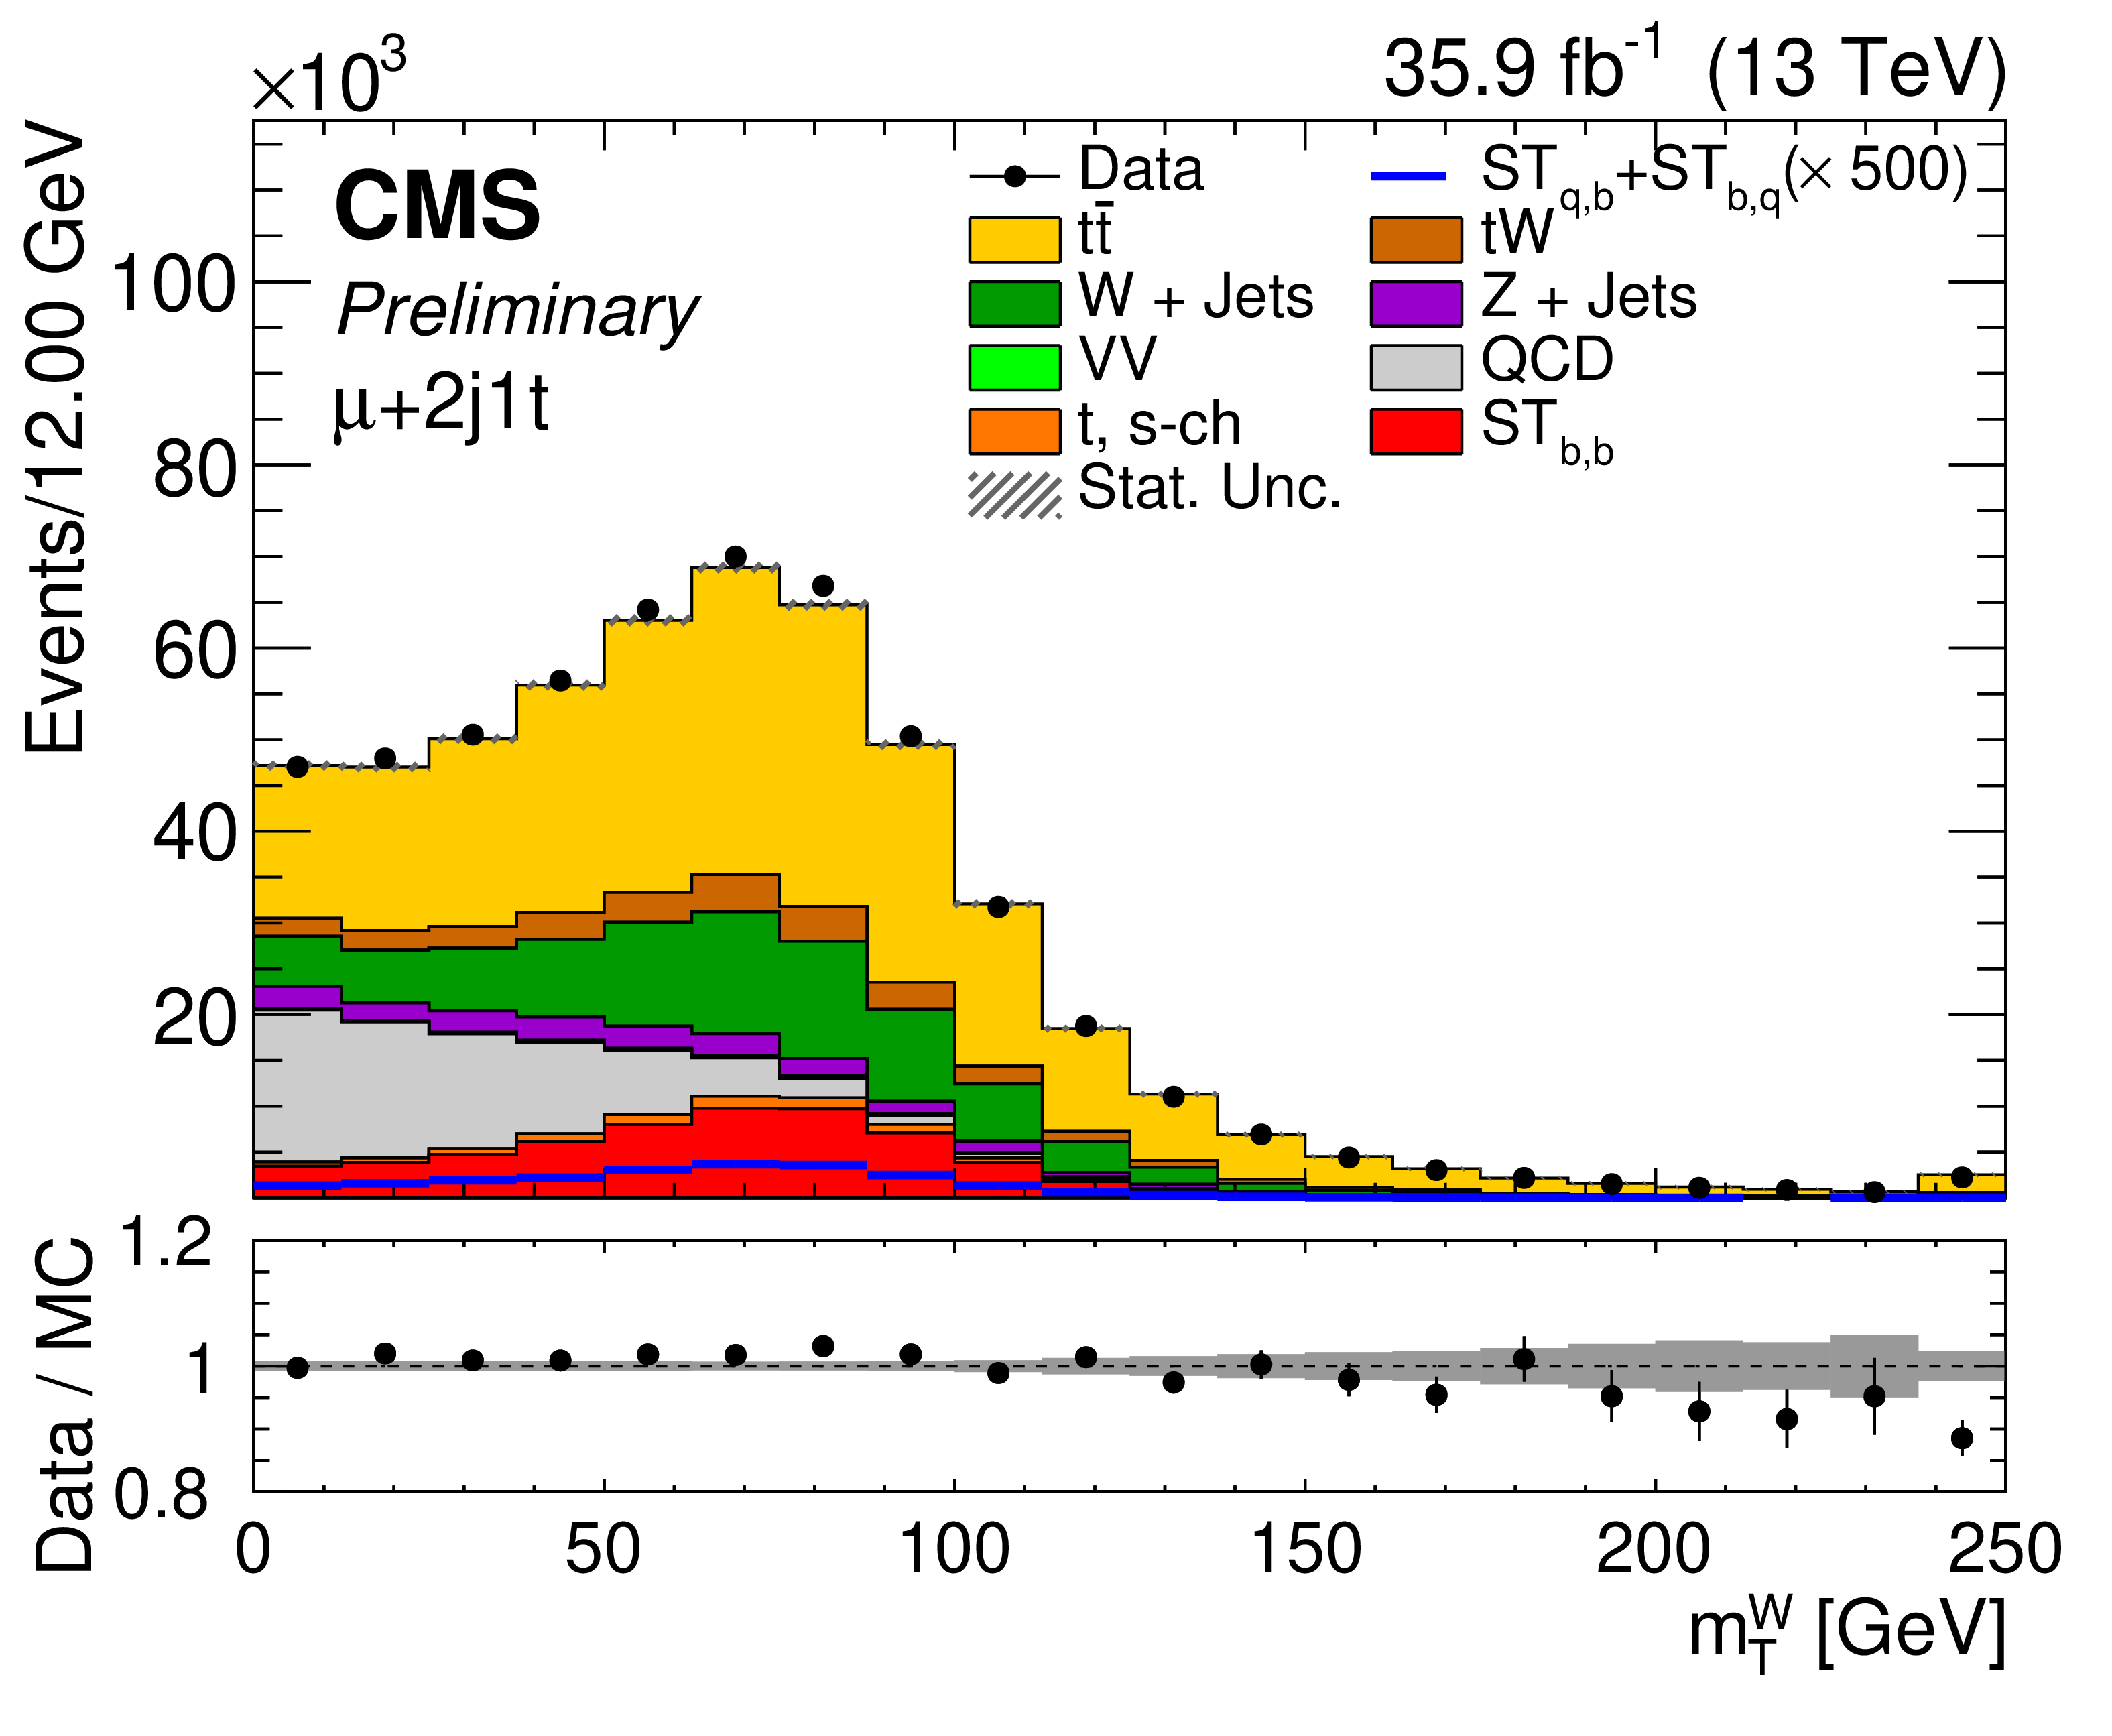
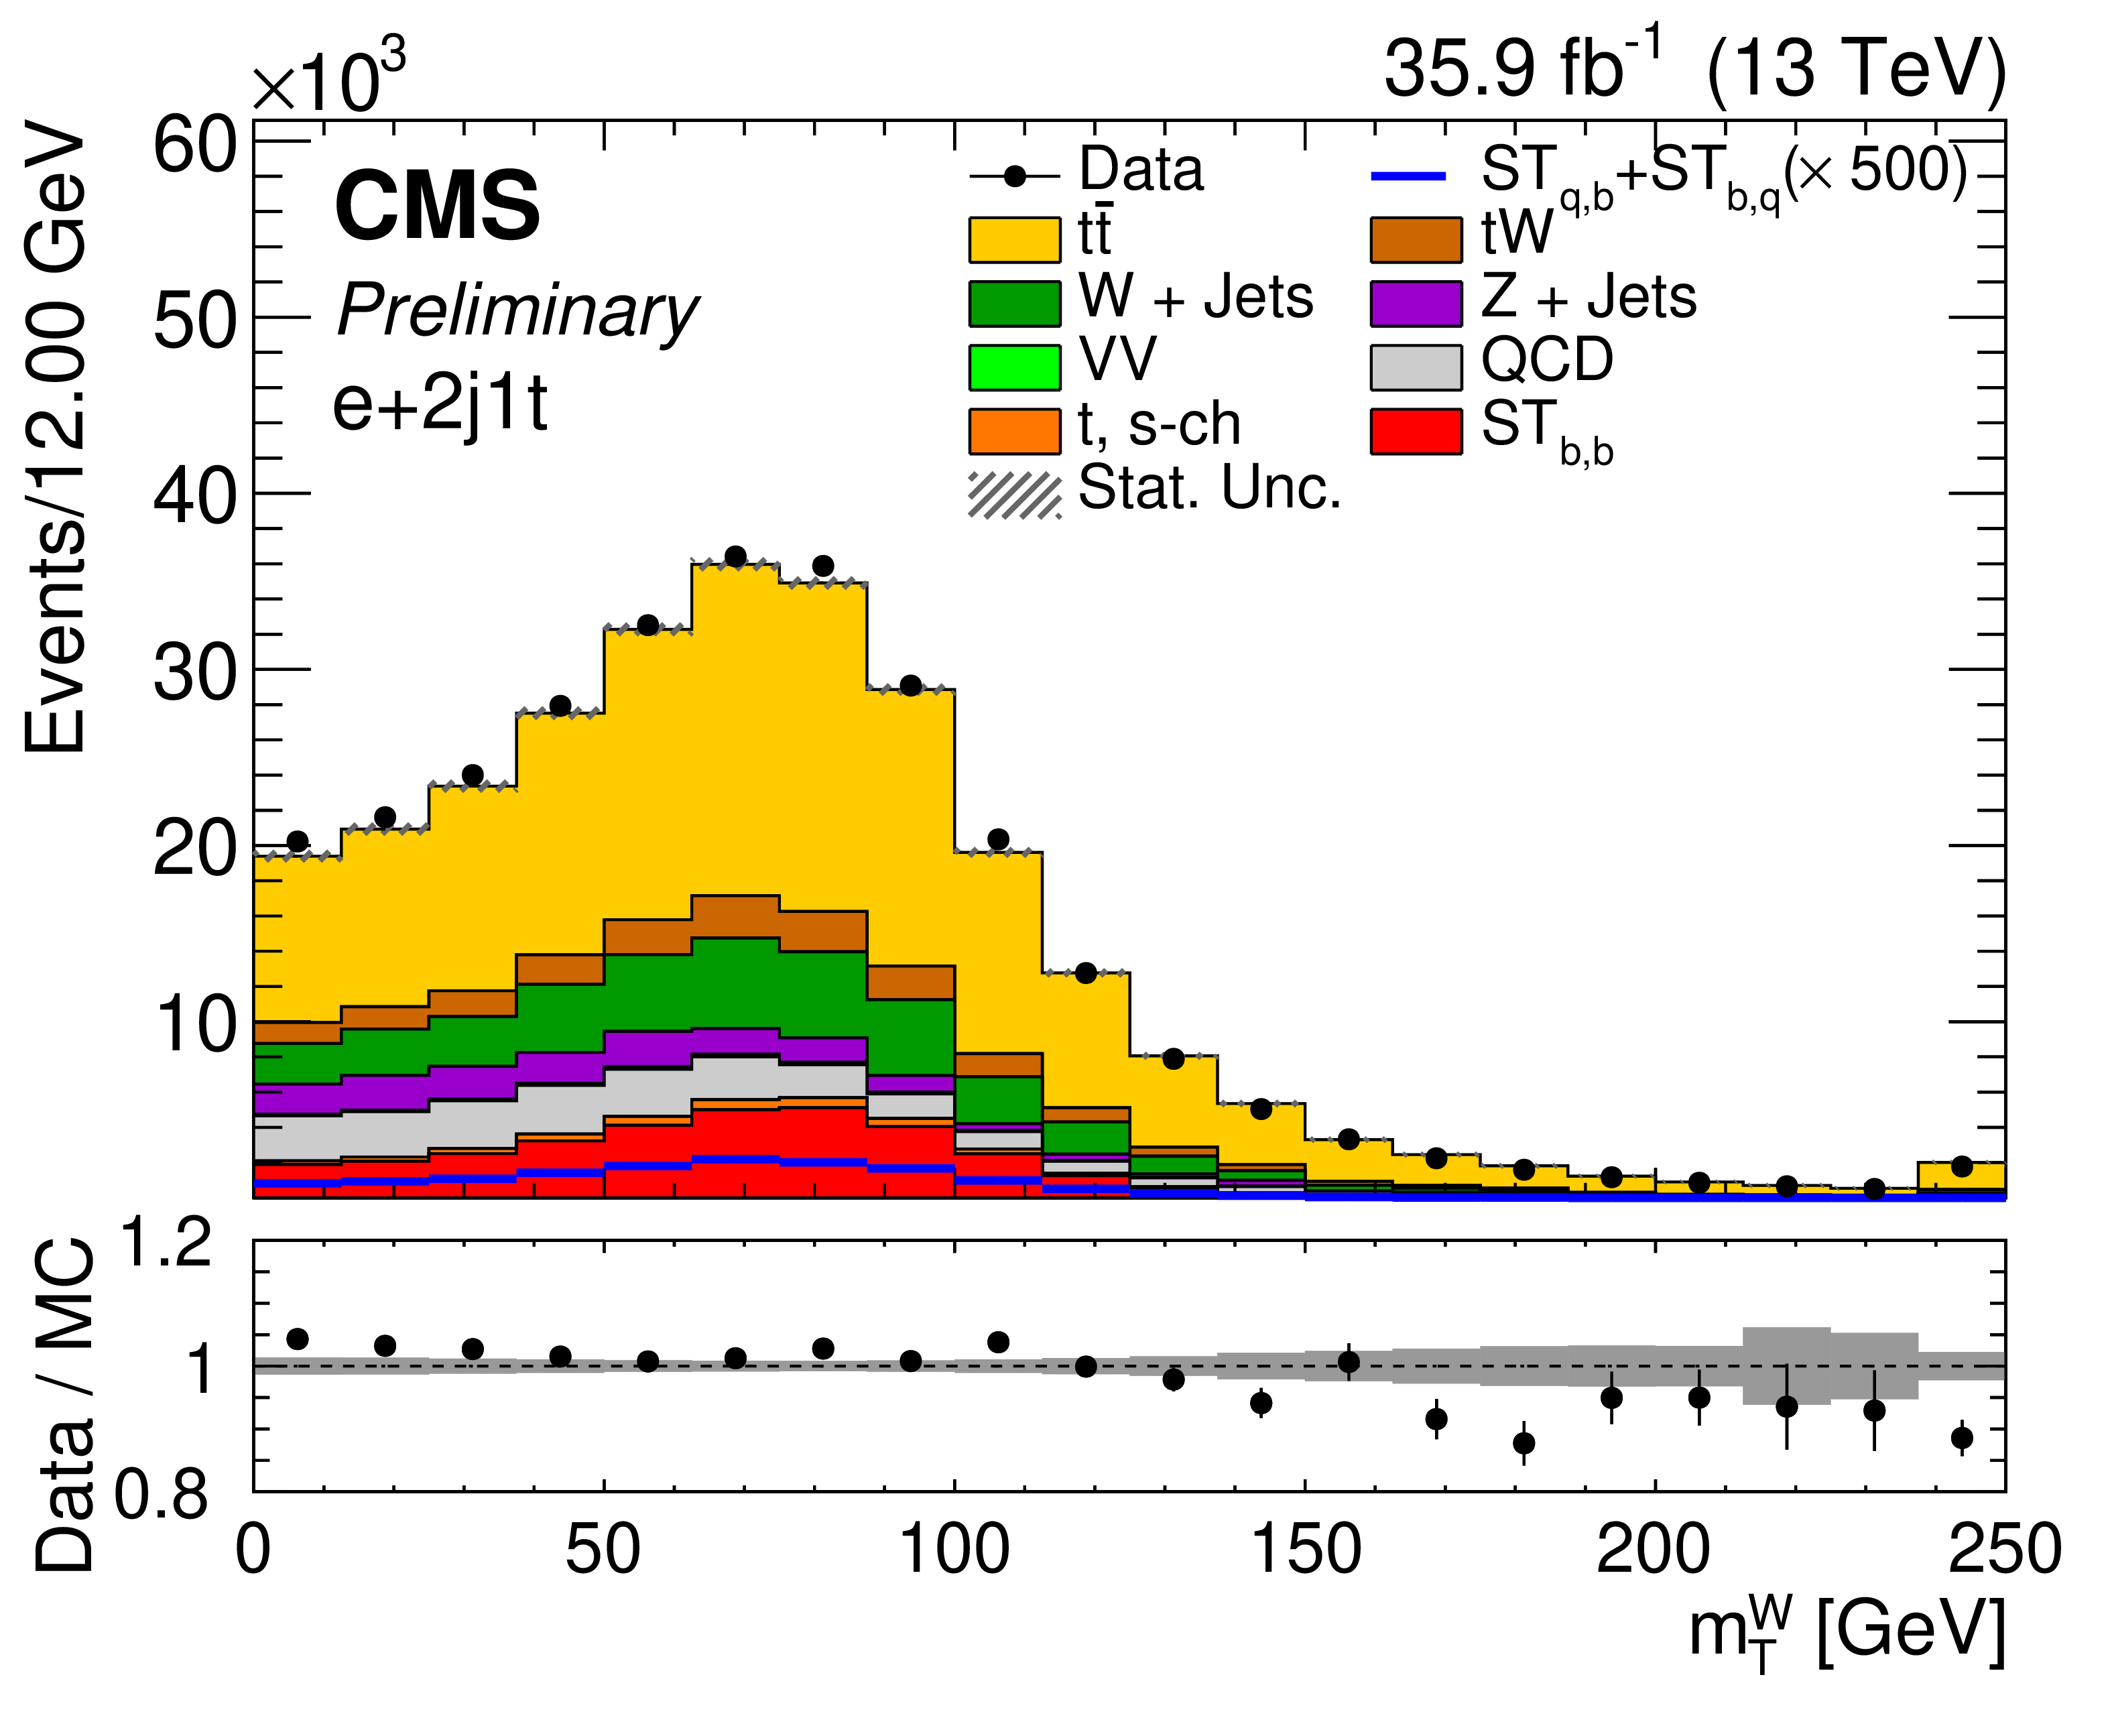
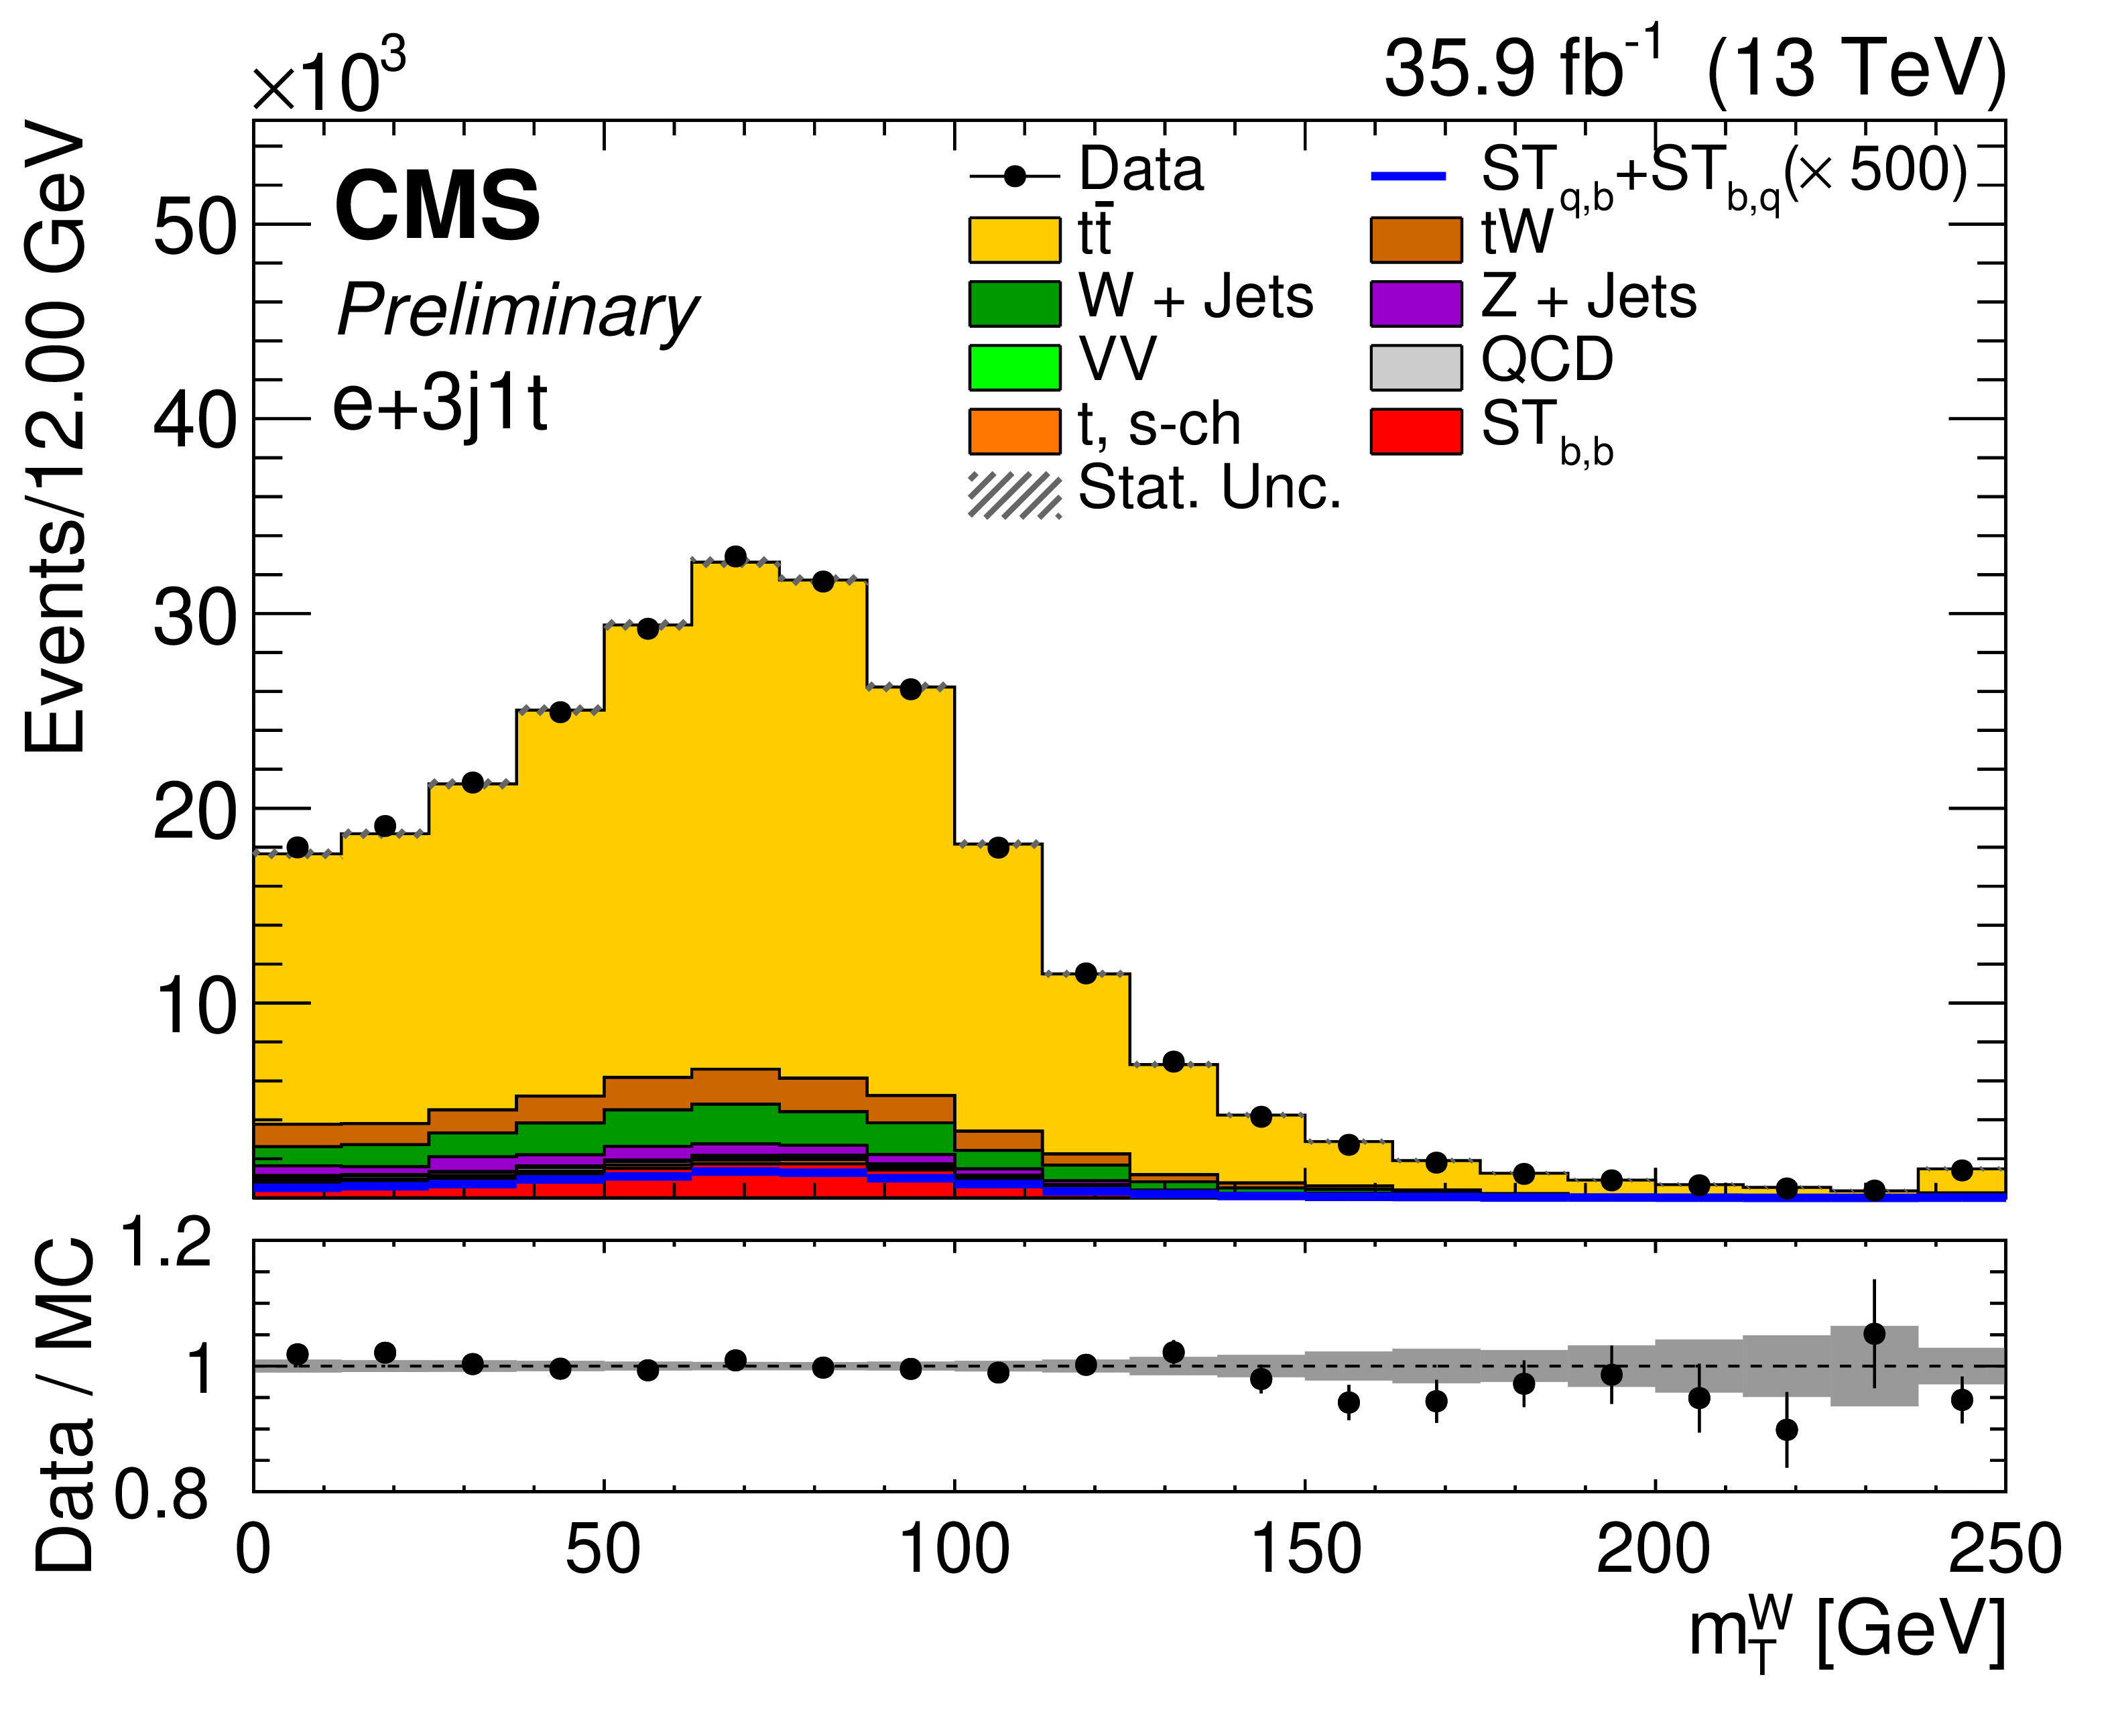
Figure 2:
The ${m_{\mathrm {T}}^{\mathrm {W}}}$ distributions in the (left) 2j1t and (right) 3j1t regions for the (upper) muon and (lower) electron channels. The lower plots show the ratio of the data to the MC prediction. |
png pdf |
Figure 2-a:
The ${m_{\mathrm {T}}^{\mathrm {W}}}$ distribution in the 2j1t region for the muon channel. The lower plot shows the ratio of the data to the MC prediction. |

png pdf |
Figure 2-b:
The ${m_{\mathrm {T}}^{\mathrm {W}}}$ distribution in the 3j1t region for the muon channel. The lower plot shows the ratio of the data to the MC prediction. |
png pdf |
Figure 2-c:
The ${m_{\mathrm {T}}^{\mathrm {W}}}$ distribution in the 2j1t region for the electron channel. The lower plot shows the ratio of the data to the MC prediction. |
png pdf |
Figure 2-d:
The ${m_{\mathrm {T}}^{\mathrm {W}}}$ distribution in the 3j1t region for the electron channel. The lower plot shows the ratio of the data to the MC prediction. |

png pdf |
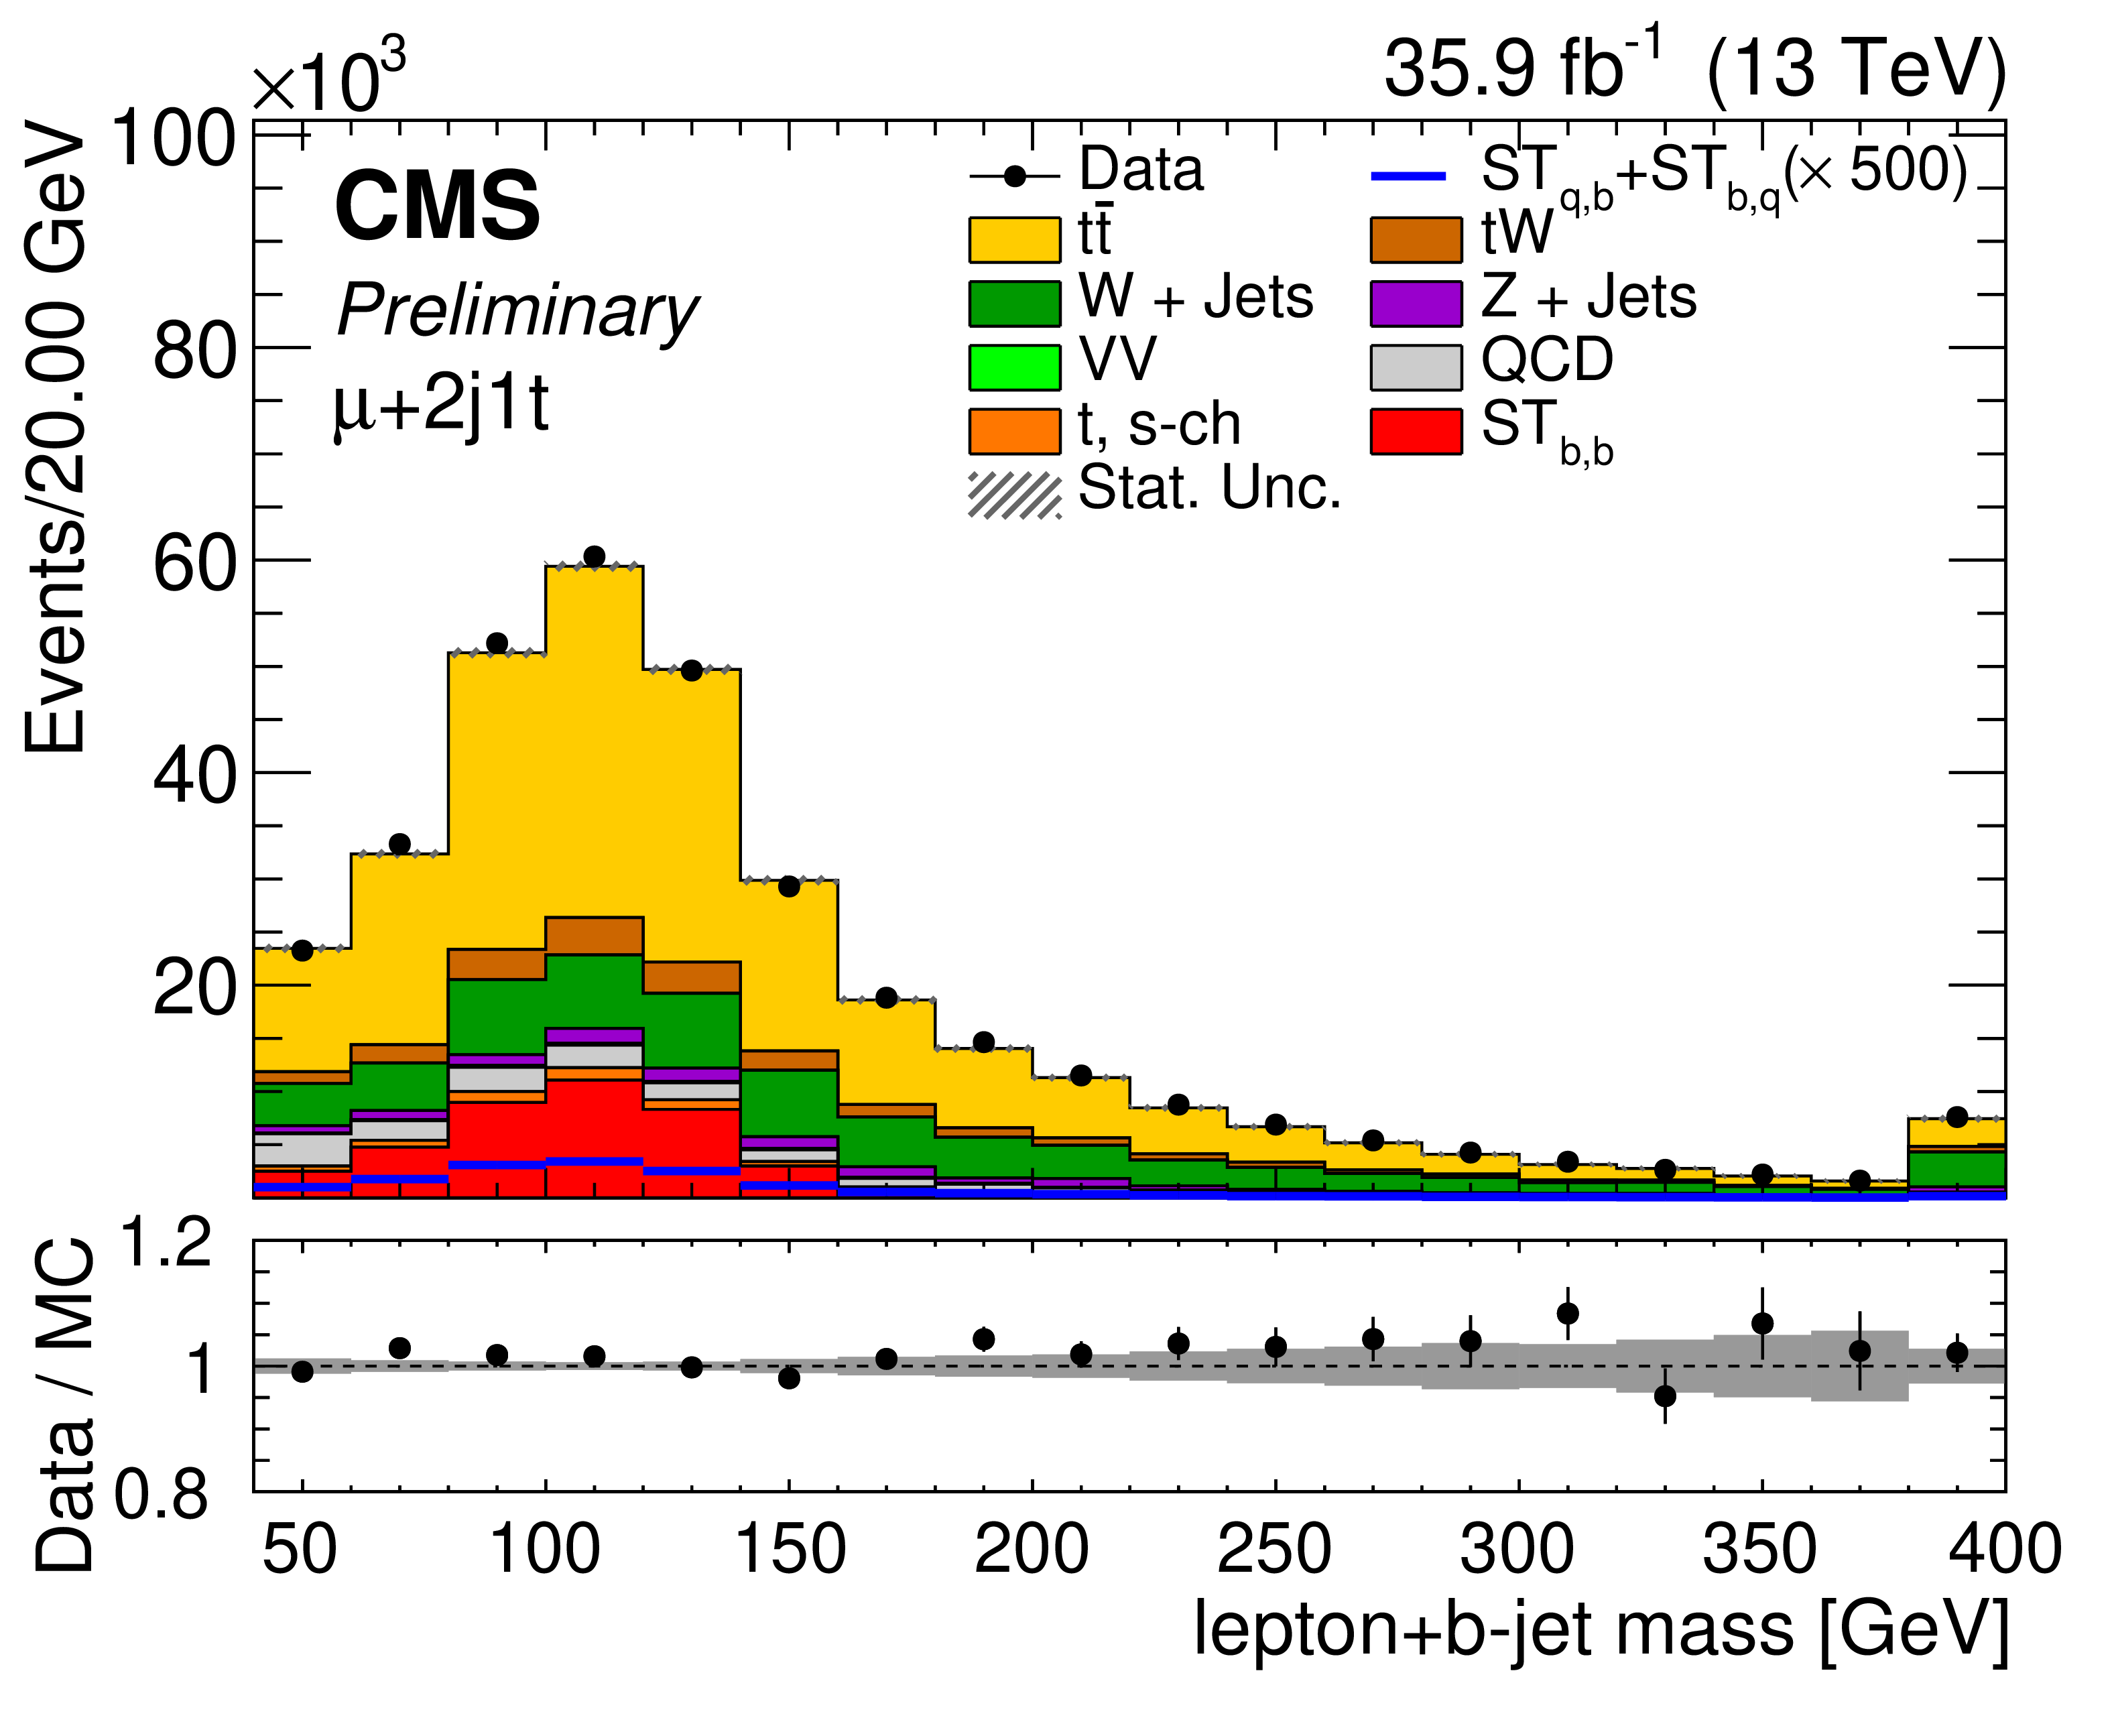
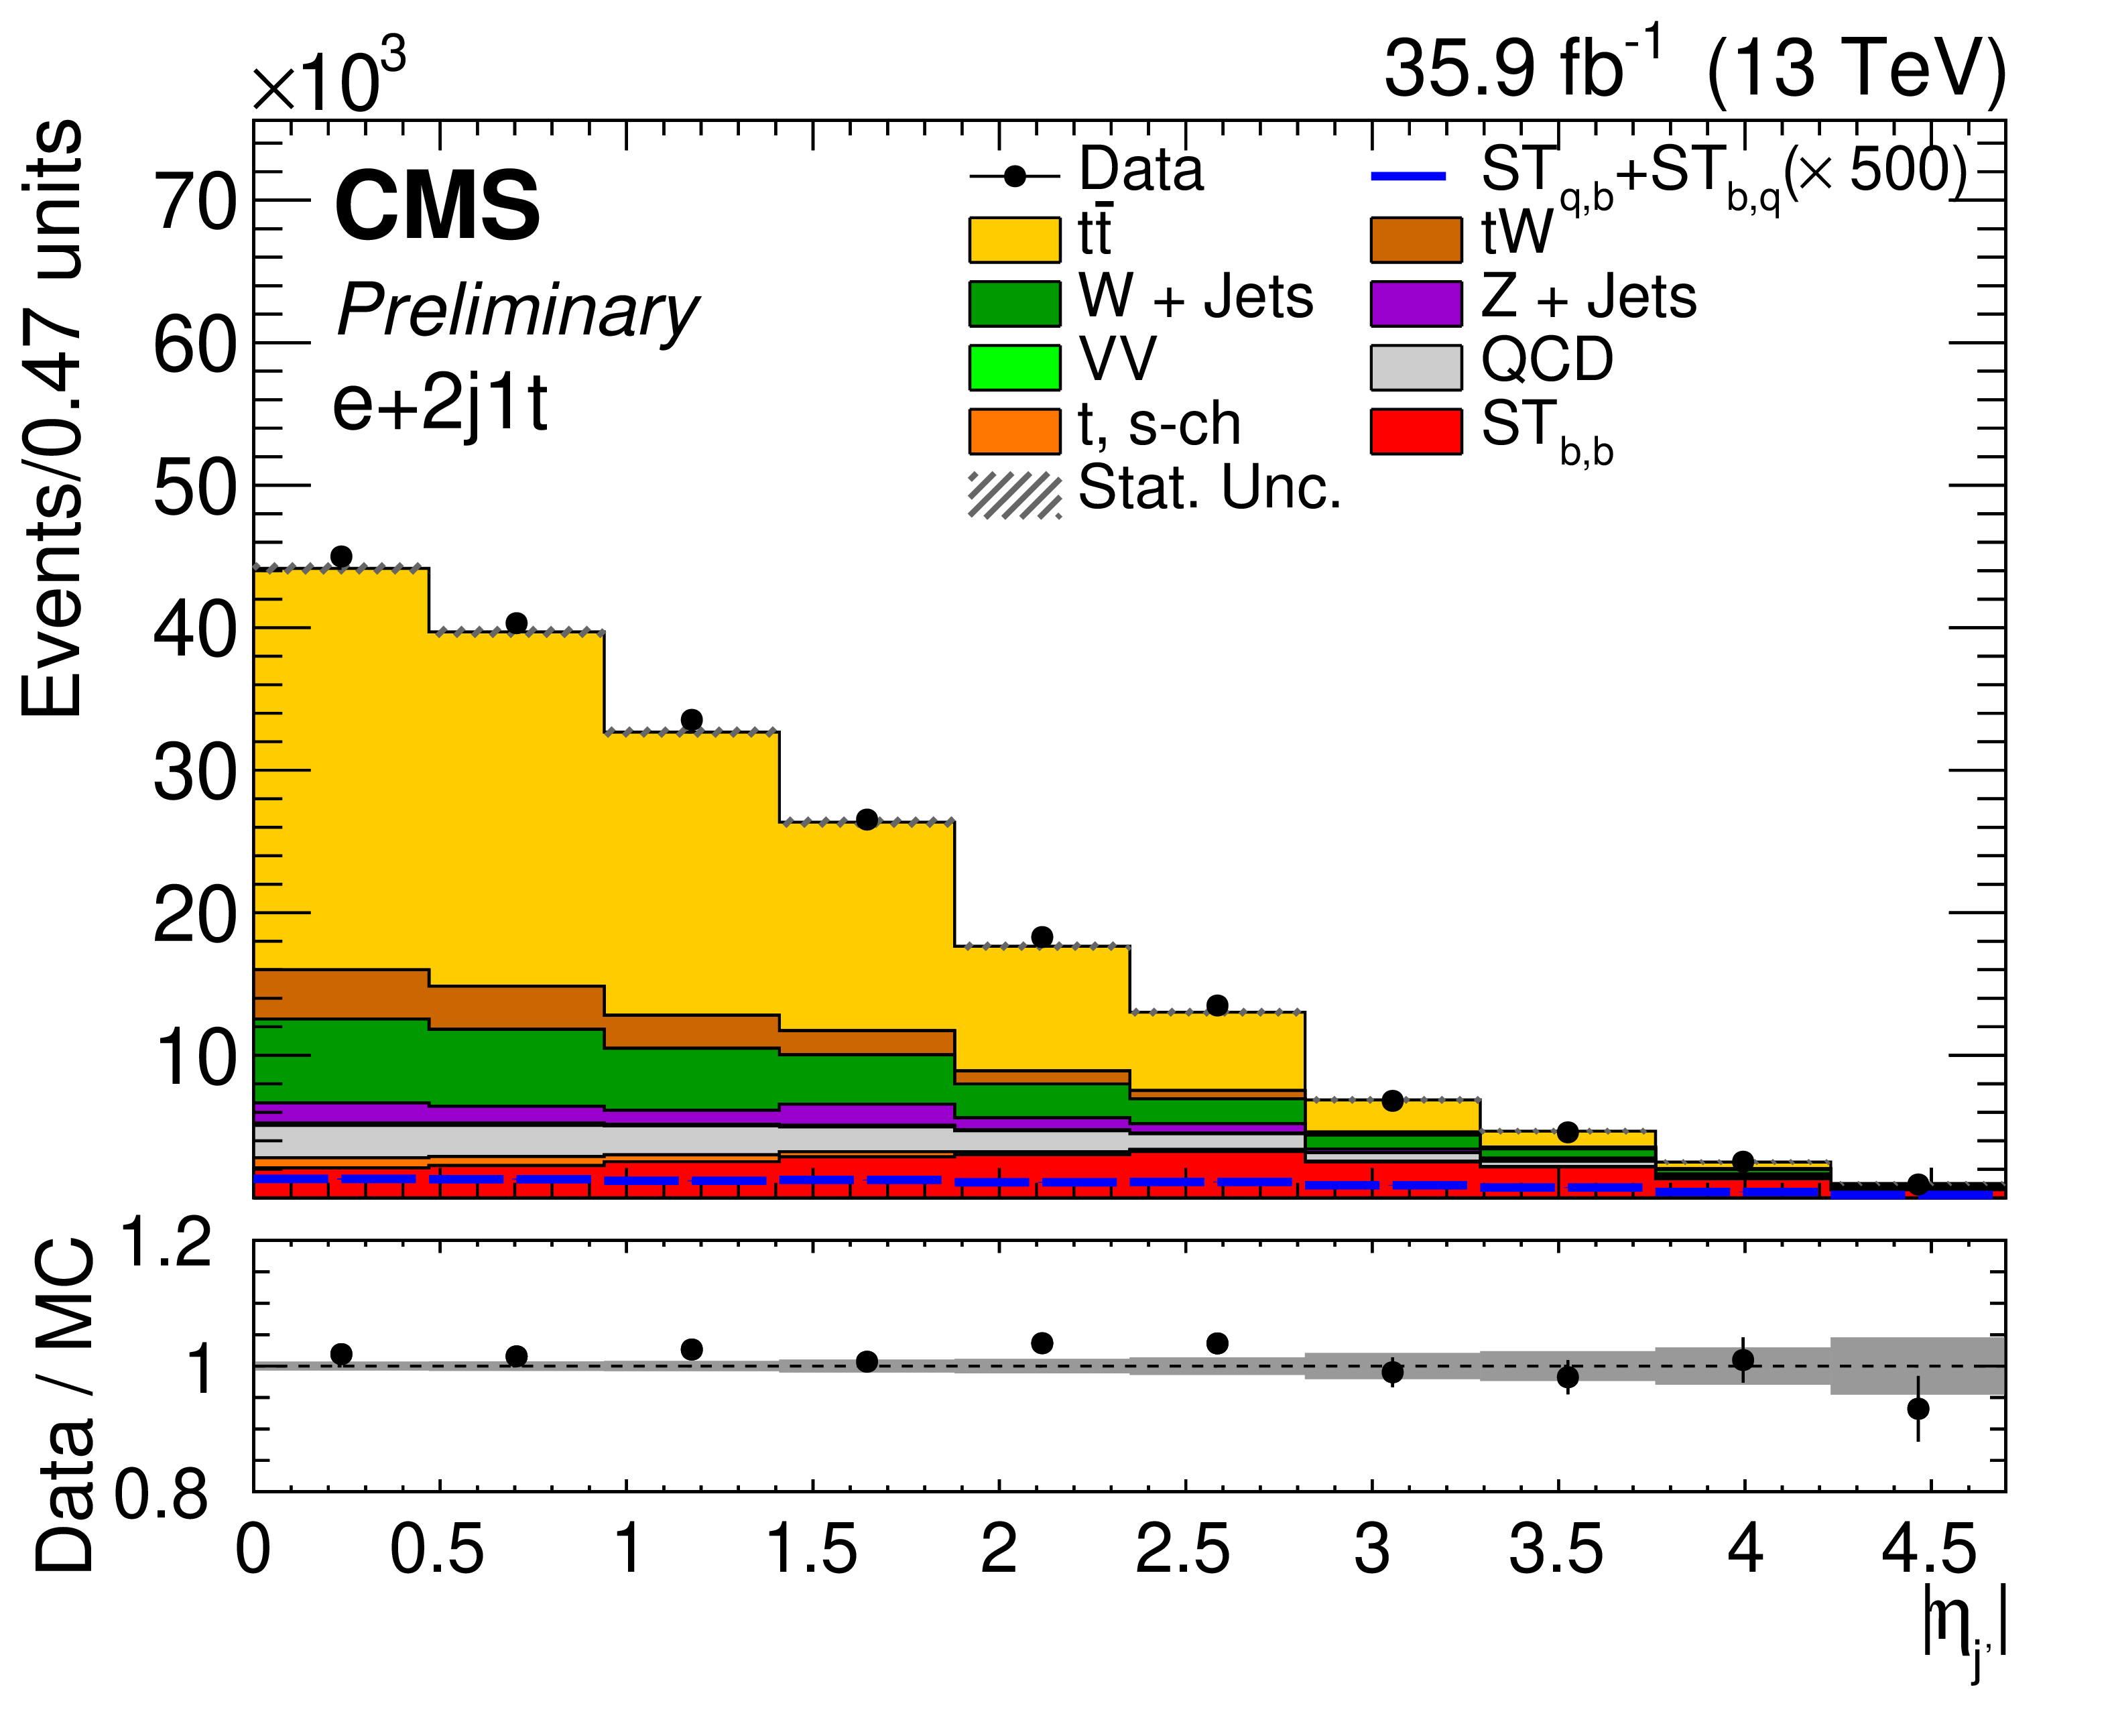
Figure 3:
Distributions of the two most discriminant variables in the 2j1t region: the absolute value of the pseudorapidity of the non b-tagged jet ${\eta _{j'}}$ (left) and the invariant mass of the vectorial sum of the lepton and b jet momenta (right), shown for the muon (upper) and electron (lower) channel, respectively. |

png pdf |
Figure 3-a:
Distribution of the absolute value of the pseudorapidity of the non b-tagged jet ${\eta _{j'}}$ in the 2j1t region, shown for the muon channel. |
png pdf |
Figure 3-b:
Distribution of the invariant mass of the vectorial sum of the lepton and b jet momenta in the 2j1t region, shown for the muon channel. |
png pdf |
Figure 3-c:
Distribution of the absolute value of the pseudorapidity of the non b-tagged jet ${\eta _{j'}}$ in the 2j1t region, shown for the electron channel. |

png pdf |
Figure 3-d:
Distribution of the invariant mass of the vectorial sum of the lepton and b jet momenta in the 2j1t region, shown for the electron channel. |

png pdf |
Figure 4:
Distributions of the two most discriminant variables in the 3j1t region: the missing momentum in the transverse plane (left) and the response of the CMVAv2 b-tagger discriminator when applied to the extra jet (right) are shown for the muon (upper) and electron (lower) channel, respectively. |

png pdf |
Figure 4-a:
Distribution of the missing momentum in the transverse plane in the 3j1t region, shown for the muon channel. |

png pdf |
Figure 4-b:
Distribution of the response of the CMVAv2 b-tagger discriminator when applied to the extra jet in the 3j1t region, shown for the muon channel. |

png pdf |
Figure 4-c:
Distribution of the missing momentum in the transverse plane in the 3j1t region, shown for the electron channel. |

png pdf |
Figure 4-d:
Distribution of the response of the CMVAv2 b-tagger discriminator when applied to the extra jet in the 3j1t region, shown for the electron channel. |

png pdf |
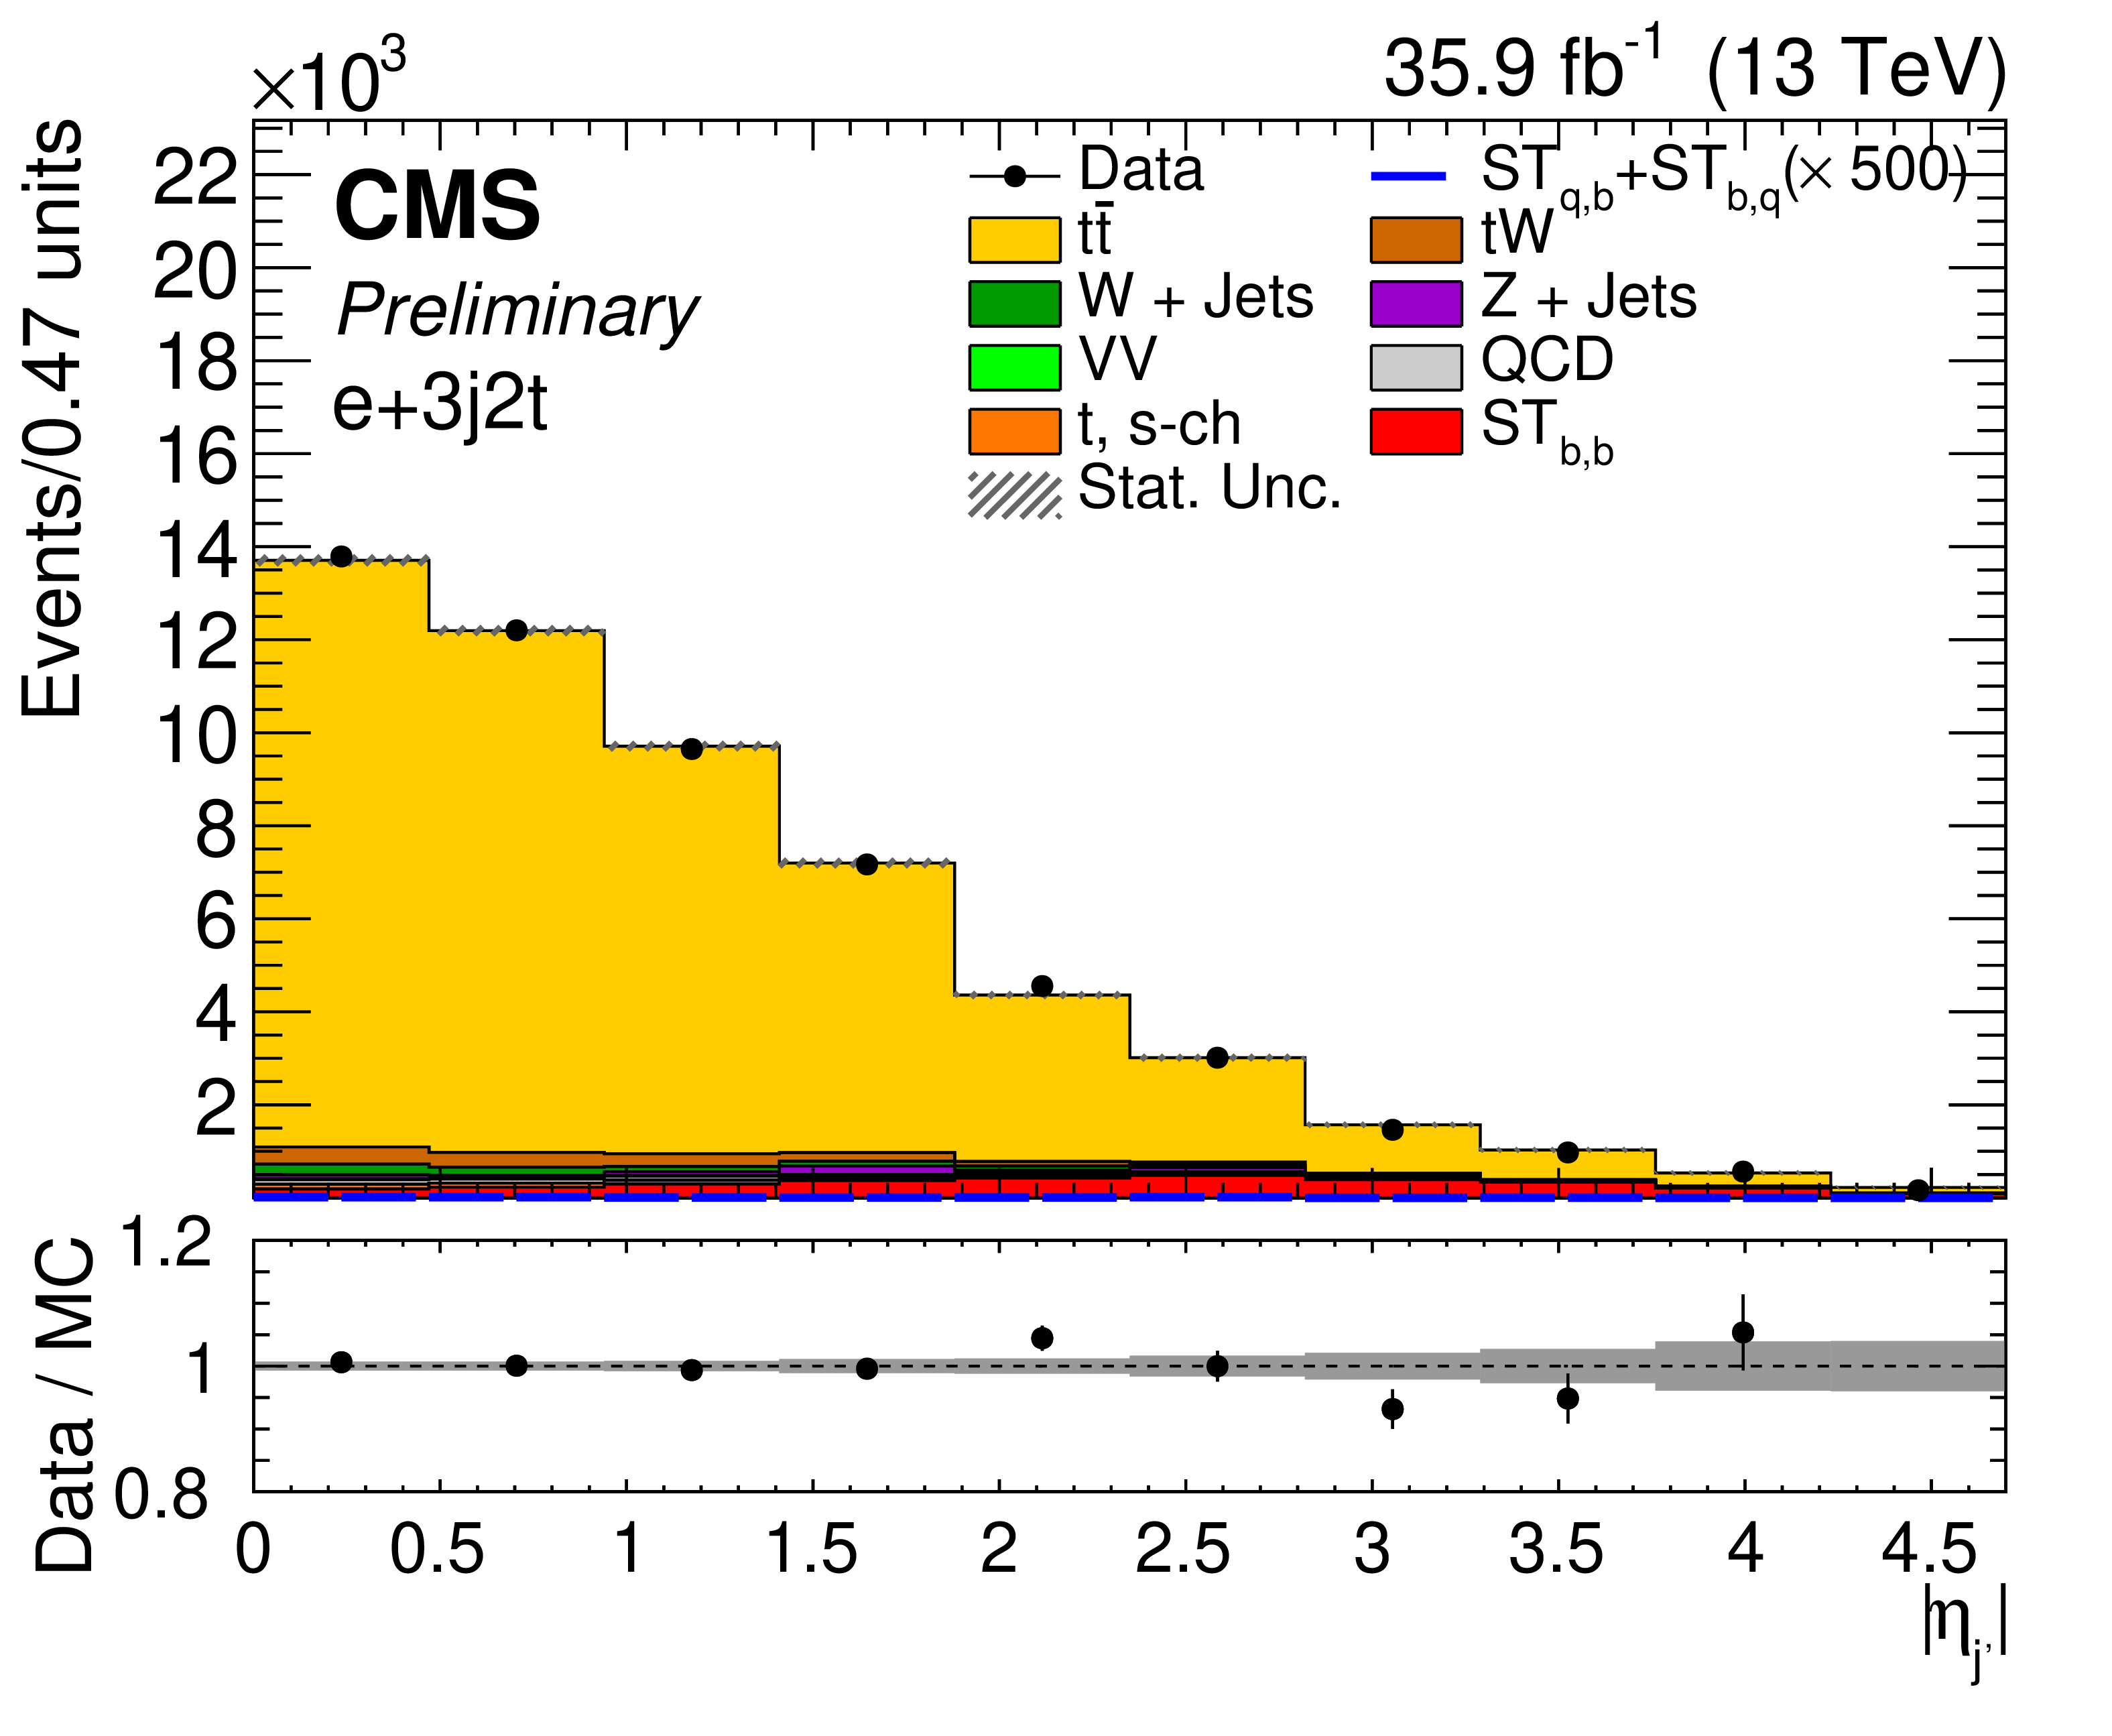
Figure 5:
Distributions of the two most discriminant variables in the 3j2t region: the absolute value of the pseudorapidity of the non b-tagged jet ${\eta _{j'}}$ (left) and the invariant mass of the vectorial sum of the lepton and non b-tagged jet (right) are shown for the muon (upper) and electron (lower) channel, respectively. |

png pdf |
Figure 5-a:
Distribution of the absolute value of the pseudorapidity of the non b-tagged jet ${\eta _{j'}}$ in the 3j2t region, shown for the muon channel. |

png pdf |
Figure 5-b:
Distribution of the absolute value of the pseudorapidity of the non b-tagged jet ${\eta _{j'}}$ in the 3j2t region, shown for the muon channel. |
png pdf |
Figure 5-c:
Distribution of the invariant mass of the vectorial sum of the lepton and non b-tagged jet in the 3j2t region, shown for the electron channel. |

png pdf |
Figure 5-d:
Distribution of the invariant mass of the vectorial sum of the lepton and non b-tagged jet in the 3j2t region, shown for the electron channel. |
png pdf |
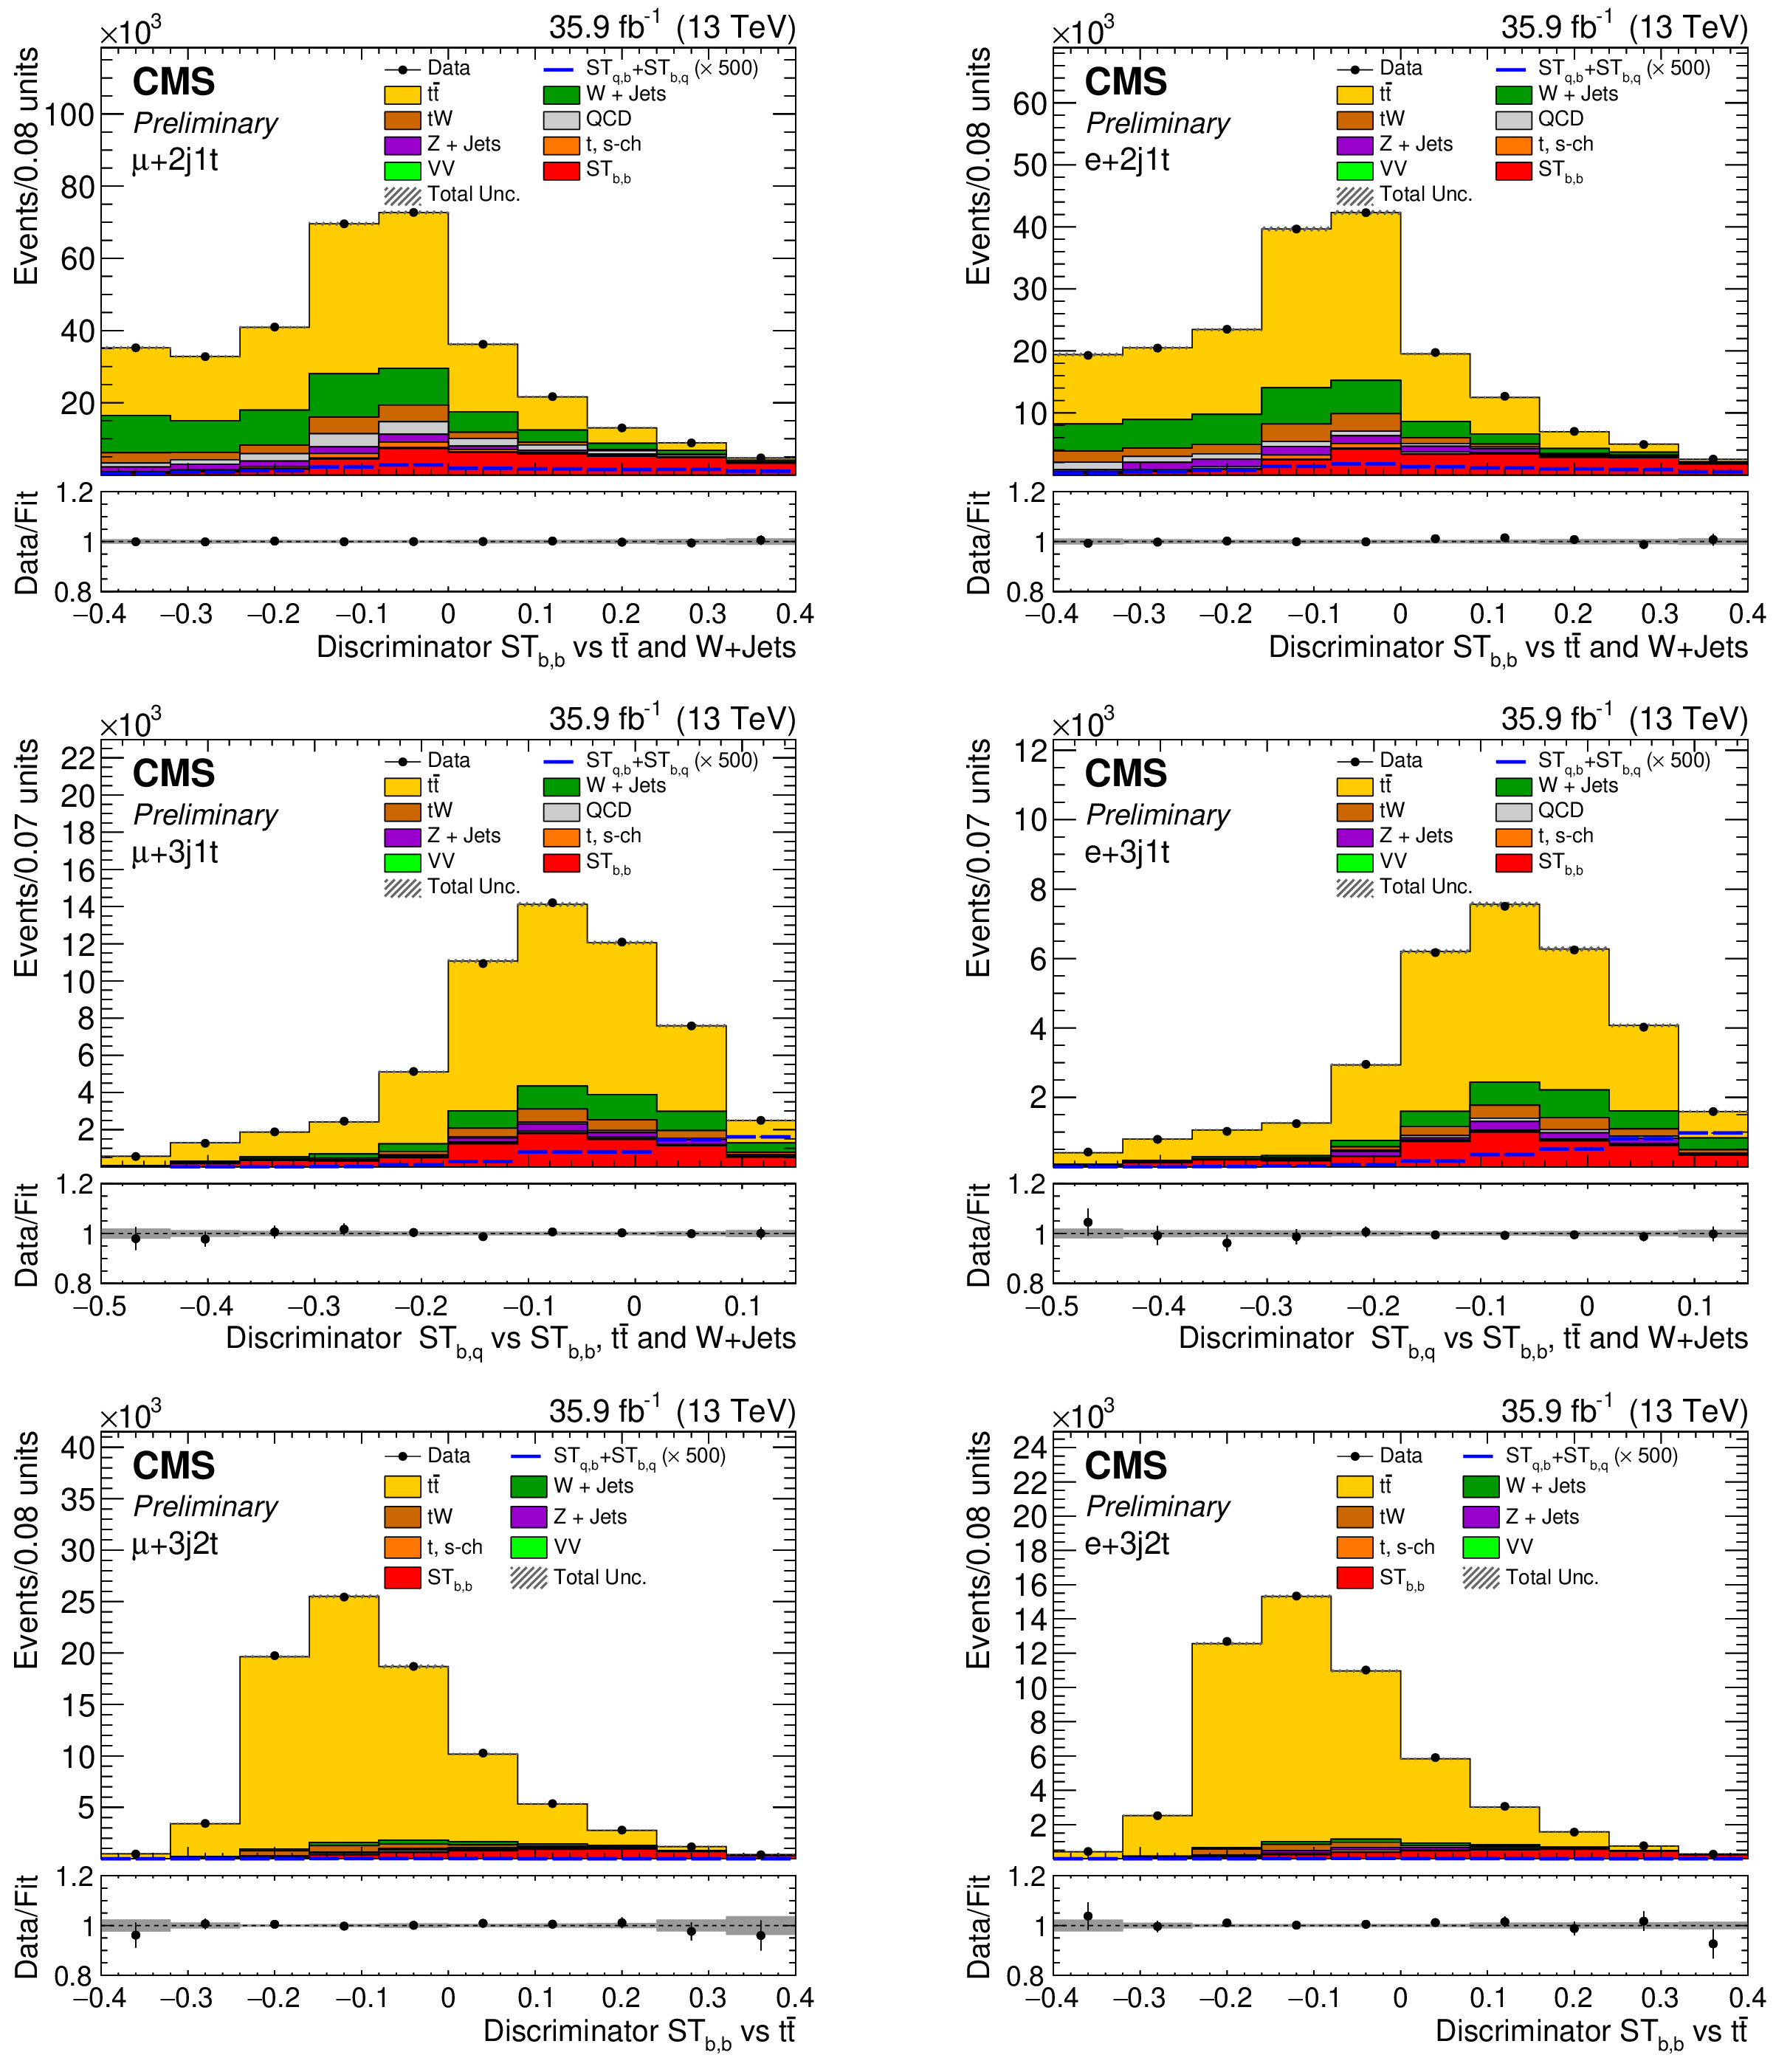
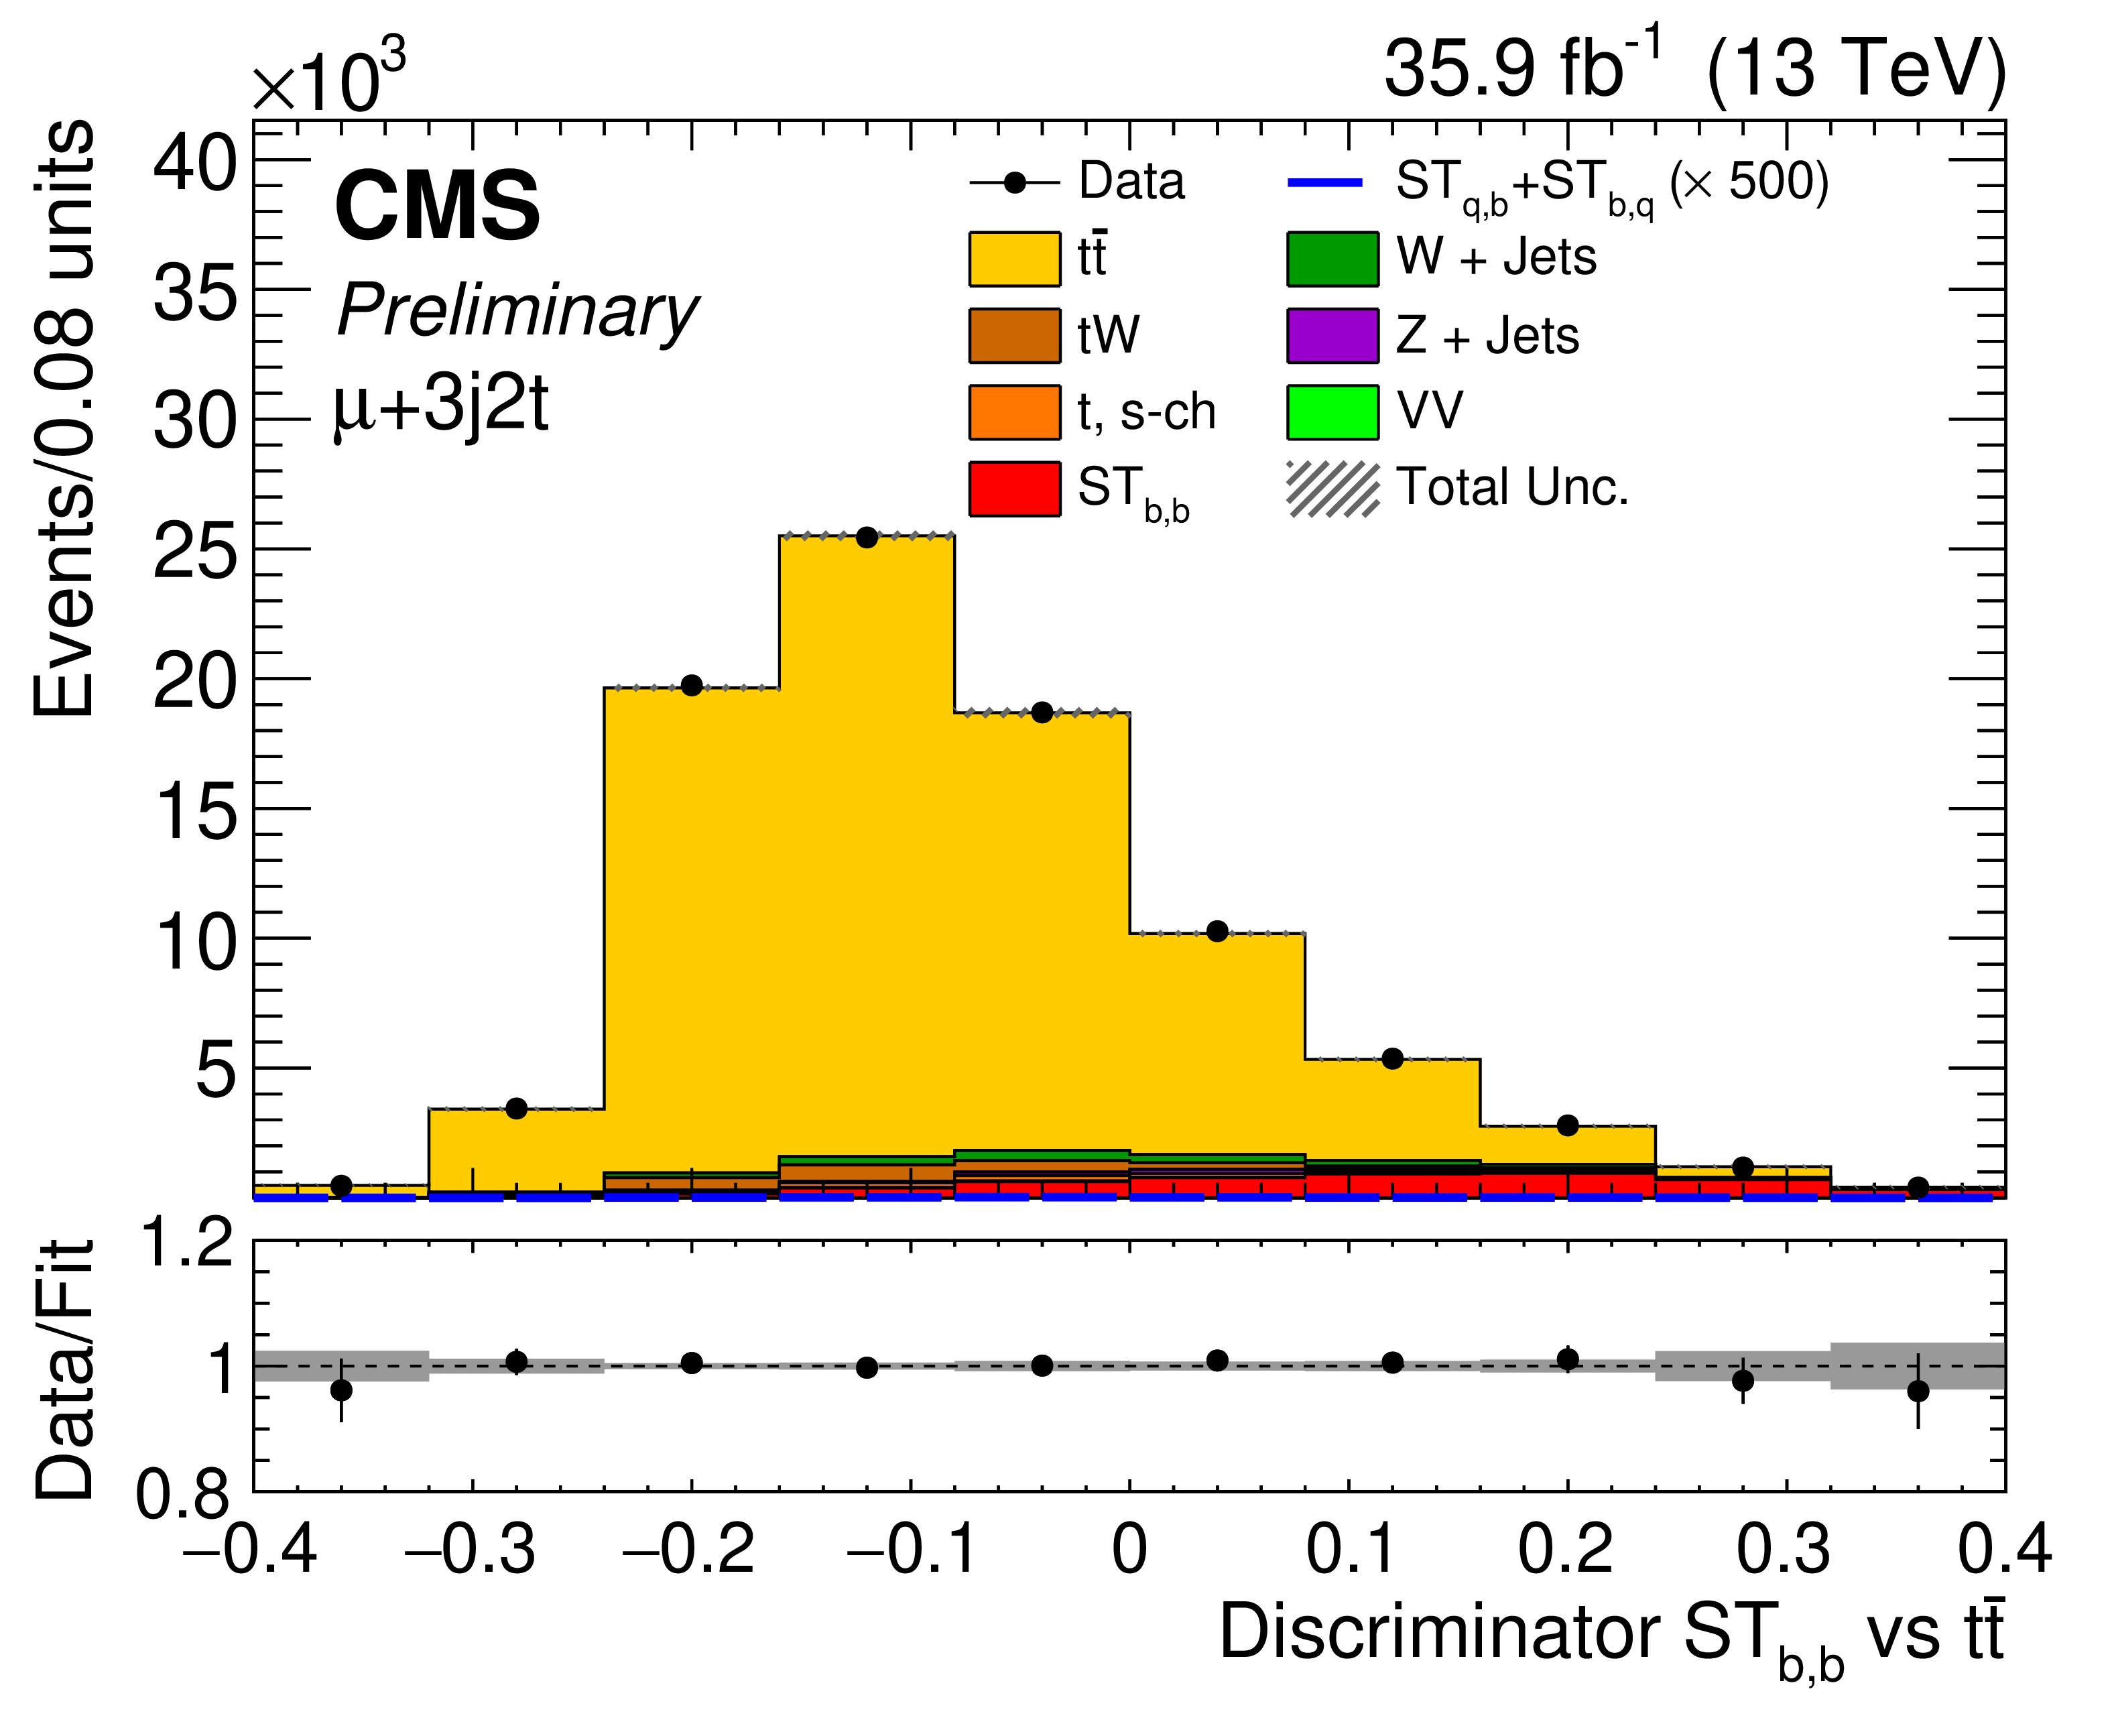
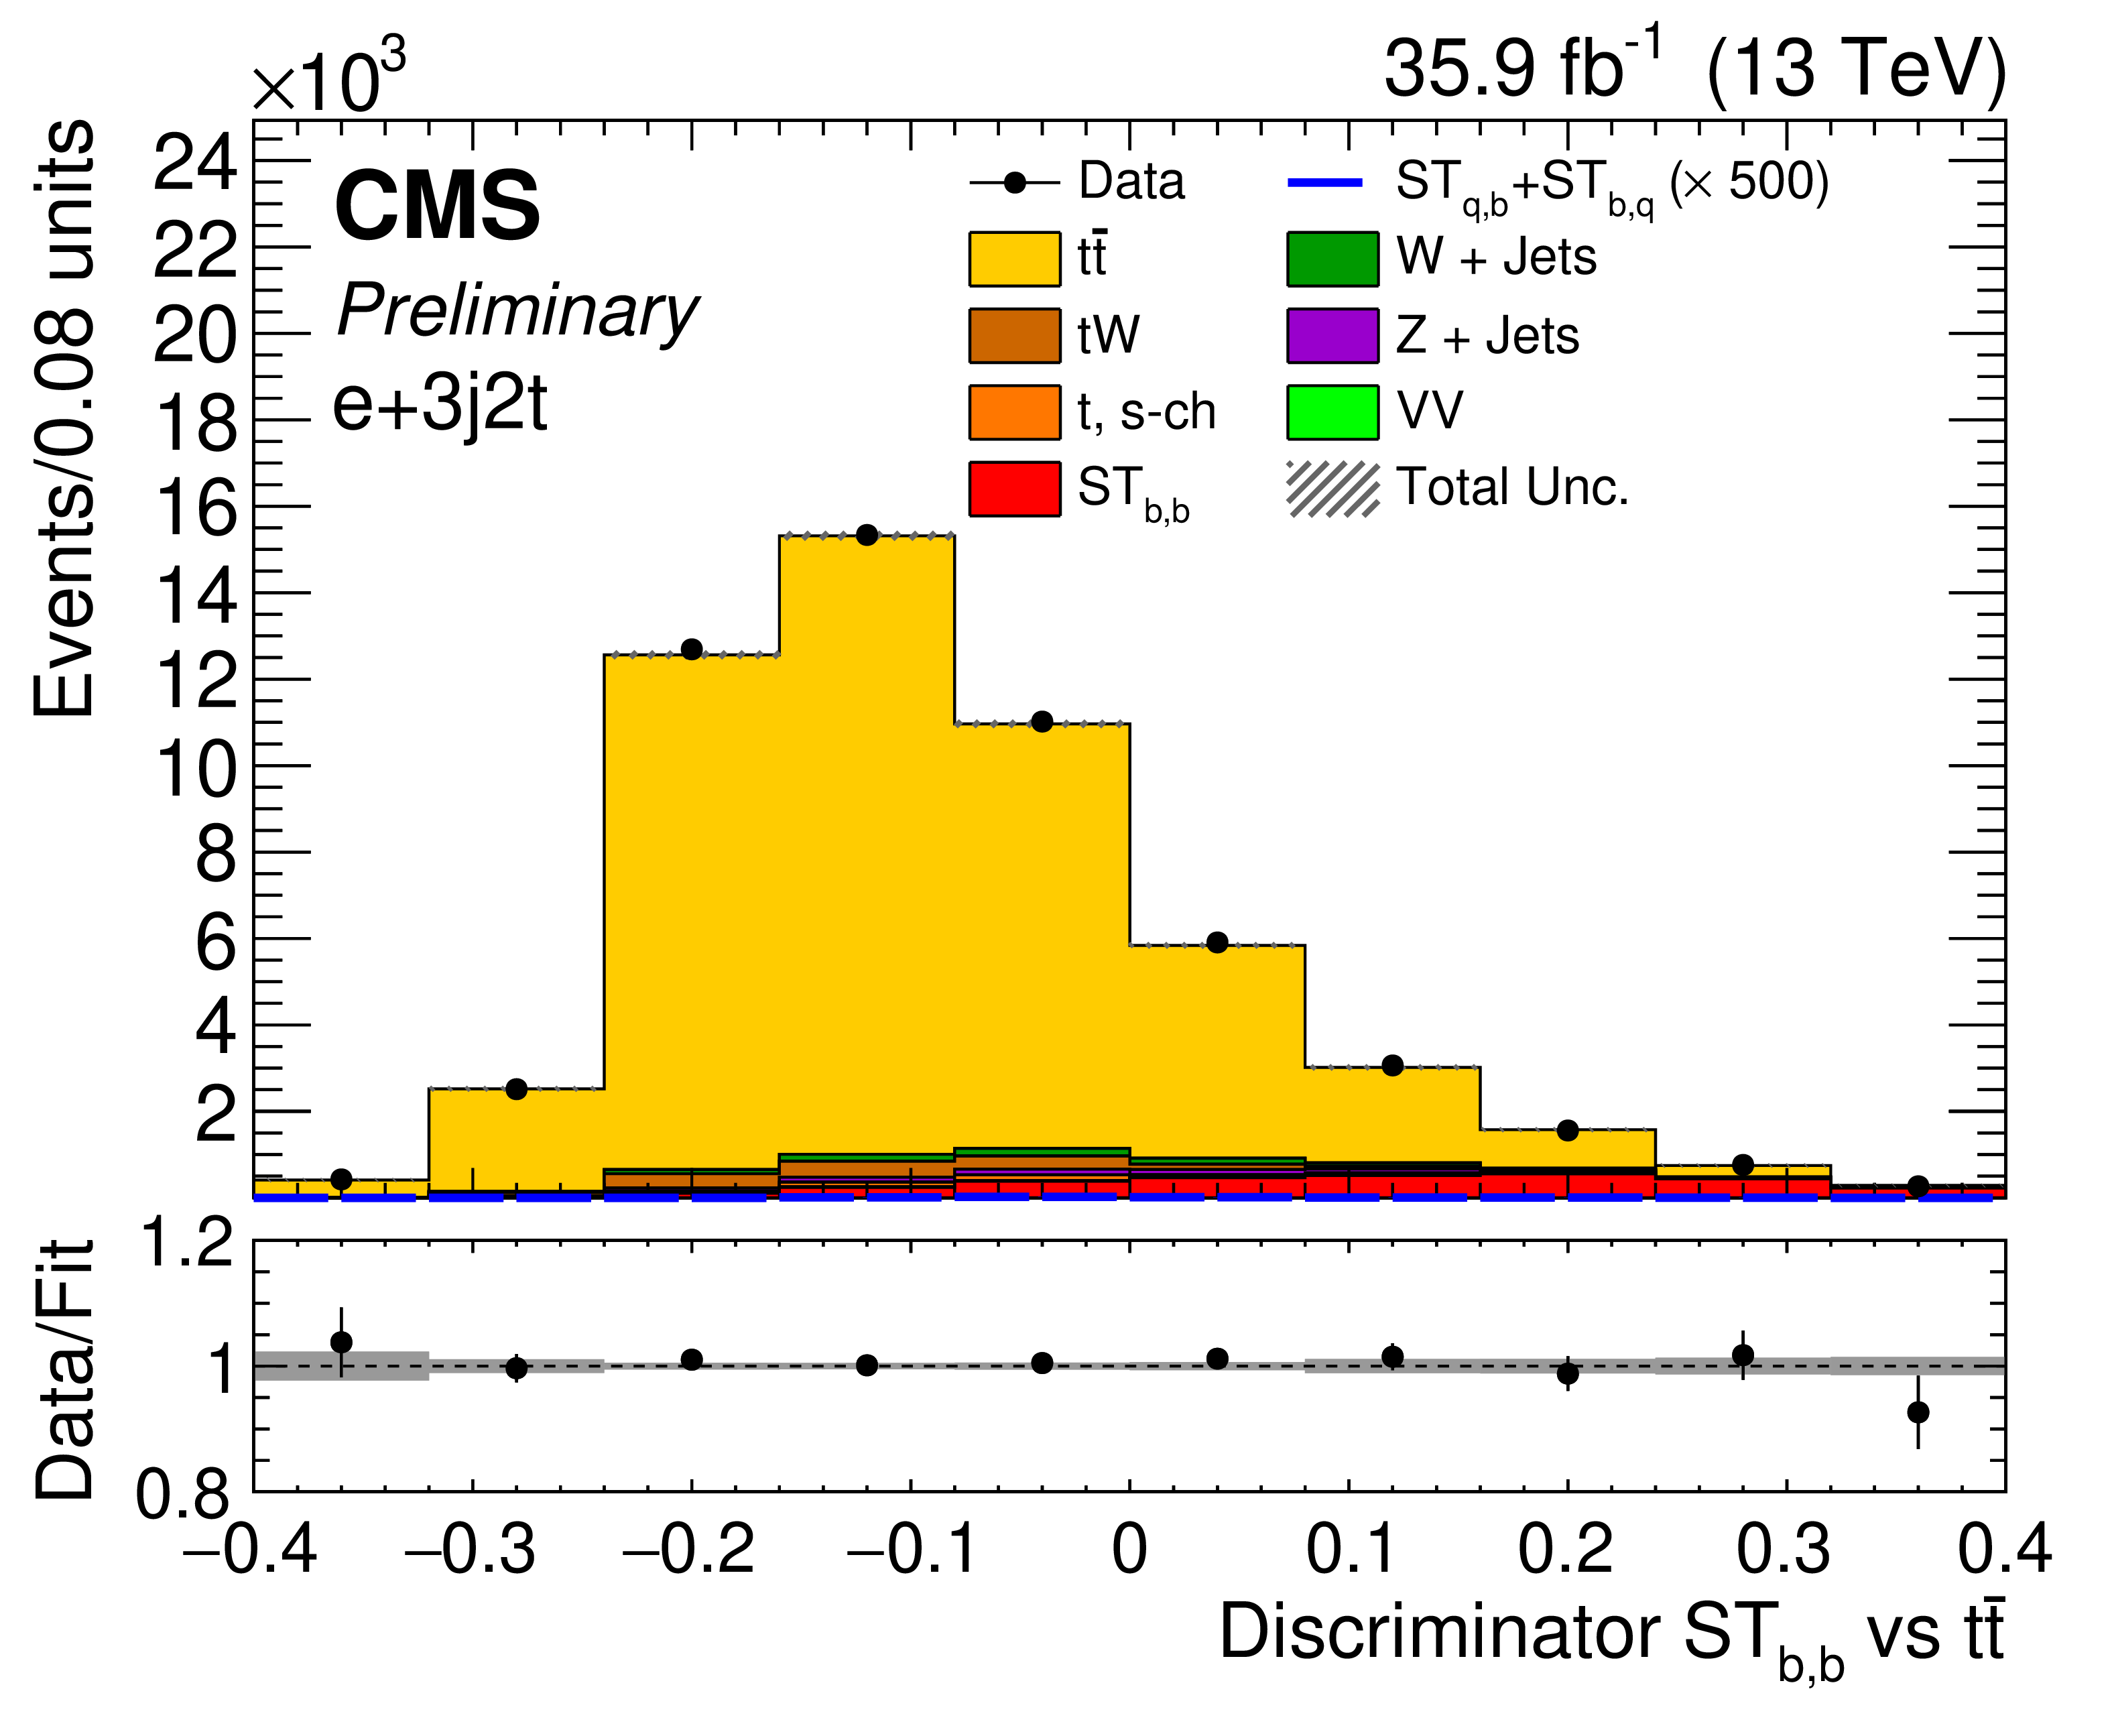
Figure 6:
Distribution of the multivariate discriminants, comparing data to simulation normalized after the fit procedure for muon channel on the left and for the electron on the right, for 2j1t (top), 3j1t (middle), and 3j2t (bottom). The systematic bands correspond to the profiled uncertainties constrained by the fit procedure. |

png pdf |
Figure 6-a:
Distribution of the multivariate discriminant, comparing data to simulation normalized after the fit procedure for muon channel, for 2j1t. The systematic band corresponds to the profiled uncertainties constrained by the fit procedure. |

png pdf |
Figure 6-b:
Distribution of the multivariate discriminant, comparing data to simulation normalized after the fit procedure for electron channel, for 2j1t. The systematic band corresponds to the profiled uncertainties constrained by the fit procedure. |

png pdf |
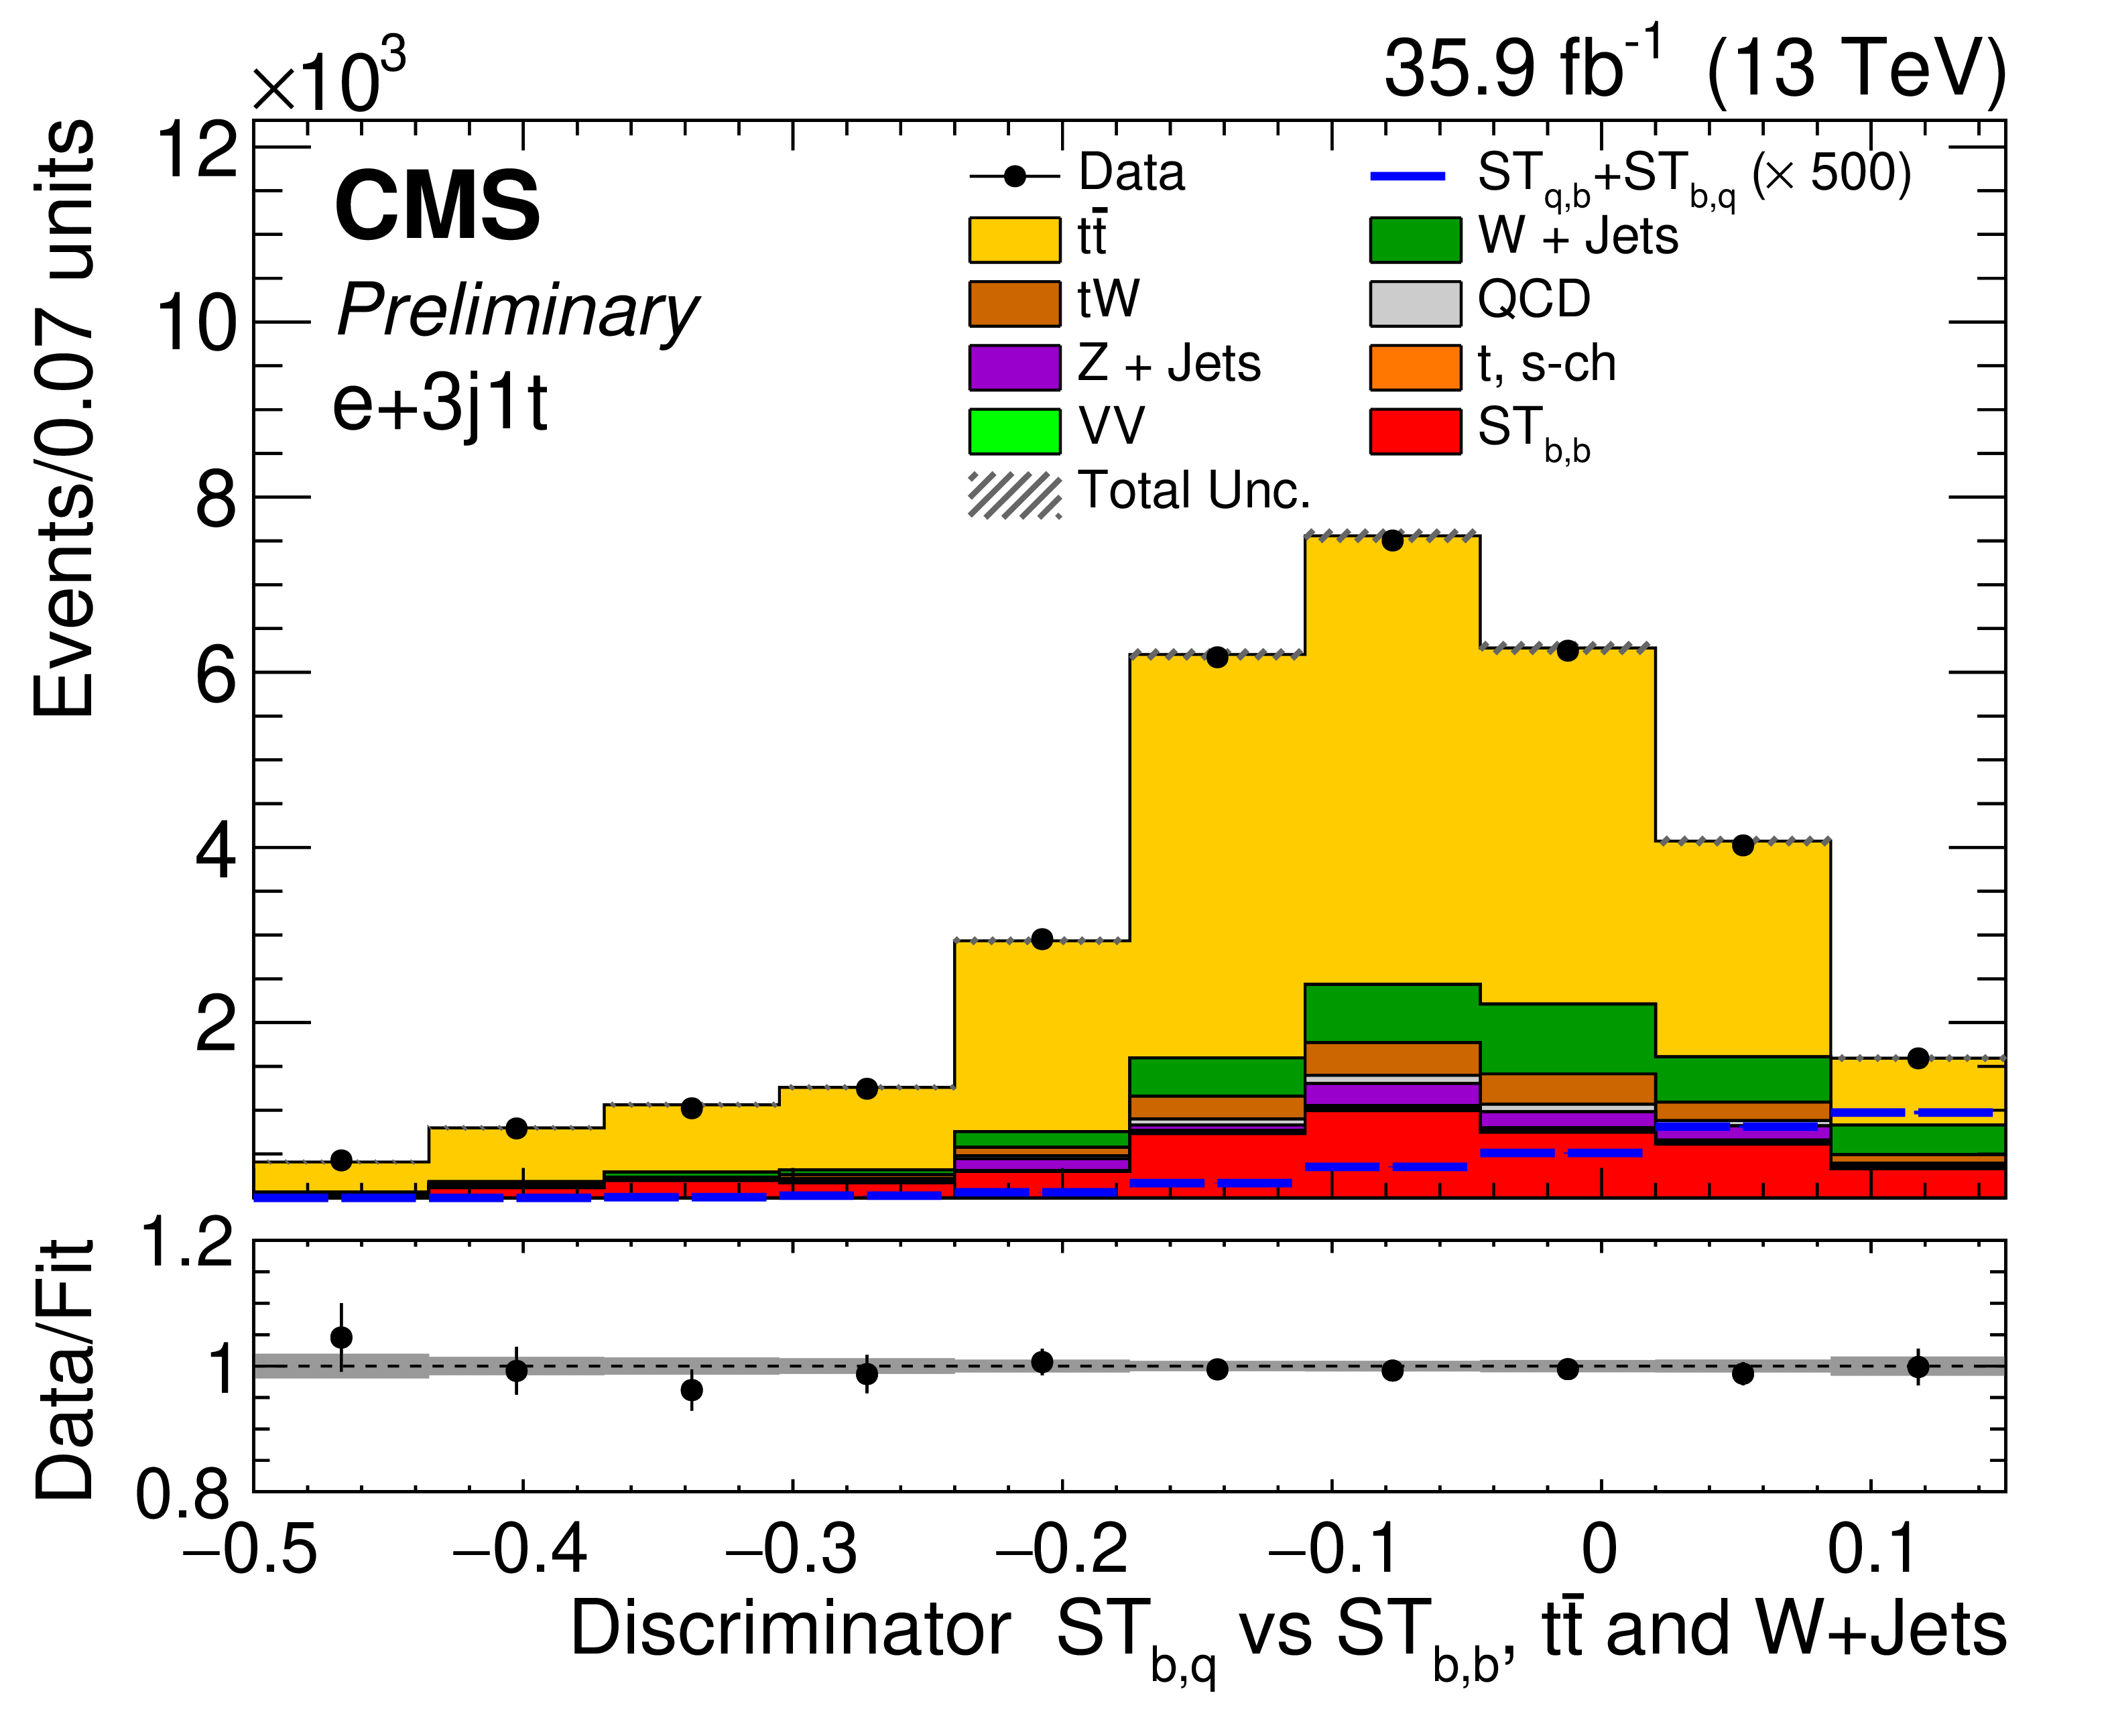
Figure 6-c:
Distribution of the multivariate discriminant, comparing data to simulation normalized after the fit procedure for muon channel, for 3j1t. The systematic band corresponds to the profiled uncertainties constrained by the fit procedure. |
png pdf |
Figure 6-d:
Distribution of the multivariate discriminant, comparing data to simulation normalized after the fit procedure for electron channel, for 3j1t. The systematic band corresponds to the profiled uncertainties constrained by the fit procedure. |
png pdf |
Figure 6-e:
Distribution of the multivariate discriminant, comparing data to simulation normalized after the fit procedure for muon channel, for 3j2t. The systematic band corresponds to the profiled uncertainties constrained by the fit procedure. |
png pdf |
Figure 6-f:
Distribution of the multivariate discriminant, comparing data to simulation normalized after the fit procedure for electron channel, for 3j2t. The systematic band corresponds to the profiled uncertainties constrained by the fit procedure. |
| Tables | |

png pdf |
Table 1:
Values of the third-row elements of the CKM matrix inferred from low-energy measurements, taken from [12], with the respective values of the top quark decay branching fractions. The q in ${\mathrm {|V_{\mathrm {tq}}}|}$ and $ {\mathcal {B}\mathrm {(t\to Wq)}}$ of the first column refers to b, s, and d quarks accordingly to the quark present in the first row. |
png pdf |
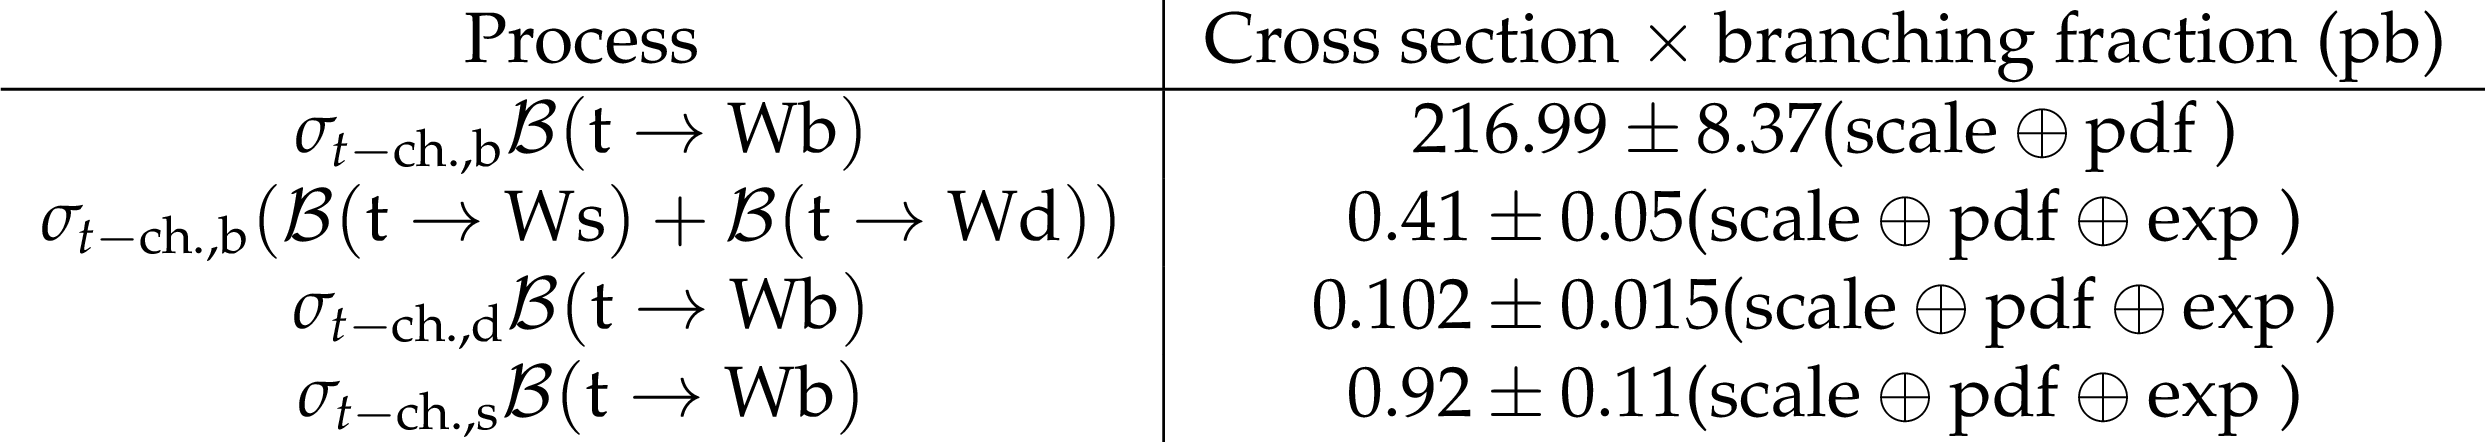
Table 2:
Production cross section of signal processes taken into consideration, where the "scale'' component of the uncertainty refers to factorisation and renormalisation scale uncertainties, "pdf'' refers to uncertainties due to the PDFs, and "exp'' denotes the experimental component of the uncertainty from low-energy measurements. |
png pdf |
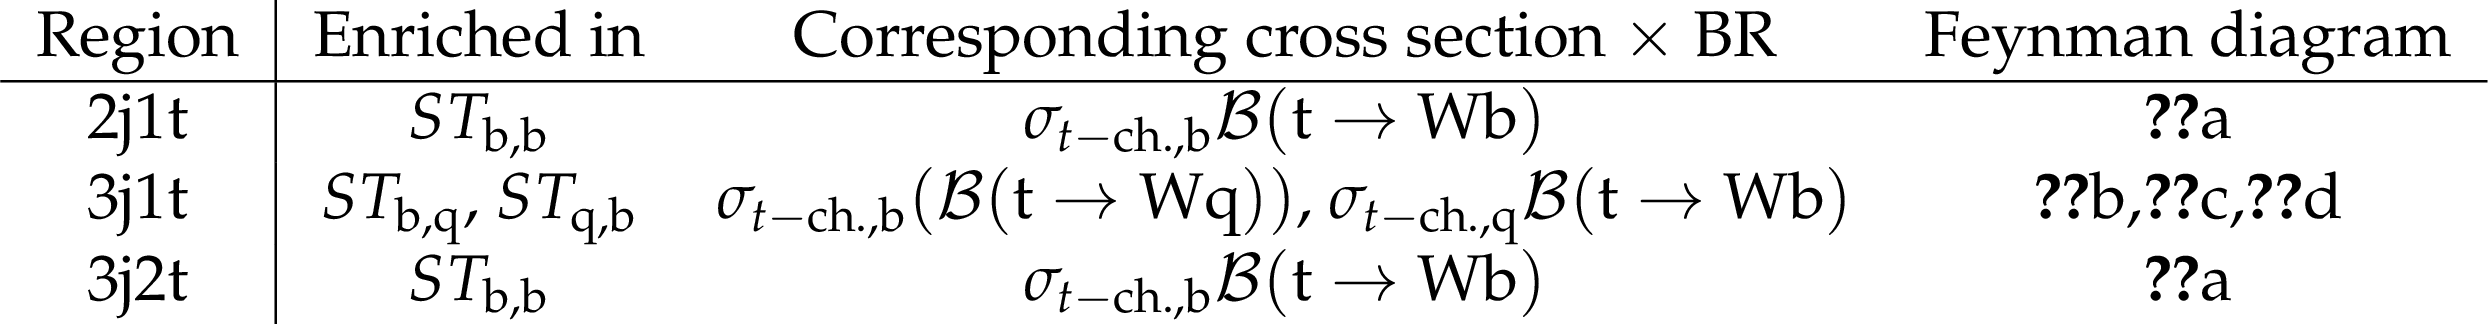
Table 3:
For each region, the corresponding signal process, the cross section times branching fraction determined, and the specific Feynman diagram from Fig. 1 involved. |

png pdf |
Table 4:
Estimated relative contributions of uncertainty sources in % to the total uncertainties of the measured cross sections for single top quark production. |
| Summary |
| A measurement of the CKM matrix elements ${\mathrm{|V_{\mathrm{tb}}}|} $, ${\mathrm{|V_{\mathrm{td}}}|} $, and ${\mathrm{|V_{\mathrm{ts}}}|} $ has been performed in an event sample enriched in $t$-channel single top quark events, featuring one muon or electron and jets in the final state. The data sample is from proton-proton collisions at $\sqrt{s} = $ 13 TeV, acquired at the LHC by the CMS experiment and corresponding to an integrated luminosity of 35.9 fb$^{-1}$ . The contributions from single top quark processes featuring all three matrix elements in the production vertex have been considered as separate signal processes, as well as contributions from decays of single top quarks involving all three quark families. The yields of the signal processes have been extracted through a simultaneous fit to data in different selected regions, and the values of the CKM matrix elements have been inferred from the signal strengths. All results are in agreement with the SM predictions. |
| References | ||||
| 1 | M. Kobayashi and T. Maskawa | CP violation in the renormalizable theory of weak interaction | Prog. Theor. Phys. 49 (1973) 652 | |
| 2 | ATLAS Collaboration | Measurement of the $ t $-channel single top-quark production cross section in pp collisions at $ \sqrt{s}= $ 7 TeV with the ATLAS detector | PLB 717 (2012) 330 | 1205.3130 |
| 3 | ATLAS Collaboration | Comprehensive measurements of $ t $-channel single top-quark production cross sections at $ \sqrt{s} = $ 7 TeV with the ATLAS detector | PRD 90 (2014) 112006 | 1406.7844 |
| 4 | ATLAS Collaboration | Fiducial, total and differential cross-section measurements of $ t $-channel single top-quark production in pp collisions at 8 TeV using data collected by the ATLAS detector | EPJC 77 (2017) 531 | 1702.02859 |
| 5 | ATLAS Collaboration | Measurement of the inclusive cross-sections of single top-quark and top-antiquark $ t $-channel production in pp collisions at $ \sqrt{s} = $ 13 TeV with the ATLAS detector | JHEP 04 (2017) 086 | 1609.03920 |
| 6 | CMS Collaboration | Measurement of the $ t $-channel single top quark production cross section in pp collisions at $ \sqrt{s} = $ 7 ~TeV | PRL 107 (2011) 091802 | CMS-TOP-10-008 1106.3052 |
| 7 | CMS Collaboration | Measurement of the single-top-quark $ t $-channel cross section in pp collisions at $ \sqrt{s}= $ 7 TeV | JHEP 12 (2012) 035 | CMS-TOP-11-021 1209.4533 |
| 8 | CMS Collaboration | Measurement of the $ t $-channel single-top-quark production cross section and of the $ | V_{\rm tb} | $ CKM matrix element in pp collisions at $ \sqrt{s} = $ 8 TeV | JHEP 06 (2014) 090 | CMS-TOP-12-038 1403.7366 |
| 9 | CMS Collaboration | Cross section measurement of $ t $-channel single top quark production in pp collisions at $ \sqrt s = $ 13 TeV | PLB 772 (2017) 752 | CMS-TOP-16-003 1610.00678 |
| 10 | CMS Collaboration | Measurement of the single top quark and antiquark production cross sections in the $ t $-channel and their ratio in proton-proton collisions at $ \sqrt{s}= $ 13 TeV | Accepted by $PLB$ | CMS-TOP-17-011 1812.10514 |
| 11 | CMS Collaboration | Measurement of differential cross sections and charge ratios for $ t $-channel single top quark production in proton-proton collisions at $ \sqrt{s}= $ 13 TeV | Submitted to $EPJC$ | CMS-TOP-17-023 1907.08330 |
| 12 | Particle Data Group, M. Tanabashi et al. | Review of particle physics | PRD 98 (2018) 030001 | |
| 13 | J. Alwall et al. | Is $ V_{\rm tb} \approx 1 $? | EPJC 49 (2007) 791 | hep-ph/0607115 |
| 14 | D0 Collaboration | Precision measurement of the ratio $ \rm B(t \to Wb)/B(t \to Wq) $ and extraction of $ V_{\rm tb} $ | PRL 107 (2011) 121802 | 1106.5436 |
| 15 | CDF Collaboration | Measurement of $ R = \mathcal{B}({\rm t \rightarrow Wb})/\mathcal{B}({\rm t \rightarrow Wq}) $ in top--quark--pair decays using lepton+jets events and the full CDF Run II data set | PRD 87 (2013) 111101 | 1303.6142 |
| 16 | CDF Collaboration | Measurement of $ B({\rm t \to Wb})/B({\rm t \to Wq}) $ in top-quark-pair decays using dilepton events and the full CDF Run II data set | PRL 112 (2014) 221801 | 1404.3392 |
| 17 | CMS Collaboration | Measurement of the ratio $ \mathcal B({\rm t \to Wb})/\mathcal B({\rm t \to Wq}) $ in pp collisions at $ \sqrt{s} = $ 8 TeV | PLB 736 (2014) 33 | CMS-TOP-12-035 1404.2292 |
| 18 | D0 Collaboration | Evidence for production of single top quarks and first direct measurement of $ |V_{\rm tb}| $ | PRL 98 (2007) 181802 | hep-ex/0612052 |
| 19 | D0 Collaboration | Evidence for production of single top quarks | PRD 78 (2008) 012005 | 0803.0739 |
| 20 | CDF Collaboration | Measurement of the single top quark production cross section at CDF | PRL 101 (2008) 252001 | 0809.2581 |
| 21 | CDF Collaboration | First observation of electroweak single top quark production | PRL 103 (2009) 092002 | 0903.0885 |
| 22 | CDF Collaboration | Observation of single top quark production and measurement of $ |V_{\rm tb}| $ with CDF | PRD 82 (2010) 112005 | 1004.1181 |
| 23 | D0 Collaboration | Observation of single top-quark production | PRL 103 (2009) 092001 | 0903.0850 |
| 24 | CDF and D0 Collaborations, Tevatron Electroweak Working Group | Combination of CDF and D0 measurements of the single top production cross section | 0908.2171 | |
| 25 | CDF Collaboration | Measurement of the single top quark production cross section and $ |V_{\rm tb}| $ in events with one charged lepton, large missing transverse energy, and jets at CDF | PRL 113 (2014) 261804 | 1407.4031 |
| 26 | D0 Collaboration | Evidence for $ s $-channel single top quark production in p$ \bar{\rm p} $ collisions at $ \sqrt{s} = $ 1.96 TeV | PLB 726 (2013) 656 | 1307.0731 |
| 27 | CDF and D0 Collaborations | Observation of $ s $-channel production of single top quarks at the Tevatron | PRL 112 (2014) 231803 | 1402.5126 |
| 28 | ATLAS and CMS Collaborations | Combinations of single-top-quark production cross-section measurements and $ |f_{\rm LV}V_{\rm tb}| $ determinations at $ \sqrt{s}= $ 7 and 8 TeV with the ATLAS and CMS experiments | JHEP 05 (2019) 088 | 1902.07158 |
| 29 | H. Lacker et al. | Model-independent extraction of $ |V_{tq}| $ matrix elements from top-quark measurements at hadron colliders | EPJC 72 (2012) 2048 | 1202.4694 |
| 30 | J. A. Aguilar-Saavedra and A. Onofre | Using single top rapidity to measure $ V_{\rm td} $, $ V_{\rm ts} $, $ V_{\rm tb} $ at hadron colliders | PRD 83 (2011) 073003 | 1002.4718 |
| 31 | W. Fang, B. Clerbaux, A. Giammanco, and R. Goldouzian | Model-independent constraints on the CKM matrix elements $ |V_{\rm tb}| $, $ |V_{\rm ts}| $ and $ |V_{\rm td}| $ | JHEP 03 (2019) 022 | 1807.07319 |
| 32 | E. Alvarez, L. Da Rold, M. Estevez, and J. F. Kamenik | Measuring $ |V_{\rm td}| $ at the LHC | PRD 97 (2018) 033002 | 1709.07887 |
| 33 | A. Giammanco and R. Schwienhorst | Single top-quark production at the Tevatron and the LHC | Rev. Mod. Phys. 90 (2018) 035001 | 1710.10699 |
| 34 | S. Frixione, P. Nason, and C. Oleari | Matching NLO QCD computations with Parton Shower simulations: the POWHEG method | JHEP 11 (2007) 070 | 0709.2092 |
| 35 | P. Artoisenet, R. Frederix, O. Mattelaer, and R. Rietkerk | Automatic spin-entangled decays of heavy resonances in Monte Carlo simulations | JHEP 03 (2013) 015 | 1212.3460 |
| 36 | T. Melia, P. Nason, R. Rontsch, and G. Zanderighi | $ \rm W^+W^- $, $ \rm WZ $ and $ \rm ZZ $ production in the POWHEG BOX | JHEP 11 (2011) 078 | 1107.5051 |
| 37 | P. Nason and G. Zanderighi | $ \rm W^+ W^- $, $ \rm W Z $ and $ \rm Z Z $ production in the POWHEG-BOX-V2 | EPJC 74 (2014) 2702 | 1311.1365 |
| 38 | E. Re | Single-top $ \rm Wt $-channel production matched with parton showers using the POWHEG method | EPJC 71 (2011) 1547 | 1009.2450 |
| 39 | T. Sjostrand, S. Mrenna, and P. Z. Skands | A Brief Introduction to PYTHIA 8.1 | CPC 178 (2008) 852 | 0710.3820 |
| 40 | CMS Collaboration | Event generator tunes obtained from underlying event and multiparton scattering measurements | EPJC 76 (2016) 155 | CMS-GEN-14-001 1512.00815 |
| 41 | CMS Collaboration | Investigations of the impact of the parton shower tuning in PYTHIA 8 in the modelling of $ \mathrm{t\overline{t}} $ at $ \sqrt{s}= $ 8 and 13 TeV | CMS-PAS-TOP-16-021 | CMS-PAS-TOP-16-021 |
| 42 | J. Alwall et al. | The automated computation of tree-level and next-to-leading order differential cross sections, and their matching to parton shower simulations | JHEP 07 (2014) 079 | 1405.0301 |
| 43 | R. Frederix and S. Frixione | Merging meets matching in MC@NLO | JHEP 12 (2012) 061 | 1209.6215 |
| 44 | NNPDF Collaboration | Parton distributions for the LHC Run II | JHEP 04 (2015) 040 | 1410.8849 |
| 45 | J. Allison et al. | GEANT4 developments and applications | IEEE Trans. Nucl. Sci. 53 (2006) 270 | |
| 46 | CMS Collaboration | Particle-flow reconstruction and global event description with the CMS detector | JINST 12 (2017) P10003 | CMS-PRF-14-001 1706.04965 |
| 47 | M. Cacciari, G. P. Salam, and G. Soyez | Fastjet user manual | EPJC 72 (2012) 1896 | 1111.6097 |
| 48 | M. Cacciari, G. P. Salam, and G. Soyez | The anti-$ k_t $ jet clustering algorithm | JHEP 04 (2008) 063 | 0802.1189 |
| 49 | M. Cacciari and G. P. Salam | Pileup subtraction using jet areas | PLB 659 (2008) 119 | 0707.1378 |
| 50 | CMS Collaboration | Identification of b-quark jets with the CMS experiment | JINST 8 (2013) P04013 | CMS-BTV-12-001 1211.4462 |
| 51 | CMS Collaboration | Identification of heavy-flavour jets with the CMS detector in pp collisions at 13 TeV | JINST 13 (2018) P05011 | CMS-BTV-16-002 1712.07158 |
| 52 | P. Nason | A new method for combining NLO QCD with shower Monte Carlo algorithms | JHEP 11 (2004) 040 | hep-ph/0409146 |
| 53 | S. Alioli, P. Nason, C. Oleari, and E. Re | A general framework for implementing NLO calculations in shower Monte Carlo programs: the POWHEG BOX | JHEP 06 (2010) 043 | 1002.2581 |
| 54 | S. Alioli, P. Nason, C. Oleari, and E. Re | NLO single-top production matched with shower in POWHEG: $ s $- and $ t $-channel contributions | JHEP 09 (2009) 111 | 0907.4076 |
| 55 | M. Aliev et al. | HATHOR: HAdronic Top and Heavy quarks crOss section calculatoR | CPC 182 (2011) 1034 | 1007.1327 |
| 56 | R. J. Barlow and C. Beeston | Fitting using finite Monte Carlo samples | Comput.Phys.Commun. 77 (1993) 219 | |
| 57 | J. S. Conway | Nuisance parameters in likelihoods for multisource spectra | in Proceedings of PHYSTAT 2011 Workshop on Statistical Issues Related to Discovery Claims in Search Experiments and Unfolding, H. Prosper and L. Lyons, eds., number CERN-2011-006, pp. 115--120 CERN | |
| 58 | CMS Collaboration | Measurements of inclusive W and Z Cross Sections in pp collisions at $ \sqrt{s}= $ 7 TeV | JHEP 01 (2011) 080 | CMS-EWK-10-002 1012.2466 |
| 59 | M. Botje et al. | The PDF4LHC Working Group interim recommendations | 1101.0538 | |
| 60 | CMS Collaboration | CMS luminosity measurements for the 2016 data taking period | CMS-PAS-LUM-17-001 | CMS-PAS-LUM-17-001 |
| 61 | CMS Collaboration | Determination of jet energy calibration and transverse momentum resolution in CMS | JINST 6 (2011) P11002 | CMS-JME-10-011 1107.4277 |
| 62 | ATLAS Collaboration | Direct top-quark decay width measurement in the $ \rm t\bar{t} $ lepton+jets channel at $ \sqrt{s} = $ 8 TeV with the ATLAS experiment | EPJC 78 (2018) 129 | 1709.04207 |
| 63 | D0 Collaboration | An improved determination of the width of the top quark | PRD 85 (2012) 091104 | 1201.4156 |
|
|
Compact Muon Solenoid LHC, CERN |
|

|

|

|

|

|