

Compact Muon Solenoid
LHC, CERN
| CMS-PAS-SUS-23-004 | ||
| Search for dark matter production in association with a single top quark | ||
| CMS Collaboration | ||
| 19 July 2024 | ||
| Abstract: A search for the production of a single top quark in association with invisible particles is performed on 138 fb$ ^{-1} $ of LHC proton-proton collision data collected at $ \sqrt{s}= $ 13 TeV. In this search, a flavor-changing neutral current produces a single top quark or antiquark and an invisible state nonresonantly. The invisible state consists of a hypothetical spin-1 particle acting as a new mediator and decaying to two spin-1/2 dark matter candidates. The analysis searches for events in which the top (anti)quark decays hadronically. No significant excess compatible with that signature is observed. Exclusion limits on the masses of the spin-1 mediator and the dark matter candidates are derived and compared to constraints from the dark matter relic density measurements. In a vector (axial vector) coupling scenario, masses of the spin-1 mediator are excluded up to 1.85 (1.85) TeV with an expectation of 2.0 (2.0) TeV whereas masses of the dark matter candidates are excluded up to 750 (550) GeV with an expectation of 850 (650) GeV. | ||
|
Links:
CDS record (PDF) ;
CADI line (restricted) ;
These preliminary results are superseded in this paper, Submitted to JHEP. The superseded preliminary plots can be found here. |
||
| Figures | |
png pdf |
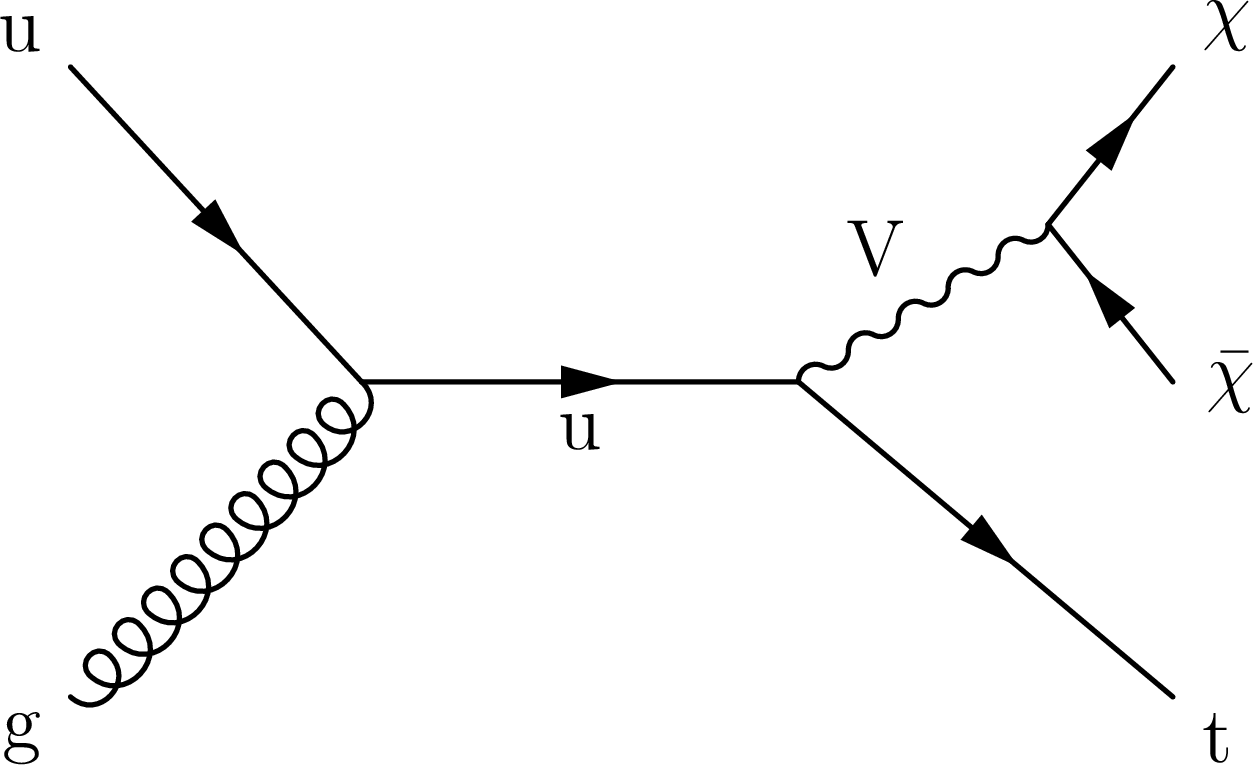
Figure 1:
Representative Feynman diagram of nonresonant mono-top production at tree level via a flavor-changing neutral current mediated by the spin-1 boson V. The off-shell up quark (u) decays into an on-shell top quark (t) and a V boson. The V boson decays directly to a pair of DM candidates $ \chi $ and $ \overline{\chi} $. |
png pdf |
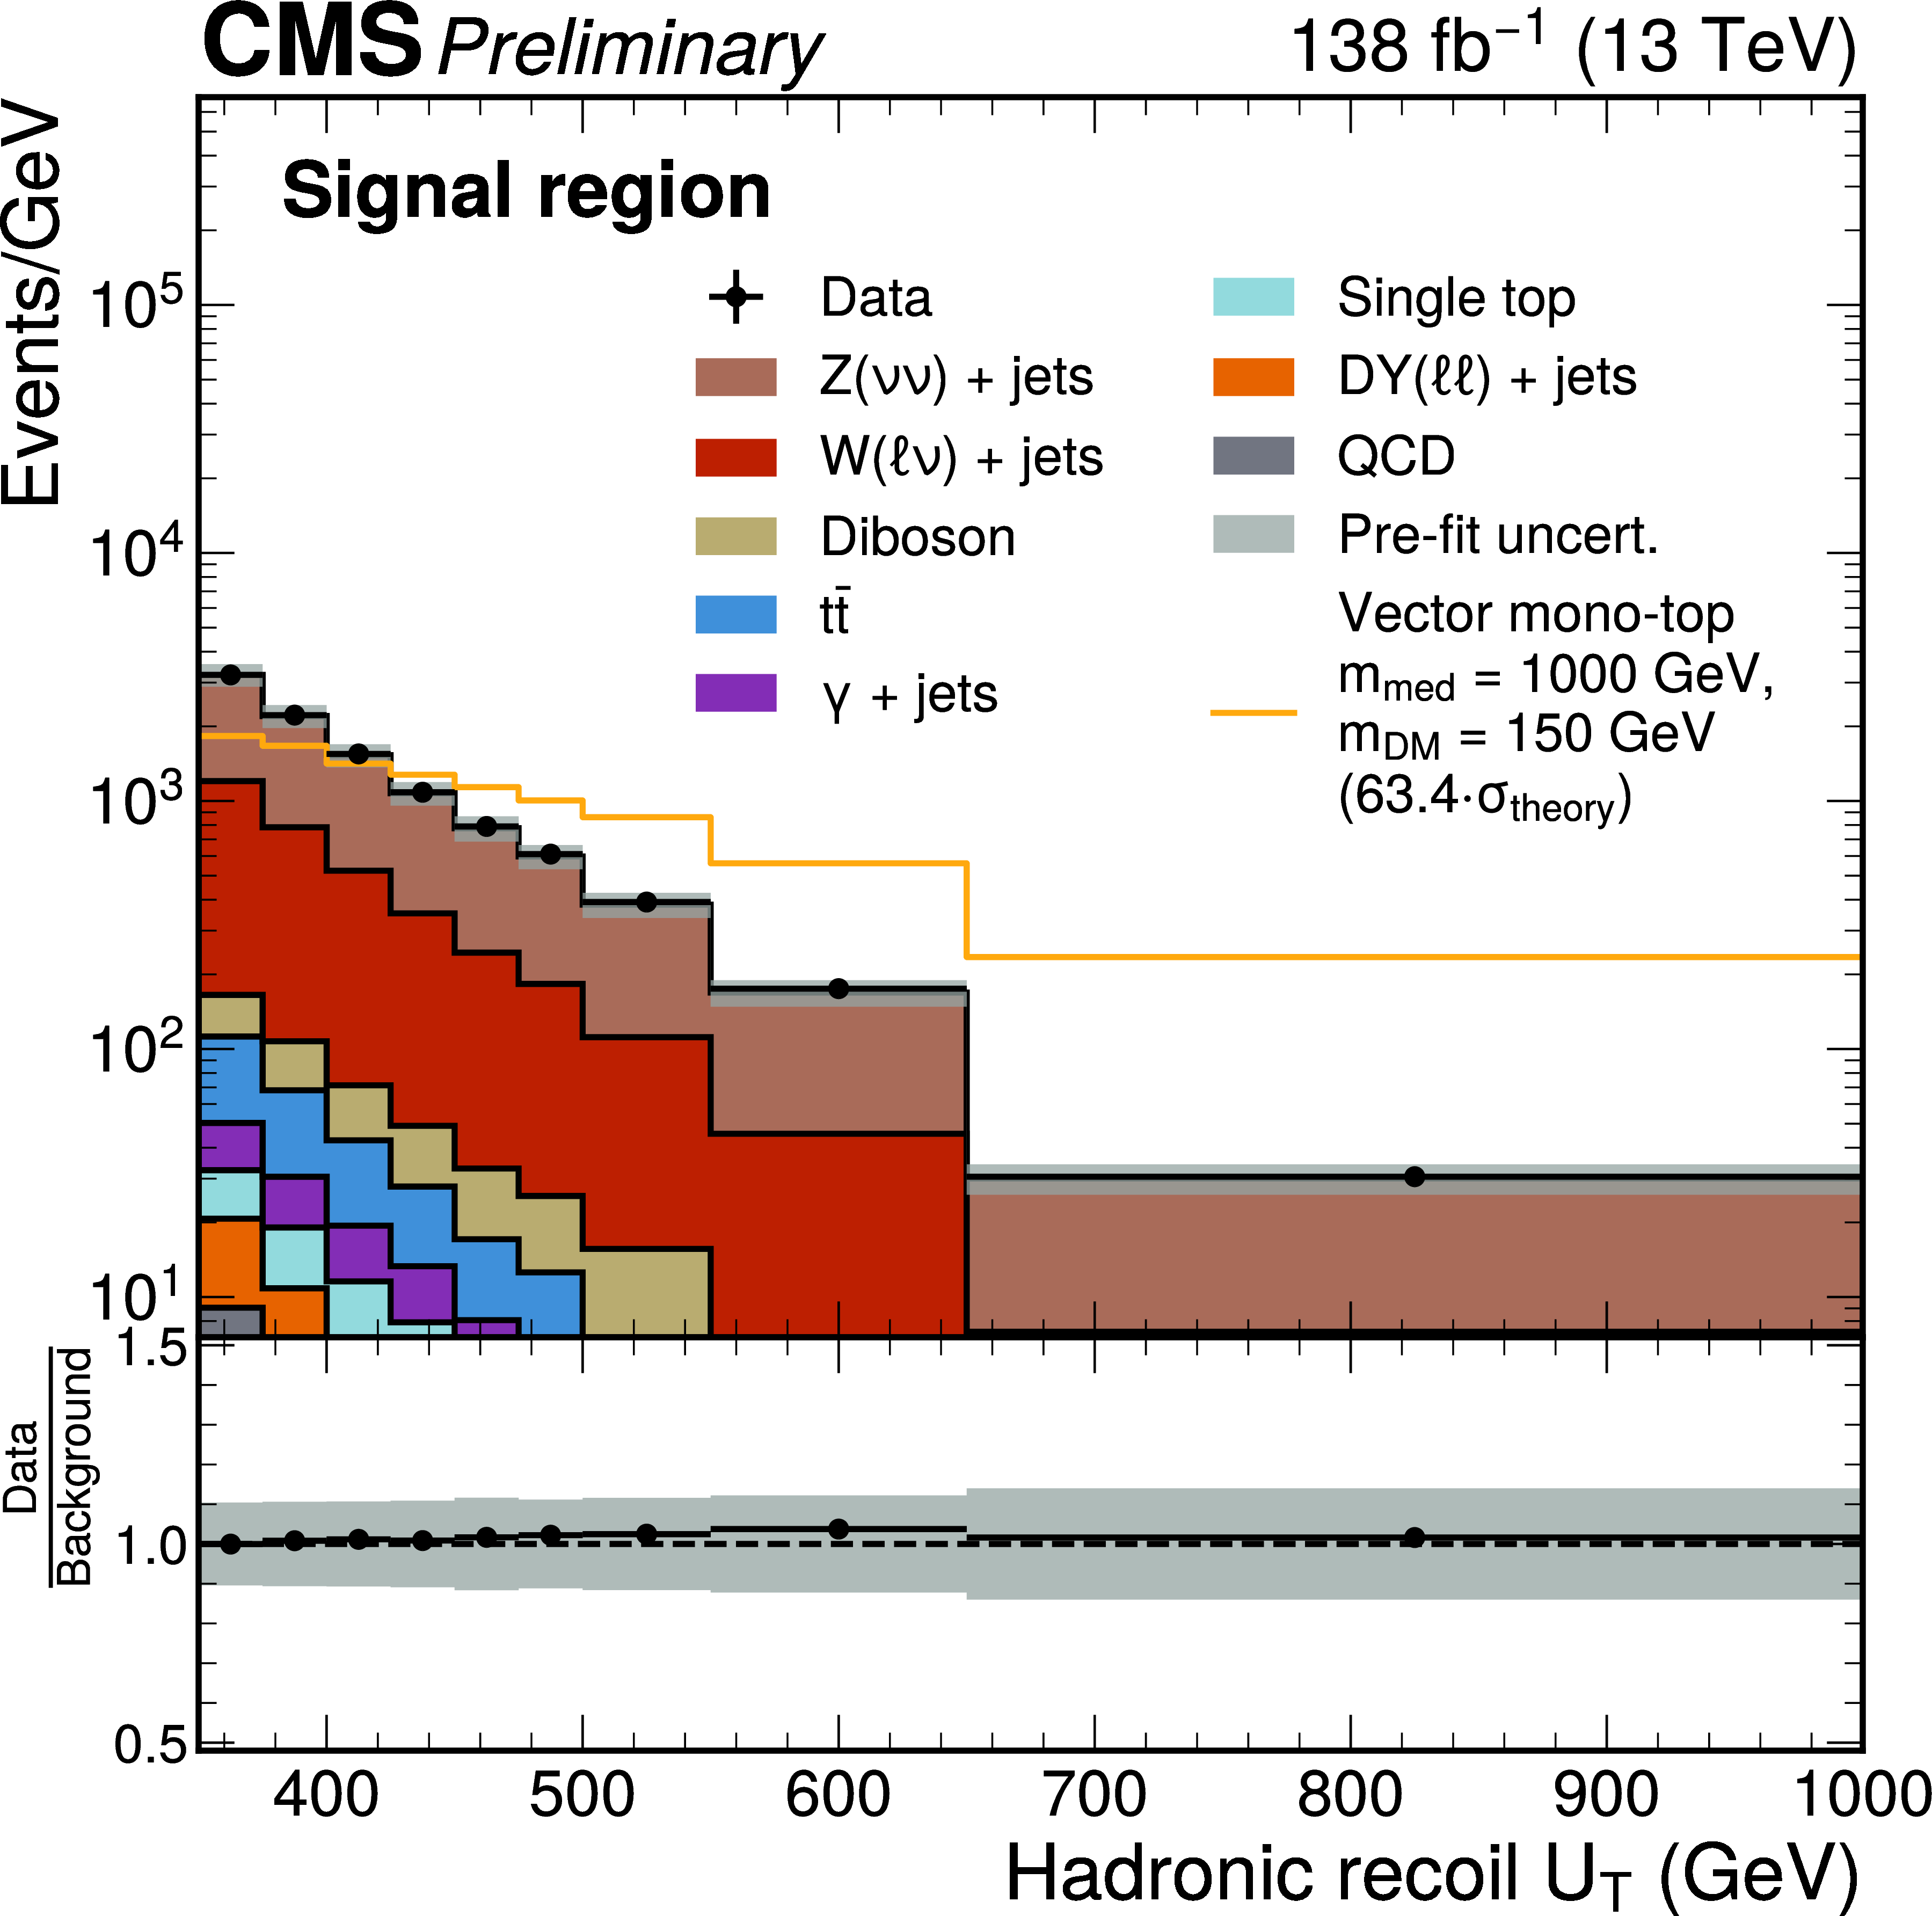
Figure 2:
Prefit distribution of the magnitude of the hadronic recoil $ U_{\text{T}} $ in the inclusive SR, which contains all events from the SR (top-pass) as well as from the SR (top-fail). The background processes are stacked together and an representative mono-top signal (vector coupling scenario) with a mediator mass of 1 TeV and a DM candidate mass of 150 GeV is overlaid as an orange line. The mono-top signal is scaled such that the total number of signal events is equal to the total number of background events. The grey band represents the systematic and statistical uncertainties on the simulated events. |
png pdf |
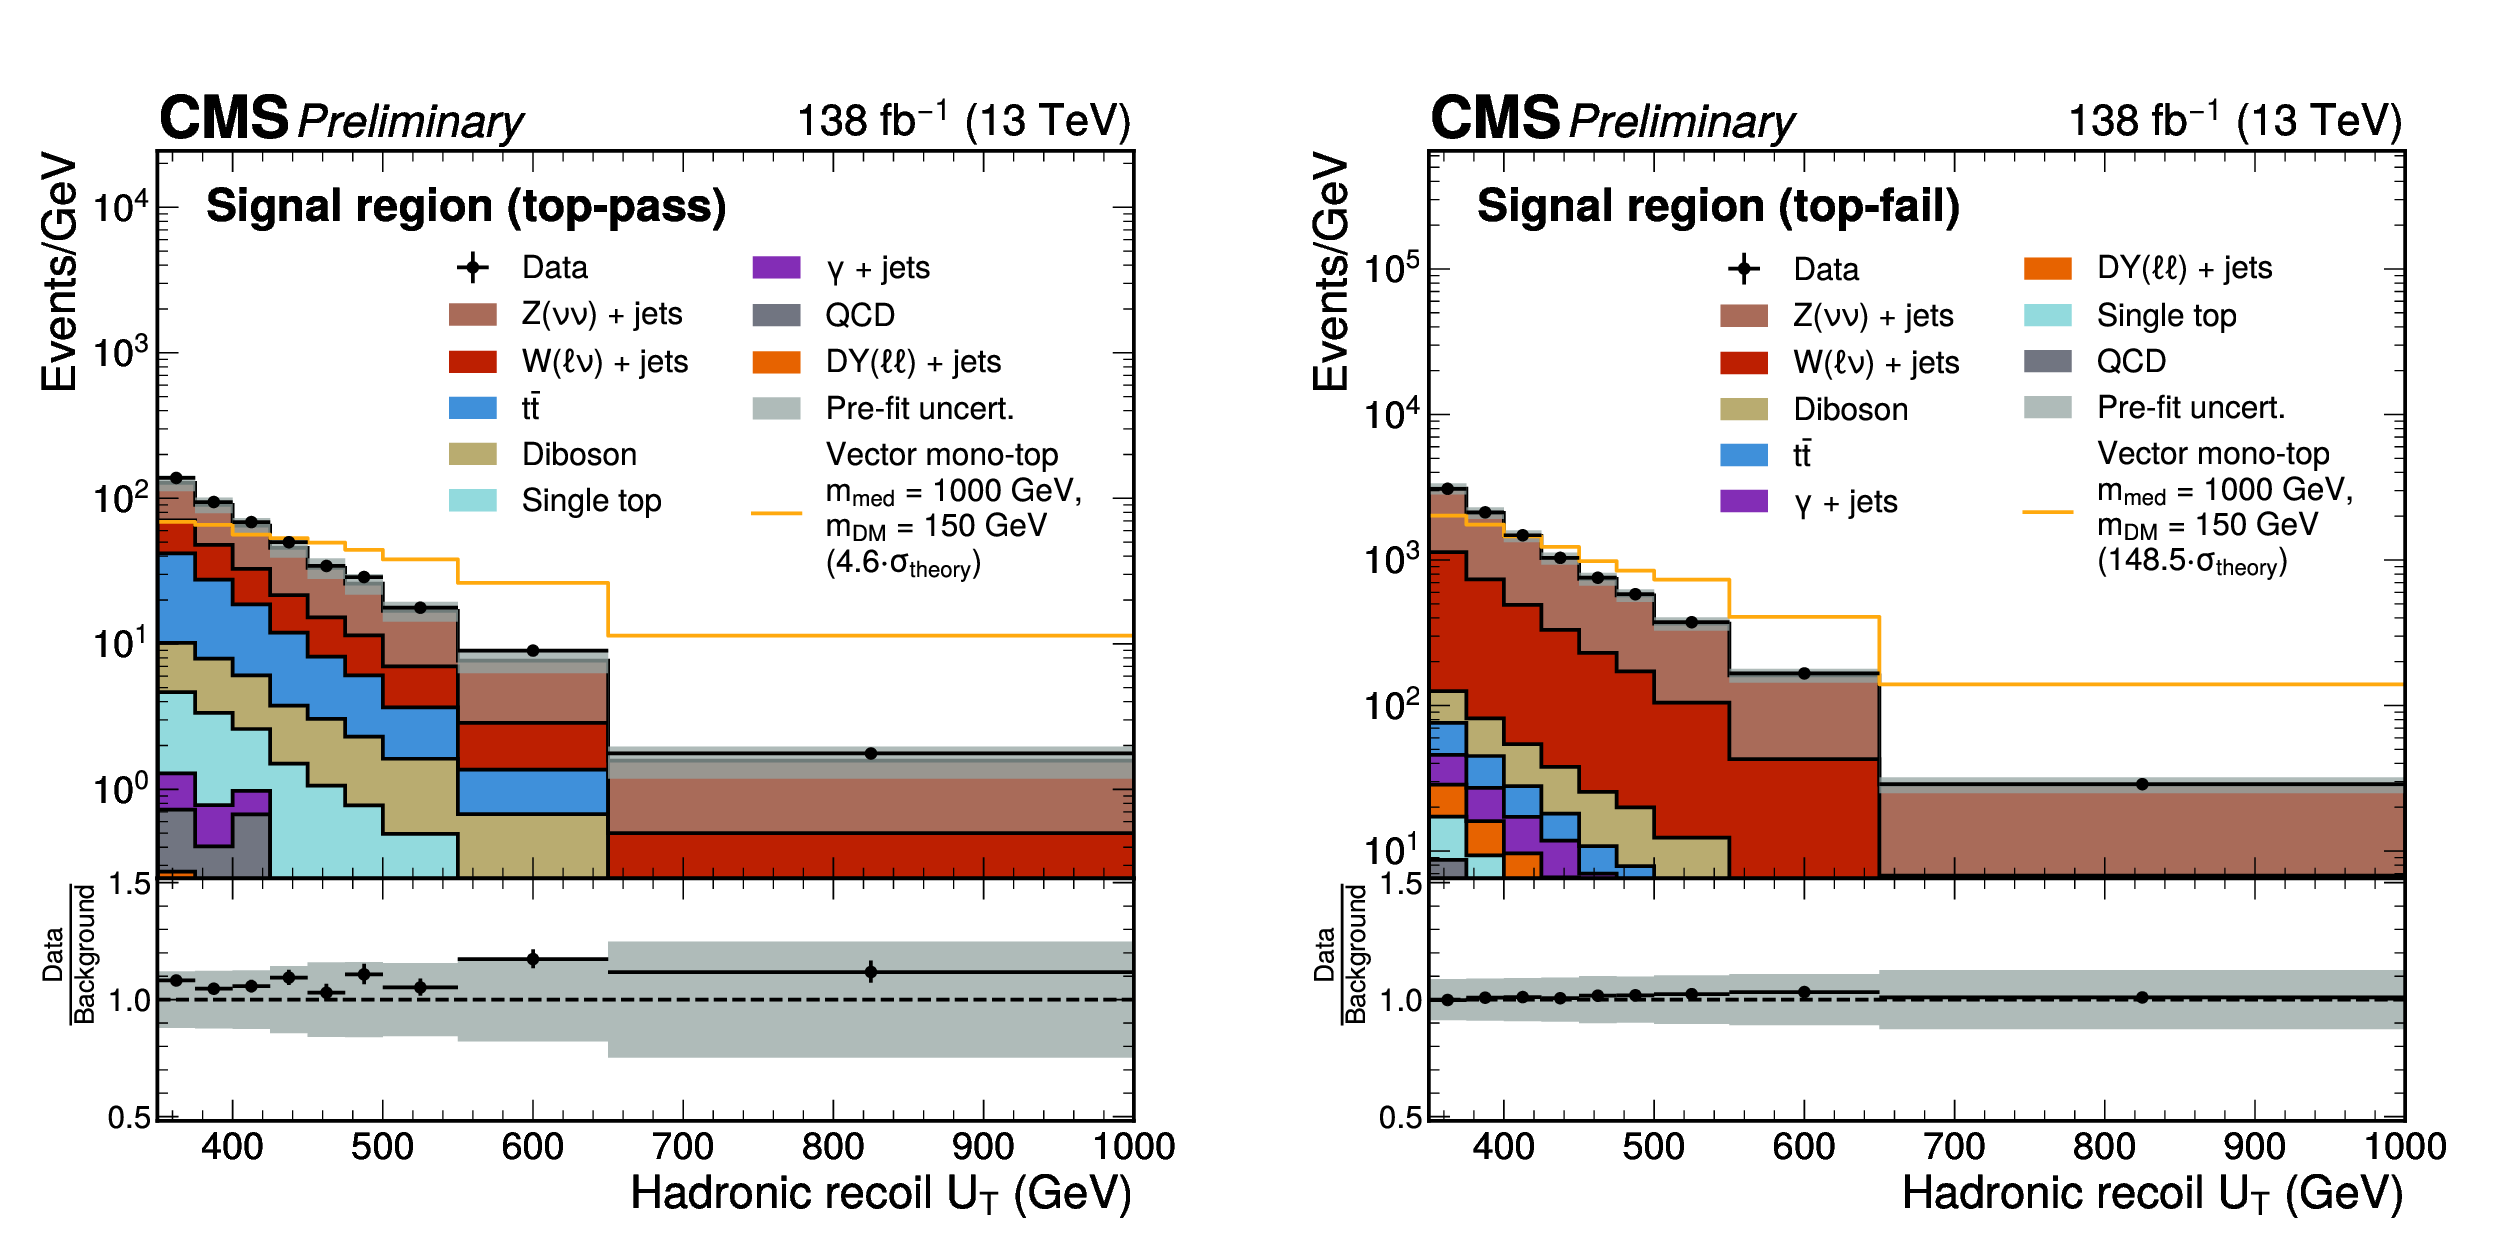
Figure 3:
Prefit distribution of the magnitude of the hadronic recoil $ U_{\text{T}} $ in the SR (top-pass) and SR (top-fail). The background processes are stacked together and an representative mono-top signal (vector coupling scenario) with a mediator mass of 1 TeV and a DM candidate mass of 150 GeV is overlaid as an orange line. The mono-top signal is scaled such that the total number of signal events is equal to the total number of background events. The grey band represents the systematic and statistical uncertainties on the simulated events. |

png pdf |
Figure 3-a:
Prefit distribution of the magnitude of the hadronic recoil $ U_{\text{T}} $ in the SR (top-pass) and SR (top-fail). The background processes are stacked together and an representative mono-top signal (vector coupling scenario) with a mediator mass of 1 TeV and a DM candidate mass of 150 GeV is overlaid as an orange line. The mono-top signal is scaled such that the total number of signal events is equal to the total number of background events. The grey band represents the systematic and statistical uncertainties on the simulated events. |

png pdf |
Figure 3-b:
Prefit distribution of the magnitude of the hadronic recoil $ U_{\text{T}} $ in the SR (top-pass) and SR (top-fail). The background processes are stacked together and an representative mono-top signal (vector coupling scenario) with a mediator mass of 1 TeV and a DM candidate mass of 150 GeV is overlaid as an orange line. The mono-top signal is scaled such that the total number of signal events is equal to the total number of background events. The grey band represents the systematic and statistical uncertainties on the simulated events. |
png pdf |
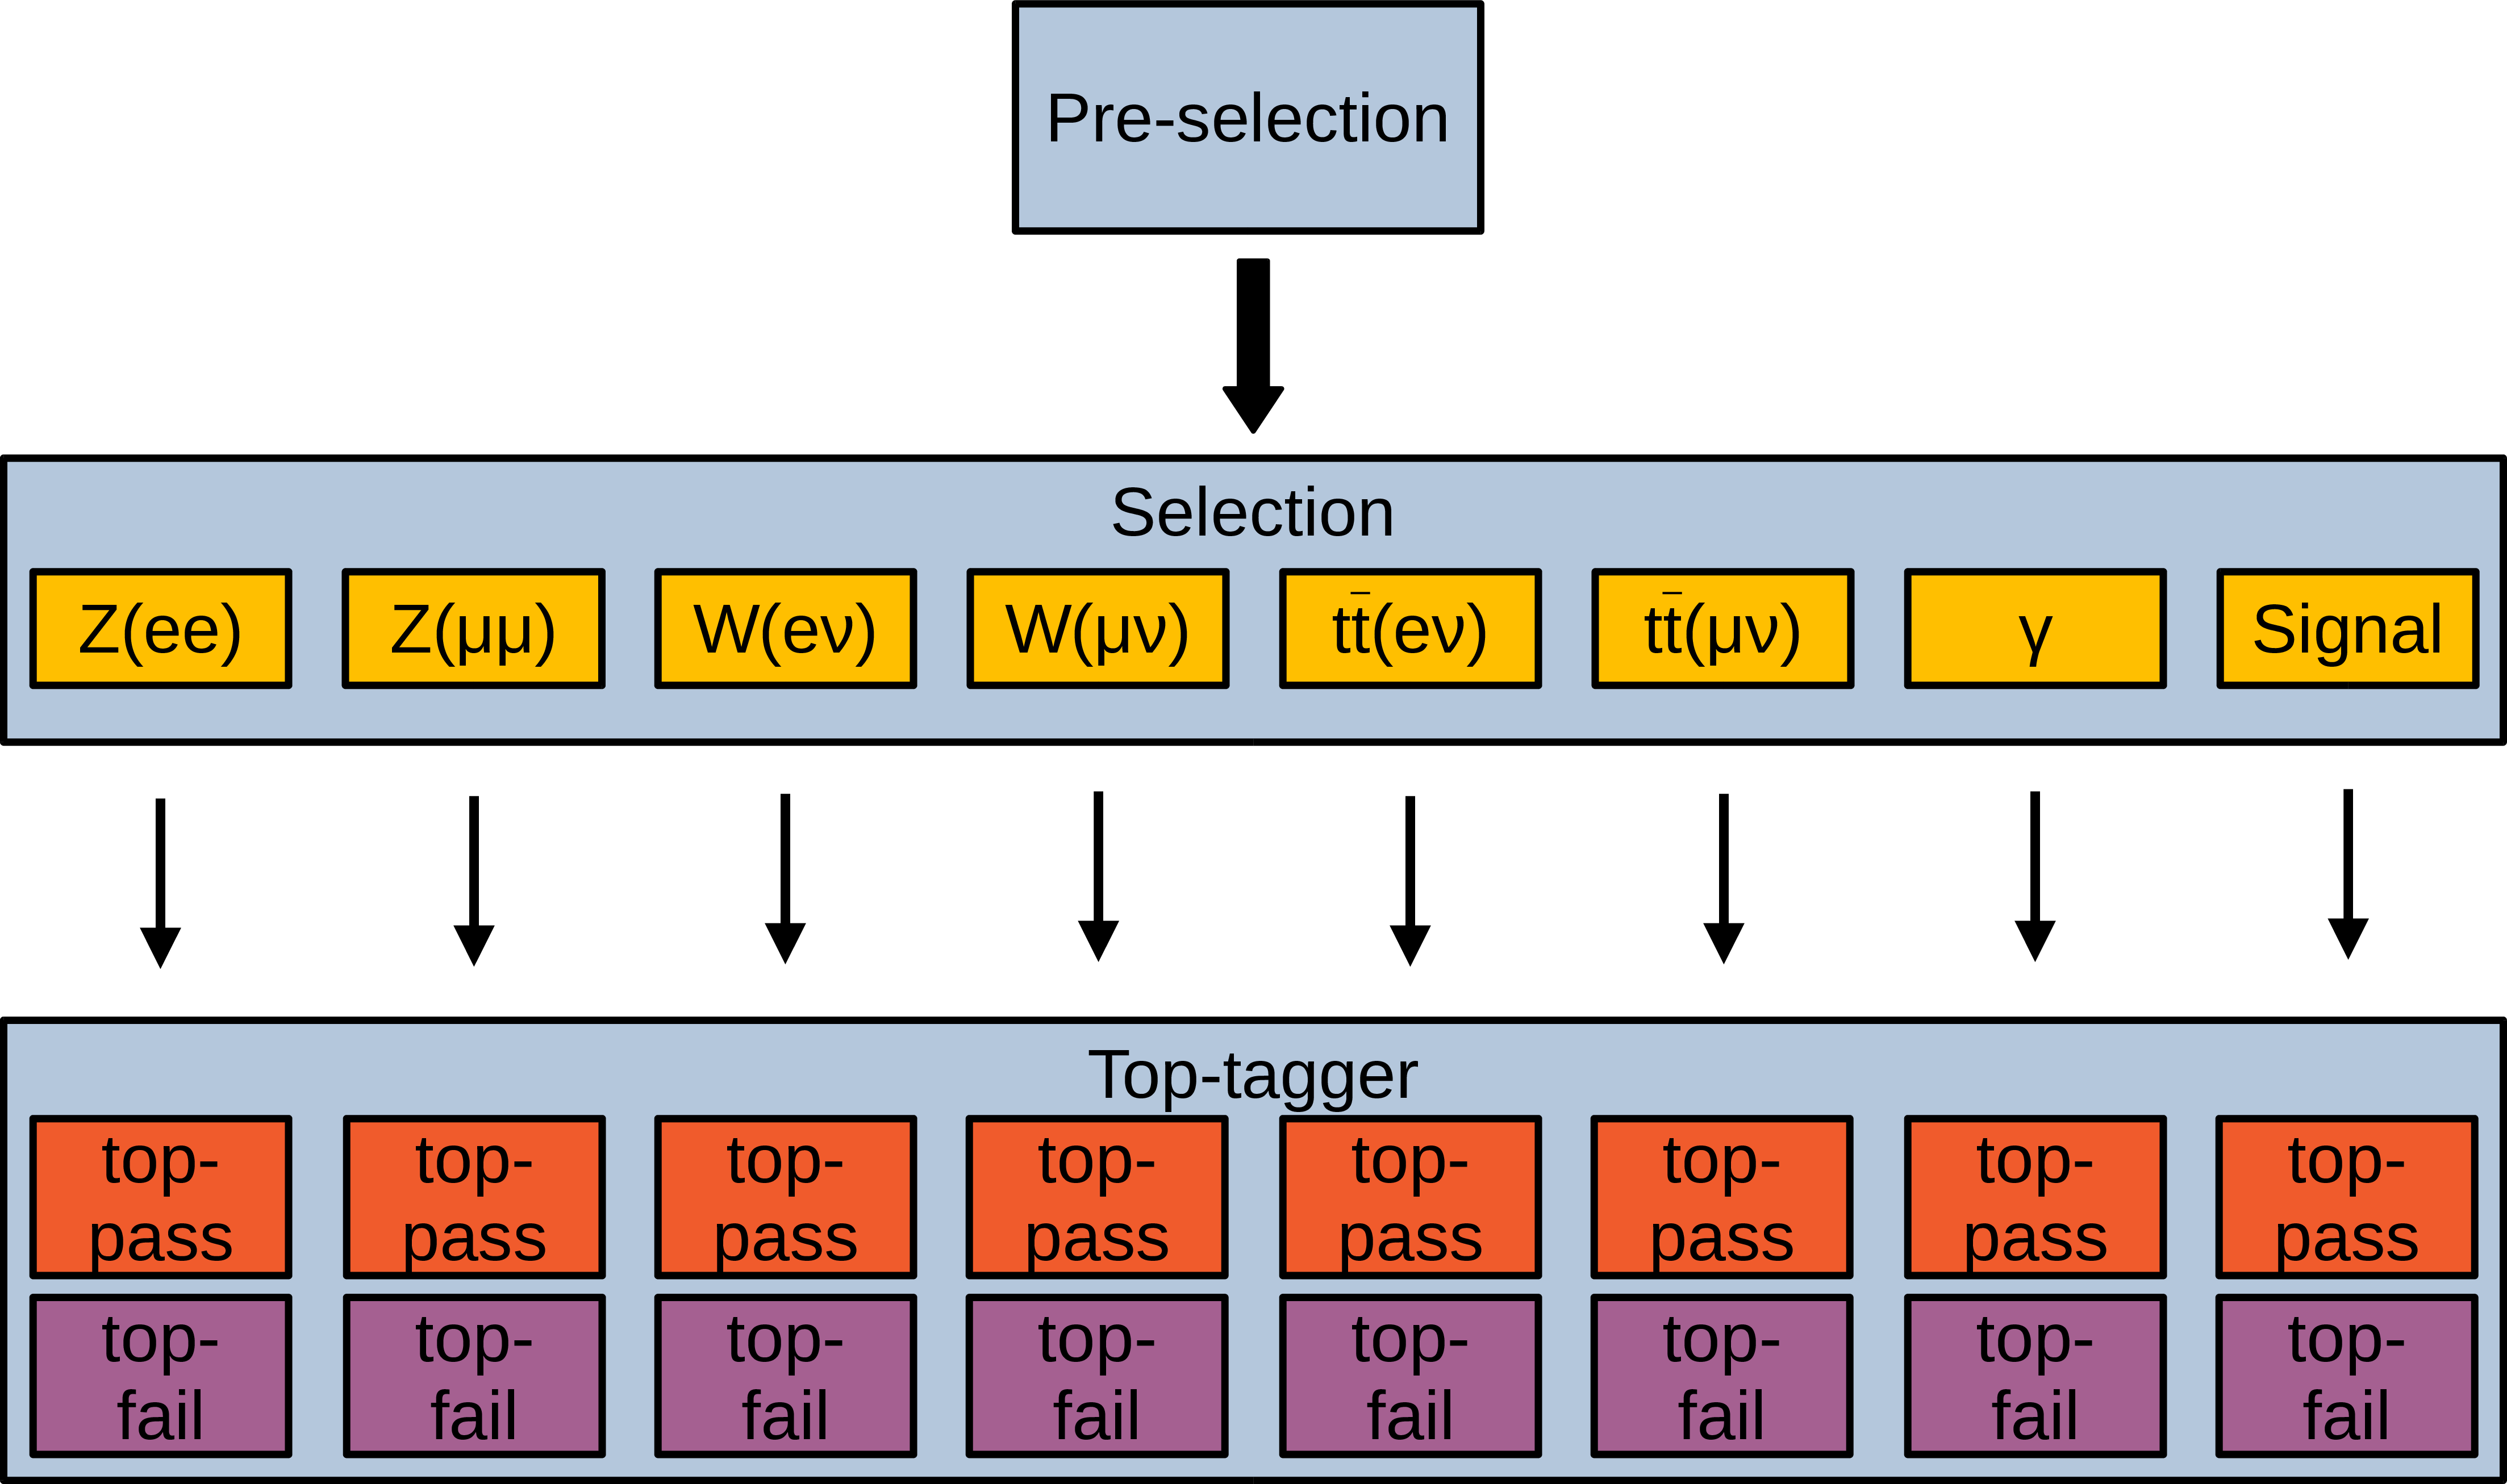
Figure 4:
Categorization of events into SRs and CRs, which are sensitive to specific process, namely the mono-top signal, $ \text{V}+\text{jets} $ processes and $ \text{t}\bar{\text{t}} $ production. |
png pdf |
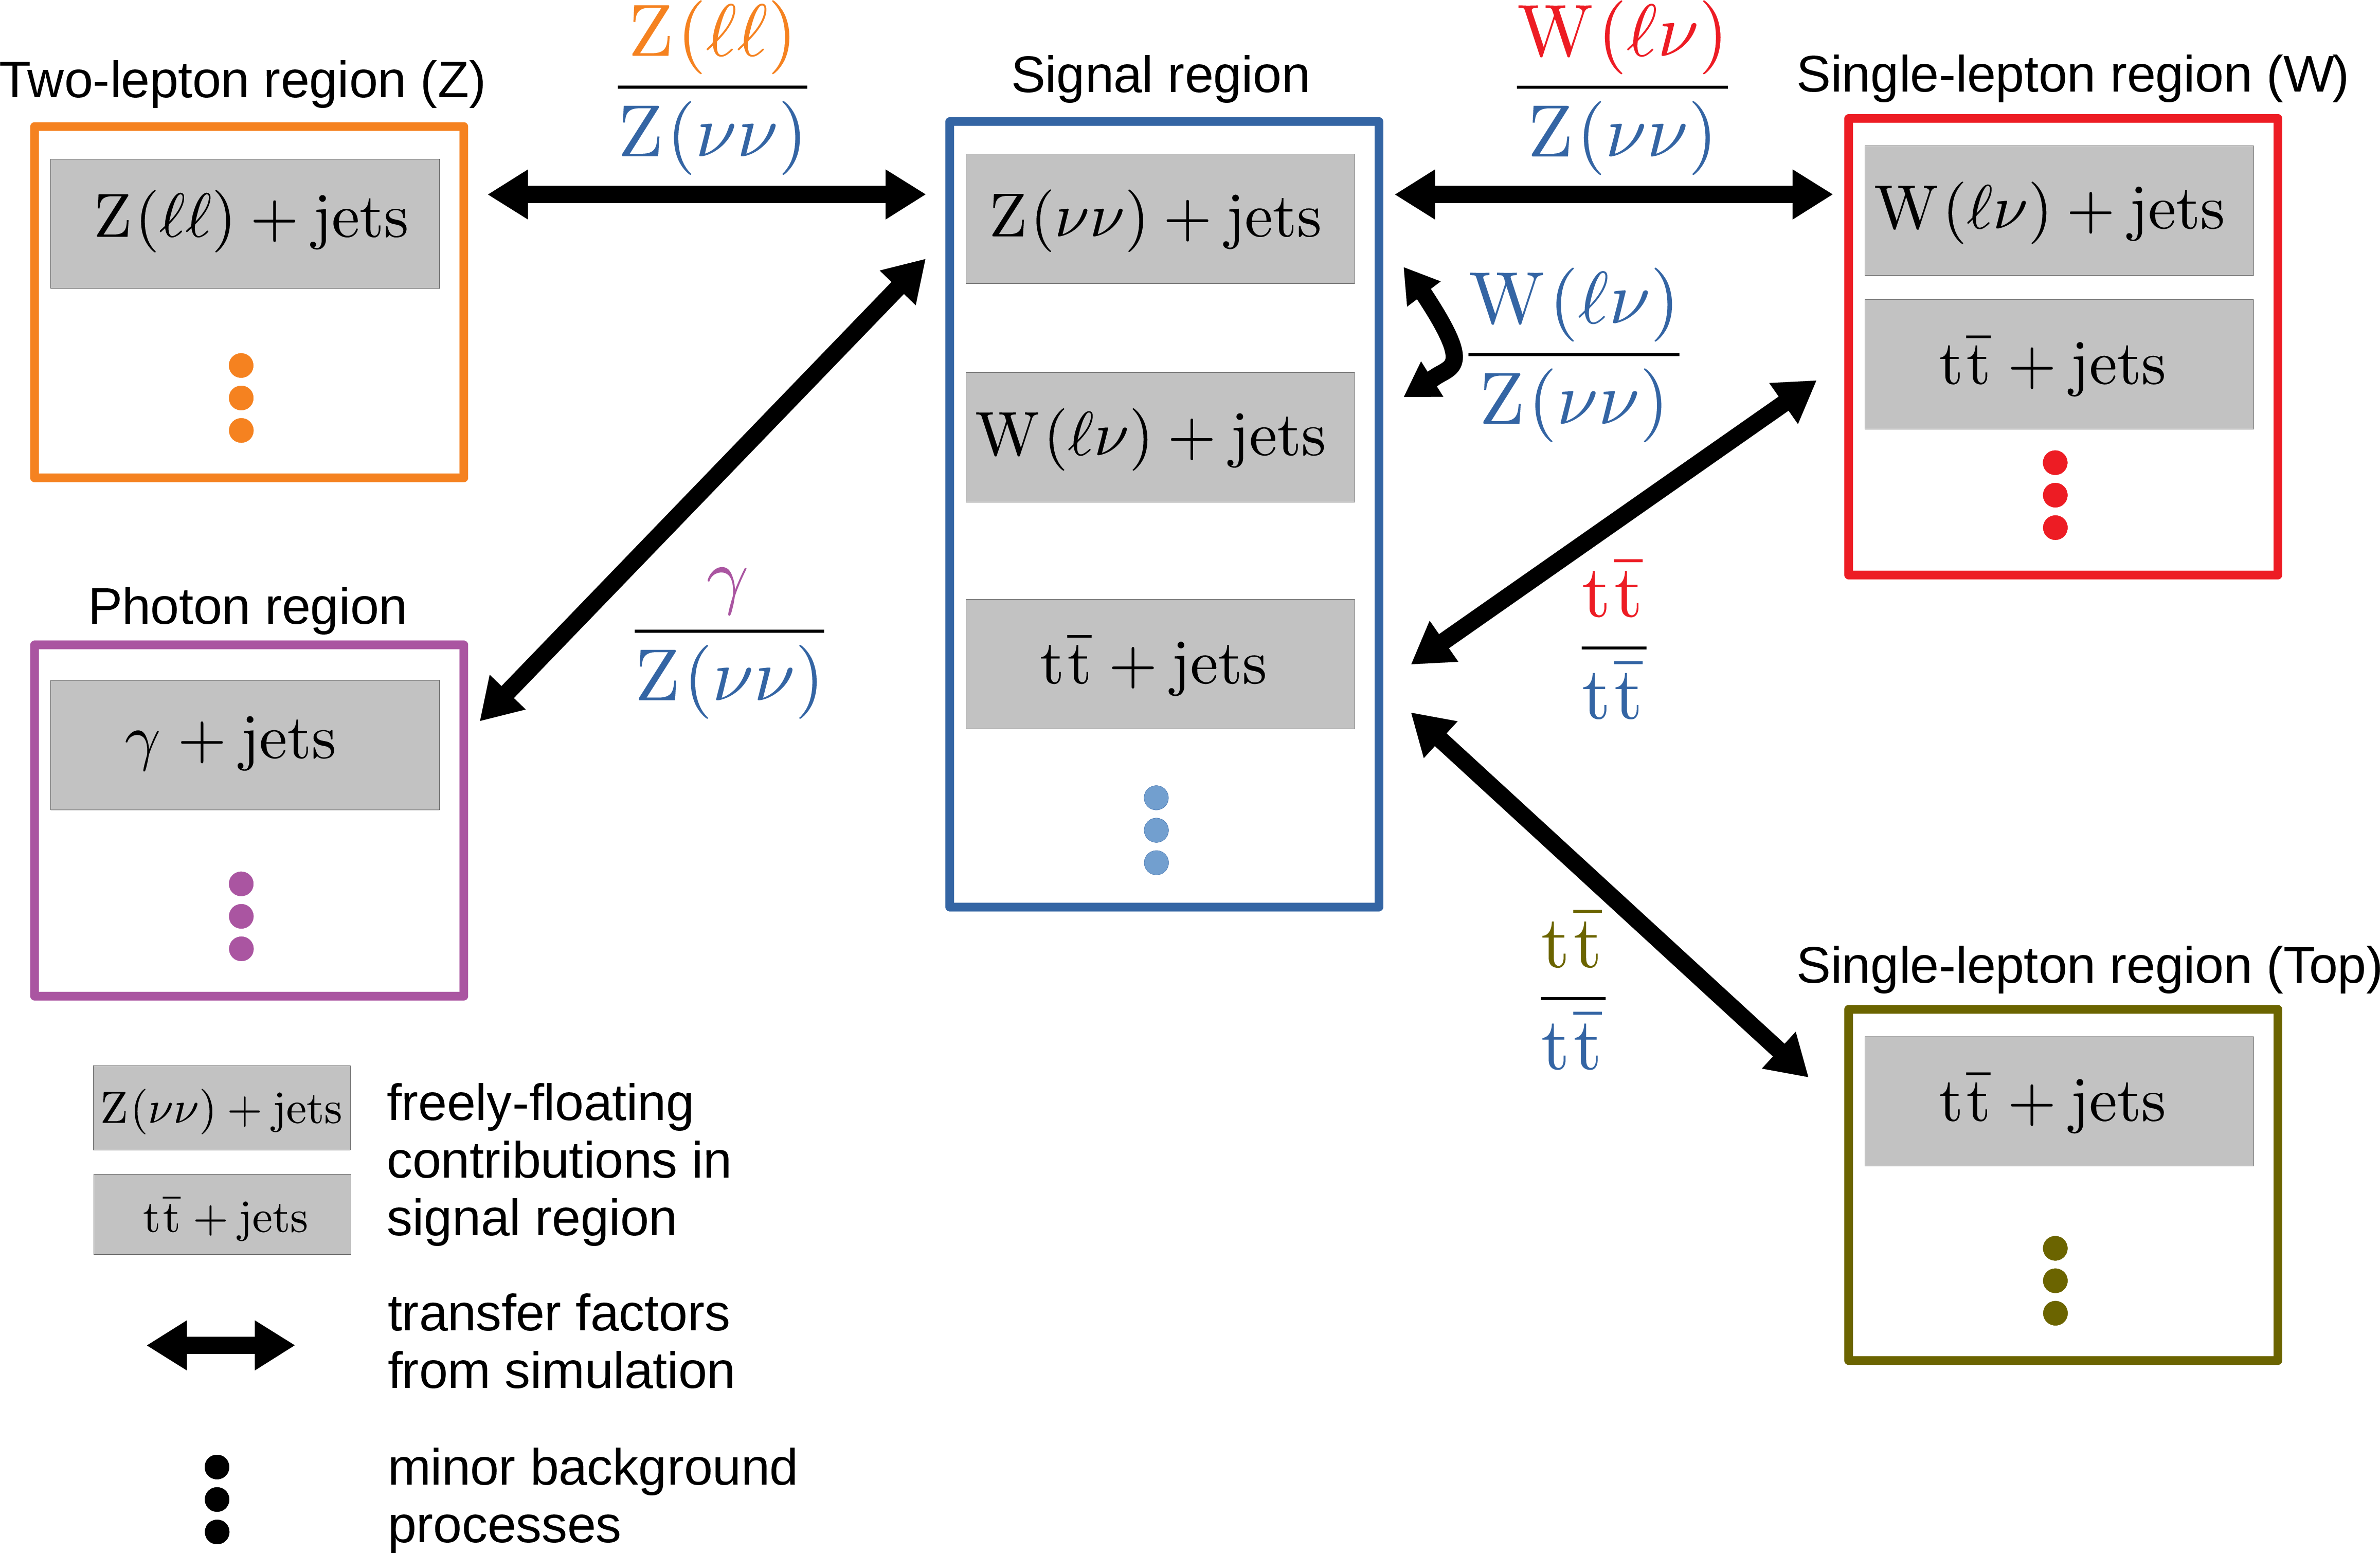
Figure 5:
Graphical illustration of the statistical model used for the estimation of the major background processes. This model is implemented for each bin of the hadronic recoil distribution, separately for the top-pass and top-fail regions. Each region containing charged leptons is included in this model twice, once for electrons and once for muons. |
png pdf |
Figure 6:
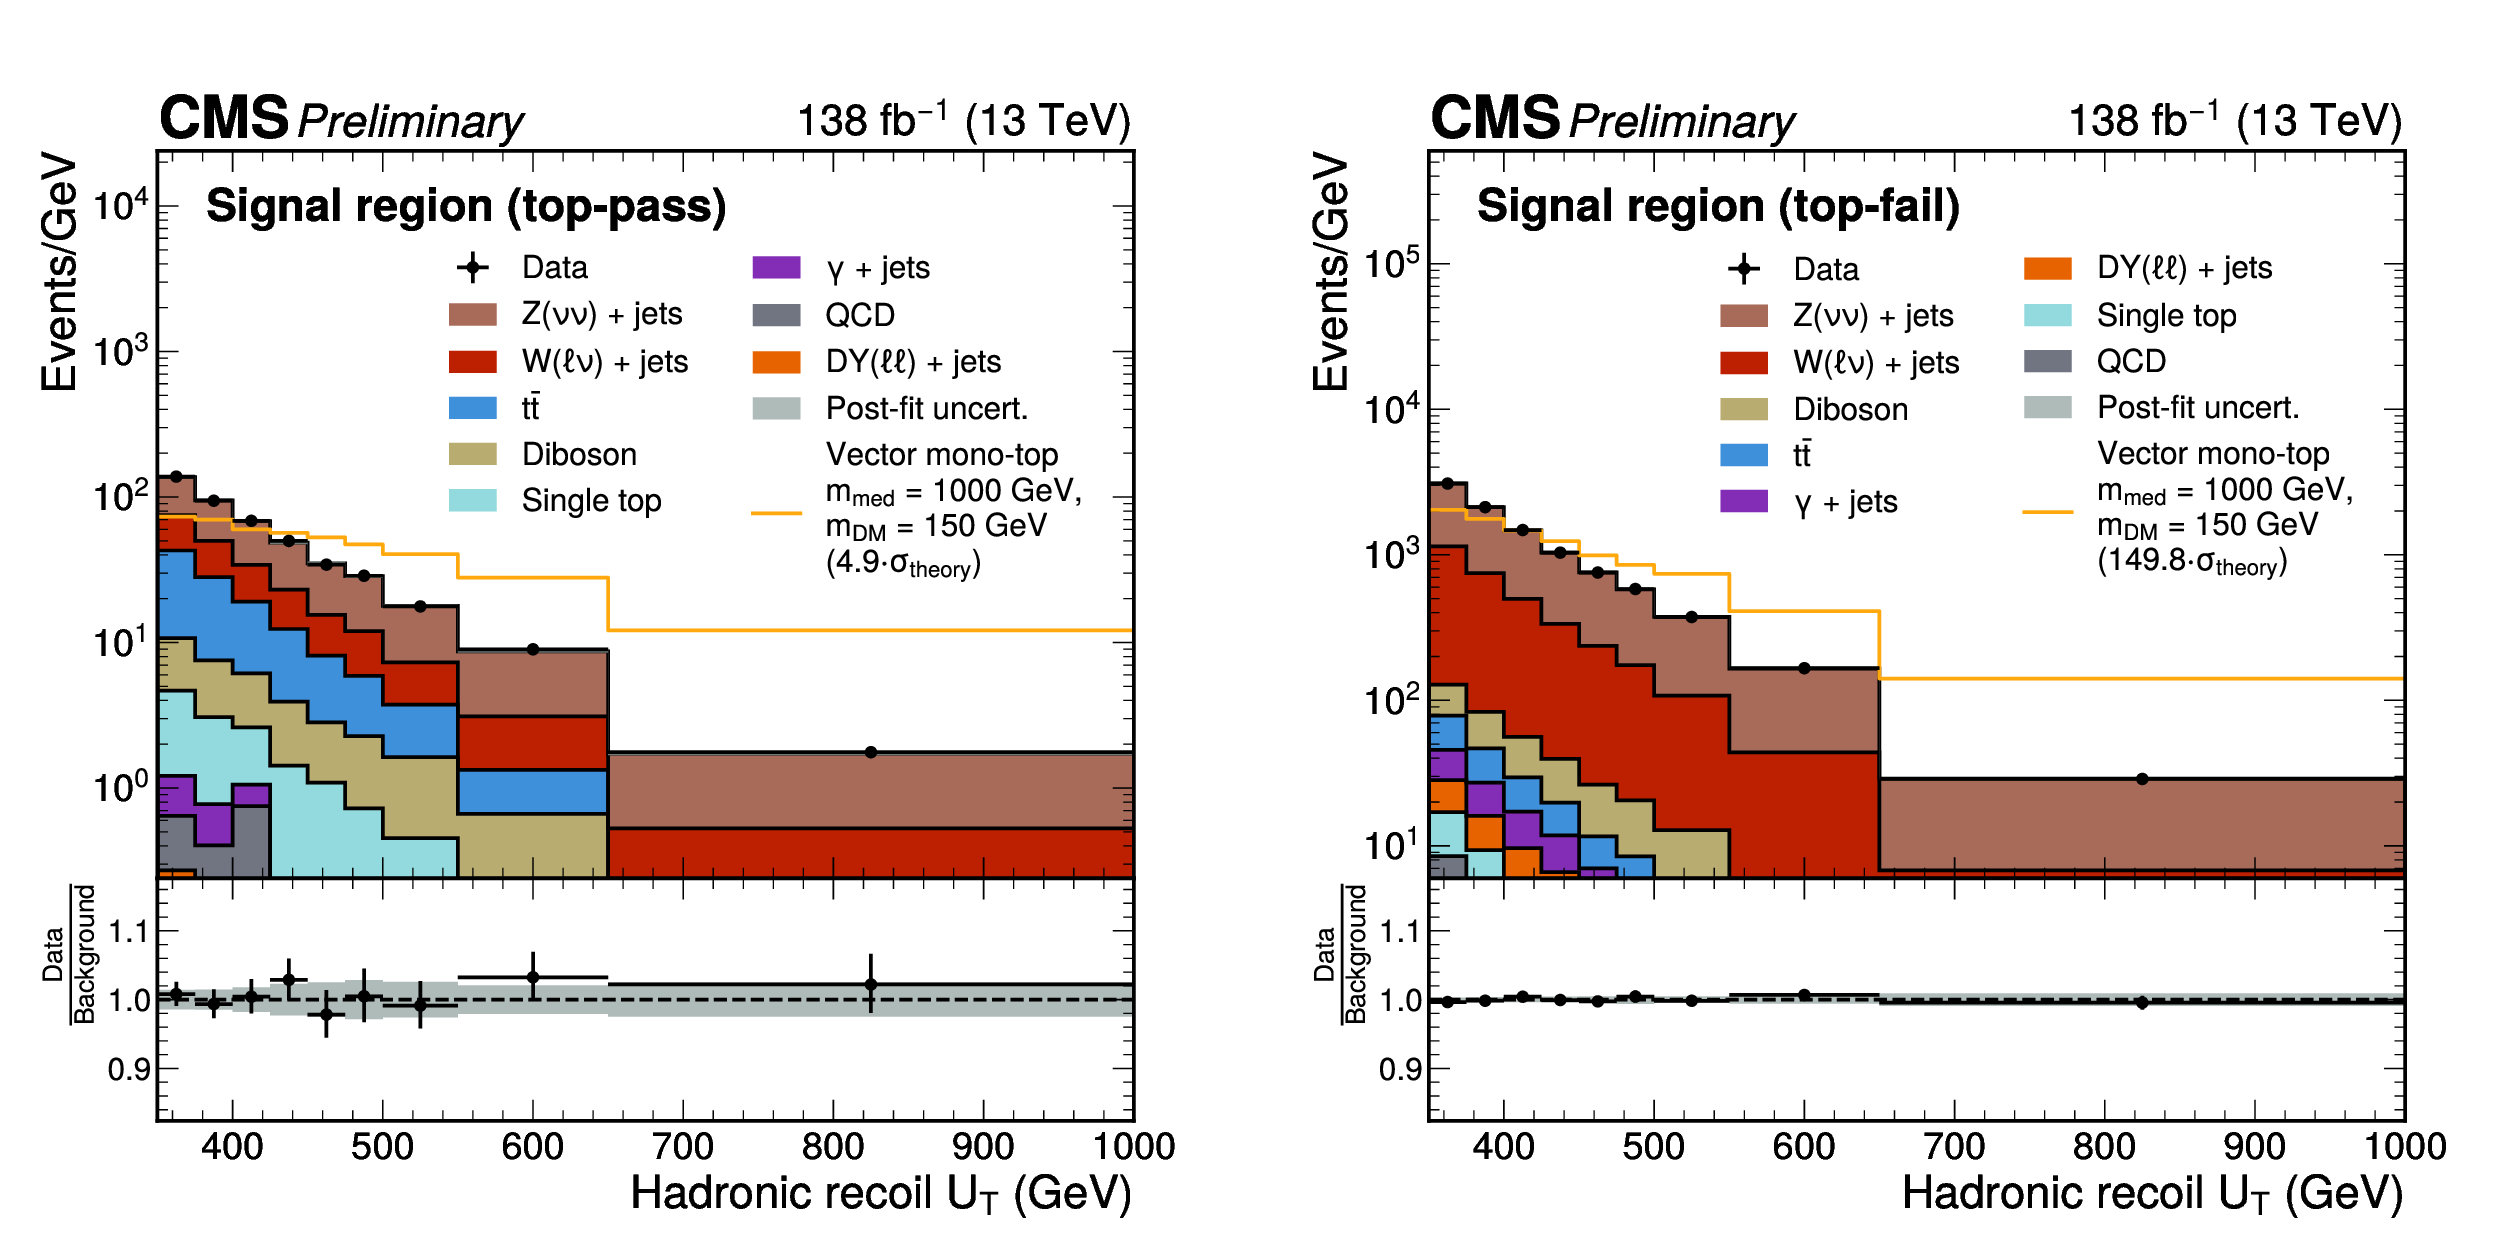
Postfit distributions in the SRs after the background-only fit across all analysis regions. The $ U_{\text{T}} $ distributions only contain events in the signal region, in which the top tagging requirement for the leading \text{AK15} jet is either passed (on the left) or failed (on the right). The orange line displays the prefit distribution of the mono-top signal with a mediator mass of 1 TeV and a DM candidate mass of 150 GeV for the vector coupling scenario, scaled such that the total number of signal events is equal to the total number of events of the postfit background prediction. The grey band represents the systematic and statistical uncertainties on the simulated events after the fit. |

png pdf |
Figure 6-a:
Postfit distributions in the SRs after the background-only fit across all analysis regions. The $ U_{\text{T}} $ distributions only contain events in the signal region, in which the top tagging requirement for the leading \text{AK15} jet is either passed (on the left) or failed (on the right). The orange line displays the prefit distribution of the mono-top signal with a mediator mass of 1 TeV and a DM candidate mass of 150 GeV for the vector coupling scenario, scaled such that the total number of signal events is equal to the total number of events of the postfit background prediction. The grey band represents the systematic and statistical uncertainties on the simulated events after the fit. |

png pdf |
Figure 6-b:
Postfit distributions in the SRs after the background-only fit across all analysis regions. The $ U_{\text{T}} $ distributions only contain events in the signal region, in which the top tagging requirement for the leading \text{AK15} jet is either passed (on the left) or failed (on the right). The orange line displays the prefit distribution of the mono-top signal with a mediator mass of 1 TeV and a DM candidate mass of 150 GeV for the vector coupling scenario, scaled such that the total number of signal events is equal to the total number of events of the postfit background prediction. The grey band represents the systematic and statistical uncertainties on the simulated events after the fit. |
png pdf |
Figure 7:
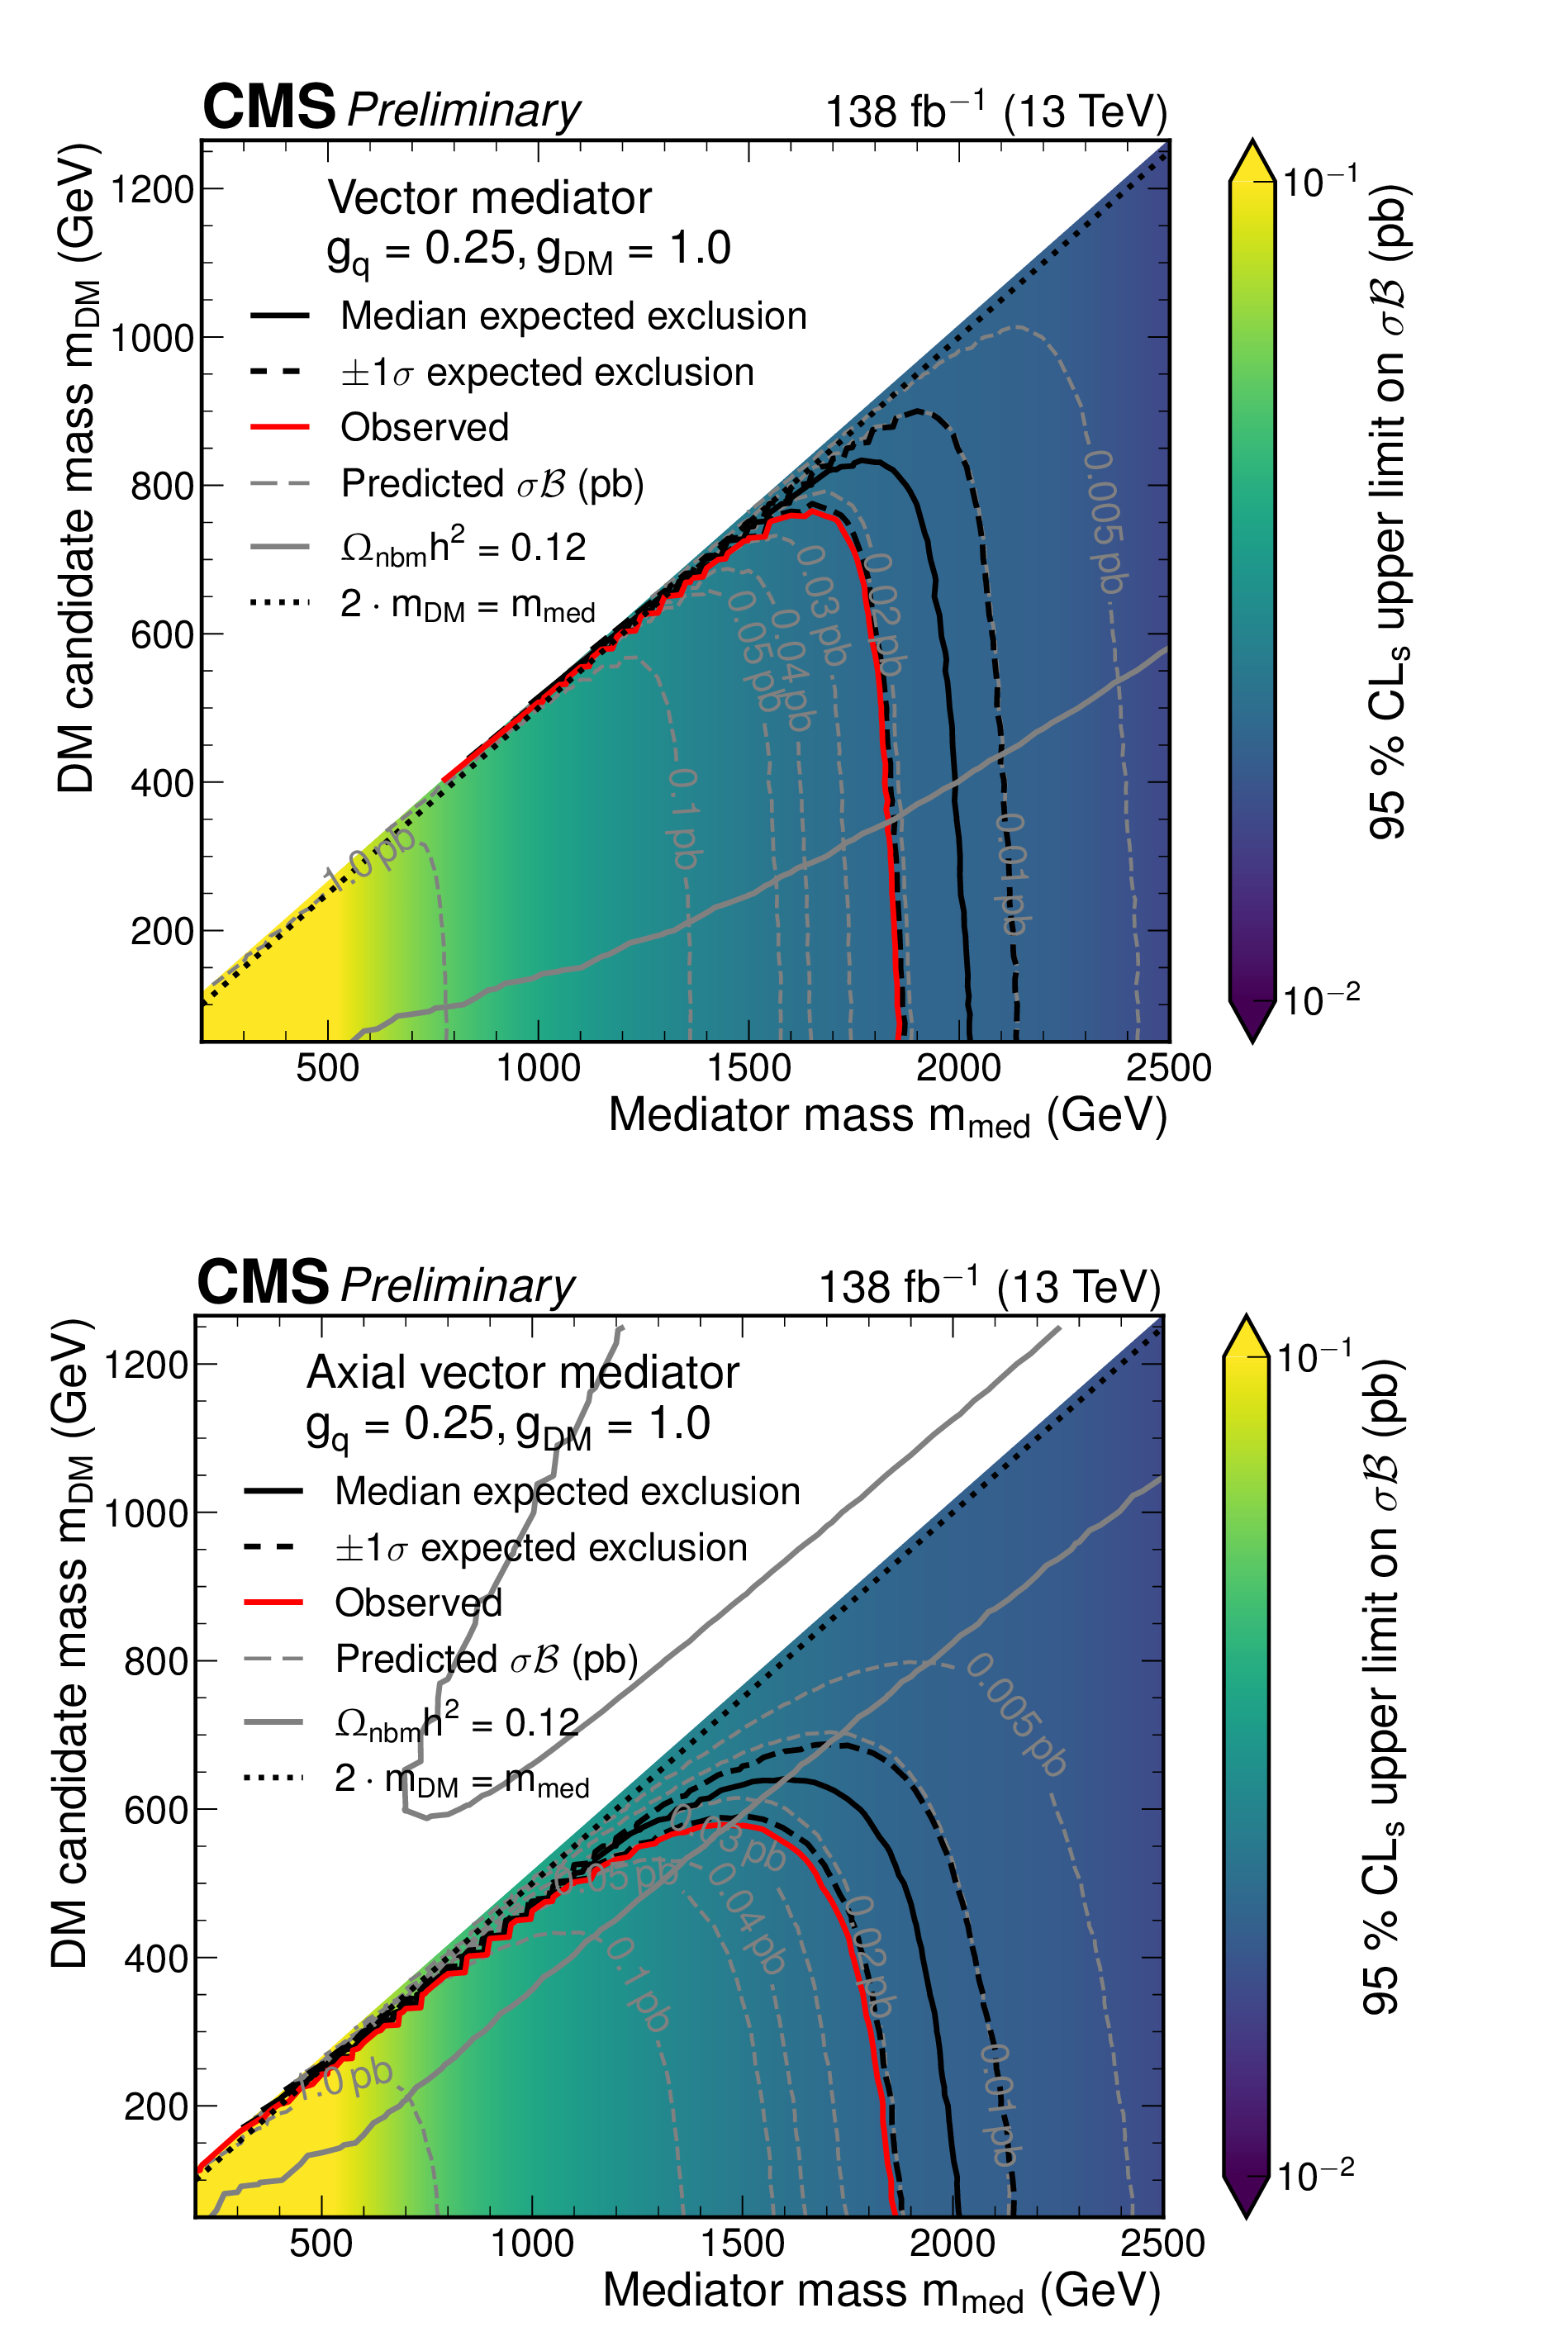
Upper limits at 95% CL on $ \sigma\mathcal{B} $ presented in the two-dimensional plane spanned by the mediator and DM candidate masses for a mediator mass between 200 GeV and 2500 GeV and a DM candidate mass between 50 GeV and 1250 GeV only considering on-shell decays of the mediator to the DM candidates. The mediator has vector couplings to quarks and DM candidates in the upper plot and axial vector couplings in the lower plot. In the upper plot, $ g_{\text{q}} $ and $ g_{\text{DM}} $ represent the values of the vector couplings $ (g_{\text{V}}^{U})_{13} $ and $ g_{\text{V}}^{\chi} $ of the mediator to quarks and to DM candidates, while they represent the values of the respective axial vector couplings $ (g_{\text{A}}^{U})_{13} $ and $ g_{\text{A}}^{\chi} $ in the lower plot. The median expected exclusion range is indicated by a black solid line, demonstrating the search sensitivity of the analysis. The 68 $ \,% $ probability interval of the expected upper limit is shown in black dashed lines. Contours of theory predictions for constant values of $ \sigma\mathcal{B} $ are shown in grey dashed lines. The observed exclusion contour of mediator and DM candidate masses is represented by the red solid line. The exclusion contour obtained from measurements of the DM relic density $ \Omega_{\text{nbm}}h^{2} $ by the Planck collaboration is shown in the grey solid line. |

png pdf |
Figure 7-a:
Upper limits at 95% CL on $ \sigma\mathcal{B} $ presented in the two-dimensional plane spanned by the mediator and DM candidate masses for a mediator mass between 200 GeV and 2500 GeV and a DM candidate mass between 50 GeV and 1250 GeV only considering on-shell decays of the mediator to the DM candidates. The mediator has vector couplings to quarks and DM candidates in the upper plot and axial vector couplings in the lower plot. In the upper plot, $ g_{\text{q}} $ and $ g_{\text{DM}} $ represent the values of the vector couplings $ (g_{\text{V}}^{U})_{13} $ and $ g_{\text{V}}^{\chi} $ of the mediator to quarks and to DM candidates, while they represent the values of the respective axial vector couplings $ (g_{\text{A}}^{U})_{13} $ and $ g_{\text{A}}^{\chi} $ in the lower plot. The median expected exclusion range is indicated by a black solid line, demonstrating the search sensitivity of the analysis. The 68 $ \,% $ probability interval of the expected upper limit is shown in black dashed lines. Contours of theory predictions for constant values of $ \sigma\mathcal{B} $ are shown in grey dashed lines. The observed exclusion contour of mediator and DM candidate masses is represented by the red solid line. The exclusion contour obtained from measurements of the DM relic density $ \Omega_{\text{nbm}}h^{2} $ by the Planck collaboration is shown in the grey solid line. |

png pdf |
Figure 7-b:
Upper limits at 95% CL on $ \sigma\mathcal{B} $ presented in the two-dimensional plane spanned by the mediator and DM candidate masses for a mediator mass between 200 GeV and 2500 GeV and a DM candidate mass between 50 GeV and 1250 GeV only considering on-shell decays of the mediator to the DM candidates. The mediator has vector couplings to quarks and DM candidates in the upper plot and axial vector couplings in the lower plot. In the upper plot, $ g_{\text{q}} $ and $ g_{\text{DM}} $ represent the values of the vector couplings $ (g_{\text{V}}^{U})_{13} $ and $ g_{\text{V}}^{\chi} $ of the mediator to quarks and to DM candidates, while they represent the values of the respective axial vector couplings $ (g_{\text{A}}^{U})_{13} $ and $ g_{\text{A}}^{\chi} $ in the lower plot. The median expected exclusion range is indicated by a black solid line, demonstrating the search sensitivity of the analysis. The 68 $ \,% $ probability interval of the expected upper limit is shown in black dashed lines. Contours of theory predictions for constant values of $ \sigma\mathcal{B} $ are shown in grey dashed lines. The observed exclusion contour of mediator and DM candidate masses is represented by the red solid line. The exclusion contour obtained from measurements of the DM relic density $ \Omega_{\text{nbm}}h^{2} $ by the Planck collaboration is shown in the grey solid line. |
png pdf |
Figure 8:
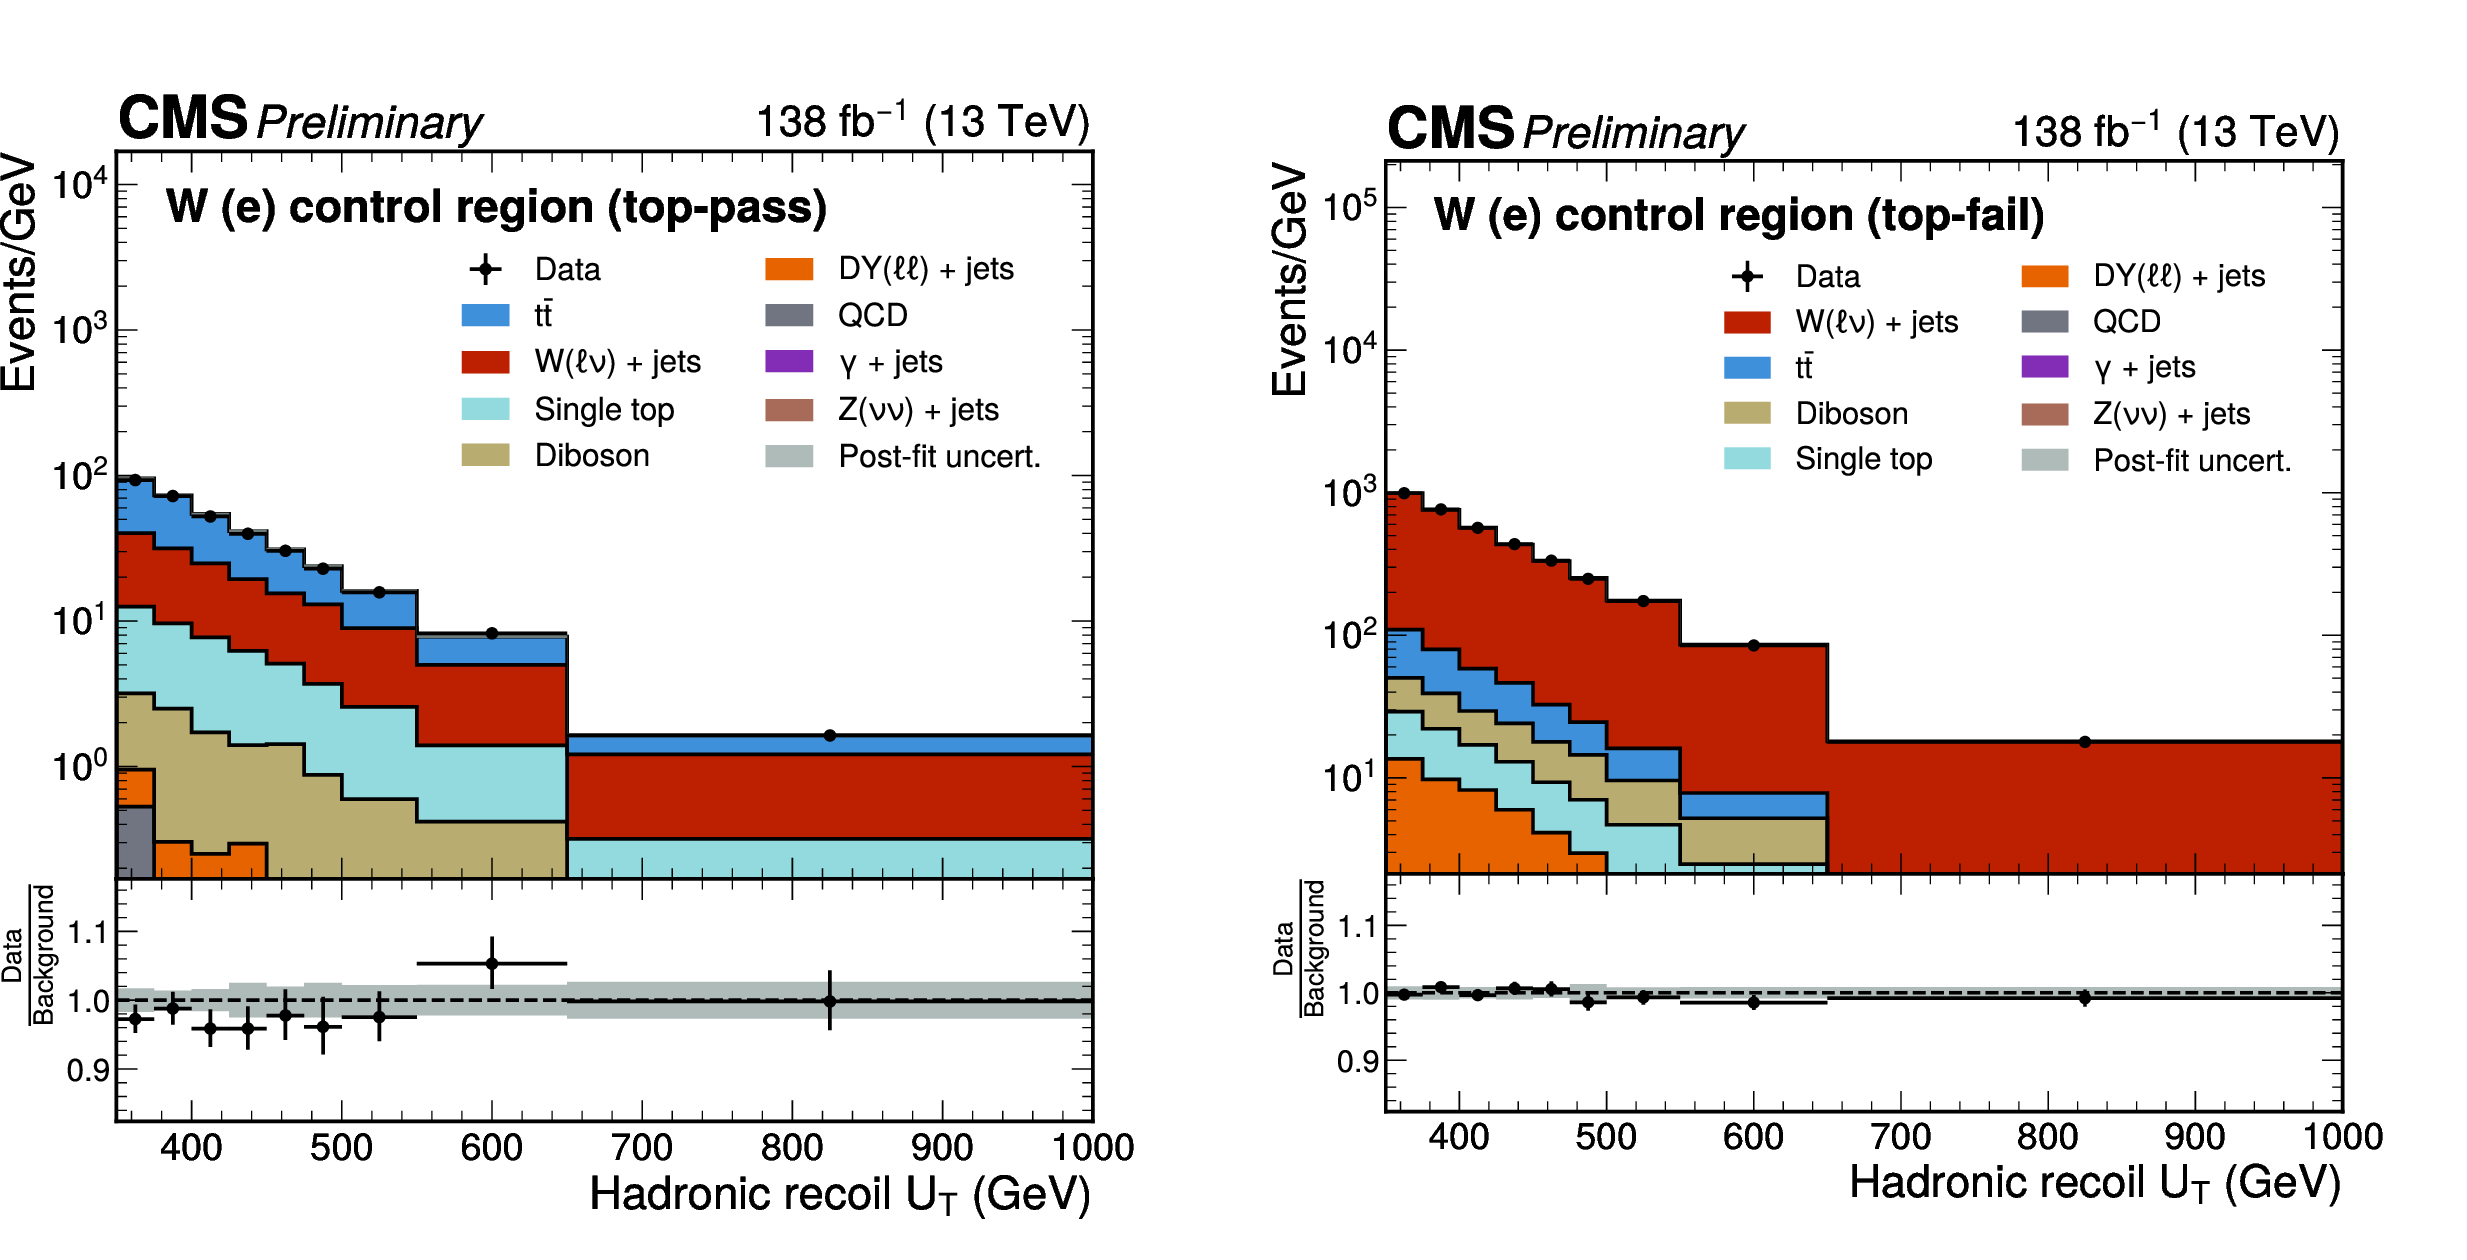
Postfit distributions in the $ \mathrm{W}(\mathrm{e}) $ CRs after the background-only fit across all analysis regions. The $ U_{\text{T}} $ distributions only contain events, in which the top tagging requirement for the leading \text{AK15} jet is either passed (on the left) or failed (on the right). The grey band represents the systematic and statistical uncertainties on the simulated events after the fit. |

png pdf |
Figure 8-a:
Postfit distributions in the $ \mathrm{W}(\mathrm{e}) $ CRs after the background-only fit across all analysis regions. The $ U_{\text{T}} $ distributions only contain events, in which the top tagging requirement for the leading \text{AK15} jet is either passed (on the left) or failed (on the right). The grey band represents the systematic and statistical uncertainties on the simulated events after the fit. |

png pdf |
Figure 8-b:
Postfit distributions in the $ \mathrm{W}(\mathrm{e}) $ CRs after the background-only fit across all analysis regions. The $ U_{\text{T}} $ distributions only contain events, in which the top tagging requirement for the leading \text{AK15} jet is either passed (on the left) or failed (on the right). The grey band represents the systematic and statistical uncertainties on the simulated events after the fit. |
png pdf |
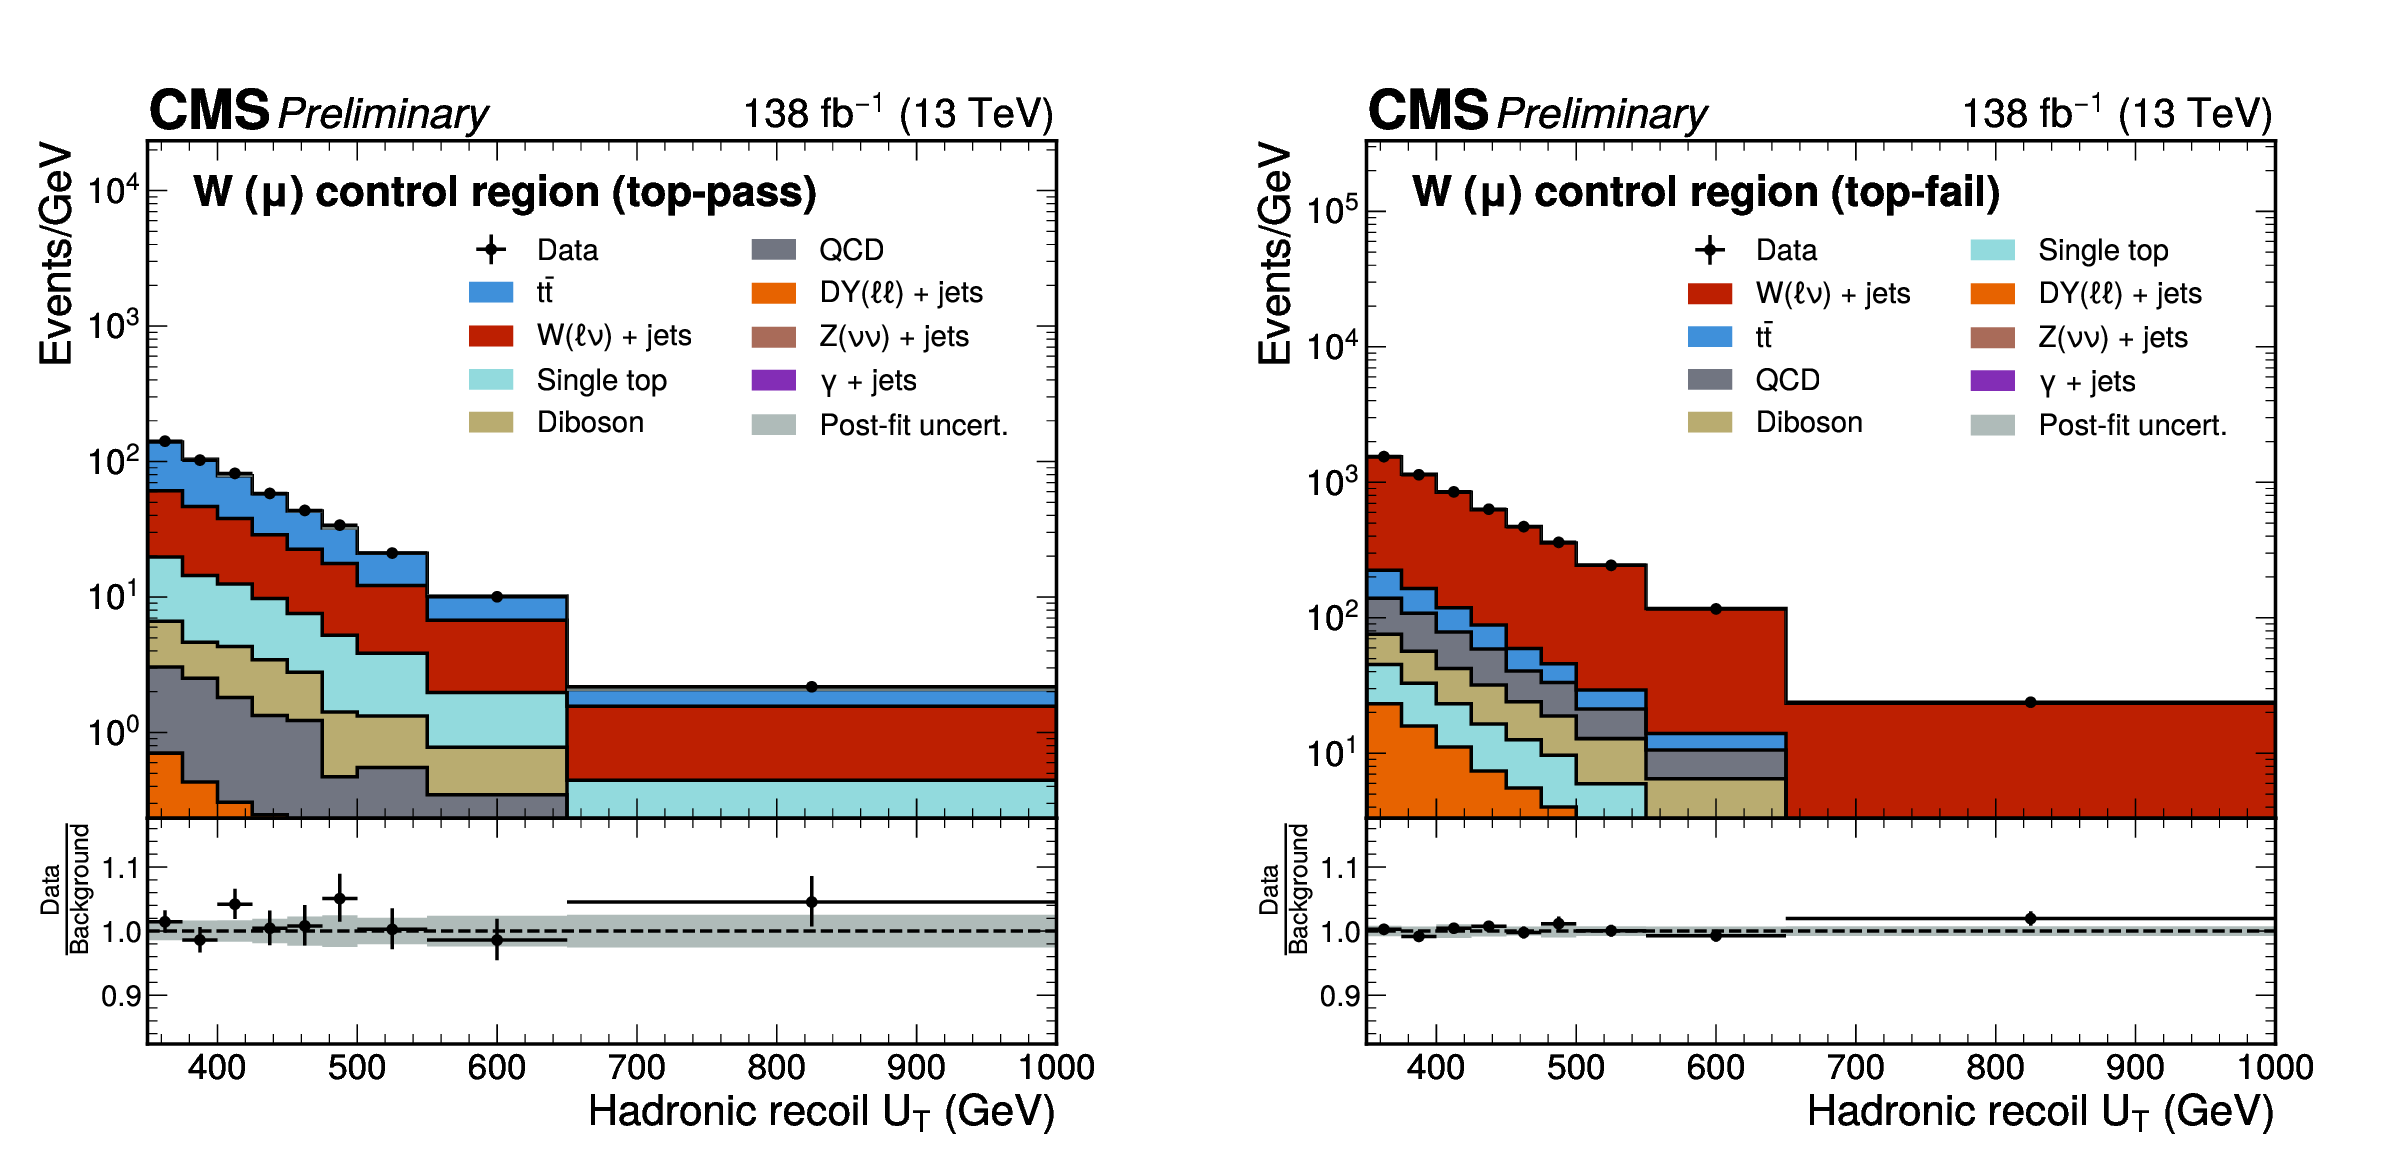
Figure 9:
Postfit distributions in the $ \mathrm{W}(\mu) $ CRs after the background-only fit across all analysis regions. The $ U_{\text{T}} $ distributions only contain events, in which the top tagging requirement for the leading \text{AK15} jet is either passed (on the left) or failed (on the right). The grey band represents the systematic and statistical uncertainties on the simulated events after the fit. |

png pdf |
Figure 9-a:
Postfit distributions in the $ \mathrm{W}(\mu) $ CRs after the background-only fit across all analysis regions. The $ U_{\text{T}} $ distributions only contain events, in which the top tagging requirement for the leading \text{AK15} jet is either passed (on the left) or failed (on the right). The grey band represents the systematic and statistical uncertainties on the simulated events after the fit. |

png pdf |
Figure 9-b:
Postfit distributions in the $ \mathrm{W}(\mu) $ CRs after the background-only fit across all analysis regions. The $ U_{\text{T}} $ distributions only contain events, in which the top tagging requirement for the leading \text{AK15} jet is either passed (on the left) or failed (on the right). The grey band represents the systematic and statistical uncertainties on the simulated events after the fit. |
png pdf |
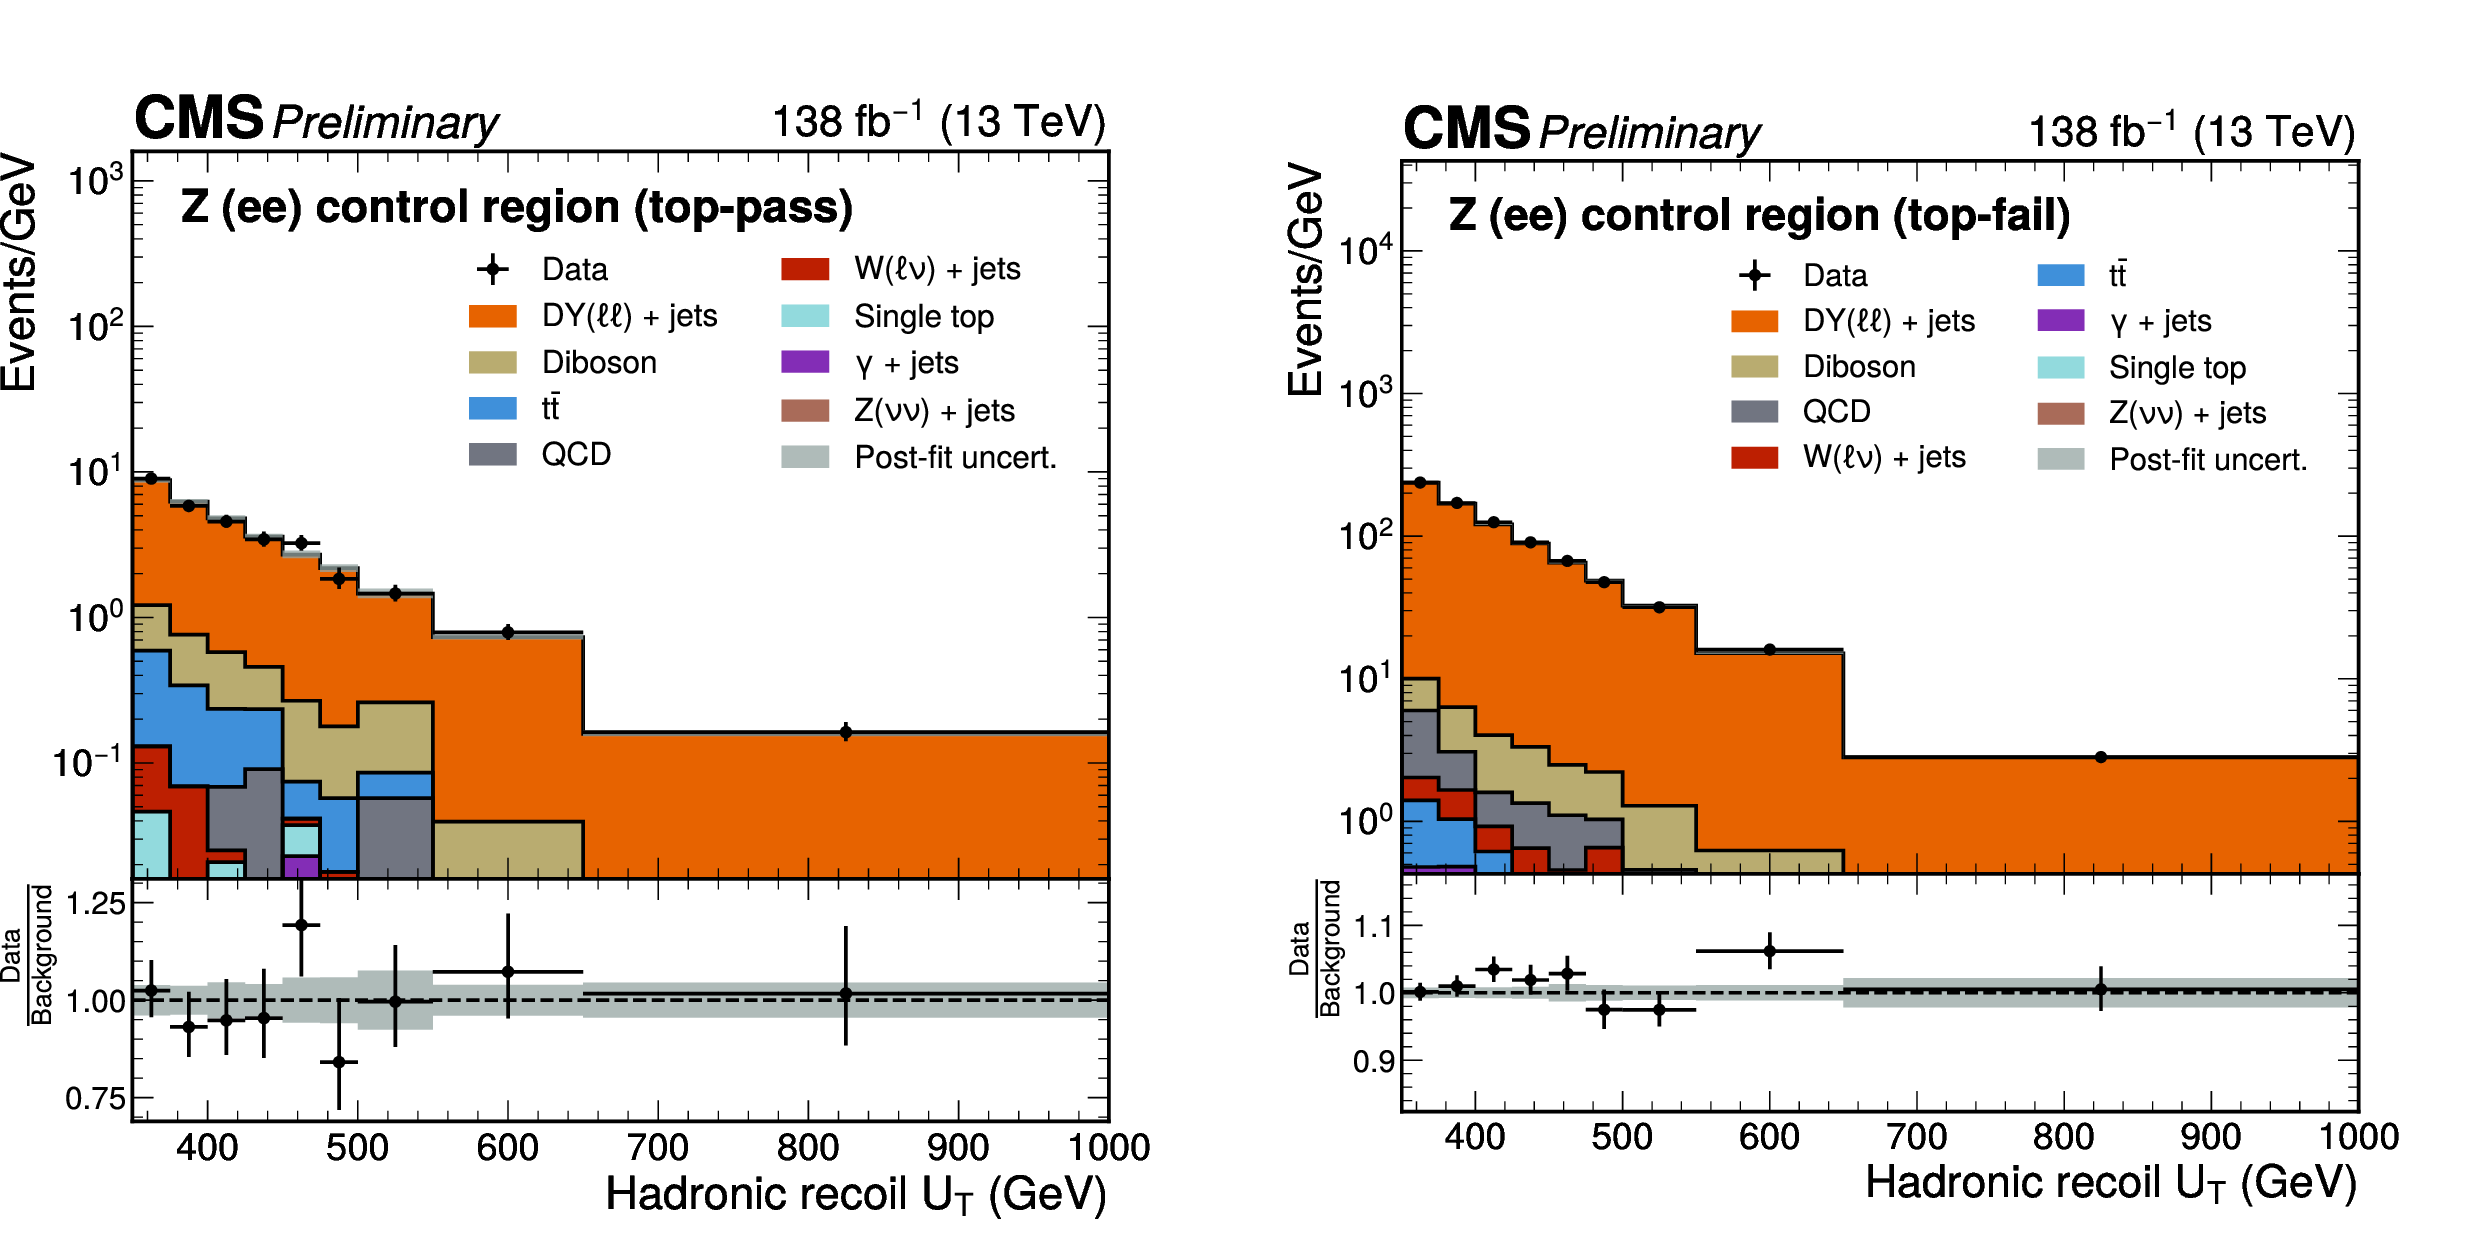
Figure 10:
Postfit distributions in the $ \mathrm{Z}(\mathrm{e}\mathrm{e}) $ CRs after the background-only fit across all analysis regions. The $ U_{\text{T}} $ distributions only contain events, in which the top tagging requirement for the leading \text{AK15} jet is either passed (on the left) or failed (on the right). The grey band represents the systematic and statistical uncertainties on the simulated events after the fit. |

png pdf |
Figure 10-a:
Postfit distributions in the $ \mathrm{Z}(\mathrm{e}\mathrm{e}) $ CRs after the background-only fit across all analysis regions. The $ U_{\text{T}} $ distributions only contain events, in which the top tagging requirement for the leading \text{AK15} jet is either passed (on the left) or failed (on the right). The grey band represents the systematic and statistical uncertainties on the simulated events after the fit. |

png pdf |
Figure 10-b:
Postfit distributions in the $ \mathrm{Z}(\mathrm{e}\mathrm{e}) $ CRs after the background-only fit across all analysis regions. The $ U_{\text{T}} $ distributions only contain events, in which the top tagging requirement for the leading \text{AK15} jet is either passed (on the left) or failed (on the right). The grey band represents the systematic and statistical uncertainties on the simulated events after the fit. |
png pdf |
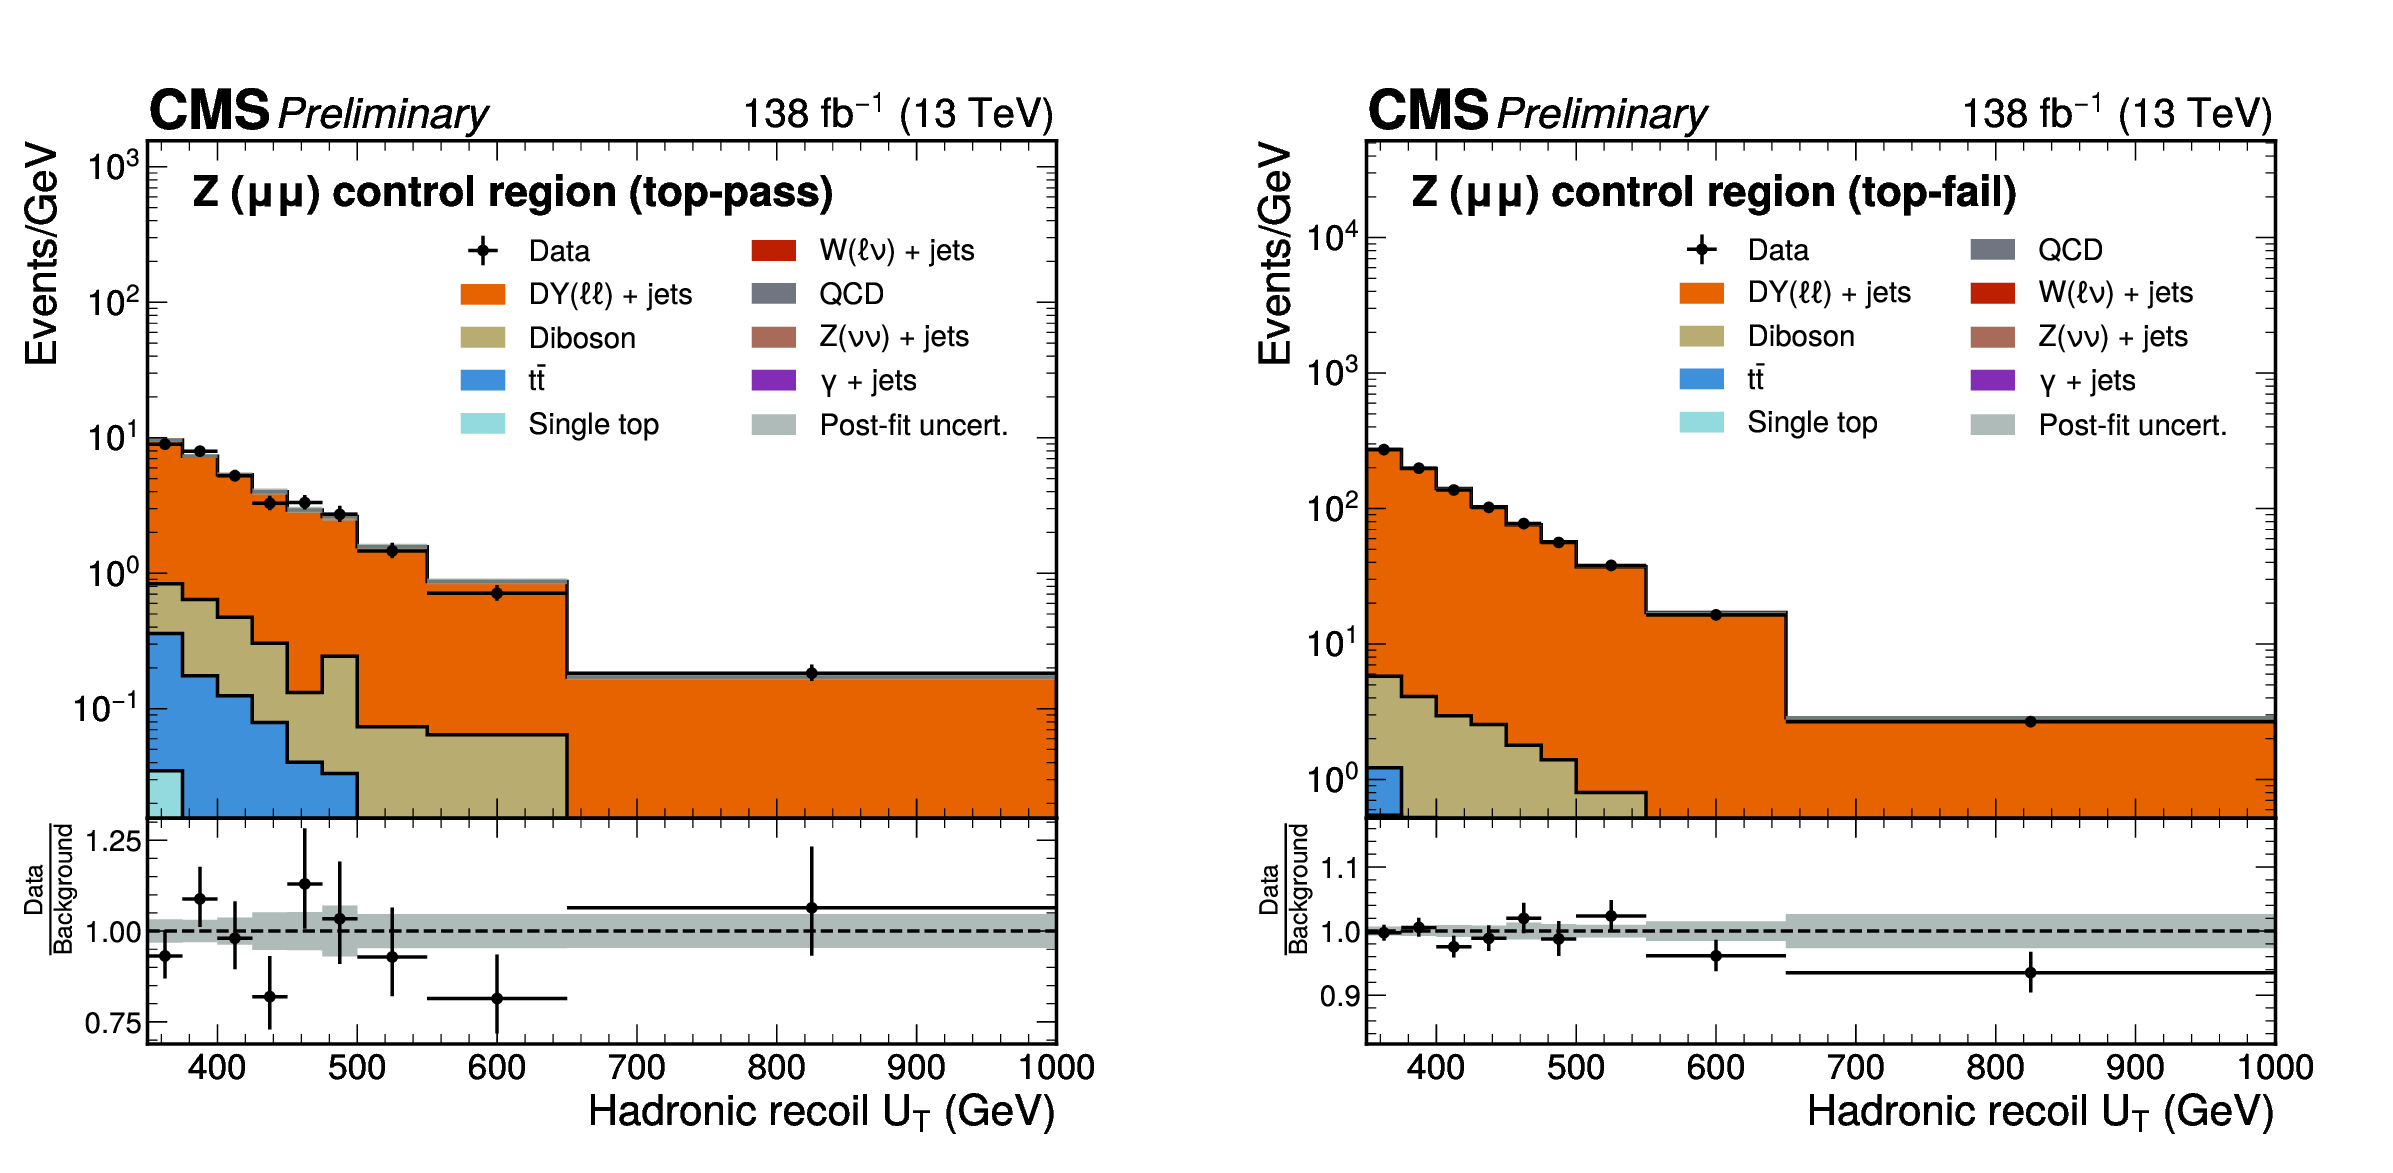
Figure 11:
Postfit distributions in the $ \mathrm{Z}(\mu\mu) $ CRs after the background-only fit across all analysis regions. The $ U_{\text{T}} $ distributions only contain events, in which the top tagging requirement for the leading \text{AK15} jet is either passed (on the left) or failed (on the right). The grey band represents the systematic and statistical uncertainties on the simulated events after the fit. |

png pdf |
Figure 11-a:
Postfit distributions in the $ \mathrm{Z}(\mu\mu) $ CRs after the background-only fit across all analysis regions. The $ U_{\text{T}} $ distributions only contain events, in which the top tagging requirement for the leading \text{AK15} jet is either passed (on the left) or failed (on the right). The grey band represents the systematic and statistical uncertainties on the simulated events after the fit. |

png pdf |
Figure 11-b:
Postfit distributions in the $ \mathrm{Z}(\mu\mu) $ CRs after the background-only fit across all analysis regions. The $ U_{\text{T}} $ distributions only contain events, in which the top tagging requirement for the leading \text{AK15} jet is either passed (on the left) or failed (on the right). The grey band represents the systematic and statistical uncertainties on the simulated events after the fit. |
png pdf |
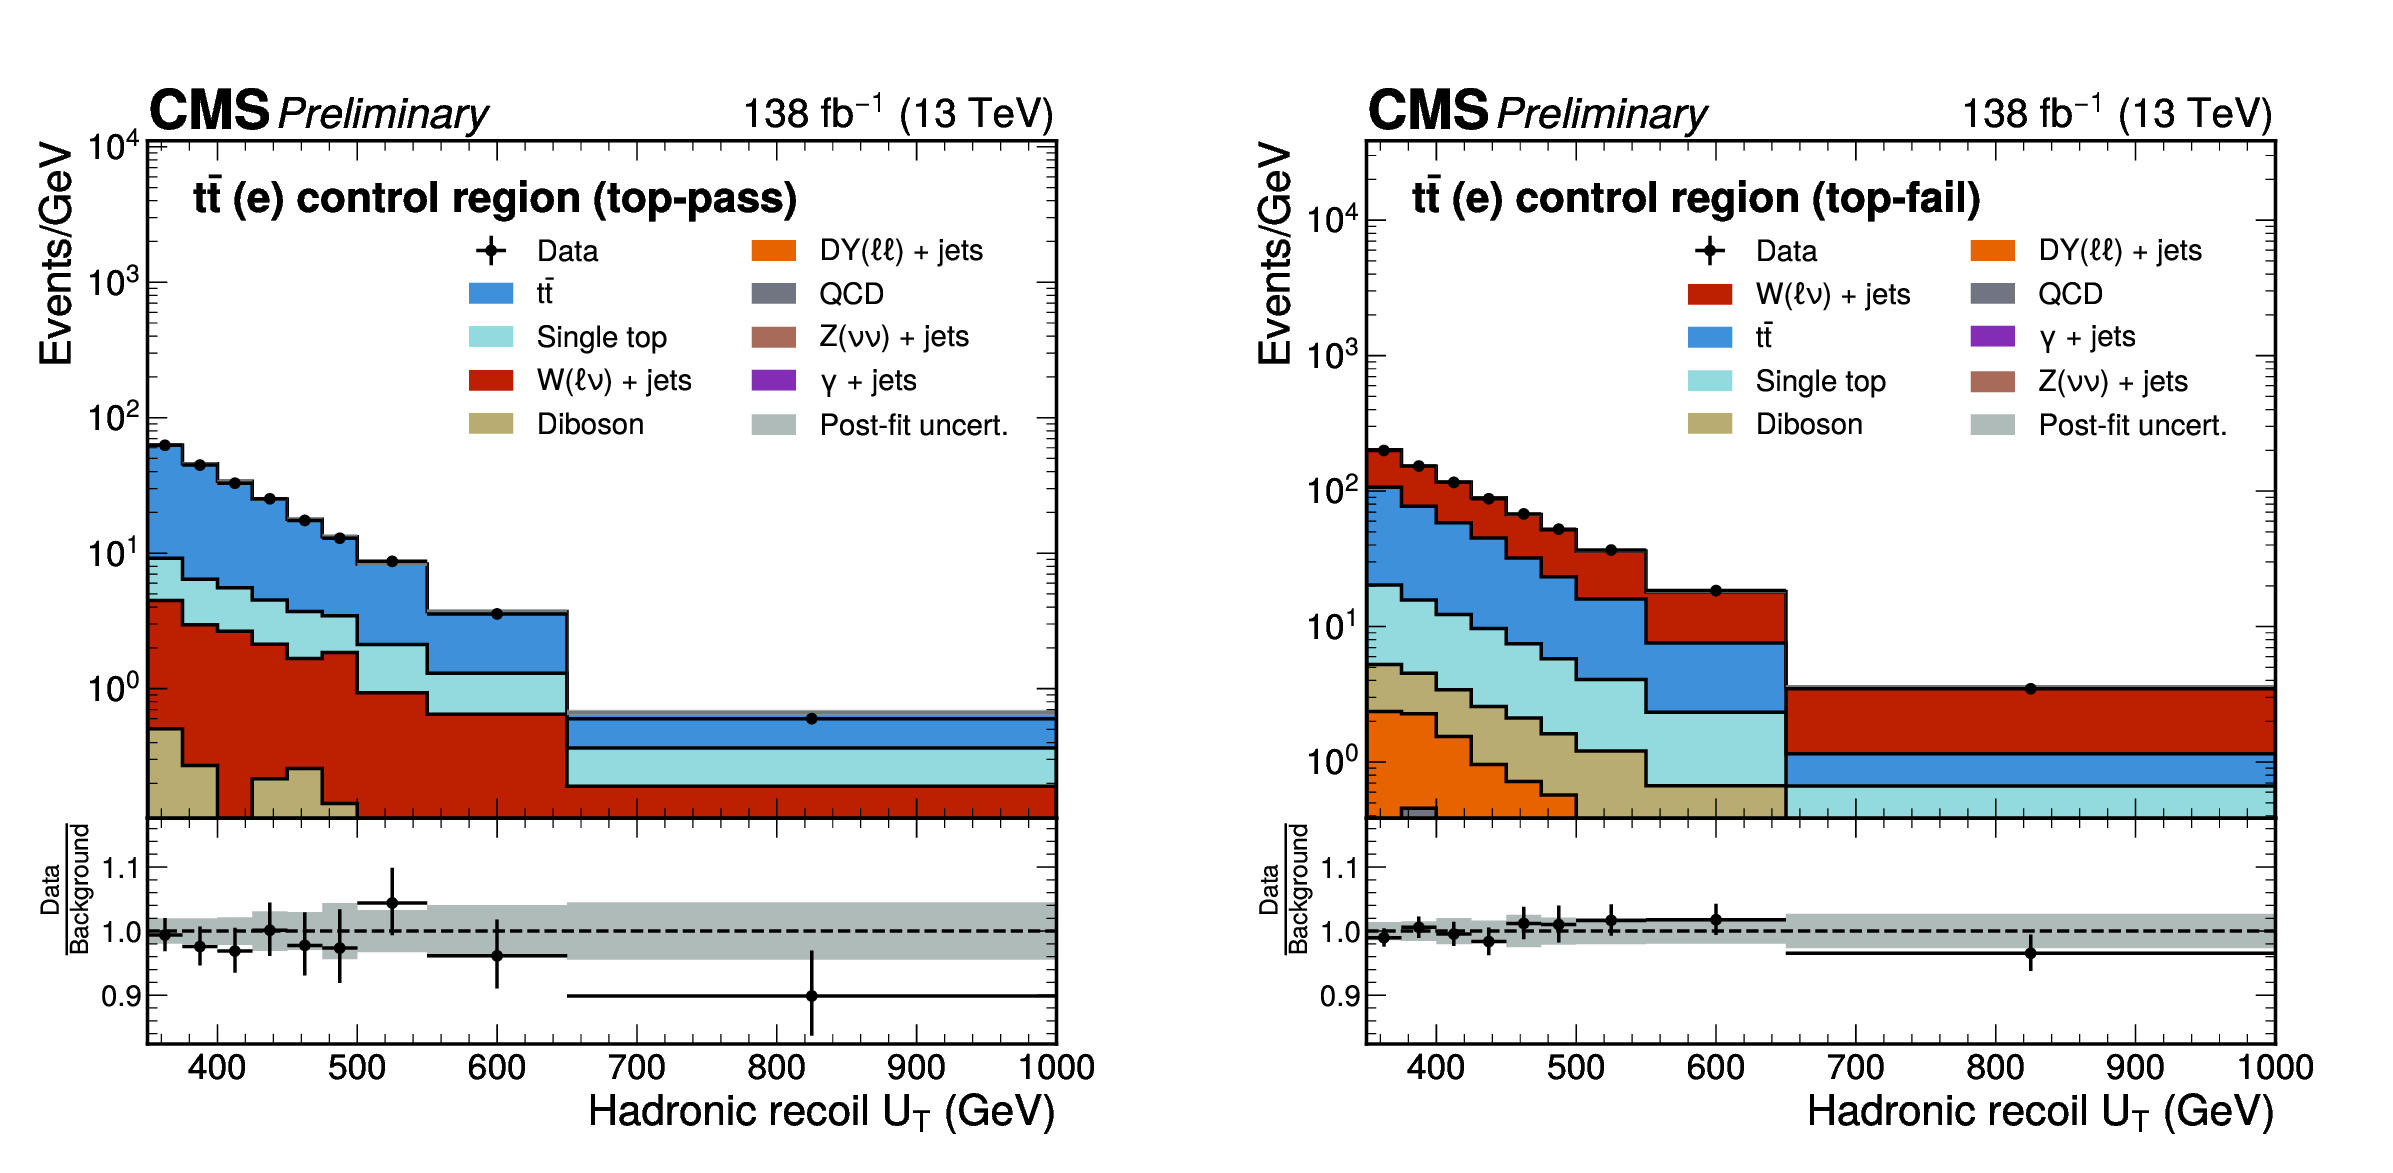
Figure 12:
Postfit distributions in the $ \mathrm{t}\bar{\mathrm{t}}(\mathrm{e}) $ CRs after the background-only fit across all analysis regions. The $ U_{\text{T}} $ distributions only contain events, in which the top tagging requirement for the leading \text{AK15} jet is either passed (on the left) or failed (on the right). The grey band represents the systematic and statistical uncertainties on the simulated events after the fit. |

png pdf |
Figure 12-a:
Postfit distributions in the $ \mathrm{t}\bar{\mathrm{t}}(\mathrm{e}) $ CRs after the background-only fit across all analysis regions. The $ U_{\text{T}} $ distributions only contain events, in which the top tagging requirement for the leading \text{AK15} jet is either passed (on the left) or failed (on the right). The grey band represents the systematic and statistical uncertainties on the simulated events after the fit. |

png pdf |
Figure 12-b:
Postfit distributions in the $ \mathrm{t}\bar{\mathrm{t}}(\mathrm{e}) $ CRs after the background-only fit across all analysis regions. The $ U_{\text{T}} $ distributions only contain events, in which the top tagging requirement for the leading \text{AK15} jet is either passed (on the left) or failed (on the right). The grey band represents the systematic and statistical uncertainties on the simulated events after the fit. |
png pdf |
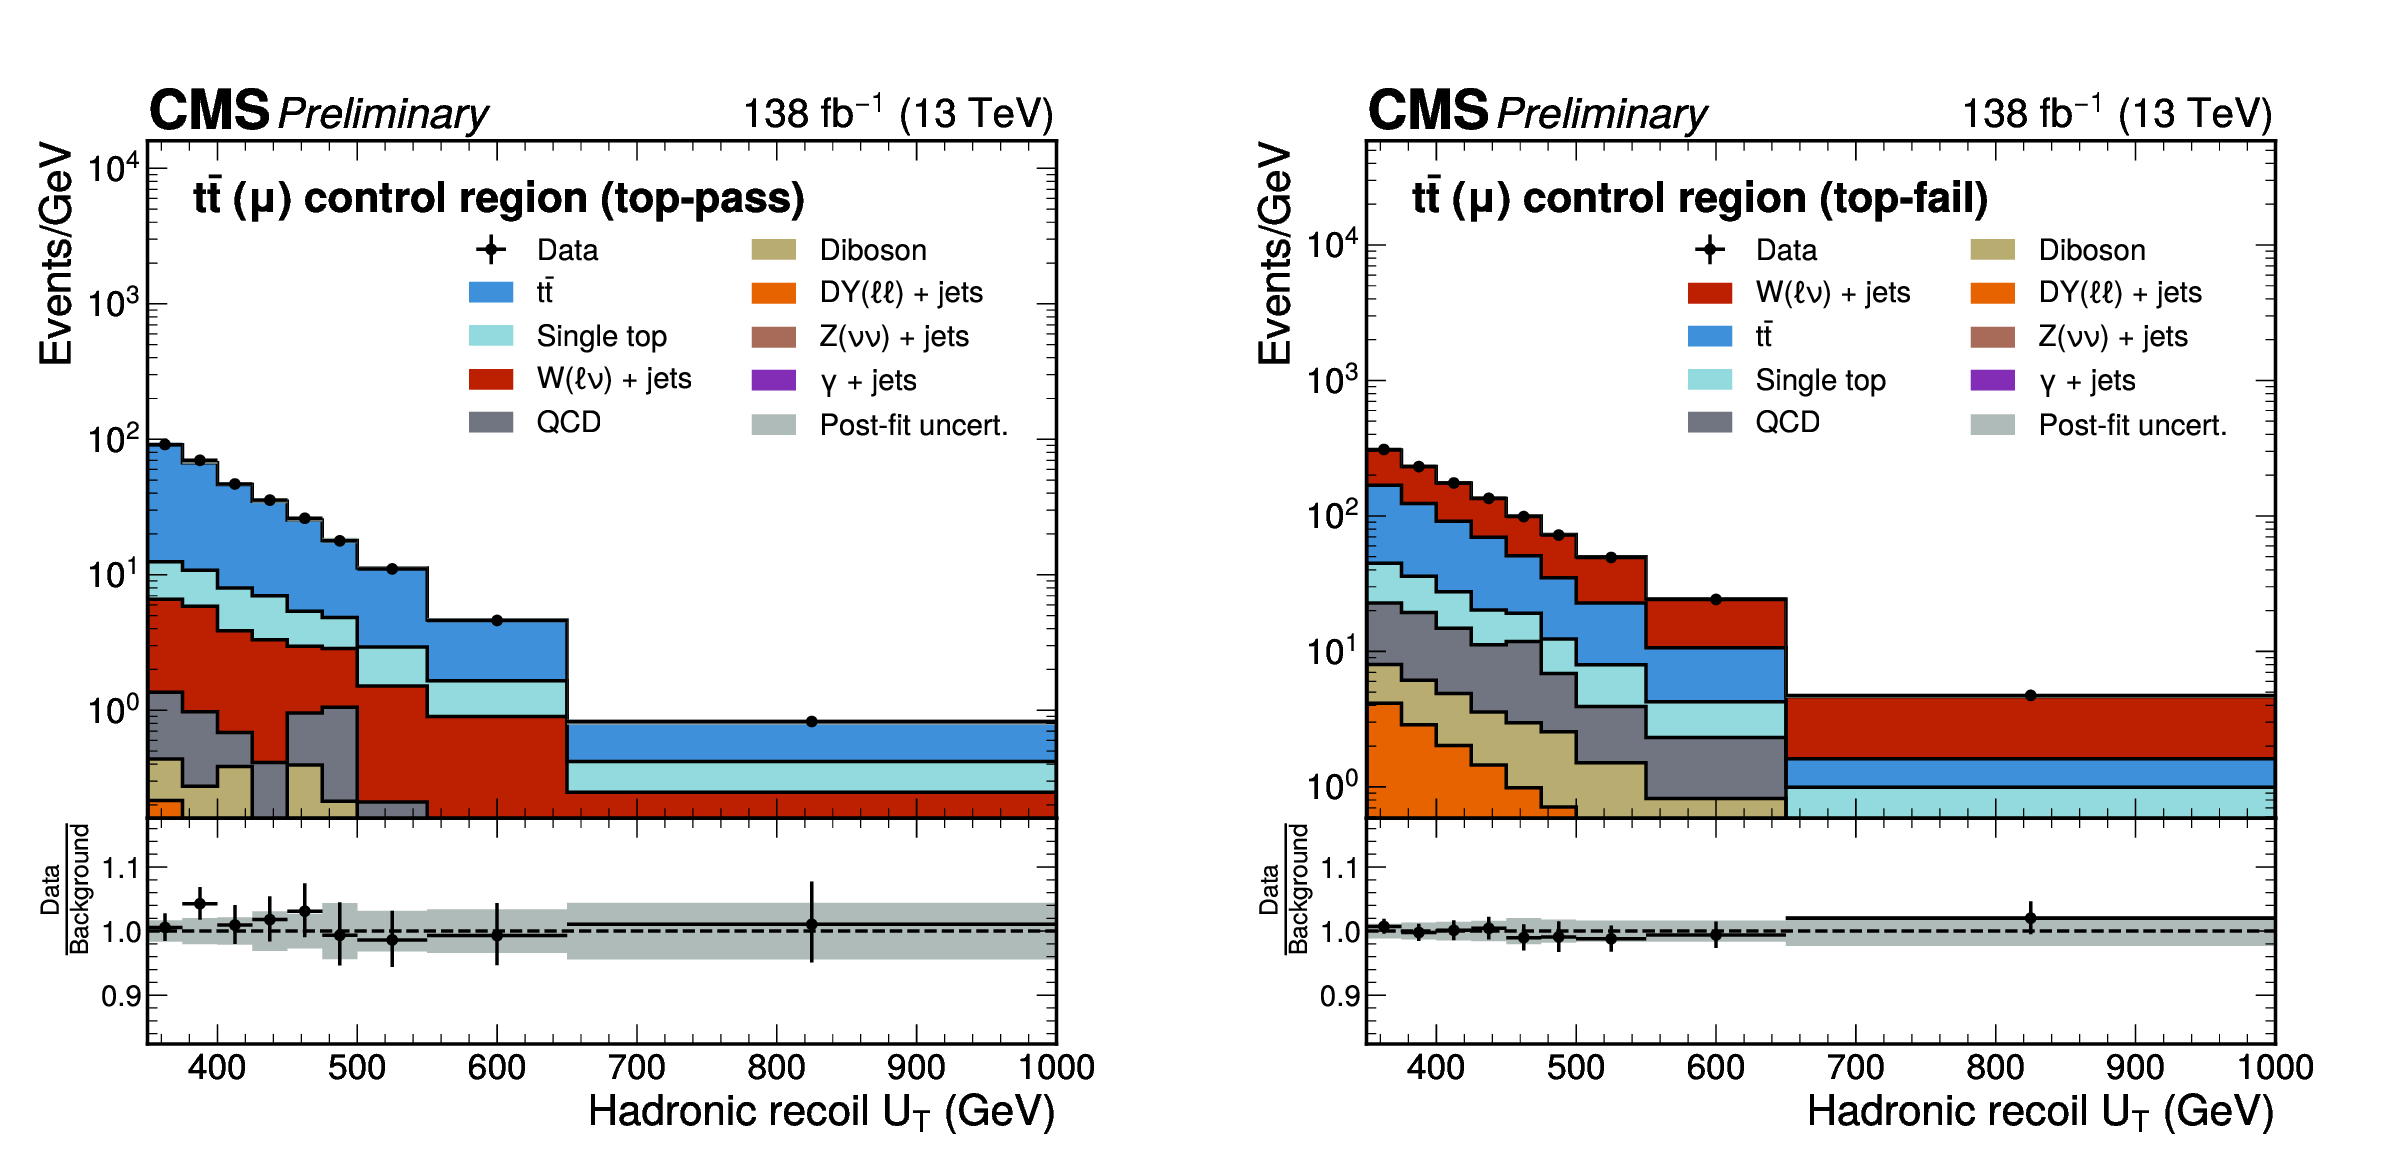
Figure 13:
Postfit distributions in the $ \mathrm{t}\bar{\mathrm{t}}(\mu) $ CRs after the background-only fit across all analysis regions. The $ U_{\text{T}} $ distributions only contain events, in which the top tagging requirement for the leading \text{AK15} jet is either passed (on the left) or failed (on the right). The grey band represents the systematic and statistical uncertainties on the simulated events after the fit. |

png pdf |
Figure 13-a:
Postfit distributions in the $ \mathrm{t}\bar{\mathrm{t}}(\mu) $ CRs after the background-only fit across all analysis regions. The $ U_{\text{T}} $ distributions only contain events, in which the top tagging requirement for the leading \text{AK15} jet is either passed (on the left) or failed (on the right). The grey band represents the systematic and statistical uncertainties on the simulated events after the fit. |

png pdf |
Figure 13-b:
Postfit distributions in the $ \mathrm{t}\bar{\mathrm{t}}(\mu) $ CRs after the background-only fit across all analysis regions. The $ U_{\text{T}} $ distributions only contain events, in which the top tagging requirement for the leading \text{AK15} jet is either passed (on the left) or failed (on the right). The grey band represents the systematic and statistical uncertainties on the simulated events after the fit. |
png pdf |
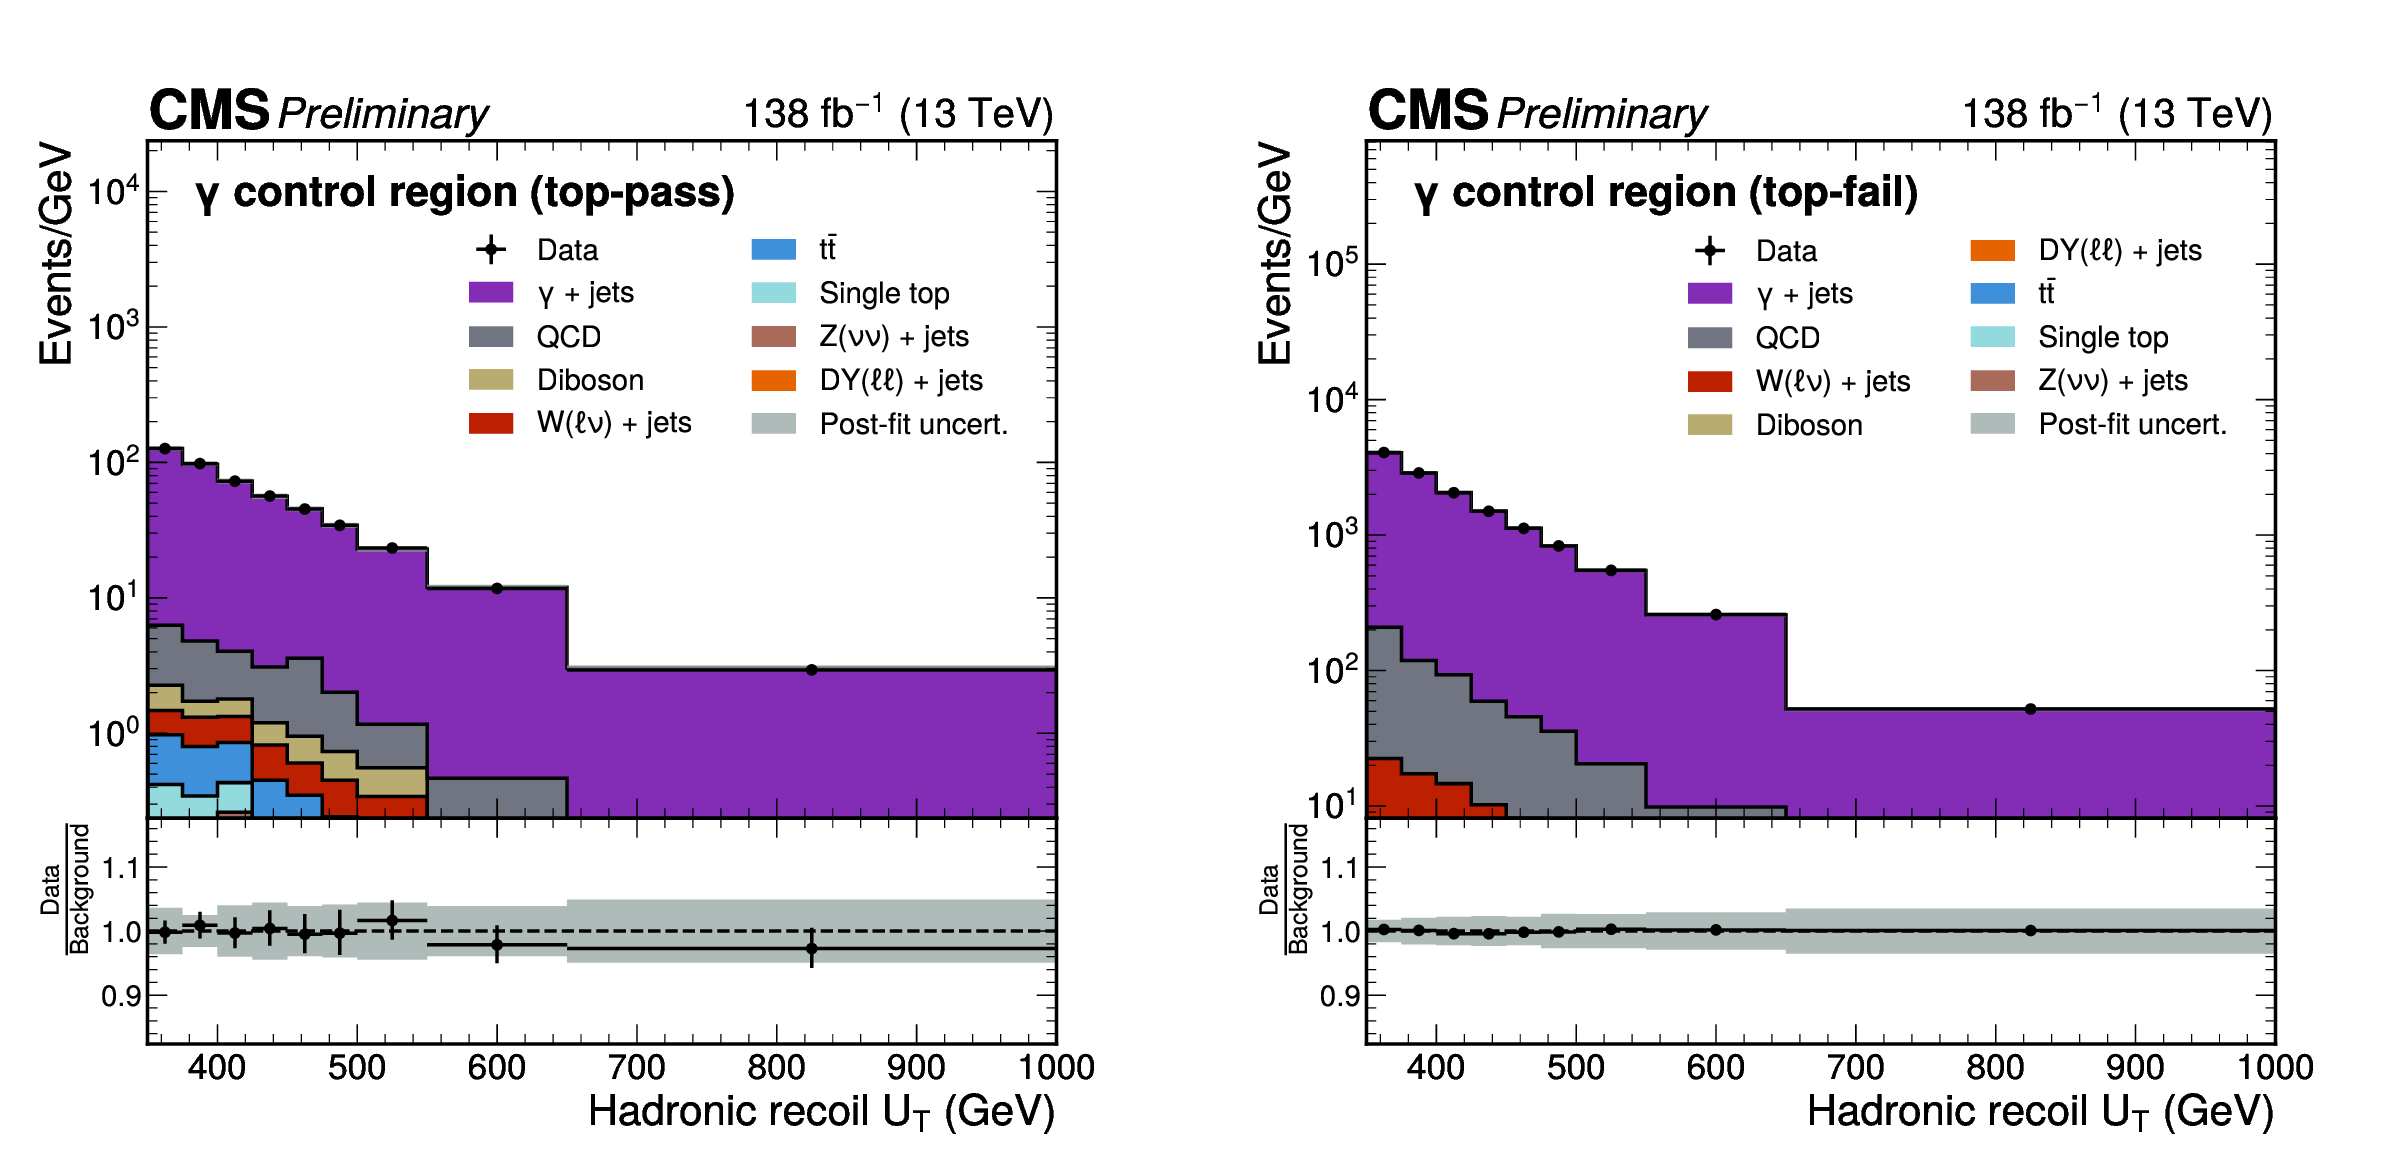
Figure 14:
Postfit distributions in the $ \gamma $ CRs after the background-only fit across all analysis regions. The $ U_{\text{T}} $ distributions only contain events, in which the top tagging requirement for the leading \text{AK15} jet is either passed (on the left) or failed (on the right). The grey band represents the systematic and statistical uncertainties on the simulated events after the fit. |

png pdf |
Figure 14-a:
Postfit distributions in the $ \gamma $ CRs after the background-only fit across all analysis regions. The $ U_{\text{T}} $ distributions only contain events, in which the top tagging requirement for the leading \text{AK15} jet is either passed (on the left) or failed (on the right). The grey band represents the systematic and statistical uncertainties on the simulated events after the fit. |

png pdf |
Figure 14-b:
Postfit distributions in the $ \gamma $ CRs after the background-only fit across all analysis regions. The $ U_{\text{T}} $ distributions only contain events, in which the top tagging requirement for the leading \text{AK15} jet is either passed (on the left) or failed (on the right). The grey band represents the systematic and statistical uncertainties on the simulated events after the fit. |
| Tables | |
png pdf |
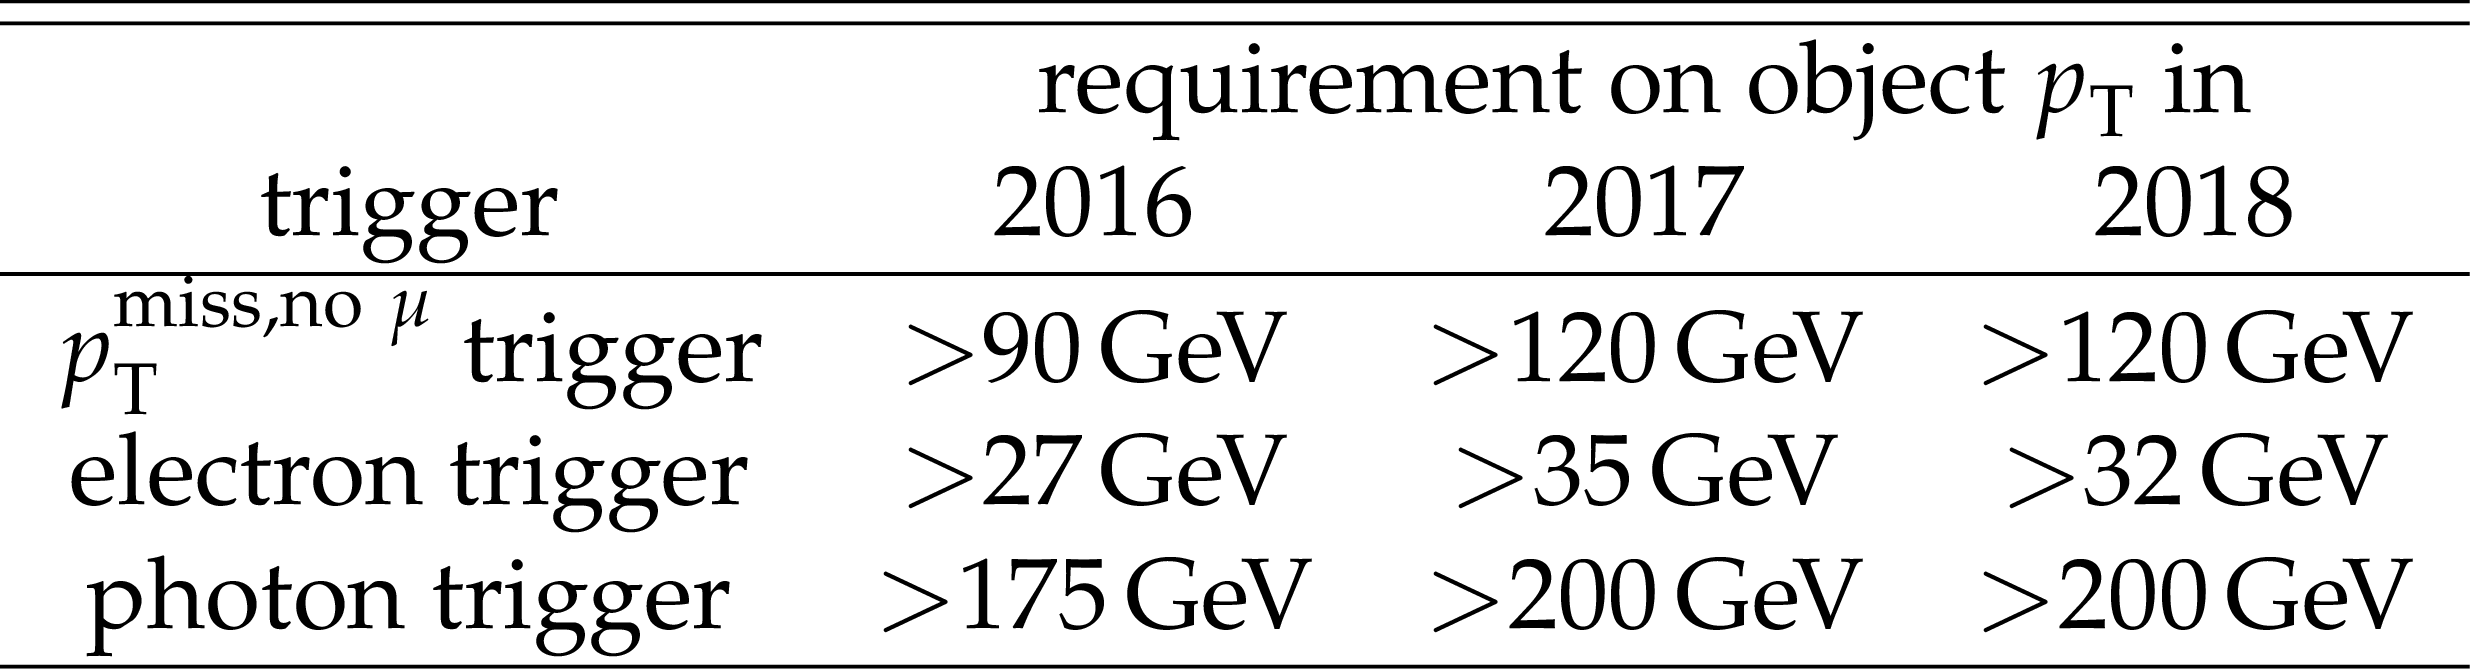
Table 1:
Requirements on the $ p_{\mathrm{T}} $ of the object, which fired the trigger, for the $ p_{\text{T}}^{\text{miss,no} \mu} $ trigger, the electron trigger, and the photon trigger, in 2016, 2017 and 2018. |
png pdf |
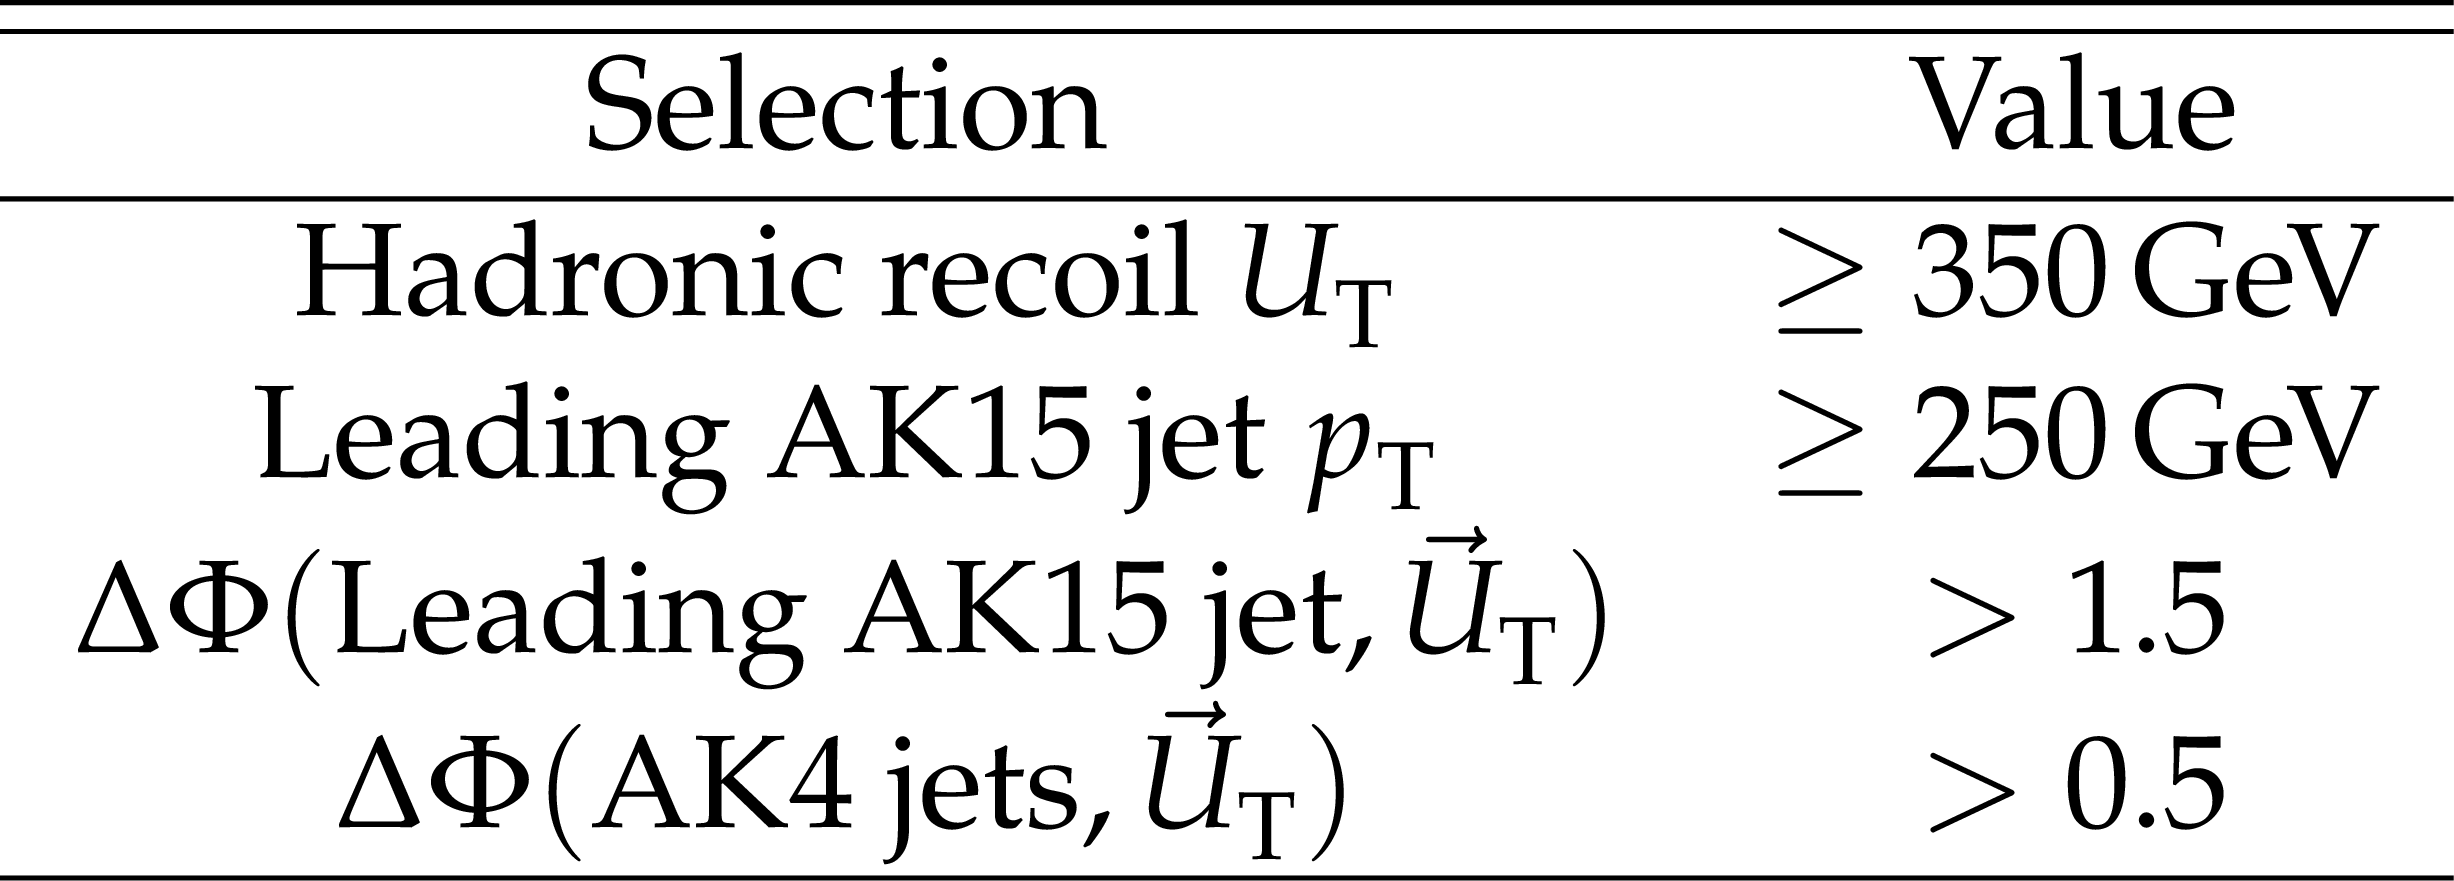
Table 2:
The analysis pre-selection. |
png pdf |
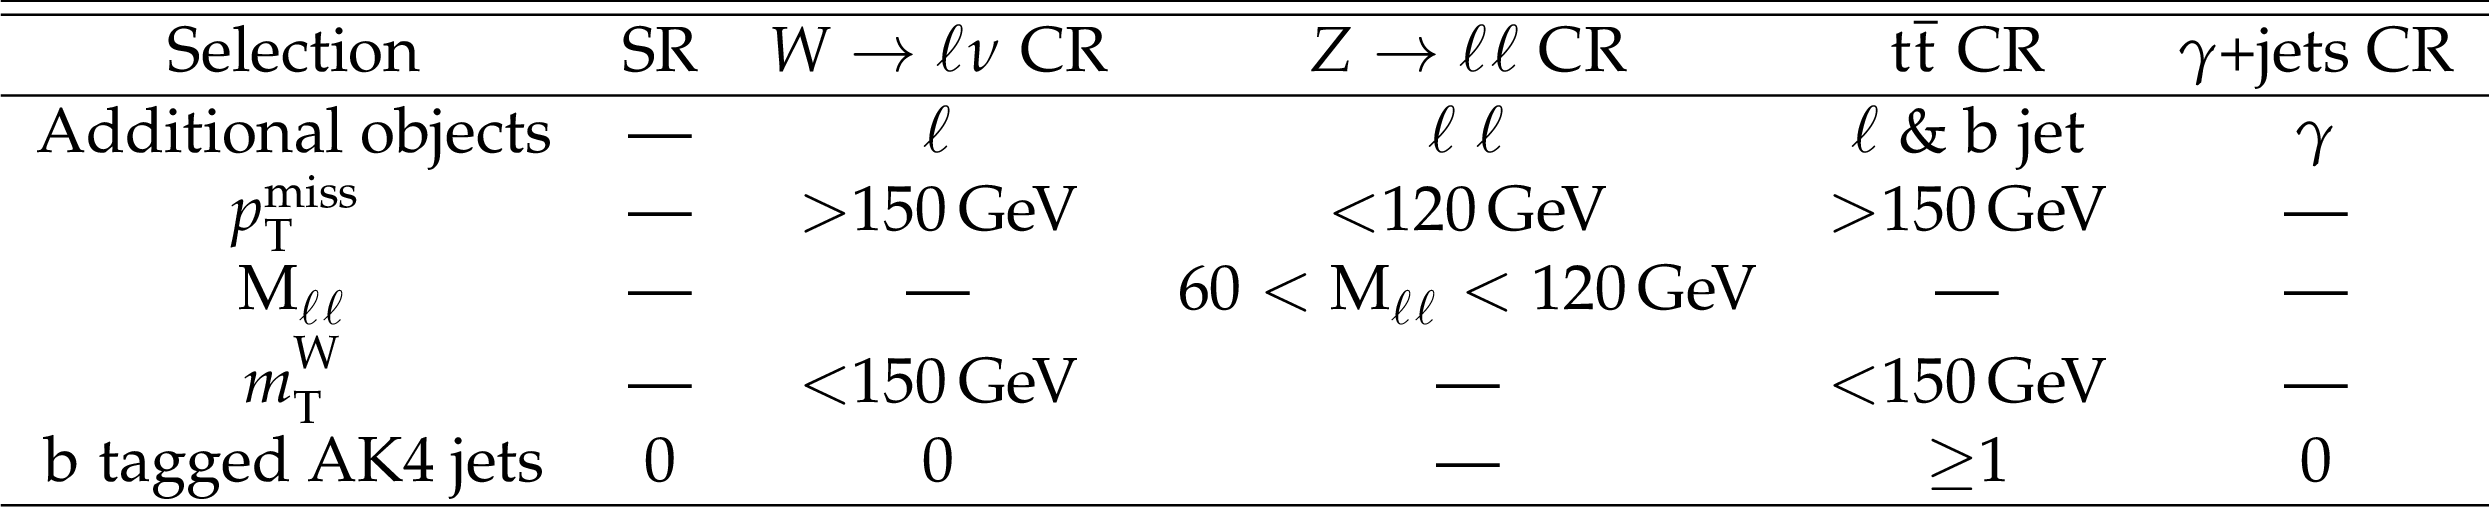
Table 3:
Analysis selections for the signal and background CRs. These selections are applied in addition to the pre-selections in Table 2. Each of the leptonic CRs exists twice, once for electron flavor and once for muon flavor. |
| Summary |
| A search for DM produced in association with a single top quark via a flavor changing neutral current, called nonresonant mono-top production, was presented. The analysis was performed using data collected by the CMS experiment in 2016, 2017, and 2018 at the LHC at $ \sqrt{s} = $ 13 TeV, and corresponding to an integrated luminosity of 138 fb$ ^{-1} $. The Lorentz boost of the top quark is exploited to cluster the products of the hadronic top quark decay into a large-radius jet. Furthermore, a machine-learning based discriminator is used to distinguish large-radius jets originating from a hadronic top quark decay and QCD-initiated large-radius jets. As an observable, the hadronic recoil is used. A robust statistical model was built to determine the main backgrounds in the signal regions from data in dedicated control regions. The data are consistent with the background-only hypothesis, and no evidence for DM produced in association with a single top quark was found. Limits at 95% confidence level are calculated for the product of the signal production cross section and the branching fraction of the mediator decaying into DM candidates. Limits were calculated for both a purely vector and purely axial vector coupling scenario between the mediator and the DM candidates as well as the standard model quarks of the first and third generation. The analysis excludes a mediator below a mass of up to 1.85 (1.85) TeV, where 2.0 (2.0) TeV is expected for the vector (axial vector) coupling scenario. Dark matter candidate masses below 750 (550) GeV, where 850 (650) GeV is expected, are excluded for the vector (axial vector) coupling scenario. In both cases, the exclusion limits are calculated for mediator masses $ {\geq} $200 GeV and DM candidate masses $ {\geq} $ ]50 GeV. The exclusion regions for the DM candidate masses from this analysis cover a wide phase space previously uncovered by the DM relic density measurement with the Planck telescope. To date, these are the most stringent exclusion limits for vector or axial vector coupled DM production via an up-top FCNC to date. |
| References | ||||
| 1 | V. C. Rubin and J. Ford , W. Kent | Rotation of the Andromeda Nebula from a Spectroscopic Survey of Emission Regions | Astrophys. J. 159 (1970) 379 | |
| 2 | M. Markevitch et al. | Direct constraints on the dark matter self-interaction cross-section from the merging galaxy cluster 1E0657-56 | Astrophys. J. 606 (2004) 819 | astro-ph/0309303 |
| 3 | Planck Collaboration | Planck 2018 results. VI. Cosmological parameters | Astron. Astrophys. 641 (2020) A6 | 1807.06209 |
| 4 | M. Beltran et al. | Maverick dark matter at colliders | JHEP 09 (2010) 037 | 1002.4137 |
| 5 | P. J. Fox, R. Harnik, J. Kopp, and Y. Tsai | Missing Energy Signatures of Dark Matter at the LHC | PRD 85 (2012) 056011 | 1109.4398 |
| 6 | J. Goodman et al. | Constraints on Dark Matter from Colliders | PRD 82 (2010) 116010 | 1008.1783 |
| 7 | A. Rajaraman, W. Shepherd, T. M. P. Tait, and A. M. Wijangco | LHC Bounds on Interactions of Dark Matter | PRD 84 (2011) 095013 | 1108.1196 |
| 8 | ATLAS Collaboration | Search for new phenomena in final states with an energetic jet and large missing transverse momentum in pp collisions at $ \sqrt{s}= $8 TeV with the ATLAS detector | EPJC 75 (2015) 299 | 1502.01518 |
| 9 | Y. Bai and T. M. P. Tait | Searches with Mono-Leptons | PLB 723 (2013) 384 | 1208.4361 |
| 10 | ATLAS Collaboration | Search for dark matter in events with a hadronically decaying W or Z boson and missing transverse momentum in $ pp $ collisions at $ \sqrt{s} = $ 8 TeV with the ATLAS detector | PRL 112 (2014) 041802 | 1309.4017 |
| 11 | CMS Collaboration | Search for physics beyond the standard model in final states with a lepton and missing transverse energy in proton-proton collisions at sqrt(s) = 8 TeV | PRD 91 (2015) 092005 | CMS-EXO-12-060 1408.2745 |
| 12 | N. F. Bell et al. | Searching for Dark Matter at the LHC with a Mono-Z | PRD 86 (2012) 096011 | 1209.0231 |
| 13 | L. M. Carpenter et al. | Collider searches for dark matter in events with a Z boson and missing energy | PRD 87 (2013) 074005 | 1212.3352 |
| 14 | ATLAS Collaboration | Search for dark matter in events with a Z boson and missing transverse momentum in pp collisions at $ \sqrt{s} = $ 8 TeV with the ATLAS detector | PRD 90 (2014) 012004 | 1404.0051 |
| 15 | L. Carpenter et al. | Mono-Higgs-boson: A new collider probe of dark matter | PRD 89 (2014) 075017 | 1312.2592 |
| 16 | A. Berlin, T. Lin, and L.-T. Wang | Mono-Higgs Detection of Dark Matter at the LHC | JHEP 06 (2014) 078 | 1402.7074 |
| 17 | CMS Collaboration | Search for new phenomena in monophoton final states in proton-proton collisions at $ \sqrt s = $ 8 TeV | PLB 755 (2016) 102 | CMS-EXO-12-047 1410.8812 |
| 18 | ATLAS Collaboration | Search for new phenomena in events with a photon and missing transverse momentum in $ pp $ collisions at $ \sqrt{s}= $ 8 TeV with the ATLAS detector | PRD 91 (2015) 012008 | 1411.1559 |
| 19 | CMS Collaboration | Search for new particles in events with energetic jets and large missing transverse momentum in proton-proton collisions at $ \sqrt{s} = $ 13 TeV | JHEP 11 (2021) 153 | CMS-EXO-20-004 2107.13021 |
| 20 | ATLAS Collaboration | Search for new phenomena in events with an energetic jet and missing transverse momentum in $ pp $ collisions at $ \sqrt {s} = $ 13 TeV with the ATLAS detector | PRD 103 (2021) 112006 | 2102.10874 |
| 21 | CMS Collaboration | Search for dark matter in events with energetic, hadronically decaying top quarks and missing transverse momentum at $ \sqrt{s}= $ 13 TeV | JHEP 06 (2018) 027 | CMS-EXO-16-051 1801.08427 |
| 22 | CMS Collaboration | Search for monotop in the muon channel in proton-proton collisions at $ \sqrt{s}= $ 8 TeV | CMS Physics Analysis Summary CMS-PAS-B2G-15-001, 2016 CDS |
|
| 23 | N. Cabibbo | Unitary symmetry and leptonic decays | PRL 10 (1963) 531 | |
| 24 | M. Kobayashi and T. Maskawa | Cp-violation in the renormalizable theory of weak interaction | link | |
| 25 | S. L. Glashow, J. Iliopoulos, and L. Maiani | Weak interactions with lepton--hadron symmetry. | link | |
| 26 | J. Andrea, B. Fuks, and F. Maltoni | Monotops at the LHC | PRD 84 (2011) 074025 | 1106.6199 |
| 27 | CMS Collaboration | Performance of the CMS Level-1 trigger in proton-proton collisions at $ \sqrt{s} = $ 13 TeV | JINST 15 (2020) P10017 | CMS-TRG-17-001 2006.10165 |
| 28 | CMS Collaboration | The CMS trigger system | JINST 12 (2017) P01020 | CMS-TRG-12-001 1609.02366 |
| 29 | CMS Collaboration | Technical proposal for the Phase-II upgrade of the Compact Muon Solenoid | CMS Technical Proposal CERN-LHCC-2015-010, CMS-TDR-15-02, 2015 CDS |
|
| 30 | CMS Collaboration | The CMS experiment at the CERN LHC | JINST 3 (2008) S08004 | |
| 31 | CMS Collaboration | Particle-flow reconstruction and global event description with the CMS detector | JINST 12 (2017) P10003 | CMS-PRF-14-001 1706.04965 |
| 32 | M. Cacciari, G. P. Salam, and G. Soyez | The anti-$ k_t $ jet clustering algorithm | JHEP 04 (2008) 063 | 0802.1189 |
| 33 | M. Cacciari, G. P. Salam, and G. Soyez | FastJet user manual | EPJC 72 (2012) 1896 | 1111.6097 |
| 34 | CMS Collaboration | Pileup mitigation at CMS in 13 TeV data | JINST 15 (2020) P09018 | CMS-JME-18-001 2003.00503 |
| 35 | D. Bertolini, P. Harris, M. Low, and N. Tran | Pileup per particle identification | JHEP 10 (2014) 059 | 1407.6013 |
| 36 | CMS Collaboration | Jet energy scale and resolution in the CMS experiment in pp collisions at 8 TeV | JINST 12 (2017) P02014 | CMS-JME-13-004 1607.03663 |
| 37 | CMS Collaboration | Performance of missing transverse momentum reconstruction in proton-proton collisions at $ \sqrt{s} = $ 13 TeV using the CMS detector | JINST 14 (2019) P07004 | CMS-JME-17-001 1903.06078 |
| 38 | E. Bols et al. | Jet Flavour Classification Using DeepJet | JINST 15 (2020) P12012 | 2008.10519 |
| 39 | H. Qu and L. Gouskos | ParticleNet: Jet Tagging via Particle Clouds | PRD 101 (2020) 056019 | 1902.08570 |
| 40 | A. Albert et al. | Recommendations of the LHC Dark Matter Working Group: Comparing LHC searches for dark matter mediators in visible and invisible decay channels and calculations of the thermal relic density | Phys. Dark Univ. 26 (2019) 100377 | 1703.05703 |
| 41 | J. Alwall et al. | The automated computation of tree-level and next-to-leading order differential cross sections, and their matching to parton shower simulations | JHEP 07 (2014) 079 | 1405.0301 |
| 42 | T. Sjöstrand et al. | An Introduction to PYTHIA 8.2 | Comput. Phys. Commun. 191 (2015) 159 | 1410.3012 |
| 43 | DMsimp | DMsimp: Simplified dark matter models | link | |
| 44 | P. Nason | A new method for combining NLO QCD with shower Monte Carlo algorithms | JHEP 11 (2004) 040 | hep-ph/0409146 |
| 45 | S. Frixione, P. Nason, and C. Oleari | Matching NLO QCD computations with parton shower simulations: the POWHEG method | JHEP 11 (2007) 070 | 0709.2092 |
| 46 | S. Alioli, P. Nason, C. Oleari, and E. Re | A general framework for implementing NLO calculations in shower Monte Carlo programs: the POWHEG BOX | JHEP 06 (2010) 043 | 1002.2581 |
| 47 | NNPDF Collaboration | Parton distributions from high-precision collider data | EPJC 77 (2017) 663 | 1706.00428 |
| 48 | R. D. Ball et al. | Parton distributions with LHC data | NPB 867 (2013) 244 | 1207.1303 |
| 49 | CMS Collaboration | Extraction and validation of a new set of CMS PYTHIA8 tunes from underlying-event measurements | EPJC 80 (2020) 4 | CMS-GEN-17-001 1903.12179 |
| 50 | GEANT4 Collaboration | GEANT4--a simulation toolkit | NIM A 506 (2003) 250 | |
| 51 | M. Beneke, P. Falgari, S. Klein, and C. Schwinn | Hadronic top-quark pair production with NNLL threshold resummation | NPB 855 (2012) 695 | 1109.1536 |
| 52 | M. Cacciari et al. | Top-pair production at hadron colliders with next-to-next-to-leading logarithmic soft-gluon resummation | PLB 710 (2012) 612 | 1111.5869 |
| 53 | P. B ä rnreuther, M. Czakon, and A. Mitov | Percent-level-precision physics at the Tevatron: next-to-next-to-leading order QCD corrections to $ \mathrm{q}\overline{\mathrm{q}}\to{\mathrm{t}\overline{\mathrm{t}}} \text{+X} $ | PRL 109 (2012) 132001 | 1204.5201 |
| 54 | M. Czakon and A. Mitov | NNLO corrections to top-pair production at hadron colliders: the all-fermionic scattering channels | JHEP 12 (2012) 054 | 1207.0236 |
| 55 | M. Czakon and A. Mitov | NNLO corrections to top pair production at hadron colliders: the quark-gluon reaction | JHEP 01 (2013) 080 | 1210.6832 |
| 56 | M. Czakon, P. Fiedler, and A. Mitov | Total Top-Quark Pair-Production Cross Section at Hadron Colliders Through $ O(\alpha\frac{4}{S}) $ | PRL 110 (2013) 252004 | 1303.6254 |
| 57 | M. Czakon and A. Mitov | Top++: a program for the calculation of the top-pair cross-section at hadron colliders | Comput. Phys. Commun. 185 (2014) 2930 | 1112.5675 |
| 58 | S. Alioli, P. Nason, C. Oleari, and E. Re | NLO single-top production matched with shower in POWHEG: $ s $- and $ t $-channel contributions | JHEP 09 (2009) 111 | 0907.4076 |
| 59 | E. Re | Single-top Wt-channel production matched with parton showers using the POWHEG method | EPJC 71 (2011) 1547 | 1009.2450 |
| 60 | N. Kidonakis | Two-loop soft anomalous dimensions for single top quark associated production with $ \mathrm{W^-} $ or $ \mathrm{H^-} $ | PRD 82 (2010) 054018 | 1005.4451 |
| 61 | M. Aliev et al. | HATHOR: HAdronic Top and Heavy quarks crOss section calculatoR | Comput. Phys. Commun. 182 (2011) 1034 | 1007.1327 |
| 62 | P. Kant et al. | HatHor for single top-quark production: Updated predictions and uncertainty estimates for single top-quark production in hadronic collisions | Comput. Phys. Commun. 191 (2015) 74 | 1406.4403 |
| 63 | R. Frederix and S. Frixione | Merging meets matching in MC@NLO | JHEP 12 (2012) 061 | 1209.6215 |
| 64 | J. M. Lindert et al. | Precise predictions for $ V+ $ jets dark matter backgrounds | EPJC 77 (2017) 829 | 1705.04664 |
| 65 | T. Gehrmann et al. | $ W^+W^- $ Production at Hadron Colliders in Next to Next to Leading Order QCD | PRL 113 (2014) 212001 | 1408.5243 |
| 66 | F. Cascioli et al. | ZZ production at hadron colliders in NNLO QCD | PLB 735 (2014) 311 | 1405.2219 |
| 67 | J. M. Campbell, R. K. Ellis, and C. Williams | Vector boson pair production at the LHC | JHEP 07 (2011) 018 | 1105.0020 |
| 68 | M. Cacciari and G. P. Salam | Pileup subtraction using jet areas | PLB 659 (2008) 119 | 0707.1378 |
| 69 | A. Buckley et al. | LHAPDF6: parton density access in the LHC precision era | EPJC 75 (2015) 132 | 1412.7420 |
| 70 | J. Butterworth et al. | PDF4LHC recommendations for LHC Run II | JPG 43 (2016) 023001 | 1510.03865 |
| 71 | CMS Collaboration | Precision luminosity measurement in proton-proton collisions at $ \sqrt{s} = $ 13 TeV in 2015 and 2016 at CMS | EPJC 81 (2021) 800 | CMS-LUM-17-003 2104.01927 |
| 72 | CMS Collaboration | CMS luminosity measurement for the 2017 data-taking period at $ \sqrt{s}= $ 13 TeV | CMS Physics Analysis Summary, 2018 CMS-PAS-LUM-17-004 |
CMS-PAS-LUM-17-004 |
| 73 | CMS Collaboration | CMS luminosity measurement for the 2018 data-taking period at $ \sqrt{s}= $ 13 TeV | CMS Physics Analysis Summary, 2019 CMS-PAS-LUM-18-002 |
CMS-PAS-LUM-18-002 |
| 74 | CMS Collaboration | Measurement of the inelastic proton-proton cross section at $ \sqrt{s}= $ 13 TeV | JHEP 07 (2018) 161 | CMS-FSQ-15-005 1802.02613 |
| 75 | CMS Collaboration | Jet energy scale and resolution performance with 13 TeV data collected by CMS in 2016-2018 | CMS Detector Performance Summary CMS-DP-2020-019, 2020 CDS |
|
| 76 | CMS Collaboration | Jet energy scale and resolution measurement with Run 2 Legacy Data Collected by CMS at 13 TeV | CMS Detector Performance Summary CMS-DP-2021-033, 2021 CDS |
|
| 77 | R. J. Barlow and C. Beeston | Fitting using finite Monte Carlo samples | Comput. Phys. Commun. 77 (1993) 219 | |
| 78 | CMS Collaboration | The CMS statistical analysis and combination tool: \textscCombine | Submitted to Comput. Softw. Big. Sci, 2024 | CMS-CAT-23-001 2404.06614 |
| 79 | G. Cowan, K. Cranmer, E. Gross, and O. Vitells | Asymptotic formulae for likelihood-based tests of new physics | EPJC 71 (2011) 1554 | 1007.1727 |
| 80 | A. L. Read | Presentation of search results: The CL(s) technique | JPG 28 (2002) 2693 | |
| 81 | A. L. Read | Modified frequentist analysis of search results (The CL(s) method) | in Workshop on Confidence Limits, 2000 | |
| 82 | T. Junk | Confidence level computation for combining searches with small statistics | NIM A 434 (1999) 435 | hep-ex/9902006 |
| 83 | T. Junk | Sensitivity, Exclusion and Discovery with Small Signals, LargeBackgrounds, and Large Systematic Uncertainties | for the CDF Collaboration, 2006 | |
| 84 | M. Backovic, K. Kong, and M. McCaskey | MadDM v.1.0: Computation of Dark Matter Relic Abundance Using MadGraph5 | Physics of the Dark Universe 5-6 (2014) 18 link |
1308.4955 |
| 85 | F. Ambrogi et al. | MadDM v.3.0: a Comprehensive Tool for Dark Matter Studies | Phys. Dark Univ. 24 (2019) 100249 | 1804.00044 |
|
|
Compact Muon Solenoid LHC, CERN |
|

|

|

|

|

|