

Compact Muon Solenoid
LHC, CERN
| CMS-PAS-HIG-22-003 | ||
| Search for the exotic decay of the Higgs boson into a Z boson and a light pseudoscalar decaying into two photons in pp collisions at $ \sqrt{s}= $ 13 TeV | ||
| CMS Collaboration | ||
| 25 March 2023 | ||
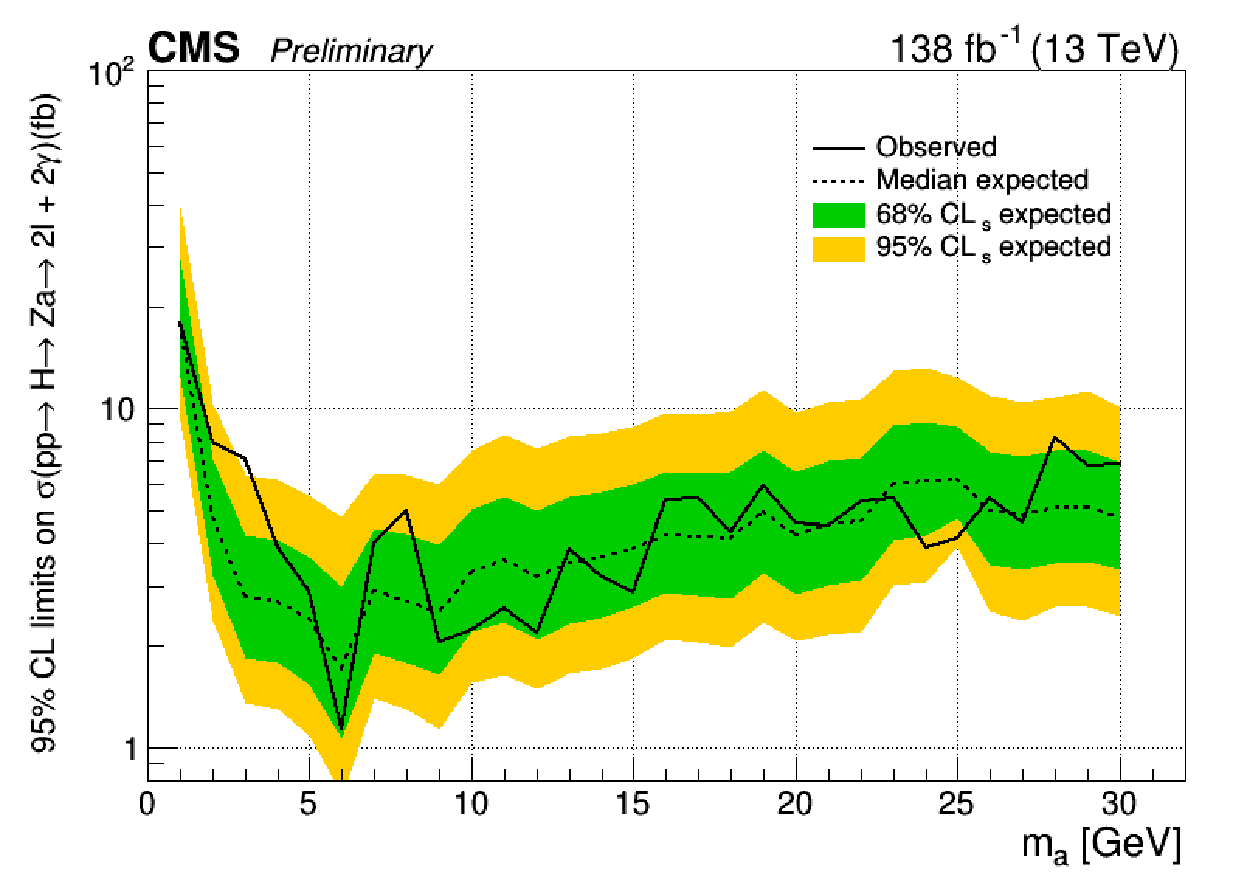
| Abstract: A search for the exotic decay of the Higgs boson to a Z boson and a light pseudoscalar particle, decaying, respectively, to two leptons and two photons, is presented. The search is based on proton-proton collision data at a center-of-mass energy of $ \sqrt{s}= $ 13 TeV, collected by the CMS detector and corresponding to an integrated luminosity of 138 fb$ ^{-1} $. The analysis probes pseudoscalar masses ($ m_a $) between 1 and 30 GeV, leading to two pairs of well-isolated leptons and photons. No significant deviation from the standard model expectation is observed. Upper limits at 95% confidence level are set on the product of the Higgs boson production cross section and its branching to two leptons and two photons. The observed (expected) limits range from 17.8 (17.9) fb for $ m_{a} = $ 1 GeV to 4.7 (6.9) fb for $ m_{a} = $ 30 GeV. Limits on axion-like particle models are also reported. | ||
|
Links:
CDS record (PDF) ;
CADI line (restricted) ;
These preliminary results are superseded in this paper, PLB 852 (2024) 138582. The superseded preliminary plots can be found here. |
||
| Figures | |

png pdf |
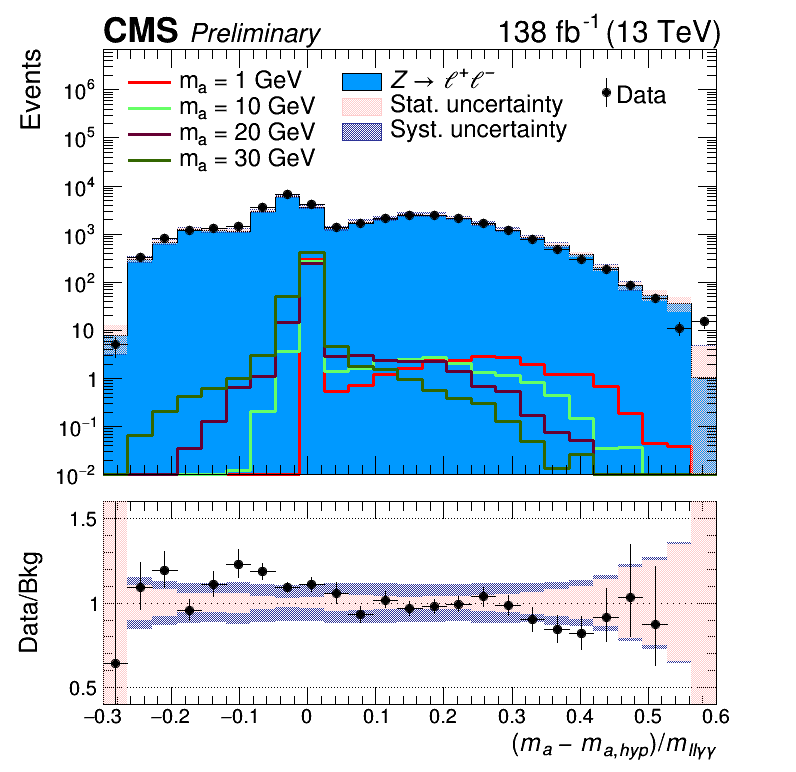
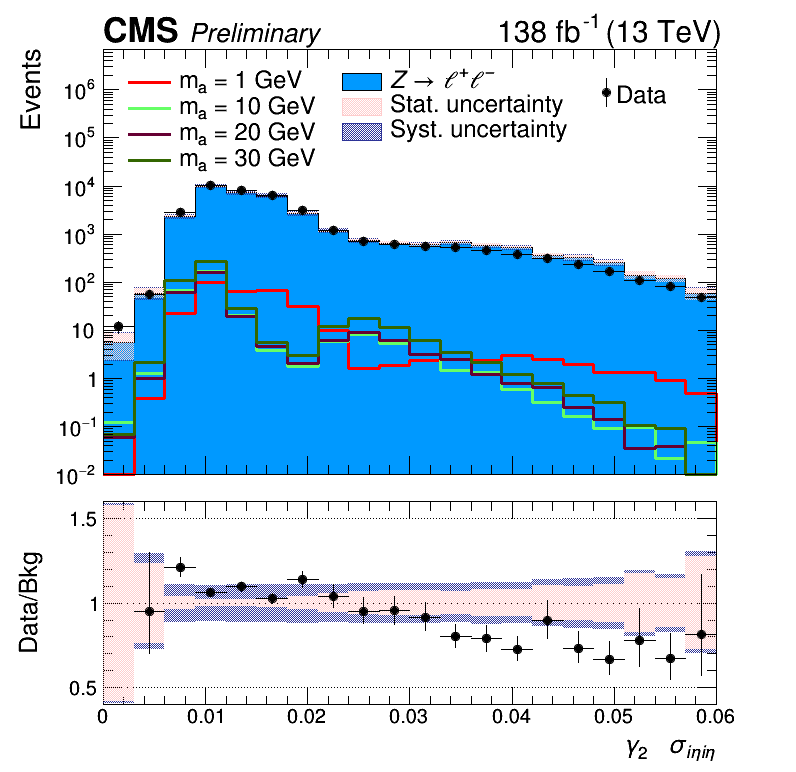
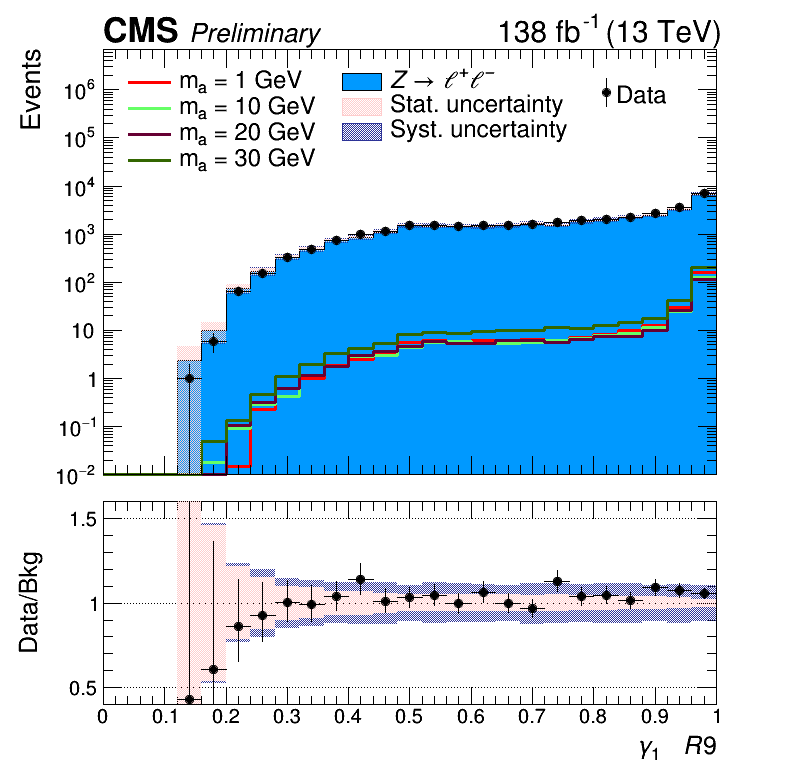
Figure 1:
Distributions of the four most discriminating variables used as input to the BDT: $ \frac{(m_{a}-m_{a,hyp})}{m_{\ell\ell\gamma\gamma}} $ (top-left), leading photon's $ \sigma_{i\eta i\eta} $ (top-right), subleading photon's $ \sigma_{i\eta i\eta} $ (bottom-left), and leading photon's R9 (bottom-right). The events pass the selection criteria described in Section 5, while the signal is scaled with a cross-section of 0.1 fb, and the background sample is normalized to 138 fb$ ^{-1} $. The systematic uncertainties included in the shaded band are related to the photon efficiency, lepton efficiency, and pile-up reweighting. |
png |
Figure 1-a:
Distributions of the four most discriminating variables used as input to the BDT: $ \frac{(m_{a}-m_{a,hyp})}{m_{\ell\ell\gamma\gamma}} $ (top-left), leading photon's $ \sigma_{i\eta i\eta} $ (top-right), subleading photon's $ \sigma_{i\eta i\eta} $ (bottom-left), and leading photon's R9 (bottom-right). The events pass the selection criteria described in Section 5, while the signal is scaled with a cross-section of 0.1 fb, and the background sample is normalized to 138 fb$ ^{-1} $. The systematic uncertainties included in the shaded band are related to the photon efficiency, lepton efficiency, and pile-up reweighting. |

png |
Figure 1-b:
Distributions of the four most discriminating variables used as input to the BDT: $ \frac{(m_{a}-m_{a,hyp})}{m_{\ell\ell\gamma\gamma}} $ (top-left), leading photon's $ \sigma_{i\eta i\eta} $ (top-right), subleading photon's $ \sigma_{i\eta i\eta} $ (bottom-left), and leading photon's R9 (bottom-right). The events pass the selection criteria described in Section 5, while the signal is scaled with a cross-section of 0.1 fb, and the background sample is normalized to 138 fb$ ^{-1} $. The systematic uncertainties included in the shaded band are related to the photon efficiency, lepton efficiency, and pile-up reweighting. |
png |
Figure 1-c:
Distributions of the four most discriminating variables used as input to the BDT: $ \frac{(m_{a}-m_{a,hyp})}{m_{\ell\ell\gamma\gamma}} $ (top-left), leading photon's $ \sigma_{i\eta i\eta} $ (top-right), subleading photon's $ \sigma_{i\eta i\eta} $ (bottom-left), and leading photon's R9 (bottom-right). The events pass the selection criteria described in Section 5, while the signal is scaled with a cross-section of 0.1 fb, and the background sample is normalized to 138 fb$ ^{-1} $. The systematic uncertainties included in the shaded band are related to the photon efficiency, lepton efficiency, and pile-up reweighting. |
png |
Figure 1-d:
Distributions of the four most discriminating variables used as input to the BDT: $ \frac{(m_{a}-m_{a,hyp})}{m_{\ell\ell\gamma\gamma}} $ (top-left), leading photon's $ \sigma_{i\eta i\eta} $ (top-right), subleading photon's $ \sigma_{i\eta i\eta} $ (bottom-left), and leading photon's R9 (bottom-right). The events pass the selection criteria described in Section 5, while the signal is scaled with a cross-section of 0.1 fb, and the background sample is normalized to 138 fb$ ^{-1} $. The systematic uncertainties included in the shaded band are related to the photon efficiency, lepton efficiency, and pile-up reweighting. |
png pdf |
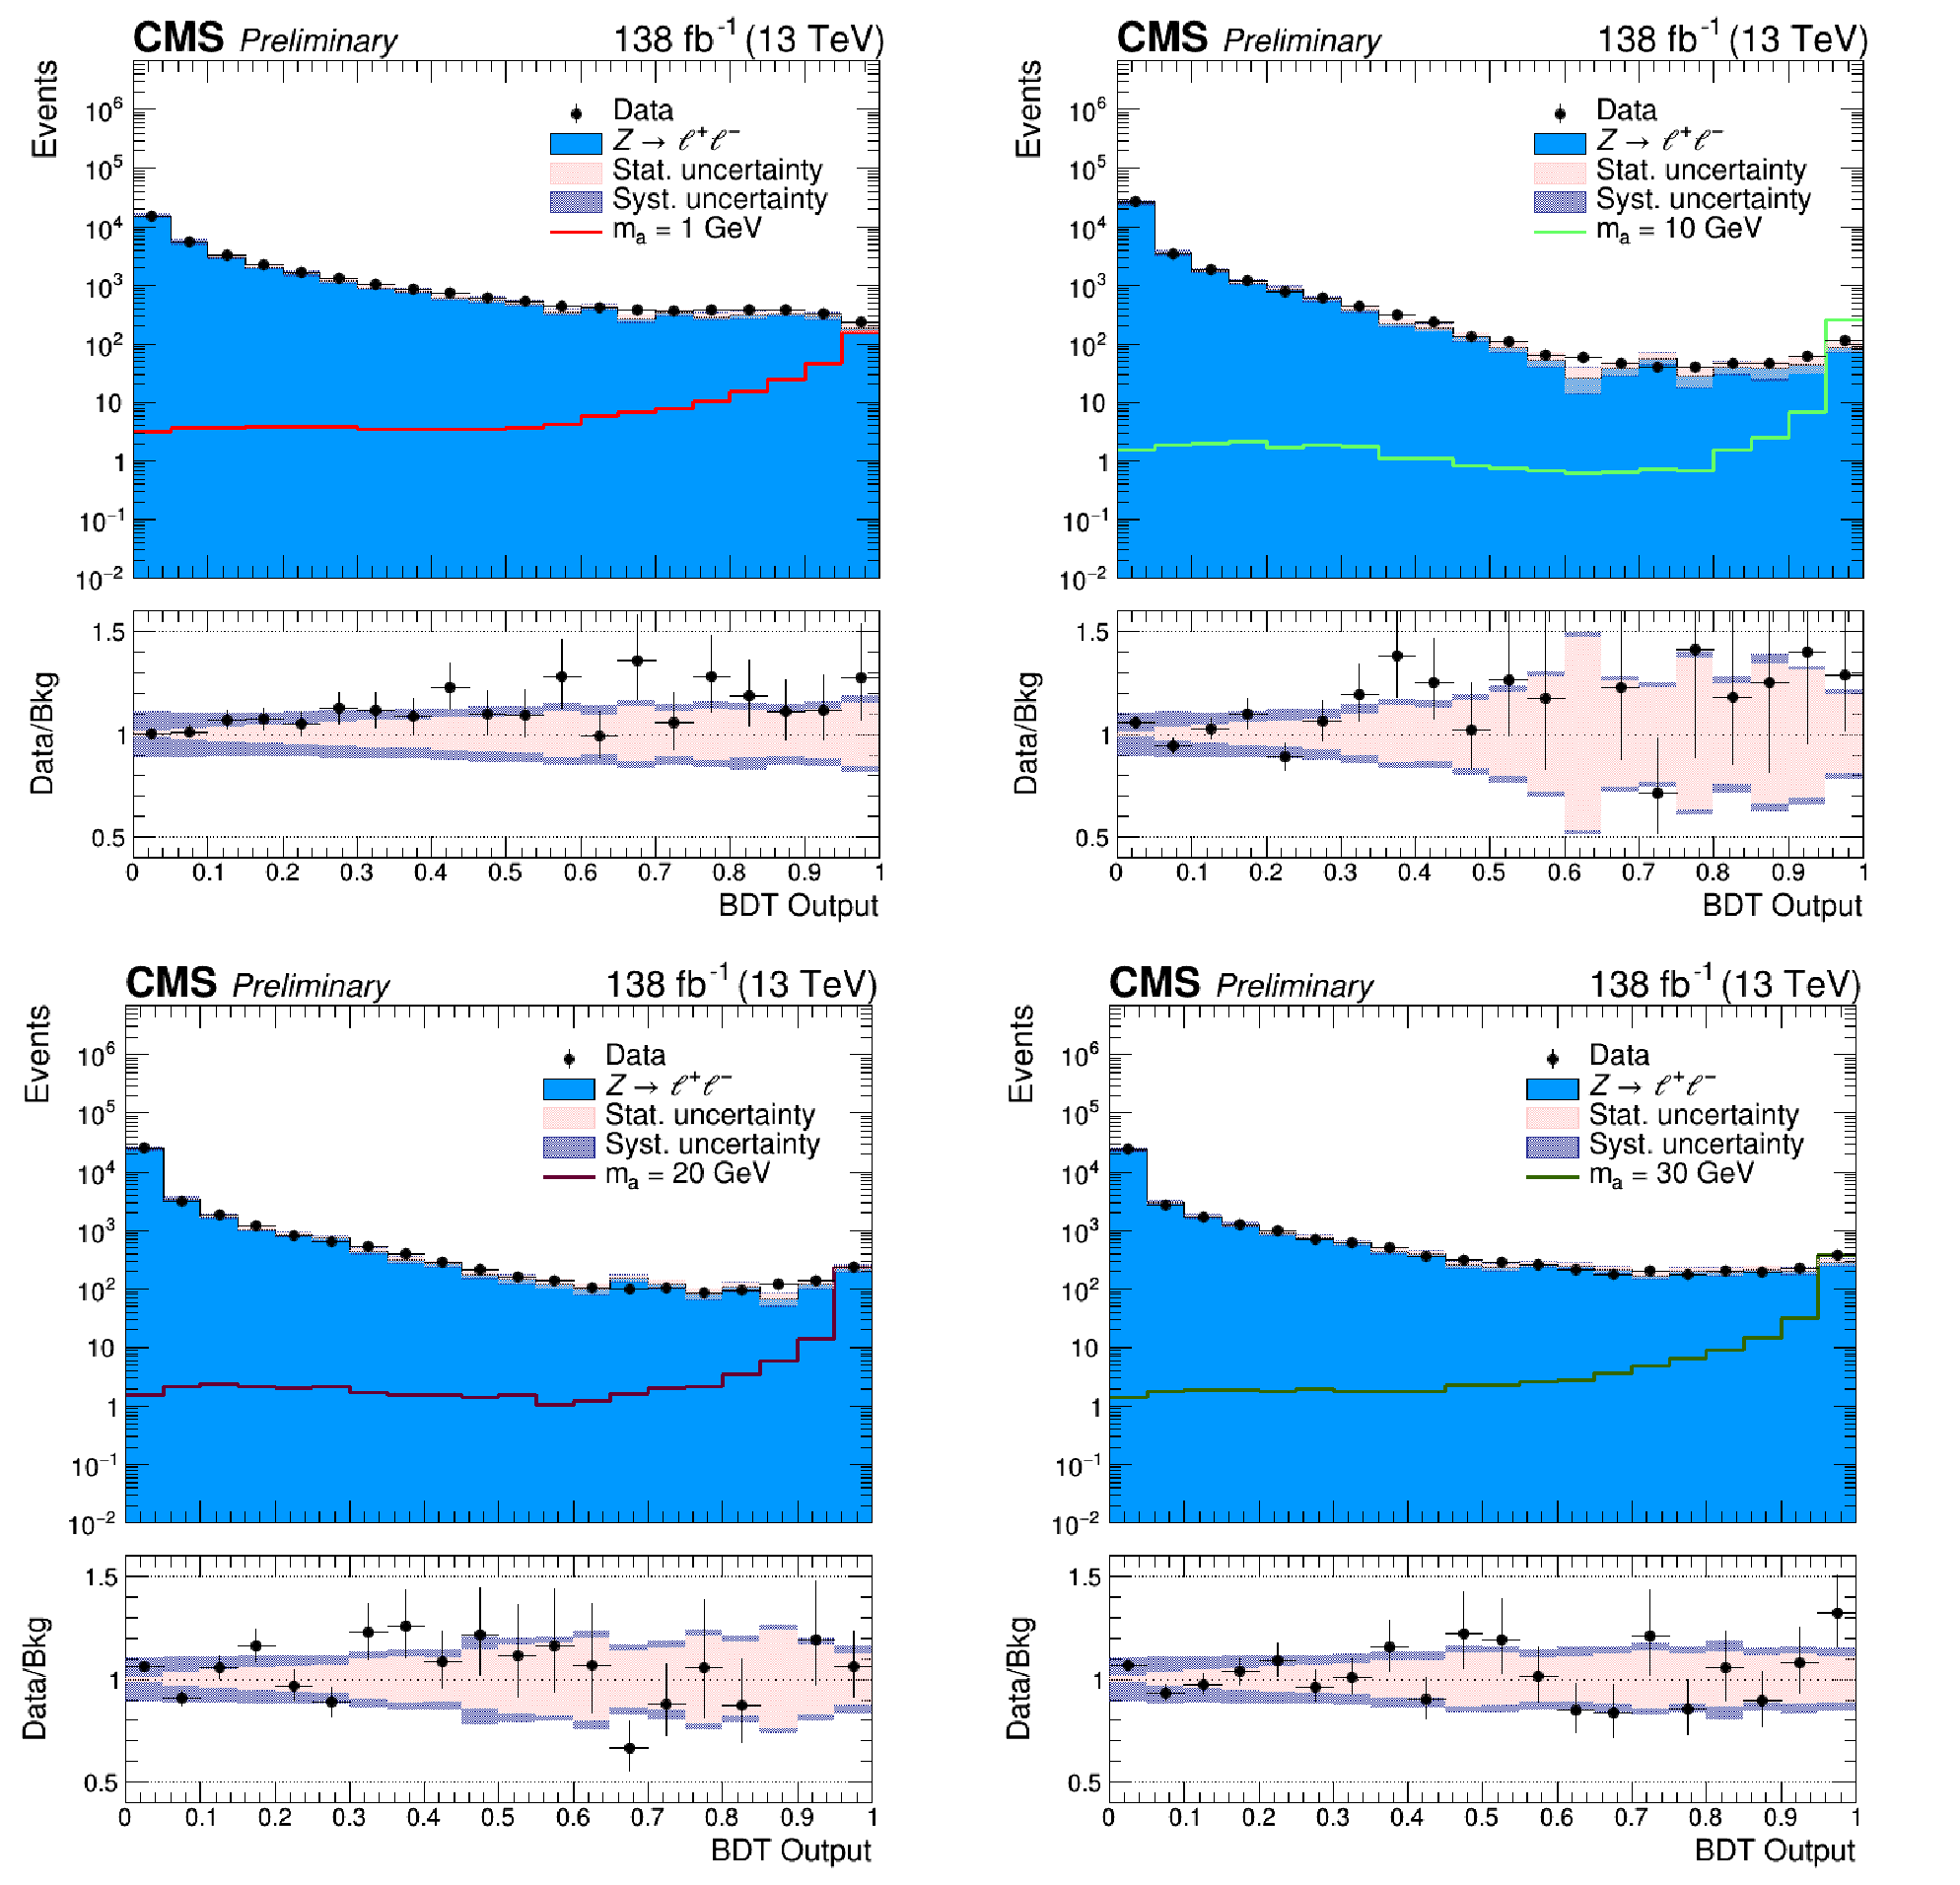
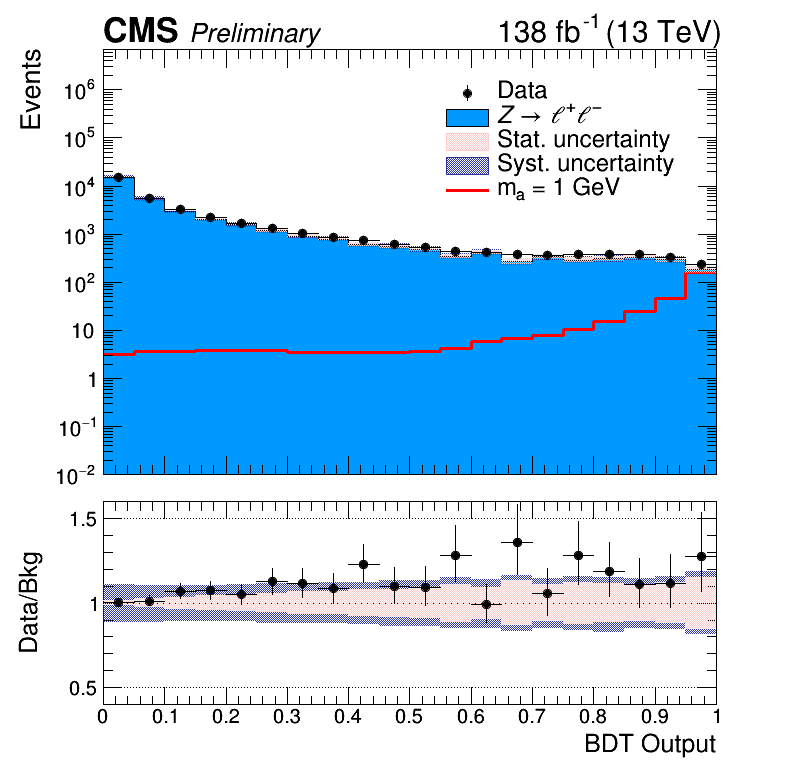
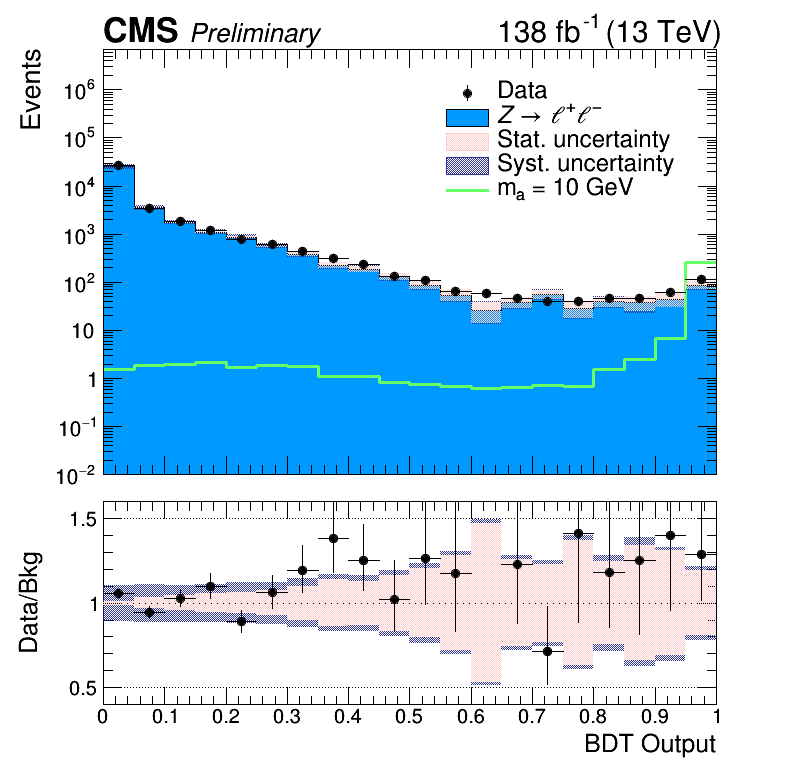
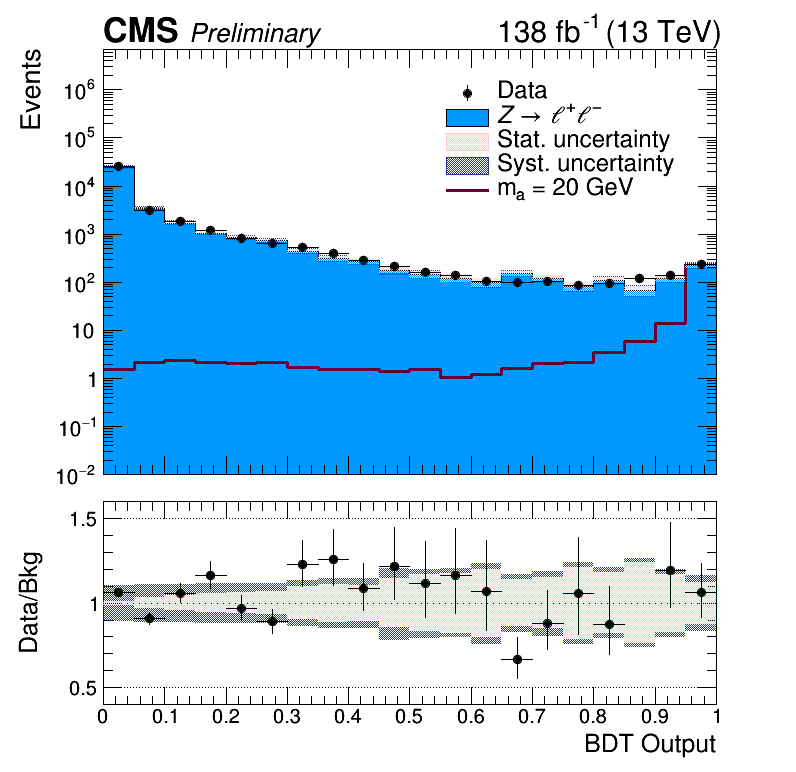
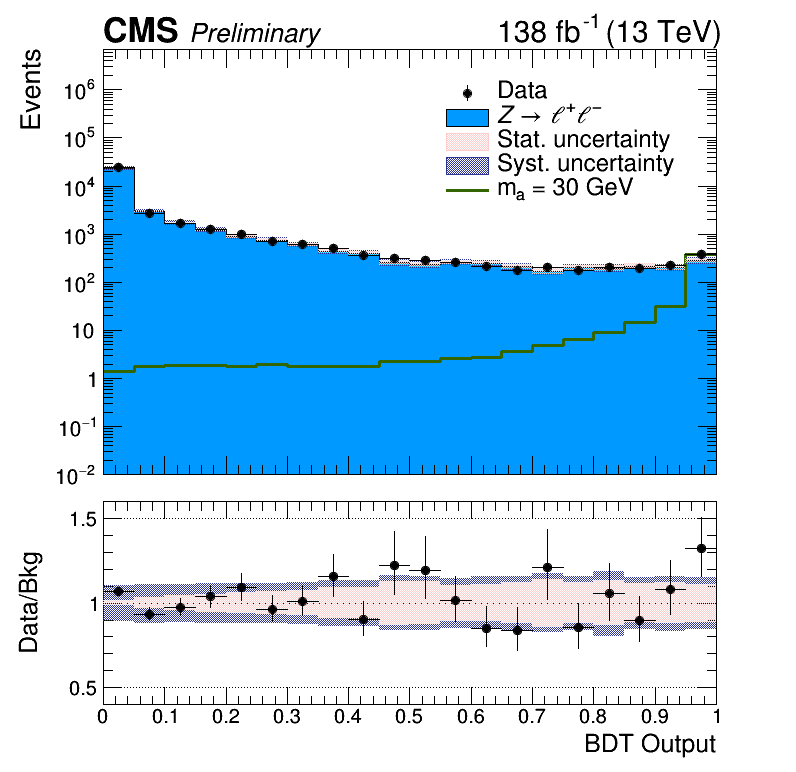
Figure 2:
Distributions of the BDT output for $ m_{a} = $ 1 GeV (top-left), 10 GeV (top-right), 20 GeV (bottom-left), and 30 GeV (bottom-right). The events pass the selection criteria described in Section 5, while the signal is scaled with a cross-section of 0.1 fb, and the background sample is normalized to 138 fb$ ^{-1} $. The systematic uncertainties included in the shaded band are related to the photon efficiency, lepton efficiency, and pile-up reweighting. |
png |
Figure 2-a:
Distributions of the BDT output for $ m_{a} = $ 1 GeV (top-left), 10 GeV (top-right), 20 GeV (bottom-left), and 30 GeV (bottom-right). The events pass the selection criteria described in Section 5, while the signal is scaled with a cross-section of 0.1 fb, and the background sample is normalized to 138 fb$ ^{-1} $. The systematic uncertainties included in the shaded band are related to the photon efficiency, lepton efficiency, and pile-up reweighting. |
png |
Figure 2-b:
Distributions of the BDT output for $ m_{a} = $ 1 GeV (top-left), 10 GeV (top-right), 20 GeV (bottom-left), and 30 GeV (bottom-right). The events pass the selection criteria described in Section 5, while the signal is scaled with a cross-section of 0.1 fb, and the background sample is normalized to 138 fb$ ^{-1} $. The systematic uncertainties included in the shaded band are related to the photon efficiency, lepton efficiency, and pile-up reweighting. |
png |
Figure 2-c:
Distributions of the BDT output for $ m_{a} = $ 1 GeV (top-left), 10 GeV (top-right), 20 GeV (bottom-left), and 30 GeV (bottom-right). The events pass the selection criteria described in Section 5, while the signal is scaled with a cross-section of 0.1 fb, and the background sample is normalized to 138 fb$ ^{-1} $. The systematic uncertainties included in the shaded band are related to the photon efficiency, lepton efficiency, and pile-up reweighting. |
png |
Figure 2-d:
Distributions of the BDT output for $ m_{a} = $ 1 GeV (top-left), 10 GeV (top-right), 20 GeV (bottom-left), and 30 GeV (bottom-right). The events pass the selection criteria described in Section 5, while the signal is scaled with a cross-section of 0.1 fb, and the background sample is normalized to 138 fb$ ^{-1} $. The systematic uncertainties included in the shaded band are related to the photon efficiency, lepton efficiency, and pile-up reweighting. |
png pdf |
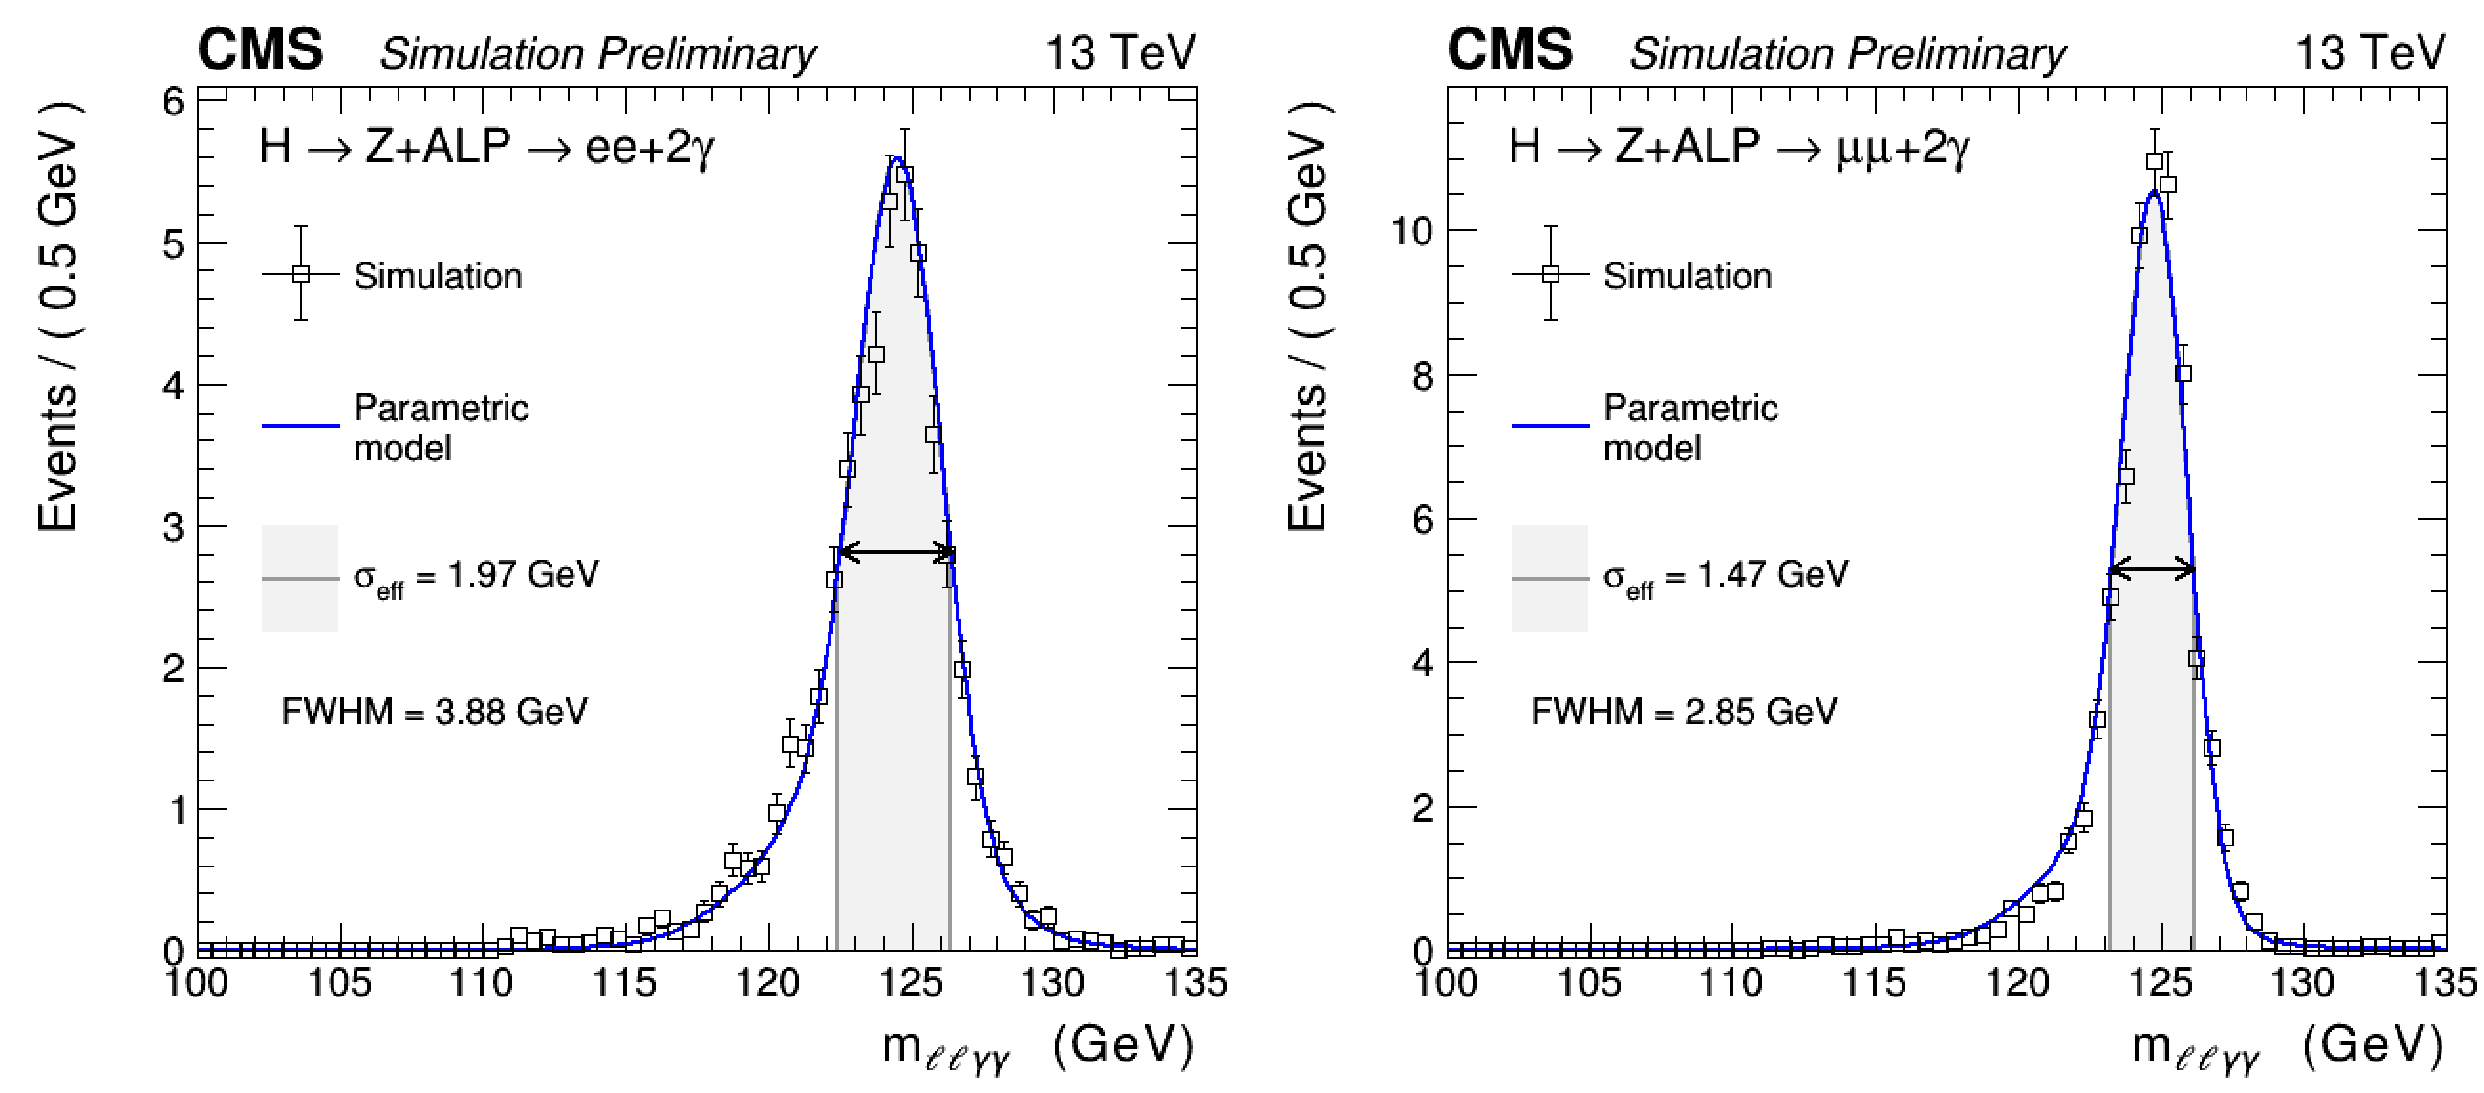
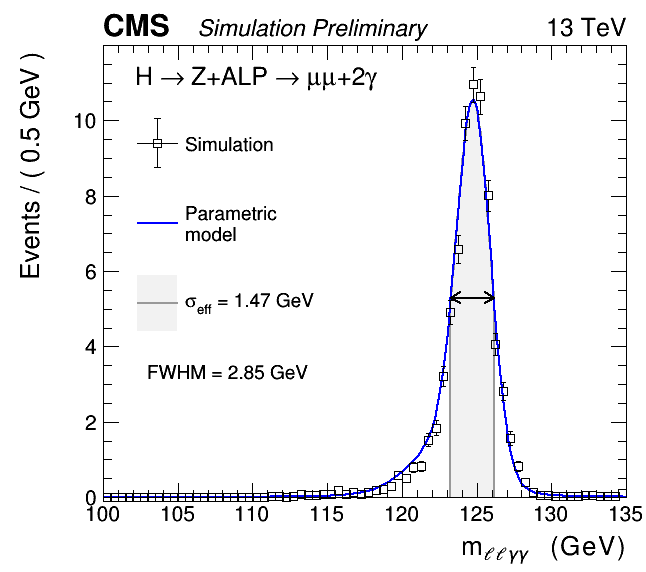
Figure 3:
Fit to the simulated $ m_{\ell\ell\gamma\gamma} $ distributions for a signal with $ m_{a}= $ 30 GeV in the electron (left) and muon (right) channels. |

png |
Figure 3-a:
Fit to the simulated $ m_{\ell\ell\gamma\gamma} $ distributions for a signal with $ m_{a}= $ 30 GeV in the electron (left) and muon (right) channels. |
png |
Figure 3-b:
Fit to the simulated $ m_{\ell\ell\gamma\gamma} $ distributions for a signal with $ m_{a}= $ 30 GeV in the electron (left) and muon (right) channels. |
png pdf |
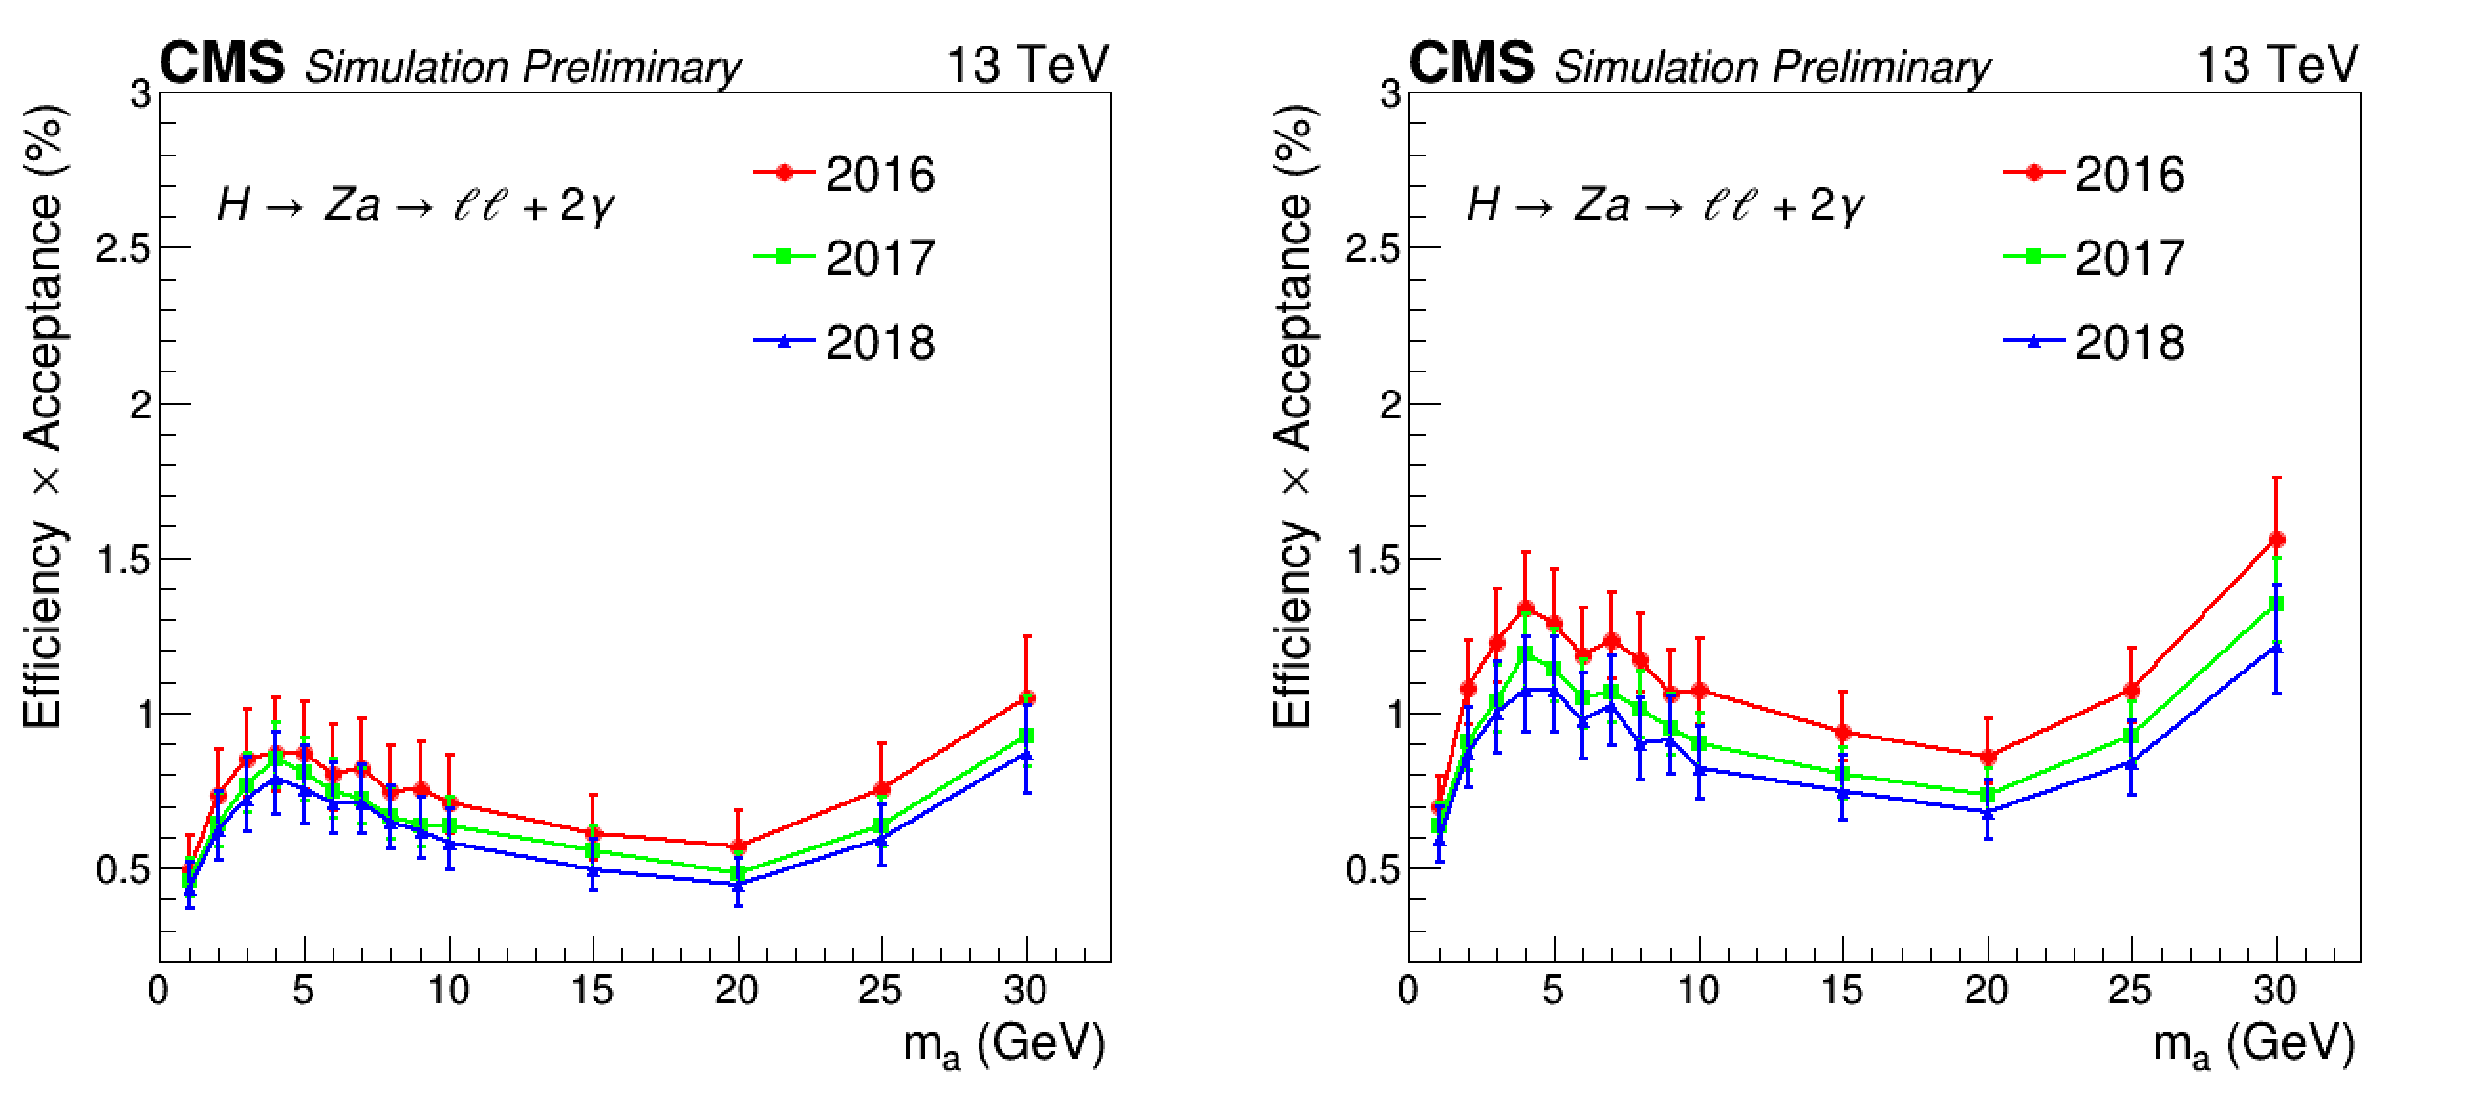
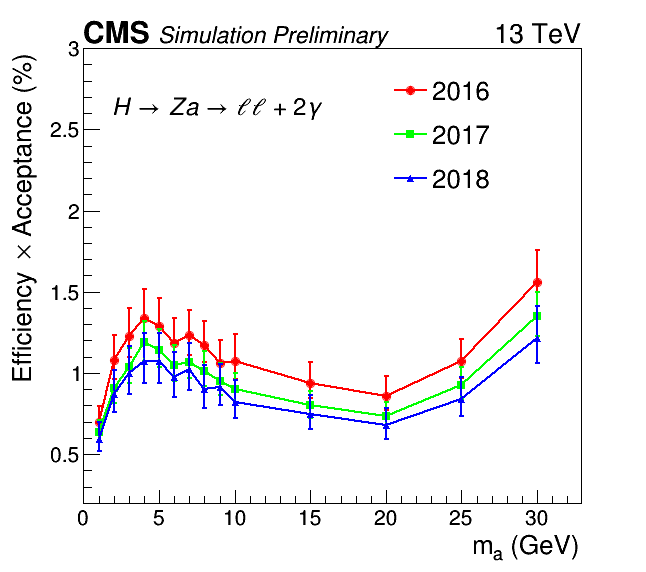
Figure 4:
Product of detector efficiency and analysis acceptance for signal samples with various $ m_{a} $. The denominator includes $ Z \rightarrow \mathrm{e}\mathrm{e}, \mu\mu, \tau\tau $ decay modes, and the numerator is the number of events after the full selection for $ Z \rightarrow \mathrm{e}\mathrm{e} $ (left) and $ \mu\mu $ (right) channel. The error bar shown here includes statistics and systematic uncertainty. The photon efficiency, lepton efficiency, and pile-up reweighting uncertainties are taken into account for the systematic uncertainty. |

png |
Figure 4-a:
Product of detector efficiency and analysis acceptance for signal samples with various $ m_{a} $. The denominator includes $ Z \rightarrow \mathrm{e}\mathrm{e}, \mu\mu, \tau\tau $ decay modes, and the numerator is the number of events after the full selection for $ Z \rightarrow \mathrm{e}\mathrm{e} $ (left) and $ \mu\mu $ (right) channel. The error bar shown here includes statistics and systematic uncertainty. The photon efficiency, lepton efficiency, and pile-up reweighting uncertainties are taken into account for the systematic uncertainty. |
png |
Figure 4-b:
Product of detector efficiency and analysis acceptance for signal samples with various $ m_{a} $. The denominator includes $ Z \rightarrow \mathrm{e}\mathrm{e}, \mu\mu, \tau\tau $ decay modes, and the numerator is the number of events after the full selection for $ Z \rightarrow \mathrm{e}\mathrm{e} $ (left) and $ \mu\mu $ (right) channel. The error bar shown here includes statistics and systematic uncertainty. The photon efficiency, lepton efficiency, and pile-up reweighting uncertainties are taken into account for the systematic uncertainty. |

png pdf |
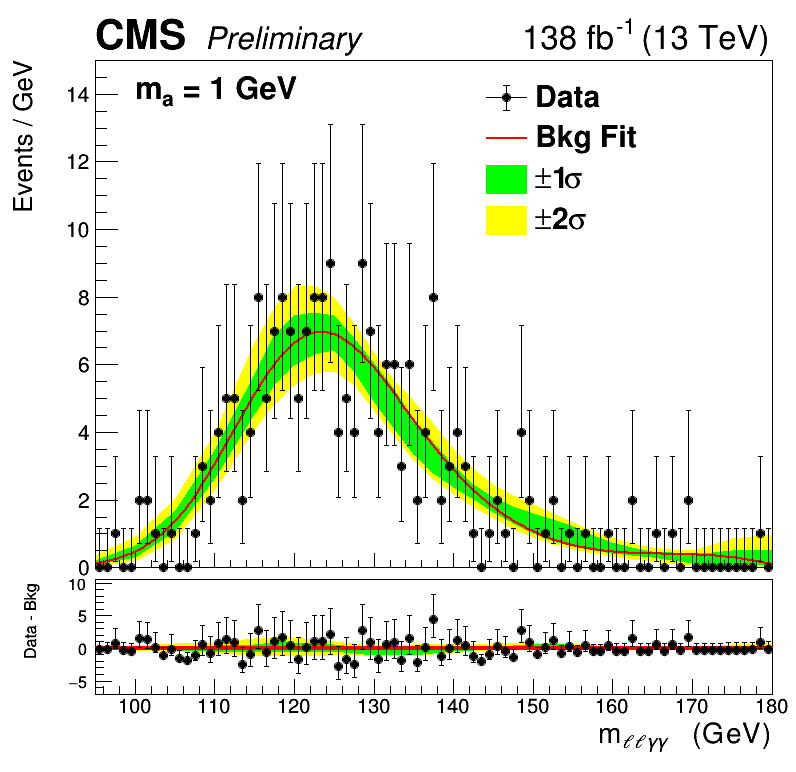
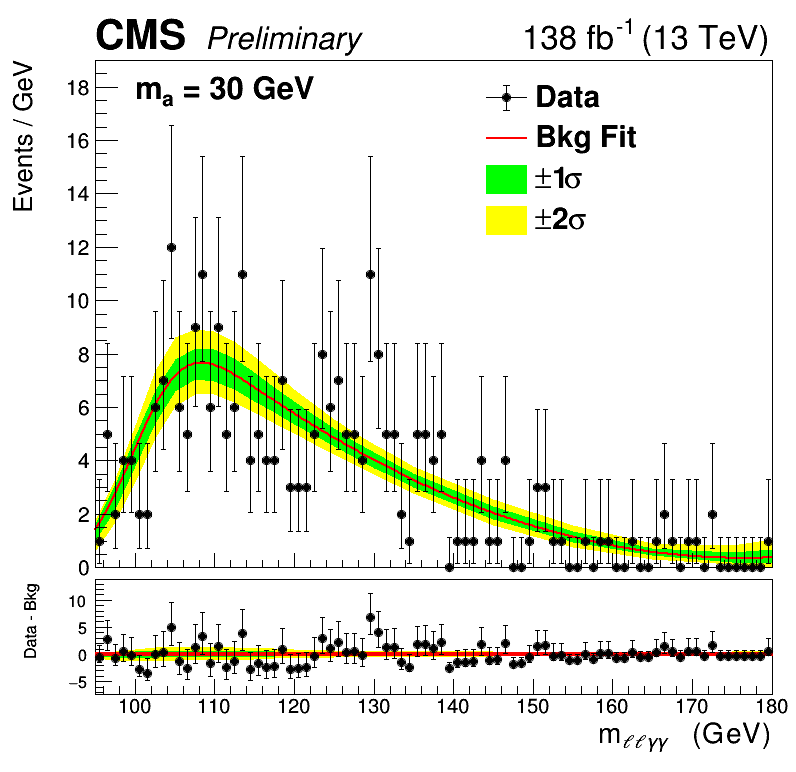
Figure 5:
Invariant mass $ m_{\ell\ell\gamma\gamma} $ distribution in data (black points). The background model fit is shown for $ m_{a} $ = 1 GeV (left) and 30 GeV (right), where the solid red line shows the background contribution. The lower panel shows the residuals after subtraction of this background component. The one (green) and two (yellow) standard deviation bands show the uncertainties in the fitted background model. |
png |
Figure 5-a:
Invariant mass $ m_{\ell\ell\gamma\gamma} $ distribution in data (black points). The background model fit is shown for $ m_{a} $ = 1 GeV (left) and 30 GeV (right), where the solid red line shows the background contribution. The lower panel shows the residuals after subtraction of this background component. The one (green) and two (yellow) standard deviation bands show the uncertainties in the fitted background model. |
png |
Figure 5-b:
Invariant mass $ m_{\ell\ell\gamma\gamma} $ distribution in data (black points). The background model fit is shown for $ m_{a} $ = 1 GeV (left) and 30 GeV (right), where the solid red line shows the background contribution. The lower panel shows the residuals after subtraction of this background component. The one (green) and two (yellow) standard deviation bands show the uncertainties in the fitted background model. |
png pdf |
Figure 6:
Expected and observed 95 % CL limits on the product of the production cross section of the Higgs boson into di-photons and di-leptons via a Z boson and a pseudoscalar, $ \sigma (\mathrm{p}\mathrm{p} \to \mathrm{H})\times \mathcal{B}(\mathrm{H} \to \mathrm{Z} \mathrm{a} \to \ell\ell\gamma\gamma) $. The green (yellow) band represents the 68% (95%) CL expected limit intervals. |
png pdf |
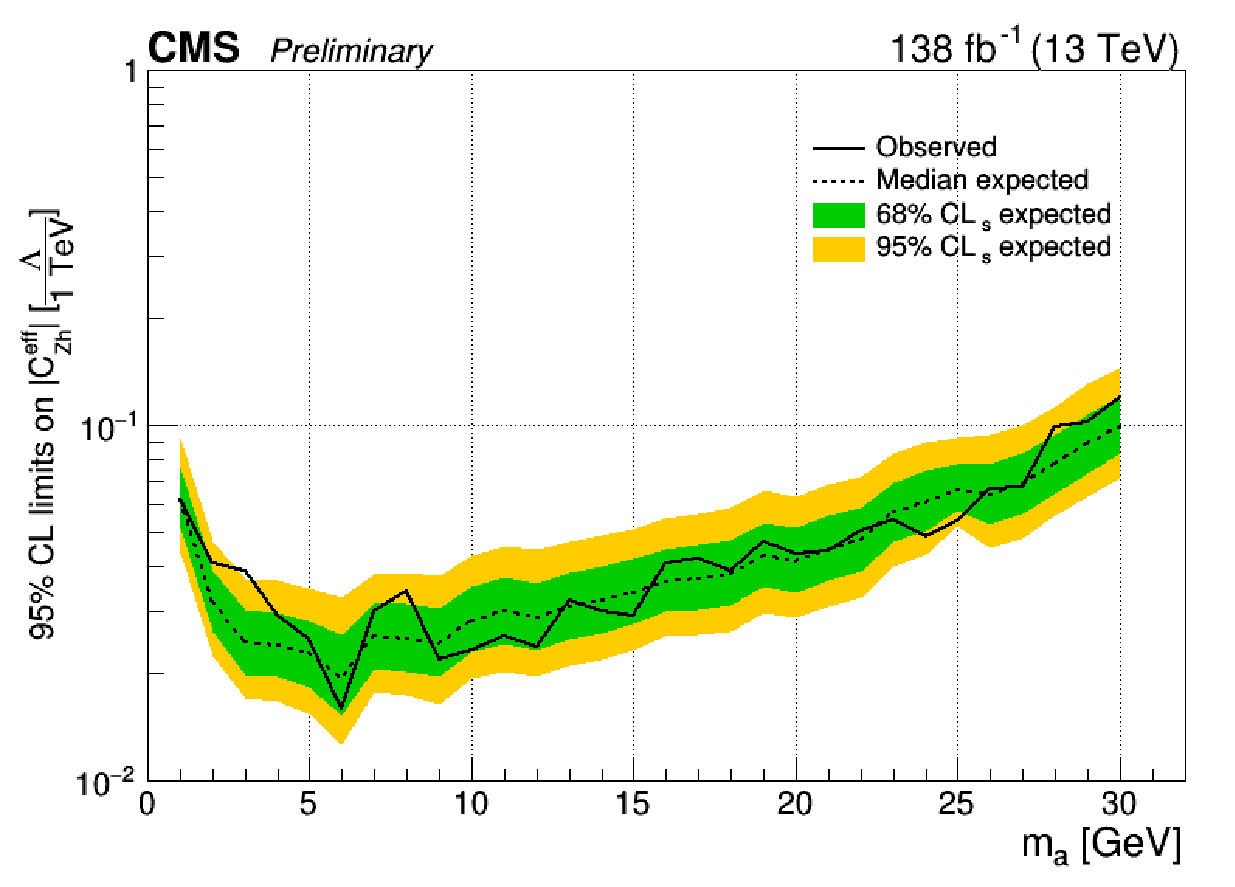
Figure 7:
Exclusion limits at 95% CL on $ C_{\mathrm{Z}\mathrm{H}}^\textrm{eff}/\Lambda $, assuming the ALP decays exclusively to a photon pair. The dashed black curve is the expected upper limit, with the one- and two-standard-deviation bands are shown in green and yellow, respectively. The solid black curve is the observed upper limit. |
| Tables | |
png pdf |
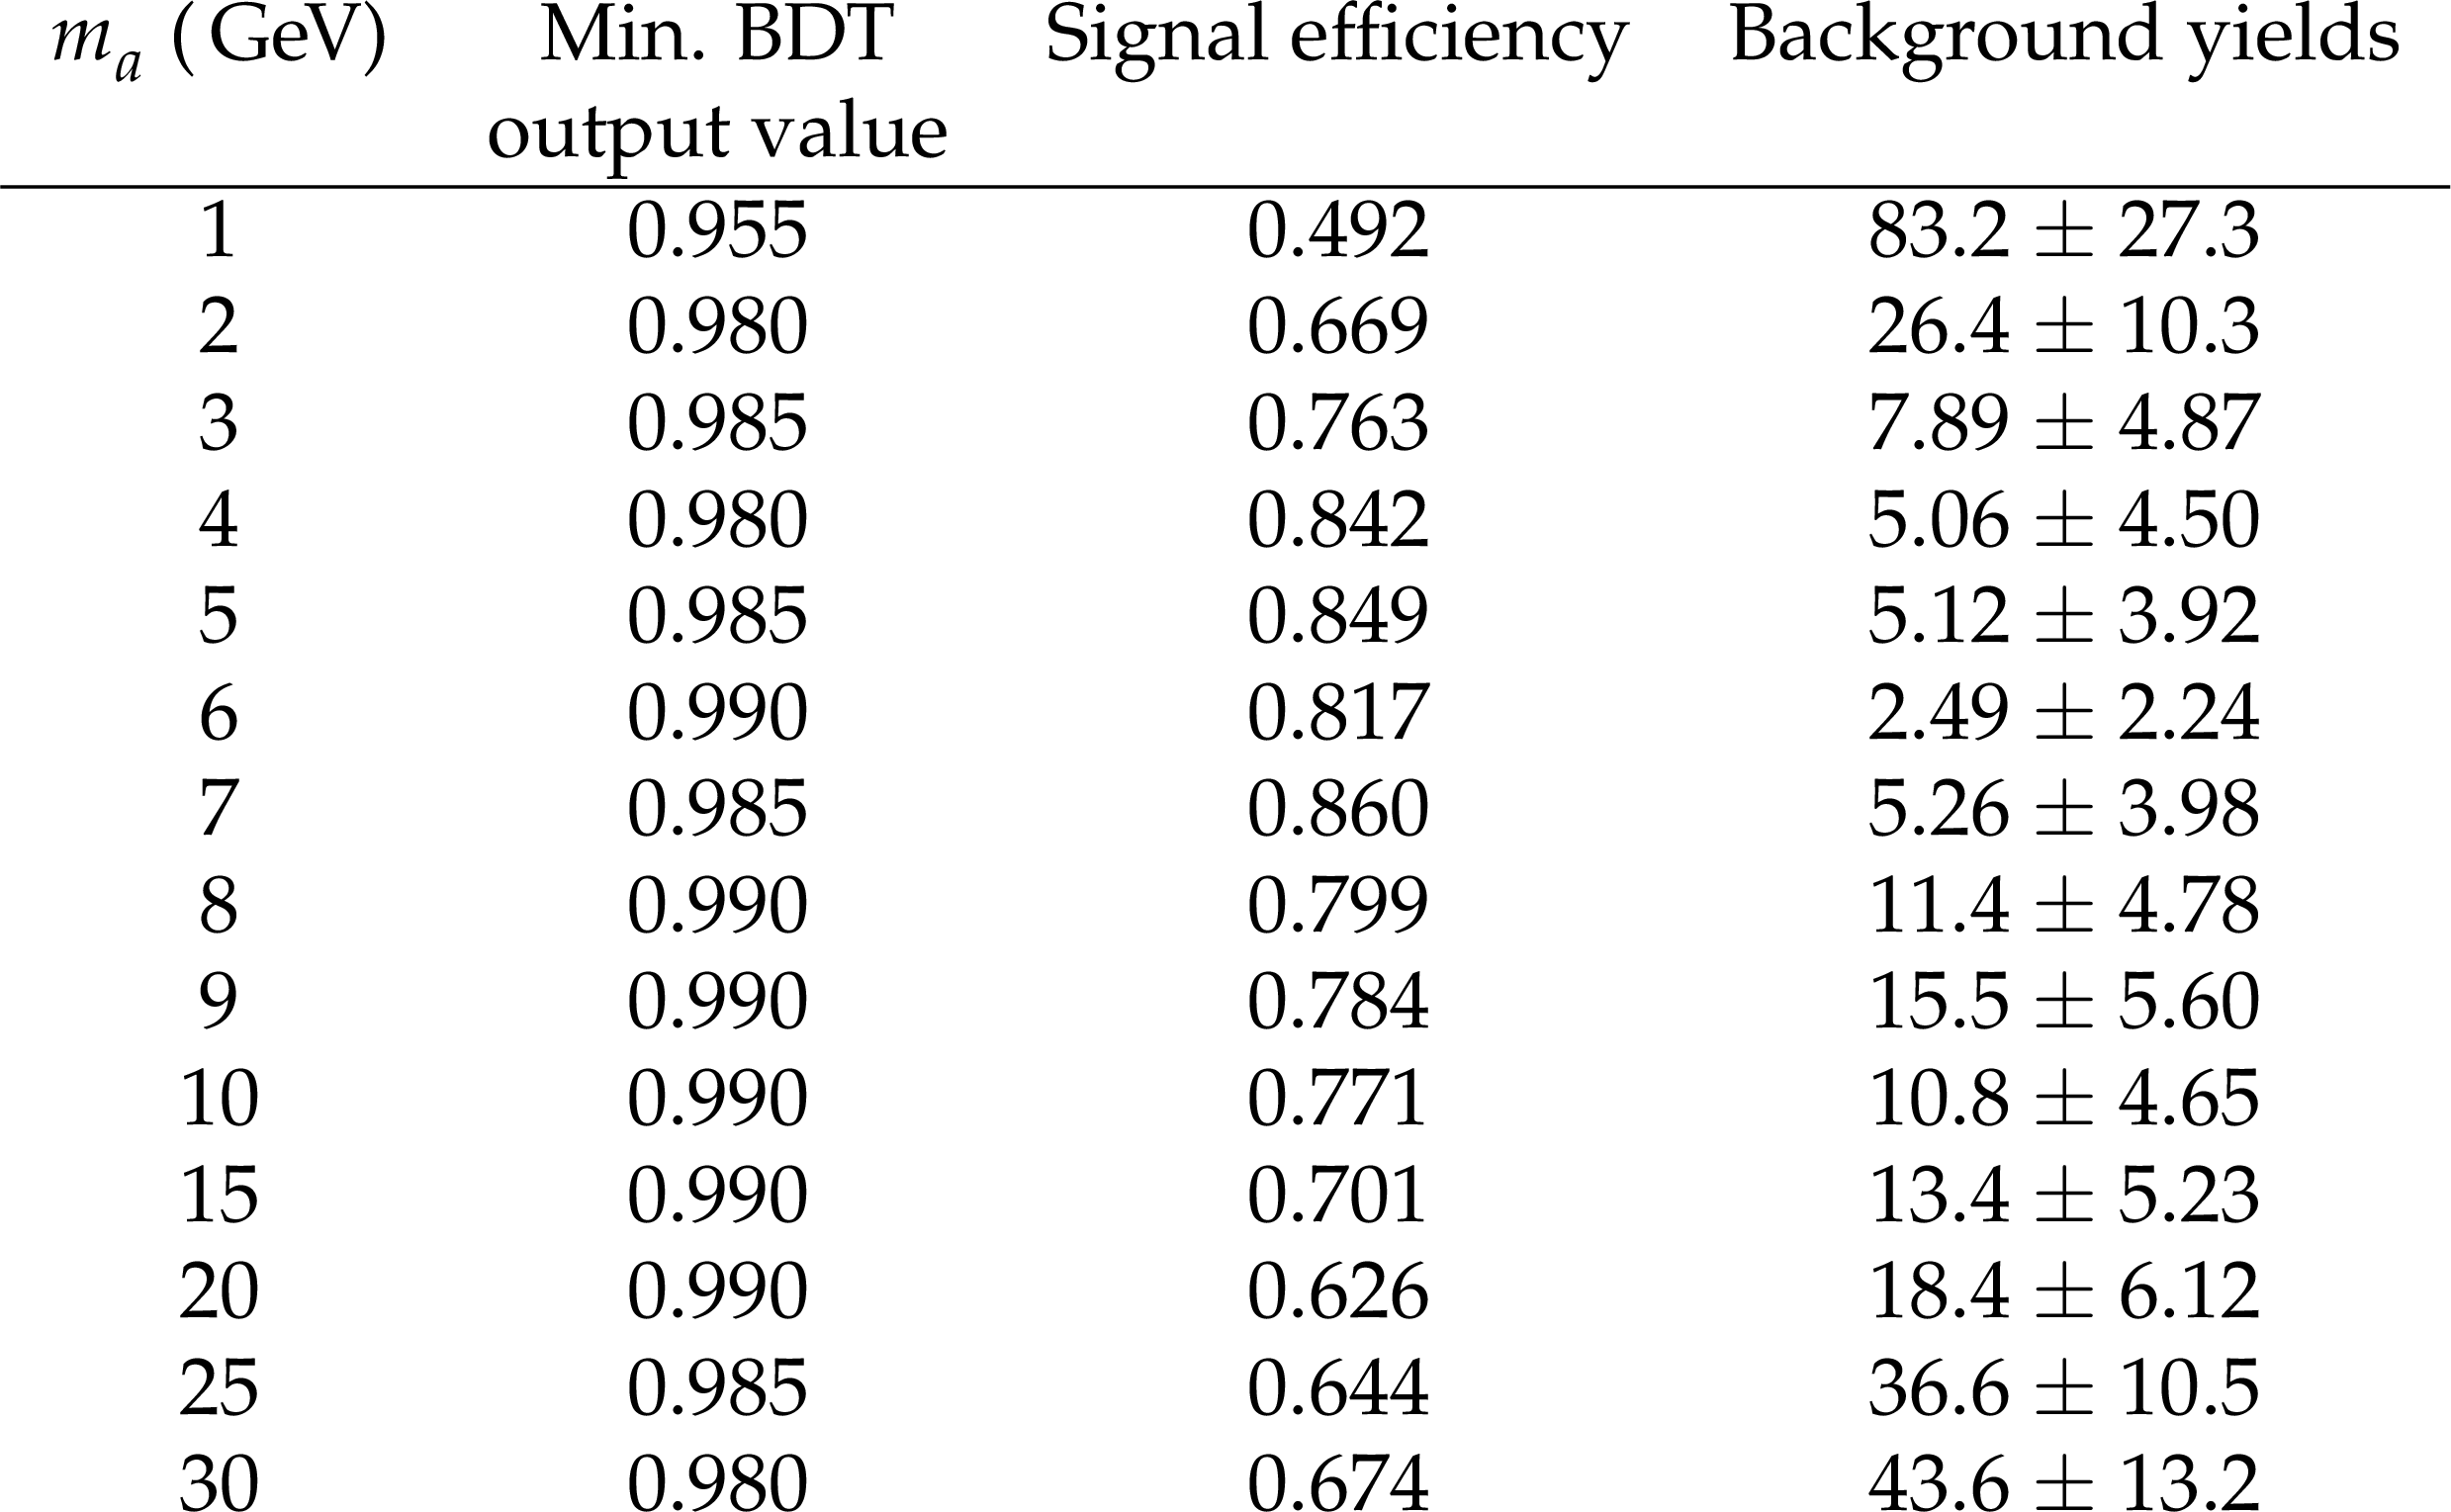
Table 1:
Minimum BDT output values used to define the analysis categories, with the associated signal efficiencies and background yields. |
png pdf |
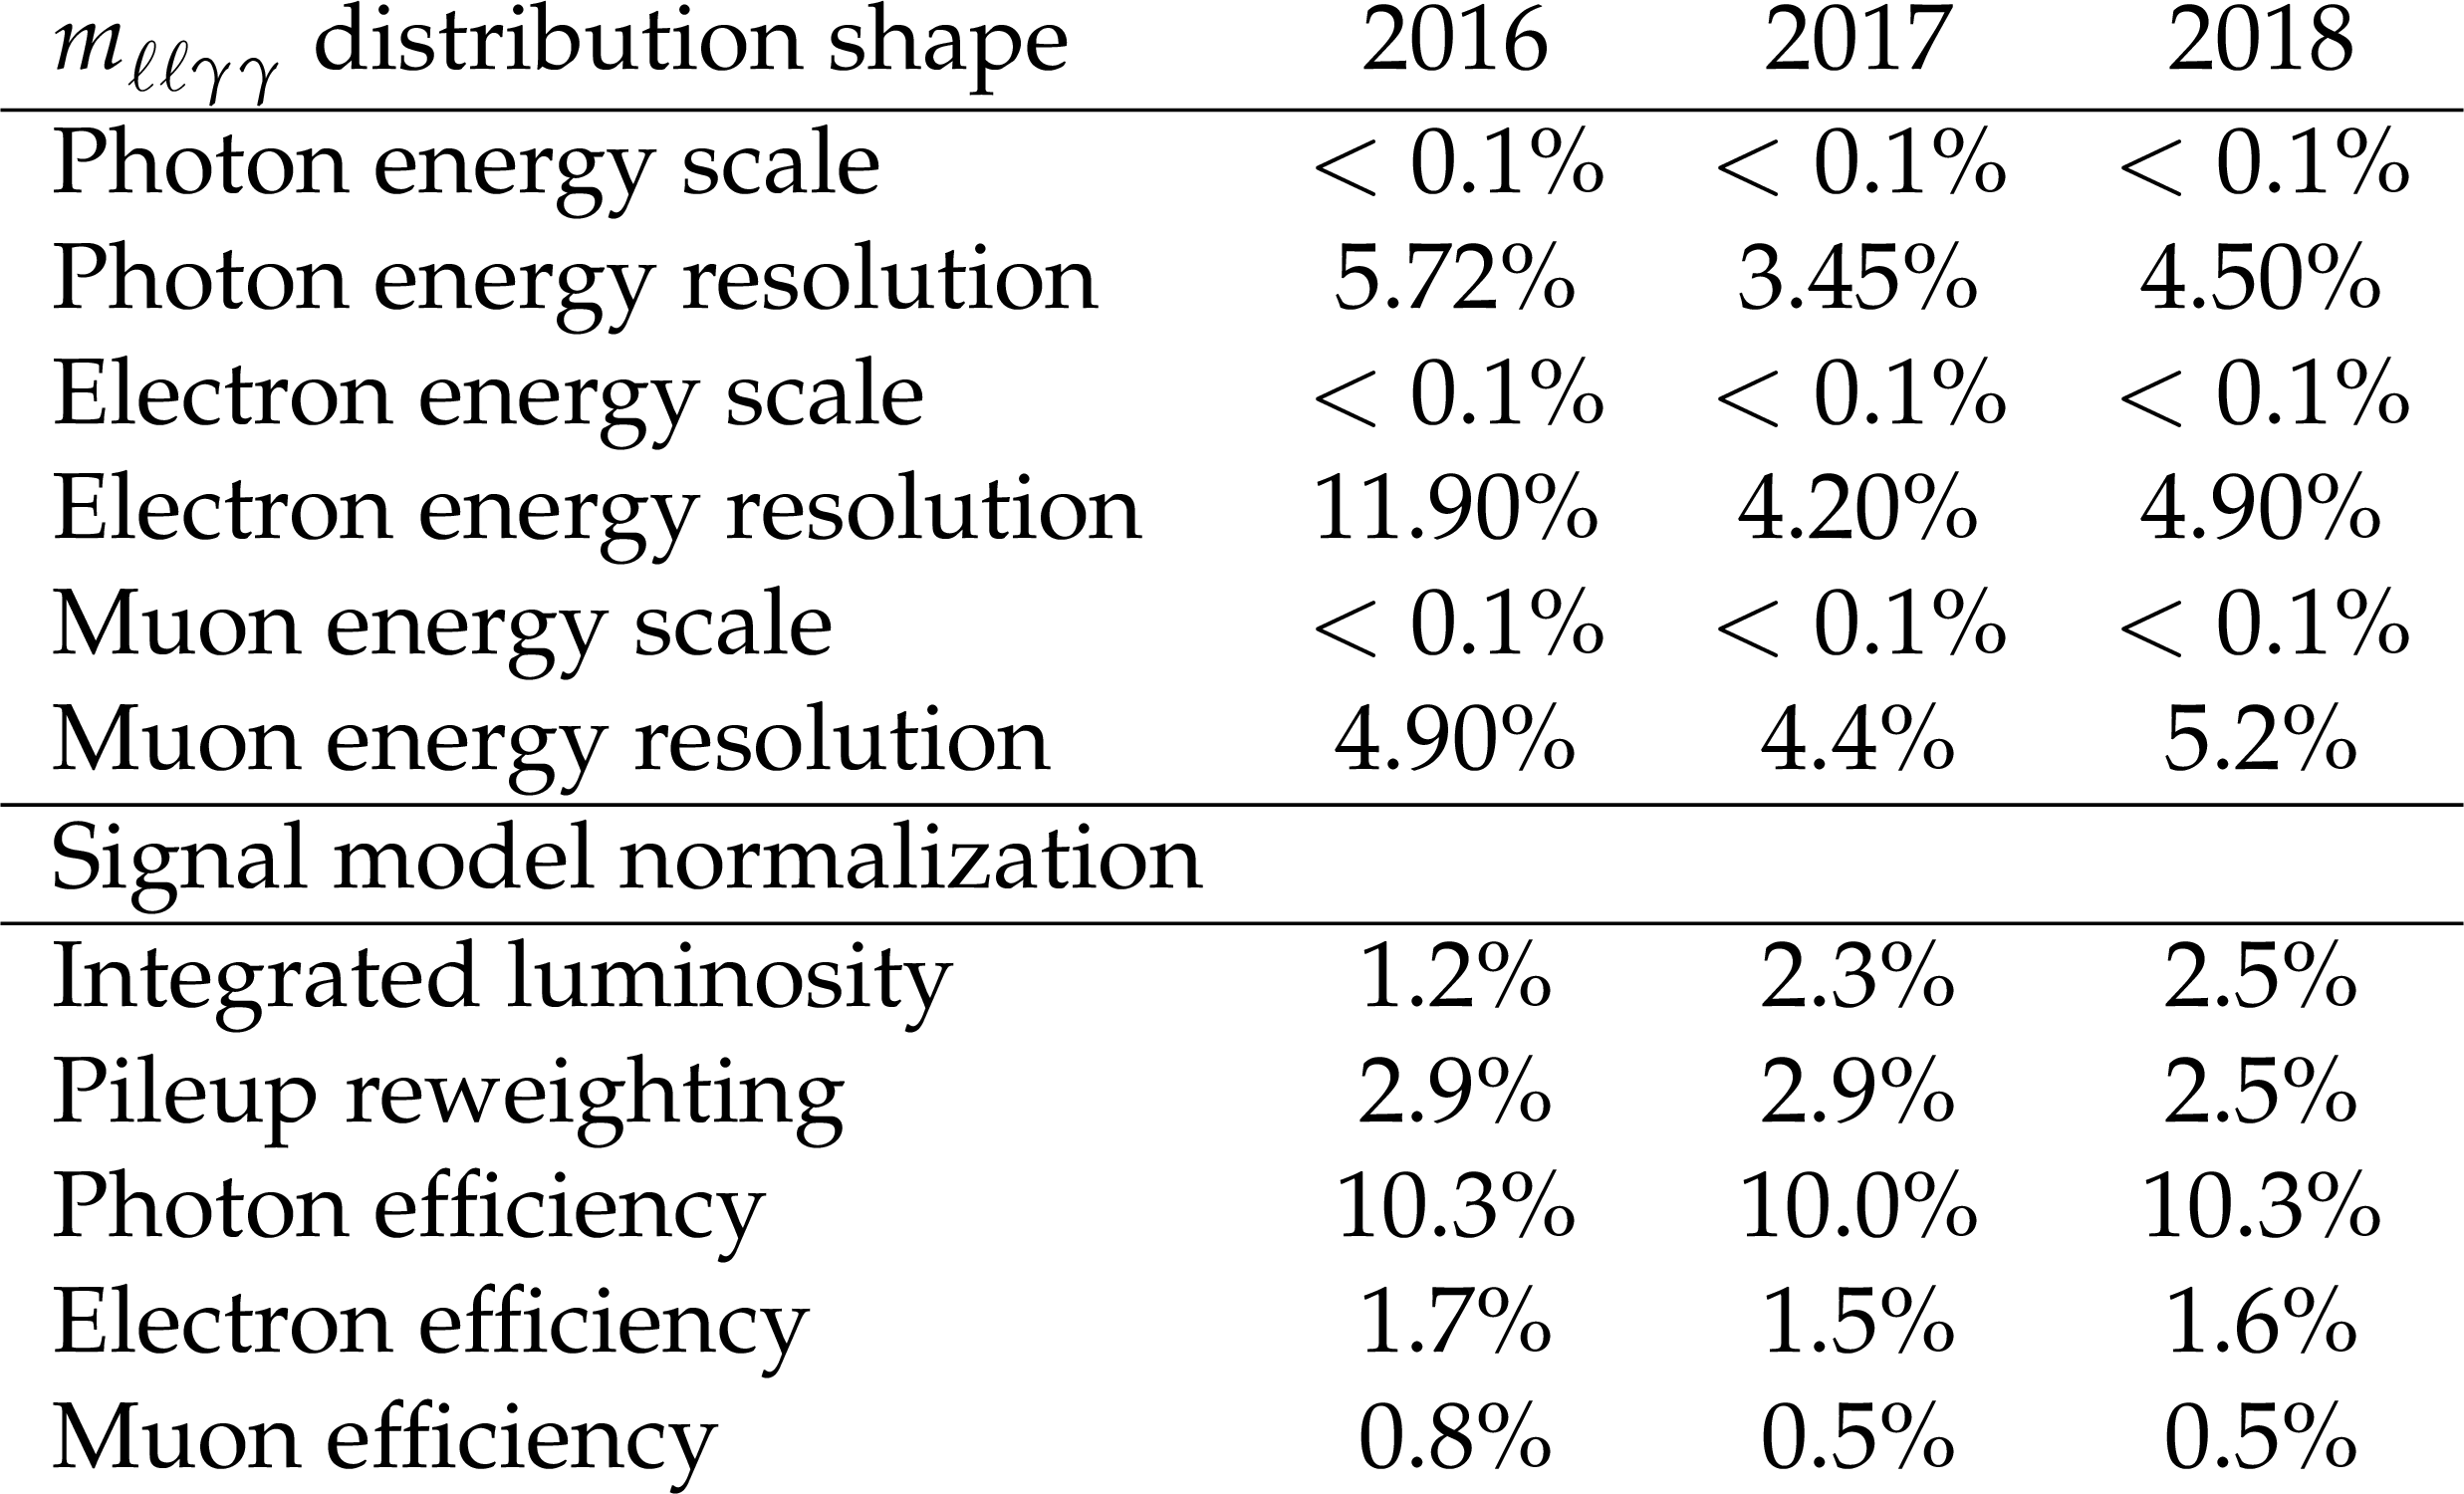
Table 2:
Sources of systematic uncertainties and their magnitudes for each data taking period. |
| Summary |
| A search for Higgs boson decays to a Z boson and a pseudoscalar, which subsequently decay into a lepton pair and a photon pair, respectively, is presented. The analysis is based on proton-proton collision data collected at $ \sqrt{s} = $ 13 TeV by the CMS experiment in 2016, 2017, and 2018, corresponding to an integrated luminosity of 138 fb$ ^{-1} $. The analysis probes pseudoscalar masses in the range 1--30 GeV. This is the first search for Higgs boson decays in the final state of two leptons and two photons. No significant deviation from the background-only hypothesis is observed. Upper limits are set at 95% confidence level on the product of the production cross section of the Higgs boson and its branching fraction into a dilepton and a diphoton pair via a Z boson and a pseudoscalar, $ \sigma (\mathrm{p}\mathrm{p}\rightarrow \mathrm{H})\times \mathcal{B}(\mathrm{H}\to\mathrm{Z} a \to \ell\ell\gamma\gamma) $. The observed (expected) limit ranges from 17.8 (17.9) fb for $ m_{a} = $ 1 GeV to 4.7 (6.9) fb for $ m_{a} = $ 30 GeV. Constraints are also set on the axion-like-particle model parameter $ C_{ZH}^{eff}/\Lambda $, which describes the coupling between the Higgs boson, Z boson, and ALP. |
| References | ||||
| 1 | ATLAS Collaboration | Observation of a new particle in the search for the Standard Model Higgs boson with the ATLAS detector at the LHC | PLB 716 (2012) 1 | 1207.7214 |
| 2 | CMS Collaboration | Observation of a new boson at a mass of 125 GeV with the CMS Experiment at the LHC | PLB 716 (2012) 30 | CMS-HIG-12-028 1207.7235 |
| 3 | CMS Collaboration | Observation of a new boson with mass near 125 GeV in pp collisions at $ \sqrt{s} $ = 7 and 8 TeV | JHEP 06 (2013) 081 | CMS-HIG-12-036 1303.4571 |
| 4 | CMS Collaboration | Measurements of production cross sections of the Higgs boson in the four-lepton final state in proton-proton collisions at $ \sqrt{s} = 13 TeV | EPJC 81 (2021) 488 | CMS-HIG-19-001 2103.04956 |
| 5 | CMS Collaboration | Constraints on anomalous Higgs boson couplings to vector bosons and fermions in its production and decay using the four-lepton final state | PRD 104 (2021) 052004 | CMS-HIG-19-009 2104.12152 |
| 6 | CMS Collaboration | Measurements of Higgs boson production cross sections and couplings in the diphoton decay channel at $ \sqrt{s} $ = 13 TeV | JHEP 07 (2021) 027 | CMS-HIG-19-015 2103.06956 |
| 7 | CMS Collaboration | Search for low-mass dilepton resonances in Higgs boson decays to four-lepton final states in proton-proton collisions at $ \sqrt{s}=$ 13 TeV | EPJC 82 (2022) 290 | CMS-HIG-19-007 2111.01299 |
| 8 | R. D. Peccei and H. R. Quinn | $ \mathrm{CP} $ conservation in the presence of pseudoparticles | PRL 38 (1977) 1440 | |
| 9 | M. Bauer, M. Neubert, and A. Thamm | LHC as an axion factory: probing an axion explanation for $ (g{-}2)_\mu $ with exotic Higgs decays | PRL 119 (2017) 031802 | 1704.08207 |
| 10 | H. Georgi, D. B. Kaplan , and L. Randall | Manifesting the invisible axion at low energies | Physics Letters B 169 (1986) 73 | |
| 11 | M. Bauer, M. Neubert, and A. Thamm | Collider probes of axion-like particles | JHEP 12 (2017) 044 | 1708.00443 |
| 12 | ATLAS Collaboration | Search for boosted diphoton resonances in the 10 to 70 gev mass range using 138 fb$ ^{-1} $ of 13 TeV pp collisions with the ATLAS detector | link | |
| 13 | ATLAS Collaboration | Search for new phenomena in events with a photon and missing transverse momentum in pp collisions at $ \sqrt{s} $ = 13 TeV with the ATLAS detector | PRD 92 (2015) | |
| 14 | ATLAS Collaboration | Search for dark matter in association with an energetic photon in pp collisions at $ \sqrt{s} $ = 13 TeV with the ATLAS detector | JHEP 2021 (2020) 46 | 2011.05259 |
| 15 | ATLAS Collaboration | Measurement of light-by-light scattering and search for axion-like particles with 2.2 fb$^{-1}$ of Pb+Pb data with the ATLAS detector | JHEP 2021 (2021) 45 | |
| 16 | CMS Collaboration | Search for the exotic decay of the Higgs boson into two light pseudoscalars with four photons in the final state in proton-proton collisions at $ \sqrt{s} $ = 13 TeV | Accepted by JHEP | CMS-HIG-21-003 2208.01469 |
| 17 | CMS Collaboration | Search for exotic higgs boson decays $ h\rightarrow aa\rightarrow 4\gamma $ with events containing two merged diphotons in proton-proton collisions at $ \sqrt{s} $ = 13 TeV | Submitted to PRL | CMS-HIG-21-016 2209.06197 |
| 18 | CMS Collaboration | The CMS experiment at the CERN LHC | JINST 3 (2008) S08004 | |
| 19 | J. Alwall et al. | The automated computation of tree-level and next-to-leading order differential cross sections, and their matching to parton shower simulations | JHEP 07 (2014) 079 | 1405.0301 |
| 20 | J. Alwall et al. | Comparative study of various algorithms for the merging of parton showers and matrix elements in hadronic collisions | EPJC 53 (2008) 473 | 0706.2569 |
| 21 | R. Frederix and S. Frixione | Merging meets matching in MC@NLO | JHEP 12 (2012) 061 | 1209.6215 |
| 22 | D. Curtin, R. Essig, S. Gori, and J. Shelton | Illuminating dark photons with high-energy colliders | JHEP 02 (2015) 157 | 1412.0018 |
| 23 | CMS Collaboration | Observation of the diphoton decay of the Higgs boson and measurement of its properties | EPJC 74 (2014) 3076 | CMS-HIG-13-001 1407.0558 |
| 24 | CMS Collaboration | Measurements of Higgs boson properties in the diphoton decay channel in proton-proton collisions at $ \sqrt{s} = $ 13 TeV | JHEP 11 (2018) 185 | CMS-HIG-16-040 1804.02716 |
| 25 | NNPDF Collaboration | Parton distributions for the LHC Run II | JHEP 04 (2015) 040 | 1410.8849 |
| 26 | NNPDF Collaboration | Parton distributions from high-precision collider data | EPJC 77 (2017) 663 | 1706.00428 |
| 27 | T. Sjöstrand et al. | An introduction to PYTHIA 8.2 | Comput. Phys. Commun. 191 (2015) 159 | 1410.3012 |
| 28 | CMS Collaboration | Event generator tunes obtained from underlying event and multiparton scattering measurements | EPJC 76 (2016) 155 | CMS-GEN-14-001 1512.00815 |
| 29 | CMS Collaboration | Extraction and validation of a new set of CMS PYTHIA8 tunes from underlying-event measurements | EPJC 80 (2020) 4 | CMS-GEN-17-001 1903.12179 |
| 30 | GEANT4 Collaboration | GEANT4: a simulation toolkit | NIM A 506 (2003) 250 | |
| 31 | J. Allison et al. | GEANT4 developments and applications | IEEE Trans. Nucl. Sci. 53 (2006) 270 | |
| 32 | CMS Collaboration | The CMS trigger system | JINST 12 (2017) P01020 | CMS-TRG-12-001 1609.02366 |
| 33 | M. Cacciari, G. P. Salam, and G. Soyez | The anti-$ k_{\mathrm{T}} $ jet clustering algorithm | JHEP 04 (2008) 063 | 0802.1189 |
| 34 | M. Cacciari, G. P. Salam, and G. Soyez | FastJet user manual | EPJC 72 (2012) 1896 | 1111.6097 |
| 35 | CMS Collaboration | Particle-flow reconstruction and global event description with the CMS detector | JINST 12 (2017) P10003 | CMS-PRF-14-001 1706.04965 |
| 36 | CMS Collaboration | Electron and photon reconstruction and identification with the CMS experiment at the CERN LHC | JINST 16 (2021) P05014 | CMS-EGM-17-001 2012.06888 |
| 37 | CMS Collaboration | Performance of the CMS muon detector and muon reconstruction with proton-proton collisions at $ \sqrt{s}= $ 13 TeV | JINST 13 (2018) P06015 | CMS-MUO-16-001 1804.04528 |
| 38 | CMS Collaboration | Measurements of properties of the Higgs boson decaying into the four-lepton final state in pp collisions at $ \sqrt{s}= $ 13 TeV | JHEP 11 (2017) 047 | CMS-HIG-16-041 1706.09936 |
| 39 | CMS Collaboration | Measurements of inclusive W and Z cross sections in pp collisions at $ \sqrt{s}= $ 7 TeV | JHEP 01 (2011) 080 | CMS-EWK-10-002 1012.2466 |
| 40 | P. Baldi et al. | Parameterized neural networks for high-energy physics | EPJC 76 (2016) | |
| 41 | G. Cowan, K. Cranmer, E. Gross, and O. Vitells | Asymptotic formulae for likelihood-based tests of new physics | EPJC 11 (2011) 1554 | 1007.1727 |
| 42 | CMS Collaboration | Precise determination of the mass of the Higgs boson and tests of compatibility of its couplings with the standard model predictions using proton collisions at 7 and 8 TeV | EPJC 75 (2015) 212 | CMS-HIG-14-009 1412.8662 |
| 43 | R. A. Fisher | On the Interpretation of $ \chi^{2} $ from Contingency Tables, and the Calculation of p | J. Royal Stat. Soc 85 (1922) 87 | |
| 44 | P. D. Dauncey, M. Kenzie, N. Wardle, and G. J. Davies | Handling uncertainties in background shapes: the discrete profiling method | JINST 10 (2015) P04015 | 1408.6865 |
| 45 | CMS Collaboration | Precision luminosity measurement in proton-proton collisions at $ \sqrt{s}= $ 13 TeV in 2015 and 2016 | EPJC 81 (2021) 800 | CMS-LUM-17-003 2104.01927 |
| 46 | CMS Collaboration | CMS luminosity measurement for the 2017 Data-Taking period at $ \sqrt{s} = $ 13 TeV | CMS Physics Analysis Summary, 2018 CMS-PAS-LUM-17-004 |
CMS-PAS-LUM-17-004 |
| 47 | CMS Collaboration | CMS luminosity measurement for the 2018 Data-Taking period at $ \sqrt{s} = $ 13 TeV | CMS Physics Analysis Summary, 2019 CMS-PAS-LUM-18-002 |
CMS-PAS-LUM-18-002 |
| 48 | A. L. Read | Presentation of search results: the $ CL_s $ technique | JPG 28 (2002) 2693 | |
| 49 | T. Junk | Confidence level computation for combining searches with small statistics | NIM A 434 (1999) 435 | hep-ex/9902006 |
| 50 | ATLAS and CMS Collaborations, and LHC Higgs Combination Group | Procedure for the LHC Higgs boson search combination in Summer 2011 | Technical Report CMS-NOTE-2011-005, ATL-PHYS-PUB-2011-11, 2011 | |
|
|
Compact Muon Solenoid LHC, CERN |
|

|

|

|

|

|