

Compact Muon Solenoid
LHC, CERN
| CMS-PAS-HIG-18-011 | ||
| Search for an exotic decay of the Higgs boson to a pair of light pseudoscalars with two muons and two b jets in the final state at $\sqrt{s} = $ 13 TeV | ||
| CMS Collaboration | ||
| November 2018 | ||
| Abstract: A search for exotic decays of the Higgs boson to a pair of light pseudoscalar particles $\mathrm{a1}$ is performed under the hypothesis that one of the pseudoscalars decays to a pair of opposite sign muons and the other decays to a $\mathrm{b\bar{b}}$ pair. Such signatures are predicted in a number of extensions of the standard model (SM), including next-to-minimal supersymmetry and two-Higgs-doublet models with an additional scalar singlet. A data sample corresponding to an integrated luminosity of 35.9 fb$^{-1}$ recorded with the CMS detector in 2016 is studied. No statistically significant excess is observed with respect to the SM backgrounds in the search region for pseudoscalar masses from 20 GeV to half of the Higgs boson mass. Upper limits at 95% confidence level are set on the production cross section times branching ratio, $\sigma_{\mathrm{h}}\times{\mathcal B}(\mathrm{h}\to \mathrm{a1}\mathrm{a1}\to\mu^+\mu^{-}\mathrm{b\bar{b}})$, ranging from 5 to 36 fb, depending on the pseudoscalar mass. Corresponding limits on the branching ratio, assuming the SM prediction for $\sigma_{\mathrm{h}}$, are (1-6)$\times 10^{-4}$. | ||
|
Links:
CDS record (PDF) ;
CADI line (restricted) ;
These preliminary results are superseded in this paper, PLB 795 (2019) 398. The superseded preliminary plots can be found here. |
||
| Figures | |
png pdf |
Figure 1:
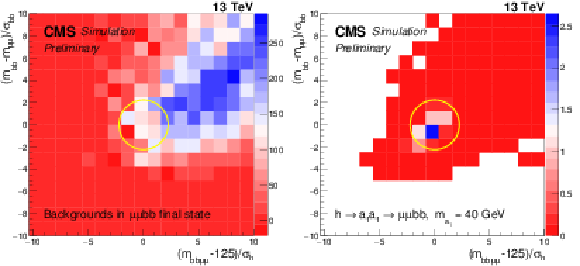
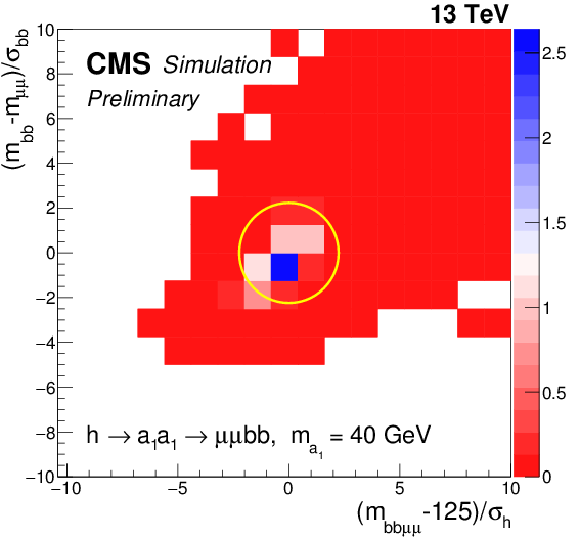
The distribution of $ {\chi _{{\mathrm {b}} {\mathrm {b}}}} $ versus $ {\chi _{{\mathrm {h}}}} $ as defined in Eq. (xxxxx) for (left) simulated background processes and (right) the signal process with $ {m_{\mathrm {a_1}}} =$ 40 GeV. The contours encircle the area with $ {\chi ^2} < $ 5. |

png pdf |
Figure 1-a:
The distribution of $ {\chi _{{\mathrm {b}} {\mathrm {b}}}} $ versus $ {\chi _{{\mathrm {h}}}} $ as defined in Eq. (xxxxx) for (left) simulated background processes and (right) the signal process with $ {m_{\mathrm {a_1}}} =$ 40 GeV. The contours encircle the area with $ {\chi ^2} < $ 5. |
png pdf |
Figure 1-b:
The distribution of $ {\chi _{{\mathrm {b}} {\mathrm {b}}}} $ versus $ {\chi _{{\mathrm {h}}}} $ as defined in Eq. (xxxxx) for (left) simulated background processes and (right) the signal process with $ {m_{\mathrm {a_1}}} =$ 40 GeV. The contours encircle the area with $ {\chi ^2} < $ 5. |
png pdf |
Figure 2:
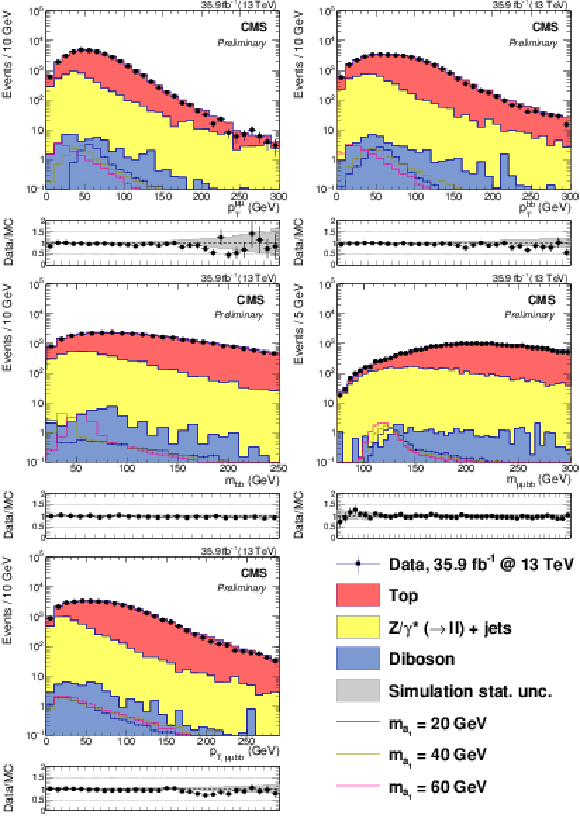
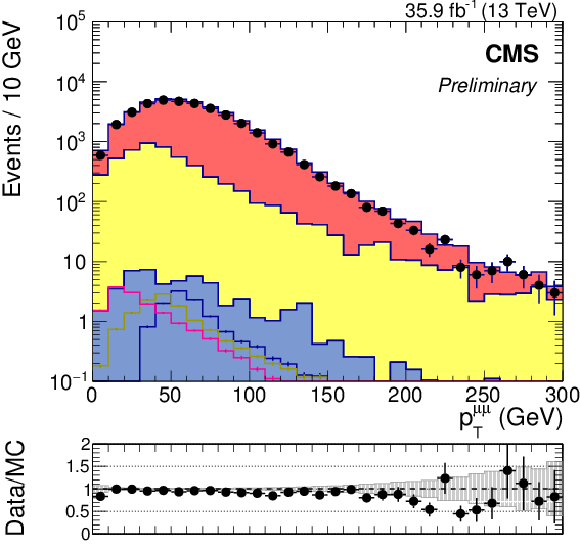
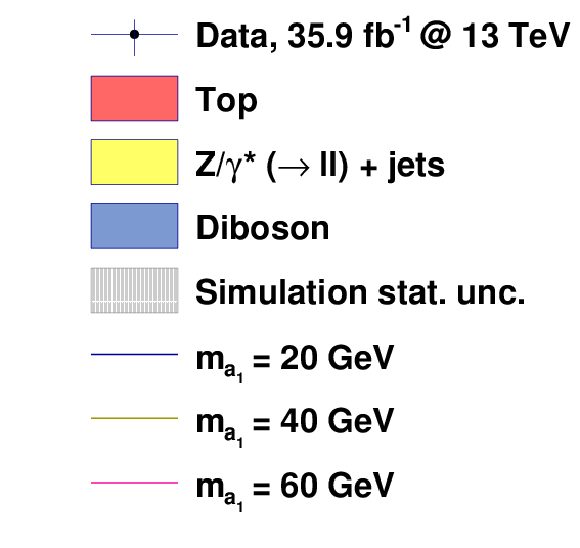
The distribution of the $ {p_{\mathrm {T}}} $ of the (top left) dimuon and (top right) di-b-jet system, the mass of the (middle left) di-b-jet and (middle right) $ {{\mu}} {{\mu}}{{\mathrm {b}} {\mathrm {b}}}$ system, and (bottom left) the $ {p_{\mathrm {T}}} $ of the $ {{\mu}} {{\mu}}{{\mathrm {b}} {\mathrm {b}}}$ system, all after requiring two muons and two b-tagged jets in the event. Simulated samples are normalised to an integrated luminosity of 35.9 fb$^{-1}$ using their theoretical cross sections. |
png pdf |
Figure 2-a:
The distribution of the $ {p_{\mathrm {T}}} $ of the (top left) dimuon and (top right) di-b-jet system, the mass of the (middle left) di-b-jet and (middle right) $ {{\mu}} {{\mu}}{{\mathrm {b}} {\mathrm {b}}}$ system, and (bottom left) the $ {p_{\mathrm {T}}} $ of the $ {{\mu}} {{\mu}}{{\mathrm {b}} {\mathrm {b}}}$ system, all after requiring two muons and two b-tagged jets in the event. Simulated samples are normalised to an integrated luminosity of 35.9 fb$^{-1}$ using their theoretical cross sections. |
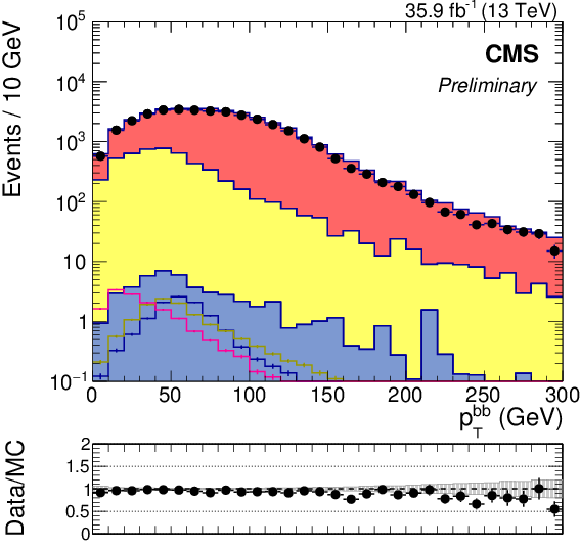
png pdf |
Figure 2-b:
The distribution of the $ {p_{\mathrm {T}}} $ of the (top left) dimuon and (top right) di-b-jet system, the mass of the (middle left) di-b-jet and (middle right) $ {{\mu}} {{\mu}}{{\mathrm {b}} {\mathrm {b}}}$ system, and (bottom left) the $ {p_{\mathrm {T}}} $ of the $ {{\mu}} {{\mu}}{{\mathrm {b}} {\mathrm {b}}}$ system, all after requiring two muons and two b-tagged jets in the event. Simulated samples are normalised to an integrated luminosity of 35.9 fb$^{-1}$ using their theoretical cross sections. |
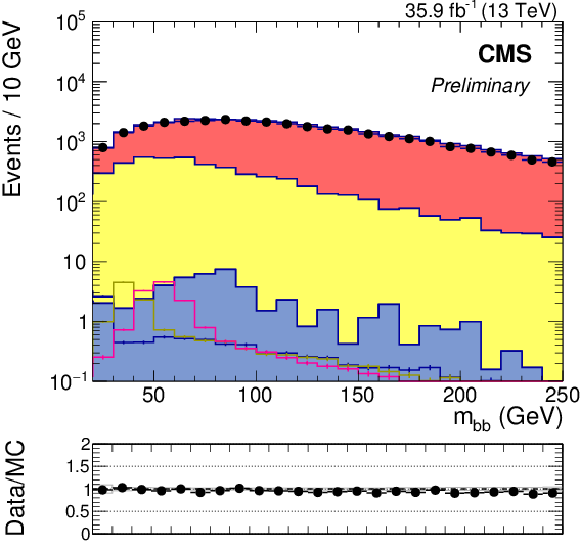
png pdf |
Figure 2-c:
The distribution of the $ {p_{\mathrm {T}}} $ of the (top left) dimuon and (top right) di-b-jet system, the mass of the (middle left) di-b-jet and (middle right) $ {{\mu}} {{\mu}}{{\mathrm {b}} {\mathrm {b}}}$ system, and (bottom left) the $ {p_{\mathrm {T}}} $ of the $ {{\mu}} {{\mu}}{{\mathrm {b}} {\mathrm {b}}}$ system, all after requiring two muons and two b-tagged jets in the event. Simulated samples are normalised to an integrated luminosity of 35.9 fb$^{-1}$ using their theoretical cross sections. |
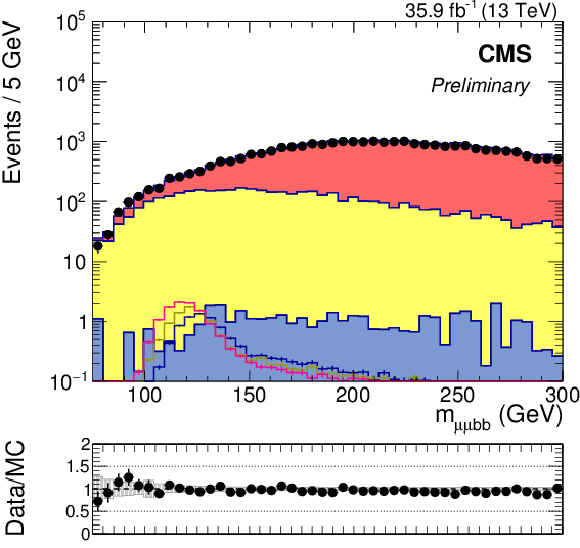
png pdf |
Figure 2-d:
The distribution of the $ {p_{\mathrm {T}}} $ of the (top left) dimuon and (top right) di-b-jet system, the mass of the (middle left) di-b-jet and (middle right) $ {{\mu}} {{\mu}}{{\mathrm {b}} {\mathrm {b}}}$ system, and (bottom left) the $ {p_{\mathrm {T}}} $ of the $ {{\mu}} {{\mu}}{{\mathrm {b}} {\mathrm {b}}}$ system, all after requiring two muons and two b-tagged jets in the event. Simulated samples are normalised to an integrated luminosity of 35.9 fb$^{-1}$ using their theoretical cross sections. |
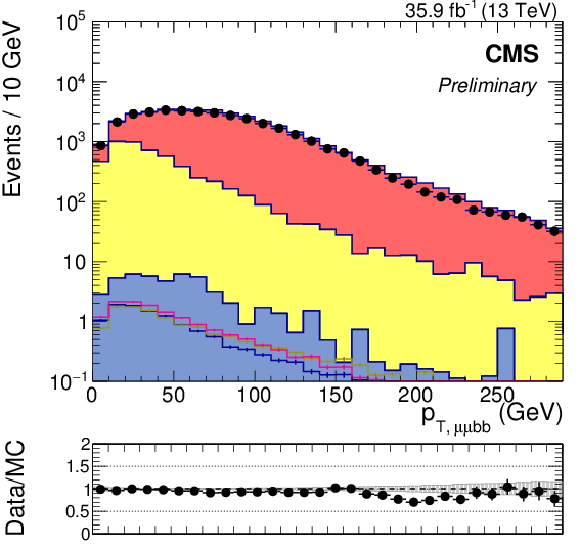
png pdf |
Figure 2-e:
The distribution of the $ {p_{\mathrm {T}}} $ of the (top left) dimuon and (top right) di-b-jet system, the mass of the (middle left) di-b-jet and (middle right) $ {{\mu}} {{\mu}}{{\mathrm {b}} {\mathrm {b}}}$ system, and (bottom left) the $ {p_{\mathrm {T}}} $ of the $ {{\mu}} {{\mu}}{{\mathrm {b}} {\mathrm {b}}}$ system, all after requiring two muons and two b-tagged jets in the event. Simulated samples are normalised to an integrated luminosity of 35.9 fb$^{-1}$ using their theoretical cross sections. |
png pdf |
Figure 2-f:
The distribution of the $ {p_{\mathrm {T}}} $ of the (top left) dimuon and (top right) di-b-jet system, the mass of the (middle left) di-b-jet and (middle right) $ {{\mu}} {{\mu}}{{\mathrm {b}} {\mathrm {b}}}$ system, and (bottom left) the $ {p_{\mathrm {T}}} $ of the $ {{\mu}} {{\mu}}{{\mathrm {b}} {\mathrm {b}}}$ system, all after requiring two muons and two b-tagged jets in the event. Simulated samples are normalised to an integrated luminosity of 35.9 fb$^{-1}$ using their theoretical cross sections. |

png pdf |
Figure 3:
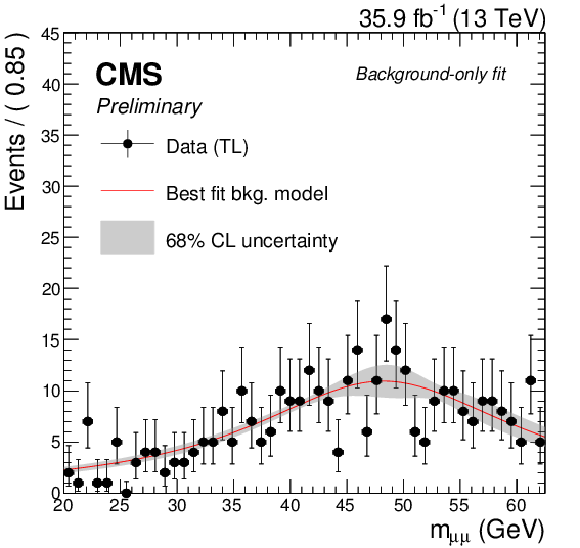
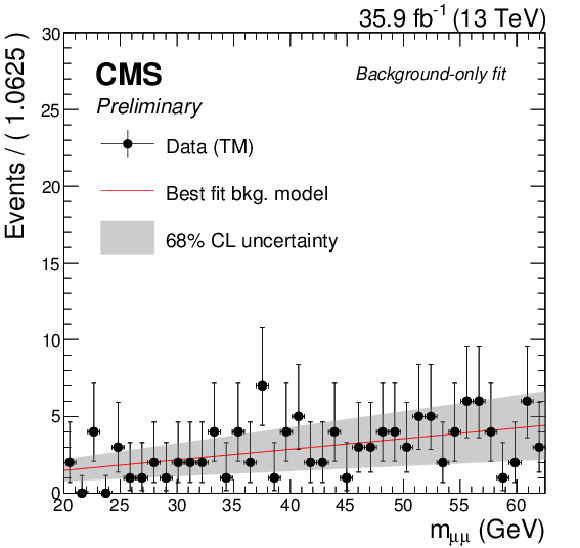
The best fit output to the data under the background-only hypothesis for the (top-left) TL category, (top right) TM category, (bottom left) TT category and (bottom right) all categories, presented together with 68% CL uncertainty band for the background model. |
png pdf |
Figure 3-a:
The best fit output to the data under the background-only hypothesis for the (top-left) TL category, (top right) TM category, (bottom left) TT category and (bottom right) all categories, presented together with 68% CL uncertainty band for the background model. |
png pdf |
Figure 3-b:
The best fit output to the data under the background-only hypothesis for the (top-left) TL category, (top right) TM category, (bottom left) TT category and (bottom right) all categories, presented together with 68% CL uncertainty band for the background model. |

png pdf |
Figure 3-c:
The best fit output to the data under the background-only hypothesis for the (top-left) TL category, (top right) TM category, (bottom left) TT category and (bottom right) all categories, presented together with 68% CL uncertainty band for the background model. |

png pdf |
Figure 3-d:
The best fit output to the data under the background-only hypothesis for the (top-left) TL category, (top right) TM category, (bottom left) TT category and (bottom right) all categories, presented together with 68% CL uncertainty band for the background model. |

png pdf |
Figure 4:
Observed and expected upper limits at 95% CL on the (left) Higgs boson production times $ {{\mathcal B}({{\mathrm {h}}}\to {{{\mathrm {a_1}}} {{\mathrm {a_1}}}}\to {{{\mu ^+}} {{\mu ^-}}} {{{\mathrm {b}} {\overline {\mathrm {b}}}}})} $ and (right) the branching ratio as a function of $ {m_{\mathrm {a_1}}} $. The inner and outer bands indicate the regions containing the distribution of limits located within 68% and 95% confidence intervals, respectively, of the expectation under the background-only hypothesis. |

png pdf |
Figure 4-a:
Observed and expected upper limits at 95% CL on the (left) Higgs boson production times $ {{\mathcal B}({{\mathrm {h}}}\to {{{\mathrm {a_1}}} {{\mathrm {a_1}}}}\to {{{\mu ^+}} {{\mu ^-}}} {{{\mathrm {b}} {\overline {\mathrm {b}}}}})} $ and (right) the branching ratio as a function of $ {m_{\mathrm {a_1}}} $. The inner and outer bands indicate the regions containing the distribution of limits located within 68% and 95% confidence intervals, respectively, of the expectation under the background-only hypothesis. |

png pdf |
Figure 4-b:
Observed and expected upper limits at 95% CL on the (left) Higgs boson production times $ {{\mathcal B}({{\mathrm {h}}}\to {{{\mathrm {a_1}}} {{\mathrm {a_1}}}}\to {{{\mu ^+}} {{\mu ^-}}} {{{\mathrm {b}} {\overline {\mathrm {b}}}}})} $ and (right) the branching ratio as a function of $ {m_{\mathrm {a_1}}} $. The inner and outer bands indicate the regions containing the distribution of limits located within 68% and 95% confidence intervals, respectively, of the expectation under the background-only hypothesis. |

png pdf |
Figure 5:
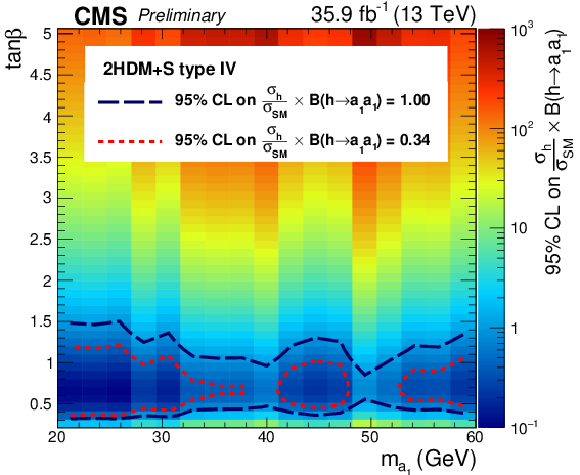
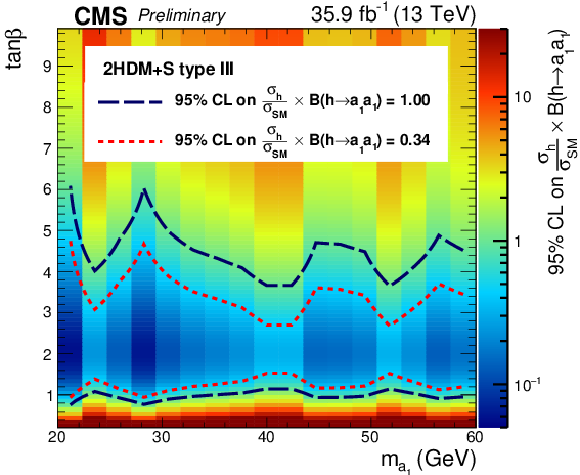
Observed upper limits on ${\mathcal B}({\mathrm {h}} \to {{\mathrm {a_1}}} {{\mathrm {a_1}}})$ in the plane of ($ {m_{\mathrm {a_1}}}, {\tan\beta} $) for (left) type-III and (right) type-IV 2HDM+S, using only the $ {{{{\mu ^+}} {{\mu ^-}}} {{\mathrm {b}} {\overline {\mathrm {b}}}}} $ signal. |

png pdf |
Figure 5-a:
Observed upper limits on ${\mathcal B}({\mathrm {h}} \to {{\mathrm {a_1}}} {{\mathrm {a_1}}})$ in the plane of ($ {m_{\mathrm {a_1}}}, {\tan\beta} $) for (left) type-III and (right) type-IV 2HDM+S, using only the $ {{{{\mu ^+}} {{\mu ^-}}} {{\mathrm {b}} {\overline {\mathrm {b}}}}} $ signal. |
png pdf |
Figure 5-b:
Observed upper limits on ${\mathcal B}({\mathrm {h}} \to {{\mathrm {a_1}}} {{\mathrm {a_1}}})$ in the plane of ($ {m_{\mathrm {a_1}}}, {\tan\beta} $) for (left) type-III and (right) type-IV 2HDM+S, using only the $ {{{{\mu ^+}} {{\mu ^-}}} {{\mathrm {b}} {\overline {\mathrm {b}}}}} $ signal. |
png pdf |
Figure 6:
Observed upper limits on ${\mathcal B}({\mathrm {h}} \to {{\mathrm {a_1}}} {{\mathrm {a_1}}})$ in the plane of ($ {m_{\mathrm {a_1}}}, {\tan\beta} $) for type-III 2HDM+S, including $ {{{{\mu ^+}} {{\mu ^-}}} {{\tau}^{+} {\tau}^{-}}} $ signal that is misidentified as ${{{{\mu ^+}} {{\mu ^-}}} {{\mathrm {b}} {\overline {\mathrm {b}}}}}$. |
| Tables | |
png pdf |
Table 1:
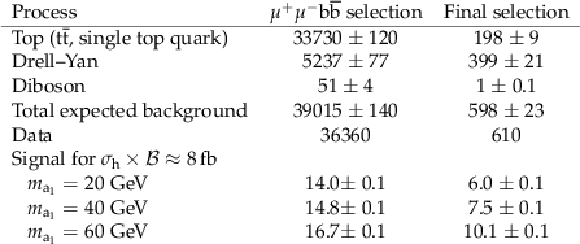
Event yields for simulated processes and data after requiring two muons and two b jets (${{{{\mu ^+}} {{\mu ^-}}} {{\mathrm {b}} {\overline {\mathrm {b}}}}}$ selection) and after the final selection. The expected number of simulated events is normalised to the integrated luminosity of 35.9 fb$^{-1}$. Uncertainties are only statistical. |
| Summary |
| A search for the Higgs boson decay to a pair of new pseudoscalars ${\mathrm{h}}\to{{\mathrm{a1}}} {{\mathrm{a1}}} \to \mu^{+}\mu^{-}\mathrm{b\bar{b}}$, motivated by the NMSSM and extensions to two-Higgs-doublet models, is carried out using a sample of proton-proton collision data corresponding to an integrated luminosity of 35.9 fb$^{-1}$ at $\sqrt{s}=$ 13 TeV. No statistically significant excess is found in data with respect to the SM background prediction. The results of the analysis are presented in the form of upper limits, at 95% Cl, on the Higgs boson production cross section times branching ration, ${\sigma_{\mathrm{h}}\times{{\mathcal B}({\mathrm{h}}\to{{{\mathrm{a1}}} {{\mathrm{a1}}} }\to\mu^{+}\mu^{-}{\mathrm{b\bar{b}}})}} $ as well as on the Higgs boson branching ratio assuming the SM prediction of $\sigma_{\mathrm{h}}$. The former ranges between 5 to 36 fb, depending on $\mathrm{m}_\mathrm{a1}$. The corresponding limits on the branching ratio are (1-6)$\times 10^{-{4}}$ for the mass range of 20 $ \leq \mathrm{a1} \leq $ 62.5 GeV. In an analysis performed by ATLAS [19], the limits on the branching ratio range between $2\times10^{-4}$ and $10^{-3}$. Compared with the similar analysis in Run I [15], the expected upper limits on the branching ratio are improved by more than a factor of two. |
| References | ||||
| 1 | ATLAS Collaboration | Observation of a new particle in the search for the standard model Higgs boson with the ATLAS detector at the LHC | PLB 716 (2012) 1 | 1207.7214 |
| 2 | CMS Collaboration | Observation of a new boson at a mass of 125 GeV with the CMS experiment at the LHC | PLB 716 (2012) 30 | CMS-HIG-12-028 1207.7235 |
| 3 | CMS Collaboration | Observation of a new boson with mass near 125 GeV in $ {\mathrm{p}}{\mathrm{p}} $ collisions at $ \sqrt{s} = $ 7 and 8 TeV | JHEP 06 (2013) 081 | CMS-HIG-12-036 1303.4571 |
| 4 | L. Evans and P. Bryant | LHC machine | JINST 3 (2008) S08001 | |
| 5 | ATLAS Collaboration | Measurement of the Higgs boson coupling properties in the $ {\mathrm{H}}\rightarrow {\mathrm{Z}\mathrm{Z}}^{*} \rightarrow 4\ell $ decay channel at $ \sqrt{s} = $ 13 TeV with the ATLAS detector | JHEP 03 (2018) 095 | 1712.02304 |
| 6 | CMS Collaboration | Measurements of properties of the Higgs boson decaying into the four-lepton final state in $ {\mathrm{p}}{\mathrm{p}} $ collisions at $ \sqrt{s}= $ 13 TeV | JHEP 11 (2017) 047 | CMS-HIG-16-041 1706.09936 |
| 7 | ATLAS and CMS Collaborations | Measurements of the Higgs boson production and decay rates and constraints on its couplings from a combined ATLAS and CMS analysis of the LHC $ {\mathrm{p}}{\mathrm{p}} $ collision data at $ \sqrt{s}= $ 7 and 8 TeV | JHEP 08 (2016) 045 | 1606.02266 |
| 8 | ATLAS Collaboration | Measurements of the Higgs boson production and decay rates and coupling strengths using $ {\mathrm{p}}{\mathrm{p}} $ collision data at $ \sqrt{s}= $ 7 and 8 TeV in the ATLAS experiment | EPJC 76 (2016) 6 | 1507.04548 |
| 9 | CMS Collaboration | Study of the mass and spin-parity of the Higgs boson candidate via its decays to $ {Z} $ boson pairs | PRL 110 (2013) 081803 | CMS-HIG-12-041 1212.6639 |
| 10 | ATLAS Collaboration | Combined measurements of Higgs boson production and decay using up to 80 fb$ ^{-1} $ of proton--proton collision data at $ \sqrt{s}= $ 13 TeV collected with the ATLAS experiment | ATLAS Conference Note ATLAS-CONF-2018-031 | |
| 11 | CMS Collaboration | Combined measurements of Higgs boson couplings in proton-proton collisions at $ \sqrt{s}= $ 13 TeV | Submitted to EPJC | CMS-HIG-17-031 1809.10733 |
| 12 | ATLAS Collaboration | Search for Higgs bosons decaying to $ aa $ in the $ \mu\mu\tau\tau $ final state in $ {{\mathrm{p}}}{{\mathrm{p}}} $ collisions at $ \sqrt{s} = $ 8 TeV with the ATLAS experiment | PRD 92 (2015) 052002 | 1505.01609 |
| 13 | CMS Collaboration | A search for pair production of new light bosons decaying into muons | PLB 752 (2016) 146 | CMS-HIG-13-010 1506.00424 |
| 14 | CMS Collaboration | Search for a very light NMSSM Higgs boson produced in decays of the 125 GeV scalar boson and decaying into $ \tau $ leptons in $ {\mathrm{p}}{\mathrm{p}} $ collisions at $ \sqrt{s}= $ 8 TeV | JHEP 01 (2016) 079 | CMS-HIG-14-019 1510.06534 |
| 15 | CMS Collaboration | Search for light bosons in decays of the 125 GeV Higgs boson in proton-proton collisions at $ \sqrt{s}= $ 8 TeV | JHEP 10 (2017) 076 | CMS-HIG-16-015 1701.02032 |
| 16 | ATLAS Collaboration | Search for the Higgs boson produced in association with a W boson and decaying to four b-quarks via two spin-zero particles in $ {\mathrm{p}}{\mathrm{p}} $ collisions at 13 TeV with the ATLAS detector | EPJC 76 (2016) 605 | 1606.08391 |
| 17 | ATLAS Collaboration | Search for Higgs boson decays to beyond-the-Standard-Model light bosons in four-lepton events with the ATLAS detector at $ \sqrt{s}= $ 13 TeV | JHEP 06 (2018) 166 | 1802.03388 |
| 18 | ATLAS Collaboration | Search for Higgs boson decays into pairs of light (pseudo)scalar particles in the $ \gamma\gamma {\rm jj} $ final state in $ {\mathrm{p}}{\mathrm{p}} $ collisions at $ \sqrt{s}= $ 13 TeV with the ATLAS detector | PLB 782 (2018) 750 | 1803.11145 |
| 19 | ATLAS Collaboration | Search for Higgs boson decays into a pair of light bosons in the $ \Pqb\Pqb\mu\mu $ final state in $ {\mathrm{p}}{\mathrm{p}} $ collision at $ \sqrt{s} = $ 13 TeV with the ATLAS detector | Submitted to PLB | 1807.00539 |
| 20 | CMS Collaboration | Search for an exotic decay of the Higgs boson to a pair of light pseudoscalars in the final state with two b quarks and two $ \tau $ leptons in proton-proton collisions at $ \sqrt{s}= $ 13 TeV | PLB 785 (2018) 462 | CMS-HIG-17-024 1805.10191 |
| 21 | CMS Collaboration | Search for an exotic decay of the Higgs boson to a pair of light pseudoscalars in the final state of two muons and two $ \tau $ leptons in proton-proton collisions at $ \sqrt{s}= $ 13 TeV | Submitted to JHEP | CMS-HIG-17-029 1805.04865 |
| 22 | D. Curtin et al. | Exotic decays of the 125 GeV Higgs boson | PRD 90 (2014) 075004 | 1312.4992 |
| 23 | M. Dine, W. Fischler, and M. Srednicki | A simple solution to the strong CP problem with a harmless axion | PLB 104 (1981) 199 | |
| 24 | J. E. Kim and H. P. Nilles | The $ \mu $-problem and the strong CP-problem | PLB 138 (1984) 150 | |
| 25 | U. Ellwanger, C. Hugonie, and A. M. Teixeira | The next-to-minimal supersymmetric standard model | Phys. Rep. 496 (2010) 1 | 0910.1785 |
| 26 | D. de Florian et al. | Handbook of LHC Higgs cross sections: 4. Deciphering the nature of the Higgs sector | CERN-2017-002-M | 1610.07922 |
| 27 | D. Curtin, R. Essig, and Y.-M. Zhong | Uncovering light scalars with exotic Higgs decays to $ \mathrm{b\bar{b}}}{\mu^{+}}{\mu^{-}} $ | JHEP 06 (2015) 025 | 1412.4779 |
| 28 | J. Alwall et al. | The automated computation of tree-level and next-to-leading order differential cross sections, and their matching to parton shower simulations | JHEP 07 (2014) 079 | 1405.0301 |
| 29 | Y. Li and F. Petriello | Combining QCD and electroweak corrections to dilepton production in $ FEWZ $ | PRD 86 (2012) 094034 | 1208.5967 |
| 30 | E. Re | Single-top $ \mathrm{W} $ t-channel production matched with parton showers using the $ POWHEG $ method | EPJC 71 (2011) 1547 | 1009.2450 |
| 31 | S. Alioli, P. Nason, C. Oleari, and E. Re | A general framework for implementing NLO calculations in shower Monte Carlo programs: the $ POWHEG $ BOX | JHEP 06 (2010) 043 | 1002.2581 |
| 32 | S. Alioli, P. Nason, C. Oleari, and E. Re | NLO single-top production matched with shower in POWHEG: s- and t-channel contributions | JHEP 09 (2009) 111 | 0907.4076 |
| 33 | S. Frixione, P. Nason, and C. Oleari | Matching NLO QCD computations with parton shower simulations: the $ POWHEG $ method | JHEP 11 (2007) 070 | 0709.2092 |
| 34 | NNPDF Collaboration | Parton distributions for the LHC Run II | JHEP 04 (2015) 040 | 1410.8849 |
| 35 | T. Sjostrand et al. | An introduction to $ PYTHIA $ 8.2 | CPC 191 (2015) 159 | 1410.3012 |
| 36 | P. Skands, S. Carrazza, and J. Rojo | Tuning $ PYTHIA $ 8.1: the Monash 2013 tune | EPJC 74 (2014) 3024 | 1404.5630 |
| 37 | CMS Collaboration | Event generator tunes obtained from underlying event and multiparton scattering measurements | EPJC 76 (2016) 155 | CMS-GEN-14-001 1512.00815 |
| 38 | GEANT4 Collaboration | GEANT4--a simulation toolkit | NIMA 506 (2003) 250 | |
| 39 | CMS Collaboration | CMS luminosity measurements for the 2016 data taking period | CMS-PAS-LUM-17-001 | CMS-PAS-LUM-17-001 |
| 40 | M. Cacciari, G. P. Salam, and G. Soyez | The anti-$ {k_{\mathrm{T}}} $ jet clustering algorithm | JHEP 04 (2008) 063 | 0802.1189 |
| 41 | M. Cacciari, G. P. Salam, and G. Soyez | FastJet user manual | EPJC72 (2012) 1896 | 1111.6097 |
| 42 | CMS Collaboration | Particle-flow reconstruction and global event description with the CMS detector | JINST 12 (2017) P10003 | CMS-PRF-14-001 1706.04965 |
| 43 | CMS Collaboration | Jet algorithms performance in 13 TeV data | CMS-PAS-JME-16-003 | CMS-PAS-JME-16-003 |
| 44 | CMS Collaboration | Determination of jet energy calibration and transverse momentum resolution in CMS | JINST 6 (2011) P11002 | CMS-JME-10-011 1107.4277 |
| 45 | CMS Collaboration | Identification of heavy-flavour jets with the CMS detector in $ {\mathrm{p}}{\mathrm{p}} $ collisions at 13 TeV | JINST 13 (2018) P05011 | CMS-BTV-16-002 1712.07158 |
| 46 | G. Pagnini and R. K. Saxena | A note on the Voigt profile function | 0805.2274 | |
| 47 | M. J. Oreglia | A study of the reactions $\psi' \to \gamma\gamma \psi$ | PhD thesis, Stanford University, 1980 SLAC Report SLAC-R-236, see A | |
| 48 | P. Dauncey, M. Kenzie, N. Wardle, and G. Davies | Handling uncertainties in background shapes: the discrete profiling method | JINST 10 (2015) P04015 | 1408.6865 |
| 49 | CMS Collaboration | Observation of the diphoton decay of the Higgs boson and measurement of its properties | EPJC 74 (2014) 3076 | CMS-HIG-13-001 1407.0558 |
| 50 | ATLAS and CMS Collaborations | Combined measurement of the Higgs boson mass in $ {\mathrm{p}}{\mathrm{p}} $ collisions at $ \sqrt{s}= $ 7 and 8 TeV with the ATLAS and CMS experiments | PRL 114 (2015) 191803 | 1503.07589 |
| 51 | F. James | Statistical methods in experimental physics | 2nd ed., World Scientific, Singapore (2007), ISBN 9789812567956 | |
| 52 | CMS Collaboration | Measurement of the inelastic proton-proton cross section at $ \sqrt{s}= $ 13 TeV | JHEP 07 (2018) 161 | CMS-FSQ-15-005 1802.02613 |
| 53 | CMS Collaboration | Measurements of inclusive $ \mathrm{W} $ and $ \mathrm{Z} $ cross sections in $ {\mathrm{p}}{\mathrm{p}} $ collisions at $ \sqrt{s}= $ 7 TeV | JHEP 01 (2011) 080 | CMS-EWK-10-002 1012.2466 |
| 54 | J. Butterworth et al. | PDF4LHC recommendations for LHC Run II | JPG 43 (2016) 023001 | 1510.03865 |
| 55 | T. Junk | Confidence level computation for combining searches with small statistics | NIMA 434 (1999) 435 | hep-ex/9902006 |
| 56 | A. L. Read | Presentation of search results: the $ \rm {CL_s} $ technique | JPG 28 (2002) 2693 | |
| 57 | G. Cowan, K. Cranmer, E. Gross, and O. Vitells | Asymptotic formulae for likelihood-based tests of new physics | EPJC 71 (2011) 1554 | 1007.1727 |

|
Compact Muon Solenoid LHC, CERN |

|

|

|

|

|

|