

Compact Muon Solenoid
LHC, CERN
| CMS-PAS-EXO-21-010 | ||
| Search for resonant and non-resonant production of pairs of identical dijet resonances in pp collisions at $\sqrt{s}=$ 13 TeV | ||
| CMS Collaboration | ||
| March 2022 | ||
| Abstract: A data-driven search for pairs of dijet resonances with identical mass is conducted in final states with at least four jets, and results are presented for both resonant and non-resonant production modes. The search uses 138 fb$^{-1}$ of integrated luminosity collected by the CMS detector in proton-proton collisions at $\sqrt{s}=$ 13 TeV. Distributions of the four-jet mass above 1.6 TeV, and average dijet mass above 0.35 TeV, are fit with functions to determine the backgrounds. Model independent limits, at 95% confidence level, are reported on the production cross section of four-jet and dijet resonances. These first LHC limits on resonant pair production at high mass, are applied to a signal model of diquarks that decay into pairs of vector-like quarks, excluding diquark masses below 7.6 TeV for a particular model scenario. There are two events on the tail of the distributions, with a four-jet mass of 8 TeV and an average dijet mass of 2 TeV, resulting in a local significance of 3.9 standard deviations and a global significance of 1.6 standard deviations if interpreted as a signal. The non-resonant search excludes pair production of top squarks with masses between 0.50 and 0.52 TeV, and between 0.58 and 0.77 TeV, for supersymmetric R-parity-violating decays to quark pairs, significantly extending previous limits. Here, the most significant signal hypothesis occurs at an average dijet mass of 0.95 TeV, for which the local significance is 3.6 standard deviations and the global significance is 2.5 standard deviations. | ||
|
Links:
CDS record (PDF) ;
CADI line (restricted) ;
These preliminary results are superseded in this paper, Submitted to JHEP. The superseded preliminary plots can be found here. |
||
| Figures | |
png pdf |
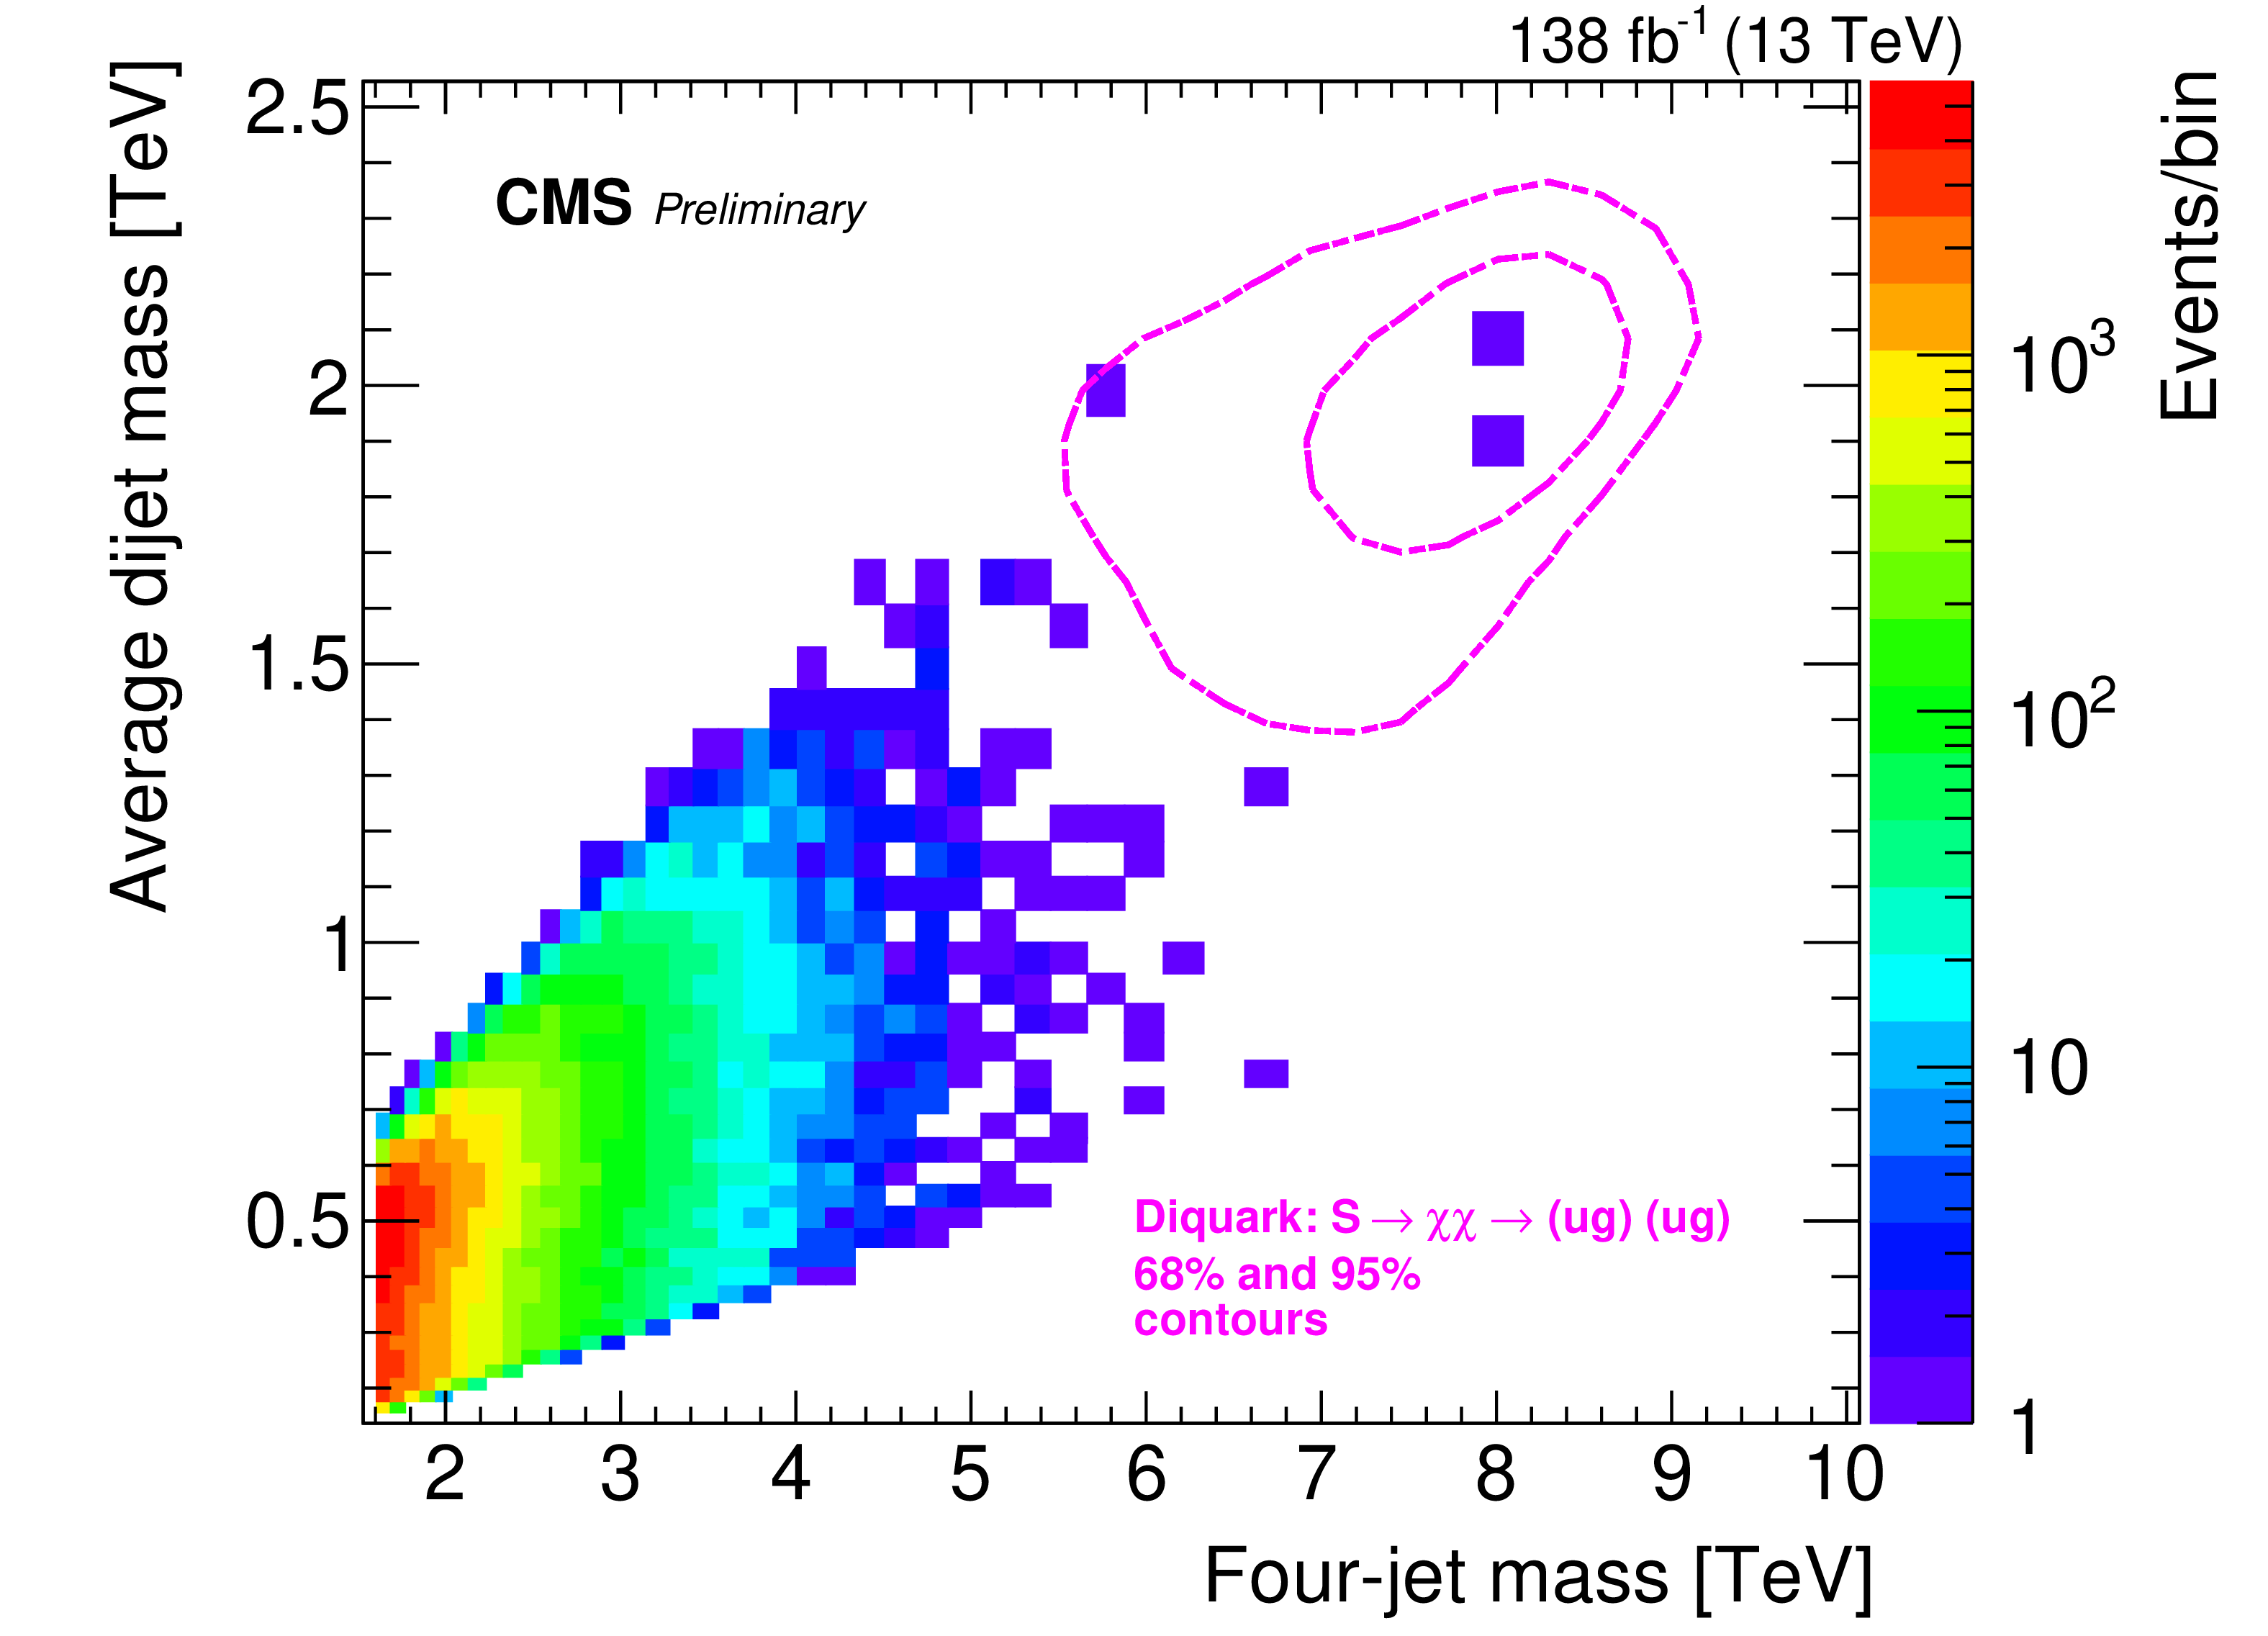
Figure 1:
Number of events observed (color scale) within bins of the four-jet mass and the average mass of the two dijets. The ellipses show the 1 and 2 $\sigma $ contours from a signal simulation of a diquark, with a mass of 8.4 TeV, decaying to a pair of vector-like quarks, each with a mass of 2.1 TeV. |
png pdf |
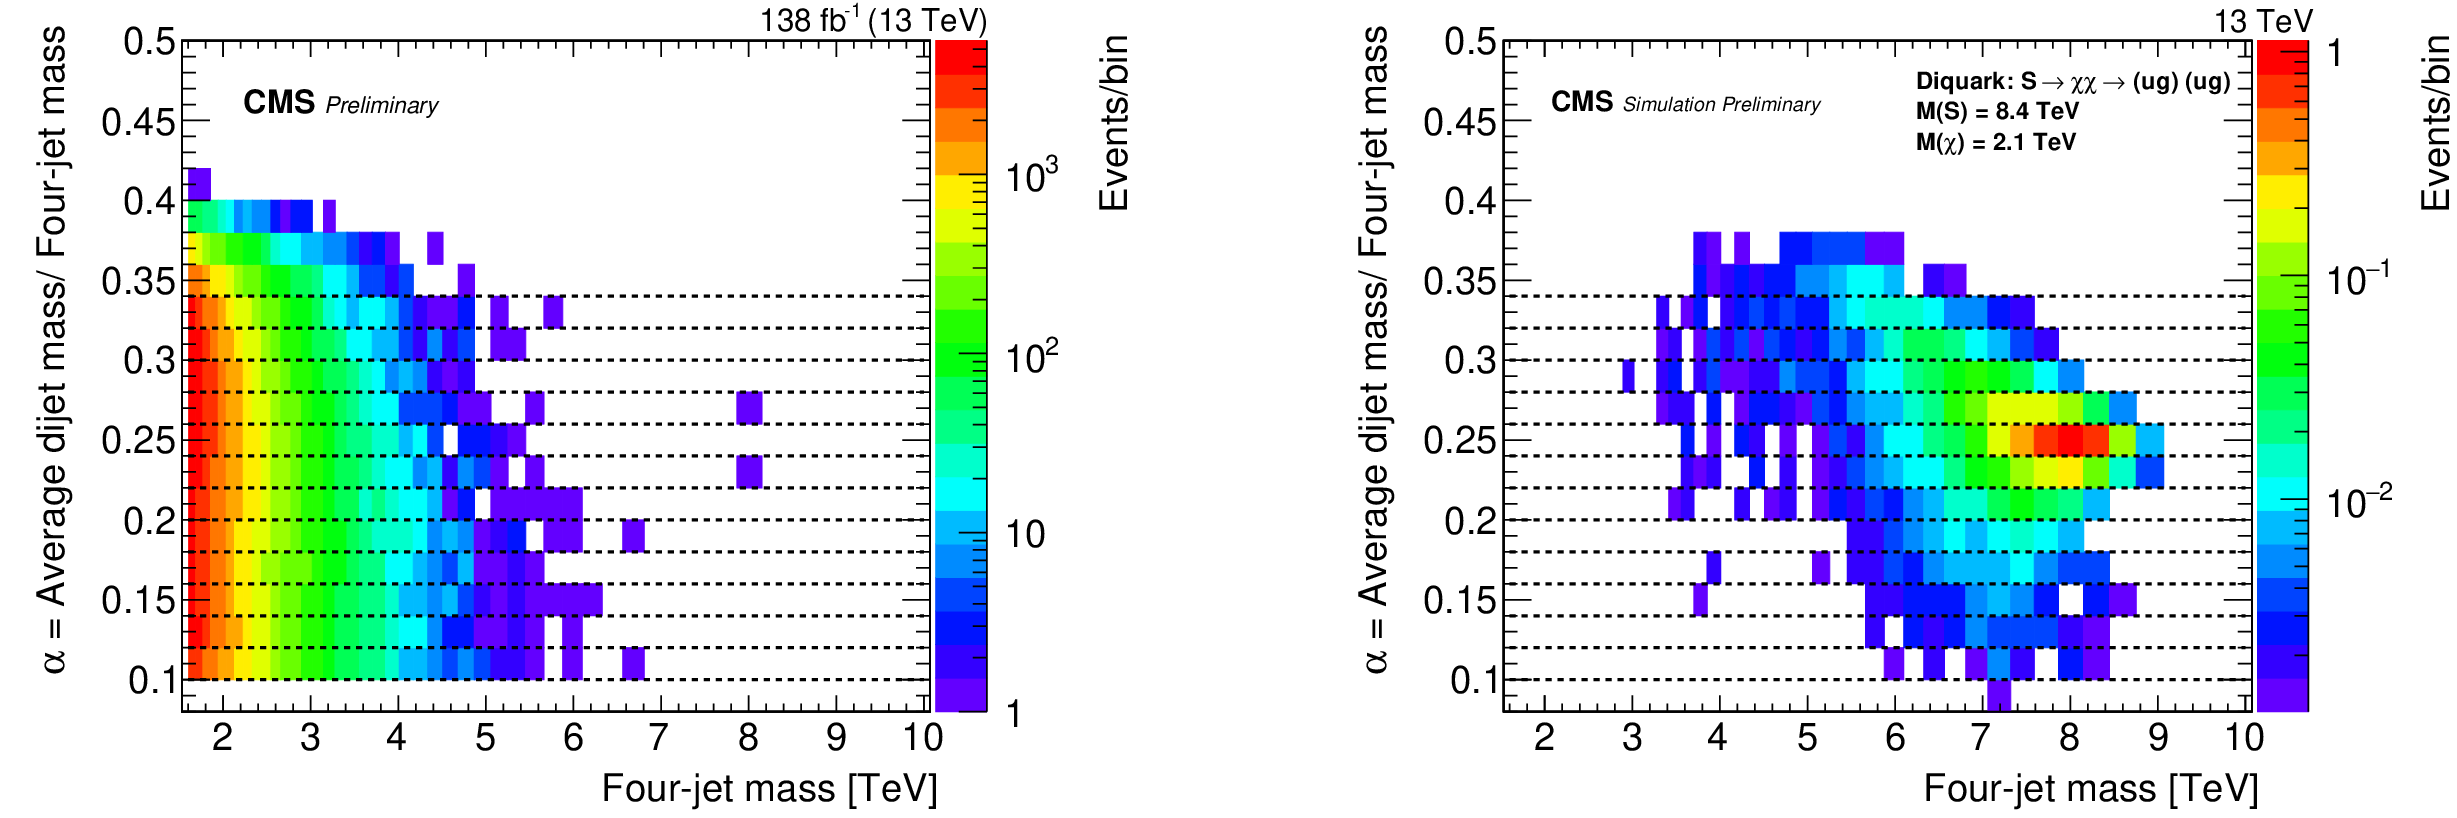
Figure 2:
(Left) Number of events observed (color scale) within bins of the four-jet mass and the ratio $\alpha $, which is the average mass of the two dijets divided by the four-jet mass. (Right) Number of events predicted in the same bins by a simulation of a diquark, with a mass of 8.4 TeV, decaying to a pair of vector-like quarks, each with a mas of 2.1 TeV. Both plots also show the edges of the thirteen $\alpha $ slices used to define the four-jet mass distributions used in the resonant search (dashed lines). |
png pdf |
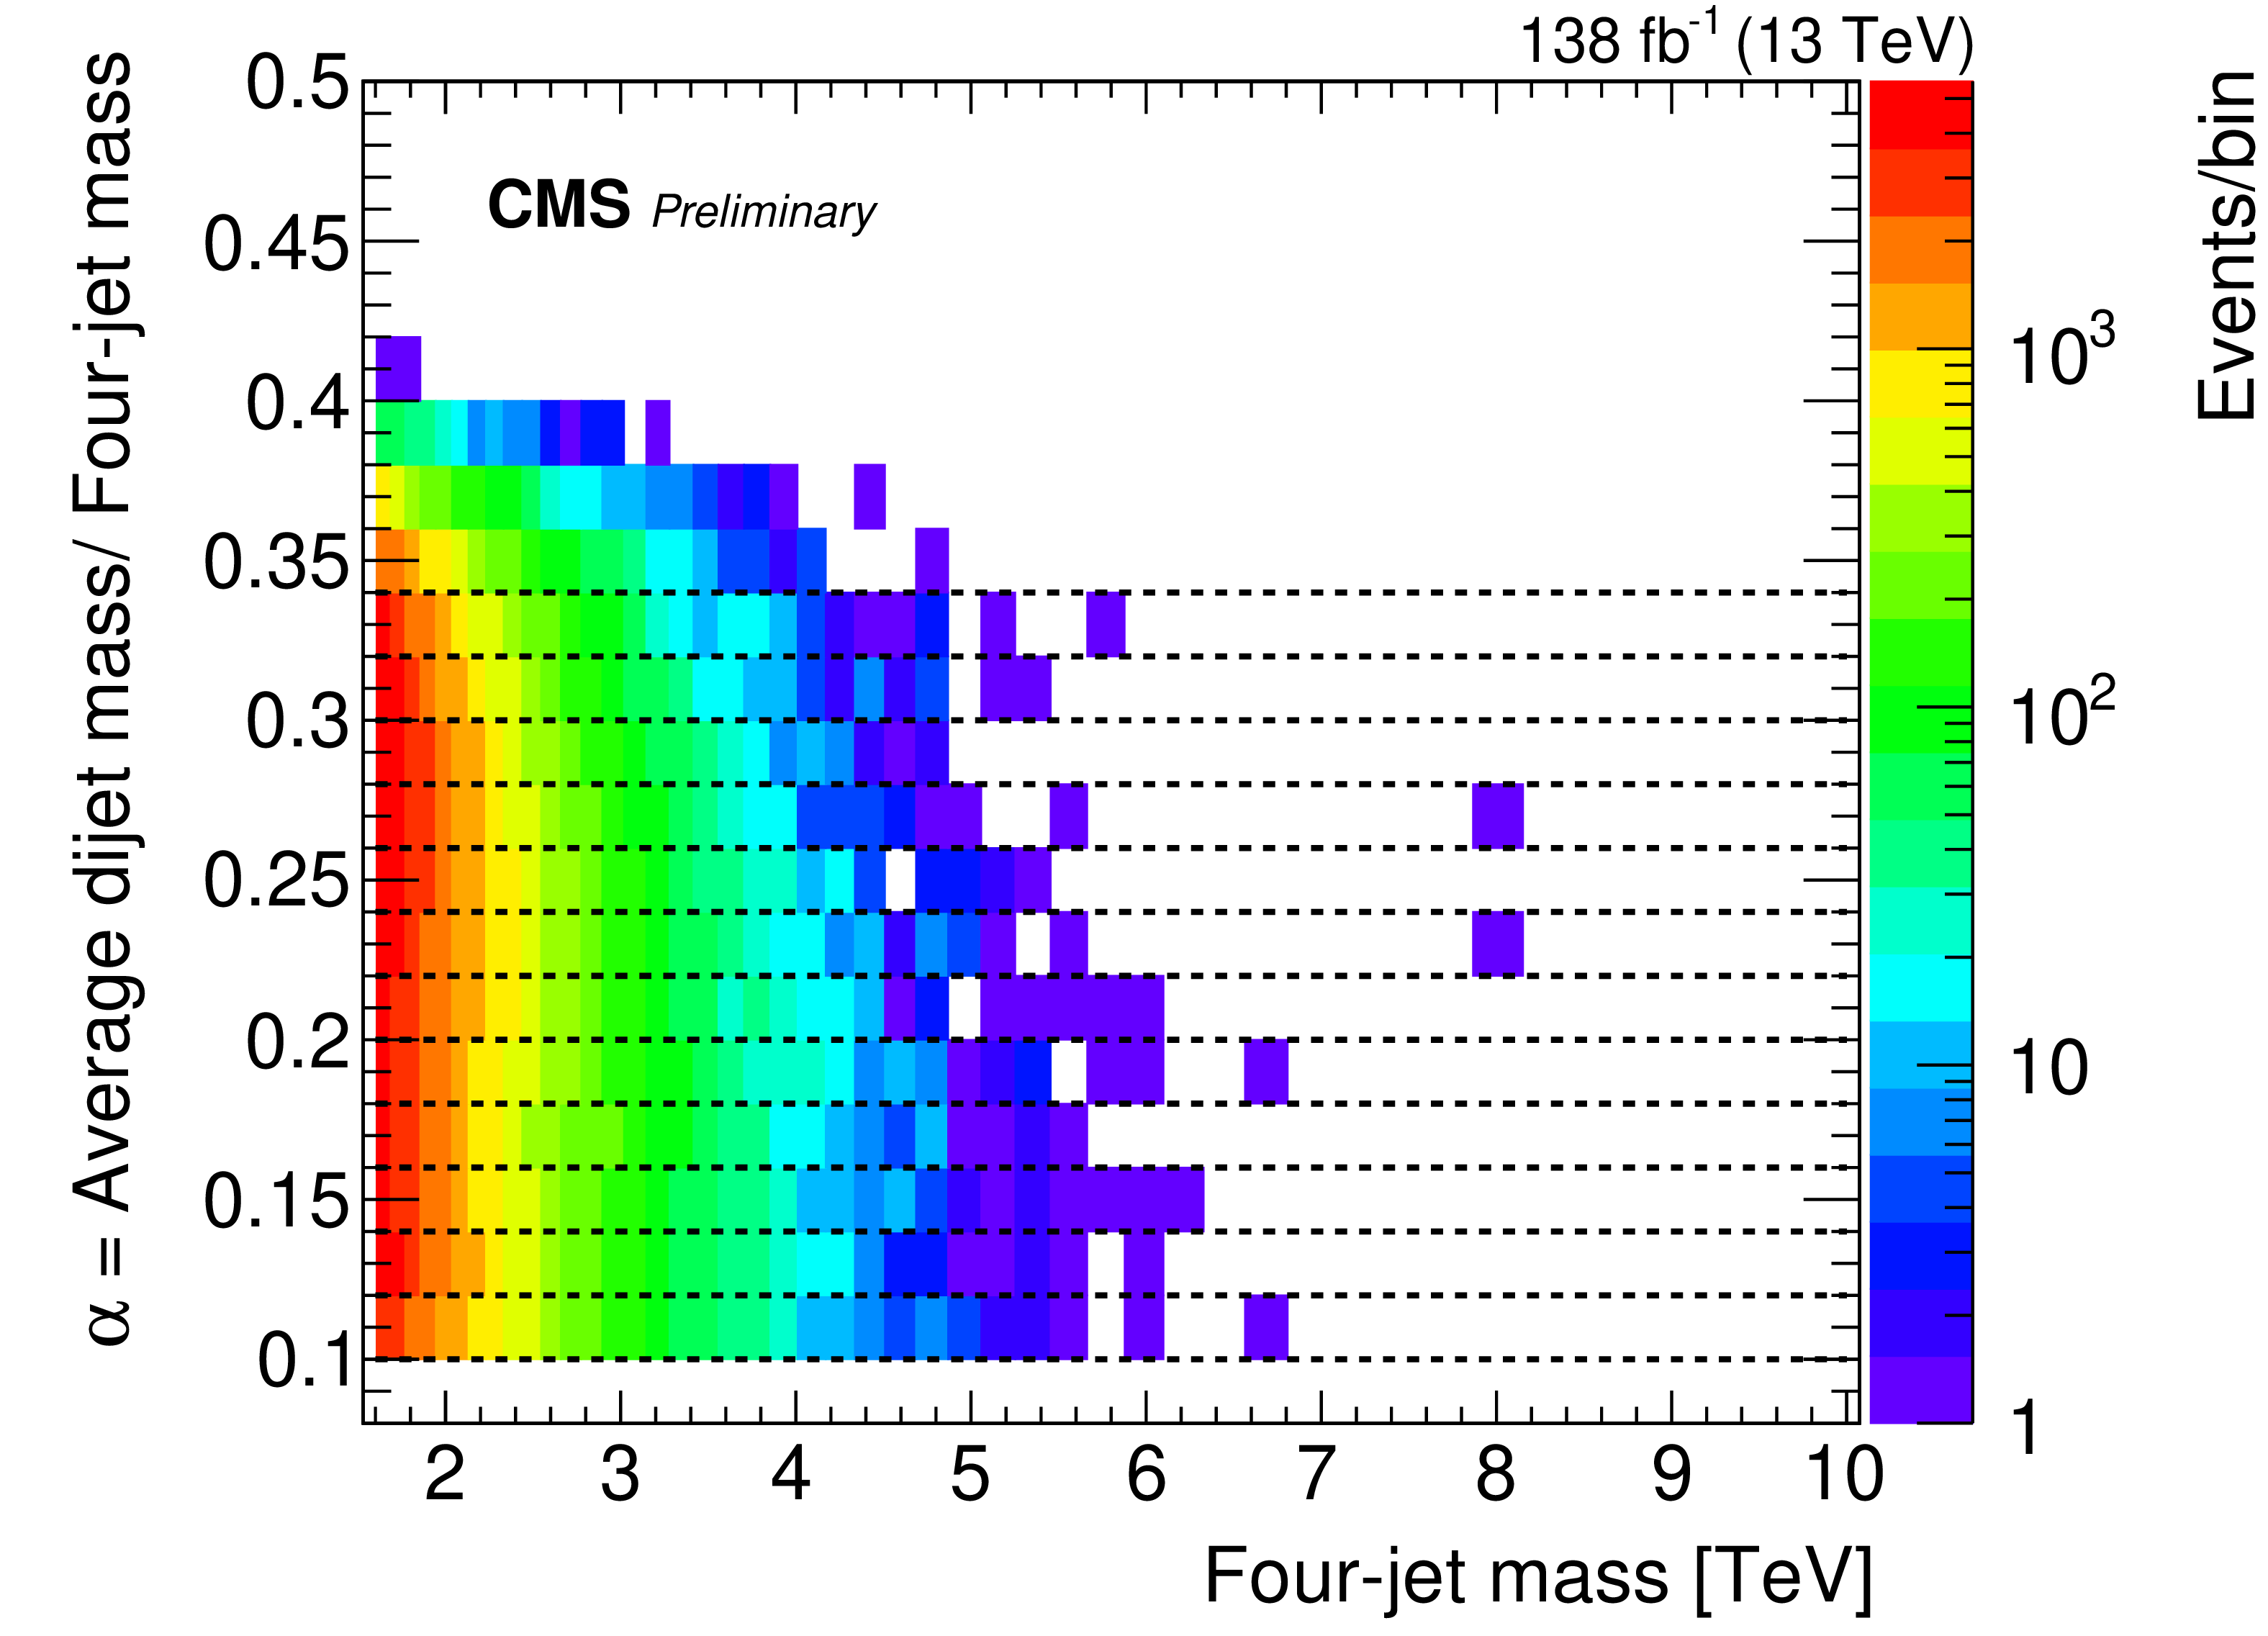
Figure 2-a:
(Left) Number of events observed (color scale) within bins of the four-jet mass and the ratio $\alpha $, which is the average mass of the two dijets divided by the four-jet mass. (Right) Number of events predicted in the same bins by a simulation of a diquark, with a mass of 8.4 TeV, decaying to a pair of vector-like quarks, each with a mas of 2.1 TeV. Both plots also show the edges of the thirteen $\alpha $ slices used to define the four-jet mass distributions used in the resonant search (dashed lines). |
png pdf |
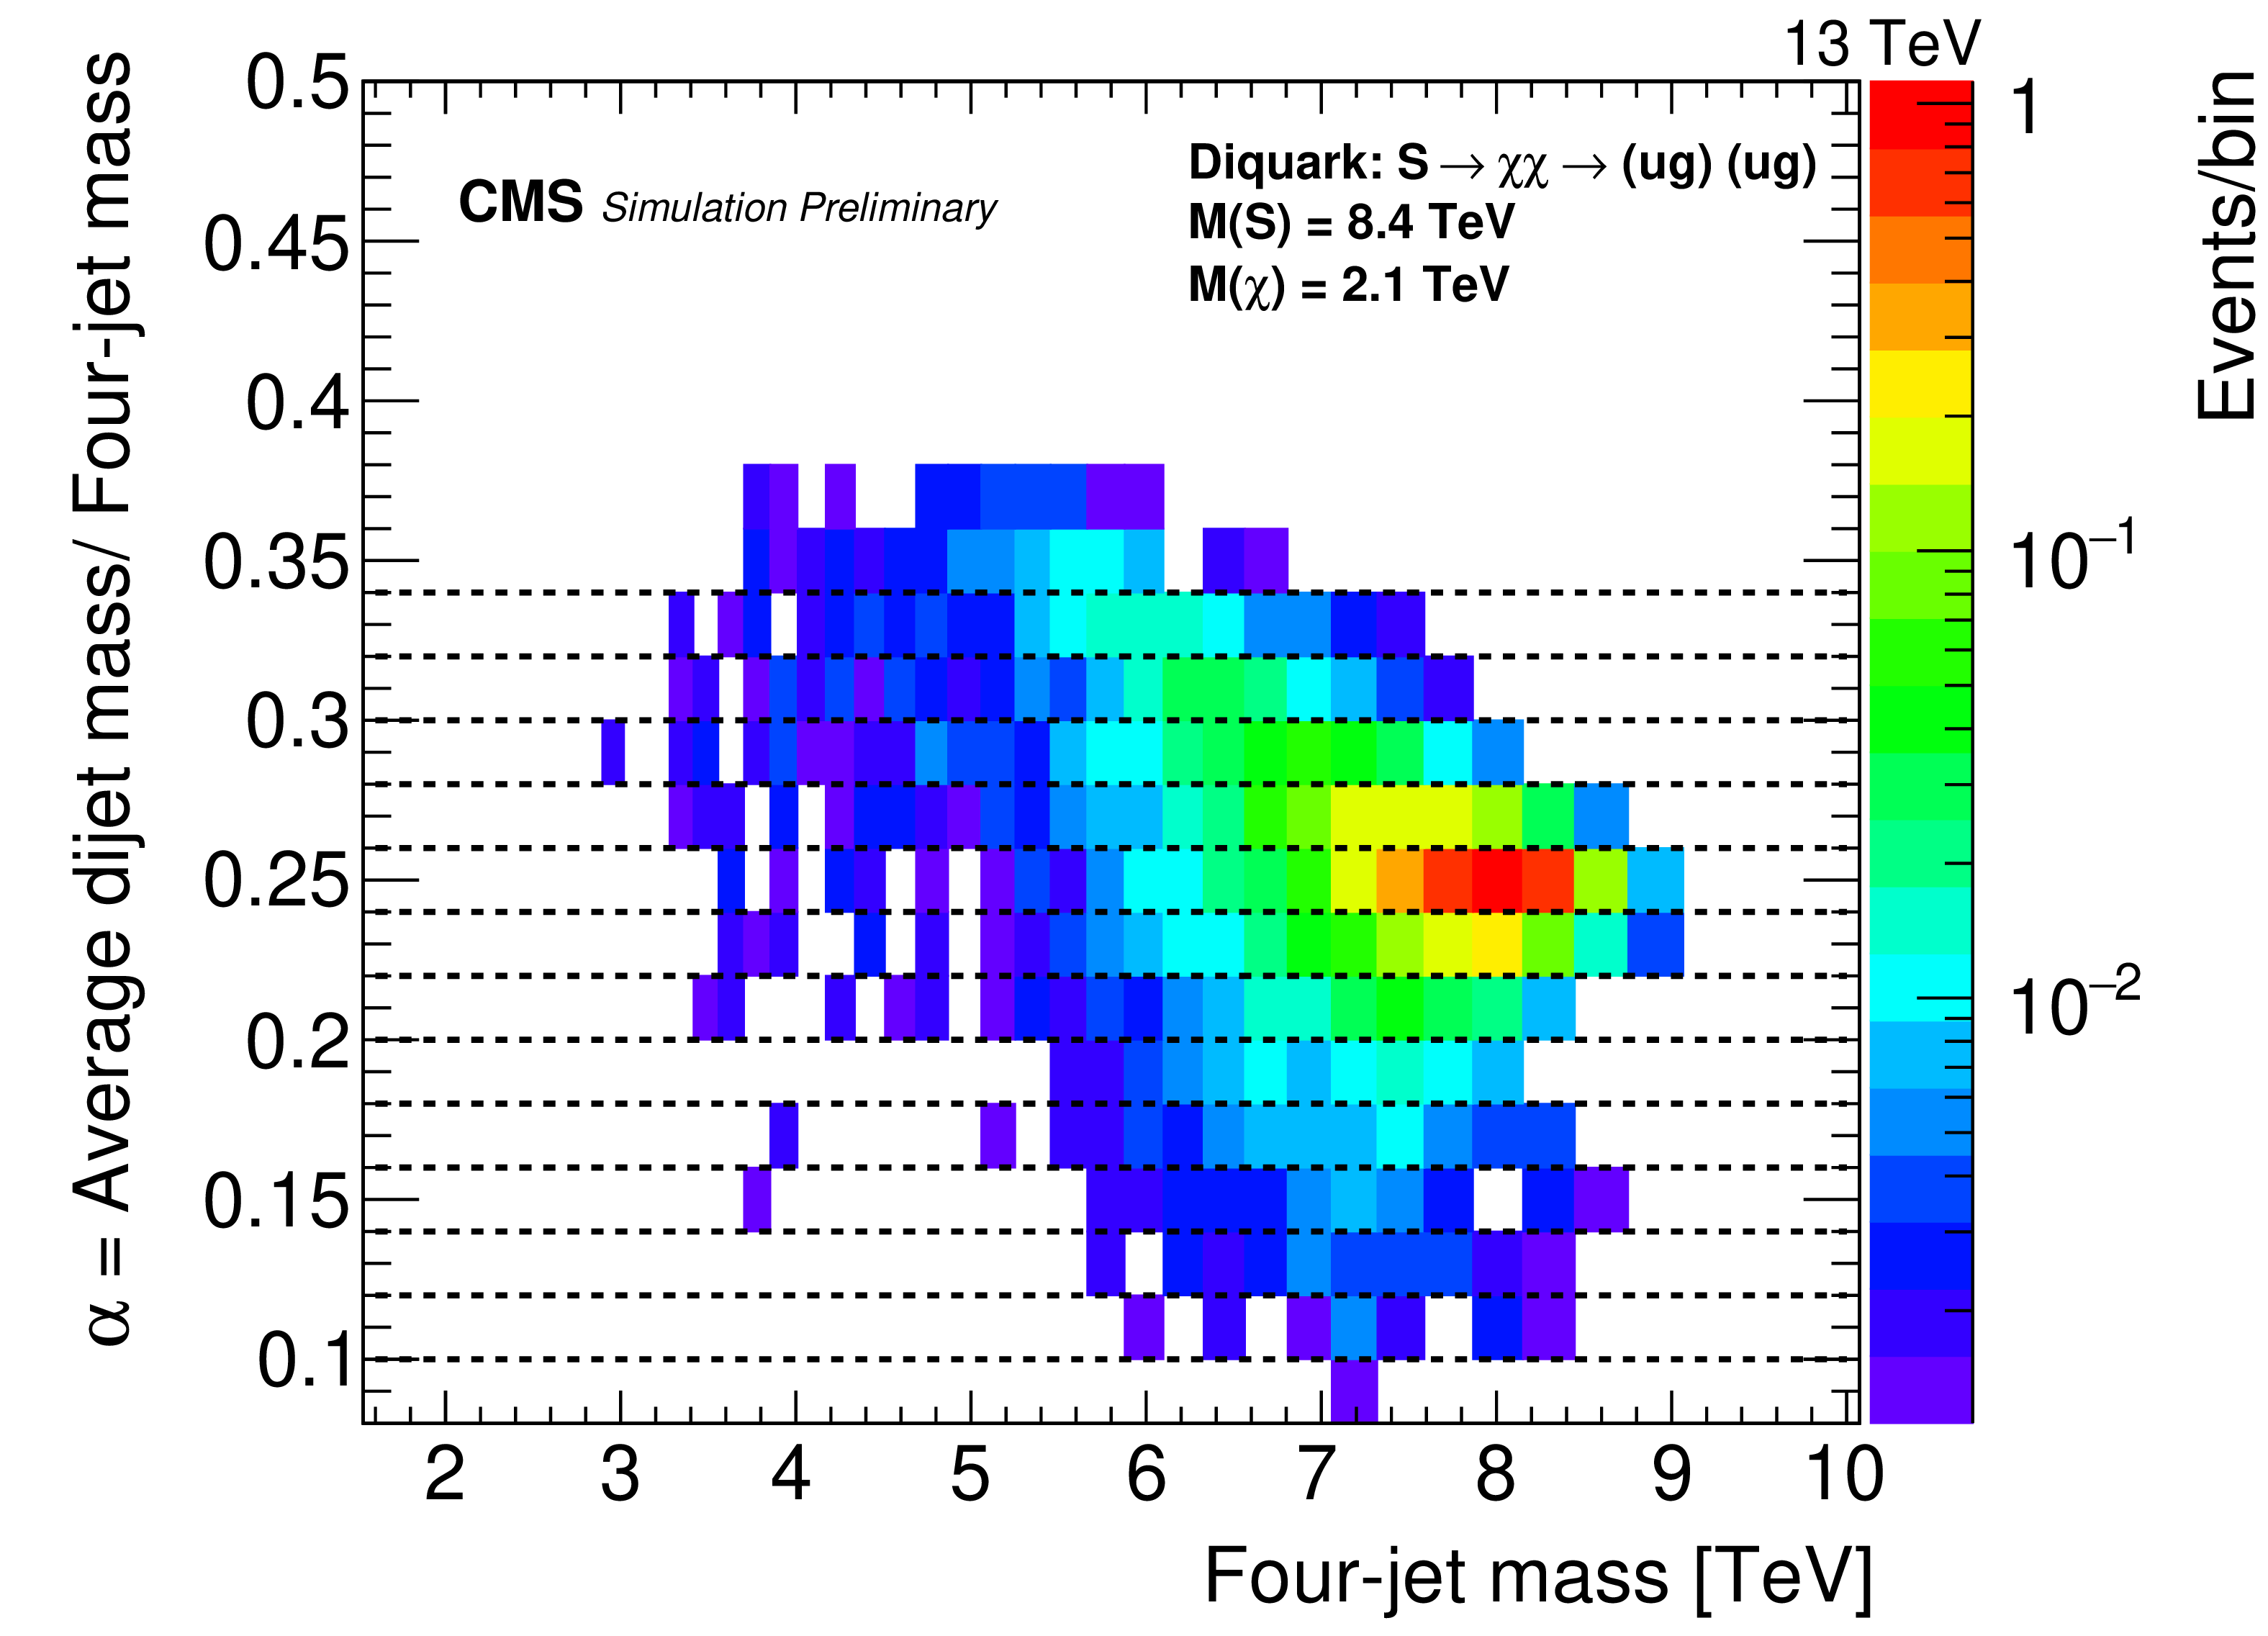
Figure 2-b:
(Left) Number of events observed (color scale) within bins of the four-jet mass and the ratio $\alpha $, which is the average mass of the two dijets divided by the four-jet mass. (Right) Number of events predicted in the same bins by a simulation of a diquark, with a mass of 8.4 TeV, decaying to a pair of vector-like quarks, each with a mas of 2.1 TeV. Both plots also show the edges of the thirteen $\alpha $ slices used to define the four-jet mass distributions used in the resonant search (dashed lines). |
png pdf |
Figure 3:
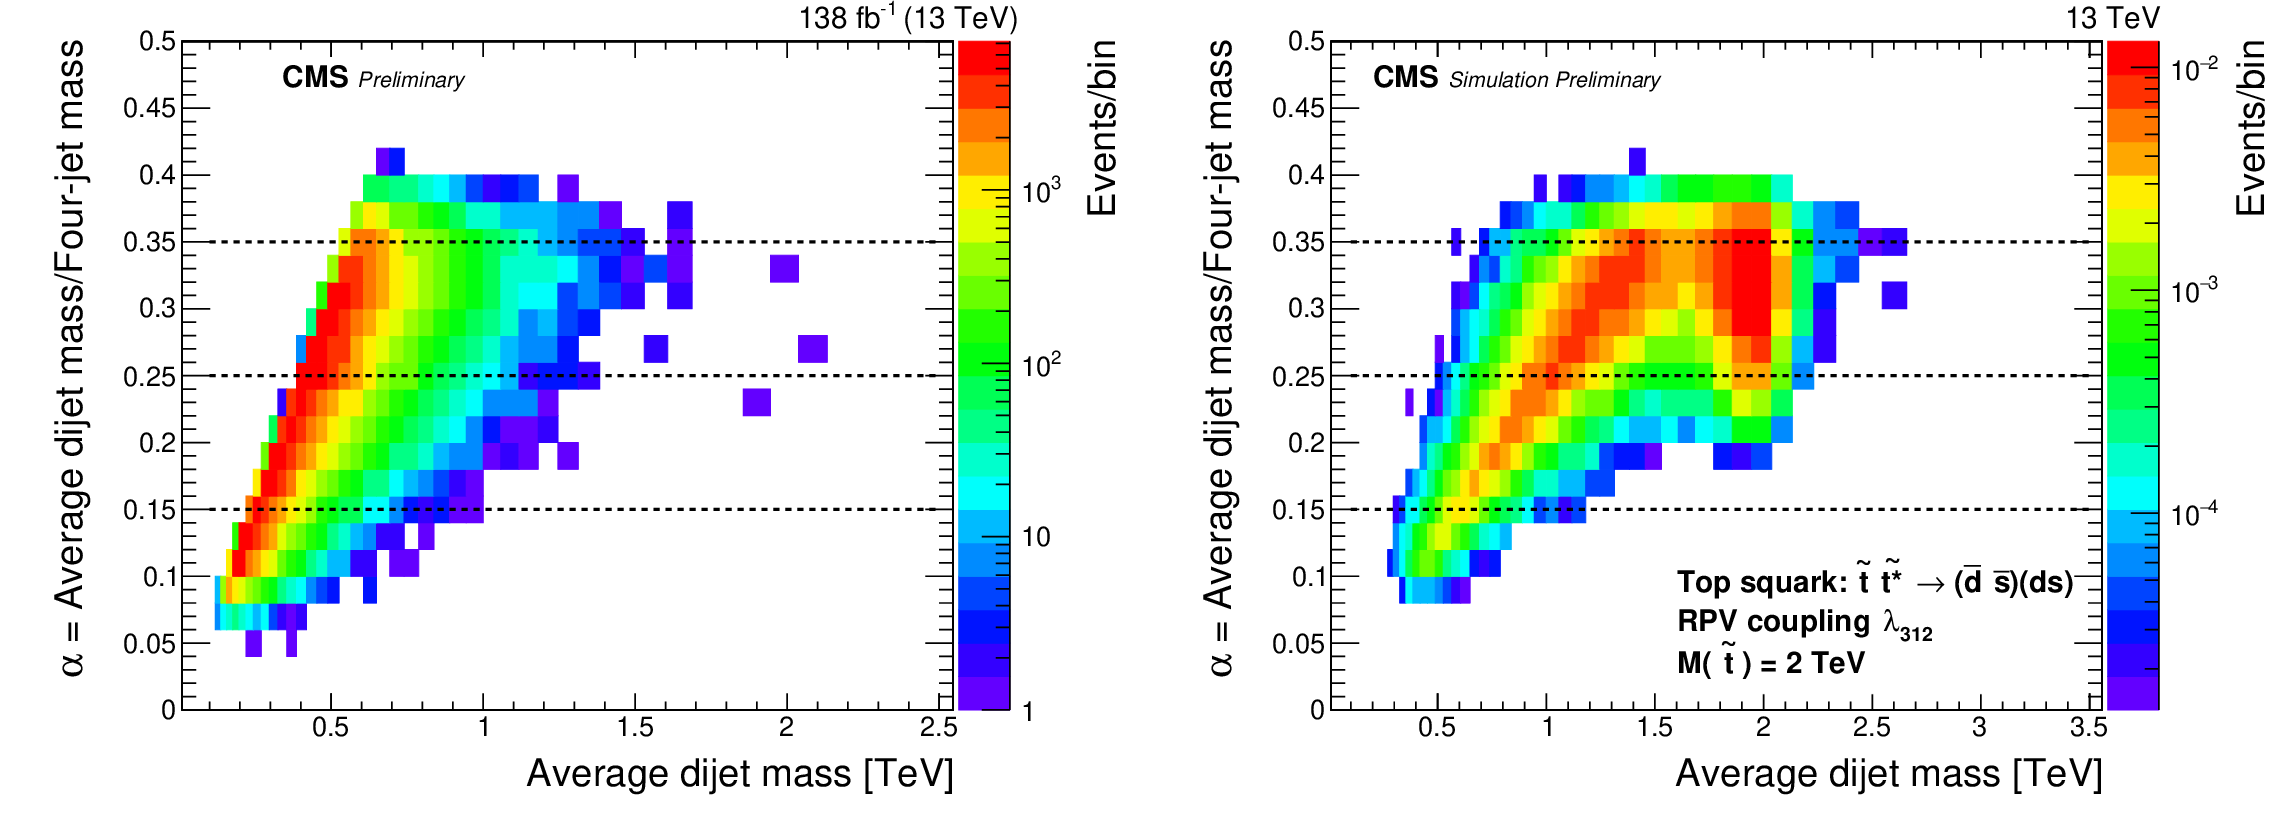
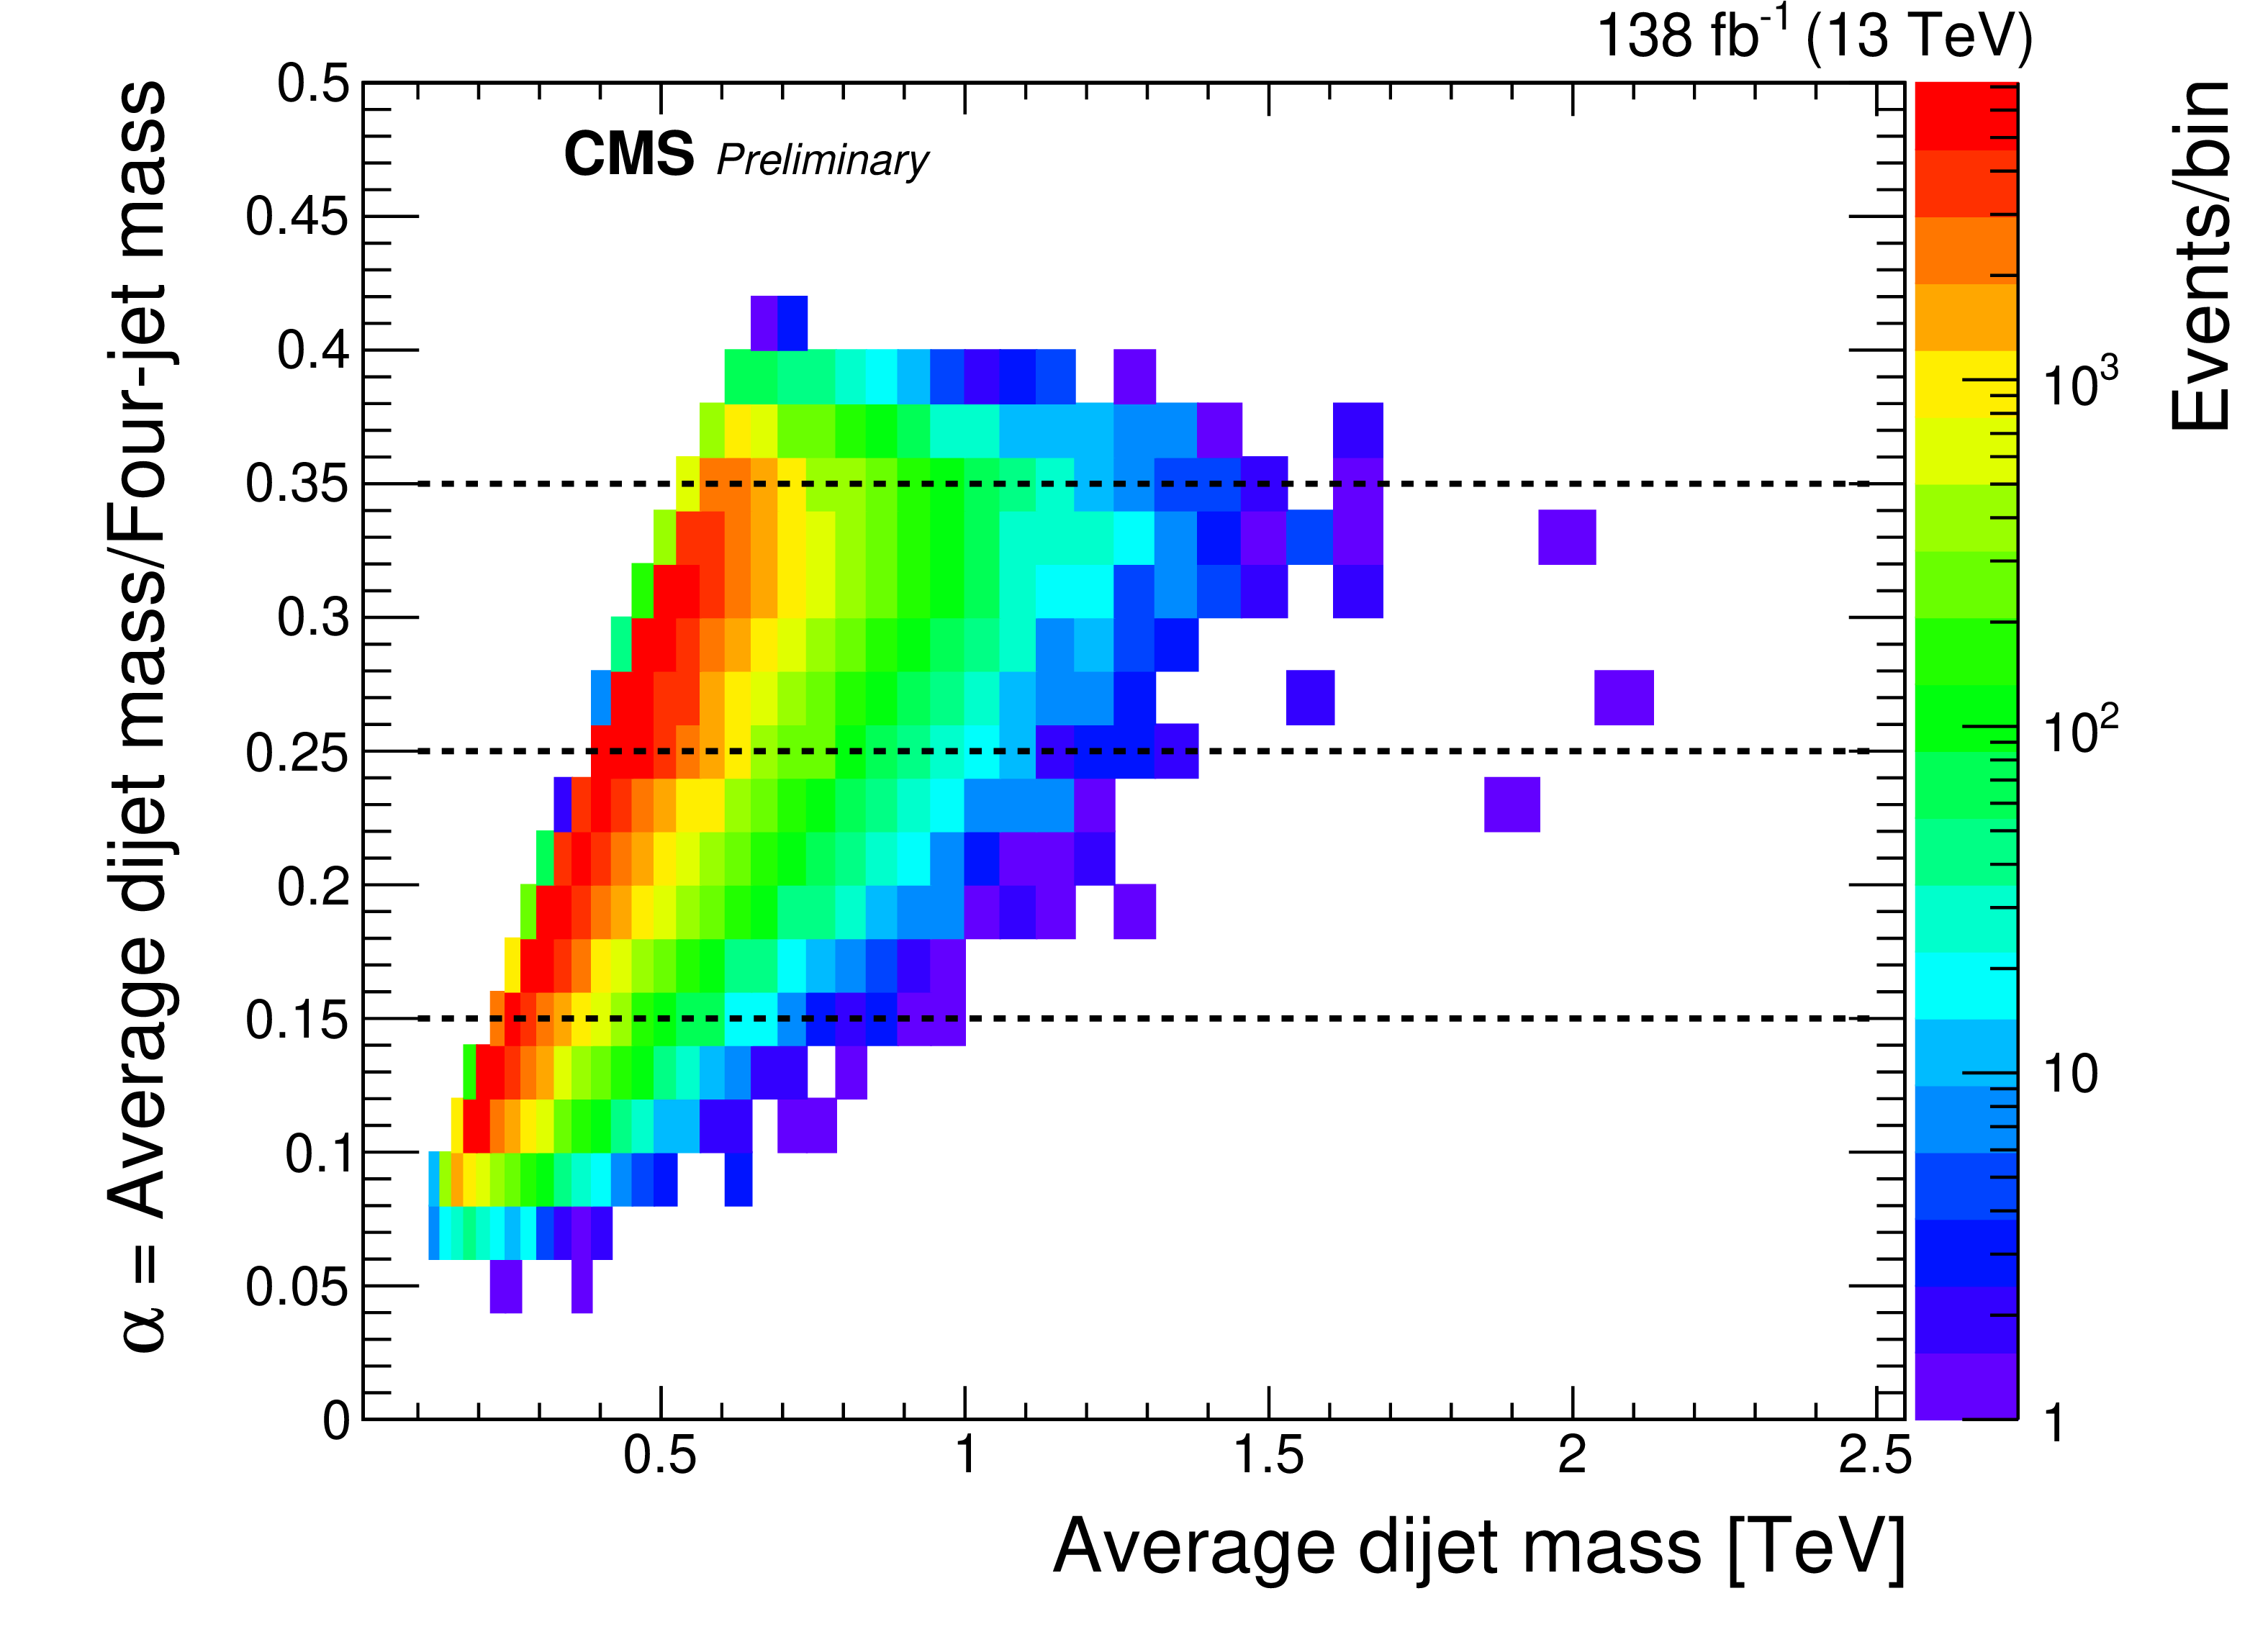
(Left) Number of events observed (color scale) within bins of the average mass of the two dijets and the ratio $\alpha $ of that mass to the four-jet mass. (Right) Number of events predicted in the same bins by a simulation of the production and R-parity violating decay of a pair of top squarks with a mass of 2 TeV. Both plots also show the edges of the three $\alpha $ slices used to define the average dijet mass distributions used in the non-resonant search (dashed lines). |
png pdf |
Figure 3-a:
(Left) Number of events observed (color scale) within bins of the average mass of the two dijets and the ratio $\alpha $ of that mass to the four-jet mass. (Right) Number of events predicted in the same bins by a simulation of the production and R-parity violating decay of a pair of top squarks with a mass of 2 TeV. Both plots also show the edges of the three $\alpha $ slices used to define the average dijet mass distributions used in the non-resonant search (dashed lines). |

png pdf |
Figure 3-b:
(Left) Number of events observed (color scale) within bins of the average mass of the two dijets and the ratio $\alpha $ of that mass to the four-jet mass. (Right) Number of events predicted in the same bins by a simulation of the production and R-parity violating decay of a pair of top squarks with a mass of 2 TeV. Both plots also show the edges of the three $\alpha $ slices used to define the average dijet mass distributions used in the non-resonant search (dashed lines). |
png pdf |
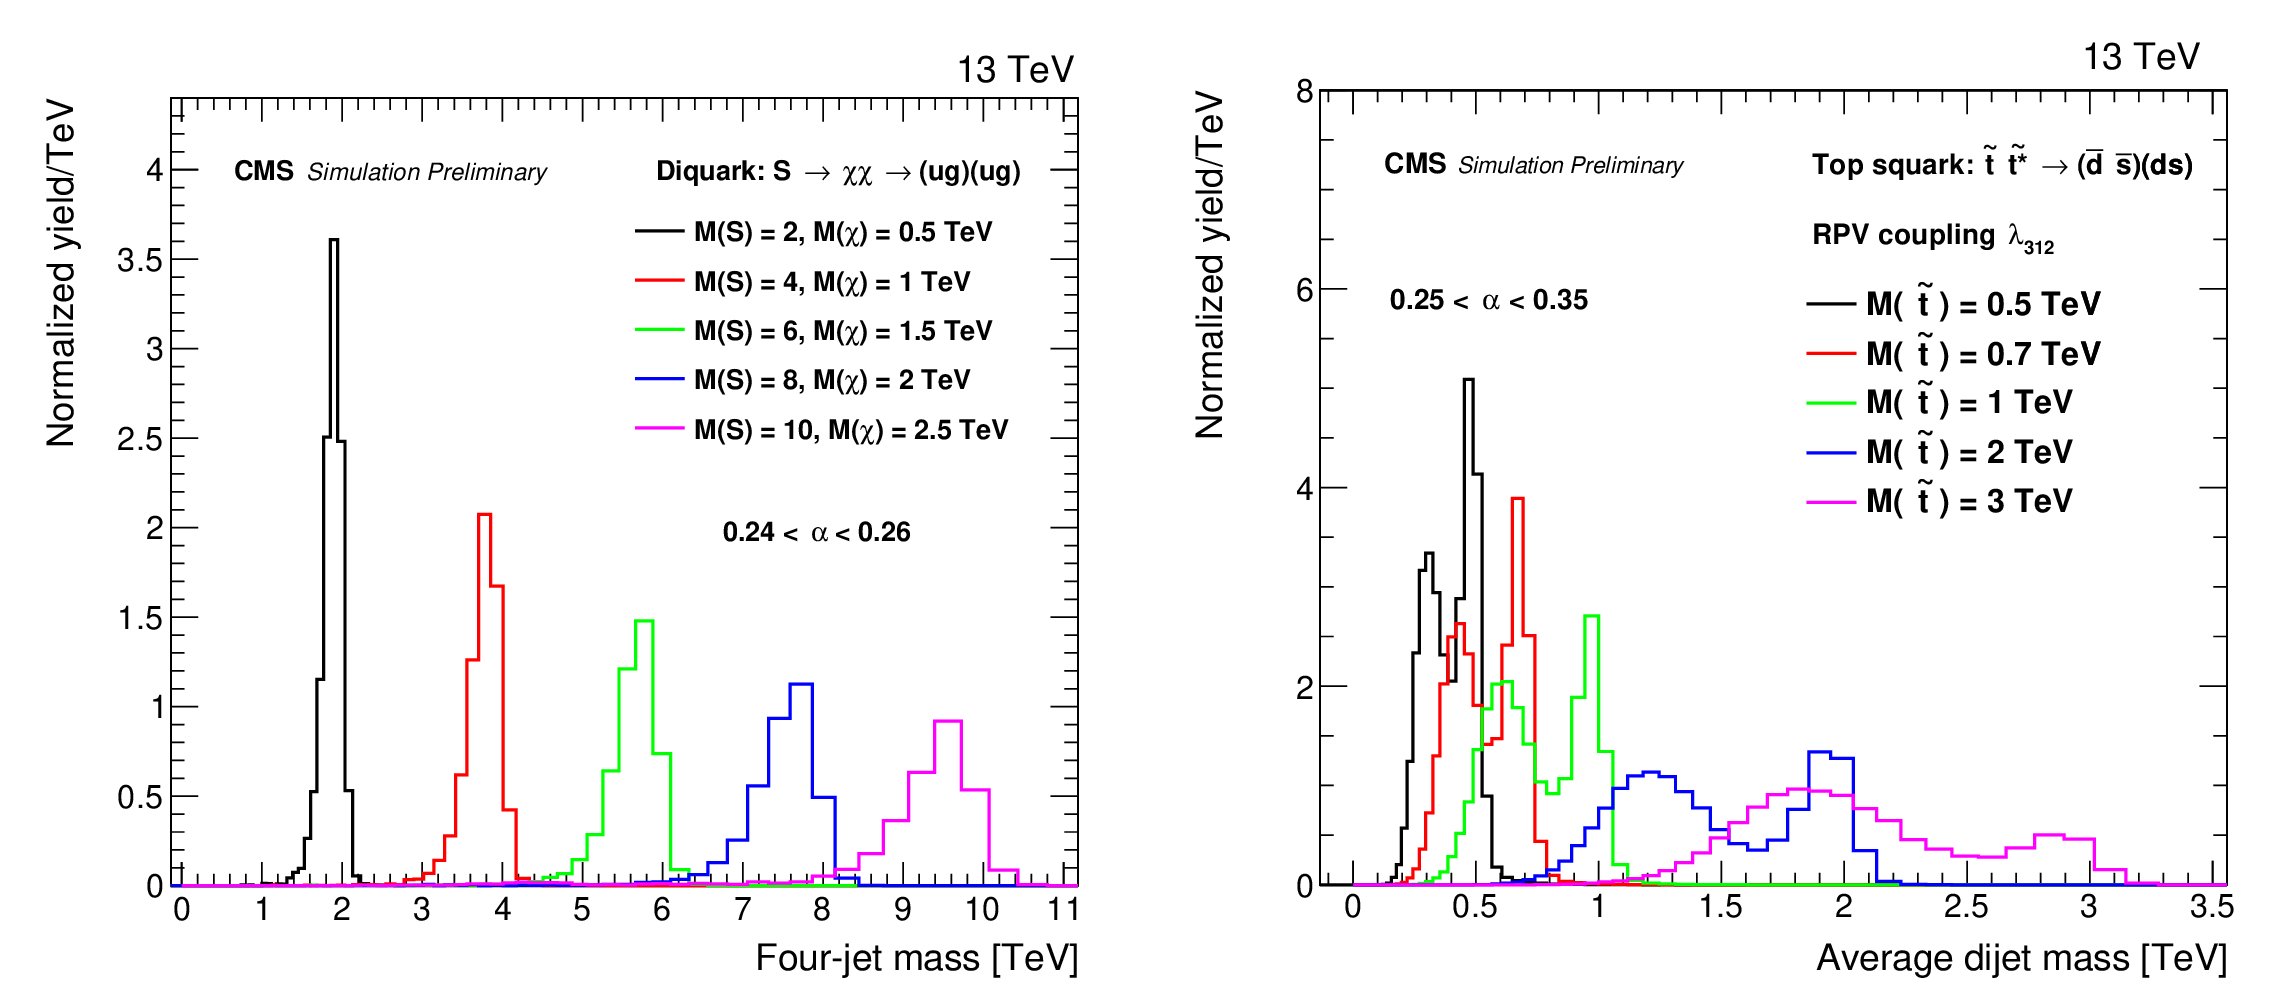
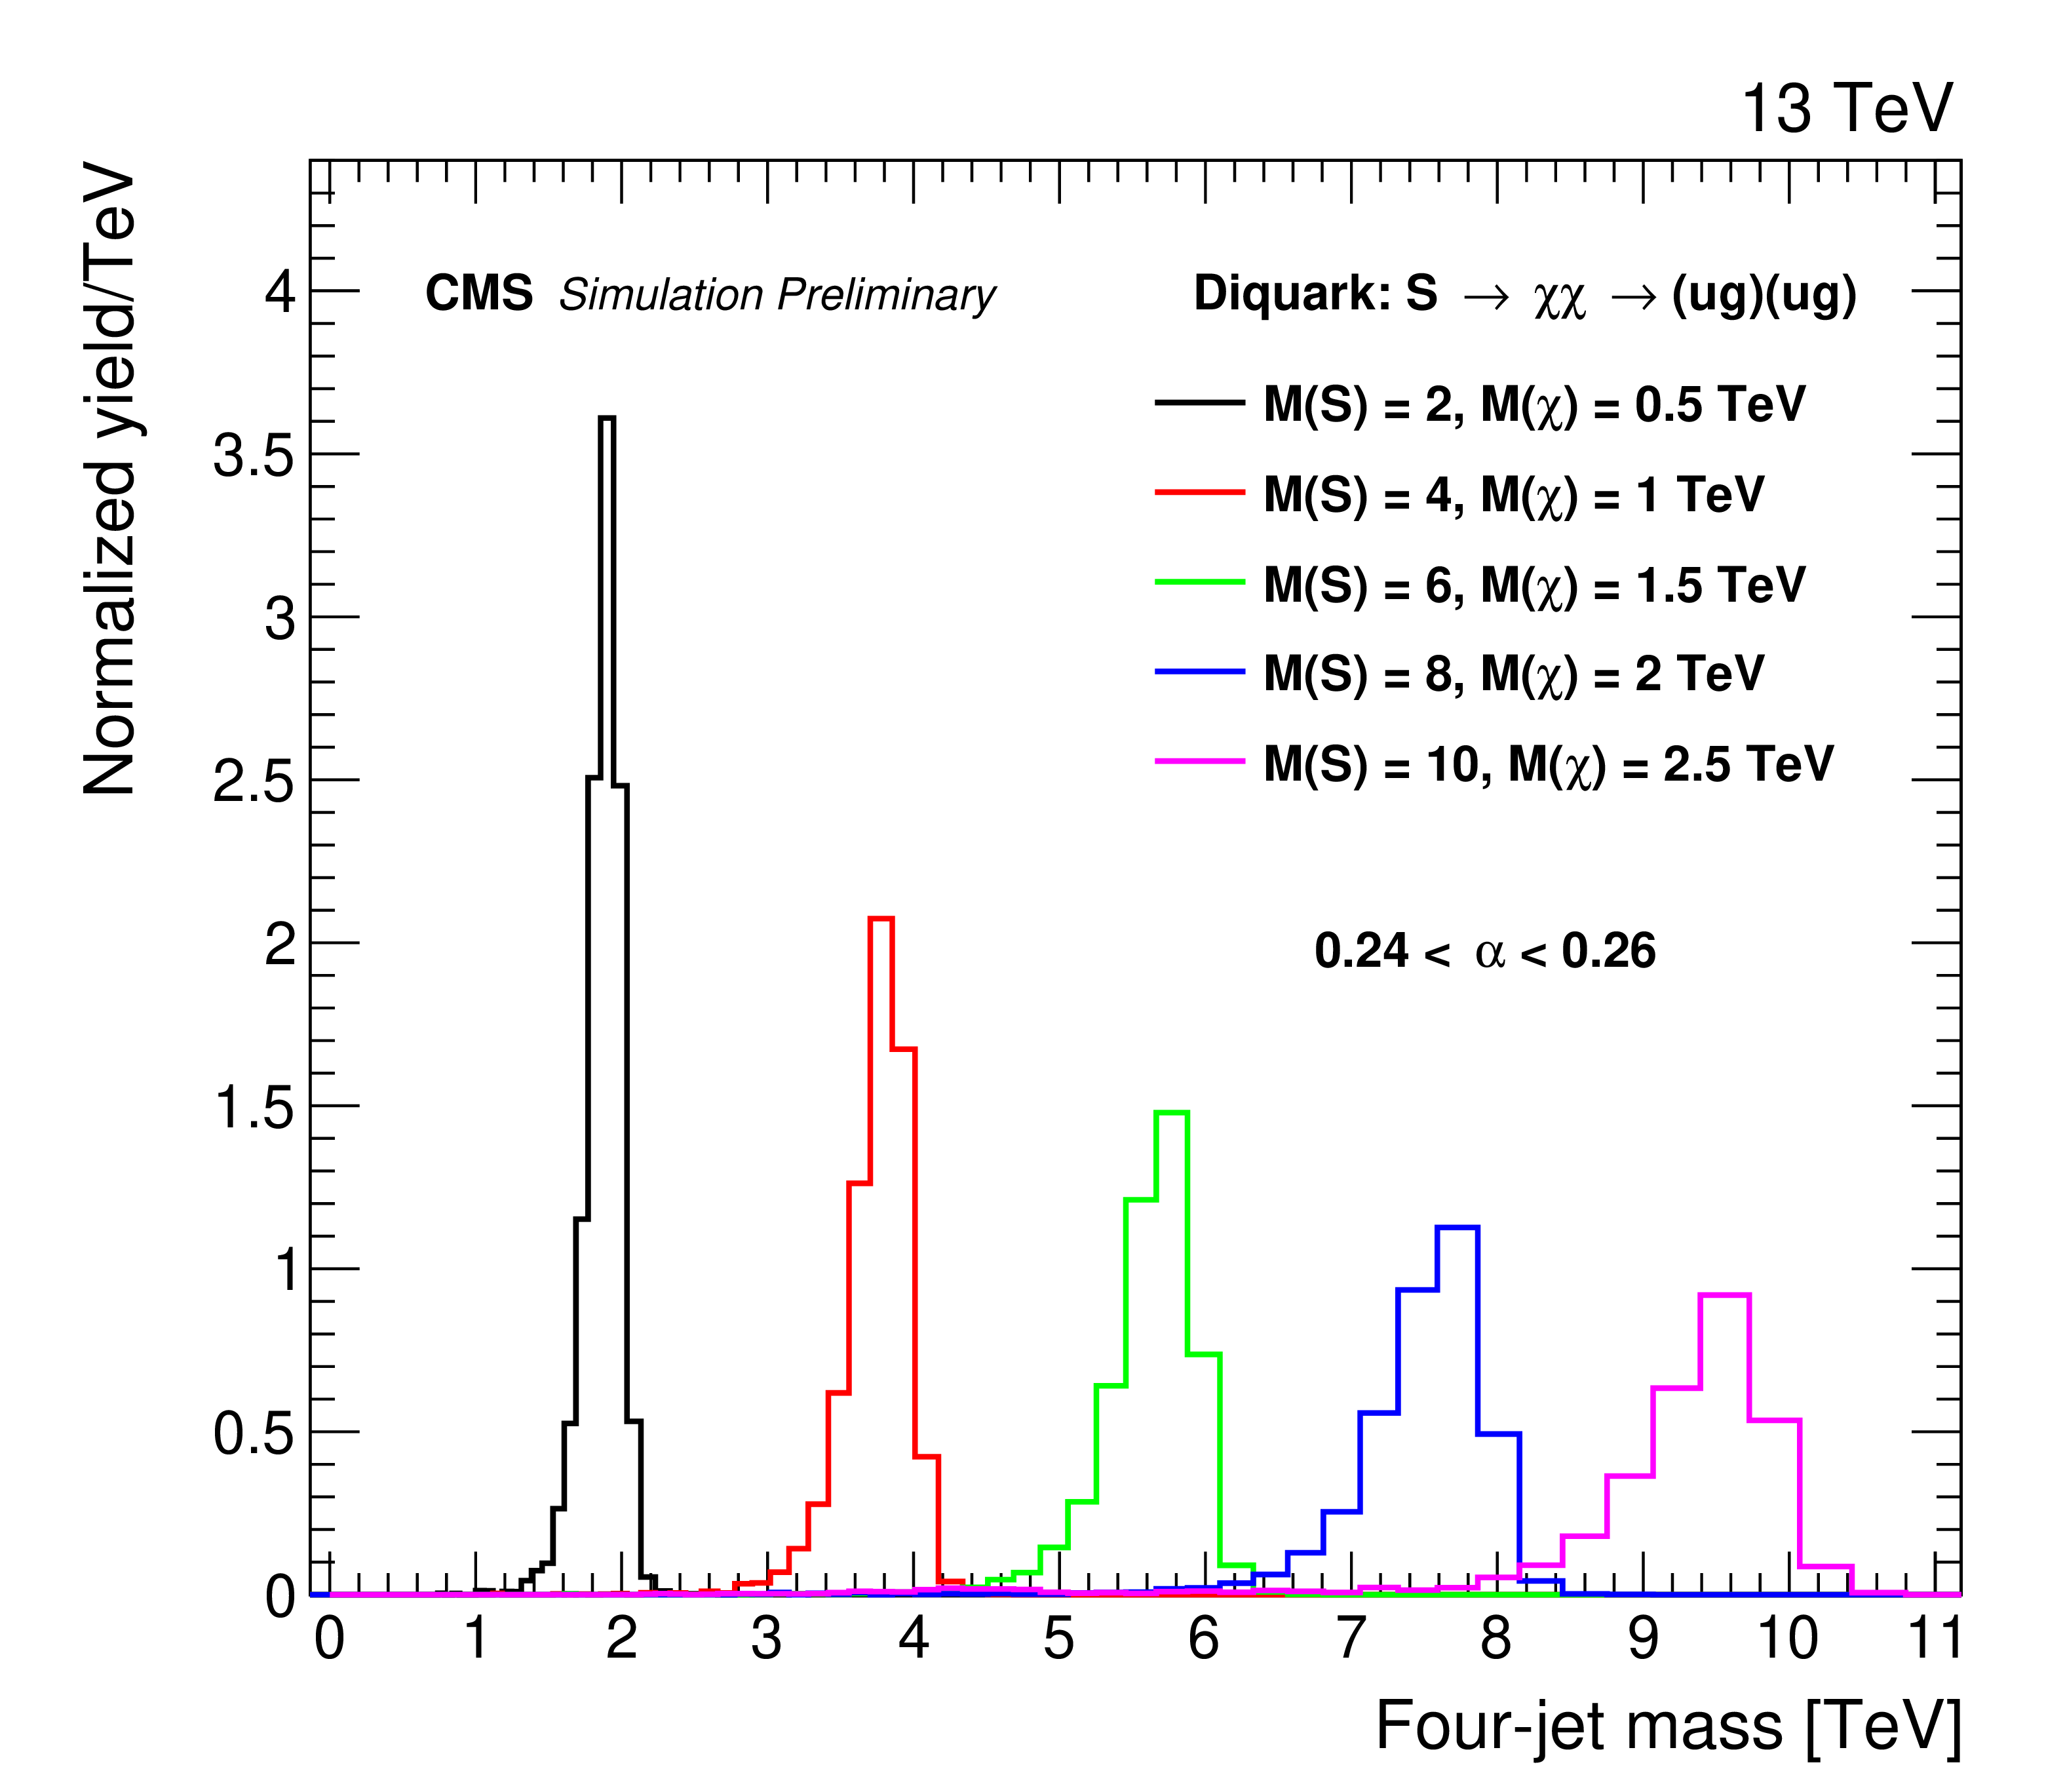
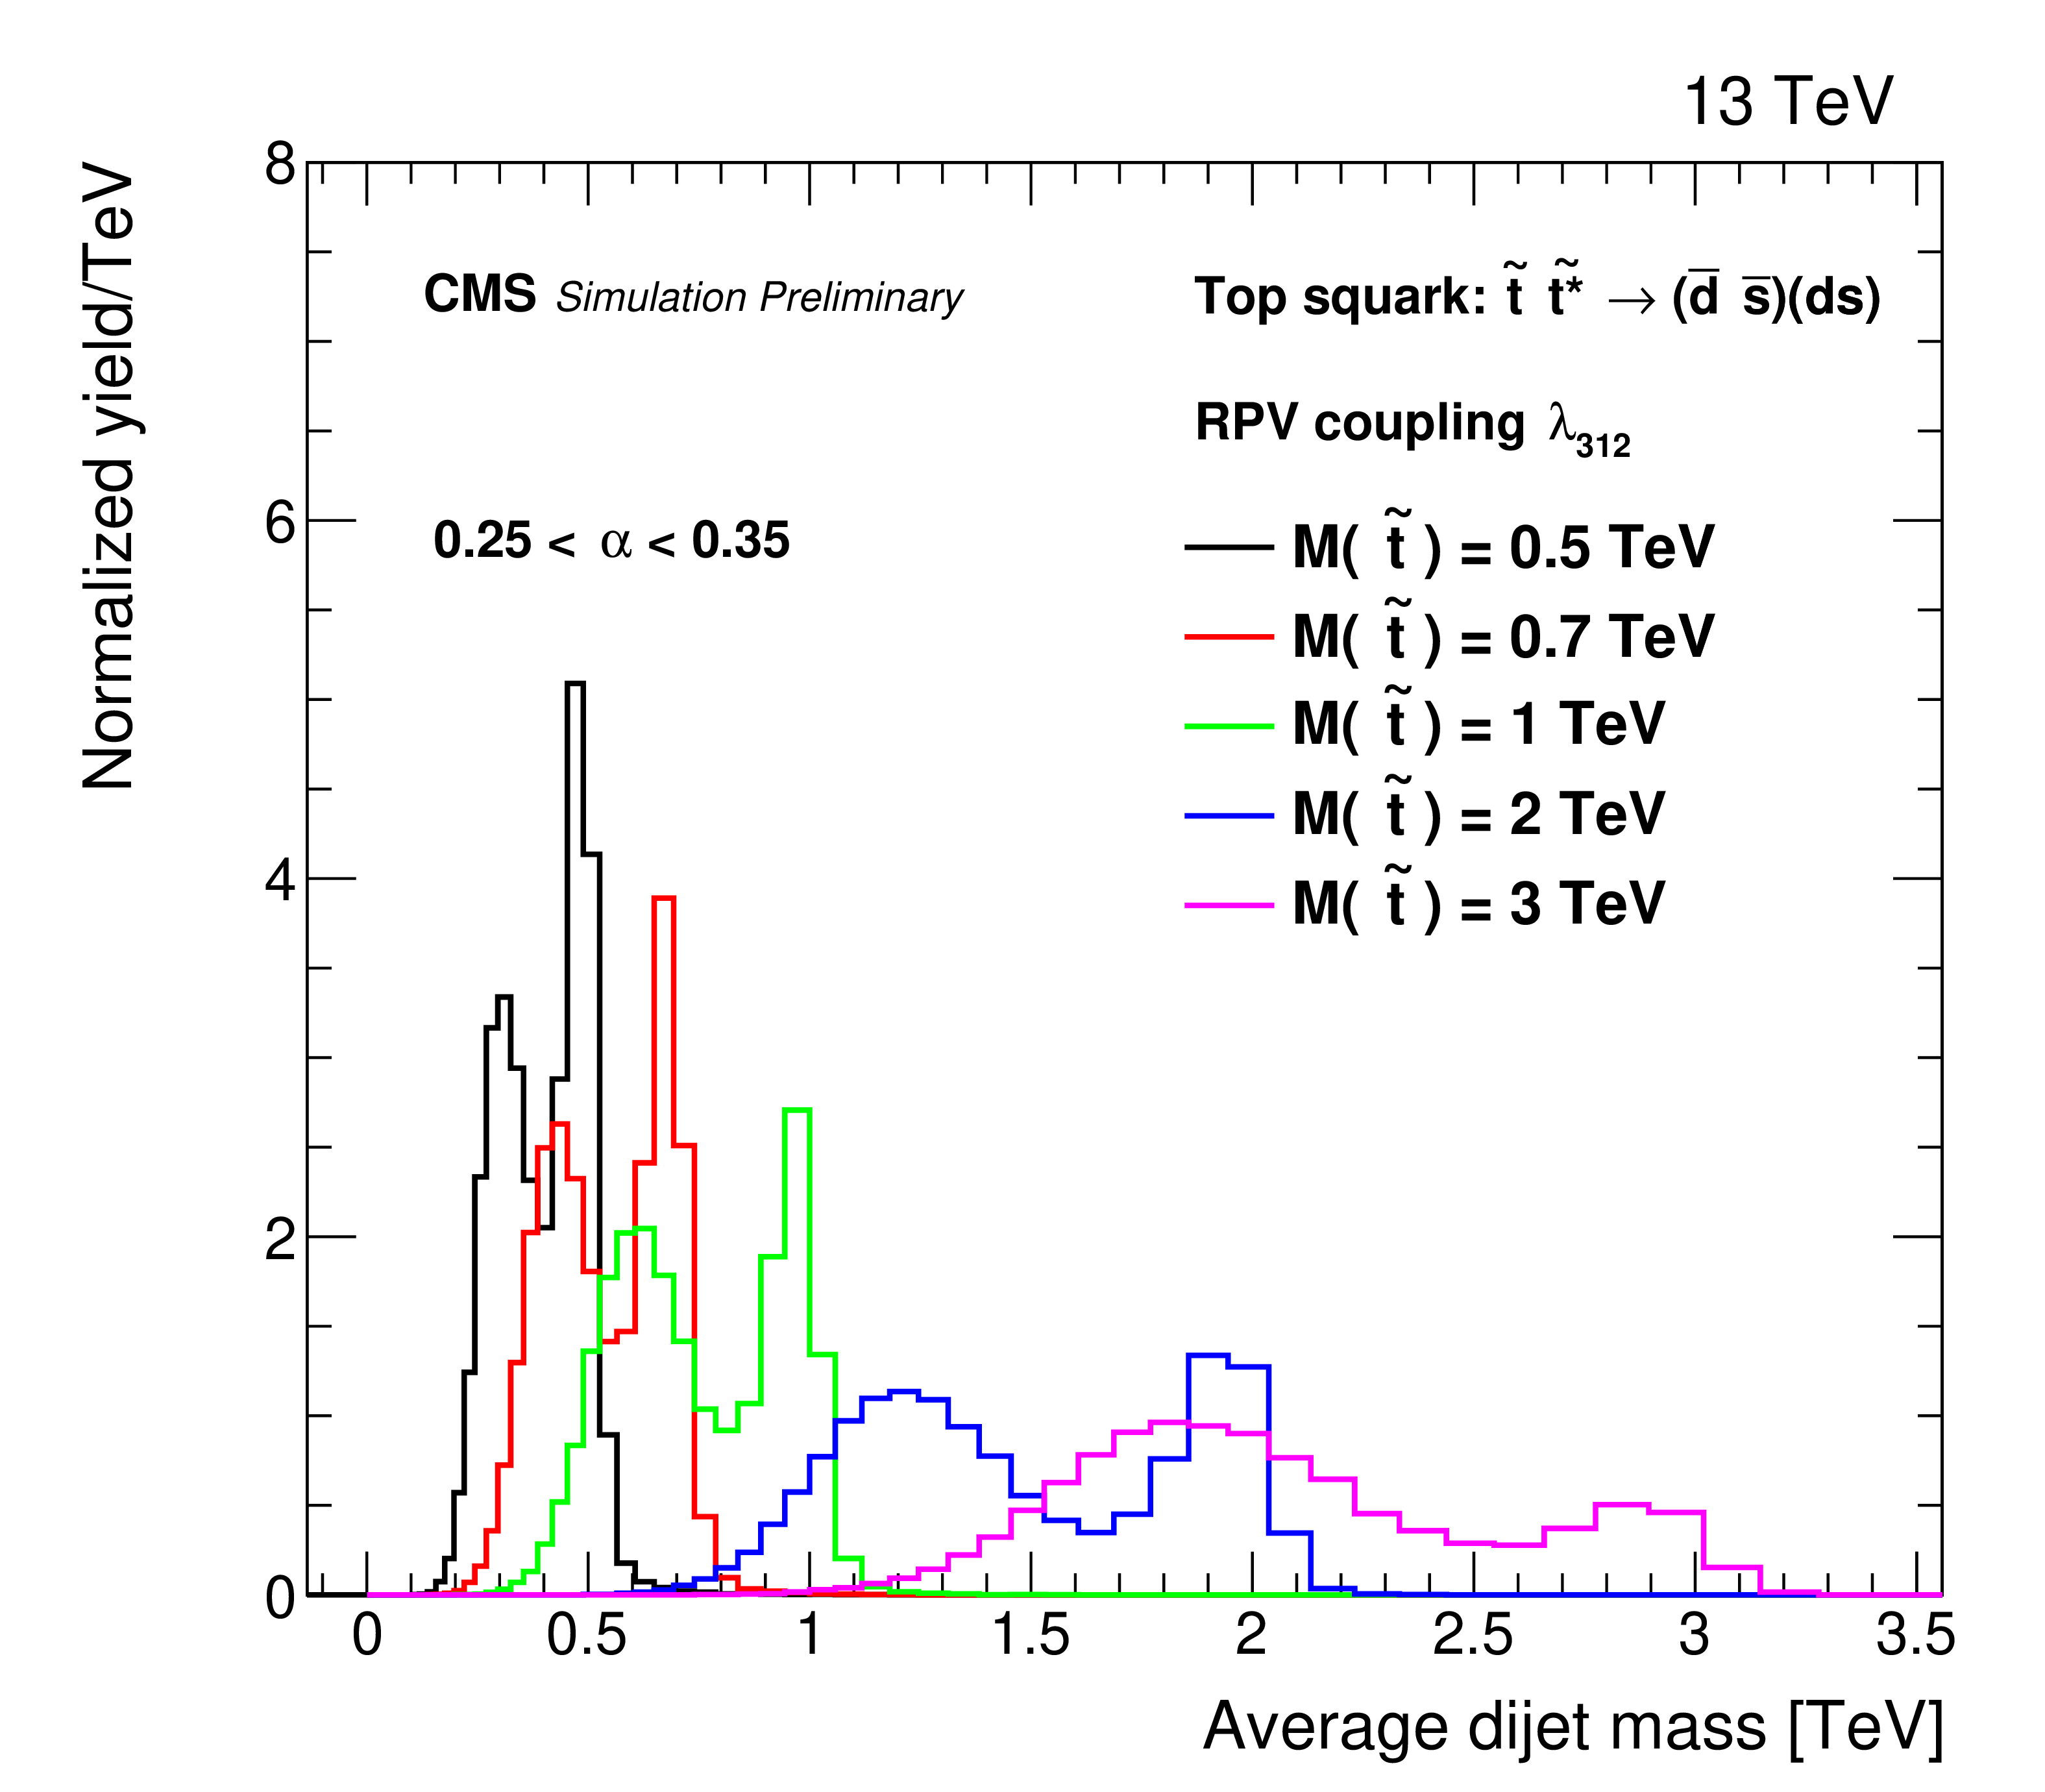
Figure 4:
Signal differential distributions for the resonant search (left) as a function of four-jet mass, and the non-resonant search (right) as a function of the average mass of the two dijets, for the $\alpha $ slice with the largest signal yield in each search. The integral of each distribution has been normalized to unity. |
png pdf |
Figure 4-a:
Signal differential distributions for the resonant search (left) as a function of four-jet mass, and the non-resonant search (right) as a function of the average mass of the two dijets, for the $\alpha $ slice with the largest signal yield in each search. The integral of each distribution has been normalized to unity. |
png pdf |
Figure 4-b:
Signal differential distributions for the resonant search (left) as a function of four-jet mass, and the non-resonant search (right) as a function of the average mass of the two dijets, for the $\alpha $ slice with the largest signal yield in each search. The integral of each distribution has been normalized to unity. |
png pdf |
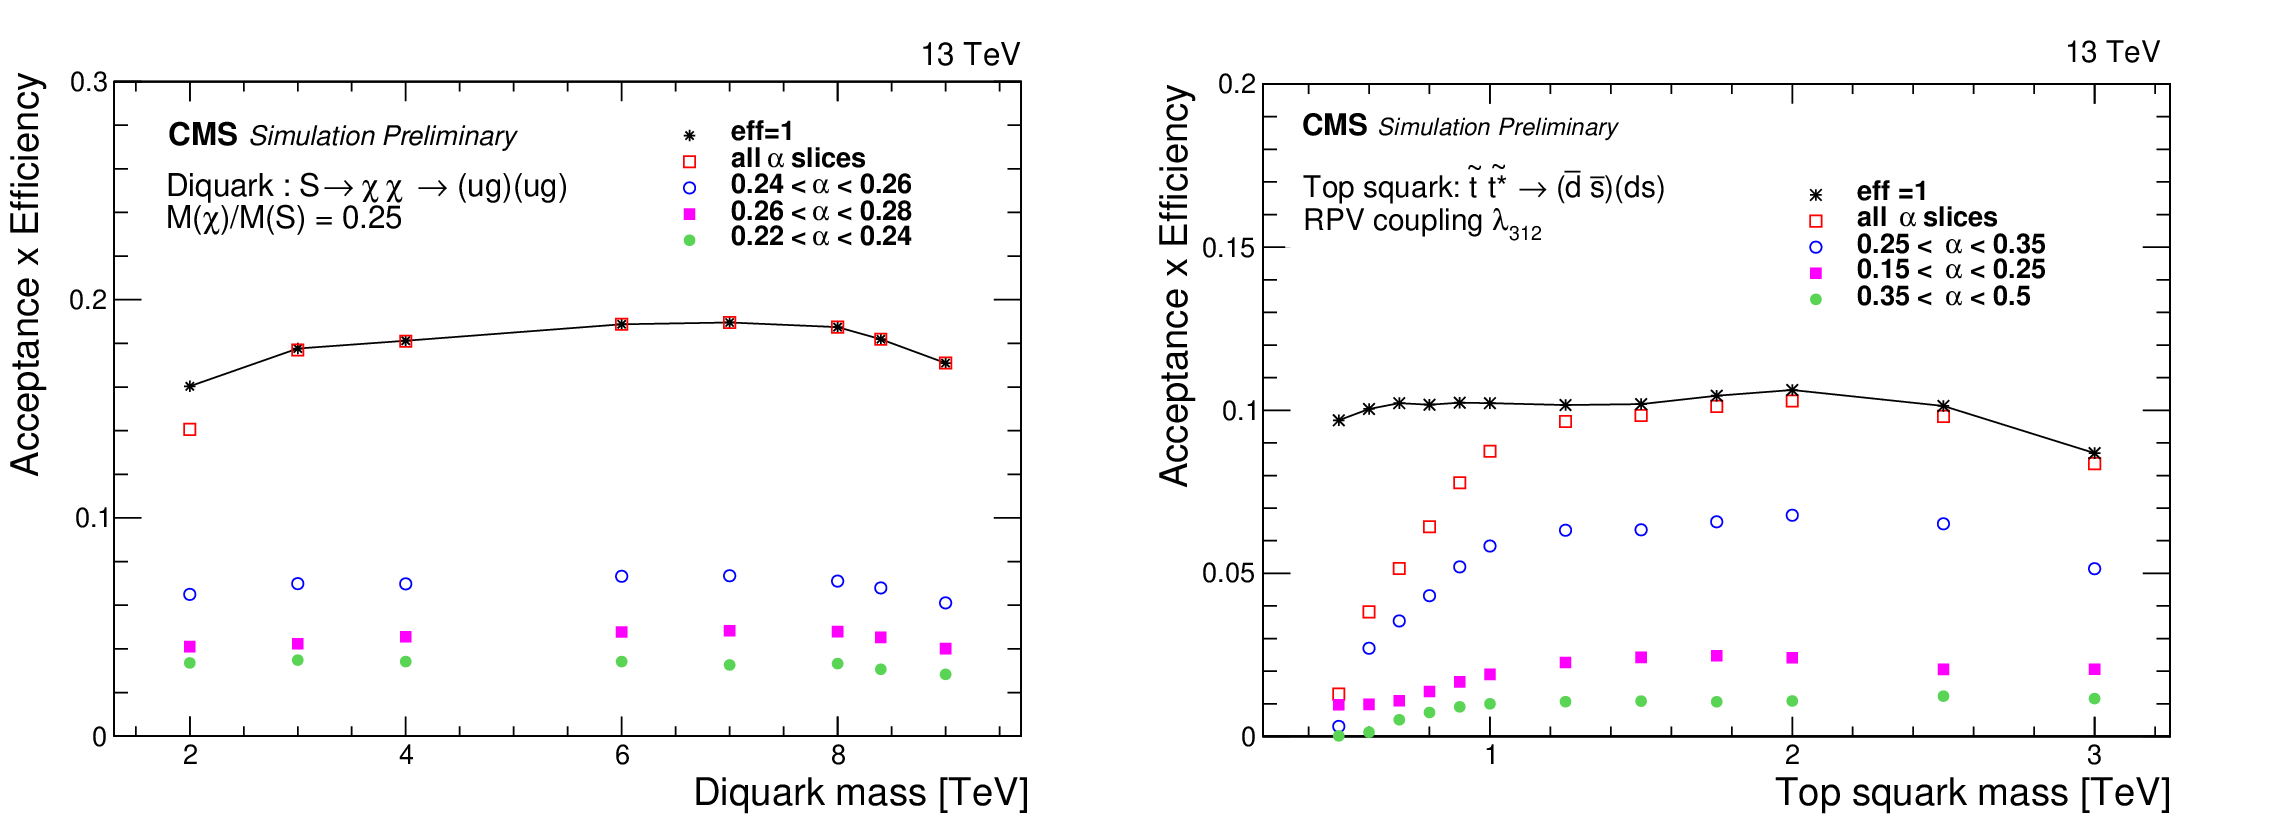
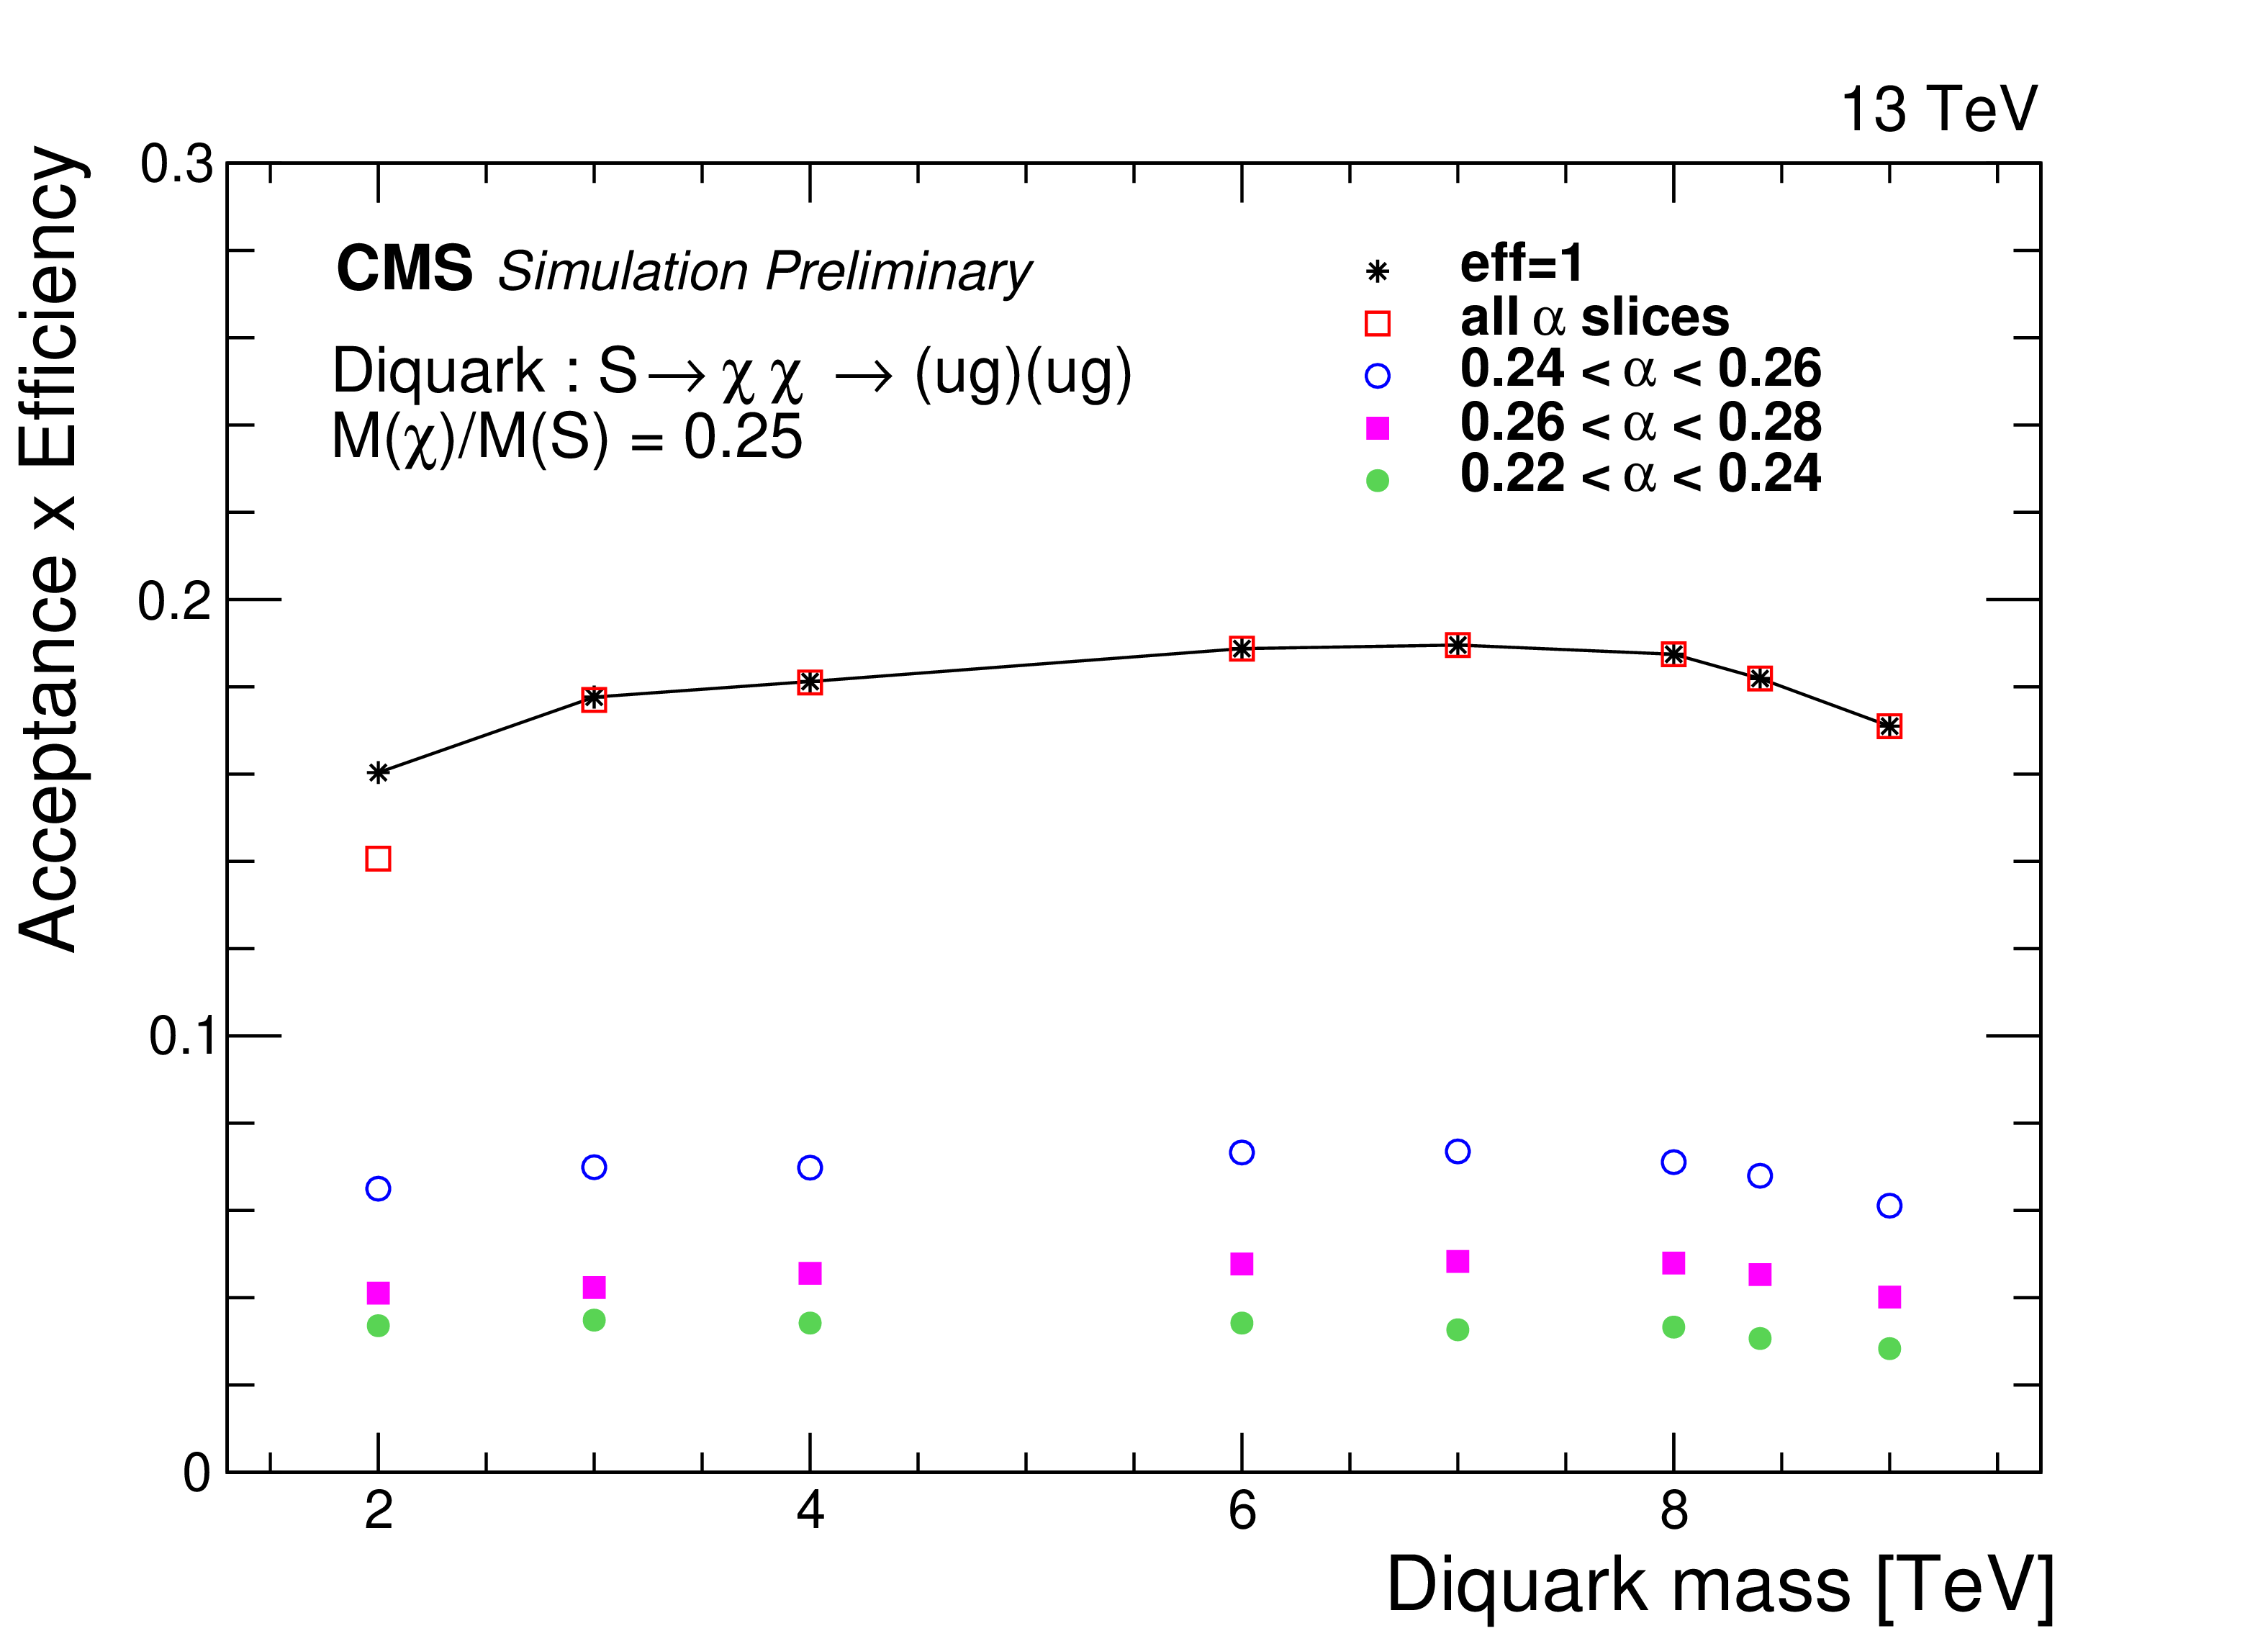
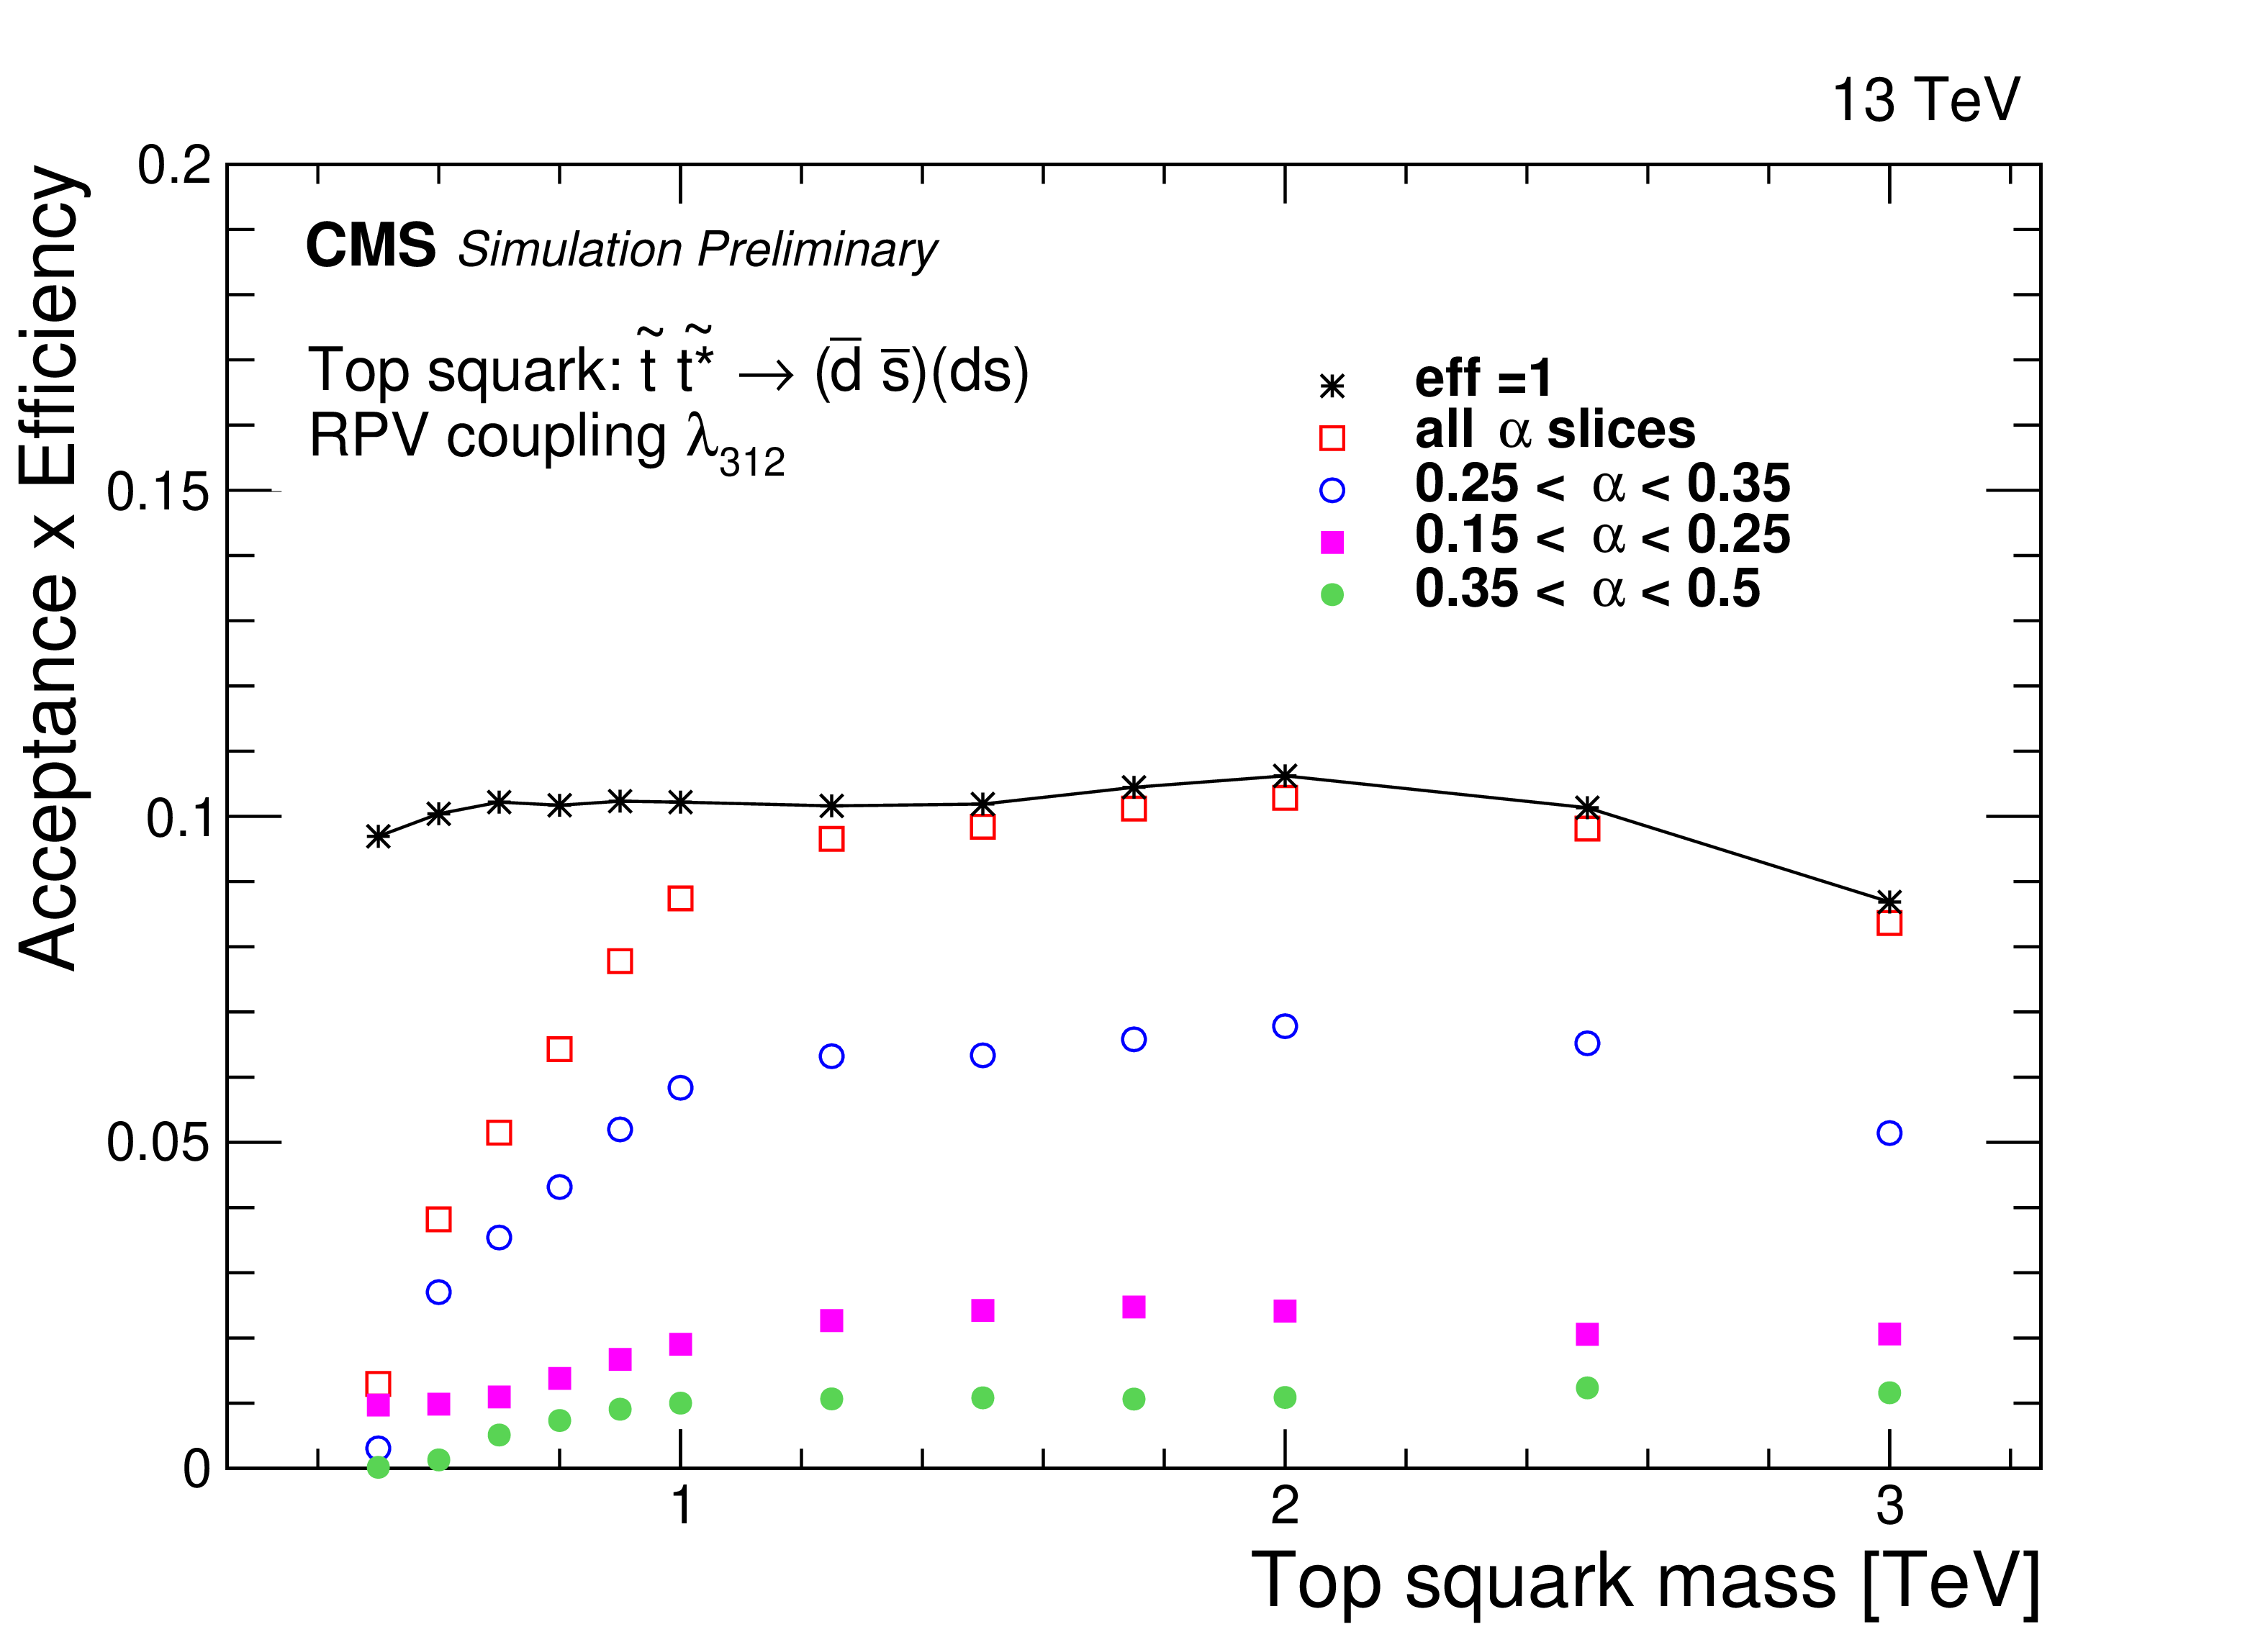
Figure 5:
The acceptance times efficiency of a resonant signal vs the diquark mass (left), and a non-resonant signal vs the top squark mass (right), inclusively, i.e. for all $\alpha $ values, and for the three $\alpha $ bins that contain the majority ($\geq$ 85%) of the signal. The case when the efficiency of the mass selection is unity is also shown as a solid line. |
png pdf |
Figure 5-a:
The acceptance times efficiency of a resonant signal vs the diquark mass (left), and a non-resonant signal vs the top squark mass (right), inclusively, i.e. for all $\alpha $ values, and for the three $\alpha $ bins that contain the majority ($\geq$ 85%) of the signal. The case when the efficiency of the mass selection is unity is also shown as a solid line. |
png pdf |
Figure 5-b:
The acceptance times efficiency of a resonant signal vs the diquark mass (left), and a non-resonant signal vs the top squark mass (right), inclusively, i.e. for all $\alpha $ values, and for the three $\alpha $ bins that contain the majority ($\geq$ 85%) of the signal. The case when the efficiency of the mass selection is unity is also shown as a solid line. |
png pdf |
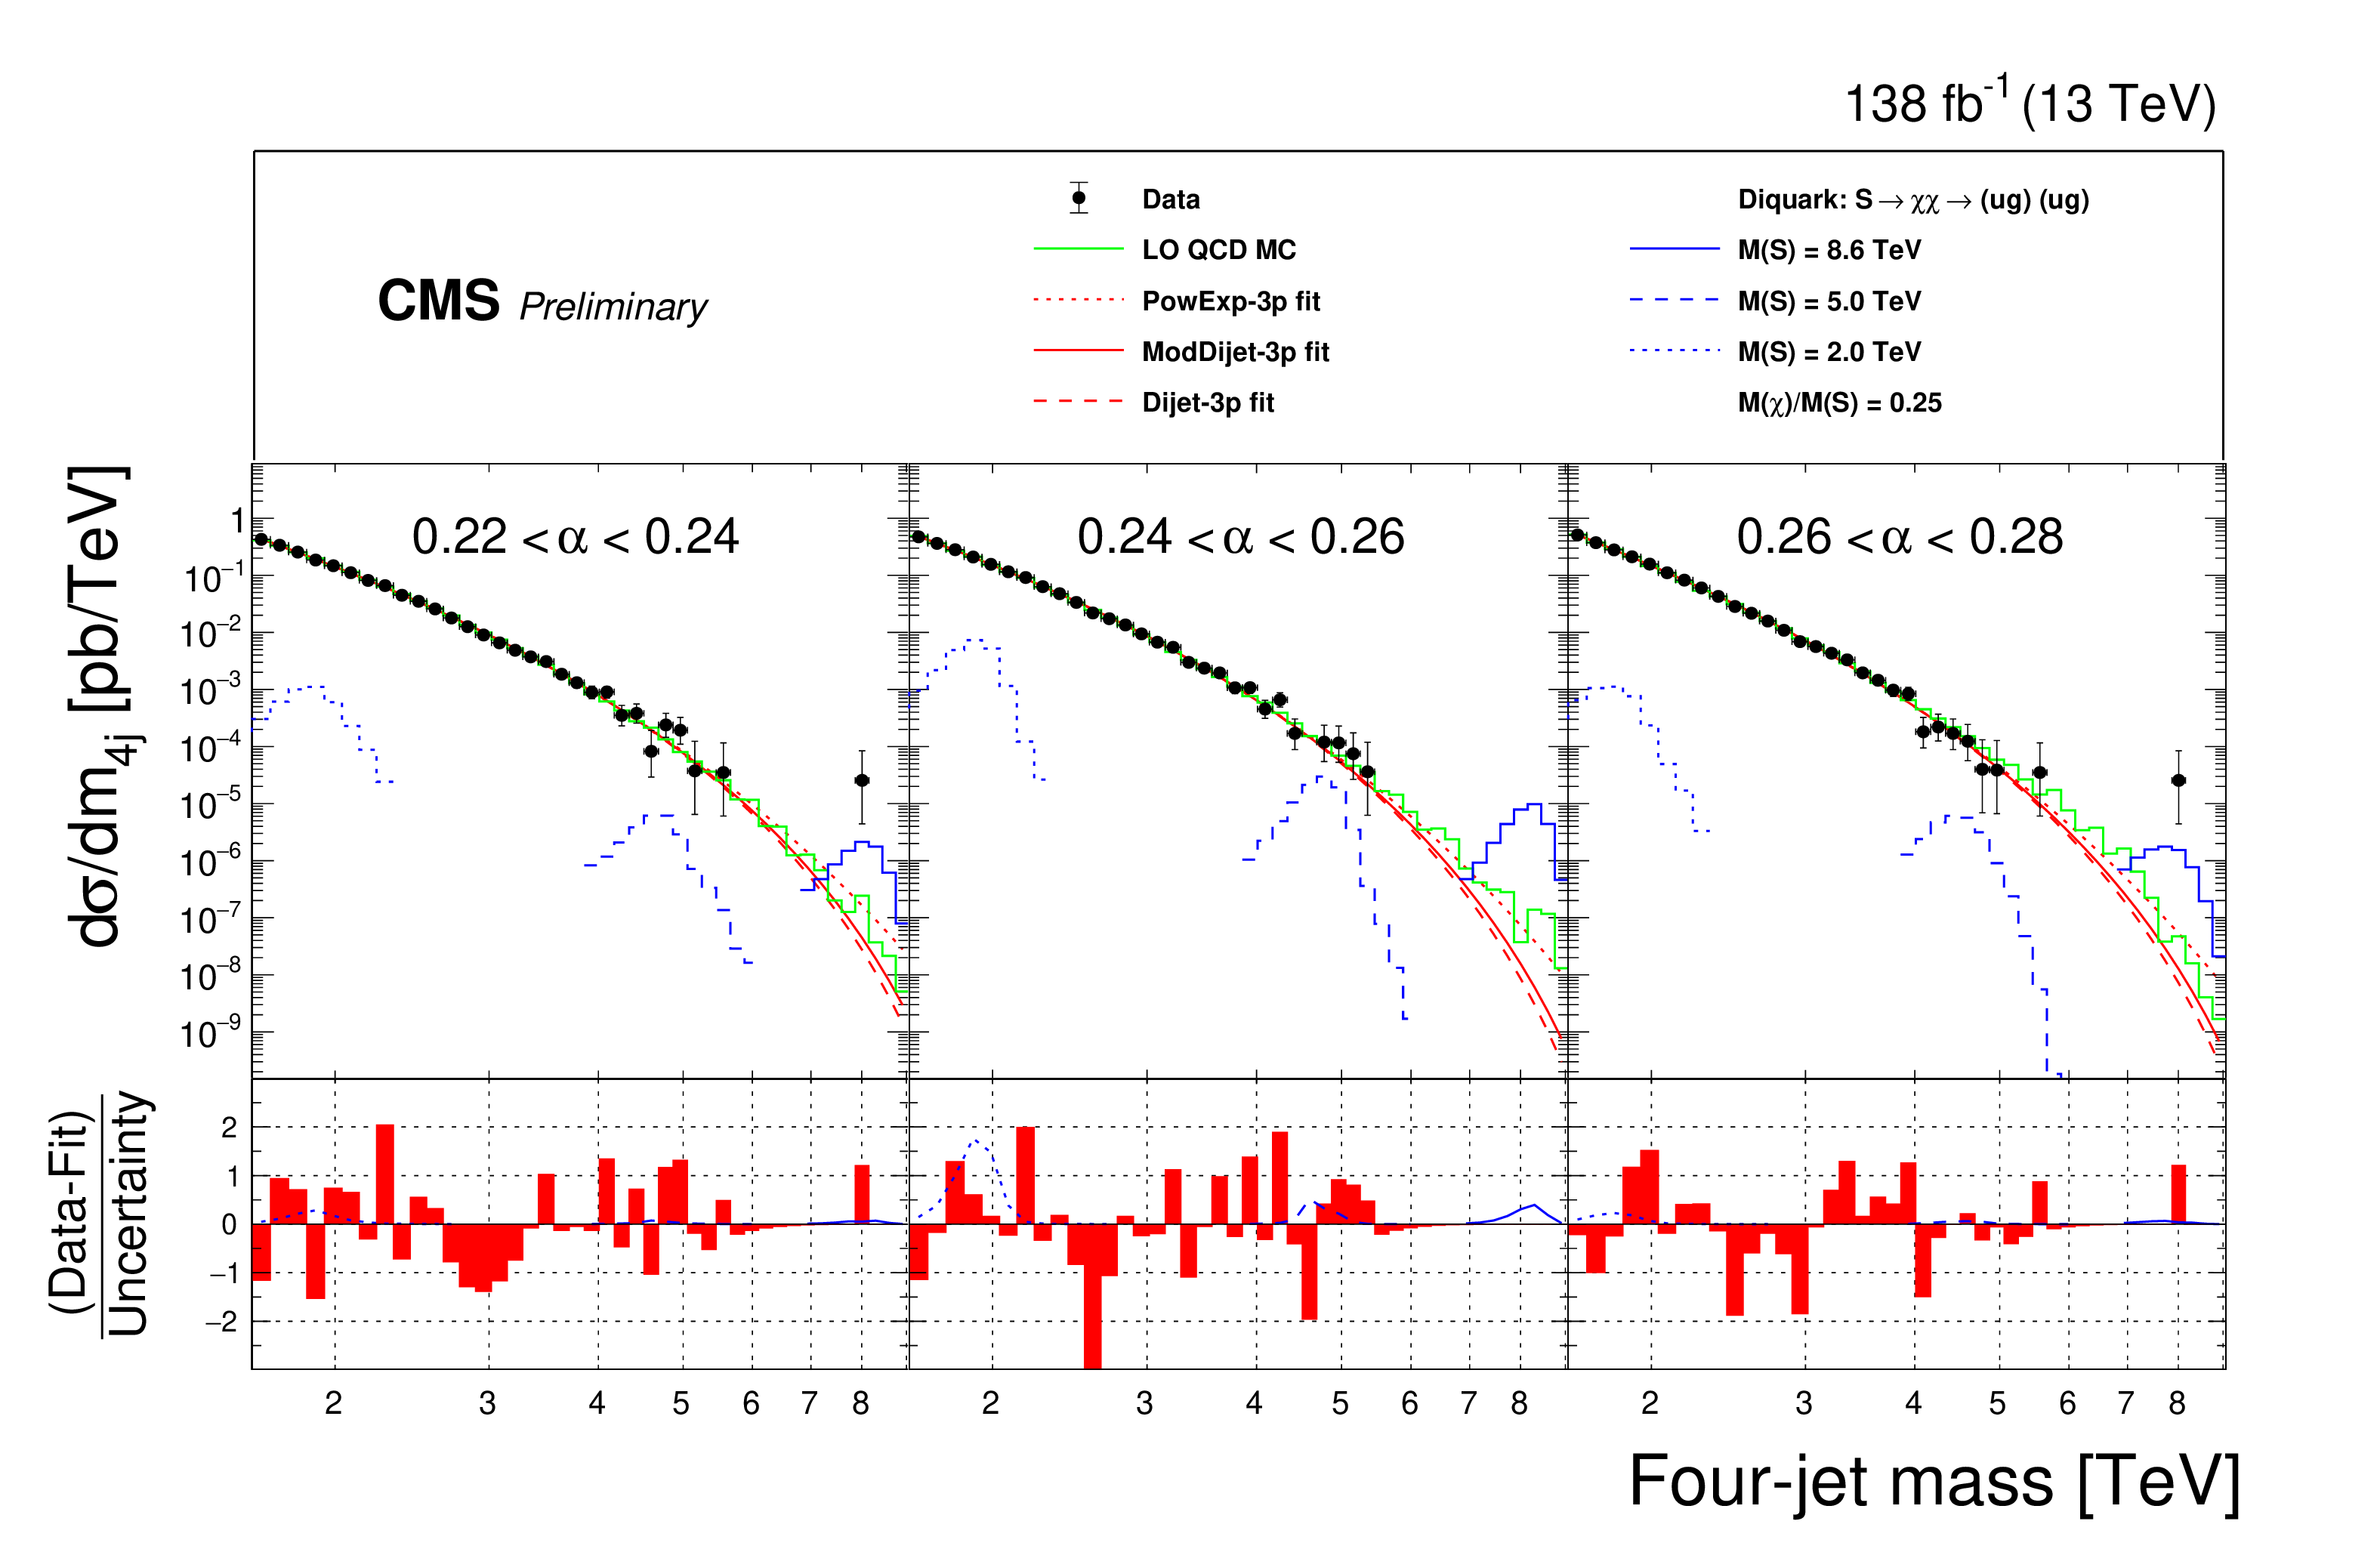
Figure 6:
The four-jet mass distributions of the data (points), within three of the thirteen $\alpha $ bins of the resonant search, compared with LO QCD (green histogram) and fitted with three functions: a power-law times an exponential, PowExp-3p (red dotted), the standard function used by dijet resonance searches, Dijet-3p (red dashed), and a modified version of that dijet function, ModDijet-3p (red solid), each function using three parameters. Examples of predicted diquark signals are shown, with cross sections equal to the observed upper limits at 95% CL, for resonance masses of 2 (blue dotted), 5 (blue dashed), and 8.6 TeV (blue solid). The lower panel shows the pulls from the fit of the ModDijet-3p function to the data. |
png pdf |
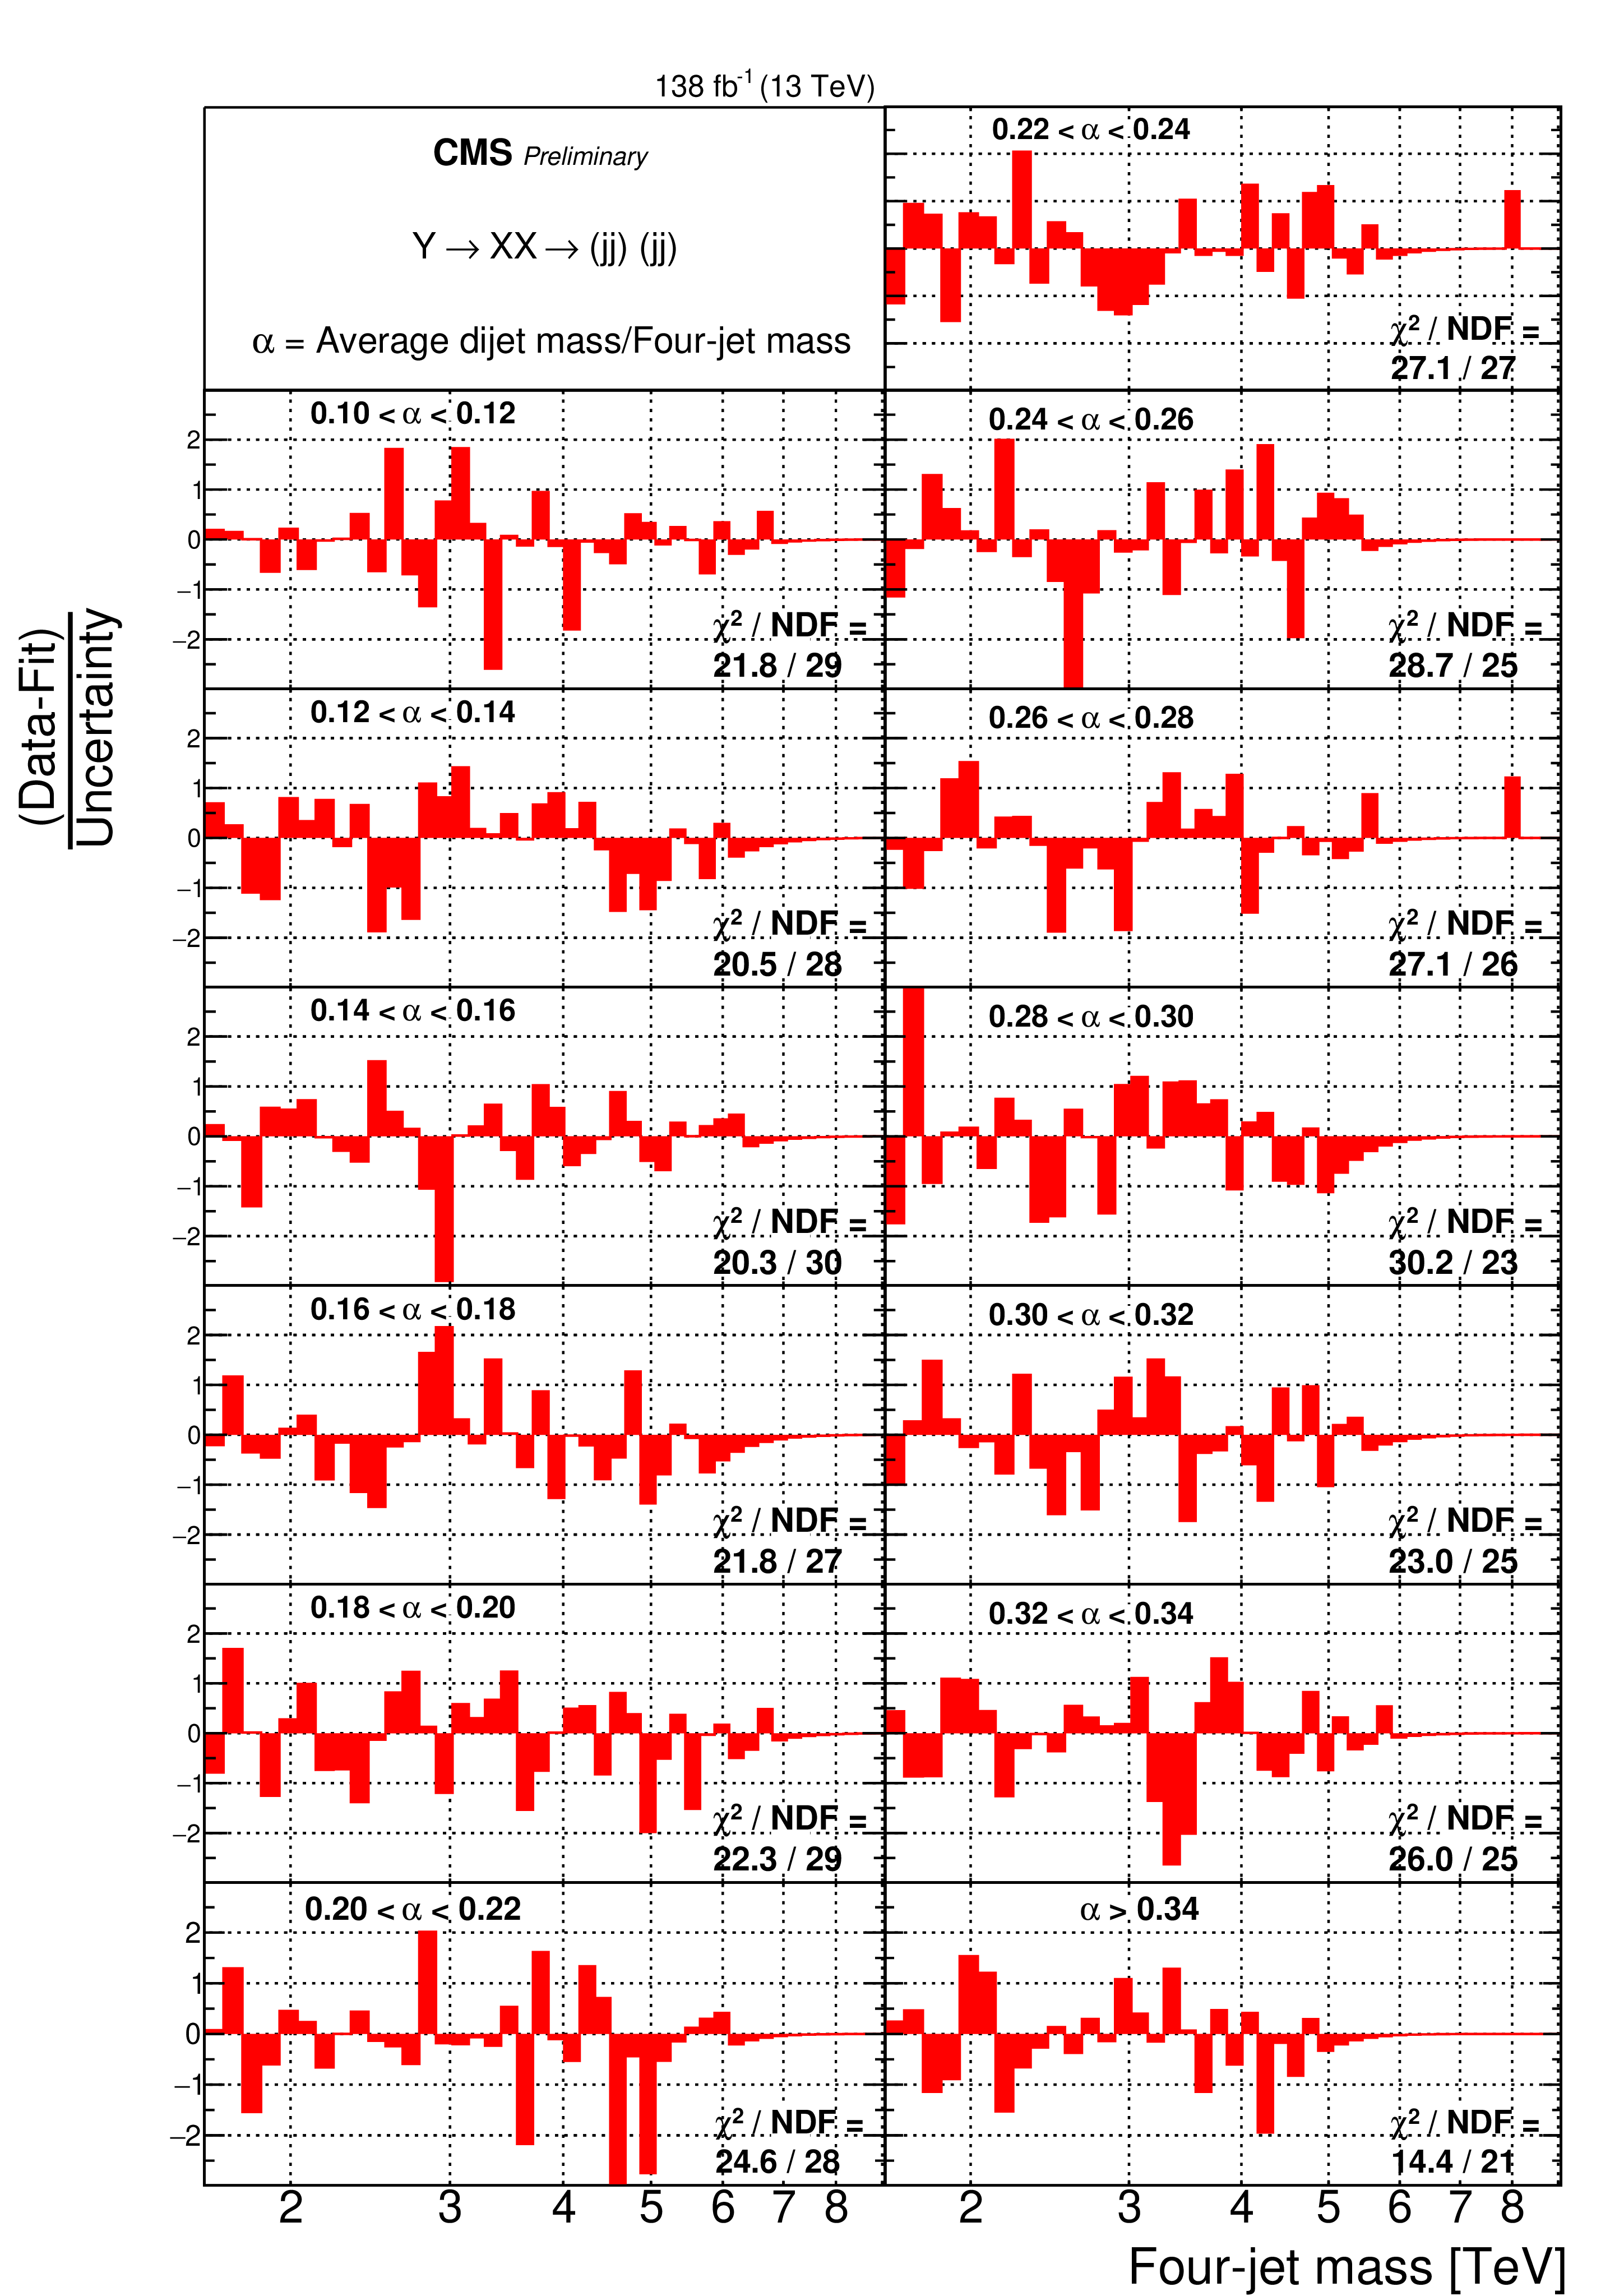
Figure 7:
The pulls from the fit of the ModDijet-3p function to the four-jet mass distribution, and the goodness of fit metric $\chi ^2$/NDF, for all thirteen $\alpha $ bins of the resonant search. The distribution and fits are presented for three of the thirteen $\alpha $ bins in the previous figure. The pulls are calculated using the statistical uncertainty of the data. |
png pdf |
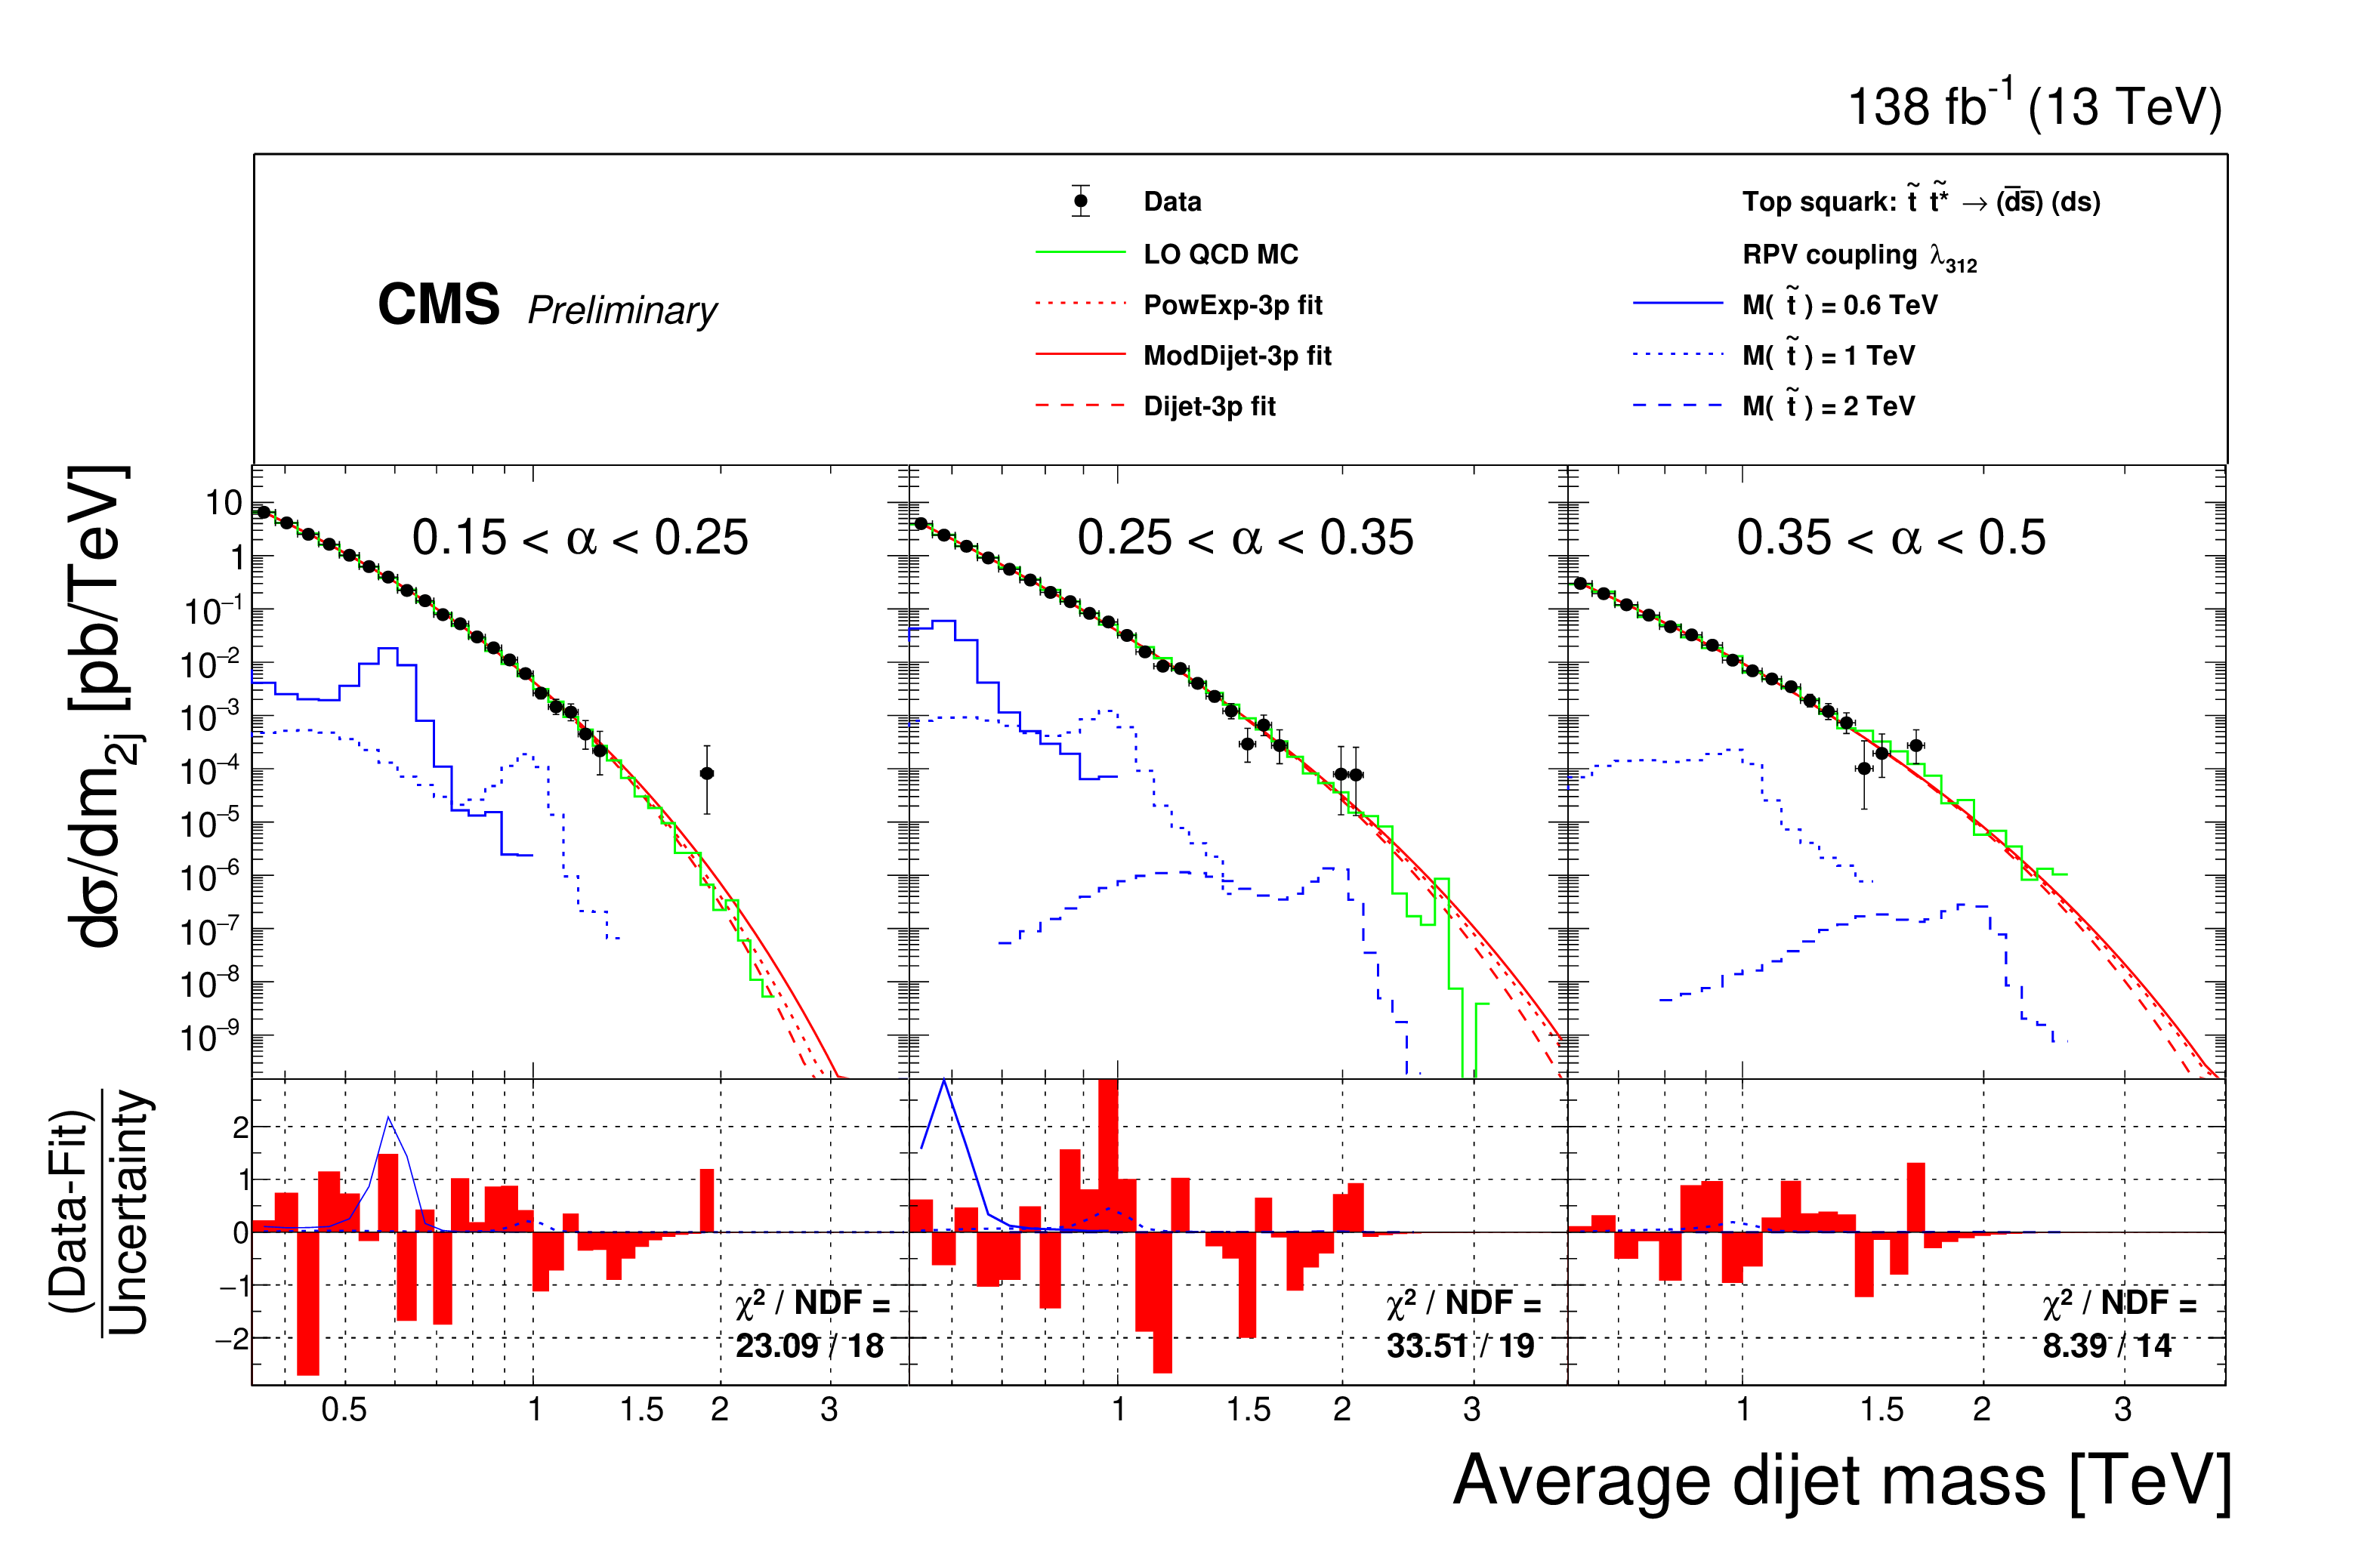
Figure 8:
The average dijet mass distributions for the data (points), within the three $\alpha $ bins of the non-resonant search, compared with LO QCD (green histogram) and fitted with three functions: a power-law times an exponential, PowExp-3p (red dotted), the standard function used by dijet resonance searches, Dijet-3p (red dashed), and a modified version of that dijet function, ModDijet-3p (red solid), each function using three parameters. Examples of predicted top squark pair production signals are shown, with cross sections equal to the expected SUSY cross sections, for top squark masses of 0.6 (blue solid), 1 (blue dotted), and 2 TeV (blue dashed). The lower panel shows the pulls from the fit of the ModDijet-3p function to the dijet mass distribution, the aforementioned signals, and the goodness of fit metric $\chi ^2$/NDF, for all three $\alpha $ bins of the non-resonant search. |
png pdf |
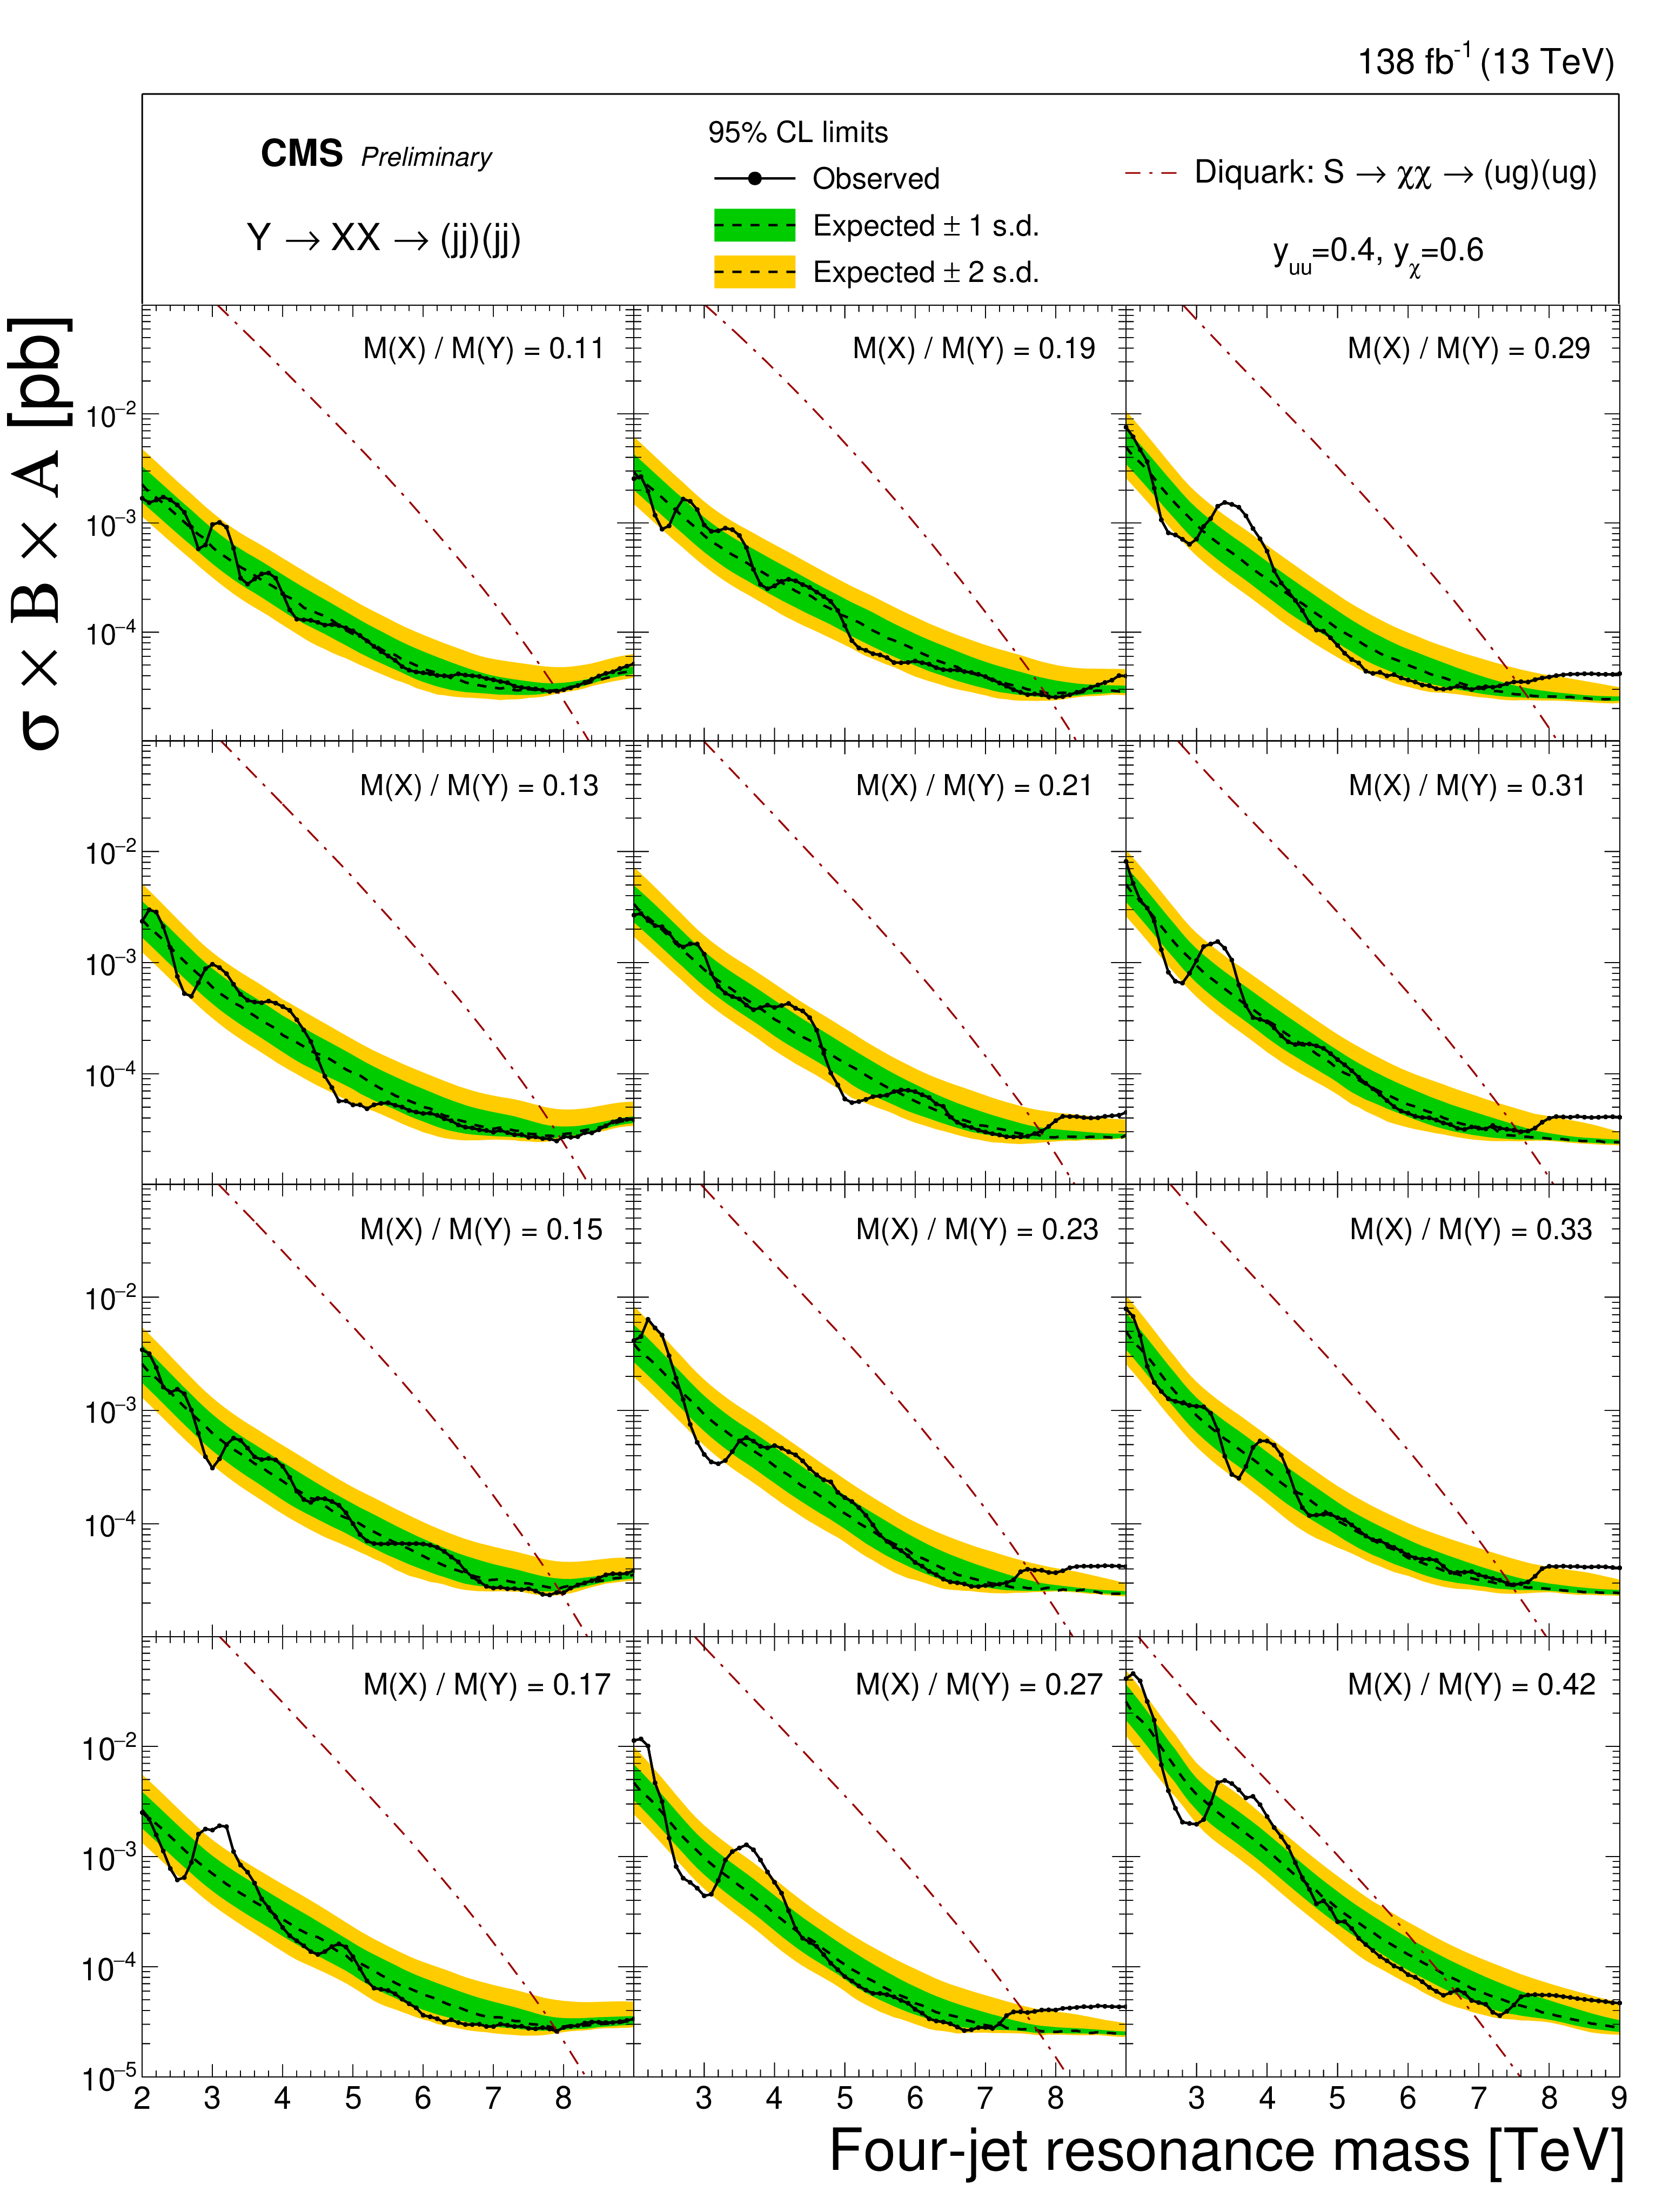
Figure 9:
The observed 95% CL upper limits (points) on the product of the cross section, branching fraction, and acceptance for resonant production of paired dijet resonances decaying to a quark-gluon pair, with the values of $\alpha _{\mathrm {true}} = M(\mathrm{X})/M(\PY) $ shown. The corresponding expected limits (dashed) and their variations at the 1 and 2 standard deviation levels (shaded bands) are also shown. Limits are compared to the scalar diquark model (arXiv:1810.09429) cross section (dot dashed). |
png pdf |
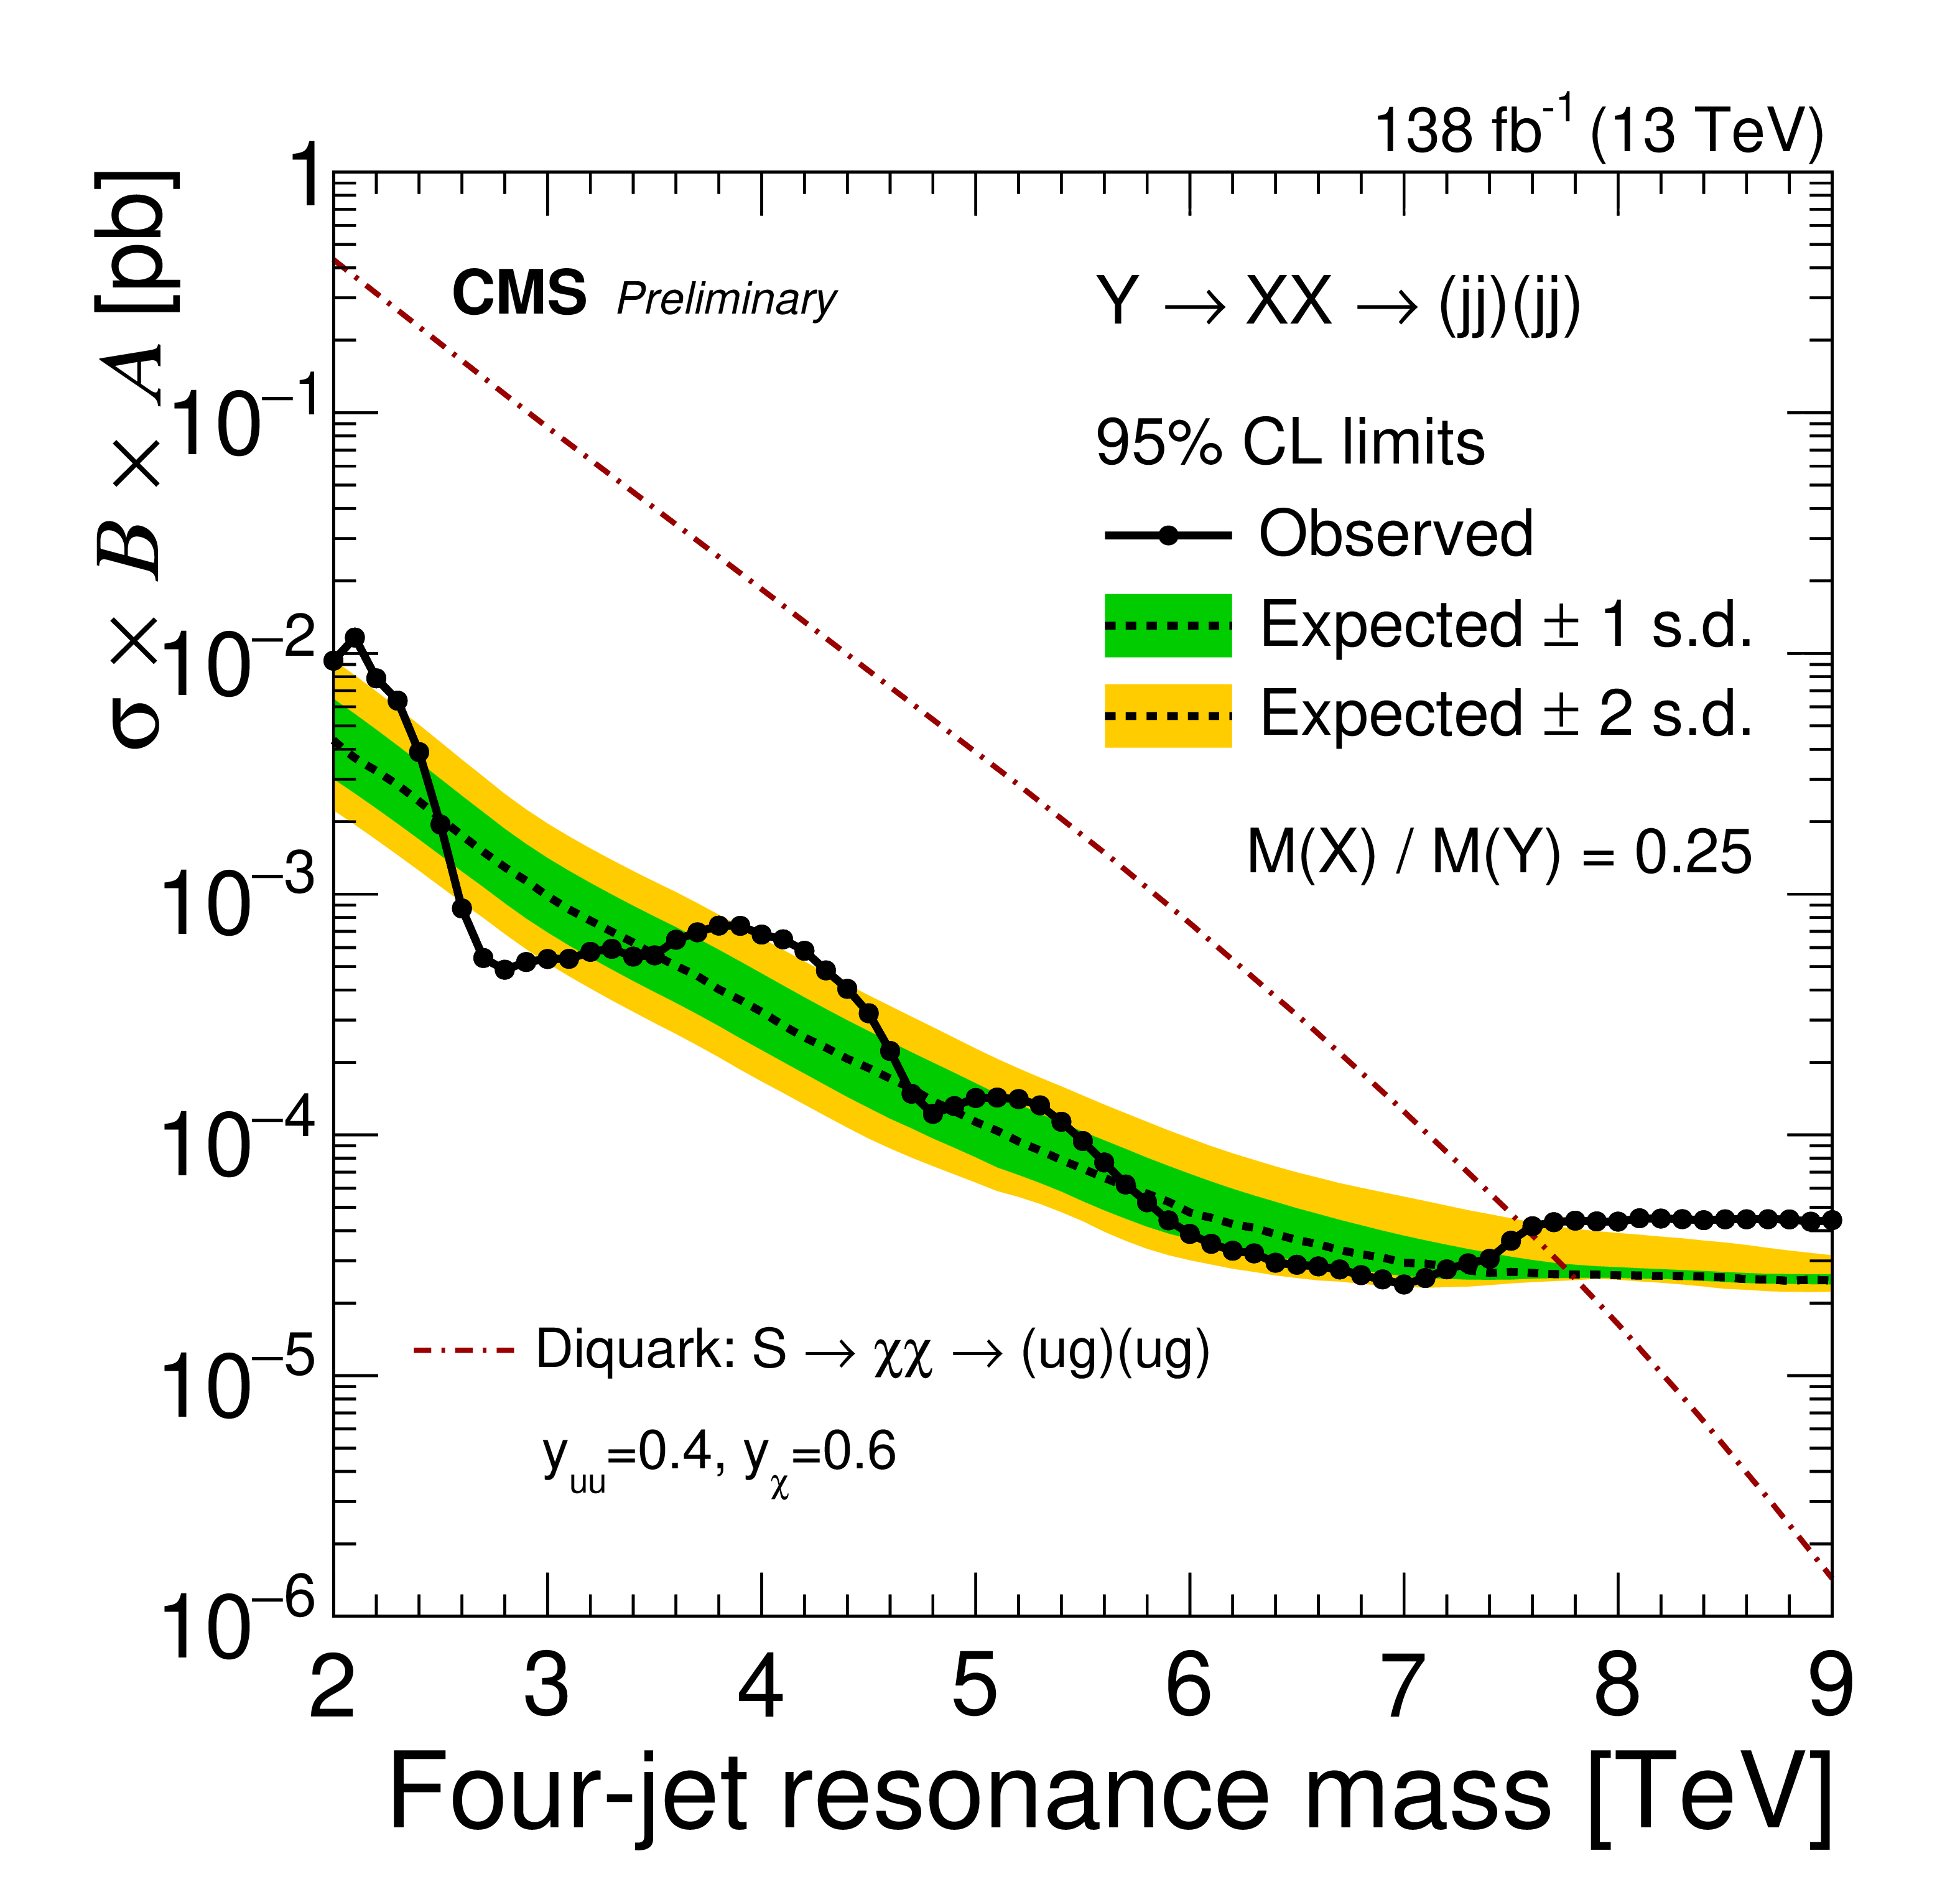
Figure 10:
The observed 95% CL upper limits (points) on the product of the cross section, branching fraction, and acceptance for resonant production of paired dijet resonances decaying to a quark-gluon pair, with $\alpha _{\mathrm {true}}=M(\mathrm{X})/M(\PY)=$ 0.25. The corresponding expected limits (dashed) and their variations at the 1 and 2 standard deviation levels (shaded bands) are also shown. Limits are compared to the scalar diquark model (arXiv:1810.09429) cross section (dot dashed). |

png pdf |
Figure 11:
The observed 95% CL upper limits (points) on the product of the cross section, branching fraction, and acceptance for the non-resonant production of top squark pairs in the RPV SUSY decay scenario. The corresponding expected limits (dashed) and their variations at the 1 and 2 standard deviation levels (shaded bands) are also shown. Limits are compared to the top squark model cross section (dot dashed). |
png pdf |
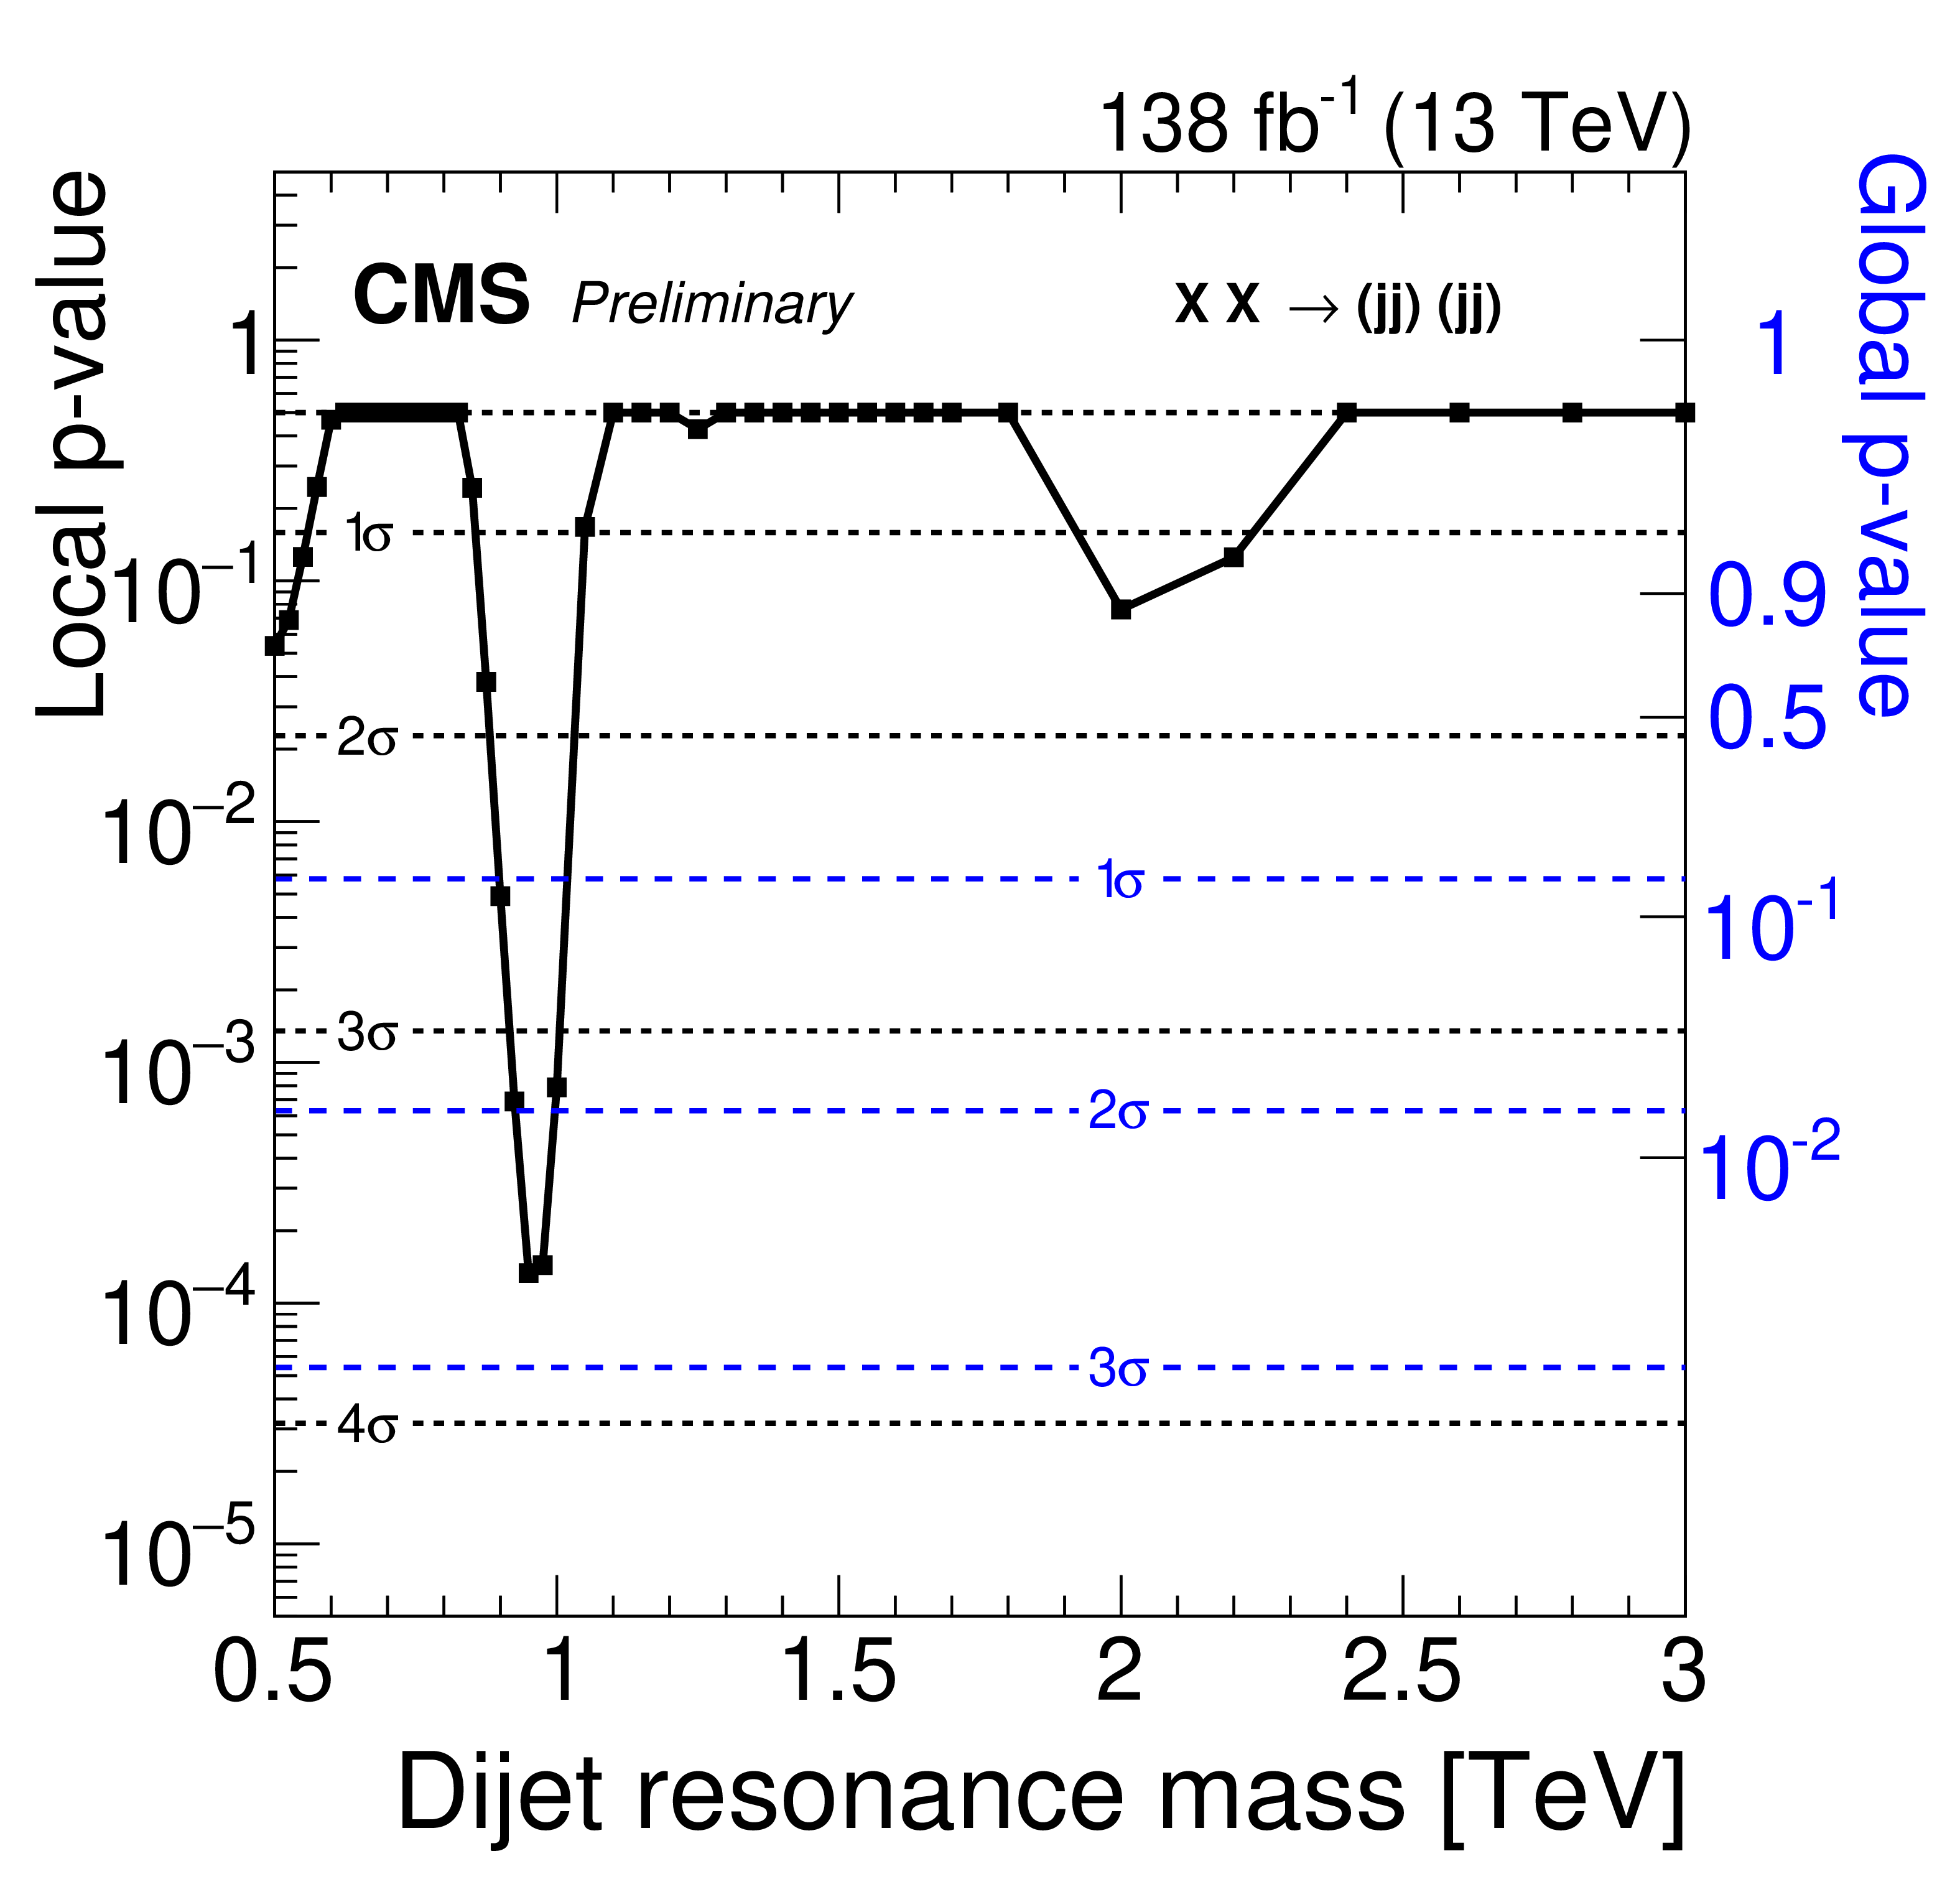
Figure 12:
Observed p-values (points) for non-resonant production of a paired dijet resonance, X. The vertical scales indicate the local p-value (left axis) and the global p-value (right axis in blue) for a signal over all alpha bins. Also shown are corresponding levels of local significance (dashed) and global significance (blue dashed) in units of standard deviation ($\sigma $). |

png pdf |
Figure 13:
Observed p-values (points) for a four-jet resonance, Y, decaying to a pair of dijet resonances, X, with $\alpha _{true} = M(X)/M(Y) =$ 0.25. The vertical scales indicate the local p-value (left axis) and the global p-value (right axis in blue) for a signal over all alpha bins. Also shown are corresponding levels of local significance (dashed) and global significance (blue dashed) in units of standard deviation ($\sigma $). |
png pdf |
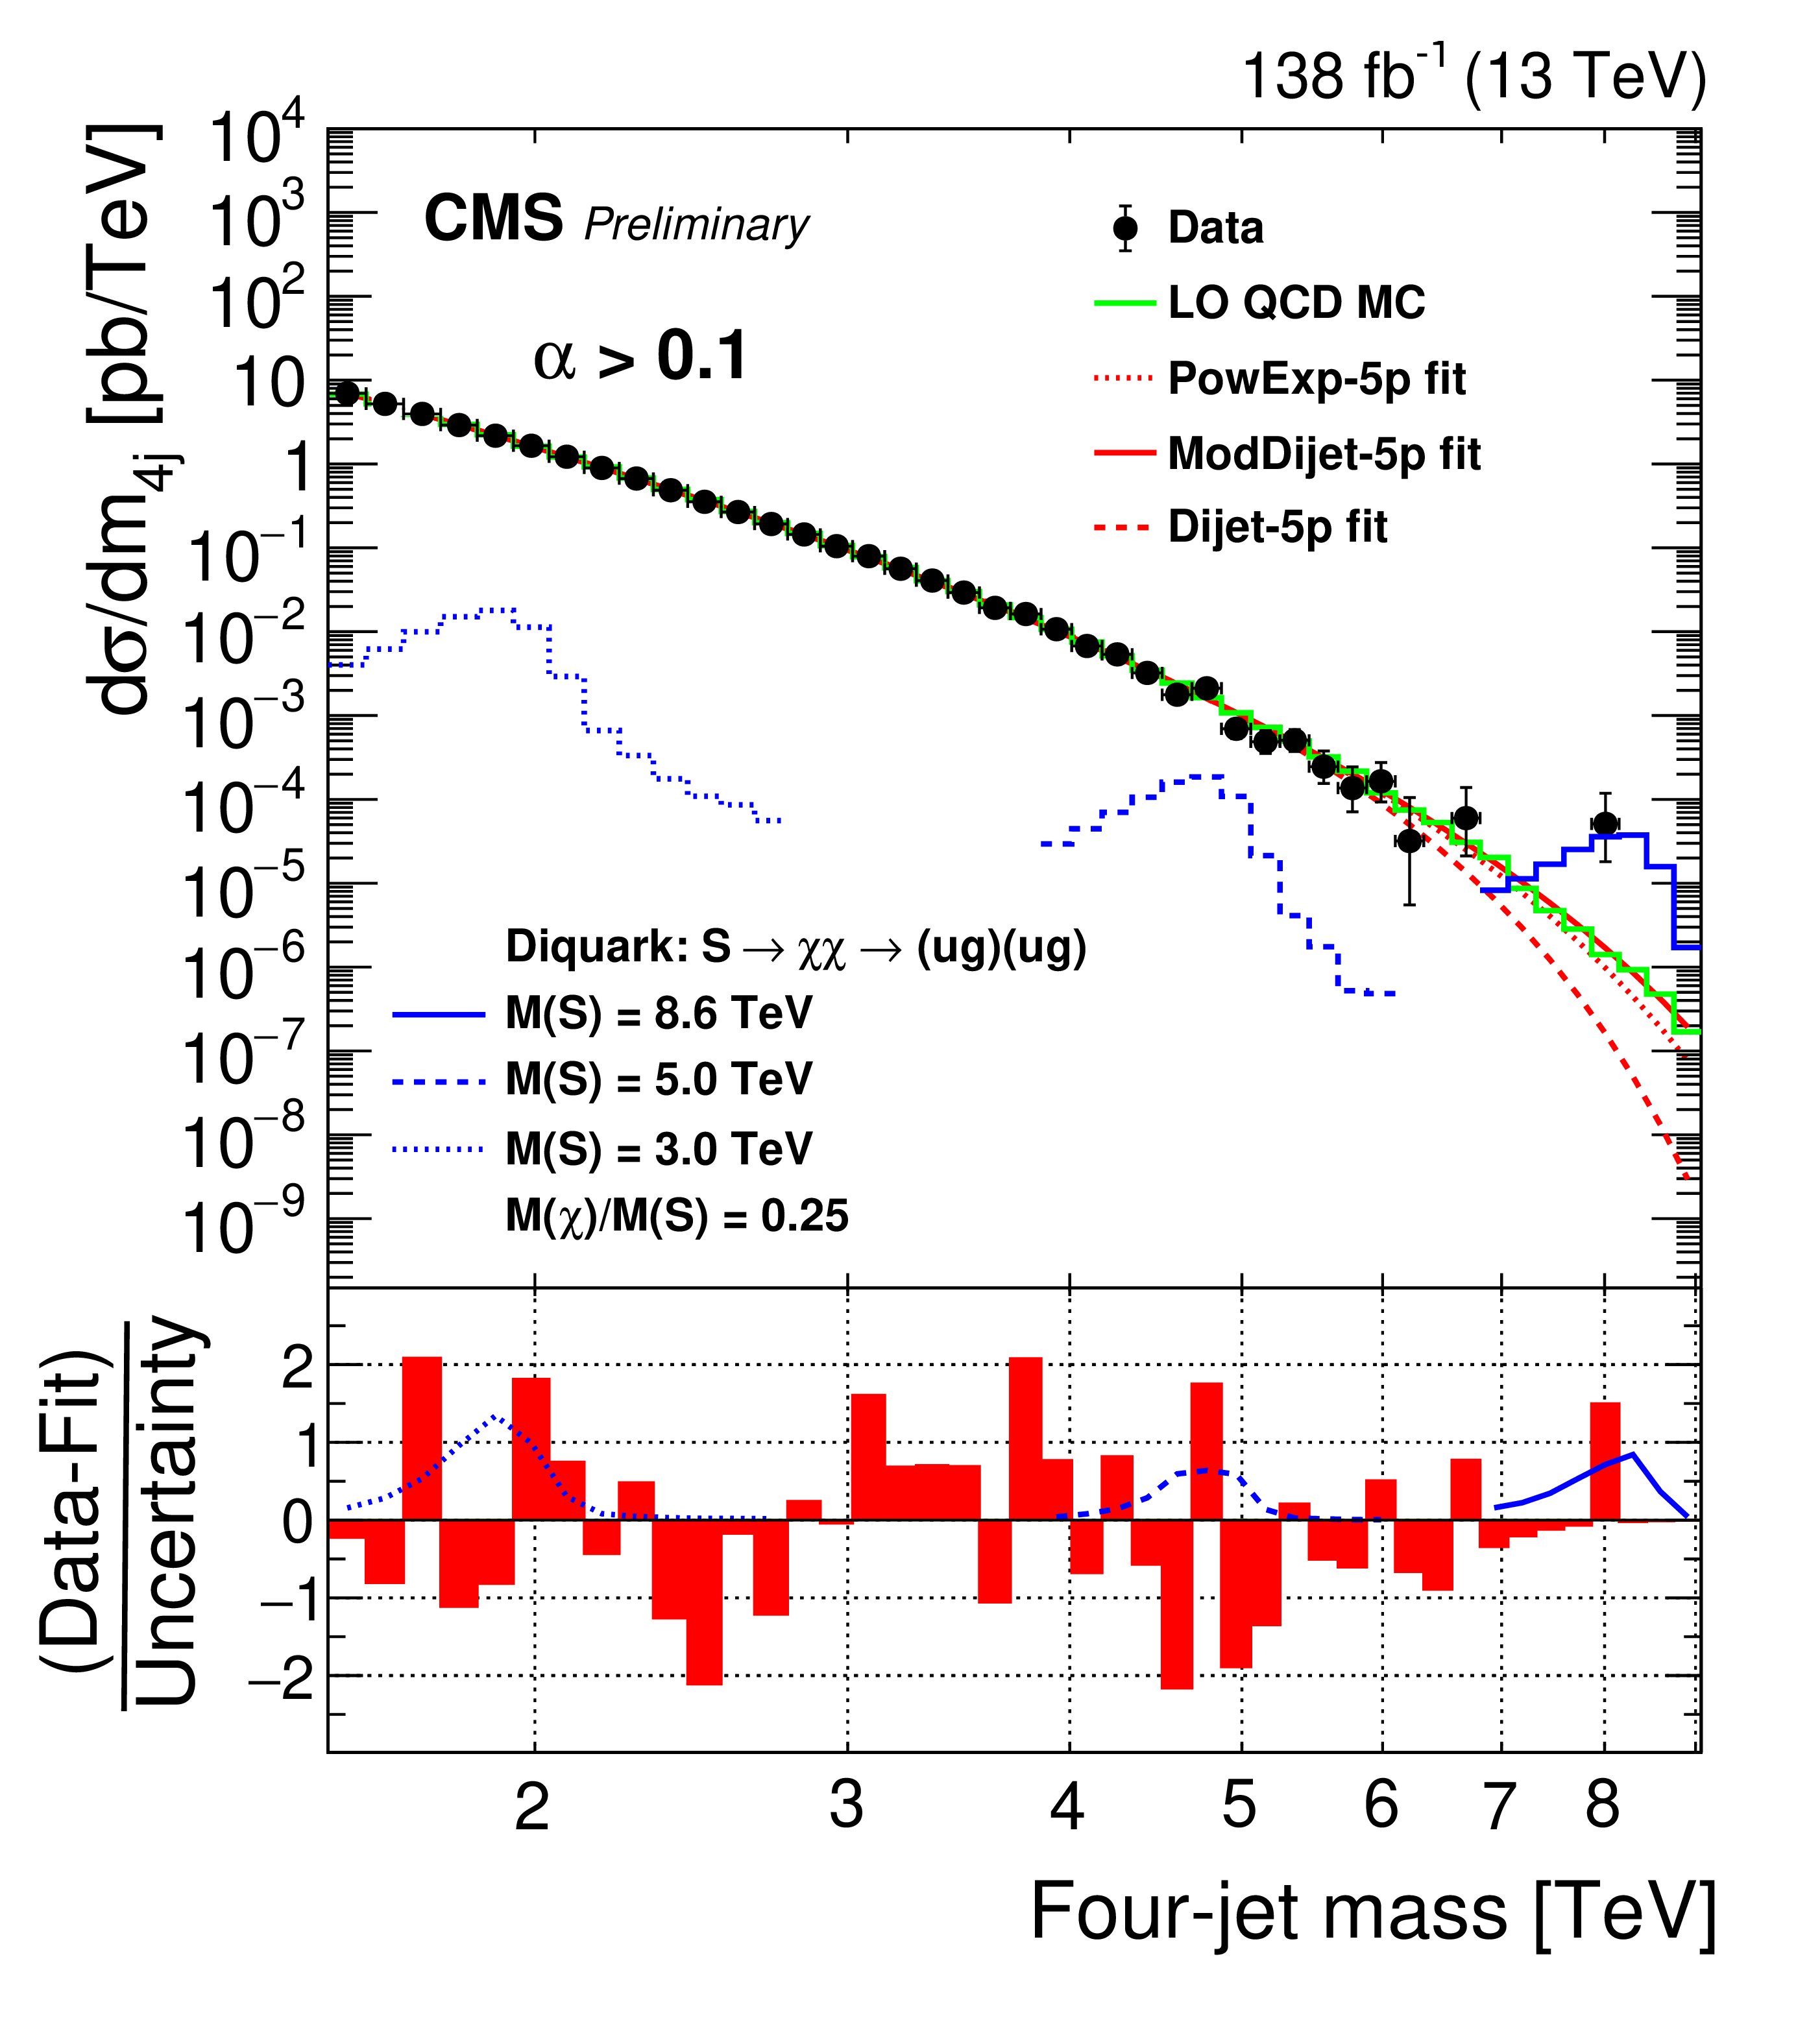
Figure 14:
The four-jet mass distributions of the data (points) for all $\alpha $ bins together. The data is compared with a lowest order QCD prediction of jet production from {pythia} 8 (green histogram) and fitted with three functions: a power-law times an exponential, PowExp-5p (red dotted), the standard function used by dijet resonance searches, Dijet-5p (red dashed), and a modified version of that dijet function, ModDijet-5p (red solid), each function using five parameters. Examples of predicted diquark signals, with cross sections equal to the observed upper limits at 95% CL, are shown for resonance masses of 2 (blue dotted), 5 (blue dashed), and 8.6 TeV (blue solid). The lower panel shows the pulls from the fit of the modified dijet function to the data. |

png pdf |
Figure 15:
Three-dimensional display of the event with the highest four-jet mass of 8.0 TeV. The display shows the energy deposited in the electromagnetic (red) and hadronic (blue) calorimeters and the reconstructed tracks of charged particles (green). The grouping of the four observed jets into two dijet pairs (purple) is discussed in the text. |

png pdf |
Figure 16:
Three-dimensional display of the event with the second highest four-jet mass of 7.9 TeV. The display shows the energy deposited in the electromagnetic (red) and hadronic (blue) calorimeters and the reconstructed tracks of charged particles (green). The grouping of the four observed jets into two dijet pairs (purple) is discussed in the text. |
| Summary |
|
A search for paired dijet resonances is presented in final states with at least four jets, probing dijet masses above 0.35 TeV and four-jet masses above 1.6 TeV. The search uses data from proton-proton collisions at $\sqrt{s} = $ 13 TeV, collected by the CMS experiment at the LHC, corresponding to an integrated luminosity of 138 fb$^{-1}$. For the first time, we search for resonant production of pairs of dijet resonances, where a massive intermediate state leads to an additional four-jet resonance in the final state. We also continue the search for non-resonant production of pairs of equal mass dijet resonances at the LHC. Empirical functions that model the background, and simulated shapes of resonance signals, are fit to the observed four-jet and dijet mass distributions. There are two events on the tail of the distributions, with a four-jet mass of 8 TeV and an average dijet mass of 2 TeV. They result in a local significance of 3.9 standard deviations and a global significance of 1.6 standard deviations, when interpreted as a signal of a four-jet resonance with mass 8.6 TeV and a dijet resonance with mass 2.15 TeV. More data are needed to establish these two events as the first hints of a signal, and LHC data with the highest possible collision energy would be the most effective. Model-independent upper limits at 95% confidence level are presented on the production cross section, times branching ratio and acceptance. For resonant production, the limits are presented as a function of four-jet resonance mass between 2 and 9 TeV, for all accessible values of the ratio of the dijet to four-jet resonance masses. For non-resonant production, the limits are presented as a function of dijet resonance mass between 0.5 and 3 TeV. Limits from the resonant search are compared to a model [22] of diquarks, which decay to pairs of vector-like quarks, which in-turn decay to a quark and a gluon. We present mass limits for all accessible values of the ratio of the vector-like quark to diquark masses, for a benchmark model where the diquark couplings to pairs of up quarks is 0.4, and the diquark couplings to pairs of vector-like quarks is 0.6. In particular, when we choose the ratio of the vector-like quark to diquark mass to be 0.25, motivated by the two observed events discussed above, we exclude at 95% CL diquarks with a mass less than 7.6 TeV (observed) and 7.8 TeV (expected). Limits from the non-resonant search are compared to a model [23] of R-parity violating supersymmetry, with pair produced top squarks decaying to down and strange quarks. We exclude at 95% CL top squarks with masses between 0.50 and 0.52 TeV, and between 0.58 and 0.77 TeV (observed), and less than 0.67 TeV (expected), significantly extending the previous limit of 0.52 TeV [21]. In this case the most significant signal hypothesis occurs at an average dijet mass of 0.95 TeV, for which the local significance is 3.6 standard deviations and the global significance is 2.5 standard deviations. |
| References | ||||
| 1 | CMS Collaboration | Search for high mass dijet resonances with a new background prediction method in proton-proton collisions at $ \sqrt{s} = $ 13 TeV | JHEP 05 (2020) 033 | CMS-EXO-19-012 1911.03947 |
| 2 | ATLAS Collaboration | Search for new resonances in mass distributions of jet pairs using 139 fb$ ^{-1} $ of $ pp $ collisions at $ \sqrt{s}= $ 13 TeV with the ATLAS detector | JHEP 03 (2020) 145 | 1910.08447 |
| 3 | CMS Collaboration | Search for narrow and broad dijet resonances in proton-proton collisions at $ \sqrt{s}= $ 13 TeV and constraints on dark matter mediators and other new particles | JHEP 08 (2018) 130 | CMS-EXO-16-056 1806.00843 |
| 4 | ATLAS Collaboration | Search for new phenomena in dijet events using 37 fb$ ^{-1} $ of $ pp $ collision data collected at $ \sqrt{s}= $ 13 TeV with the ATLAS detector | PRD 96 (2017) 052004 | 1703.09127 |
| 5 | CMS Collaboration | Search for dijet resonances in proton-proton collisions at $ \sqrt{s} = $ 13 TeV and constraints on dark matter and other models | PLB 769 (2017) 520 | CMS-EXO-16-032 1611.03568 |
| 6 | CMS Collaboration | Search for narrow resonances decaying to dijets in proton-proton collisions at $ \sqrt{s} = $ 13 TeV | PRL 116 (2016) 071801 | CMS-EXO-15-001 1512.01224 |
| 7 | ATLAS Collaboration | Search for new phenomena in dijet mass and angular distributions from pp collisions at $ \sqrt{s}= $ 13 TeV with the ATLAS detector | PLB 754 (2016) 302 | 1512.01530 |
| 8 | CMS Collaboration | Search for narrow resonances in dijet final states at $ \sqrt{s}= $ 8 TeV with the novel CMS technique of data scouting | PRL 117 (2016) 031802 | CMS-EXO-14-005 1604.08907 |
| 9 | CMS Collaboration | Search for resonances and quantum black holes using dijet mass spectra in proton-proton collisions at $ \sqrt{s} = $ 8 TeV | PRD 91 (2015) 052009 | CMS-EXO-12-059 1501.04198 |
| 10 | ATLAS Collaboration | Search for new phenomena in the dijet mass distribution using pp collision data at $ \sqrt{s}= $ 8 TeV with the ATLAS detector | PRD 91 (2015) 052007 | 1407.1376 |
| 11 | CMS Collaboration | Search for narrow resonances using the dijet mass spectrum in pp collisions at $ \sqrt{s} = $ 8 TeV | PRD 87 (2013) 114015 | CMS-EXO-12-016 1302.4794 |
| 12 | CMS Collaboration | Search for narrow resonances and quantum black holes in inclusive and b-tagged dijet mass spectra from pp collisions at $ \sqrt{s}= $ 7 TeV | JHEP 01 (2013) 013 | CMS-EXO-11-094 1210.2387 |
| 13 | ATLAS Collaboration | Search for new physics in the dijet mass distribution using 1 fb$ ^{-1} $ of $ pp $ collision data at $ \sqrt{s} = $ 7 TeV collected by the ATLAS detector | PLB 708 (2012) 37 | 1108.6311 |
| 14 | ATLAS Collaboration | ATLAS search for new phenomena in dijet mass and angular distributions using pp collisions at $ \sqrt{s}= $ 7 TeV | JHEP 01 (2013) 029 | 1210.1718 |
| 15 | CMS Collaboration | Search for resonances in the dijet mass spectrum from 7 TeV pp collisions at CMS | PLB 704 (2011) 123 | CMS-EXO-11-015 1107.4771 |
| 16 | ATLAS Collaboration | Search for new physics in dijet mass and angular distributions in $ pp $ collisions at $ \sqrt{s} = $ 7 TeV measured with the ATLAS detector | New J. Phys. 13 (2011) 053044 | 1103.3864 |
| 17 | CMS Collaboration | Search for dijet resonances in 7 TeV pp collisions at CMS | PRL 105 (2010) 211801 | CMS-EXO-10-010 1010.0203 |
| 18 | ATLAS Collaboration | Search for new particles in two-jet final states in 7 TeV proton-proton collisions with the ATLAS detector at the LHC | PRL 105 (2010) 161801 | 1008.2461 |
| 19 | R. M. Harris and K. Kousouris | Searches for Dijet Resonances at Hadron Colliders | Int. J. Mod. Phys. A 26 (2011) 5005--5055 | 1110.5302 |
| 20 | ATLAS Collaboration | Dijet resonance search with weak supervision using $ \sqrt{s}=$ 13 TeV pp collisions in the ATLAS detector | PRL 125 (2020) 131801 | 2005.02983 |
| 21 | CMS Collaboration | Search for pair-produced resonances decaying to quark pairs in proton-proton collisions at $ \sqrt{s}= $ 13 TeV | PRD 98 (2018) 112014 | CMS-EXO-17-021 1808.03124 |
| 22 | B. A. Dobrescu, R. M. Harris, and J. Isaacson | Ultraheavy resonances at the LHC: beyond the QCD background | 1810.09429 | |
| 23 | R. Barbier et al. | R-parity violating supersymmetry | PR 420 (2005) 1 | hep-ph/0406039 |
| 24 | ATLAS Collaboration | A search for pair-produced resonances in four-jet final states at $ \sqrt{s} = $ 13 TeV with the ATLAS detector | EPJC 78 (2018) 250 | 1710.07171 |
| 25 | CMS Collaboration | Search for pair-produced resonances decaying to jet pairs in proton-proton collisions at $ \sqrt{s} = $ 8 TeV | PLB 747 (2015) 98 | CMS-EXO-12-052 1412.7706 |
| 26 | ATLAS Collaboration | A search for top squarks with R-parity-violating decays to all-hadronic final states with the ATLAS detector in $ \sqrt{s} = $ 8 TeV proton-proton collisions | JHEP 06 (2016) 067 | 1601.07453 |
| 27 | CMS Collaboration | Search for Pair-Produced Dijet Resonances in Four-Jet Final States in pp Collisions at $ \sqrt{s} = $ 7 TeV | PRL 110 (2013) 141802 | CMS-EXO-11-016 1302.0531 |
| 28 | ATLAS Collaboration | Search for pair-produced massive coloured scalars in four-jet final states with the ATLAS detector in proton-proton collisions at $ \sqrt{s}= $ 7 TeV | EPJC 73 (2013) 2263 | 1210.4826 |
| 29 | CMS Collaboration | The CMS experiment at the CERN LHC | JINST 3 (2008) S08004 | CMS-00-001 |
| 30 | CMS Collaboration | Particle-flow reconstruction and global event description with the CMS detector | JINST 12 (2017) P10003 | CMS-PRF-14-001 1706.04965 |
| 31 | M. Cacciari and G. P. Salam | Dispelling the $ N^{3} $ myth for the $ k_\mathrm{t} $ jet-finder | PLB 641 (2006) 57 | hep-ph/0512210 |
| 32 | M. Cacciari, G. P. Salam, and G. Soyez | The anti-$ {k_{\mathrm{T}}} $ jet clustering algorithm | JHEP 04 (2008) 063 | 0802.1189 |
| 33 | M. Cacciari, G. P. Salam, and G. Soyez | FastJet user manual | EPJC 72 (2012) 1896 | 1111.6097 |
| 34 | M. Cacciari and G. P. Salam | Pileup subtraction using jet areas | PLB 659 (2008) 119 | 0707.1378 |
| 35 | CMS Collaboration | Jet energy scale and resolution in the CMS experiment in pp collisions at 8 TeV | JINST 12 (2017) P02014 | CMS-JME-13-004 1607.03663 |
| 36 | CMS Collaboration | The CMS trigger system | JINST 12 (2017) P01020 | CMS-TRG-12-001 1609.02366 |
| 37 | CMS Collaboration | Jet algorithms performance in 13 TeV data | CMS-PAS-JME-16-003 | CMS-PAS-JME-16-003 |
| 38 | J. Alwall et al. | MadGraph 5 : Going Beyond | JHEP 1106 (2011) 128 | 1106.0522 |
| 39 | J. A. Evans and Y. Kats | LHC Coverage of RPV MSSM with Light Stops | JHEP 1304 (2013) 028 | 1209.0764 |
| 40 | T. Sjostrand et al. | An introduction to PYTHIA 8.2 | CPC 191 (2015) 159 | 1410.3012 |
| 41 | GEANT 4 Collaboration | Geant4 -- a simulation toolkit | Nucl. Instr. and Methods A 506 (2003) 250 | |
| 42 | CMS Collaboration | Event generator tunes obtained from underlying event and multiparton scattering measurements | EPJC 76 (2016) 155 | CMS-GEN-14-001 1512.00815 |
| 43 | P. Skands, S. Carrazza, and J. Rojo | Tuning PYTHIA 8.1: the Monash 2013 tune | EPJC 74 (2014) 3024 | 1404.5630 |
| 44 | NNPDF Collaboration | Parton distributions with LHC data | NPB 867 (2013) 244 | 1207.1303 |
| 45 | CDF Collaboration | Search for new particles decaying into dijets in proton-antiproton collisions at $ \sqrt{s} = $ 1.96 ~TeV | PRD 79 (2009) 112002 | 0812.4036 |
| 46 | CMS Collaboration | Precision luminosity measurement in proton-proton collisions at $ \sqrt{s} = $ 13 TeV in 2015 and 2016 at CMS | 2021. Submitted to EPJC | CMS-LUM-17-003 2104.01927 |
| 47 | CMS Collaboration | CMS luminosity measurements for the 2017 data taking period | CMS-PAS-LUM-17-004 | CMS-PAS-LUM-17-004 |
| 48 | CMS Collaboration | CMS luminosity measurements for the 2018 data taking period | CMS-PAS-LUM-18-002 | CMS-PAS-LUM-18-002 |
| 49 | P. D. Dauncey, M. Kenzie, N. Wardle, and G. J. Davies | Handling uncertainties in background shapes: the discrete profiling method | JINST 10 (2015) P04015 | 1408.6865 |
| 50 | T. Junk | Confidence level computation for combining searches with small statistics | Nucl. Instr. Meth. A 434 (1999) 435 | hep-ex/9902006 |
| 51 | A. L. Read | Presentation of search results: the $ CL_s $ technique | JPG 28 (2002) 2693 | |
| 52 | LHC Higgs Combination Group | Procedure for the LHC Higgs boson search combination in Summer 2011 | CMS-NOTE-2011-005 | |
| 53 | G. Cowan, K. Cranmer, E. Gross, and O. Vitells | Asymptotic formulae for likelihood-based tests of new physics | EPJC 71 (2011) 1554 | 1007.1727 |
| 54 | R. D. Cousins and V. L. Highland | Incorporating systematic uncertainties into an upper limit | NIMA 320 (1992) 331 | |
| 55 | C. Borschensky et al. | Squark and gluino production cross sections in pp collisions at $ \sqrt{s} = $ 13, 14, 33 and 100 TeV | EPJC74 (2014) 3174 | 1407.5066 |
| 56 | W. Beenakker et al. | NLO+NLL squark and gluino production cross-sections with threshold-improved parton distributions | EPJC76 (2016), no. 2, 53 | 1510.00375 |
|
|
Compact Muon Solenoid LHC, CERN |
|

|

|

|

|

|