

Compact Muon Solenoid
LHC, CERN
| CMS-PAS-EXO-19-017 | ||
| Search for new physics in the lepton plus missing transverse momentum final state in proton-proton collisions at 13 TeV center-of-mass energy | ||
| CMS Collaboration | ||
| March 2021 | ||
| Abstract: A search for physics beyond the standard model in final states with an electron, or muon, and missing transverse momentum is presented. The analysis uses data from proton-proton collisions at 13 TeV center-of-mass energy, collected with the CMS detector at the LHC in 2016, 2017, and 2018 corresponding to a total integrated luminosity of 137 fb$^{-1}$. No significant deviation from the standard model prediction is observed. Model-independent limits are set on the production cross section of W' bosons decaying into lepton plus neutrino final states. This analysis also sets limits on the parameters of other new physics models. The best exclusion limit obtained is 5.7 TeV at 95% confidence level on the mass of a sequential standard model W' boson with standard-model-like couplings and comes from combining electron and muon decay channels. Results on oblique electroweak parameters, in particular on the W parameter, are also presented, for the first time using LHC data. | ||
|
Links:
CDS record (PDF) ;
inSPIRE record ;
CADI line (restricted) ;
These preliminary results are superseded in this paper, Submitted to JHEP. The superseded preliminary plots can be found here. |
||
| Figures & Tables | Summary | Additional Figures | References | CMS Publications |
|---|
| Figures | |

png pdf |
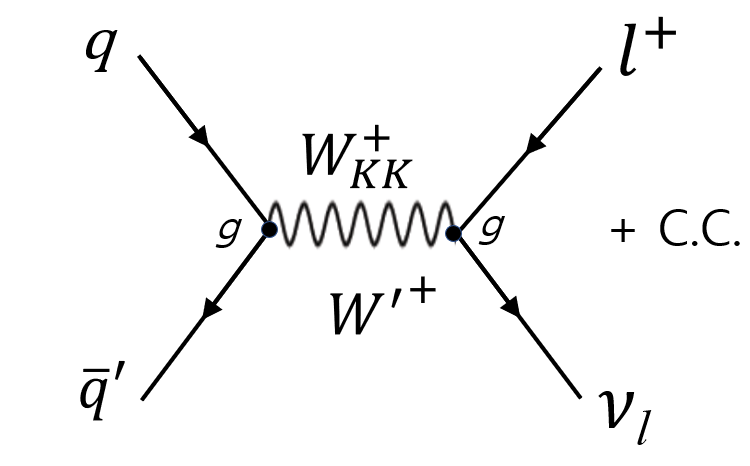
Figure 1:
Feynman diagrams for the production and decay of a new heavy boson, an SSM W', or a W$ _{\mathrm {KK}}$ (left). In RPV SUSY, a tau slepton ($\tilde{\tau}$) could also act as a mediator (right) with corresponding coupling strength, $\lambda $, for the decay. The coupling strength is allowed to be different between the two final states, denoted by $\lambda _{231}$ and $\lambda _{132}$ for the electron and muon final states, respectively. |
png |
Figure 1-a:
Feynman diagrams for the production and decay of a new heavy boson, an SSM W', or a W$ _{\mathrm {KK}}$ (left). In RPV SUSY, a tau slepton ($\tilde{\tau}$) could also act as a mediator (right) with corresponding coupling strength, $\lambda $, for the decay. The coupling strength is allowed to be different between the two final states, denoted by $\lambda _{231}$ and $\lambda _{132}$ for the electron and muon final states, respectively. |
png |
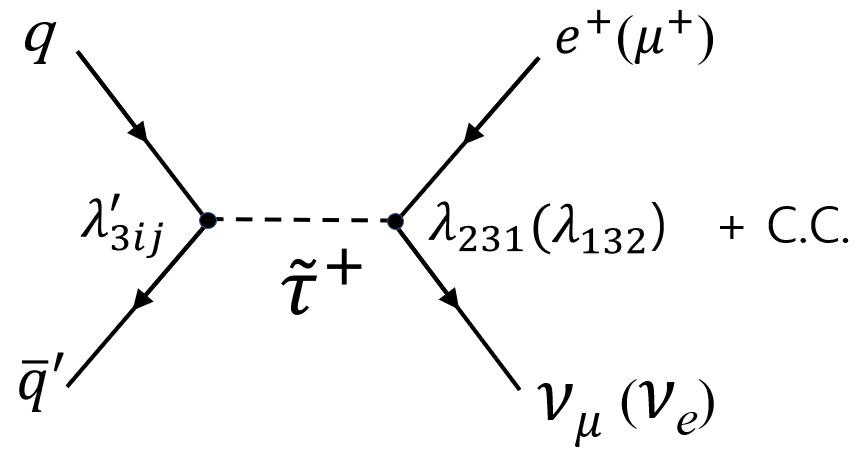
Figure 1-b:
Feynman diagrams for the production and decay of a new heavy boson, an SSM W', or a W$ _{\mathrm {KK}}$ (left). In RPV SUSY, a tau slepton ($\tilde{\tau}$) could also act as a mediator (right) with corresponding coupling strength, $\lambda $, for the decay. The coupling strength is allowed to be different between the two final states, denoted by $\lambda _{231}$ and $\lambda _{132}$ for the electron and muon final states, respectively. |

png pdf |
Figure 2:
Signal acceptance times efficiency for the SSM W' boson as a function of the W' boson mass. This is after all selection criteria are applied for the electron (filled purple markers) and the muon (open blue markers) channels. |
png pdf |
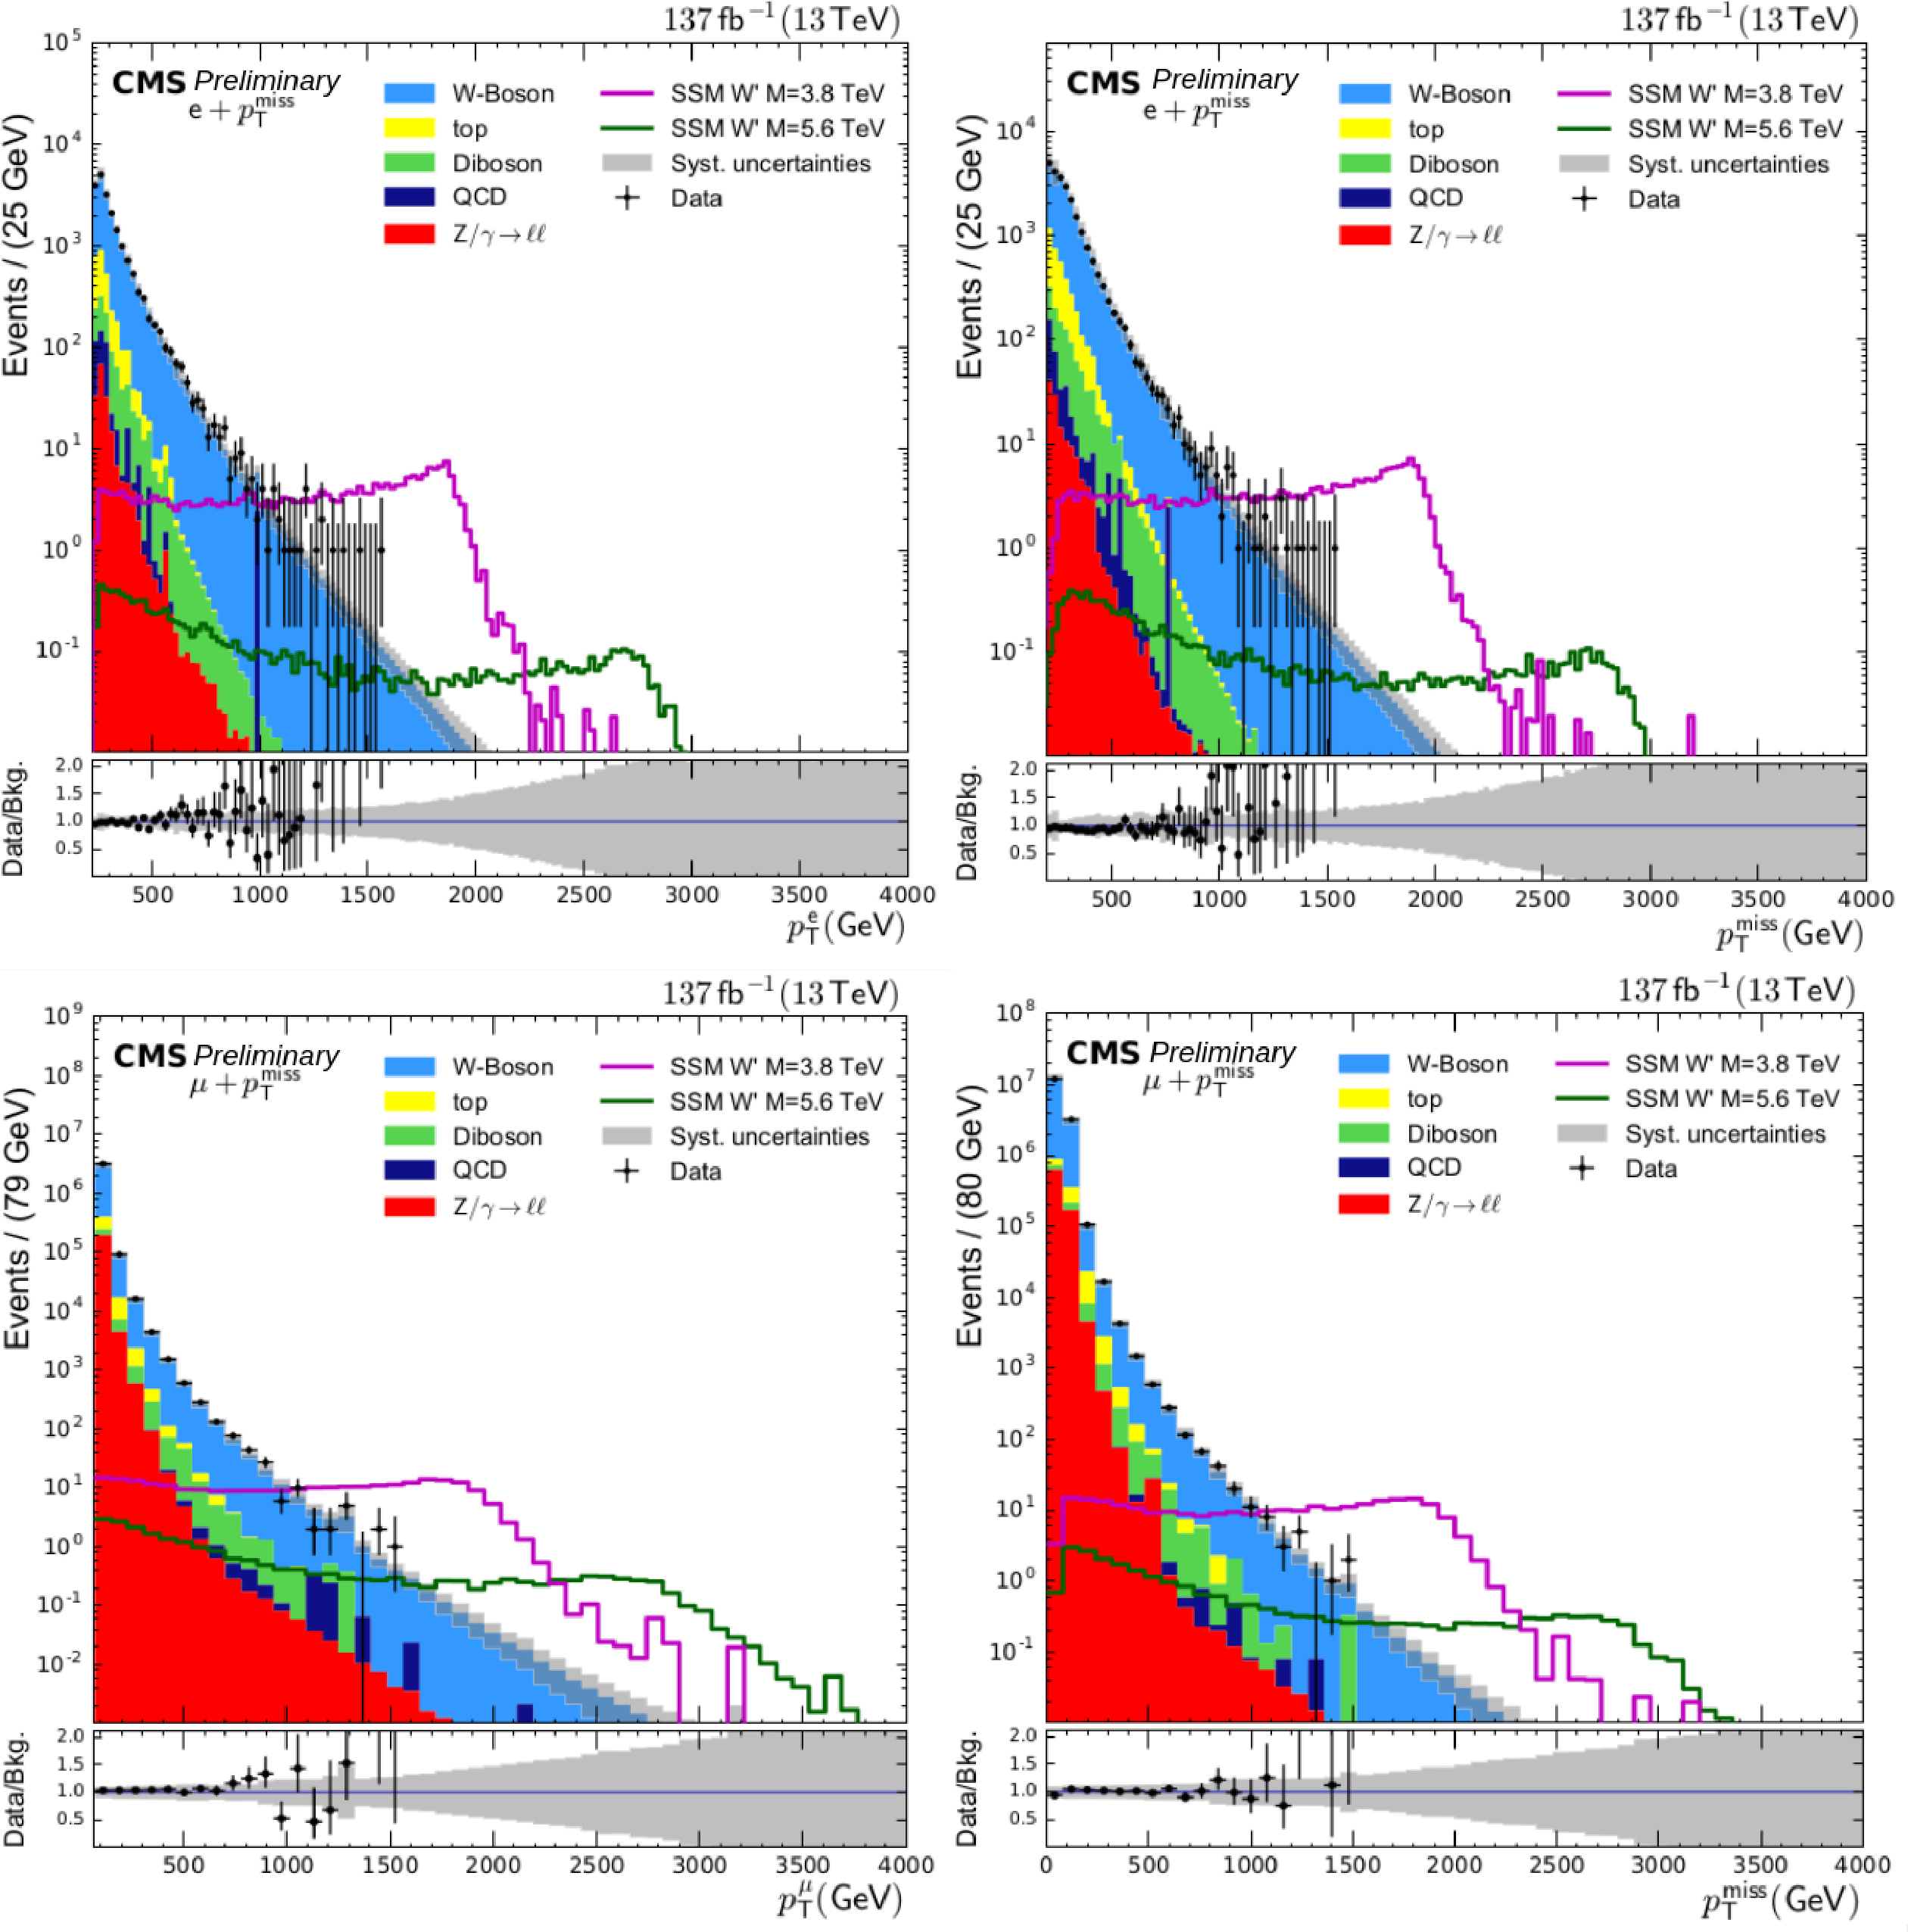
Figure 3:
The distributions for lepton ${p_{\mathrm {T}}}$ (left) and ${{p_{\mathrm {T}}} ^\text {miss}}$ (right) for the electron (upper) and muon (bottom) channels using the full Run 2 data set of 137 fb$^{-1}$. The complete set of selection criteria were applied to all distributions. Two examples of SSM W' boson signal samples having W' boson masses of 3.8 and 5.6 TeV are shown. The lower panel shows the ratio of data to SM prediction and the shaded band represents the systematic uncertainties. |

png |
Figure 3-a:
The distributions for lepton ${p_{\mathrm {T}}}$ (left) and ${{p_{\mathrm {T}}} ^\text {miss}}$ (right) for the electron (upper) and muon (bottom) channels using the full Run 2 data set of 137 fb$^{-1}$. The complete set of selection criteria were applied to all distributions. Two examples of SSM W' boson signal samples having W' boson masses of 3.8 and 5.6 TeV are shown. The lower panel shows the ratio of data to SM prediction and the shaded band represents the systematic uncertainties. |

png |
Figure 3-b:
The distributions for lepton ${p_{\mathrm {T}}}$ (left) and ${{p_{\mathrm {T}}} ^\text {miss}}$ (right) for the electron (upper) and muon (bottom) channels using the full Run 2 data set of 137 fb$^{-1}$. The complete set of selection criteria were applied to all distributions. Two examples of SSM W' boson signal samples having W' boson masses of 3.8 and 5.6 TeV are shown. The lower panel shows the ratio of data to SM prediction and the shaded band represents the systematic uncertainties. |

png pdf |
Figure 4:
The $ {M_\mathrm {T}} $ distributions for the electron (left) and muon (right) channels after applying complete selection criteria are shown for the full Run 2 data set of 137 fb$^{-1}$. Two signal examples for SSM W' boson masses of 3.8 and 5.6 TeV are shown. The lower panel shows the ratio of data to SM prediction and the shaded band represents the systematic uncertainties. |

png pdf |
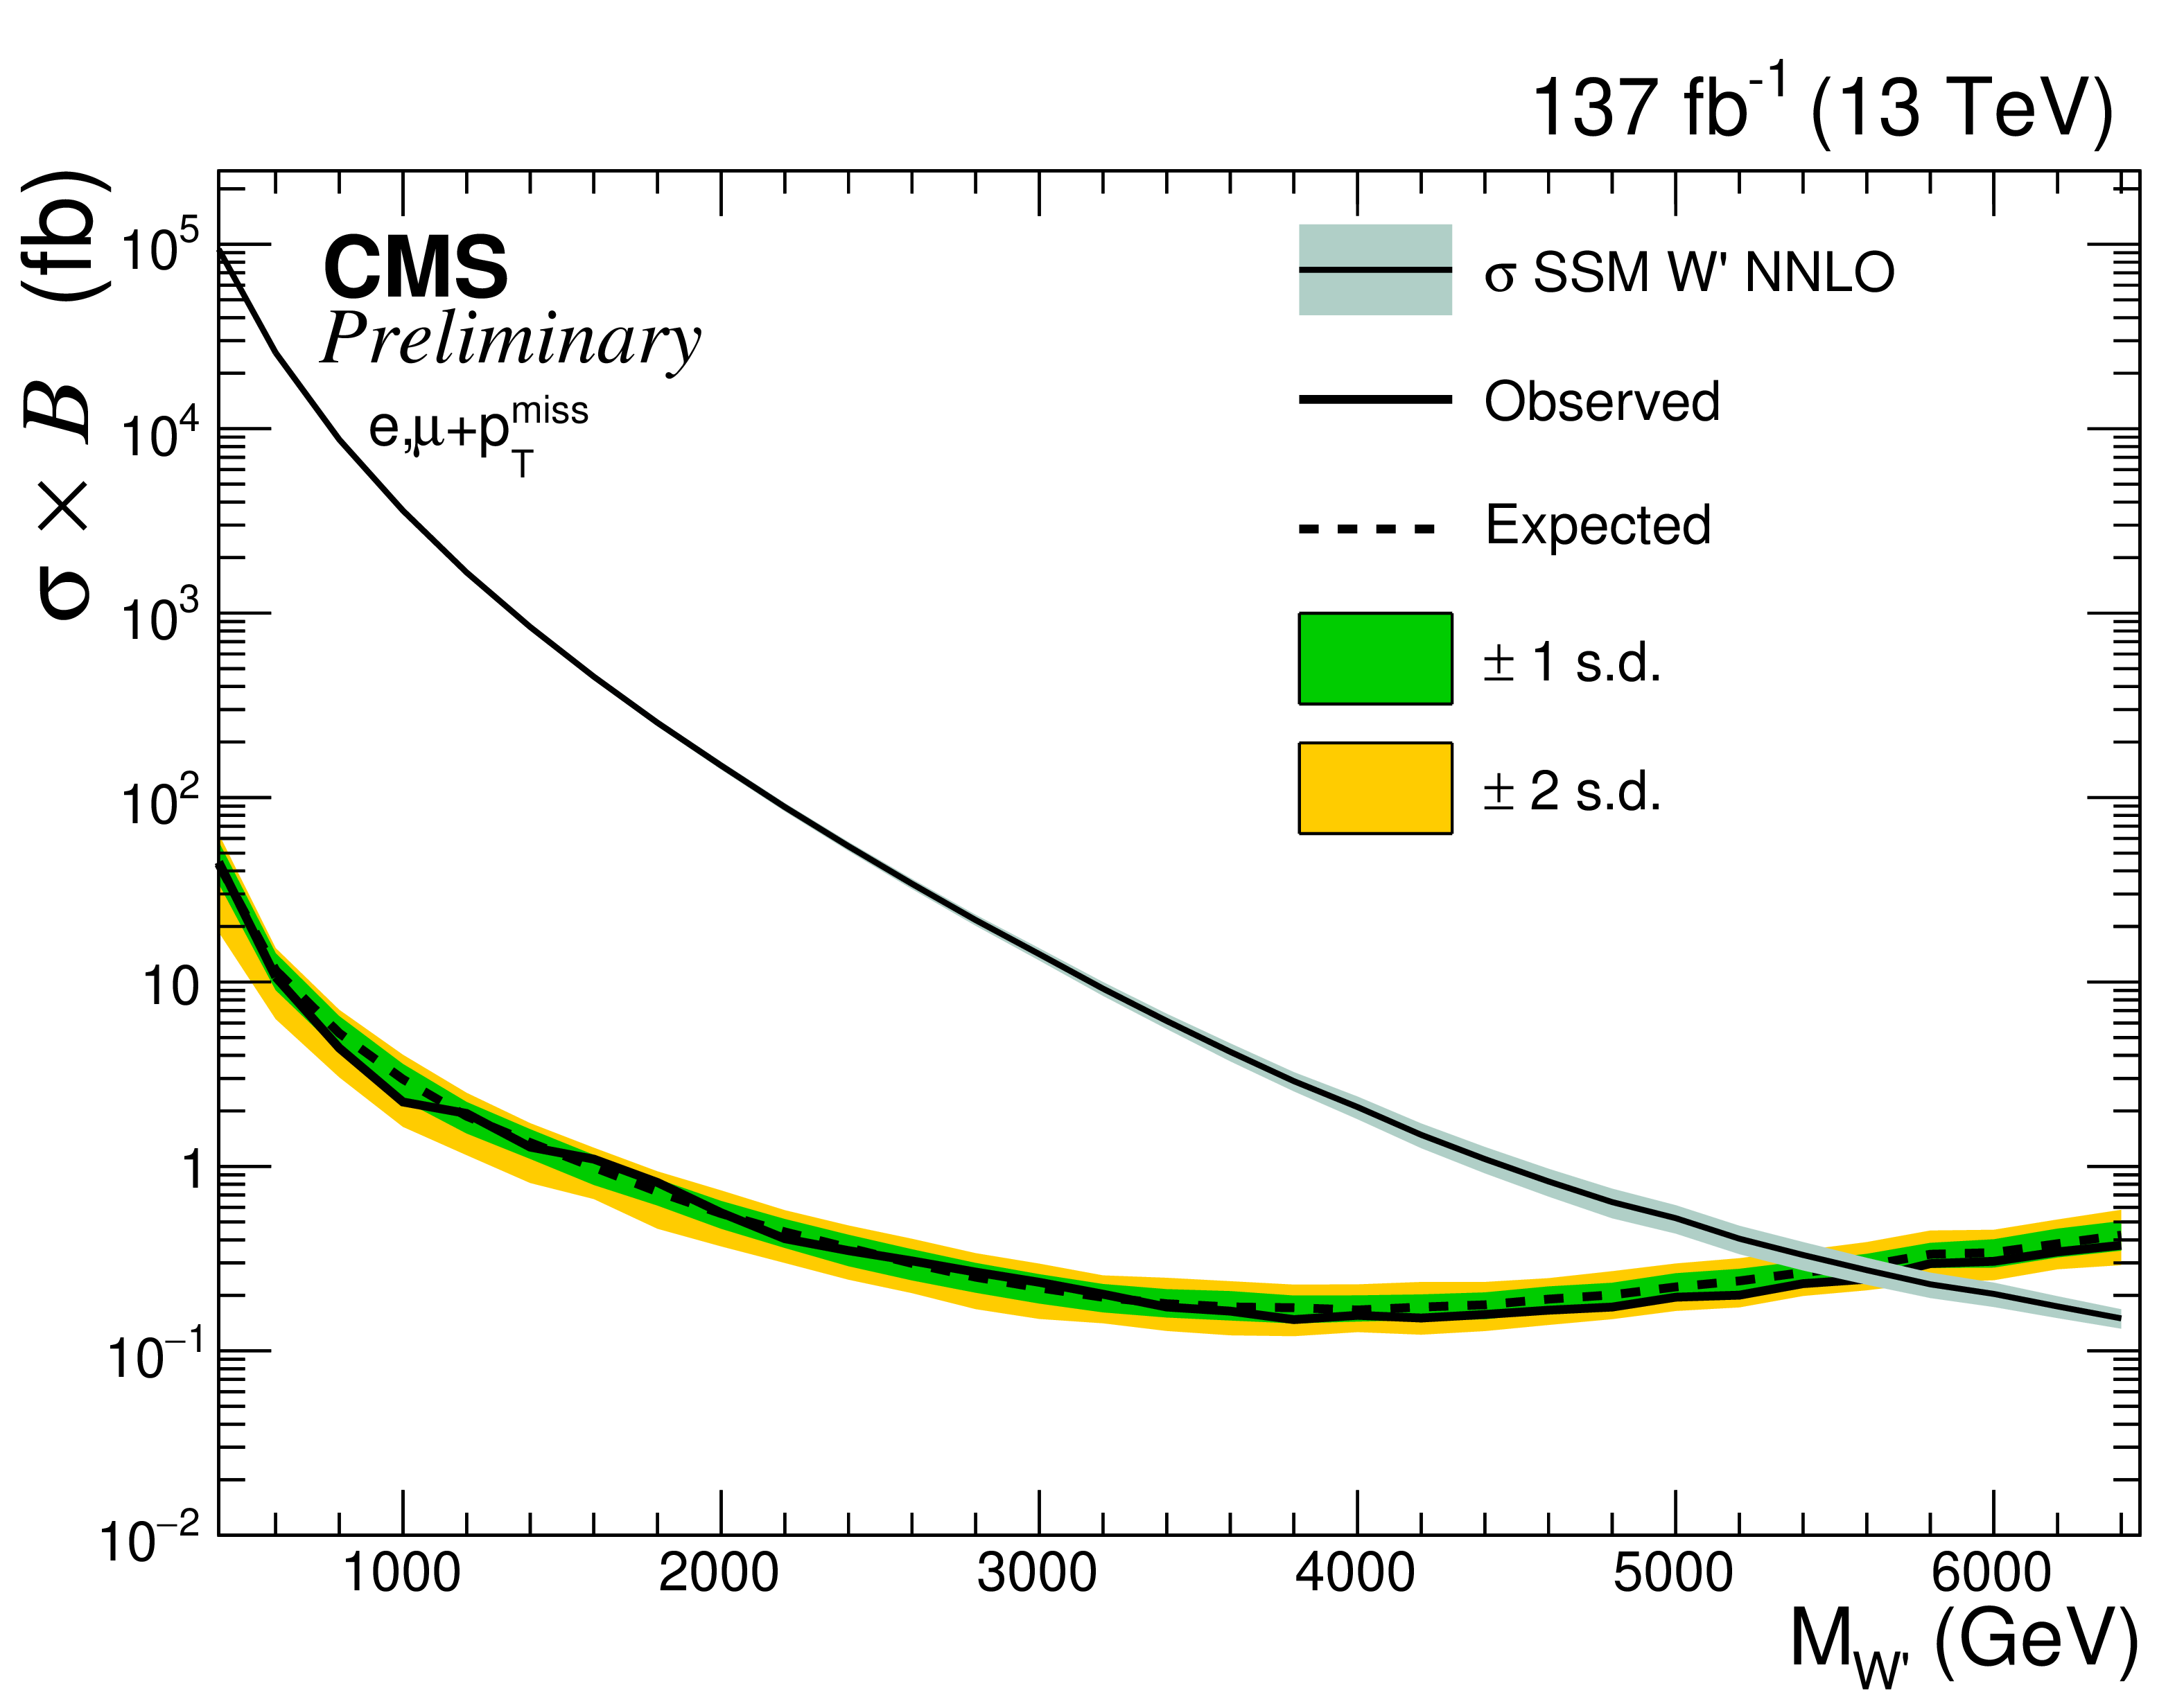
Figure 5:
The observed (solid line) and expected (dashed line) upper limits at 95% CL on $\sigma _{\mathrm{W'}} \times \mathcal {B}(\mathrm{W'} \rightarrow \ell \nu)$ for an SSM W' boson model as a function of W' boson mass for the electron (upper-left), muon (upper-right) channels, and the combination of both channels (bottom). The shaded bands represent the one (green) and two (yellow) standard deviation uncertainty bands for the expected limits. The theoretical prediction for SSM at NNLO-QCD level is shown with a narrow gray band corresponding to the PDF and $\alpha _{s}$ uncertainties. |

png pdf |
Figure 5-a:
The observed (solid line) and expected (dashed line) upper limits at 95% CL on $\sigma _{\mathrm{W'}} \times \mathcal {B}(\mathrm{W'} \rightarrow \ell \nu)$ for an SSM W' boson model as a function of W' boson mass for the electron (upper-left), muon (upper-right) channels, and the combination of both channels (bottom). The shaded bands represent the one (green) and two (yellow) standard deviation uncertainty bands for the expected limits. The theoretical prediction for SSM at NNLO-QCD level is shown with a narrow gray band corresponding to the PDF and $\alpha _{s}$ uncertainties. |

png pdf |
Figure 5-b:
The observed (solid line) and expected (dashed line) upper limits at 95% CL on $\sigma _{\mathrm{W'}} \times \mathcal {B}(\mathrm{W'} \rightarrow \ell \nu)$ for an SSM W' boson model as a function of W' boson mass for the electron (upper-left), muon (upper-right) channels, and the combination of both channels (bottom). The shaded bands represent the one (green) and two (yellow) standard deviation uncertainty bands for the expected limits. The theoretical prediction for SSM at NNLO-QCD level is shown with a narrow gray band corresponding to the PDF and $\alpha _{s}$ uncertainties. |
png pdf |
Figure 5-c:
The observed (solid line) and expected (dashed line) upper limits at 95% CL on $\sigma _{\mathrm{W'}} \times \mathcal {B}(\mathrm{W'} \rightarrow \ell \nu)$ for an SSM W' boson model as a function of W' boson mass for the electron (upper-left), muon (upper-right) channels, and the combination of both channels (bottom). The shaded bands represent the one (green) and two (yellow) standard deviation uncertainty bands for the expected limits. The theoretical prediction for SSM at NNLO-QCD level is shown with a narrow gray band corresponding to the PDF and $\alpha _{s}$ uncertainties. |

png pdf |
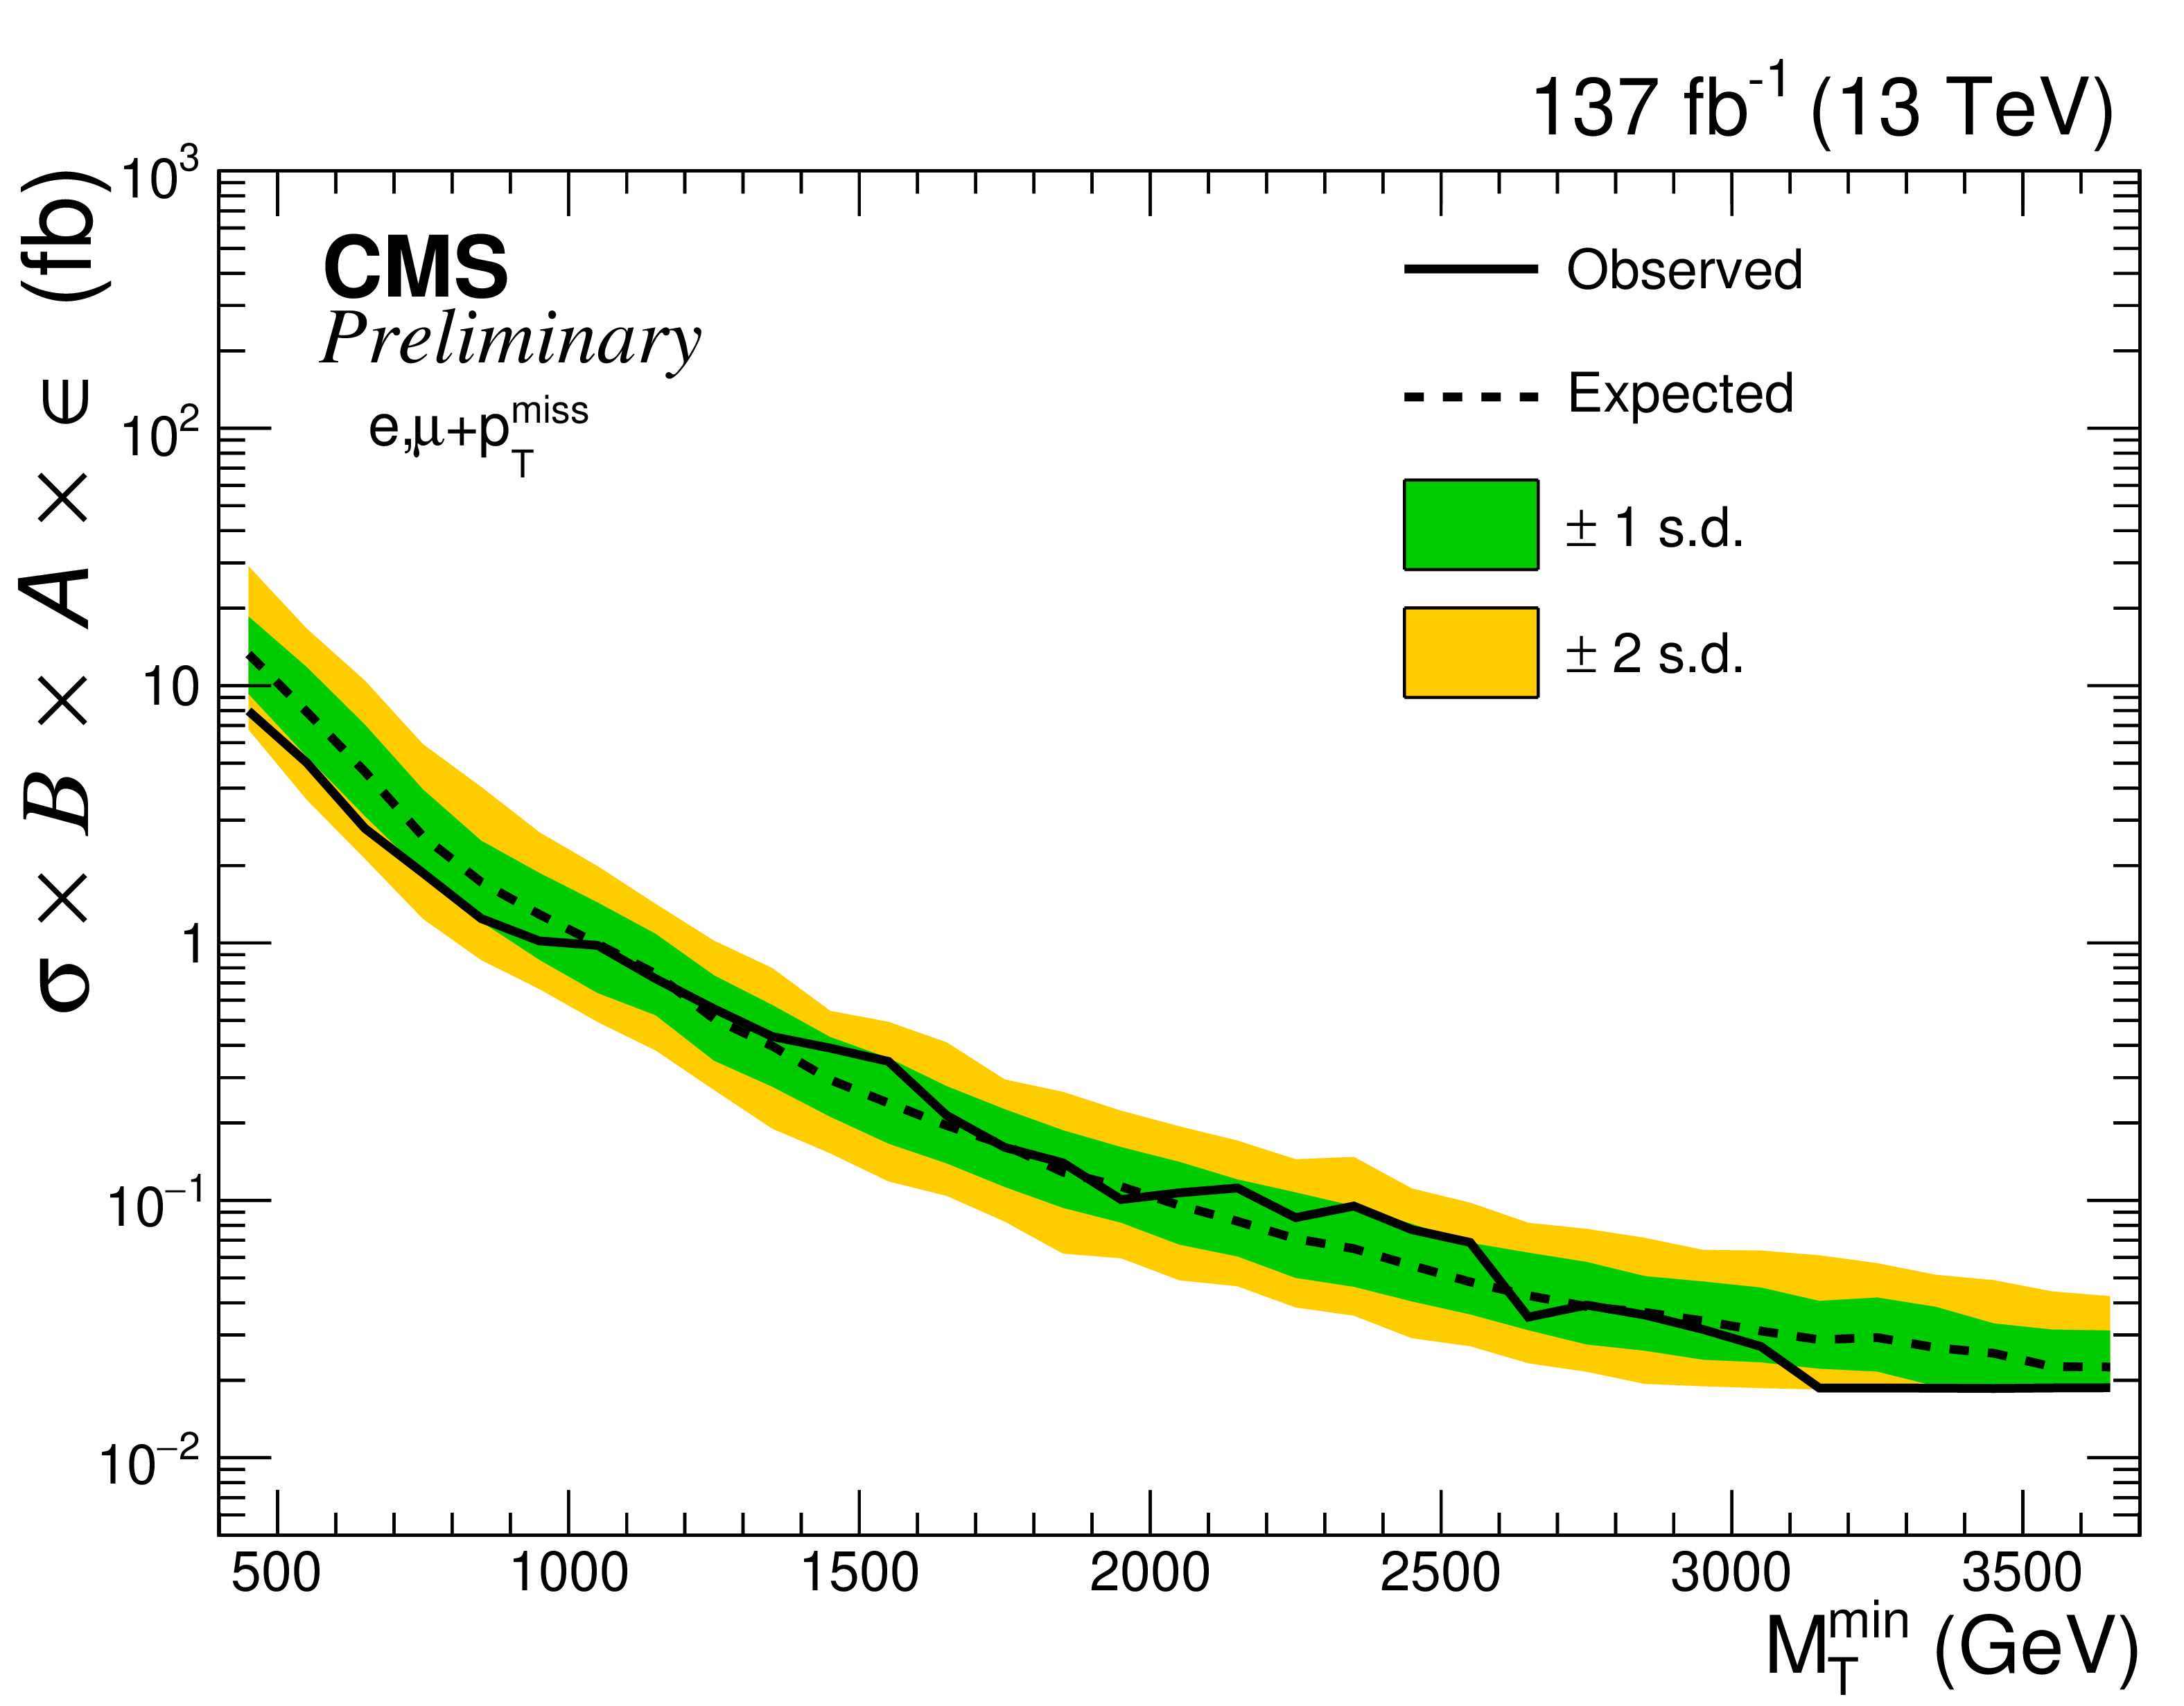
Figure 6:
The 95% CL observed (solid line) and expected (dashed line) model-independent cross section limits as a function of $M_{\rm {T}}^{\rm {min}}$ threshold. These are shown for the electron (upper-left) and muon (upper-right) channels and combination of both channels (bottom). The one (green) and two (yellow) standard deviation uncertainty band for the expected limits are shown. |

png pdf |
Figure 6-a:
The 95% CL observed (solid line) and expected (dashed line) model-independent cross section limits as a function of $M_{\rm {T}}^{\rm {min}}$ threshold. These are shown for the electron (upper-left) and muon (upper-right) channels and combination of both channels (bottom). The one (green) and two (yellow) standard deviation uncertainty band for the expected limits are shown. |

png pdf |
Figure 6-b:
The 95% CL observed (solid line) and expected (dashed line) model-independent cross section limits as a function of $M_{\rm {T}}^{\rm {min}}$ threshold. These are shown for the electron (upper-left) and muon (upper-right) channels and combination of both channels (bottom). The one (green) and two (yellow) standard deviation uncertainty band for the expected limits are shown. |
png pdf |
Figure 6-c:
The 95% CL observed (solid line) and expected (dashed line) model-independent cross section limits as a function of $M_{\rm {T}}^{\rm {min}}$ threshold. These are shown for the electron (upper-left) and muon (upper-right) channels and combination of both channels (bottom). The one (green) and two (yellow) standard deviation uncertainty band for the expected limits are shown. |
png pdf |
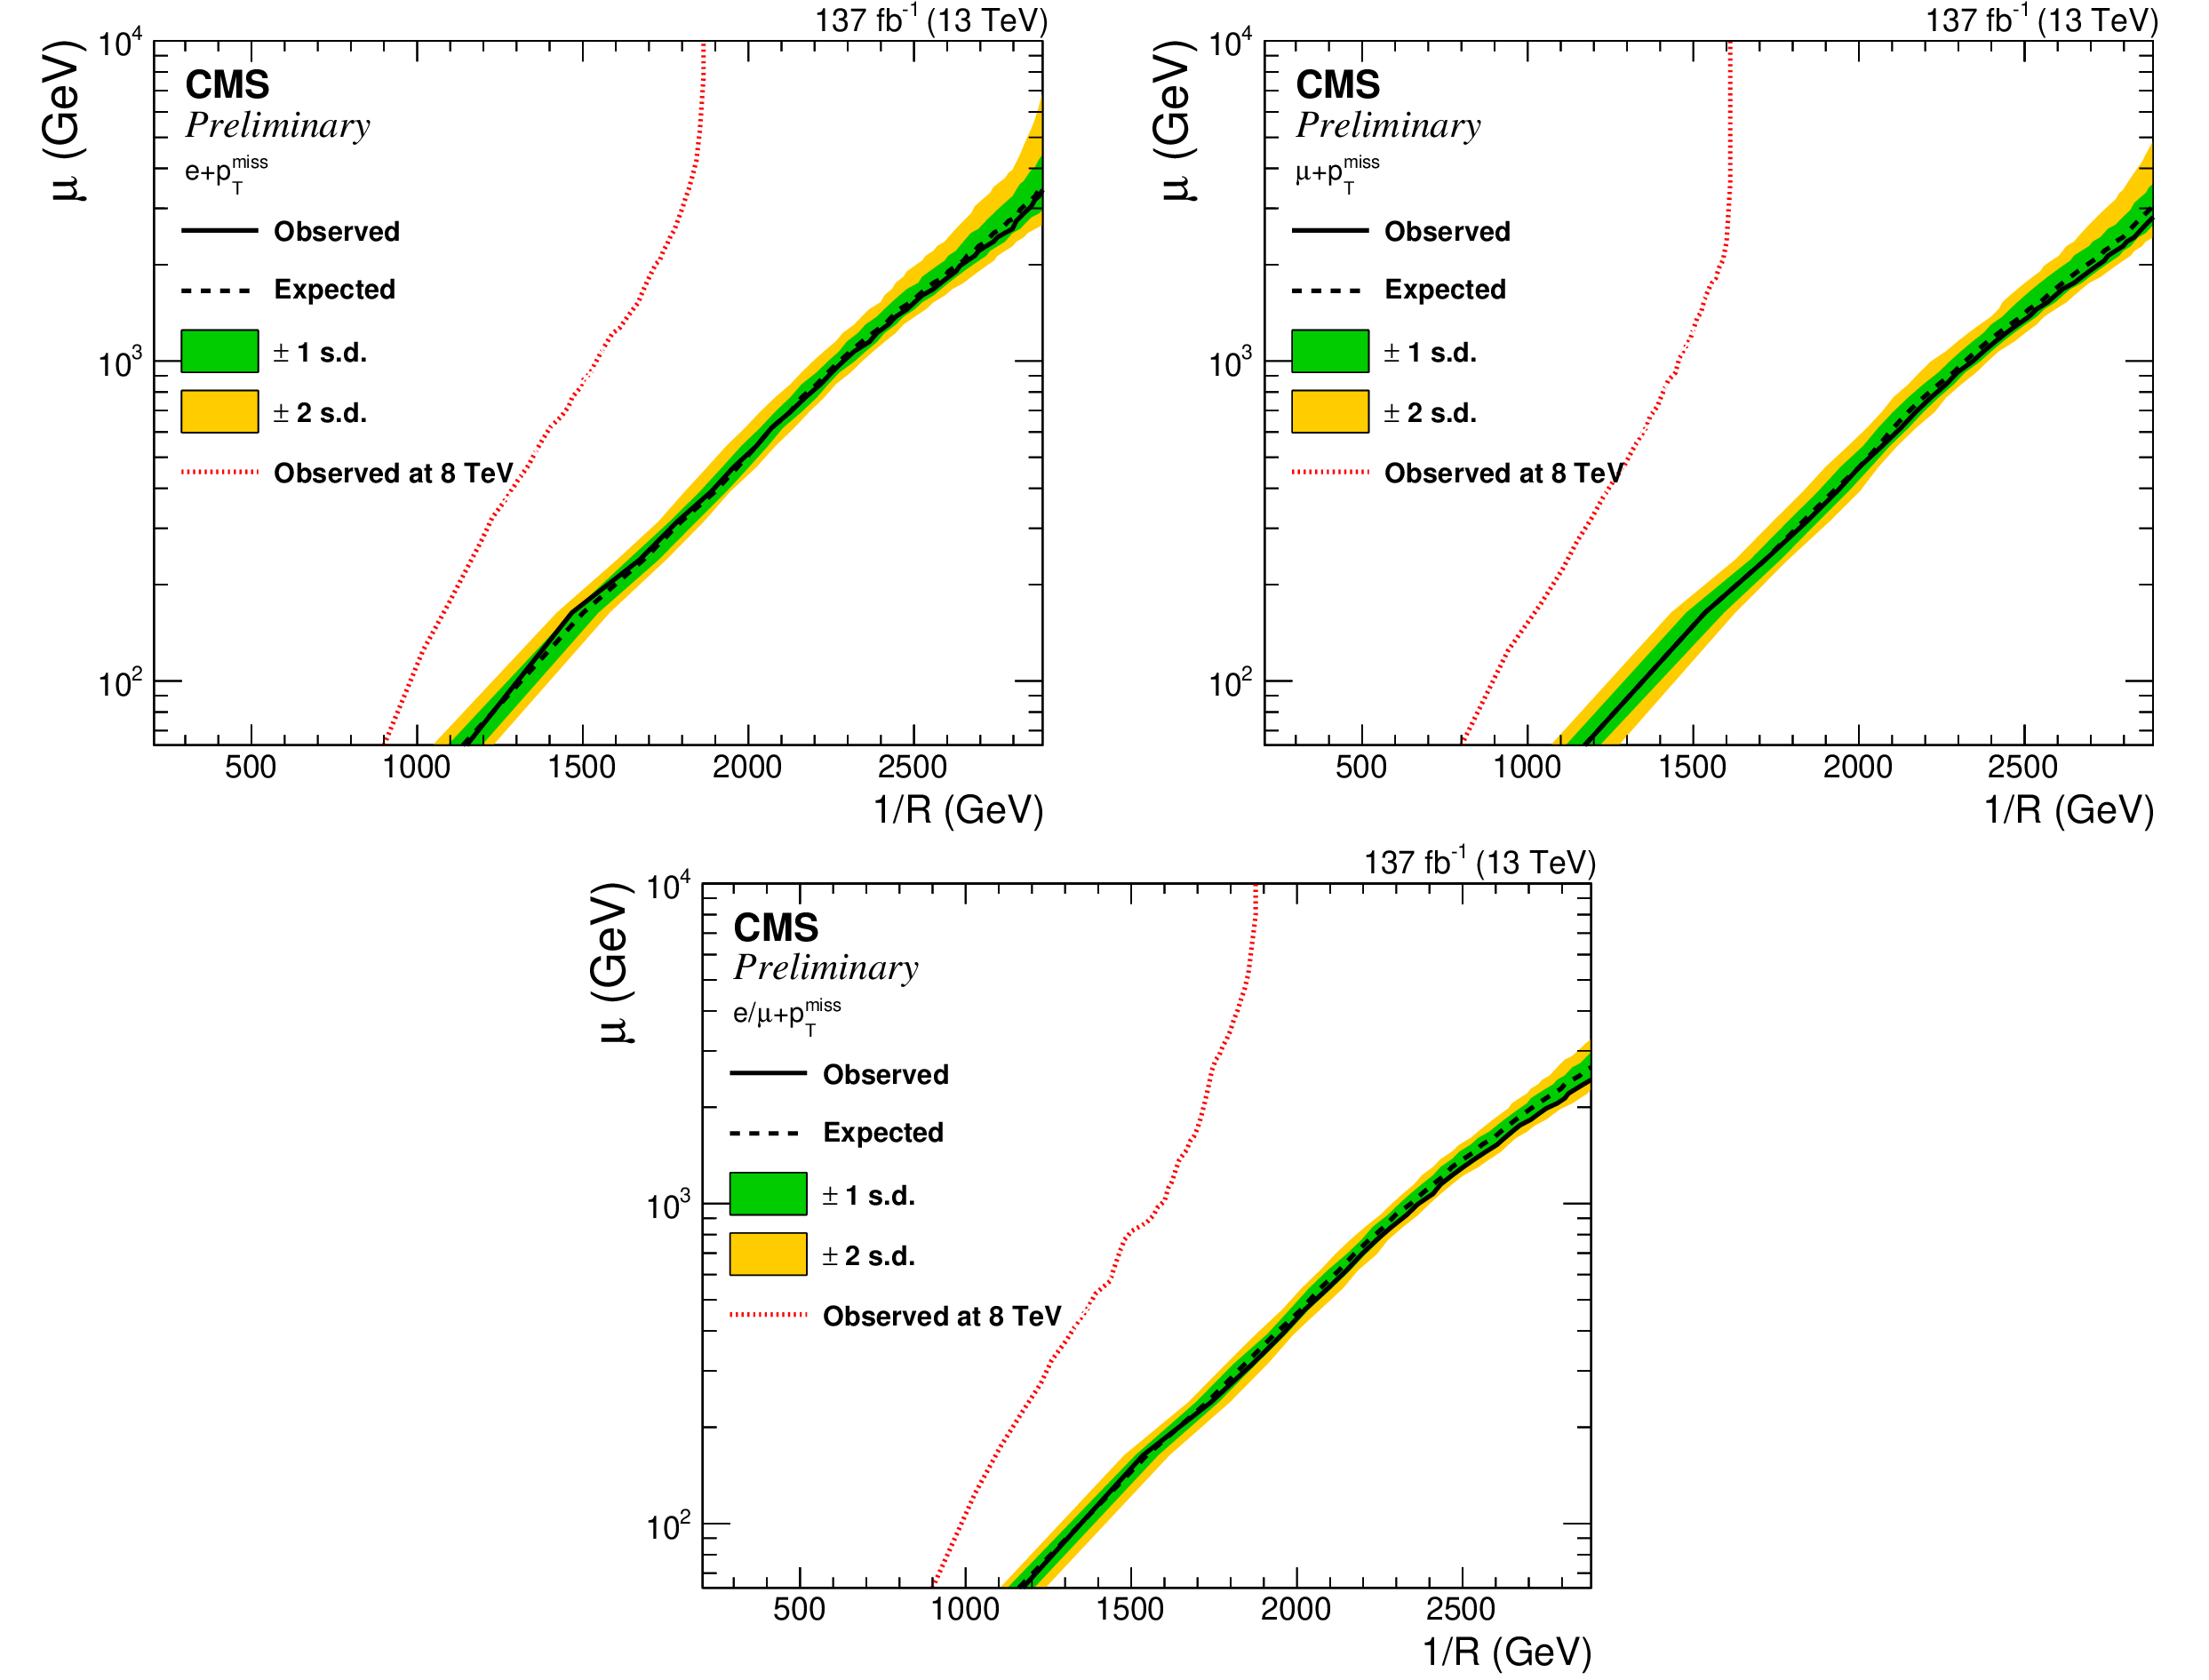
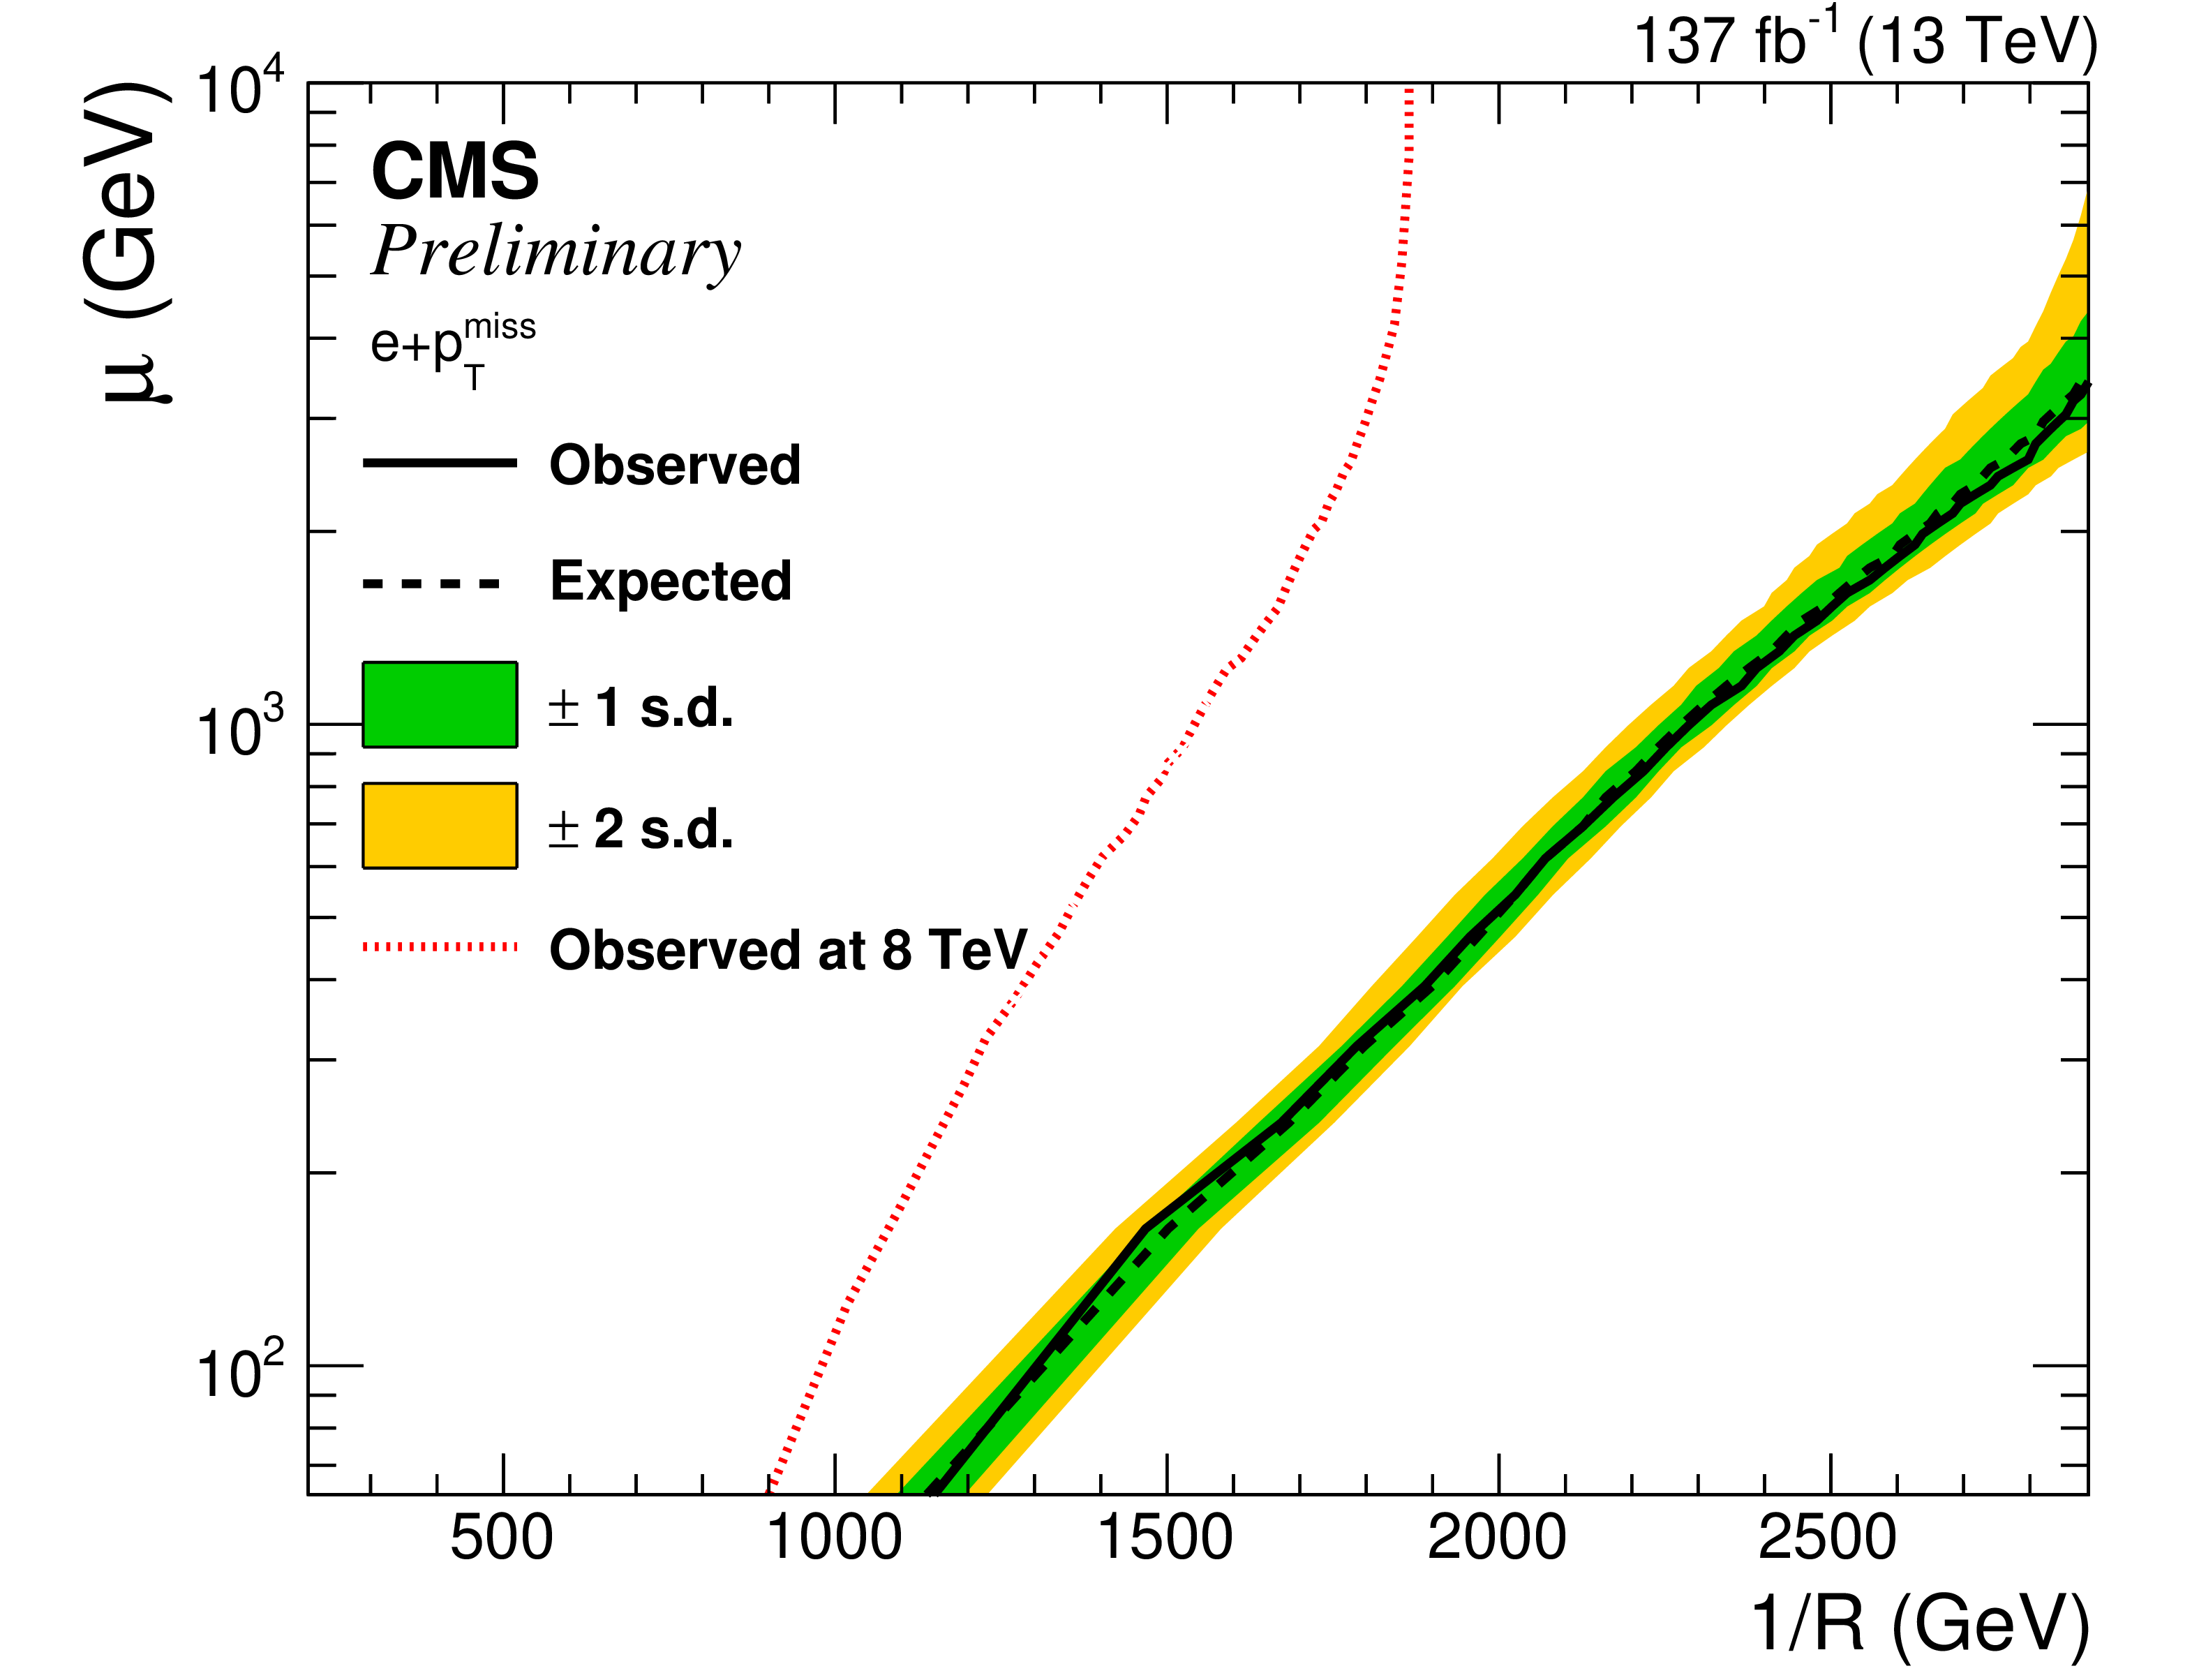
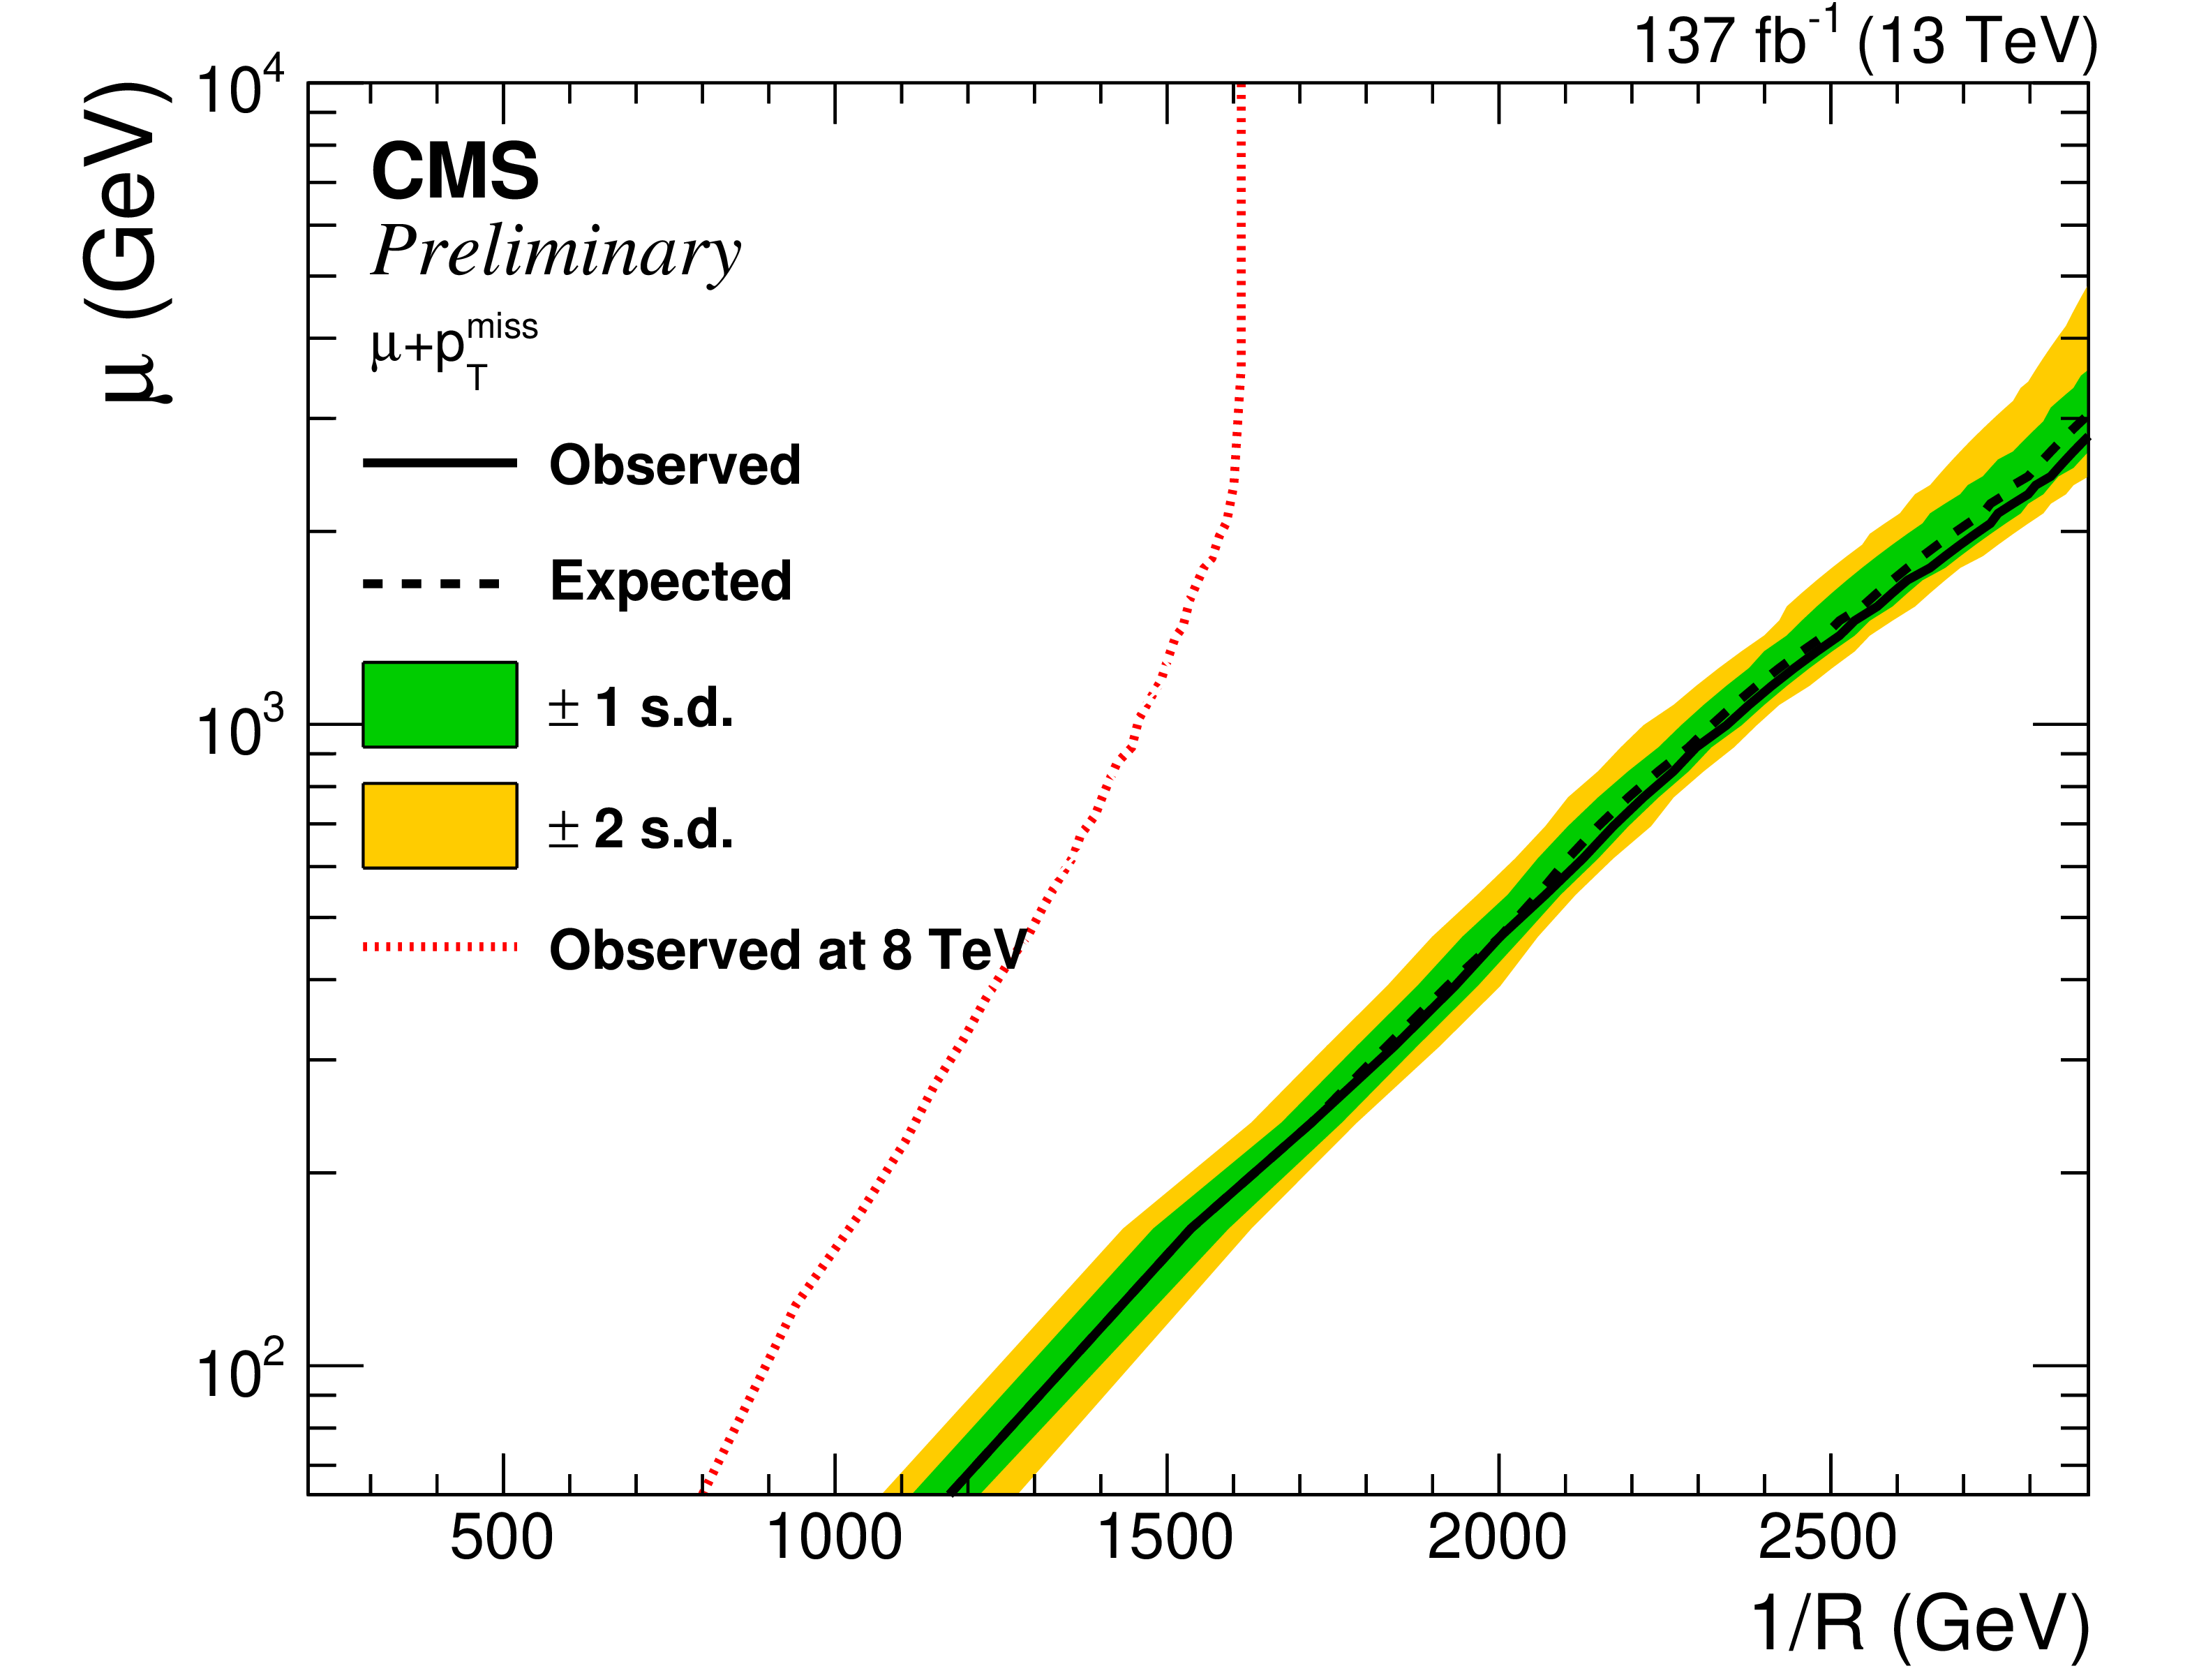
Figure 7:
Exclusion limits on the 2-d plane ($1/R,\mu $) for the split-UED interpretation for the $n = 2$ case. These are shown for the electron (upper left), muon (upper right), and the combination of both (bottom) channels for the full Run 2 data set. The expected limit is depicted as a black dashed line. The one (green) and two (yellow) standard deviation uncertainty band for the expected limits are shown. The experimentally excluded region is the entire area to the left of the solid black line. For comparison the 8 TeV result from Ref. [14] is given as a red line. |
png pdf |
Figure 7-a:
Exclusion limits on the 2-d plane ($1/R,\mu $) for the split-UED interpretation for the $n = 2$ case. These are shown for the electron (upper left), muon (upper right), and the combination of both (bottom) channels for the full Run 2 data set. The expected limit is depicted as a black dashed line. The one (green) and two (yellow) standard deviation uncertainty band for the expected limits are shown. The experimentally excluded region is the entire area to the left of the solid black line. For comparison the 8 TeV result from Ref. [14] is given as a red line. |
png pdf |
Figure 7-b:
Exclusion limits on the 2-d plane ($1/R,\mu $) for the split-UED interpretation for the $n = 2$ case. These are shown for the electron (upper left), muon (upper right), and the combination of both (bottom) channels for the full Run 2 data set. The expected limit is depicted as a black dashed line. The one (green) and two (yellow) standard deviation uncertainty band for the expected limits are shown. The experimentally excluded region is the entire area to the left of the solid black line. For comparison the 8 TeV result from Ref. [14] is given as a red line. |

png pdf |
Figure 7-c:
Exclusion limits on the 2-d plane ($1/R,\mu $) for the split-UED interpretation for the $n = 2$ case. These are shown for the electron (upper left), muon (upper right), and the combination of both (bottom) channels for the full Run 2 data set. The expected limit is depicted as a black dashed line. The one (green) and two (yellow) standard deviation uncertainty band for the expected limits are shown. The experimentally excluded region is the entire area to the left of the solid black line. For comparison the 8 TeV result from Ref. [14] is given as a red line. |

png pdf |
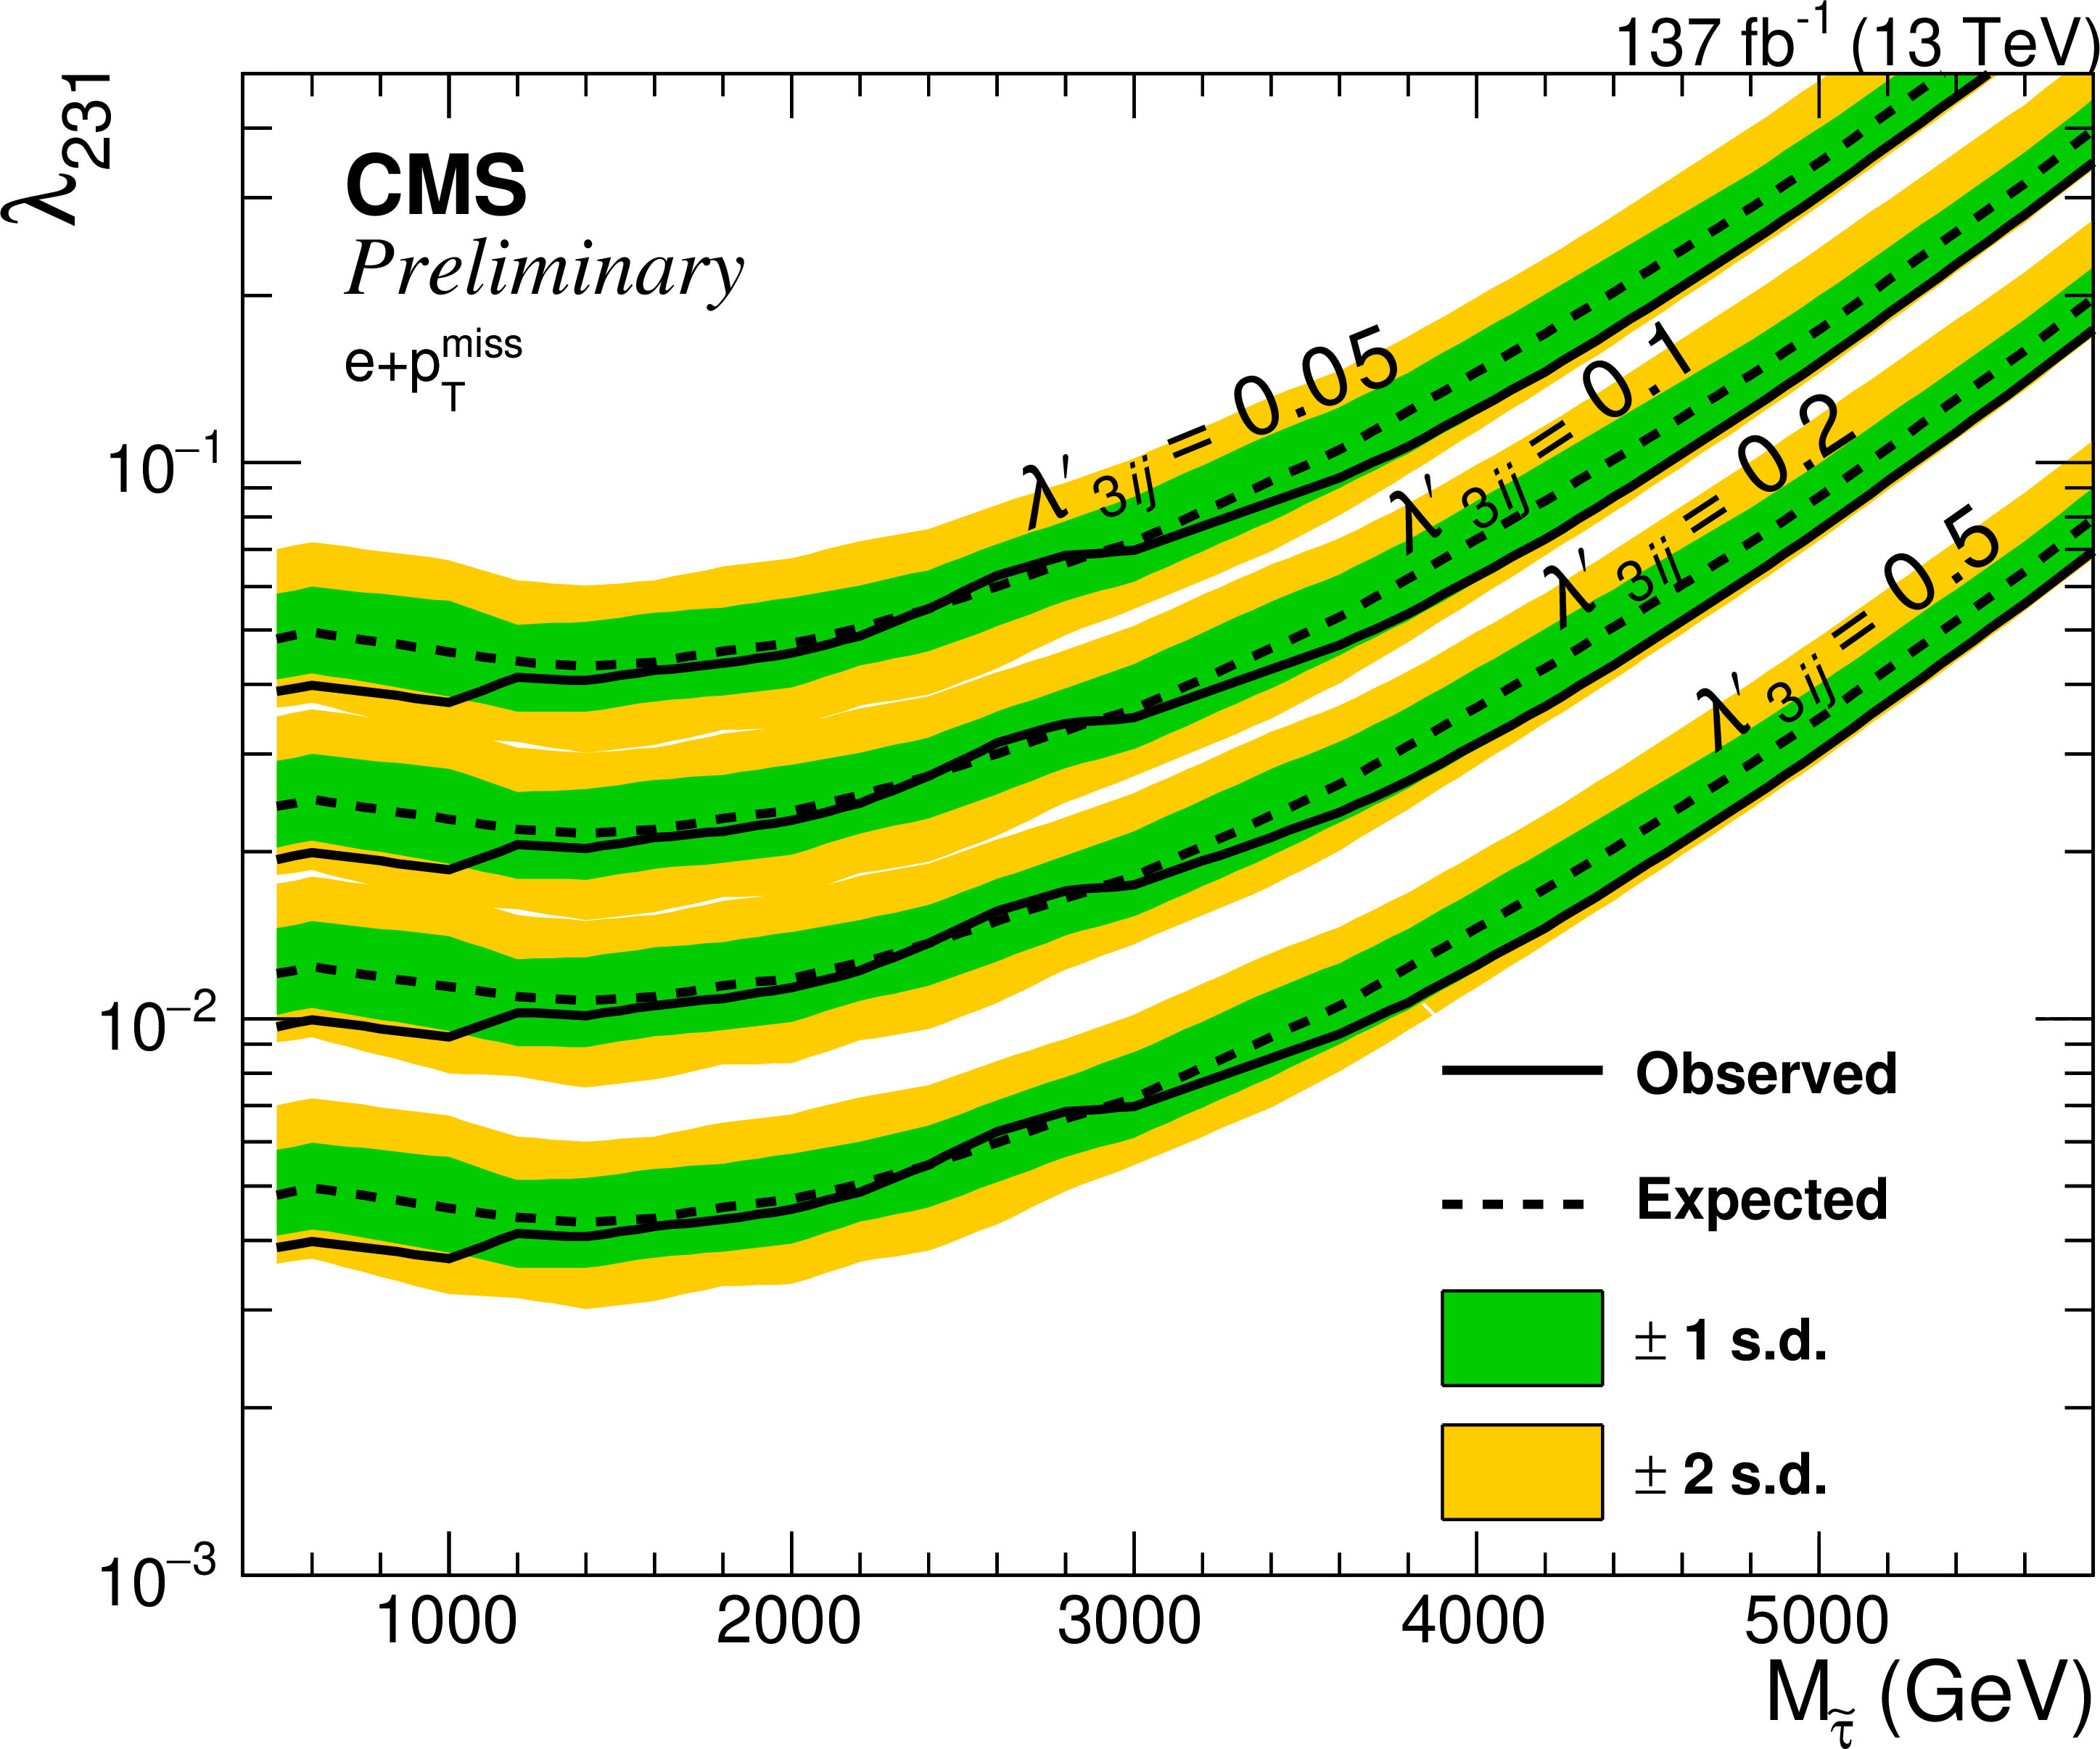
Figure 8:
The observed (solid line) and expected (dashed line) limits at 95% CL on the various couplings in the RPV SUSY model with a $\tilde{\tau} $ mediator, as a function of the mass of $\tilde{\tau} $. These are shown for the electron (left) and muon (right) channels. The couplings $\lambda ^{\prime}_{3ij}$, $\lambda _{231}$, and $\lambda _{132}$ are defined in Fig. 1. The one (green) and two (yellow) standard deviation uncertainty bands for the expected limits are shown. The area above the limit line is excluded. |
png pdf |
Figure 8-a:
The observed (solid line) and expected (dashed line) limits at 95% CL on the various couplings in the RPV SUSY model with a $\tilde{\tau} $ mediator, as a function of the mass of $\tilde{\tau} $. These are shown for the electron (left) and muon (right) channels. The couplings $\lambda ^{\prime}_{3ij}$, $\lambda _{231}$, and $\lambda _{132}$ are defined in Fig. 1. The one (green) and two (yellow) standard deviation uncertainty bands for the expected limits are shown. The area above the limit line is excluded. |

png pdf |
Figure 8-b:
The observed (solid line) and expected (dashed line) limits at 95% CL on the various couplings in the RPV SUSY model with a $\tilde{\tau} $ mediator, as a function of the mass of $\tilde{\tau} $. These are shown for the electron (left) and muon (right) channels. The couplings $\lambda ^{\prime}_{3ij}$, $\lambda _{231}$, and $\lambda _{132}$ are defined in Fig. 1. The one (green) and two (yellow) standard deviation uncertainty bands for the expected limits are shown. The area above the limit line is excluded. |
png pdf |
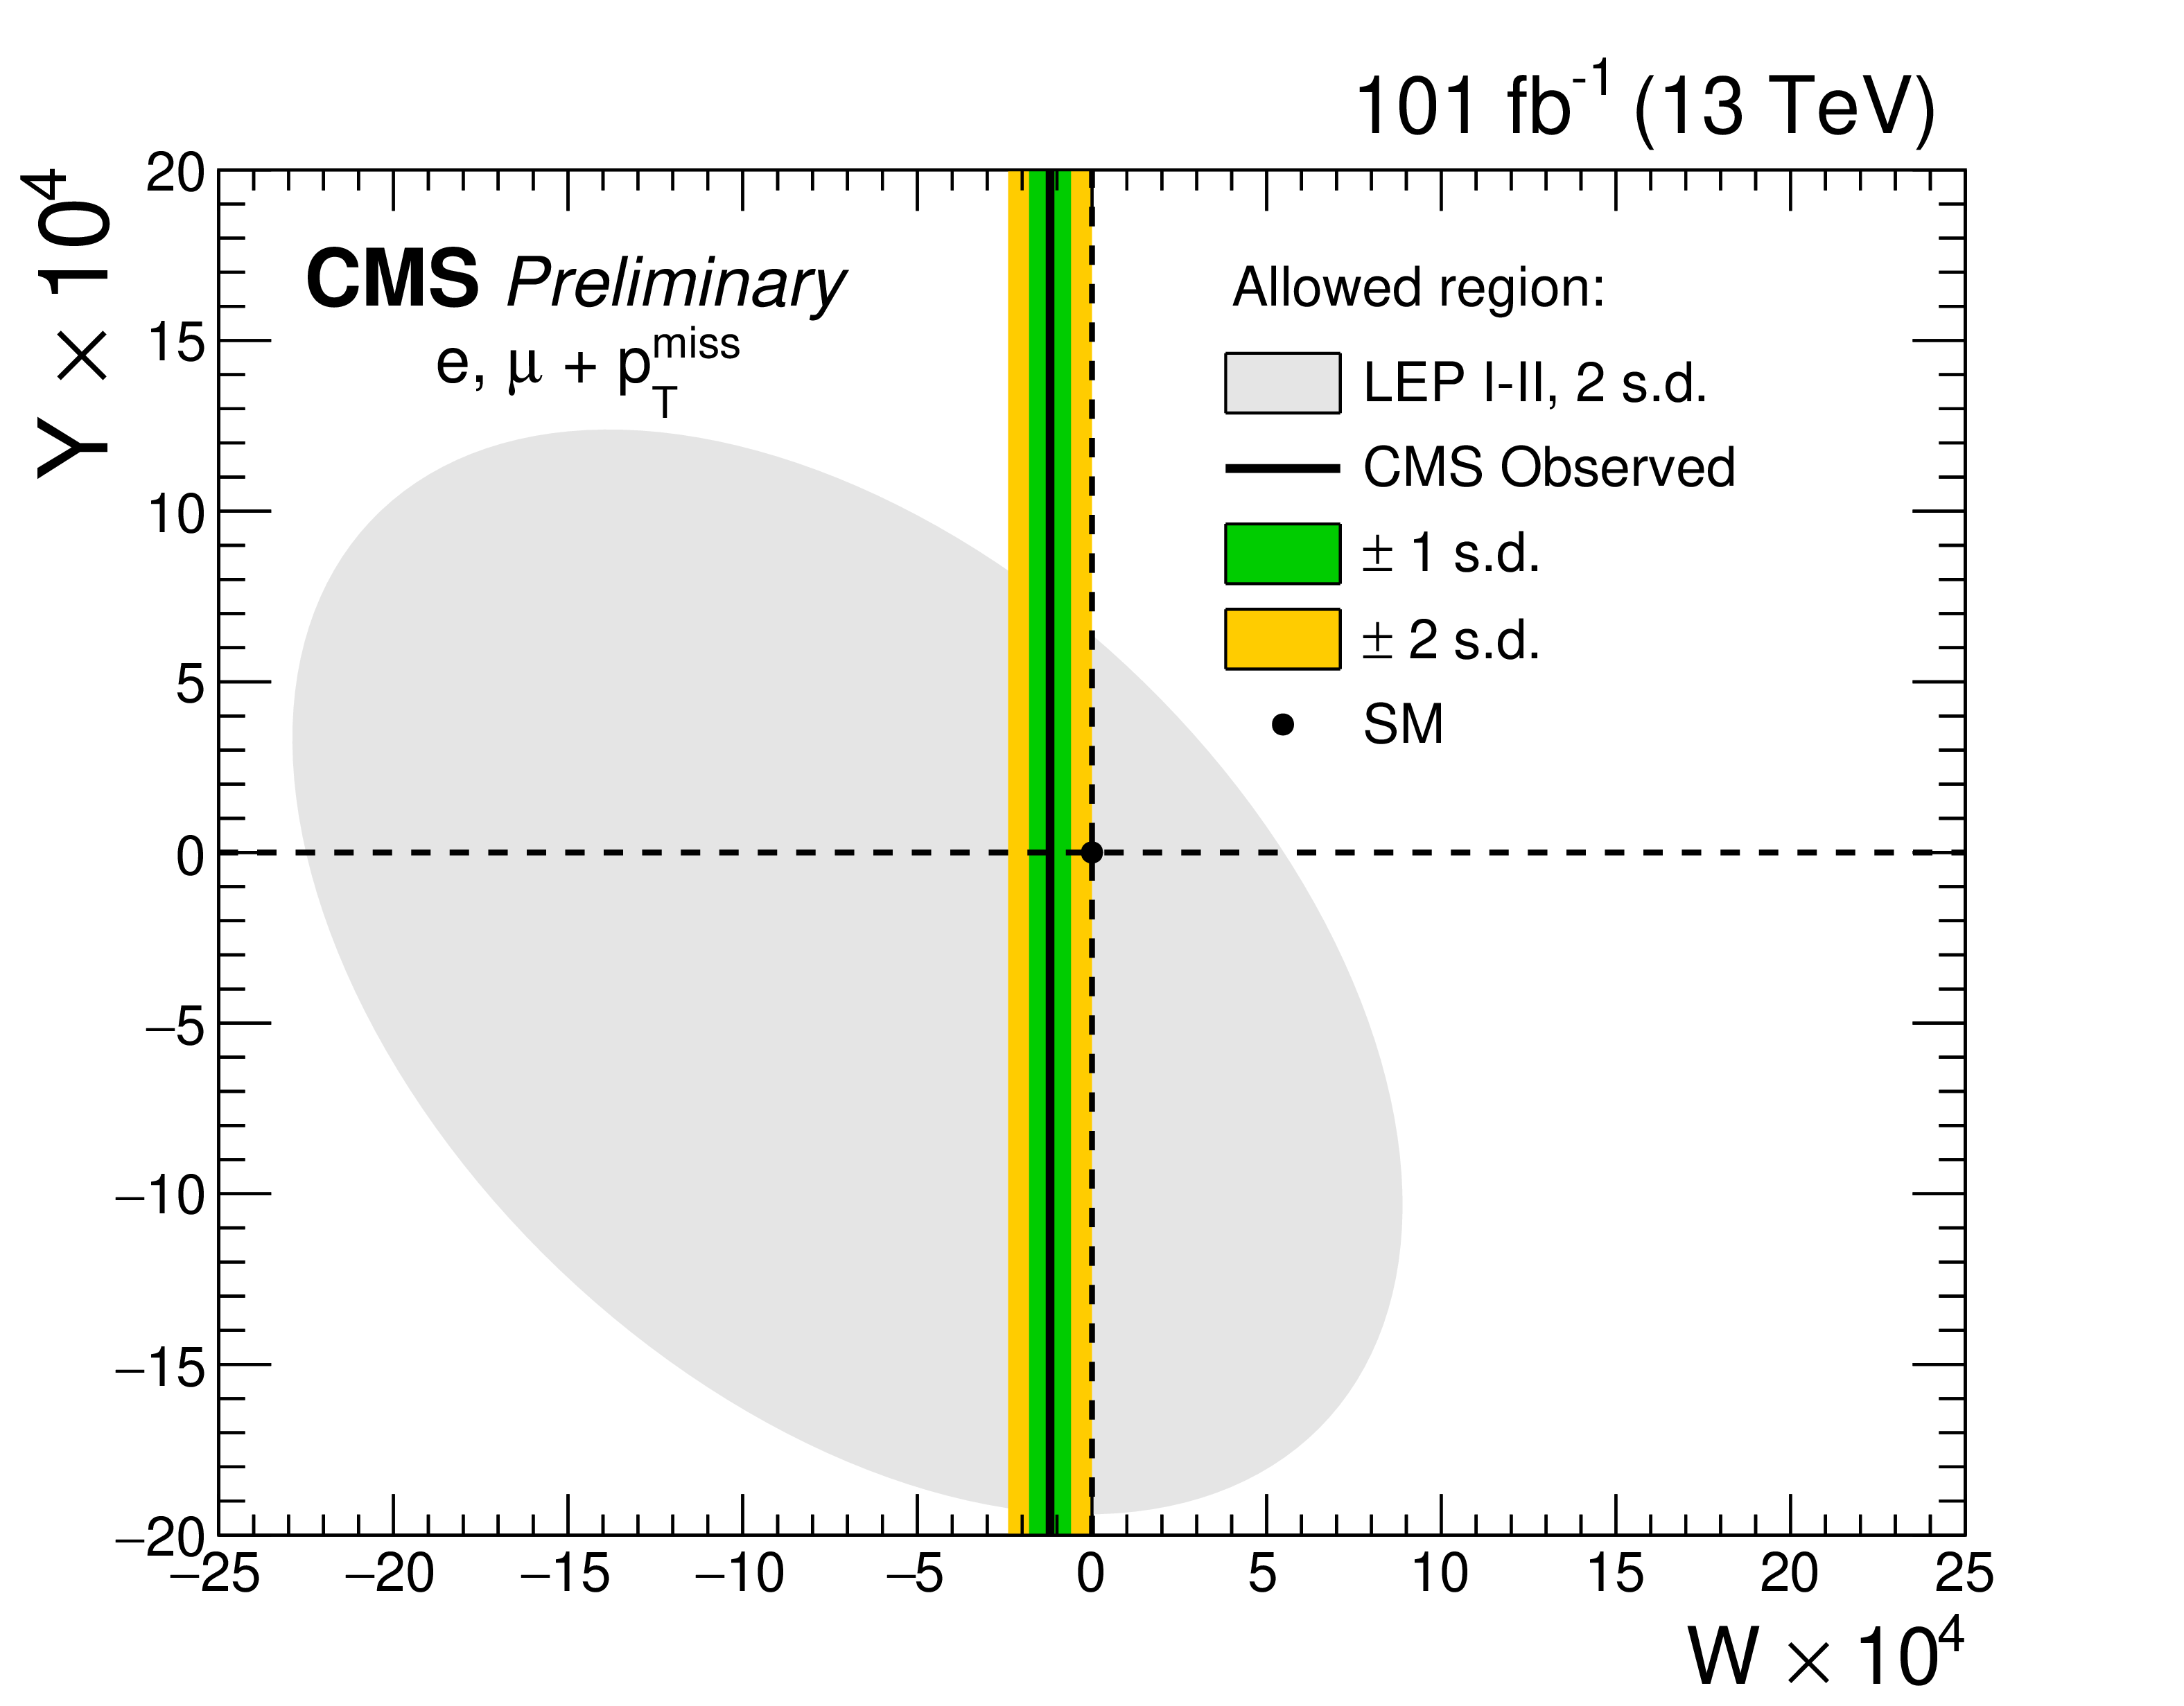
Figure 9:
Region in the $Y-W$ parameter phase space allowed by the current analysis at the 2$\sigma $ level. This uses the combination of the electron and muon channel distributions from the 2017 + 2018 pp collision data at $\sqrt {s} = $ 13 TeV, having 101 fb$^{-1}$ of luminosity. Previous constraints obtained by LEP experiments [20] are included in the grey area at the 2$\sigma $ CL for comparison. |
| Tables | |
png pdf |
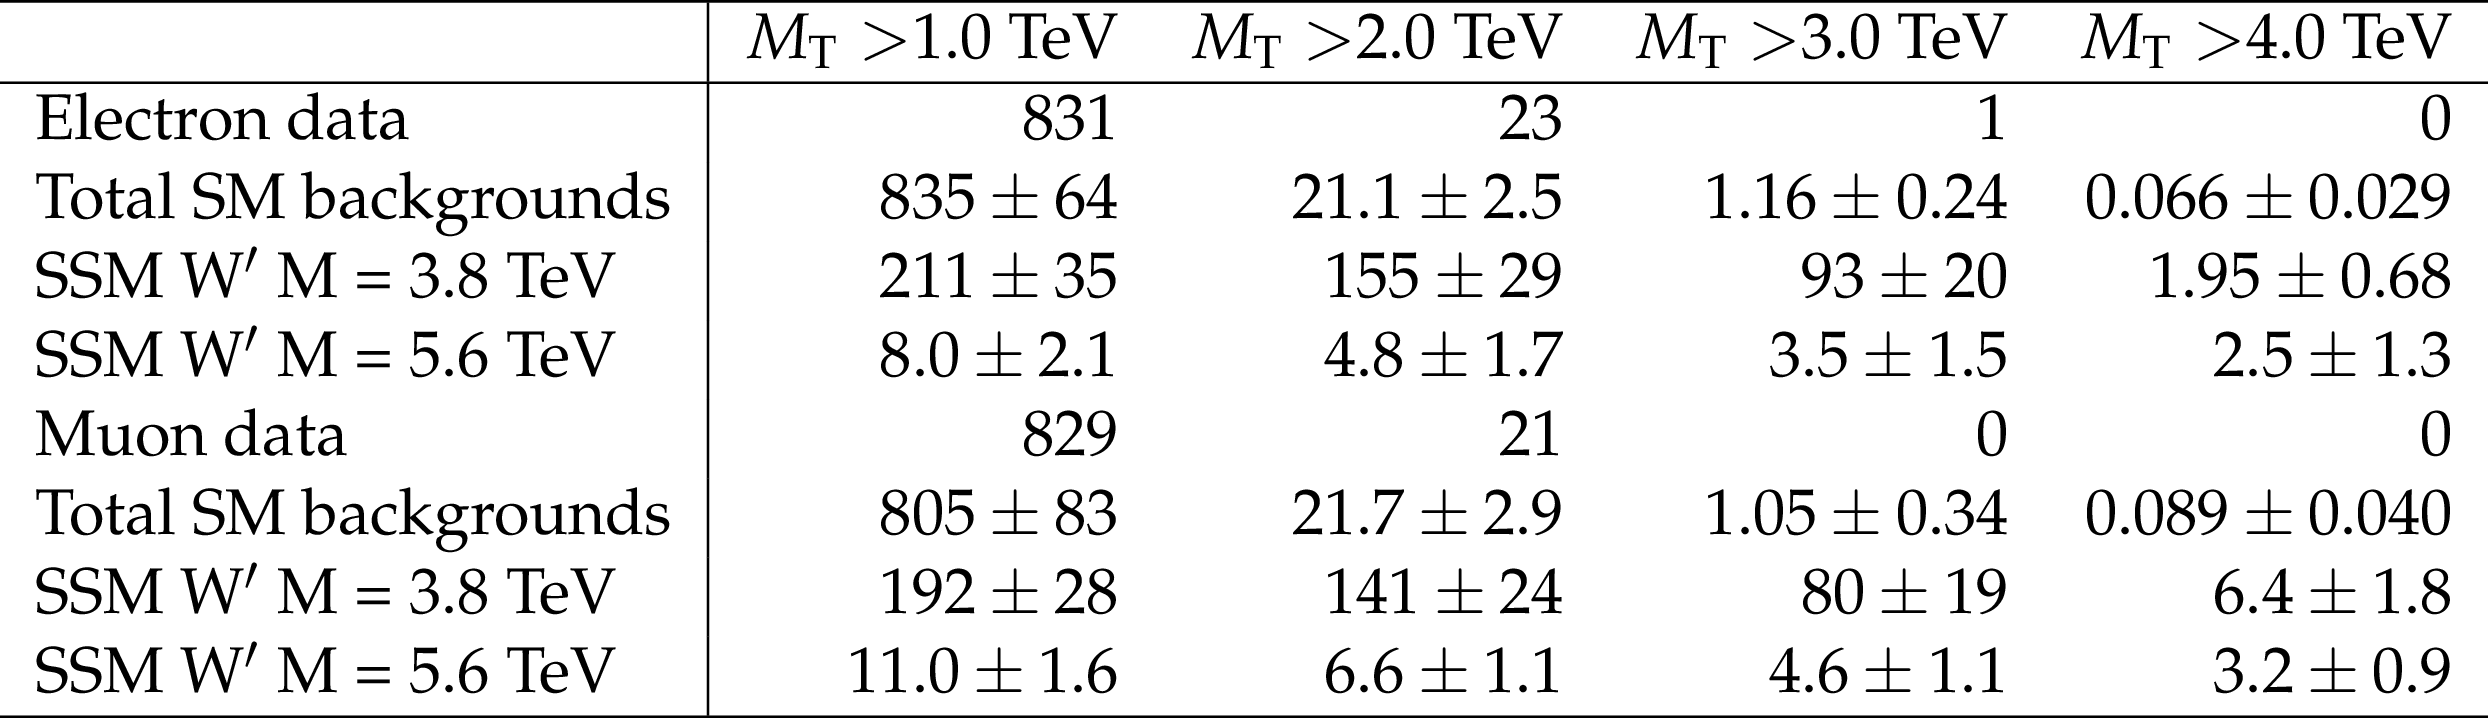
Table 1:
The observed and expected number of events in the electron (top) and muon (bottom) channels, collected during three years (2016, 2017, and 2018), for selected values of ${M_\mathrm {T}}$ thresholds. The statistical and systematic uncertainties are added in quadrature providing the total uncertainty. |

png pdf |
Table 2:
Expected and observed exclusion limits at 95% CL on the SSM W' boson mass for the electron, muon, and combination of both channels, respectively, by using the data collected in the three years (2016-2018). |

png pdf |
Table 3:
Summary of all 95% CL exclusion limit results with various theoretical model interpretations in the electron and muon channels, and the combination of both channels. The result in EFT is obtained using 2017 + 2018 data only. |
| Summary |
|
A search for a deviation relative to SM expectations in events with a final state consisting of a lepton (electron or muon) and missing transverse momentum in proton-proton collisions at a center of mass energy of 13 TeV has been performed. This search used data collected by the CMS detector between 2016 and 2018 corresponding to 137 fb$^{-1}$ of total integrated luminosity. The analysis strategy is similar to the previous study [17]. No evidence for new physics was observed when examining the transverse mass distributions. These observations are interpreted as limits on the parameters of several models. The 95% CL exclusion limits on an SSM W' boson are set to be 5.4 (5.6) TeV for the electron (muon) channels. When combining both channels a 95% CL limit of 5.7 TeV is obtained. These results yield the best limits to date on the split universal extra dimension model's parameters. For this model, the inverse radius of the extra dimension $1/R$ is constrained by this analysis to be 2.8 TeV at $\mu =$ 2 TeV. In addition, model-independent limits are provided. The R-parity violating SUSY model is reinterpreted by using the model-independent limit. Limits on the coupling strengths at the decay vertex have been derived as a function of the mediator $\tilde{\tau}$ mass, for various coupling values, $\lambda^{\prime}_{3ij}$, at the production vertex. This is the first time using the dilepton final states within LHC Run 2 data to derive the exclusion limits on the oblique W parameter coming from an effective field theory interpretation of data and SM expectation. The allowed range of the W oblique parameter is reduced by more than an order of magnitude relative to previous results at LEP experiments. |
| Additional Figures | |
png pdf |
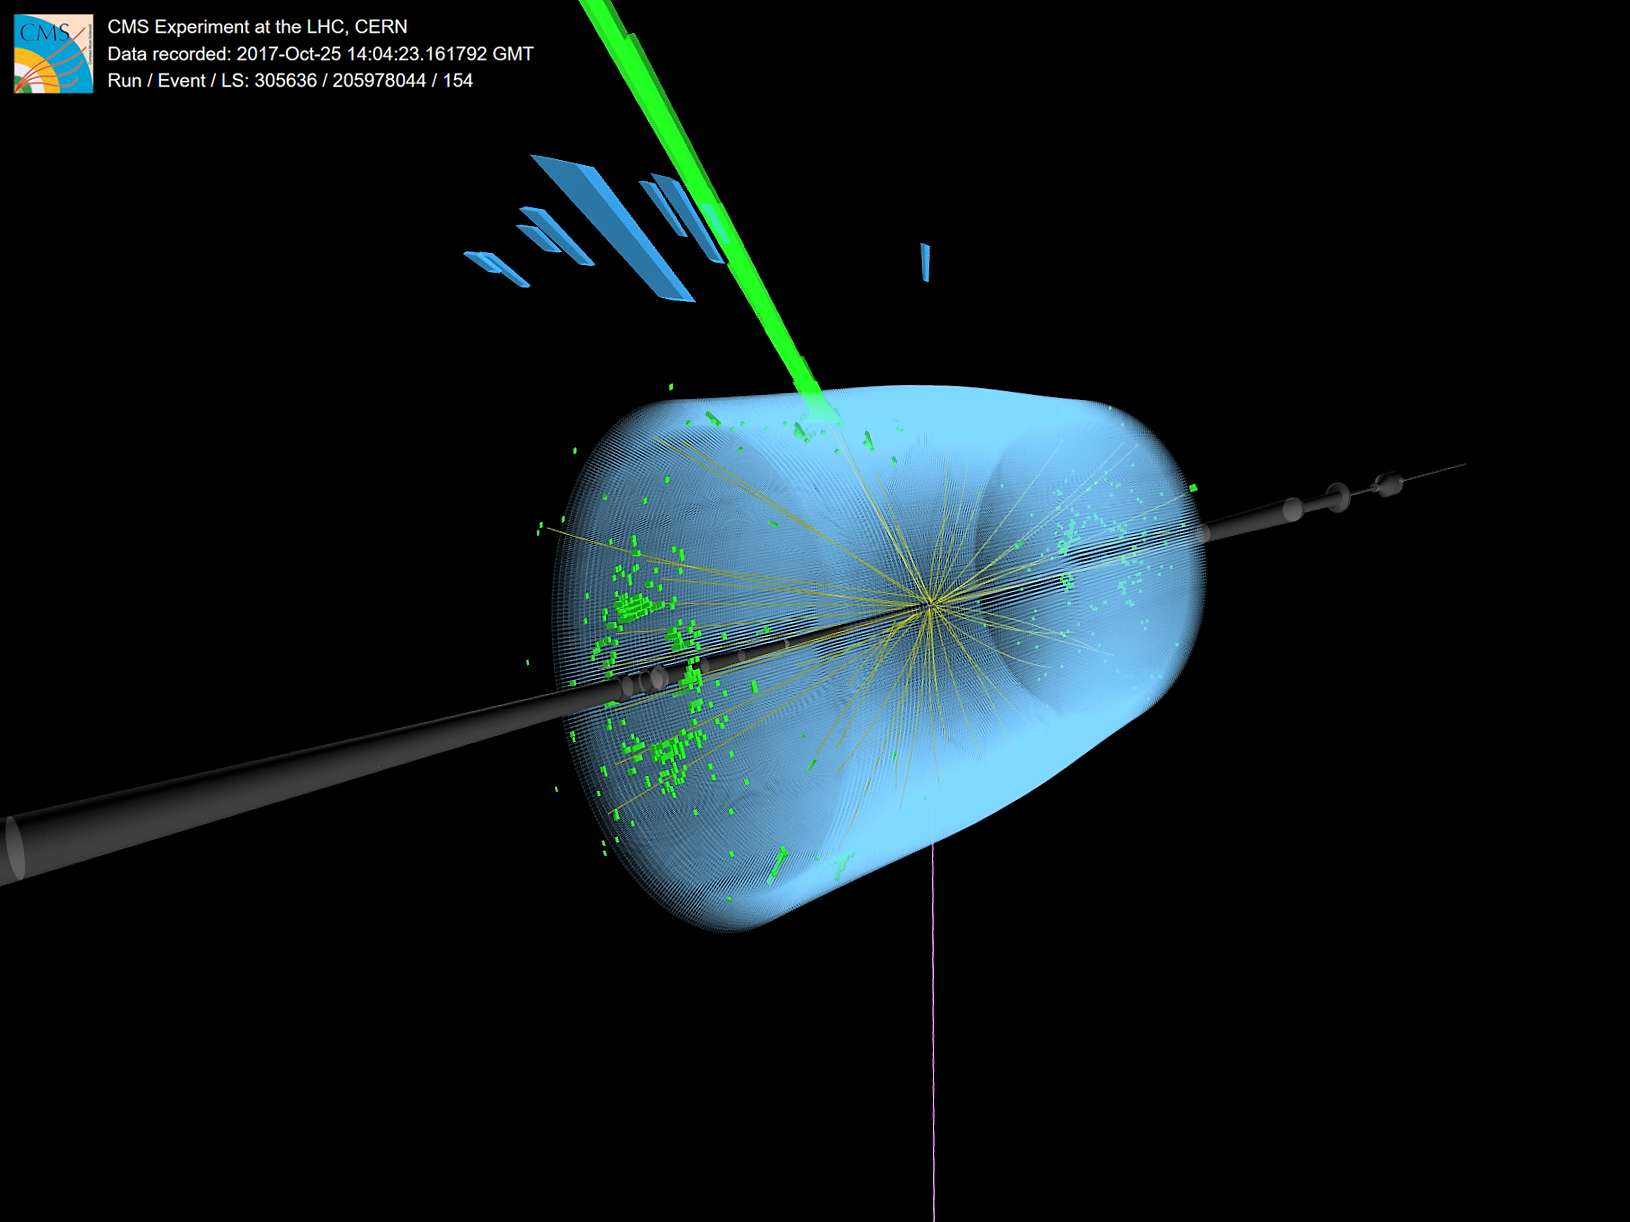
Additional Figure 1:
A collision event recorded by the CMS experiment in 2017, with a balanced high energy electron and missing transverse momentum (MET). The event has the largest transverse mass of 3.1 TeV after the signal selection criteria are applied. The electron energy deposit, shown in the green bars, has a transverse momentum of 1.57 TeV. The MET is 1.55 TeV, denoted by the purple line. |

png pdf |
Additional Figure 2:
A collision event recorded by the CMS experiment in 2017, with a balanced high energy electron and missing transverse momentum (MET). The event has the largest transverse mass of 3.1 TeV after the signal selection criteria are applied. The electron energy deposit, shown in the green bars, has a transverse momentum of 1.57 TeV. The MET is 1.55 TeV, denoted by the purple line. |
png pdf |
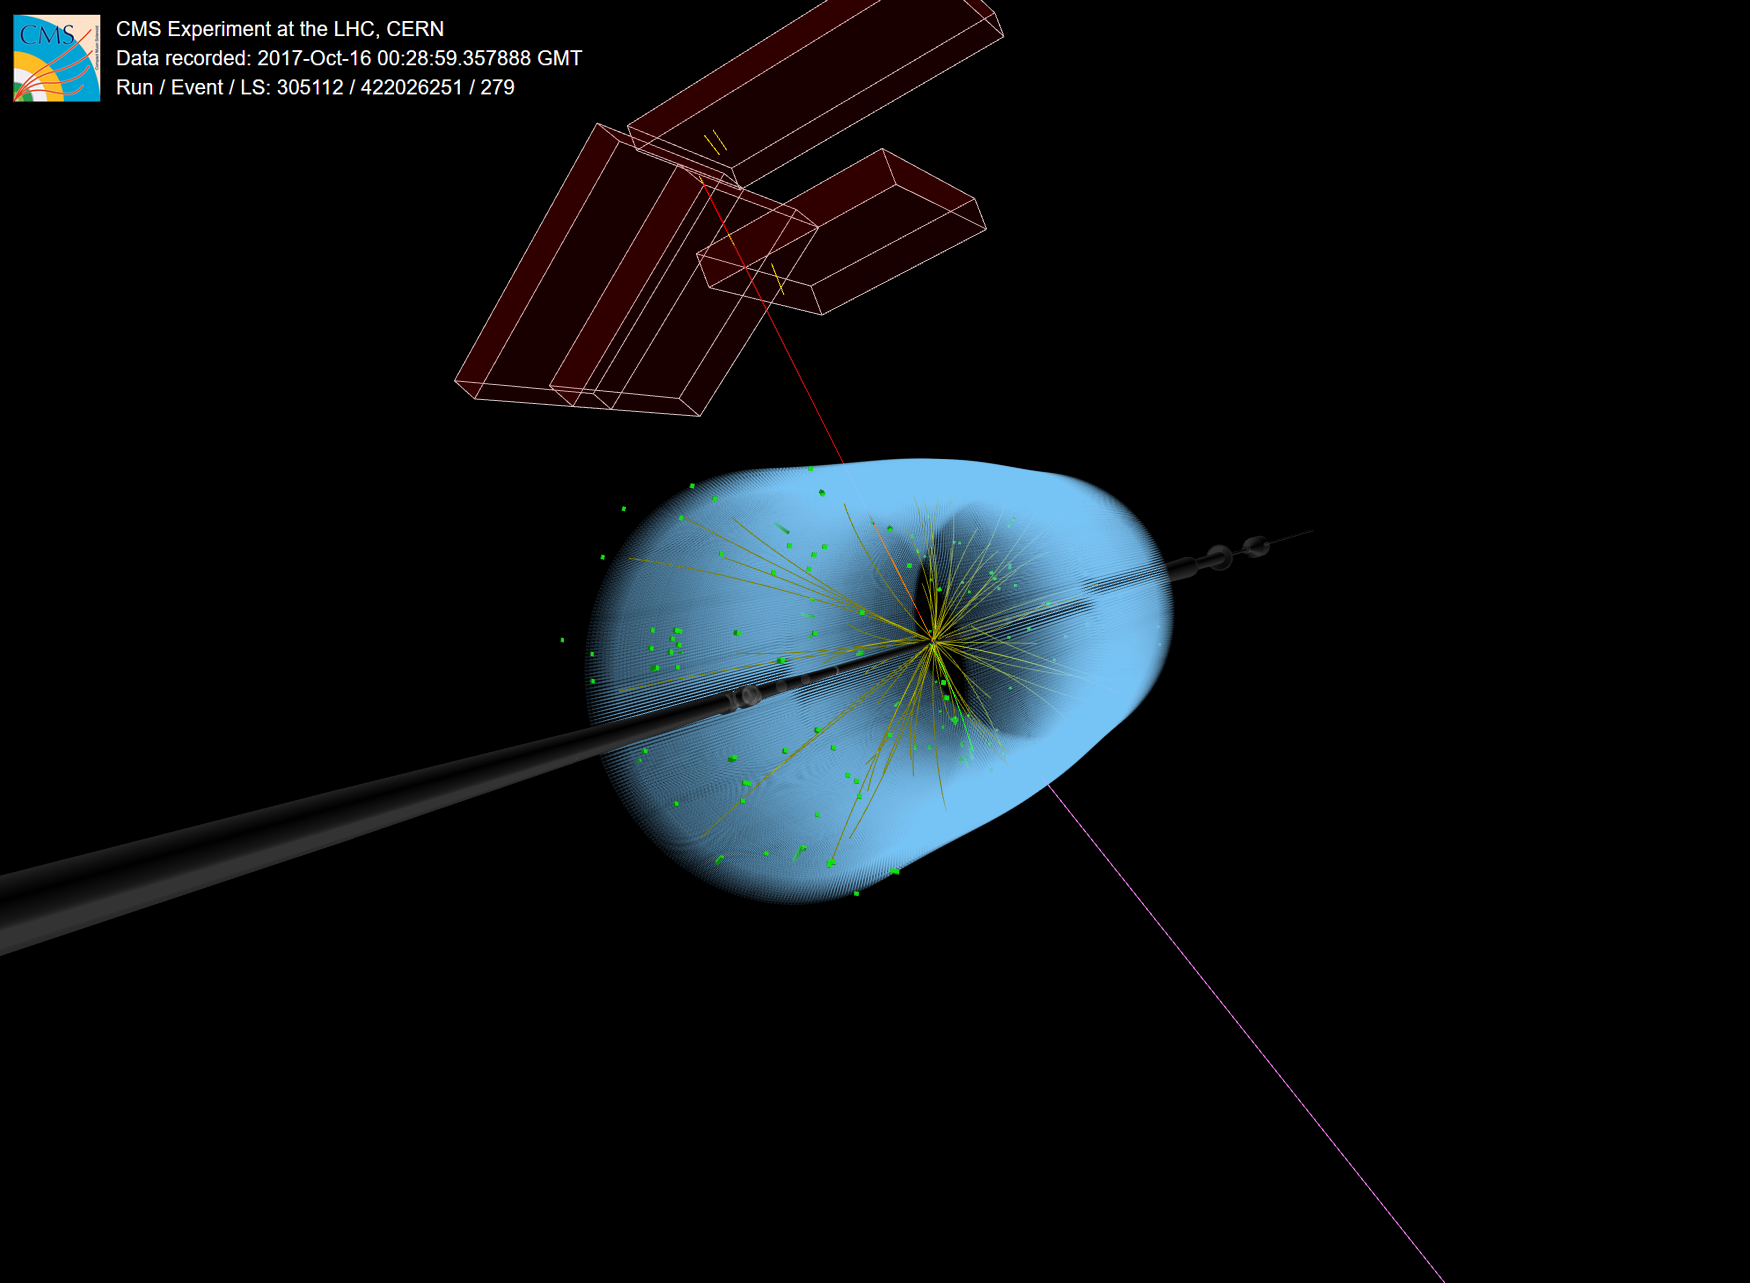
Additional Figure 3:
A collision event recorded by the CMS experiment in 2017, with a balanced high energy muon and missing transverse momentum (MET). The event has the largest transverse mass of 2.9 TeV after the signal selection criteria are applied. The muon, shown as a red line, has a transverse momentum of 1.49 TeV. The MET is 1.50 TeV, denoted by the purple line. |

png pdf |
Additional Figure 4:
A collision event recorded by the CMS experiment in 2017, with a balanced high energy muon and missing transverse momentum (MET). The event has the largest transverse mass of 2.9 TeV after the signal selection criteria are applied. The muon, shown as a red line, has a transverse momentum of 1.49 TeV. The MET is 1.50 TeV, denoted by the purple line. |
| References | ||||
| 1 | R. N. Mohapatra and J. C. Pati | A "Natural" left-right symmetry | PRD 11 (1975) 2558 | |
| 2 | R. N. Mohapatra and J. C. Pati | Left-right gauge symmetry and an "isoconjugate" model of $ \mathrm{CP} $ violation | PRD 11 (1975) 566 | |
| 3 | K. Hsieh, K. Schmitz, J.-H. Yu, and C.-P. Yuan | Global analysis of general SU(2)$ \times $SU(2)$ \times $U(1) models with precision data | PRD 82 (2010) 035011 | 1003.3482 |
| 4 | N. Arkani-Hamed, S. Dimopoulos, and G. Dvali | The hierarchy problem and new dimensions at a millimeter | PLB 429 (1998) 263 | hep-ph/9803315 |
| 5 | T. Appelquist, H.-C. Cheng, and B. A. Dobrescu | Bounds on universal extra dimensions | PRD 64 (2001) 035002 | hep-ph/0012100 |
| 6 | G. Altarelli, B. Mele, and M. Ruiz-Altaba | Searching for new heavy vector bosons in $ {\mathrm{p}}\mathrm{\bar{p}} $ colliders | Z. Phys. C 45 (1989) 109 | |
| 7 | K. Kong, S. C. Park, and T. G. Rizzo | Collider phenomenology with Split-UED | JHEP 04 (2010) 081 | 1002.0602 |
| 8 | C.-R. Chen et al. | Dark matter and collider phenomenology of split-UED | JHEP 09 (2009) 078 | 0903.1971 |
| 9 | H. K. Dreiner and T. Stefaniak | Bounds on R-parity violation from resonant slepton production at the LHC | PRD 86 (2012) 055010 | 1201.5014 |
| 10 | G. R. Farrar and P. Fayet | Phenomenology of the production, decay, and detection of new hadronic states associated with Supersymmetry | PLB 76 (1978) 575 | |
| 11 | ATLAS Collaboration | ATLAS search for a heavy gauge boson decaying to a charged lepton and a neutrino in $ pp $ collisions at $ \sqrt{s}= $ 7 TeV | EPJC 72 (2012) 2241 | 1209.4446 |
| 12 | CMS Collaboration | Search for leptonic decays of $ W $ ' bosons in $ pp $ collisions at $ \sqrt{s}= $ 7 TeV | JHEP 08 (2012) 023 | CMS-EXO-11-024 1204.4764 |
| 13 | ATLAS Collaboration | Search for new particles in events with one lepton and missing transverse momentum in $ pp $ collisions at $ \sqrt{s} = $ 8 TeV with the ATLAS detector | JHEP 09 (2014) 037 | 1407.7494 |
| 14 | CMS Collaboration | Search for physics beyond the standard model in final states with a lepton and missing transverse energy in proton-proton collisions at $ \sqrt{s} = $ 8 TeV | PRD 91 (2015) 092005 | CMS-EXO-12-060 1408.2745 |
| 15 | ATLAS Collaboration | Search for a new heavy gauge boson resonance decaying into a lepton and missing transverse momentum in 36 fb$ ^{-1} $ of $ pp $ collisions at $ \sqrt{s} = $ 13 TeV with the ATLAS experiment | EPJC 78 (2018) 401 | 1706.04786 |
| 16 | CMS Collaboration | Search for heavy gauge W' boson in events with an energetic lepton and large missing transverse momentum at $ \sqrt{s} = $ 13 TeV | PLB 770 (2017) 278 | CMS-EXO-15-006 1612.09274 |
| 17 | CMS Collaboration | Search for high-mass resonances in final states with a lepton and missing transverse momentum at $ \sqrt{s}= $ 13 TeV | JHEP 06 (2018) 128 | CMS-EXO-16-033 1803.11133 |
| 18 | ATLAS Collaboration | Search for a heavy charged boson in events with a charged lepton and missing transverse momentum from $ pp $ collisions at $ \sqrt{s} = $ 13 TeV with the ATLAS detector | PRD 100 (2019) 052013 | 1906.05609 |
| 19 | M. E. Peskin and T. Takeuchi | Estimation of oblique electroweak corrections | PRD 46 (1992) 381 | |
| 20 | A. Falkowski and K. Mimouni | Model independent constraints on four-lepton operators | JHEP 02 (2016) 086 | 1511.07434 |
| 21 | CMS Collaboration | Performance of the CMS Level-1 trigger in proton-proton collisions at $ \sqrt{s} = $ 13 TeV | JINST 15 (2020) P10017 | CMS-TRG-17-001 2006.10165 |
| 22 | CMS Collaboration | The CMS trigger system | JINST 12 (2017) P01020 | CMS-TRG-12-001 1609.02366 |
| 23 | CMS Collaboration | The CMS Experiment at the CERN LHC | JINST 3 (2008) S08004 | CMS-00-001 |
| 24 | D. Pappadopulo, A. Thamm, R. Torre, and A. Wulzer | Heavy vector triplets: bridging theory and data | JHEP 09 (2014) 060 | 1402.4431 |
| 25 | T. Sjostrand et al. | An introduction to PYTHIA 8.2 | Comp. Phys. Comm. 191 (2015) 159 | 1410.3012 |
| 26 | Y. Li and F. Petriello | Combining QCD and electroweak corrections to dilepton production in FEWZ | PRD 86 (2012) 094034 | 1208.5967 |
| 27 | M. Farina et al. | Energy helps accuracy: Electroweak precision tests at hadron colliders | PLB 772 (2017) 210 | 1609.08157 |
| 28 | CMS Collaboration | Extraction and validation of a new set of CMS PYTHIA8 tunes from underlying-event measurements | EPJC 80 (2020) 4 | CMS-GEN-17-001 1903.12179 |
| 29 | NNPDF Collaboration | Parton distributions from high-precision collider data | EPJC 77 (2017) 663 | 1706.00428 |
| 30 | GEANT4 Collaboration | GEANT4--a simulation toolkit | NIMA 506 (2003) 250 | |
| 31 | J. Allison and K. A. et al. | Recent developments in Geant4 | NIMA 835 (2016) 186 | |
| 32 | A. Arbuzov et al. | Update of the MCSANC Monte Carlo integrator, v.1.20 | JEPTL 103 (2016) 131 | 1509.03052 |
| 33 | S. Alioli et al. | Precision studies of observables in $ p p \rightarrow W \rightarrow l\nu _l $ and $ pp \rightarrow \gamma,Z \rightarrow l^+ l^- $ processes at the LHC | EPJC 77 (2017) 280 | 1606.02330 |
| 34 | M. L. Mangano, M. Moretti, F. Piccinini, and M. Treccani | Matching matrix elements and shower evolution for top-pair production in hadronic collisions | JHEP 01 (2007) 013 | hep-ph/0611129 |
| 35 | S. Frixione and B. R. Webber | Matching NLO QCD computations and parton shower simulations | JHEP 06 (2002) 029 | hep-ph/0204244 |
| 36 | S. Alioli, P. Nason, C. Oleari, and E. Re | A general framework for implementing NLO calculations in shower Monte Carlo programs: the POWHEG BOX | JHEP 06 (2010) 043 | 1002.2581 |
| 37 | M. Czakon, P. Fiedler, and A. Mitov | Total Top-Quark Pair-Production Cross Section at Hadron Colliders Through $ \mathcal{O}({{\alpha}}_{S}^{4}) $ | PRL 110 (2013) 252004 | 1303.6254 |
| 38 | M. Czakon et al. | Top-pair production at the LHC through NNLO QCD and NLO EW | JHEP 10 (2017) 186 | 1705.04105 |
| 39 | CMS Collaboration | Particle-flow reconstruction and global event description with the CMS detector | JINST 12 (2017) P10003 | CMS-PRF-14-001 1706.04965 |
| 40 | M. Cacciari, G. P. Salam, and G. Soyez | The anti-$ k_t $ jet clustering algorithm | JHEP 04 (2008) 063 | 0802.1189 |
| 41 | M. Cacciari, G. P. Salam, and G. Soyez | FastJet User Manual | EPJC 72 (2012) 1896 | 1111.6097 |
| 42 | CMS Collaboration | Performance of missing transverse momentum reconstruction in proton-proton collisions at $ \sqrt{s} = $ 13 TeV using the CMS detector | JINST 14 (2019), no. 07, P07004--P07004 | |
| 43 | CMS Collaboration | Search for narrow resonances in dilepton mass spectra in proton-proton collisions at $ \sqrt{s} = $ 13 TeV and combination with 8 TeV data | PLB 768 (2017) 57 | CMS-EXO-15-005 1609.05391 |
| 44 | CMS Collaboration | Electron and photon reconstruction and identification with the CMS detector in LHC Run 2 | CDS | |
| 45 | CMS Collaboration | Performance of the CMS muon detector and muon reconstruction with proton-proton collisions at $ \sqrt{s}= $ 13 TeV | JINST 13 (2018) P06015 | CMS-MUO-16-001 1804.04528 |
| 46 | CMS Collaboration | Performance of the reconstruction and identification of high-momentum muons in proton-proton collisions at $ \sqrt{s} = $ 13 TeV | JINST 15 (2020) P02027 | CMS-MUO-17-001 1912.03516 |
| 47 | CMS Collaboration | Jet energy scale and resolution in the CMS experiment in pp collisions at 8 TeV | JINST 12 (2017) P02014 | CMS-JME-13-004 1607.03663 |
| 48 | CMS Collaboration | Performance of missing transverse momentum reconstruction in proton-proton collisions as $ \sqrt{s} = $ 13 TeV using the CMS detector | JINST 14 (2019) P07004 | CMS-JME-17-001 1903.06078 |
| 49 | CMS Collaboration | Measurement of the Inclusive $ W $ and $ Z $ Production Cross Sections in $ pp $ Collisions at $ \sqrt{s}= $ 7 TeV | JHEP 10 (2011) 132 | CMS-EWK-10-005 1107.4789 |
| 50 | CMS Collaboration | Identification of heavy-flavour jets with the CMS detector in pp collisions at 13 TeV | JINST 13 (2018) P05011 | CMS-BTV-16-002 1712.07158 |
| 51 | J. Butterworth et al. | PDF4LHC recommendations for LHC Run II | JPG 43 (2016) 023001 | 1510.03865 |
| 52 | CMS Collaboration | CMS luminosity measurement for the 2017 data-taking period at $ \sqrt{s} = $ 13 TeV | CMS-PAS-LUM-17-004 | CMS-PAS-LUM-17-004 |
| 53 | CMS Collaboration | CMS luminosity measurement for the 2018 data-taking period at $ \sqrt{s} = $ 13 TeV | CMS-PAS-LUM-18-002 | CMS-PAS-LUM-18-002 |
| 54 | CMS Collaboration | Performance of the reconstruction and identification of high-momentum muons in proton-proton collisions at $ \sqrt{s} = $ 13 TeV | JINST 15 (2020) P02027 | CMS-MUO-17-001 1912.03516 |
| 55 | Particle Data Group, P. A. Zyla et al. | Review of particle physics | Prog. Theor. Exp. Phys. (2020) 083C01 | |
| 56 | R. Barlow and C. Beeston | Fitting using finite Monte Carlo samples | Computer Physics Communications 77 (1993) 2 | |
|
|
Compact Muon Solenoid LHC, CERN |
|

|

|

|

|

|