

Compact Muon Solenoid
LHC, CERN
| CMS-PAS-B2G-20-002 | ||
| Search for W' decaying to a vector-like quark and a top or bottom quark in the all-jets final state | ||
| CMS Collaboration | ||
| March 2021 | ||
| Abstract: A search for a heavy W' boson resonance decaying to one B or T vector-like quark and a top or bottom quark, respectively, is presented. The analysis is performed using proton-proton collision data collected from the year 2016 to 2018 with the CMS detector at the LHC. The data correspond to an integrated luminosity of 137 fb$^{-1}$ at a center-of-mass energy of 13 TeV. Both decay channels result in a final state with a top quark, a Higgs or Z boson, and a b quark, each produced with significant energy. The all-hadronic decays of both the Higgs boson and the top quark are considered. The final-state jets, some of which correspond to merged decay products of a boosted top quark and a Higgs or Z boson, are selected using jet substructure techniques, which help to suppress standard model backgrounds. A W' boson signal would appear as a narrow peak in the invariant mass distribution of these three jets. No significant deviation in data with respect to the standard model background predictions is observed. The 95% confidence level upper limits on the cross section for W' boson production and the subsequent decay into a top quark, Higgs or Z boson, and b quark are set as a function of the W' boson mass, for several vector-like quark mass hypotheses. We exclude a W' boson in this channel with a mass below 3.2 TeV given benchmark model assumptions, and additionally present limits based on generalizations of these assumptions. This is the first search for a W' boson in this channel using the full 2016 to 2018 CMS data. | ||
|
Links:
CDS record (PDF) ;
inSPIRE record ;
CADI line (restricted) ;
These preliminary results are superseded in this paper, Submitted to JHEP. The superseded preliminary plots can be found here. |
||
| Figures | |

png pdf |
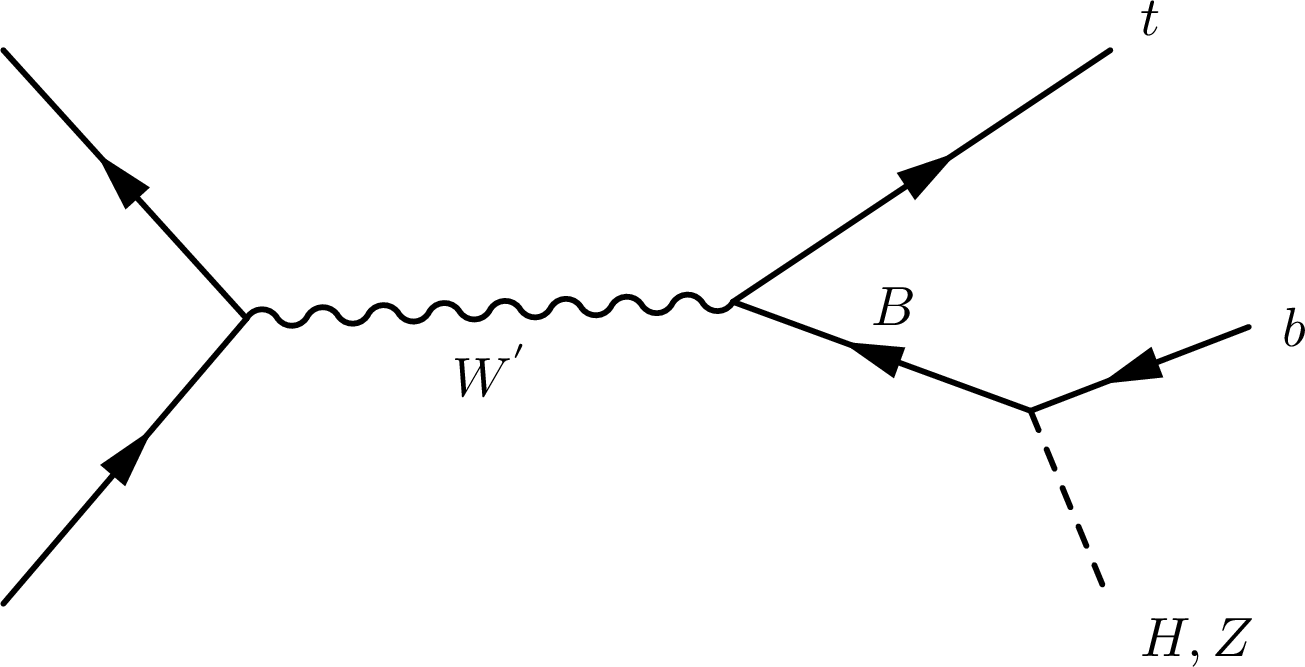
Figure 1:
Dominant diagrams for the signal model considered in the analysis. The analysis assumes equal branching fractions for W' boson to tB and bT and 50% for each VLQ to qH and qZ for the benchmark model. |
png pdf |
Figure 1-a:
Dominant diagram for tB production in the considered signal model. The analysis assumes equal branching fractions for the B-VQL to bH and bZ for the benchmark model. |
png pdf |
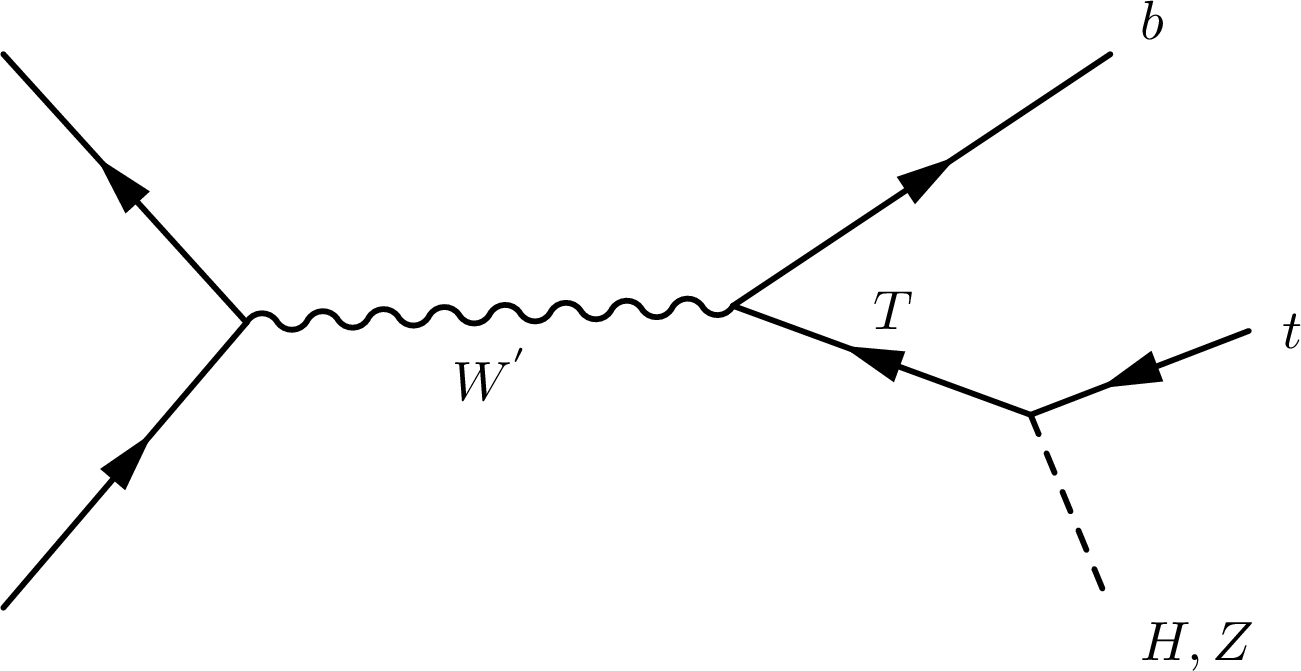
Figure 1-b:
Dominant diagram for bT production in the considered signal model. The analysis assumes equal branching fractions for the T-VQL to tH and tZ for the benchmark model. |
png pdf |
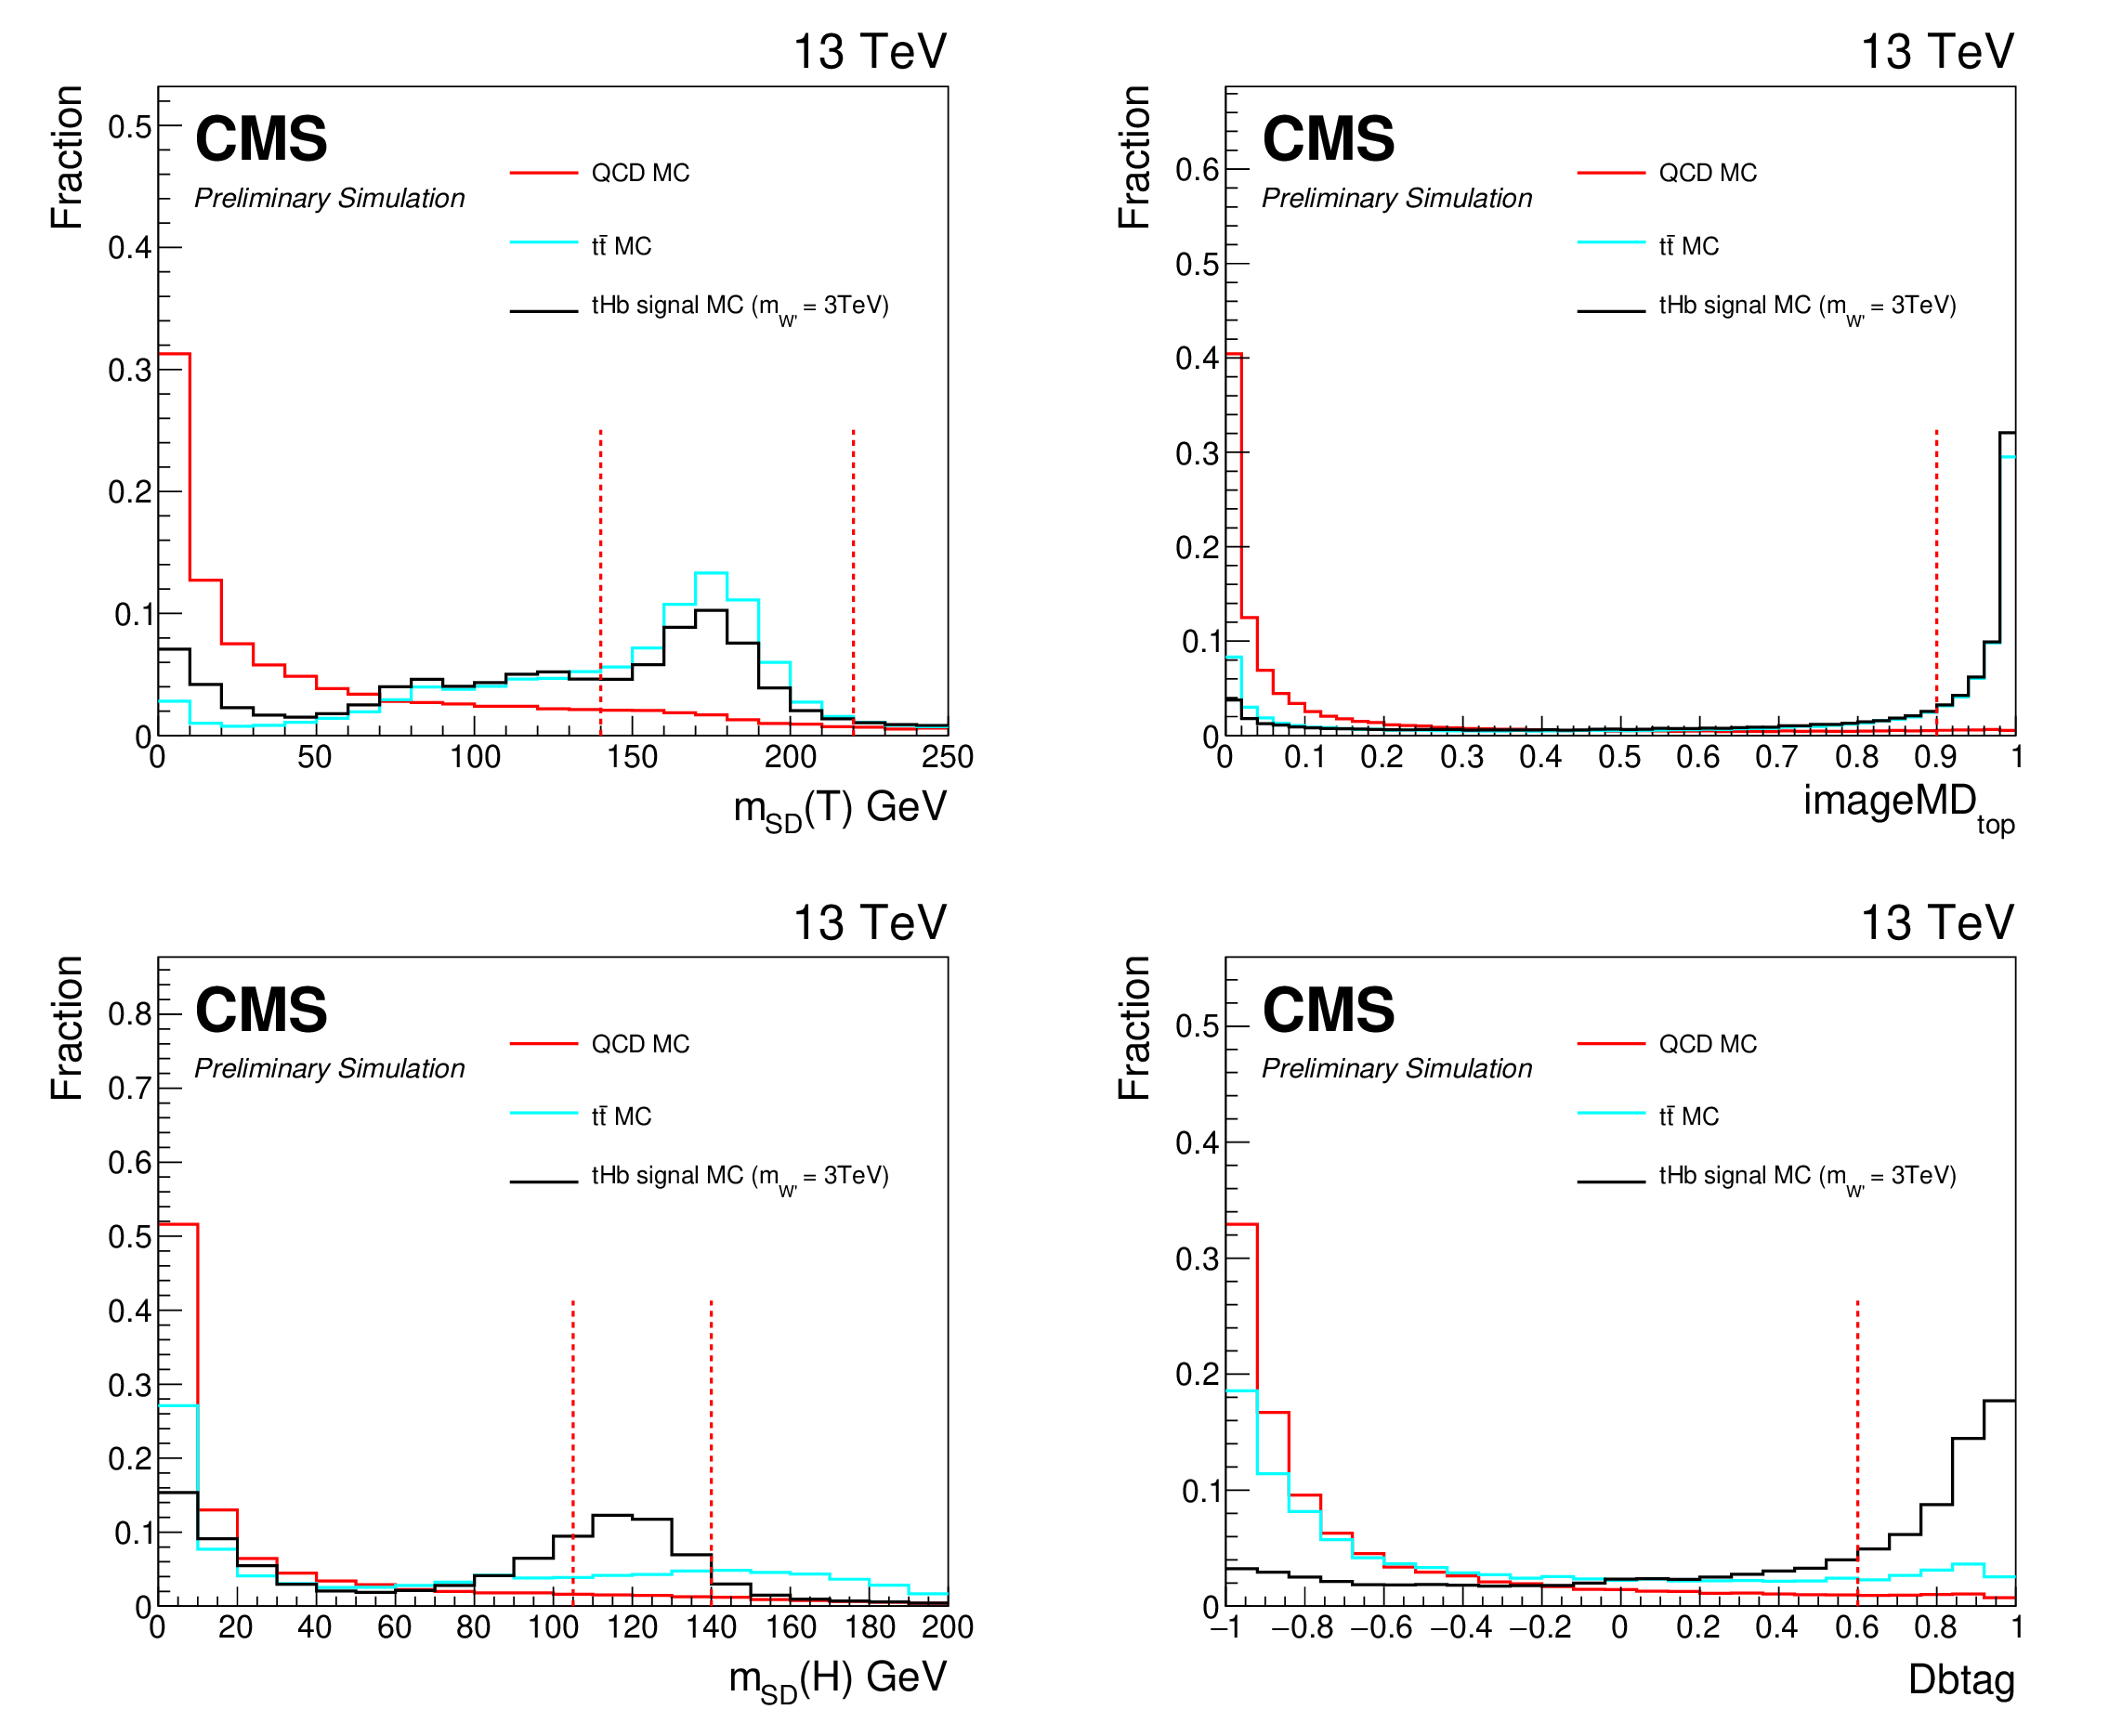
Figure 2:
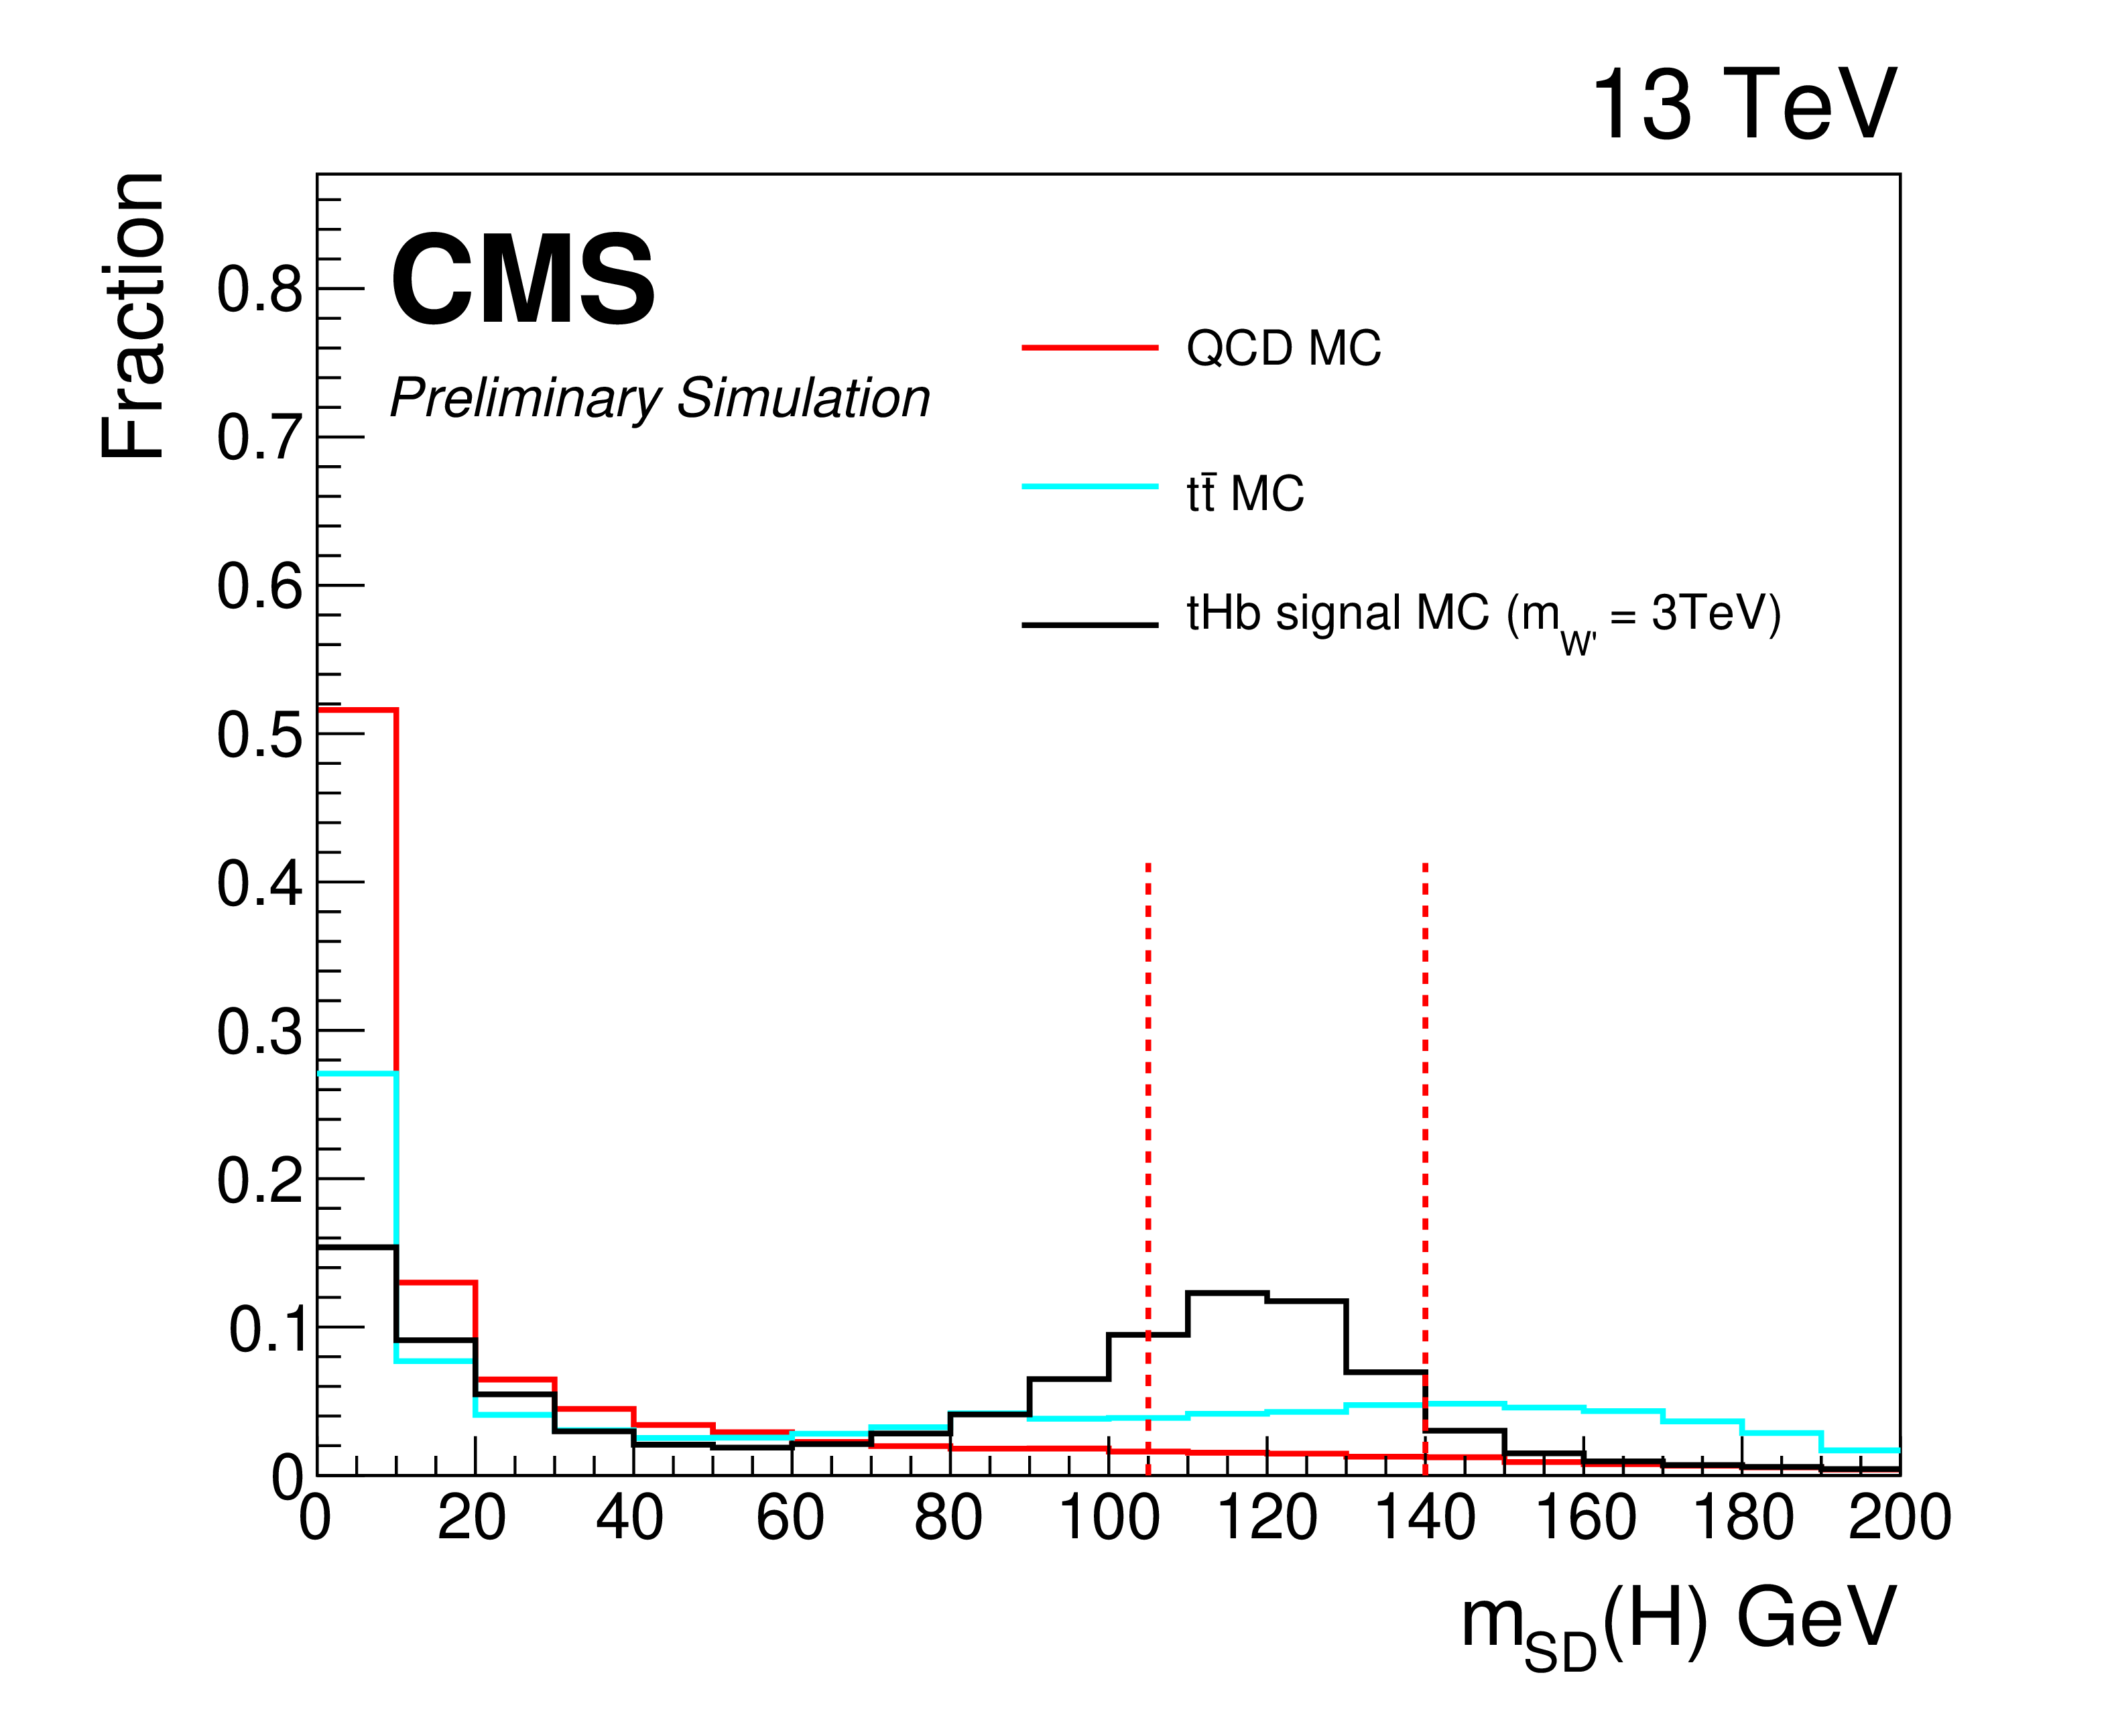
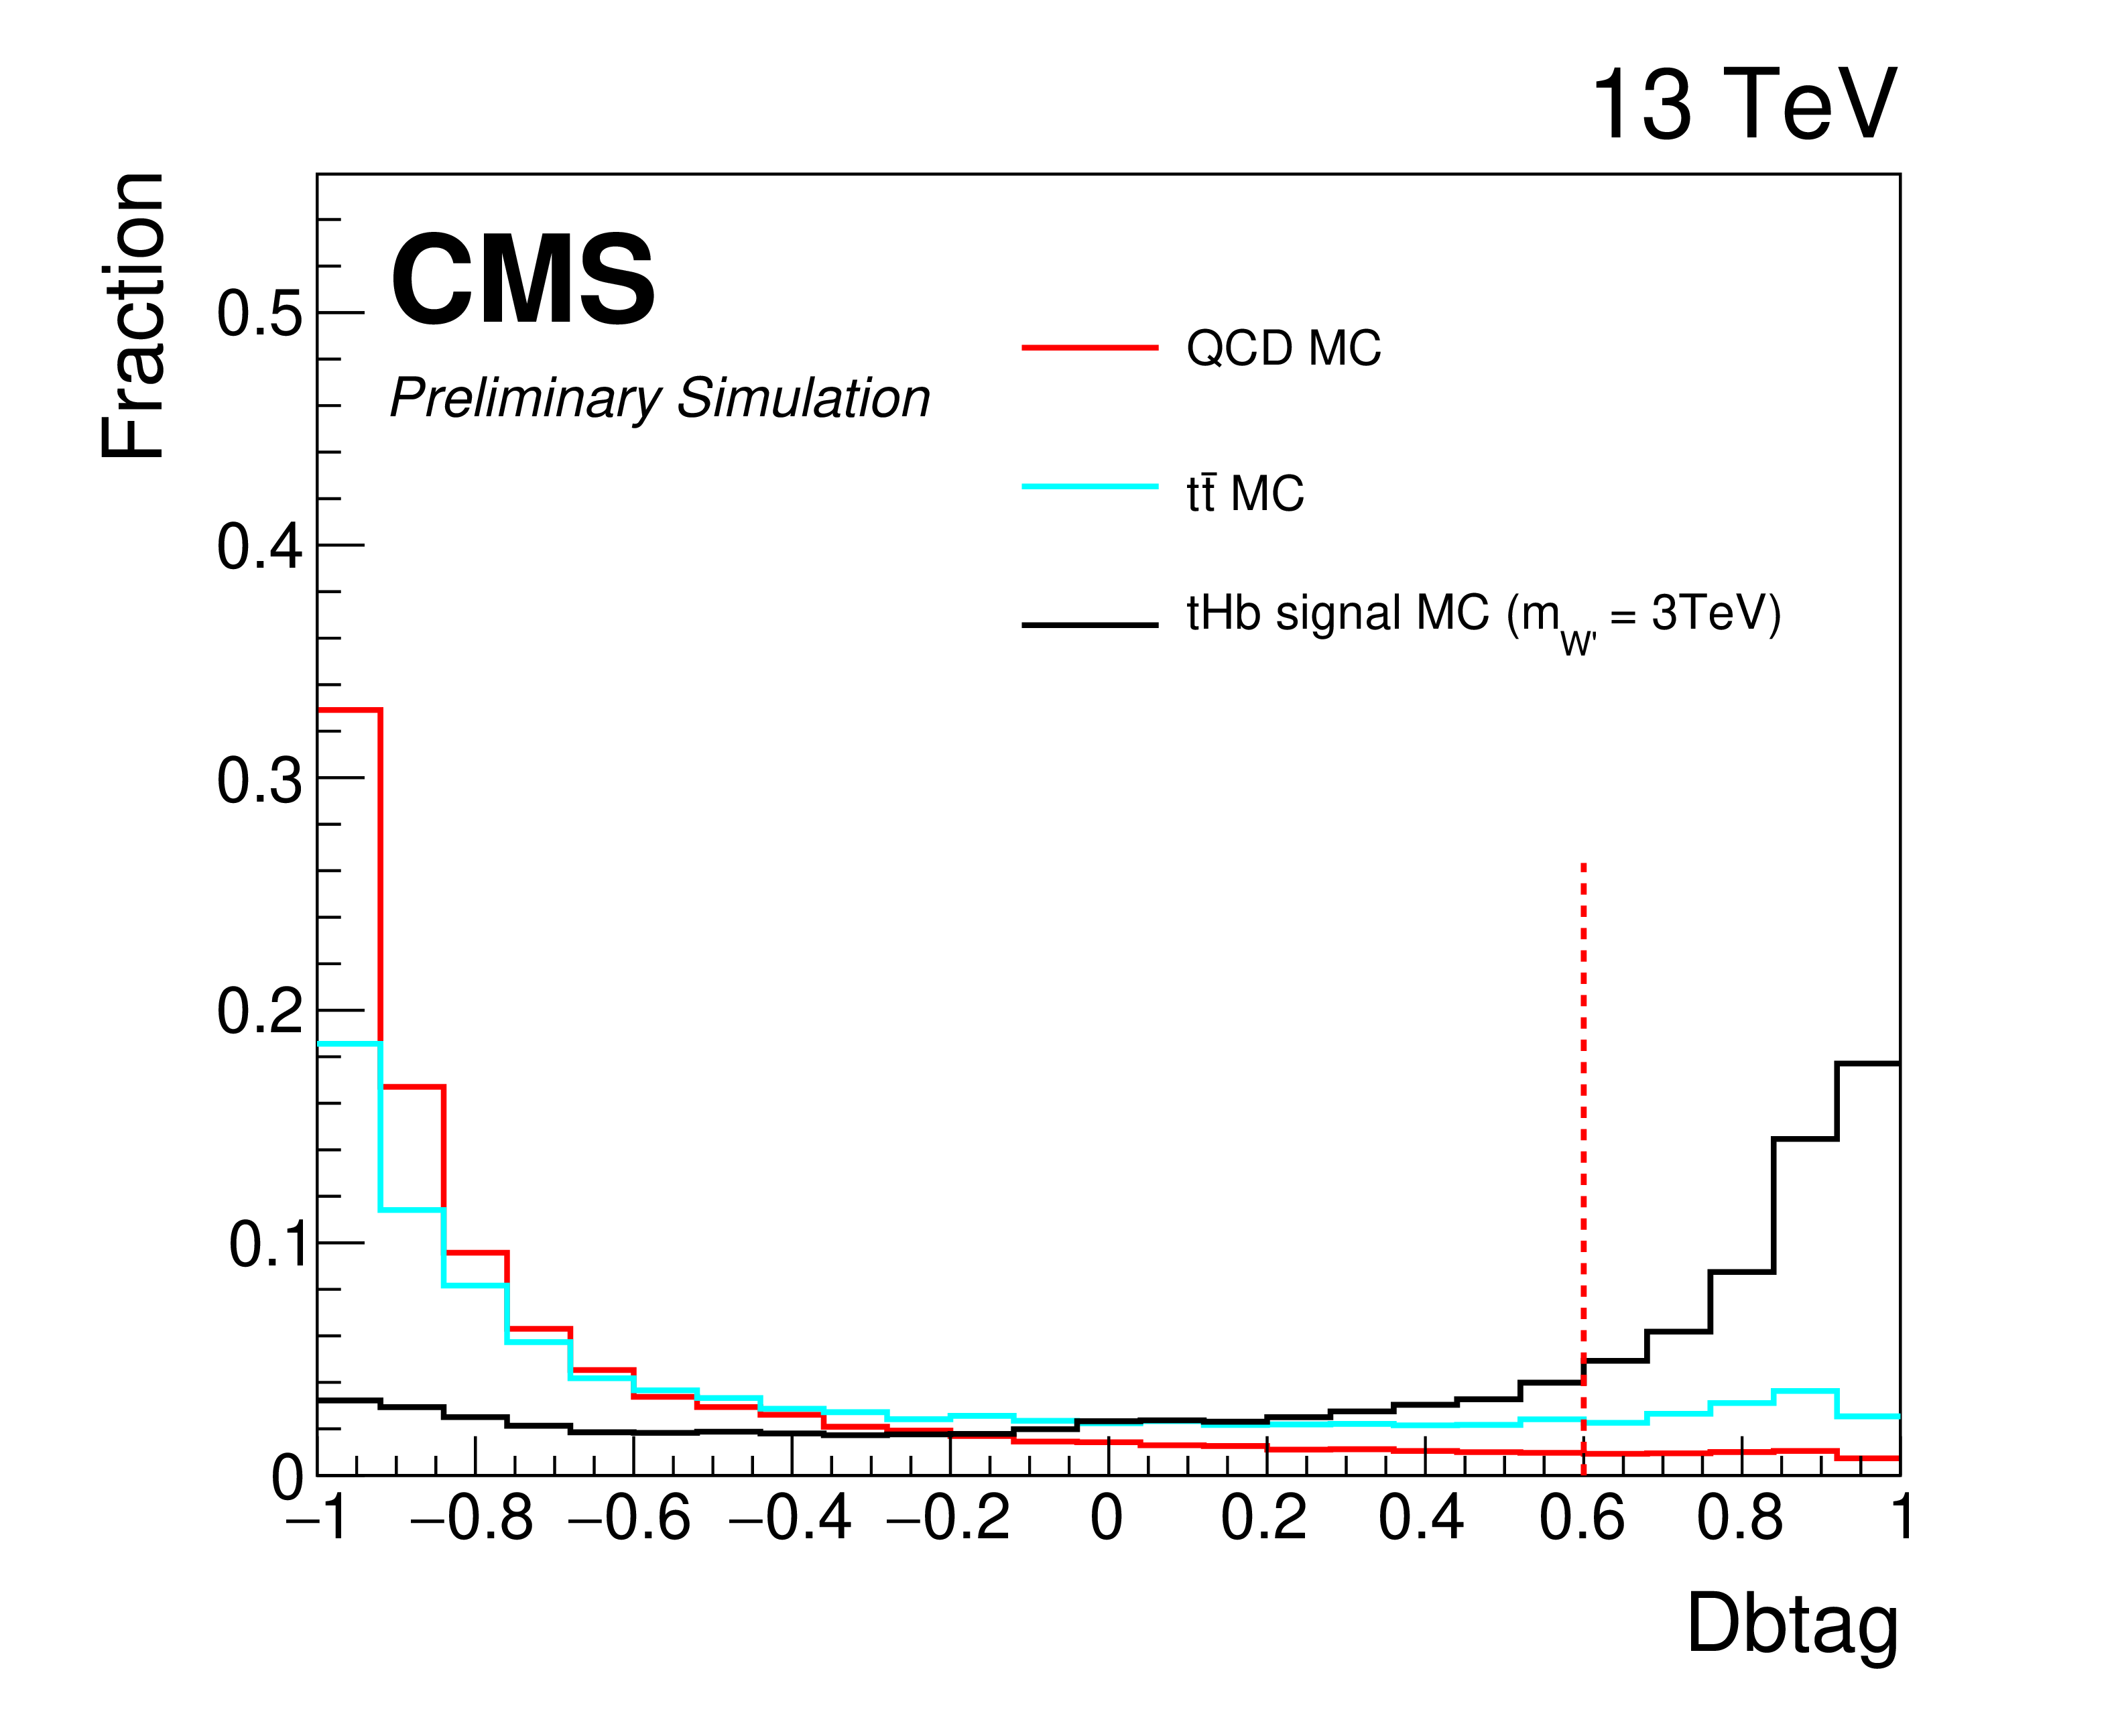
Normalized distributions of the discriminating variables in ${\mathrm{t} {}\mathrm{\bar{t}}} $, QCD, and tHb signal MC simulation for the tHb analysis. Each variable distribution in this set of figures is required to pass a loosened event selection that preserves same-jet variable correlations. |
png pdf |
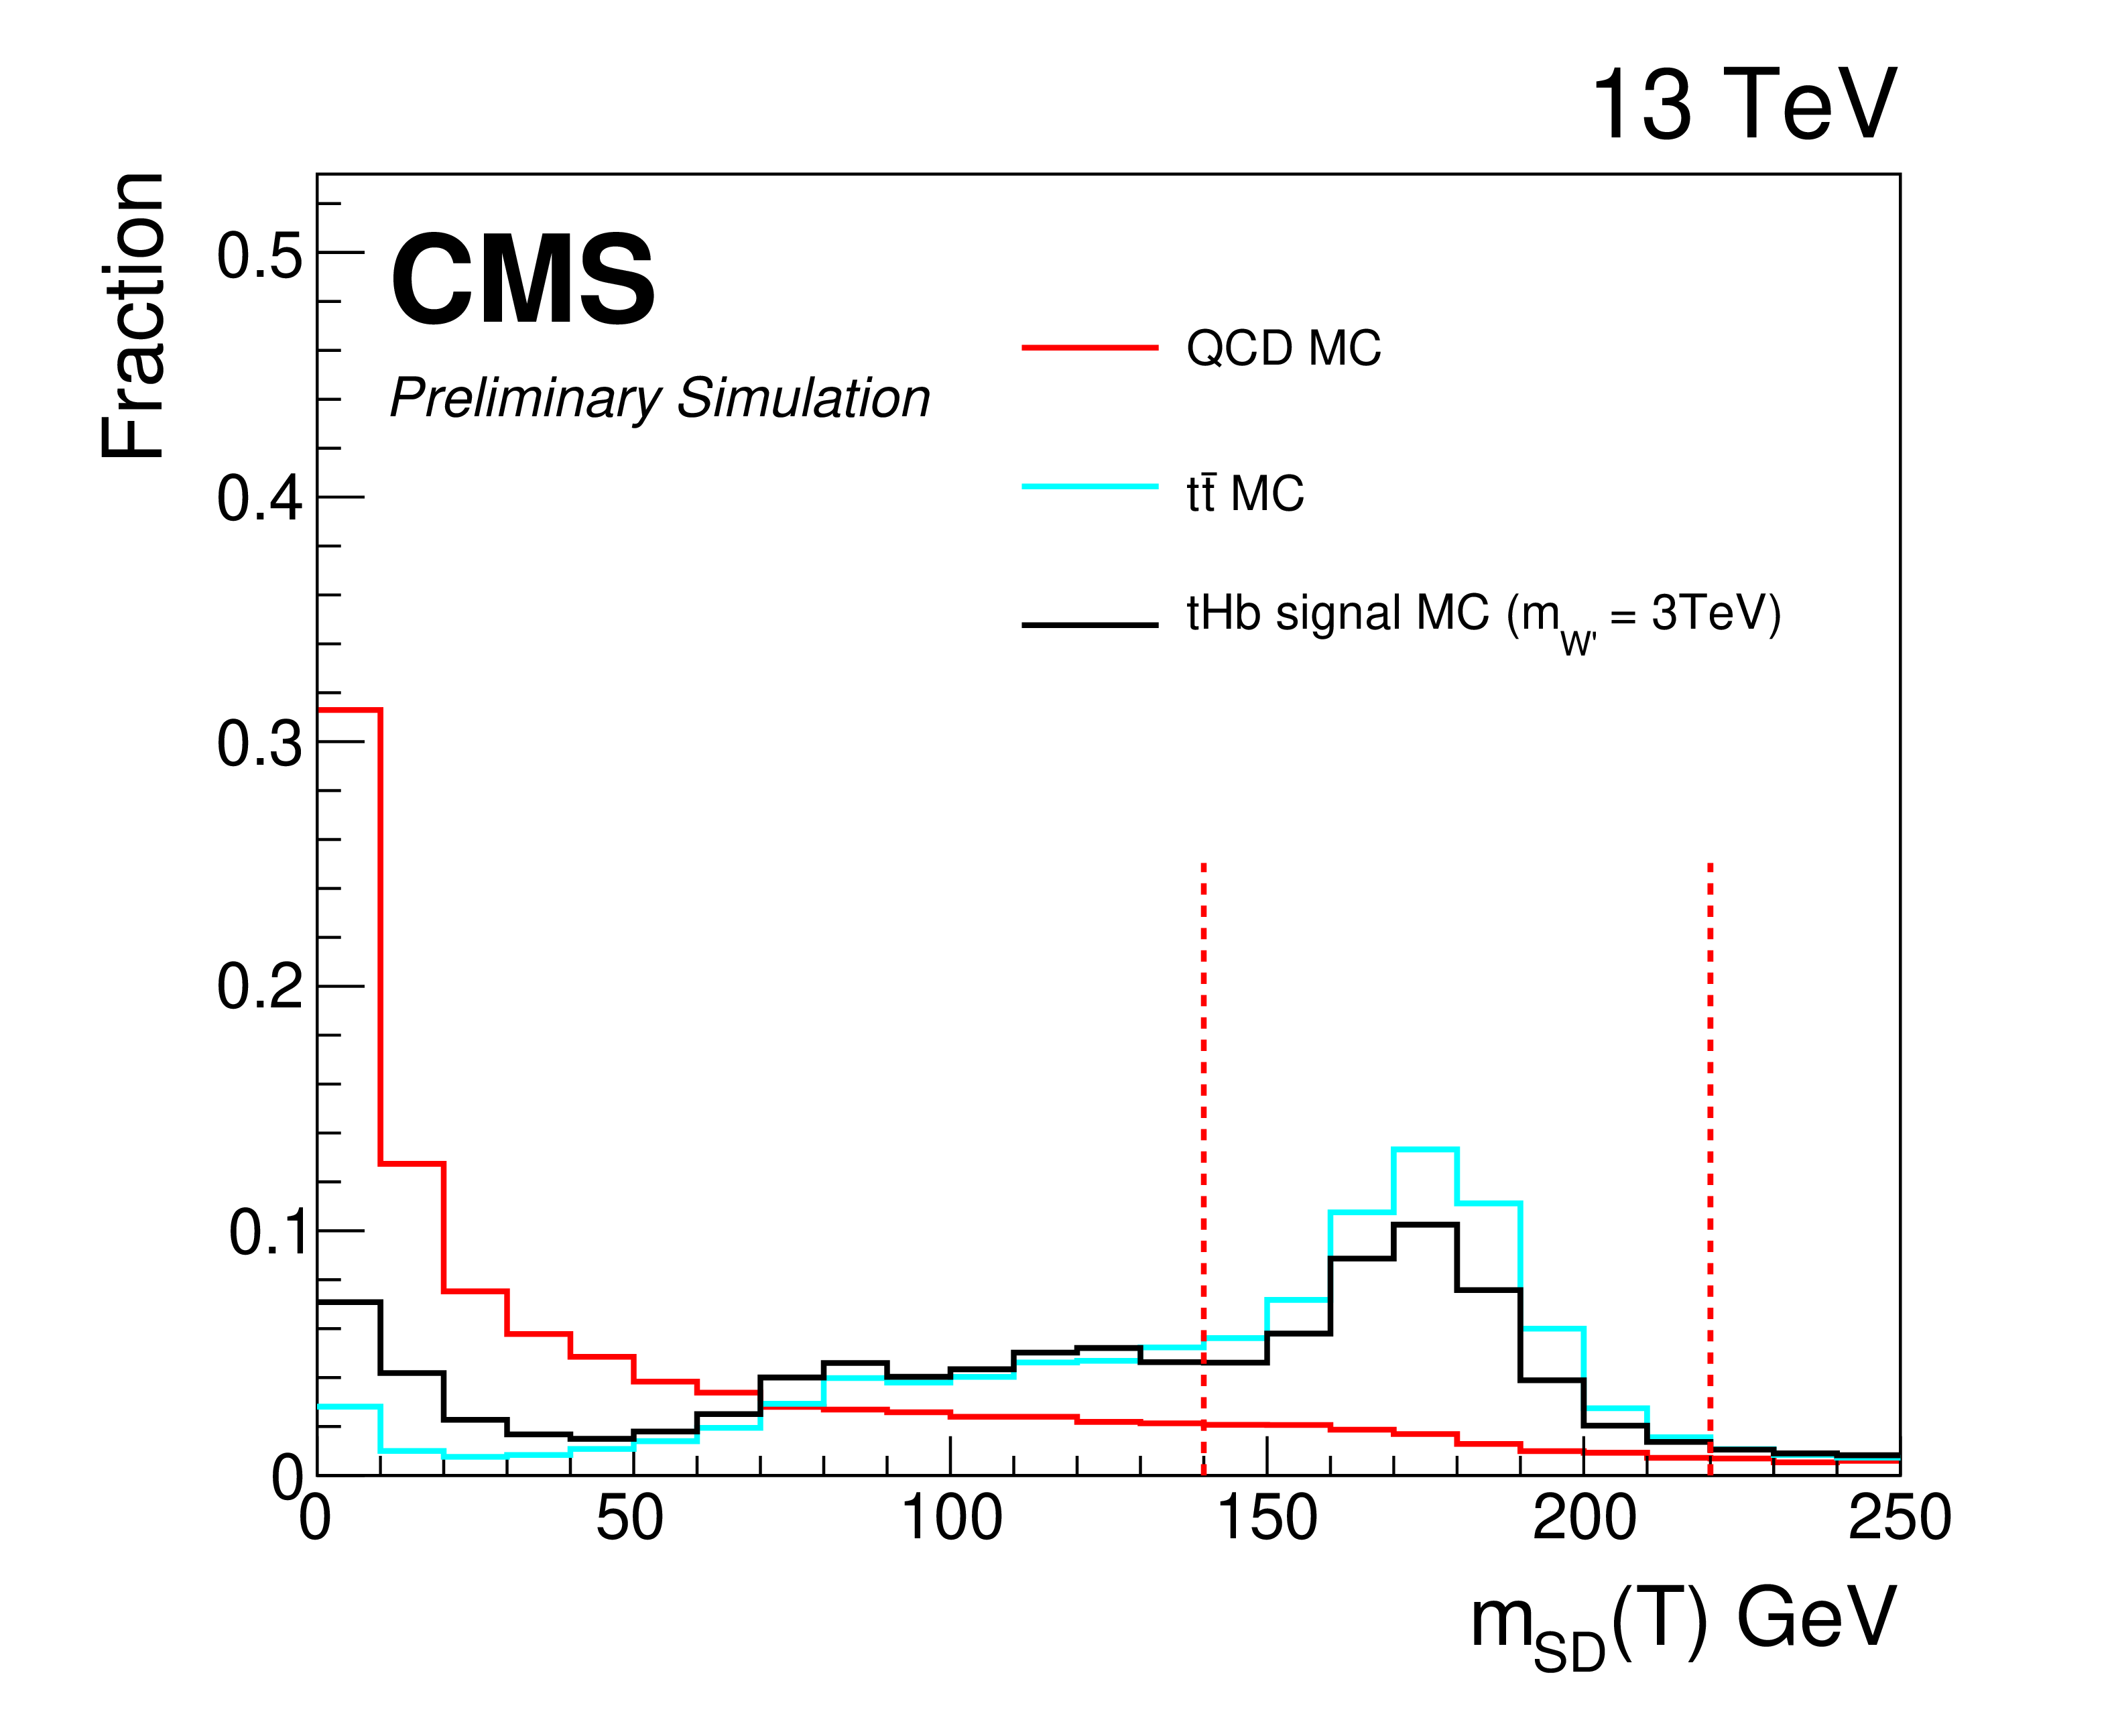
Figure 2-a:
Normalized distribution of the $m_{\mathrm{SD}}(\mathrm{T})$ variable in ${\mathrm{t} {}\mathrm{\bar{t}}} $, QCD, and tHb signal MC simulation for the tHb analysis. In this distribution, the variable is required to pass a loosened event selection that preserves same-jet variable correlations. |

png pdf |
Figure 2-b:
Normalized distribution of the imageMD$_{\mathrm{top}}$ variable in ${\mathrm{t} {}\mathrm{\bar{t}}} $, QCD, and tHb signal MC simulation for the tHb analysis. In this distribution, the variable is required to pass a loosened event selection that preserves same-jet variable correlations. |
png pdf |
Figure 2-c:
Normalized distribution of the $m_{\mathrm{SD}}(\mathrm{H})$ variable in ${\mathrm{t} {}\mathrm{\bar{t}}} $, QCD, and tHb signal MC simulation for the tHb analysis. In this distribution, the variable is required to pass a loosened event selection that preserves same-jet variable correlations. |
png pdf |
Figure 2-d:
Normalized distribution of the Dbtag variable in ${\mathrm{t} {}\mathrm{\bar{t}}} $, QCD, and tHb signal MC simulation for the tHb analysis. In this distribution, the variable is required to pass a loosened event selection that preserves same-jet variable correlations. |
png pdf |
Figure 3:
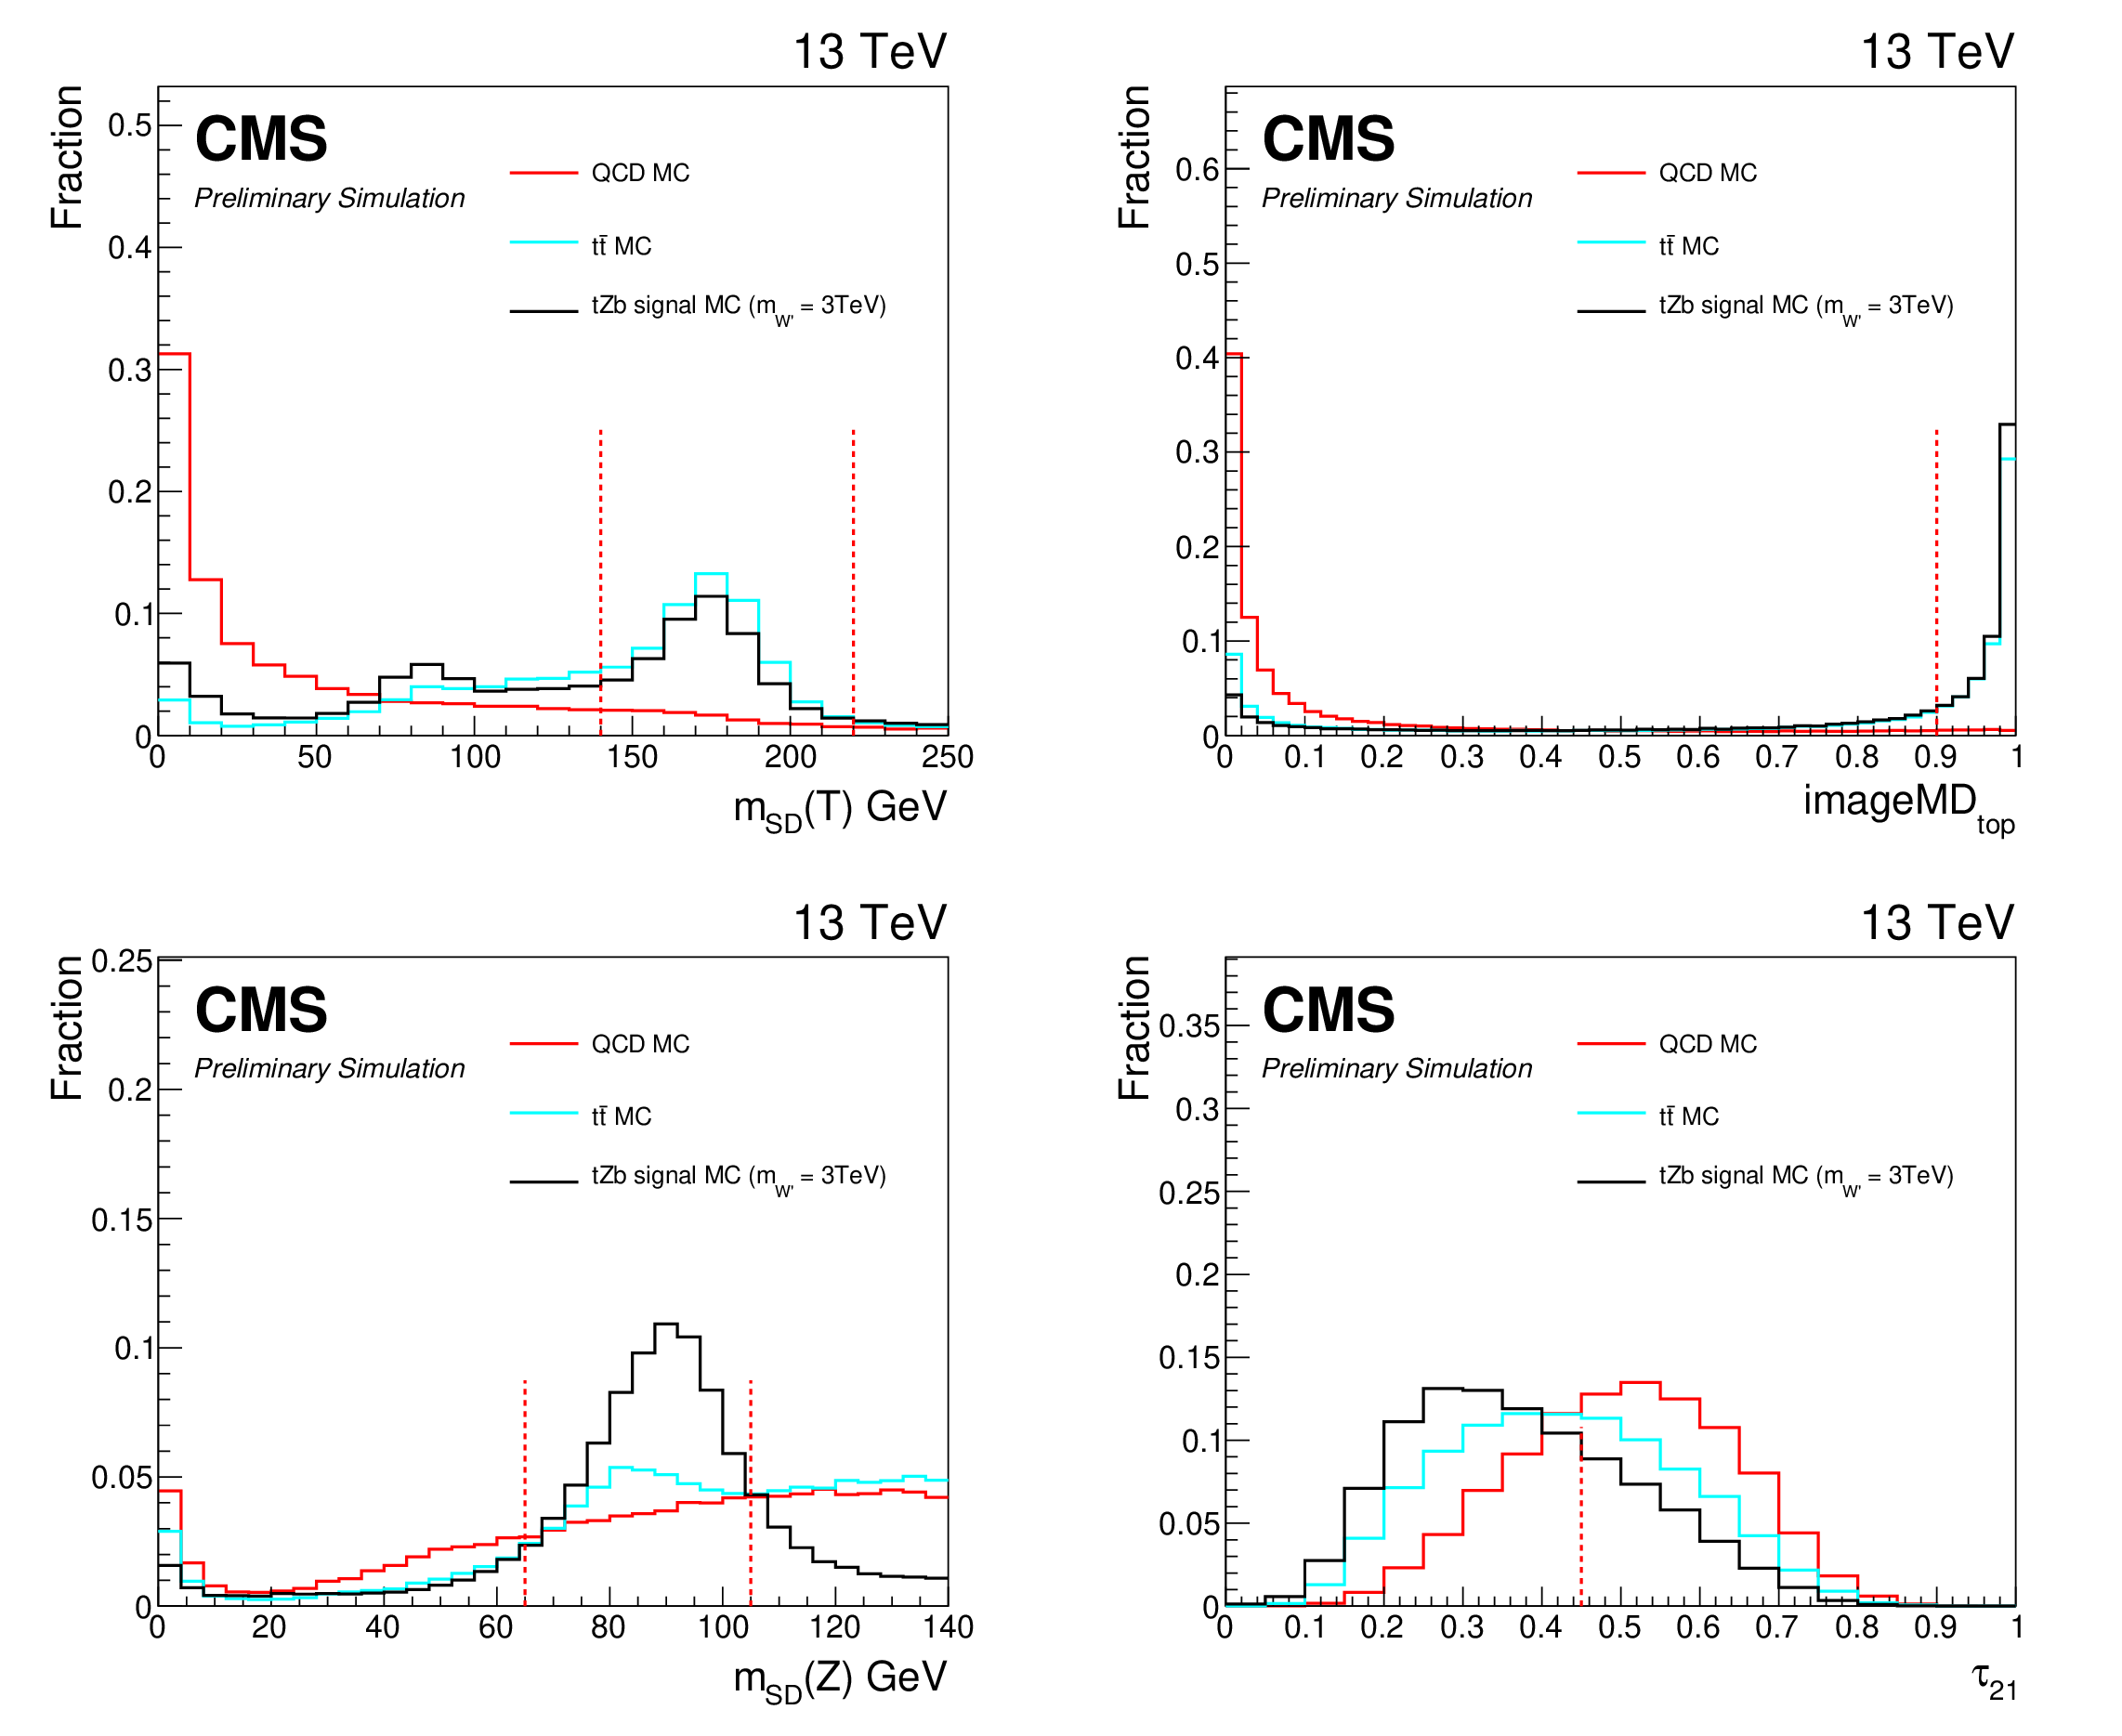
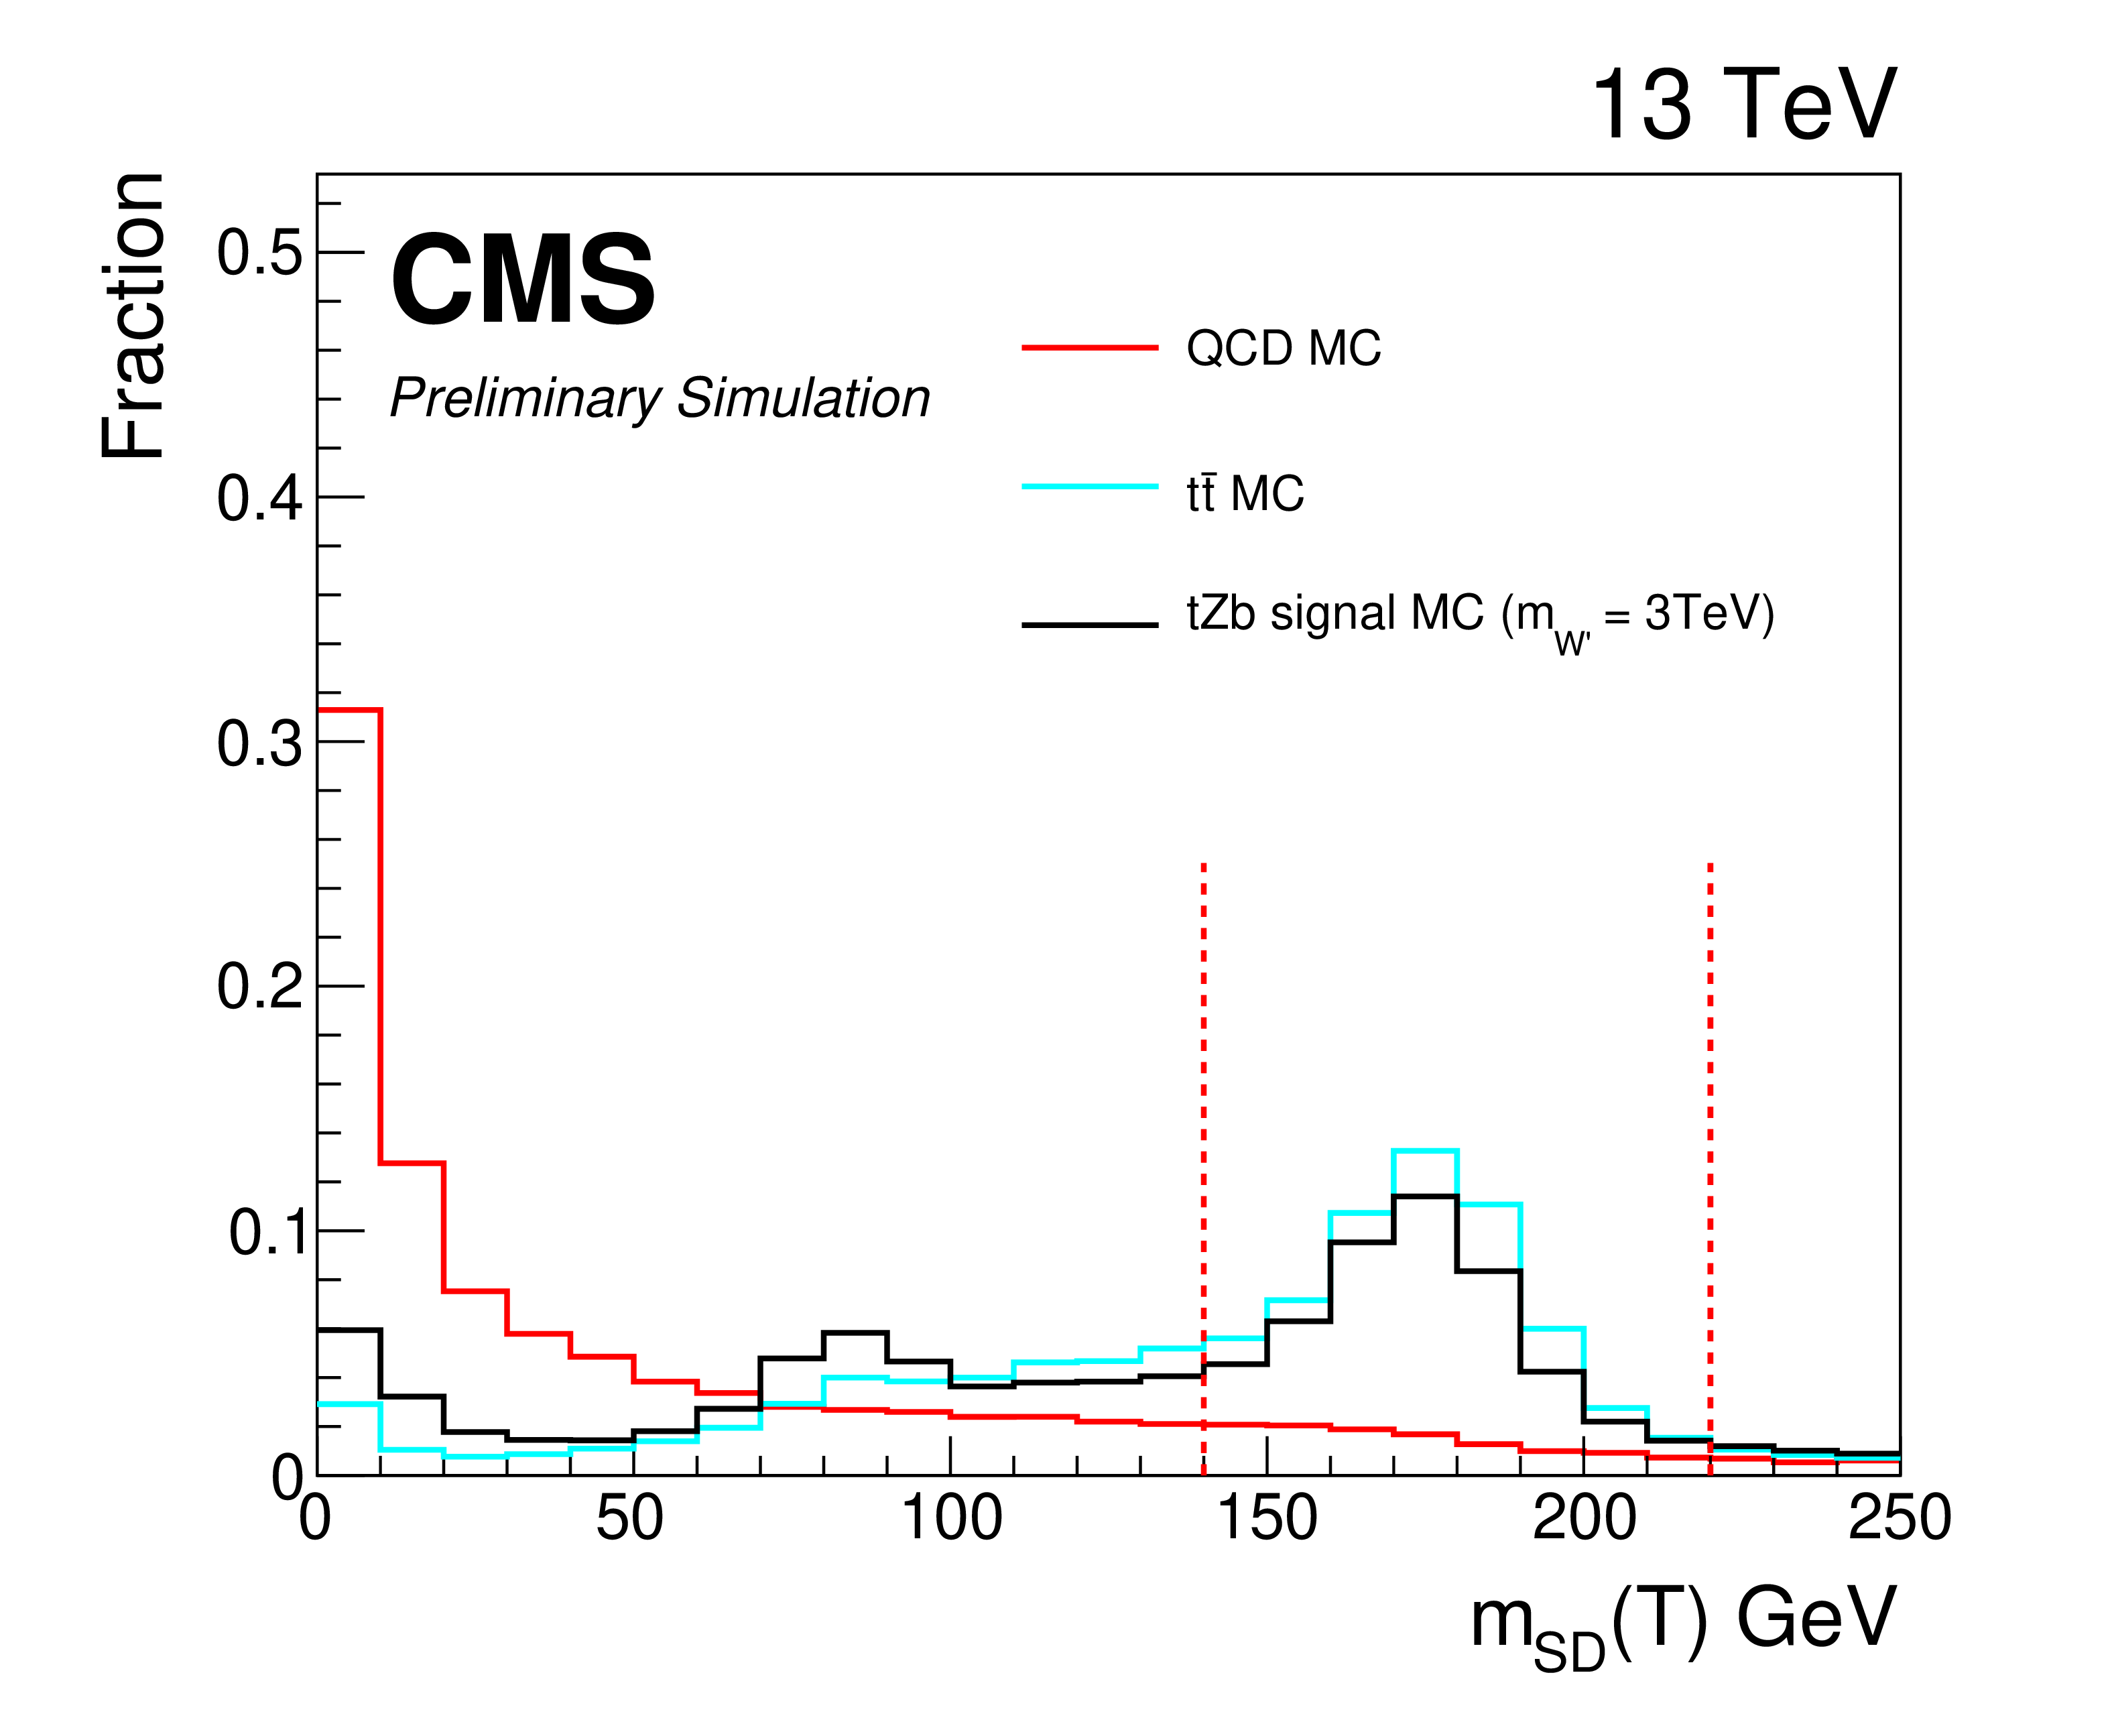
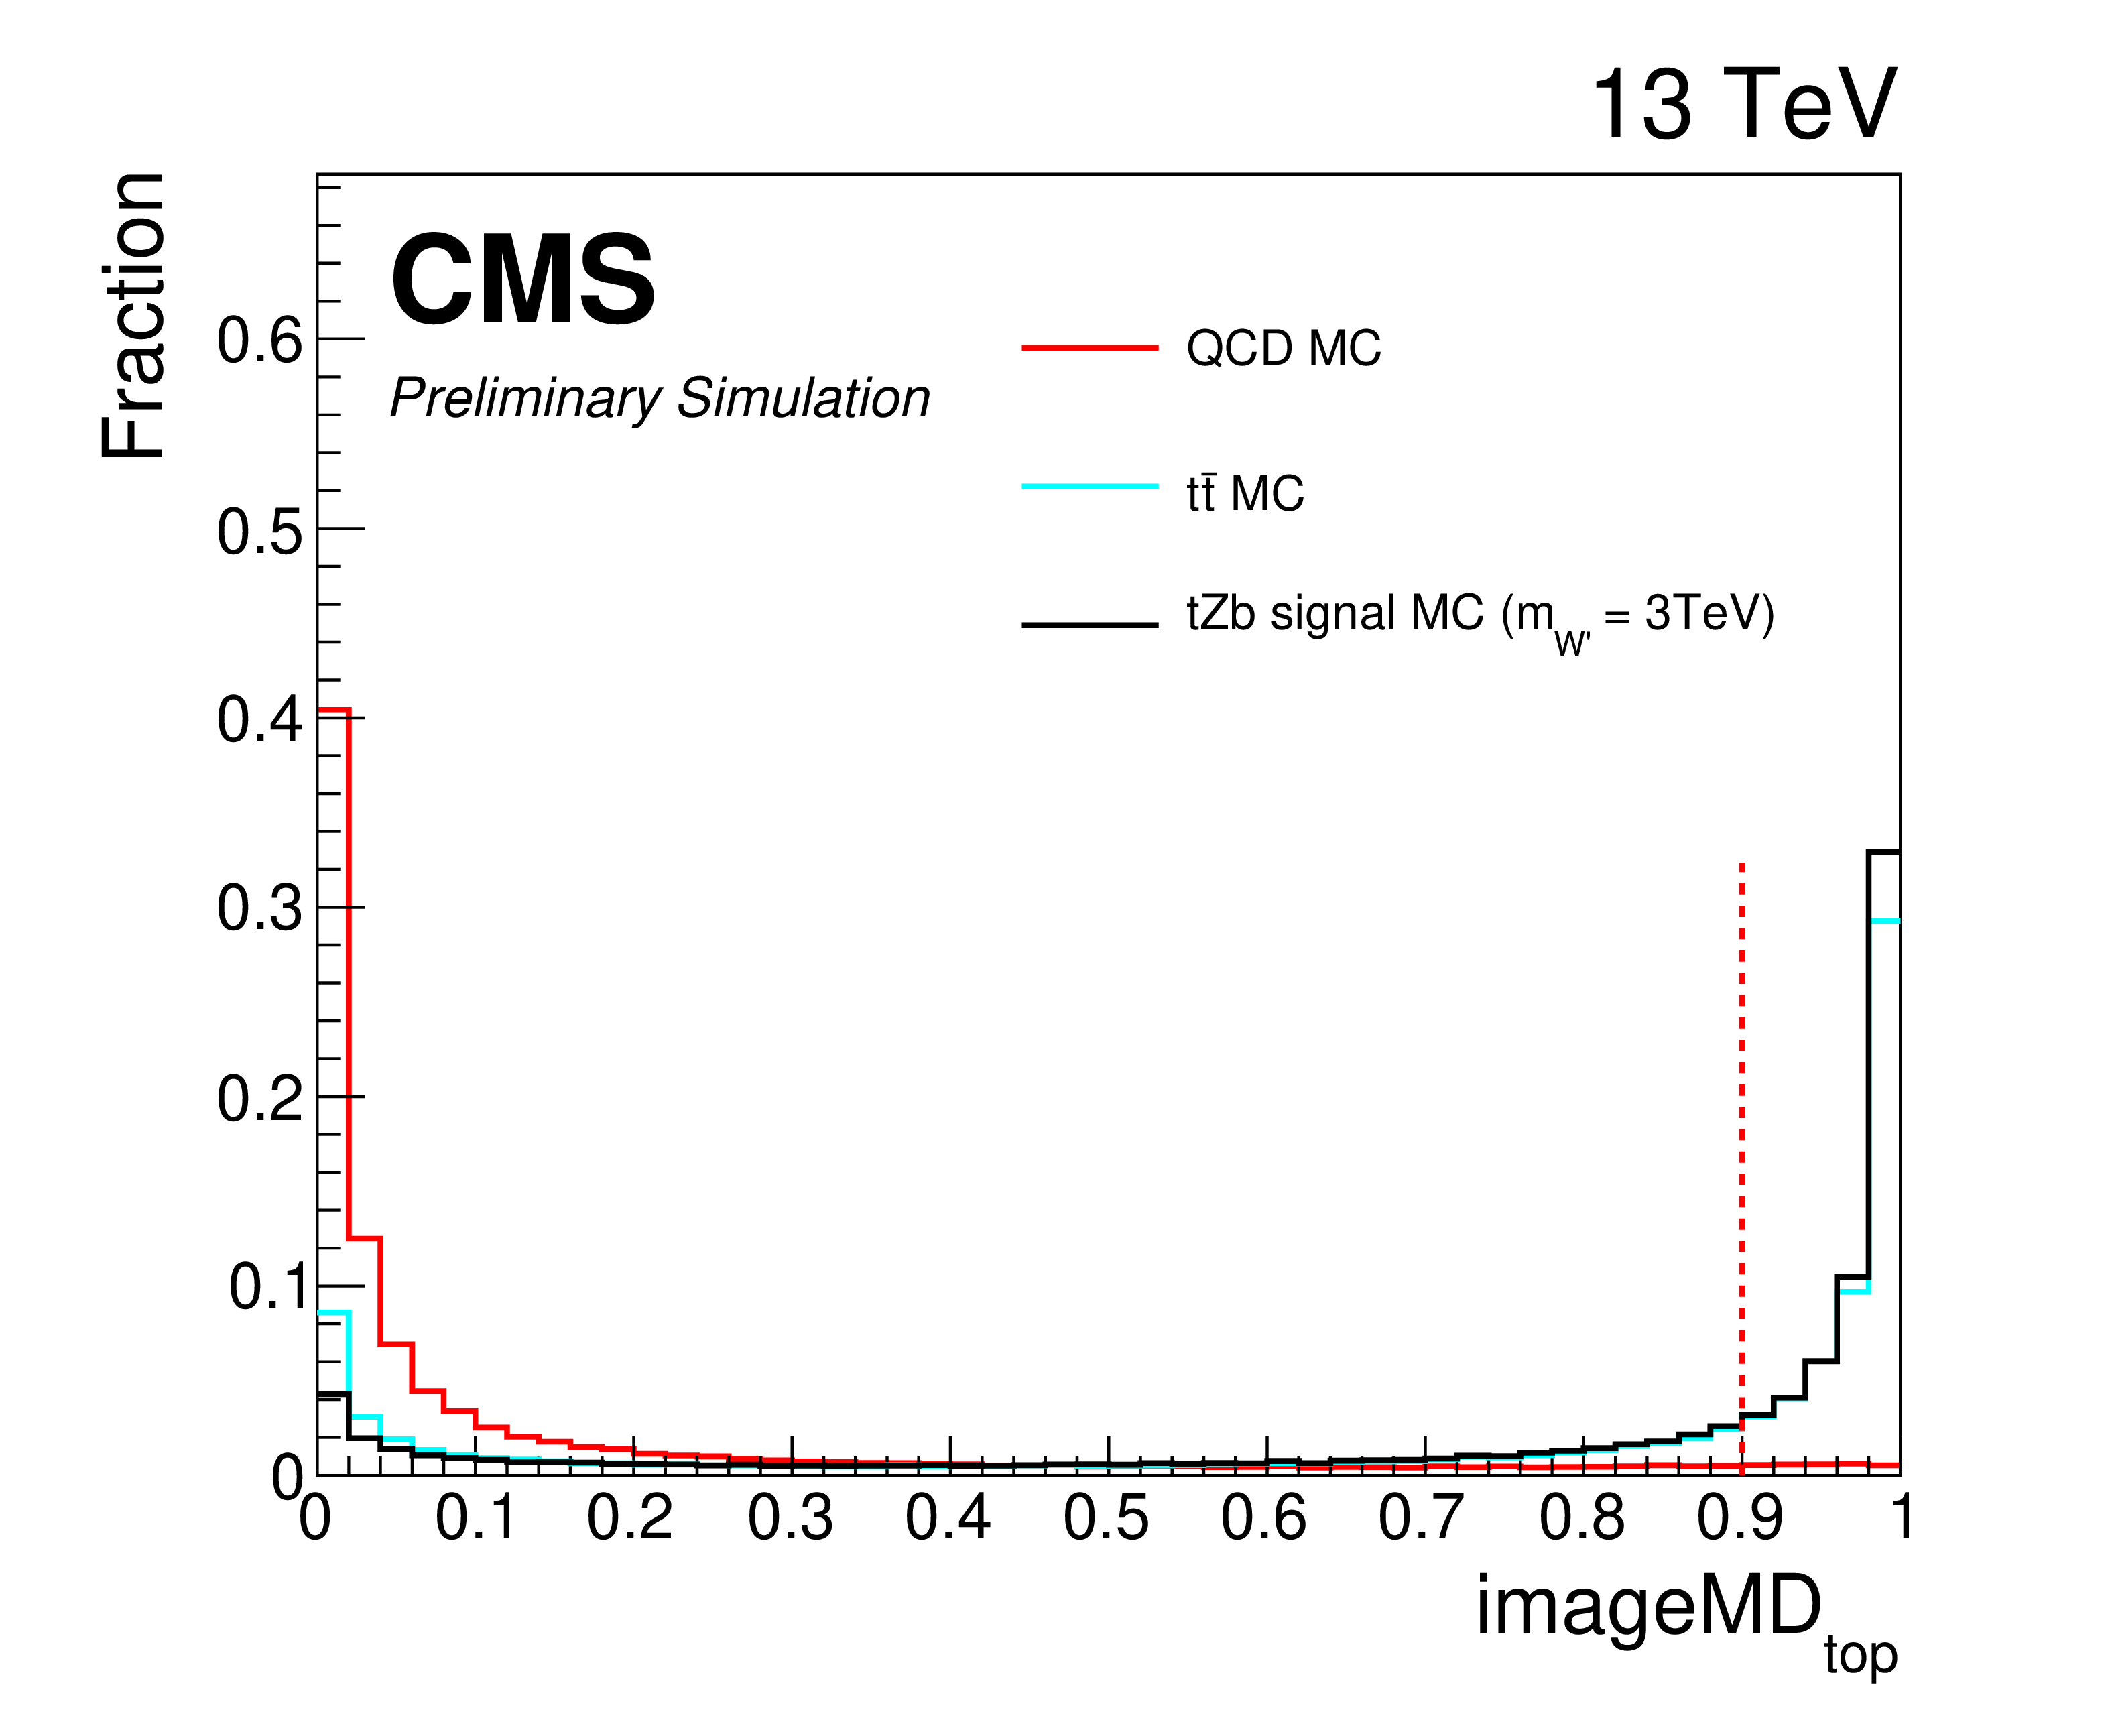
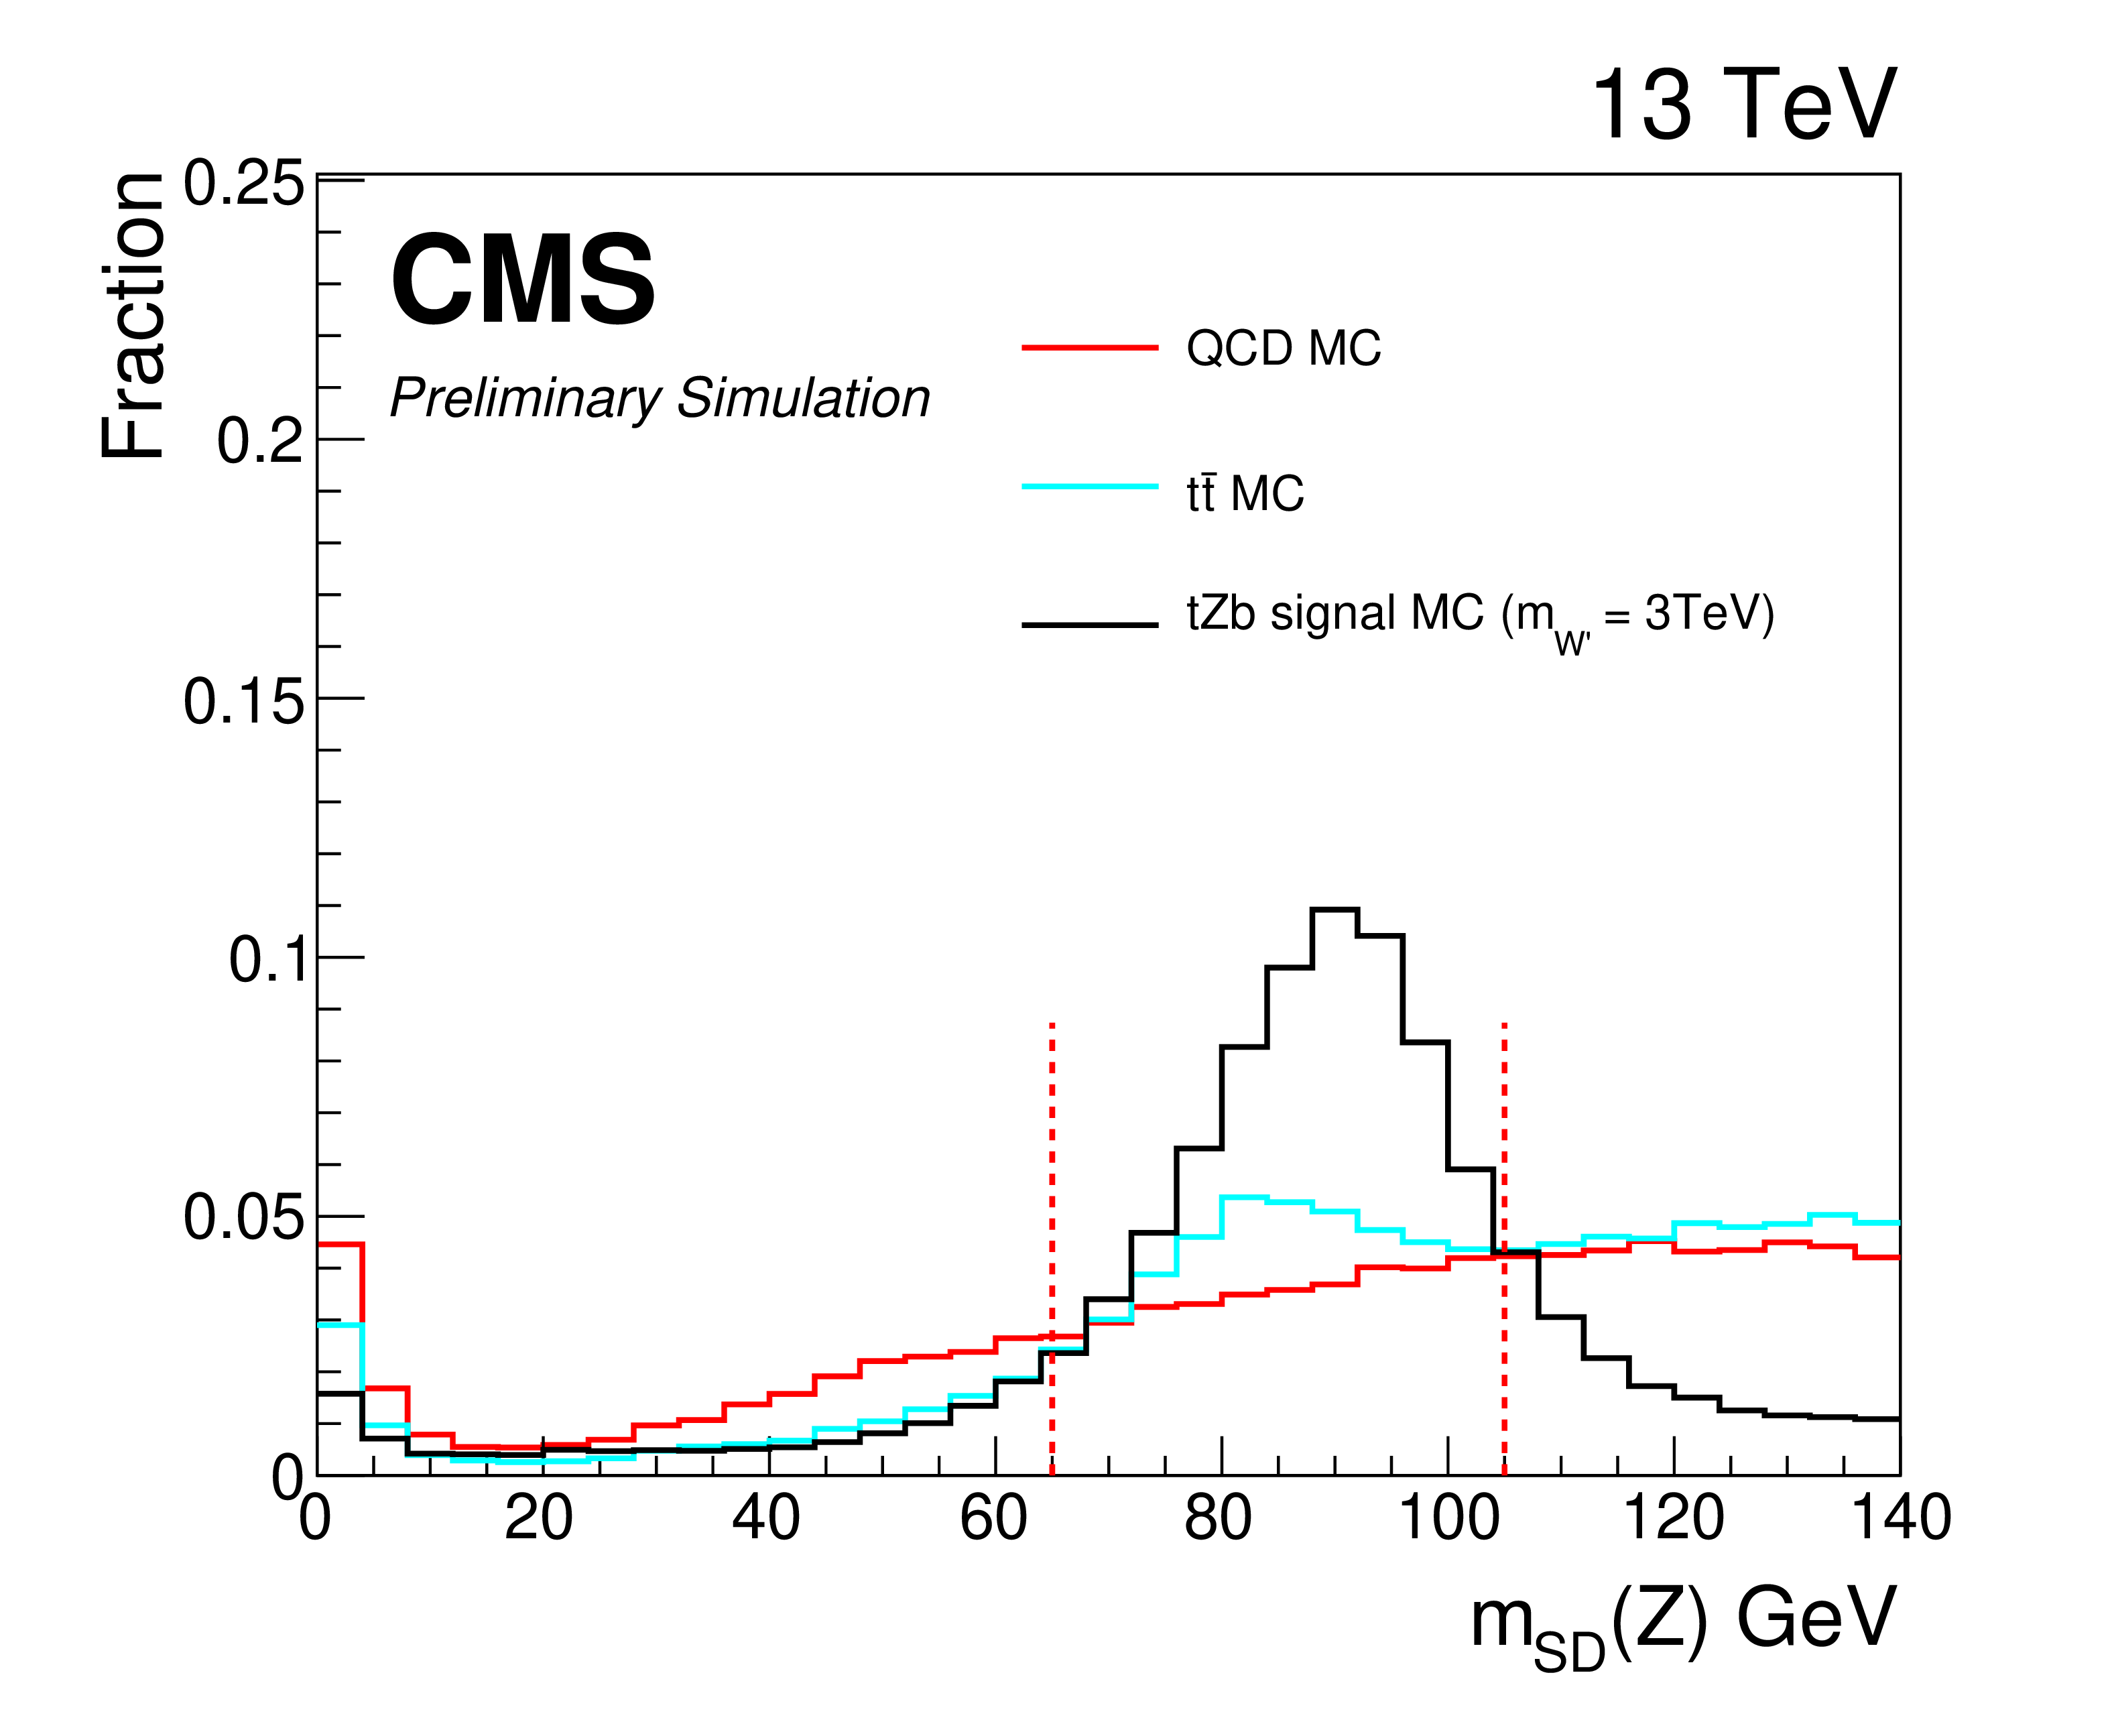
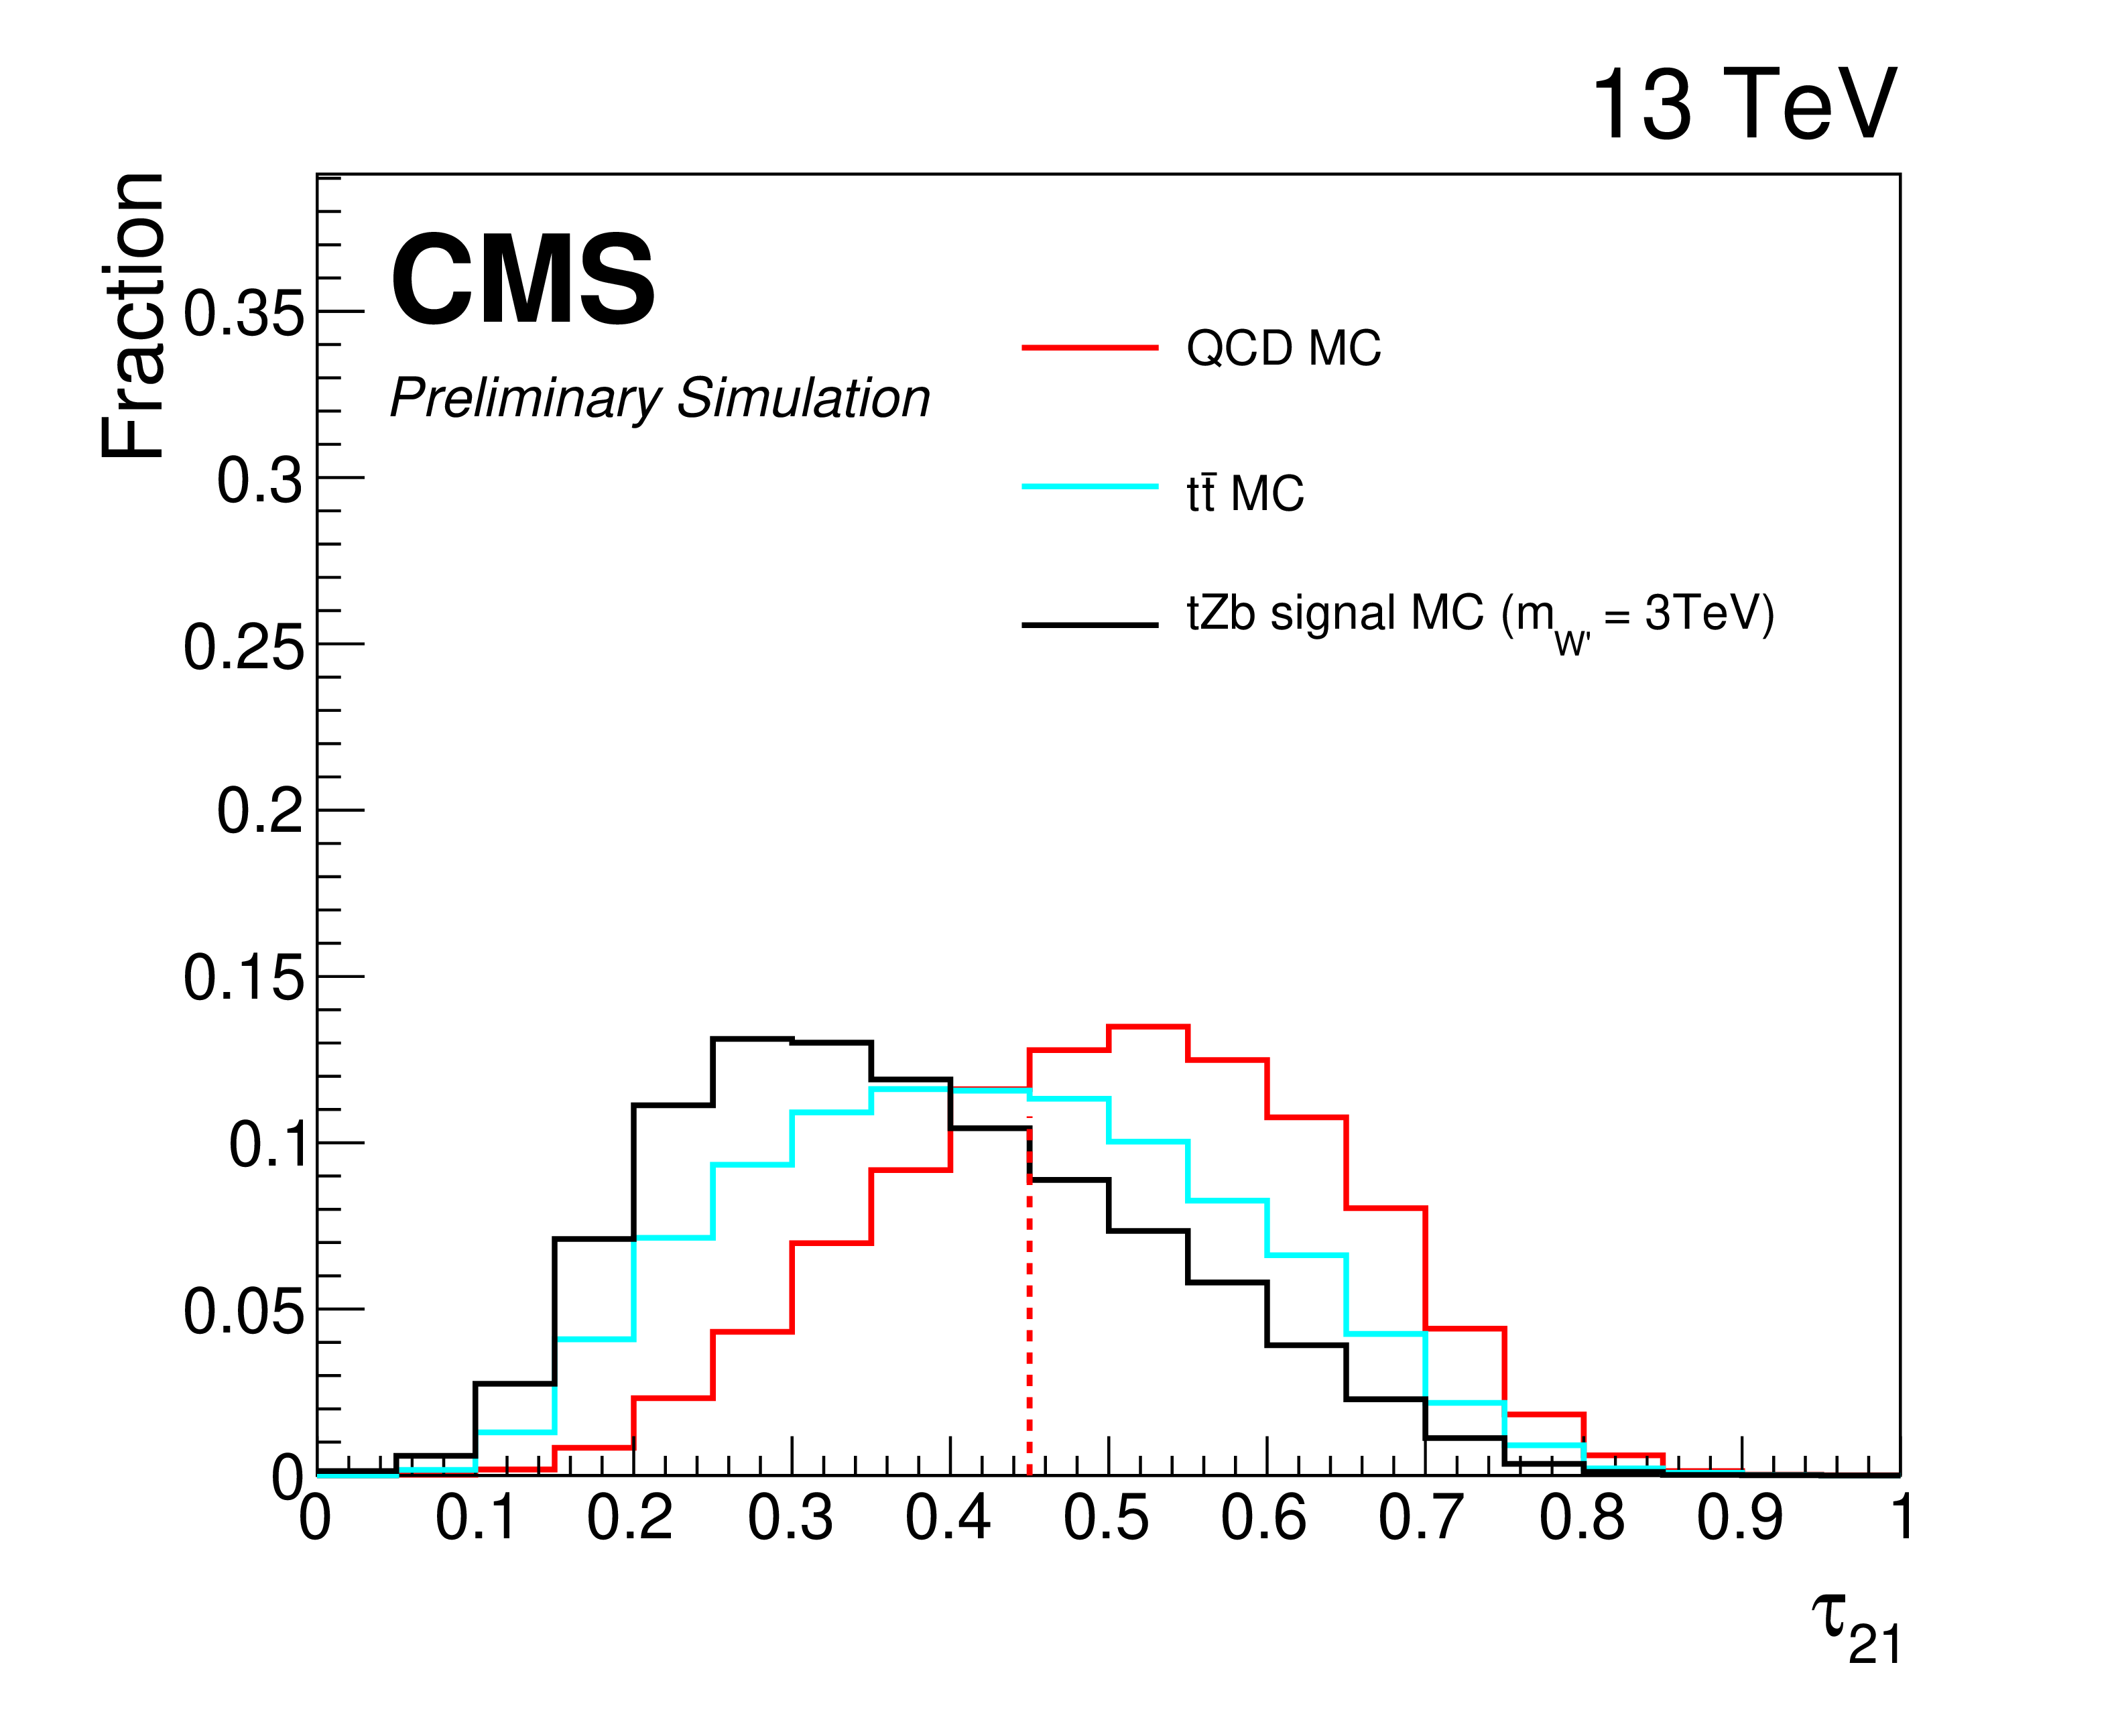
Normalized distributions of the discriminating variables in ${\mathrm{t} {}\mathrm{\bar{t}}} $, QCD, and tZb signal MC simulation for the tZb analysis. Each variable distribution in this set of figures is required to pass a loosened event selection that preserves same-jet variable correlations. |
png pdf |
Figure 3-a:
Normalized distribution of the $m_{\mathrm{SD}}(\mathrm{T})$ variable in ${\mathrm{t} {}\mathrm{\bar{t}}} $, QCD, and tZb signal MC simulation for the tZb analysis. In this distribution, the variable is required to pass a loosened event selection that preserves same-jet variable correlations. |
png pdf |
Figure 3-b:
Normalized distribution of the imageMD$_{\mathrm{top}}$ variable in ${\mathrm{t} {}\mathrm{\bar{t}}} $, QCD, and tZb signal MC simulation for the tZb analysis. In this distribution, the variable is required to pass a loosened event selection that preserves same-jet variable correlations. |
png pdf |
Figure 3-c:
Normalized distribution of the $m_{\mathrm{SD}}(\mathrm{Z})$ variable in ${\mathrm{t} {}\mathrm{\bar{t}}} $, QCD, and tZb signal MC simulation for the tZb analysis. In this distribution, the variable is required to pass a loosened event selection that preserves same-jet variable correlations. |
png pdf |
Figure 3-d:
Normalized distribution of the $\tau_{21}$ variable in ${\mathrm{t} {}\mathrm{\bar{t}}} $, QCD, and tZb signal MC simulation for the tZb analysis. In this distribution, the variable is required to pass a loosened event selection that preserves same-jet variable correlations. |
png pdf |
Figure 4:
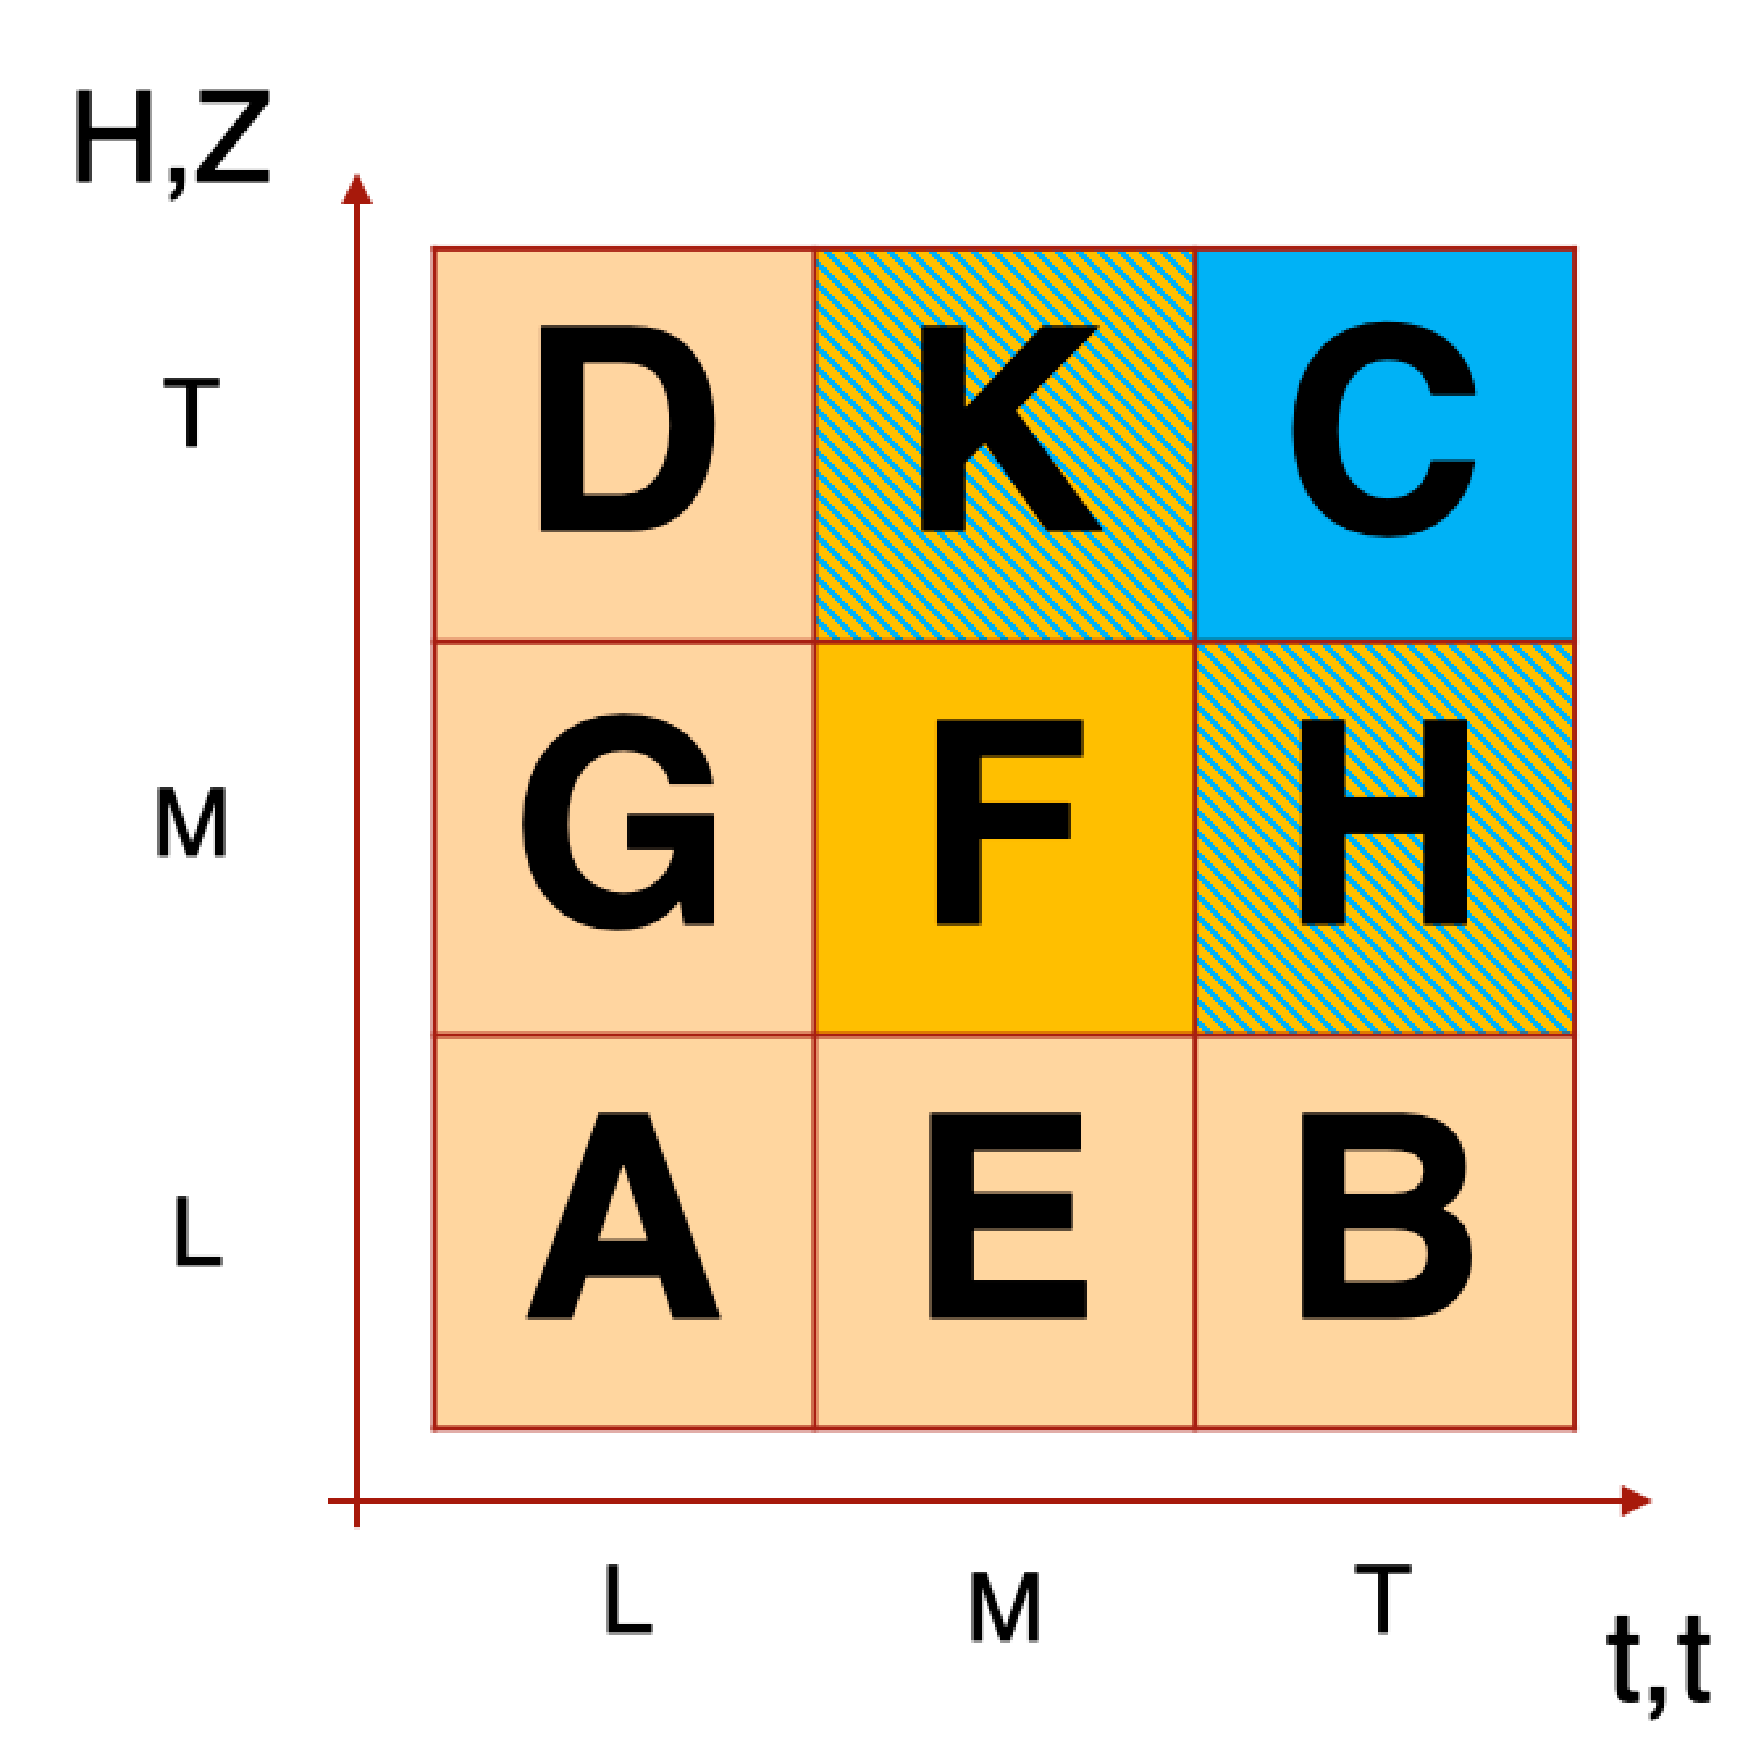
Cut profile diagram used for background estimation. The signal region is labeled C, the A and B regions are used for the purpose of creating the $ {TF({p_{\mathrm {T}}},\eta)} $, and F is the validation region. After a senisitivity comparison, K and H are additionally used as validation regions. The loose, medium, and tight tag definitions are given in Table 1. |

png pdf |
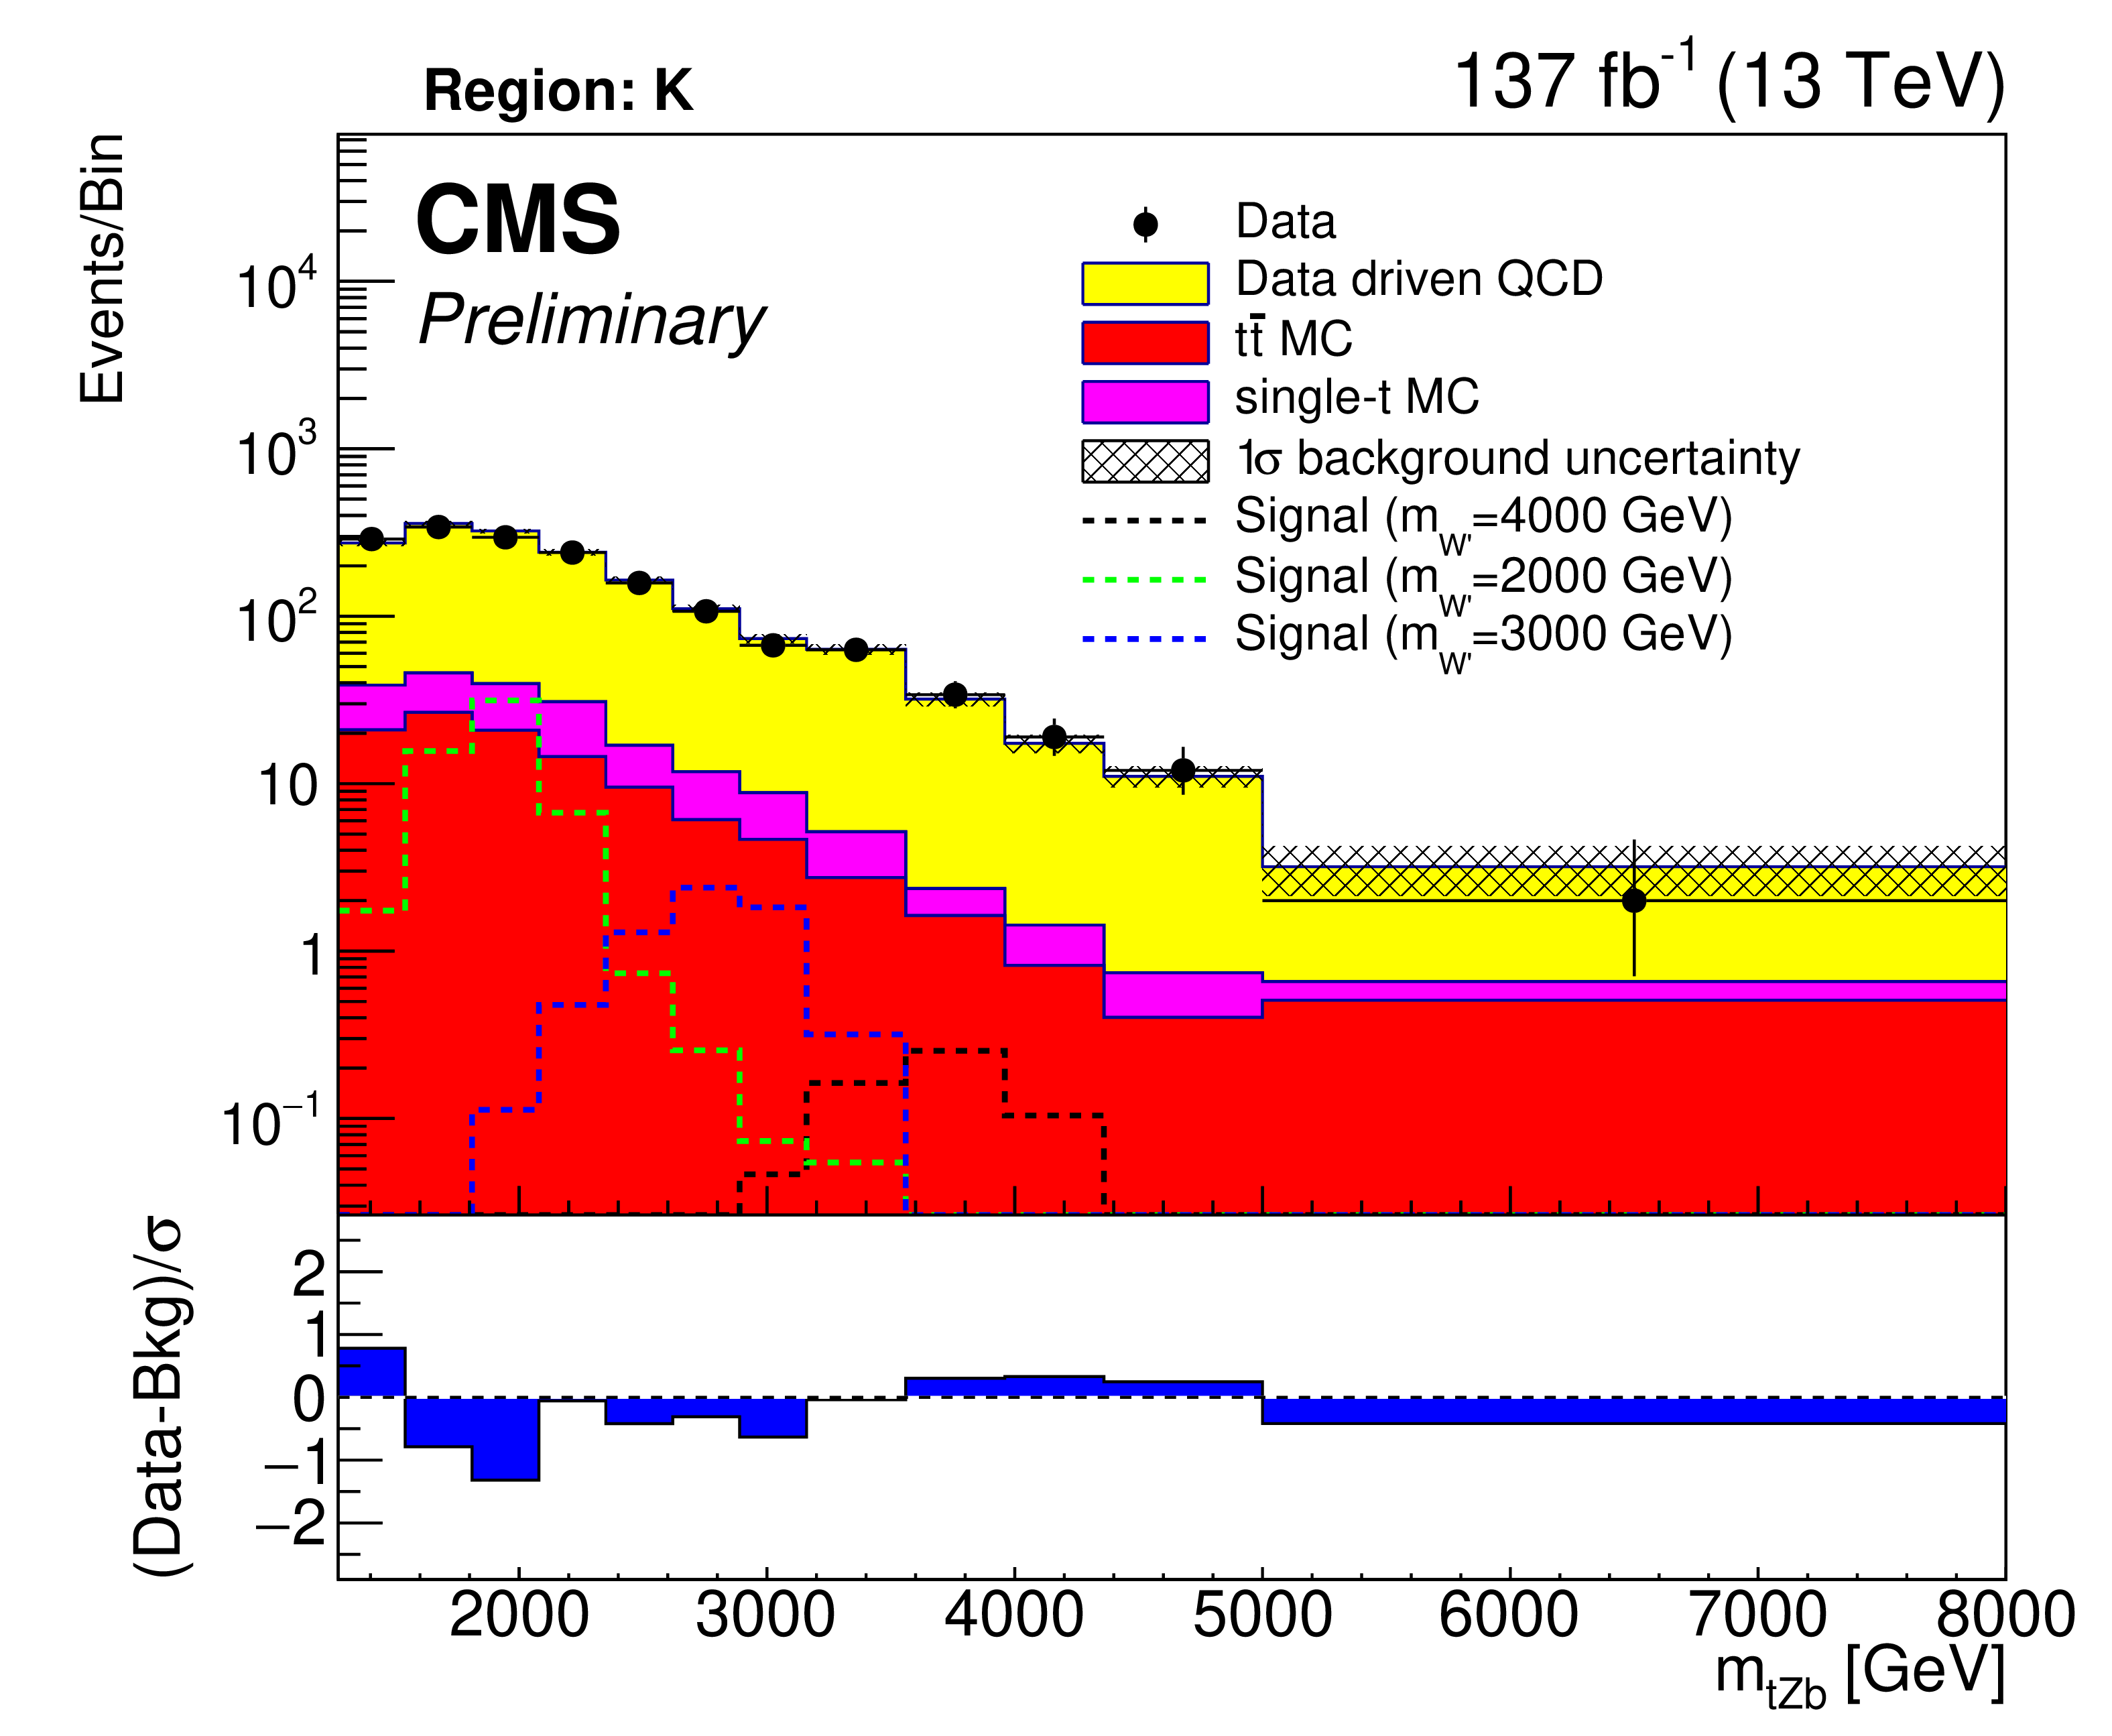
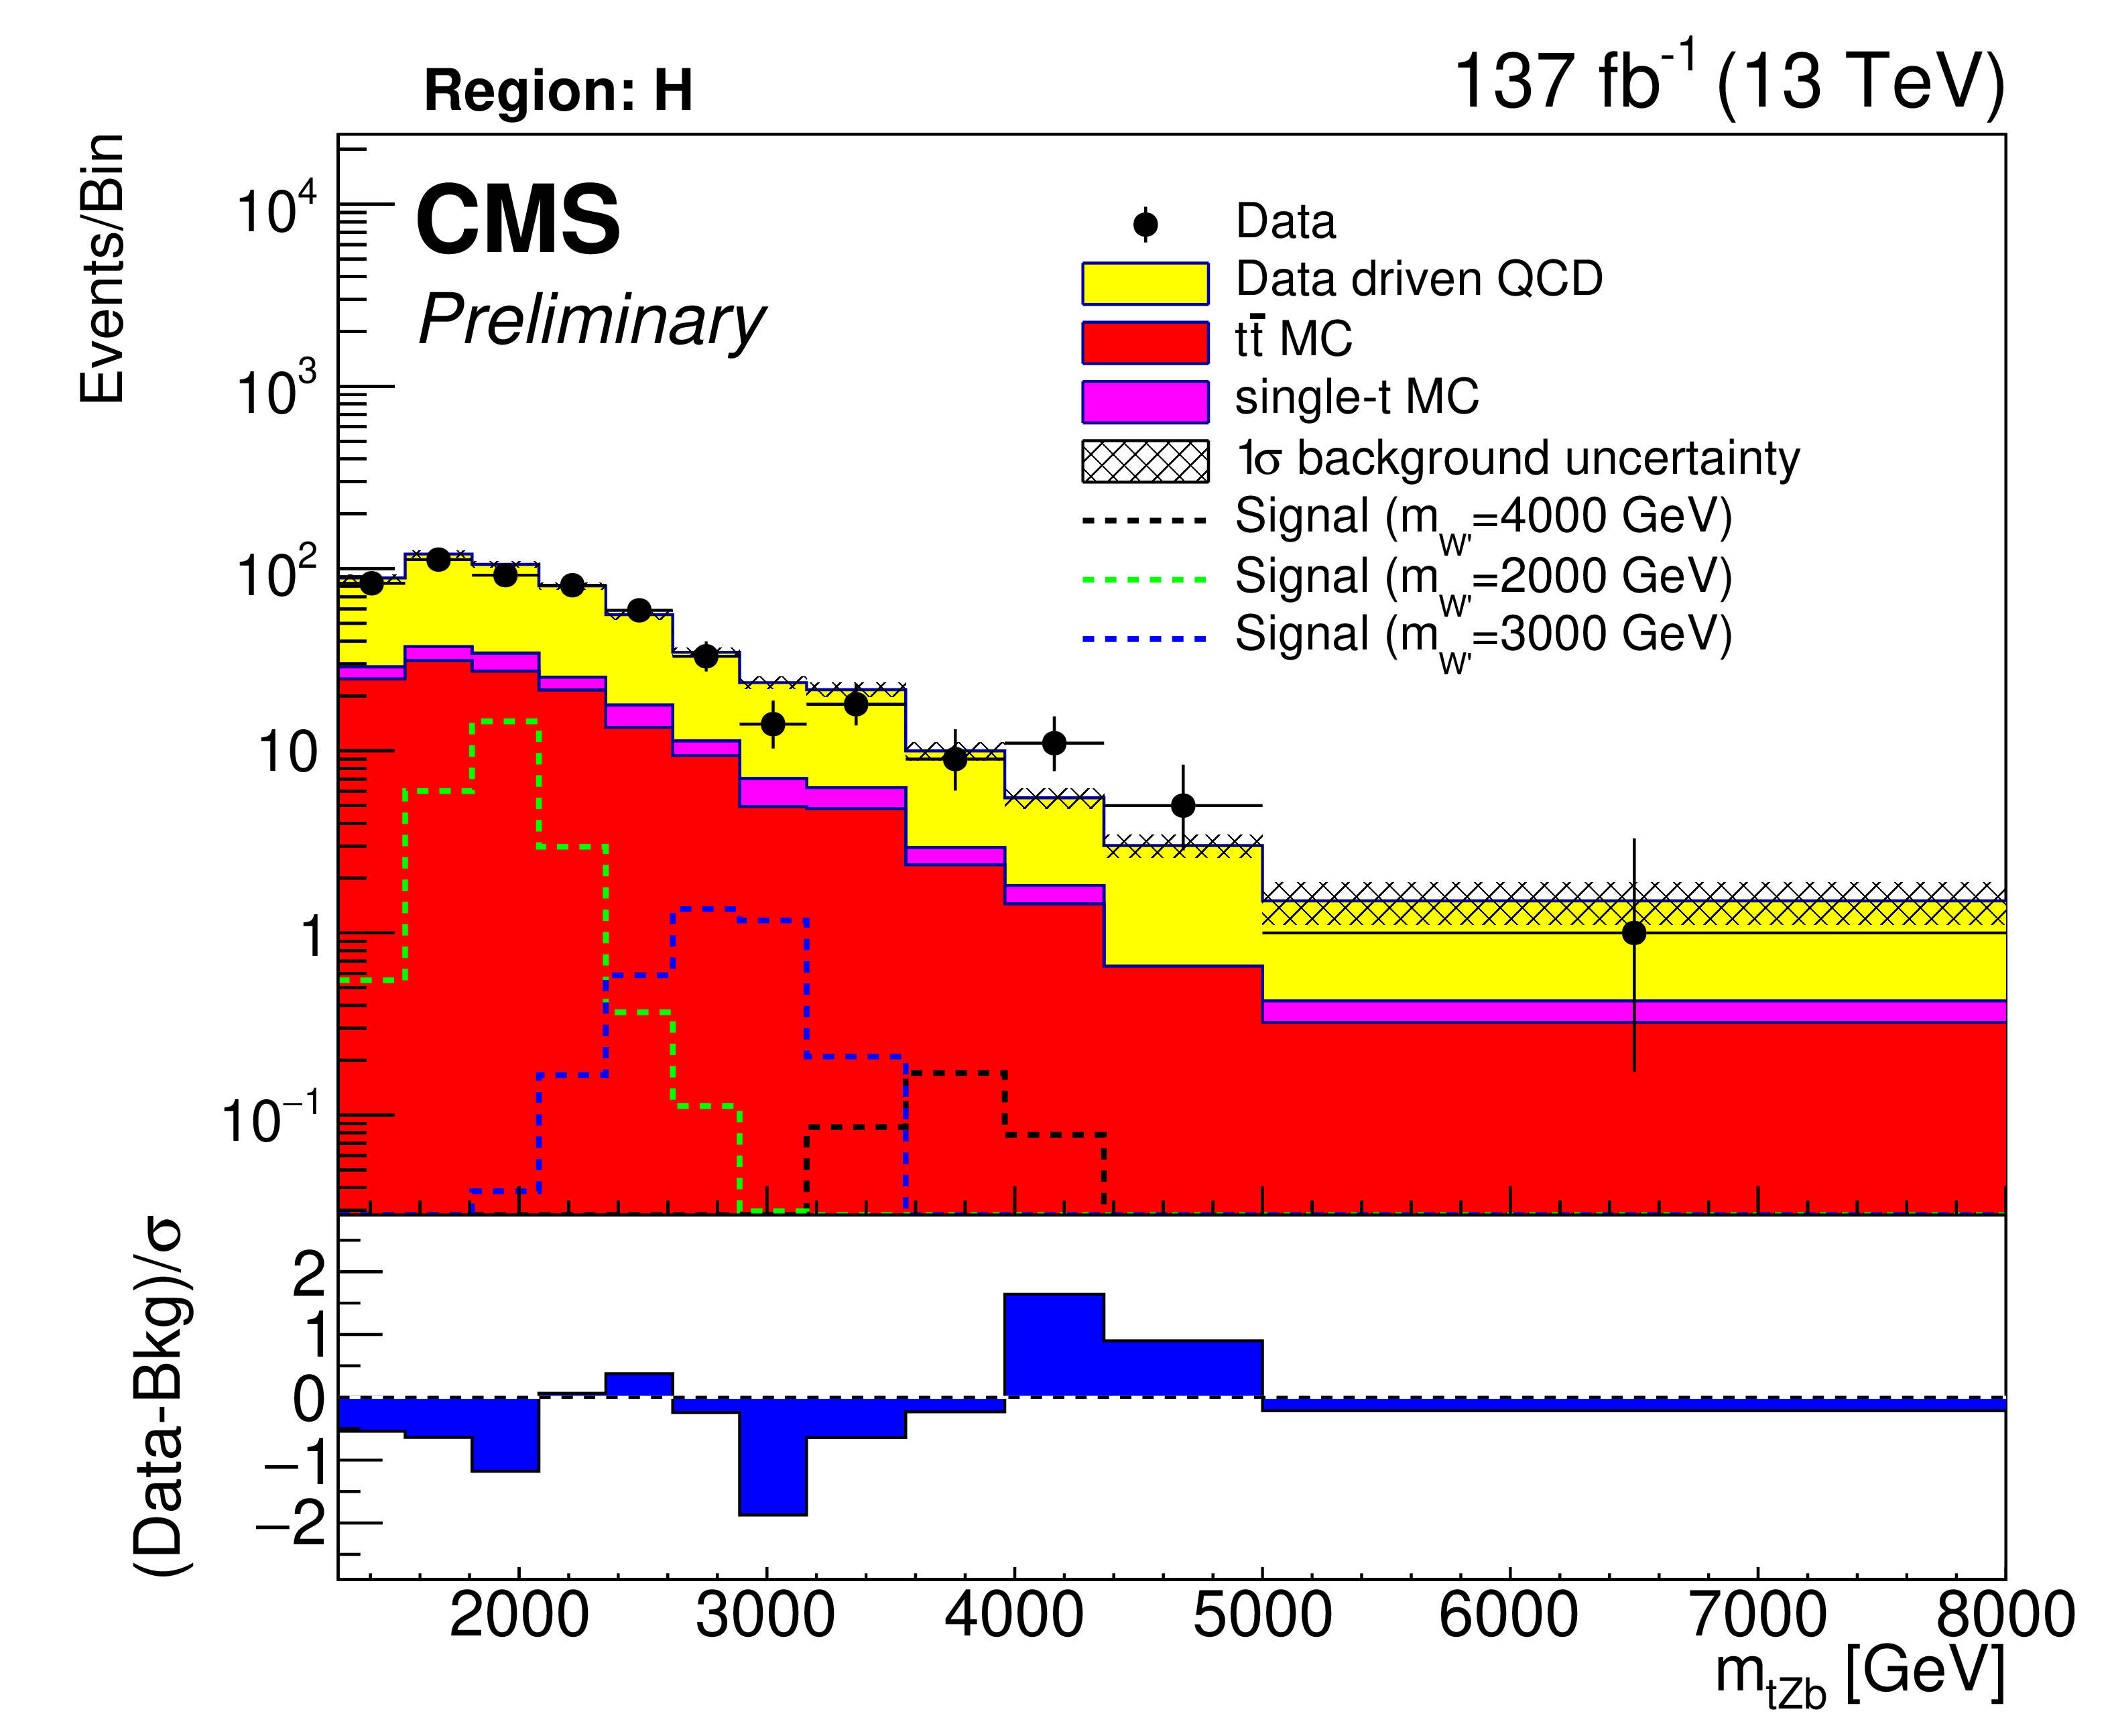
Figure 5:
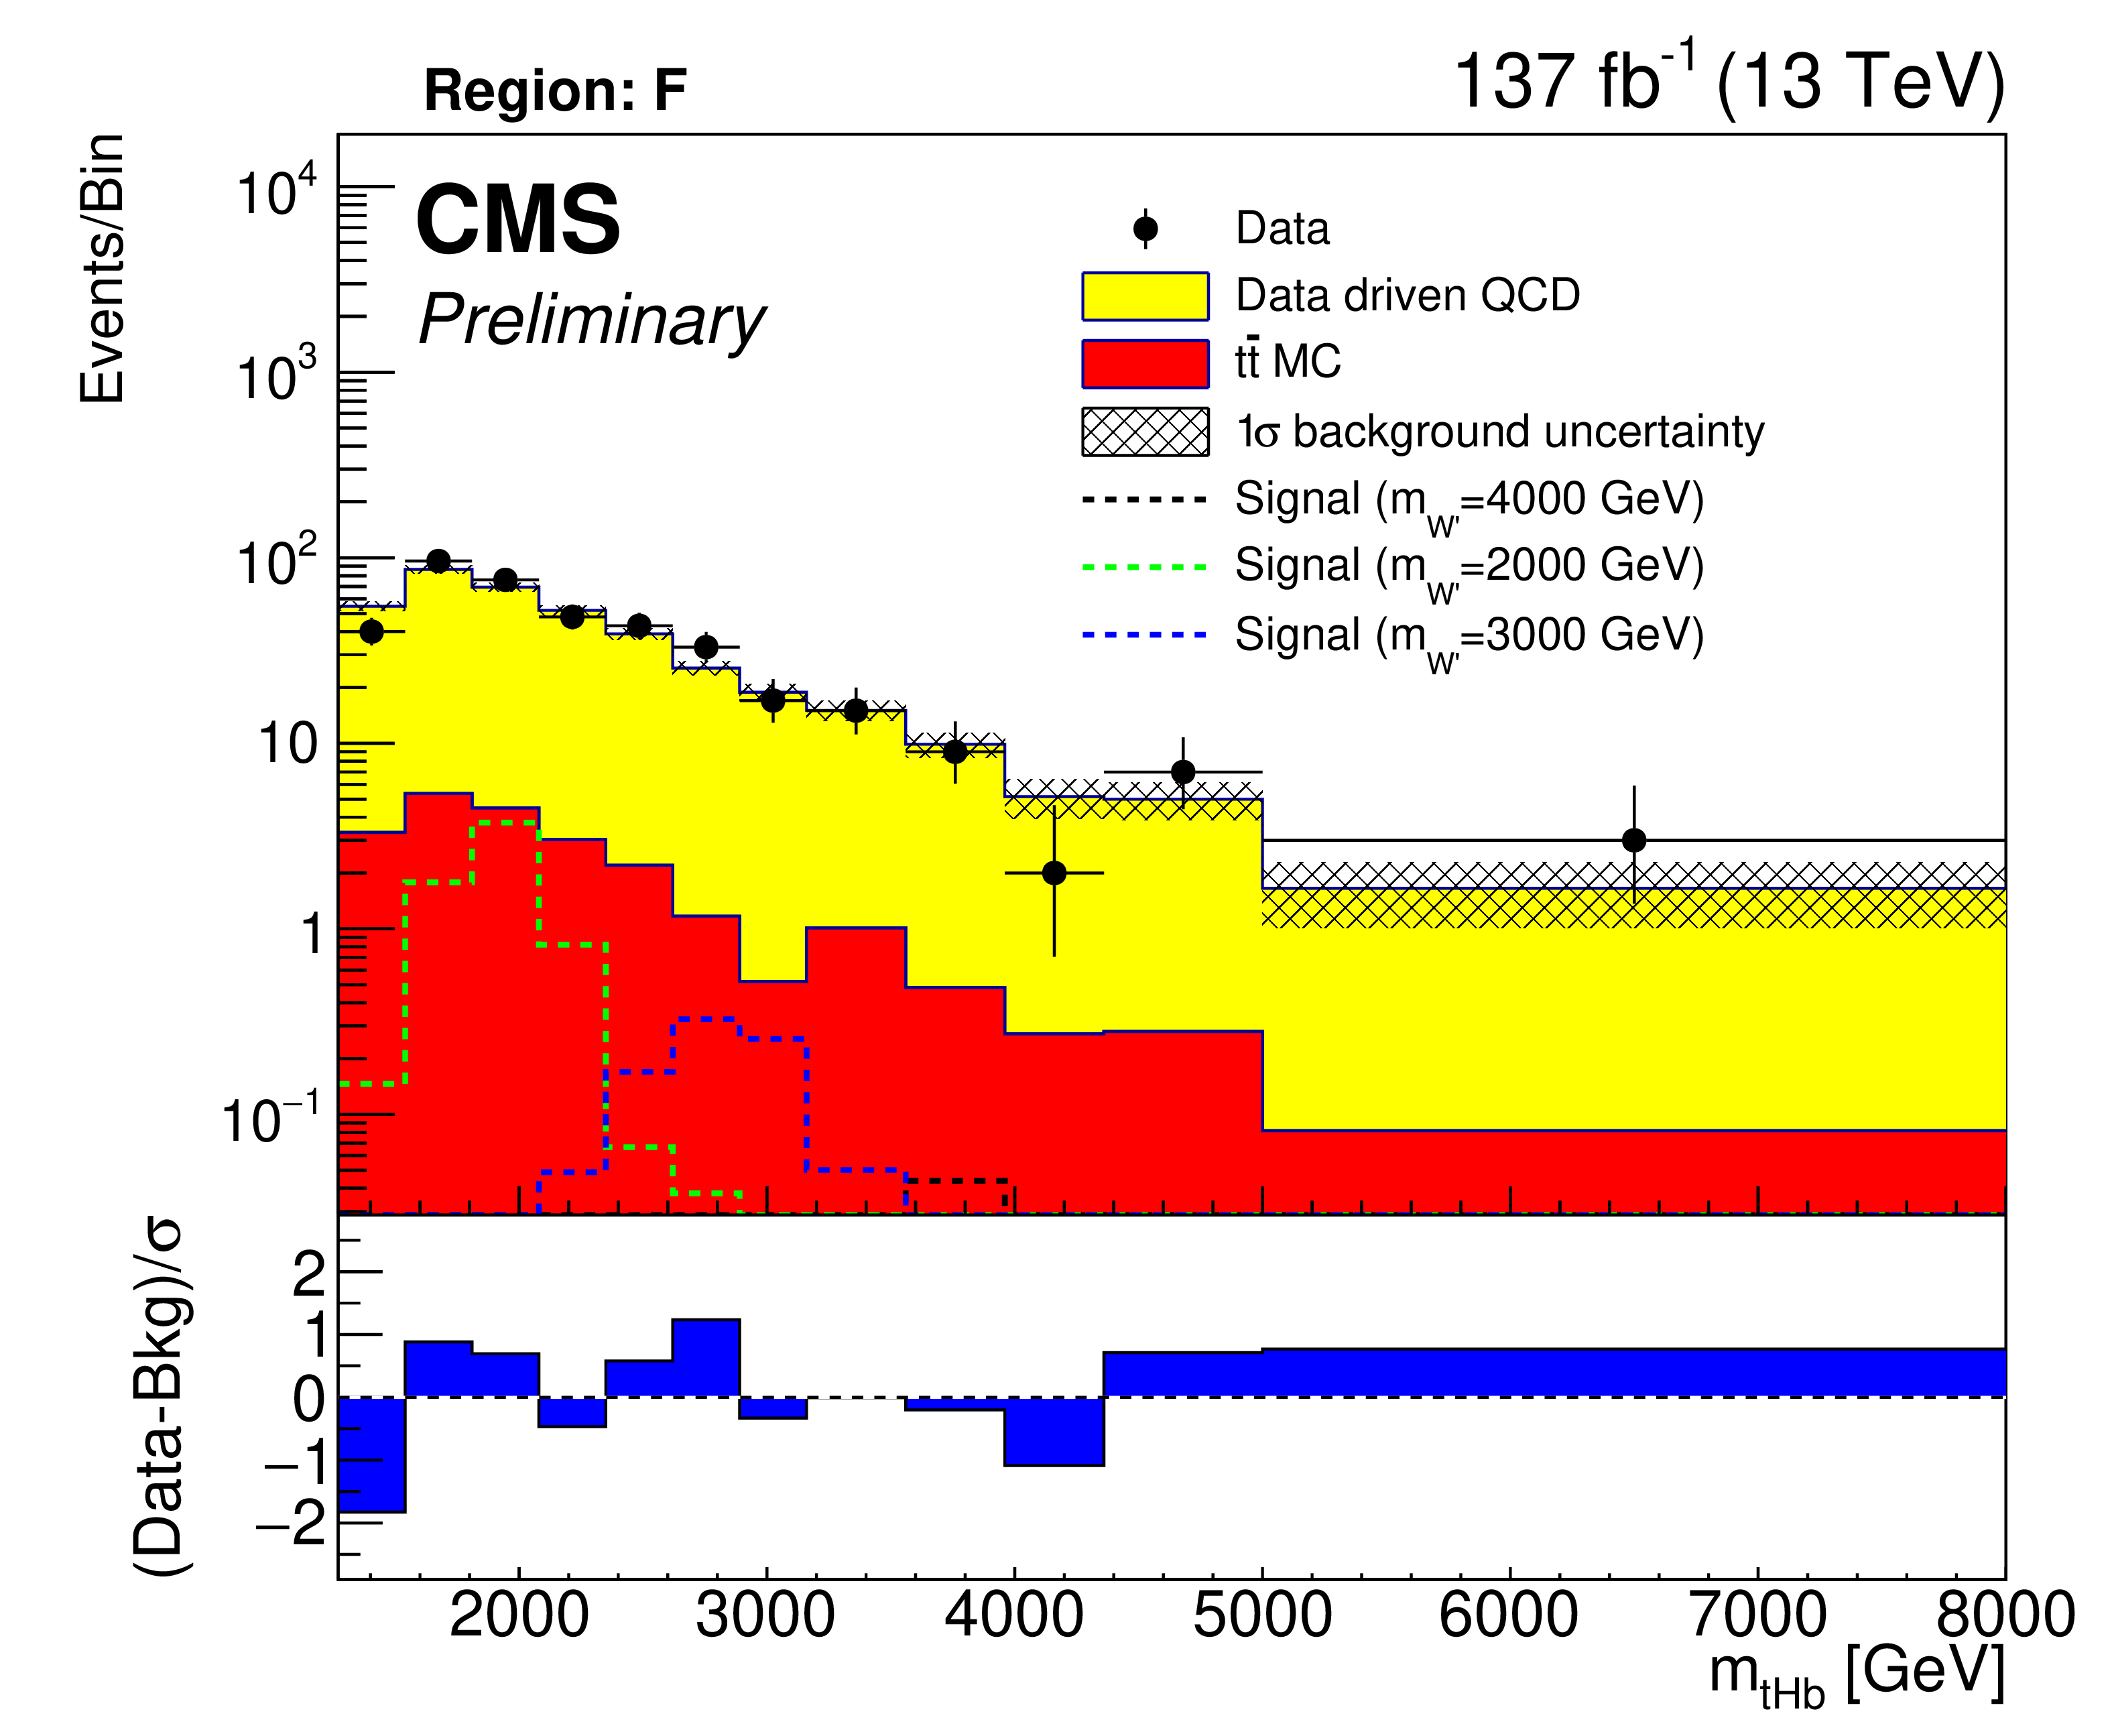
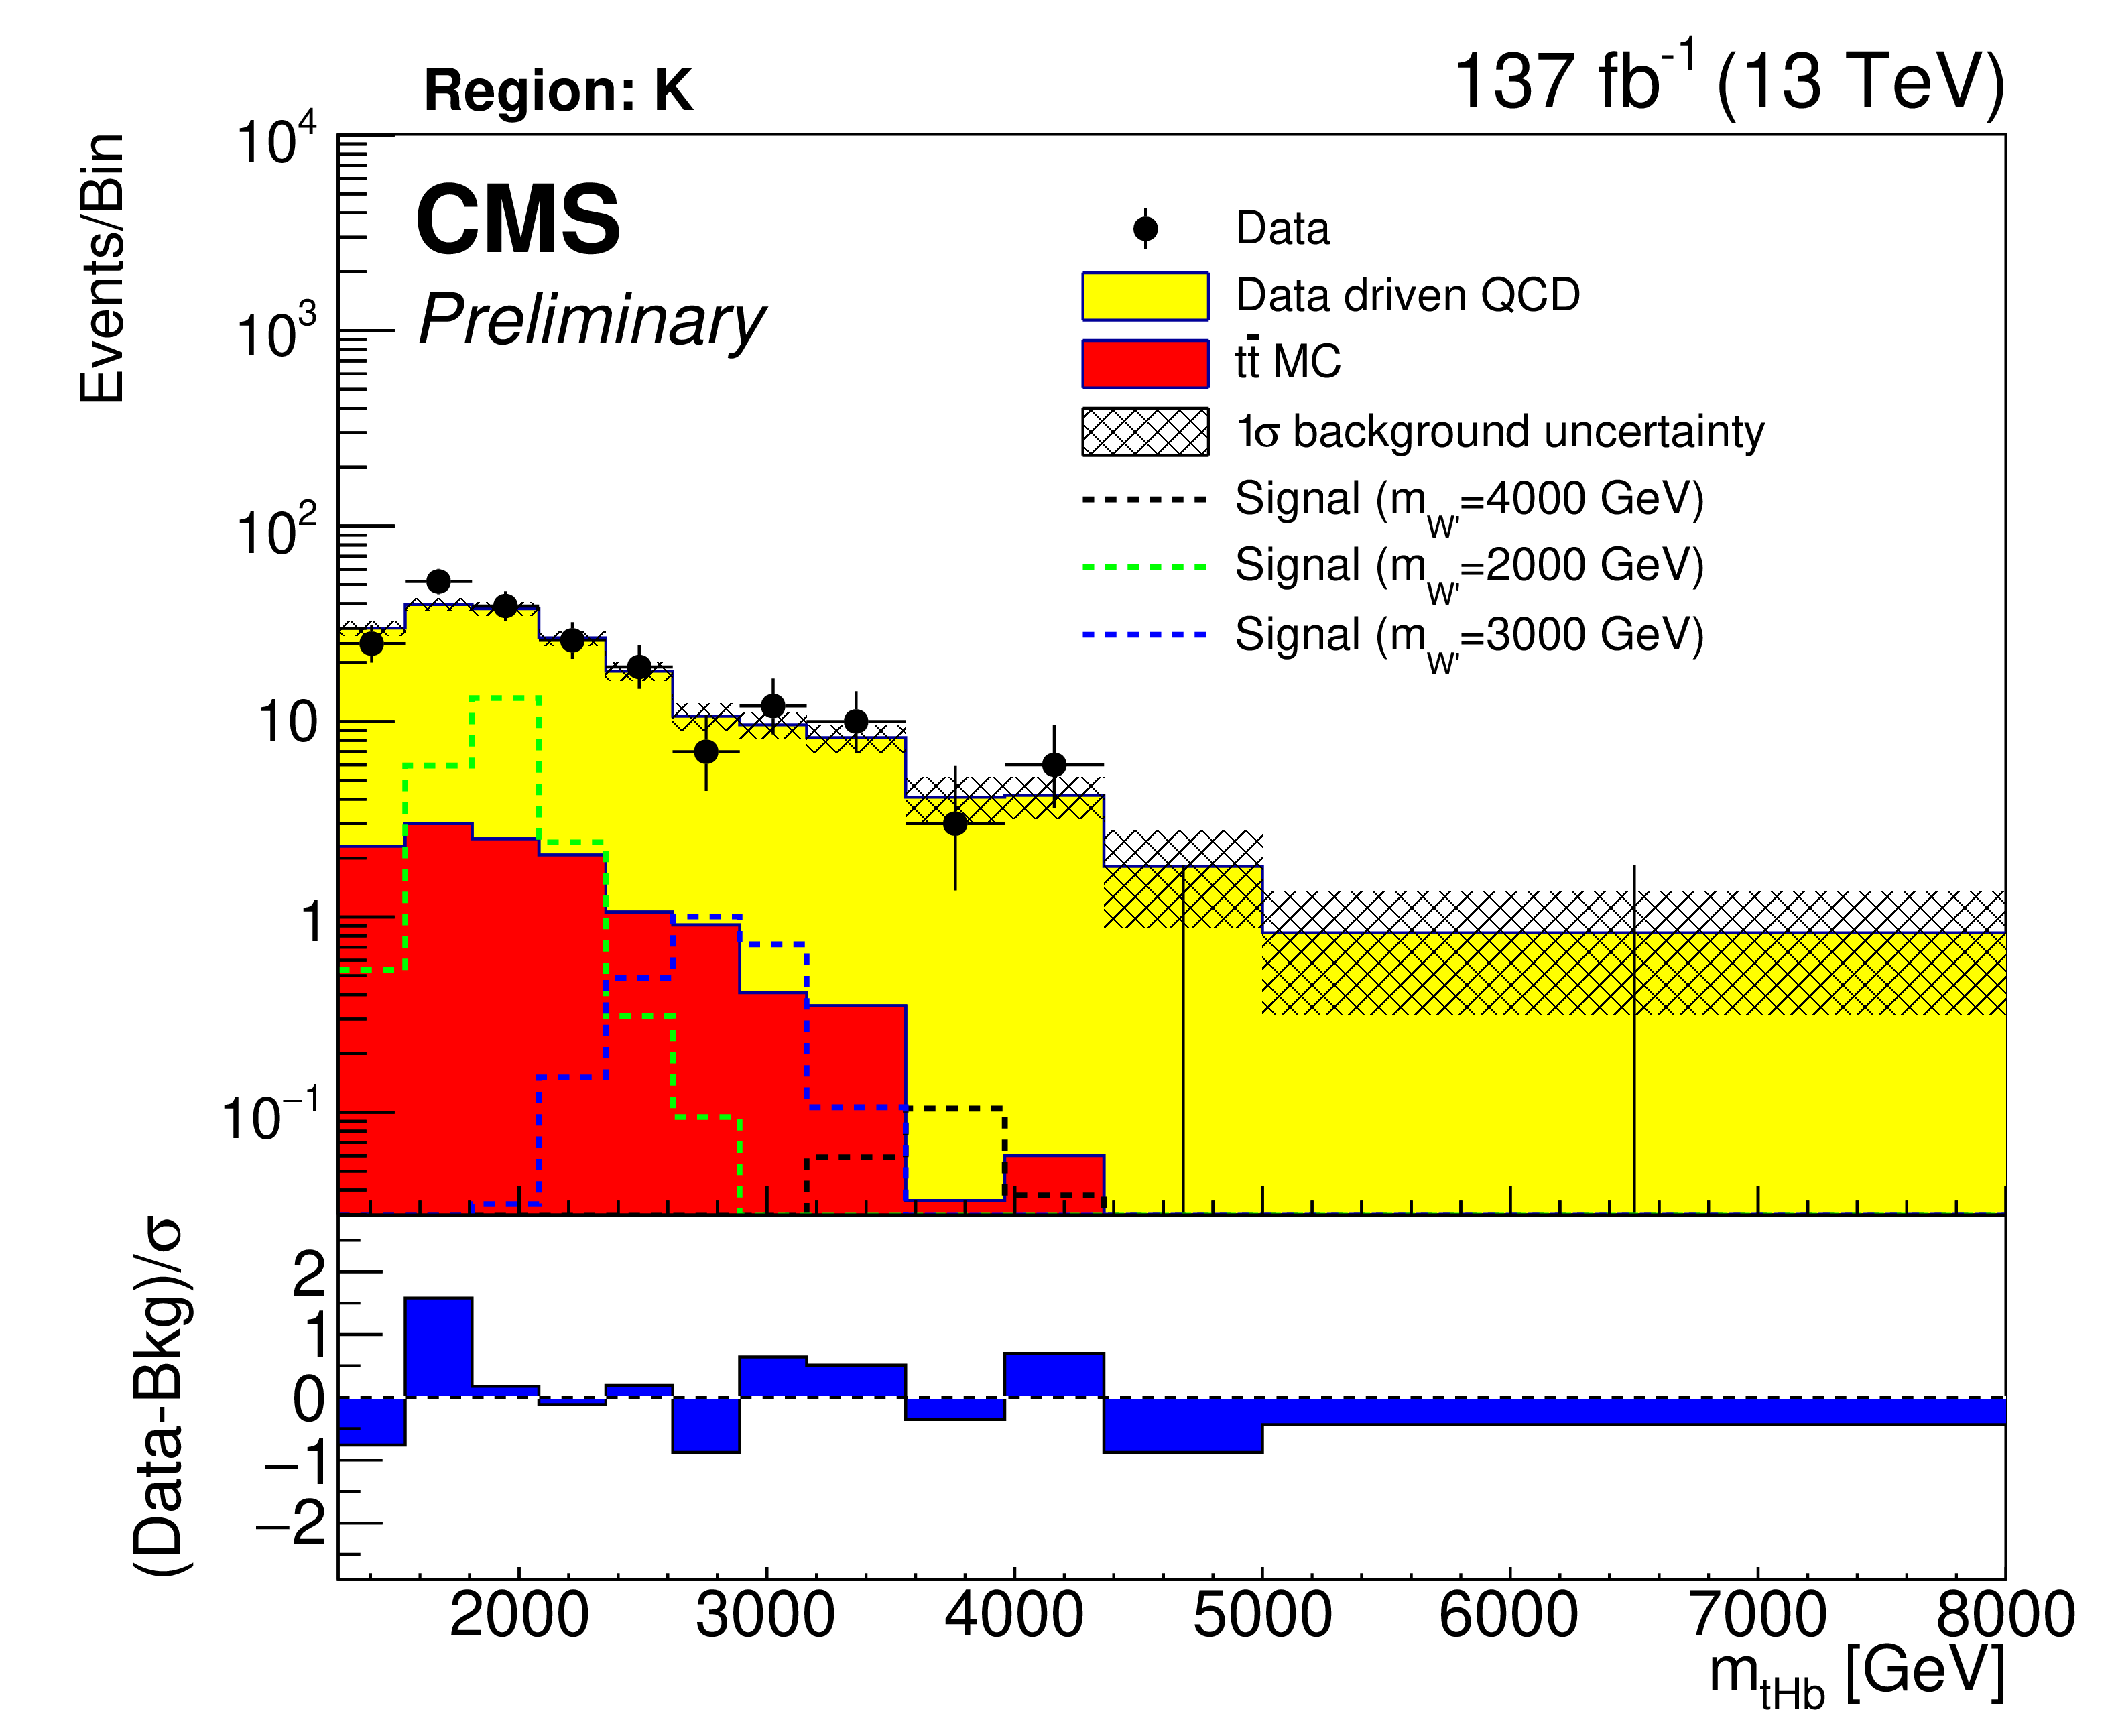
Background closure for the reconstructed W' boson invariant mass in region F (upper left), K (upper right), and H (bottom) for the purpose of validation in the tHb analyses. The lower panels show the difference between the number of events observed in the data and the predicted background, divided by the systematic uncertainty in the background and the statistical uncertainty in the data added in quadrature. |
png pdf |
Figure 5-a:
Background closure for the reconstructed W' boson invariant mass in region F for the purpose of validation in the tHb analyses. The lower panel shows the difference between the number of events observed in the data and the predicted background, divided by the systematic uncertainty in the background and the statistical uncertainty in the data added in quadrature. |
png pdf |
Figure 5-b:
Background closure for the reconstructed W' boson invariant mass in region K for the purpose of validation in the tHb analyses. The lower panel shows the difference between the number of events observed in the data and the predicted background, divided by the systematic uncertainty in the background and the statistical uncertainty in the data added in quadrature. |

png pdf |
Figure 5-c:
Background closure for the reconstructed W' boson invariant mass in region H for the purpose of validation in the tHb analyses. The lower panel shows the difference between the number of events observed in the data and the predicted background, divided by the systematic uncertainty in the background and the statistical uncertainty in the data added in quadrature. |
png pdf |
Figure 6:
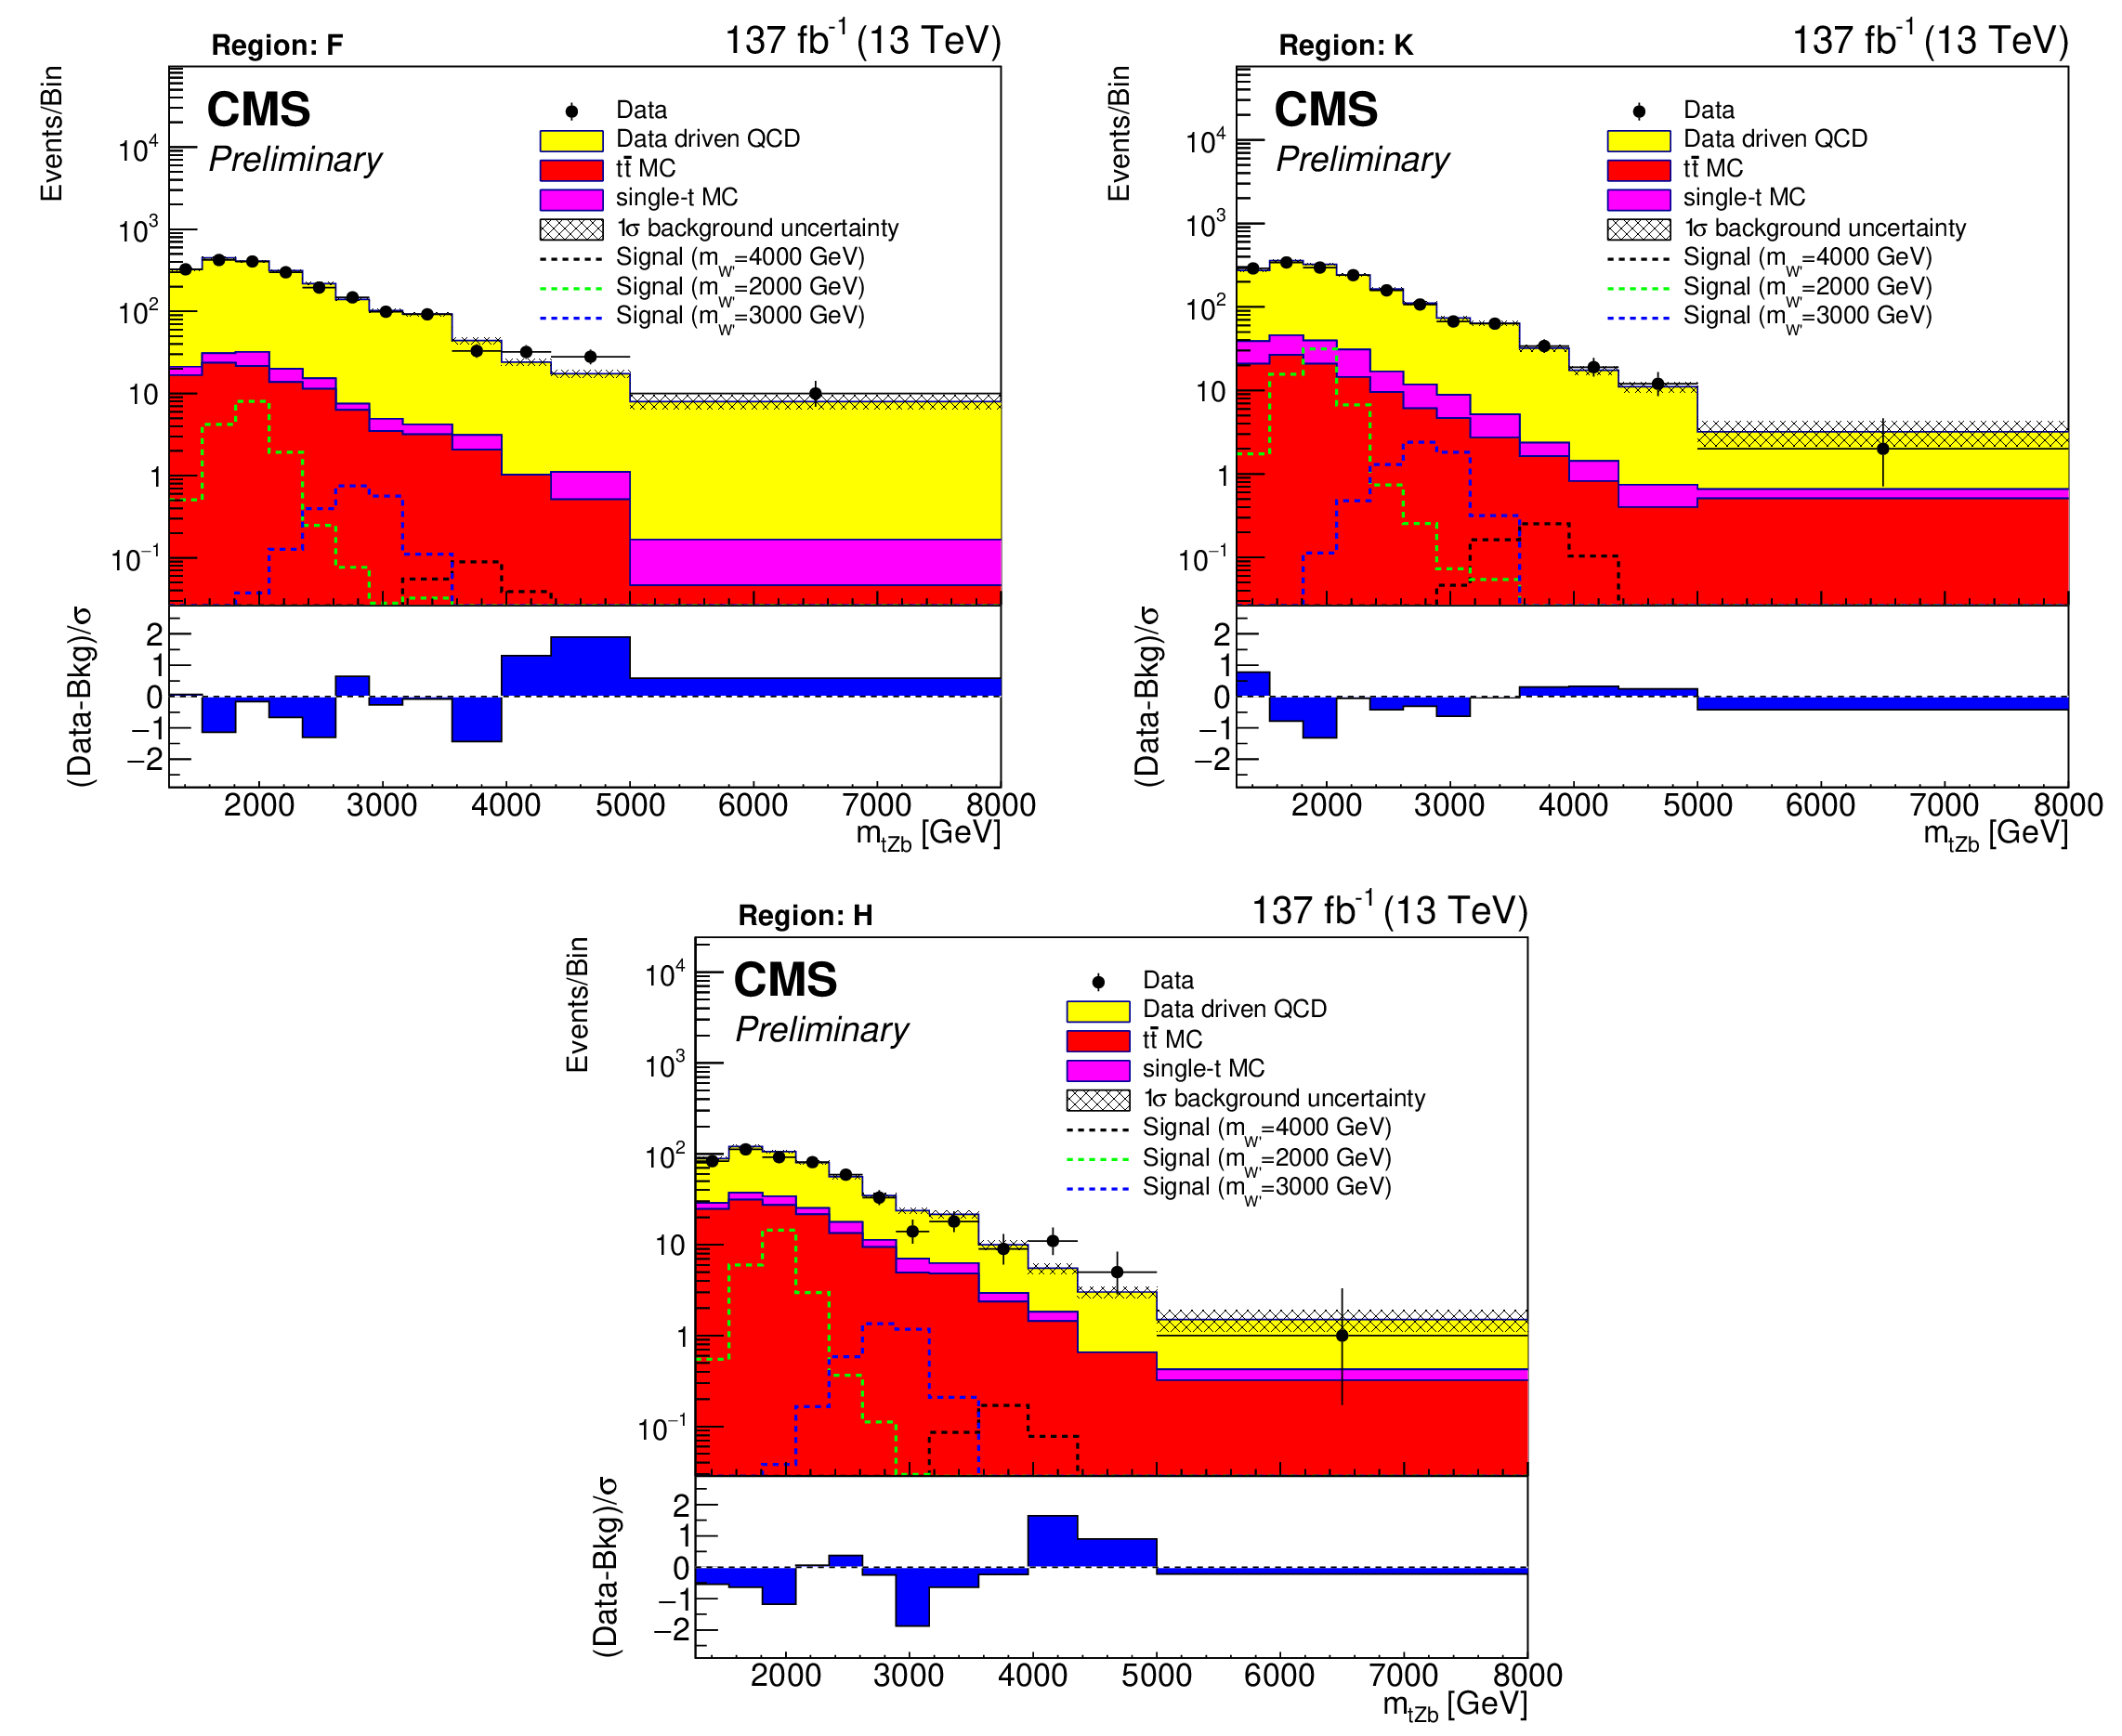
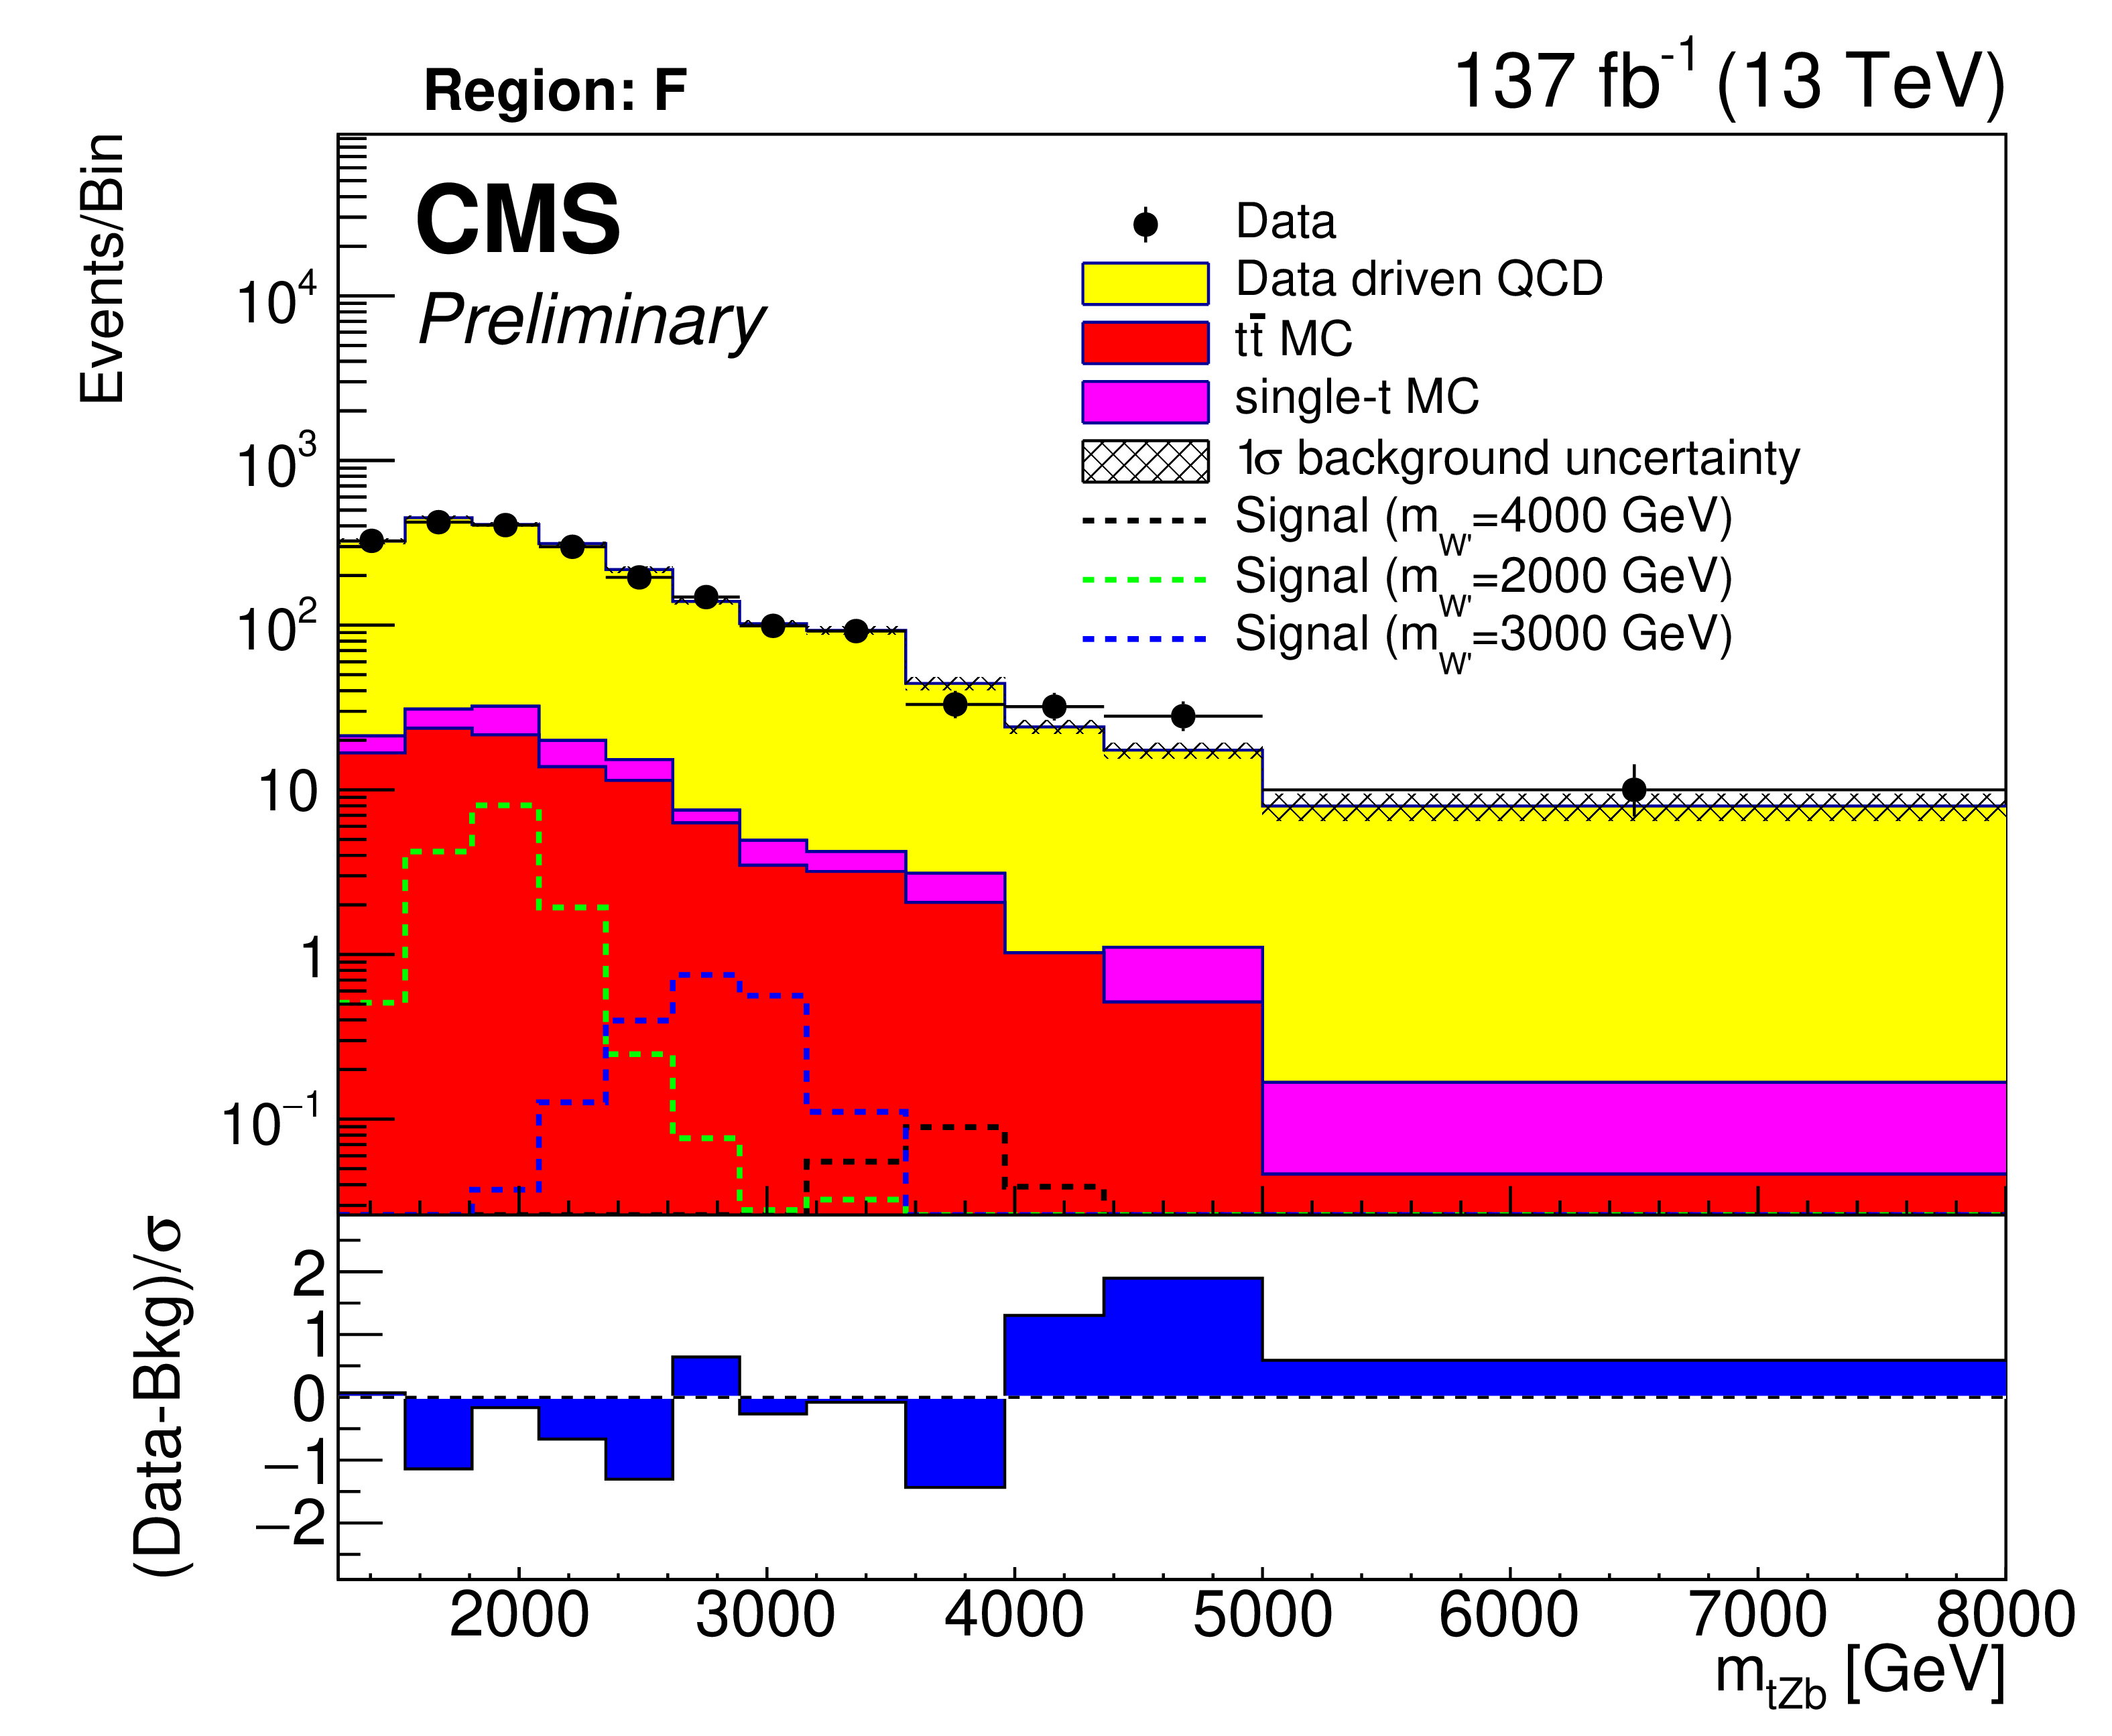
Background closure for the reconstructed W' boson invariant mass in region F (upper left), K (upper right), and H (bottom) for the purpose of validation in the tZb analyses. The lower panels show the difference between the number of events observed in the data and the predicted background, divided by the systematic uncertainty in the background and the statistical uncertainty in the data added in quadrature. |
png pdf |
Figure 6-a:
Background closure for the reconstructed W' boson invariant mass in region F for the purpose of validation in the tZb analyses. The lower panel shows the difference between the number of events observed in the data and the predicted background, divided by the systematic uncertainty in the background and the statistical uncertainty in the data added in quadrature. |
png pdf |
Figure 6-b:
Background closure for the reconstructed W' boson invariant mass in region K for the purpose of validation in the tZb analyses. The lower panel shows the difference between the number of events observed in the data and the predicted background, divided by the systematic uncertainty in the background and the statistical uncertainty in the data added in quadrature. |
png pdf |
Figure 6-c:
Background closure for the reconstructed W' boson invariant mass in region H for the purpose of validation in the tZb analyses. The lower panel shows the difference between the number of events observed in the data and the predicted background, divided by the systematic uncertainty in the background and the statistical uncertainty in the data added in quadrature. |
png pdf |
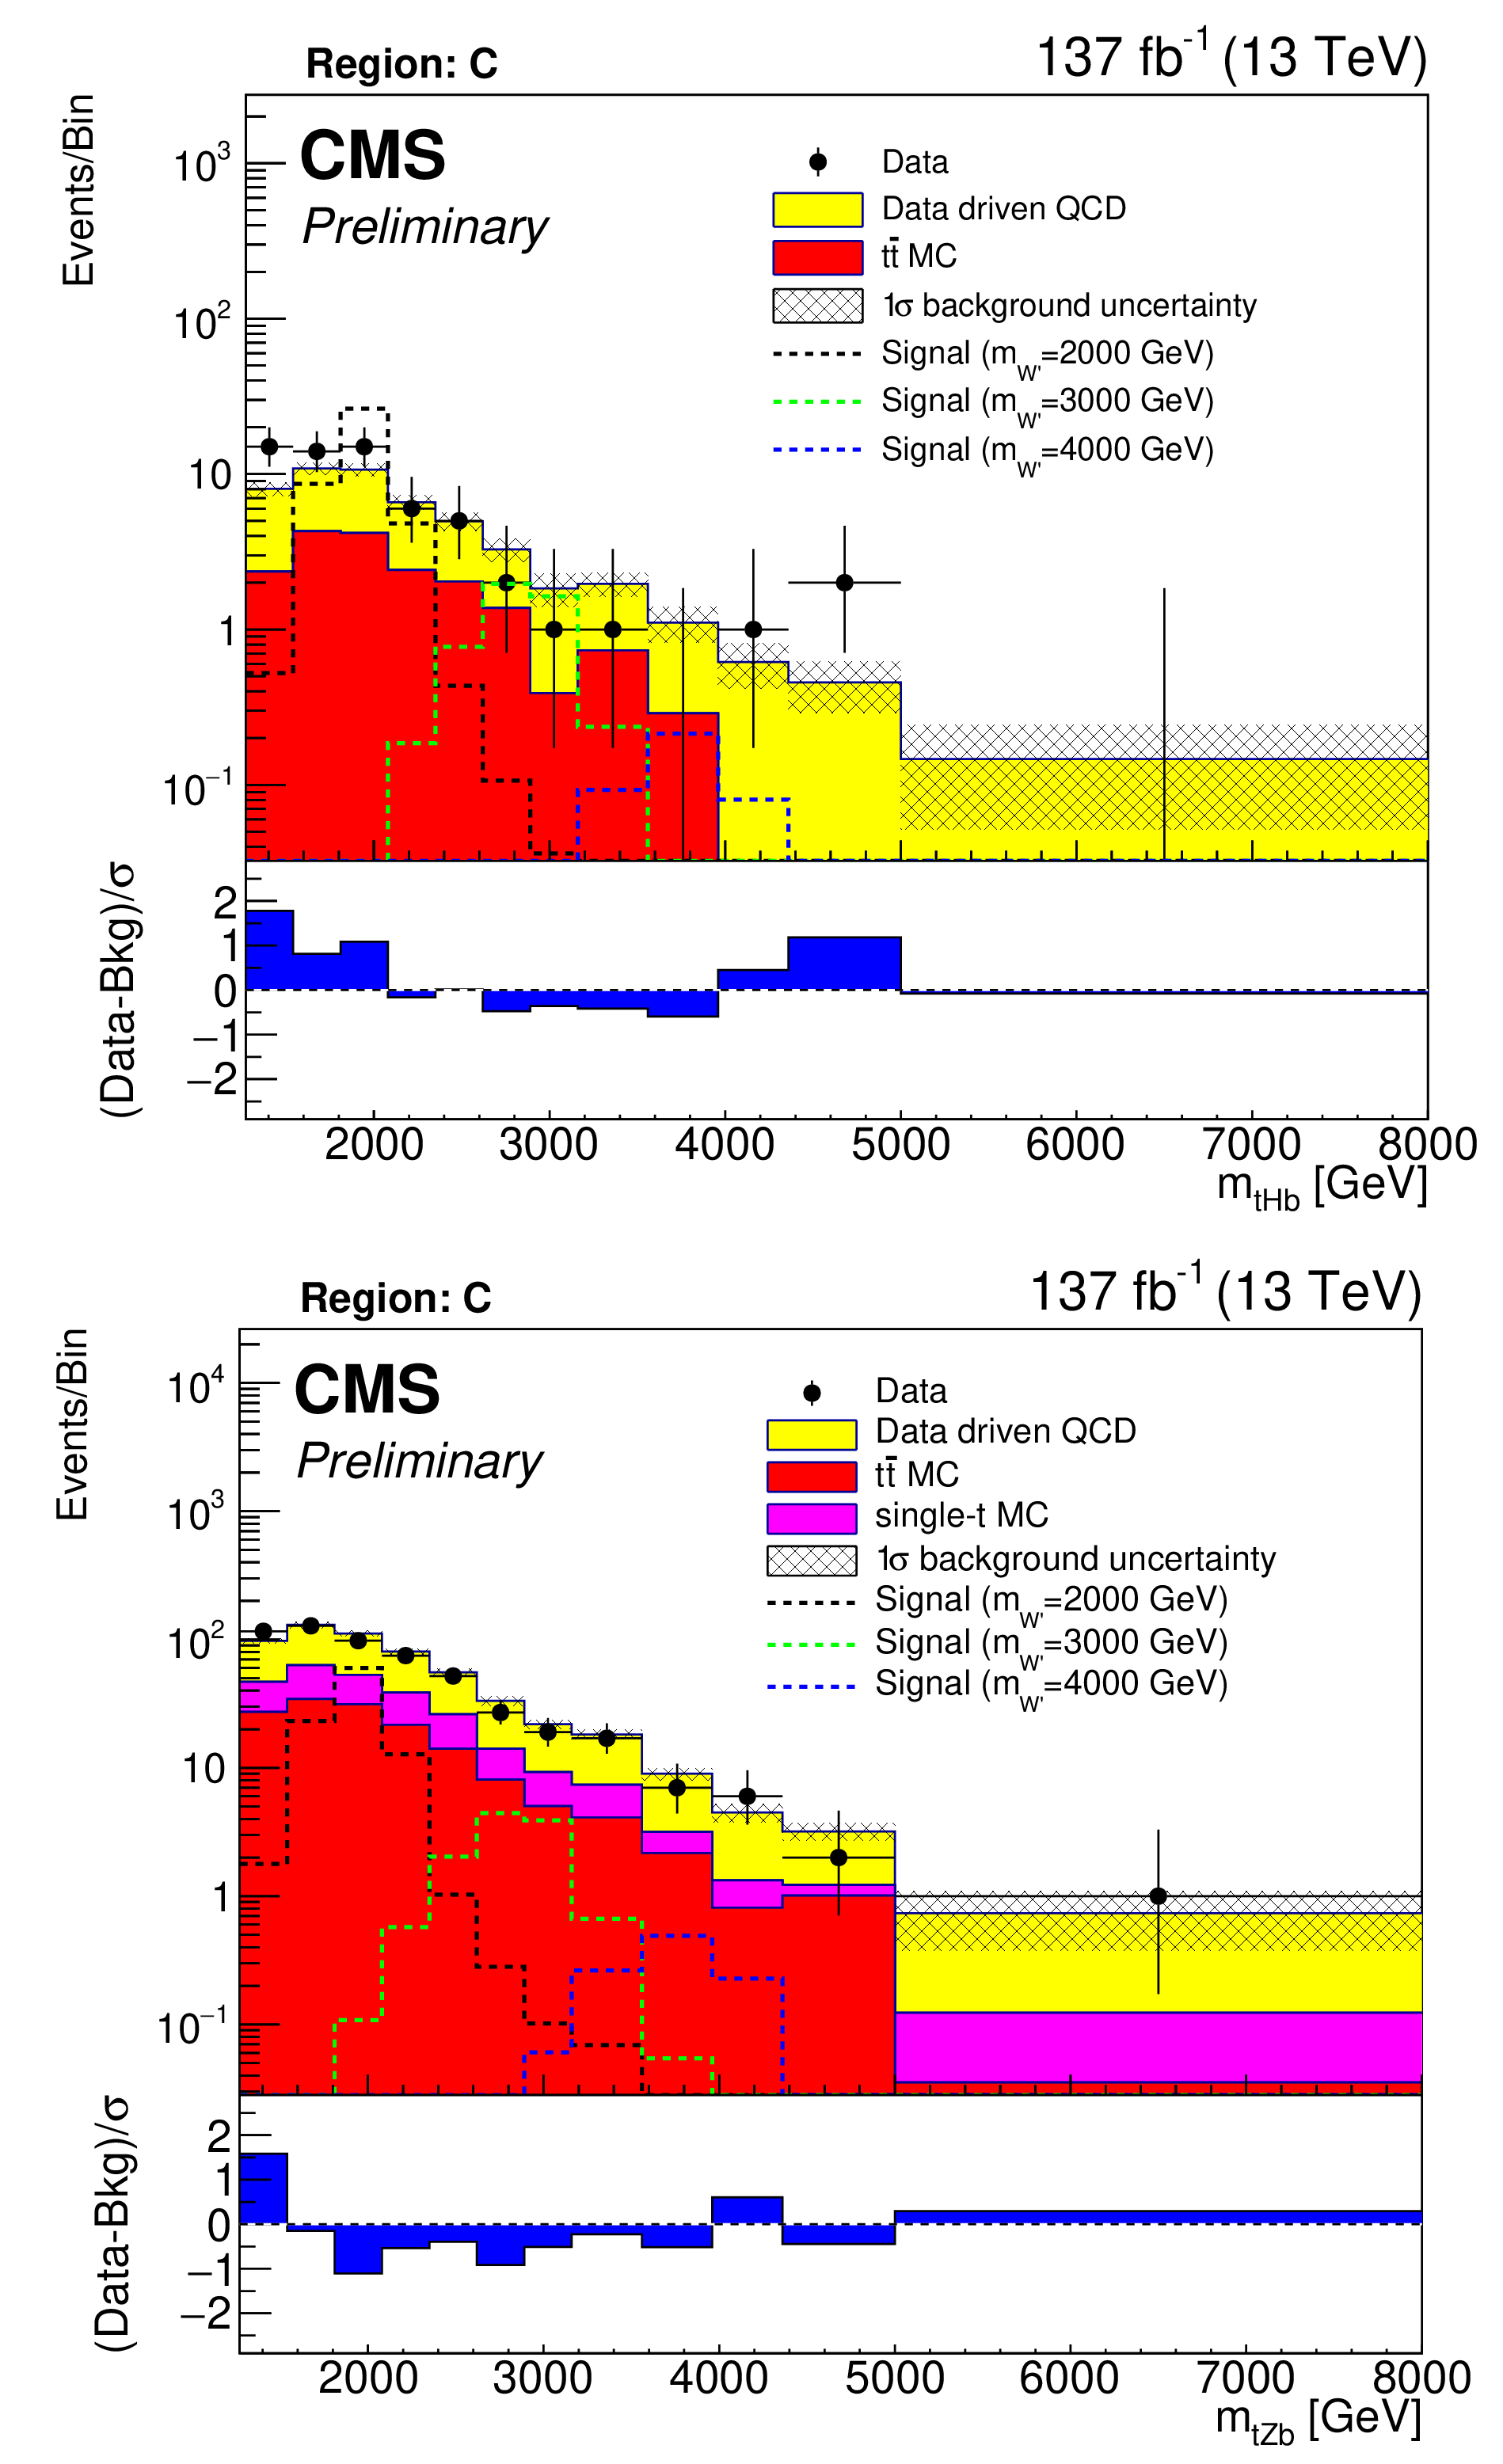
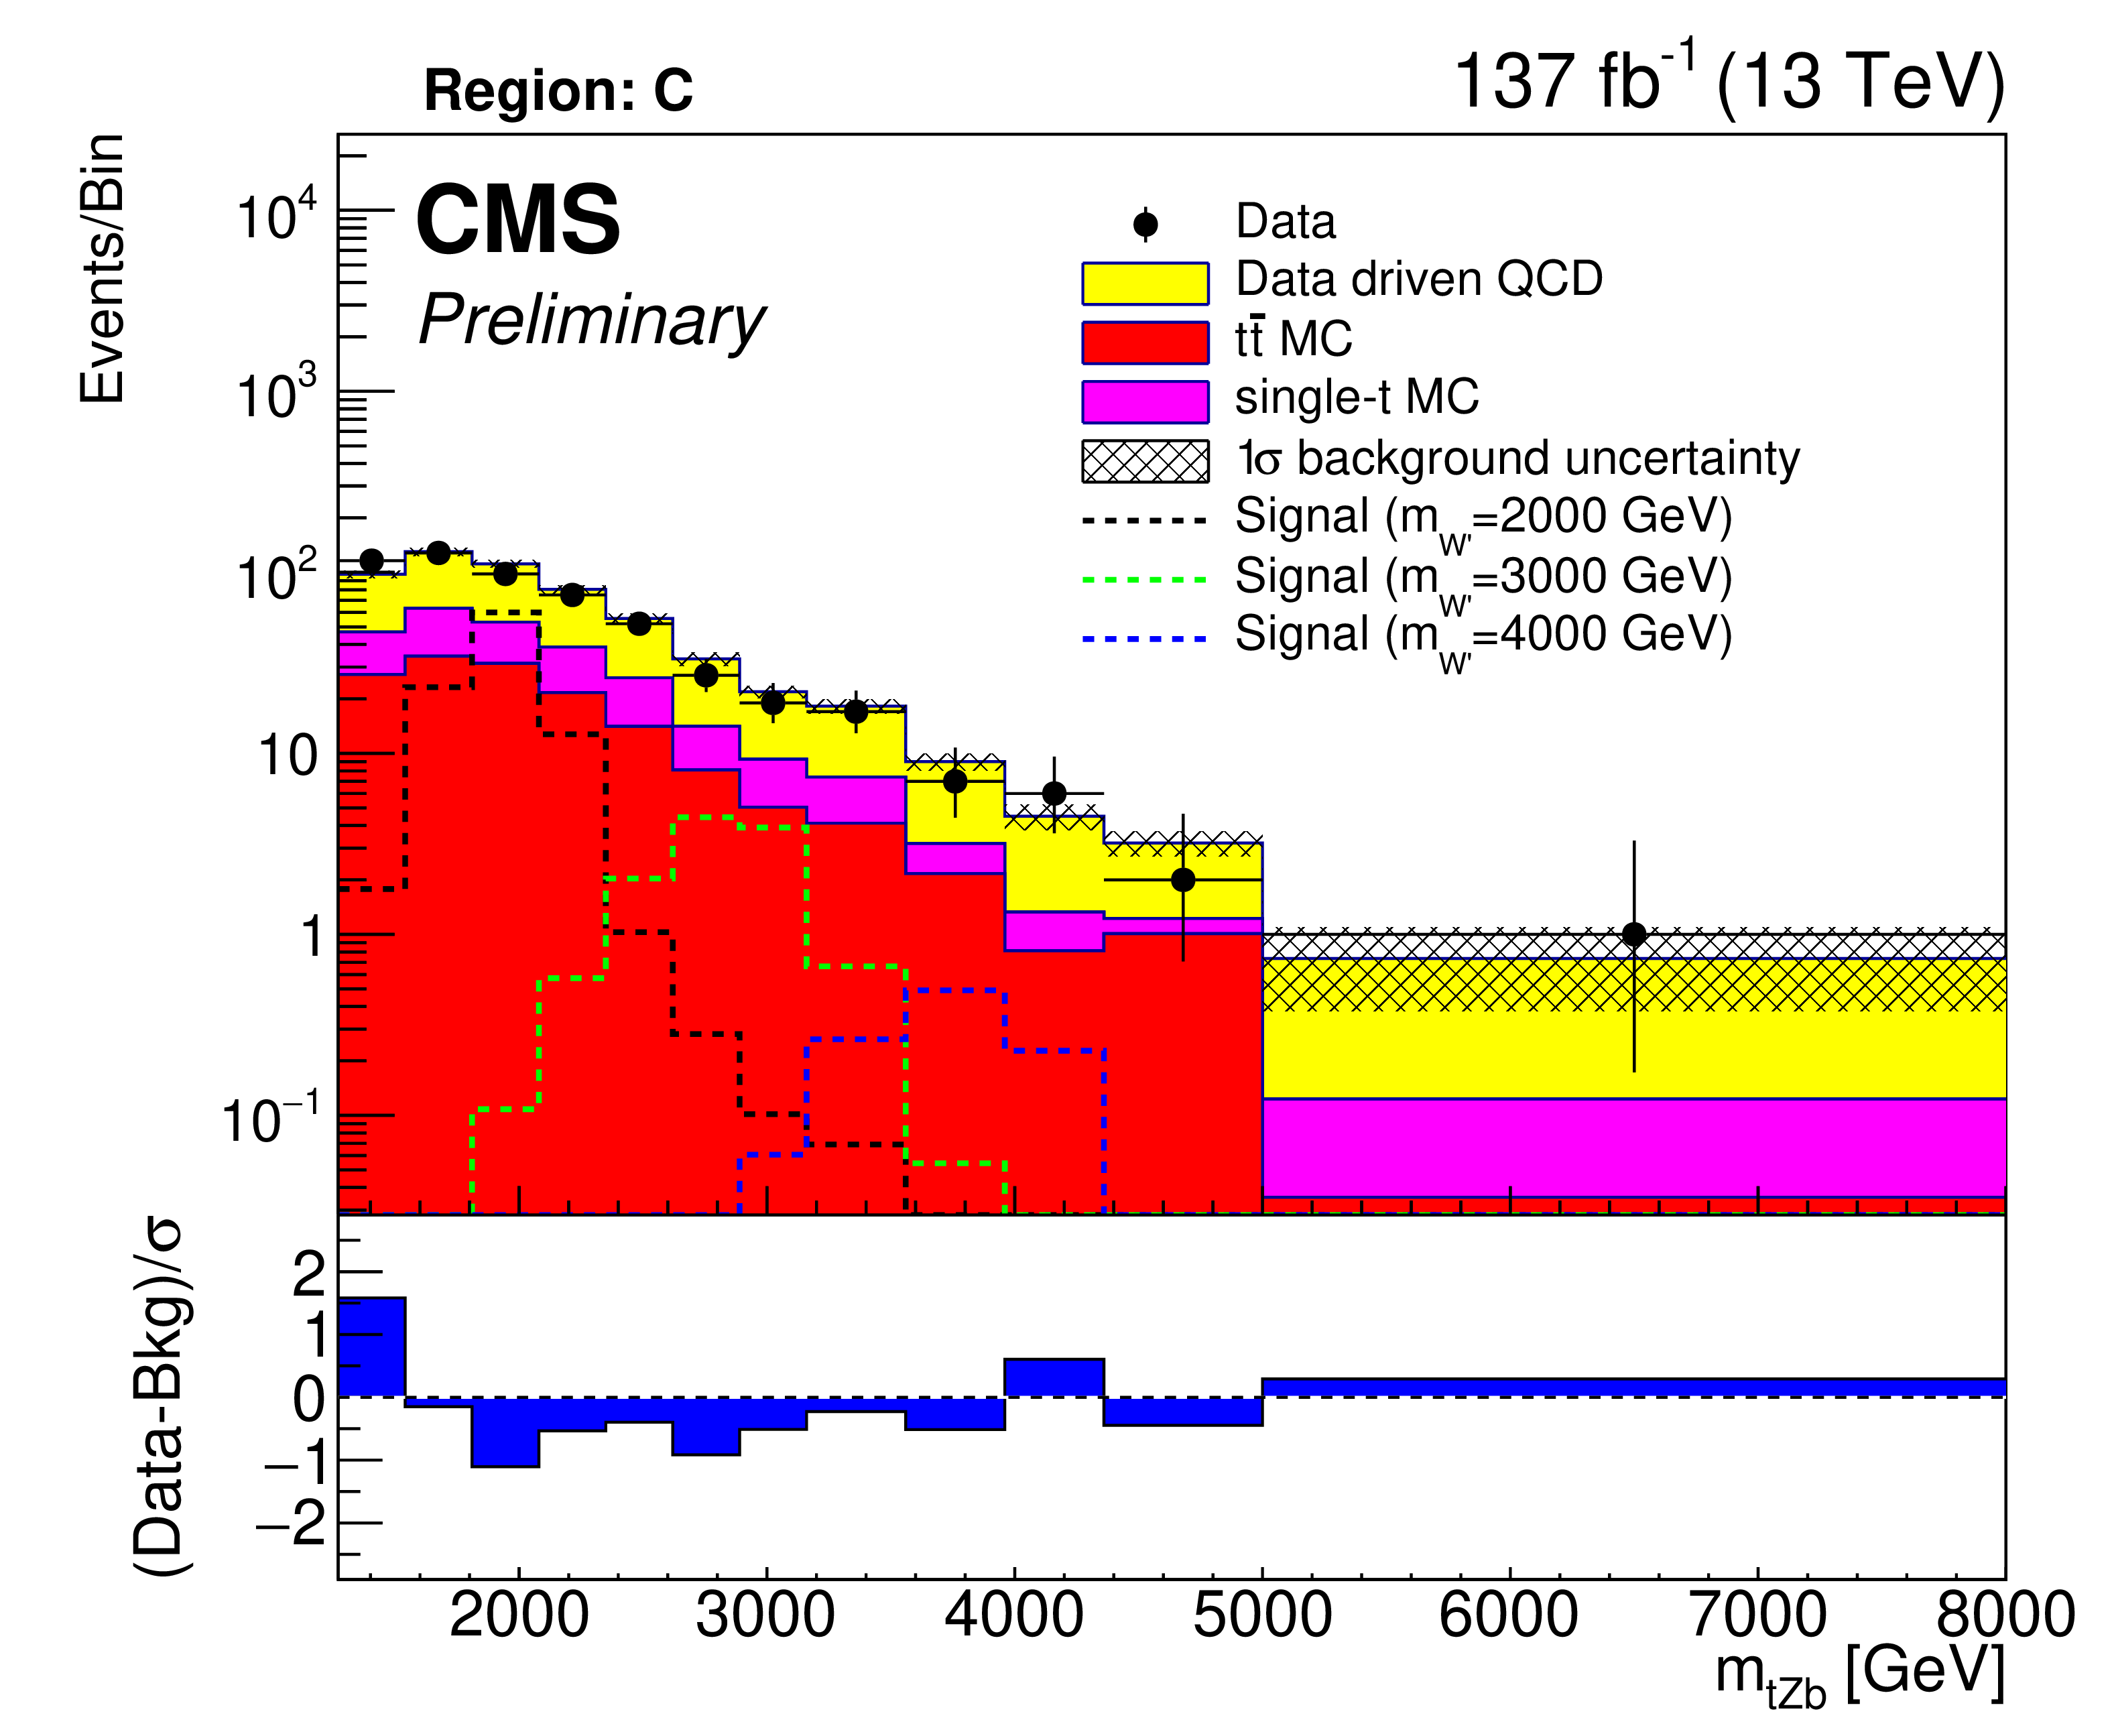
Figure 7:
Reconstructed W' boson mass distributions ($ {m_{\mathrm {\mathrm{t} \mathrm{H} \mathrm{b}}}} $ (top), and $ {m_{\mathrm {\mathrm{t} \mathrm{Z} \mathrm{b}}}} $ (bottom)) in the signal region with estimated backgrounds, and several signal benchmarks. The uncertainties shown in the hatched region contain both statistical and systematic uncertainties of all background components. The lower panels show the difference between the number of events observed in the data and the predicted background, divided by the systematic uncertainty in the background and the statistical uncertainty in the data added in quadrature. |

png pdf |
Figure 7-a:
Reconstructed W' boson mass distribution ($ {m_{\mathrm {\mathrm{t} \mathrm{H} \mathrm{b}}}})in the signal region with estimated backgrounds, and several signal benchmarks. The uncertainties shown in the hatched region contain both statistical and systematic uncertainties of all background components. The lower panel shows the difference between the number of events observed in the data and the predicted background, divided by the systematic uncertainty in the background and the statistical uncertainty in the data added in quadrature. |
png pdf |
Figure 7-b:
Reconstructed W' boson mass distribution (($ {m_{\mathrm {\mathrm{t} \mathrm{Z} \mathrm{b}}}} $) in the signal region with estimated backgrounds, and several signal benchmarks. The uncertainties shown in the hatched region contain both statistical and systematic uncertainties of all background components. The lower panel shows the difference between the number of events observed in the data and the predicted background, divided by the systematic uncertainty in the background and the statistical uncertainty in the data added in quadrature. |
png pdf |
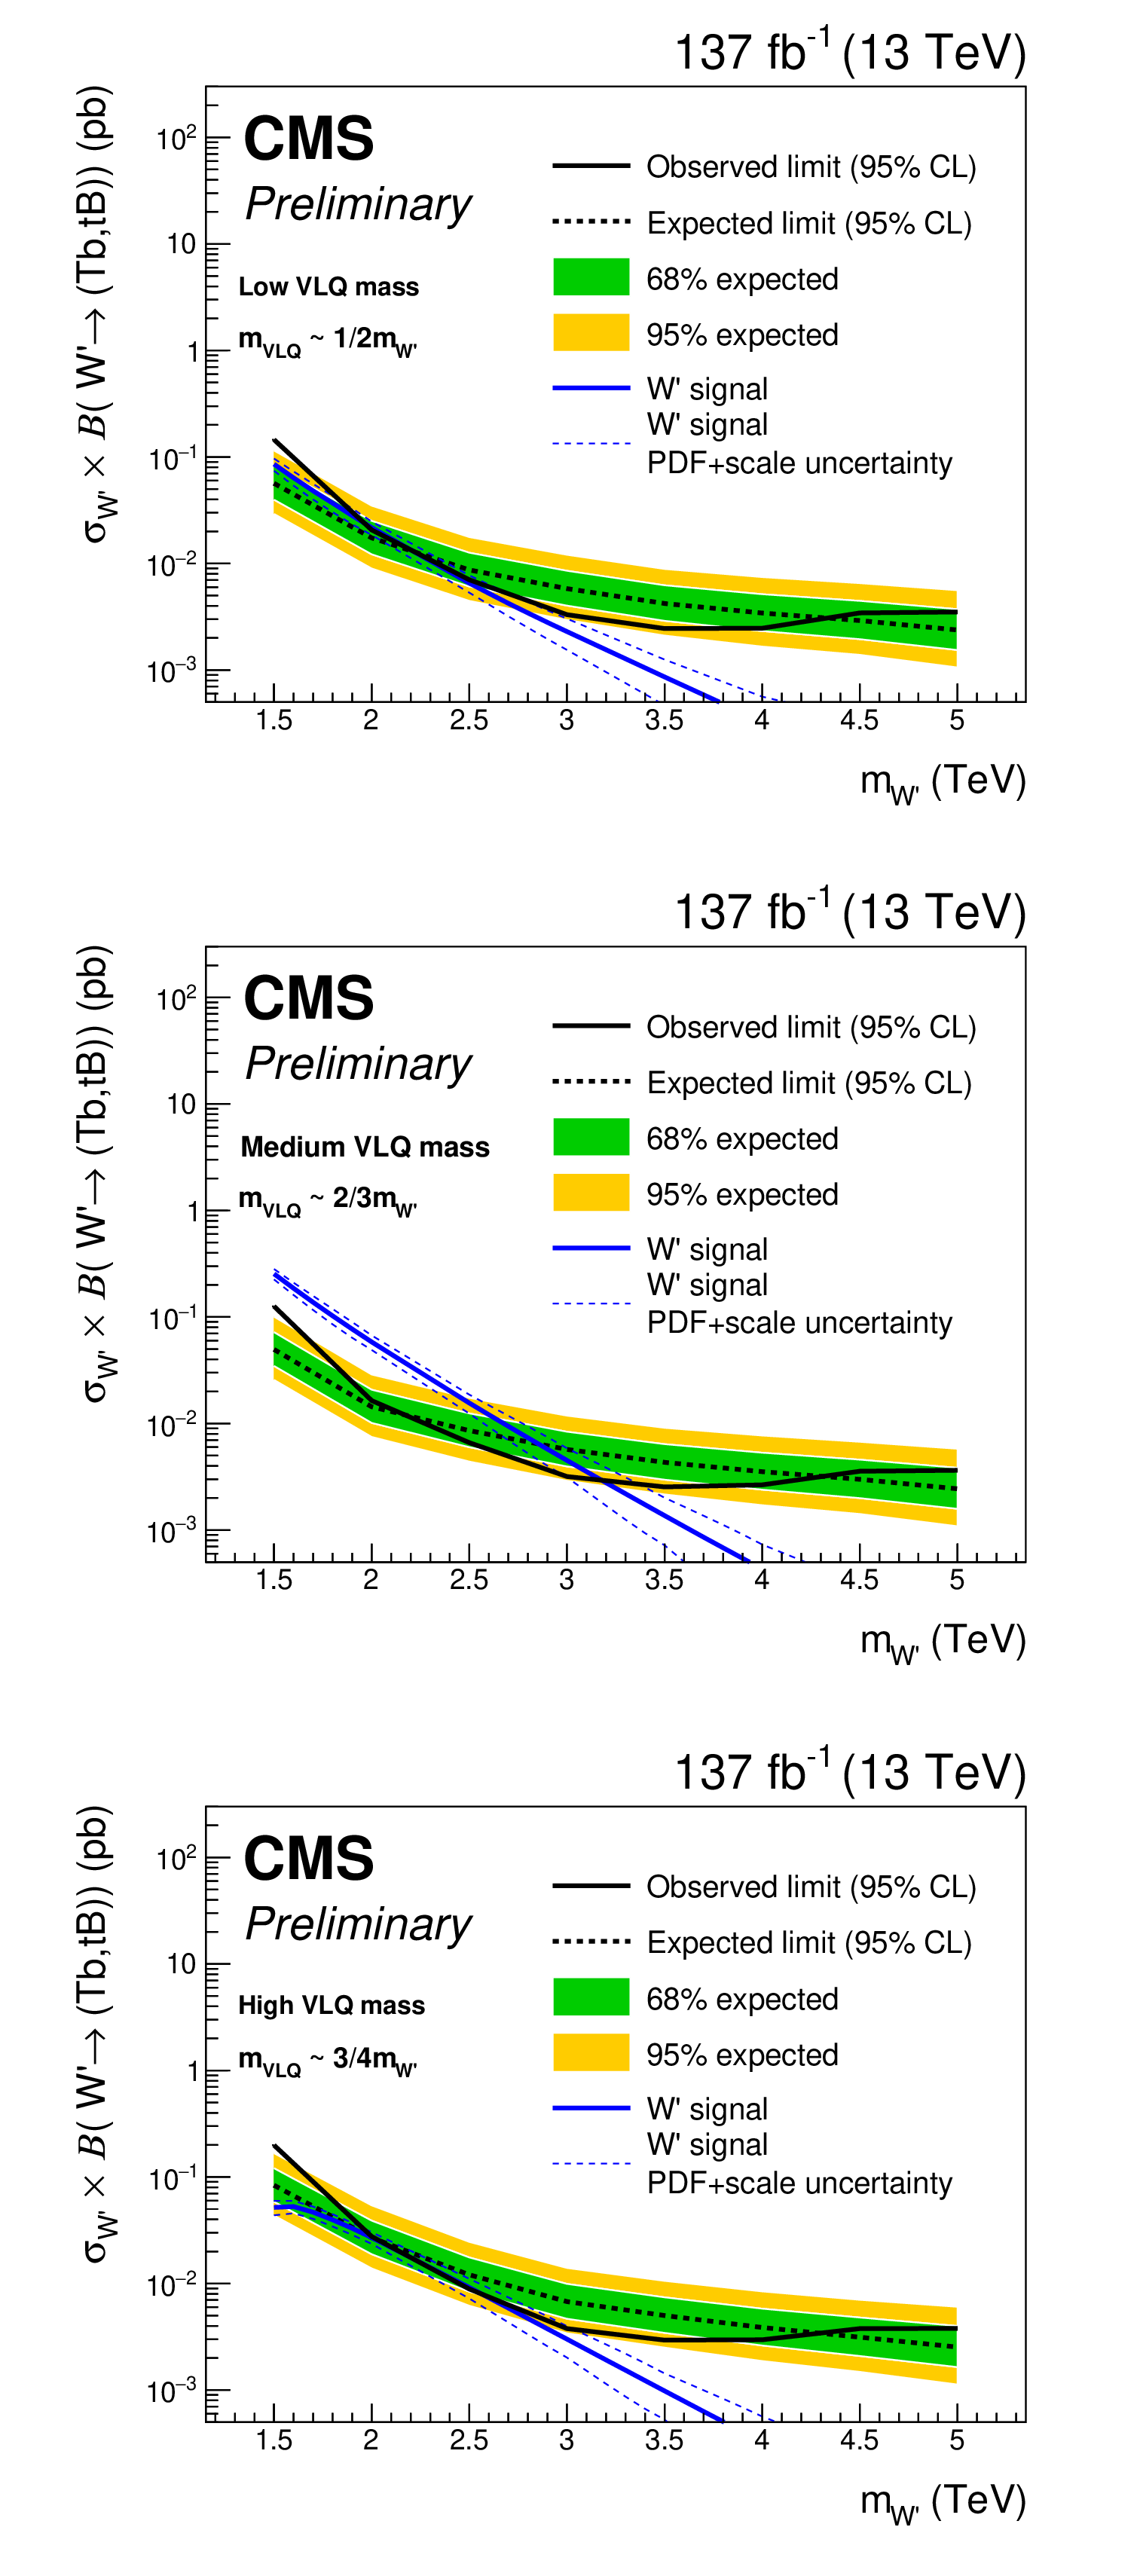
Figure 8:
The W' boson 95% CL production cross section limits. The expected limits (dashed) and observed limits (solid), as well as the W' boson theoretical cross section and the PDF and scale normalization uncertainties are shown. The bands around the expected limit represent the $\pm $1 and ${\pm}$2$\sigma _{exp}$ uncertainties in the expected limit. The limits for low- (top), medium- (center), and high- (bottom) mass VLQ mass ranges are shown. |

png pdf |
Figure 8-a:
The W' boson 95% CL production cross section limits. The expected limits (dashed) and observed limits (solid), as well as the W' boson theoretical cross section and the PDF and scale normalization uncertainties are shown. The bands around the expected limit represent the $\pm $1 and ${\pm}$2$\sigma _{exp}$ uncertainties in the expected limit. The limits for the low-mass VLQ range are shown. |
png pdf |
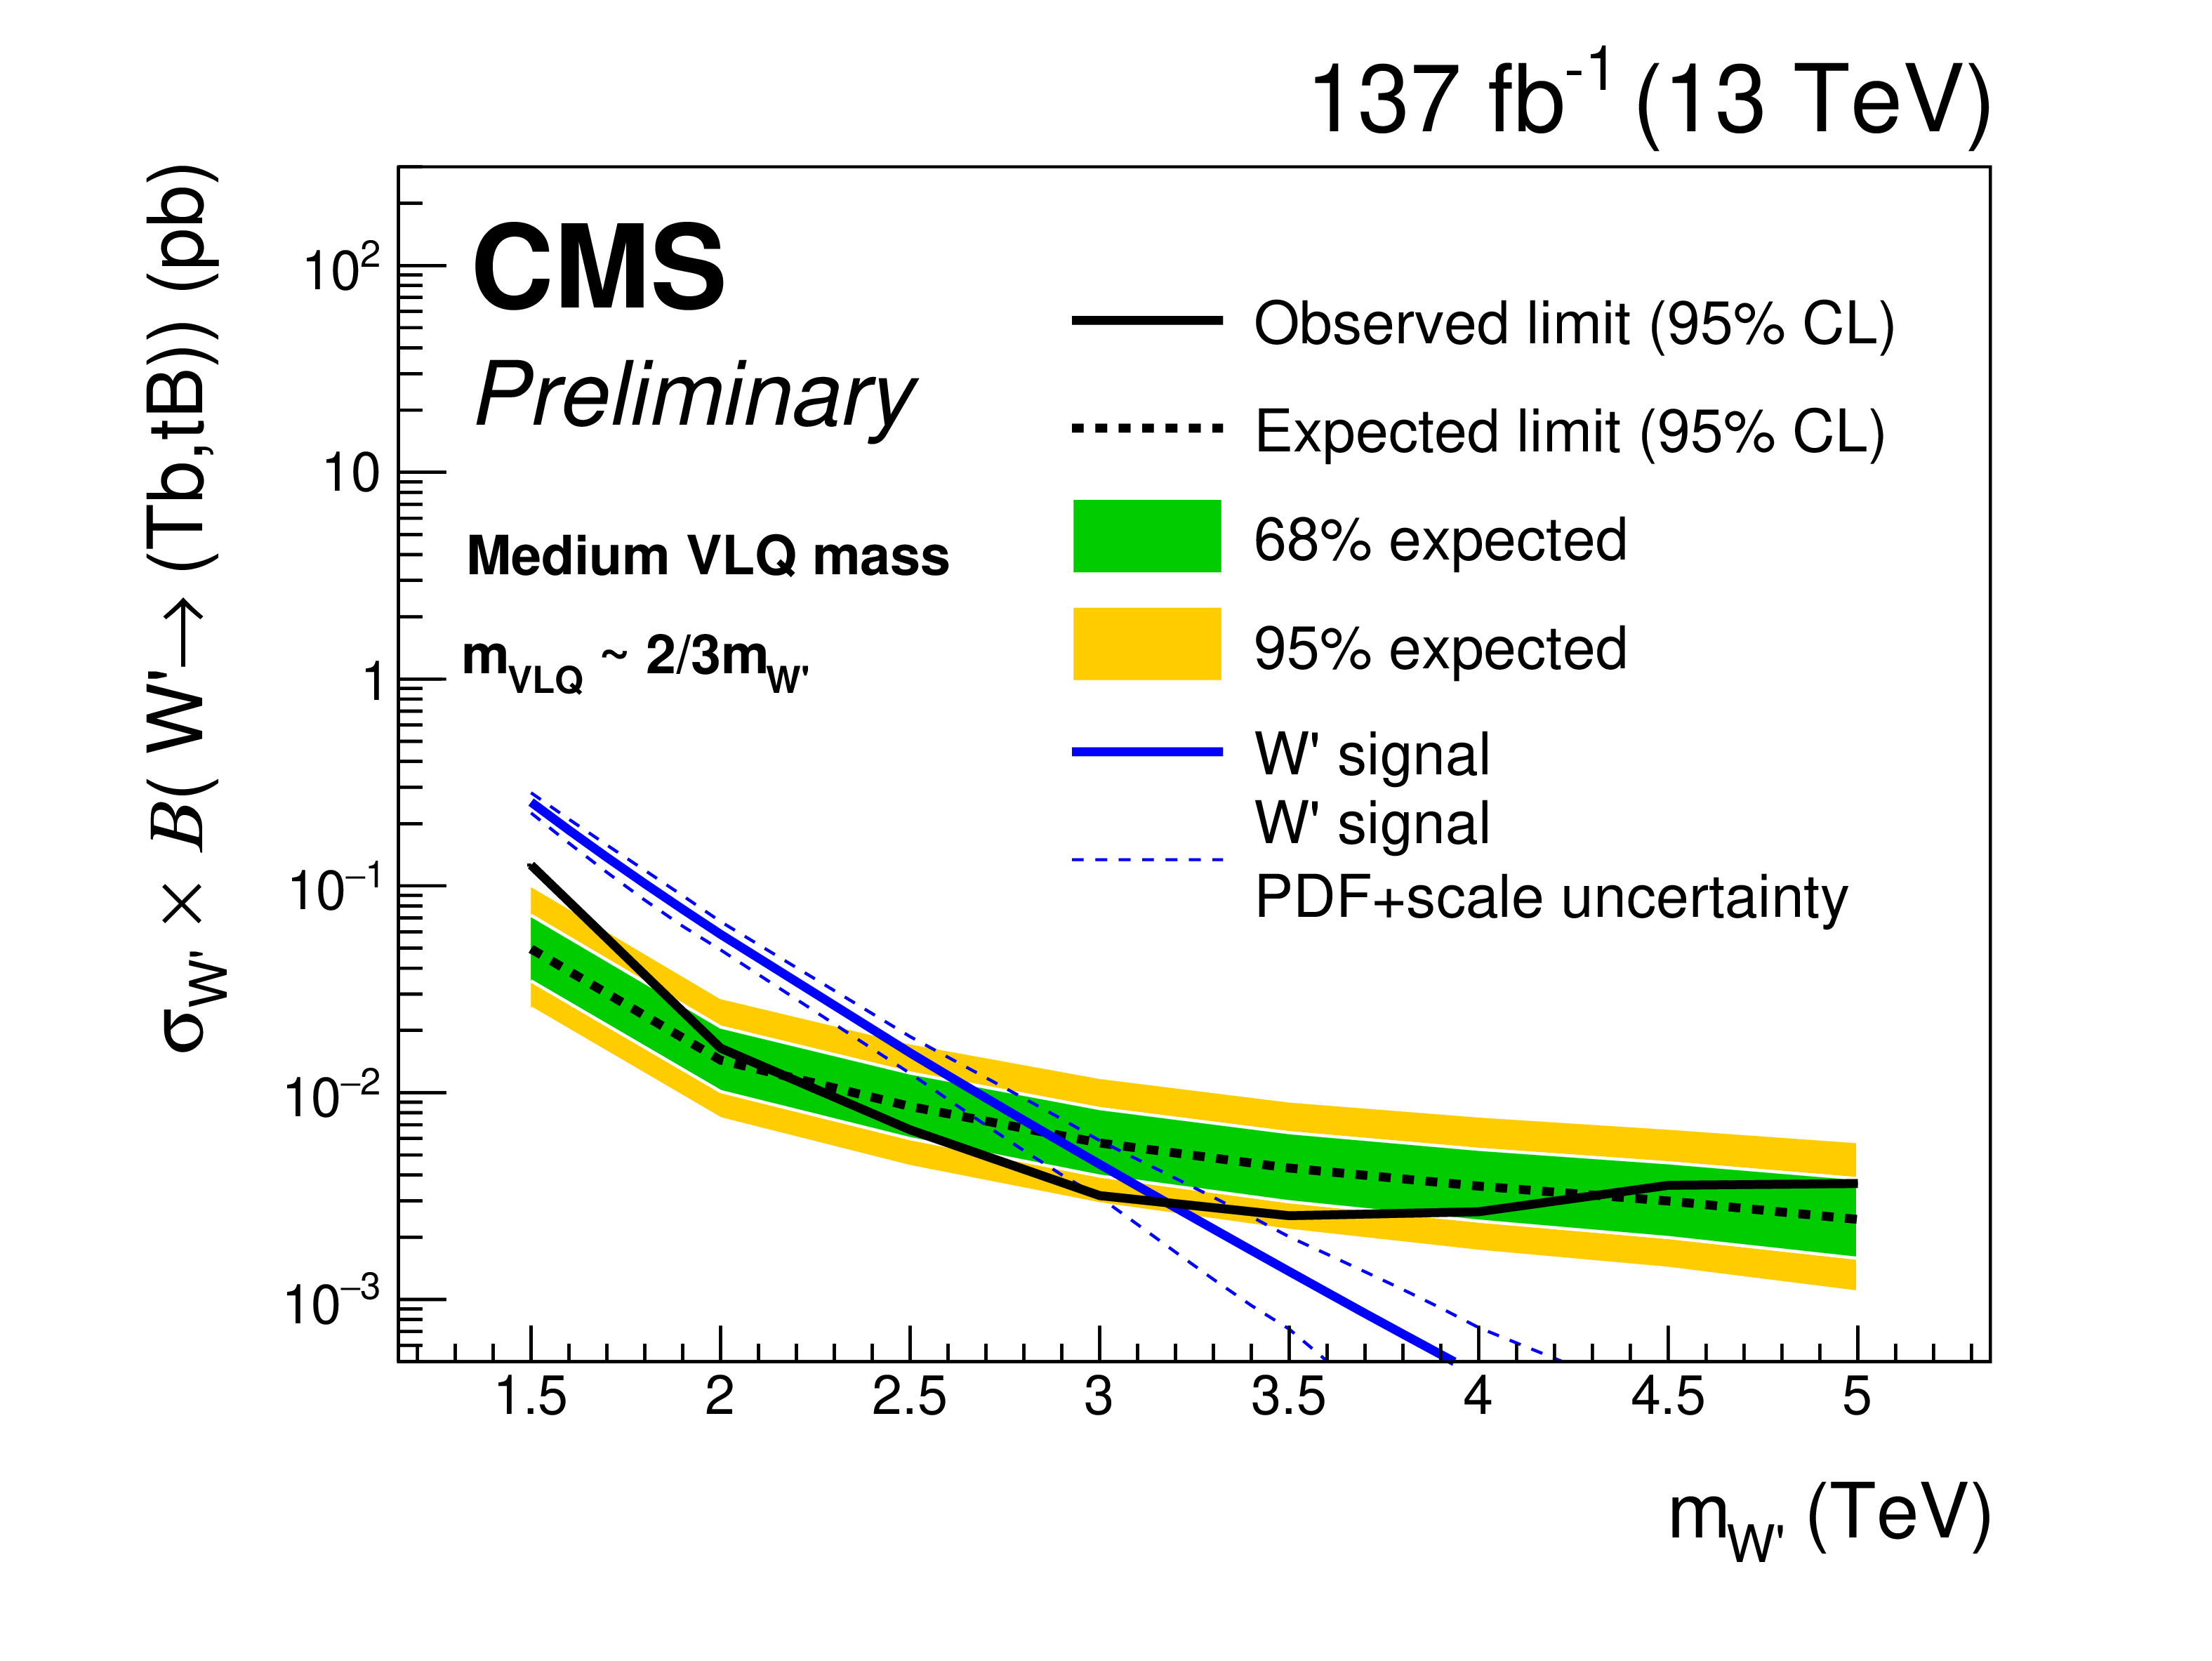
Figure 8-b:
The W' boson 95% CL production cross section limits. The expected limits (dashed) and observed limits (solid), as well as the W' boson theoretical cross section and the PDF and scale normalization uncertainties are shown. The bands around the expected limit represent the $\pm $1 and ${\pm}$2$\sigma _{exp}$ uncertainties in the expected limit. The limits for the medium-mass VLQ range are shown. |
png pdf |
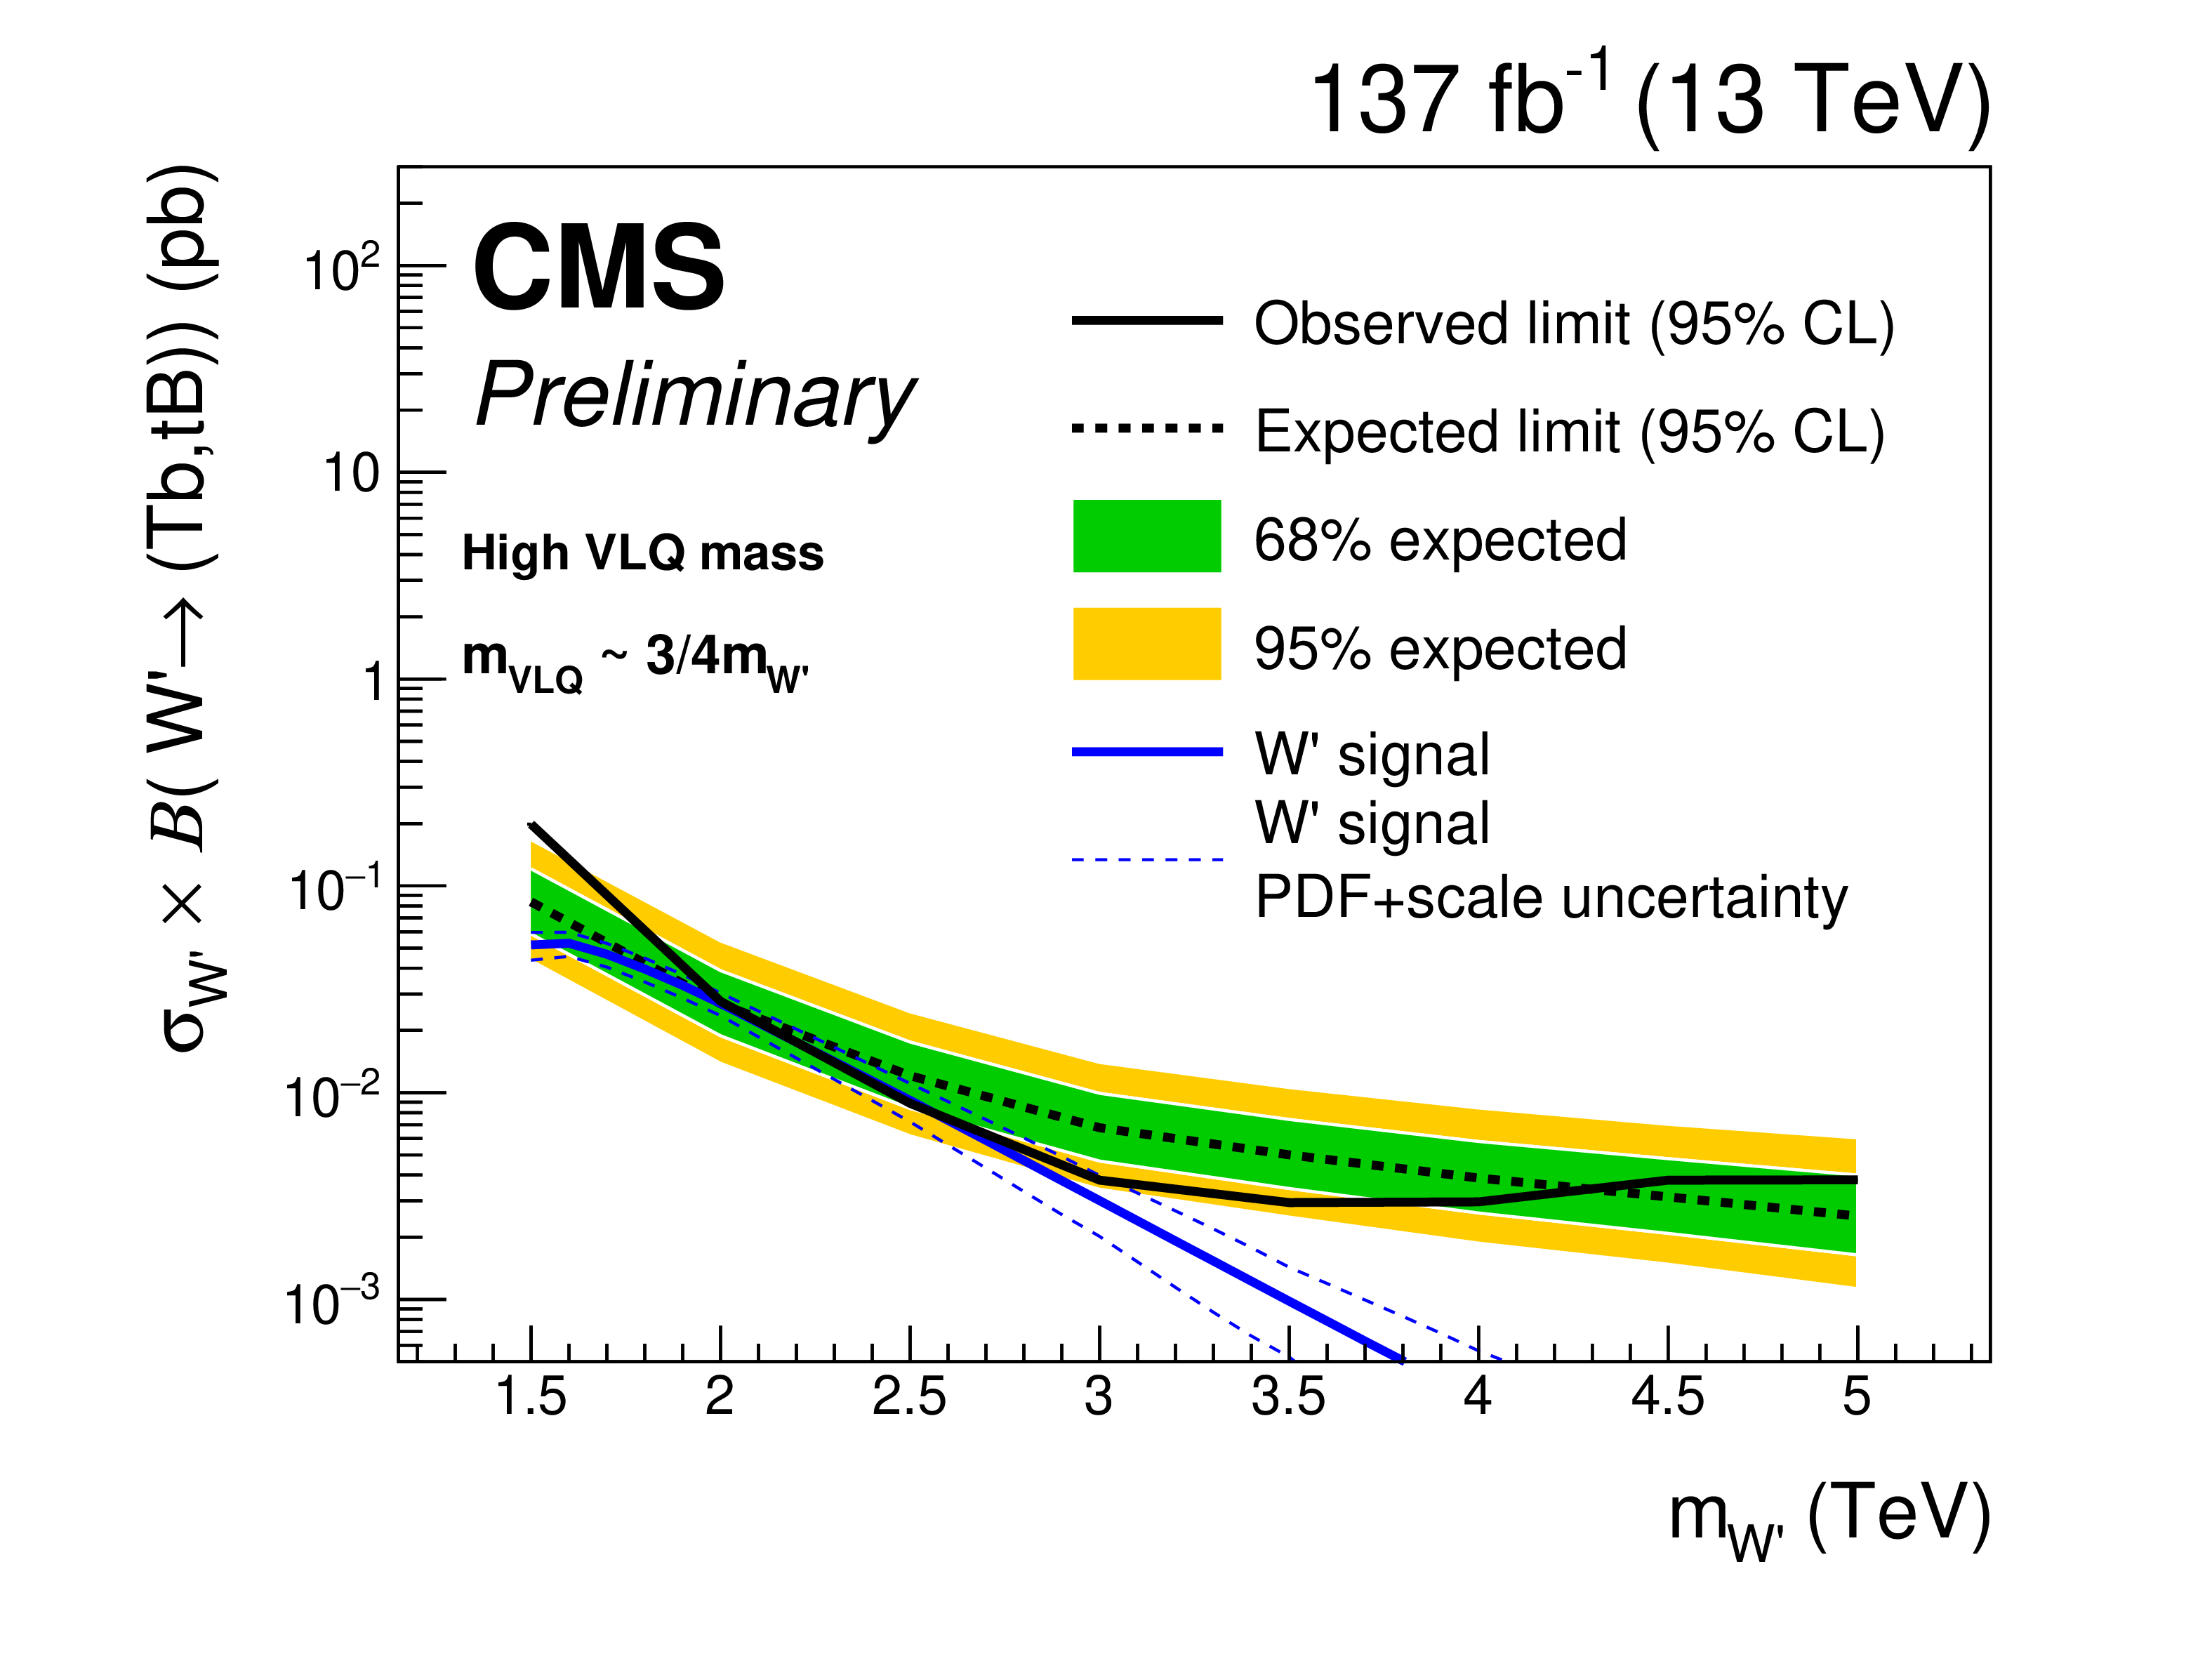
Figure 8-c:
The W' boson 95% CL production cross section limits. The expected limits (dashed) and observed limits (solid), as well as the W' boson theoretical cross section and the PDF and scale normalization uncertainties are shown. The bands around the expected limit represent the $\pm $1 and ${\pm}$2$\sigma _{exp}$ uncertainties in the expected limit. The limits for the high-mass VLQ range are shown. |
png pdf |
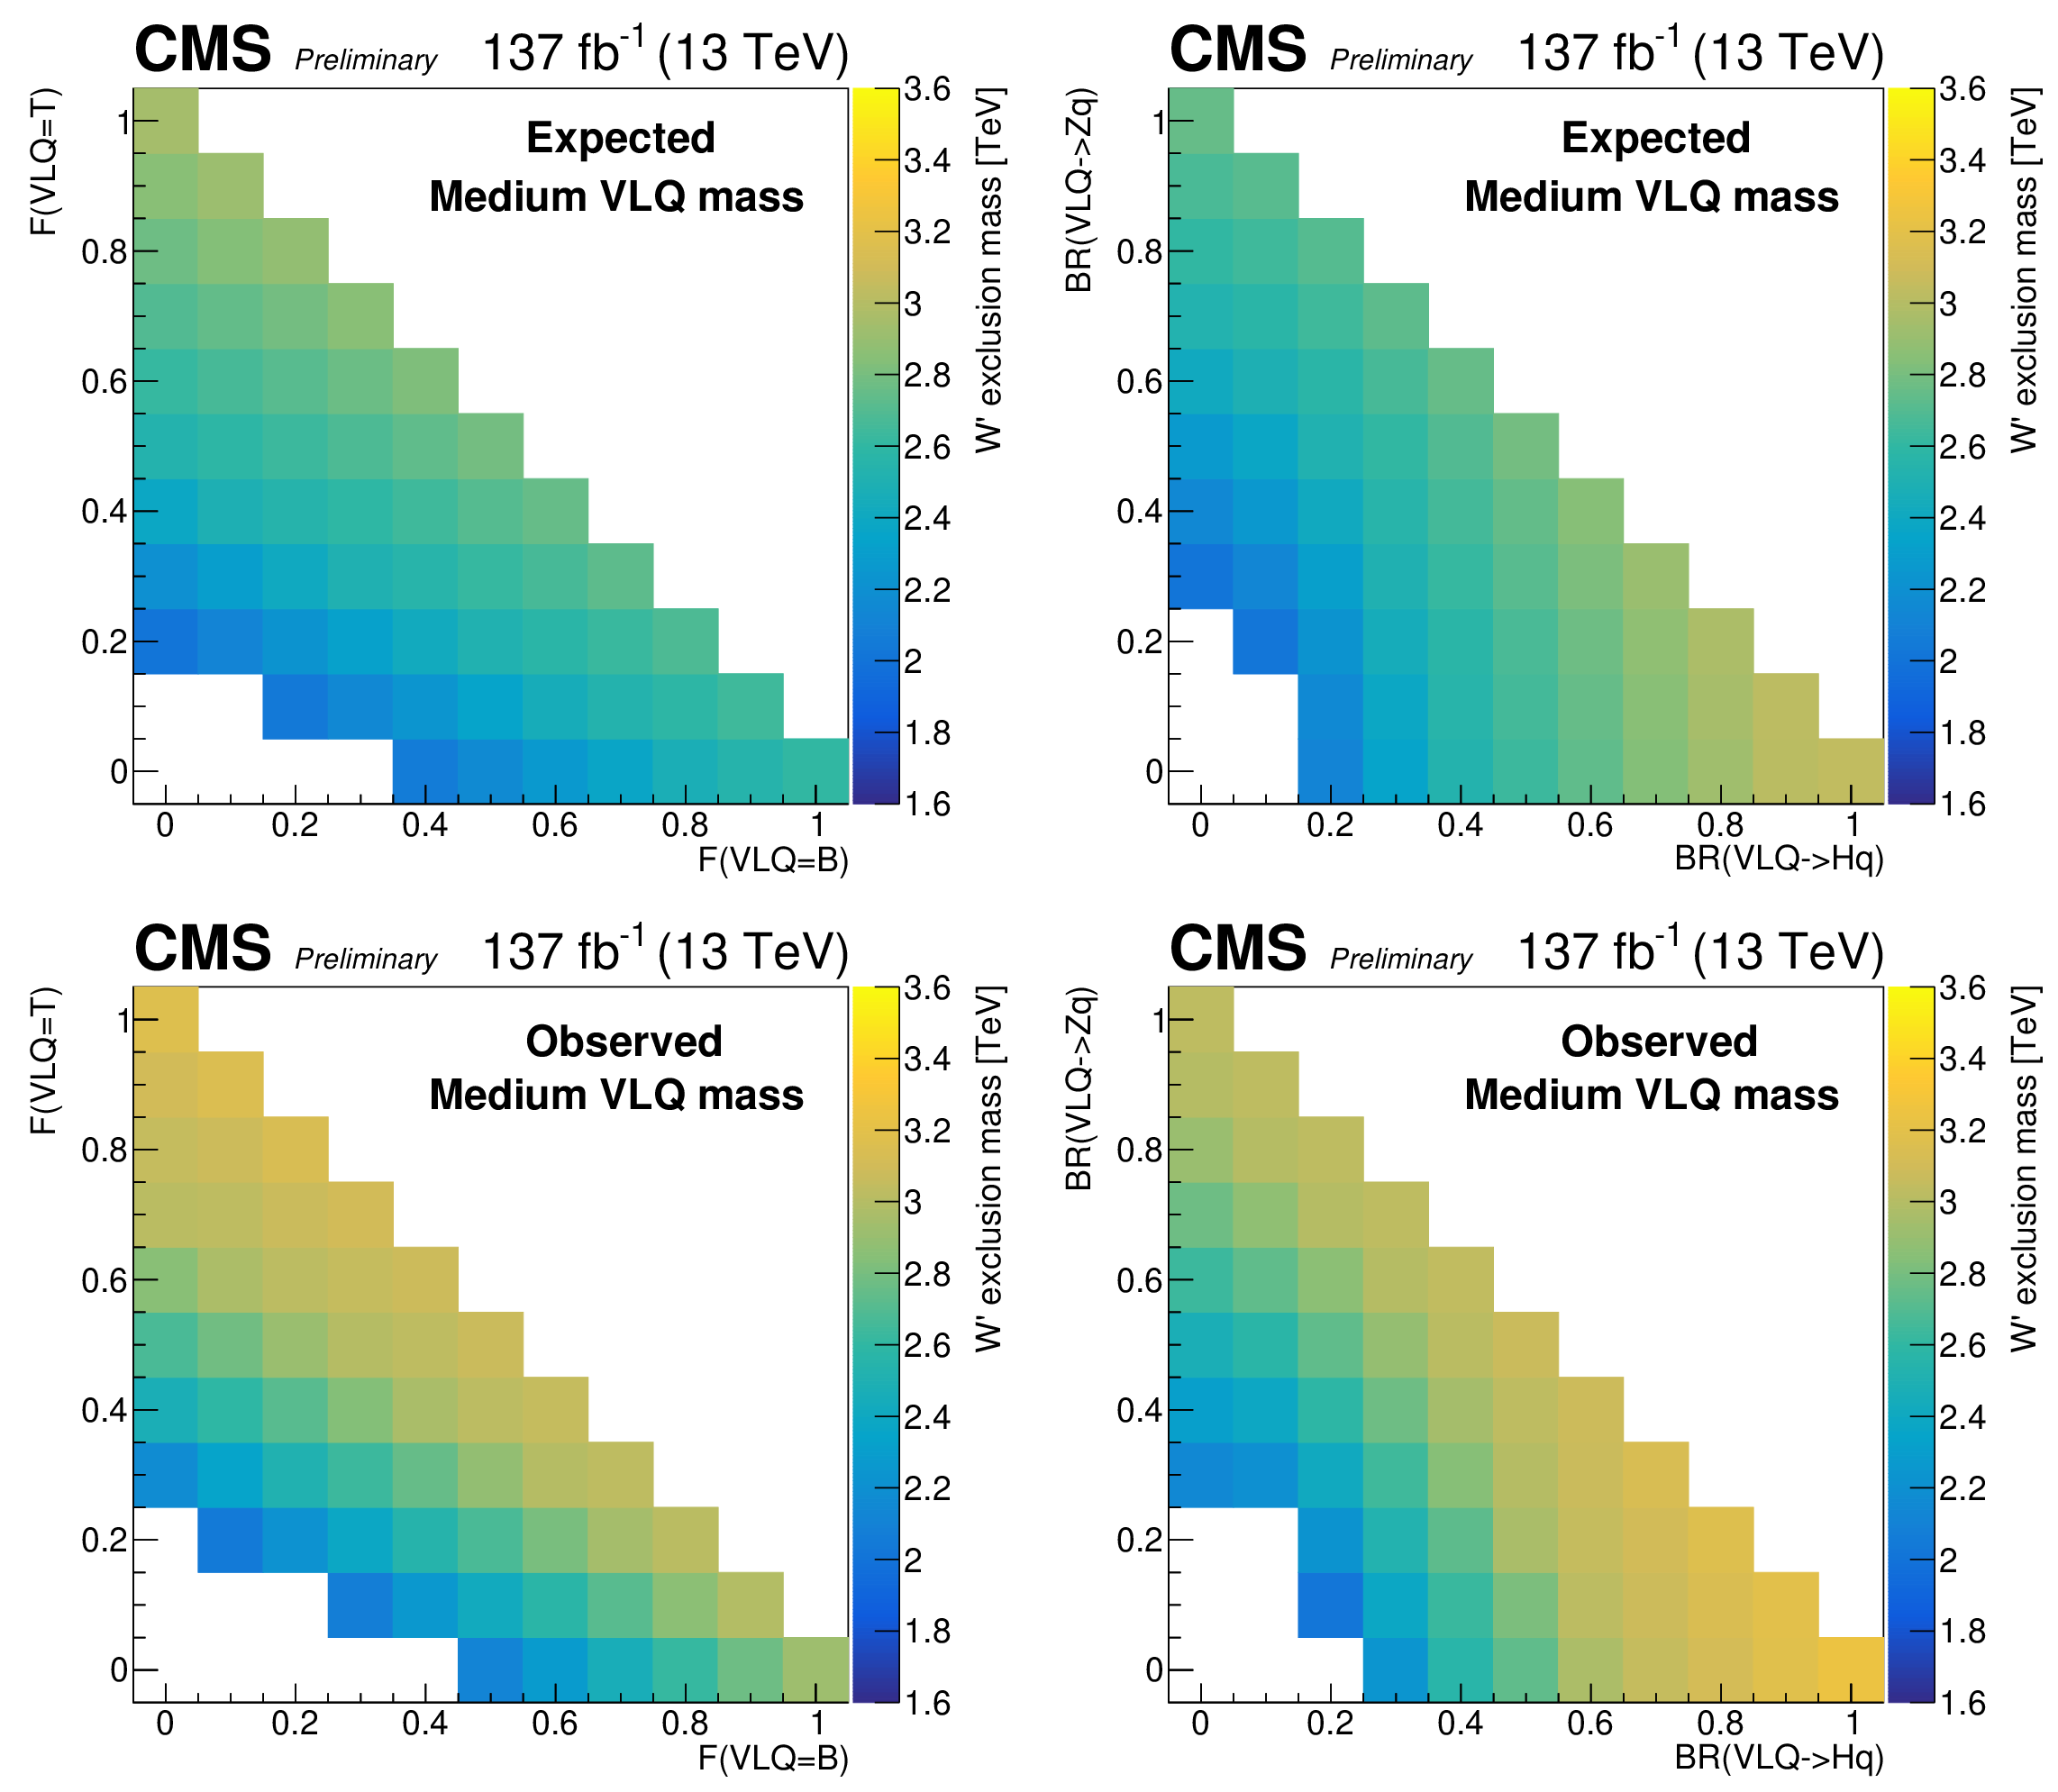
Figure 9:
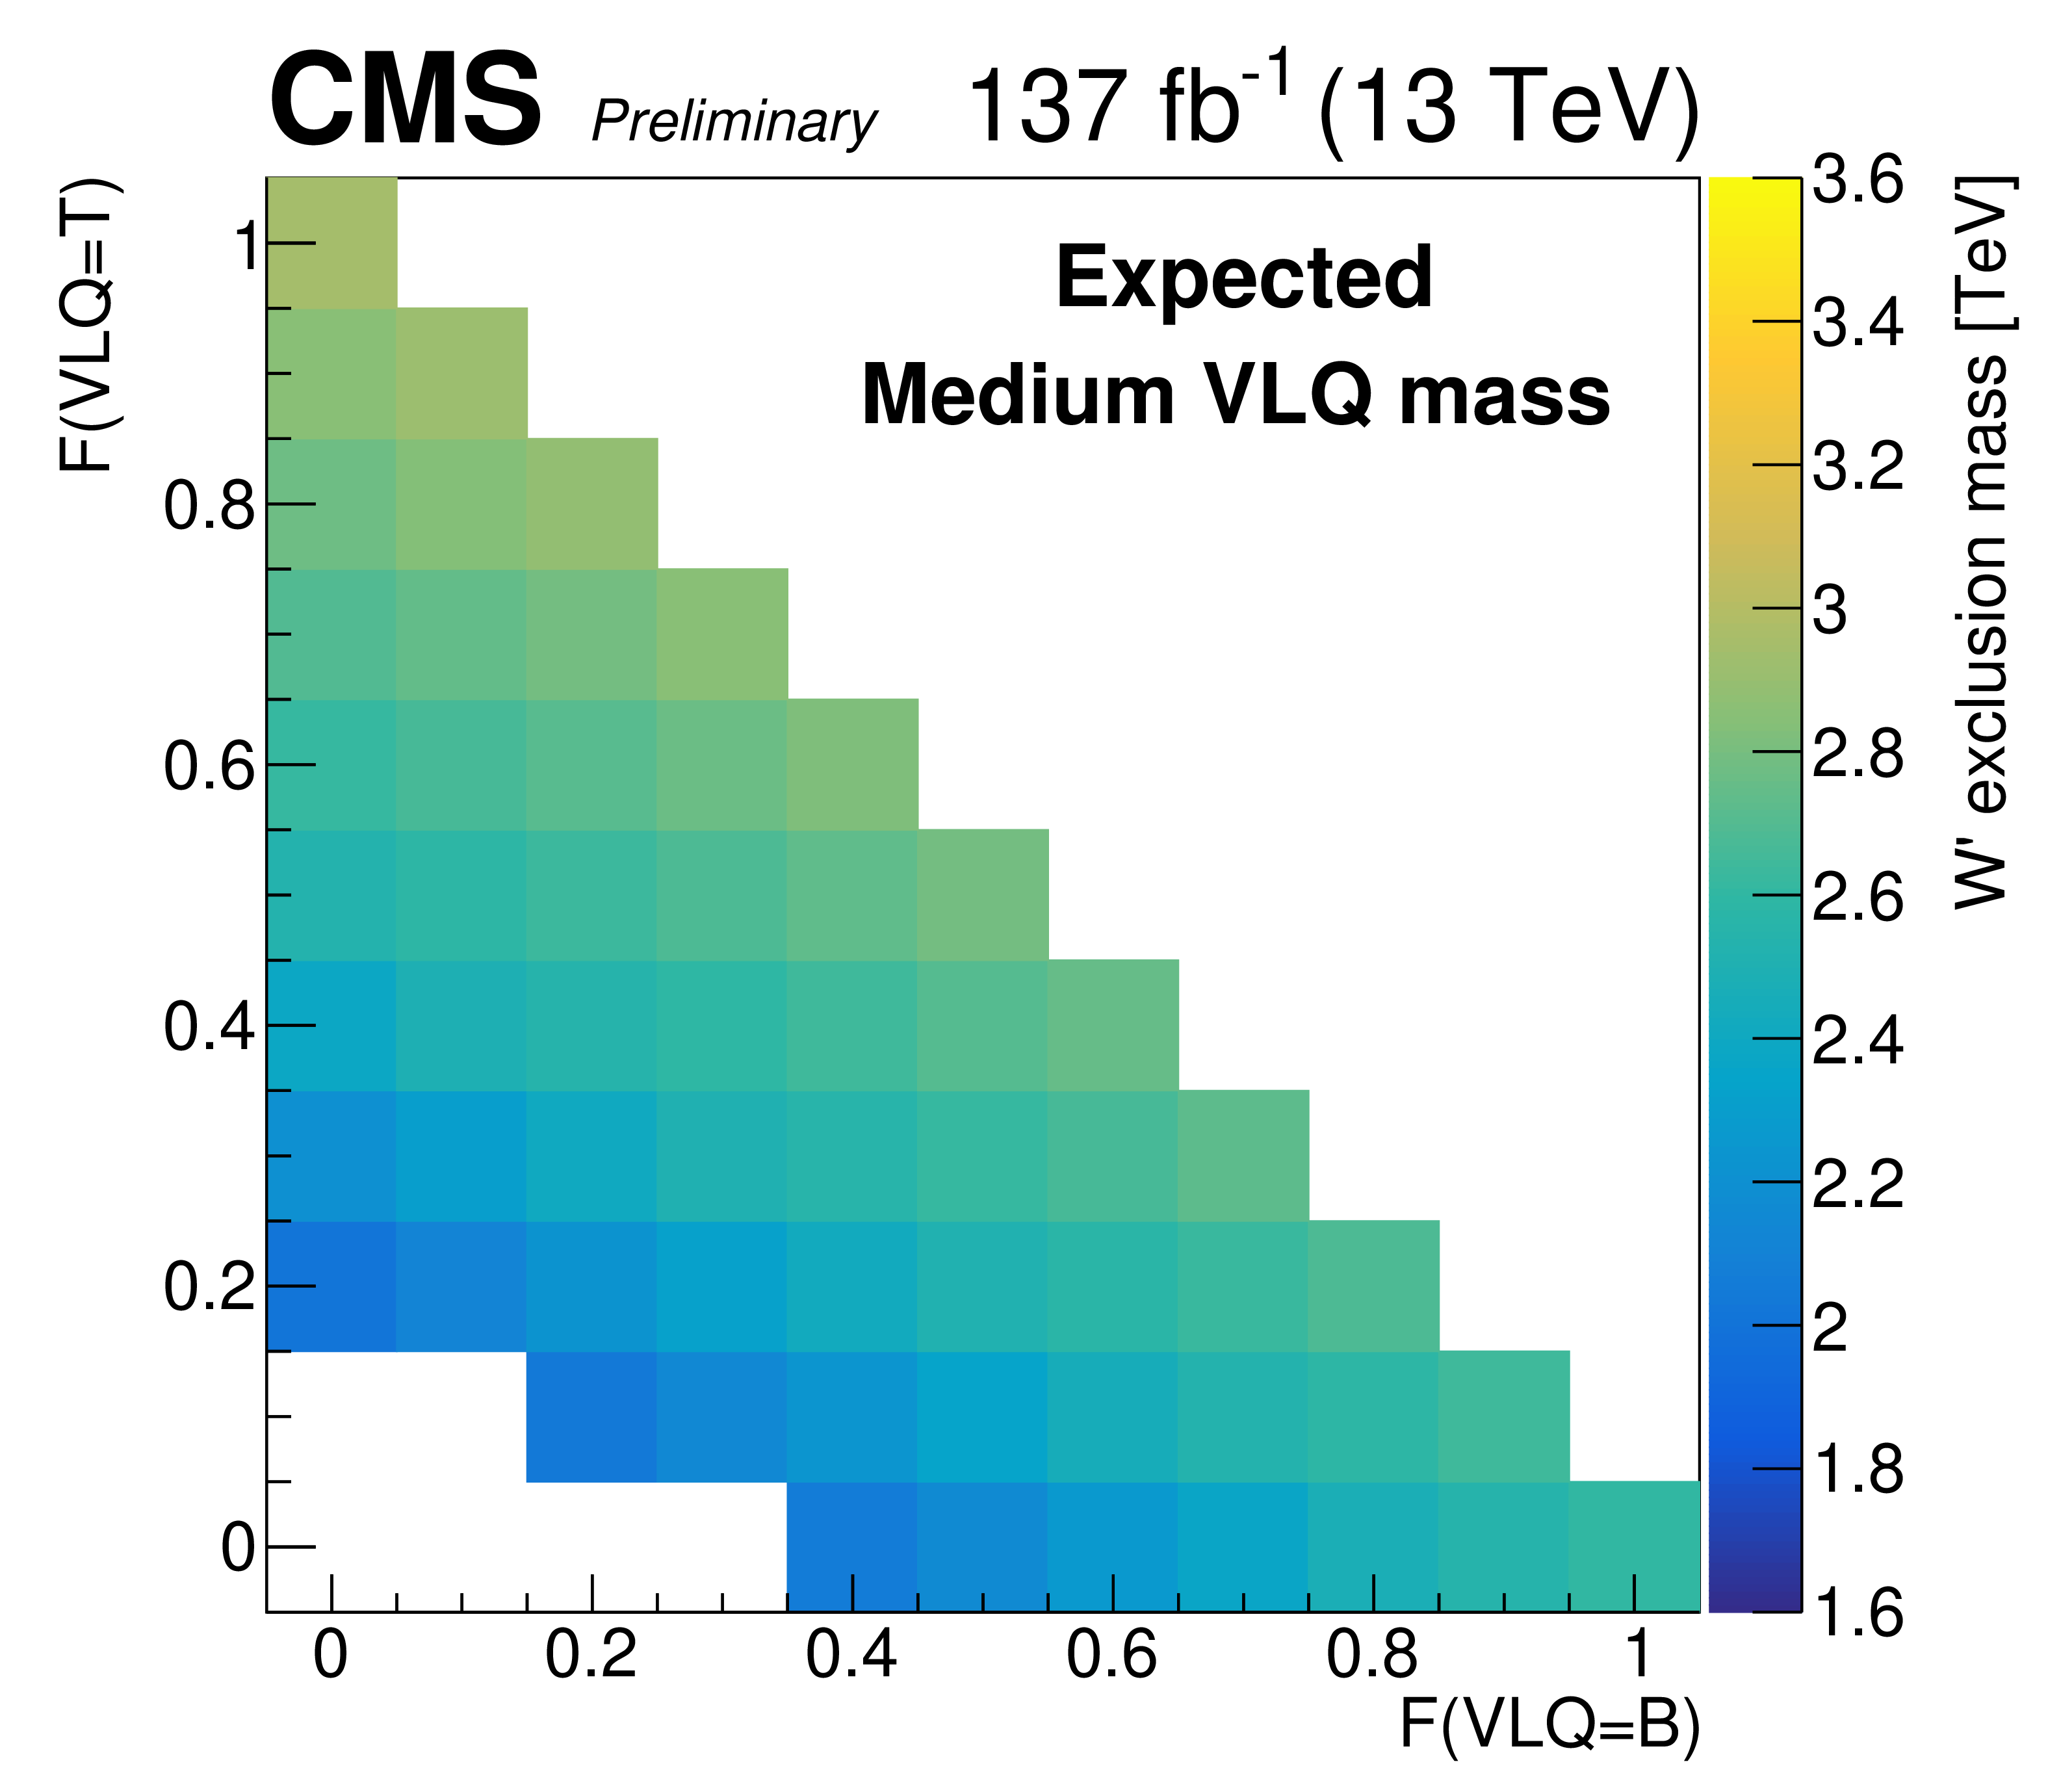
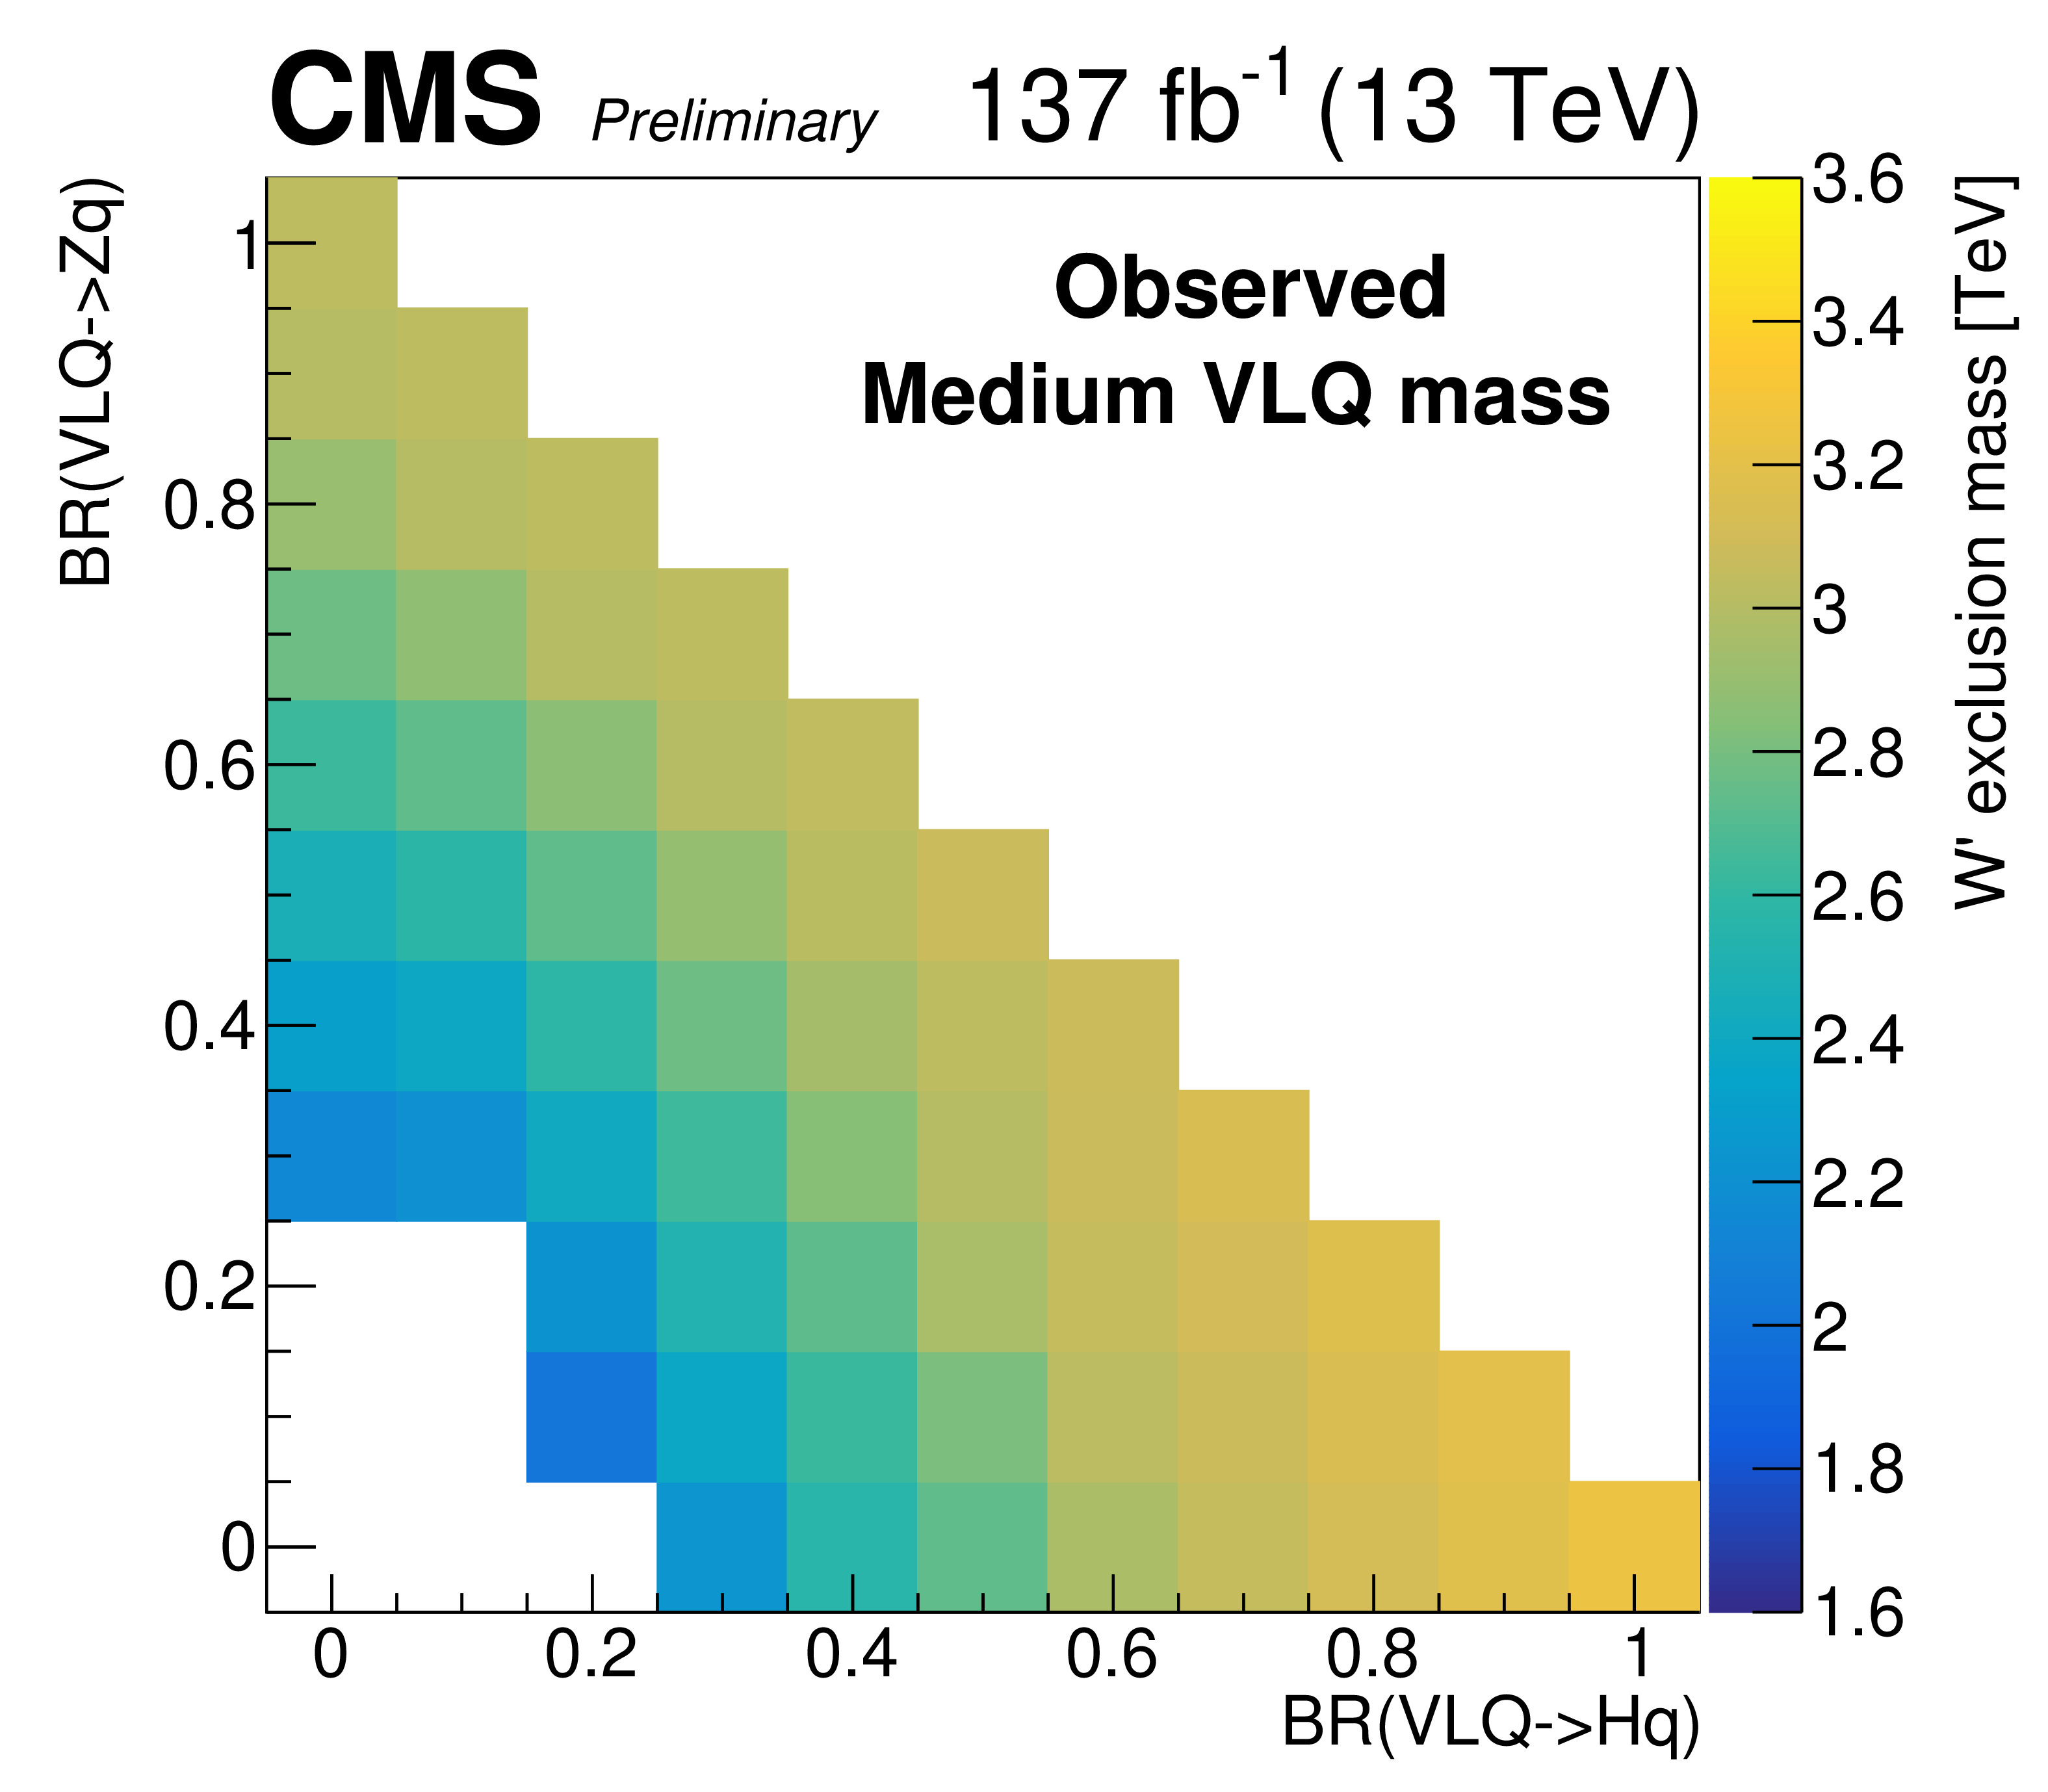
Generalized exclusion maps for hypotheses other than the benchmark model for the expected (top) and observed (bottom) limits, which assumes equal fraction of VLQ (B, T) flavor and equal VLQ branching ratio to qZ and qH. The VLQ flavor assumption (left) is generalized by varying the fraction of qB and qT from the W' decay between 0 and 1. The VLQ branching ratio (right) is generalized by varying the VLQ $\to $ qH and VLQ $\to $ qZ branching ratios. |
png pdf |
Figure 9-a:
Generalized exclusion maps for hypotheses other than the benchmark model for the expected limits, which assumes equal fraction of VLQ (B, T) flavor and equal VLQ branching ratio to qZ and qH. The VLQ flavor assumption is generalized by varying the fraction of qB and qT from the W' decay between 0 and 1. |

png pdf |
Figure 9-b:
Generalized exclusion maps for hypotheses other than the benchmark model for the expected limits, which assumes equal fraction of VLQ (B, T) flavor and equal VLQ branching ratio to qZ and qH. The VLQ branching ratio is generalized by varying the VLQ $\to $ qH and VLQ $\to $ qZ branching ratios. |

png pdf |
Figure 9-c:
Generalized exclusion maps for hypotheses other than the benchmark model for the observed limits, which assumes equal fraction of VLQ (B, T) flavor and equal VLQ branching ratio to qZ and qH. The VLQ flavor assumption is generalized by varying the fraction of qB and qT from the W' decay between 0 and 1. |
png pdf |
Figure 9-d:
Generalized exclusion maps for hypotheses other than the benchmark model for the observed limits, which assumes equal fraction of VLQ (B, T) flavor and equal VLQ branching ratio to qZ and qH. The VLQ branching ratio is generalized by varying the VLQ $\to $ qH and VLQ $\to $ qZ branching ratios. |
| Tables | |
png pdf |
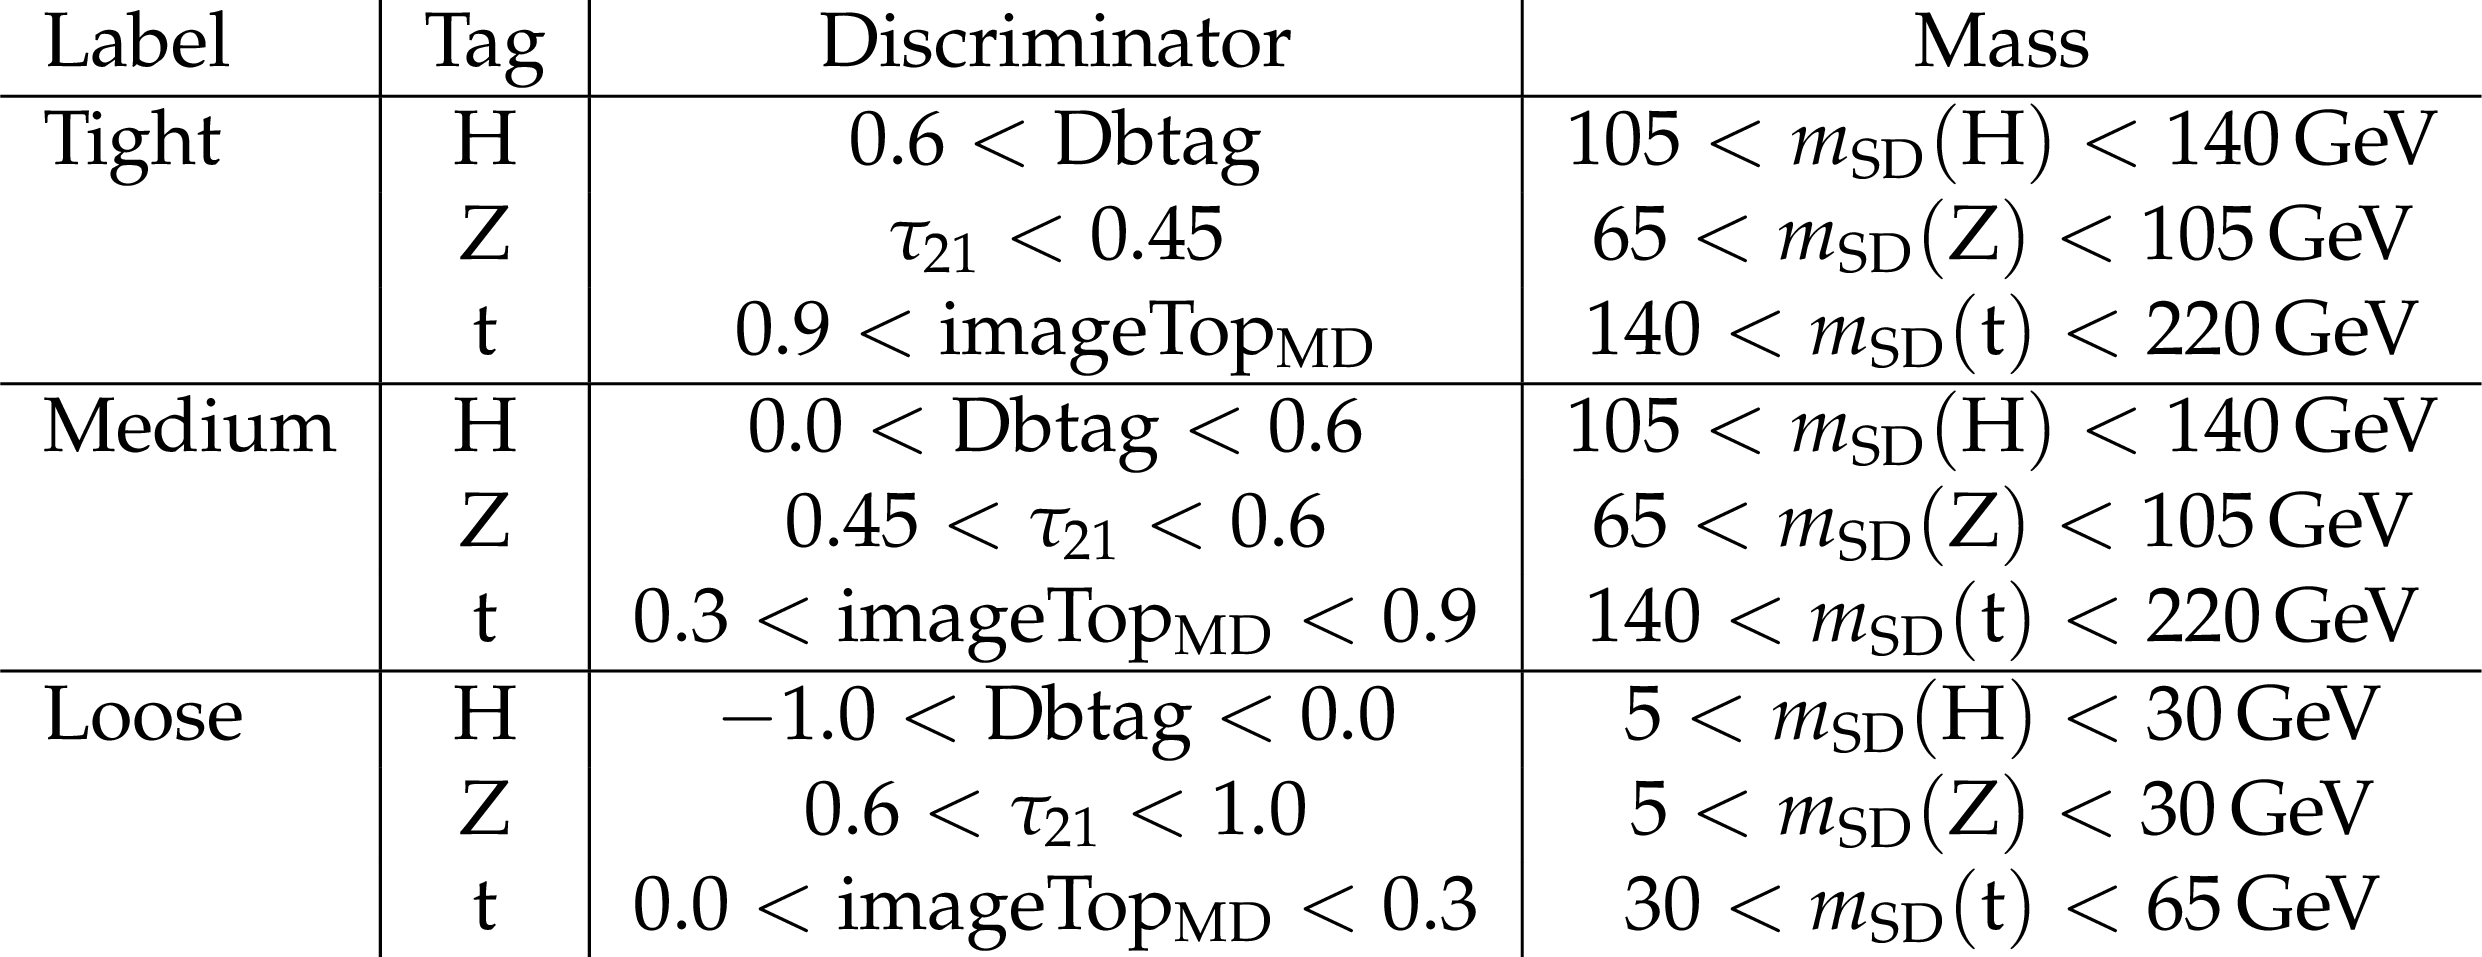
Table 1:
Selection regions used in the analysis. The AK8 jet discriminator and mass selections are explicitly defined here. |

png pdf |
Table 2:
The signal efficiency (in percent) from the three VLQ mass ranges considered in the analysis. The efficiency is given for both the tHb and tZb final states considering the corresponding selection. |
png pdf |
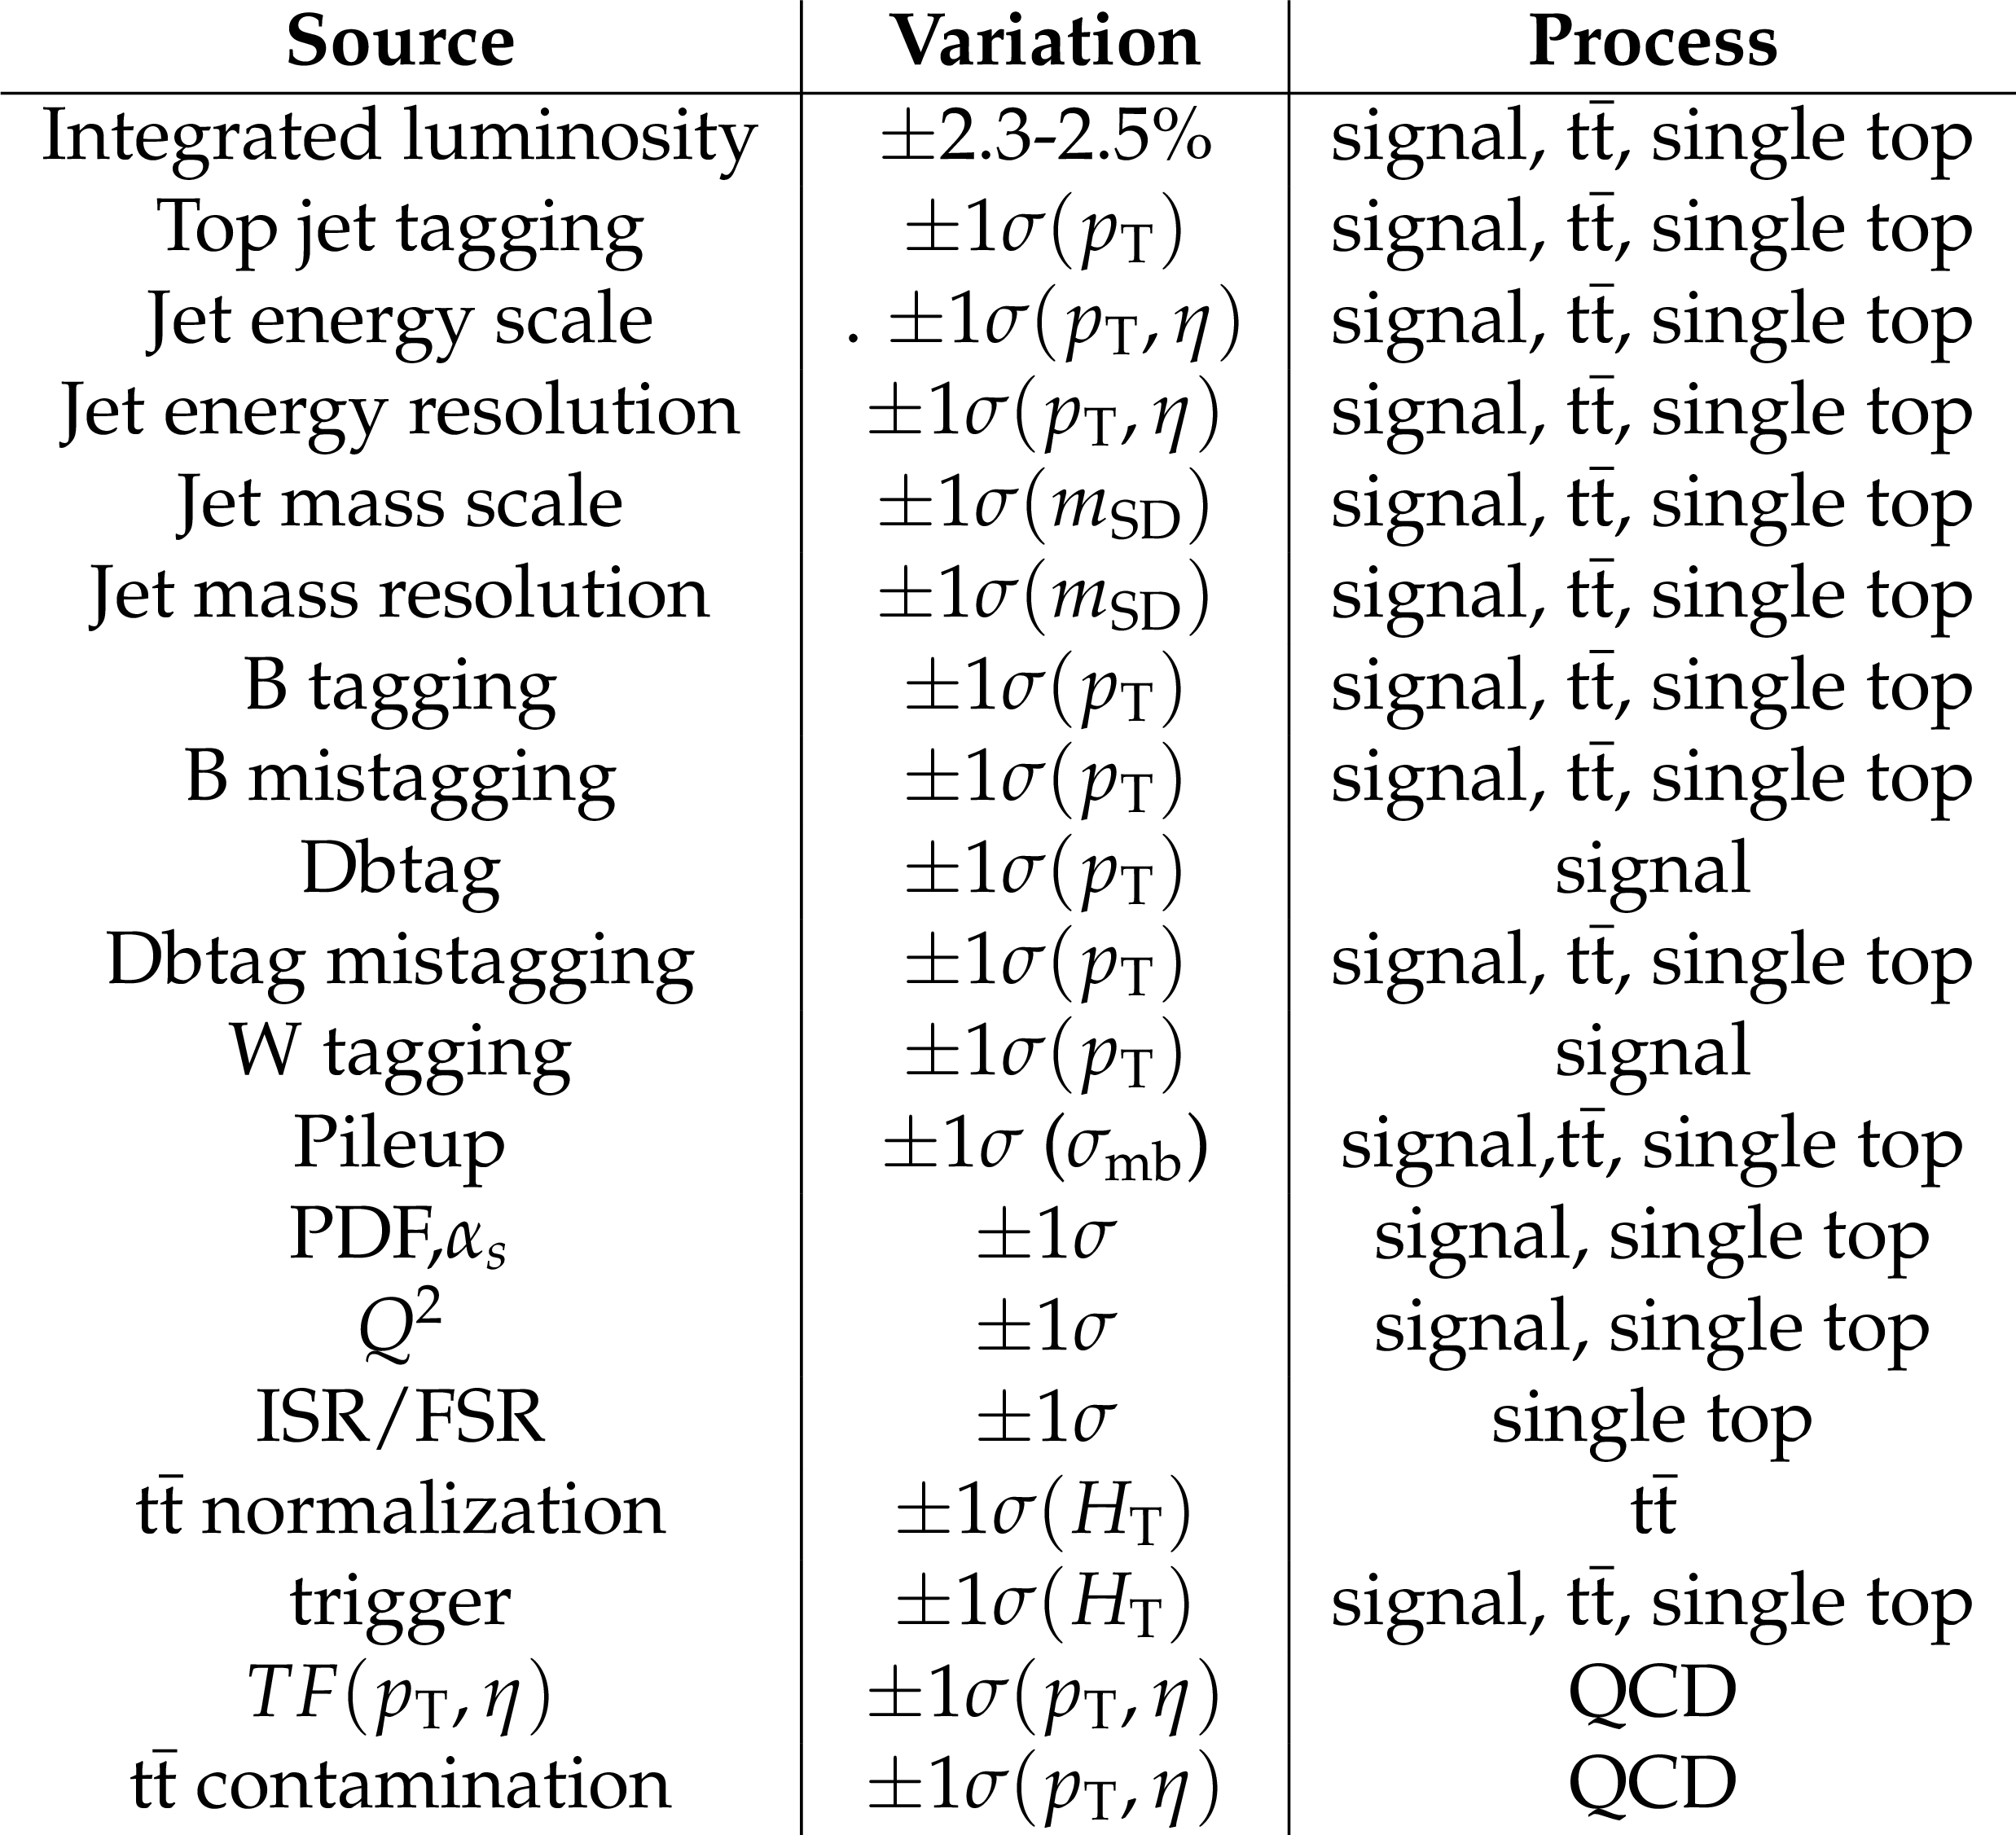
Table 3:
Sources of systematic uncertainty that affect the final distributions. Sources that list the systematic variation as $ \pm $1$ \sigma $ have a shape effect which is dependent on the variable given in the parentheses, while those that list the variation in percent are rate uncertainties with the range of values specifying the year-to-year envelope. |
| Summary |
| A search for a heavy W' boson decaying to a B or T vector-like quark and a top or b quark, respectively, has been presented. The data correspond to an integrated luminosity of 137 fb$^{-1}$ collected between 2016 and 2018 with the CMS detector at the LHC. The signature considered for both decay modes is a top quark and a Higgs or Z boson, both decaying hadronically, and a b quark jet. Boosted heavy-resonance identification techniques are used to select the event signature of three energetic jets and to suppress standard model backgrounds. No significant deviation from the standard model background prediction has been observed. Cross section upper limits on W' boson production in the top quark, Higgs or Z boson, and b quark decay mode are set as a function of the W' boson mass, for several vector-like quark mass hypotheses. A W' boson with a mass below 3.2 TeV is excluded at 95% CL given benchmark model assumptions. |
| References | ||||
| 1 | M. Schmaltz and D. Tucker-Smith | Little Higgs theories | Ann. Rev. of Nucl. and Part. Sci. 55 (2005) 229 | hep-ph/0502182 |
| 2 | T. Appelquist, H.-C. Cheng, and B. A. Dobrescu | Bounds on universal extra dimensions | PRD 64 (2001) 035002 | hep-ph/0012100 |
| 3 | R. N. Mohapatra and J. C. Pati | Left-right gauge symmetry and an 'isoconjugate' model of CP violation | PRD 11 (1975) 566 | |
| 4 | CMS Collaboration | Search for heavy gauge W' boson in events with an energetic lepton and large missing transverse momentum at $ \sqrt{s} = $ 13 TeV | PLB 770 (2017) 278 | CMS-EXO-15-006 1612.09274 |
| 5 | ATLAS Collaboration | Search for a new heavy gauge boson resonance decaying into a lepton and missing transverse momentum in 36 fb$ ^{-1} $ of $ pp $ collisions at $ \sqrt{s} = $ 13 TeV with the ATLAS experiment | EPJC 78 (2018) 401 | 1706.04786 |
| 6 | CMS Collaboration | Search for a heavy resonance decaying to a pair of vector bosons in the lepton plus merged jet final state at $ \sqrt{s}= $ 13 TeV | JHEP 05 (2018) 088 | CMS-B2G-16-029 1802.09407 |
| 7 | ATLAS Collaboration | Search for WW/WZ resonance production in $ \nu $qq final states in pp collisions at $ \sqrt{s} = $ 13 TeV with the ATLAS detector | JHEP 03 (2018) 042 | 1710.07235 |
| 8 | CMS Collaboration | Searches for $ \mathrm{W'} $ bosons decaying to a top quark and a bottom quark in proton-proton collisions at 13 TeV | JHEP 08 (2017) 029 | CMS-B2G-16-016 1706.04260 |
| 9 | ATLAS Collaboration | Search for $ W' \rightarrow tb $ decays in the hadronic final state using pp collisions at $ \sqrt{s}= $ 13 TeV with the ATLAS detector | PLB 781 (2018) 327 | 1801.07893 |
| 10 | CMS Collaboration | Search for single production of a vector-like T quark decaying to a Z boson and a top quark in proton-proton collisions at $ \sqrt{s} = $ 13 TeV | PLB 781 (2018) 574 | CMS-B2G-17-007 1708.01062 |
| 11 | CMS Collaboration | Search for single production of vector-like quarks decaying to a b quark and a Higgs boson | JHEP 06 (2018) 031 | CMS-B2G-17-009 1802.01486 |
| 12 | ATLAS Collaboration | Search for pair- and single-production of vector-like quarks in final states with at least one $ Z $ boson decaying into a pair of electrons or muons in $ pp $ collision data collected with the ATLAS detector at $ \sqrt{s} = $ 13 TeV | PRD 98 (2018), no. 11, 112010 | 1806.10555 |
| 13 | CMS Collaboration | Search for single production of vector-like quarks decaying into a b quark and a W boson in proton-proton collisions at $ \sqrt s = $ 13 TeV | PLB 772 (2017) 634 | CMS-B2G-16-006 1701.08328 |
| 14 | CMS Collaboration | Search for pair production of vector-like quarks in the bWbW channel from proton-proton collisions at $ \sqrt{s} = $ 13 TeV | PLB 779 (2018) 82 | CMS-B2G-17-003 1710.01539 |
| 15 | CMS Collaboration | Search for vector-like T and B quark pairs in final states with leptons at $ \sqrt{s} = $ 13 TeV | JHEP 08 (2018) 177 | CMS-B2G-17-011 1805.04758 |
| 16 | CMS Collaboration | A search for bottom-type, vector-like quark pair production in a fully hadronic final state in proton-proton collisions at $ \sqrt{s} = $ 13 TeV | PRD 102 (2020) 112004 | CMS-B2G-19-005 2008.09835 |
| 17 | ATLAS Collaboration | Combination of the searches for pair-produced vector-like partners of the third-generation quarks at $ \sqrt{s} = $ 13 TeV with the ATLAS detector | PRL 121 (2018), no. 21, 211801 | 1808.02343 |
| 18 | K. Agashe, R. Contino, and A. Pomarol | The minimal composite Higgs model | NPB 719 (2005) 165 | hep-ph/0412089 |
| 19 | D. Barducci et al. | Exploring drell-yan signals from the 4d composite higgs model at the lhc | JHEP 04 (2013) 152 | 1210.2927 |
| 20 | D. Barducci and C. Delaunay | Bounding wide composite vector resonances at the lhc | JHEP 02 (2016) 55 | 1511.01101 |
| 21 | N. Vignaroli | New W$ ' $ signals at the LHC | PRD 89 (2014) 095027 | 1404.5558 |
| 22 | CMS Collaboration | CMS luminosity measurements for the 2016 data taking period | CMS-PAS-LUM-17-001 | CMS-PAS-LUM-17-001 |
| 23 | CMS Collaboration | CMS luminosity measurement for the 2017 data-taking period at $ \sqrt{s} = $ 13 TeV | CMS-PAS-LUM-17-004 | CMS-PAS-LUM-17-004 |
| 24 | CMS Collaboration | CMS luminosity measurement for the 2018 data-taking period at $ \sqrt{s} = $ 13 TeV | CMS-PAS-LUM-18-002 | CMS-PAS-LUM-18-002 |
| 25 | CMS Collaboration | The CMS experiment at the CERN LHC | JINST 3 (2008) S08004 | CMS-00-001 |
| 26 | CMS Collaboration | Particle-flow reconstruction and global event description with the CMS detector | JINST 12 (2017) P10003 | CMS-PRF-14-001 1706.04965 |
| 27 | M. Cacciari, G. P. Salam, and G. Soyez | The anti-$ {k_{\mathrm{T}}} $ jet clustering algorithm | JHEP 04 (2008) 063 | 0802.1189 |
| 28 | M. Cacciari, G. P. Salam, and G. Soyez | Fastjet user manual | EPJC 72 (2012) 1896 | 1111.6097 |
| 29 | D. Bertolini, P. Harris, M. Low, and N. Tran | Pileup per particle identification | JHEP 10 (2014) 059 | 1407.6013 |
| 30 | CMS Collaboration | Jet energy scale and resolution in the CMS experiment in pp collisions at 8 TeV | JINST 12 (2017) P02014 | CMS-JME-13-004 1607.03663 |
| 31 | CMS Collaboration | The CMS trigger system | JINST 12 (2017) P01020 | CMS-TRG-12-001 1609.02366 |
| 32 | S. Frixione, P. Nason, and C. Oleari | Matching NLO QCD computations with parton shower simulations: the POWHEG method | JHEP 11 (2007) 070 | 0709.2092 |
| 33 | S. Alioli, P. Nason, C. Oleari, and E. Re | A general framework for implementing NLO calculations in shower Monte Carlo programs: the POWHEG BOX | JHEP 06 (2010) 043 | 1002.2581 |
| 34 | P. Nason | A new method for combining NLO QCD with shower Monte Carlo algorithms | JHEP 11 (2004) 040 | hep-ph/0409146 |
| 35 | S. Frixione, P. Nason, and G. Ridolfi | A positive-weight next-to-leading-order Monte Carlo for heavy flavour hadroproduction | JHEP 09 (2007) 126 | 0707.3088 |
| 36 | J. Alwall et al. | The automated computation of tree-level and next-to-leading order differential cross sections, and their matching to parton shower simulations | JHEP 07 (2014) 079 | 1405.0301 |
| 37 | J. Alwall et al. | Comparative study of various algorithms for the merging of parton showers and matrix elements in hadronic collisions | EPJC 53 (2008) 473 | 0706.2569 |
| 38 | NNPDF Collaboration | Parton distributions for the LHC Run II | JHEP 04 (2015) 040 | 1410.8849 |
| 39 | NNPDF Collaboration | Parton distributions from high-precision collider data | EPJC 77 (2017) 663 | 1706.00428 |
| 40 | T. Sjostrand et al. | An introduction to PYTHIA 8.2 | CPC 191 (2015) 159 | 1410.3012 |
| 41 | CMS Collaboration | Investigations of the impact of the parton shower tuning in Pythia 8 in the modelling of $ \mathrm{t\overline{t}} $ at $ \sqrt{s}= $ 8 and 13 TeV | CMS-PAS-TOP-16-021 | CMS-PAS-TOP-16-021 |
| 42 | CMS Collaboration | Event generator tunes obtained from underlying event and multiparton scattering measurements | EPJC 76 (2016) 155 | CMS-GEN-14-001 1512.00815 |
| 43 | GEANT4 Collaboration | GEANT4--a a simulation toolkit | NIM506 (2003) 250 | |
| 44 | CMS Collaboration | Jet algorithms performance in 13 TeV data | CMS-PAS-JME-16-003 | CMS-PAS-JME-16-003 |
| 45 | CMS Collaboration | Identification of heavy, energetic, hadronically decaying particles using machine-learning techniques | JINST 15 (2020) P06005 | CMS-JME-18-002 2004.08262 |
| 46 | M. Dasgupta, A. Fregoso, S. Marzani, and G. P. Salam | Towards an understanding of jet substructure | JHEP 09 (2013) 029 | 1307.0007 |
| 47 | A. J. Larkoski, S. Marzani, G. Soyez, and J. Thaler | Soft Drop | JHEP 05 (2014) 146 | 1402.2657 |
| 48 | CMS Collaboration | A Cambridge-Aachen (C-A) based jet algorithm for boosted top-jet tagging | CDS | |
| 49 | CMS Collaboration | Search for massive resonances decaying into $ WW $, $ WZ $, $ ZZ $, $ qW $, and $ qZ $ with dijet final states at $ \sqrt{s}= $ 13 TeV | PRD 97 (2018) 072006 | CMS-B2G-17-001 1708.05379 |
| 50 | CMS Collaboration | Identification of heavy-flavour jets with the CMS detector in pp collisions at 13 TeV | JINST 13 (2018) P05011 | CMS-BTV-16-002 1712.07158 |
| 51 | J. Thaler and K. Van Tilburg | Maximizing boosted top identification by minimizing N-subjettiness | JHEP 02 (2012) 093 | 1108.2701 |
| 52 | CMS Collaboration | Measurement of differential cross sections for top quark pair production using the lepton+jets final state in proton-proton collisions at 13 TeV | PRD 95 (2017) 092001 | CMS-TOP-16-008 1610.04191 |
| 53 | J. S. Conway | Incorporating nuisance parameters in likelihoods for multisource spectra | in Proceedings, PHYSTAT 2011 workshop on statistical issues related to discovery claims in search experiments and unfolding, CERN, January 2011 | 1103.0354 |
| 54 | CMS Collaboration | Measurement of the inelastic proton-proton cross section at $ \sqrt{s}= $ 13 TeV | JHEP 07 (2018) 161 | CMS-FSQ-15-005 1802.02613 |
| 55 | R. J. Barlow and C. Beeston | Fitting using finite Monte Carlo samples | CPC 77 (1993) 219 | |
|
|
Compact Muon Solenoid LHC, CERN |
|

|

|

|

|

|