

Compact Muon Solenoid
LHC, CERN
| CMS-TOP-21-007 ; CERN-EP-2023-113 | ||
| Search for central exclusive production of top quark pairs in proton-proton collisions at $ \sqrt{s} = $ 13 TeV with tagged protons | ||
| CMS and TOTEM Collaborations | ||
| 11 October 2023 | ||
| JHEP 06 (2024) 187 | ||
| Abstract: A search for the central exclusive production of top quark-antiquark pairs ($ \mathrm{t} \bar{\mathrm{t}} $) is performed for the first time using proton-tagged events in proton-proton collisions at the LHC at a centre-of-mass energy of 13 TeV. The data correspond to an integrated luminosity of 29.4 fb$ ^{-1} $. The $ \mathrm{t} \bar{\mathrm{t}} $ decay products are reconstructed using the central CMS detector, while forward protons are measured in the CMS-TOTEM precision proton spectrometer. An observed (expected) upper bound on the production cross section of 0.59 (1.14) pb is set at 95% confidence level, for collisions of protons with fractional momentum losses between 2 and 20%. | ||
| Links: e-print arXiv:2310.11231 [hep-ex] (PDF) ; CDS record ; inSPIRE record ; HepData record ; Physics Briefing ; CADI line (restricted) ; | ||
| Figures | |
png pdf |
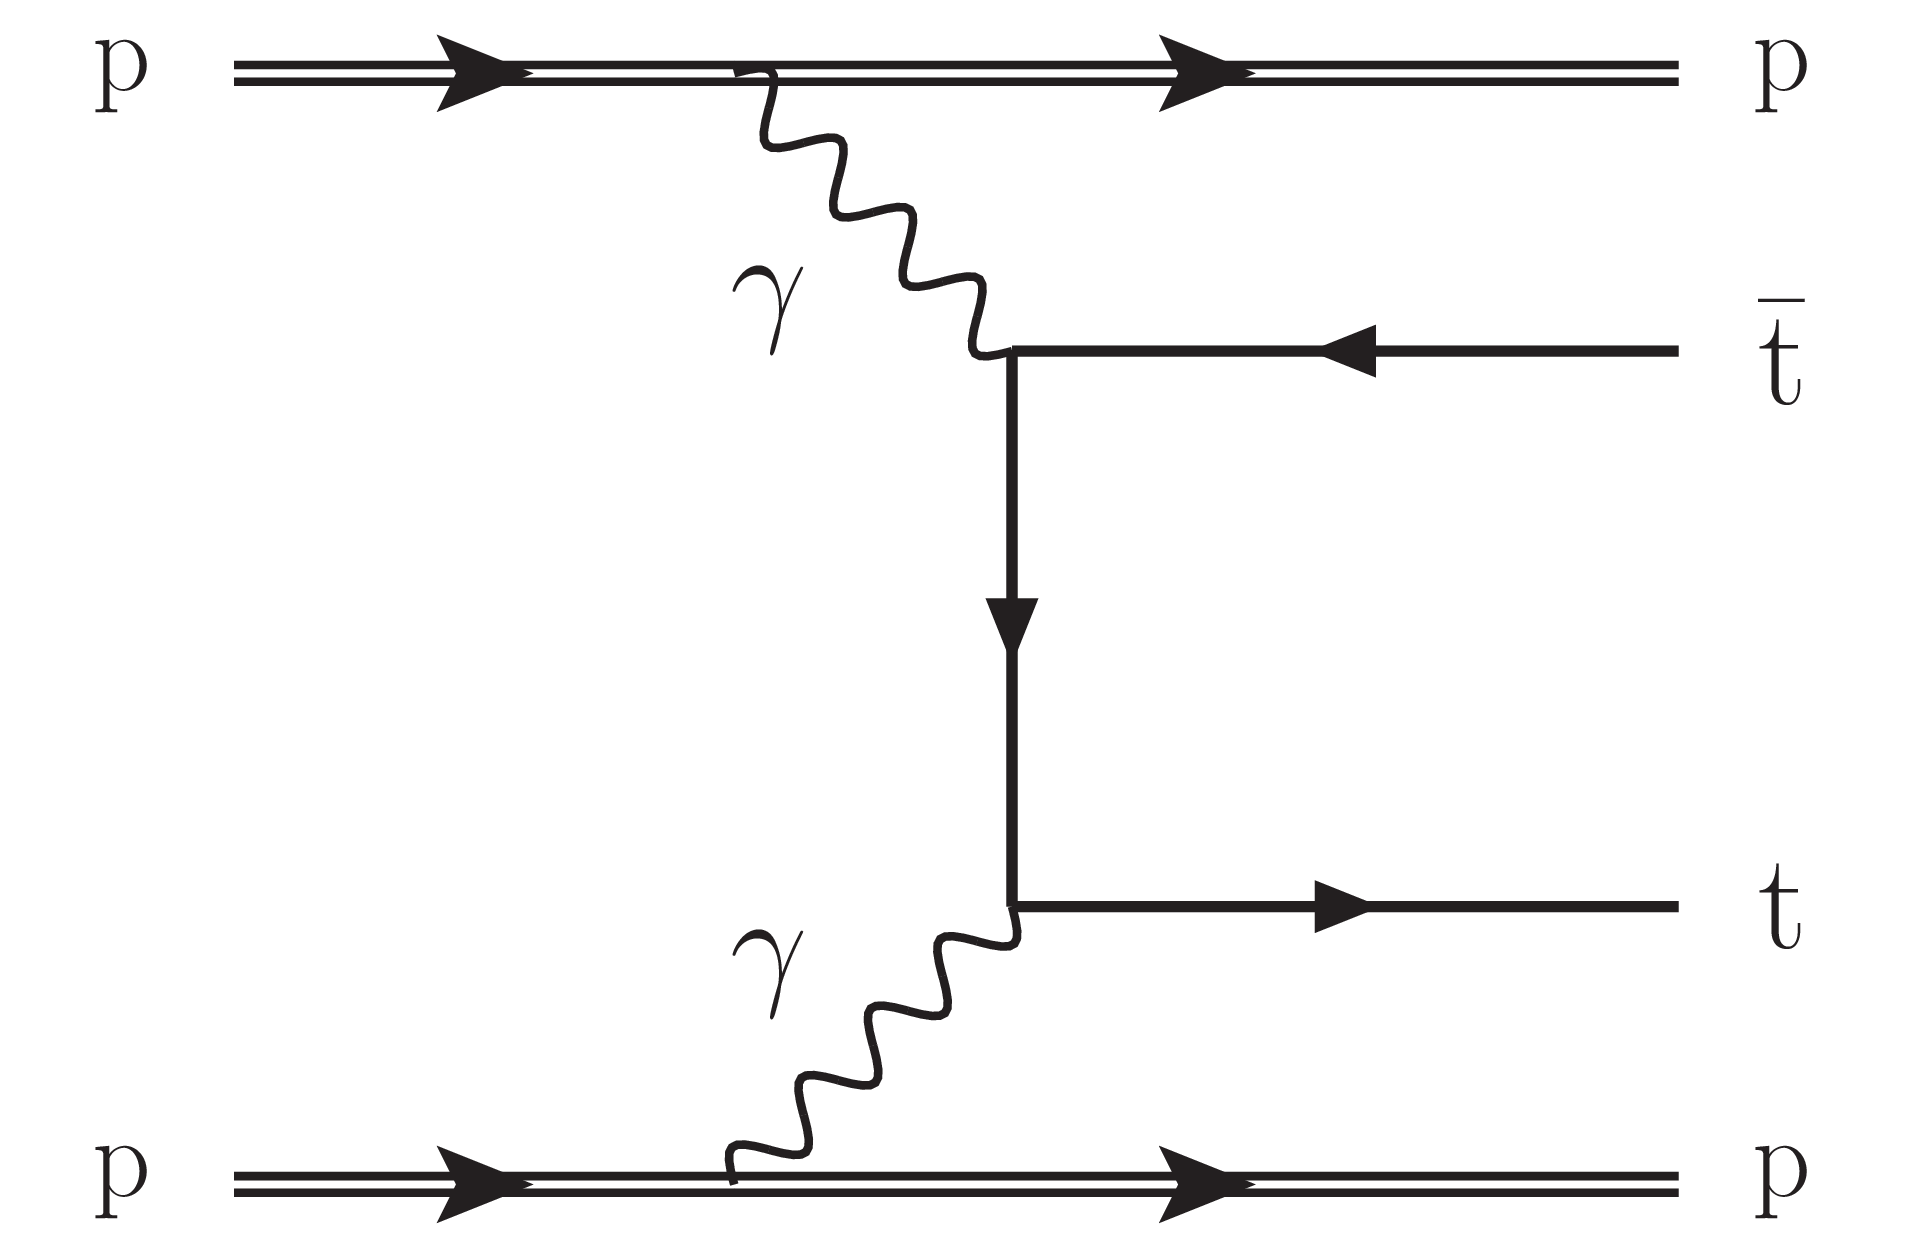
Figure 1:
Leading Feynman diagram for $ \mathrm{t} \bar{\mathrm{t}} $ central exclusive production via $ \gamma\gamma $ fusion. |

png pdf |
Figure 2:
A schematic layout of one arm of CT-PPS along the LHC beam line. The RPs shown in red are those used by CT-PPS. |
png pdf |
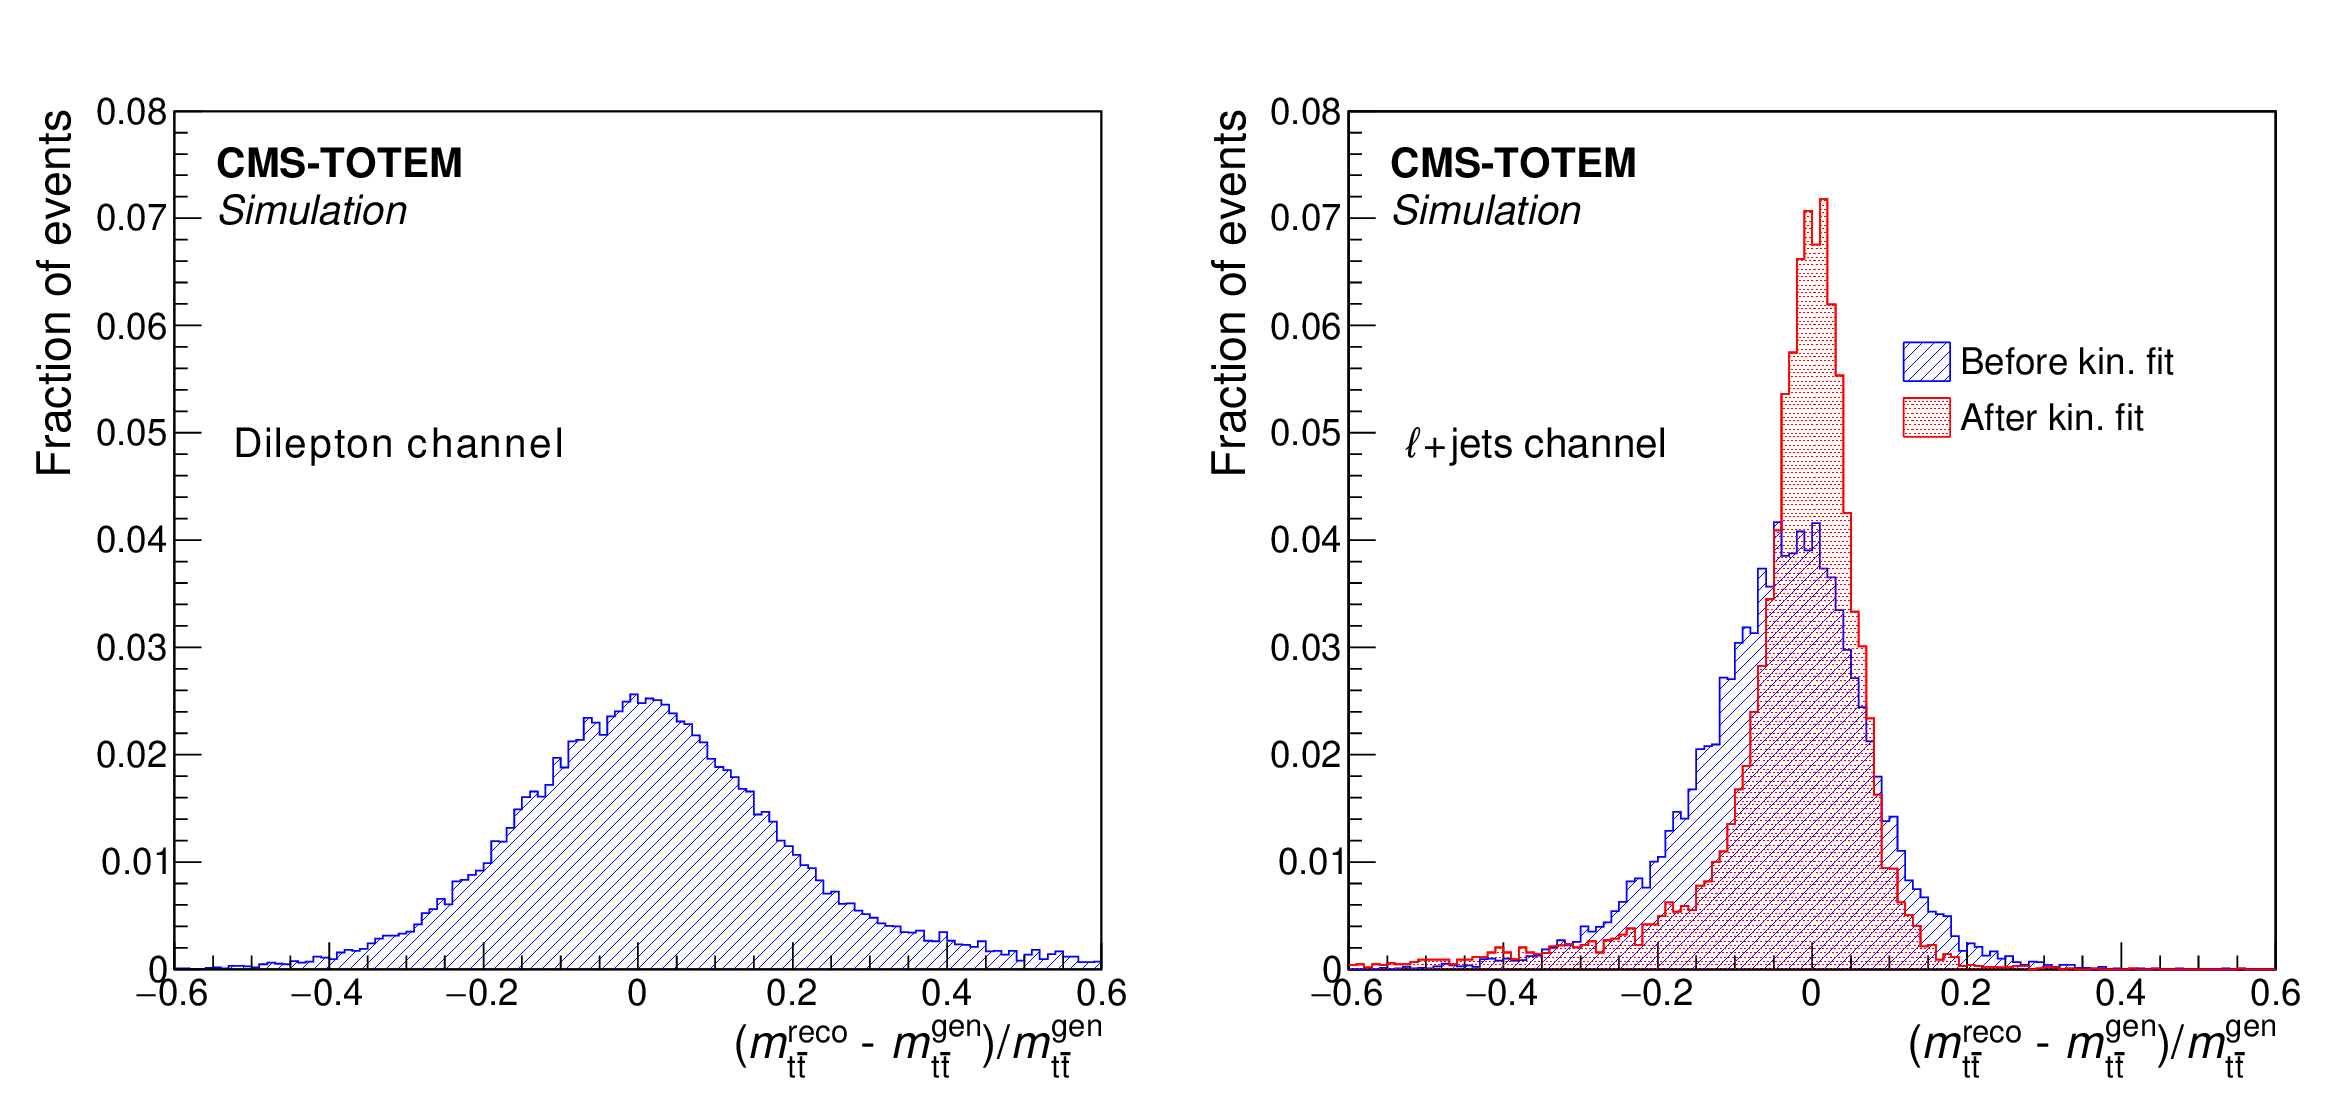
Figure 3:
Normalised distribution of the relative resolution of the reconstructed $ m_{{\mathrm{t}\bar{\mathrm{t}}} } $ in simulated signal events, for the dilepton (left) and $ \ell+$jets (right) analyses. The resolution is shown only for events where the reconstruction is successful. For the $ \ell+$jets decay mode, the hatched blue and the dotted red histograms represent the distribution before and after applying the kinematic fit, respectively. |
png pdf |
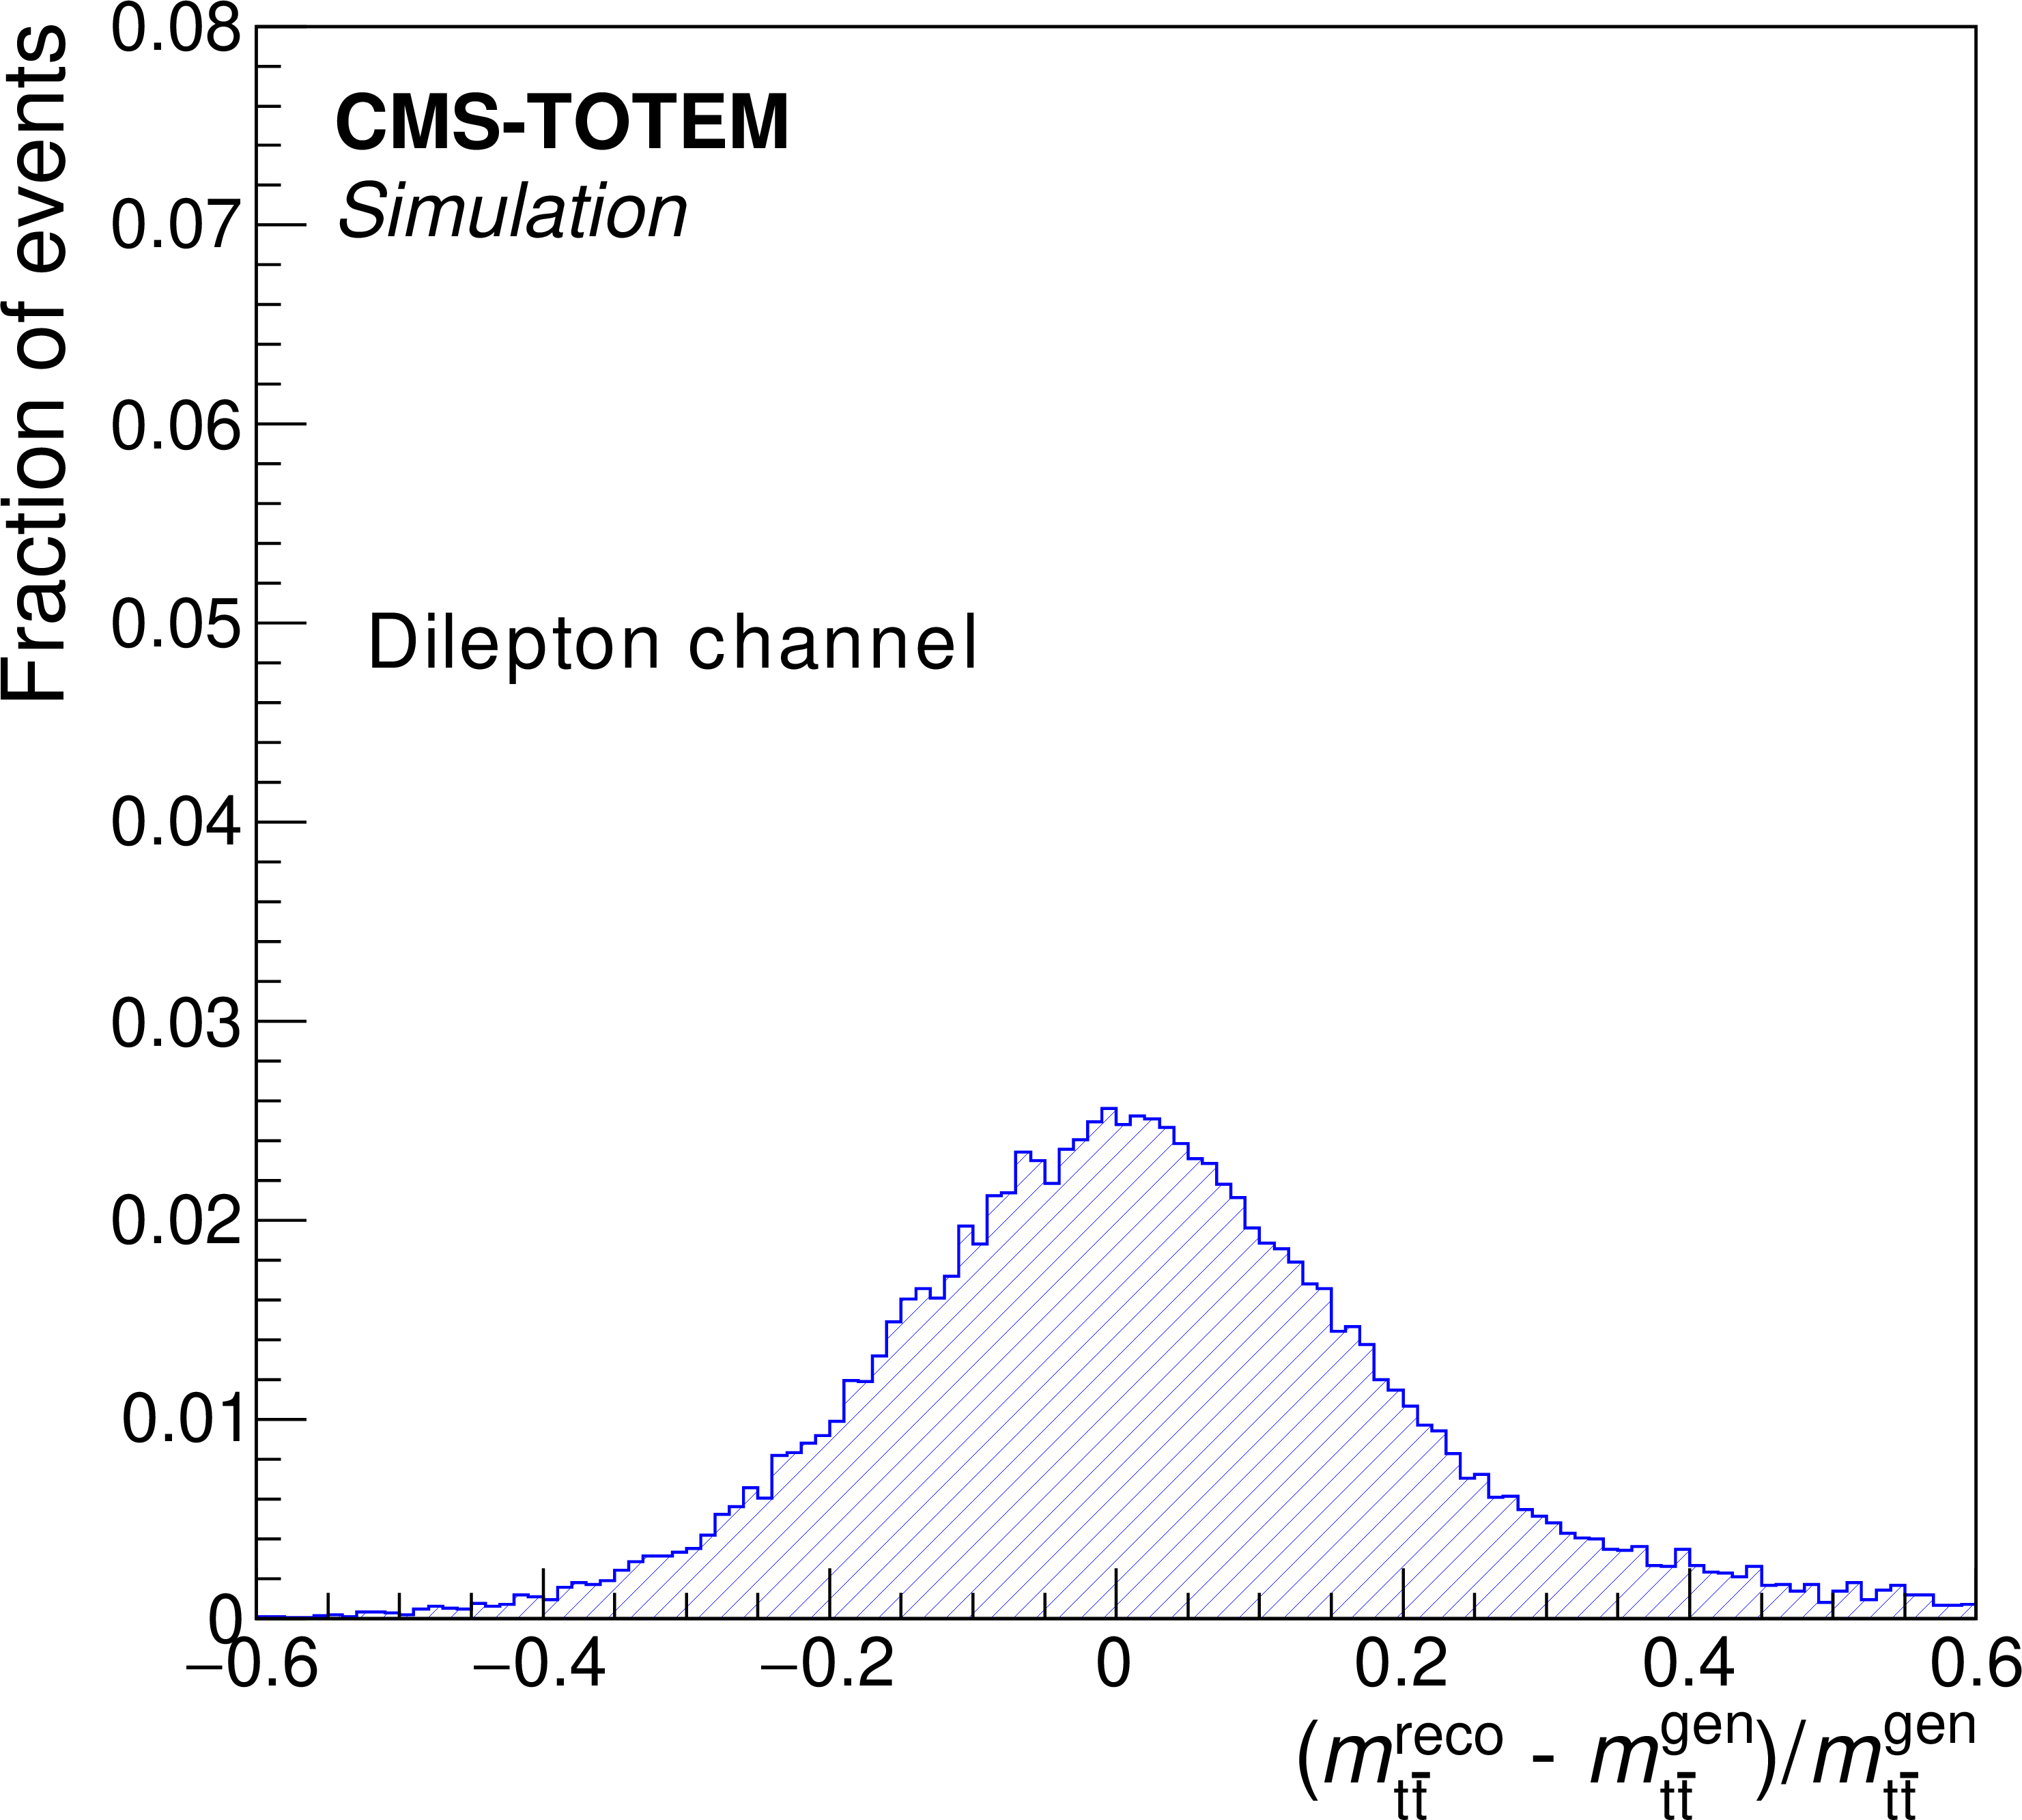
Figure 3-a:
Normalised distribution of the relative resolution of the reconstructed $ m_{{\mathrm{t}\bar{\mathrm{t}}} } $ in simulated signal events, for the dilepton $ \ell+$jets analysis. The resolution is shown only for events where the reconstruction is successful. For the $ \ell+$jets decay mode, the hatched blue and the dotted red histograms represent the distribution before and after applying the kinematic fit, respectively. |
png pdf |
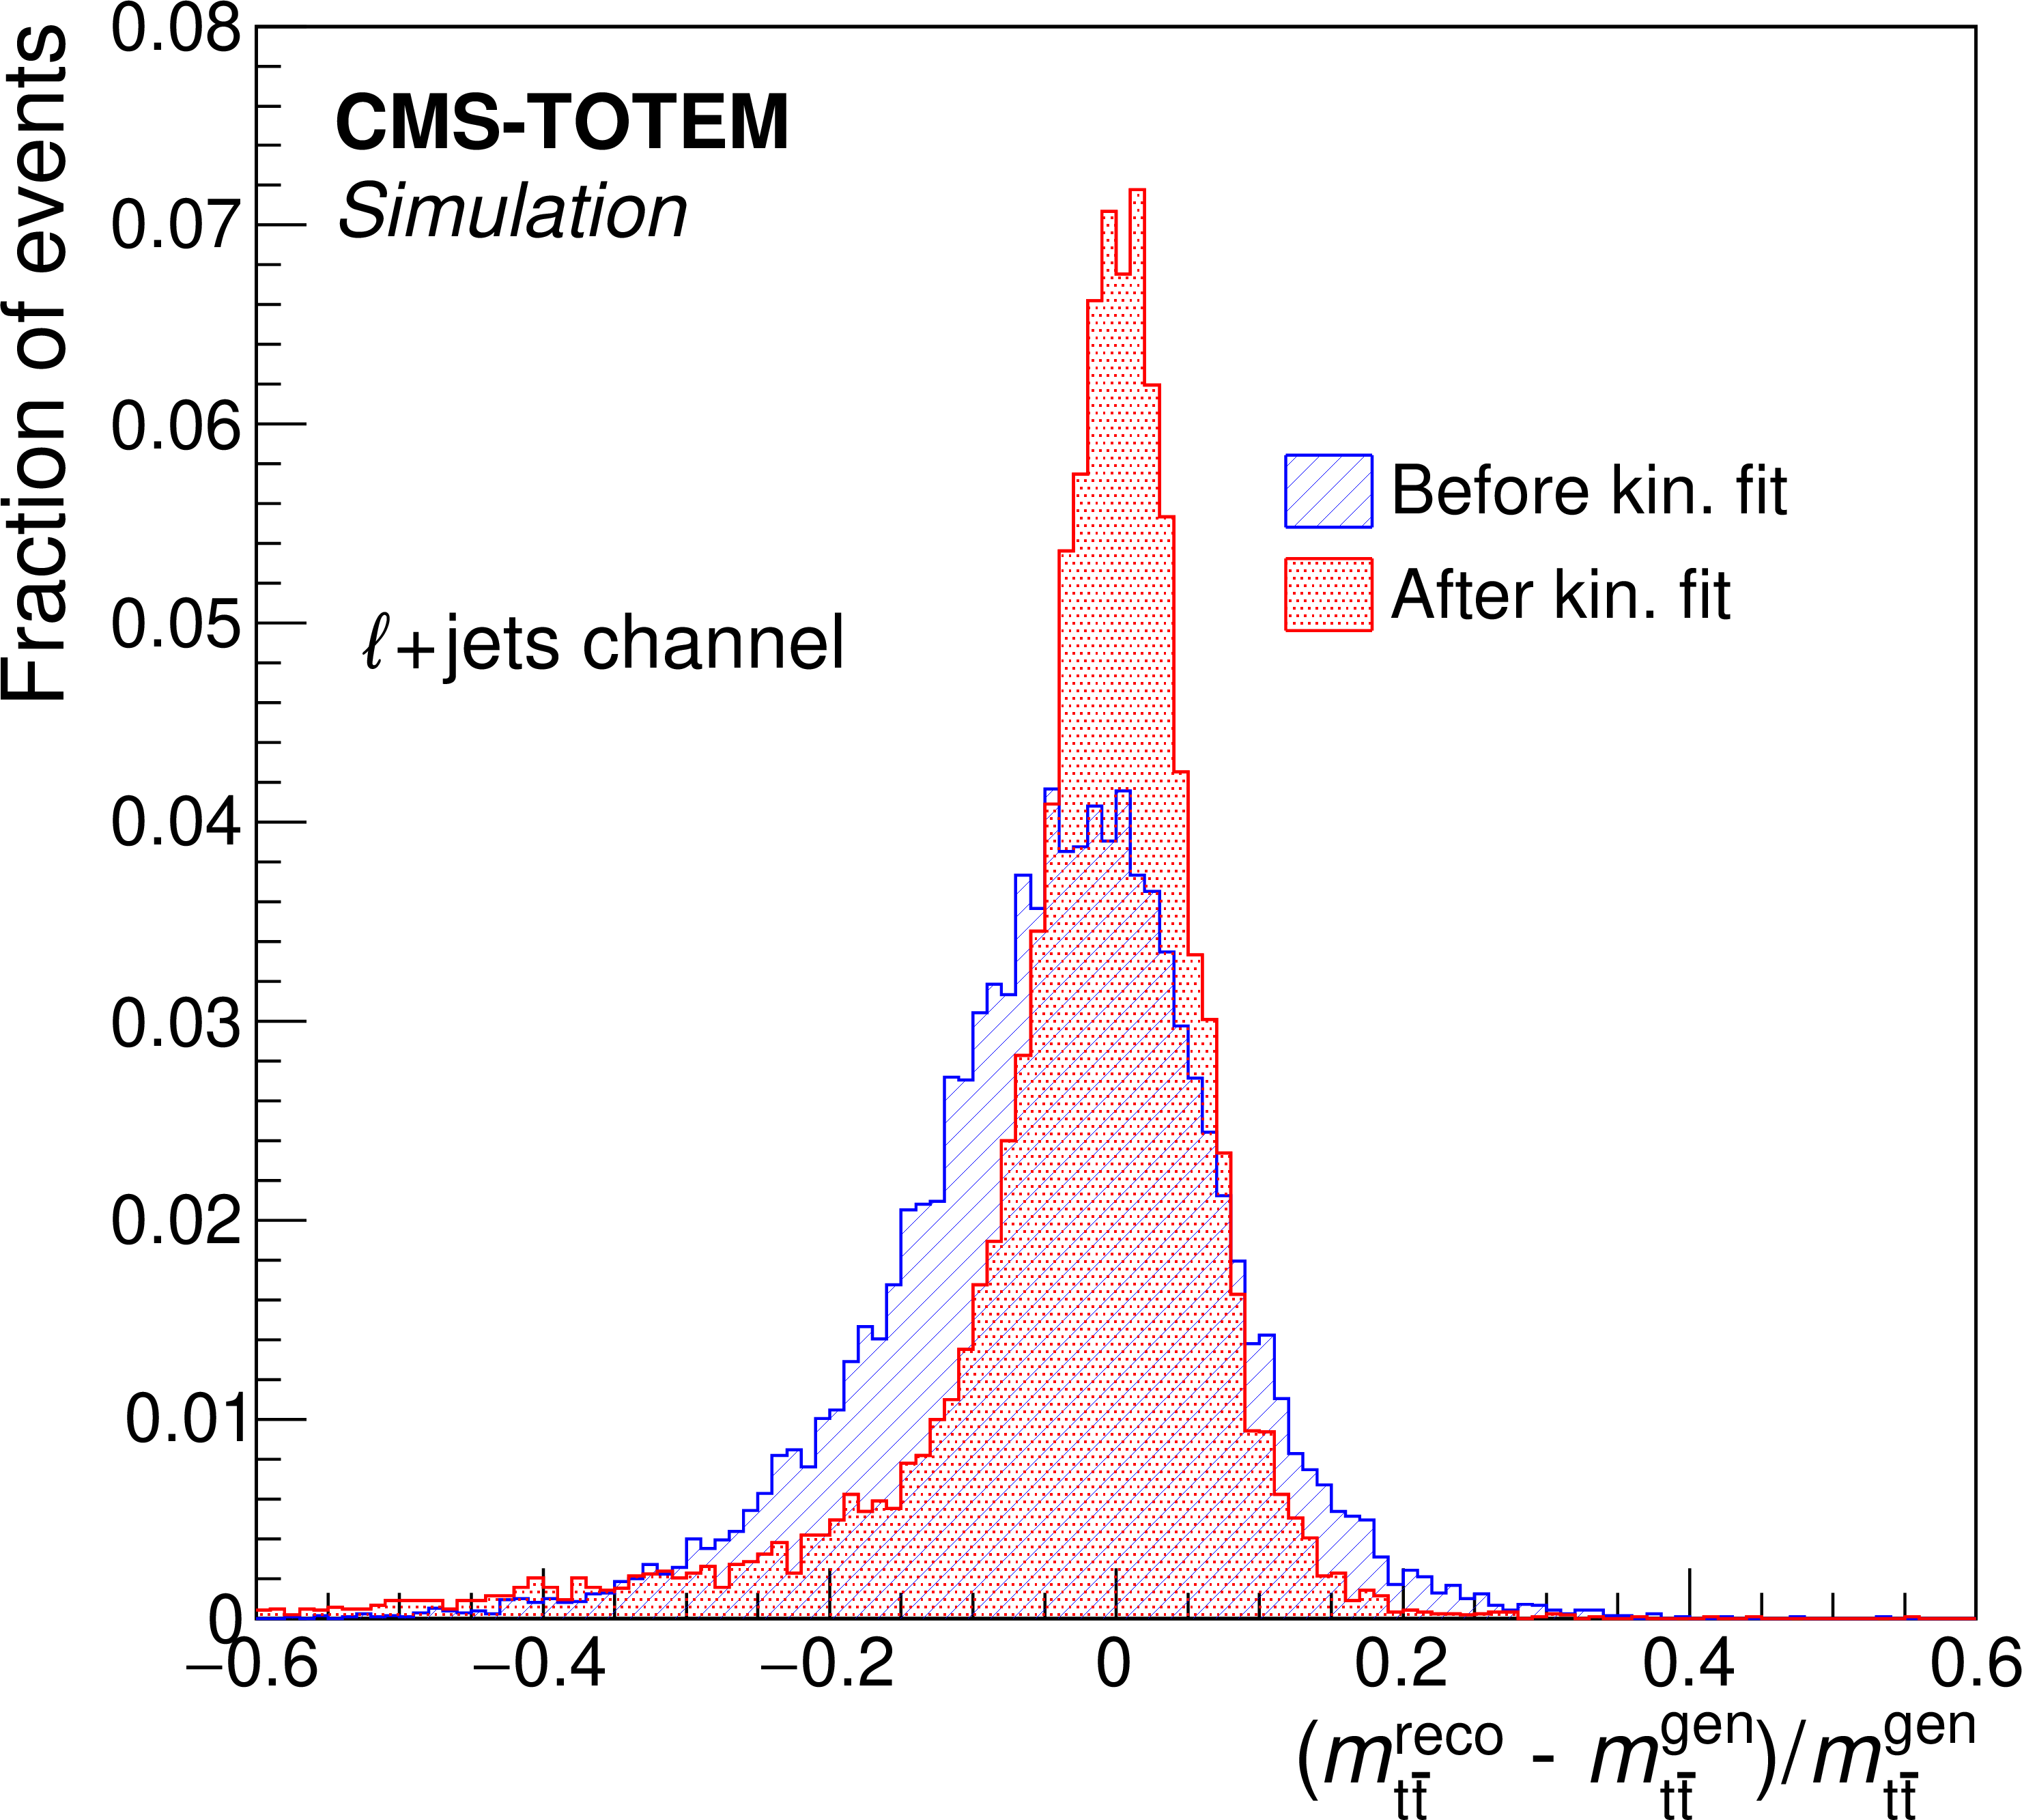
Figure 3-b:
Normalised distribution of the relative resolution of the reconstructed $ m_{{\mathrm{t}\bar{\mathrm{t}}} } $ in simulated signal events, for the dilepton $ \ell+$jets analysis. The resolution is shown only for events where the reconstruction is successful. For the $ \ell+$jets decay mode, the hatched blue and the dotted red histograms represent the distribution before and after applying the kinematic fit, respectively. |

png pdf |
Figure 4:
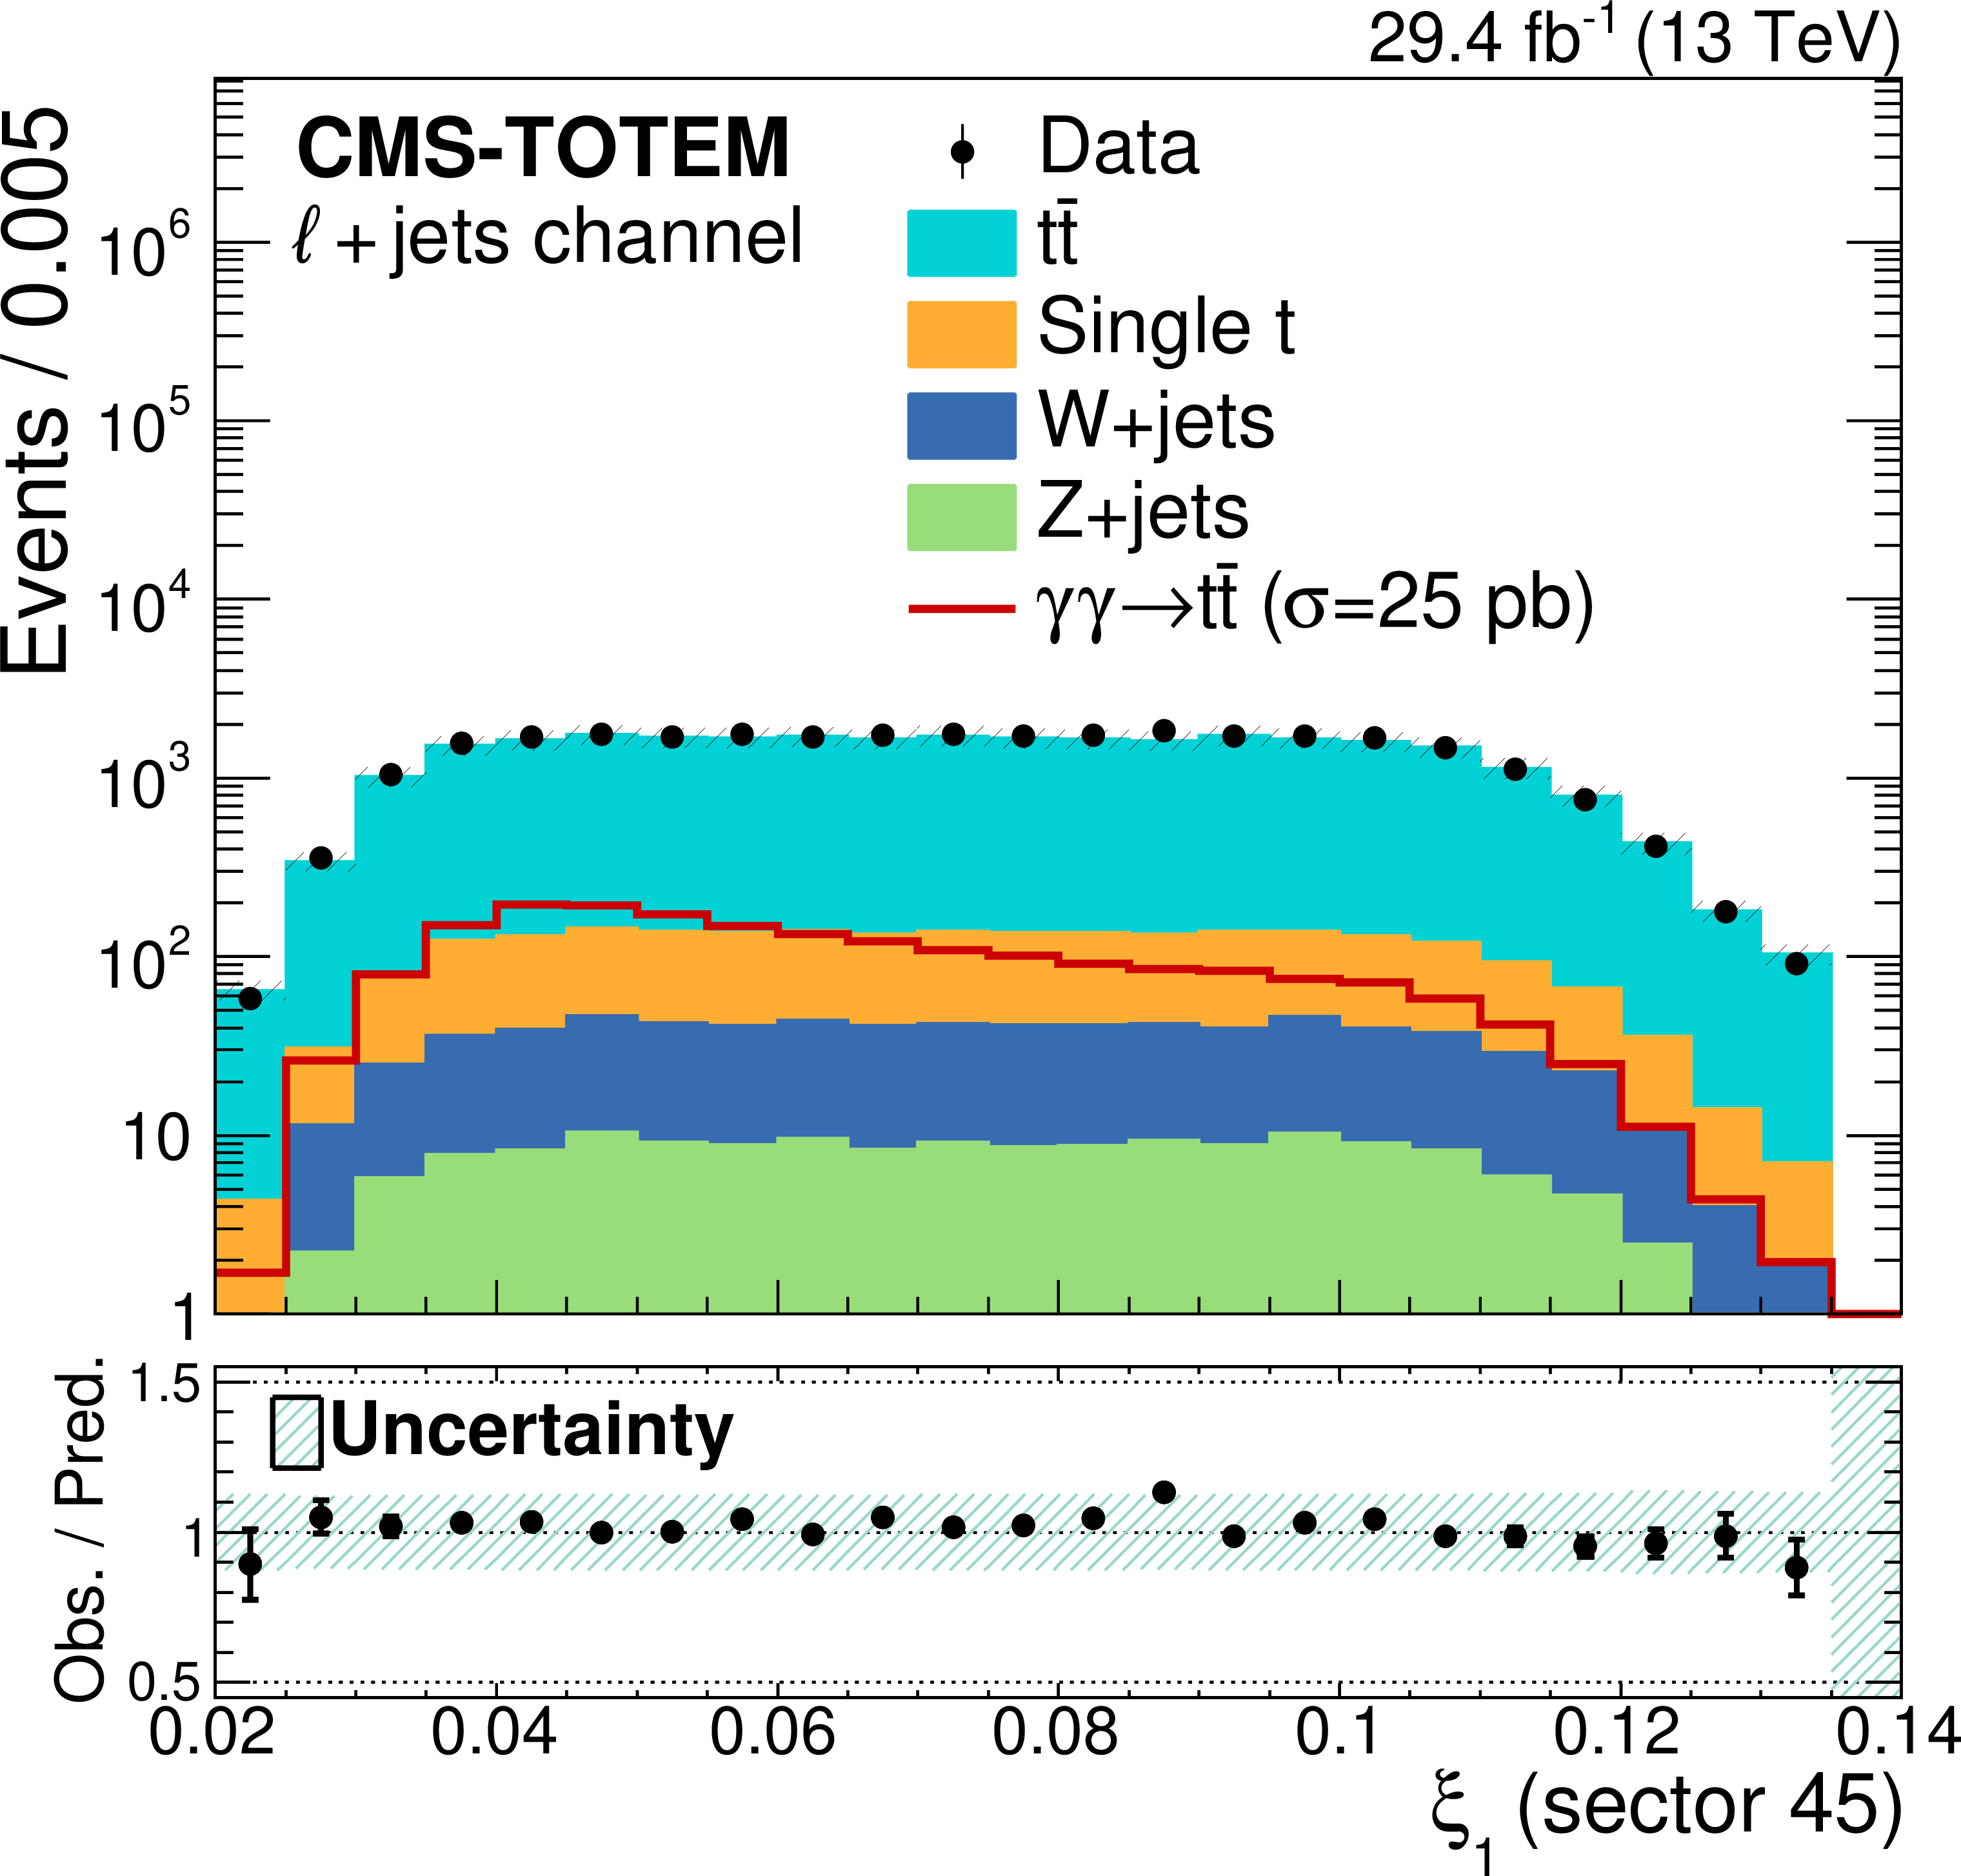
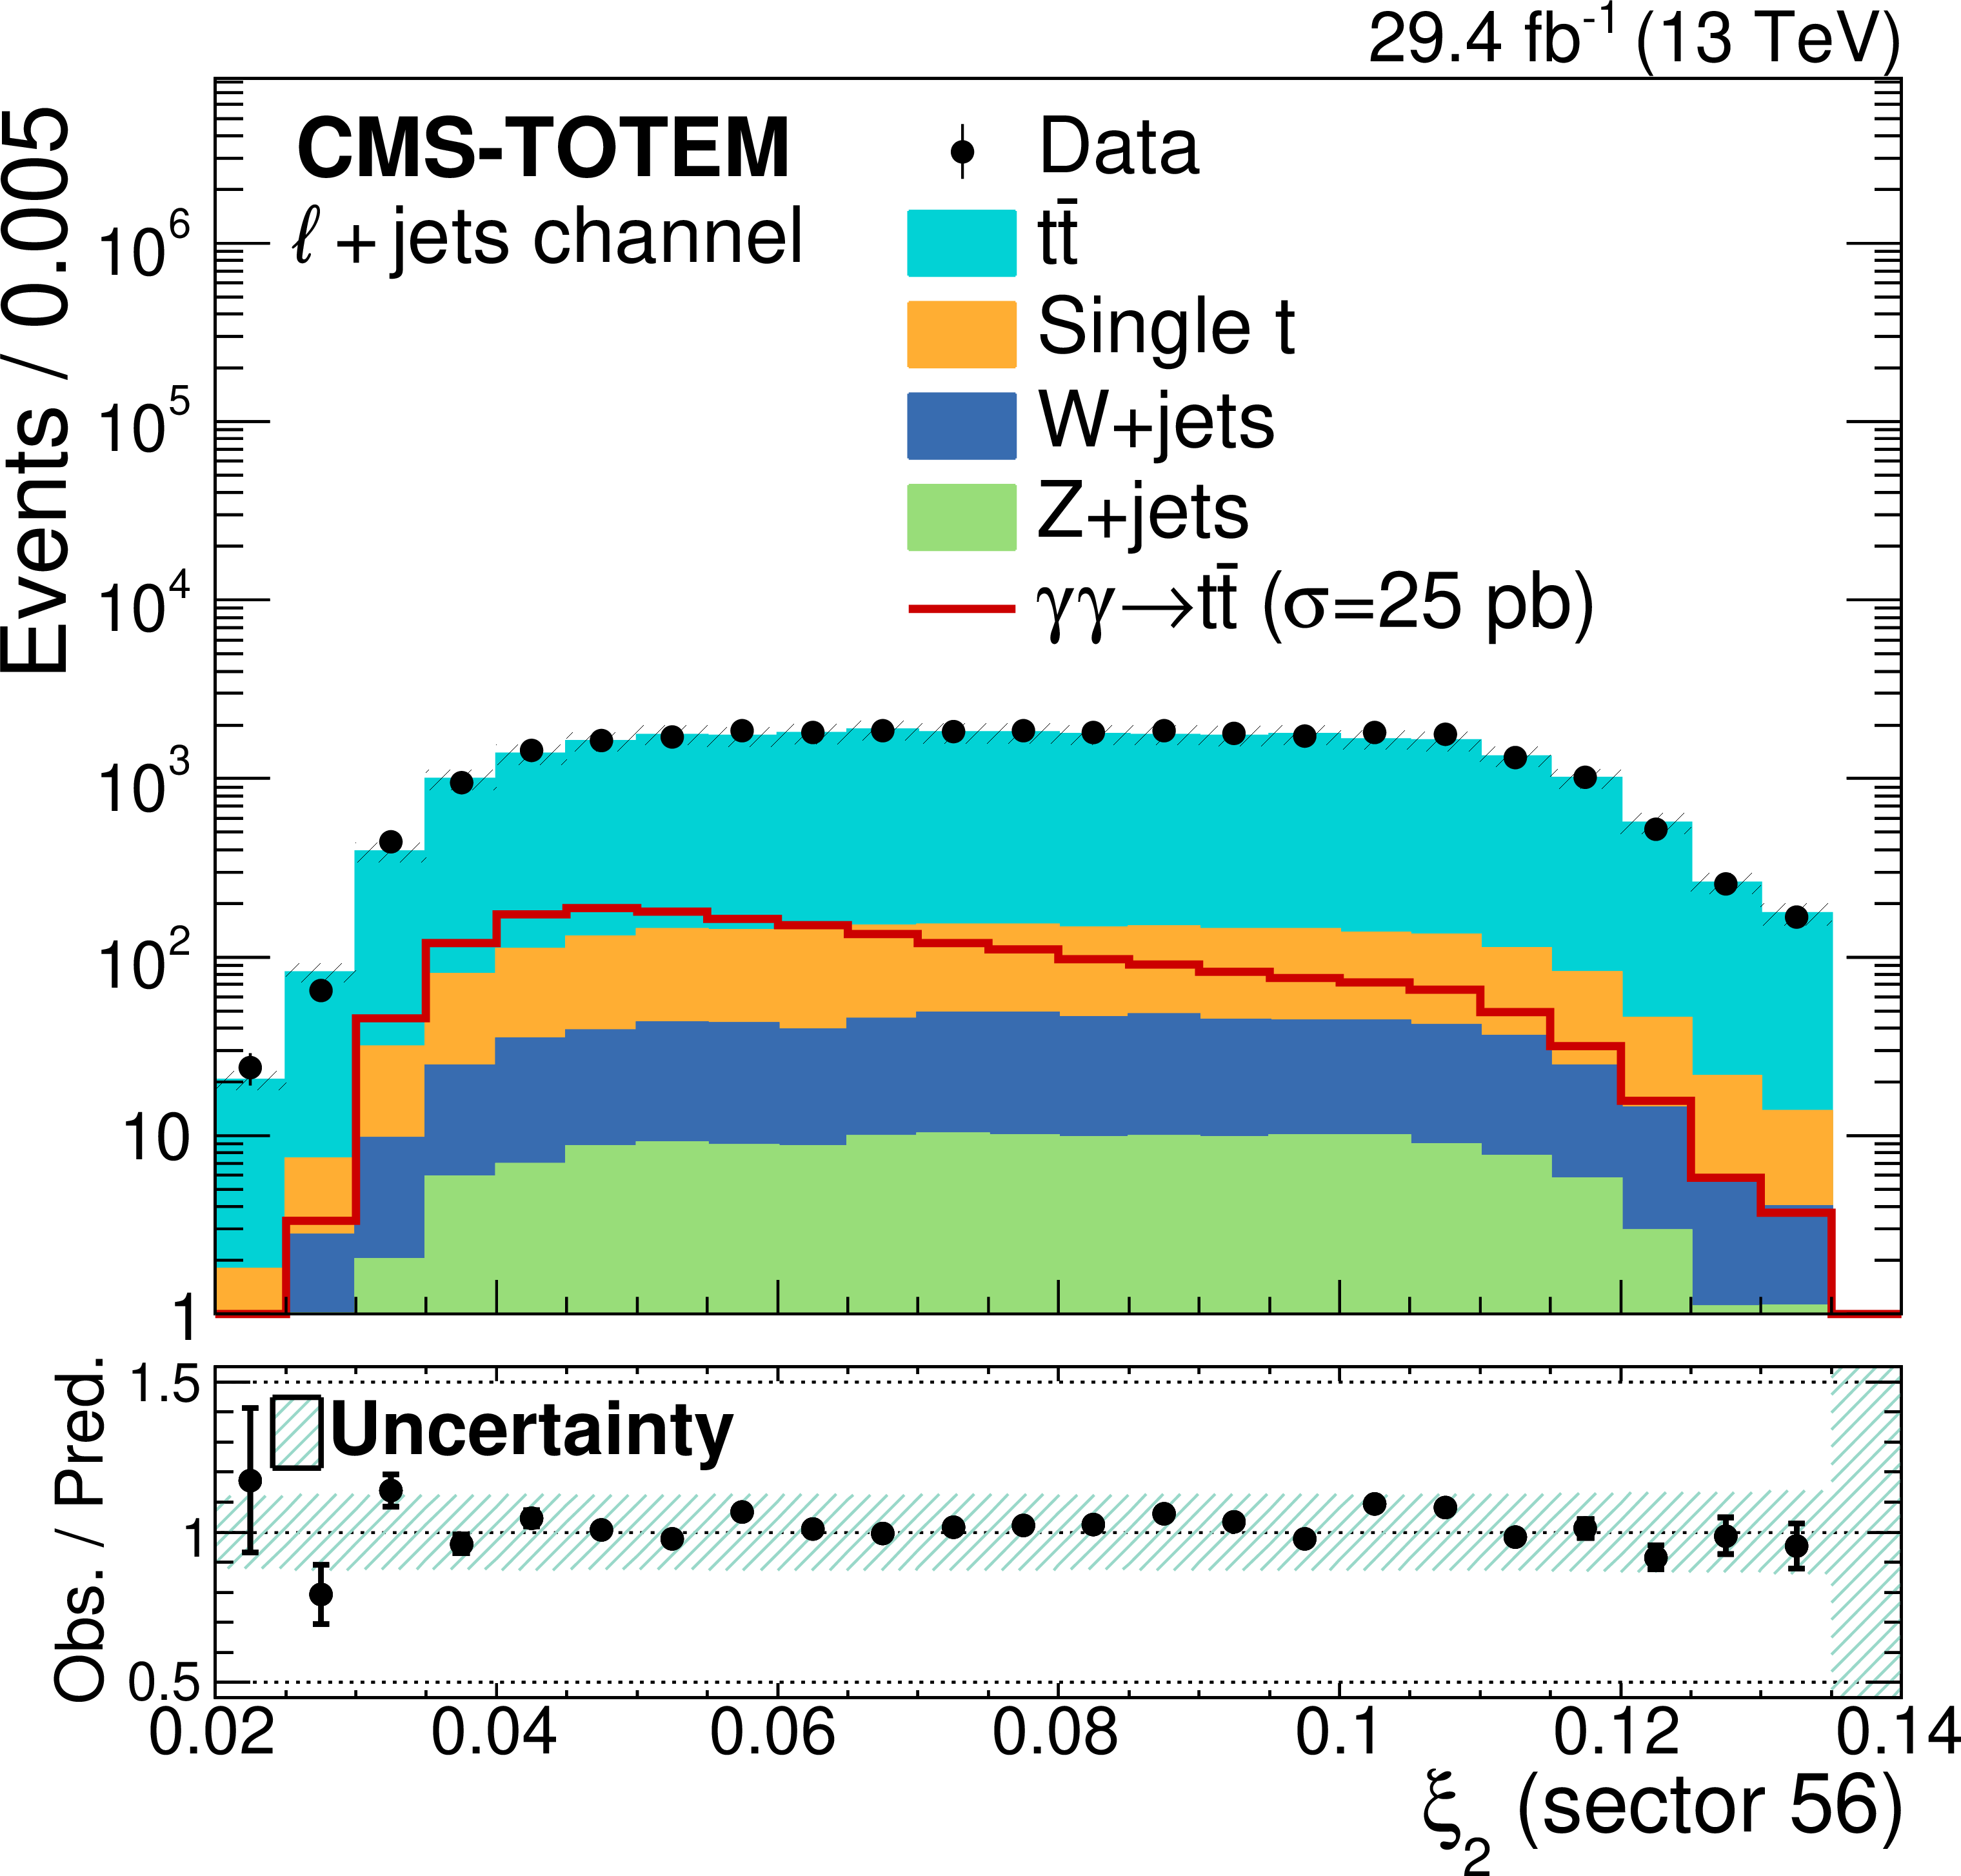
Distribution of $ \xi $ in data and background simulated samples after pileup proton mixing and pileup reweighting, in the $ \ell+$jets channel. Protons in CT-PPS arm 0 (left) and arm 1 (right), as defined in the text. The solid histograms show the expected background contributions, while the red open histograms show the expected signal shapes, normalised to a cross section of 25 pb, approximately 10$^5 $ larger than the SM cross section prediction from Ref. [32]; points with statistical error bars represent collision data. The lower panels show the data-to-prediction ratios; the hatched bands represent the relative uncertainty in the predictions. |
png pdf |
Figure 4-a:
Distribution of $ \xi $ in data and background simulated samples after pileup proton mixing and pileup reweighting, in the $ \ell+$jets channel. Protons in CT-PPS arm 0, as defined in the text. The solid histograms show the expected background contributions, while the red open histograms show the expected signal shapes, normalised to a cross section of 25 pb, approximately 10$^5 $ larger than the SM cross section prediction from Ref. [32]; points with statistical error bars represent collision data. The lower panel shows the data-to-prediction ratio; the hatched bands represent the relative uncertainty in the predictions. |
png pdf |
Figure 4-b:
Distribution of $ \xi $ in data and background simulated samples after pileup proton mixing and pileup reweighting, in the $ \ell+$jets channel. Protons in CT-PPS arm 1, as defined in the text. The solid histograms show the expected background contributions, while the red open histograms show the expected signal shapes, normalised to a cross section of 25 pb, approximately 10$^5 $ larger than the SM cross section prediction from Ref. [32]; points with statistical error bars represent collision data. The lower panel shows the data-to-prediction ratio; the hatched bands represent the relative uncertainty in the predictions. |
png pdf |
Figure 5:
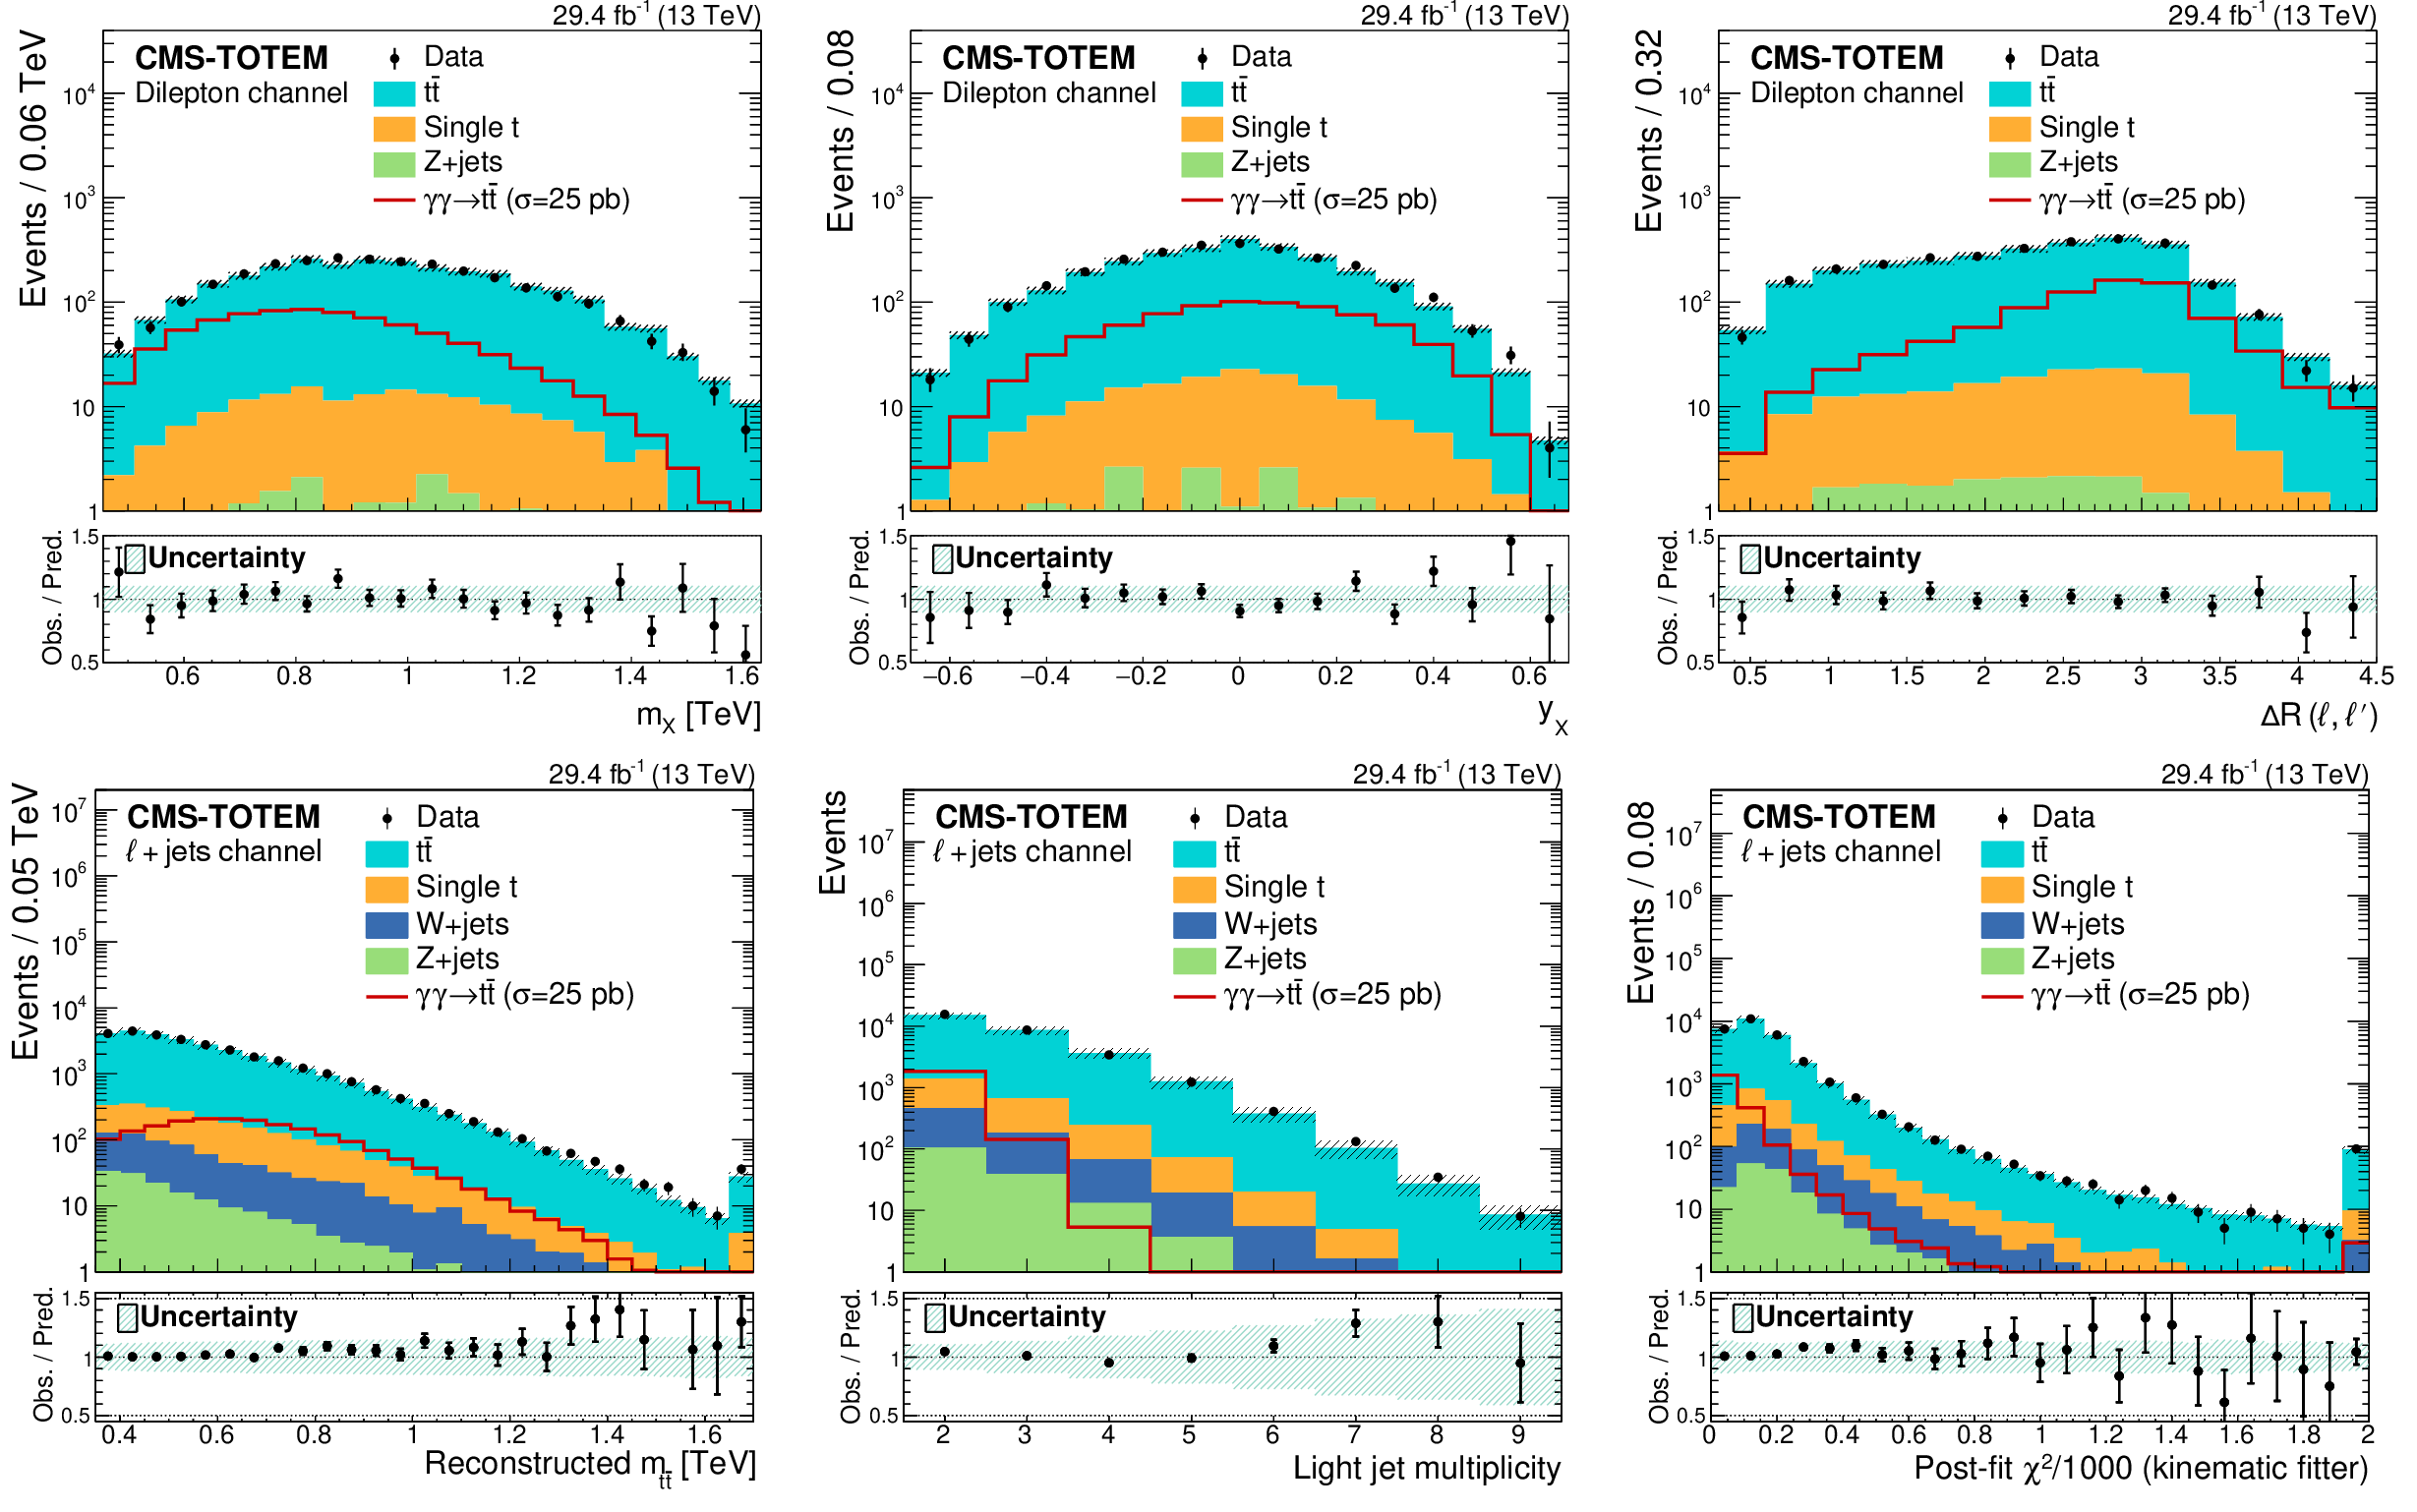
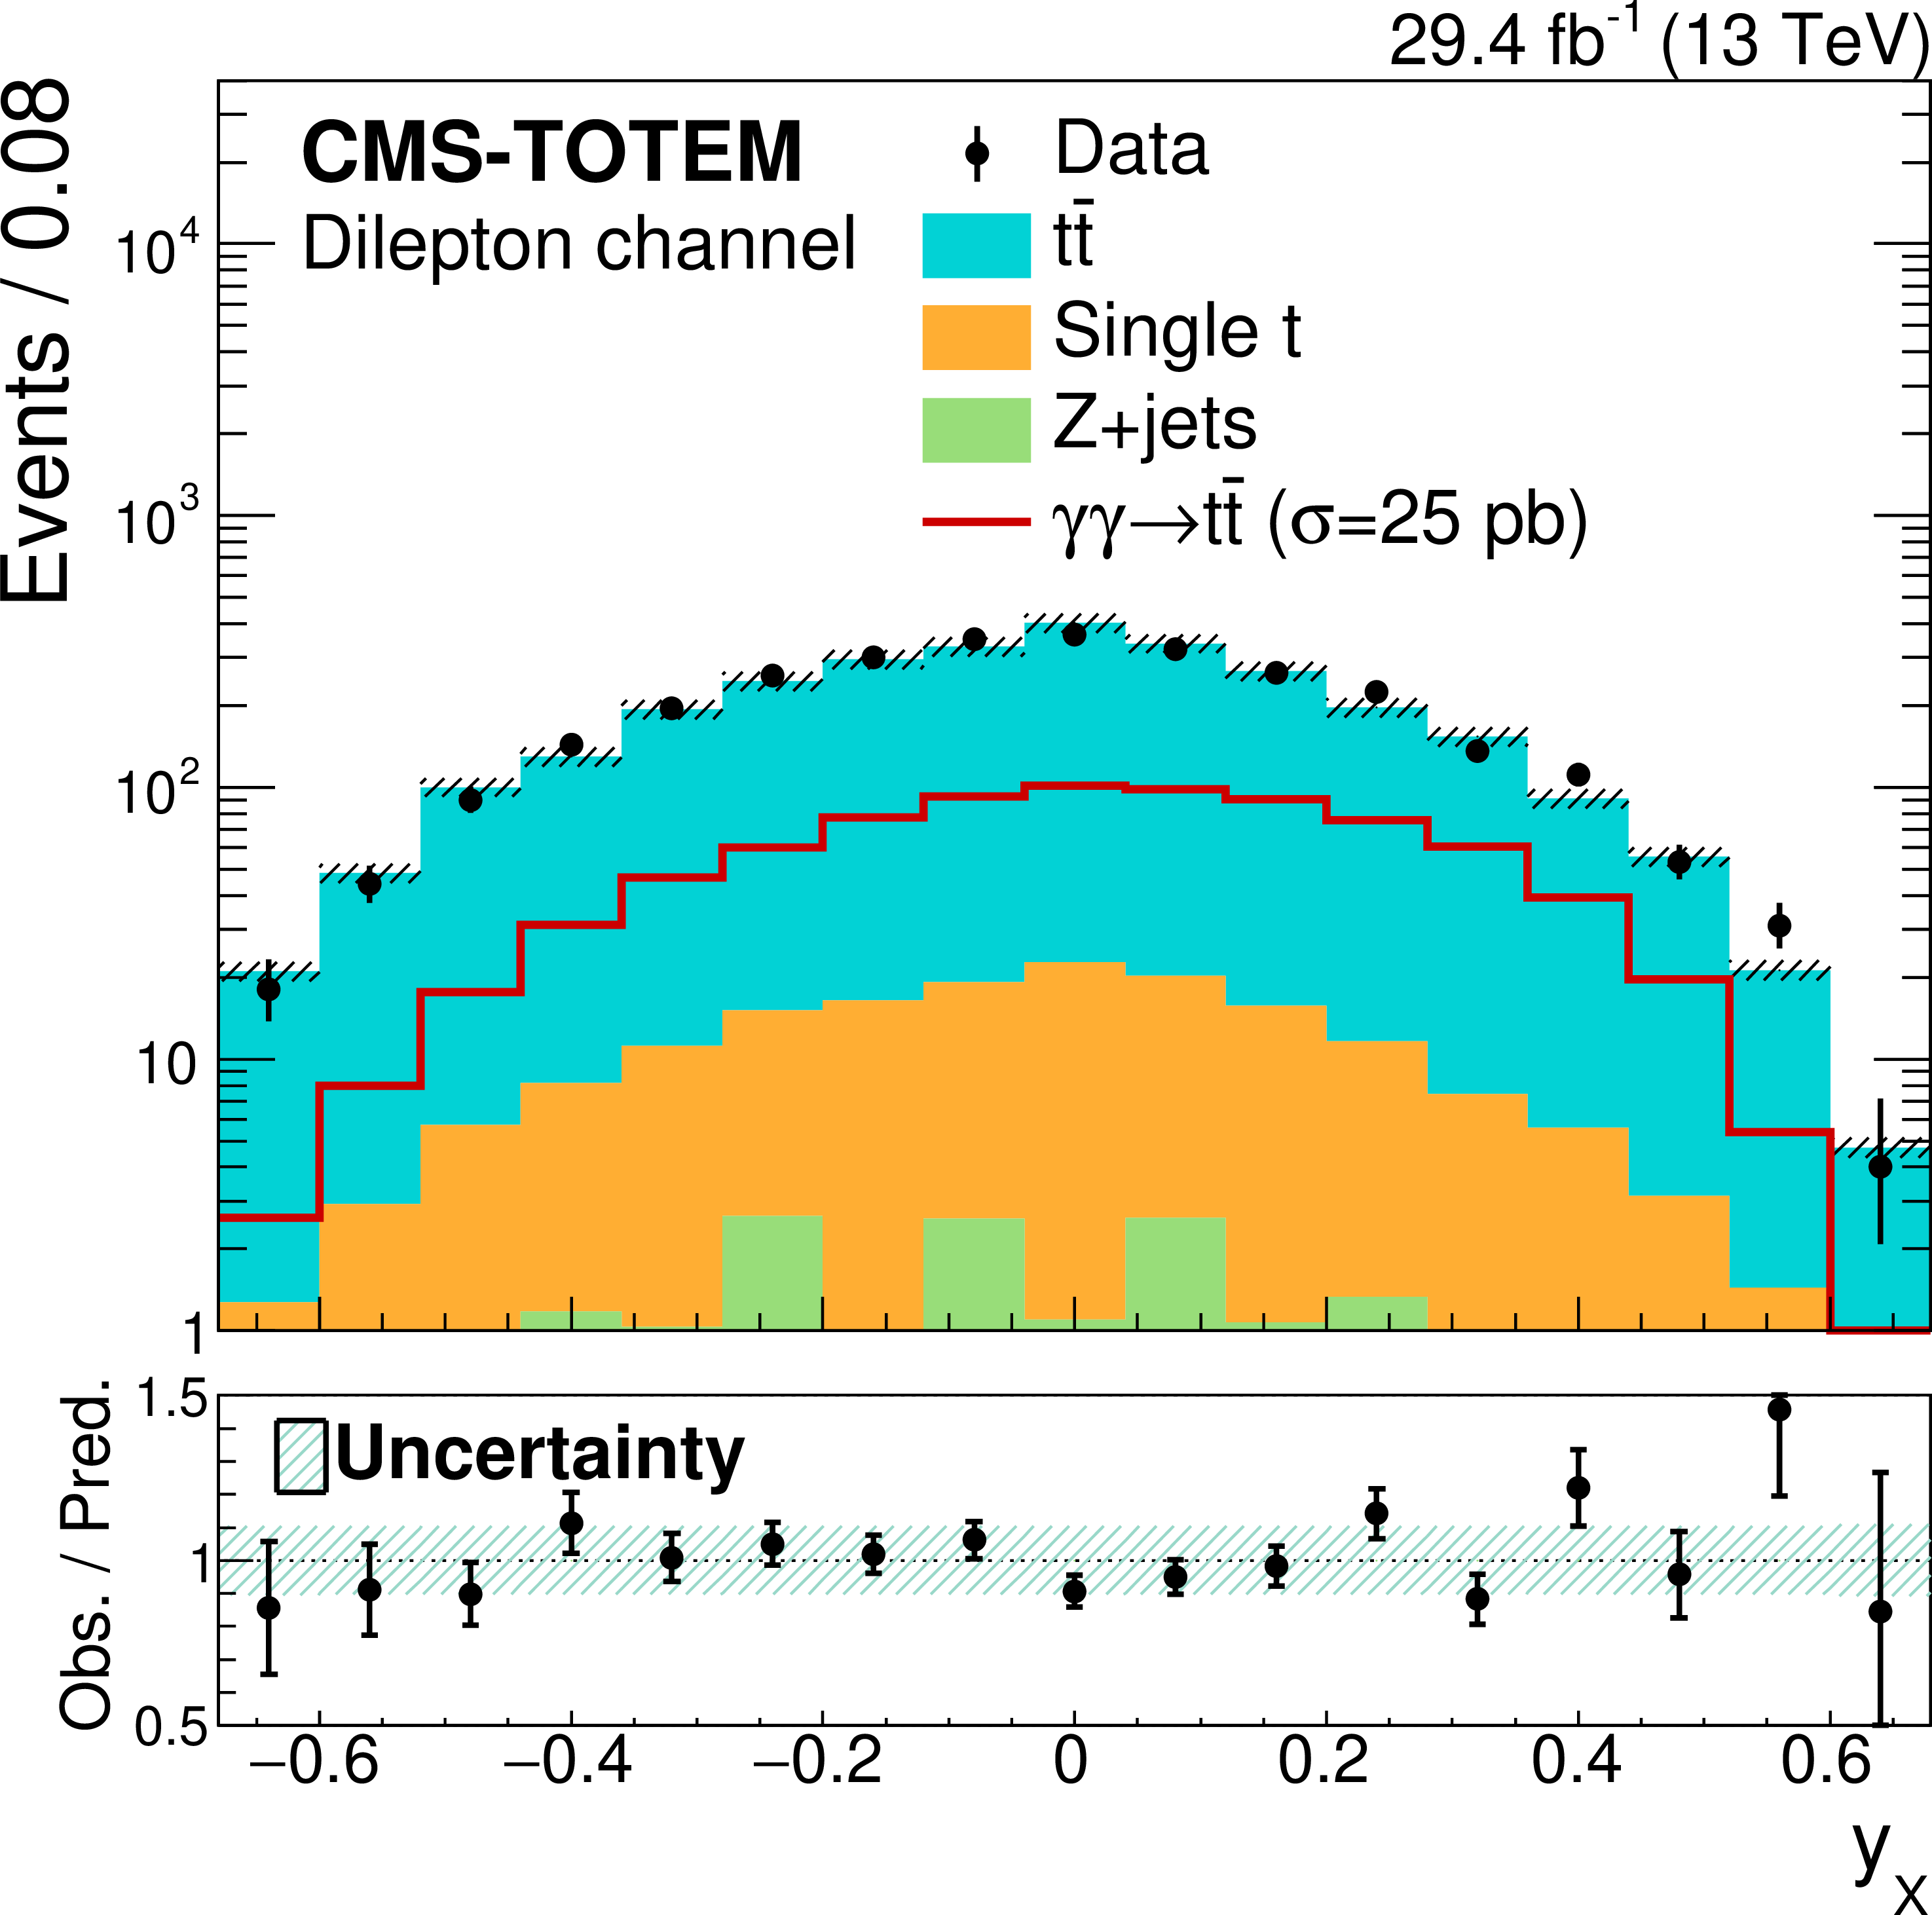
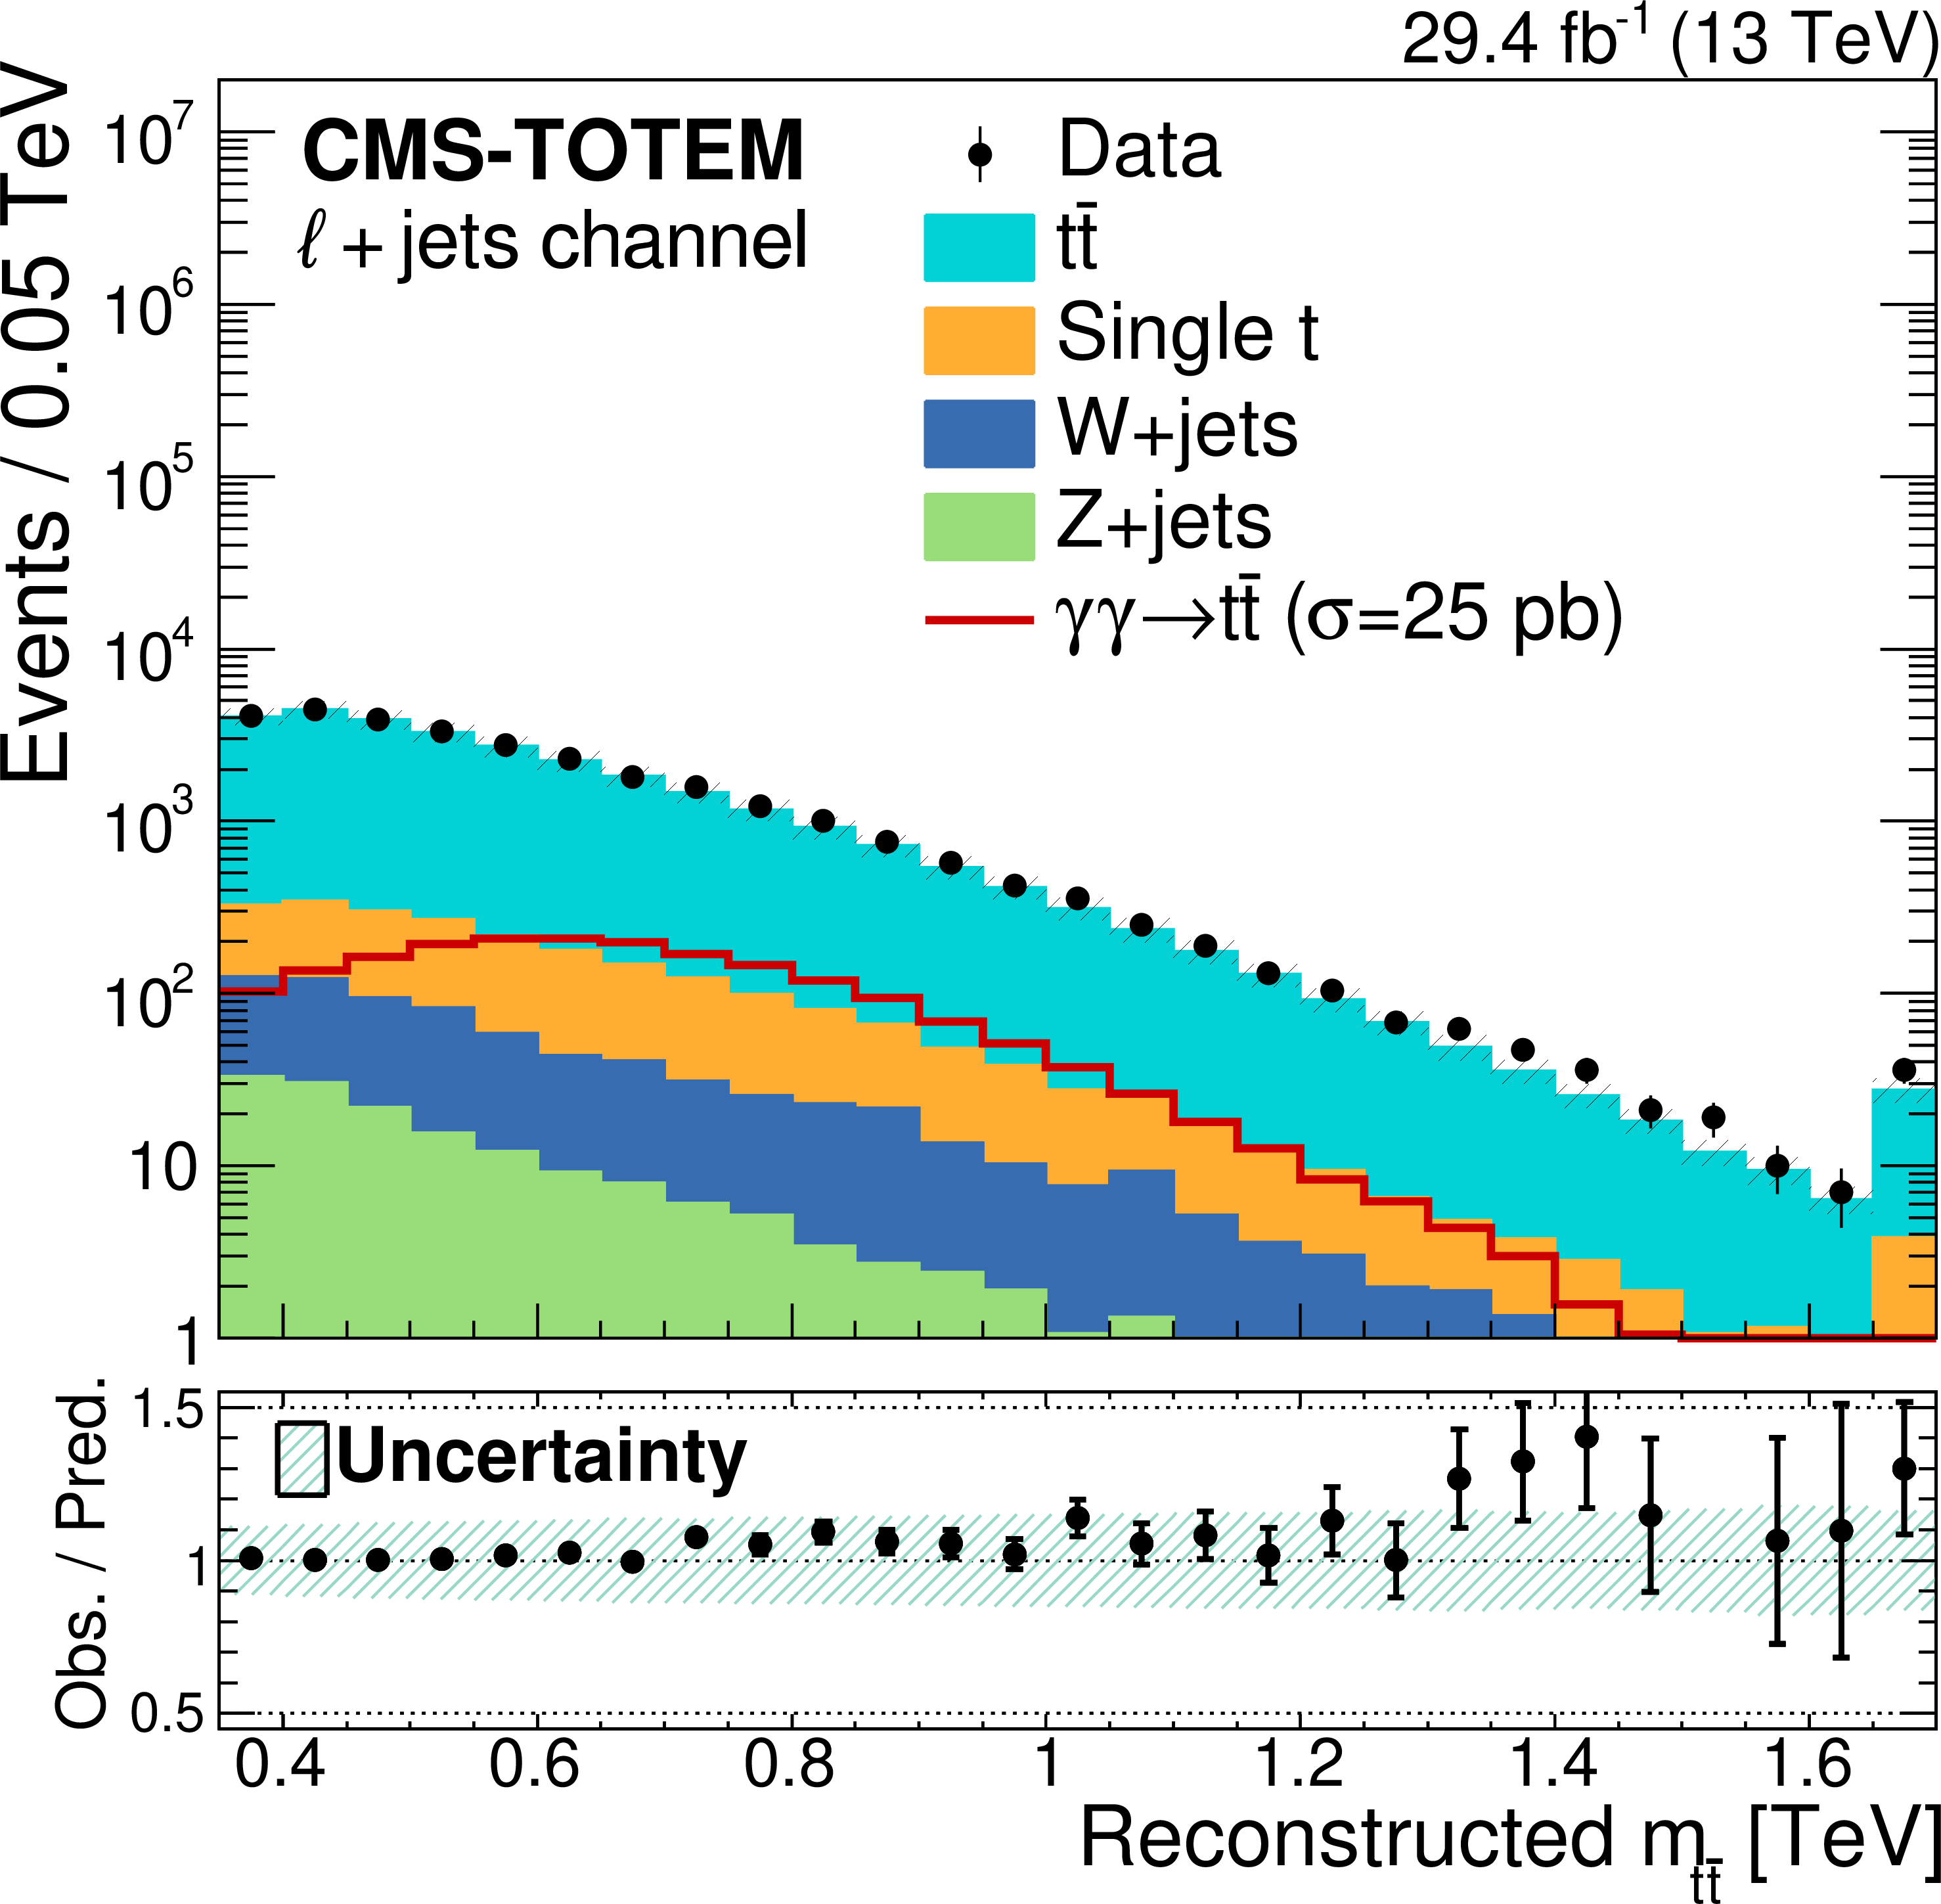
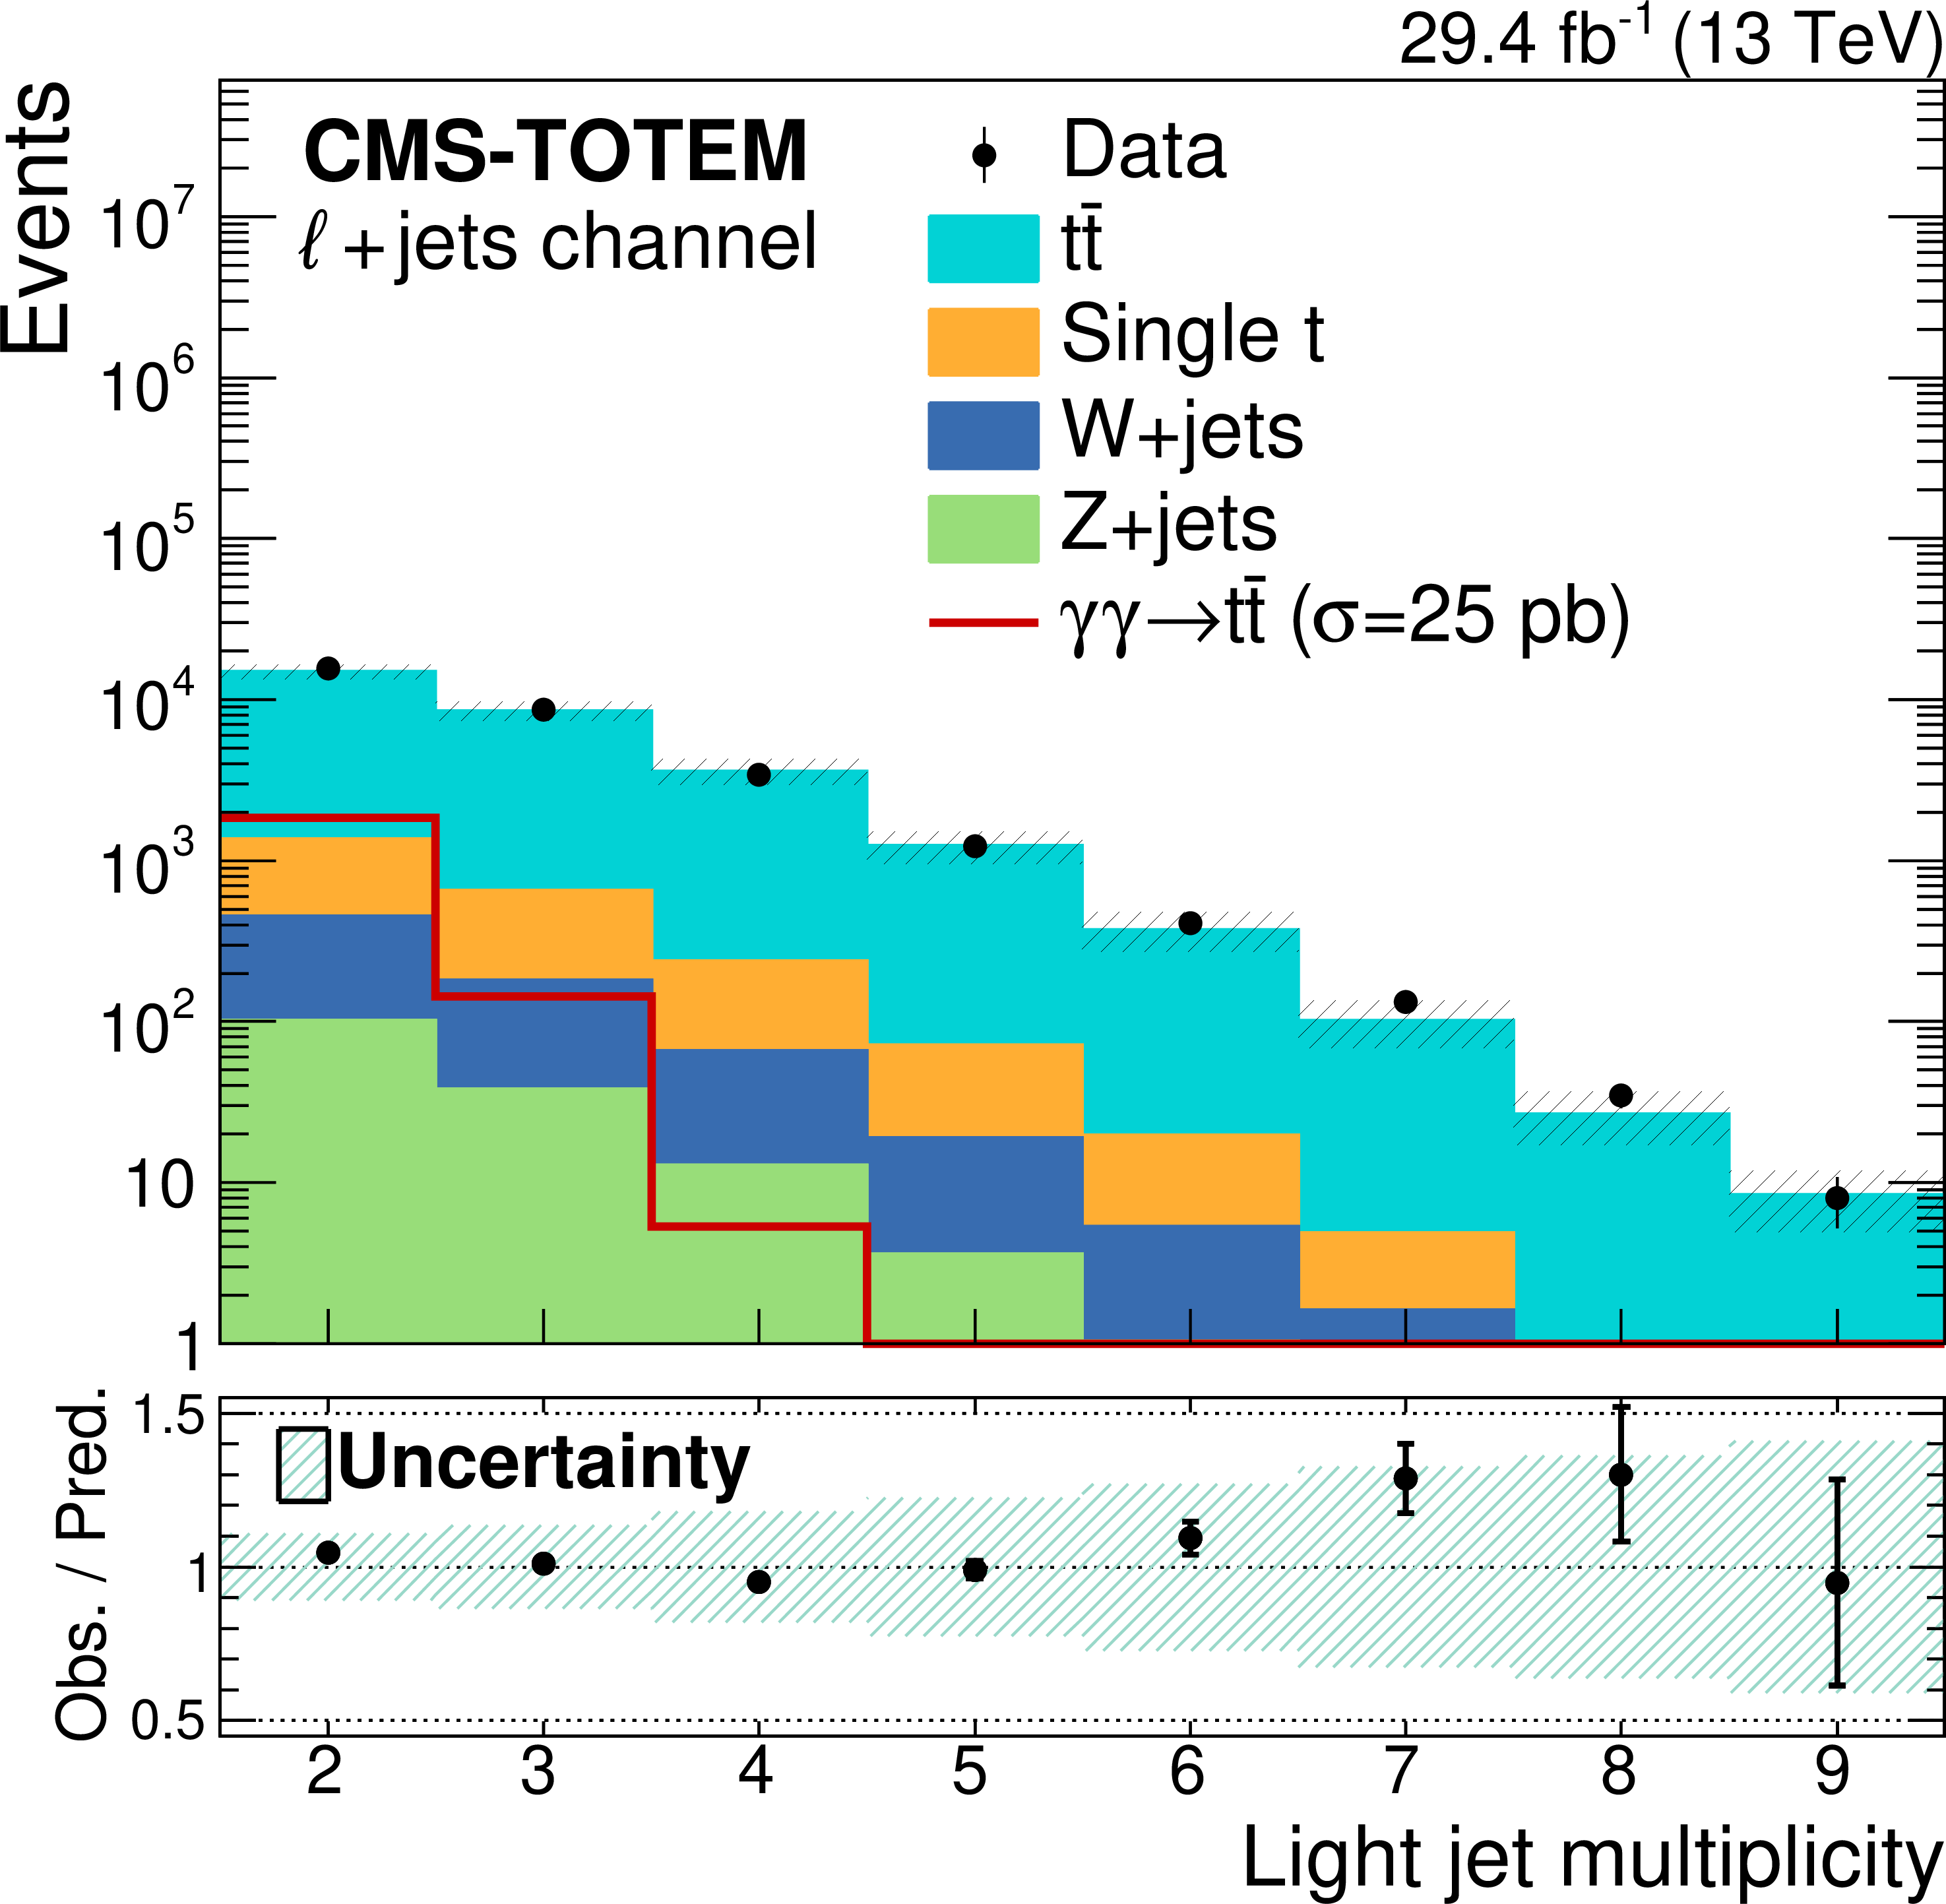
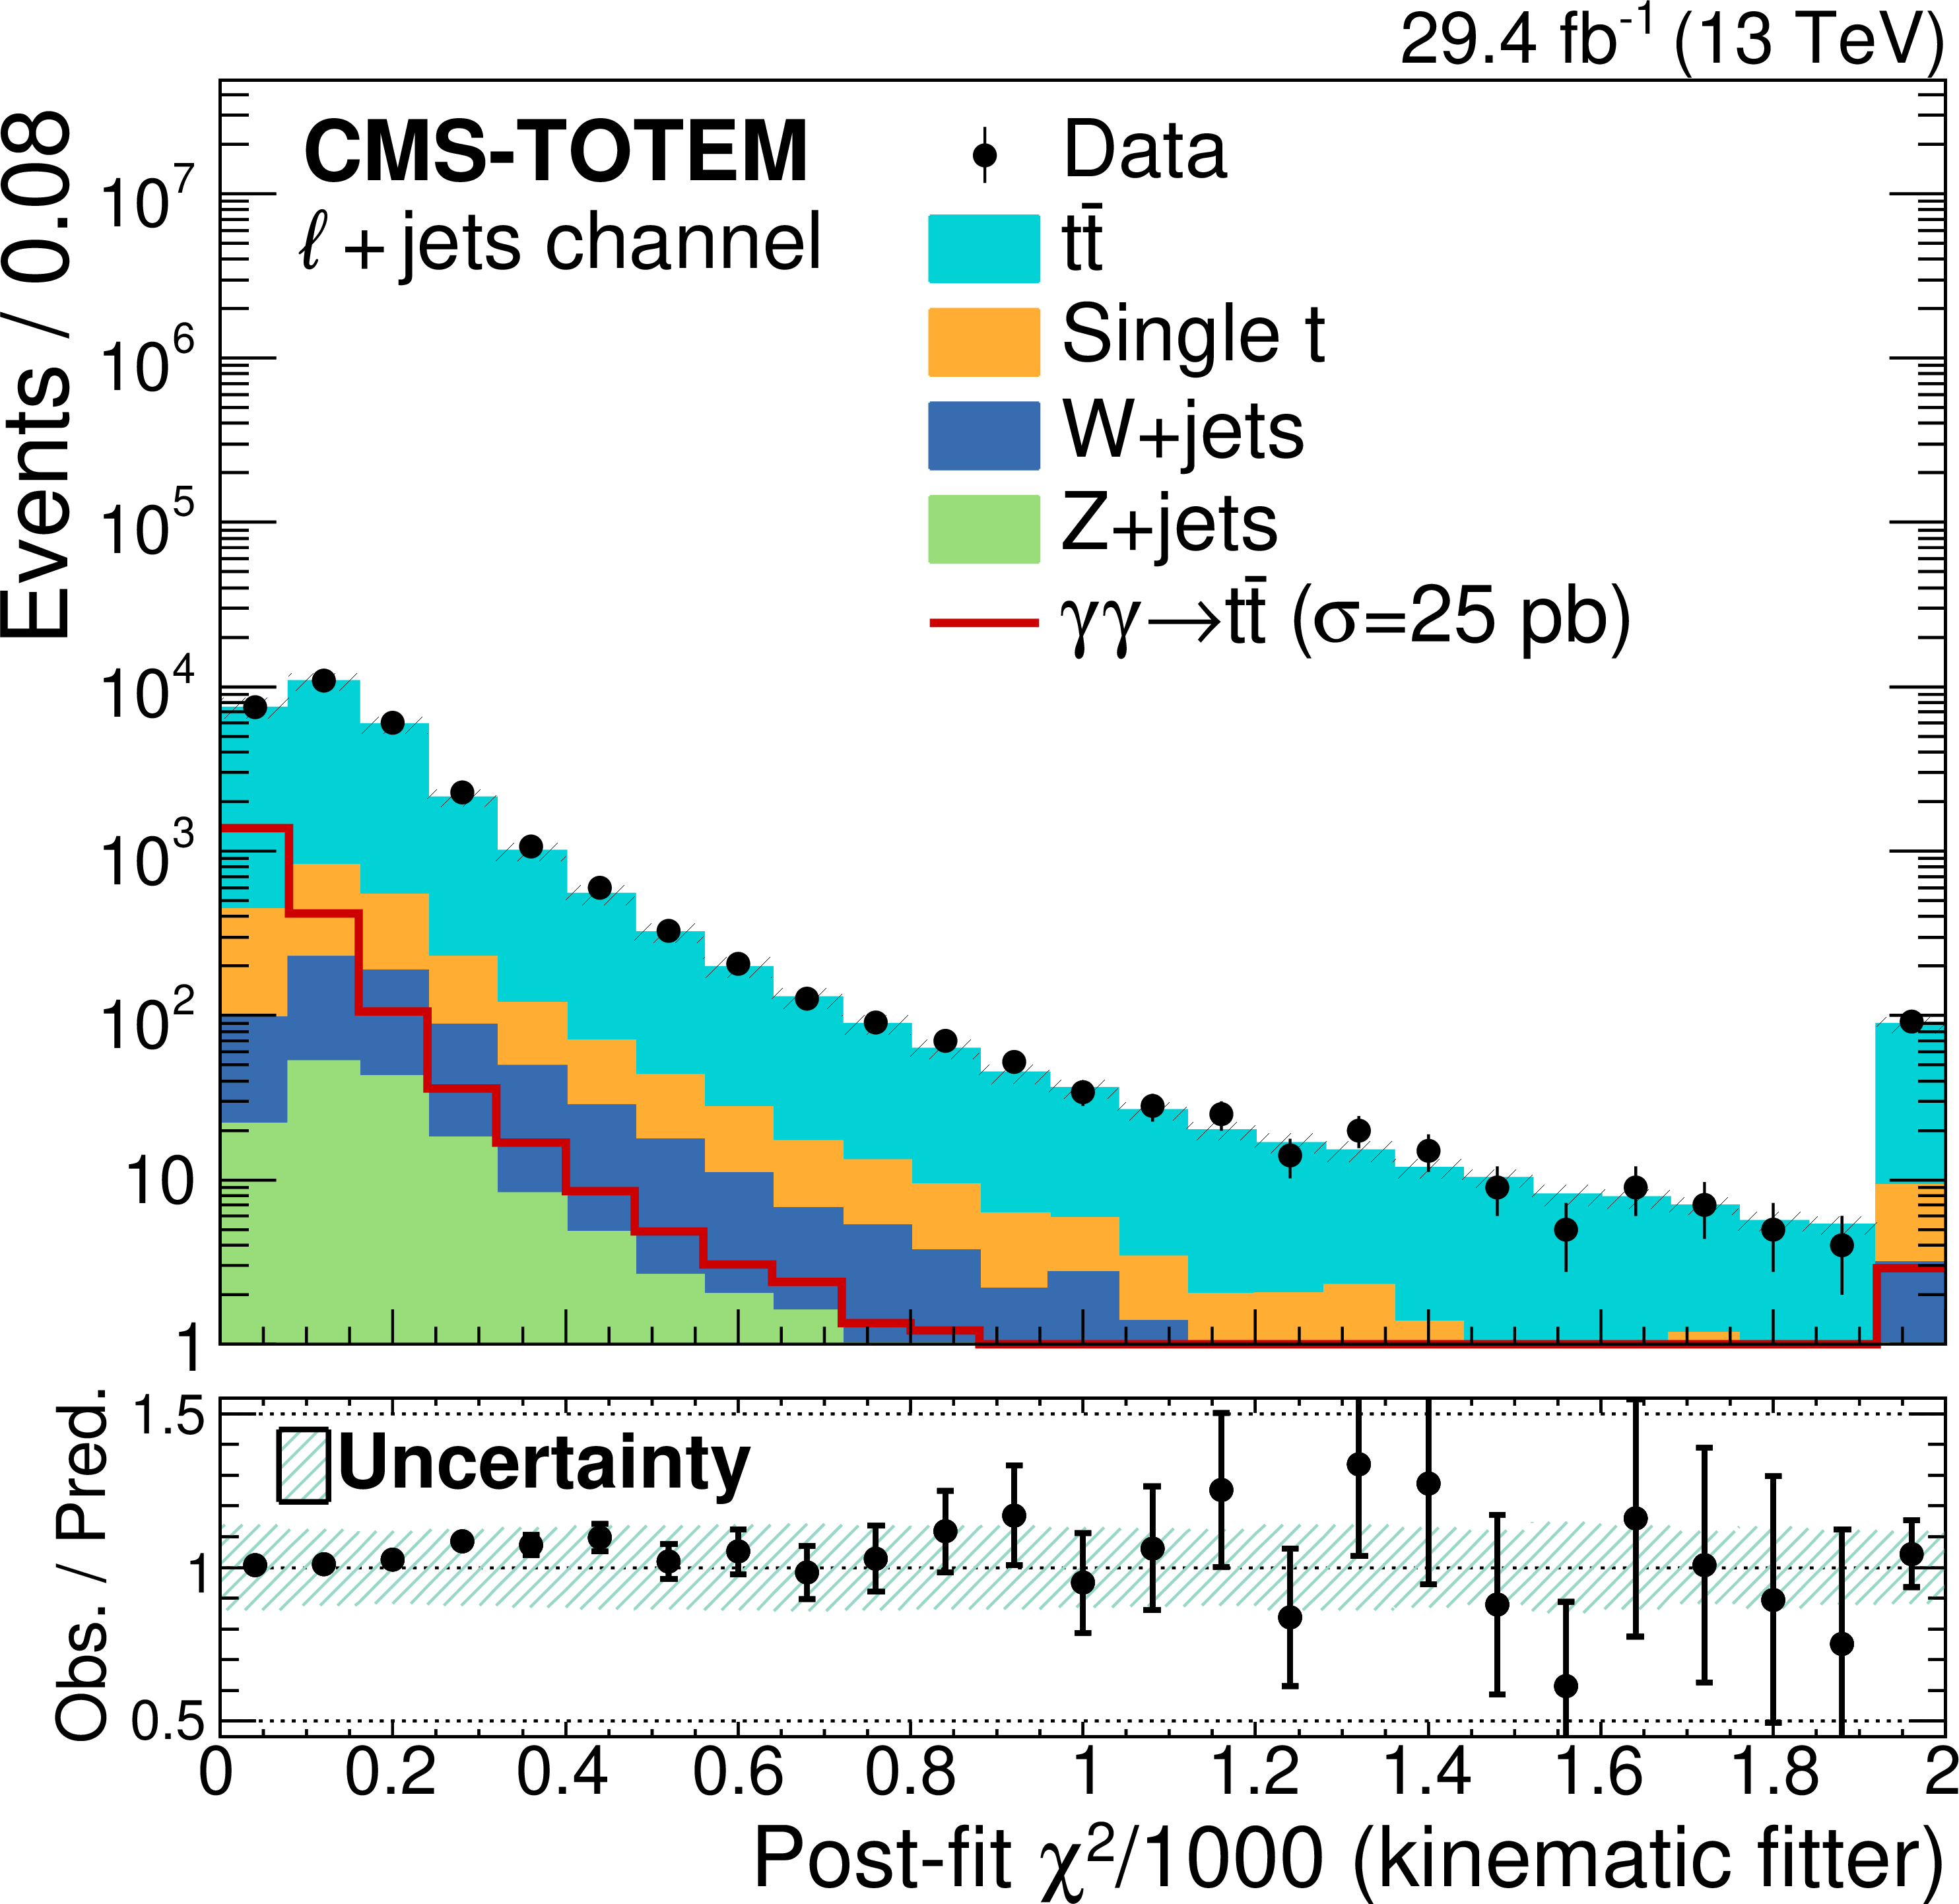
Distribution of a selection of the kinematic variables of interest for the dilepton (upper) and $ \ell+$jets (lower) analysis. The solid histograms show the expected background contributions, while the red open histograms show the expected signal shapes, normalised to a cross section of 25 pb, approximately 10$^5 $ larger than the SM cross section prediction from Ref. [32]; points with statistical error bars represent collision data. The lower panels show the data-to-prediction ratios; the hatched bands represent the uncertainty in the predictions. The leftmost and rightmost bin in each histogram includes accepted events outside the histogram range. |
png pdf |
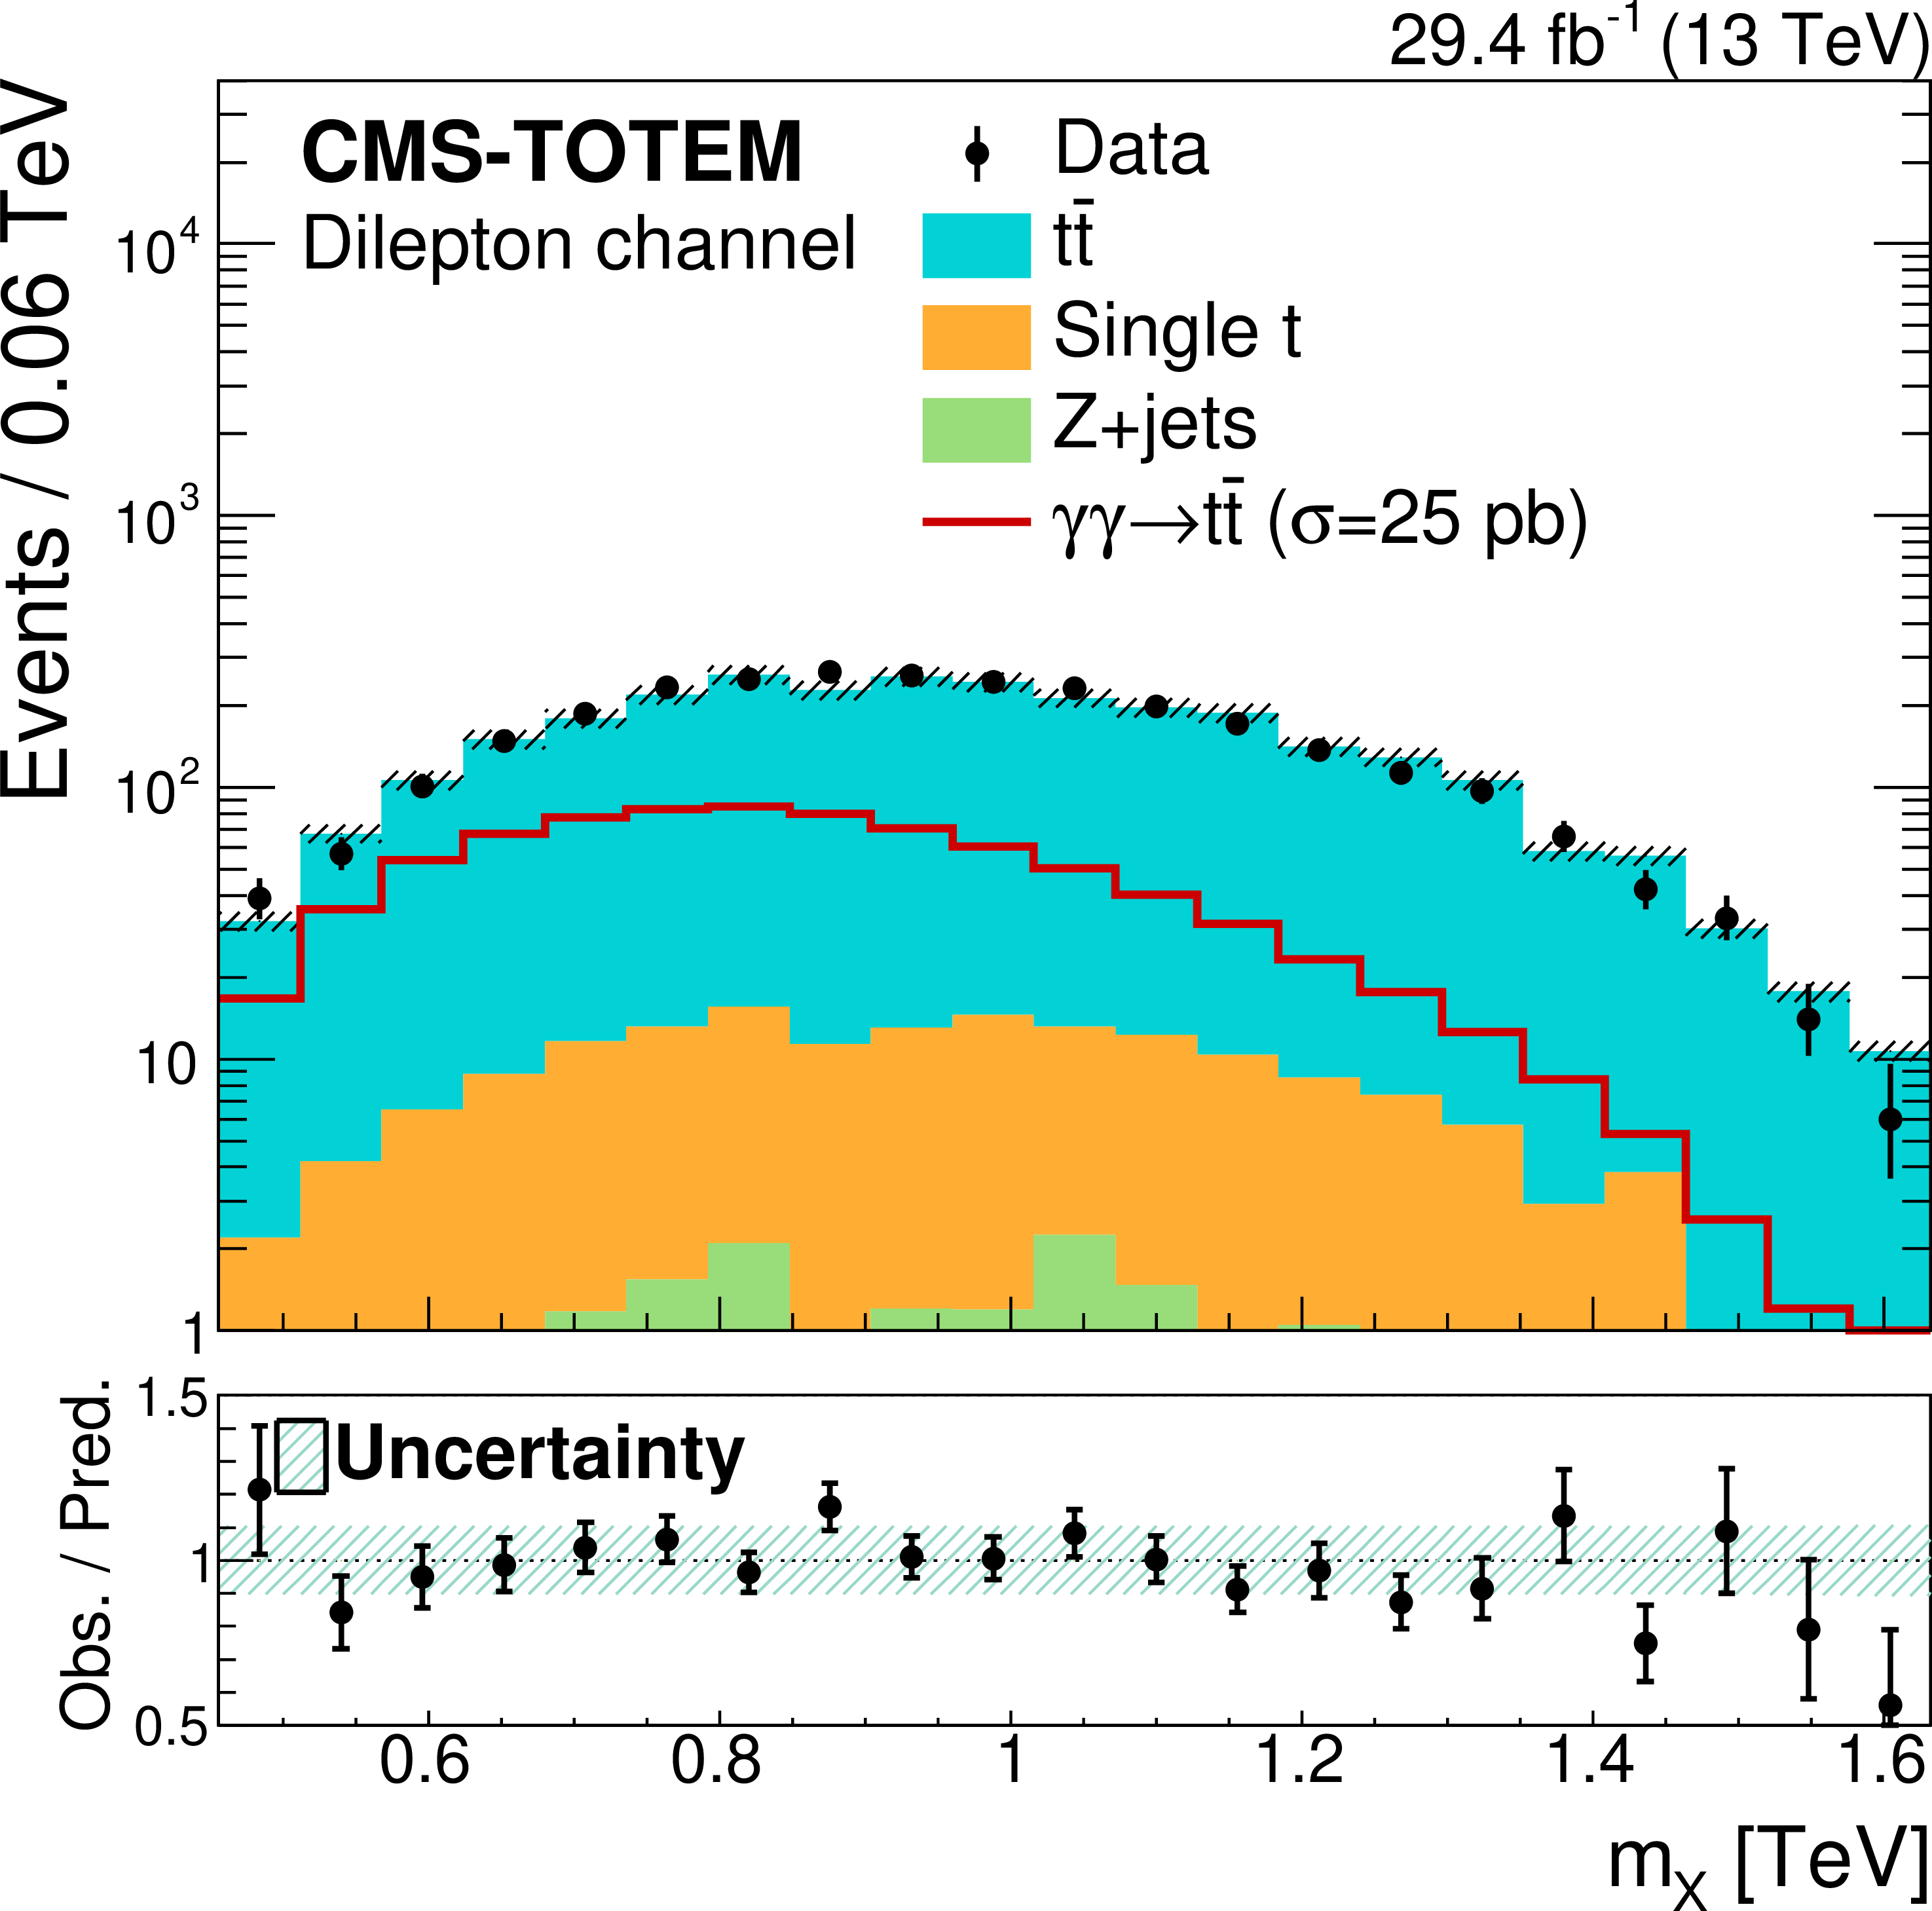
Figure 5-a:
Distribution of $m_{\mathrm{X}}$ for the dilepton analysis. The solid histograms show the expected background contributions, while the red open histograms show the expected signal shapes, normalised to a cross section of 25 pb, approximately 10$^5 $ larger than the SM cross section prediction from Ref. [32]; points with statistical error bars represent collision data. The lower panel shows the data-to-prediction ratio; the hatched bands represent the uncertainty in the predictions. The leftmost and rightmost bin in the histogram includes accepted events outside the histogram range. |
png pdf |
Figure 5-b:
Distribution of $y_{\mathrm{X}}$ for the dilepton analysis. The solid histograms show the expected background contributions, while the red open histograms show the expected signal shapes, normalised to a cross section of 25 pb, approximately 10$^5 $ larger than the SM cross section prediction from Ref. [32]; points with statistical error bars represent collision data. The lower panel shows the data-to-prediction ratio; the hatched bands represent the uncertainty in the predictions. The leftmost and rightmost bin in the histogram includes accepted events outside the histogram range. |

png pdf |
Figure 5-c:
Distribution of $\Delta R(\ell,\, \ell')$ for the dilepton analysis. The solid histograms show the expected background contributions, while the red open histograms show the expected signal shapes, normalised to a cross section of 25 pb, approximately 10$^5 $ larger than the SM cross section prediction from Ref. [32]; points with statistical error bars represent collision data. The lower panel shows the data-to-prediction ratio; the hatched bands represent the uncertainty in the predictions. The leftmost and rightmost bin in the histogram includes accepted events outside the histogram range. |
png pdf |
Figure 5-d:
Distribution of $m_{\mathrm{t\bar{t}}}$ for the $ \ell+$jets analysis. The solid histograms show the expected background contributions, while the red open histograms show the expected signal shapes, normalised to a cross section of 25 pb, approximately 10$^5 $ larger than the SM cross section prediction from Ref. [32]; points with statistical error bars represent collision data. The lower panel shows the data-to-prediction ratio; the hatched bands represent the uncertainty in the predictions. The leftmost and rightmost bin in the histogram includes accepted events outside the histogram range. |
png pdf |
Figure 5-e:
Distribution of the light jet multiplicity for the $ \ell+$jets analysis. The solid histograms show the expected background contributions, while the red open histograms show the expected signal shapes, normalised to a cross section of 25 pb, approximately 10$^5 $ larger than the SM cross section prediction from Ref. [32]; points with statistical error bars represent collision data. The lower panel shows the data-to-prediction ratio; the hatched bands represent the uncertainty in the predictions. The rightmost bin in the histogram includes accepted events outside the histogram range. |
png pdf |
Figure 5-f:
Distribution of the post-fit $\chi^2/$1000 for the $ \ell+$jets analysis. The solid histograms show the expected background contributions, while the red open histograms show the expected signal shapes, normalised to a cross section of 25 pb, approximately 10$^5 $ larger than the SM cross section prediction from Ref. [32]; points with statistical error bars represent collision data. The lower panel shows the data-to-prediction ratio; the hatched bands represent the uncertainty in the predictions. The rightmost bin in the histogram includes accepted events outside the histogram range. |

png pdf |
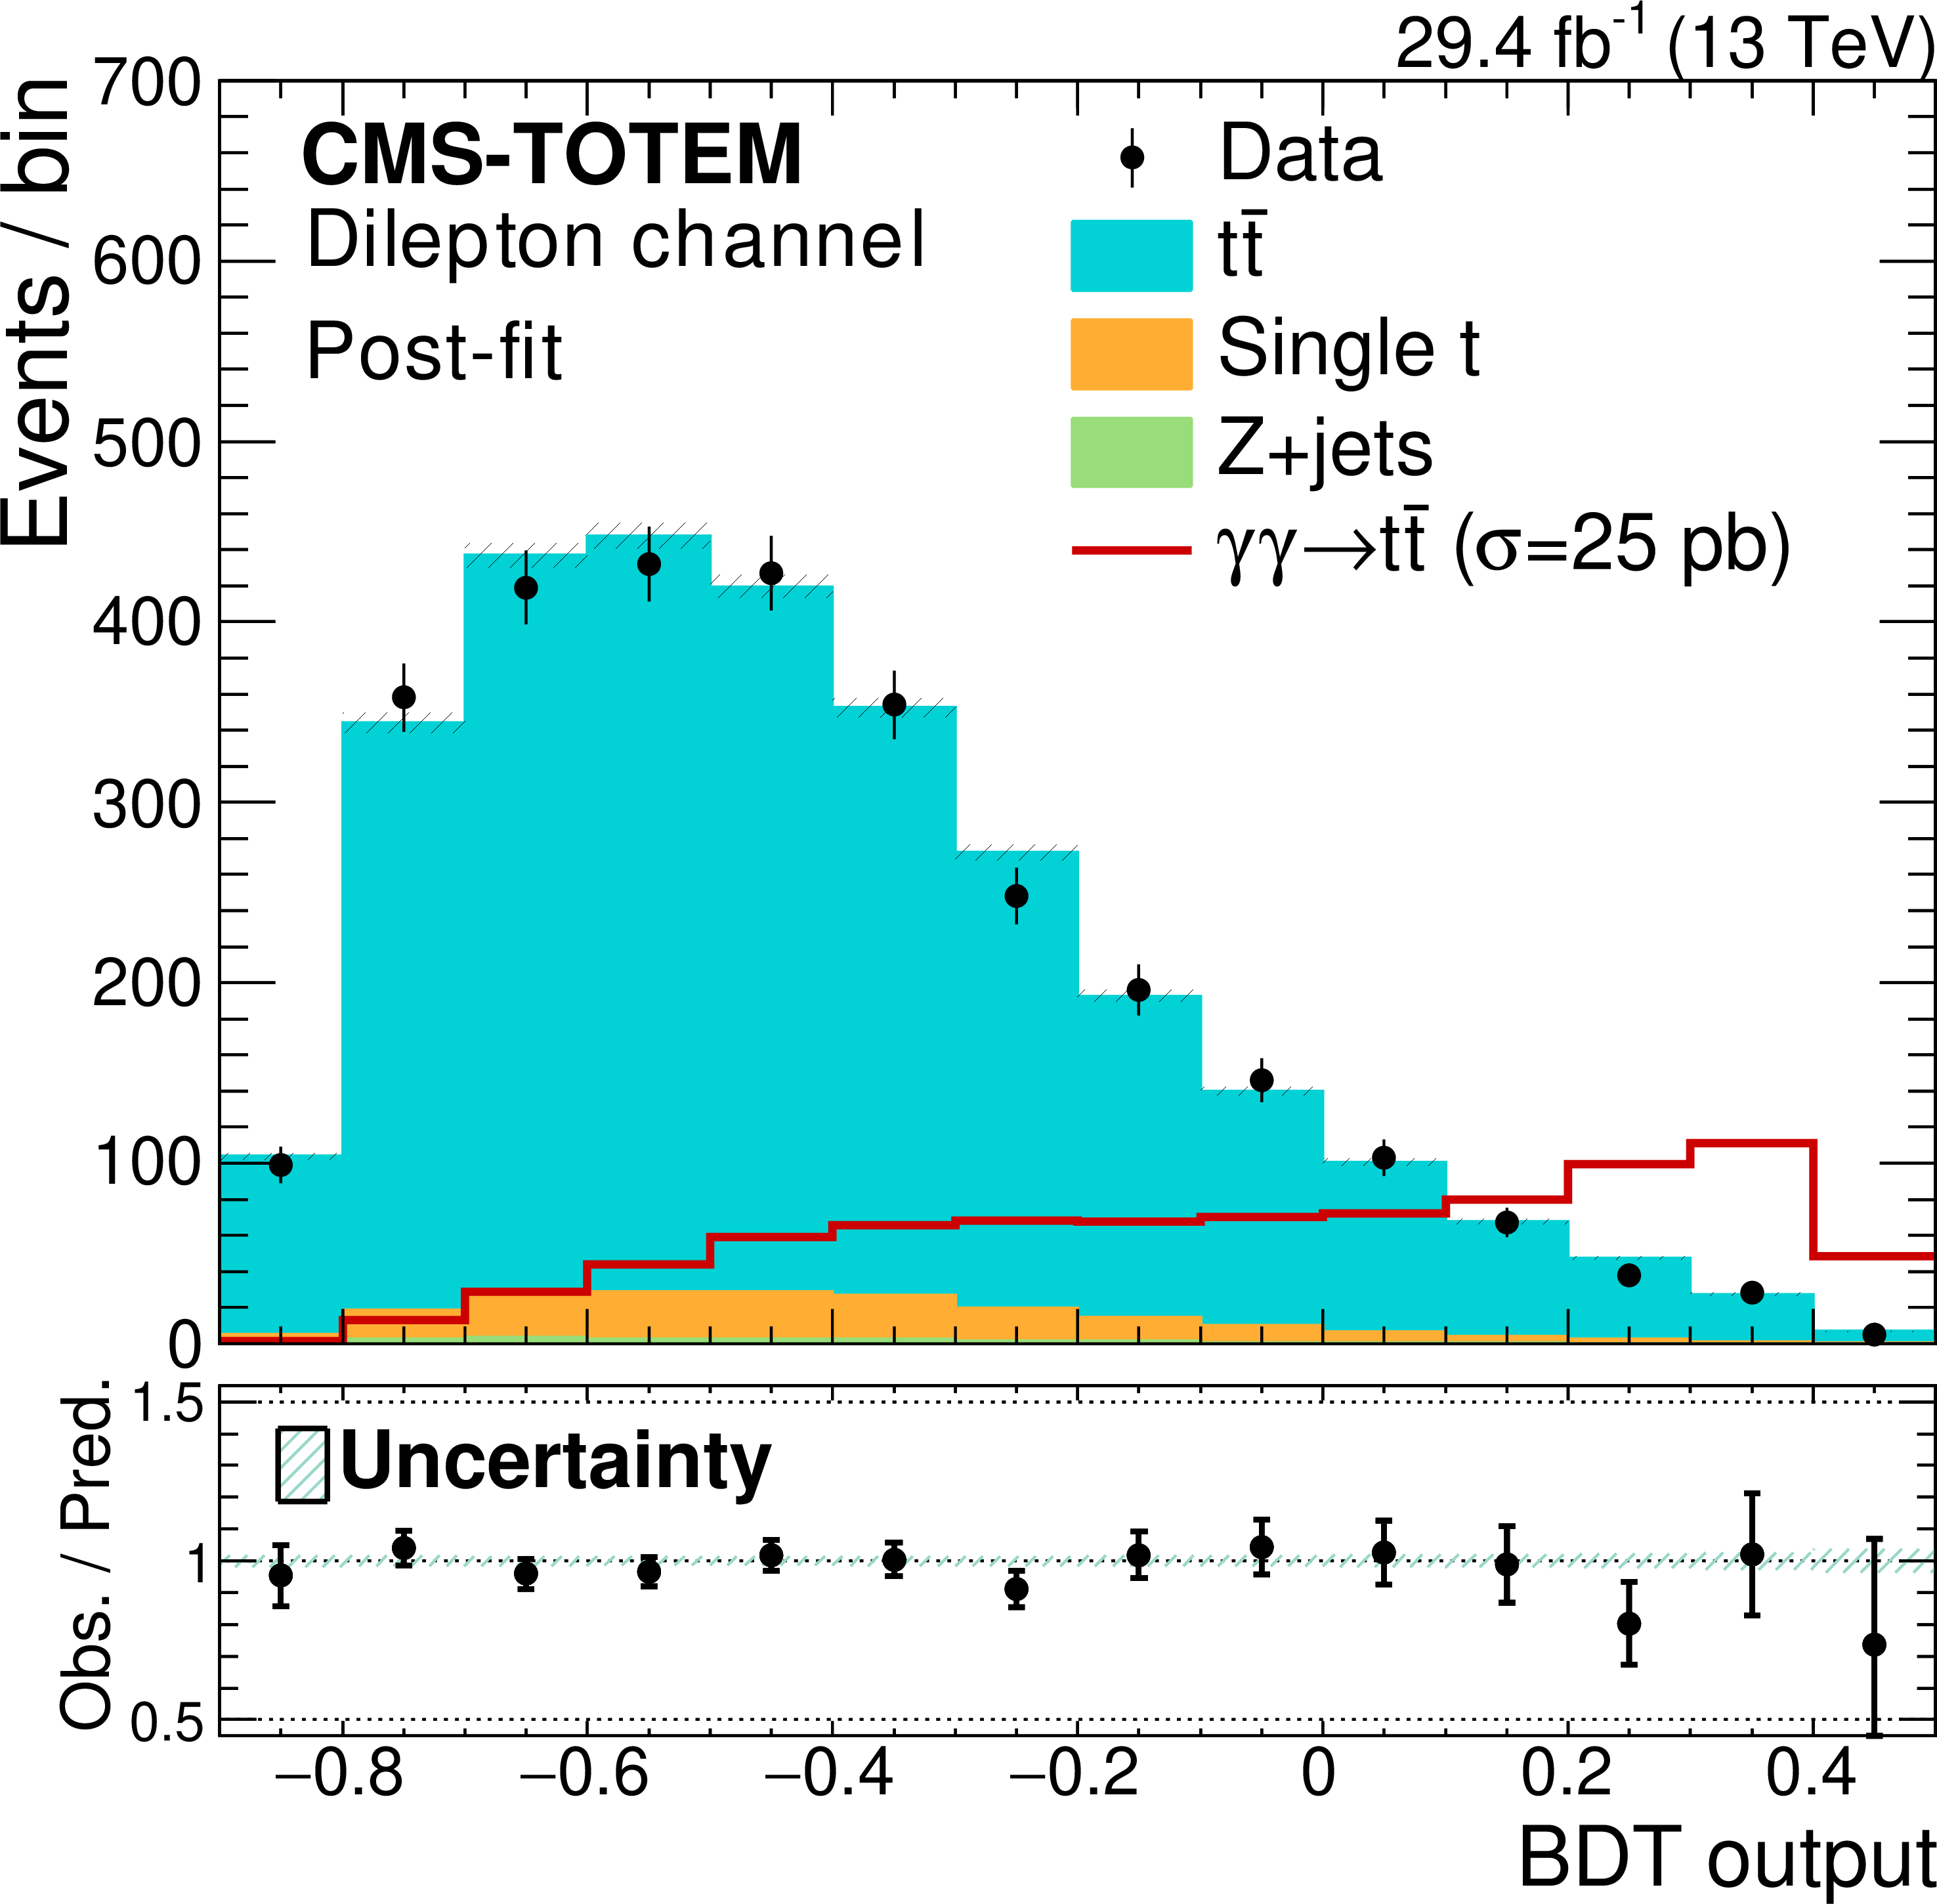
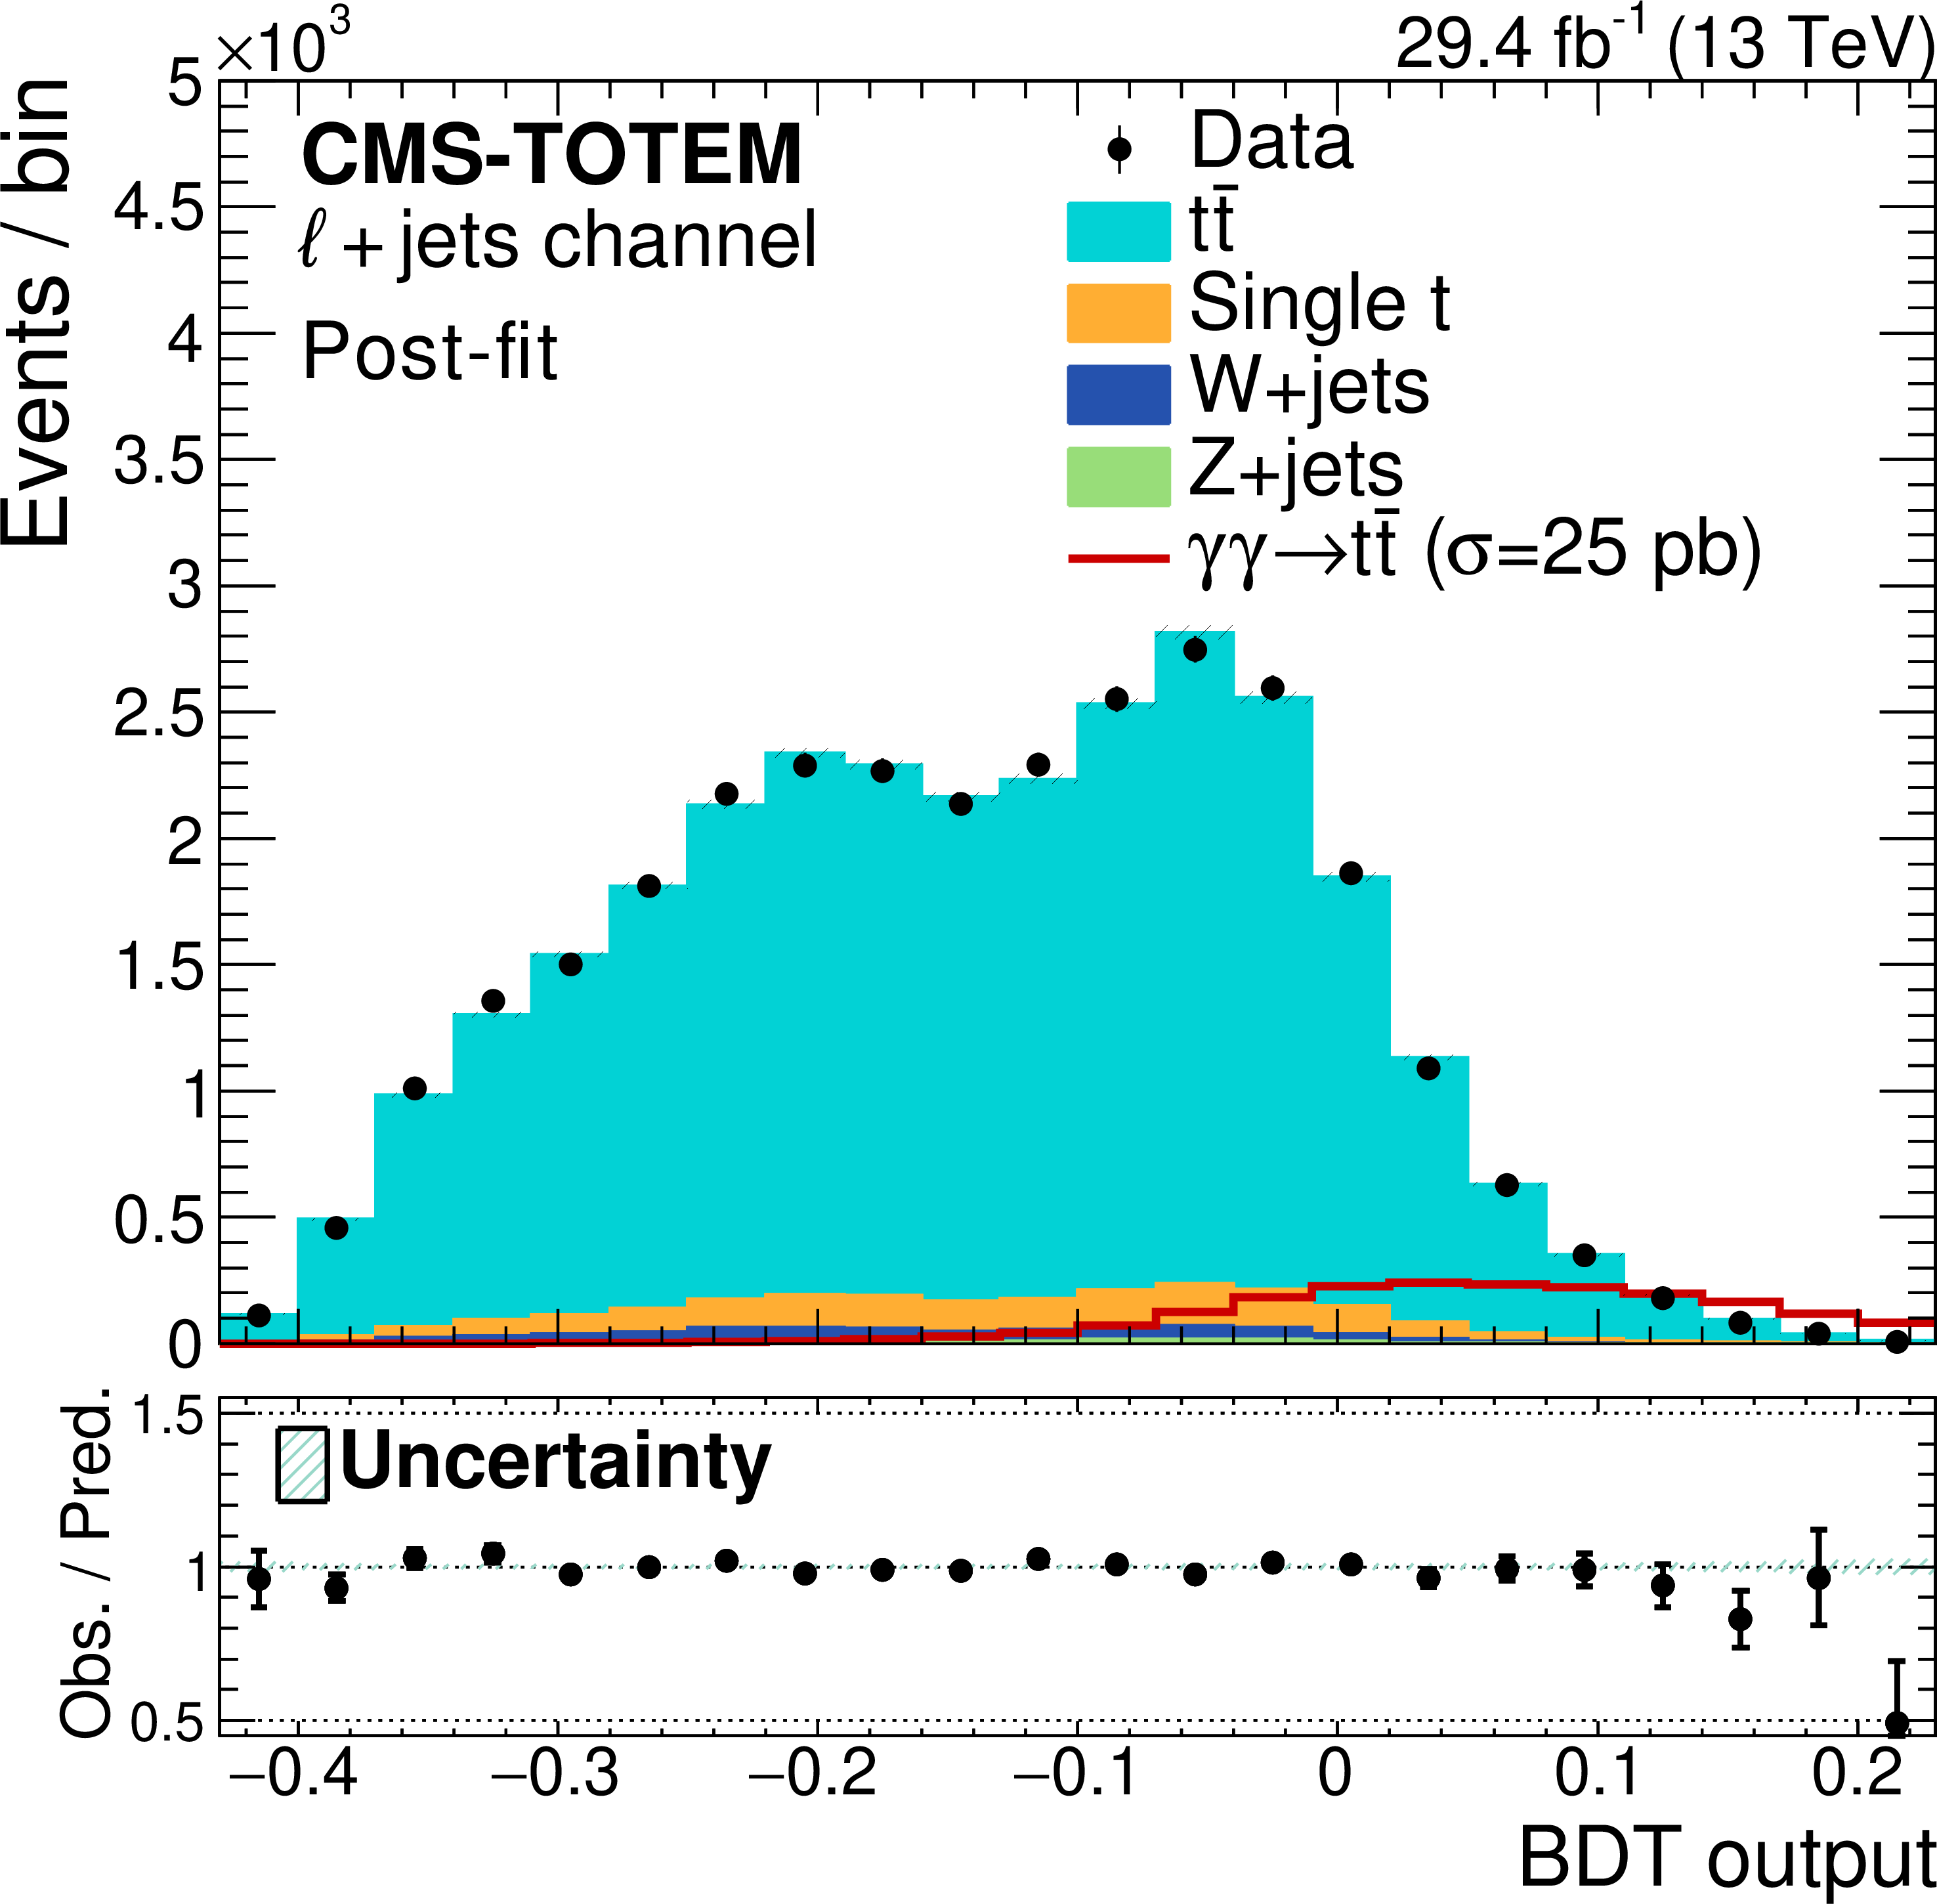
Figure 6:
Distribution of the BDT output in the signal region for simulated events after the fit, and for data. Left: dilepton channel; right: $ \ell+$jets channel. The different ranges of the two BDT output distributions are a consequence of the different architectures of the algorithms. The solid histograms show the expected background contributions, while the red open histograms show the expected signal shapes, normalised to a cross section of 25 pb, approximately 10$^5 $ larger than the SM cross section prediction from Ref. [32]; points with statistical error bars represent collision data. For both reconstruction modes, all signal regions are combined. The lower panels show the data-to-prediction ratios; the hatched bands represent the relative uncertainty in the predictions. |
png pdf |
Figure 6-a:
Distribution of the BDT output in the signal region for simulated events after the fit, and for data in the dilepton channel. The different ranges of the two BDT output distributions are a consequence of the different architectures of the algorithms. The solid histograms show the expected background contributions, while the red open histograms show the expected signal shapes, normalised to a cross section of 25 pb, approximately 10$^5 $ larger than the SM cross section prediction from Ref. [32]; points with statistical error bars represent collision data. For both reconstruction modes, all signal regions are combined. The lower panel shows the data-to-prediction ratio; the hatched bands represent the relative uncertainty in the predictions. |
png pdf |
Figure 6-b:
Distribution of the BDT output in the signal region for simulated events after the fit, and for data in the $ \ell+$jets channel. The different ranges of the two BDT output distributions are a consequence of the different architectures of the algorithms. The solid histograms show the expected background contributions, while the red open histograms show the expected signal shapes, normalised to a cross section of 25 pb, approximately 10$^5 $ larger than the SM cross section prediction from Ref. [32]; points with statistical error bars represent collision data. For both reconstruction modes, all signal regions are combined. The lower panel shows the data-to-prediction ratio; the hatched bands represent the relative uncertainty in the predictions. |
png pdf |
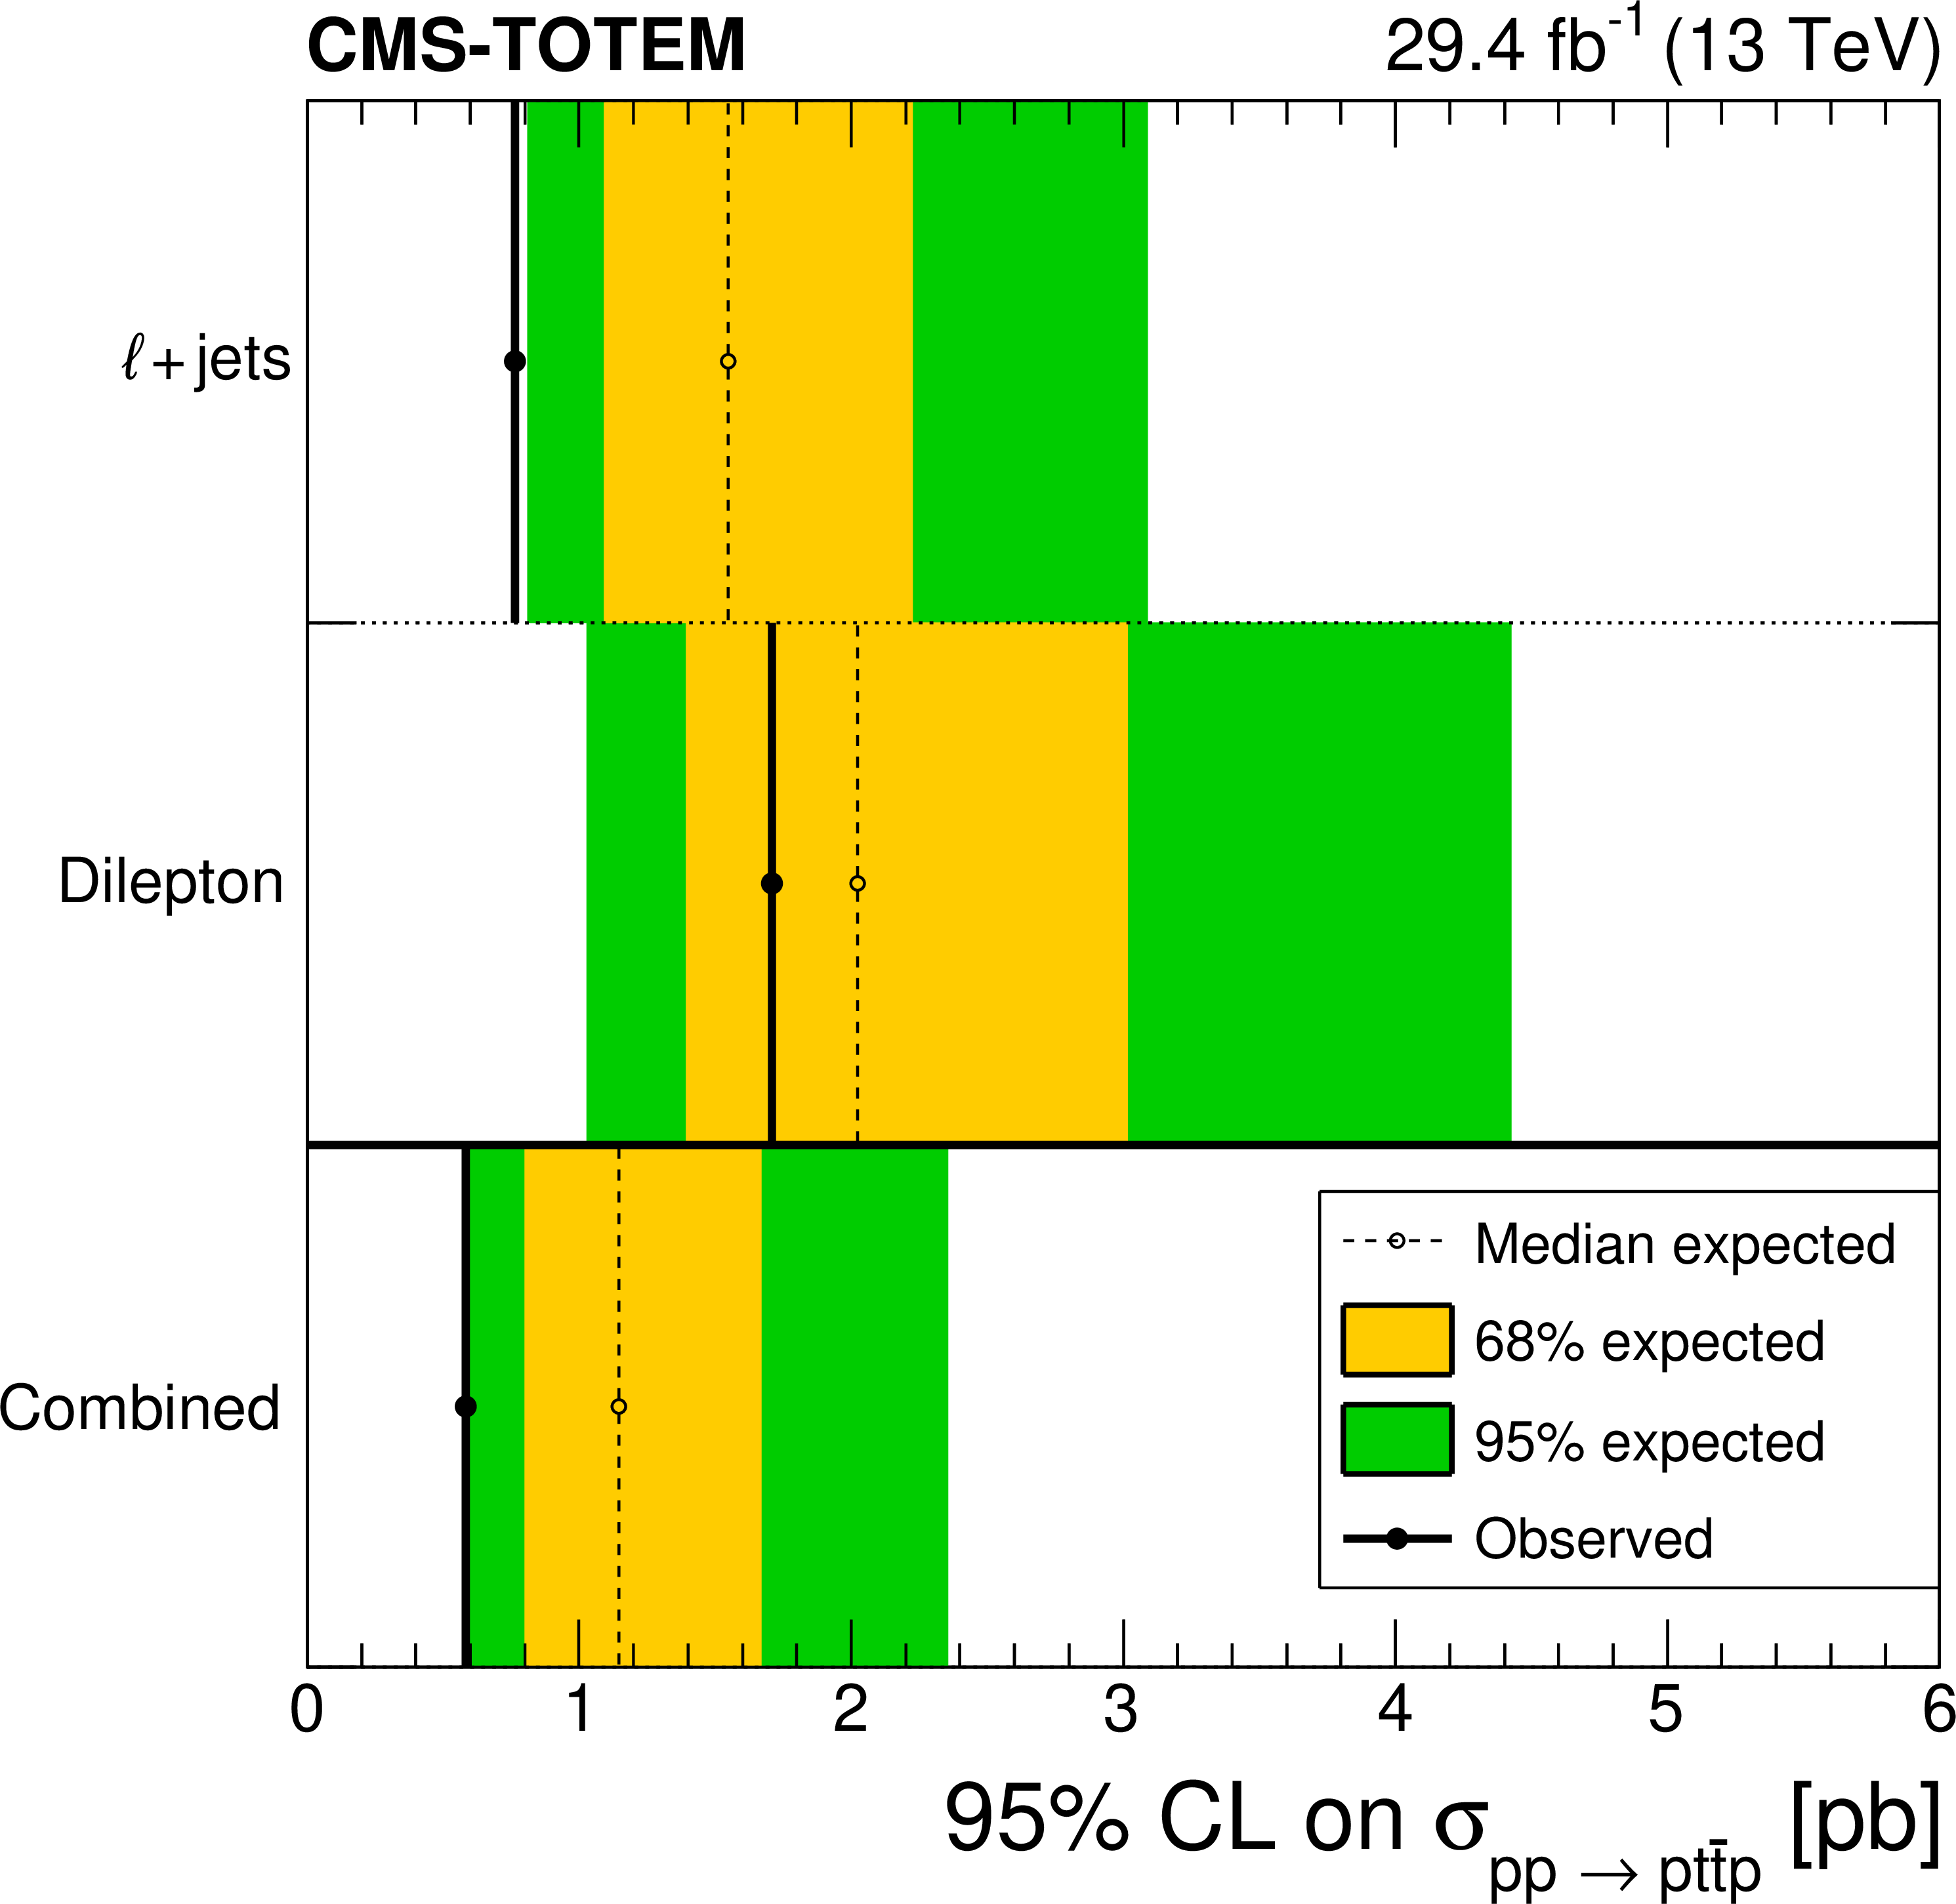
Figure 7:
Expected and observed 95% confidence level (CL) upper limits for the cross section of $ \mathrm{p}\mathrm{p}\to\mathrm{p}{\mathrm{t}\bar{\mathrm{t}}} \mathrm{p} $, for the dilepton and $ \ell+$jets channels separately and combined. The green and yellow bands show the 68 and 95% intervals, respectively, for the expected upper limit. |
| Summary |
| A search is reported for the central exclusive production of top quark-antiquark pairs in proton-proton interactions, $ \mathrm{p}\mathrm{p}\to\mathrm{p}{\mathrm{t}\bar{\mathrm{t}}} \mathrm{p} $, for the first time using tagged intact protons, reconstructed by the CMS-TOTEM precision proton spectrometer. The $ \mathrm{t} \bar{\mathrm{t}} $ pairs are reconstructed by the CMS detector either in the dilepton or the lepton+jets decay modes. The search is conducted both separately for the two modes, and in a combined fit. With a data sample of proton-proton collisions at a centre-of-mass energy of 13 TeV corresponding to an integrated luminosity of 29.4 fb$ ^{-1} $, results consistent with predictions from the standard model are obtained. An upper limit of 0.59 pb at 95% confidence level (compared to an expected limit of 1.14 pb) is set on the central exclusive production of $ \mathrm{t} \bar{\mathrm{t}} $ pairs, with fractional momentum loss of the intact protons in the range 0.02 $ < \xi < $ 0.20. |
| References | ||||
| 1 | CMS Collaboration | Measurement of the $ \mathrm{t} \overline{\mathrm{t}} $ production cross section in the all-jet final state in $ {\mathrm{p}\mathrm{p}} $ collisions at $ \sqrt{s}= $ 7 TeV | JHEP 05 (2013) 065 | CMS-TOP-11-007 1302.0508 |
| 2 | ATLAS Collaboration | Measurement of the $ \mathrm{t} \overline{\mathrm{t}} $ production cross-section using $ {\mathrm{e}\mu} $ events with b-tagged jets in $ {\mathrm{p}\mathrm{p}} $ collisions at $ \sqrt{s}= $ 7 and 8 TeV with the ATLAS detector | EPJC 74 (2014) 3109 | 1406.5375 |
| 3 | CMS Collaboration | Measurement of the $ \mathrm{t} \overline{\mathrm{t}} $ production cross section in the all-jets final state in $ {\mathrm{p}\mathrm{p}} $ collisions at $ \sqrt{s}= $ 8 TeV | EPJC 76 (2016) 128 | CMS-TOP-14-018 1509.06076 |
| 4 | CMS Collaboration | Measurements of the $ \mathrm{t} \overline{\mathrm{t}} $ production cross section in lepton+jets final states in $ {\mathrm{p}\mathrm{p}} $ collisions at 8 TeV and ratio of 8 to 7 TeV cross sections | EPJC 77 (2017) 15 | CMS-TOP-12-006 1602.09024 |
| 5 | CMS Collaboration | Measurement of the $ \mathrm{t} \overline{\mathrm{t}} $ production cross section in the $ {\mathrm{e}\mu} $ channel in proton-proton collisions at $ \sqrt{s}= $ 7 and 8 TeV | JHEP 08 (2016) 029 | CMS-TOP-13-004 1603.02303 |
| 6 | ATLAS Collaboration | Measurement of the $ \mathrm{t} \overline{\mathrm{t}} $ production cross section in the $ \tau $+jets final state in $ {\mathrm{p}\mathrm{p}} $ collisions at $ \sqrt{s}= $ 8 TeV using the ATLAS detector | PRD 95 (2017) 072003 | 1702.08839 |
| 7 | ATLAS Collaboration | Measurement of the inclusive and fiducial $ \mathrm{t} \overline{\mathrm{t}} $ production cross-sections in the lepton+jets channel in $ {\mathrm{p}\mathrm{p}} $ collisions at $ \sqrt{s}= $ 8 TeV with the ATLAS detector | EPJC 78 (2018) 487 | 1712.06857 |
| 8 | LHCb Collaboration | Measurement of forward top pair production in the dilepton channel in $ {\mathrm{p}\mathrm{p}} $ collisions at $ \sqrt{s}= $ 13 TeV | JHEP 08 (2018) 174 | 1803.05188 |
| 9 | CMS Collaboration | Measurement of the $ \mathrm{t} \overline{\mathrm{t}} $ production cross section, the top quark mass, and the strong coupling constant using dilepton events in $ {\mathrm{p}\mathrm{p}} $ collisions at $ \sqrt{s}= $ 13 TeV | EPJC 79 (2019) 368 | CMS-TOP-17-001 1812.10505 |
| 10 | CMS Collaboration | Measurement of the top quark pair production cross section in dilepton final states containing one $ \tau $ lepton in $ {\mathrm{p}\mathrm{p}} $ collisions at $ \sqrt{s}= $ 13 TeV | JHEP 02 (2020) 191 | CMS-TOP-18-005 1911.13204 |
| 11 | ATLAS Collaboration | Measurements of top-quark pair single- and double-differential cross-sections in the all-hadronic channel in $ {\mathrm{p}\mathrm{p}} $ collisions at $ \sqrt{s}= $ 13 TeV using the ATLAS detector | JHEP 01 (2021) 033 | 2006.09274 |
| 12 | ATLAS Collaboration | Measurement of the $ \mathrm{t} \overline{\mathrm{t}} $ production cross-section in the lepton+jets channel at $ \sqrt{s}= $ 13 TeV with the ATLAS experiment | PLB 810 (2020) 135797 | 2006.13076 |
| 13 | CMS Collaboration | Measurement of differential $ \mathrm{t} \overline{\mathrm{t}} $ production cross sections in the full kinematic range using lepton+jets events from proton-proton collisions at $ \sqrt{s}= $ 13 TeV | PRD 104 (2021) 092013 | CMS-TOP-20-001 2108.02803 |
| 14 | CMS Collaboration | Measurement of the inclusive $ \mathrm{t} \overline{\mathrm{t}} $ production cross section in proton-proton collisions at $ \sqrt{s}= $ 5.02 TeV | JHEP 04 (2022) 144 | CMS-TOP-20-004 2112.09114 |
| 15 | ATLAS and CMS Collaboration | Combination of inclusive top-quark pair production cross-section measurements using ATLAS and CMS data at $ \sqrt{s}= $ 7 and 8 TeV | JHEP 07 (2023) 213 | CMS-TOP-18-014 2205.13830 |
| 16 | ATLAS Collaboration | Measurement of the $ \mathrm{t} \overline{\mathrm{t}} $ production cross-section in $ {\mathrm{p}\mathrm{p}} $ collisions at $ \sqrt{s}= $ 5.02 TeV with the ATLAS detector | JHEP 06 (2023) 138 | 2207.01354 |
| 17 | ATLAS Collaboration | Measurement of the inclusive $ \mathrm{t} \overline{\mathrm{t}} $ production cross section in the lepton+jets channel in $ {\mathrm{p}\mathrm{p}} $ collisions at $ \sqrt{s}= $ 7 TeV with the ATLAS detector using support vector machines | PRD 108 (2023) 032014 | 2212.00571 |
| 18 | ATLAS Collaboration | Inclusive and differential cross-sections for dilepton $ \mathrm{t} \overline{\mathrm{t}} $ production measured in $ \sqrt{s}= $ 13 TeV $ {\mathrm{p}\mathrm{p}} $ collisions with the ATLAS detector | JHEP 07 (2023) 141 | 2303.15340 |
| 19 | CMS Collaboration | First measurement of the top quark pair production cross section in proton-proton collisions at $ \sqrt{s}= $ 13.6 TeV | JHEP 08 (2023) 204 | CMS-TOP-22-012 2303.10680 |
| 20 | ATLAS Collaboration | Measurement of the $ \mathrm{t} \overline{\mathrm{t}} $ cross section and its ratio to the Z production cross section using $ {\mathrm{p}\mathrm{p}} $ collisions at $ \sqrt{s}= $ 13.6 TeV with the ATLAS detector | PLB 848 (2024) 138376 | 2308.09529 |
| 21 | ATLAS and CMS Collaborations | Combinations of single-top-quark production cross-section measurements at $ \sqrt{s}= $ 7 and 8 TeV with the ATLAS and CMS experiments | JHEP 05 (2019) 088 | CMS-TOP-17-006 1902.07158 |
| 22 | ATLAS Collaboration | Measurement of the inclusive cross-sections of single top-quark and top-antiquark $ t $-channel production in $ {\mathrm{p}\mathrm{p}} $ collisions at $ \sqrt{s}= $ 13 TeV with the ATLAS detector | JHEP 04 (2017) 086 | 1609.03920 |
| 23 | CMS Collaboration | Measurement of differential cross sections and charge ratios for $ t $-channel single top quark production in proton-proton collisions at $ \sqrt{s}= $ 13 TeV | EPJC 80 (2020) 370 | CMS-TOP-17-023 1907.08330 |
| 24 | ATLAS Collaboration | Measurement of the cross-section for producing a W boson in association with a single top quark in $ {\mathrm{p}\mathrm{p}} $ collisions at $ \sqrt{s}= $ 13 TeV with ATLAS | JHEP 01 (2018) 063 | 1612.07231 |
| 25 | V. A. Khoze, A. D. Martin, and M. G. Ryskin | Prospects for new physics observations in diffractive processes at the lhc and tevatron | EPJC 23 (2002) 311 | hep-ph/0111078 |
| 26 | S. Fichet et al. | Light-by-light scattering with intact protons at the LHC: from standard model to new physics | JHEP 02 (2015) 165 | 1411.6629 |
| 27 | J. de Favereau de Jeneret et al. | High energy photon interactions at the LHC | 0908.2020 | |
| 28 | D. d'Enterria and J.-P. Lansberg | Study of Higgs boson production and its $ \mathrm{b}\overline{\mathrm{b}} $ decay in $ {\gamma\gamma} $ processes in proton-nucleus collisions at the LHC | PRD 81 (2010) 014004 | 0909.3047 |
| 29 | S. Fayazbakhsh, S. T. Monfared, and M. Mohammadi Najafabadi | Top quark anomalous electromagnetic couplings in photon-photon scattering at the LHC | PRD 92 (2015) 014006 | 1504.06695 |
| 30 | M. Łuszczak, L. Forthomme, W. Schäfer, and A. Szczurek | Production of $ \mathrm{t} \overline{\mathrm{t}} $ pairs via $ {\gamma\gamma} $ fusion with photon transverse momenta and proton dissociation | JHEP 02 (2019) 100 | 1810.12432 |
| 31 | V. P. Gonçalves, D. E. Martins, M. S. Rangel, and M. Tasevsky | Top quark pair production in the exclusive processes at the LHC | PRD 102 (2020) 074014 | 2007.04565 |
| 32 | H.-S. Shao and D. d'Enterria | gamma-UPC: automated generation of exclusive photon-photon processes in ultraperipheral proton and nuclear collisions with varying form factors | JHEP 09 (2022) 248 | 2207.03012 |
| 33 | CMS Collaboration | The CMS precision proton spectrometer at the HL-LHC: Expression of interest | CMS Technical Proposal CMS-NOTE-2020-008, 2020 | 2103.02752 |
| 34 | J. A. Aguilar-Saavedra et al. | Interpreting top-quark LHC measurements in the standard-model effective field theory | LHC TOP WG note CERN-LPCC-2018-01, 2018 | 1802.07237 |
| 35 | C. Baldenegro et al. | Searching for anomalous top quark interactions with proton tagging and timing detectors at the LHC | JHEP 08 (2022) 021 | 2205.01173 |
| 36 | CMS Collaboration | Measurement of the inclusive and differential $ {{\mathrm{t}\overline{\mathrm{t}}} \gamma} $ cross sections in the dilepton channel and effective field theory interpretation in proton-proton collisions at $ \sqrt{s}= $ 13 TeV | JHEP 05 (2022) 091 | CMS-TOP-21-004 2201.07301 |
| 37 | CMS Collaboration | Measurement of the inclusive and differential $ {{\mathrm{t}\overline{\mathrm{t}}} \gamma} $ cross sections in the single-lepton channel and EFT interpretation at $ \sqrt{s}= $ 13 TeV | JHEP 12 (2021) 180 | CMS-TOP-18-010 2107.01508 |
| 38 | ATLAS Collaboration | Measurements of inclusive and differential fiducial cross-sections of $ {{\mathrm{t}\overline{\mathrm{t}}} \gamma} $ production in leptonic final states at $ \sqrt{s}= $ 13 TeV in ATLAS | EPJC 79 (2019) 382 | 1812.01697 |
| 39 | ATLAS Collaboration | Measurements of inclusive and differential cross-sections of combined $ {{\mathrm{t}\overline{\mathrm{t}}} \gamma} $ and $ {\mathrm{t}\mathrm{W}\gamma} $ production in the $ {\mathrm{e}\mu} $ channel at 13 TeV with the ATLAS detector | JHEP 09 (2020) 049 | 2007.06946 |
| 40 | S. C. Inan and A. A. Billur | Polarized top pair production in extra dimension models via photon-photon fusion at the CERN LHC | PRD 84 (2011) 095002 | |
| 41 | CMS and TOTEM Collaborations | CMS-TOTEM precision proton spectrometer | TOTEM Technical Proposal CERN-LHCC-2014-021, TOTEM-TDR-003, CMS-TDR-013, 2014 link |
|
| 42 | CMS Collaboration | The CMS experiment at the CERN LHC | JINST 3 (2008) S08004 | |
| 43 | G. Ruggiero et al. | Characteristics of edgeless silicon detectors for the roman pots of the TOTEM experiment at the LHC | in Proc. 8th International Conference on Position Sensitive Detectors (PSD8): Glasgow, UK, 2009 NIM A 604 (2009) 242 |
|
| 44 | F. Ravera on behalf of the CMS and TOTEM Collaborations | The CT-PPS tracking system with 3D pixel detectors | in Proc. 8th International Workshop on Semiconductor Pixel Detectors for Particles and Imaging (PIXEL ): Sestri Levante, Italy, September 5--9, . . [], 2016 JINST 11 (2016) C11027 |
|
| 45 | CMS Collaboration | Particle-flow reconstruction and global event description with the CMS detector | JINST 12 (2017) P10003 | CMS-PRF-14-001 1706.04965 |
| 46 | CMS Collaboration | Electron and photon reconstruction and identification with the CMS experiment at the CERN LHC | JINST 16 (2021) P05014 | CMS-EGM-17-001 2012.06888 |
| 47 | CMS Collaboration | Performance of the CMS muon detector and muon reconstruction with proton-proton collisions at $ \sqrt{s}= $ 13 TeV | JINST 13 (2018) P06015 | CMS-MUO-16-001 1804.04528 |
| 48 | CMS Collaboration | Technical proposal for the Phase-II upgrade of the Compact Muon Solenoid | CMS Technical Proposal CERN-LHCC-2015-010, CMS-TDR-15-02, 2015 CDS |
|
| 49 | M. Cacciari, G. P. Salam, and G. Soyez | The anti-$ k_{\mathrm{T}} $ jet clustering algorithm | JHEP 04 (2008) 063 | 0802.1189 |
| 50 | M. Cacciari, G. P. Salam, and G. Soyez | FASTJET user manual | EPJC 72 (2012) 1896 | 1111.6097 |
| 51 | M. Cacciari, G. P. Salam, and G. Soyez | The catchment area of jets | JHEP 04 (2008) 005 | 0802.1188 |
| 52 | M. Cacciari and G. P. Salam | Pileup subtraction using jet areas | PLB 659 (2008) 119 | 0707.1378 |
| 53 | CMS Collaboration | Jet energy scale and resolution in the CMS experiment in $ {\mathrm{p}\mathrm{p}} $ collisions at 8 TeV | JINST 12 (2017) P02014 | CMS-JME-13-004 1607.03663 |
| 54 | CMS Collaboration | Performance of missing transverse momentum reconstruction in proton-proton collisions at $ \sqrt{s}= $ 13 TeV using the CMS detector | JINST 14 (2019) P07004 | CMS-JME-17-001 1903.06078 |
| 55 | CMS and TOTEM Collaborations | Proton reconstruction with the CMS-TOTEM precision proton spectrometer | JINST 18 (2023) P09009 | CMS-PRO-21-001 2210.05854 |
| 56 | CMS Collaboration | CMS luminosity measurement for the 2017 data-taking period at $ \sqrt{s}= $ 13 TeV | CMS Physics Analysis Summary, 2018 CMS-PAS-LUM-17-004 |
CMS-PAS-LUM-17-004 |
| 57 | CMS Collaboration | Precision luminosity measurement in proton-proton collisions at $ \sqrt{s}= $ 13 TeV in 2015 and 2016 at CMS | EPJC 81 (2021) 800 | CMS-LUM-17-003 2104.01927 |
| 58 | GEANT4 Collaboration | GEANT 4---a simulation toolkit | NIM A 506 (2003) 250 | |
| 59 | M. Boonekamp et al. | FPMC: a generator for forward physics | 1102.2531 | |
| 60 | V. M. Budnev, I. F. Ginzburg, G. V. Meledin, and V. G. Serbo | The two-photon particle production mechanism. Physical problems. Applications. Equivalent photon approximation | Phys. Rept. 15 (1975) 181 | |
| 61 | P. Artoisenet, R. Frederix, O. Mattelaer, and R. Rietkerk | Automatic spin-entangled decays of heavy resonances in Monte Carlo simulations | JHEP 03 (2013) 015 | 1212.3460 |
| 62 | P. Nason | A new method for combining NLO QCD with shower Monte Carlo algorithms | JHEP 11 (2004) 040 | hep-ph/0409146 |
| 63 | S. Frixione, P. Nason, and C. Oleari | Matching NLO QCD computations with parton shower simulations: the POWHEG method | JHEP 11 (2007) 070 | 0709.2092 |
| 64 | S. Alioli, P. Nason, C. Oleari, and E. Re | A general framework for implementing NLO calculations in shower Monte Carlo programs: the POWHEG \textscbox | JHEP 06 (2010) 043 | 1002.2581 |
| 65 | M. Czakon, P. Fiedler, and A. Mitov | Total top-quark pair-production cross section at hadron colliders through $ \mathcal{O}({\alpha_\mathrm{S}}^4) $ | PRL 110 (2013) 252004 | 1303.6254 |
| 66 | M. Czakon et al. | Top-pair production at the LHC through NNLO QCD and NLO EW | JHEP 10 (2017) 186 | 1705.04105 |
| 67 | T. Sjöstrand et al. | An introduction to PYTHIA8.2 | Comput. Phys. Commun. 191 (2015) 159 | 1410.3012 |
| 68 | CMS Collaboration | Extraction and validation of a new set of CMS PYTHIA8 tunes from underlying-event measurements | EPJC 80 (2020) 4 | CMS-GEN-17-001 1903.12179 |
| 69 | NNPDF Collaboration | Parton distributions from high-precision collider data | EPJC 77 (2017) 663 | 1706.00428 |
| 70 | CMS Collaboration | Performance of the CMS Level-1 trigger in proton-proton collisions at $ \sqrt{s}= $ 13 TeV | JINST 15 (2020) P10017 | CMS-TRG-17-001 2006.10165 |
| 71 | CMS Collaboration | The CMS trigger system | JINST 12 (2017) P01020 | CMS-TRG-12-001 1609.02366 |
| 72 | CMS Collaboration | Identification of heavy-flavour jets with the CMS detector in $ {\mathrm{p}\mathrm{p}} $ collisions at 13 TeV | JINST 13 (2018) P05011 | CMS-BTV-16-002 1712.07158 |
| 73 | CMS Collaboration | Measurements of $ \mathrm{t} \overline{\mathrm{t}} $ differential cross sections in proton-proton collisions at $ \sqrt{s}= $ 13 TeV using events containing two leptons | JHEP 02 (2019) 149 | CMS-TOP-17-014 1811.06625 |
| 74 | Particle Data Group , R. L. Workman et al. | Review of particle physics | Prog. Theor. Exp. Phys. 2022 (2022) 083C01 | |
| 75 | L. Breiman, J. Friedman, R. A. Olshen, and C. J. Stone | Classification and regression trees | Chapman & Hall/CRC, Boca Raton FL, USA. ISBN~978-0-412-04841-8, 1984 | |
| 76 | H. Voss, A. Höcker, J. Stelzer, and F. Tegenfeldt | TMVA, the toolkit for multivariate data analysis with ROOT | in Proc. 11th Int. Workshop on Advanced Computing and Analysis Techniques in Phys. Research (ACAT ): Amsterdam, The Netherlands, 2017 [PoS (ACAT) 040] |
physics/0703039 |
| 77 | J. H. Friedman | Data analysis techniques for high energy particle physics | in Proc. 3rd CERN School of Computing: Godøysund, Norway, 1974 link |
|
| 78 | R. Brun et al. | HBOOK: Statistical analysis and histogramming: Reference manual | CERN Program Library Long Writeups Y250, 1998 link |
|
| 79 | M. Cacciari et al. | The $ \mathrm{t} \overline{\mathrm{t}} $ cross-section at 1.8 and 1.96 TeV: a study of the systematics due to parton densities and scale dependence | JHEP 04 (2004) 068 | hep-ph/0303085 |
| 80 | J. Butterworth et al. | PDF4LHC recommendations for LHC Run II | JPG 43 (2016) 023001 | 1510.03865 |
| 81 | N. Kidonakis and N. Yamanaka | Higher-order corrections for $ {\mathrm{t}\mathrm{W}} $ production at high-energy hadron colliders | JHEP 05 (2021) 278 | 2102.11300 |
| 82 | CMS Collaboration | Measurement of the production cross section of a W boson in association with two b jets in $ {\mathrm{p}\mathrm{p}} $ collisions at $ \sqrt{s}= $ 8 TeV | EPJC 77 (2017) 92 | CMS-SMP-14-020 1608.07561 |
| 83 | CMS Collaboration | $ {\mathrm{W^+}\mathrm{W^-}} $ boson pair production in proton-proton collisions at $ \sqrt{s}= $ 13 TeV | PRD 102 (2020) 092001 | CMS-SMP-18-004 2009.00119 |
| 84 | CMS Collaboration | Measurement of the production cross section for $ {\mathrm{Z}+\mathrm{b}} $ jets in proton-proton collisions at $ \sqrt{s}= $ 13 TeV | PRD 105 (2022) 092014 | CMS-SMP-20-015 2112.09659 |
| 85 | R. J. Barlow and C. Beeston | Fitting using finite Monte Carlo samples | Comput. Phys. Commun. 77 (1993) 219 | |
| 86 | T. Junk | Confidence level computation for combining searches with small statistics | NIM A 434 (1999) 435 | hep-ex/9902006 |
| 87 | A. L. Read | Presentation of search results: The $ \text{CL}_\text{s} $ technique | JPG 28 (2002) 2693 | |
| 88 | G. Cowan, K. Cranmer, E. Gross, and O. Vitells | Asymptotic formulae for likelihood-based tests of new physics | EPJC 71 (2011) 1554 | 1007.1727 |
| 89 | CMS Collaboration | HEPData record for this analysis | link | |
|
|
Compact Muon Solenoid LHC, CERN |
|

|

|

|

|

|