

Compact Muon Solenoid
LHC, CERN
| CMS-SMP-19-007 ; CERN-EP-2025-134 | ||
| Studies of $ \mathrm{Z} \to 4\ell $ decays in proton-proton collisions at $ \sqrt{s} = $ 8 and 13 TeV | ||
| CMS Collaboration | ||
| 24 May 2026 | ||
| Submitted to Physical Review D | ||
| Abstract: Decays of Z bosons to four charged leptons (electrons and muons) are studied in proton-proton collisions at $ \sqrt{s} = $ 8 and 13 TeV. The analysis is based on data collected with the CMS detector at the LHC corresponding to an integrated luminosity of 19.7 fb$ ^{-1} $ at 8 TeV and 138 fb$ ^{-1} $ at 13 TeV. The measured value of the inclusive branching fraction for all four-lepton decay modes, $ \mathcal{B}(\mathrm{Z} \to 4\ell) $, is $ [ $ 4.67 $ \pm $ 0.11 (stat) $ \pm $ 0.10 (syst) $ ] \times 10^{-6} $, which has a precision of about 3% limited by both statistical and systematic uncertainties. Measurements of the individual branching fractions for the decays $ \mathrm{Z} \to 4\mu $, $ \mathrm{Z} \to 4\mathrm{e} $, and $ \mathrm{Z} \to 2\mu 2\mathrm{e} $ are also reported. Differential decay rates are presented as functions of kinematic and angular quantities in the Z boson rest frame. Measurements of triple-product asymmetries, which are sensitive to possible violations of charge conjugation and parity invariance, are performed for $ \mathrm{Z} \to 4\ell $ decays. The results are compared with standard model predictions and used to set limits on the production of new gauge bosons. | ||
| Links: e-print arXiv:2605.25158 [hep-ex] (PDF) ; CDS record ; inSPIRE record ; HepData record ; CADI line (restricted) ; | ||
| Figures | |

png pdf |
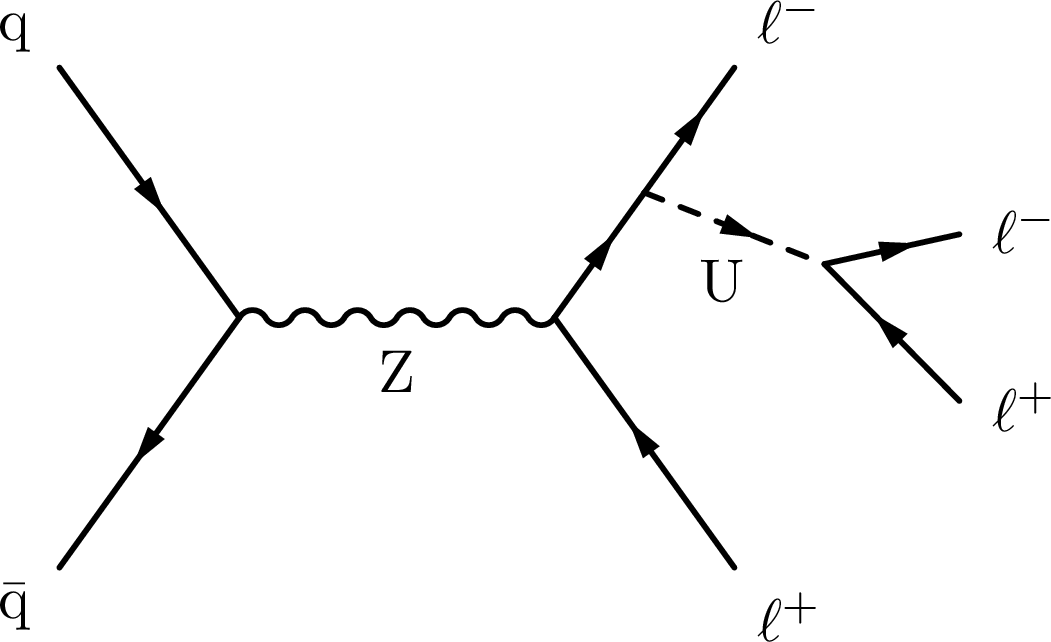
Figure 1:
The $ \mathrm{Z} \to 4\ell $ decay process in $ \mathrm{p}\mathrm{p} $ collisions. |
png pdf |
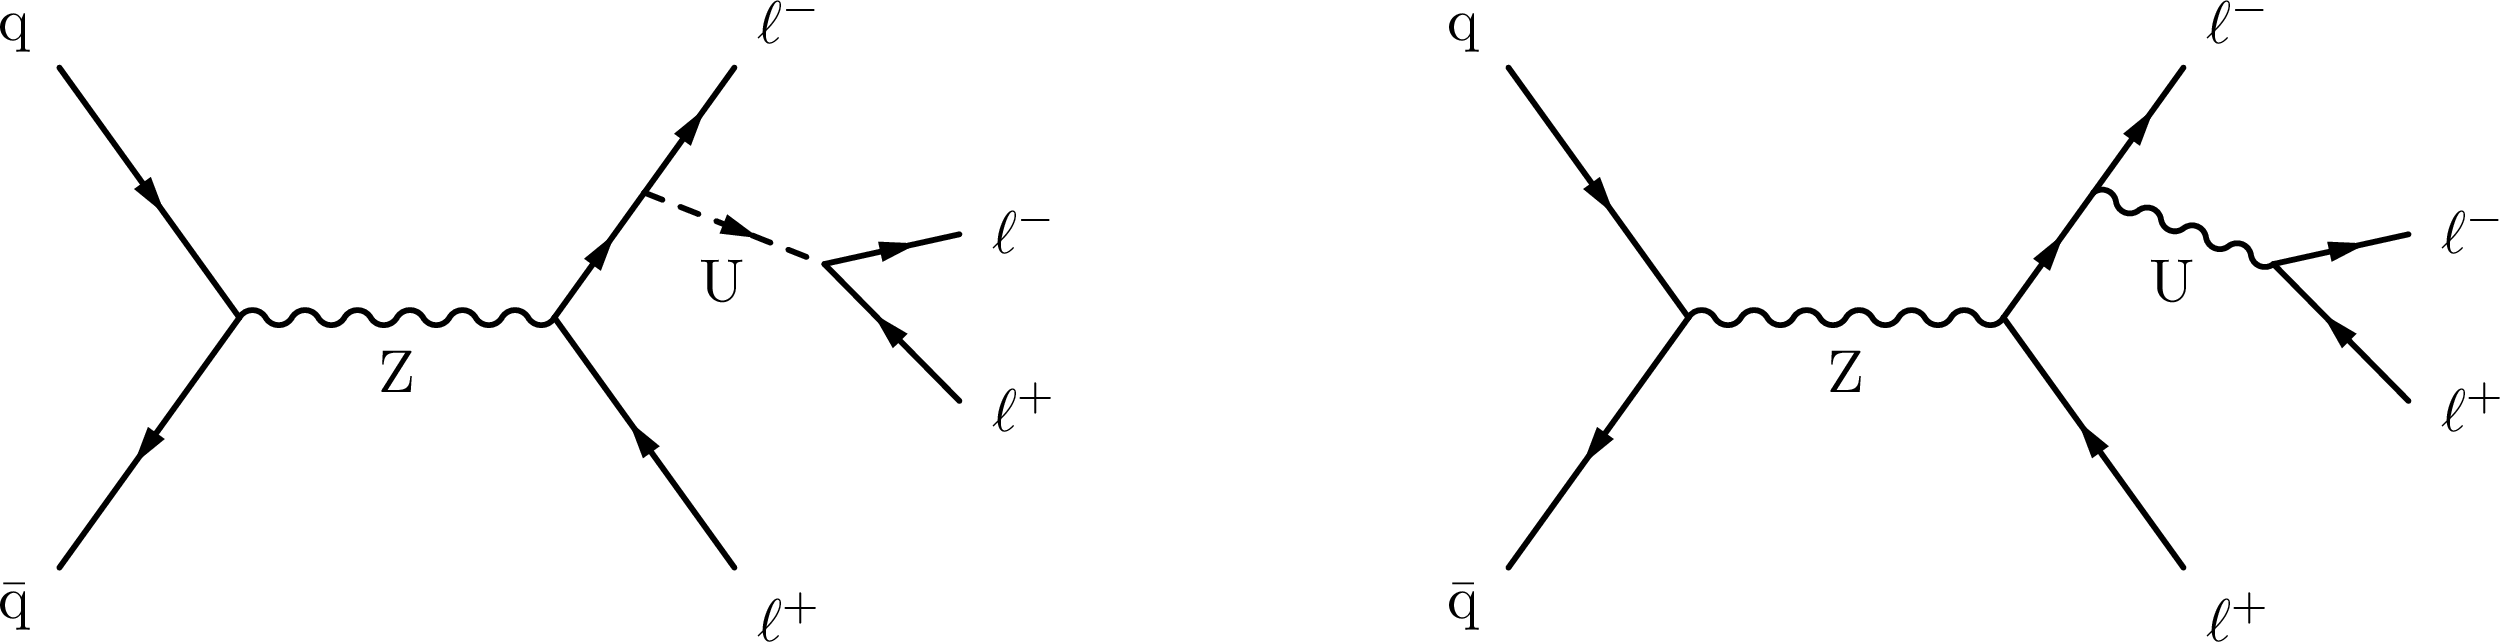
Figure 2:
The $ \mathrm{Z} \to 4\ell $ process mediated by a scalar (left) or vector (right) boson $ \mathrm{U} $. |

png pdf |
Figure 2-a:
The $ \mathrm{Z} \to 4\ell $ process mediated by a scalar (left) or vector (right) boson $ \mathrm{U} $. |
png pdf |
Figure 2-b:
The $ \mathrm{Z} \to 4\ell $ process mediated by a scalar (left) or vector (right) boson $ \mathrm{U} $. |
png pdf |
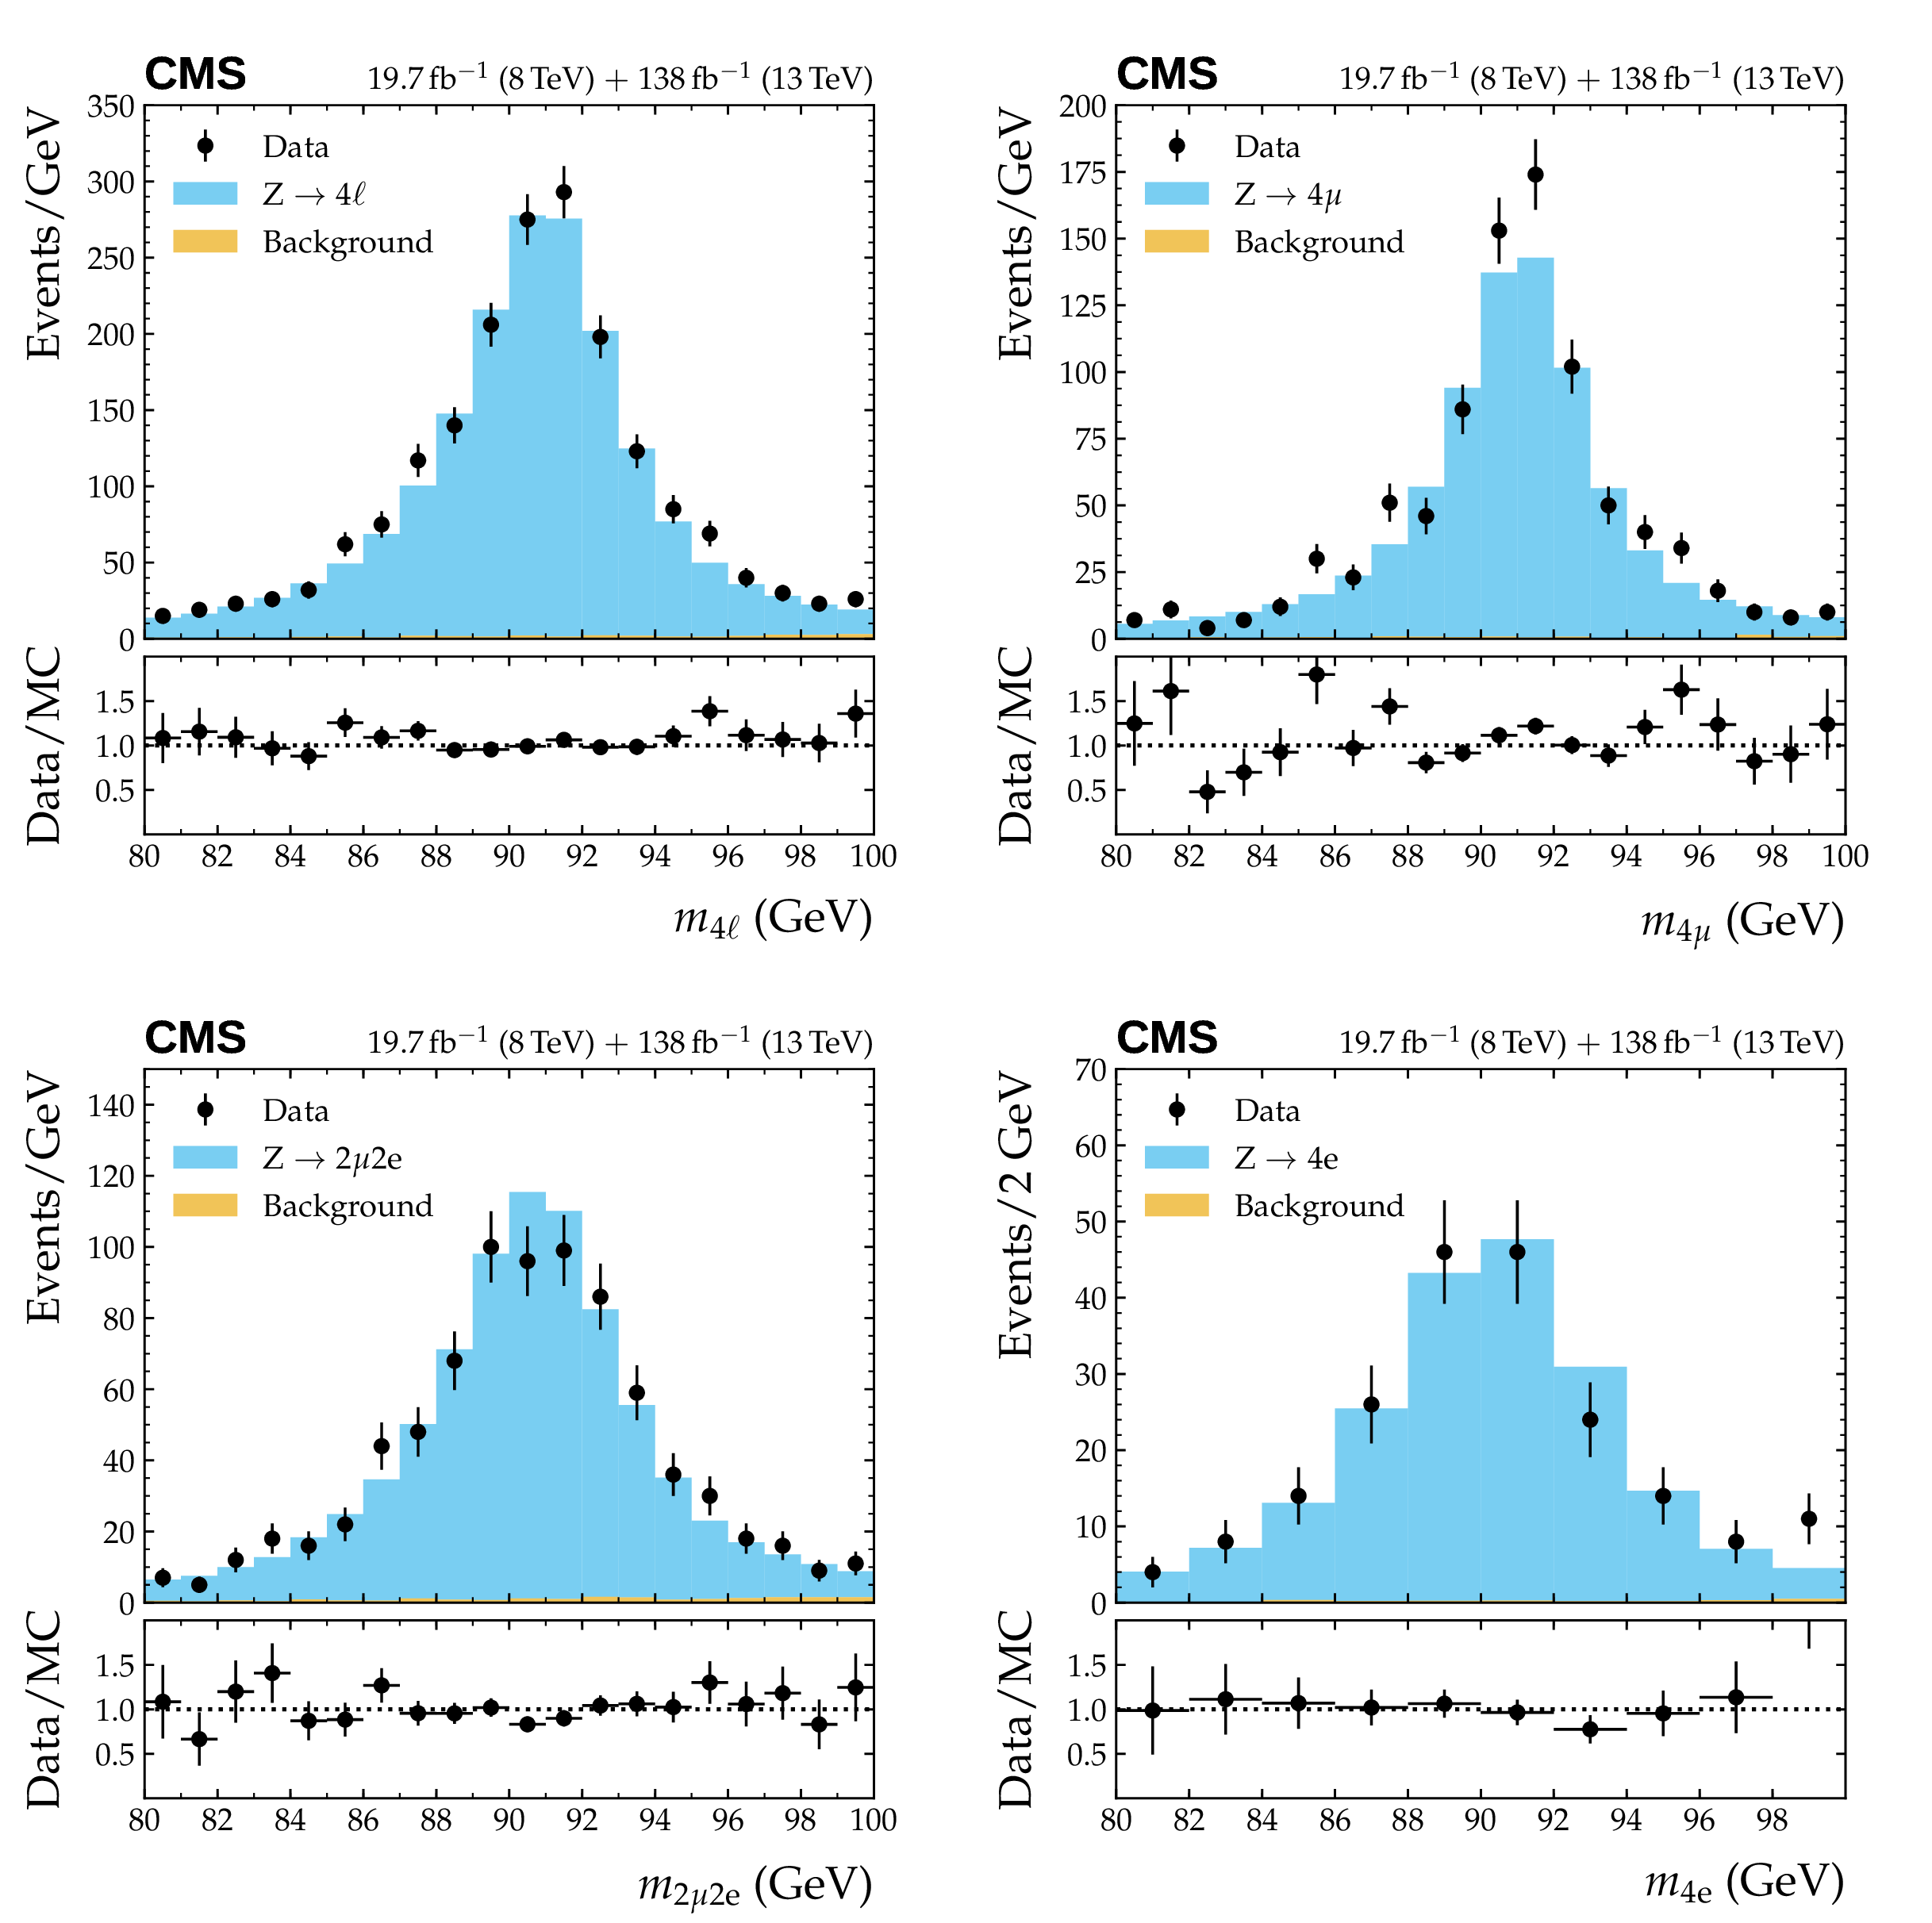
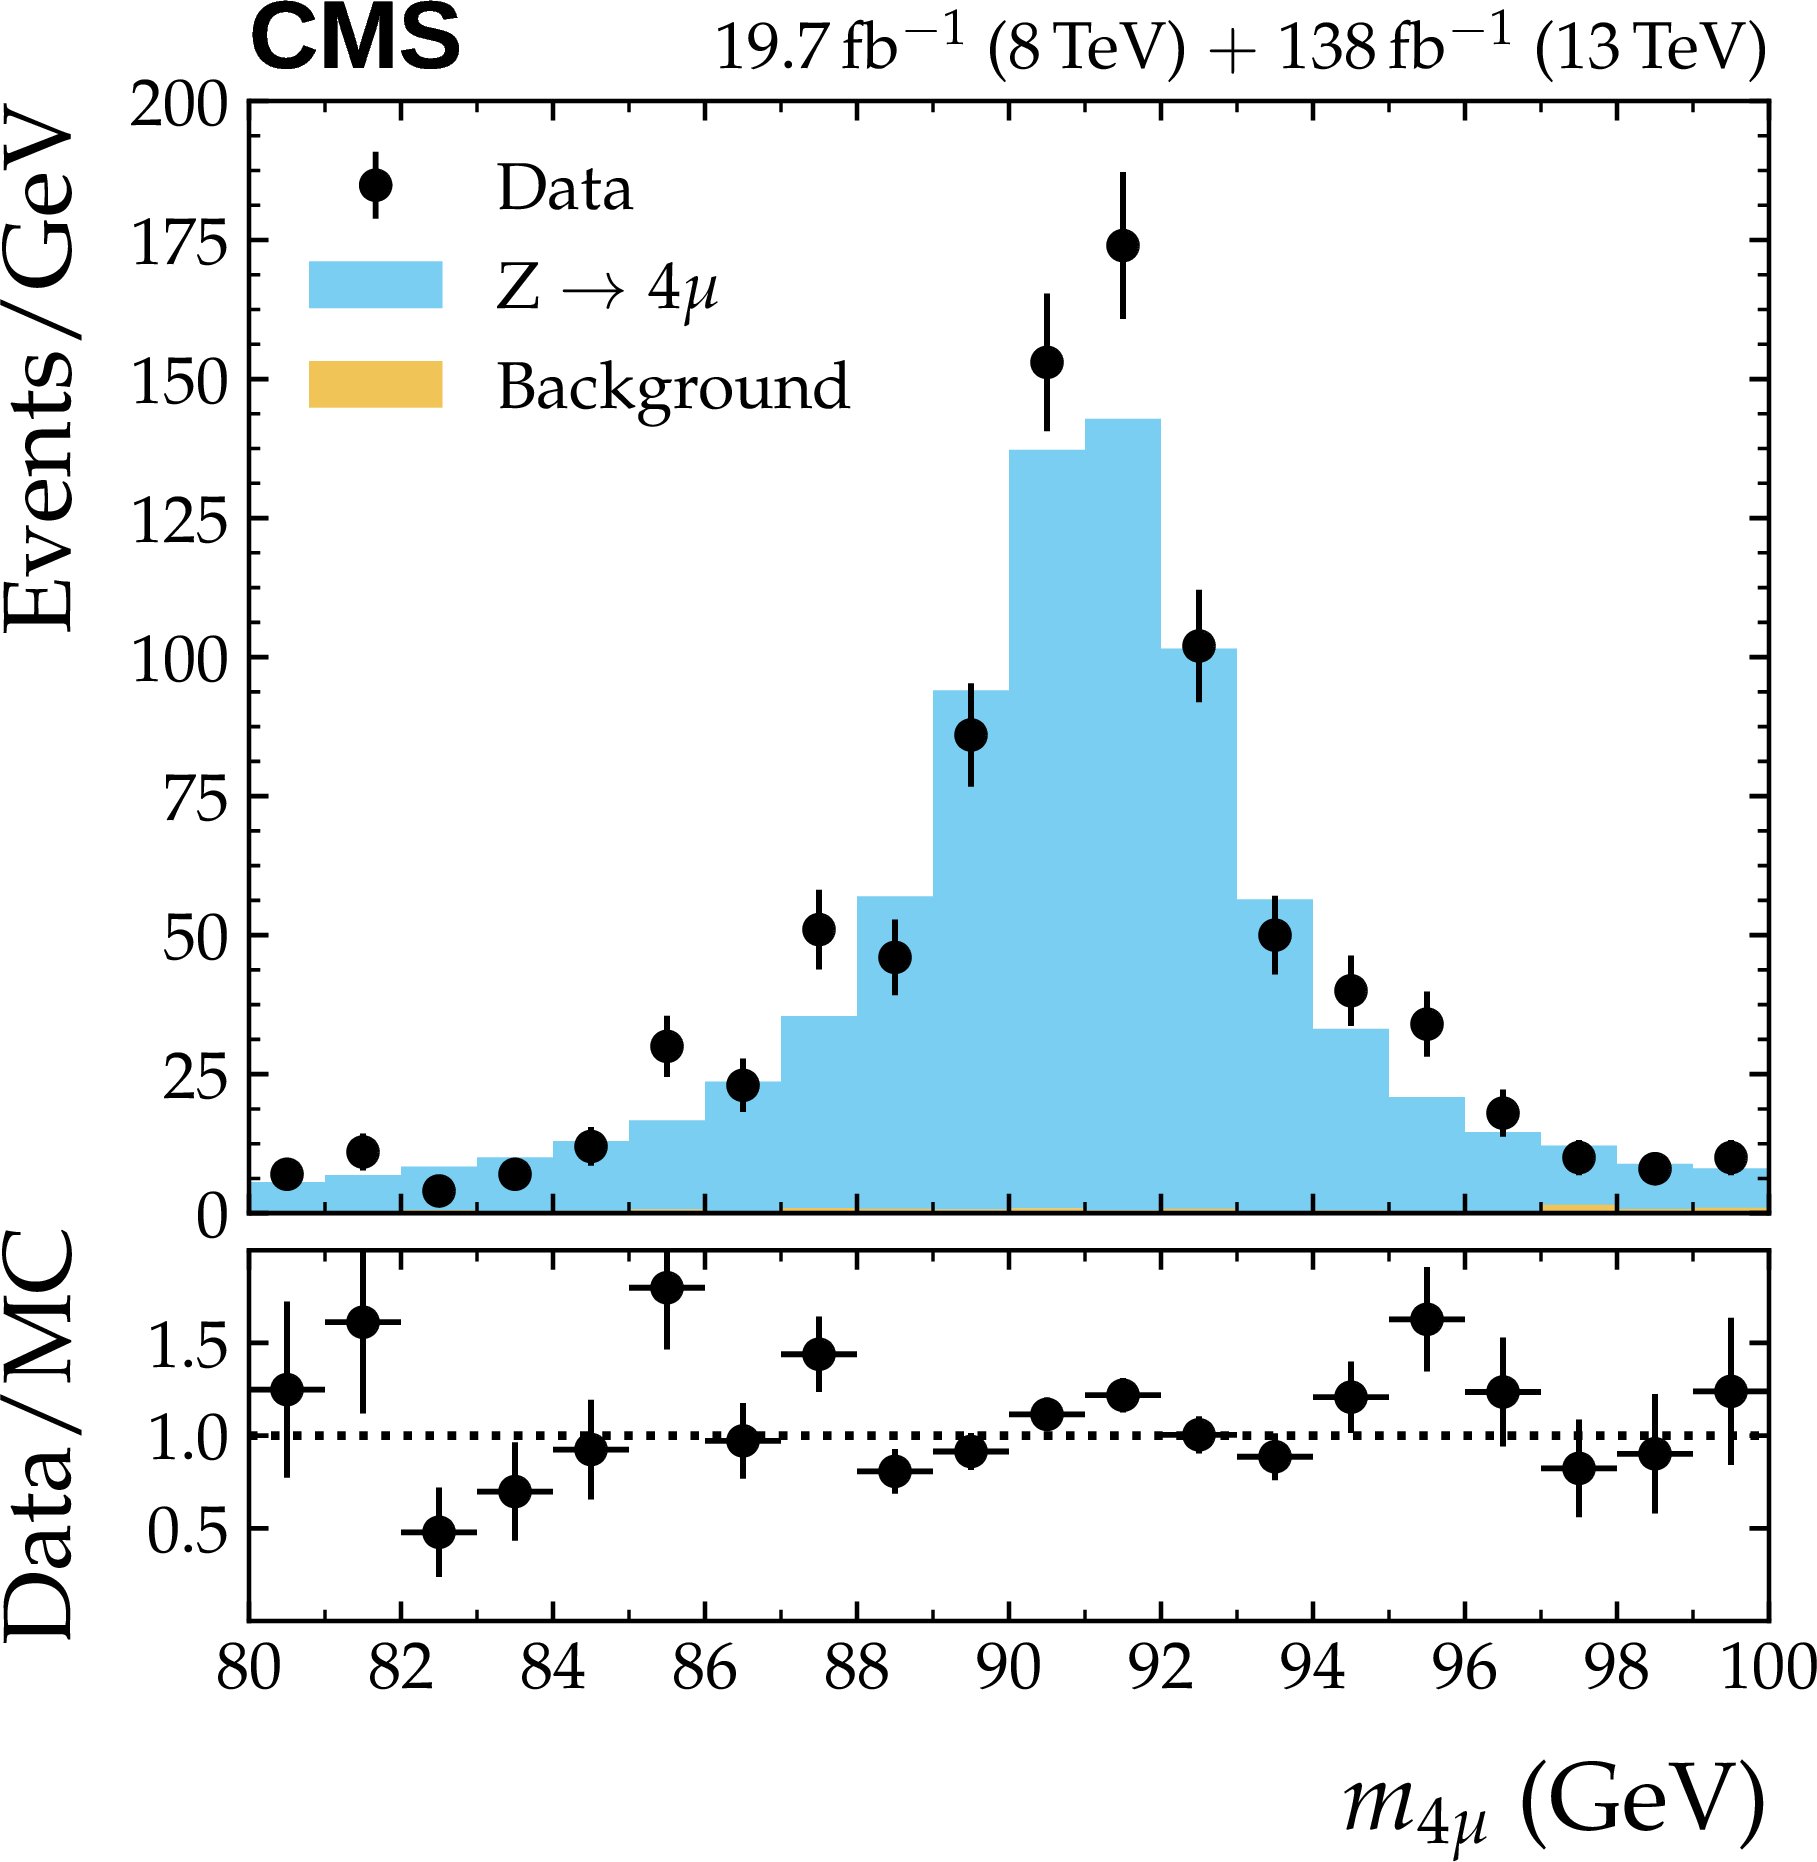
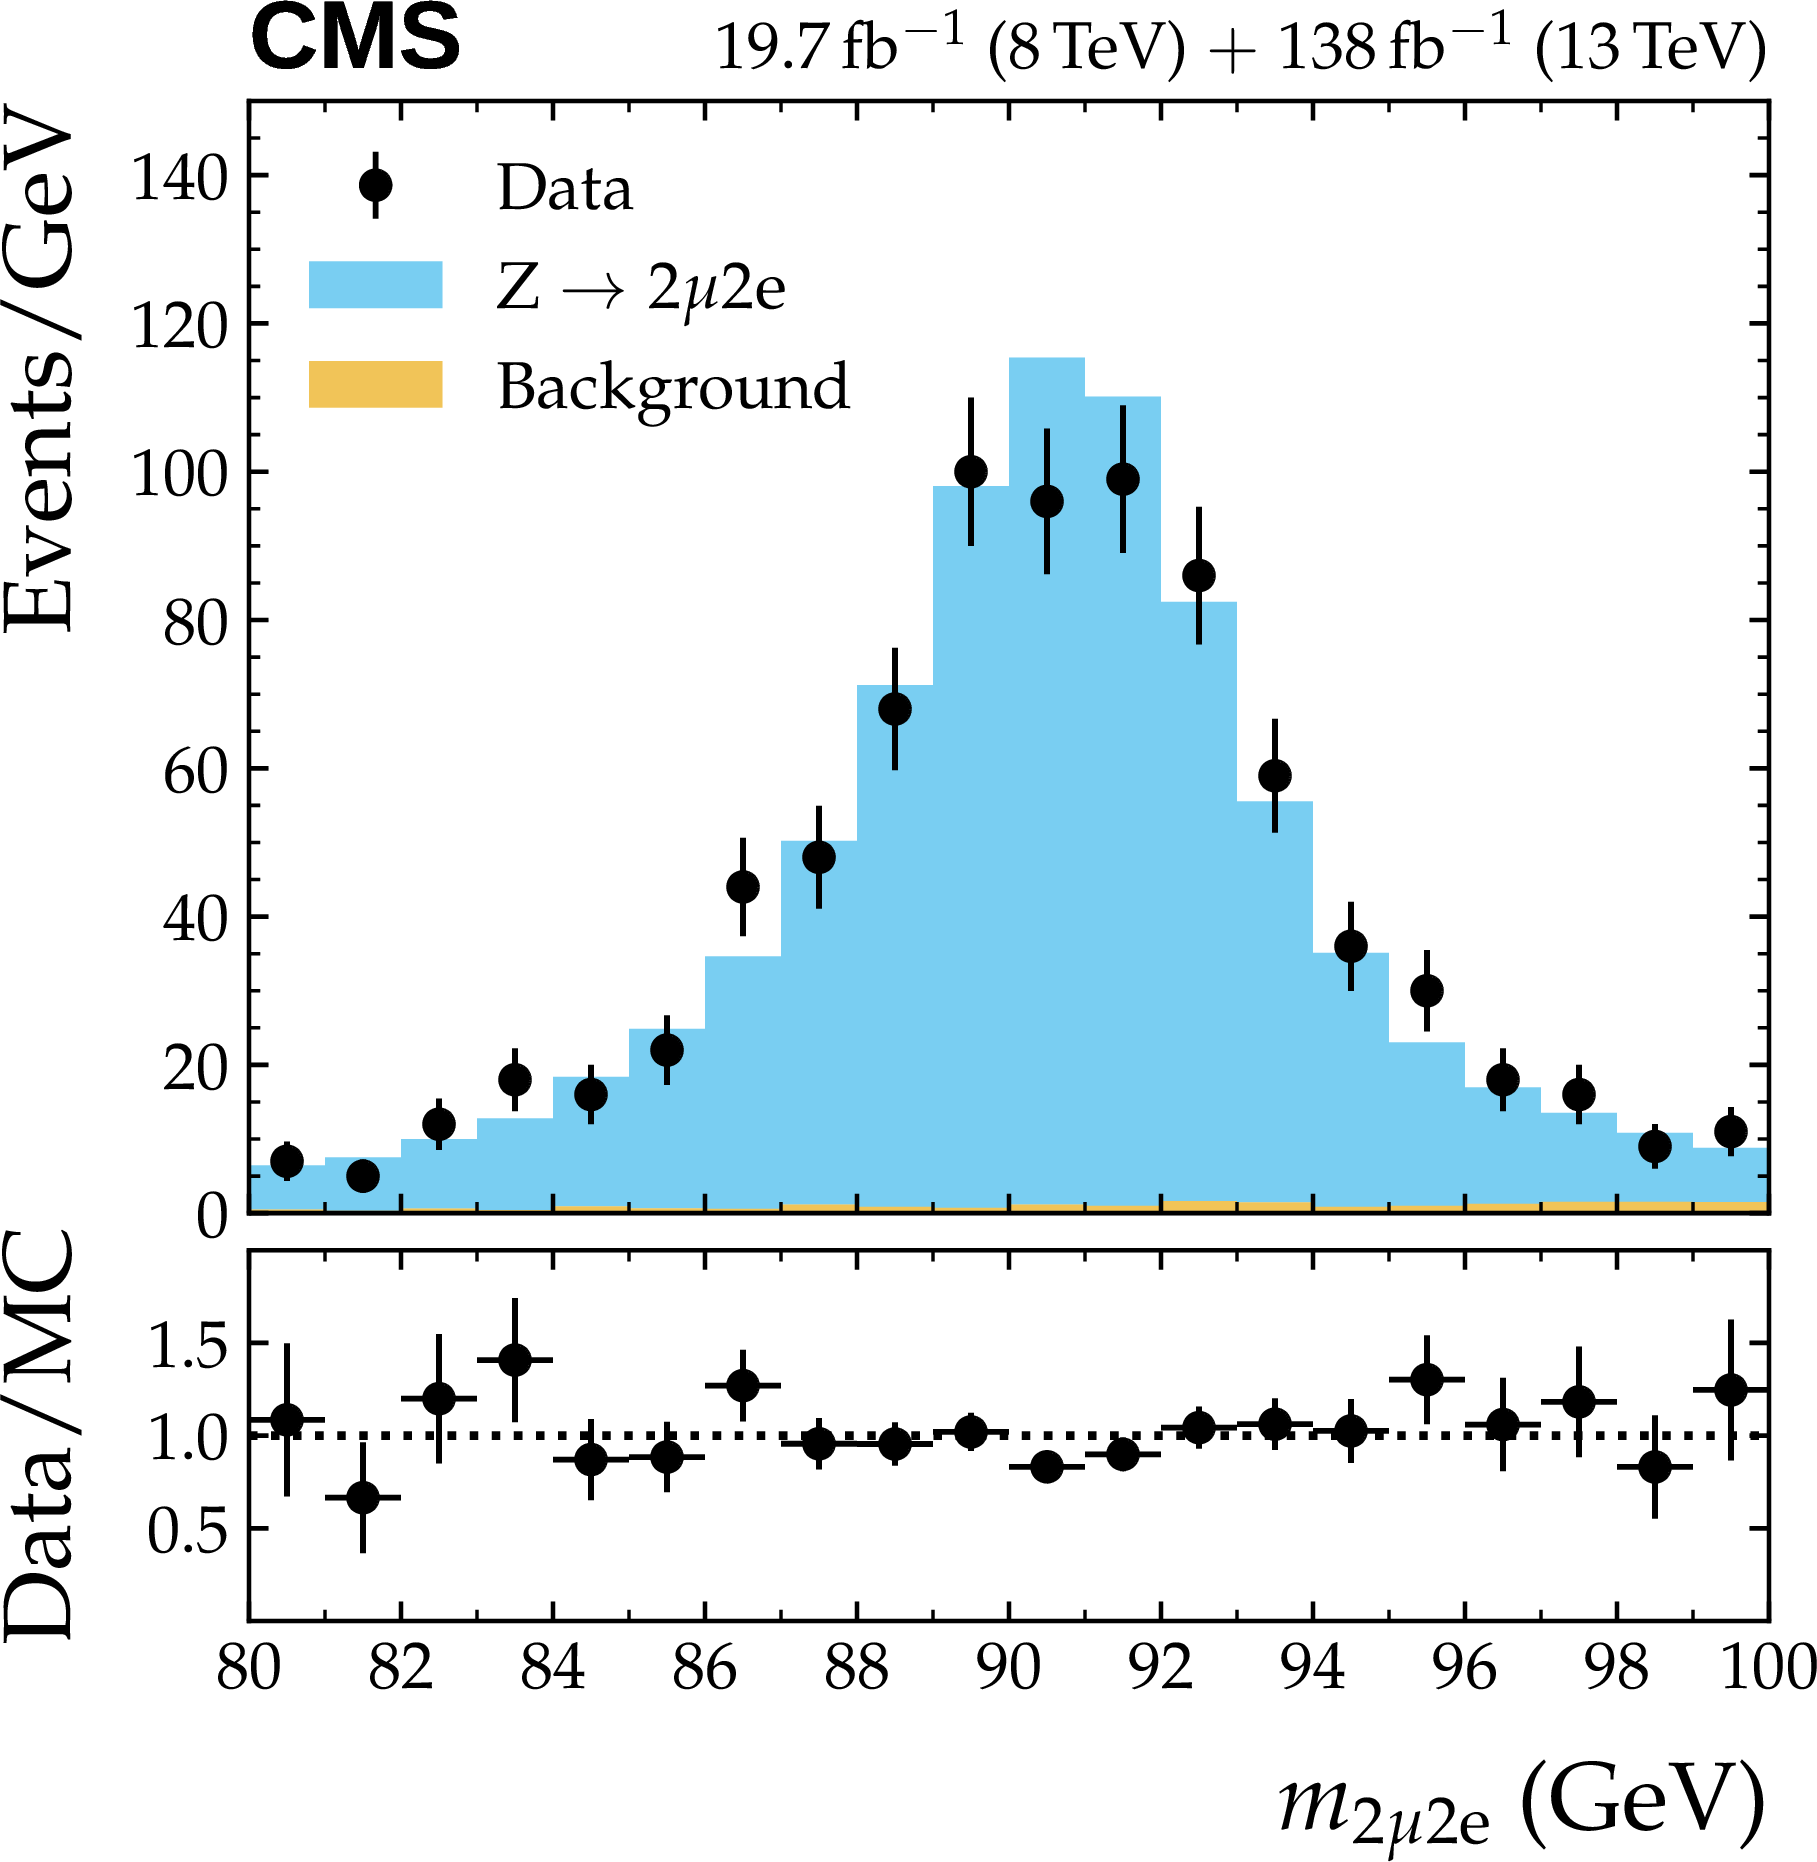
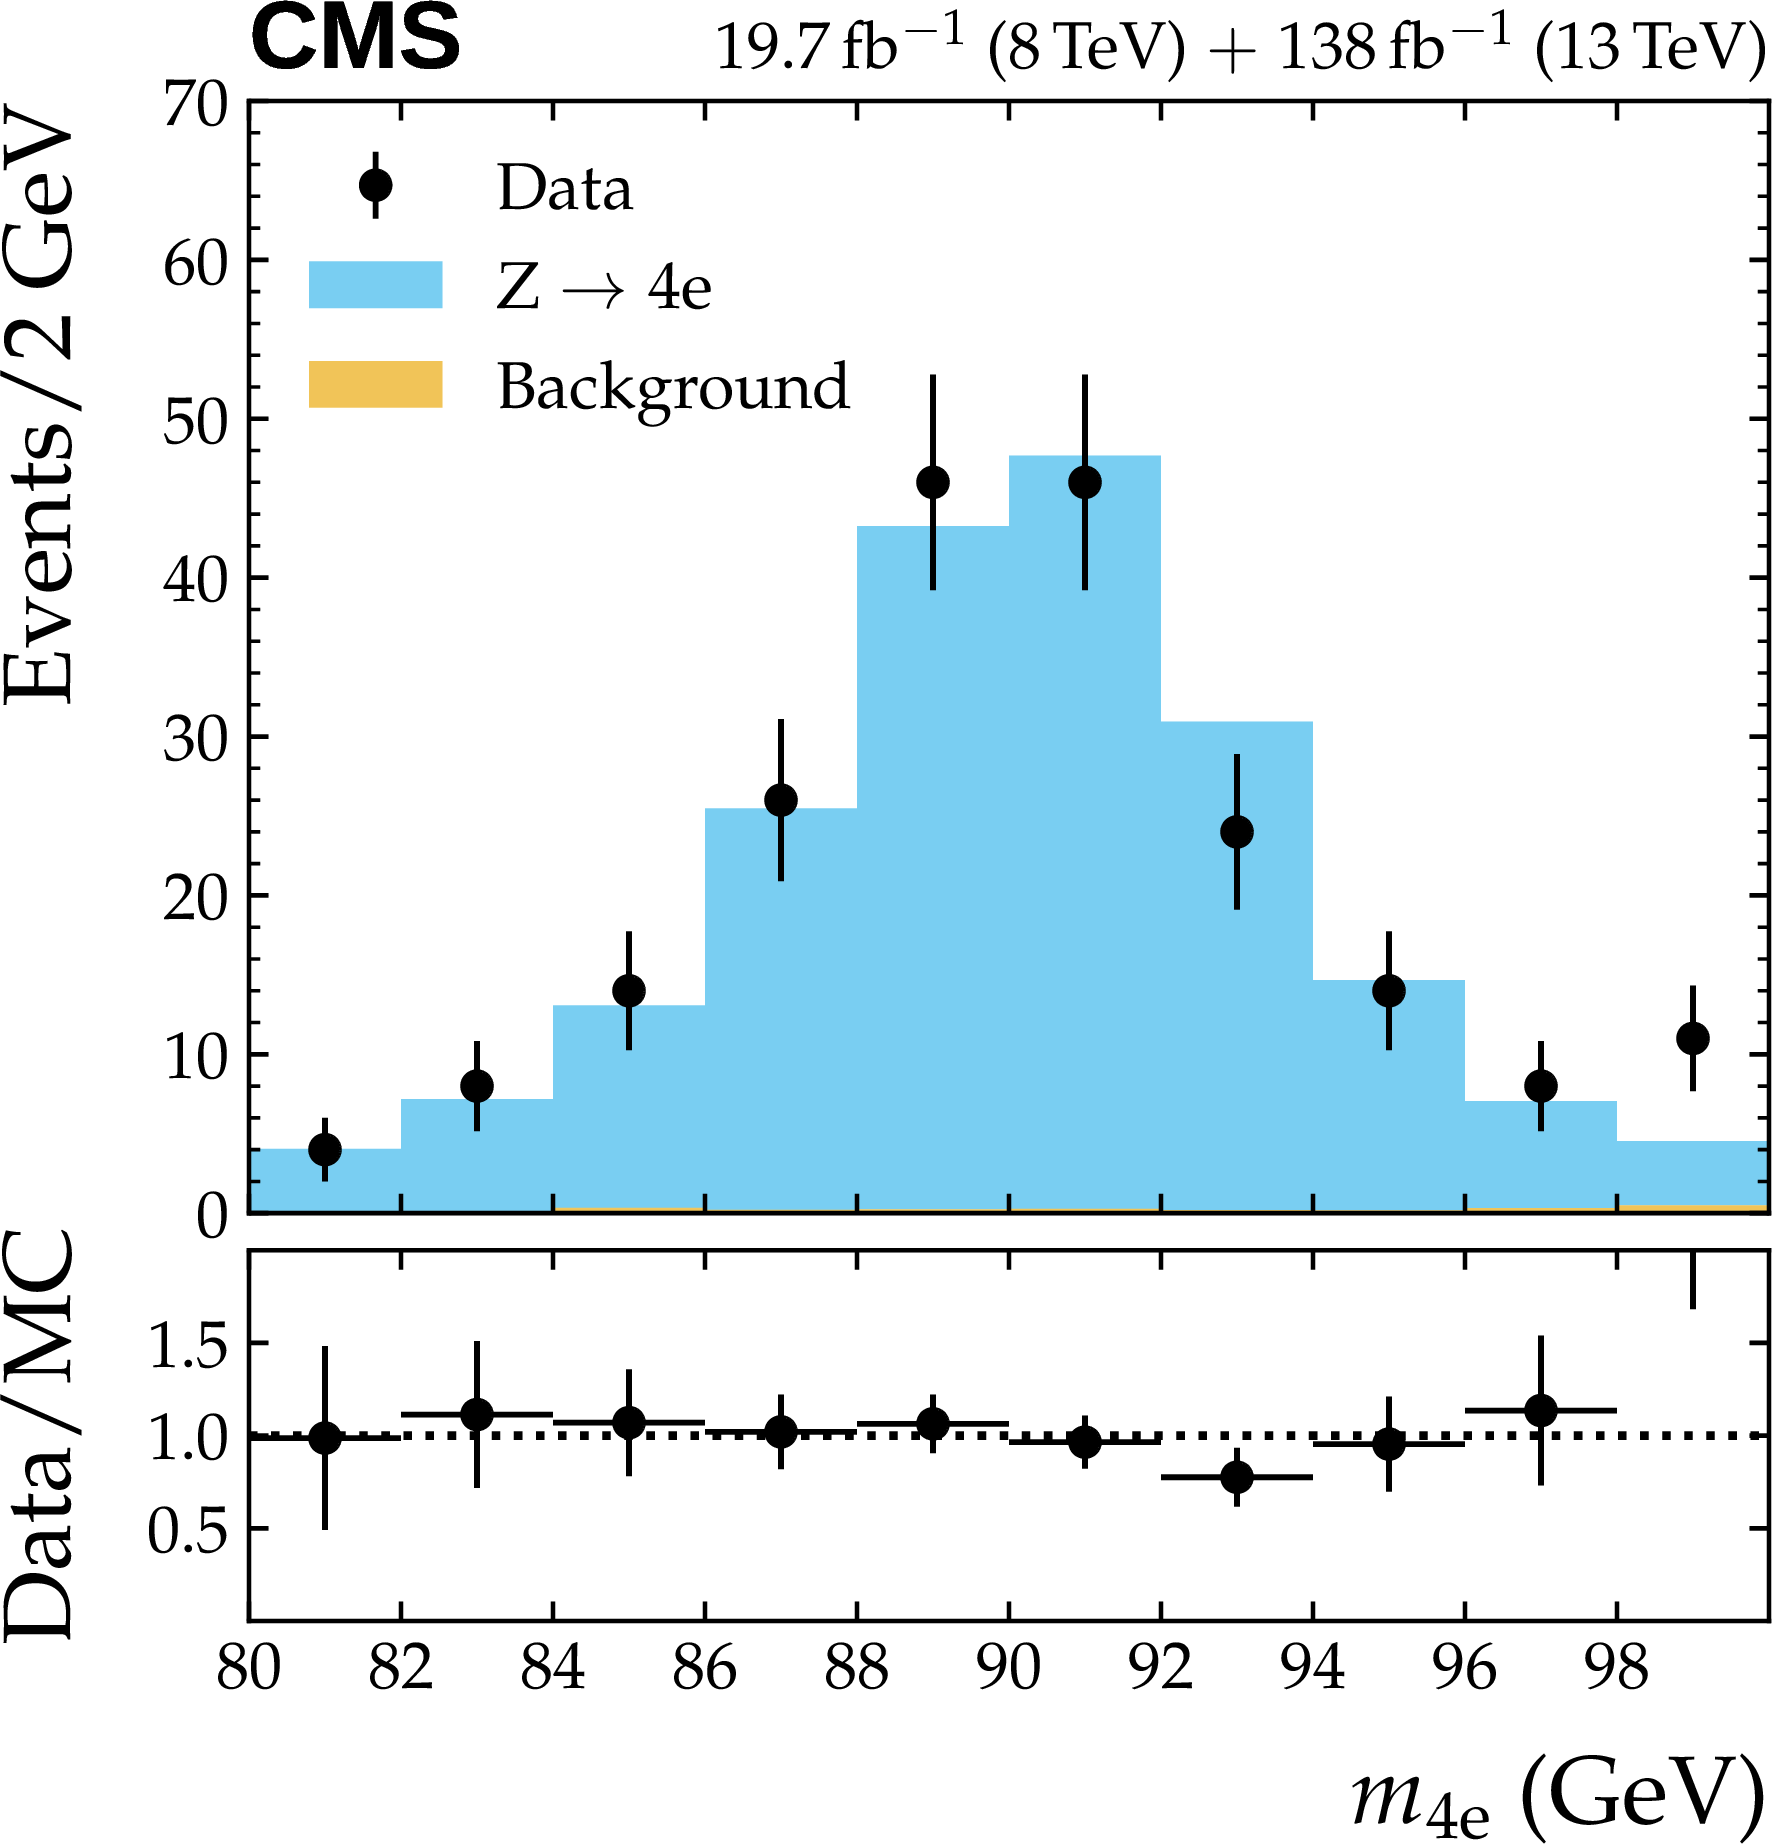
Figure 3:
Invariant mass distributions for events passing the $ \mathrm{Z} \to 4\ell $ selection for the sum of all 4 $ \ell $ channels (upper left), the 4 $ \mu $ channel (upper right), the 2 $ \mu 2\mathrm{e} $ channel (lower left), and the 4 e channel (lower right). Vertical error bars represent the total uncertainty on each point. The simulations are normalized according to predicted cross sections and the integrated luminosity. |
png pdf |
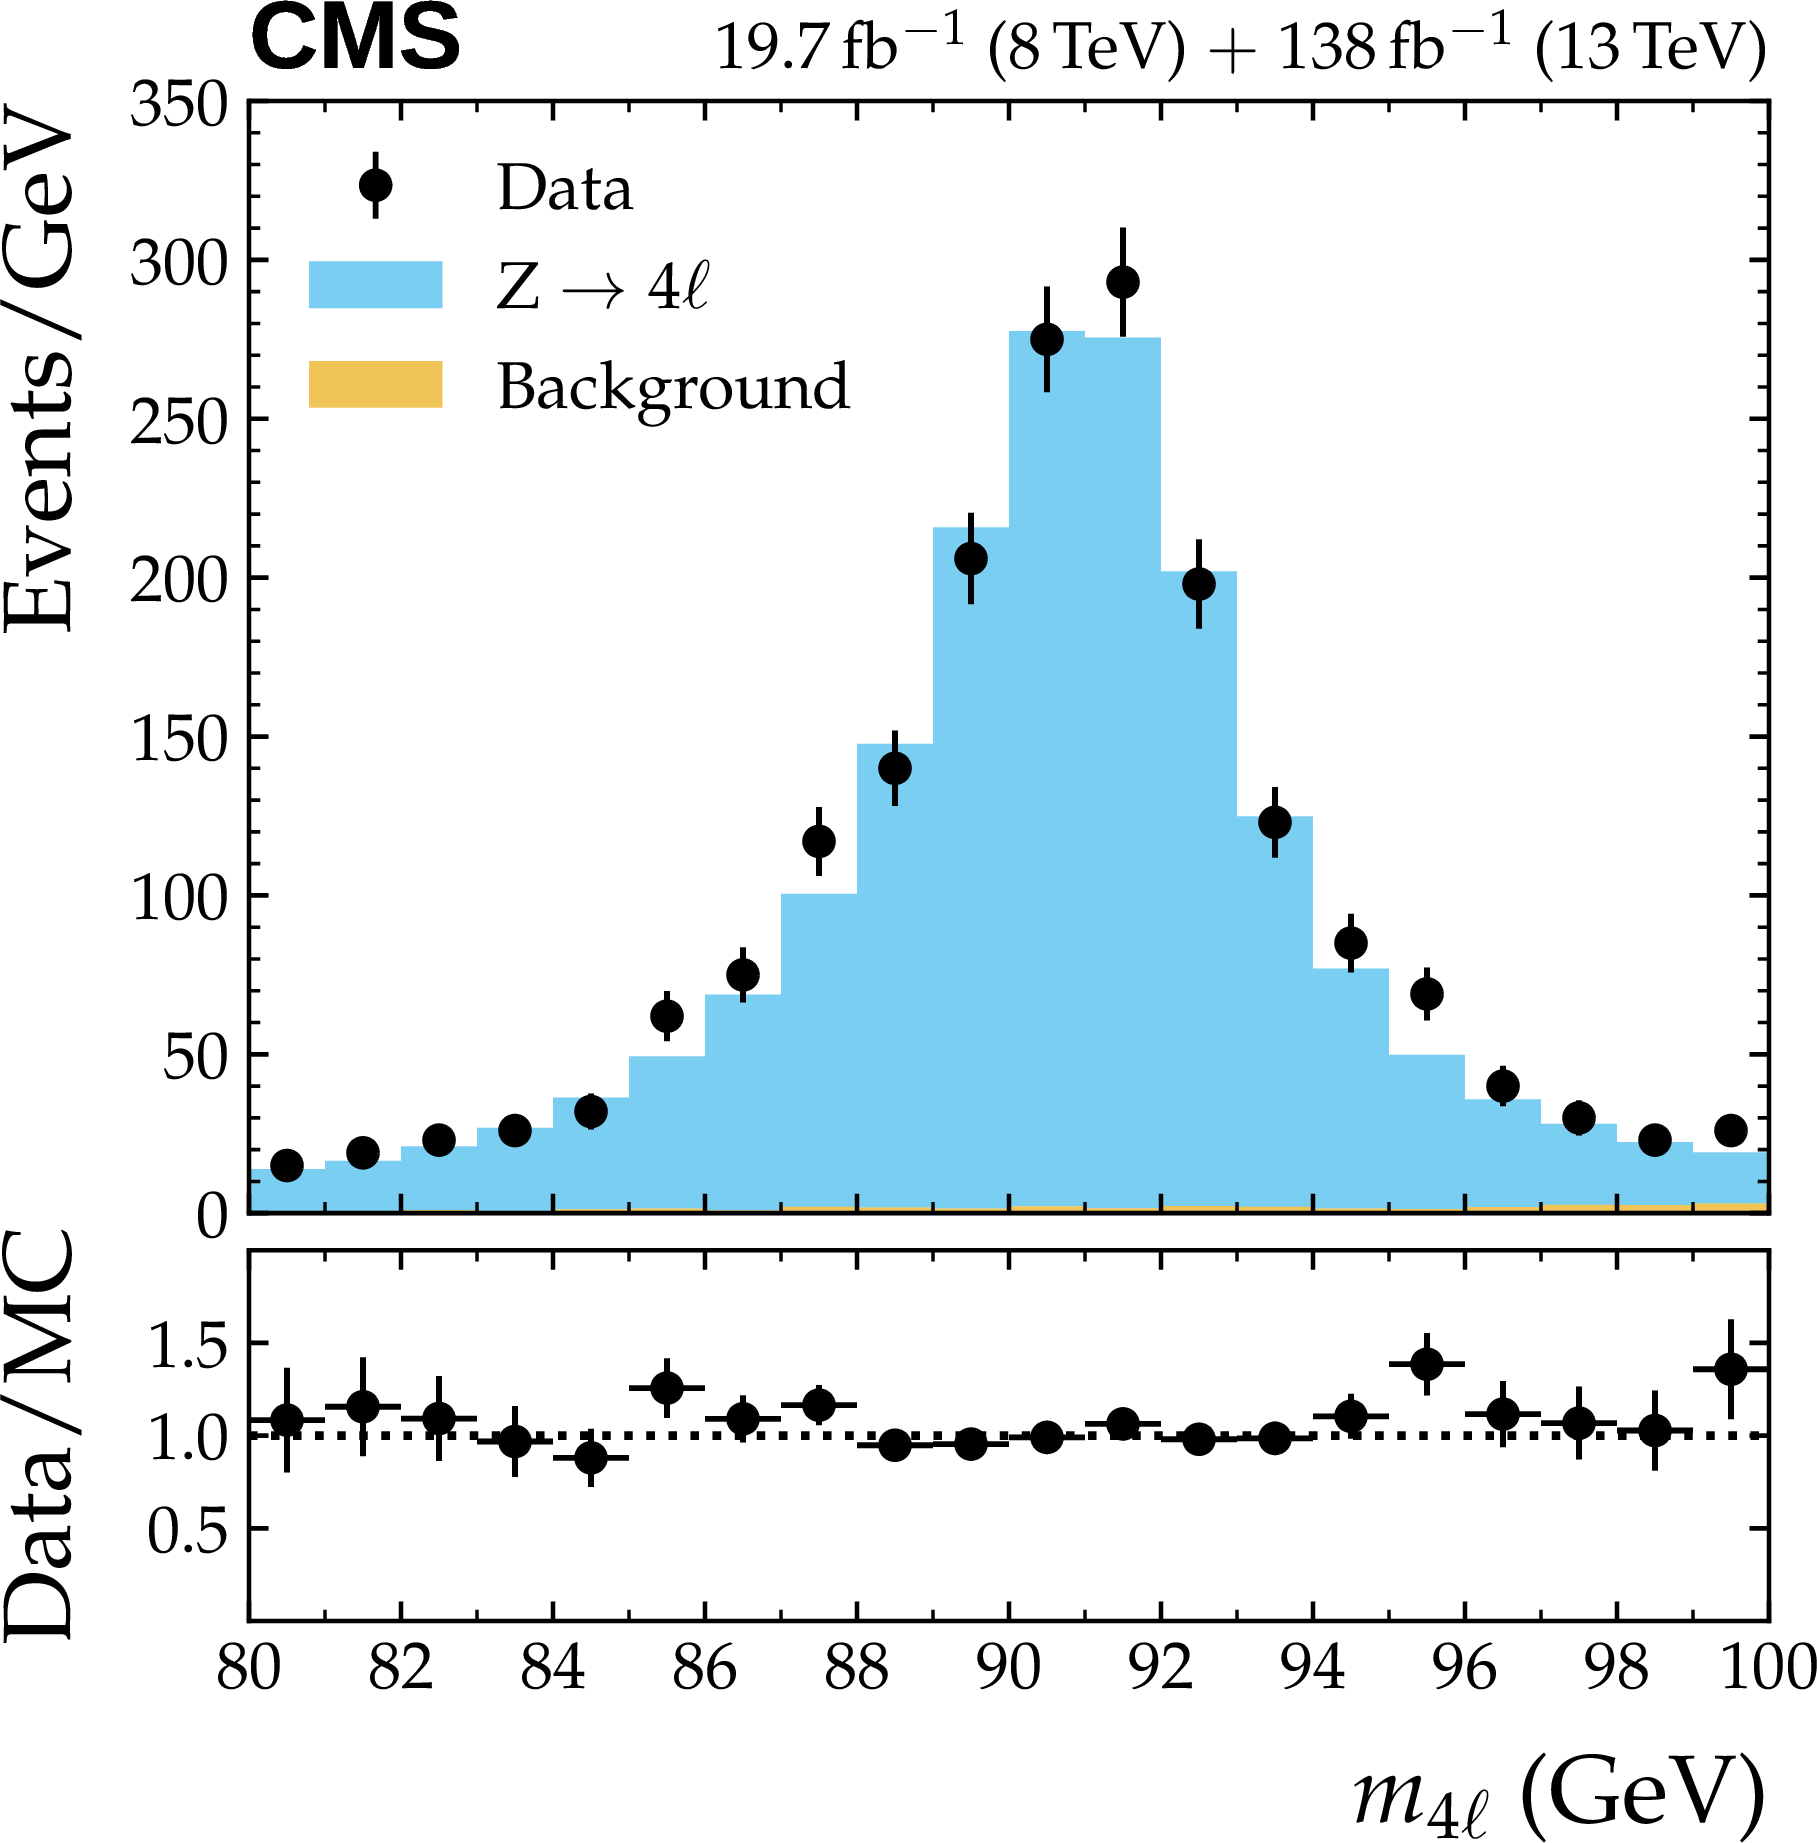
Figure 3-a:
Invariant mass distributions for events passing the $ \mathrm{Z} \to 4\ell $ selection for the sum of all 4 $ \ell $ channels (upper left), the 4 $ \mu $ channel (upper right), the 2 $ \mu 2\mathrm{e} $ channel (lower left), and the 4 e channel (lower right). Vertical error bars represent the total uncertainty on each point. The simulations are normalized according to predicted cross sections and the integrated luminosity. |
png pdf |
Figure 3-b:
Invariant mass distributions for events passing the $ \mathrm{Z} \to 4\ell $ selection for the sum of all 4 $ \ell $ channels (upper left), the 4 $ \mu $ channel (upper right), the 2 $ \mu 2\mathrm{e} $ channel (lower left), and the 4 e channel (lower right). Vertical error bars represent the total uncertainty on each point. The simulations are normalized according to predicted cross sections and the integrated luminosity. |
png pdf |
Figure 3-c:
Invariant mass distributions for events passing the $ \mathrm{Z} \to 4\ell $ selection for the sum of all 4 $ \ell $ channels (upper left), the 4 $ \mu $ channel (upper right), the 2 $ \mu 2\mathrm{e} $ channel (lower left), and the 4 e channel (lower right). Vertical error bars represent the total uncertainty on each point. The simulations are normalized according to predicted cross sections and the integrated luminosity. |
png pdf |
Figure 3-d:
Invariant mass distributions for events passing the $ \mathrm{Z} \to 4\ell $ selection for the sum of all 4 $ \ell $ channels (upper left), the 4 $ \mu $ channel (upper right), the 2 $ \mu 2\mathrm{e} $ channel (lower left), and the 4 e channel (lower right). Vertical error bars represent the total uncertainty on each point. The simulations are normalized according to predicted cross sections and the integrated luminosity. |
png pdf |
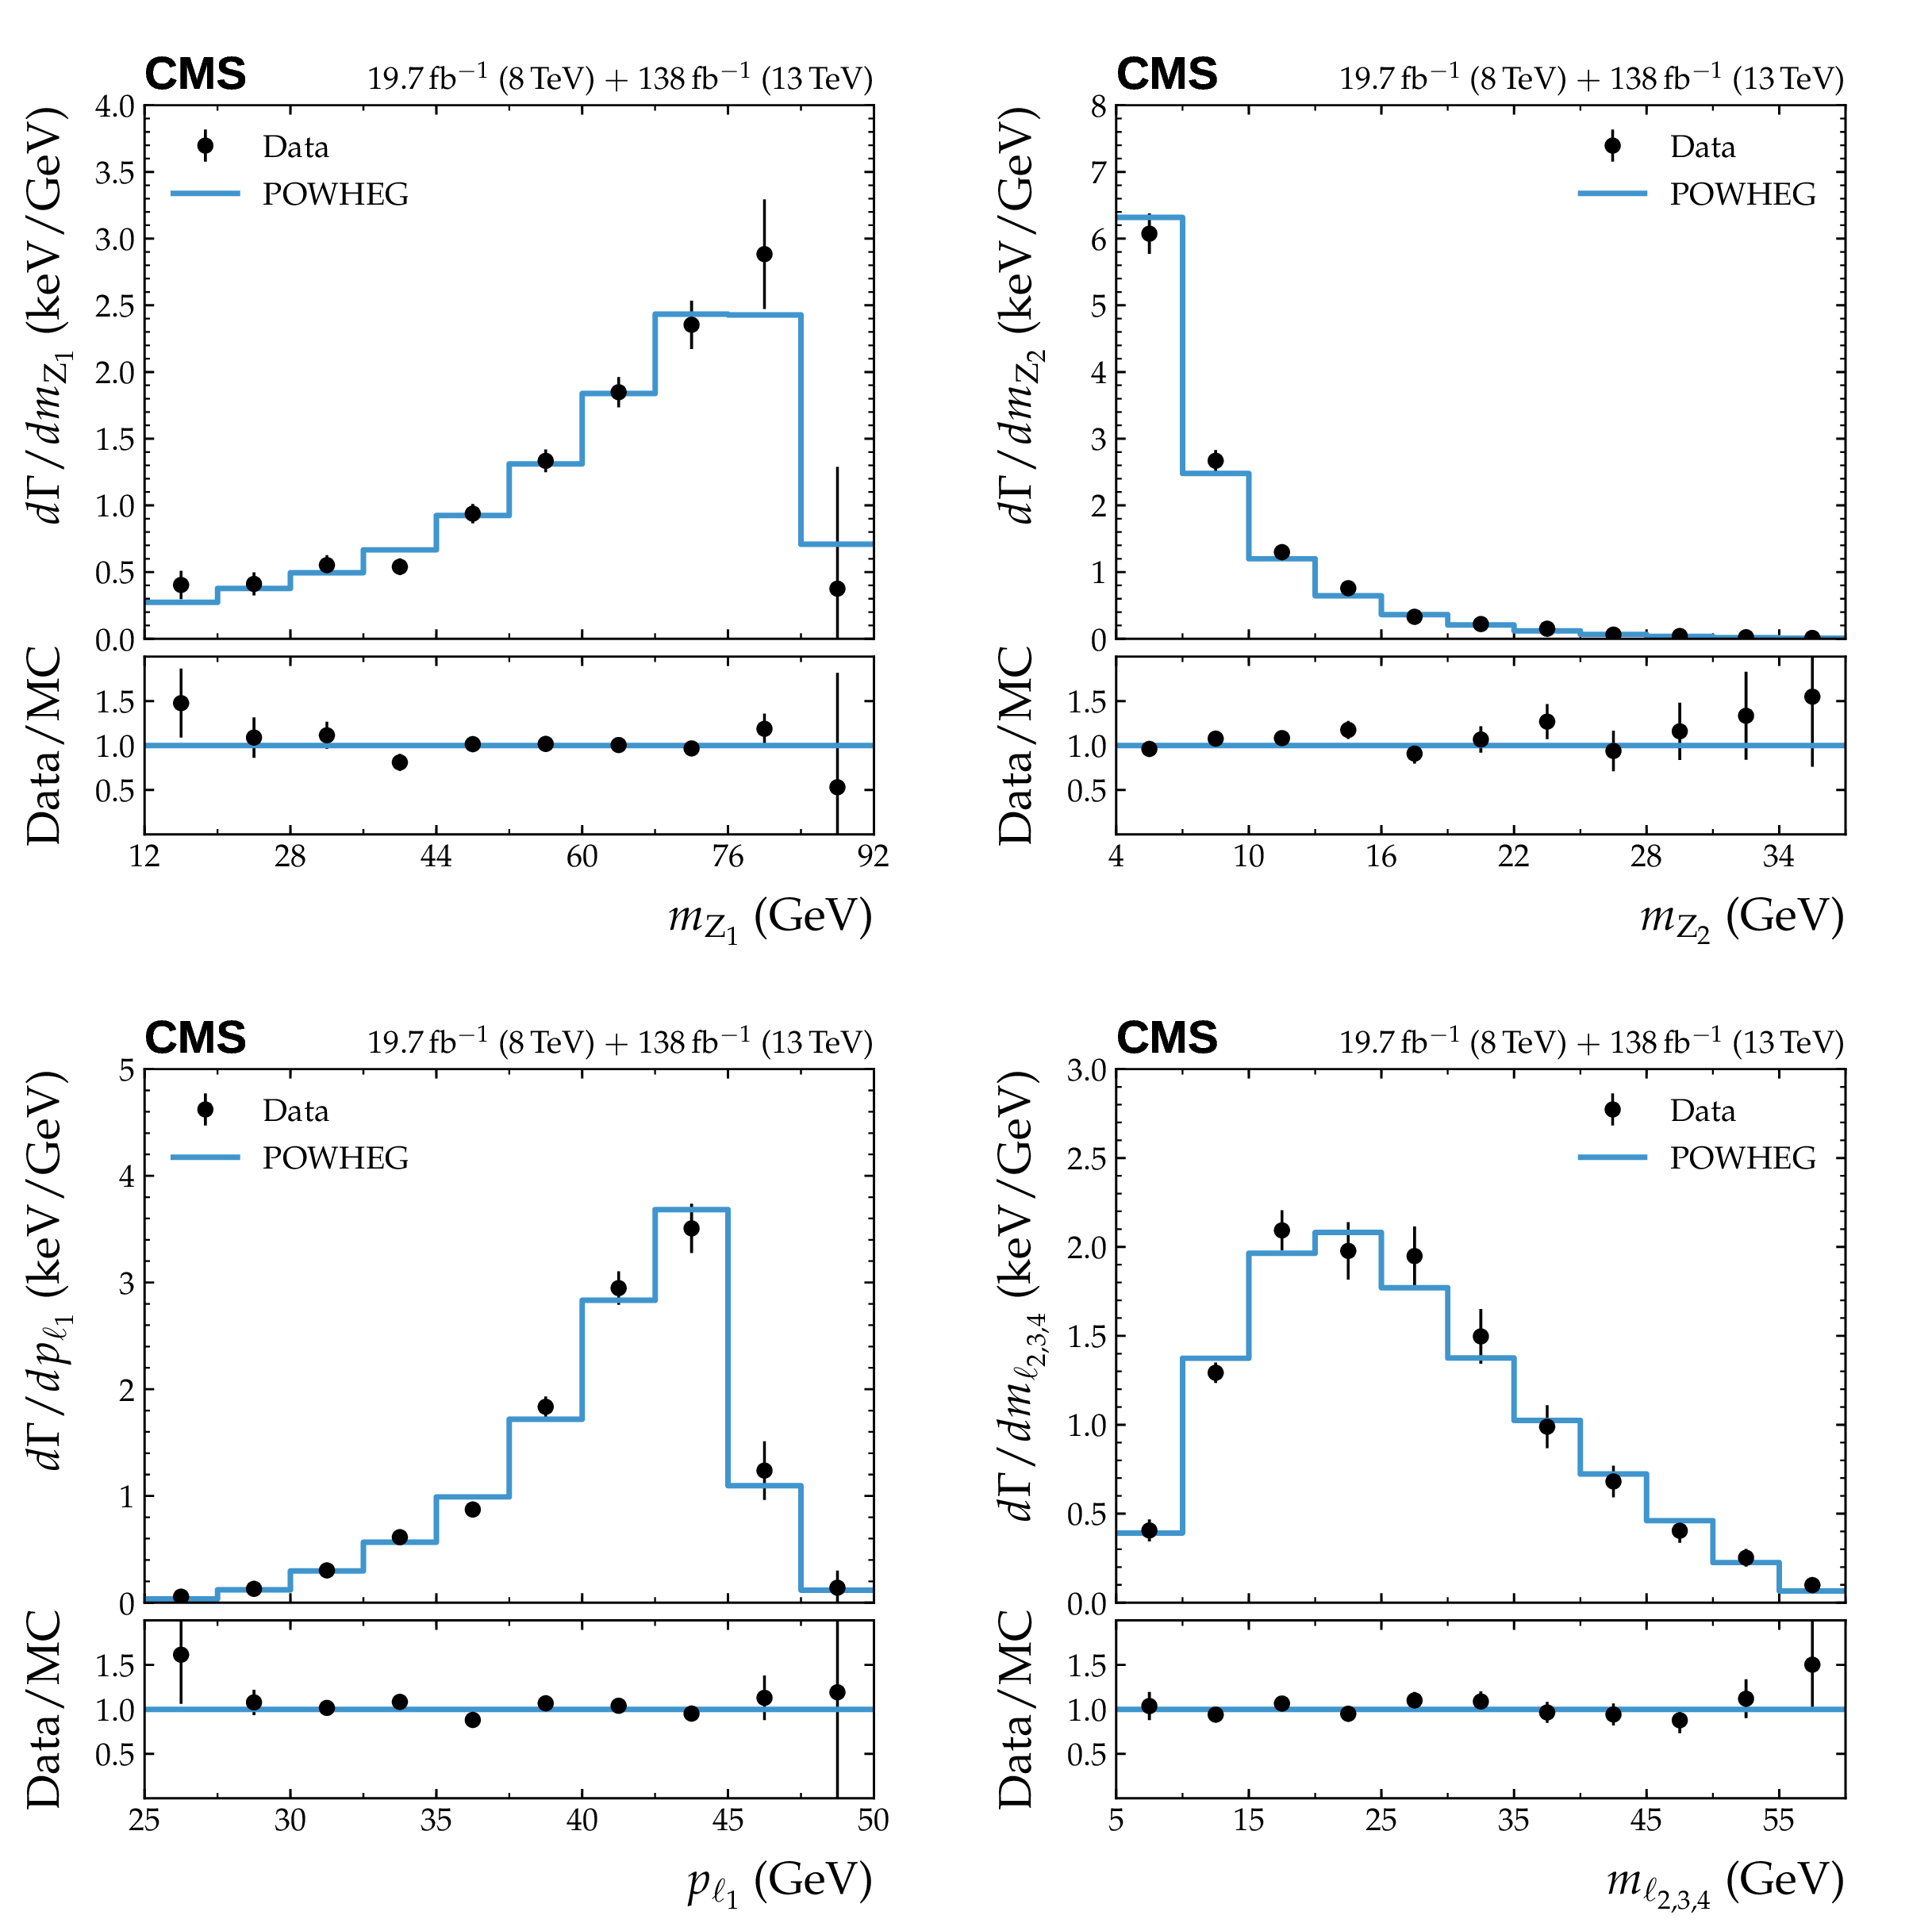
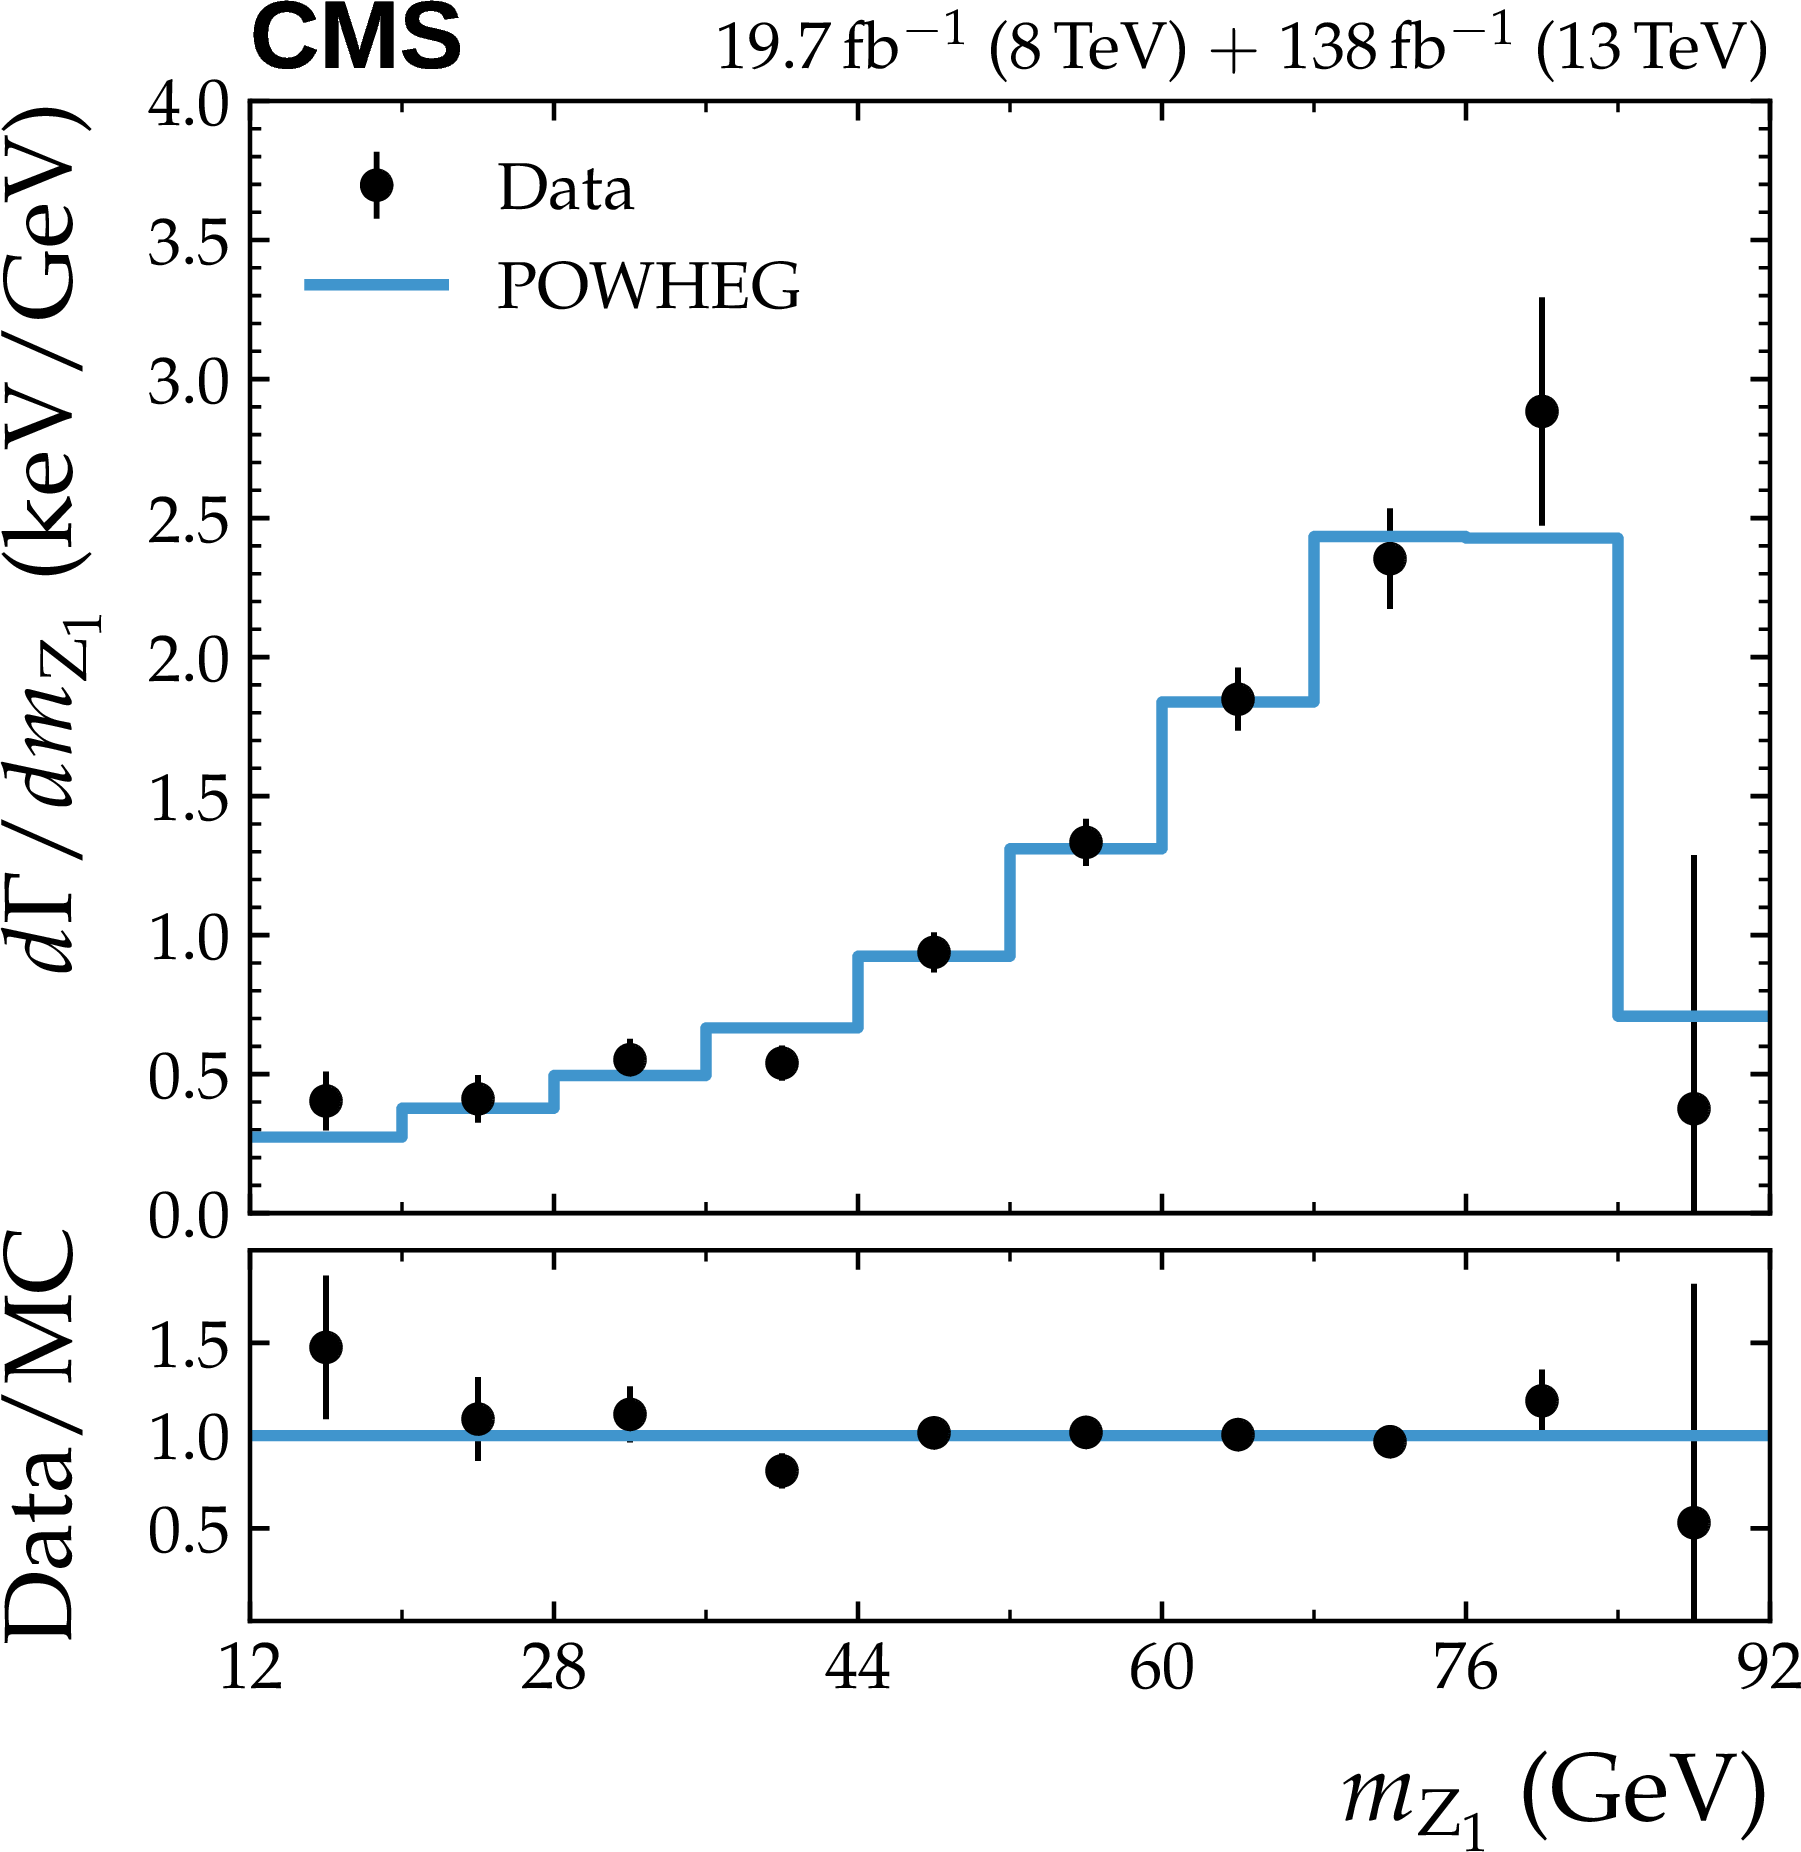
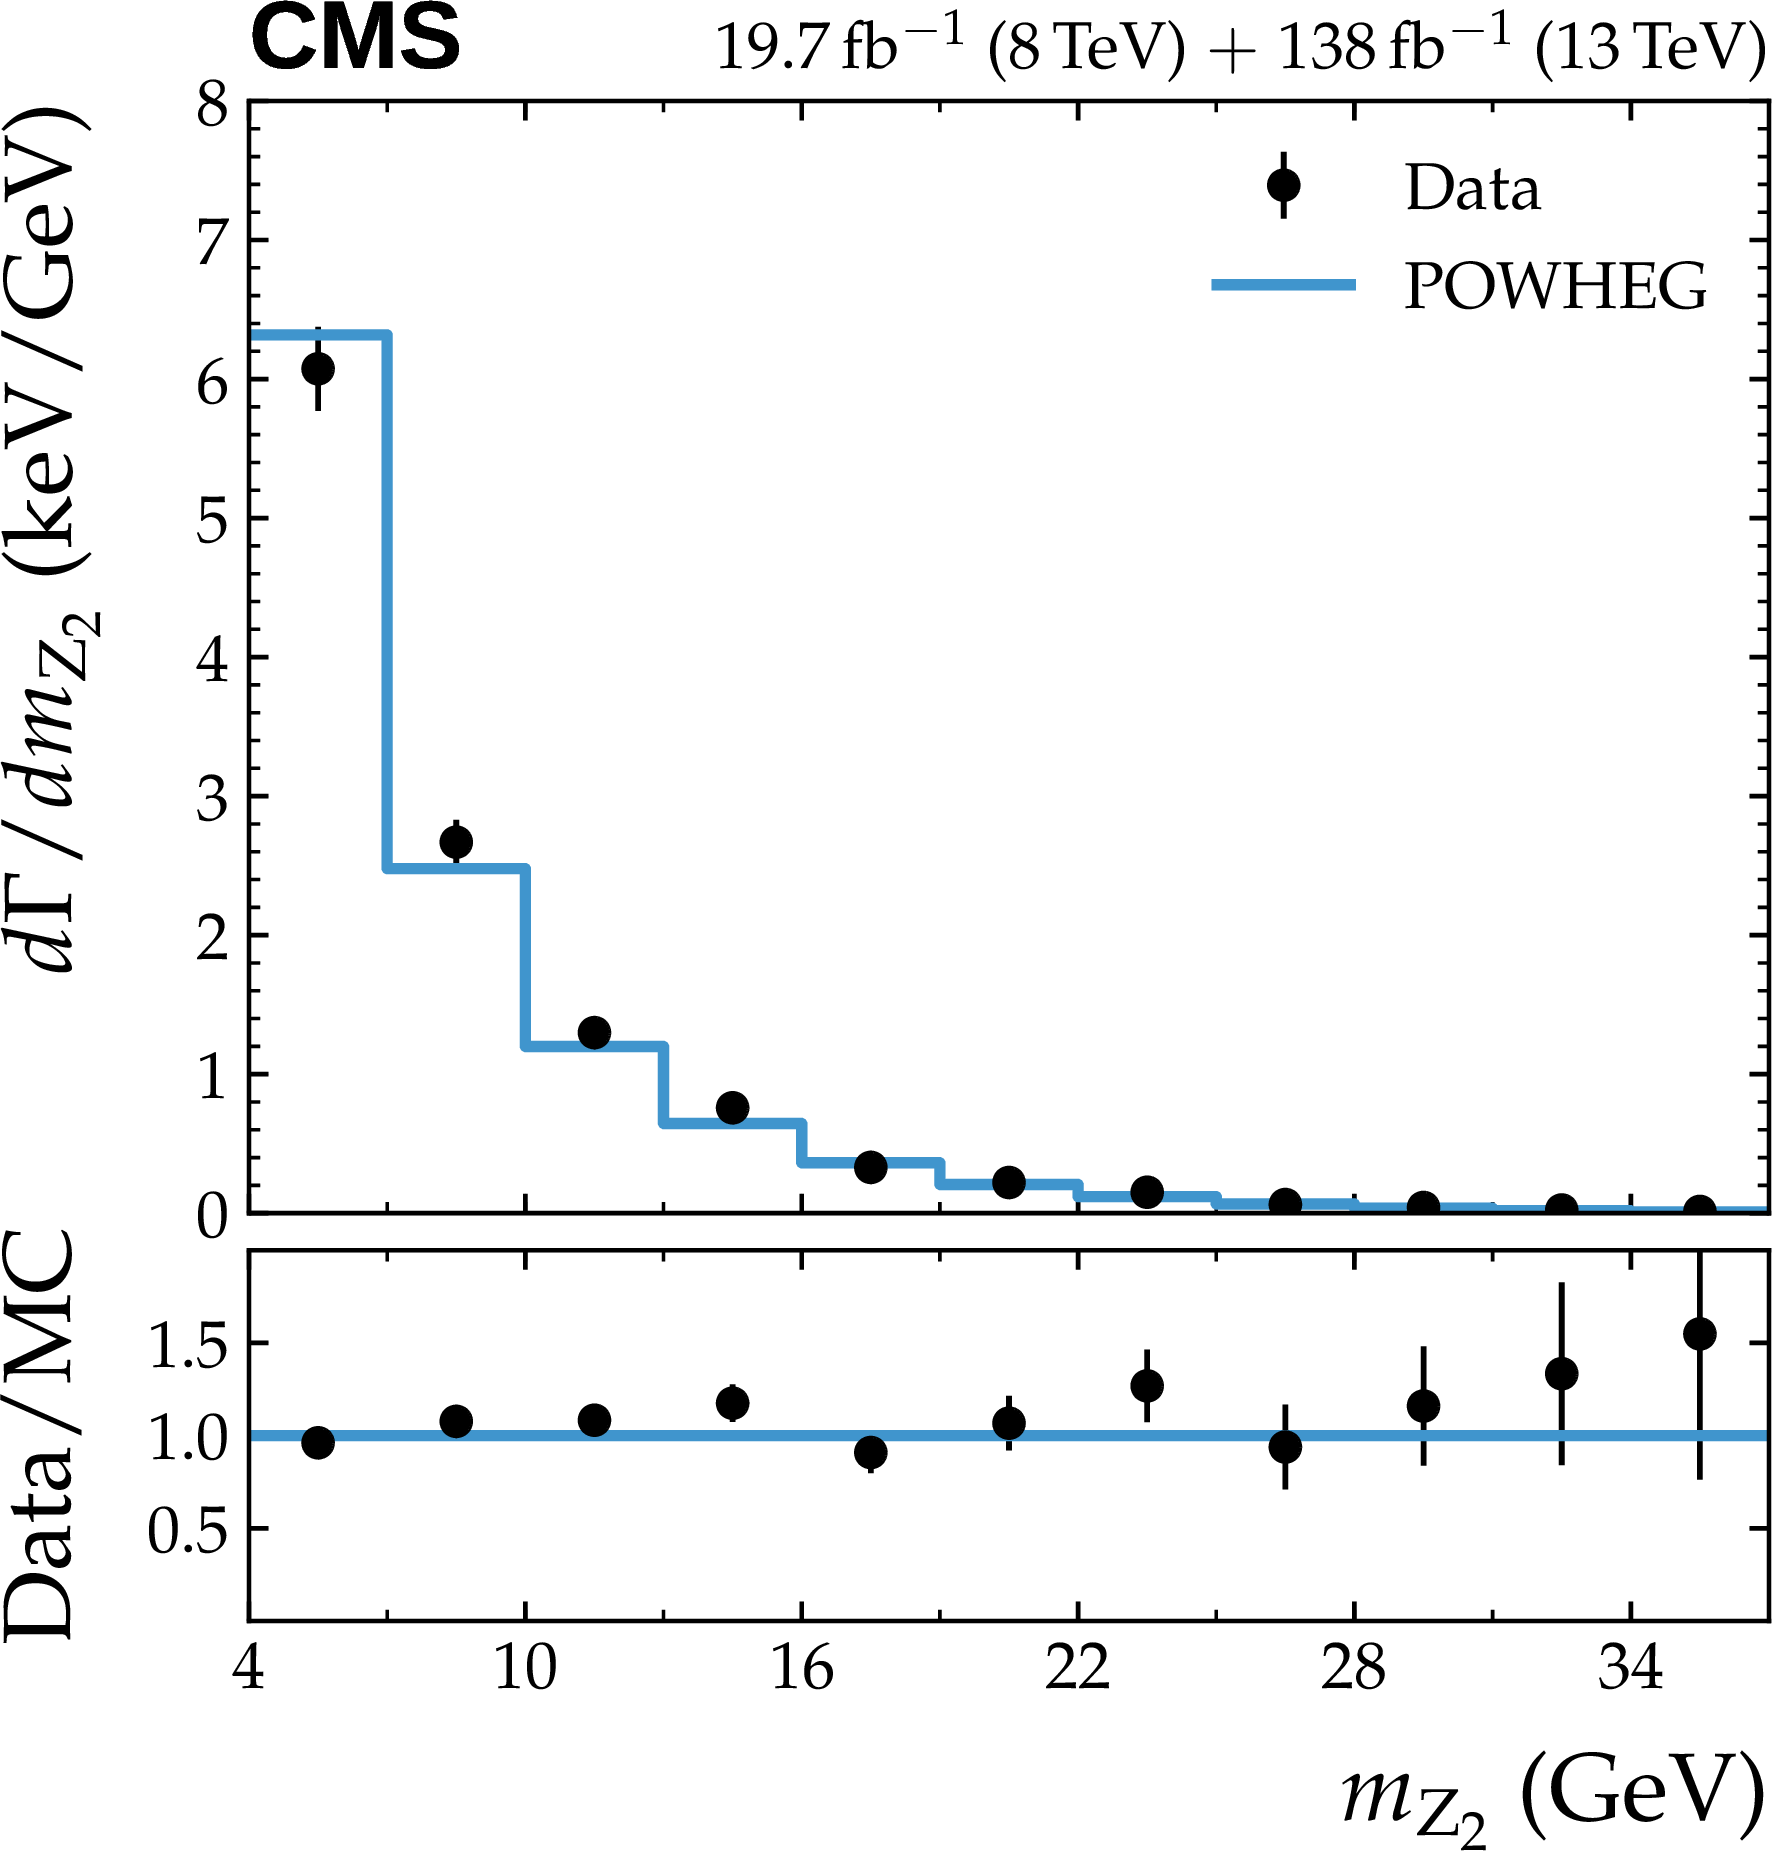
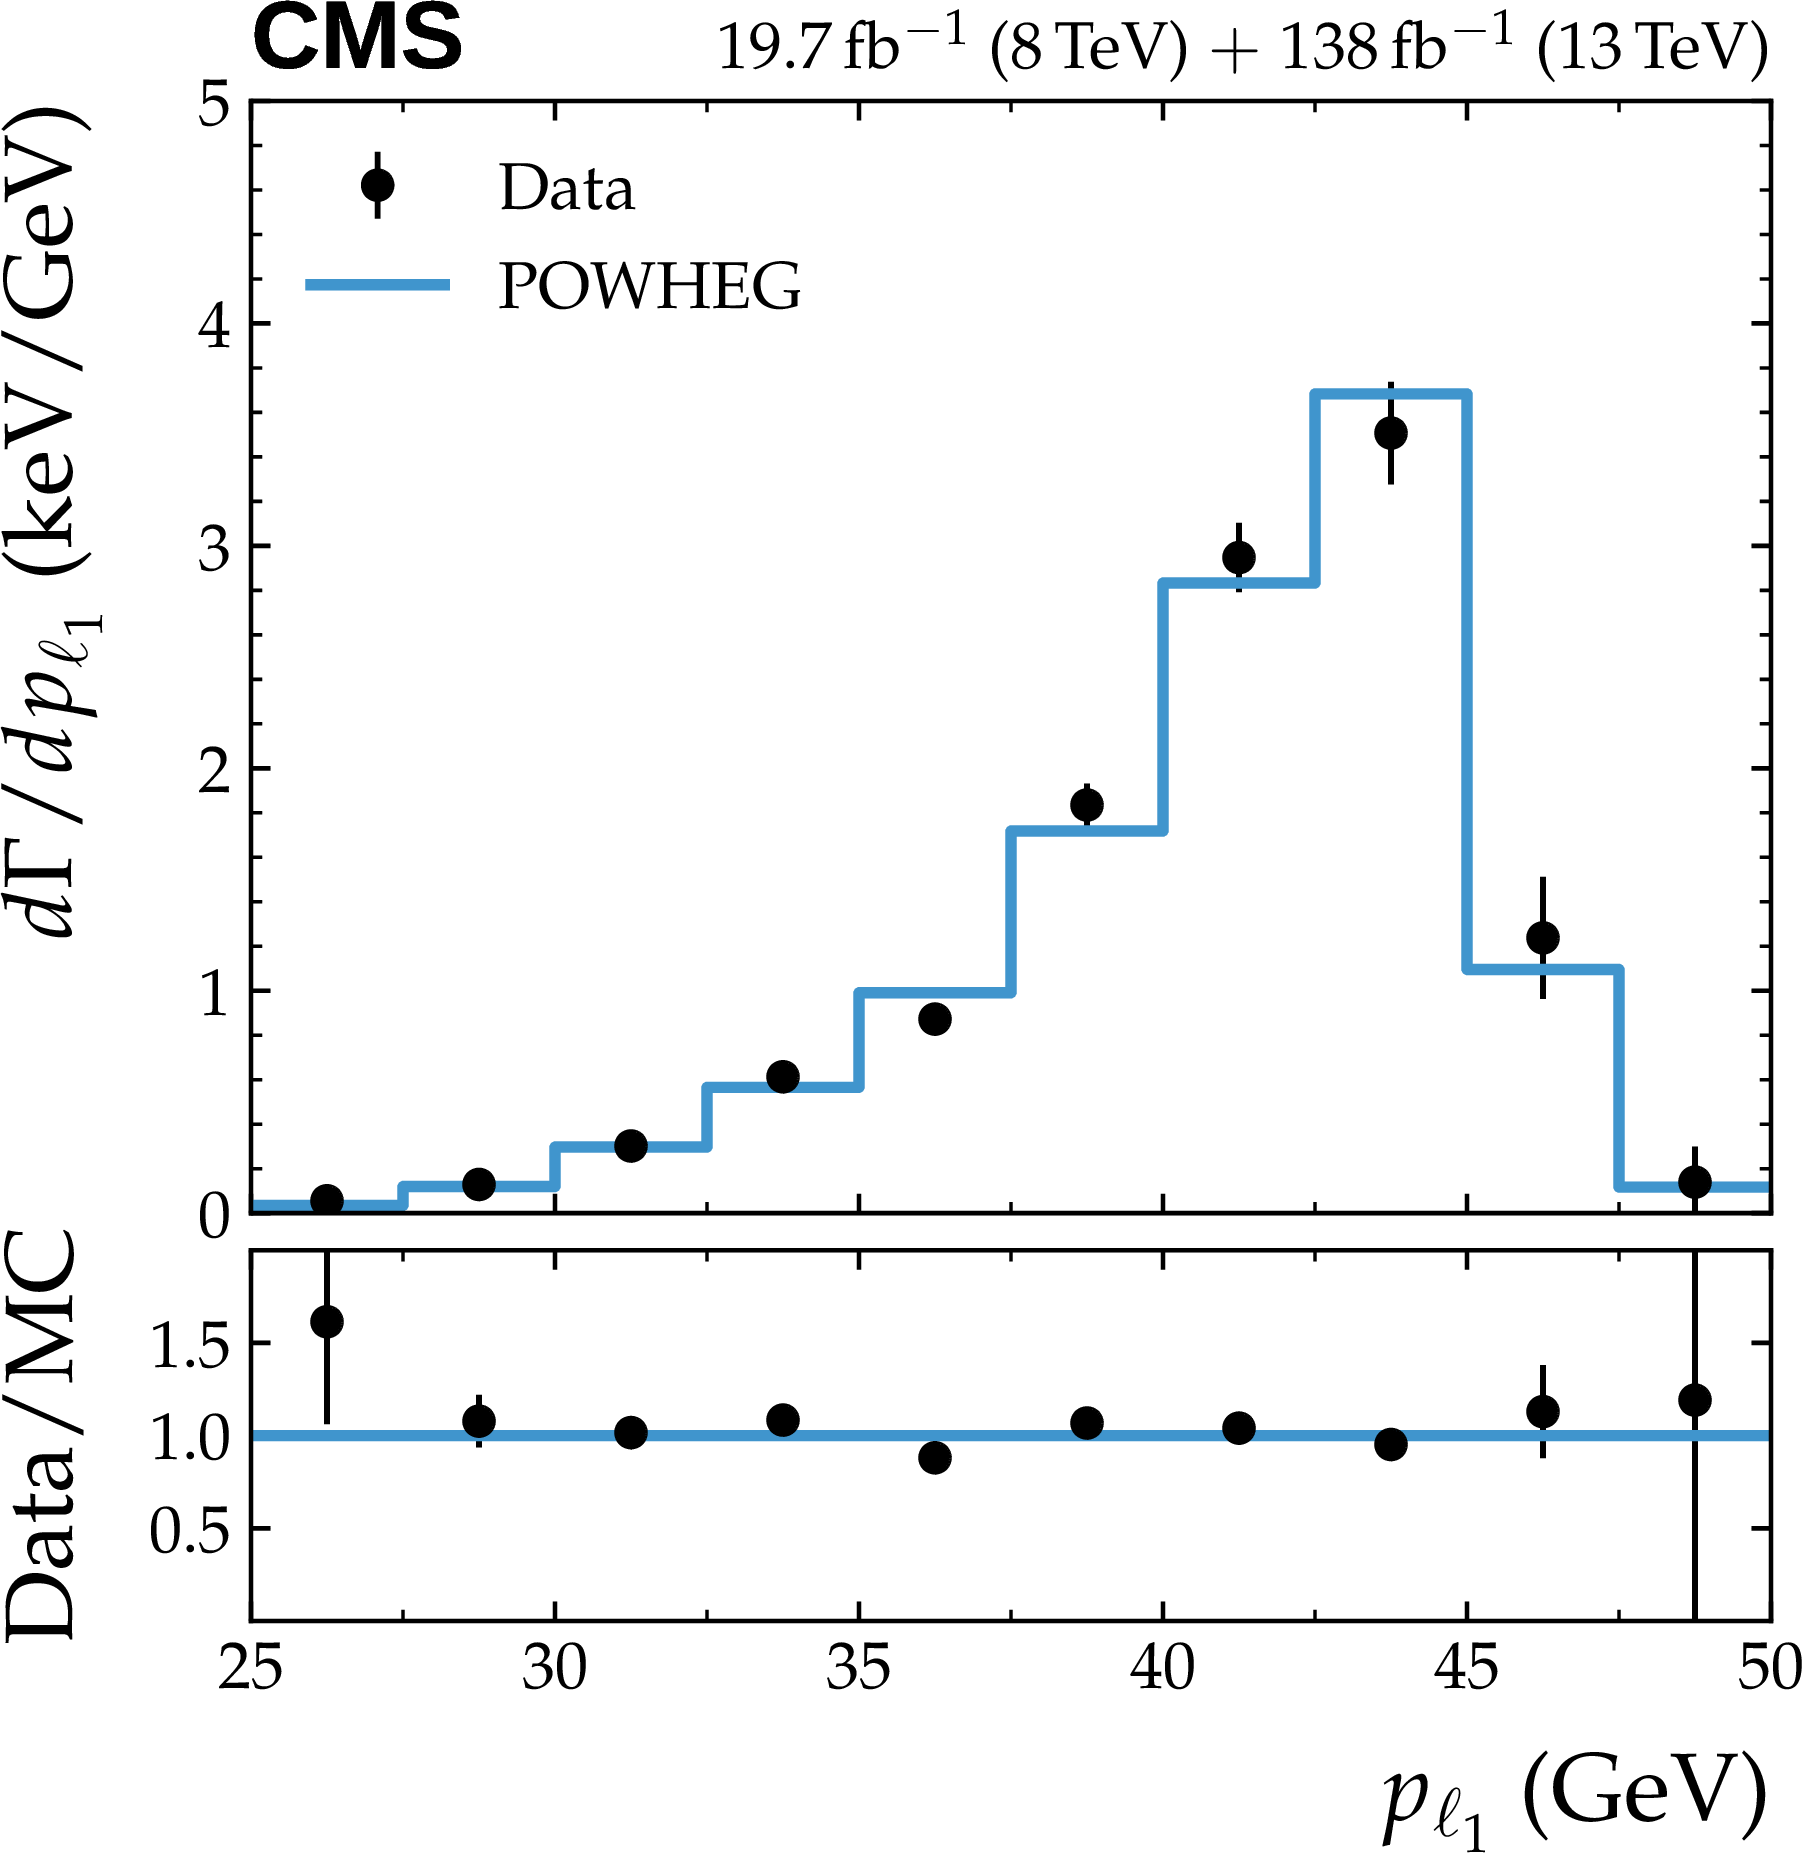
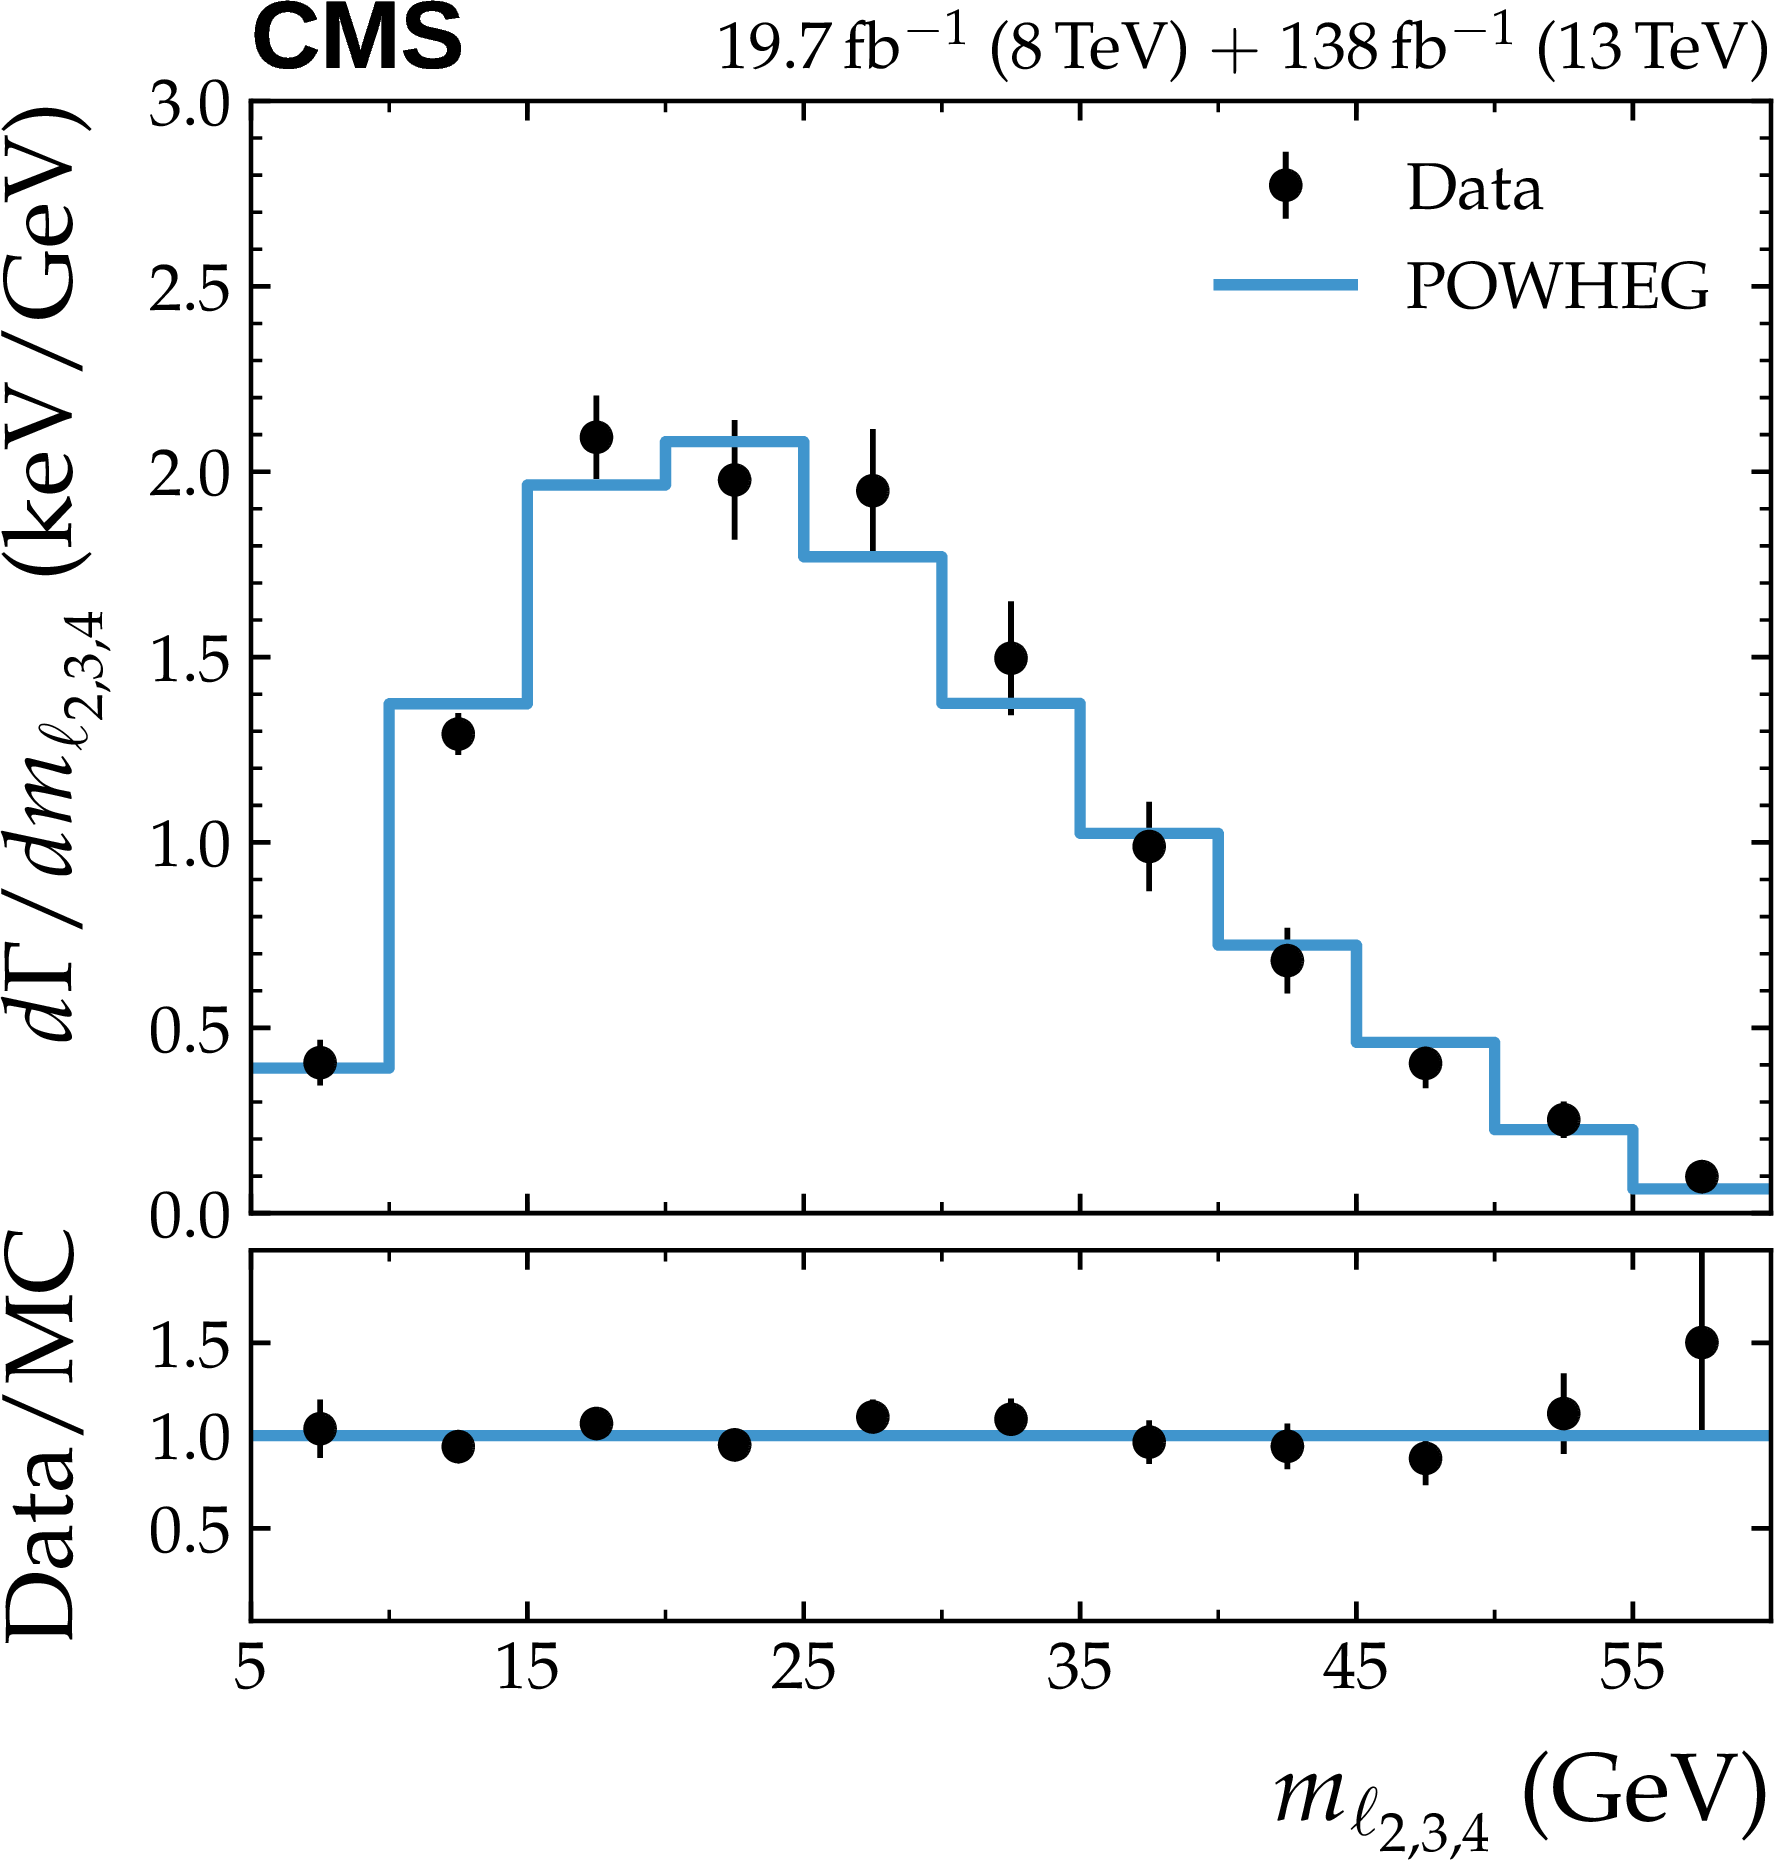
Figure 4:
The differential $ \mathrm{Z} \to 4\ell $ decay rate $ \mathrm{d}\Gamma_{\mathrm{Z} \to 4\ell}{\mathrm{d}x} $ as a function of the quantities $ m_{Z_{1}} $ (upper left), $ m_{Z_{2}} $ (upper right), $ p_{\ell_1} $ (lower left), and $ m_{\ell_{2,3,4}} $ (lower right) defined in Section 8.2. These distributions have been unfolded and scaled to the full phase space region using the $ \mathcal{B}(\mathrm{Z} \to 4\ell) $ result of Table 5. For each bin, the total uncertainty is shown. |
png pdf |
Figure 4-a:
The differential $ \mathrm{Z} \to 4\ell $ decay rate $ \mathrm{d}\Gamma_{\mathrm{Z} \to 4\ell}{\mathrm{d}x} $ as a function of the quantities $ m_{Z_{1}} $ (upper left), $ m_{Z_{2}} $ (upper right), $ p_{\ell_1} $ (lower left), and $ m_{\ell_{2,3,4}} $ (lower right) defined in Section 8.2. These distributions have been unfolded and scaled to the full phase space region using the $ \mathcal{B}(\mathrm{Z} \to 4\ell) $ result of Table 5. For each bin, the total uncertainty is shown. |
png pdf |
Figure 4-b:
The differential $ \mathrm{Z} \to 4\ell $ decay rate $ \mathrm{d}\Gamma_{\mathrm{Z} \to 4\ell}{\mathrm{d}x} $ as a function of the quantities $ m_{Z_{1}} $ (upper left), $ m_{Z_{2}} $ (upper right), $ p_{\ell_1} $ (lower left), and $ m_{\ell_{2,3,4}} $ (lower right) defined in Section 8.2. These distributions have been unfolded and scaled to the full phase space region using the $ \mathcal{B}(\mathrm{Z} \to 4\ell) $ result of Table 5. For each bin, the total uncertainty is shown. |
png pdf |
Figure 4-c:
The differential $ \mathrm{Z} \to 4\ell $ decay rate $ \mathrm{d}\Gamma_{\mathrm{Z} \to 4\ell}{\mathrm{d}x} $ as a function of the quantities $ m_{Z_{1}} $ (upper left), $ m_{Z_{2}} $ (upper right), $ p_{\ell_1} $ (lower left), and $ m_{\ell_{2,3,4}} $ (lower right) defined in Section 8.2. These distributions have been unfolded and scaled to the full phase space region using the $ \mathcal{B}(\mathrm{Z} \to 4\ell) $ result of Table 5. For each bin, the total uncertainty is shown. |
png pdf |
Figure 4-d:
The differential $ \mathrm{Z} \to 4\ell $ decay rate $ \mathrm{d}\Gamma_{\mathrm{Z} \to 4\ell}{\mathrm{d}x} $ as a function of the quantities $ m_{Z_{1}} $ (upper left), $ m_{Z_{2}} $ (upper right), $ p_{\ell_1} $ (lower left), and $ m_{\ell_{2,3,4}} $ (lower right) defined in Section 8.2. These distributions have been unfolded and scaled to the full phase space region using the $ \mathcal{B}(\mathrm{Z} \to 4\ell) $ result of Table 5. For each bin, the total uncertainty is shown. |
png pdf |
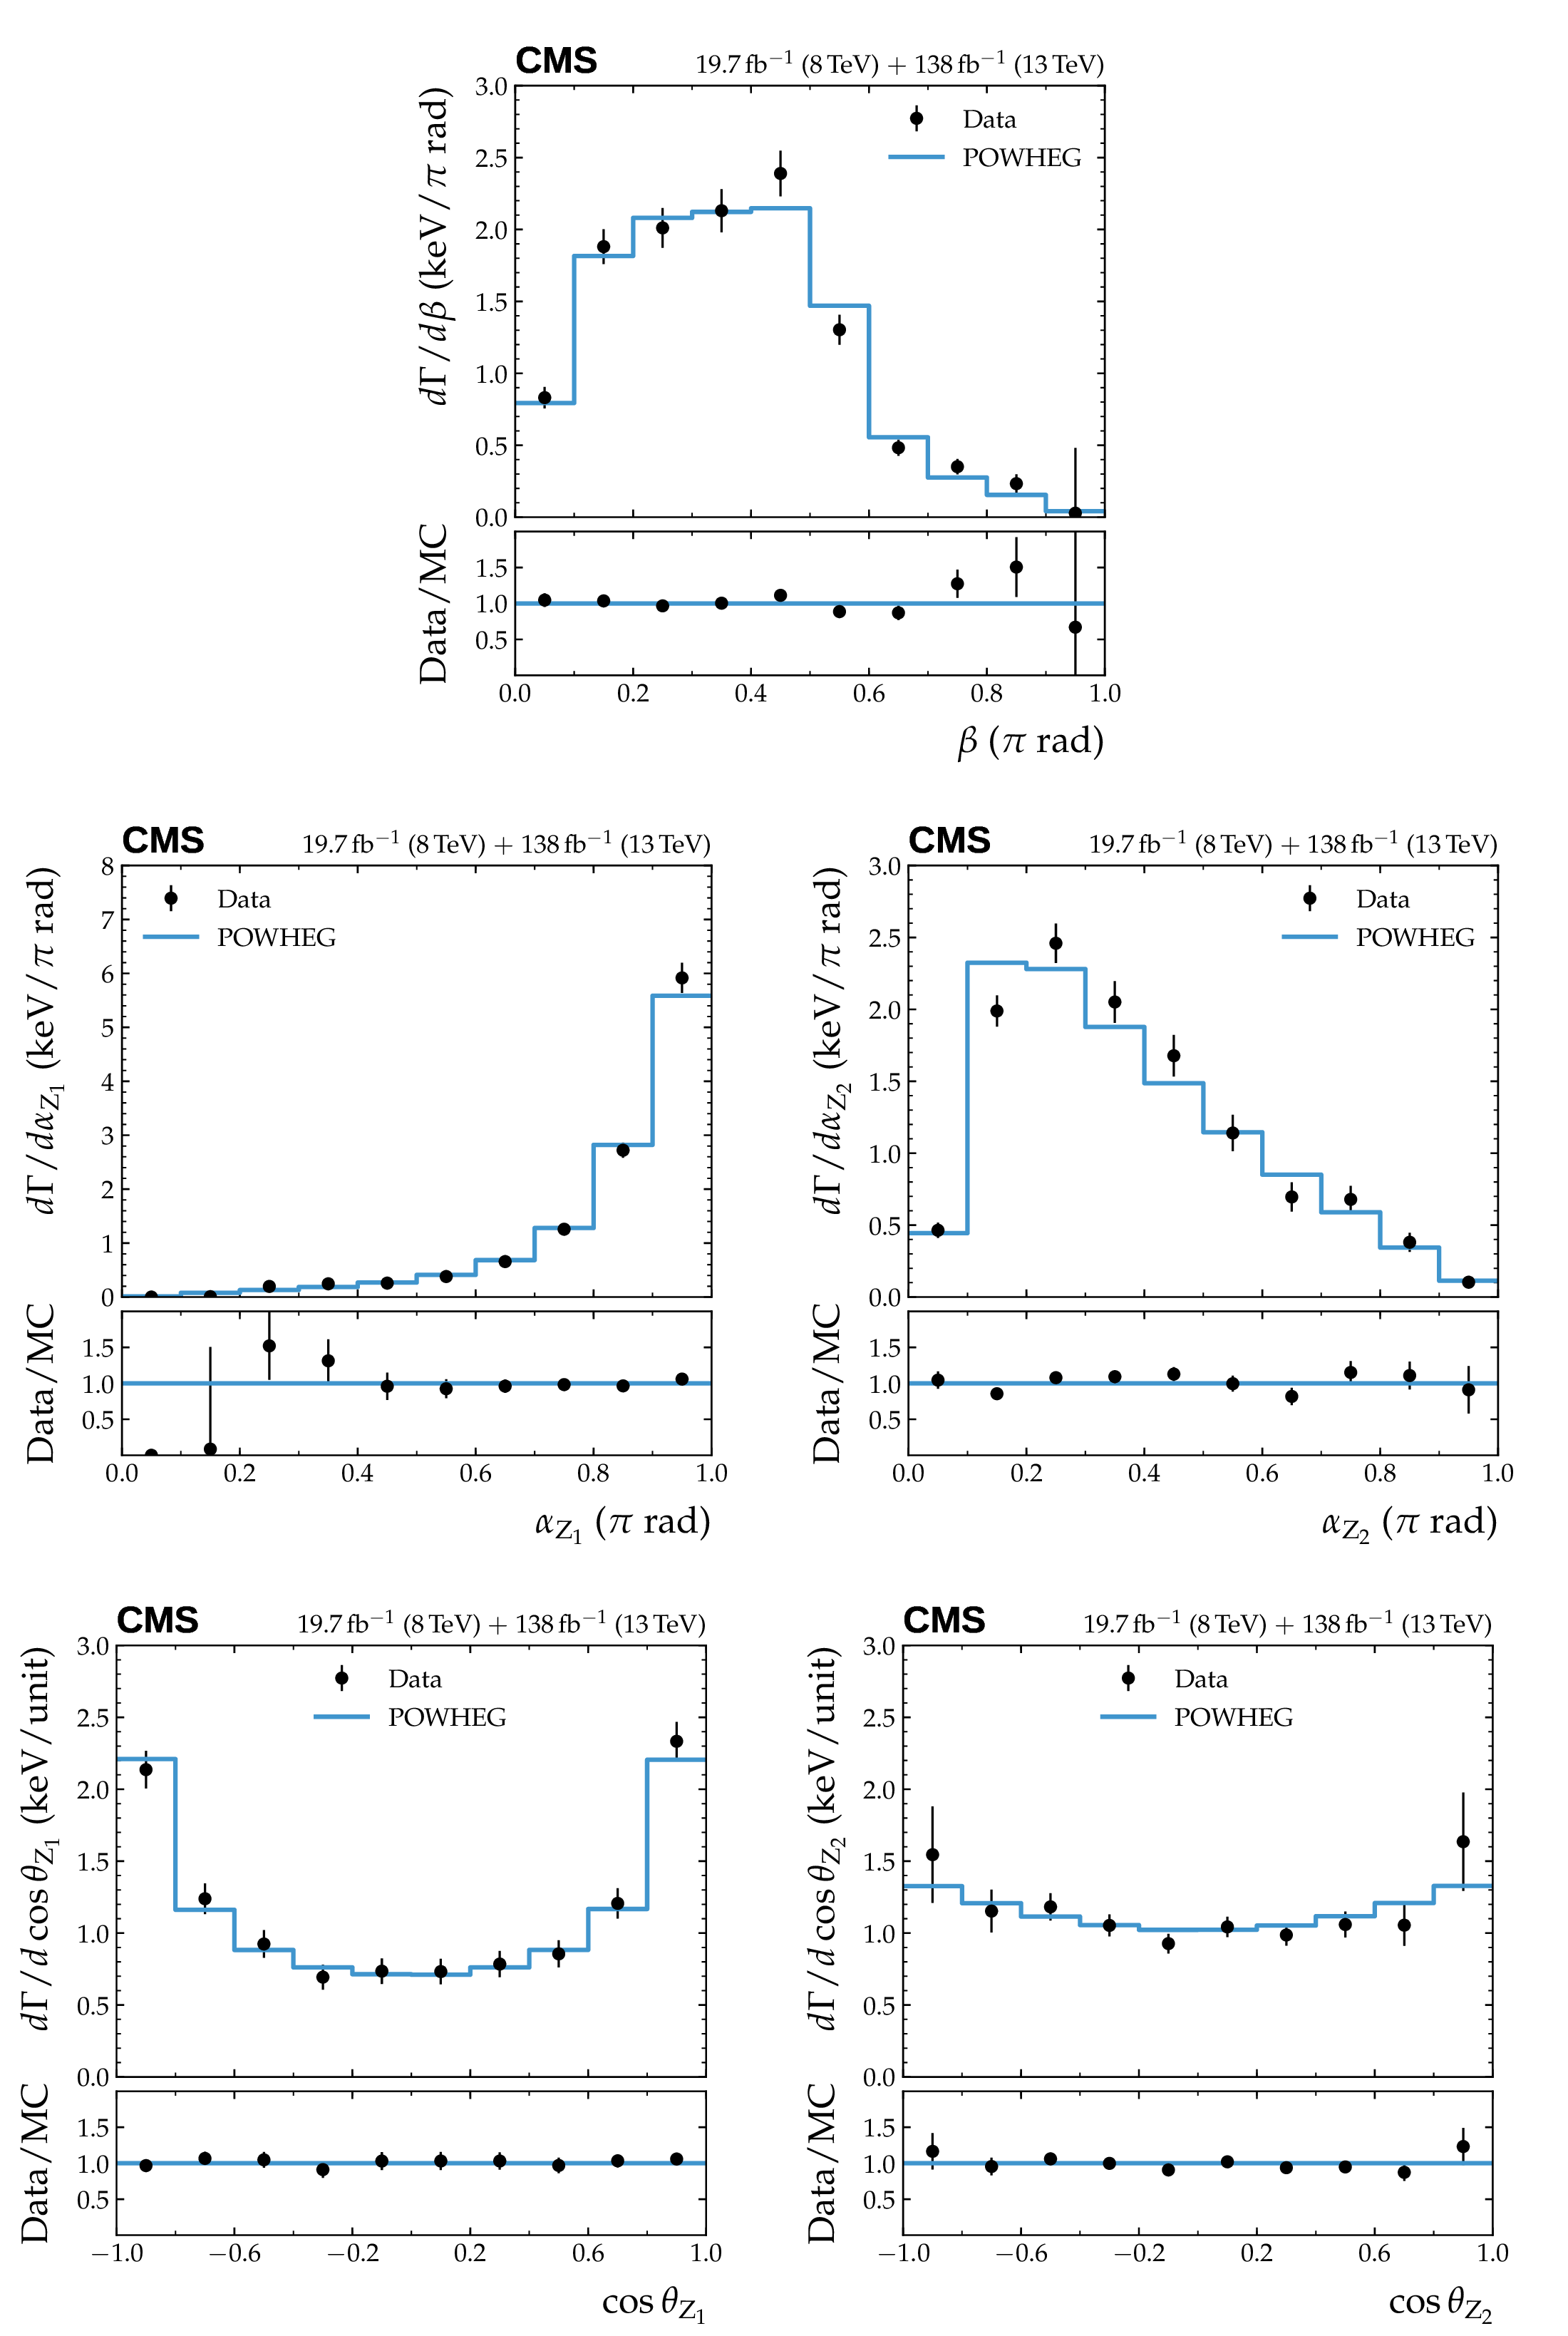
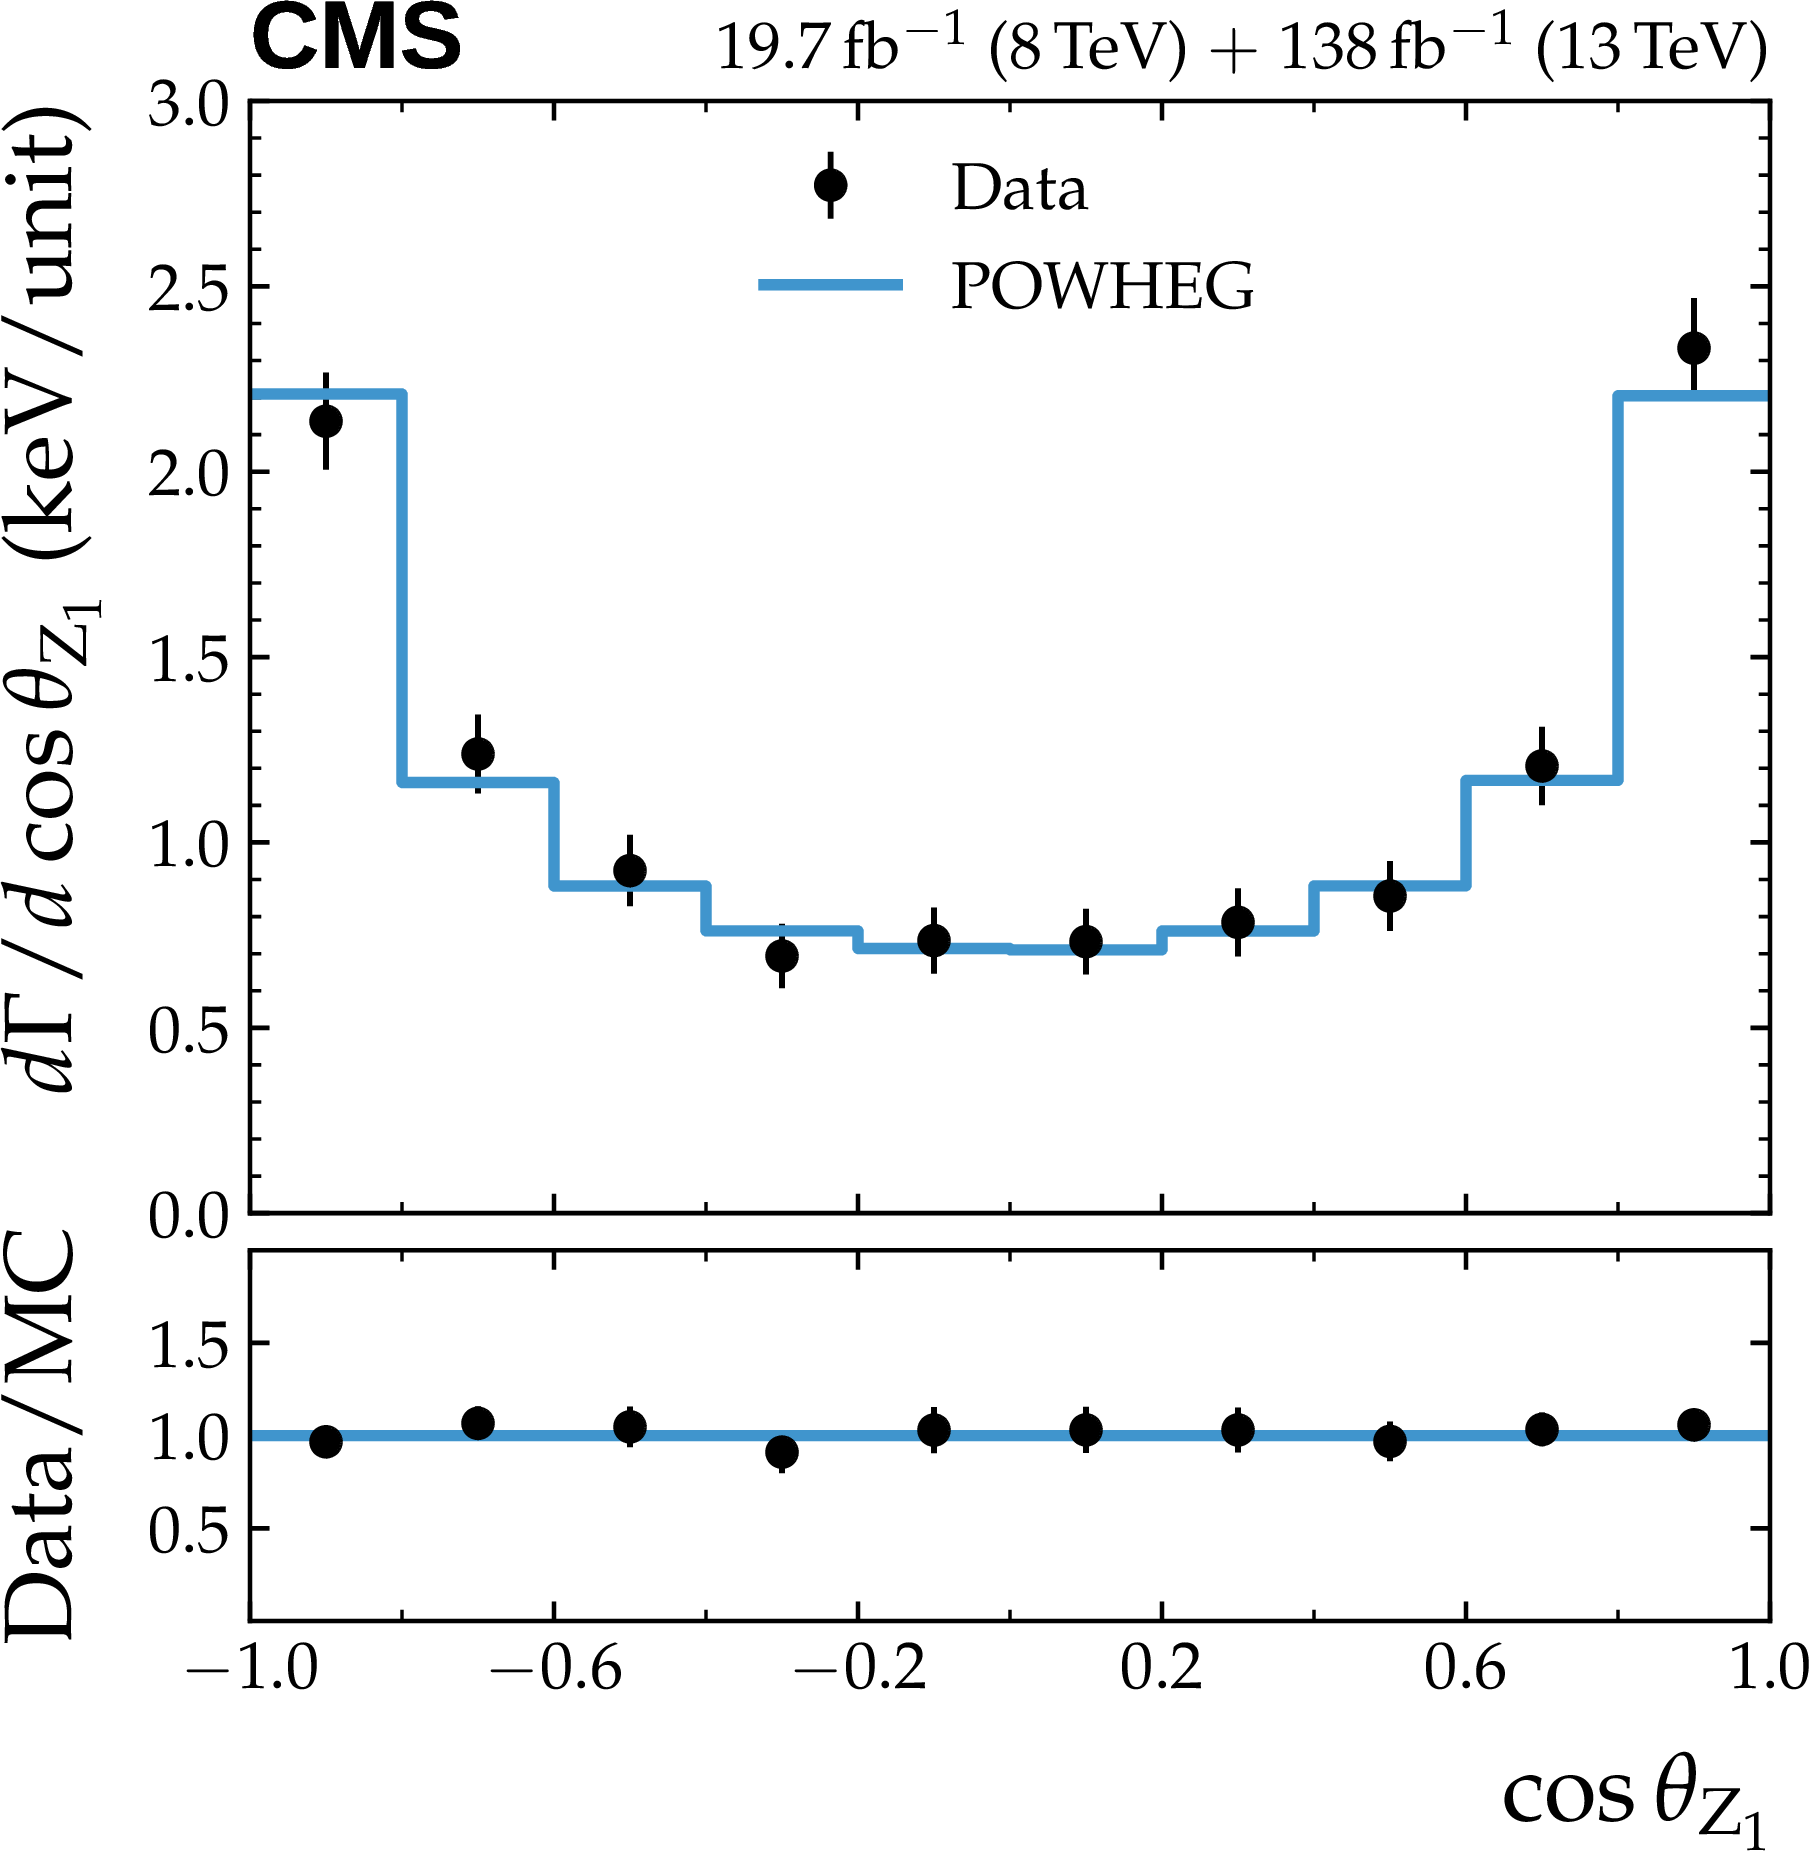
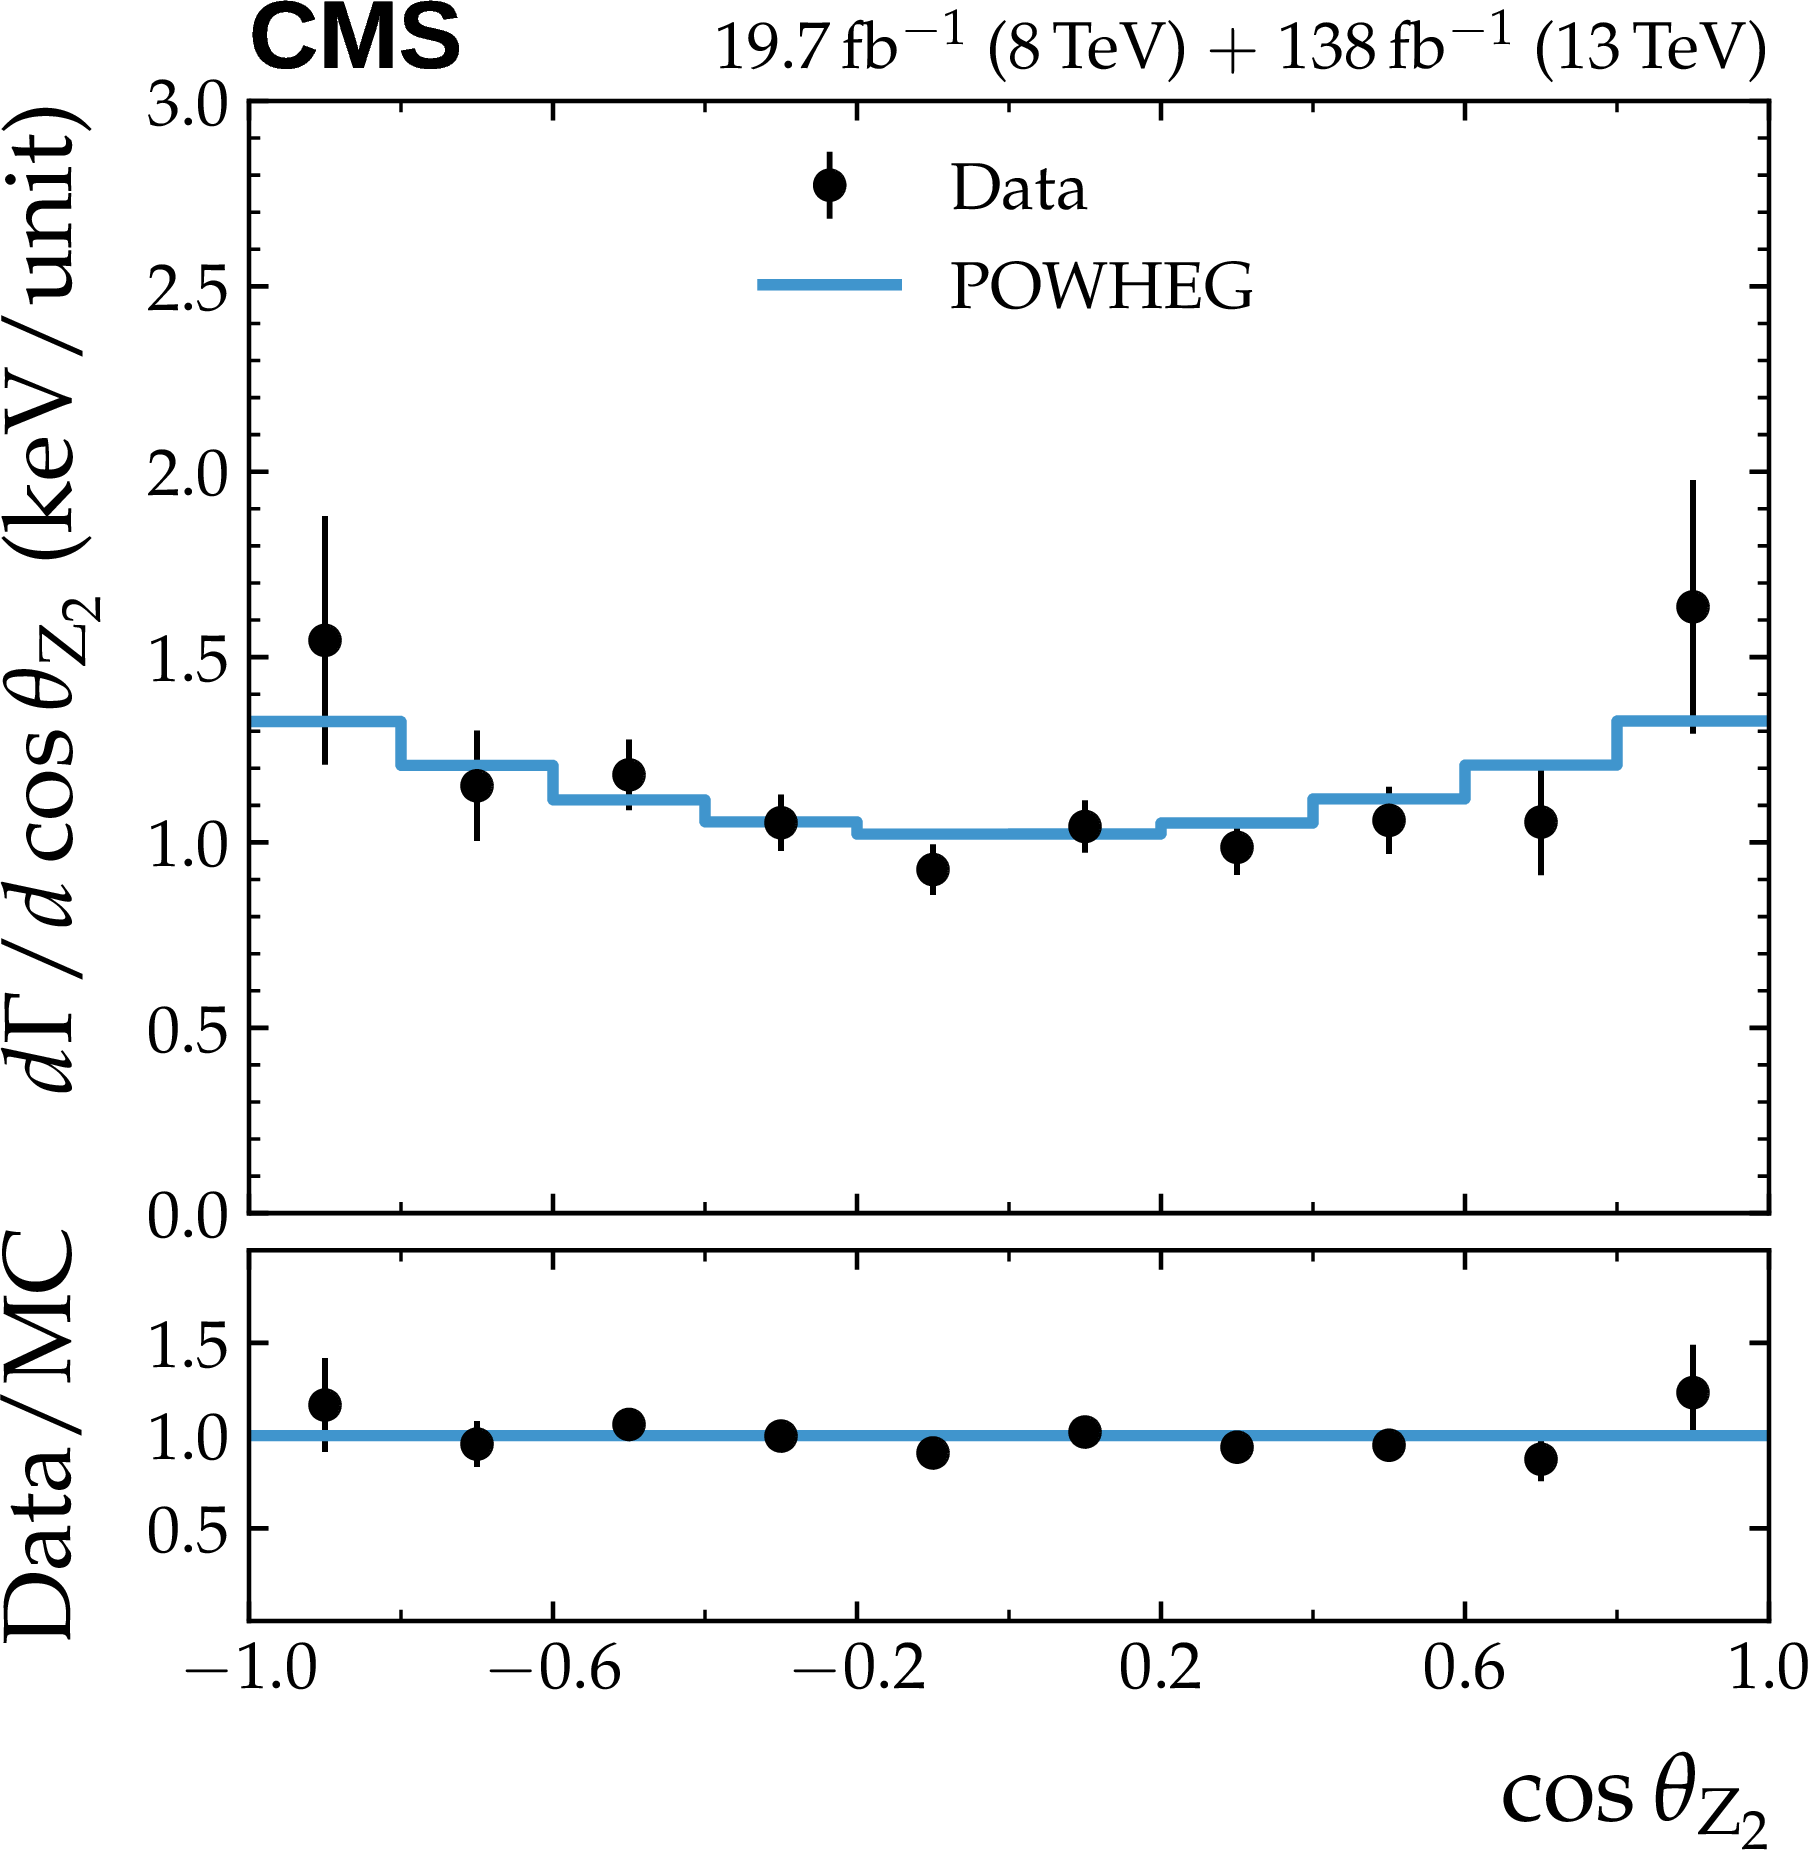
Figure 5:
The differential decay rates $ \mathrm{d}\Gamma_{Z \to 4\ell}/\mathrm{d}{\beta} $ (upper), $ \mathrm{d}\Gamma_{Z \to 4\ell}/\mathrm{d}{\alpha_{\mathrm{Z}_1}} $ (middle left), $ \mathrm{d}\Gamma_{Z \to 4\ell}/\mathrm{d}{\alpha_{\mathrm{Z}_2}} $ (middle right), $ \mathrm{d}\Gamma_{Z \to 4\ell}/\mathrm{d}{\cos\theta_{\mathrm{Z}_1}} $ (lower left), and $ \mathrm{d}\Gamma_{Z \to 4\ell}/\mathrm{d}{\cos\theta_{\mathrm{Z}_2}} $ (lower right). Here, $ \beta $ and $ \alpha_{\mathrm{Z}_1} $ have been scaled so that $ \pi $ radians corresponds to 1.0 on the plot. These distributions have been unfolded and scaled to the full phase space region using the $ \mathcal{B}(\mathrm{Z} \to 4\ell) $ result of Table 5. For each bin, the total uncertainty is shown. |
png pdf |
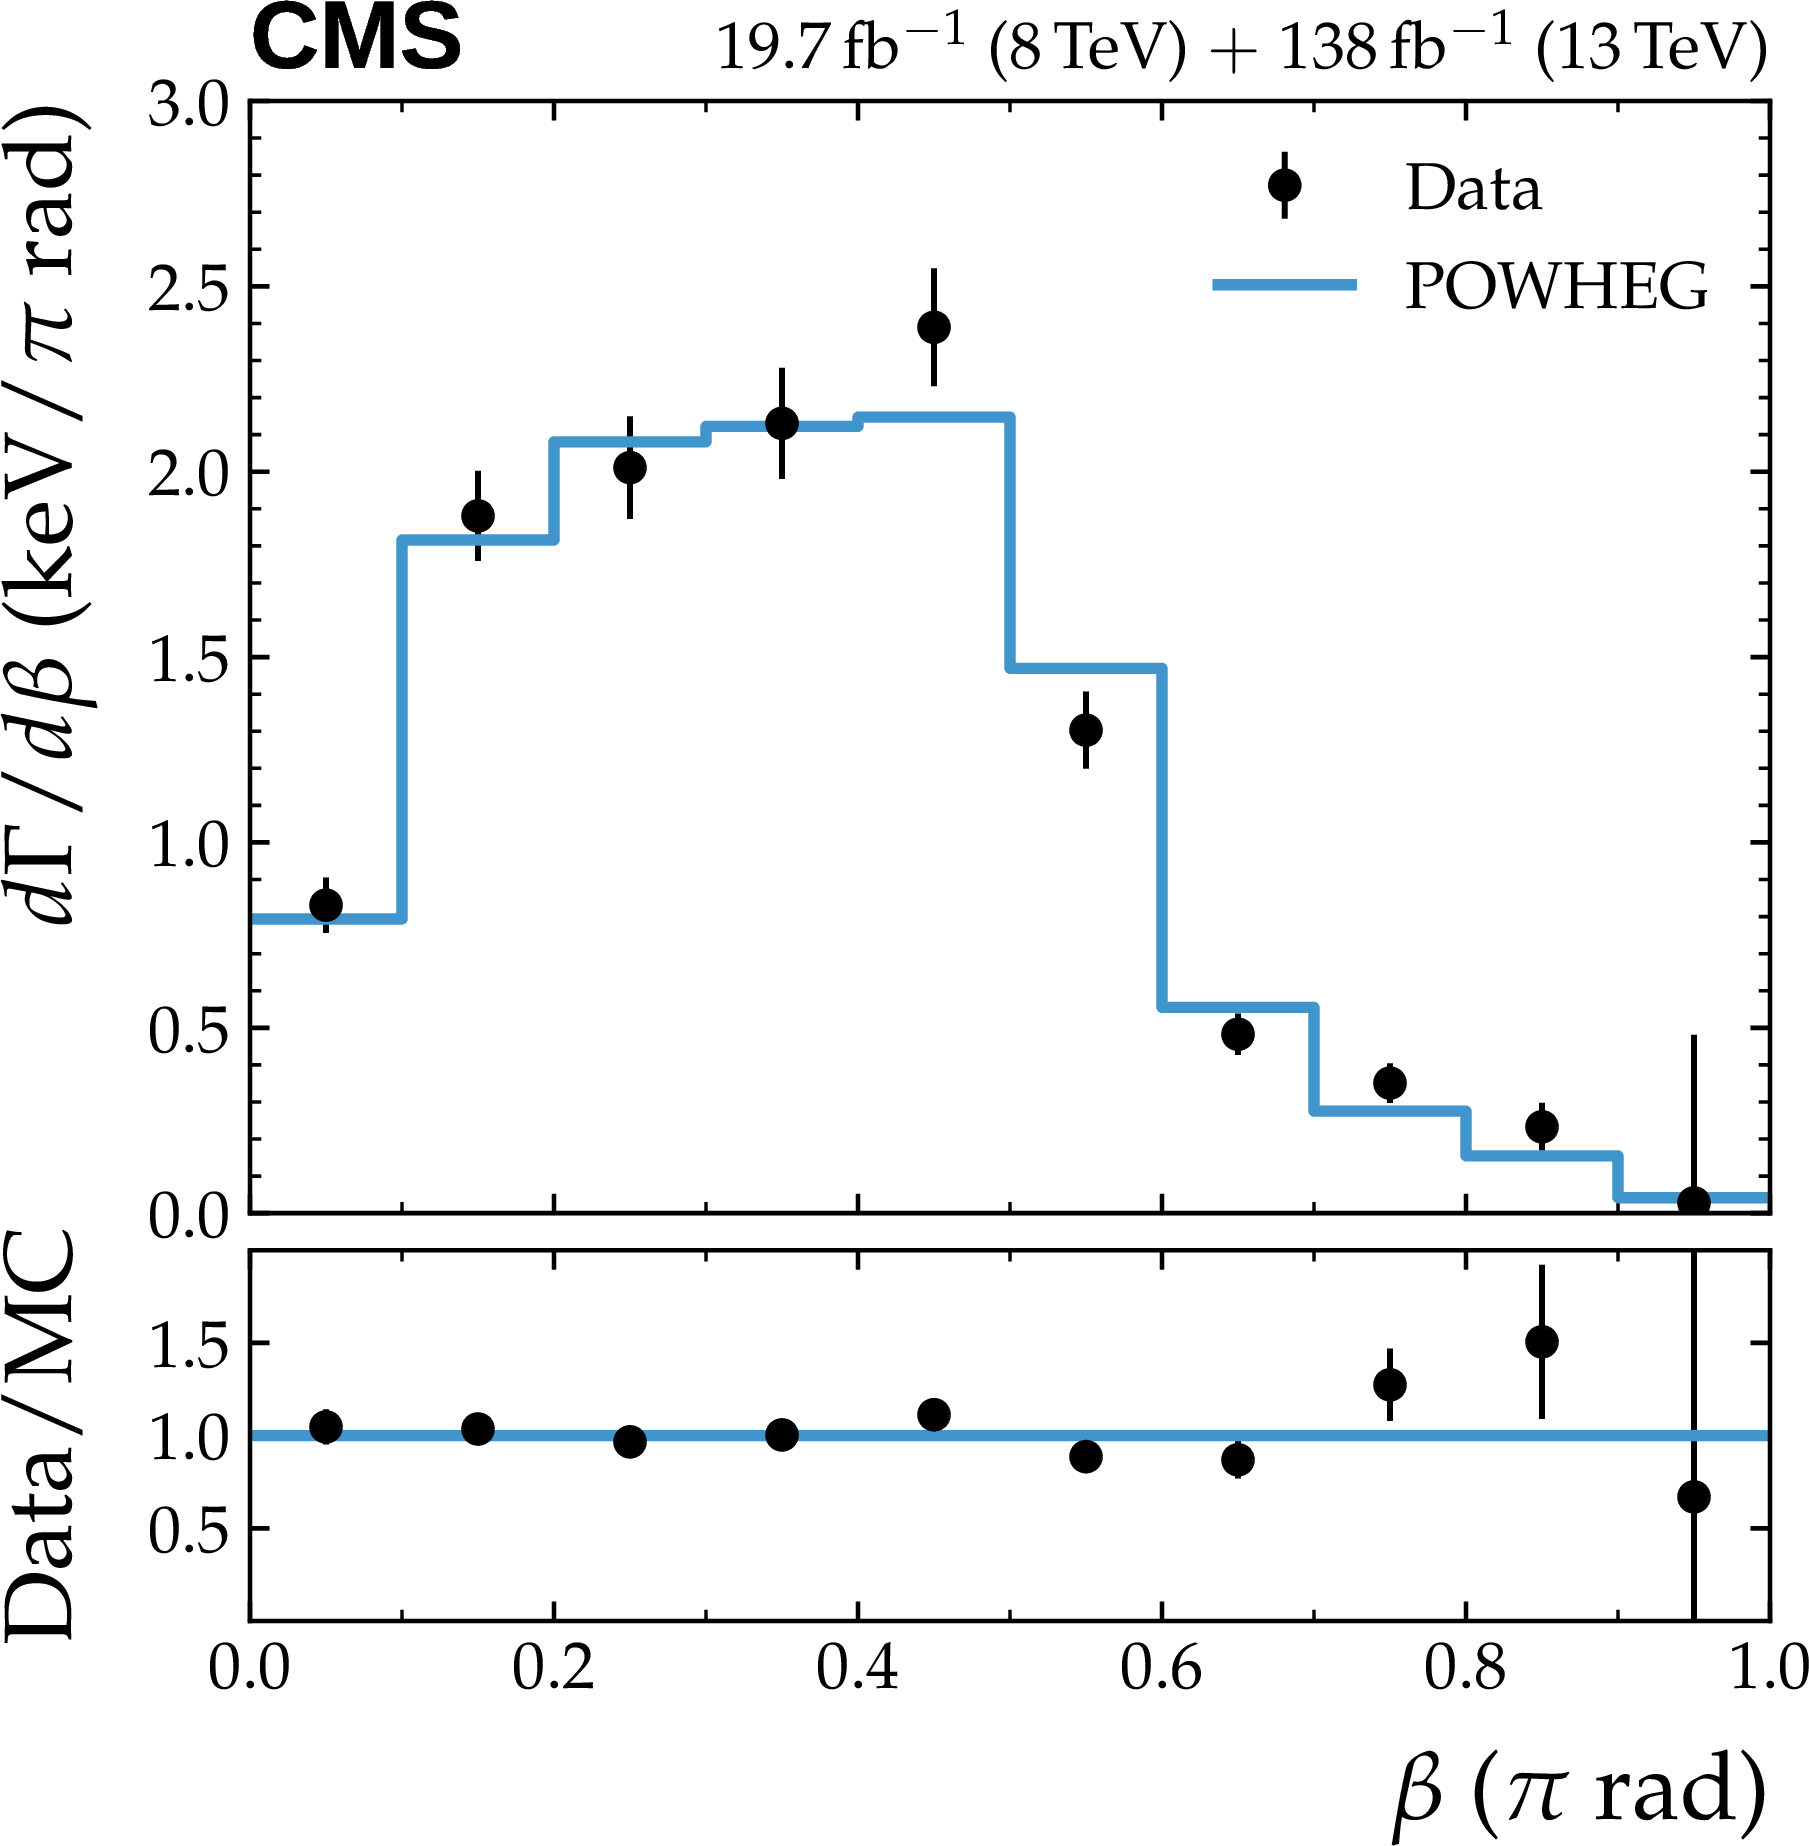
Figure 5-a:
The differential decay rates $ \mathrm{d}\Gamma_{Z \to 4\ell}/\mathrm{d}{\beta} $ (upper), $ \mathrm{d}\Gamma_{Z \to 4\ell}/\mathrm{d}{\alpha_{\mathrm{Z}_1}} $ (middle left), $ \mathrm{d}\Gamma_{Z \to 4\ell}/\mathrm{d}{\alpha_{\mathrm{Z}_2}} $ (middle right), $ \mathrm{d}\Gamma_{Z \to 4\ell}/\mathrm{d}{\cos\theta_{\mathrm{Z}_1}} $ (lower left), and $ \mathrm{d}\Gamma_{Z \to 4\ell}/\mathrm{d}{\cos\theta_{\mathrm{Z}_2}} $ (lower right). Here, $ \beta $ and $ \alpha_{\mathrm{Z}_1} $ have been scaled so that $ \pi $ radians corresponds to 1.0 on the plot. These distributions have been unfolded and scaled to the full phase space region using the $ \mathcal{B}(\mathrm{Z} \to 4\ell) $ result of Table 5. For each bin, the total uncertainty is shown. |
png pdf |
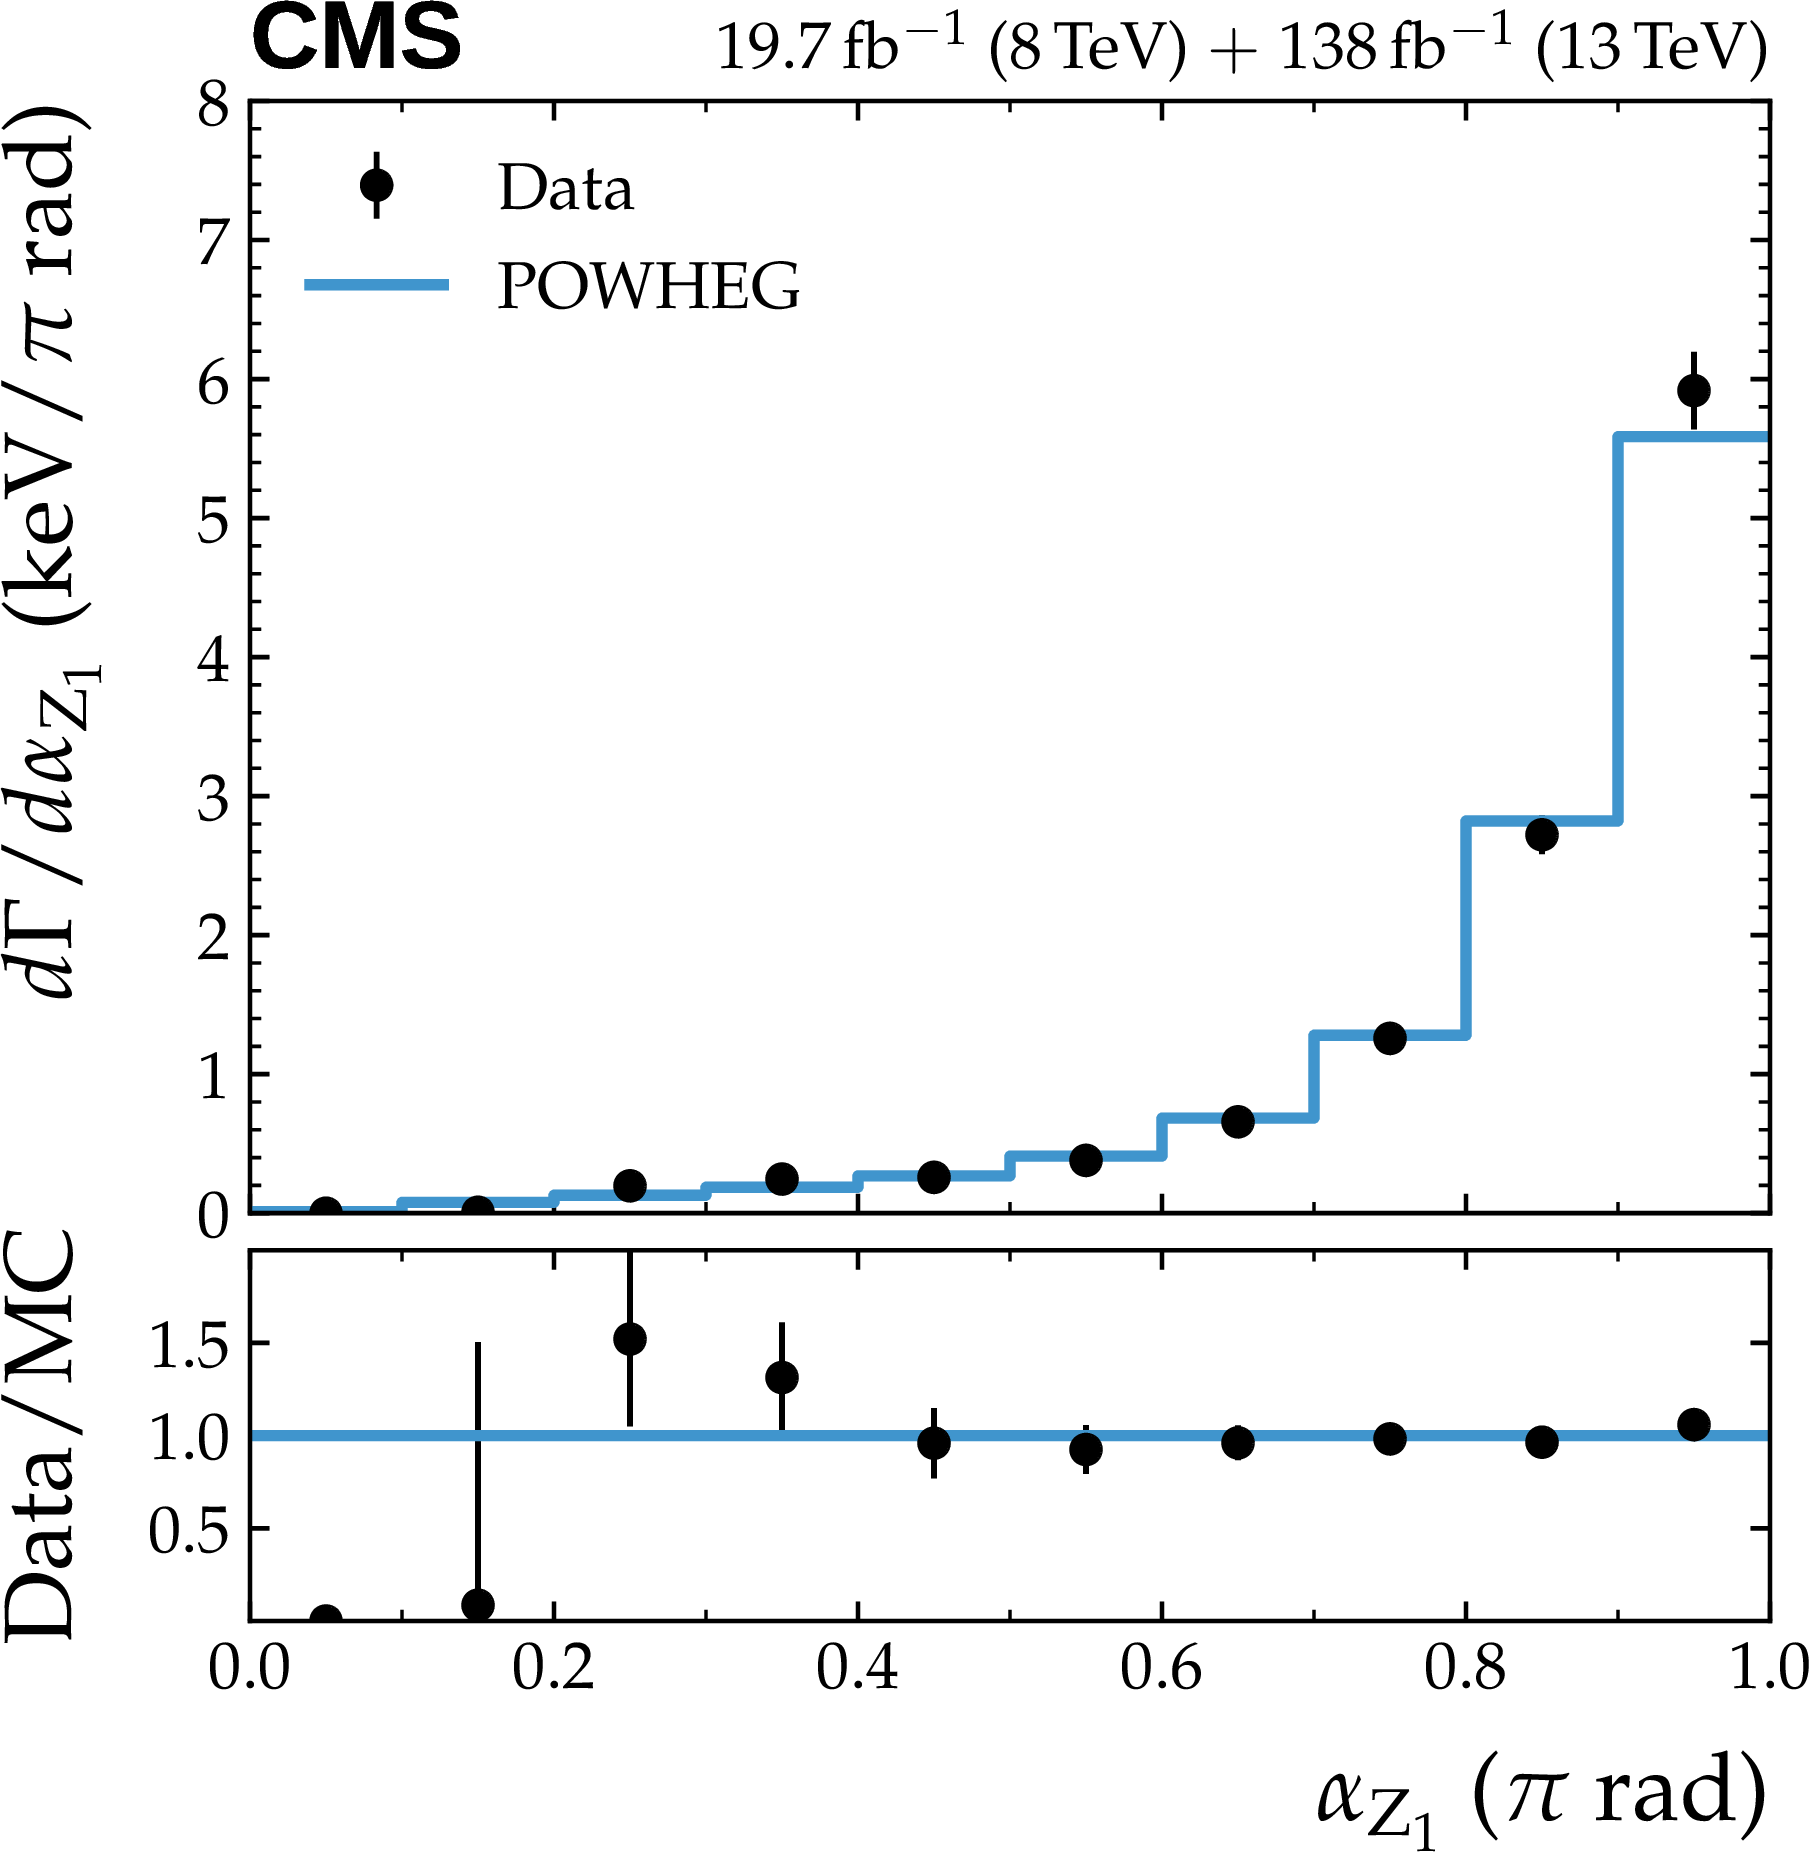
Figure 5-b:
The differential decay rates $ \mathrm{d}\Gamma_{Z \to 4\ell}/\mathrm{d}{\beta} $ (upper), $ \mathrm{d}\Gamma_{Z \to 4\ell}/\mathrm{d}{\alpha_{\mathrm{Z}_1}} $ (middle left), $ \mathrm{d}\Gamma_{Z \to 4\ell}/\mathrm{d}{\alpha_{\mathrm{Z}_2}} $ (middle right), $ \mathrm{d}\Gamma_{Z \to 4\ell}/\mathrm{d}{\cos\theta_{\mathrm{Z}_1}} $ (lower left), and $ \mathrm{d}\Gamma_{Z \to 4\ell}/\mathrm{d}{\cos\theta_{\mathrm{Z}_2}} $ (lower right). Here, $ \beta $ and $ \alpha_{\mathrm{Z}_1} $ have been scaled so that $ \pi $ radians corresponds to 1.0 on the plot. These distributions have been unfolded and scaled to the full phase space region using the $ \mathcal{B}(\mathrm{Z} \to 4\ell) $ result of Table 5. For each bin, the total uncertainty is shown. |
png pdf |
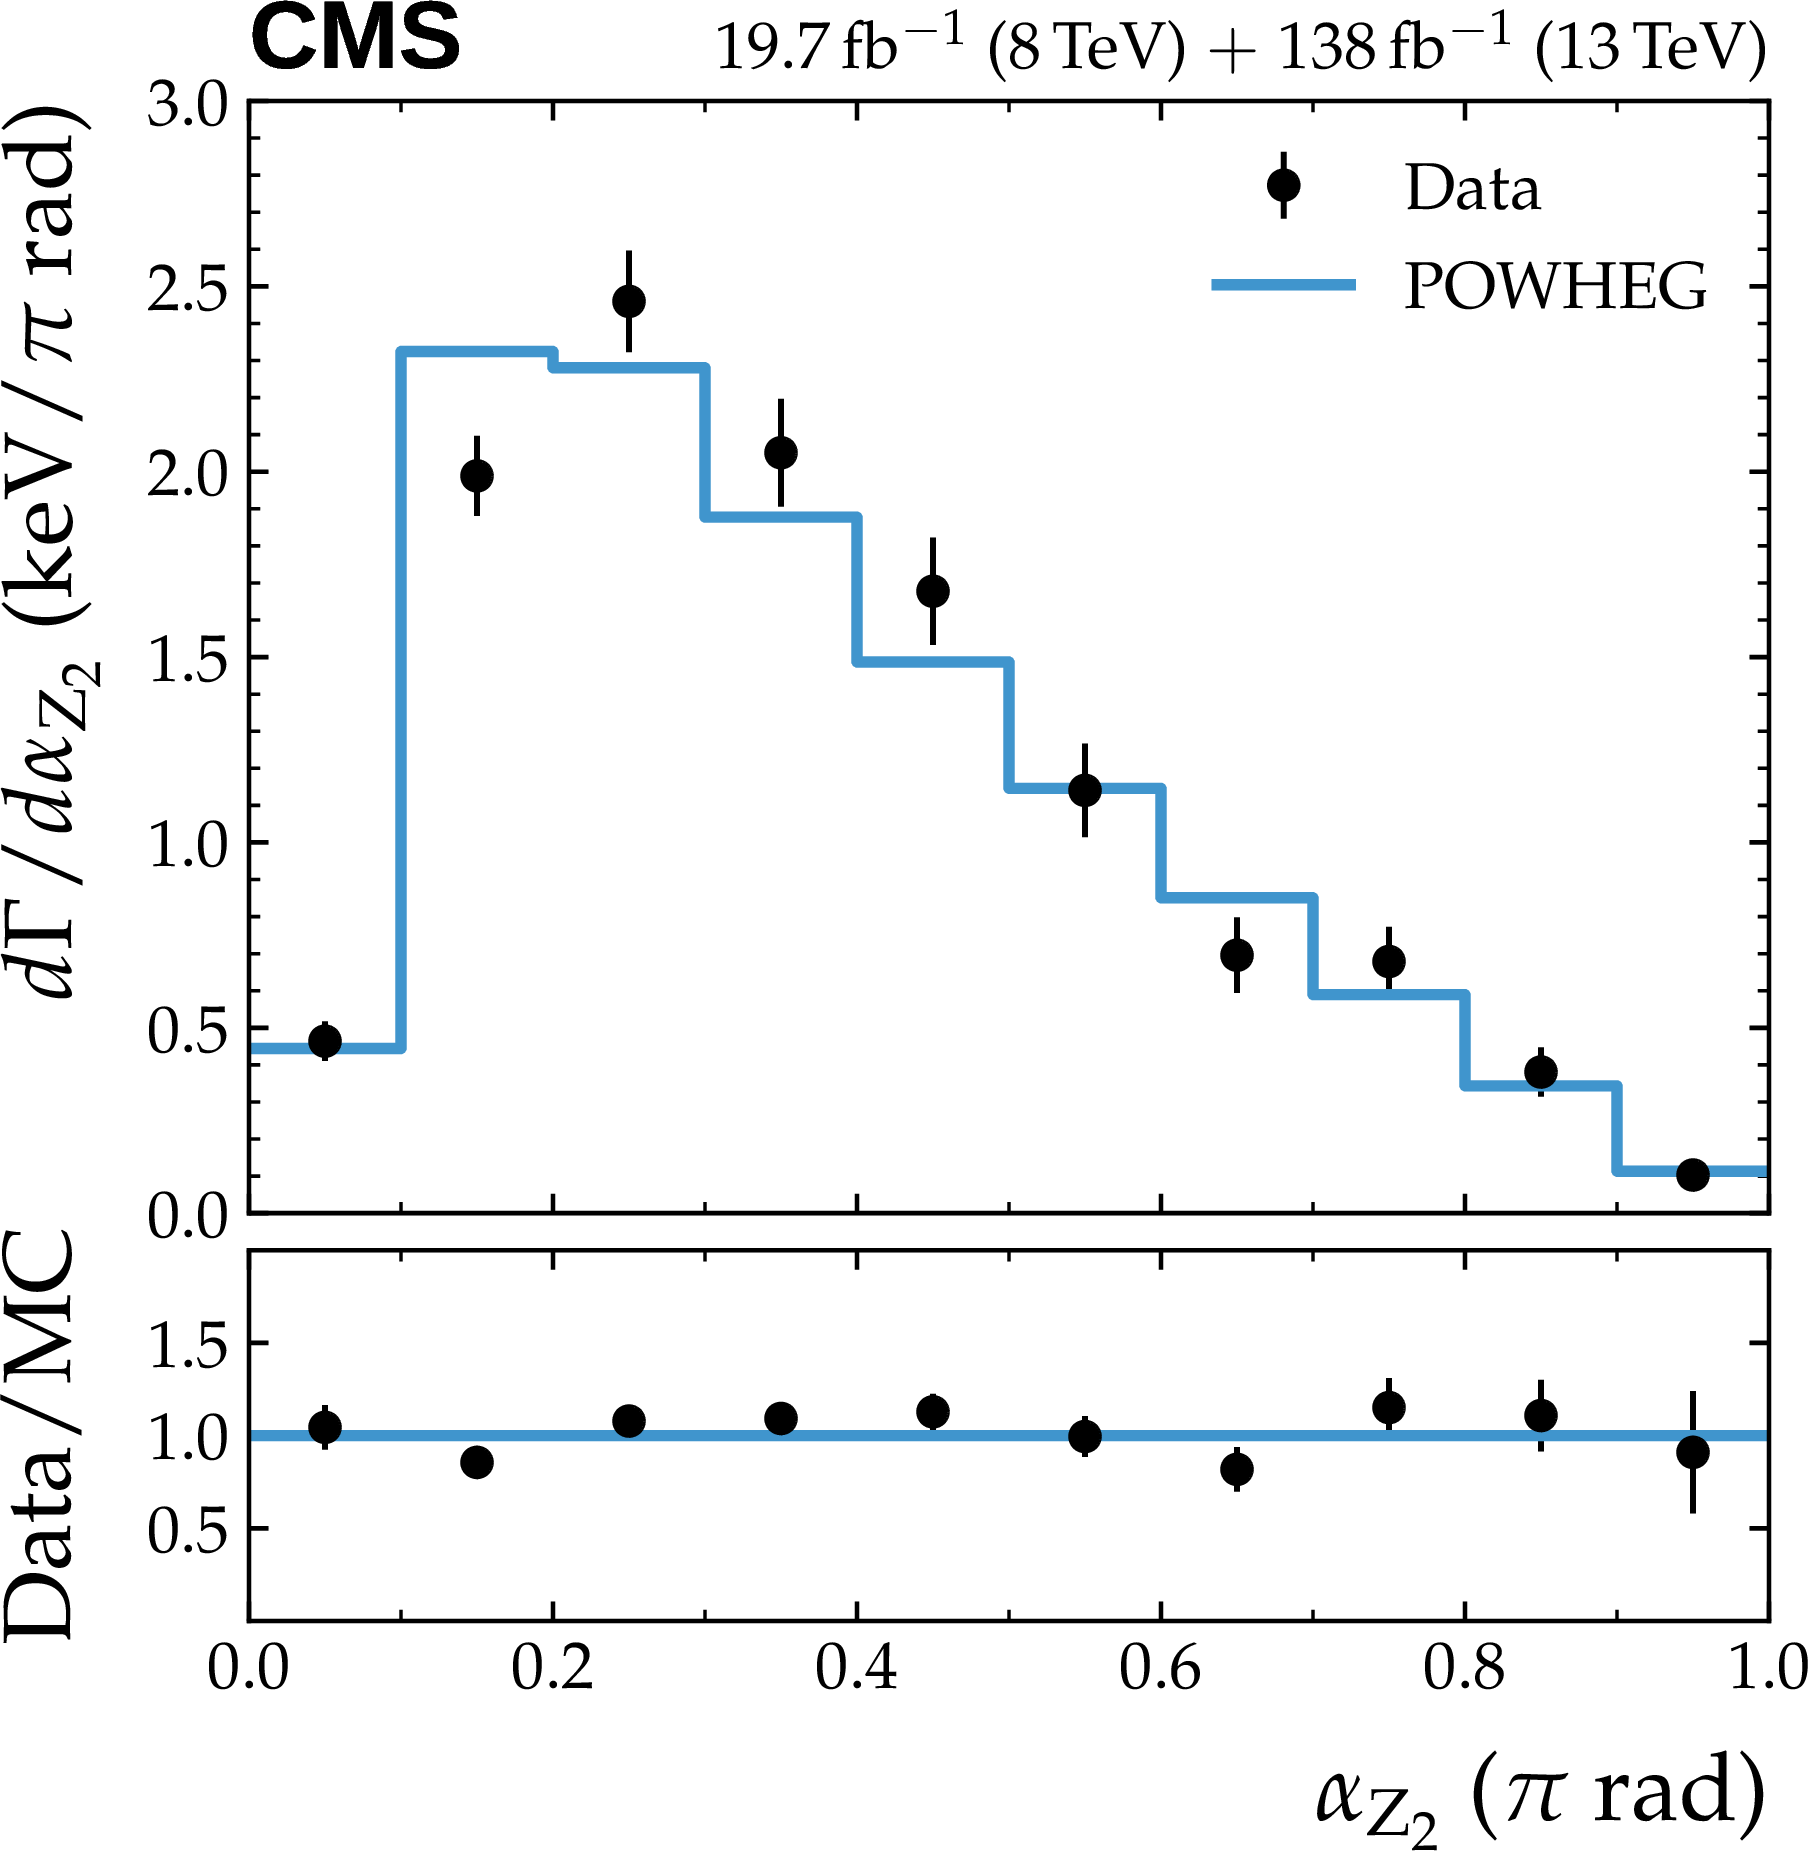
Figure 5-c:
The differential decay rates $ \mathrm{d}\Gamma_{Z \to 4\ell}/\mathrm{d}{\beta} $ (upper), $ \mathrm{d}\Gamma_{Z \to 4\ell}/\mathrm{d}{\alpha_{\mathrm{Z}_1}} $ (middle left), $ \mathrm{d}\Gamma_{Z \to 4\ell}/\mathrm{d}{\alpha_{\mathrm{Z}_2}} $ (middle right), $ \mathrm{d}\Gamma_{Z \to 4\ell}/\mathrm{d}{\cos\theta_{\mathrm{Z}_1}} $ (lower left), and $ \mathrm{d}\Gamma_{Z \to 4\ell}/\mathrm{d}{\cos\theta_{\mathrm{Z}_2}} $ (lower right). Here, $ \beta $ and $ \alpha_{\mathrm{Z}_1} $ have been scaled so that $ \pi $ radians corresponds to 1.0 on the plot. These distributions have been unfolded and scaled to the full phase space region using the $ \mathcal{B}(\mathrm{Z} \to 4\ell) $ result of Table 5. For each bin, the total uncertainty is shown. |
png pdf |
Figure 5-d:
The differential decay rates $ \mathrm{d}\Gamma_{Z \to 4\ell}/\mathrm{d}{\beta} $ (upper), $ \mathrm{d}\Gamma_{Z \to 4\ell}/\mathrm{d}{\alpha_{\mathrm{Z}_1}} $ (middle left), $ \mathrm{d}\Gamma_{Z \to 4\ell}/\mathrm{d}{\alpha_{\mathrm{Z}_2}} $ (middle right), $ \mathrm{d}\Gamma_{Z \to 4\ell}/\mathrm{d}{\cos\theta_{\mathrm{Z}_1}} $ (lower left), and $ \mathrm{d}\Gamma_{Z \to 4\ell}/\mathrm{d}{\cos\theta_{\mathrm{Z}_2}} $ (lower right). Here, $ \beta $ and $ \alpha_{\mathrm{Z}_1} $ have been scaled so that $ \pi $ radians corresponds to 1.0 on the plot. These distributions have been unfolded and scaled to the full phase space region using the $ \mathcal{B}(\mathrm{Z} \to 4\ell) $ result of Table 5. For each bin, the total uncertainty is shown. |
png pdf |
Figure 5-e:
The differential decay rates $ \mathrm{d}\Gamma_{Z \to 4\ell}/\mathrm{d}{\beta} $ (upper), $ \mathrm{d}\Gamma_{Z \to 4\ell}/\mathrm{d}{\alpha_{\mathrm{Z}_1}} $ (middle left), $ \mathrm{d}\Gamma_{Z \to 4\ell}/\mathrm{d}{\alpha_{\mathrm{Z}_2}} $ (middle right), $ \mathrm{d}\Gamma_{Z \to 4\ell}/\mathrm{d}{\cos\theta_{\mathrm{Z}_1}} $ (lower left), and $ \mathrm{d}\Gamma_{Z \to 4\ell}/\mathrm{d}{\cos\theta_{\mathrm{Z}_2}} $ (lower right). Here, $ \beta $ and $ \alpha_{\mathrm{Z}_1} $ have been scaled so that $ \pi $ radians corresponds to 1.0 on the plot. These distributions have been unfolded and scaled to the full phase space region using the $ \mathcal{B}(\mathrm{Z} \to 4\ell) $ result of Table 5. For each bin, the total uncertainty is shown. |
png pdf |
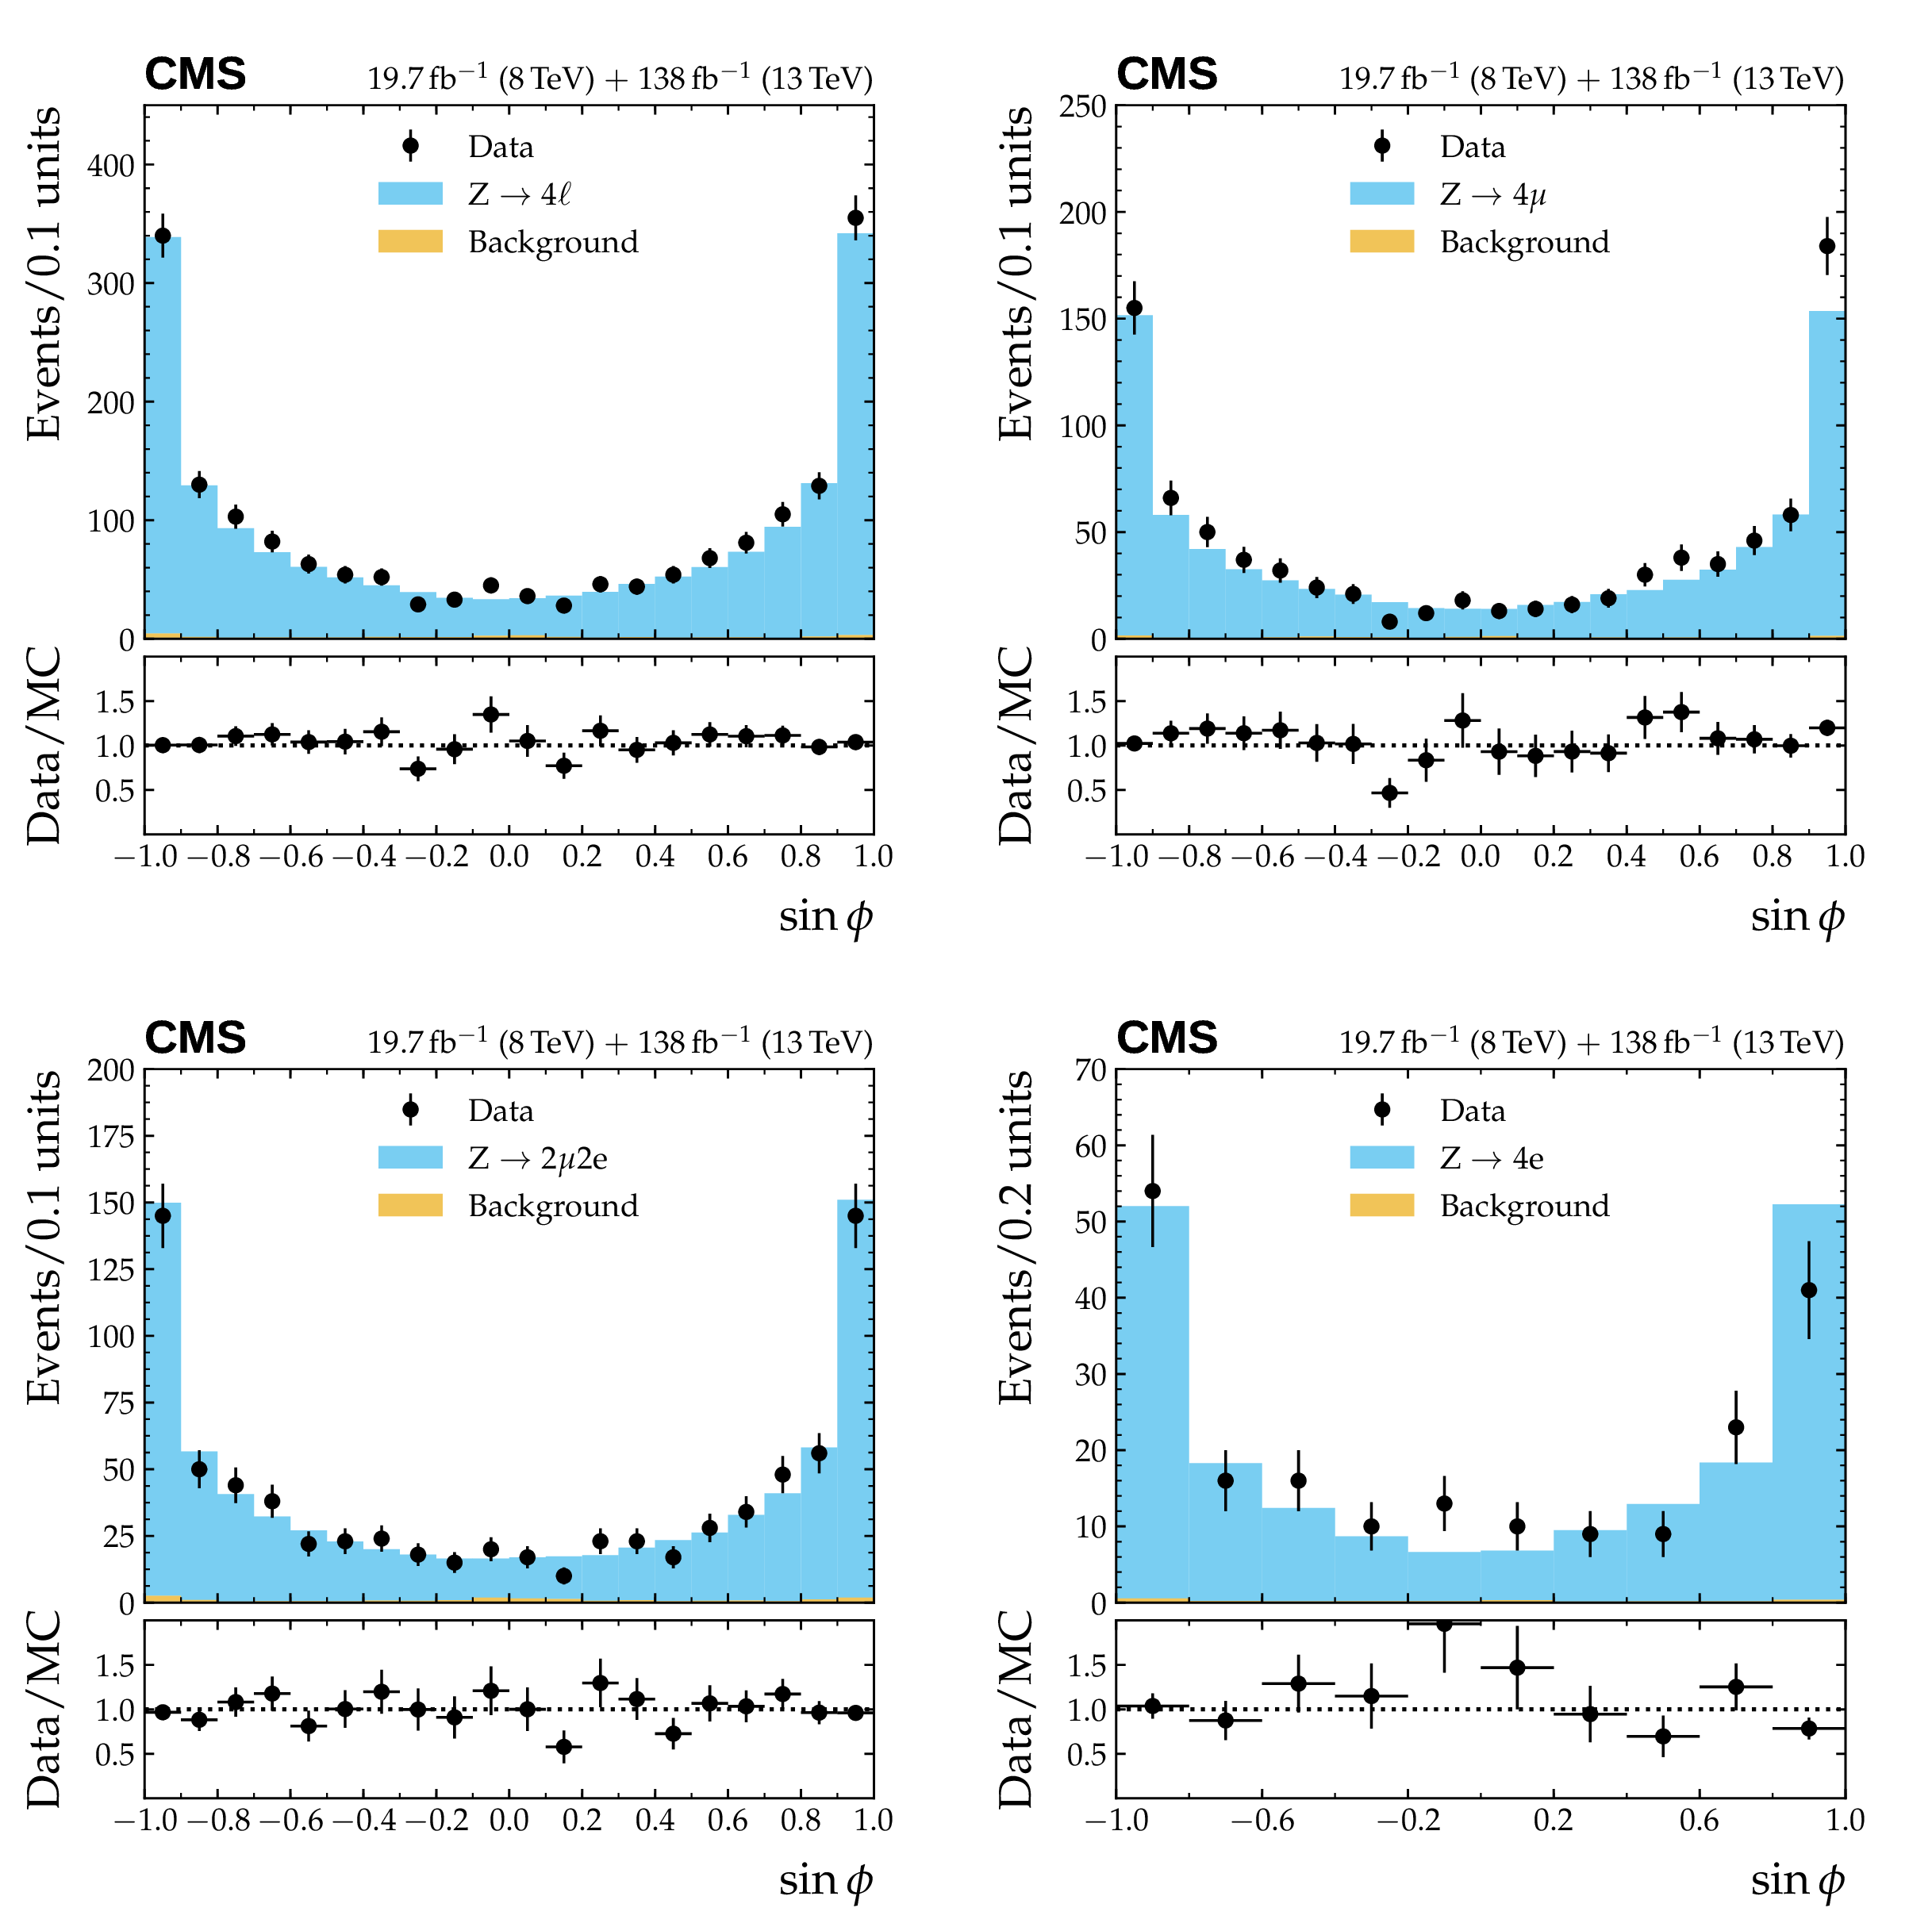
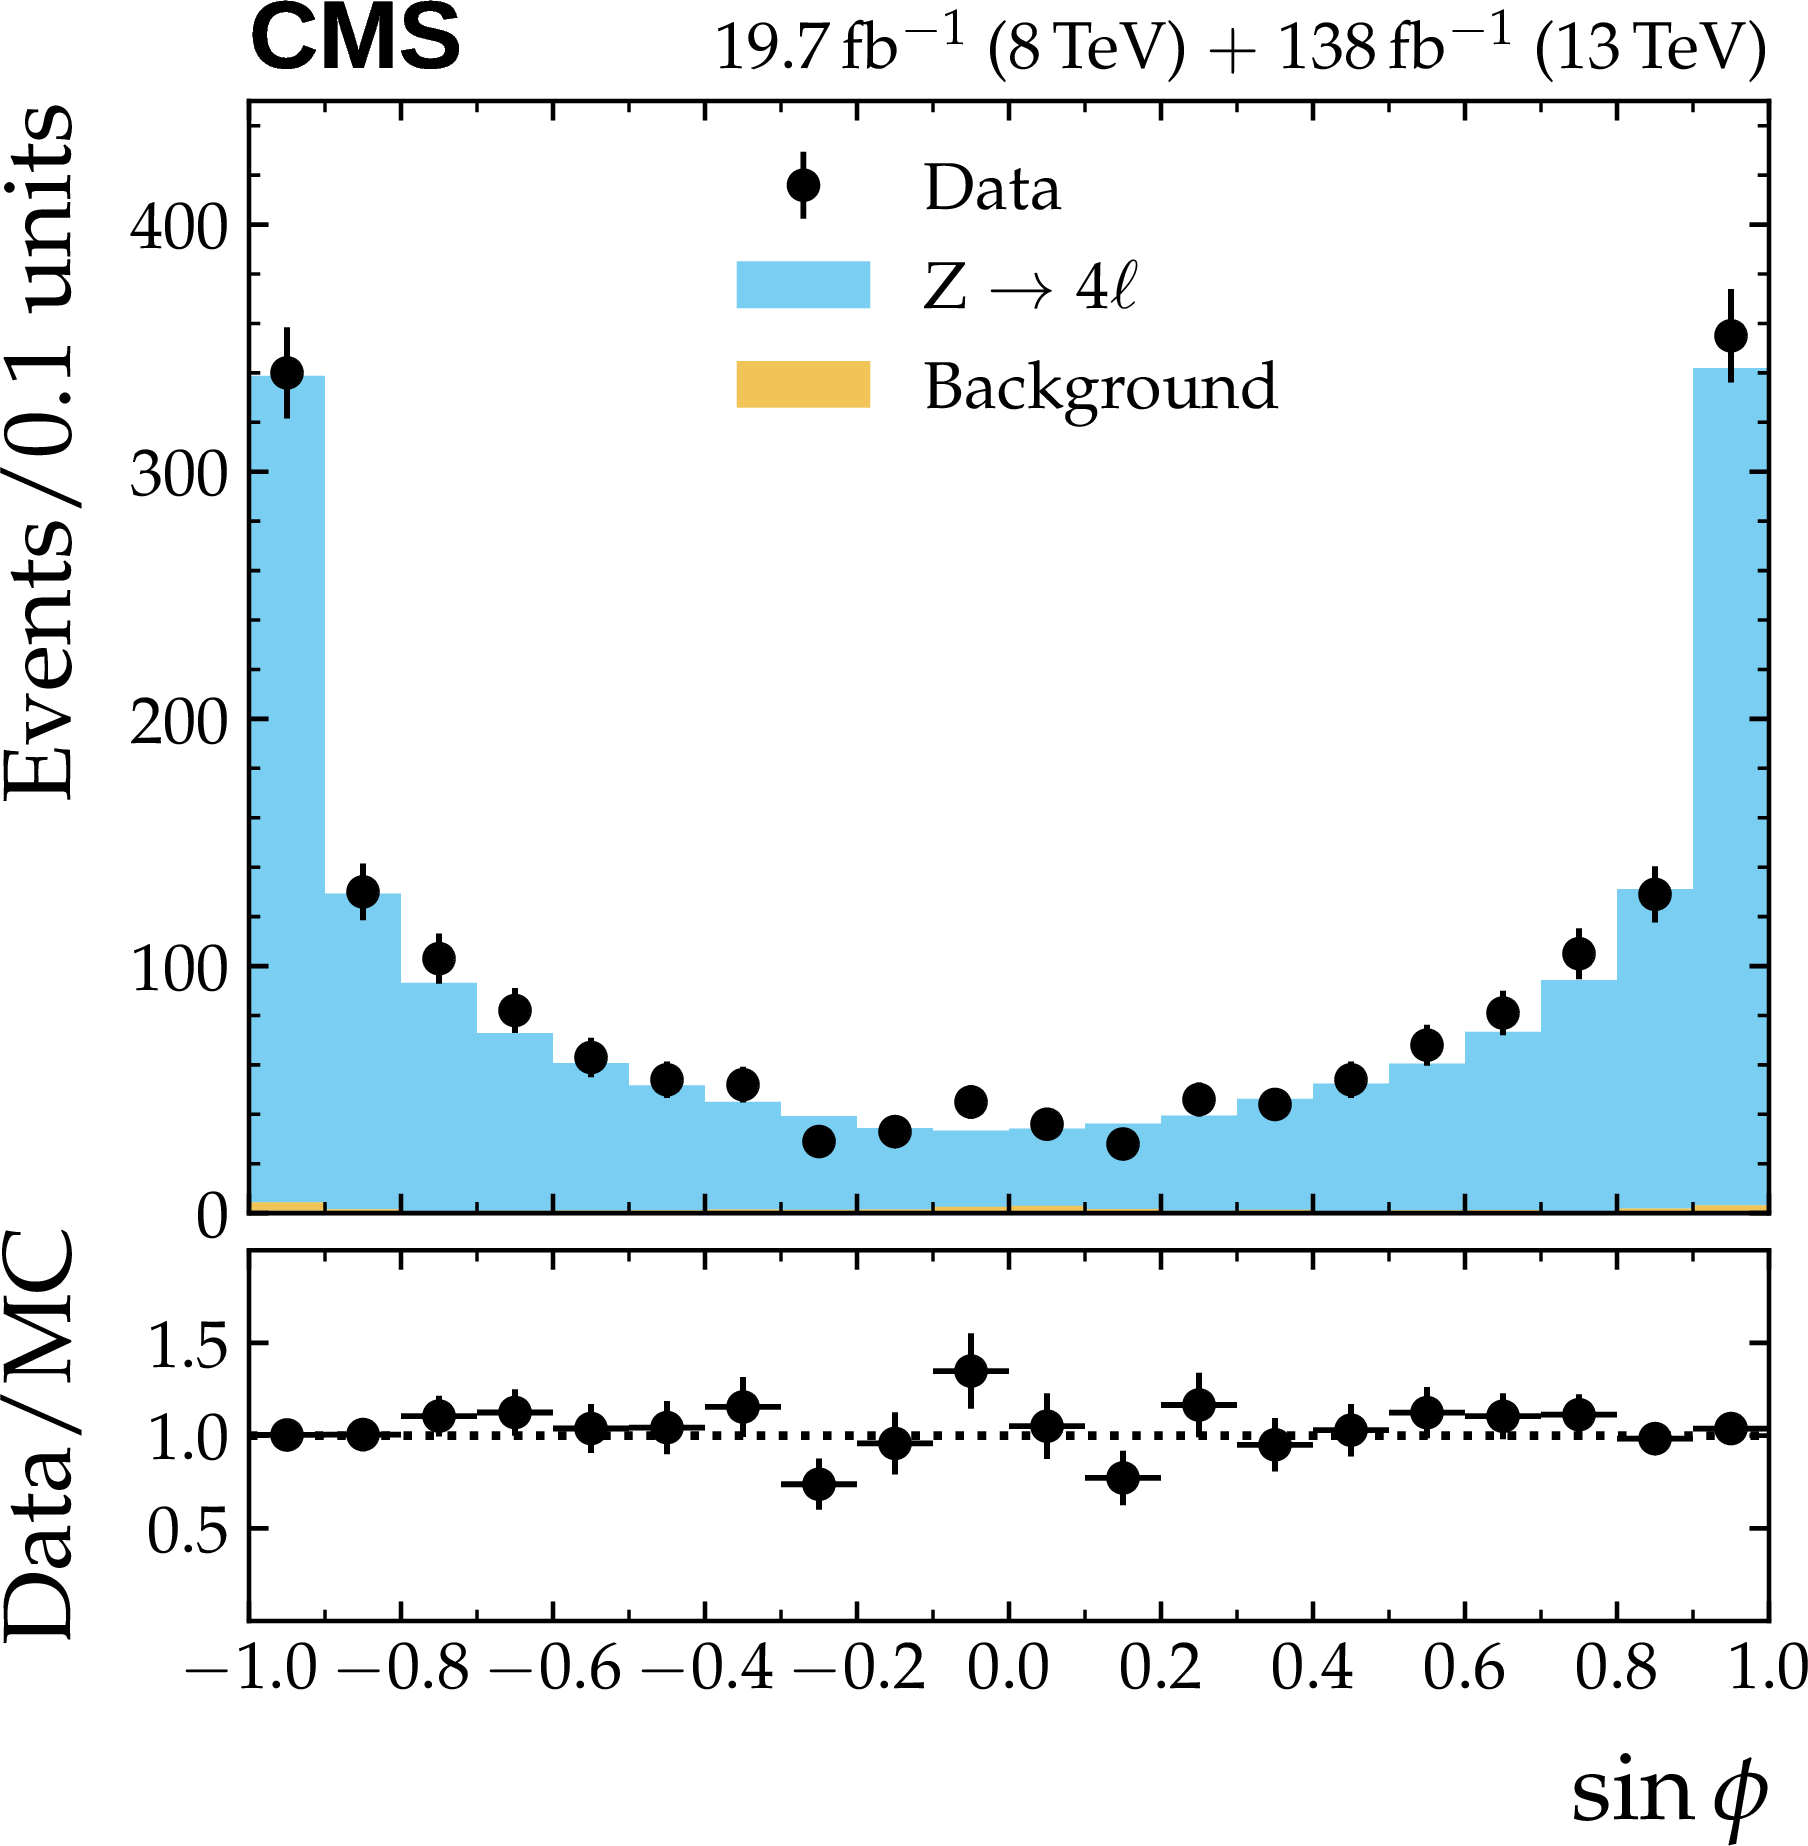
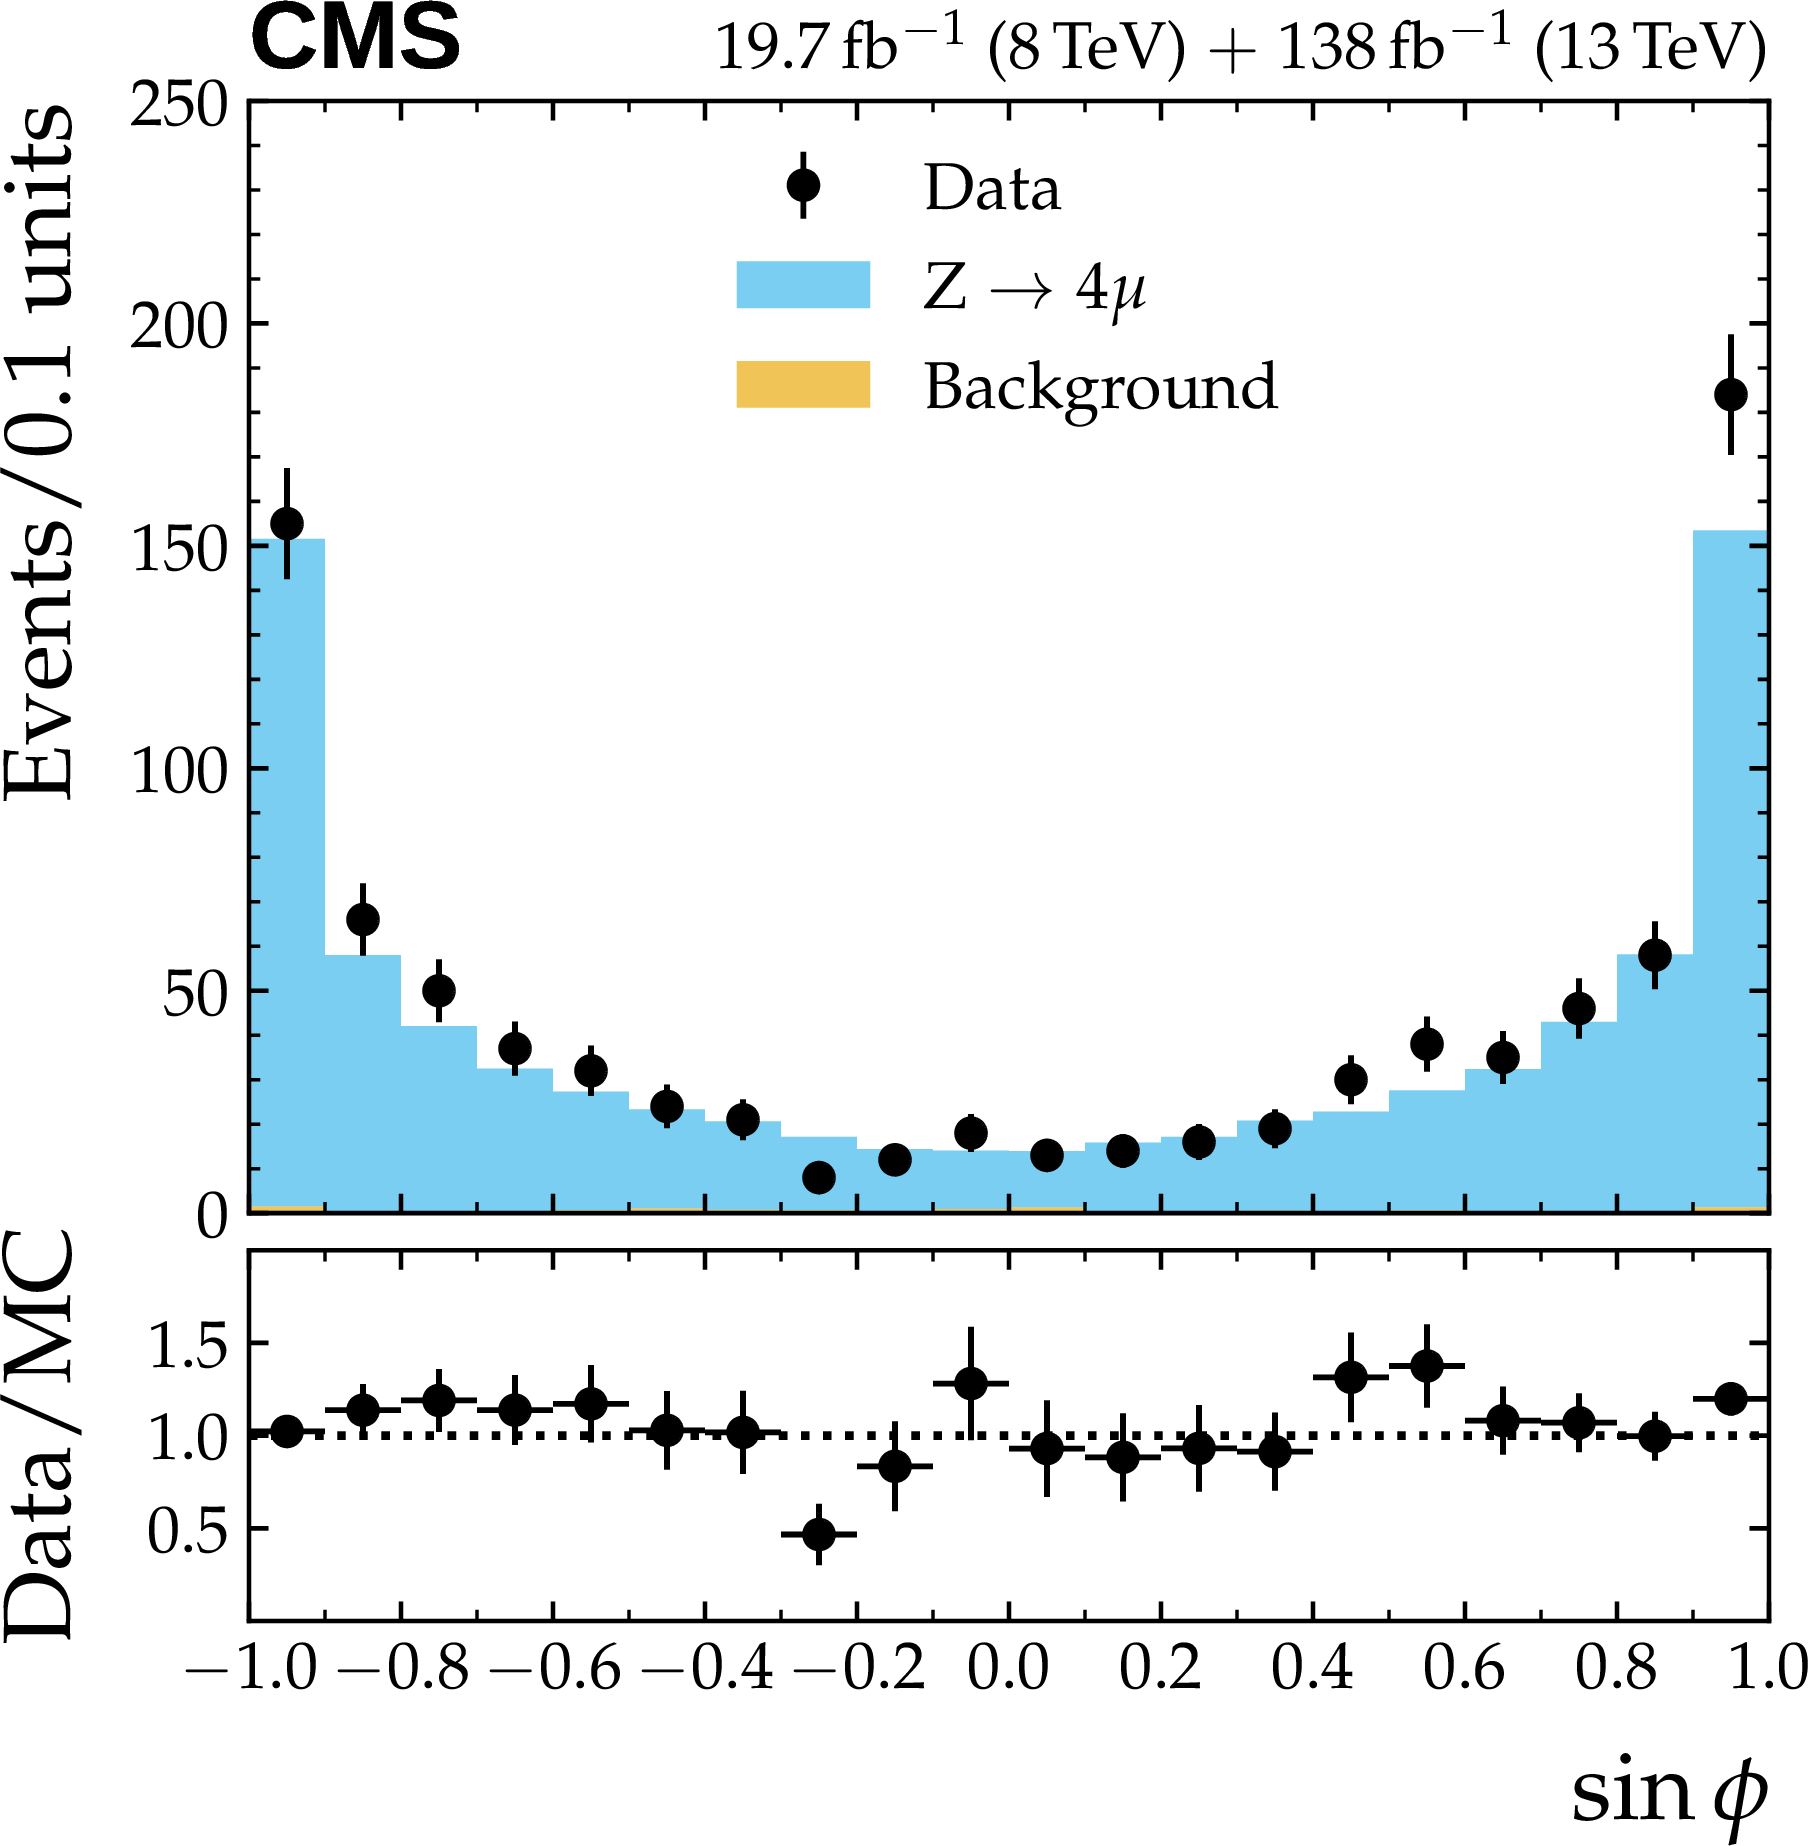
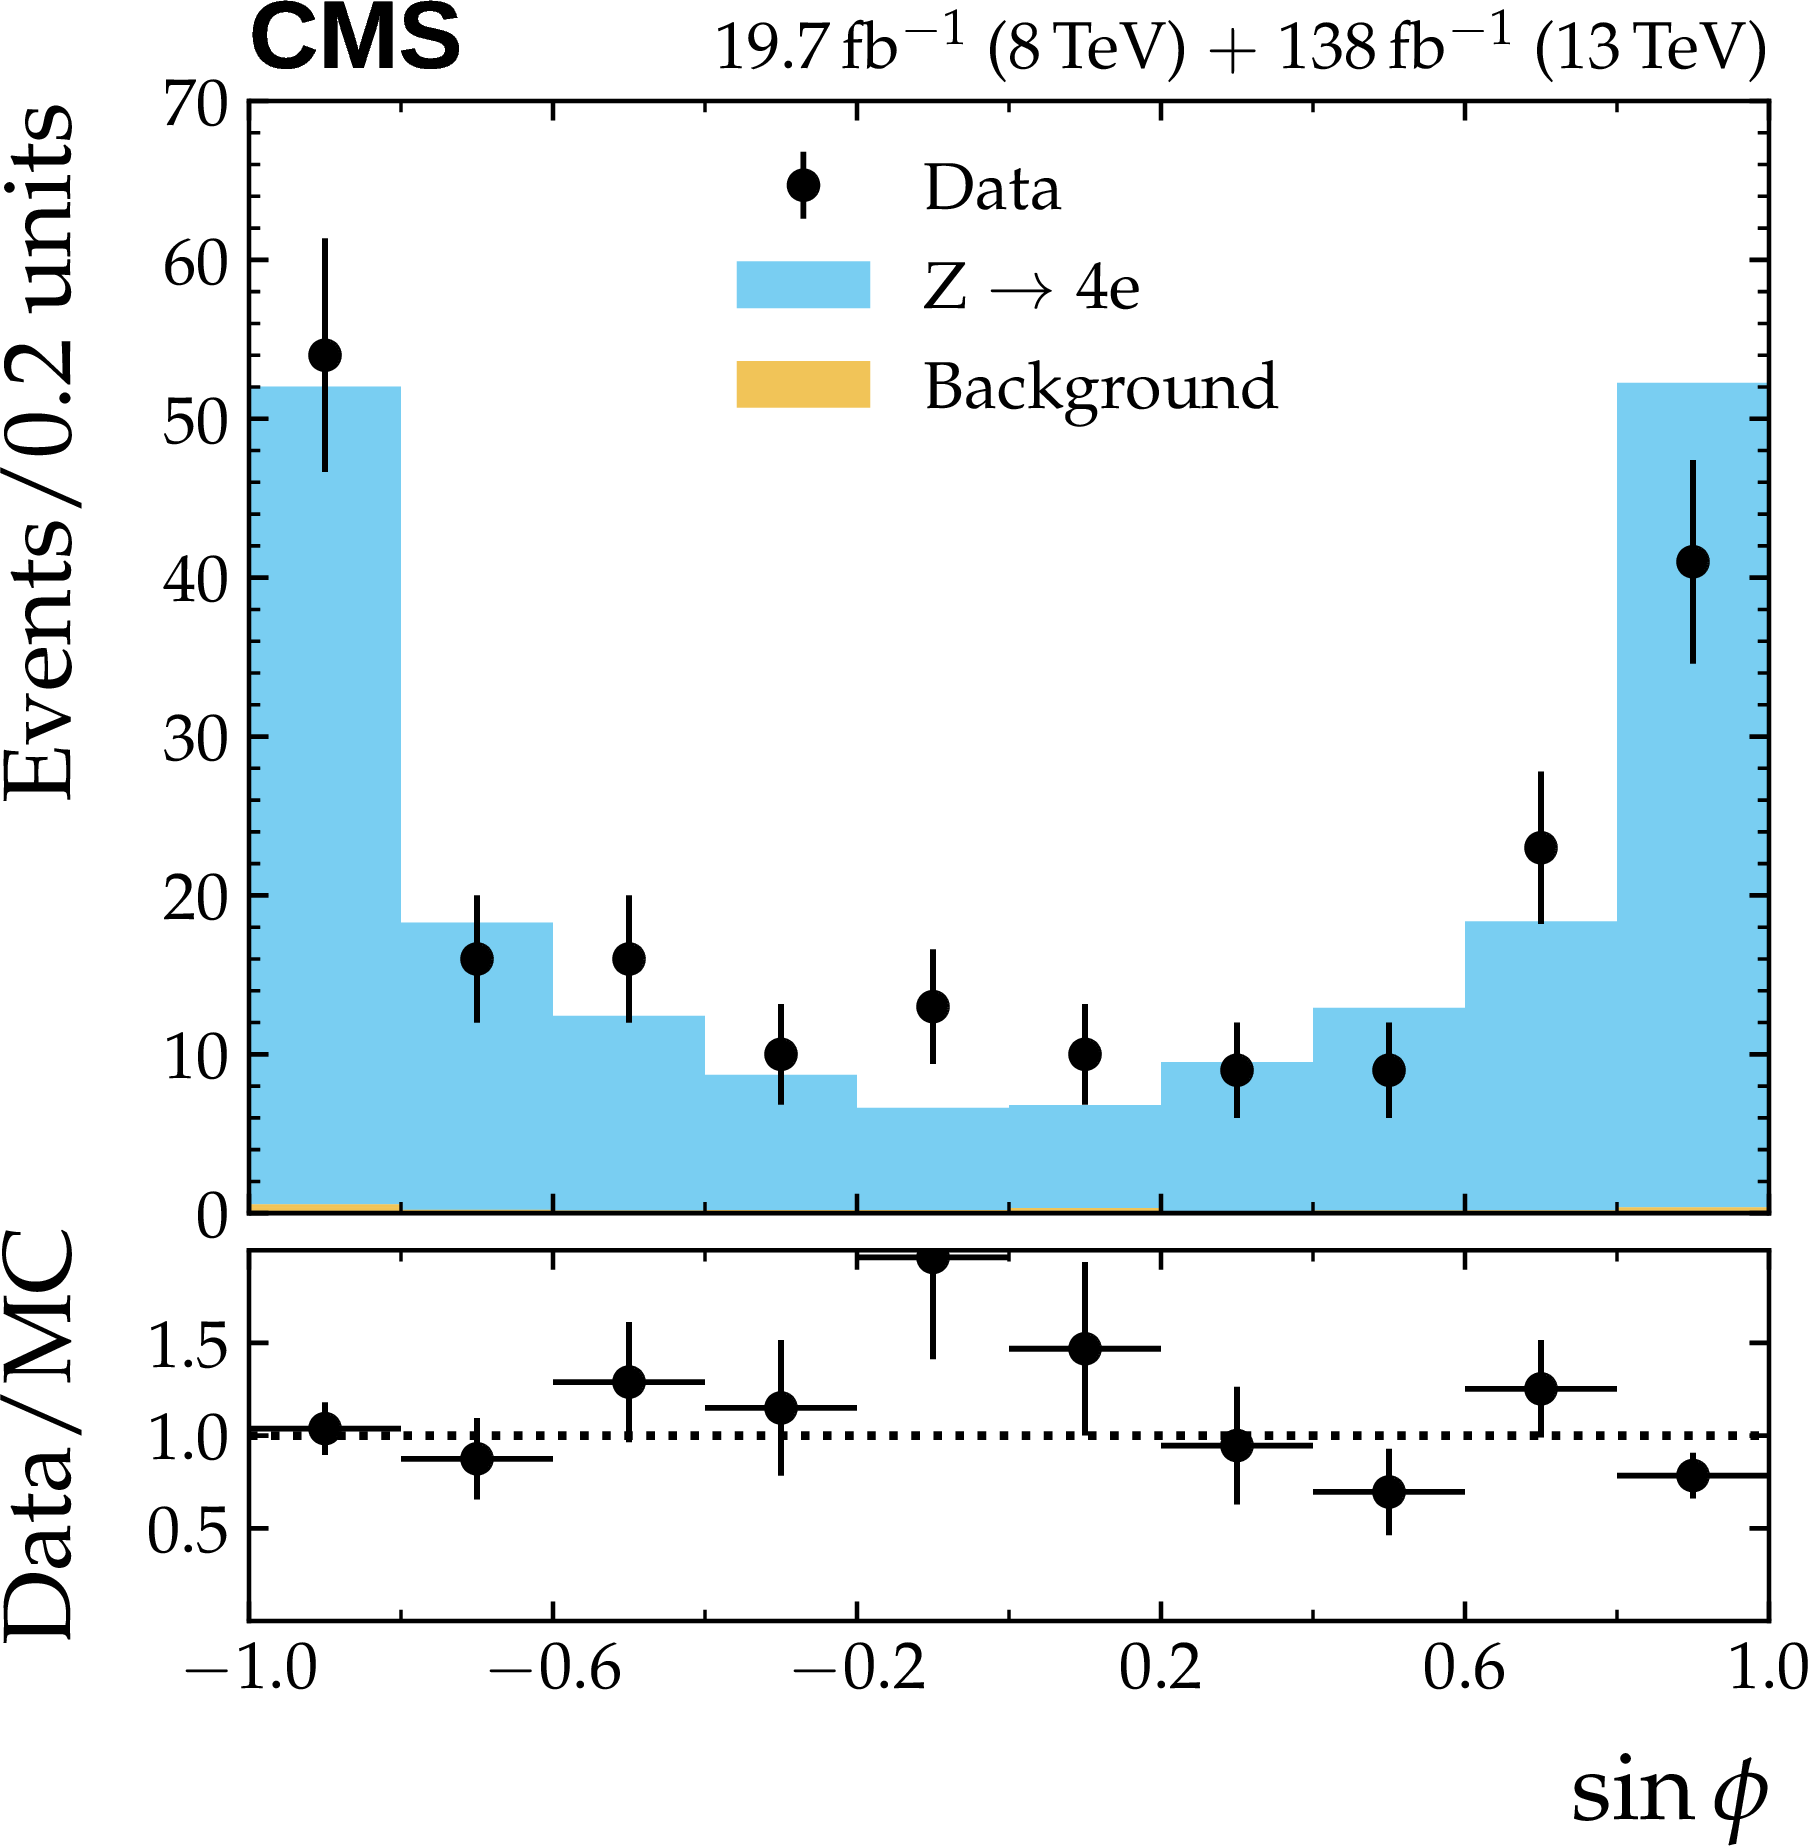
Figure 6:
Distributions of $ \sin\phi $ for the sum of all 4 $ \ell $ channels (upper left), the 4 $ \mu $ channel (upper right), the 2 $ \mu 2\mathrm{e} $ channel (lower left), and the 4 e channel (lower right). Vertical error bars represent the total uncertainty on each point. The simulations are normalized according to predicted cross sections and the integrated luminosity. |
png pdf |
Figure 6-a:
Distributions of $ \sin\phi $ for the sum of all 4 $ \ell $ channels (upper left), the 4 $ \mu $ channel (upper right), the 2 $ \mu 2\mathrm{e} $ channel (lower left), and the 4 e channel (lower right). Vertical error bars represent the total uncertainty on each point. The simulations are normalized according to predicted cross sections and the integrated luminosity. |
png pdf |
Figure 6-b:
Distributions of $ \sin\phi $ for the sum of all 4 $ \ell $ channels (upper left), the 4 $ \mu $ channel (upper right), the 2 $ \mu 2\mathrm{e} $ channel (lower left), and the 4 e channel (lower right). Vertical error bars represent the total uncertainty on each point. The simulations are normalized according to predicted cross sections and the integrated luminosity. |

png pdf |
Figure 6-c:
Distributions of $ \sin\phi $ for the sum of all 4 $ \ell $ channels (upper left), the 4 $ \mu $ channel (upper right), the 2 $ \mu 2\mathrm{e} $ channel (lower left), and the 4 e channel (lower right). Vertical error bars represent the total uncertainty on each point. The simulations are normalized according to predicted cross sections and the integrated luminosity. |
png pdf |
Figure 6-d:
Distributions of $ \sin\phi $ for the sum of all 4 $ \ell $ channels (upper left), the 4 $ \mu $ channel (upper right), the 2 $ \mu 2\mathrm{e} $ channel (lower left), and the 4 e channel (lower right). Vertical error bars represent the total uncertainty on each point. The simulations are normalized according to predicted cross sections and the integrated luminosity. |
png pdf |
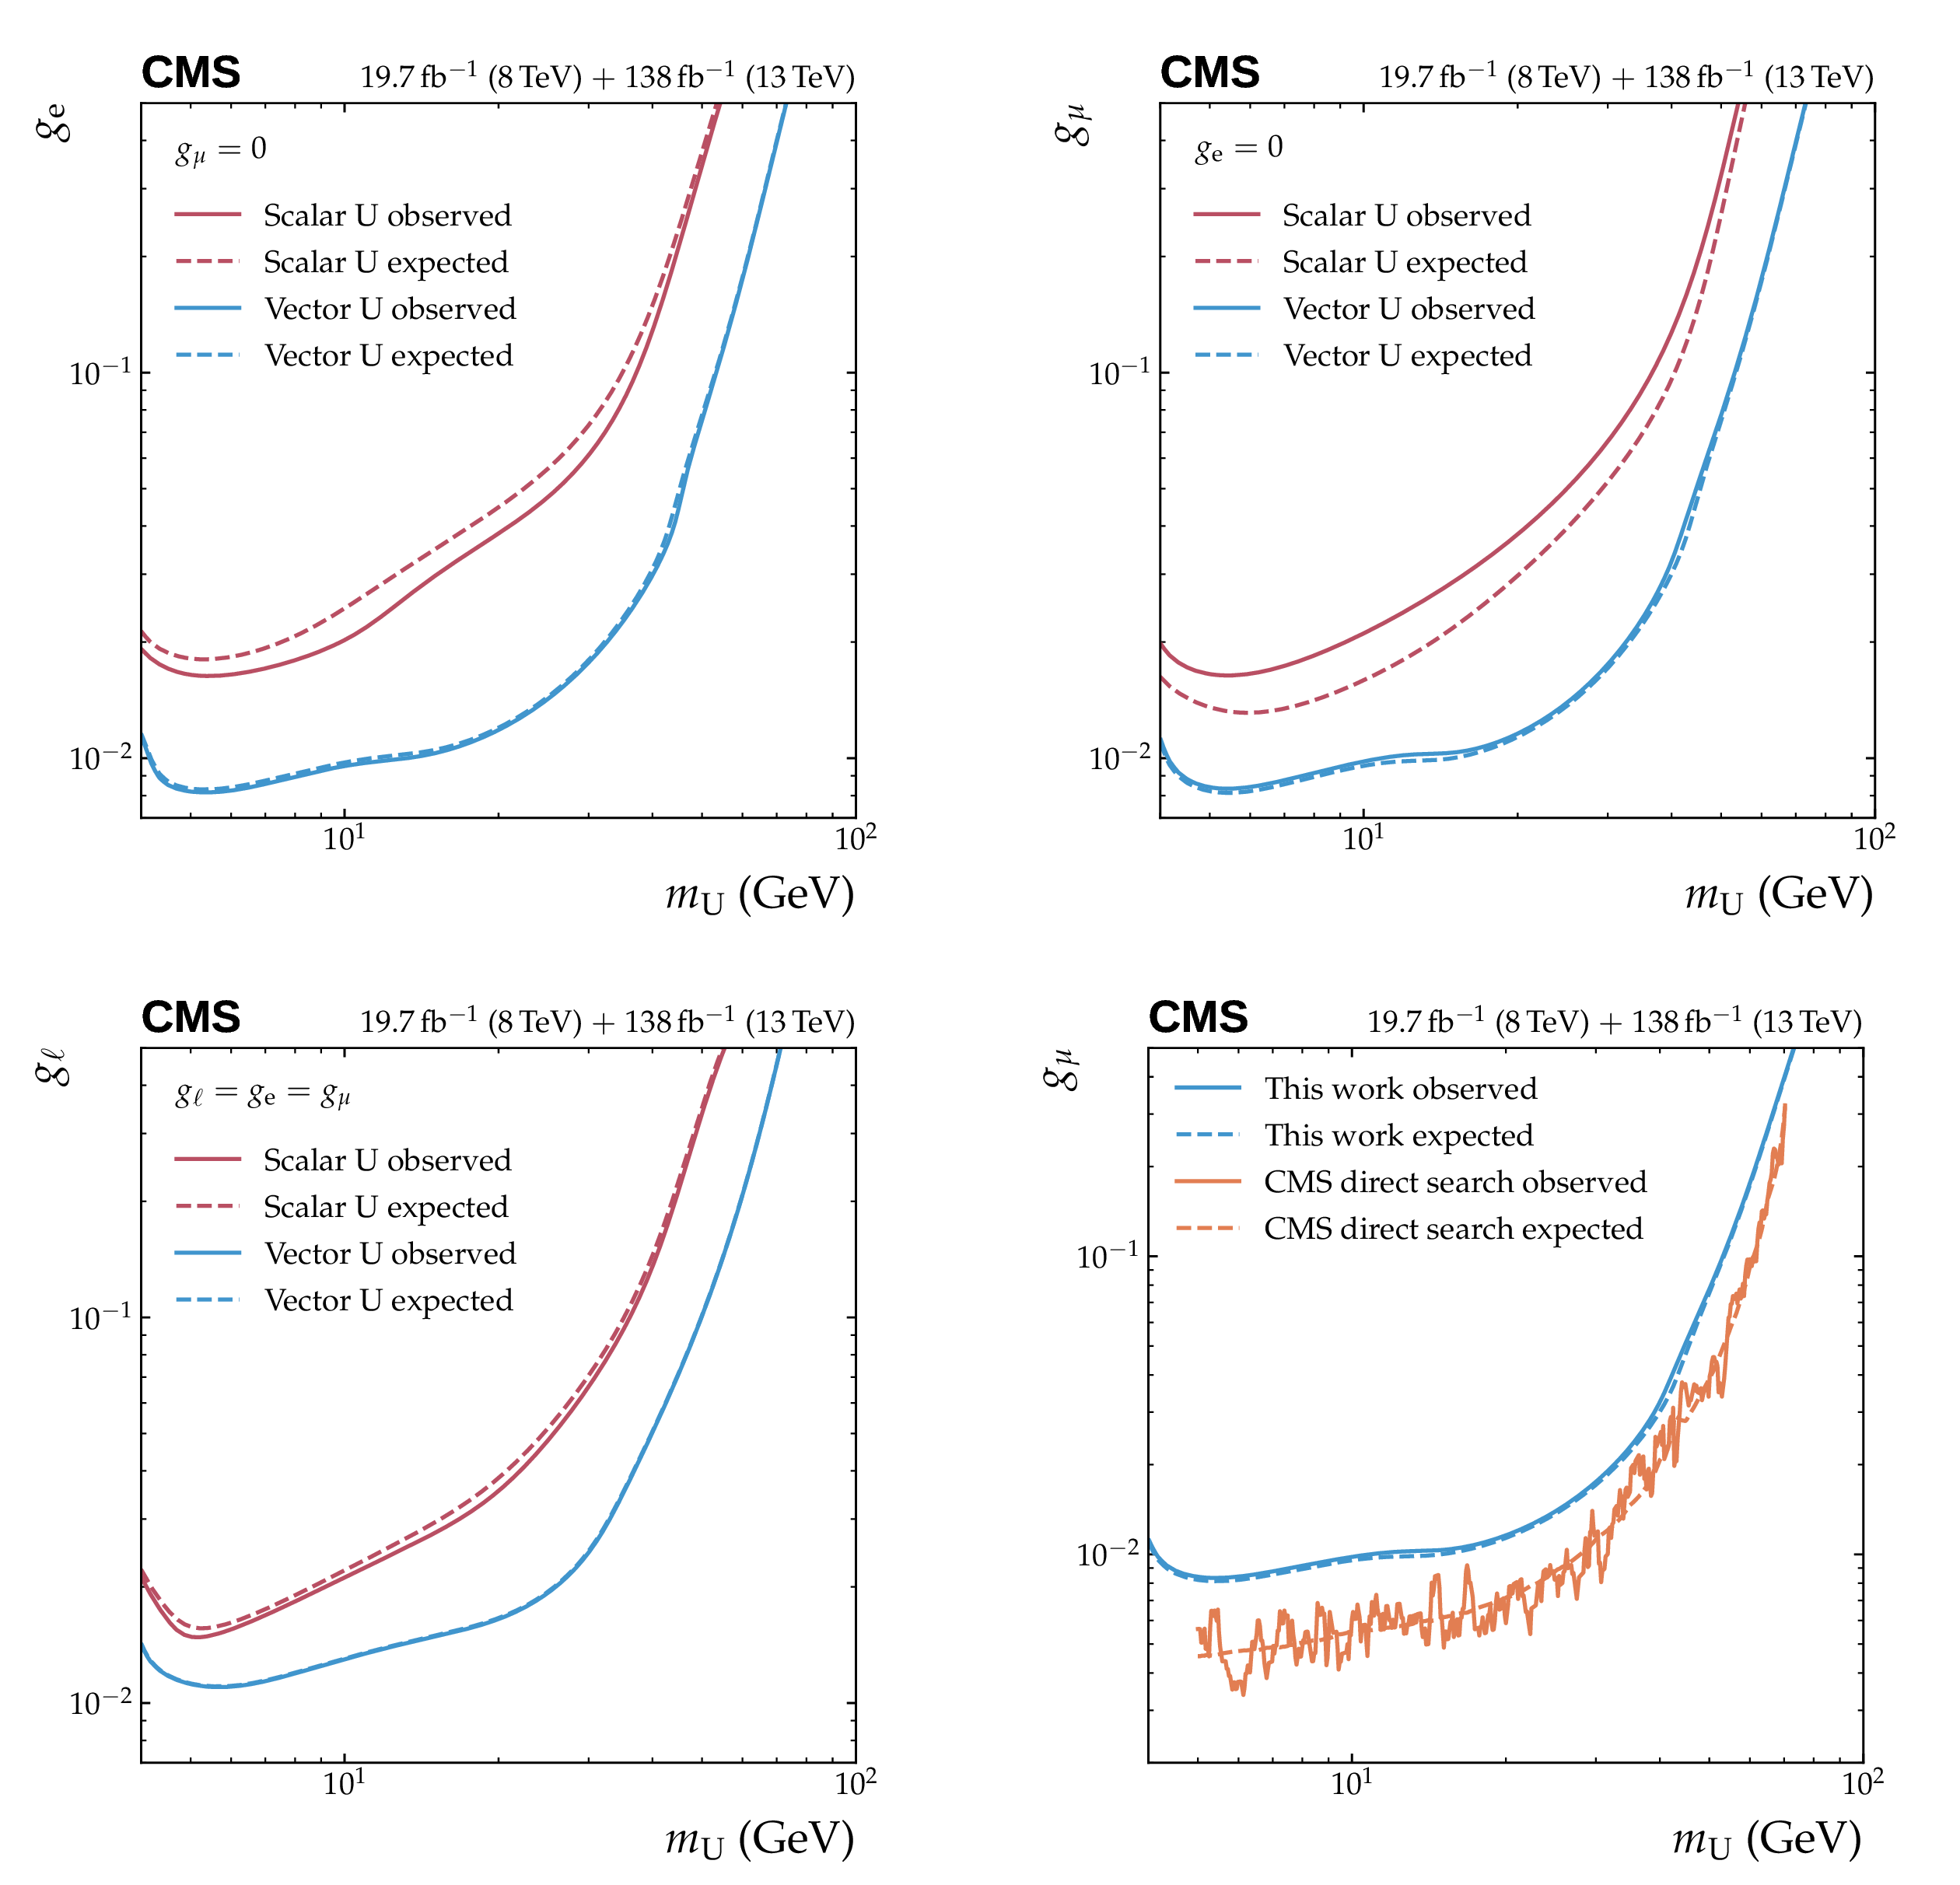
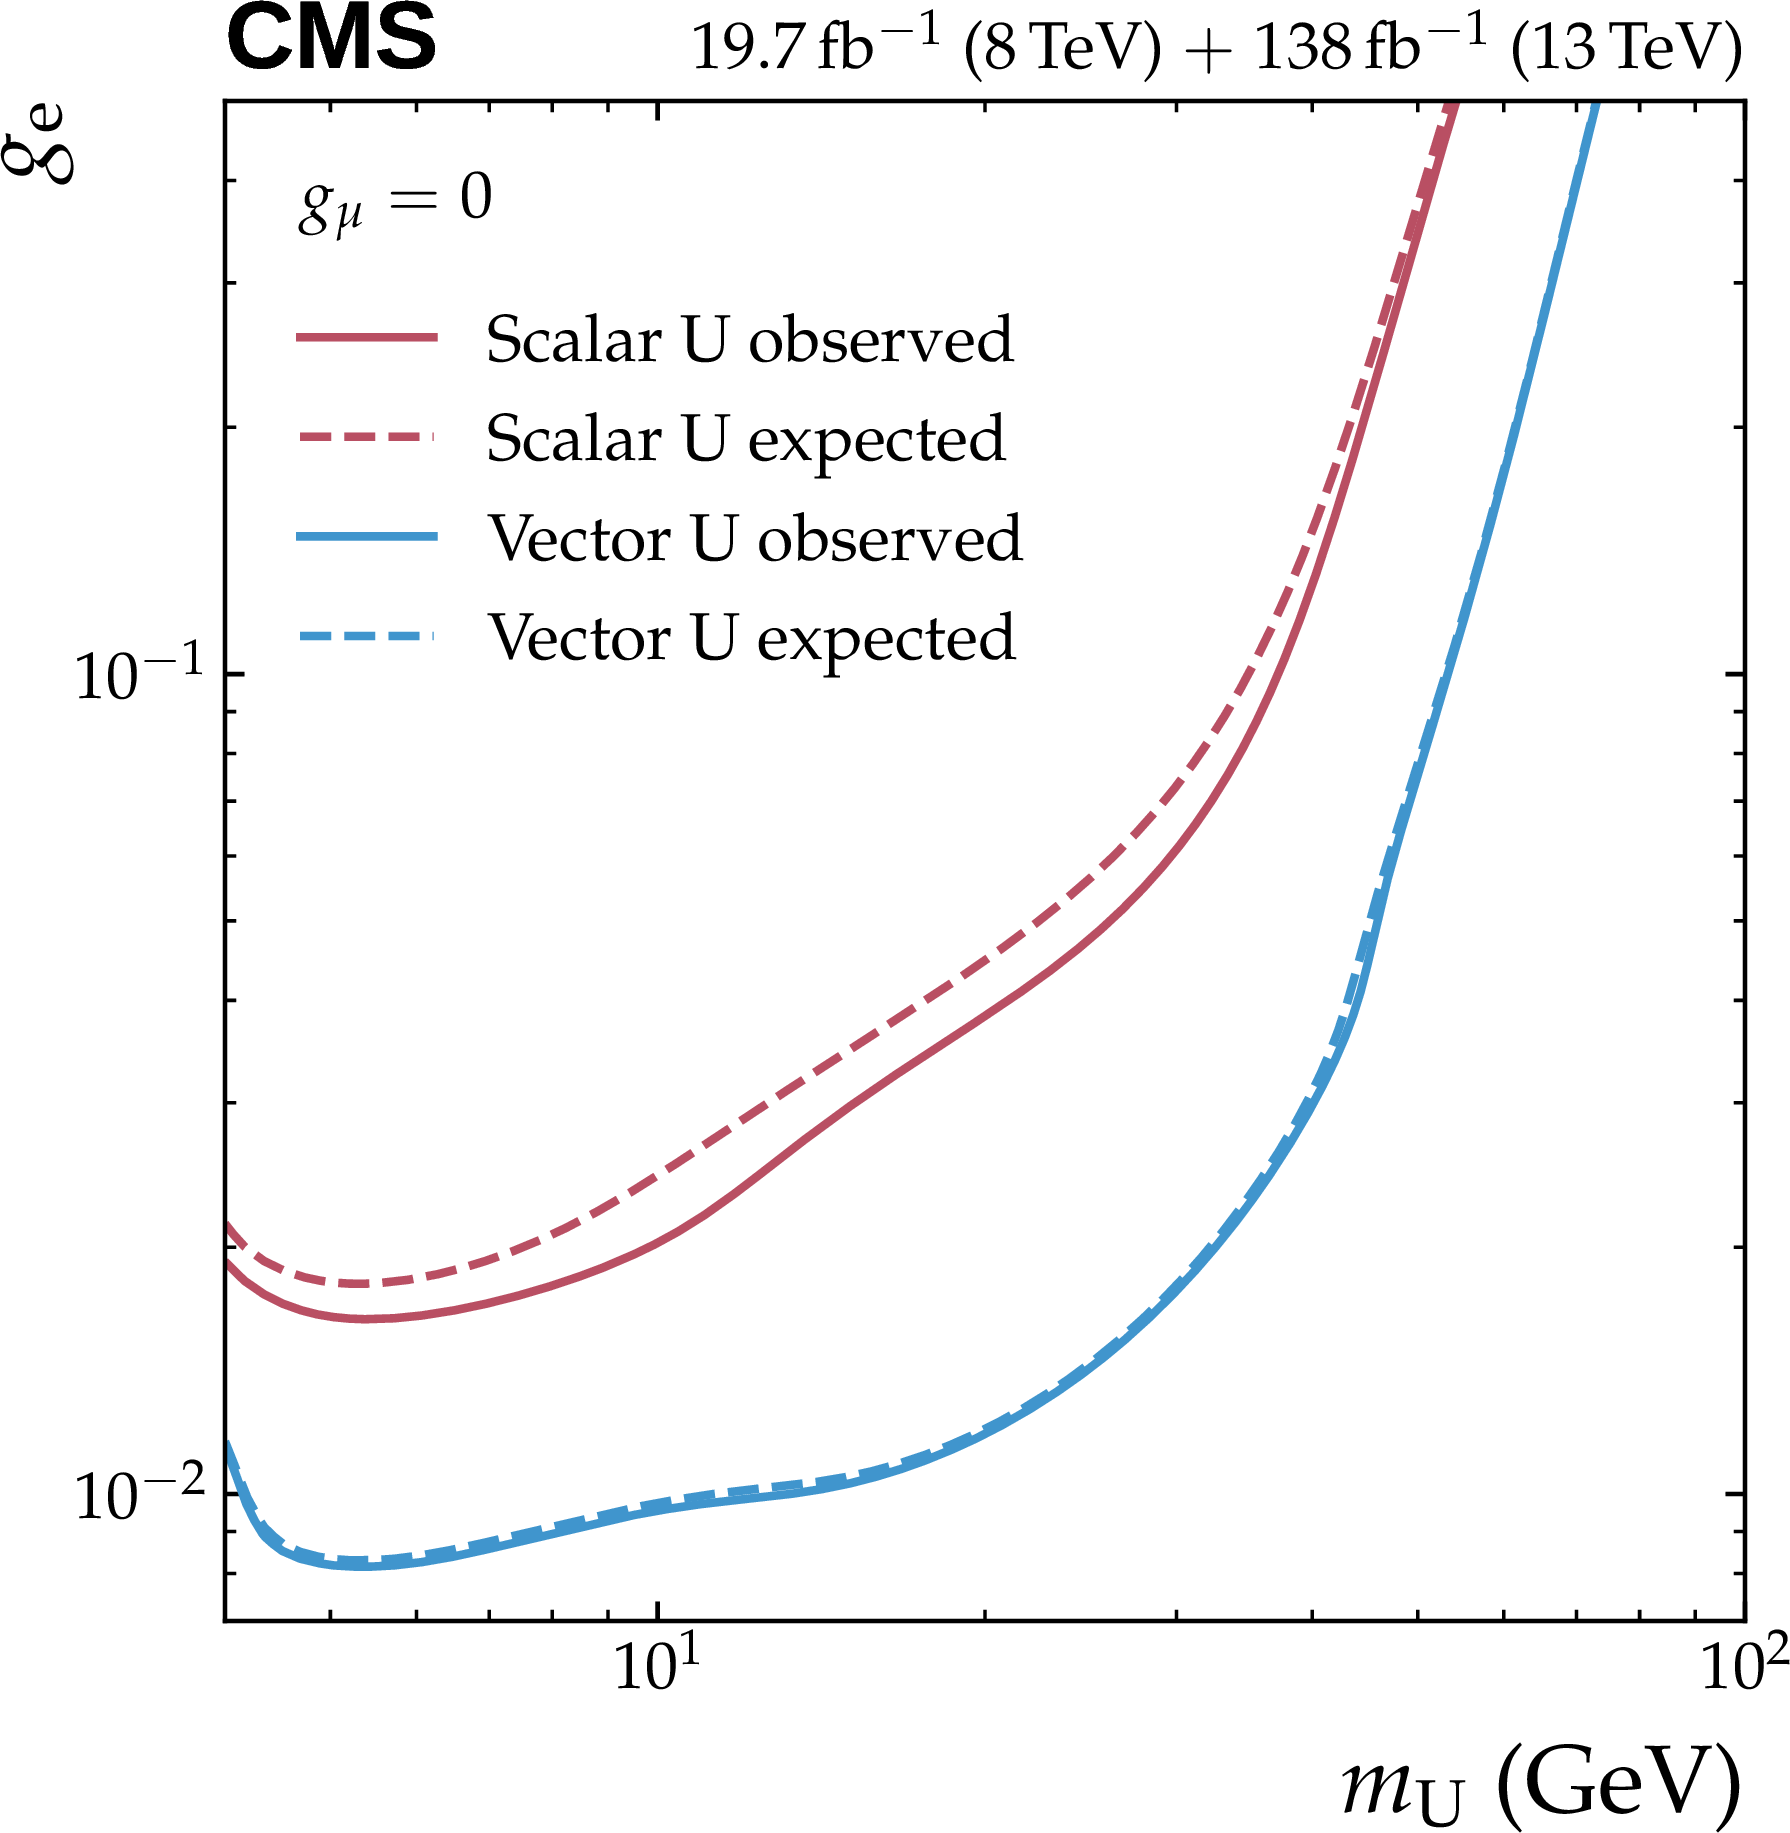
Figure 7:
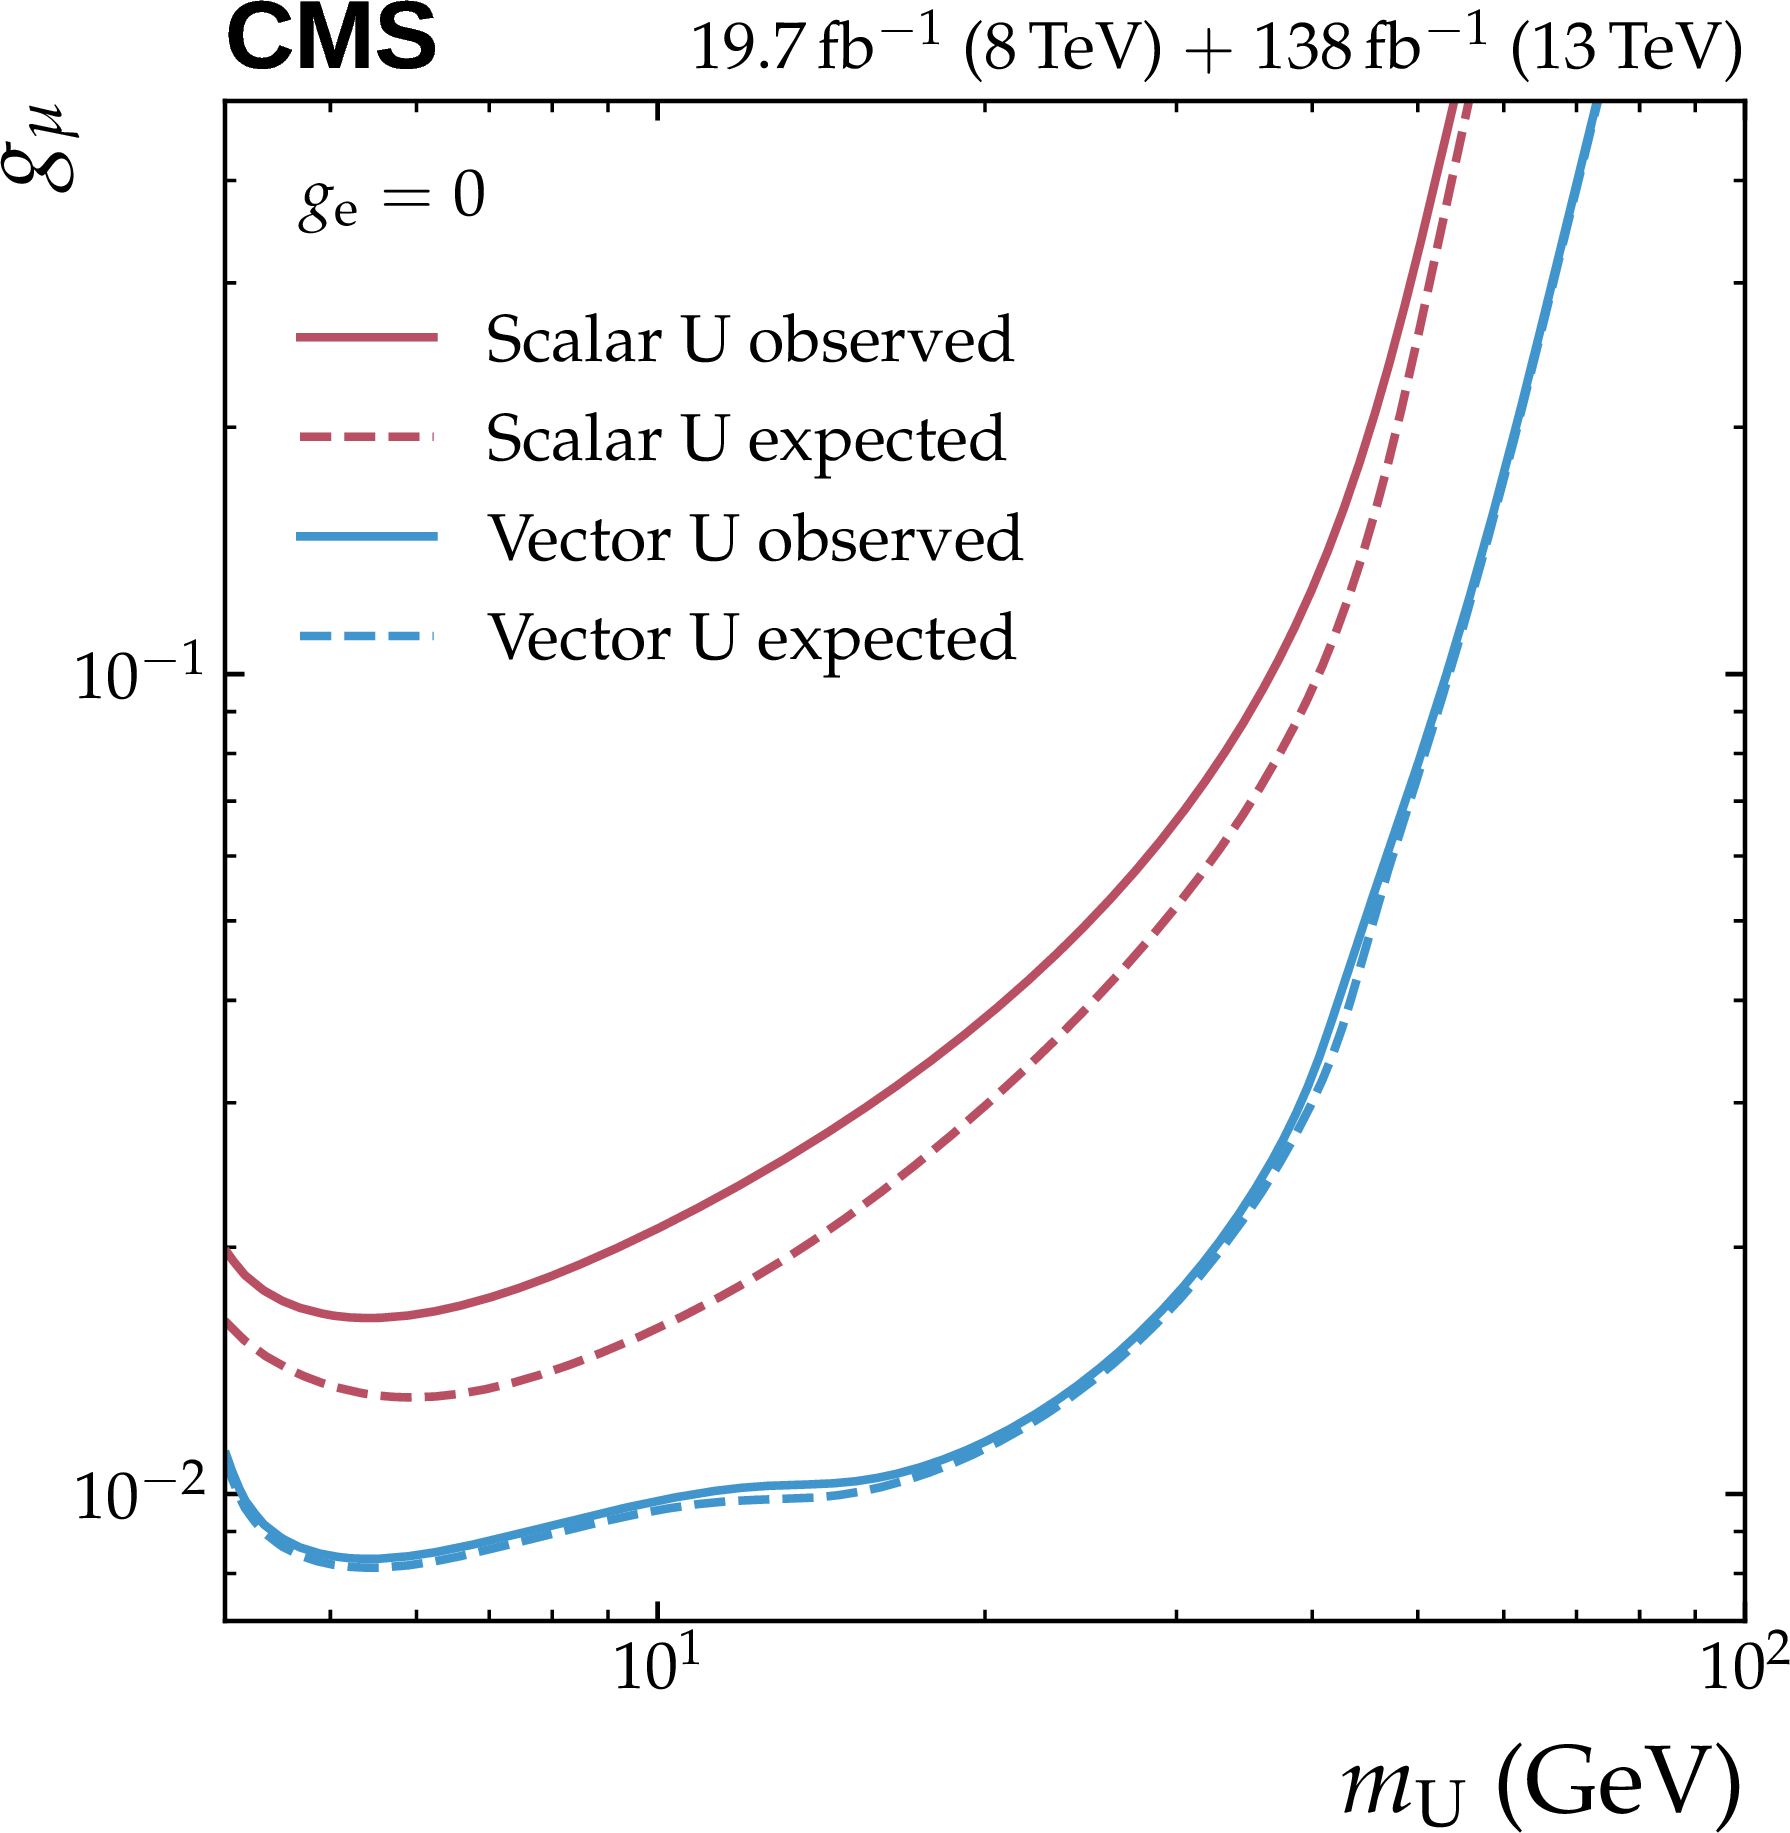
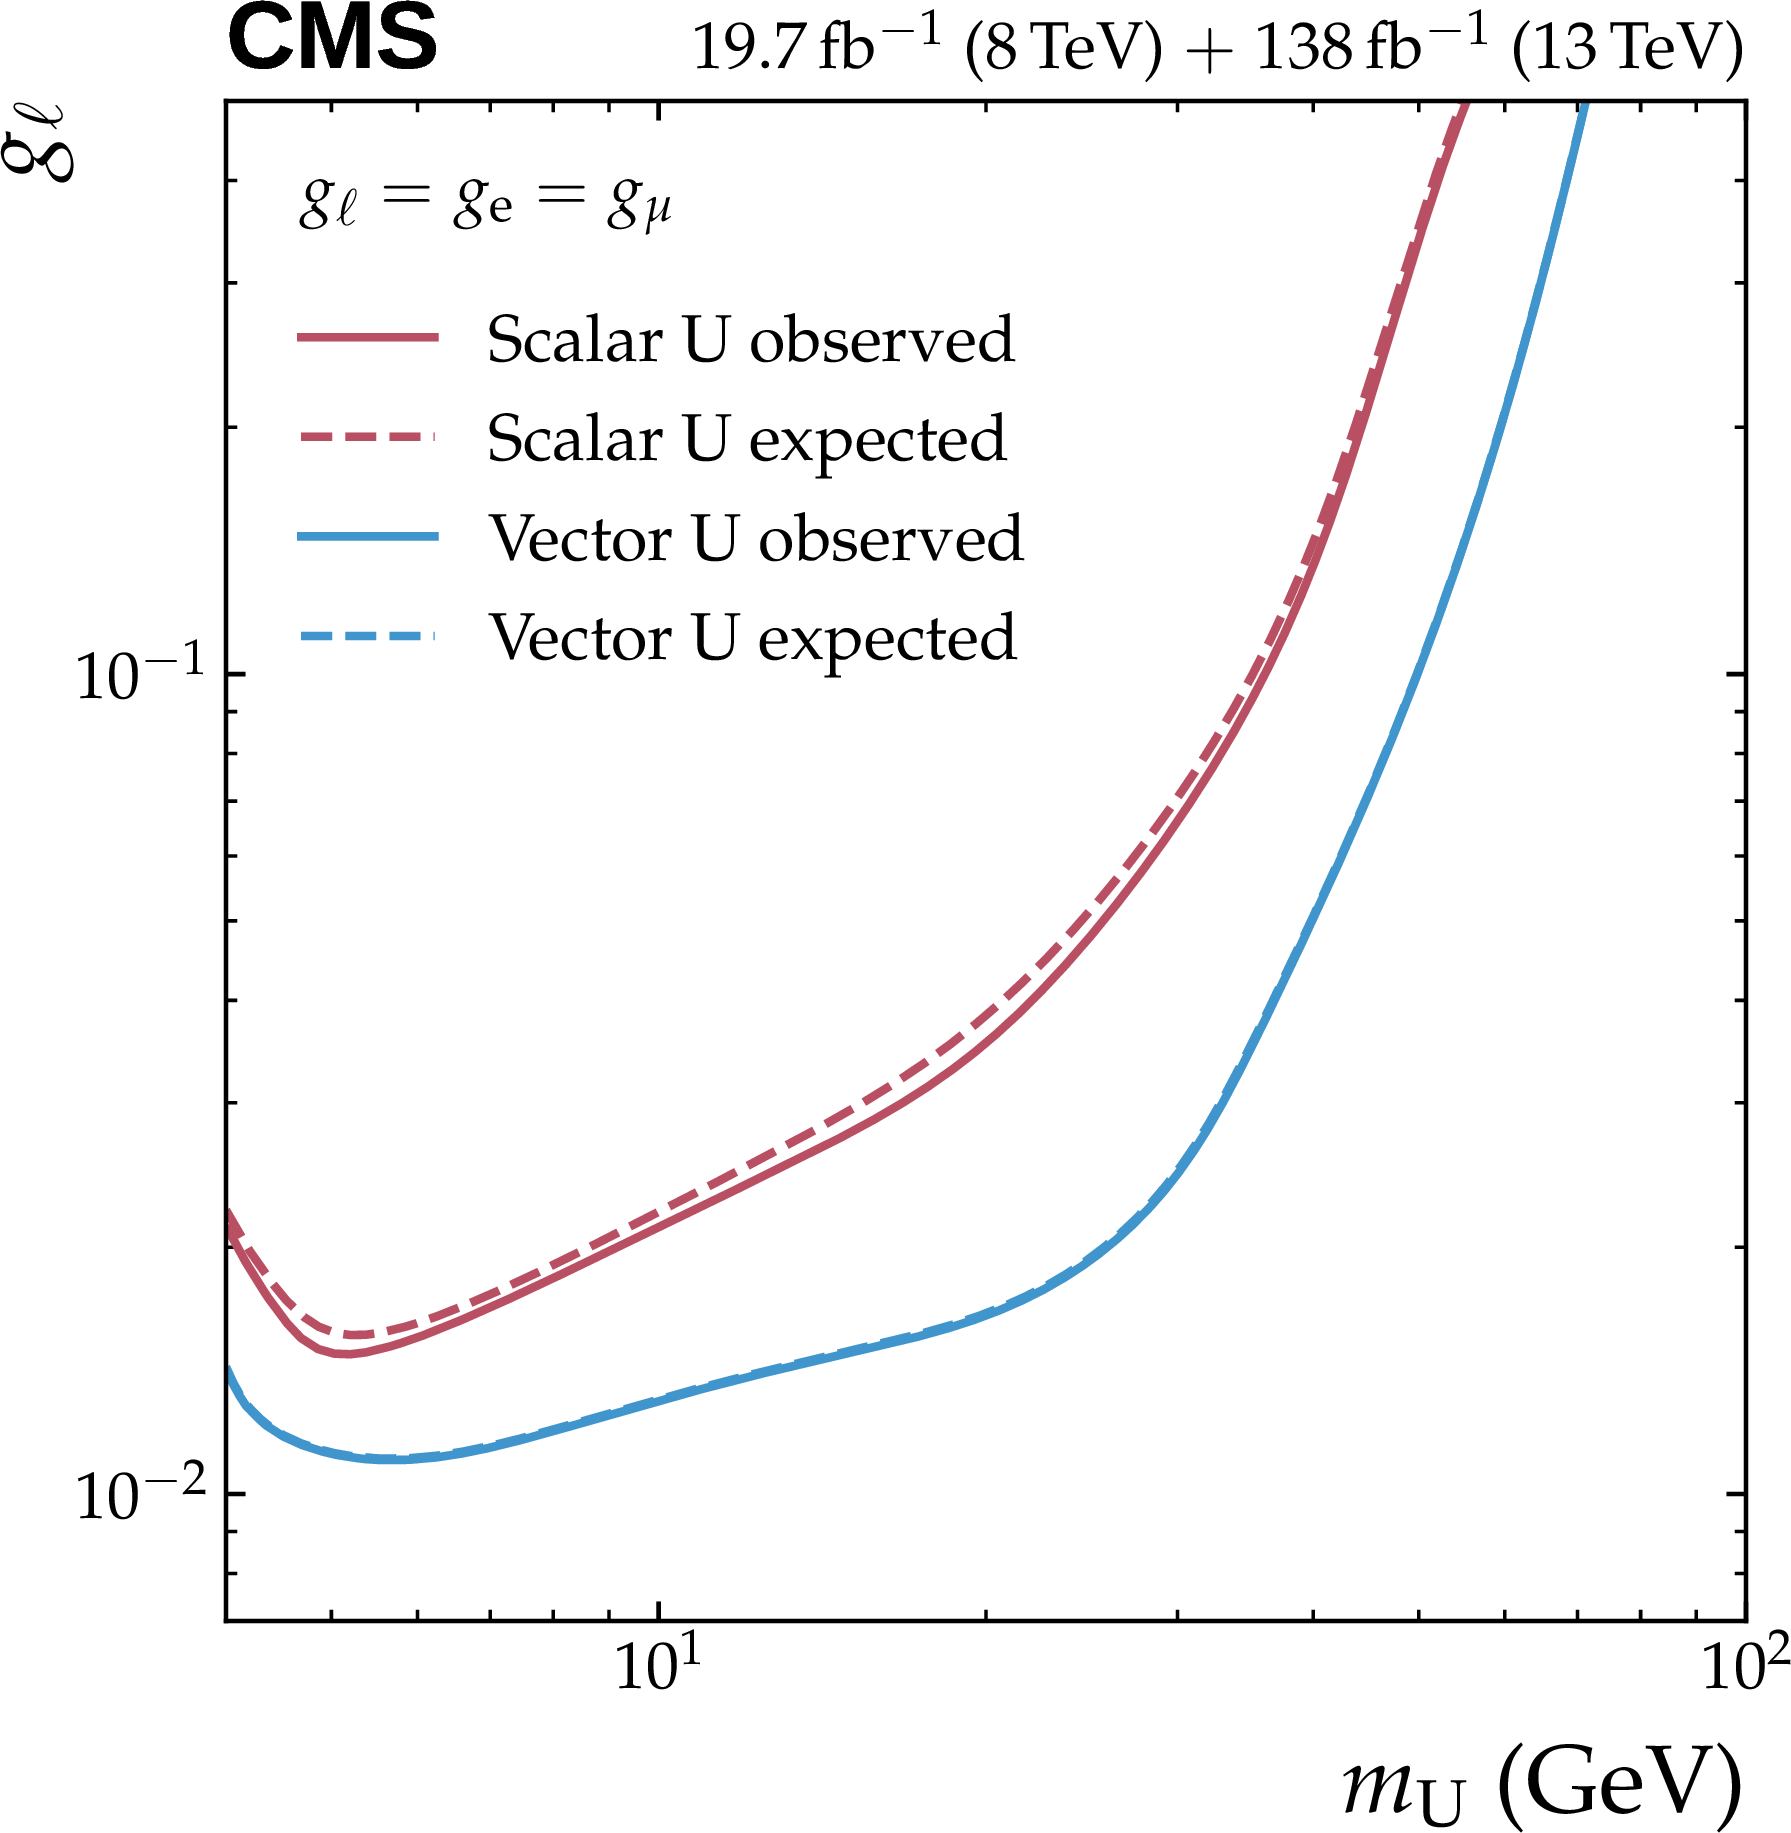
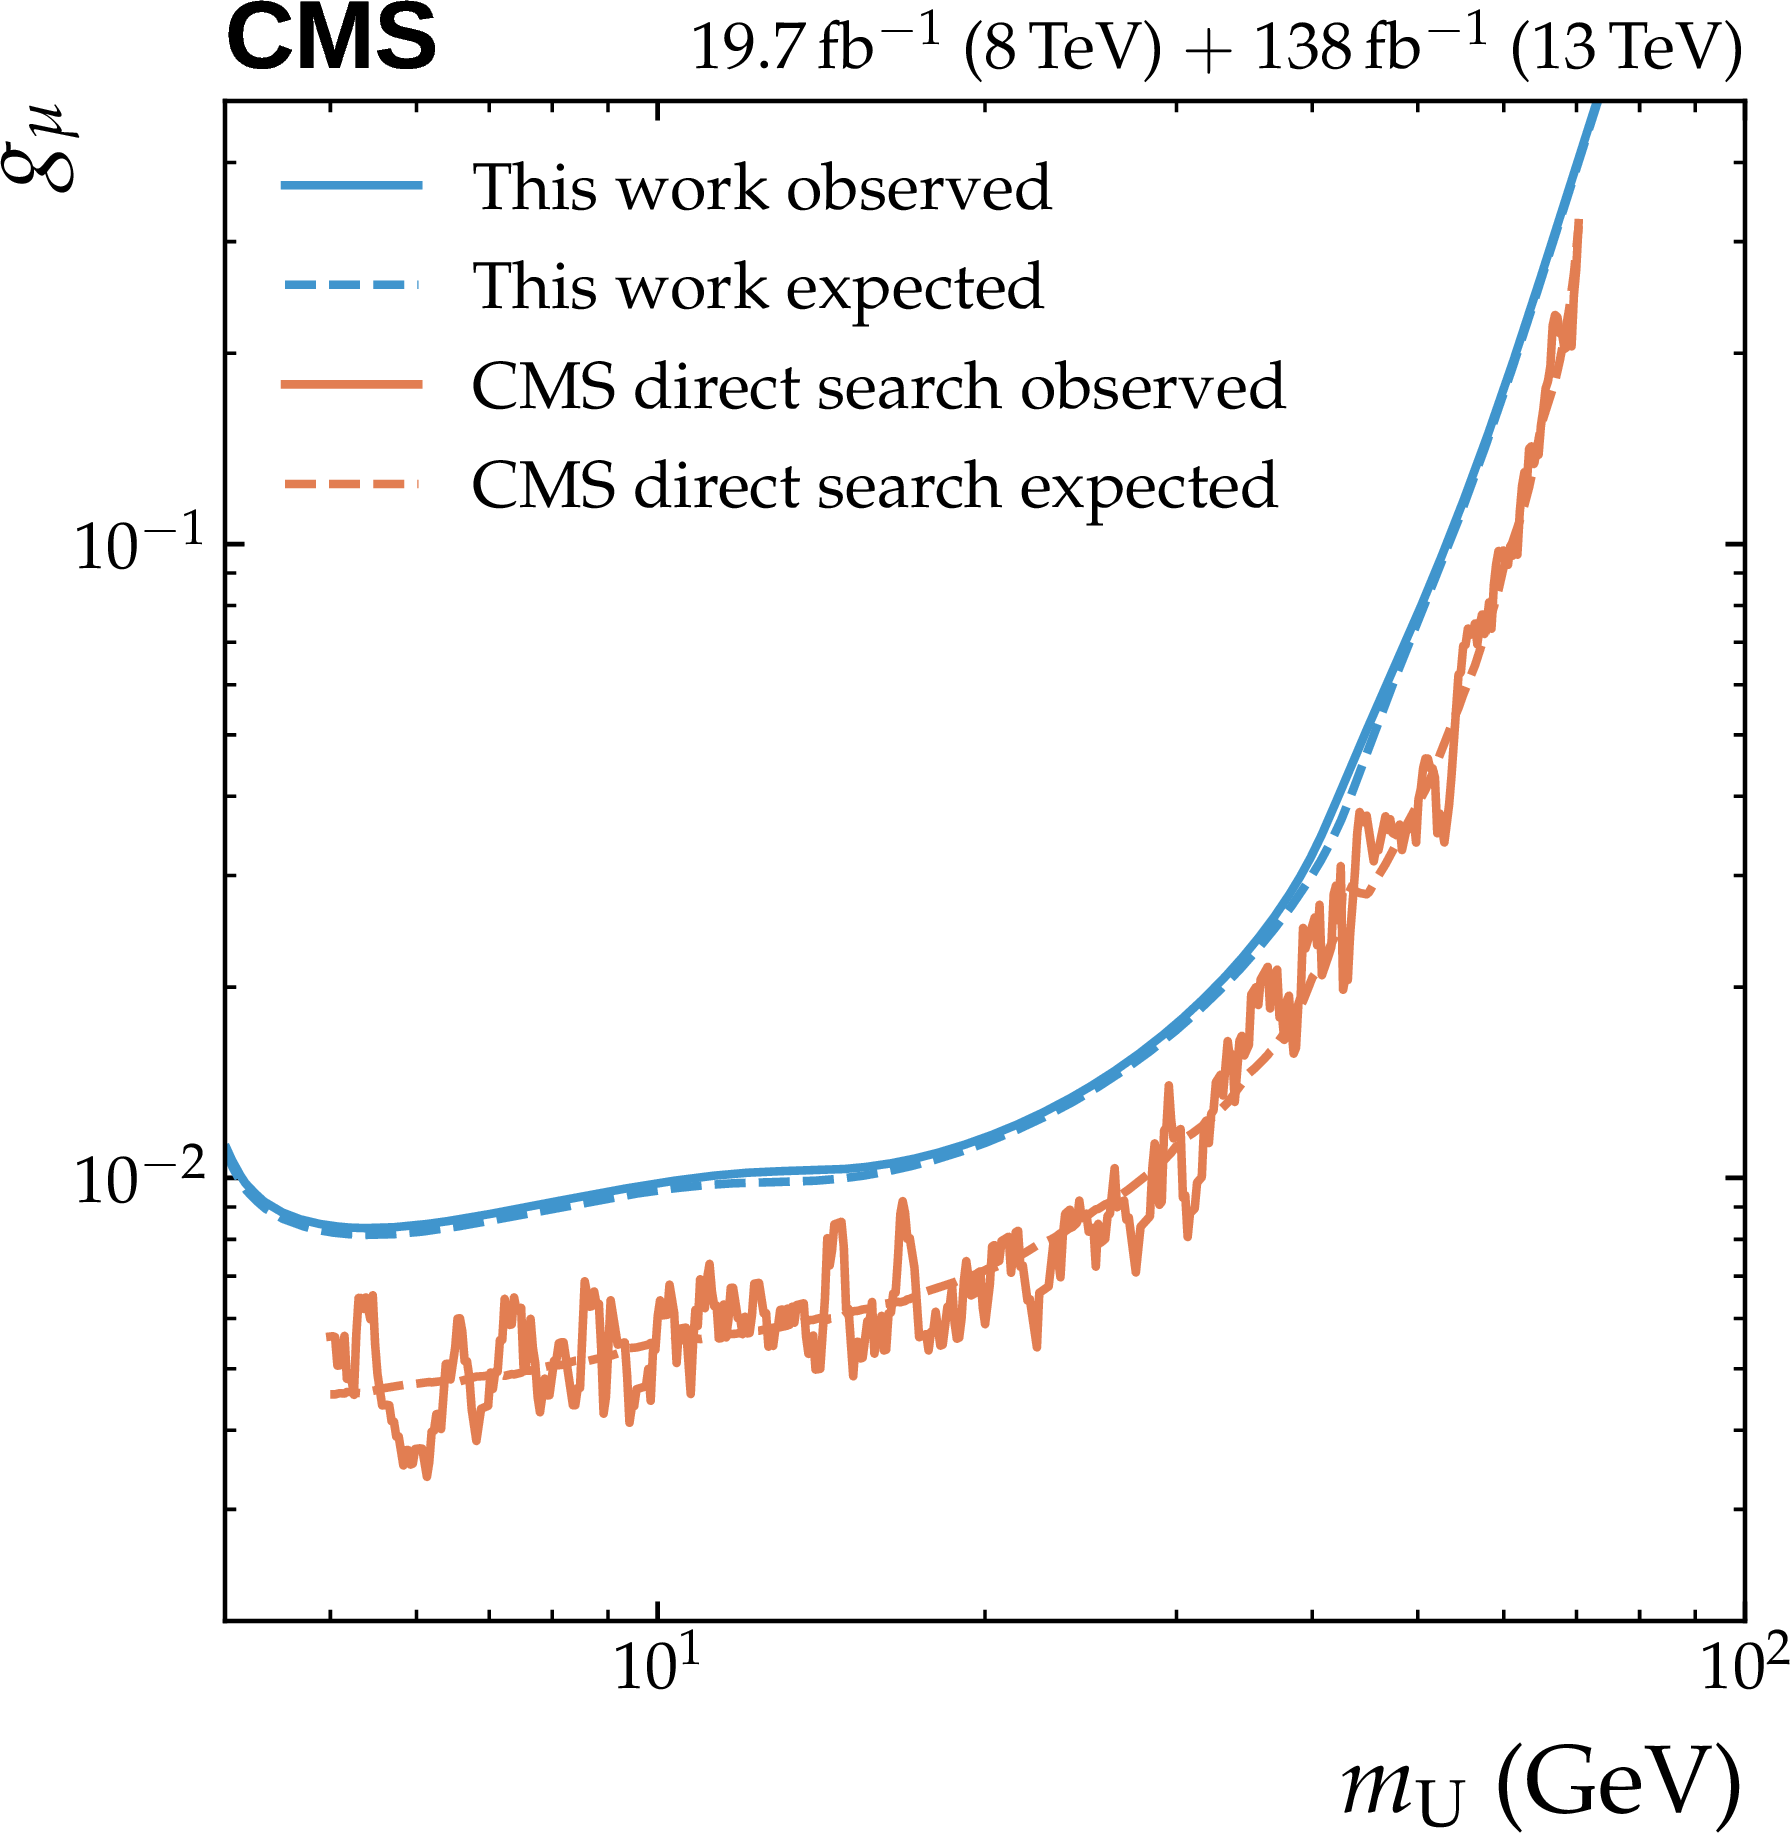
Exclusion contours at 95% CL for a BSM boson $ \mathrm{U} $: (upper left) $ \mathrm{U} $ couples only to electrons, (upper right) $ \mathrm{U} $ couples only to muons, (lower left) $ \mathrm{U} $ couples equally to electrons and muons. The region above and to the left of the curve is excluded. The lower right plot compares the exclusion contour obtain in this analysis to the CMS direct search [14] for a vector $ \mathrm{U} $ boson that couples only to muons. The dashed (solid) lines show the expected (observed) exclusion contours. |
png pdf |
Figure 7-a:
Exclusion contours at 95% CL for a BSM boson $ \mathrm{U} $: (upper left) $ \mathrm{U} $ couples only to electrons, (upper right) $ \mathrm{U} $ couples only to muons, (lower left) $ \mathrm{U} $ couples equally to electrons and muons. The region above and to the left of the curve is excluded. The lower right plot compares the exclusion contour obtain in this analysis to the CMS direct search [14] for a vector $ \mathrm{U} $ boson that couples only to muons. The dashed (solid) lines show the expected (observed) exclusion contours. |
png pdf |
Figure 7-b:
Exclusion contours at 95% CL for a BSM boson $ \mathrm{U} $: (upper left) $ \mathrm{U} $ couples only to electrons, (upper right) $ \mathrm{U} $ couples only to muons, (lower left) $ \mathrm{U} $ couples equally to electrons and muons. The region above and to the left of the curve is excluded. The lower right plot compares the exclusion contour obtain in this analysis to the CMS direct search [14] for a vector $ \mathrm{U} $ boson that couples only to muons. The dashed (solid) lines show the expected (observed) exclusion contours. |
png pdf |
Figure 7-c:
Exclusion contours at 95% CL for a BSM boson $ \mathrm{U} $: (upper left) $ \mathrm{U} $ couples only to electrons, (upper right) $ \mathrm{U} $ couples only to muons, (lower left) $ \mathrm{U} $ couples equally to electrons and muons. The region above and to the left of the curve is excluded. The lower right plot compares the exclusion contour obtain in this analysis to the CMS direct search [14] for a vector $ \mathrm{U} $ boson that couples only to muons. The dashed (solid) lines show the expected (observed) exclusion contours. |
png pdf |
Figure 7-d:
Exclusion contours at 95% CL for a BSM boson $ \mathrm{U} $: (upper left) $ \mathrm{U} $ couples only to electrons, (upper right) $ \mathrm{U} $ couples only to muons, (lower left) $ \mathrm{U} $ couples equally to electrons and muons. The region above and to the left of the curve is excluded. The lower right plot compares the exclusion contour obtain in this analysis to the CMS direct search [14] for a vector $ \mathrm{U} $ boson that couples only to muons. The dashed (solid) lines show the expected (observed) exclusion contours. |
| Tables | |
png pdf |
Table 1:
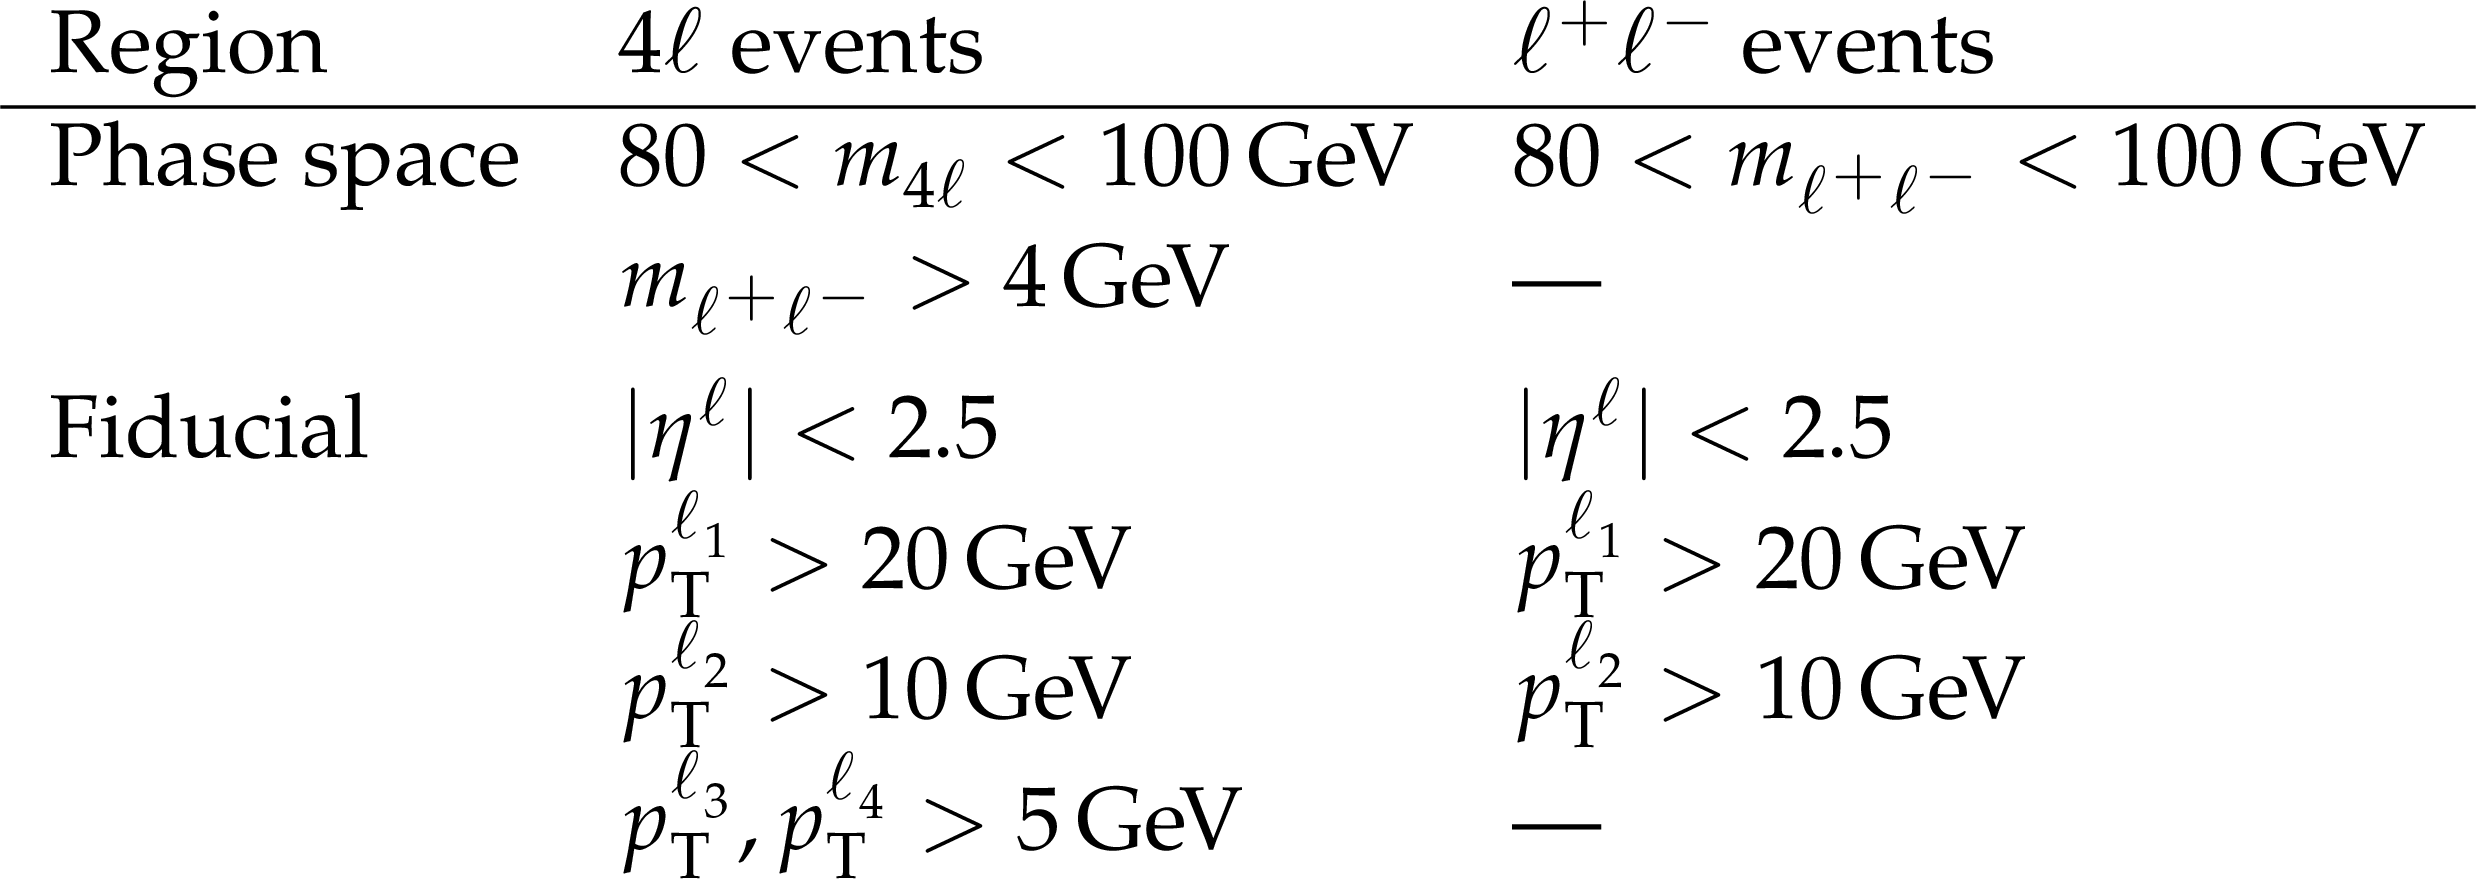
Definitions of the phase space and fiducial regions for four-lepton and for dilepton events. The $ m_{\ell^+ \ell^-} $ requirement for four-lepton events applies to all possible same-flavor, opposite-sign lepton pairs. |
png pdf |
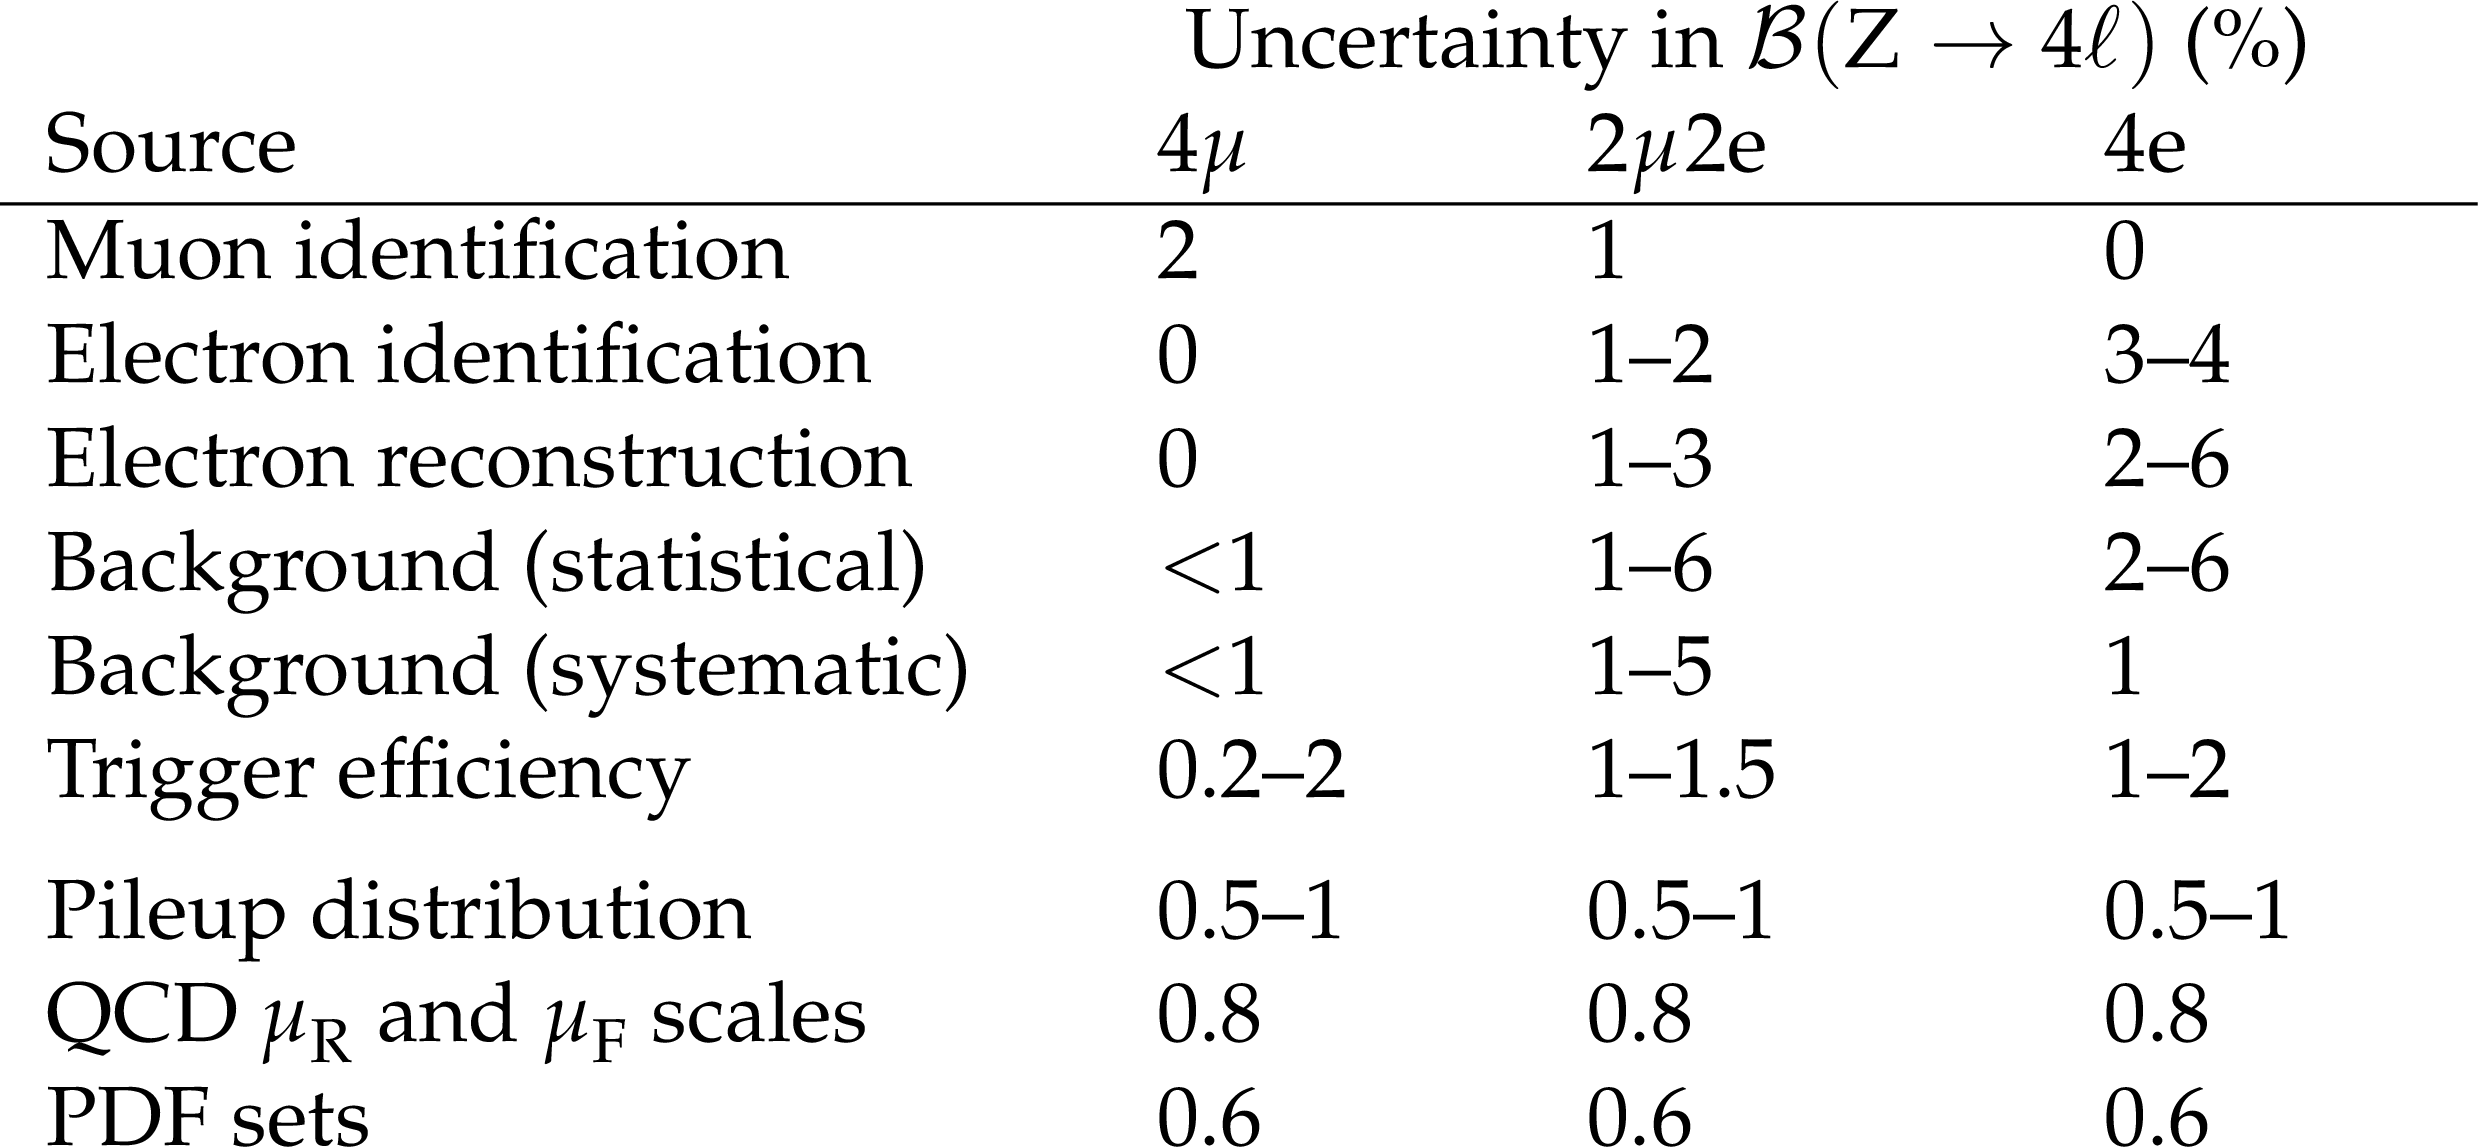
Table 2:
Systematic uncertainties in the branching fraction, listed by source and by final state. The uncertainty from each source varies by data-taking period. Uncertainties from pileup and theory sources are identical for all final states. |
png pdf |
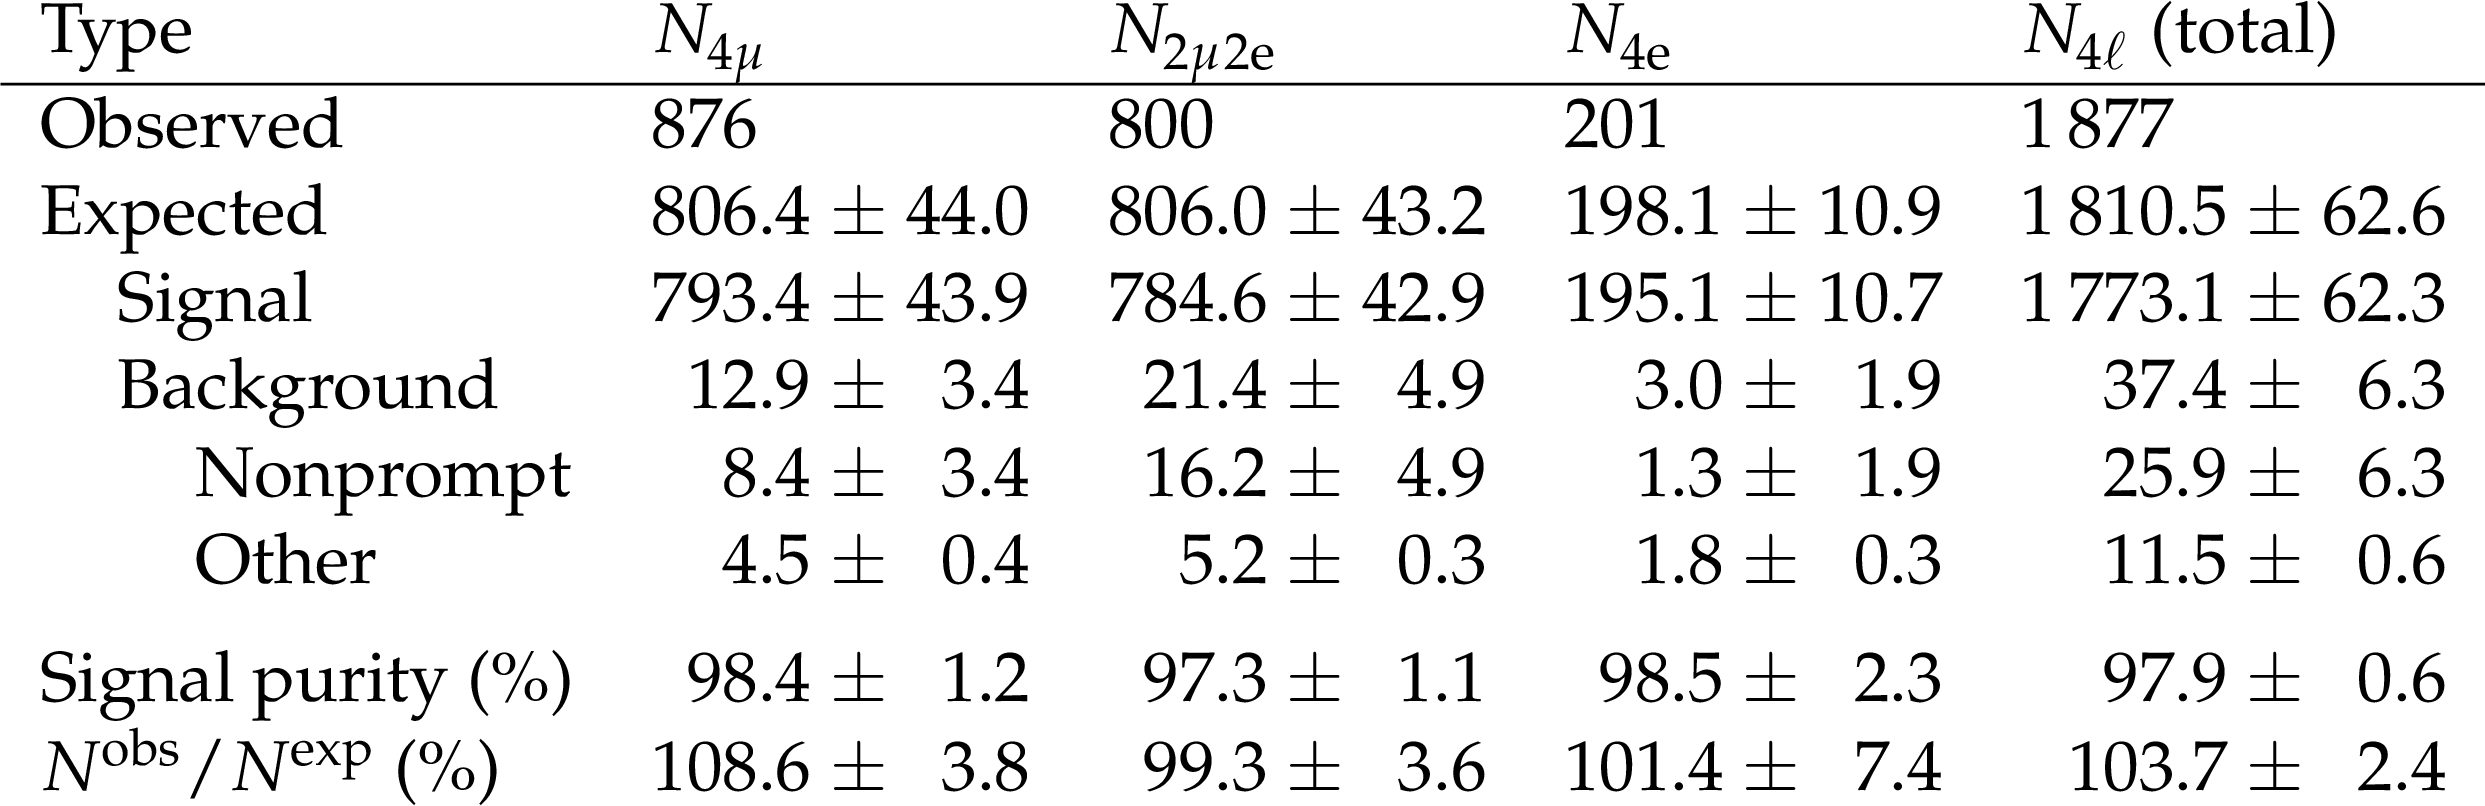
Table 3:
Observed event yields and sample composition for the $ \mathrm{Z} \to 4\ell $ signal region listed for the sum of all 4 $ \ell $ channels and for each channel individually. These yields are inclusive of all 8 and 13 TeV data samples. The uncertainties shown are obtained by combining statistical and systematic uncertainties in quadrature. |
png pdf |
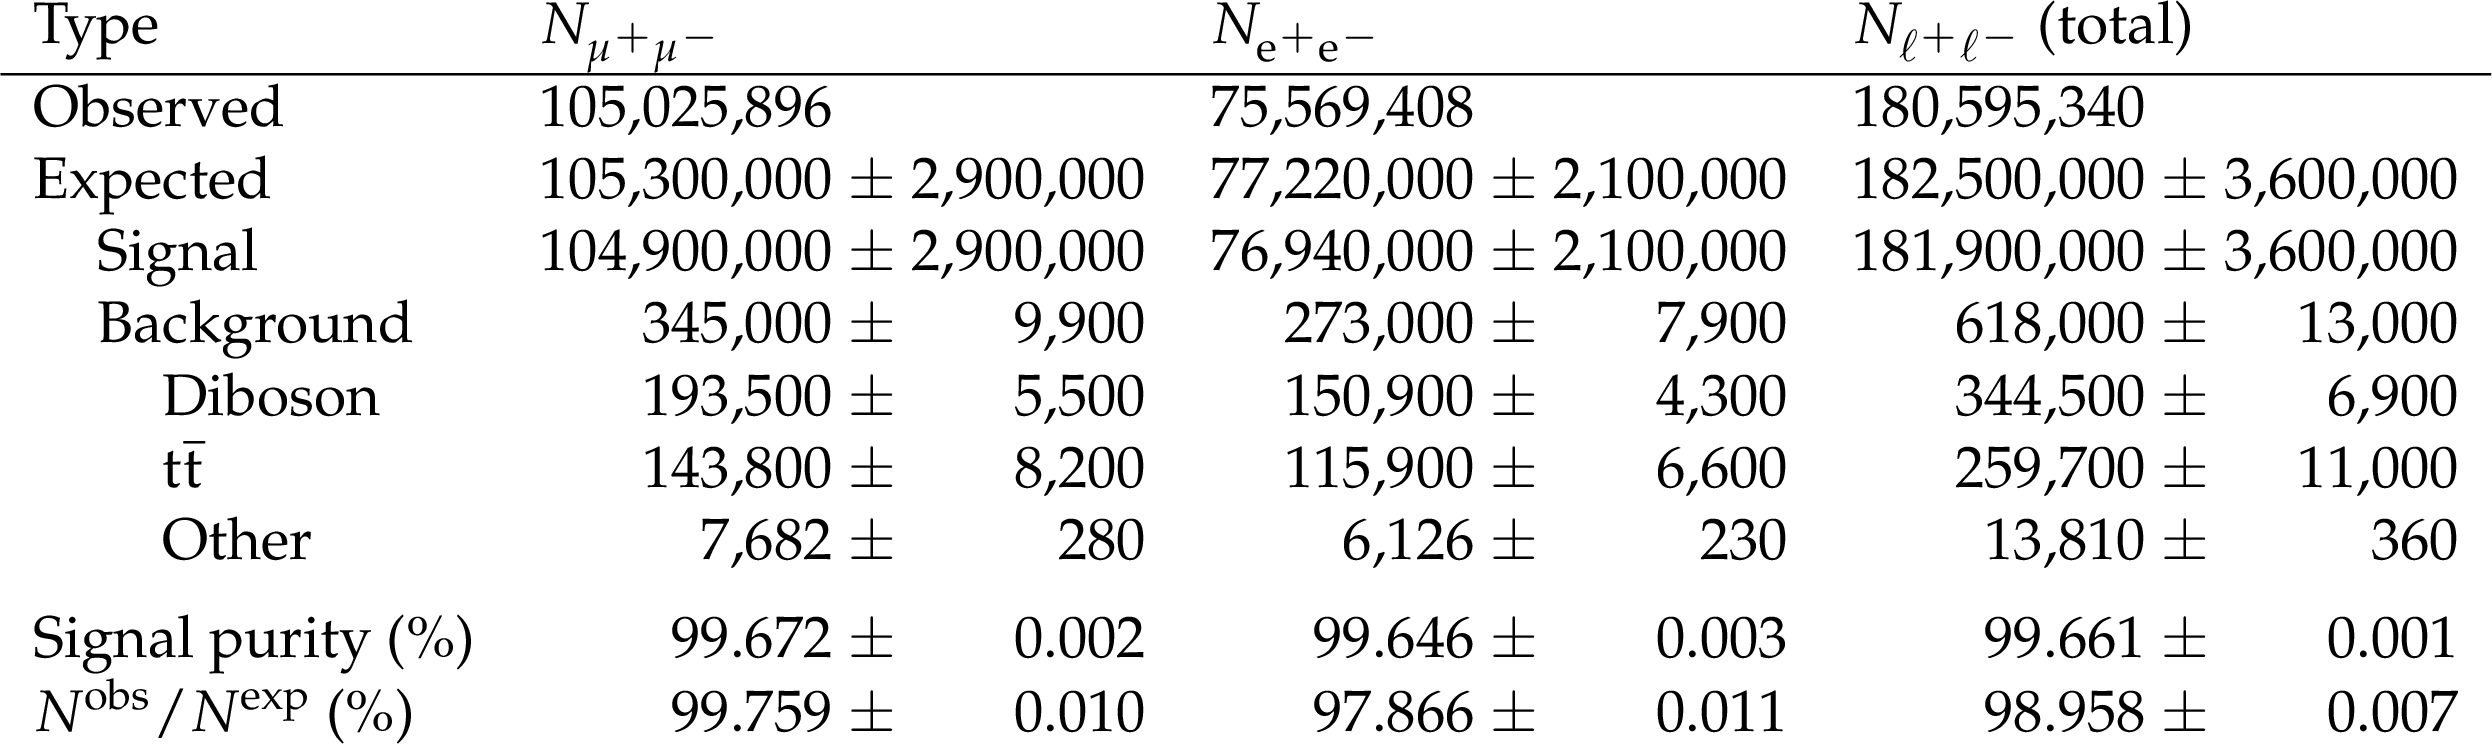
Table 4:
Observed event yields and sample composition for the $ \mathrm{Z} \to \ell^+\ell^-$ signal regions, inclusive of all 8 and 13 TeV data samples. The uncertainties shown are obtained by combining statistical and systematic uncertainties in quadrature. |
png pdf |
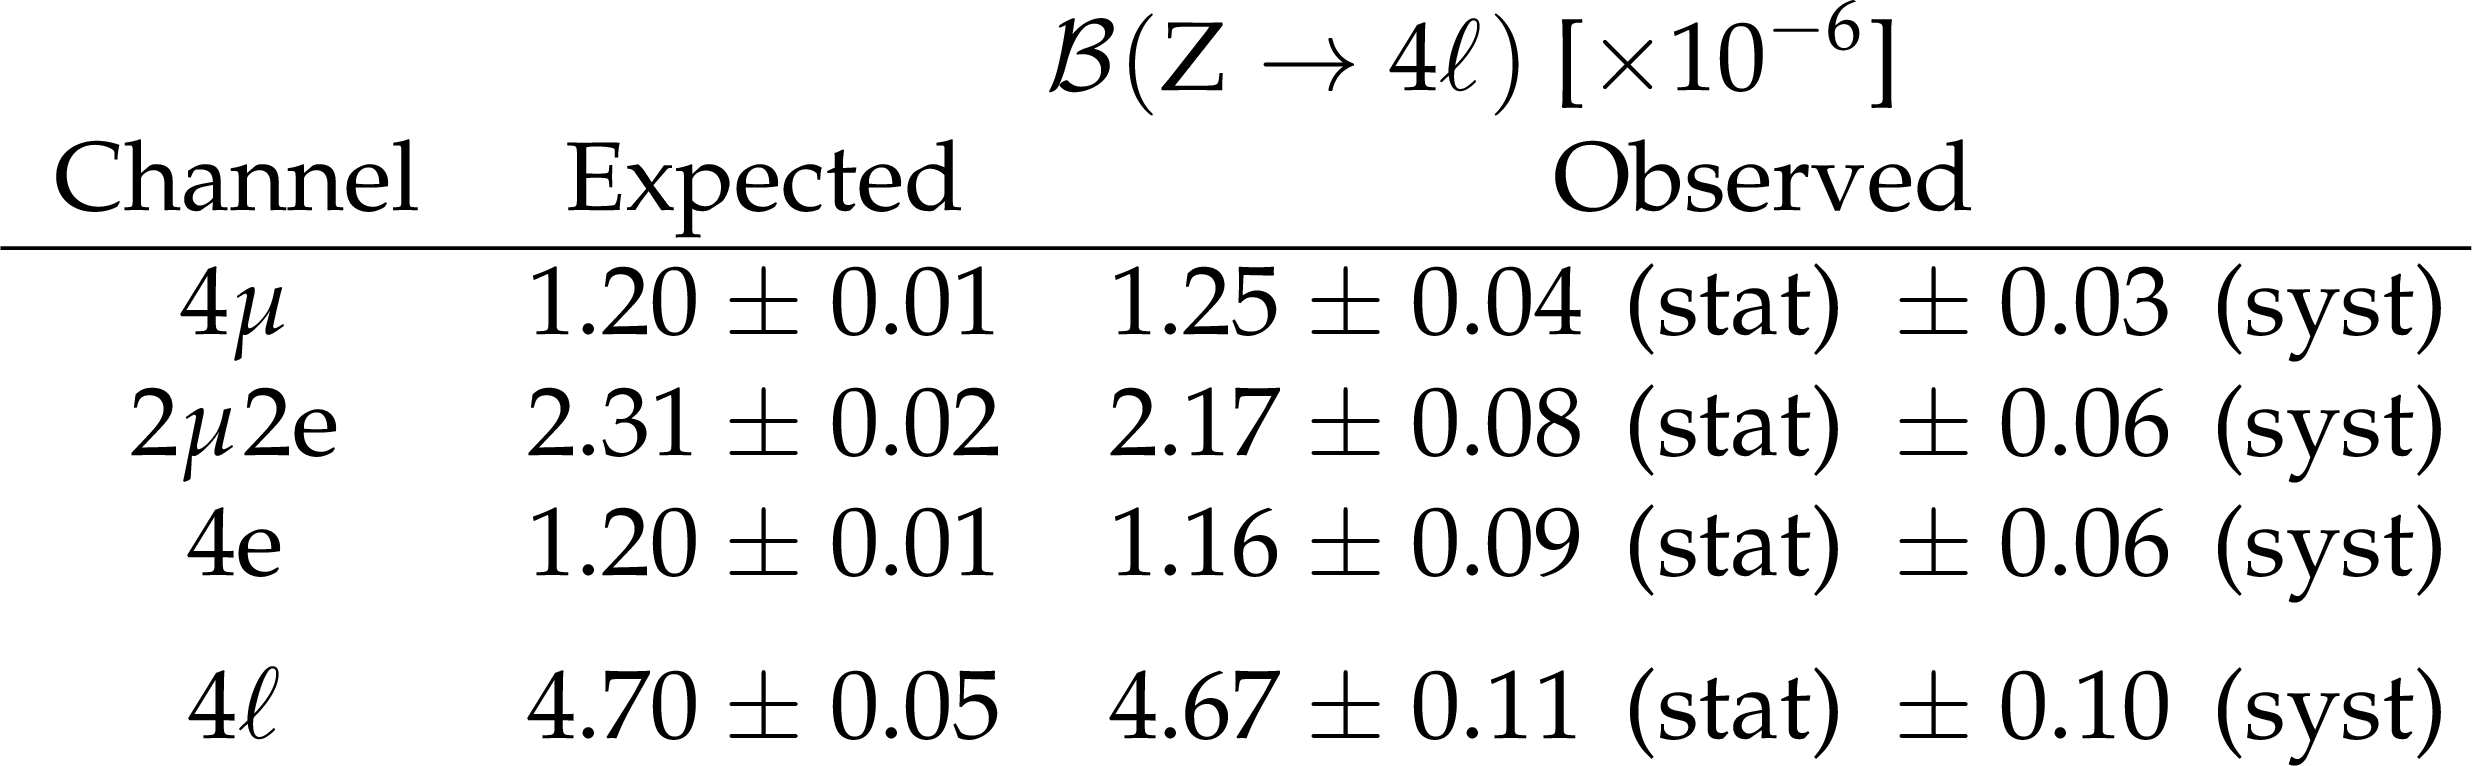
Table 5:
Measured branching fractions. The measured values for individual channels 4 $ \mu $, 2 $ \mu 2\mathrm{e} $, and 4 e are obtained from the BSM fit described in Section 8.1. The value for the combined channel 4 $ \ell $ is obtained from the SM fit. |
png pdf |
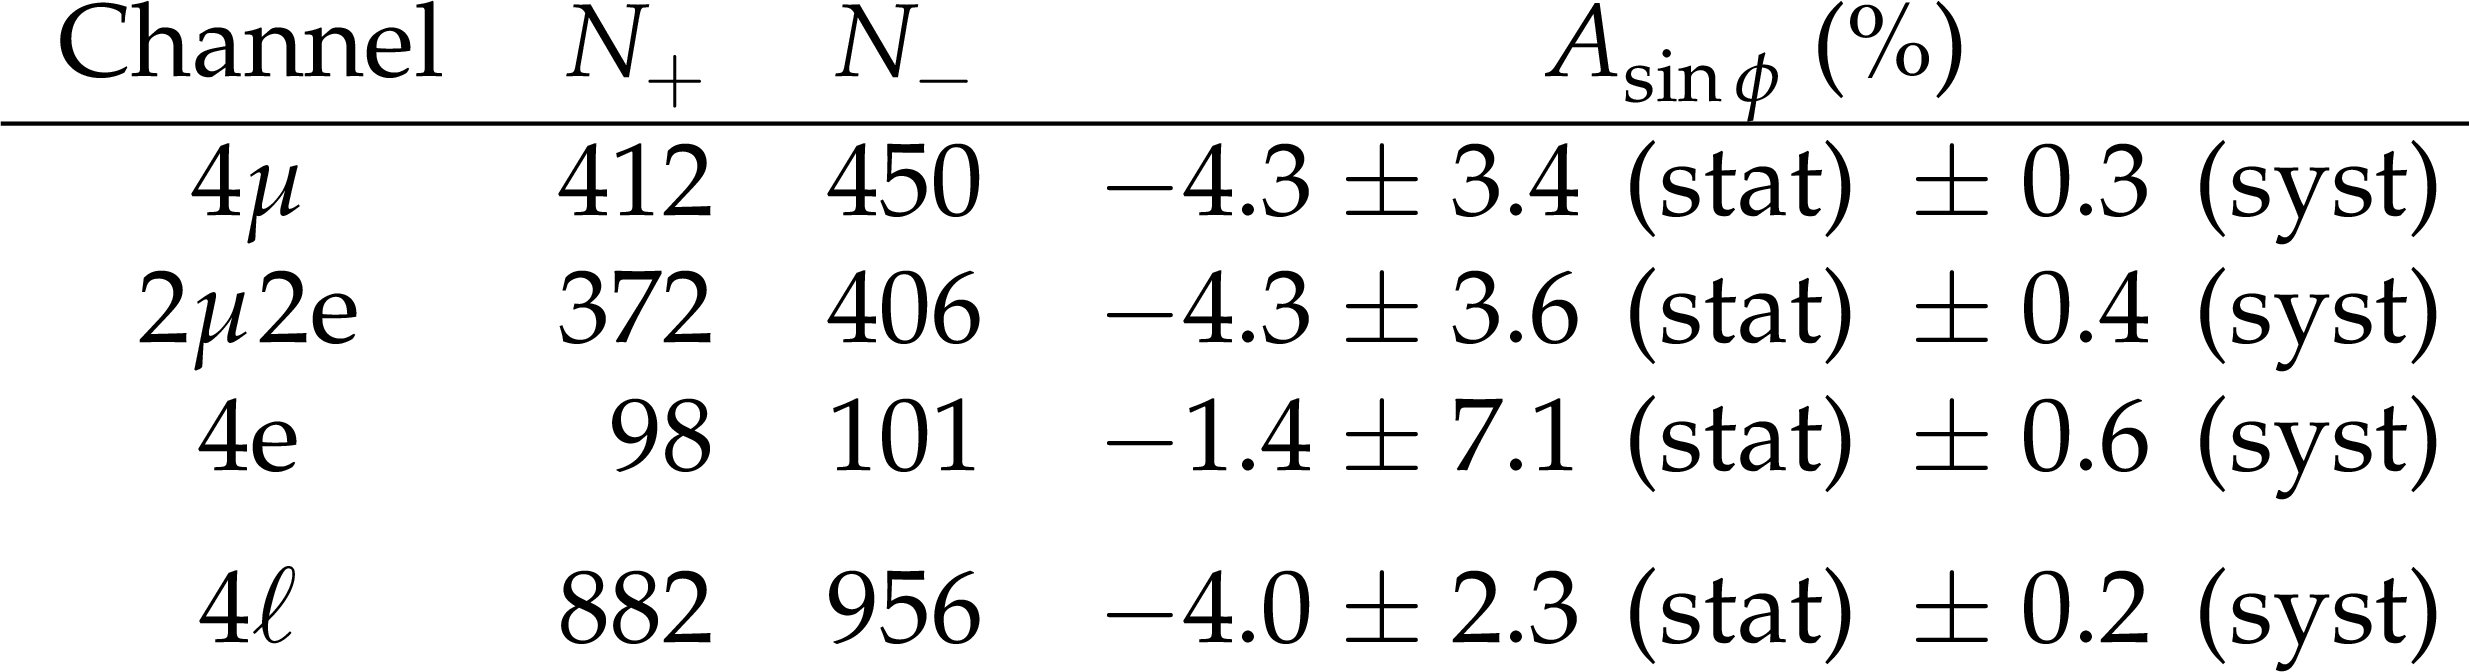
Table 6:
The number of signal $ \mathrm{Z} \to 4\ell $ events $ N_+ $ ($ N_- $) in which $ \sin\phi > $ 0 ($ < $ 0), and the associated asymmetry $ A_{\sin\phi} $ defined in Eq. \refeqeqn:TripleProductAsymmetry. The yields $ N_+ $ and $ N_- $ are reported after subtraction of backgrounds. Uncertainties are computed with respect to $ A_{\sin\phi} = $ 0. |
png pdf |
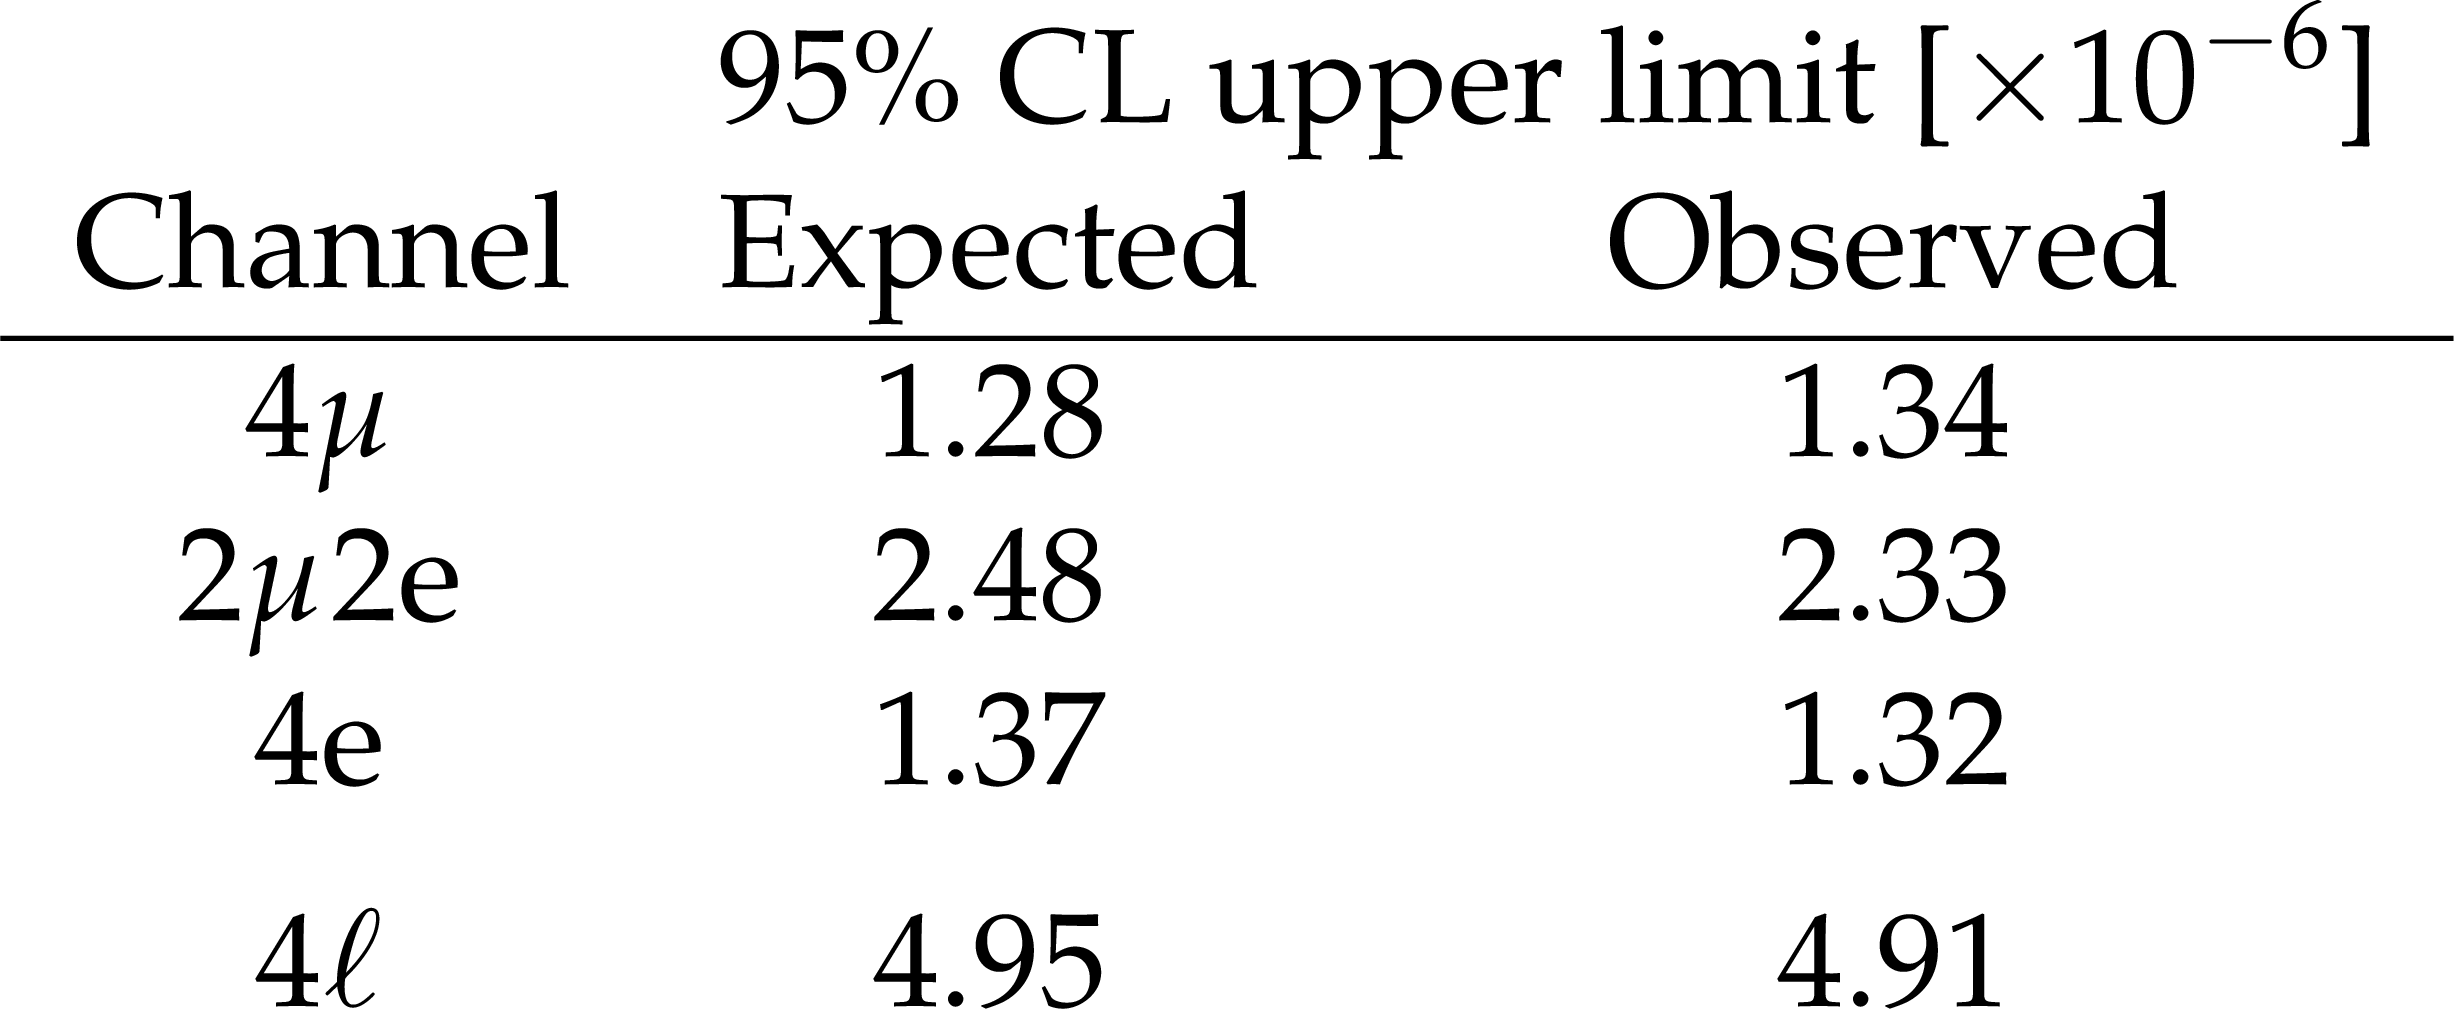
Table 7:
Upper limits at 95% CL on the branching fractions listed in Table 5. |
| Summary |
| A detailed study of $ \mathrm{Z} \to 4\ell $ decays (\ell = $ \mathrm{e} $ or $ \mu $) in proton-proton collisions at $ \sqrt{s} = $ 8 and 13 TeV has been presented. The data correspond to an integrated luminosity of 19.7 fb$ ^{-1} $ collected at 8 TeV and 138 fb$ ^{-1} $ at 13 TeV with the CMS detector. A total of 1,877 events is observed in the $ \mathrm{Z} \to 4\ell $ signal region. The signal purity for each of the 4 $ \mu $, 2 $ \mu 2\mathrm{e} $, and 4 e final states is above 97%. A measurement of the branching fraction for the sum of all four-lepton decay modes has been reported: $ \mathcal{B}(\mathrm{Z} \to 4\ell) = ( $ 4.67 $ \pm $ 0.11 (stat) $ \pm $ 0.10 (syst) $) \times 10^{-6} $. This measurement is more precise than all previous CMS and ATLAS results [1,2,3,4,5,6] and has a combined statistical and systematic precision of 3.2%. Measurements of the branching fractions for the decays $ \mathrm{Z} \to 4\mu $, $ \mathrm{Z} \to 4\mathrm{e} $, and $ \mathrm{Z} \to 2\mu 2\mathrm{e} $ have also been reported. All measured branching fractions are consistent with standard model (SM) expectations. Measurements of differential decay rates for the $ \mathrm{Z} \to 4\ell $ decay process as functions of nine kinematic and angular quantities were presented. These measurements are reported in terms of the $ \mathrm{Z} \to 4\ell $ partial width $ \Gamma_{\mathrm{Z} \to 4\ell} $. They are unfolded to correct for the effects of detector resolution and scaled to the full phase space region defined by the four-lepton invariant mass 80 $ < m_{4\ell} < $ 100 GeV and the dilepton invariant mass $ m_{\ell^+ \ell^-} > $ 4 GeV. These differential decay rates characterize the behavior of the $ \mathrm{Z} \to 4\ell $ decay process and are consistent with simulations based on the SM. In the interest of exploring possible contributions of new physics to the $ \mathrm{Z} \to 4\ell $ channel, a triple-product asymmetry measurement was performed. The measurement was made possible by the high statistical precision of the analysis, and may be used to probe for possible violations of charge conjugation and parity invariance in this decay. This asymmetry is observed to be consistent with zero for all 4 $ \ell $ channels, as expected in the SM. Finally, the $ \mathcal{B}(\mathrm{Z} \to 4\mu\!) $, $ \mathcal{B}(\mathrm{Z} \to 4\mathrm{e}\!) $, and $ \mathcal{B}(\mathrm{Z} \to 2\mu 2\mathrm{e}\!) $ measurements were used to set limits on new physics in the form of a scalar or vector boson that may mediate the $ \mathrm{Z} \to 4\ell $ process. These limits are more stringent than those set using previous measurements of $ \mathcal{B}(\mathrm{Z} \to 4\ell) $ [11] and complement direct searches for a narrow-width vector boson decaying to a $ \mu^{+}\mu^{-} $ pair [14]. |
| References | ||||
| 1 | CMS Collaboration | Observation of Z decays to four leptons with the CMS detector at the LHC | JHEP 12 (2012) 034 | CMS-SMP-12-009 1210.3844 |
| 2 | CMS Collaboration | Measurement of the ZZ production cross section and $ \mathrm{Z} \to \ell^+ \ell^- \ell'^+ \ell'^- $ branching fraction in pp collisions at $ \sqrt{s} = $ 13 TeV | Erratum: doi/10./j.physletb.09.030, 2016 PLB 763 (2016) 280 |
CMS-SMP-16-001 1607.08834 |
| 3 | CMS Collaboration | Measurements of the $ \mathrm{p}\mathrm{p} \to \mathrm{Z}\mathrm{Z} $ production cross section and the $ \mathrm{Z} \to 4\ell $ branching fraction, and constraints on anomalous triple gauge couplings at $ \sqrt{s} = $ 13 TeV | EPJC 78 (2018) 165 | CMS-SMP-16-017 1709.08601 |
| 4 | ATLAS Collaboration | Measurements of four-lepton production at the Z resonance in pp collisions at $ \sqrt{s} = $ 7 and 8 TeV with ATLAS | PRL 112 (2014) 231806 | 1403.5657 |
| 5 | ATLAS Collaboration | Measurement of the four-lepton invariant mass spectrum in 13 TeV proton-proton collisions with the ATLAS detector | JHEP 04 (2019) 048 | 1902.05892 |
| 6 | ATLAS Collaboration | Measurements of differential cross-sections in four-lepton events in 13 TeV proton-proton collisions with the ATLAS detector | JHEP 07 (2021) 005 | 2103.01918 |
| 7 | J. Alwall et al. | The automated computation of tree-level and next-to-leading order differential cross sections, and their matching to parton shower simulations | JHEP 07 (2014) 079 | 1405.0301 |
| 8 | CMS Collaboration | Search for the Z boson decay to \ensuremath\tau\ensuremath\tau\ensuremath\mu\ensuremath\mu in proton-proton collisions at $ \sqrt{s} = $ 13 TeV | PRL 133 (2024) 161805 | CMS-SMP-22-016 2404.18298 |
| 9 | LHCb Collaboration | Study of the rare decay $ {\mathrm{J}/\psi} \rightarrow \mu^{+}\mu^{-}\mu^{+}\mu^{-} $ | JHEP 12 (2024) 062 | 2408.16646 |
| 10 | CMS Collaboration | Observation of the $ {\mathrm{J}/\psi} \to \mu^{+}\mu^{-}\mu^{+}\mu^{-} $ decay in proton-proton collisions at $ \sqrt{s} = $ 13 TeV | PRD 109 (2024) L111101 | CMS-BPH-22-006 2403.11352 |
| 11 | J. L. Rainbolt and M. Schmitt | Branching fraction for Z decays to four leptons and constraints on new physics | PRD 99 (2019) 013004 | 1805.05791 |
| 12 | M. Drees, M. Shi, and Z. Zhang | Constraints on $ U(1)_{L_\mu-L_\tau} $ from LHC Data | PLB 791 (2019) 130 | 1811.12446 |
| 13 | N. F. Bell, Y. Cai, R. K. Leane, and A. D. Medina | Leptophilic dark matter with $ \mathrm{Z}^{'} $ interactions | PRD 90 (2014) 035027 | 1407.3001 |
| 14 | CMS Collaboration | Search for an $ L_\mu - L_\tau $ gauge boson using $ \mathrm{Z} \to 4\mu $ events in proton-proton collisions at $ \sqrt{s} = $ 13 TeV | PLB 792 (2019) 345 | CMS-EXO-18-008 1808.03684 |
| 15 | ATLAS Collaboration | Search for a new $ \mathrm{Z}^\prime $ gauge boson in 4 $ \mu $ events with the ATLAS experiment | JHEP 07 (2023) 090 | 2301.09342 |
| 16 | CMS Collaboration | Precision luminosity measurement in proton-proton collisions at $ \sqrt{s} = $ 13 TeV in 2015 and 2016 at CMS | EPJC 81 (2021) 800 | CMS-LUM-17-003 2104.01927 |
| 17 | CMS Collaboration | CMS luminosity measurement for the 2017 data-taking period at $ \sqrt{s} = $ 13 TeV | CMS Physics Analysis Summary, 2018 link |
CMS-PAS-LUM-17-004 |
| 18 | CMS Collaboration | CMS luminosity measurement for the 2018 data-taking period at $ \sqrt{s} = $ 13 TeV | CMS Physics Analysis Summary, 2019 link |
CMS-PAS-LUM-18-002 |
| 19 | CMS Collaboration | Observation of the $ \mathrm{Z}\to\psi\ell^+\ell^- $ decay in pp collisions at $ \sqrt{s} = $ 13 TeV | PRL 121 (2018) 141801 | CMS-BPH-16-001 1806.04213 |
| 20 | Particle Data Group Collaboration | Review of particle physics | PRD 110 (2024) 030001 | |
| 21 | A. J. Bevan | $ C $, $ P $, and $ C\!P $ asymmetry observables based on triple product asymmetries | 1408.3813 | |
| 22 | A. J. Bevan | $ \mathit{C} $, $ \mathit{P} $, and $ C\!P $ asymmetry observables based on triple product asymmetries | in Proceedings, 7th International Workshop on Charm Physics,: Detroit, USA, May 18-22, 2015 CHARM 201 (2015) 5 |
1506.04246 |
| 23 | Belle Collaboration | Search for $ C\!P $ violation with kinematic asymmetries in the $ \mathrm{D^0} \to \mathrm{K^+} \mathrm{K^-} \pi^{+} \pi^{-} $ decay | PRD 99 (2019) 011104 | 1810.06457 |
| 24 | NA48 Collaboration | Investigation of $ {\HepParticle{\mathrm{K}}{L,S}{0}} \to \pi^{+} \pi^{-} \mathrm{e}^+\mathrm{e}^- $ decays | EPJC 30 (2003) 33 | |
| 25 | CMS Collaboration | The CMS experiment at the CERN LHC | JINST 3 (2008) S08004 | |
| 26 | A. M. Sirunyan et al. | Particle-flow reconstruction and global event description with the CMS detector | JINST 12 (2017) P10003 | 1706.04965 |
| 27 | CMS Collaboration | Performance of the CMS muon detector and muon reconstruction with proton-proton collisions at $ \sqrt{s} = $ 13 TeV | JINST 13 (2018) P06015 | CMS-MUO-16-001 1804.04528 |
| 28 | CMS Collaboration | Performance of CMS muon reconstruction in $ \mathrm{p}\mathrm{p} $ collision events at $ \sqrt{s} = $ 7 TeV | JINST 7 (2012) P10002 | CMS-MUO-10-004 1206.4071 |
| 29 | CMS Collaboration | Electron and photon reconstruction and identification with the CMS experiment at the CERN LHC | JINST 16 (2021) P05014 | CMS-EGM-17-001 2012.06888 |
| 30 | CMS Collaboration | Performance of electron reconstruction and selection with the CMS detector in proton-proton collisions at $ \sqrt{s} = $ 8 TeV | JINST 10 (2015) P06005 | CMS-EGM-13-001 1502.02701 |
| 31 | CMS Collaboration | Performance of missing transverse momentum reconstruction in proton-proton collisions at $ \sqrt{s} = $ 13 TeV using the CMS detector | JINST 14 (2019) P07004 | CMS-JME-17-001 1903.06078 |
| 32 | CMS Collaboration | Jet performance in pp collisions at $ \sqrt{s} = $ 7 TeV | CMS Physics Analysis Summary, CERN, 2010 CMS-PAS-JME-10-003 |
|
| 33 | CMS Collaboration | Pileup mitigation at CMS in 13 TeV data | JINST 15 (2020) P09018 | CMS-JME-18-001 2003.00503 |
| 34 | M. Cacciari, G. P. Salam, and G. Soyez | The anti-$ k_{\mathrm{T}} $ jet clustering algorithm | JHEP 04 (2008) 063 | 0802.1189 |
| 35 | M. Cacciari, G. P. Salam, and G. Soyez | FastJet user manual | EPJC 72 (2012) 1896 | 1111.6097 |
| 36 | CMS Collaboration | The CMS trigger system | JINST 12 (2017) P01020 | CMS-TRG-12-001 1609.02366 |
| 37 | CMS Collaboration | Performance of the CMS level-1 trigger in proton-proton collisions at $ \sqrt{s} = $ 13 TeV | JINST 15 (2020) P10017 | CMS-TRG-17-001 2006.10165 |
| 38 | P. Nason | A new method for combining NLO QCD with shower Monte Carlo algorithms | JHEP 11 (2004) 040 | hep-ph/0409146 |
| 39 | S. Frixione, P. Nason, and C. Oleari | Matching NLO QCD computations with parton shower simulations: the POWHEG method | JHEP 11 (2007) 070 | 0709.2092 |
| 40 | S. Alioli, P. Nason, C. Oleari, and E. Re | A general framework for implementing NLO calculations in shower Monte Carlo programs: the POWHEG BOX | JHEP 06 (2010) 043 | 1002.2581 |
| 41 | T. Melia, P. Nason, R. Röntsch, and G. Zanderighi | $ \mathrm{W^+}\mathrm{W^-} $, WZ and ZZ production in the POWHEG BOX | JHEP 11 (2011) 078 | 1107.5051 |
| 42 | NNPDF Collaboration | Parton distributions for the LHC Run II | JHEP 04 (2015) 040 | 1410.8849 |
| 43 | NNPDF Collaboration | Parton distributions from high-precision collider data | EPJC 77 (2017) 663 | 1706.00428 |
| 44 | H.-L. Lai et al. | New parton distributions for collider physics | PRD 82 (2010) 074024 | 1007.2241 |
| 45 | NNPDF Collaboration | Parton distributions with LHC data | NPB 867 (2013) 244 | 1207.1303 |
| 46 | T. Sjöstrand et al. | High-energy physics event generation with PYTHIA 6.1 | Comput. Phys. Commun. 135 (2001) 238 | hep-ph/0010017 |
| 47 | T. Sjöstrand et al. | An introduction to PYTHIA 8.2 | Comput. Phys. Commun. 191 (2015) 159 | 1410.3012 |
| 48 | CMS Collaboration | Event generator tunes obtained from underlying event and multiparton scattering measurements | EPJC 76 (2016) 155 | CMS-GEN-14-001 1512.00815 |
| 49 | CMS Collaboration | Investigations of the impact of the parton shower tuning in PYTHIA8 in the modelling of $ {\mathrm{t}\overline{\mathrm{t}}} $ at $ \sqrt{s} = $ 8 and 13 TeV | CMS Physics Analysis Summary, CERN, 2016 CMS-PAS-TOP-16-021 |
CMS-PAS-TOP-16-021 |
| 50 | CMS Collaboration | Extraction and validation of a new set of CMS PYTHIA8 tunes from underlying-event measurements | EPJC 80 (2020) 4 | CMS-GEN-17-001 1903.12179 |
| 51 | CMS Collaboration | Study of the underlying event at forward rapidity in pp collisions at $ \sqrt{s} = $ 0.9, 2.76, and 7 TeV | JHEP 04 (2013) 072 | CMS-FWD-11-003 1302.2394 |
| 52 | \GEANTfour Collaboration | GEANT 4---a simulation toolkit | NIM A 506 (2003) 250 | |
| 53 | \GEANTfour Collaboration | GEANT 4 developments and applications | IEEE Trans. Nucl. Sci. 53 (2006) 270 | |
| 54 | A. Alloul et al. | FeynRules 2.0---A complete toolbox for tree-level phenomenology | Comput. Phys. Commun. 185 (2014) 2250 | 1310.1921 |
| 55 | M. Cacciari and G. P. Salam | Pileup subtraction using jet areas | PLB 659 (2008) 119 | 0707.1378 |
| 56 | CMS Collaboration | Measurement of the inclusive W and Z production cross sections in $ \mathrm{p}\mathrm{p} $ collisions at $ \sqrt{s}= $ 7 TeV | JHEP 10 (2011) 132 | CMS-EWK-10-005 1107.4789 |
| 57 | CMS Collaboration | HEPData record for this analysis | link | |
| 58 | L. Lyons, D. Gibaut, and P. Clifford | How to combine correlated estimates of a single physical quantity | NIM A 270 (1988) 110 | |
| 59 | J. Bourbeau and Z. Hampel-Arias | PyUnfold: A Python package for iterative unfolding | J. Open Source Softw. 3 (2018) 741 | 1806.03350 |
| 60 | G. D'Agostini | A multidimensional unfolding method based on Bayes' theorem | NIM A 362 (1995) 487 | |
| 61 | W. Bensalem, A. Datta, and D. London | New physics effects on triple product correlations in $ \Lambda_{\mathrm{b}} $ decays | PRD 66 (2002) 094004 | hep-ph/0208054 |
| 62 | R. Boughezal, C.-Y. Chen, F. Petriello, and D. Wiegand | Four-lepton Z boson decay constraints on the standard model EFT | PRD 103 (2021) 055015 | 2010.06685 |
|
|
Compact Muon Solenoid LHC, CERN |
|

|

|

|

|

|