

Compact Muon Solenoid
LHC, CERN
| CMS-HIN-24-021 ; CERN-EP-2026-066 | ||
| Measurement of the top quark pair production cross section in $ \mathrm{Pb}\mathrm{Pb} $ collisions at$ \sqrt{\smash[b]{s_{_{\mathrm{NN}}}}}= $ 5.36 TeV | ||
| CMS Collaboration | ||
| 29 April 2026 | ||
| Accepted for publication in the Journal of High Energy Physics | ||
| Abstract: The inclusive cross section for top quark pair ( $ \mathrm{t} \overline{\mathrm{t}} $) production in lead-lead ($ \mathrm{Pb}\mathrm{Pb} $) collisions is reported for the first time at a center-of-mass energy per nucleon pair of 5.36 TeV. The analysis uses data corresponding to an integrated luminosity of 1.58$ \text{nb}^{-1}$ collected by the CMS experiment at the CERN LHC in 2023. The $ \mathrm{t} \overline{\mathrm{t}} $ production cross section, $ \sigma_{{\mathrm{t}\overline{\mathrm{t}}} }= $ 3.42 $ ^{+0.54}_{-0.51} $ $ $ (stat) $ ^{+0.50}_{-0.43} $ (syst) $\mu b$, is measured in dilepton final states using a fit to a multivariate discriminator that combines the decay electron and muon kinematic properties with the multiplicity of bottom quark jets. The result is consistent with perturbative quantum chromodynamics calculations at next-to-next-to-leading order (NNLO) accuracy employing several nuclear parton distribution functions. In addition, the Drell--Yan production cross section ($ \sigma_\text{DY} $) for dilepton masses above 10 GeV and the ratio of $ \mathrm{t} \overline{\mathrm{t}} $ to DY cross sections ($ R_{{\mathrm{t}\overline{\mathrm{t}}} /\mathrm{DY}} $) are found to be compatible with the NNLO predictions. The observables $ \sigma_{{\mathrm{t}\overline{\mathrm{t}}} } $, $ \sigma_\text{DY} $, and $ R_{{\mathrm{t}\overline{\mathrm{t}}} /\mathrm{DY}} $ are measured separately for central and semicentral $ \mathrm{Pb}\mathrm{Pb} $ collisions to investigate for the first time the dependence of top quark production on the collision impact parameter. | ||
| Links: e-print arXiv:2604.27091 [hep-ex] (PDF) ; CDS record ; inSPIRE record ; HepData record ; Physics Briefing ; CADI line (restricted) ; | ||
| Figures | |
png pdf |
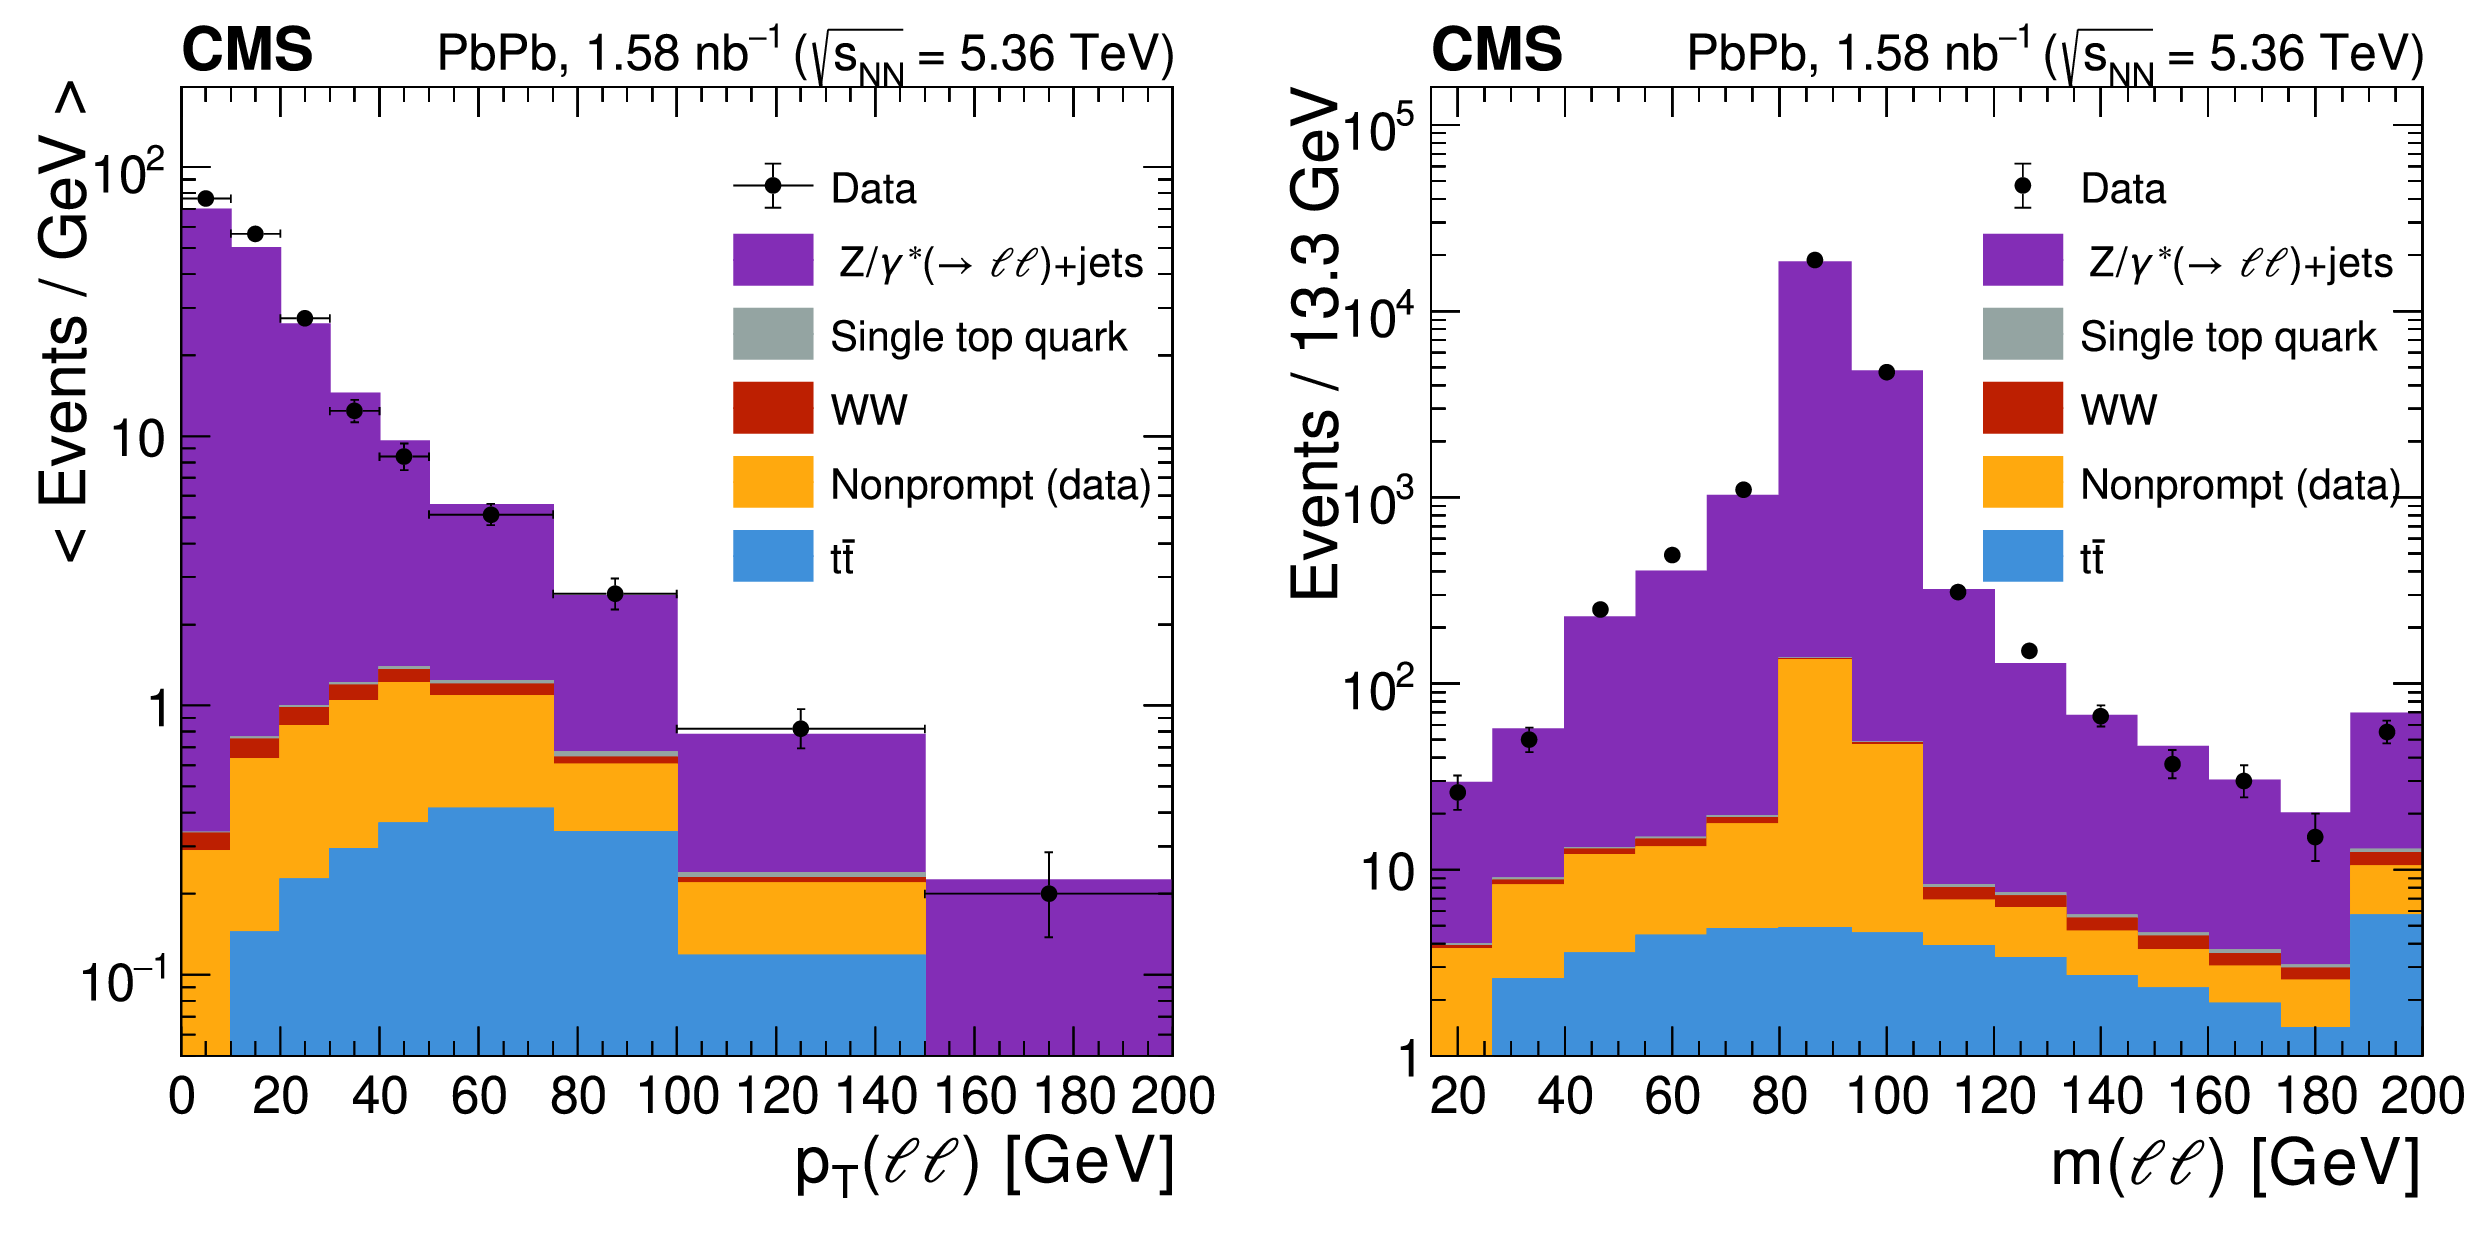
Figure 1:
Distributions of dilepton $ p_{\mathrm{T}}(\ell\ell) $ (left) and invariant mass $ m(\ell\ell) $ (right) variables in the same-flavor ($ \ell\ell $) channels. The $ m(\ell\ell) $ distribution is shown before applying the veto of the Z boson resonant region. The data (black markers with error bars representing statistical uncertainties) are overlaid on top of the stacked contributions from the expected $ \mathrm{t} \overline{\mathrm{t}} $ (blue), nonprompt (light orange), WW (red), single top quark (gray), and $ \mathrm{DY} $ (violet) processes. The last bin includes the overflow entries. In the left panel, the event counts are divided by the variable bin width. |
png pdf |
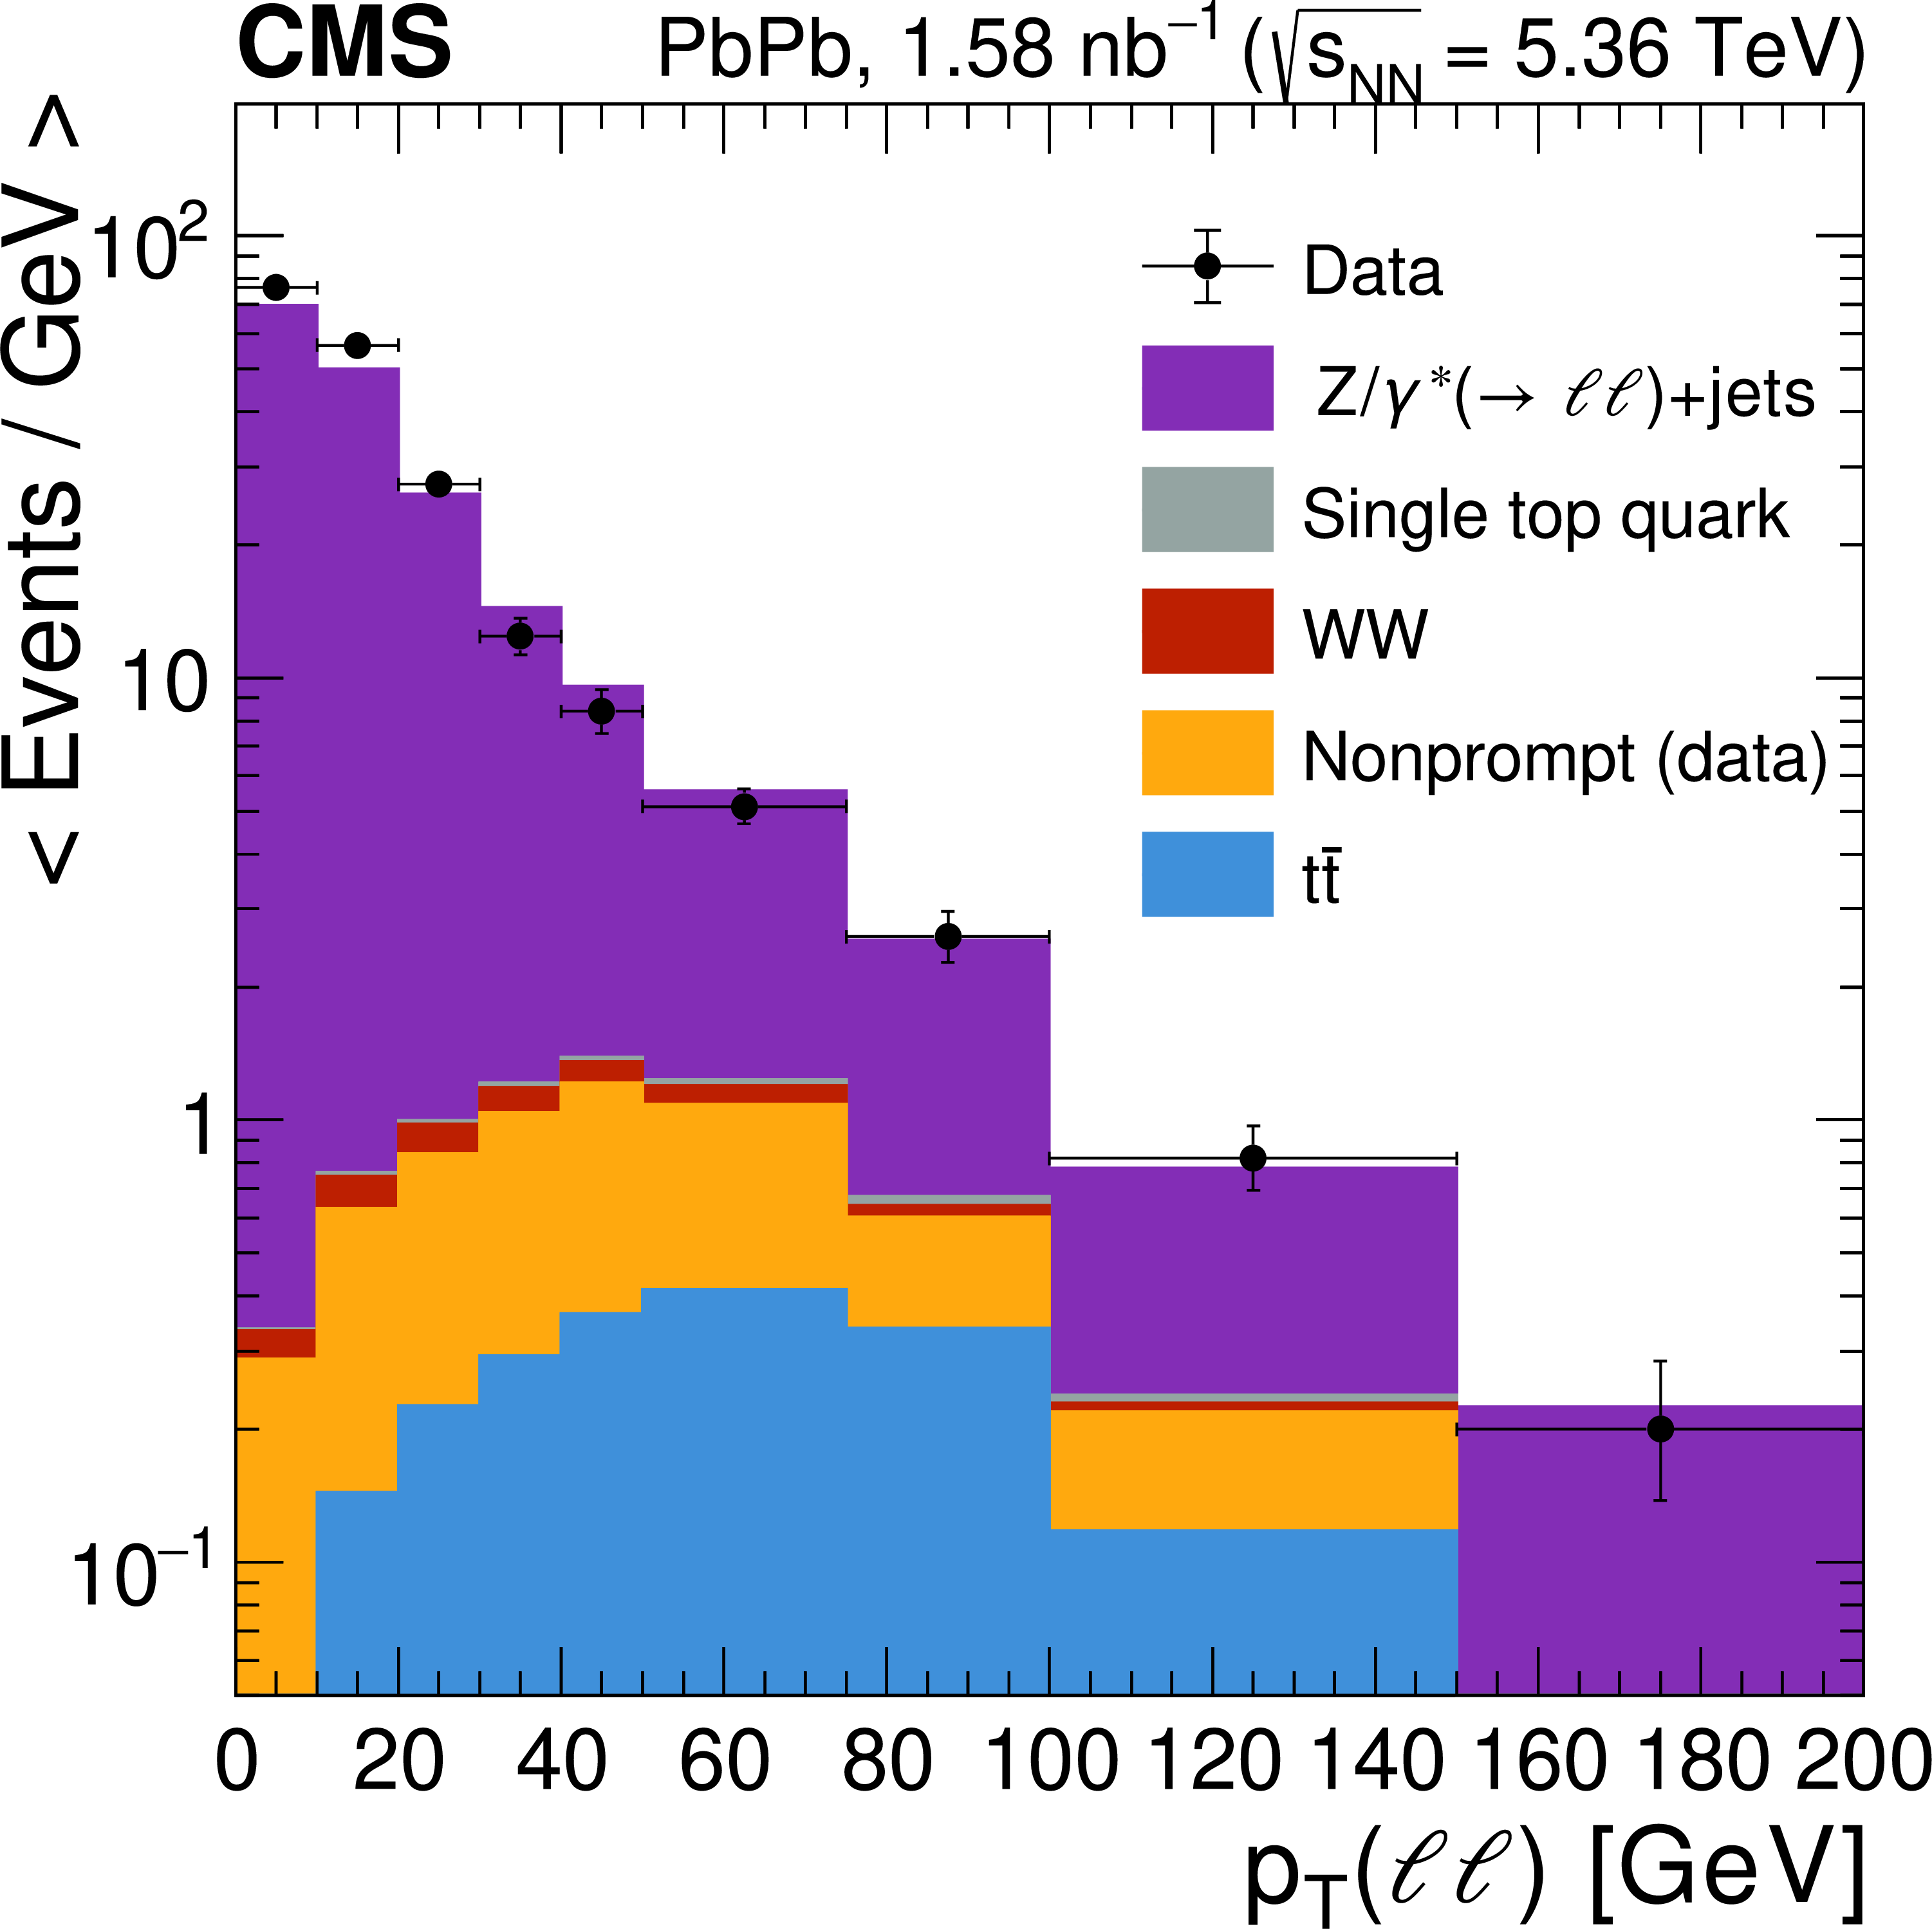
Figure 1-a:
Distributions of dilepton $ p_{\mathrm{T}}(\ell\ell) $ (left) and invariant mass $ m(\ell\ell) $ (right) variables in the same-flavor ($ \ell\ell $) channels. The $ m(\ell\ell) $ distribution is shown before applying the veto of the Z boson resonant region. The data (black markers with error bars representing statistical uncertainties) are overlaid on top of the stacked contributions from the expected $ \mathrm{t} \overline{\mathrm{t}} $ (blue), nonprompt (light orange), WW (red), single top quark (gray), and $ \mathrm{DY} $ (violet) processes. The last bin includes the overflow entries. In the left panel, the event counts are divided by the variable bin width. |
png pdf |
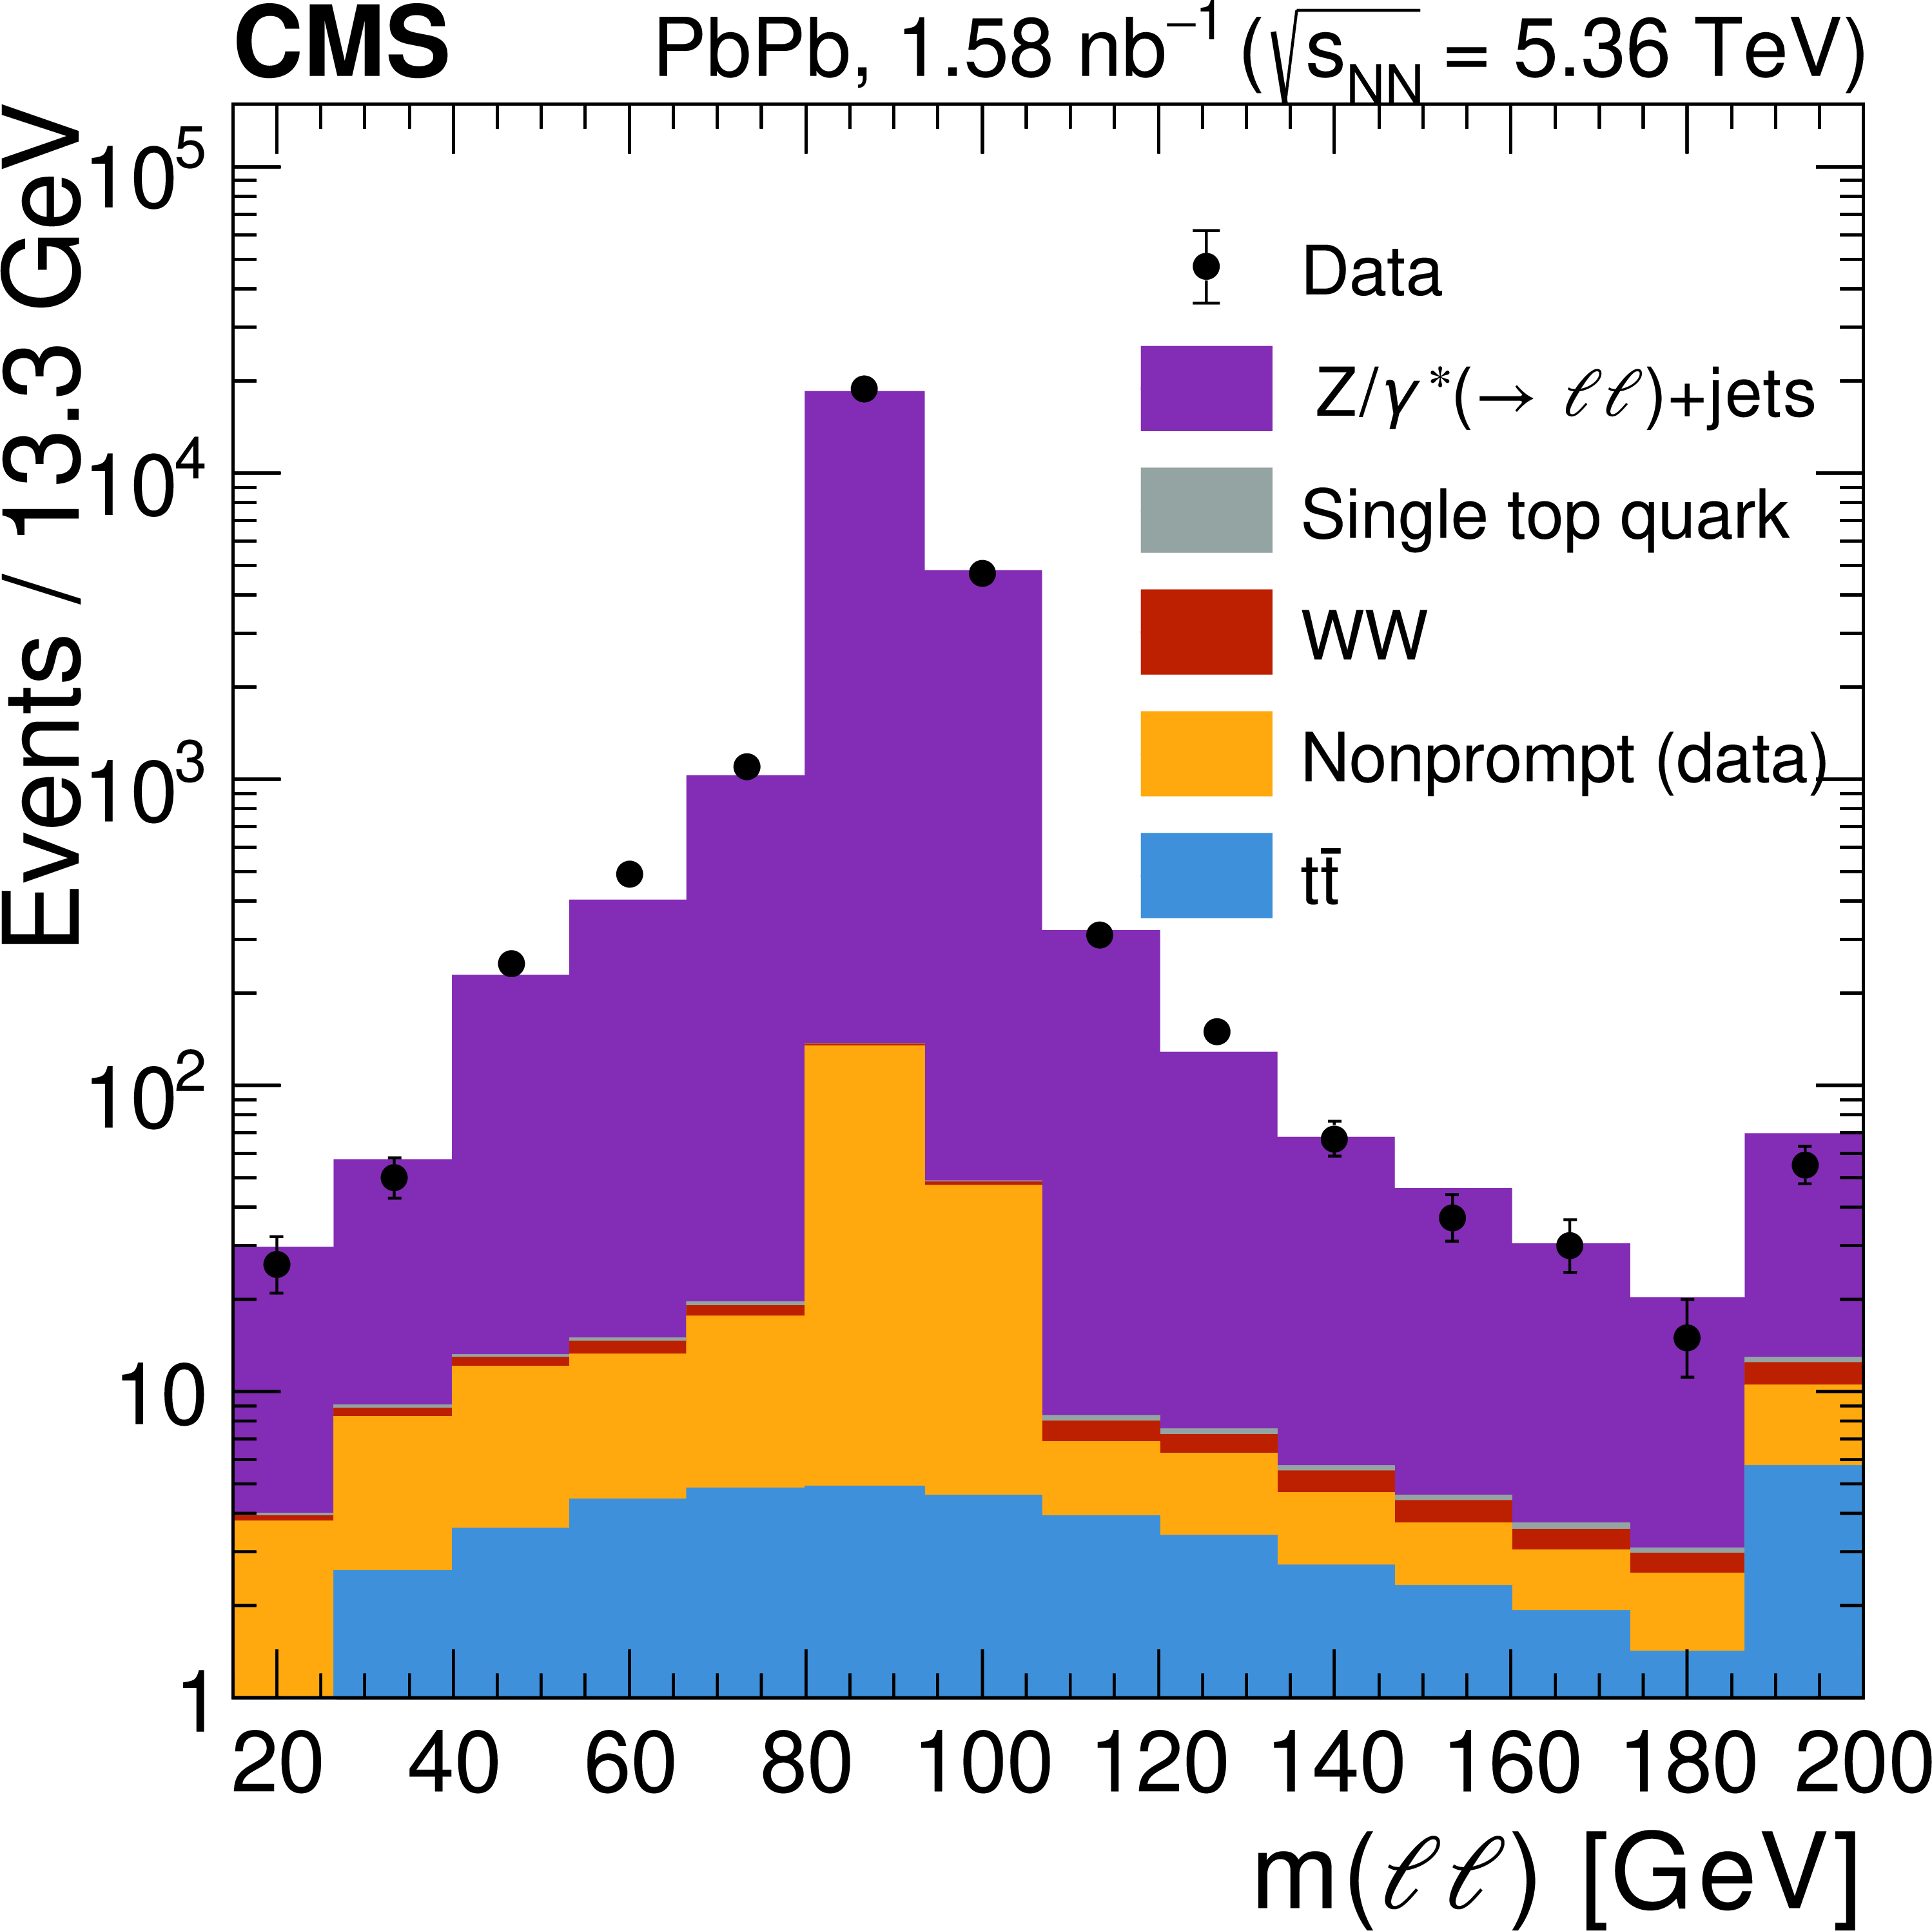
Figure 1-b:
Distributions of dilepton $ p_{\mathrm{T}}(\ell\ell) $ (left) and invariant mass $ m(\ell\ell) $ (right) variables in the same-flavor ($ \ell\ell $) channels. The $ m(\ell\ell) $ distribution is shown before applying the veto of the Z boson resonant region. The data (black markers with error bars representing statistical uncertainties) are overlaid on top of the stacked contributions from the expected $ \mathrm{t} \overline{\mathrm{t}} $ (blue), nonprompt (light orange), WW (red), single top quark (gray), and $ \mathrm{DY} $ (violet) processes. The last bin includes the overflow entries. In the left panel, the event counts are divided by the variable bin width. |
png pdf |
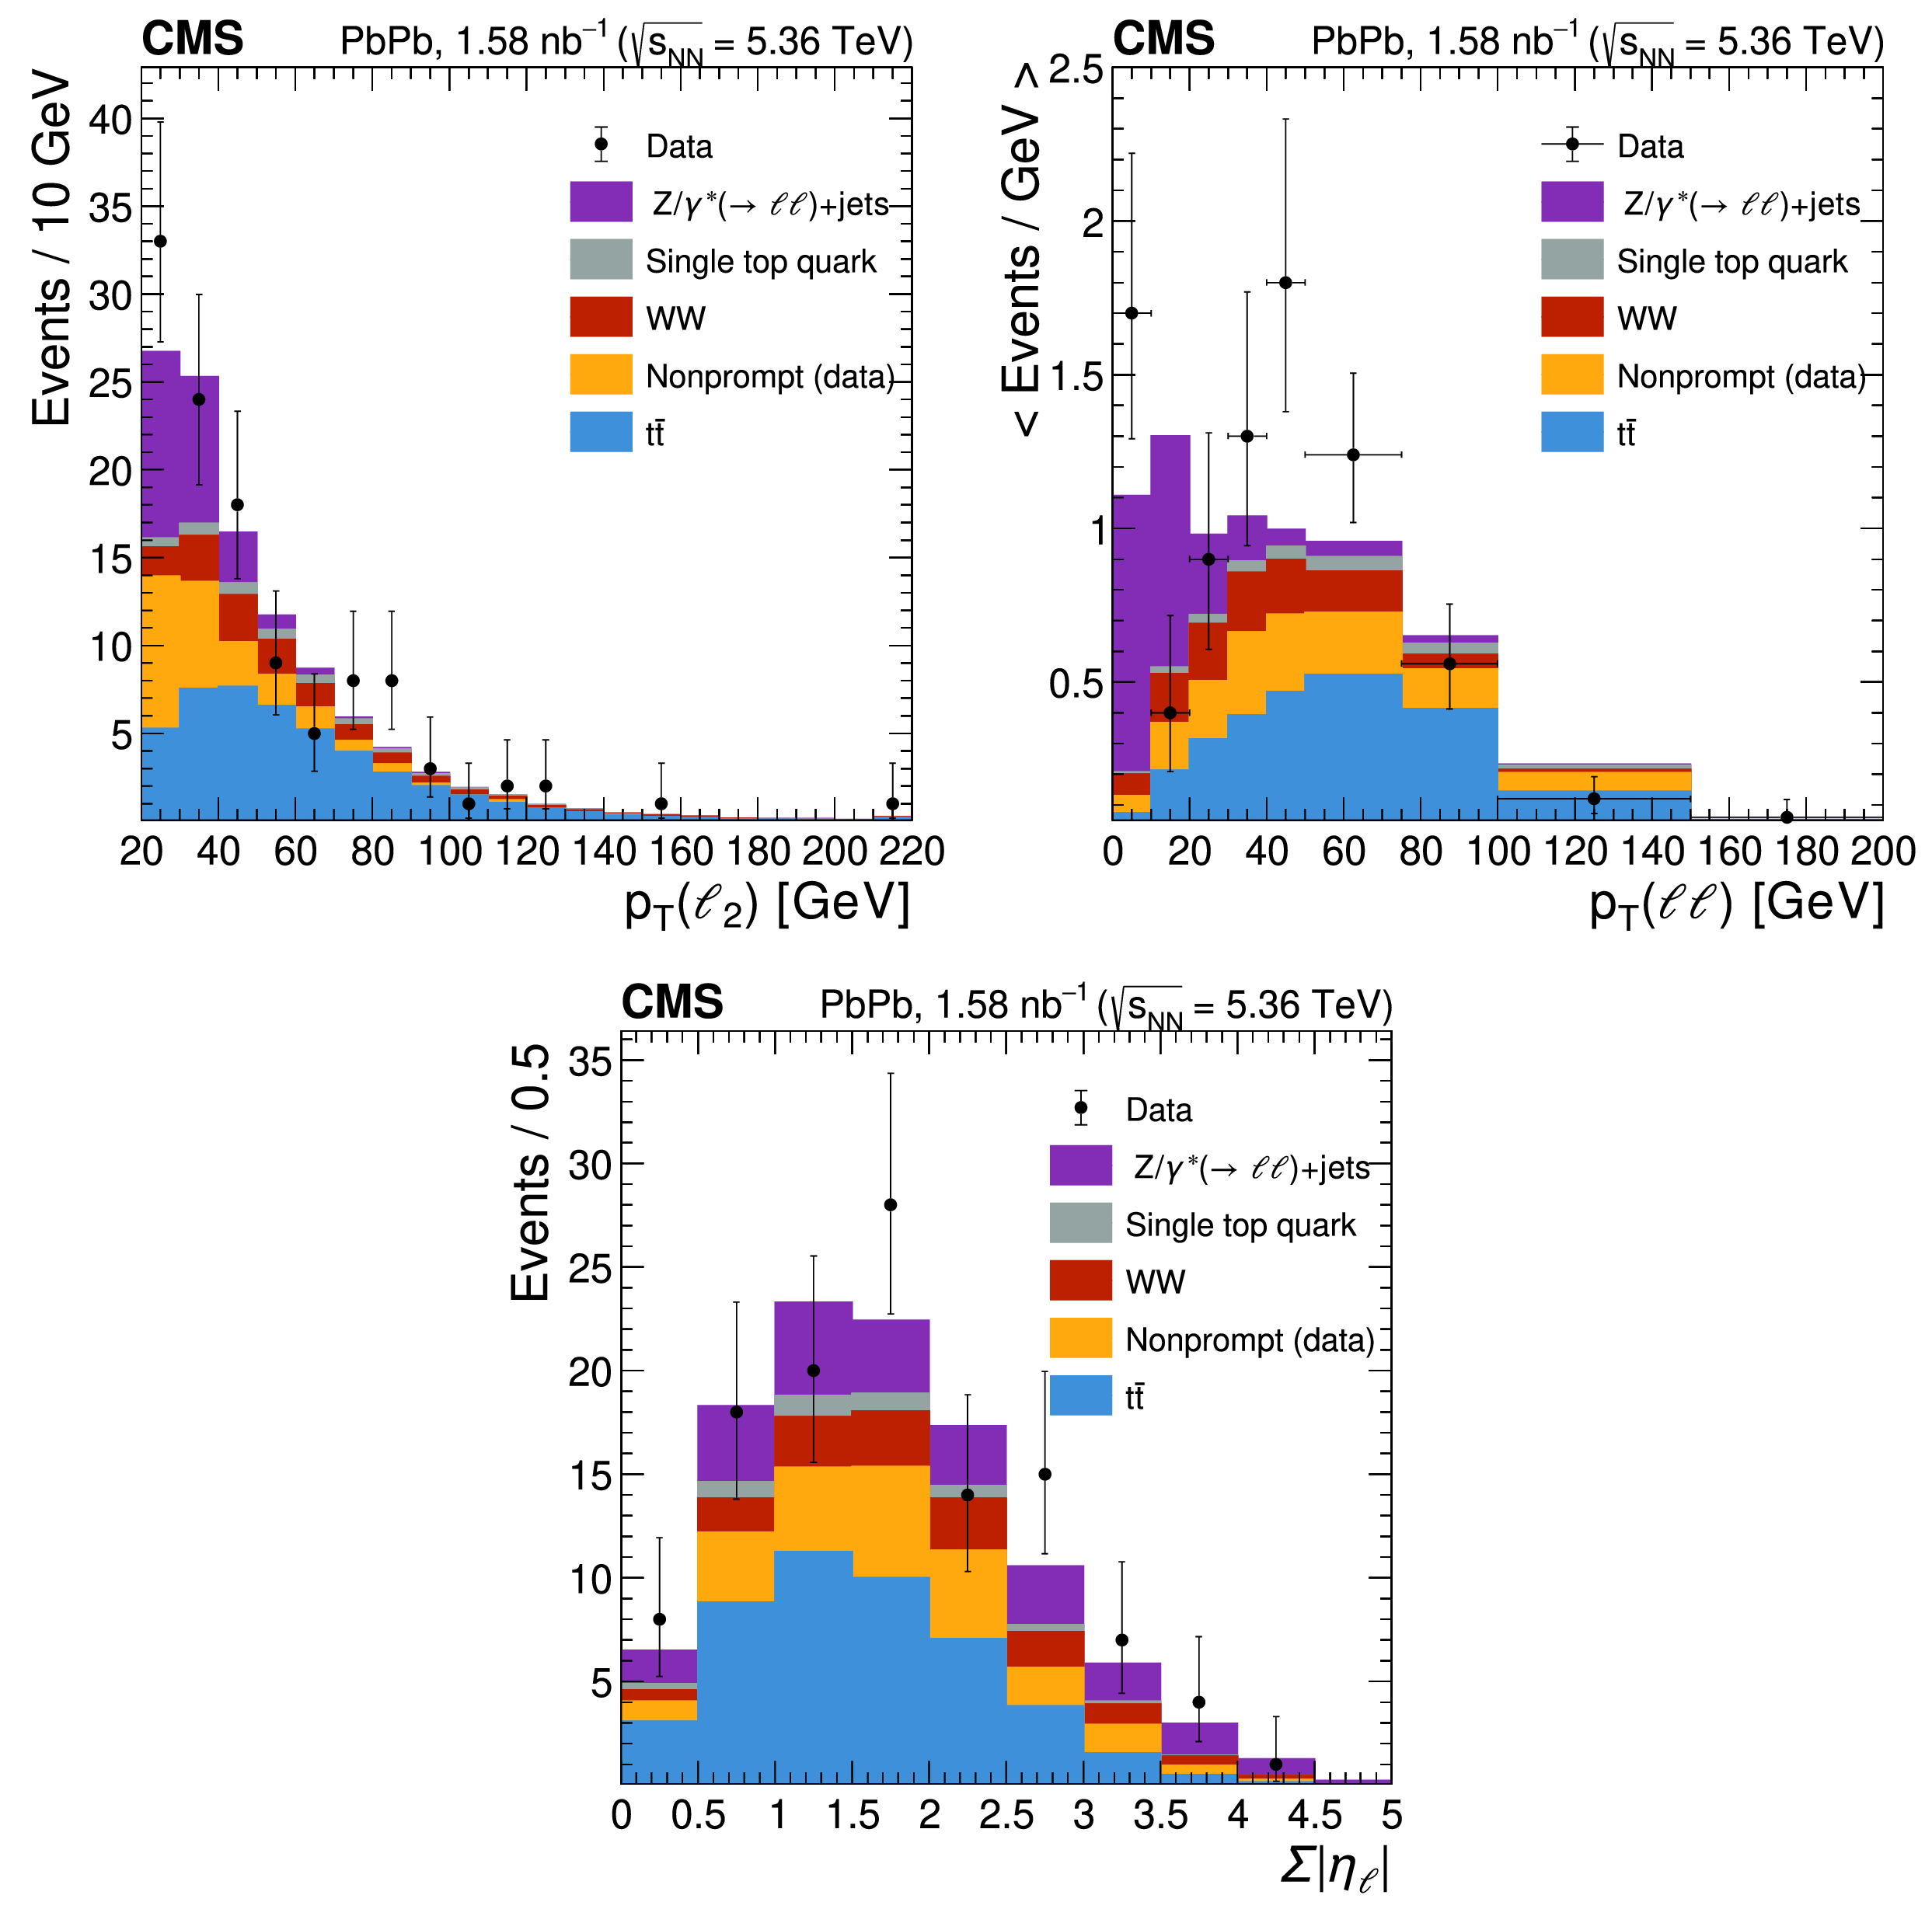
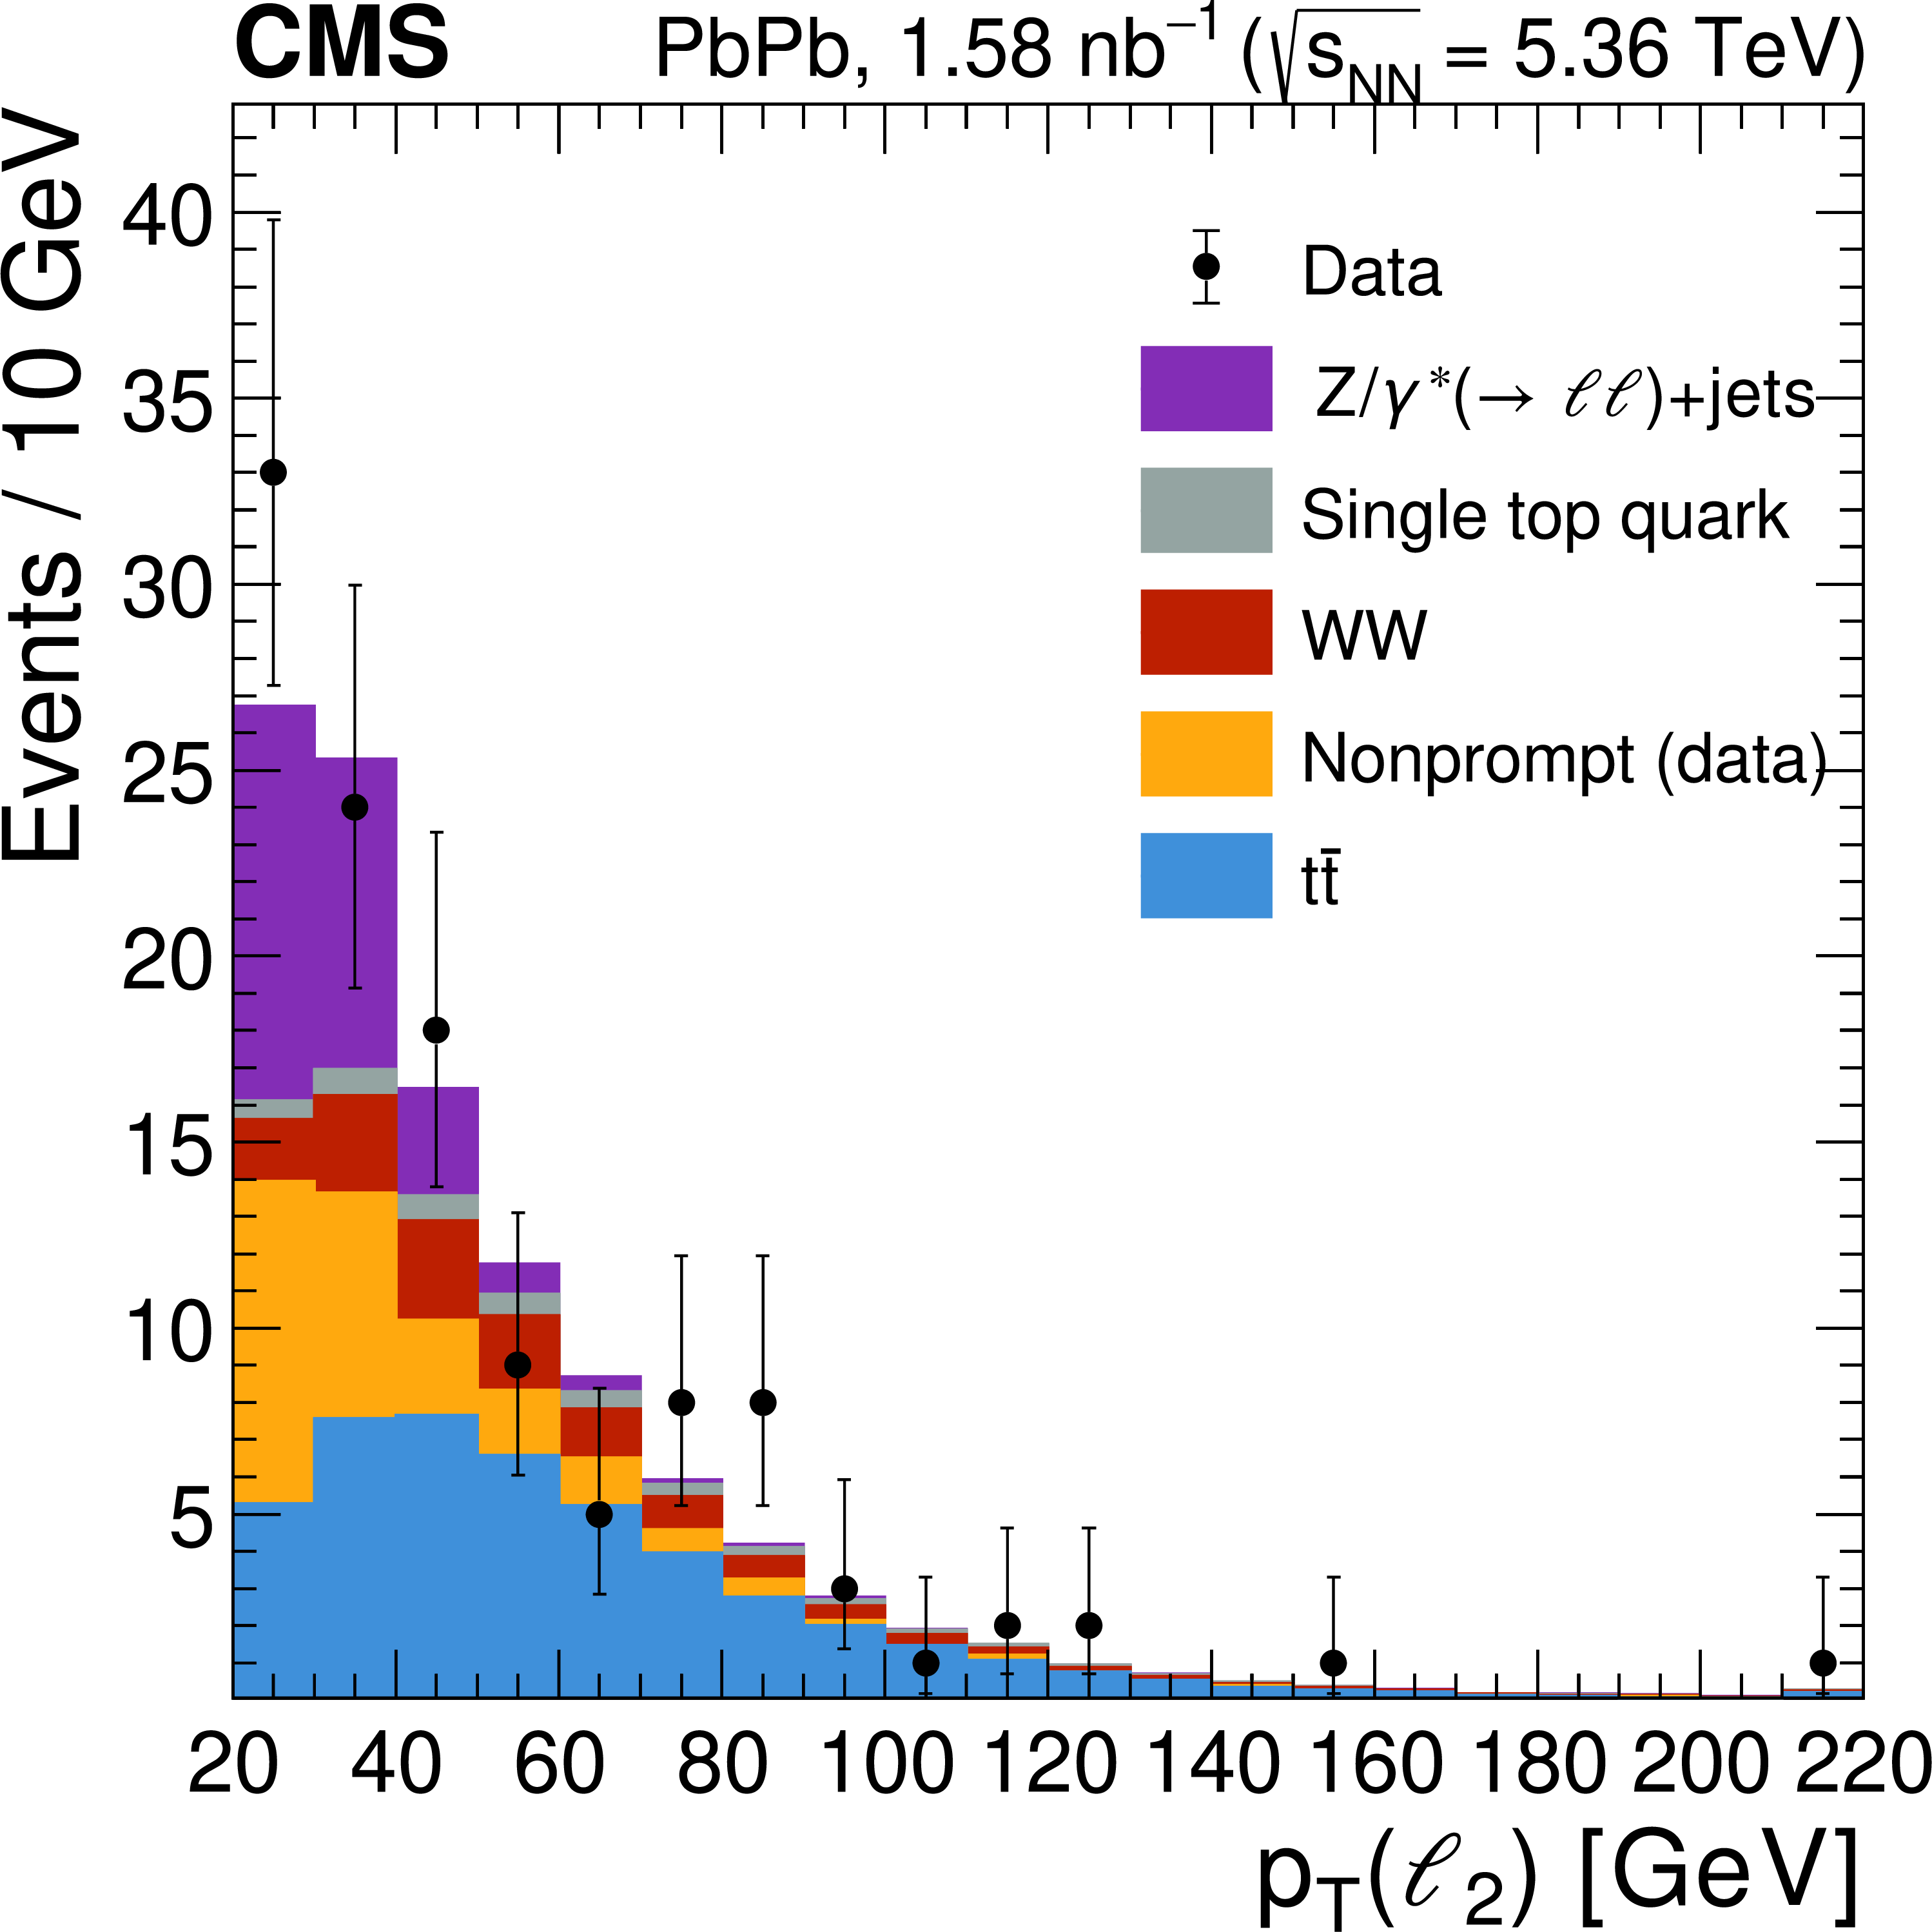
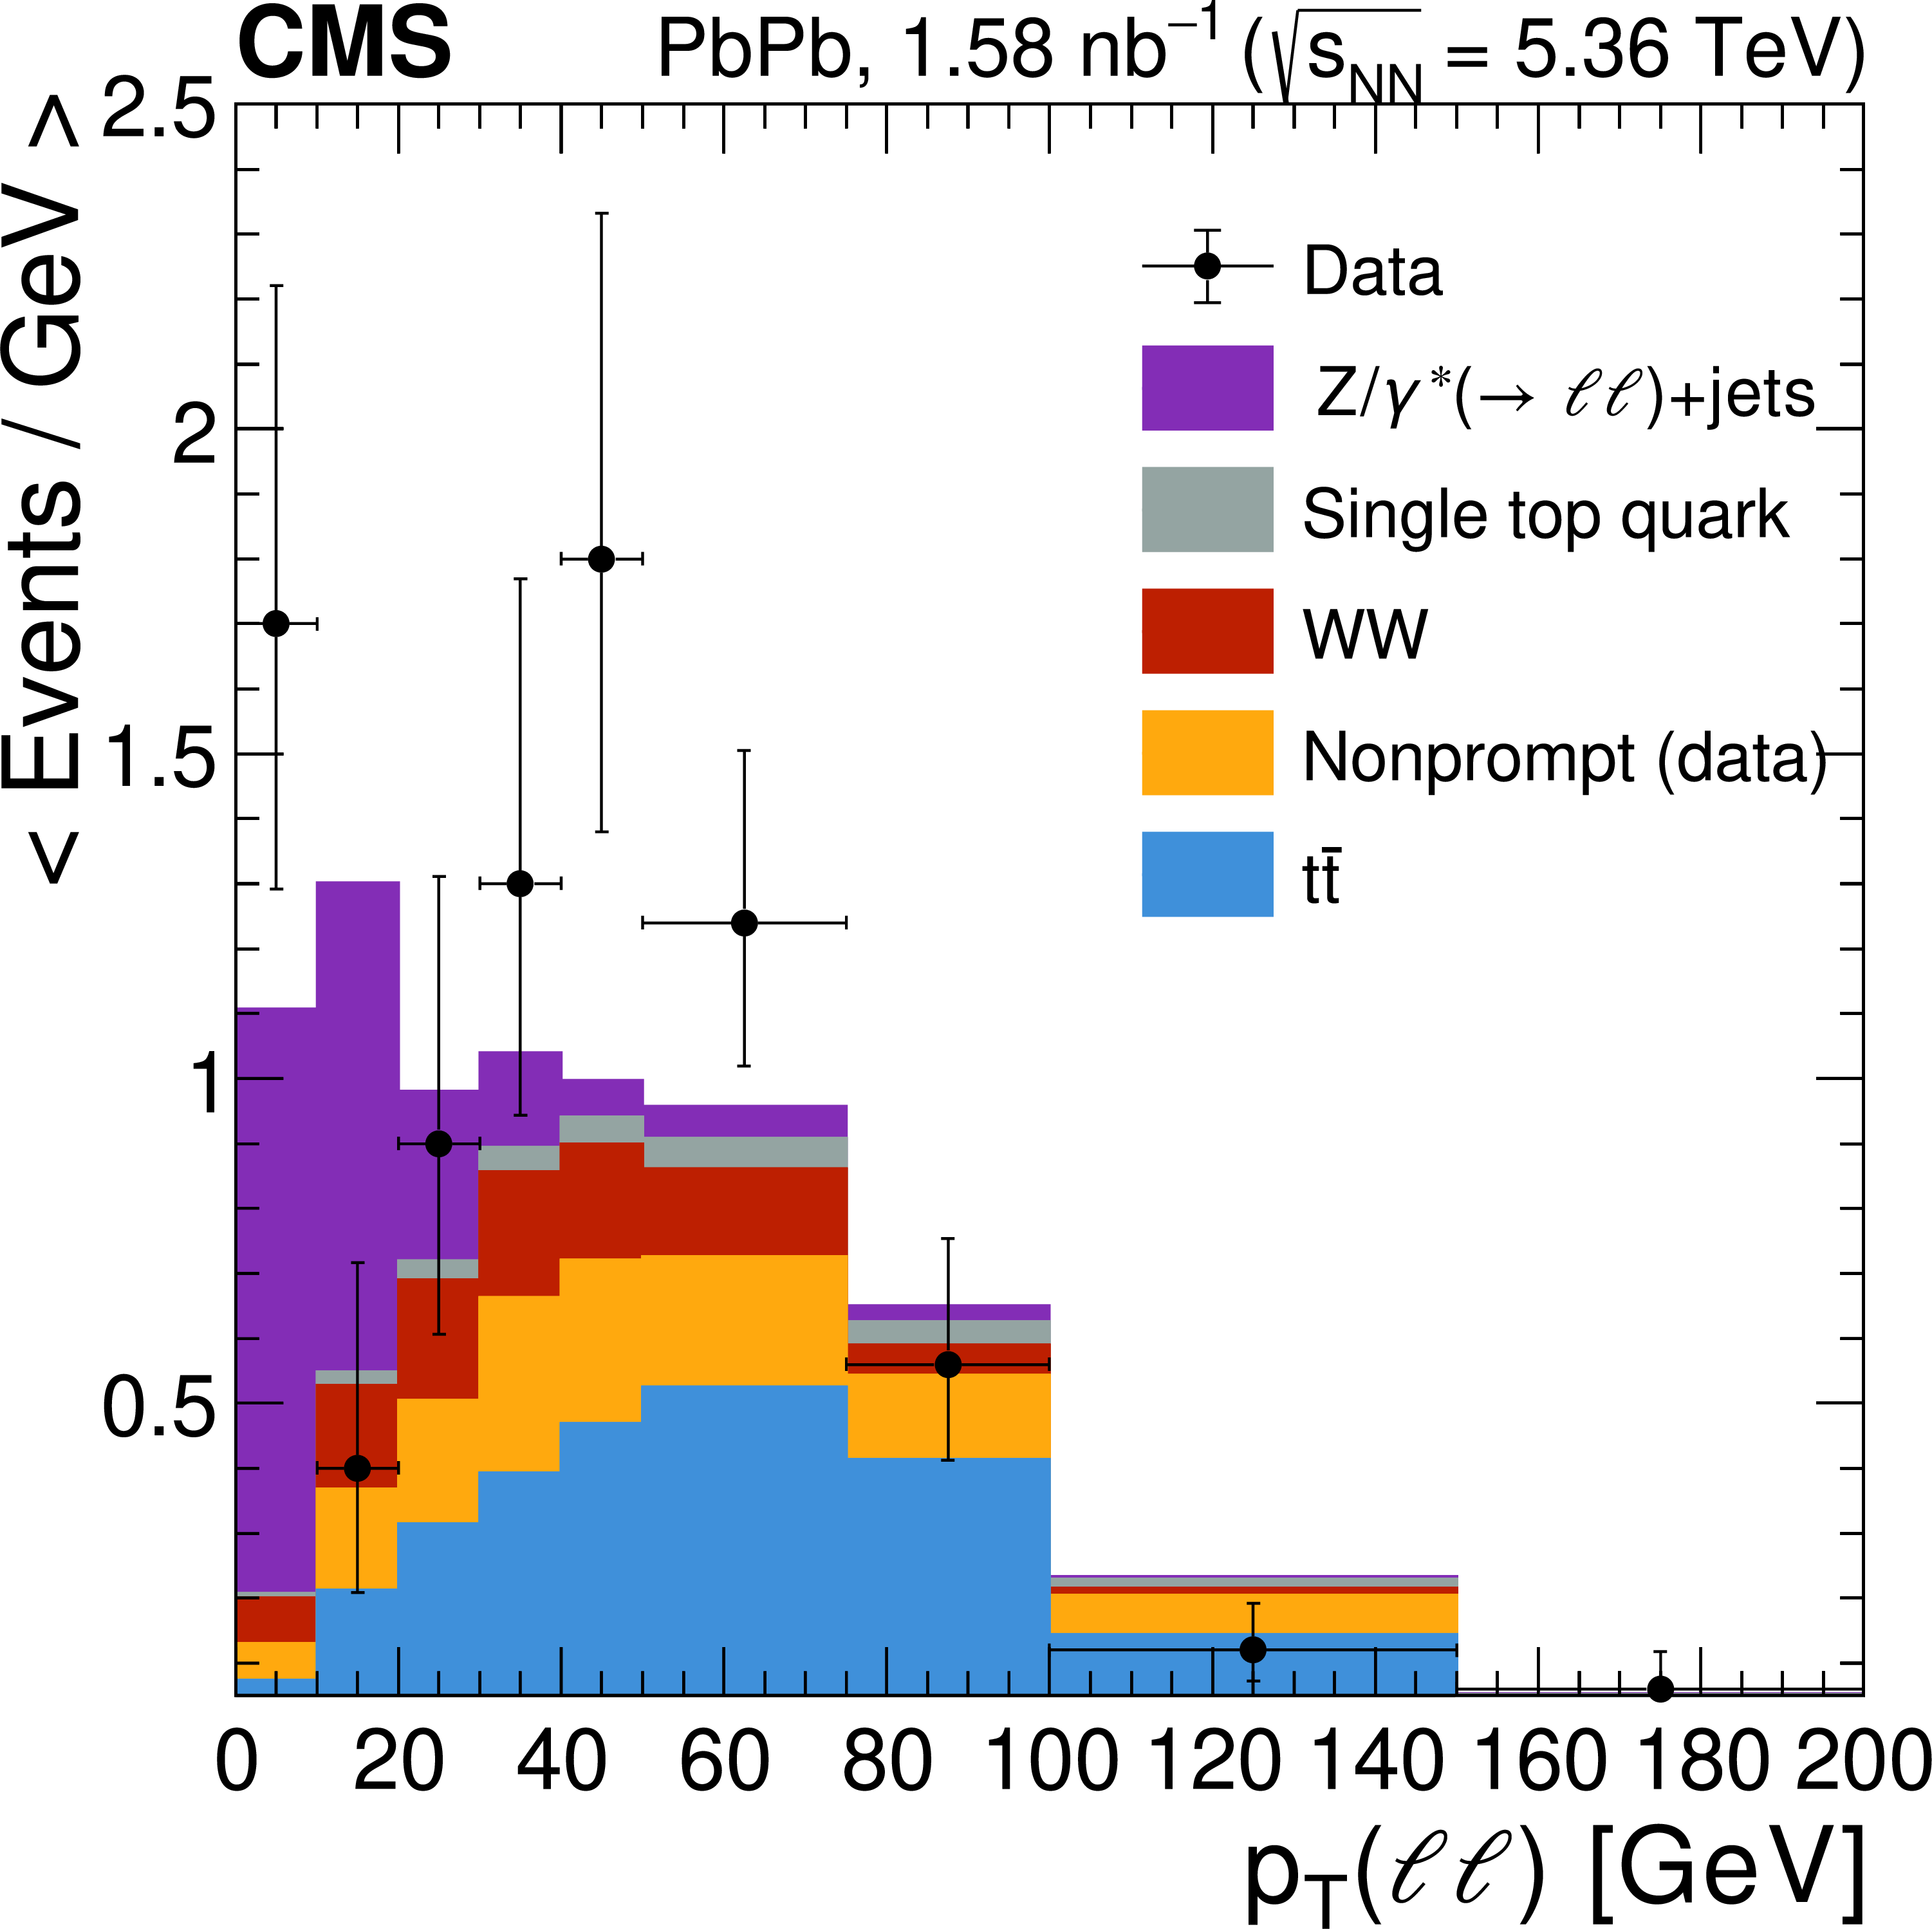
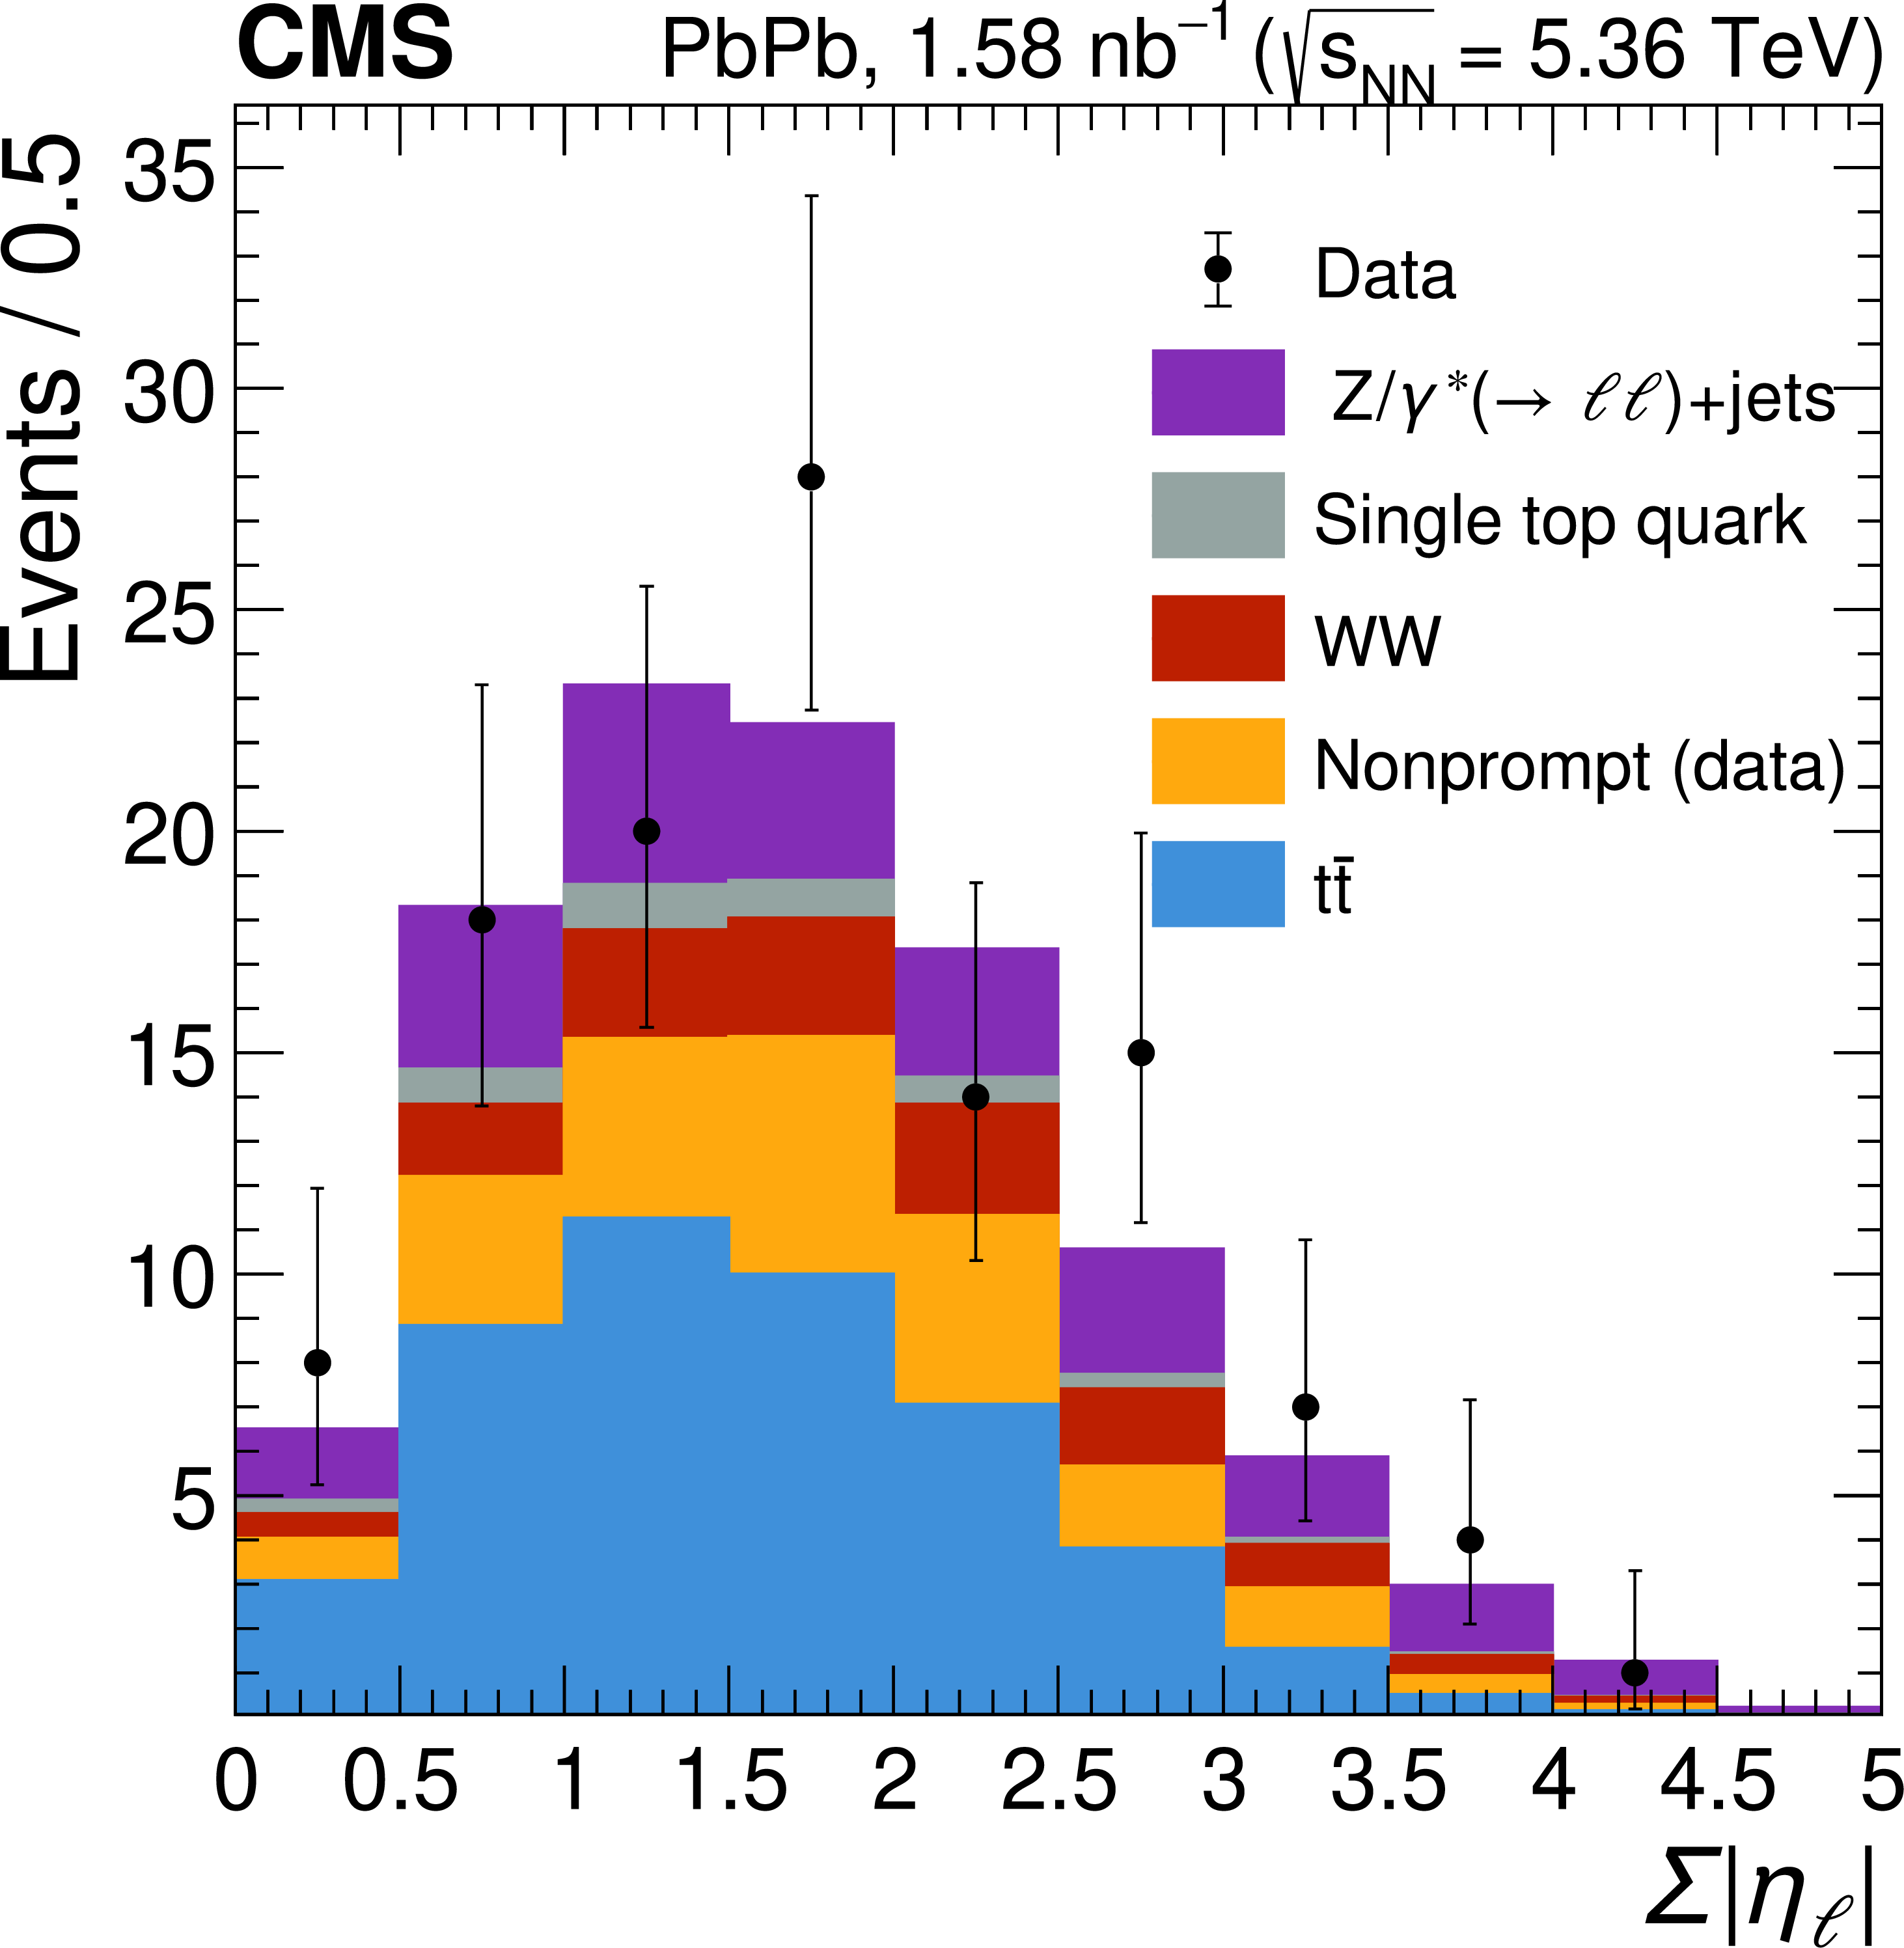
Figure 2:
Distributions of $ p_{\mathrm{T}}(\ell_2) $ (upper left), $ p_{\mathrm{T}}(\ell\ell) $ (upper right), and $ \sum|\eta_\ell| $ (lower) variables in the different-flavor ($ \mathrm{e}^{\mp}\mu^{\pm} $) channel. The data (black markers with error bars representing statistical uncertainties) are overlaid on top of the stacked contributions from the expected $ \mathrm{t} \overline{\mathrm{t}} $ (blue), nonprompt (light orange), WW (red), single top quark (gray), and $ \mathrm{DY} $ (violet) processes. The last bin includes the overflow entries. |
png pdf |
Figure 2-a:
Distributions of $ p_{\mathrm{T}}(\ell_2) $ (upper left), $ p_{\mathrm{T}}(\ell\ell) $ (upper right), and $ \sum|\eta_\ell| $ (lower) variables in the different-flavor ($ \mathrm{e}^{\mp}\mu^{\pm} $) channel. The data (black markers with error bars representing statistical uncertainties) are overlaid on top of the stacked contributions from the expected $ \mathrm{t} \overline{\mathrm{t}} $ (blue), nonprompt (light orange), WW (red), single top quark (gray), and $ \mathrm{DY} $ (violet) processes. The last bin includes the overflow entries. |
png pdf |
Figure 2-b:
Distributions of $ p_{\mathrm{T}}(\ell_2) $ (upper left), $ p_{\mathrm{T}}(\ell\ell) $ (upper right), and $ \sum|\eta_\ell| $ (lower) variables in the different-flavor ($ \mathrm{e}^{\mp}\mu^{\pm} $) channel. The data (black markers with error bars representing statistical uncertainties) are overlaid on top of the stacked contributions from the expected $ \mathrm{t} \overline{\mathrm{t}} $ (blue), nonprompt (light orange), WW (red), single top quark (gray), and $ \mathrm{DY} $ (violet) processes. The last bin includes the overflow entries. |
png pdf |
Figure 2-c:
Distributions of $ p_{\mathrm{T}}(\ell_2) $ (upper left), $ p_{\mathrm{T}}(\ell\ell) $ (upper right), and $ \sum|\eta_\ell| $ (lower) variables in the different-flavor ($ \mathrm{e}^{\mp}\mu^{\pm} $) channel. The data (black markers with error bars representing statistical uncertainties) are overlaid on top of the stacked contributions from the expected $ \mathrm{t} \overline{\mathrm{t}} $ (blue), nonprompt (light orange), WW (red), single top quark (gray), and $ \mathrm{DY} $ (violet) processes. The last bin includes the overflow entries. |
png pdf |
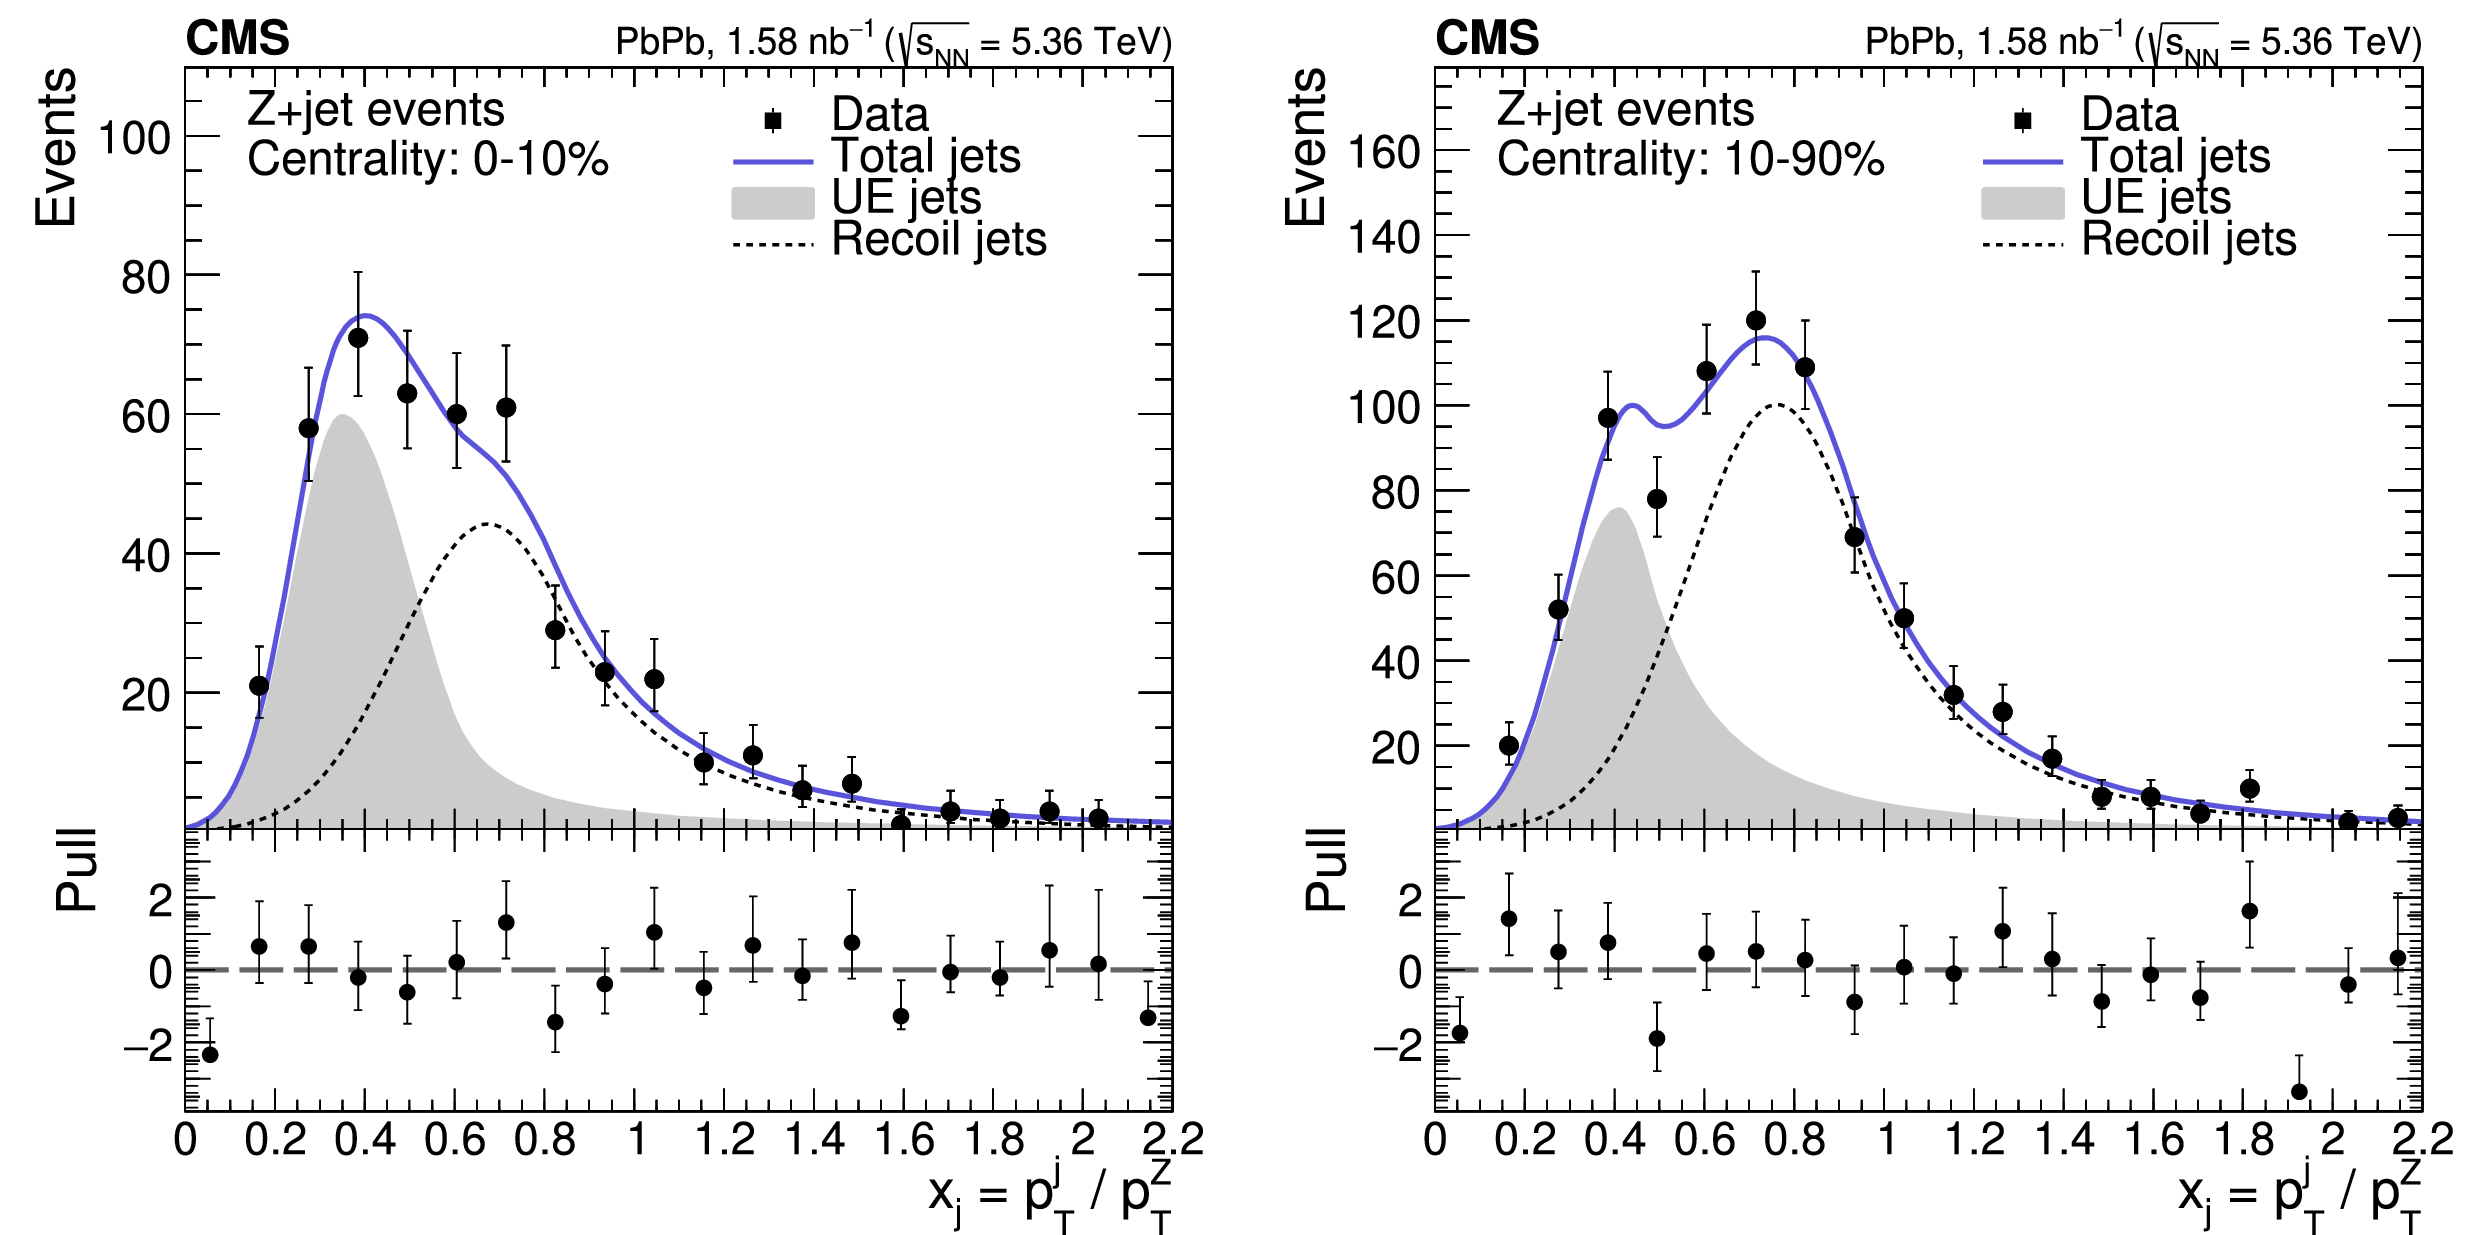
Figure 3:
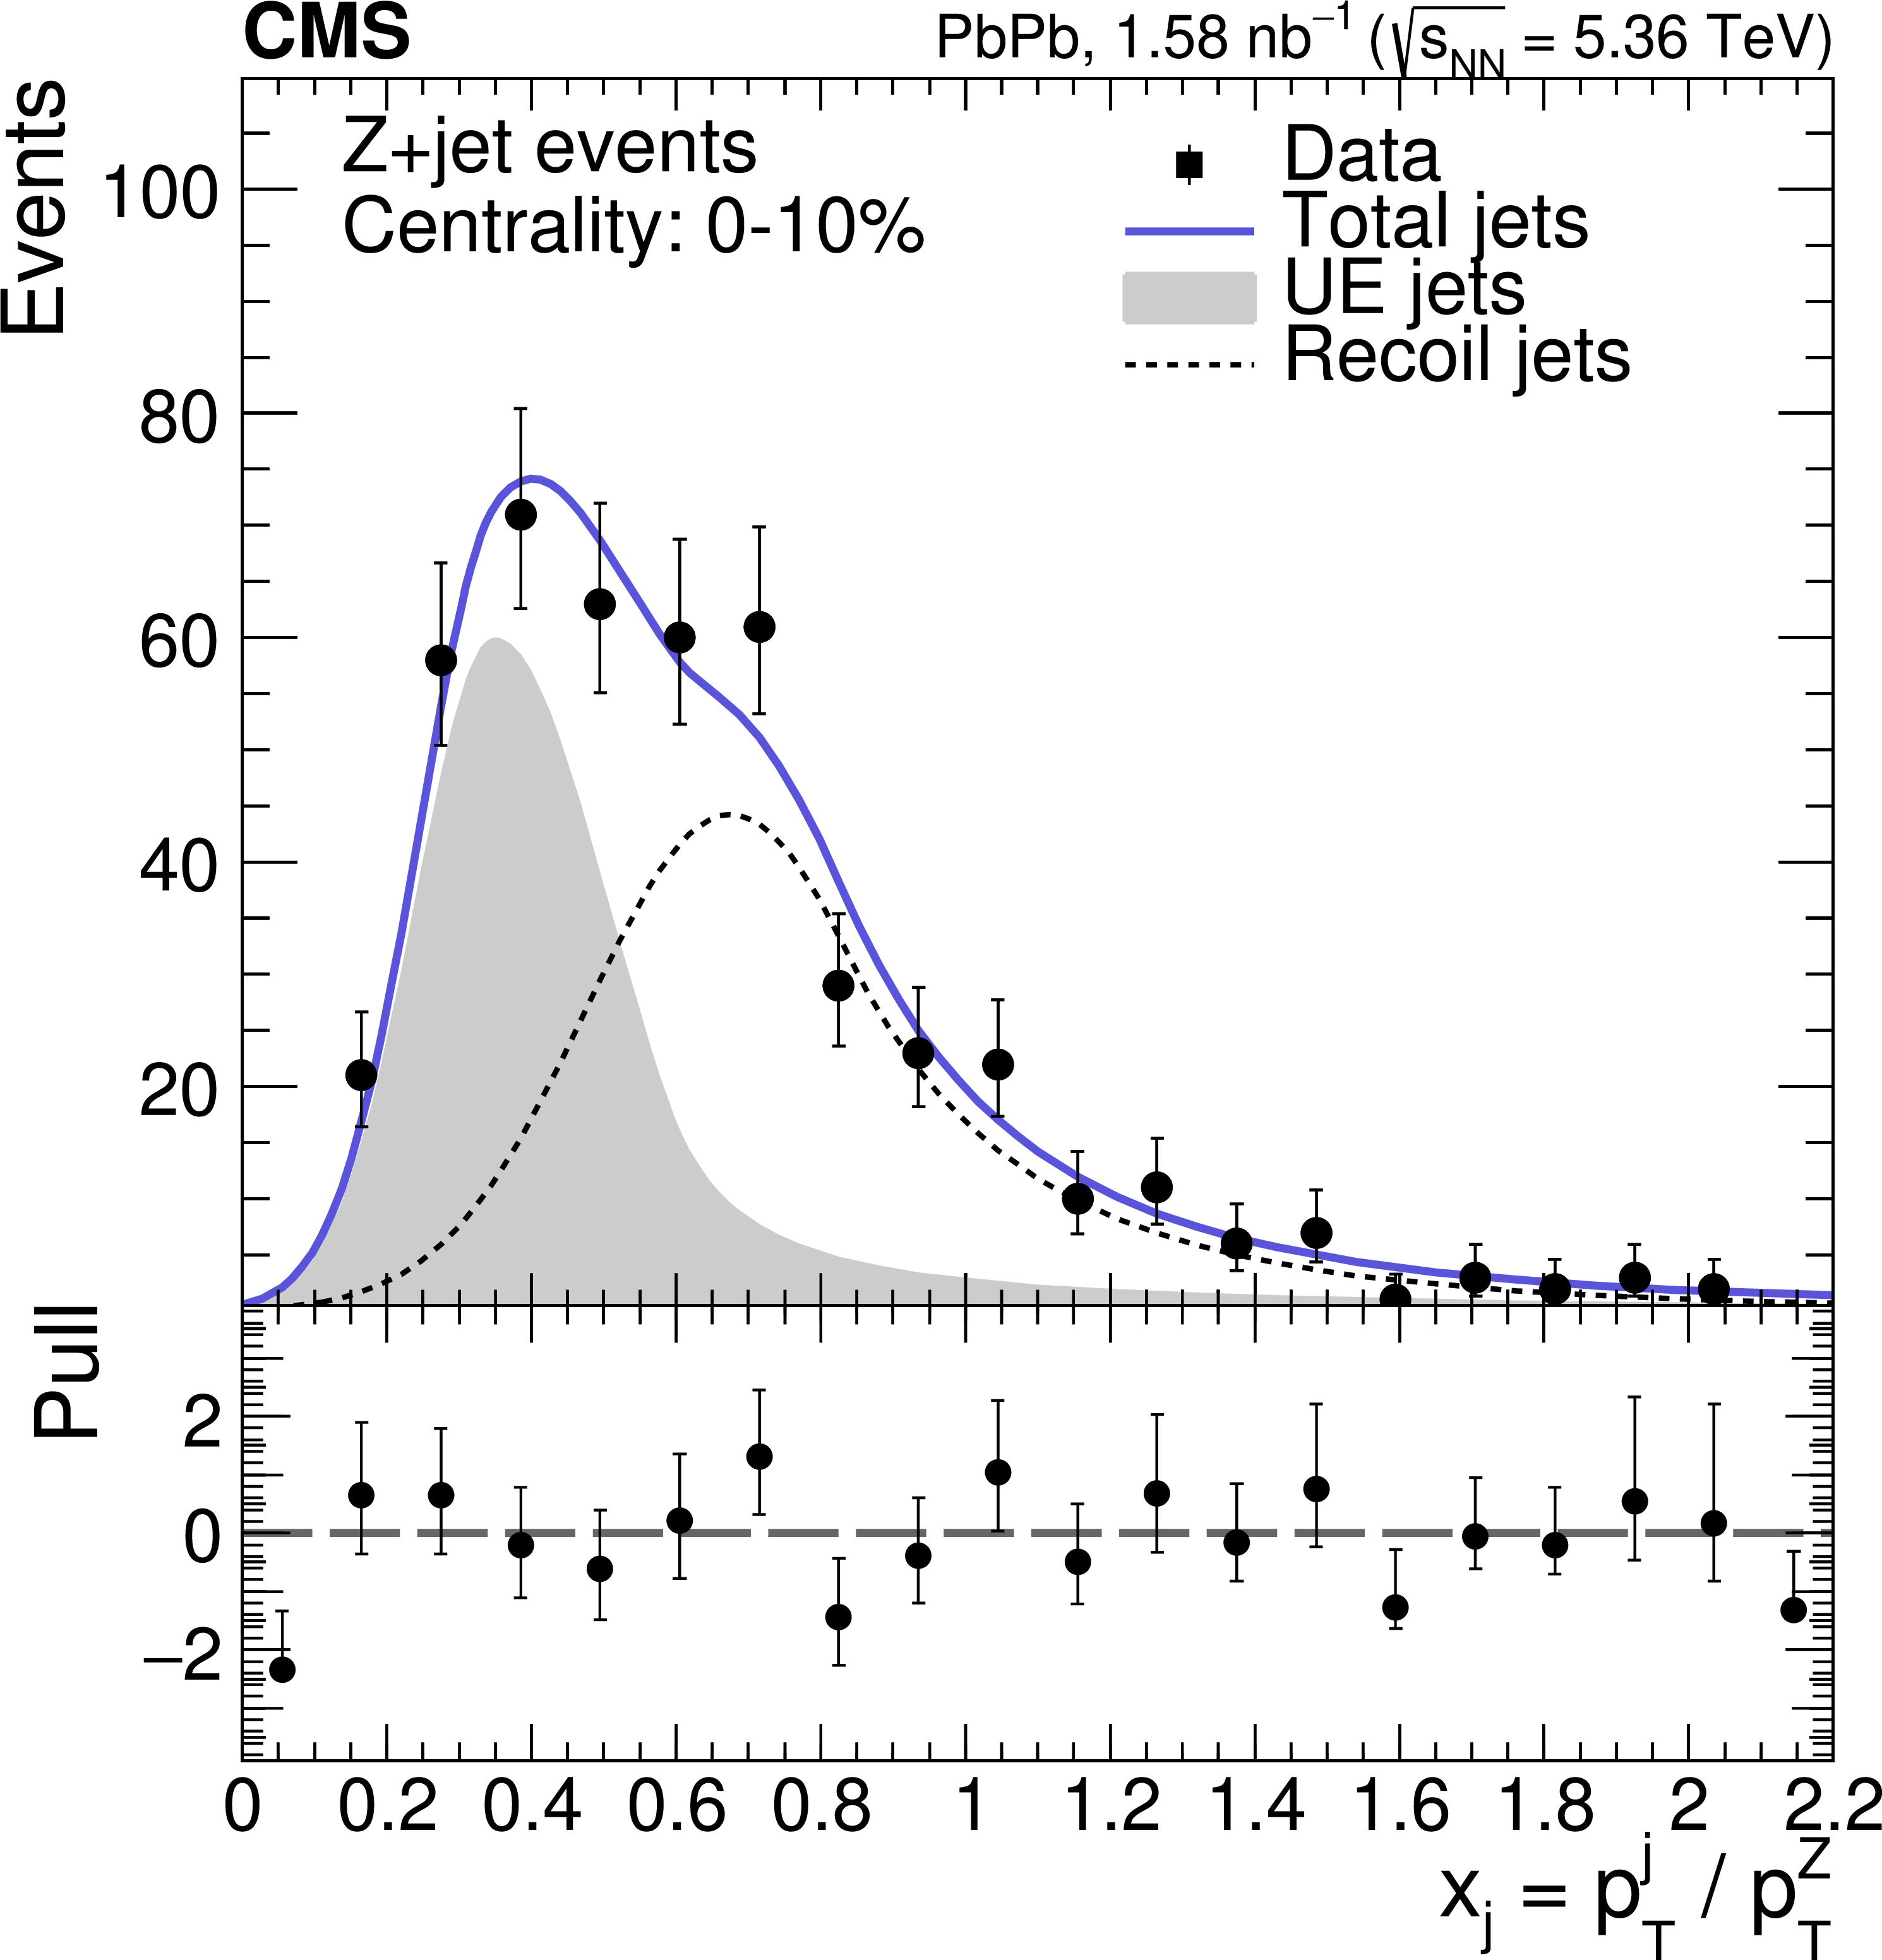
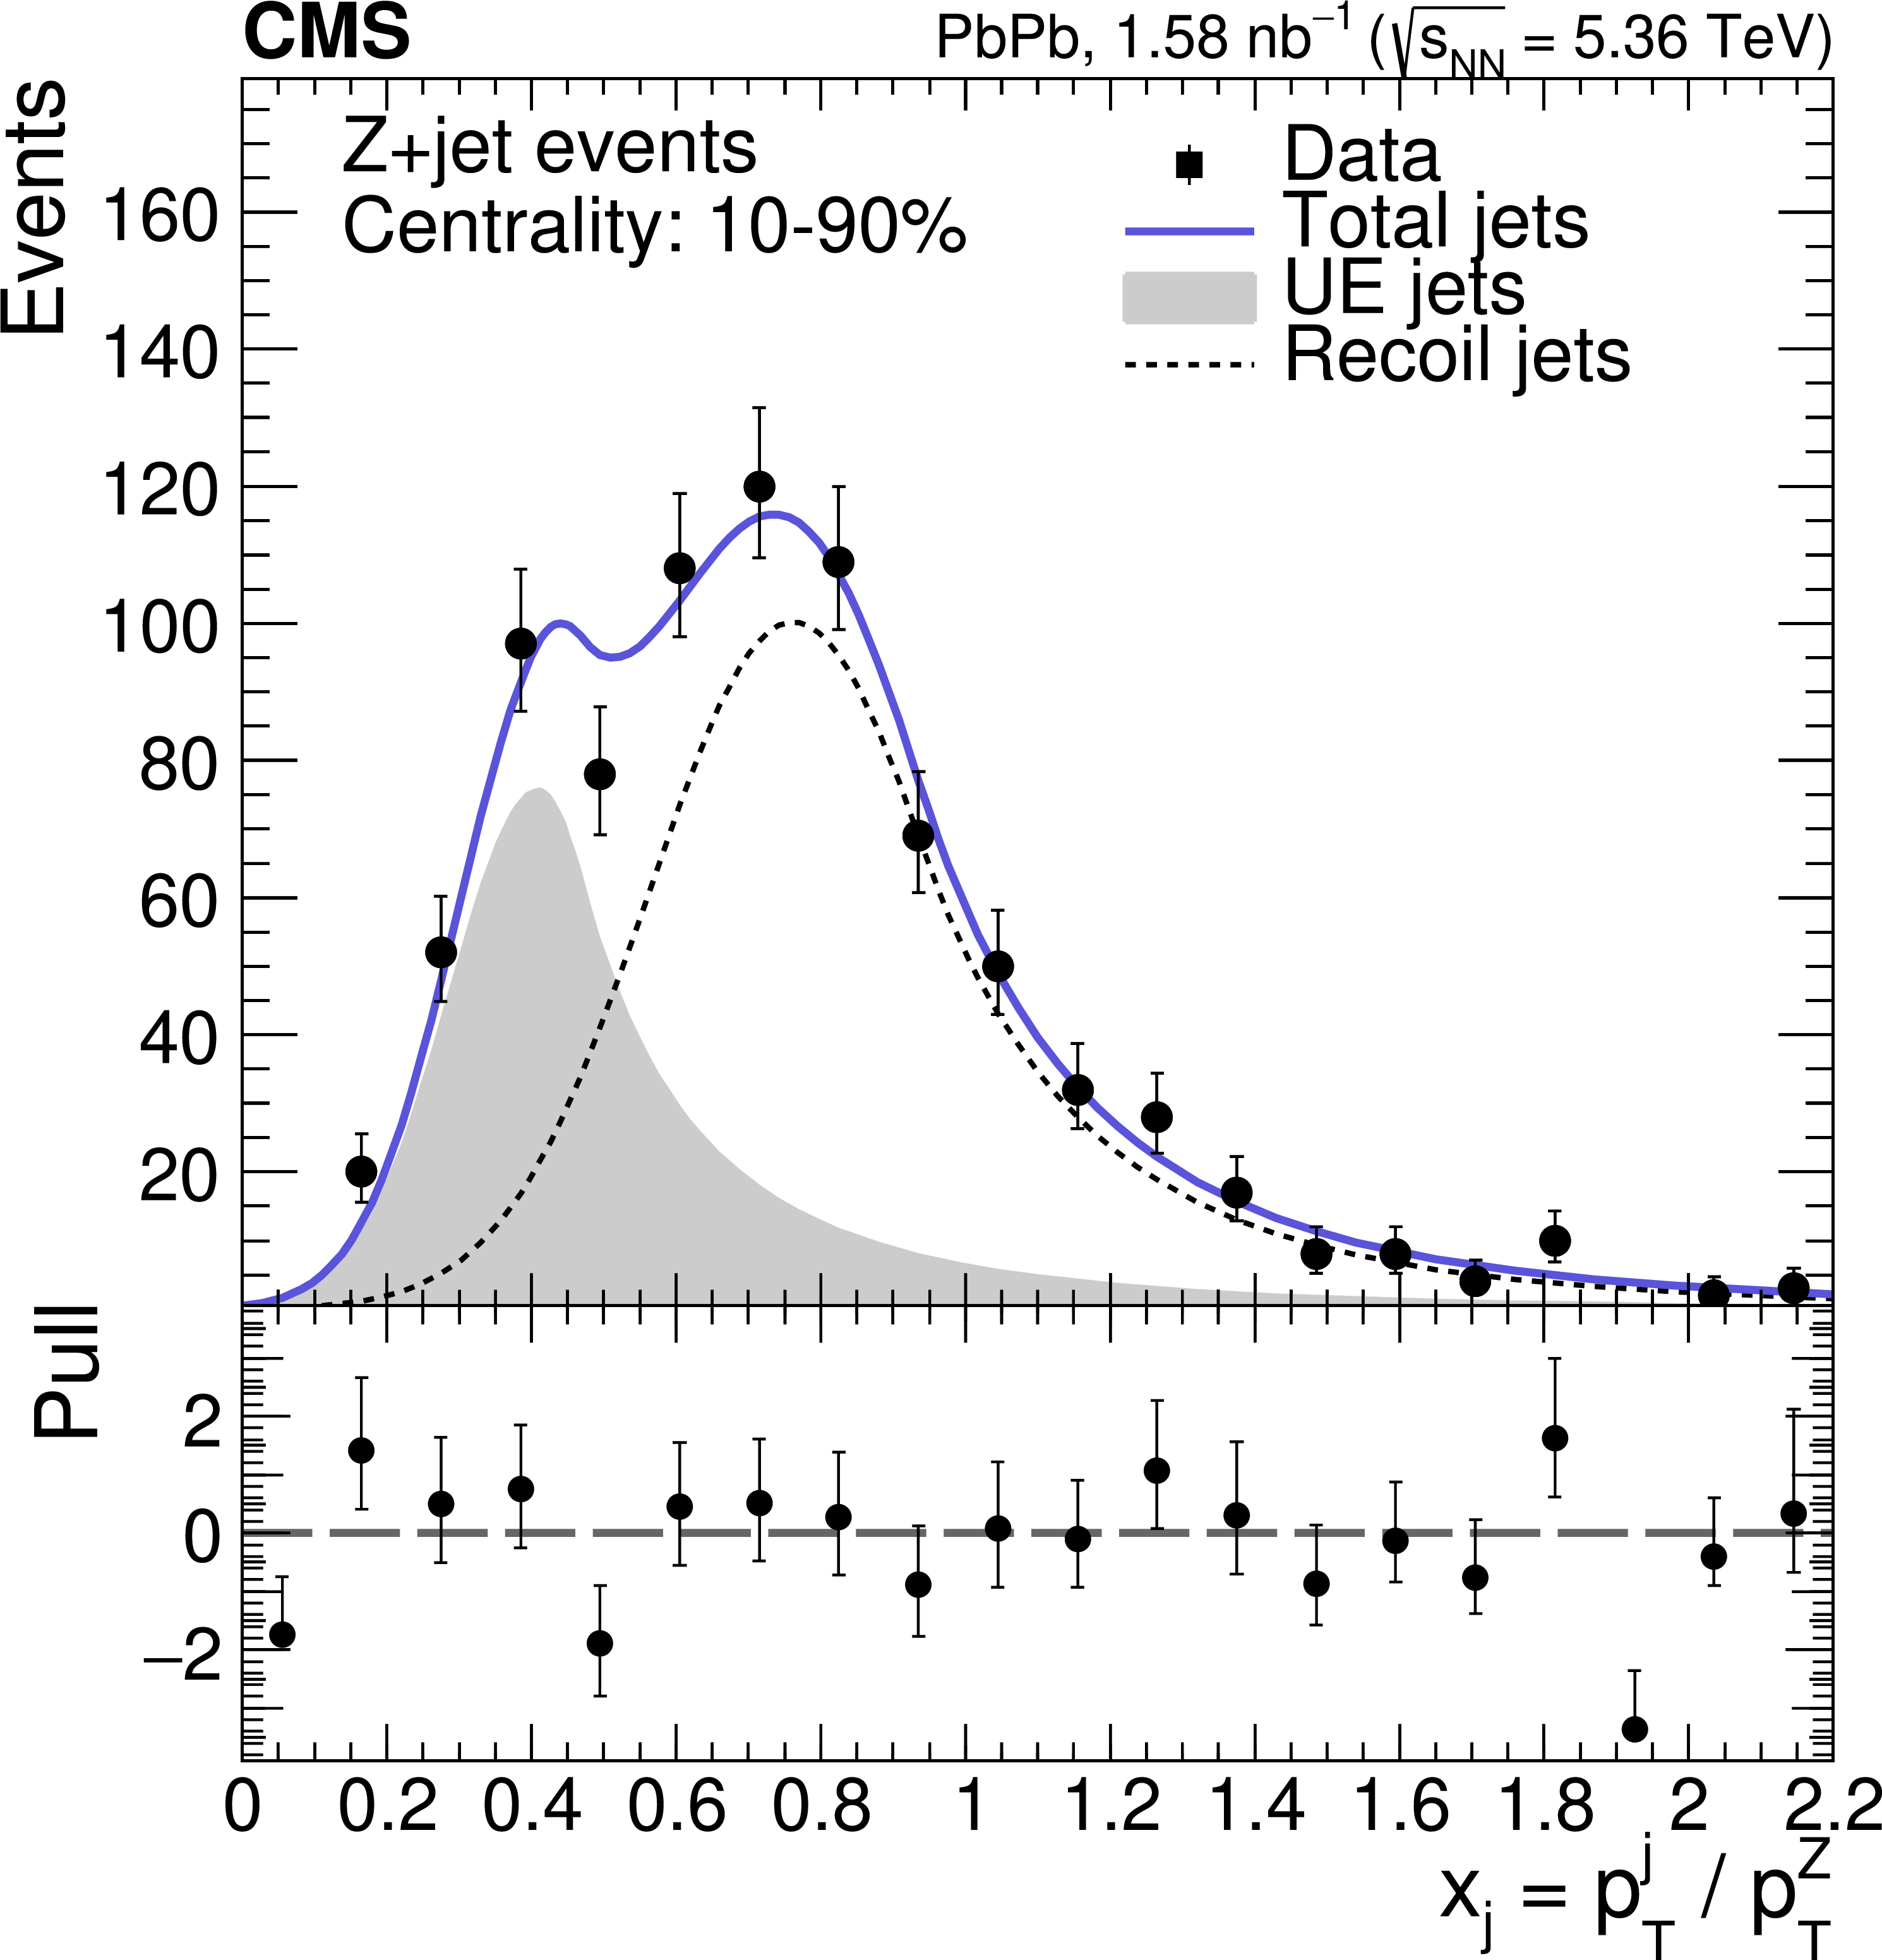
Distribution of the $ x_\mathrm{j}=p_{\mathrm{T}} $ (jet) $ /p_{\mathrm{T}}(\mathrm{Z}) $ ratio in $ \mathrm{Z}+\text{jet} $ events in the 0--10% (left) and 10--90% (right) $ \mathrm{Pb}\mathrm{Pb} $ centralities. The data (solid dots with error bars) are compared with the contributions from UE jets (gray histograms) and true recoil jets (black dashed curves) stacked. The blue curves show the sum of UE and recoil jet contributions. |
png pdf |
Figure 3-a:
Distribution of the $ x_\mathrm{j}=p_{\mathrm{T}} $ (jet) $ /p_{\mathrm{T}}(\mathrm{Z}) $ ratio in $ \mathrm{Z}+\text{jet} $ events in the 0--10% (left) and 10--90% (right) $ \mathrm{Pb}\mathrm{Pb} $ centralities. The data (solid dots with error bars) are compared with the contributions from UE jets (gray histograms) and true recoil jets (black dashed curves) stacked. The blue curves show the sum of UE and recoil jet contributions. |
png pdf |
Figure 3-b:
Distribution of the $ x_\mathrm{j}=p_{\mathrm{T}} $ (jet) $ /p_{\mathrm{T}}(\mathrm{Z}) $ ratio in $ \mathrm{Z}+\text{jet} $ events in the 0--10% (left) and 10--90% (right) $ \mathrm{Pb}\mathrm{Pb} $ centralities. The data (solid dots with error bars) are compared with the contributions from UE jets (gray histograms) and true recoil jets (black dashed curves) stacked. The blue curves show the sum of UE and recoil jet contributions. |
png pdf |
Figure 4:
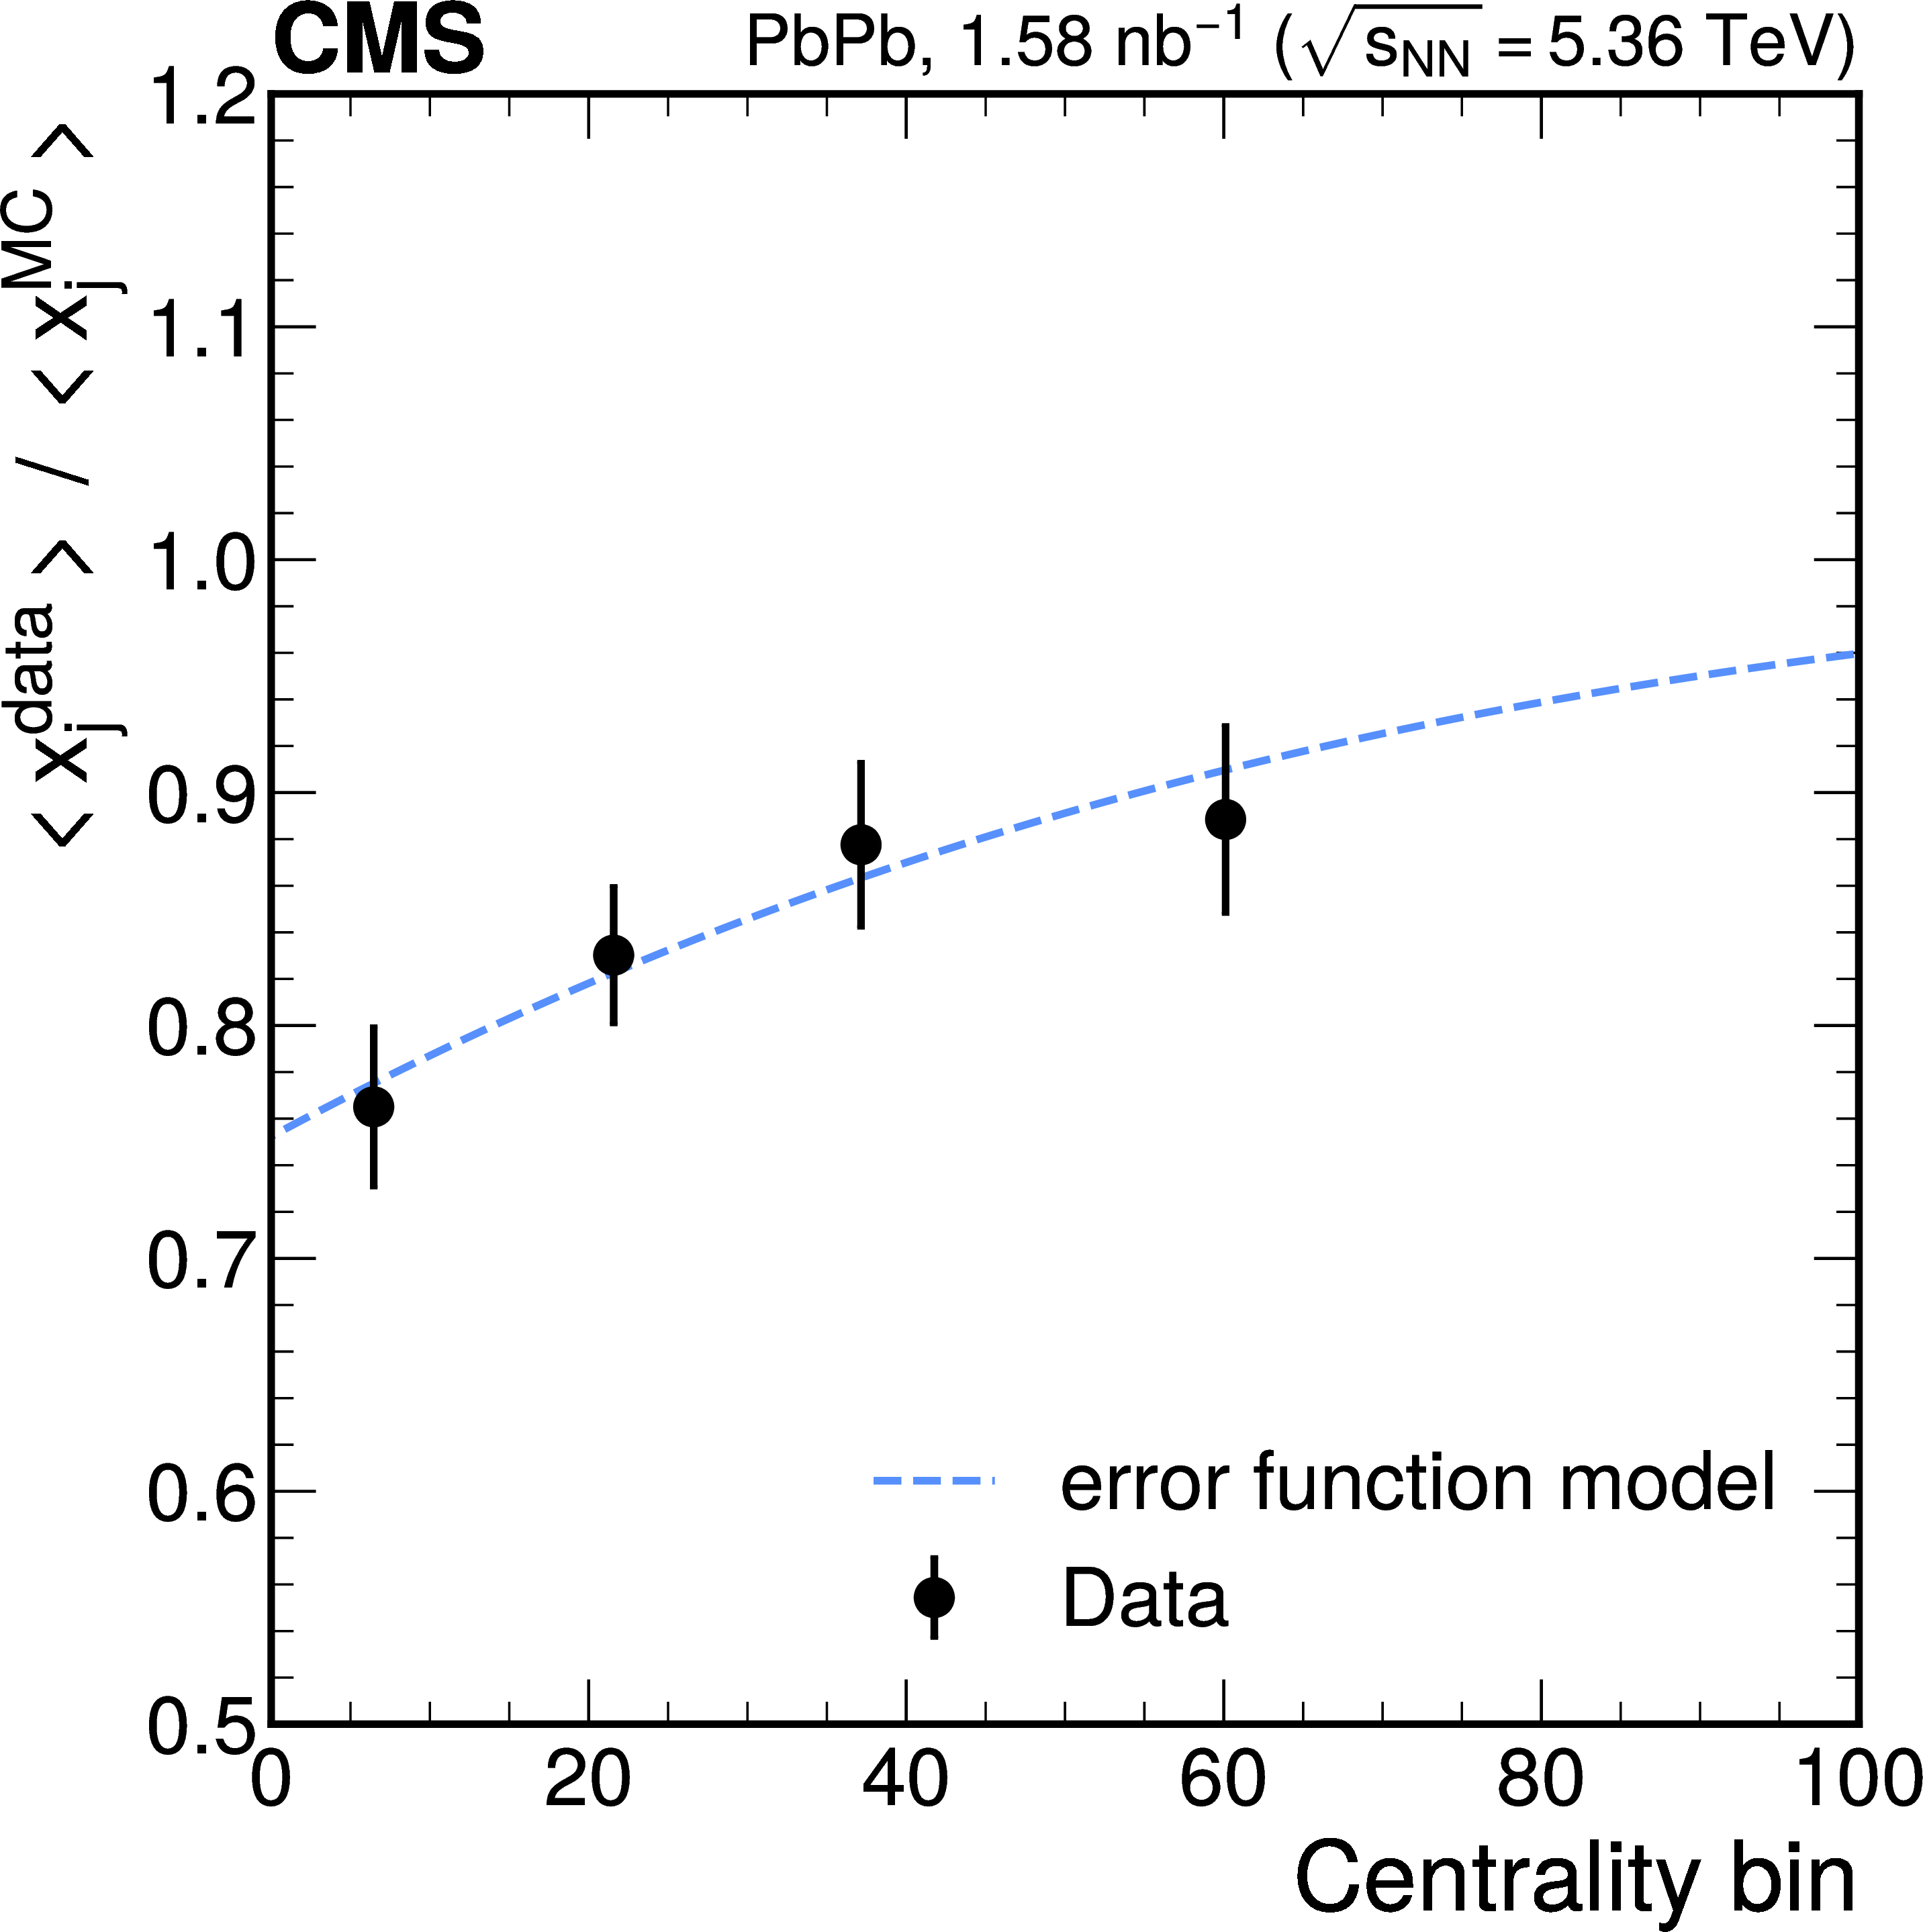
Ratio of the average $ \langle{x_\mathrm{j}}\rangle $ detector-level distributions measured in data over simulation as a function of the collision centrality with a fit to an error function (blue dashed curve) superimposed. |
png pdf |
Figure 5:
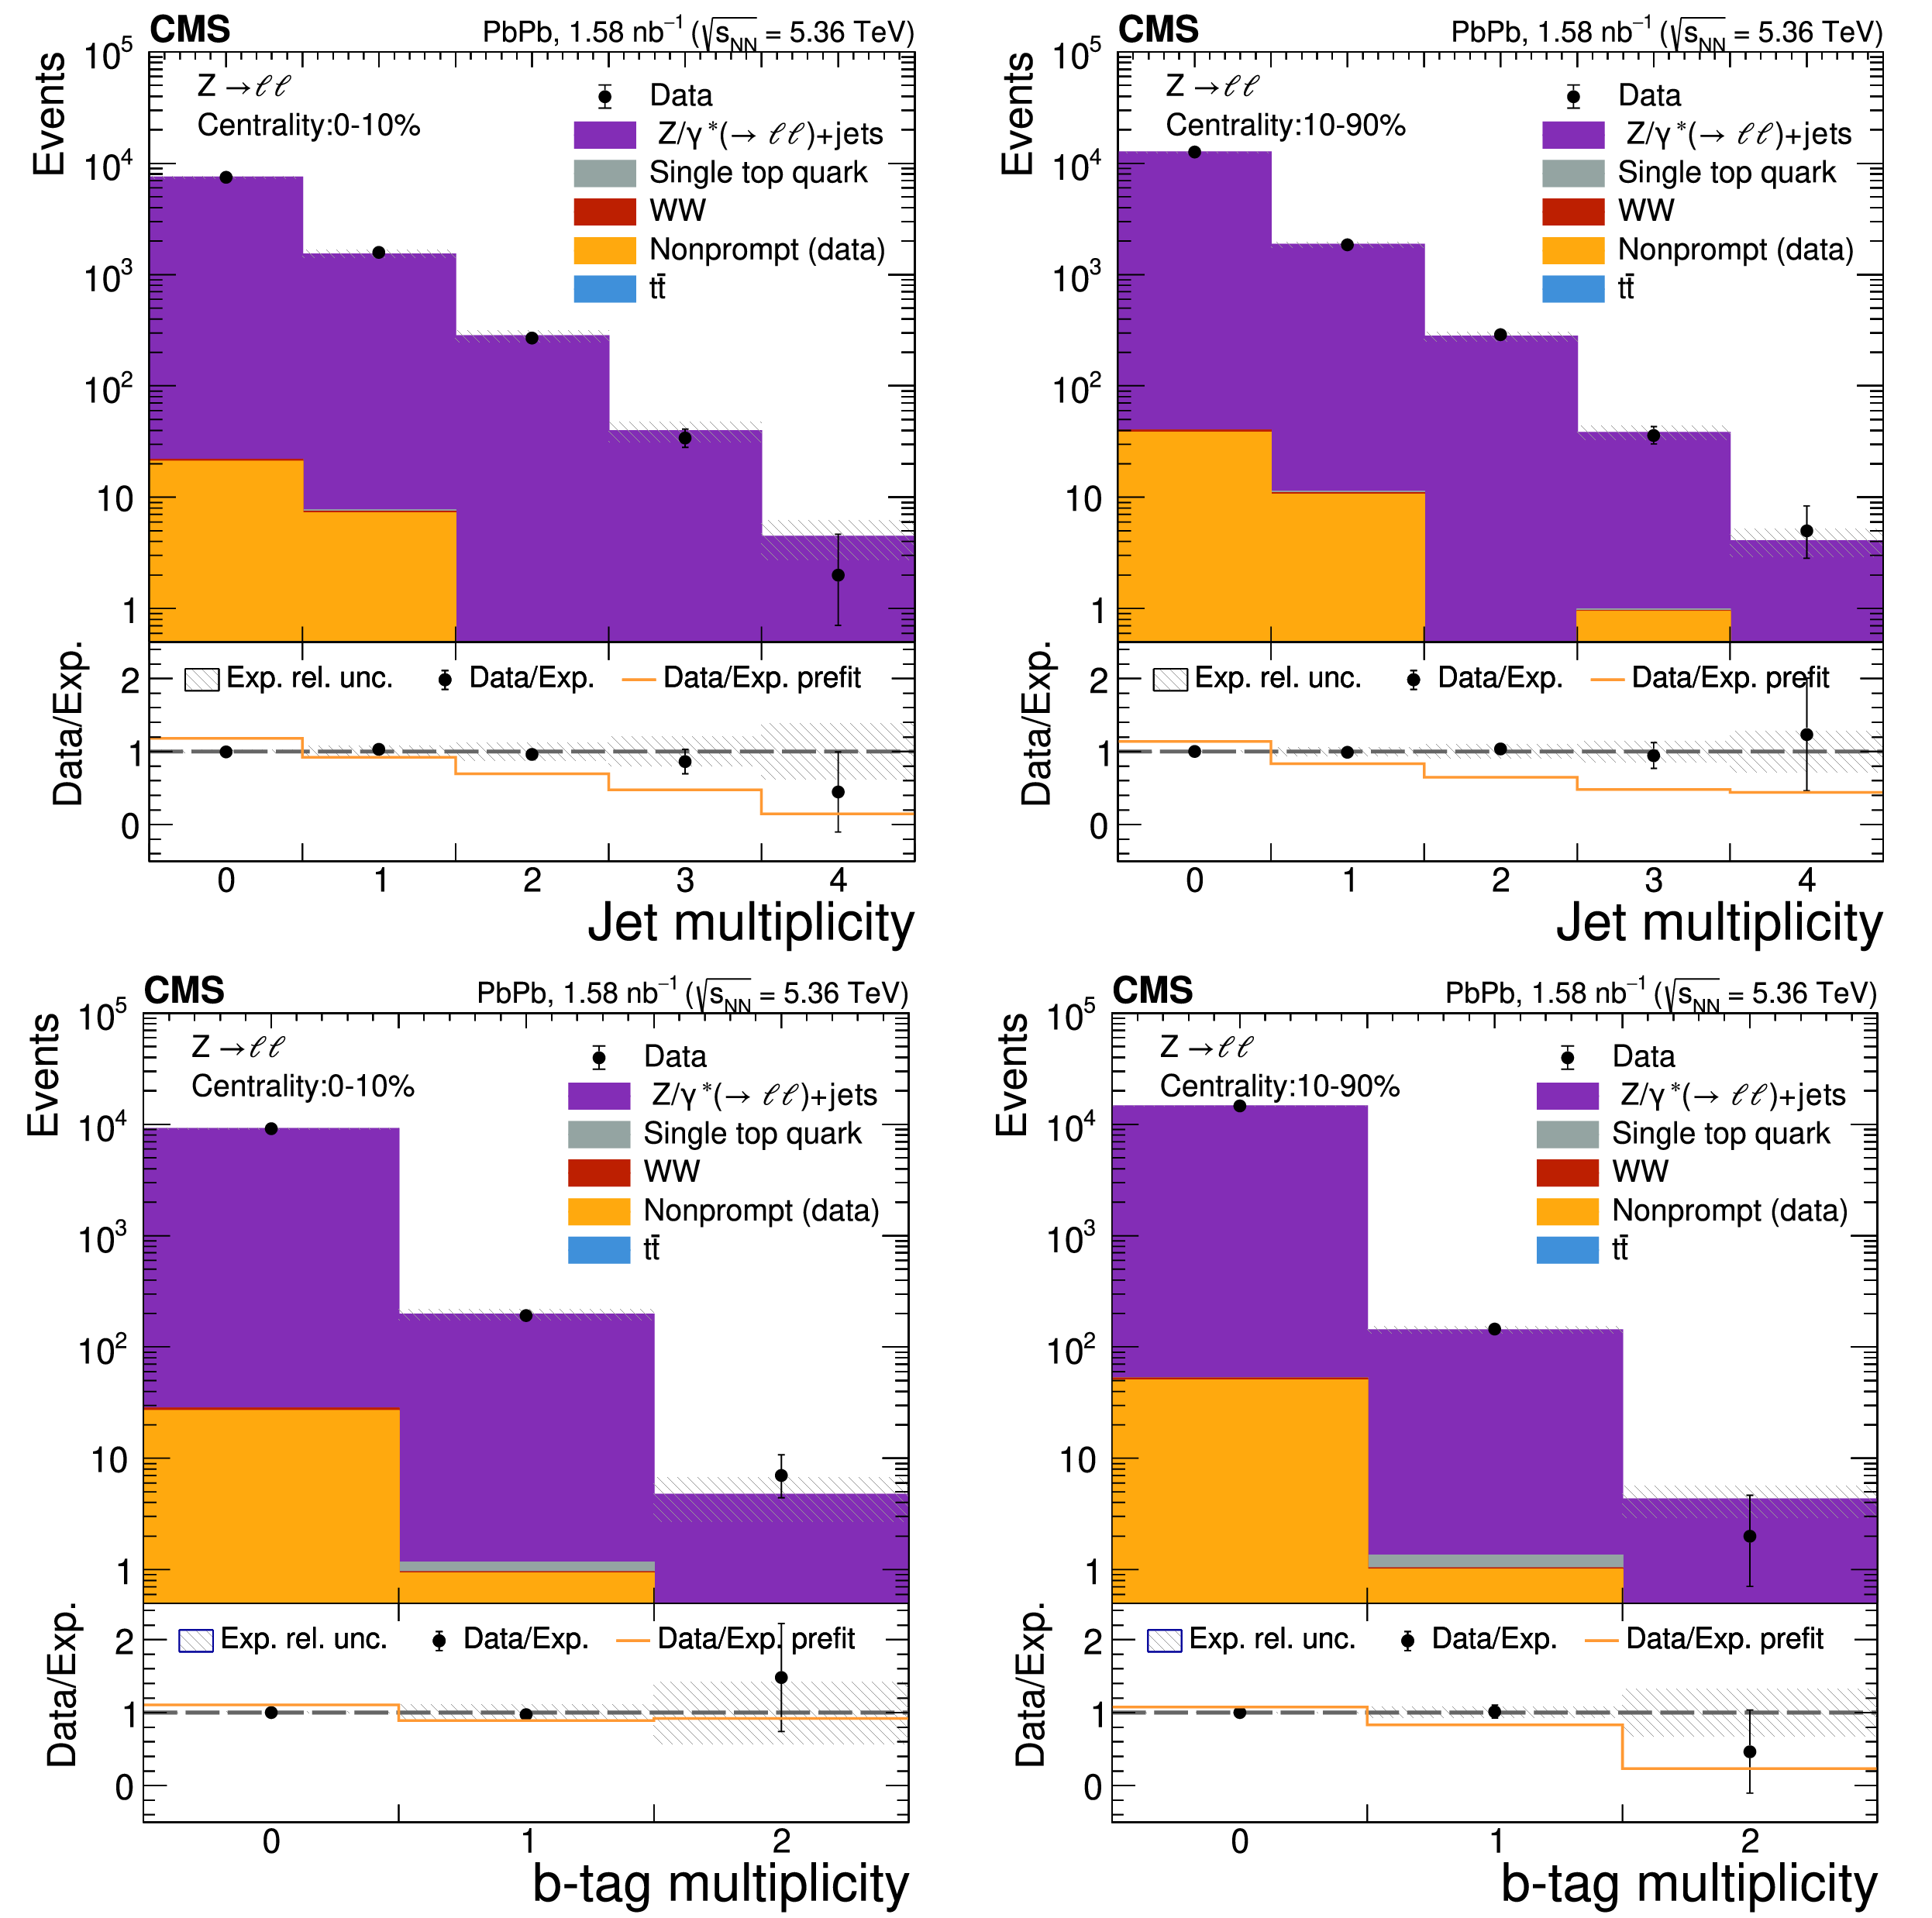
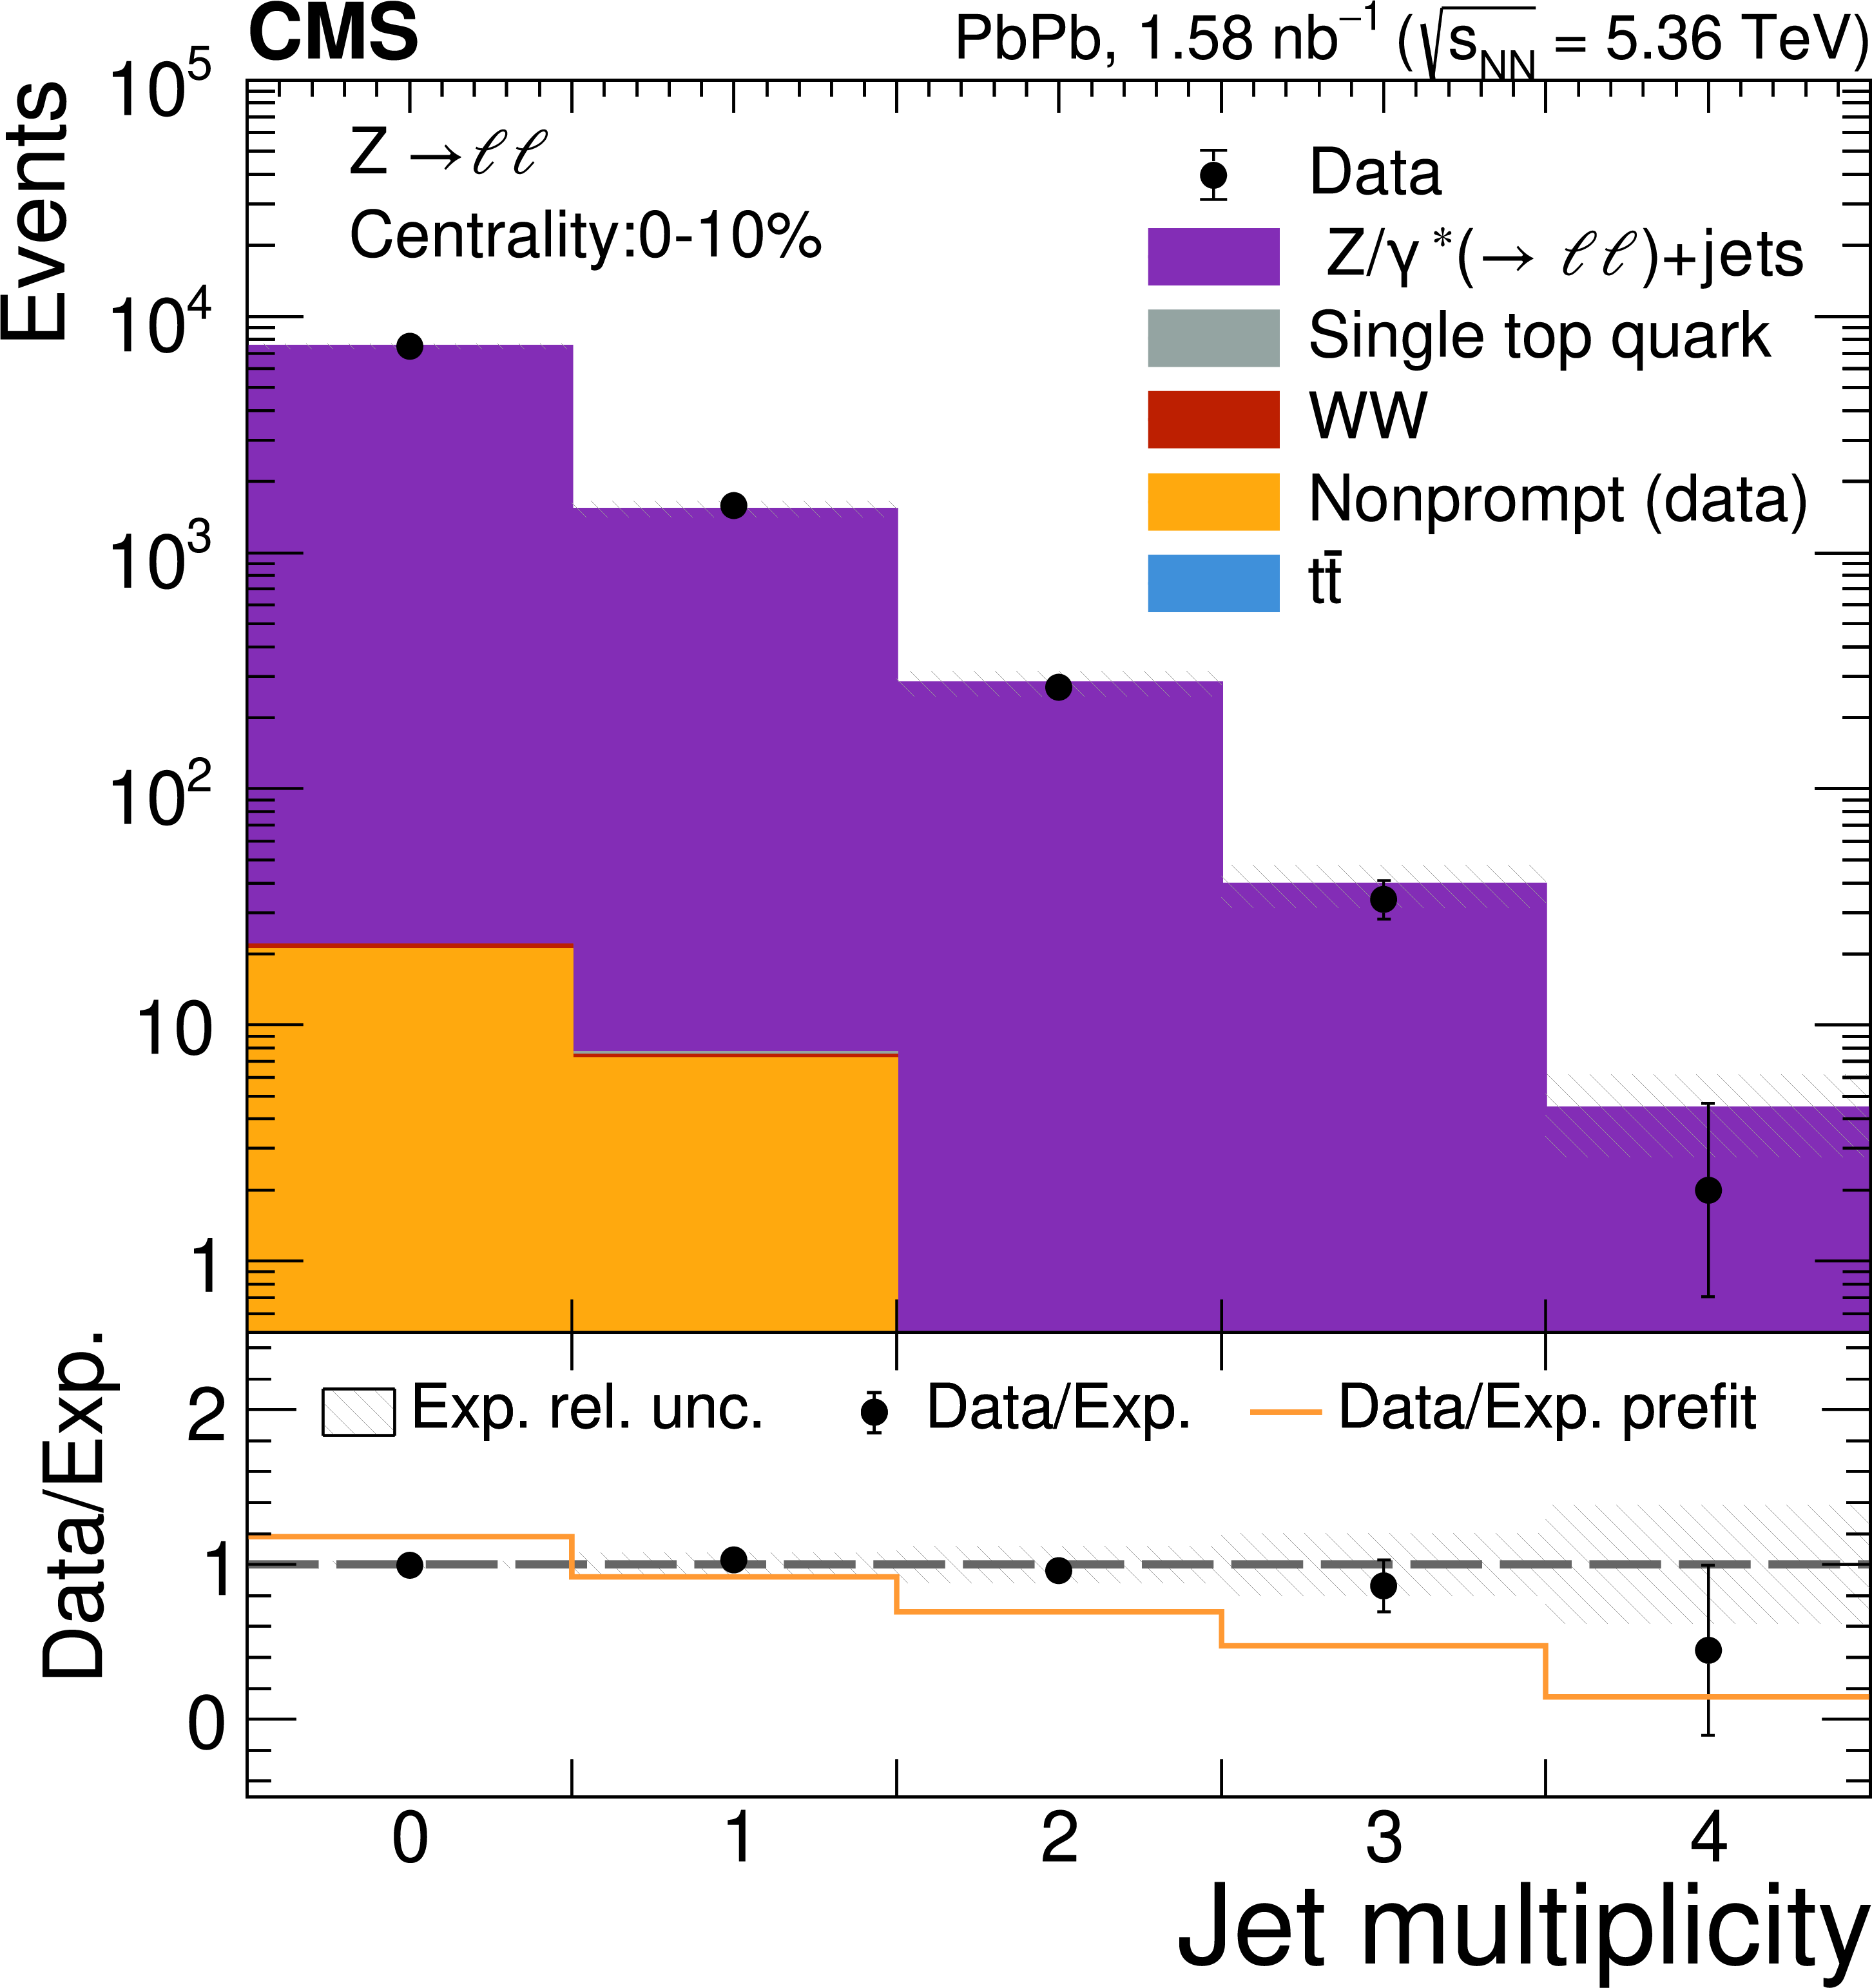
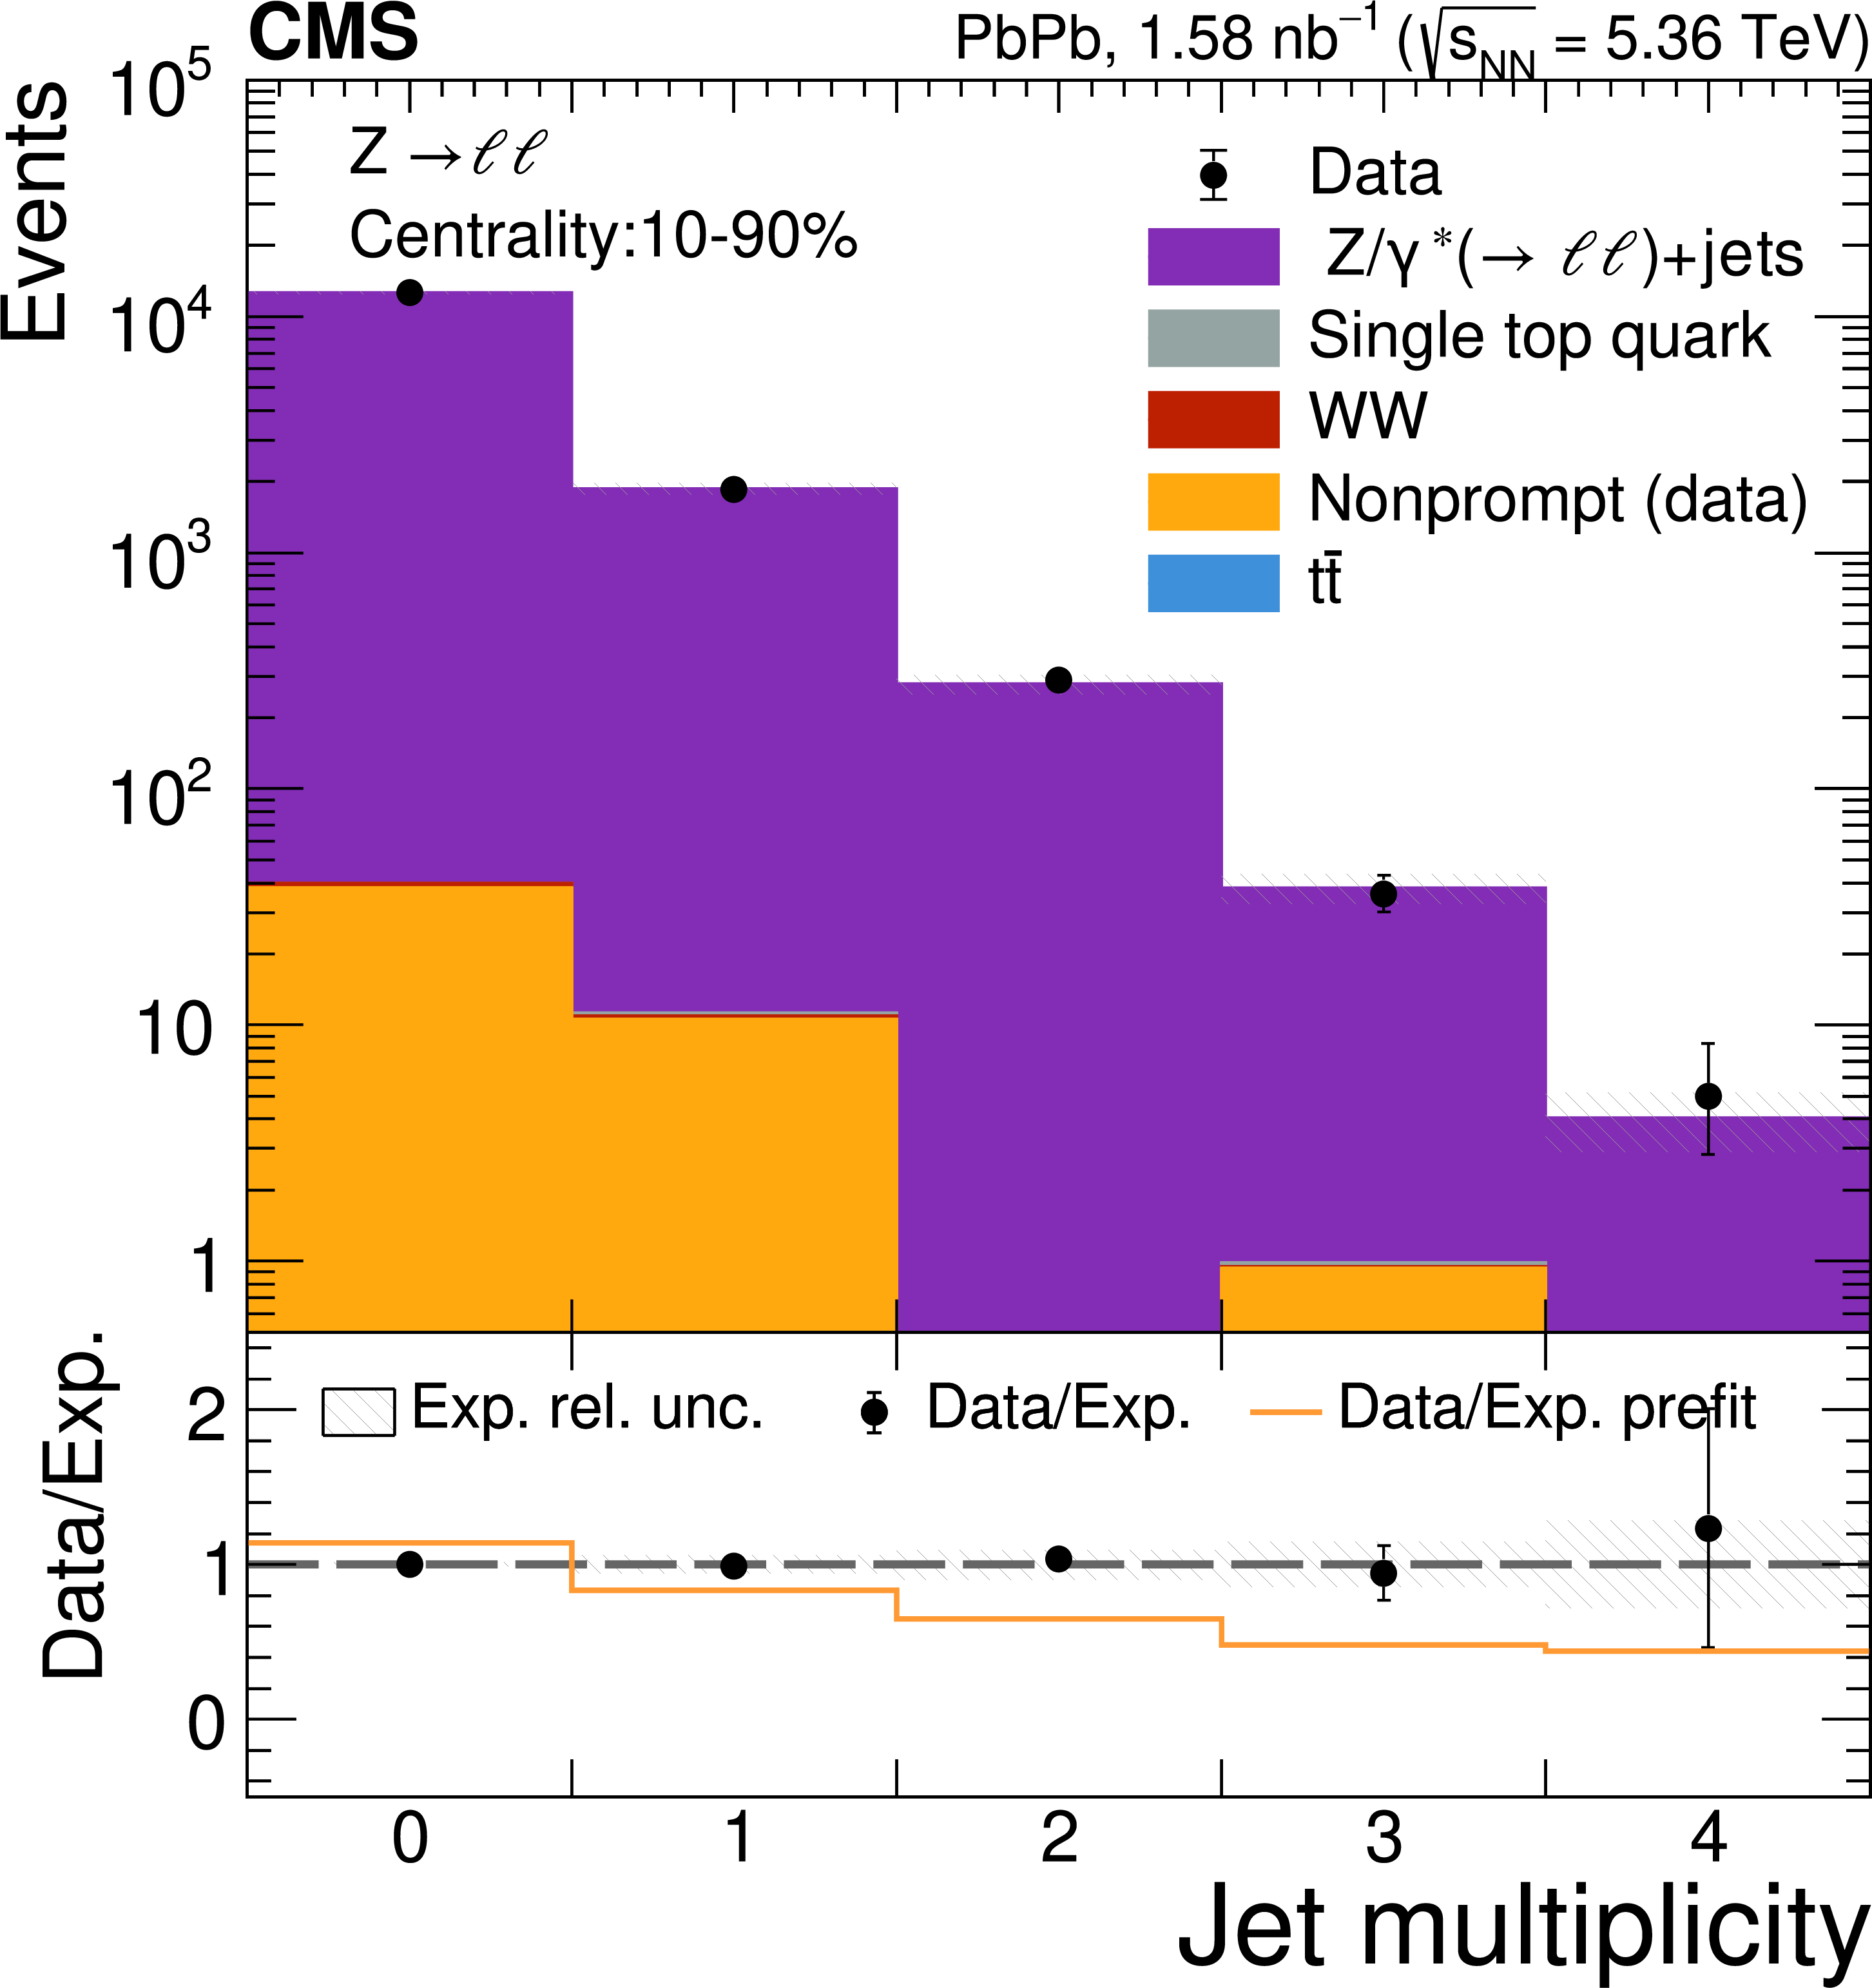
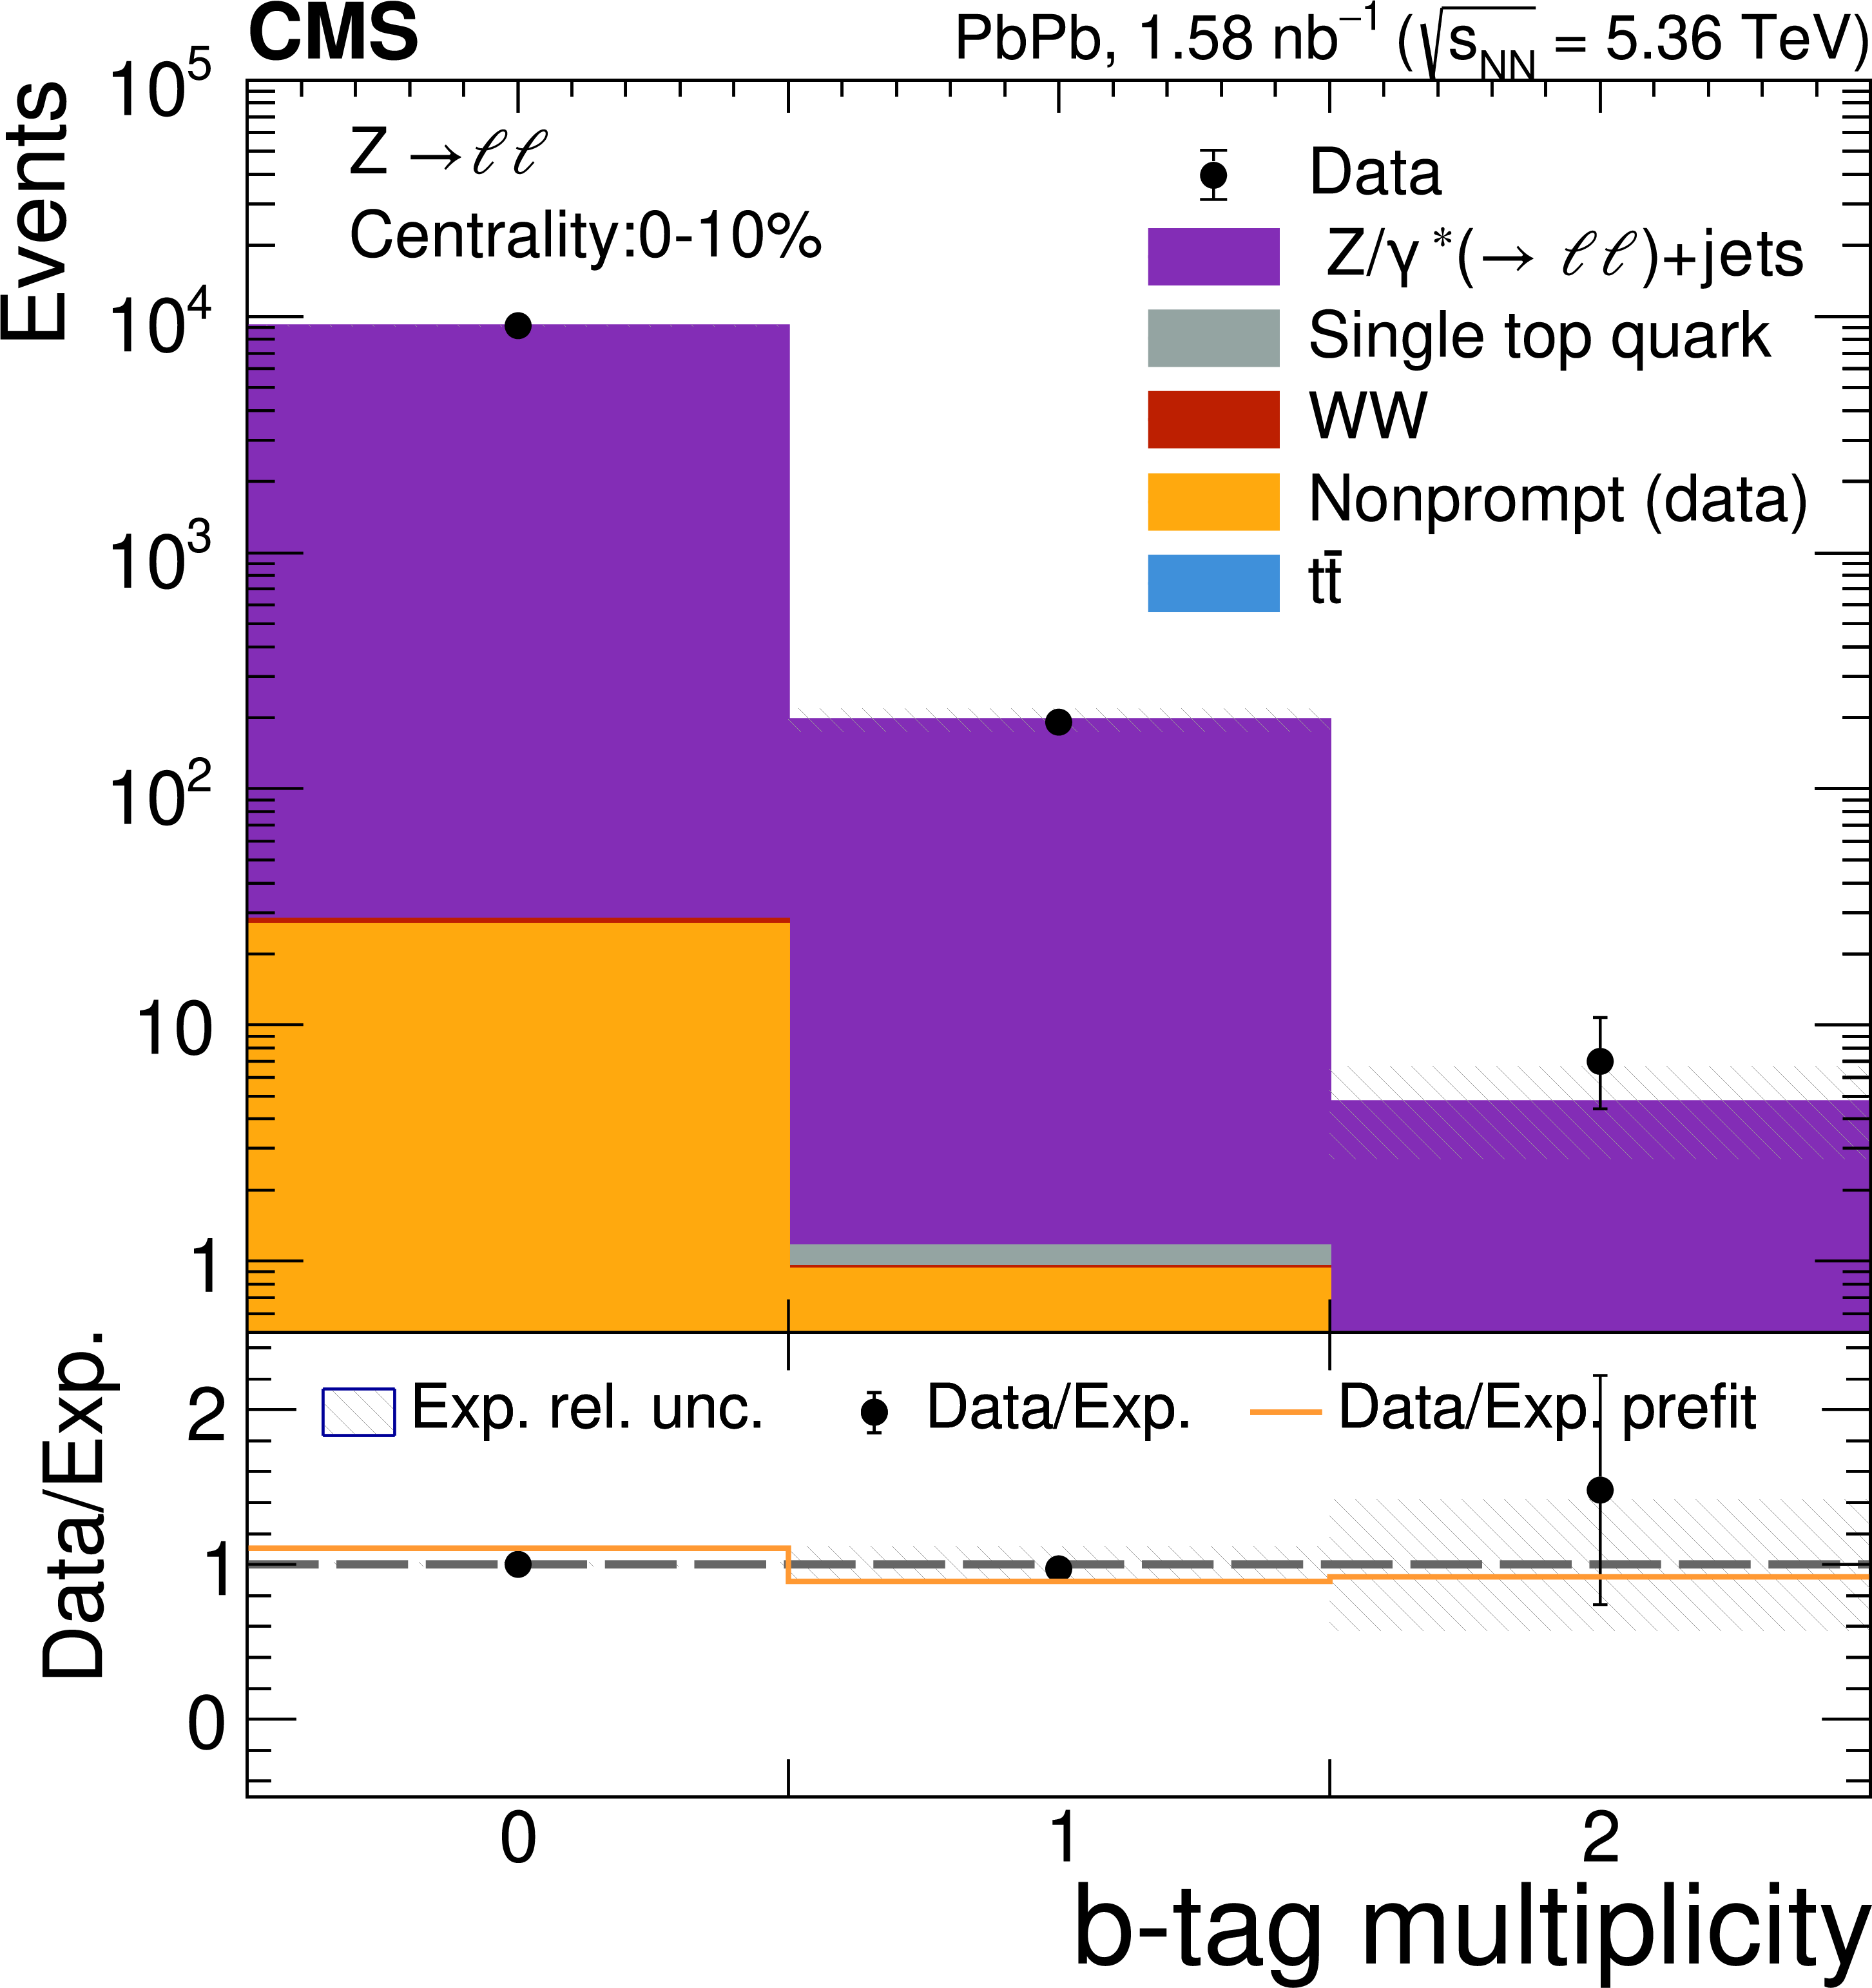
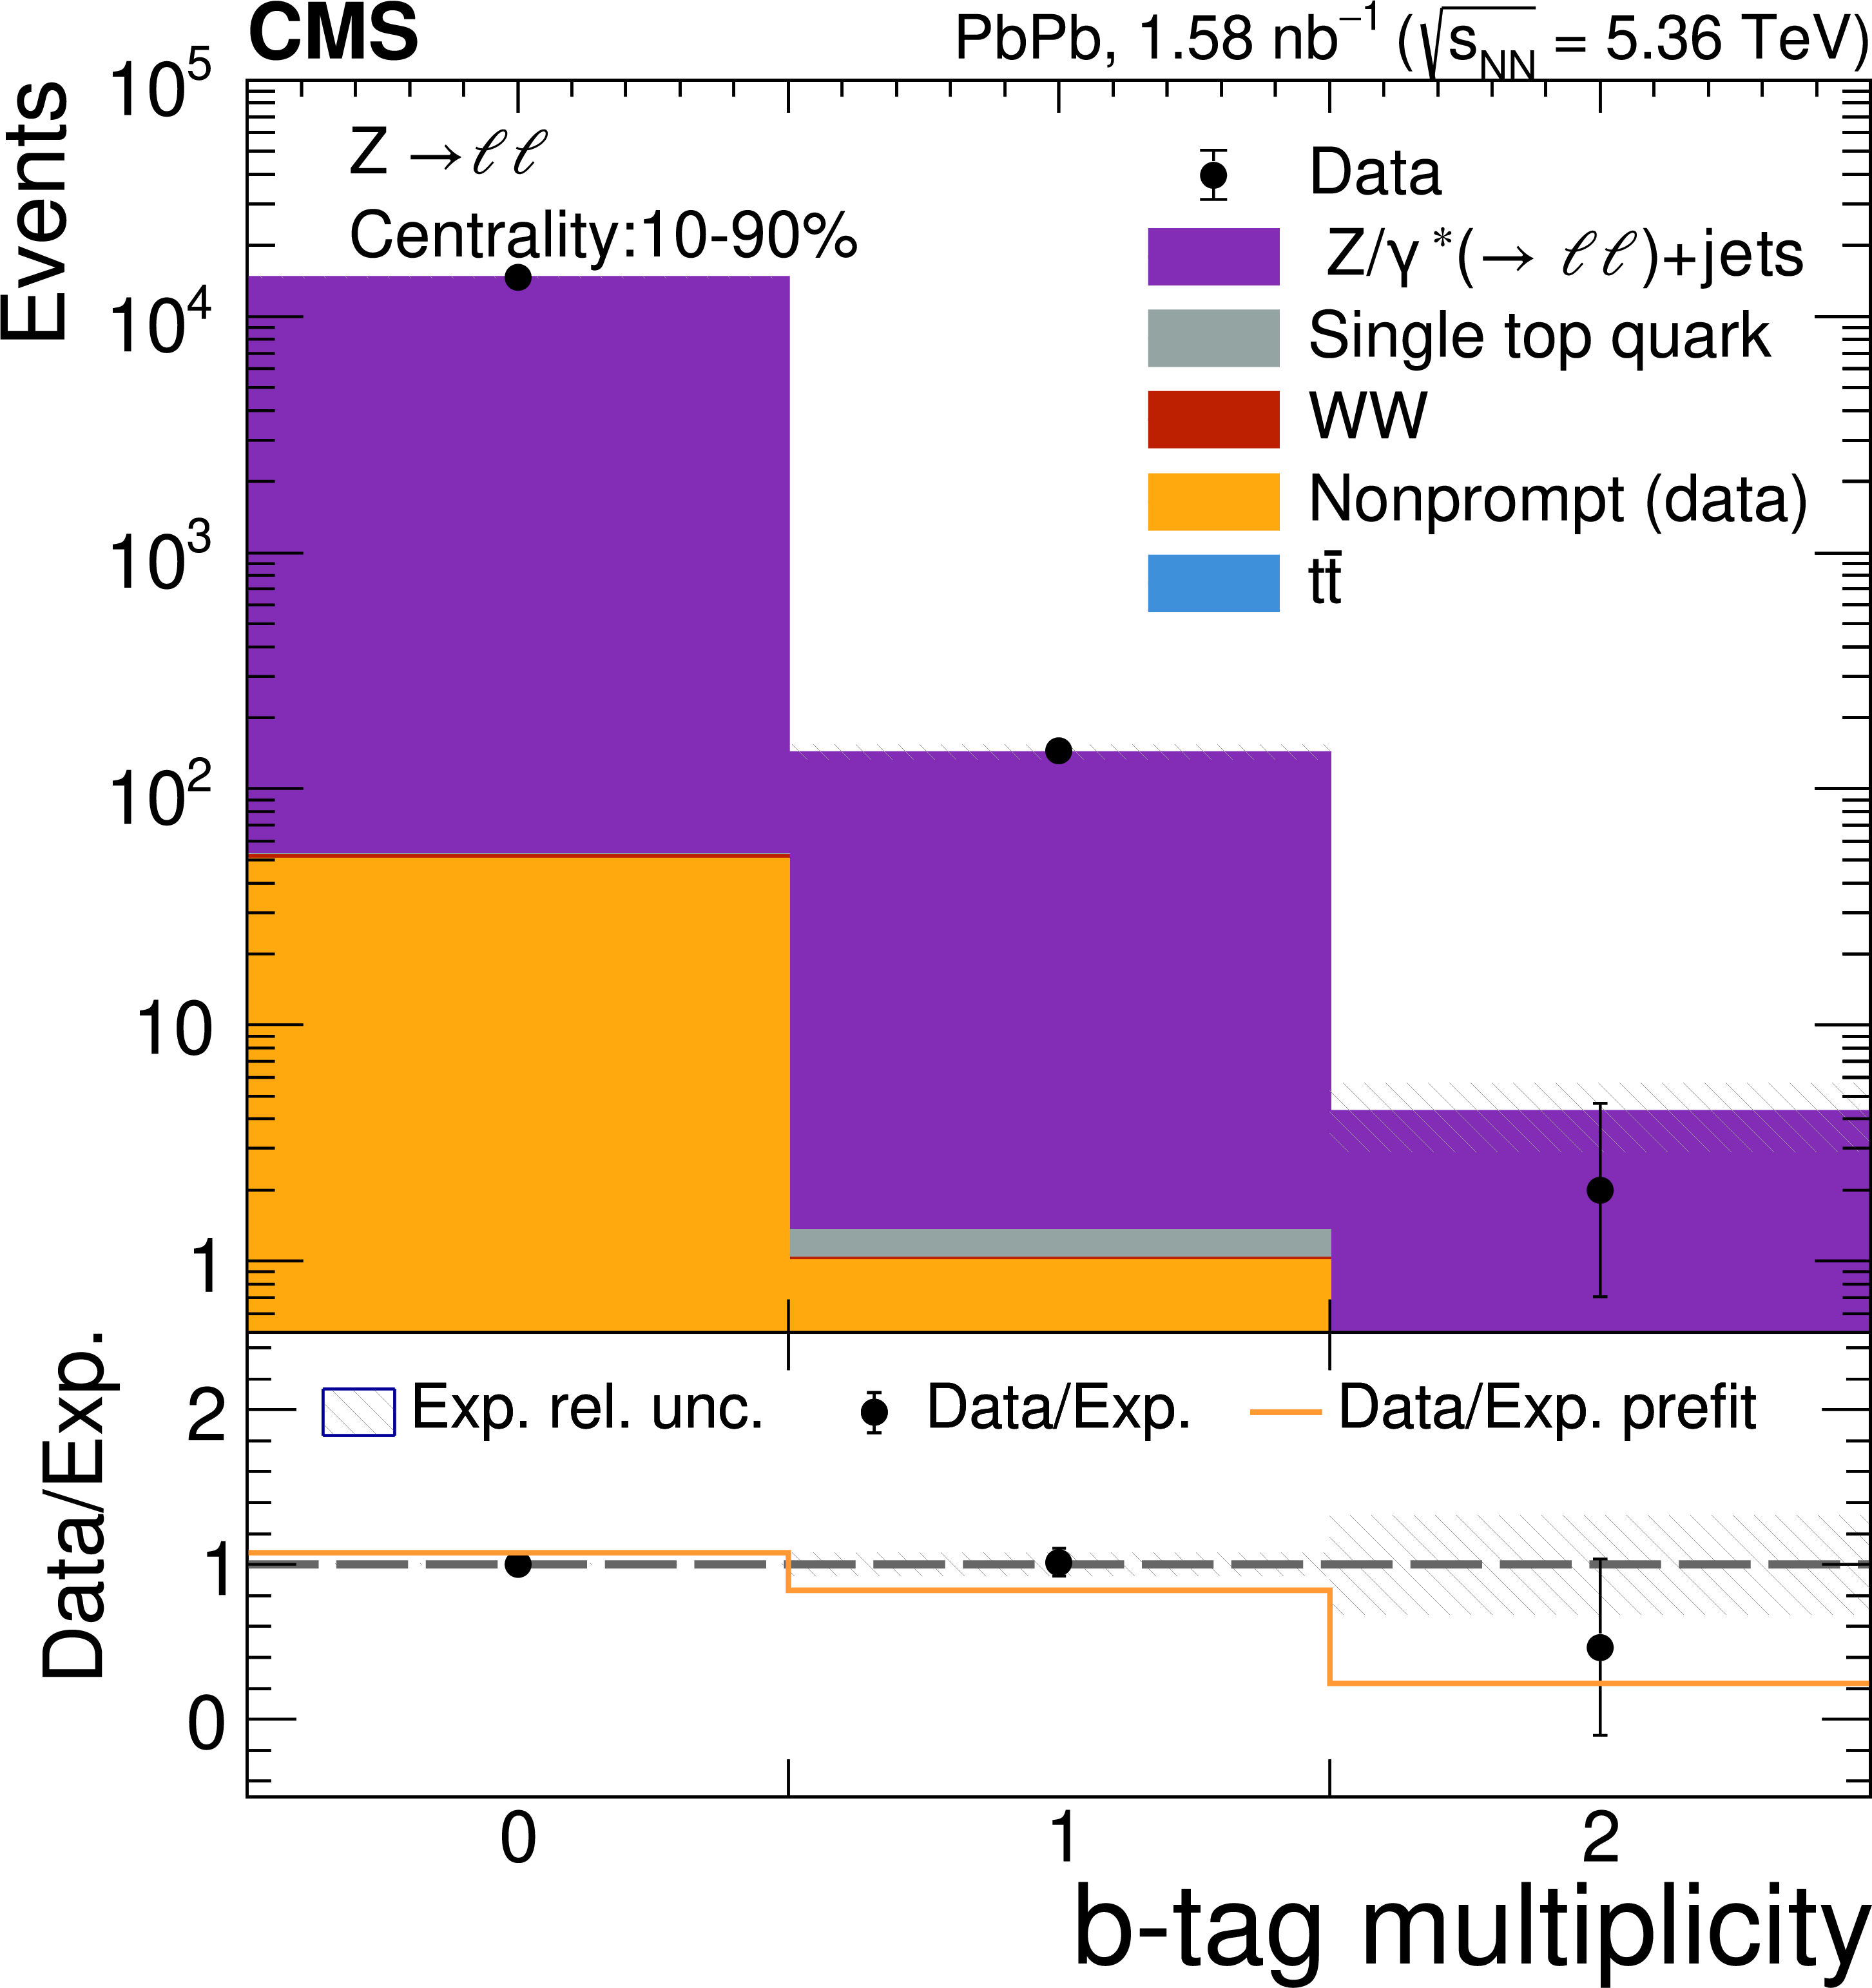
Multiplicities of inclusive (upper) and b-tagged (lower) jets in Z boson candidate events in the 0--10% (left) and 10--90% (right) centrality bins measured in the data (black markers) compared with the post-fit stacked model of the $ \mathrm{t} \overline{\mathrm{t}} $ (blue), nonprompt (light orange), WW (red), single top quark (gray), and $ \mathrm{DY} $ (violet) contributions. The lower panels show the data-to-expectation ratios before (orange lines) and after (black markers) the fit. The hatched band represents the post-fit uncertainty of the model in each bin. The last bins include the overflow entries. |
png pdf |
Figure 5-a:
Multiplicities of inclusive (upper) and b-tagged (lower) jets in Z boson candidate events in the 0--10% (left) and 10--90% (right) centrality bins measured in the data (black markers) compared with the post-fit stacked model of the $ \mathrm{t} \overline{\mathrm{t}} $ (blue), nonprompt (light orange), WW (red), single top quark (gray), and $ \mathrm{DY} $ (violet) contributions. The lower panels show the data-to-expectation ratios before (orange lines) and after (black markers) the fit. The hatched band represents the post-fit uncertainty of the model in each bin. The last bins include the overflow entries. |
png pdf |
Figure 5-b:
Multiplicities of inclusive (upper) and b-tagged (lower) jets in Z boson candidate events in the 0--10% (left) and 10--90% (right) centrality bins measured in the data (black markers) compared with the post-fit stacked model of the $ \mathrm{t} \overline{\mathrm{t}} $ (blue), nonprompt (light orange), WW (red), single top quark (gray), and $ \mathrm{DY} $ (violet) contributions. The lower panels show the data-to-expectation ratios before (orange lines) and after (black markers) the fit. The hatched band represents the post-fit uncertainty of the model in each bin. The last bins include the overflow entries. |
png pdf |
Figure 5-c:
Multiplicities of inclusive (upper) and b-tagged (lower) jets in Z boson candidate events in the 0--10% (left) and 10--90% (right) centrality bins measured in the data (black markers) compared with the post-fit stacked model of the $ \mathrm{t} \overline{\mathrm{t}} $ (blue), nonprompt (light orange), WW (red), single top quark (gray), and $ \mathrm{DY} $ (violet) contributions. The lower panels show the data-to-expectation ratios before (orange lines) and after (black markers) the fit. The hatched band represents the post-fit uncertainty of the model in each bin. The last bins include the overflow entries. |
png pdf |
Figure 5-d:
Multiplicities of inclusive (upper) and b-tagged (lower) jets in Z boson candidate events in the 0--10% (left) and 10--90% (right) centrality bins measured in the data (black markers) compared with the post-fit stacked model of the $ \mathrm{t} \overline{\mathrm{t}} $ (blue), nonprompt (light orange), WW (red), single top quark (gray), and $ \mathrm{DY} $ (violet) contributions. The lower panels show the data-to-expectation ratios before (orange lines) and after (black markers) the fit. The hatched band represents the post-fit uncertainty of the model in each bin. The last bins include the overflow entries. |
png pdf |
Figure 6:
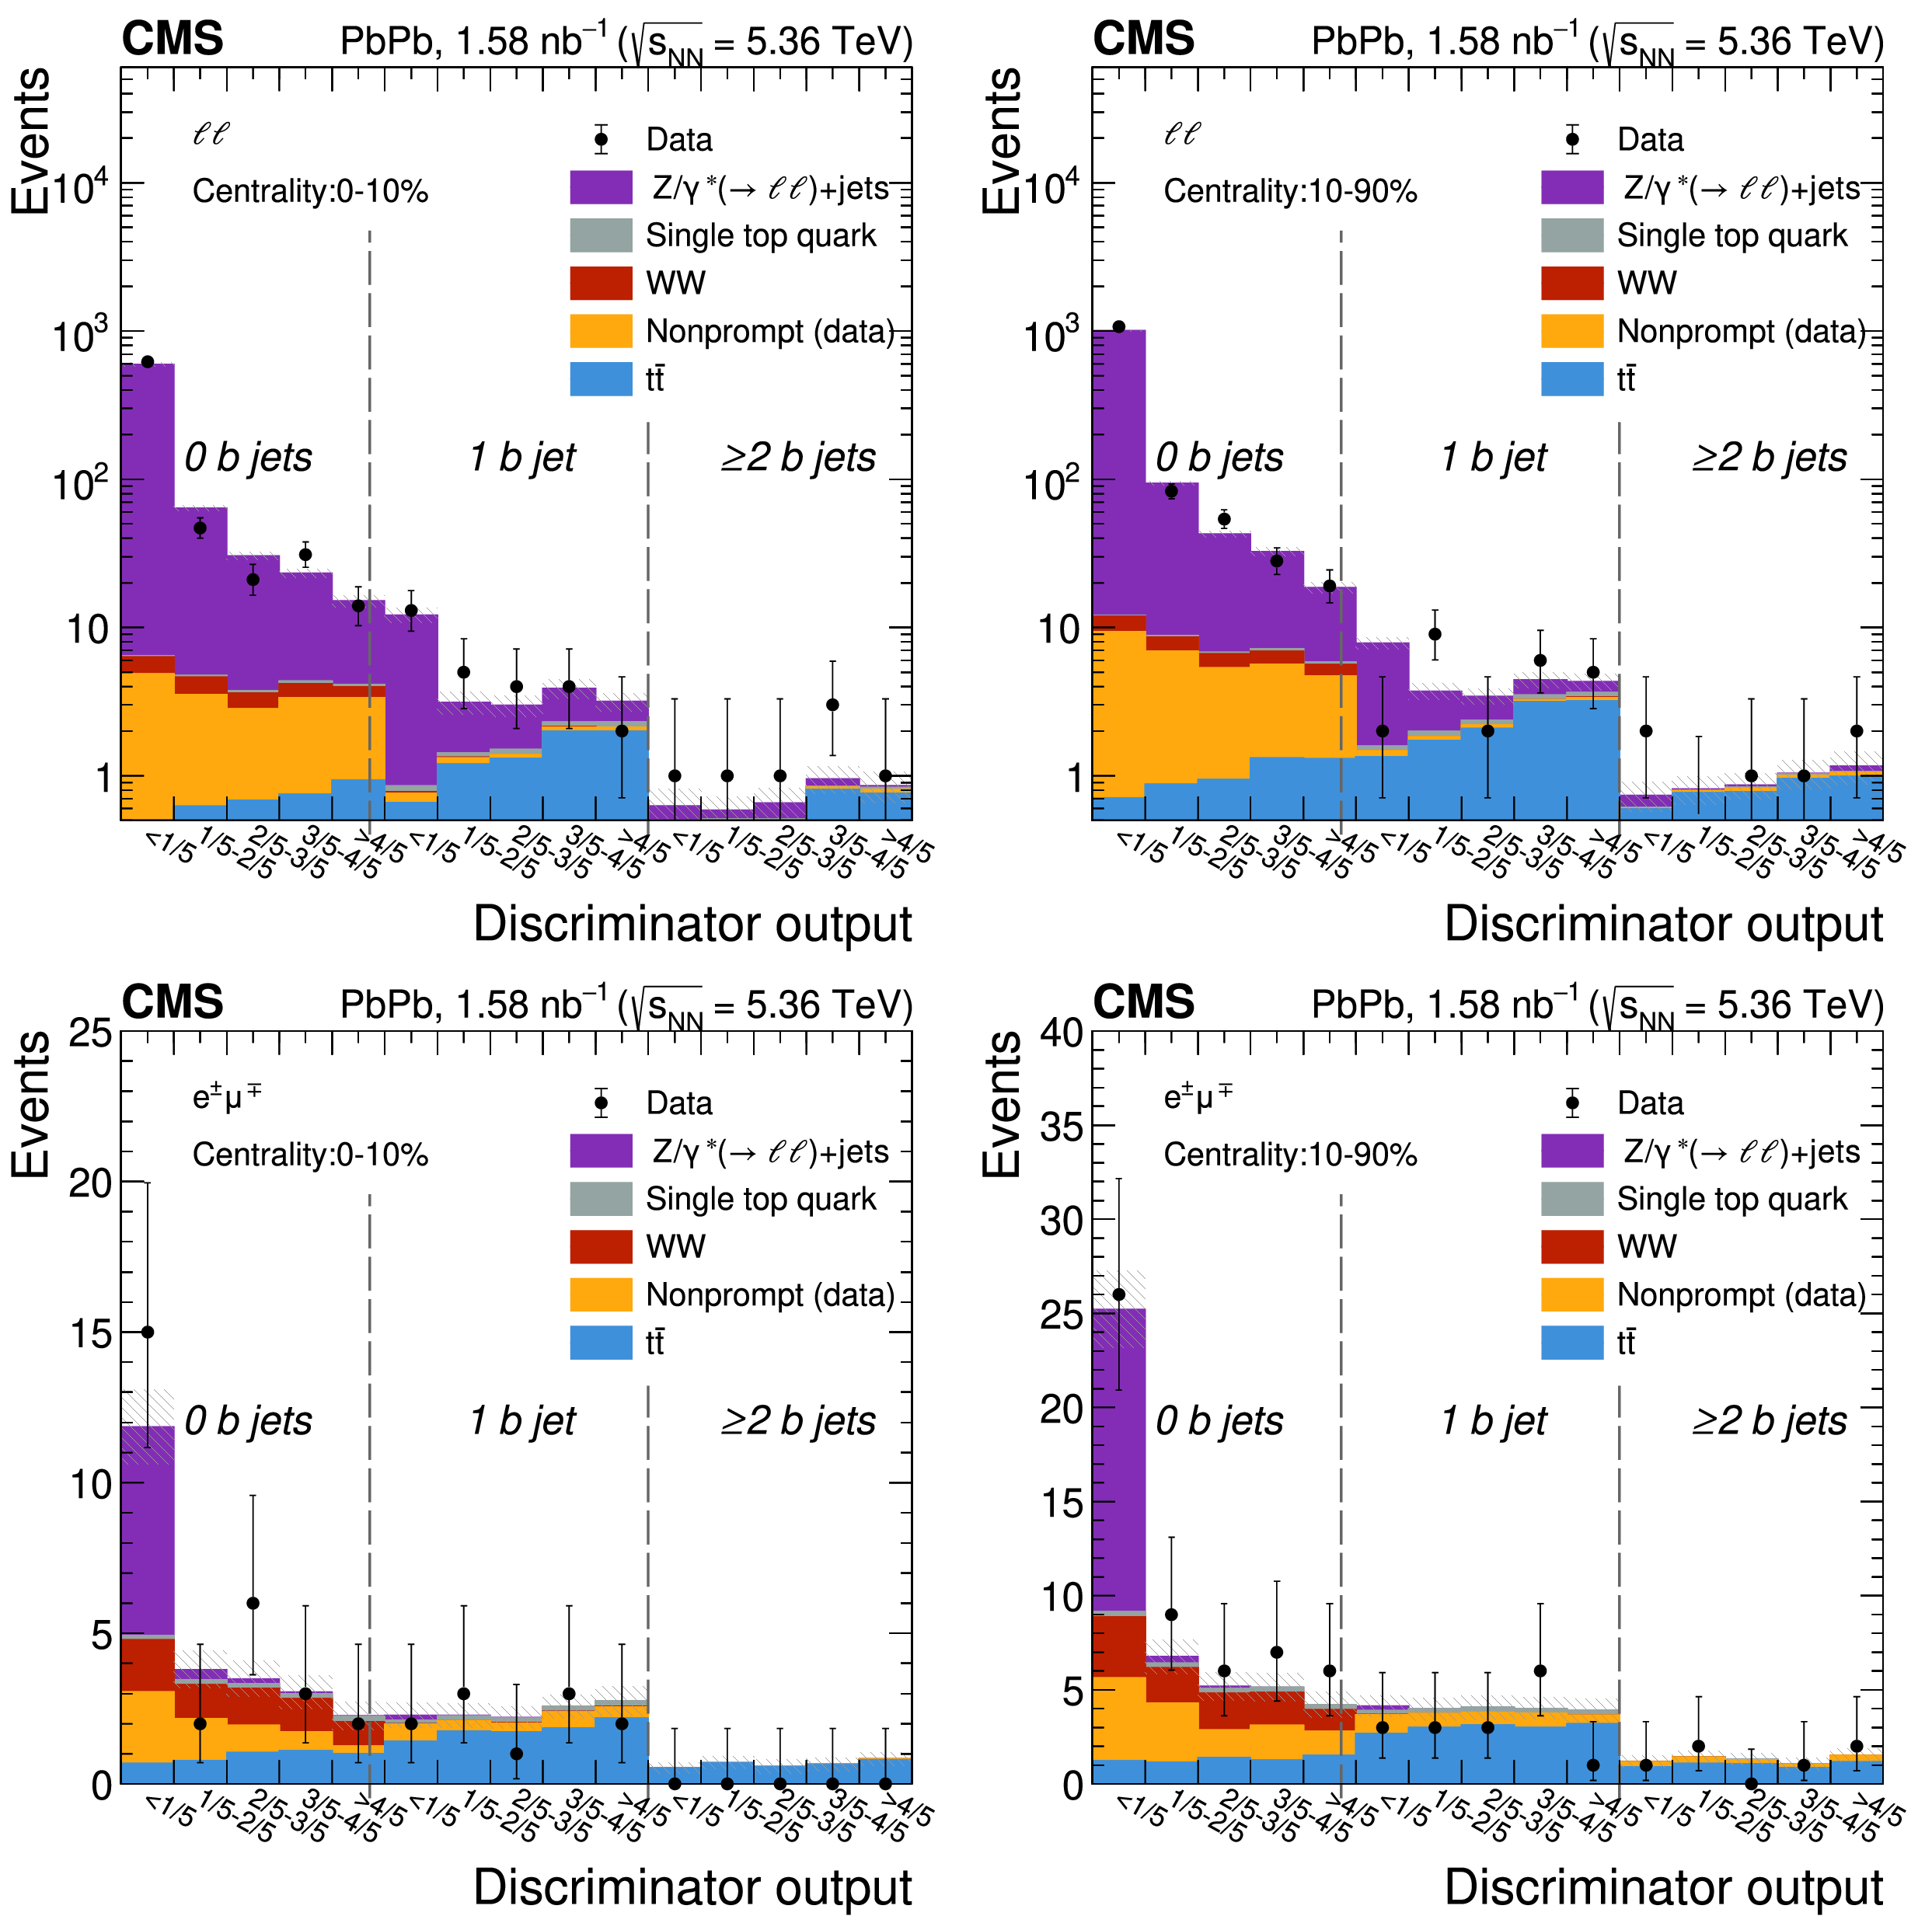
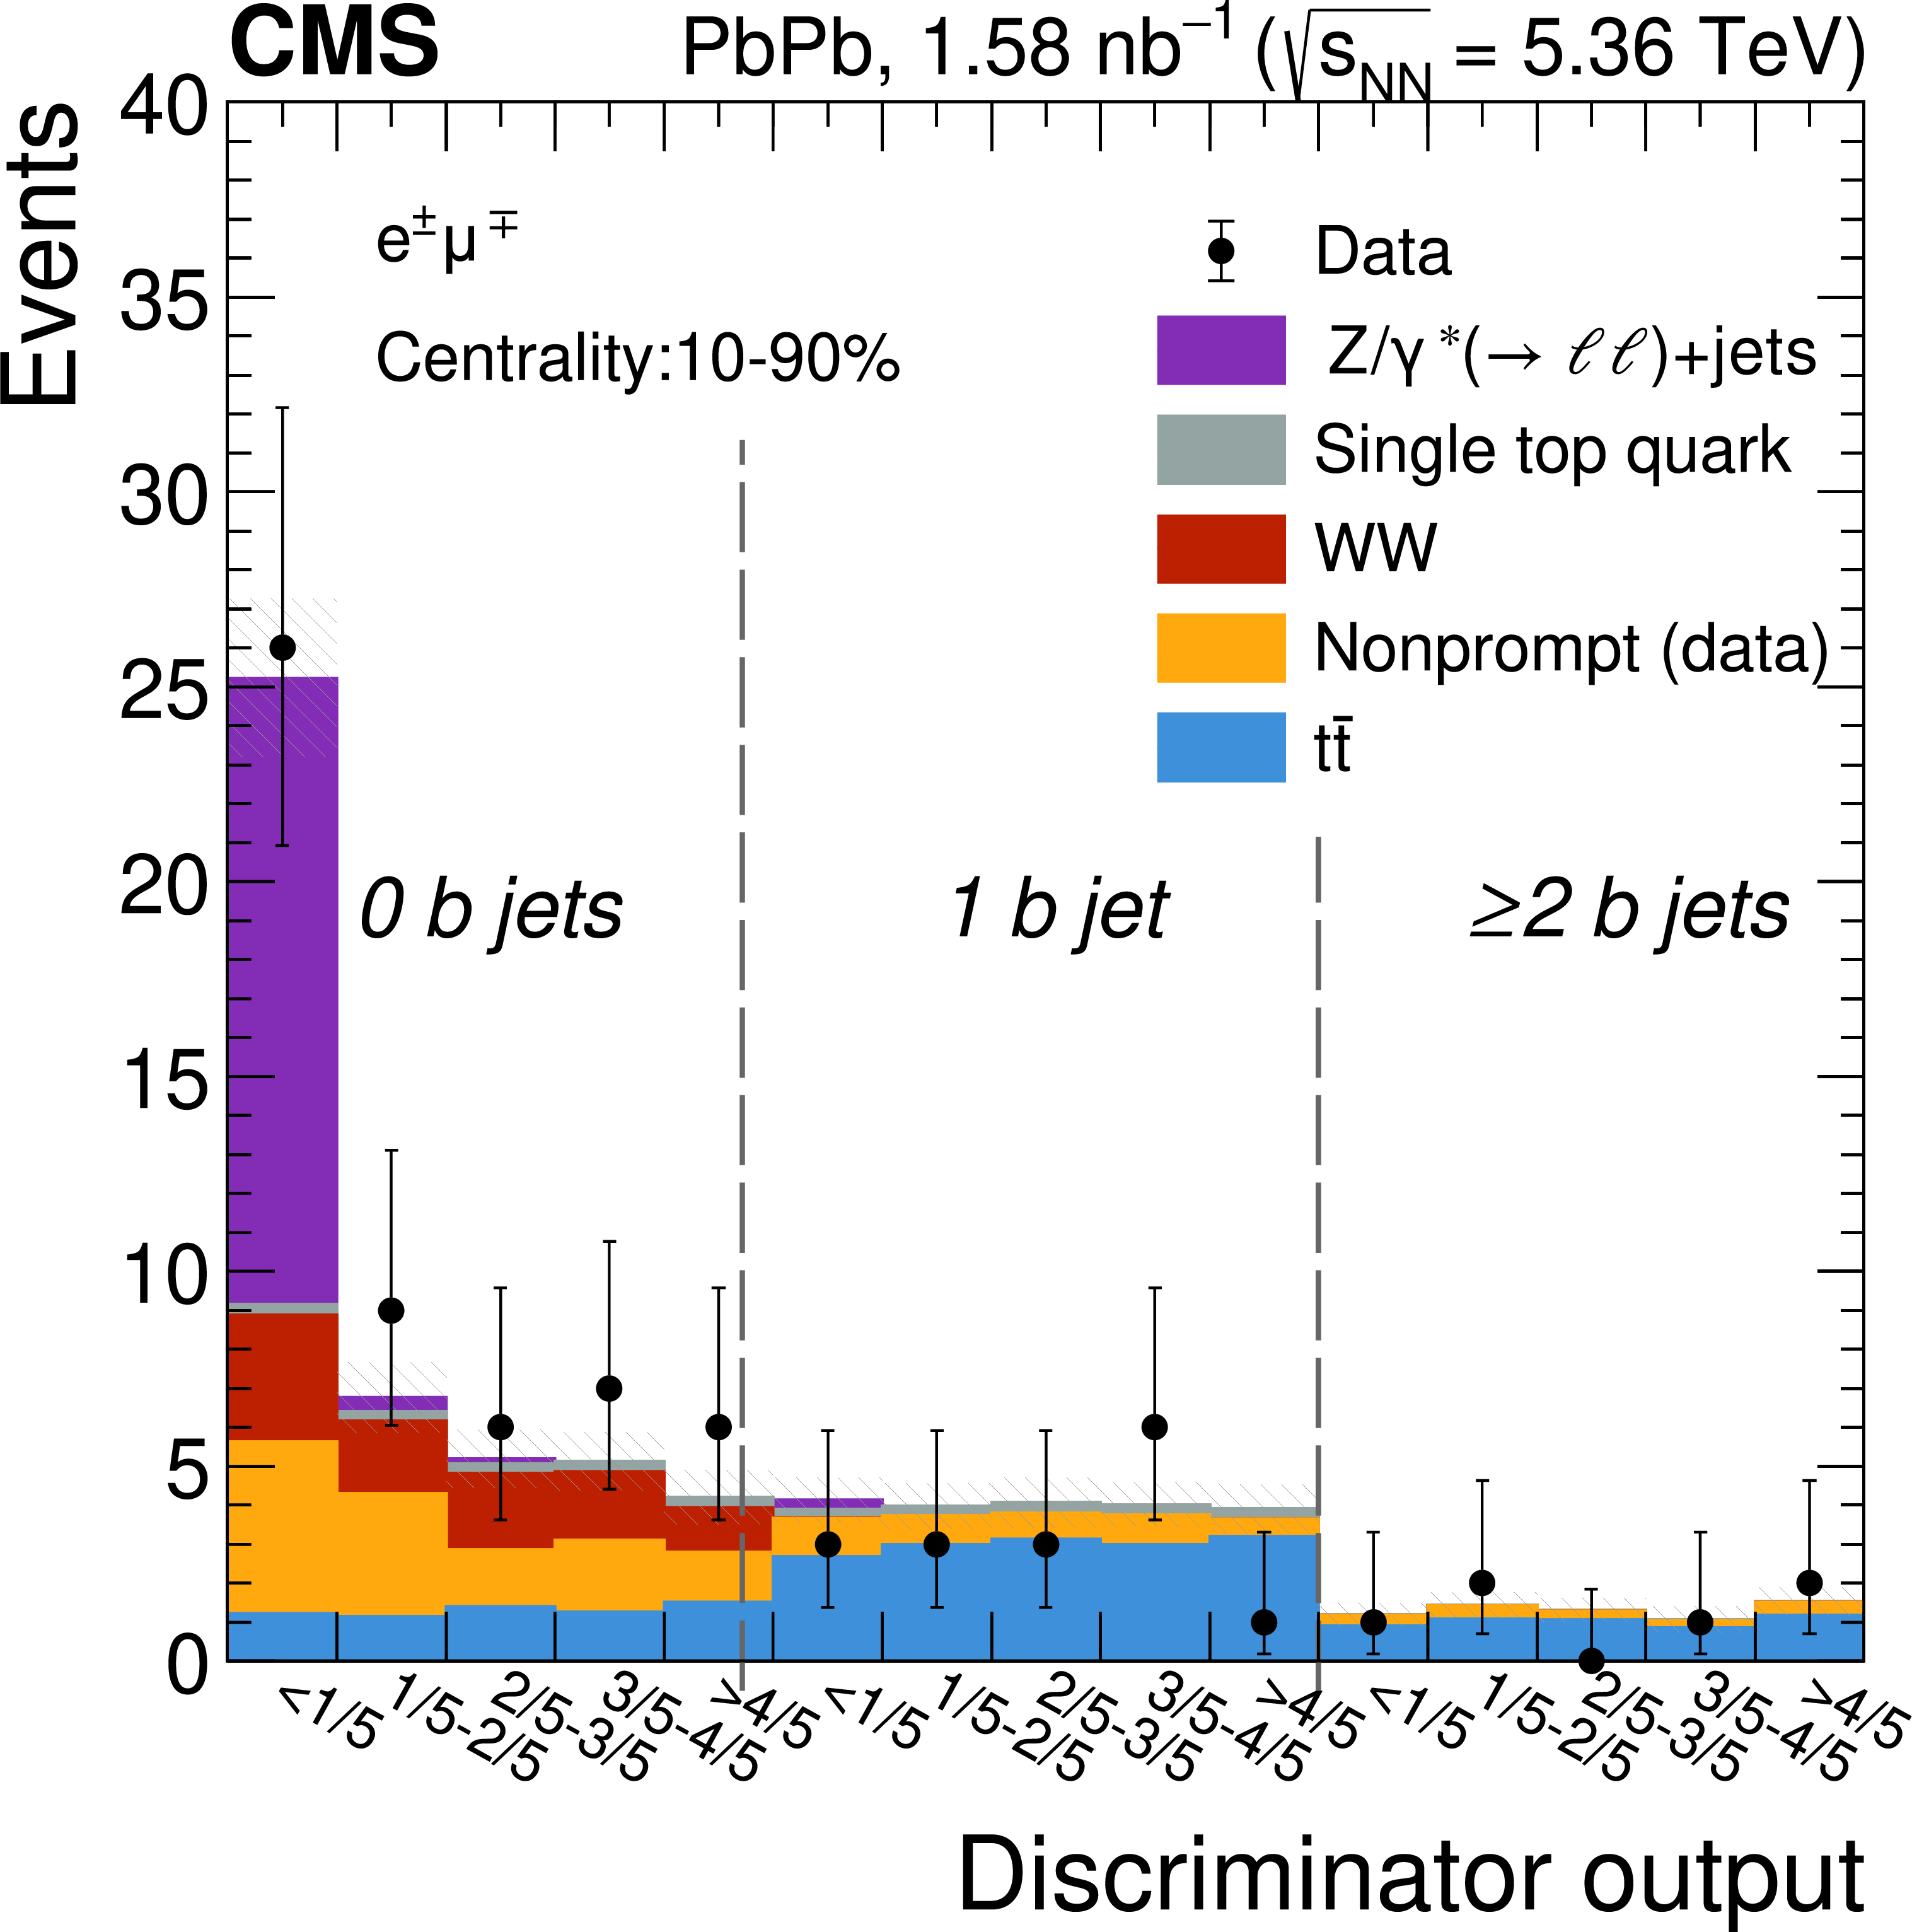
Distributions of the final BDT discriminator after the fit for the same-flavor $ \ell\ell $ (upper) and different-flavor $ \mathrm{e}^{\mp}\mu^{\pm} $ (lower) channels. The discriminator output is shown for 0, 1, and $ \geq $ 2 b-tagged jet events. The left (right) figures correspond to events reconstructed in the 0--10% (10--90%) centrality bin. The data (black markers) are compared with the stacked histograms corresponding to the $ \mathrm{t} \overline{\mathrm{t}} $ signal (blue), and the nonprompt (light orange), WW (red), single top quark (gray), and $ \mathrm{DY} $ (violet) background processes normalized to their post-fit expectations. The hatched gray bands show the total uncertainty in the predicted yields after the fit is performed. |
png pdf |
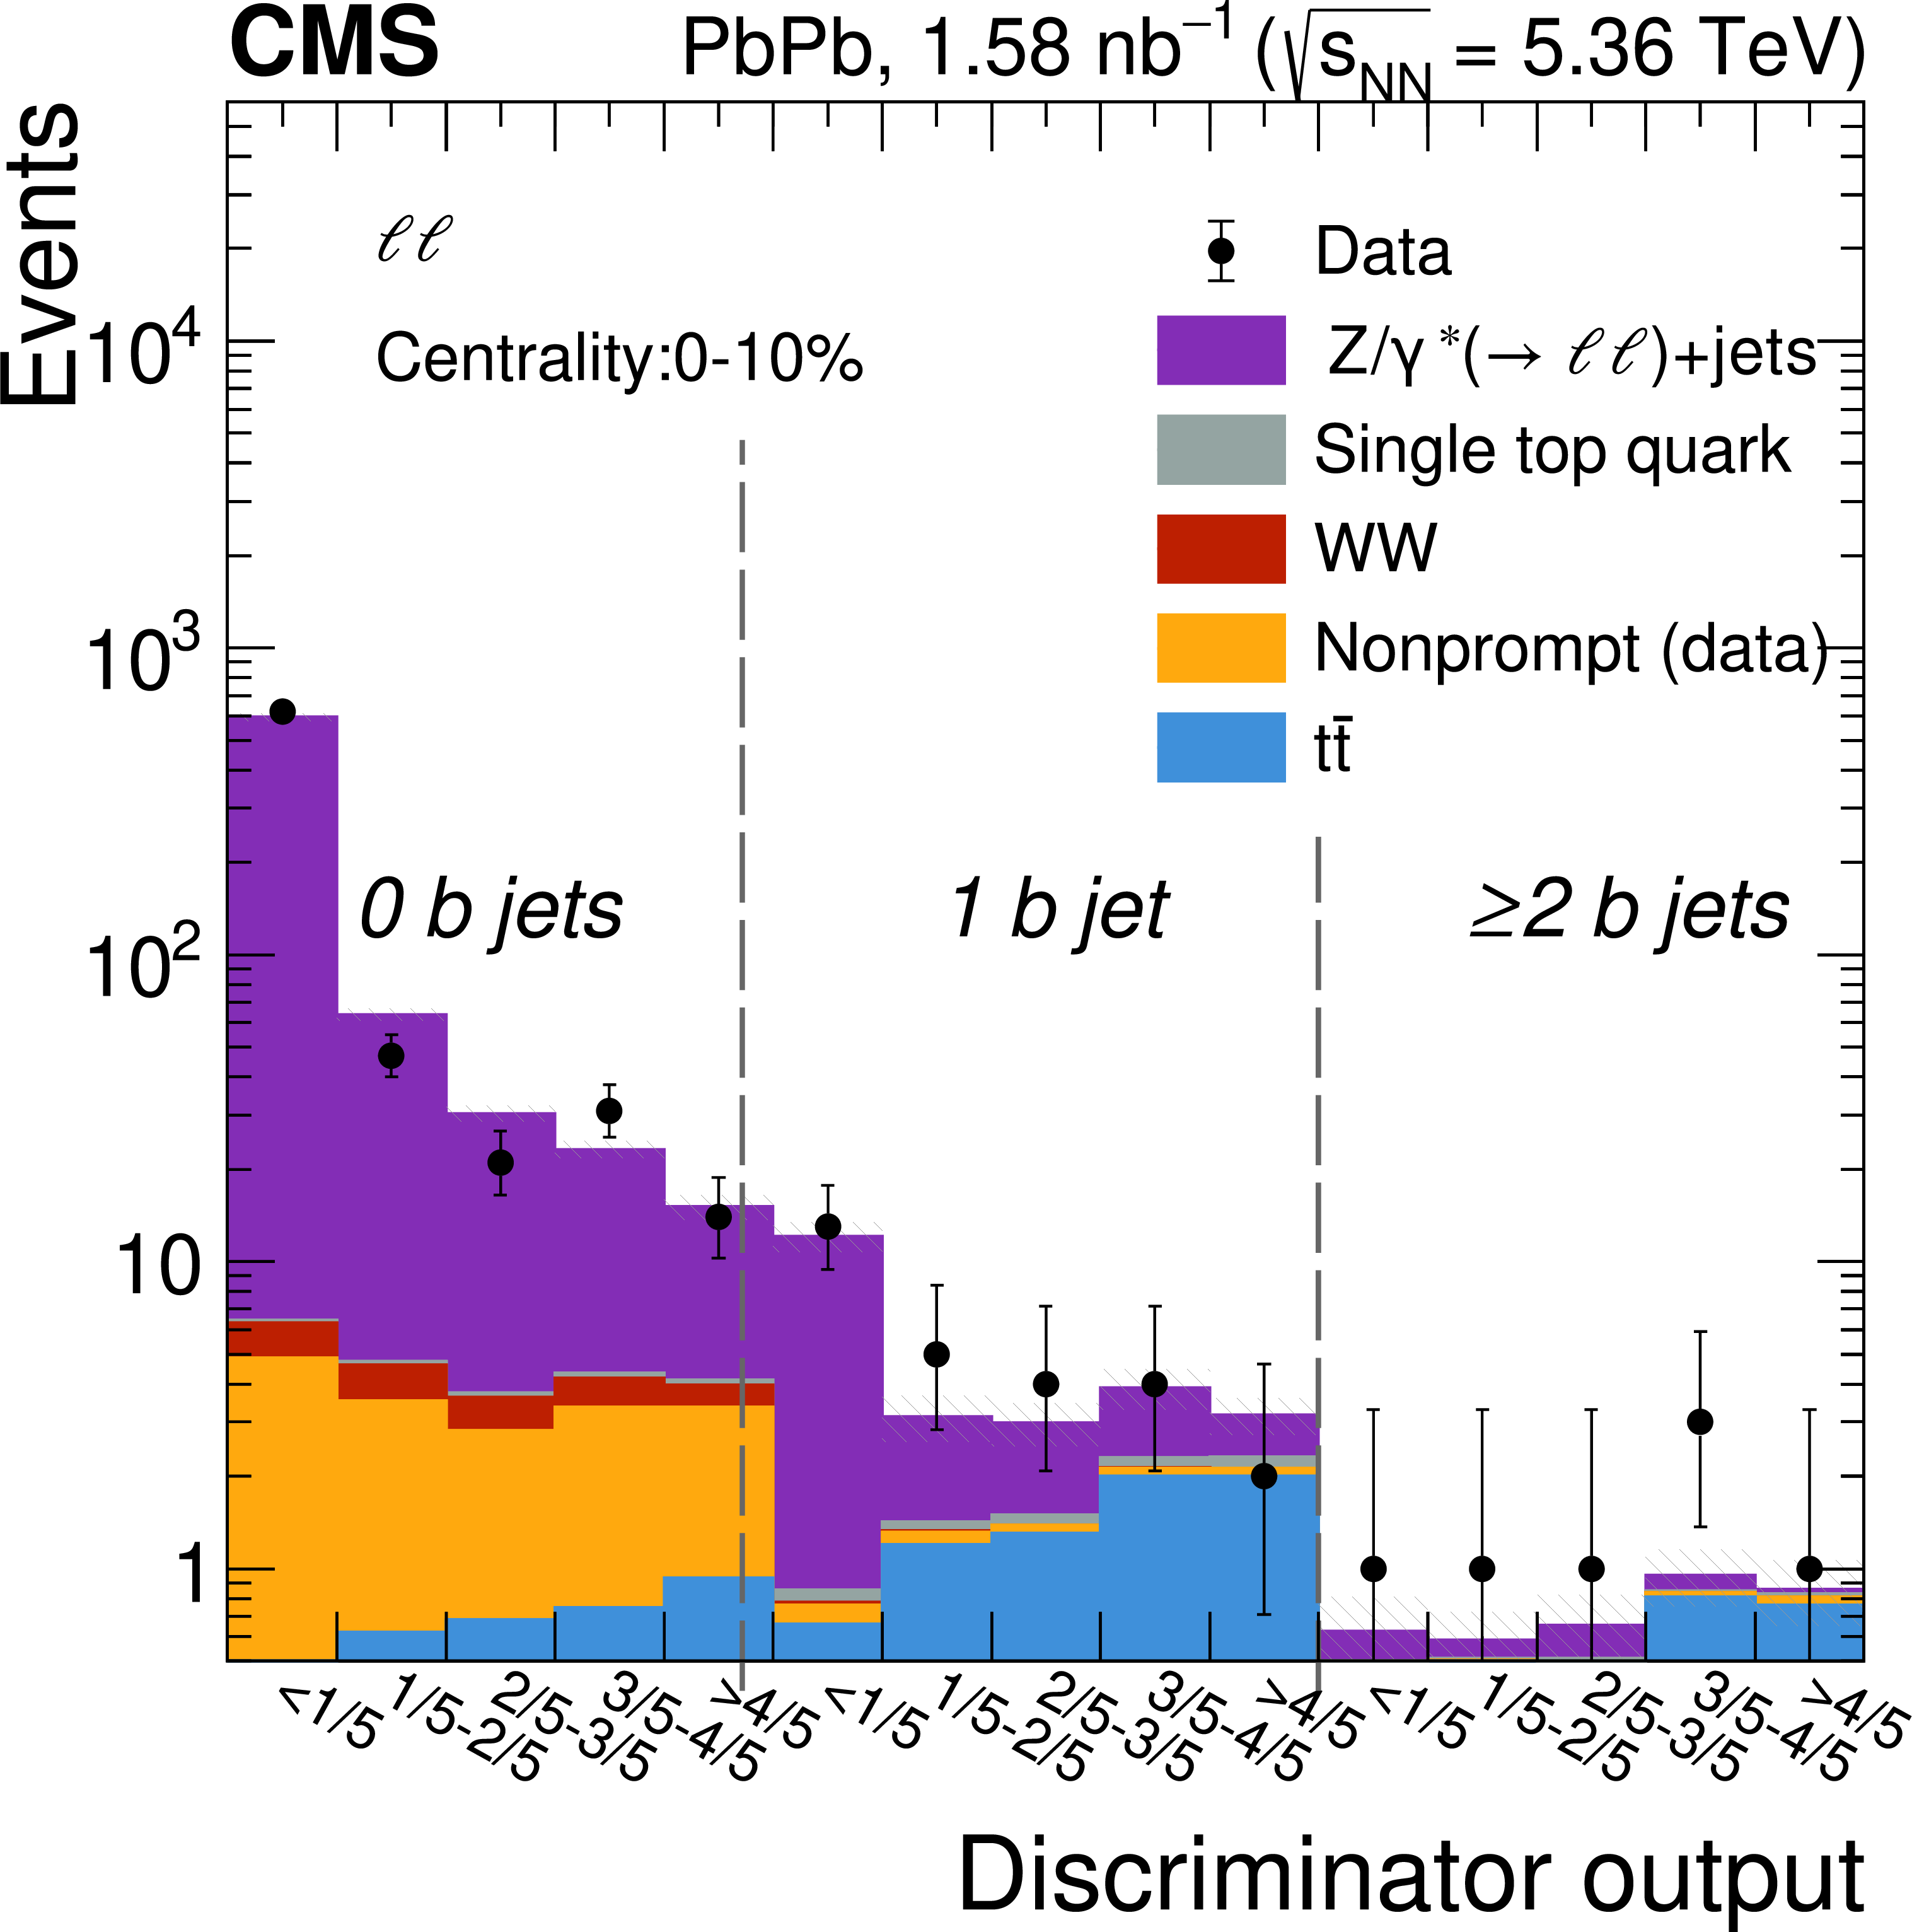
Figure 6-a:
Distributions of the final BDT discriminator after the fit for the same-flavor $ \ell\ell $ (upper) and different-flavor $ \mathrm{e}^{\mp}\mu^{\pm} $ (lower) channels. The discriminator output is shown for 0, 1, and $ \geq $ 2 b-tagged jet events. The left (right) figures correspond to events reconstructed in the 0--10% (10--90%) centrality bin. The data (black markers) are compared with the stacked histograms corresponding to the $ \mathrm{t} \overline{\mathrm{t}} $ signal (blue), and the nonprompt (light orange), WW (red), single top quark (gray), and $ \mathrm{DY} $ (violet) background processes normalized to their post-fit expectations. The hatched gray bands show the total uncertainty in the predicted yields after the fit is performed. |
png pdf |
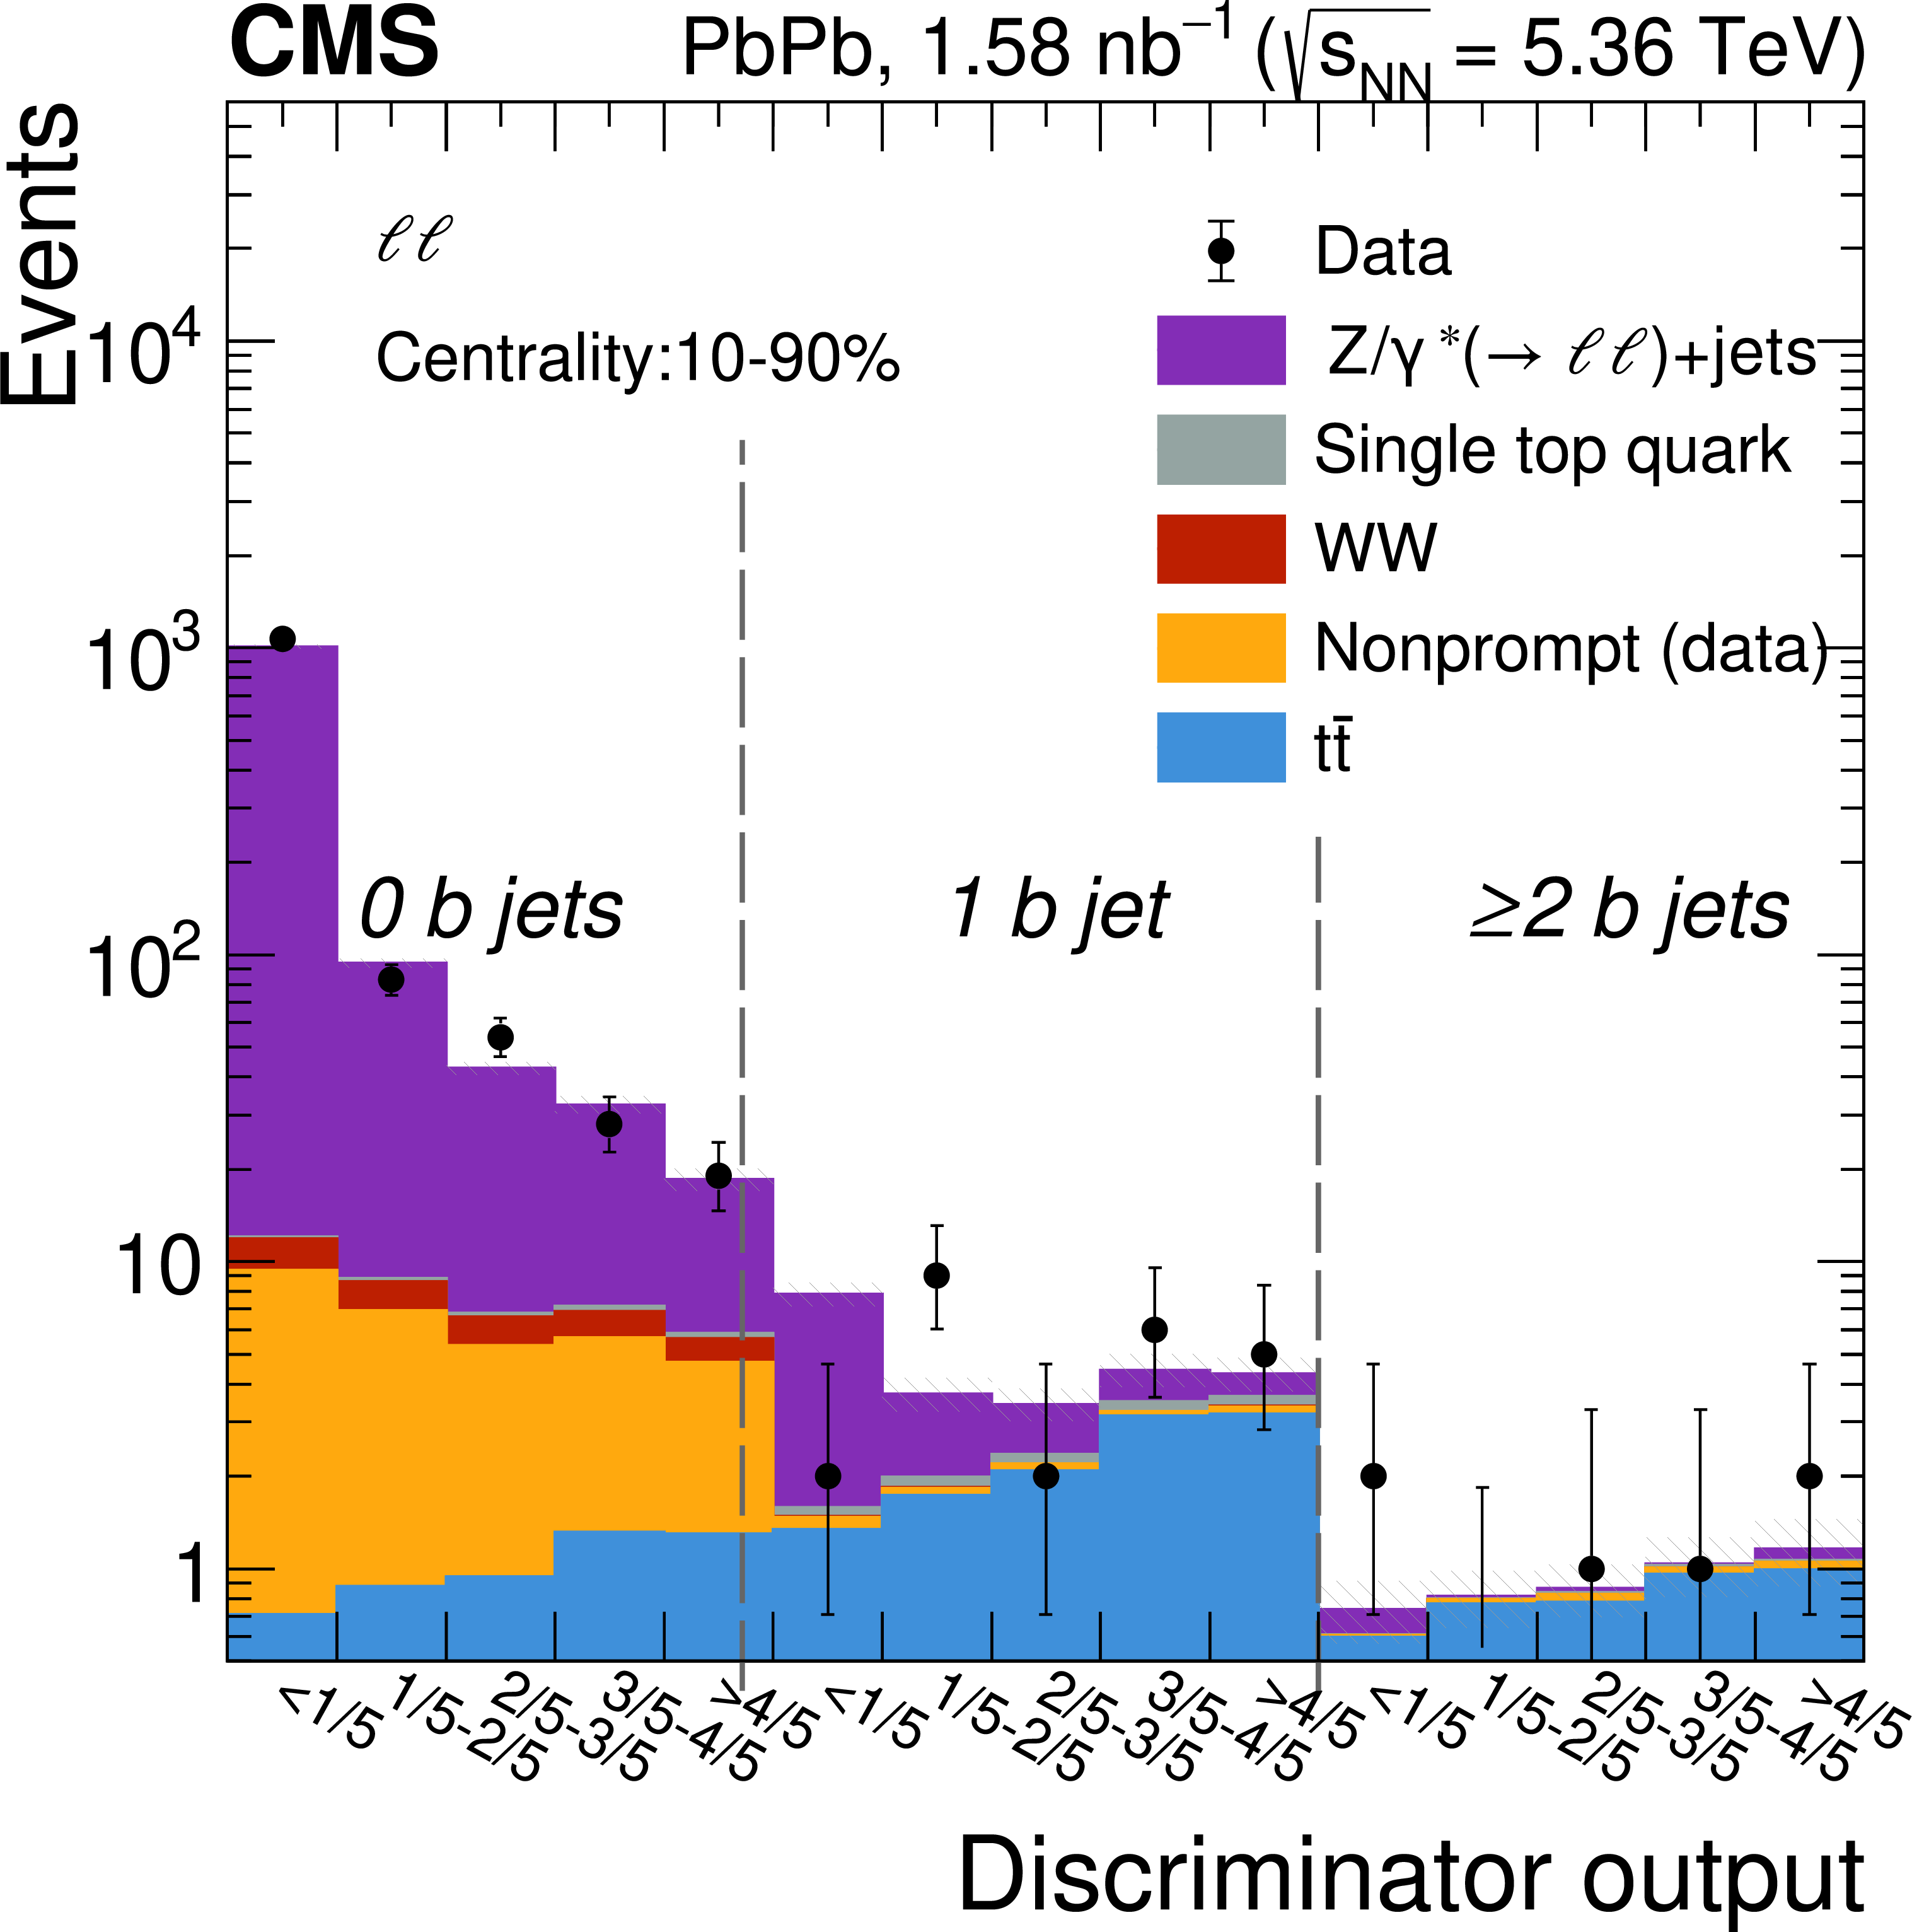
Figure 6-b:
Distributions of the final BDT discriminator after the fit for the same-flavor $ \ell\ell $ (upper) and different-flavor $ \mathrm{e}^{\mp}\mu^{\pm} $ (lower) channels. The discriminator output is shown for 0, 1, and $ \geq $ 2 b-tagged jet events. The left (right) figures correspond to events reconstructed in the 0--10% (10--90%) centrality bin. The data (black markers) are compared with the stacked histograms corresponding to the $ \mathrm{t} \overline{\mathrm{t}} $ signal (blue), and the nonprompt (light orange), WW (red), single top quark (gray), and $ \mathrm{DY} $ (violet) background processes normalized to their post-fit expectations. The hatched gray bands show the total uncertainty in the predicted yields after the fit is performed. |
png pdf |
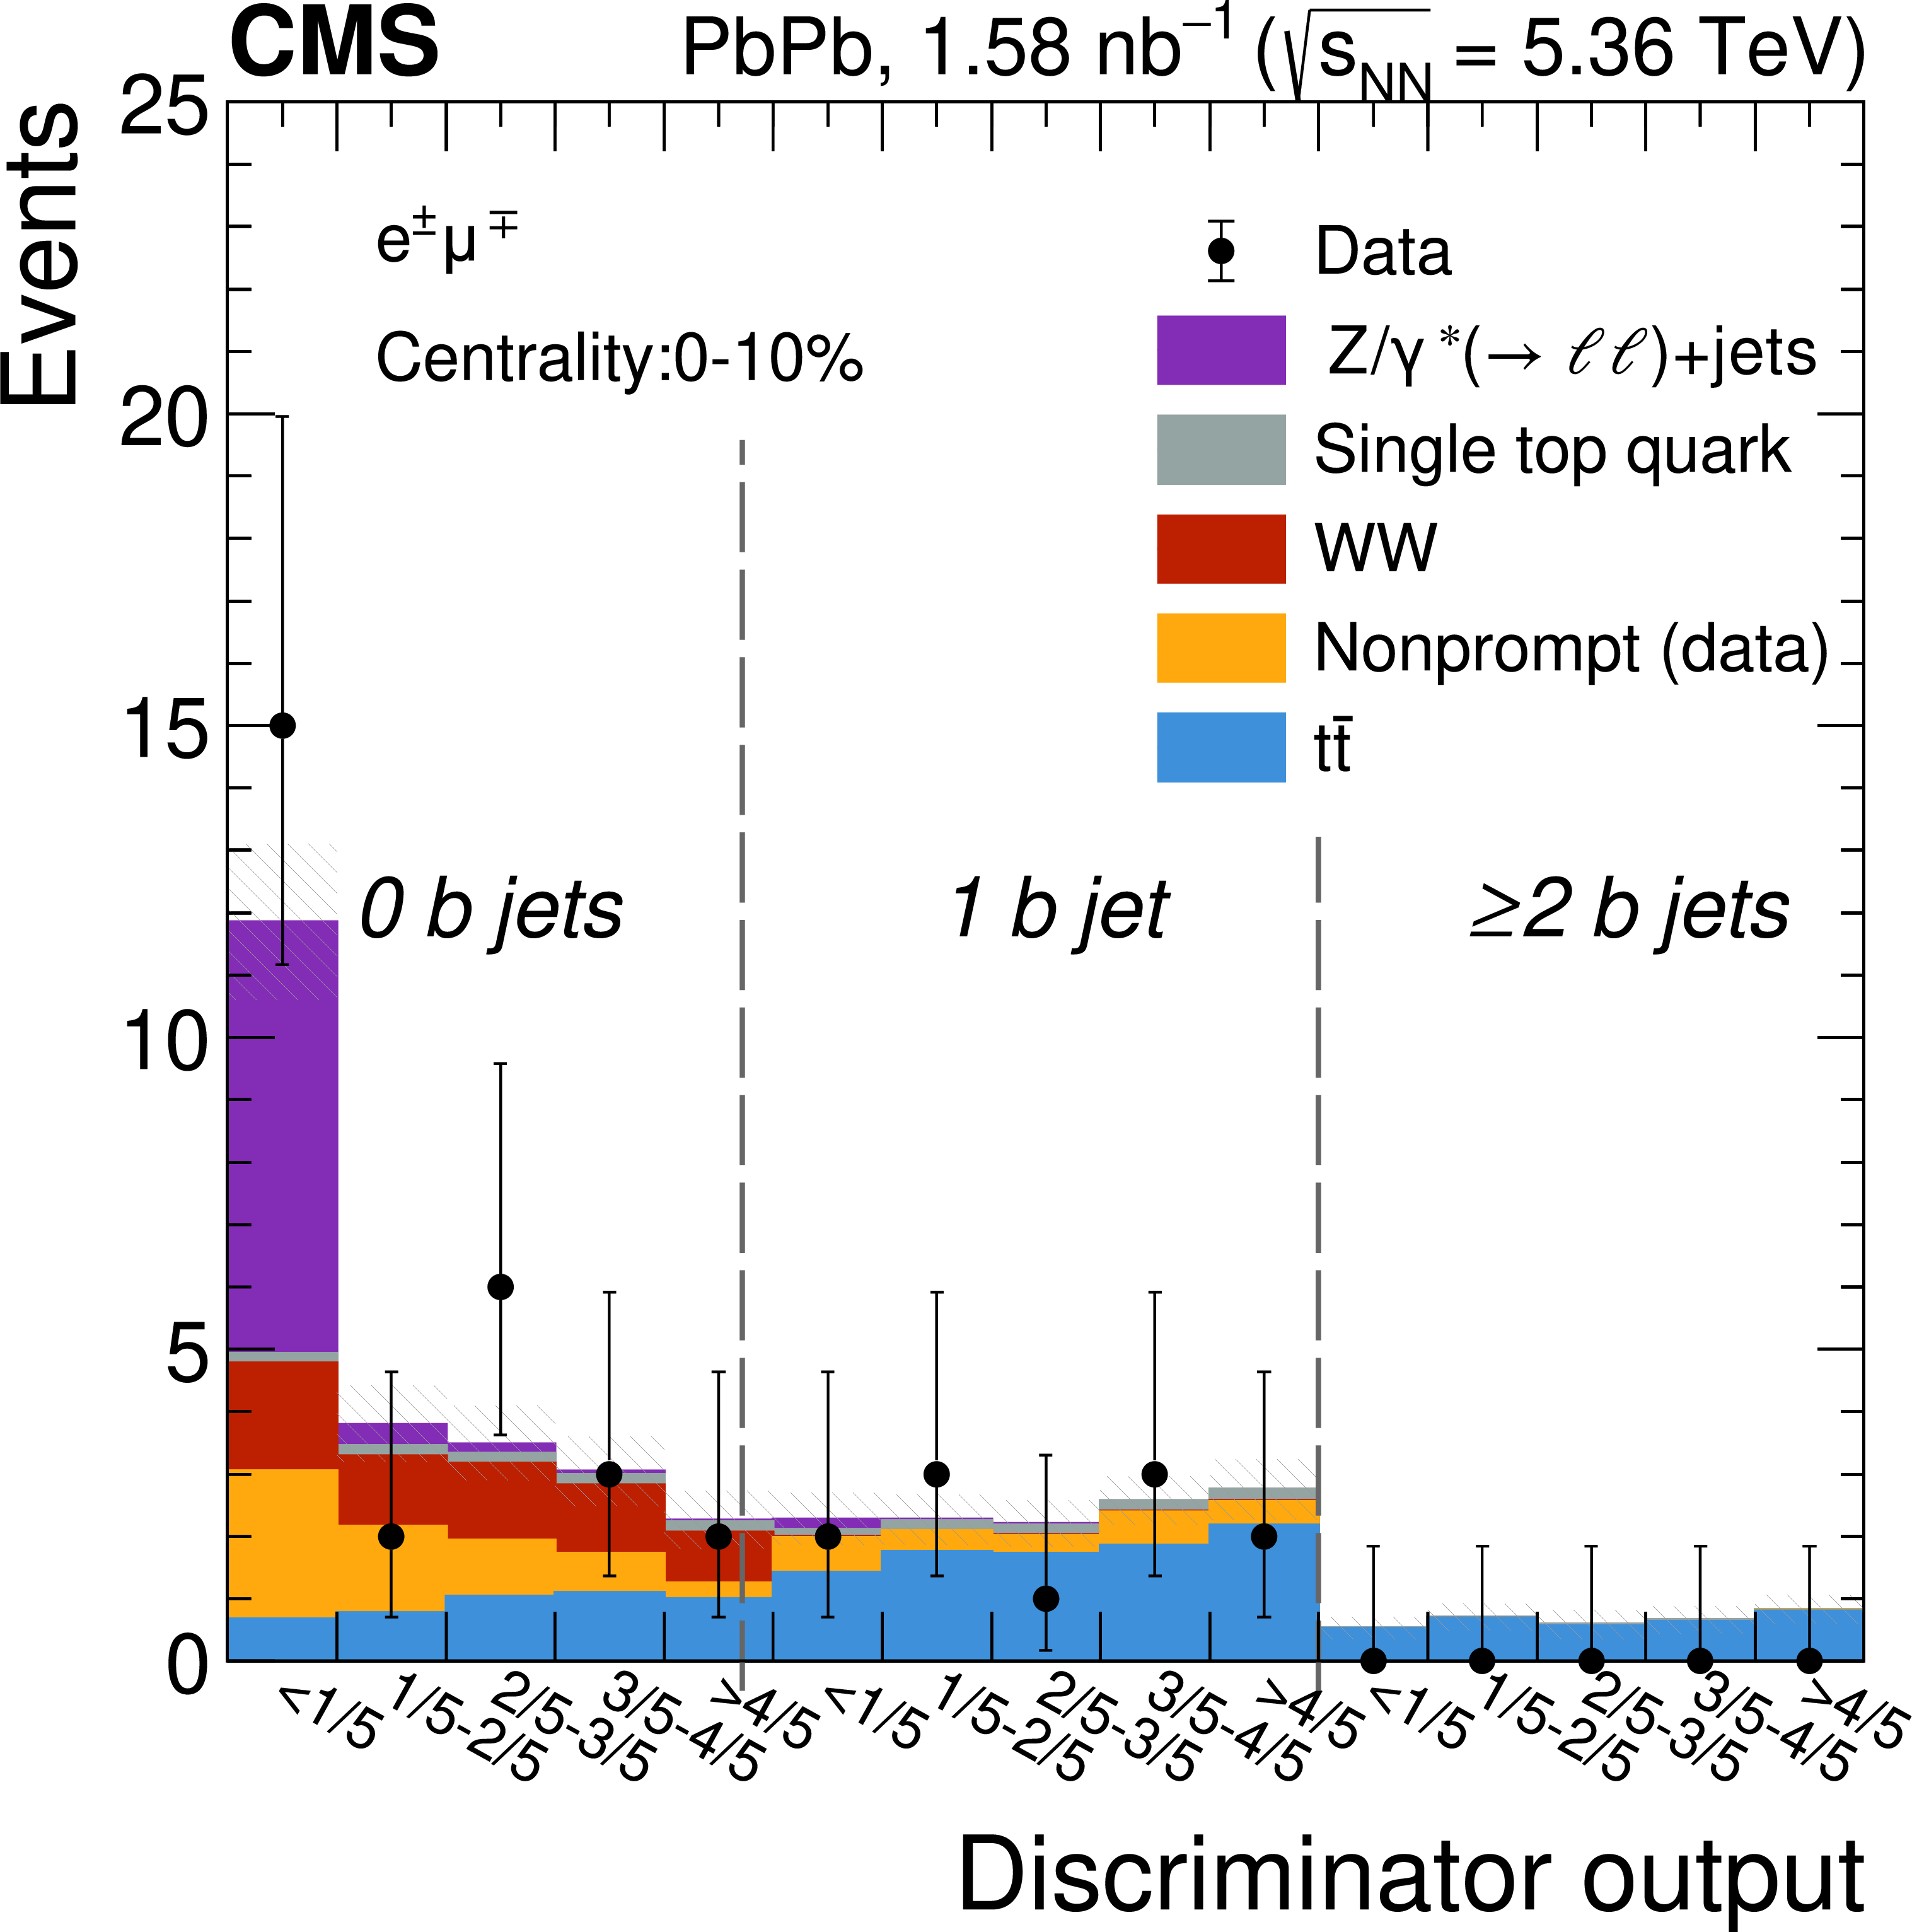
Figure 6-c:
Distributions of the final BDT discriminator after the fit for the same-flavor $ \ell\ell $ (upper) and different-flavor $ \mathrm{e}^{\mp}\mu^{\pm} $ (lower) channels. The discriminator output is shown for 0, 1, and $ \geq $ 2 b-tagged jet events. The left (right) figures correspond to events reconstructed in the 0--10% (10--90%) centrality bin. The data (black markers) are compared with the stacked histograms corresponding to the $ \mathrm{t} \overline{\mathrm{t}} $ signal (blue), and the nonprompt (light orange), WW (red), single top quark (gray), and $ \mathrm{DY} $ (violet) background processes normalized to their post-fit expectations. The hatched gray bands show the total uncertainty in the predicted yields after the fit is performed. |
png pdf |
Figure 6-d:
Distributions of the final BDT discriminator after the fit for the same-flavor $ \ell\ell $ (upper) and different-flavor $ \mathrm{e}^{\mp}\mu^{\pm} $ (lower) channels. The discriminator output is shown for 0, 1, and $ \geq $ 2 b-tagged jet events. The left (right) figures correspond to events reconstructed in the 0--10% (10--90%) centrality bin. The data (black markers) are compared with the stacked histograms corresponding to the $ \mathrm{t} \overline{\mathrm{t}} $ signal (blue), and the nonprompt (light orange), WW (red), single top quark (gray), and $ \mathrm{DY} $ (violet) background processes normalized to their post-fit expectations. The hatched gray bands show the total uncertainty in the predicted yields after the fit is performed. |
png pdf |
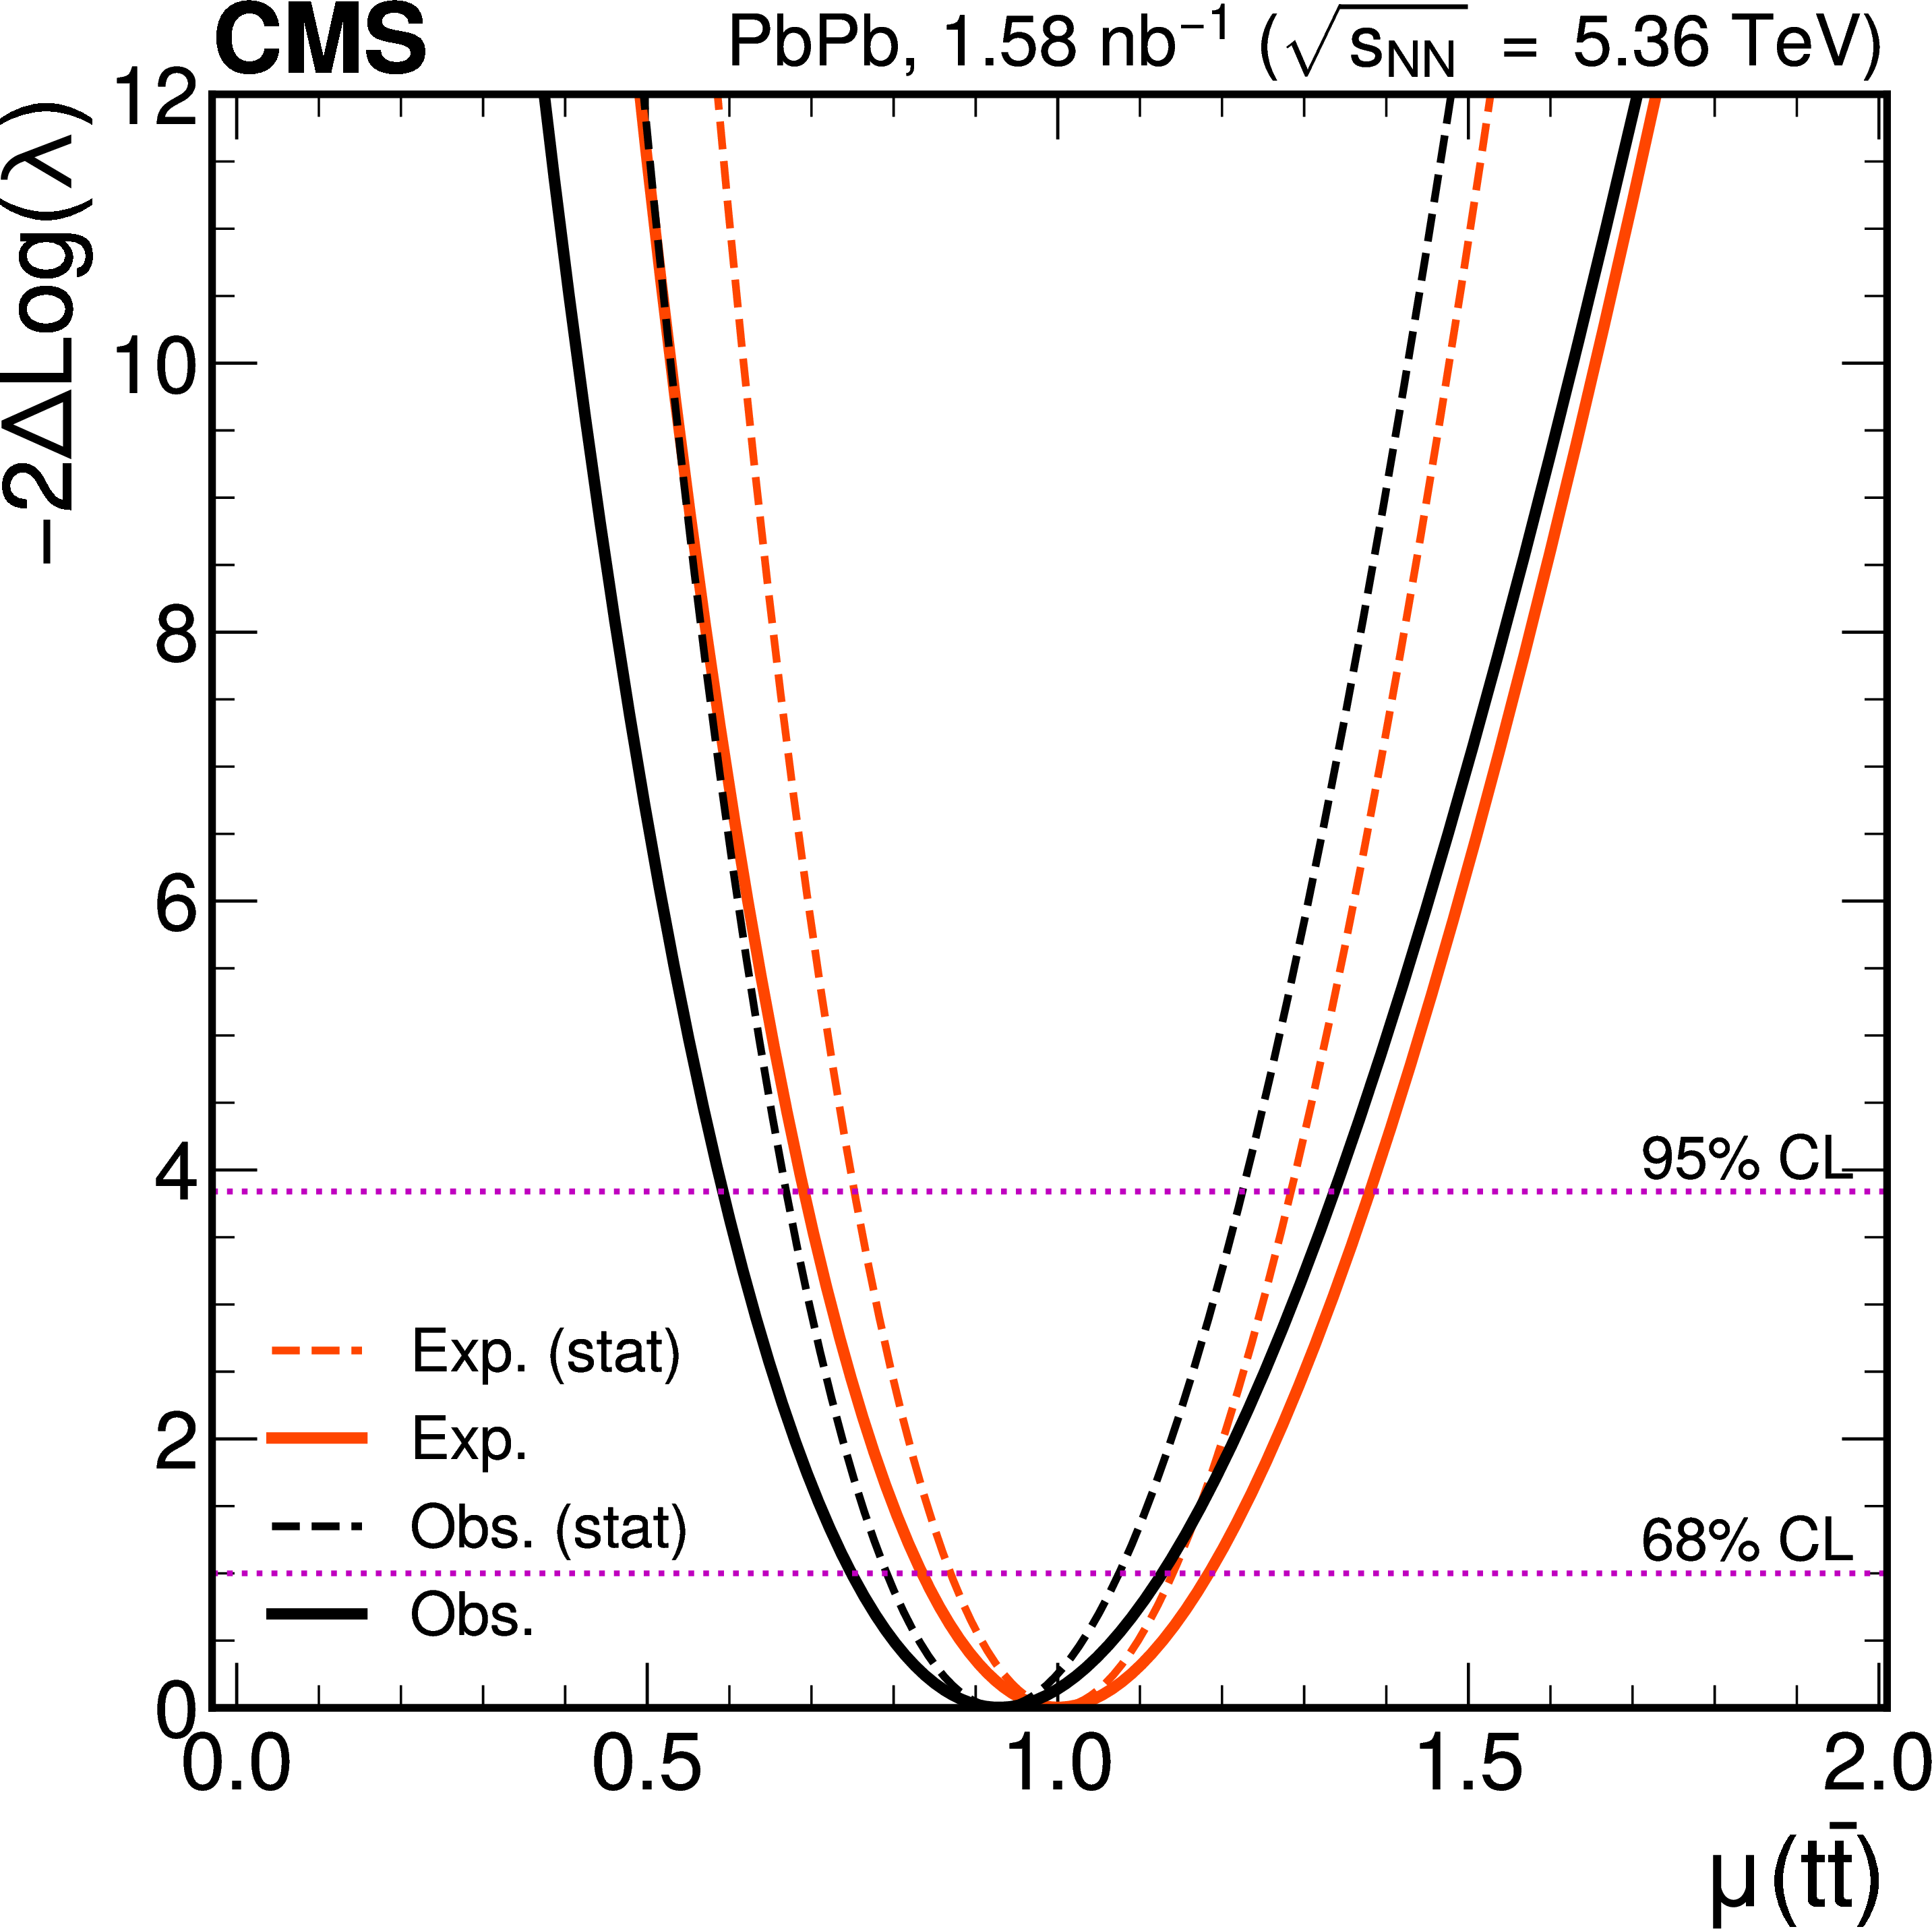
Figure 7:
Scan of the profile likelihood as a function of the $ \mathrm{t} \overline{\mathrm{t}} $ signal strength. The expected (orange) and observed (black) scans are displayed with (solid curve) and without (dashed curve) accounting for systematic uncertainties. The horizontal dashed lines indicate the likelihood values used to extract the 68% and 95% CL intervals on the parameter of interest. |
png pdf |
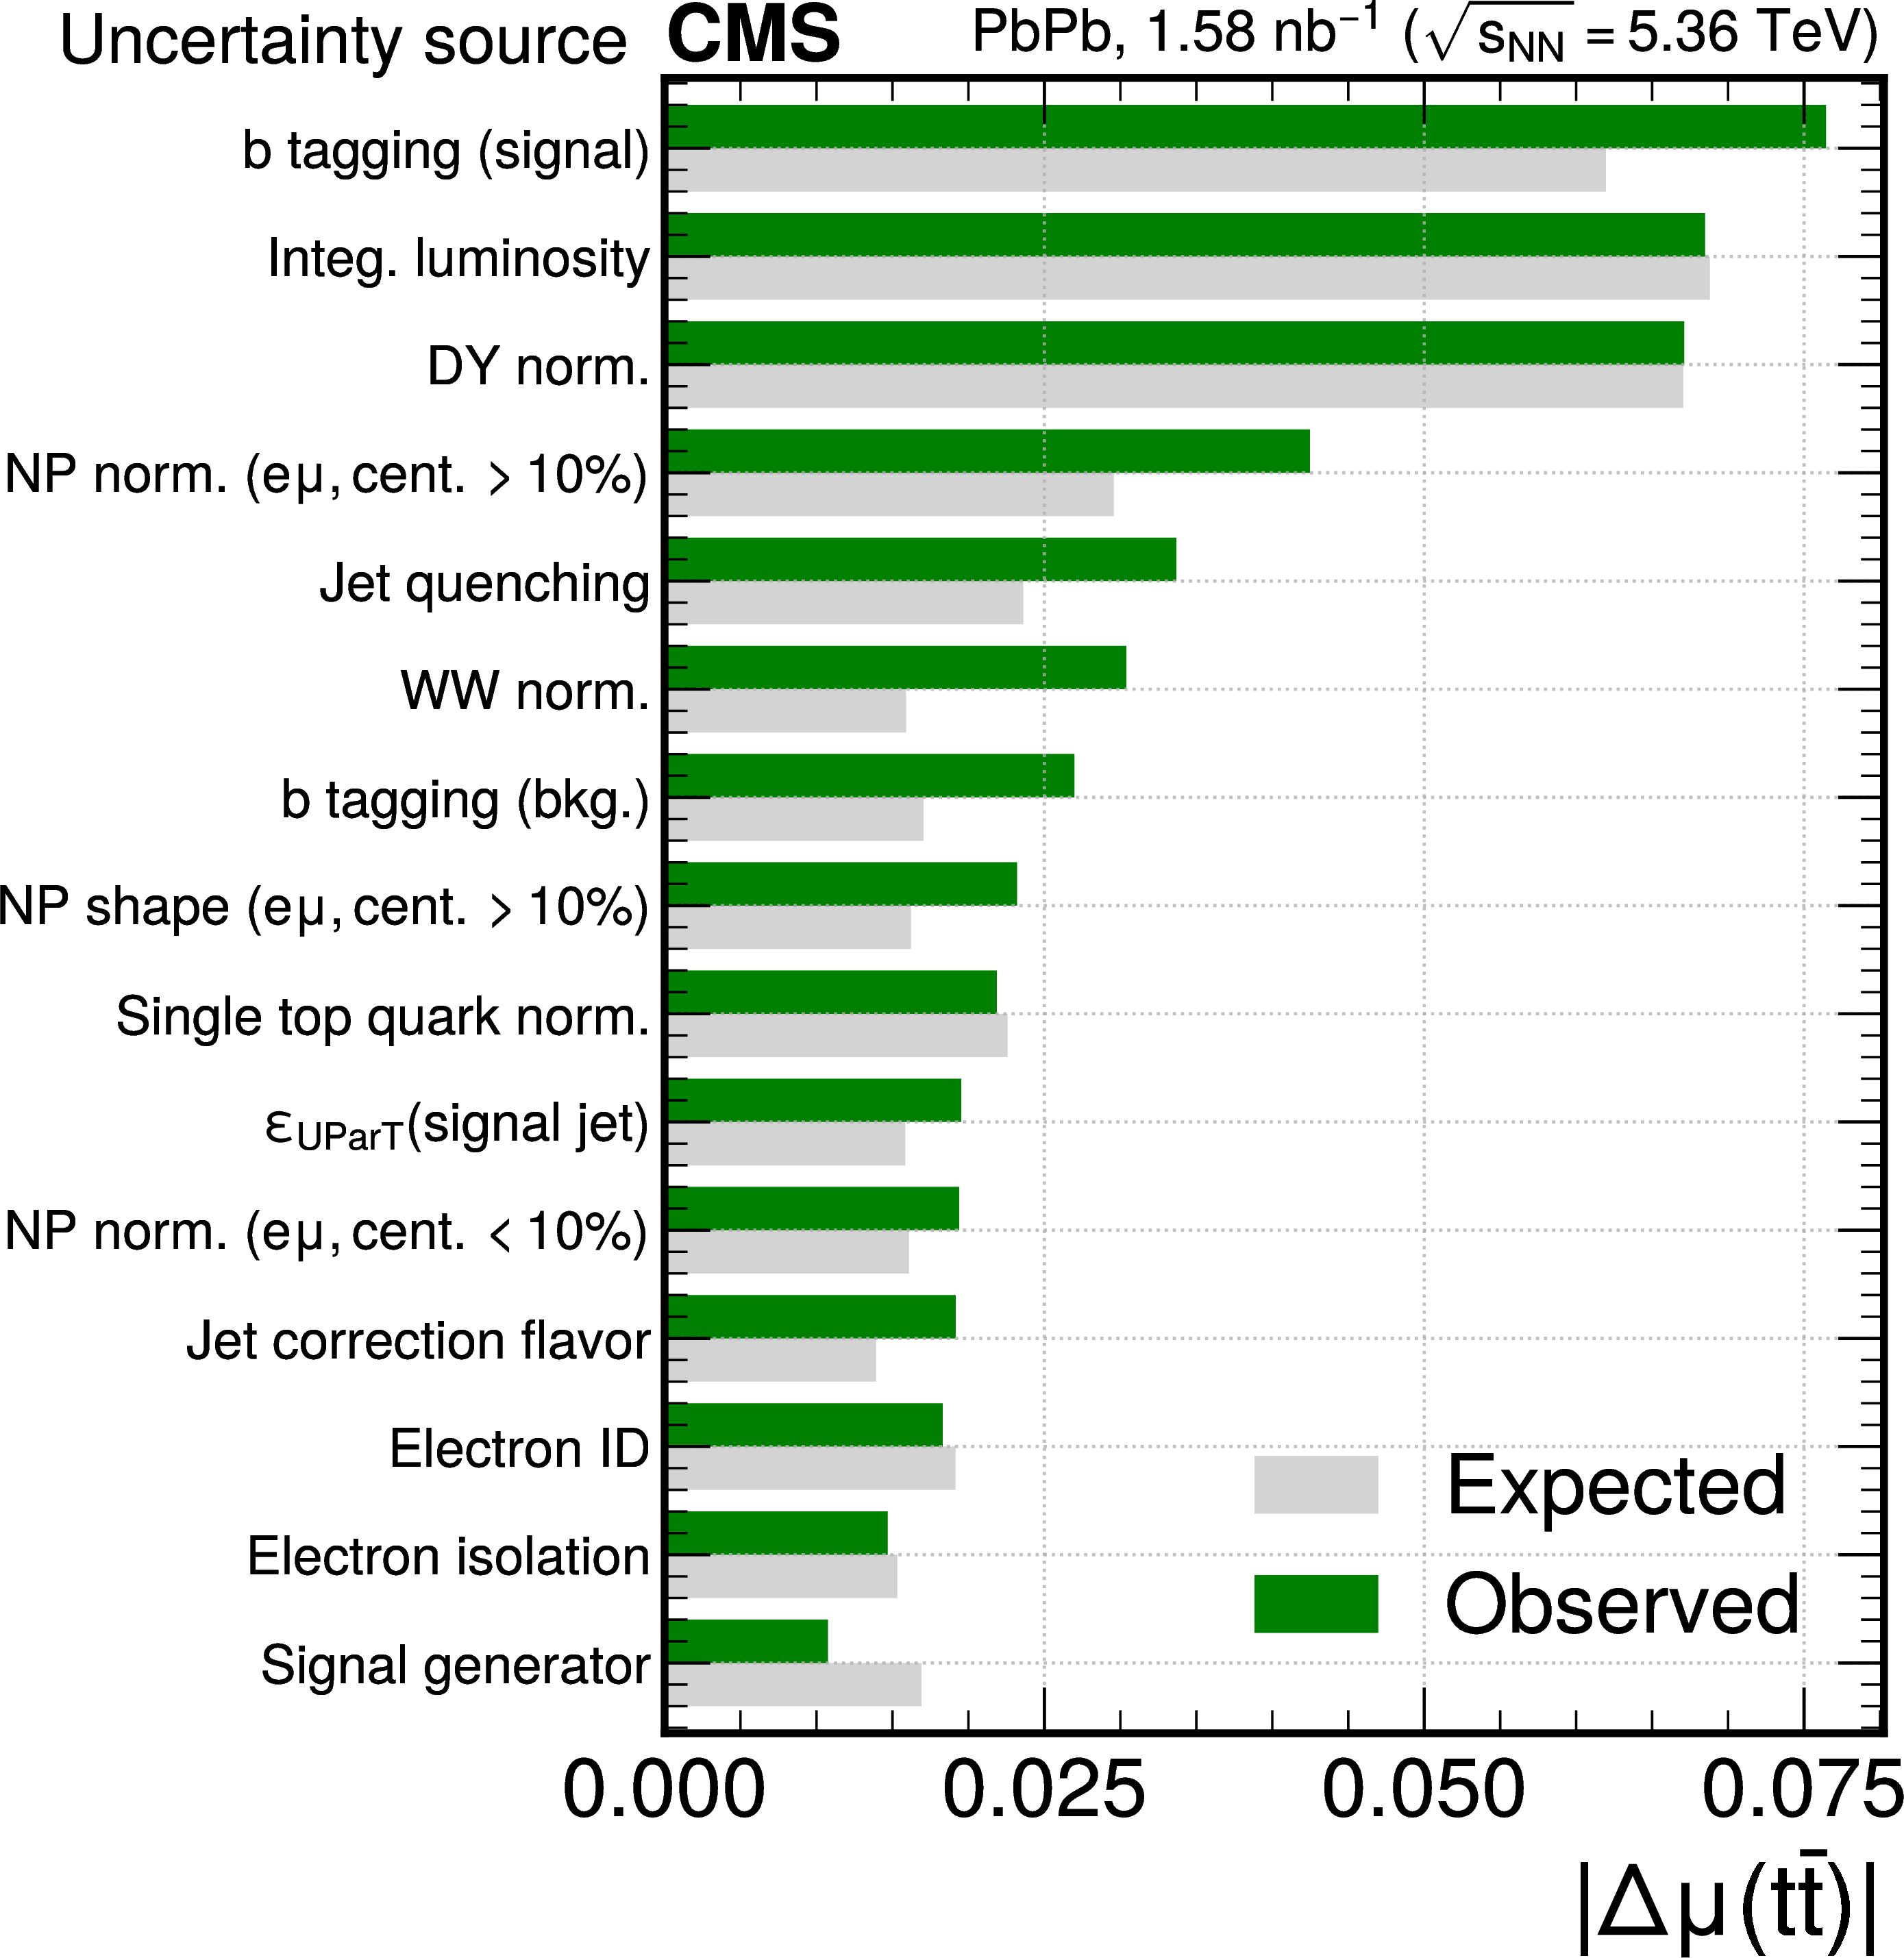
Figure 8:
Impact of systematic uncertainties on the fitted $ \mathrm{t} \overline{\mathrm{t}} $ signal strength parameter. The systematic uncertainties are listed in decreasing order of their impact on the signal strength. |
png pdf |
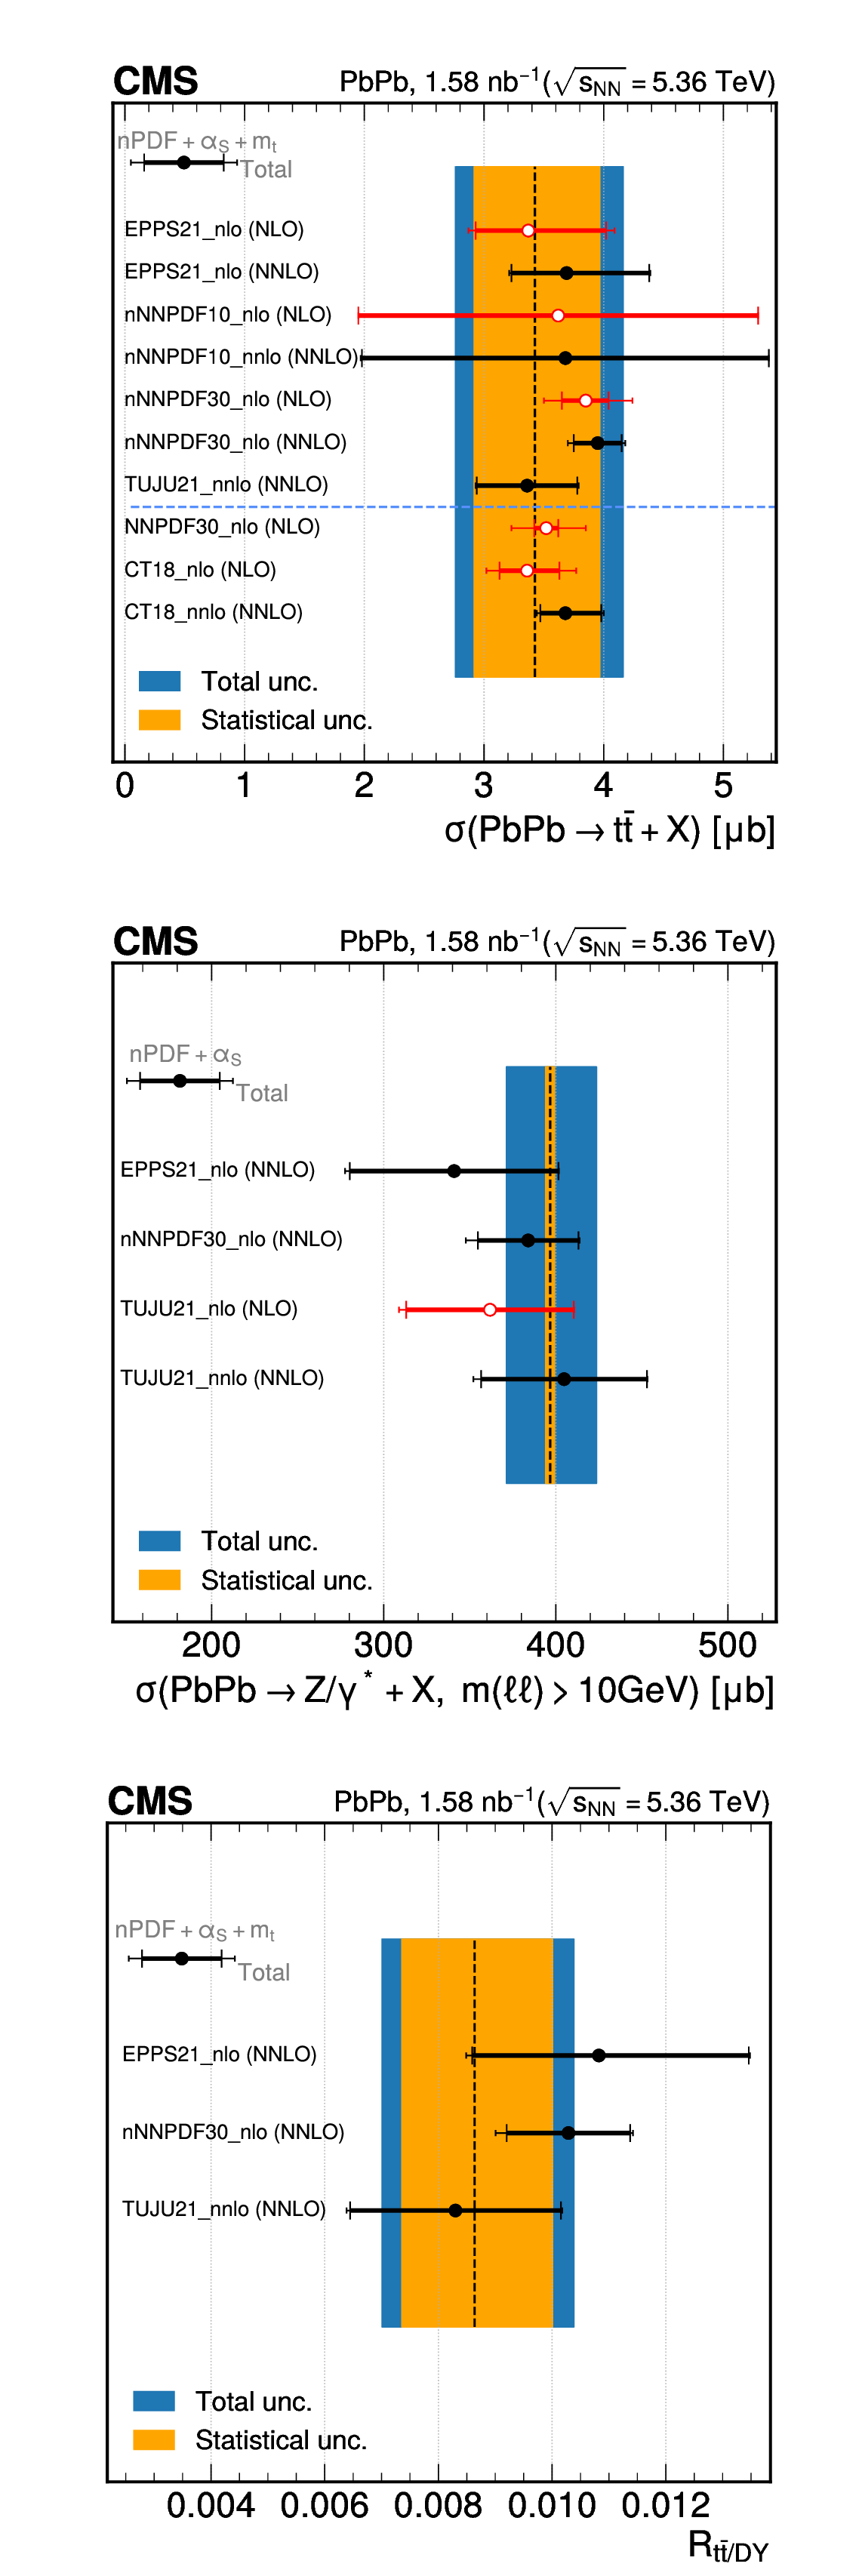
Figure 9:
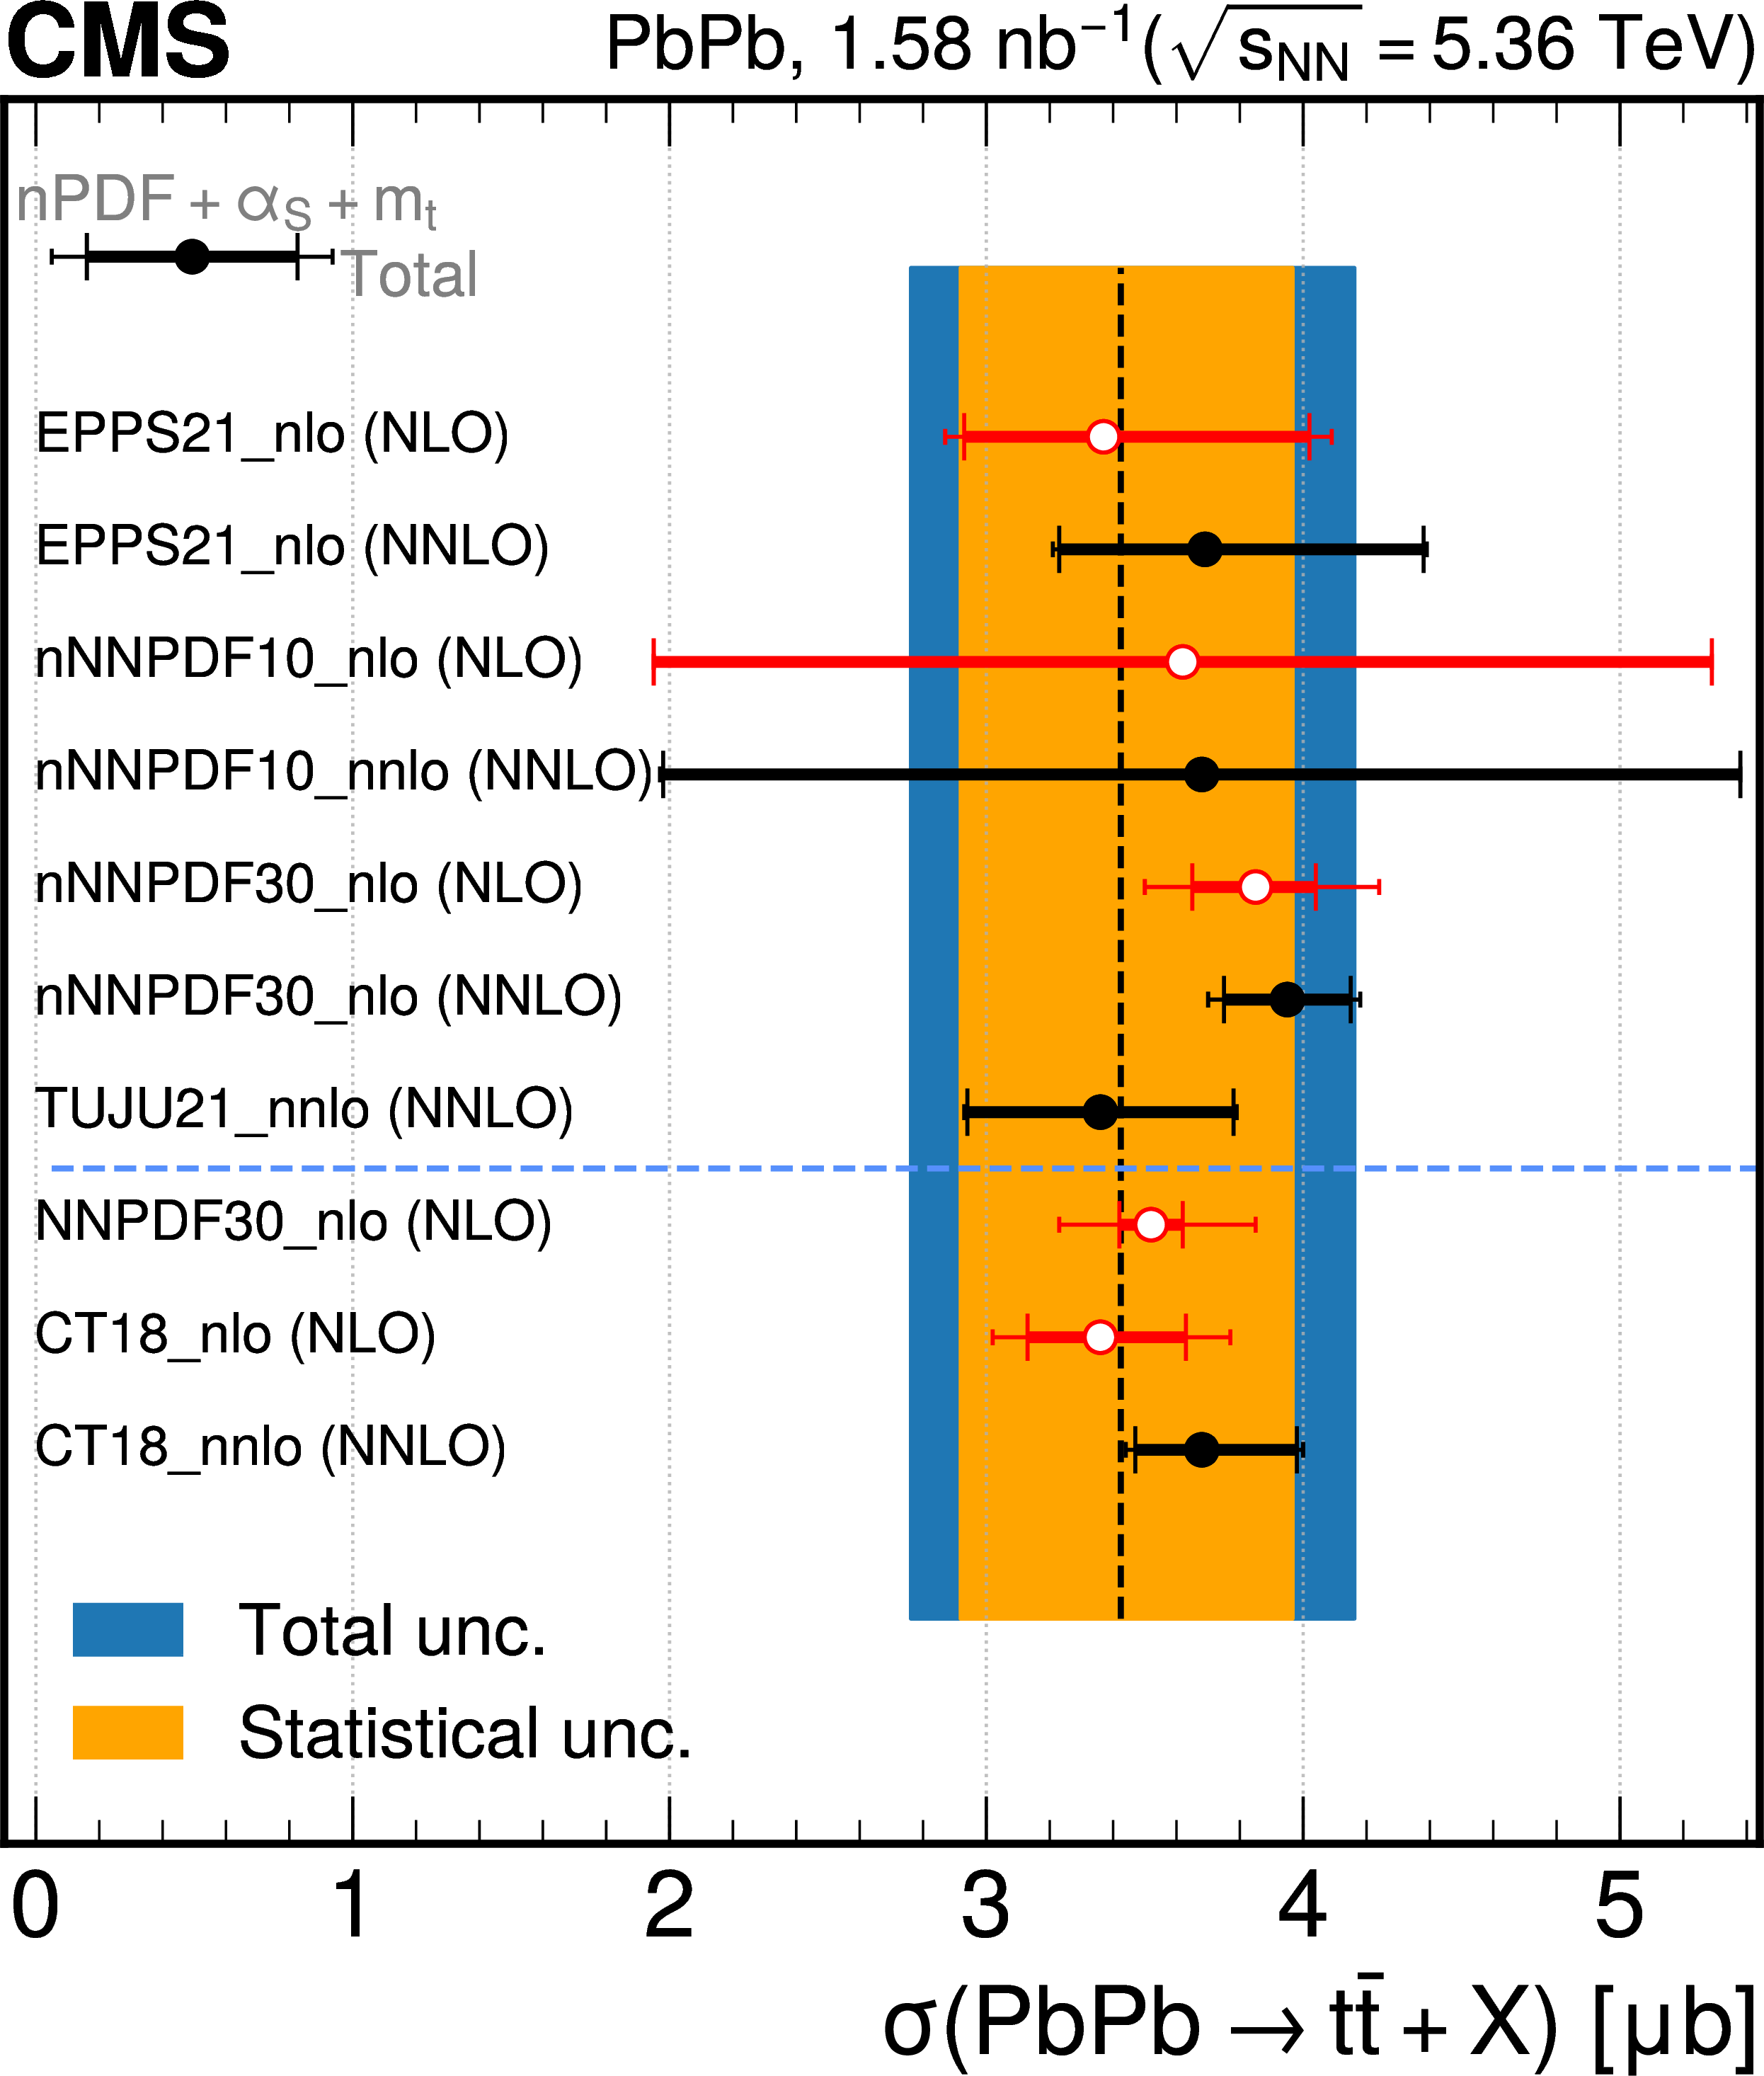
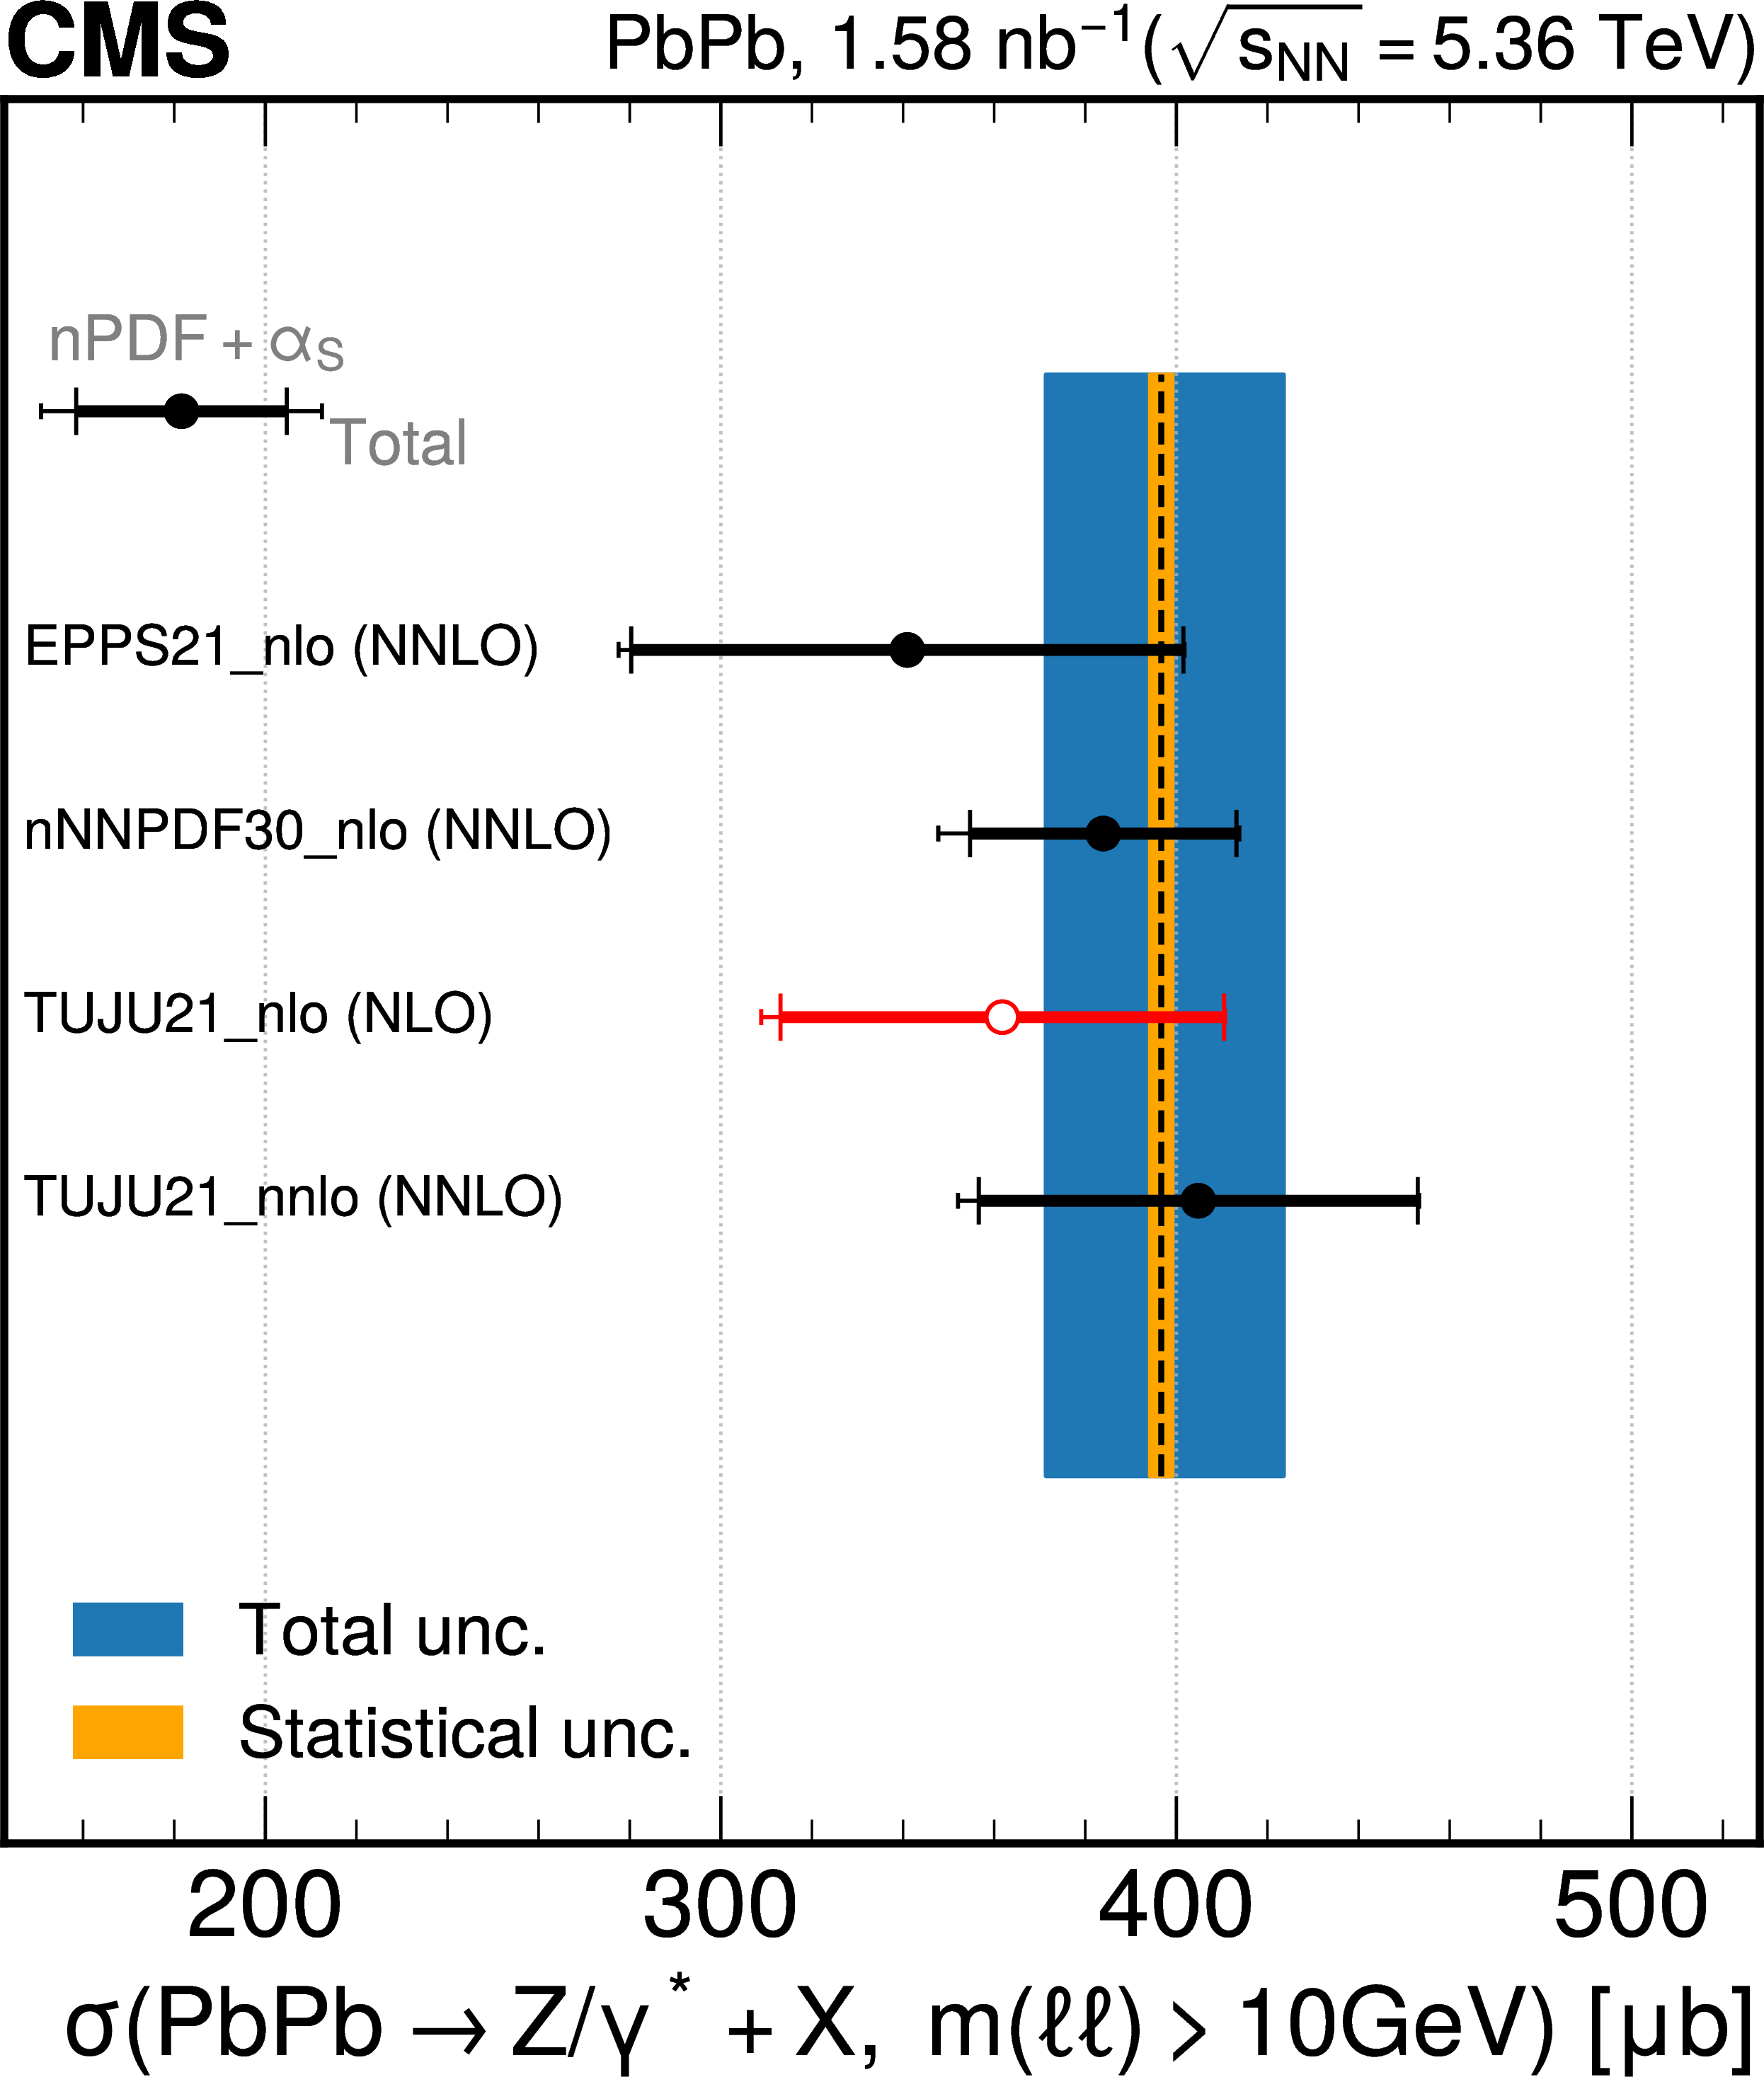
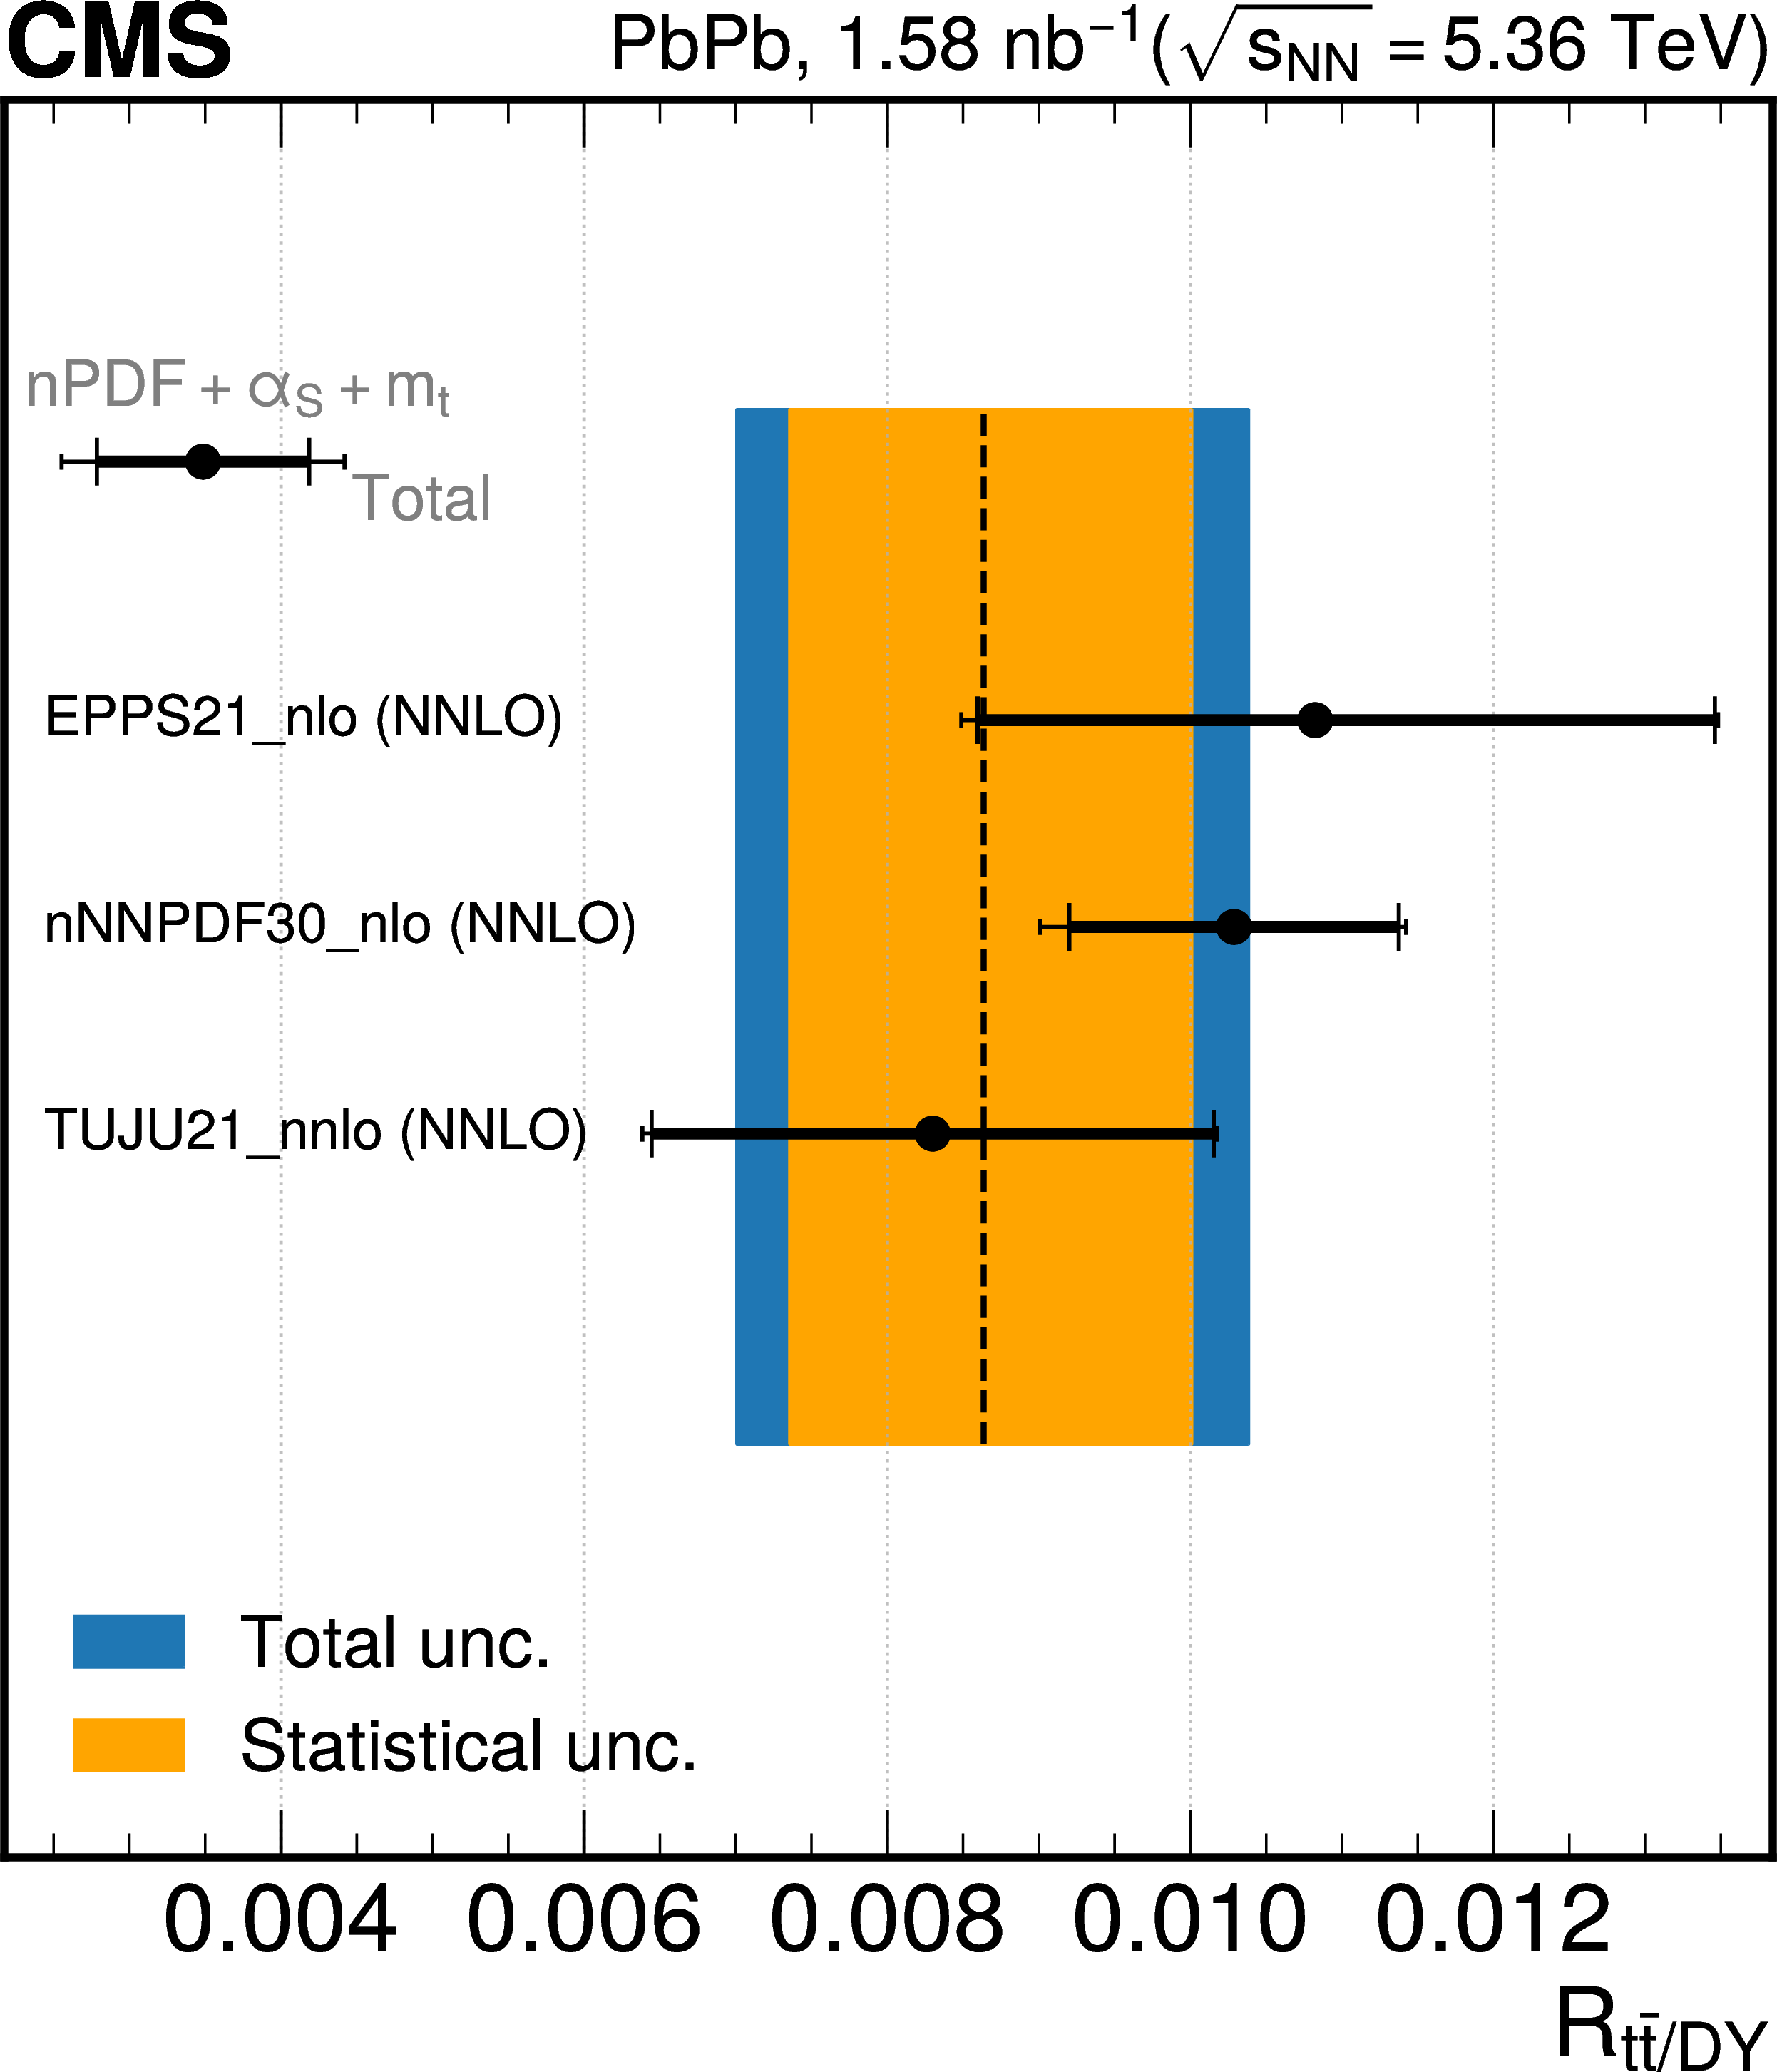
Experimental measurements (colored bands) of the $ \mathrm{t} \overline{\mathrm{t}} $ cross section (upper), DY cross section (middle), and $ R_{{\mathrm{t}\overline{\mathrm{t}}} /\mathrm{DY}} $ ratio (lower) in inclusive $ \mathrm{Pb}\mathrm{Pb} $ collisions at $ \sqrt{\smash[b]{s_{_{\mathrm{NN}}}}}= $ 5.36 TeV compared with the corresponding NLO (red bars) or NNLO $ + $ NNLL (black bars) theoretical predictions obtained with the EPPS21_nlo, nNNPDF10_(n)nlo, nNNPDF30_nlo, and TUJU21_(n)nlo nPDF sets. The error bars represent the theoretical uncertainties, and the blue (orange) area shows the total (statistical) uncertainties of the measurements. In the upper plot a dashed line separates the theory predictions obtained with nuclear PDFs (above the line) from those with the proton PDFs (below the line). |
png pdf |
Figure 9-a:
Experimental measurements (colored bands) of the $ \mathrm{t} \overline{\mathrm{t}} $ cross section (upper), DY cross section (middle), and $ R_{{\mathrm{t}\overline{\mathrm{t}}} /\mathrm{DY}} $ ratio (lower) in inclusive $ \mathrm{Pb}\mathrm{Pb} $ collisions at $ \sqrt{\smash[b]{s_{_{\mathrm{NN}}}}}= $ 5.36 TeV compared with the corresponding NLO (red bars) or NNLO $ + $ NNLL (black bars) theoretical predictions obtained with the EPPS21_nlo, nNNPDF10_(n)nlo, nNNPDF30_nlo, and TUJU21_(n)nlo nPDF sets. The error bars represent the theoretical uncertainties, and the blue (orange) area shows the total (statistical) uncertainties of the measurements. In the upper plot a dashed line separates the theory predictions obtained with nuclear PDFs (above the line) from those with the proton PDFs (below the line). |
png pdf |
Figure 9-b:
Experimental measurements (colored bands) of the $ \mathrm{t} \overline{\mathrm{t}} $ cross section (upper), DY cross section (middle), and $ R_{{\mathrm{t}\overline{\mathrm{t}}} /\mathrm{DY}} $ ratio (lower) in inclusive $ \mathrm{Pb}\mathrm{Pb} $ collisions at $ \sqrt{\smash[b]{s_{_{\mathrm{NN}}}}}= $ 5.36 TeV compared with the corresponding NLO (red bars) or NNLO $ + $ NNLL (black bars) theoretical predictions obtained with the EPPS21_nlo, nNNPDF10_(n)nlo, nNNPDF30_nlo, and TUJU21_(n)nlo nPDF sets. The error bars represent the theoretical uncertainties, and the blue (orange) area shows the total (statistical) uncertainties of the measurements. In the upper plot a dashed line separates the theory predictions obtained with nuclear PDFs (above the line) from those with the proton PDFs (below the line). |
png pdf |
Figure 9-c:
Experimental measurements (colored bands) of the $ \mathrm{t} \overline{\mathrm{t}} $ cross section (upper), DY cross section (middle), and $ R_{{\mathrm{t}\overline{\mathrm{t}}} /\mathrm{DY}} $ ratio (lower) in inclusive $ \mathrm{Pb}\mathrm{Pb} $ collisions at $ \sqrt{\smash[b]{s_{_{\mathrm{NN}}}}}= $ 5.36 TeV compared with the corresponding NLO (red bars) or NNLO $ + $ NNLL (black bars) theoretical predictions obtained with the EPPS21_nlo, nNNPDF10_(n)nlo, nNNPDF30_nlo, and TUJU21_(n)nlo nPDF sets. The error bars represent the theoretical uncertainties, and the blue (orange) area shows the total (statistical) uncertainties of the measurements. In the upper plot a dashed line separates the theory predictions obtained with nuclear PDFs (above the line) from those with the proton PDFs (below the line). |
png pdf |
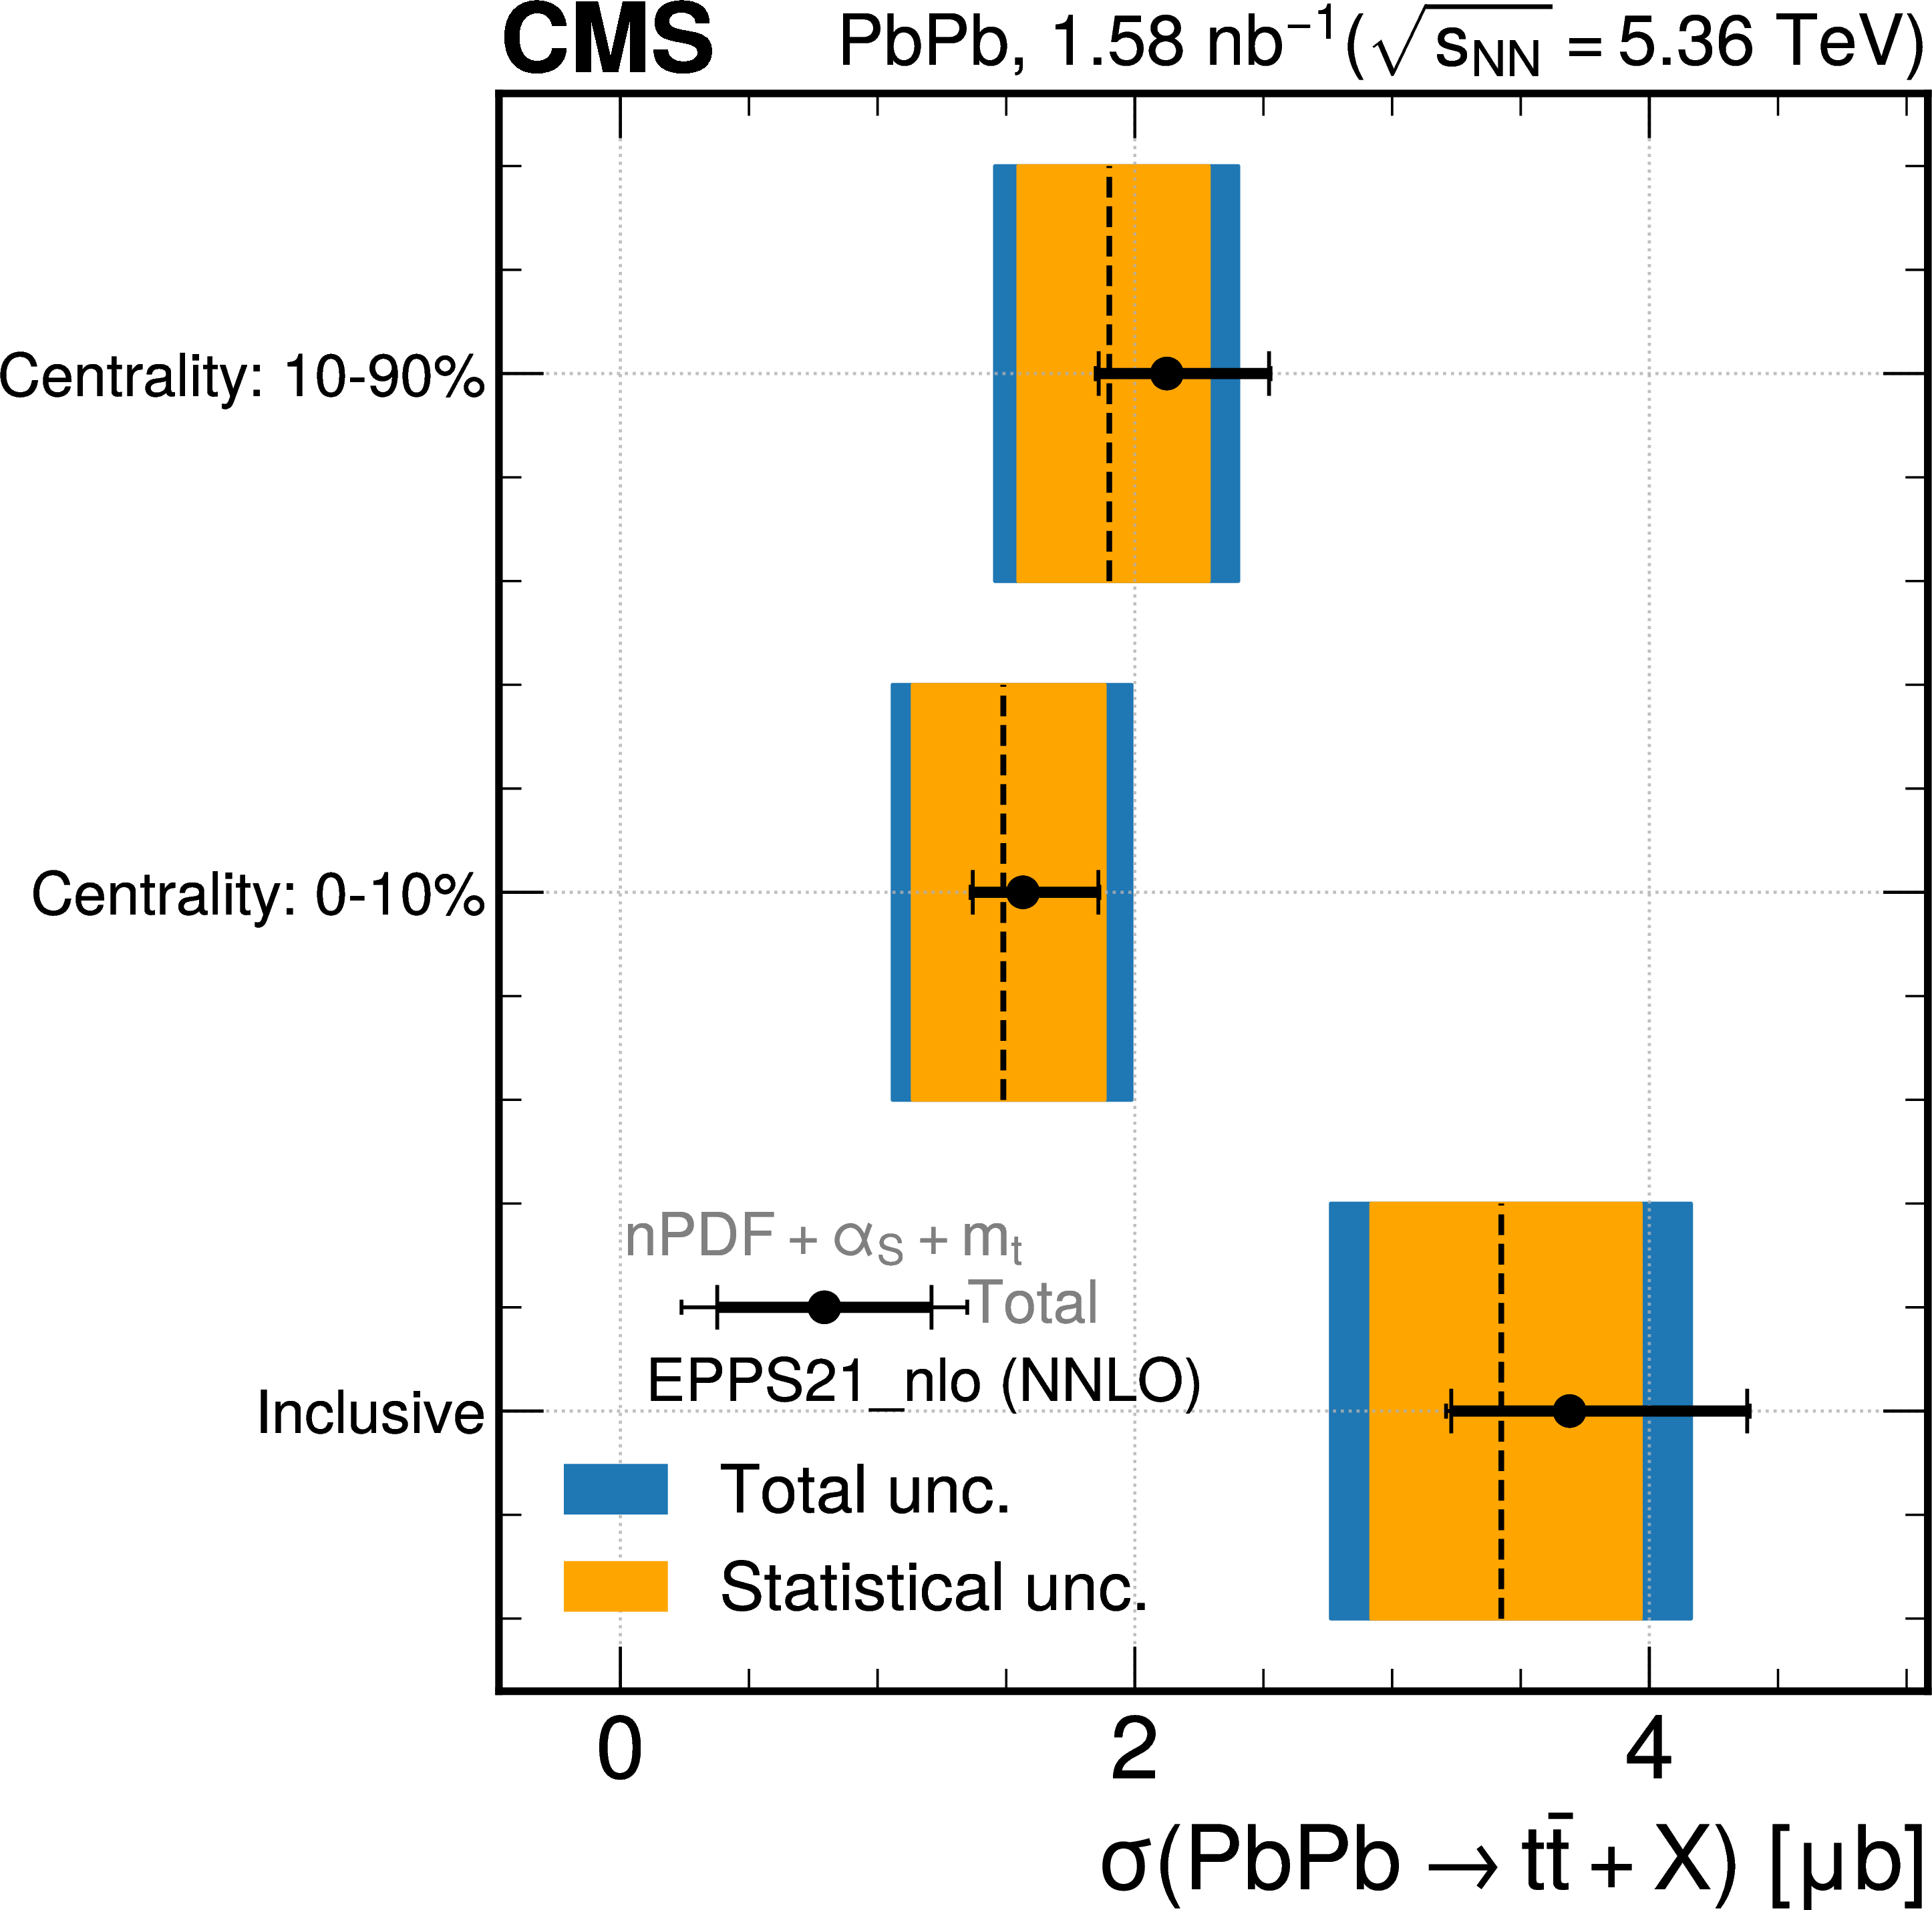
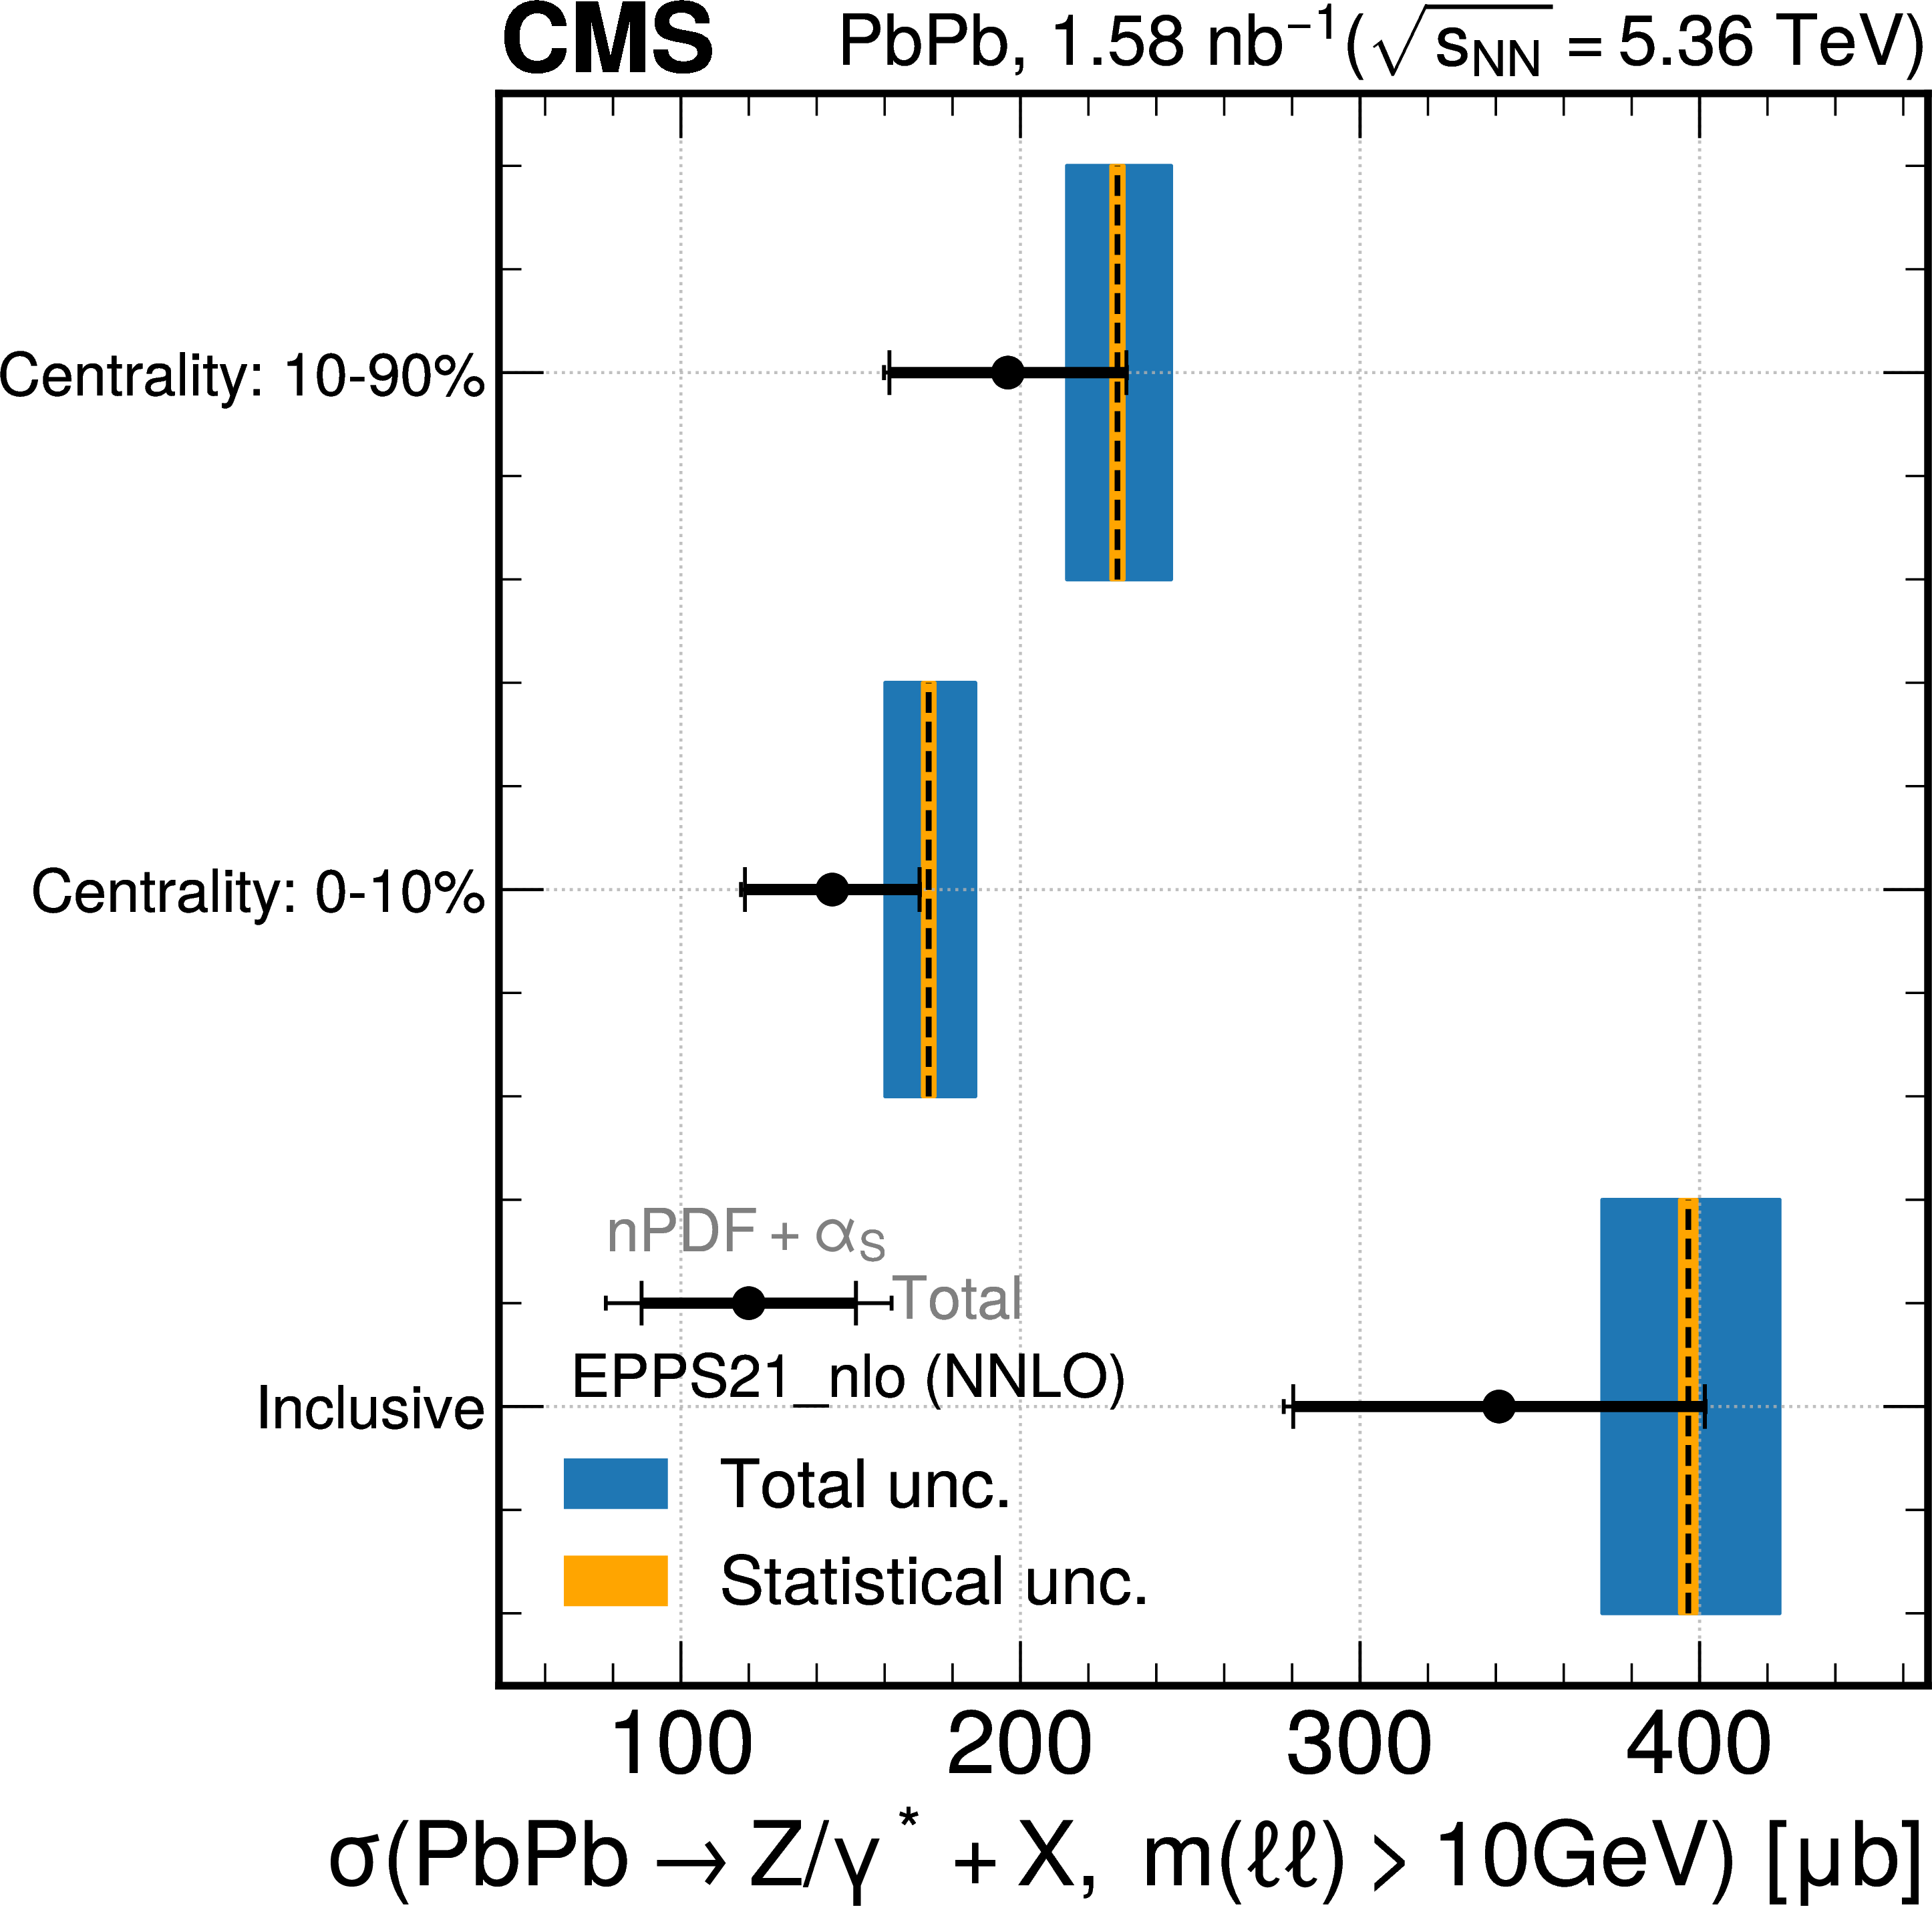
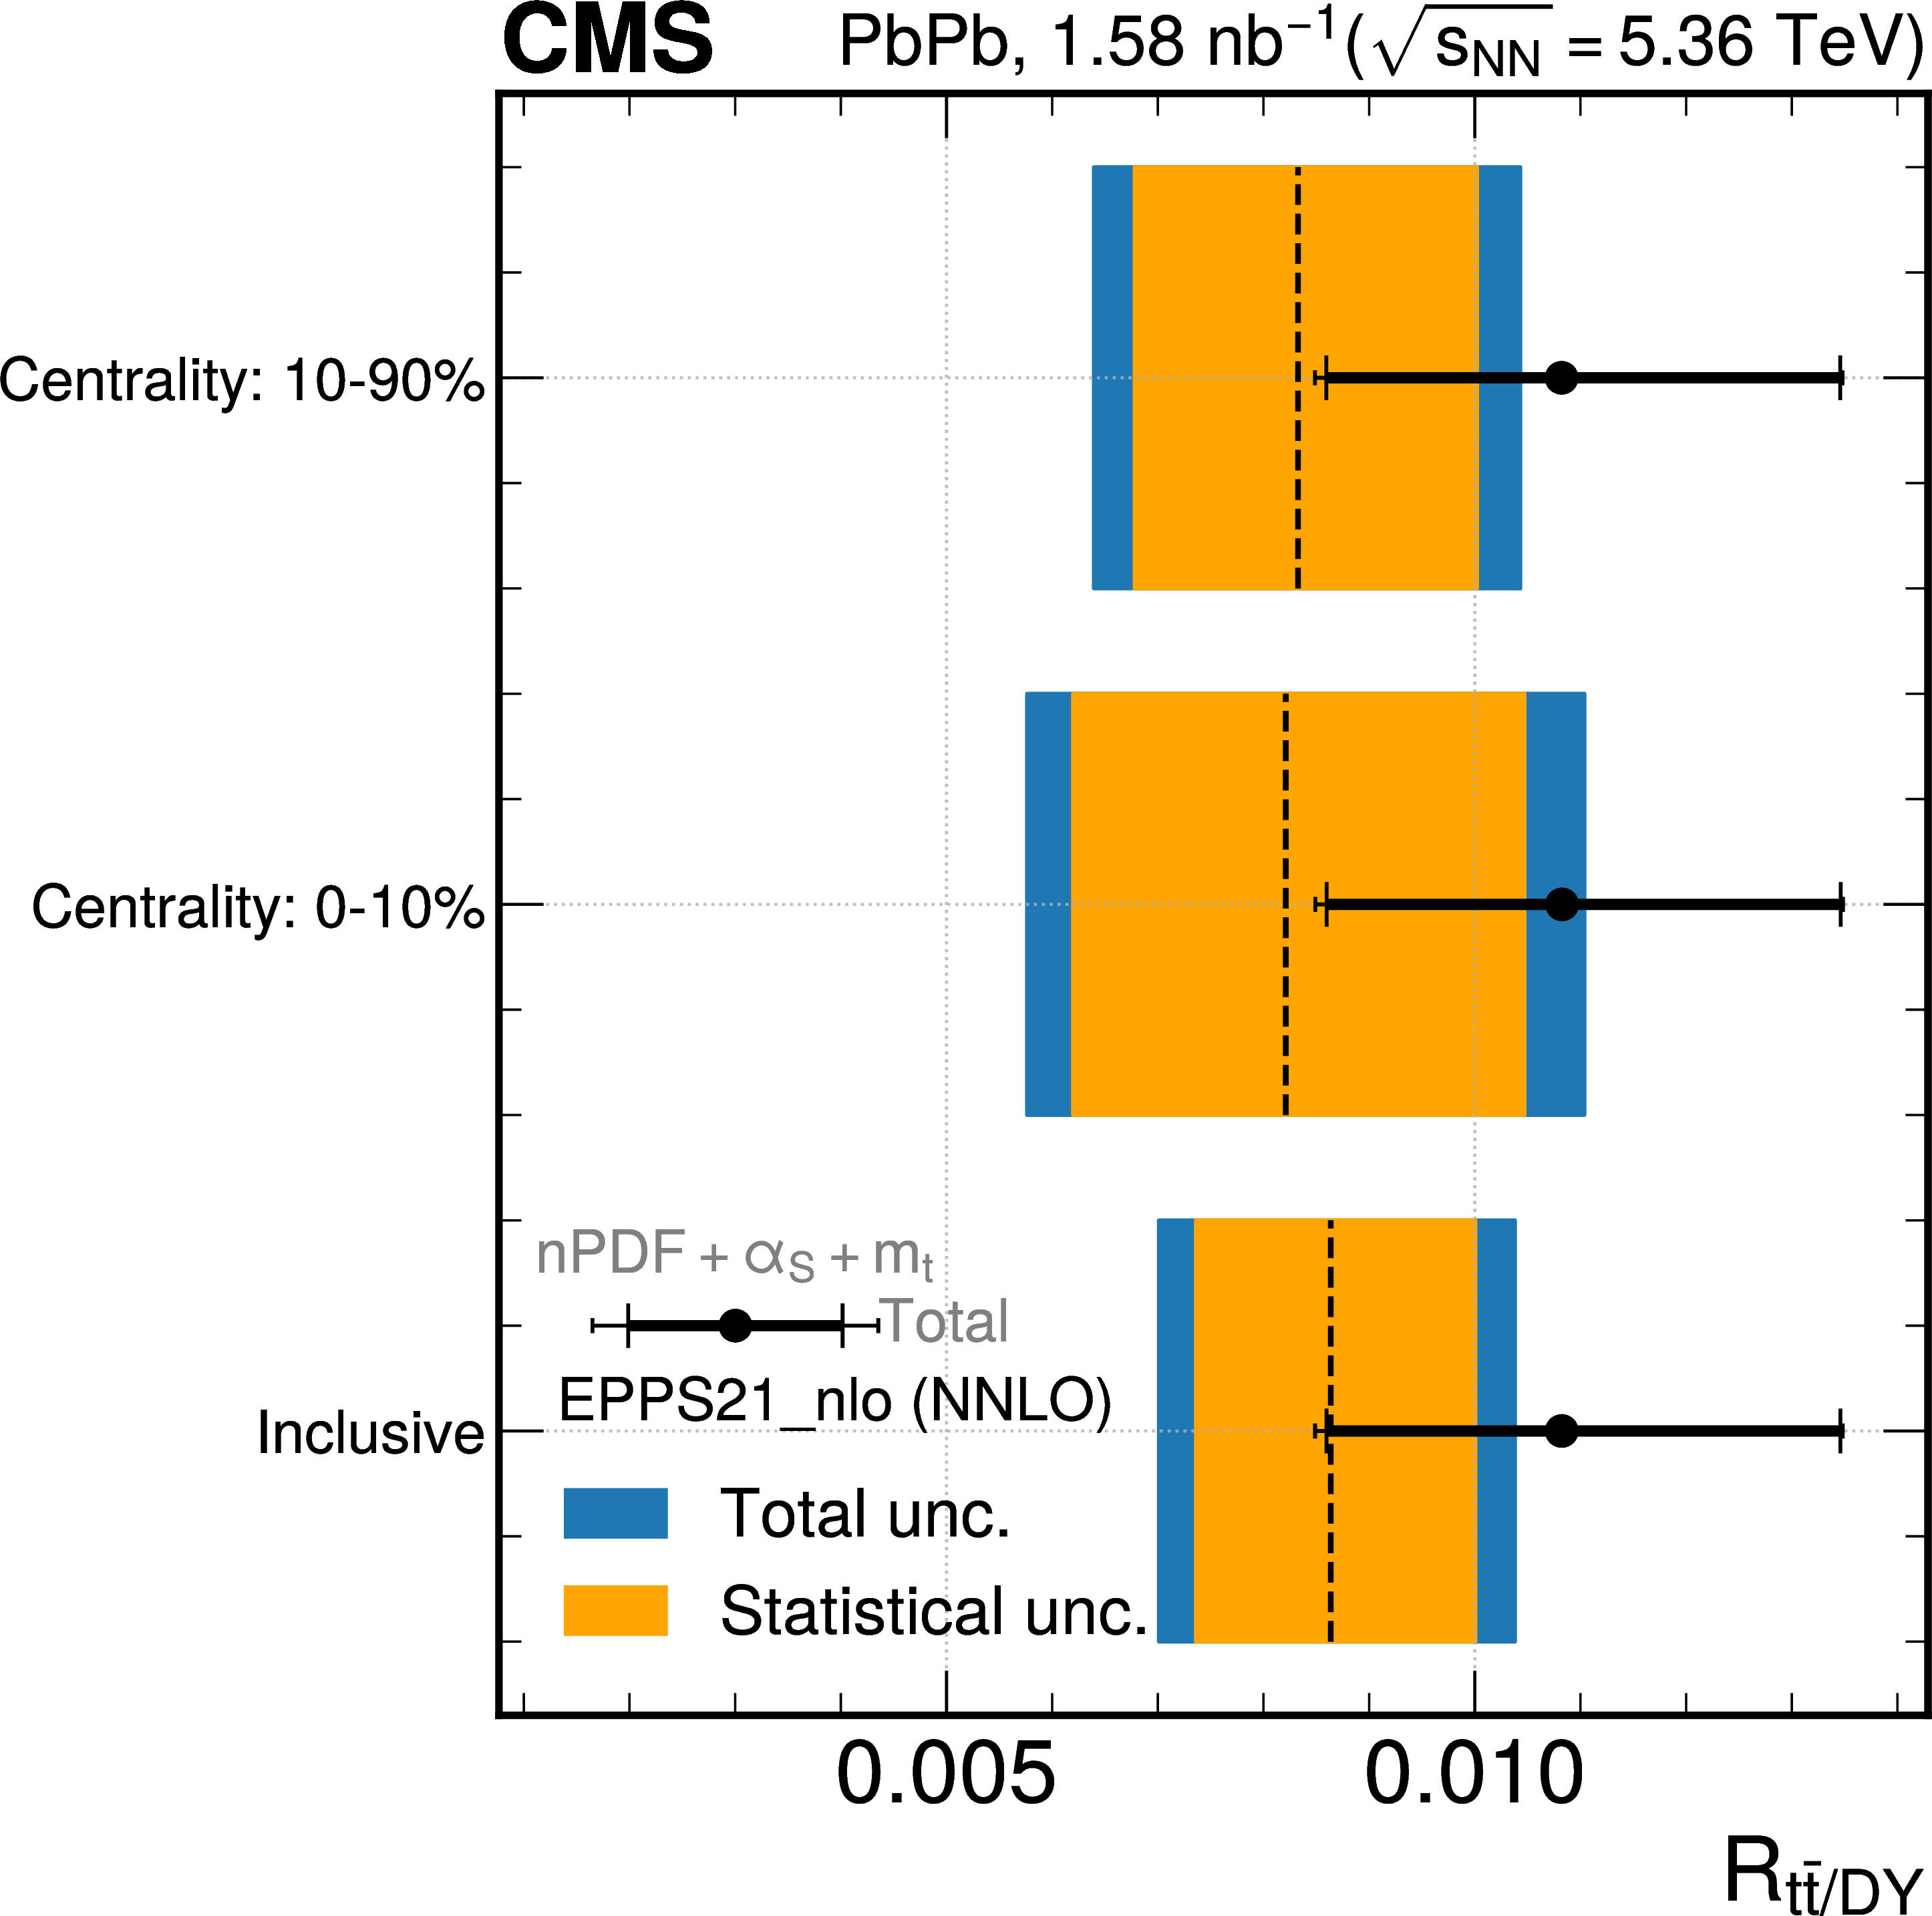
Figure 10:
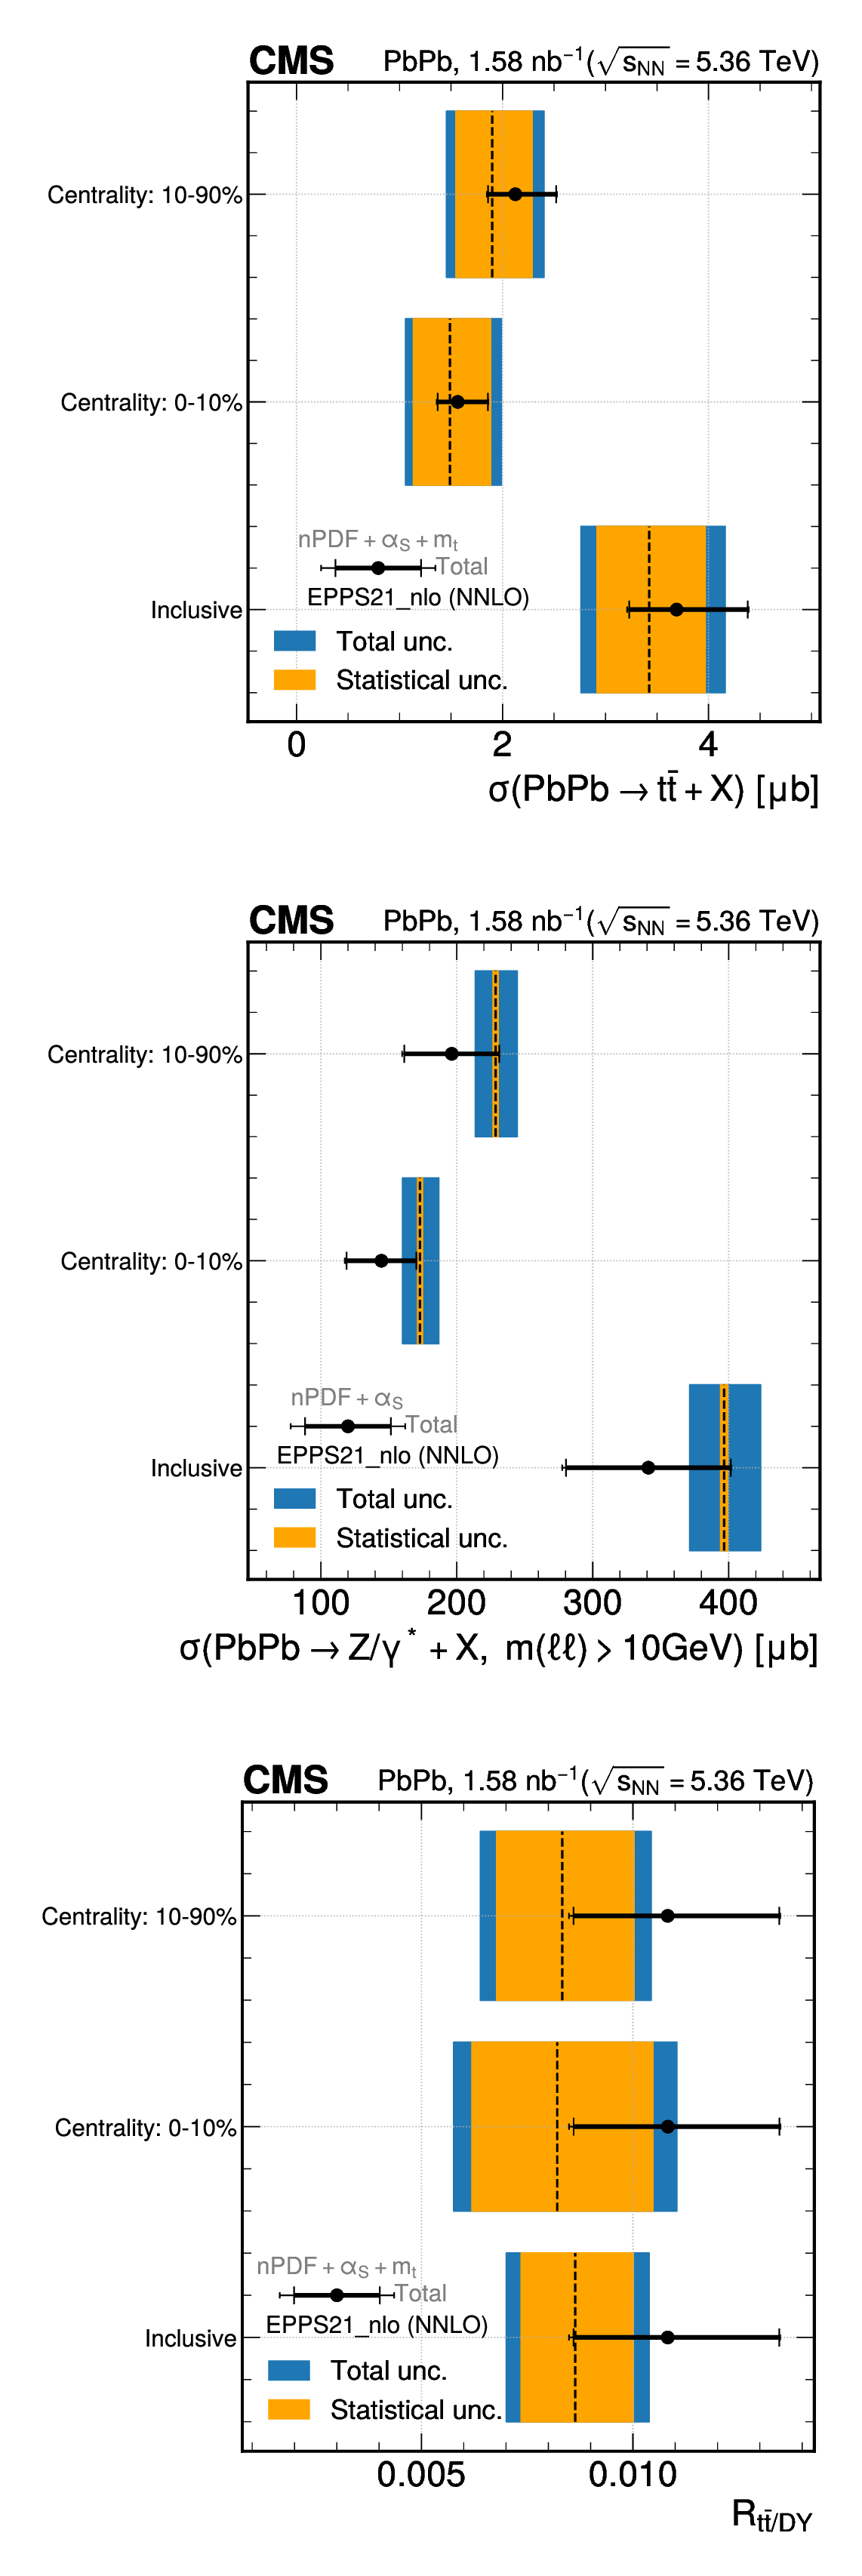
Experimental measurements (colored bands) of the $ \mathrm{t} \overline{\mathrm{t}} $ cross section (upper), DY cross section (middle), and $ R_{{\mathrm{t}\overline{\mathrm{t}}} /\mathrm{DY}} $ ratio (lower) in semicentral (10--90%), central (0--10%), and inclusive $ \mathrm{Pb}\mathrm{Pb} $ collisions at $ \sqrt{\smash[b]{s_{_{\mathrm{NN}}}}}= $ 5.36 TeV compared with the corresponding NNLO $ + $ NNLL theoretical predictions (black markers with error bars) obtained with the EPPS21_nlo [23] nPDF set. The blue (orange) bands indicate the total (statistical) uncertainties of the measured observables, whereas the error bars represent the uncertainties in the theory calculations. |
png pdf |
Figure 10-a:
Experimental measurements (colored bands) of the $ \mathrm{t} \overline{\mathrm{t}} $ cross section (upper), DY cross section (middle), and $ R_{{\mathrm{t}\overline{\mathrm{t}}} /\mathrm{DY}} $ ratio (lower) in semicentral (10--90%), central (0--10%), and inclusive $ \mathrm{Pb}\mathrm{Pb} $ collisions at $ \sqrt{\smash[b]{s_{_{\mathrm{NN}}}}}= $ 5.36 TeV compared with the corresponding NNLO $ + $ NNLL theoretical predictions (black markers with error bars) obtained with the EPPS21_nlo [23] nPDF set. The blue (orange) bands indicate the total (statistical) uncertainties of the measured observables, whereas the error bars represent the uncertainties in the theory calculations. |
png pdf |
Figure 10-b:
Experimental measurements (colored bands) of the $ \mathrm{t} \overline{\mathrm{t}} $ cross section (upper), DY cross section (middle), and $ R_{{\mathrm{t}\overline{\mathrm{t}}} /\mathrm{DY}} $ ratio (lower) in semicentral (10--90%), central (0--10%), and inclusive $ \mathrm{Pb}\mathrm{Pb} $ collisions at $ \sqrt{\smash[b]{s_{_{\mathrm{NN}}}}}= $ 5.36 TeV compared with the corresponding NNLO $ + $ NNLL theoretical predictions (black markers with error bars) obtained with the EPPS21_nlo [23] nPDF set. The blue (orange) bands indicate the total (statistical) uncertainties of the measured observables, whereas the error bars represent the uncertainties in the theory calculations. |
png pdf |
Figure 10-c:
Experimental measurements (colored bands) of the $ \mathrm{t} \overline{\mathrm{t}} $ cross section (upper), DY cross section (middle), and $ R_{{\mathrm{t}\overline{\mathrm{t}}} /\mathrm{DY}} $ ratio (lower) in semicentral (10--90%), central (0--10%), and inclusive $ \mathrm{Pb}\mathrm{Pb} $ collisions at $ \sqrt{\smash[b]{s_{_{\mathrm{NN}}}}}= $ 5.36 TeV compared with the corresponding NNLO $ + $ NNLL theoretical predictions (black markers with error bars) obtained with the EPPS21_nlo [23] nPDF set. The blue (orange) bands indicate the total (statistical) uncertainties of the measured observables, whereas the error bars represent the uncertainties in the theory calculations. |
| Tables | |
png pdf |
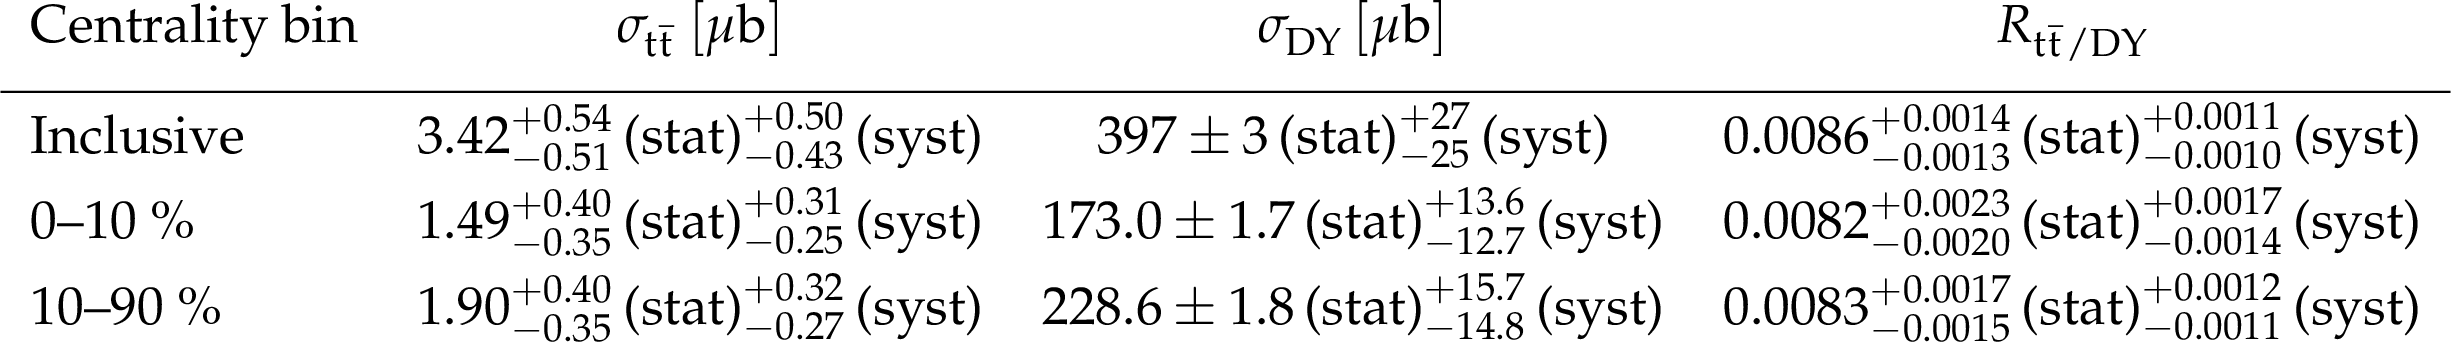
Table 1:
Measured $ \mathrm{t} \overline{\mathrm{t}} $ cross section, DY cross section, and $ R_{{\mathrm{t}\overline{\mathrm{t}}} /\mathrm{DY}} $ ratio for three different $ \mathrm{Pb}\mathrm{Pb} $ centrality selections. For each measurement, the statistical and systematic uncertainty components are shown separately. |
| Summary |
| The first measurement of the inclusive production of top quark pairs ($ {\mathrm{t}\overline{\mathrm{t}}} $) in lead-lead ($ \mathrm{Pb}\mathrm{Pb} $) collisions at a nucleon-nucleon center-of-mass energy of $ \sqrt{\smash[b]{s_{_{\mathrm{NN}}}}}= $ 5.36 TeV has been presented, extending earlier studies performed at lower collision energies. The analysis is based on dilepton events selected from the 2023 dataset recorded by the CMS experiment, corresponding to an integrated luminosity of 1.58$ \text{nb}^{-1}$. Several improvements have been implemented---including enhanced electron identification and lepton isolation, refined heavy-flavor jet identification, and a dedicated calibration of the b jet energy scale---which collectively provide a substantial gain in precision compared with previous analyses. The cross sections $ \sigma_{{\mathrm{t}\overline{\mathrm{t}}} }= $ 3.42 $ ^{+0.54}_{-0.51} $ $ $ (stat) $ ^{+0.50}_{-0.43} $ (syst) $\mu b$, and $ \sigma_\text{DY}= $ 397 $ \pm $ 3 (stat) $ ^{+27}_{-25} $ (syst) $\mu b$ for the Drell--Yan process, along with their ratio $ R_{{\mathrm{t}\overline{\mathrm{t}}} /\mathrm{DY}}= $ 0.0086 $ ^{+0.0014}_{-0.0013} $ $ $ (stat) $ ^{+0.0011}_{-0.0010} $ (syst), have been measured. The $ \sigma_{{\mathrm{t}\overline{\mathrm{t}}} } $ and $ R_{{\mathrm{t}\overline{\mathrm{t}}} /\mathrm{DY}} $ measurements have total uncertainties of $ {\approx}20% $ and are consistent with perturbative quantum chromodynamics calculations at next-to-next-to-leading-order accuracy obtained using different nuclear parton distribution functions. Results for central and semicentral $ \mathrm{Pb}\mathrm{Pb} $ collisions are also reported for the first time to examine the dependence of the top quark yields on the collision impact parameter. Combined with the higher collision energy and the larger data samples anticipated for the remainder of Run 3, these developments firmly establish top quark production as a future probe of initial- and final-state effects in heavy ions. |
| References | ||||
| 1 | CMS Collaboration | Stairway to discovery: a report on the CMS programme of cross section measurements from millibarns to femtobarns | Phys. Rept. 1115 (2025) 3 | CMS-SMP-23-004 2405.18661 |
| 2 | ATLAS Collaboration | Climbing to the top of the ATLAS 13 TeV data | Phys. Rept. 1116 (2025) 127 | 2404.10674 |
| 3 | D. d'Enterria, K. Krajcz \'a r, and H. Paukkunen | Top-quark production in proton-nucleus and nucleus-nucleus collisions at LHC energies and beyond | PLB 746 (2015) 64 | 1501.05879 |
| 4 | L. Apolinario, J. G. Milhano, G. P. Salam, and C. A. Salgado | Probing the time structure of the quark-gluon plasma with top quarks | PRL 120 (2018) 232301 | 1711.03105 |
| 5 | Particle Data Group , S. Navas et al. | Review of particle physics | PRD 110 (2024) 030001 | |
| 6 | CMS Collaboration | Measurement of differential $ \mathrm{t} \overline{\mathrm{t}} $ production cross sections in the full kinematic range using lepton+jets events from proton-proton collisions at $ \sqrt{s} = $ 13 TeV | PRD 104 (2021) 092013 | CMS-TOP-20-001 2108.02803 |
| 7 | CMS Collaboration | Measurement of the $ \mathrm{t} \overline{\mathrm{t}} $ production cross section, the top quark mass, and the strong coupling constant using dilepton events in pp collisions at $ \sqrt{s} = $ 13 TeV | EPJC 79 (2019) 368 | CMS-TOP-17-001 1812.10505 |
| 8 | CMS Collaboration | Observation of top quark production in proton-nucleus collisions | PRL 119 (2017) 242001 | CMS-HIN-17-002 1709.07411 |
| 9 | ATLAS Collaboration | Observation of $ \mathrm{t} \overline{\mathrm{t}} $ production in the lepton+jets and dilepton channels in p+Pb collisions at $ {\sqrt{\smash[b]{s_{_{\mathrm{NN}}}}}} = $ 8.16 TeV with the ATLAS detector | JHEP 11 (2024) 101 | 2405.05078 |
| 10 | CMS Collaboration | Evidence for top quark production in nucleus-nucleus collisions | PRL 125 (2020) 222001 | CMS-HIN-19-001 2006.11110 |
| 11 | ATLAS Collaboration | Observation of $ \mathrm{t} \overline{\mathrm{t}} $ production in Pb+Pb collisions at $ {\sqrt{\smash[b]{s_{_{\mathrm{NN}}}}}} = $ 5.02 TeV with the ATLAS detector | PRL 134 (2025) 142301 | 2411.10186 |
| 12 | CMS Collaboration | HEPData record for this analysis | link | |
| 13 | CMS Collaboration | The CMS experiment at the CERN LHC | JINST 3 (2008) S08004 | |
| 14 | CMS Collaboration | Development of the CMS detector for the CERN LHC Run 3 | JINST 19 (2024) P05064 | CMS-PRF-21-001 2309.05466 |
| 15 | CMS Collaboration | Performance of the CMS level-1 trigger in proton-proton collisions at $ \sqrt{s} = $ 13 TeV | JINST 15 (2020) P10017 | CMS-TRG-17-001 2006.10165 |
| 16 | CMS Collaboration | The CMS trigger system | JINST 12 (2017) P01020 | CMS-TRG-12-001 1609.02366 |
| 17 | CMS Collaboration | Performance of the CMS high-level trigger during LHC run 2 | JINST 19 (2024) P11021 | CMS-TRG-19-001 2410.17038 |
| 18 | CMS Collaboration | Electron and photon reconstruction and identification with the CMS experiment at the CERN LHC | JINST 16 (2021) P05014 | CMS-EGM-17-001 2012.06888 |
| 19 | CMS Collaboration | Performance of the CMS muon detector and muon reconstruction with proton-proton collisions at $ \sqrt{s}= $ 13 TeV | JINST 13 (2018) P06015 | CMS-MUO-16-001 1804.04528 |
| 20 | CMS Collaboration | Description and performance of track and primary-vertex reconstruction with the CMS tracker | JINST 9 (2014) P10009 | CMS-TRK-11-001 1405.6569 |
| 21 | CMS Collaboration | Status of zero degree calorimeter for the CMS experiment | AIP Conf. Proc. 867 (2006) 258 | nucl-ex/0608052 |
| 22 | CMS Collaboration | Particle-flow reconstruction and global event description with the CMS detector | JINST 12 (2017) P10003 | CMS-PRF-14-001 1706.04965 |
| 23 | K. J. Eskola, P. Paakkinen, H. Paukkunen, and C. A. Salgado | EPPS21: a global QCD analysis of nuclear PDFs | EPJC 82 (2022) 413 | 2112.12462 |
| 24 | T.-J. Hou et al. | New CTEQ global analysis of quantum chromodynamics with high-precision data from the LHC | PRD 103 (2021) 014013 | 1912.10053 |
| 25 | T. Sjöstrand et al. | An introduction to PYTHIA 8.2 | Comput. Phys. Commun. 191 (2015) 159 | 1410.3012 |
| 26 | CMS Collaboration | Extraction and validation of a new set of CMS PYTHIA 8 tunes from underlying-event measurements | EPJC 80 (2020) 4 | CMS-GEN-17-001 1903.12179 |
| 27 | I. P. Lokhtin et al. | Heavy ion event generator HYDJET++ (HYDrodynamics plus JETs) | Comput. Phys. Commun. 180 (2009) 779 | 0809.2708 |
| 28 | D. d'Enterria and C. Loizides | Progress in the Glauber model at collider energies | Ann. Rev. Nucl. Part. Sci. 71 (2021) 315 | 2011.14909 |
| 29 | GEANT4 Collaboration | GEANT 4---a simulation toolkit | NIM A 506 (2003) 250 | |
| 30 | J. Alwall et al. | The automated computation of tree-level and next-to-leading order differential cross sections, and their matching to parton shower simulations | JHEP 07 (2014) 079 | 1405.0301 |
| 31 | S. Frixione, P. Nason, and G. Ridolfi | A positive-weight next-to-leading-order Monte Carlo for heavy flavour hadroproduction | JHEP 09 (2007) 126 | 0707.3088 |
| 32 | R. Frederix and S. Frixione | Merging meets matching in MC@NLO | JHEP 12 (2012) 061 | 1209.6215 |
| 33 | M. Czakon, P. Fiedler, and A. Mitov | Total top-quark pair-production cross section at hadron colliders through $ \mathcal{O}(\alpha_s^4) $ | PRL 110 (2013) 252004 | 1303.6254 |
| 34 | E. Re | Single-top $ {\mathrm{W}} t $-channel production matched with parton showers using the POWHEG method | EPJC 71 (2011) 1547 | 1009.2450 |
| 35 | T. Chen and C. Guestrin | XGBoost: a scalable tree boosting system | in 22nd ACM SIGKDD Int. Conf. on Knowledge Discovery and Data Mining (KDD'16), 2016 link |
|
| 36 | F. Pedregosa et al. | Scikit-learn: machine learning in Python | J. Mach. Learn. Res. 12 (2011) 2825 | 1201.0490 |
| 37 | M. Cacciari, G. P. Salam, and G. Soyez | SoftKiller, a particle-level pileup removal method | EPJC 75 (2015) 59 | 1407.0408 |
| 38 | CMS Collaboration | Measurement of light-by-light scattering and the Breit--Wheeler process, and search for axion-like particles in ultraperipheral PbPb collisions at $ {\sqrt{\smash[b]{s_{_{\mathrm{NN}}}}}} = $ 5.02 TeV | JHEP 08 (2025) 006 | CMS-HIN-21-015 2412.15413 |
| 39 | R. Pezoa, L. Salinas, and C. Torres | Explainability of high energy physics events classification using SHAP | J. Phys. Conf. Ser. 2438 (2023) 12082 | |
| 40 | T. Akiba et al. | Optuna: a next-generation hyperparameter optimization framework | in 25th ACM SIGKDD Int. Conf. on Knowledge Discovery and Data Mining (KDD'19), 2019 link |
|
| 41 | M. Cacciari, G. P. Salam, and G. Soyez | The anti-$ k_{\mathrm{T}} $ jet clustering algorithm | JHEP 04 (2008) 063 | 0802.1189 |
| 42 | M. Cacciari, G. P. Salam, and G. Soyez | FastJet user manual | EPJC 72 (2012) 1896 | 1111.6097 |
| 43 | CMS Collaboration | A unified approach for jet tagging in Run 3 at $ \sqrt{s}= $ 13.6 TeV in CMS | CMS Detector Performance Summary CMS-DP-2024-066, 2024 CDS |
|
| 44 | CMS Collaboration | Jet tagging performance in Run 3 PbPb collisions at 5.36 TeV in CMS | CMS Detector Performance Summary CMS-DP-2024-088, 2024 CDS |
|
| 45 | CMS Collaboration | Performance of heavy-flavour jet identification in Lorentz-boosted topologies in proton-proton collisions at $ \sqrt{s} = $ 13 TeV | JINST 20 (2025) P11006 | CMS-BTV-22-001 2510.10228 |
| 46 | M. J. Oreglia | A study of the reactions $ \psi^\prime \to \gamma \gamma \psi $ | PhD thesis, Stanford University, SLAC Report SLAC-R-236, see Appendix D, 1980 link |
|
| 47 | J. L. Bentley | Multidimensional binary search trees used for associative searching | Commun. ACM 18 (1975) 509 | |
| 48 | R. Brun and F. Rademakers | ROOT: an object-oriented data analysis framework | NIM A 389 (1997) 81 | |
| 49 | J. S. Conway | Incorporating nuisance parameters in likelihoods for multisource spectra | in, 2011 PHYSTAT 201 (2011) 115 |
1103.0354 |
| 50 | CMS Collaboration | The CMS statistical analysis and combination tool: Combine | Comput. Softw. Big Sci. 8 (2024) 19 | CMS-CAT-23-001 2404.06614 |
| 51 | W. Verkerke and D. Kirkby | The RooFit toolkit for data modeling | in the Int. Conf. on Computing in High Energy and Nuclear Physics (CHEP ): La Jolla CA, United States, March 24--28, 2003 Proc. 1 (2003) 3 |
physics/0306116 |
| 52 | L. Moneta et al. | The RooStats project | in the Int. Workshop on Advanced Computing and Analysis Techniques in Physics Research (ACAT ): Jaipur, India, February 22--27,, 2010 Proc. 1 (2010) 3 |
1009.1003 |
| 53 | CMS Collaboration | Precise determination of the mass of the Higgs boson and tests of compatibility of its couplings with the standard model predictions using proton collisions at 7 and 8 TeV | EPJC 75 (2015) 212 | CMS-HIG-14-009 1412.8662 |
| 54 | L. Demortier | $ p $ values and nuisance parameters | in Statistical issues for LHC physics. Proceedings, Workshop, PHYSTAT-LHC, Geneva, Switzerland, June 27-29,, 2007 link |
|
| 55 | M. Bahr et al. | Herwig++ physics and manual | EPJC 58 (2008) 639 | 0803.0883 |
| 56 | J. Bellm et al. | Herwig 7.0/Herwig++ 3.0 release note | EPJC 76 (2016) 196 | 1512.01178 |
| 57 | CMS Collaboration | Luminosity measurement for lead-lead collisions at $ {\sqrt{\smash[b]{s_{_{\mathrm{NN}}}}}} = $ 5.02 TeV in 2015 and 2018 at CMS | Submitted to Eur. Phys. J. C | CMS-LUM-20-002 2503.03946 |
| 58 | R. J. Barlow and C. Beeston | Fitting using finite Monte Carlo samples | Comput. Phys. Commun. 77 (1993) 219 | |
| 59 | CMS Collaboration | Differential cross section measurements for the production of top quark pairs and of additional jets using dilepton events from pp collisions at $ \sqrt{s} = $ 13 TeV | JHEP 02 (2025) 064 | CMS-TOP-20-006 2402.08486 |
| 60 | J. Butterworth et al. | PDF4LHC recommendations for LHC Run II | JPG 43 (2016) 23001 | 1510.03865 |
| 61 | G. Cowan, K. Cranmer, E. Gross, and O. Vitells | Asymptotic formulae for likelihood-based tests of new physics | EPJC 71 (2011) 1554 | 1007.1727 |
| 62 | S. Camarda et al. | DYTurbo: fast predictions for Drell--Yan processes | EPJC 80 (2020) 251 | 1910.07049 |
| 63 | NNPDF Collaboration | Nuclear parton distributions from lepton-nucleus scattering and the impact of an electron-ion collider | EPJC 79 (2019) 471 | 1904.00018 |
| 64 | R. Abdul Khalek et al. | nNNPDF3.0: evidence for a modified partonic structure in heavy nuclei | EPJC 82 (2022) 507 | 2201.12363 |
| 65 | I. Helenius, M. Walt, and W. Vogelsang | NNLO nuclear parton distribution functions with electroweak-boson production data from the LHC | PRD 105 (2022) 094031 | 2112.11904 |
| 66 | NNPDF Collaboration | Parton distributions for the LHC Run II | JHEP 04 (2015) 040 | 1410.8849 |
|
|
Compact Muon Solenoid LHC, CERN |
|

|

|

|

|

|