

Compact Muon Solenoid
LHC, CERN
| CMS-HIN-23-004 ; CERN-EP-2025-014 | ||
| Observation of nuclear modification of energy-energy correlators inside jets in heavy ion collisions | ||
| CMS Collaboration | ||
| 25 March 2025 | ||
| Phys. Lett. B 866 (2025) 139556 | ||
| Abstract: Energy-energy correlators are constructed by averaging the number of charged particle pairs within jets, weighted by the product of their transverse momenta, as a function of the angular separation of the particles within a pair. They are sensitive to a multitude of perturbative and nonperturbative quantum chromodynamics phenomena in high-energy particle collisions. Using lead-lead data recorded with the CMS detector, energy-energy correlators inside high transverse momentum jets are measured in heavy ion collisions for the first time. The data are obtained at a nucleon-nucleon center-of-mass energy of 5.02 TeV and correspond to an integrated luminosity of 1.70 nb$^{-1]$. A similar analysis is done for proton-proton collisions at the same center-of-mass energy to establish a reference. The ratio of lead-lead to proton-proton energy-energy correlators reveals significant jet substructure modifications in the quark-gluon plasma. The results are compared to different models that incorporate either color coherence or medium response effects, where the two effects predict similar substructure modifications. | ||
| Links: e-print arXiv:2503.19993 [hep-ex] (PDF) ; CDS record ; inSPIRE record ; HepData record ; Physics Briefing ; CADI line (restricted) ; | ||
| Figures | |
png pdf |
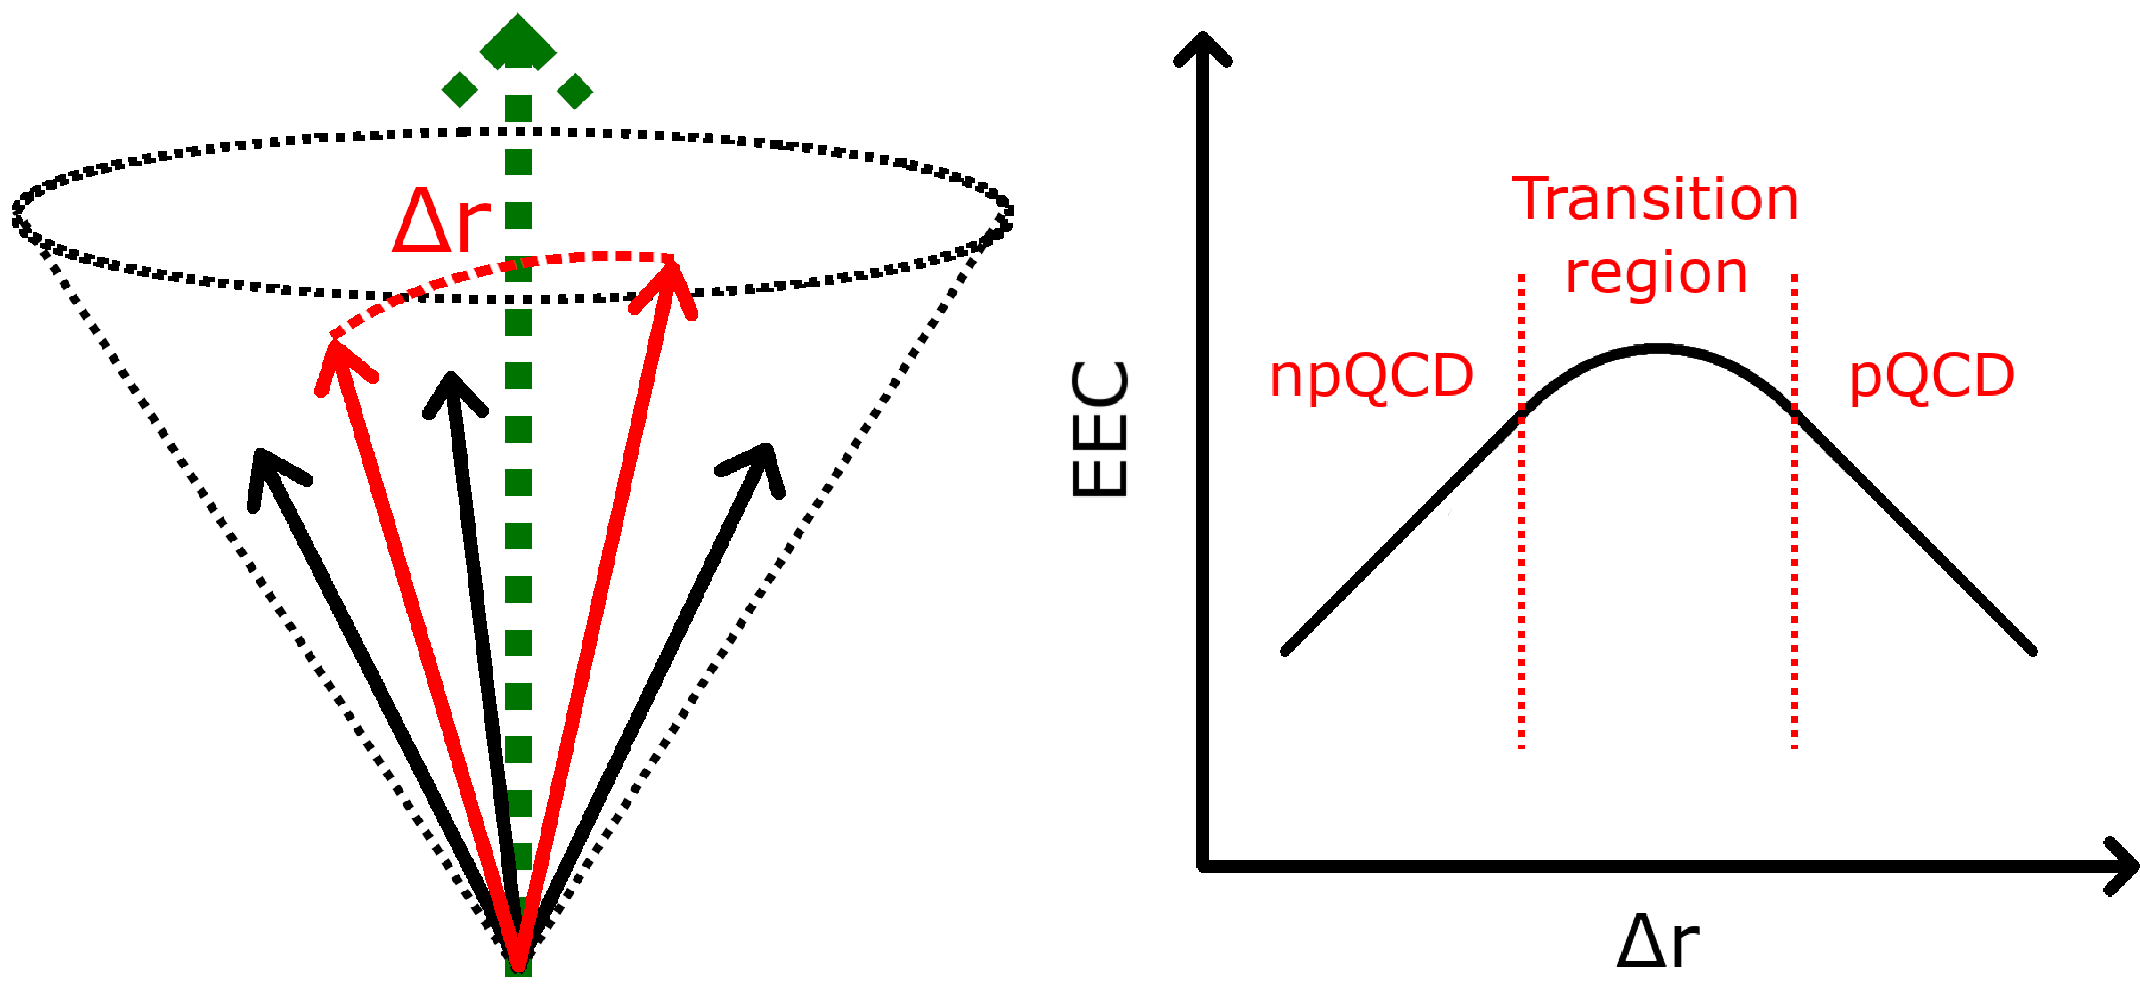
Figure 1:
Left: Illustration on how energy-energy correlators are constructed. The green dashed arrow represents the jet axis and the solid arrows represent charged particles. Right: Schematic structure of an energy-energy correlator distribution in pp collisions. |
png pdf |
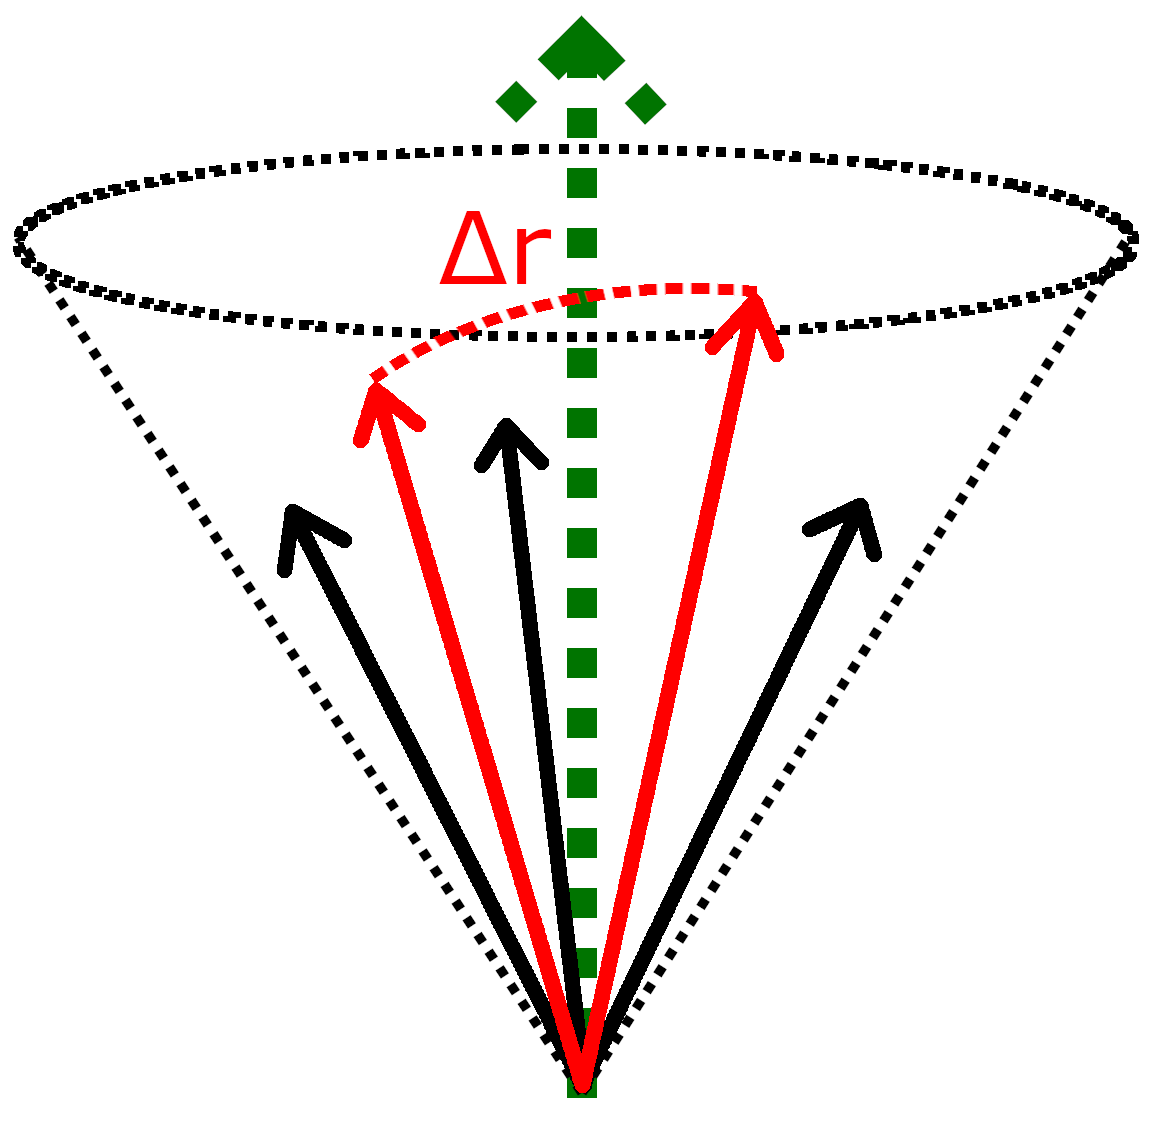
Figure 1-a:
Left: Illustration on how energy-energy correlators are constructed. The green dashed arrow represents the jet axis and the solid arrows represent charged particles. Right: Schematic structure of an energy-energy correlator distribution in pp collisions. |
png pdf |
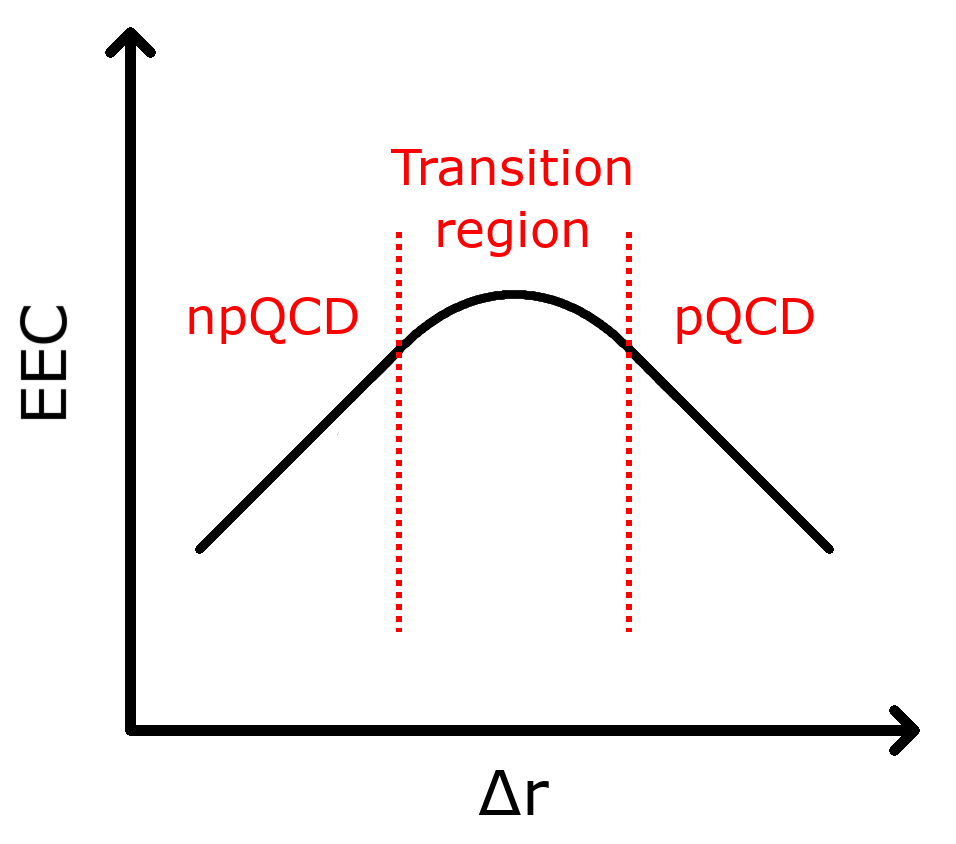
Figure 1-b:
Left: Illustration on how energy-energy correlators are constructed. The green dashed arrow represents the jet axis and the solid arrows represent charged particles. Right: Schematic structure of an energy-energy correlator distribution in pp collisions. |
png pdf |
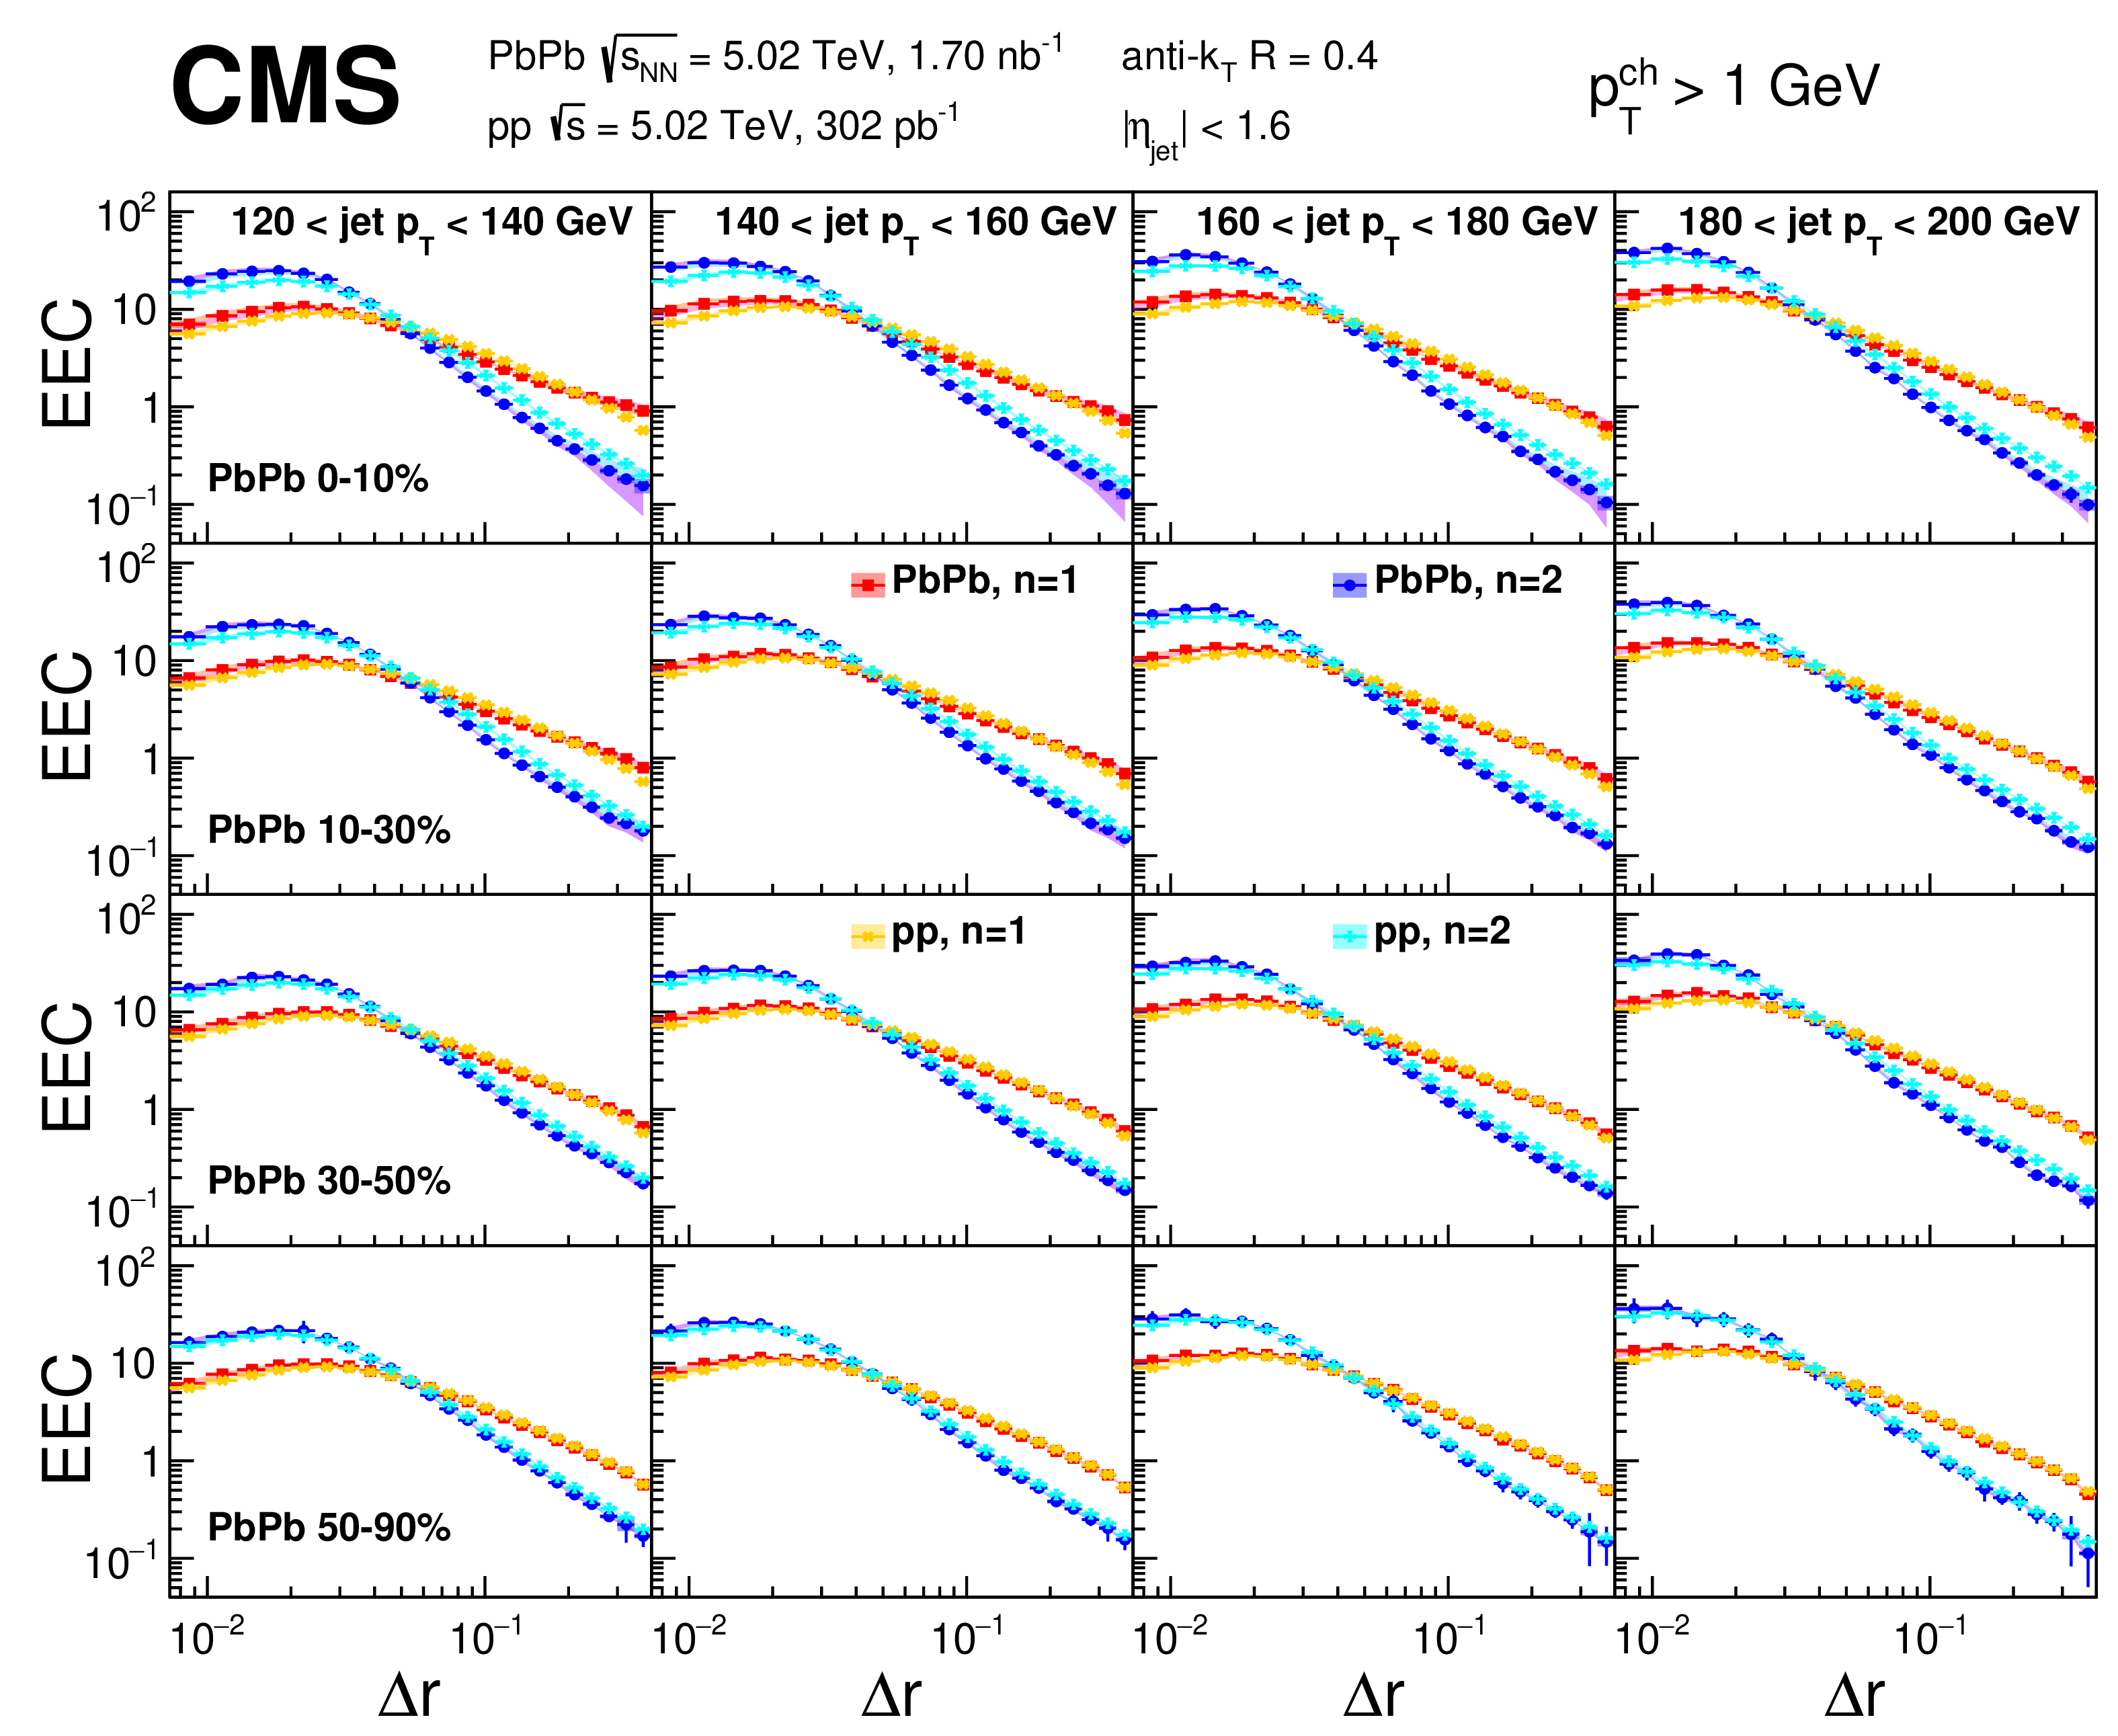
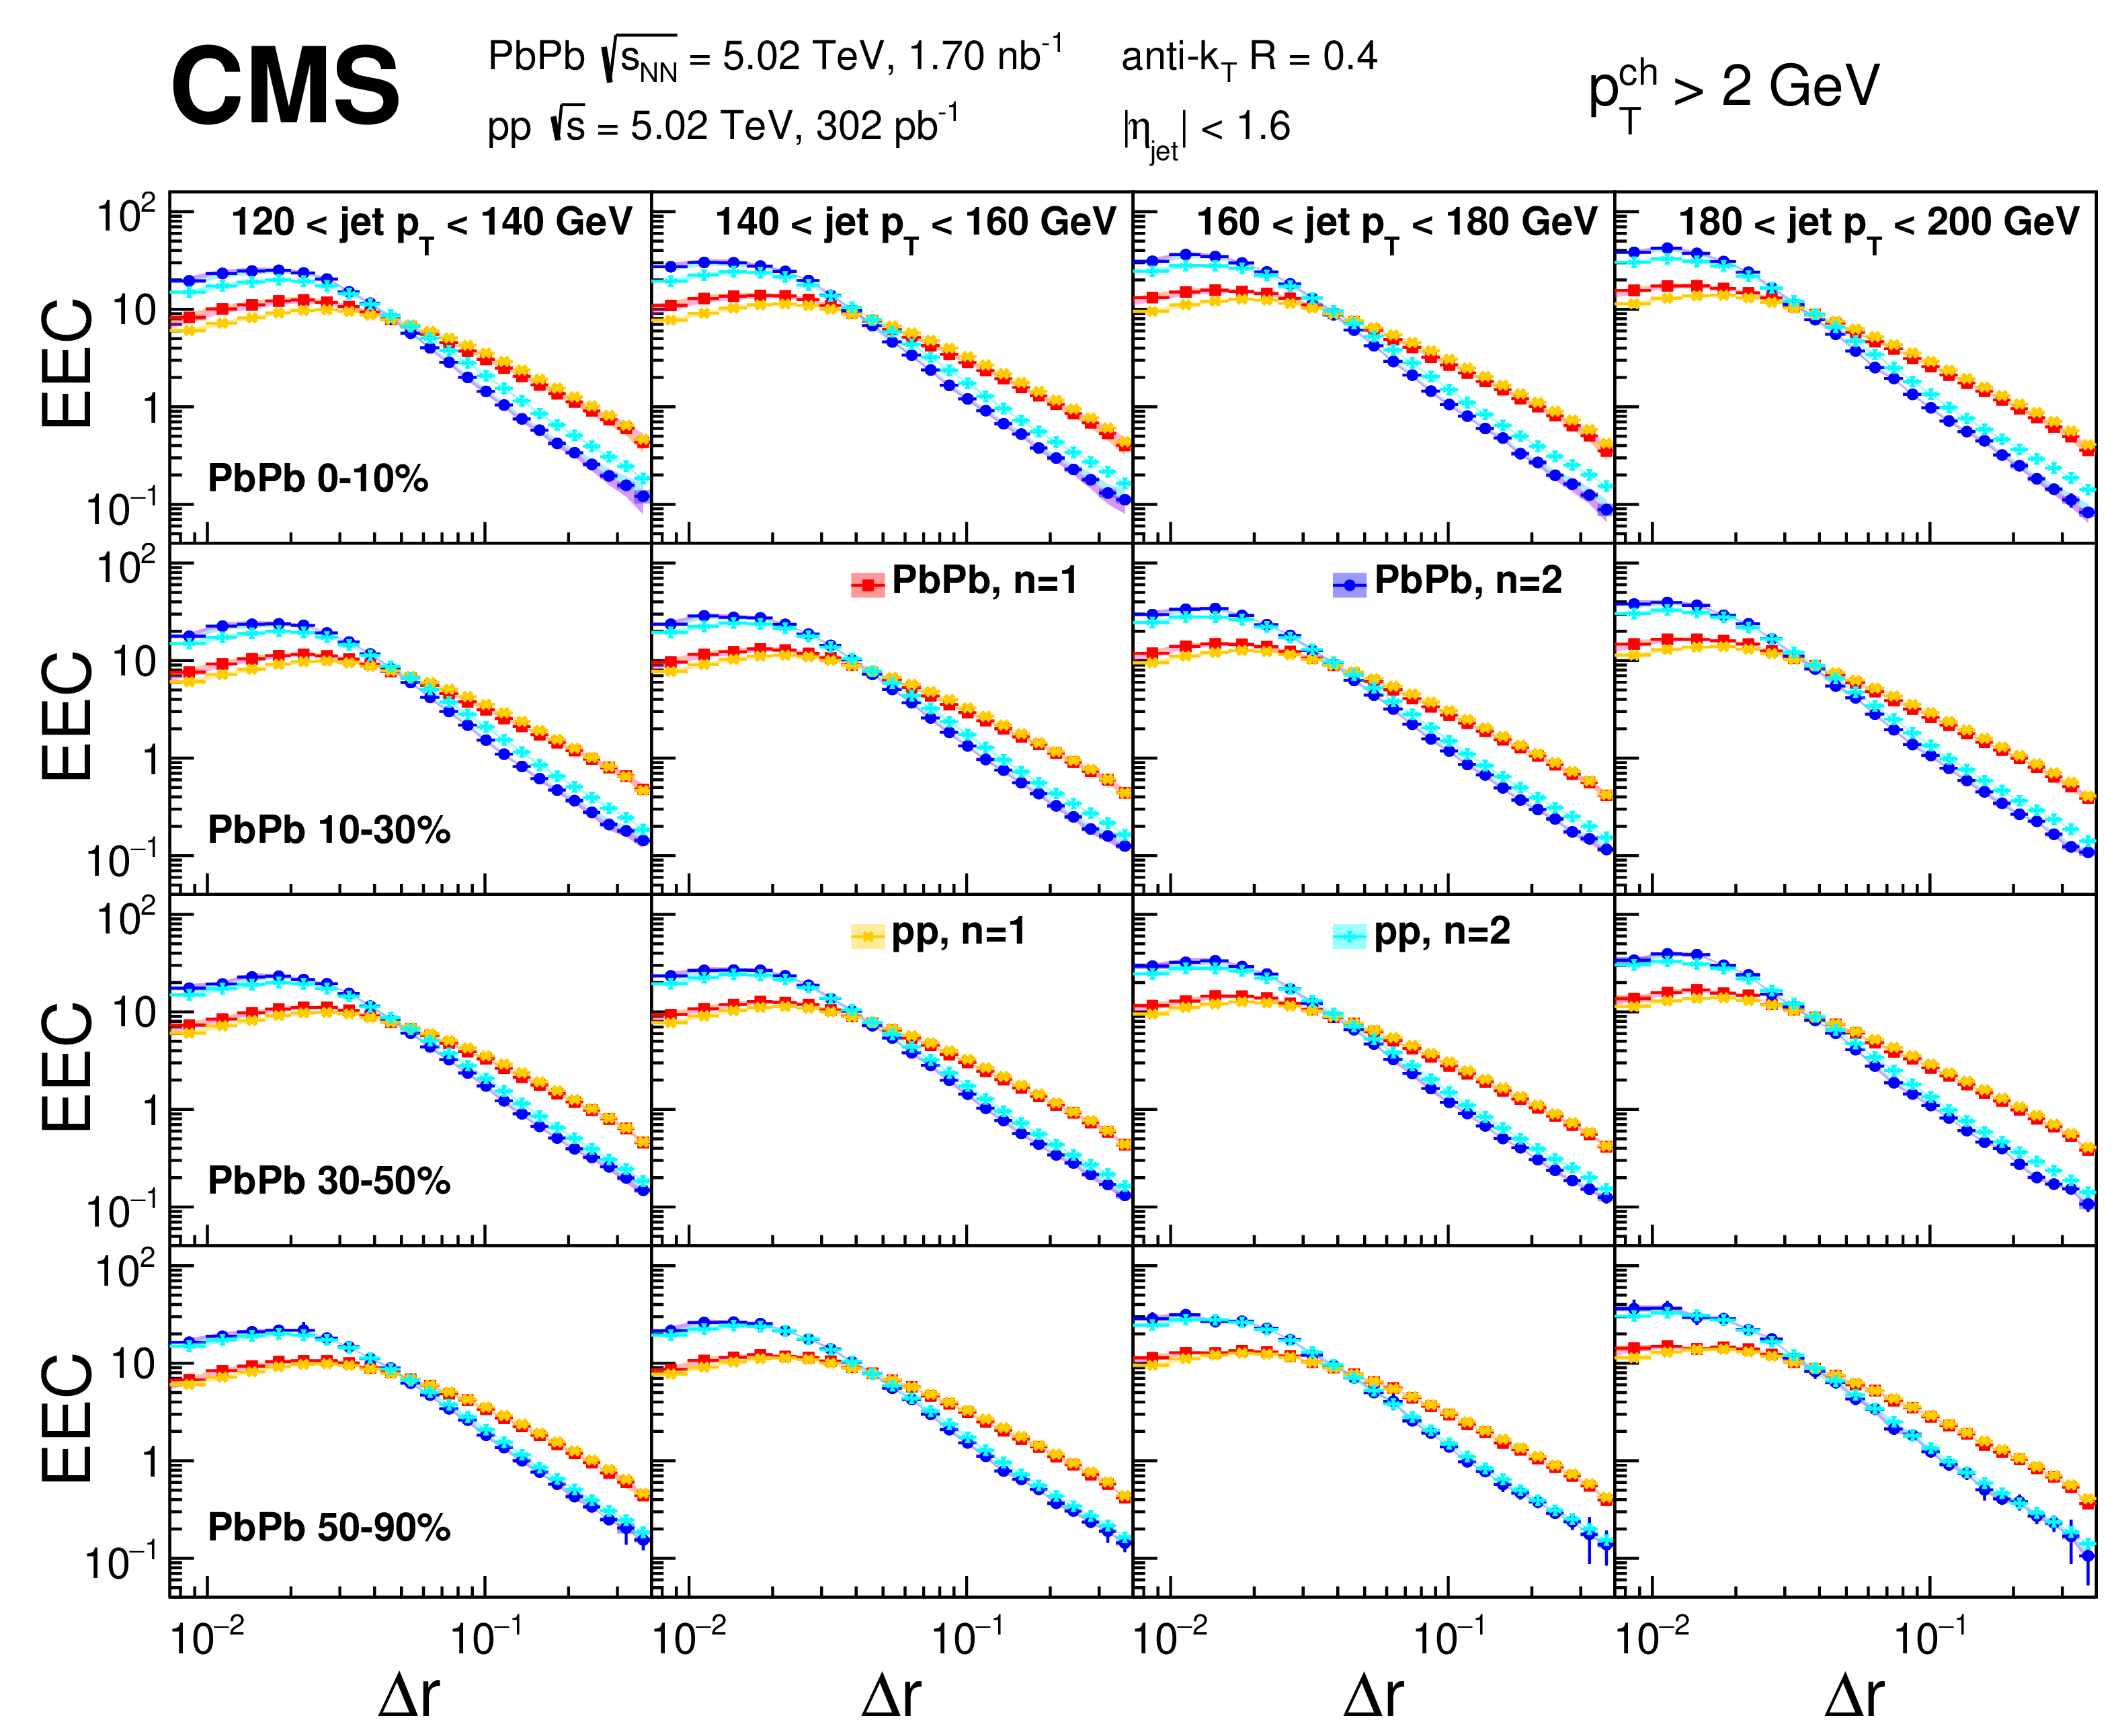
Figure 2:
Centrality and $ p_{\text{T,jet}} $ dependent energy-energy correlators for $ p_{\mathrm{T}}^{\text{ch}} > $ 1 GeV. The red squares show the $ n= $ 1 and the blue circles the $ n= $ 2 distributions for PbPb collisions. The pp results for different centralities are identical, with orange crosses showing the $ n= $ 1 and cyan triangle crosses the $ n= $ 2 distributions. The error bars show statistical uncertainties, the point-by-point systematic uncertainties are shown in boxes, while the error bands show systematic uncertainties related to the shape of the distribution. The two colors illustrate that the shape uncertainties tend to tilt the distribution one way or another. All correlators have been normalized to unity in the plotted range. |
png pdf |
Figure 3:
Centrality and $ p_{\text{T,jet}} $ dependent energy-energy correlators for $ p_{\mathrm{T}}^{\text{ch}} > $ 2 GeV. The red squares show the $ n= $ 1 and the blue circles the $ n= $ 2 distributions for PbPb collisions. The pp results for different centralities are identical, with orange crosses showing the $ n= $ 1 and cyan triangle crosses the $ n= $ 2 distributions. The error bars show statistical uncertainties, the point-by-point systematic uncertainties are shown in boxes, while the error bands show systematic uncertainties related to the shape of the distribution. The two colors illustrate that the shape uncertainties tend to tilt the distribution one way or another. All correlators have been normalized to unity in the plotted range. |
png pdf |
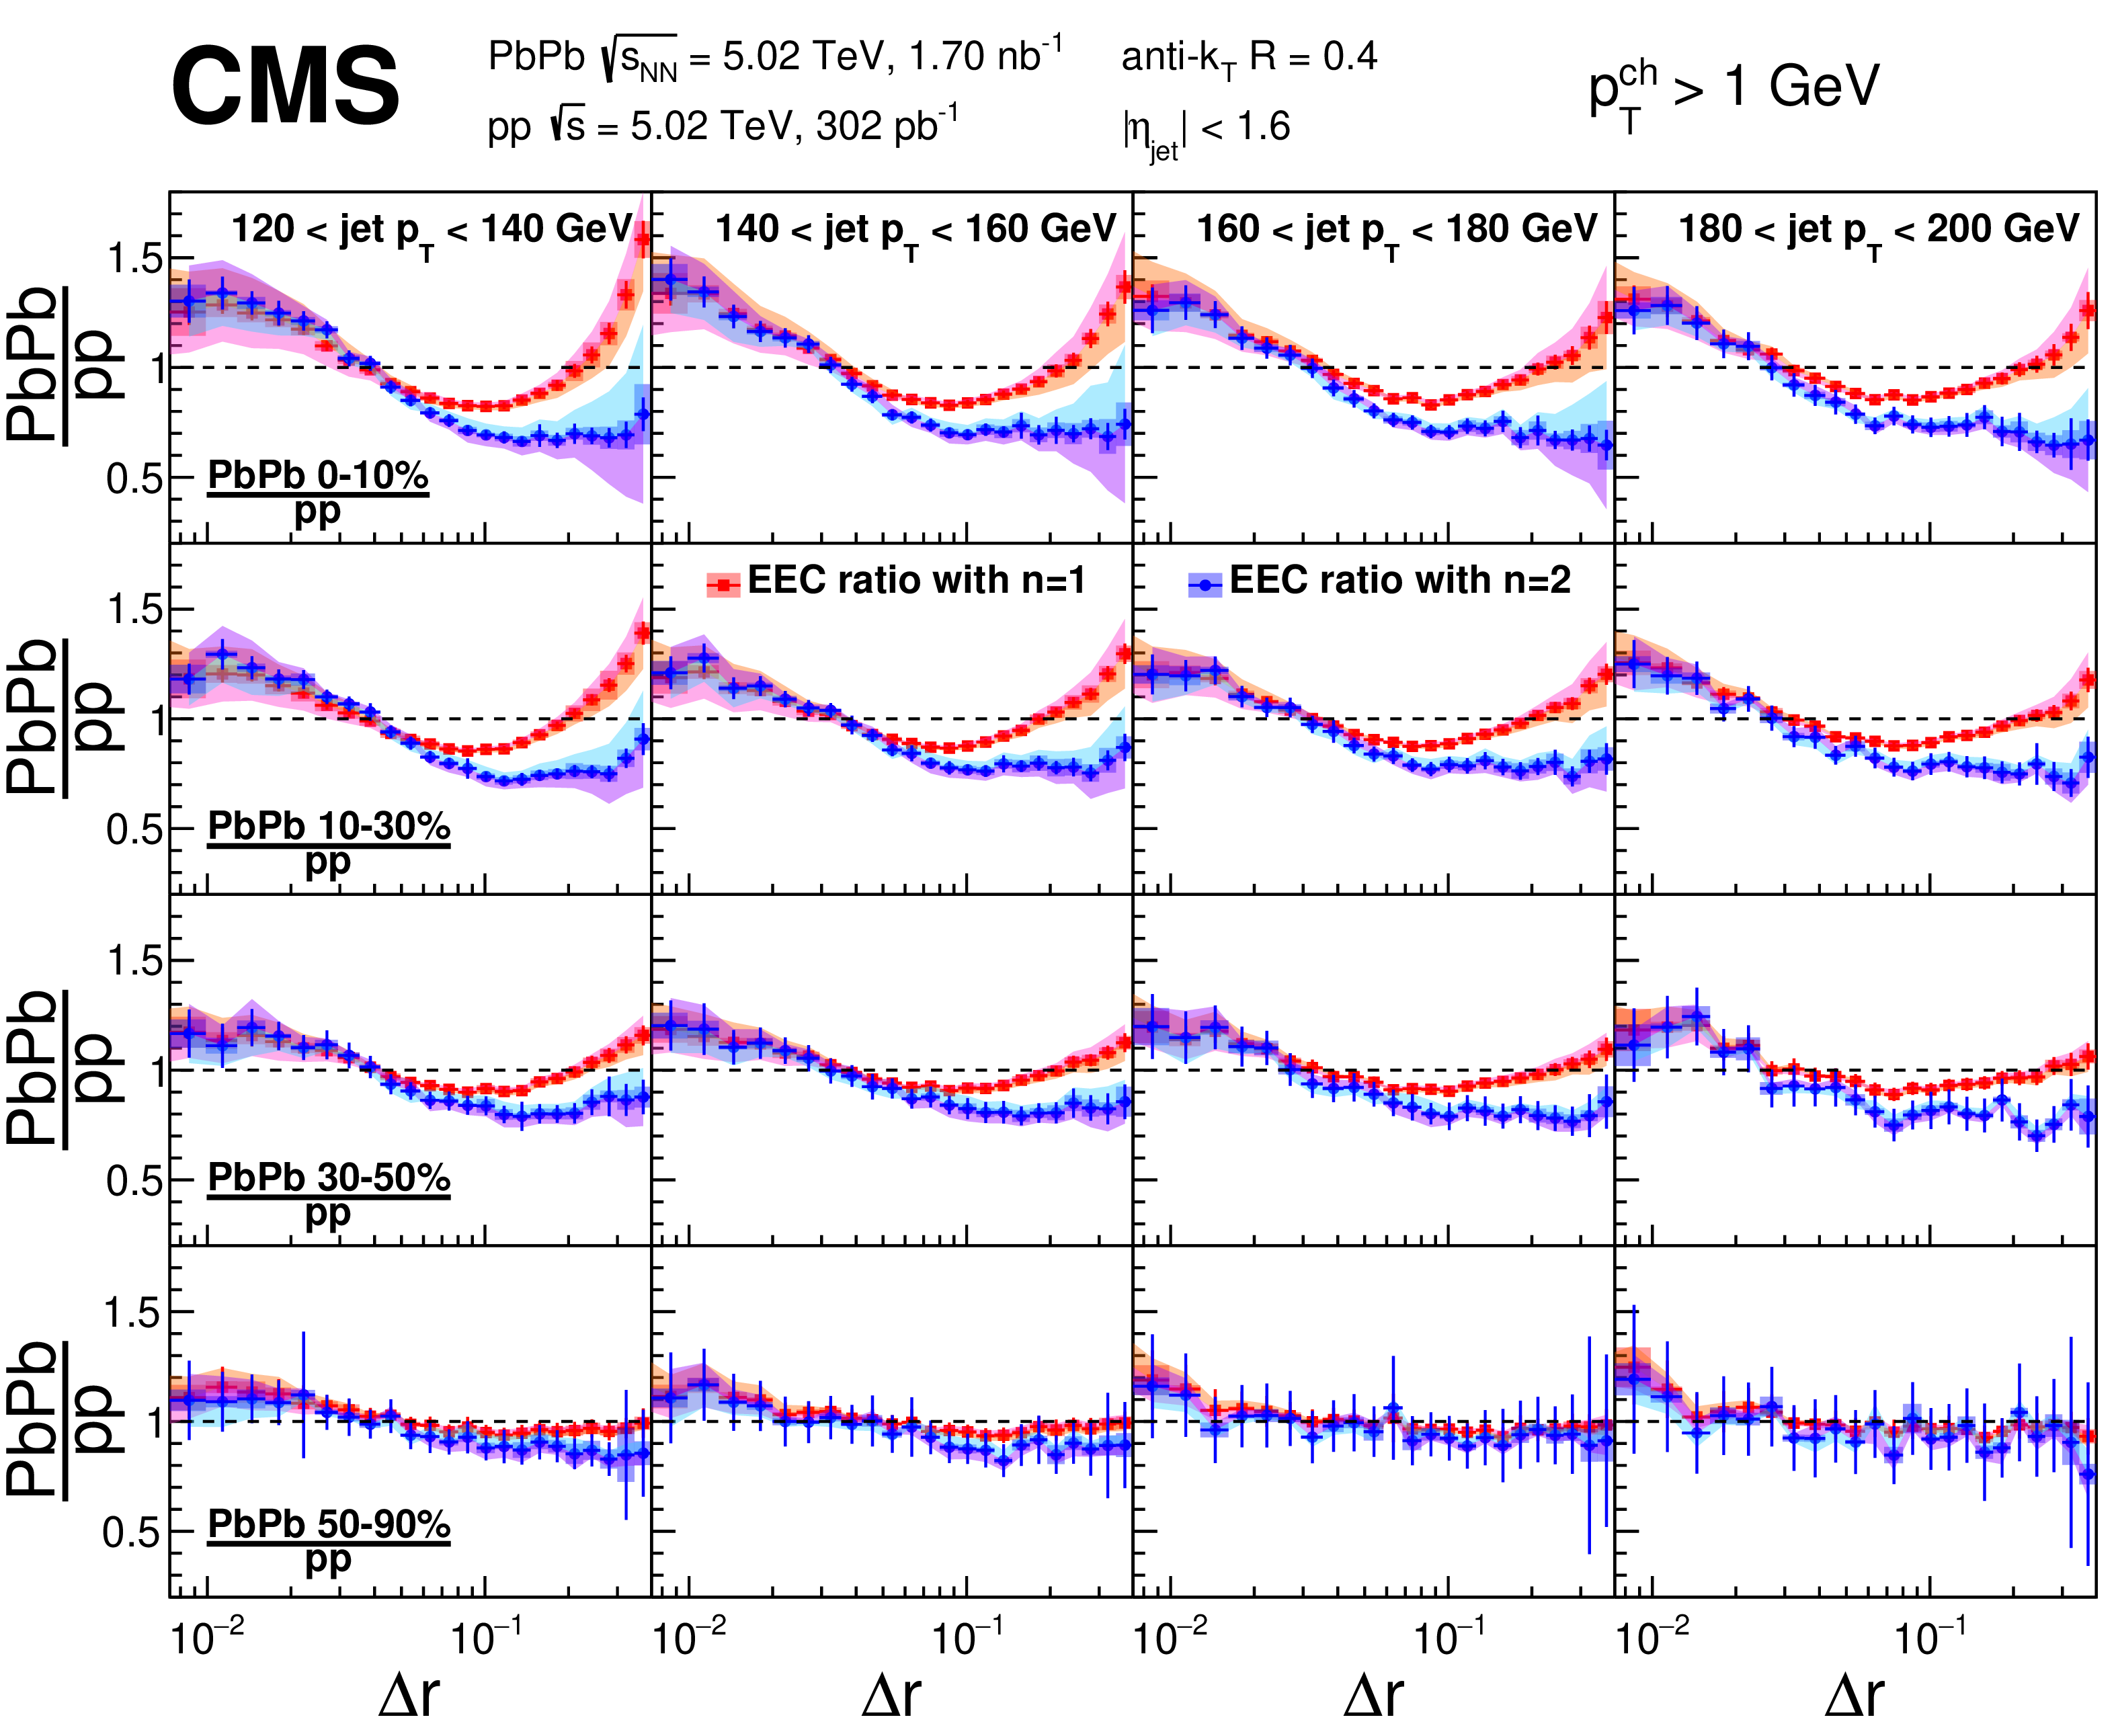
Figure 4:
Centrality- and $ p_{\text{T,jet}} $-dependent ratios of PbPb to pp energy-energy correlators with $ p_{\mathrm{T}}^{\text{ch}} > $ 1 GeV and for both $ n= $ 1 (red squares) and $ n= $ 2 (blue circles). The error bars show statistical uncertainties, the point-by-point systematic uncertainties are shown in boxes, while the error bands show systematic uncertainties related to the shape of the ratio. The two colors illustrate that the shape uncertainties tend to tilt the ratio one way or another. |
png pdf |
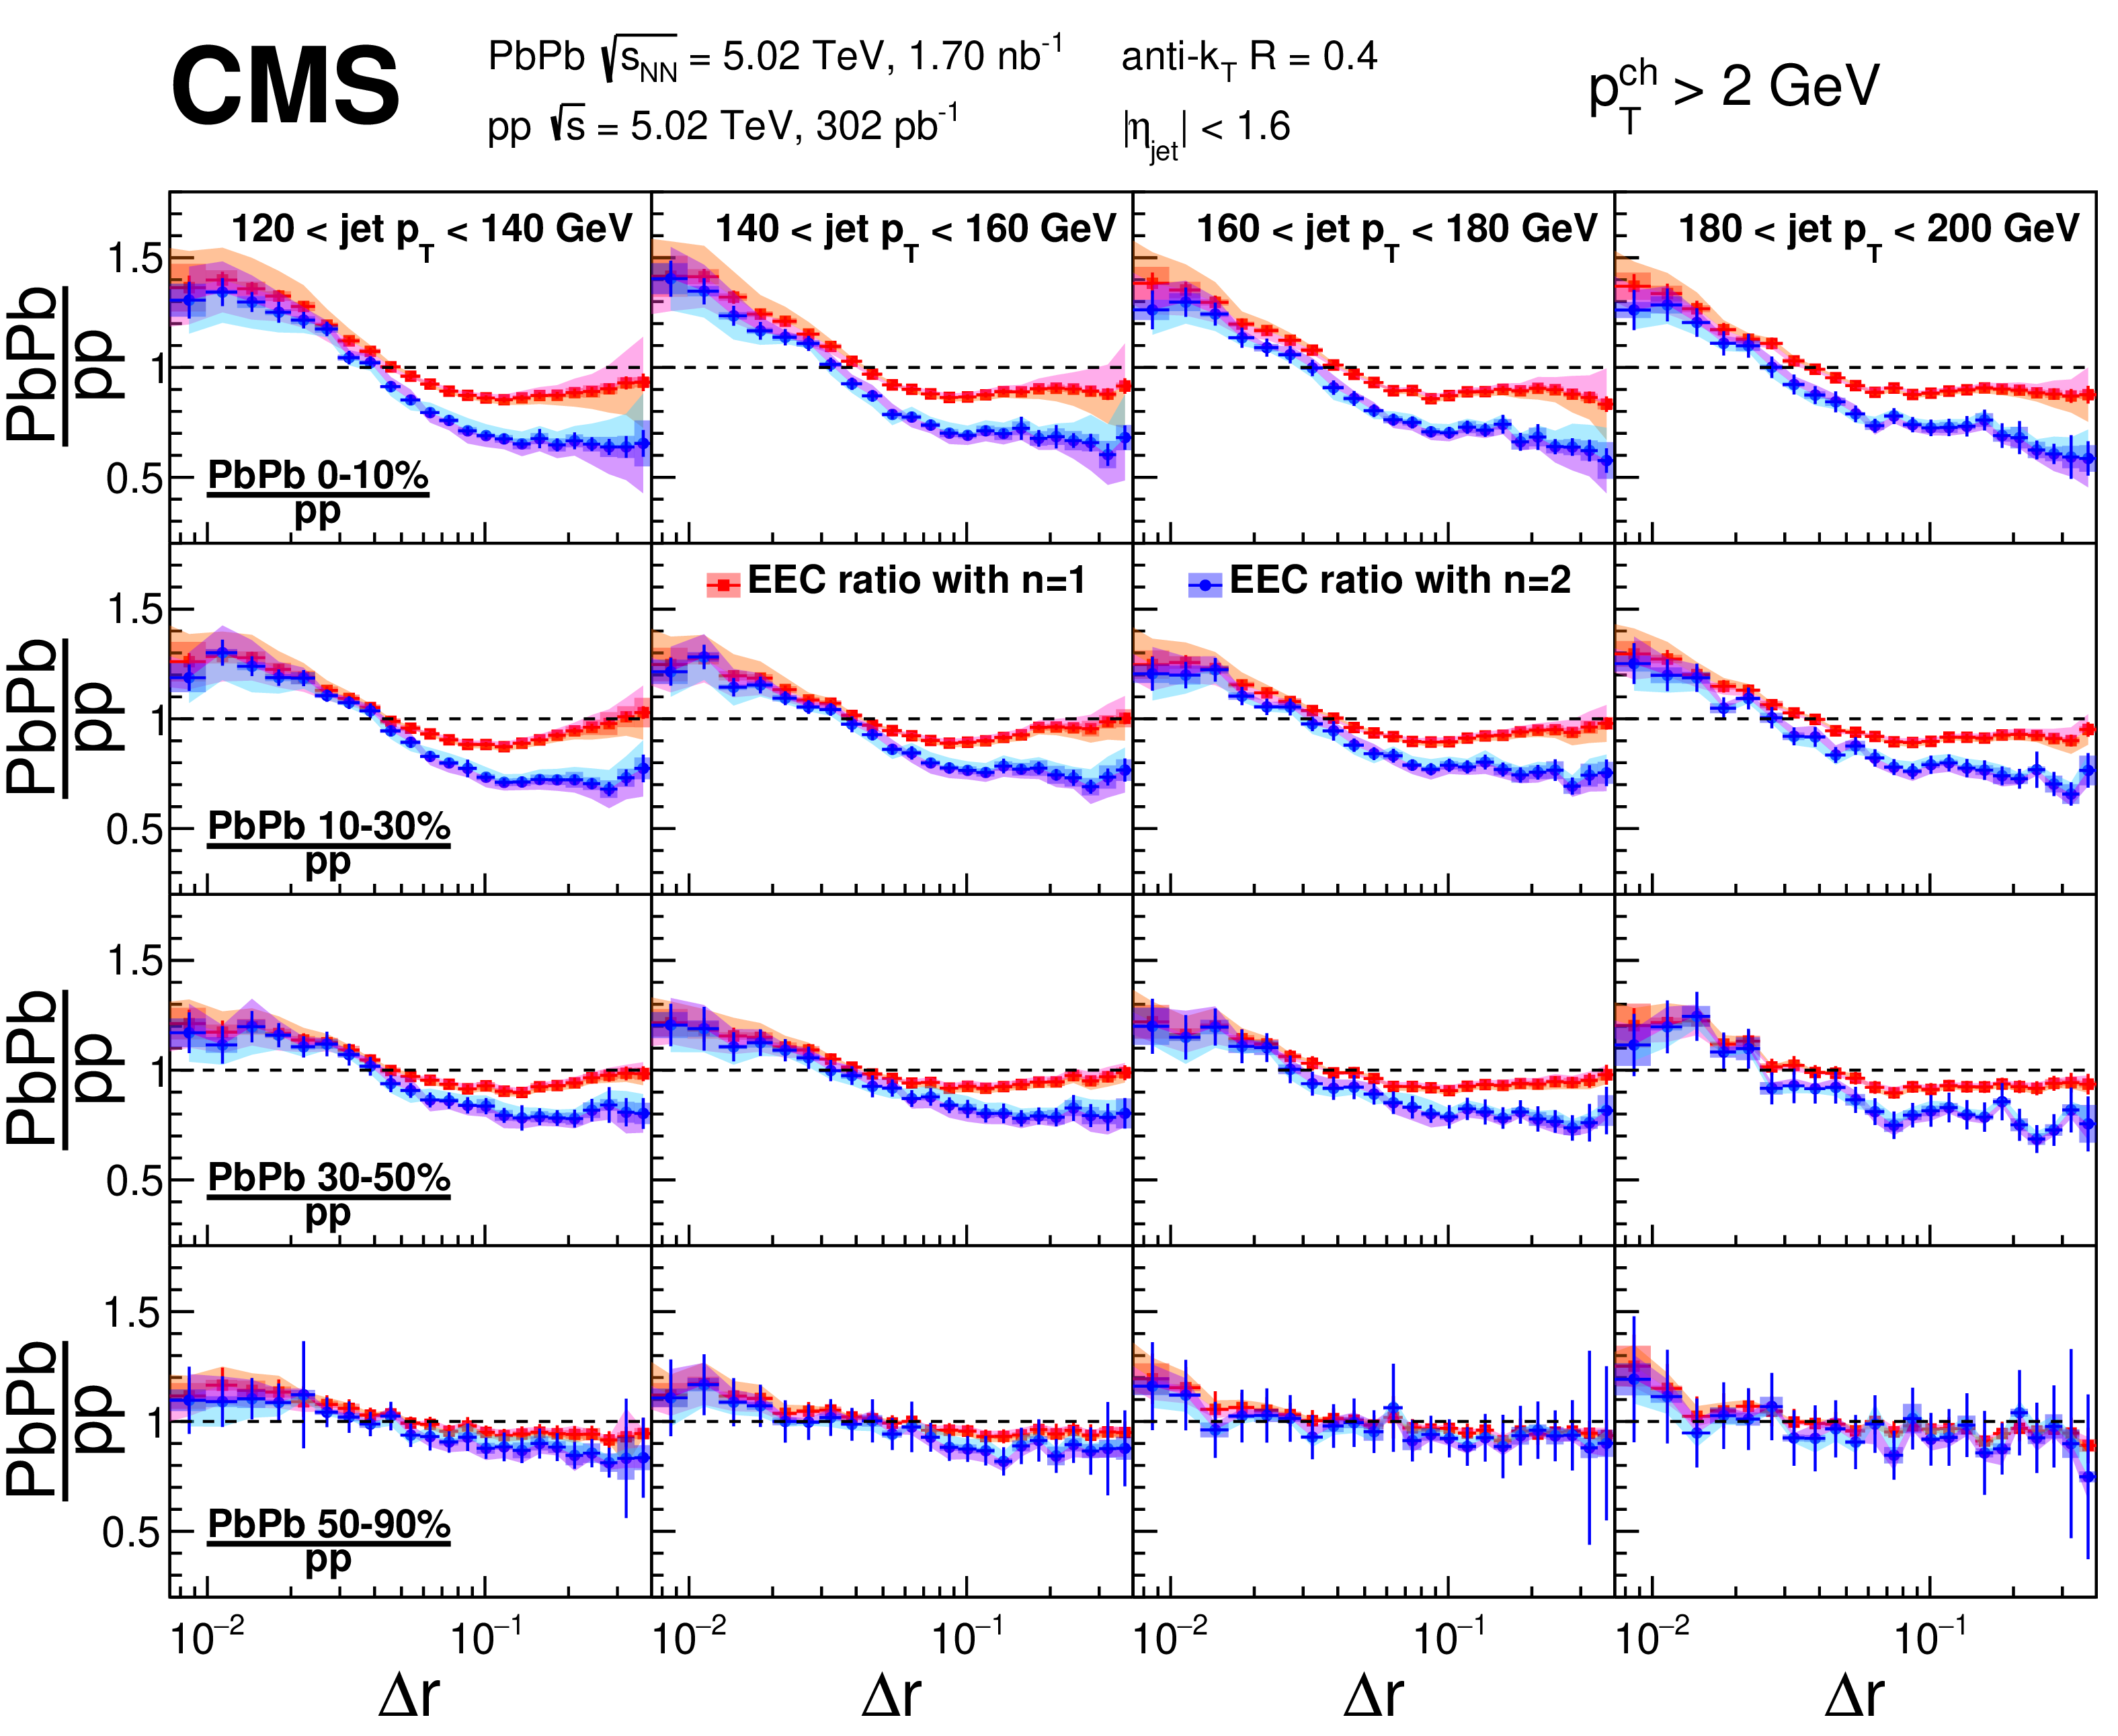
Figure 5:
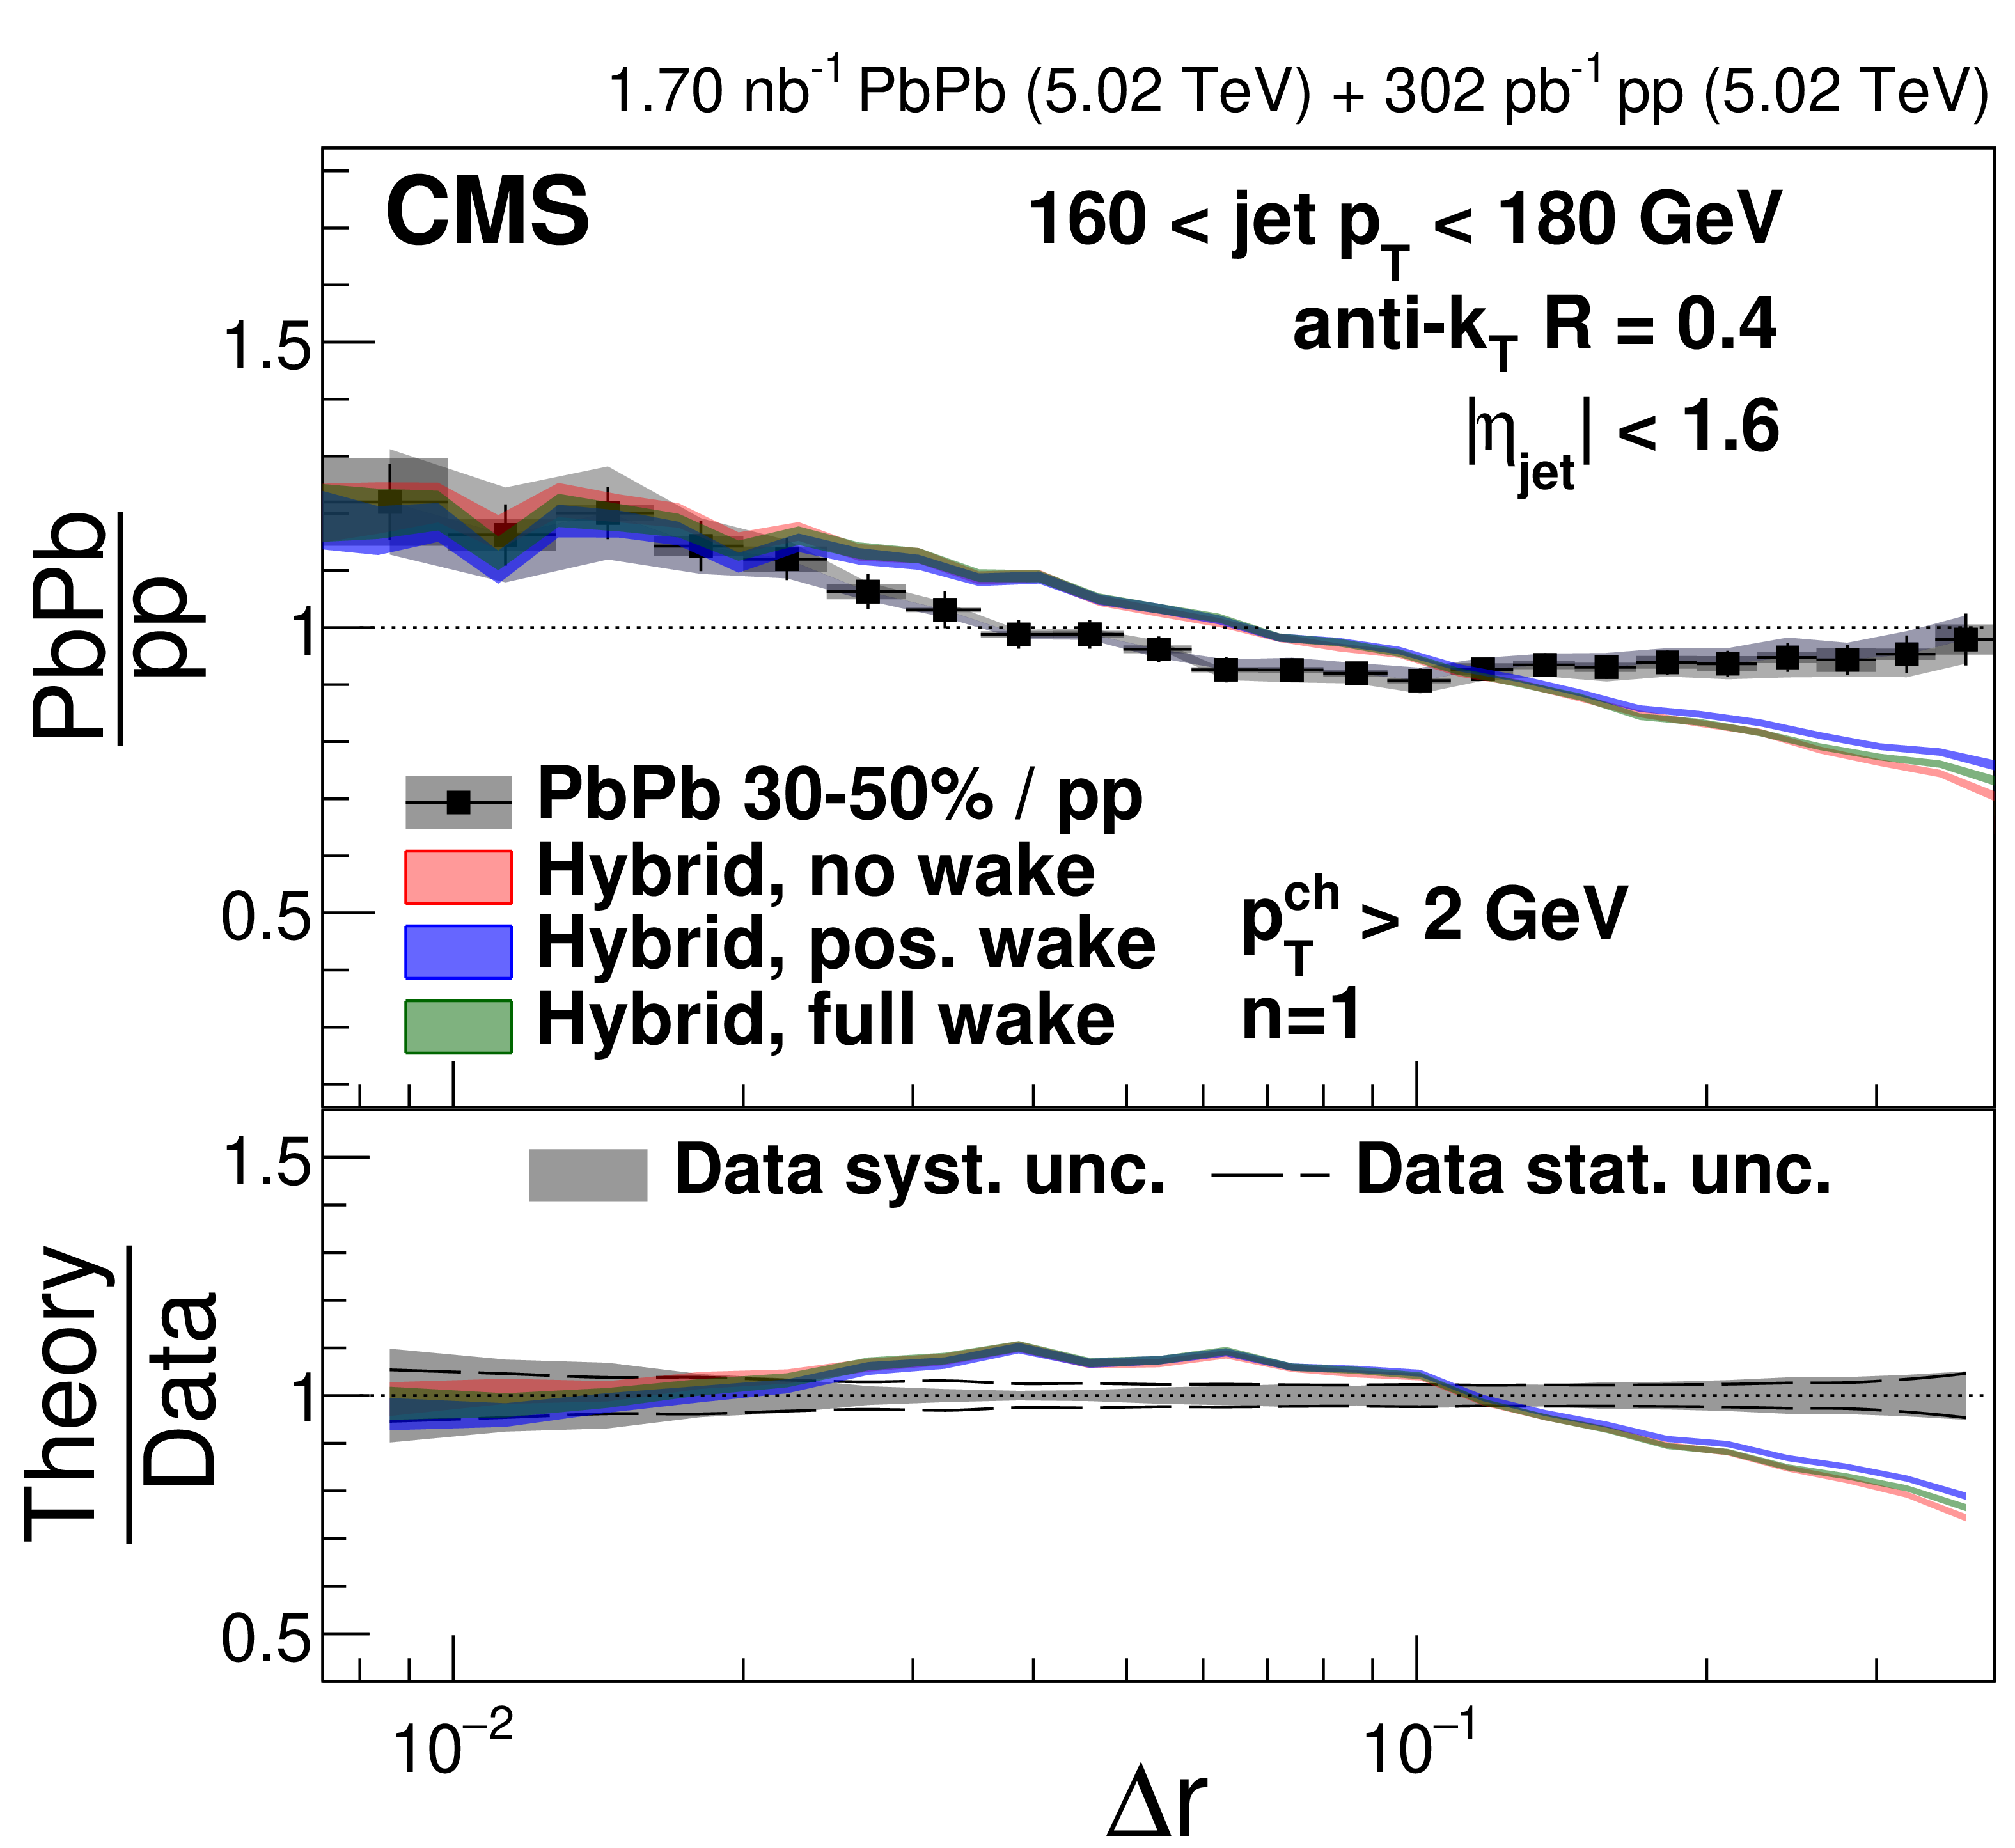
Centrality- and $ p_{\text{T,jet}} $-dependent ratios of PbPb to pp energy-energy correlators with $ p_{\mathrm{T}}^{\text{ch}} > $ 2 GeV and for both $ n= $ 1 (red squares) and $ n= $ 2 (blue circles). The error bars show statistical uncertainties, the point-by-point systematic uncertainties are shown in boxes, while the error bands show systematic uncertainties related to the shape of the ratio. The two colors illustrate that the shape uncertainties tend to tilt the ratio one way or another. |
png pdf |
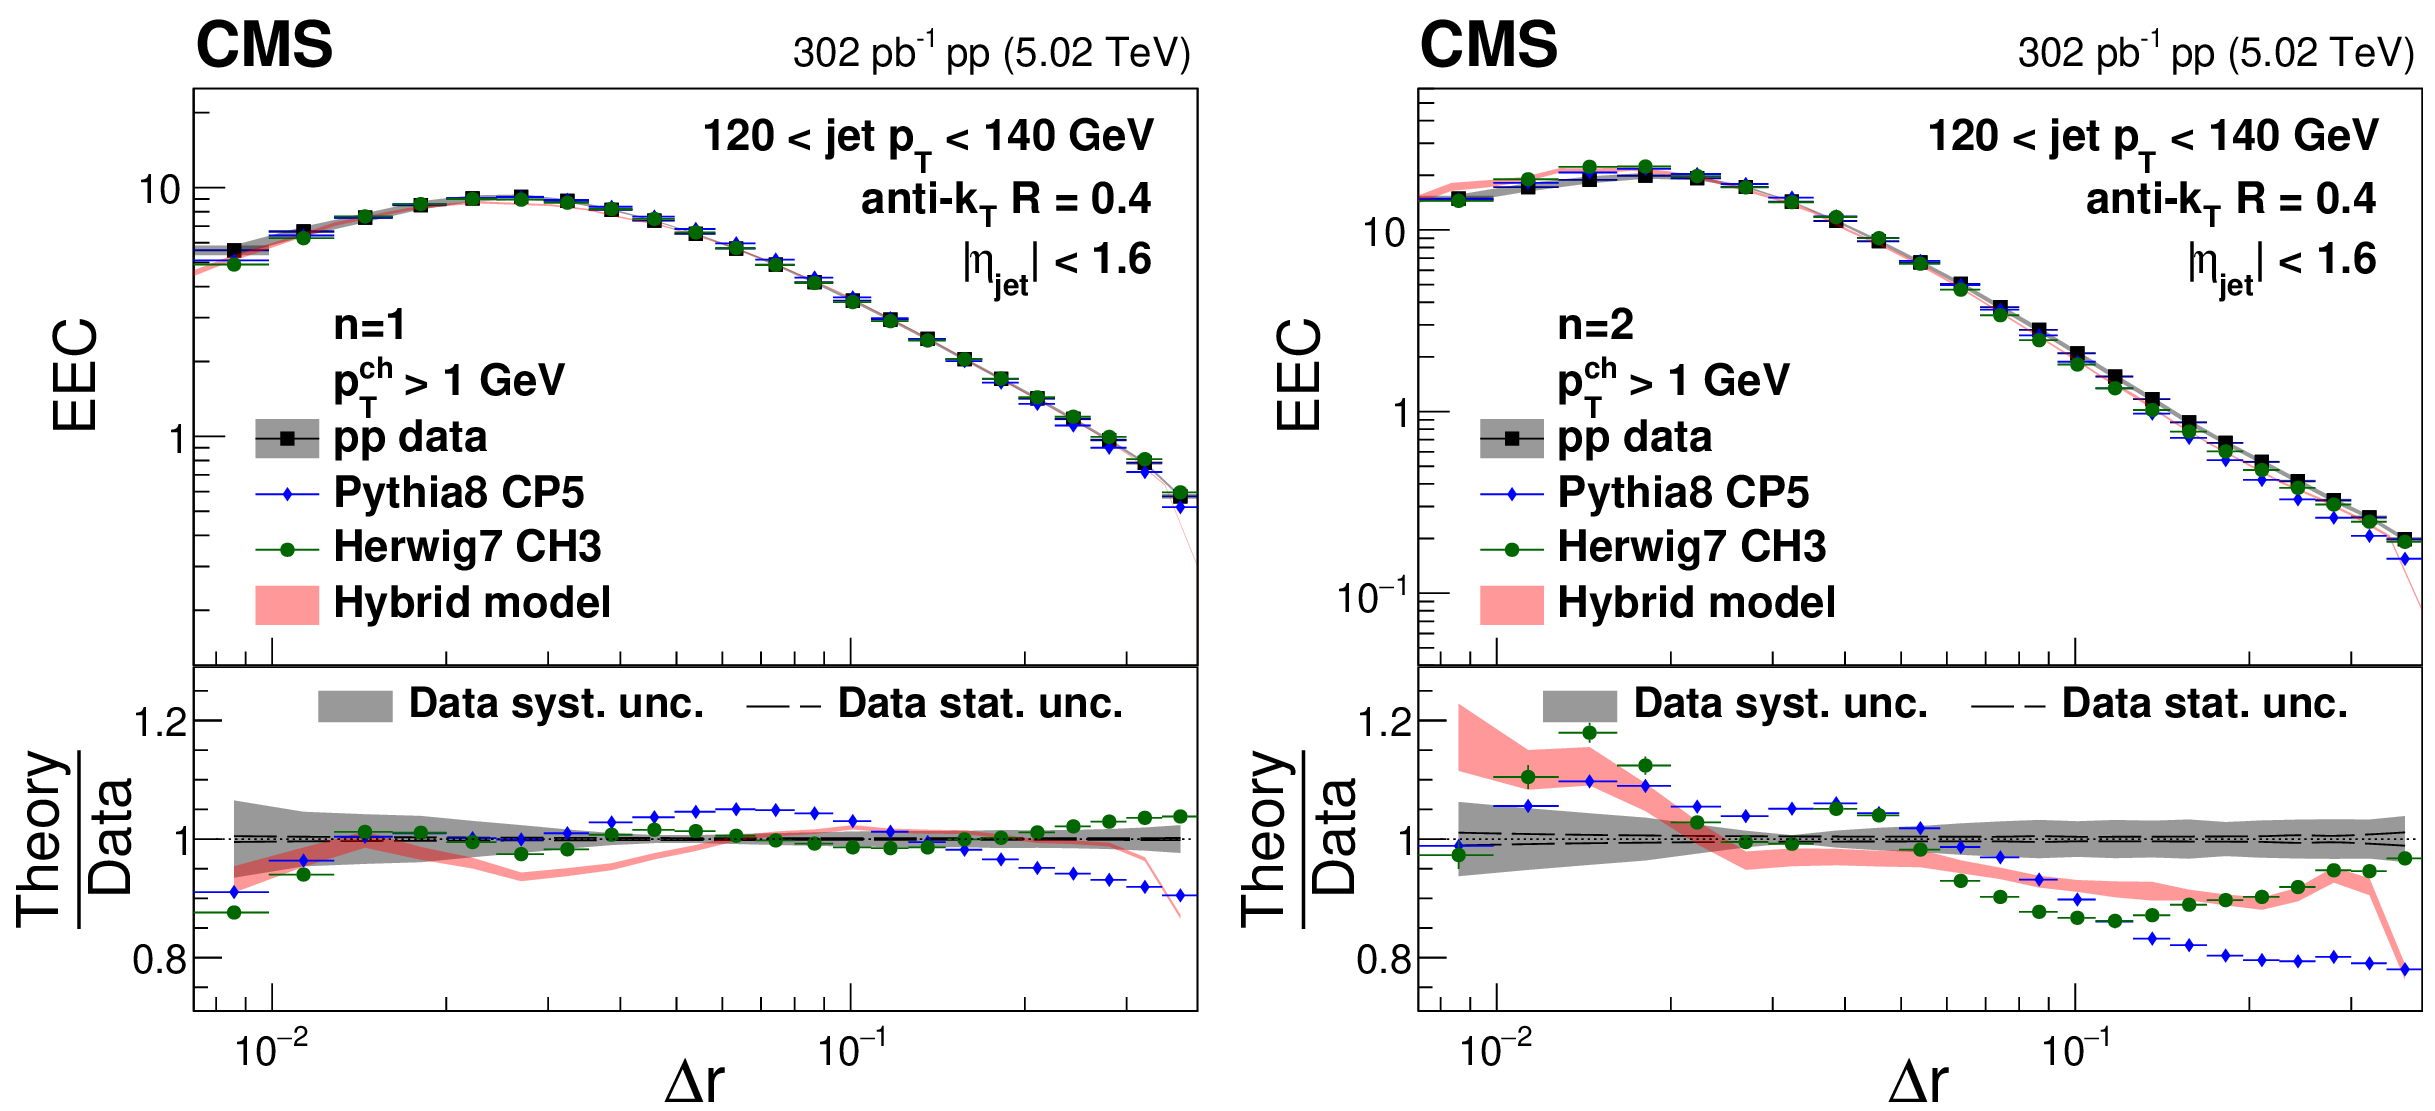
Figure 6:
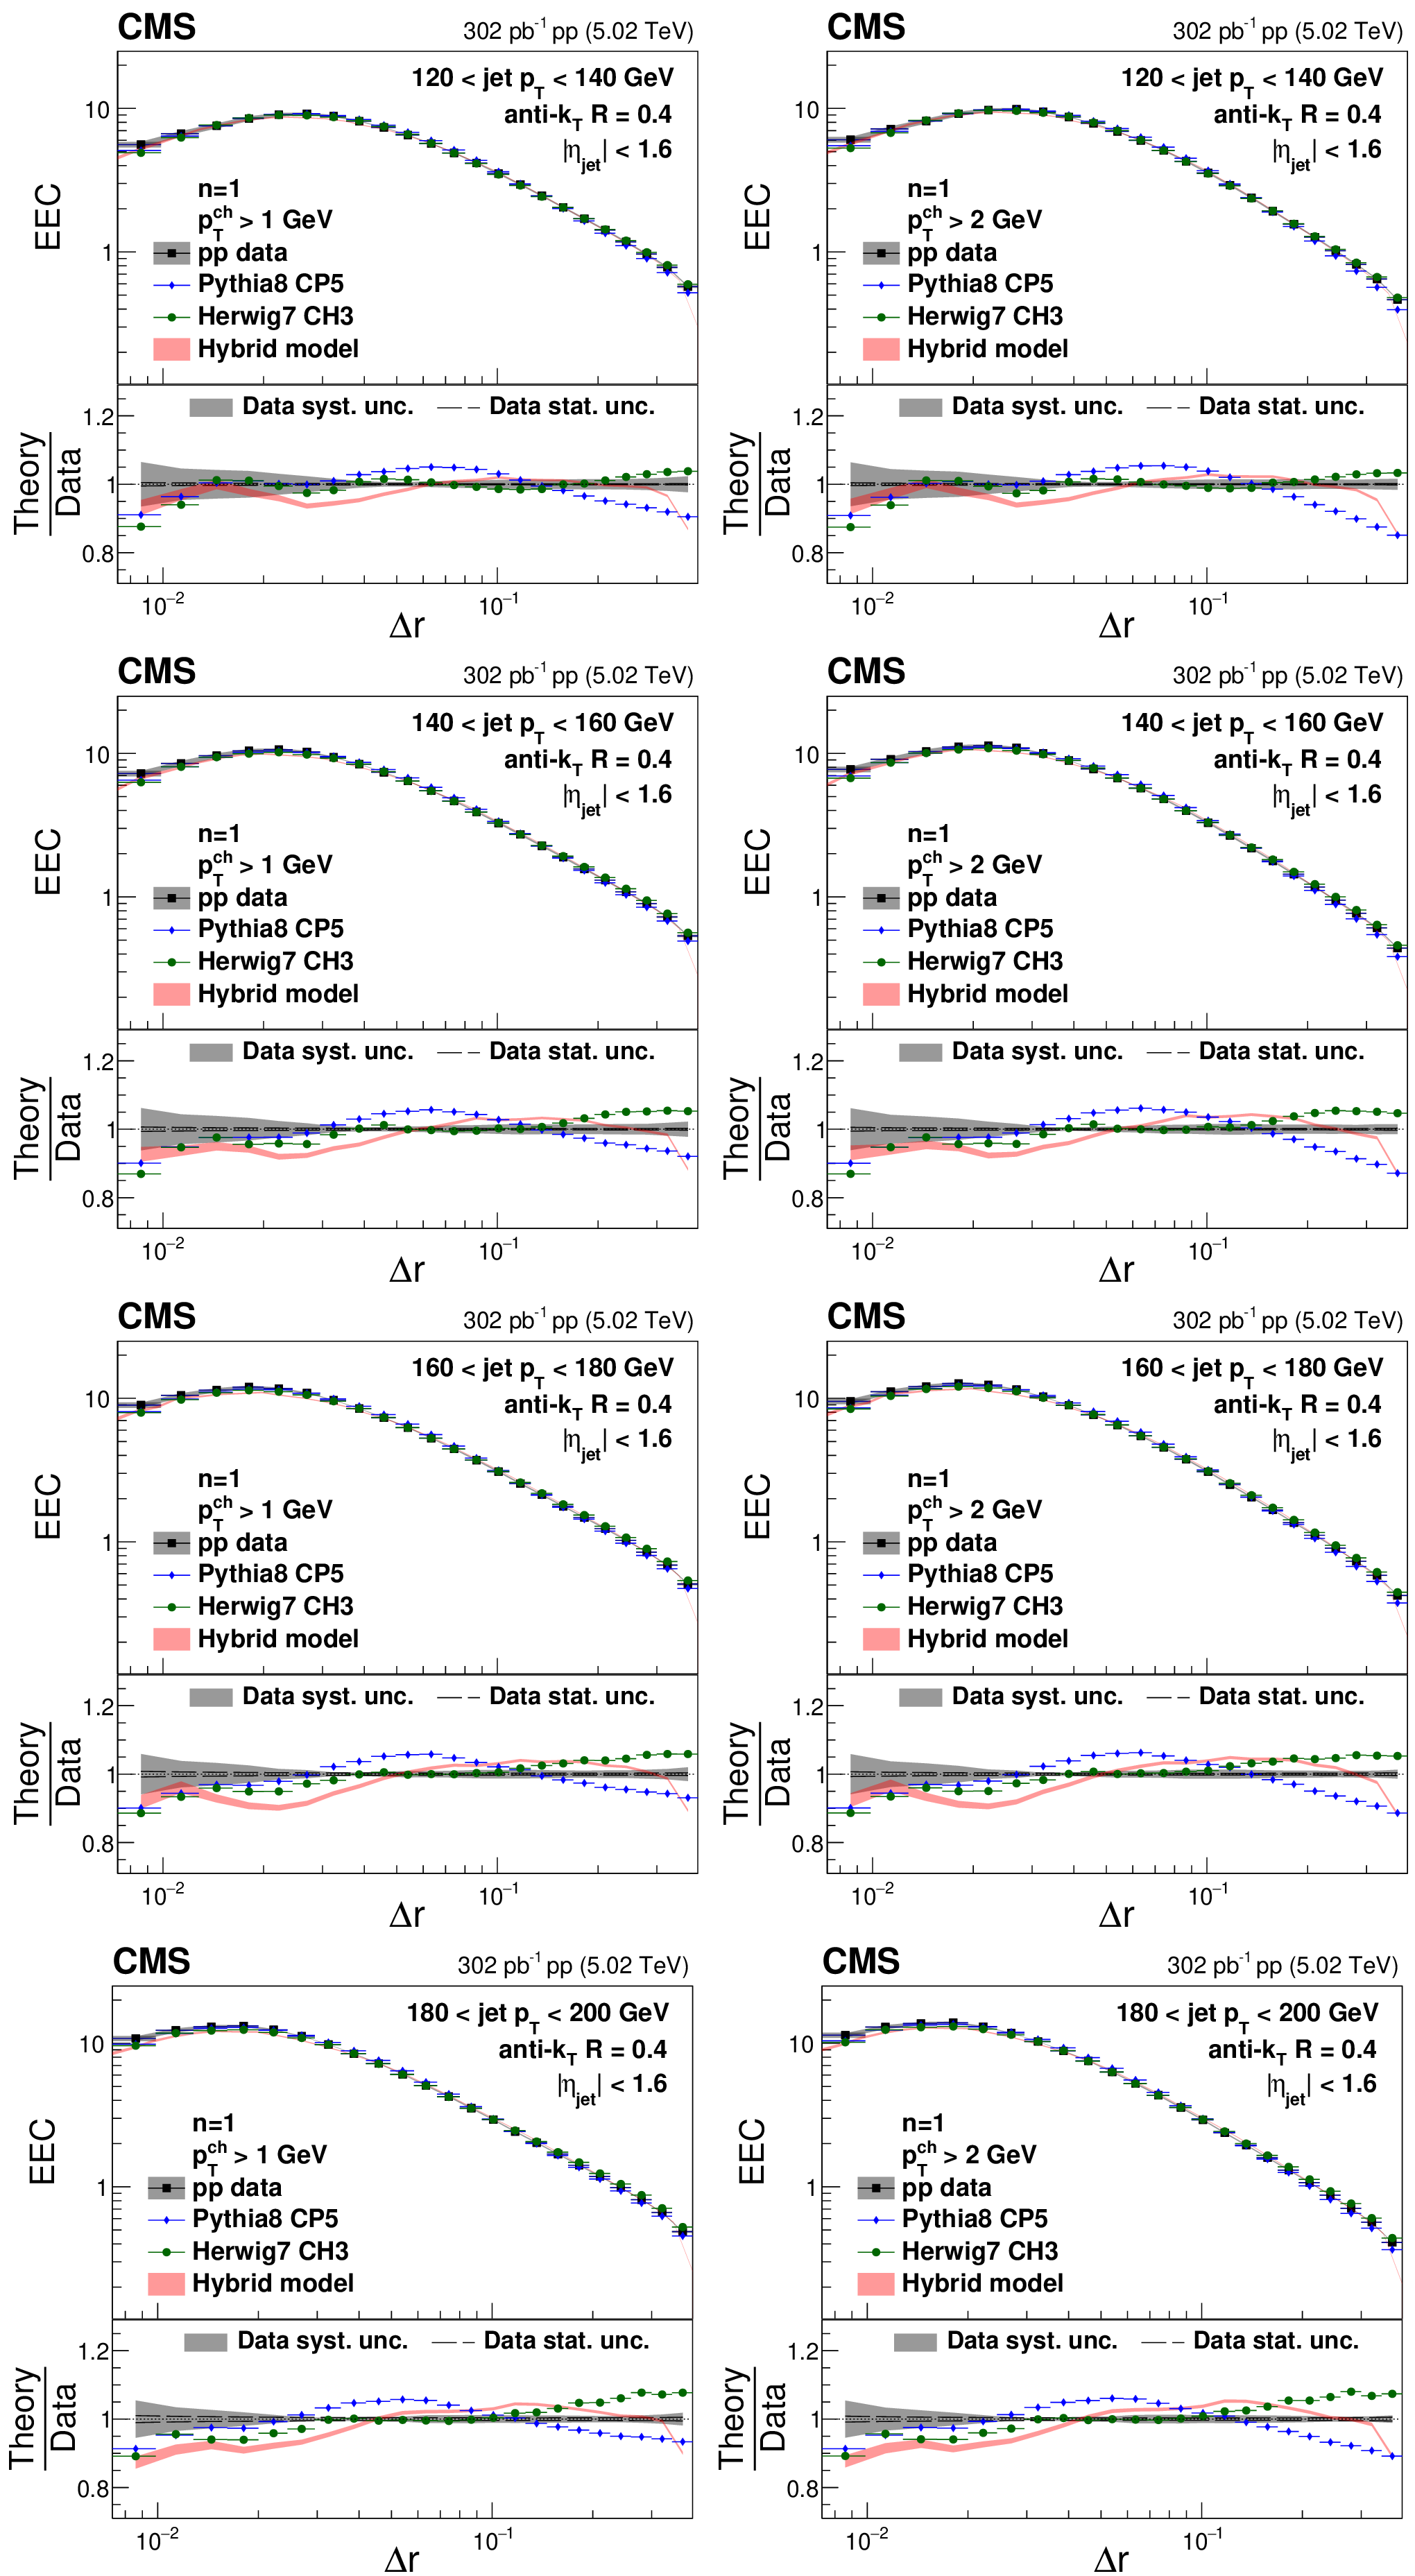
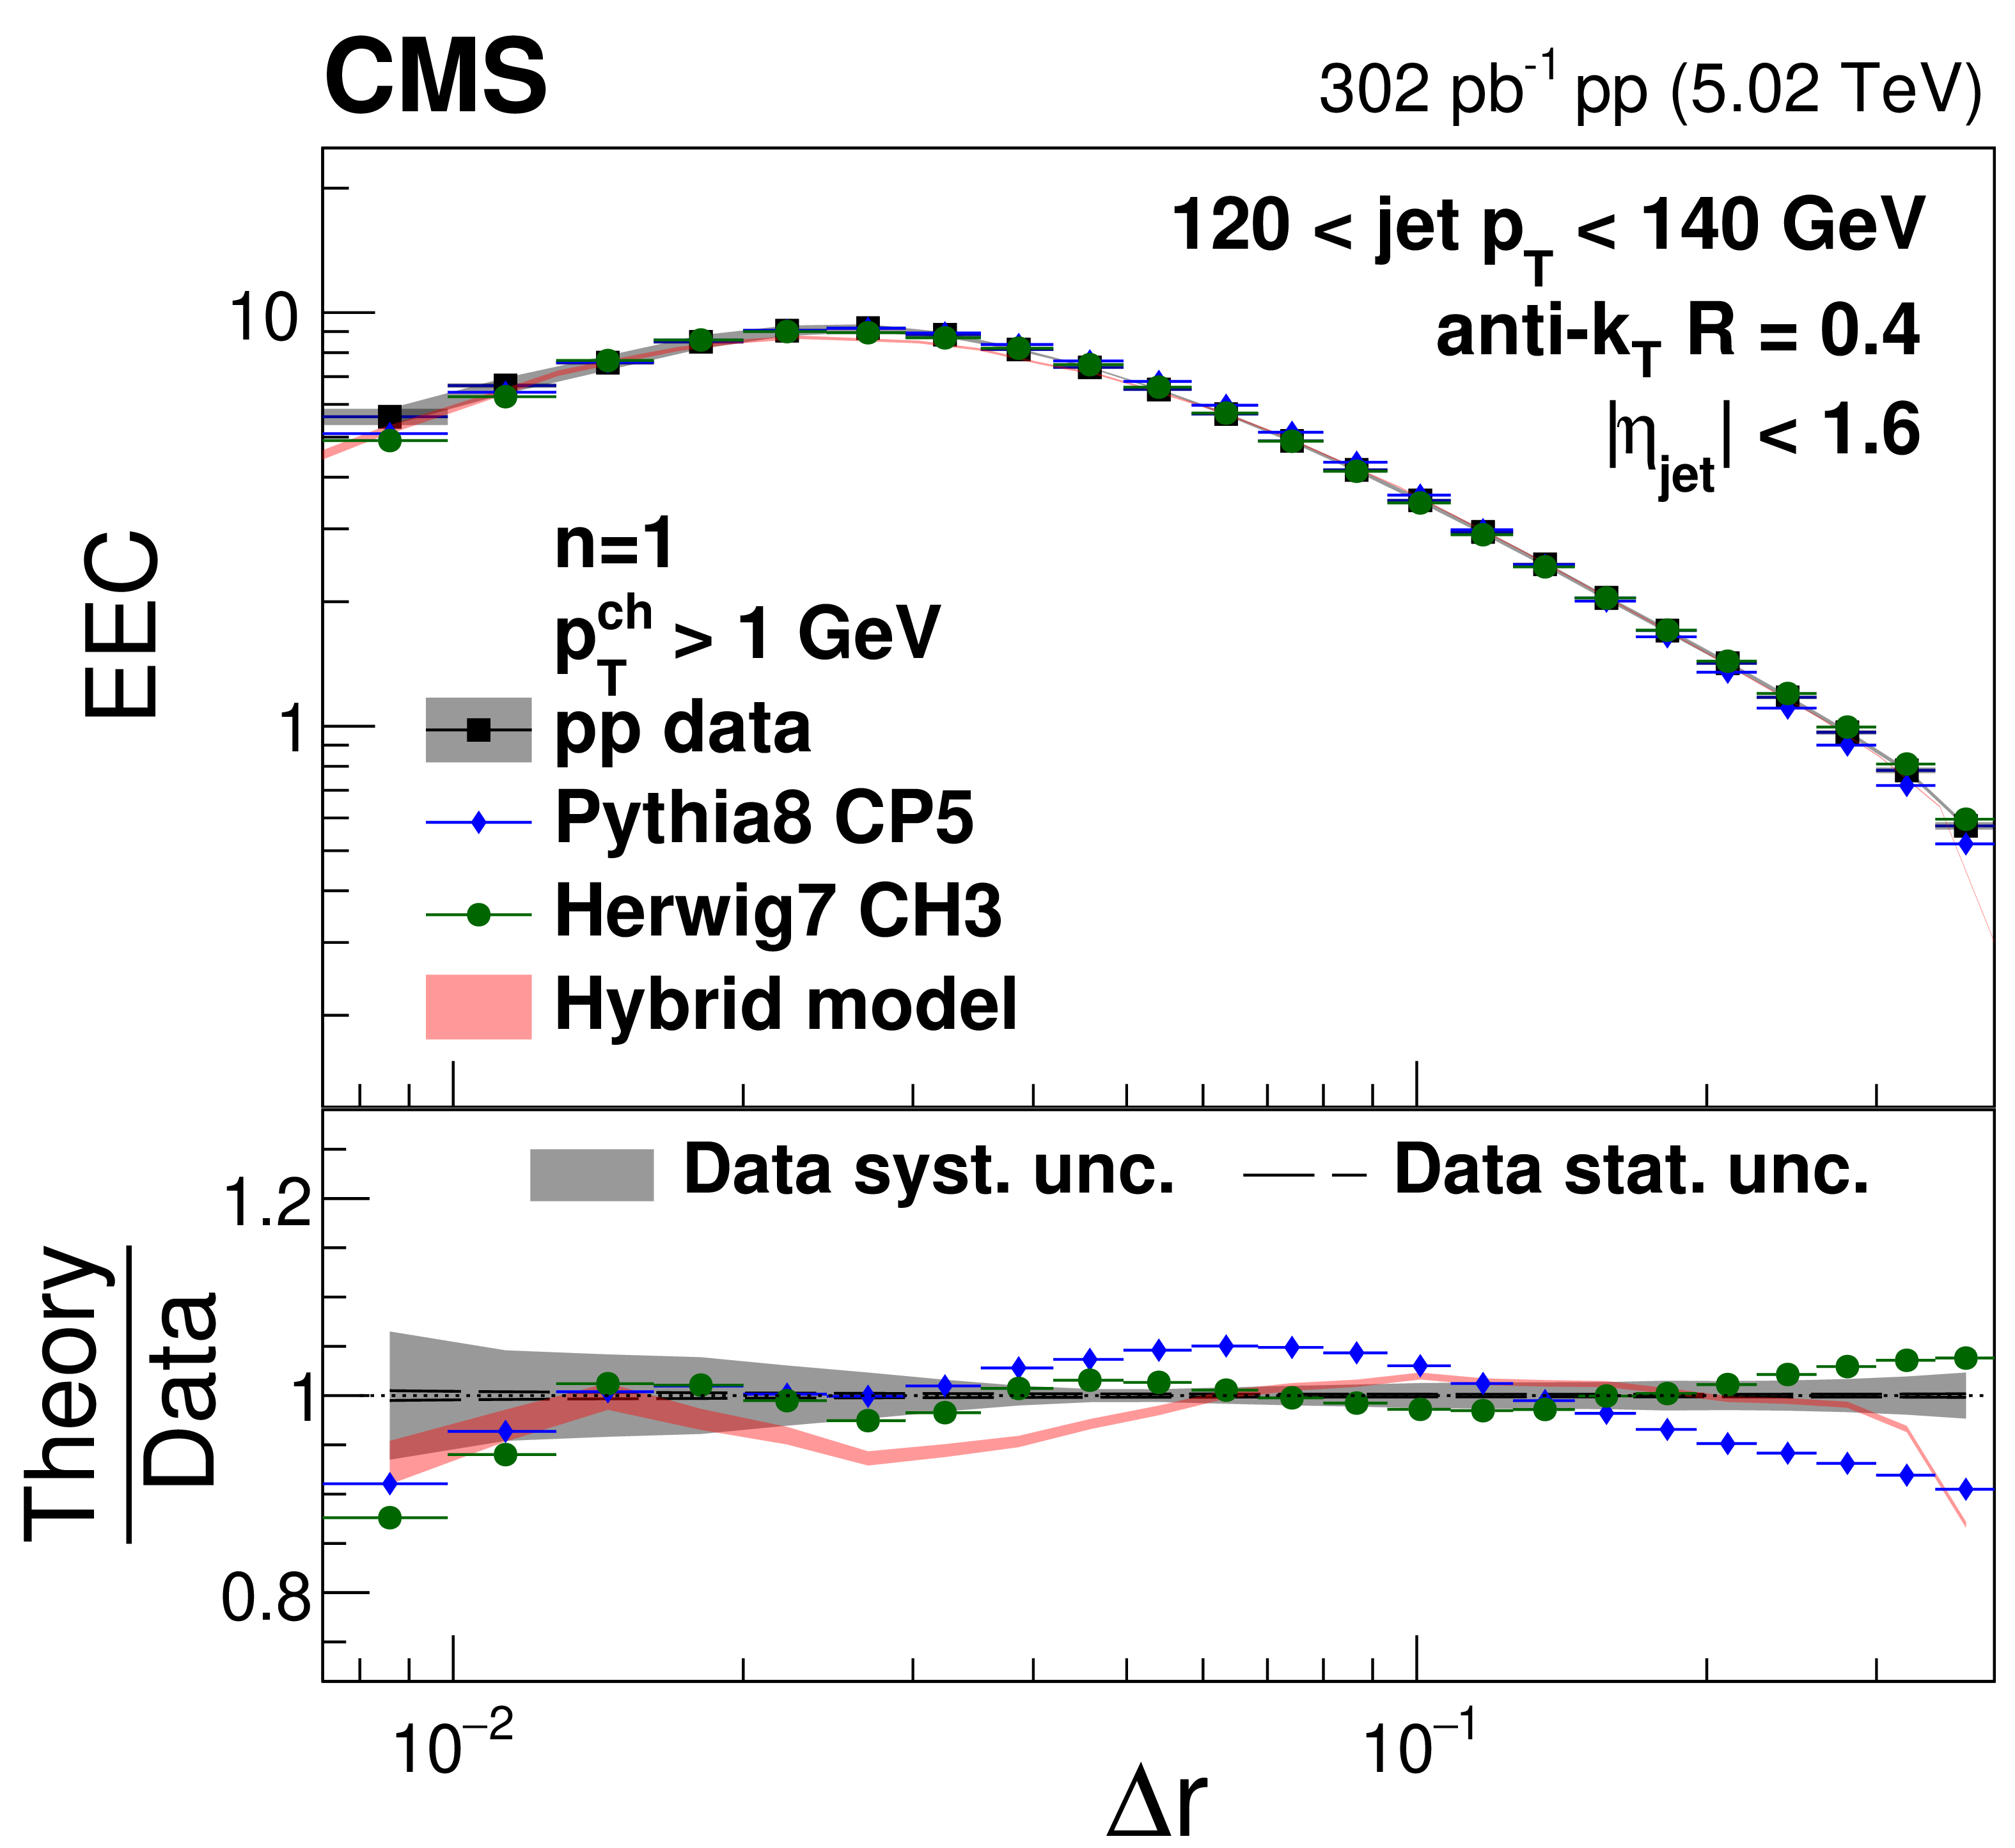
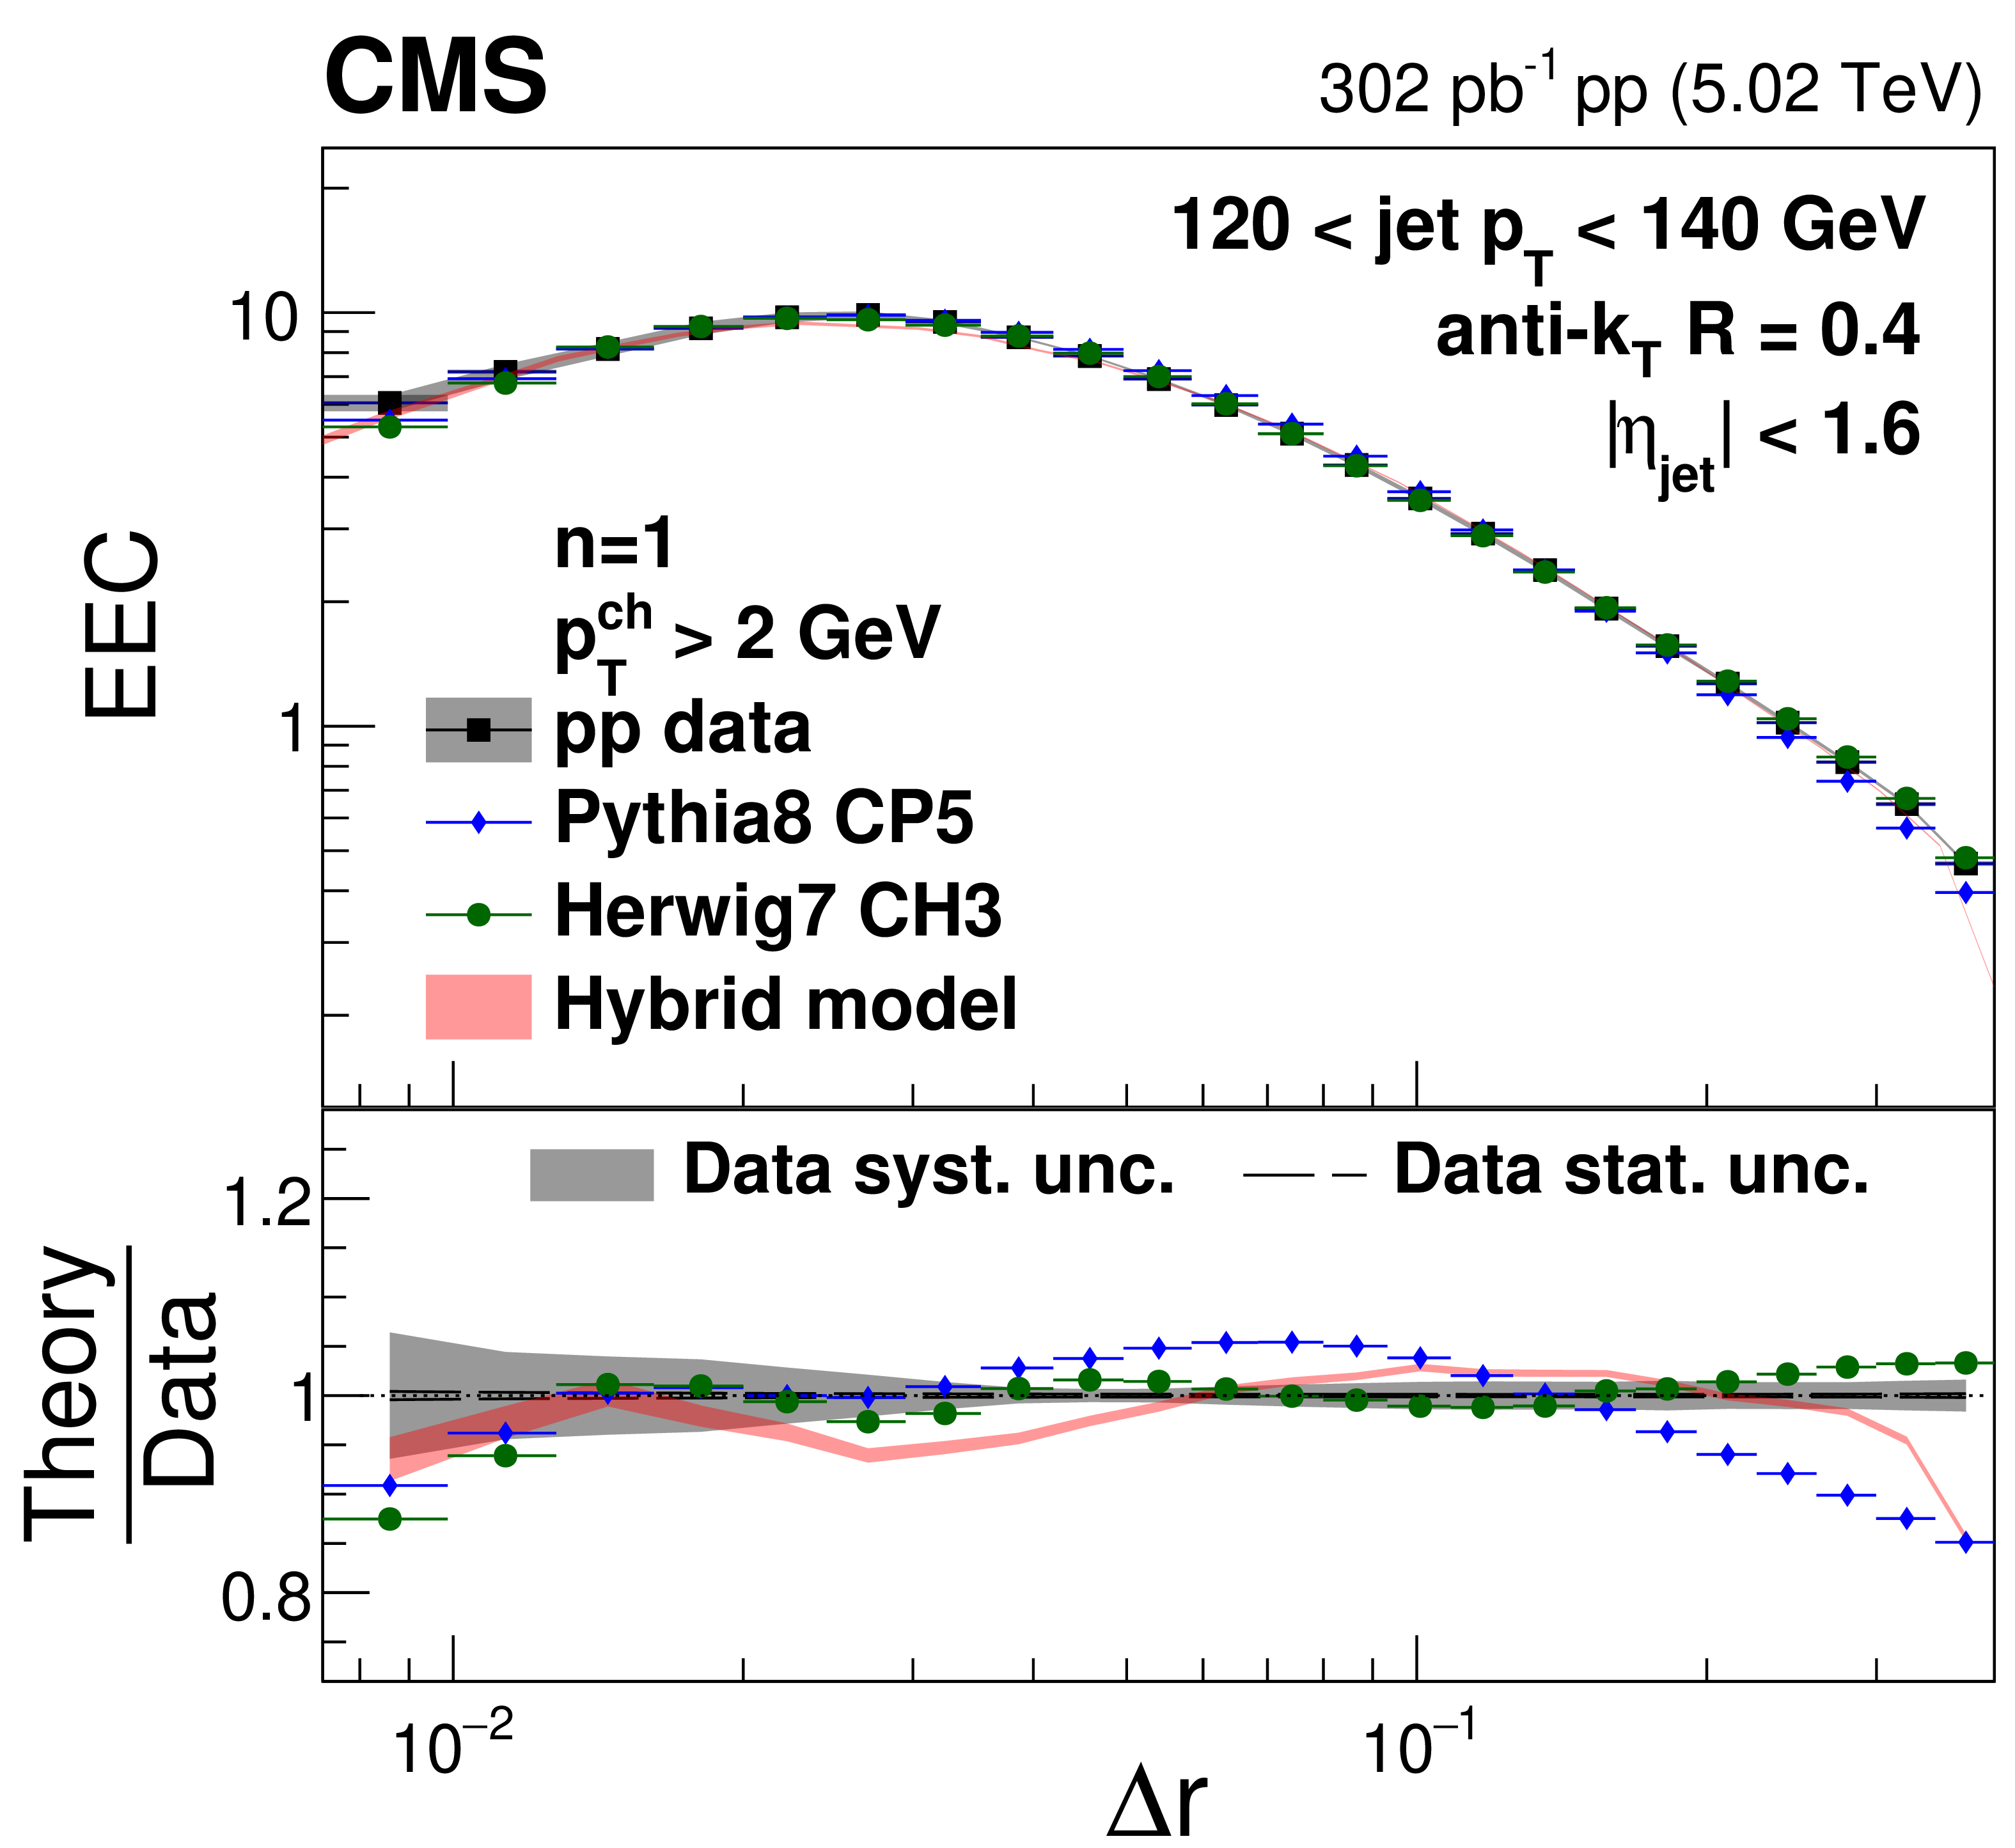
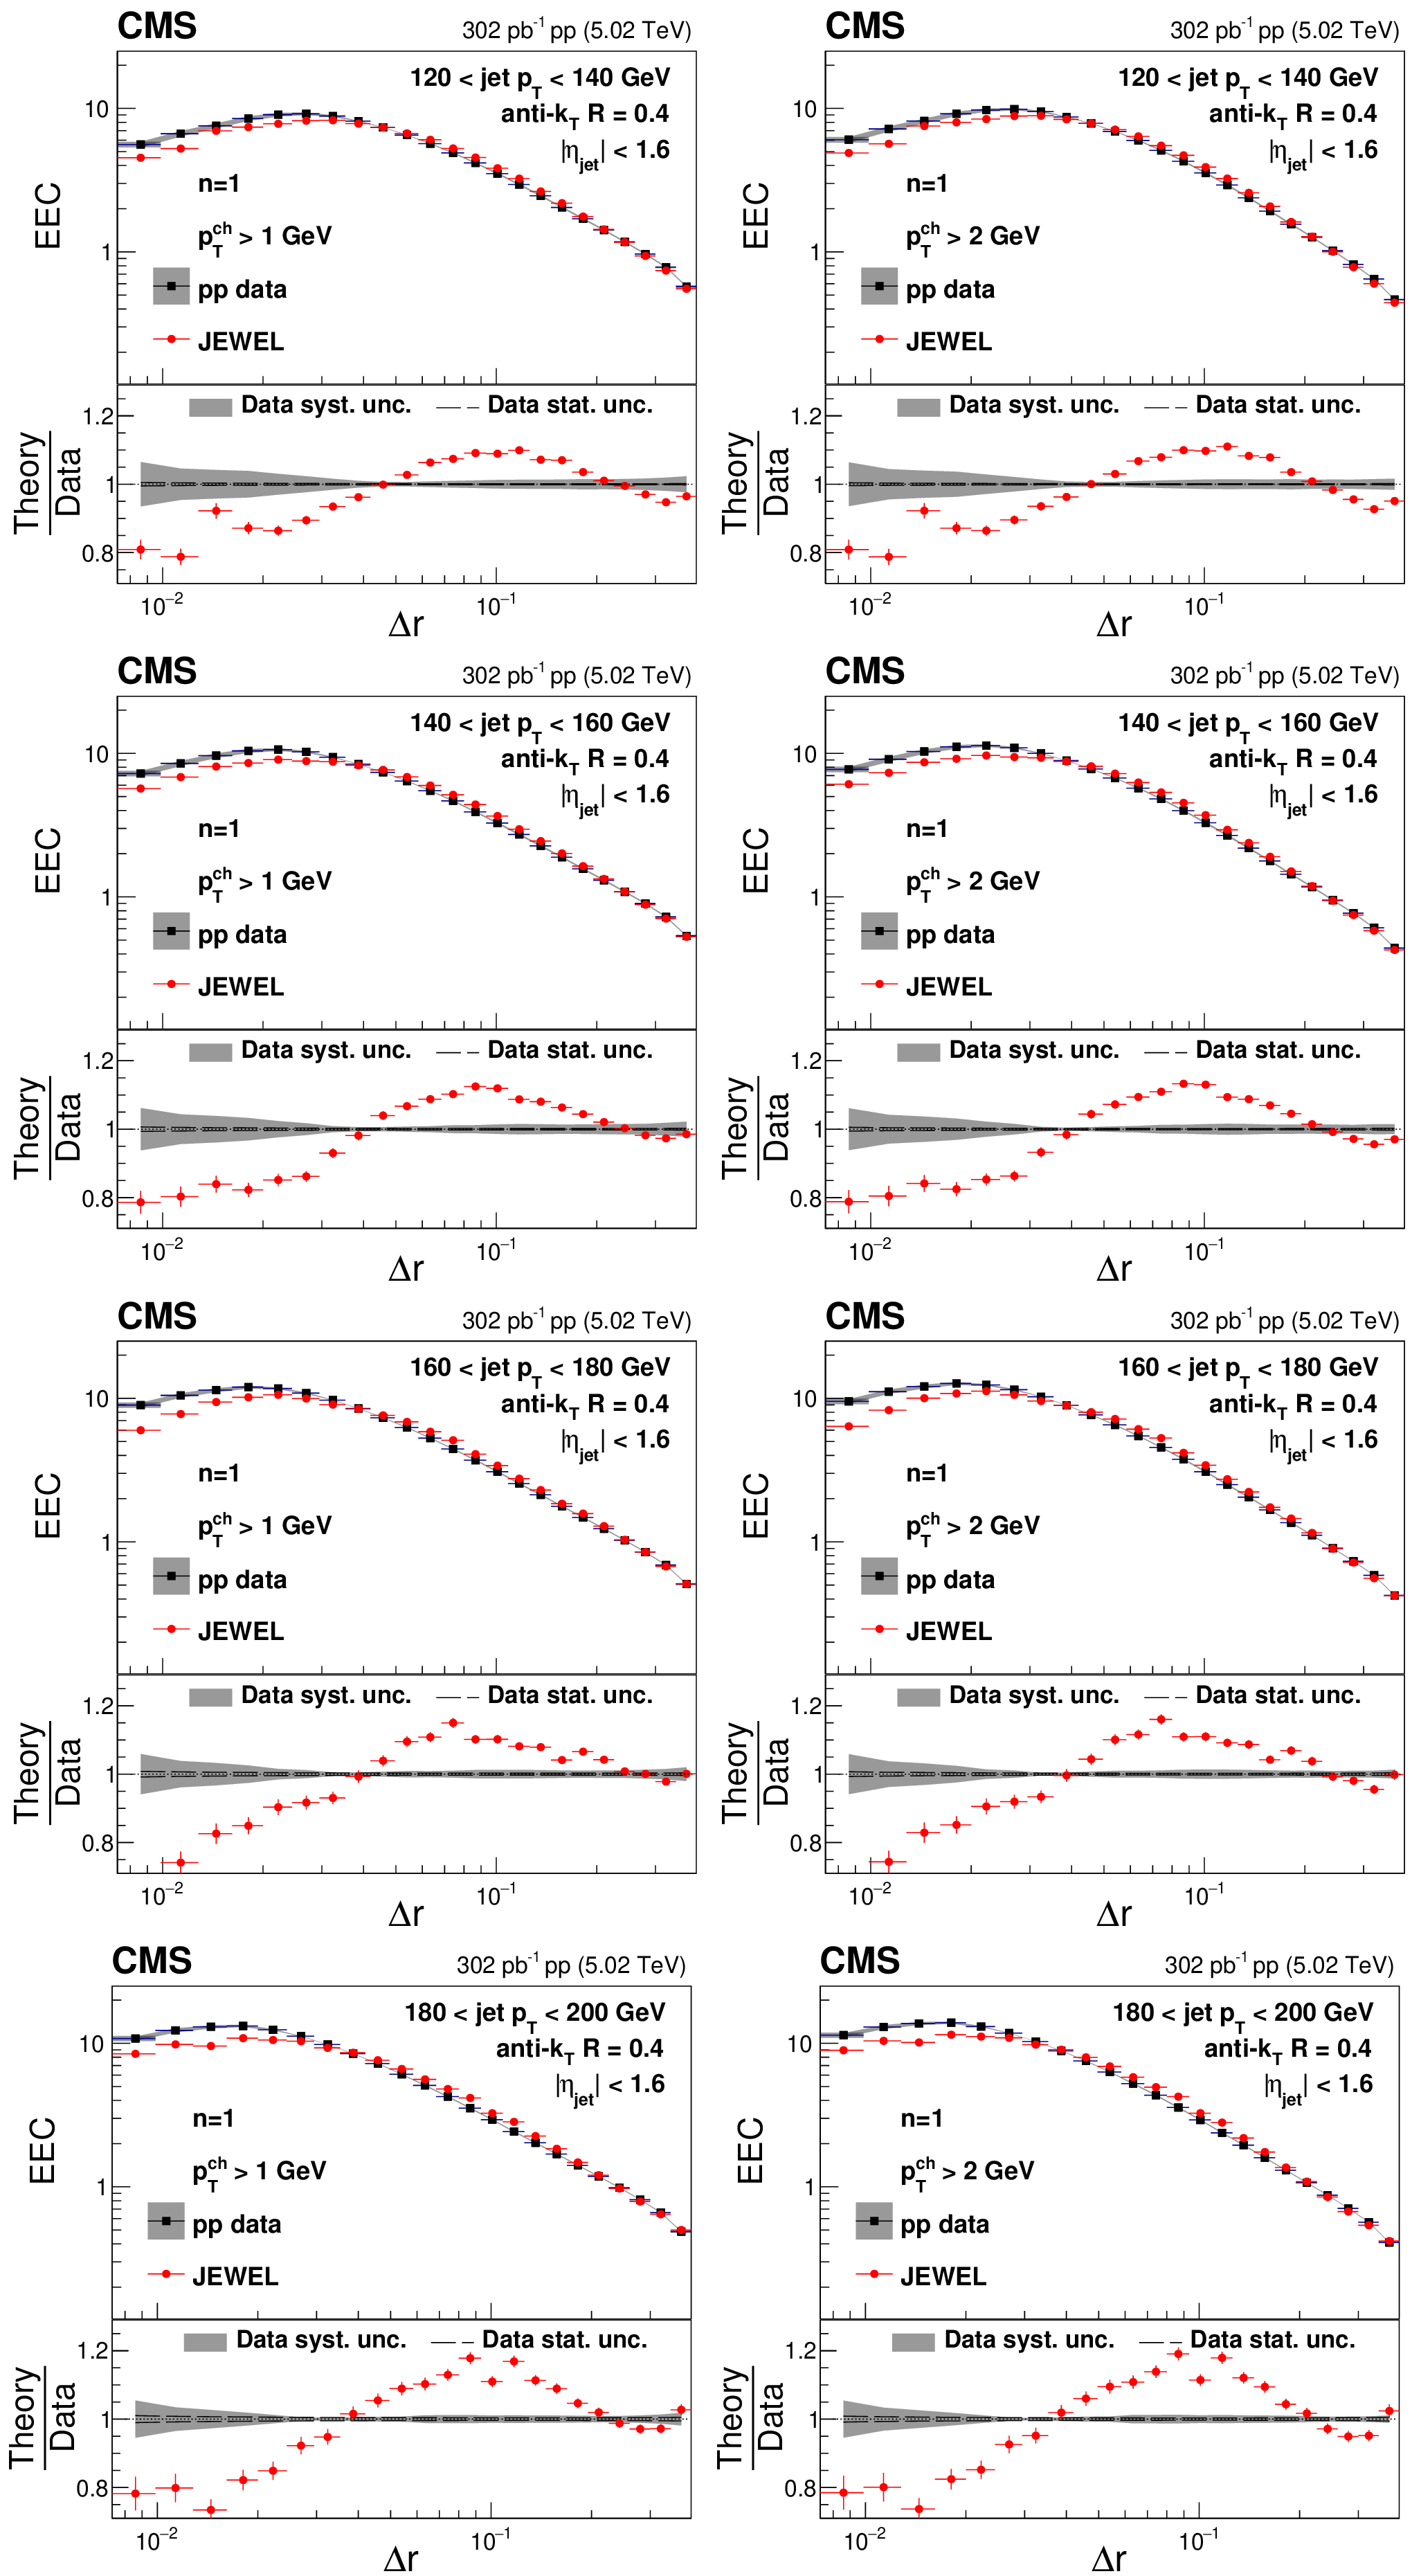
Comparison of PYTHIA [58], HERWIG [61,62], and the hybrid model [82,83,84] calculations to the observed energy-energy correlators for $ p_{\mathrm{T}}^{\text{ch}} > $ 1 GeV, 120 $ < p_{\text{T,jet}} < $ 140 GeV and $ n= $ 1 (left) and $ n= $ 2 (right) in pp collisions. In the lower panels, the experimental uncertainties are indicated by the bands around unity. |

png pdf |
Figure 6-a:
Comparison of PYTHIA [58], HERWIG [61,62], and the hybrid model [82,83,84] calculations to the observed energy-energy correlators for $ p_{\mathrm{T}}^{\text{ch}} > $ 1 GeV, 120 $ < p_{\text{T,jet}} < $ 140 GeV and $ n= $ 1 (left) and $ n= $ 2 (right) in pp collisions. In the lower panels, the experimental uncertainties are indicated by the bands around unity. |

png pdf |
Figure 6-b:
Comparison of PYTHIA [58], HERWIG [61,62], and the hybrid model [82,83,84] calculations to the observed energy-energy correlators for $ p_{\mathrm{T}}^{\text{ch}} > $ 1 GeV, 120 $ < p_{\text{T,jet}} < $ 140 GeV and $ n= $ 1 (left) and $ n= $ 2 (right) in pp collisions. In the lower panels, the experimental uncertainties are indicated by the bands around unity. |
png pdf |
Figure 7:
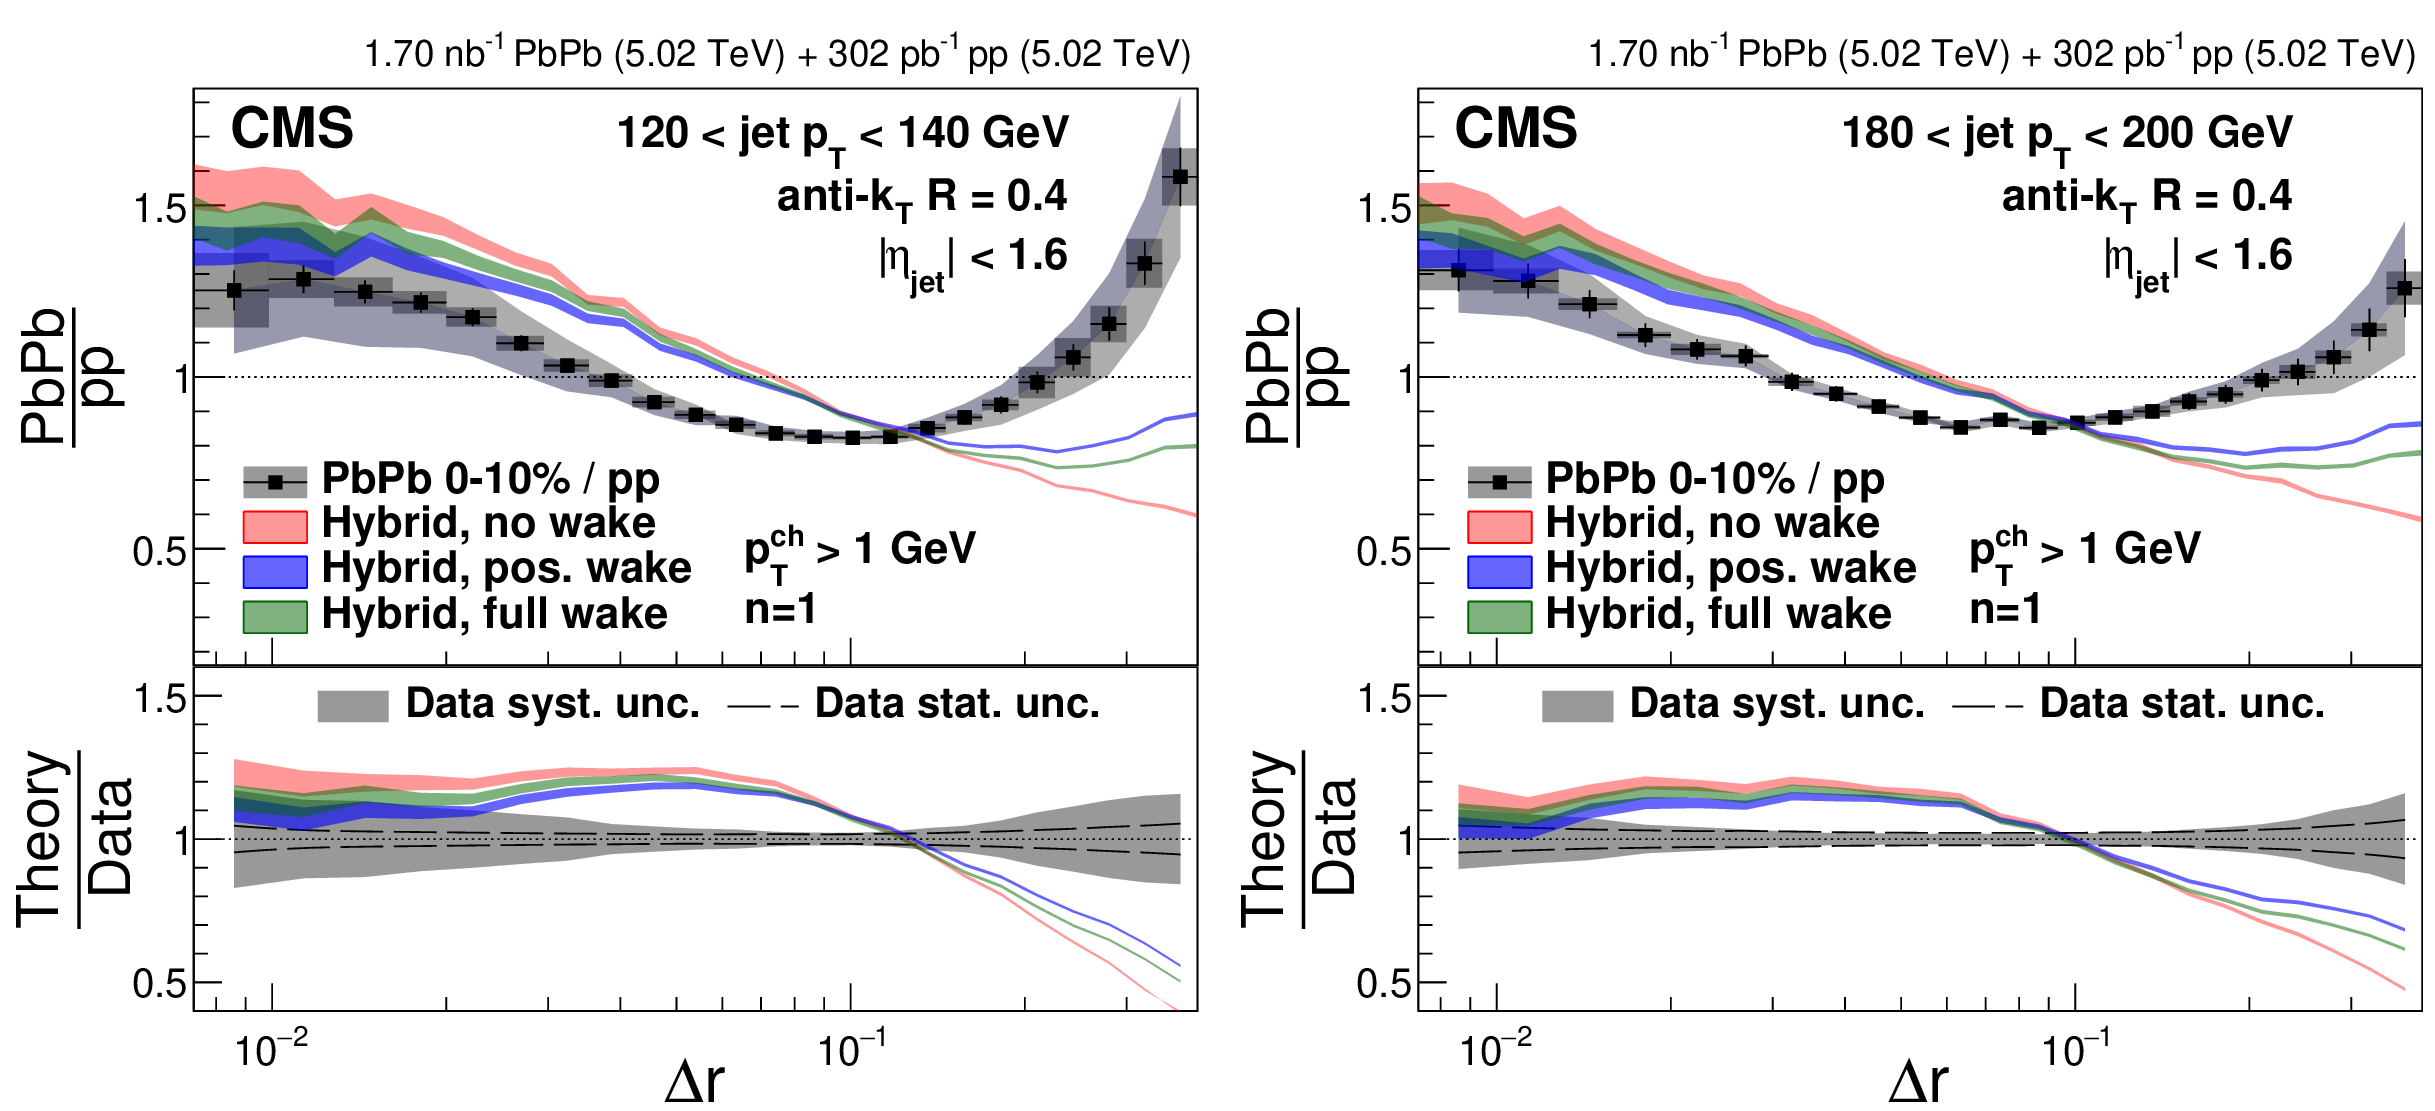
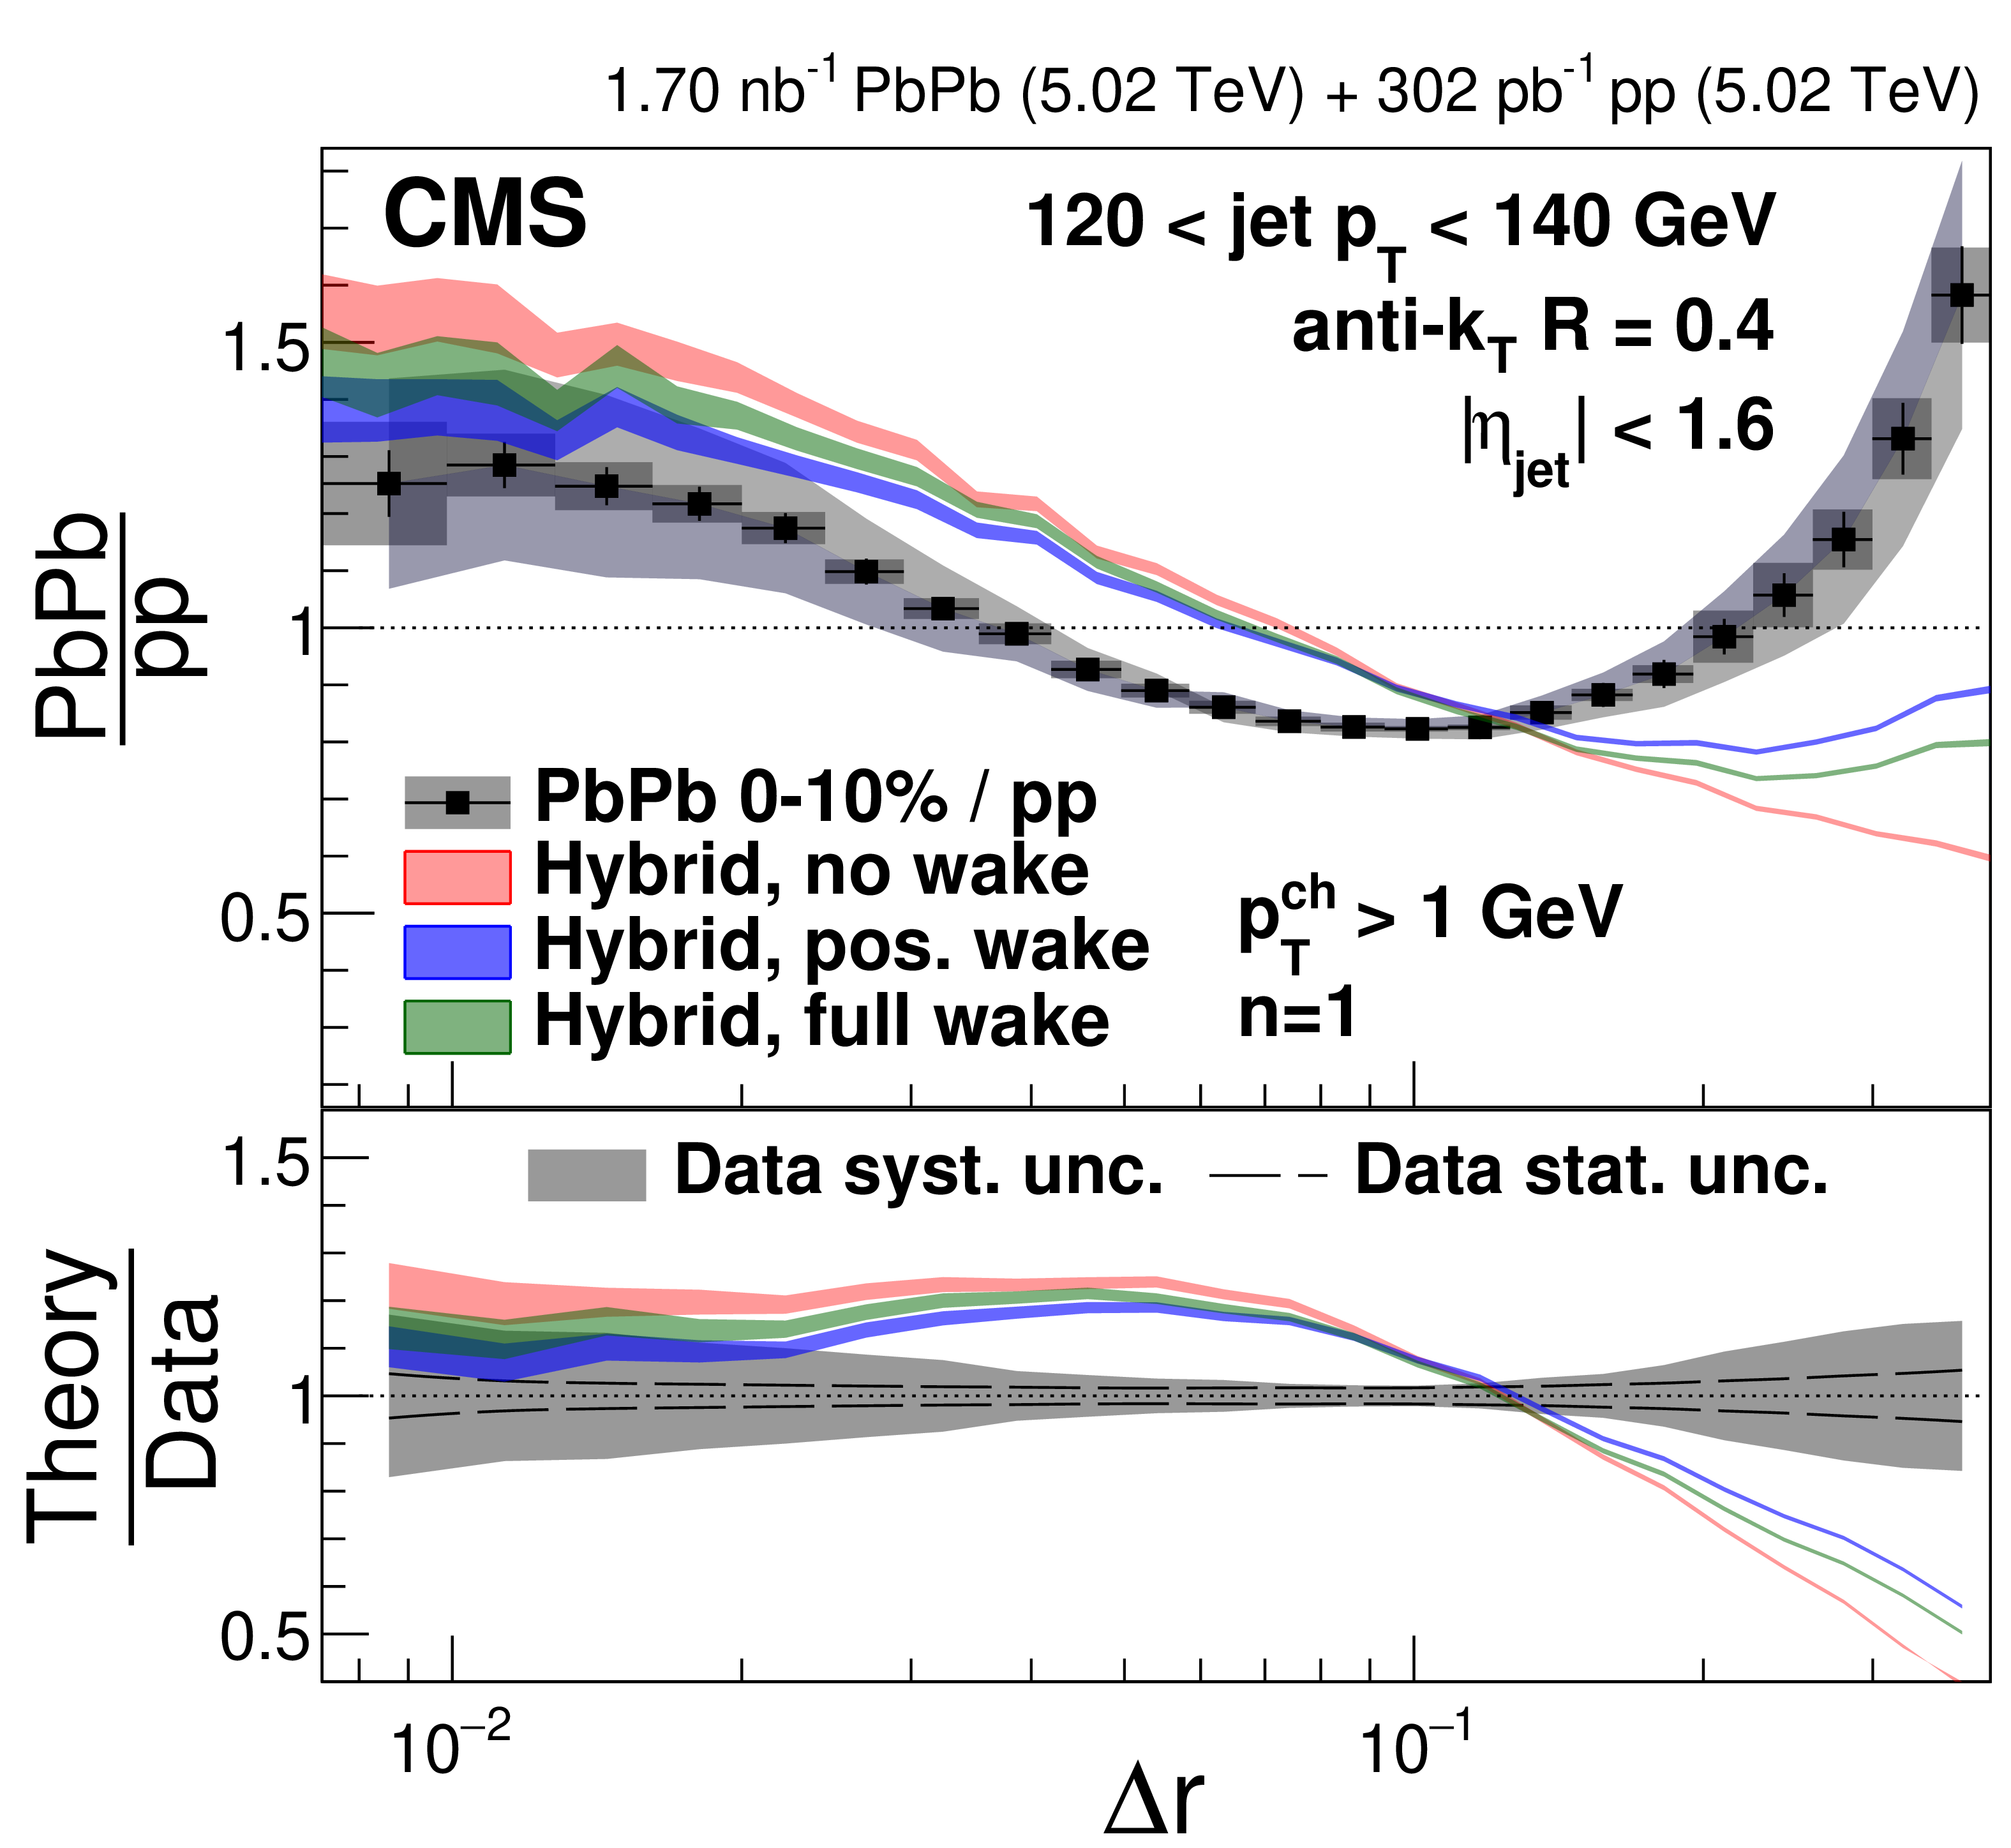
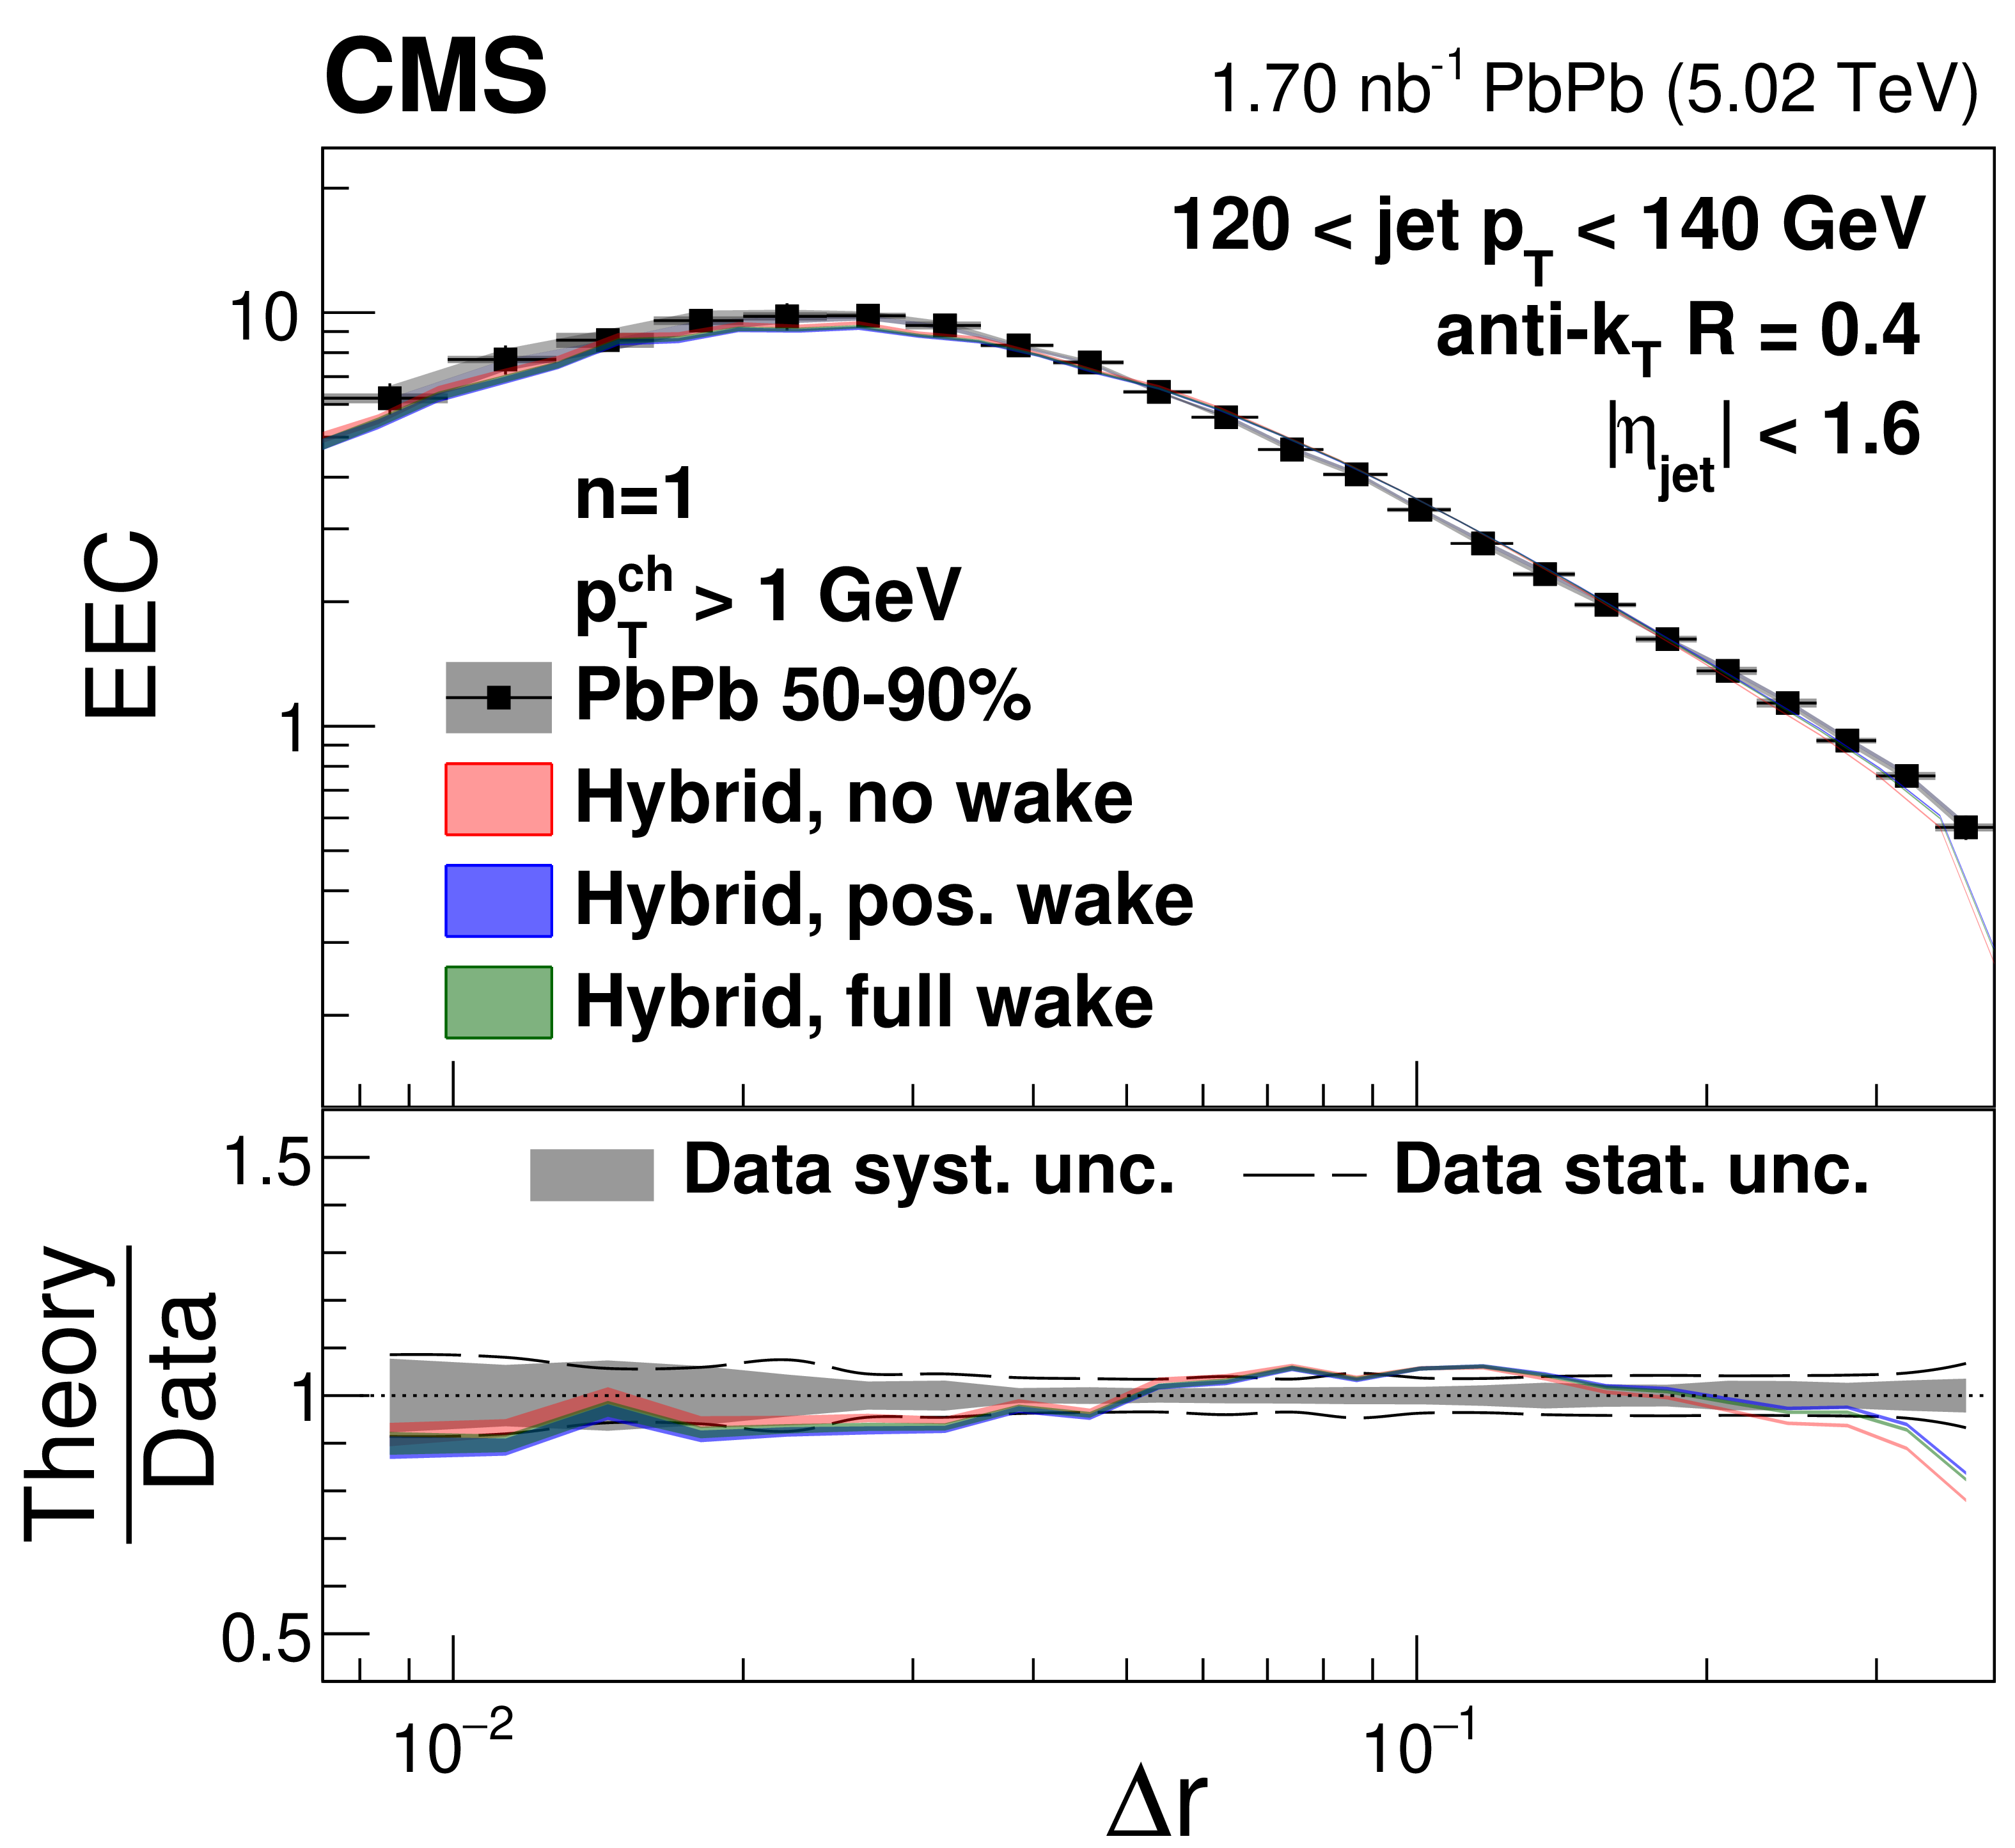
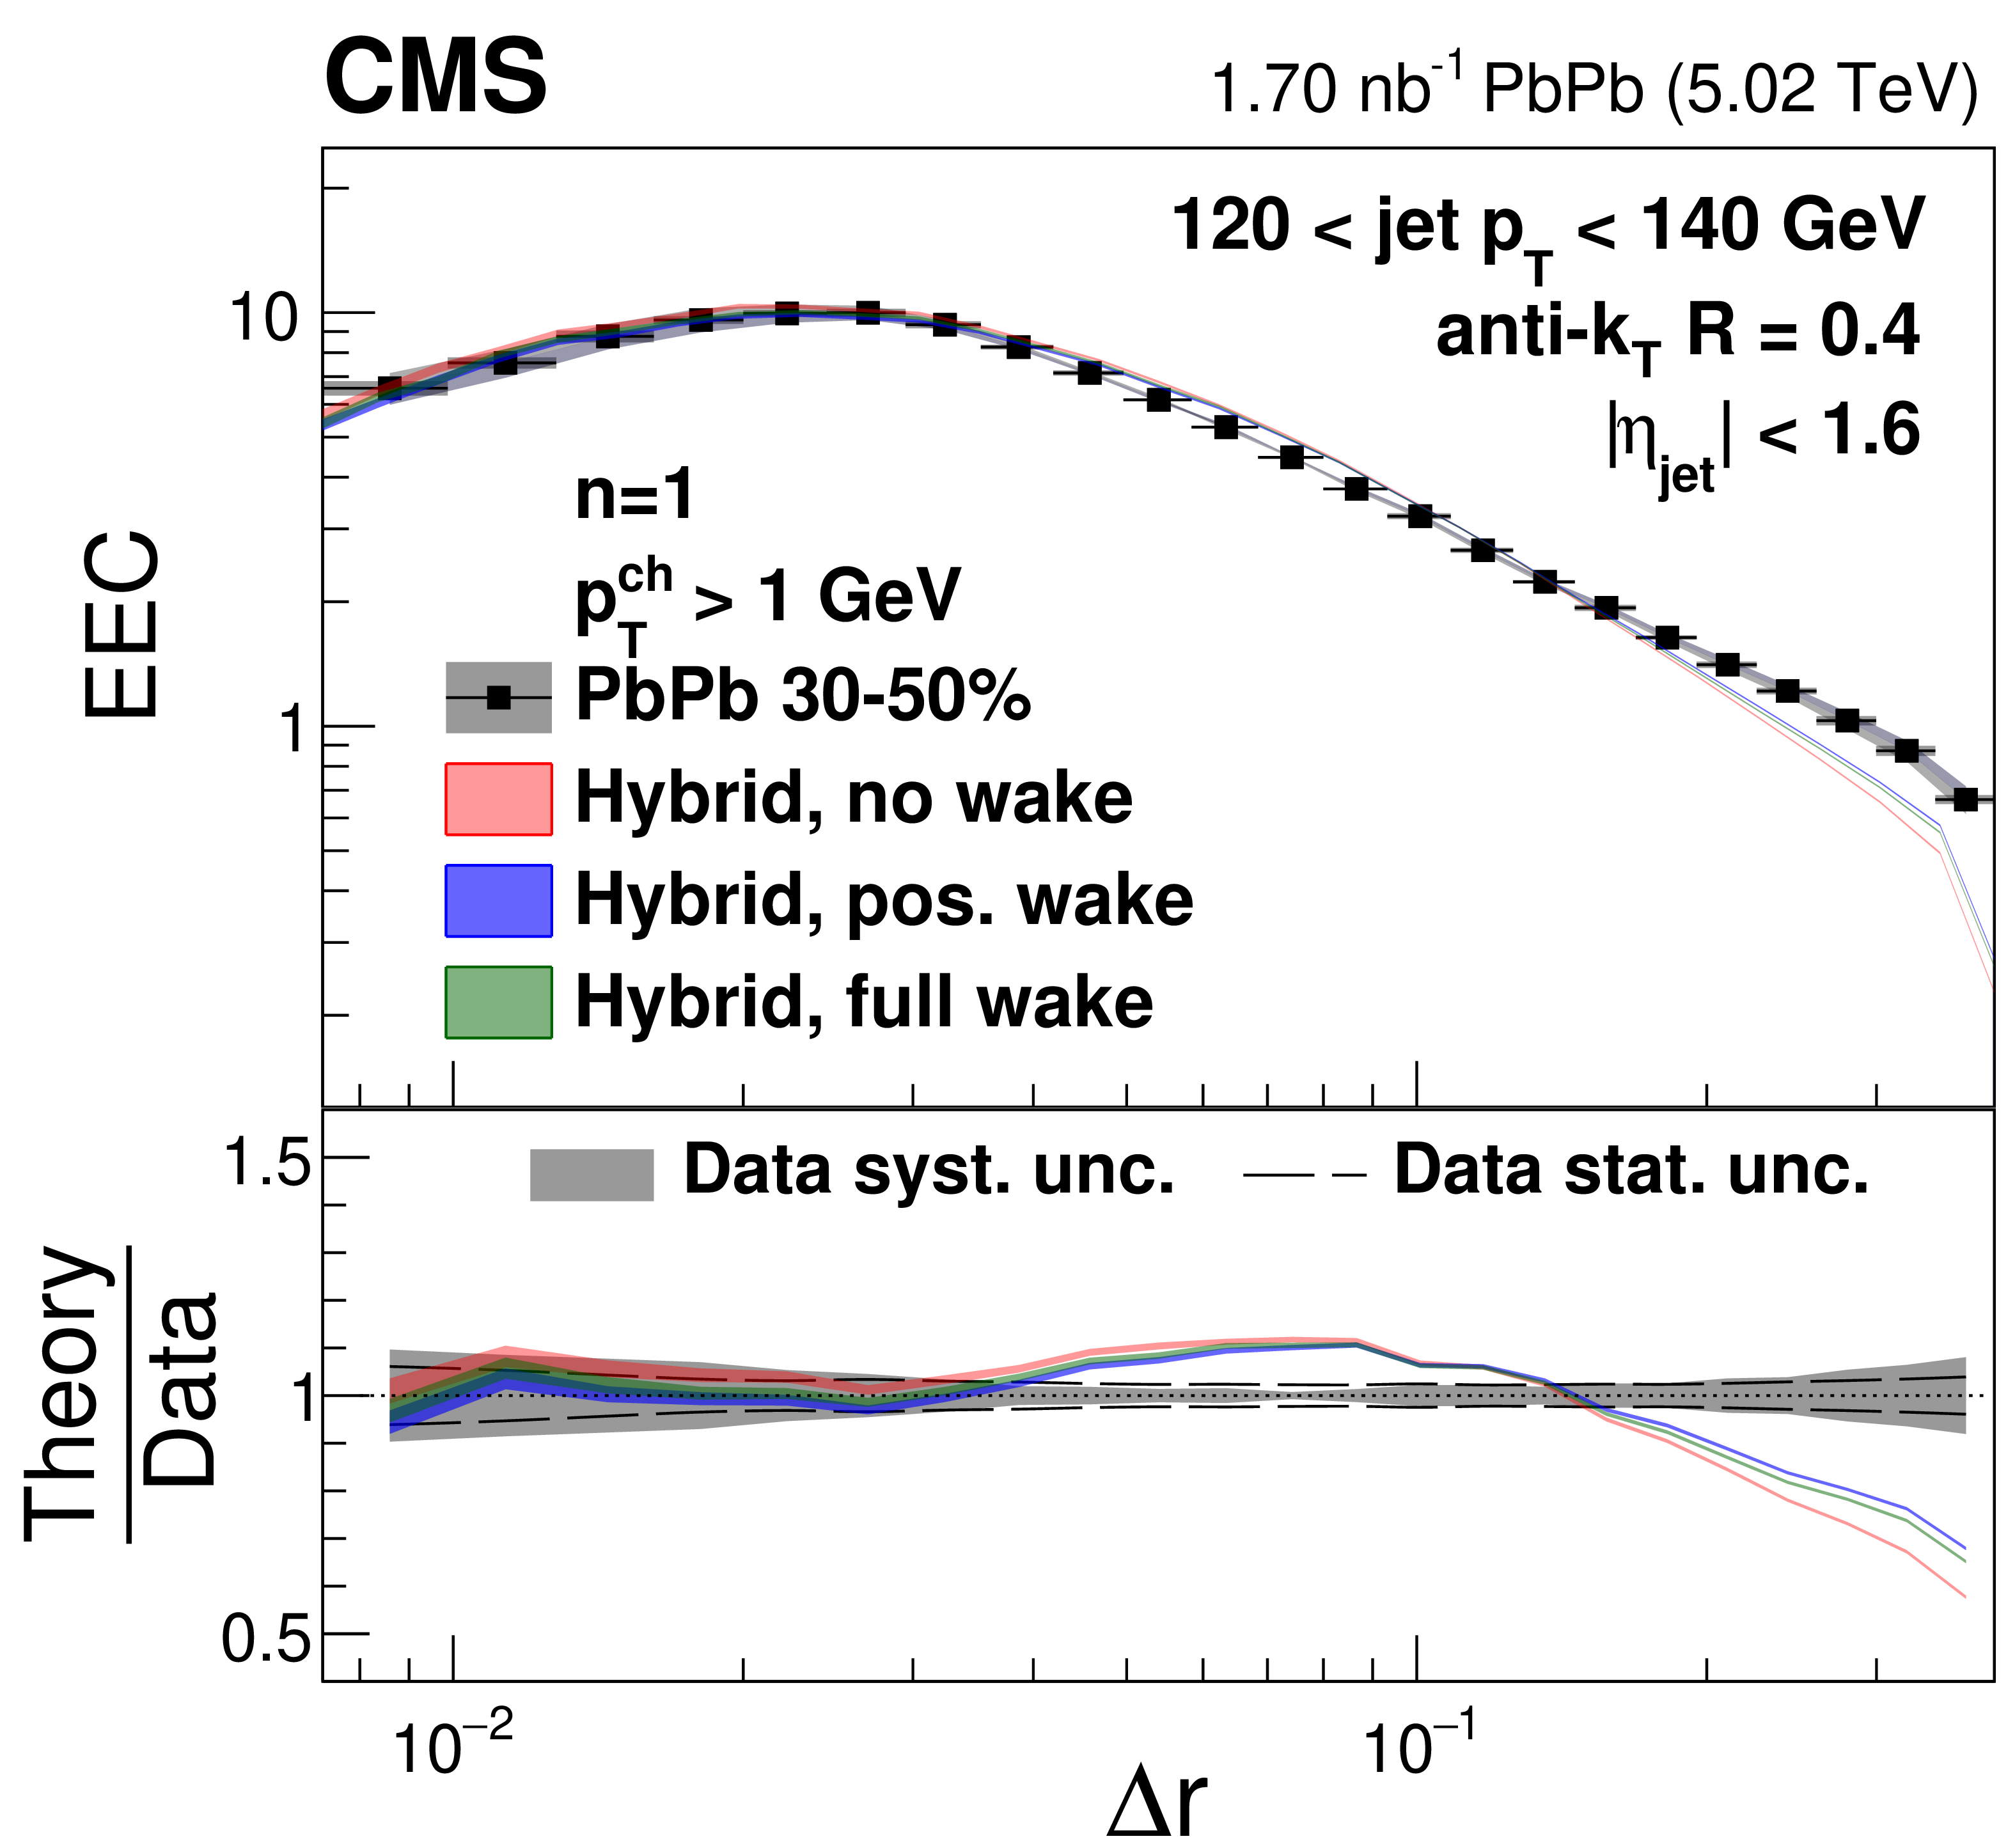
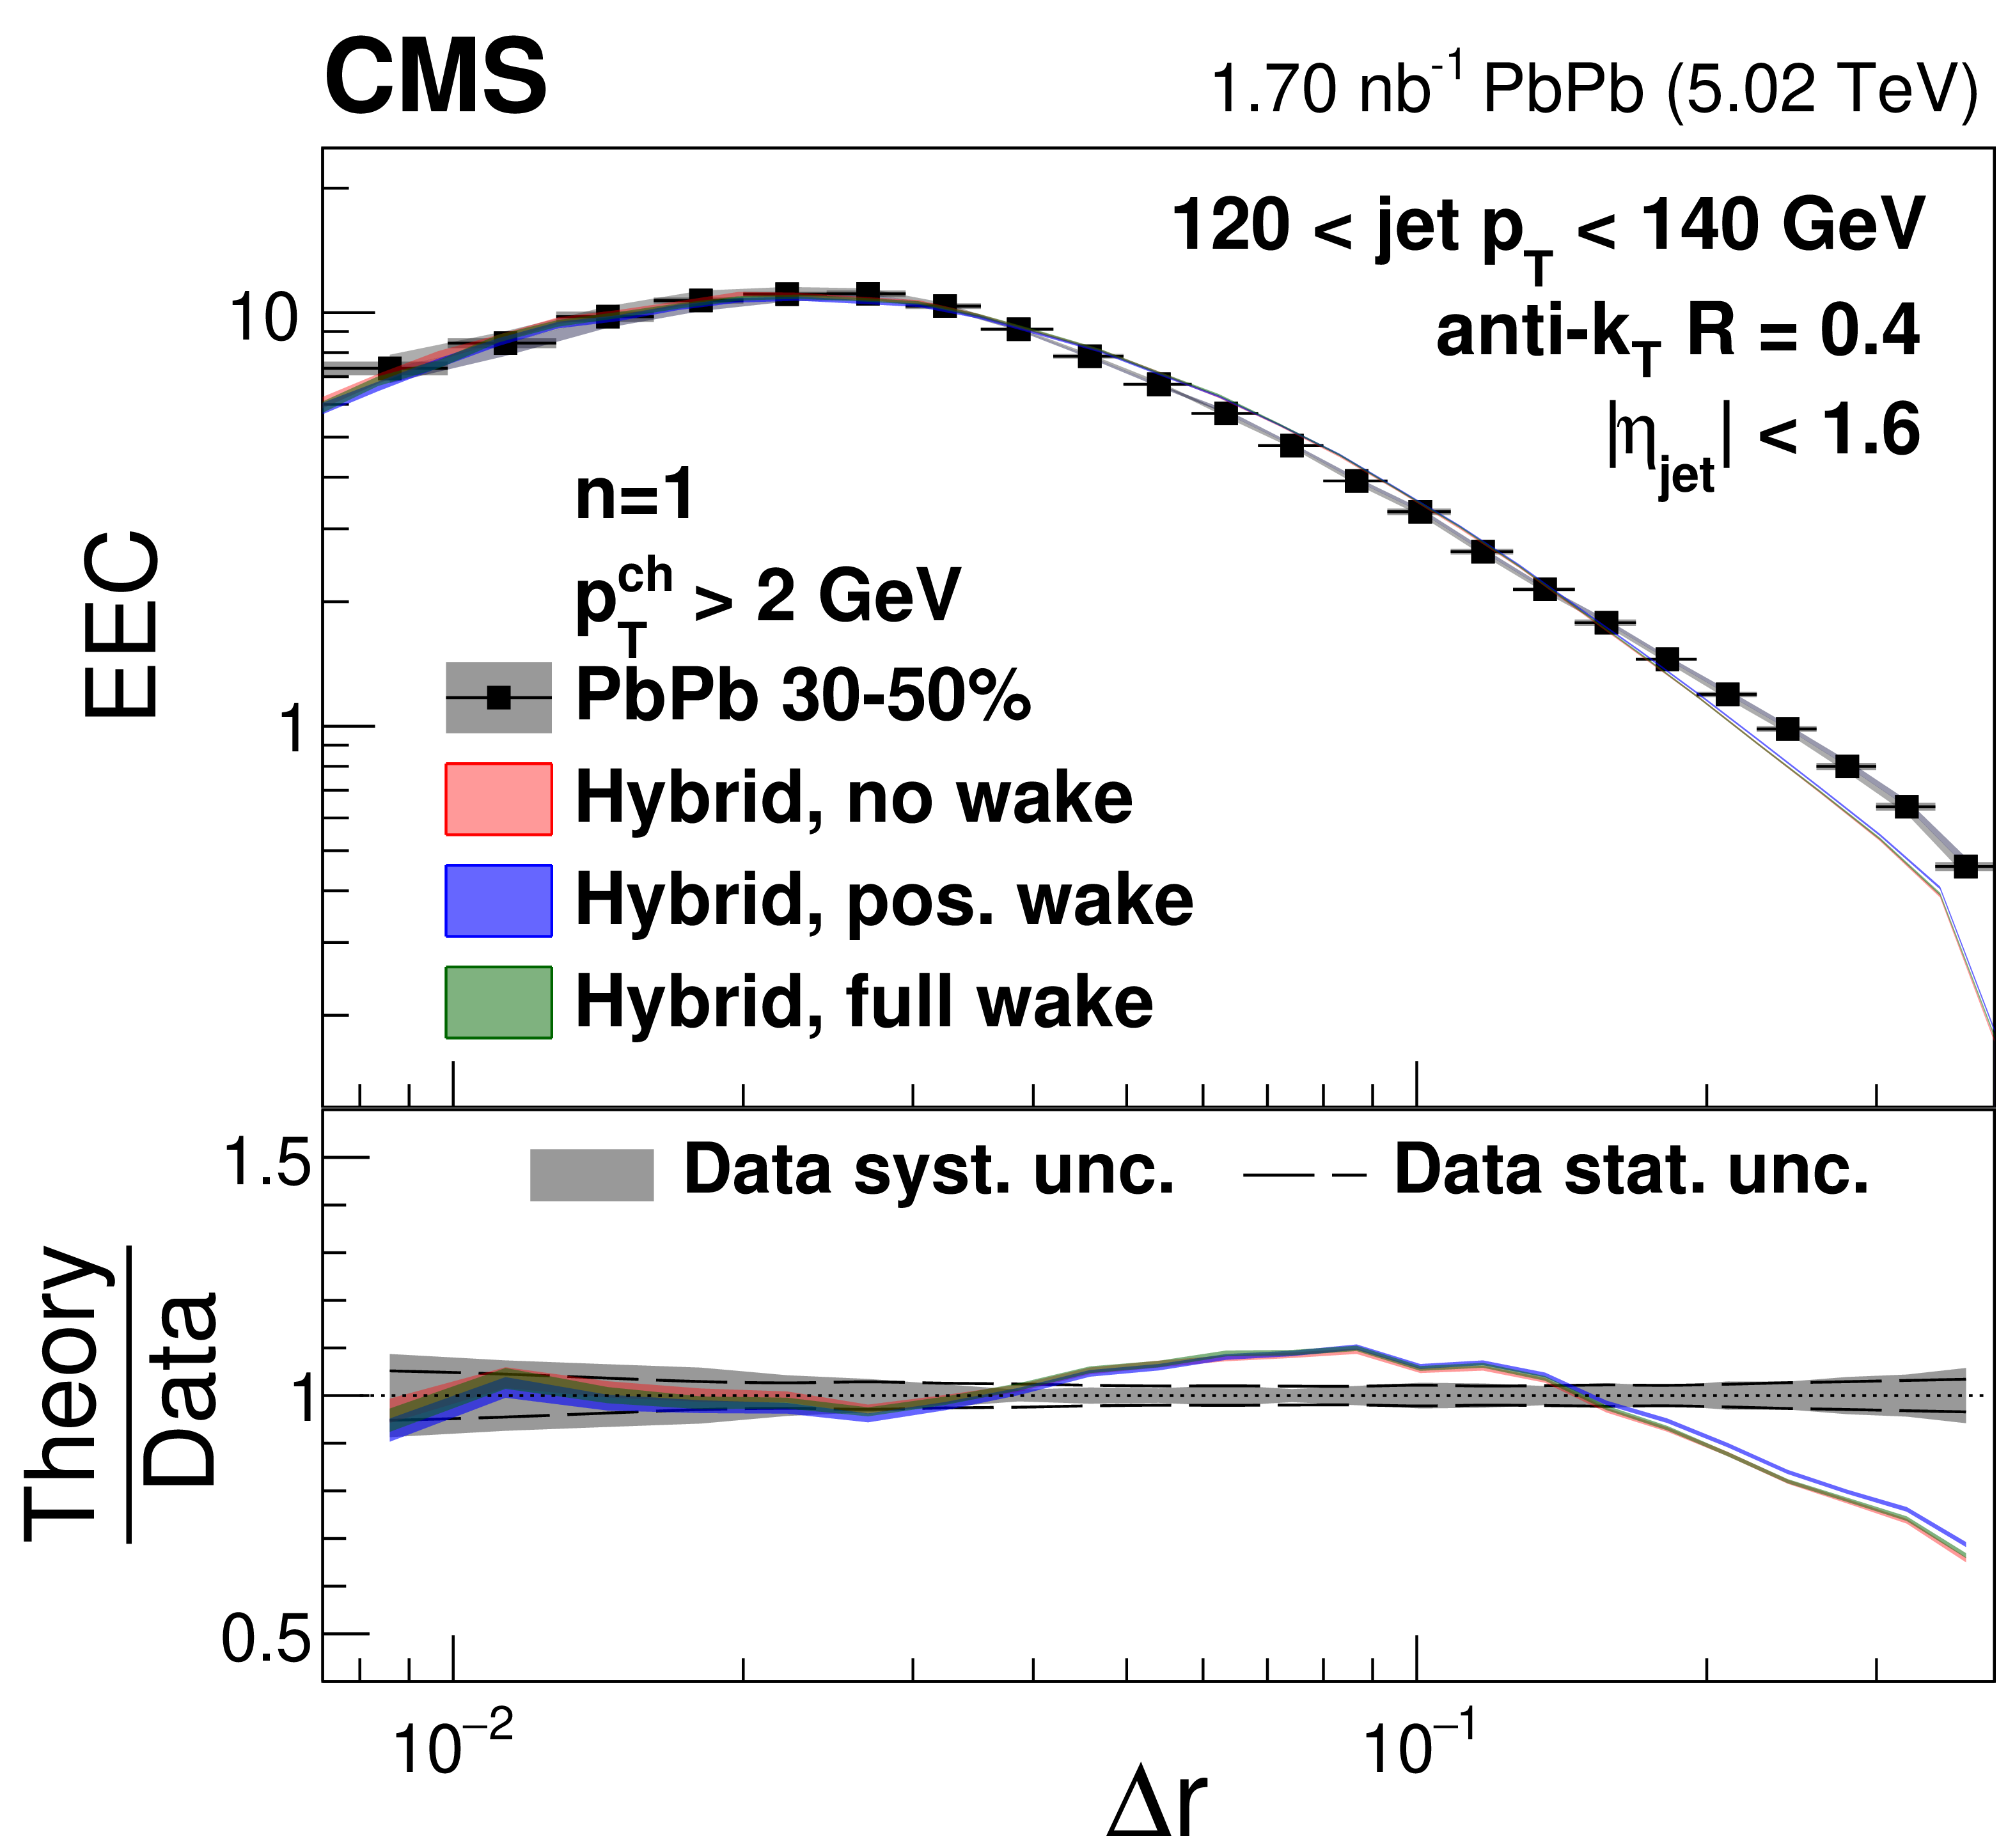
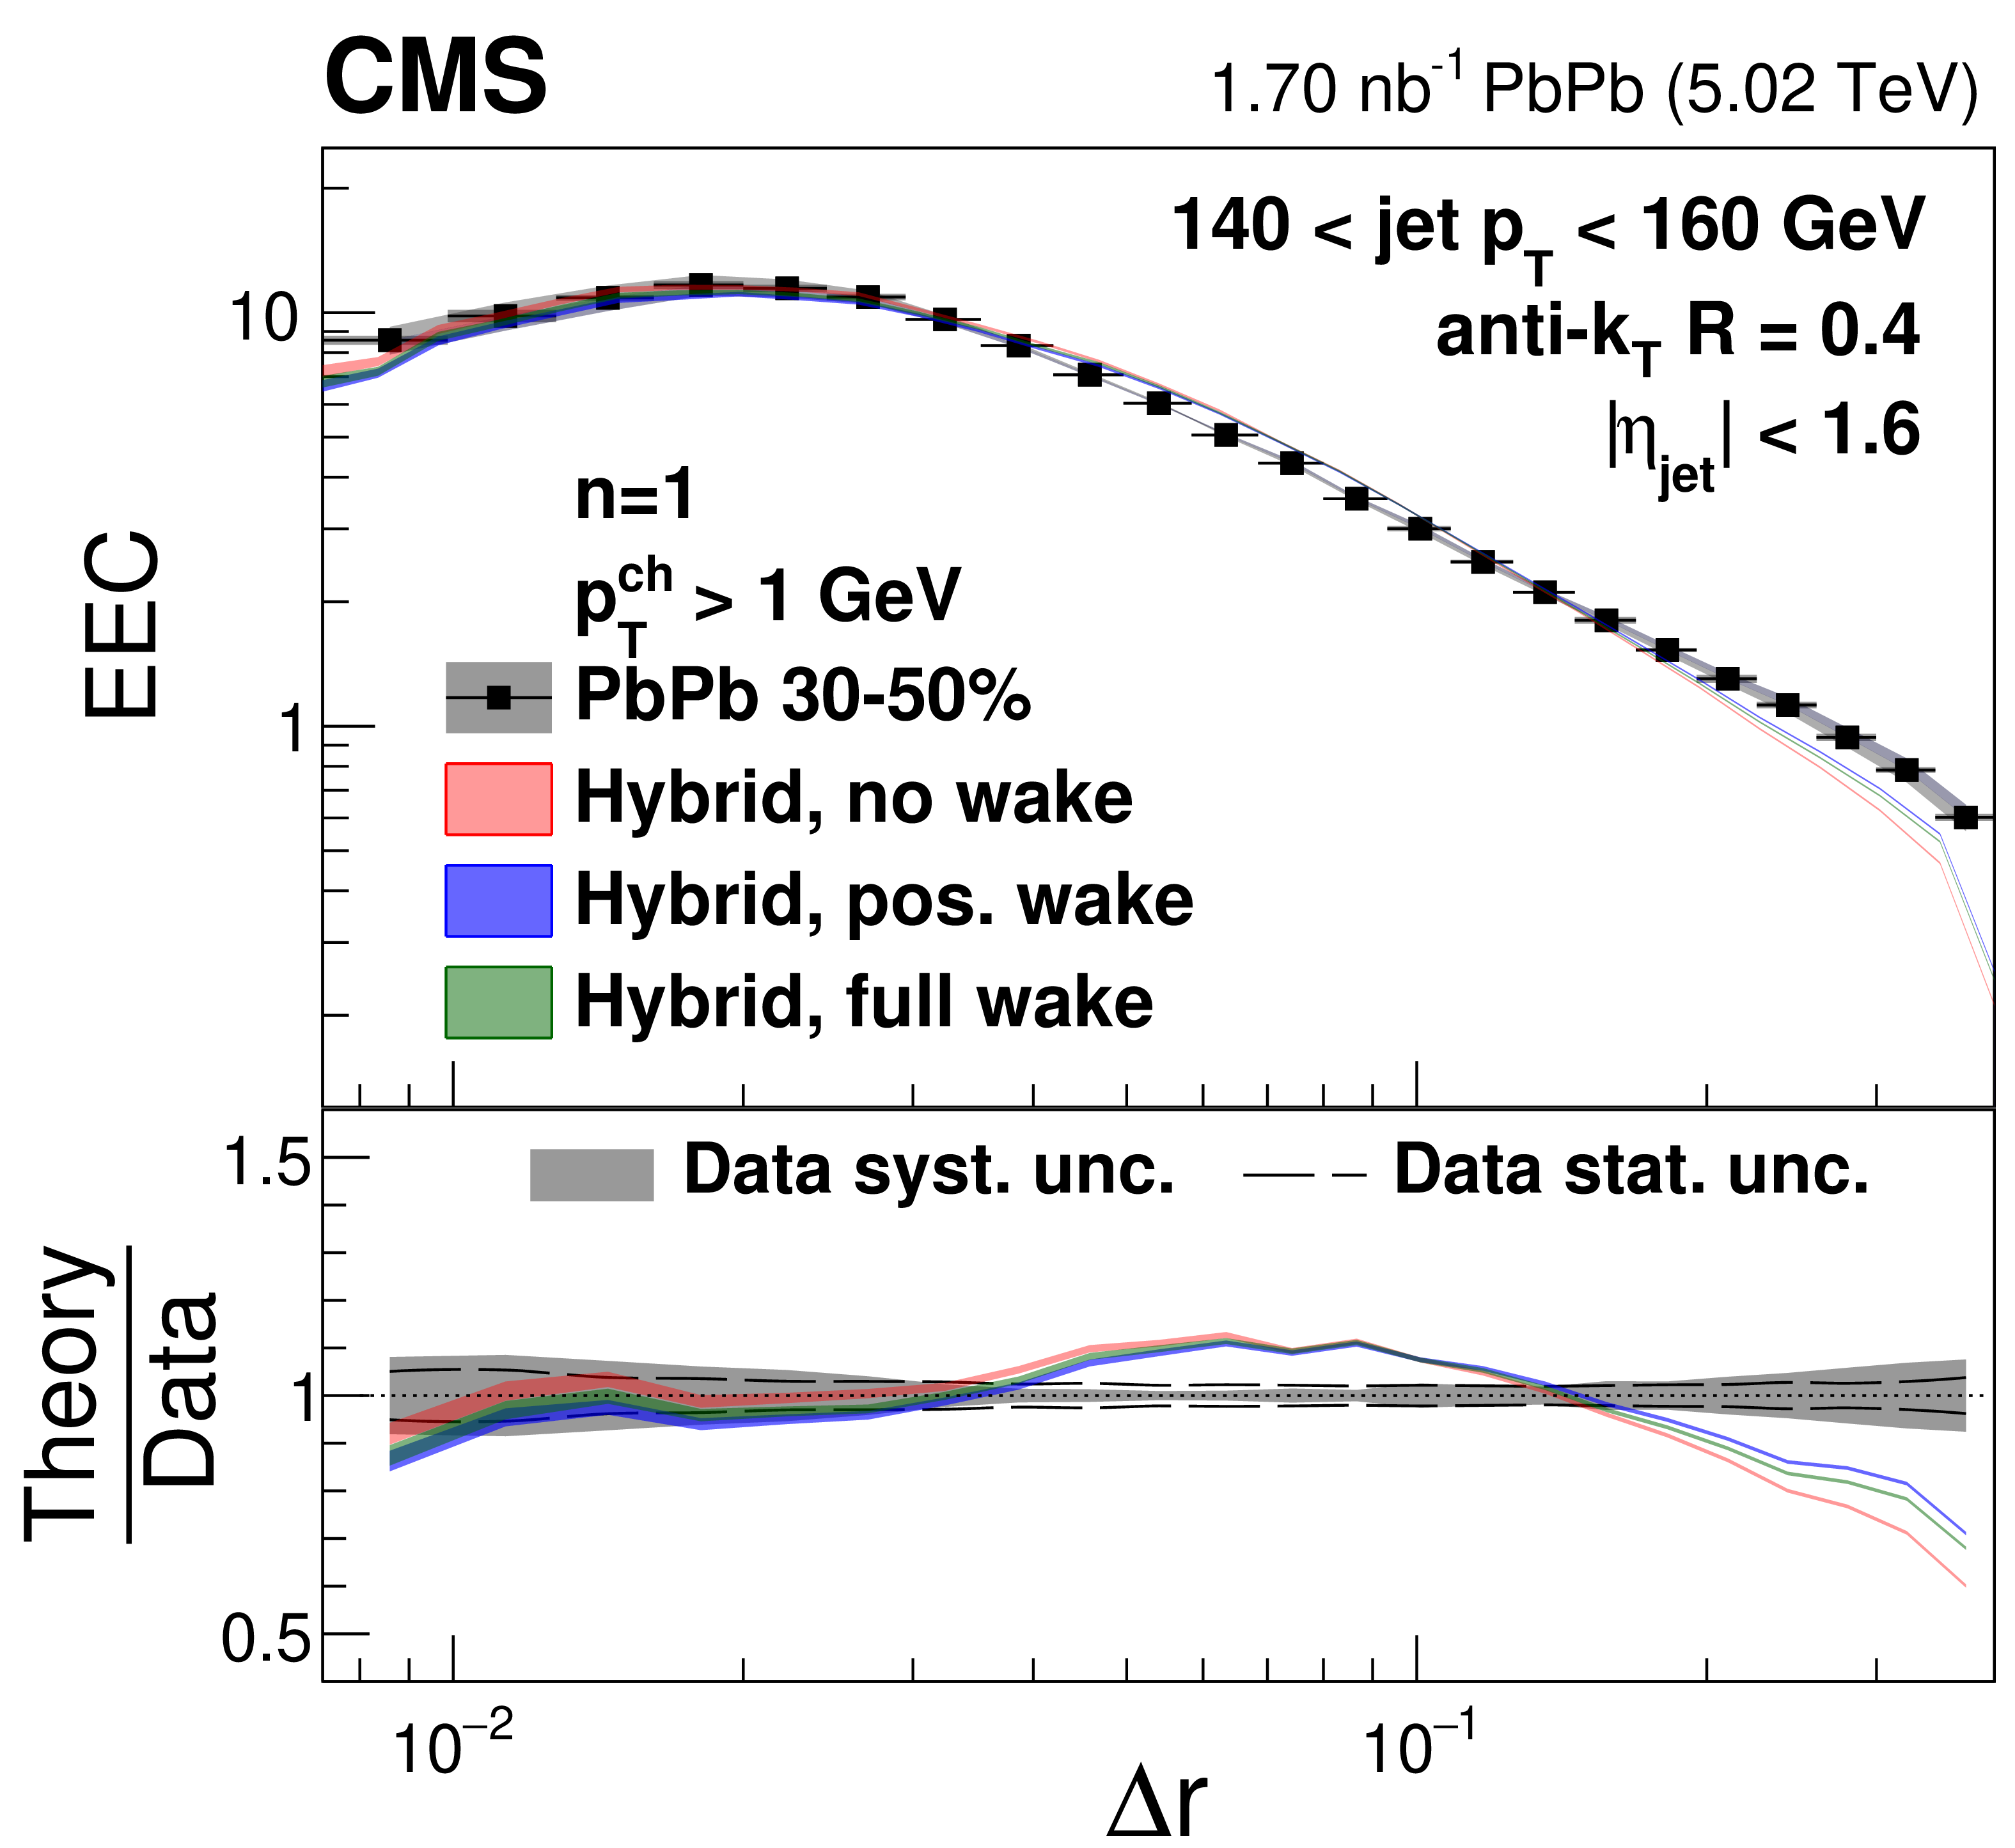
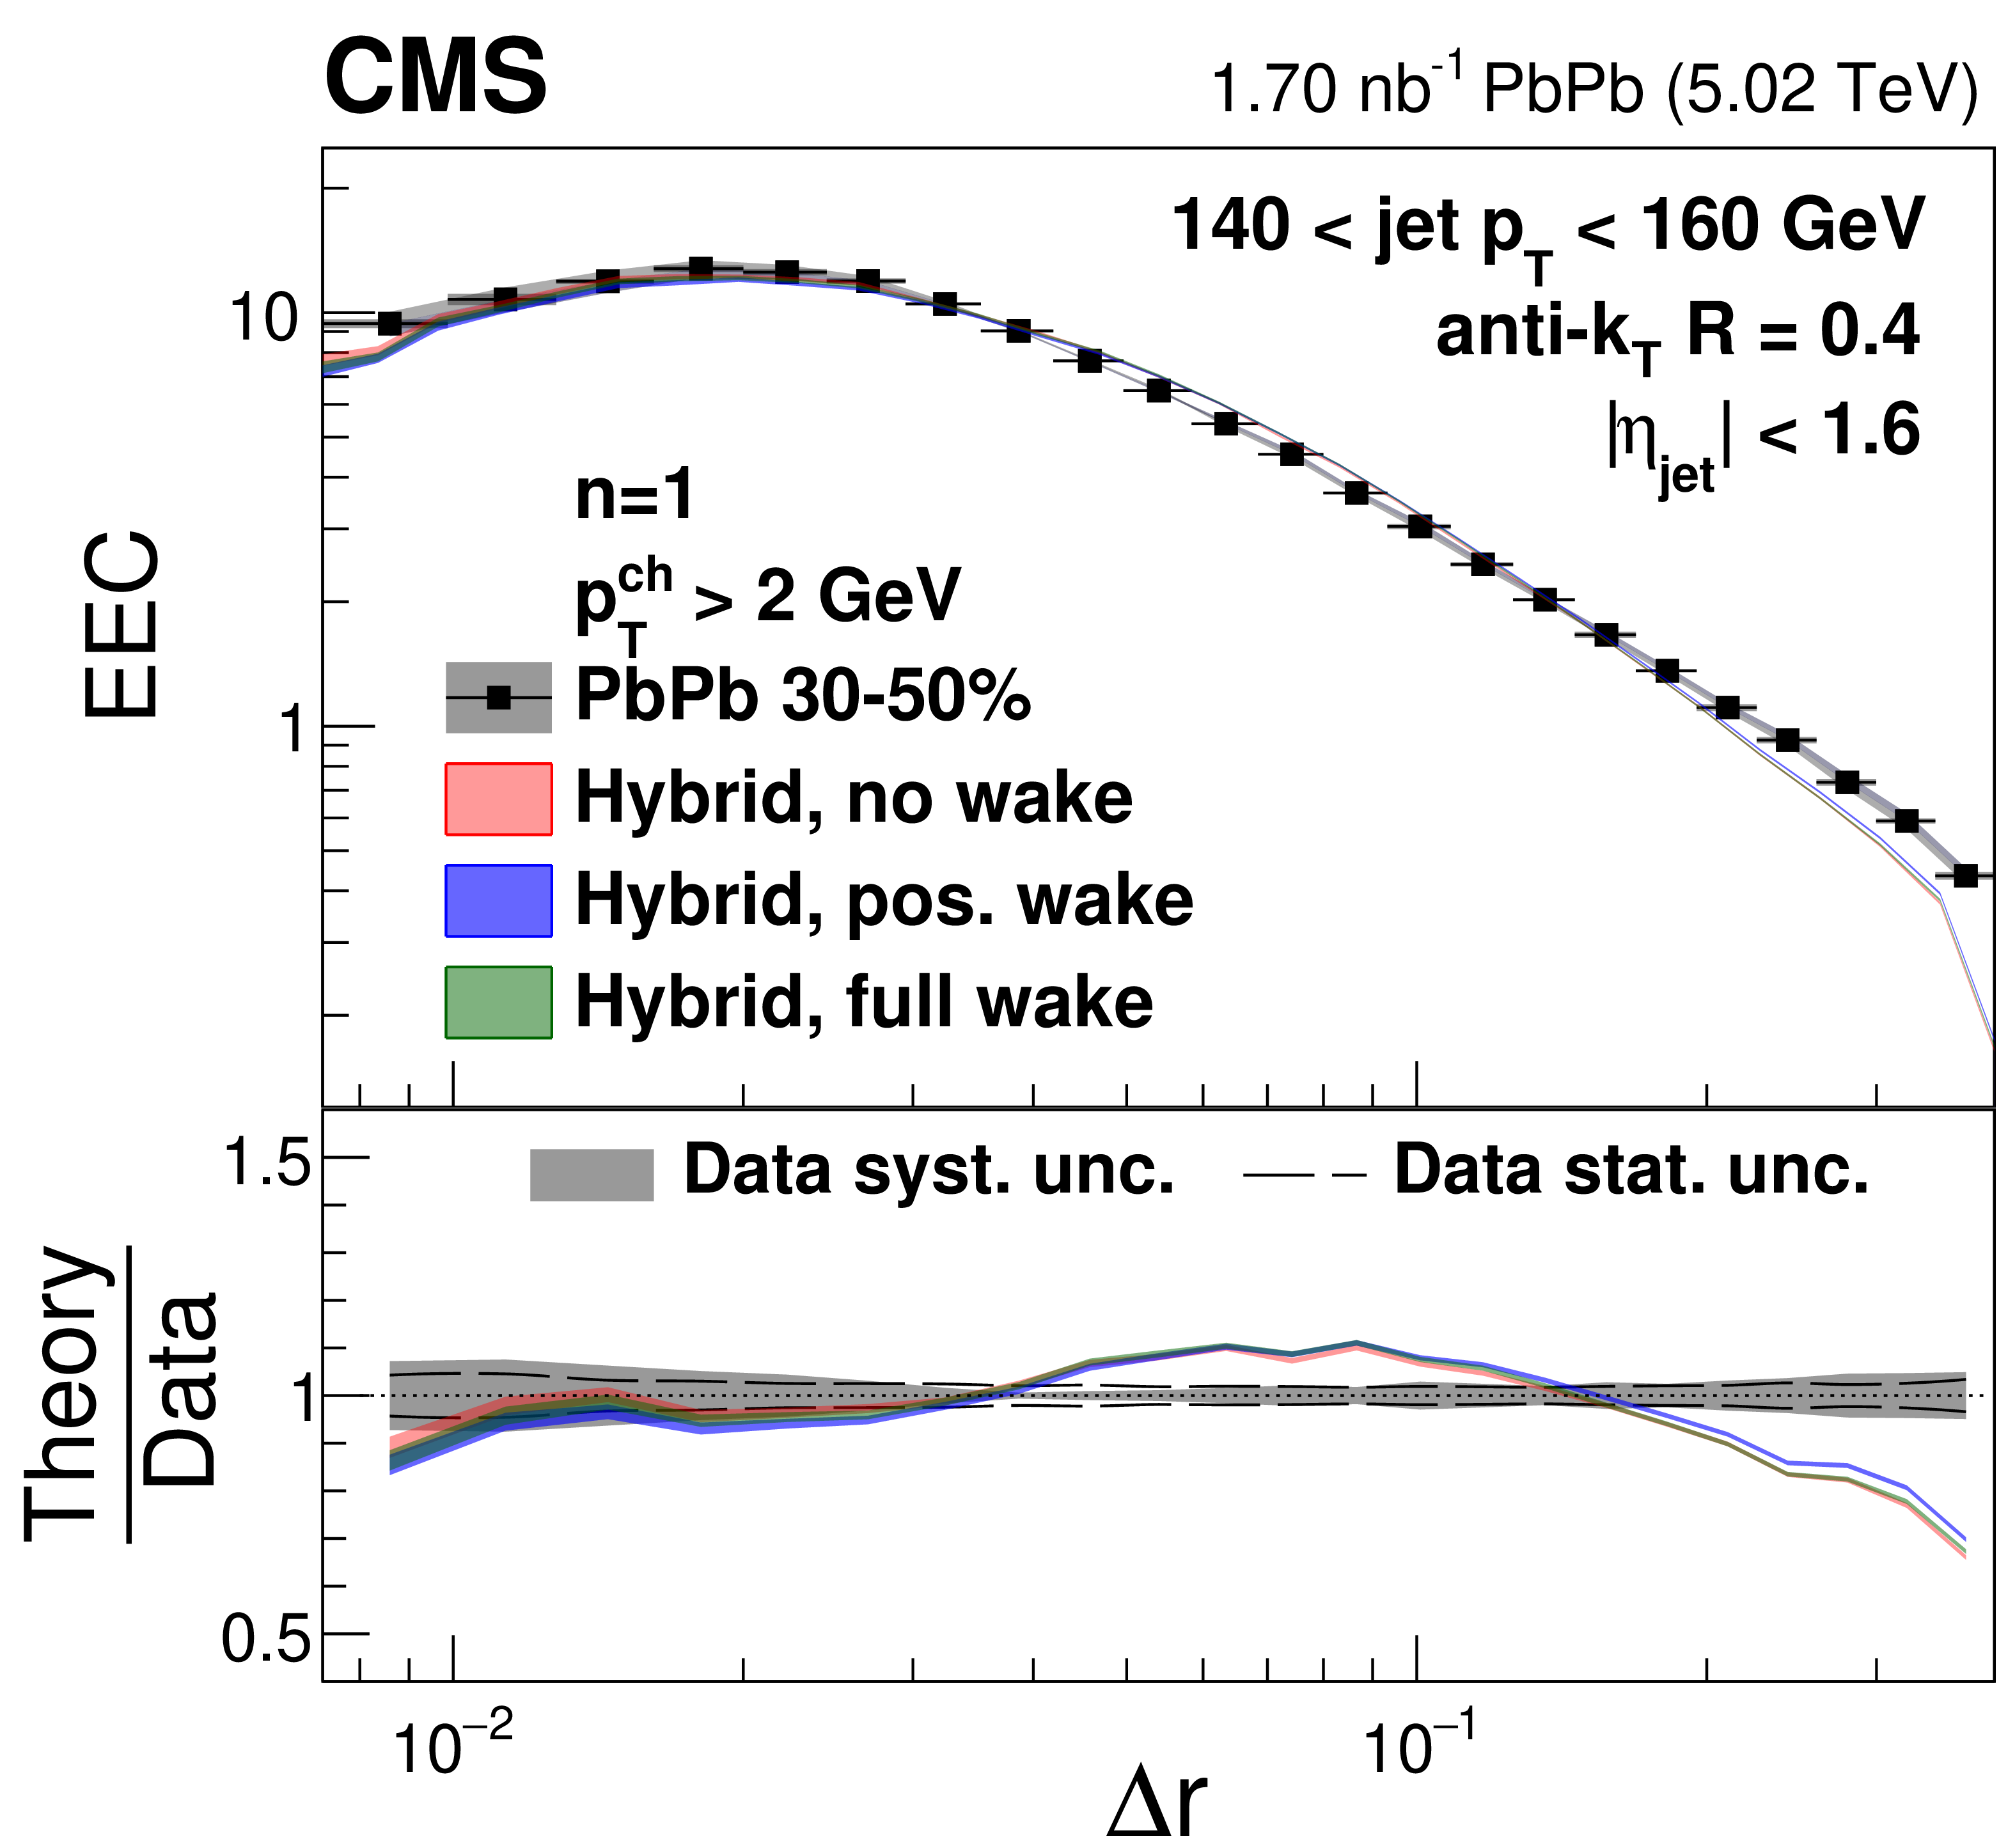
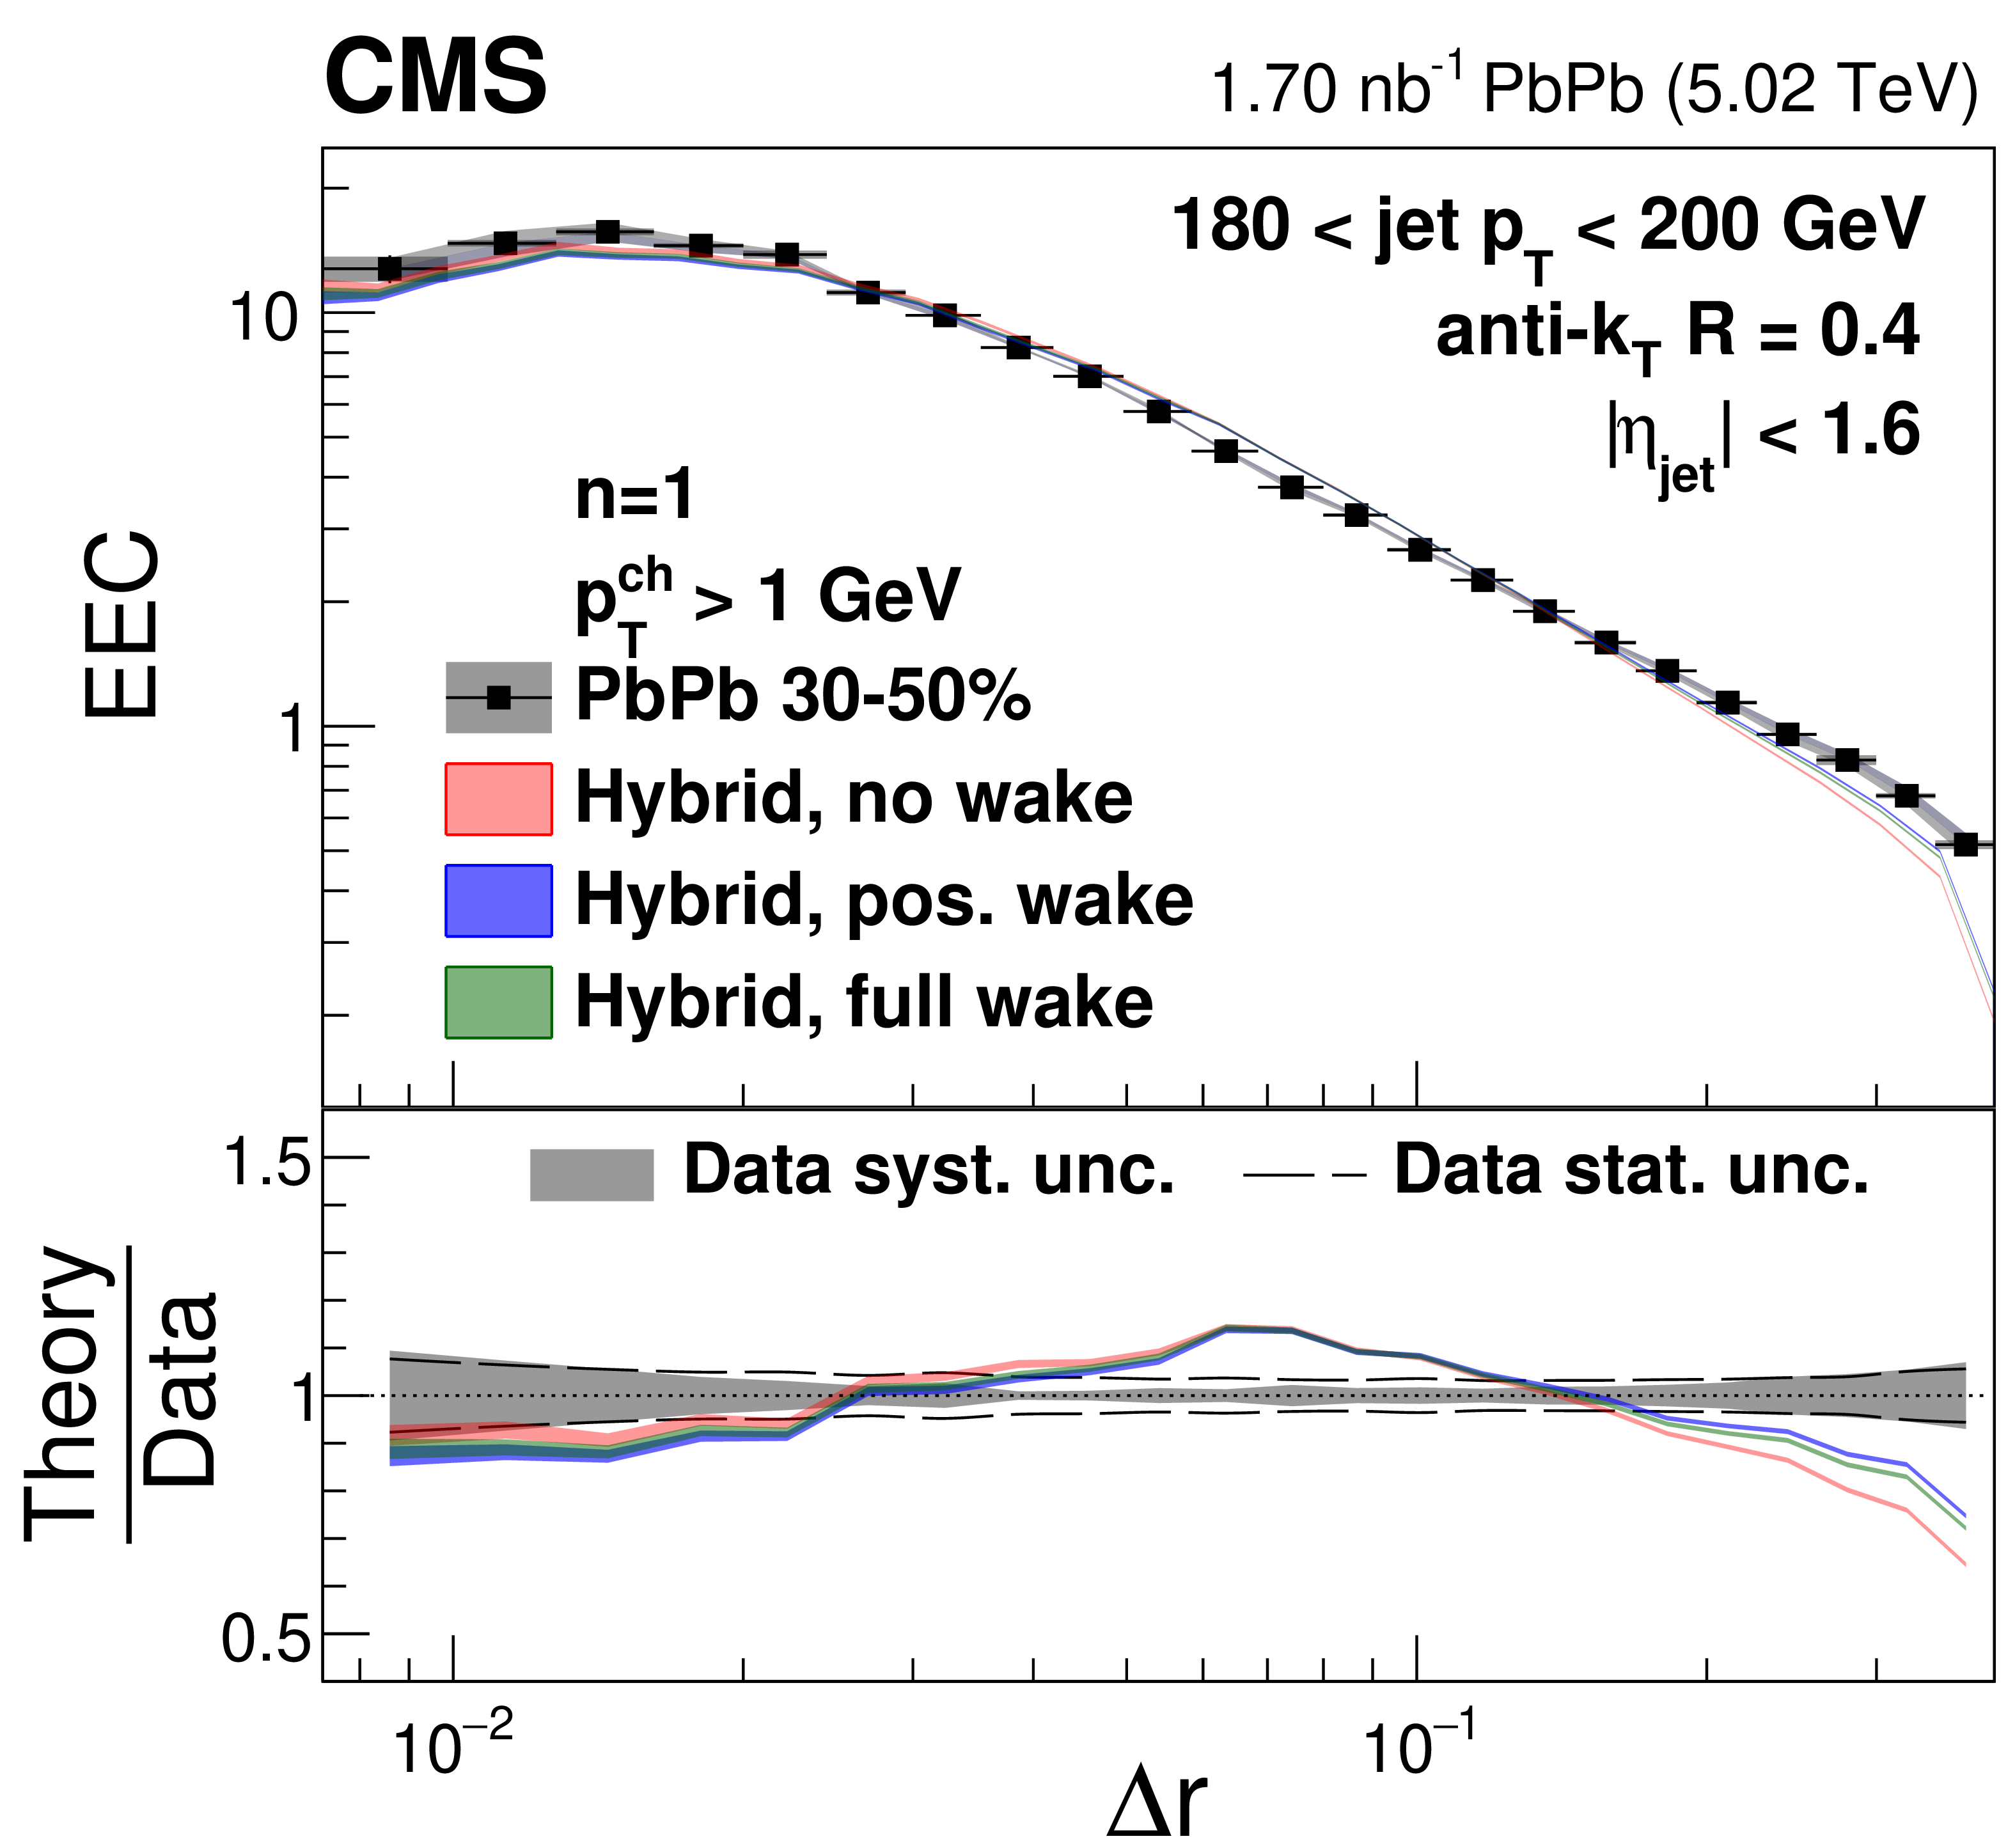
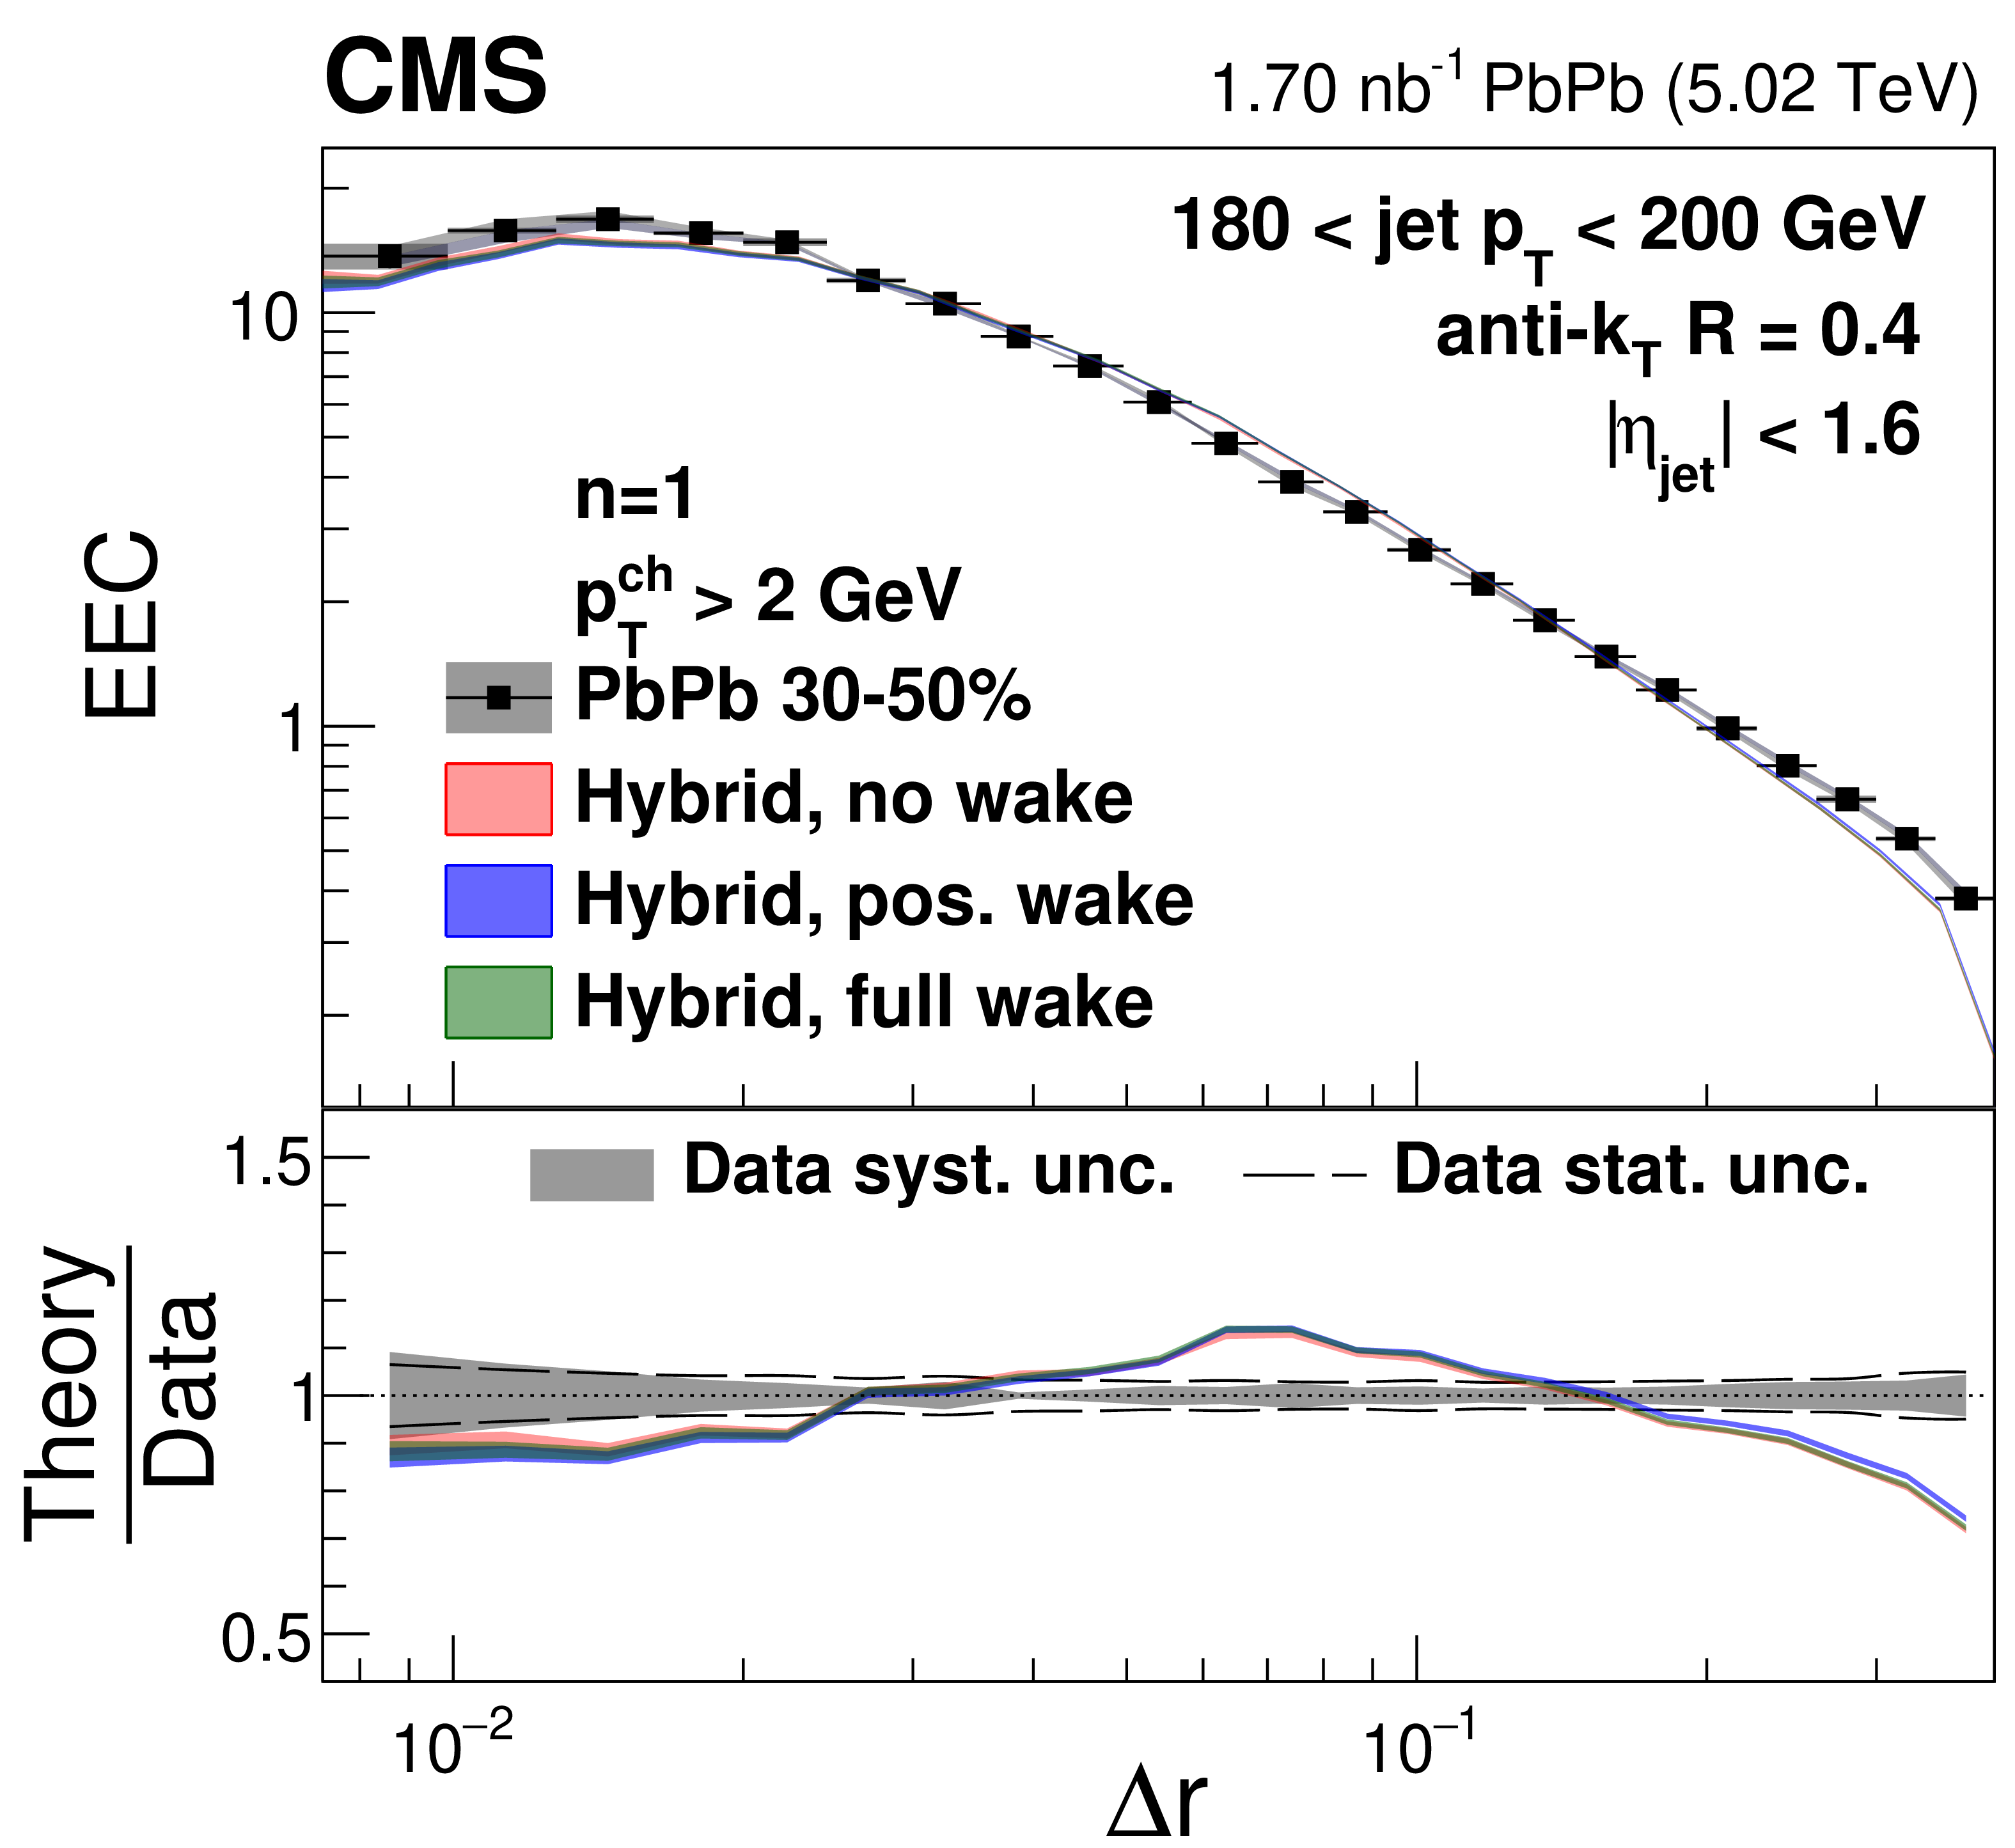
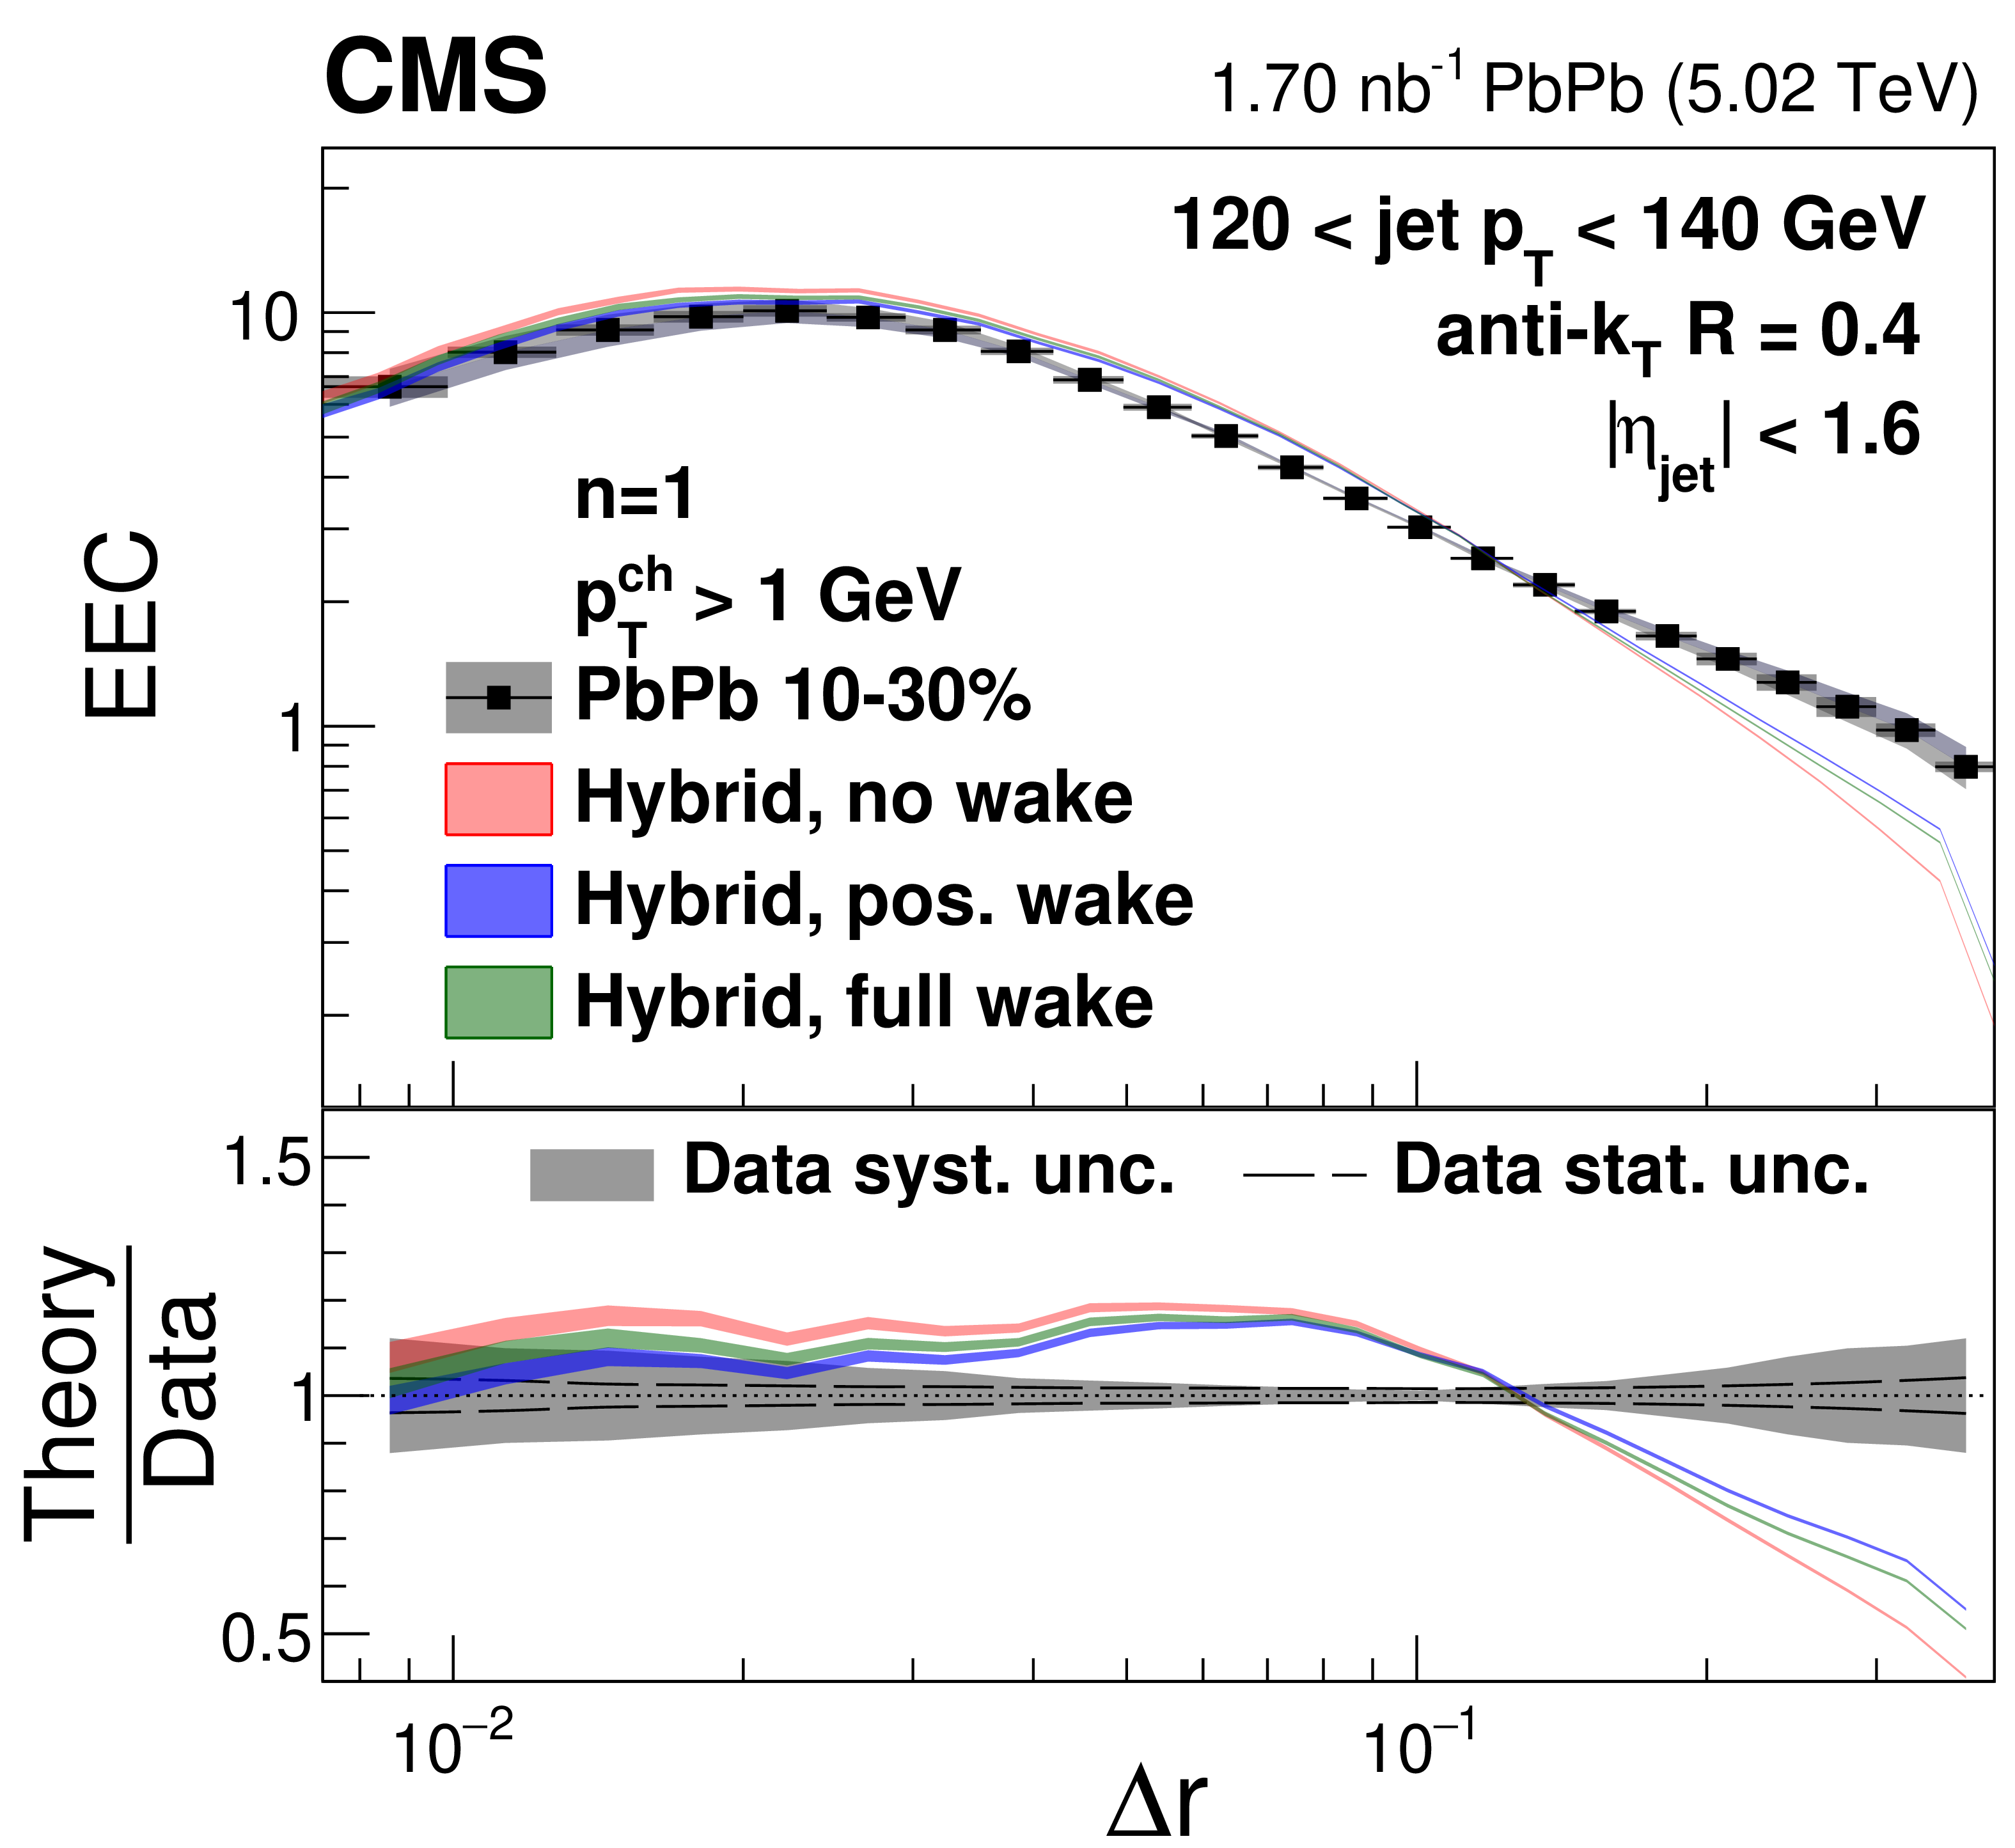
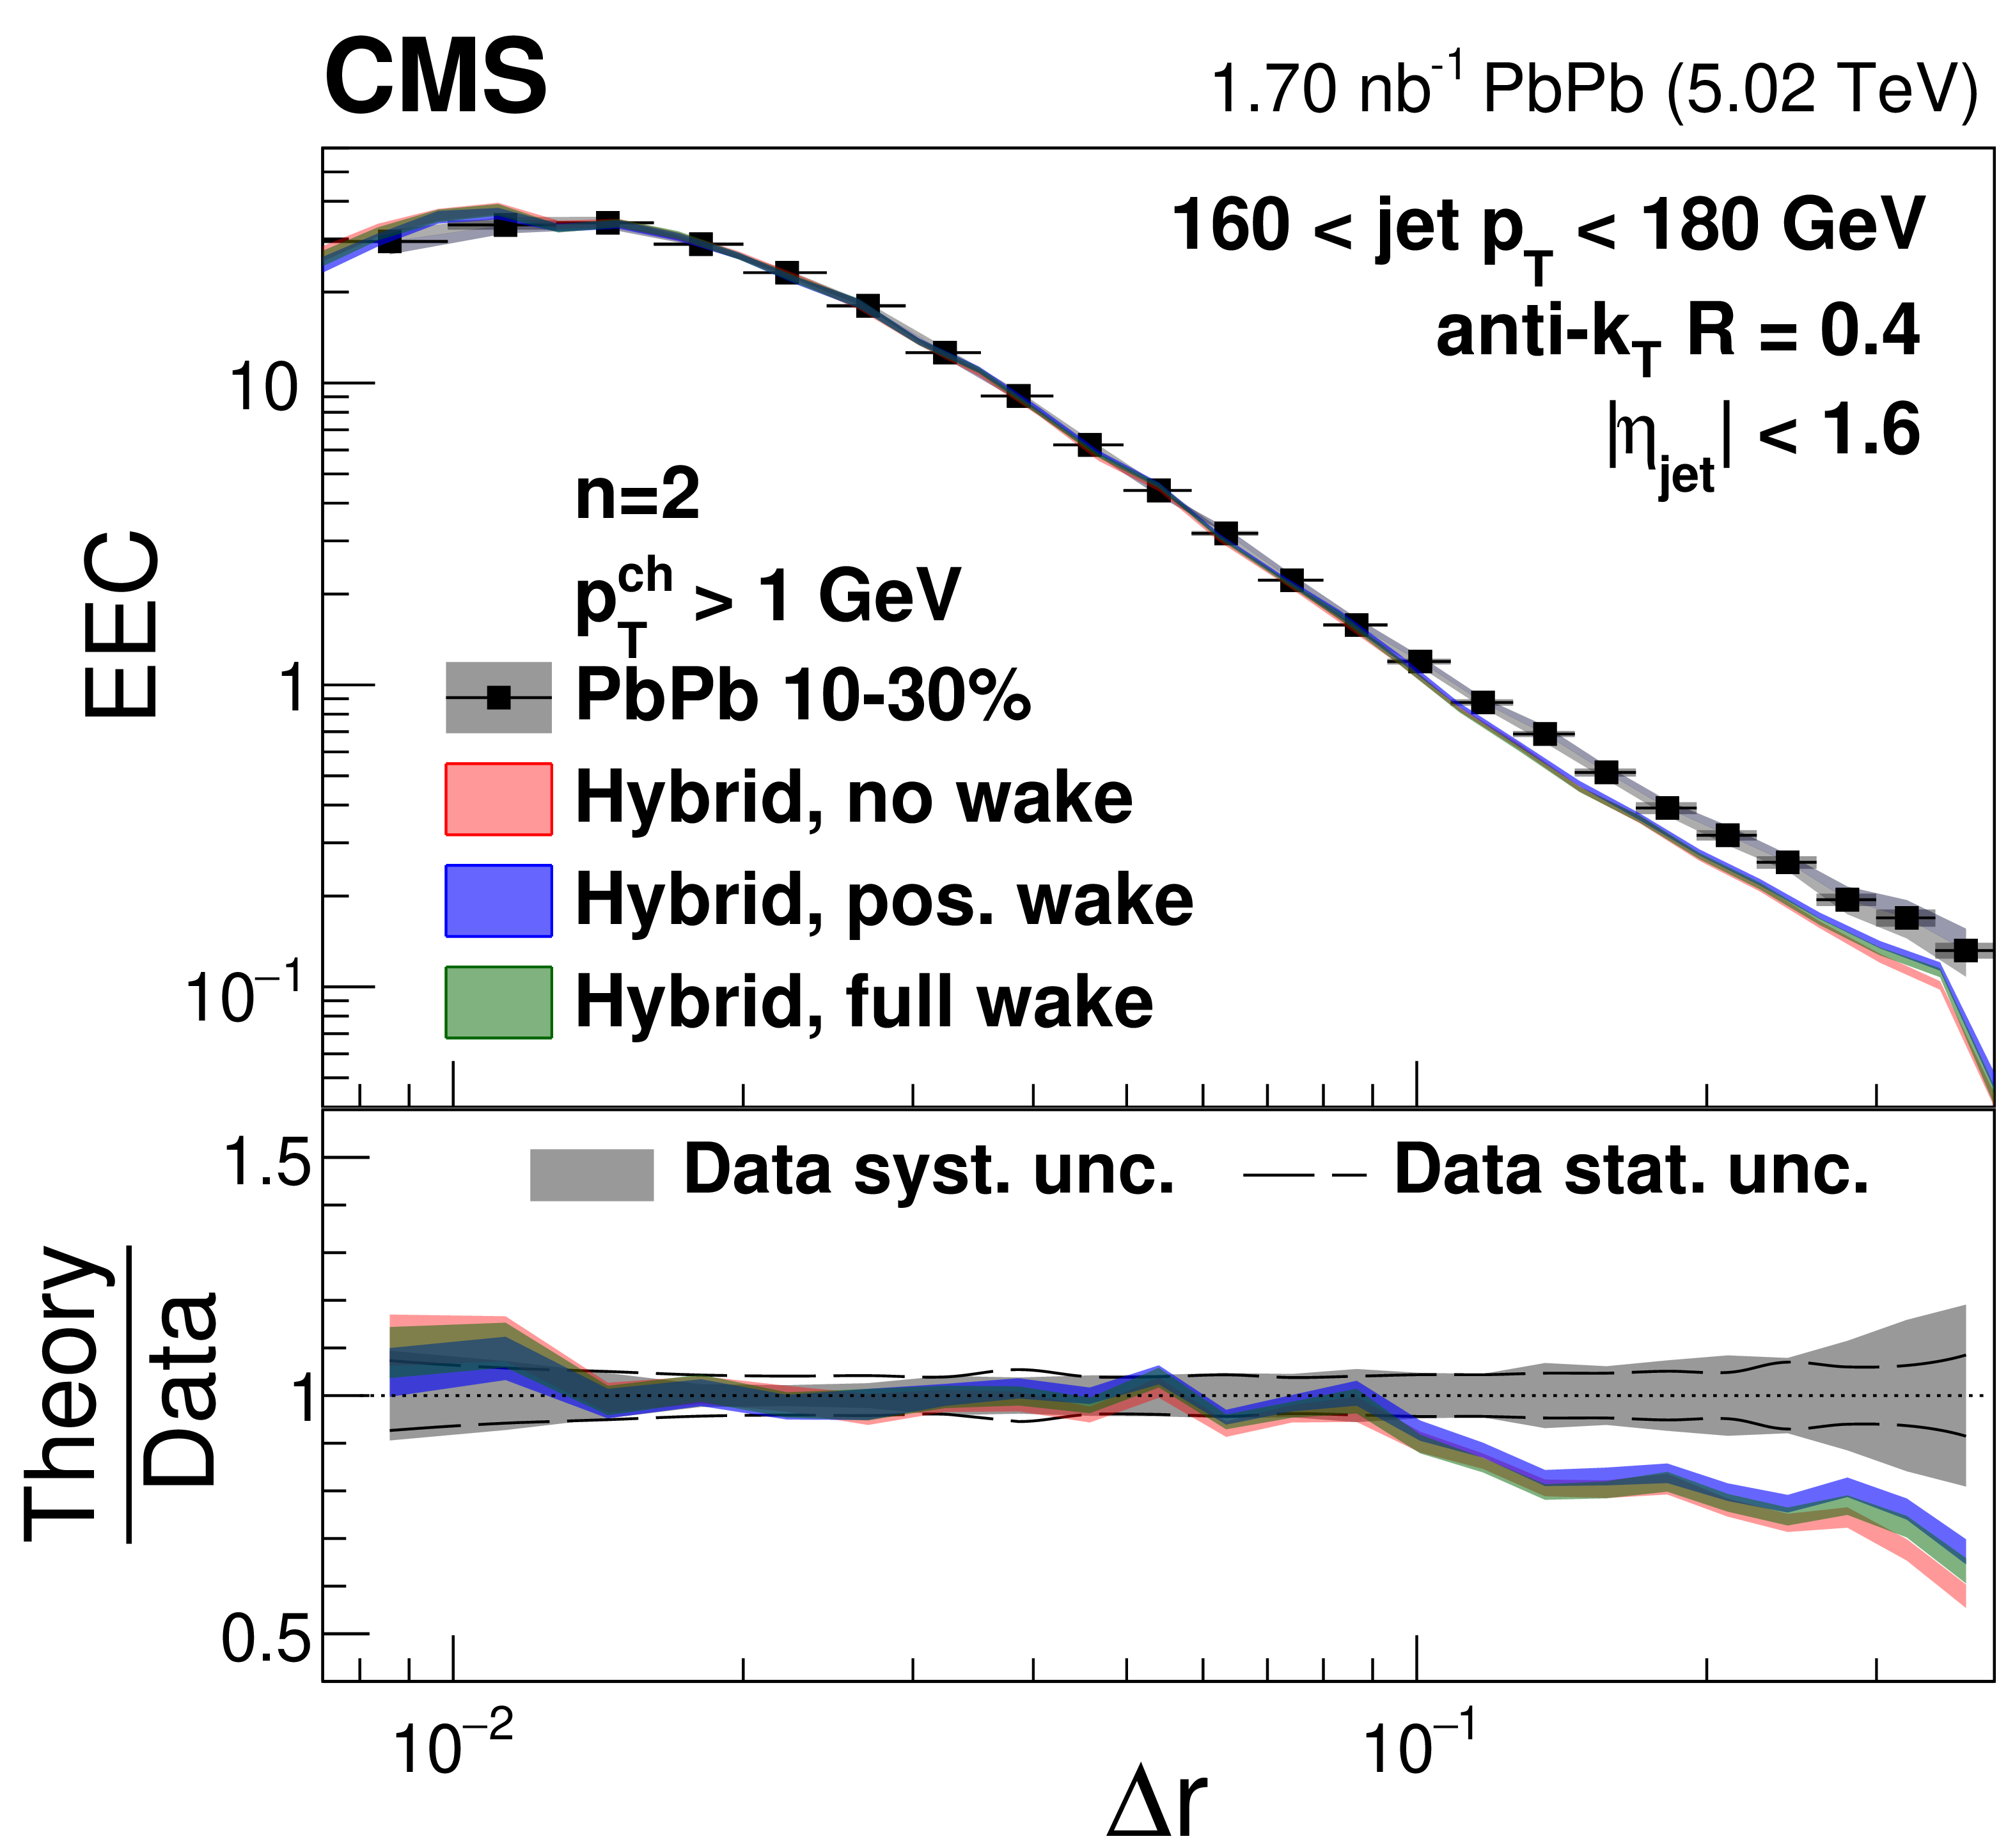
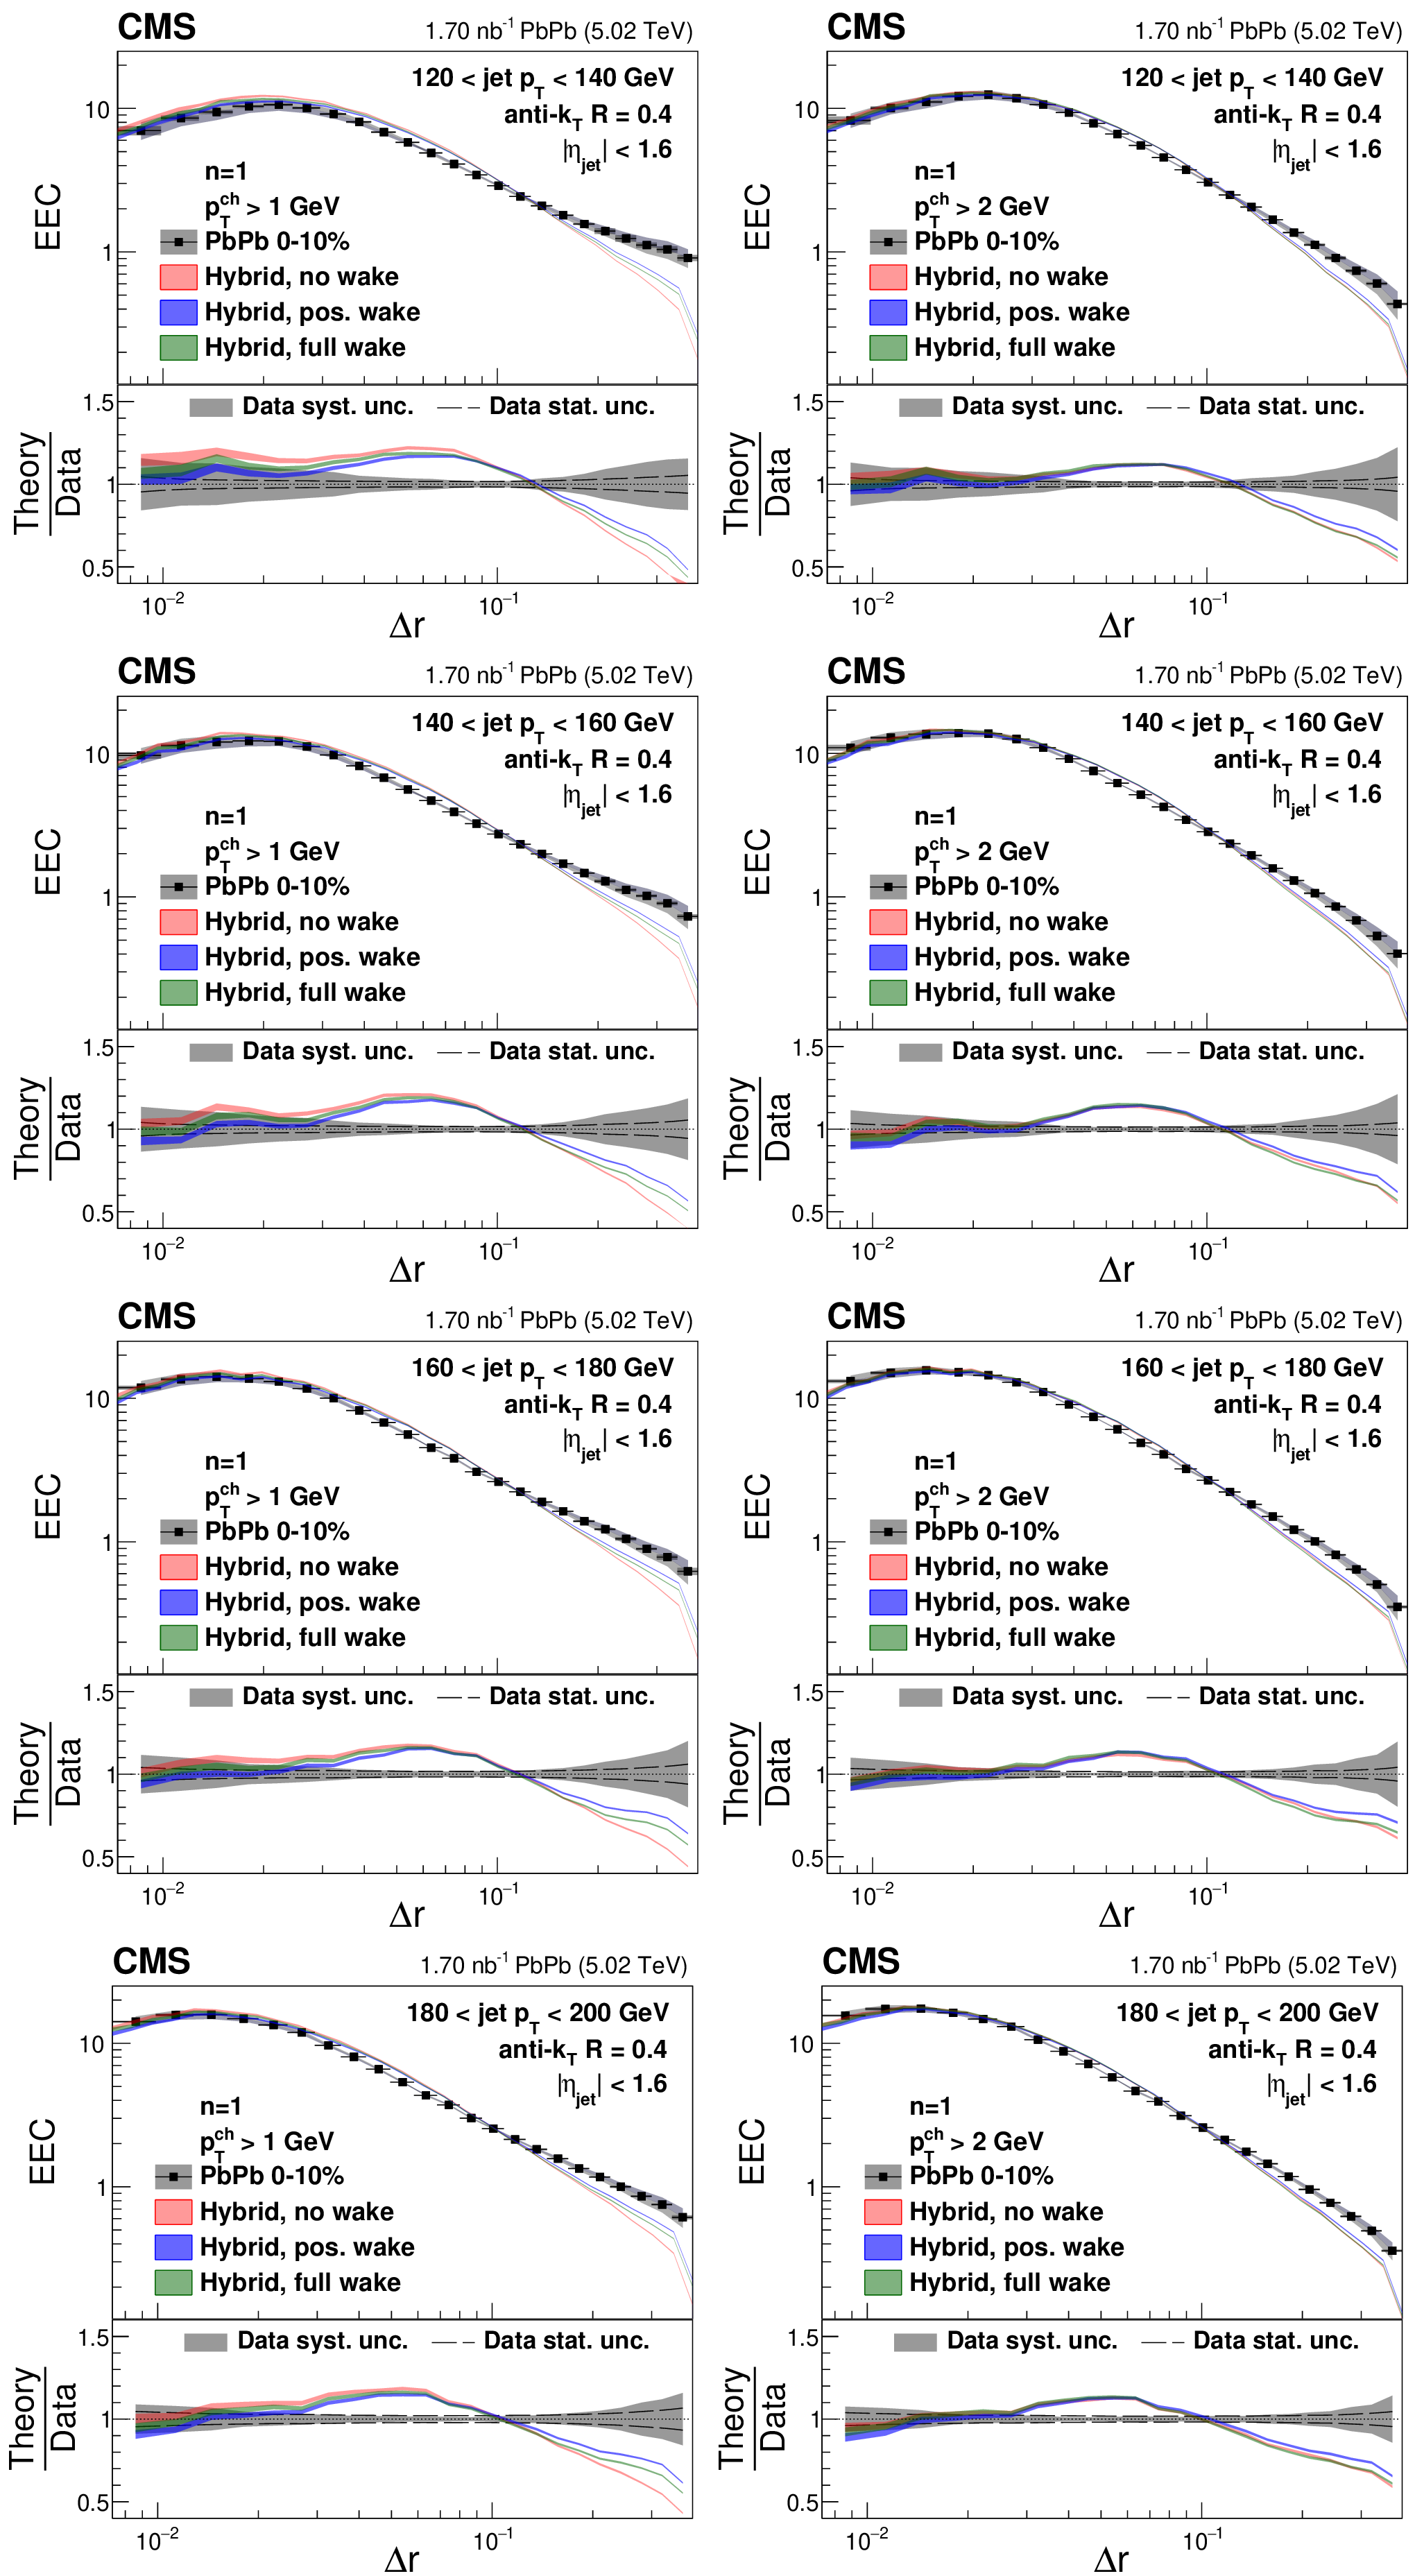
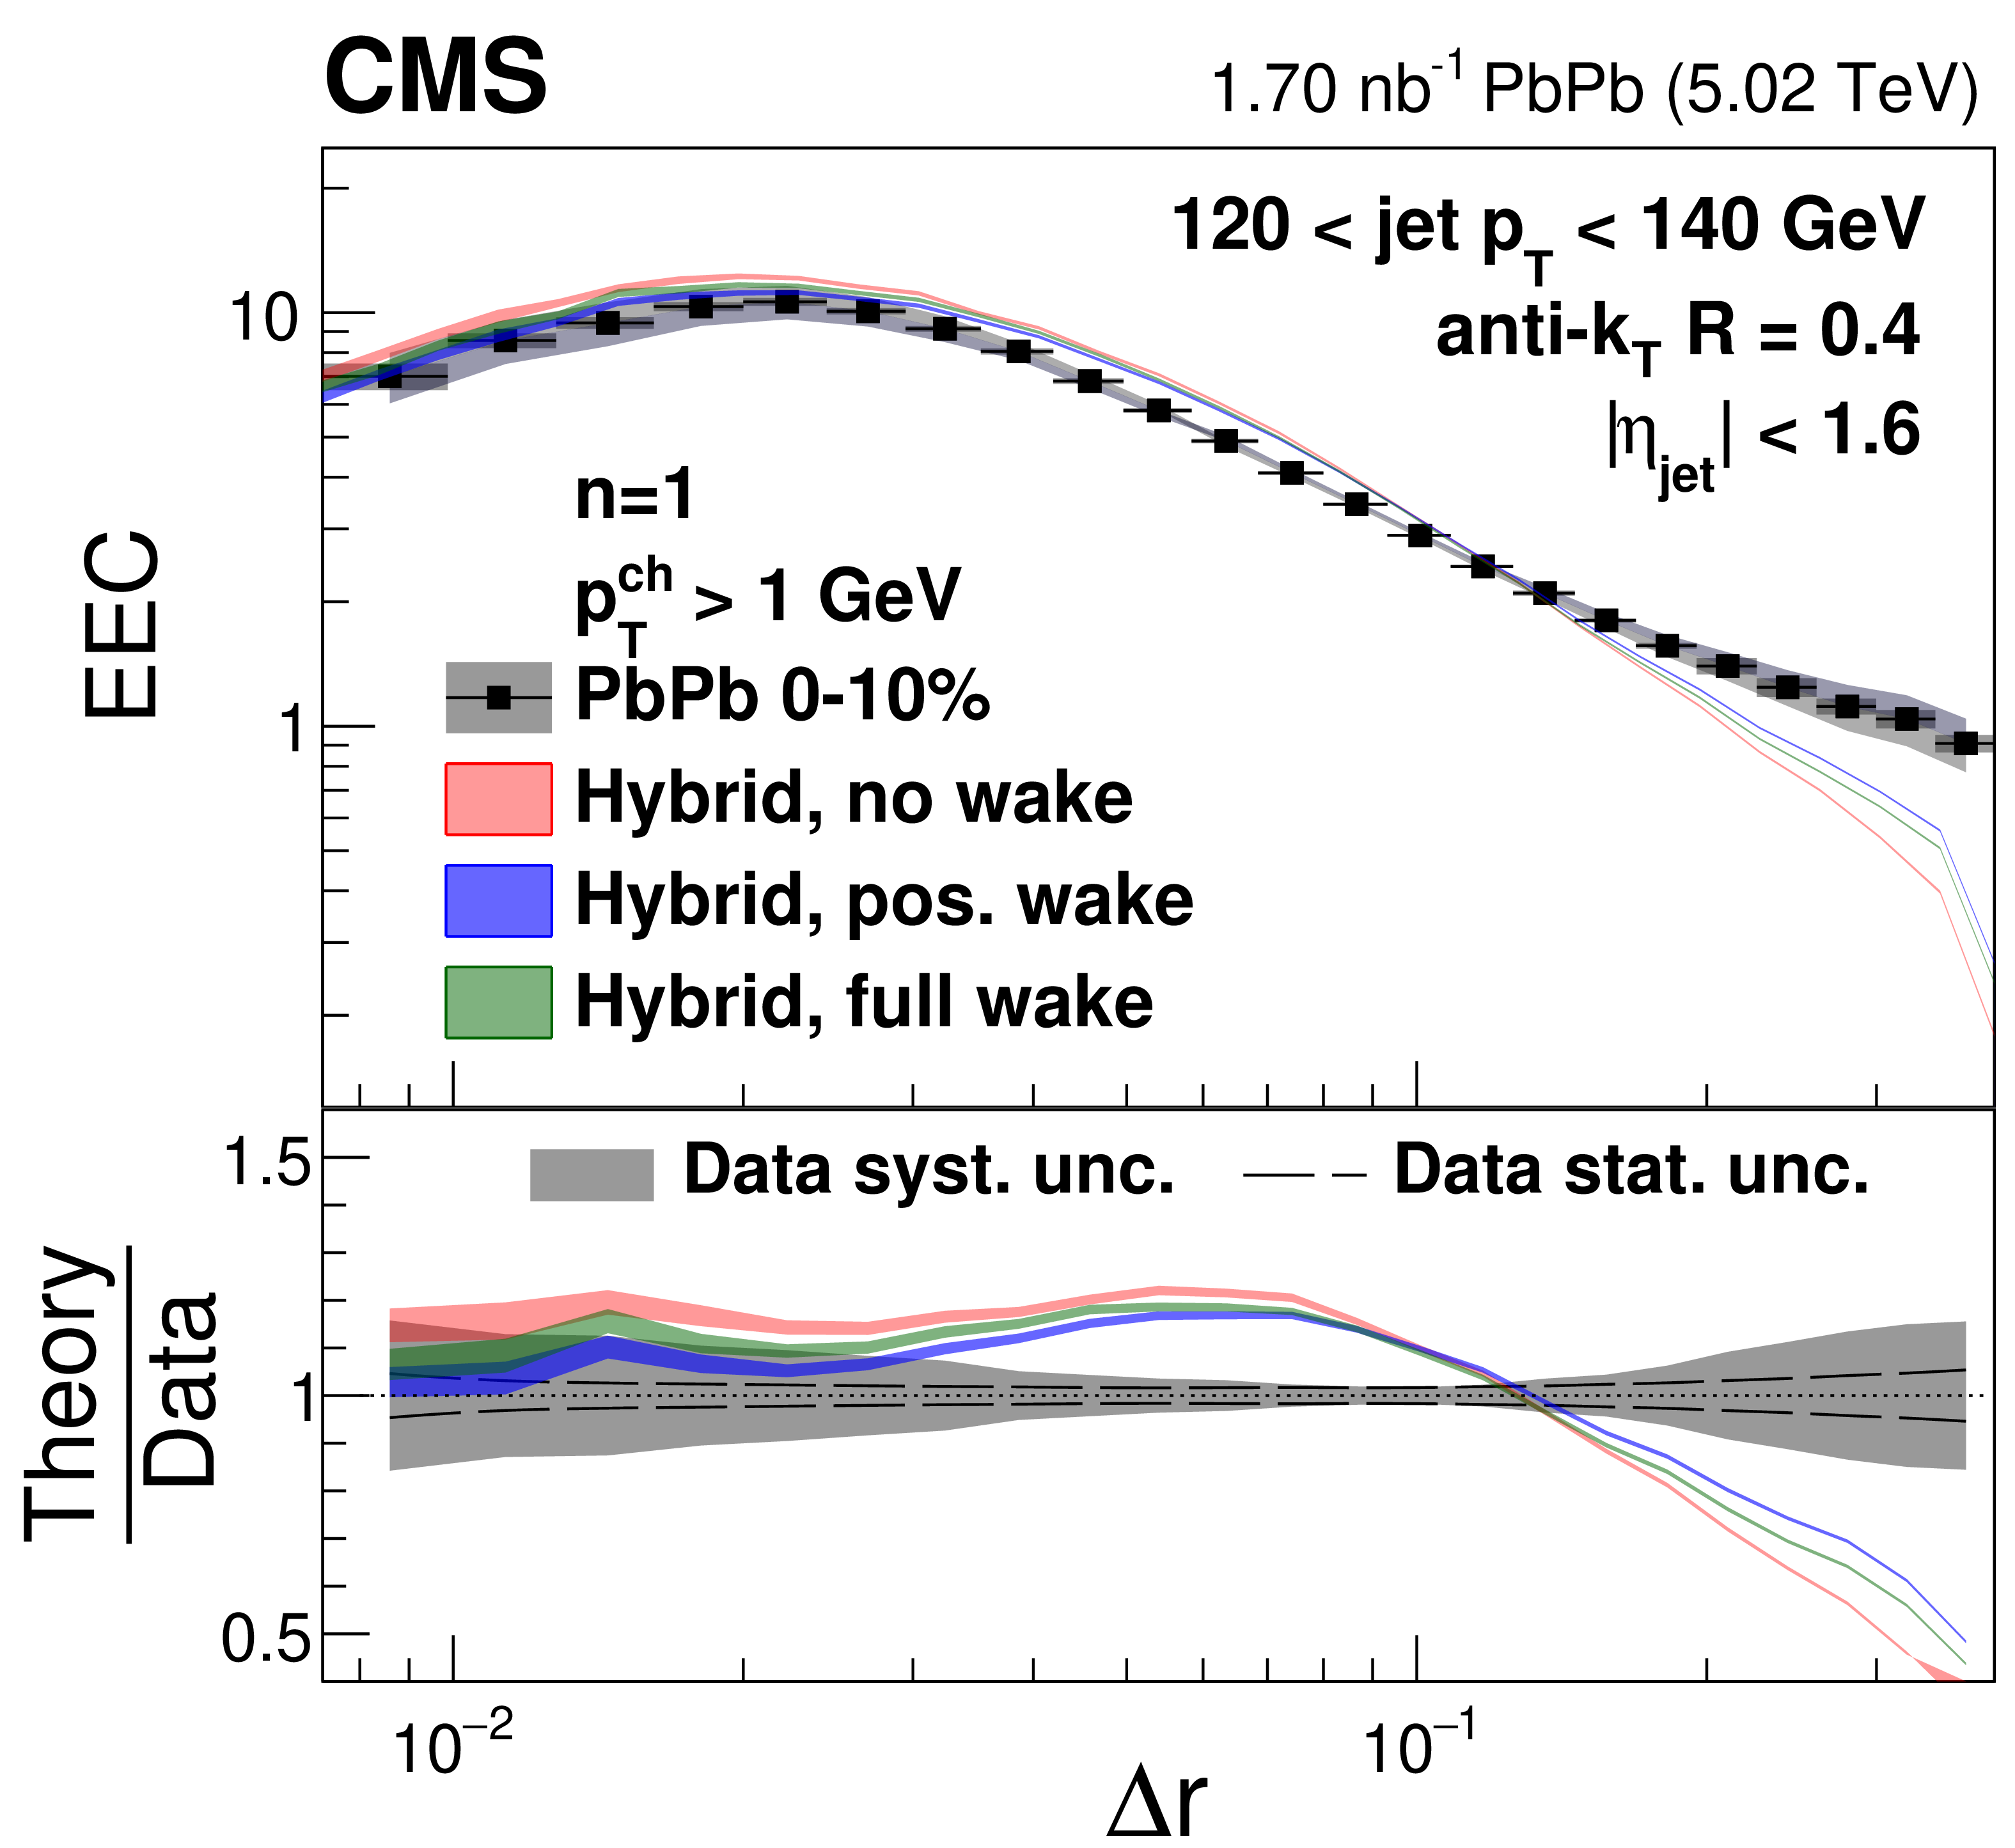
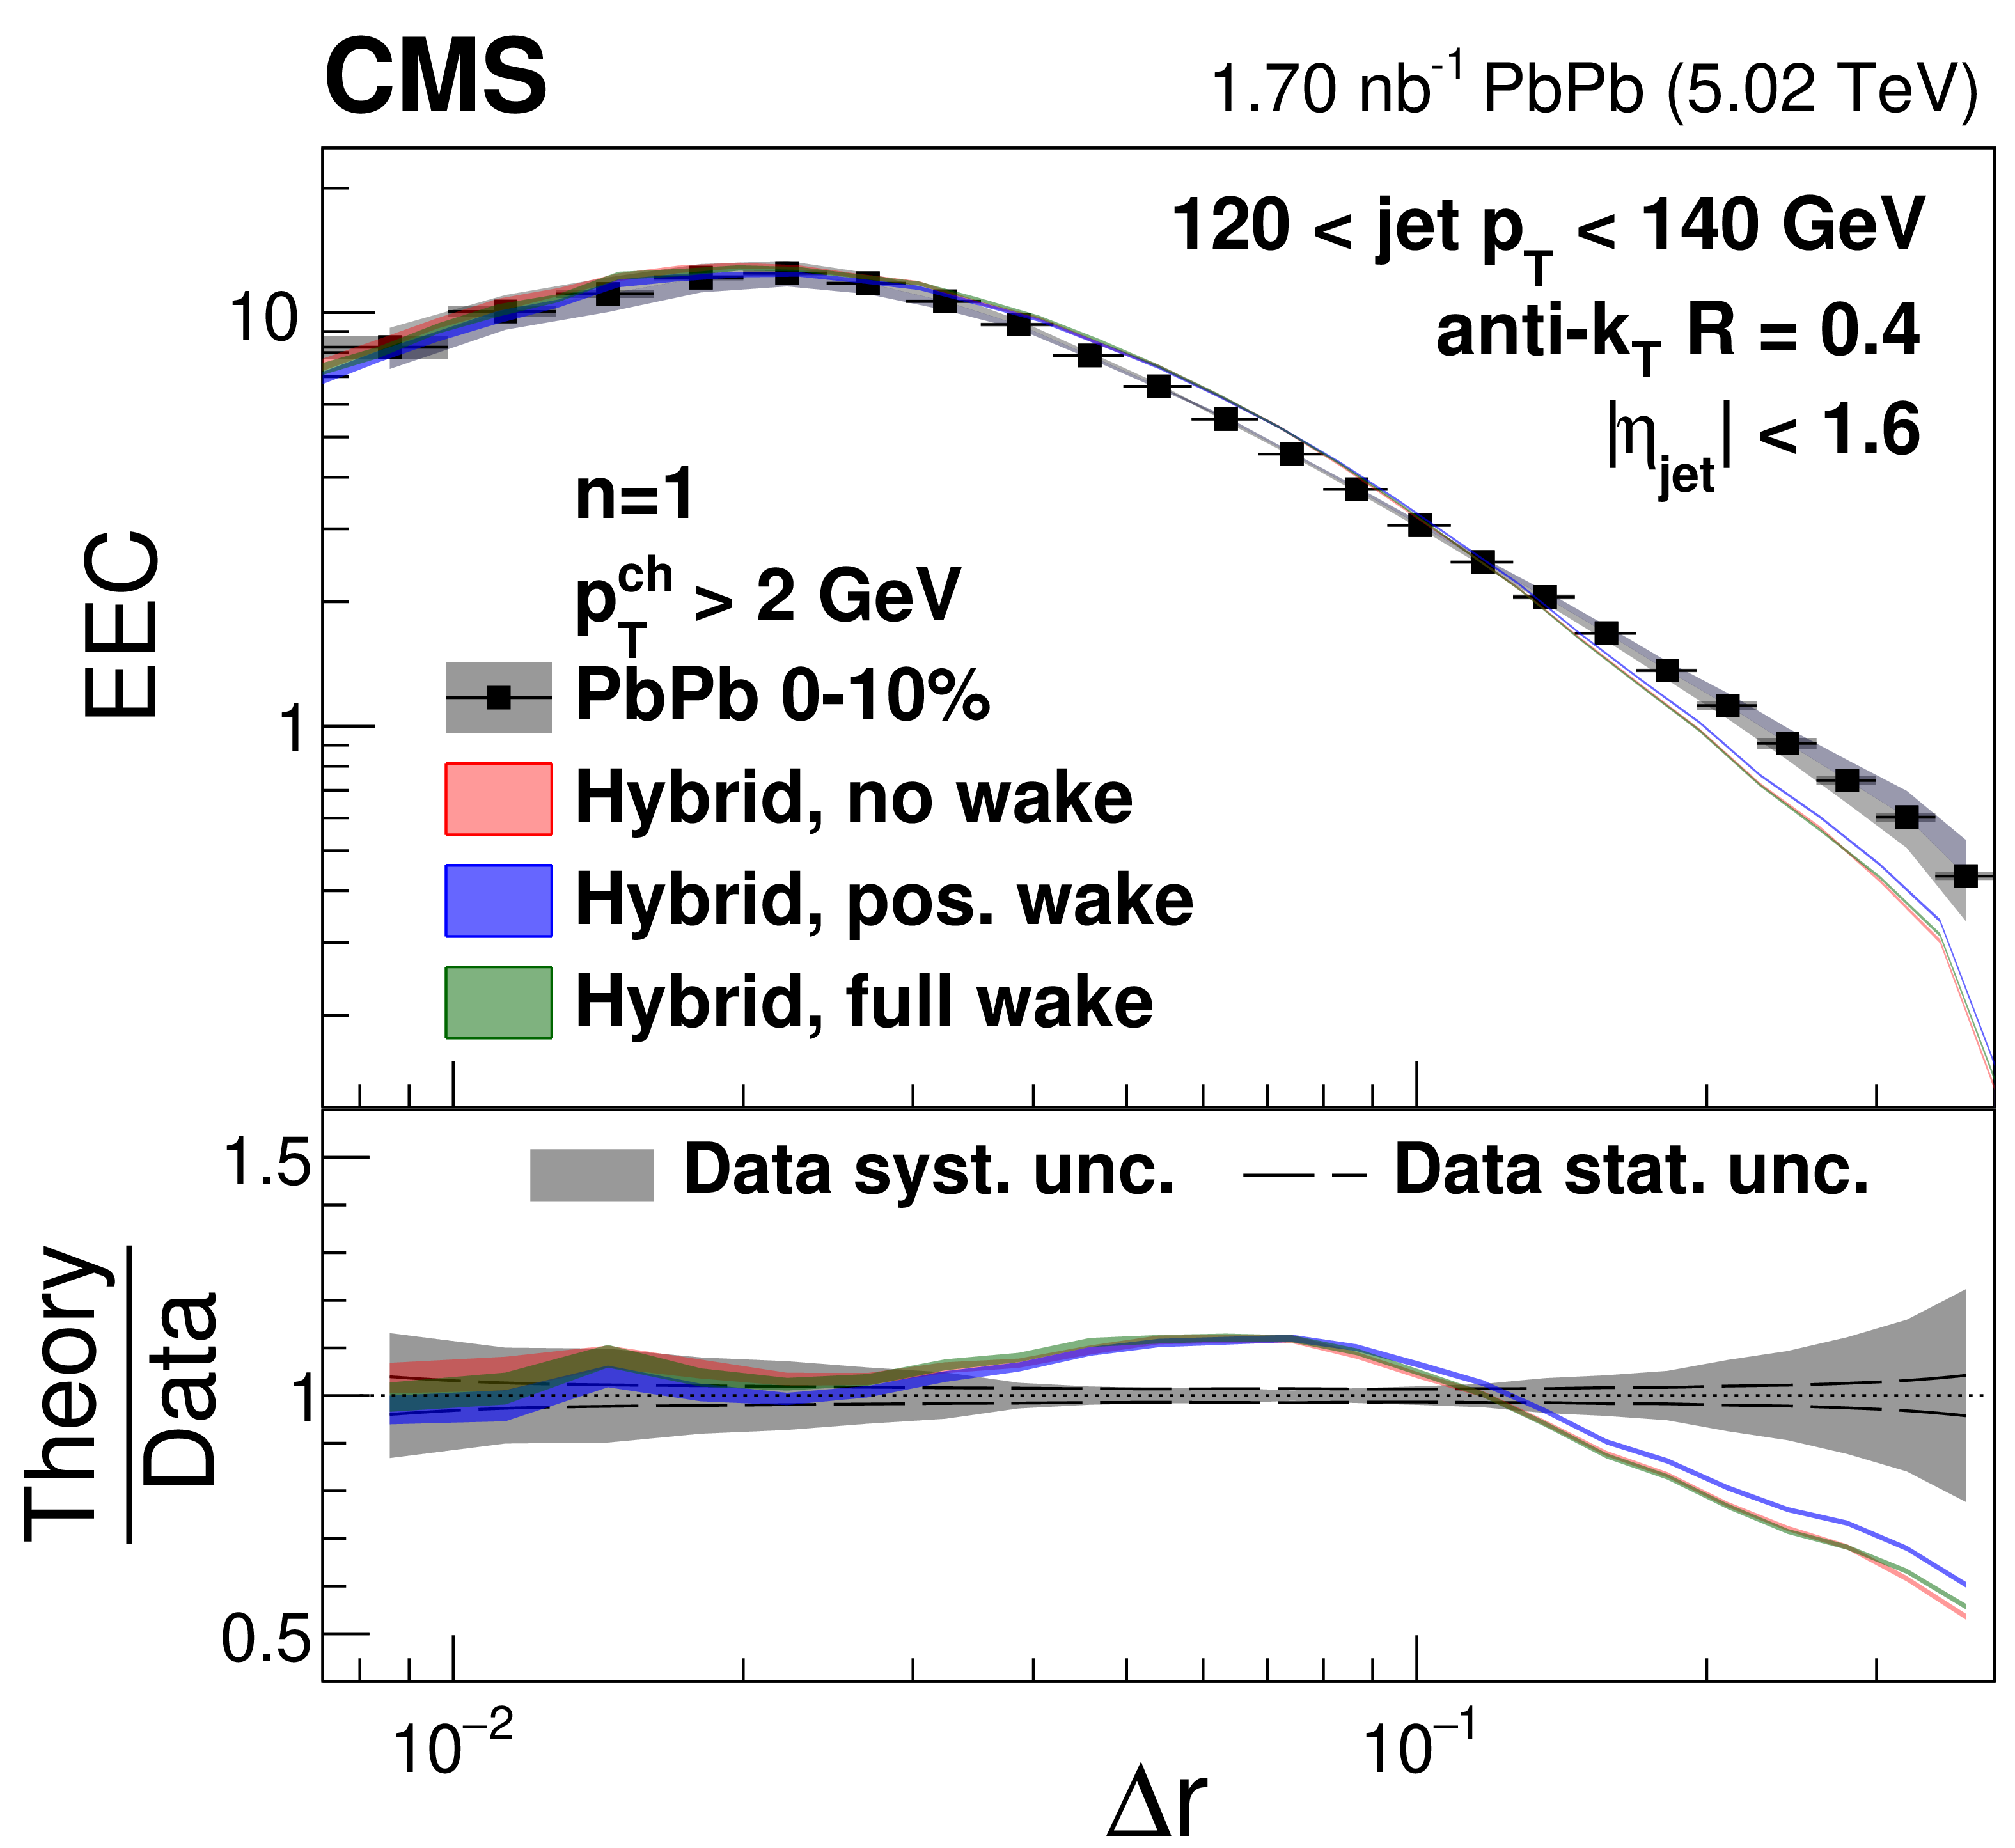
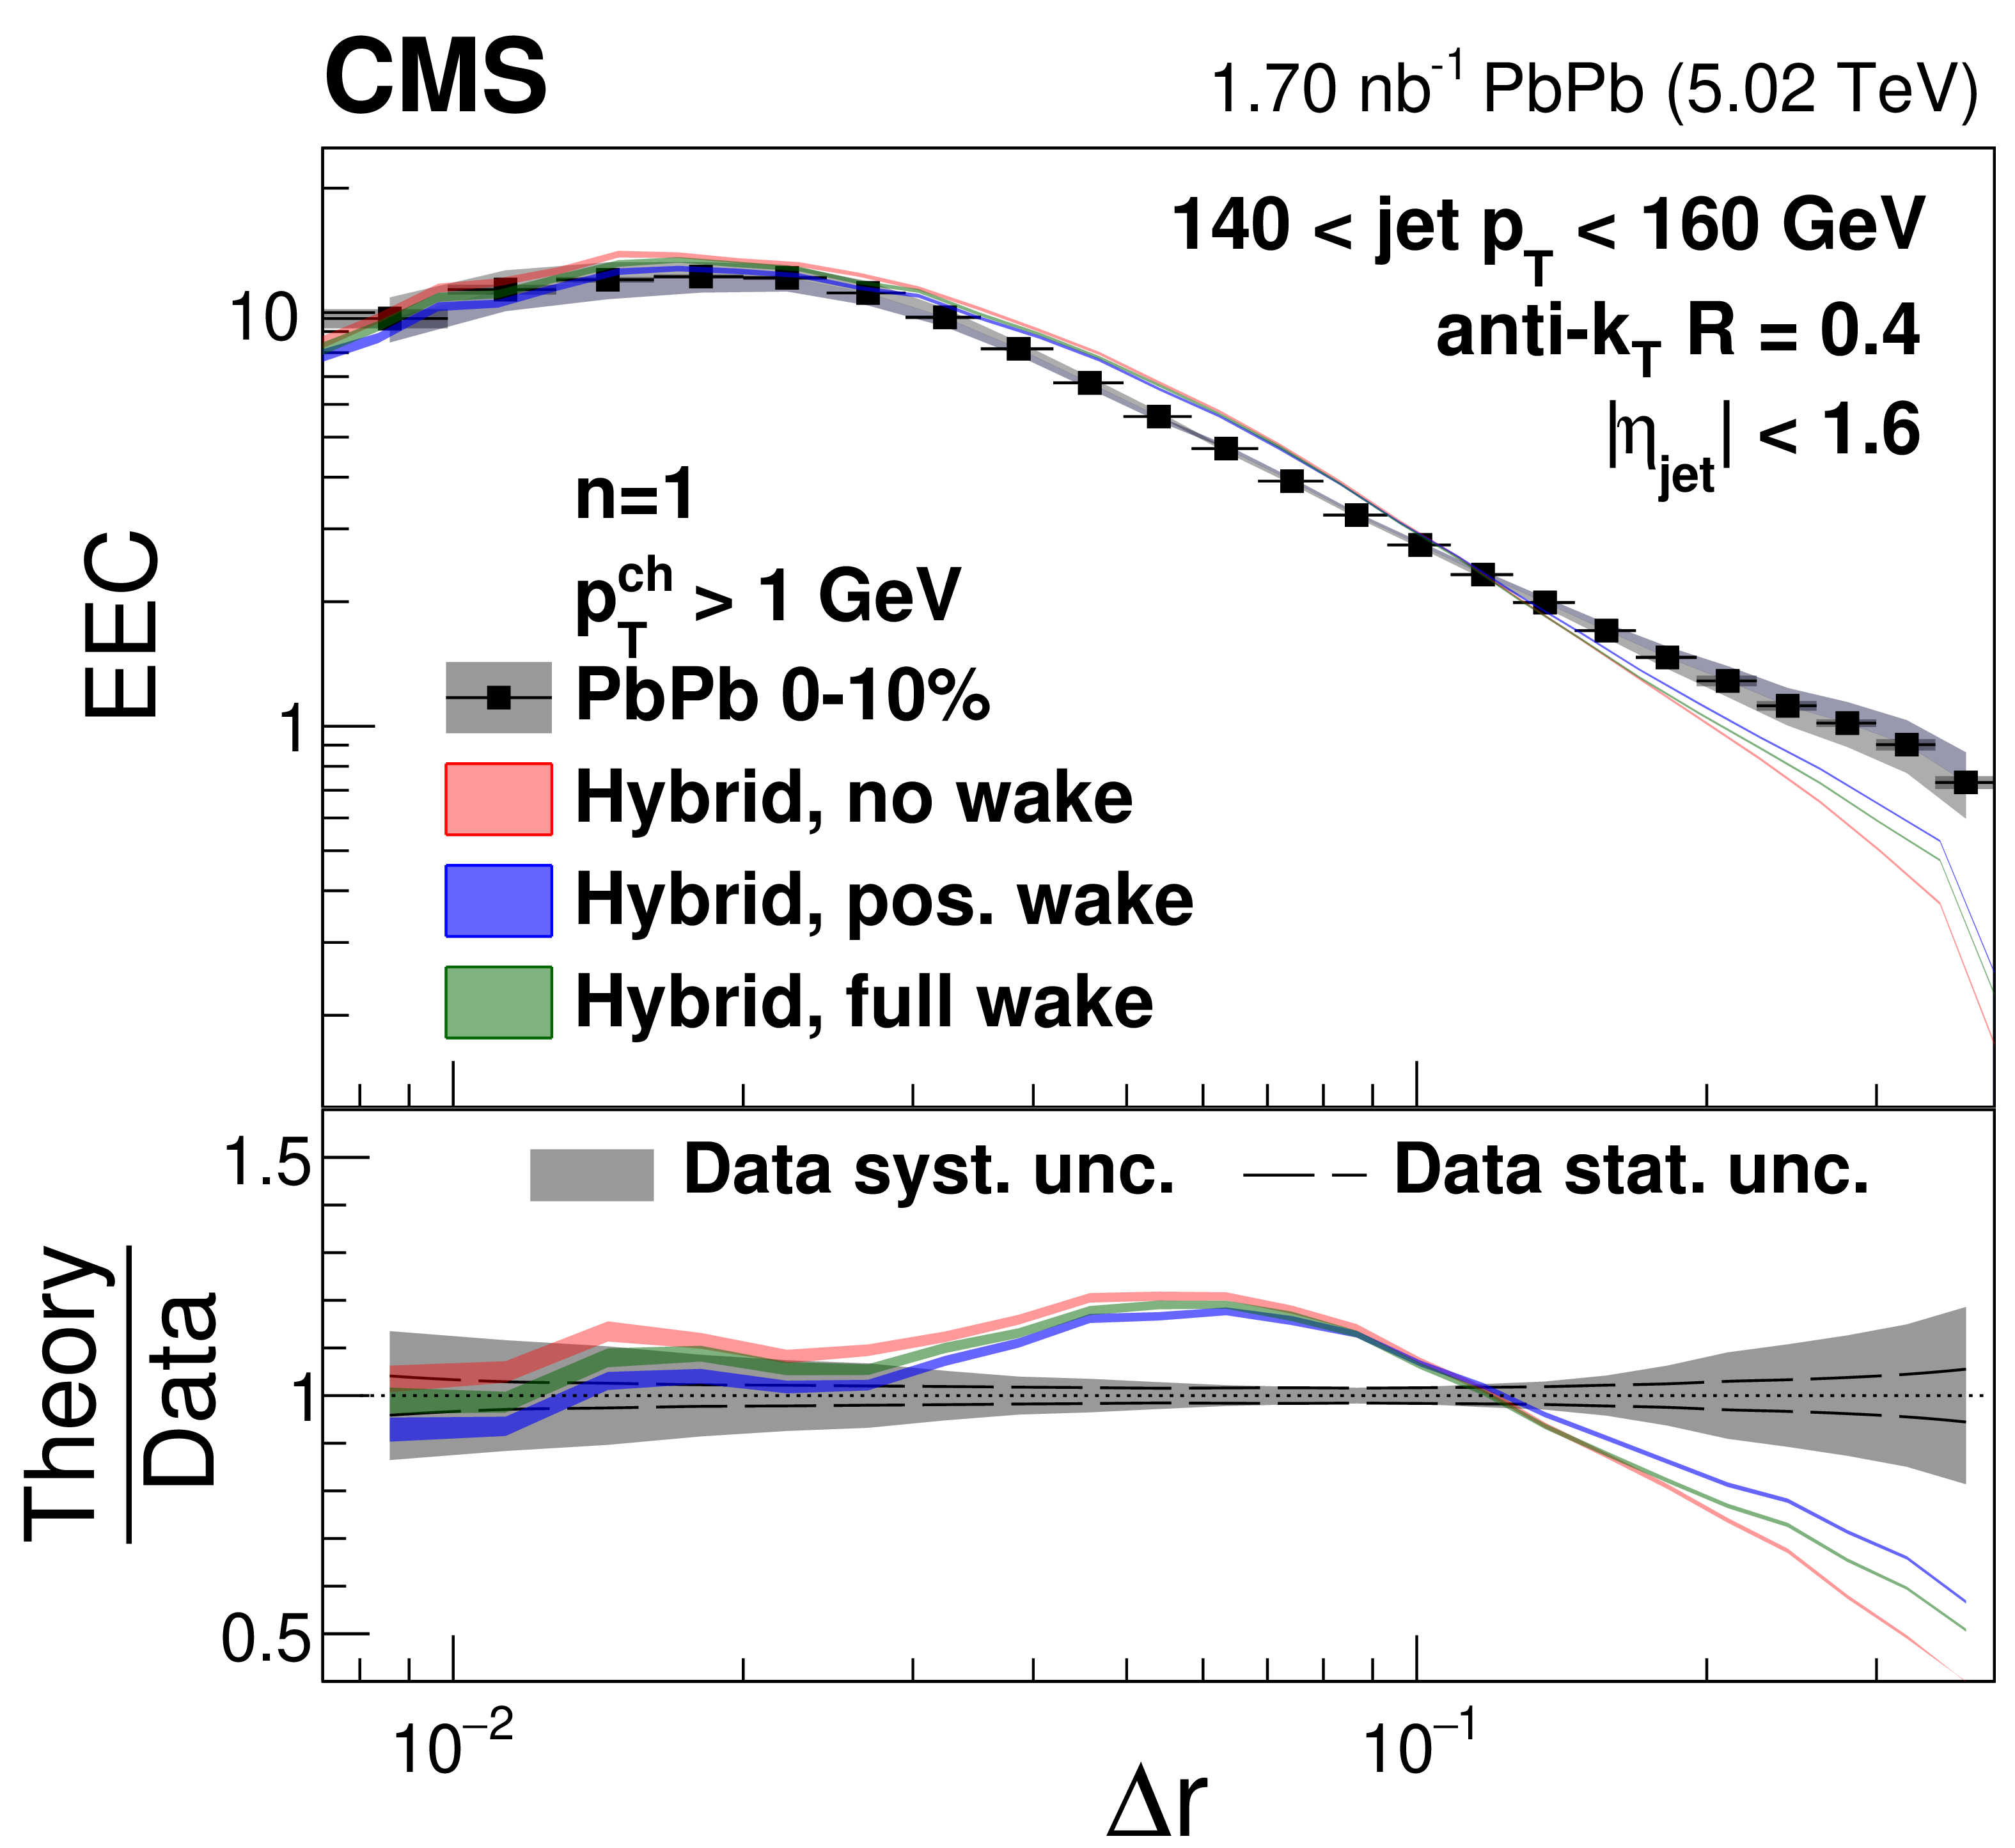
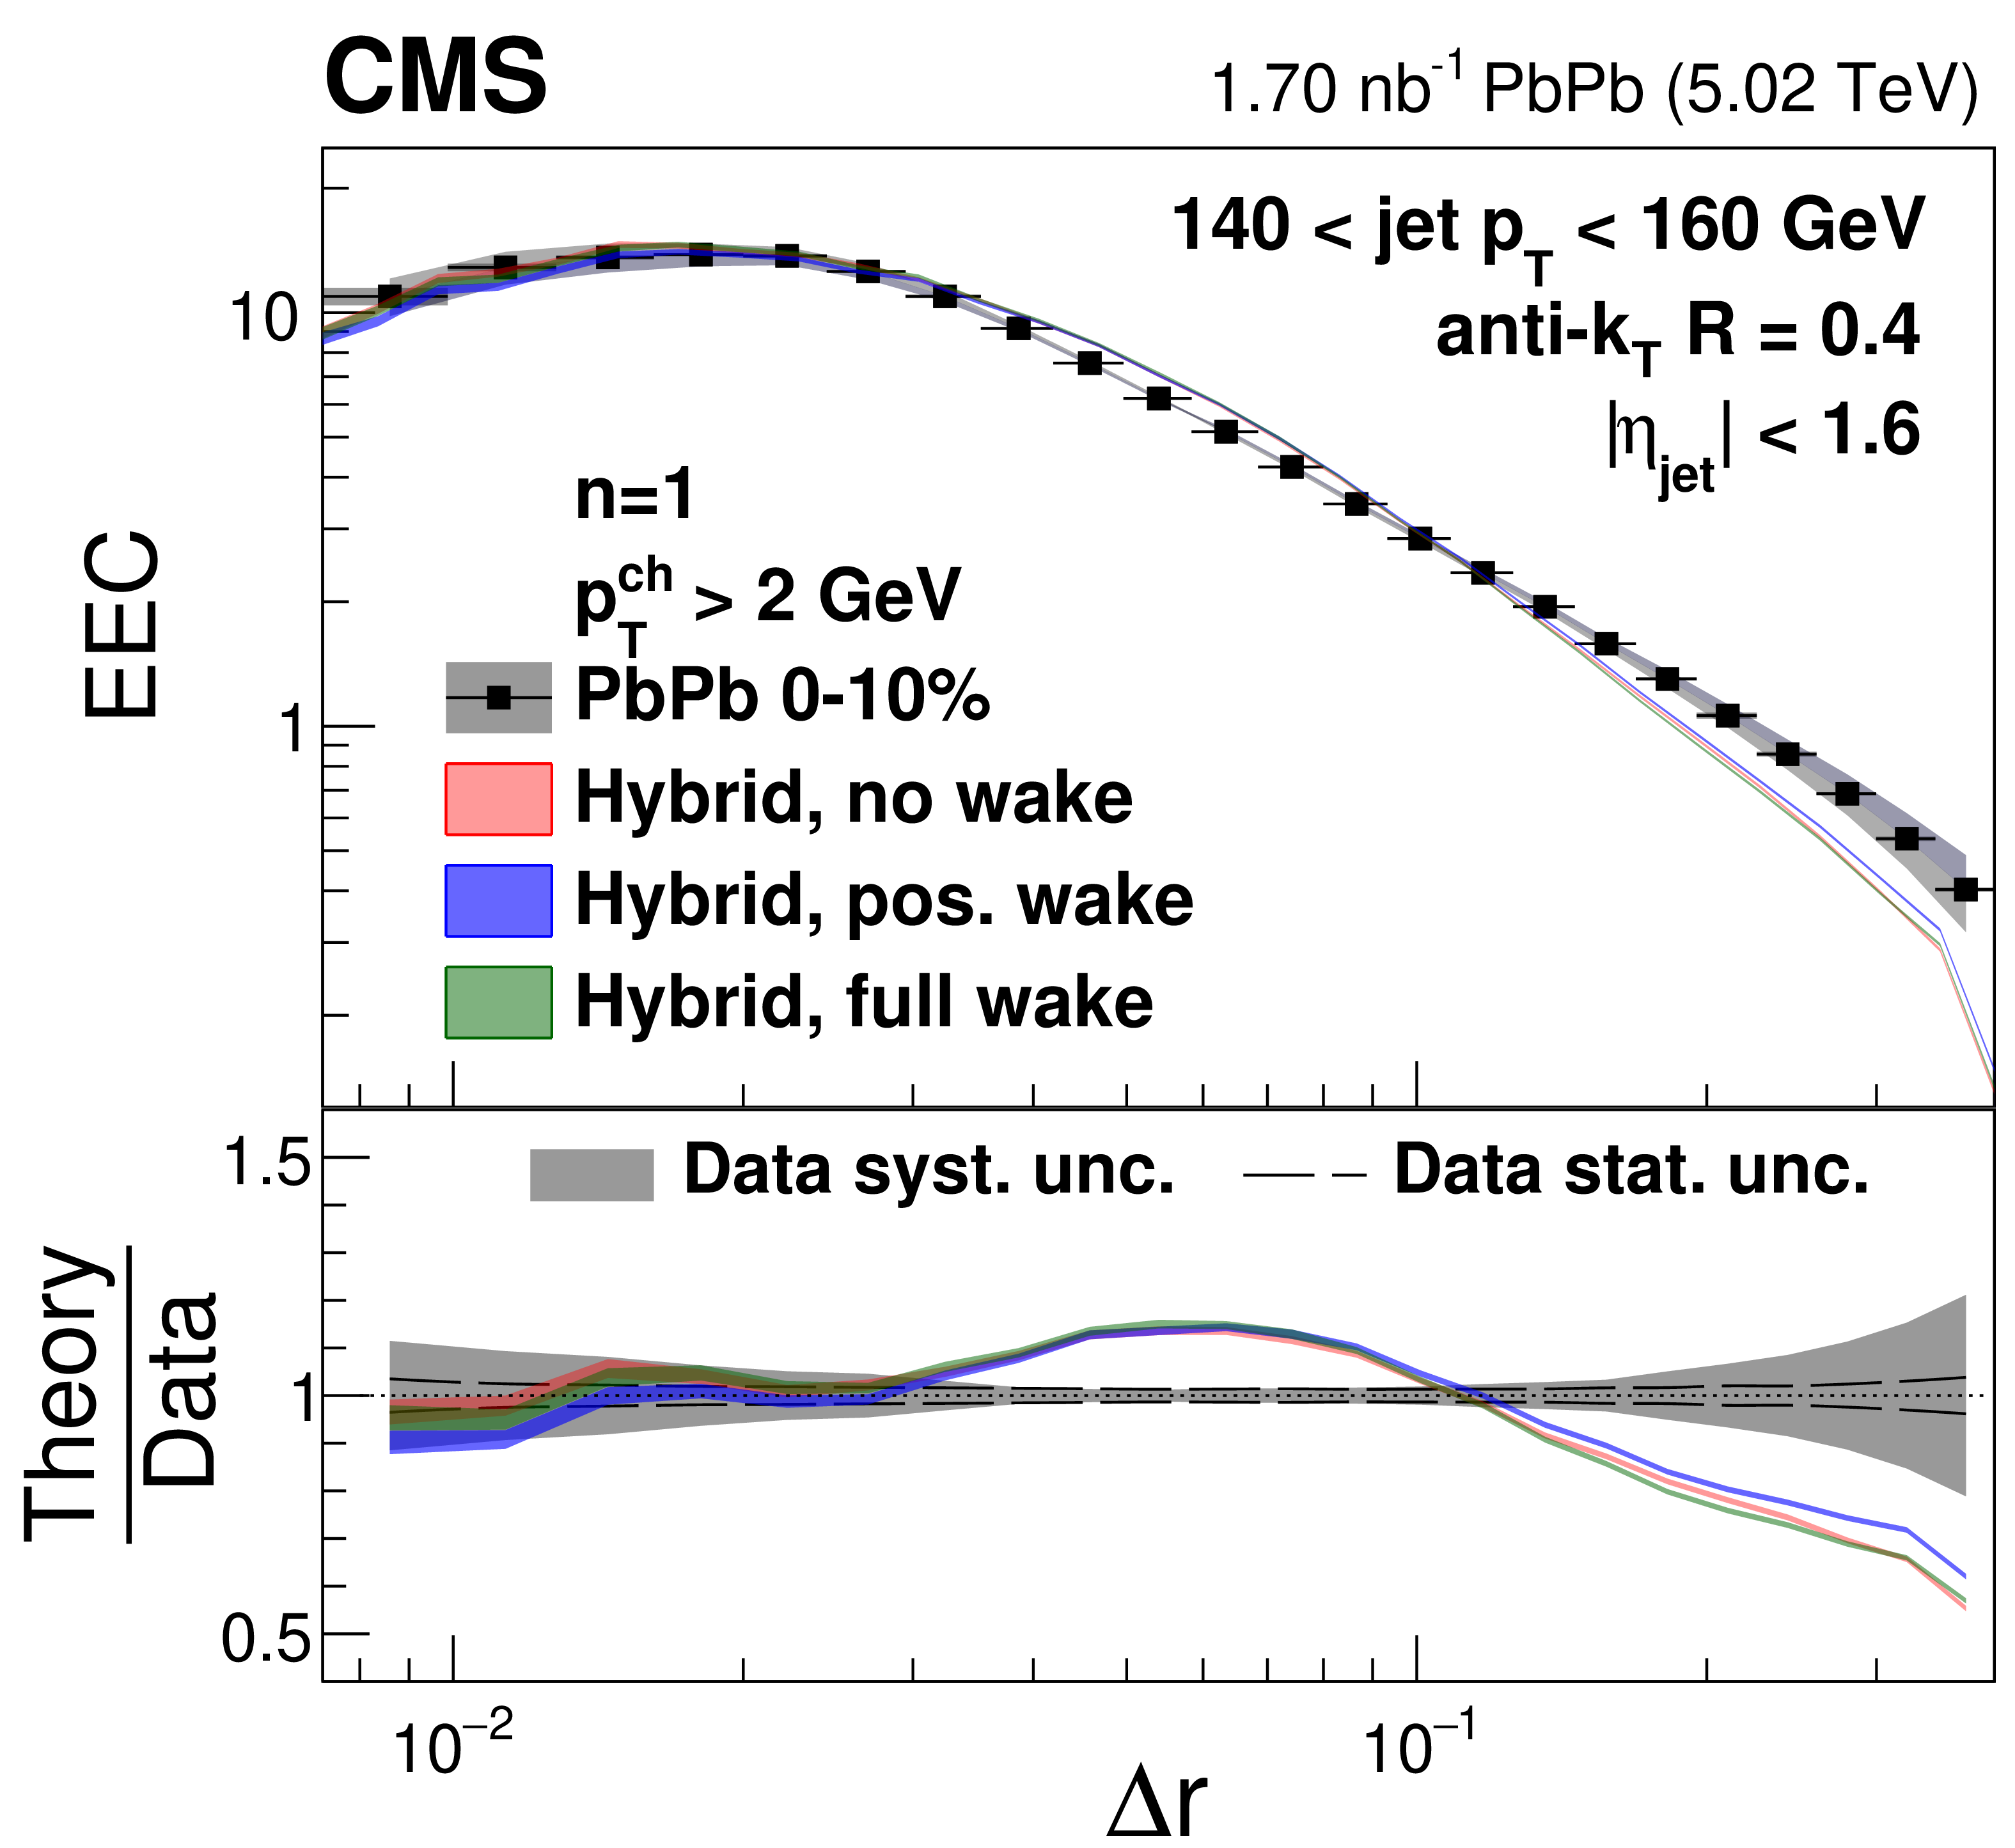
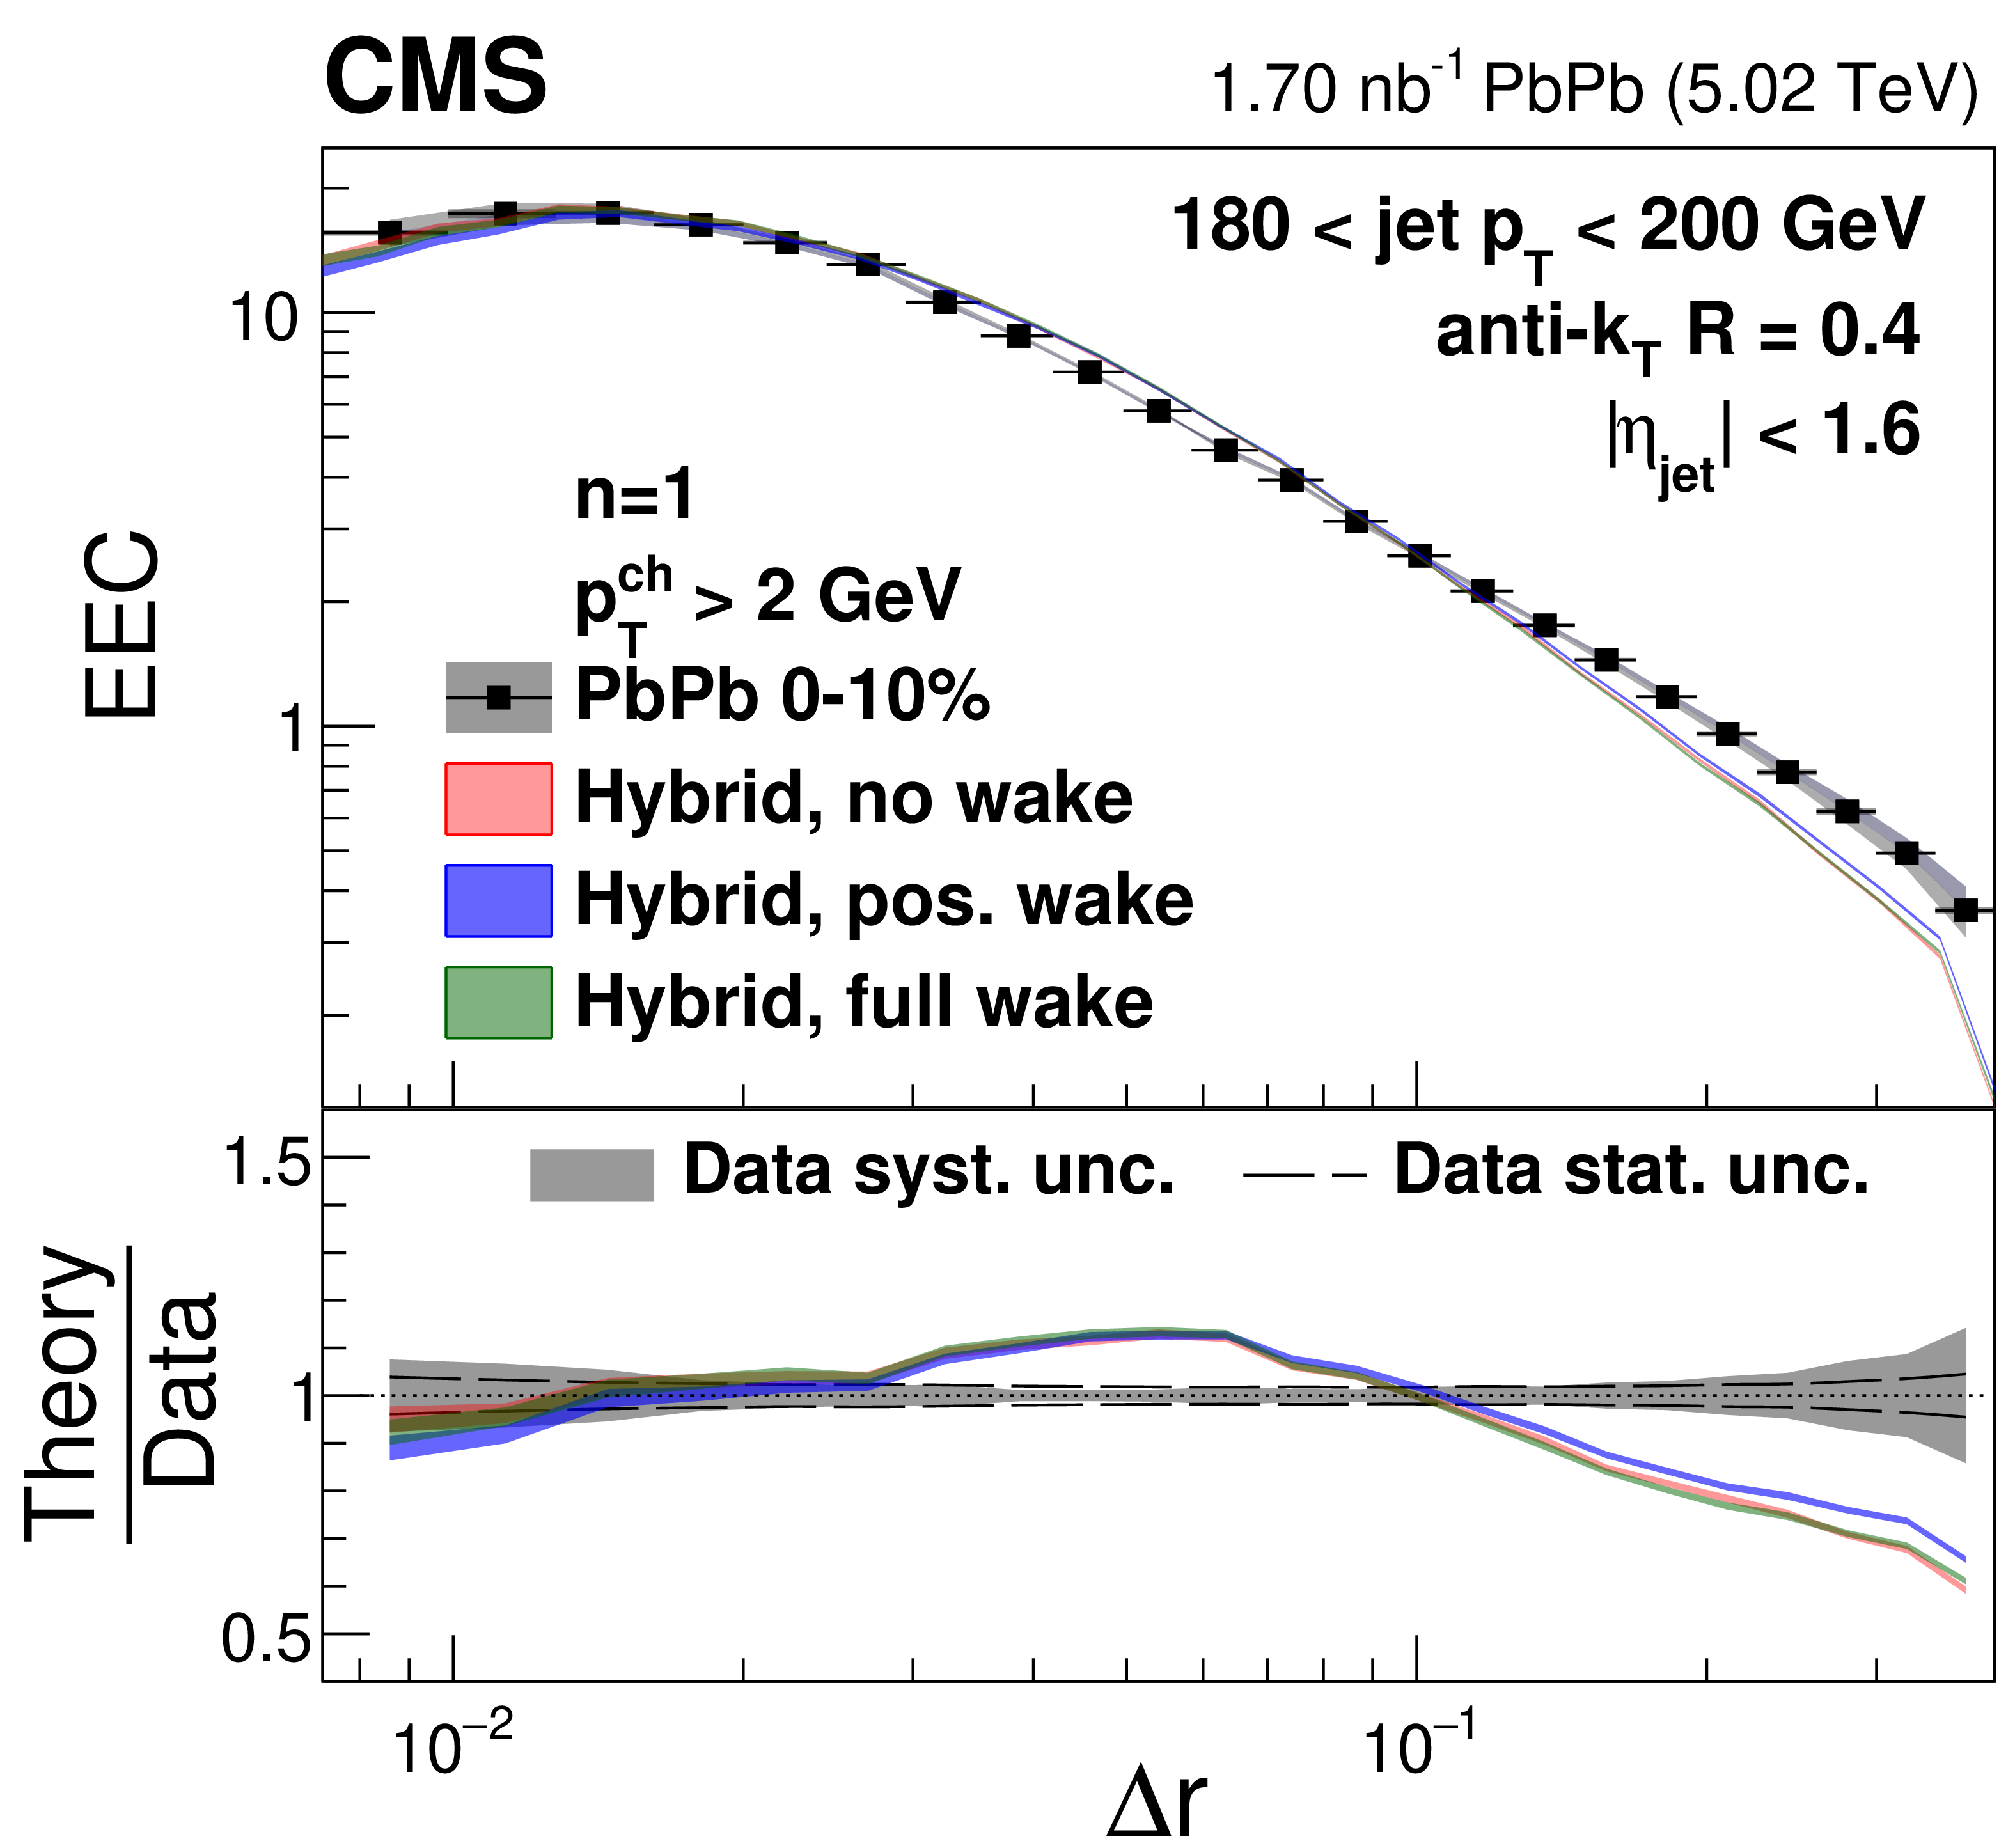
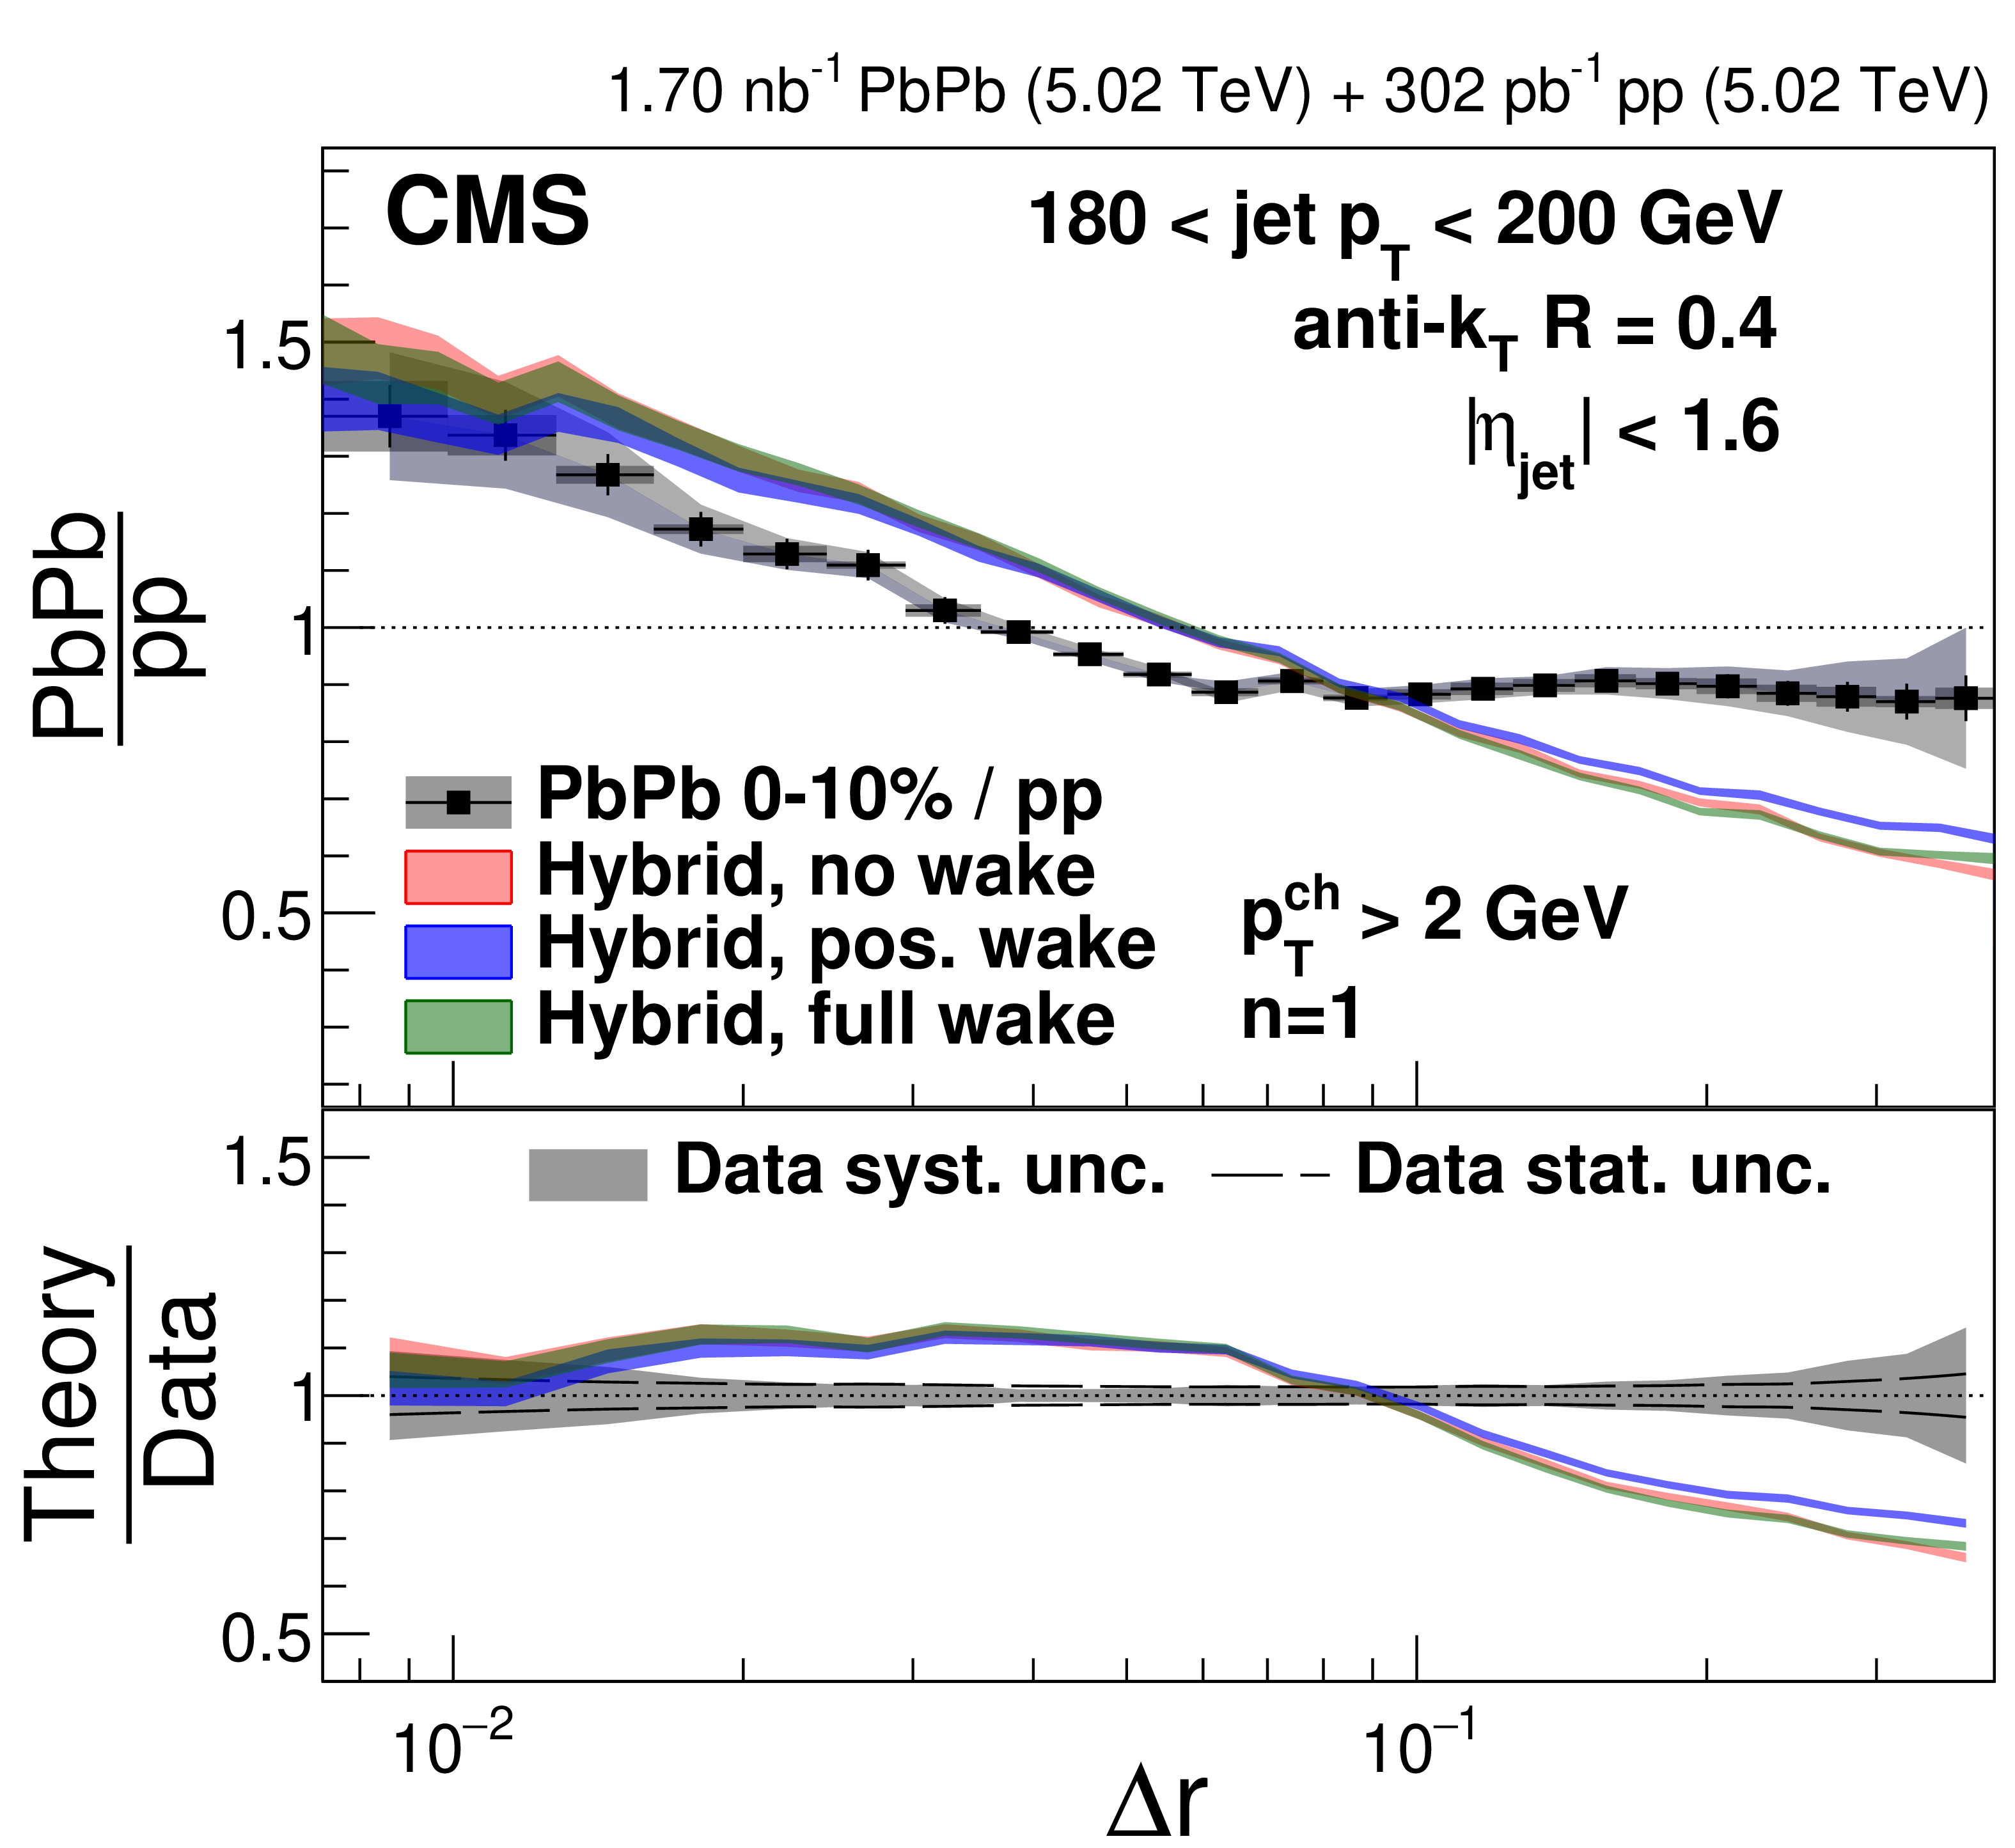
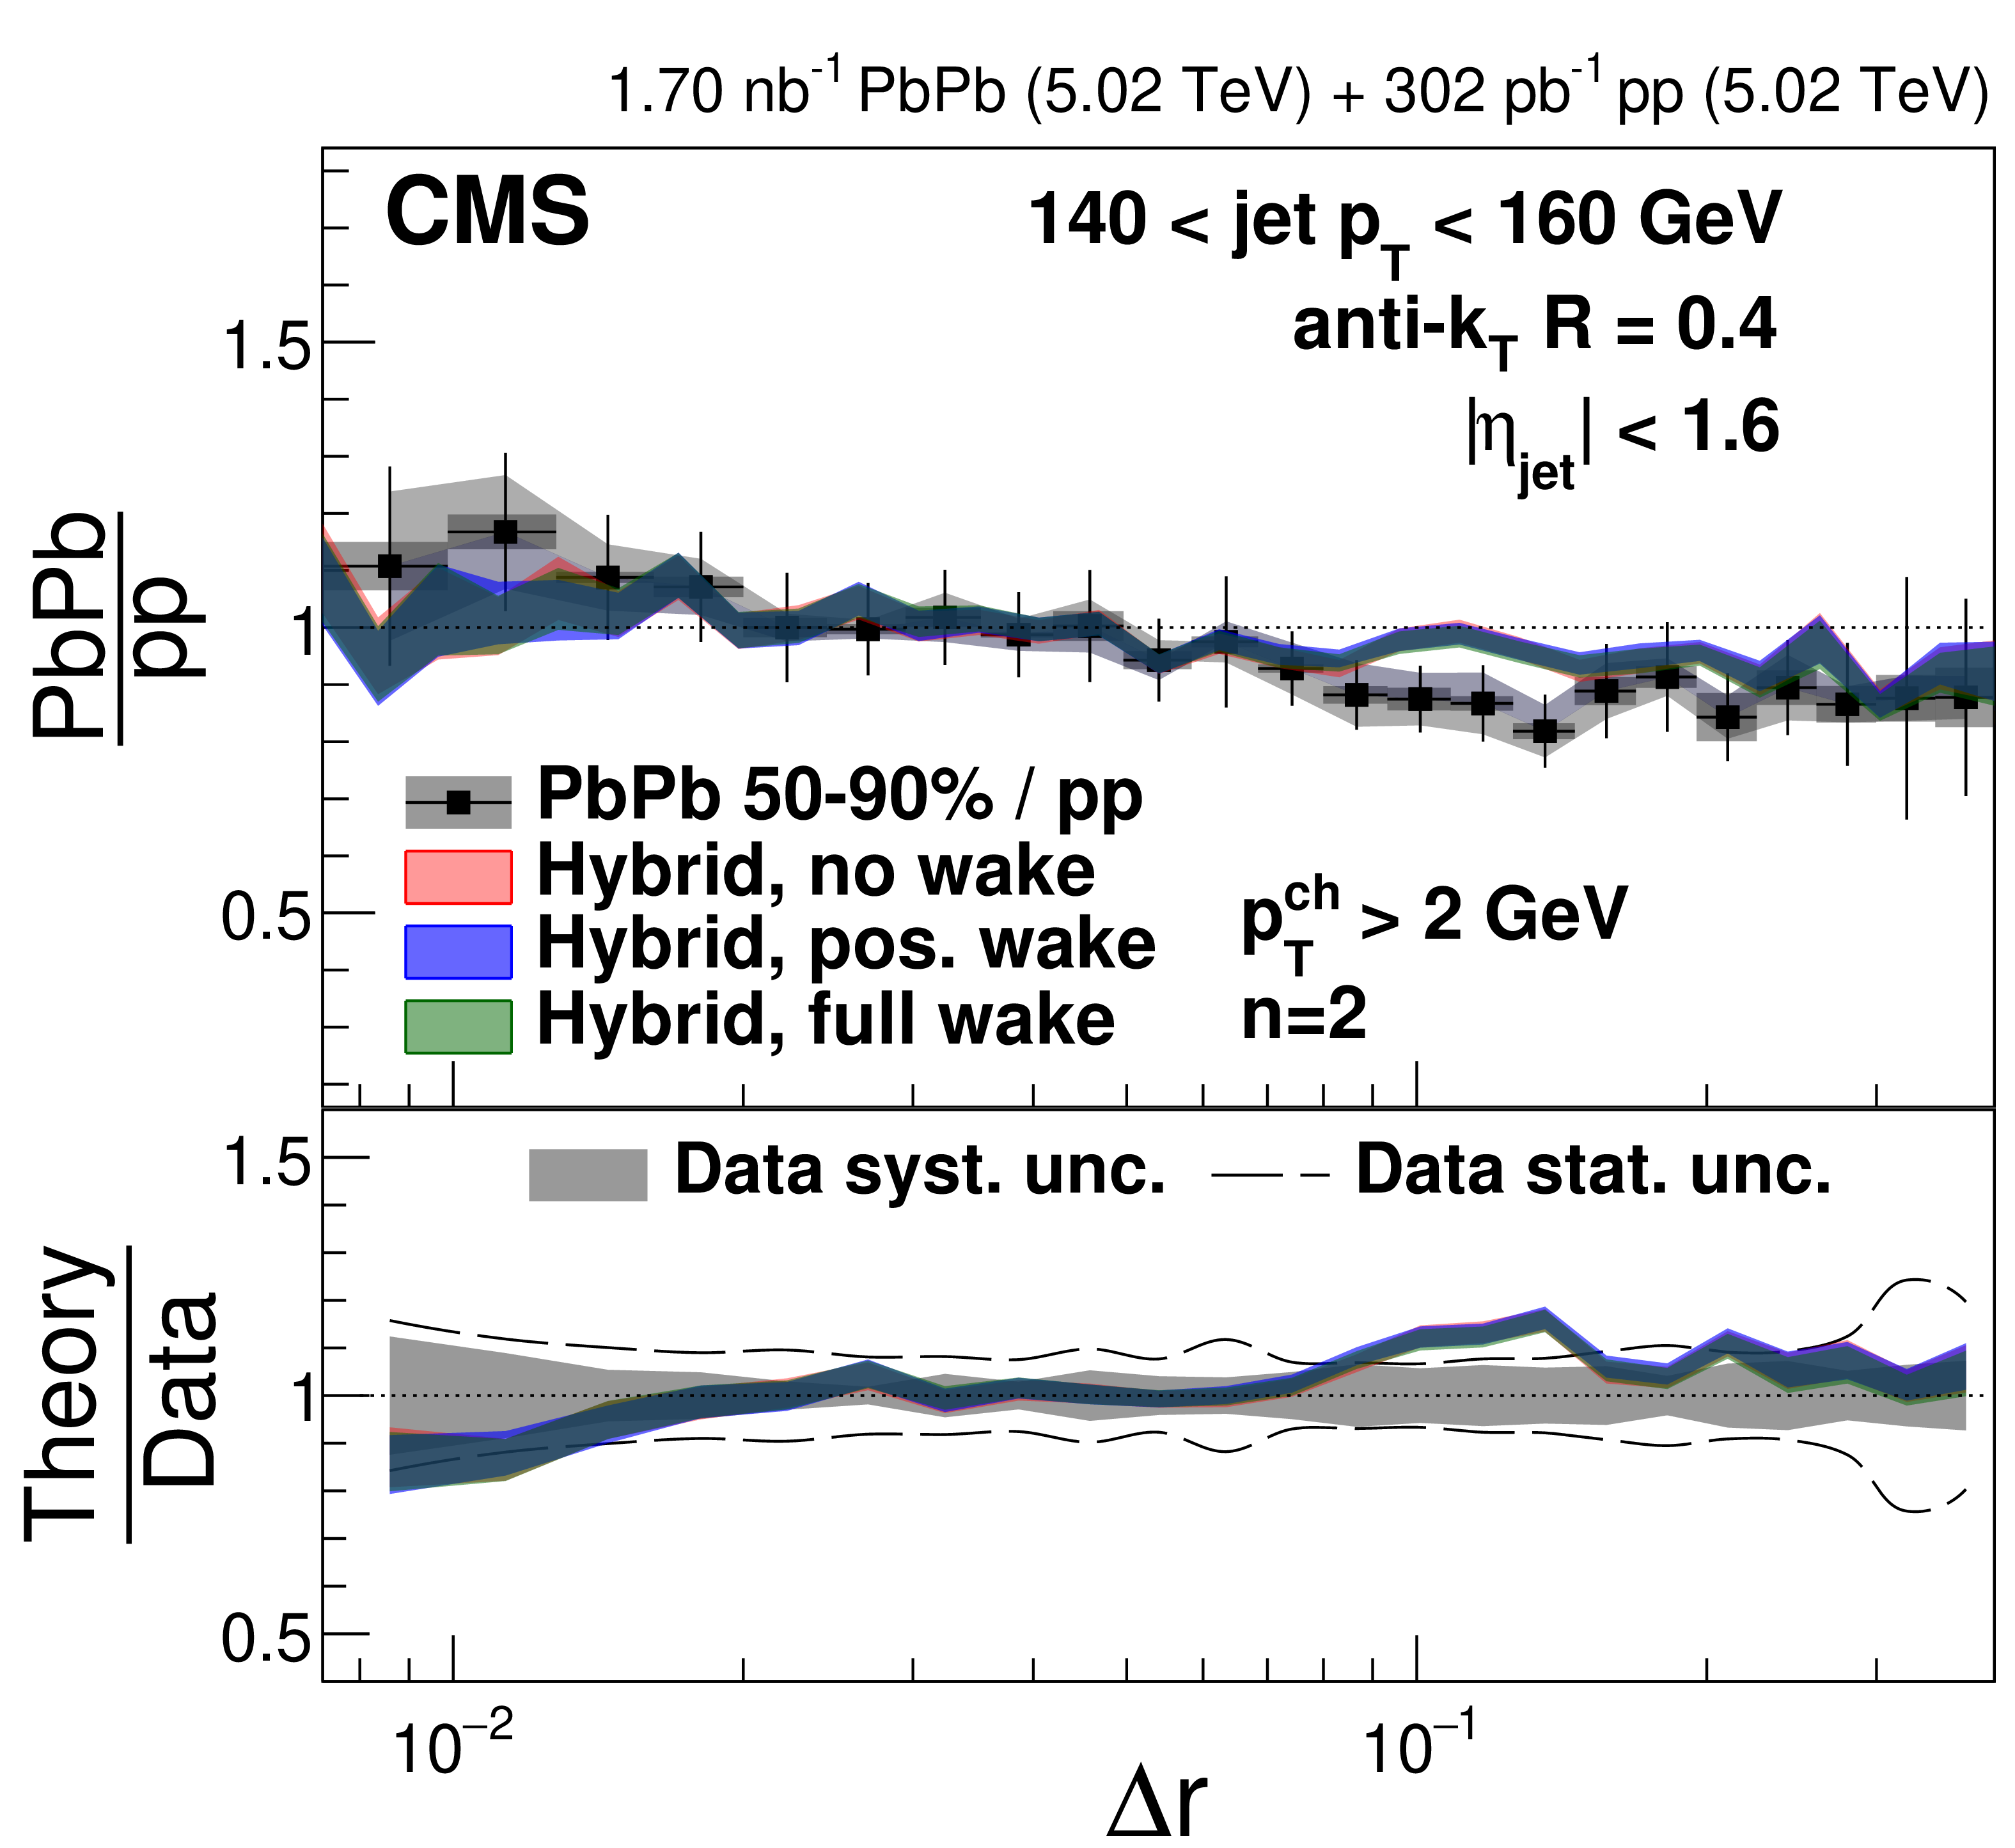
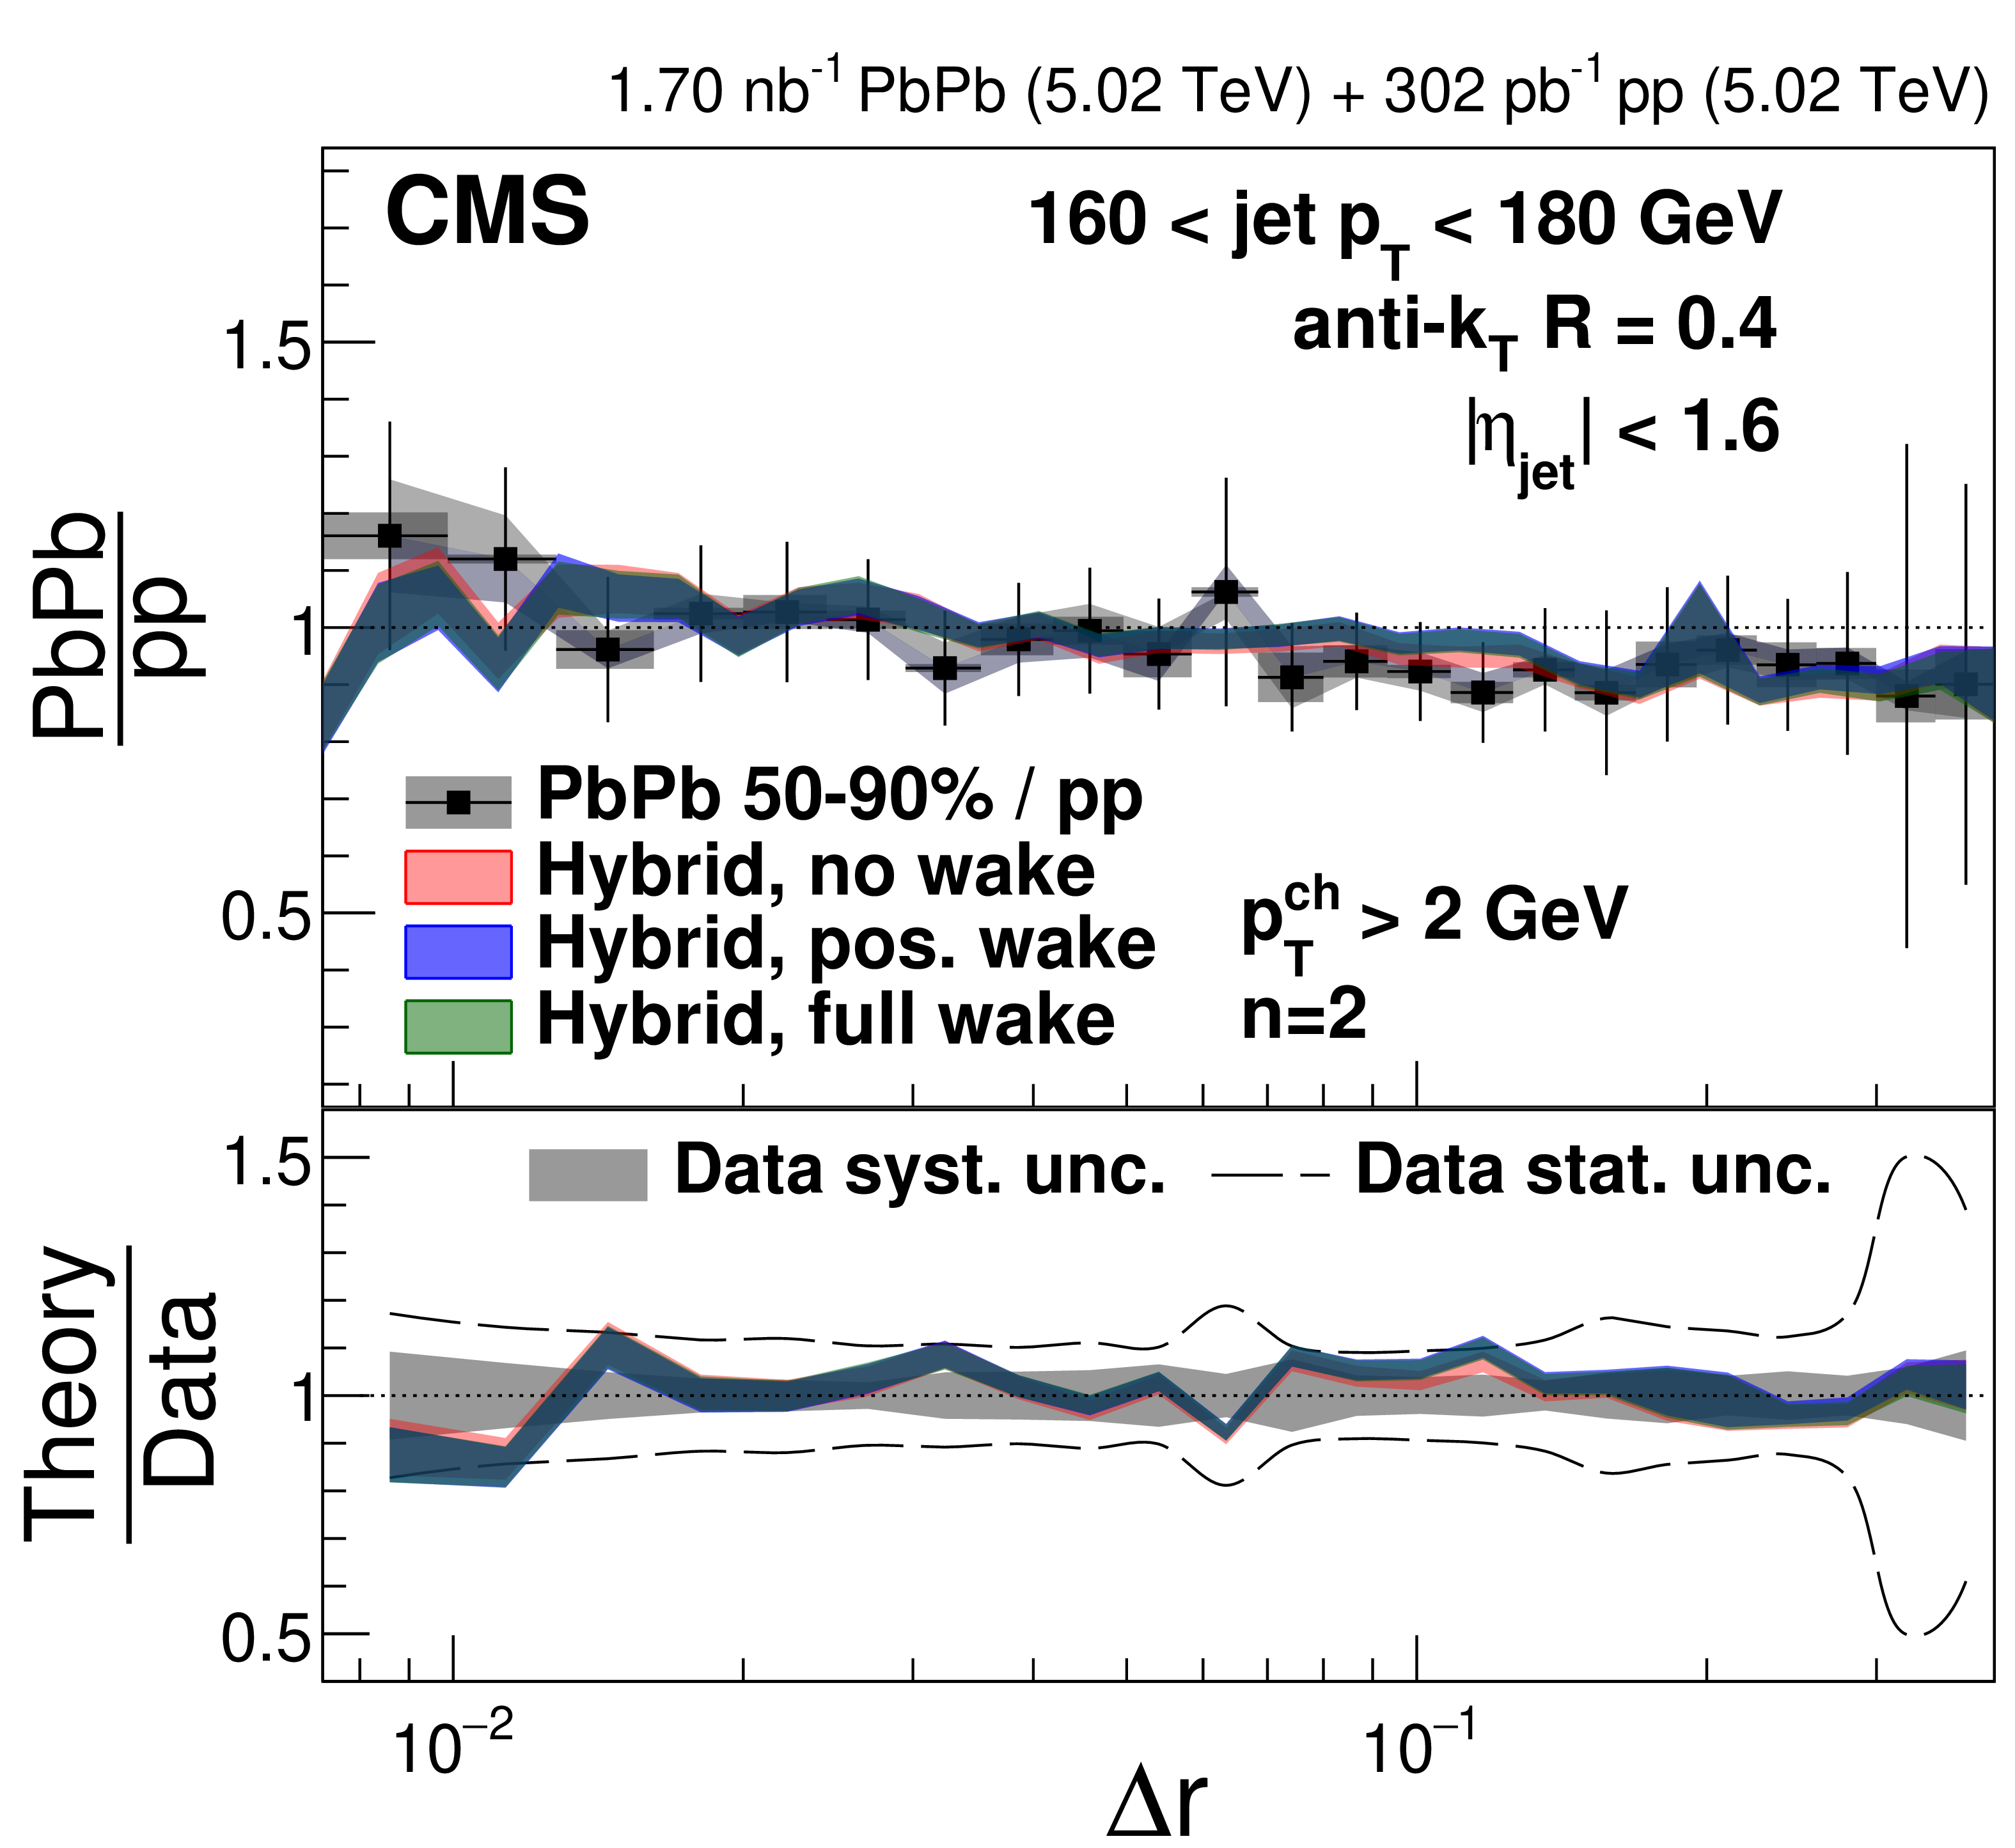
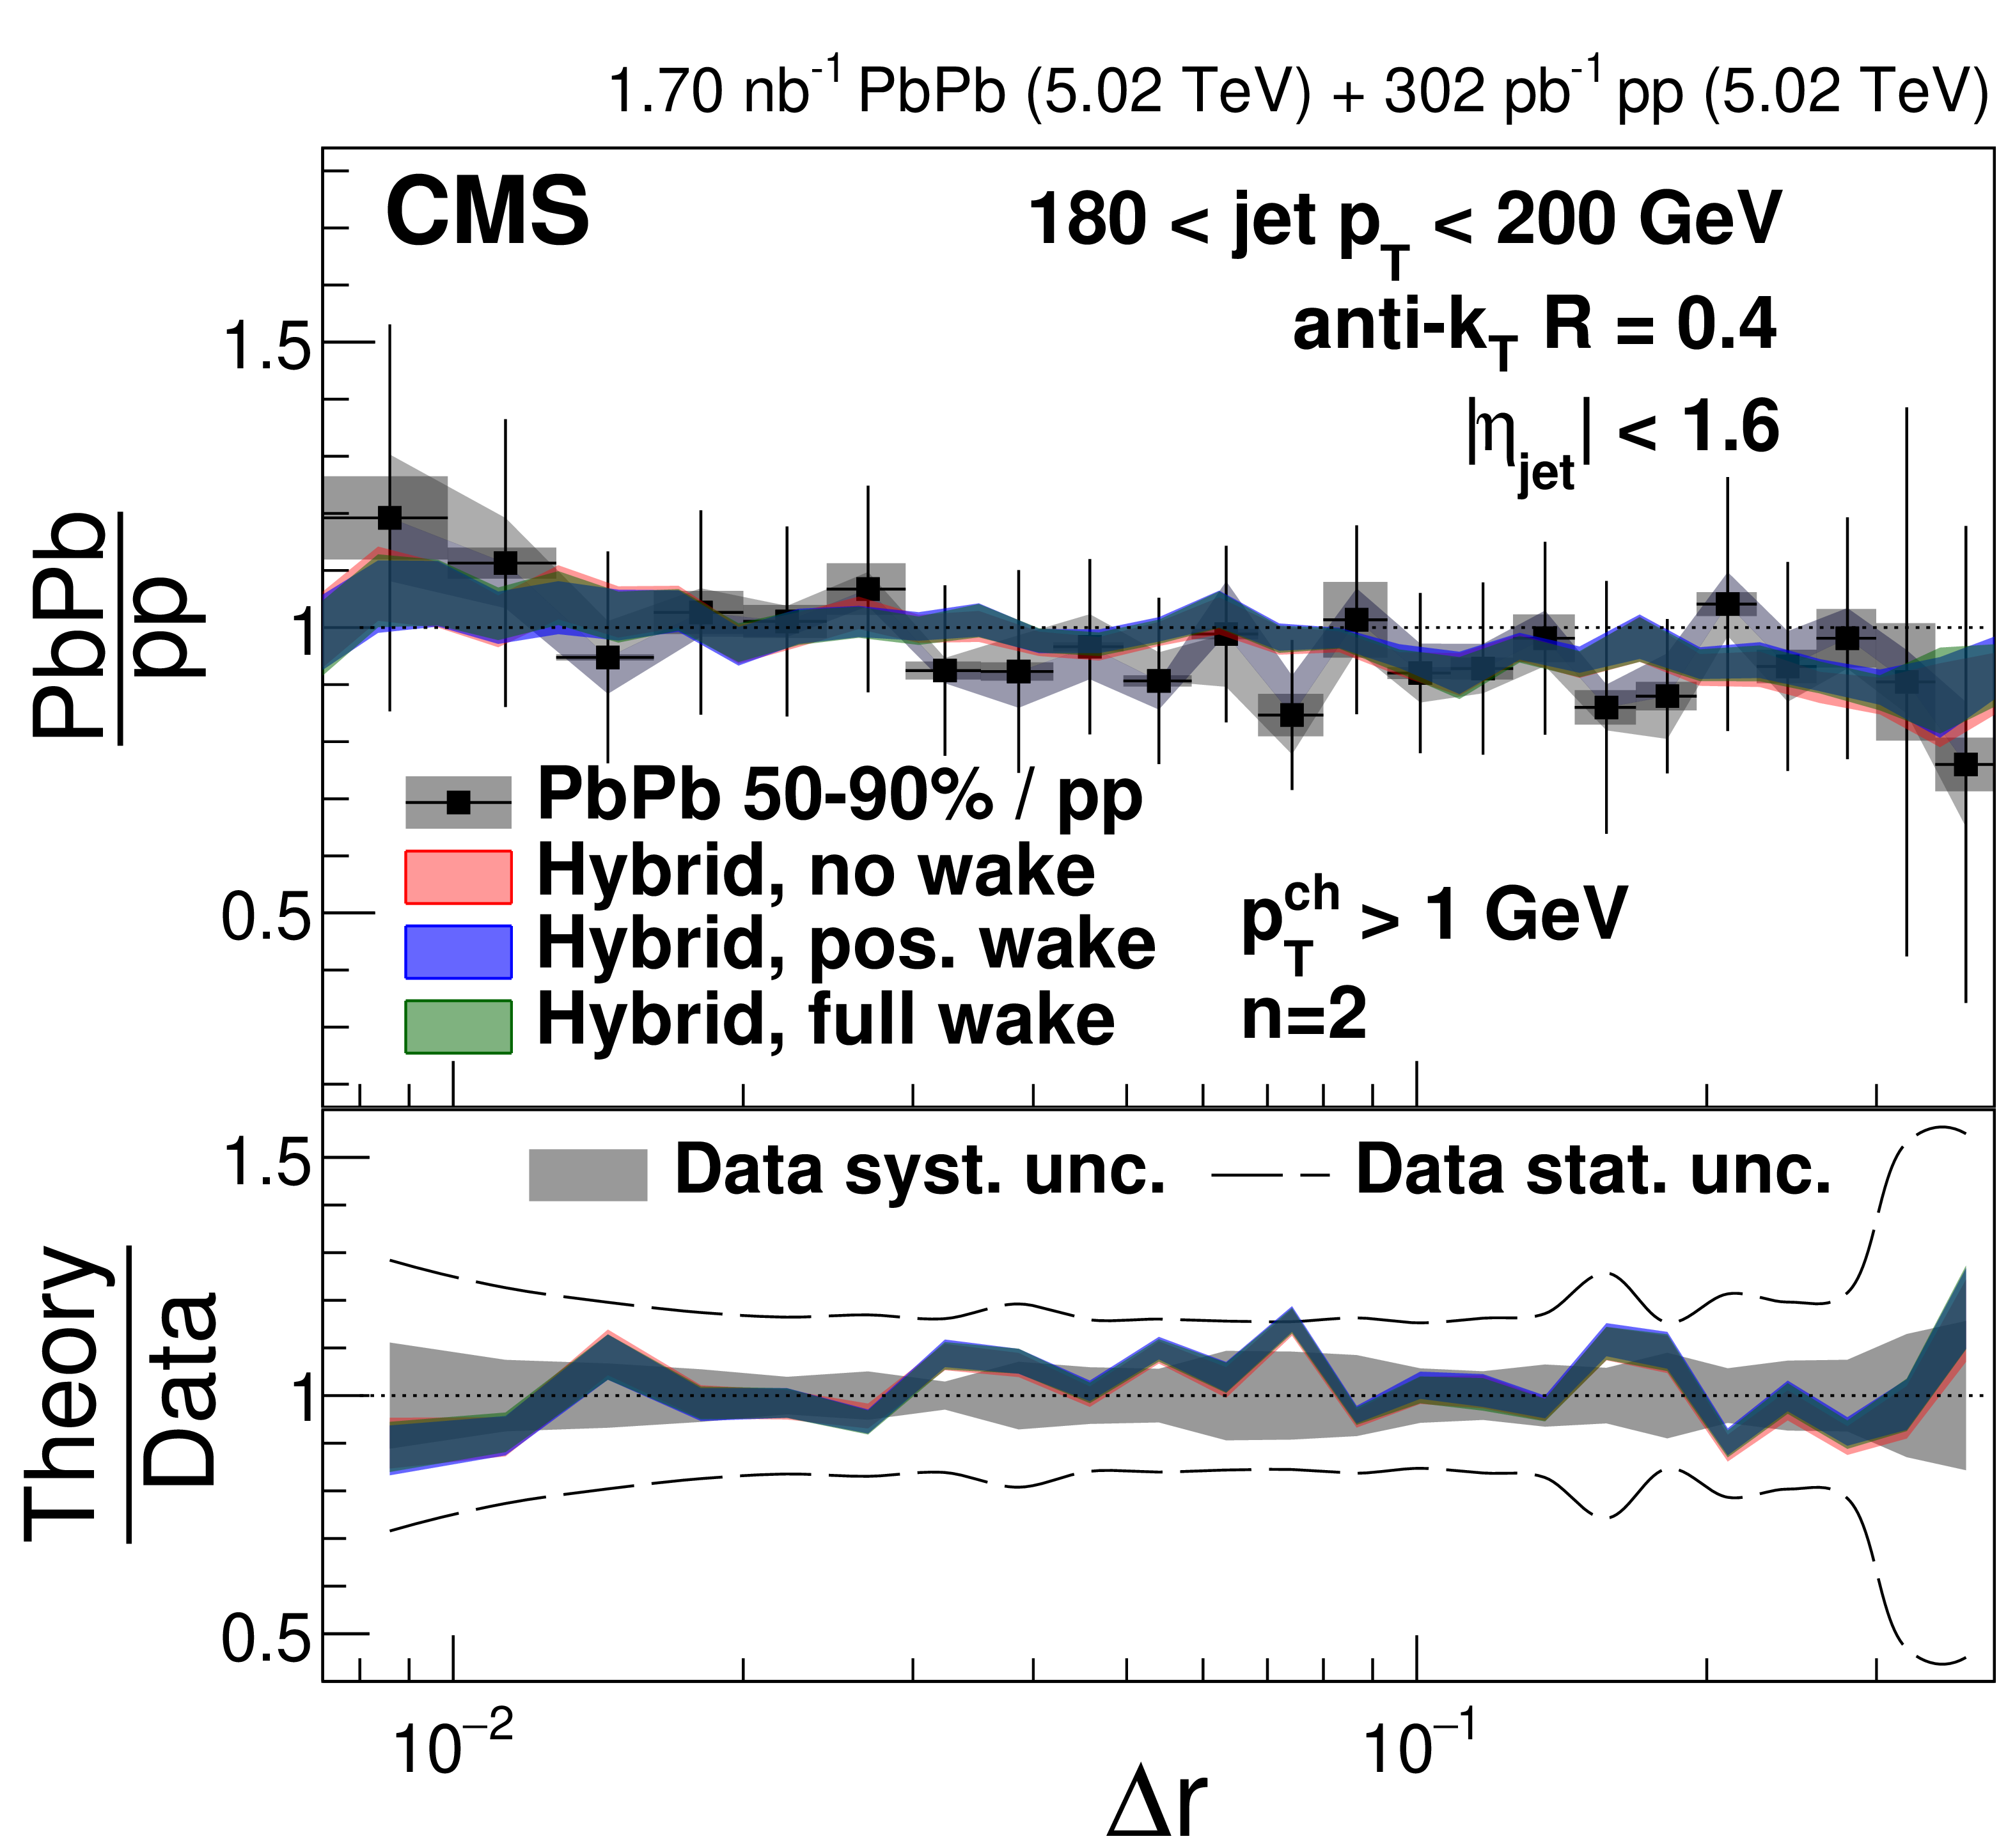
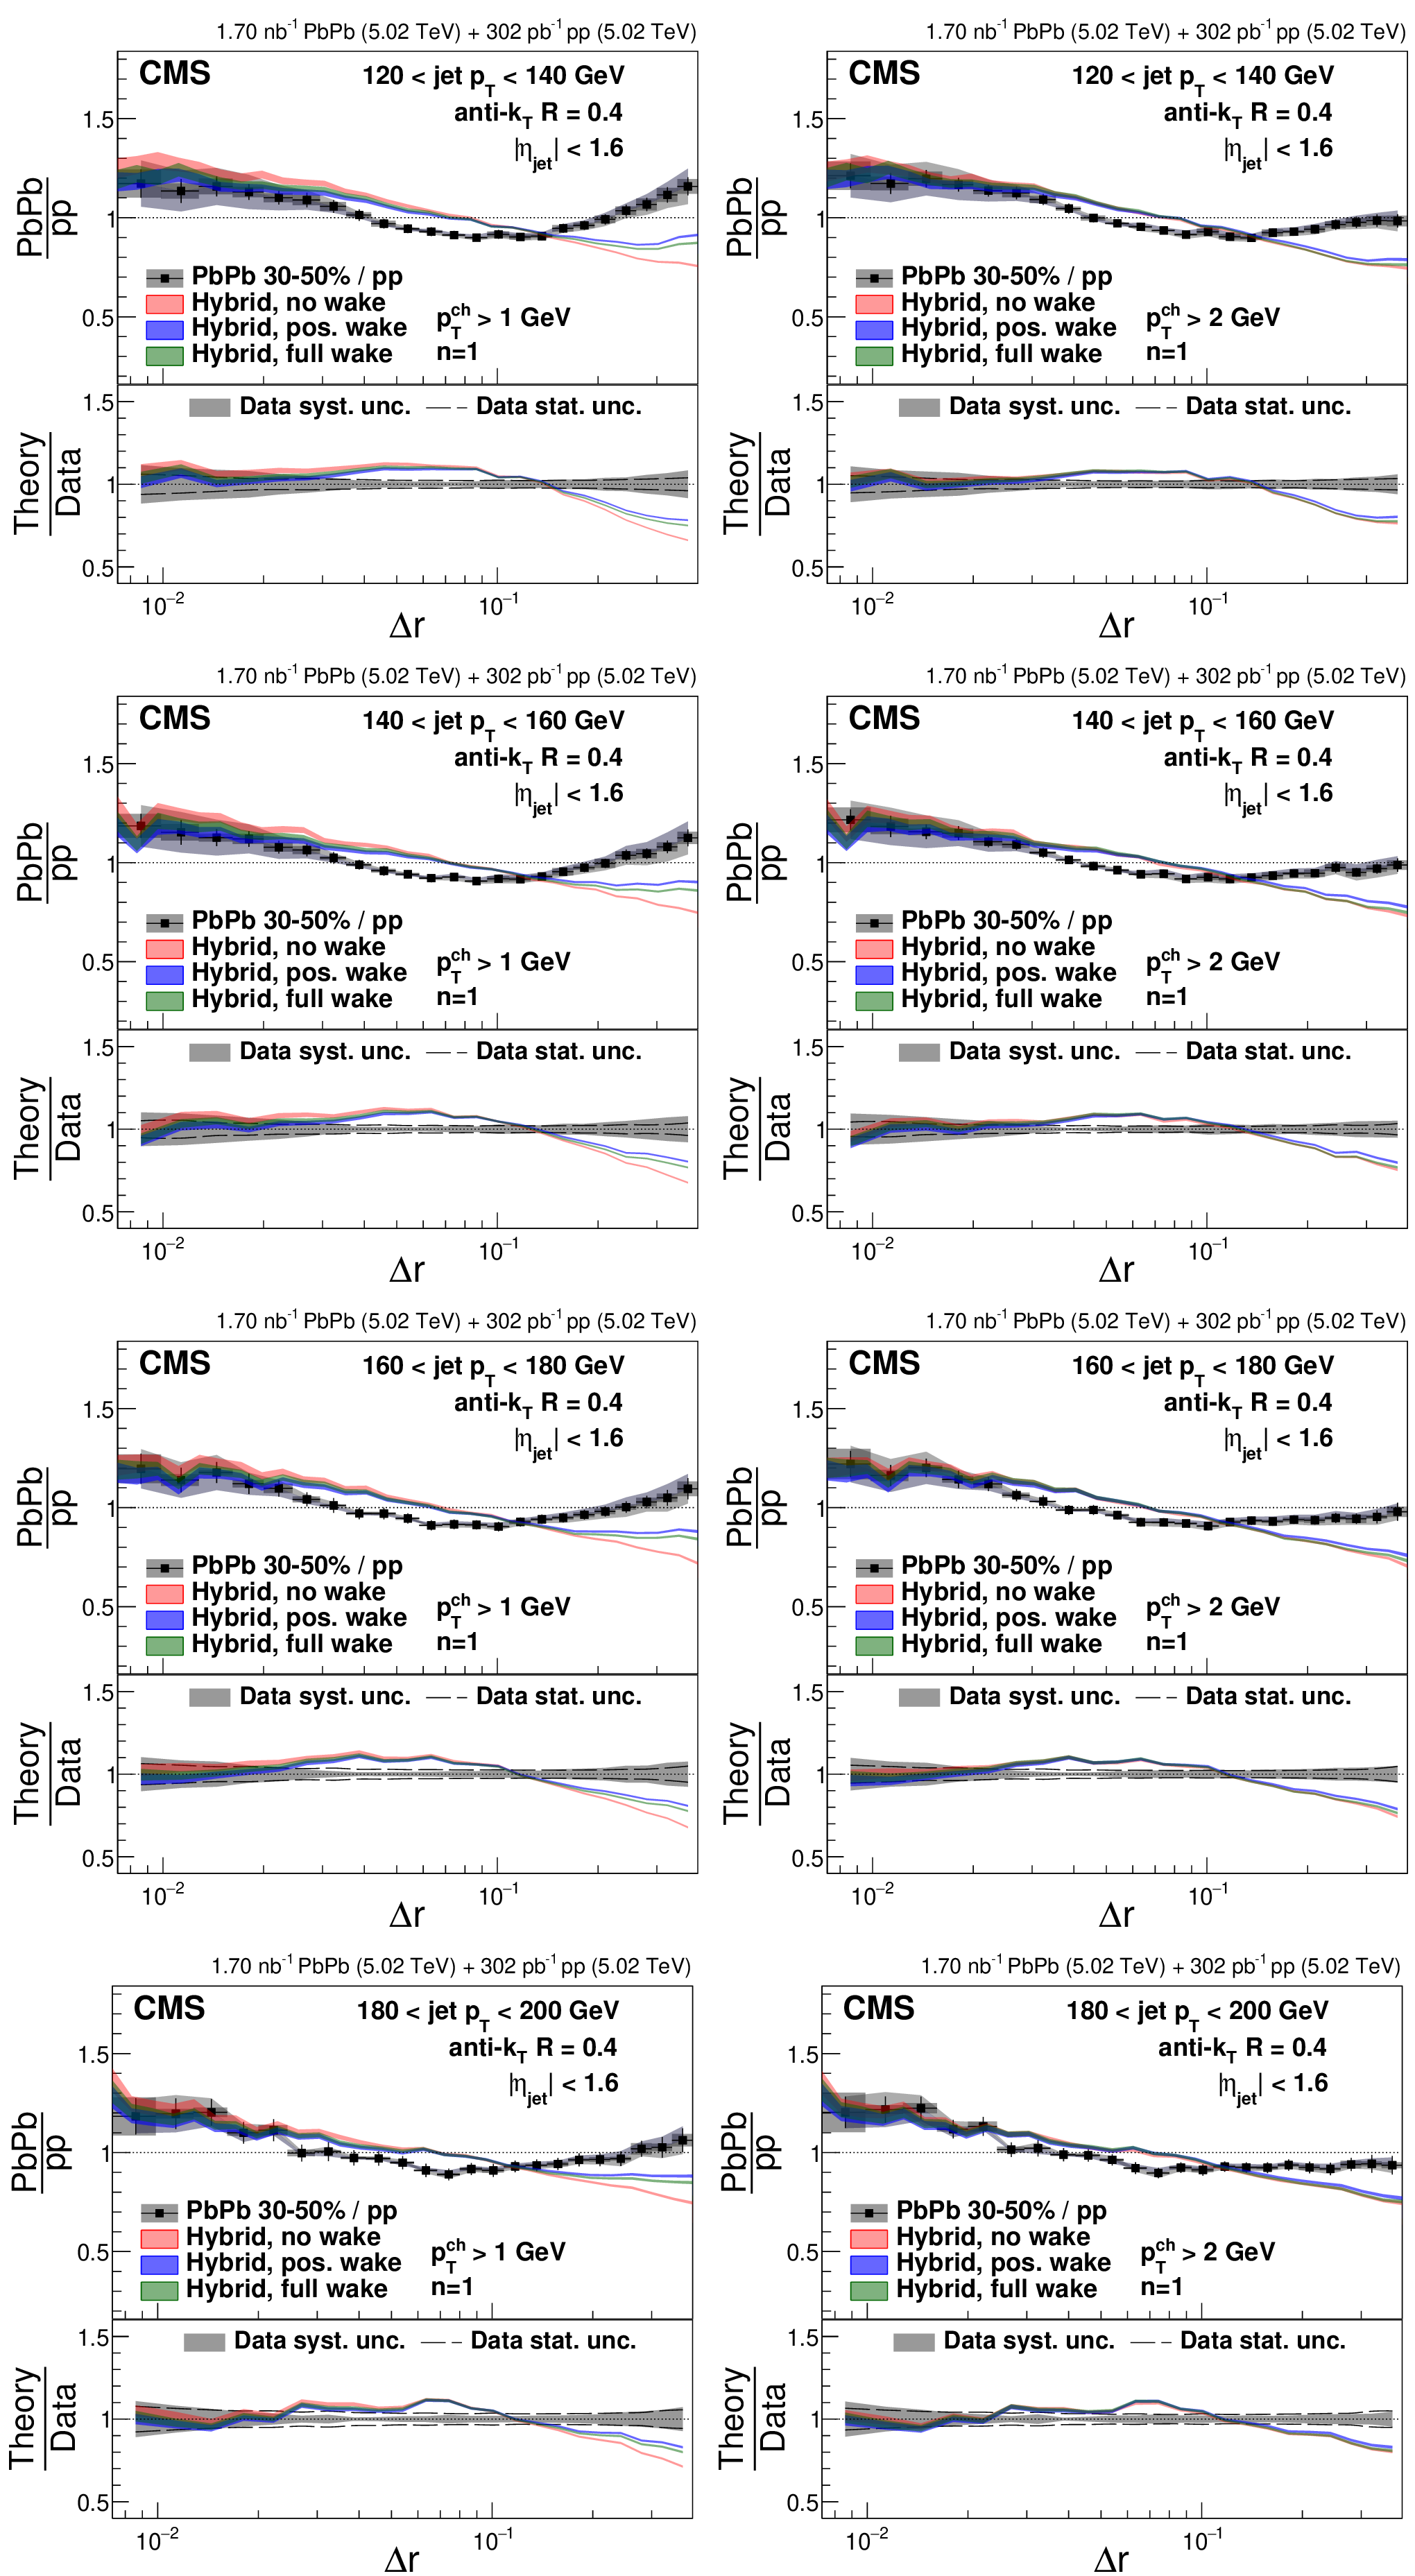
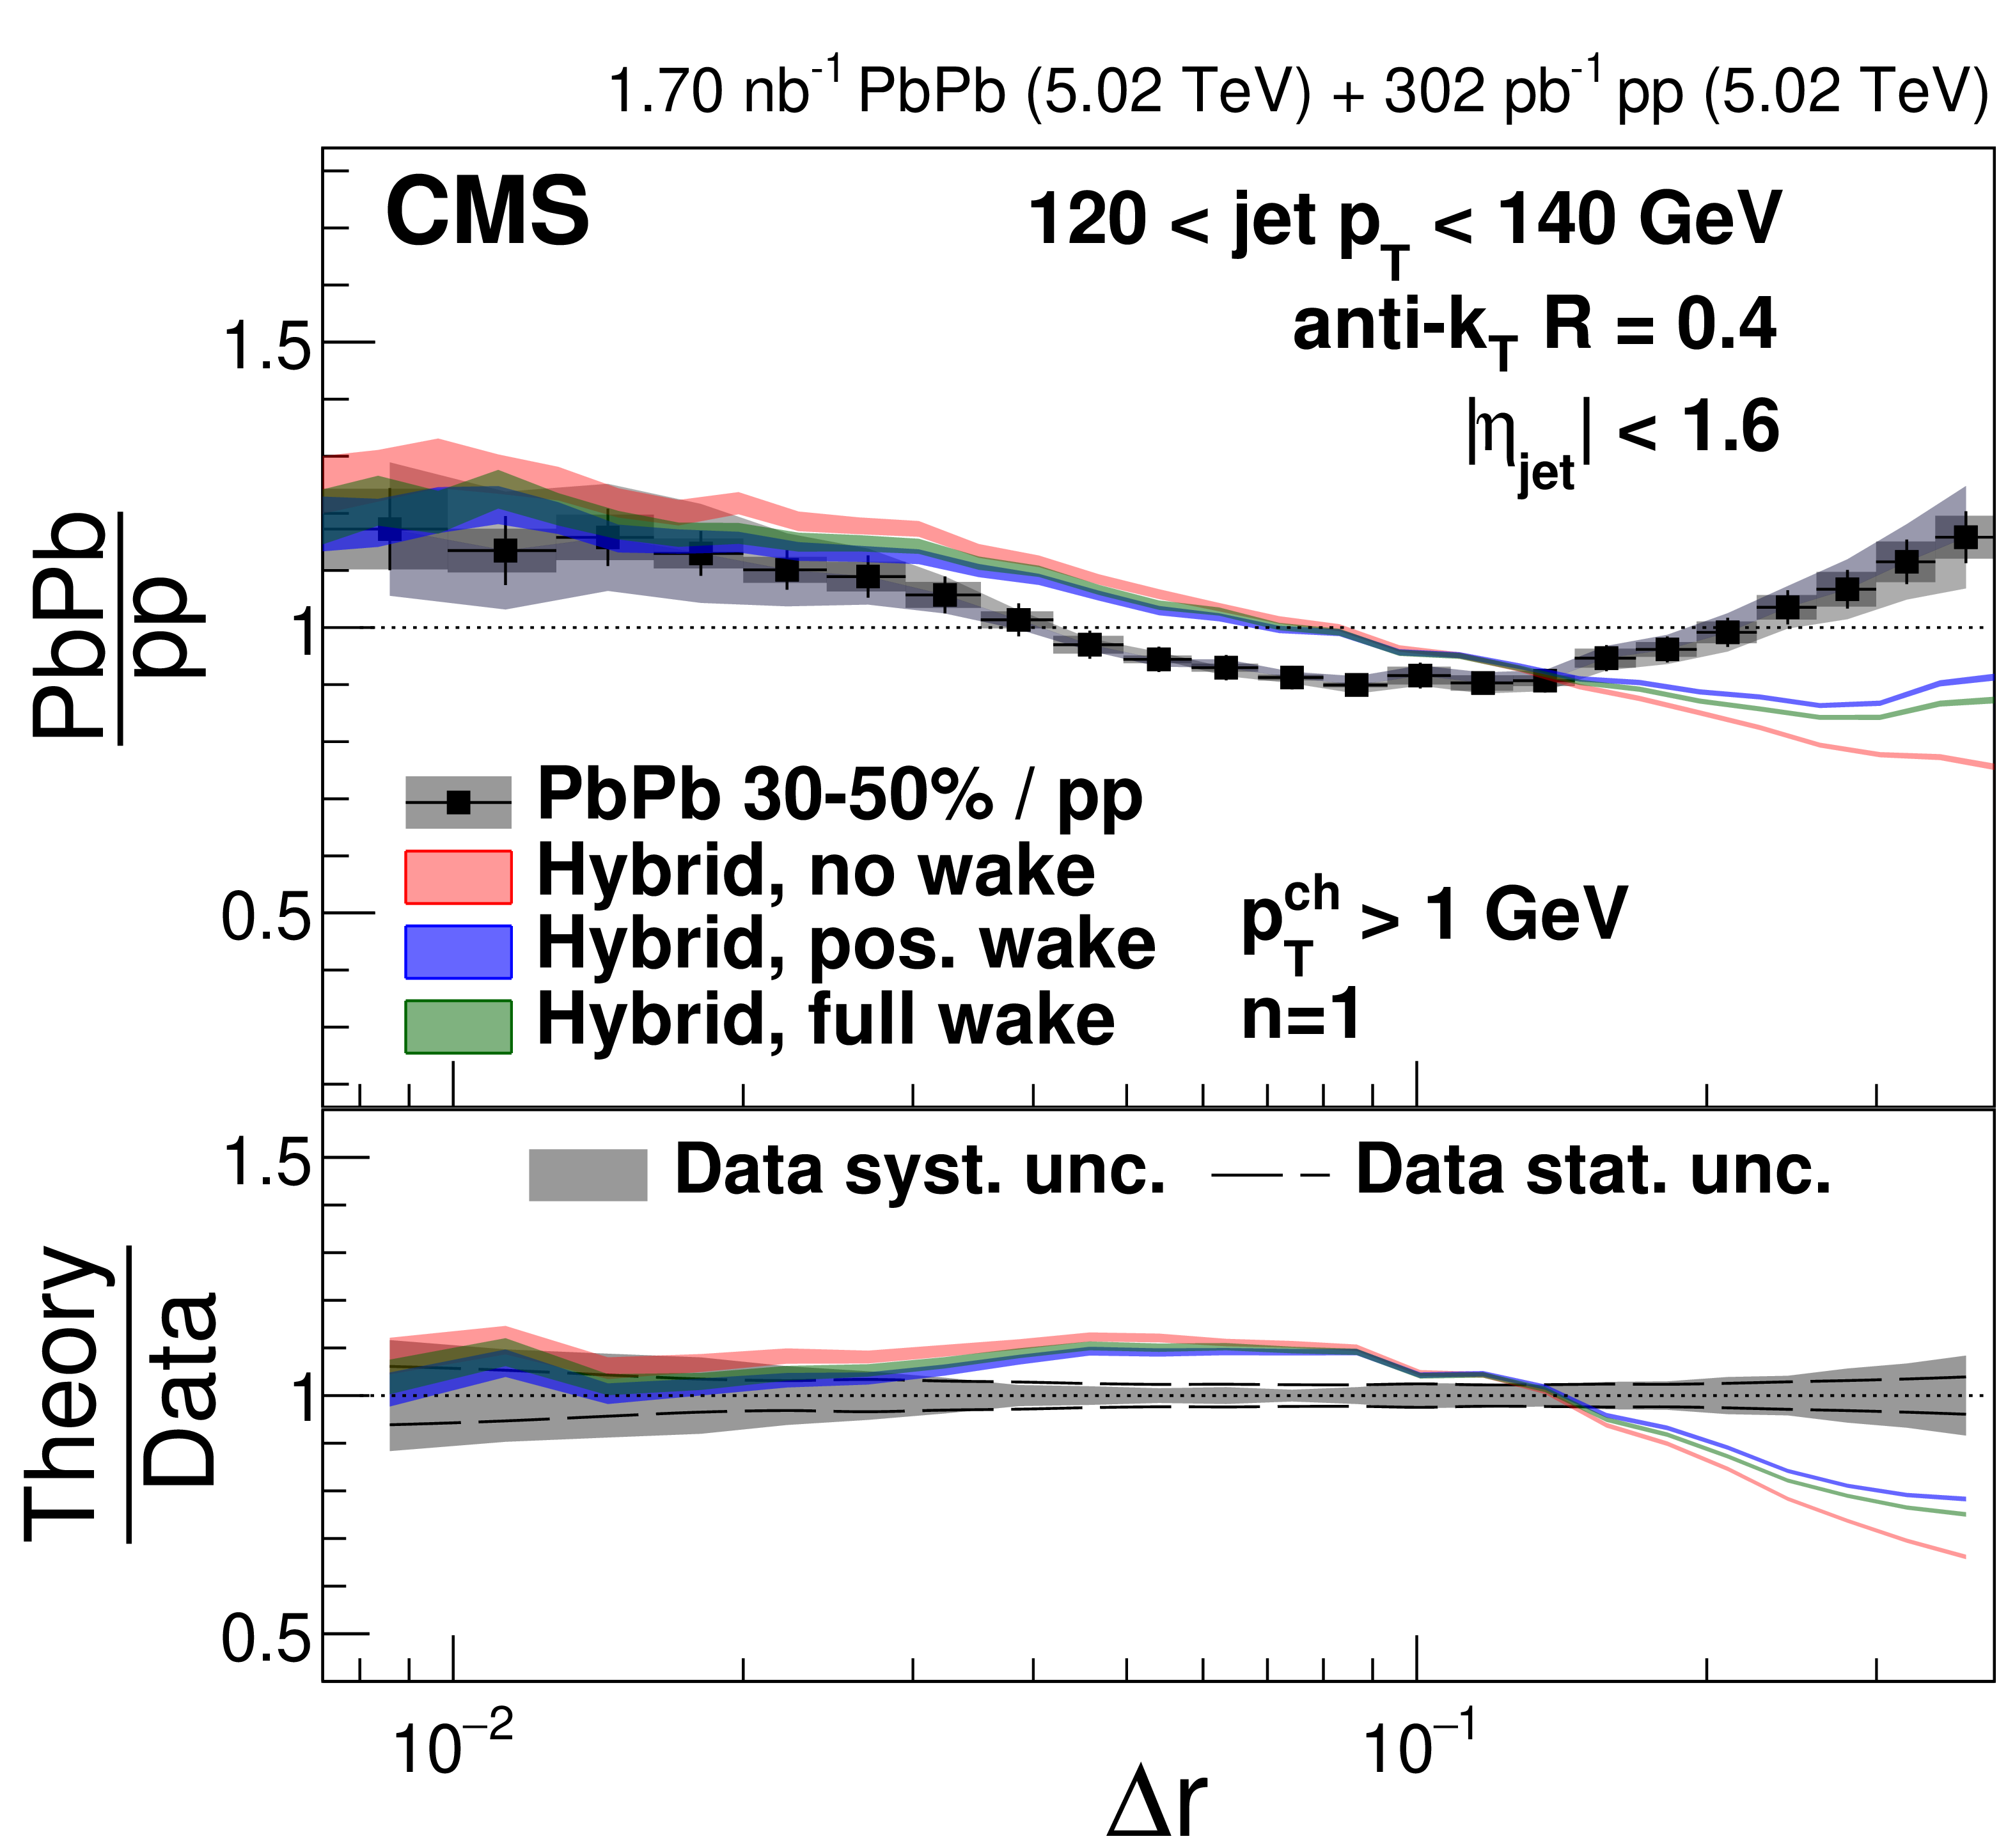
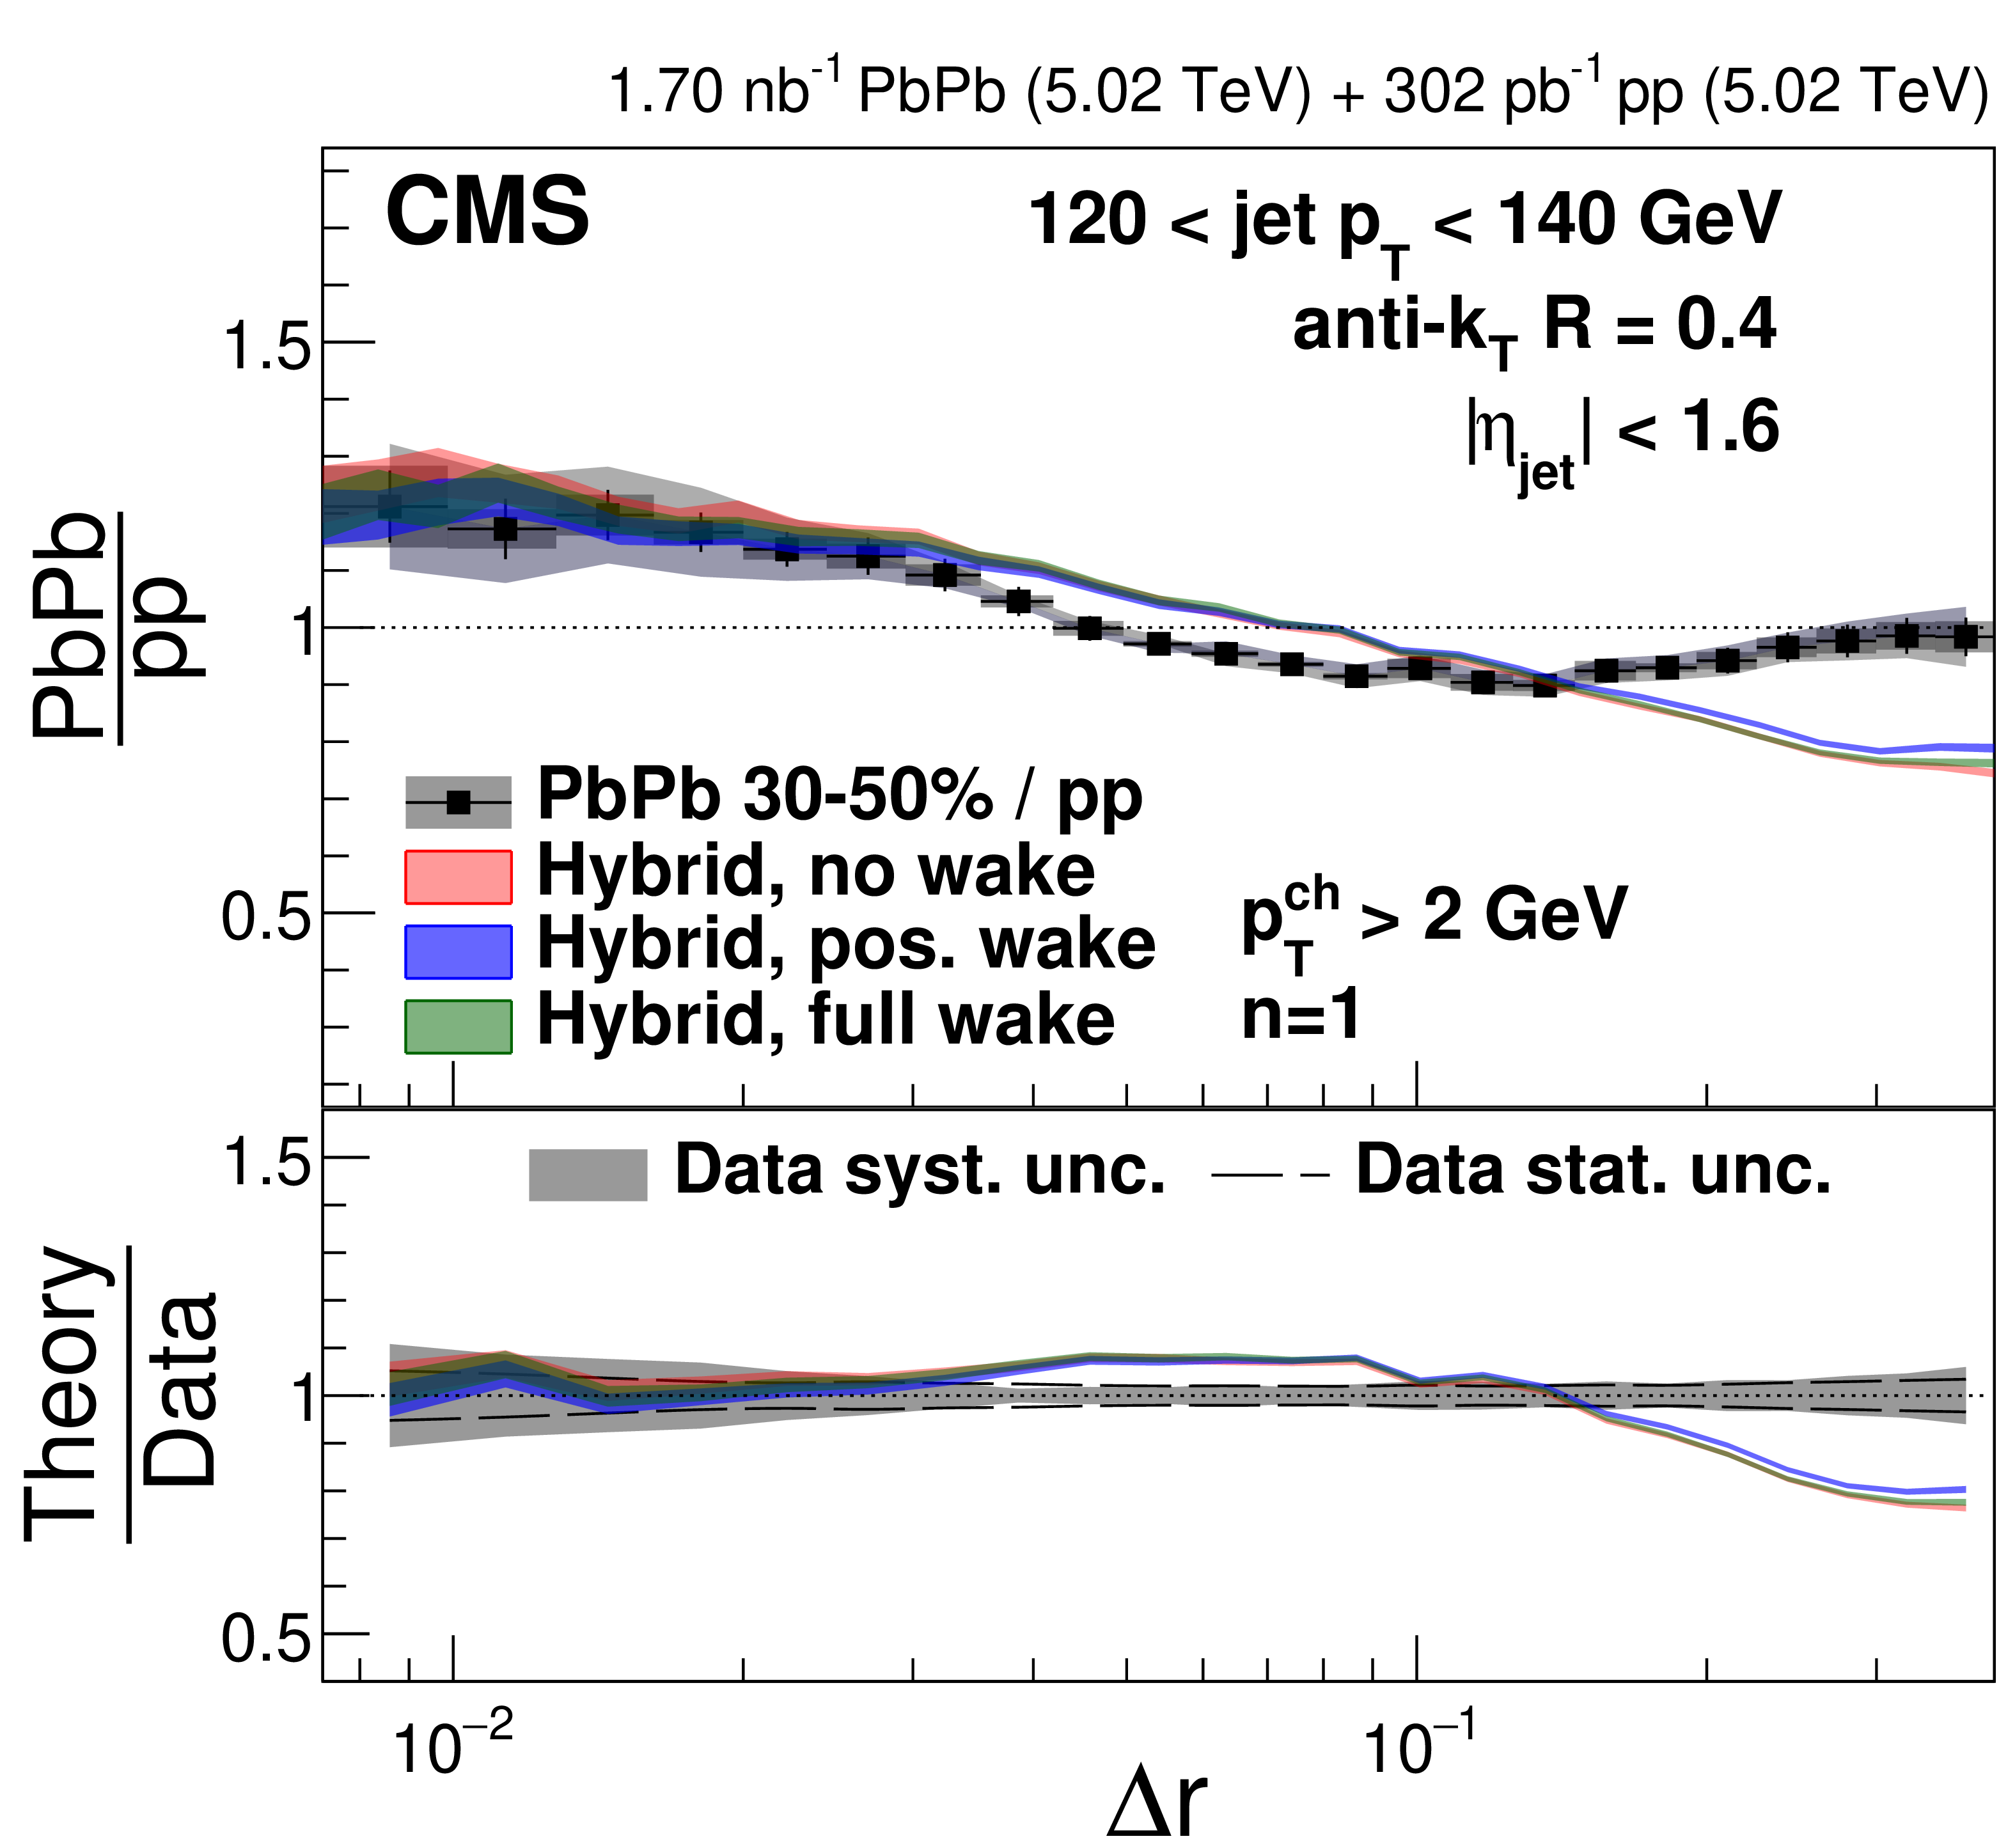
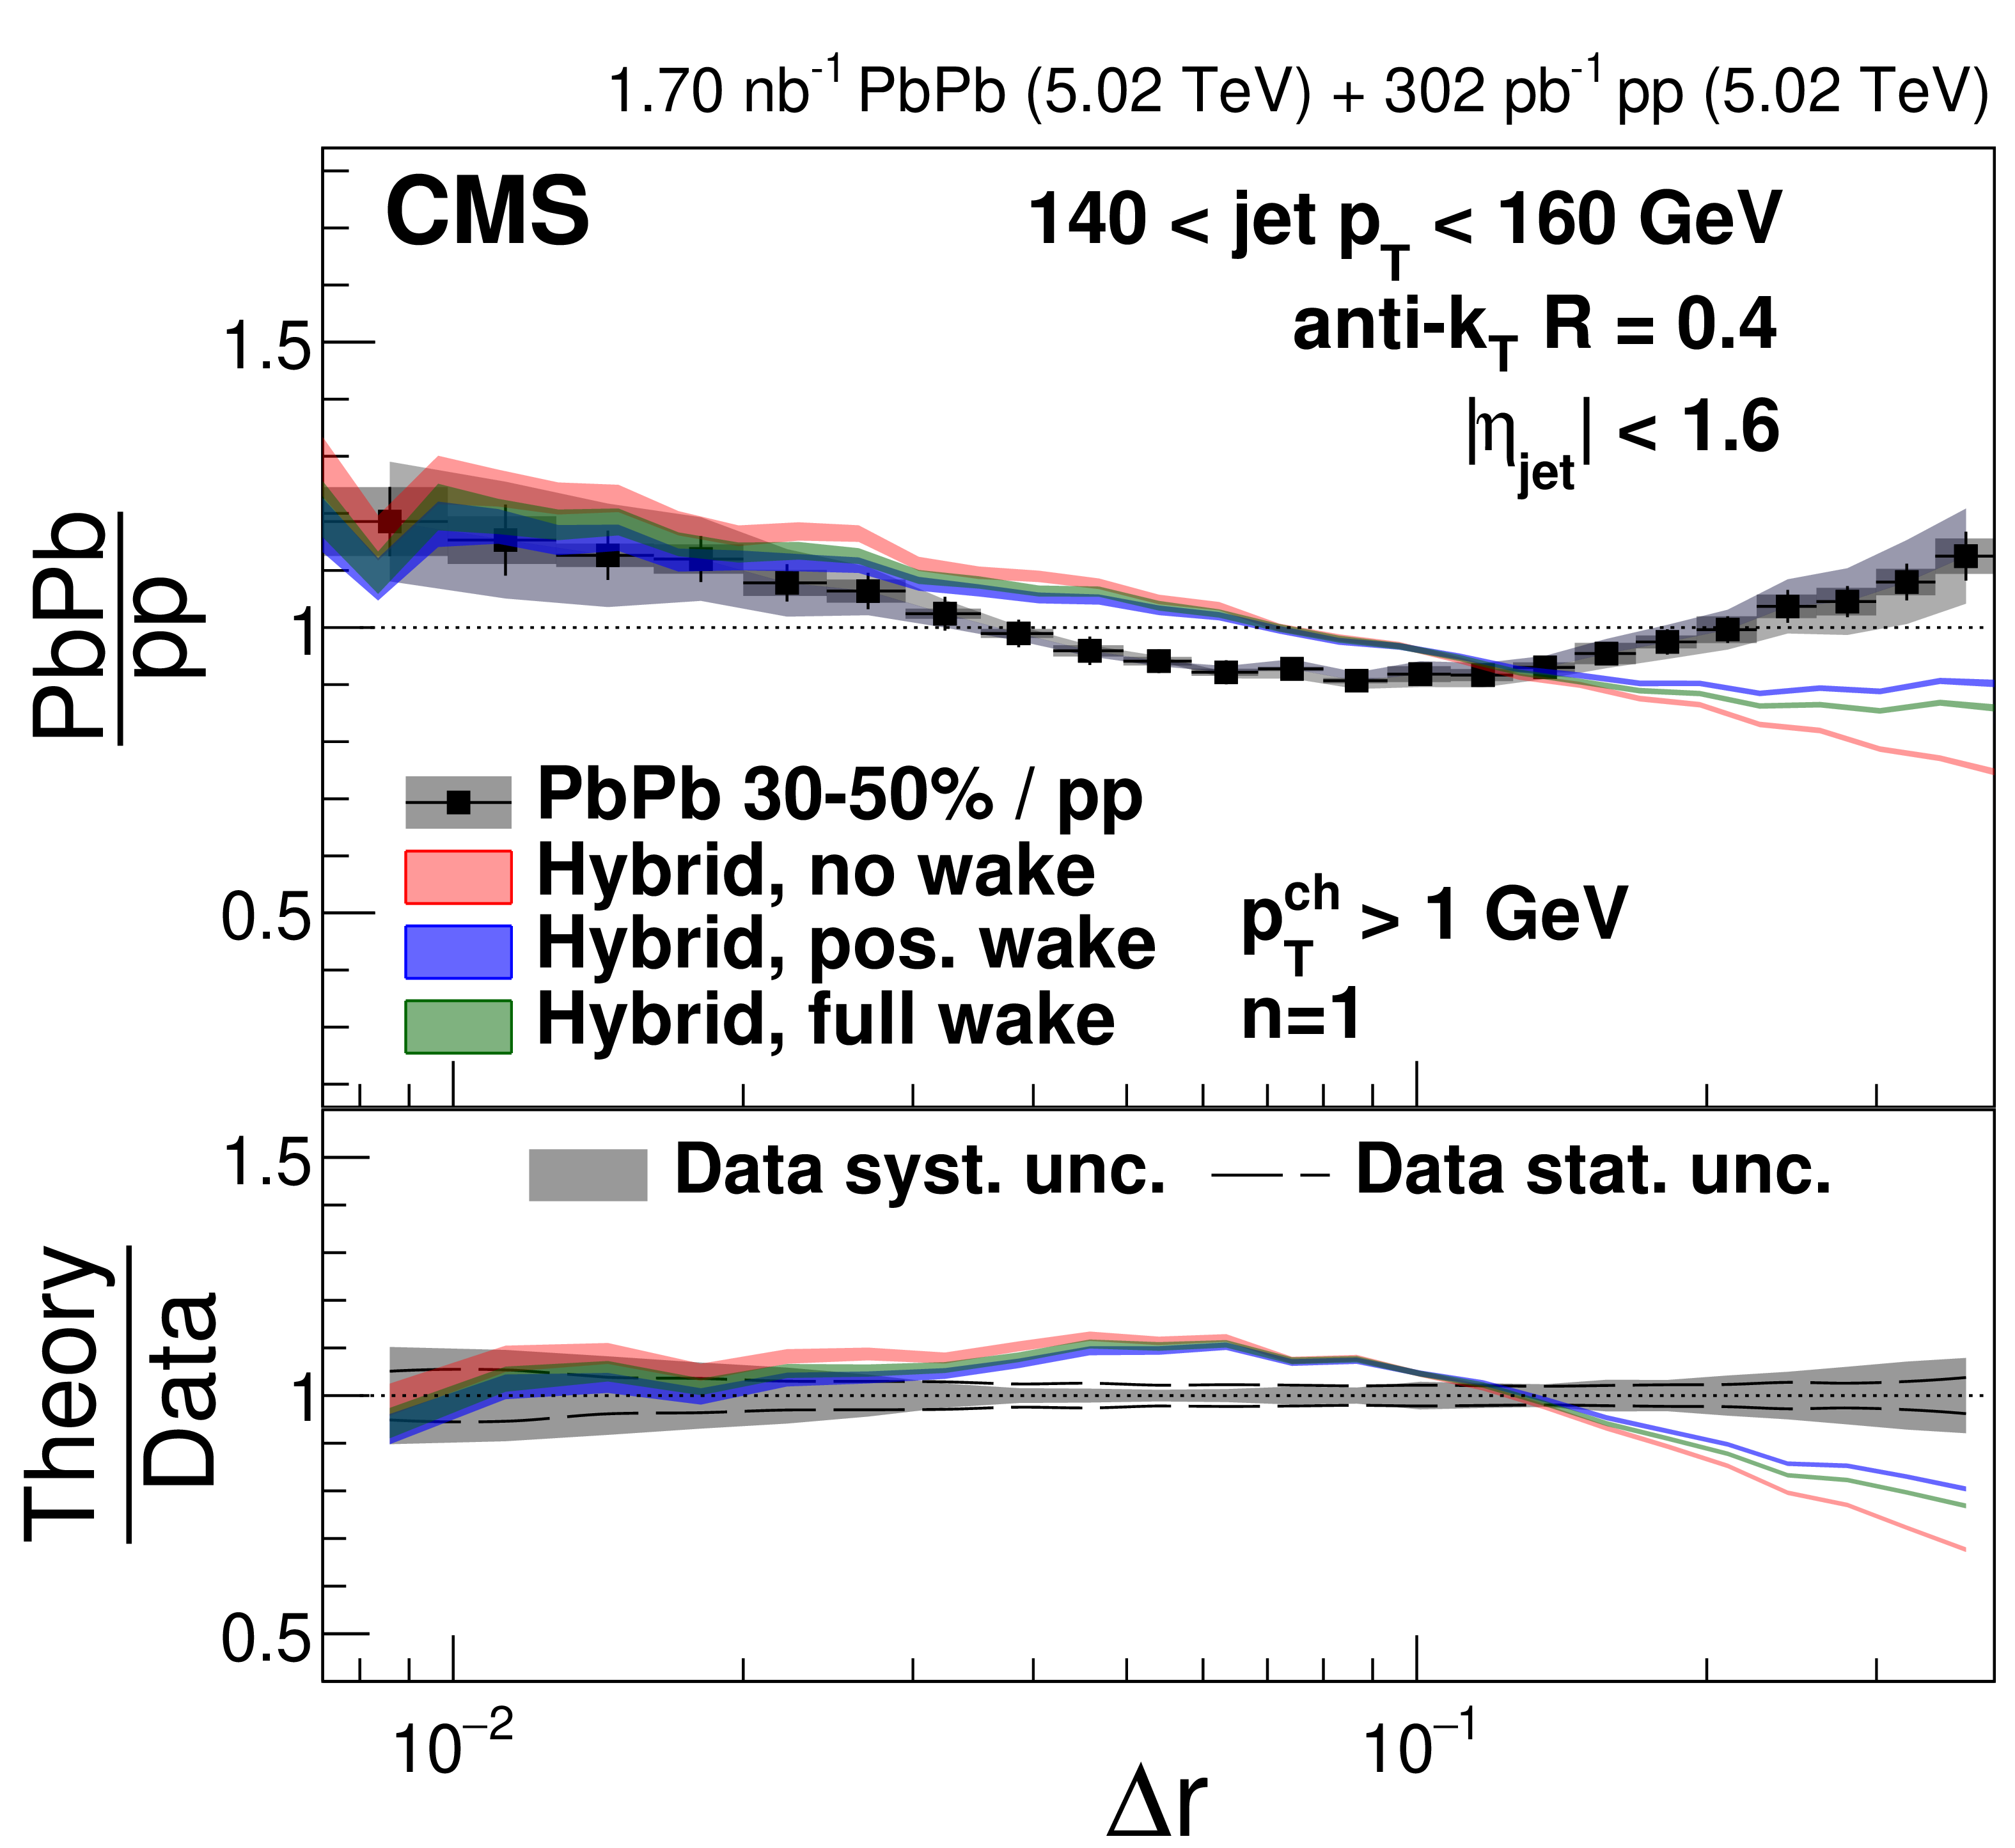
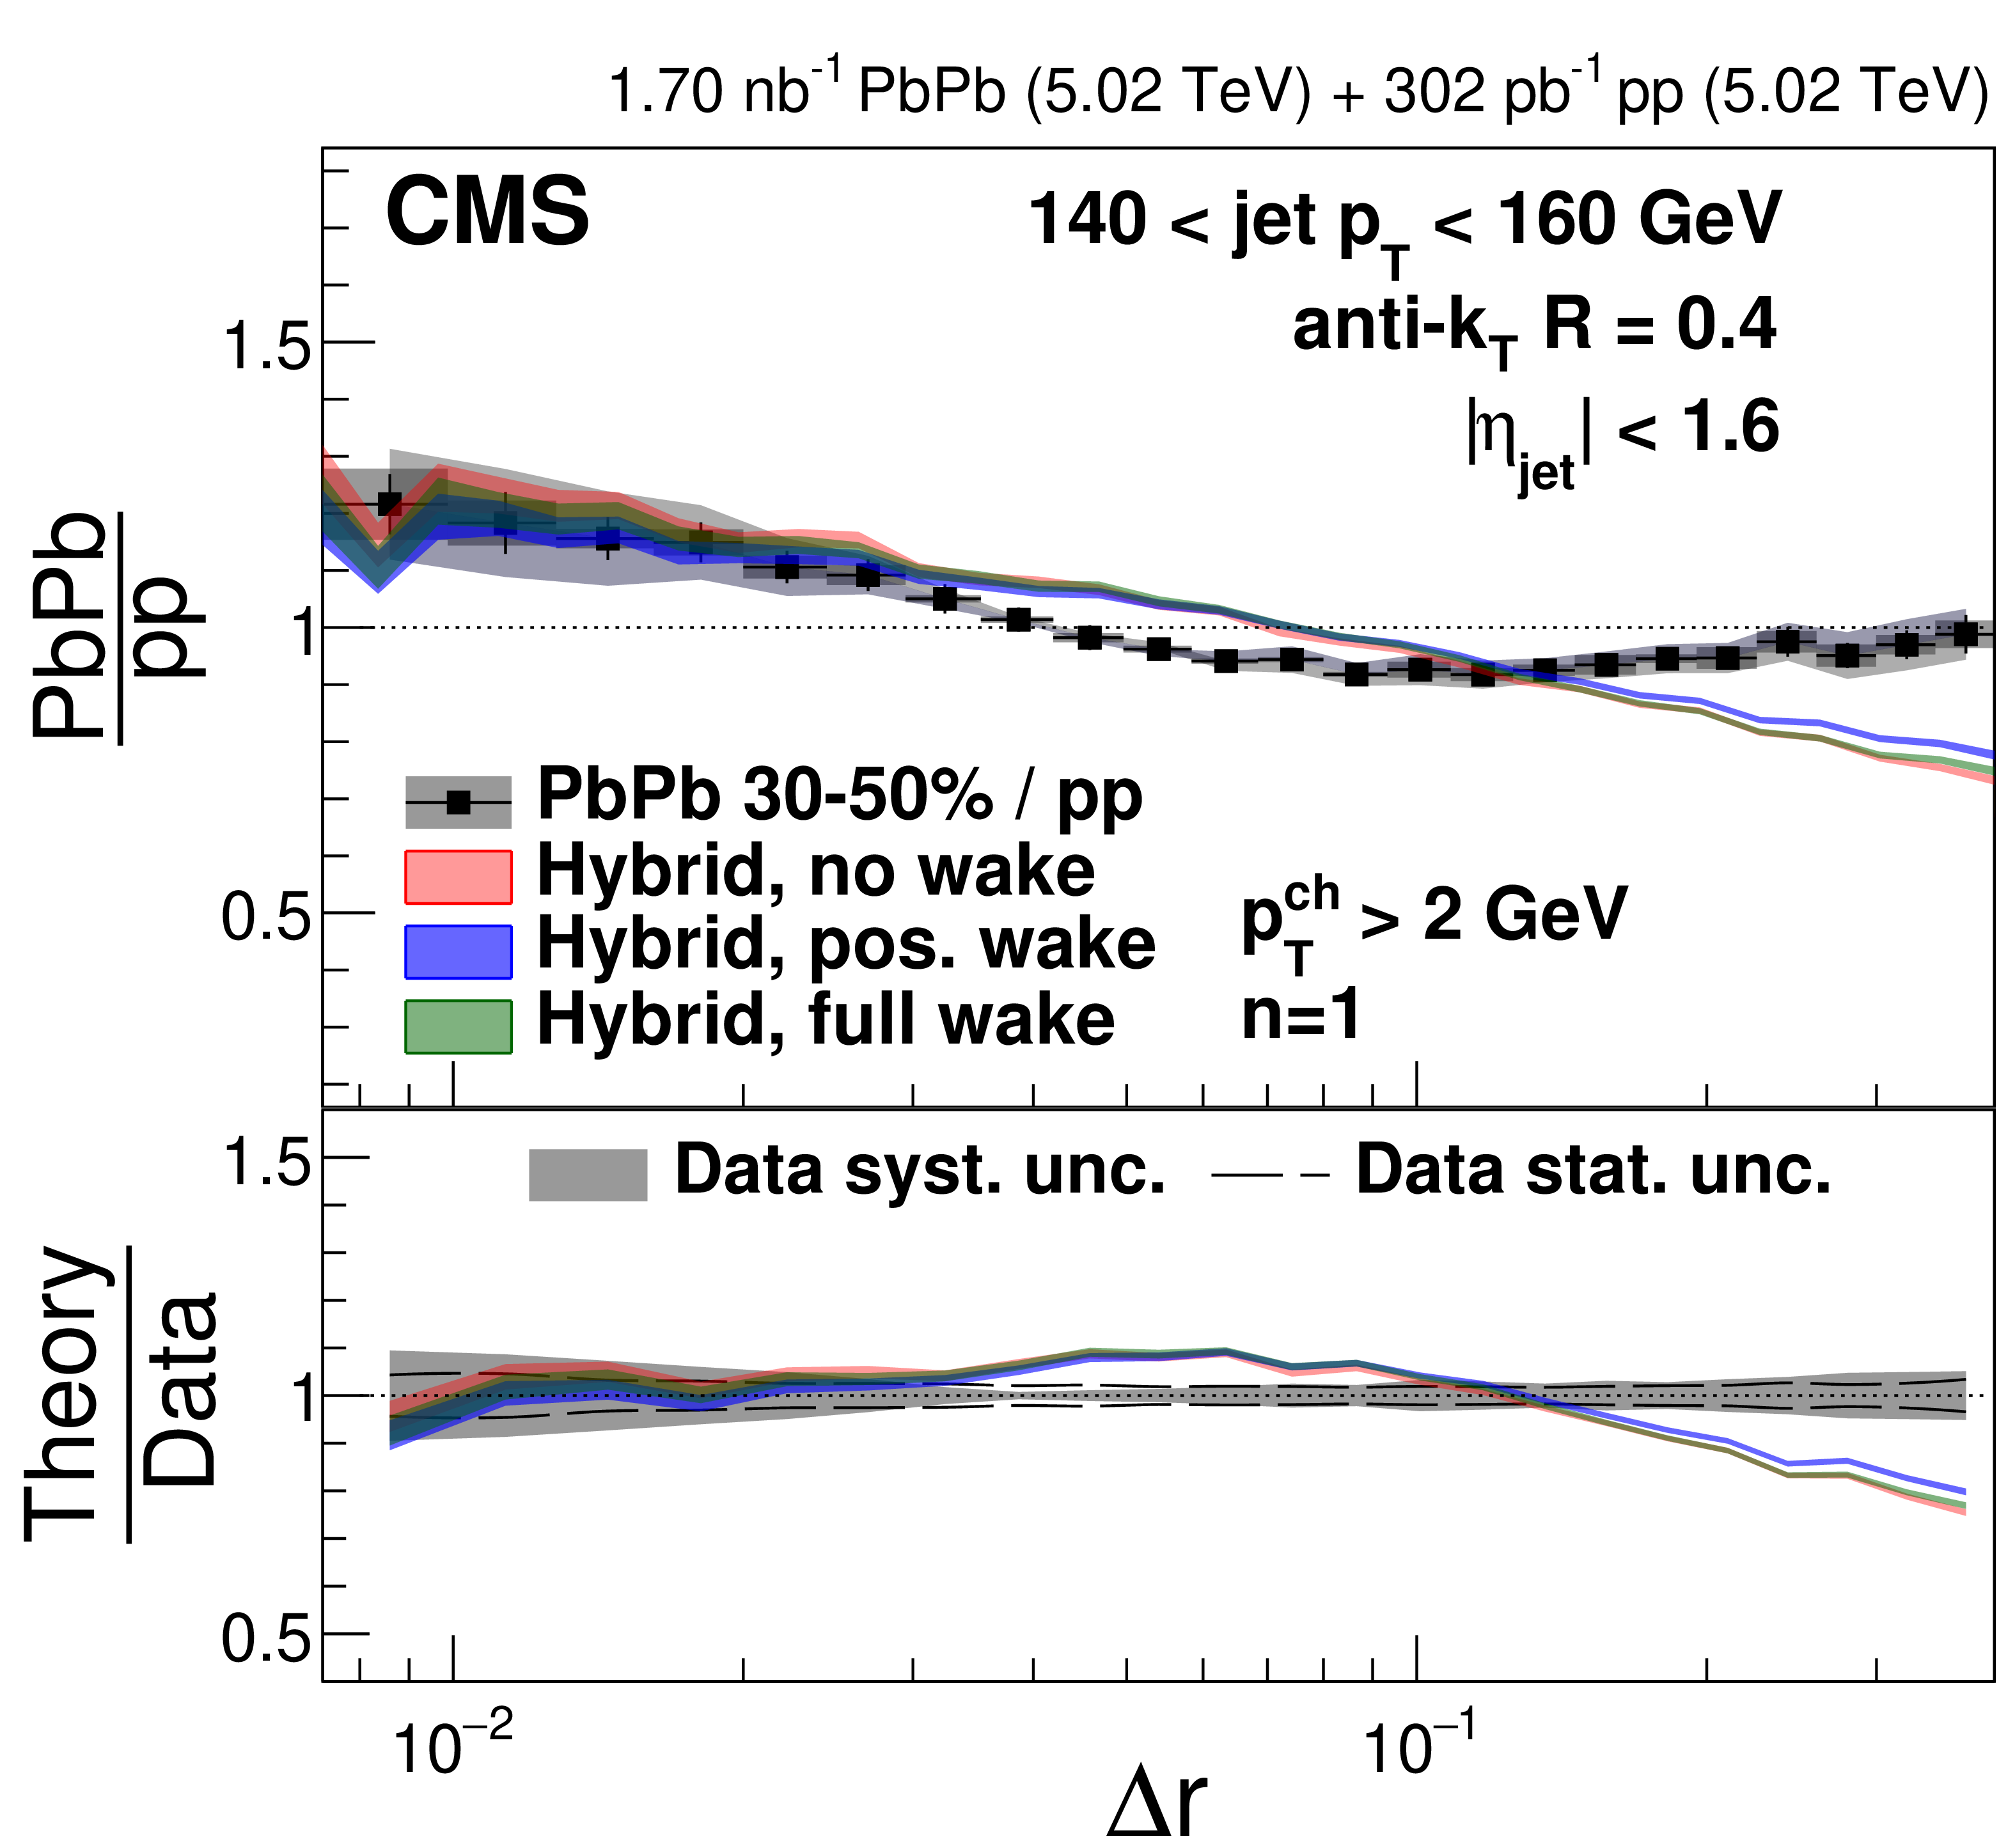
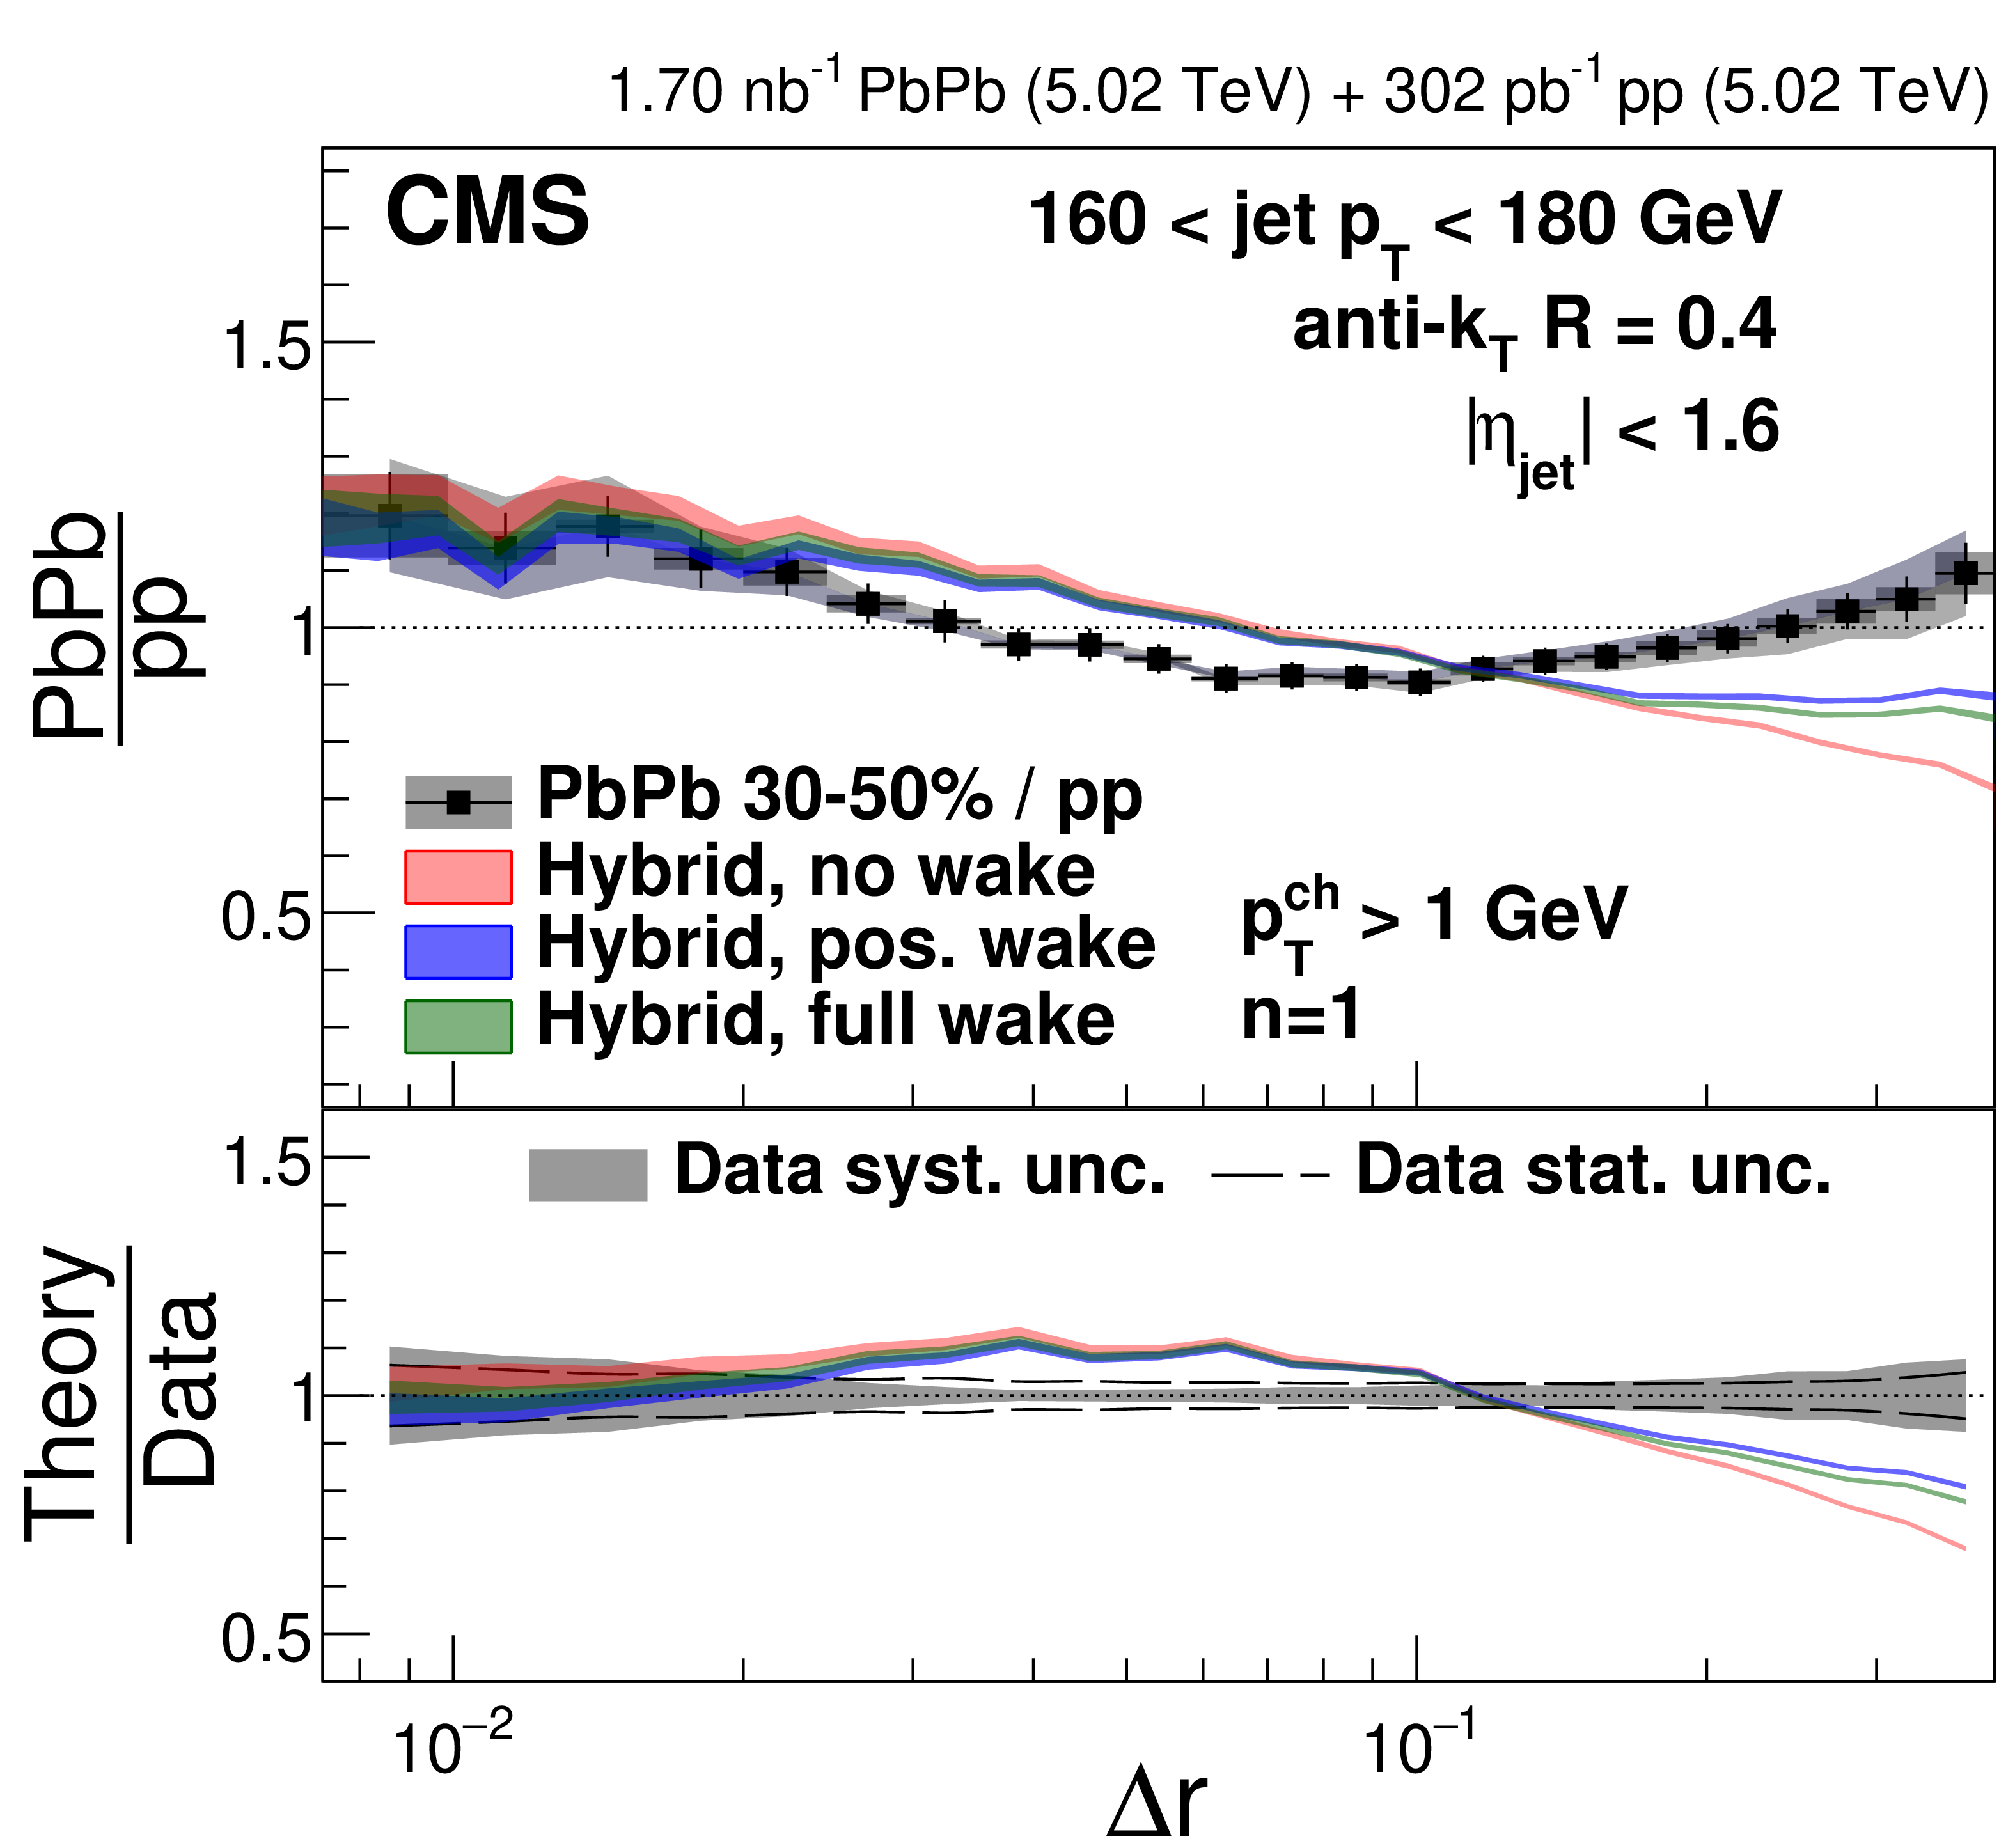
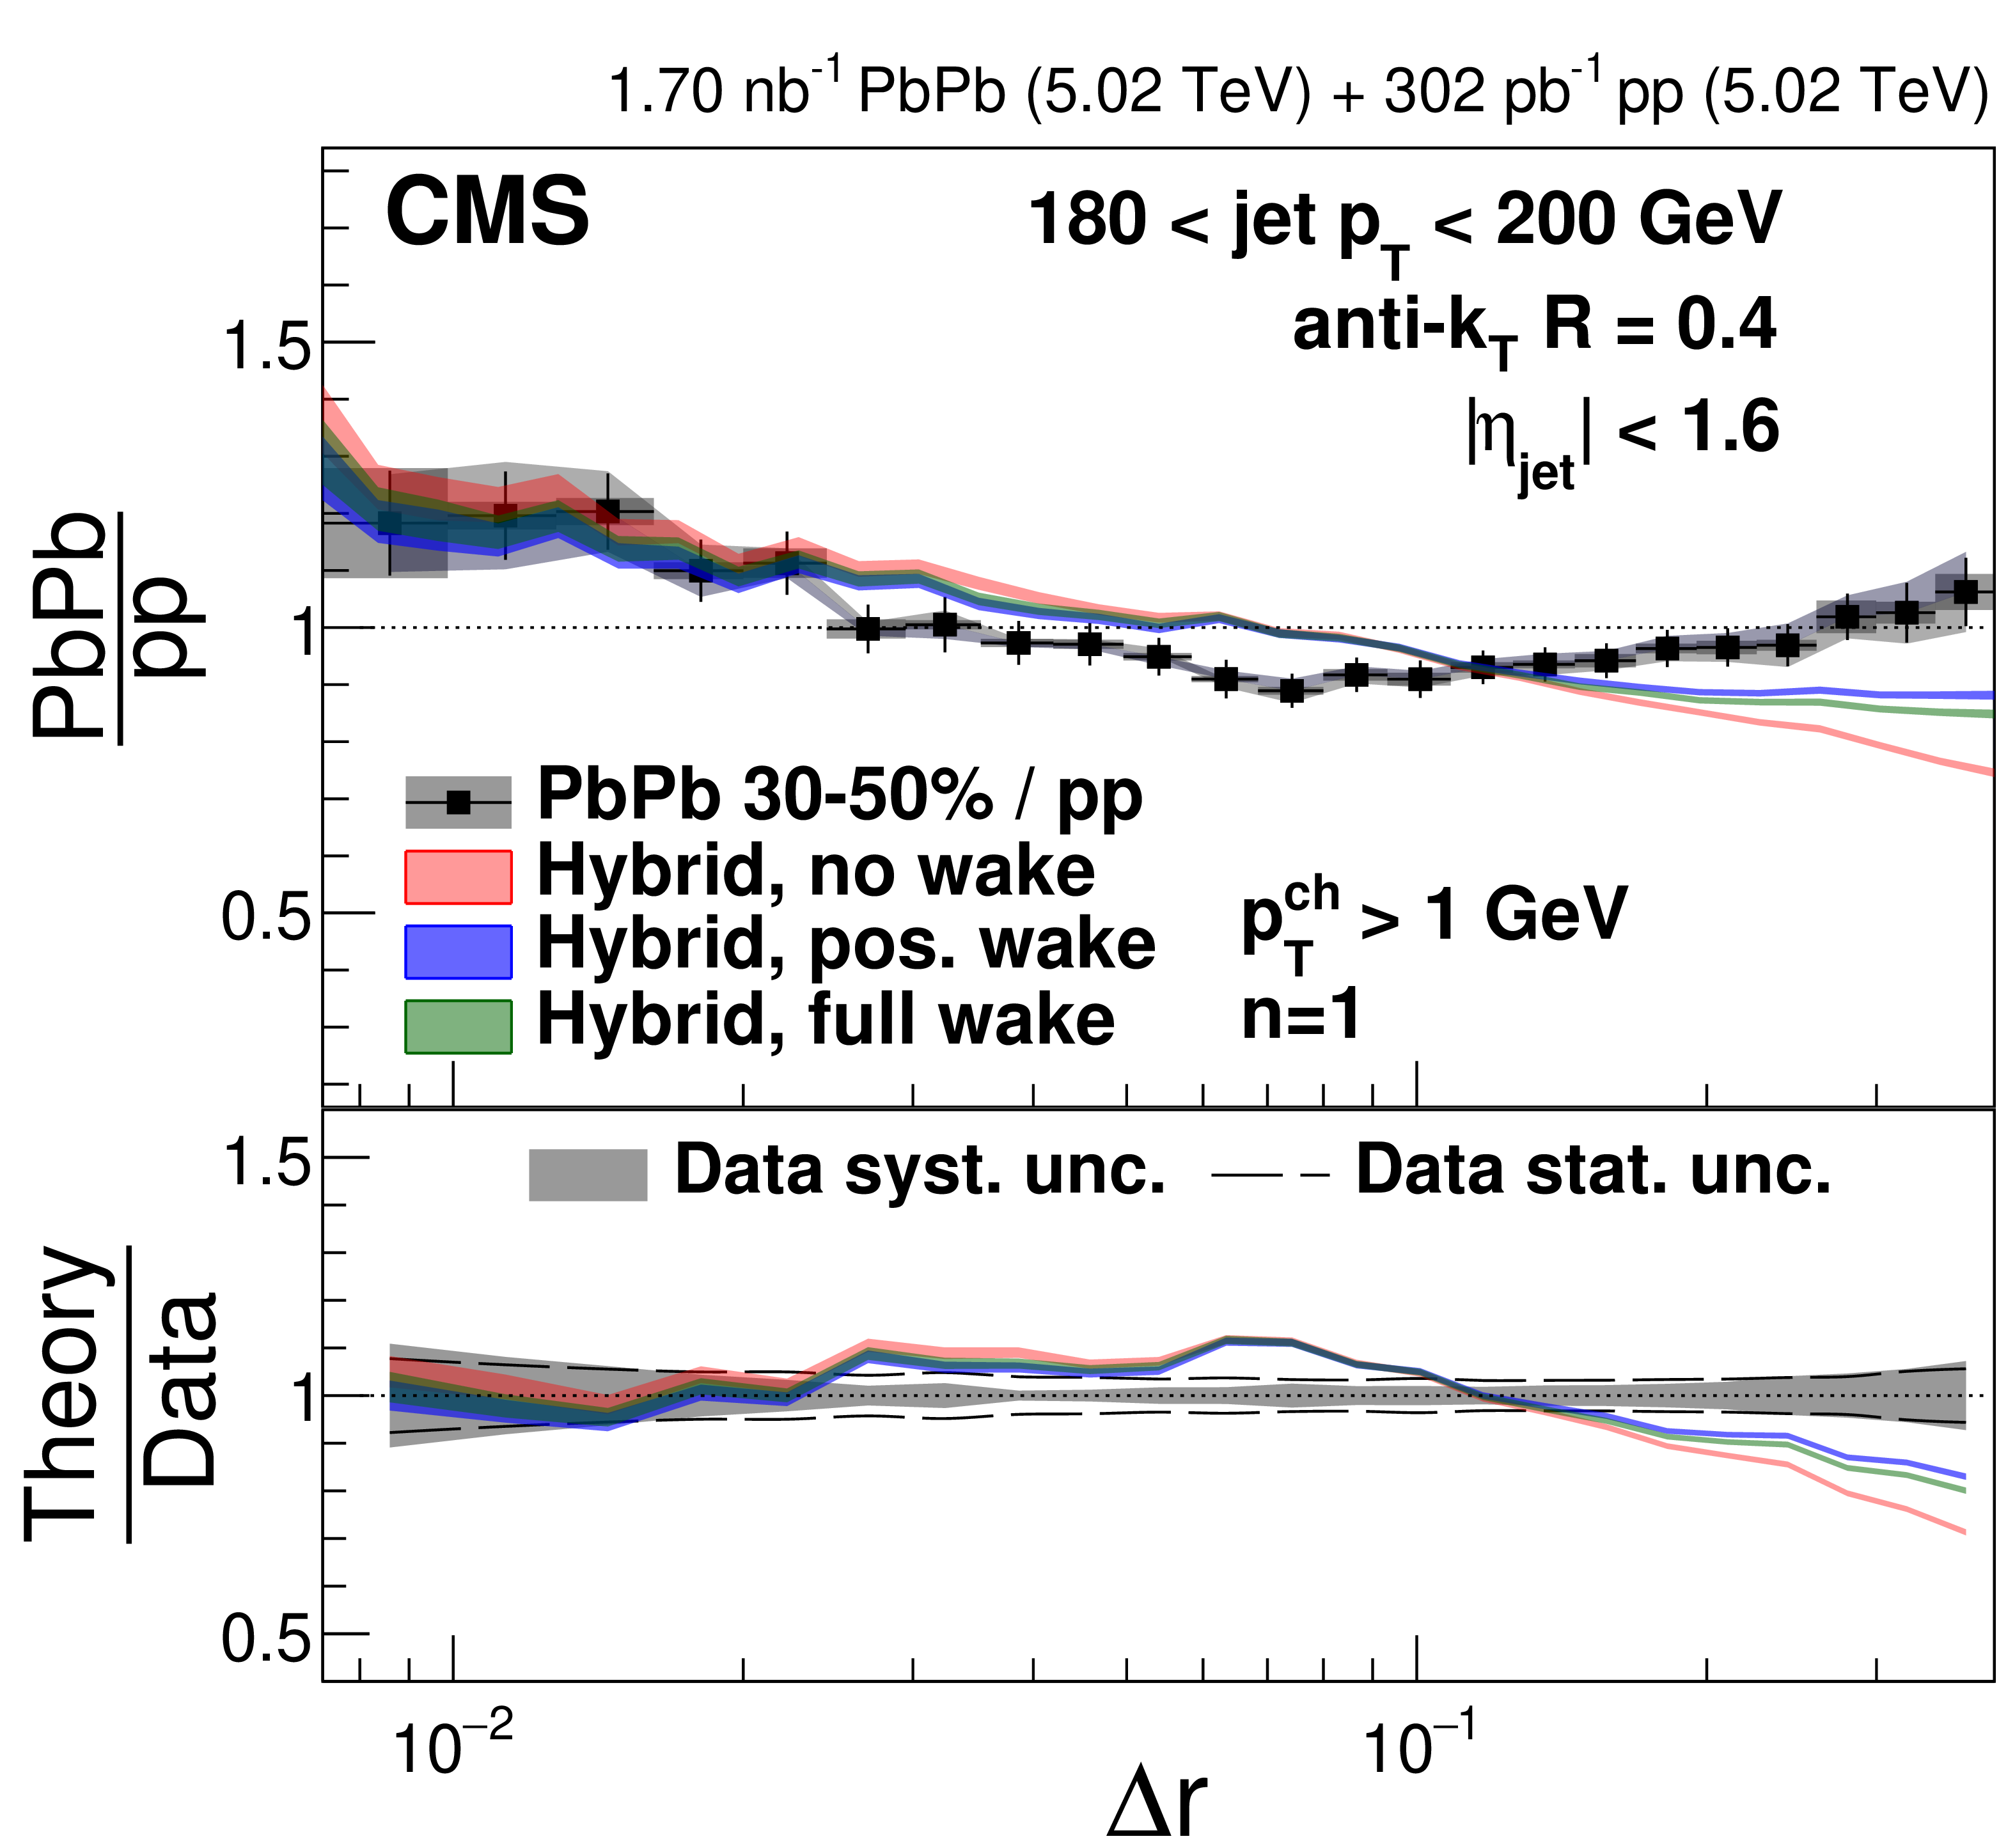
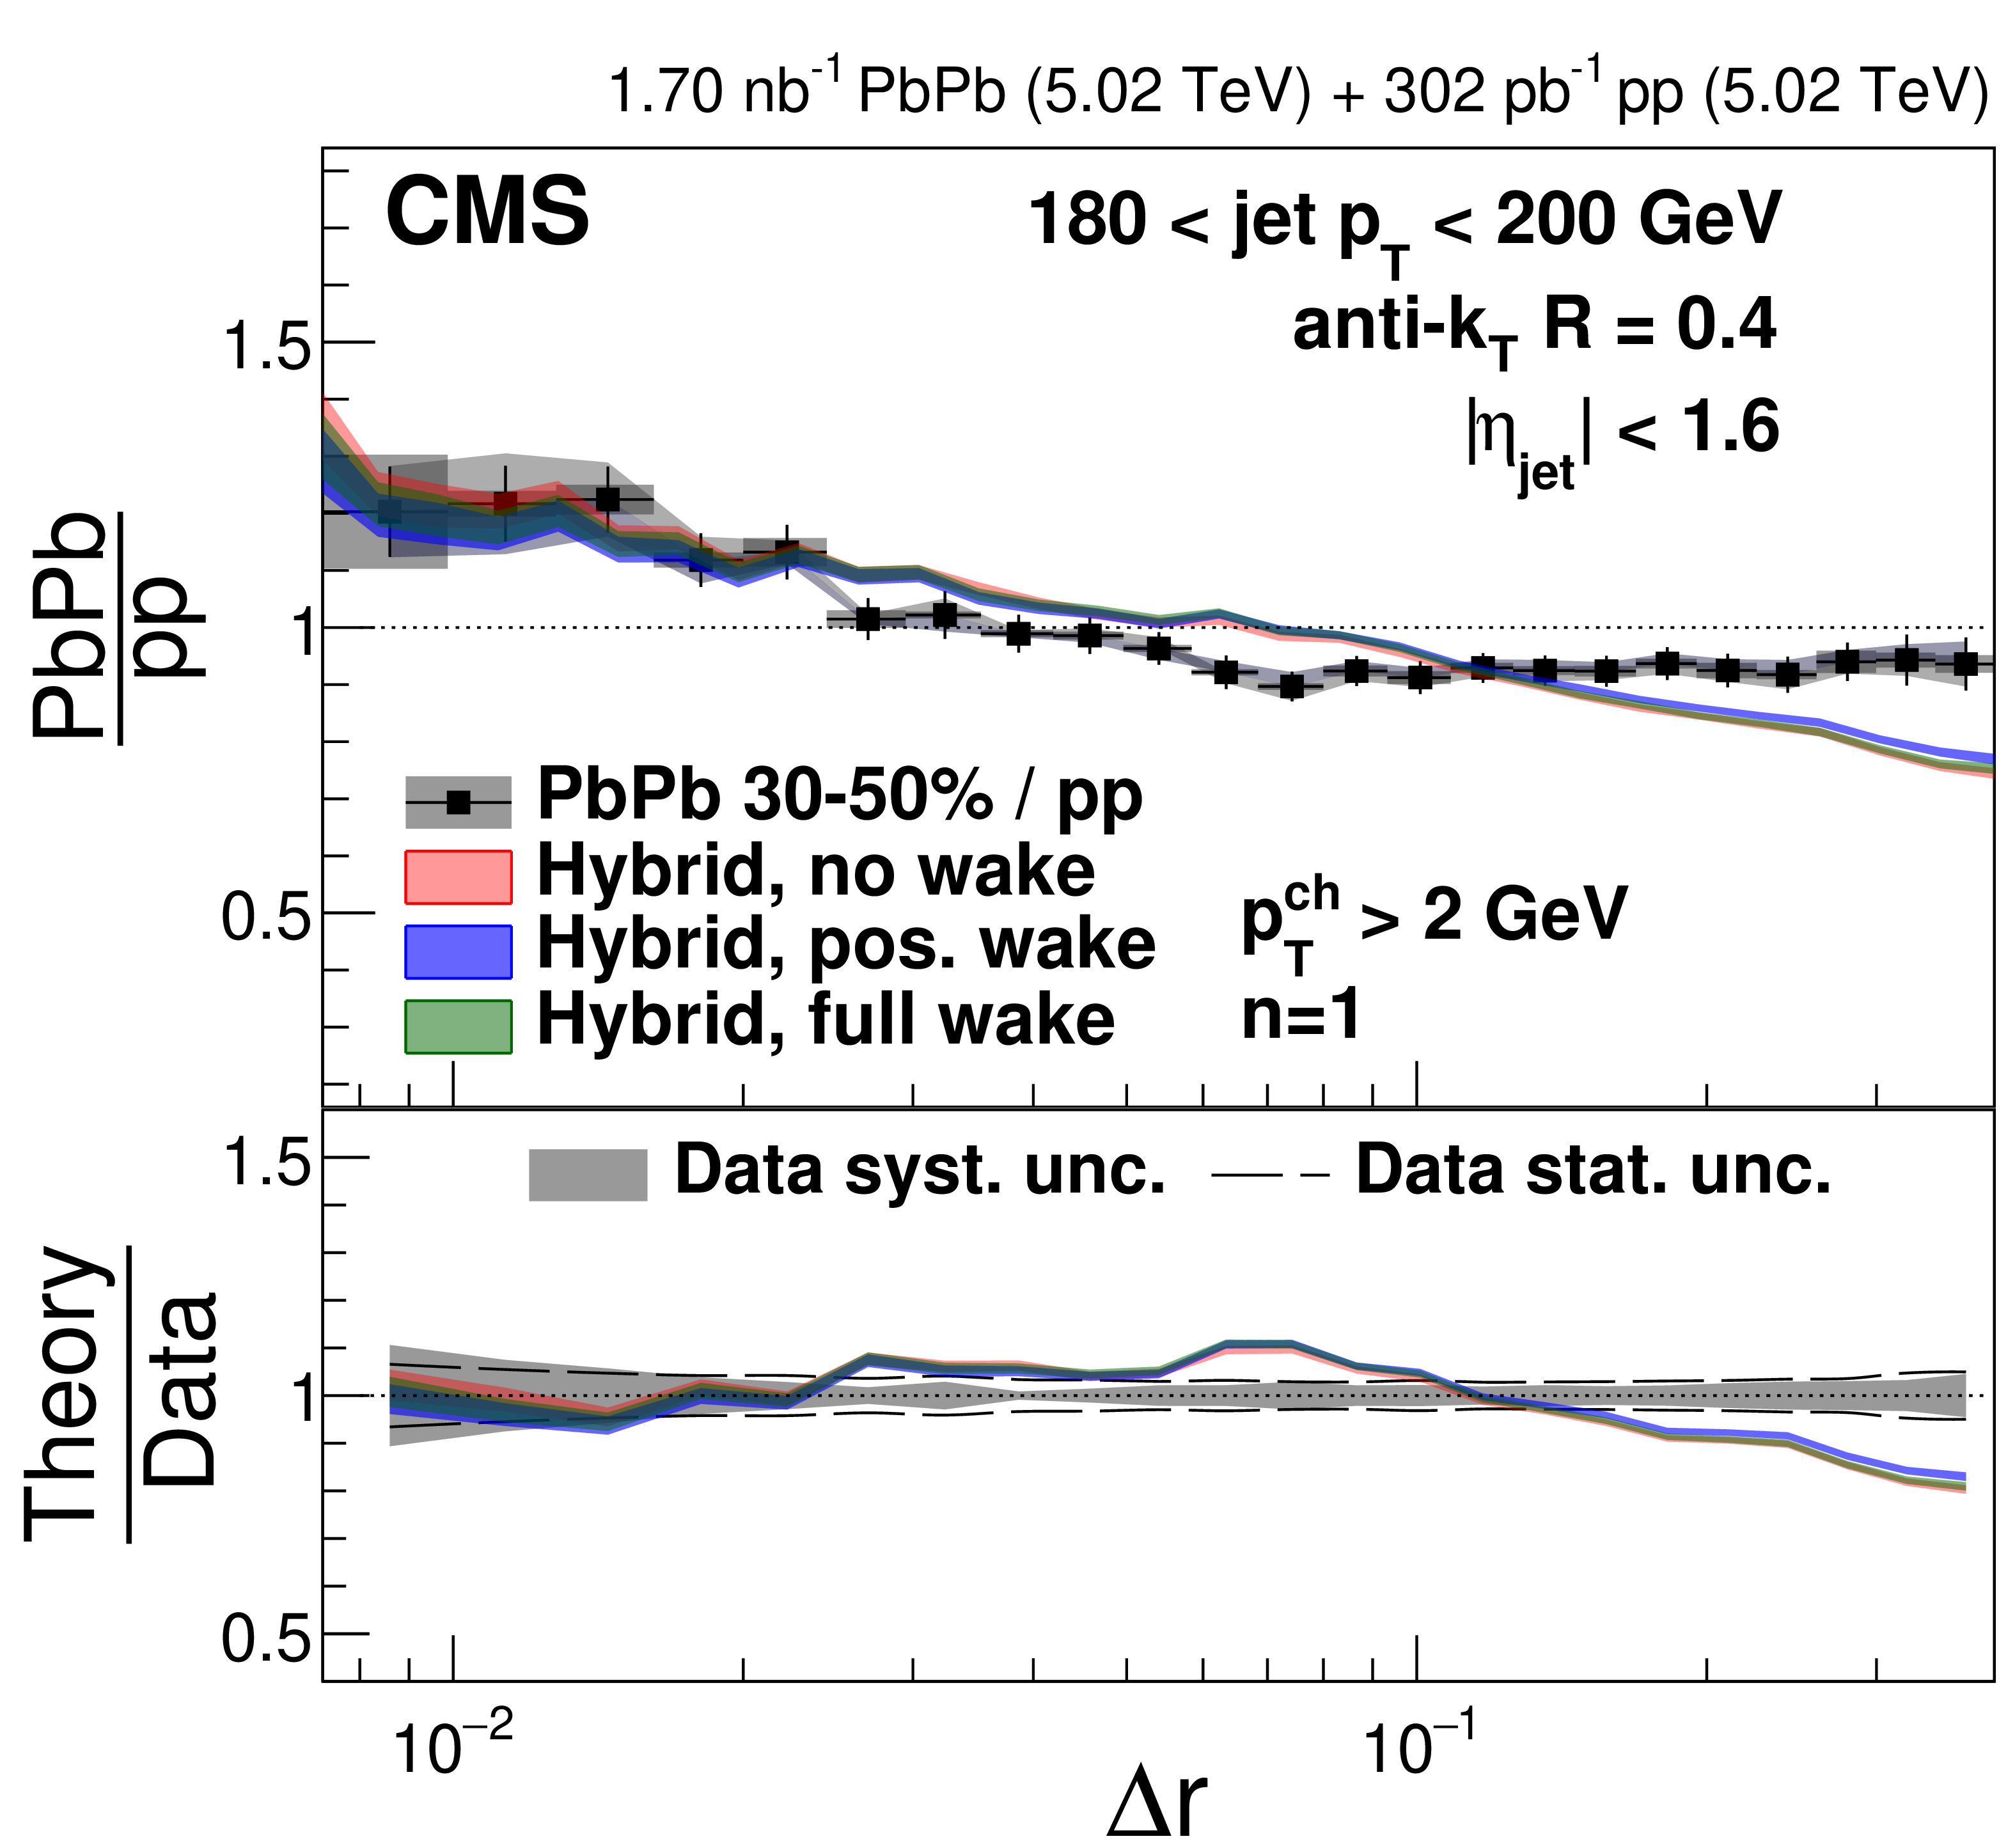
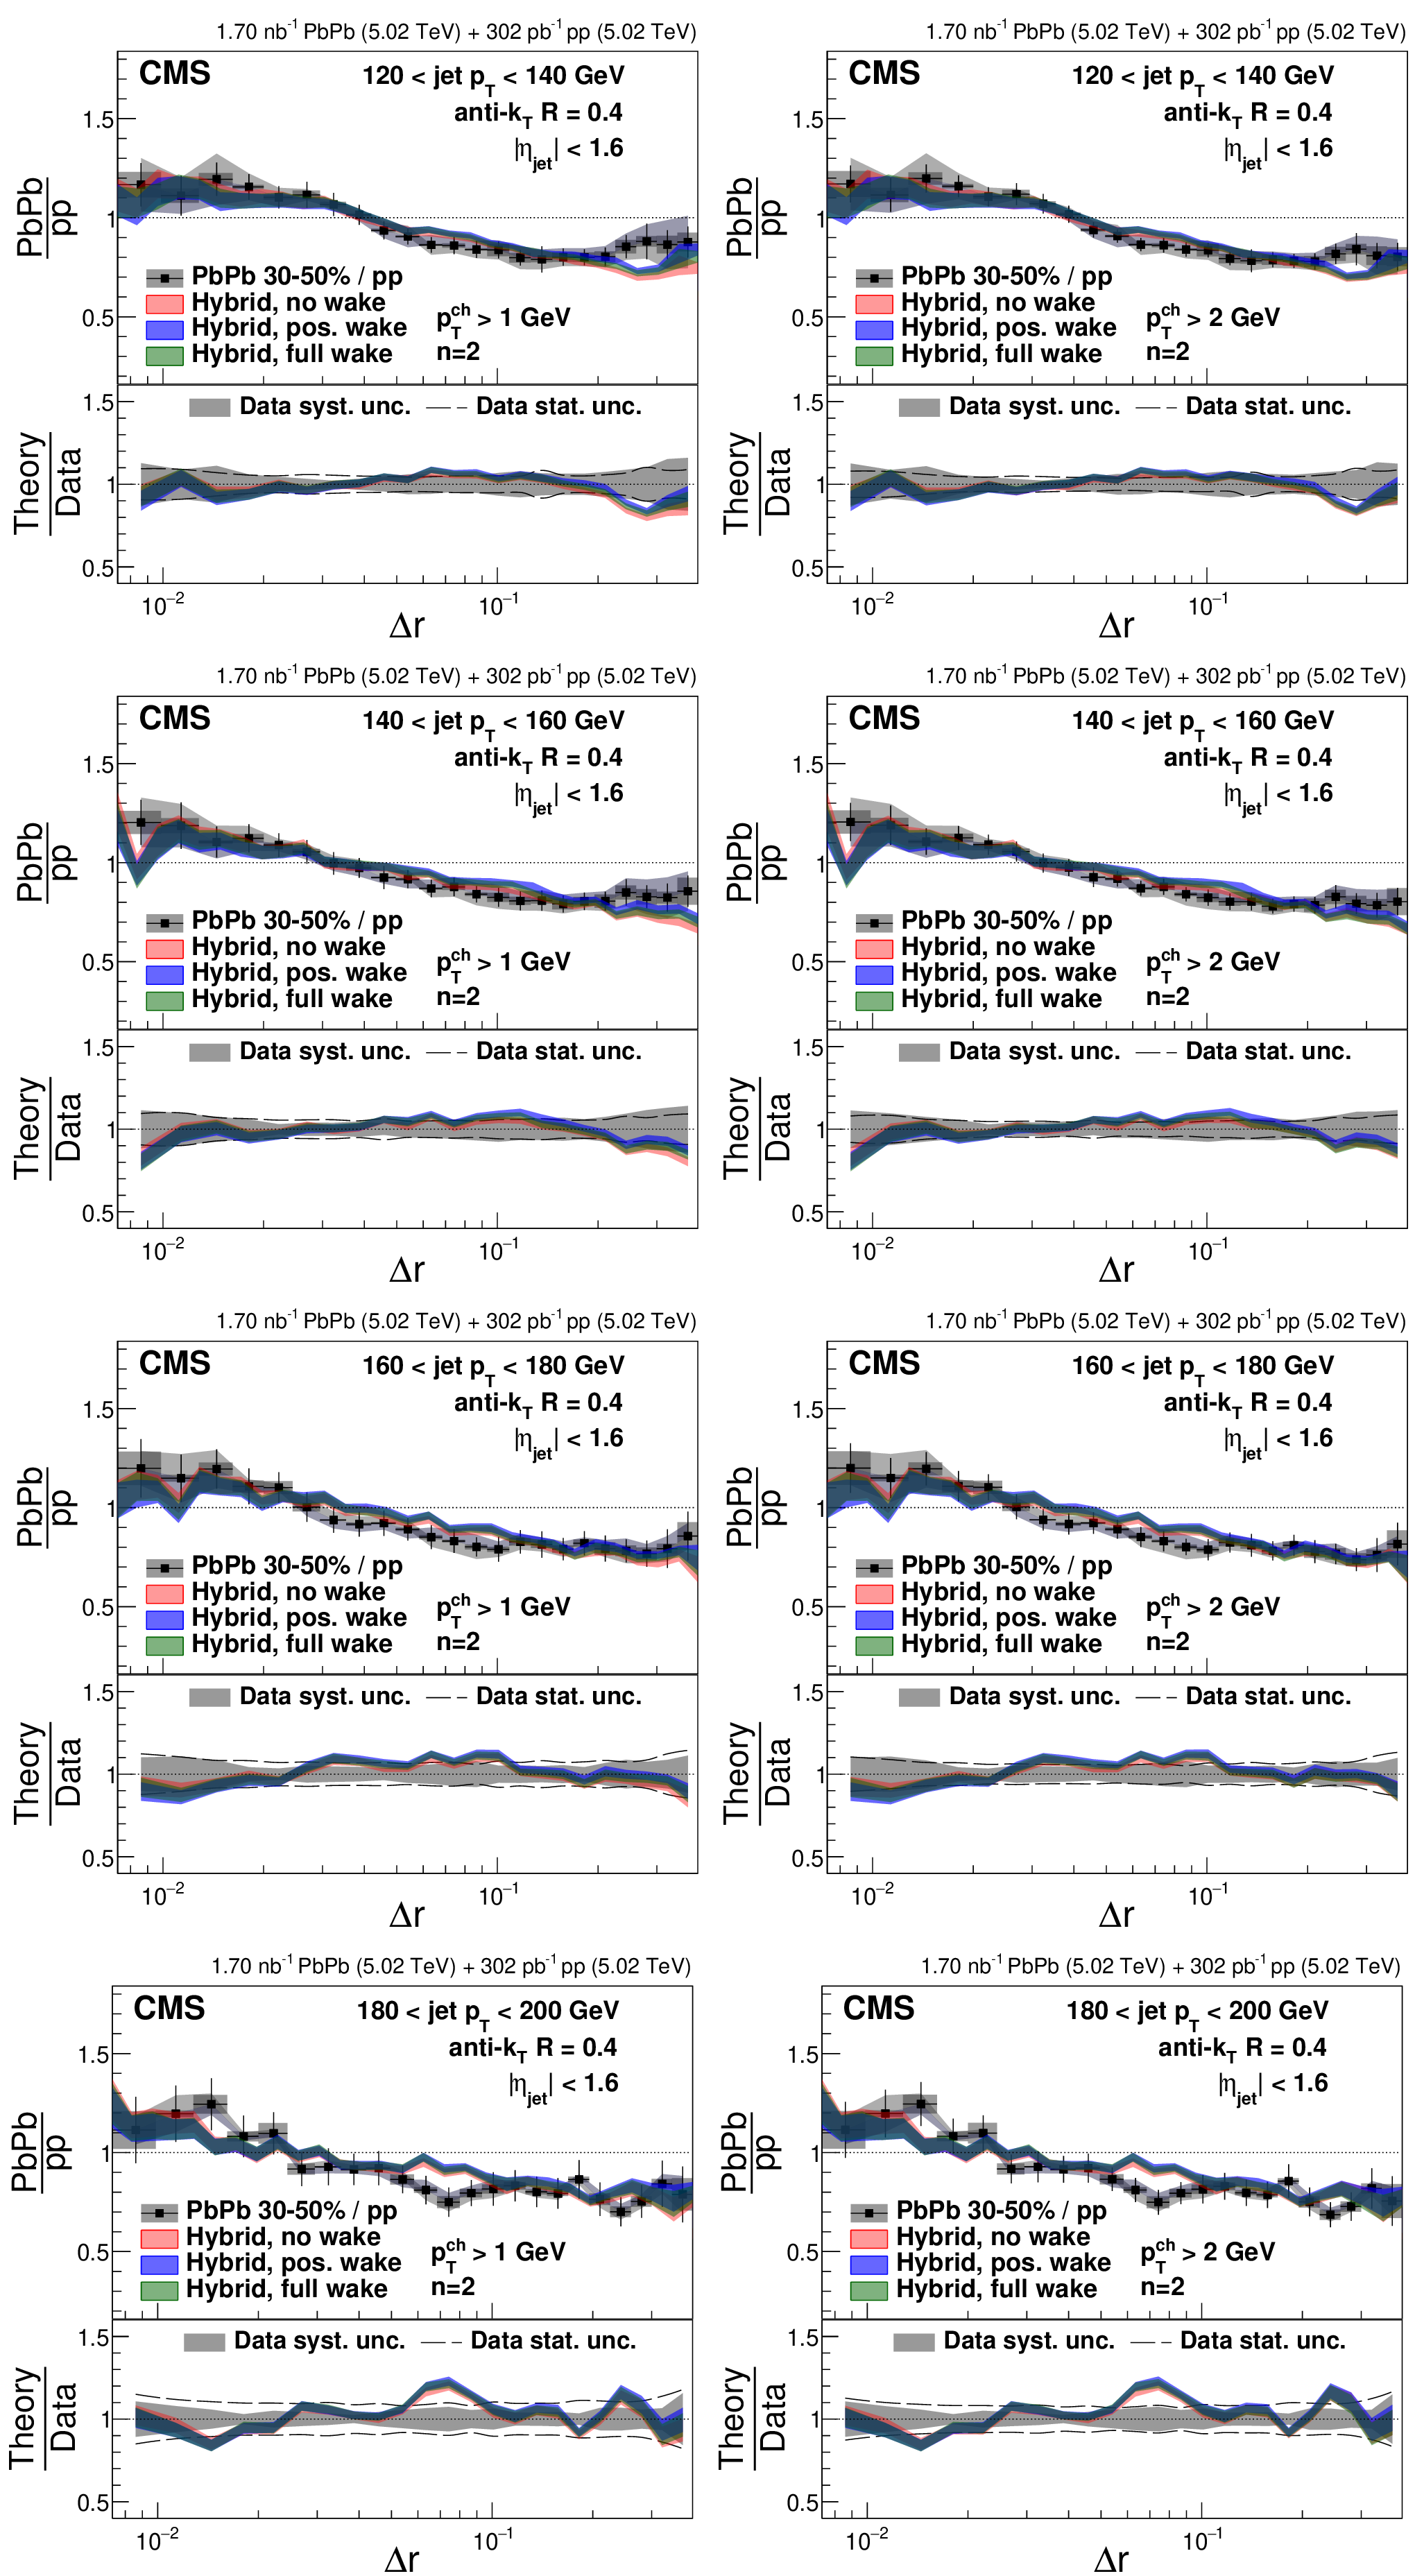
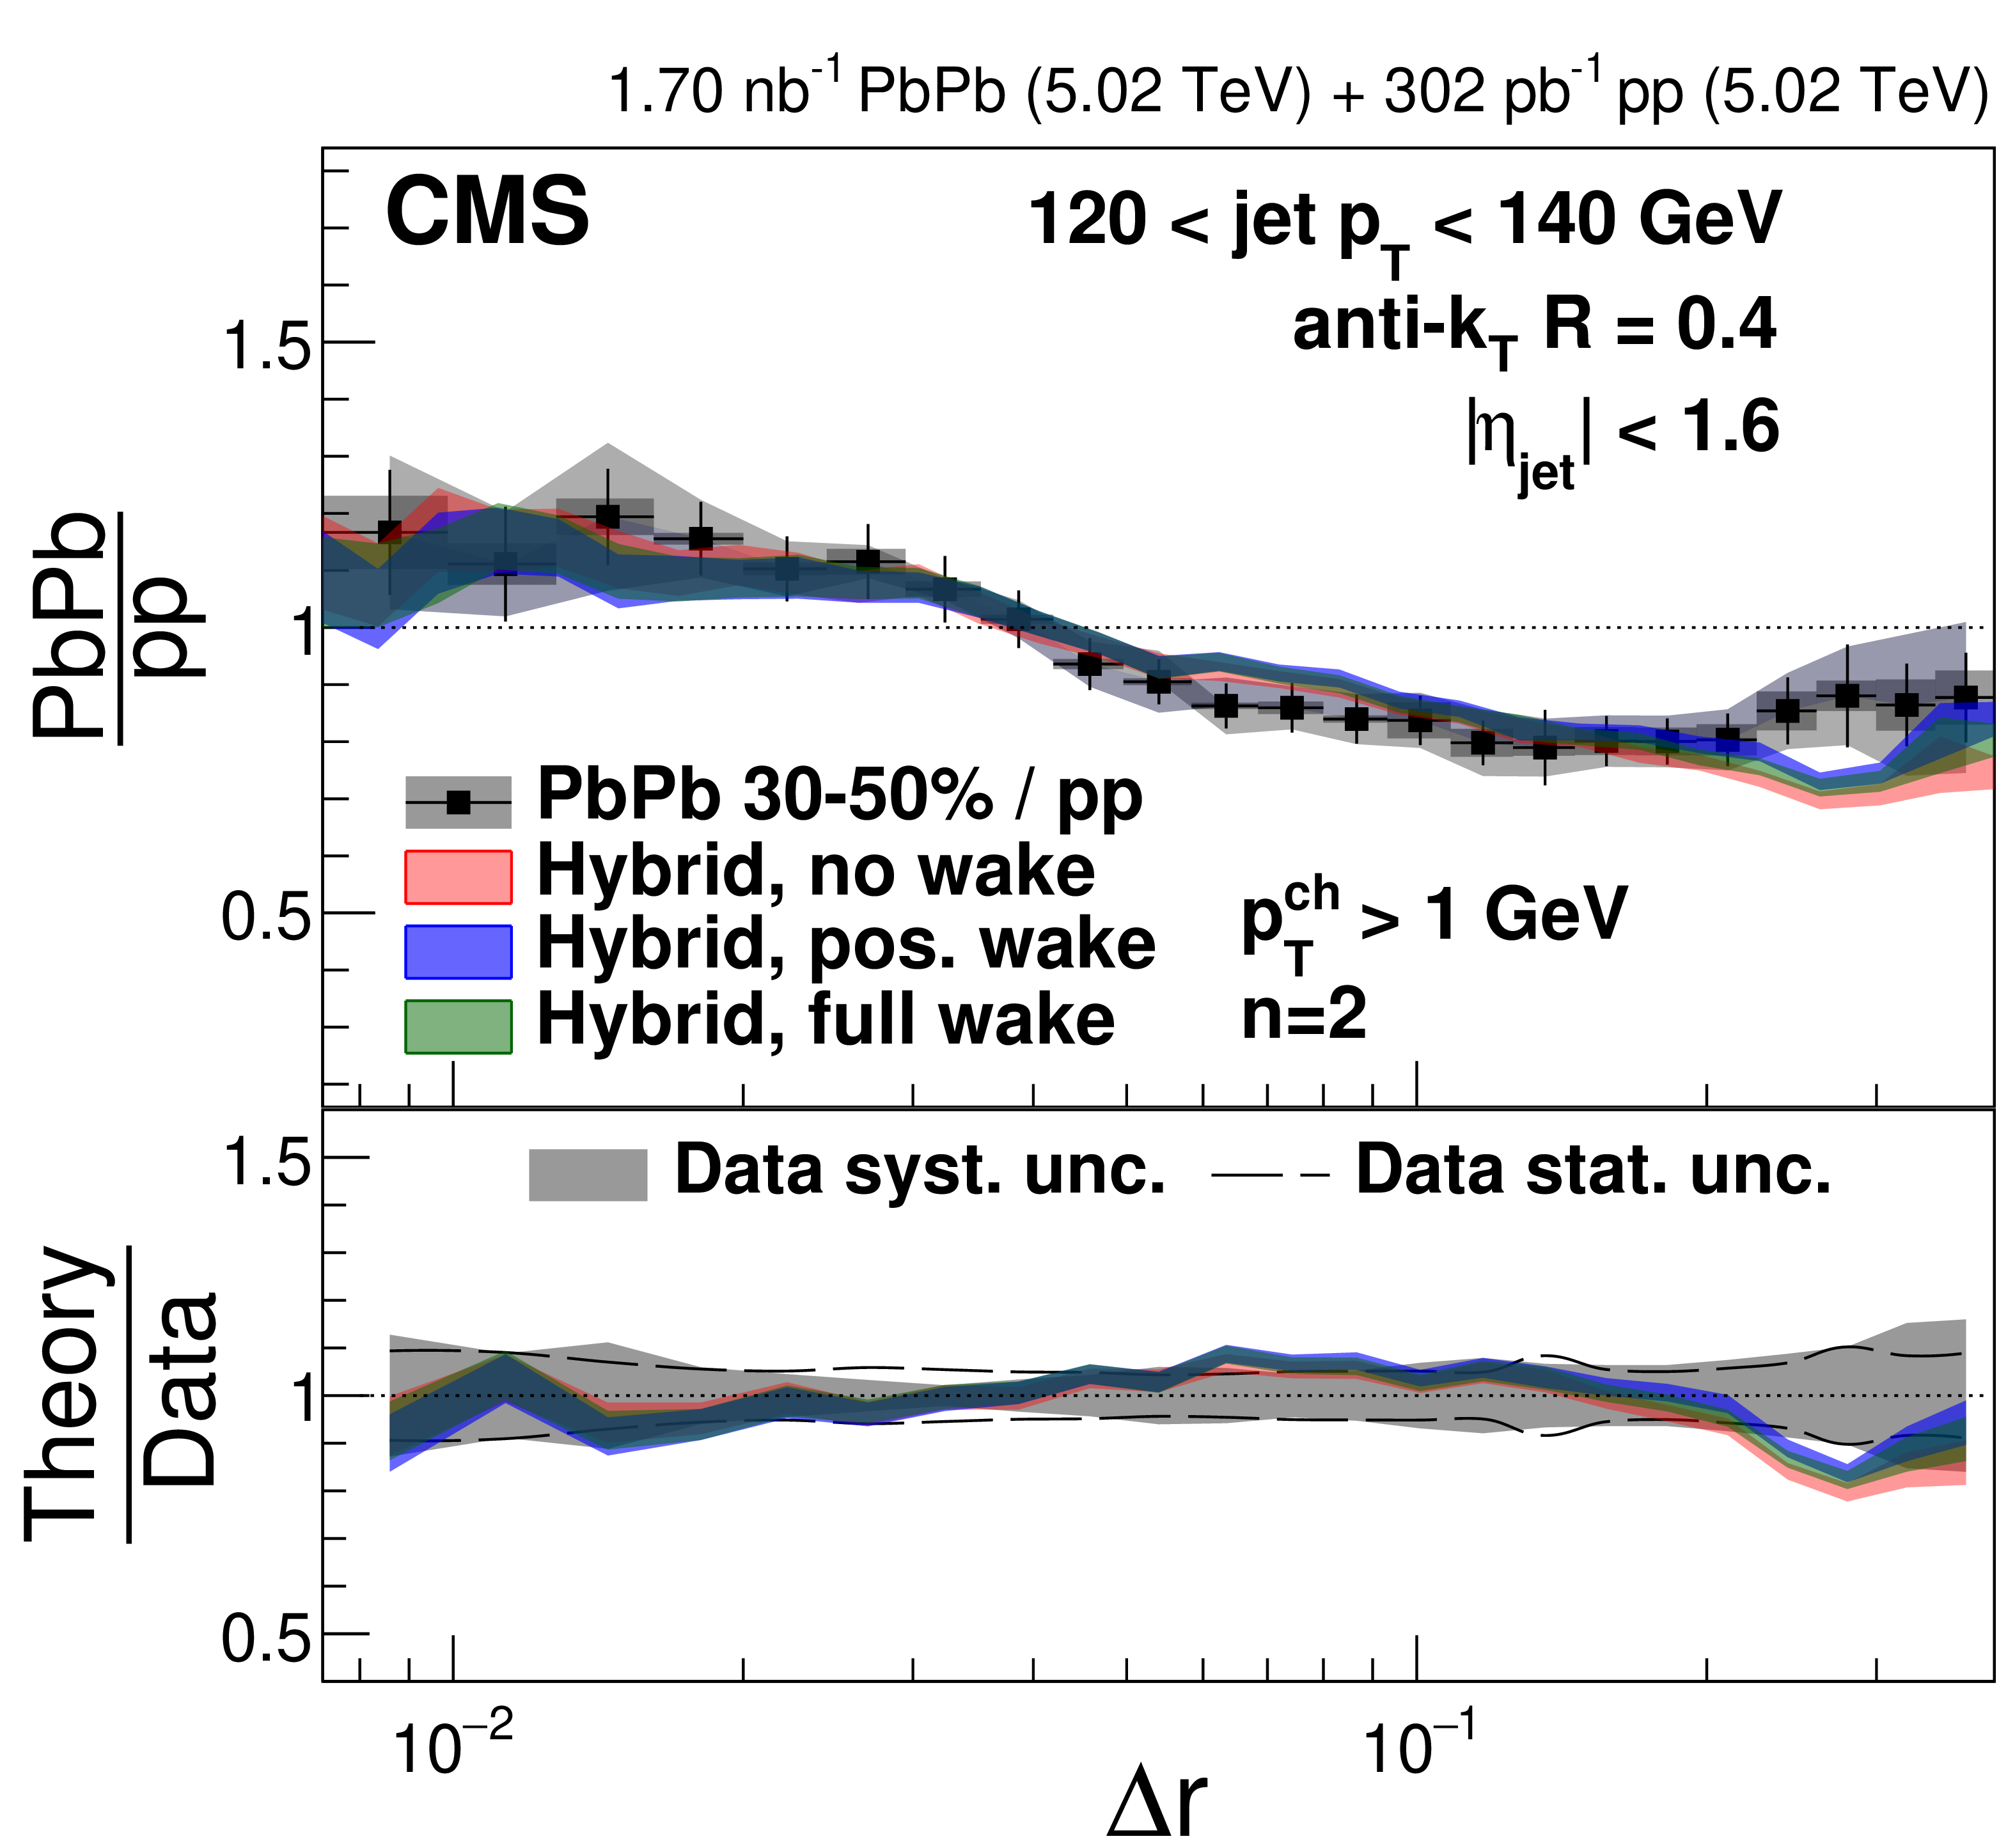
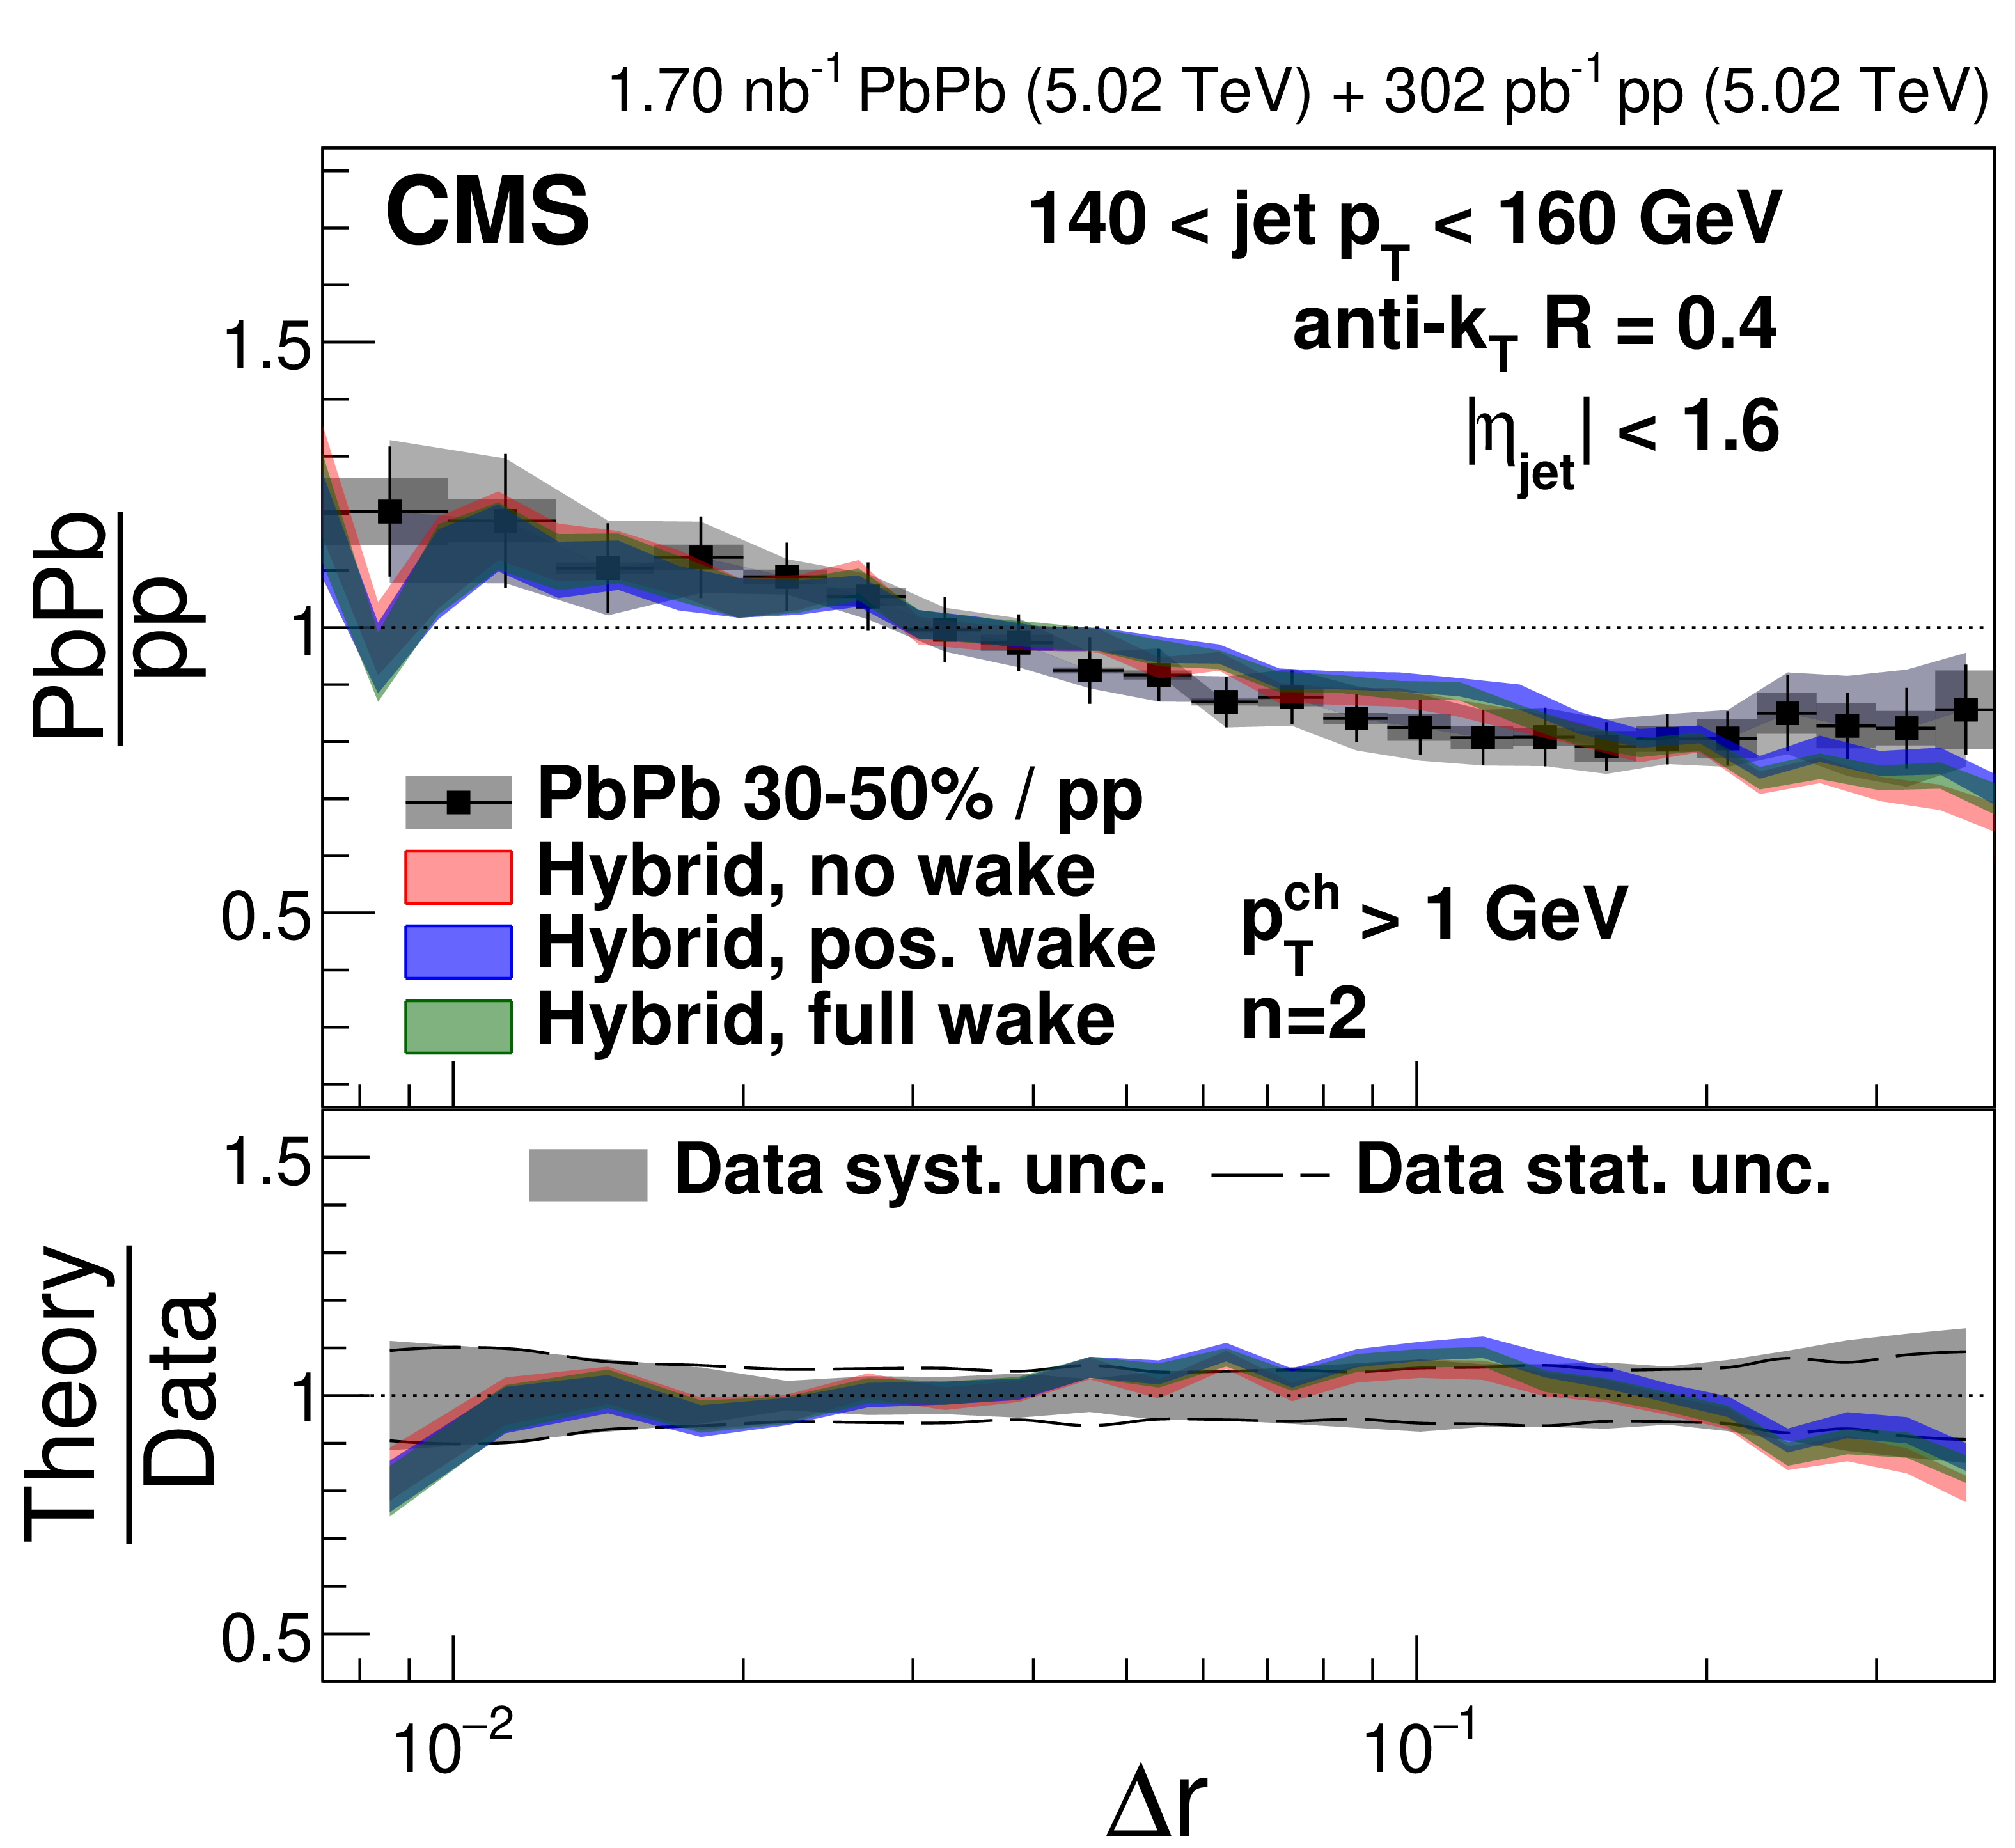
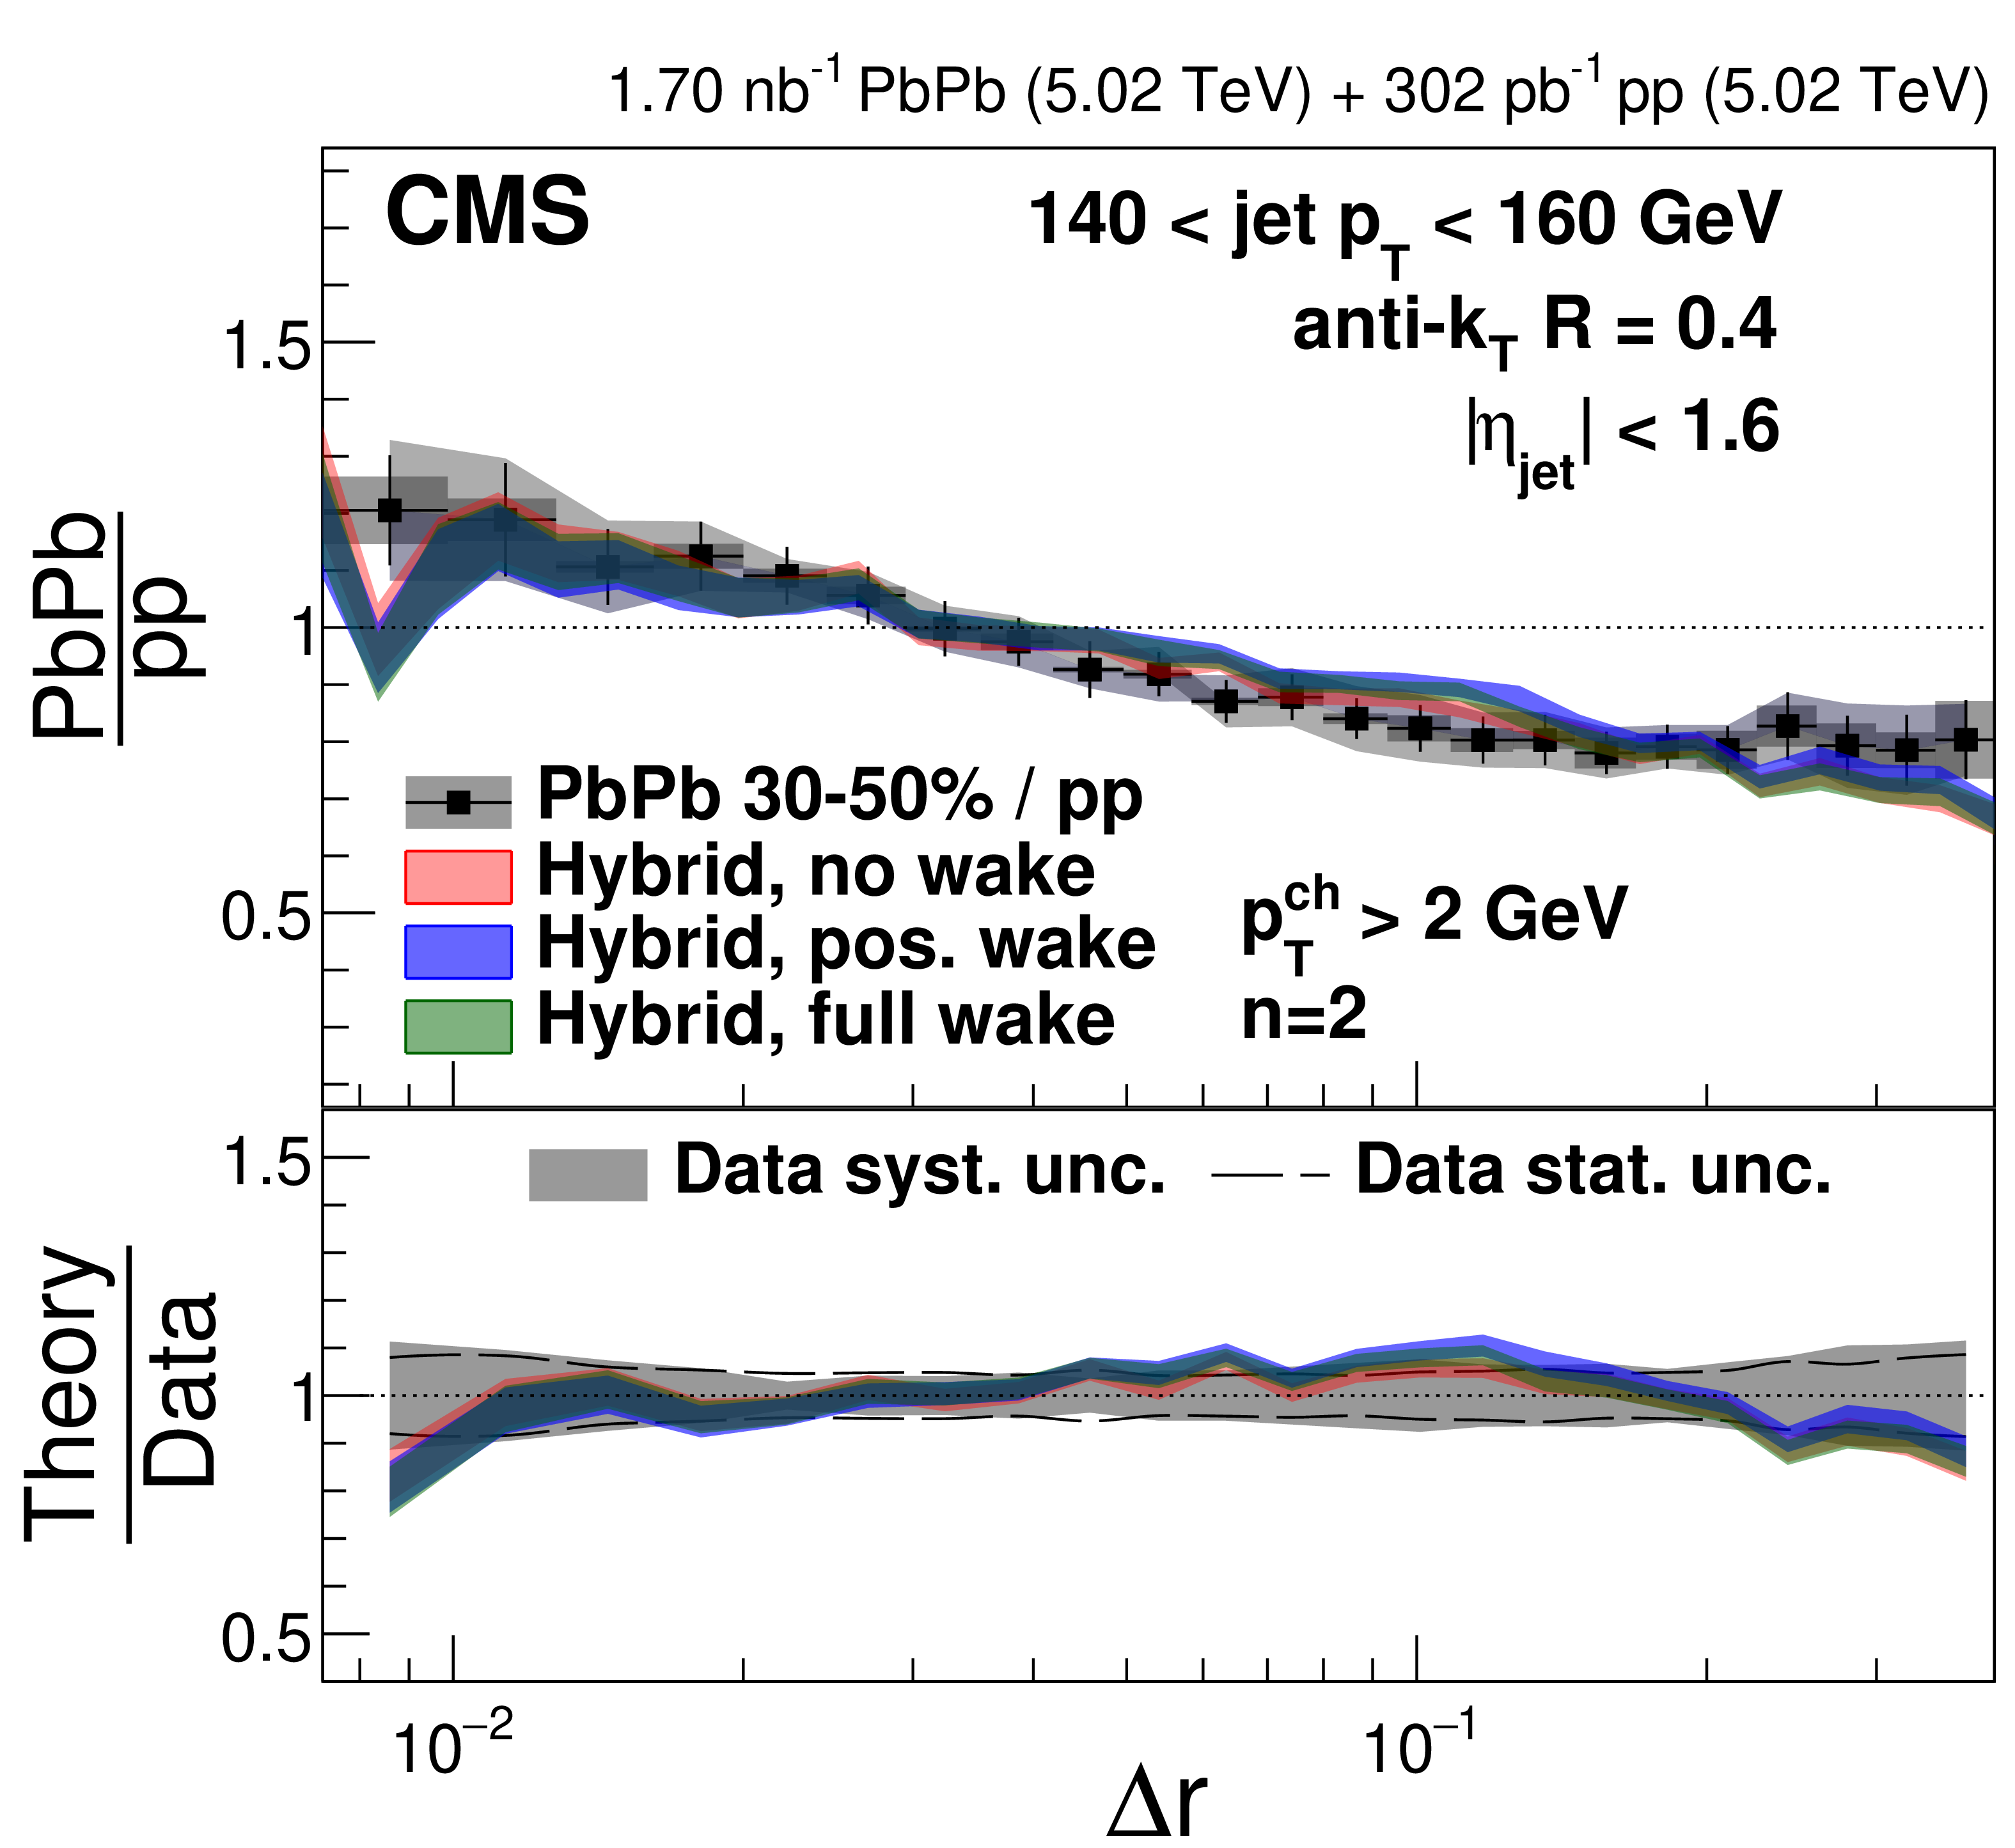
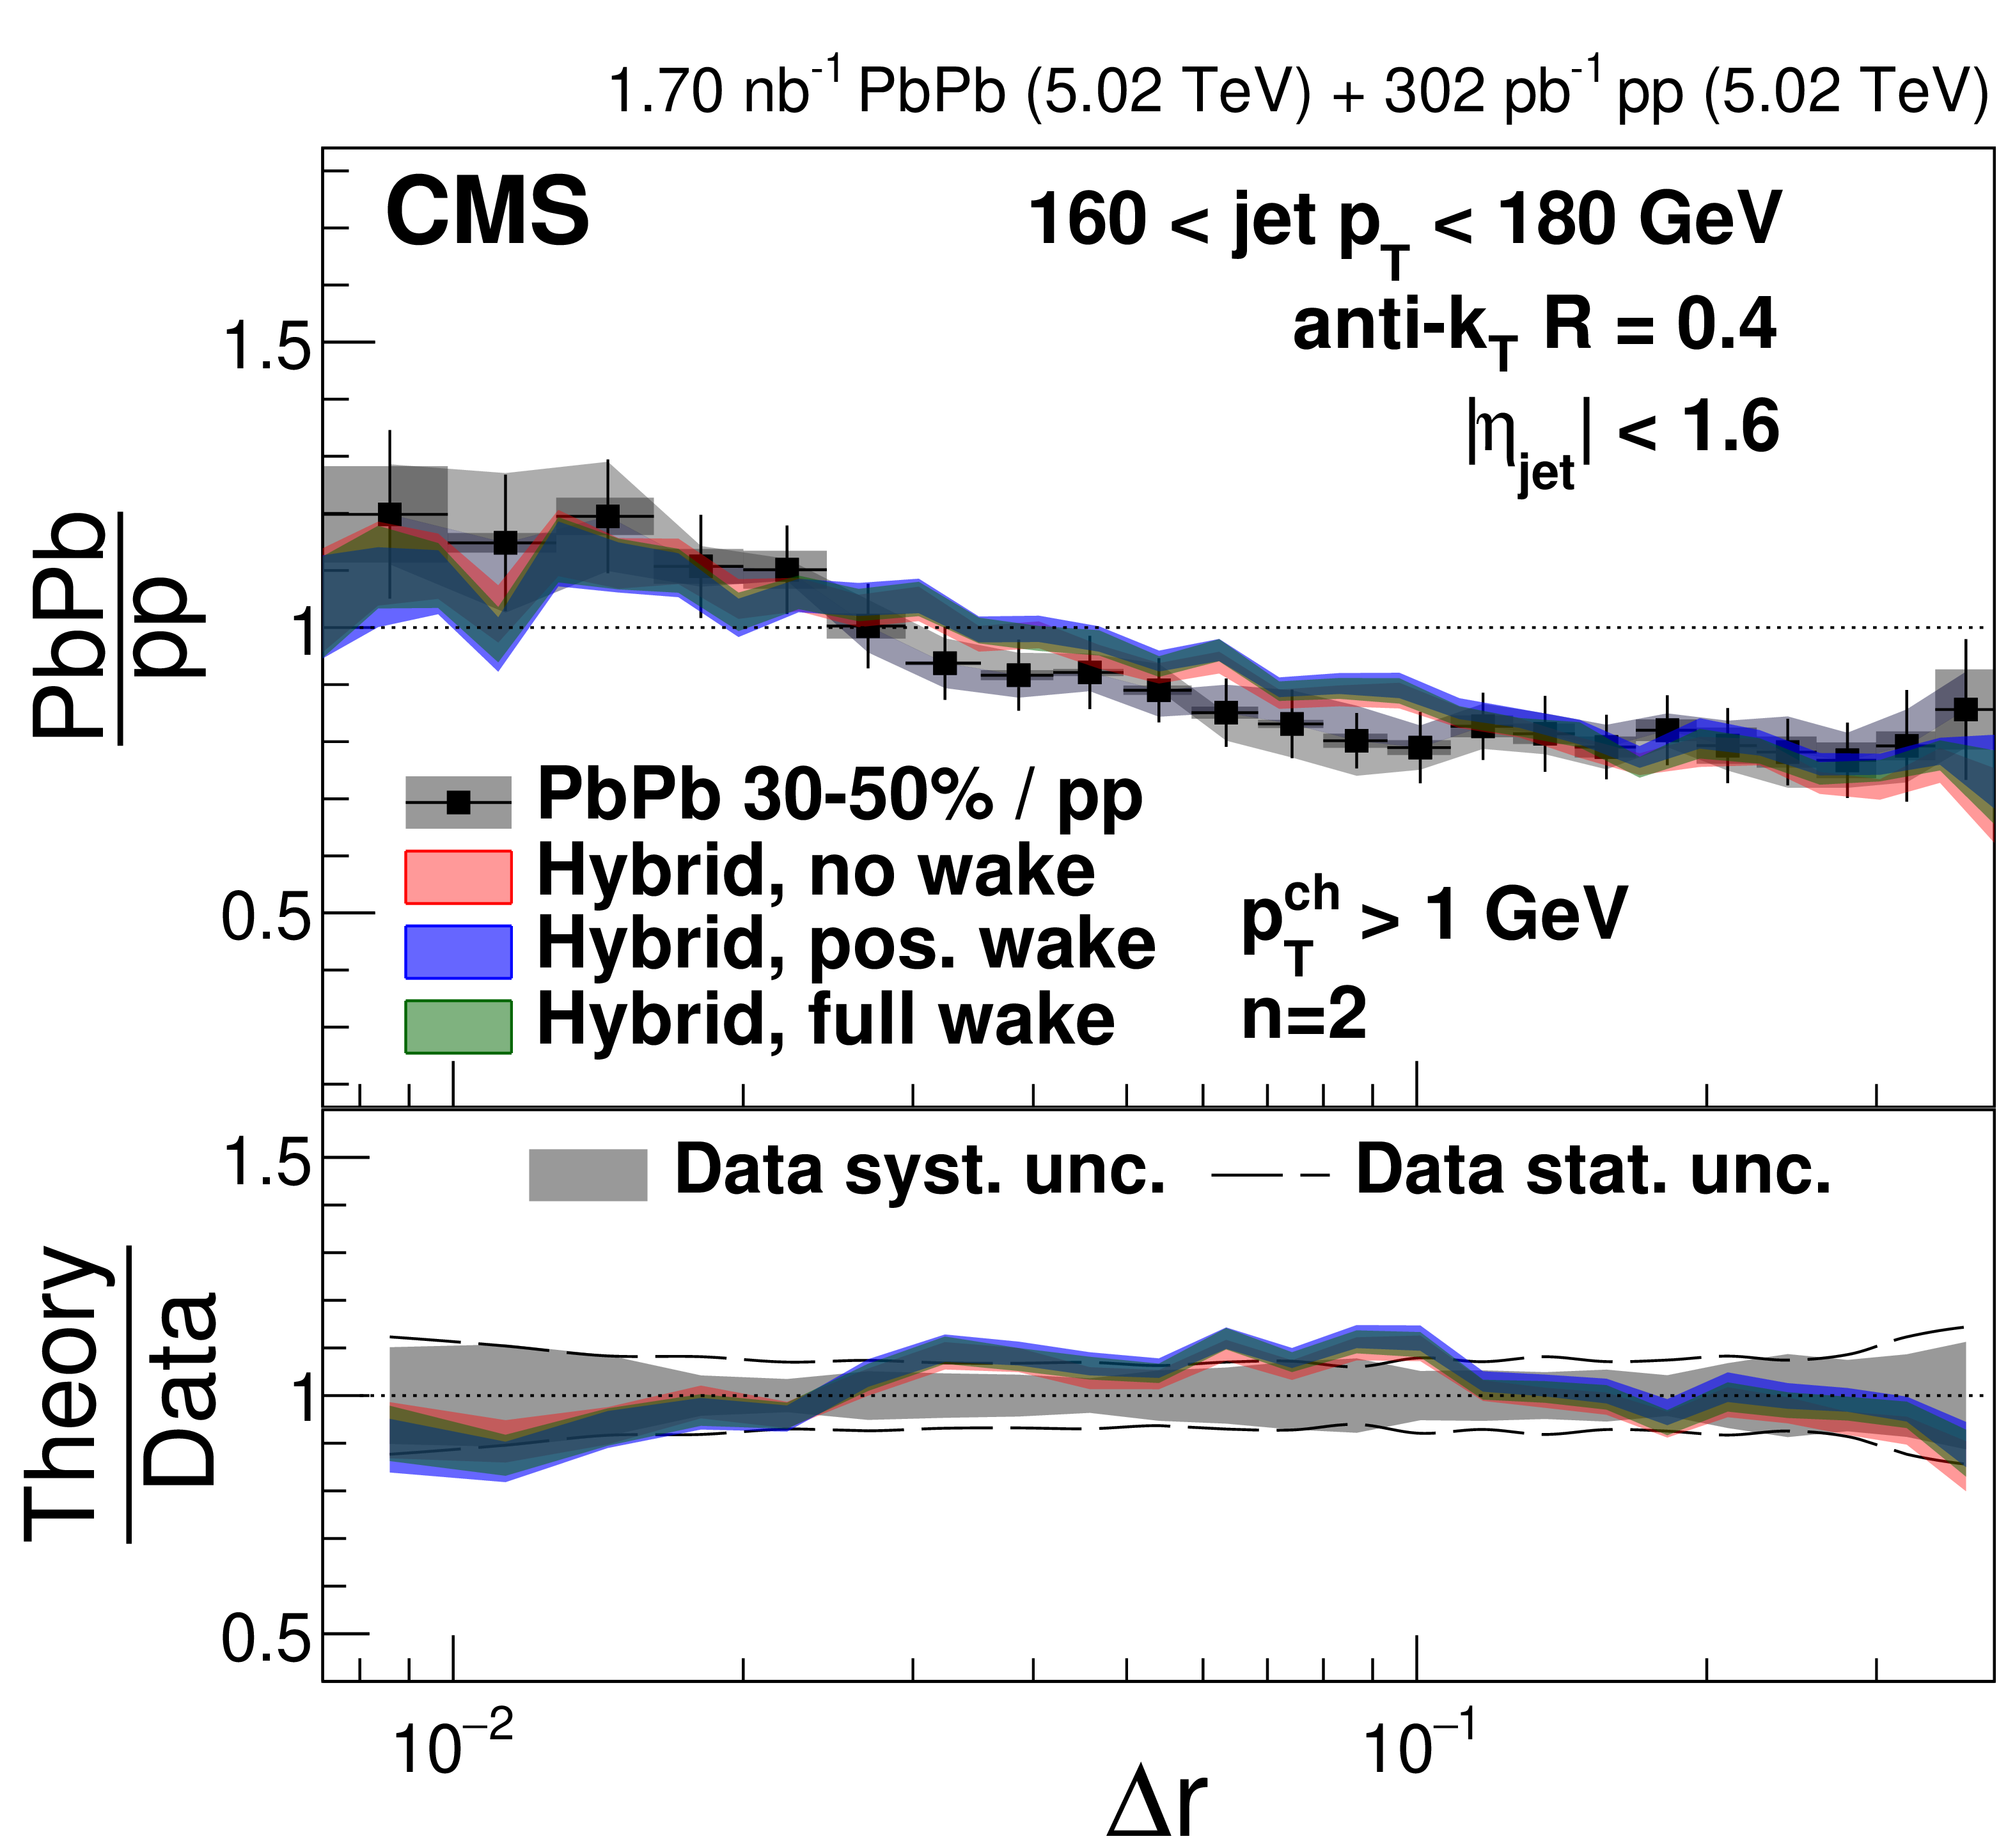
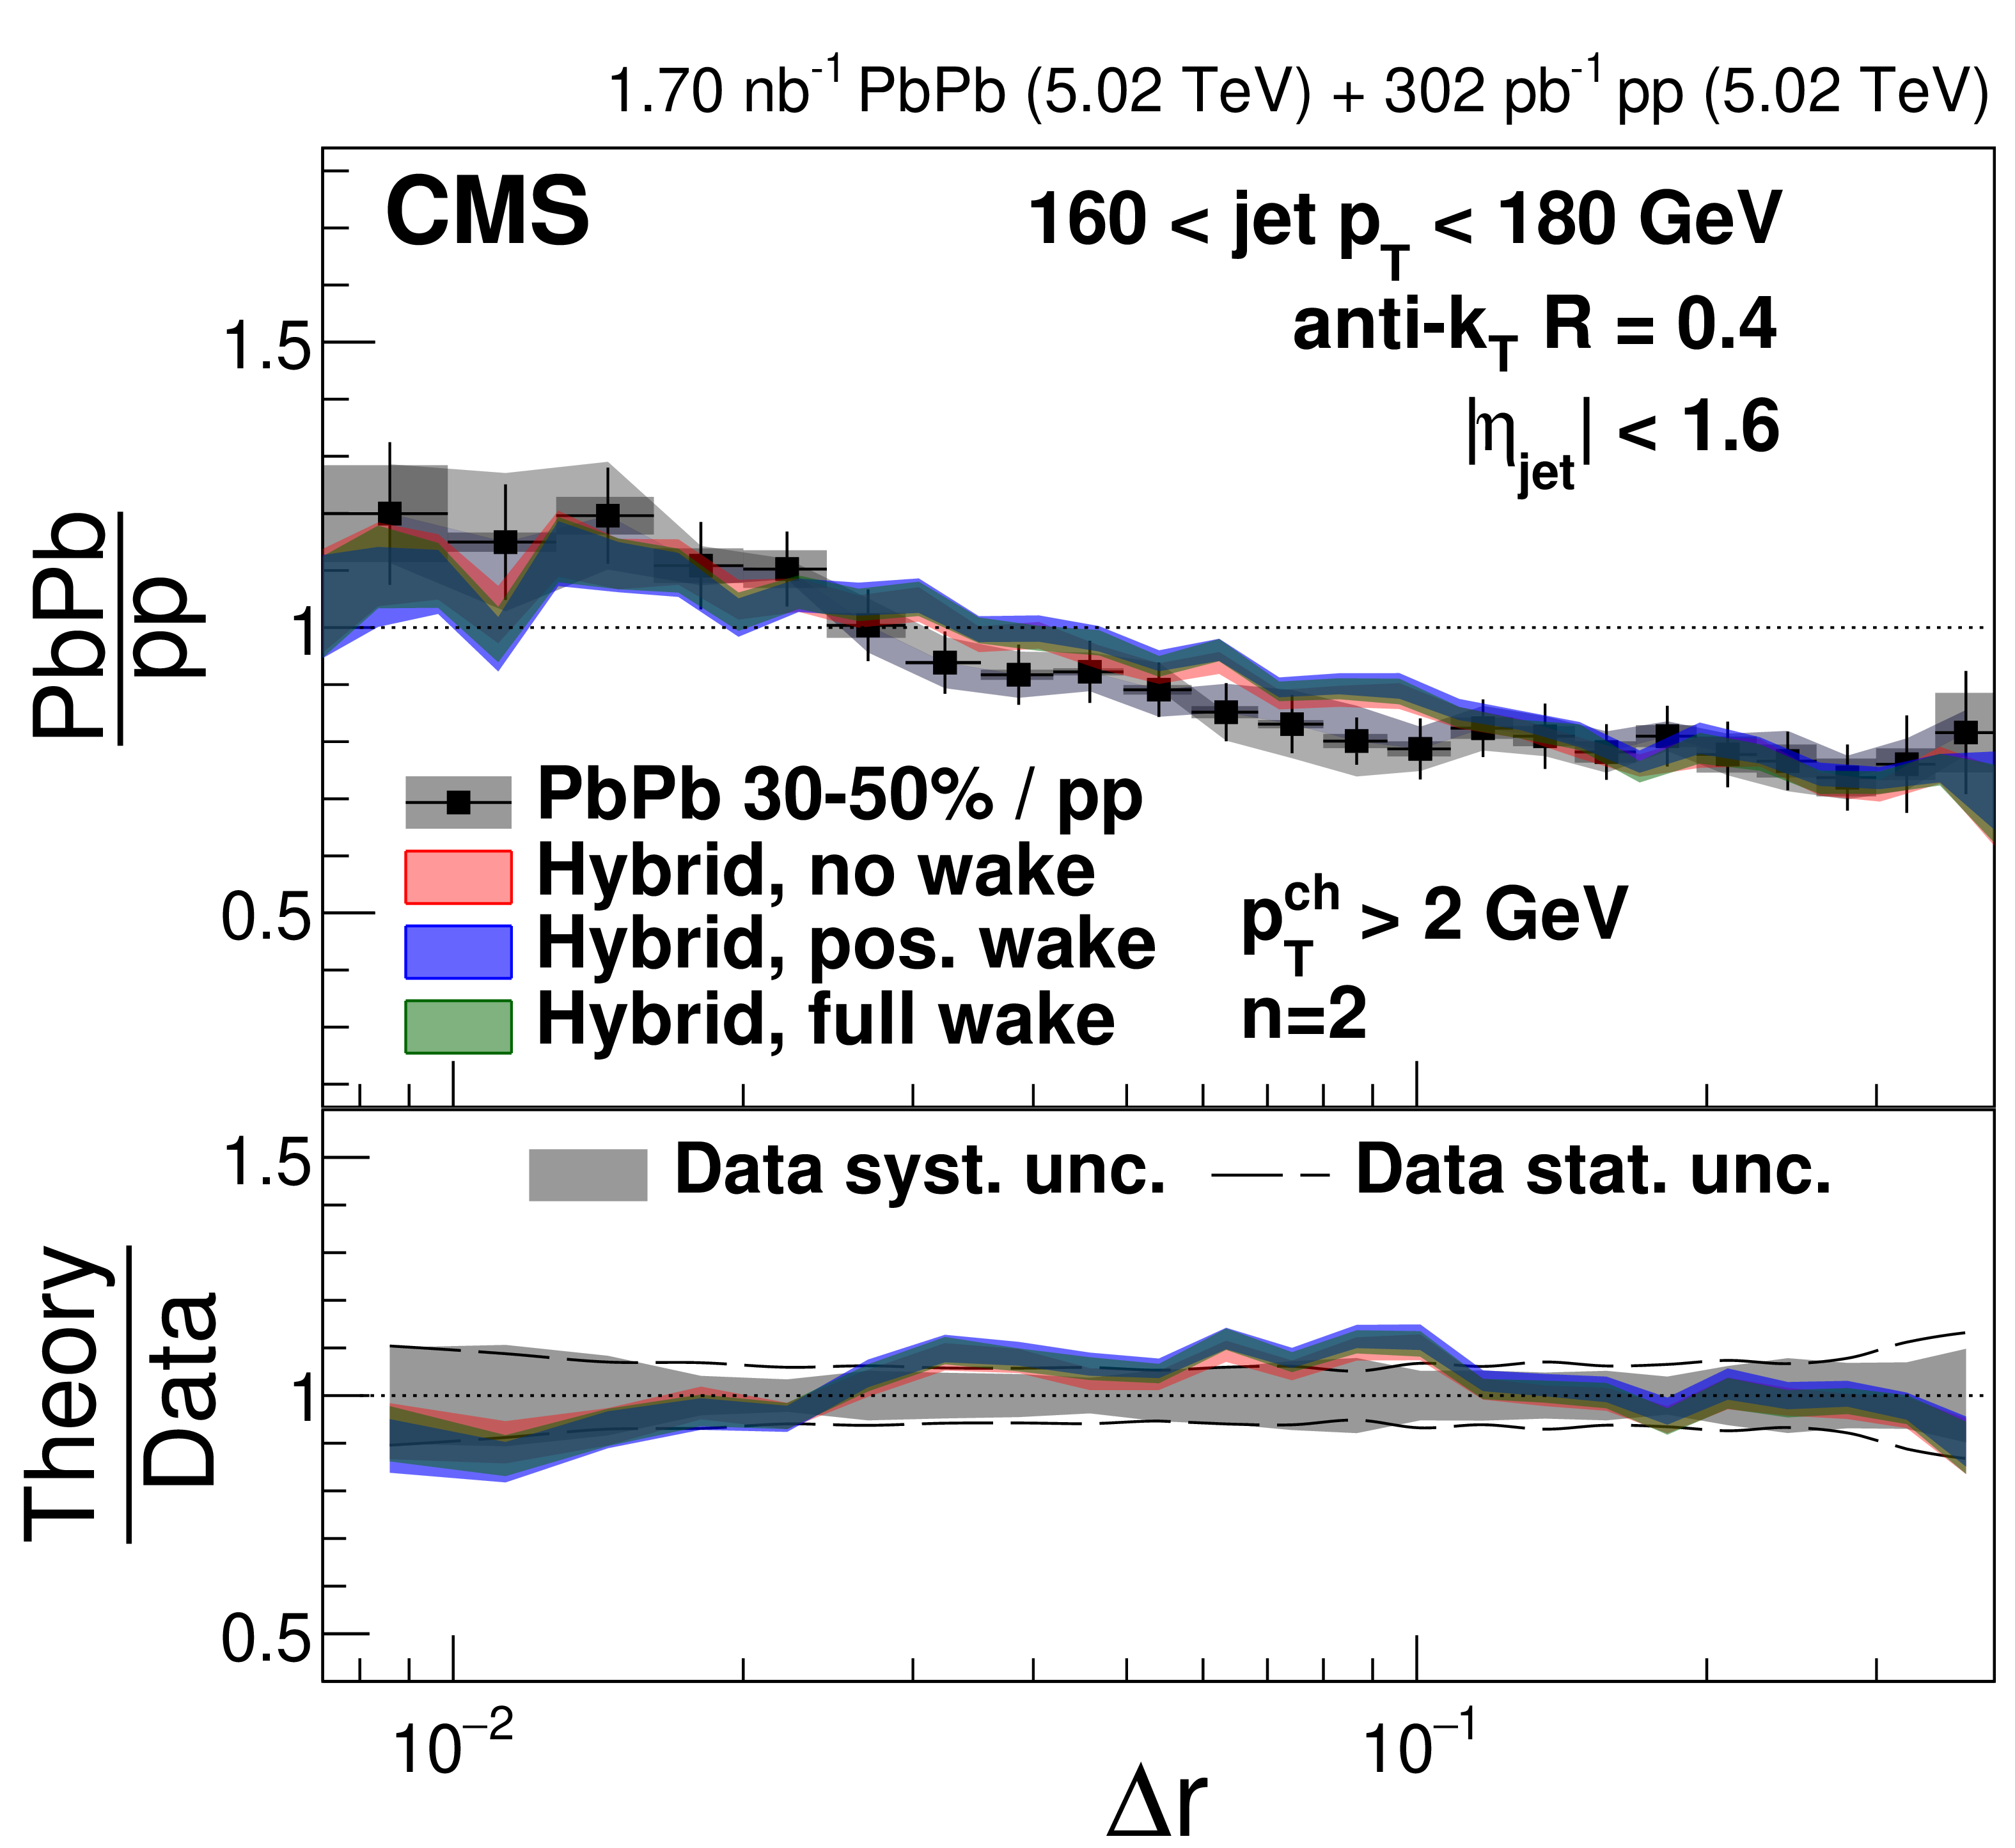
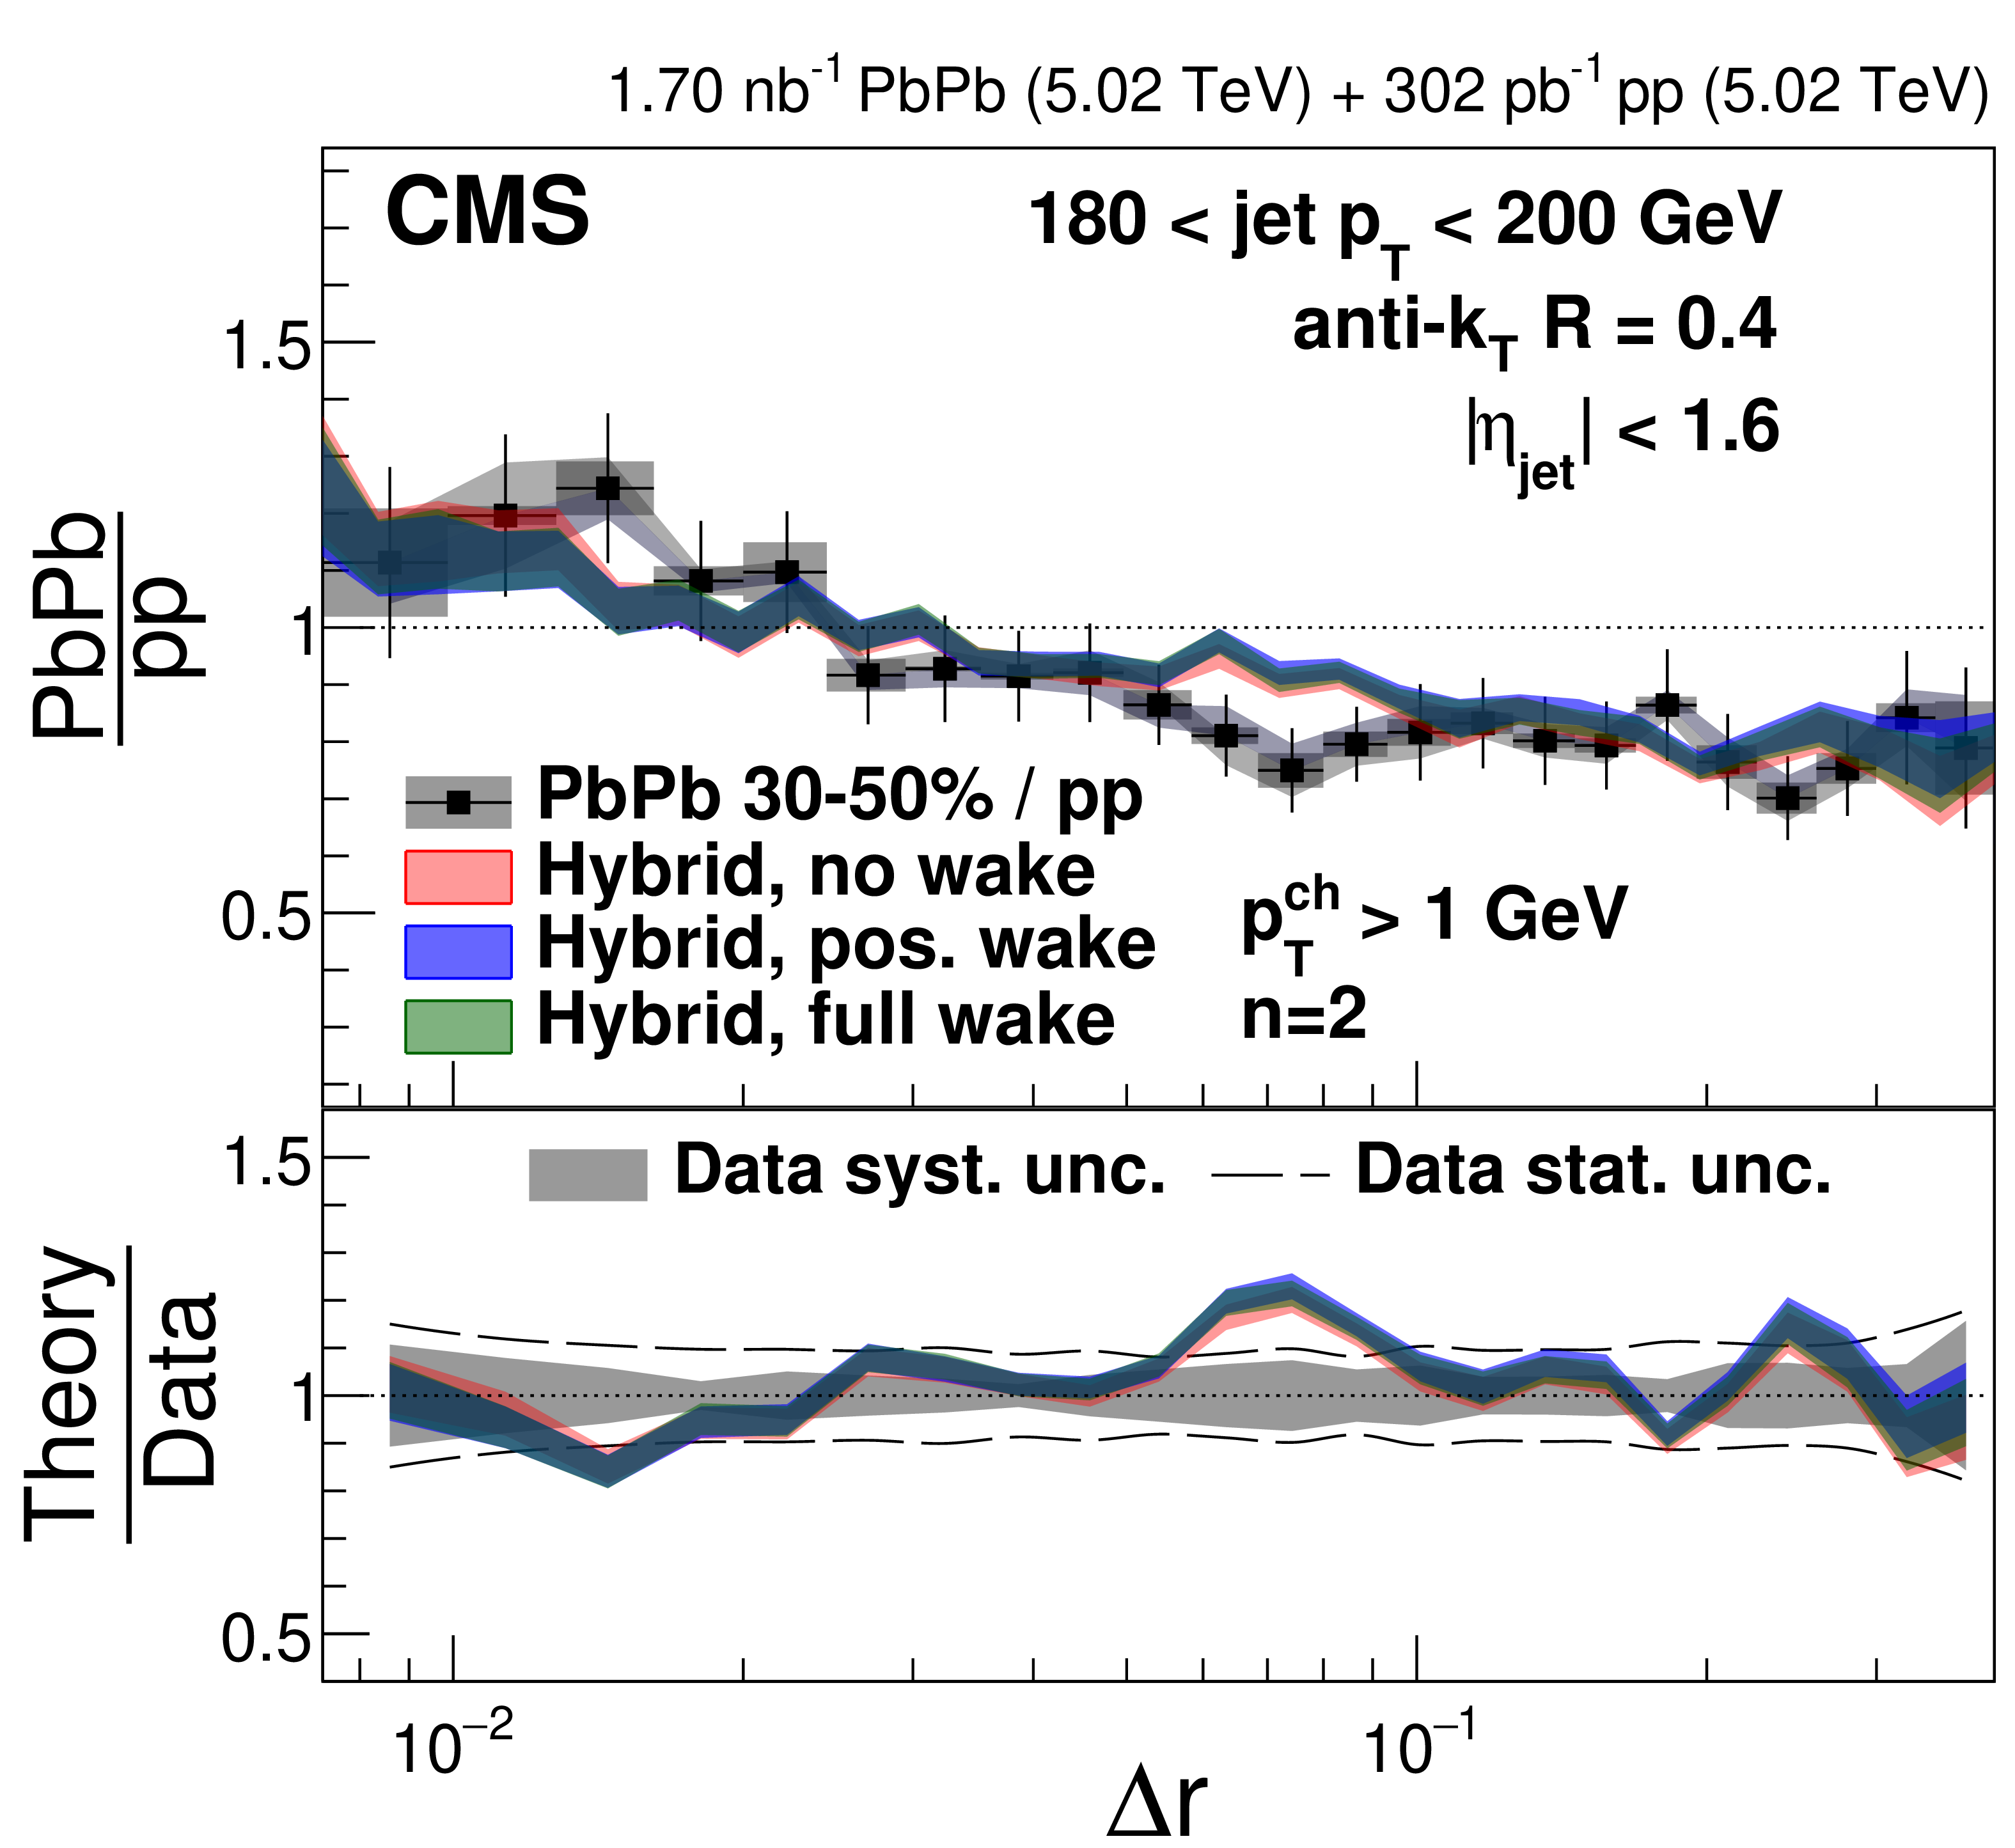
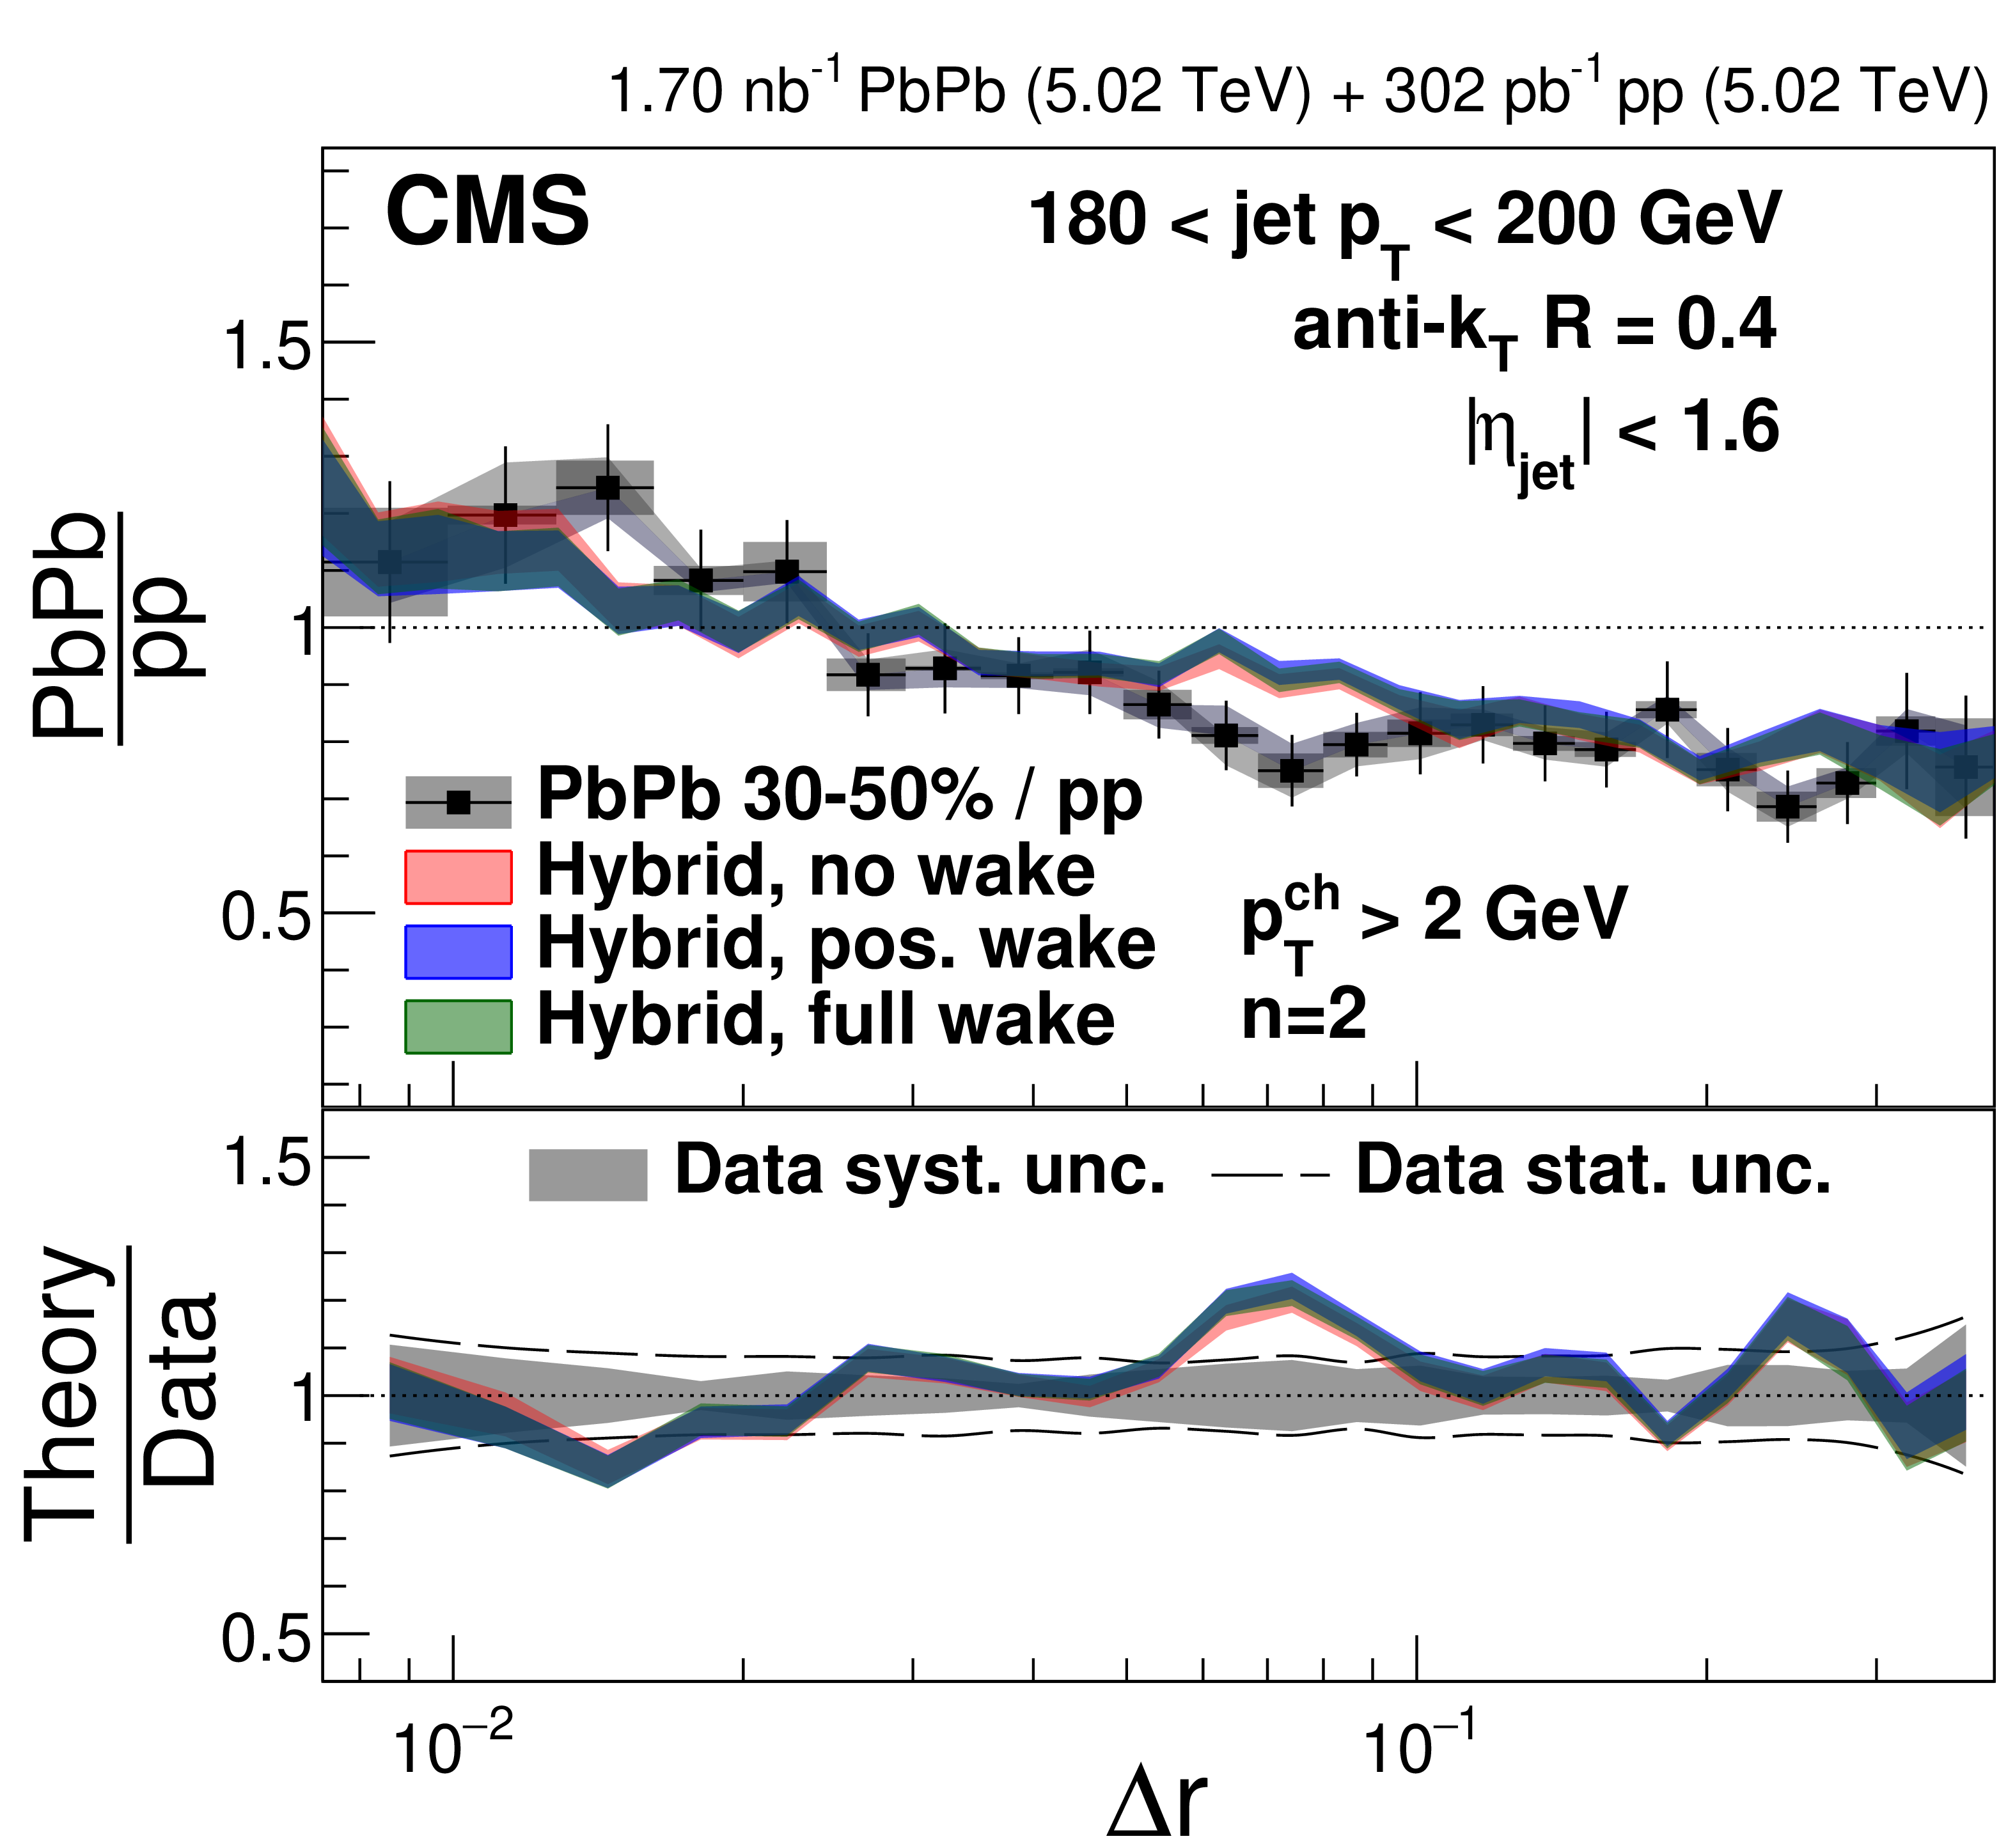
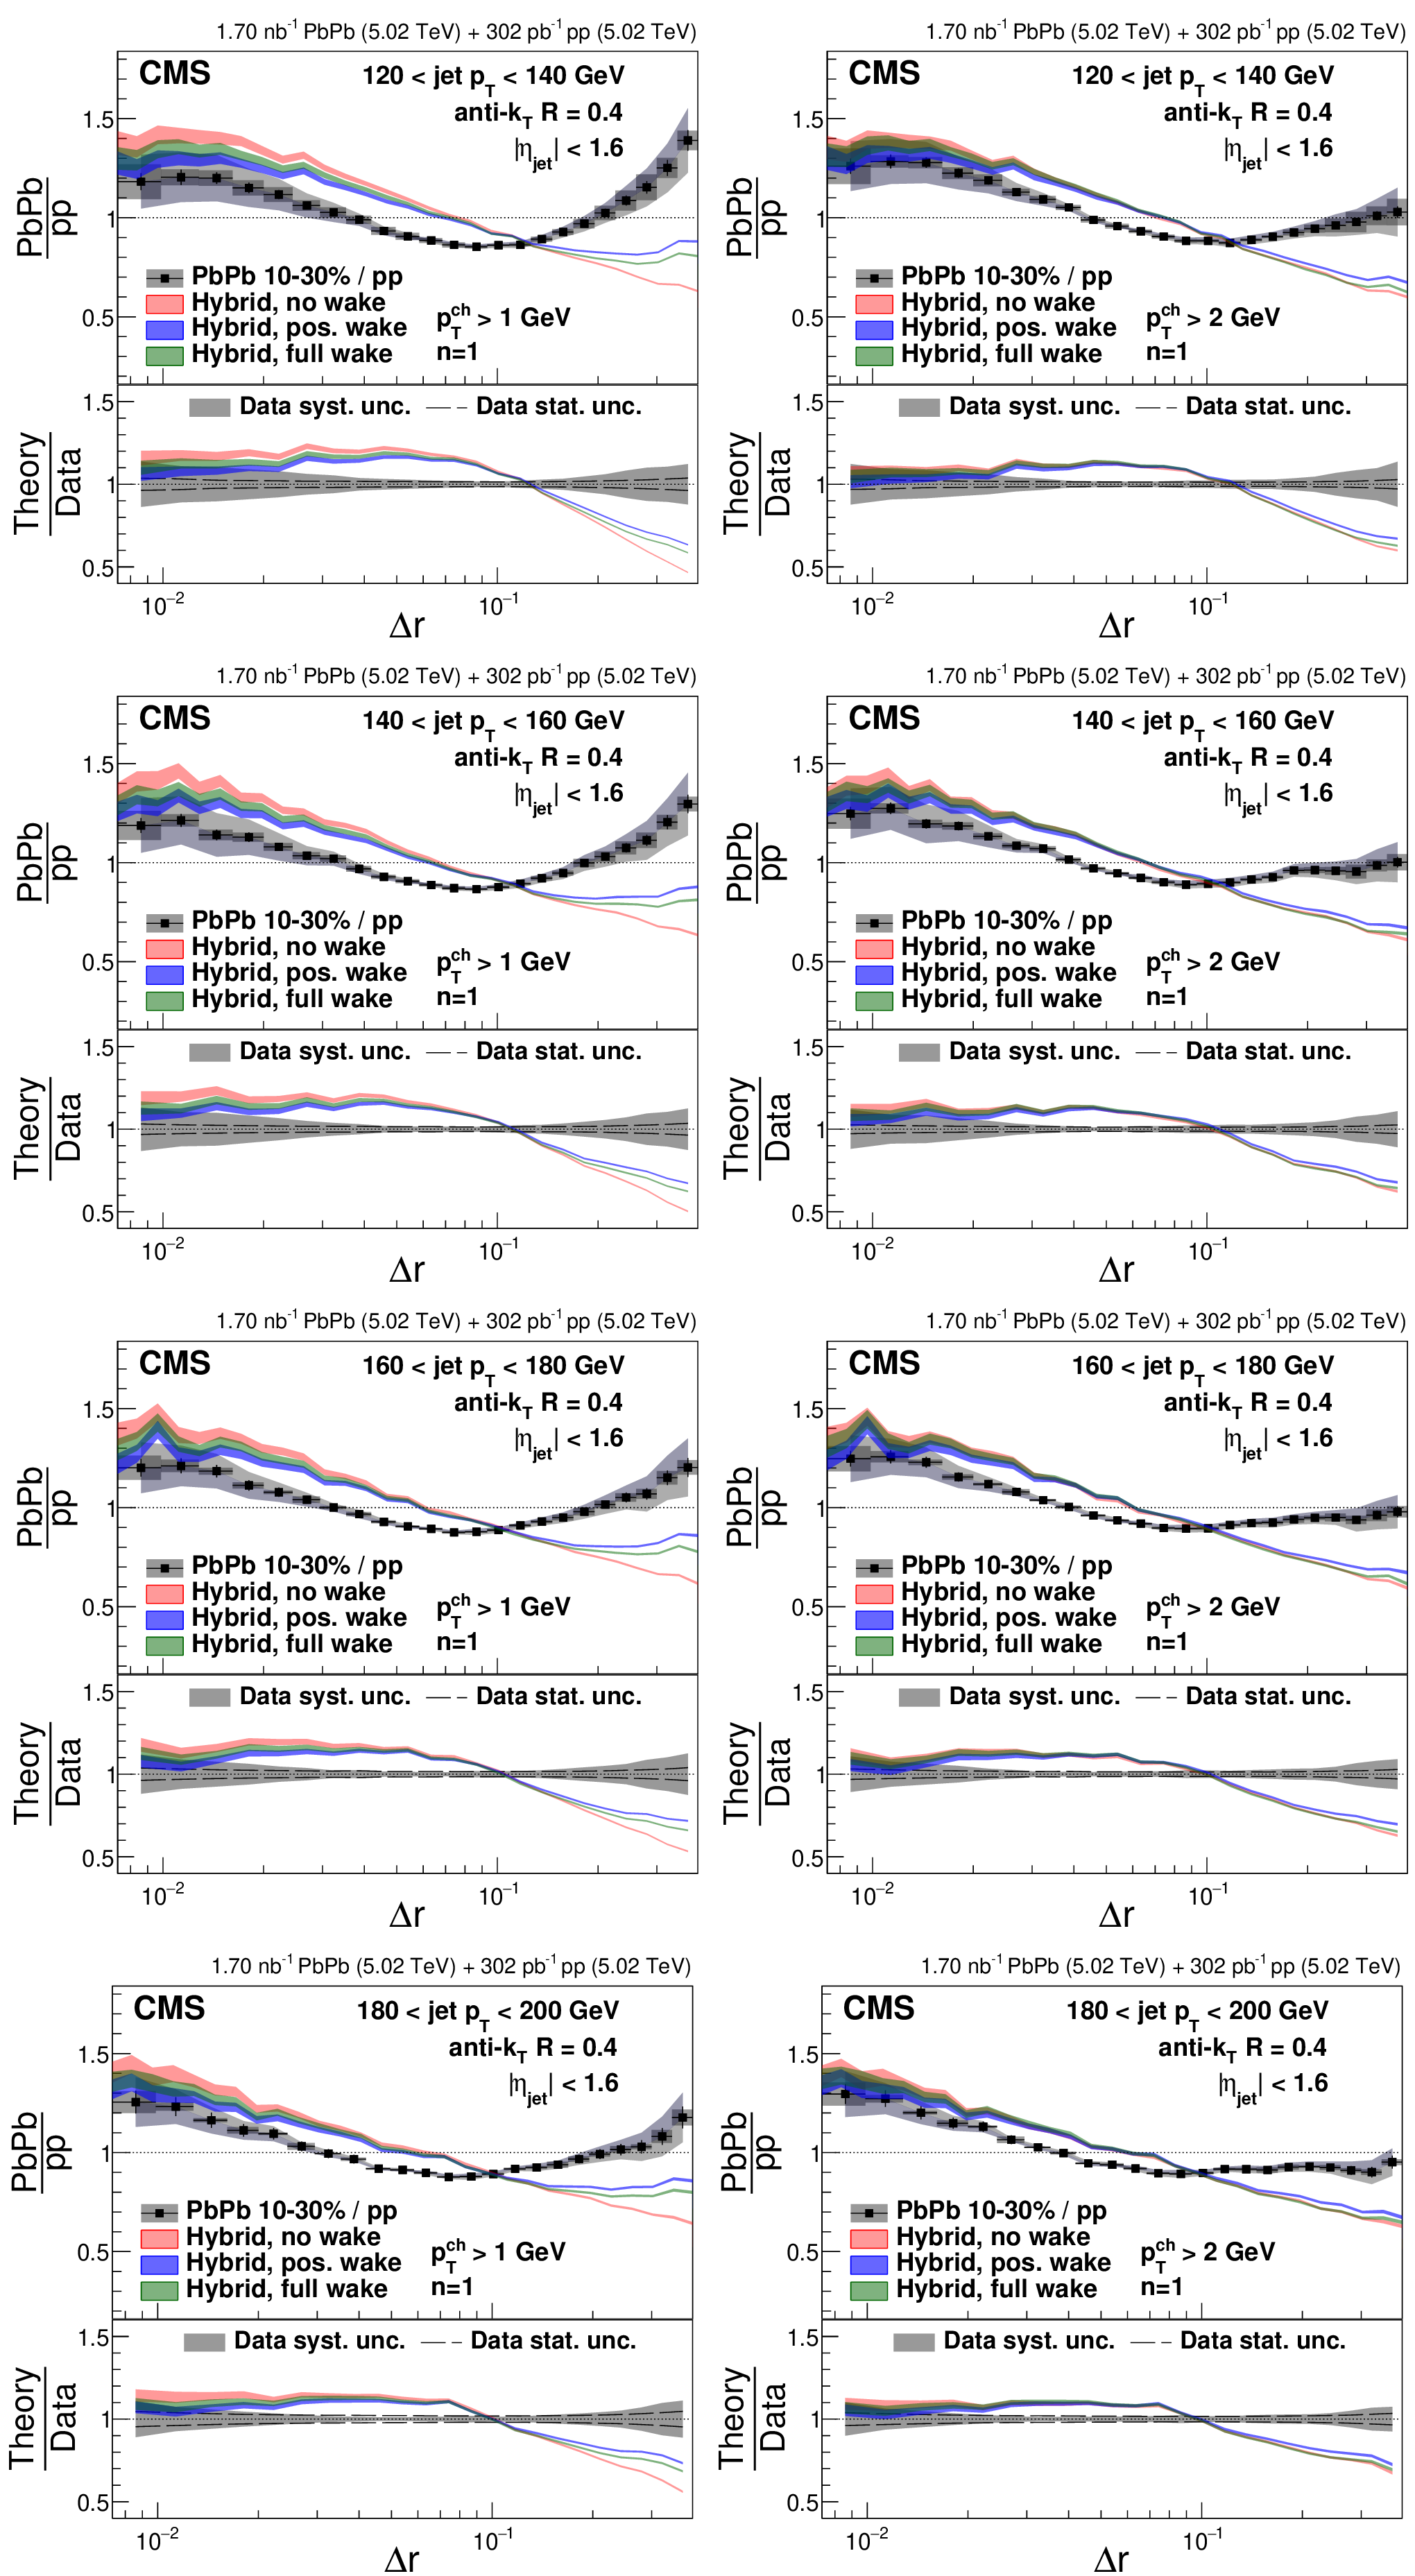
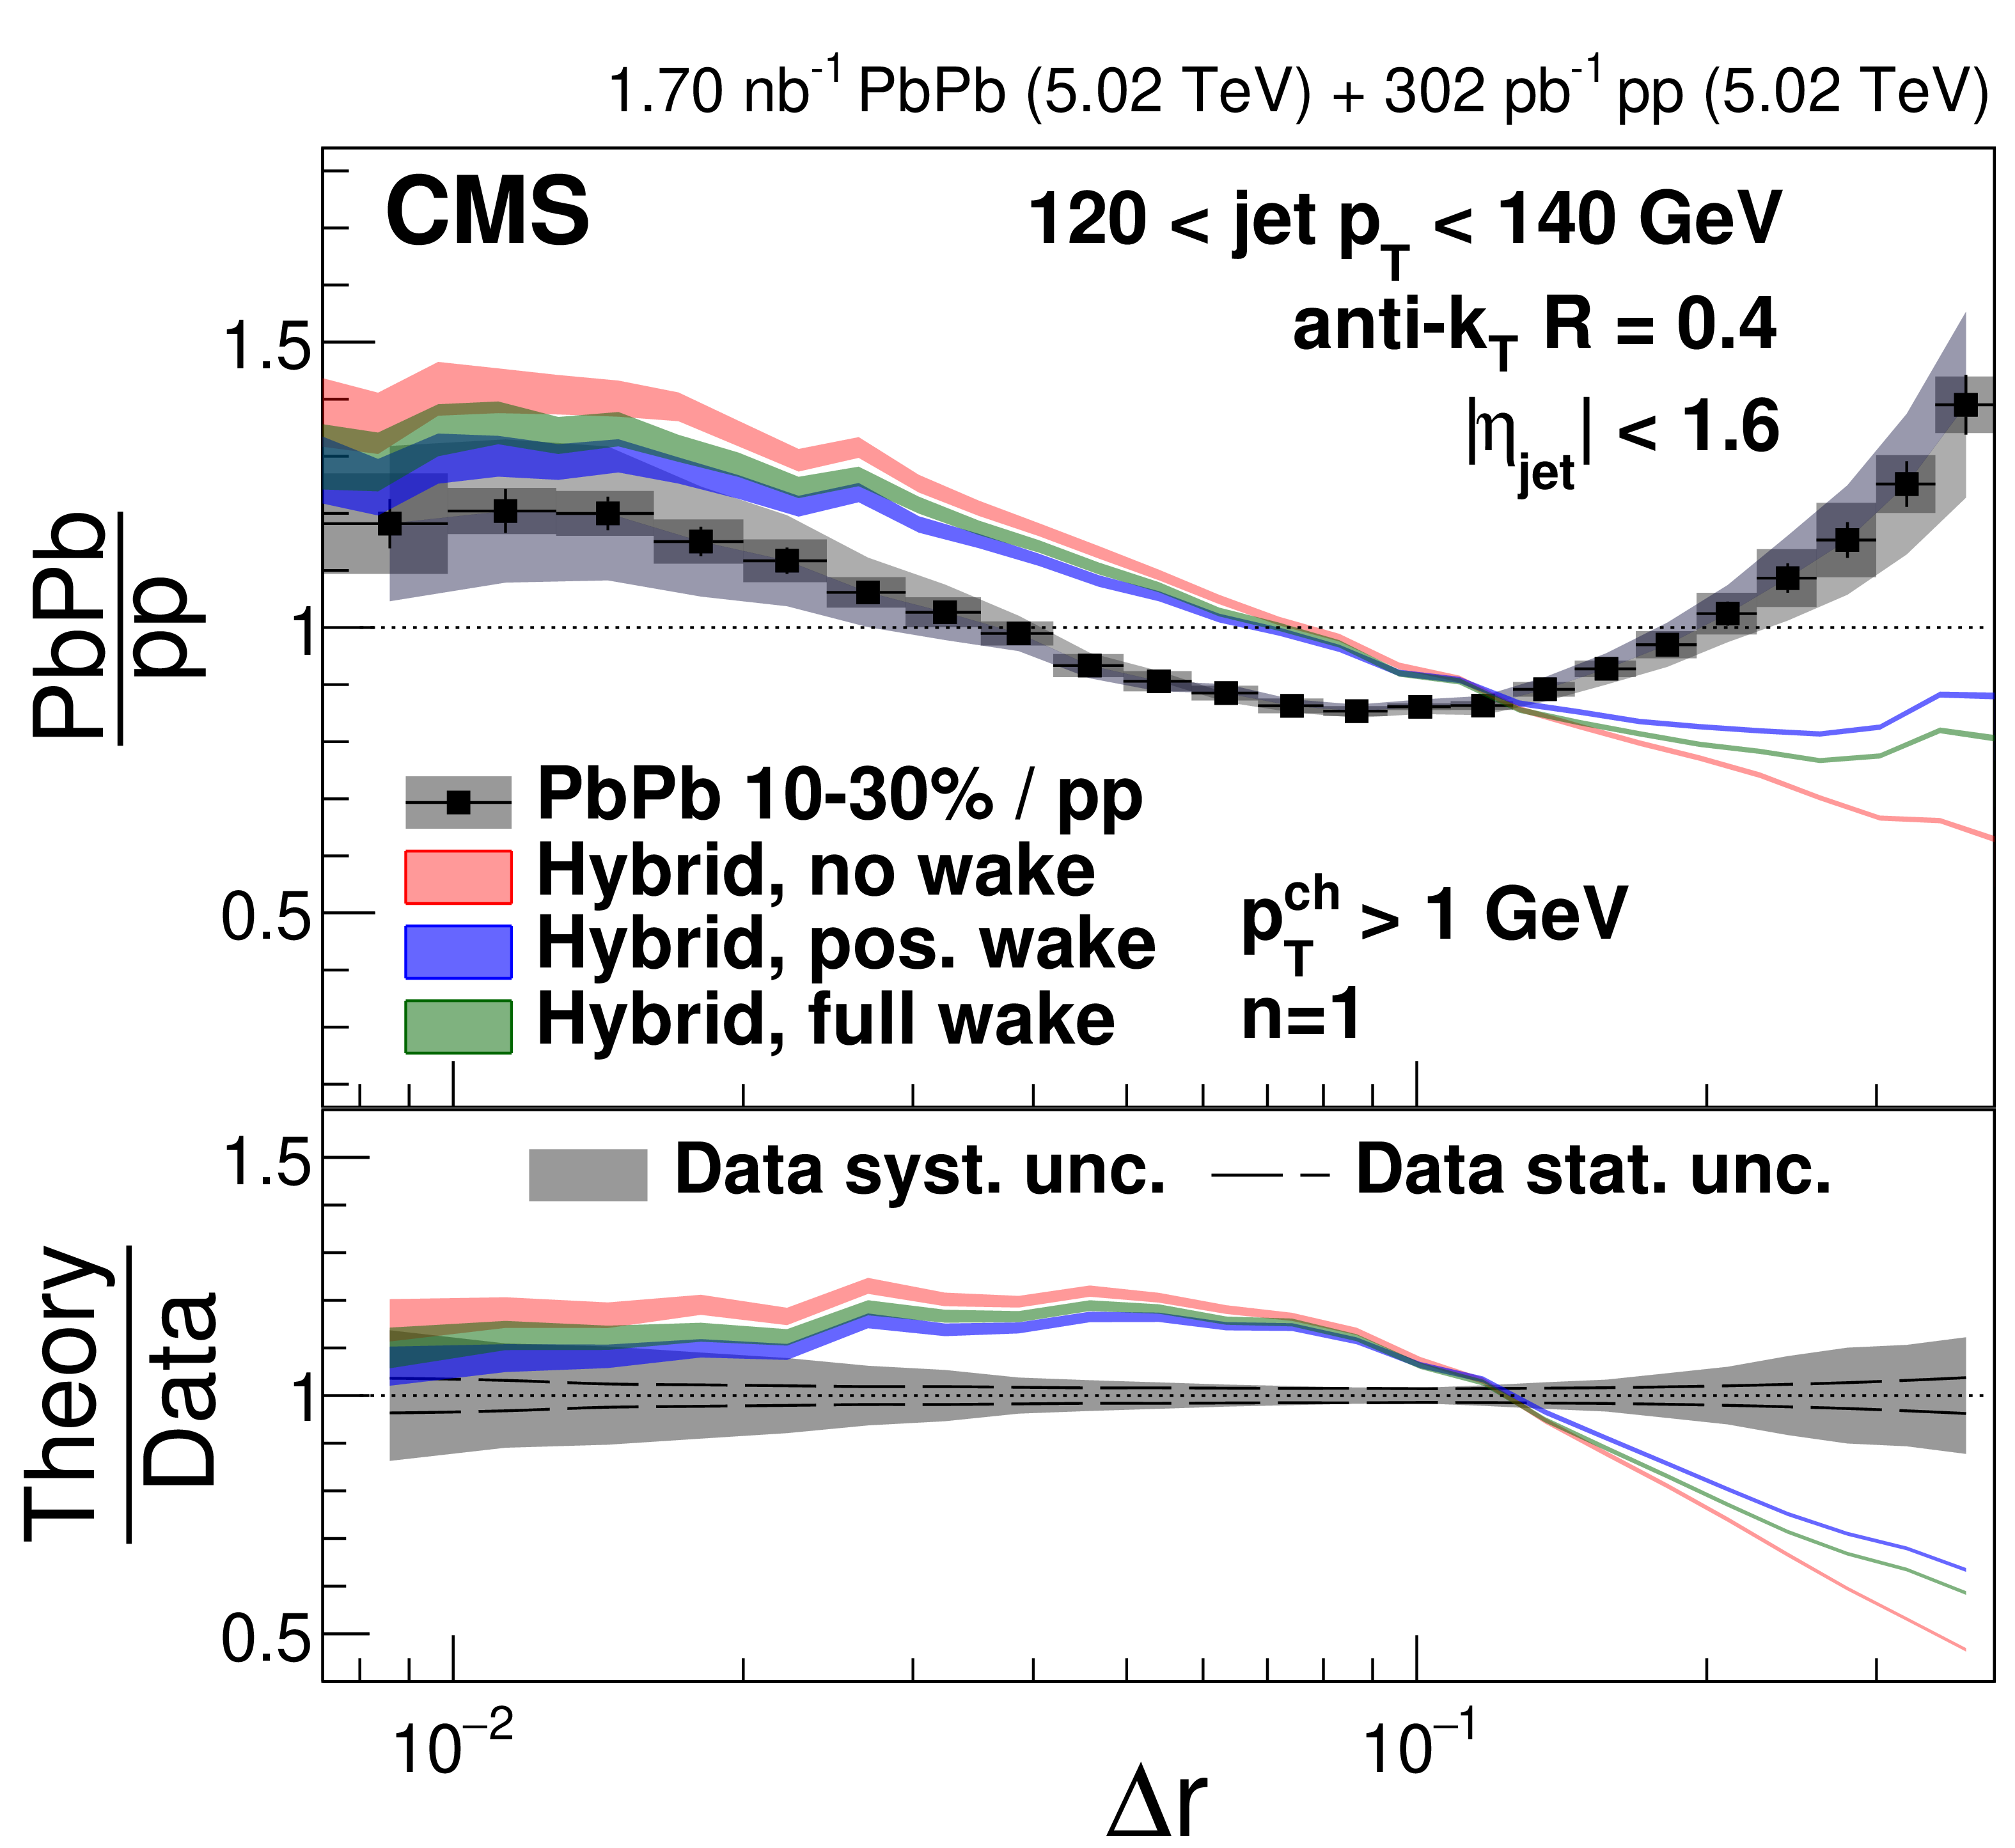
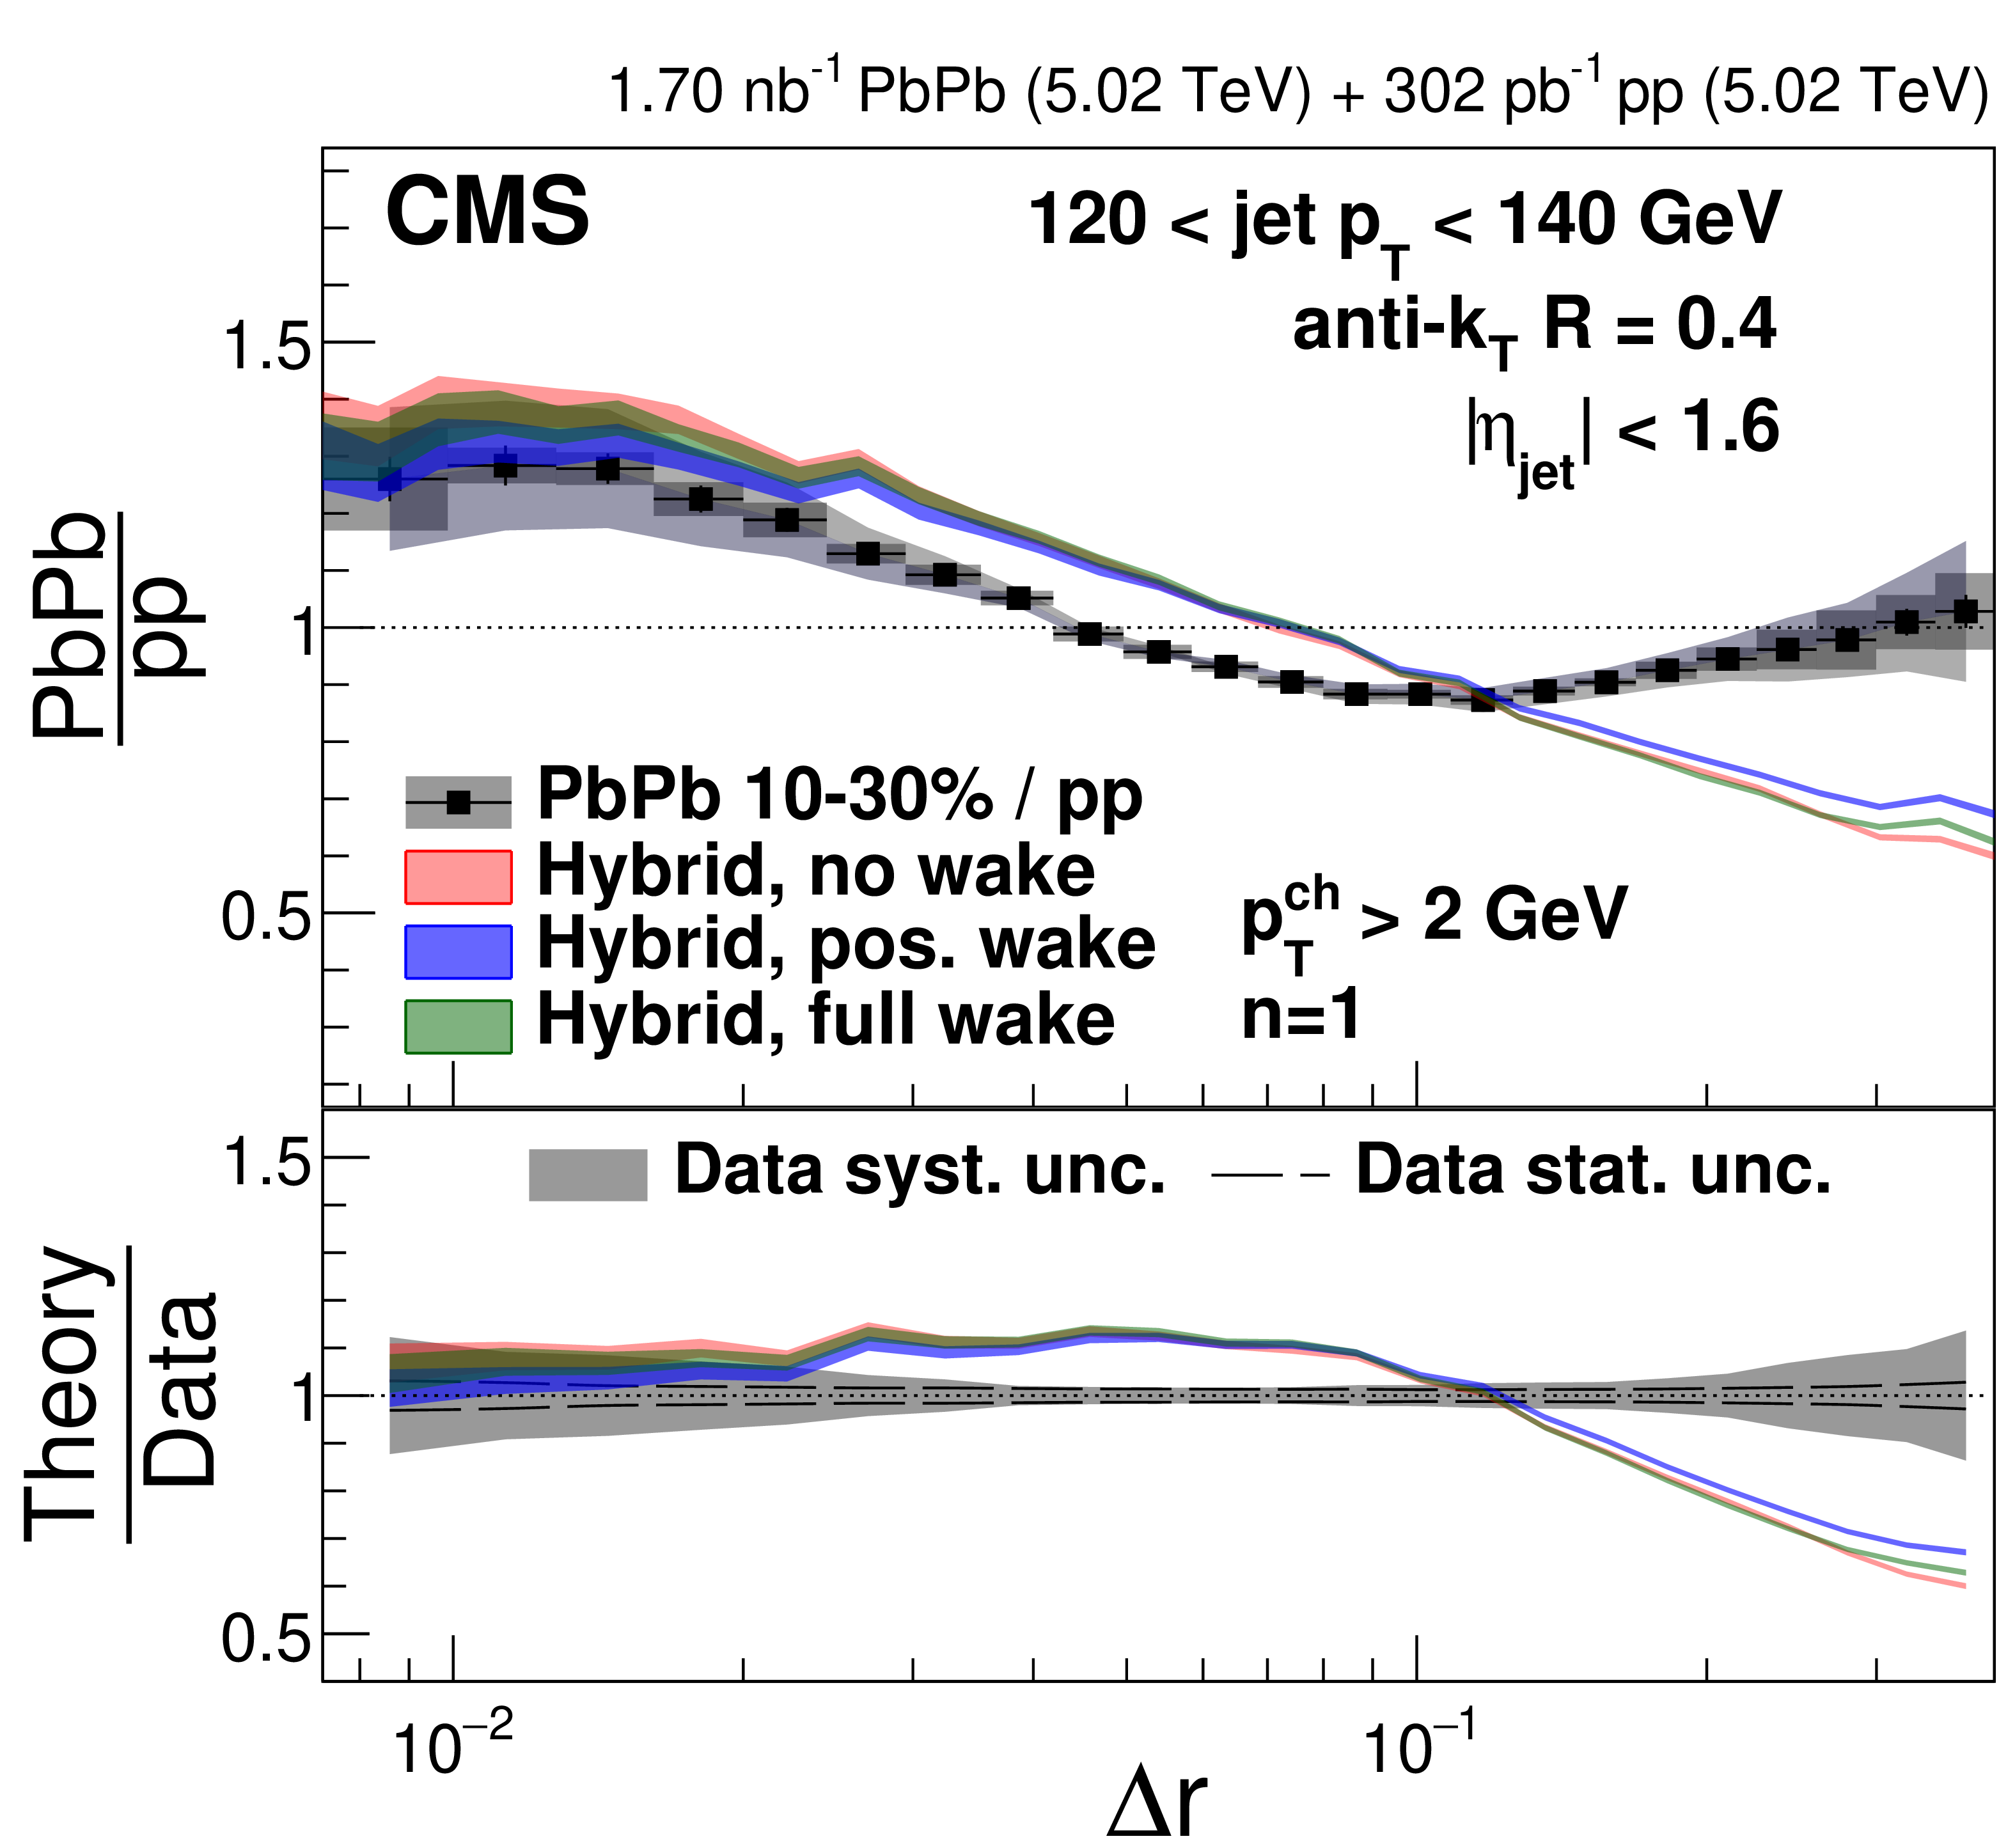
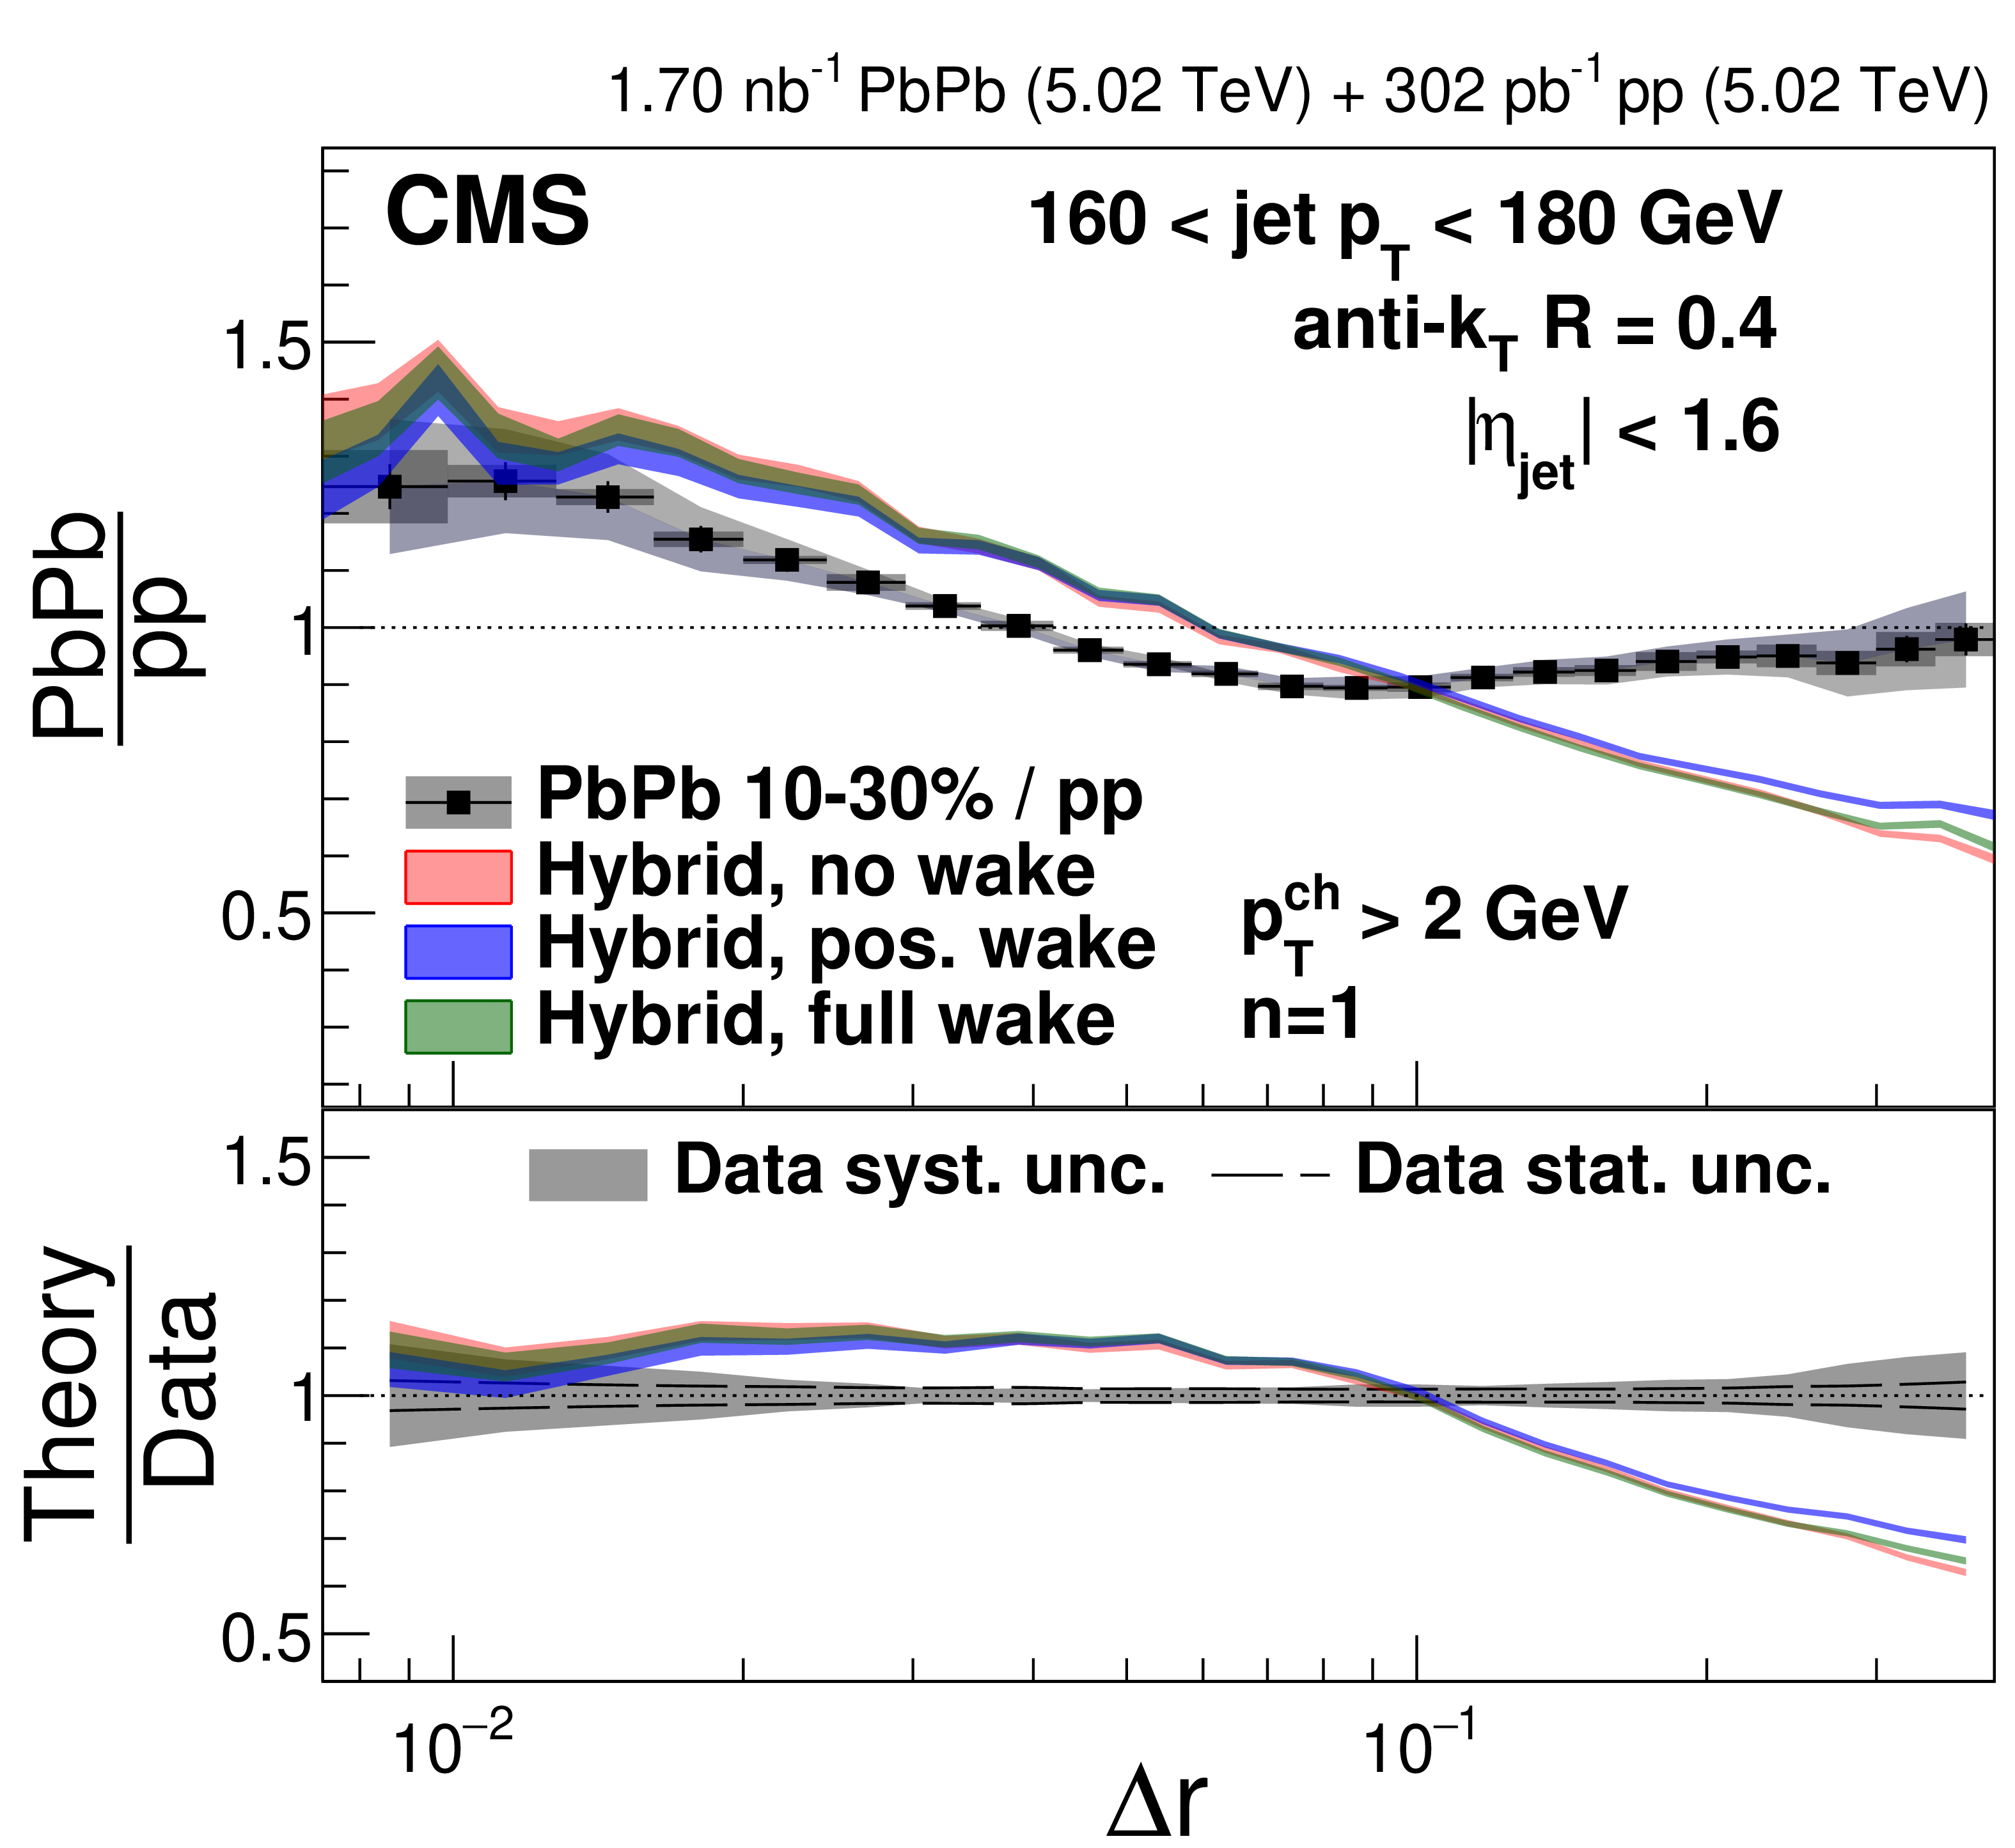
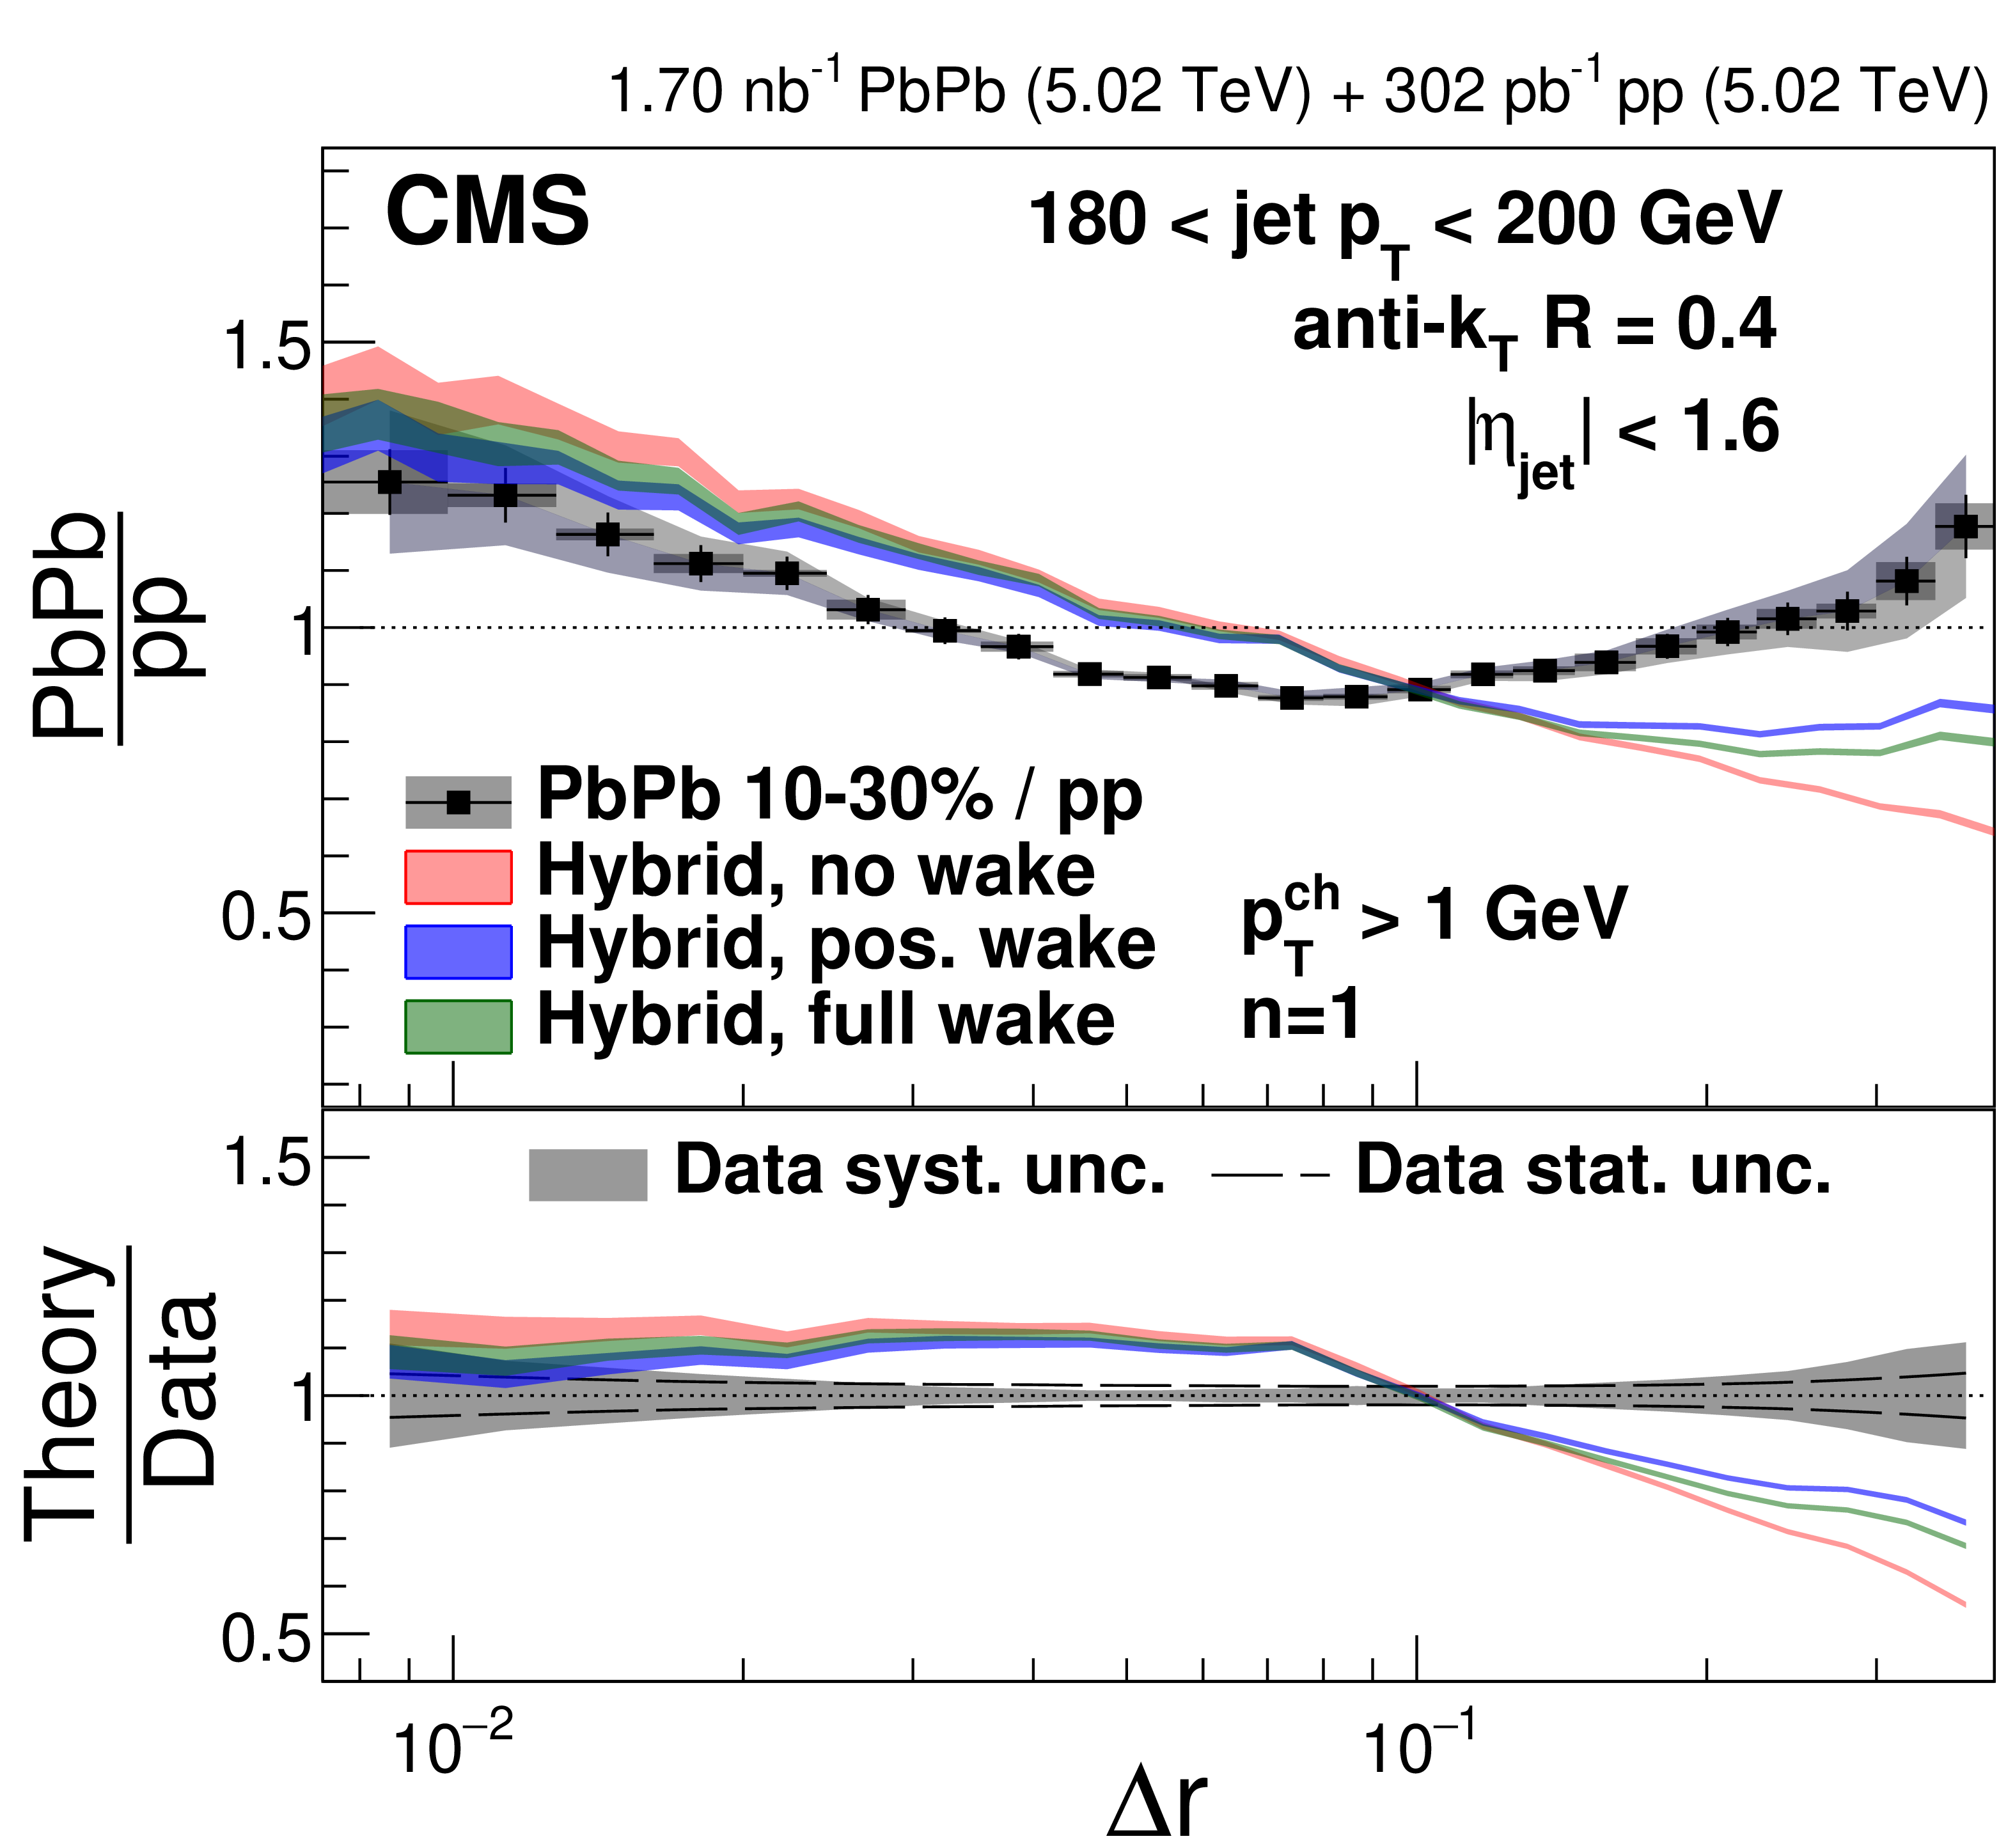
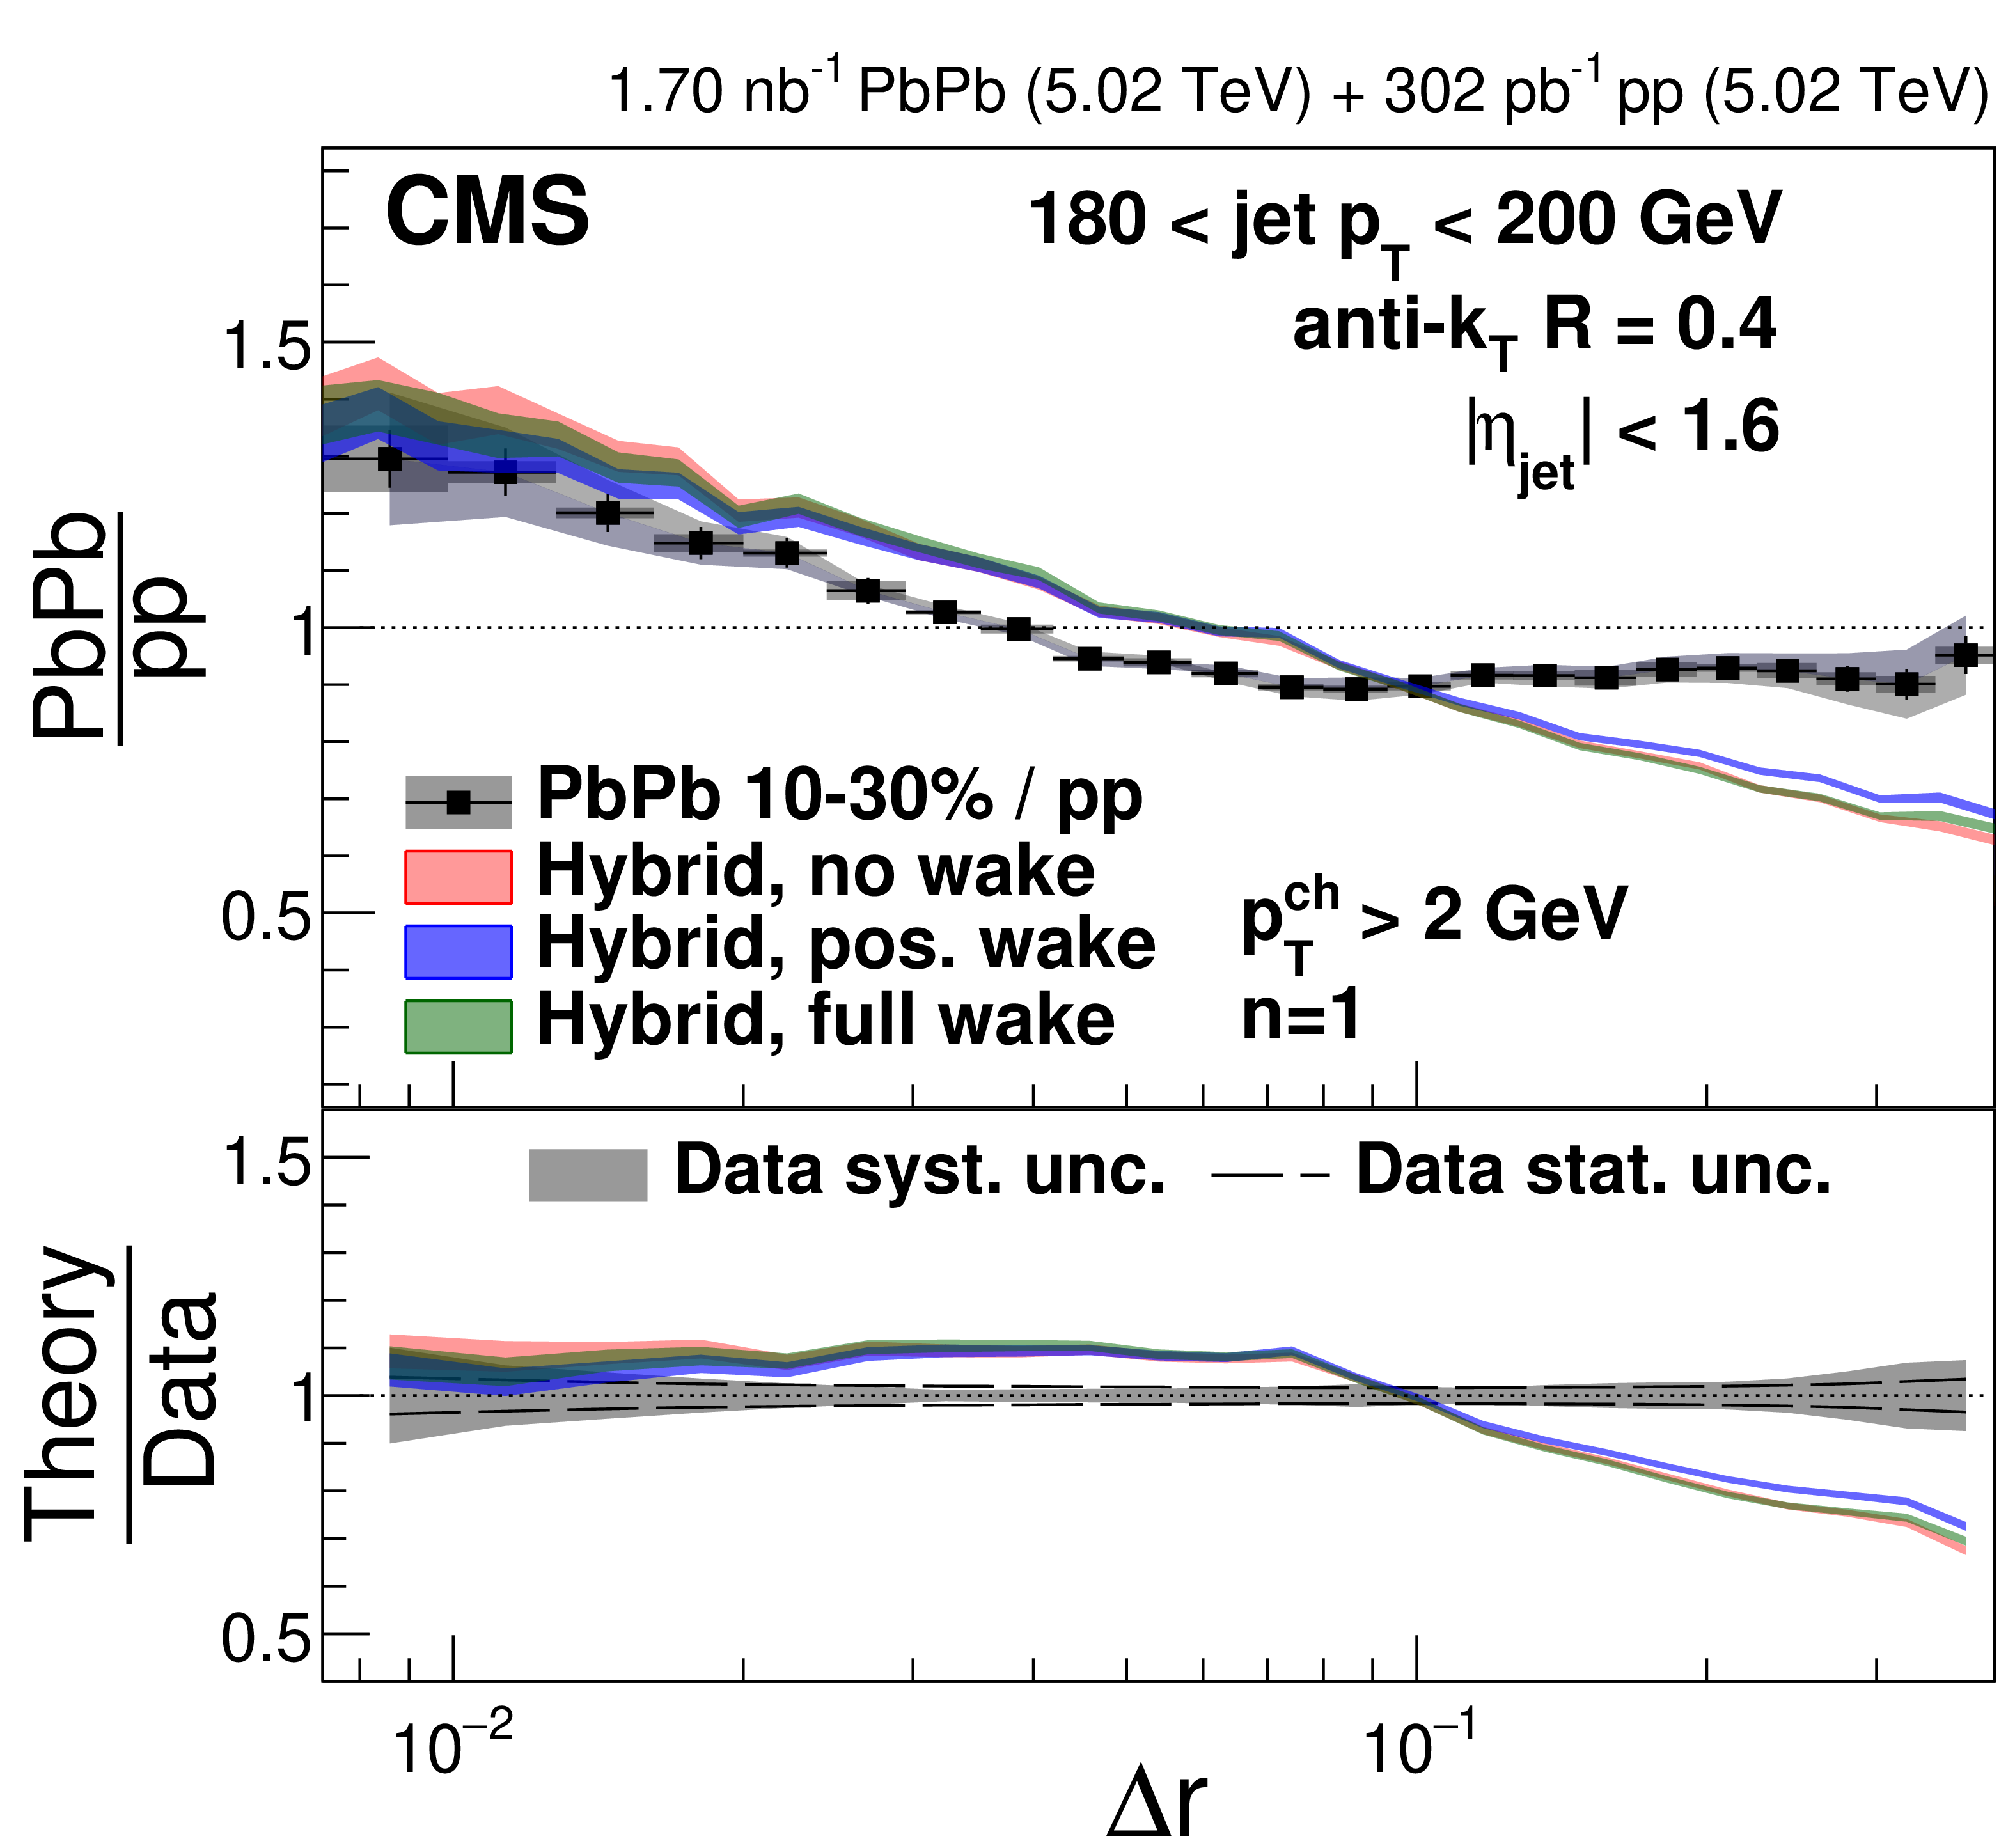
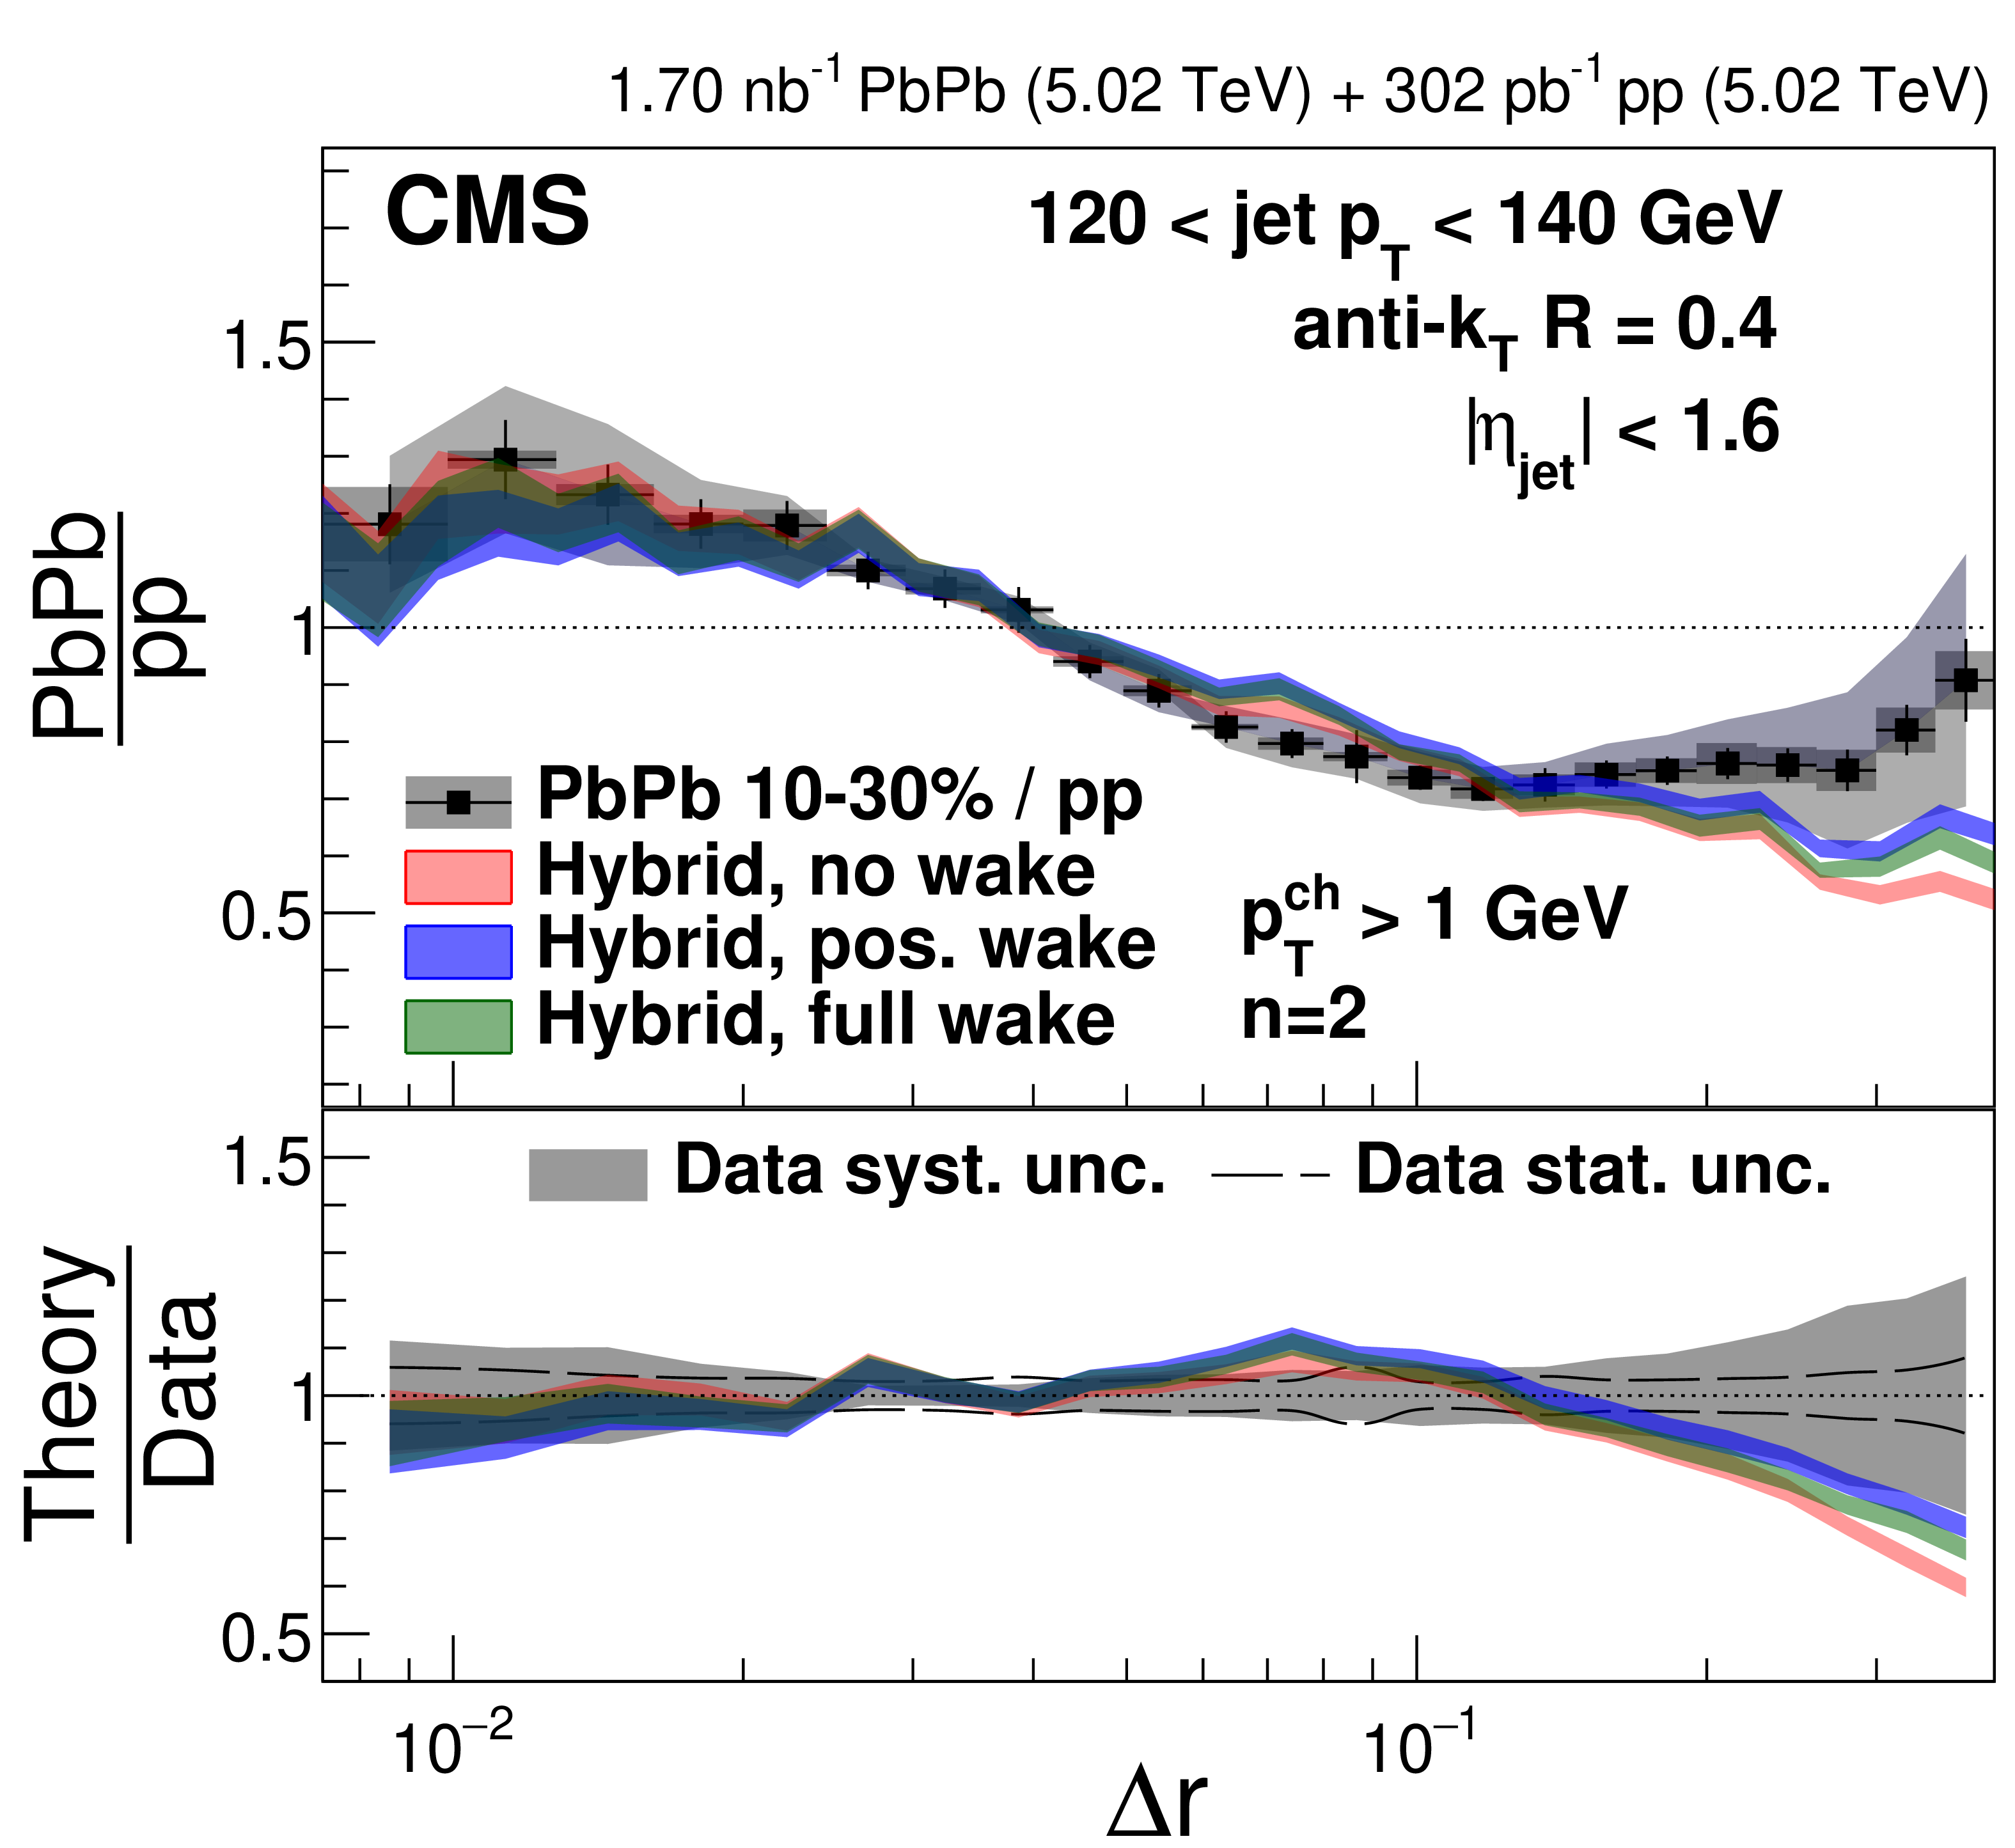
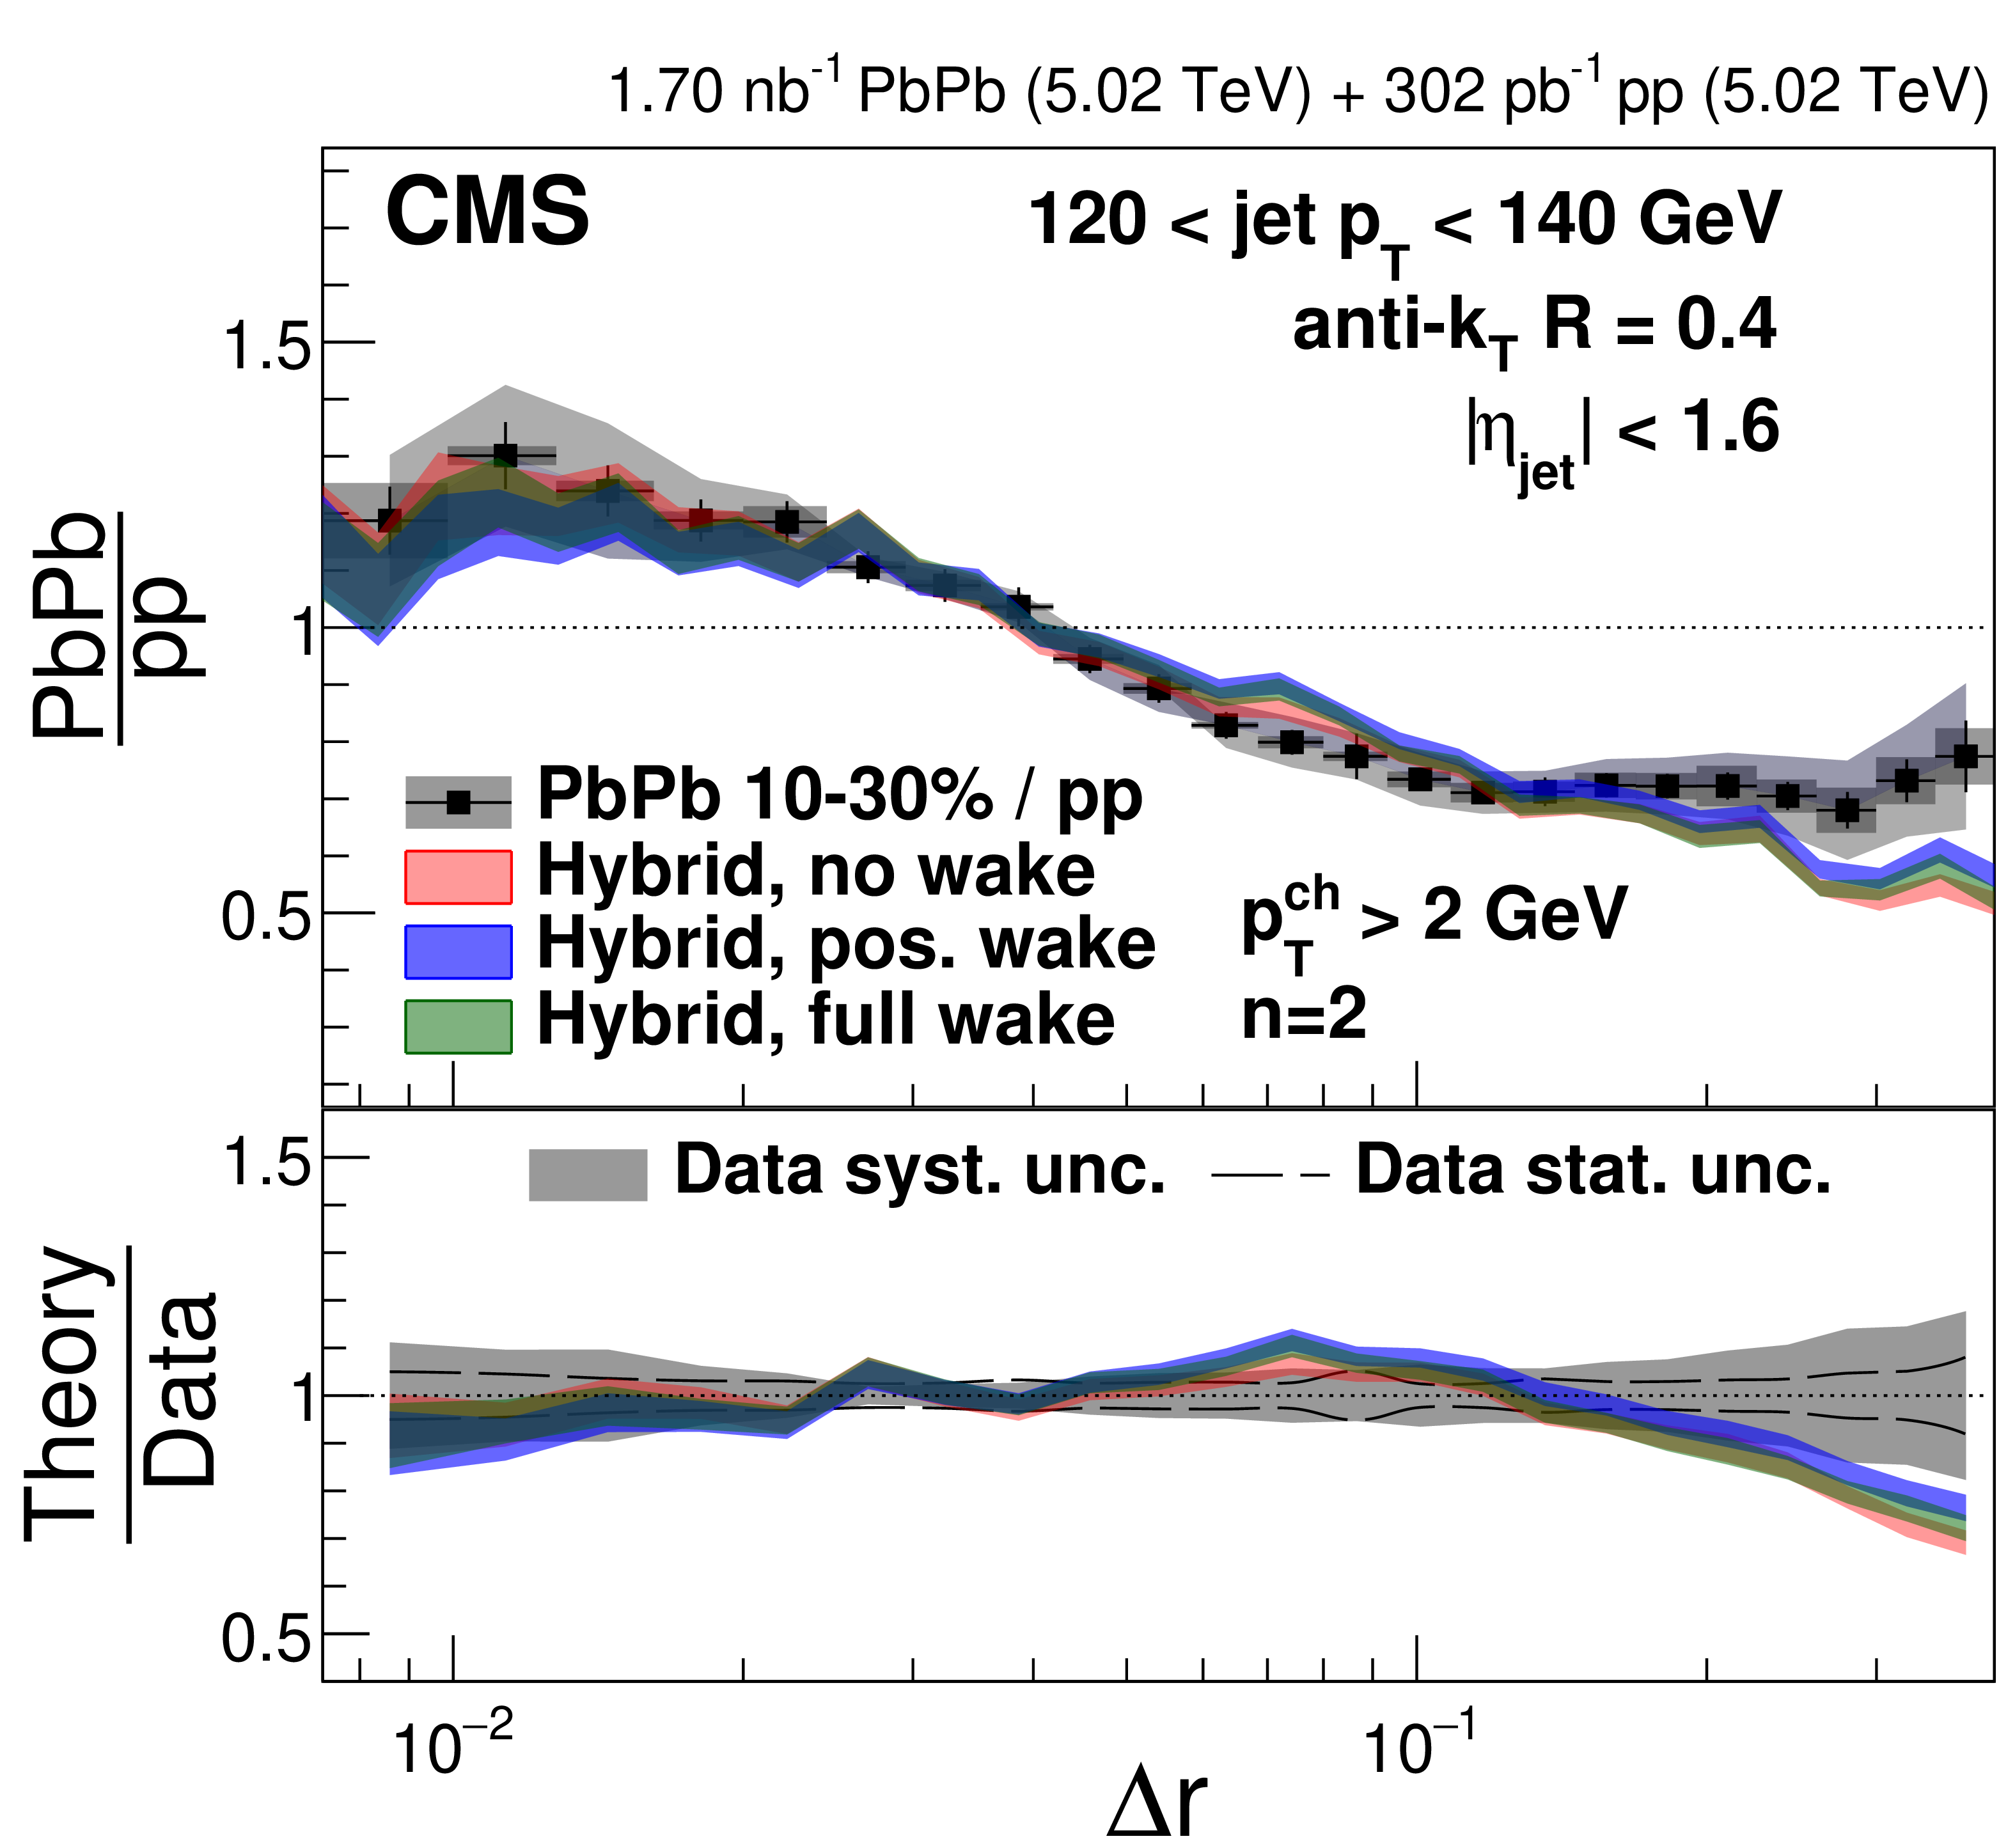
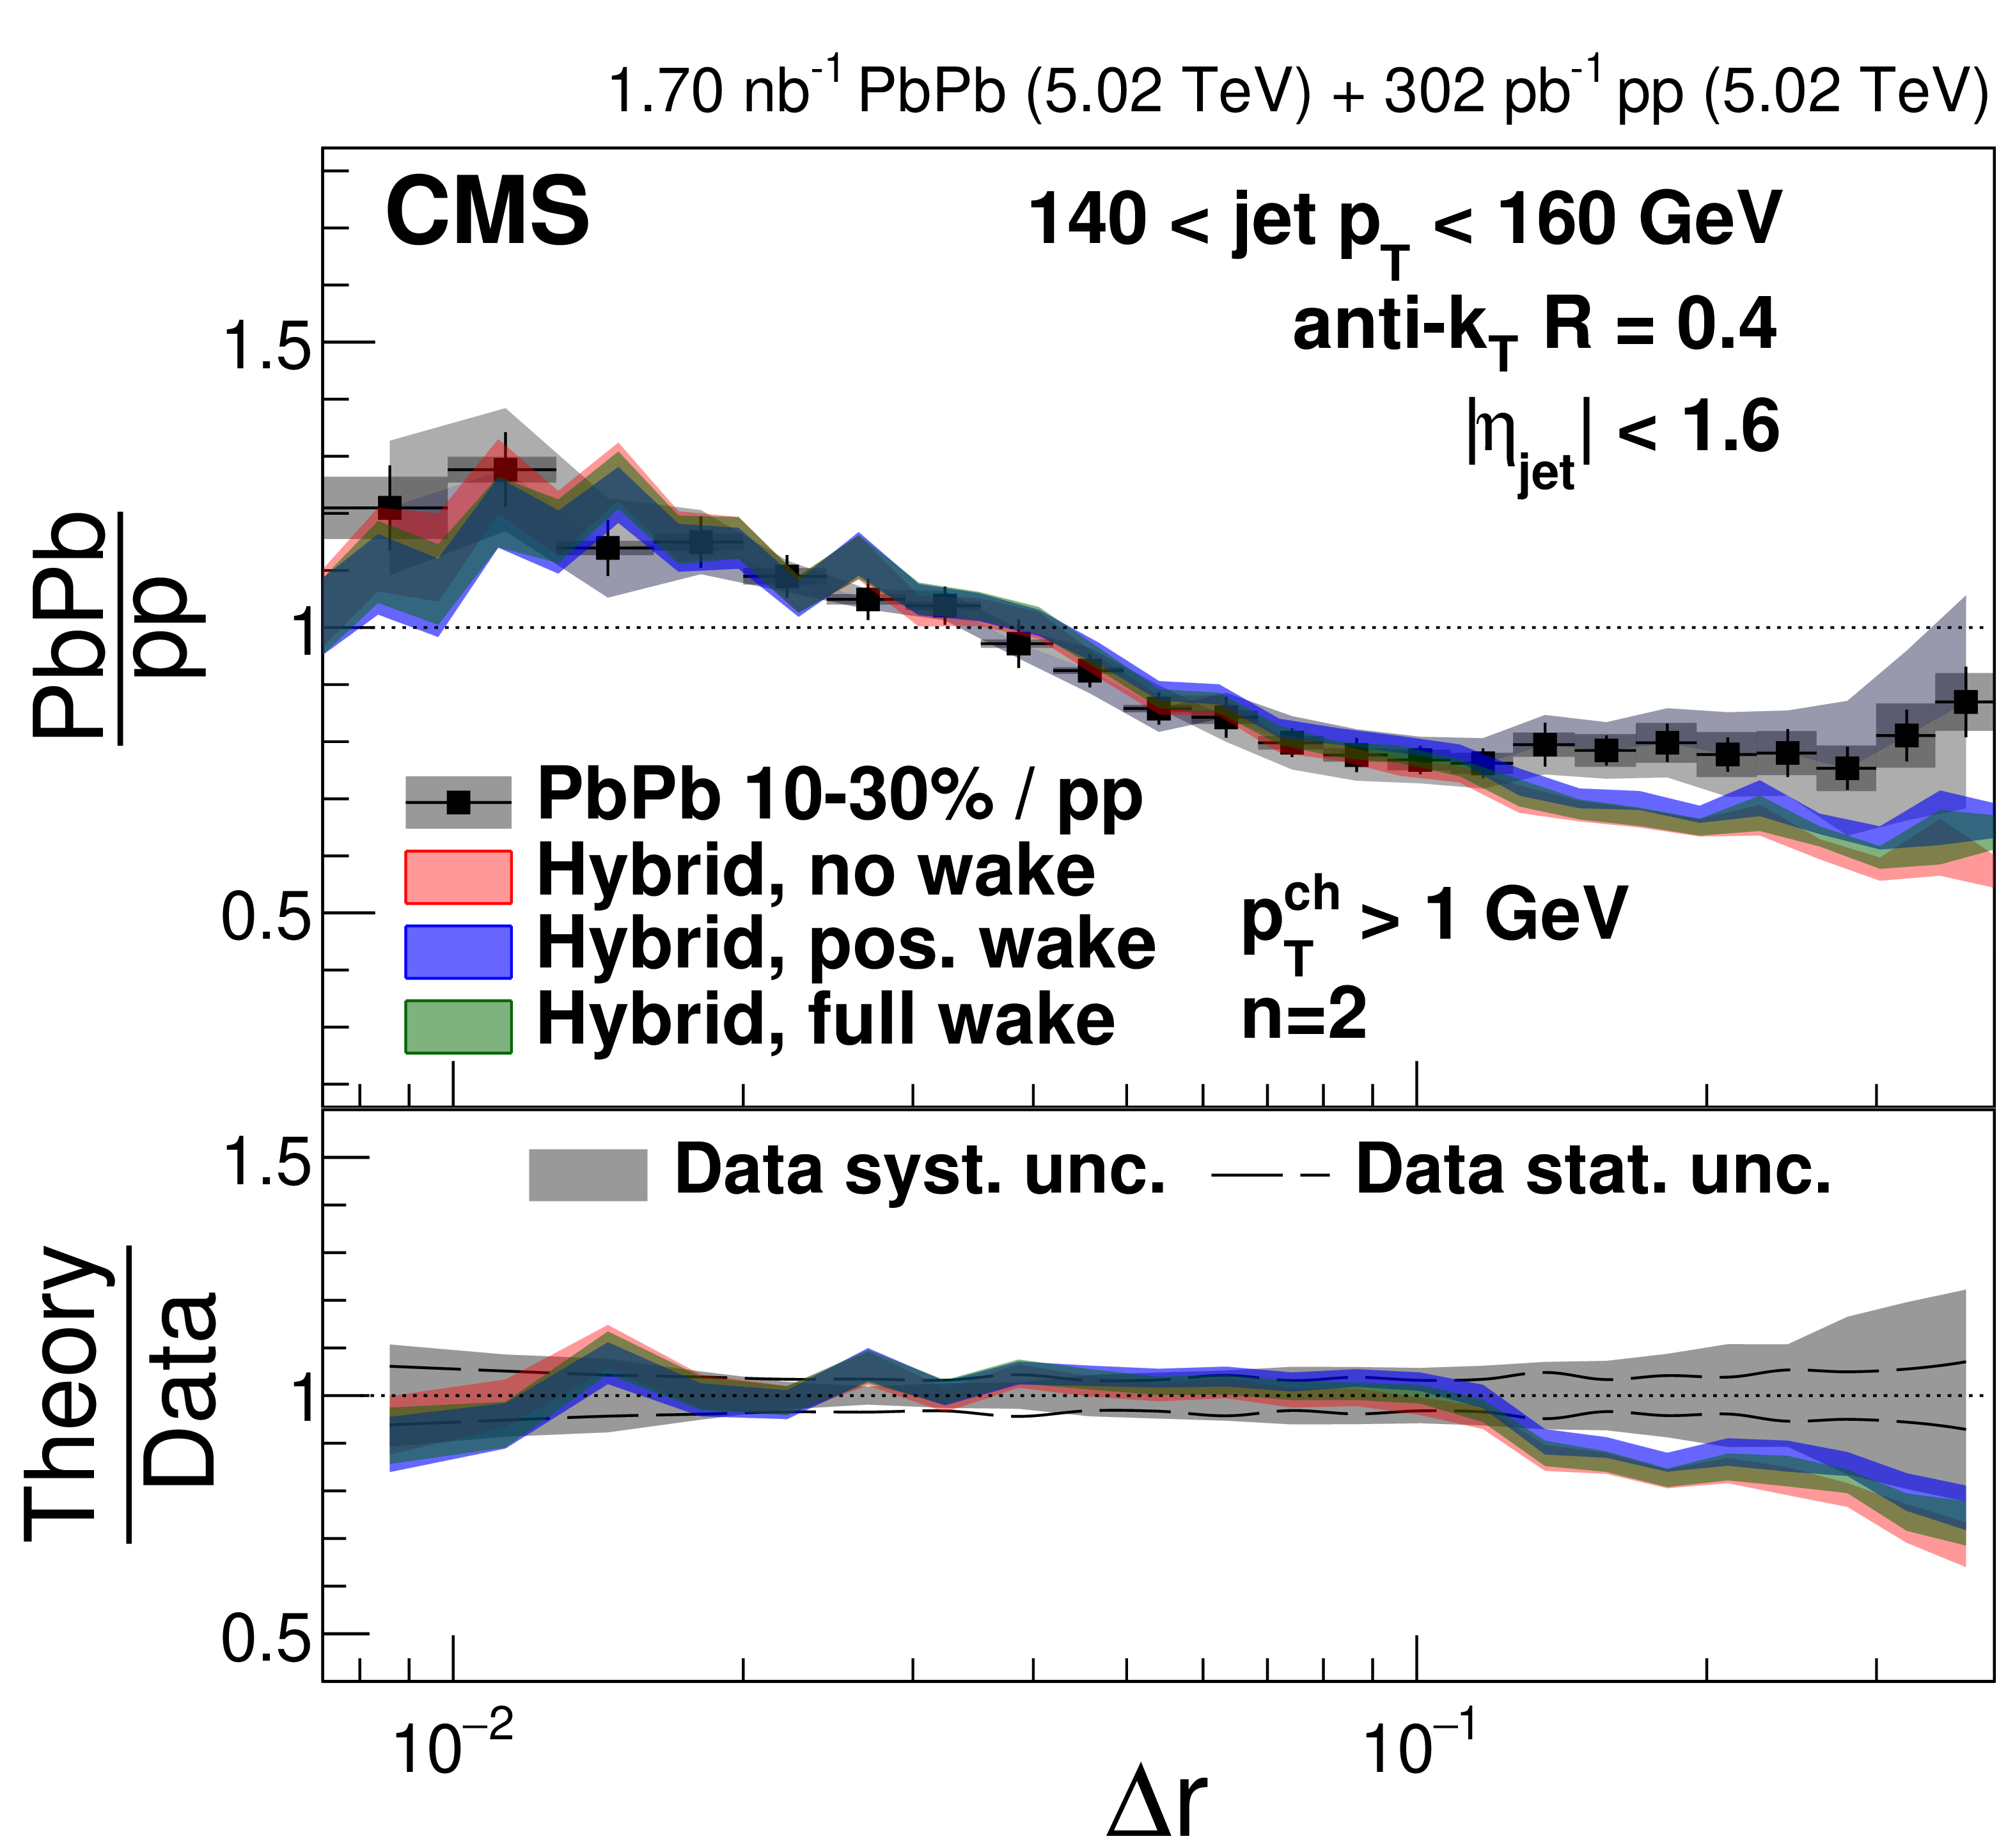
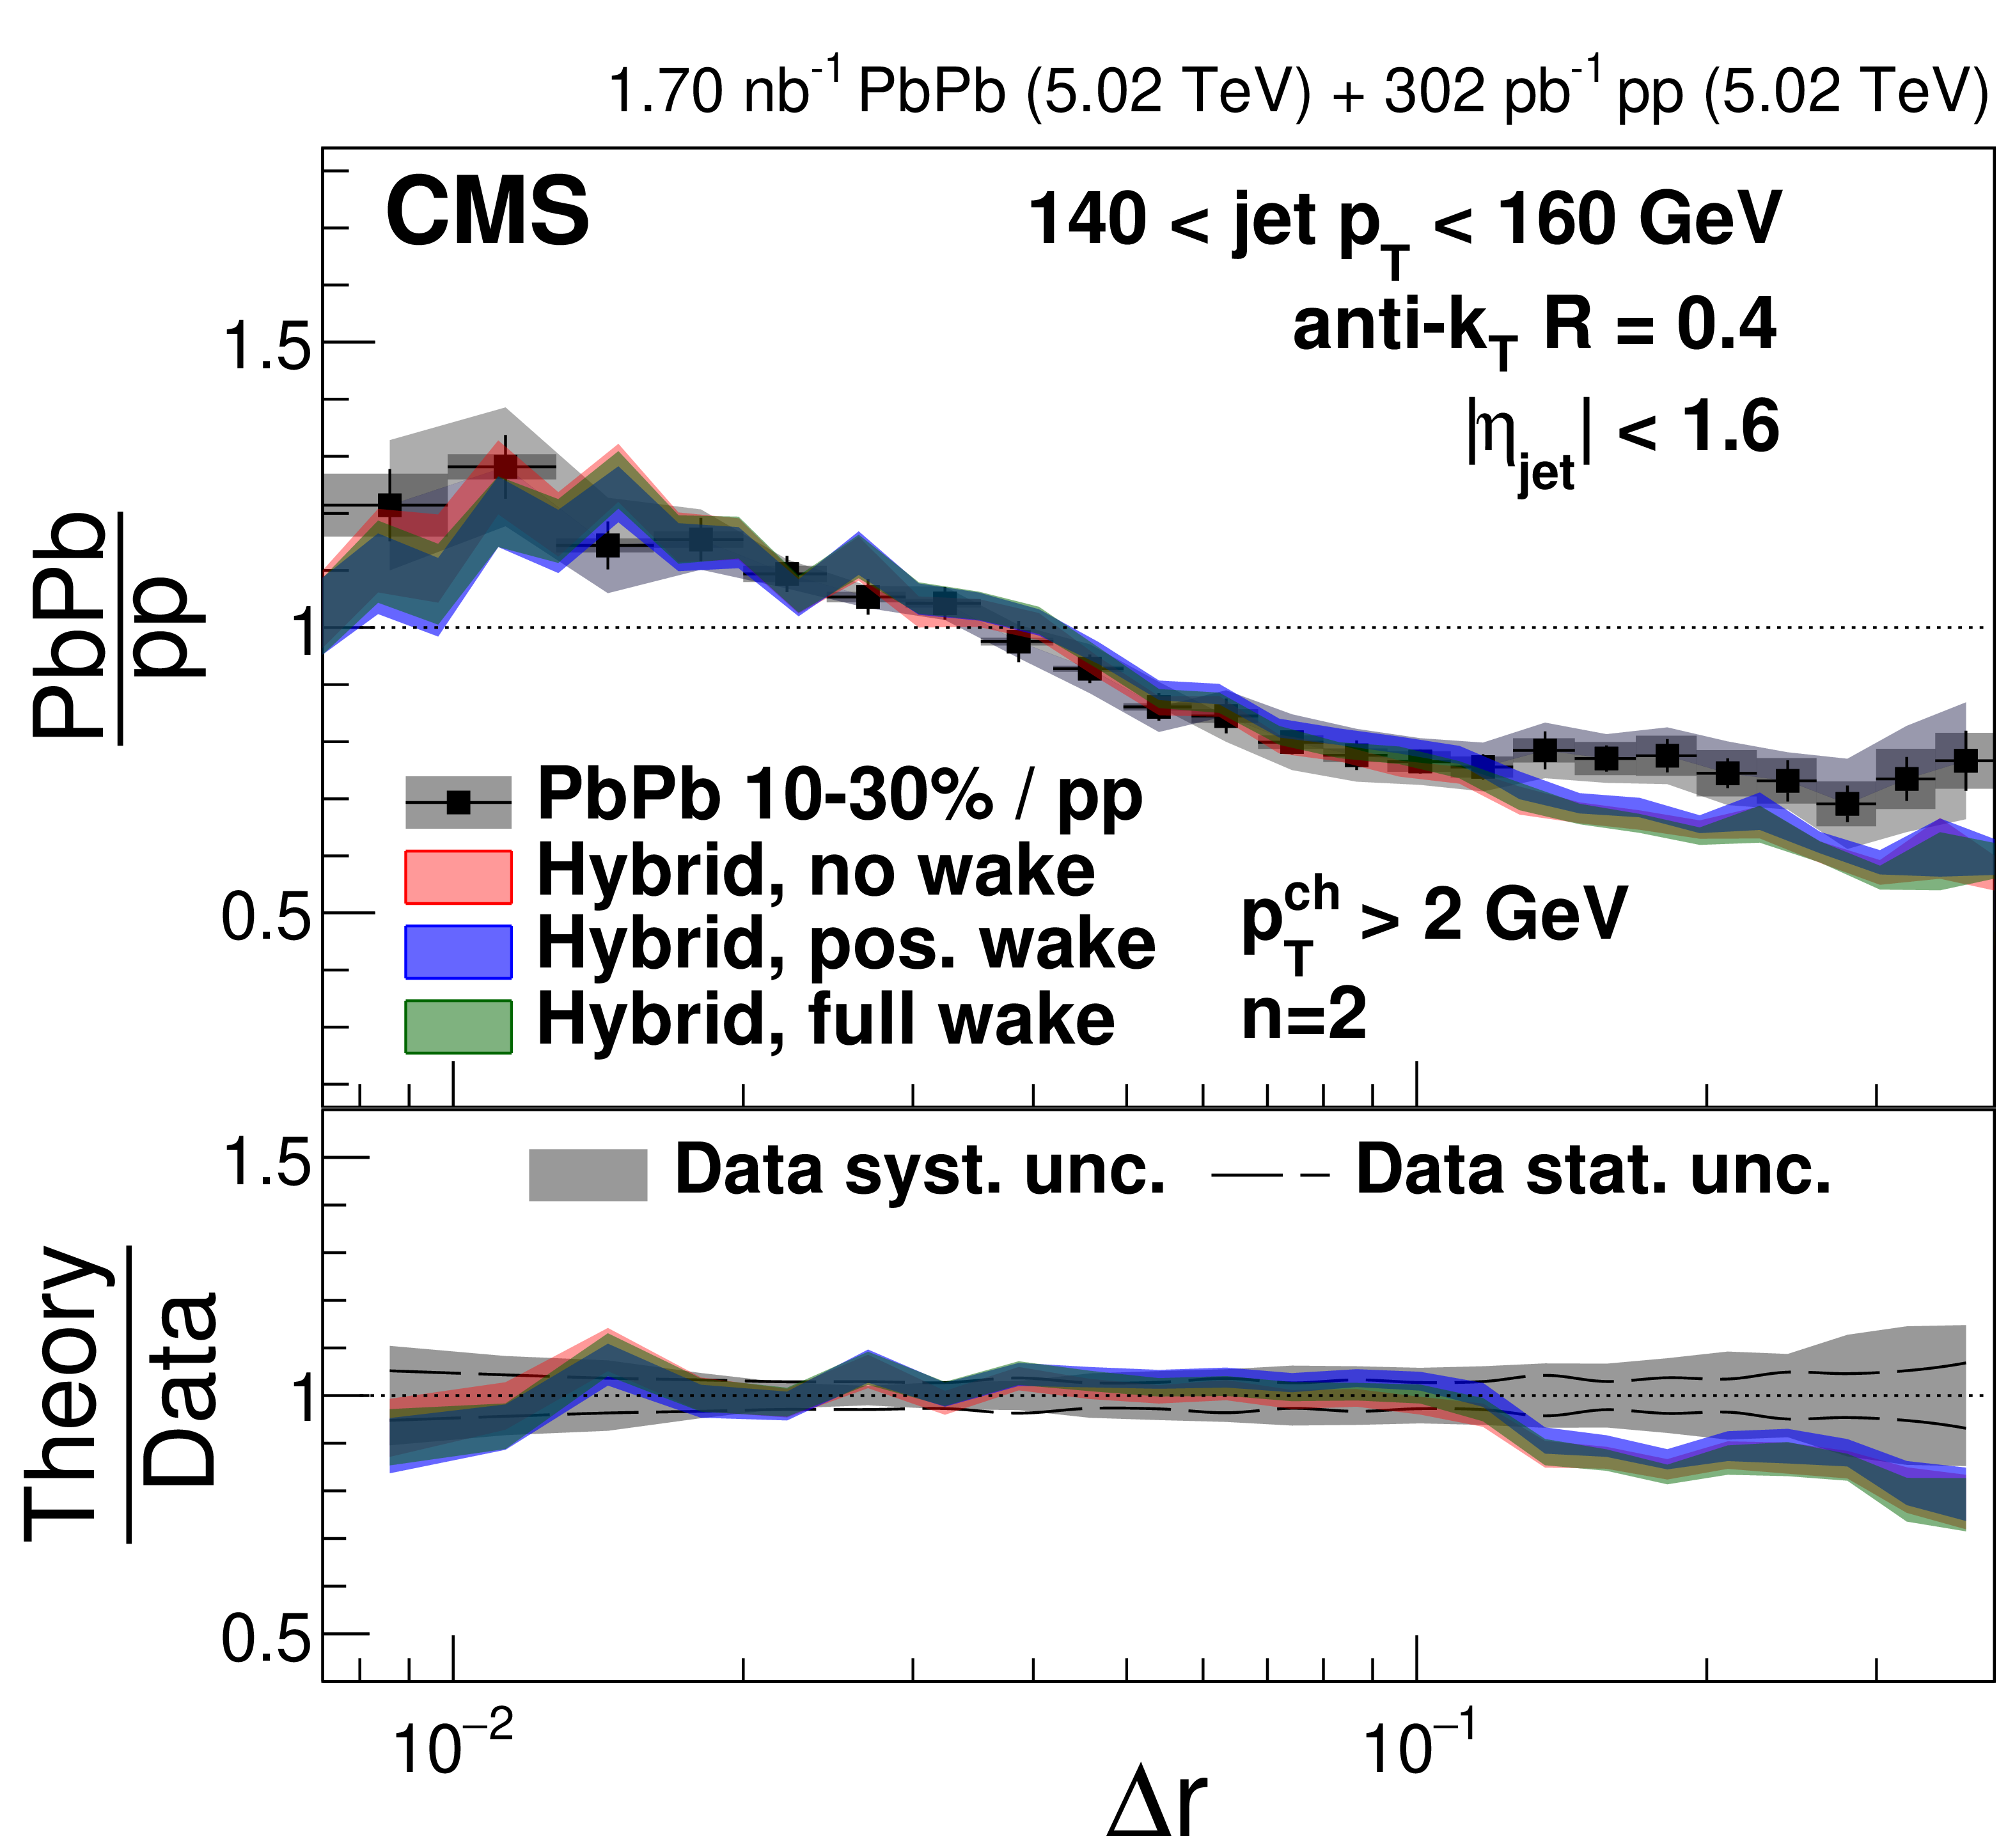
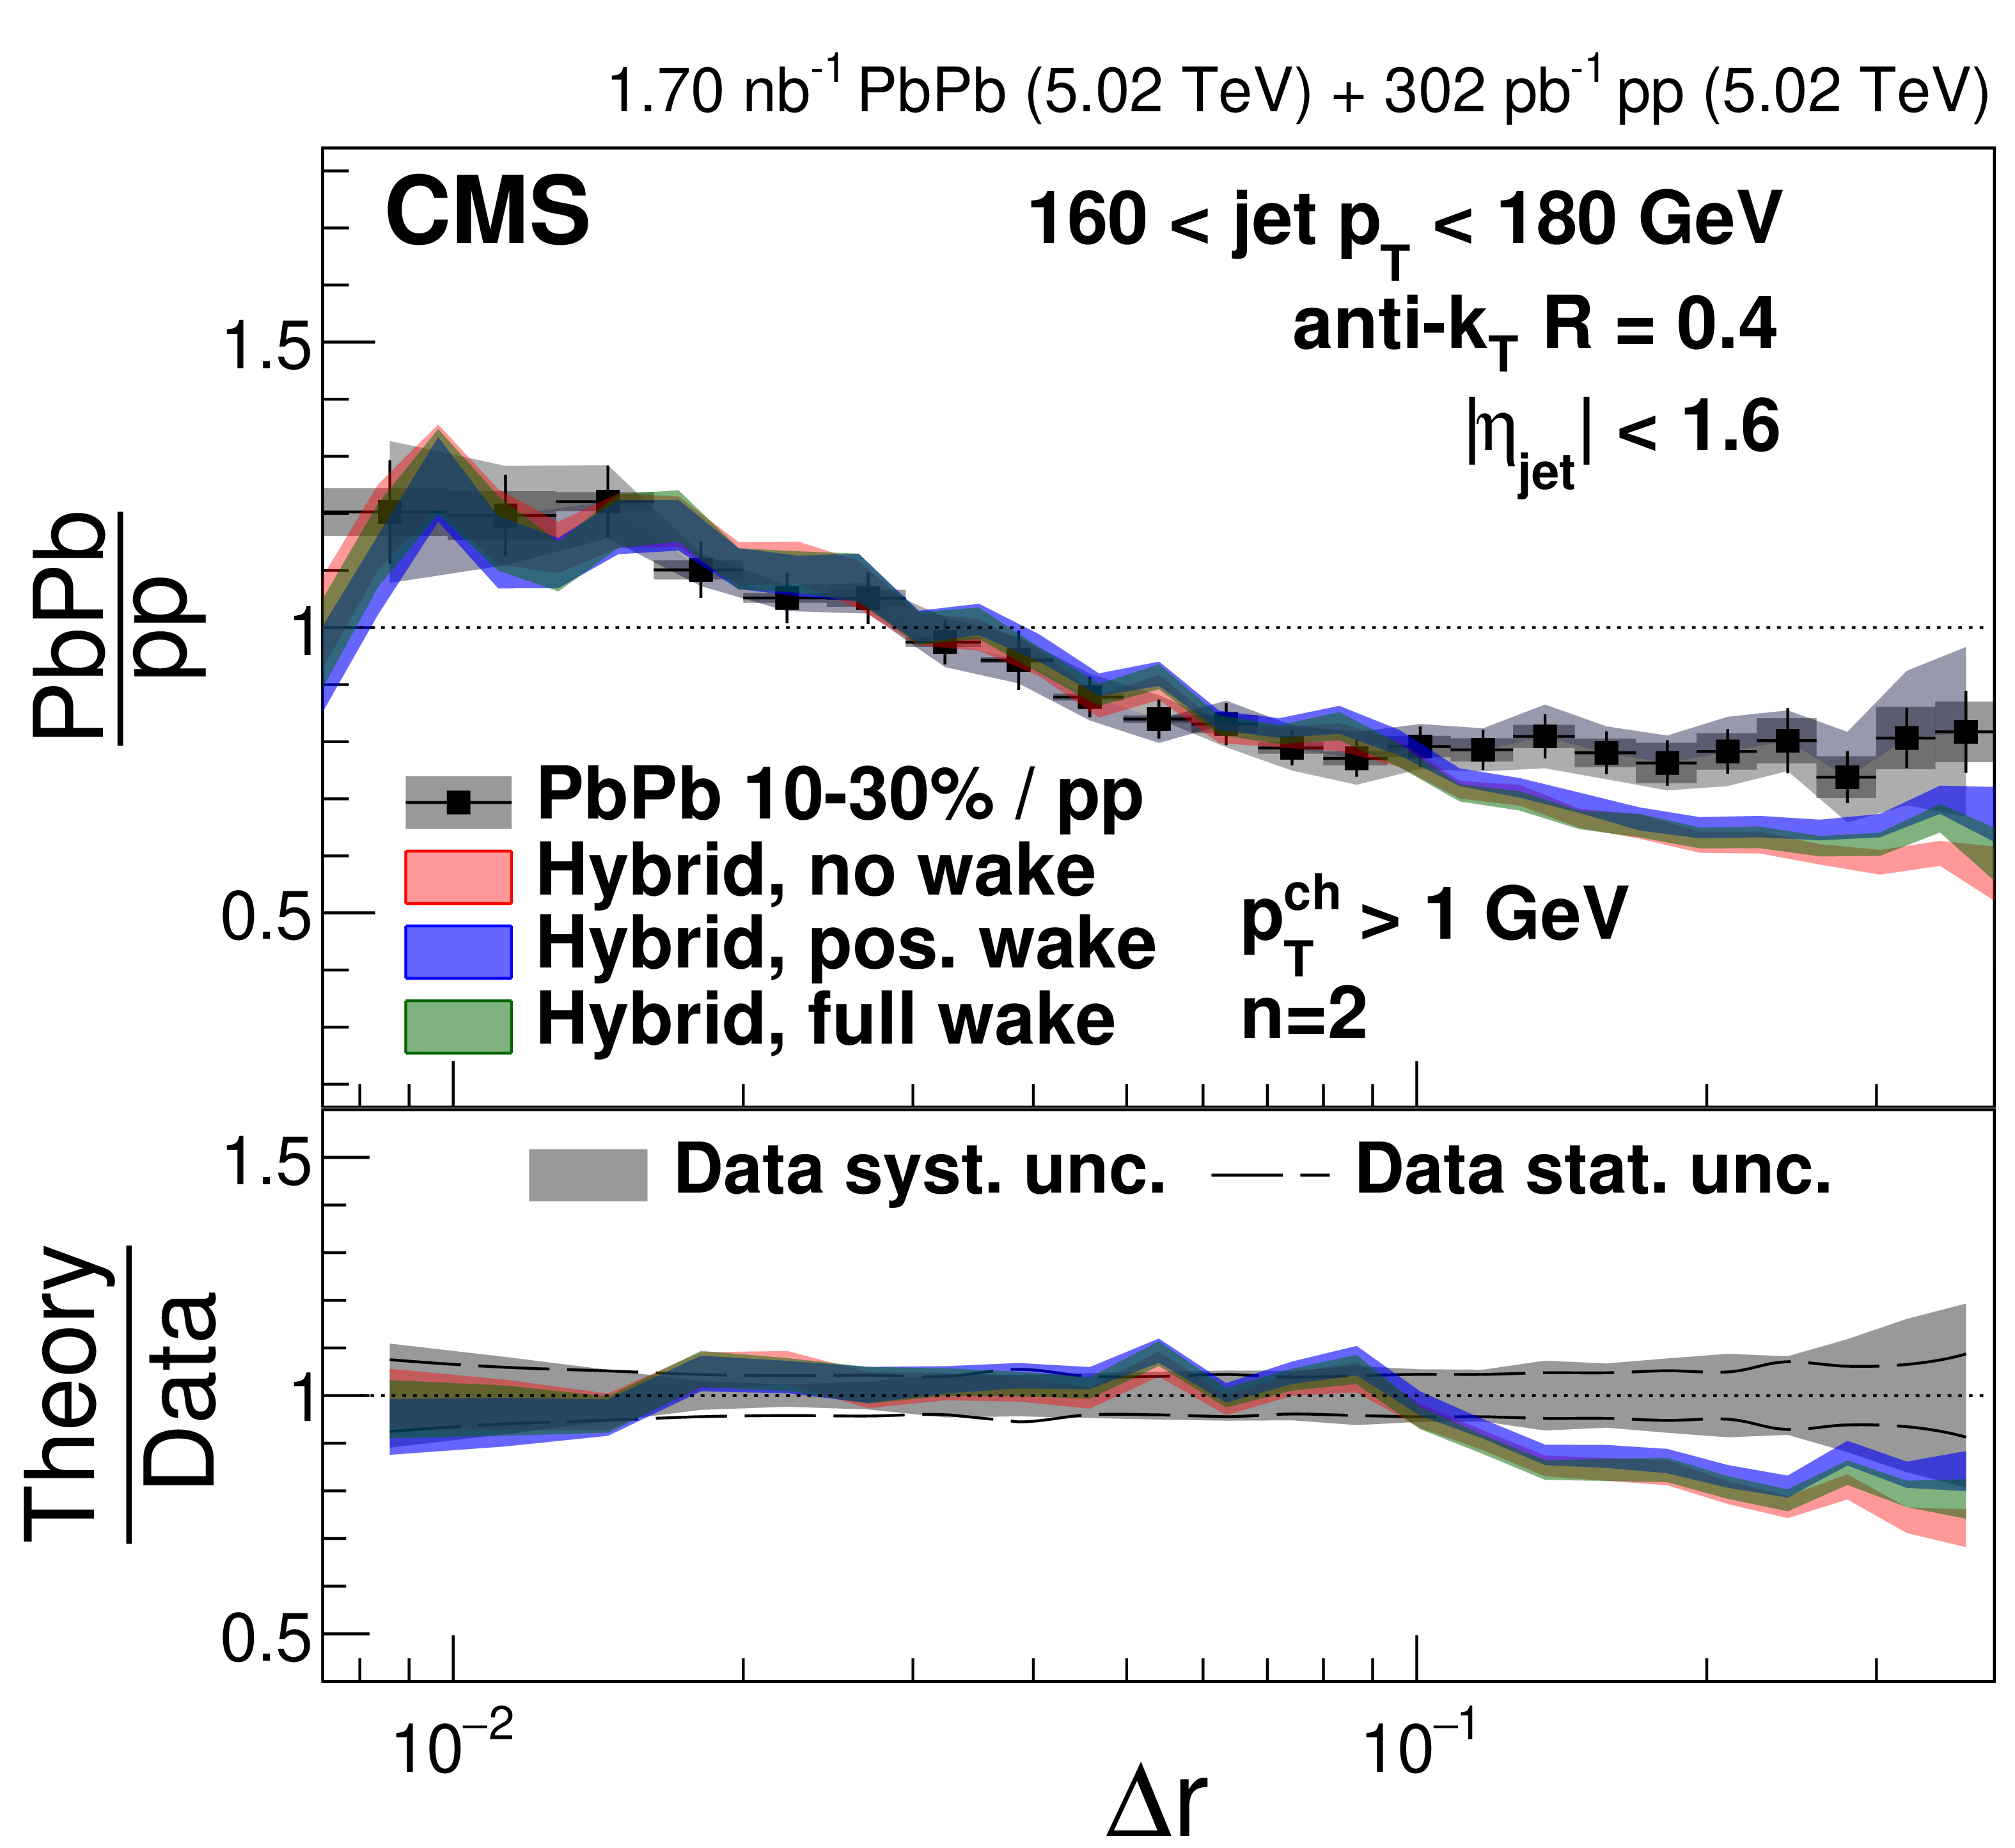
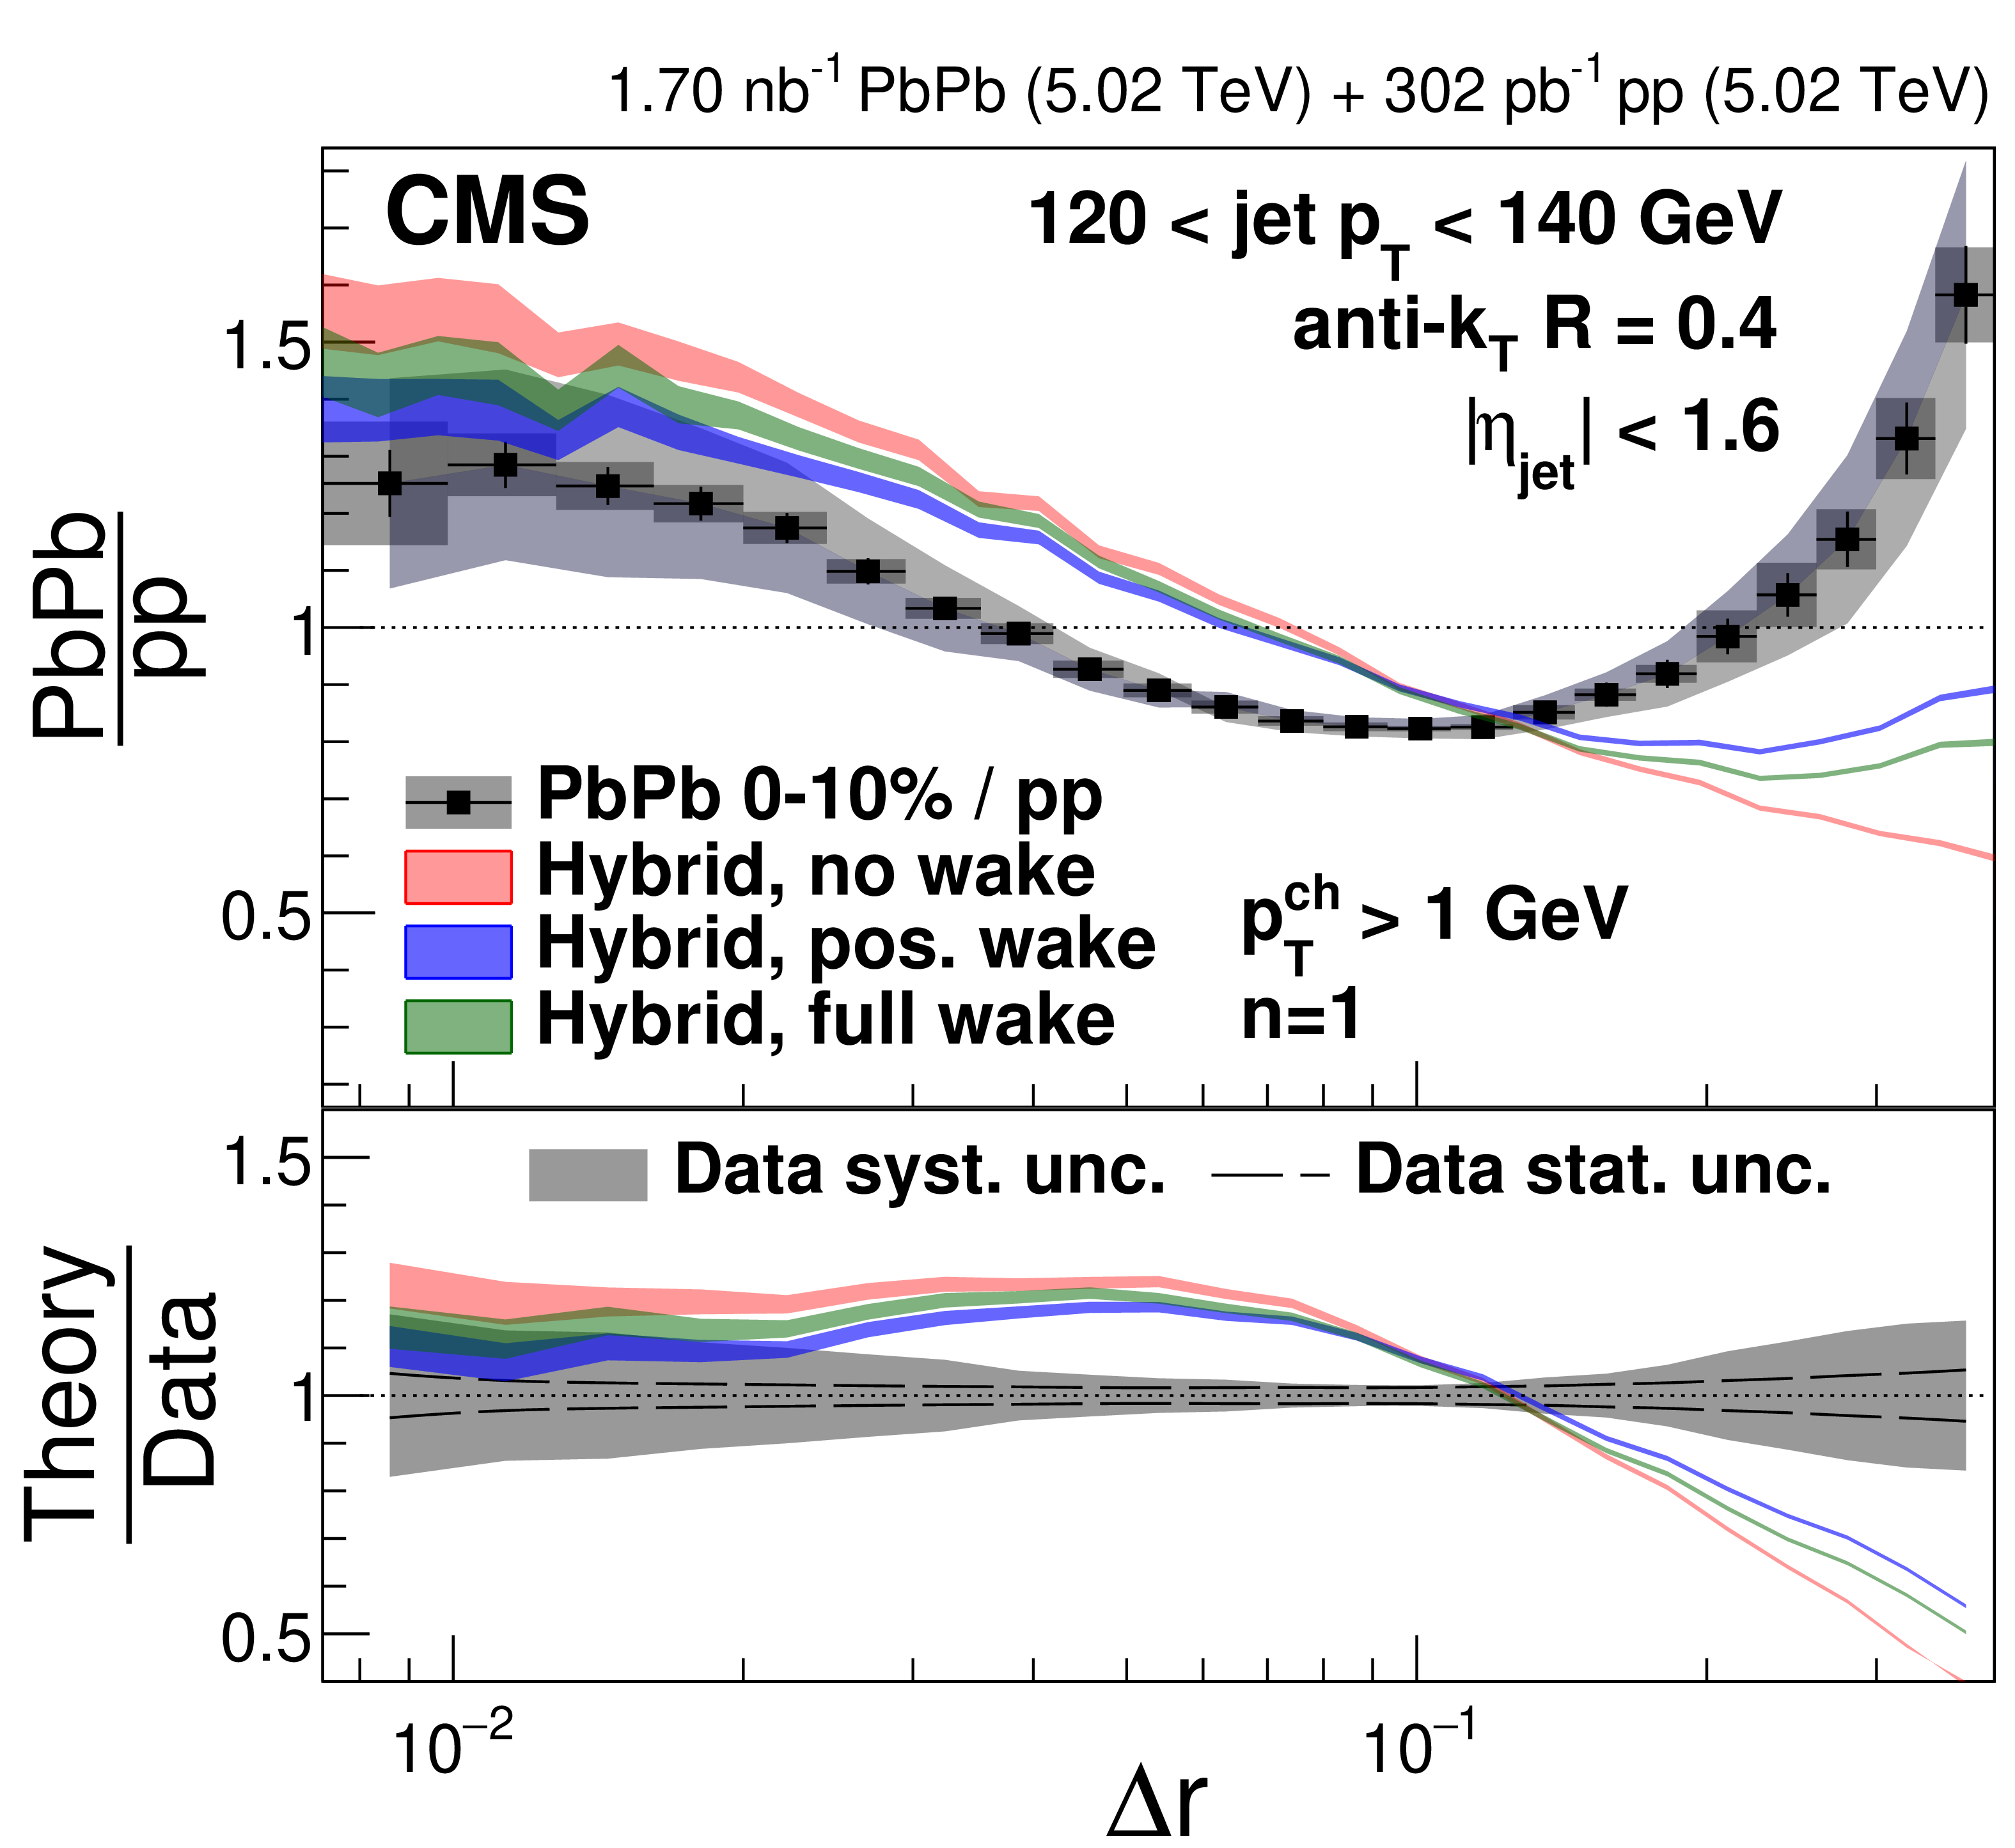
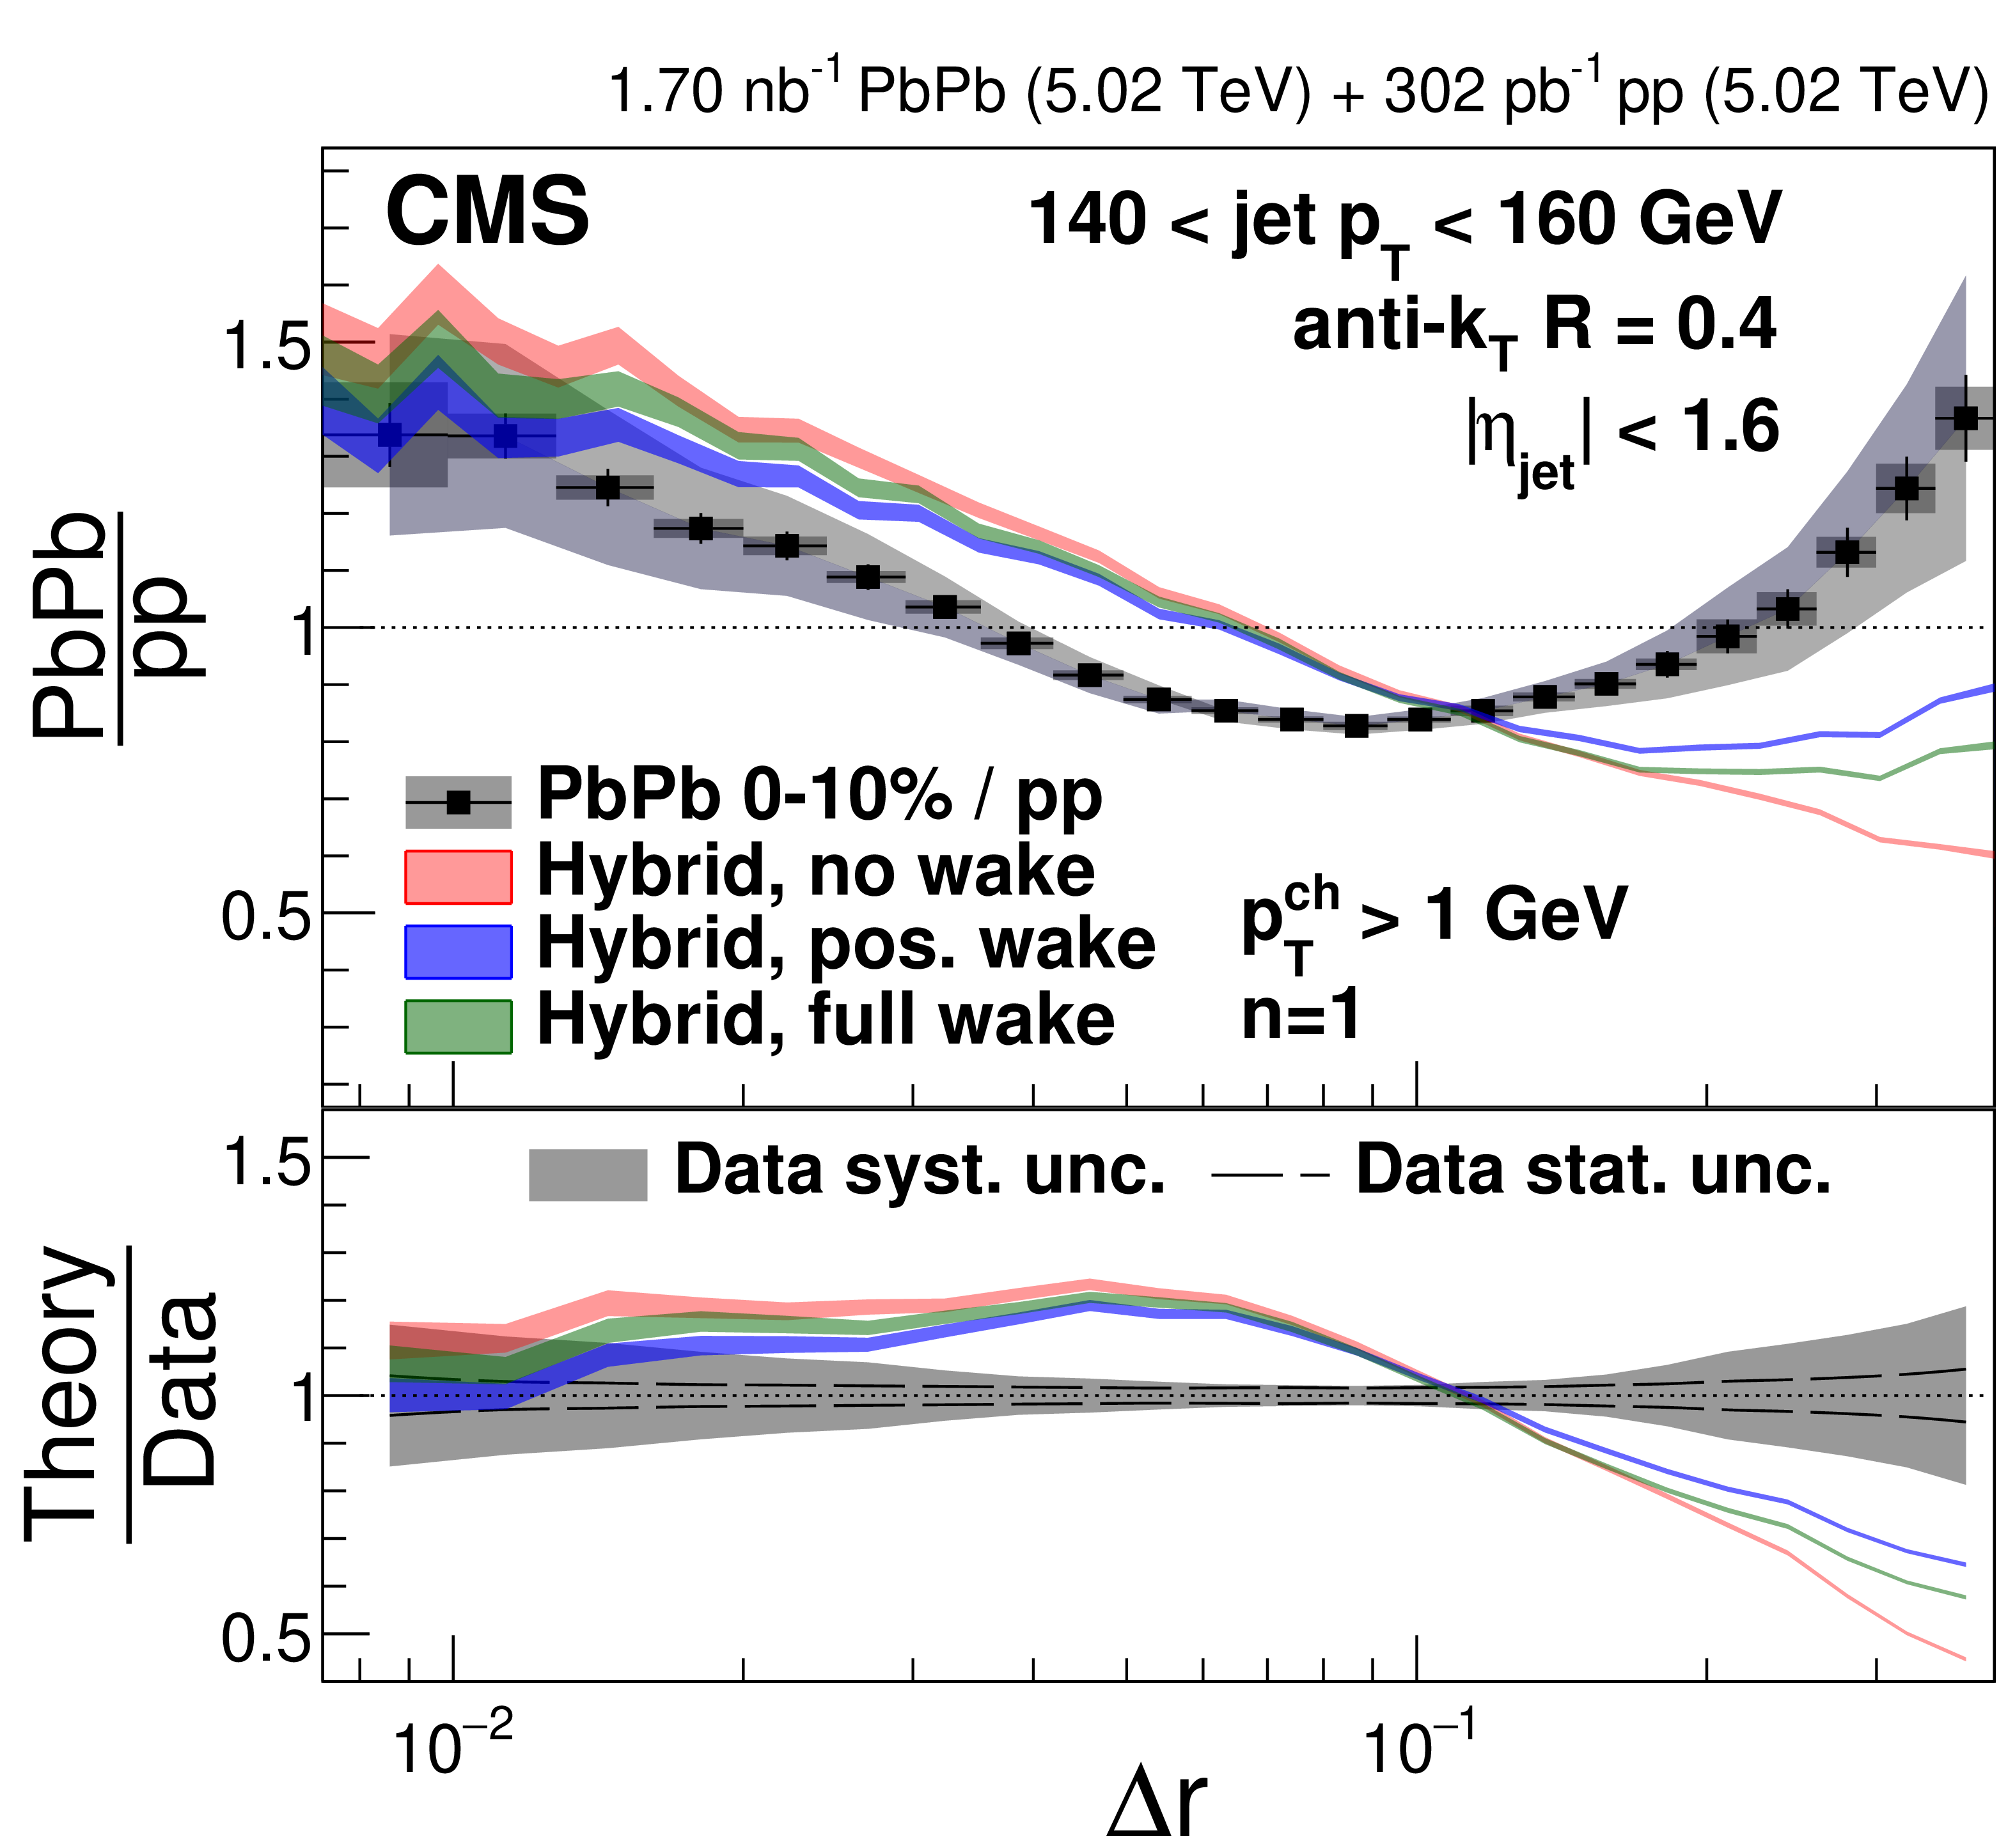
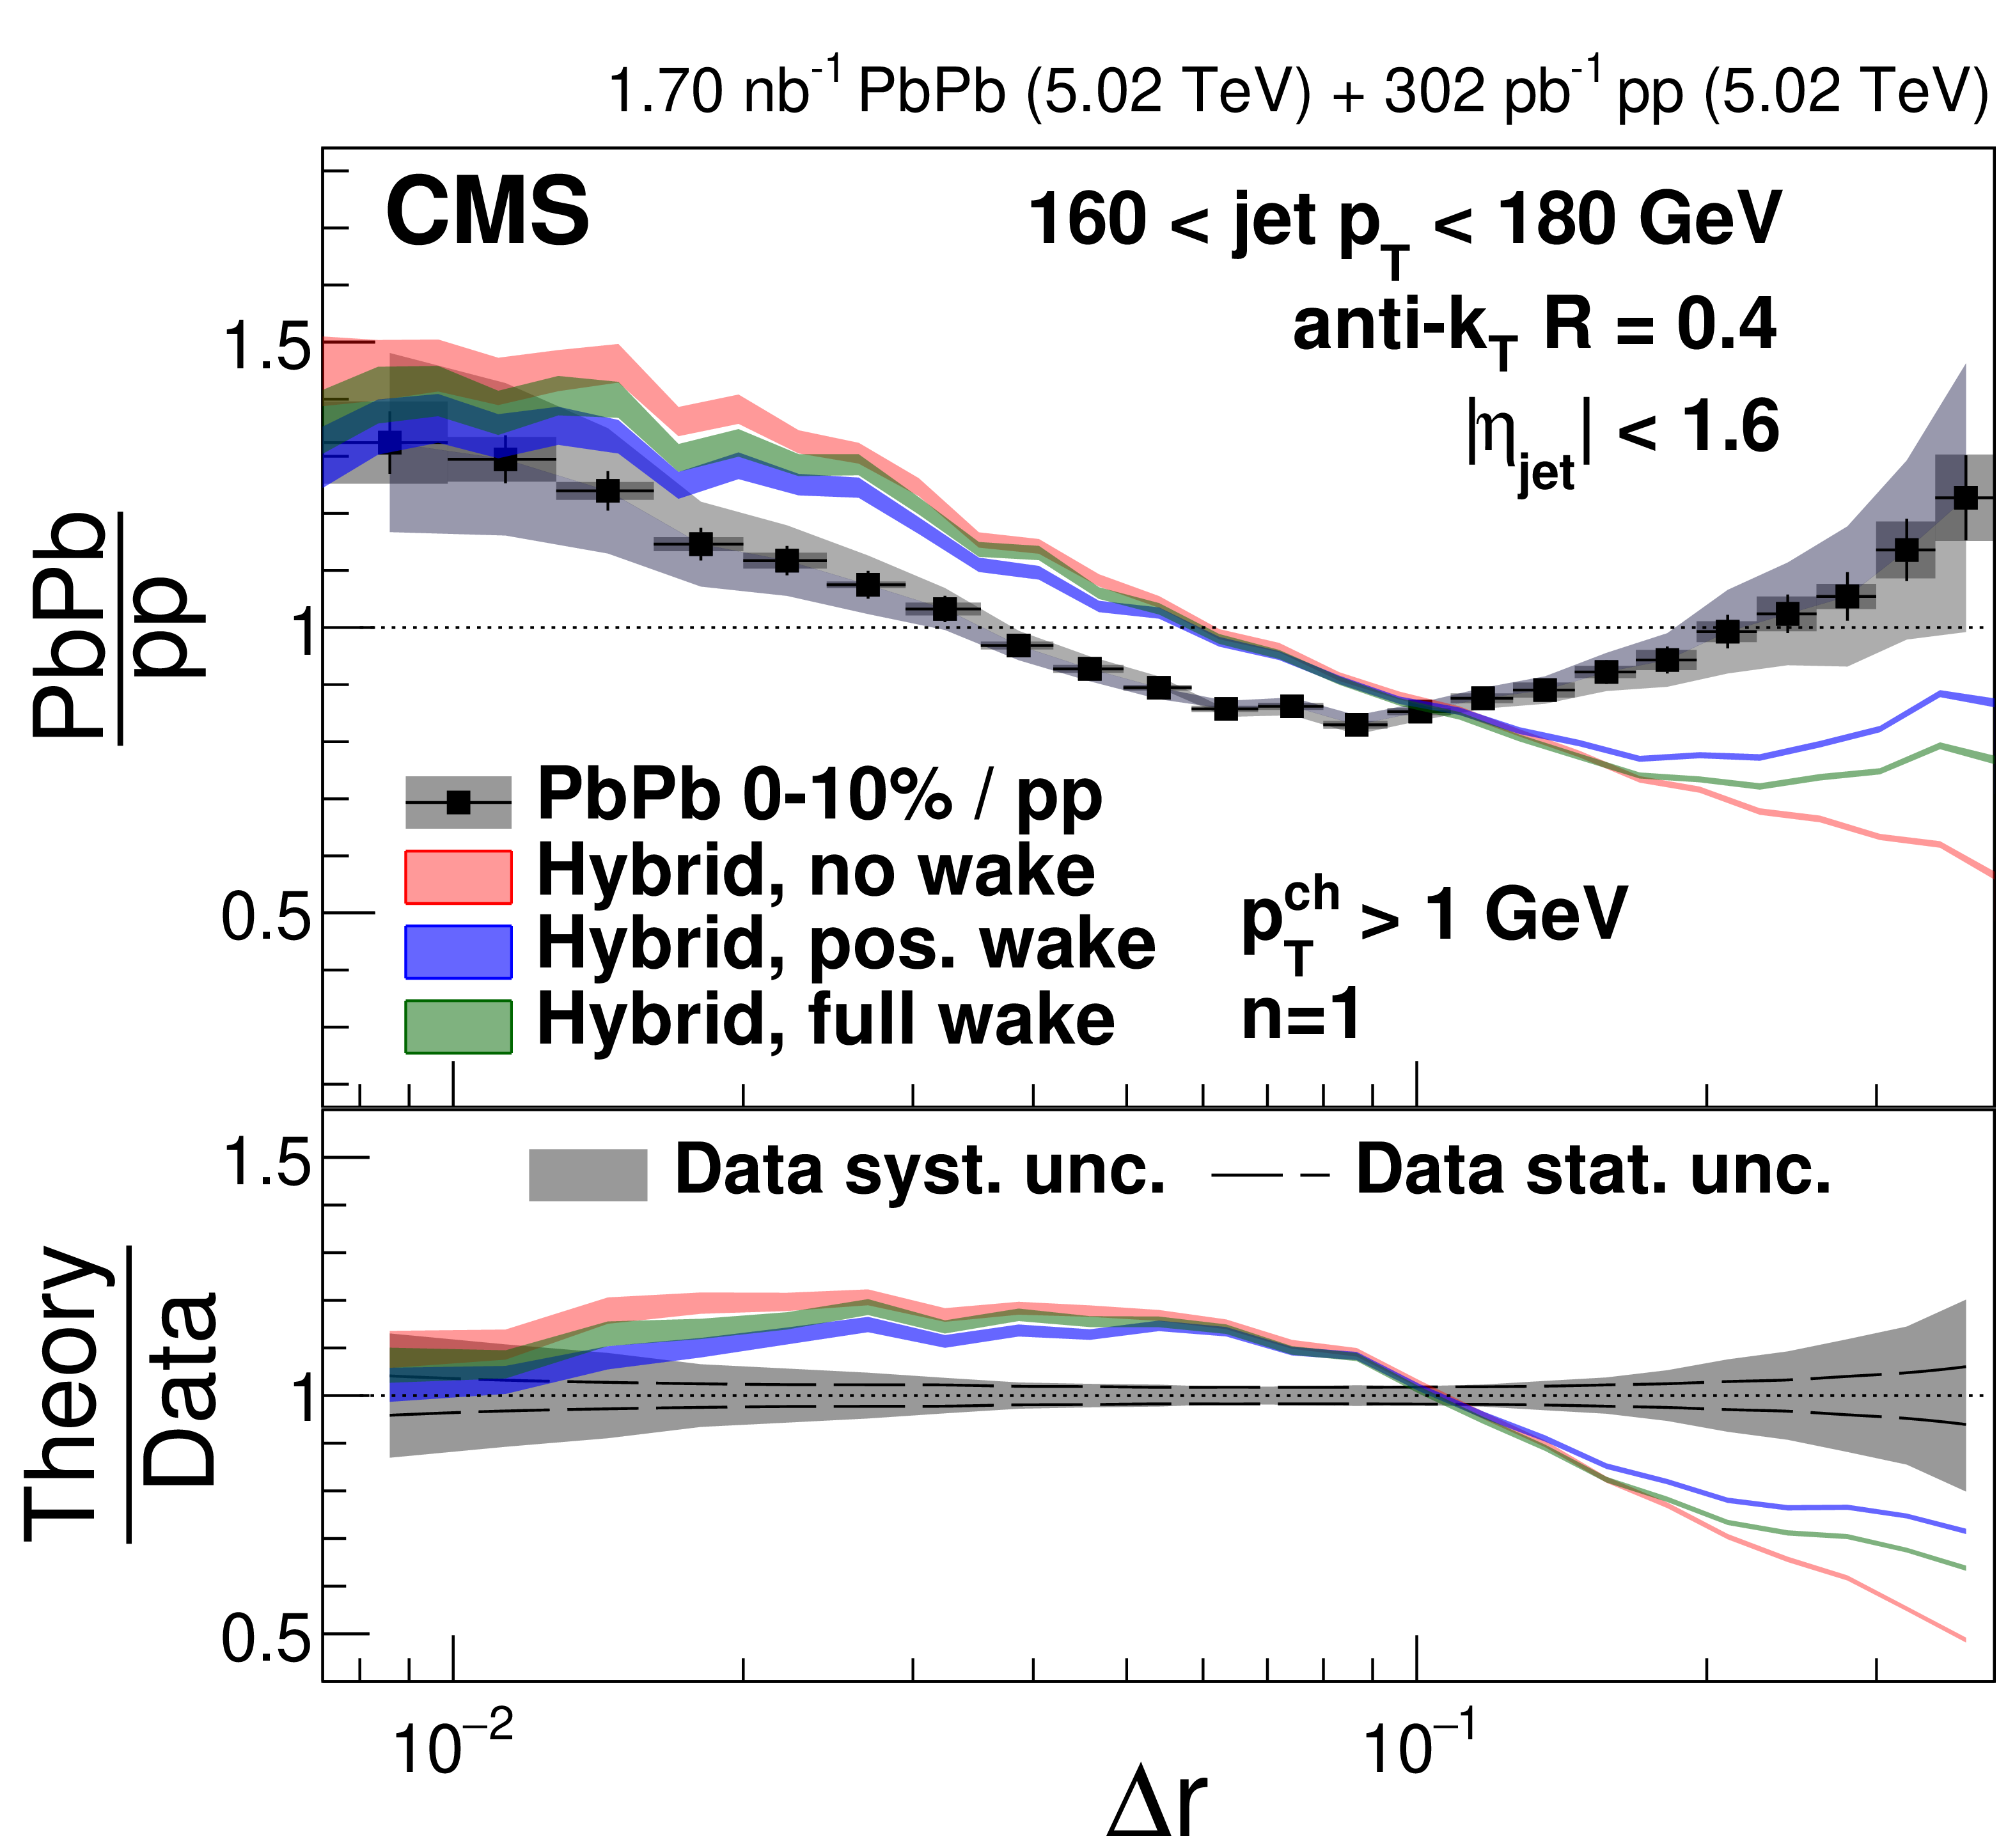
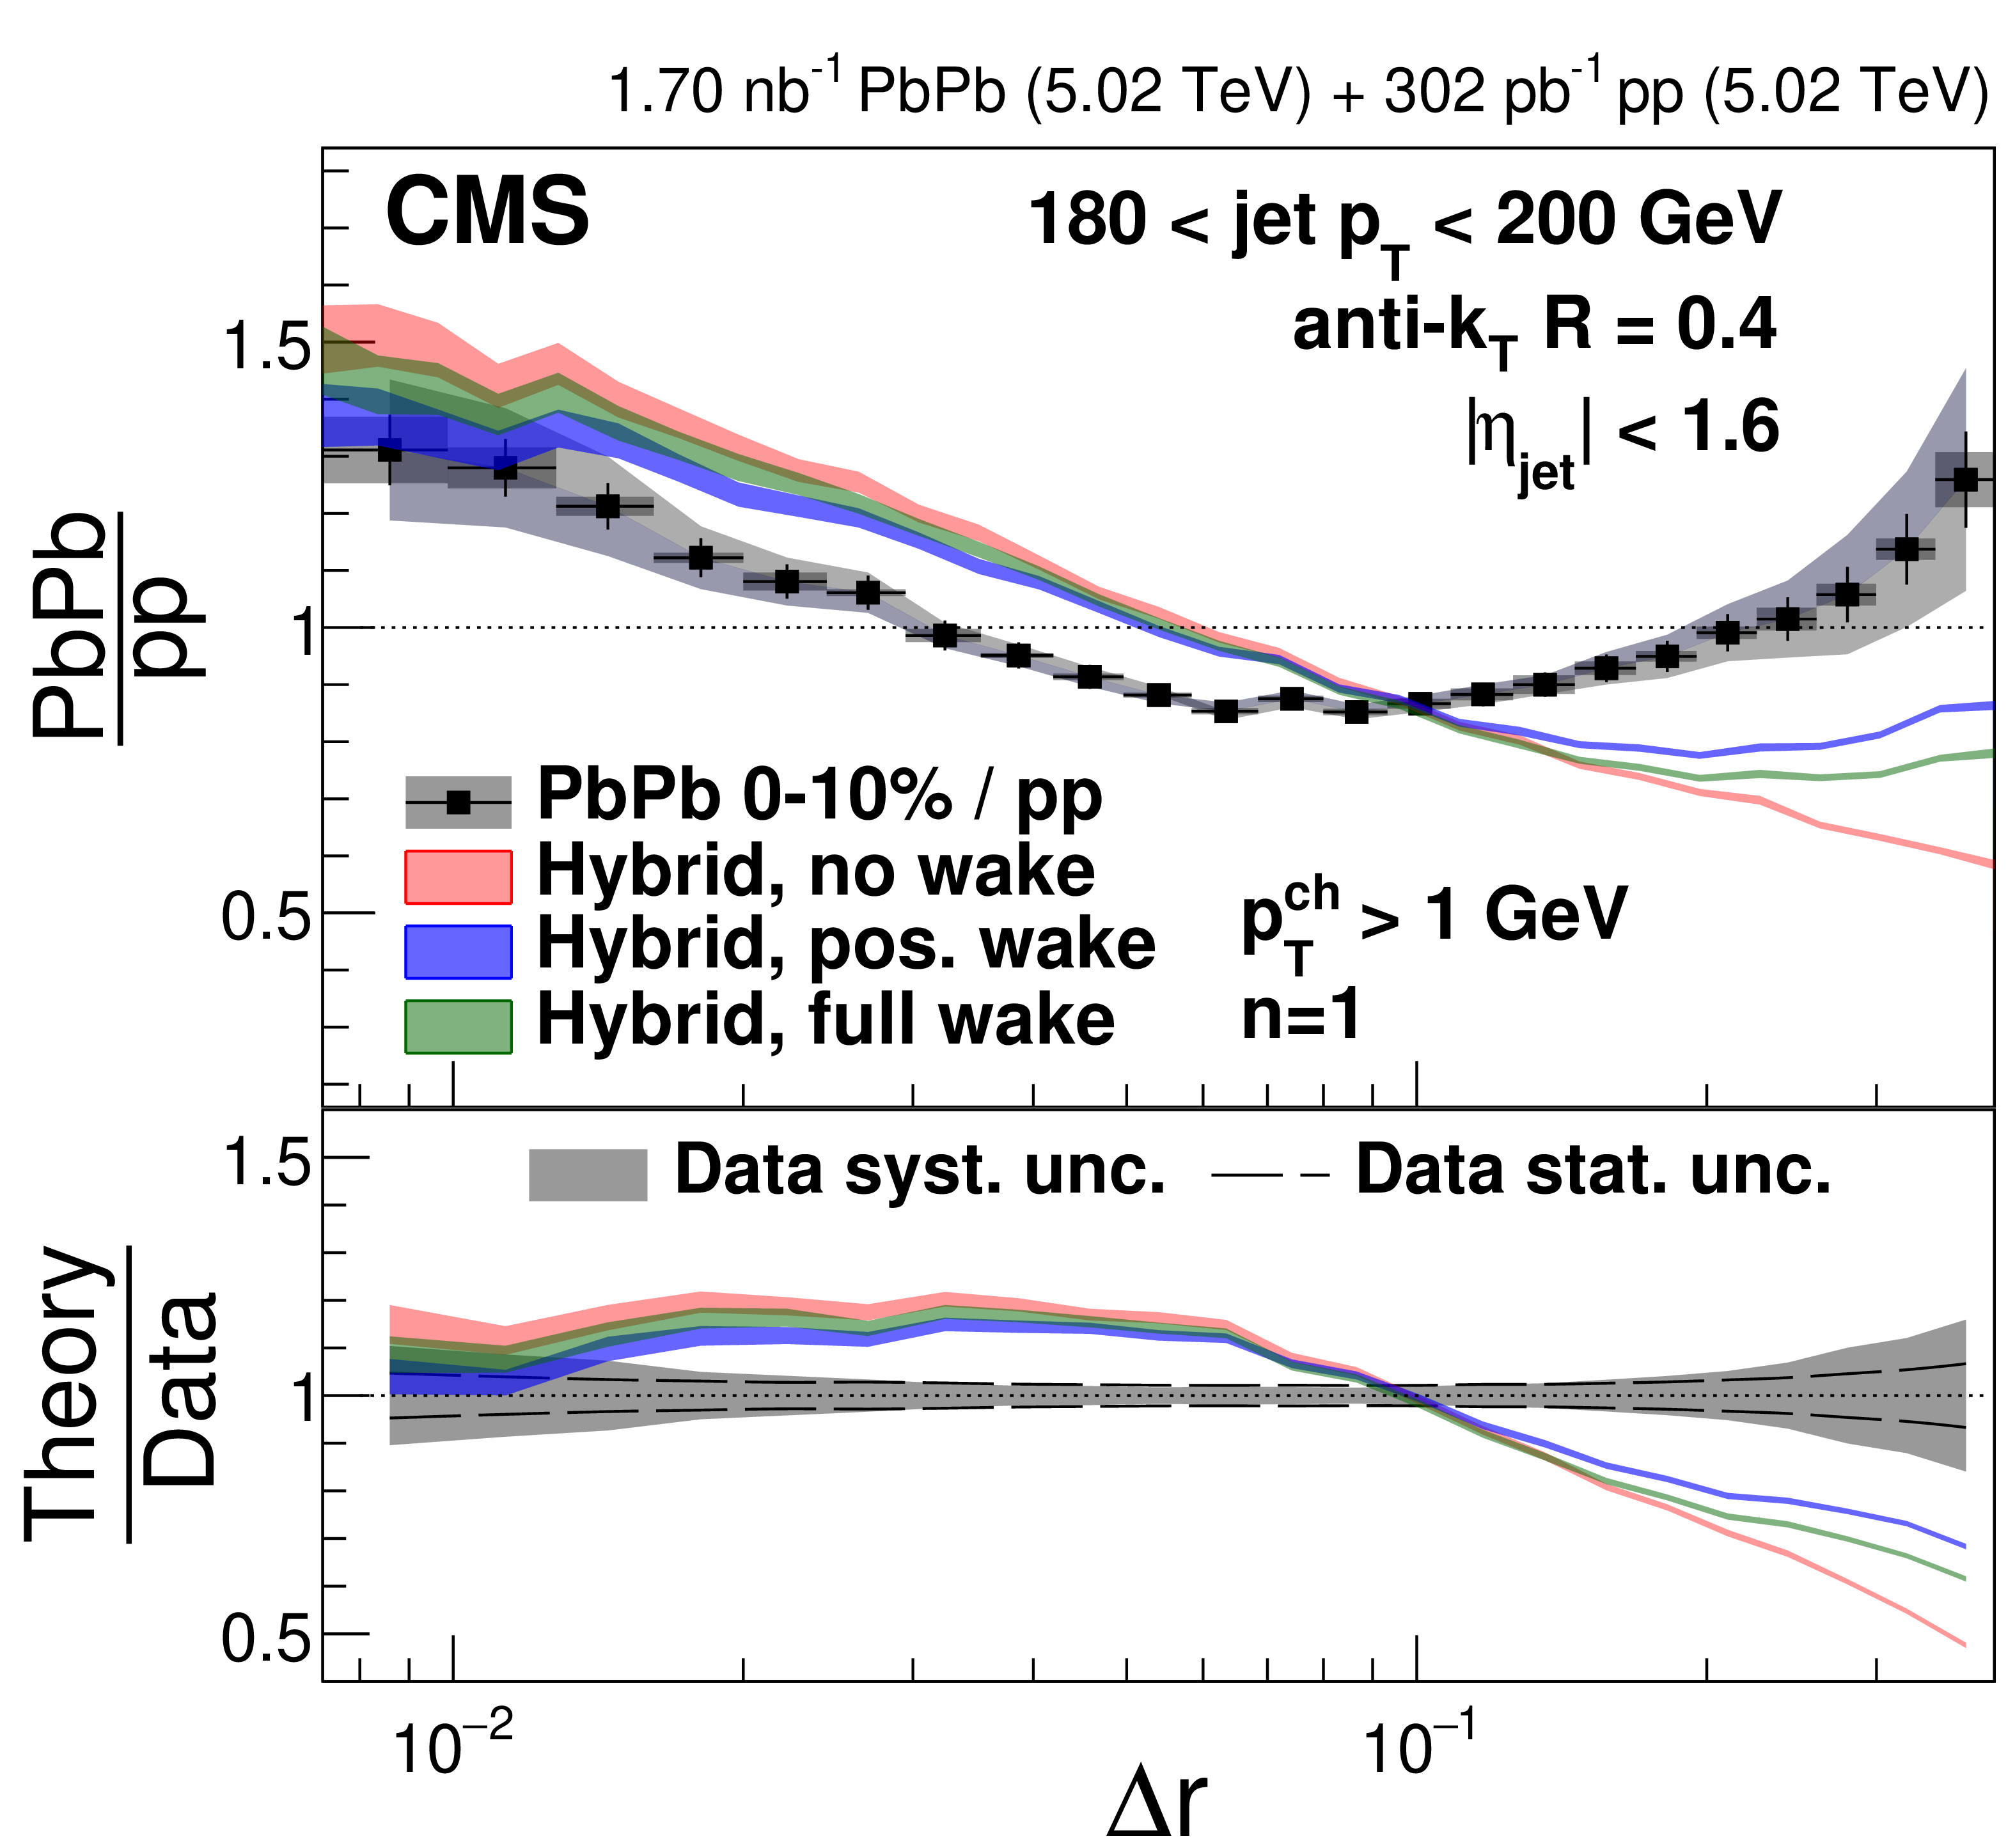
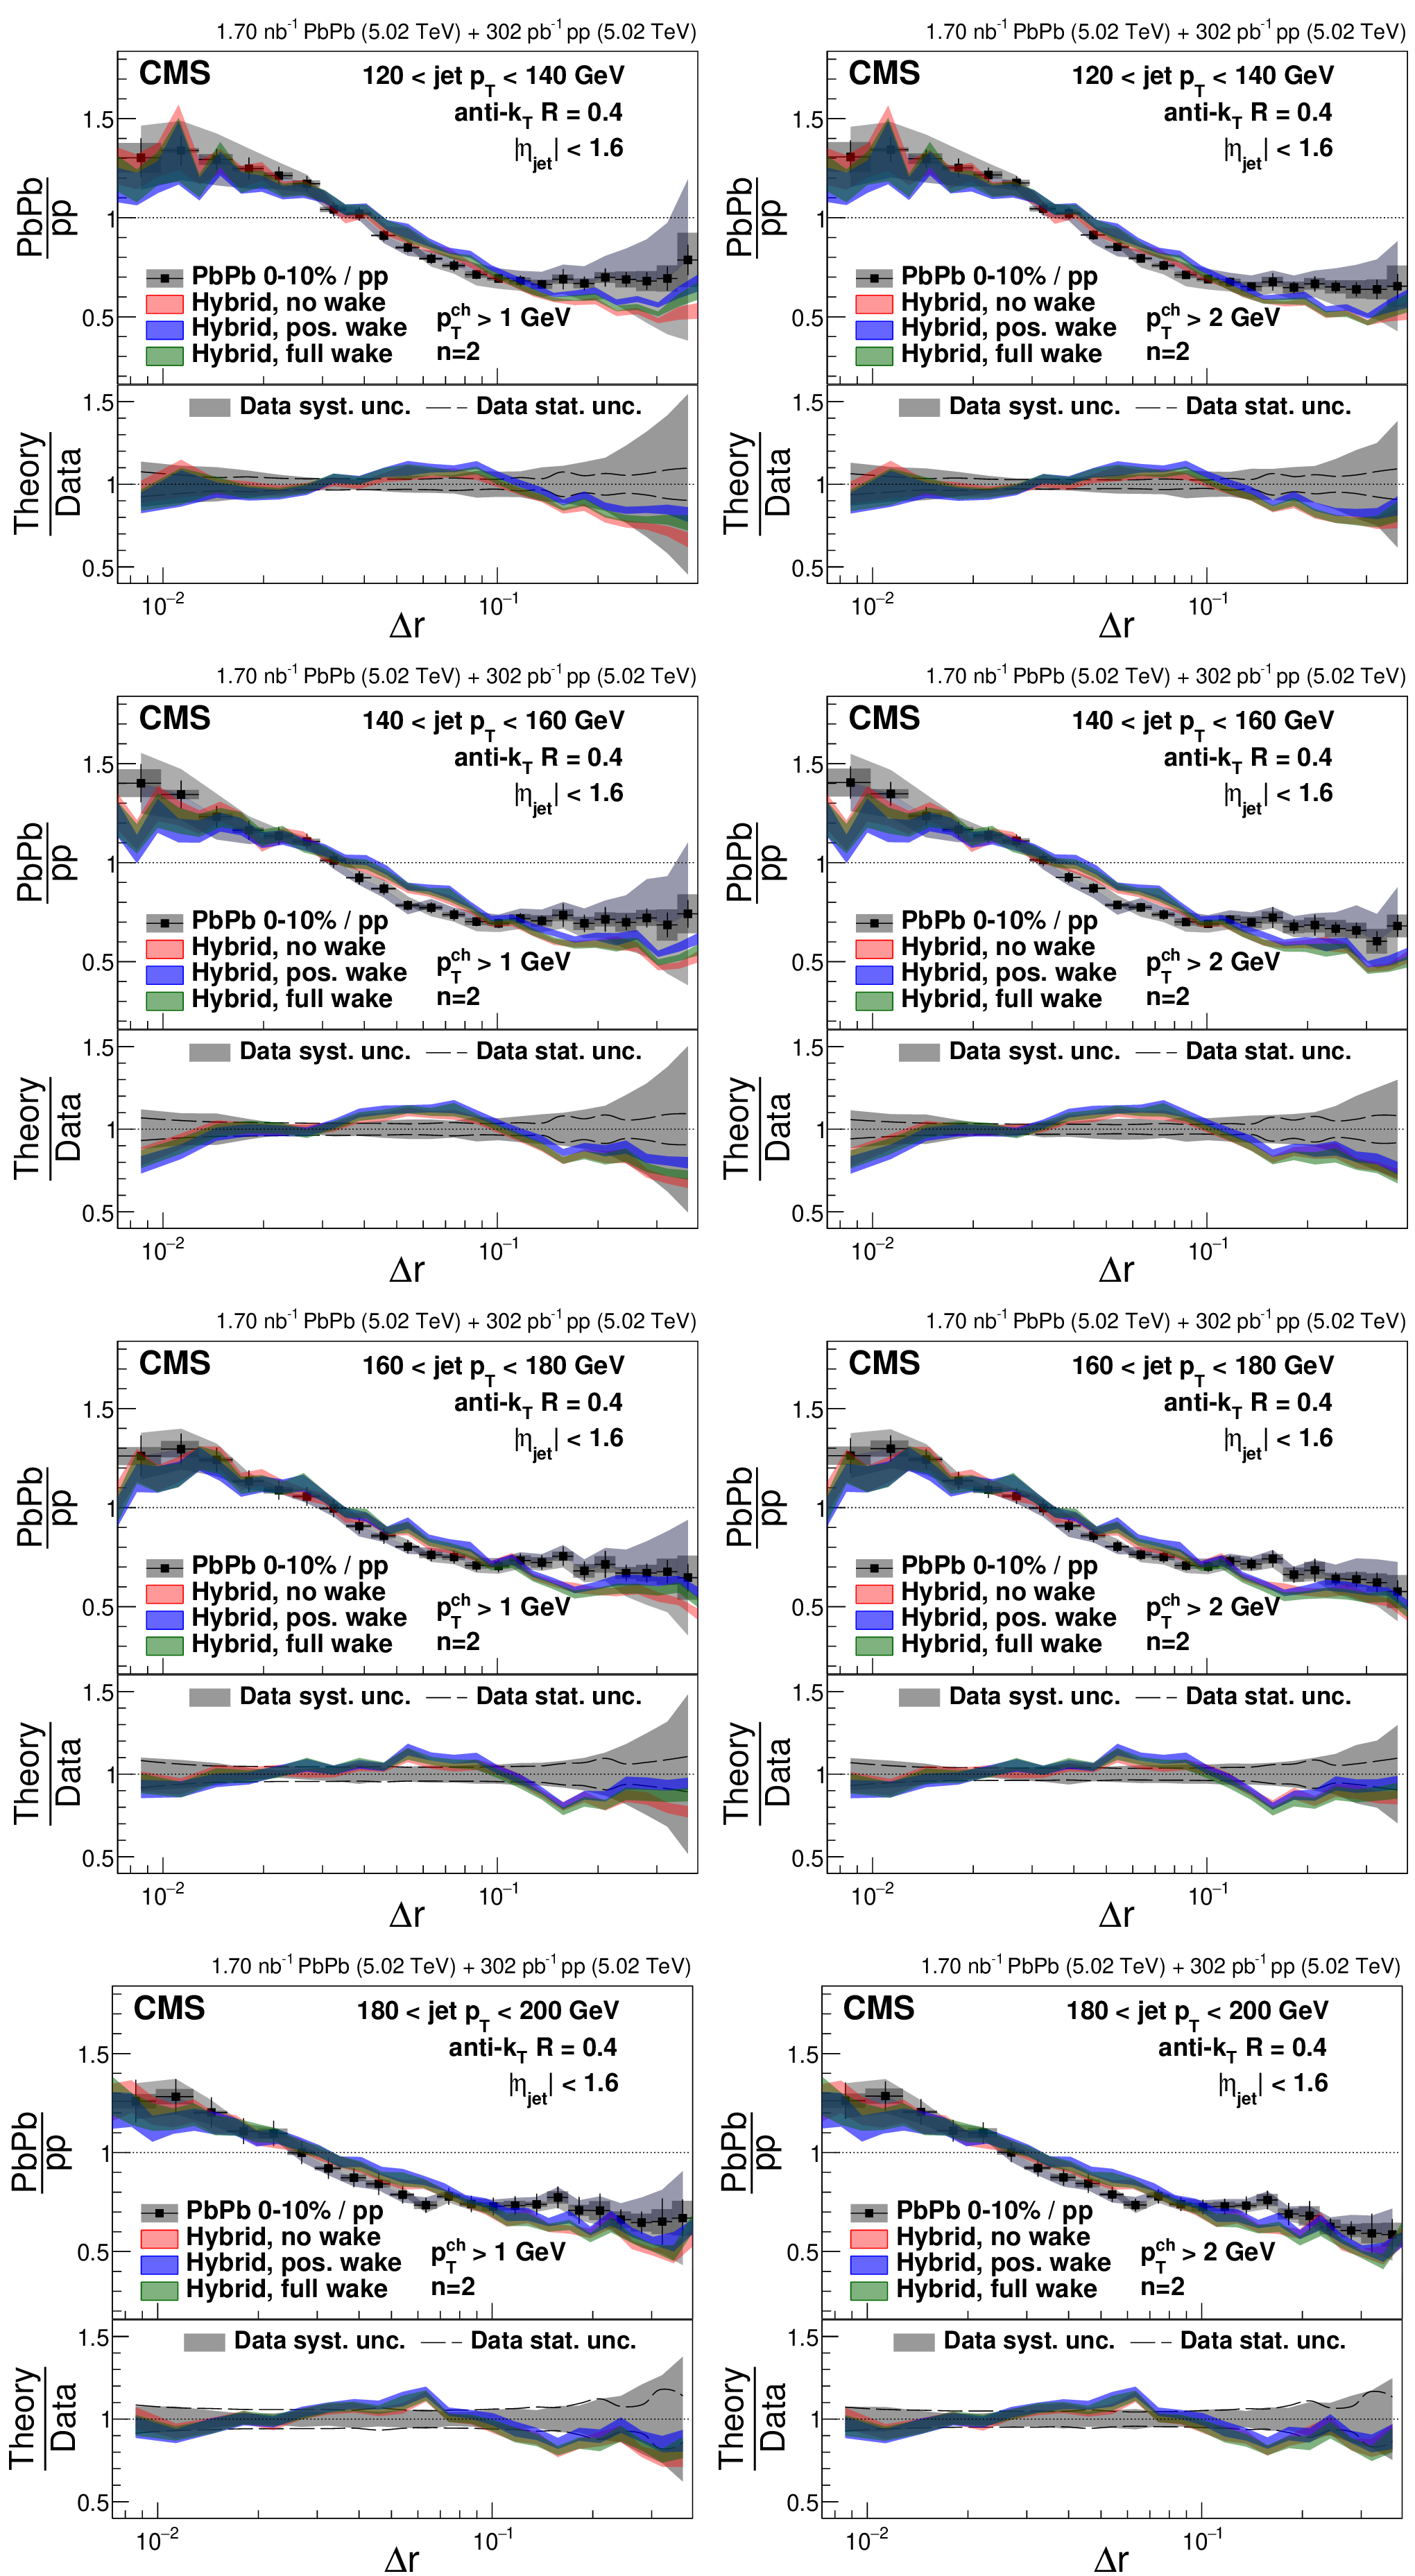
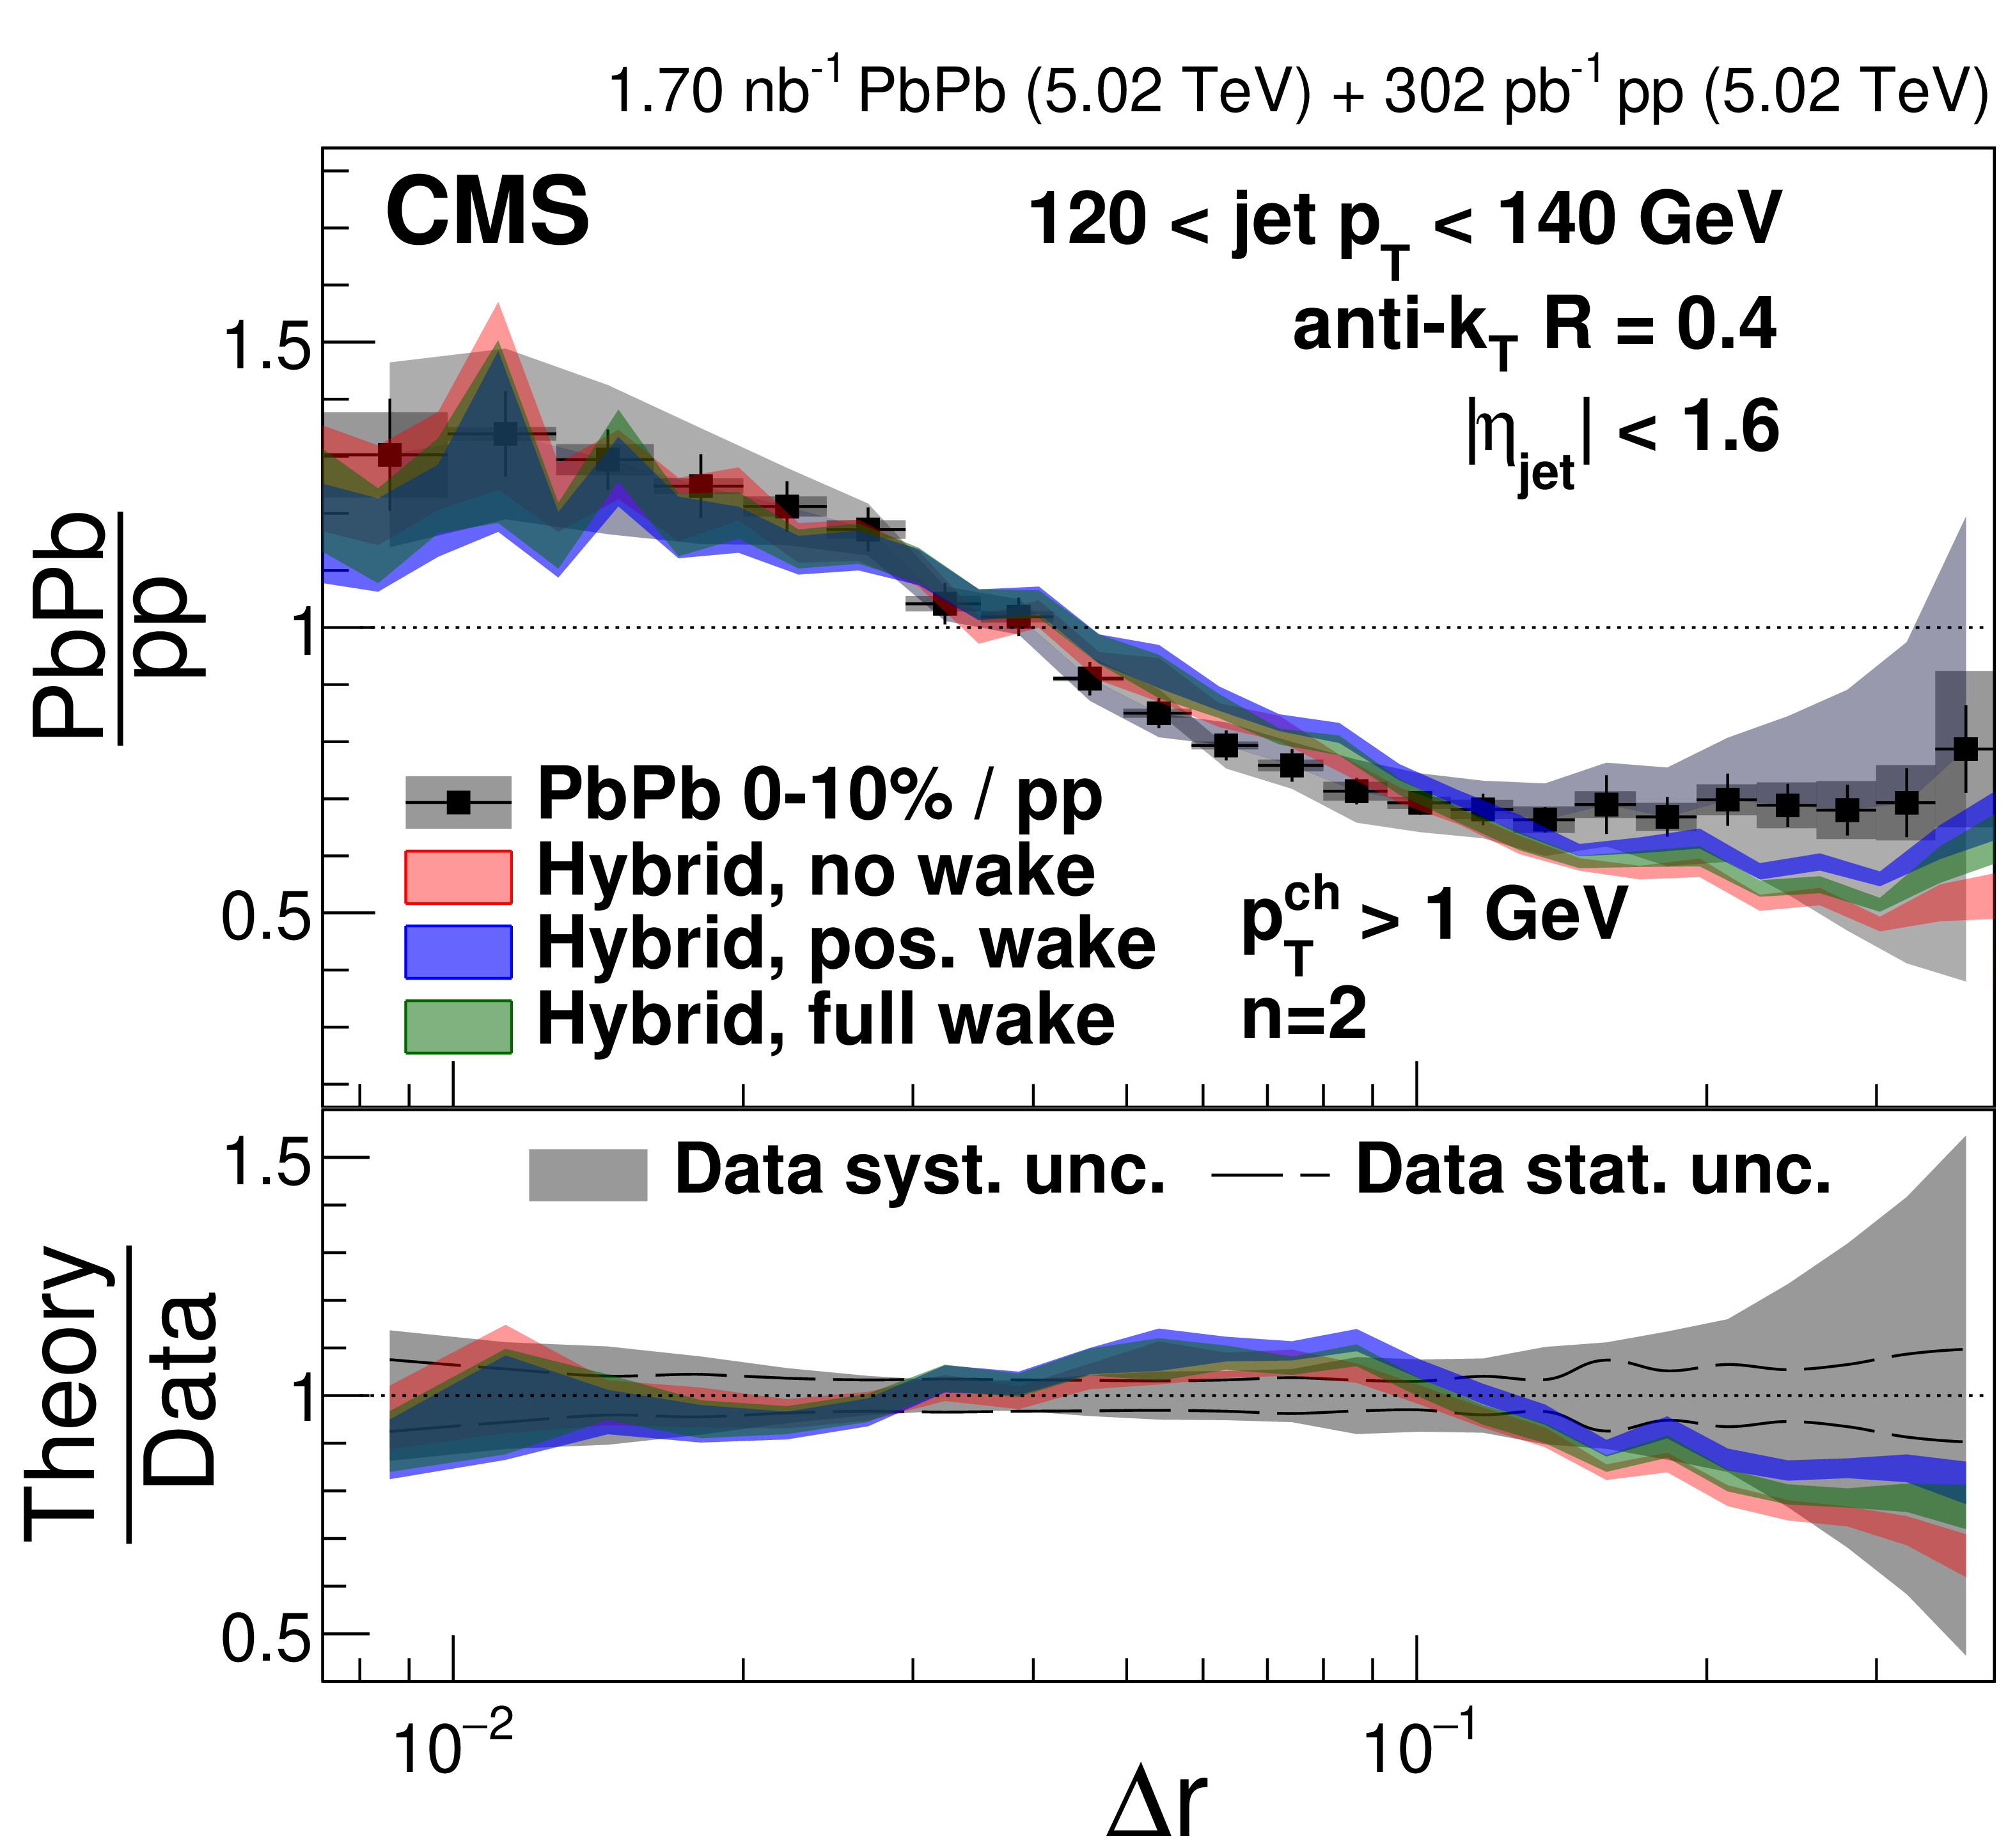
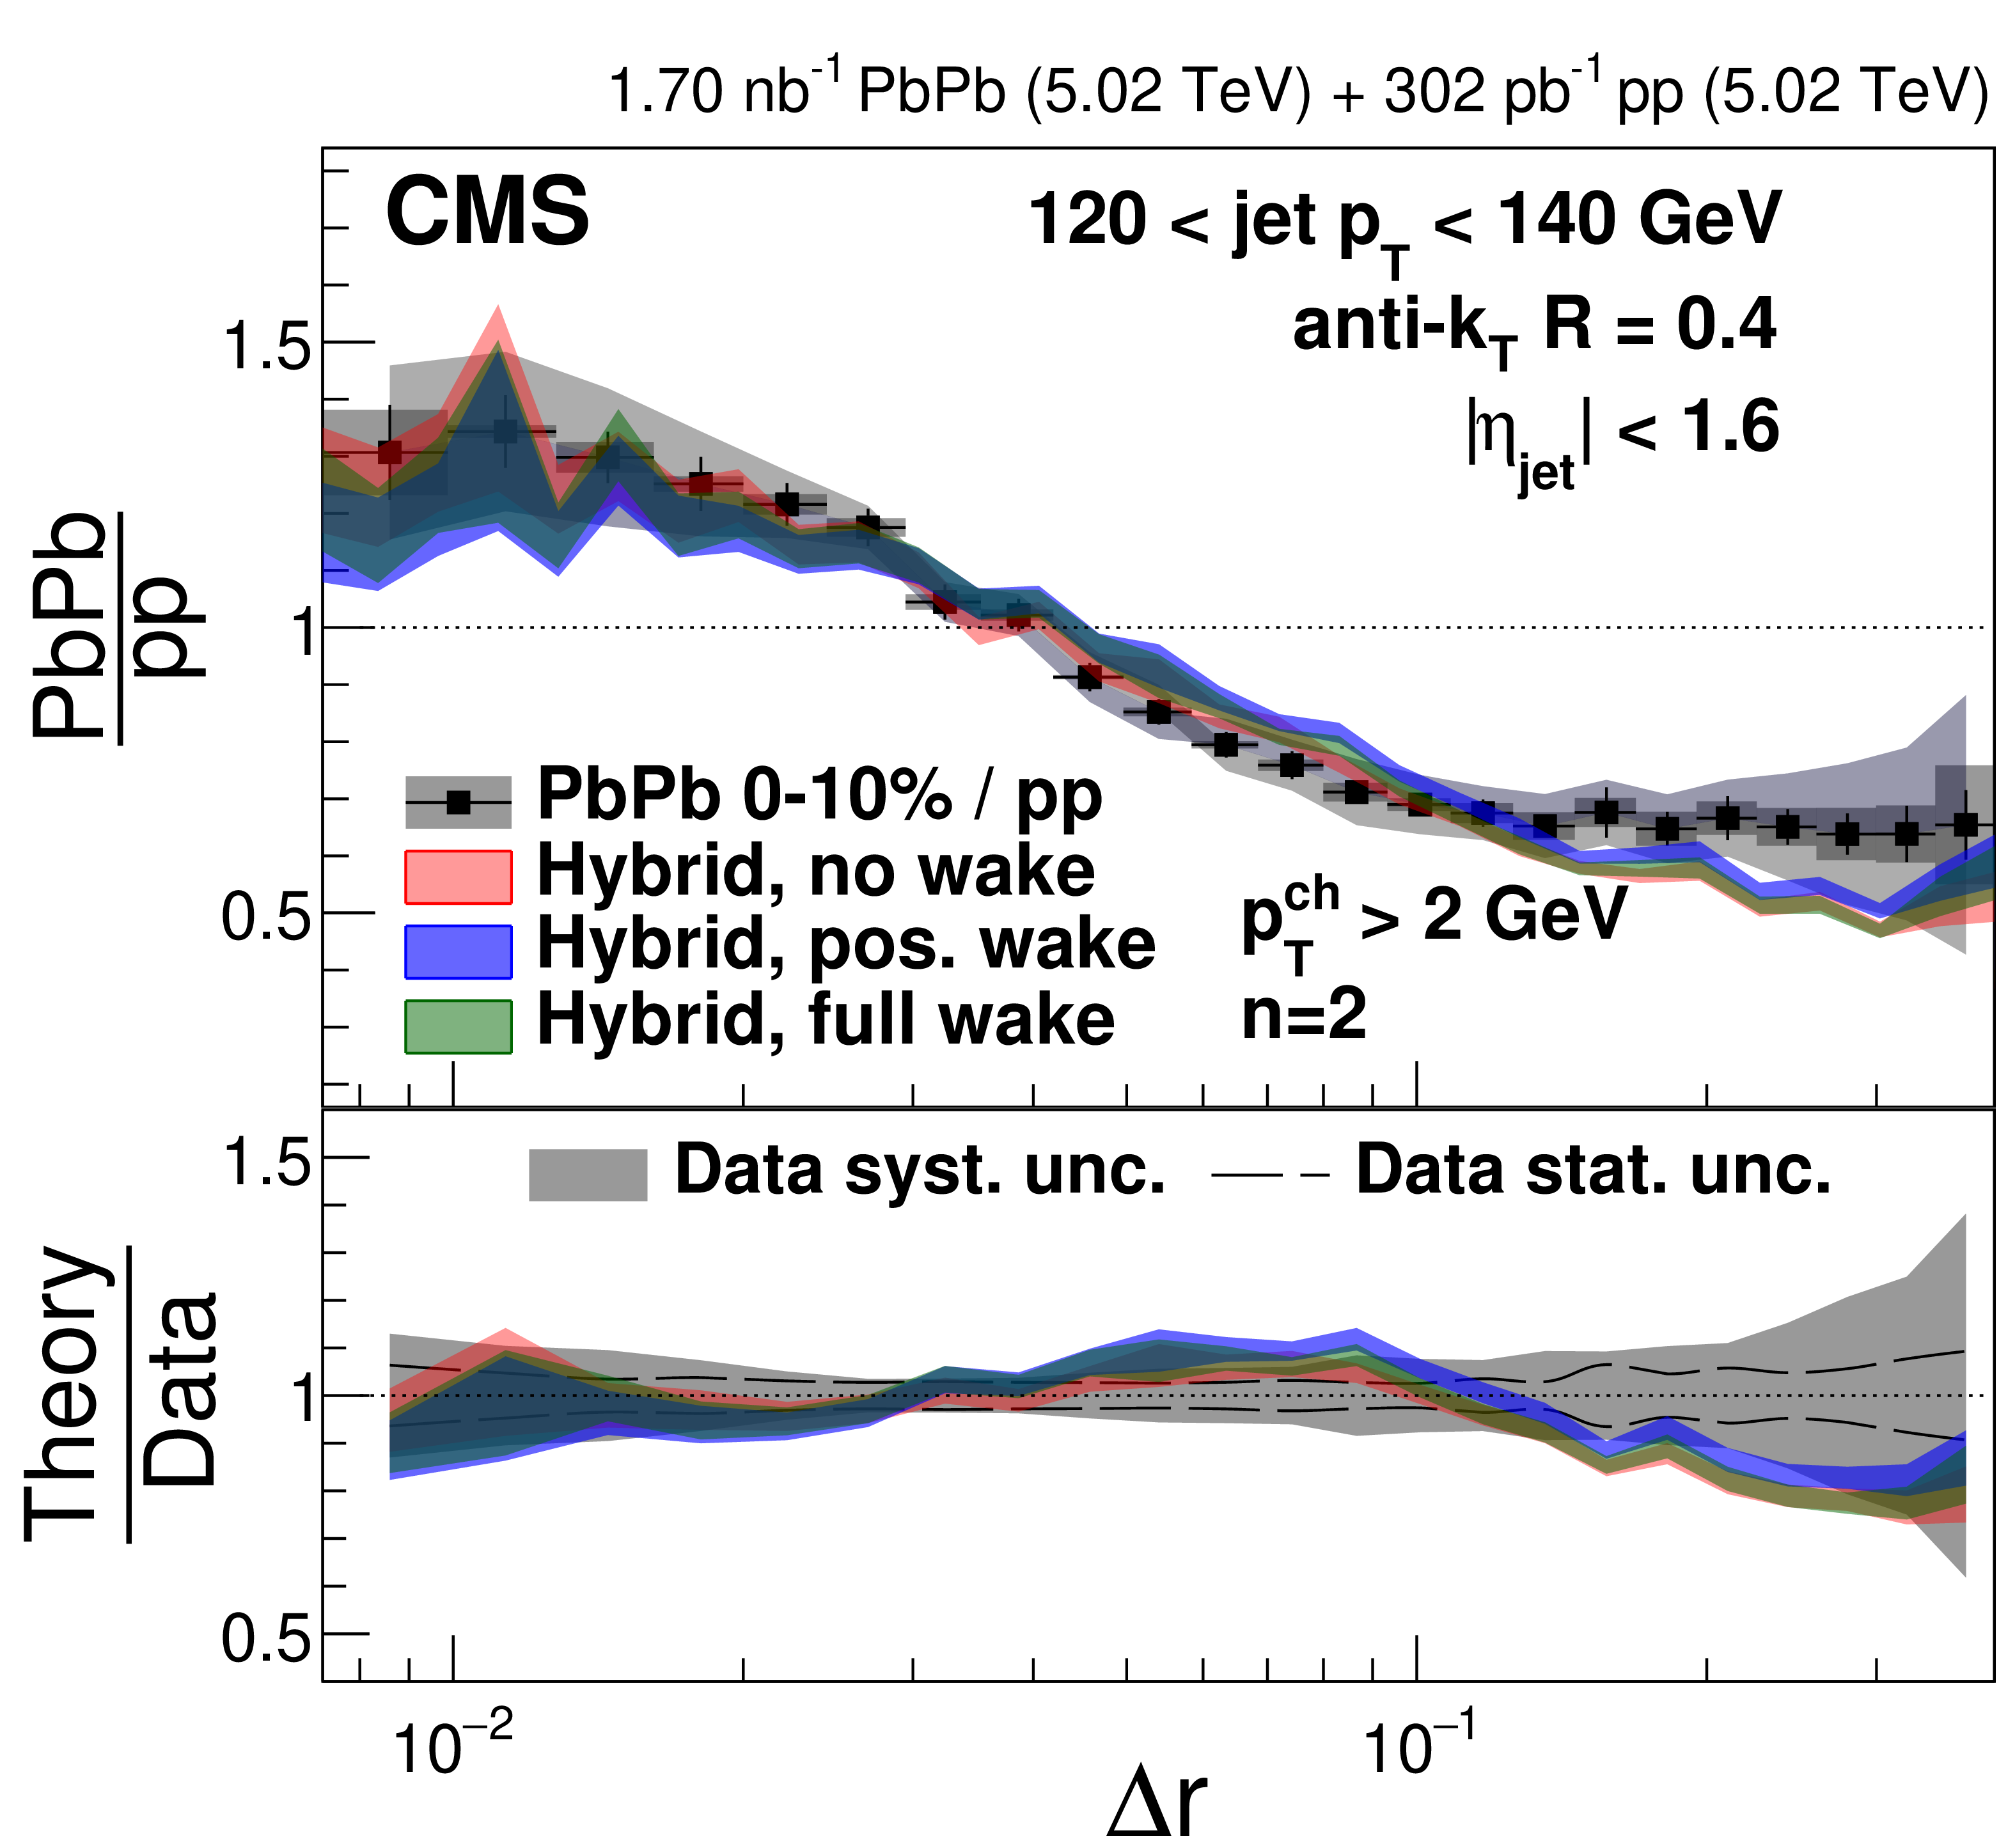
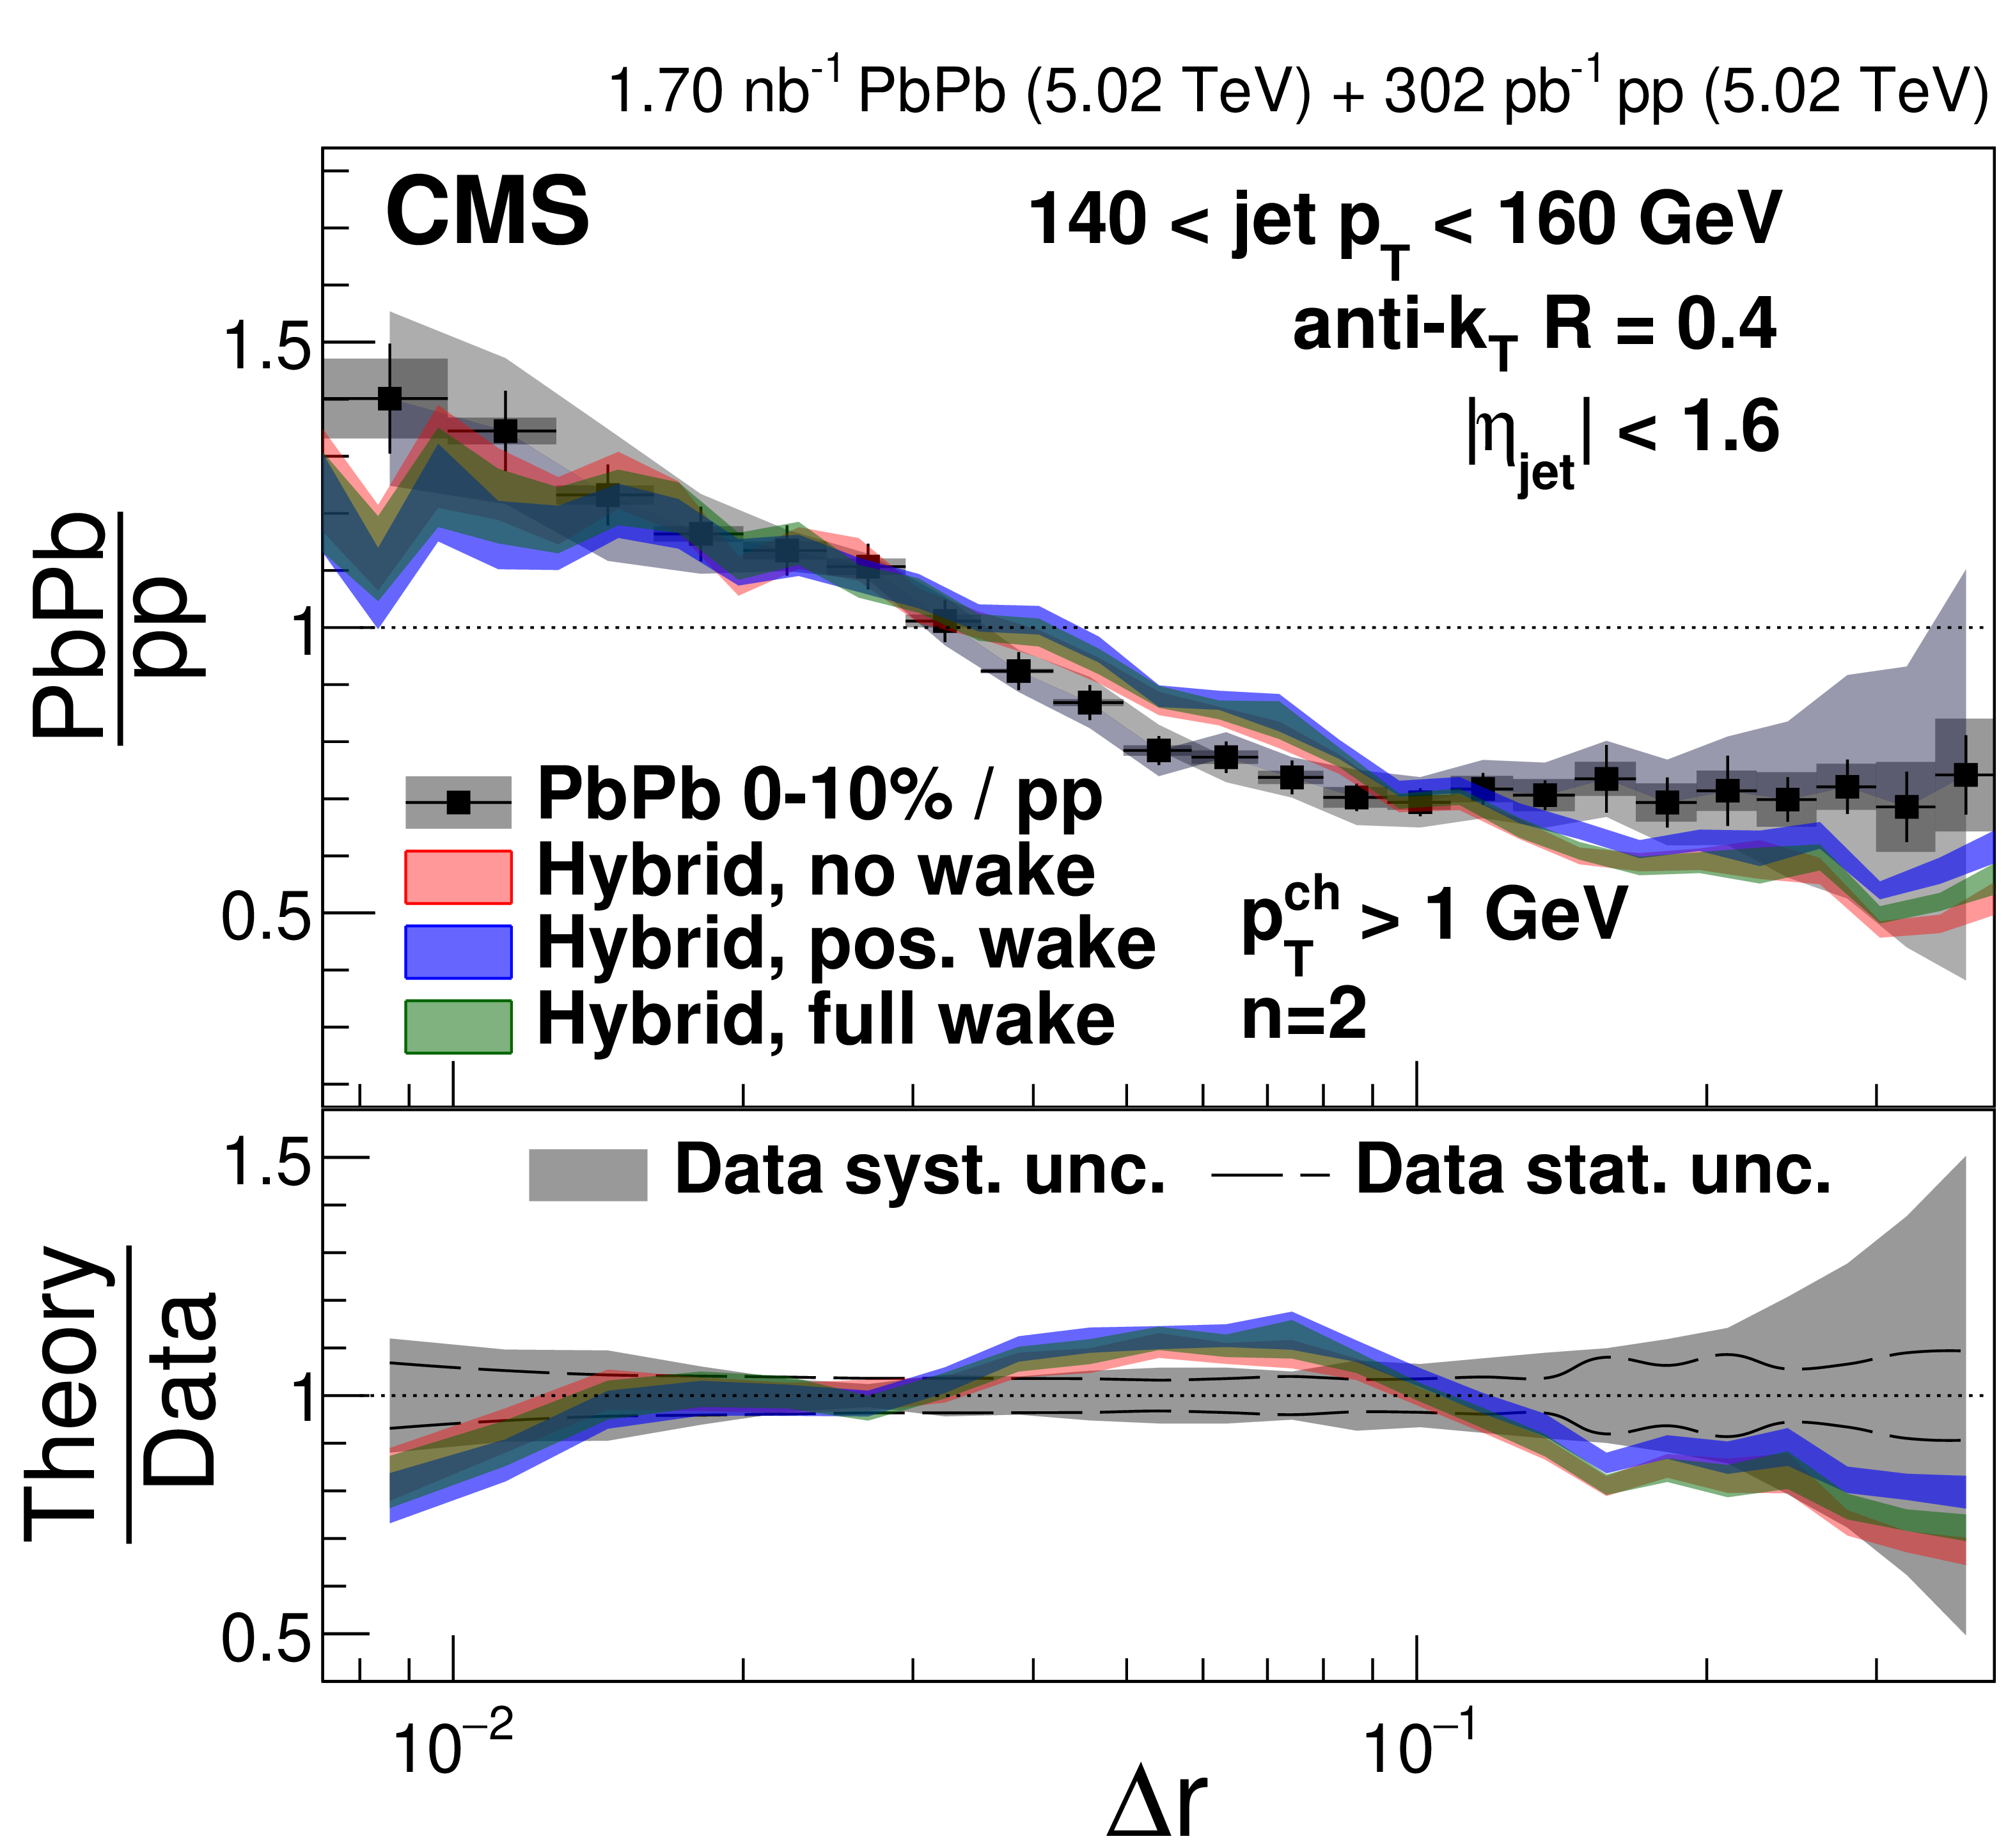
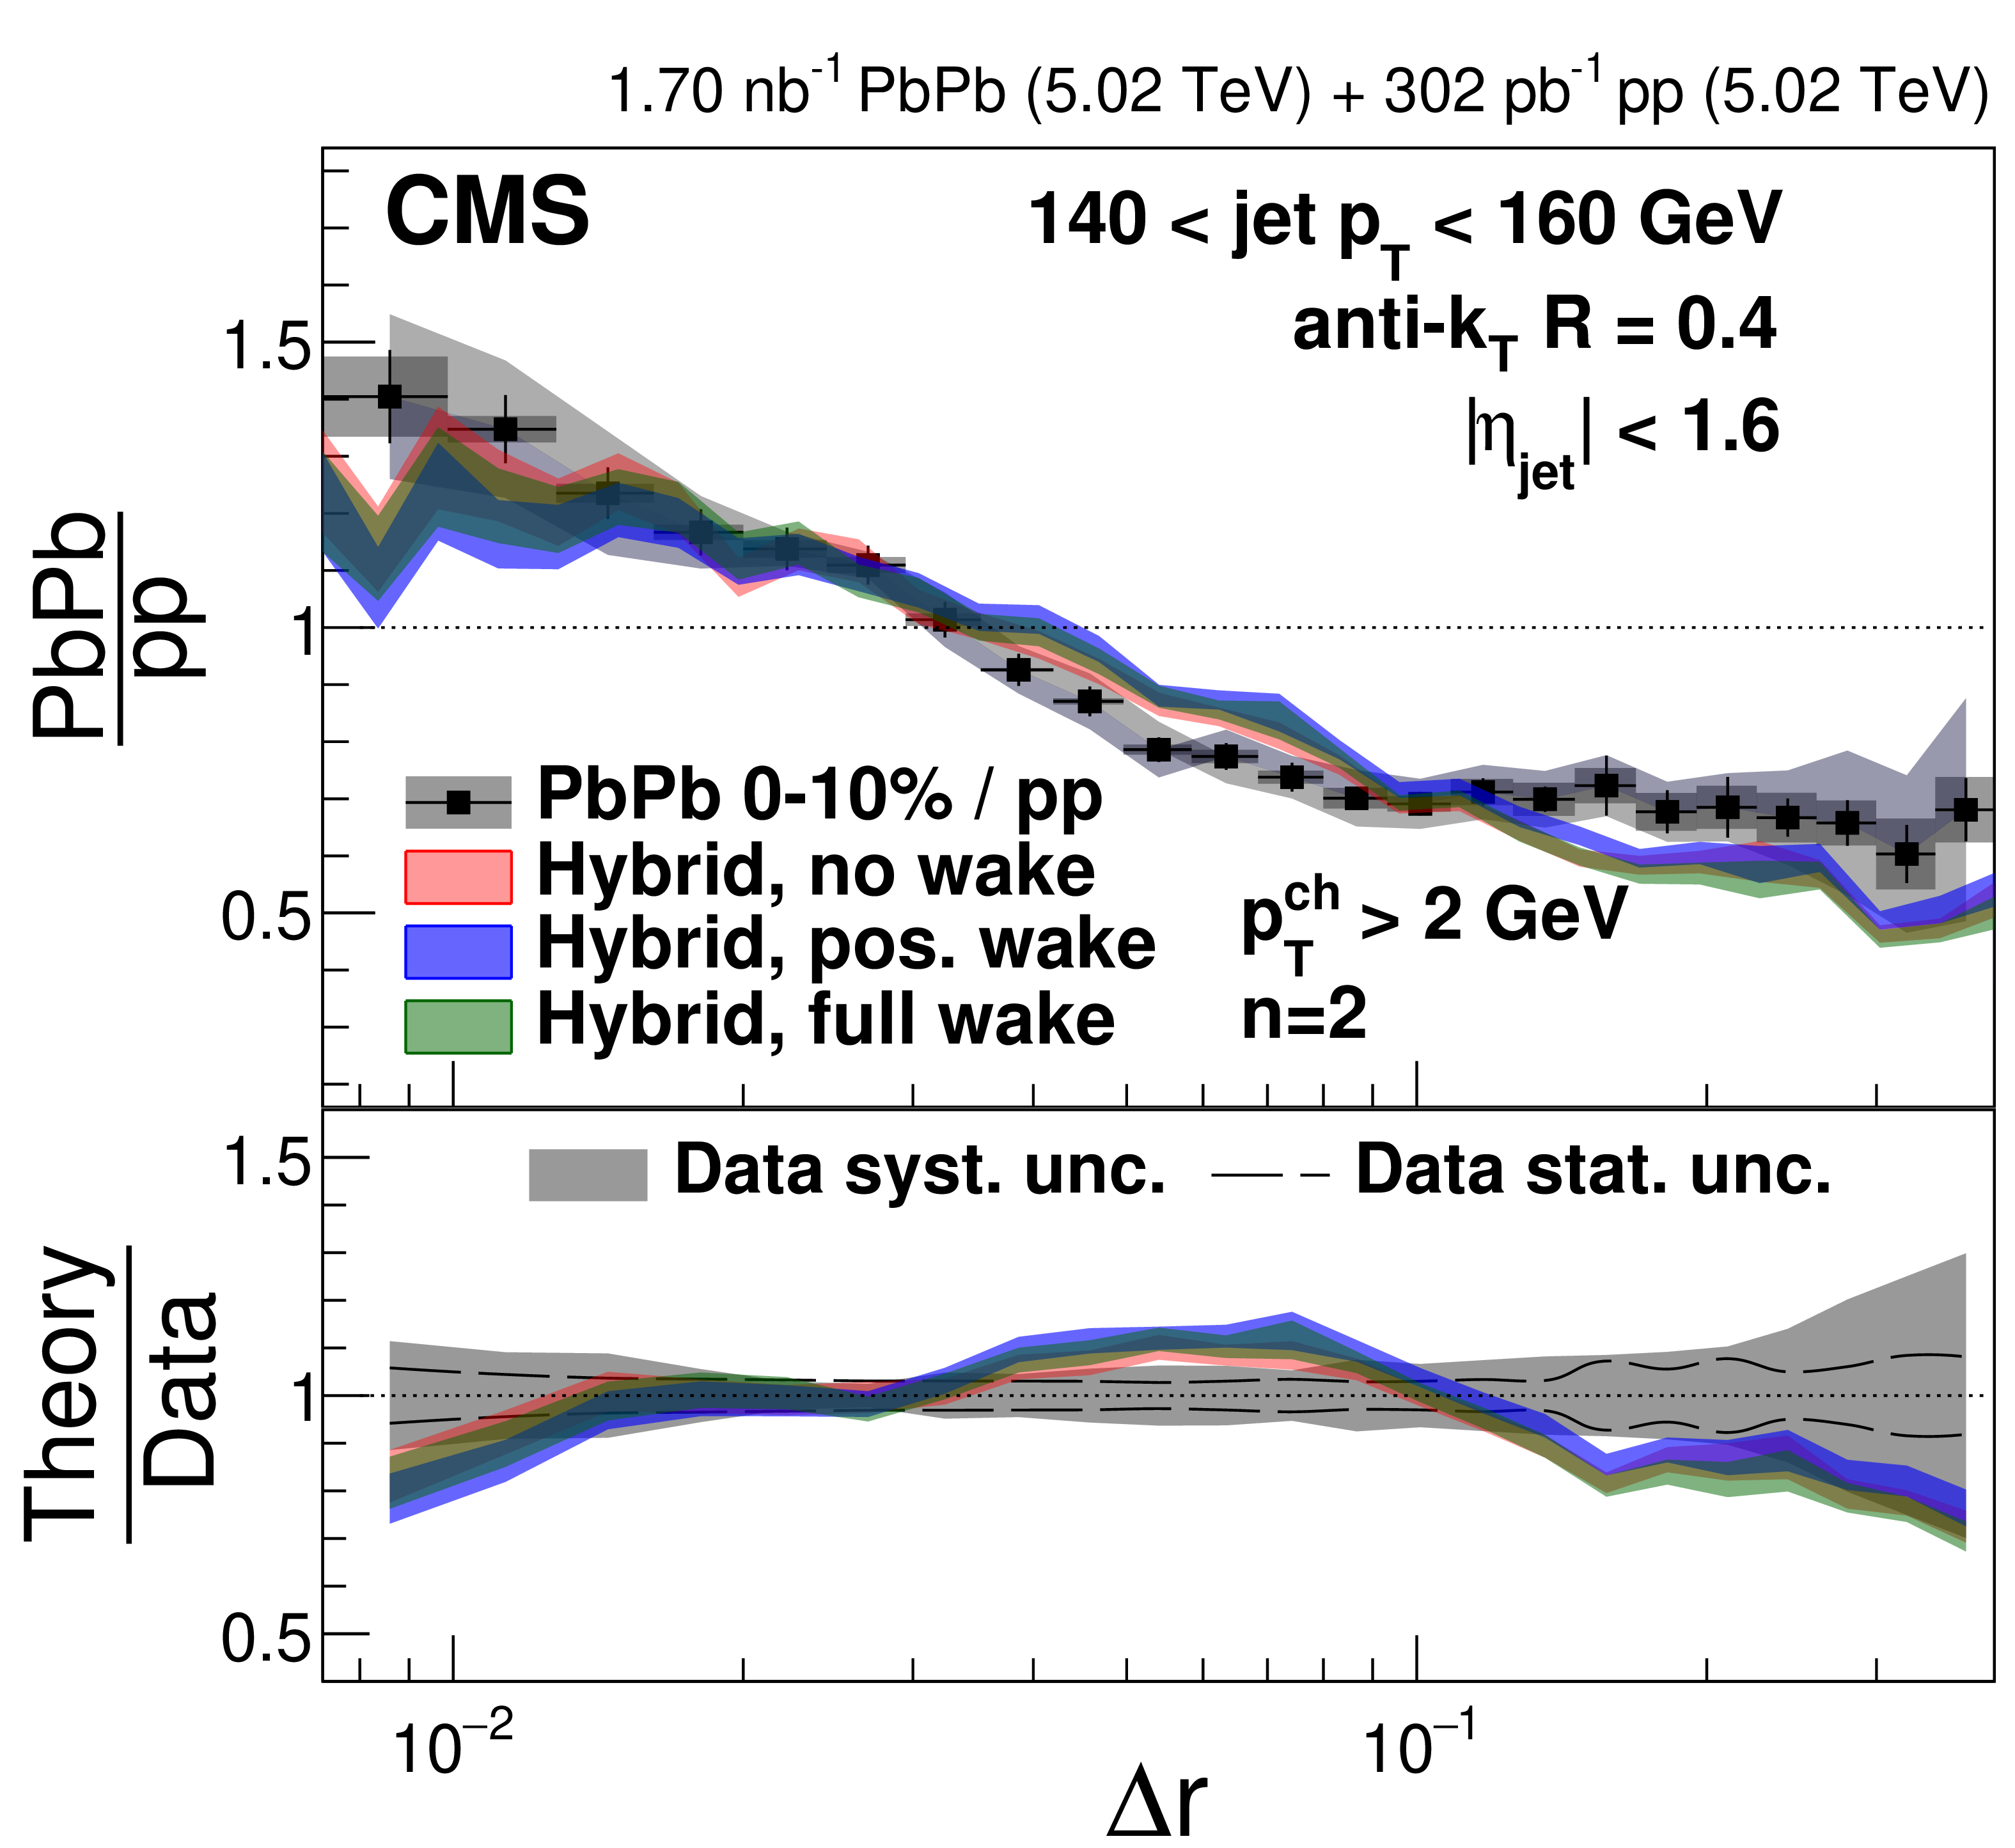
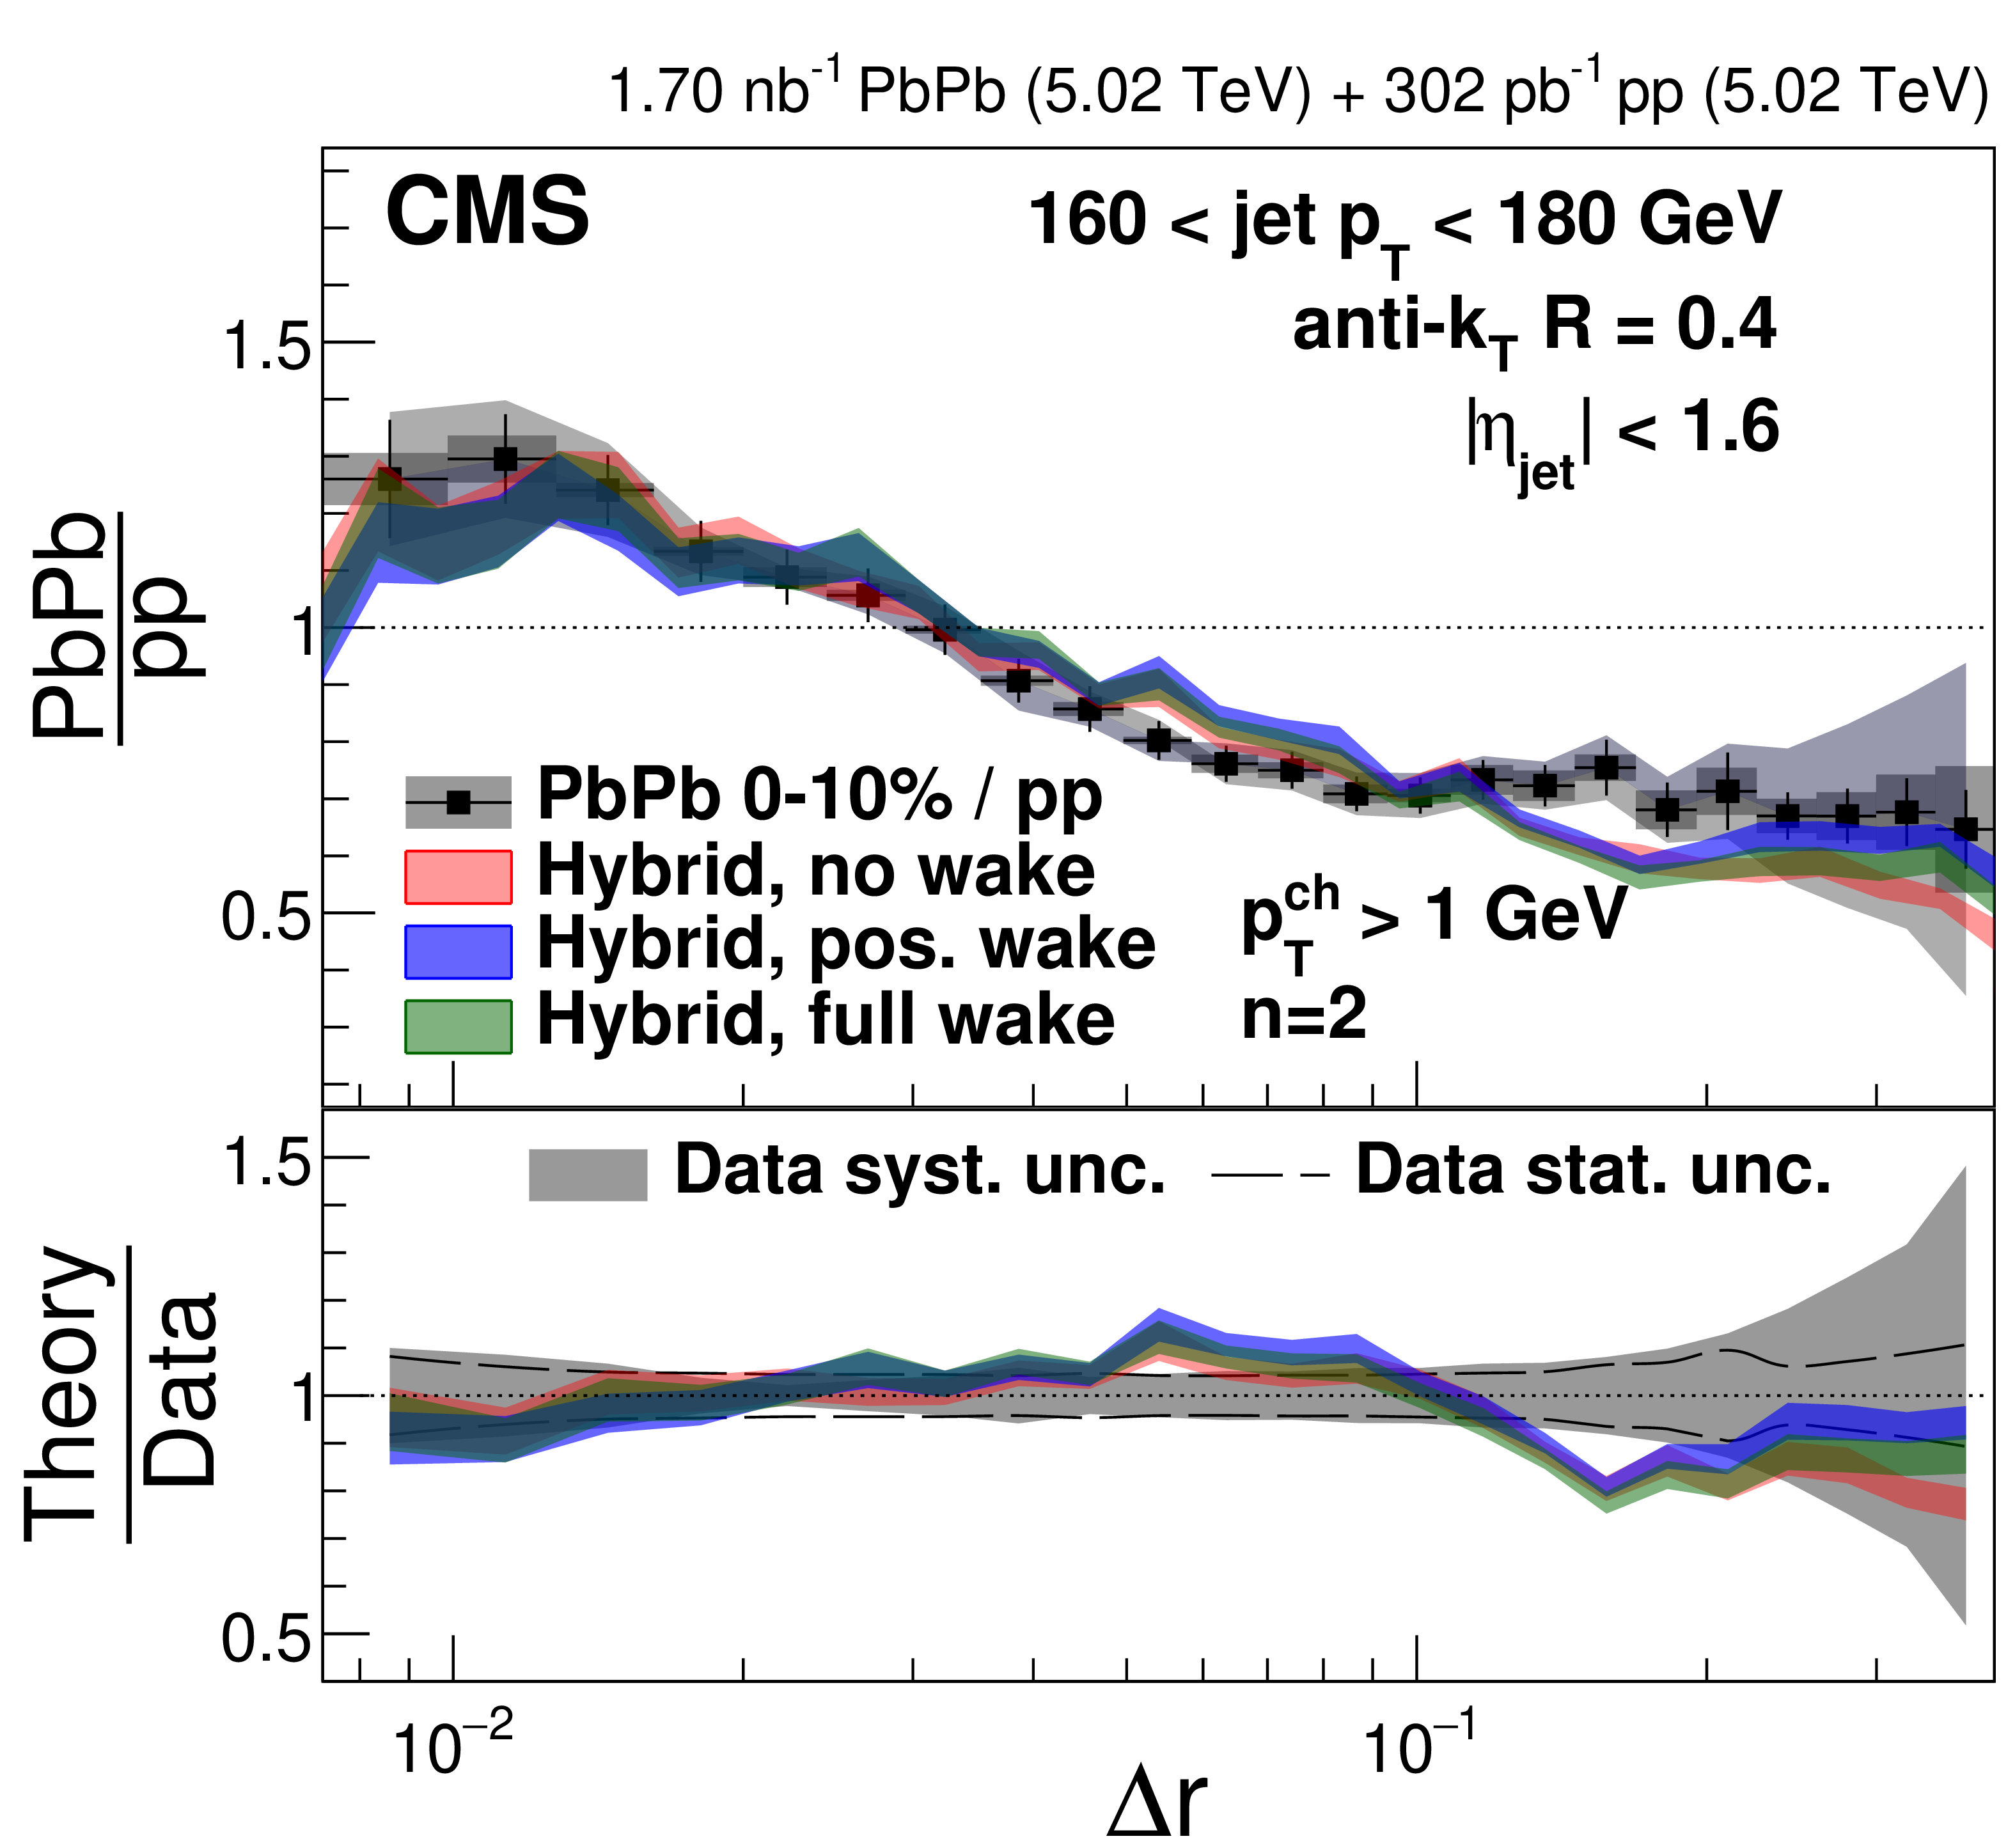
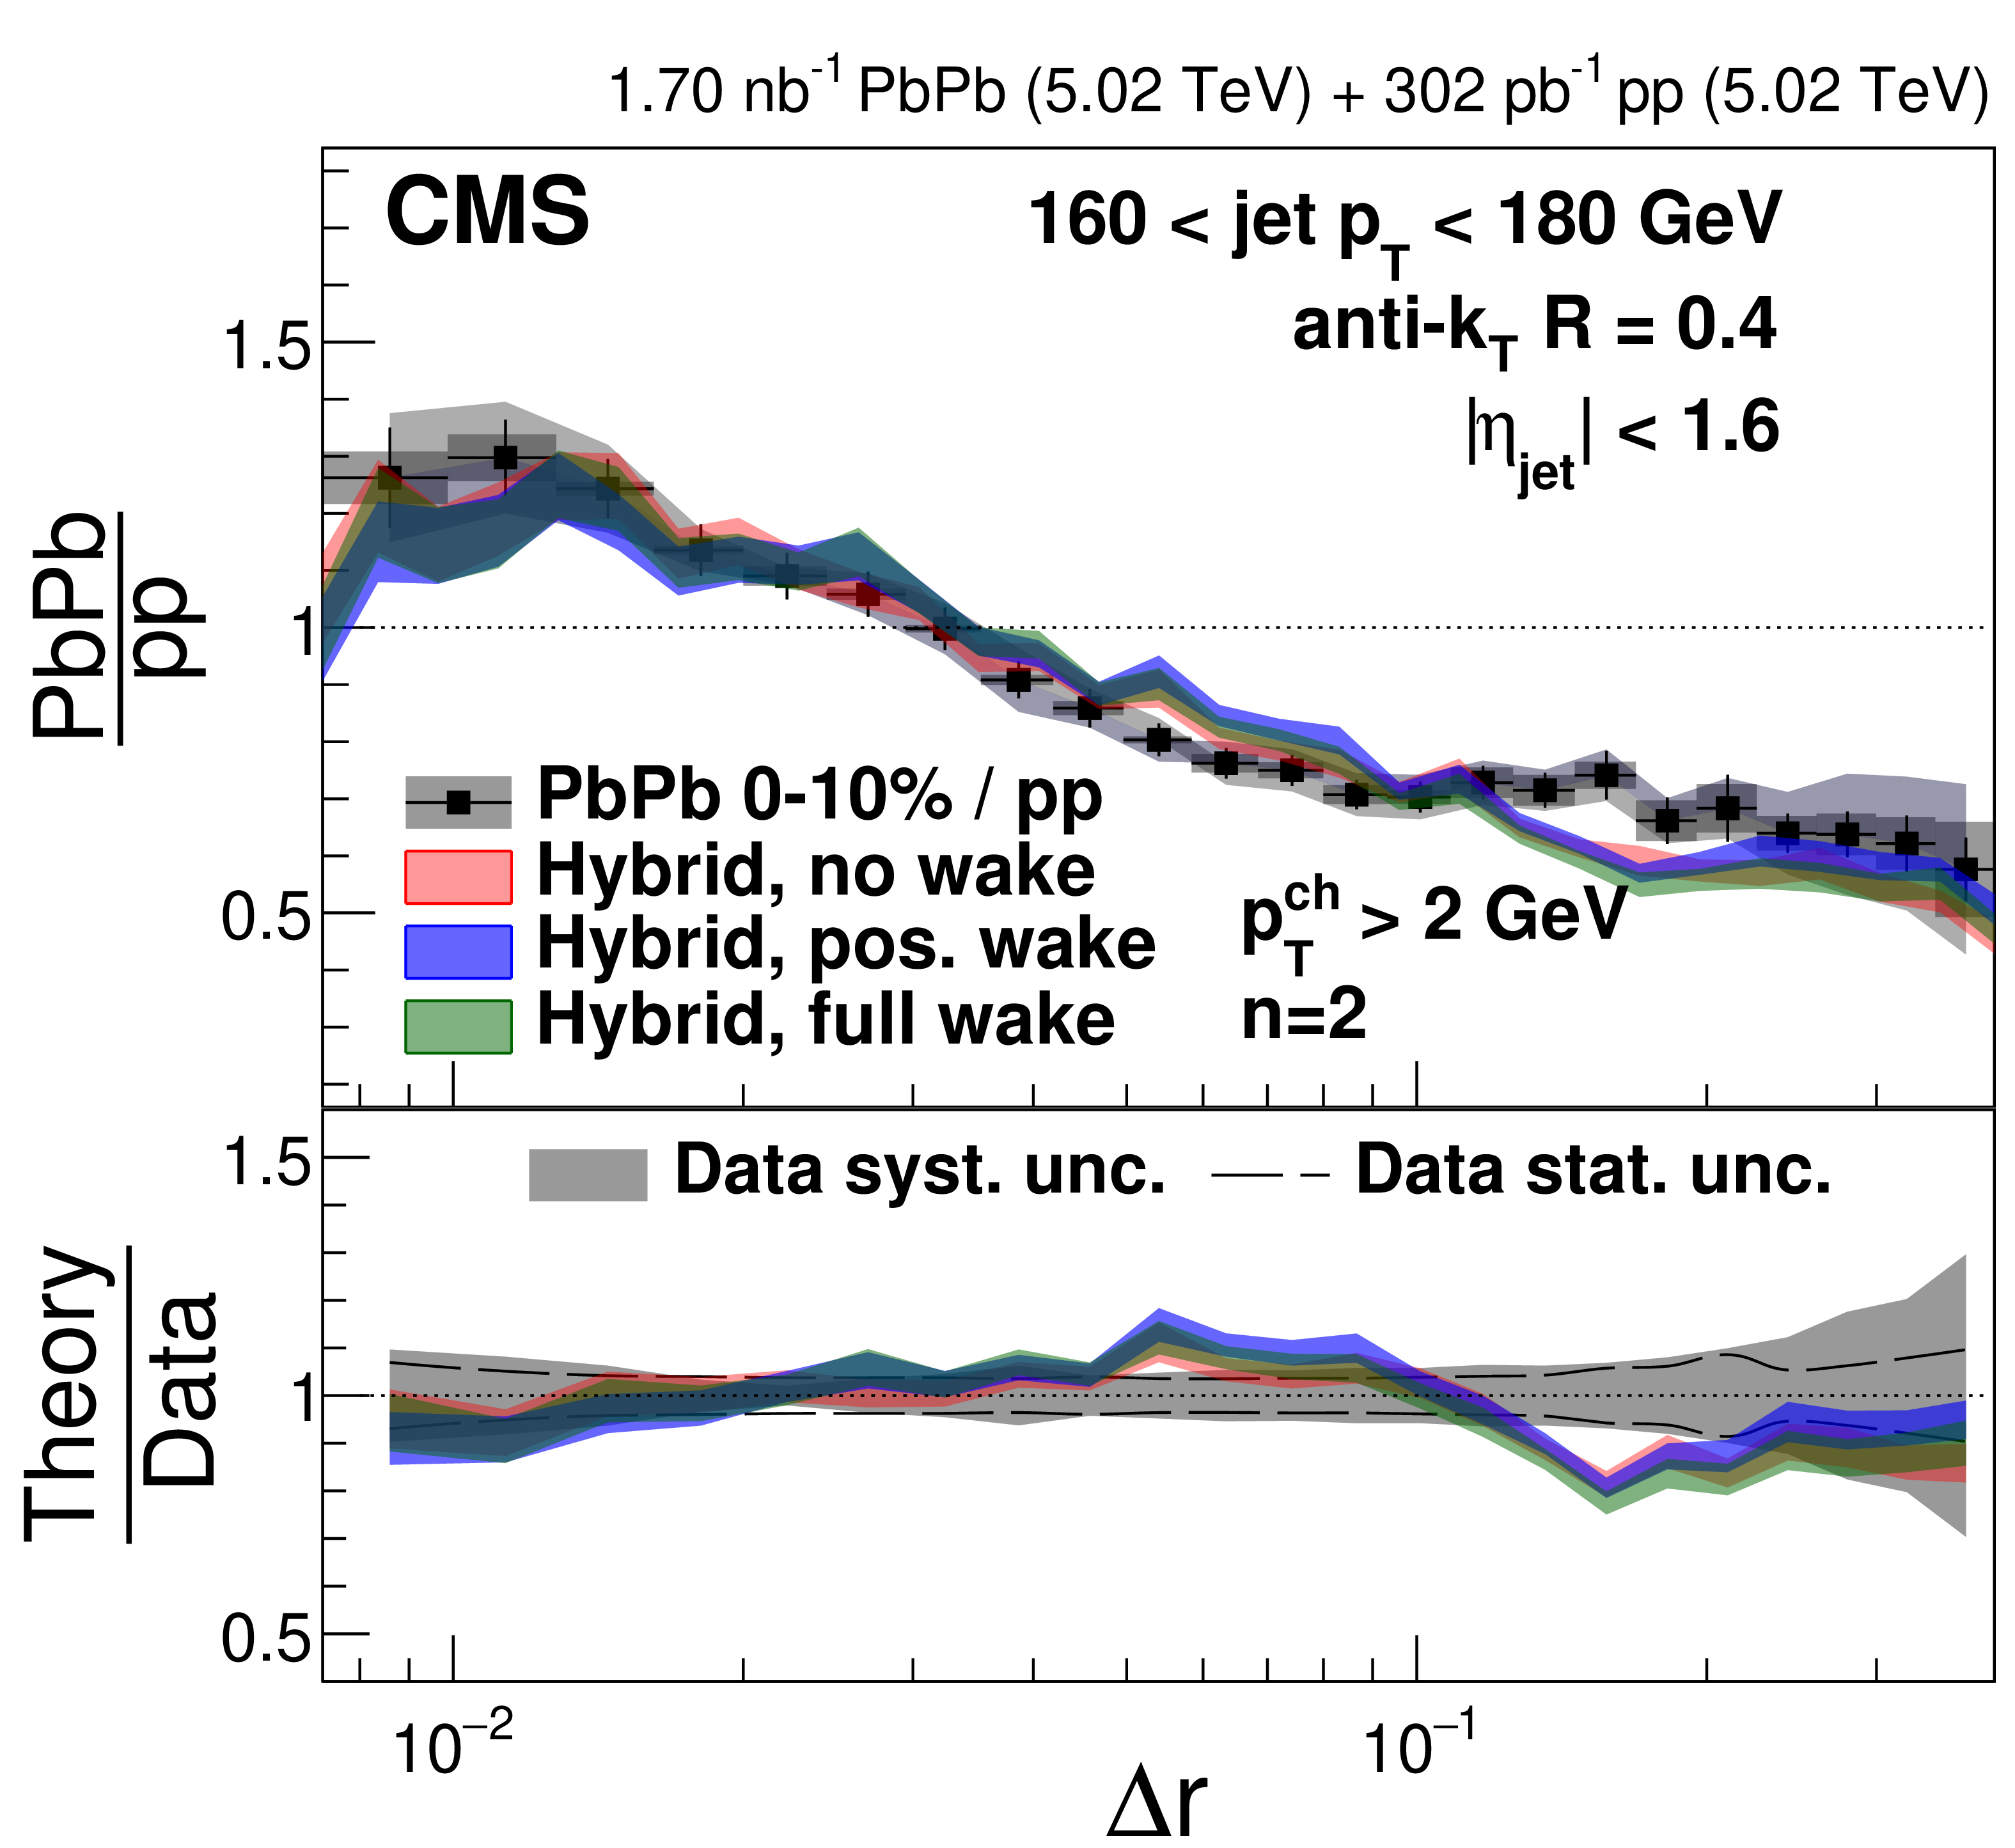
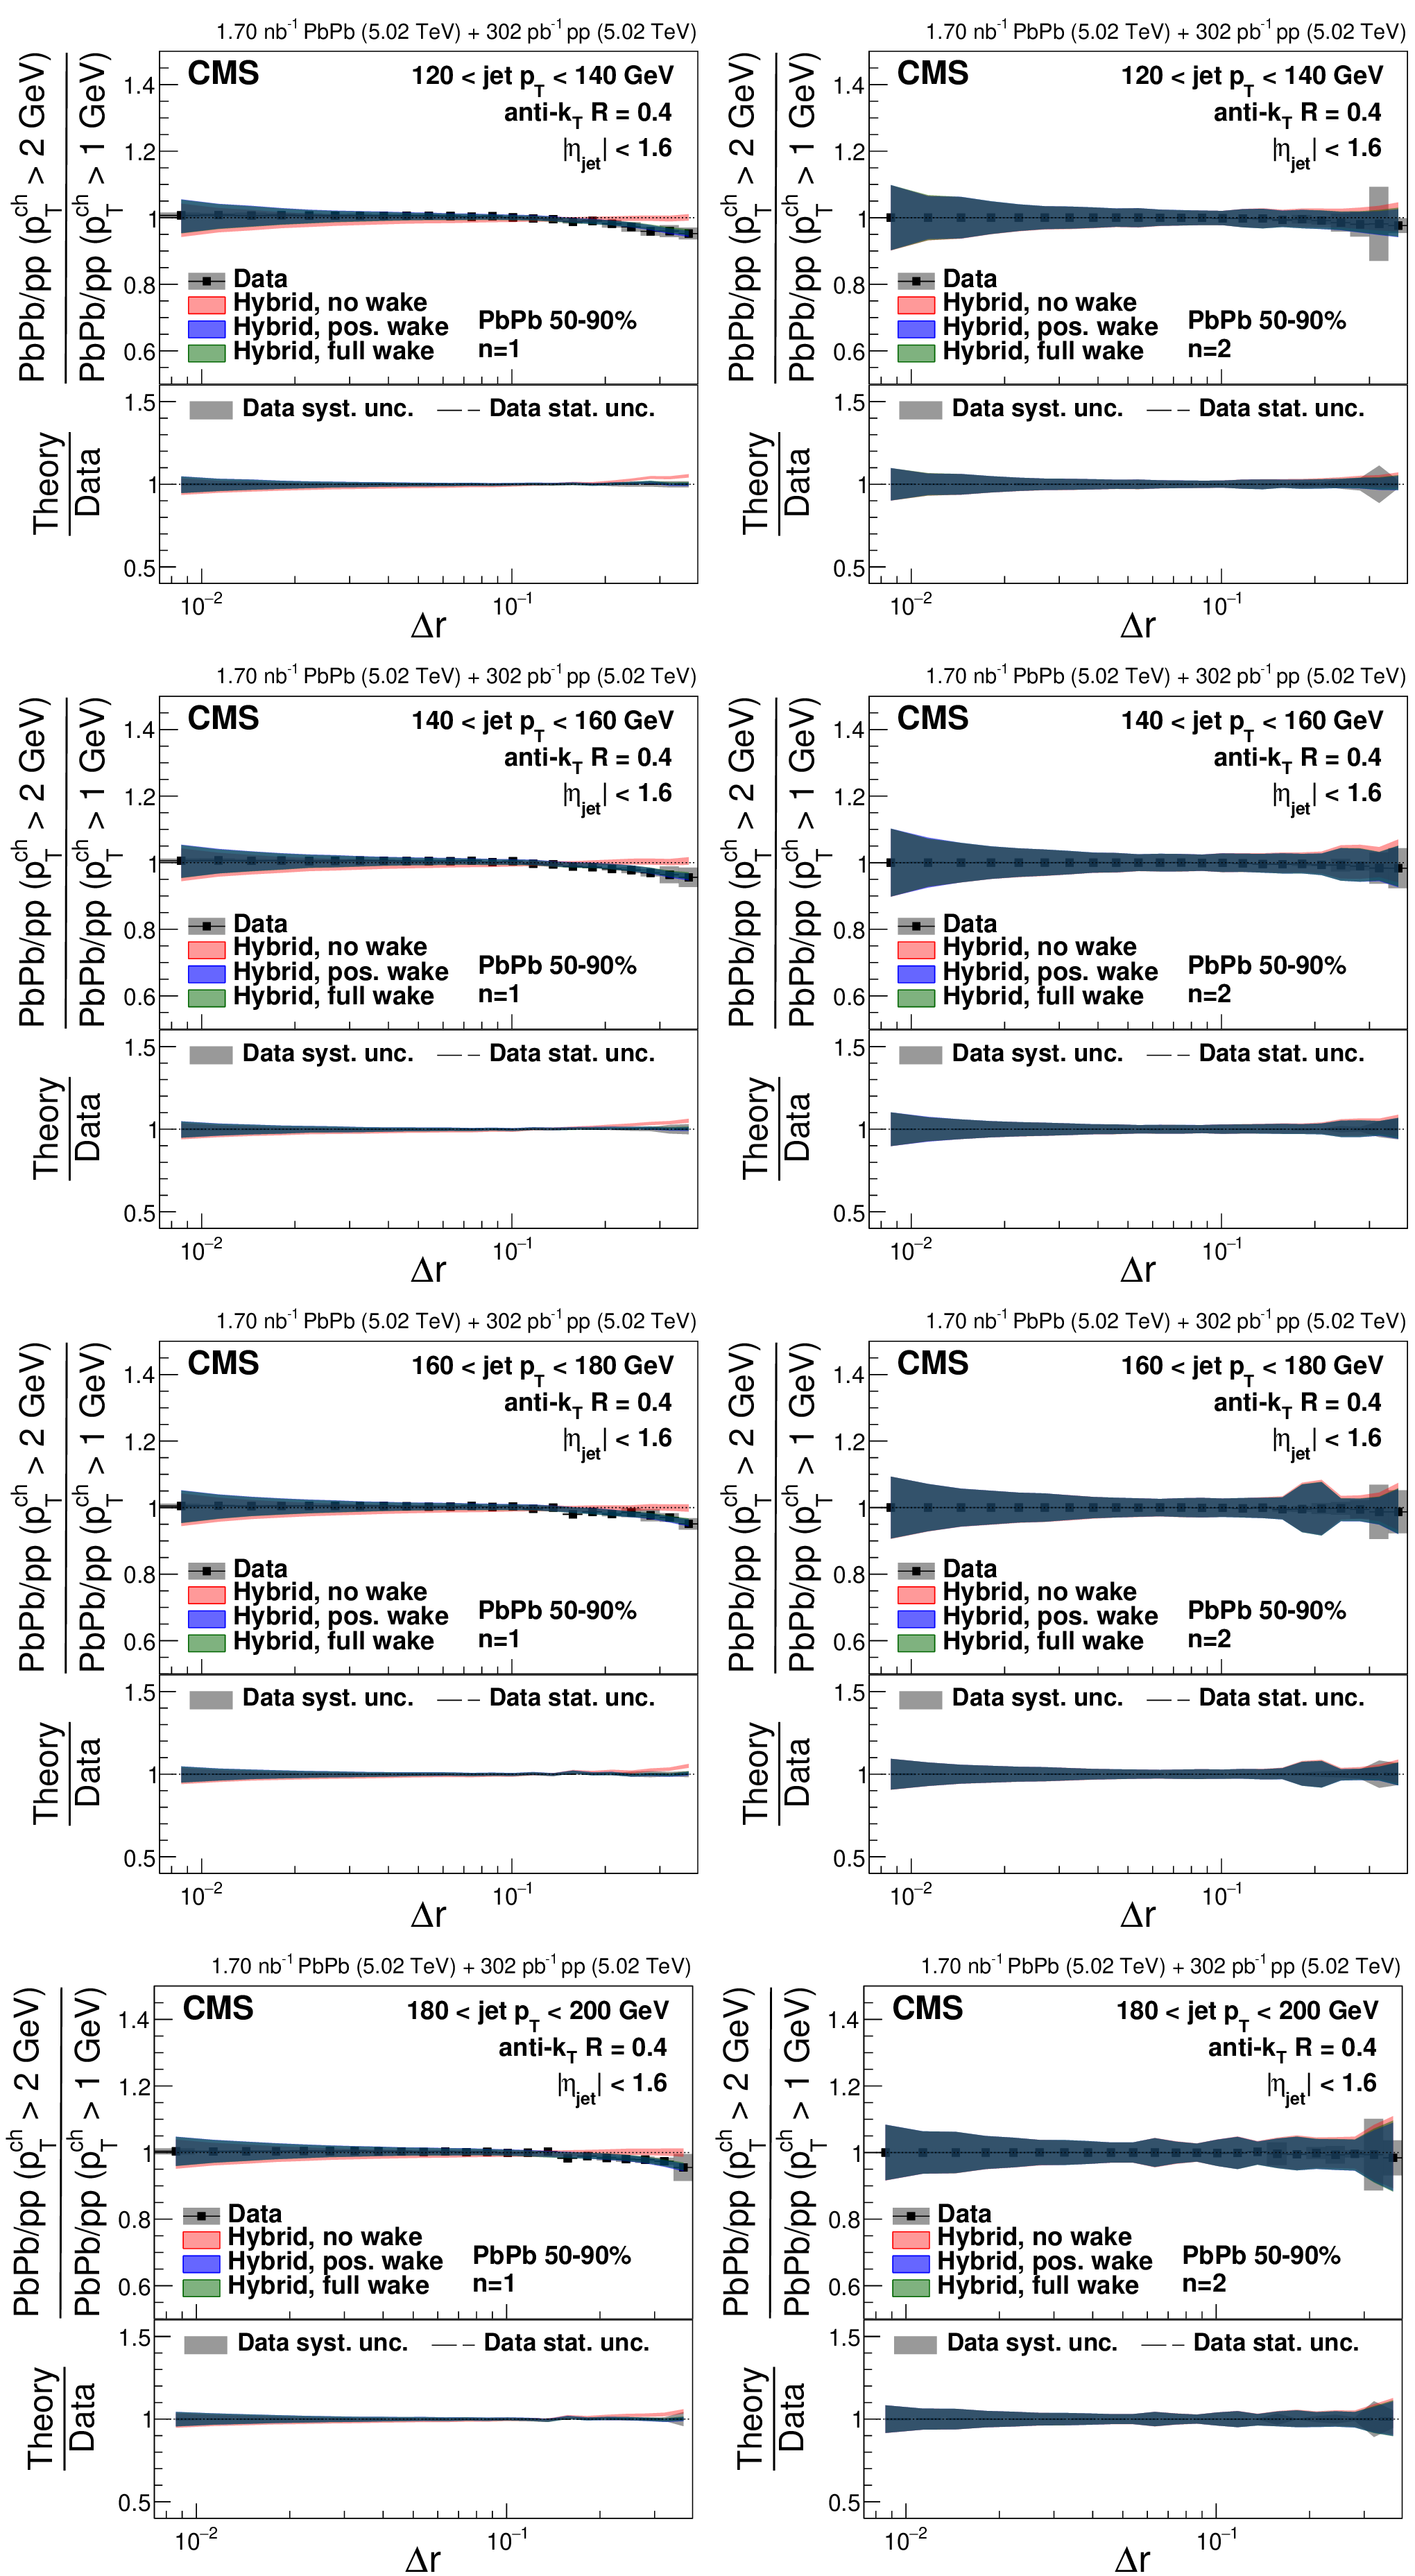
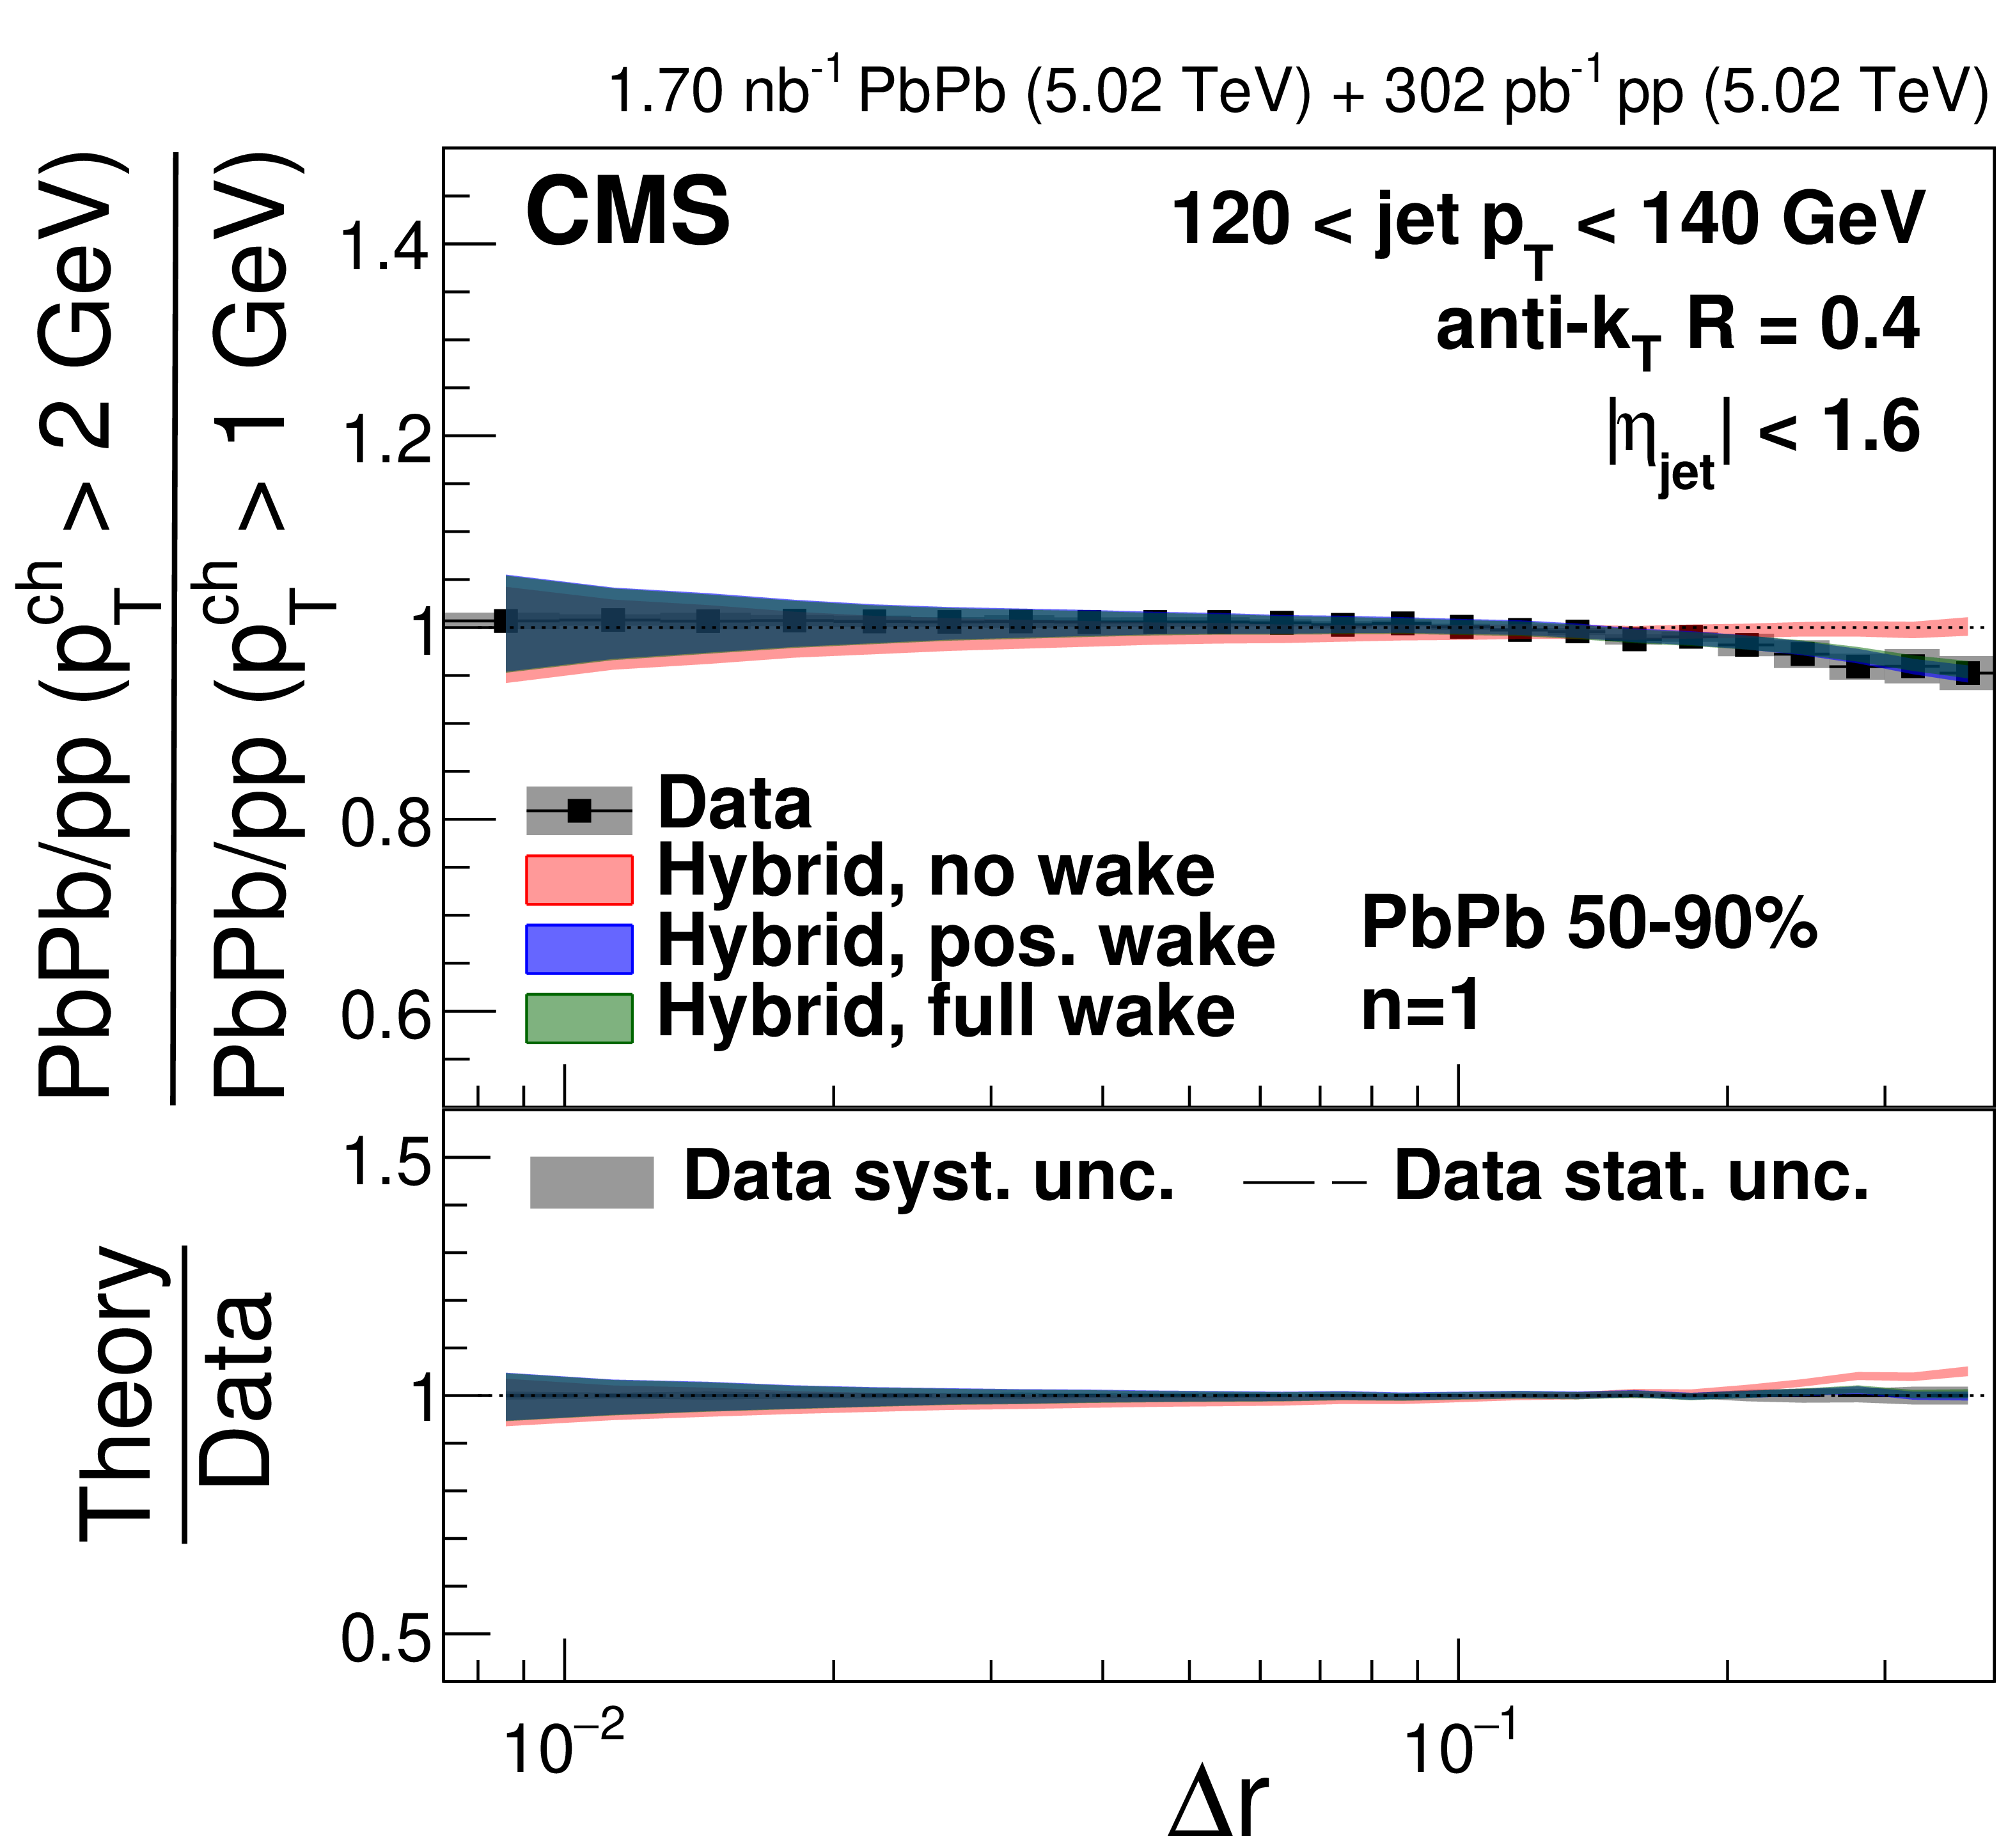
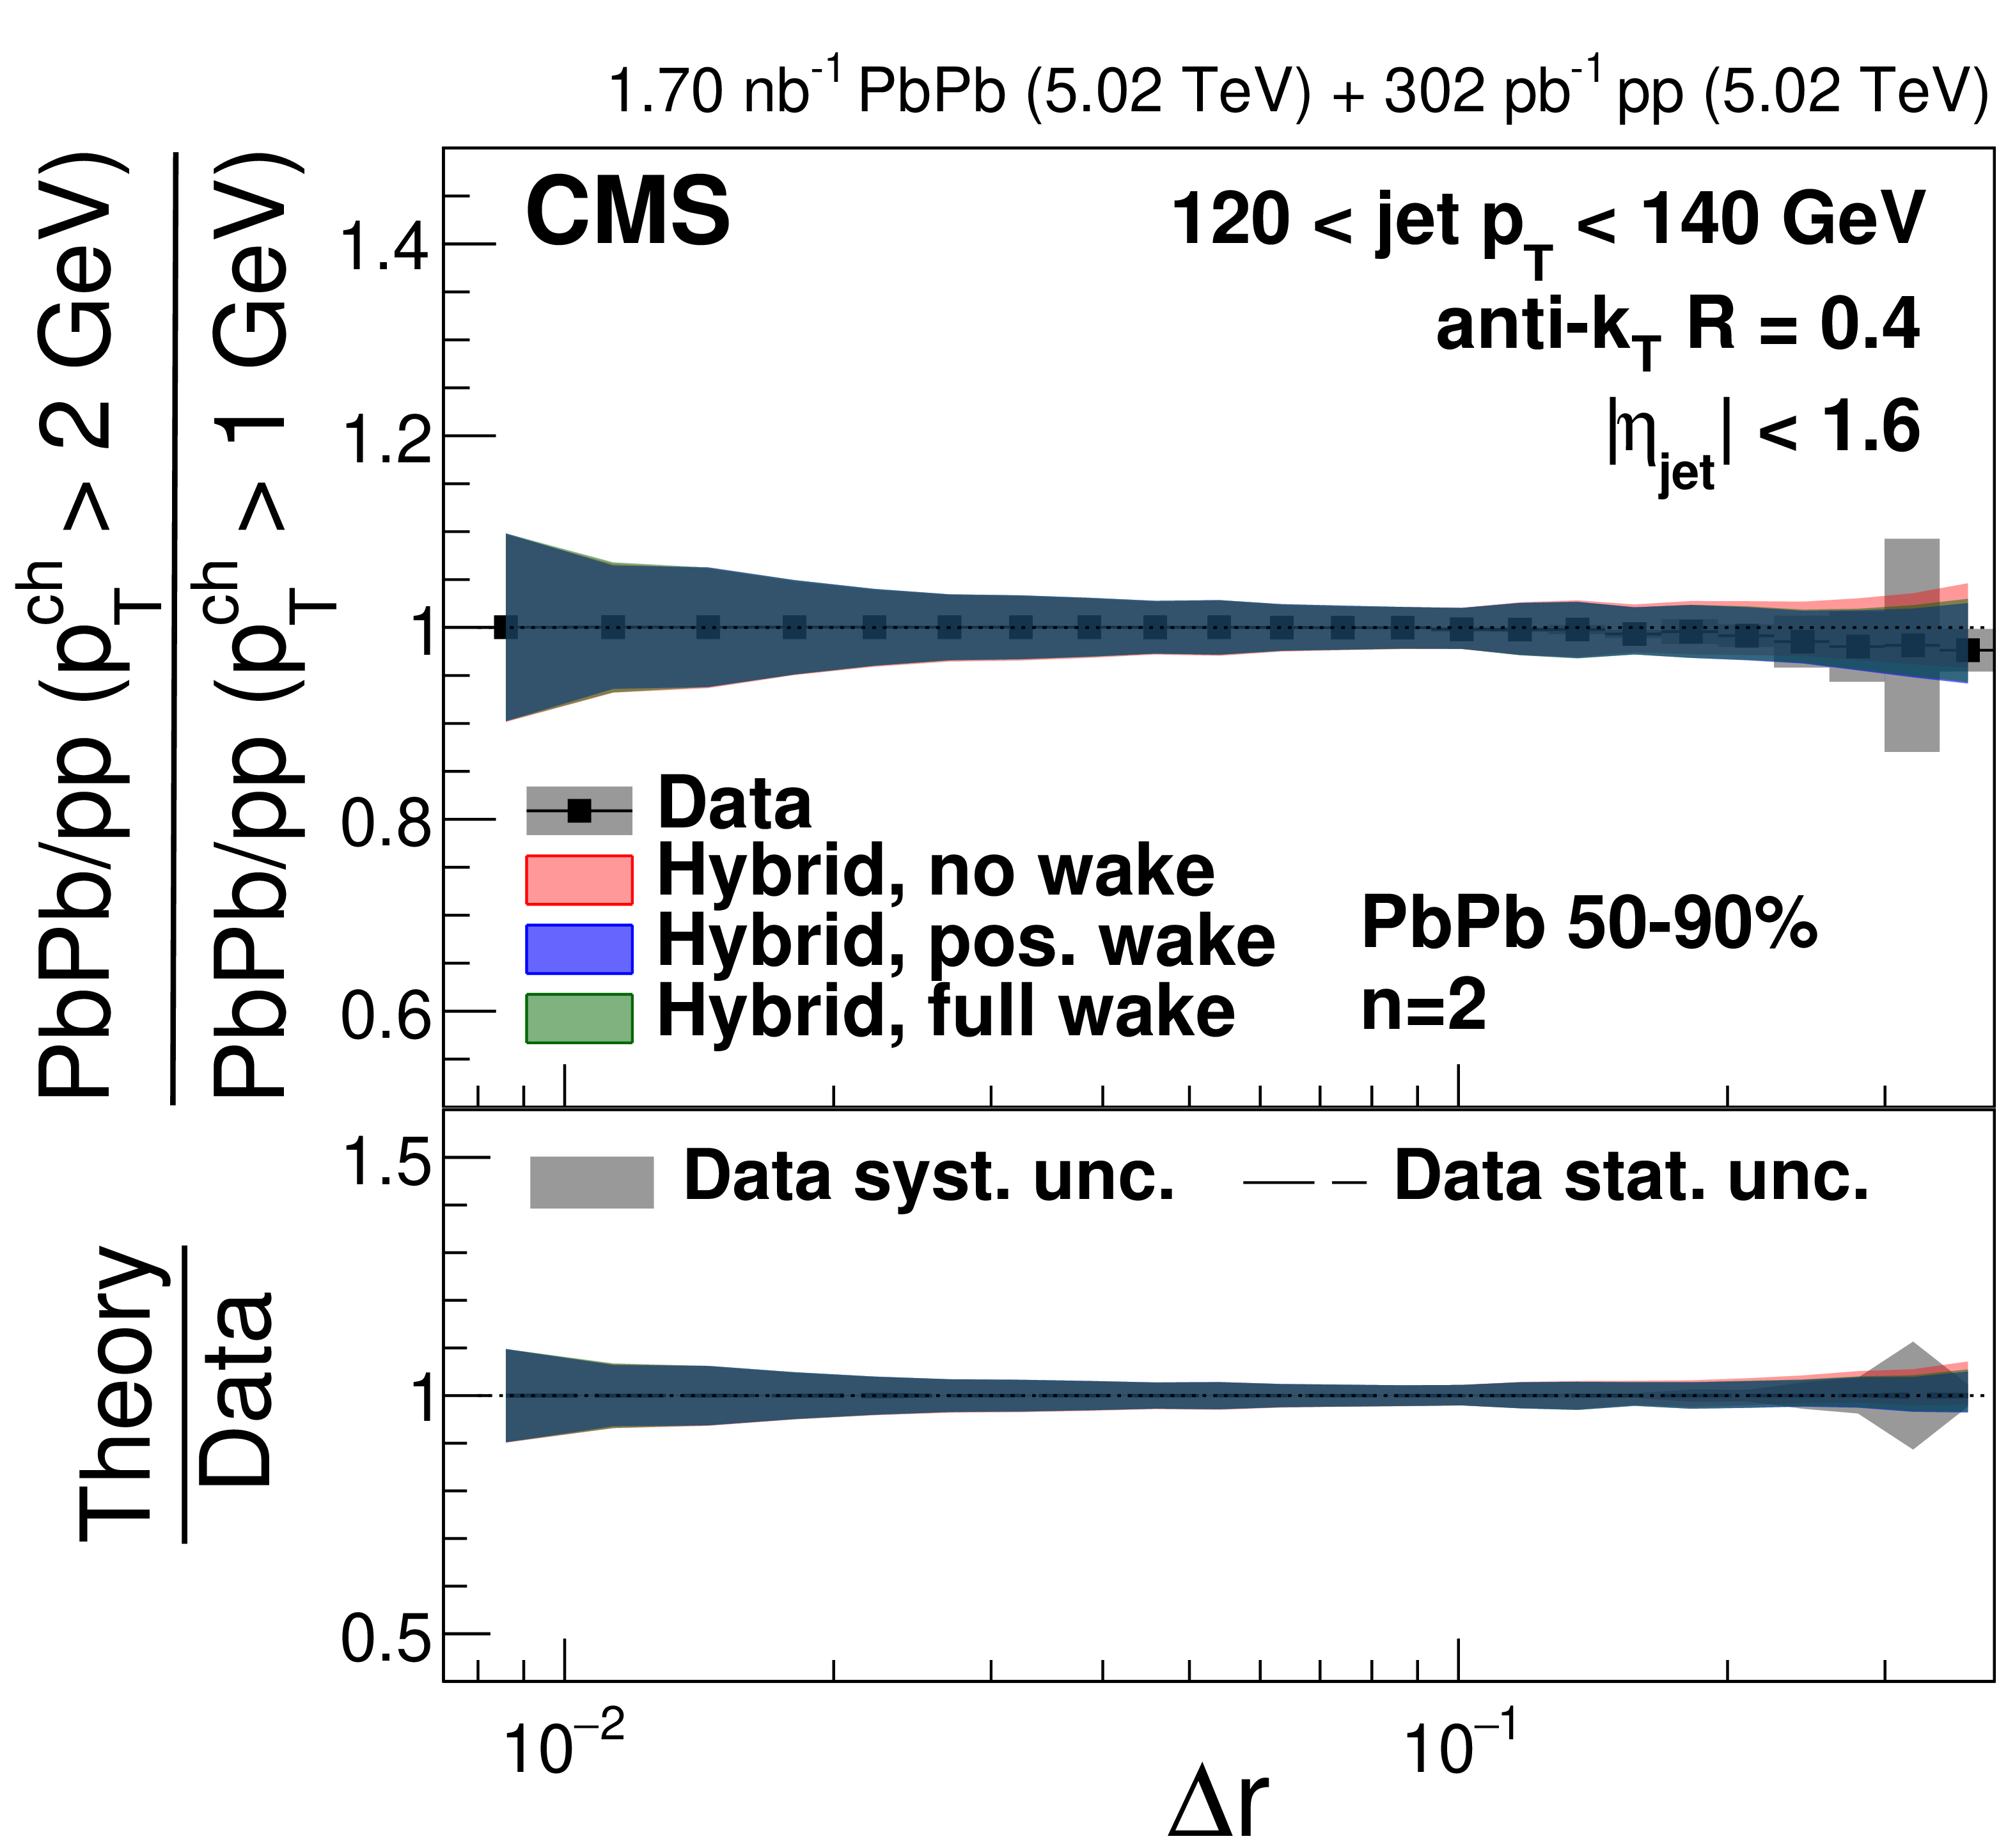
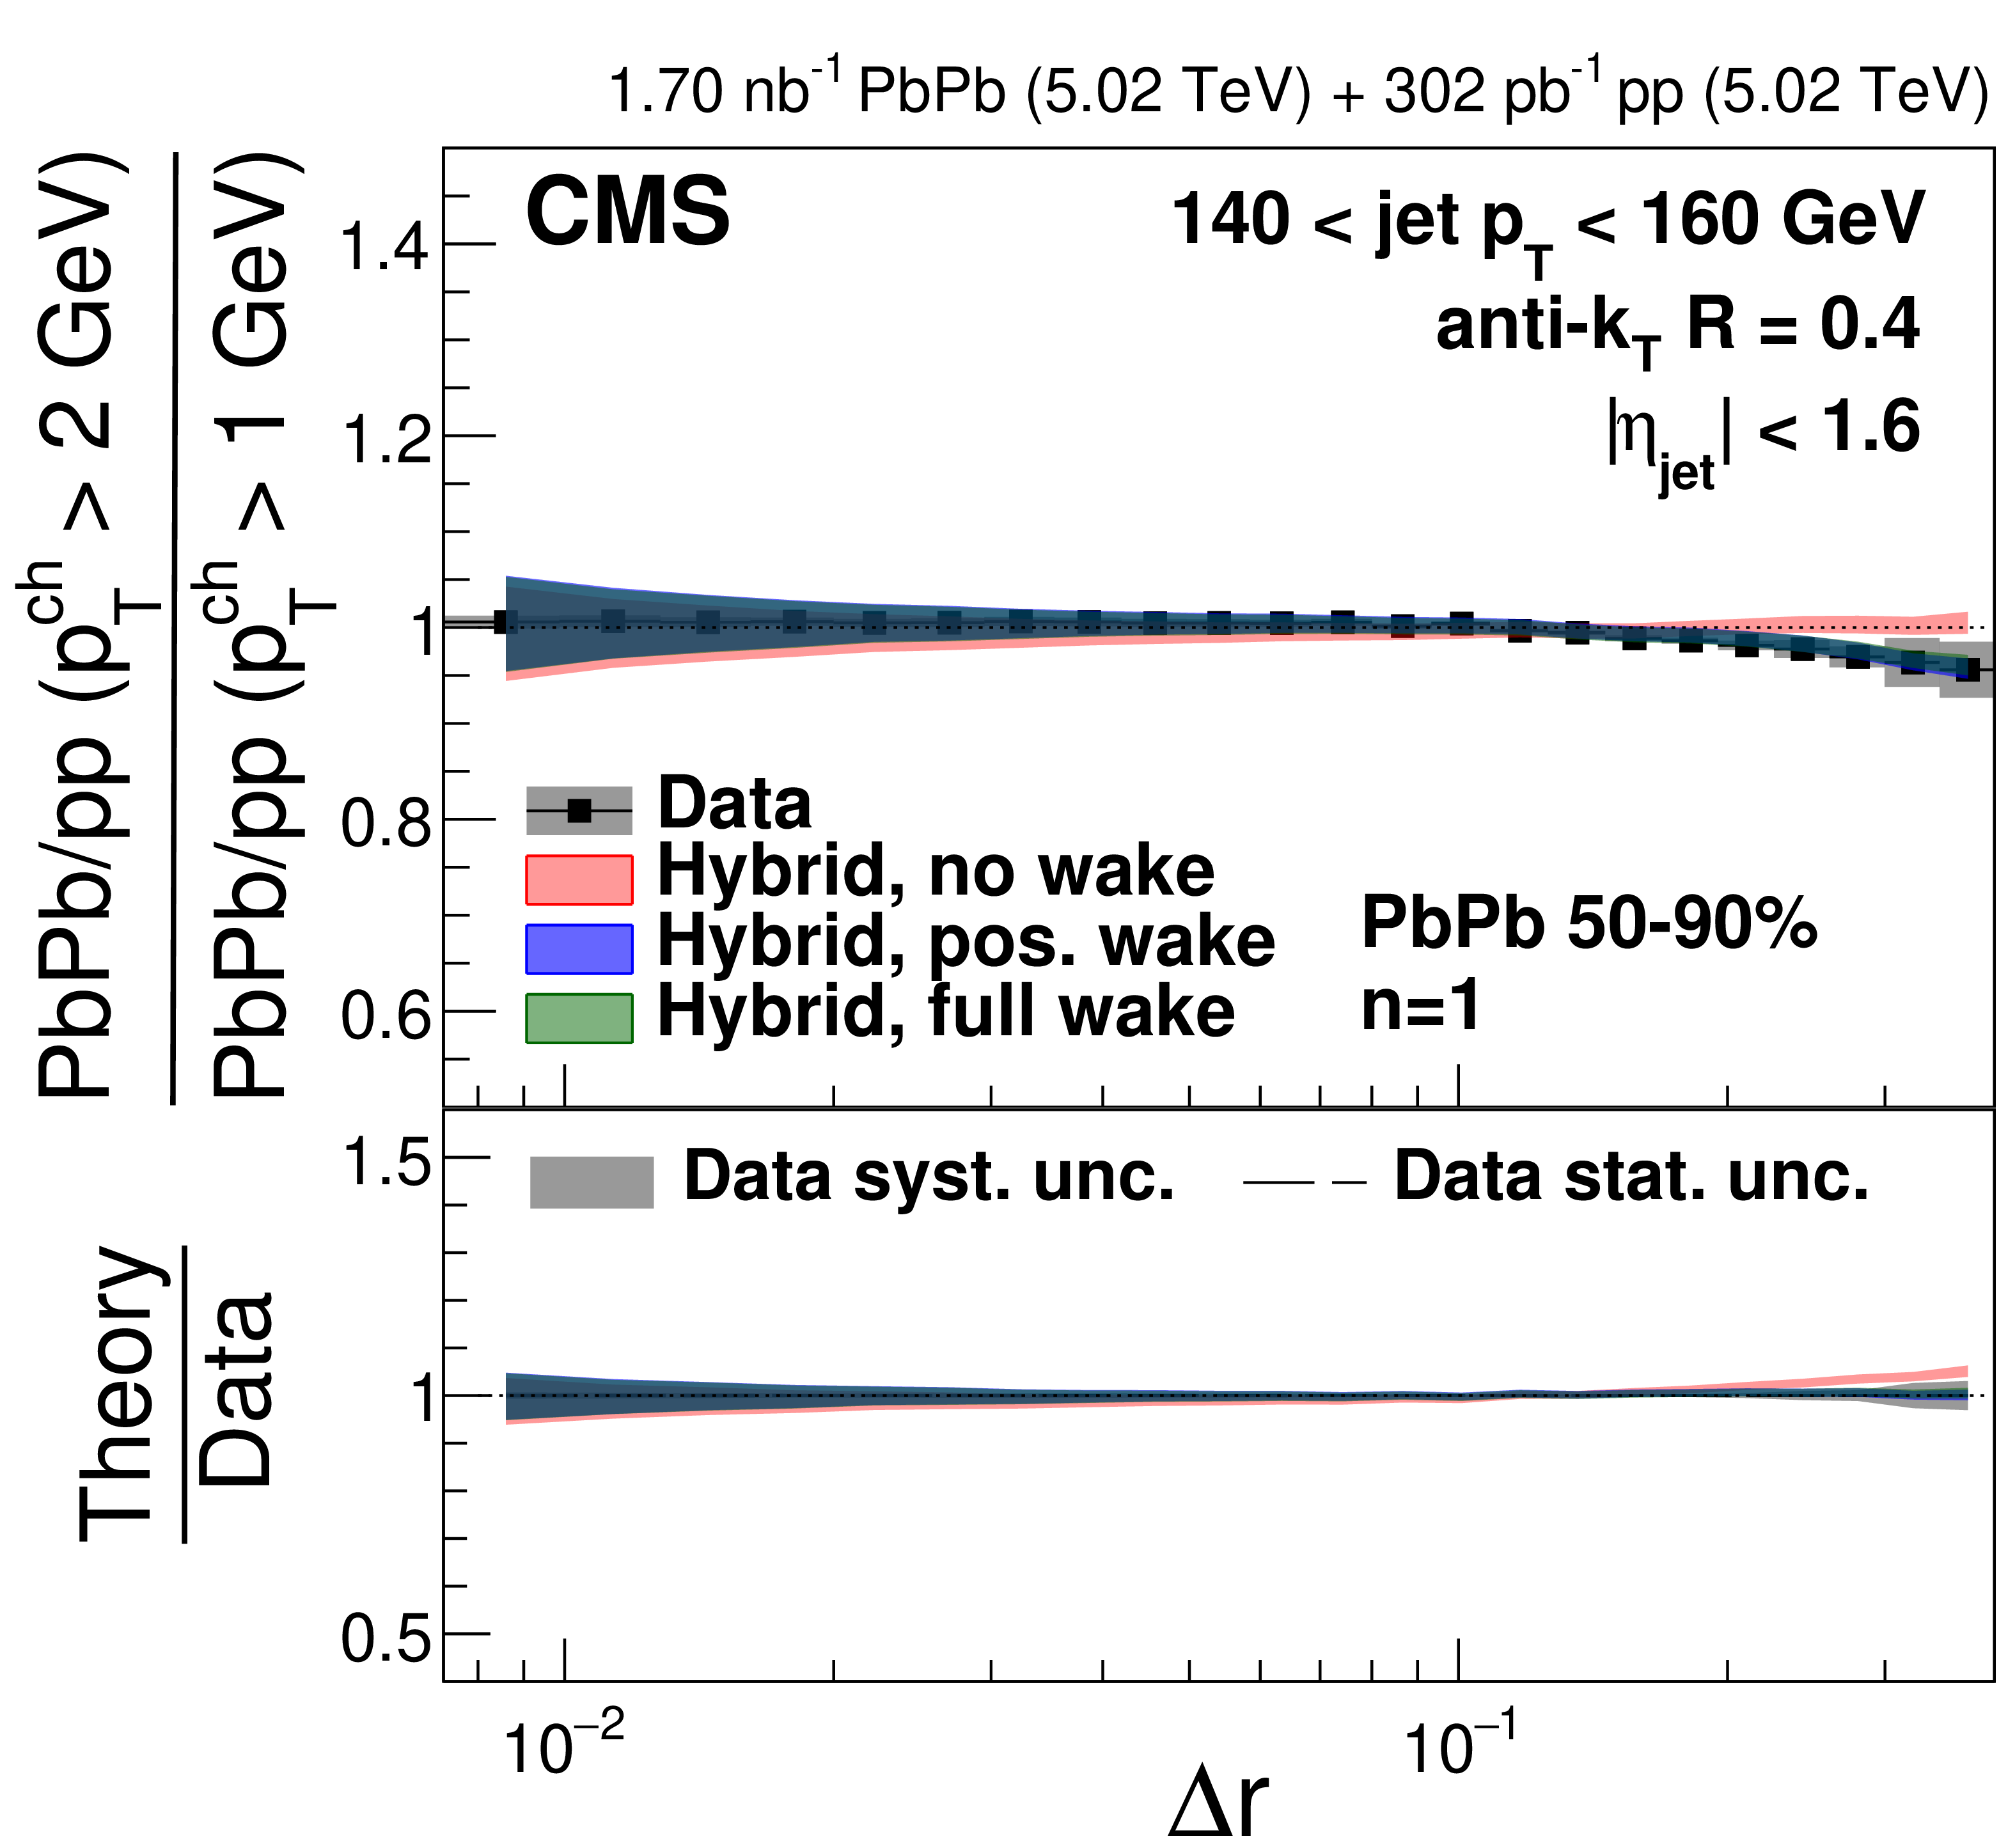
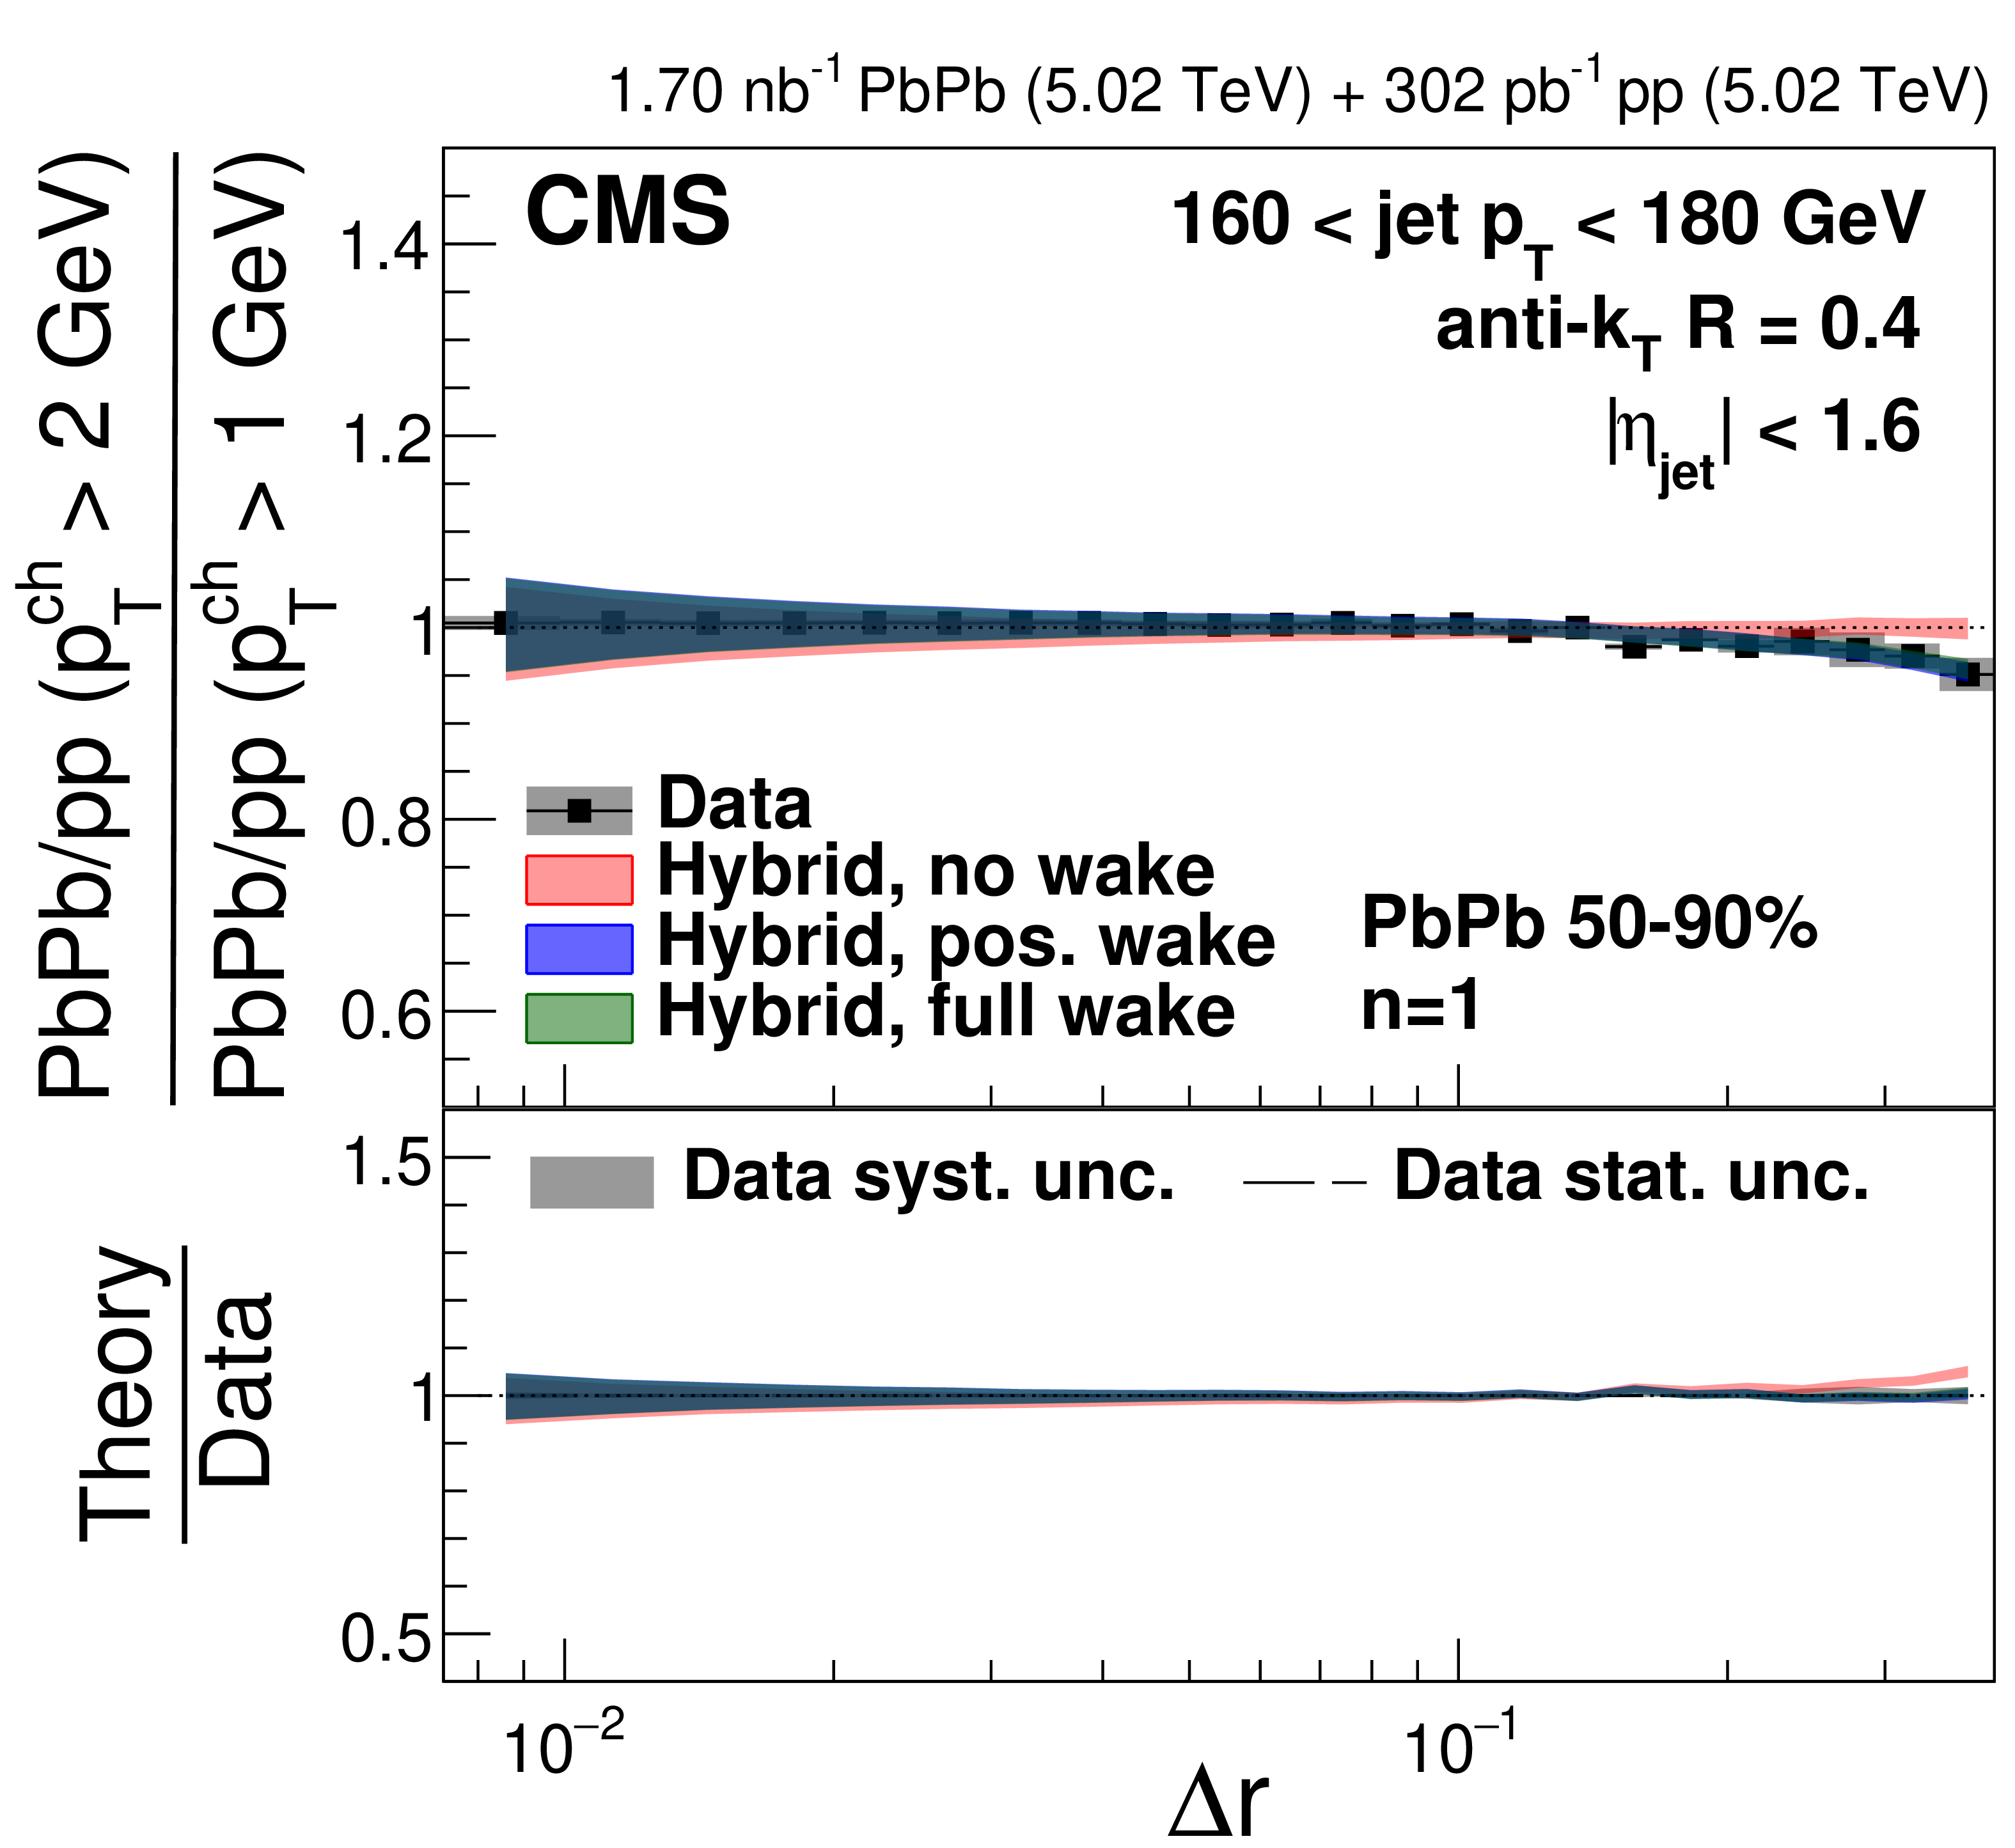
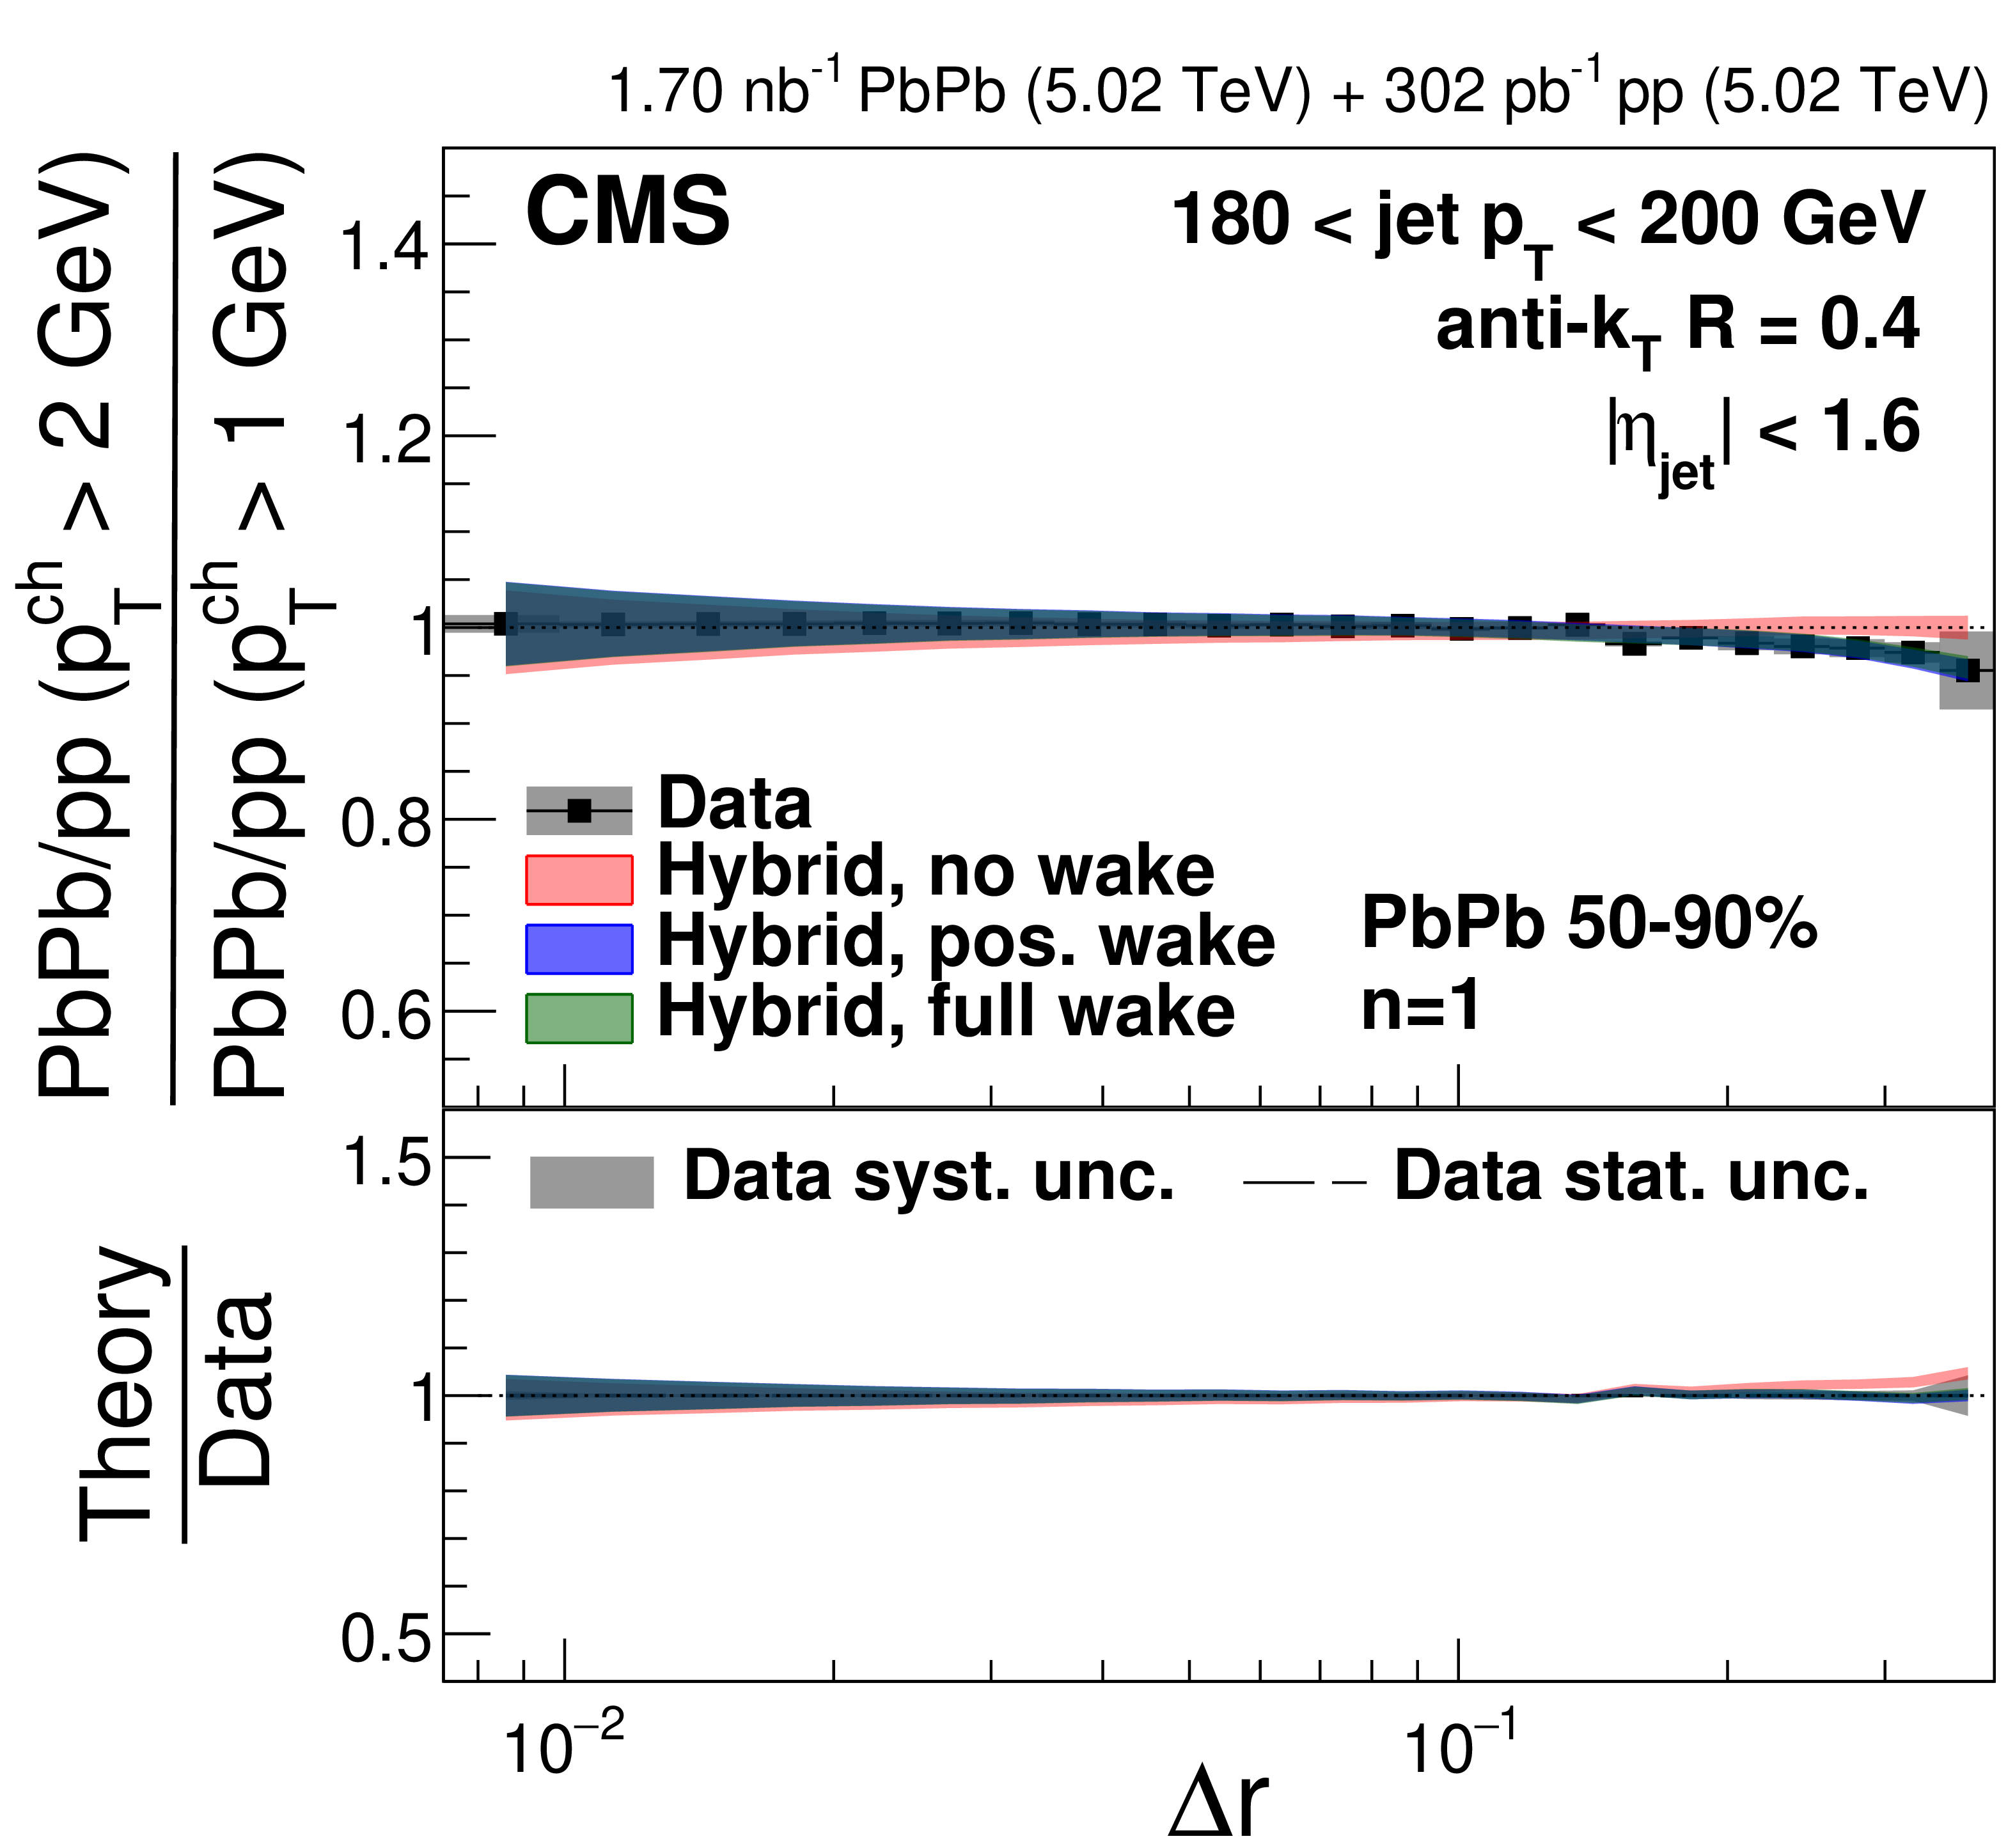
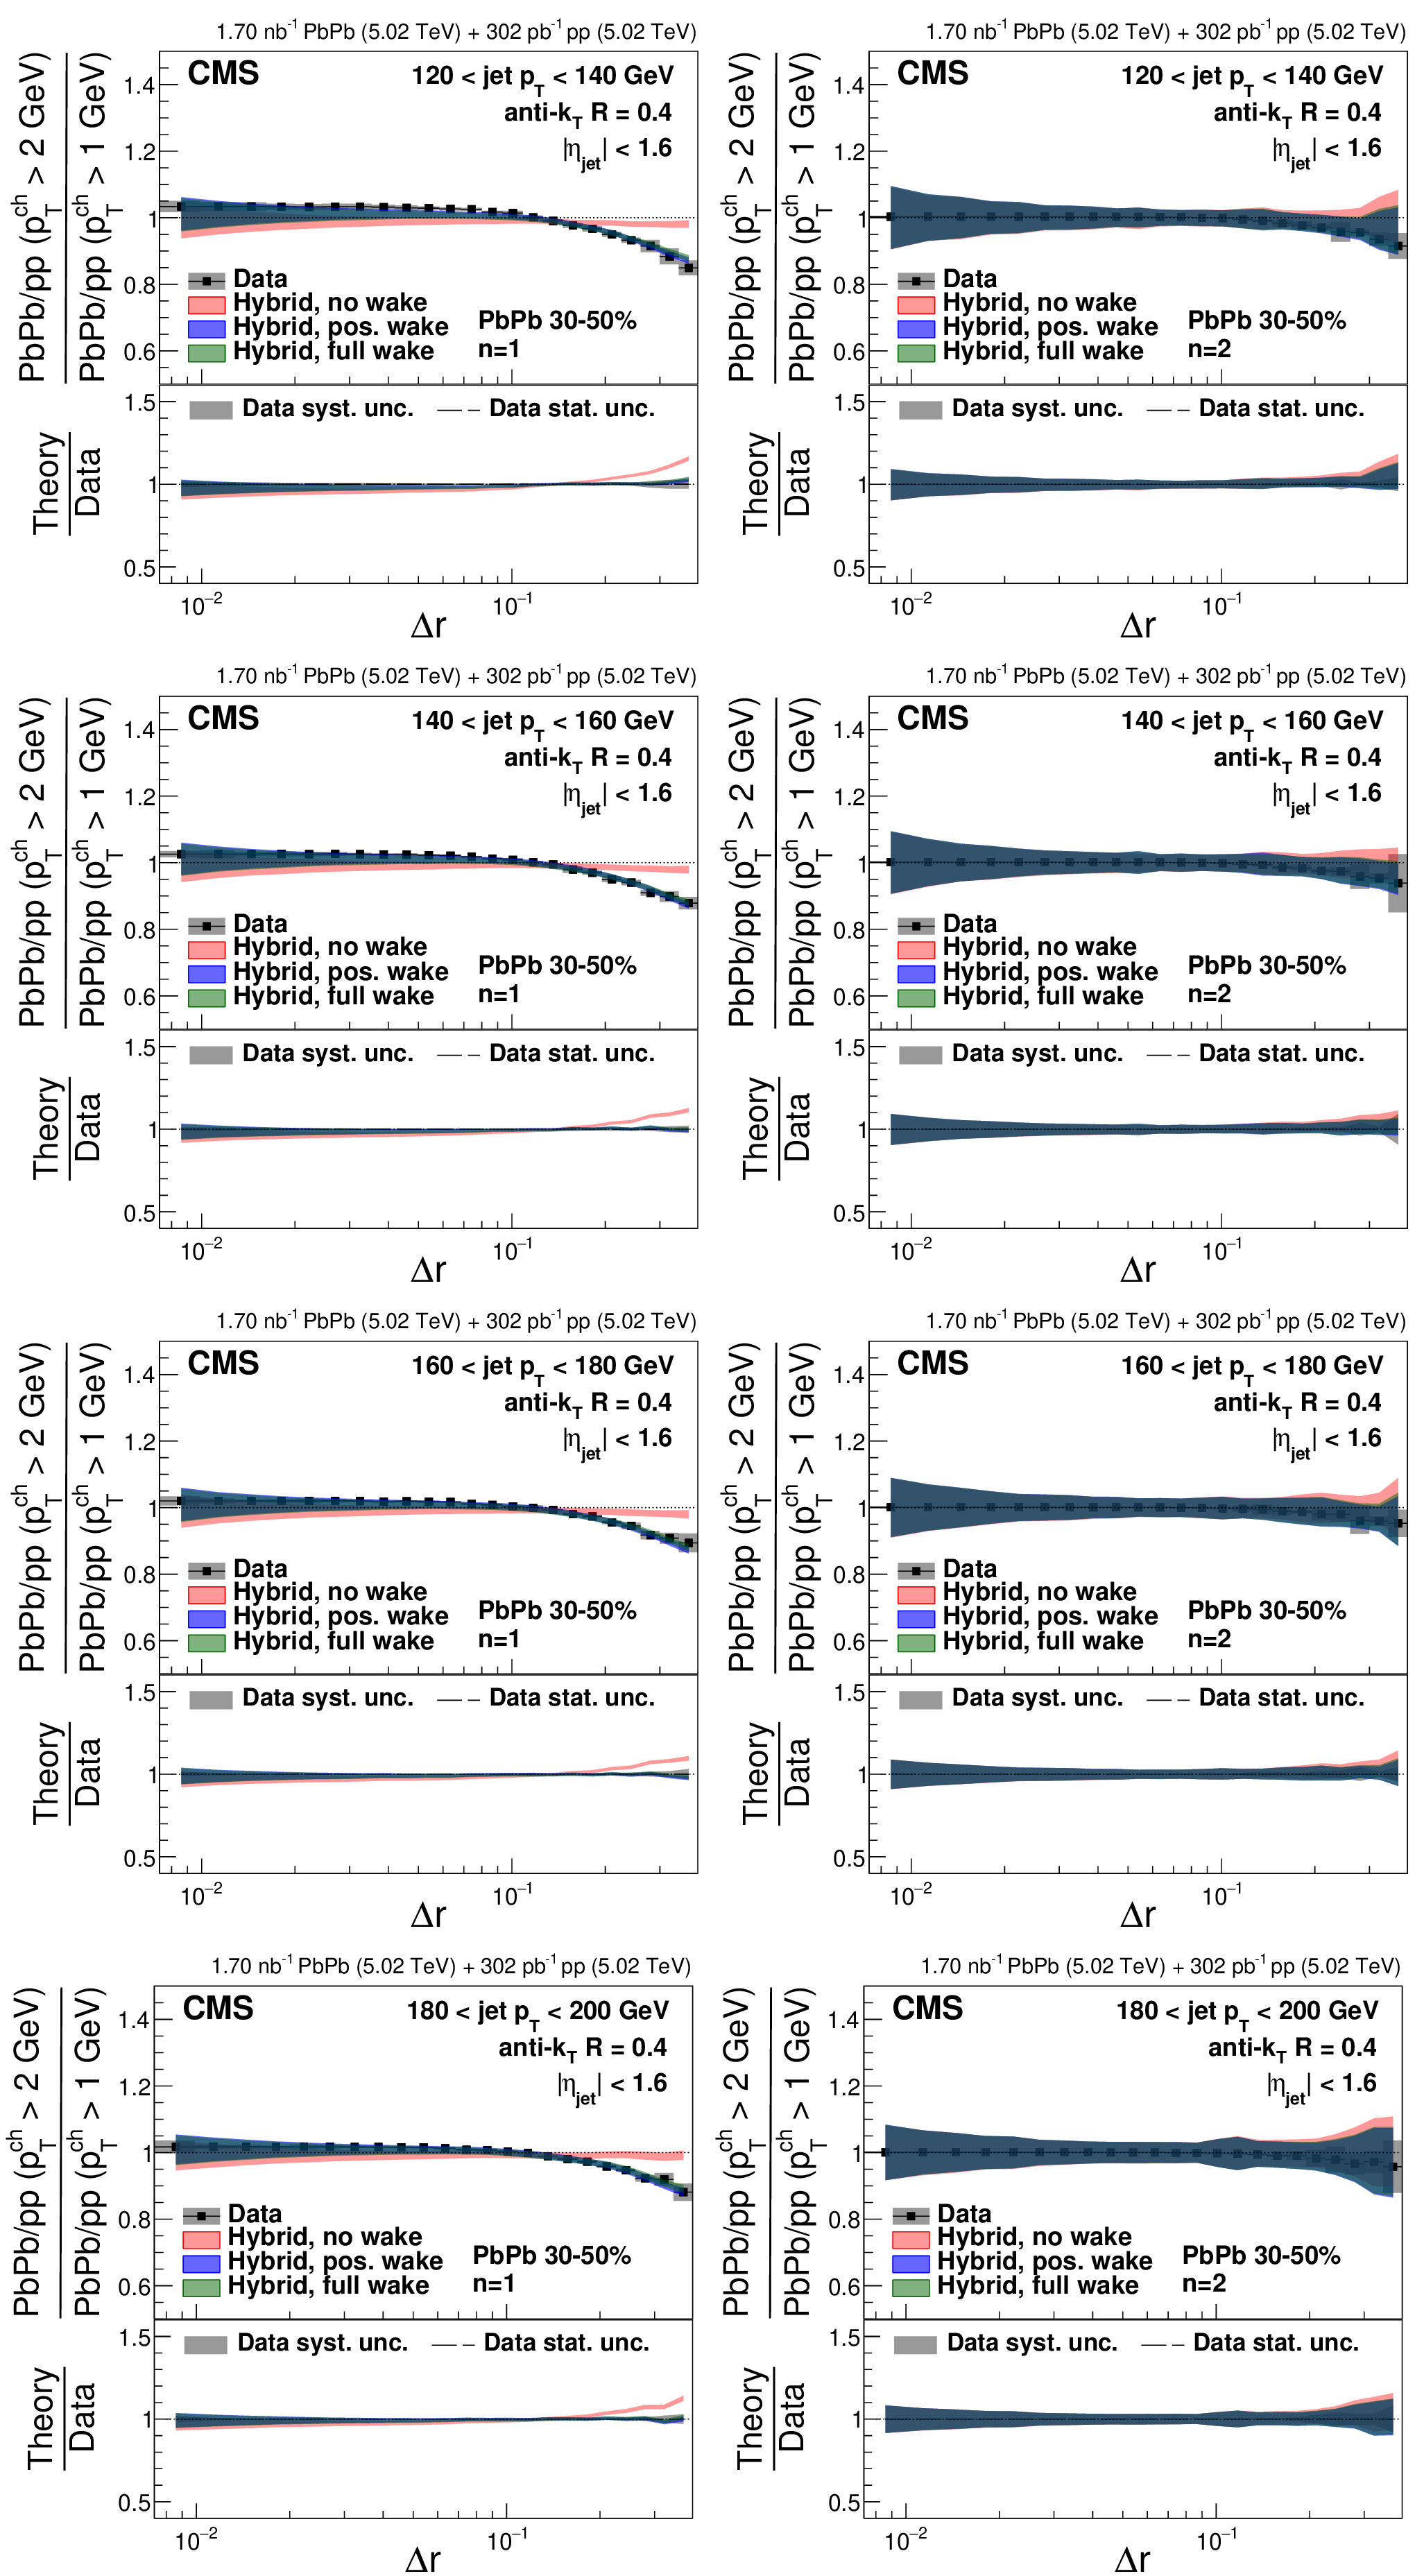
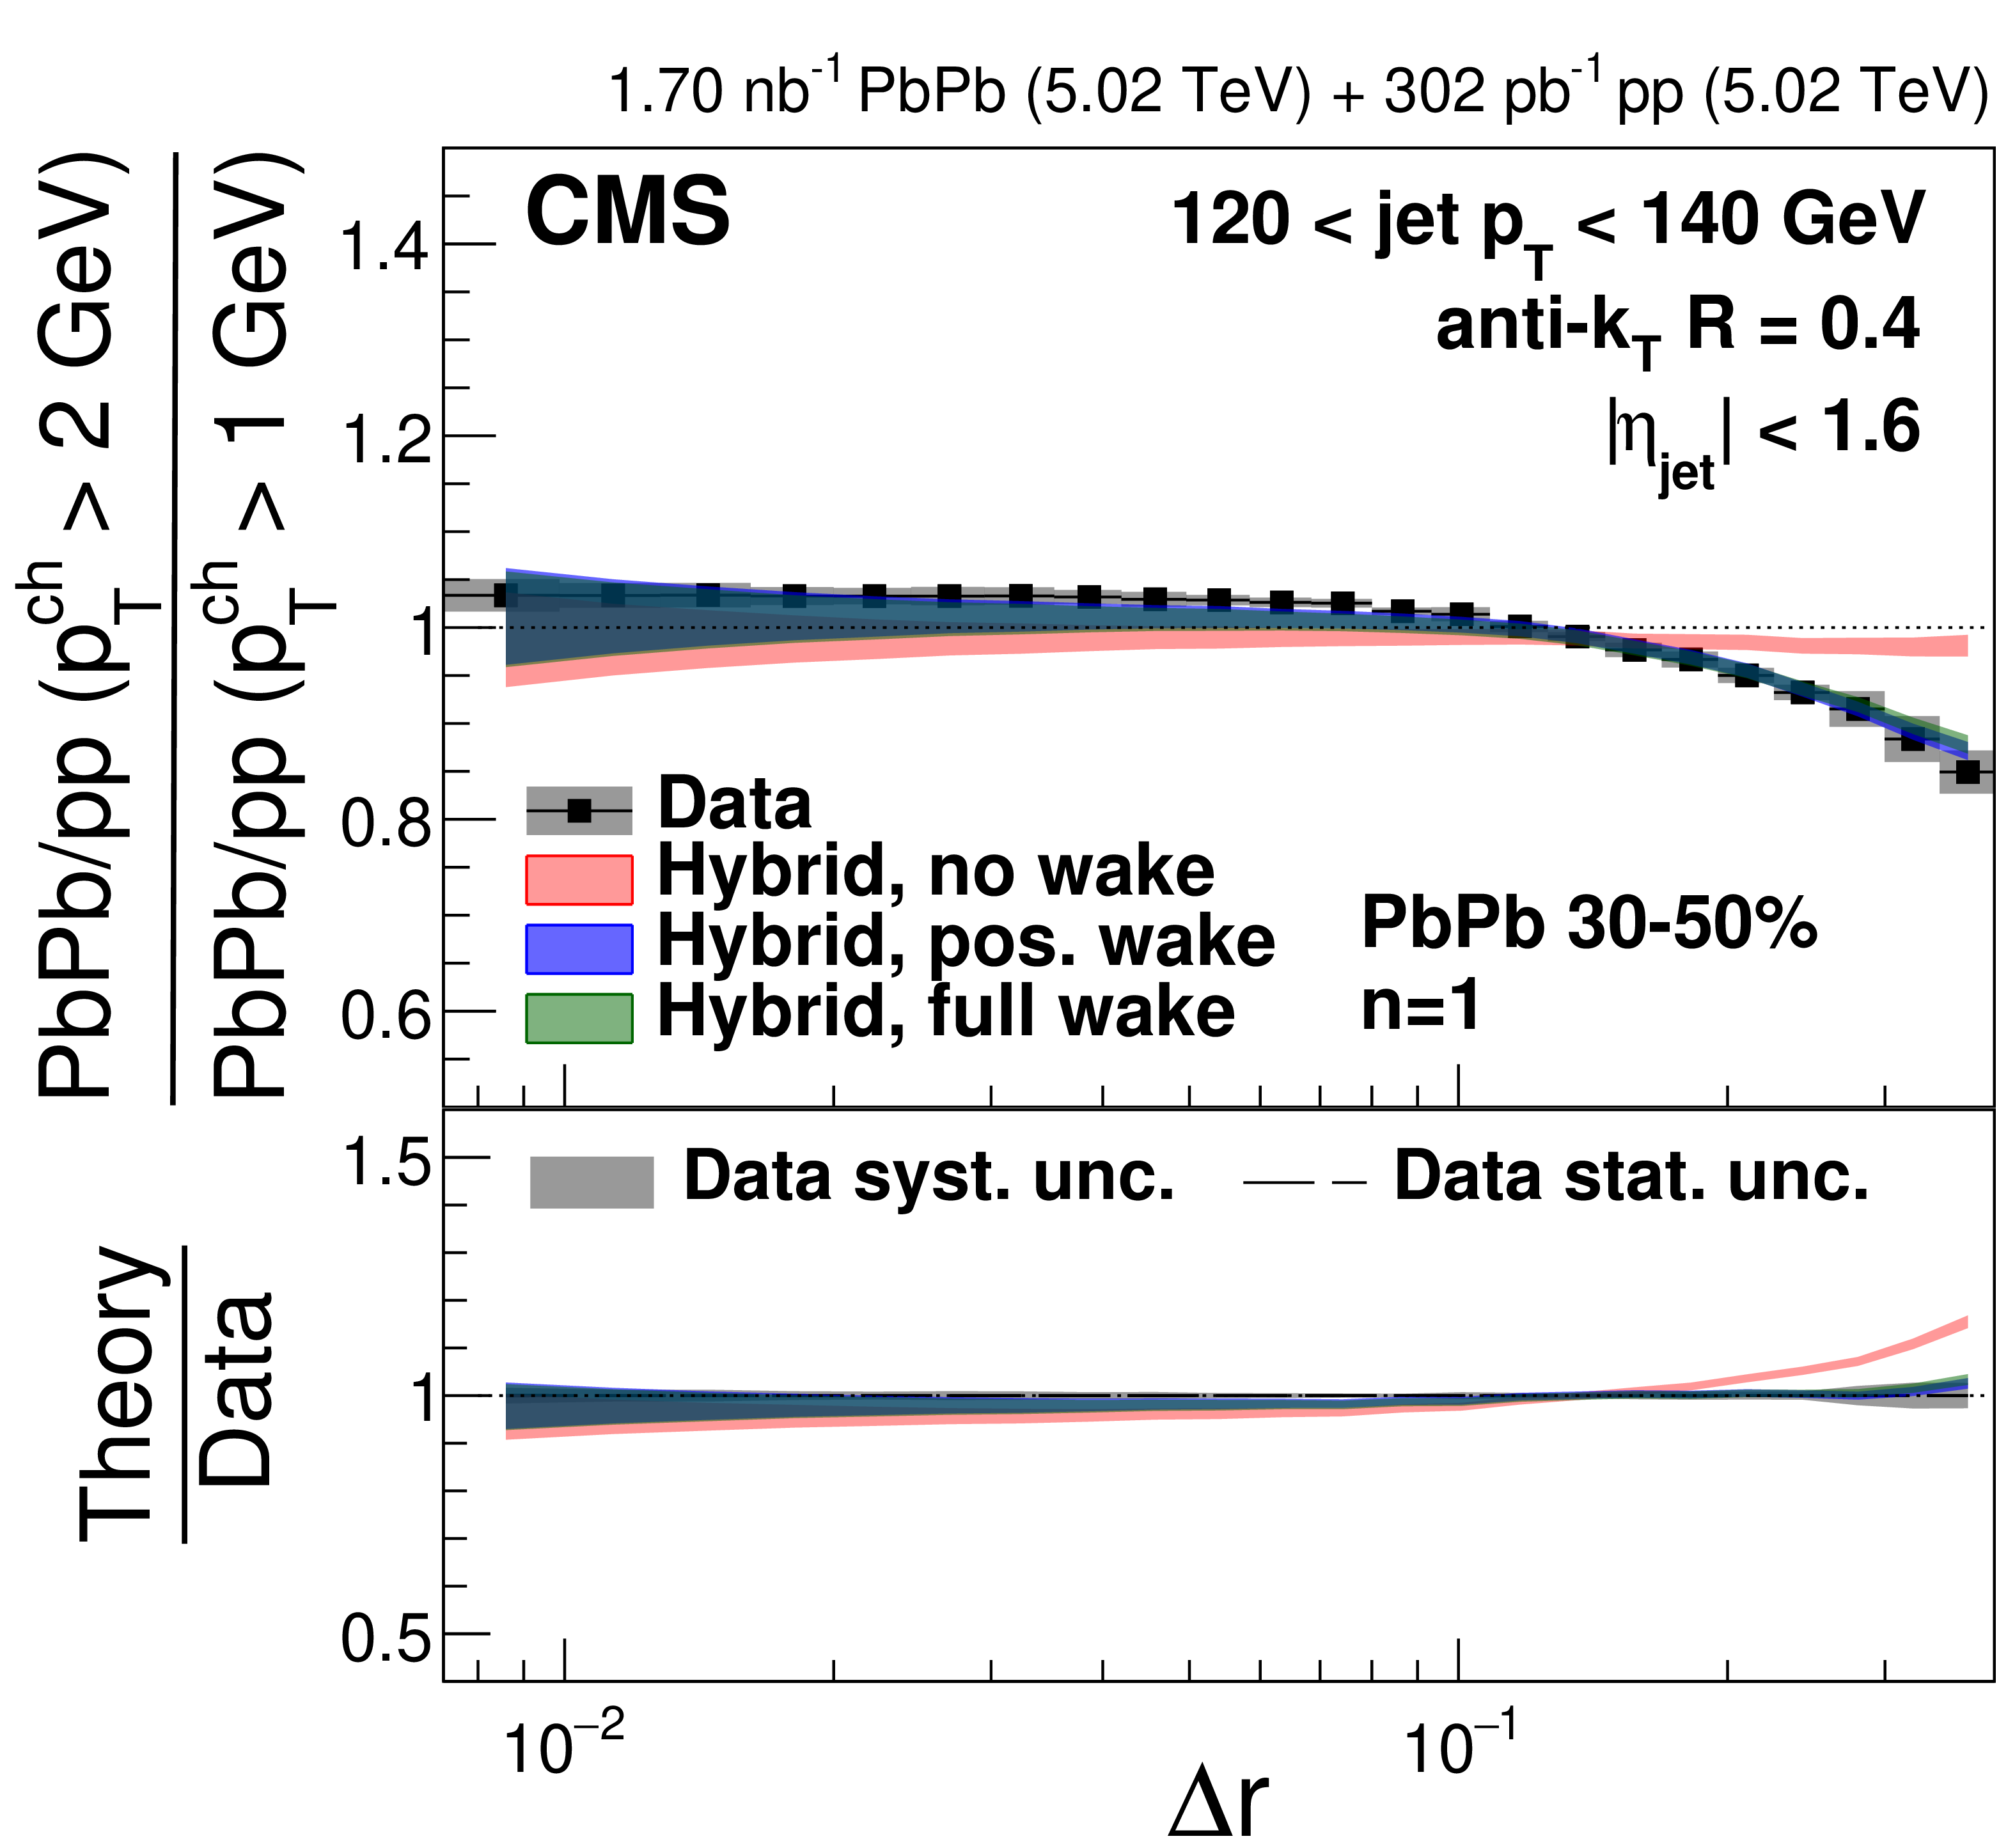
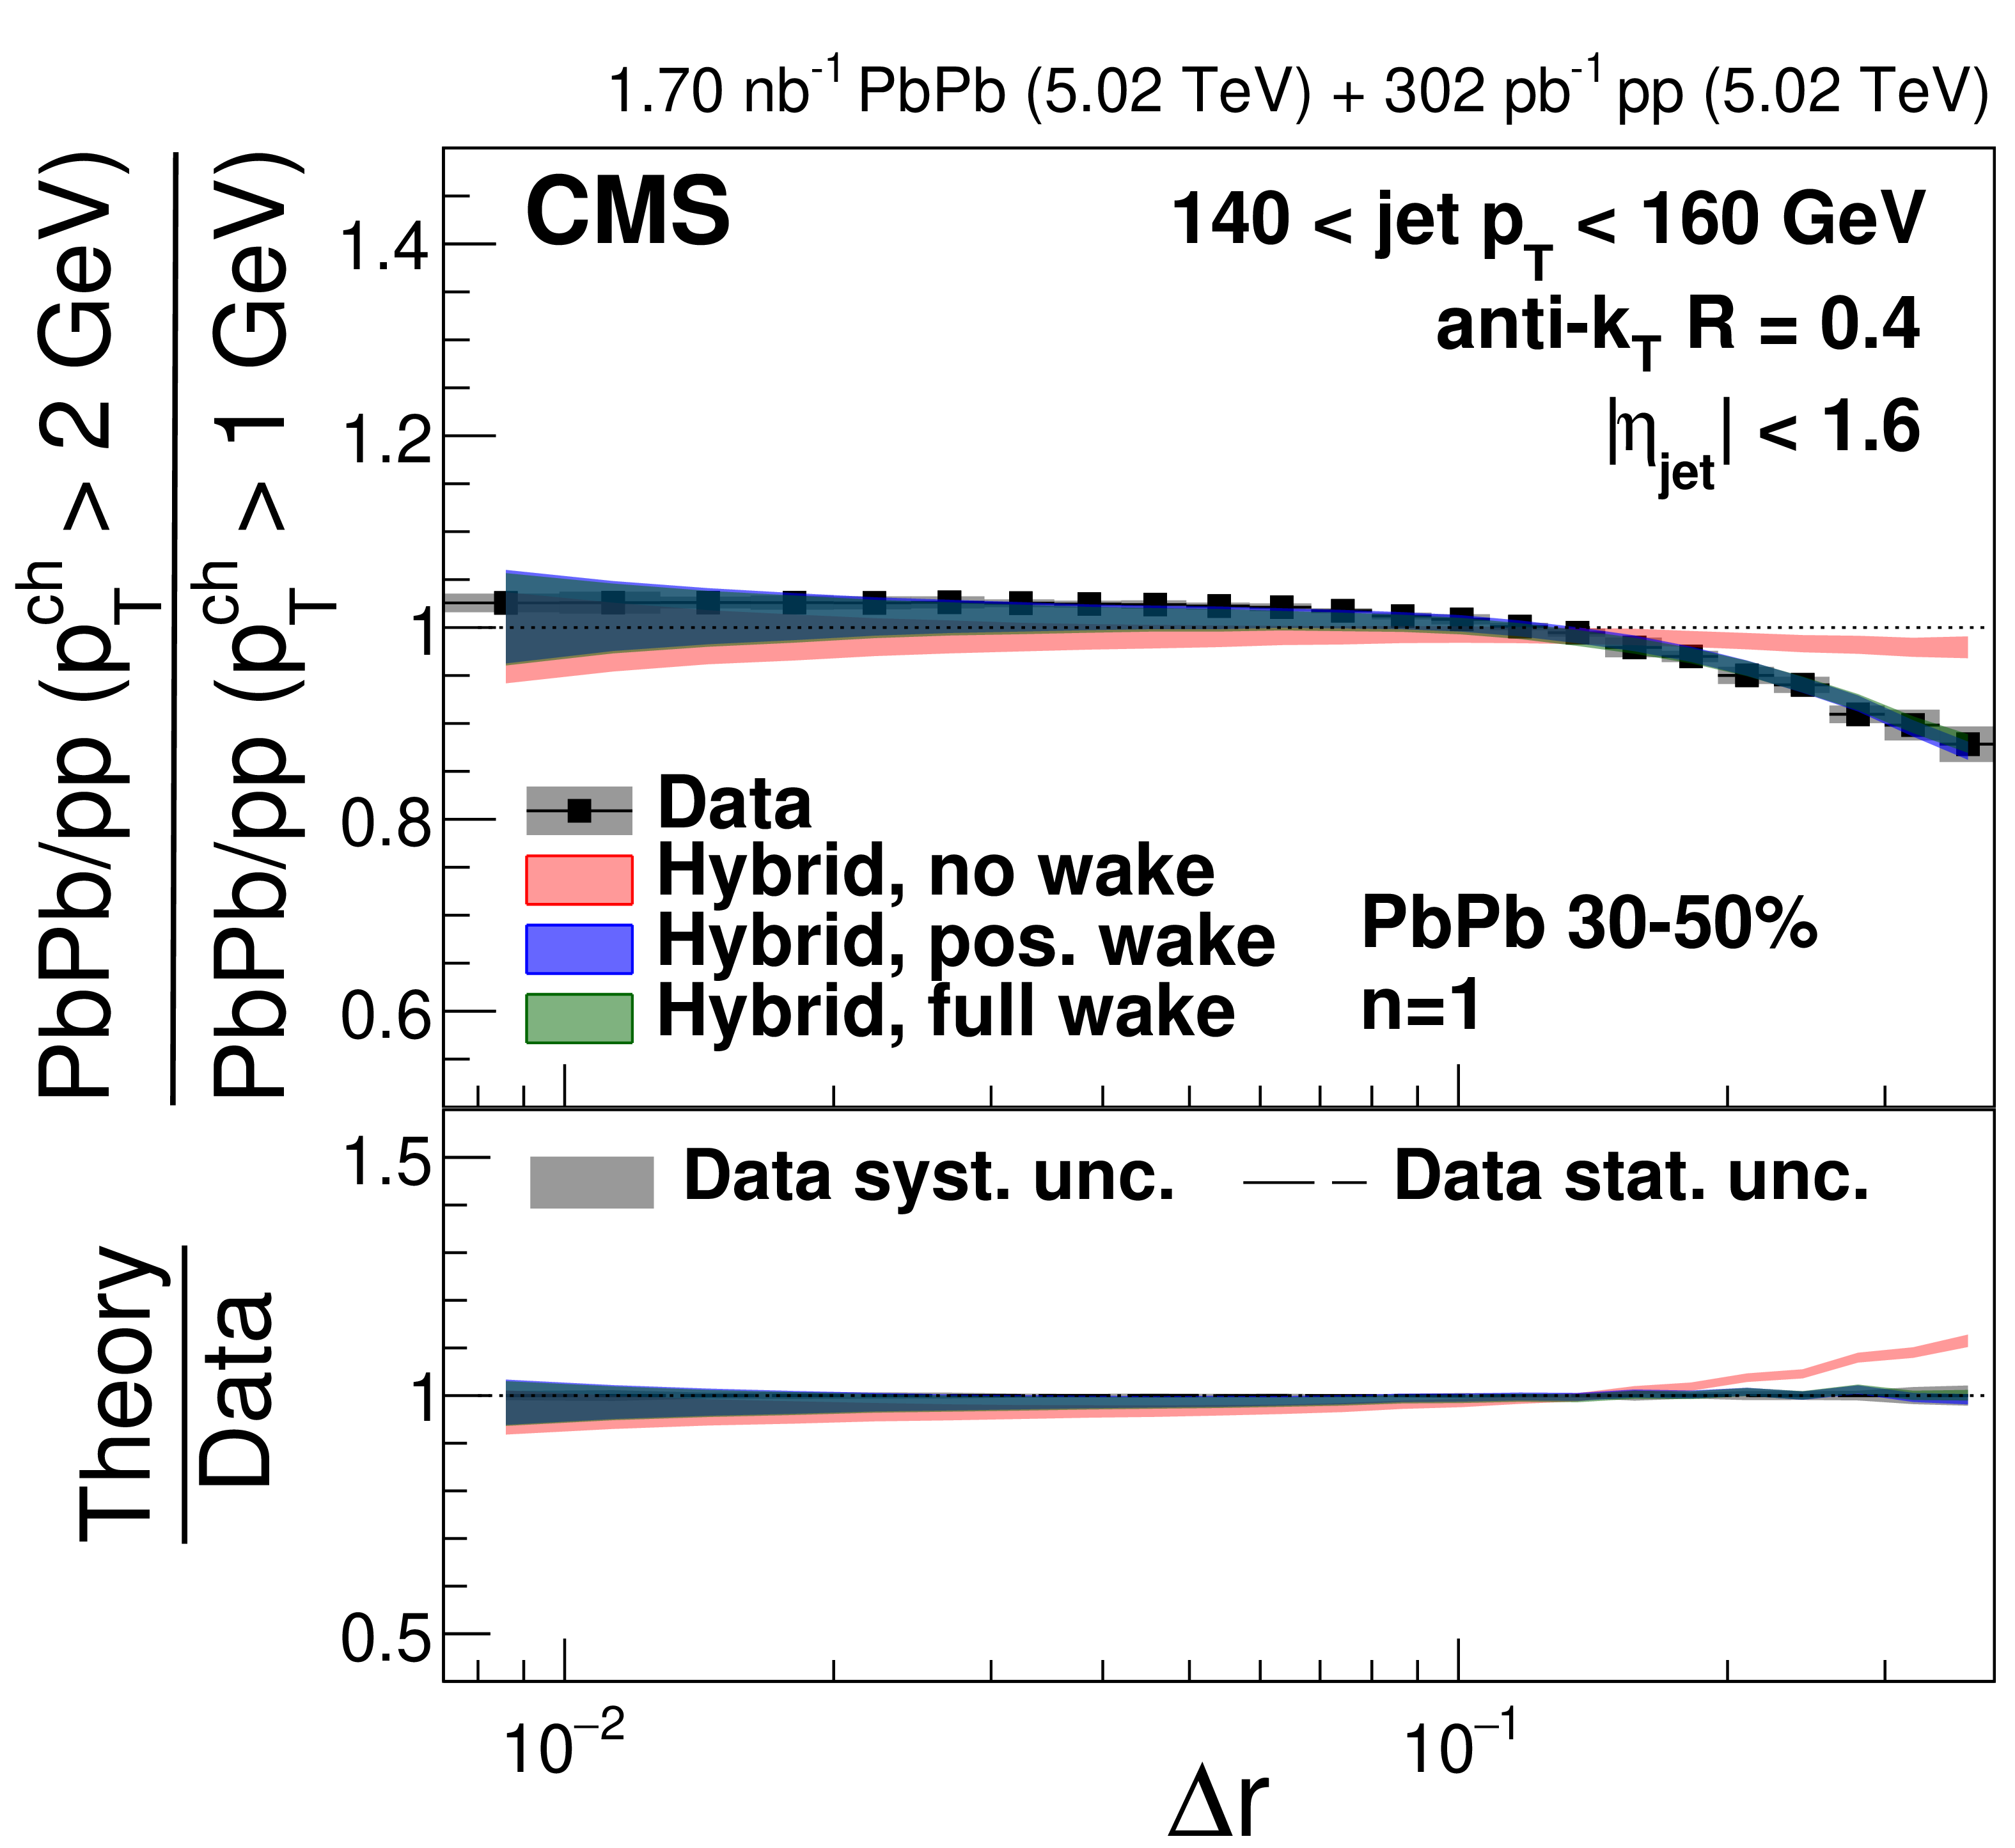
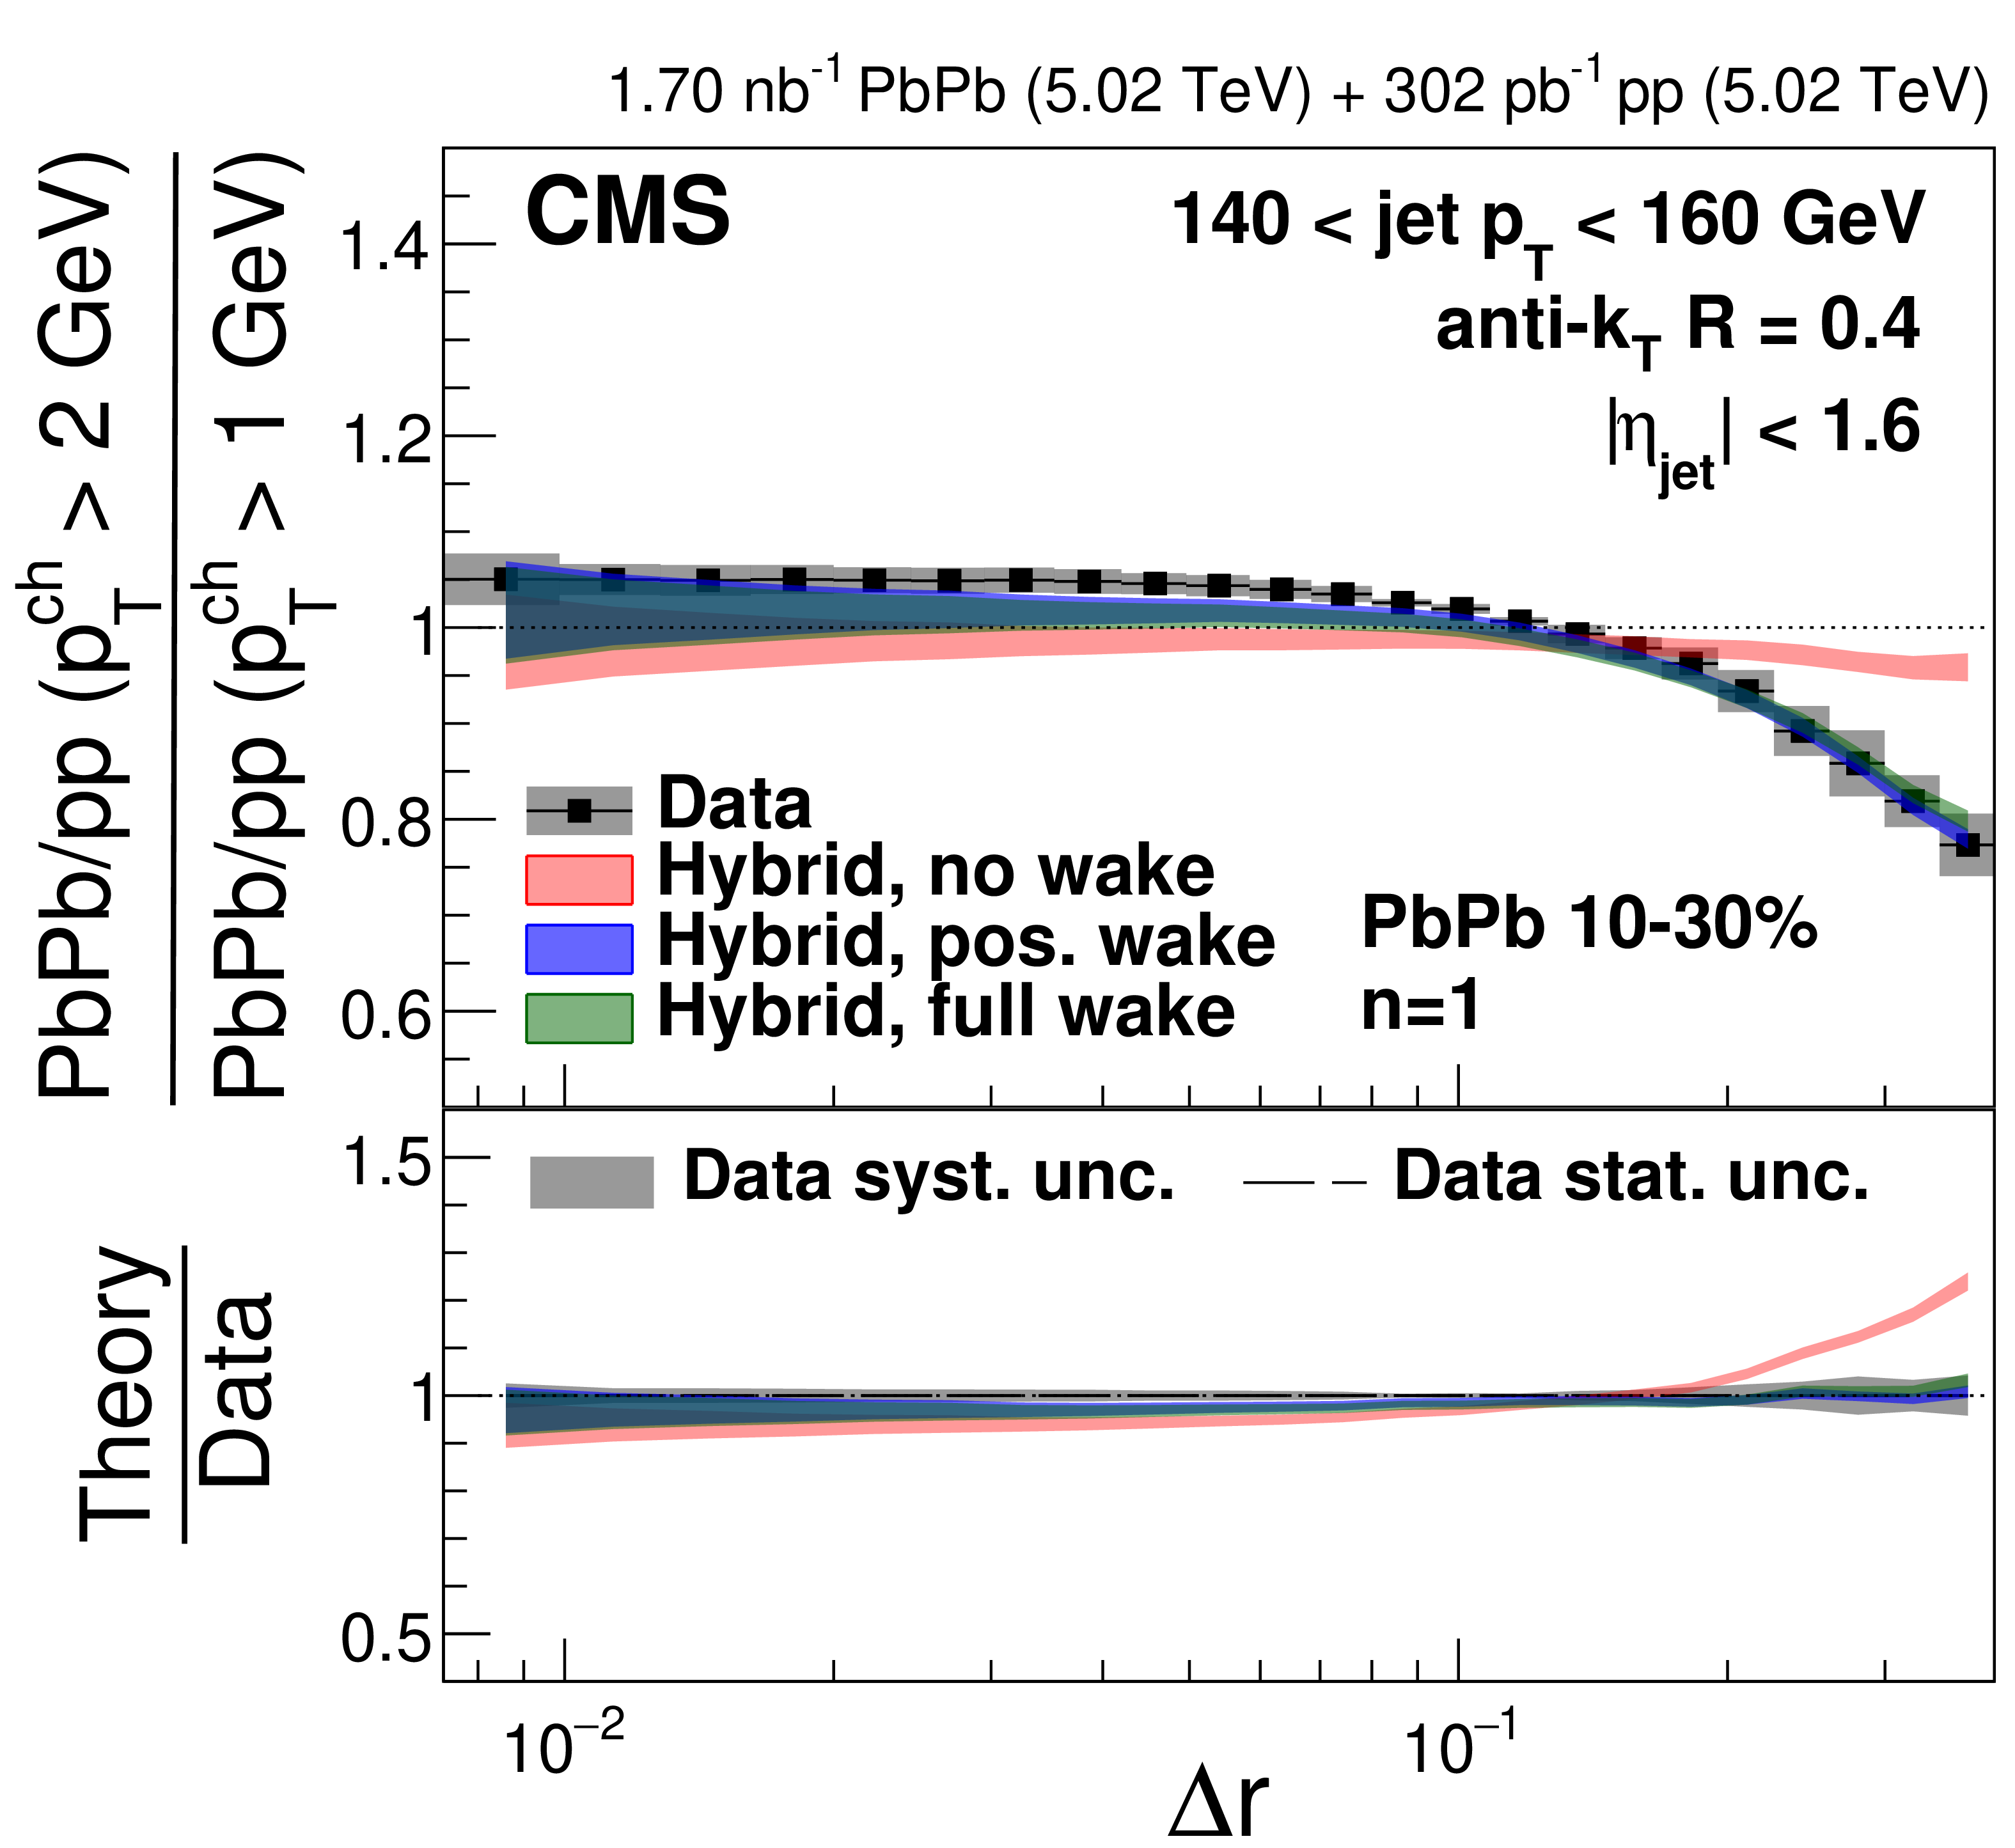
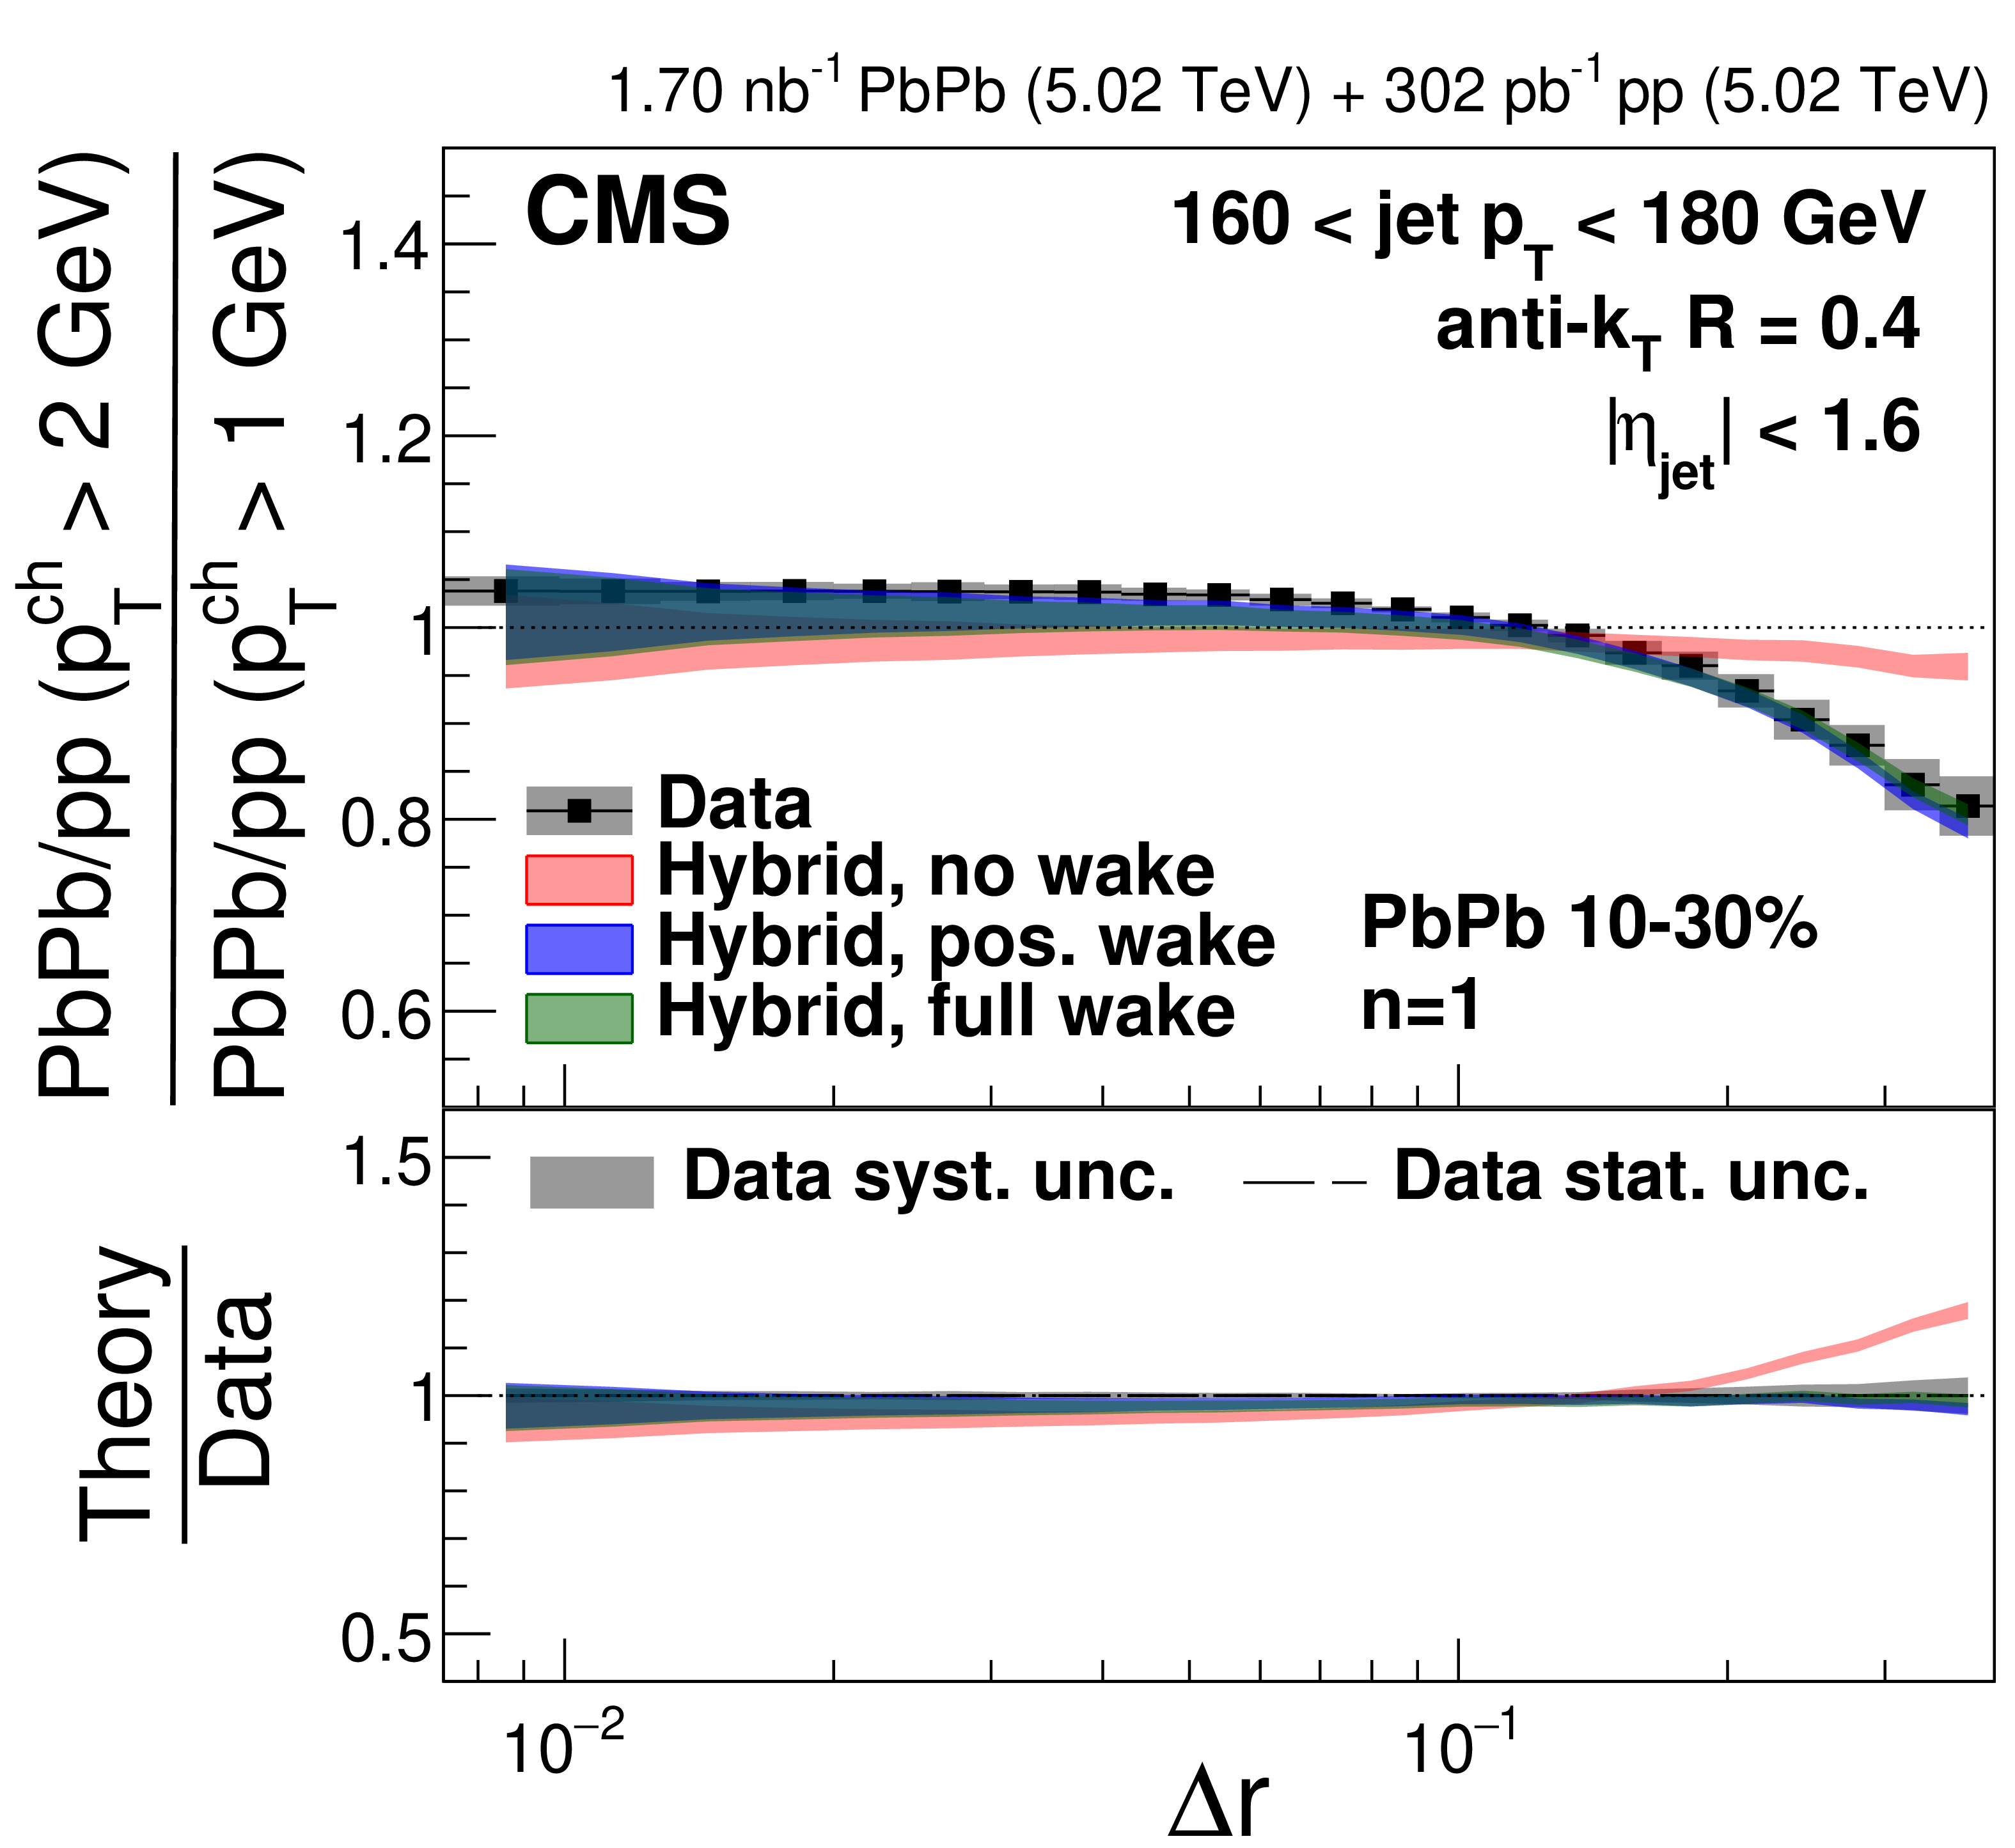
The PbPb to pp ratios of energy-energy correlators with $ p_{\mathrm{T}}^{\text{ch}} > $ 1 GeV and $ n= $ 1 are shown for 120 $ < p_{\text{T,jet}} < $ 140 GeV (left) and 180 $ < p_{\text{T,jet}} < $ 200 GeV (right) together with the hybrid model [82,83,84] predictions with three different wake settings. In the lower panels, the experimental uncertainties are indicated by the bands around unity. |
png pdf |
Figure 7-a:
The PbPb to pp ratios of energy-energy correlators with $ p_{\mathrm{T}}^{\text{ch}} > $ 1 GeV and $ n= $ 1 are shown for 120 $ < p_{\text{T,jet}} < $ 140 GeV (left) and 180 $ < p_{\text{T,jet}} < $ 200 GeV (right) together with the hybrid model [82,83,84] predictions with three different wake settings. In the lower panels, the experimental uncertainties are indicated by the bands around unity. |

png pdf |
Figure 7-b:
The PbPb to pp ratios of energy-energy correlators with $ p_{\mathrm{T}}^{\text{ch}} > $ 1 GeV and $ n= $ 1 are shown for 120 $ < p_{\text{T,jet}} < $ 140 GeV (left) and 180 $ < p_{\text{T,jet}} < $ 200 GeV (right) together with the hybrid model [82,83,84] predictions with three different wake settings. In the lower panels, the experimental uncertainties are indicated by the bands around unity. |
png pdf |
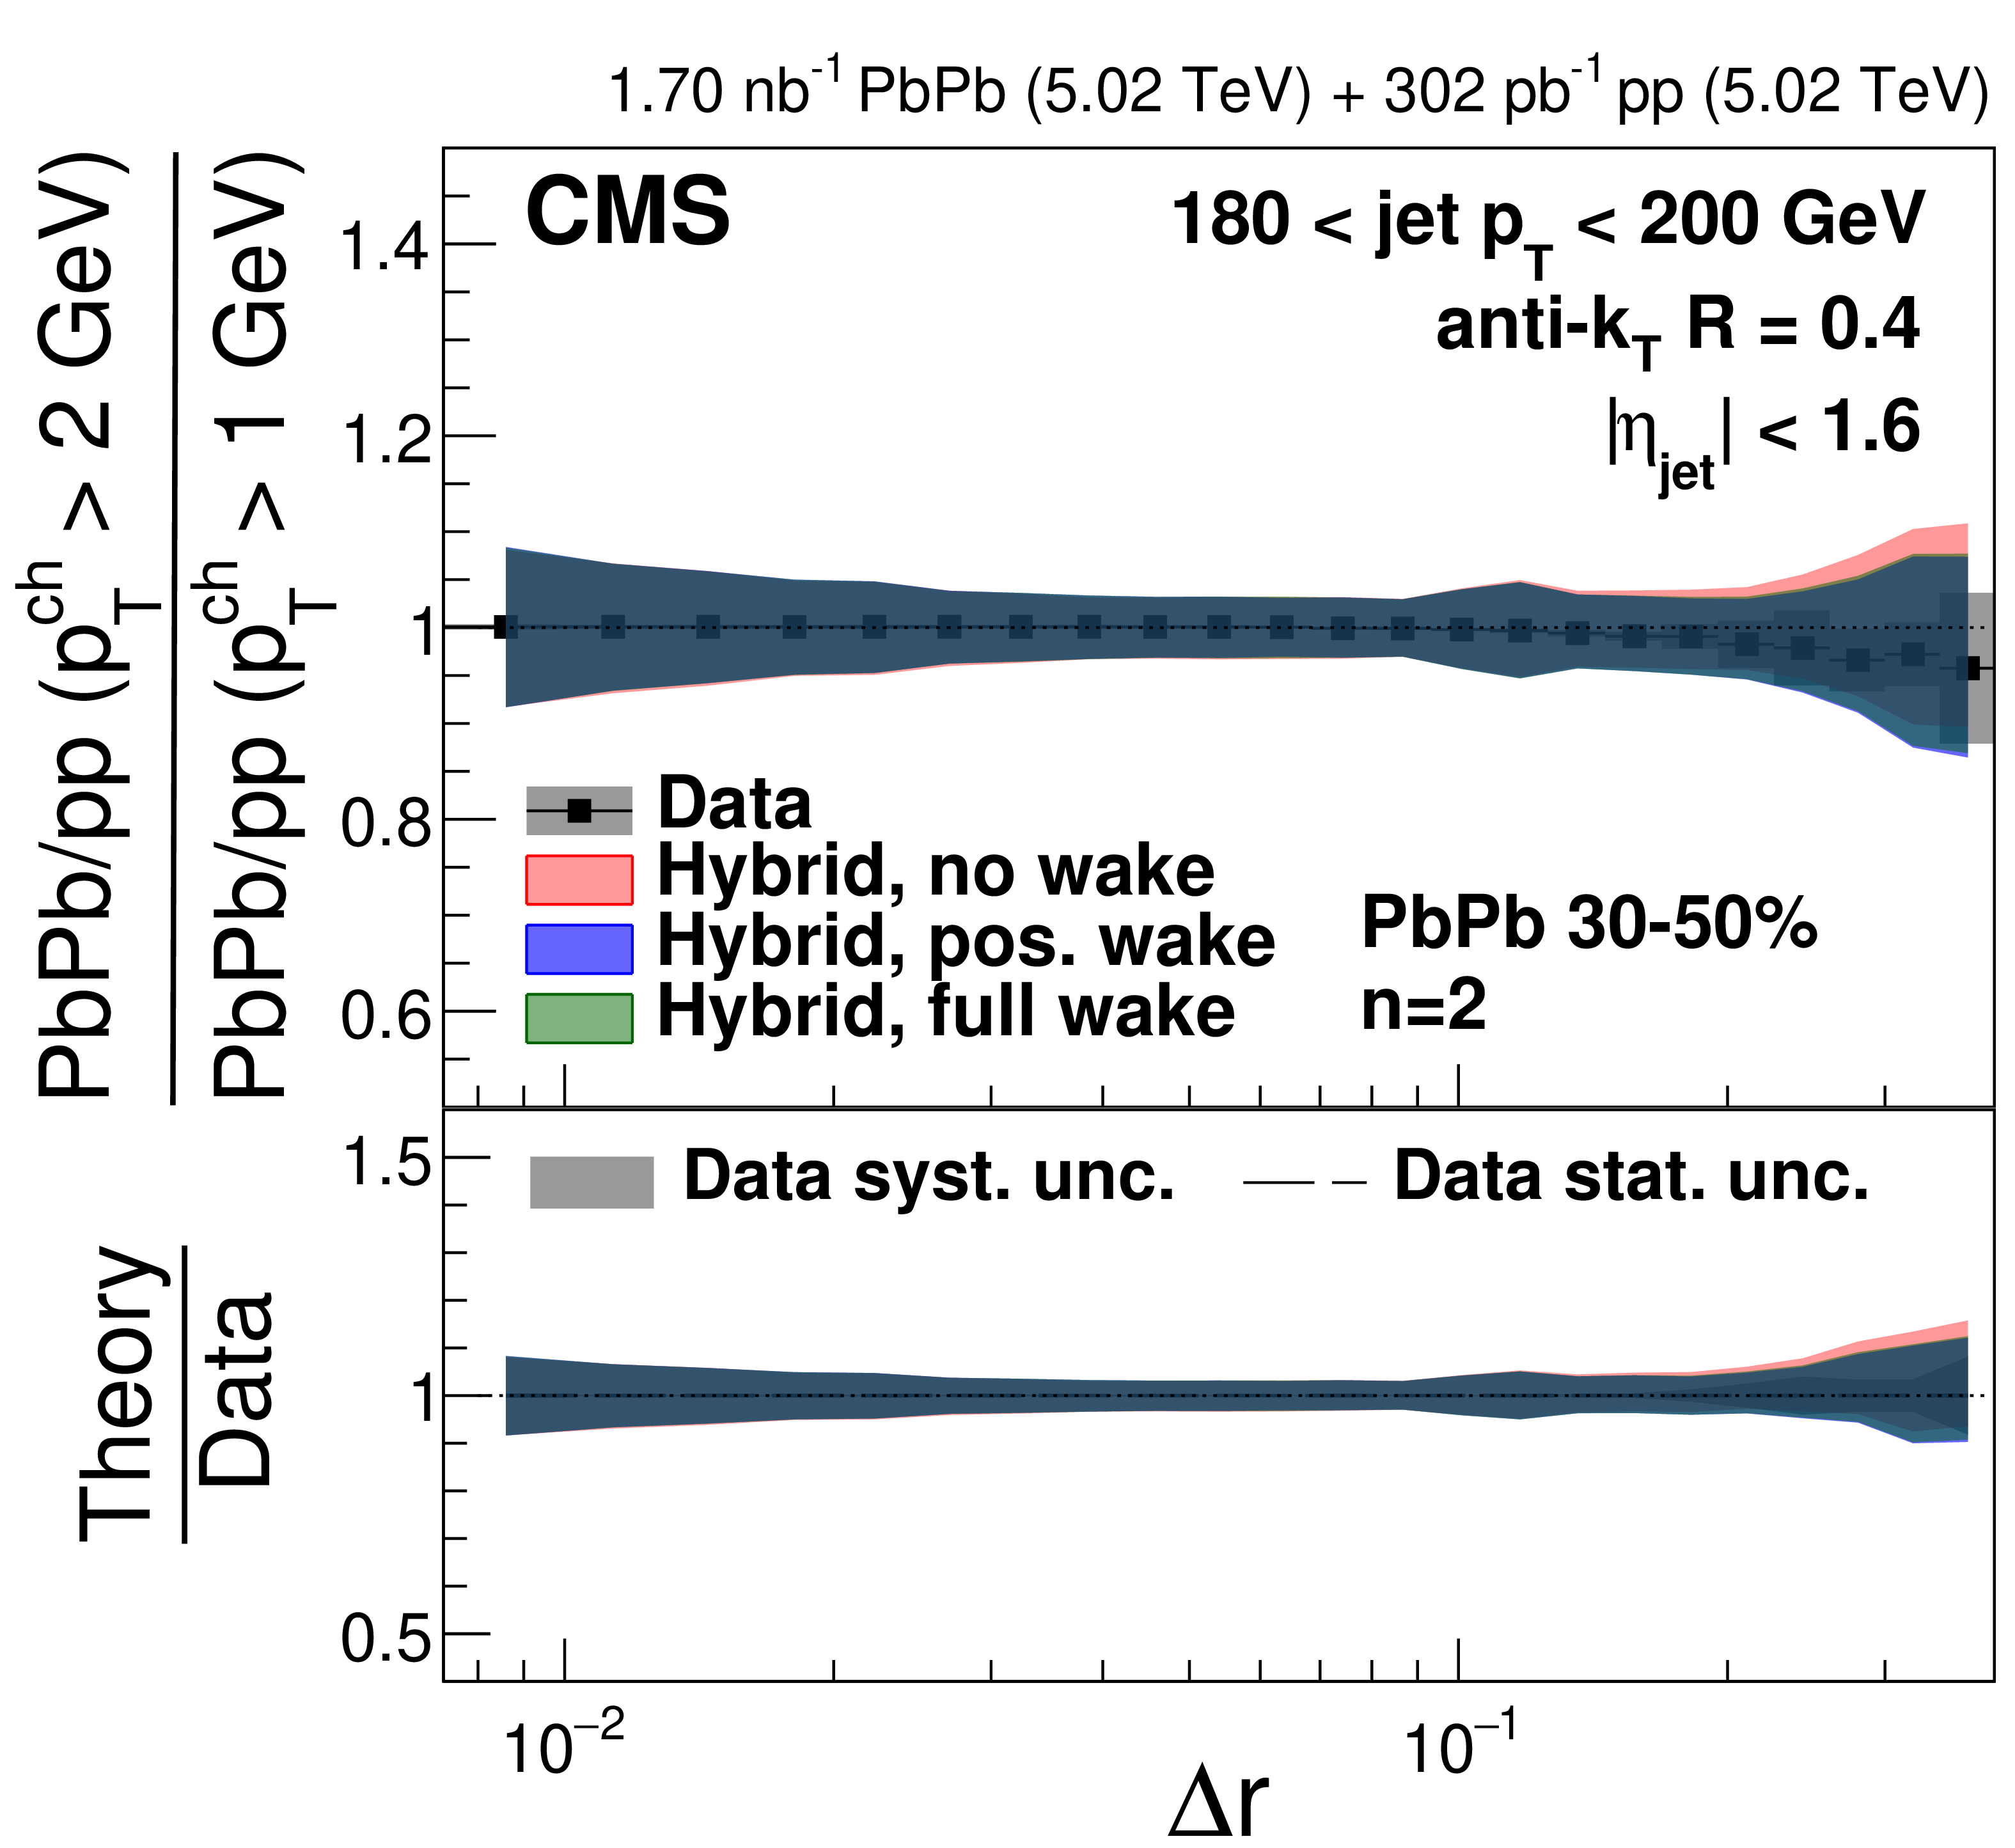
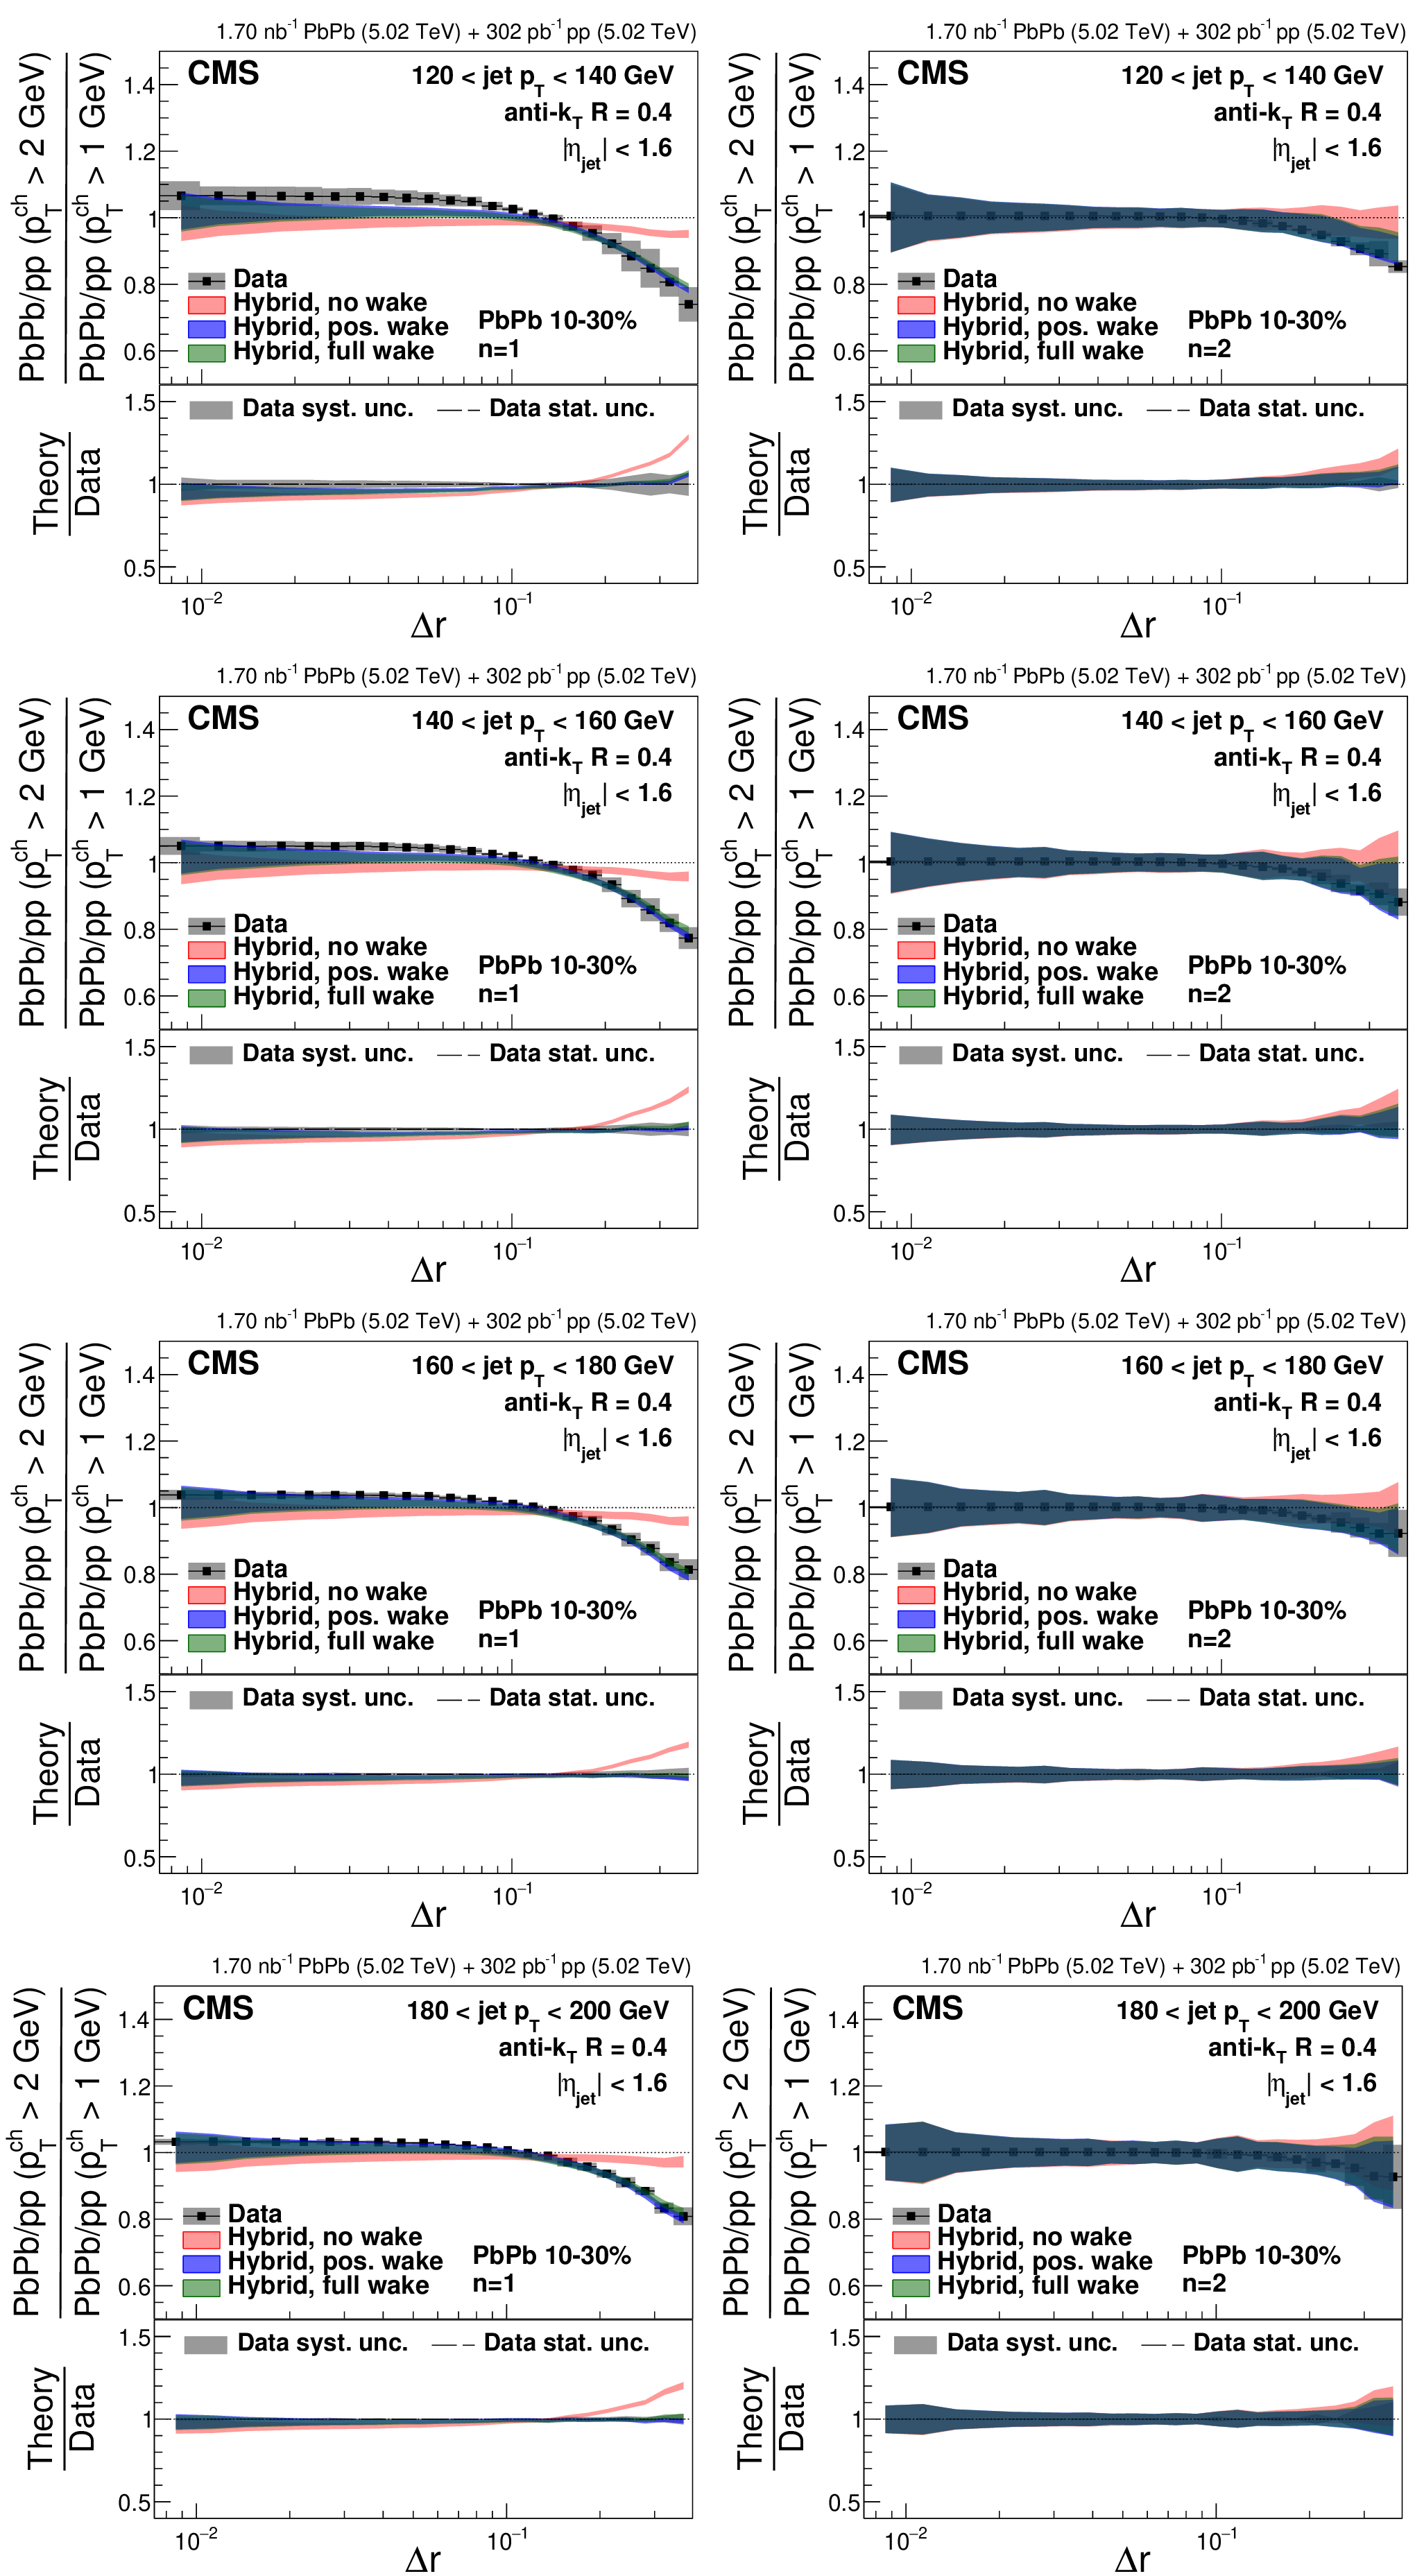
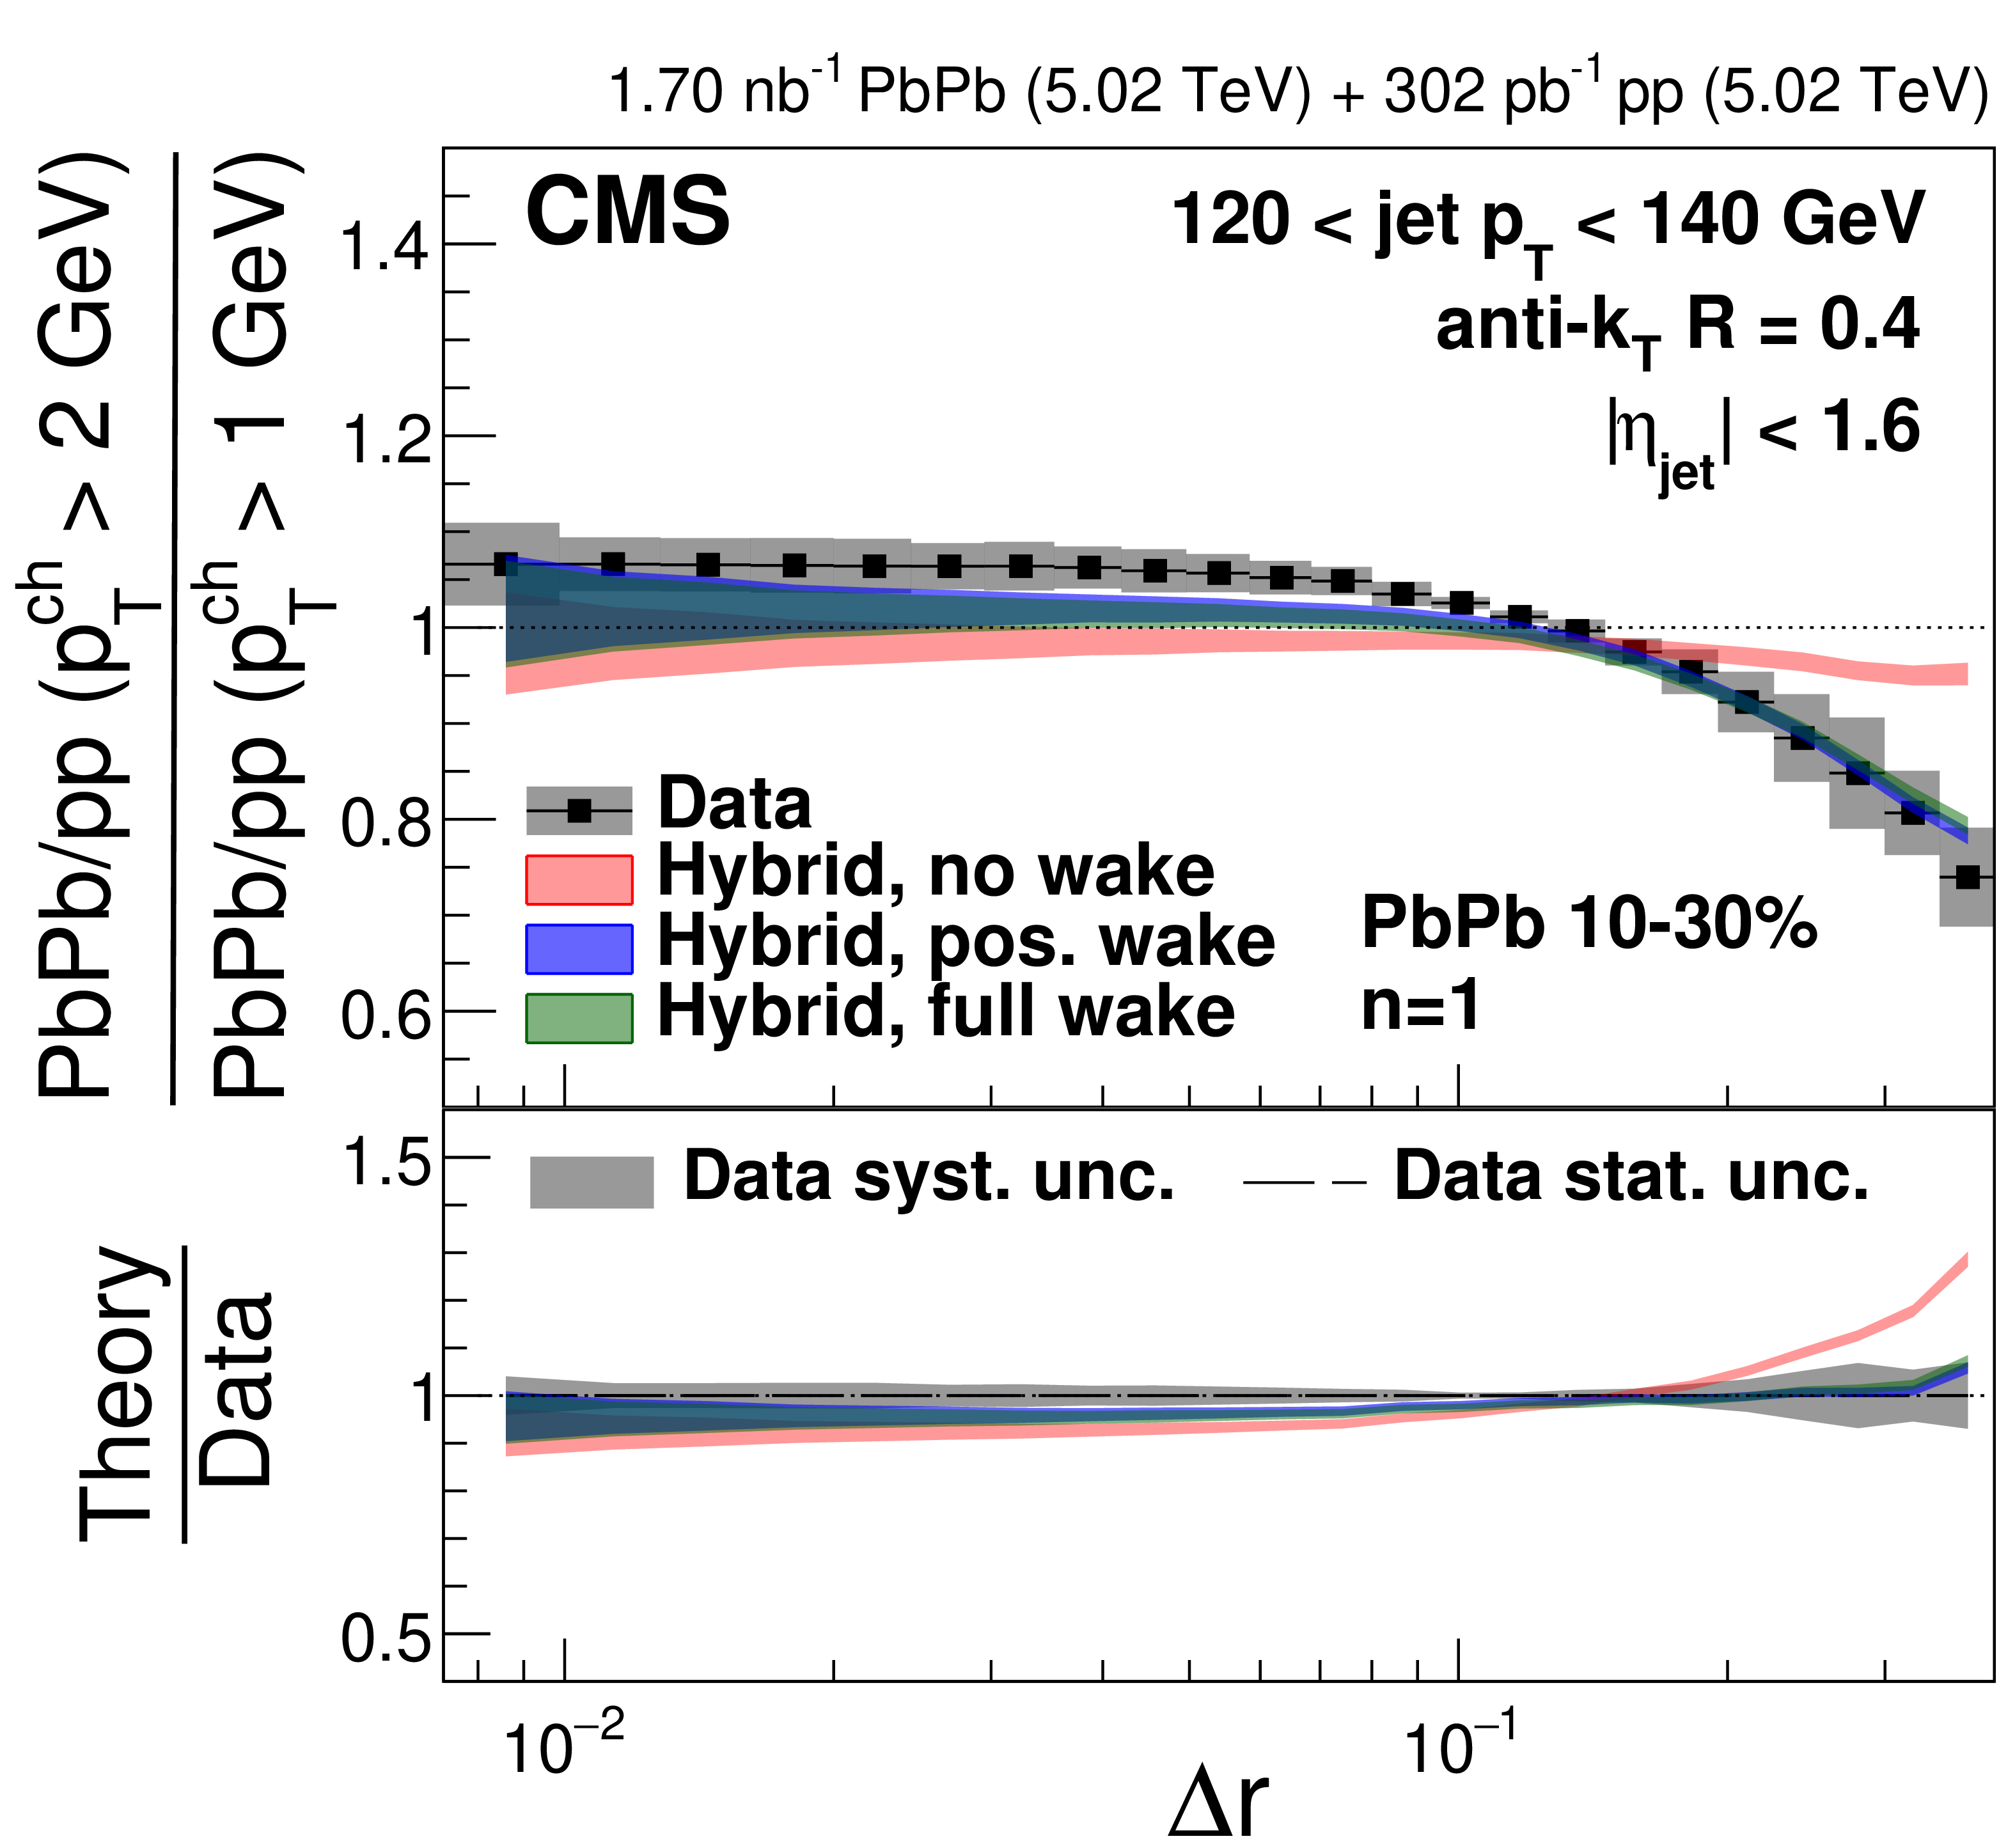
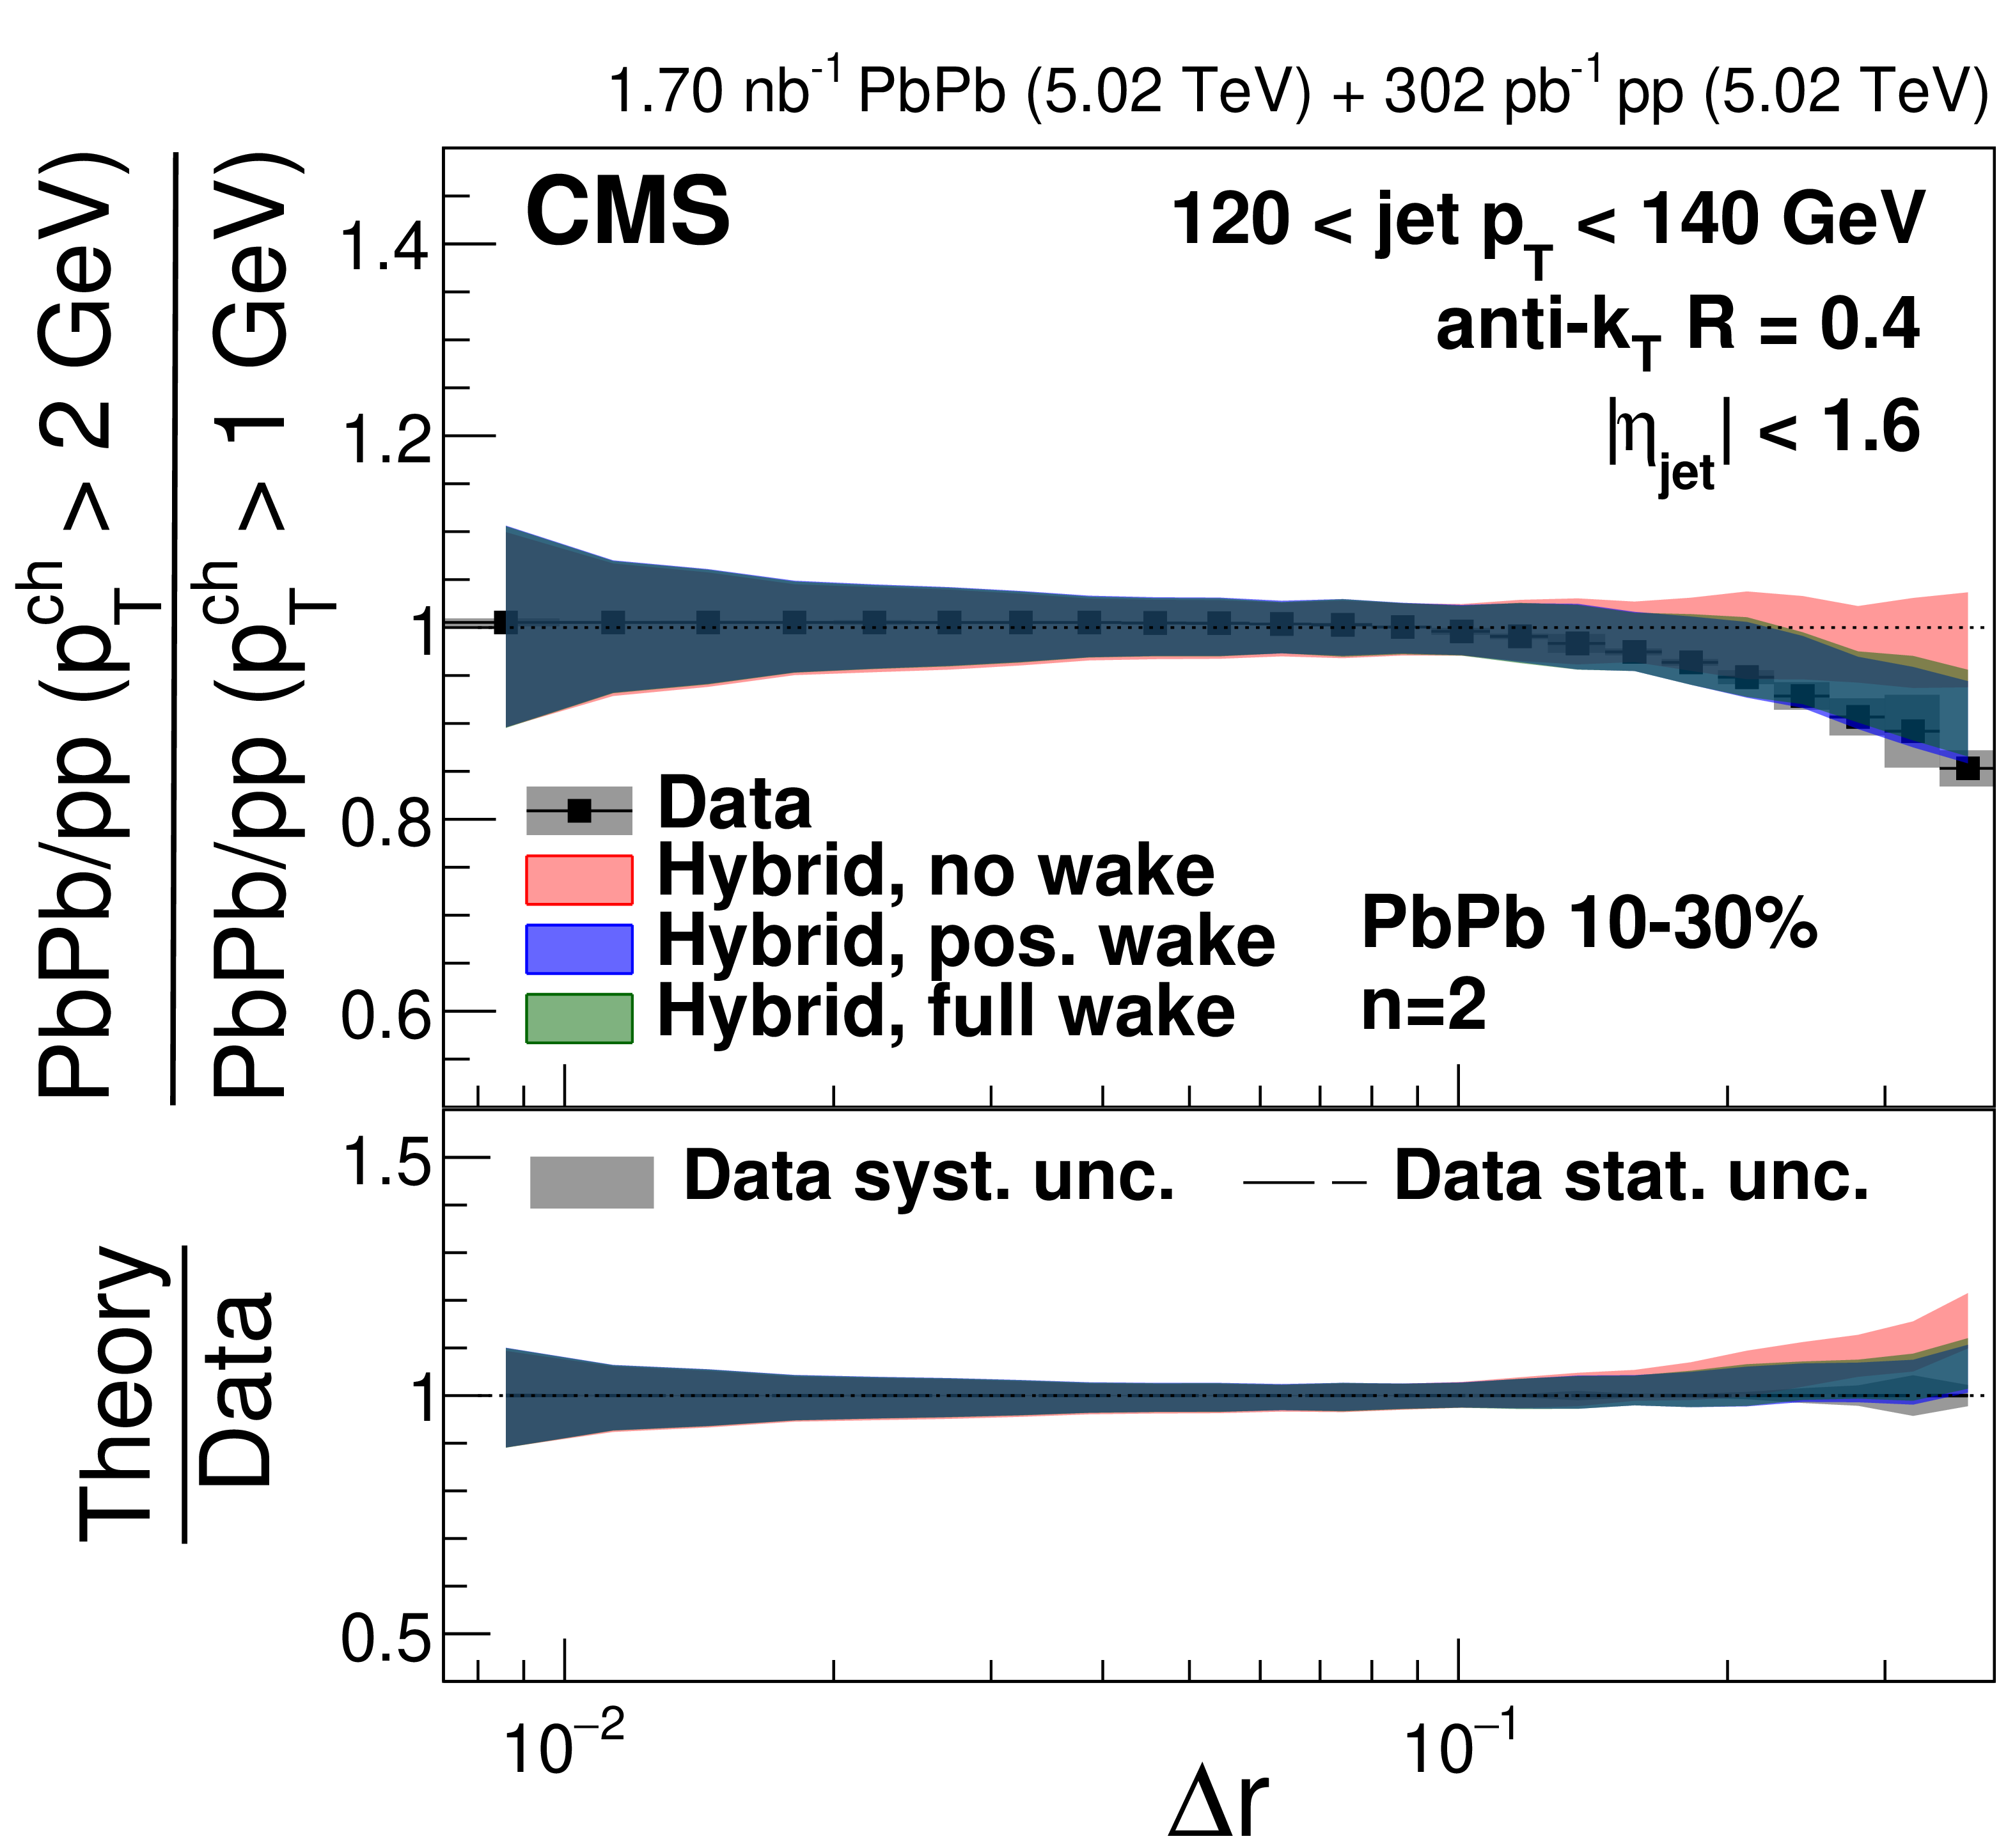
Figure 8:
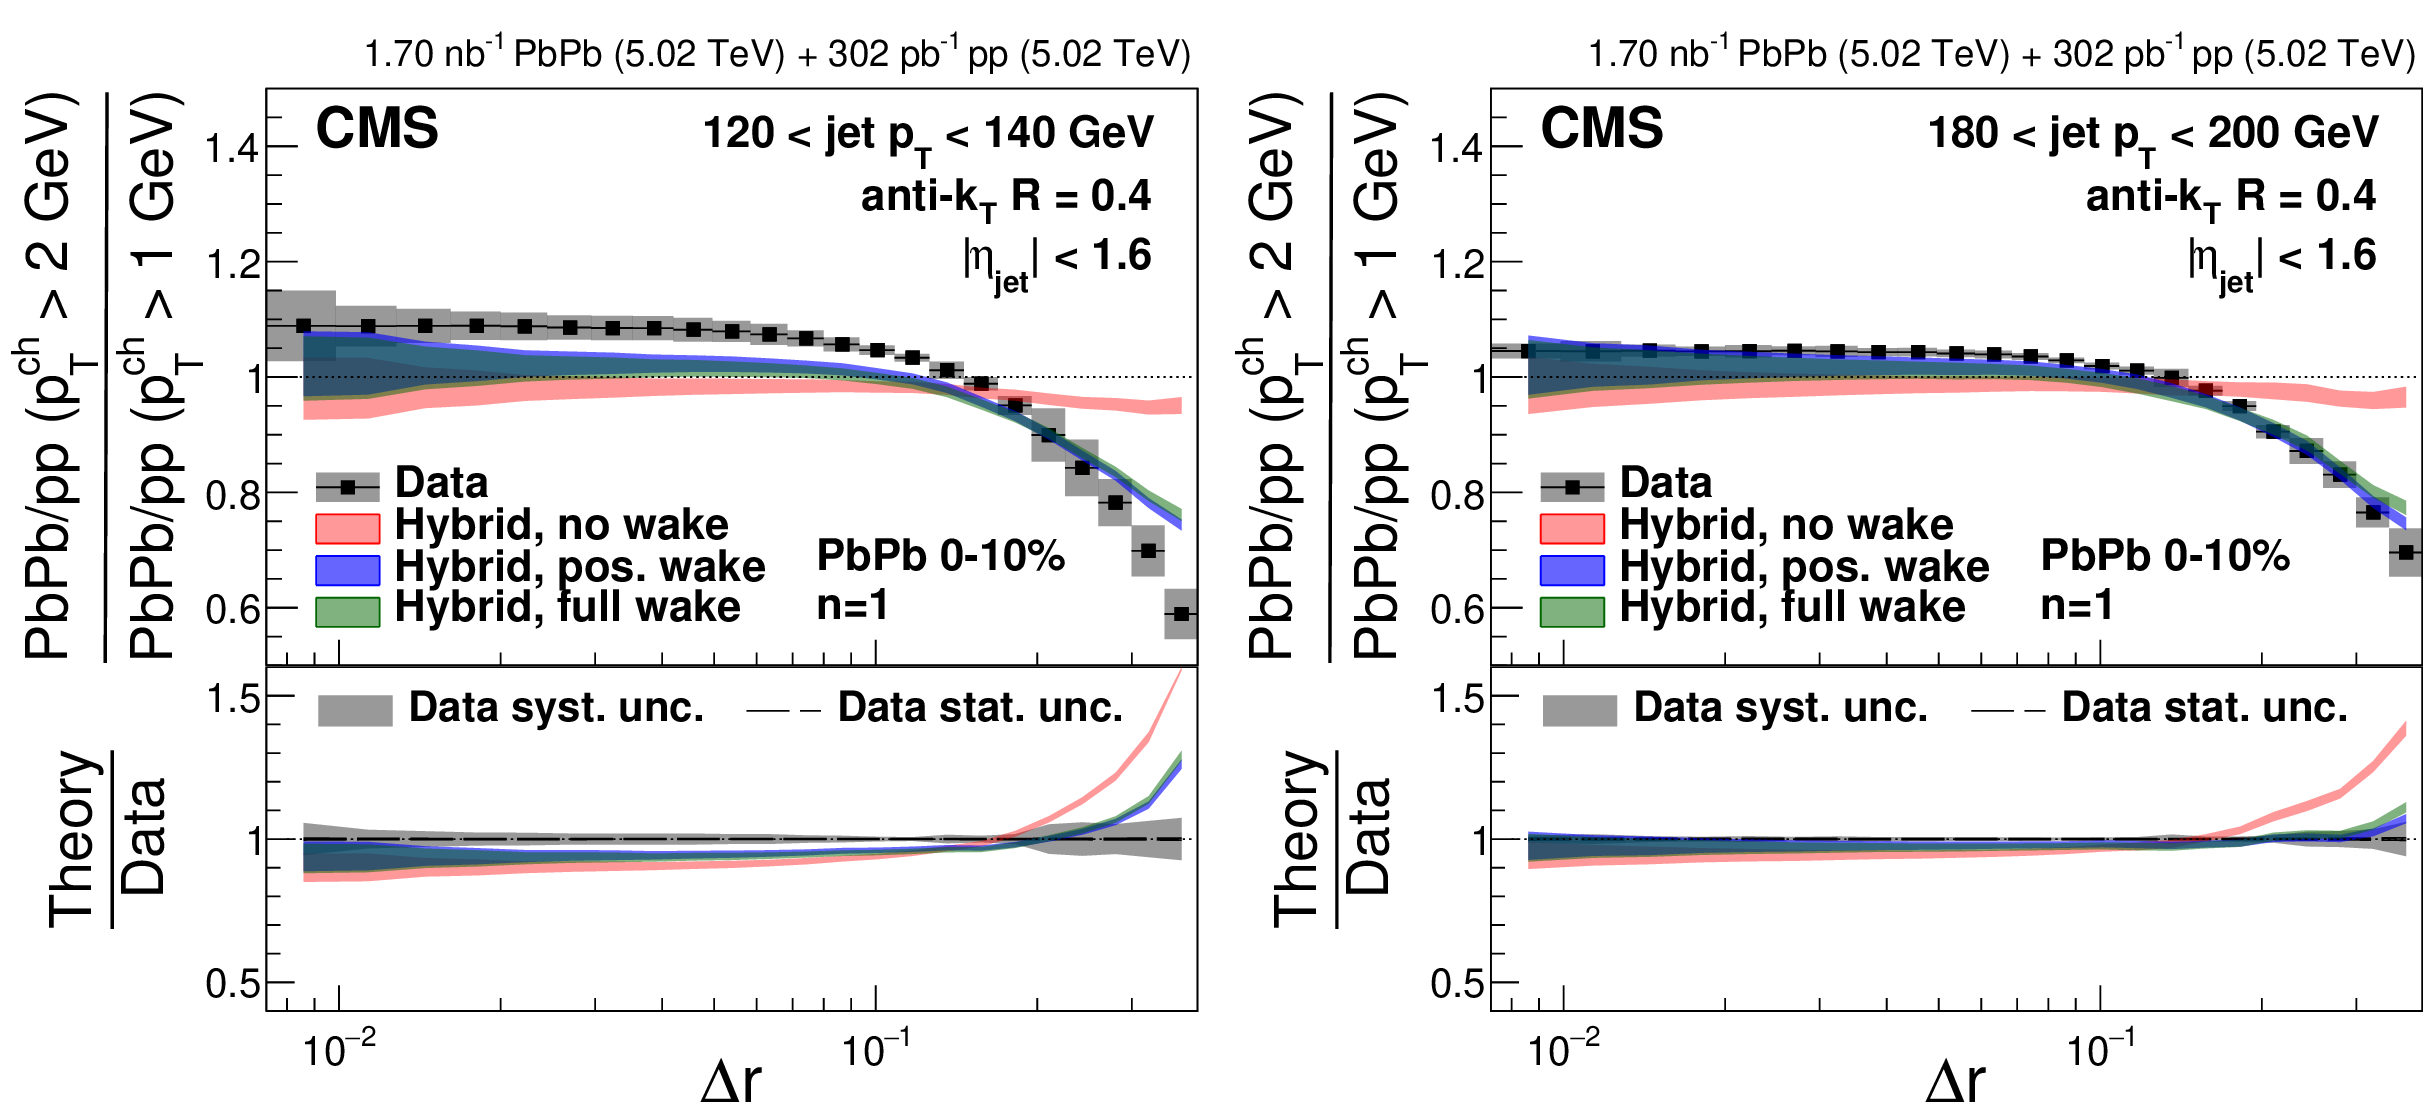
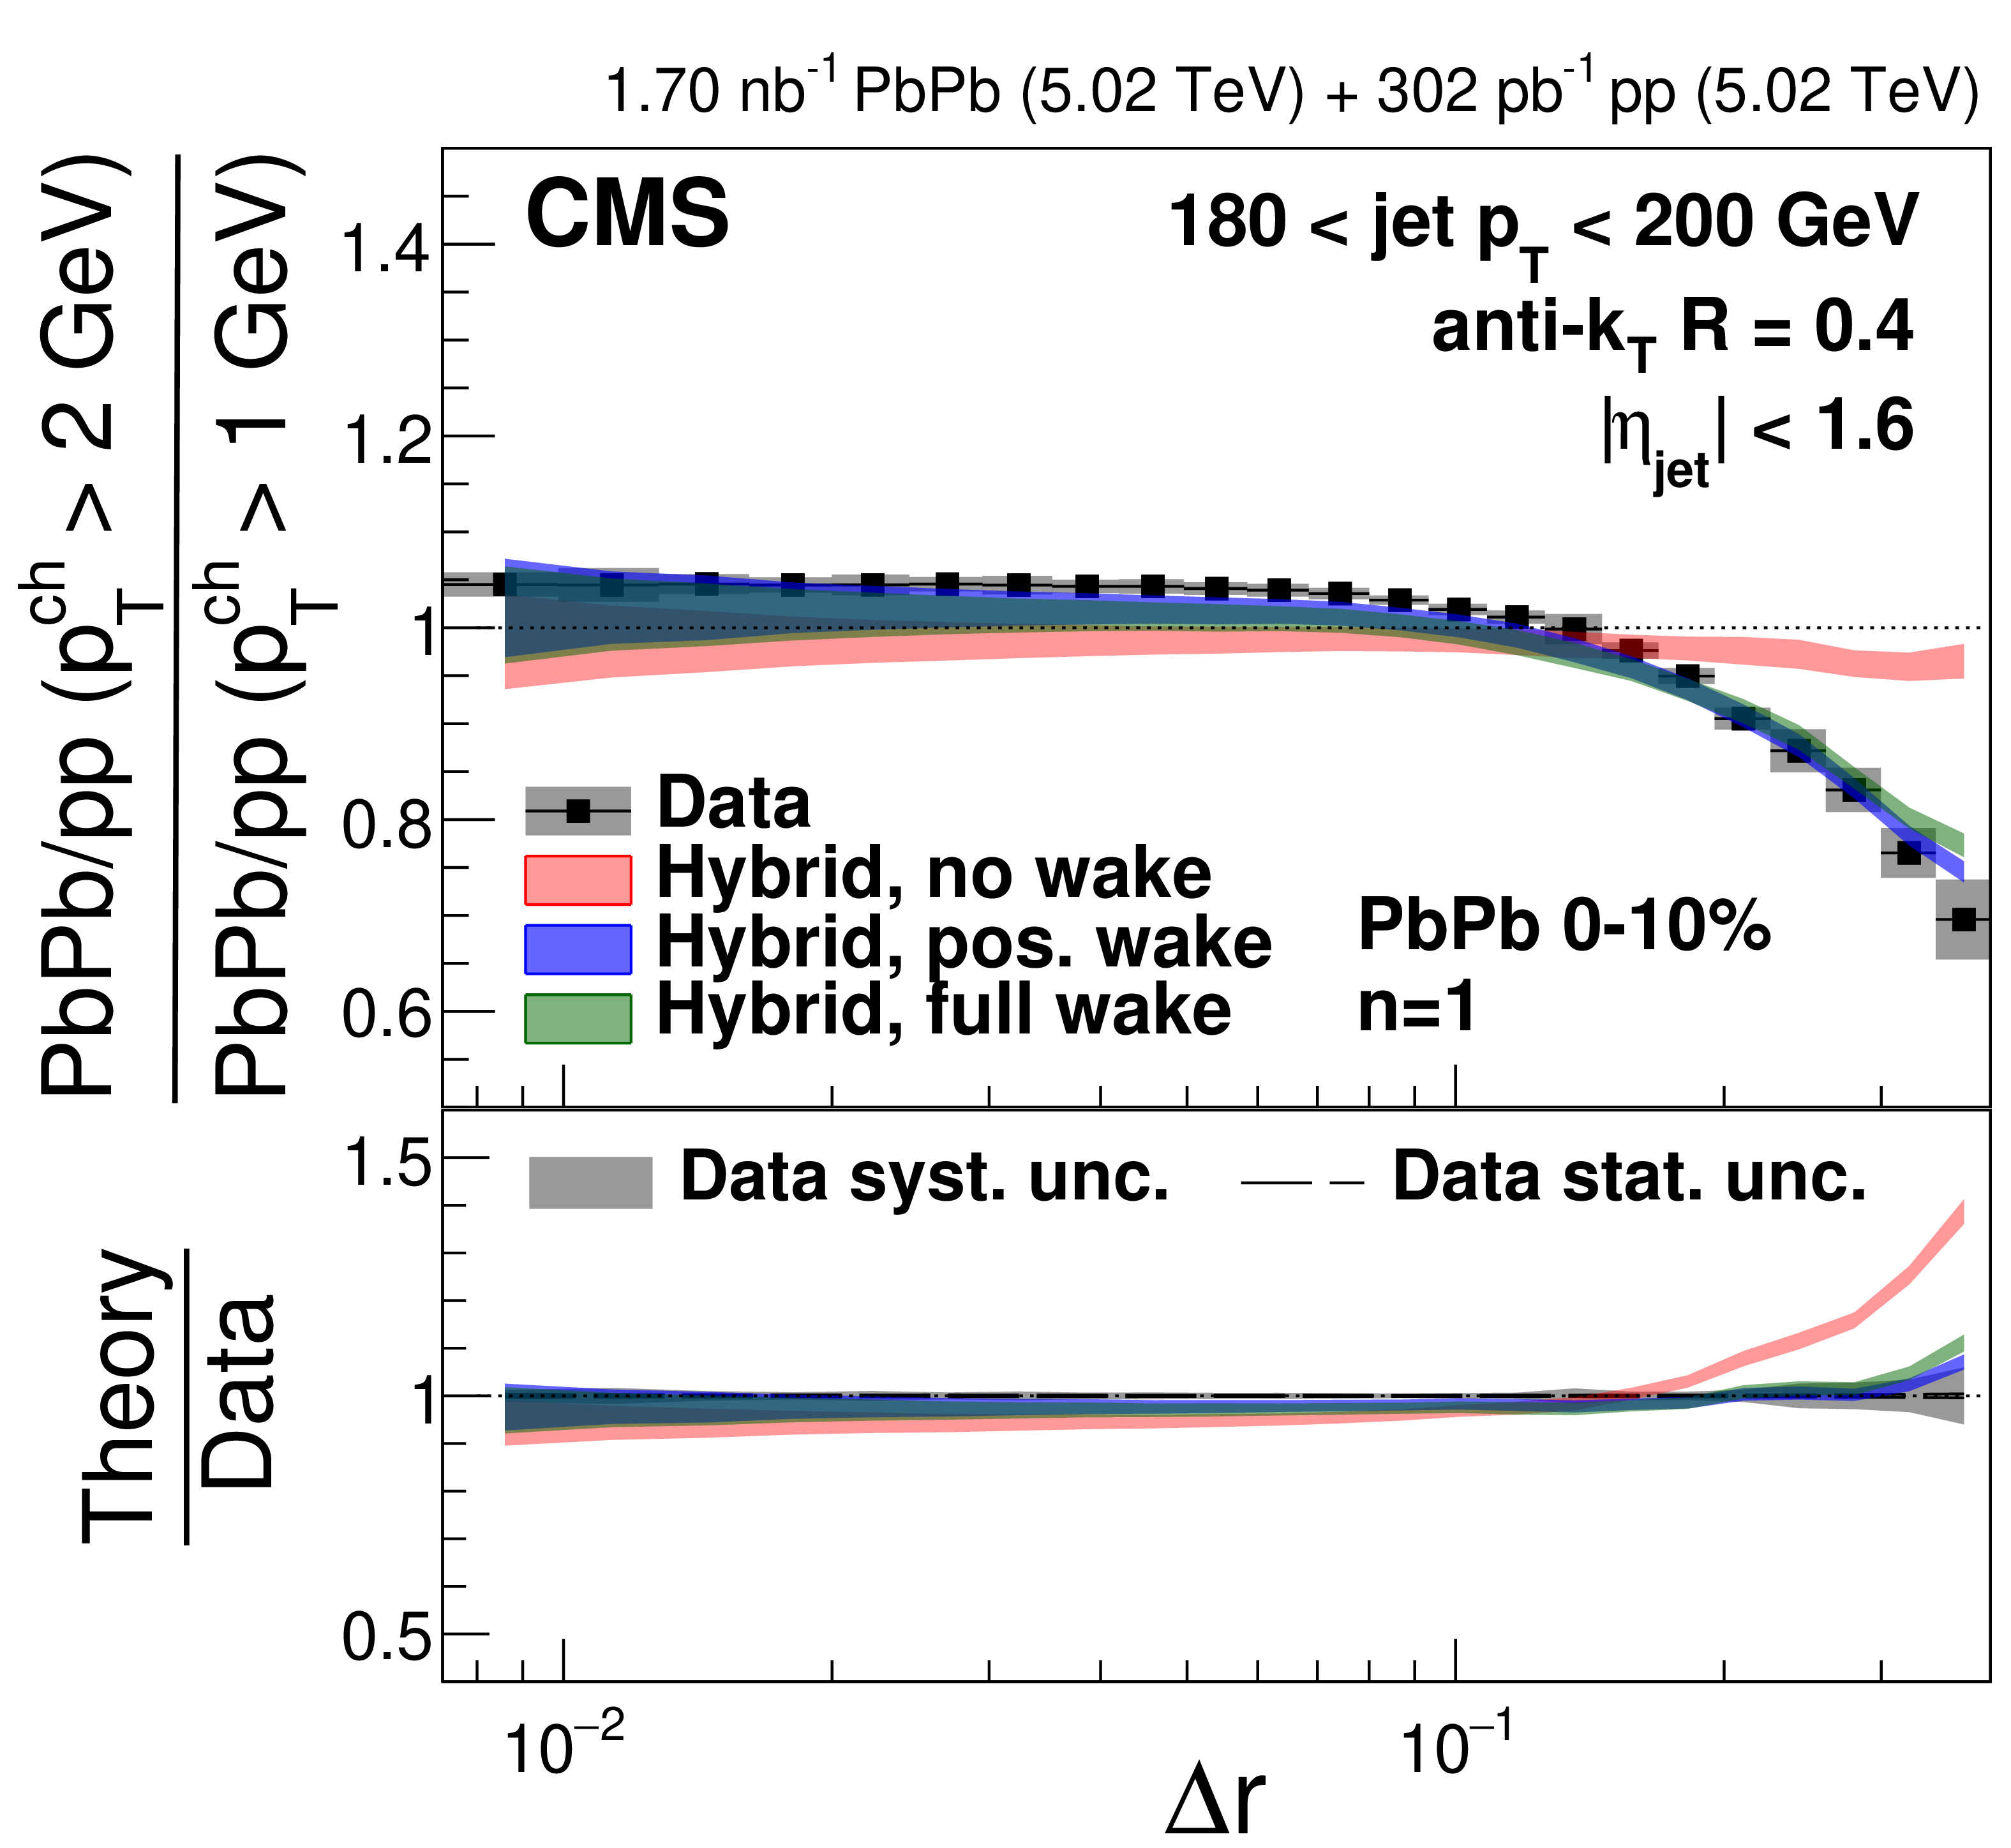
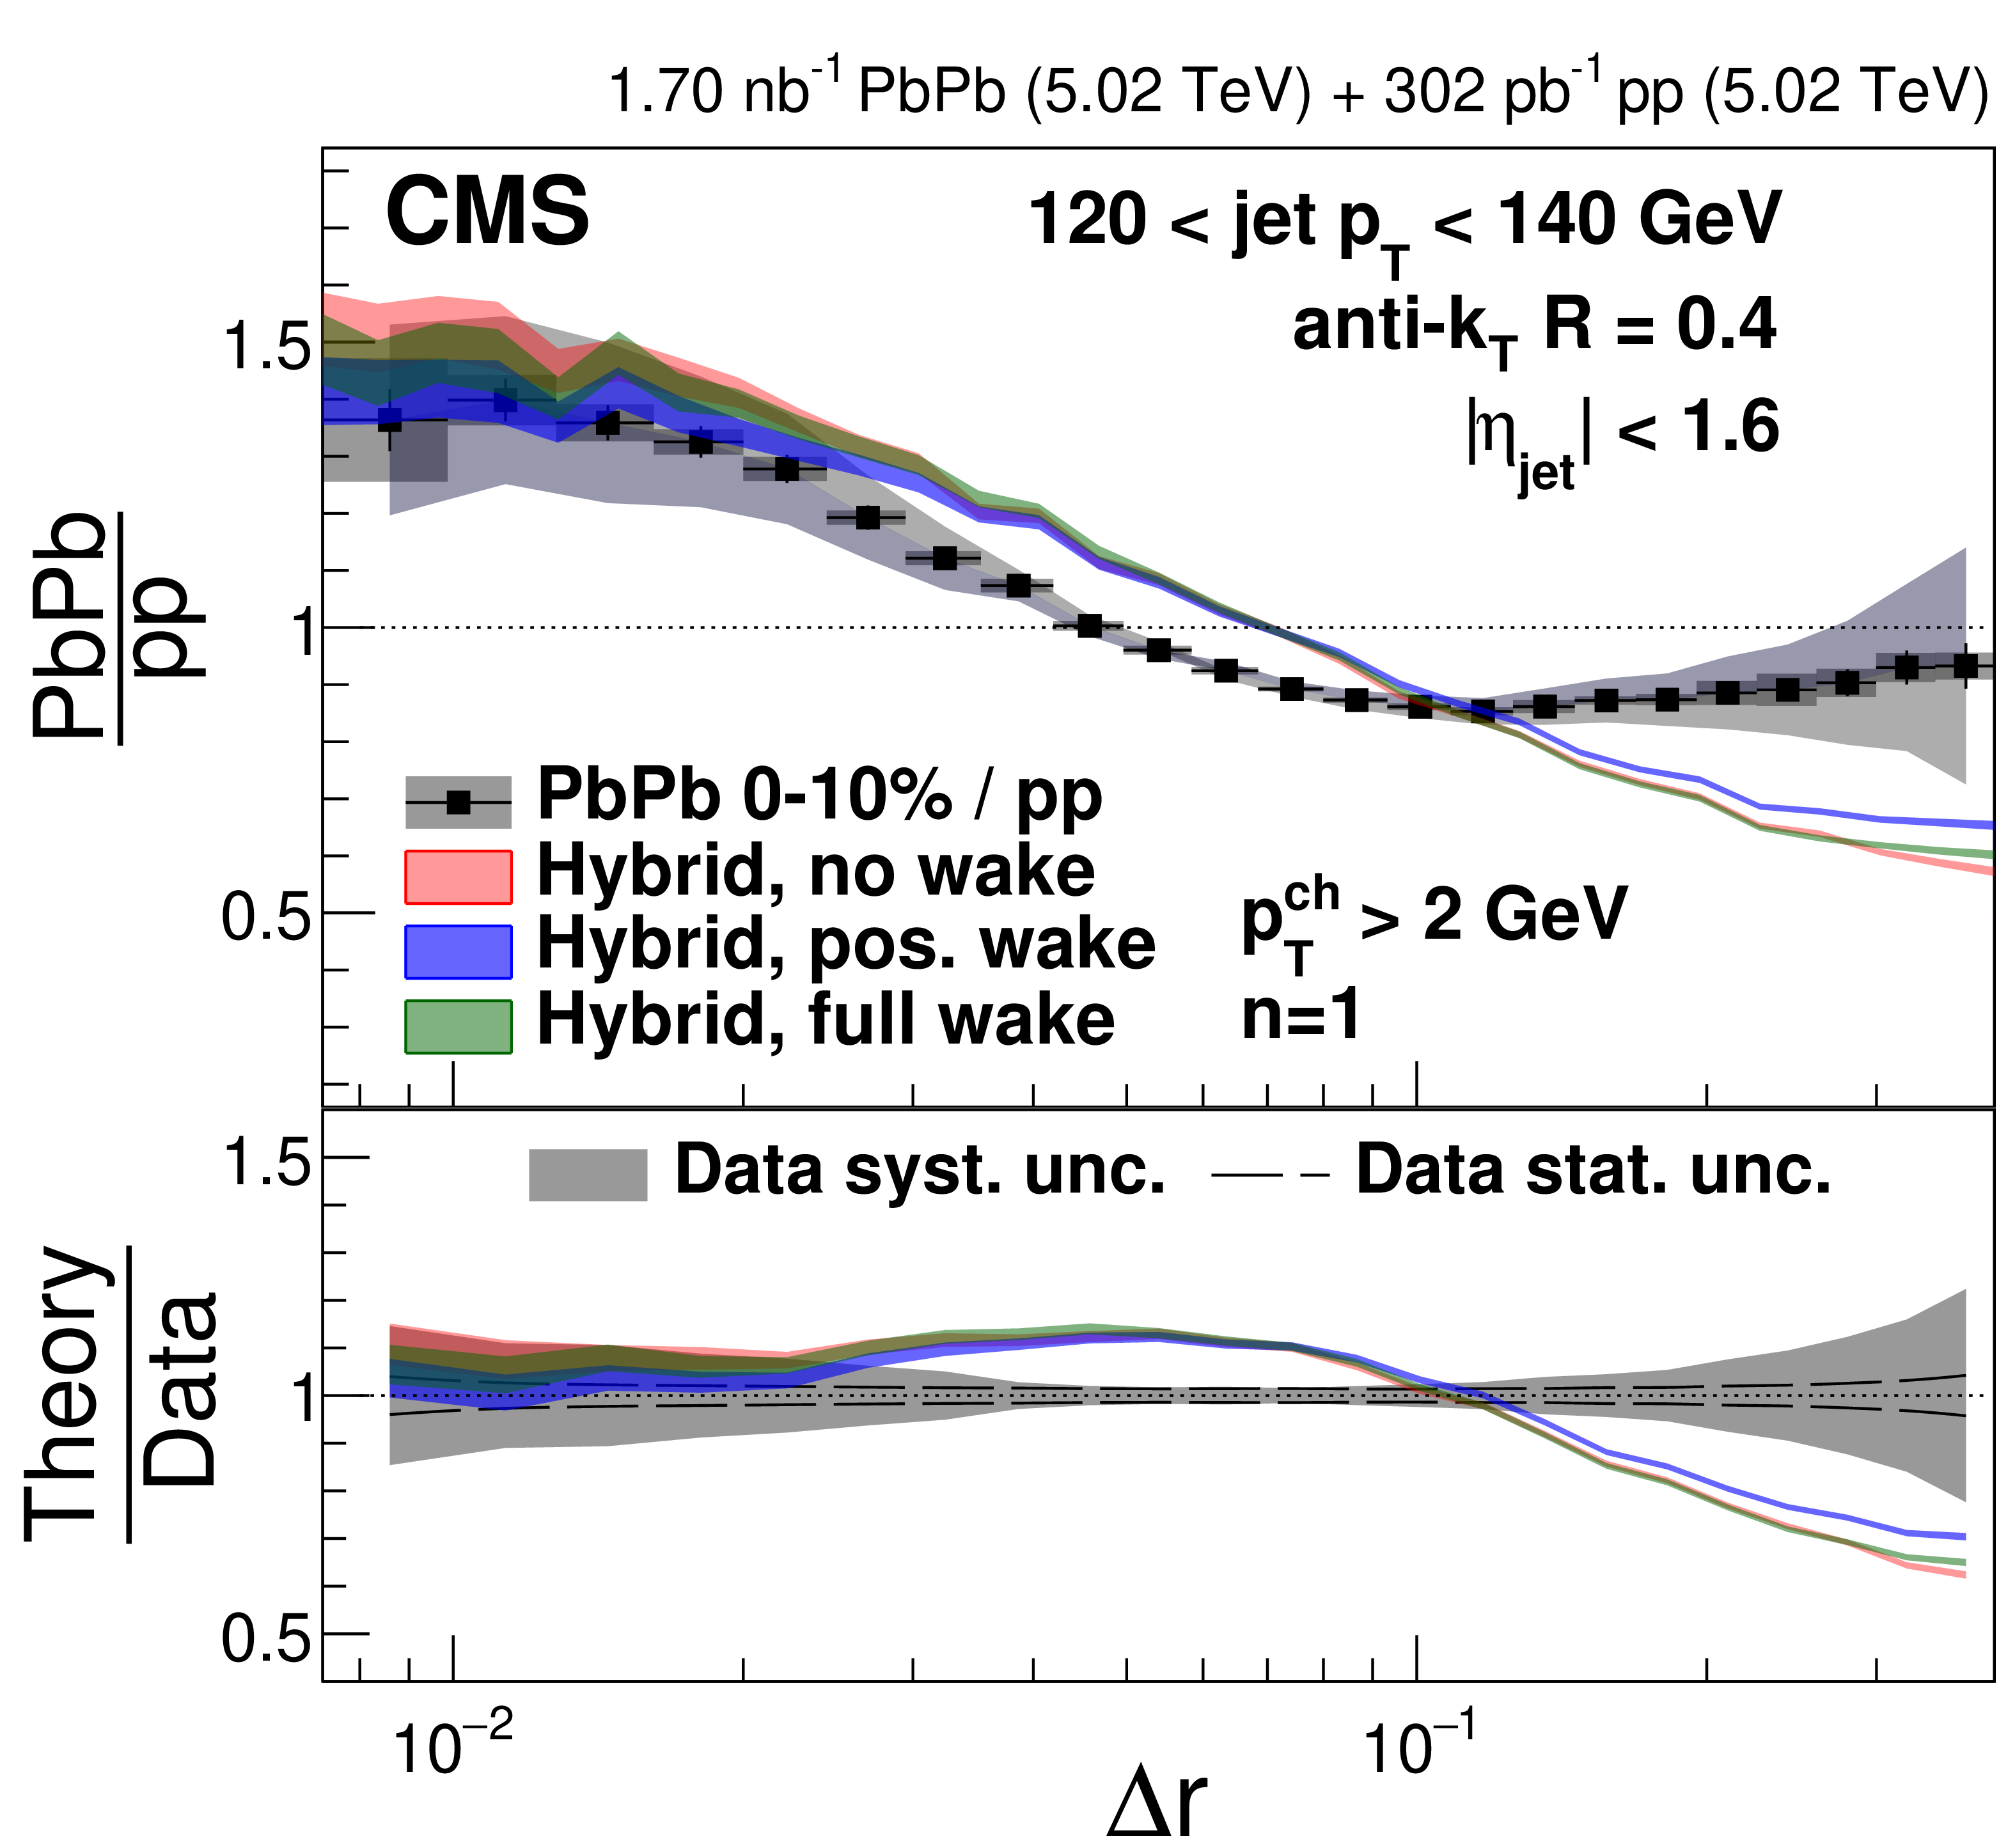
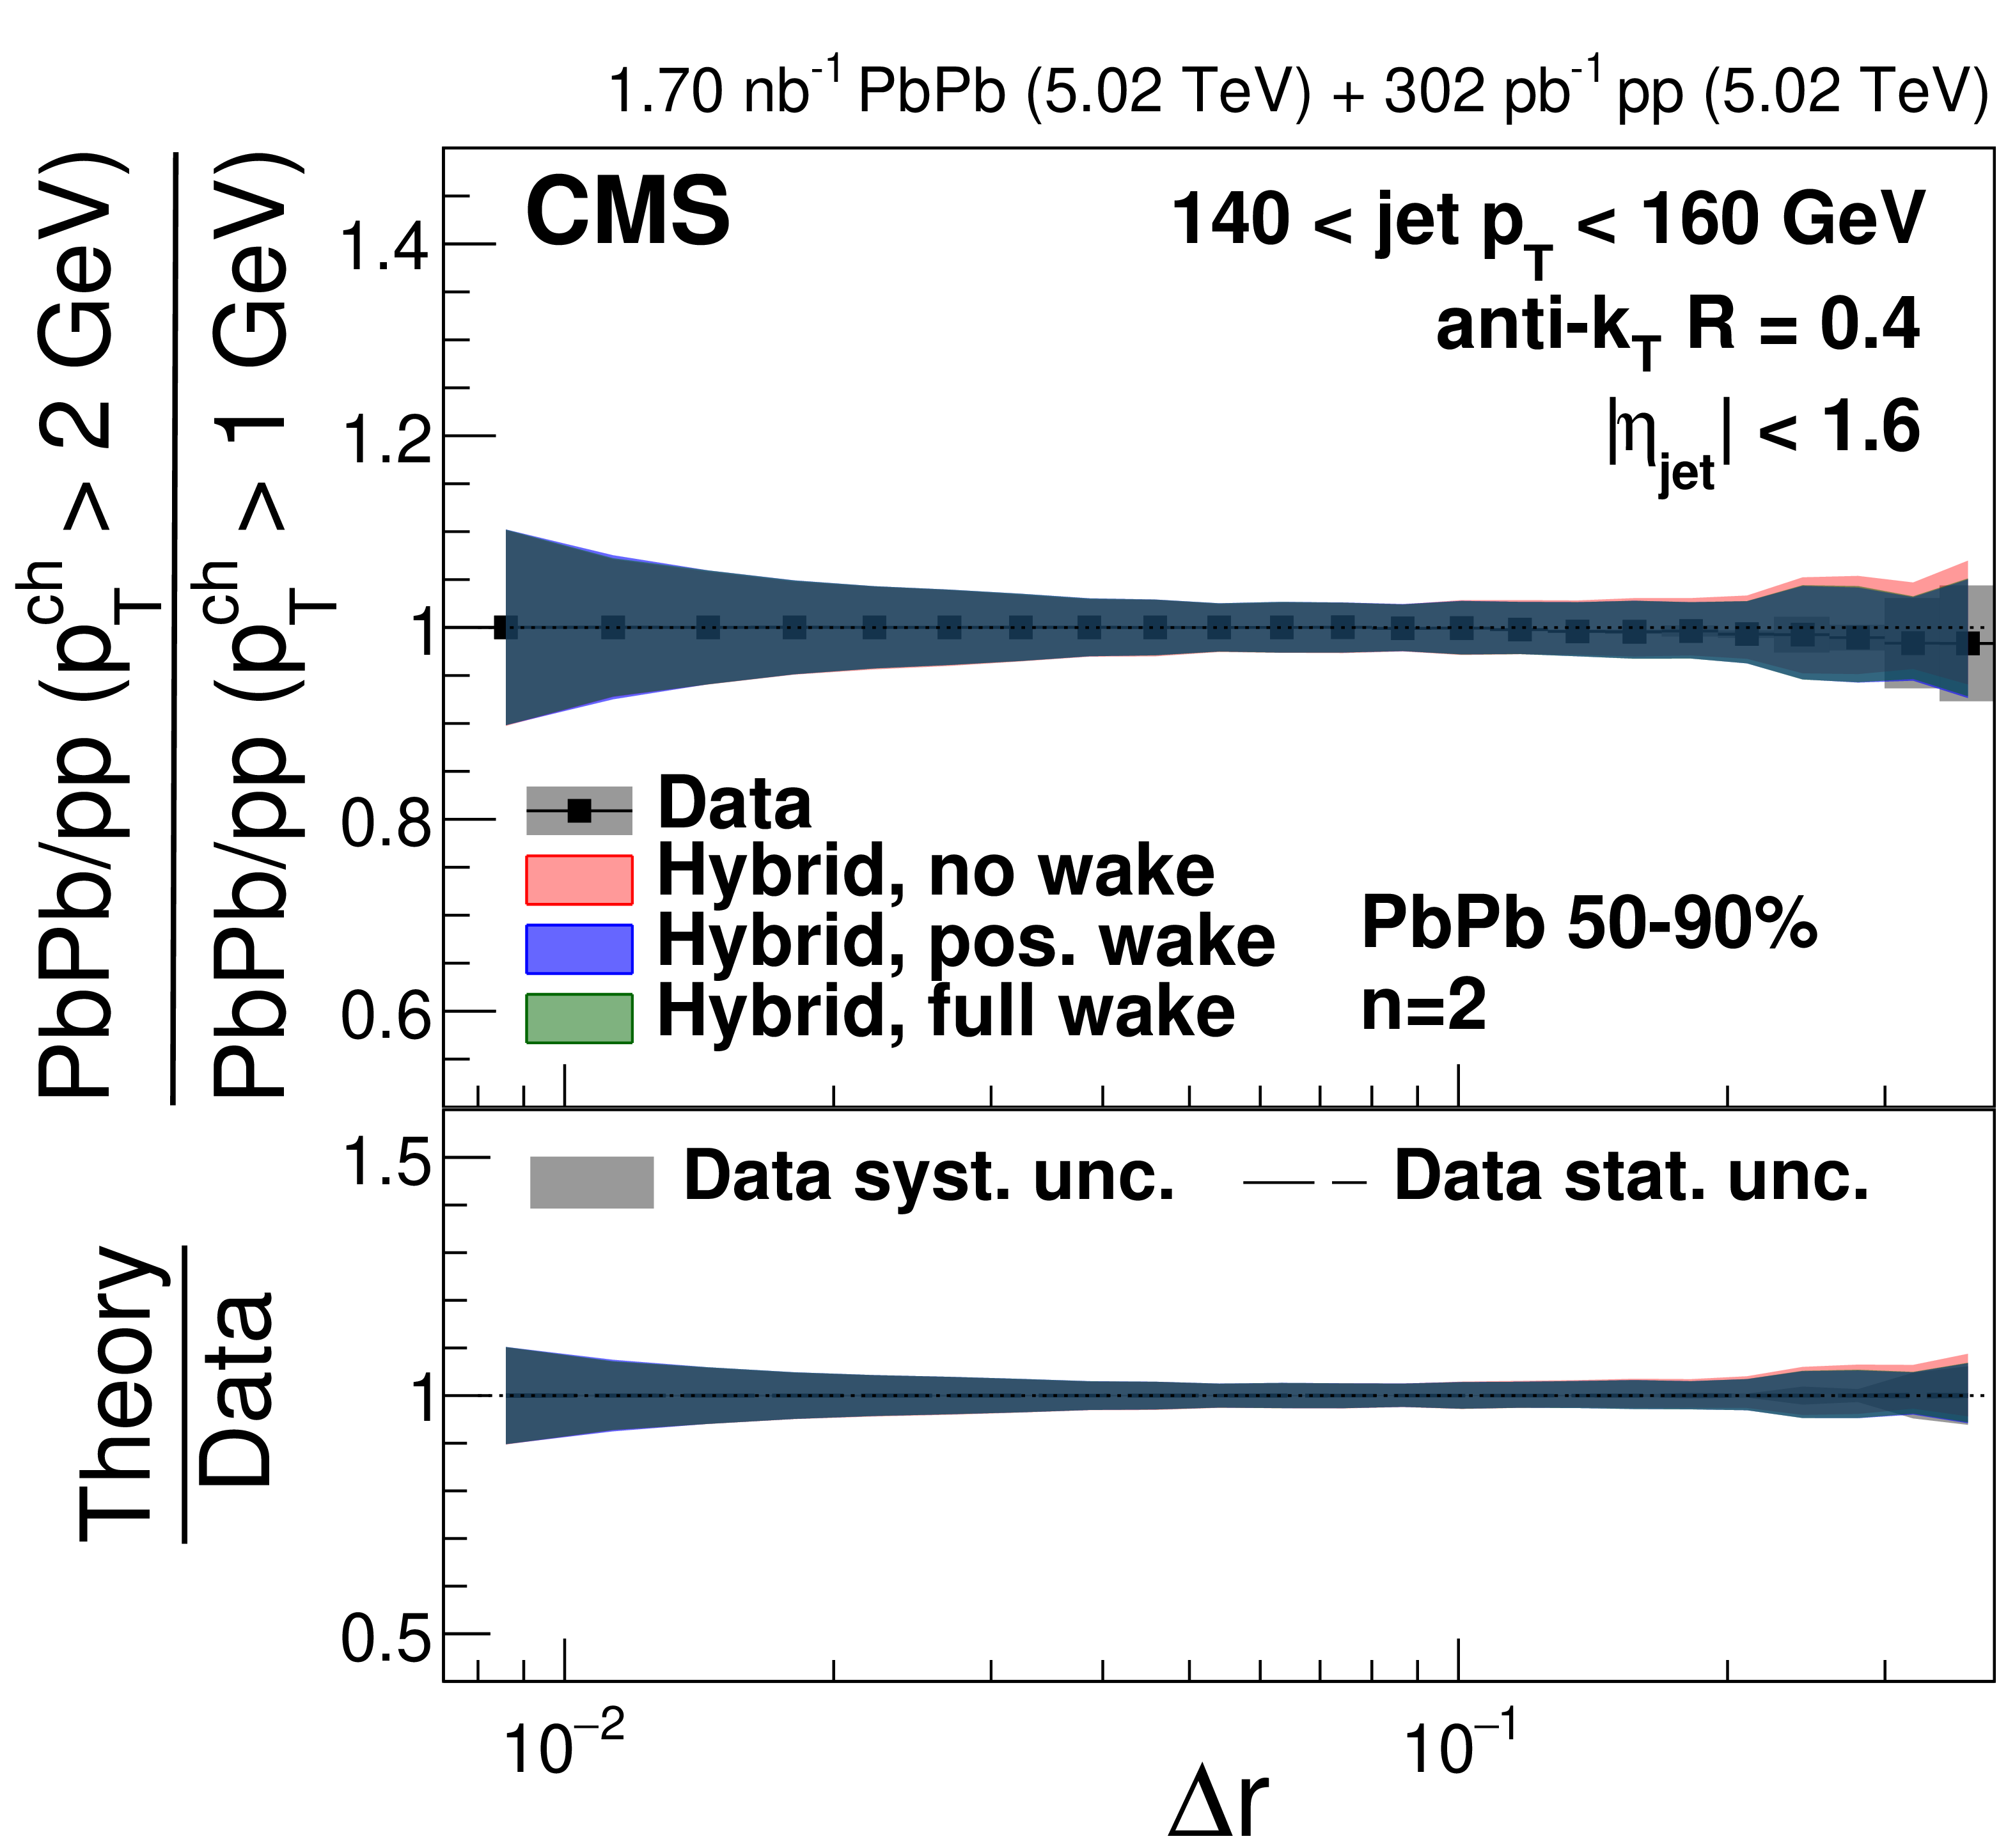
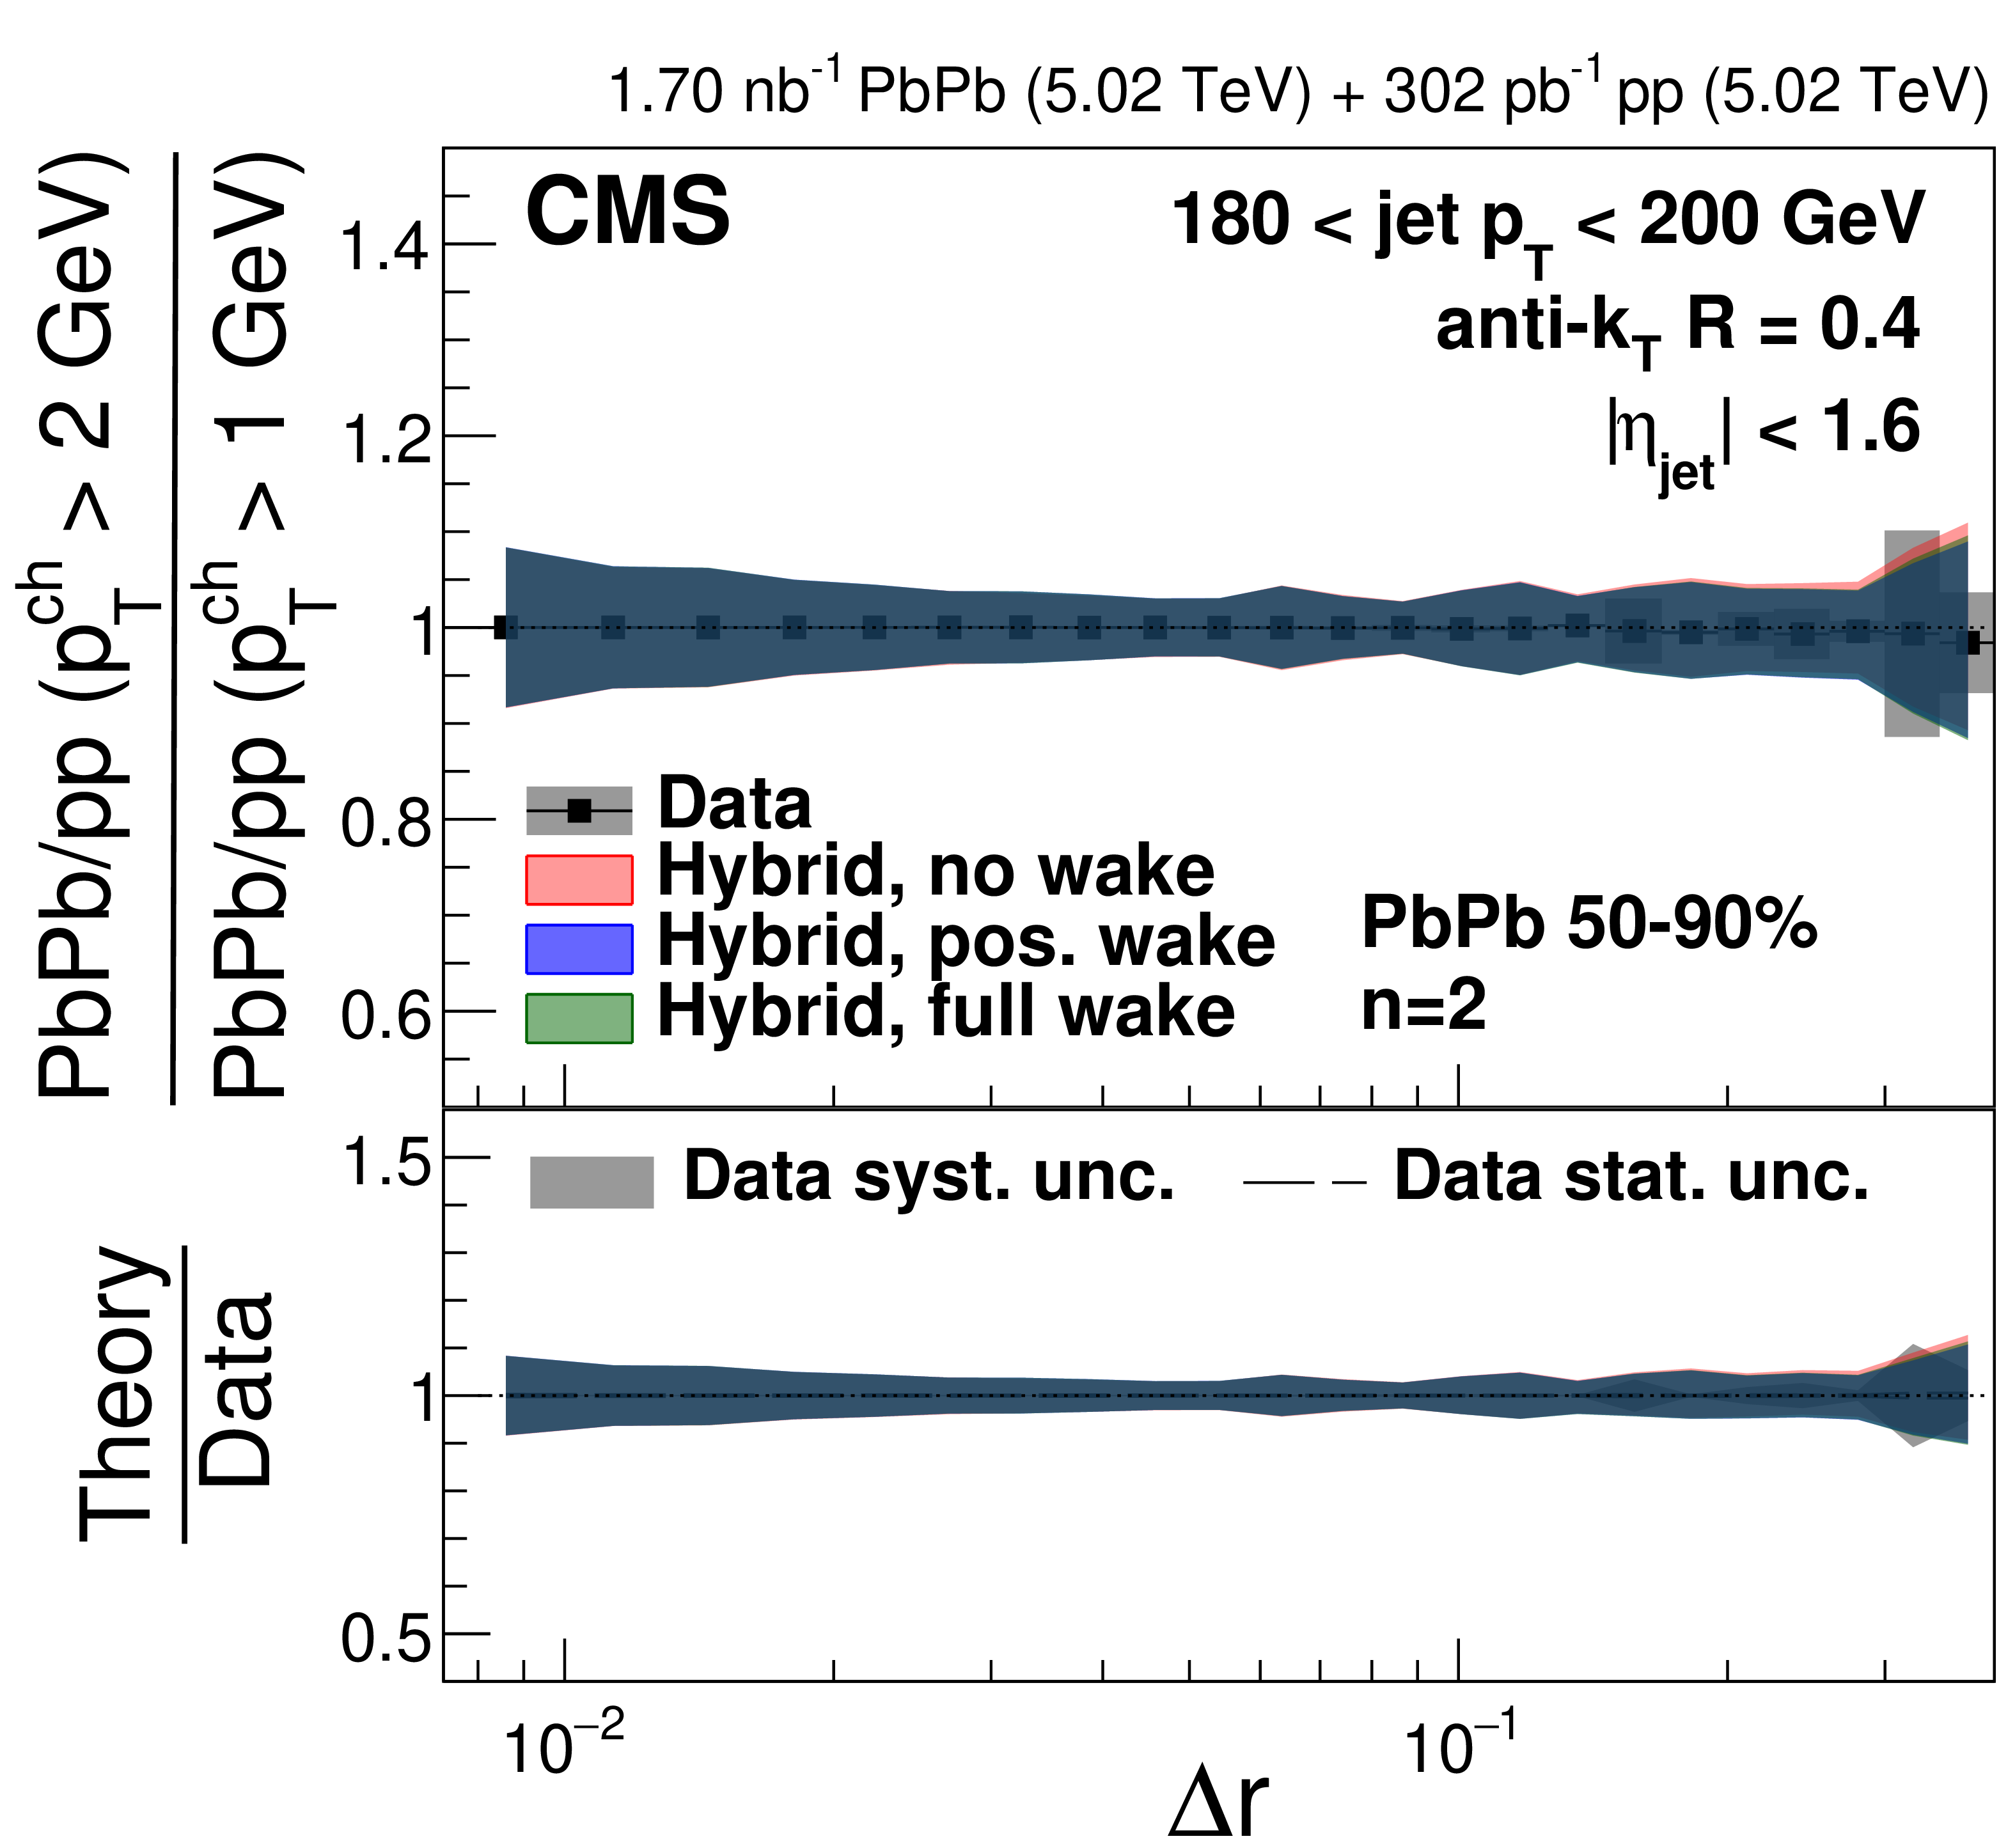
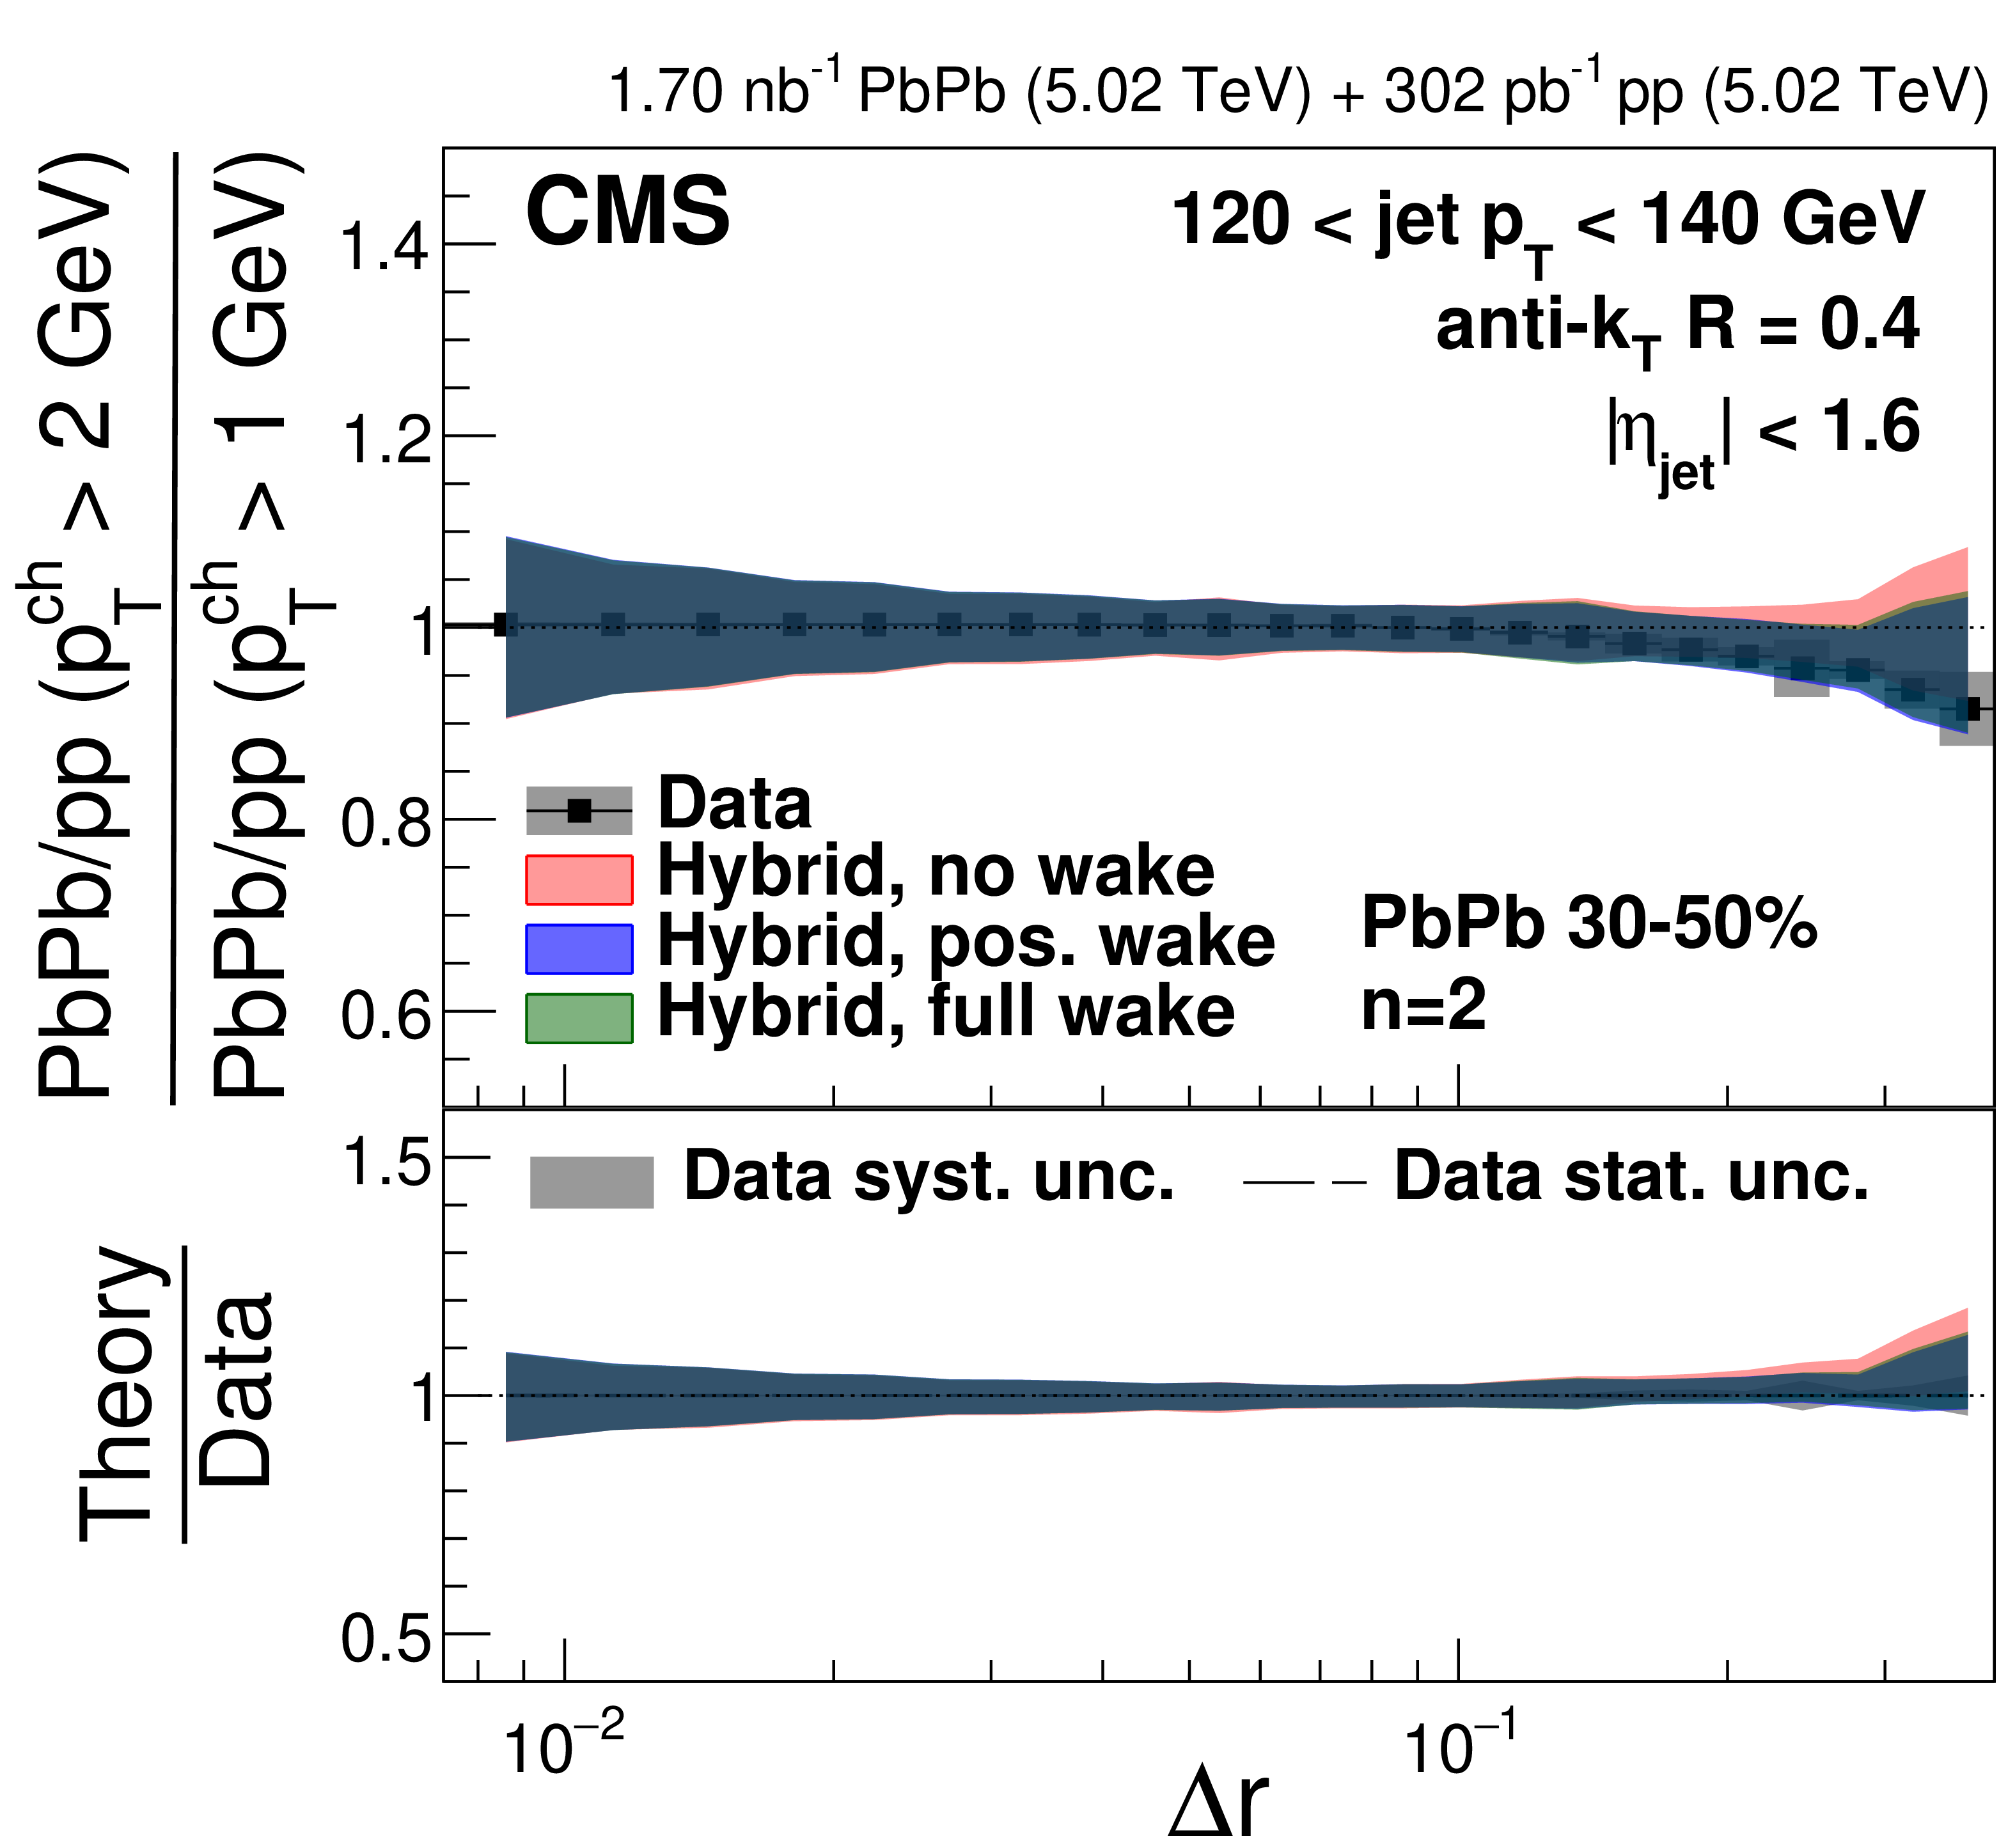
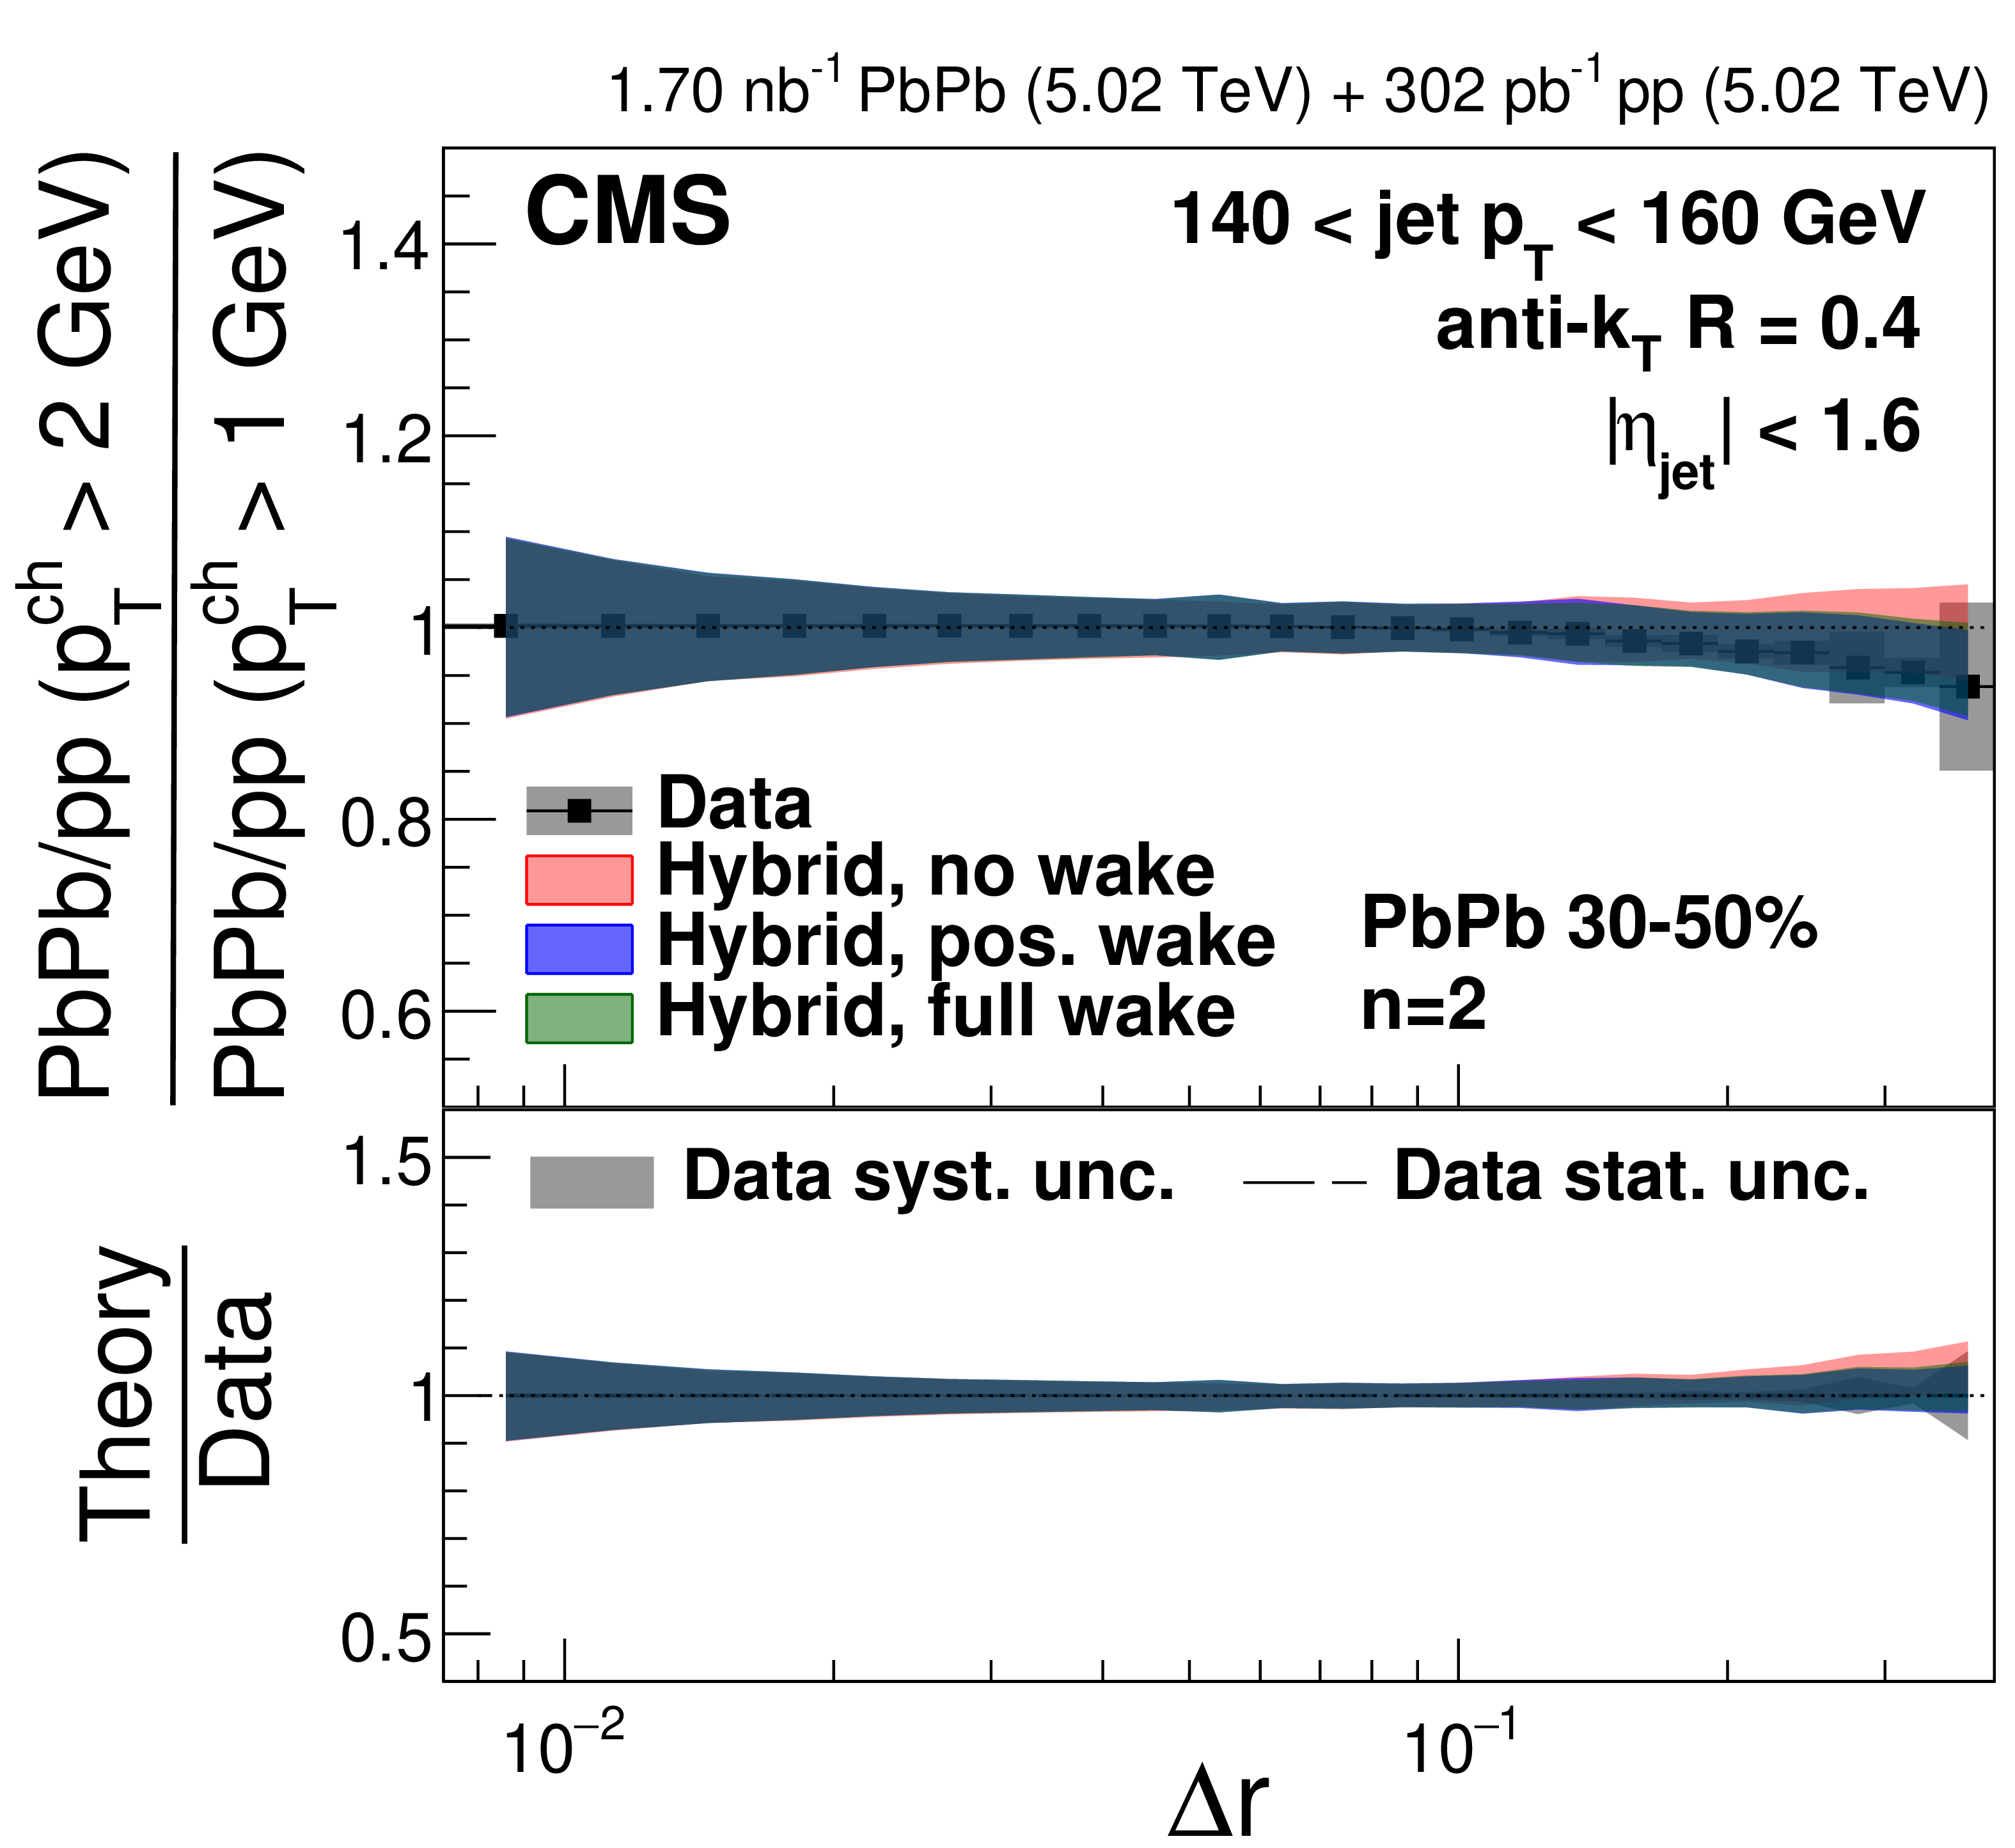
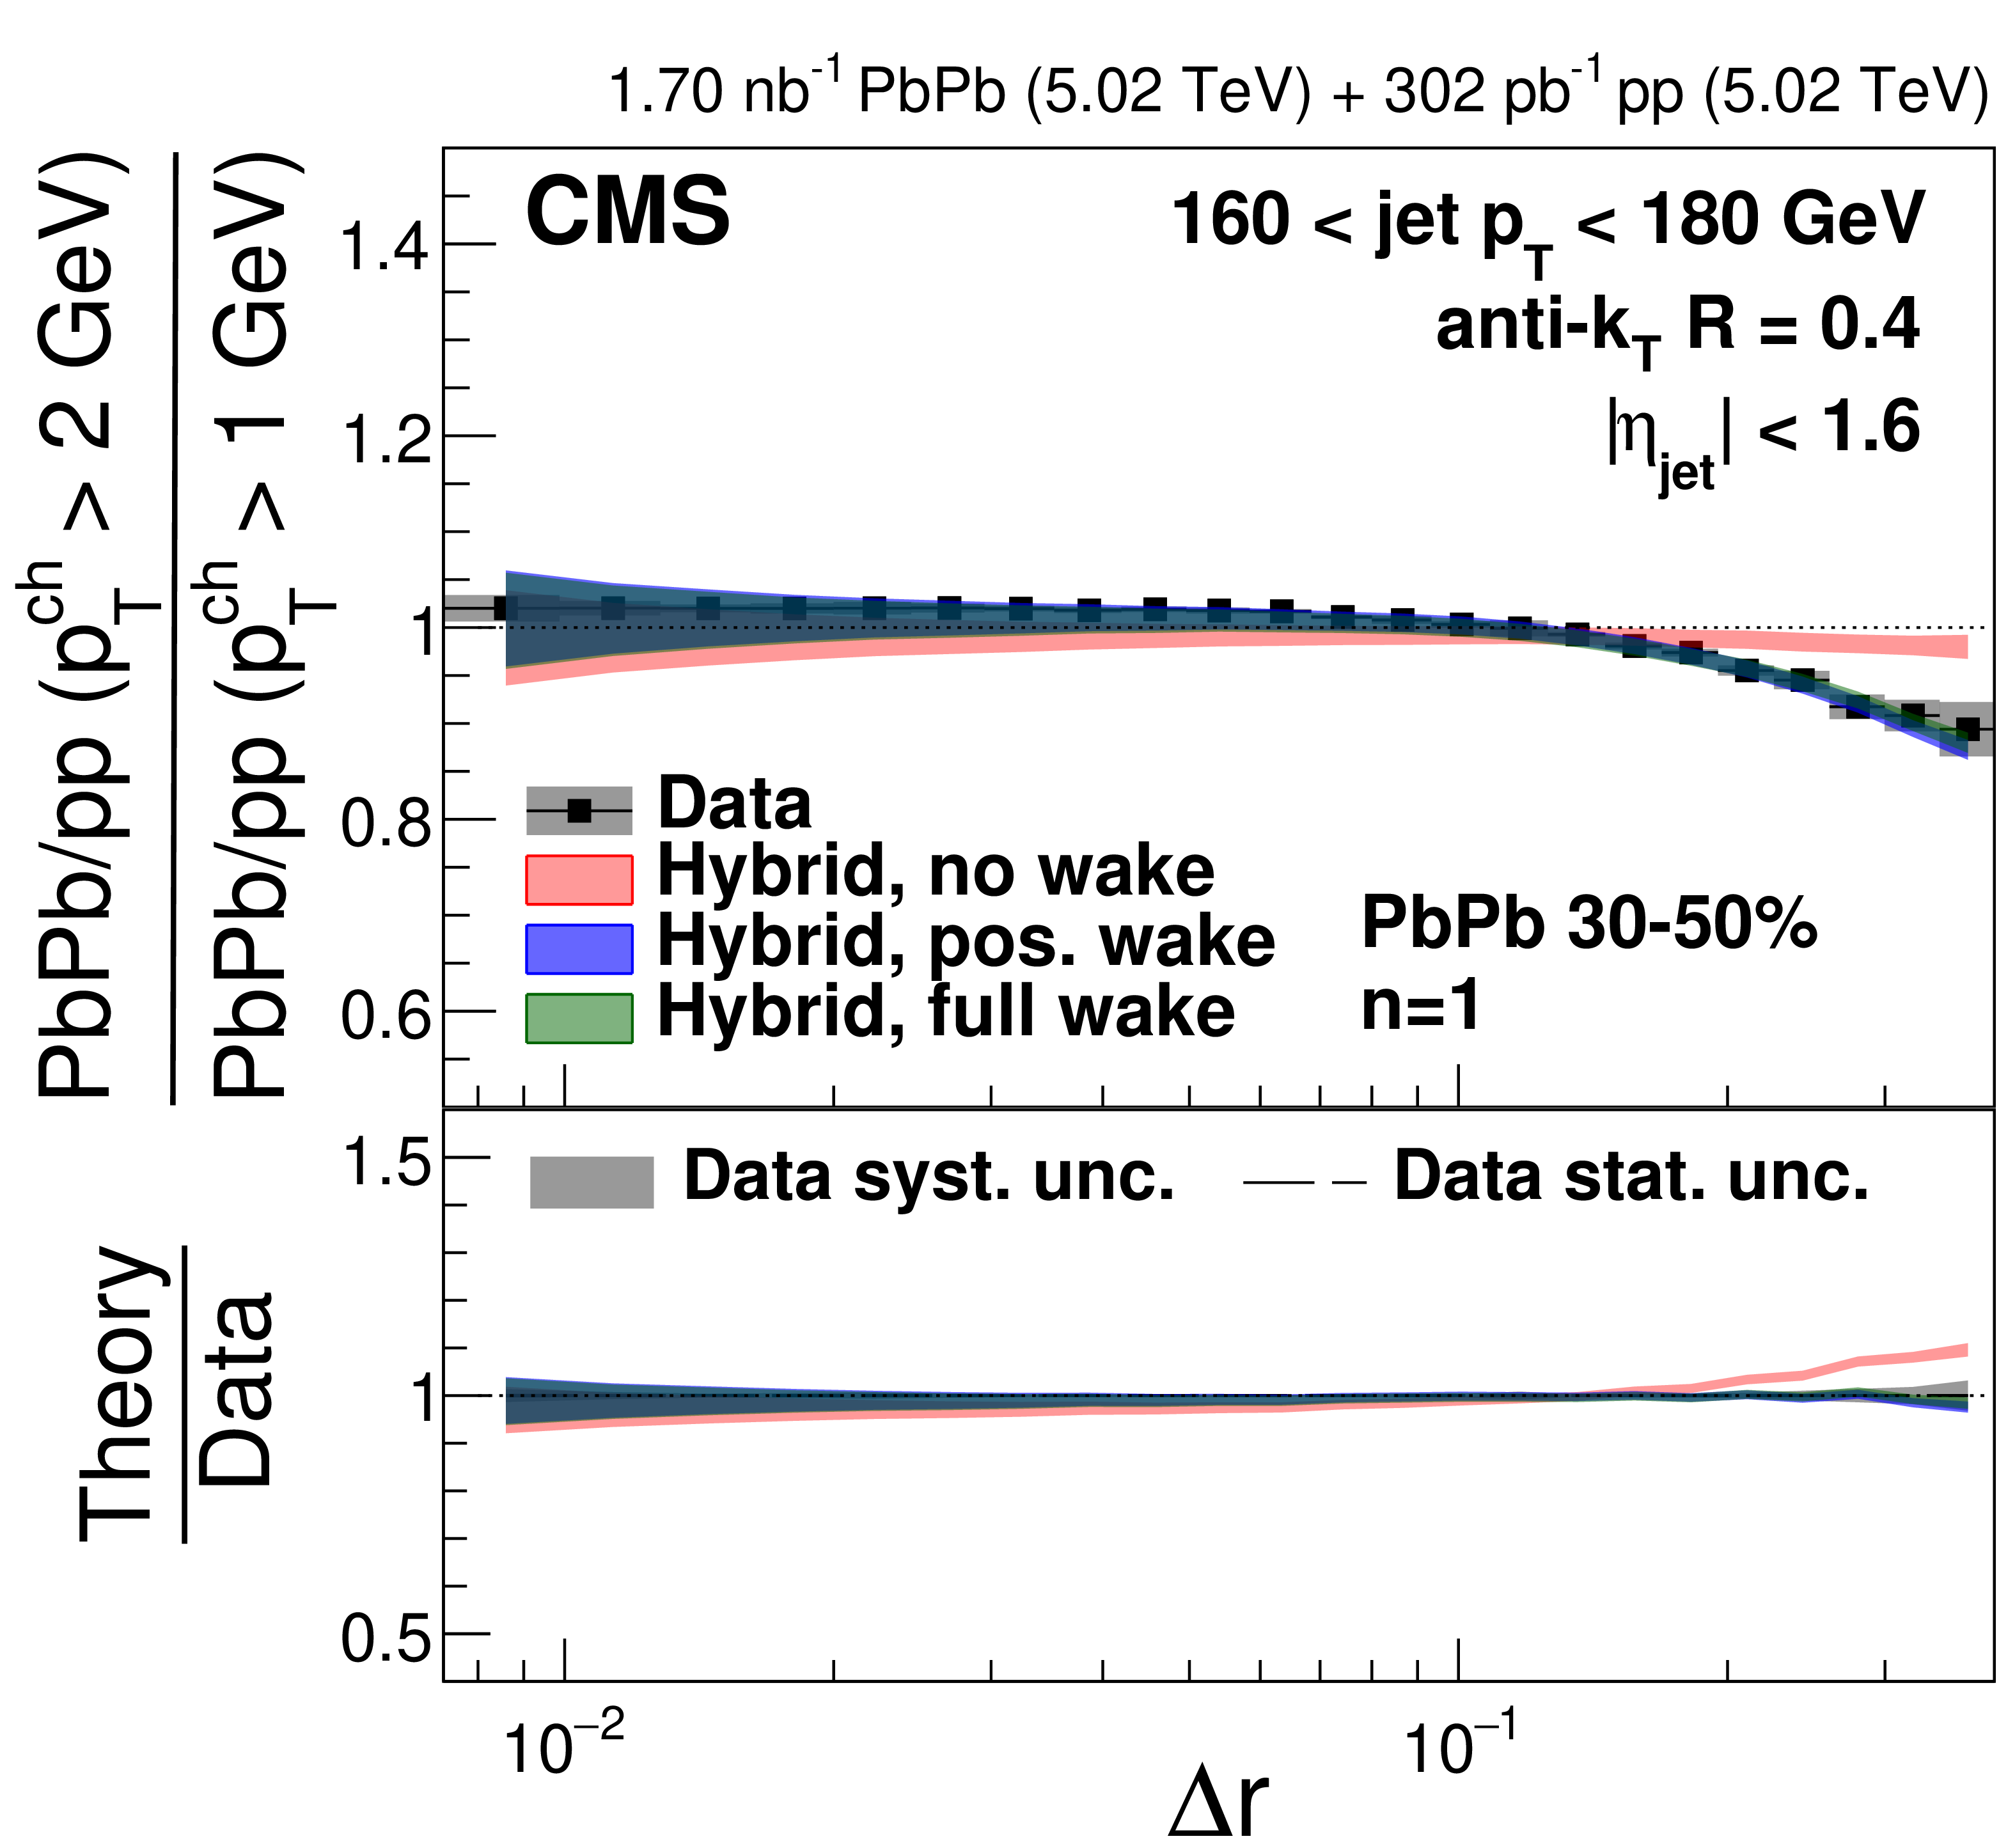
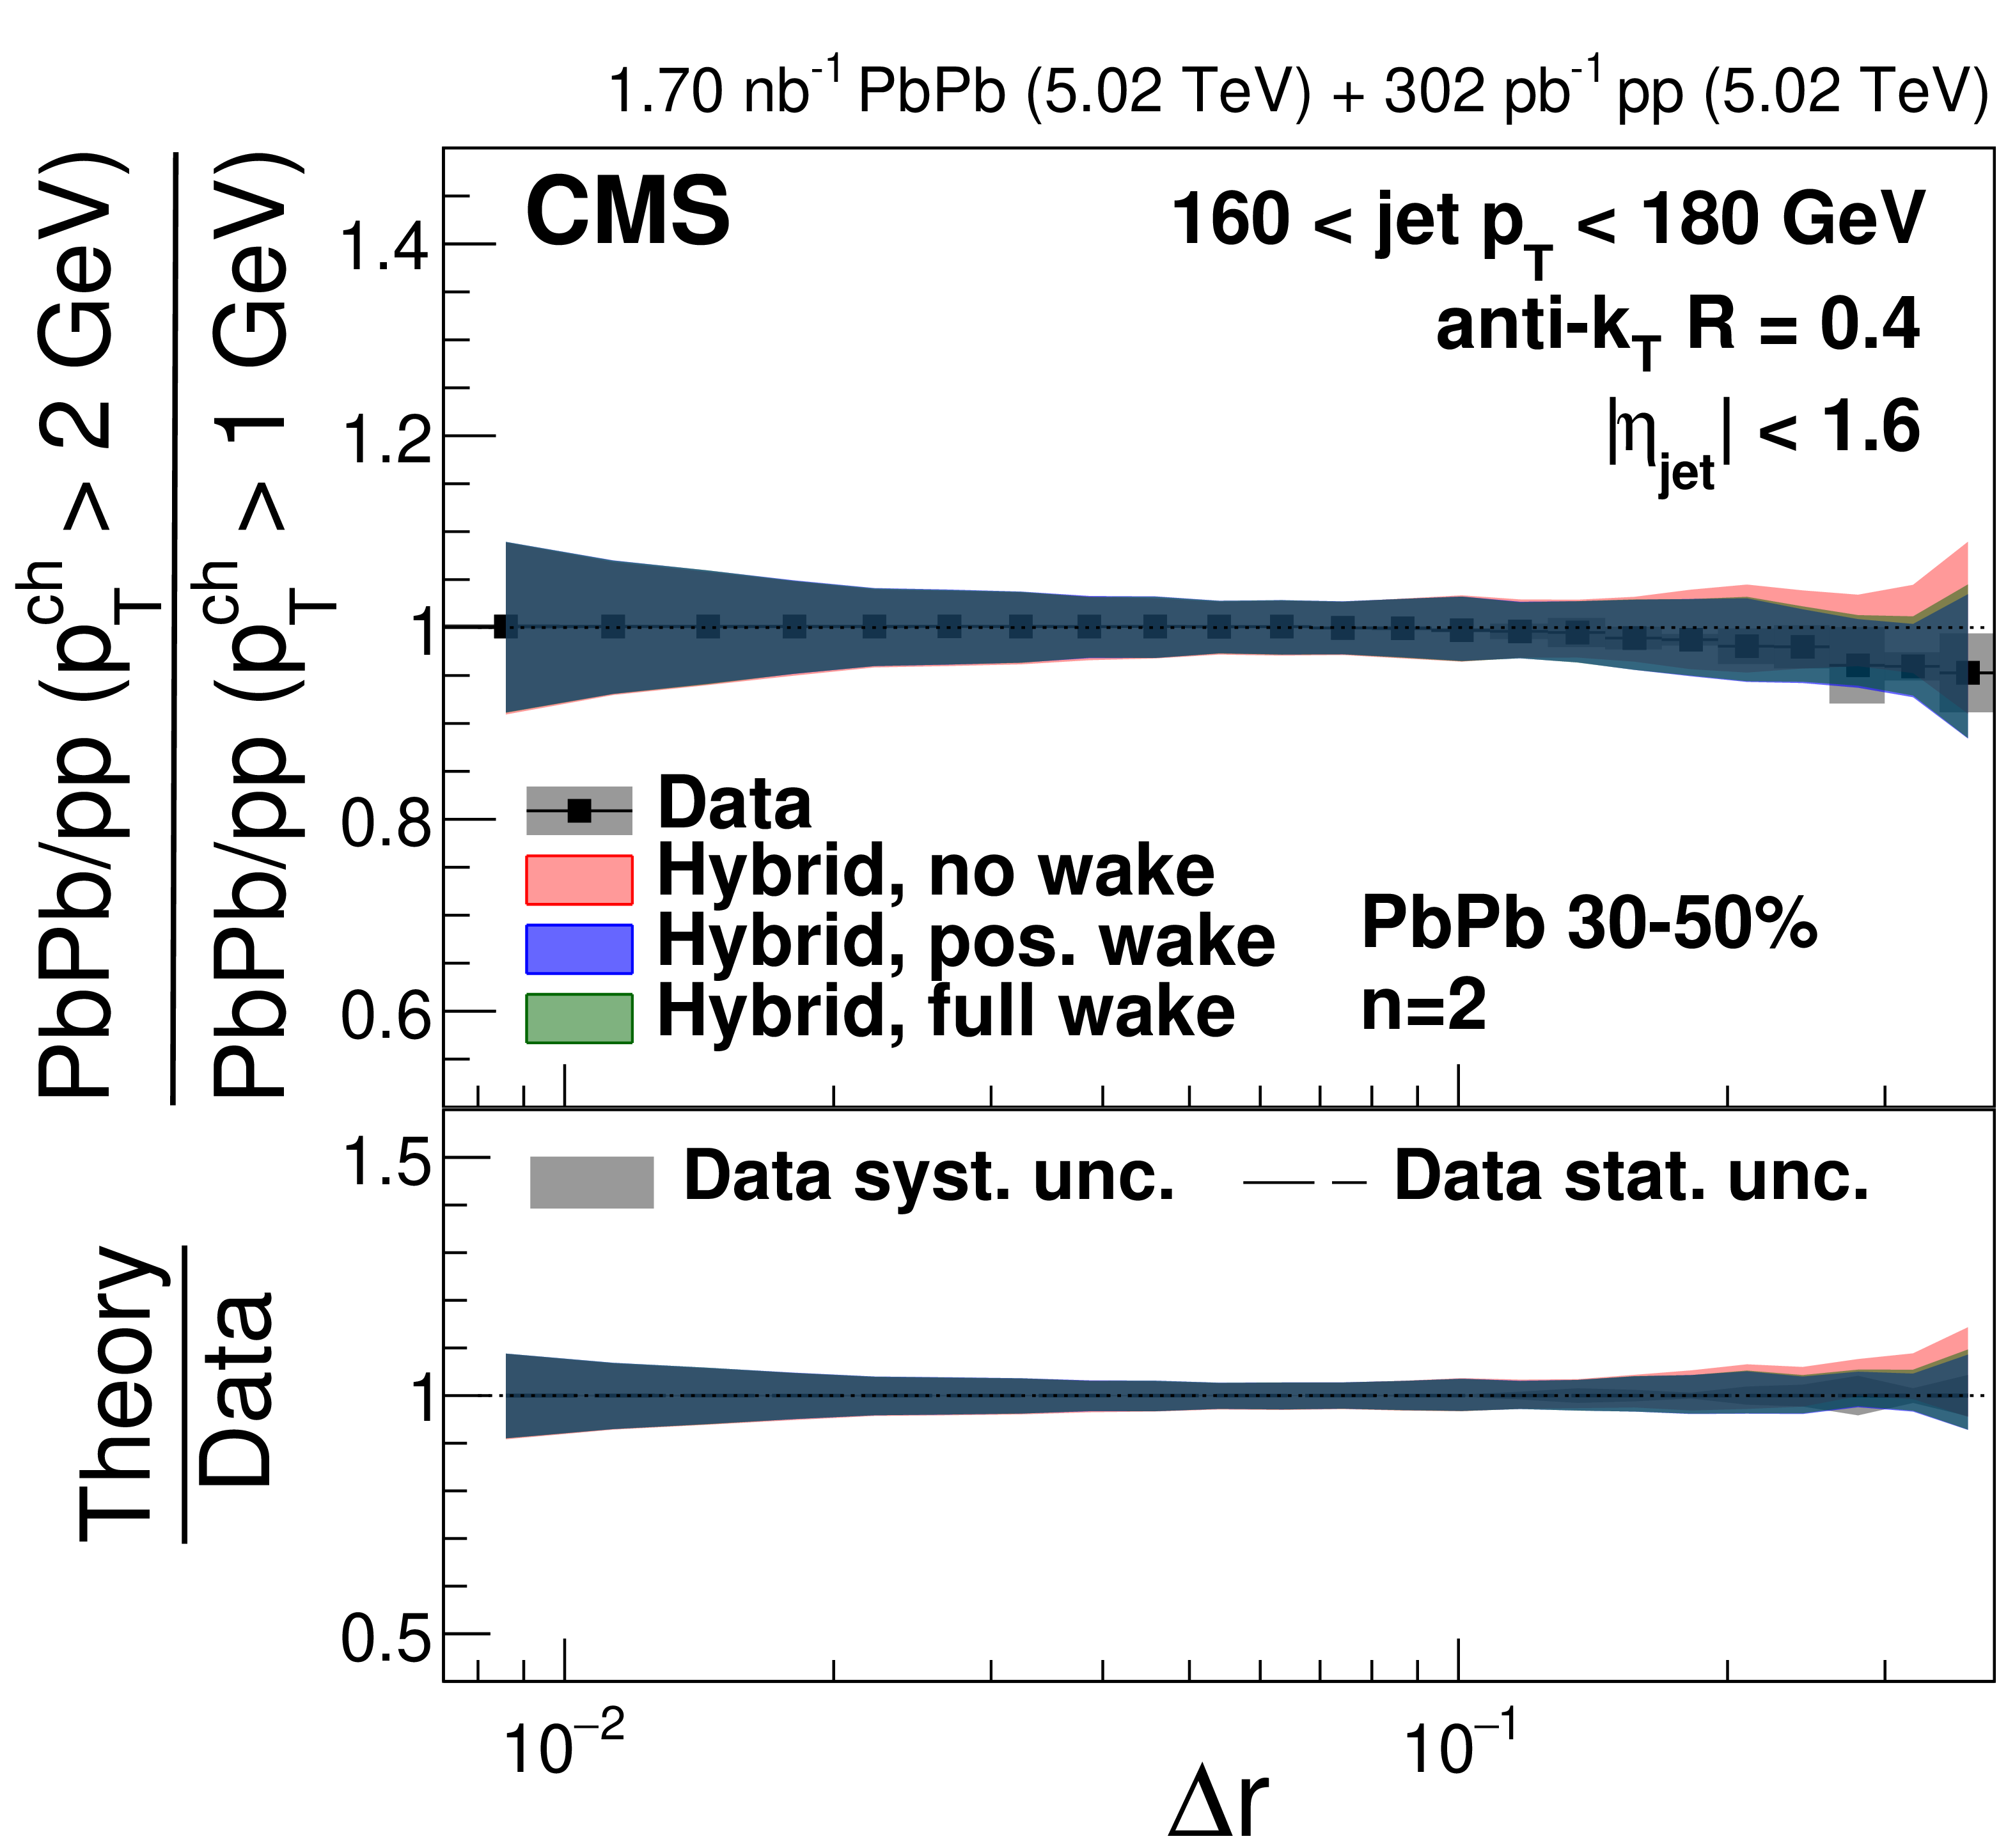
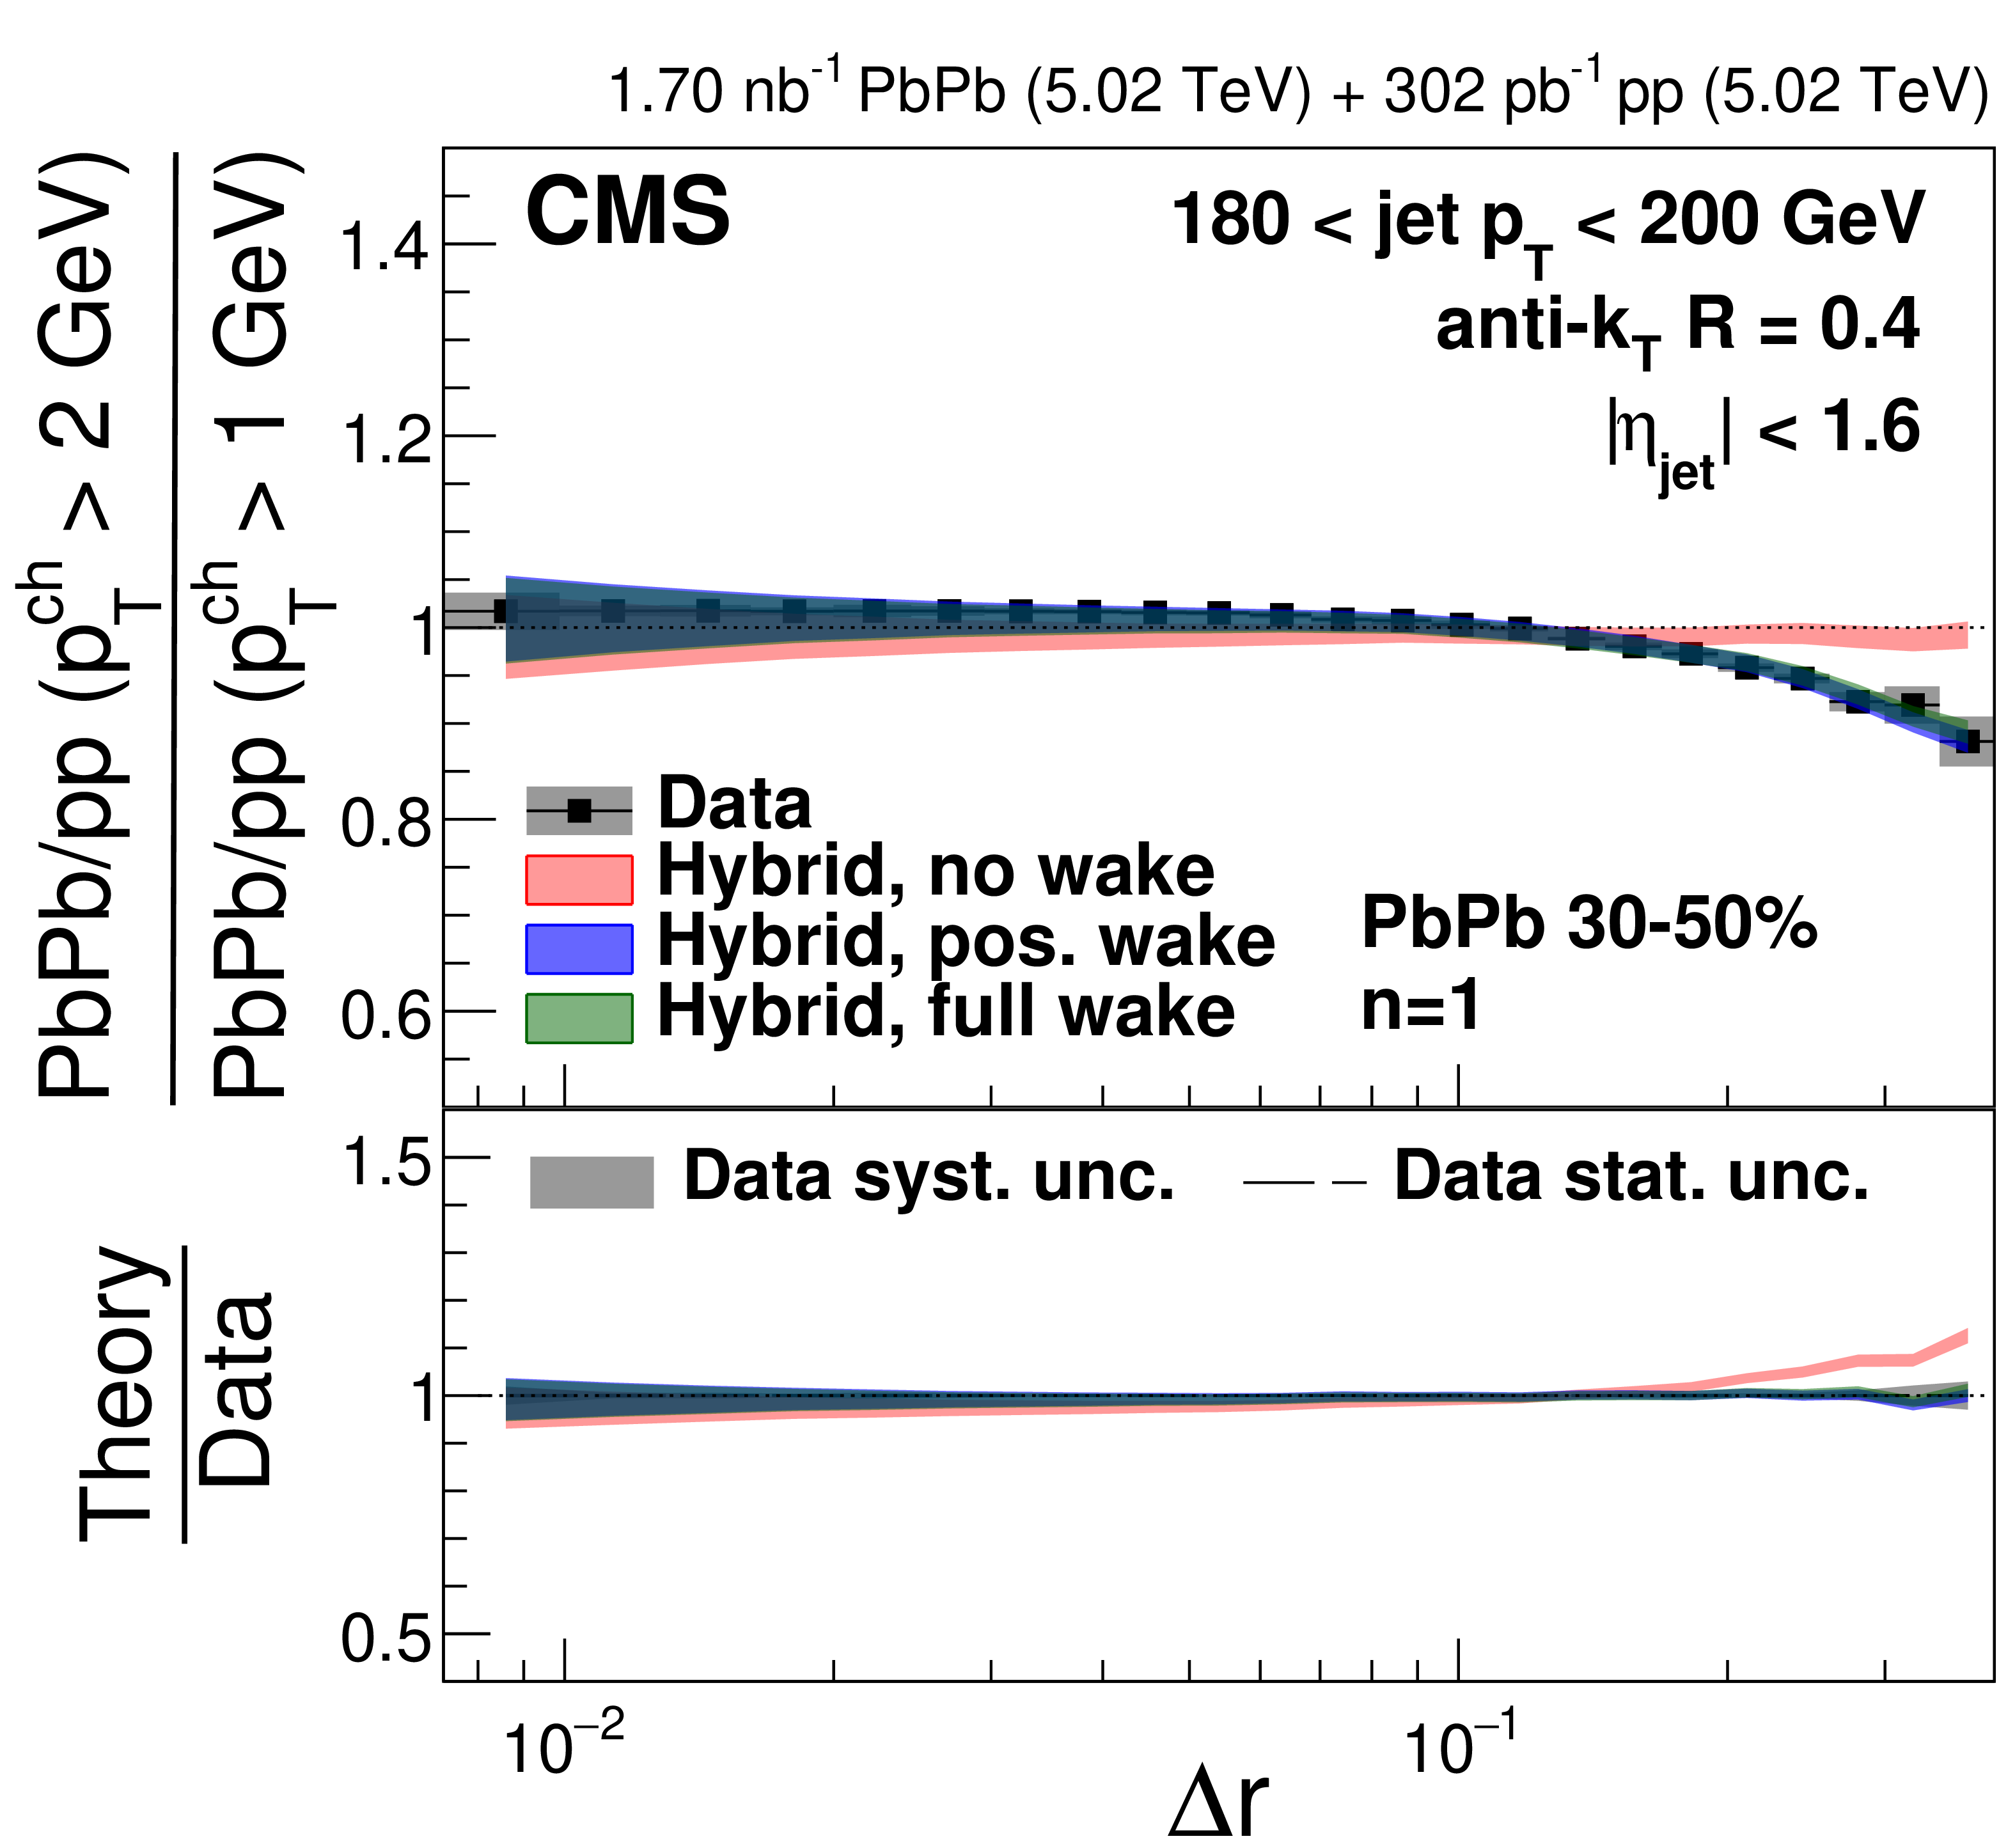
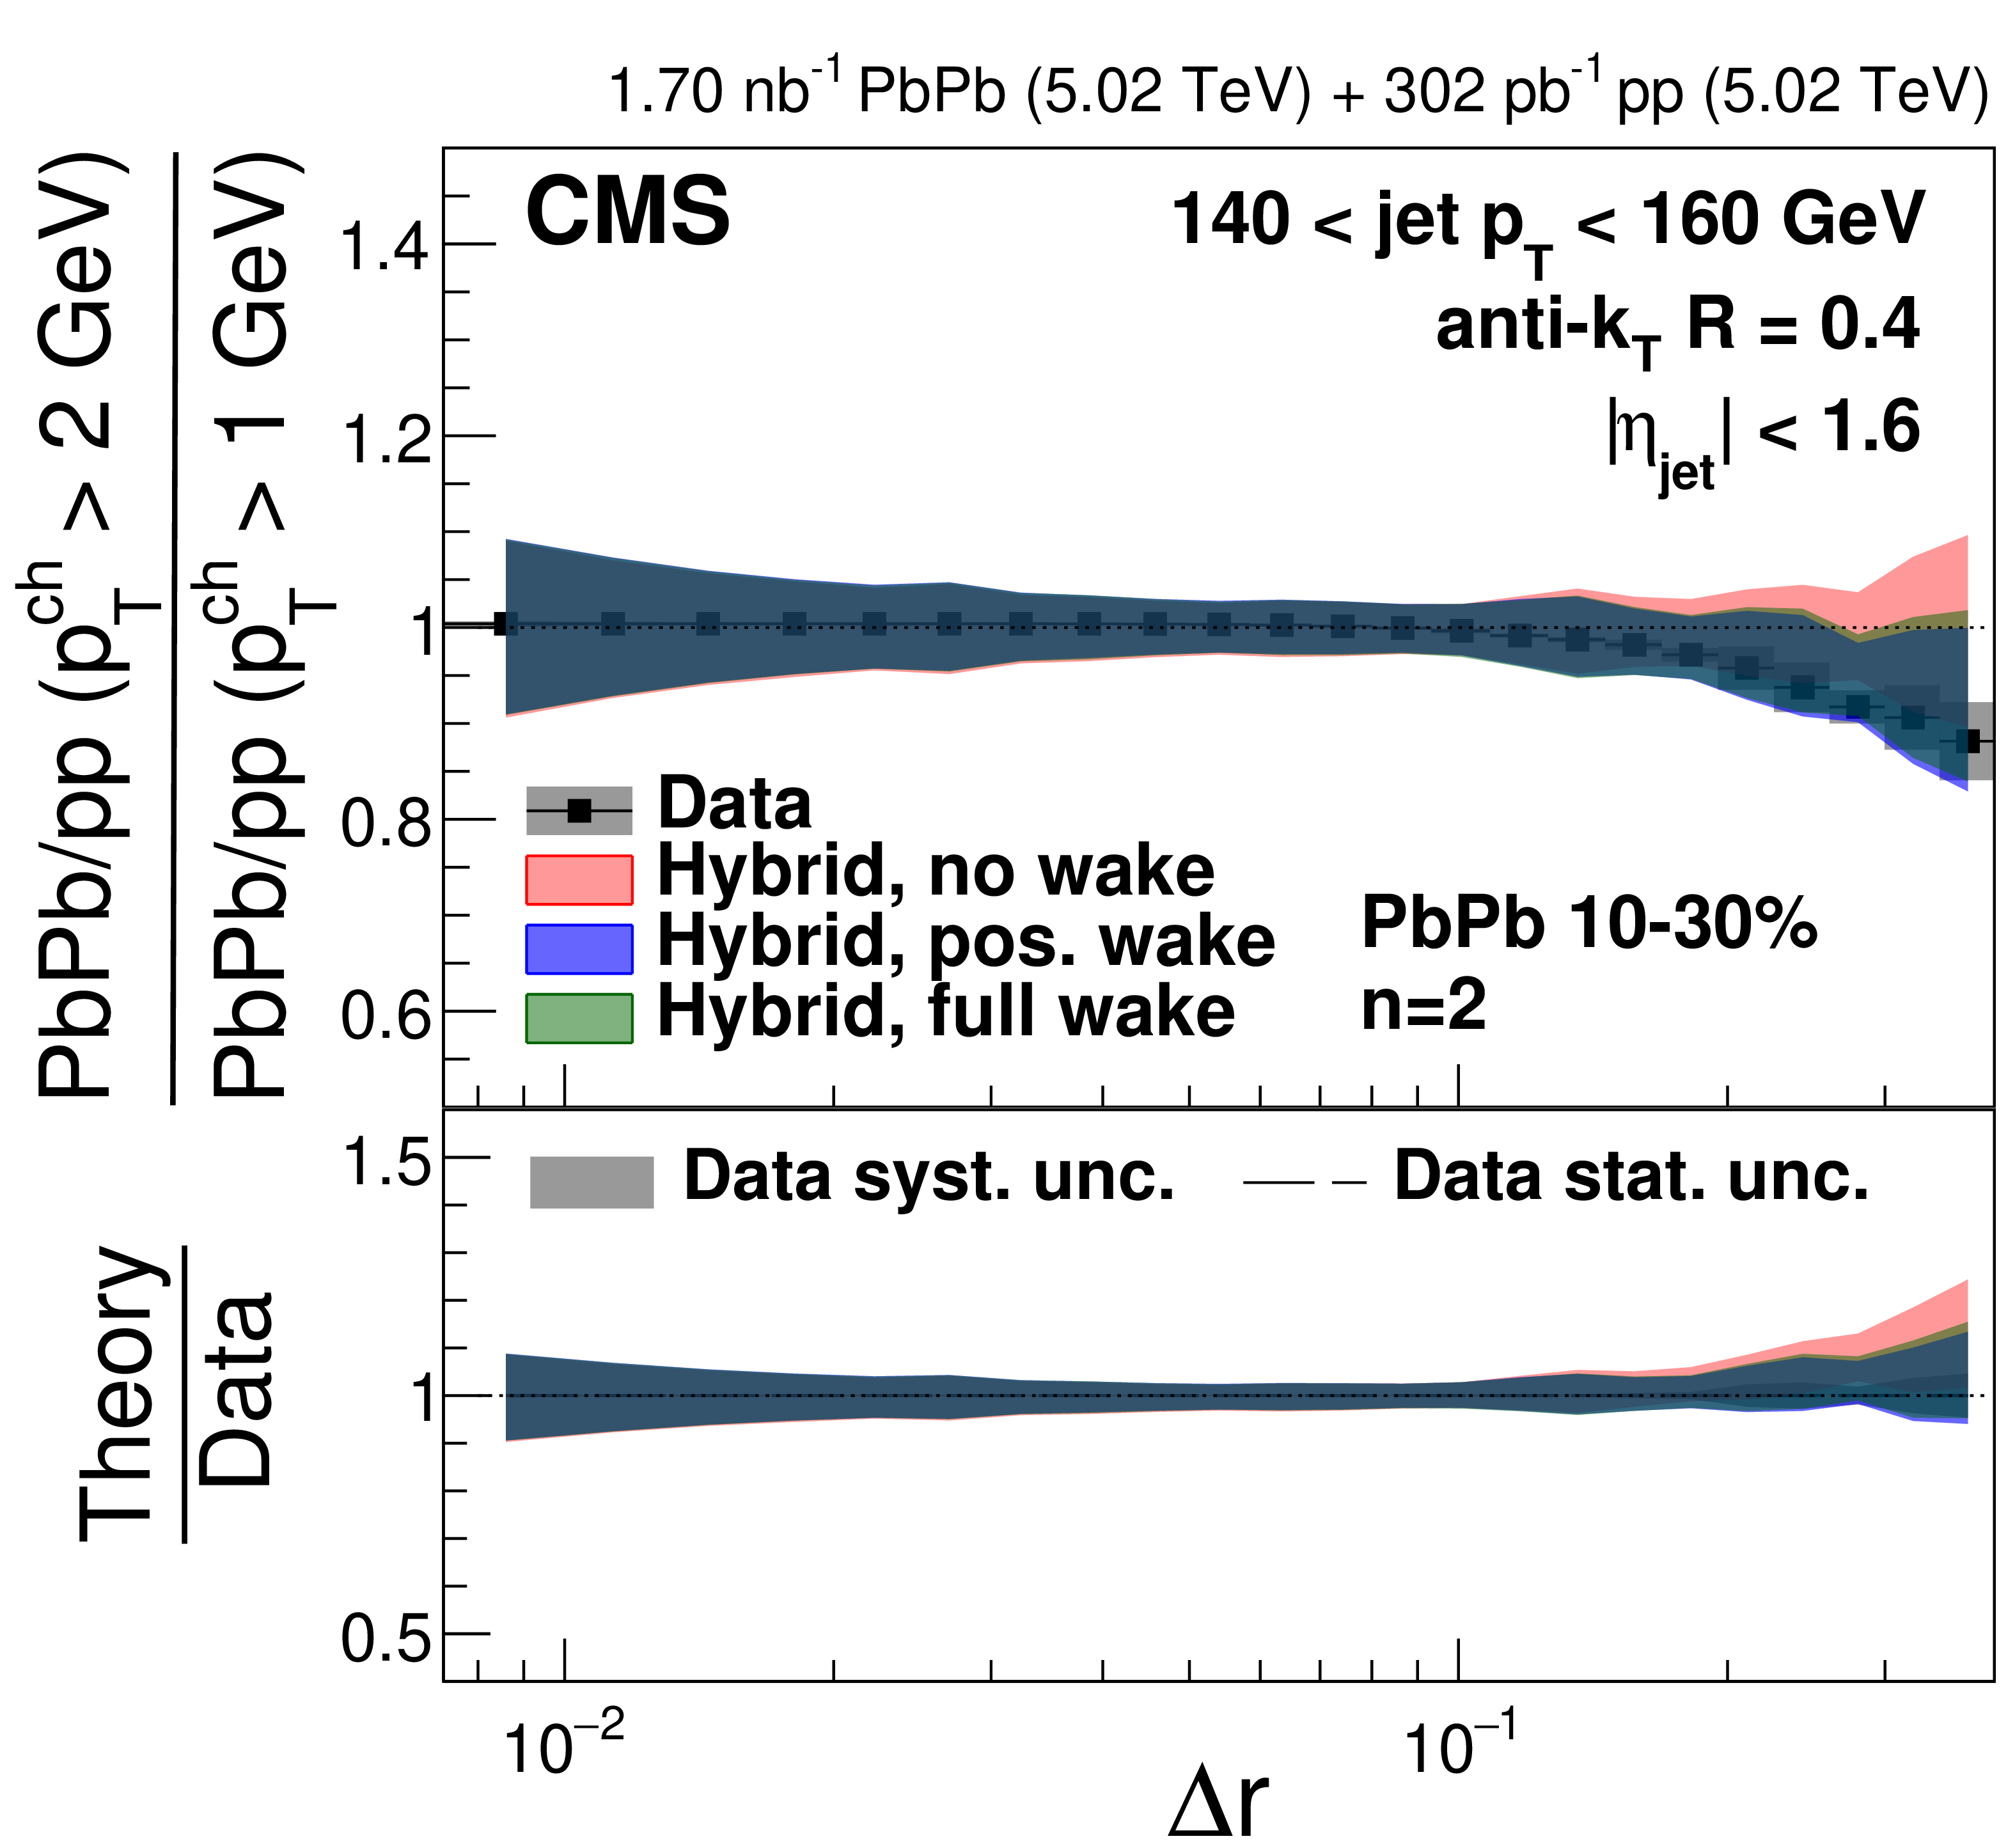
The double ratios of $ n= $ 1 PbPb to pp single ratios with $ p_{\mathrm{T}}^{\text{ch}} > $ 2 GeV to $ p_{\mathrm{T}}^{\text{ch}} > $ 1 GeV are shown for 120 $ < p_{\text{T,jet}} < $ 140 GeV (left) and 180 $ < p_{\text{T,jet}} < $ 200 GeV (right) together with the hybrid model [82,83,84] predictions with three different wake settings. In the lower panels, the experimental uncertainties are indicated by the bands around unity. |

png pdf |
Figure 8-a:
The double ratios of $ n= $ 1 PbPb to pp single ratios with $ p_{\mathrm{T}}^{\text{ch}} > $ 2 GeV to $ p_{\mathrm{T}}^{\text{ch}} > $ 1 GeV are shown for 120 $ < p_{\text{T,jet}} < $ 140 GeV (left) and 180 $ < p_{\text{T,jet}} < $ 200 GeV (right) together with the hybrid model [82,83,84] predictions with three different wake settings. In the lower panels, the experimental uncertainties are indicated by the bands around unity. |
png pdf |
Figure 8-b:
The double ratios of $ n= $ 1 PbPb to pp single ratios with $ p_{\mathrm{T}}^{\text{ch}} > $ 2 GeV to $ p_{\mathrm{T}}^{\text{ch}} > $ 1 GeV are shown for 120 $ < p_{\text{T,jet}} < $ 140 GeV (left) and 180 $ < p_{\text{T,jet}} < $ 200 GeV (right) together with the hybrid model [82,83,84] predictions with three different wake settings. In the lower panels, the experimental uncertainties are indicated by the bands around unity. |
png pdf |
Figure 9:
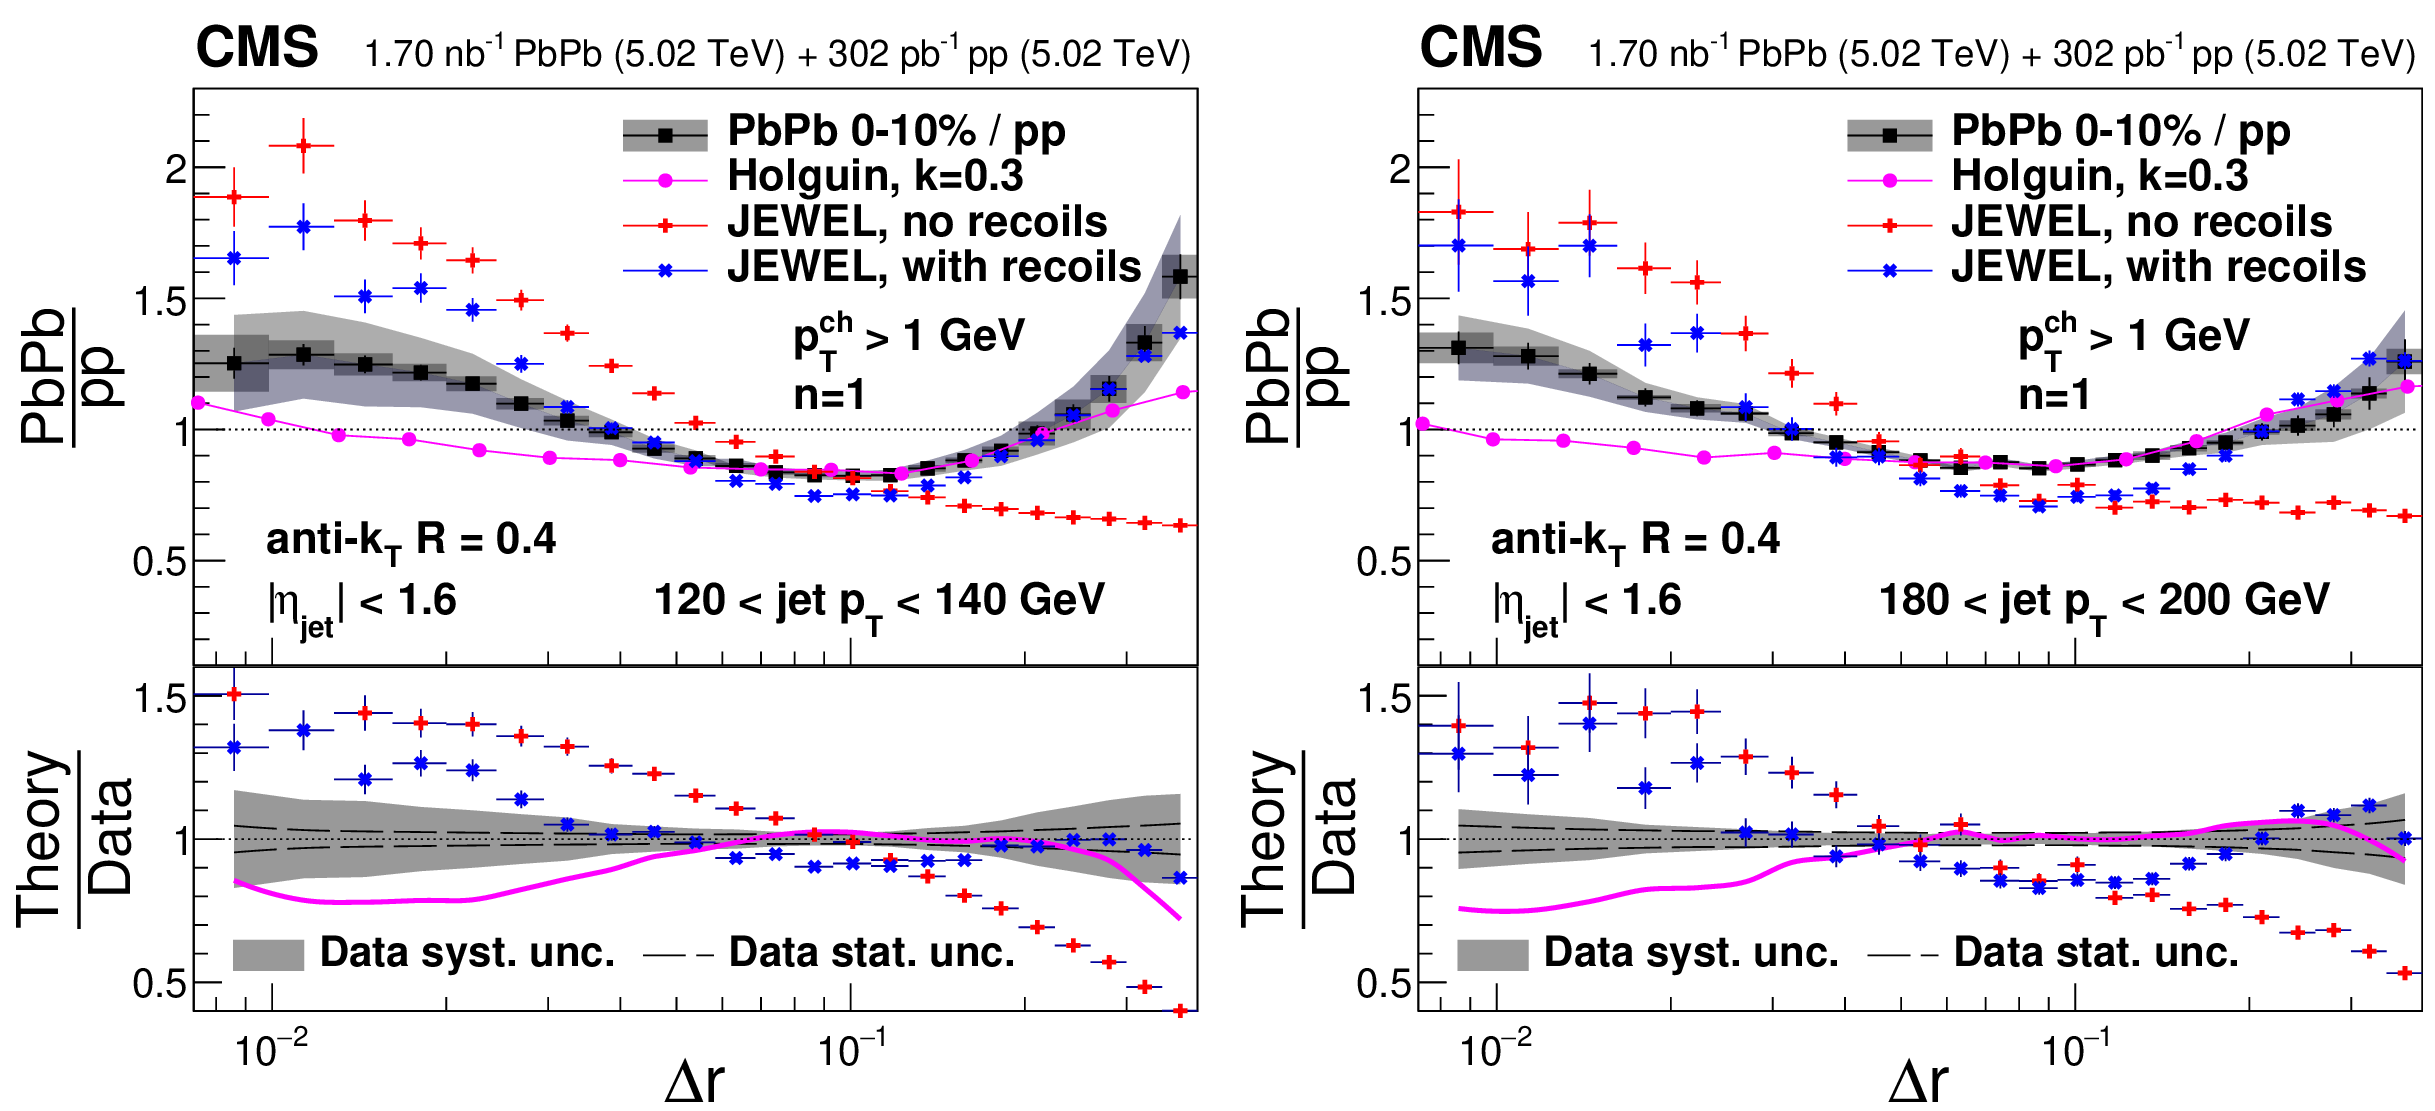
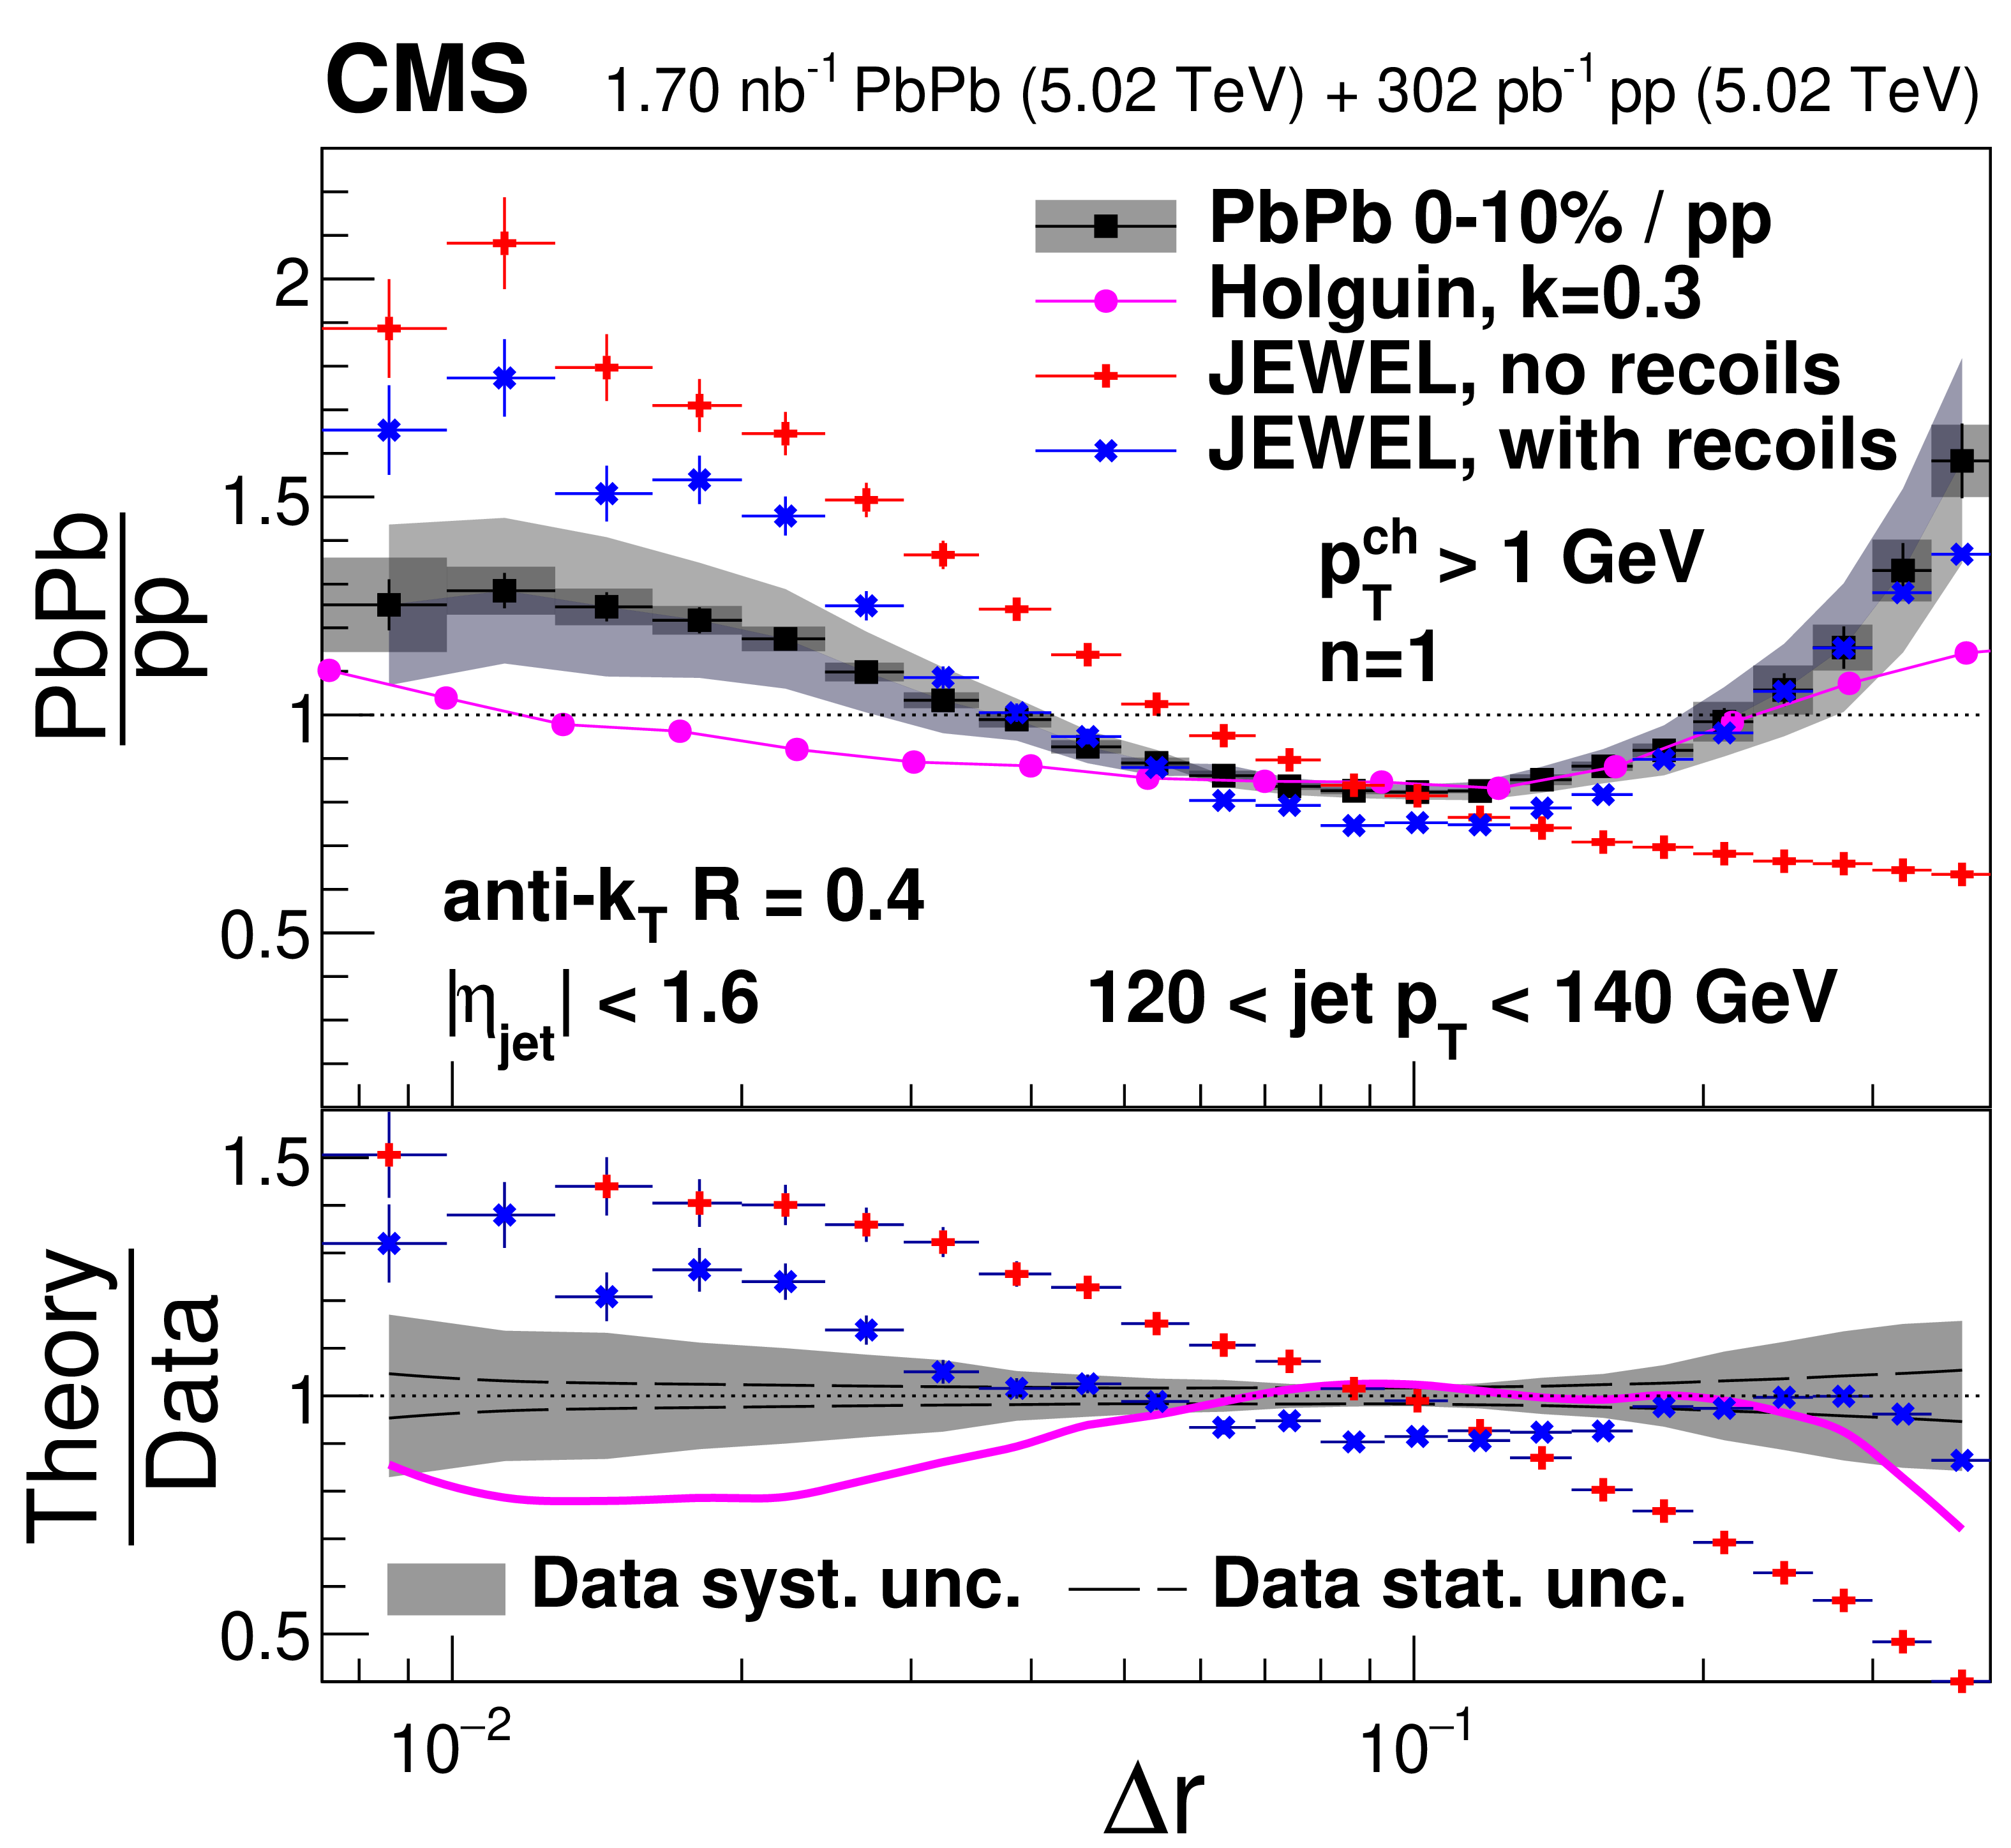
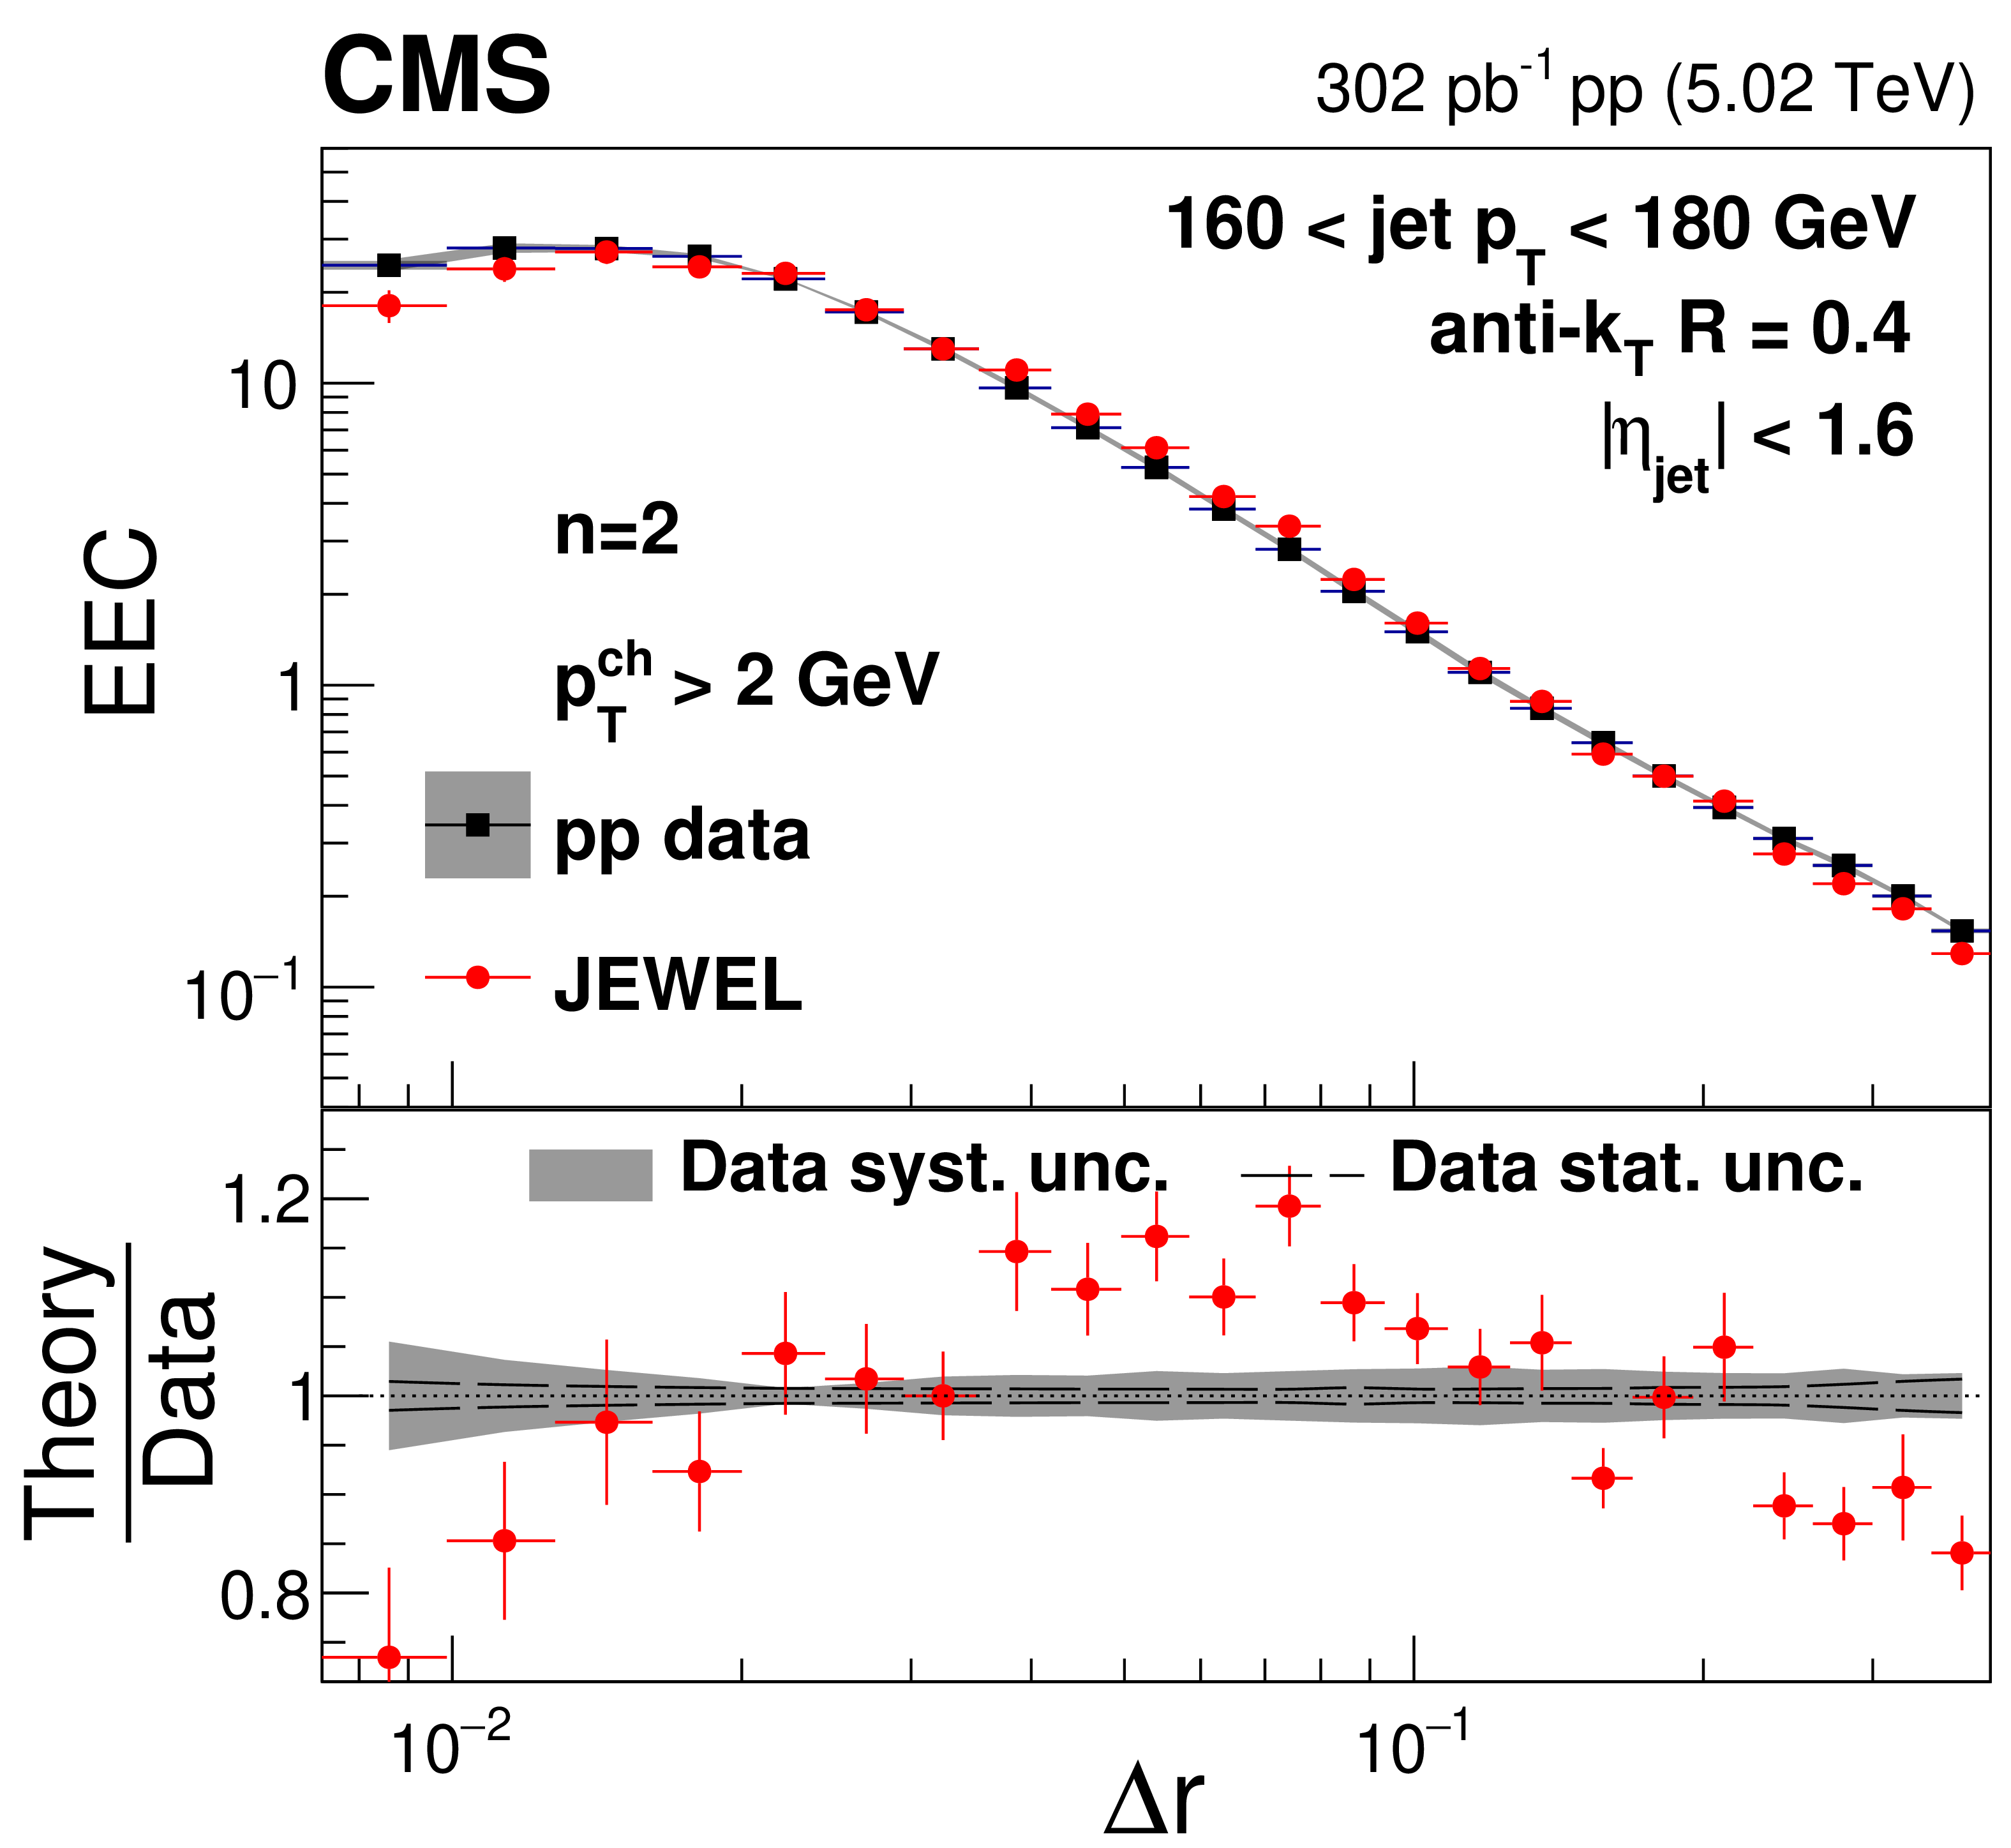
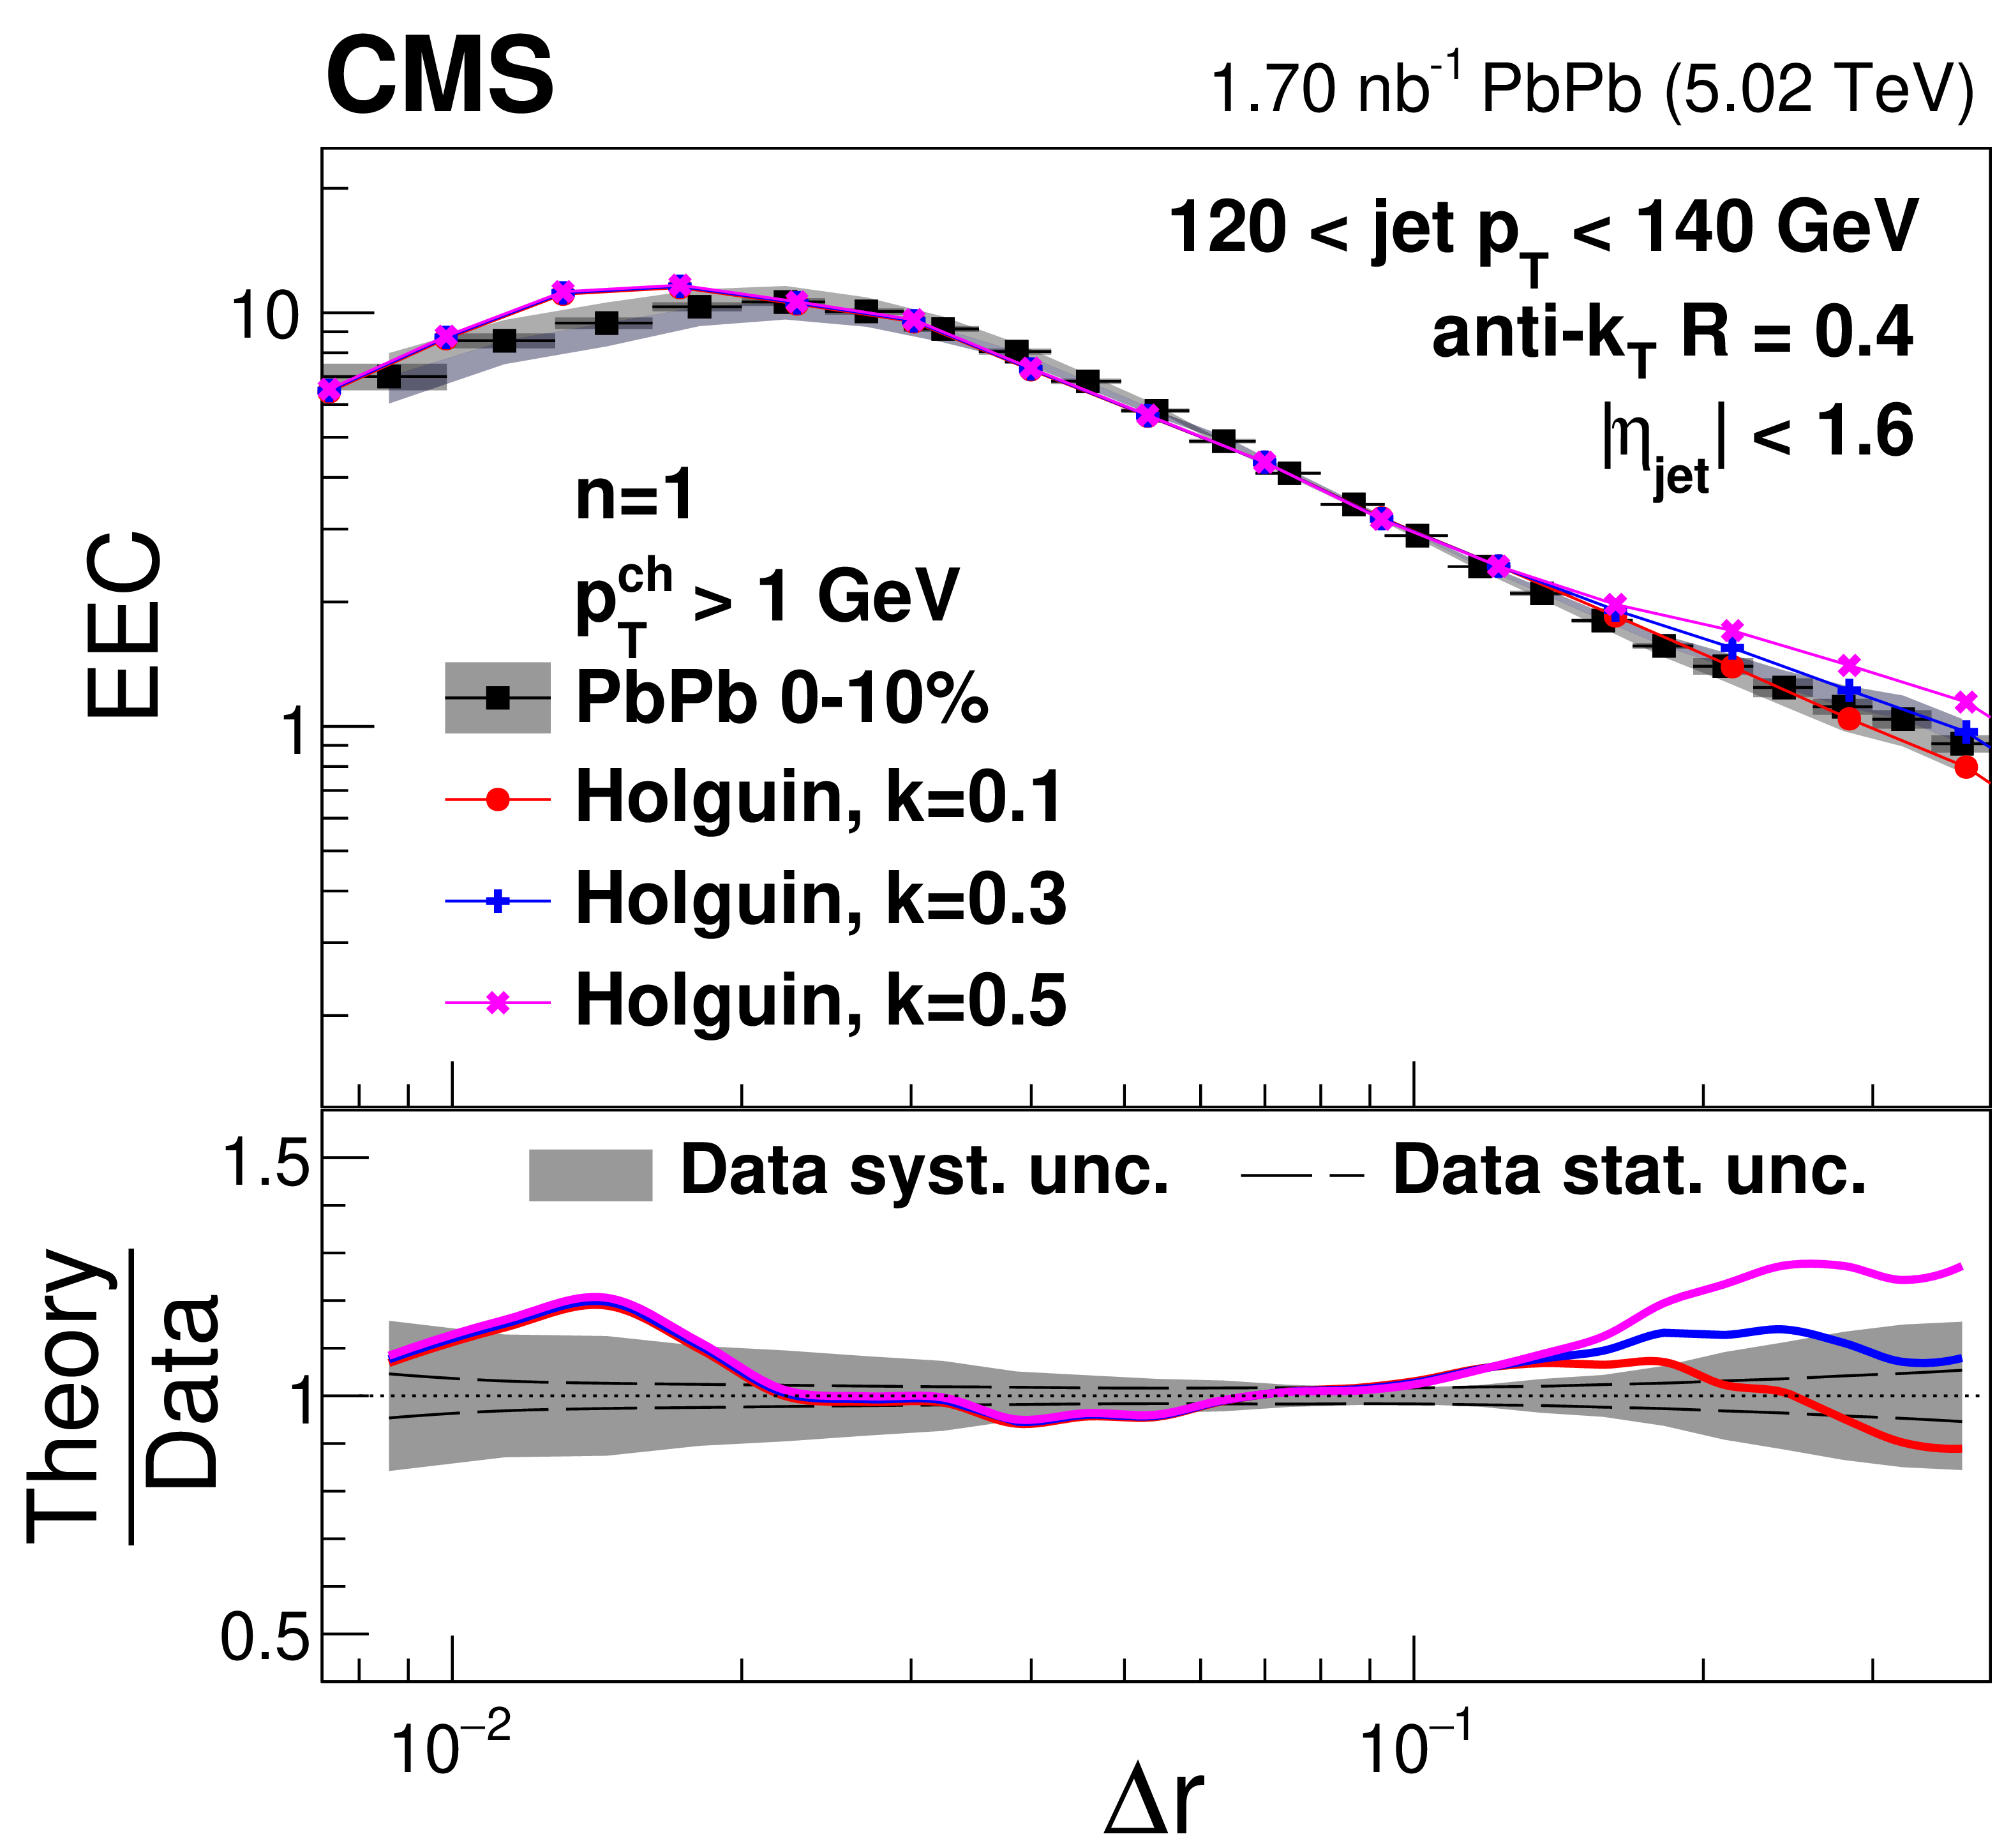
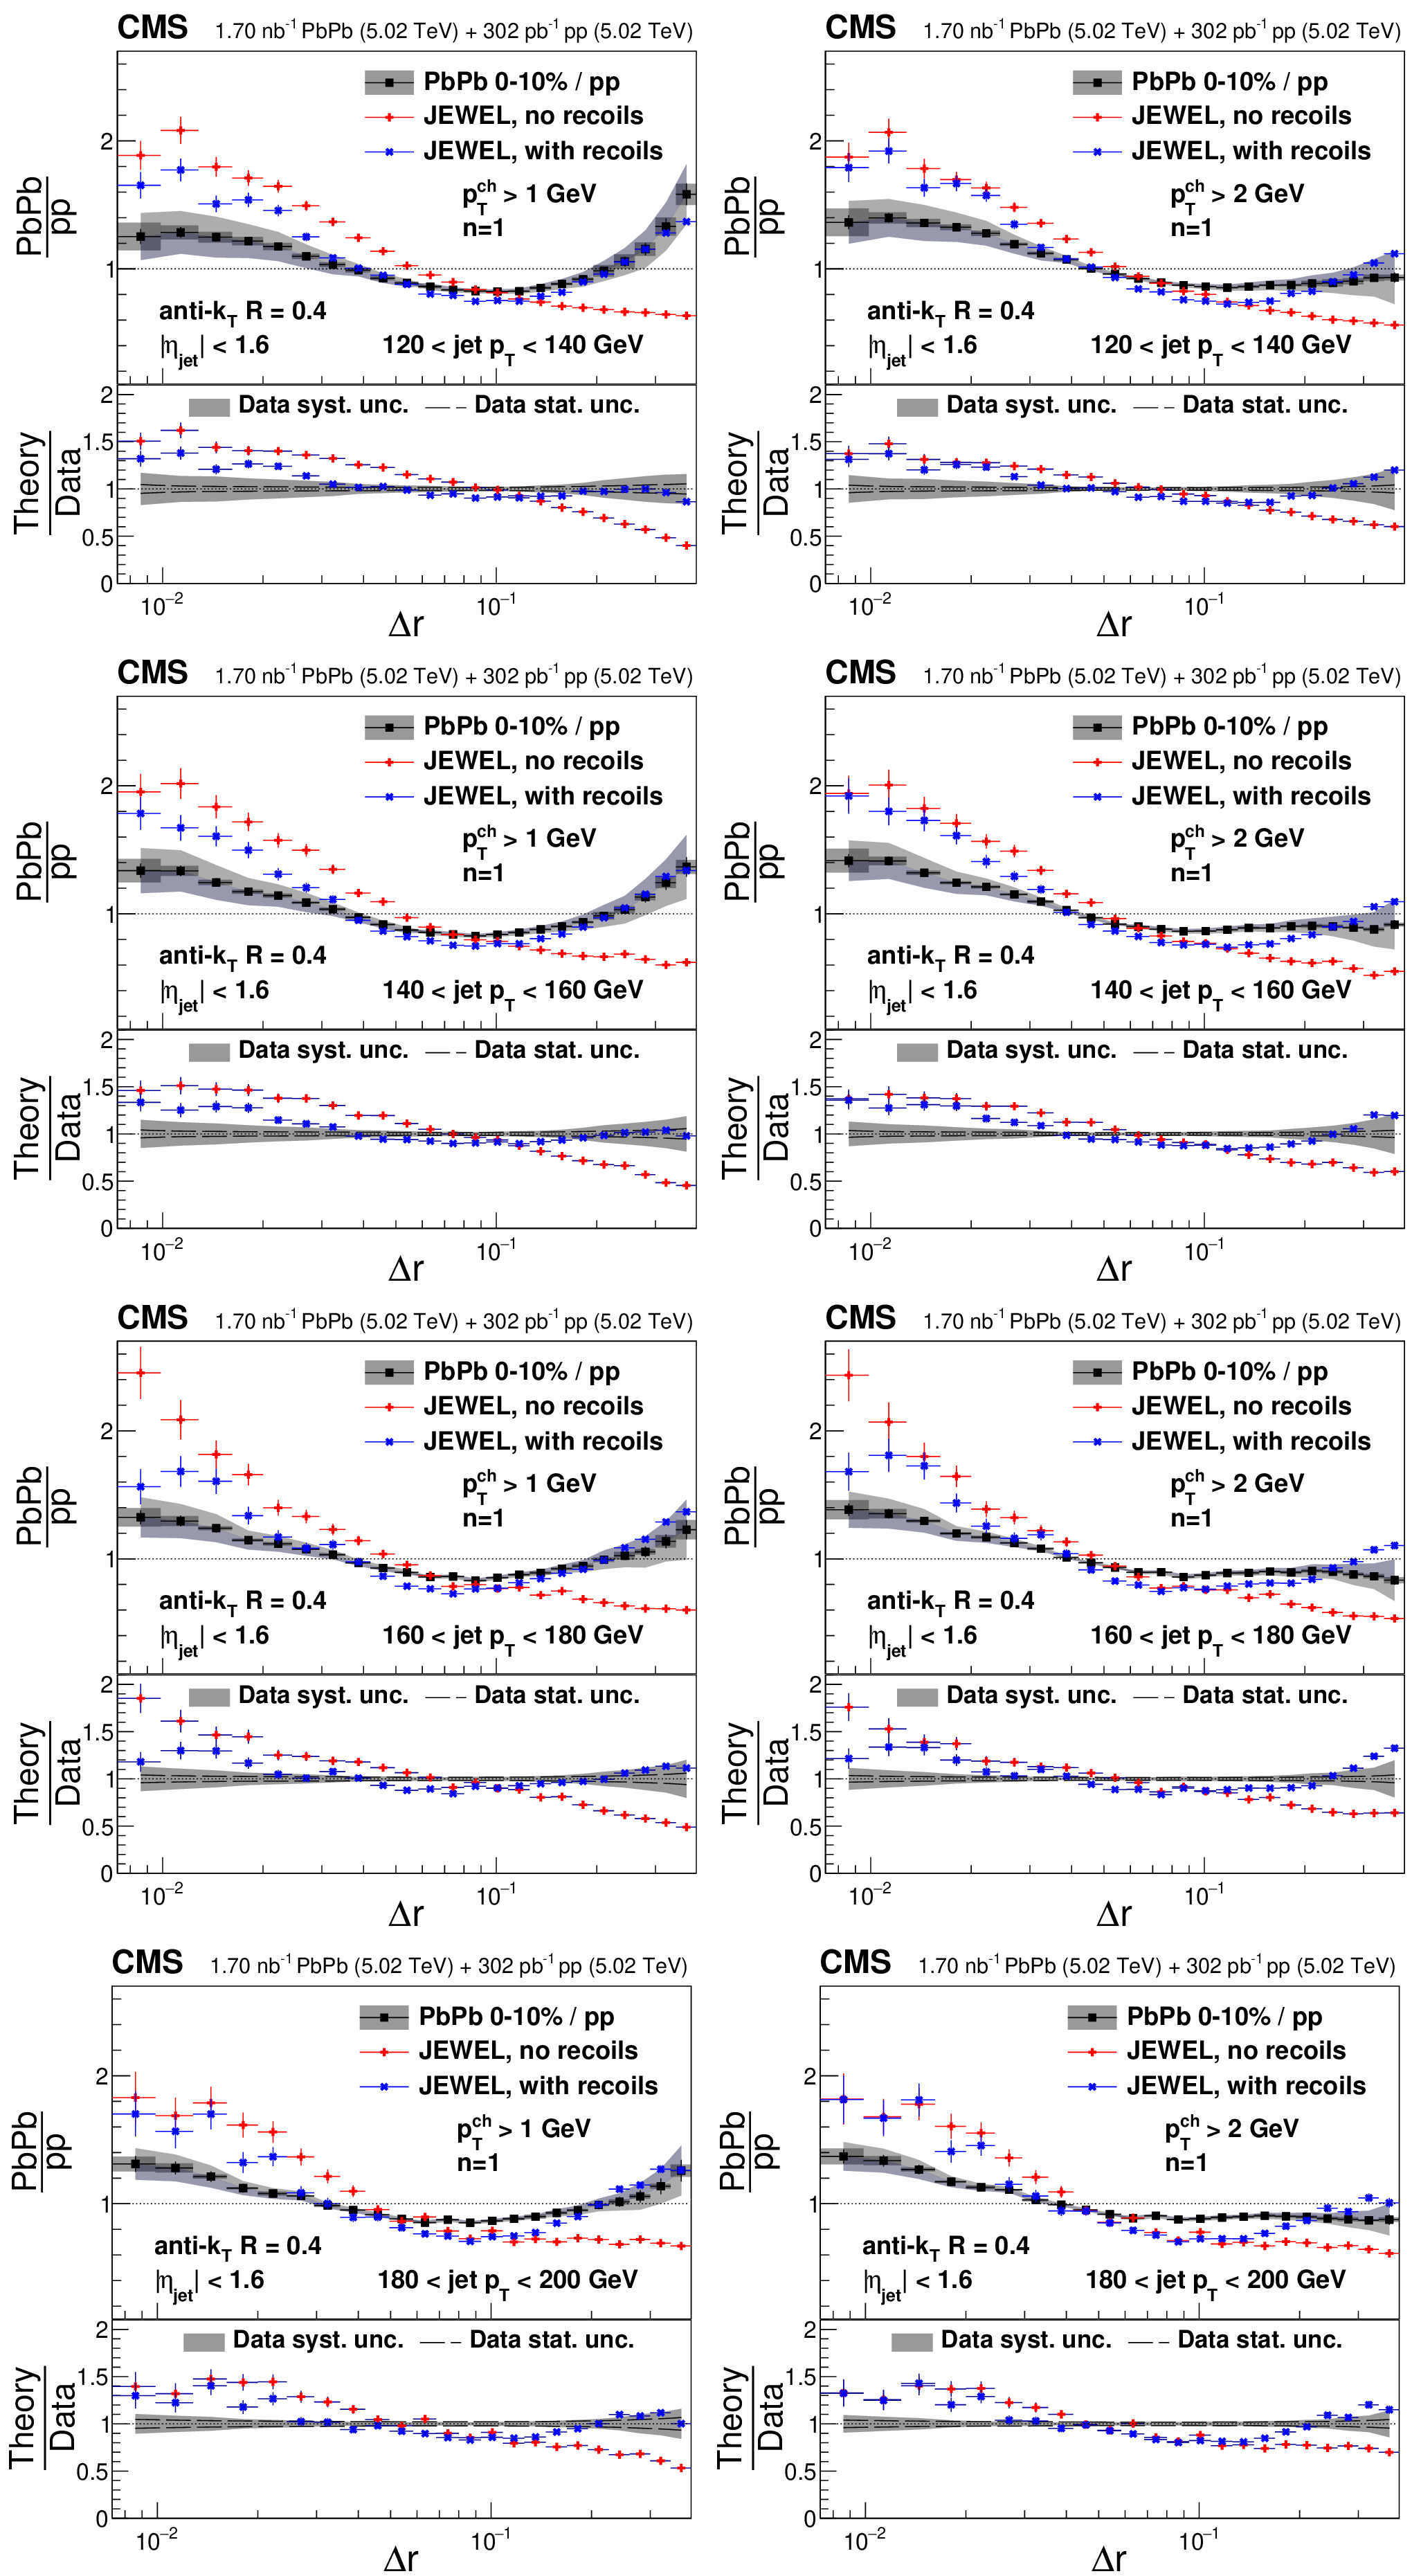
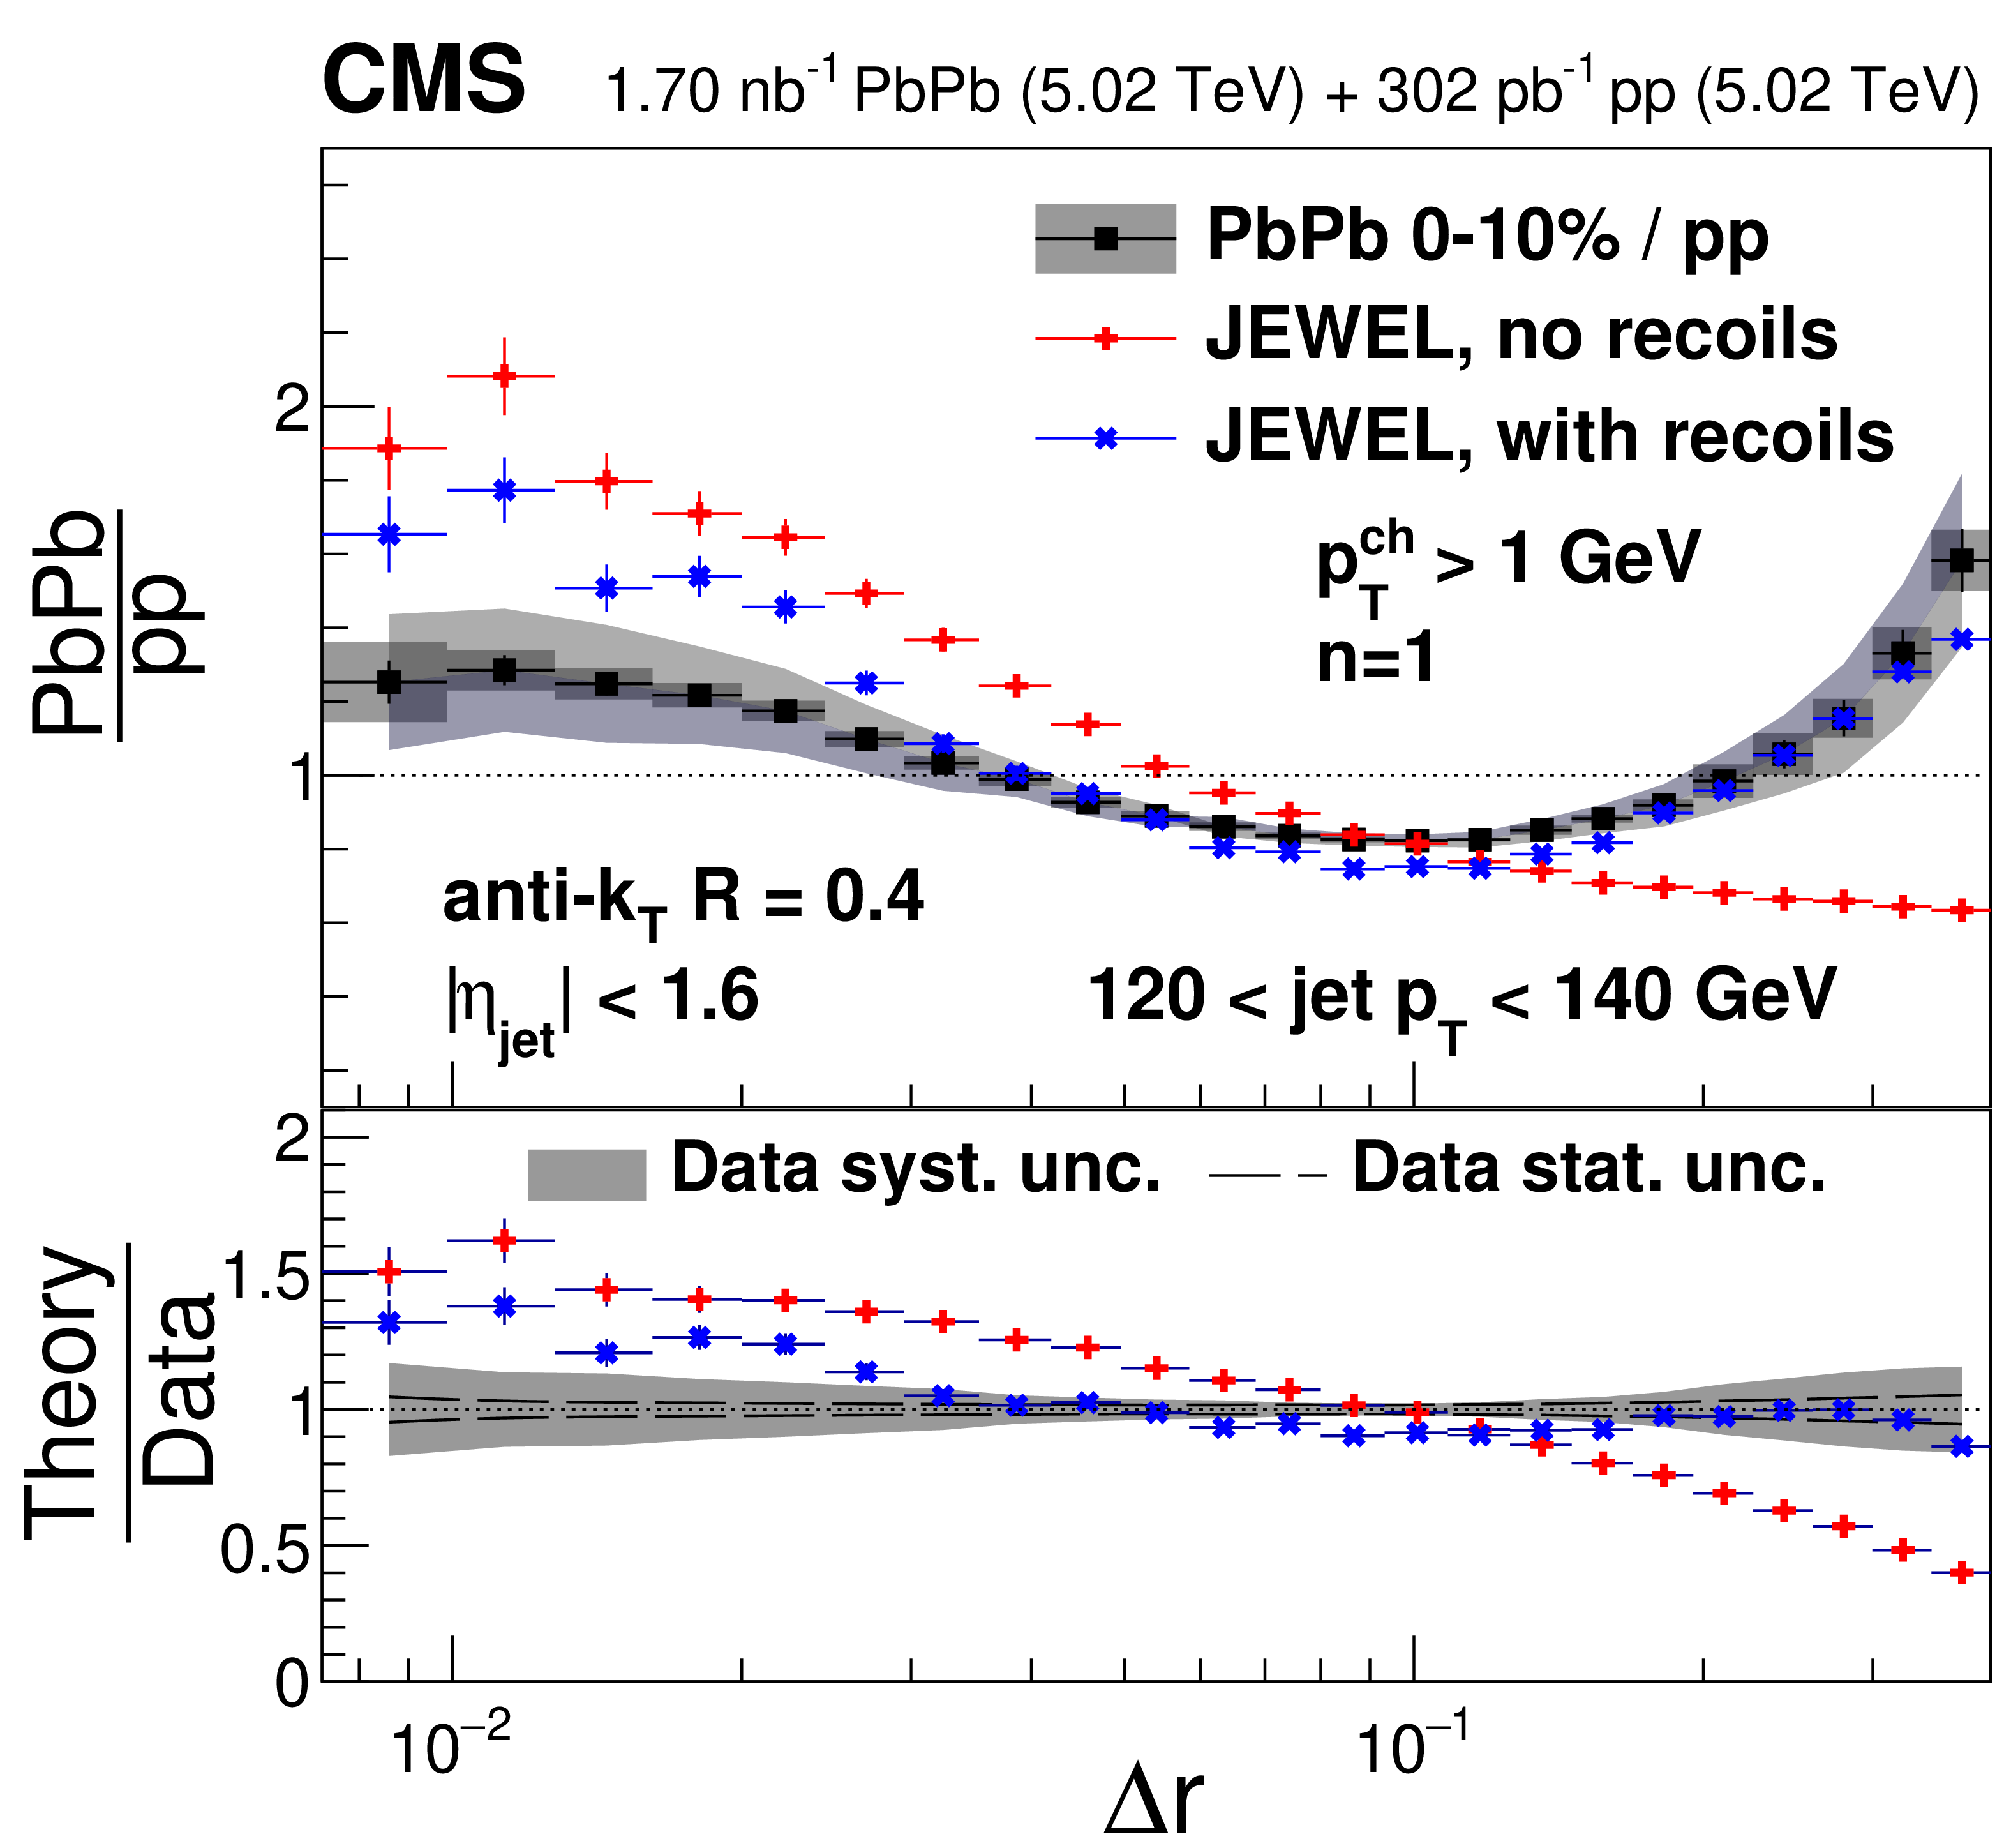
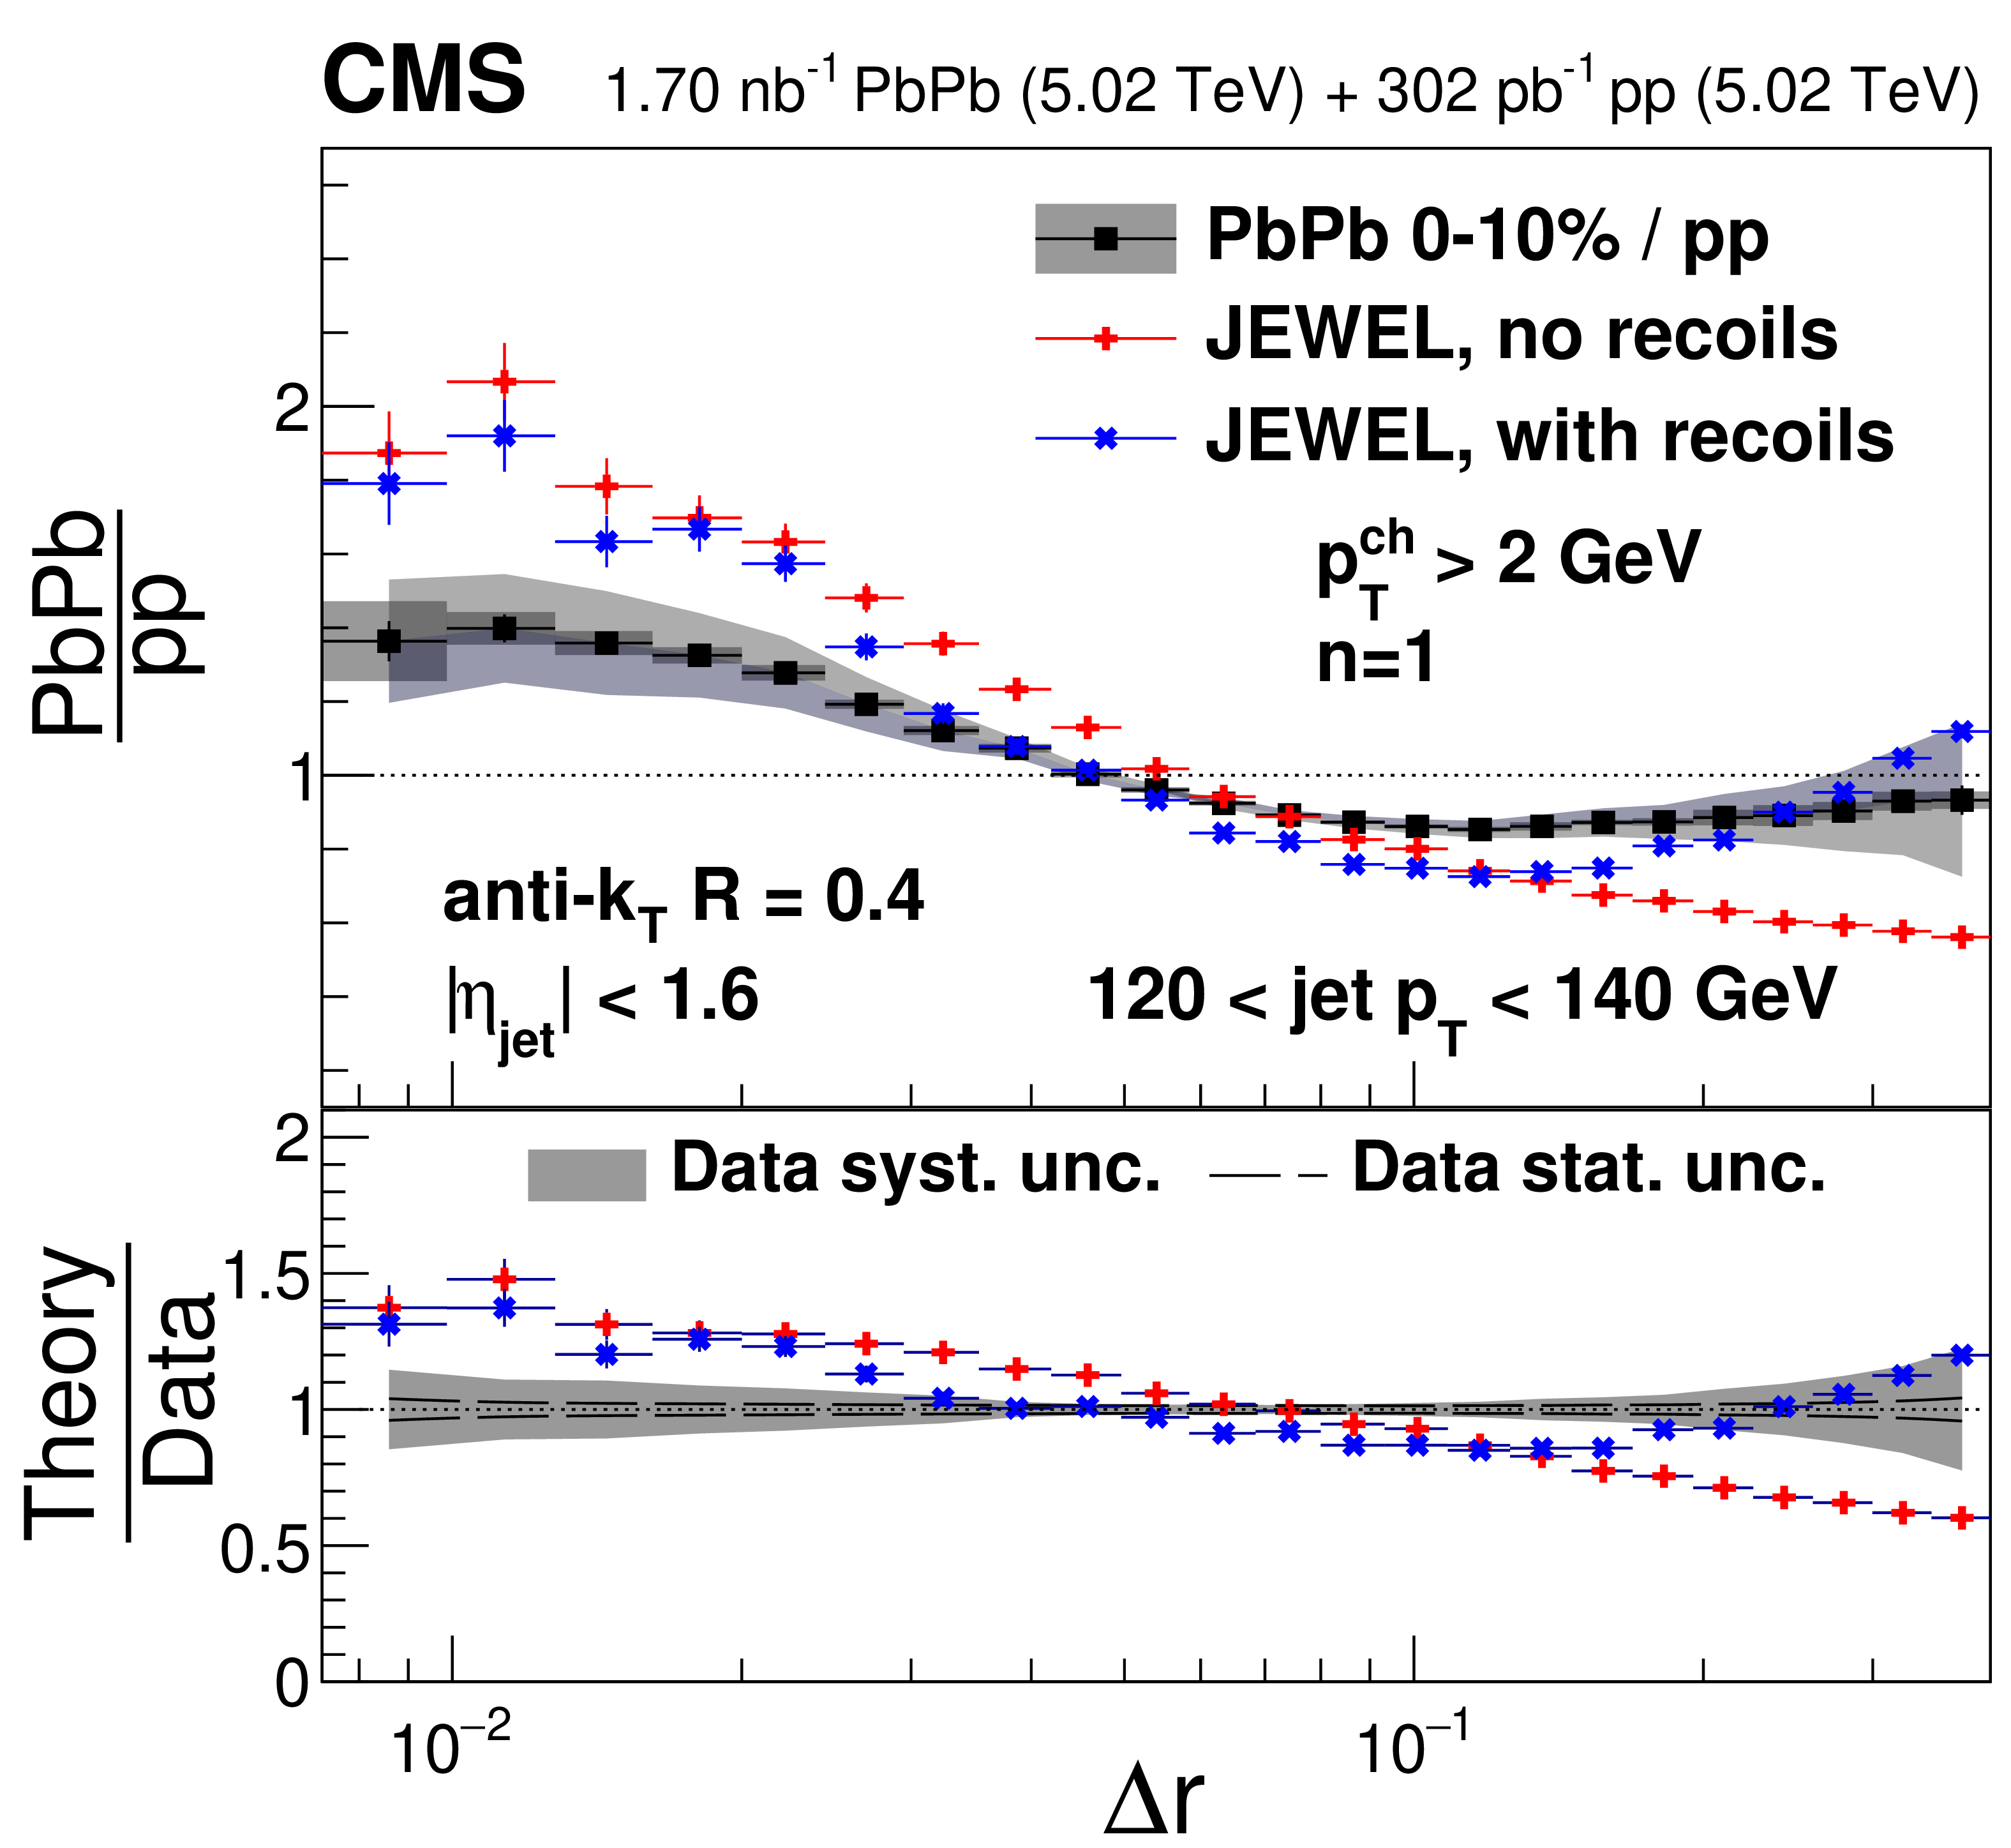
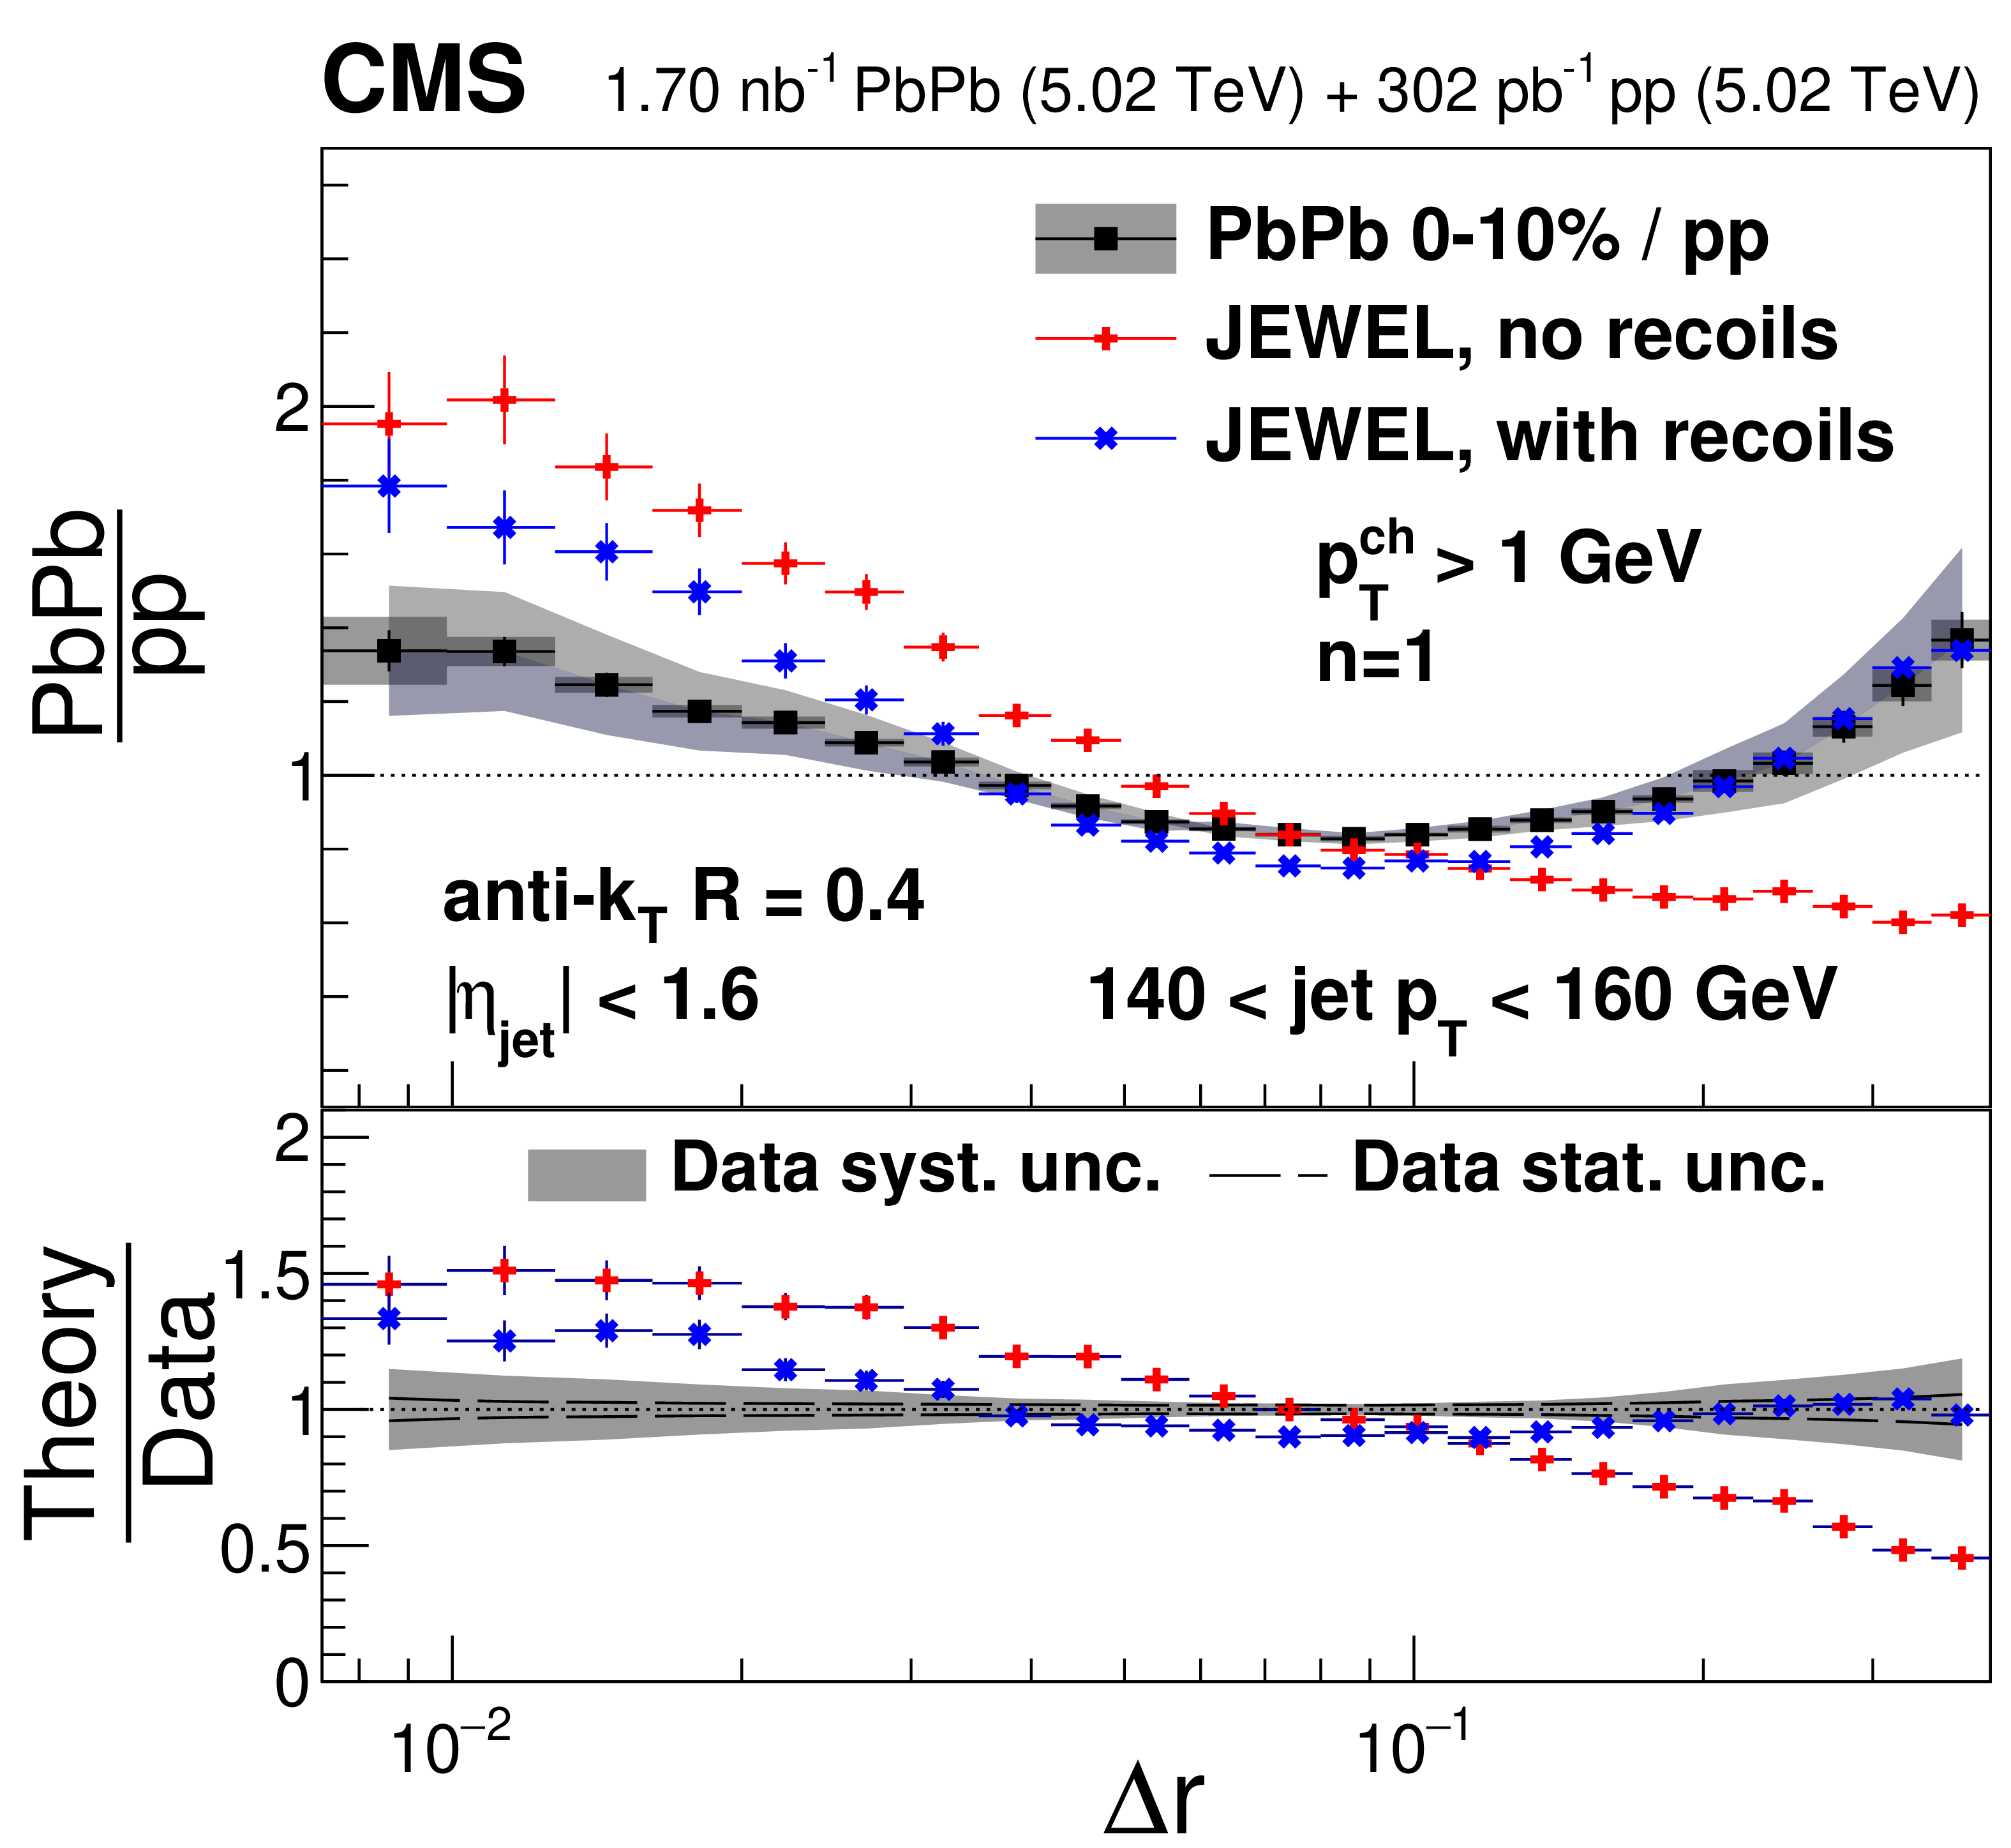
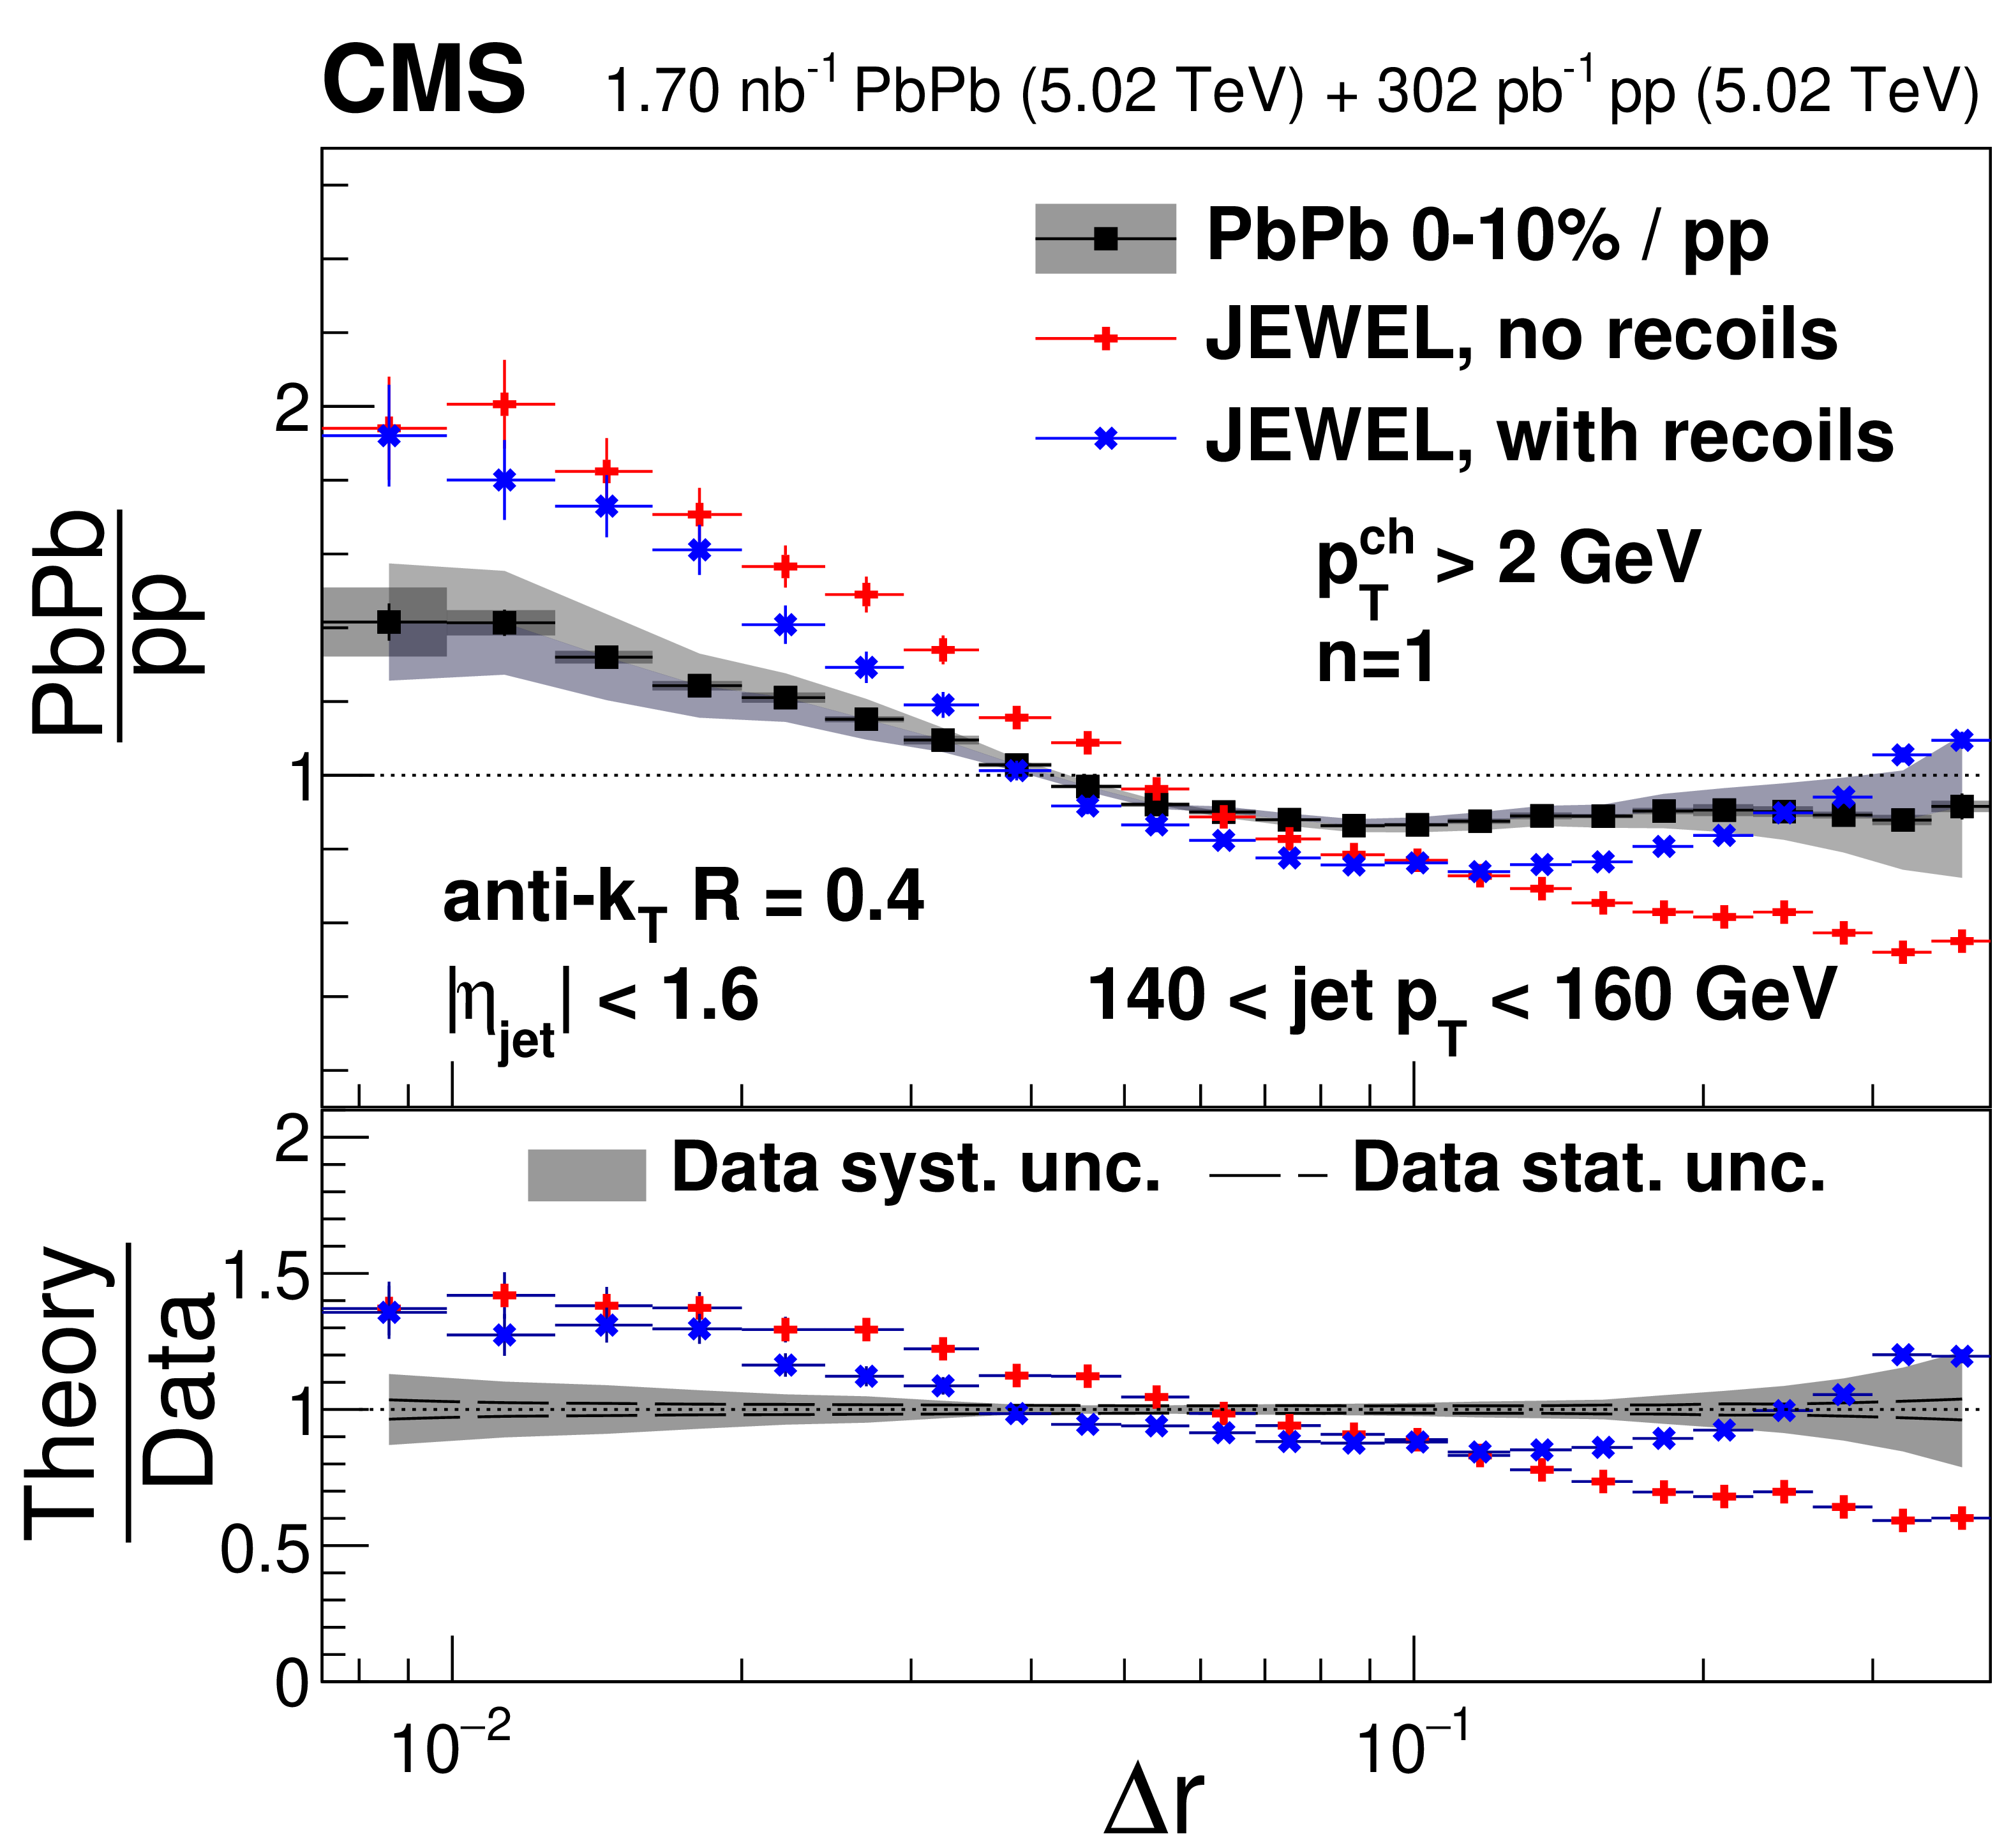
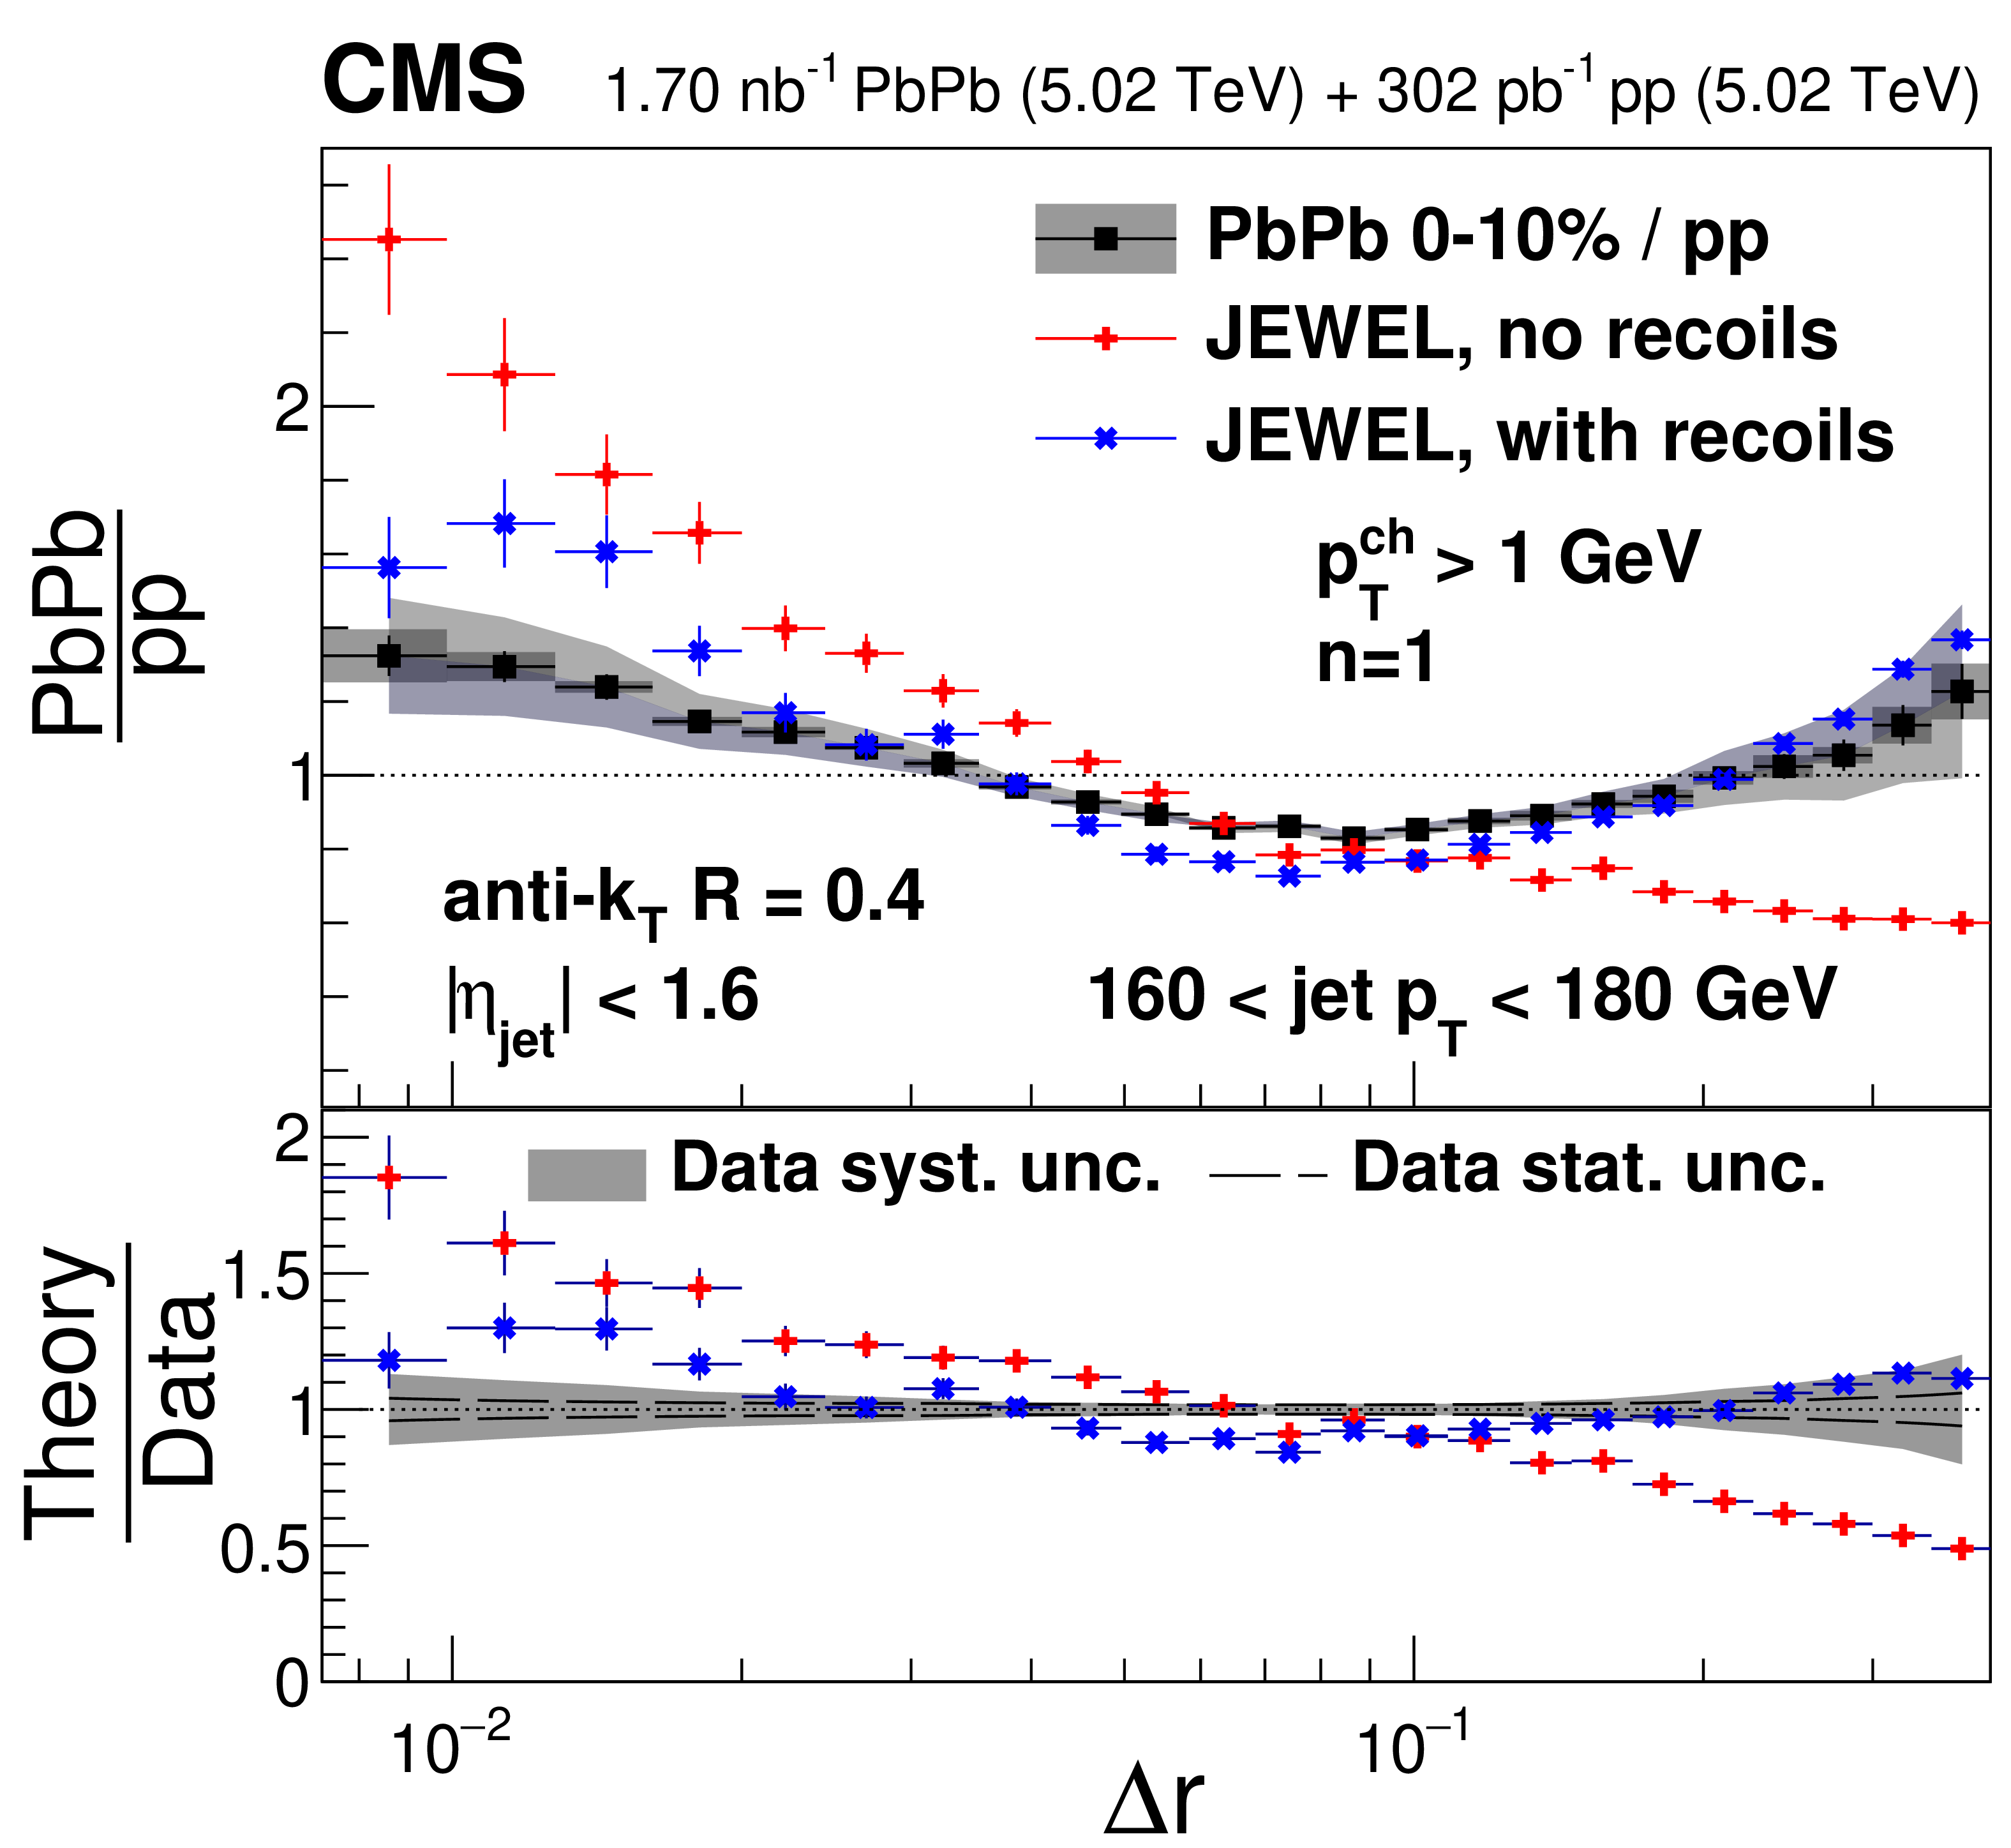
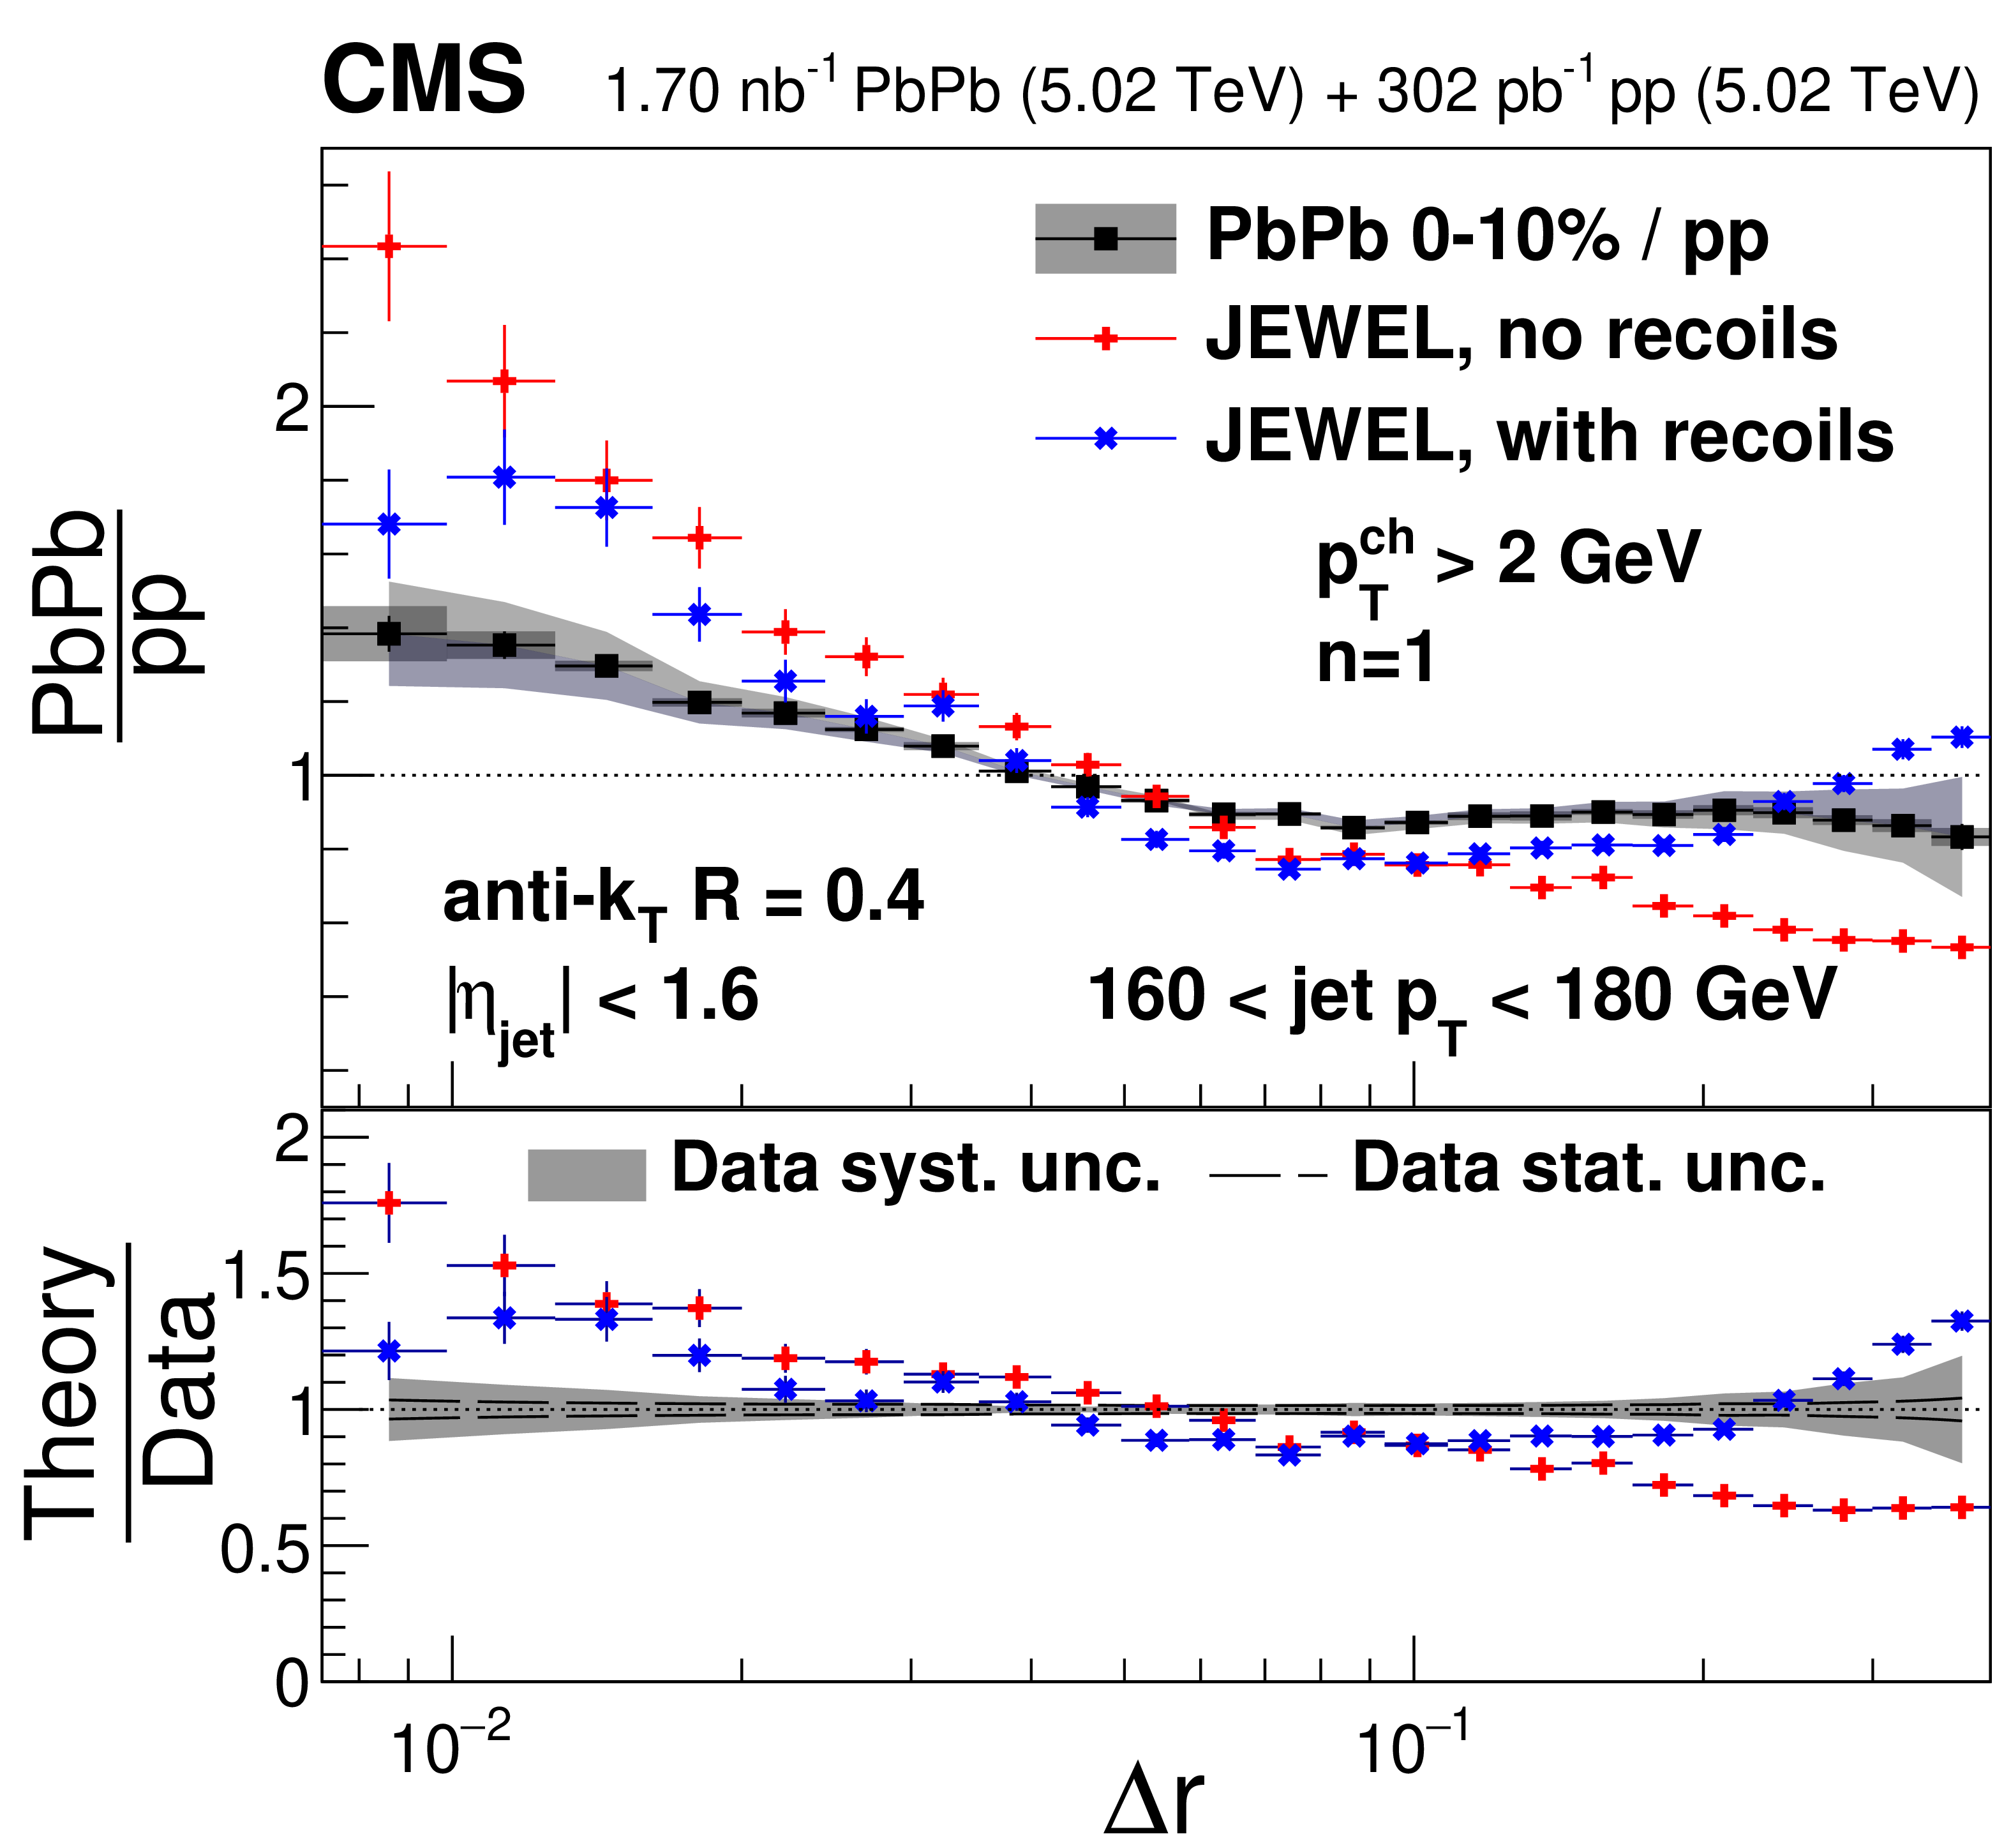
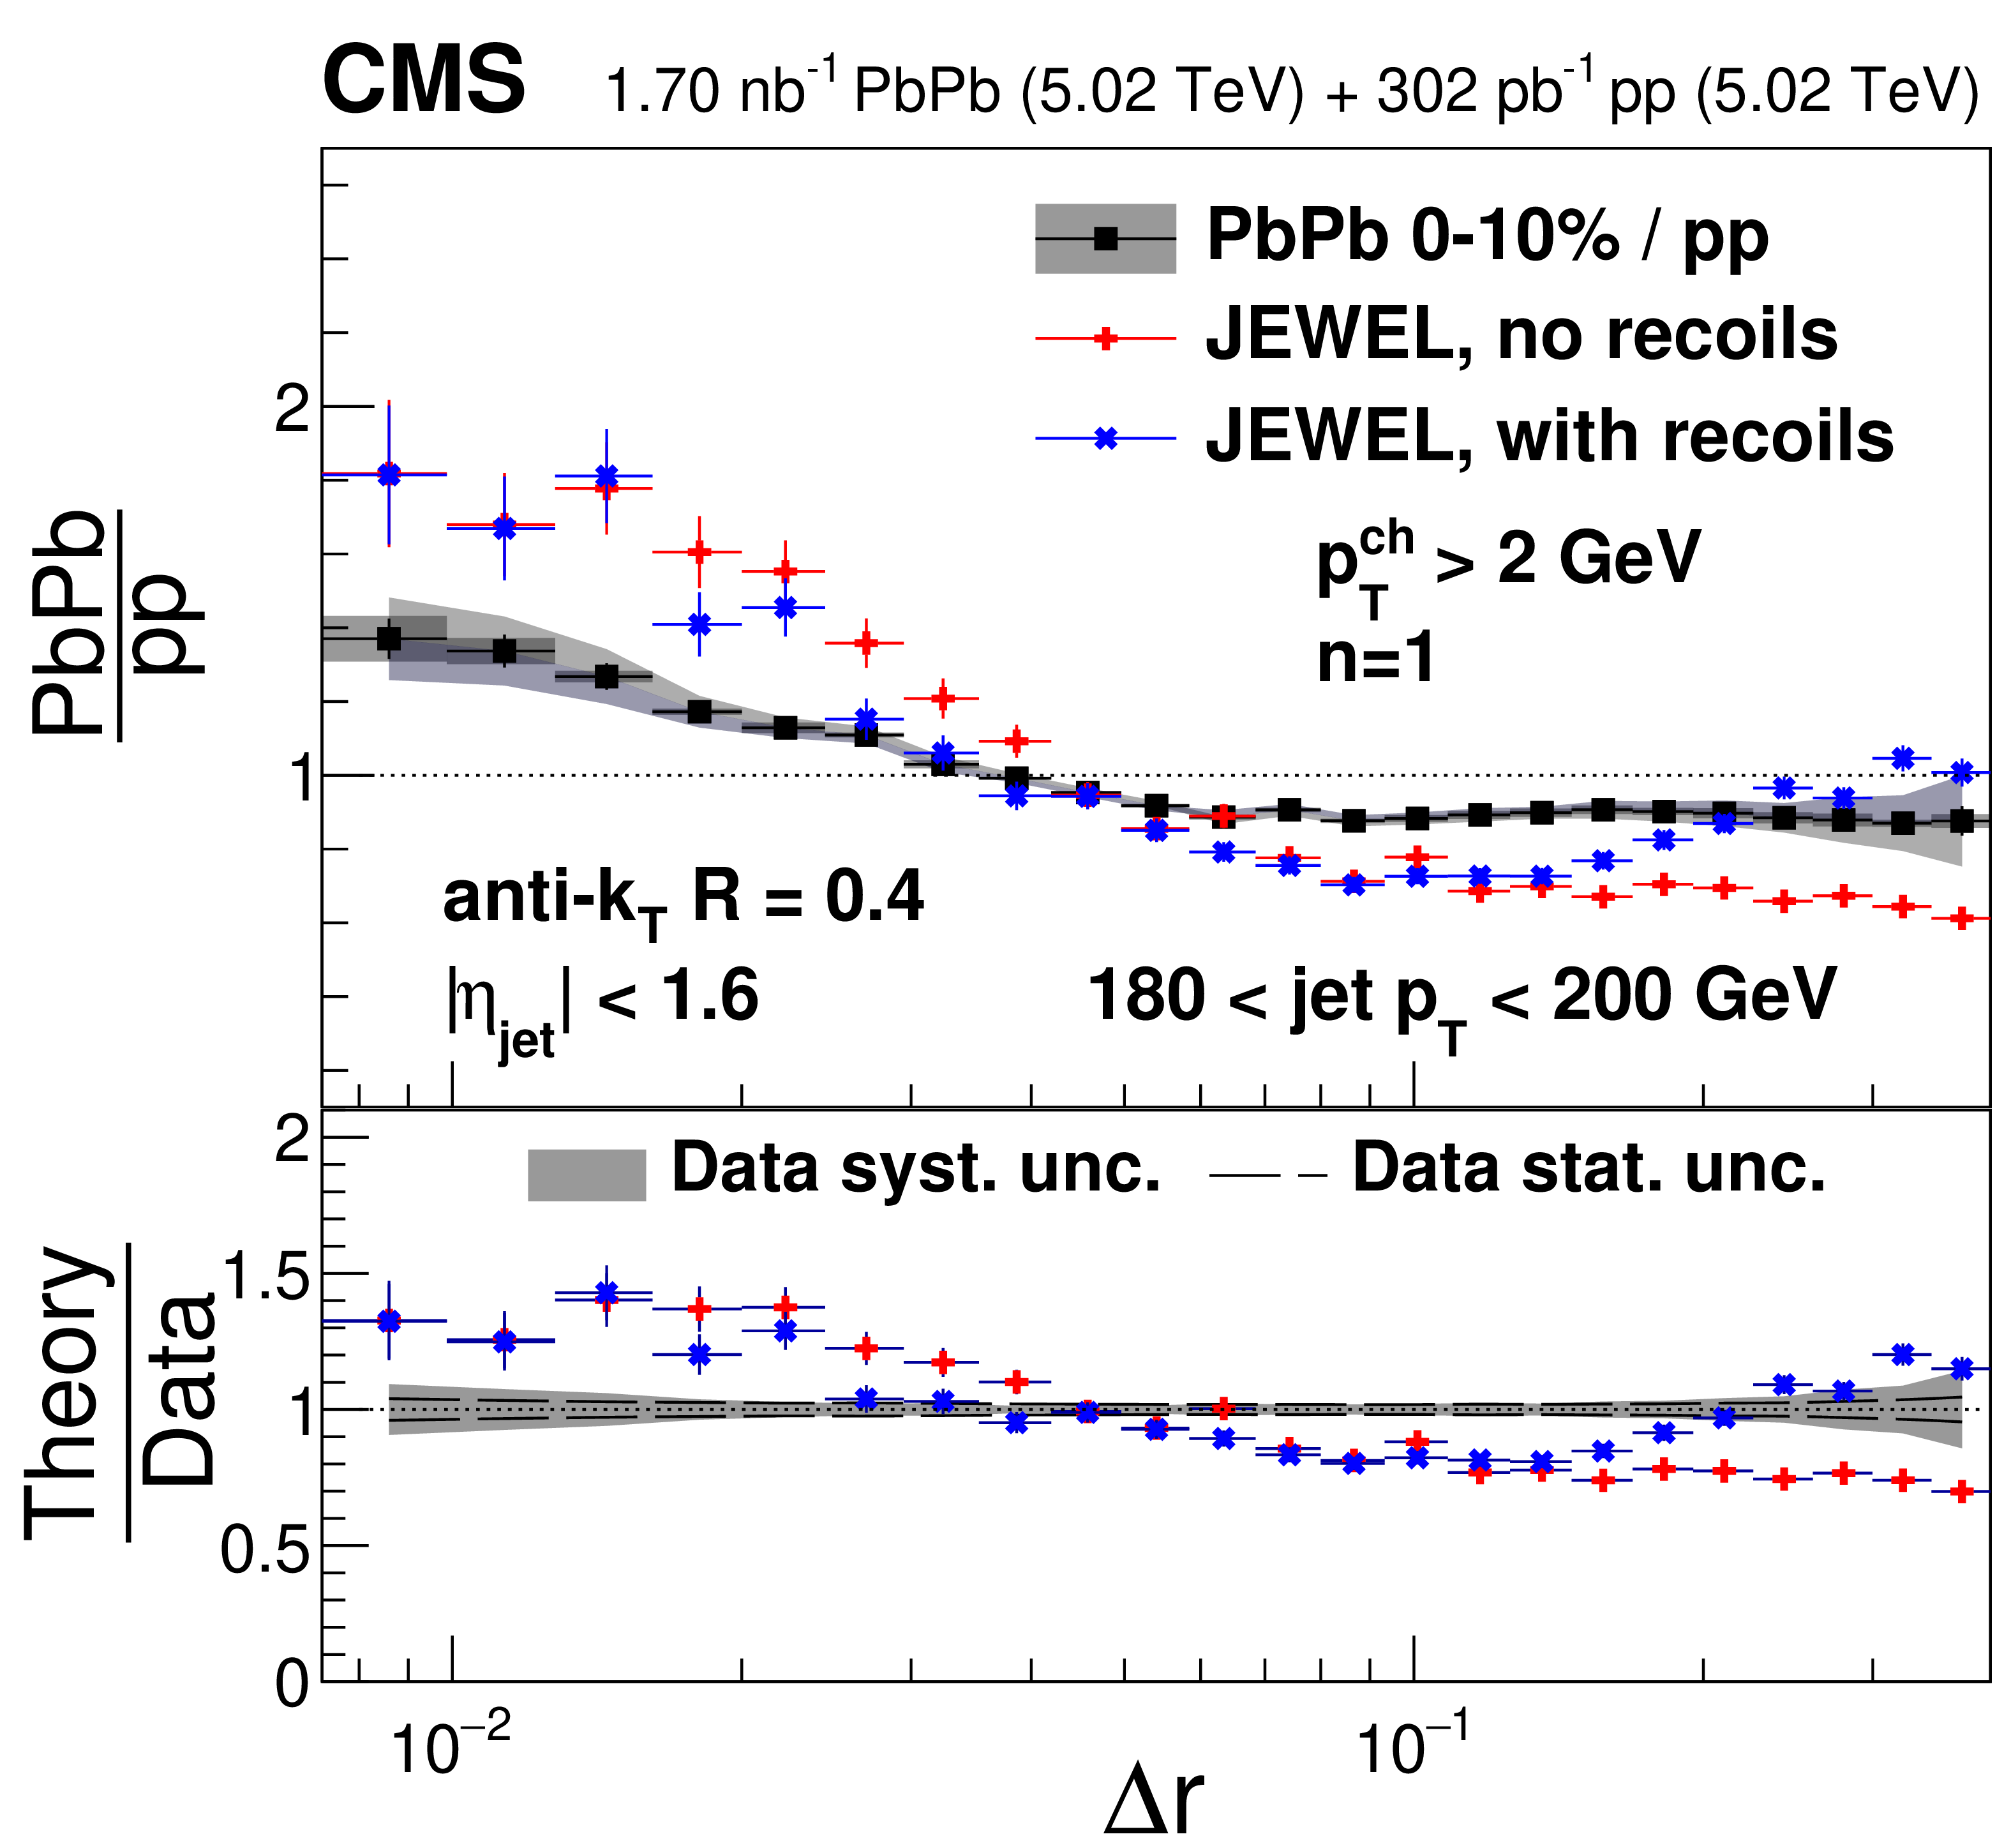
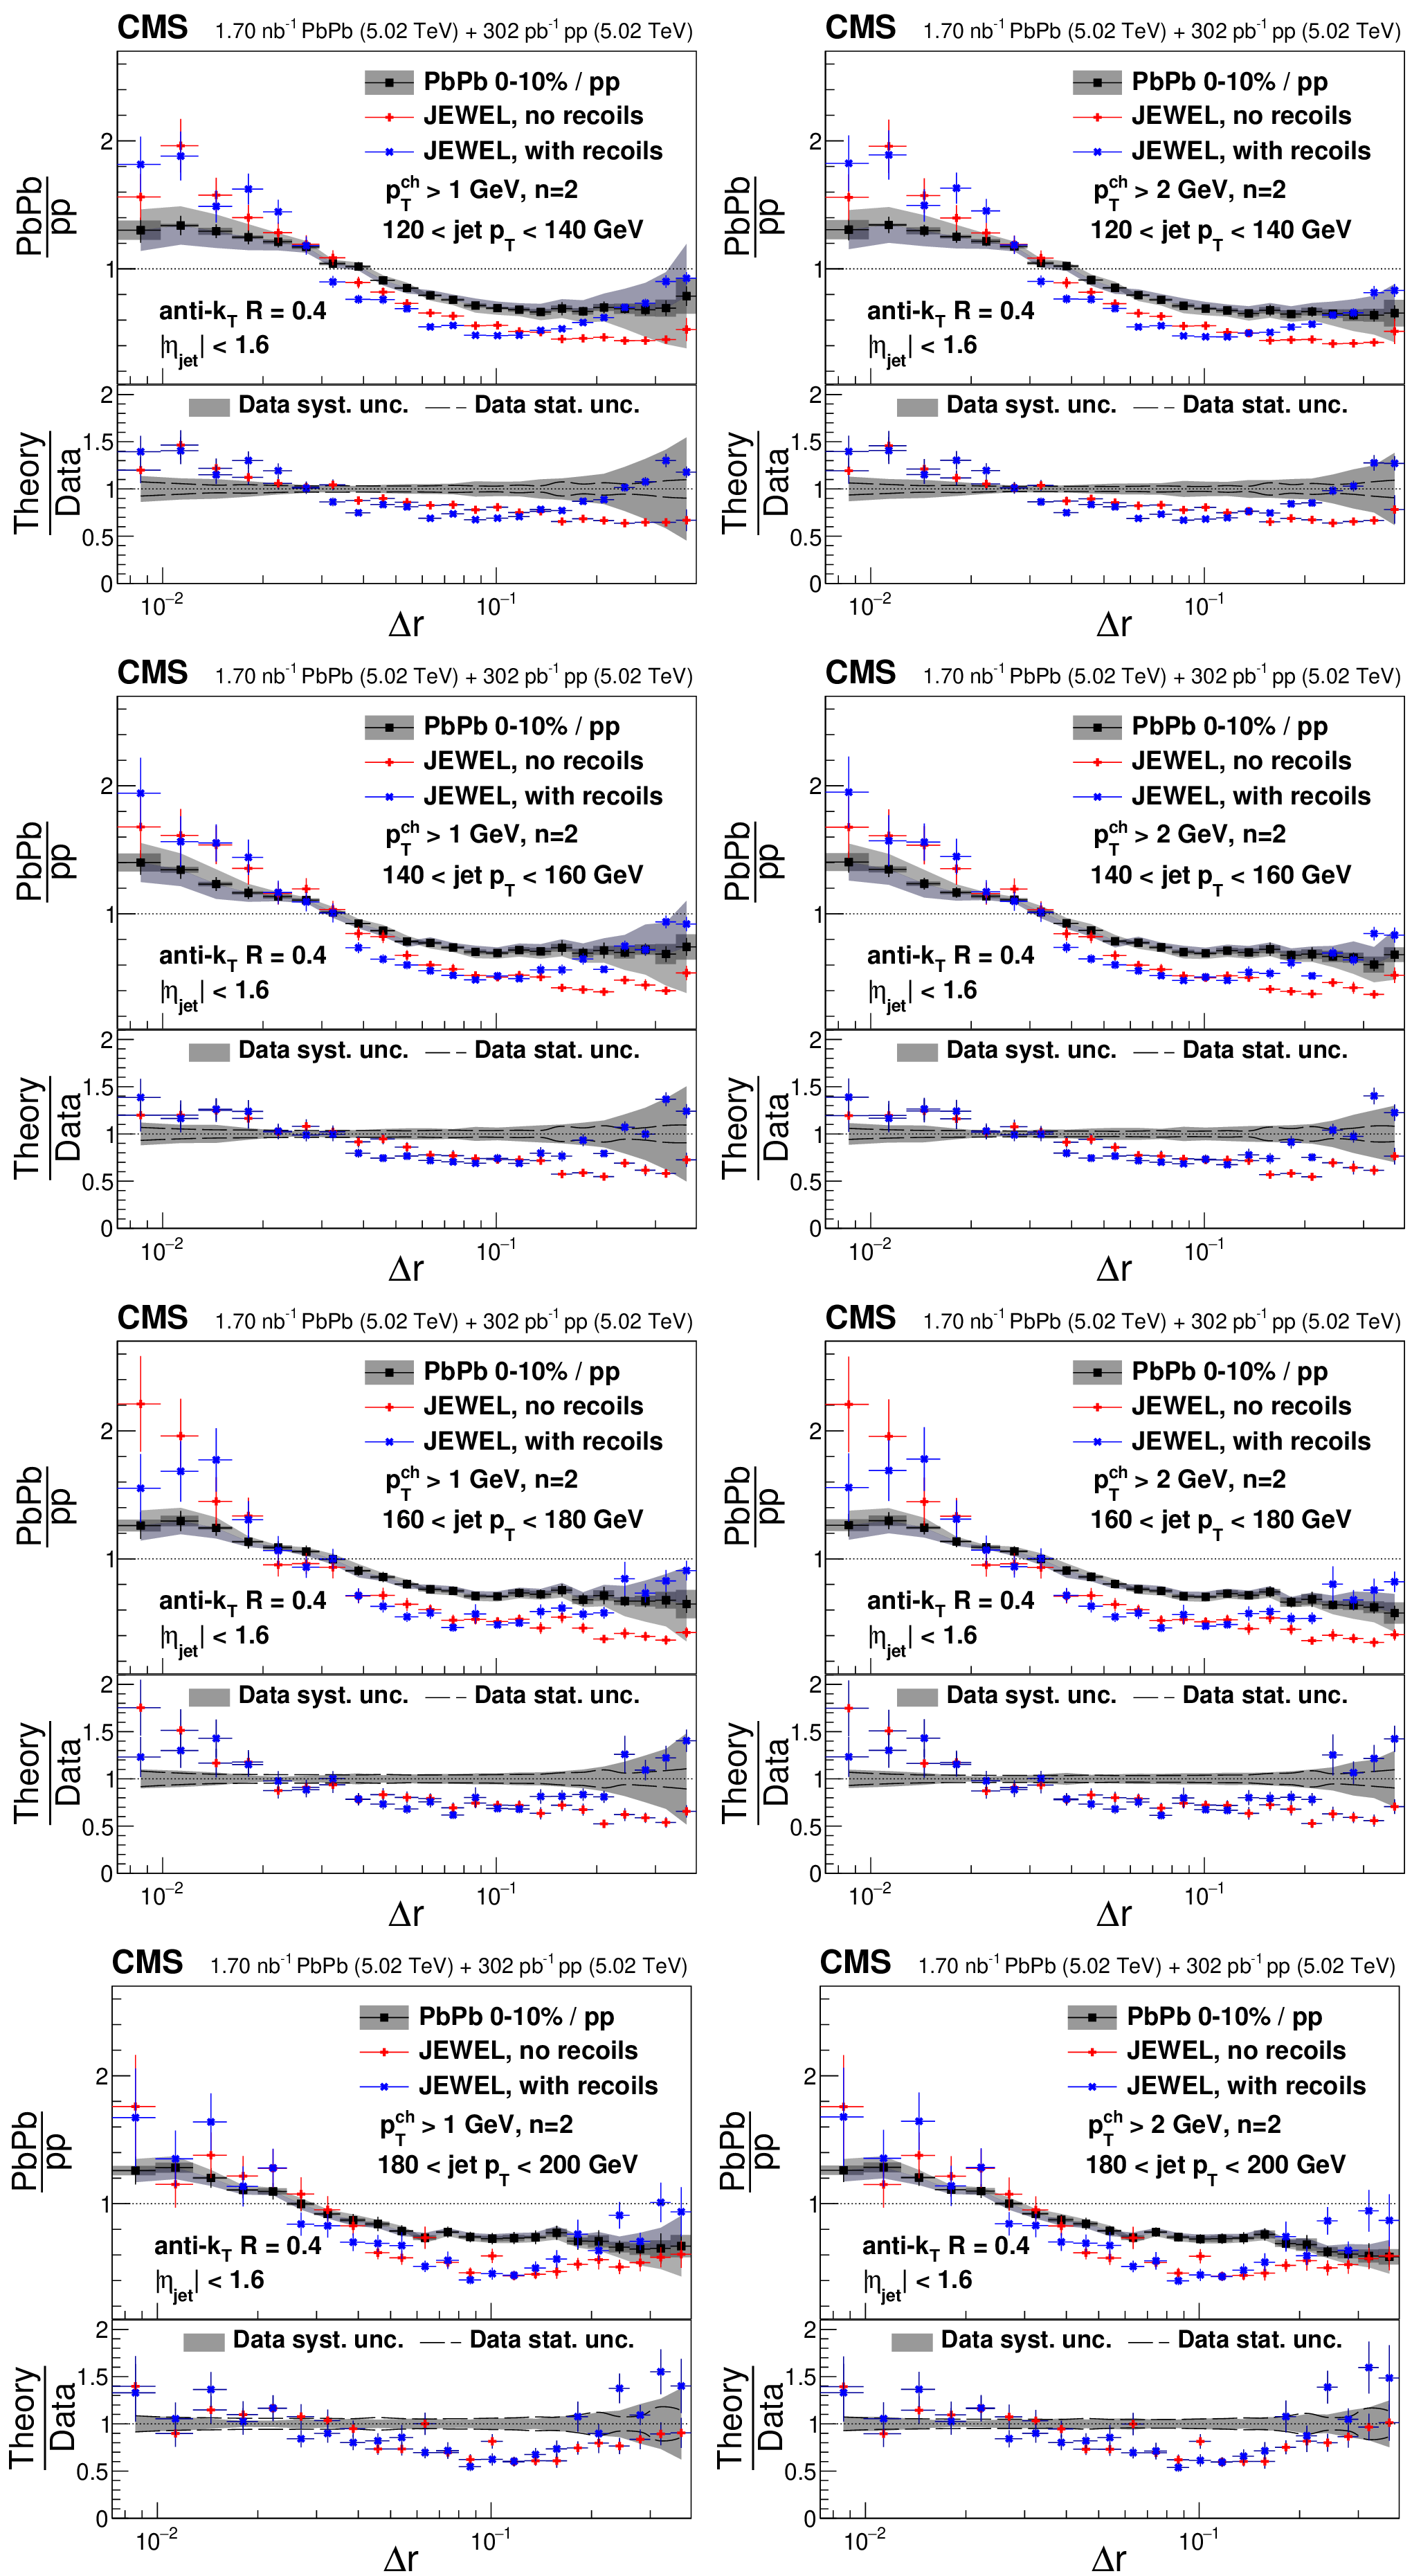
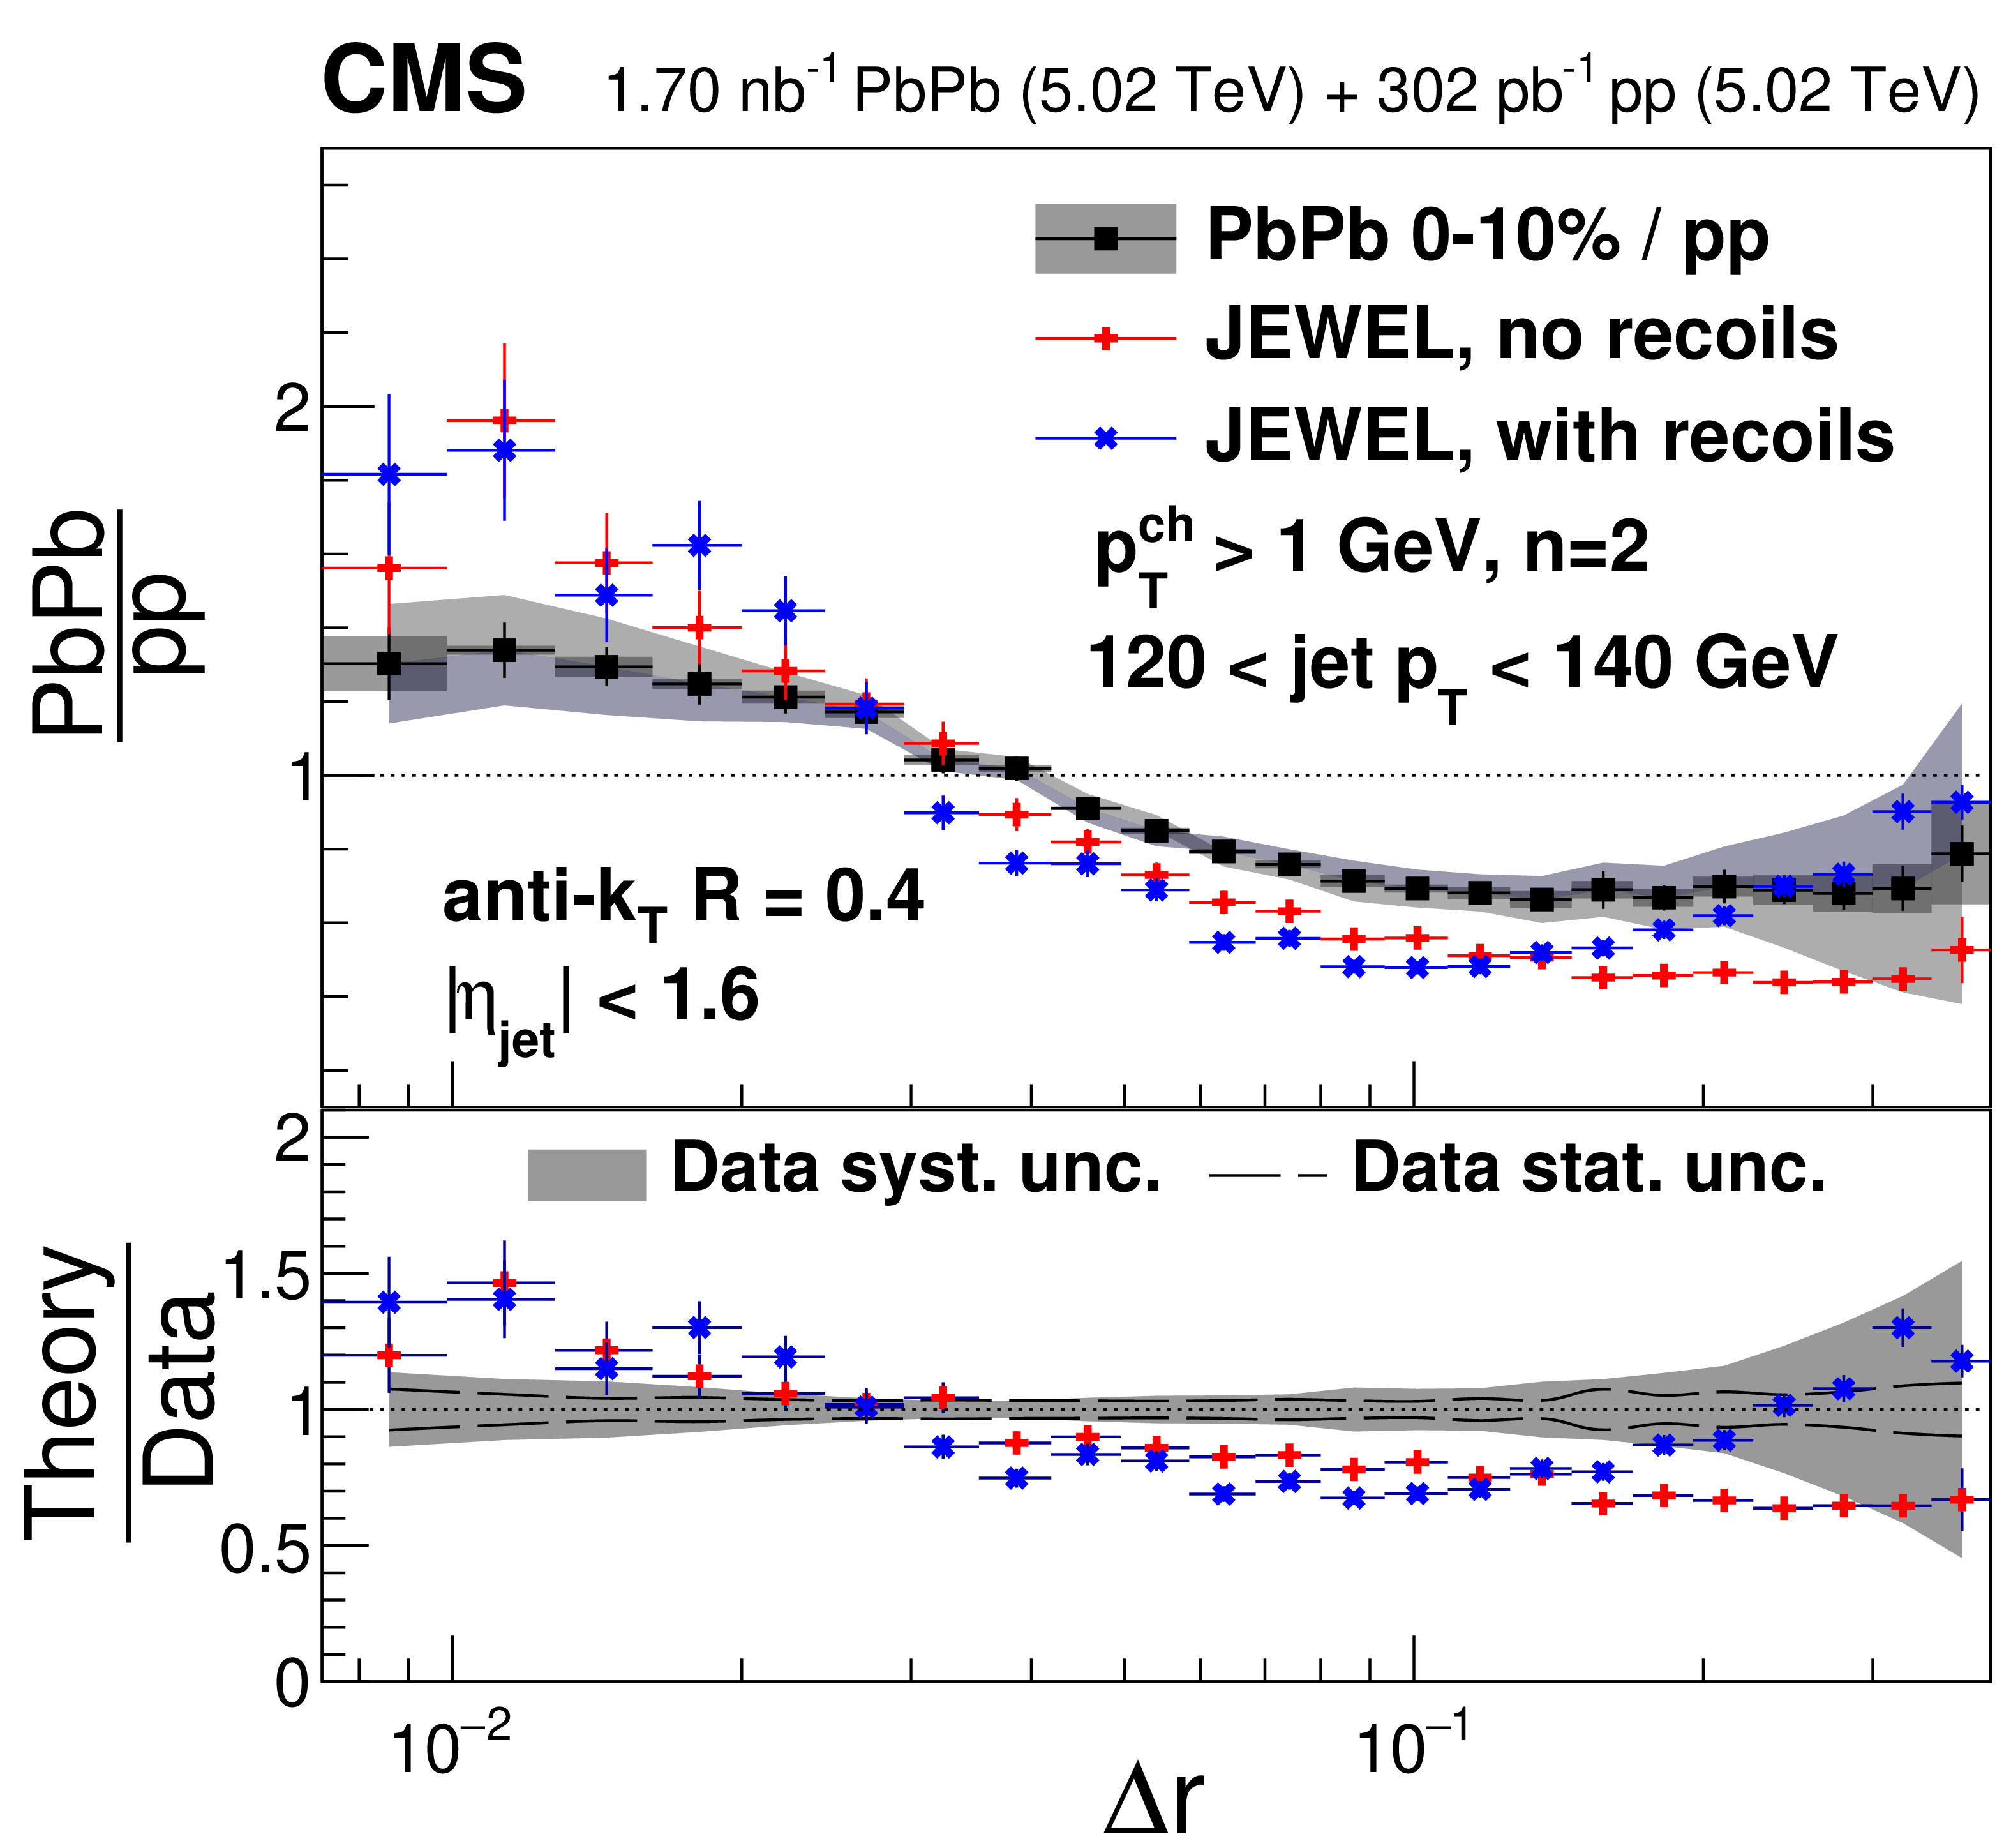
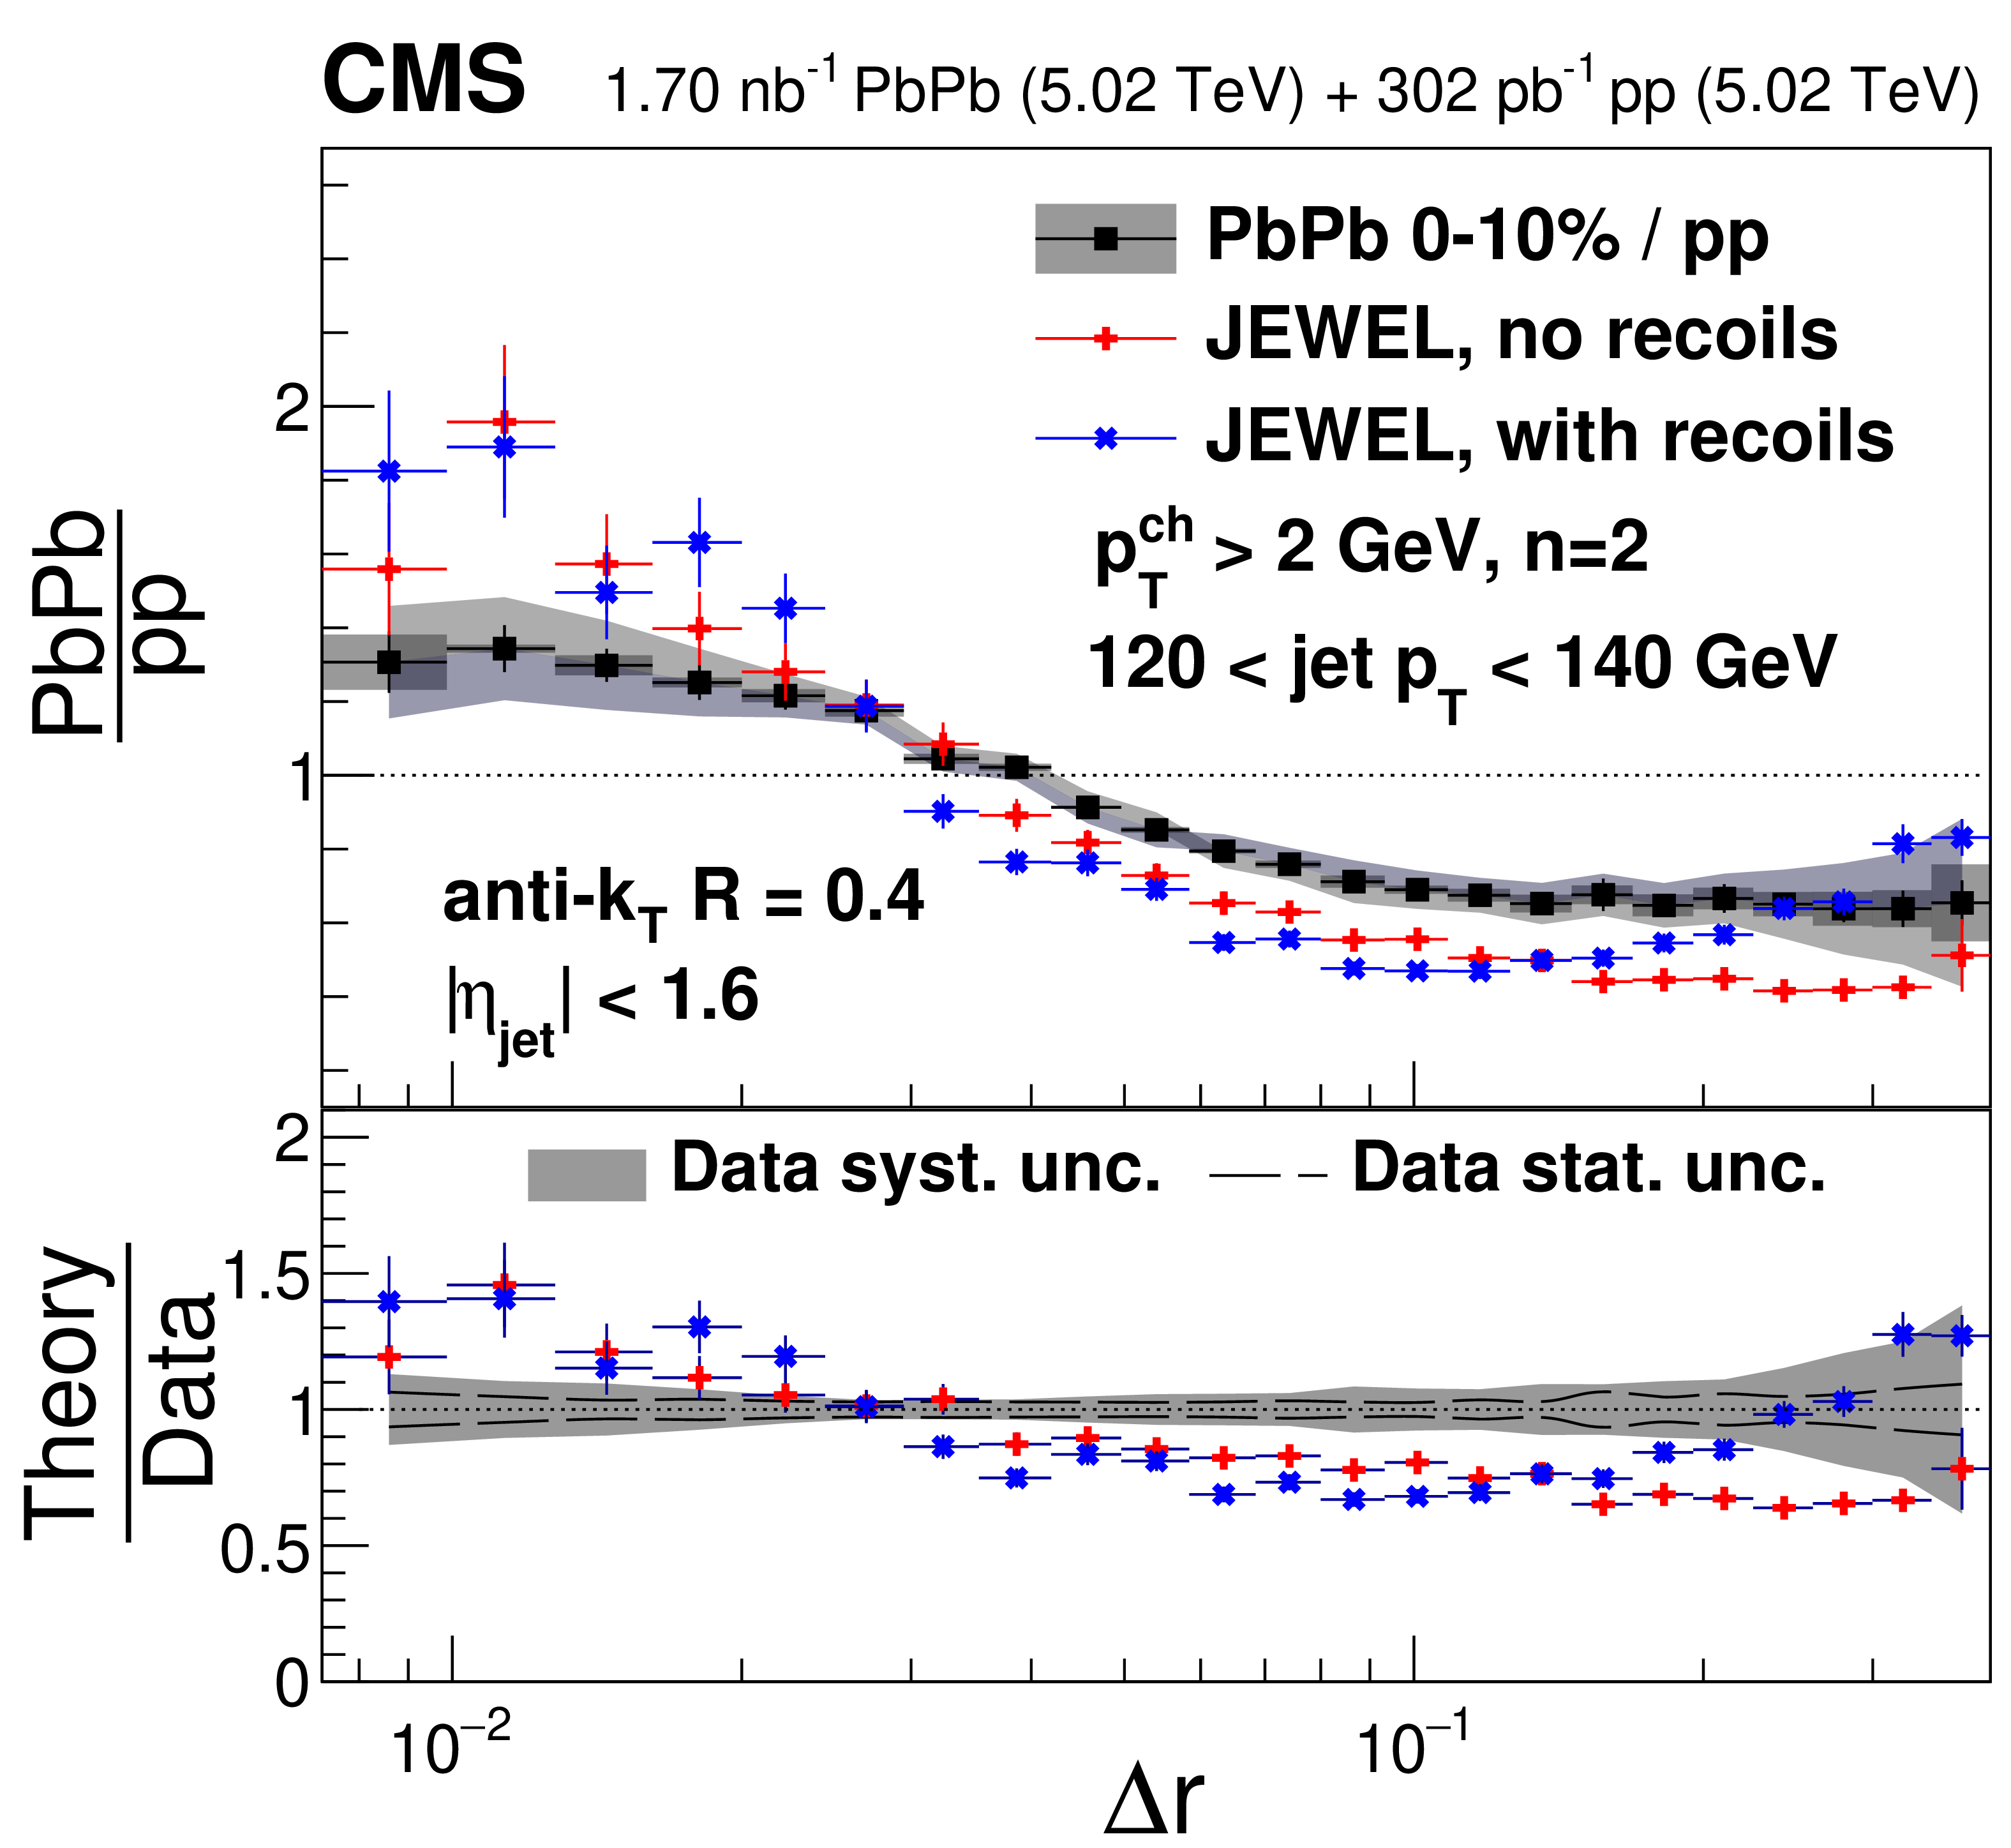
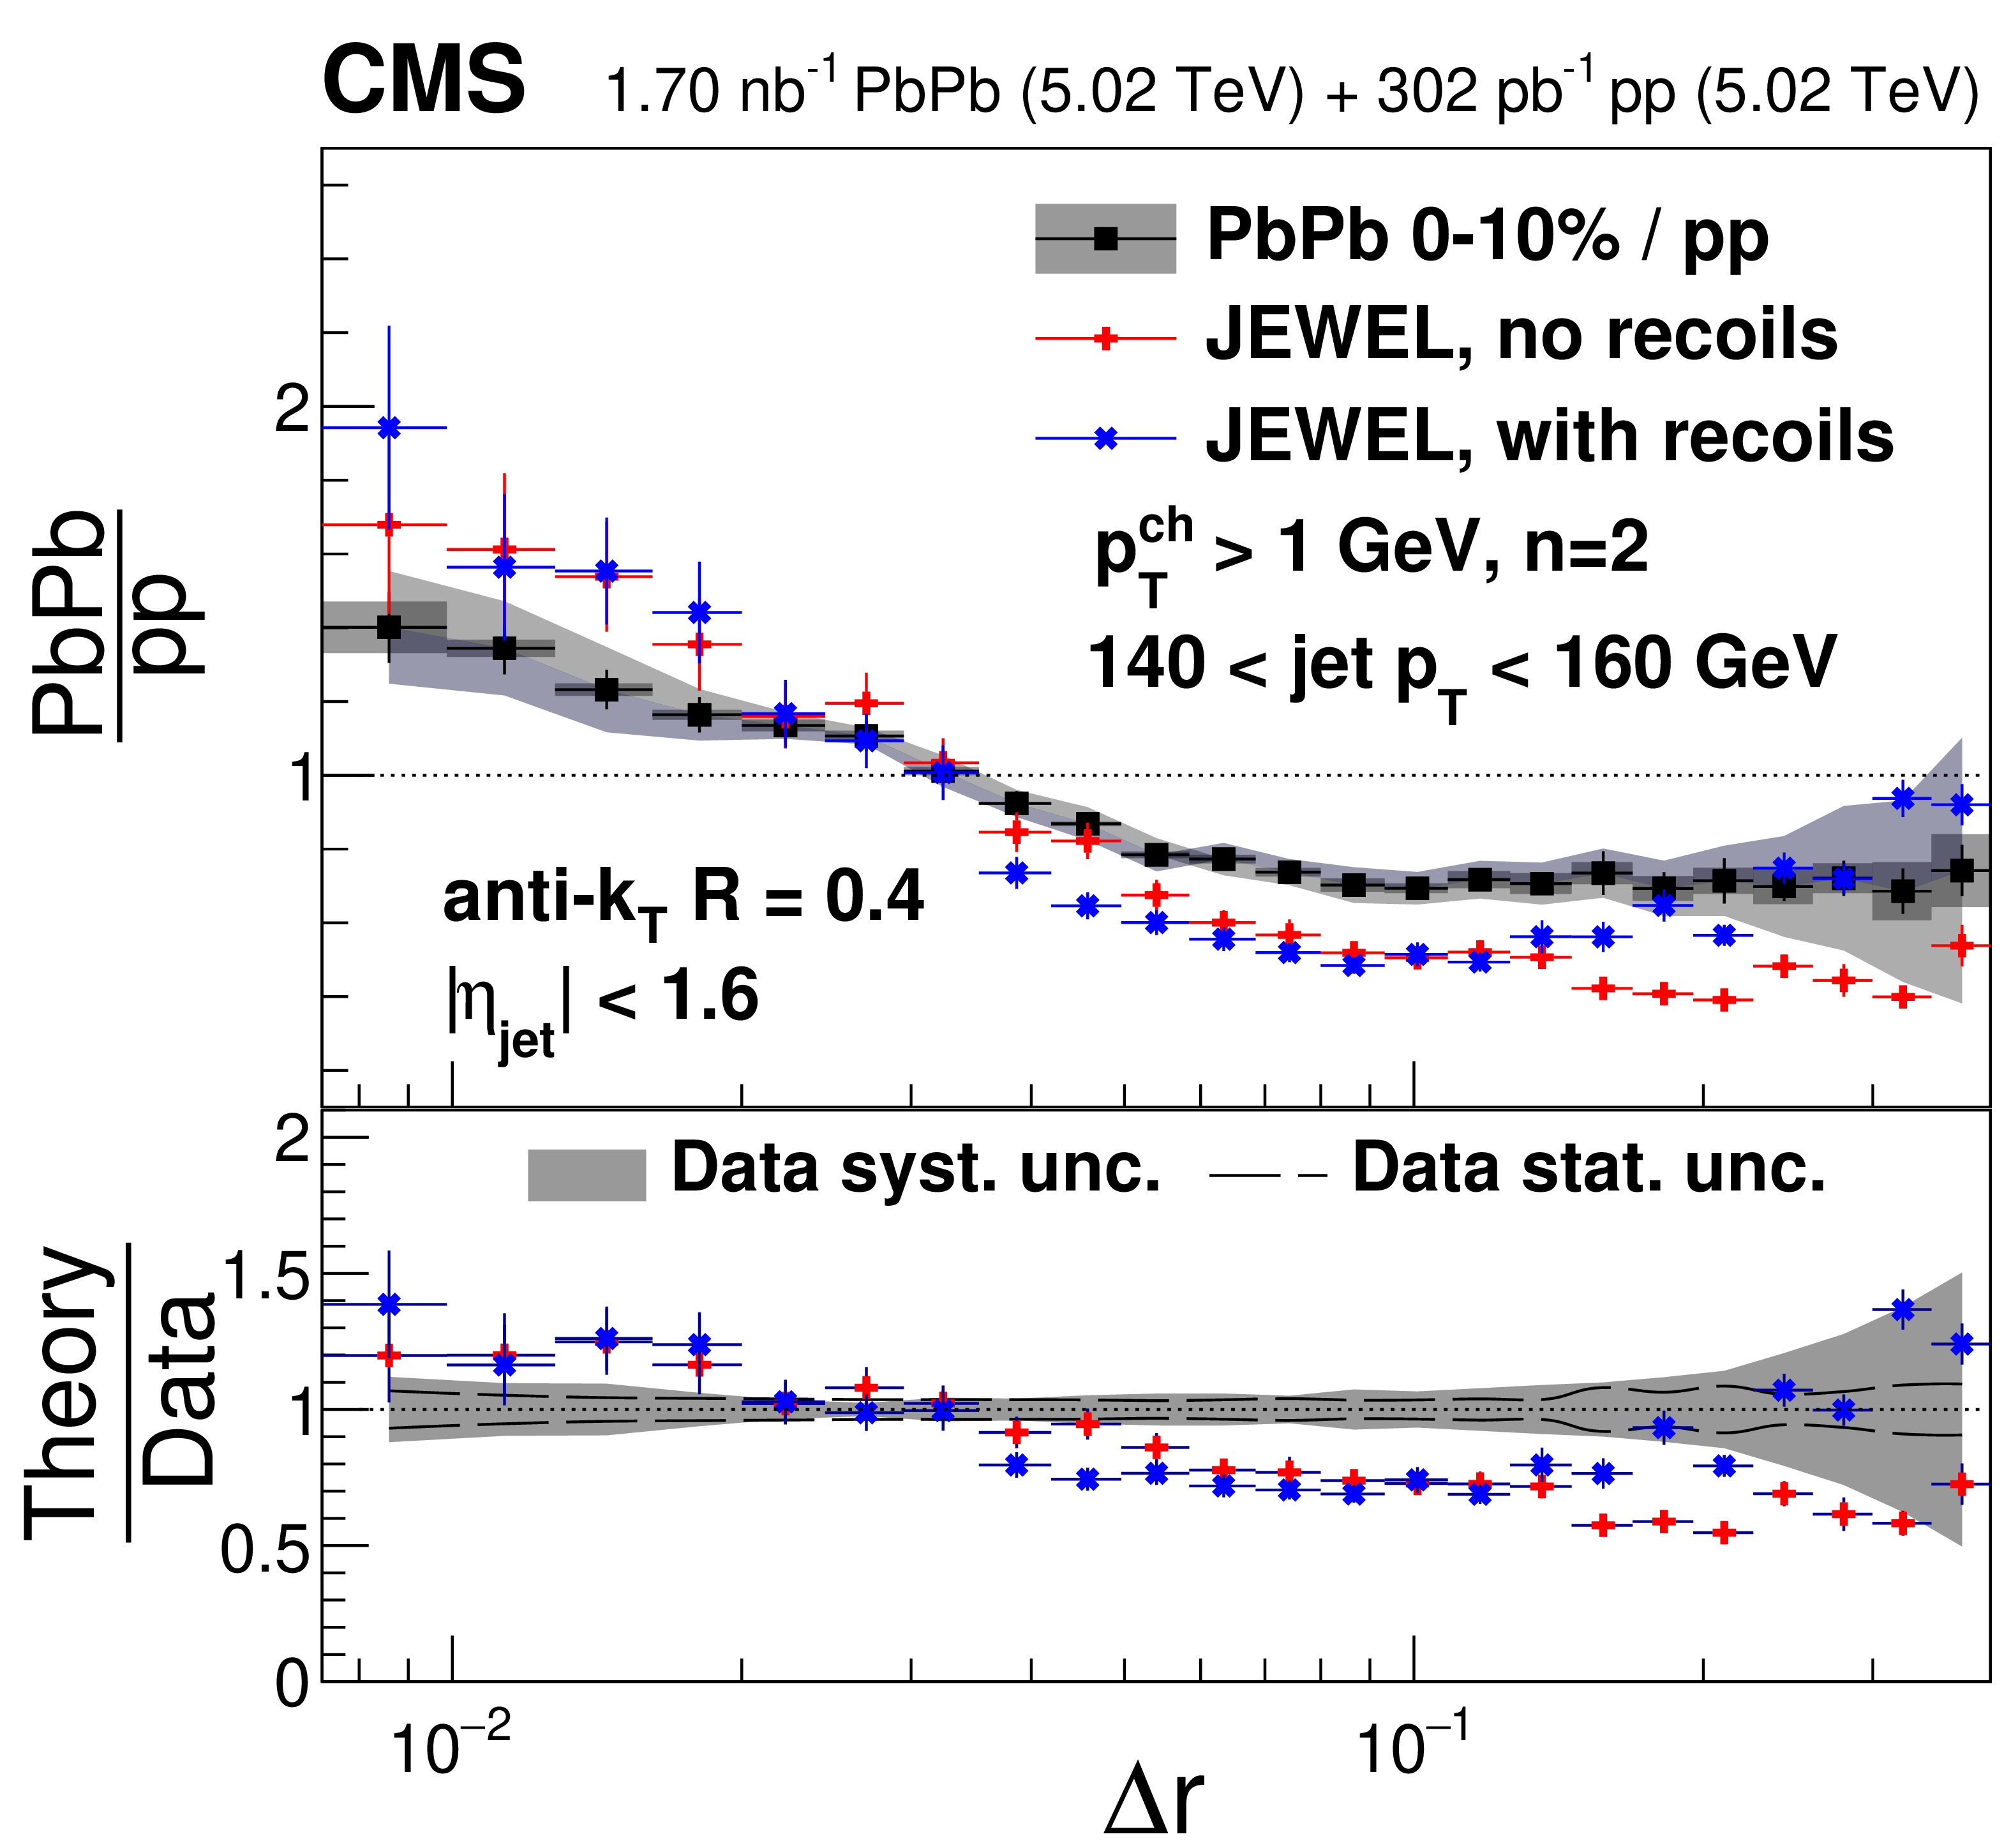
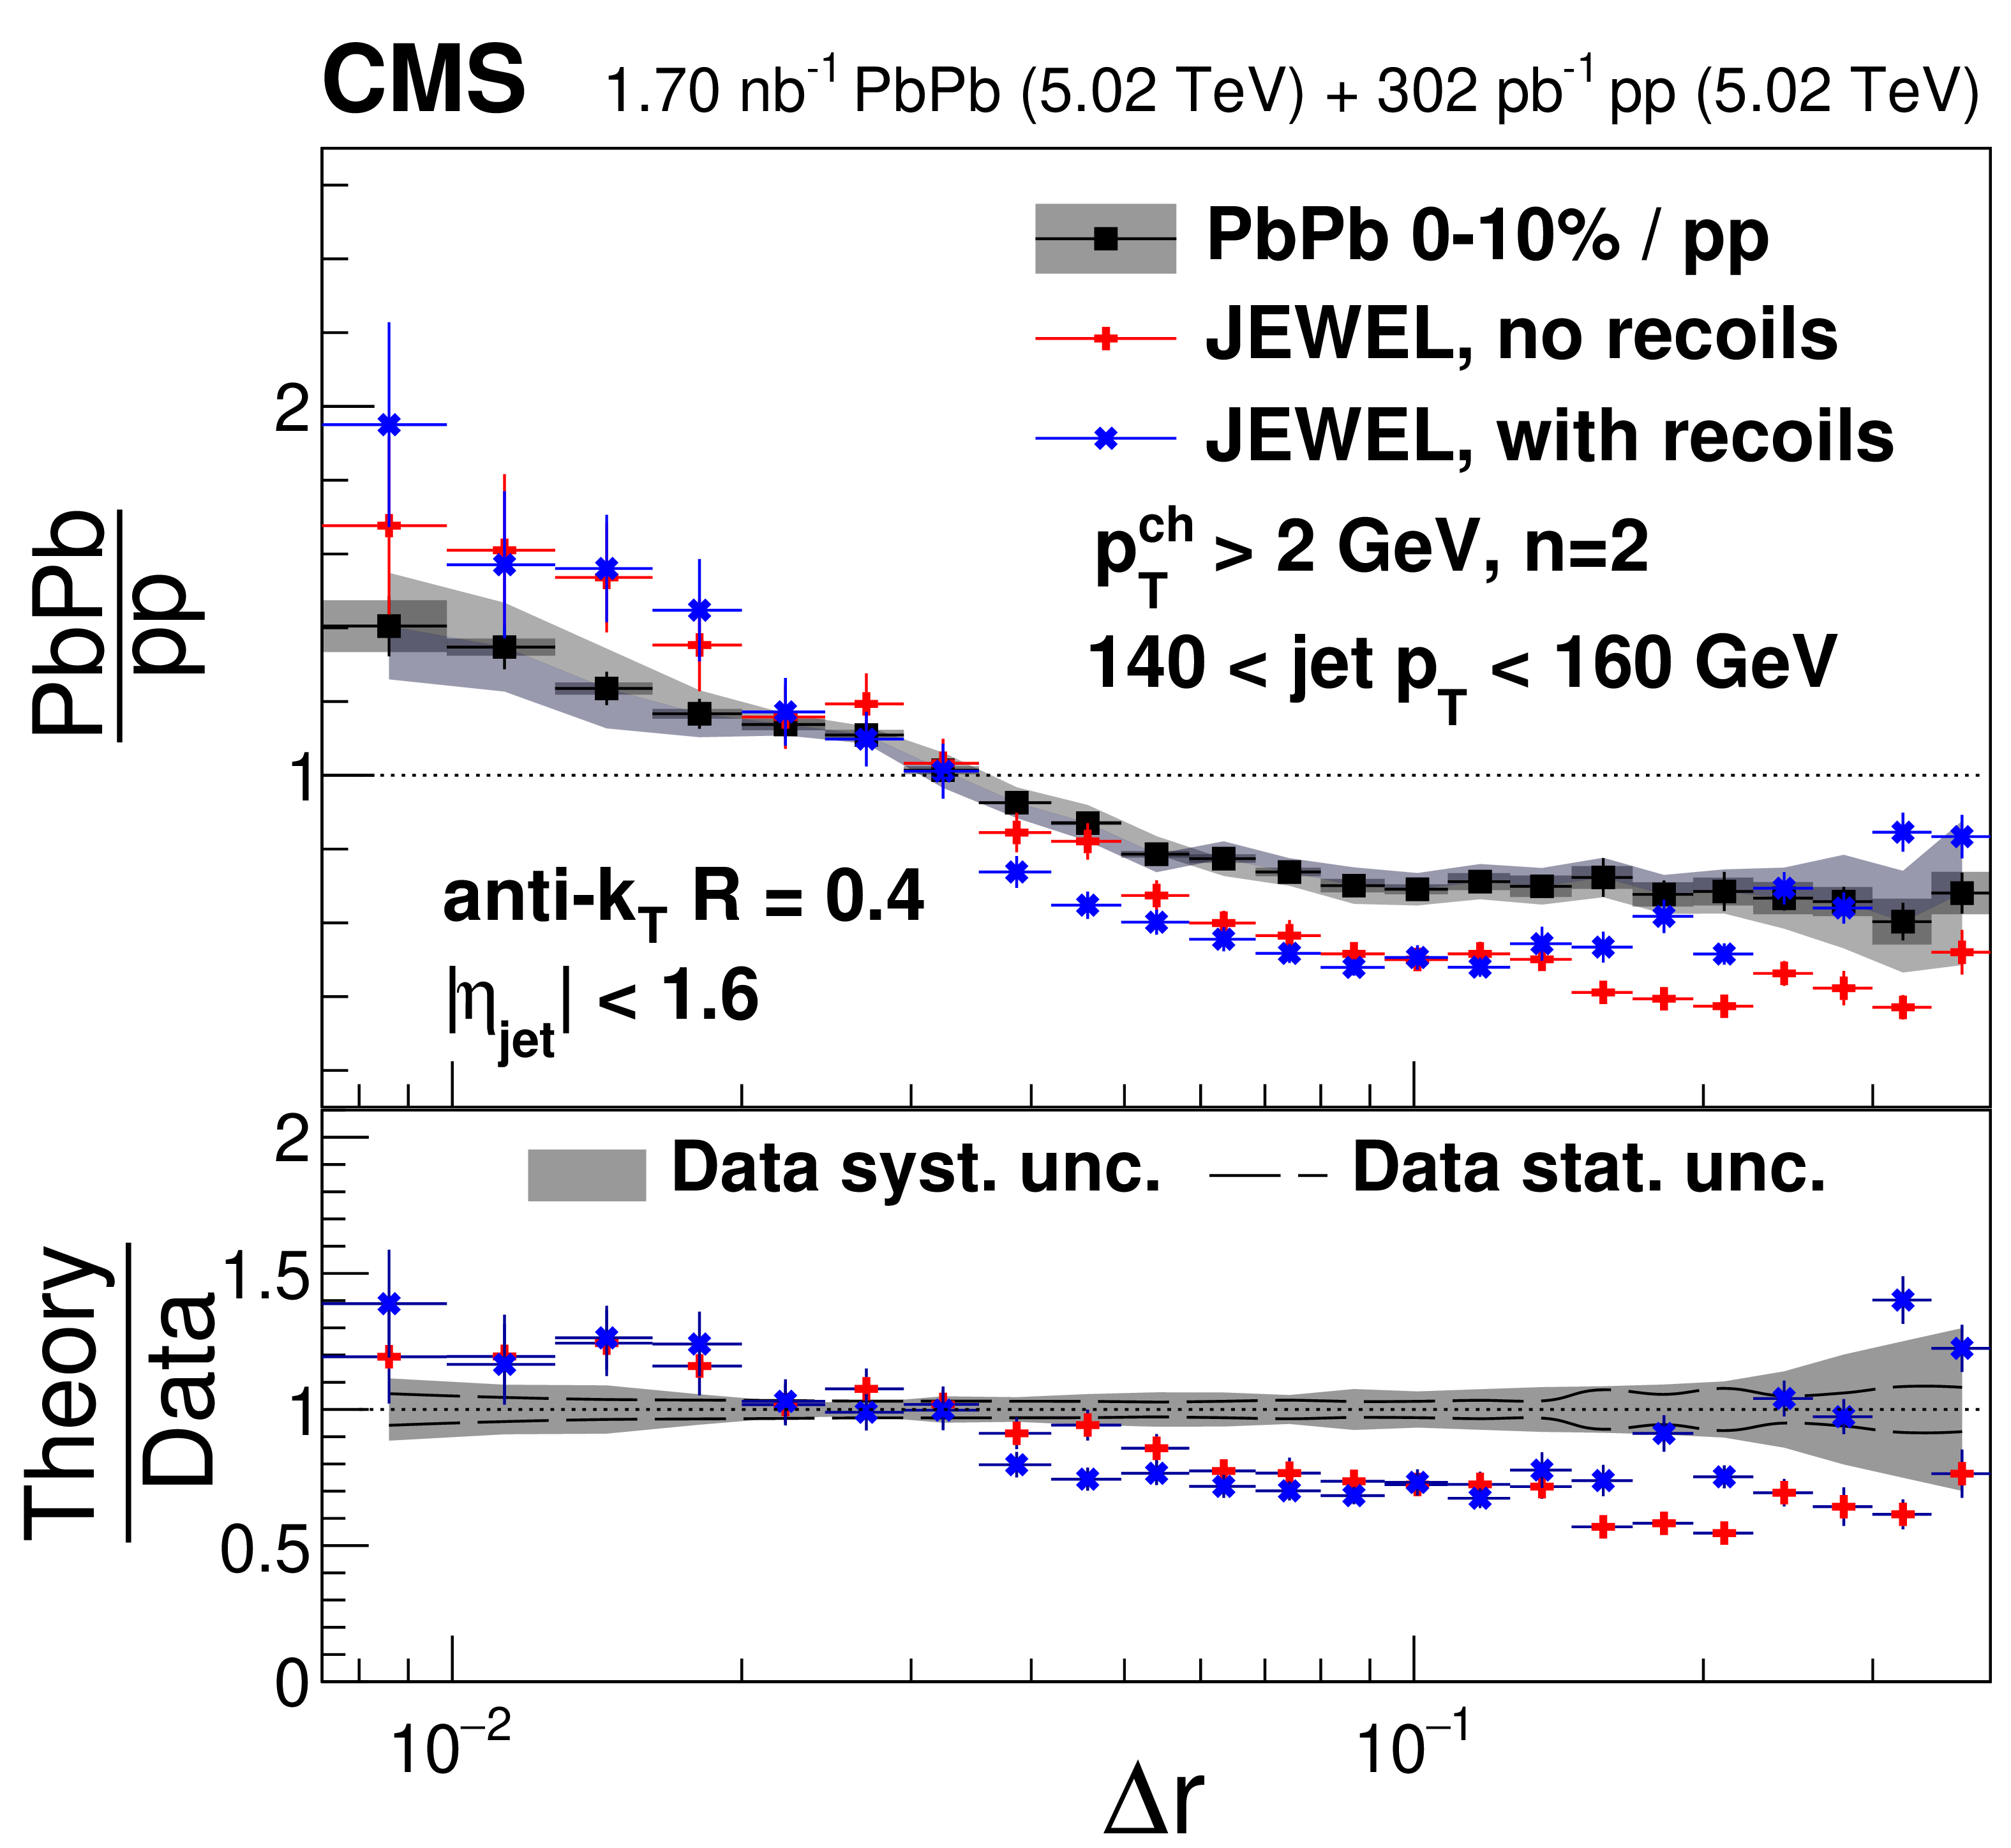
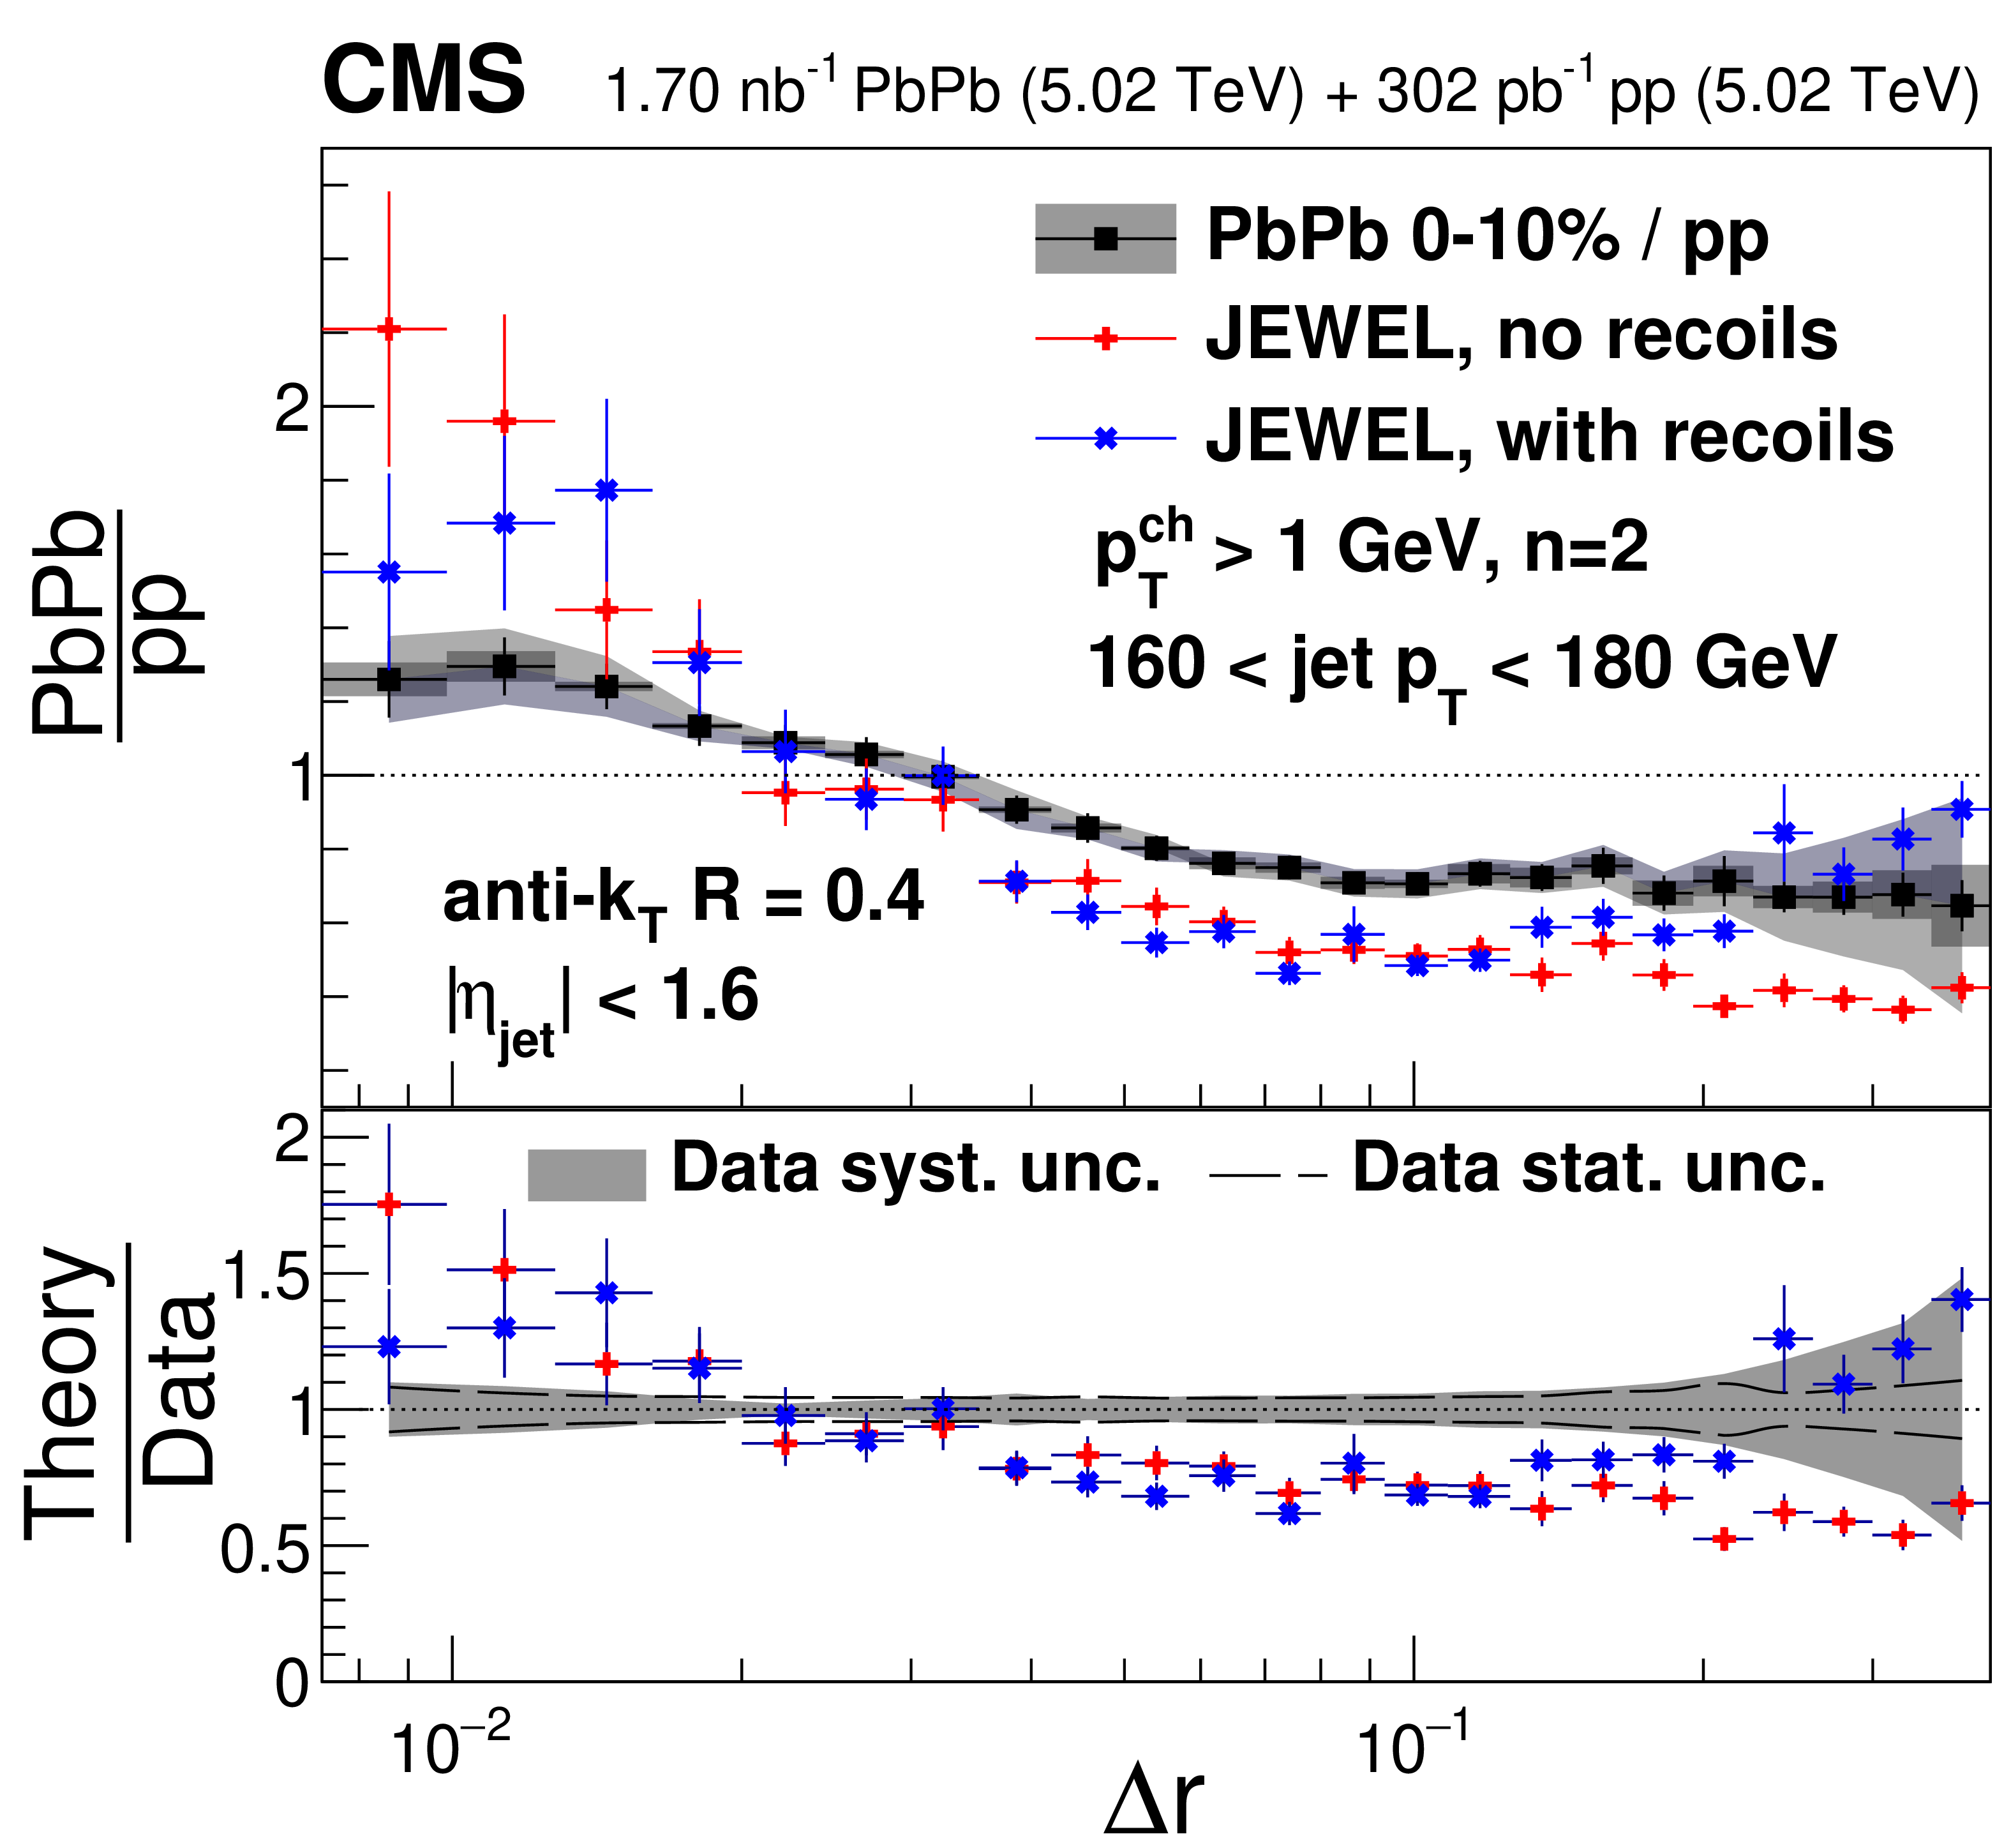
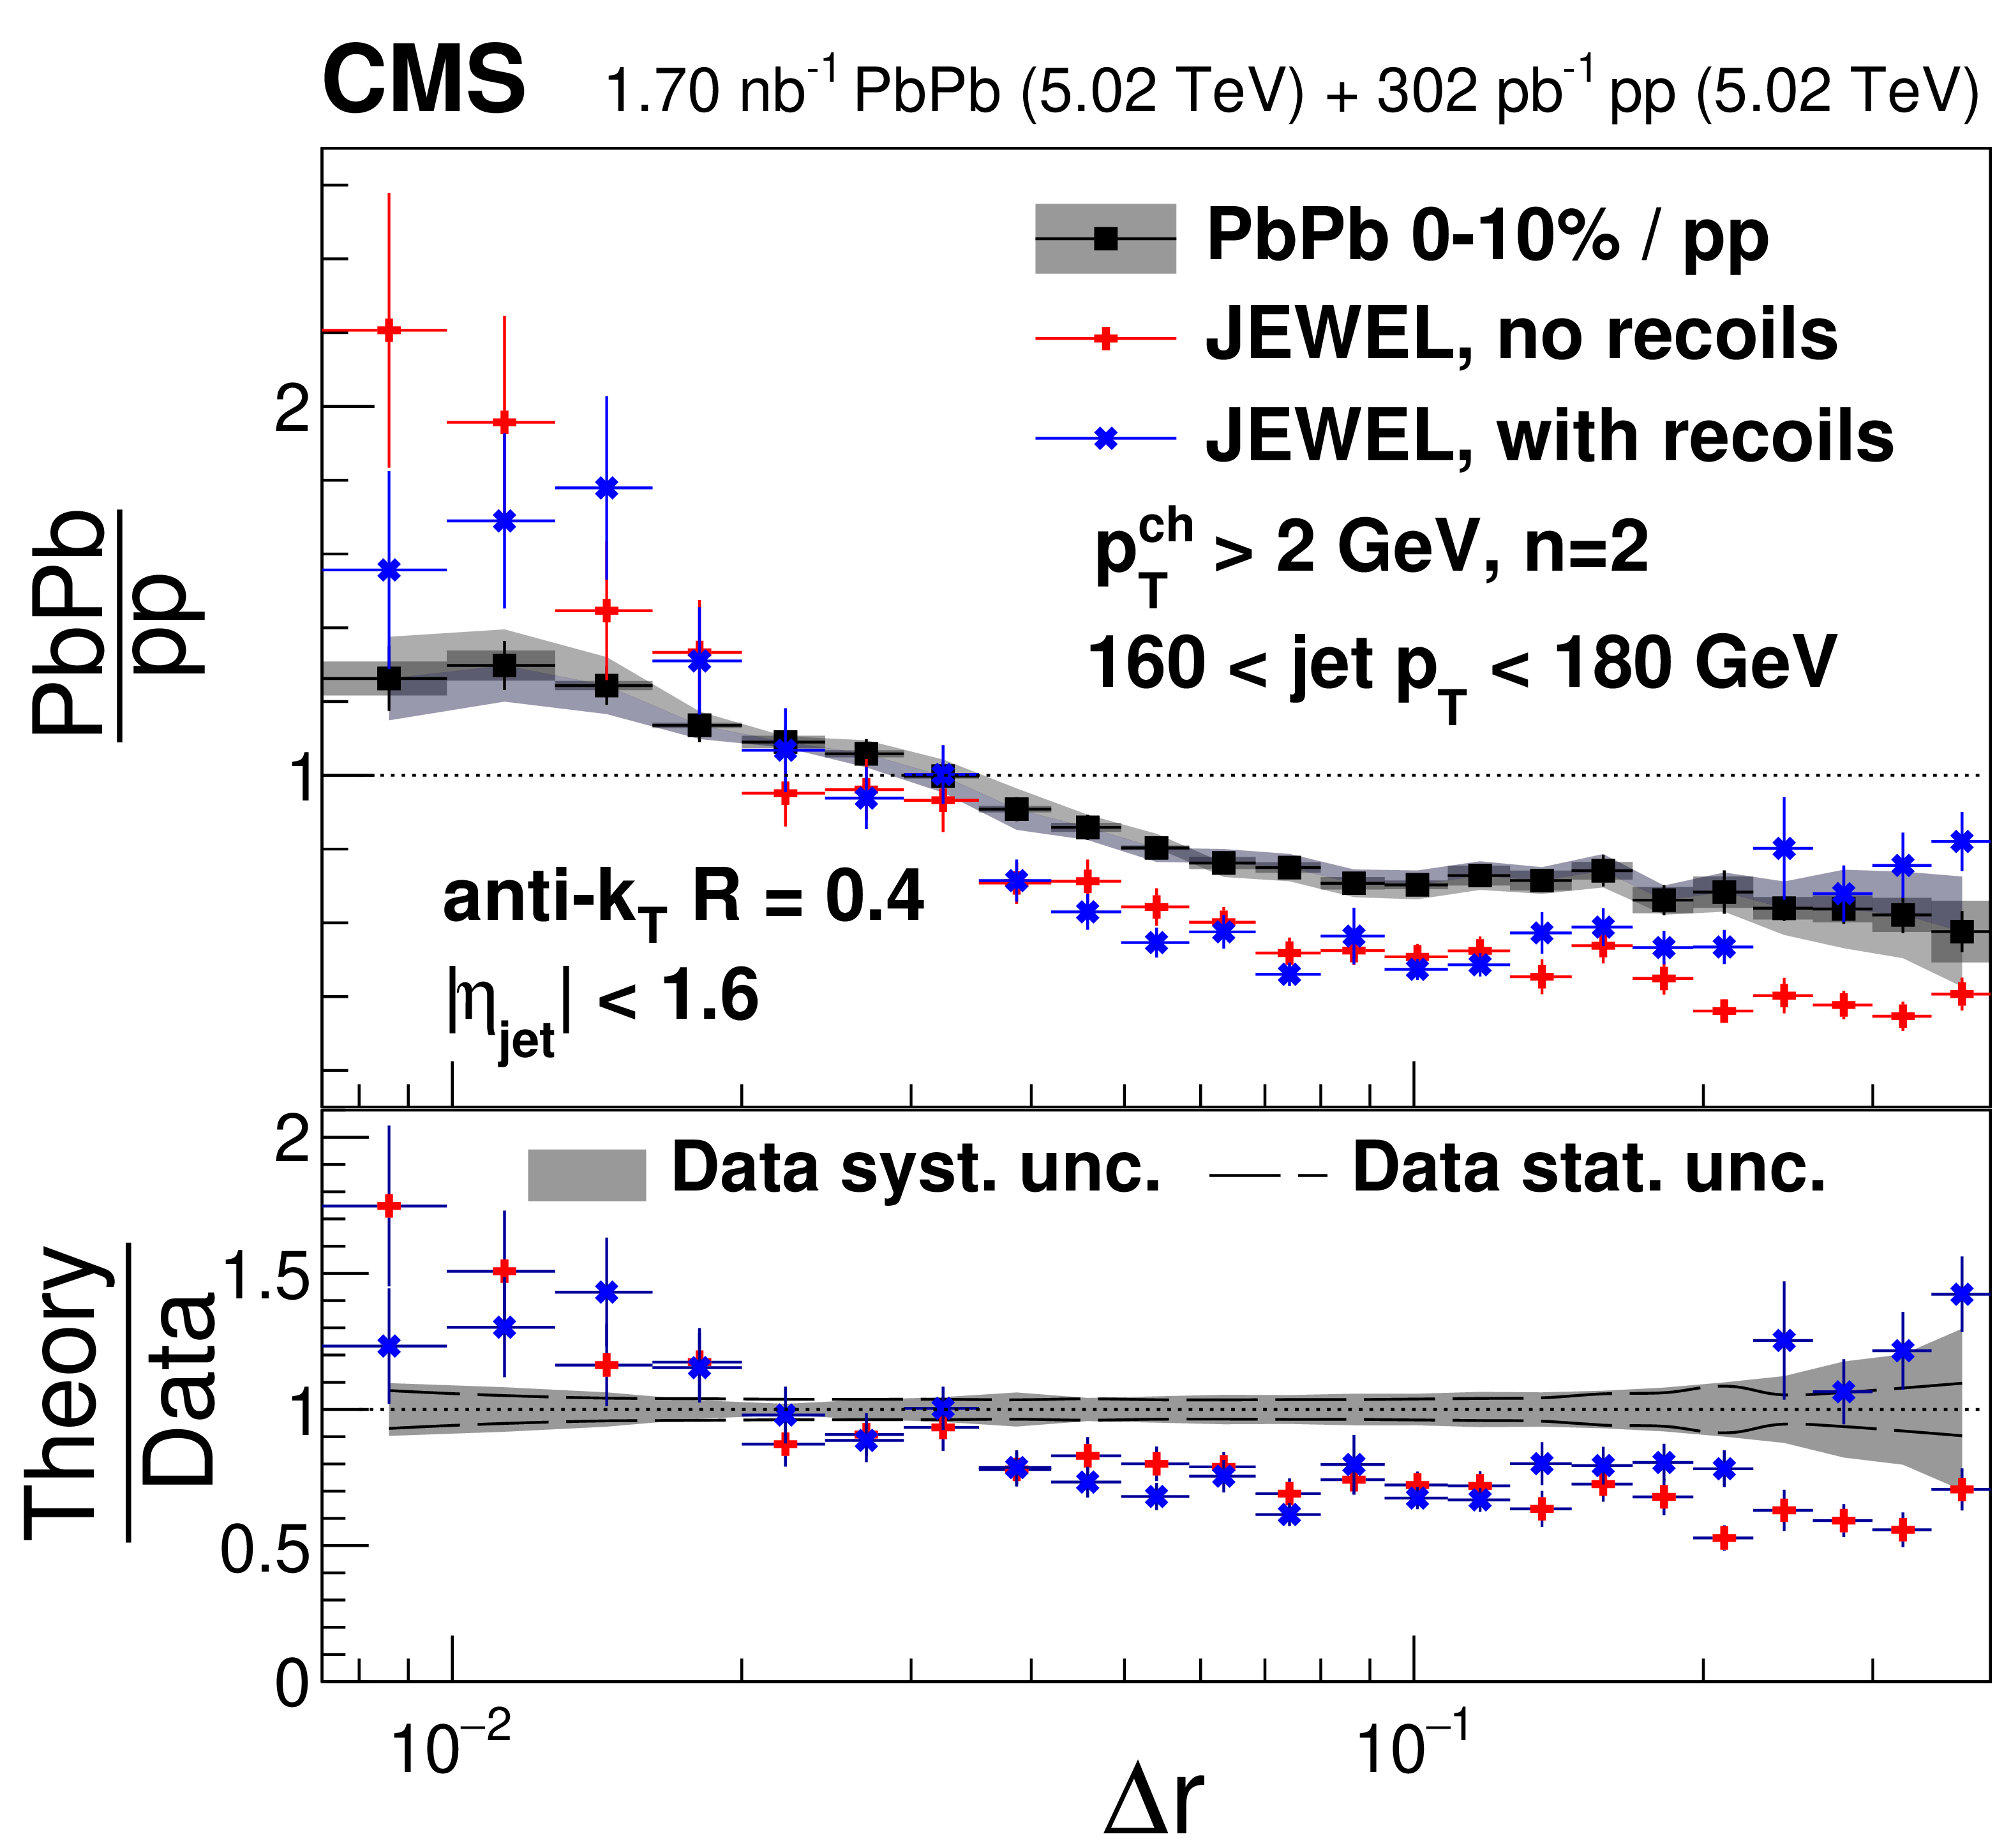
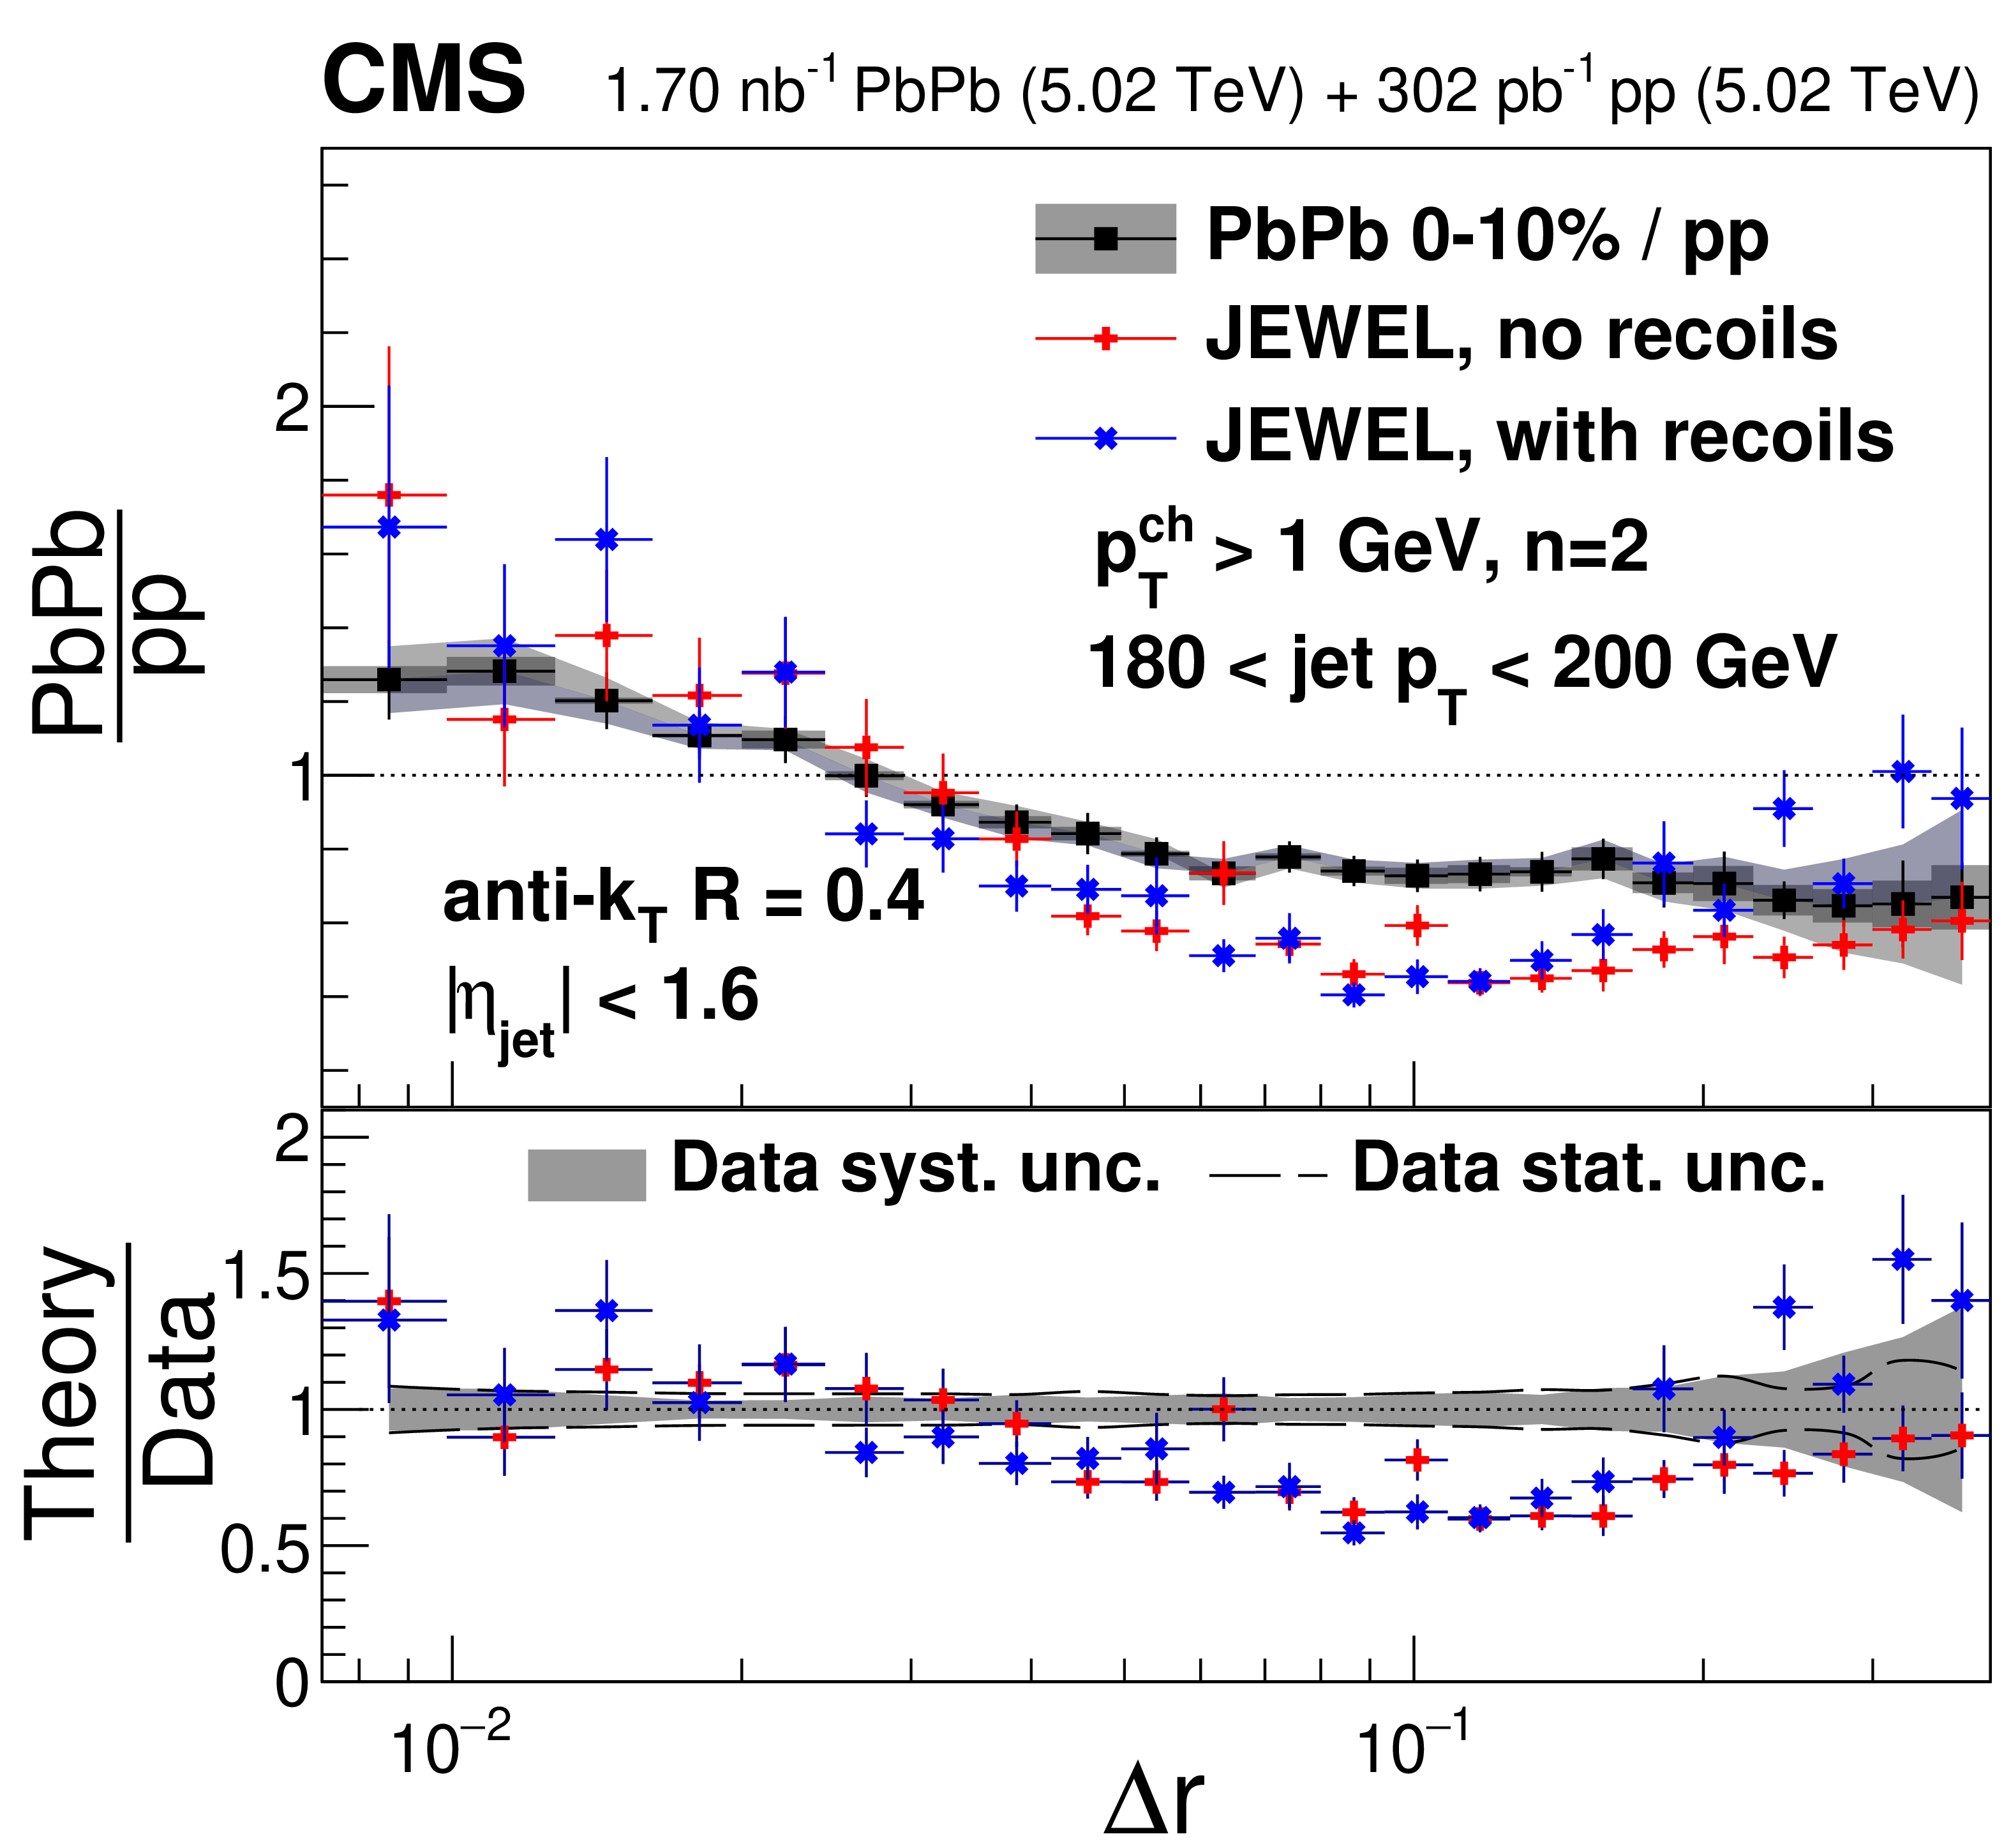
The PbPb to pp ratios of energy-energy correlators with $ p_{\mathrm{T}}^{\text{ch}} > $ 1 GeV and $ n= $ 1 are shown for 120 $ < p_{\text{T,jet}} < $ 140 GeV (left) and 180 $ < p_{\text{T,jet}} < $ 200 GeV (right) together with predictions from perturbative calculation by Holguin and collaborators [85] and from JEWEL simulation [86,87]. In the lower panels, the experimental uncertainties are indicated by the bands around unity. |
png pdf |
Figure 9-a:
The PbPb to pp ratios of energy-energy correlators with $ p_{\mathrm{T}}^{\text{ch}} > $ 1 GeV and $ n= $ 1 are shown for 120 $ < p_{\text{T,jet}} < $ 140 GeV (left) and 180 $ < p_{\text{T,jet}} < $ 200 GeV (right) together with predictions from perturbative calculation by Holguin and collaborators [85] and from JEWEL simulation [86,87]. In the lower panels, the experimental uncertainties are indicated by the bands around unity. |

png pdf |
Figure 9-b:
The PbPb to pp ratios of energy-energy correlators with $ p_{\mathrm{T}}^{\text{ch}} > $ 1 GeV and $ n= $ 1 are shown for 120 $ < p_{\text{T,jet}} < $ 140 GeV (left) and 180 $ < p_{\text{T,jet}} < $ 200 GeV (right) together with predictions from perturbative calculation by Holguin and collaborators [85] and from JEWEL simulation [86,87]. In the lower panels, the experimental uncertainties are indicated by the bands around unity. |
png pdf |
Figure 10:
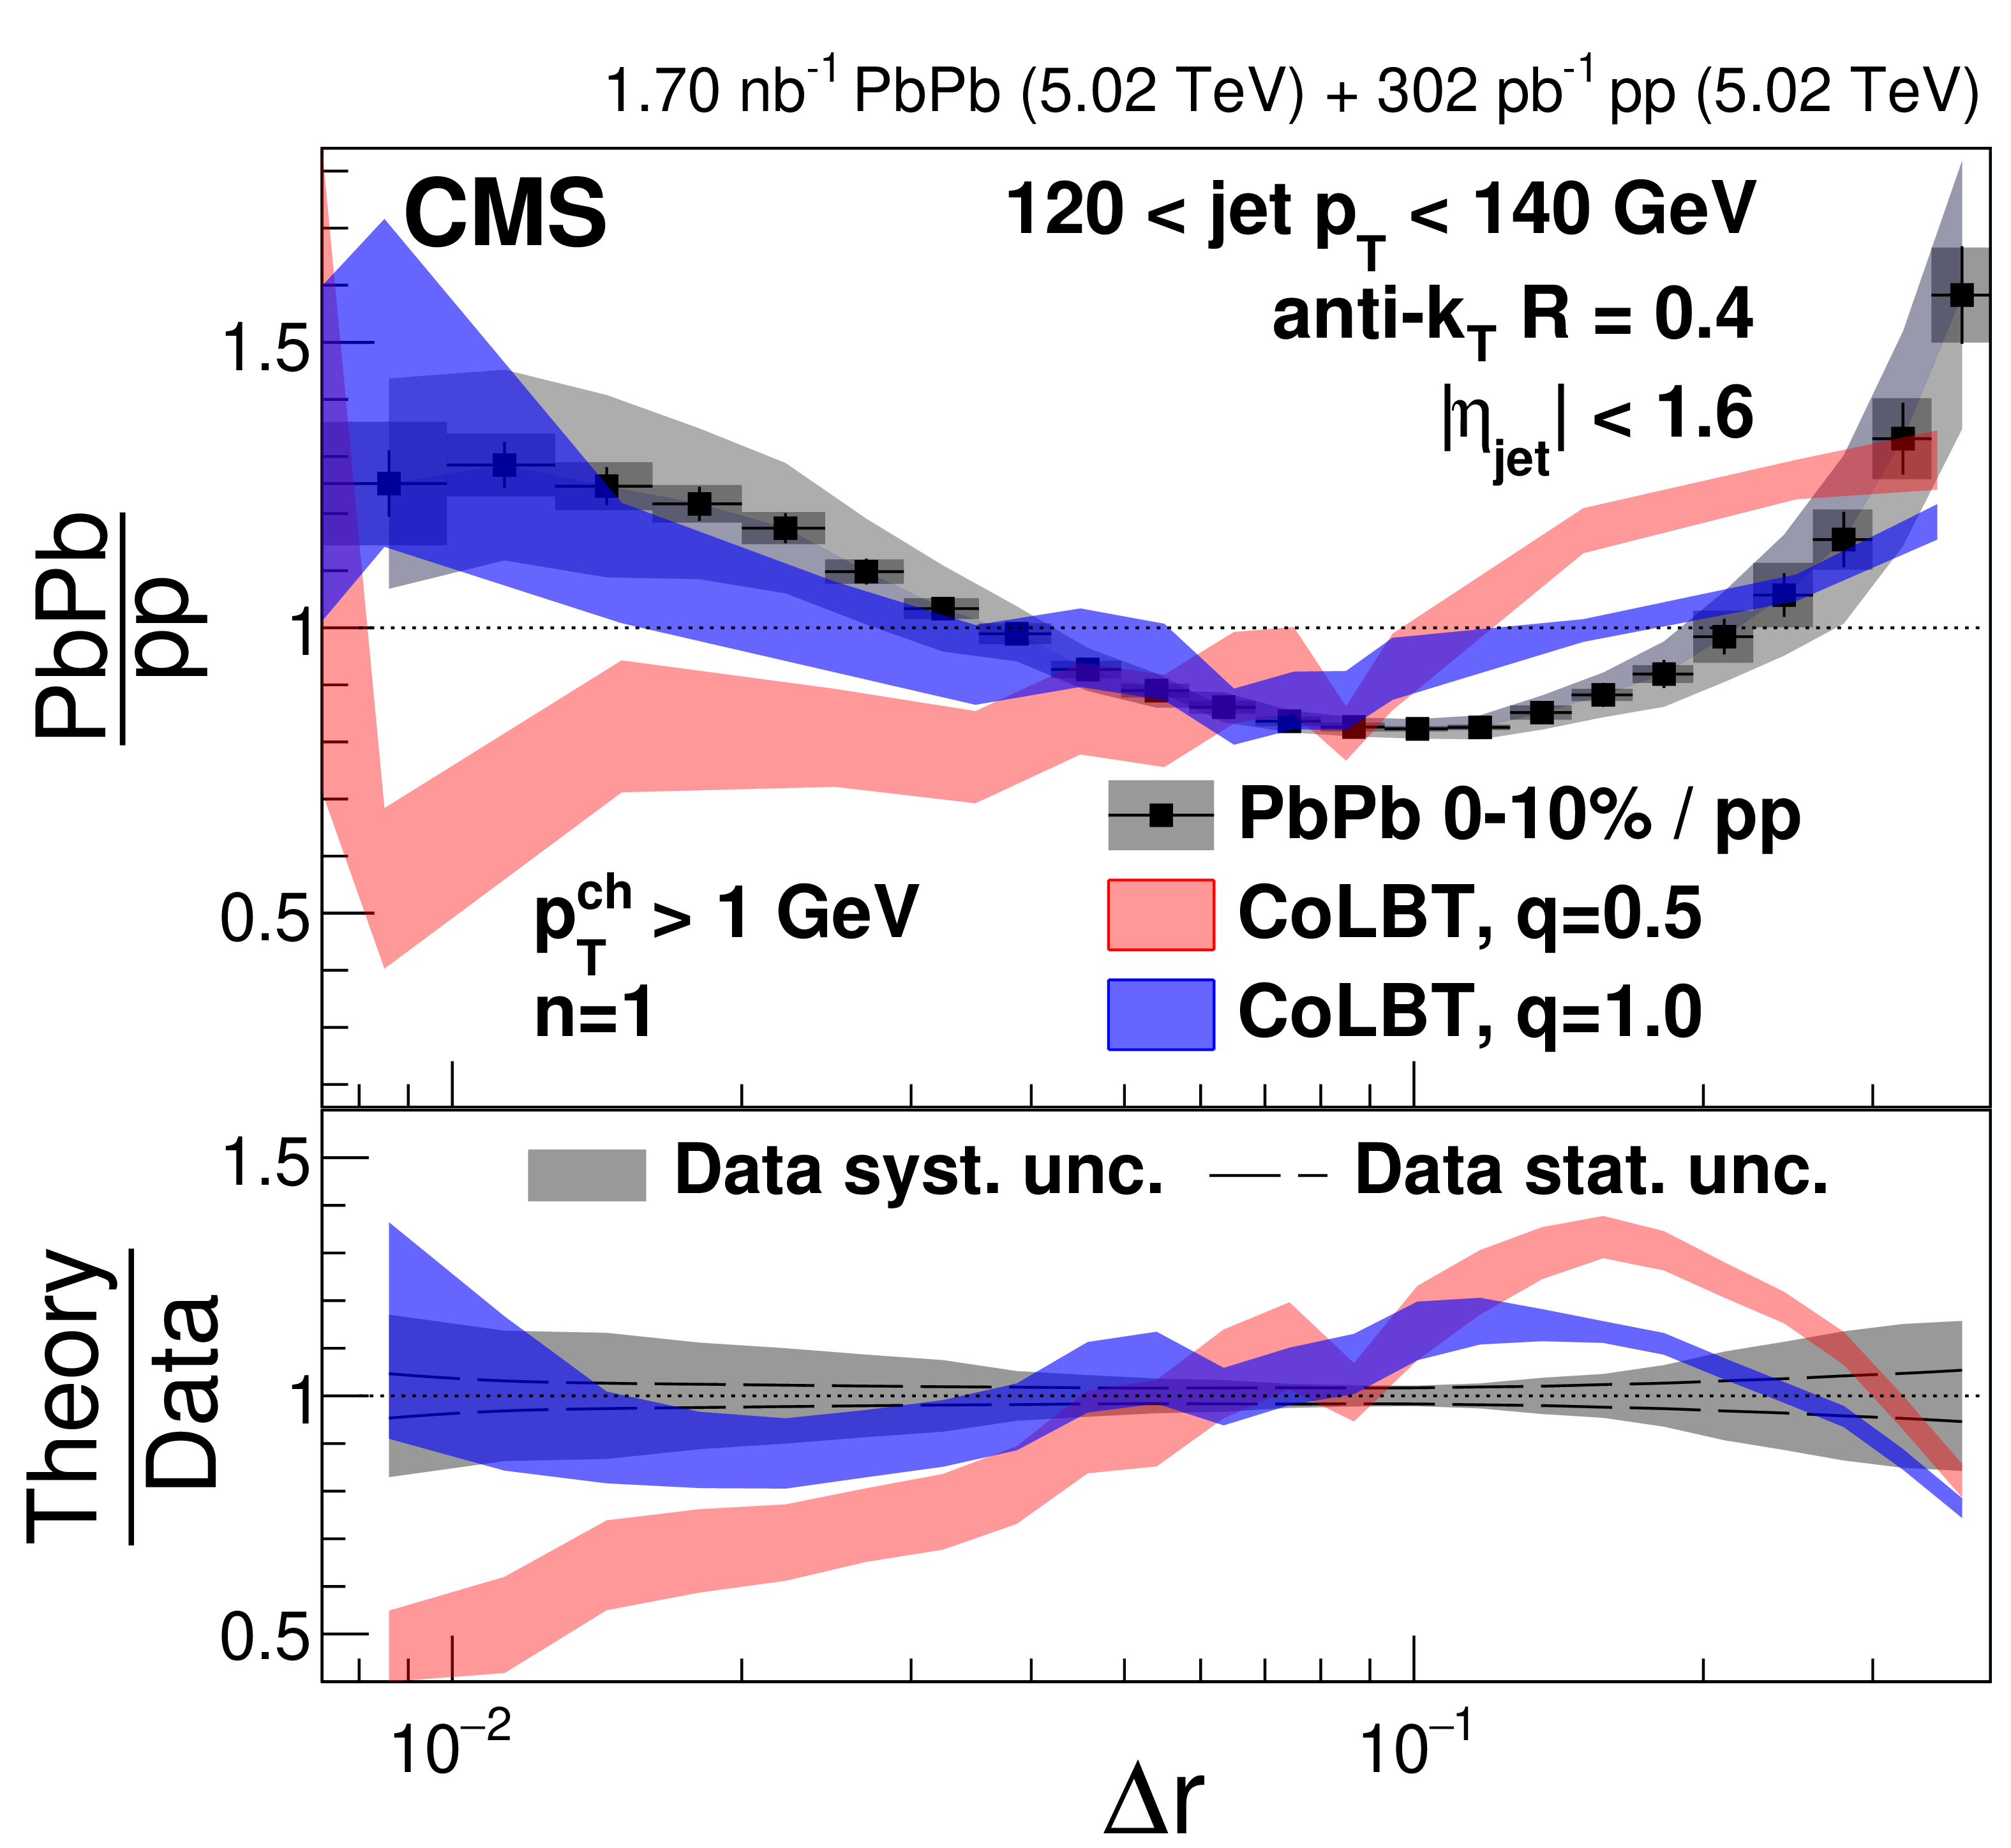
The PbPb to pp ratios of energy-energy correlators with $ p_{\mathrm{T}}^{\text{ch}} > $ 1 GeV and $ n= $ 1 are shown for 120 $ < p_{\text{T,jet}} < $ 140 GeV together with predictions from CoLBT model [88,89,90]. The q-values are shown for PbPb collisions, the value is fixed to 0.5 for pp. In the lower panel, the experimental uncertainties are indicated by the bands around unity. |
png pdf |
Figure 11:
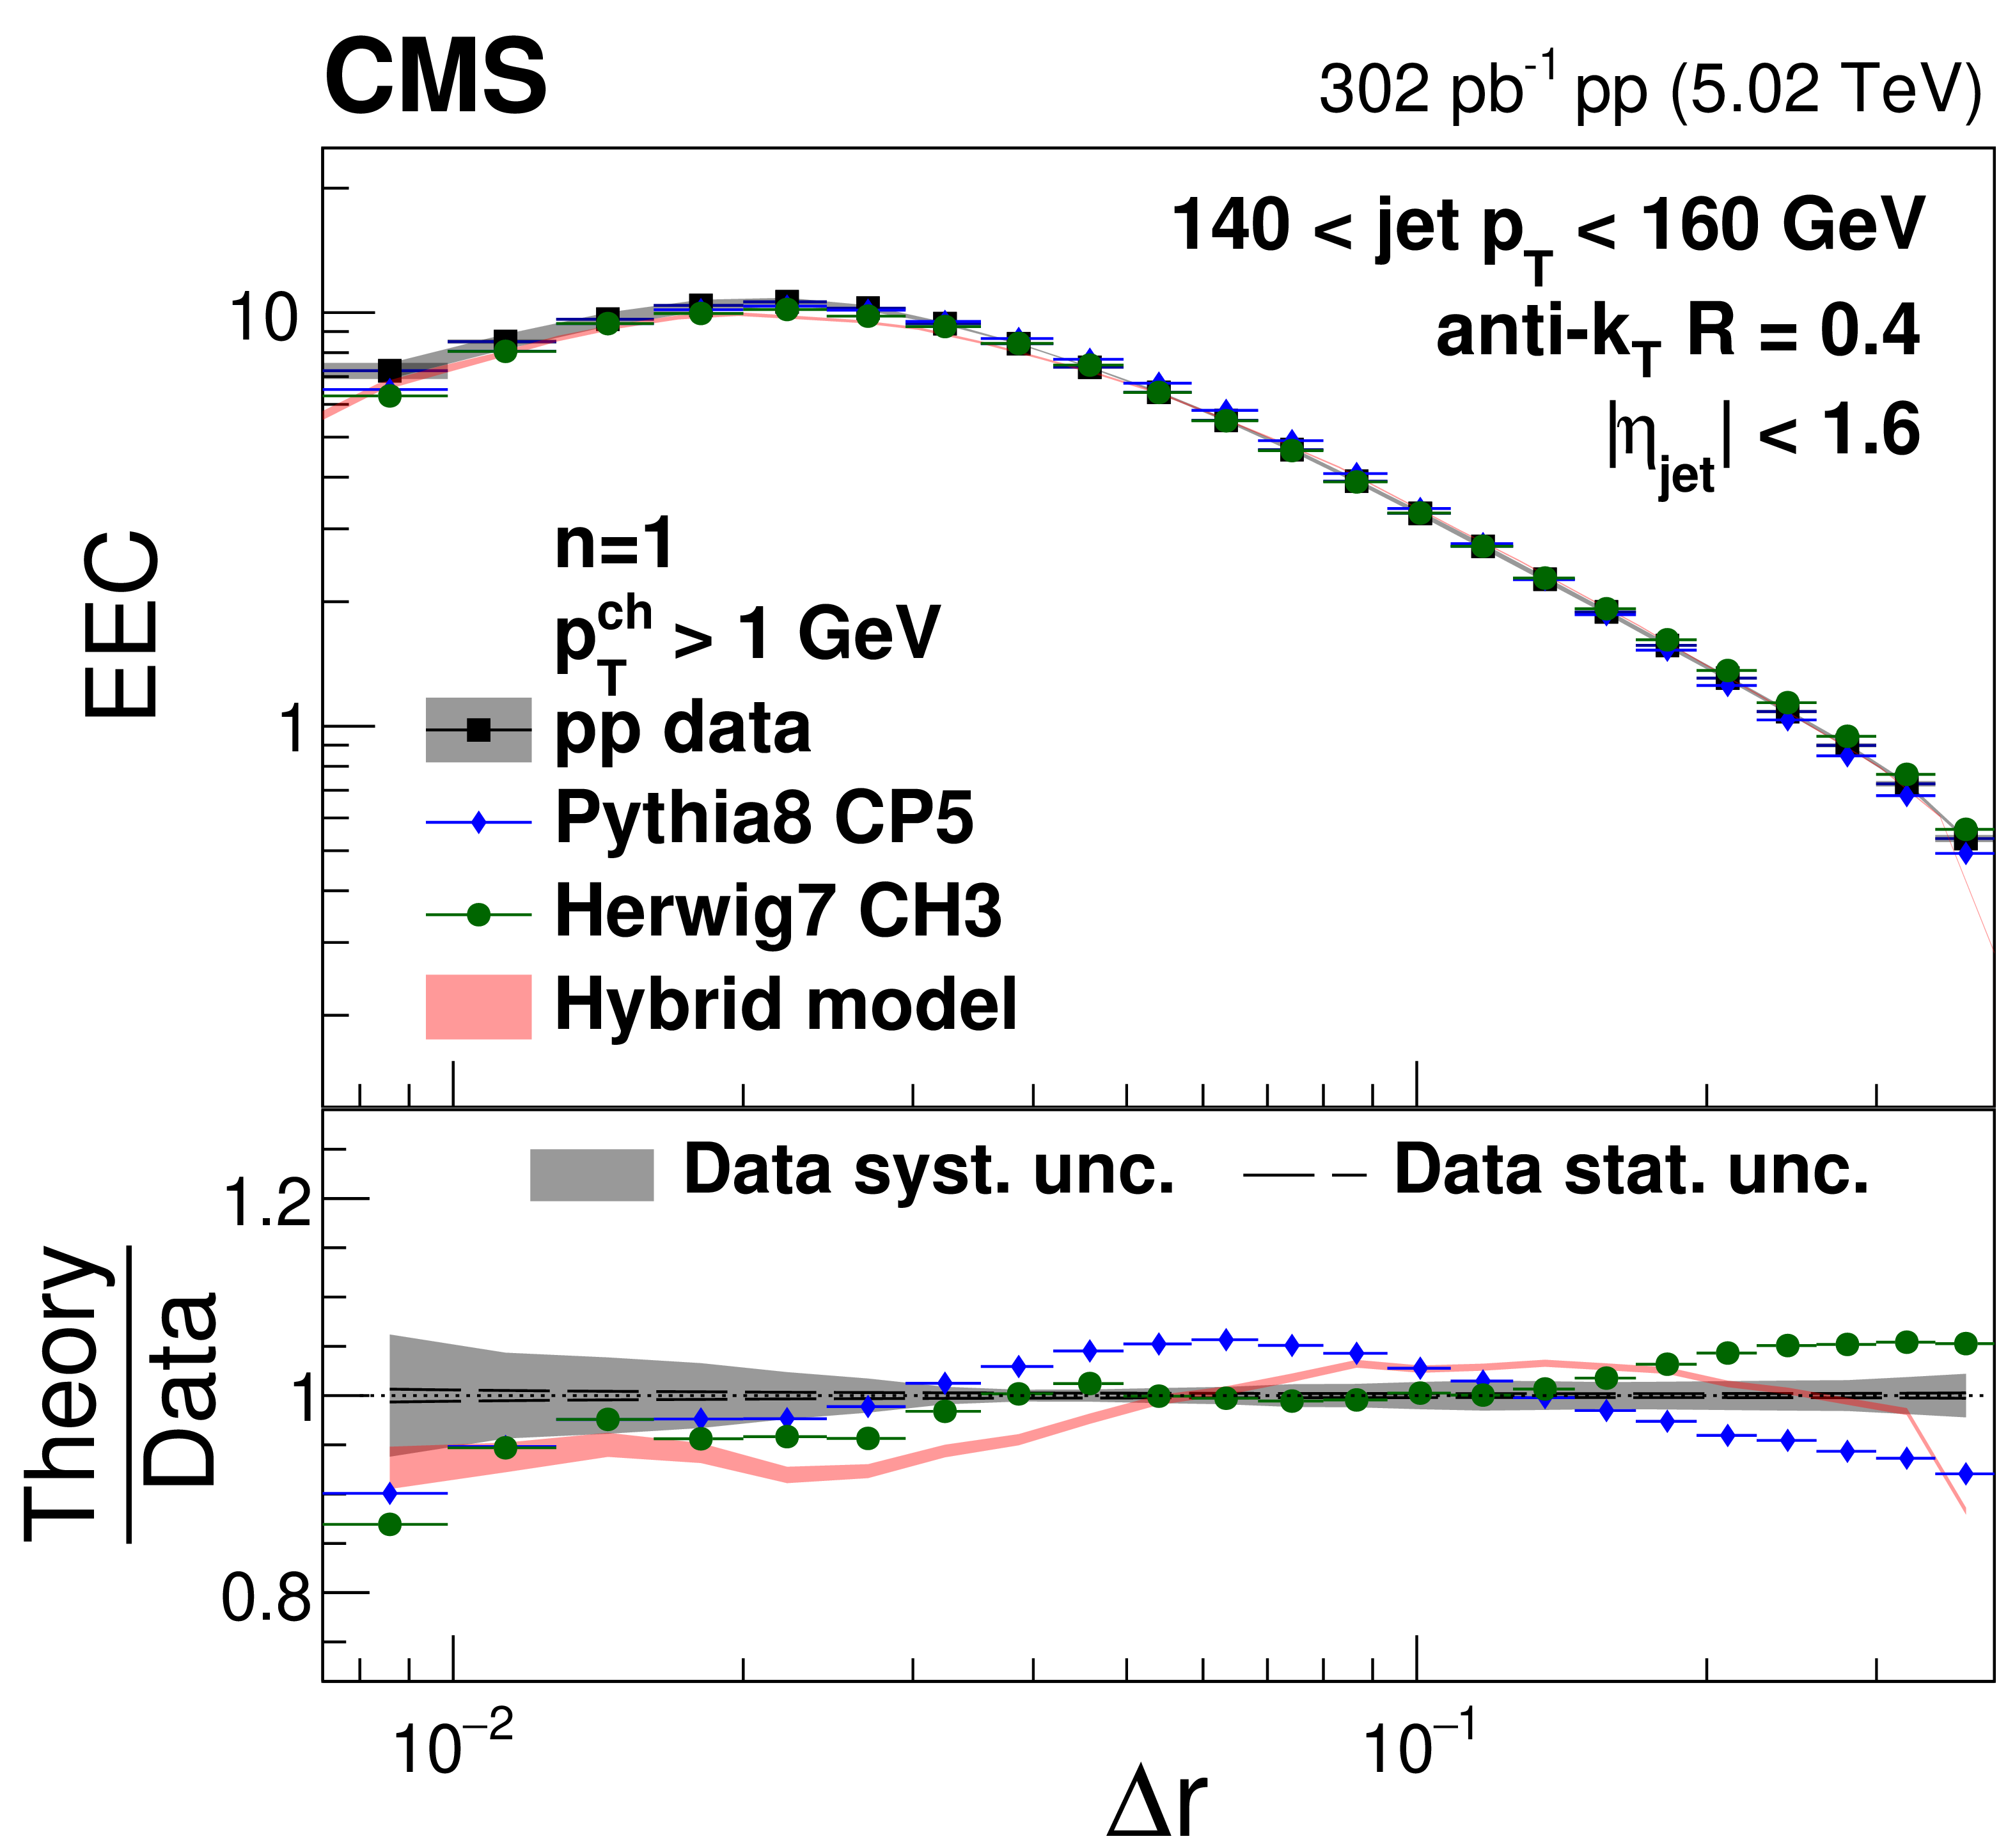
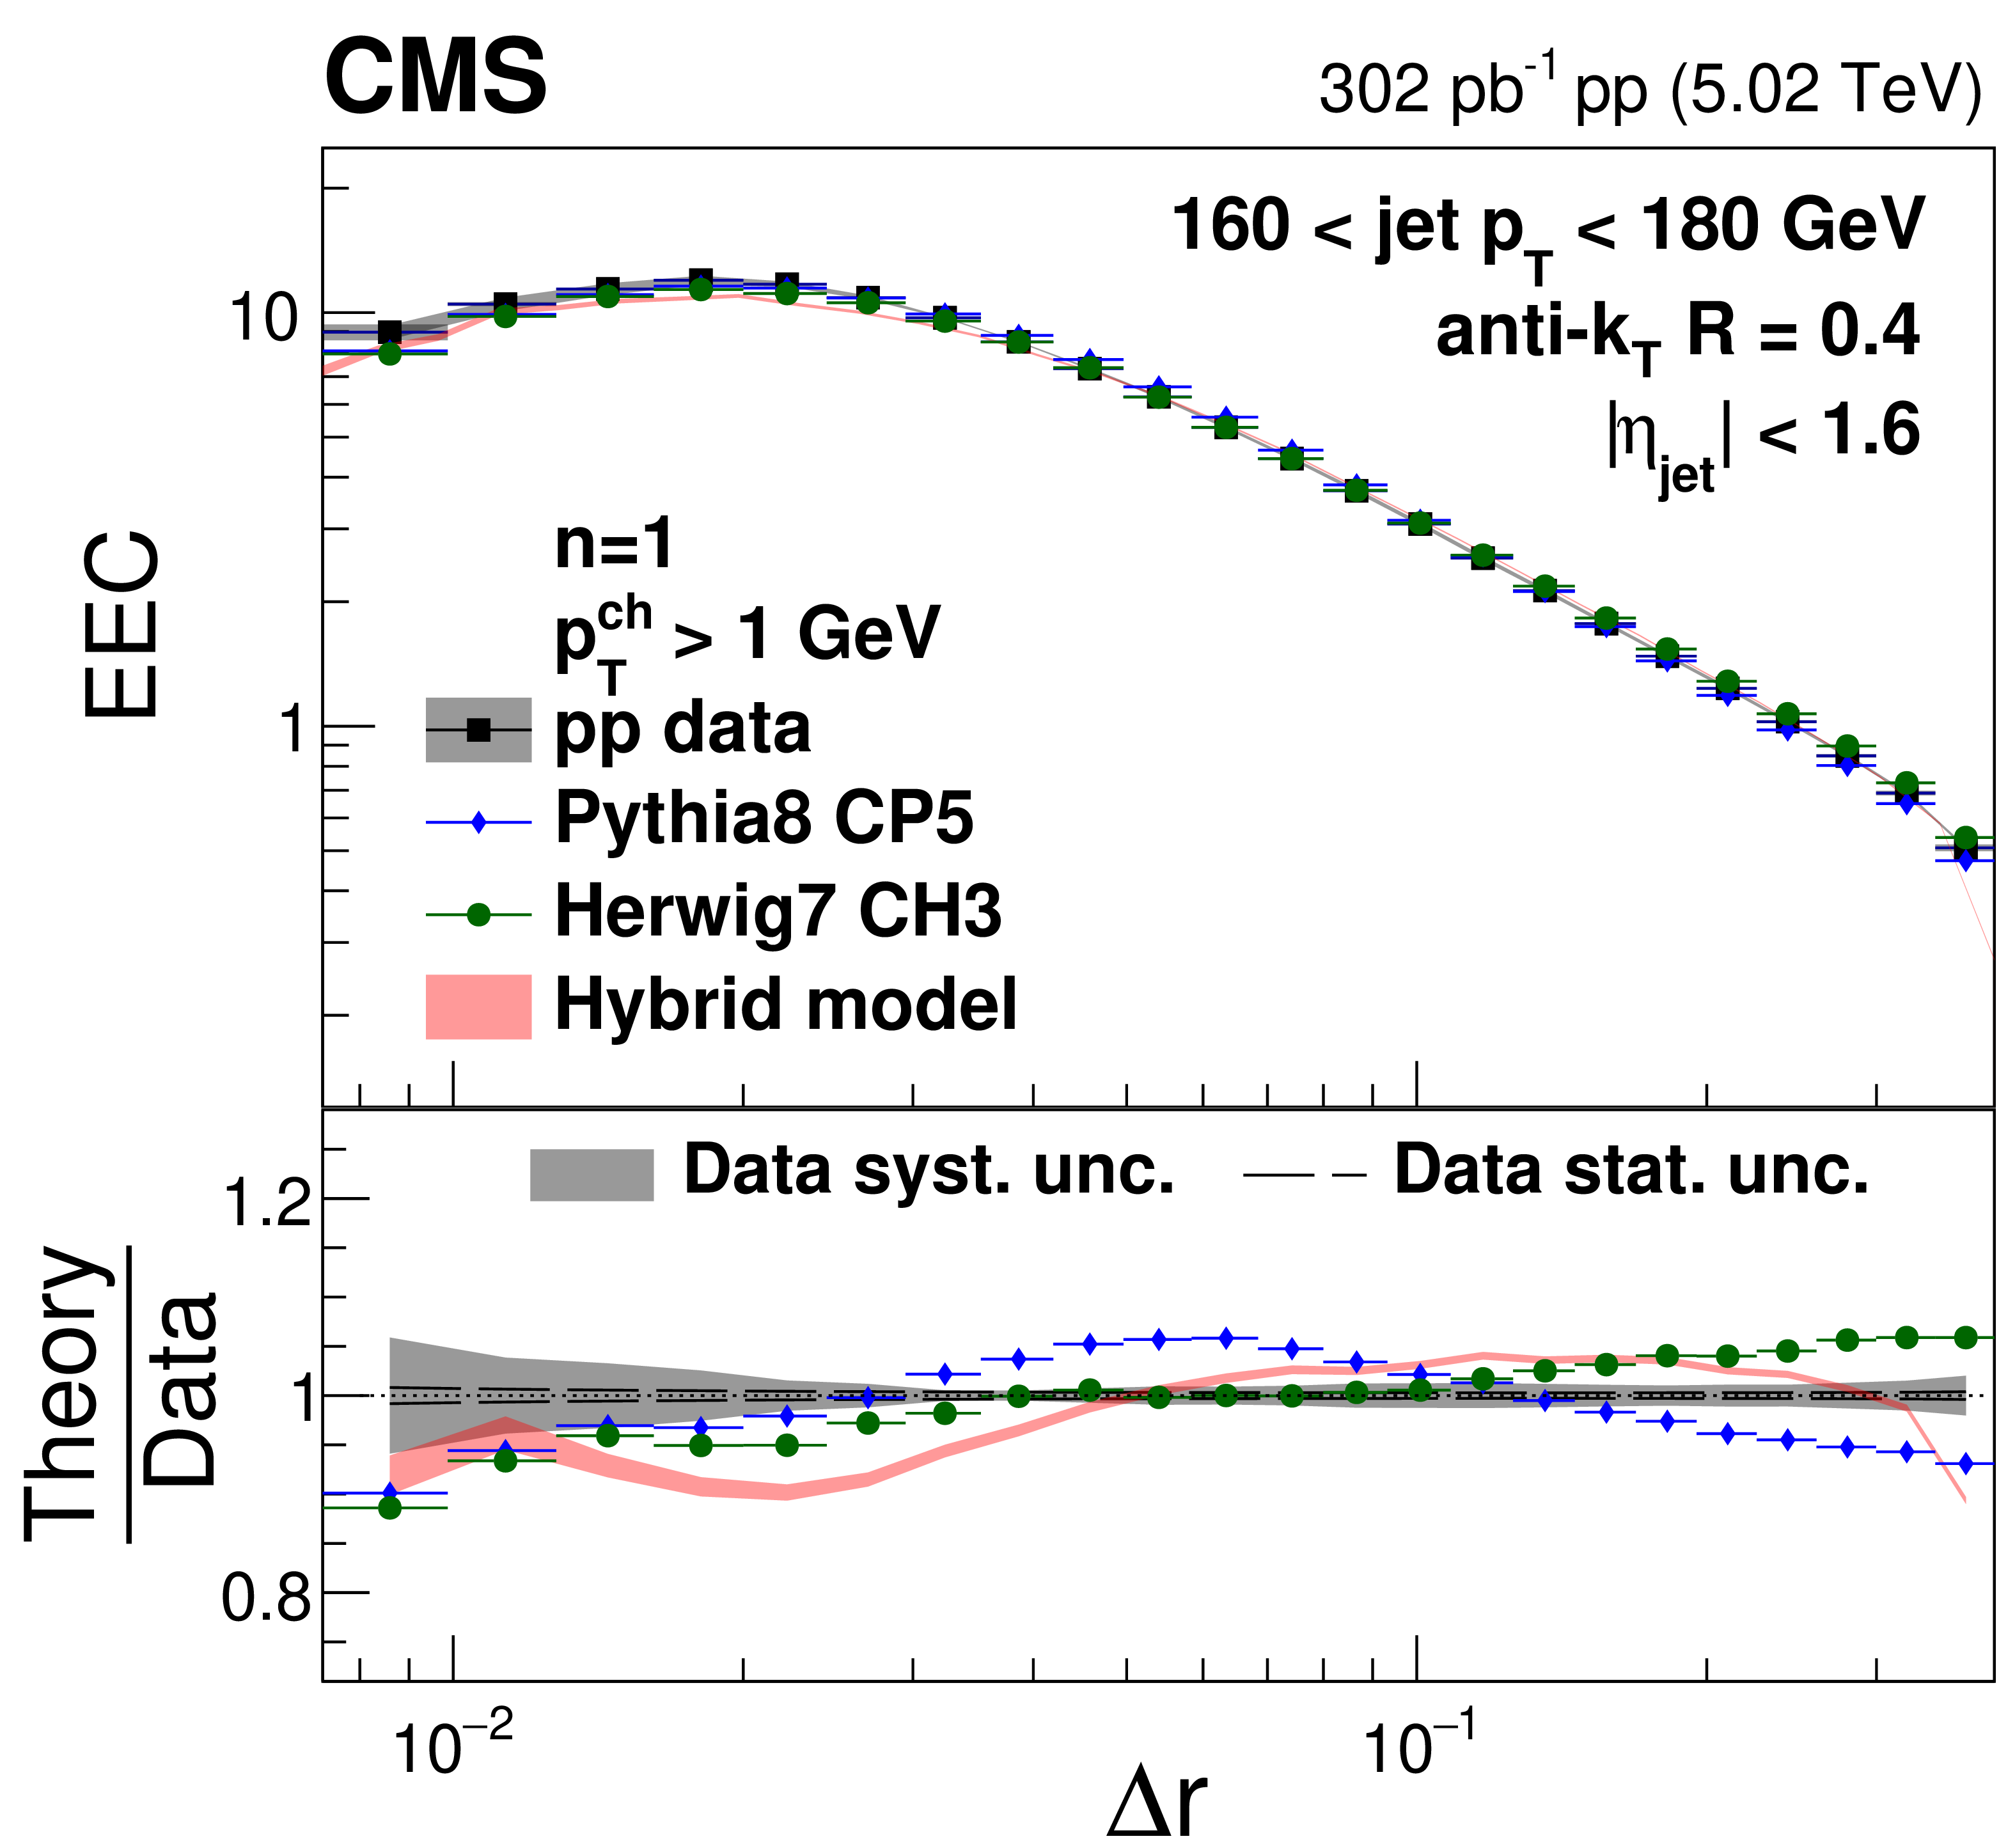
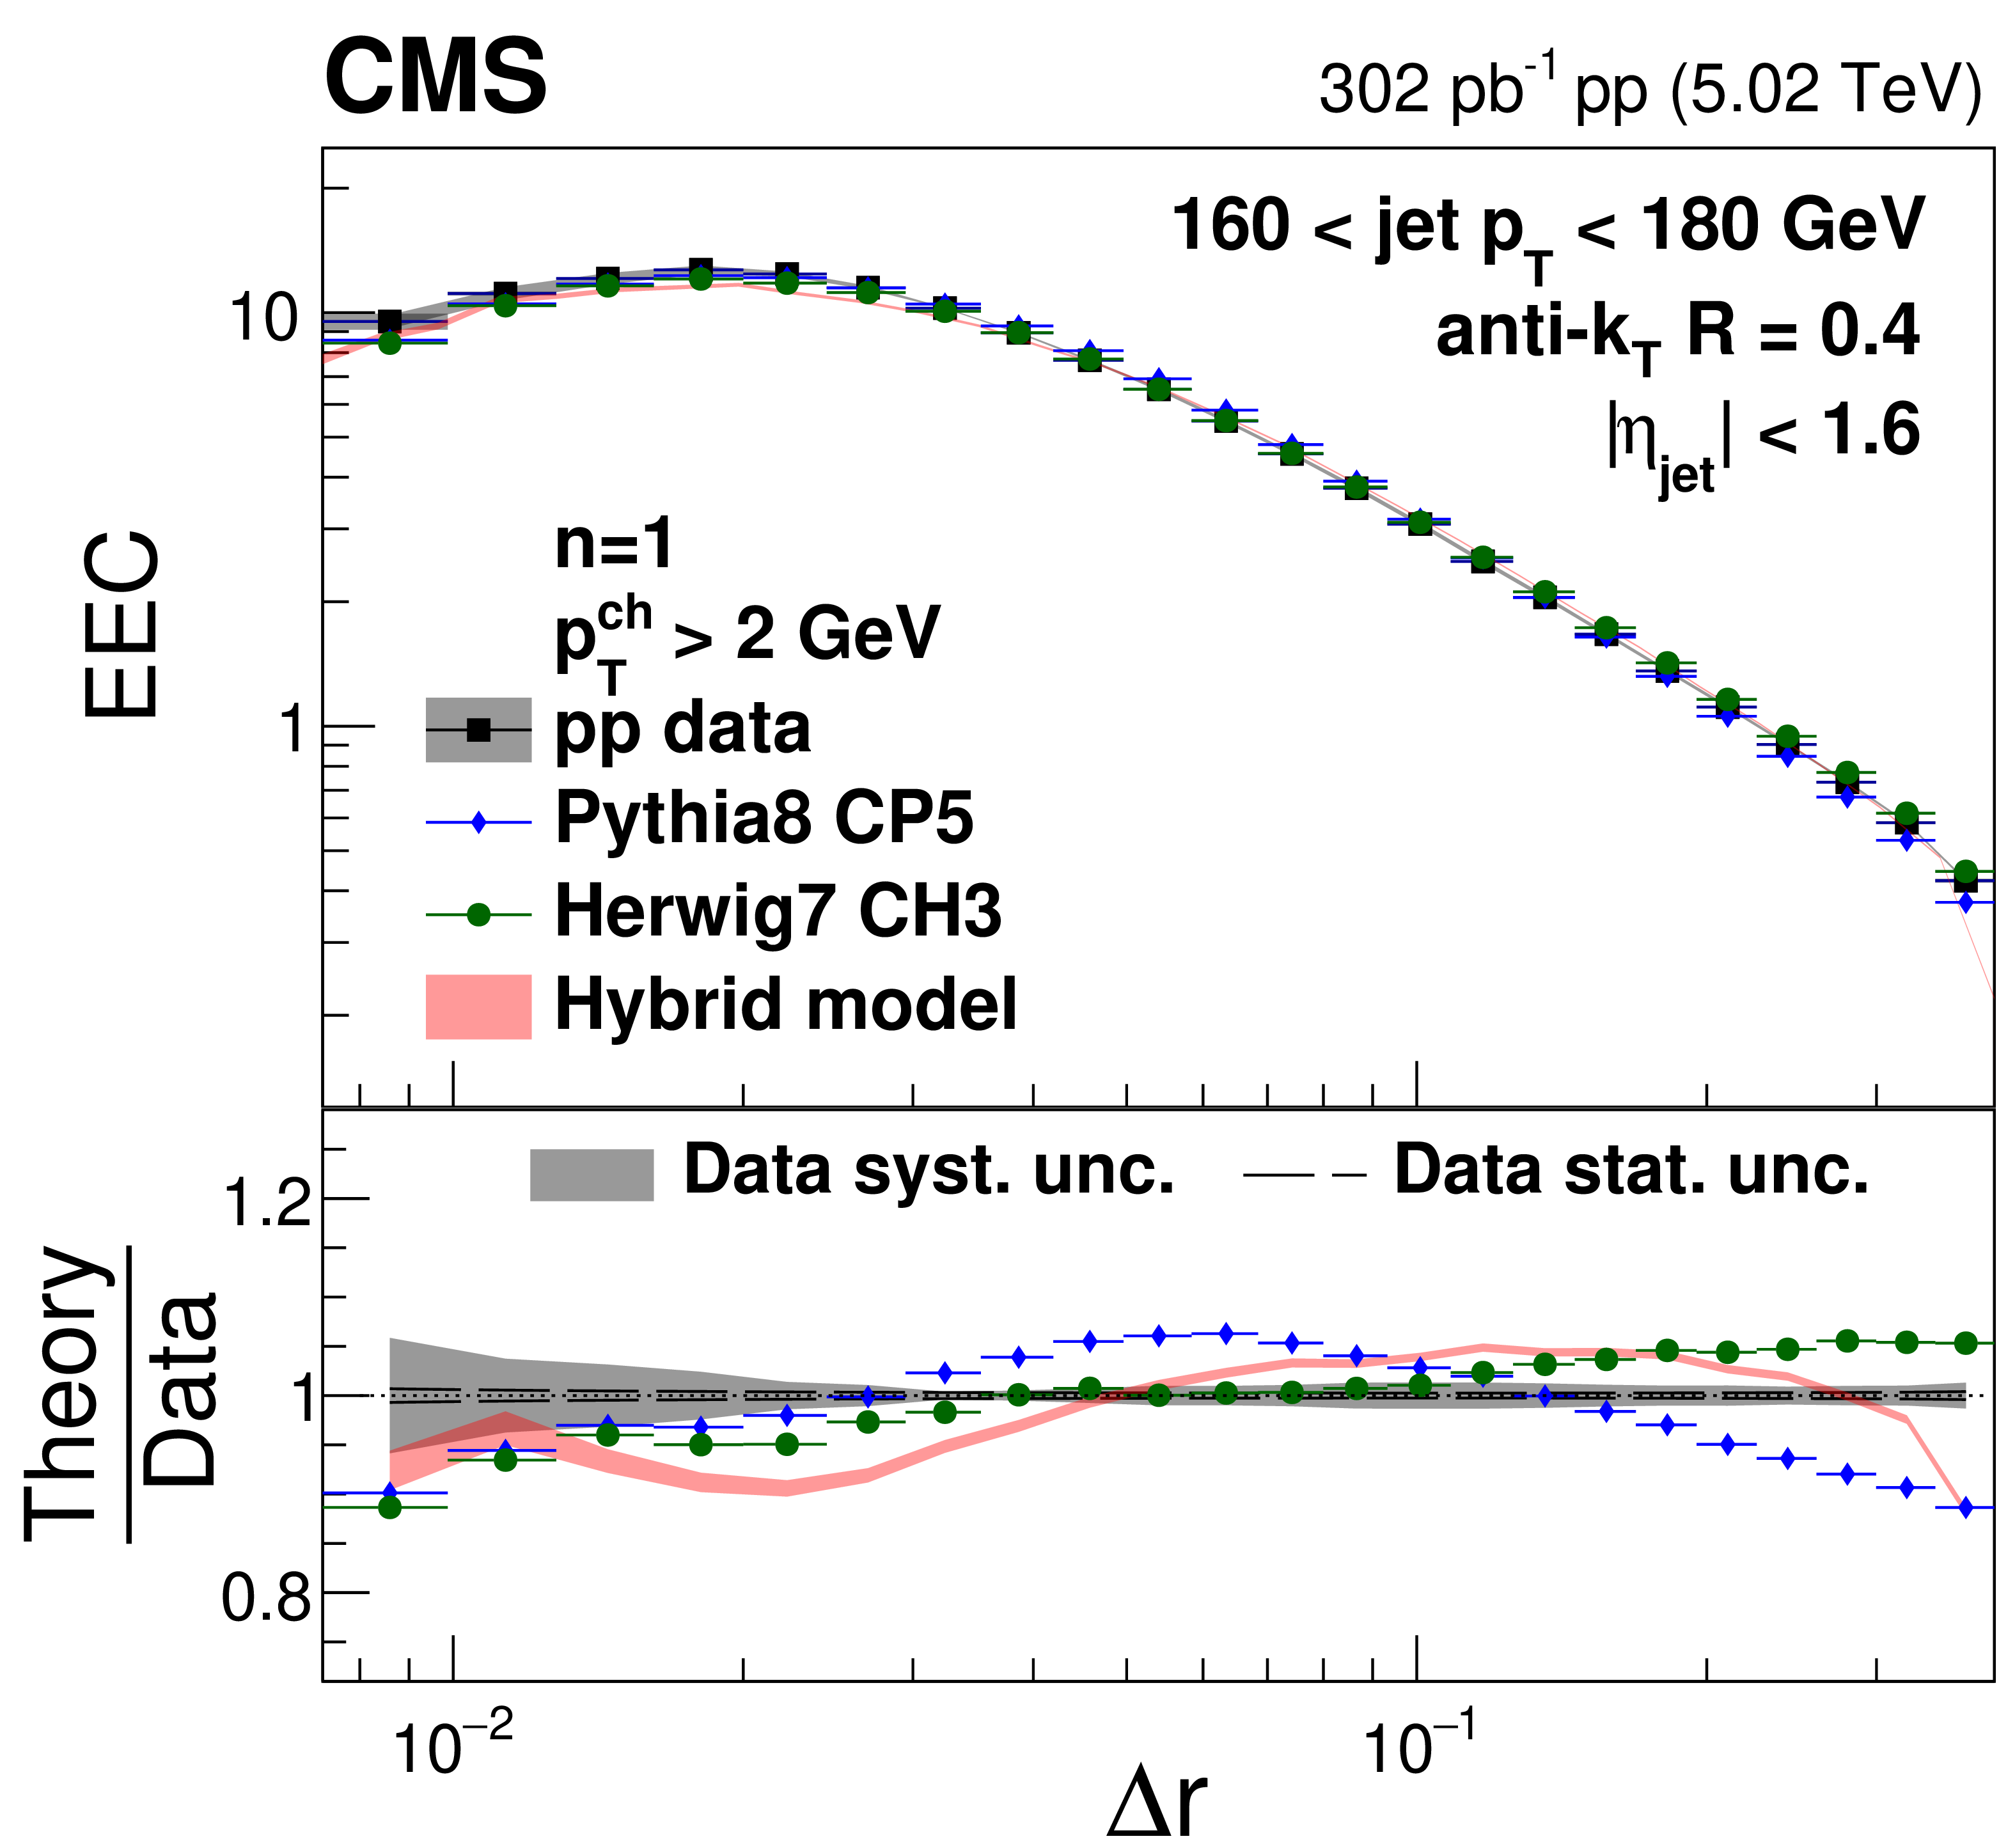
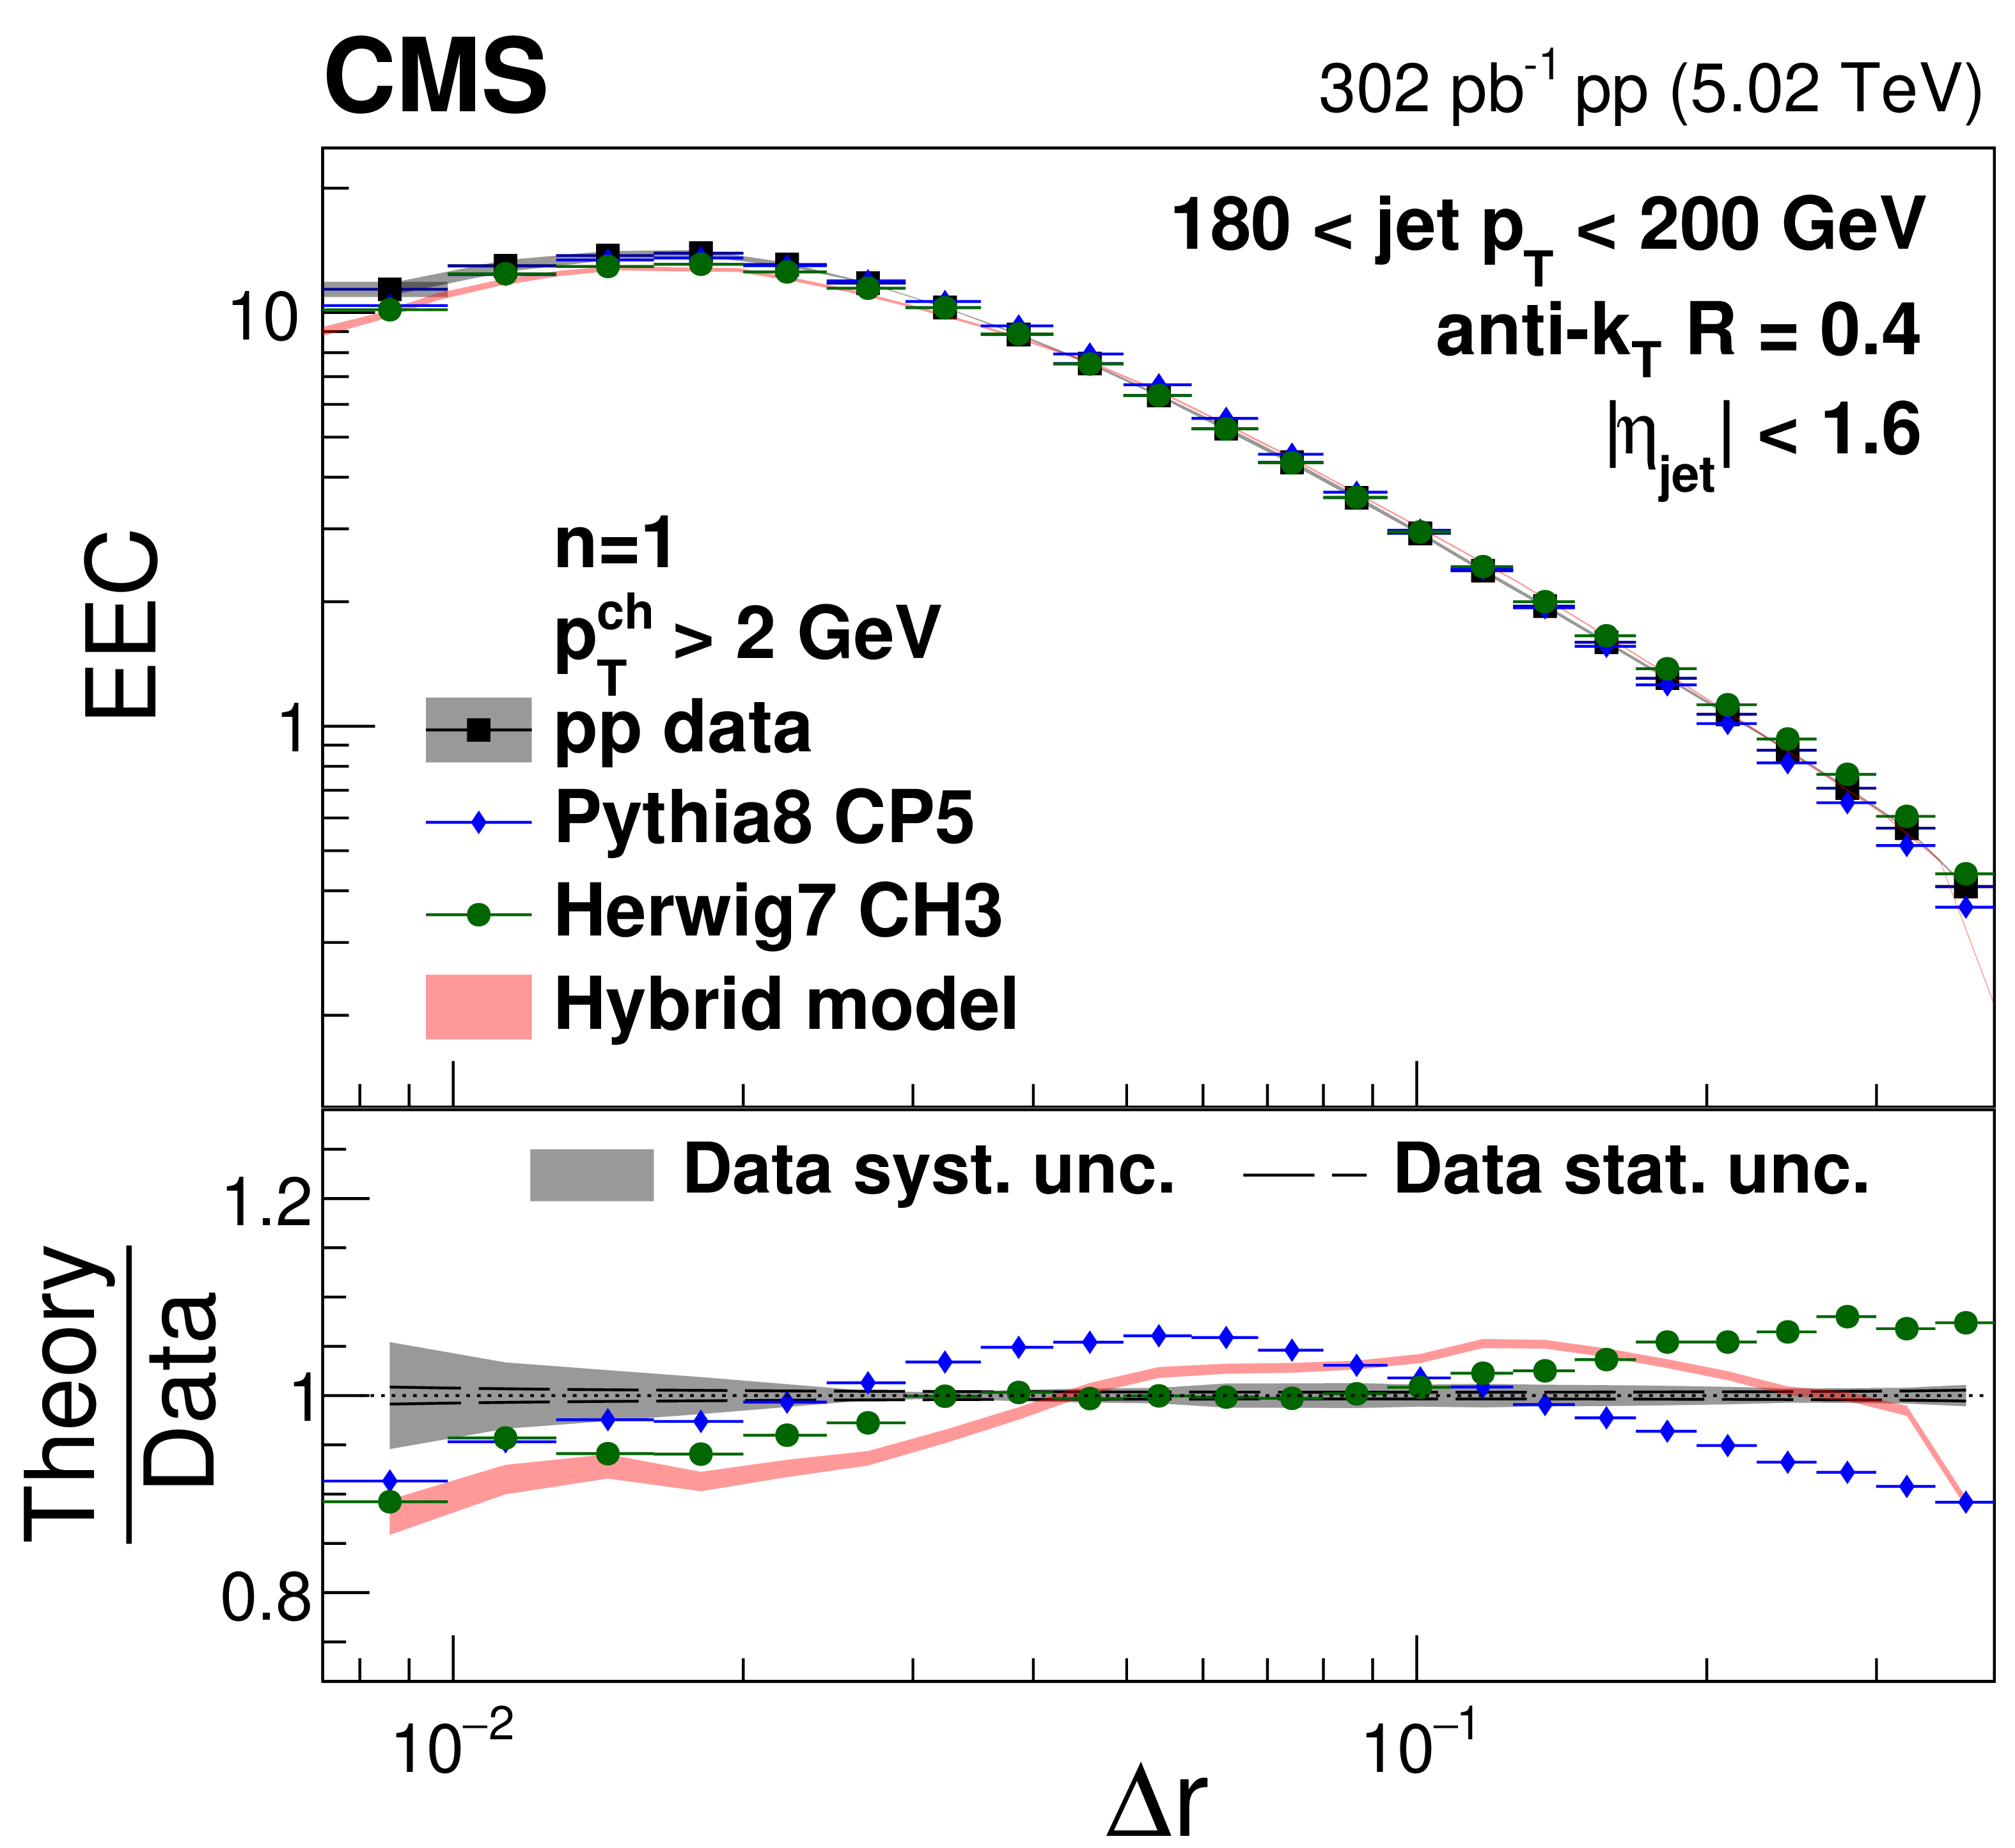
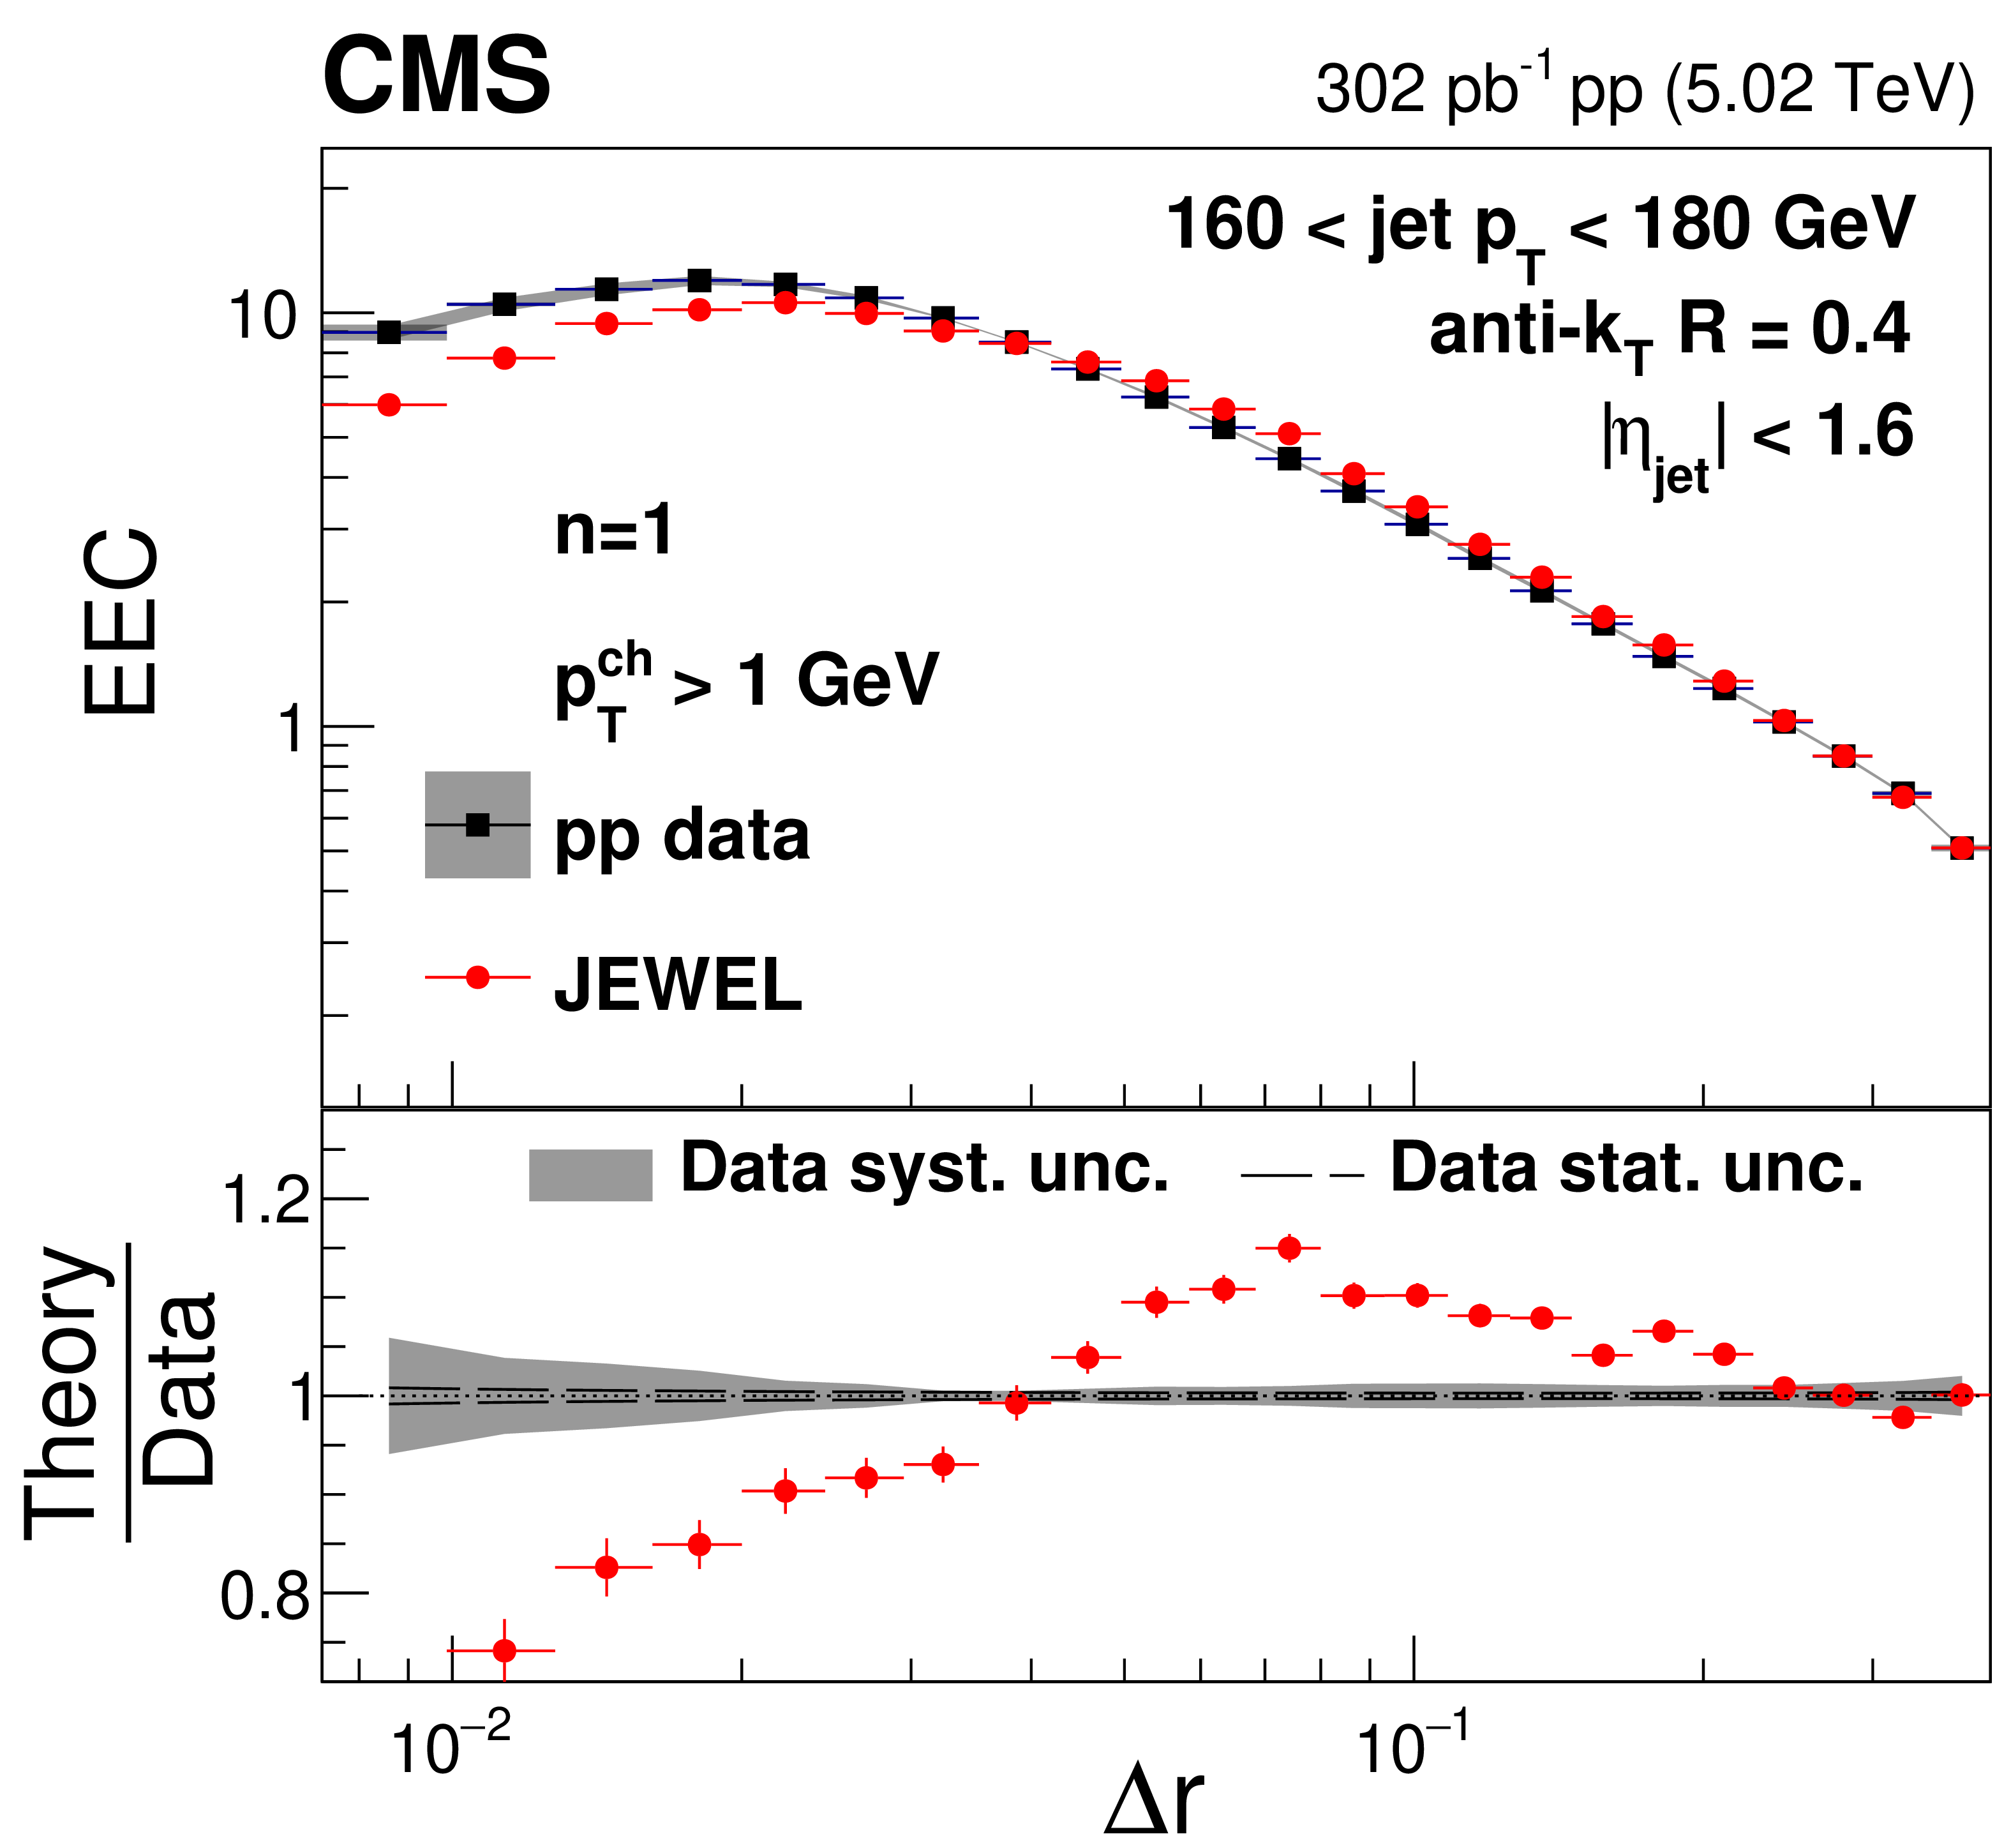
Energy-energy correlator distributions from pp collisions with $ n= $ 1 in different $ p_{\mathrm{T}}^{\text{ch}} $ and $ p_{\text{T,jet}} $ bins compared to predictions from PYTHIA, HERWIG, and the hybrid model. |
png pdf |
Figure 11-a:
Energy-energy correlator distributions from pp collisions with $ n= $ 1 in different $ p_{\mathrm{T}}^{\text{ch}} $ and $ p_{\text{T,jet}} $ bins compared to predictions from PYTHIA, HERWIG, and the hybrid model. |
png pdf |
Figure 11-b:
Energy-energy correlator distributions from pp collisions with $ n= $ 1 in different $ p_{\mathrm{T}}^{\text{ch}} $ and $ p_{\text{T,jet}} $ bins compared to predictions from PYTHIA, HERWIG, and the hybrid model. |
png pdf |
Figure 11-c:
Energy-energy correlator distributions from pp collisions with $ n= $ 1 in different $ p_{\mathrm{T}}^{\text{ch}} $ and $ p_{\text{T,jet}} $ bins compared to predictions from PYTHIA, HERWIG, and the hybrid model. |

png pdf |
Figure 11-d:
Energy-energy correlator distributions from pp collisions with $ n= $ 1 in different $ p_{\mathrm{T}}^{\text{ch}} $ and $ p_{\text{T,jet}} $ bins compared to predictions from PYTHIA, HERWIG, and the hybrid model. |
png pdf |
Figure 11-e:
Energy-energy correlator distributions from pp collisions with $ n= $ 1 in different $ p_{\mathrm{T}}^{\text{ch}} $ and $ p_{\text{T,jet}} $ bins compared to predictions from PYTHIA, HERWIG, and the hybrid model. |
png pdf |
Figure 11-f:
Energy-energy correlator distributions from pp collisions with $ n= $ 1 in different $ p_{\mathrm{T}}^{\text{ch}} $ and $ p_{\text{T,jet}} $ bins compared to predictions from PYTHIA, HERWIG, and the hybrid model. |

png pdf |
Figure 11-g:
Energy-energy correlator distributions from pp collisions with $ n= $ 1 in different $ p_{\mathrm{T}}^{\text{ch}} $ and $ p_{\text{T,jet}} $ bins compared to predictions from PYTHIA, HERWIG, and the hybrid model. |
png pdf |
Figure 11-h:
Energy-energy correlator distributions from pp collisions with $ n= $ 1 in different $ p_{\mathrm{T}}^{\text{ch}} $ and $ p_{\text{T,jet}} $ bins compared to predictions from PYTHIA, HERWIG, and the hybrid model. |
png pdf |
Figure 12:
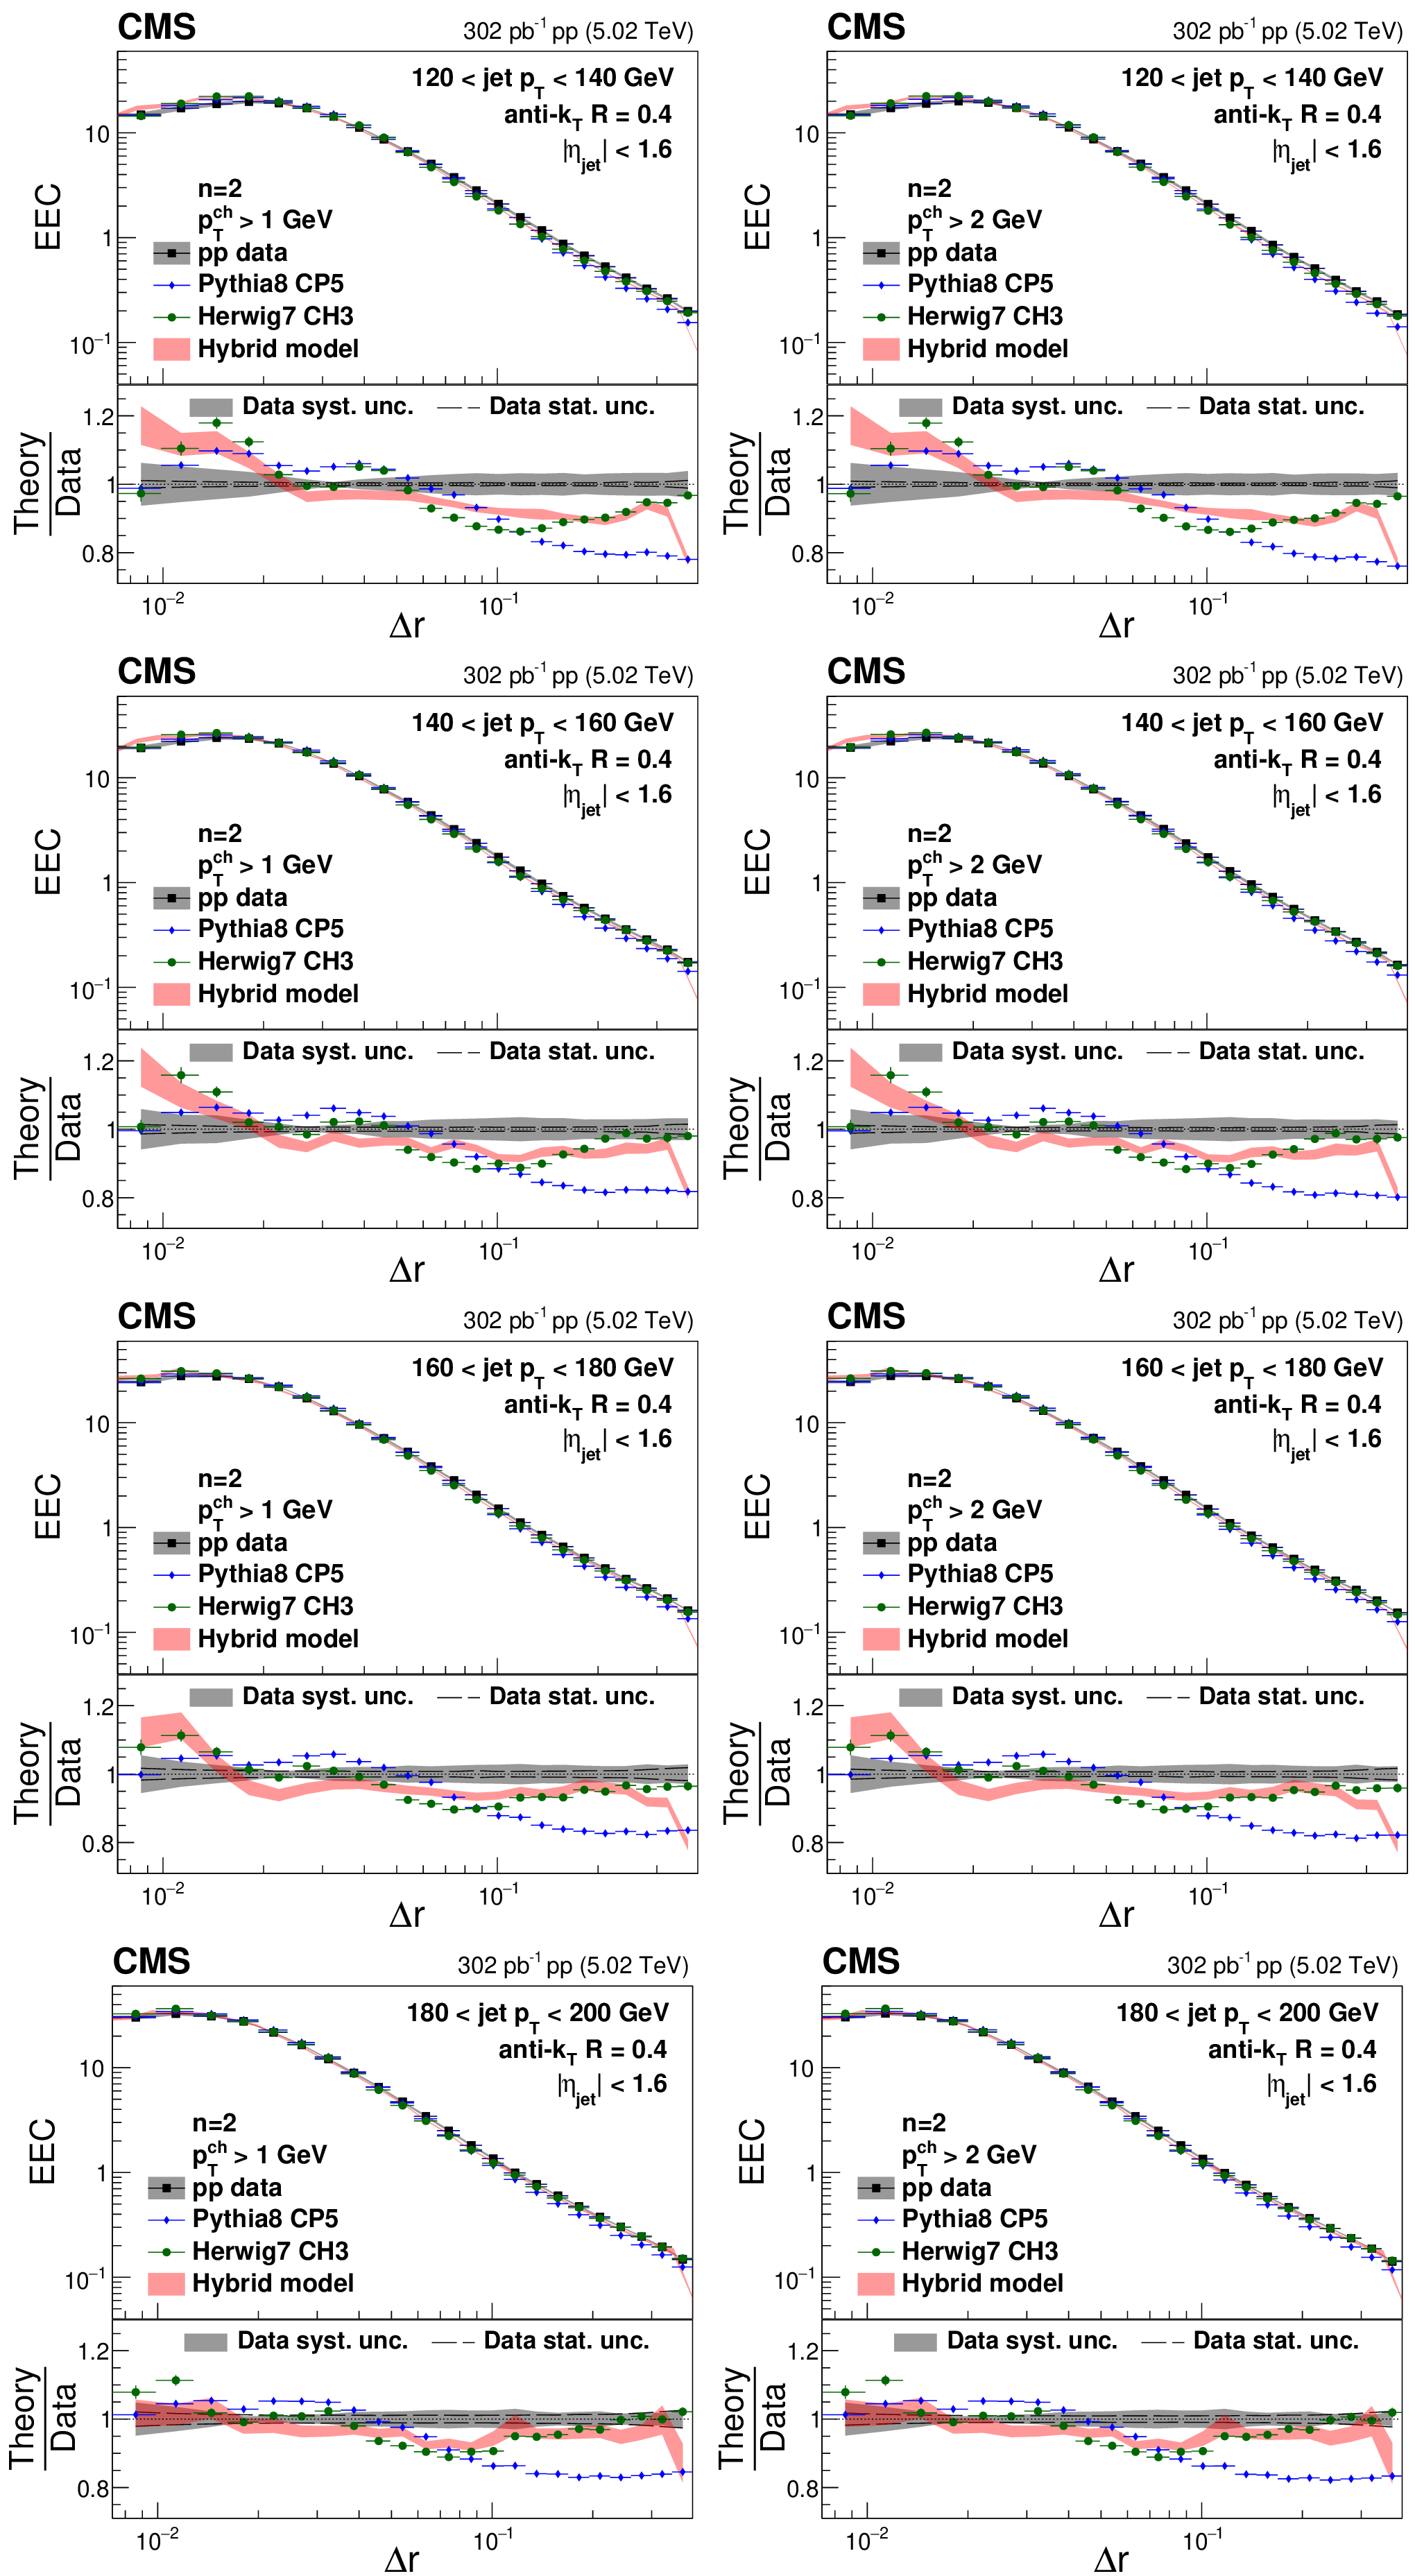
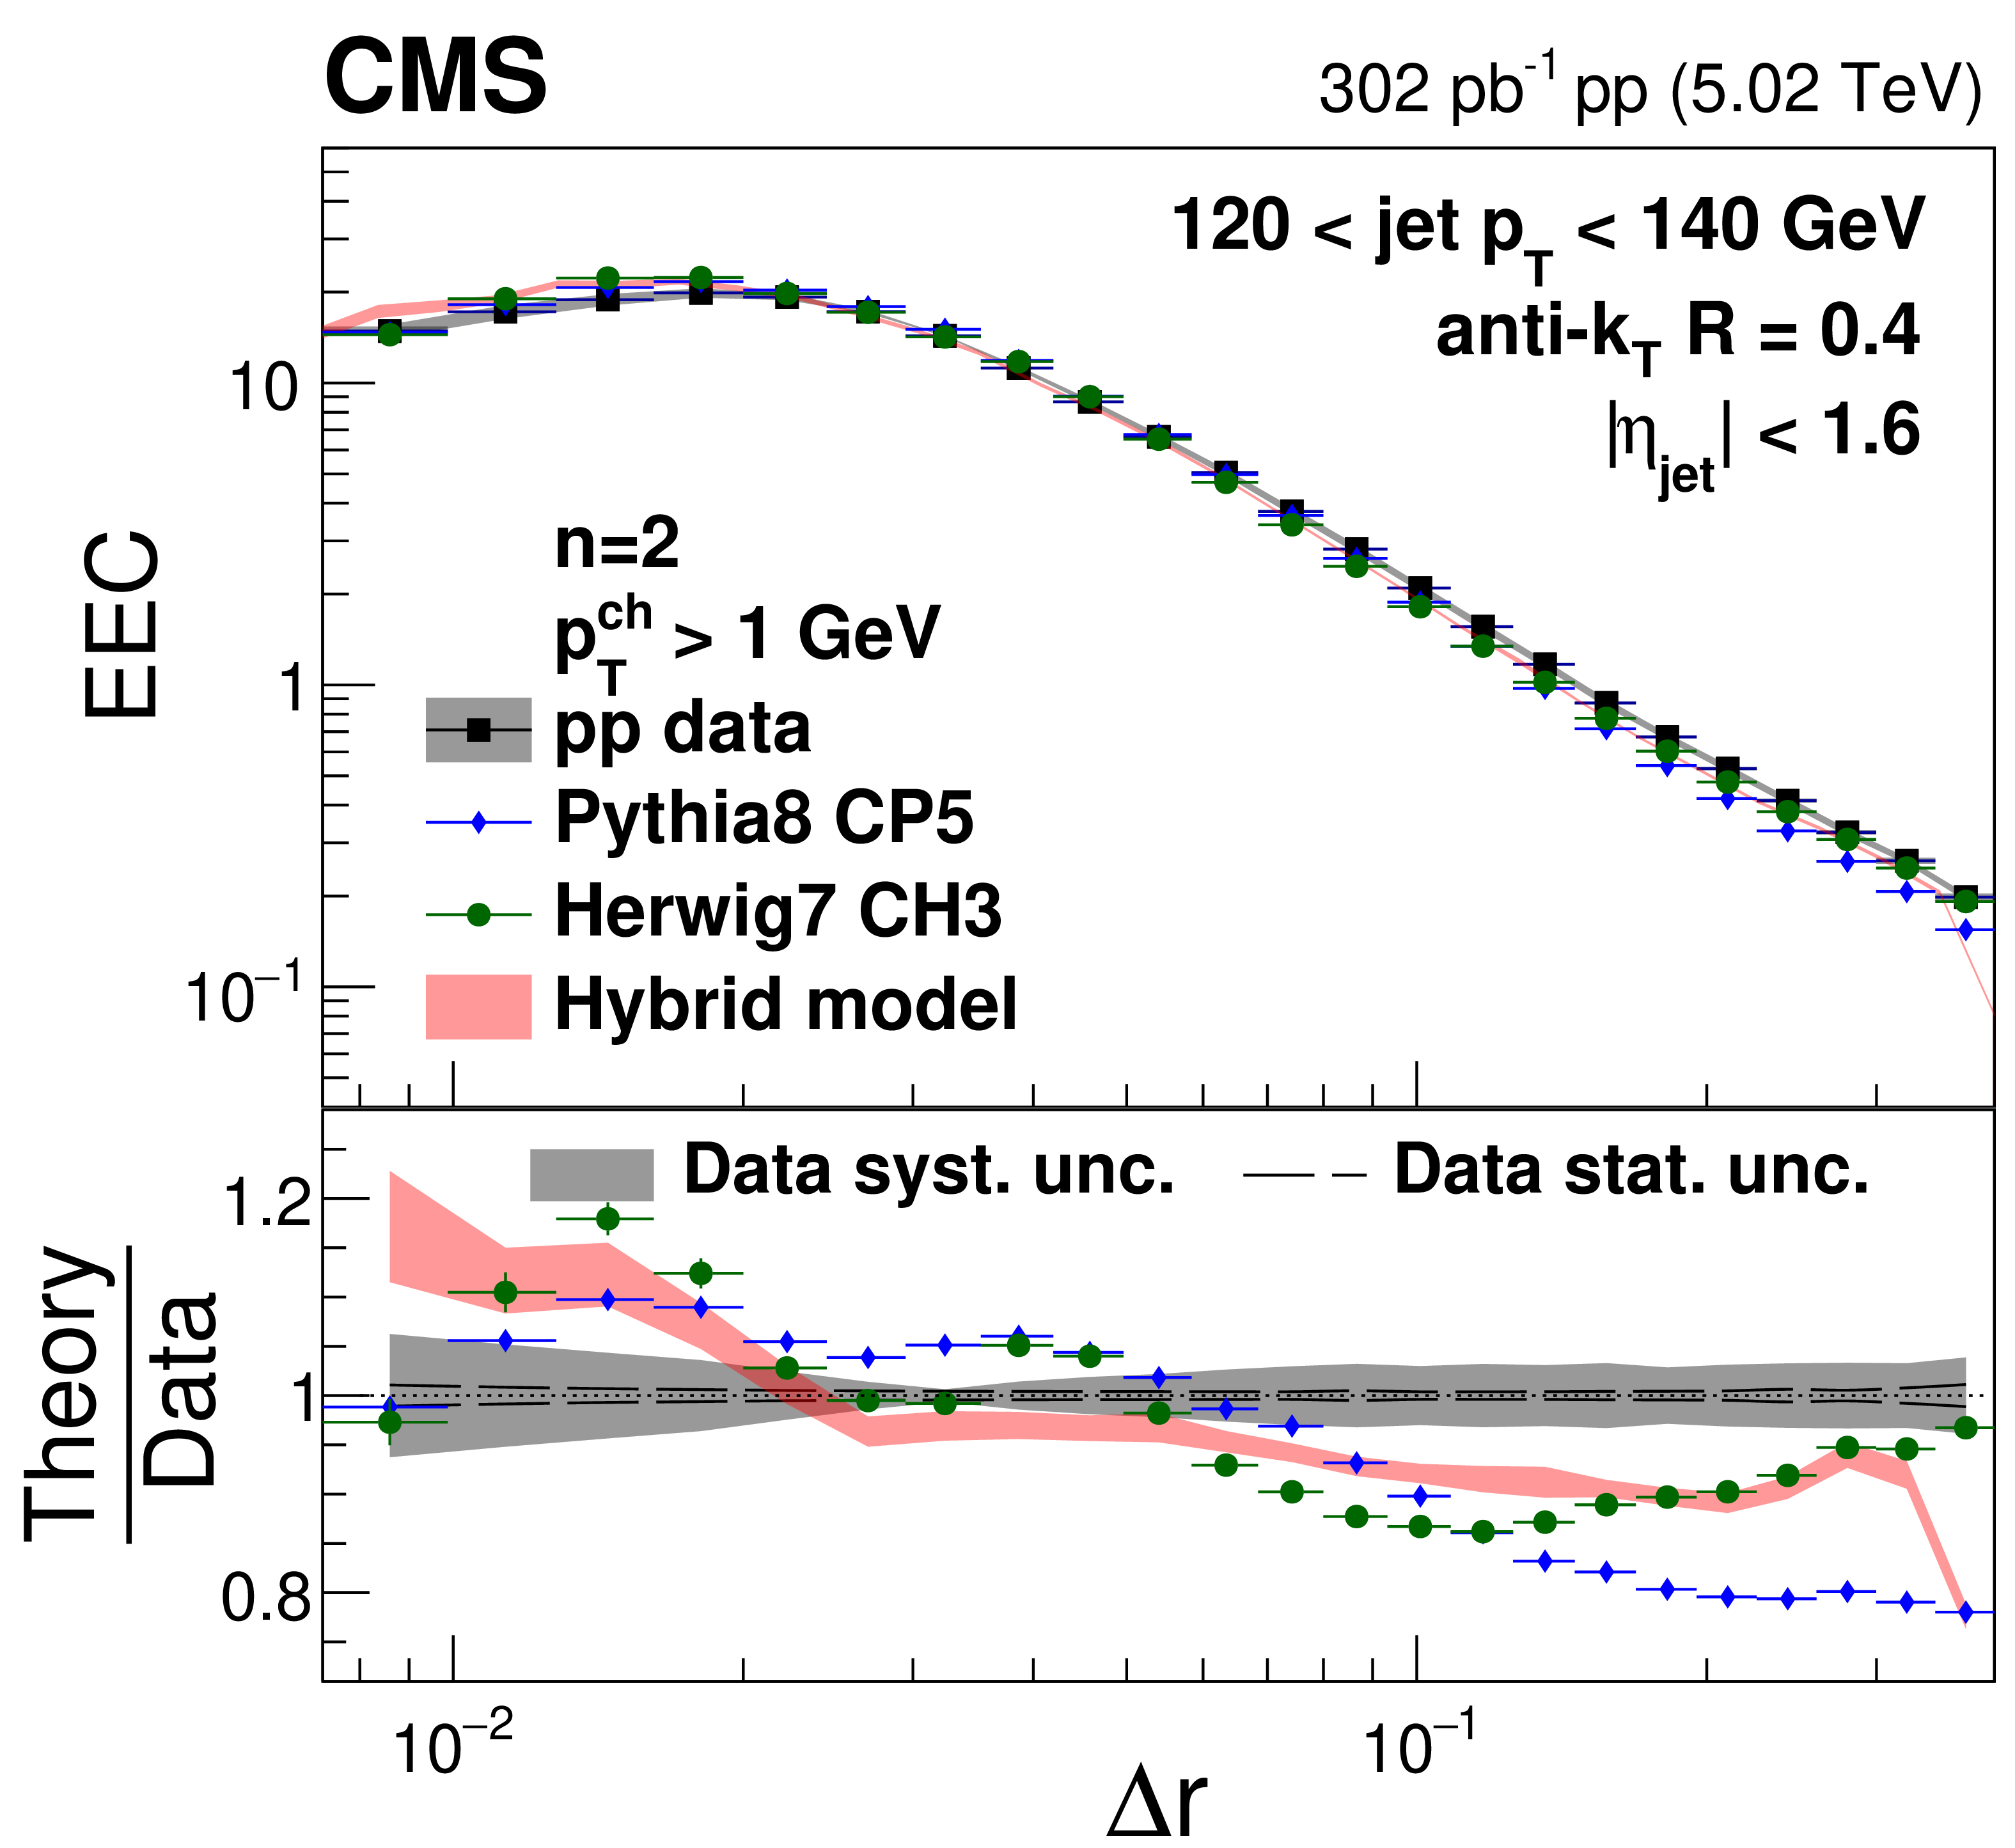
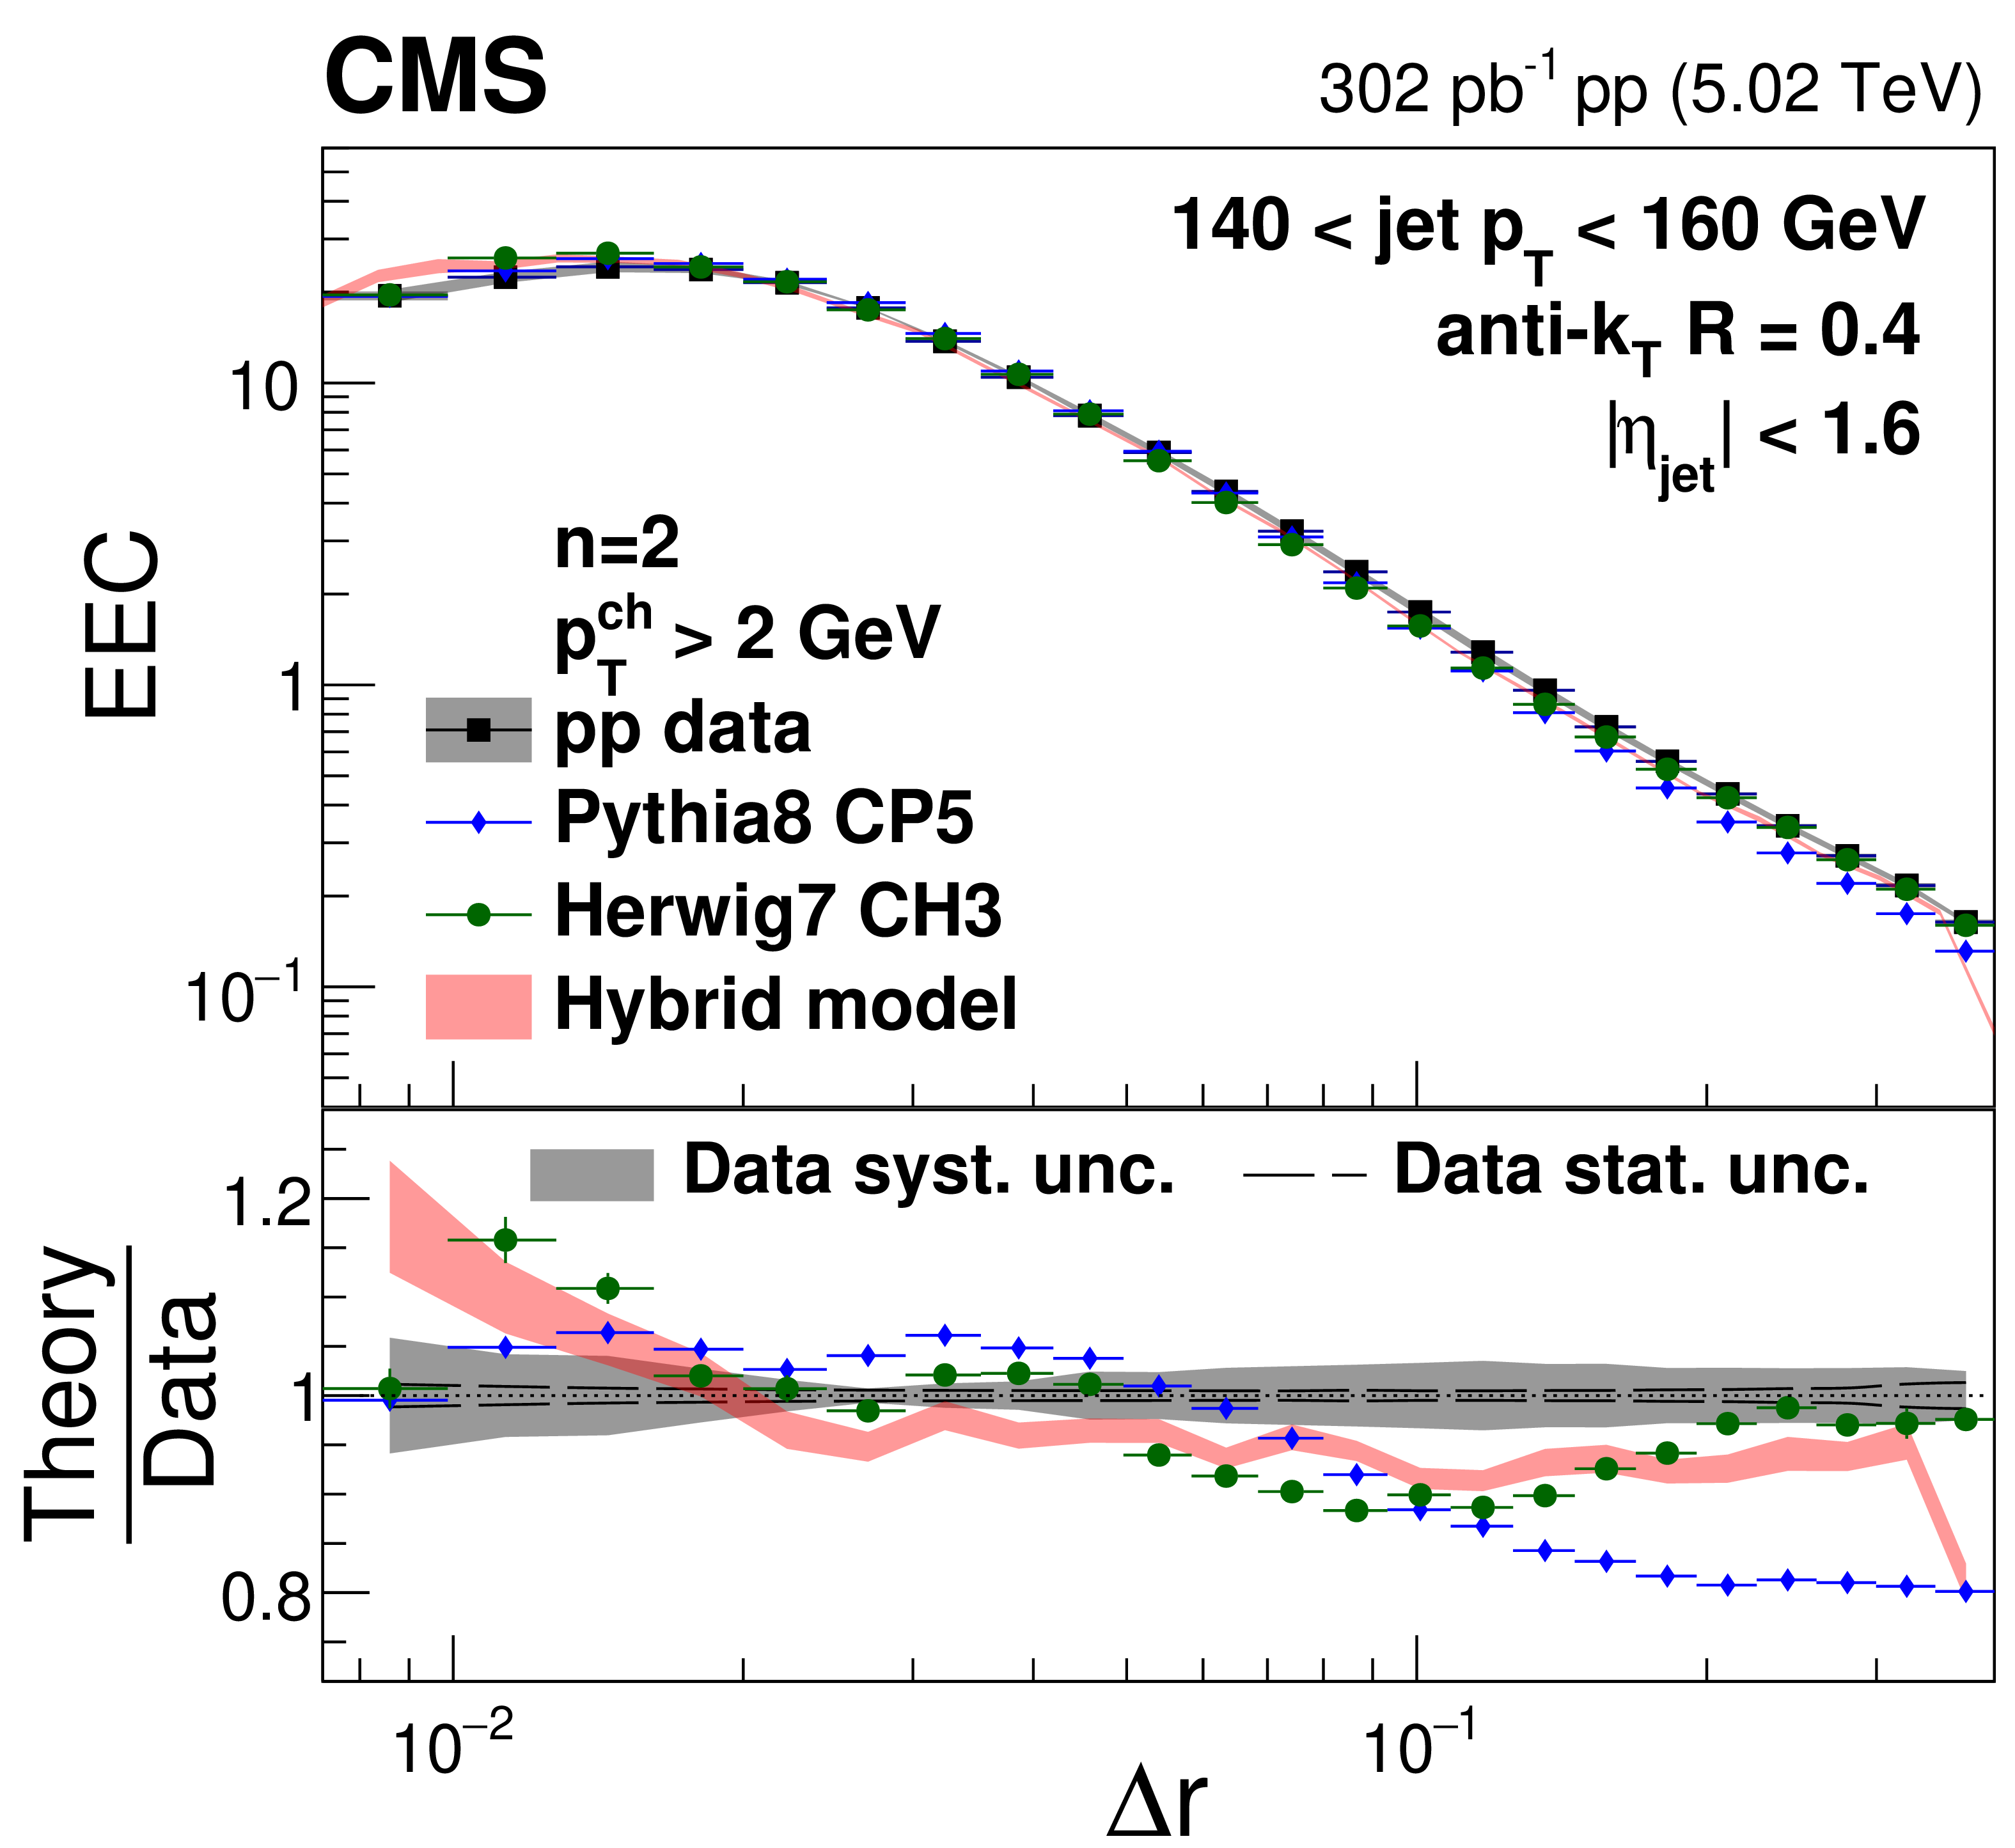
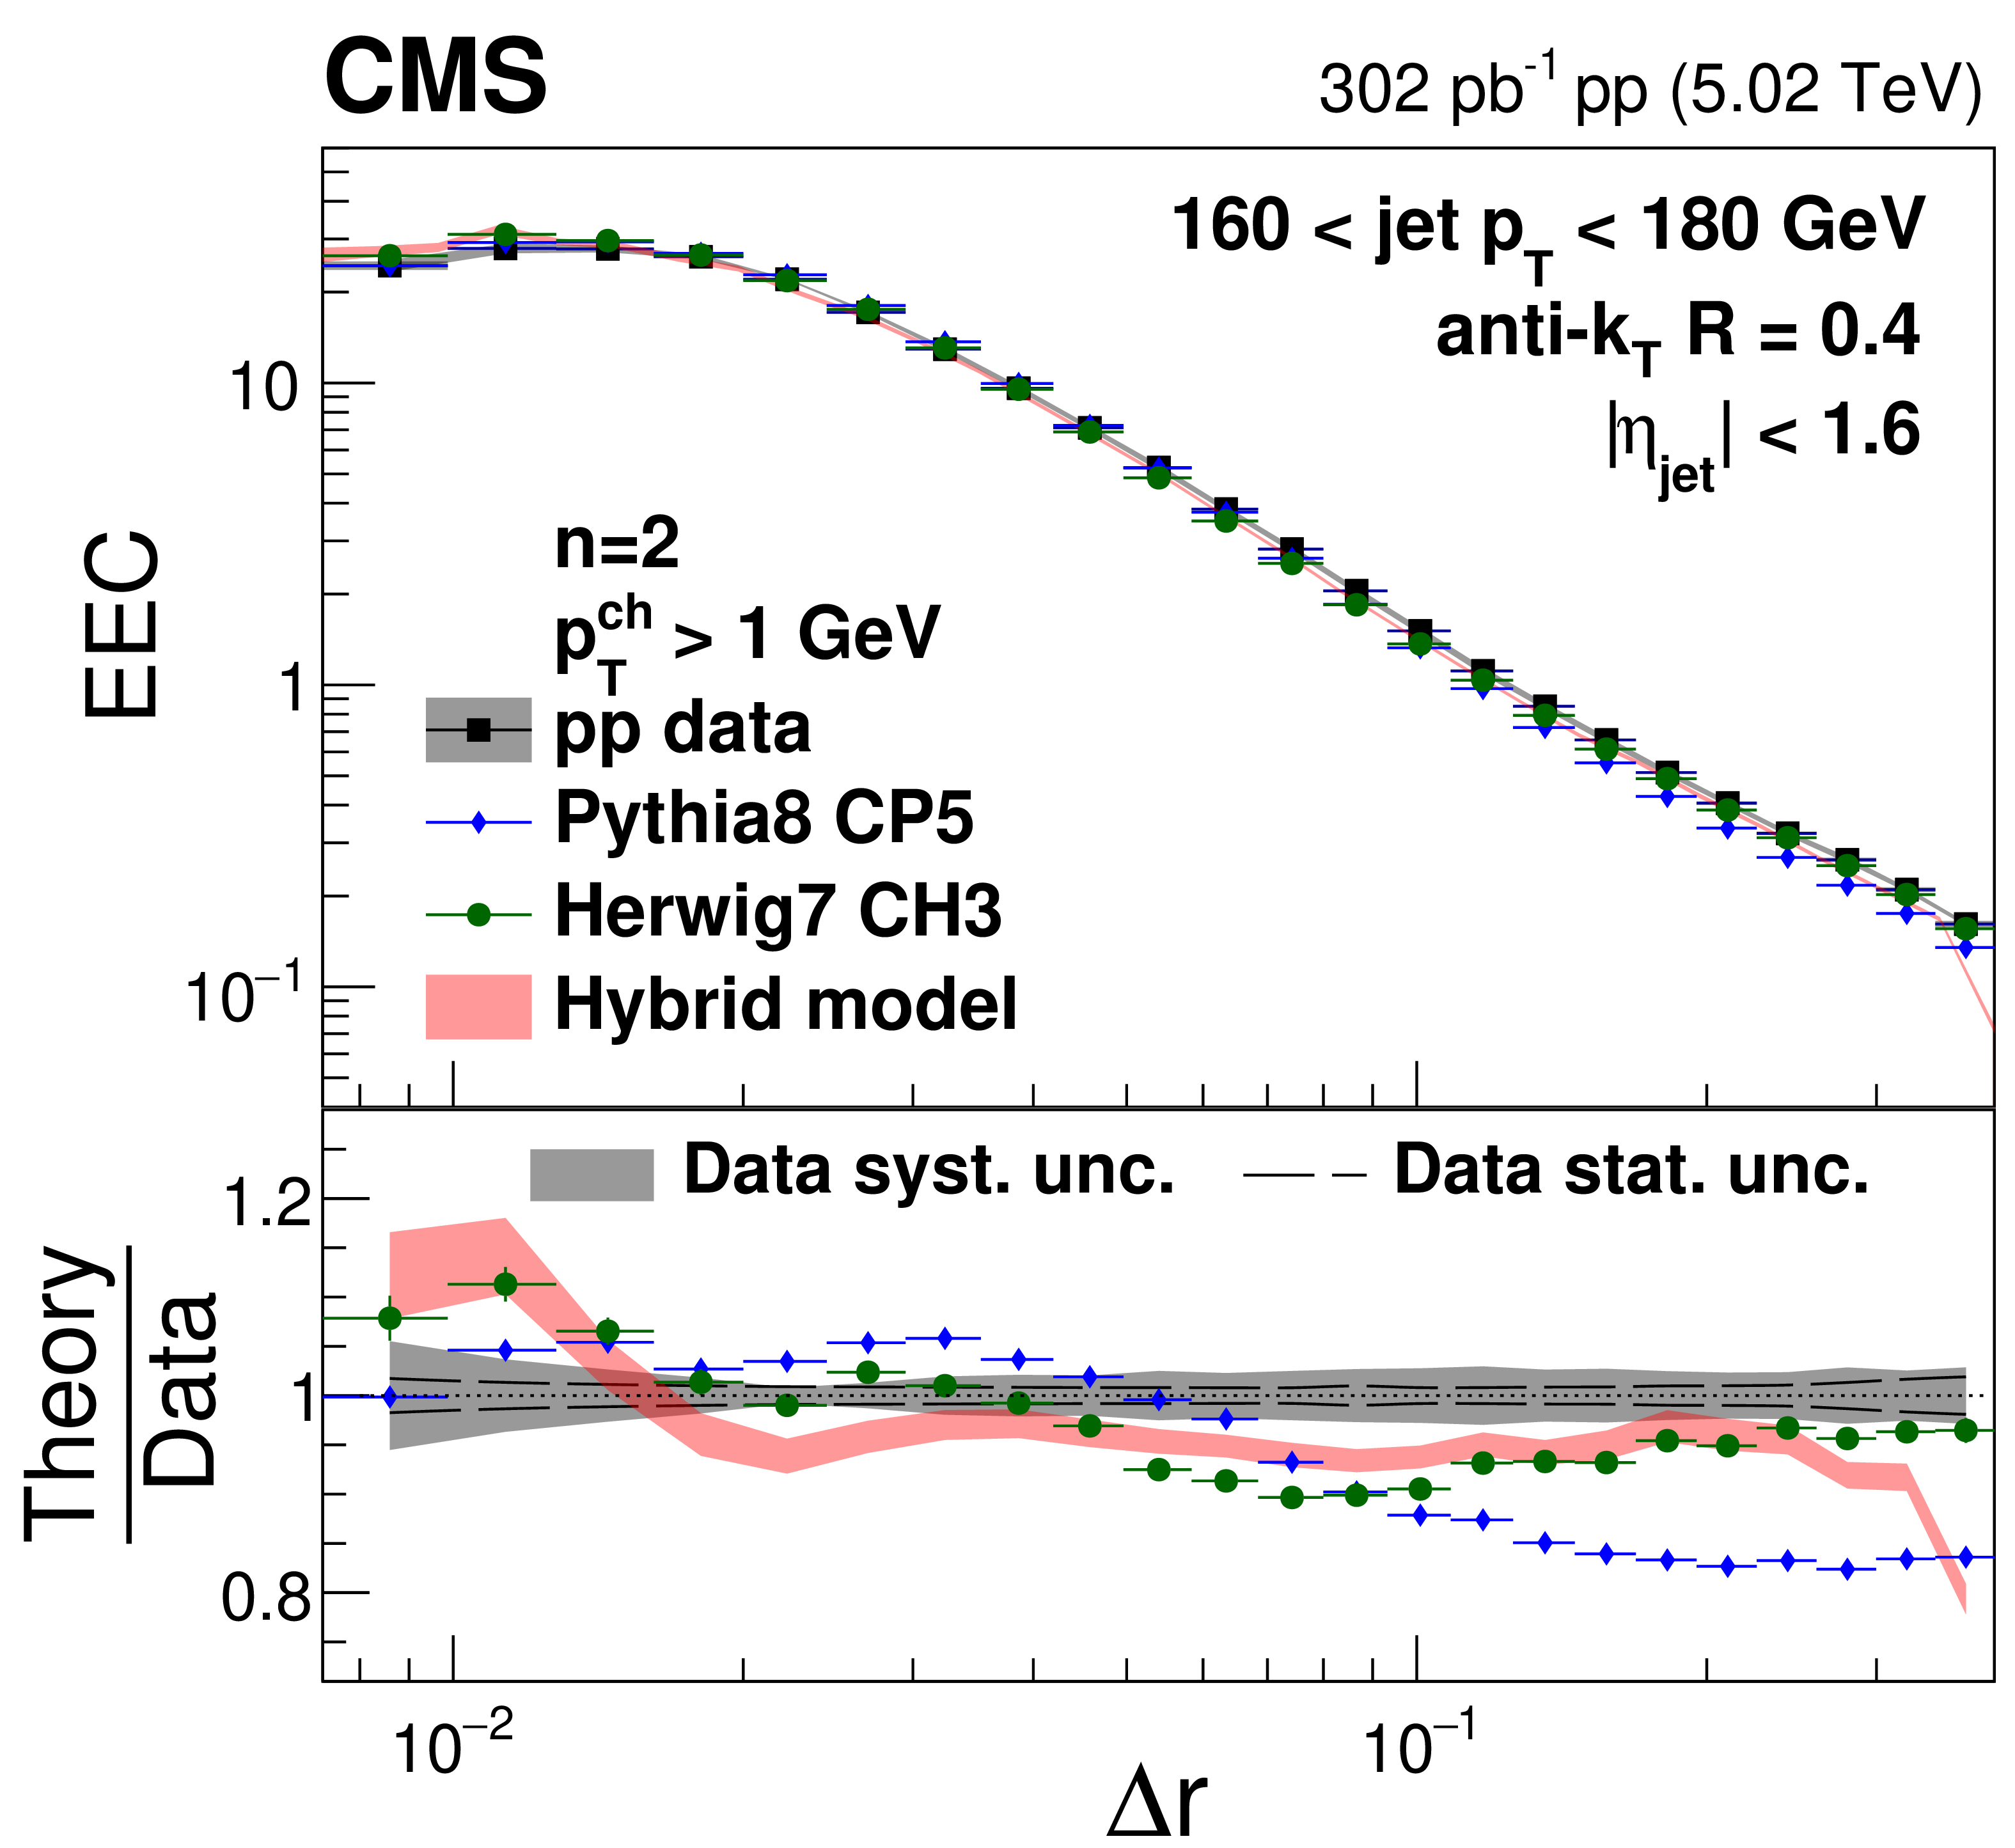
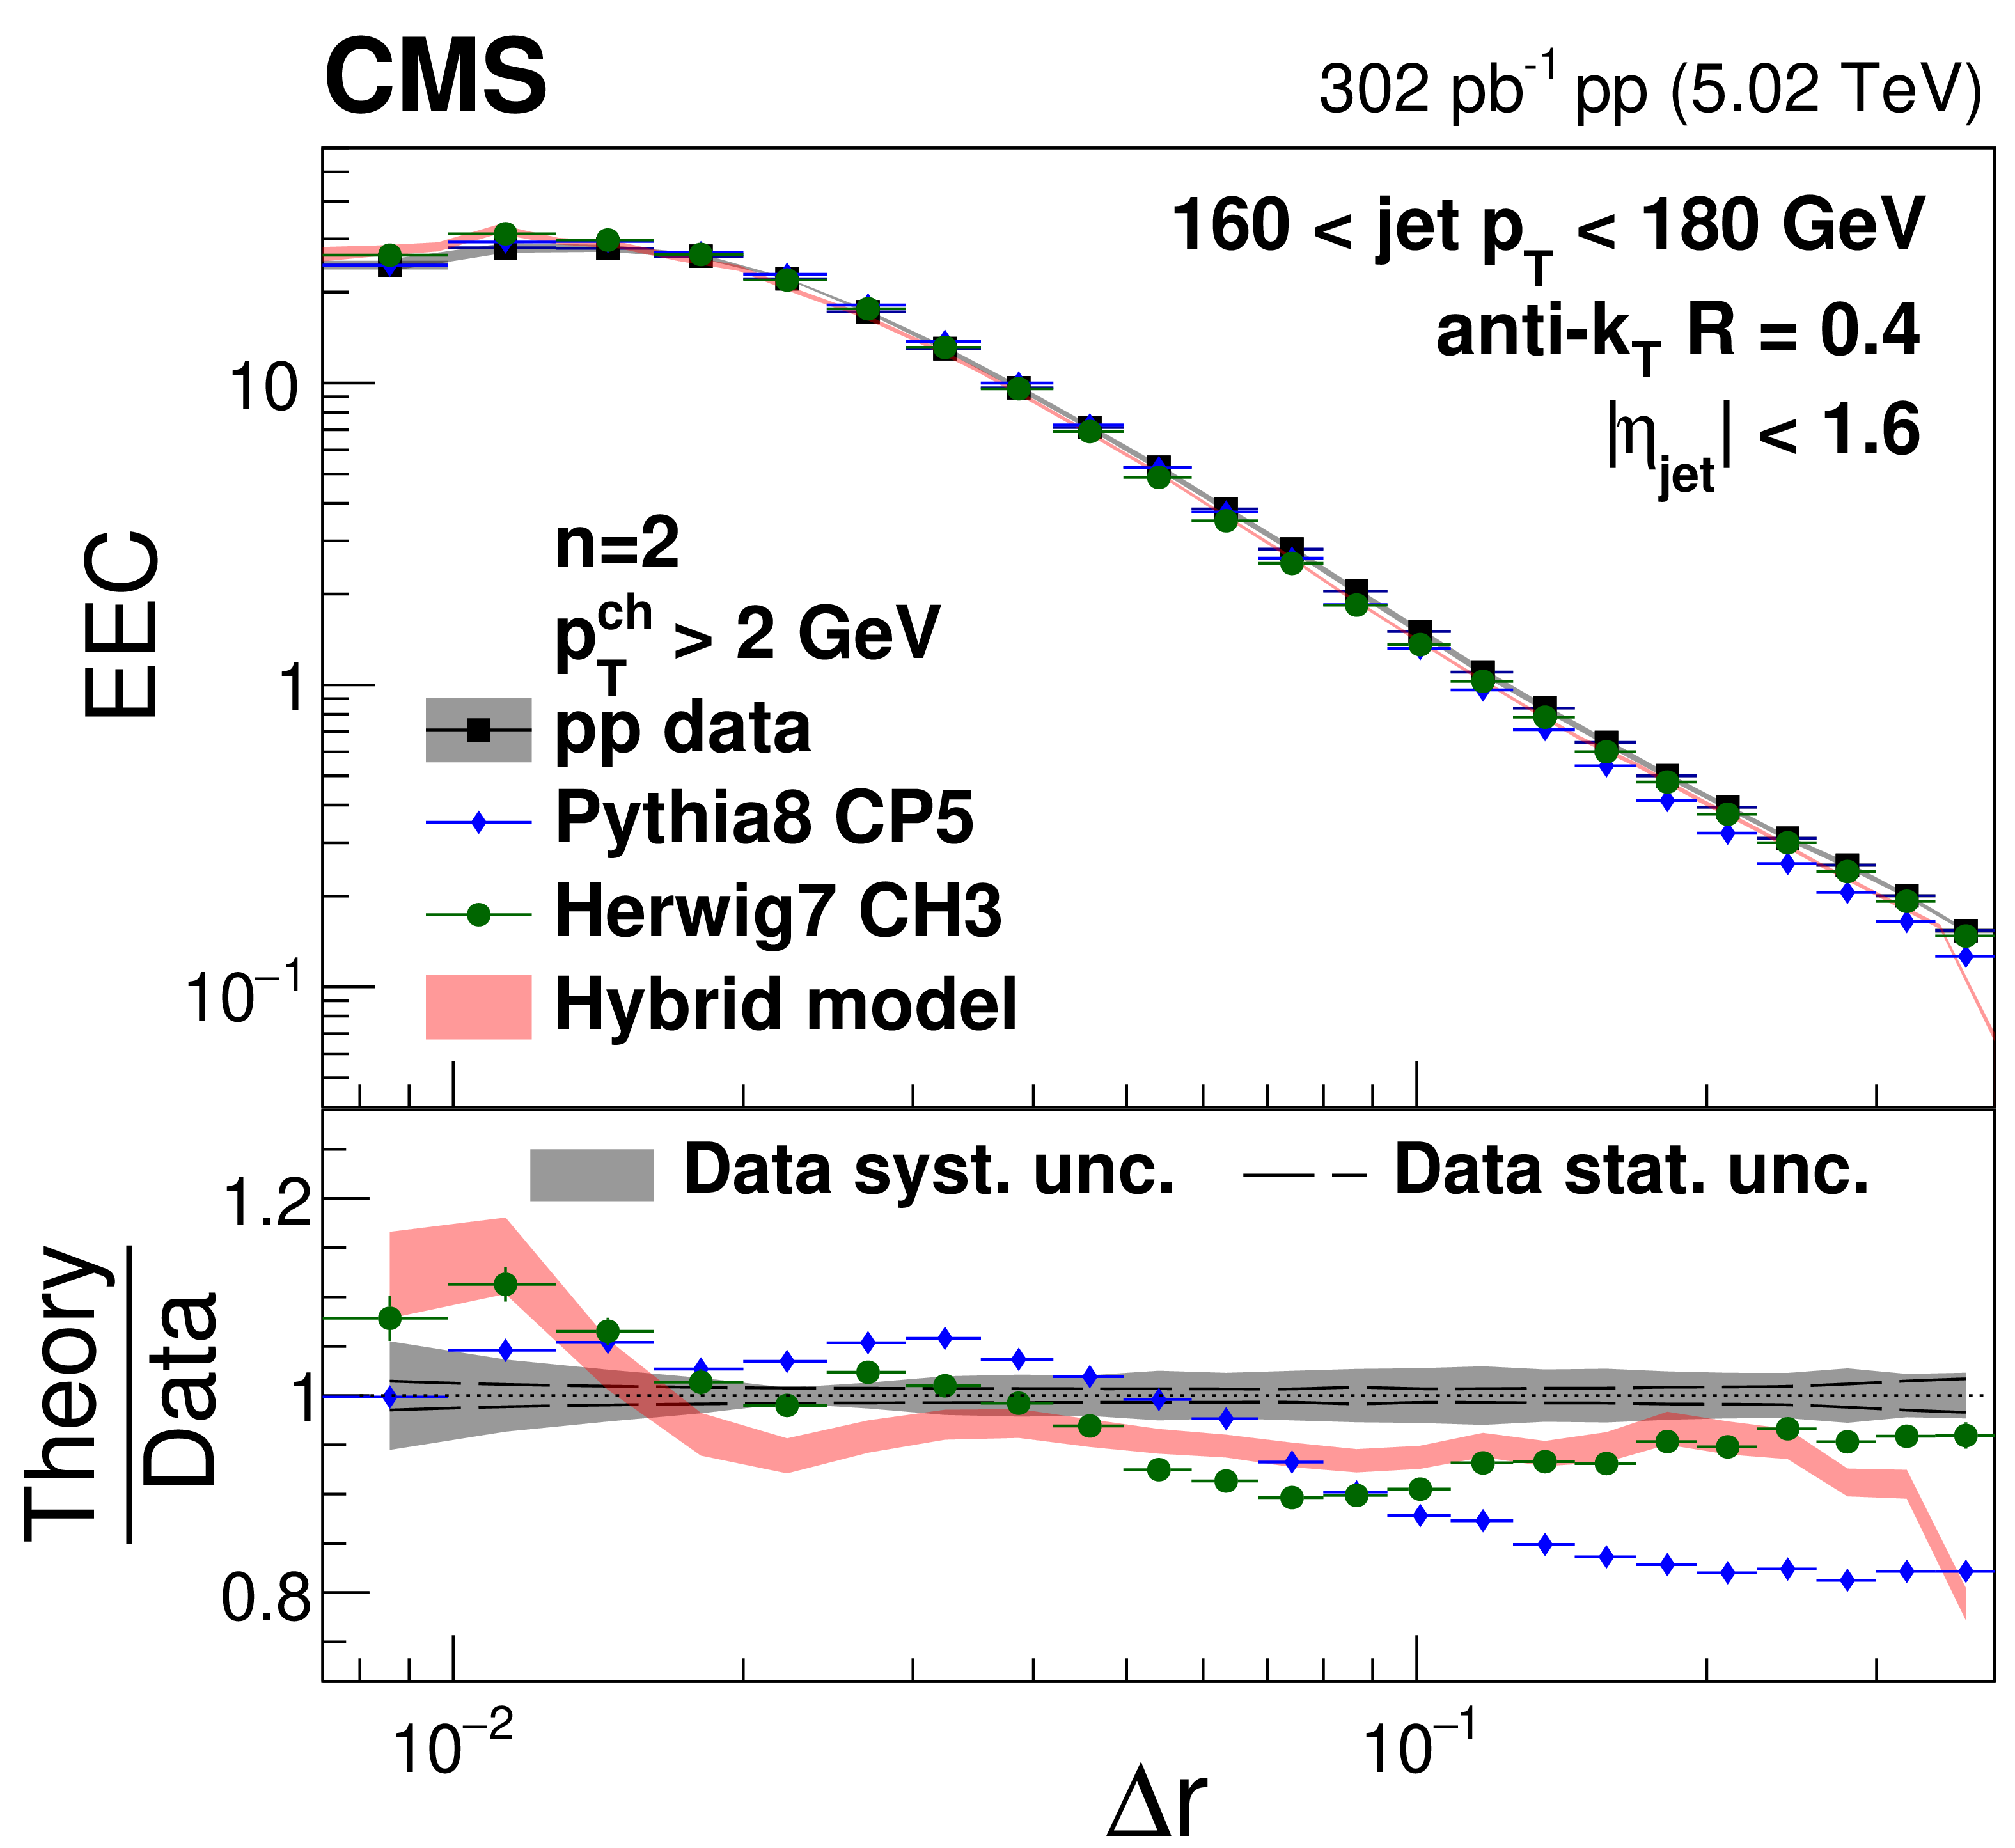
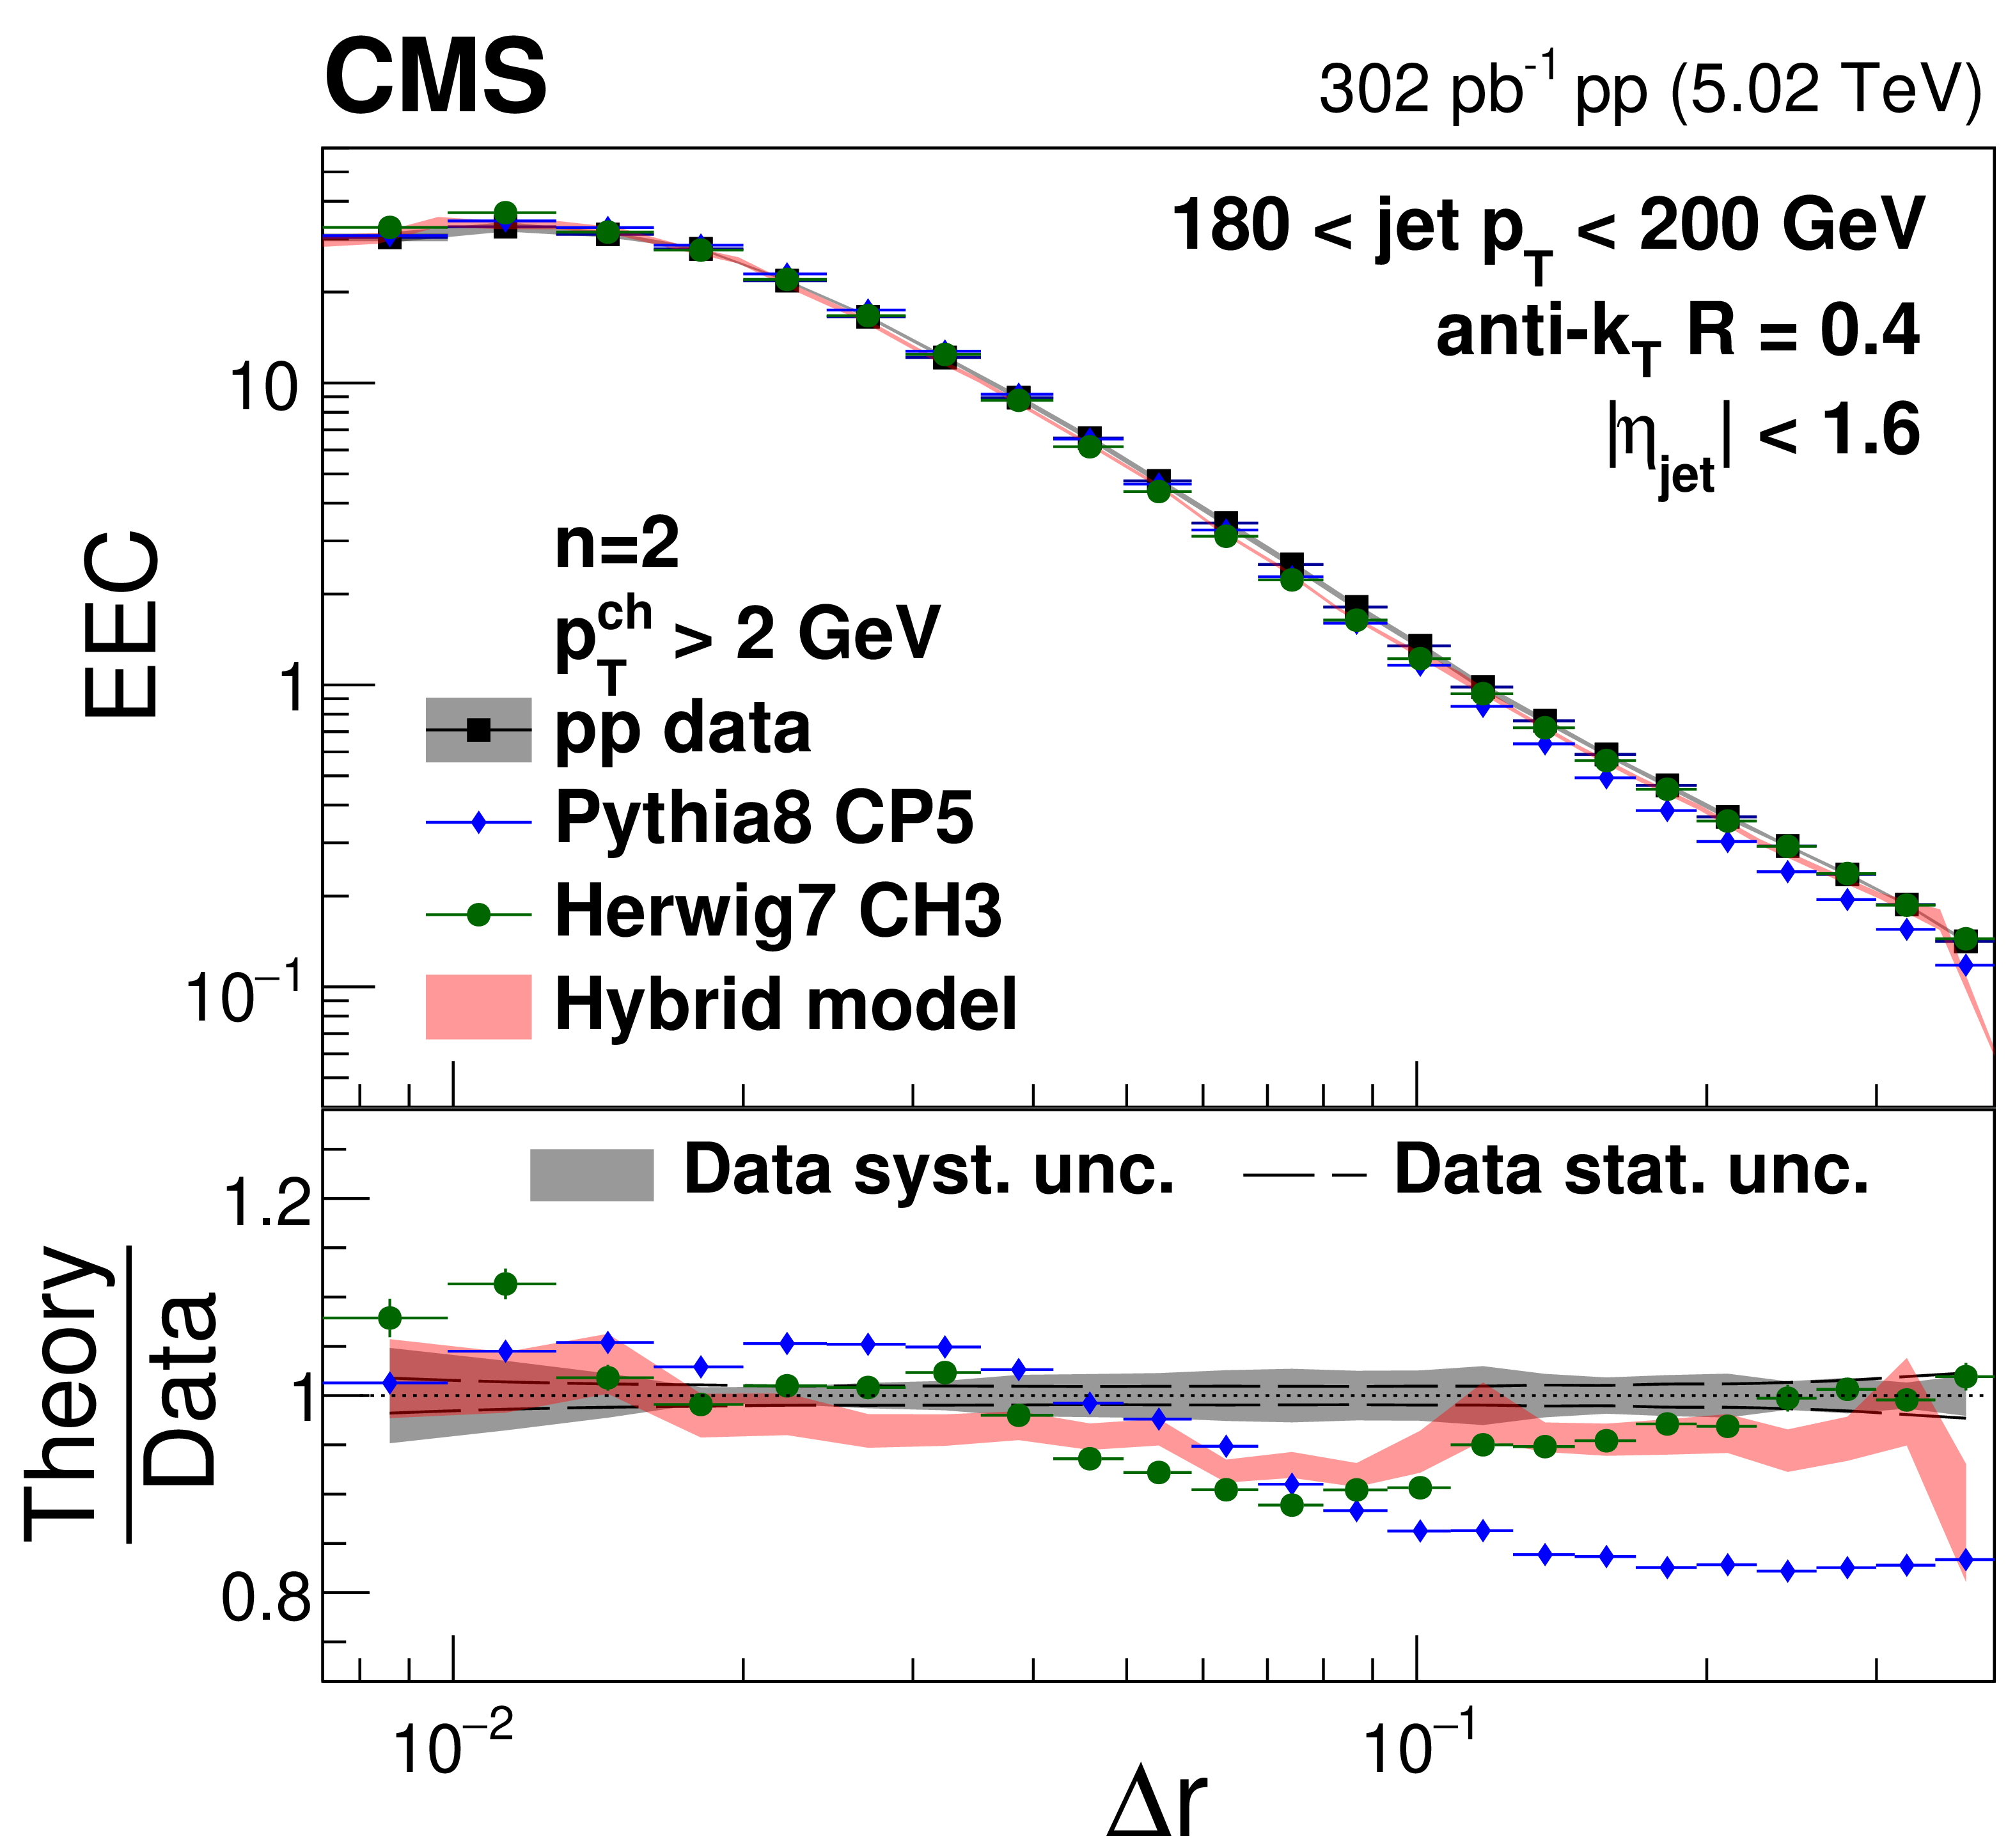
Energy-energy correlator distributions from pp collisions with $ n= $ 2 in different $ p_{\mathrm{T}}^{\text{ch}} $ and $ p_{\text{T,jet}} $ bins compared to predictions from PYTHIA, HERWIG, and the hybrid model. |
png pdf |
Figure 12-a:
Energy-energy correlator distributions from pp collisions with $ n= $ 2 in different $ p_{\mathrm{T}}^{\text{ch}} $ and $ p_{\text{T,jet}} $ bins compared to predictions from PYTHIA, HERWIG, and the hybrid model. |

png pdf |
Figure 12-b:
Energy-energy correlator distributions from pp collisions with $ n= $ 2 in different $ p_{\mathrm{T}}^{\text{ch}} $ and $ p_{\text{T,jet}} $ bins compared to predictions from PYTHIA, HERWIG, and the hybrid model. |

png pdf |
Figure 12-c:
Energy-energy correlator distributions from pp collisions with $ n= $ 2 in different $ p_{\mathrm{T}}^{\text{ch}} $ and $ p_{\text{T,jet}} $ bins compared to predictions from PYTHIA, HERWIG, and the hybrid model. |
png pdf |
Figure 12-d:
Energy-energy correlator distributions from pp collisions with $ n= $ 2 in different $ p_{\mathrm{T}}^{\text{ch}} $ and $ p_{\text{T,jet}} $ bins compared to predictions from PYTHIA, HERWIG, and the hybrid model. |
png pdf |
Figure 12-e:
Energy-energy correlator distributions from pp collisions with $ n= $ 2 in different $ p_{\mathrm{T}}^{\text{ch}} $ and $ p_{\text{T,jet}} $ bins compared to predictions from PYTHIA, HERWIG, and the hybrid model. |
png pdf |
Figure 12-f:
Energy-energy correlator distributions from pp collisions with $ n= $ 2 in different $ p_{\mathrm{T}}^{\text{ch}} $ and $ p_{\text{T,jet}} $ bins compared to predictions from PYTHIA, HERWIG, and the hybrid model. |

png pdf |
Figure 12-g:
Energy-energy correlator distributions from pp collisions with $ n= $ 2 in different $ p_{\mathrm{T}}^{\text{ch}} $ and $ p_{\text{T,jet}} $ bins compared to predictions from PYTHIA, HERWIG, and the hybrid model. |
png pdf |
Figure 12-h:
Energy-energy correlator distributions from pp collisions with $ n= $ 2 in different $ p_{\mathrm{T}}^{\text{ch}} $ and $ p_{\text{T,jet}} $ bins compared to predictions from PYTHIA, HERWIG, and the hybrid model. |
png pdf |
Figure 13:
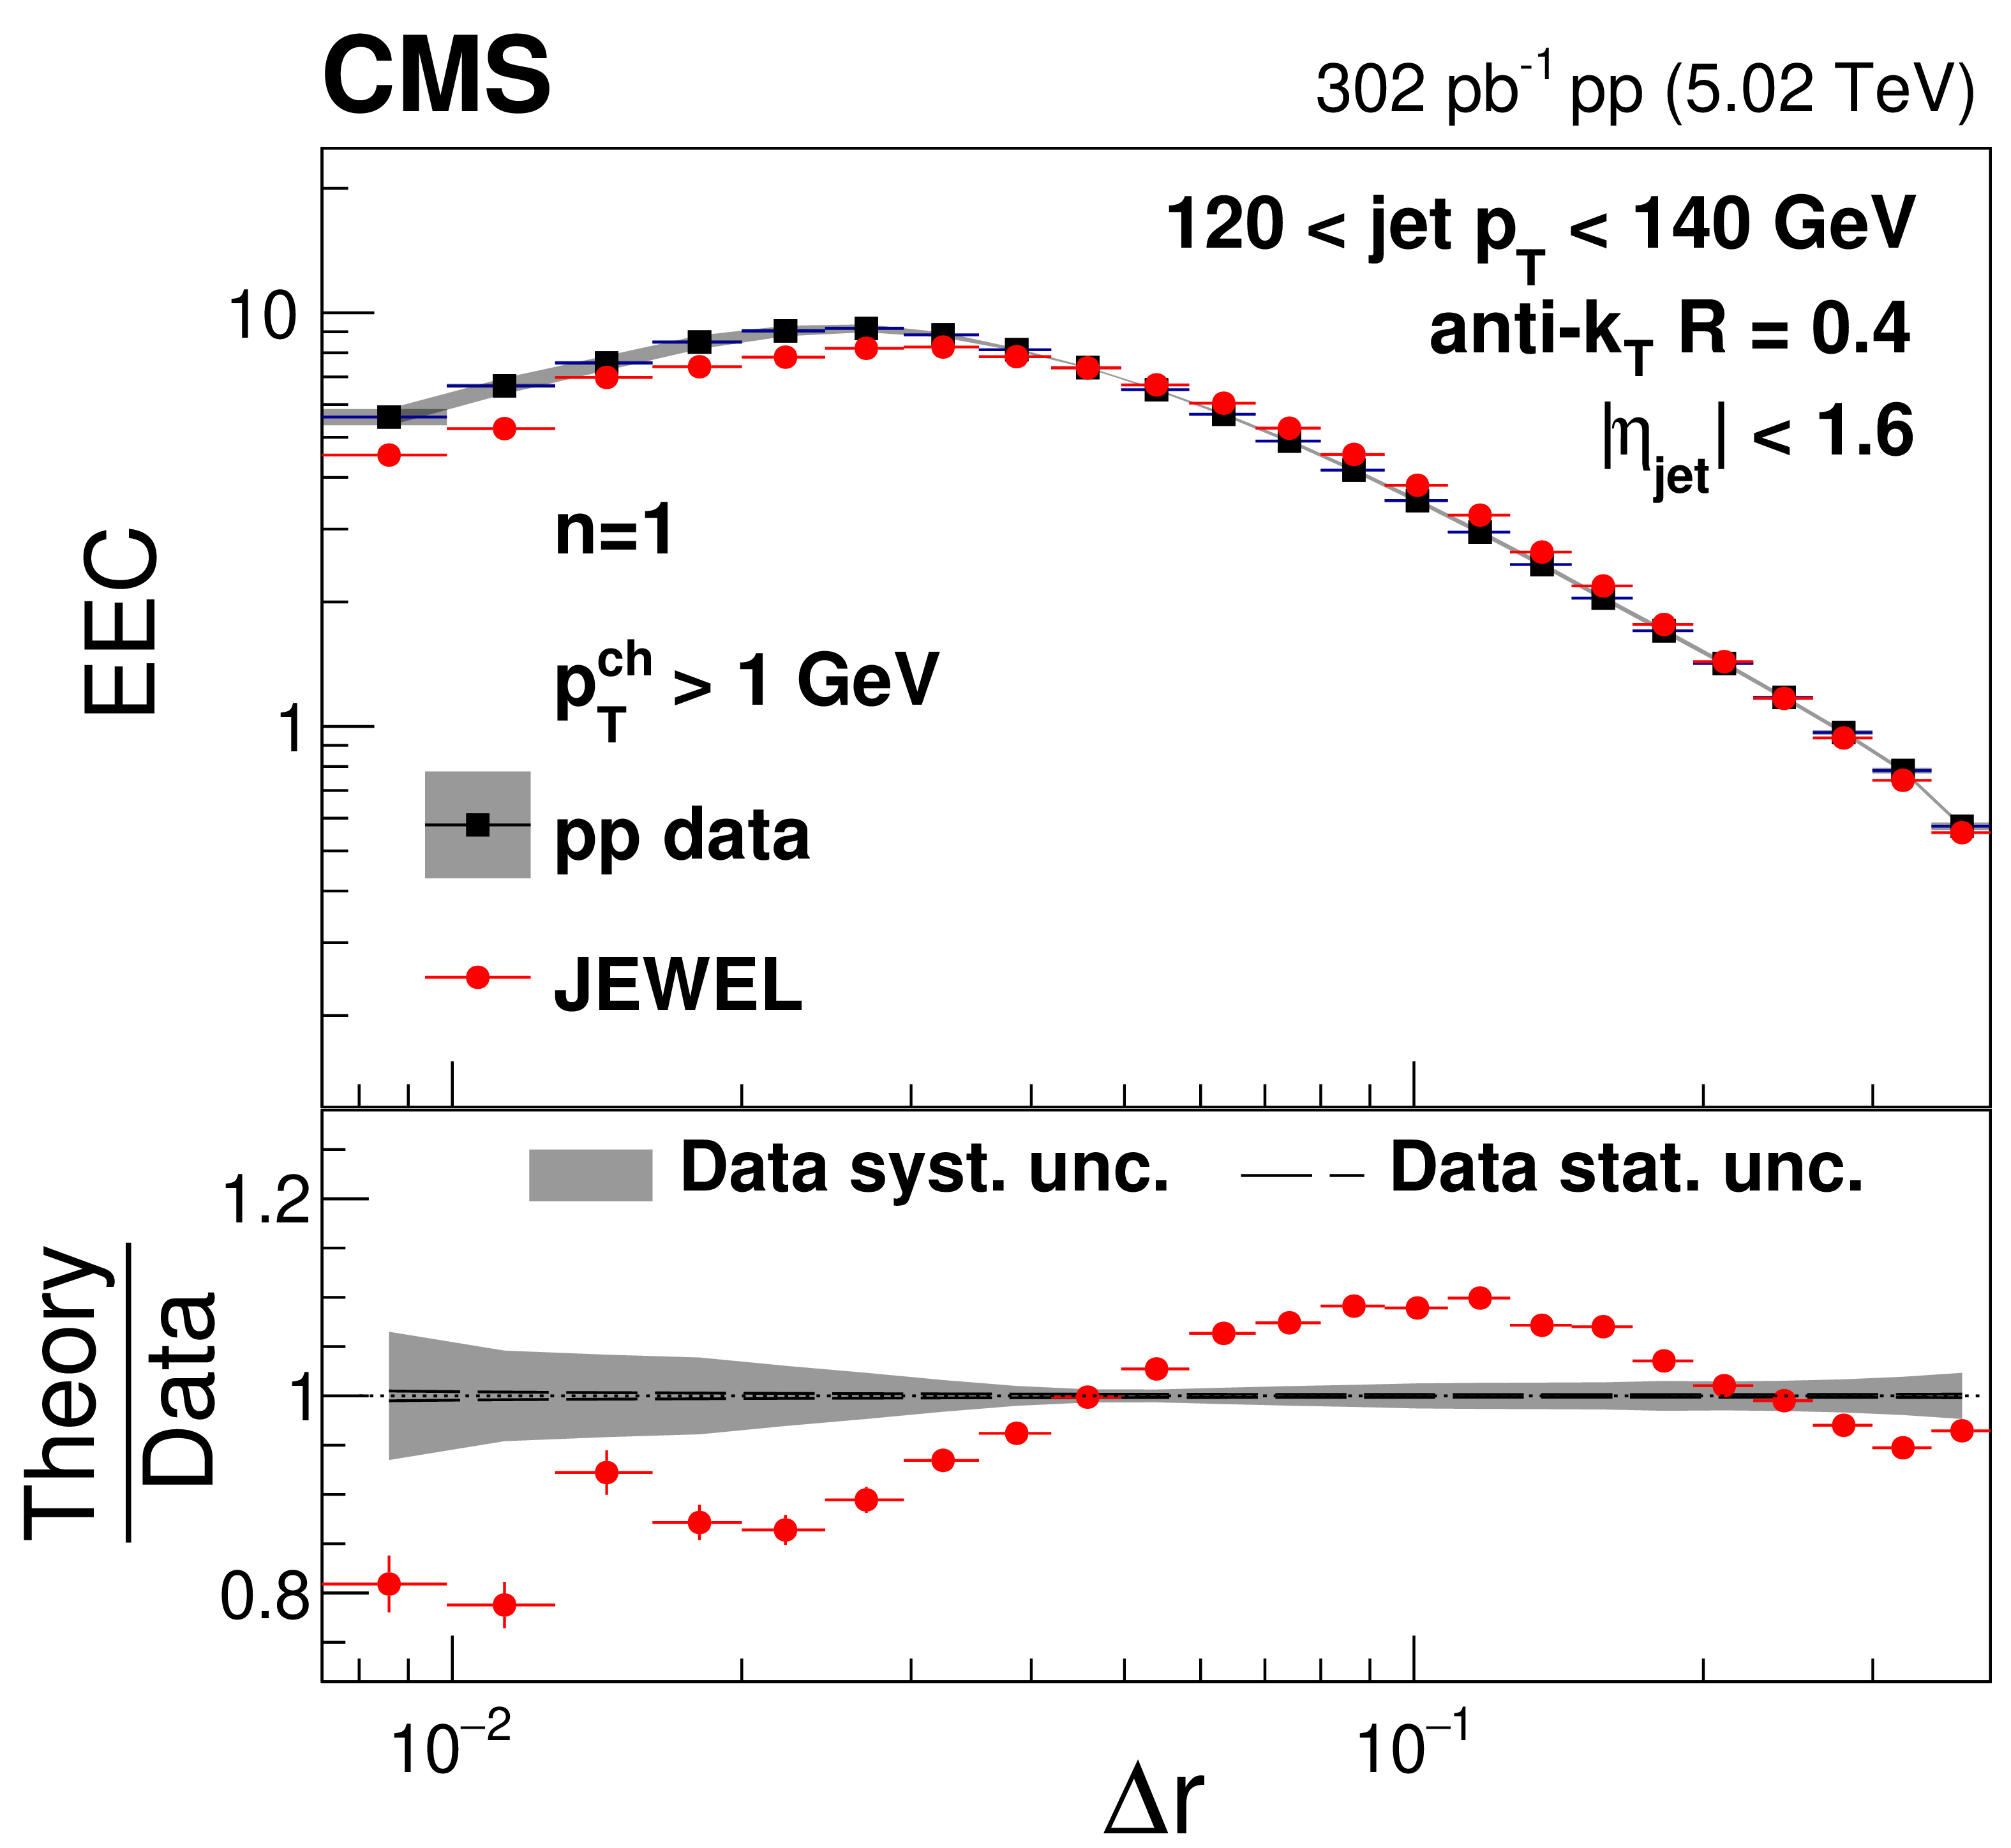
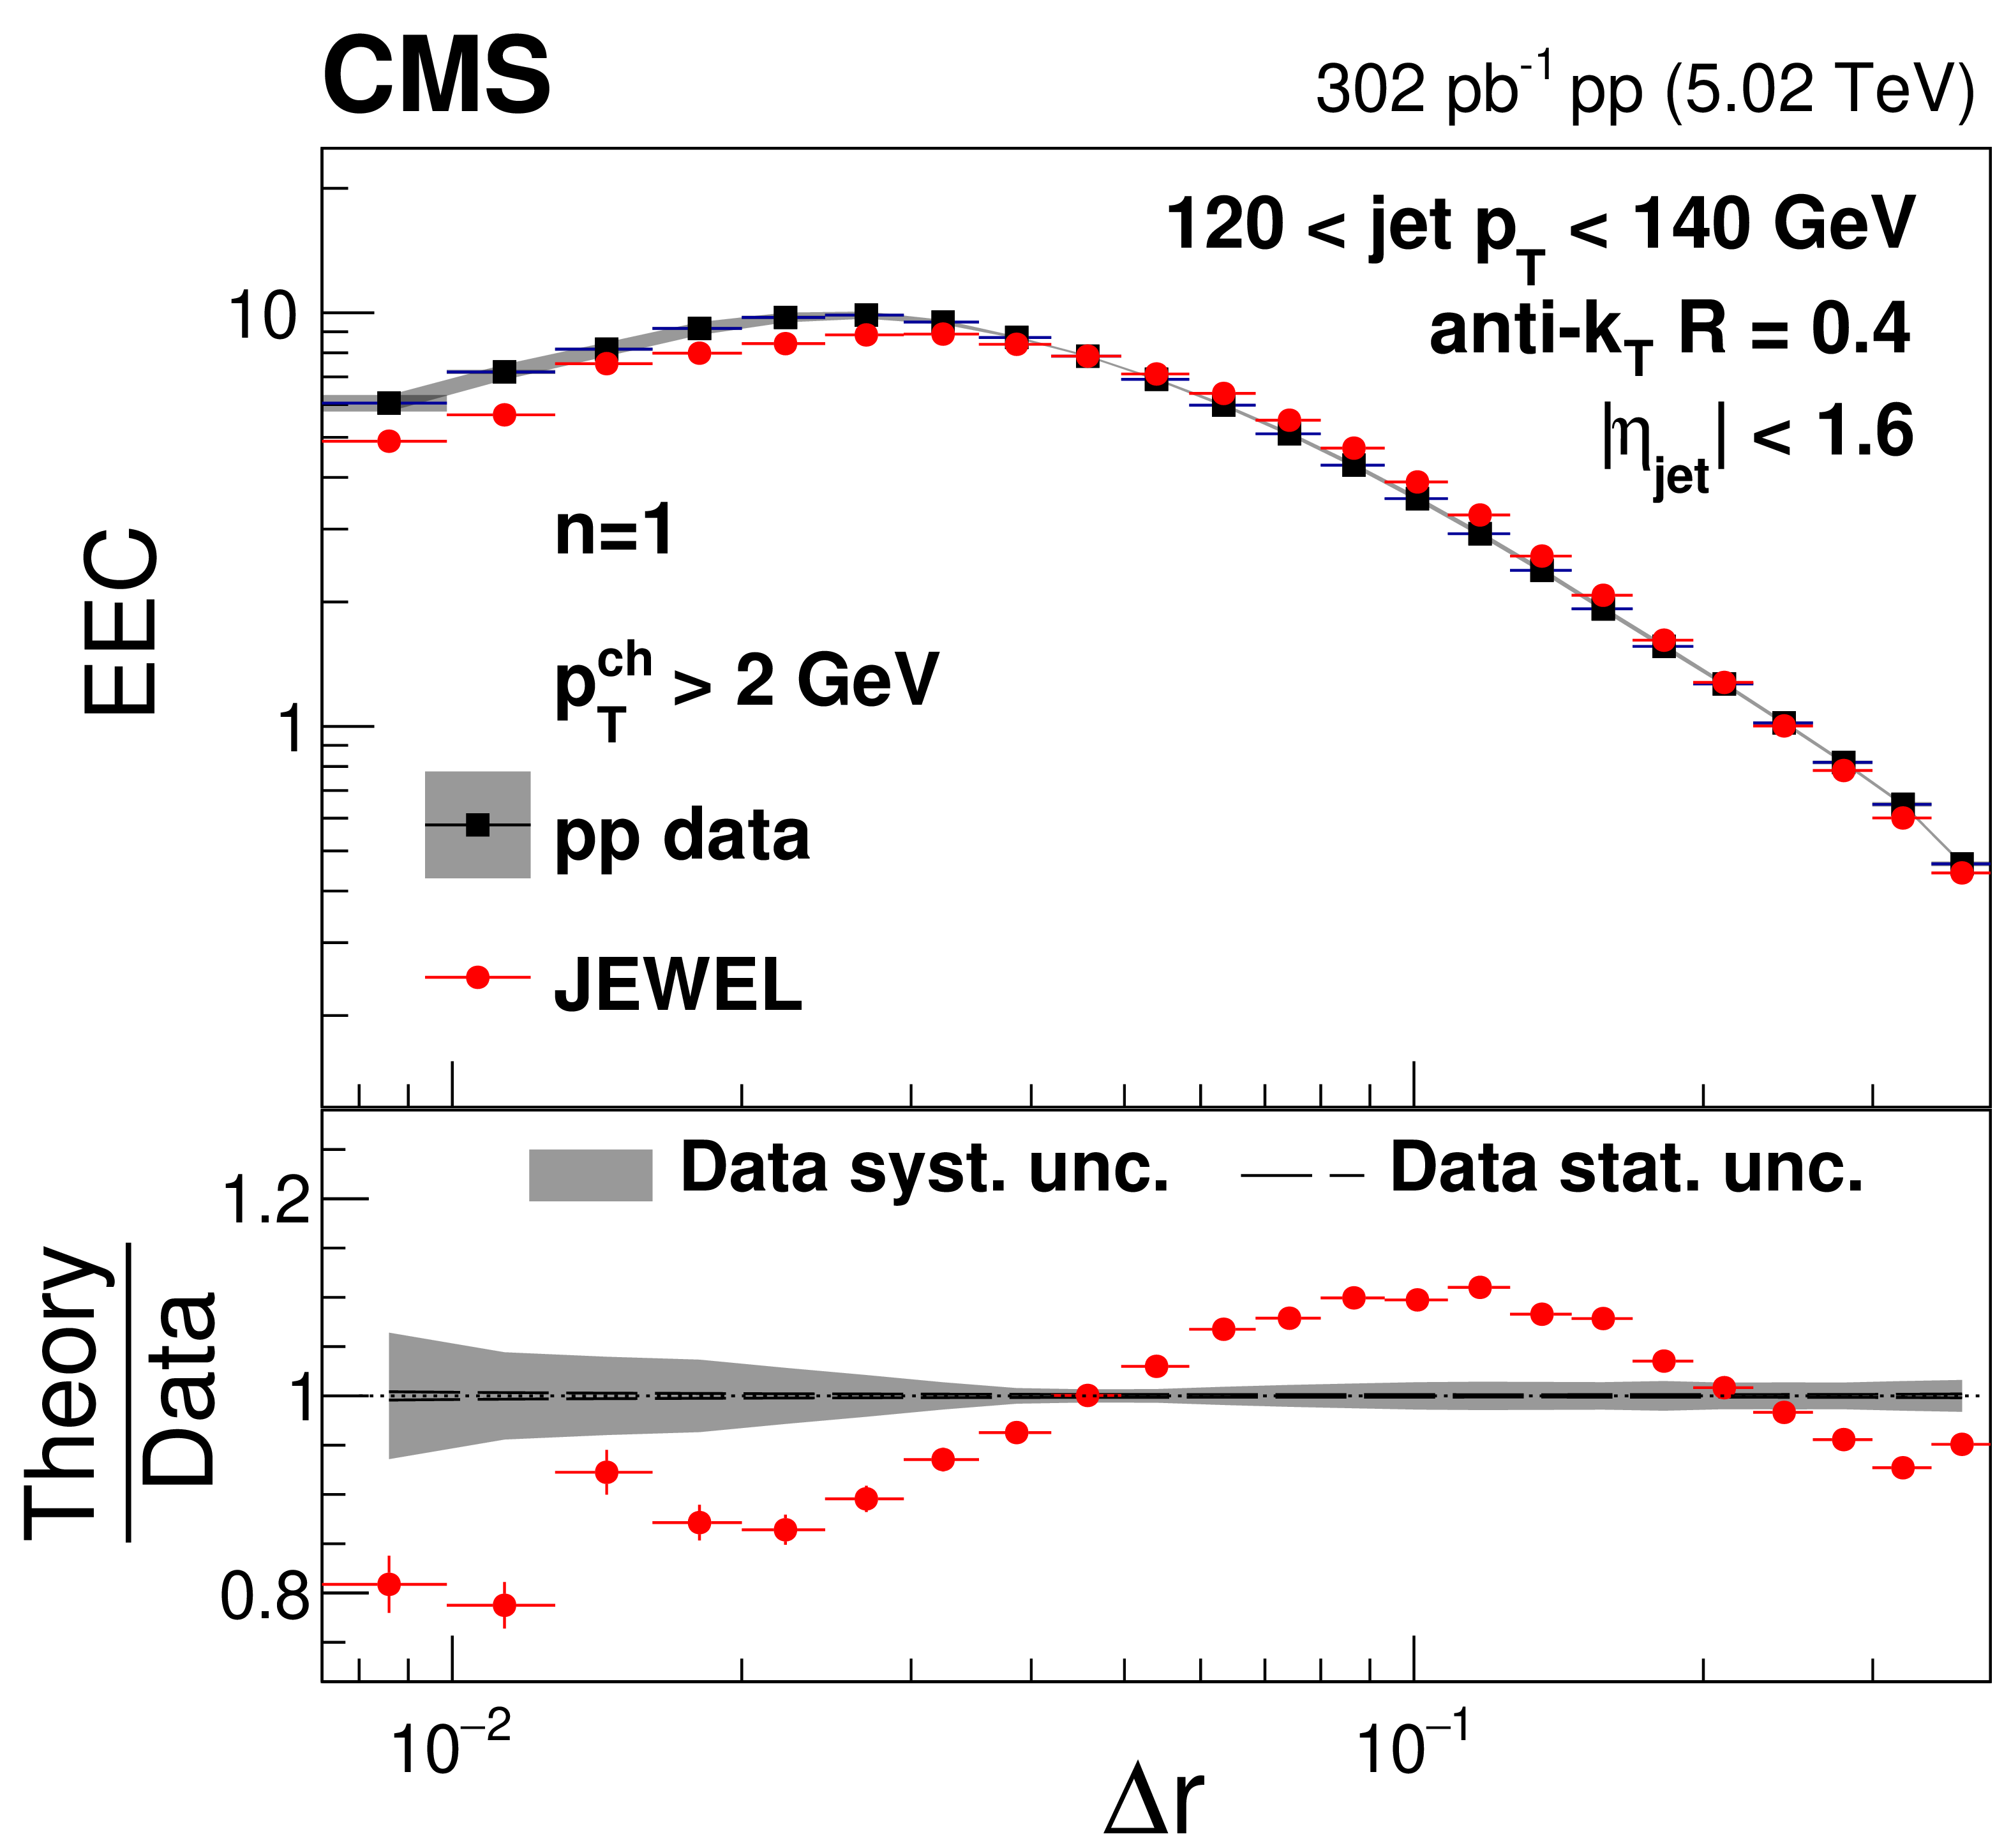
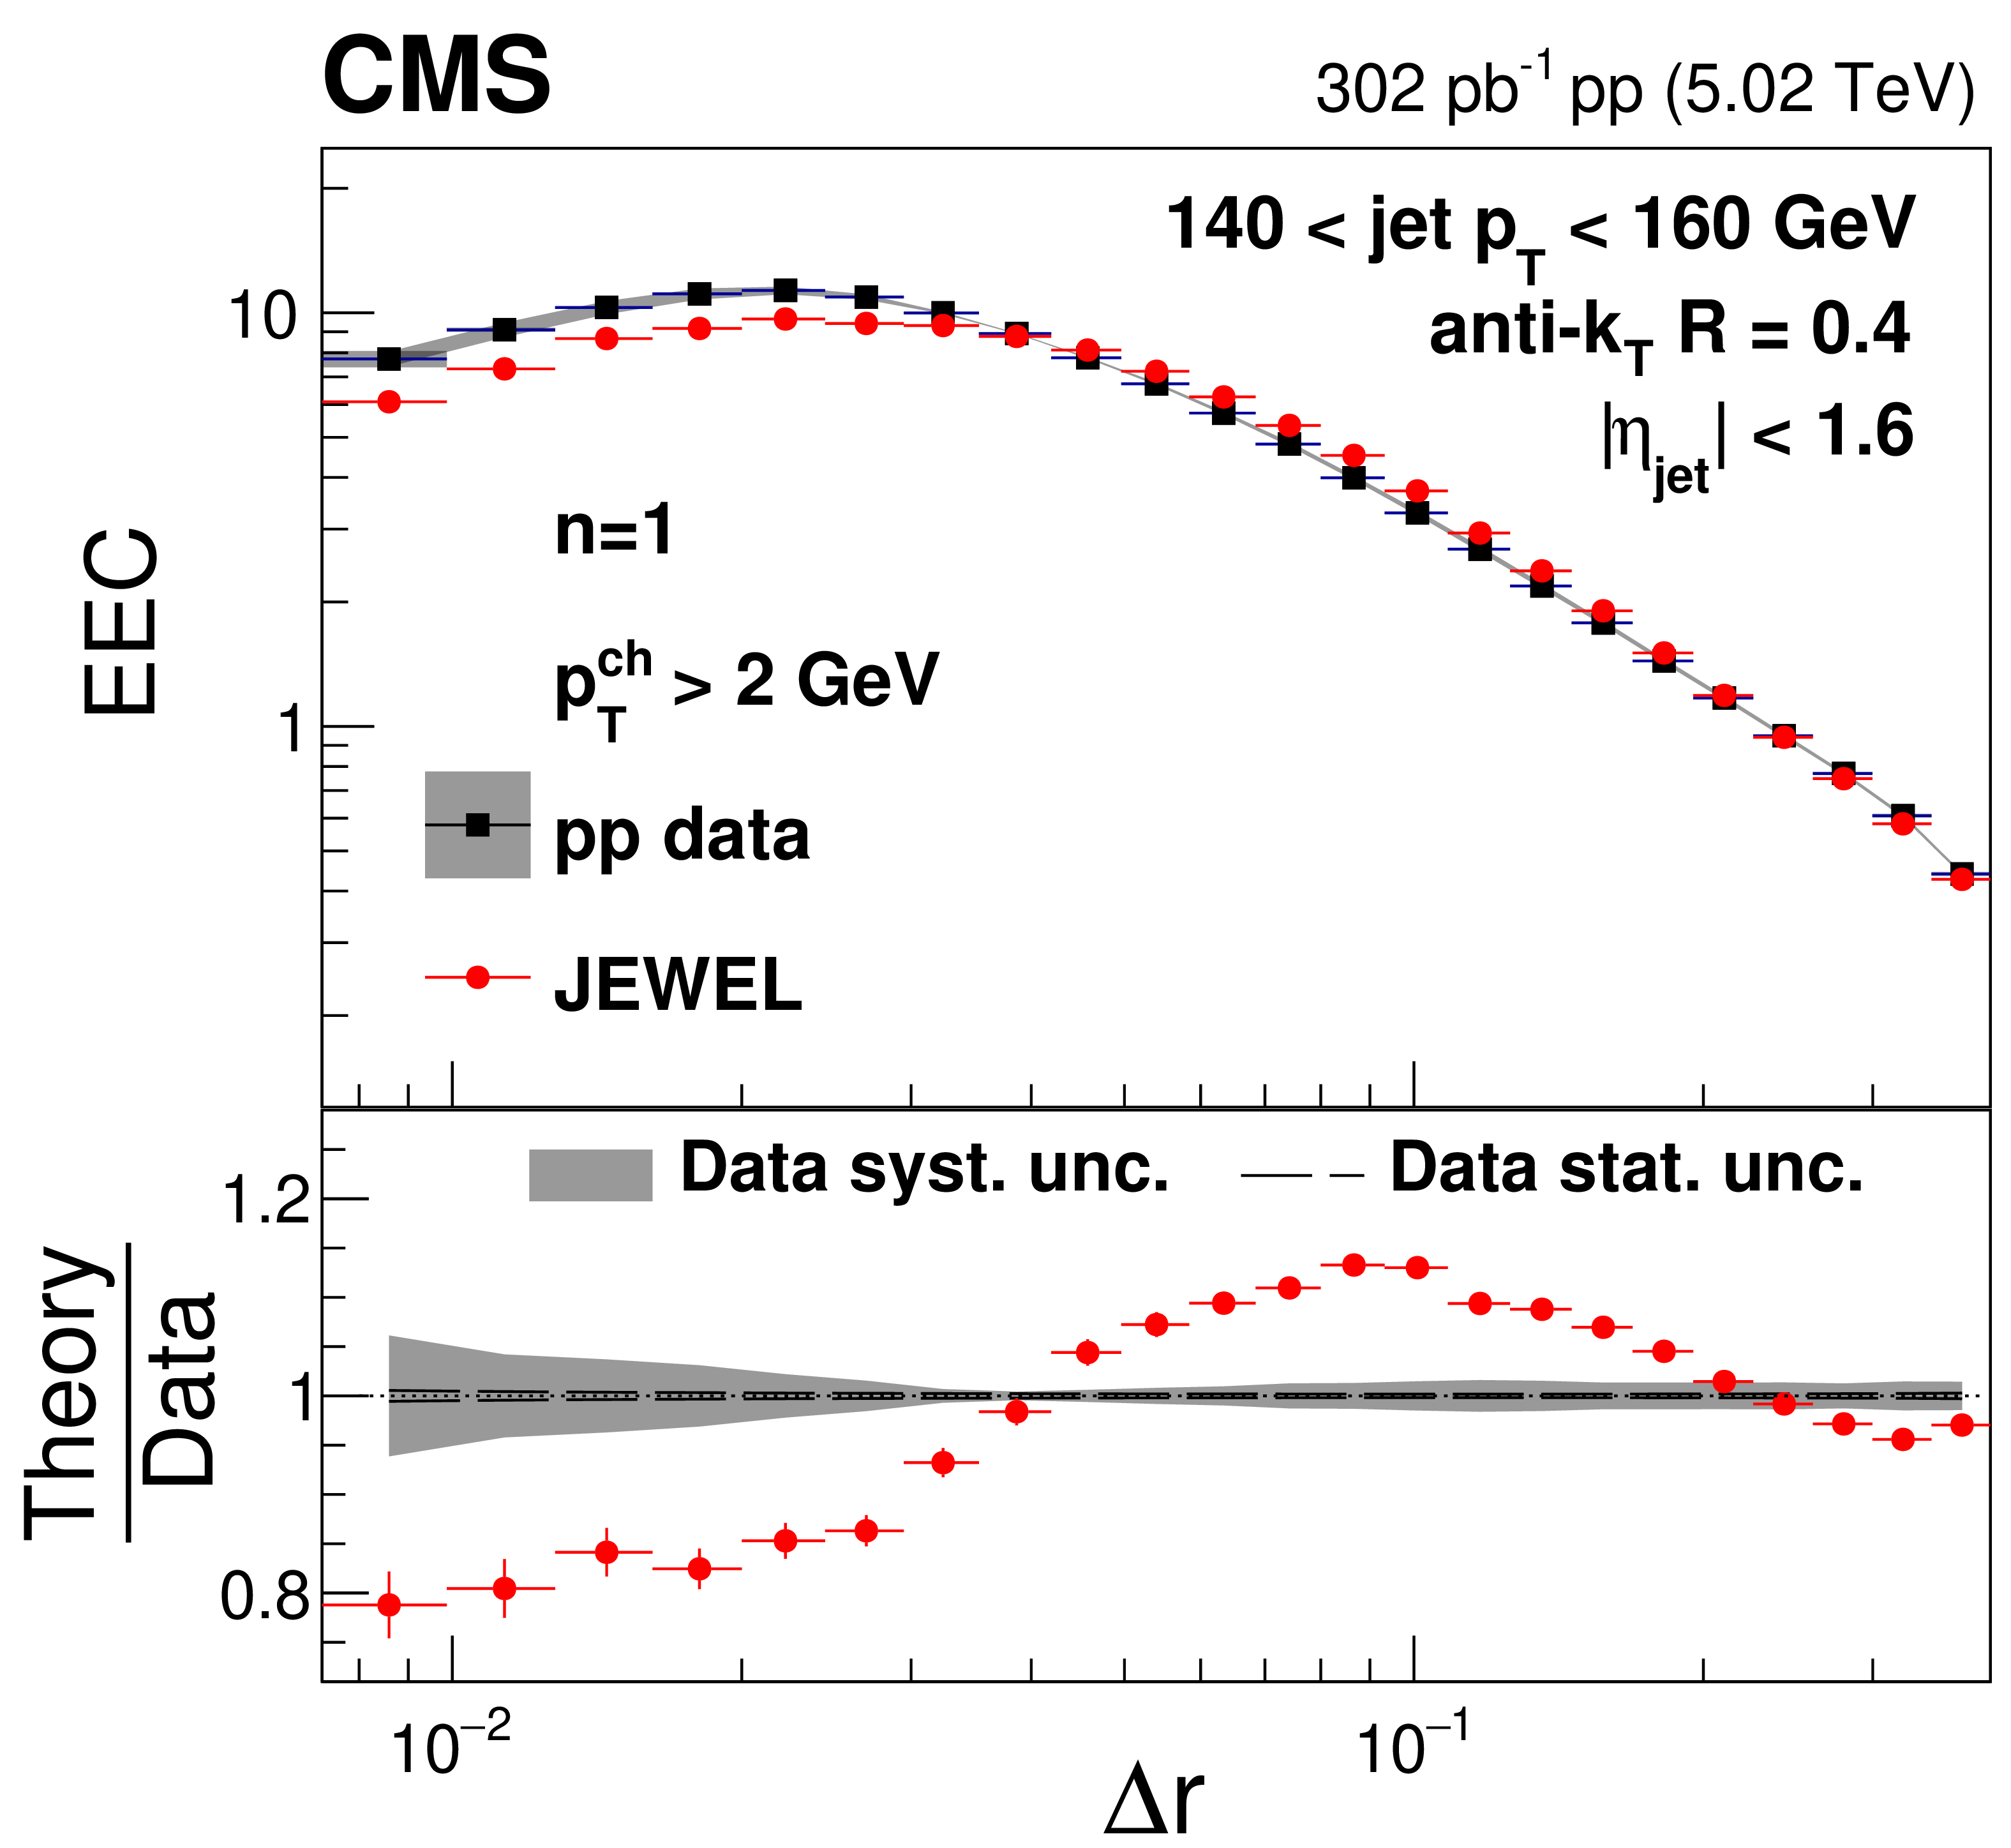
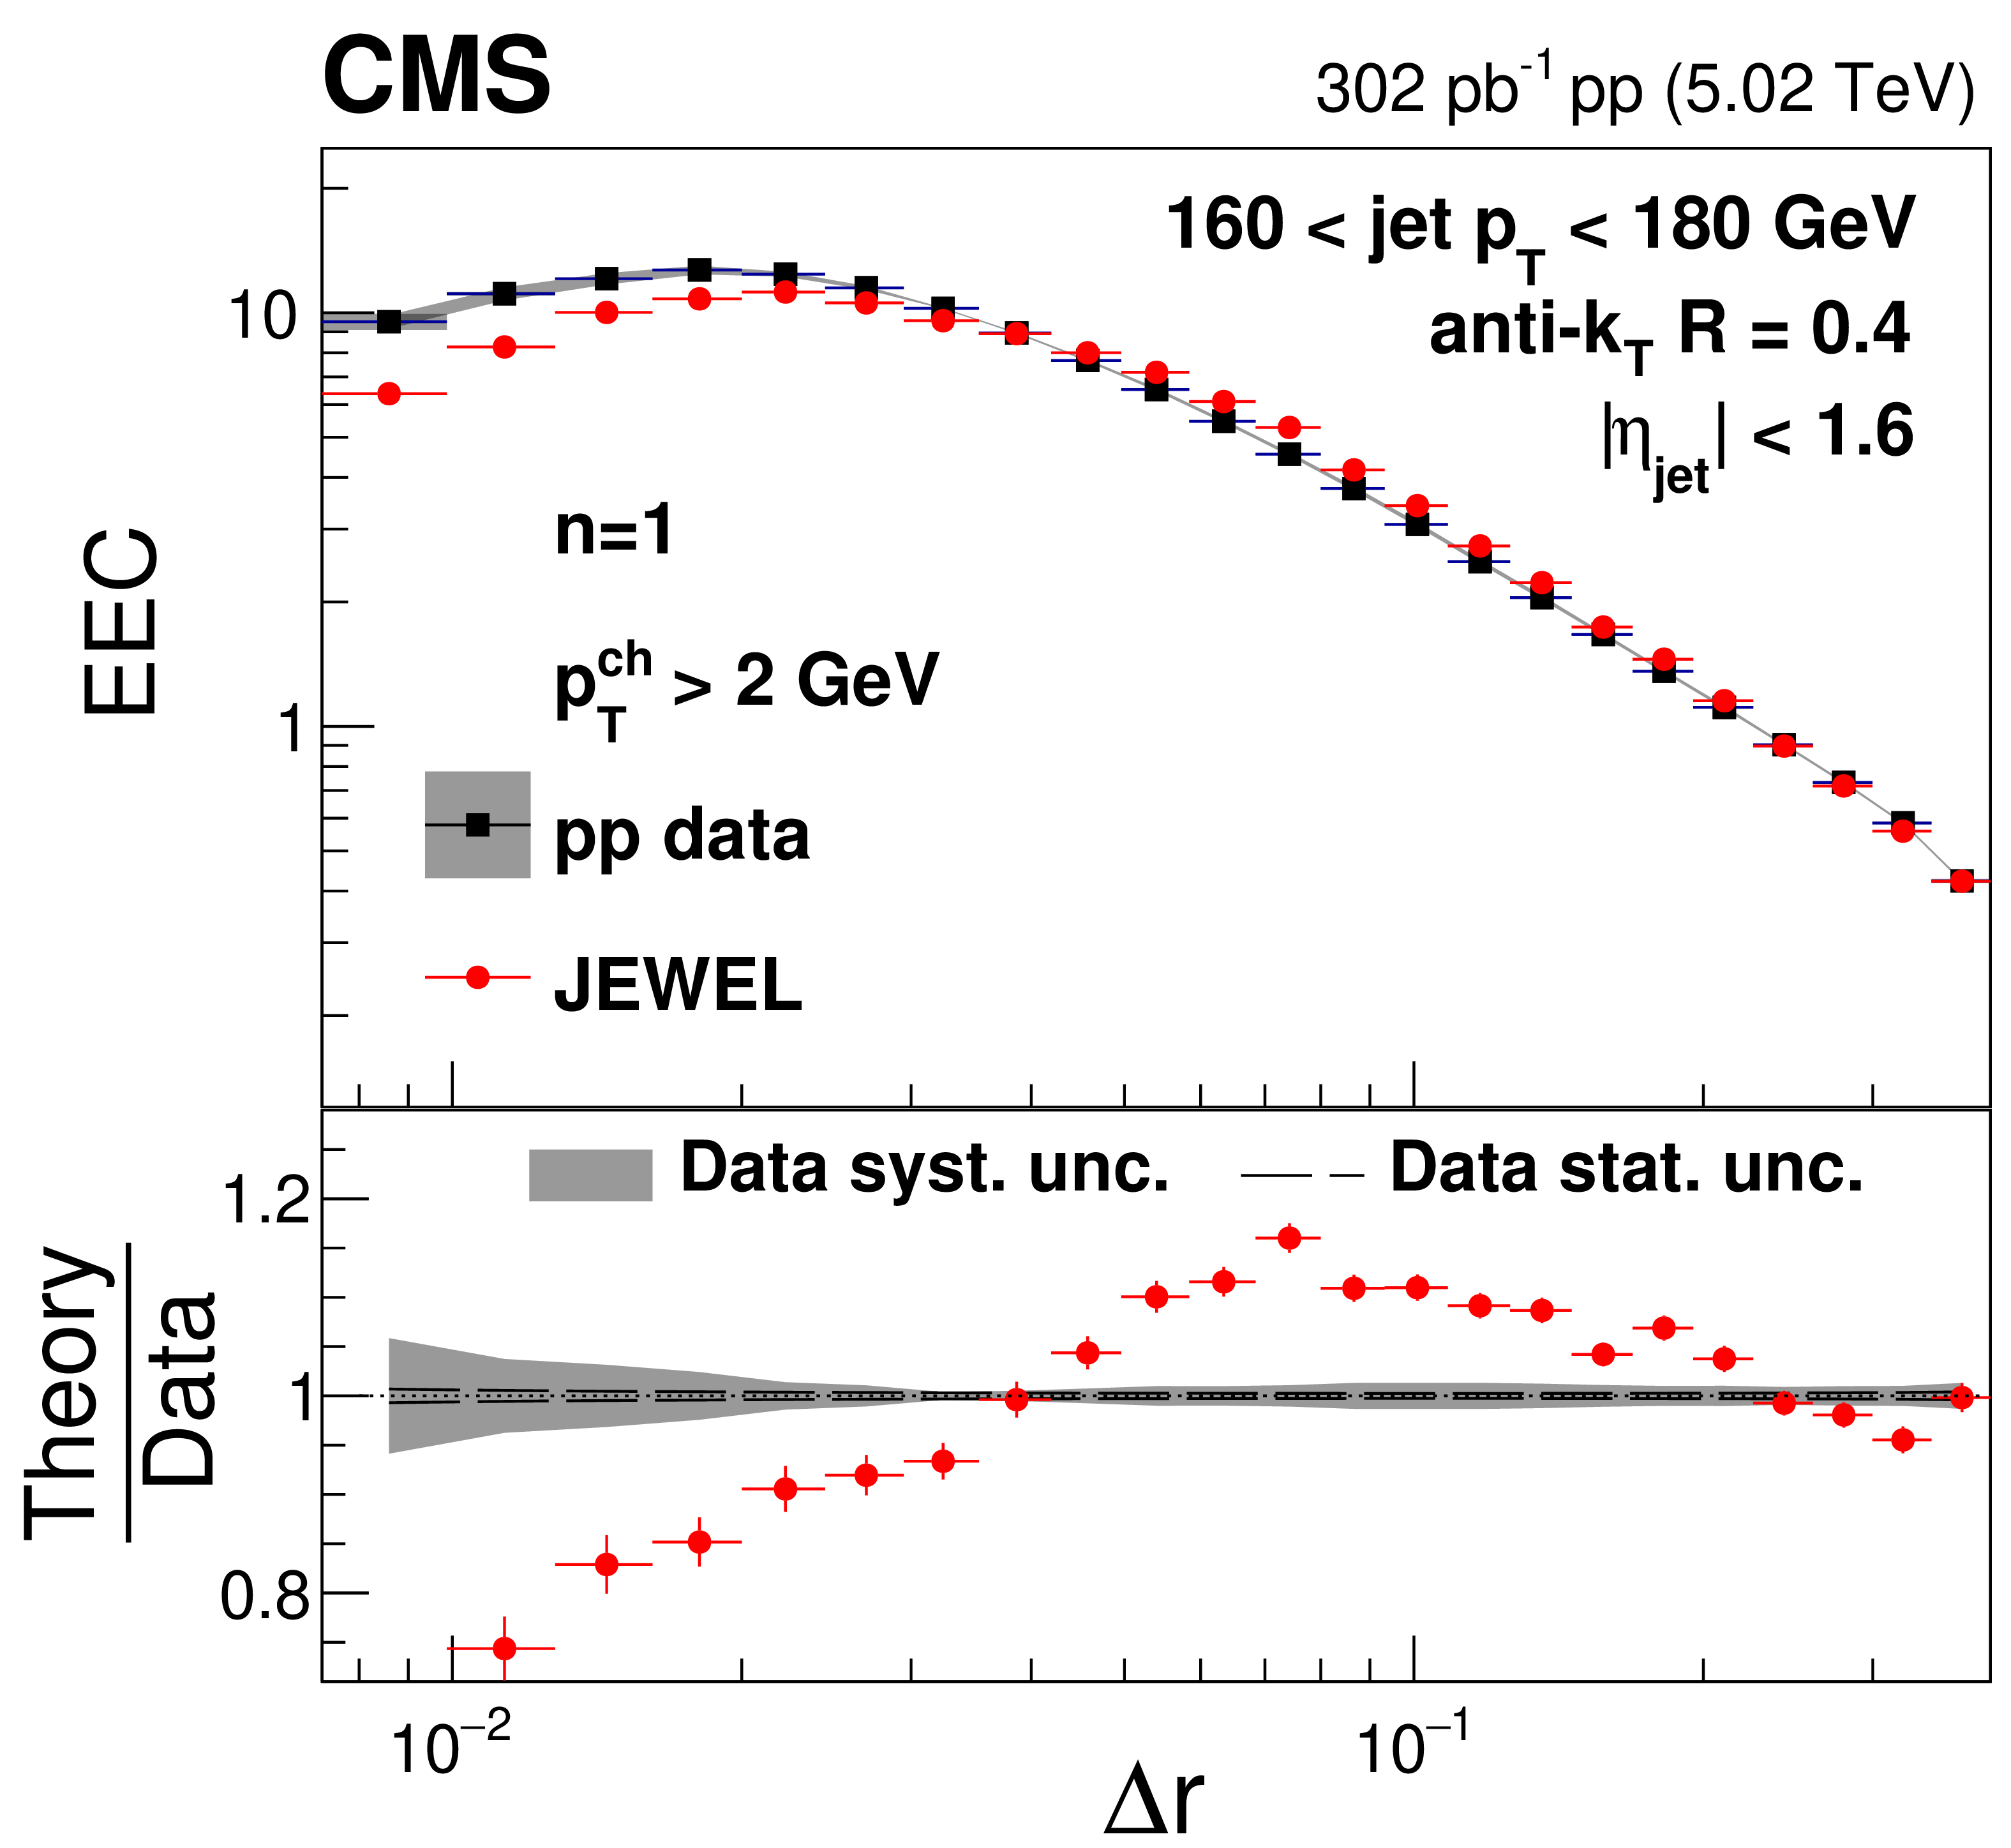
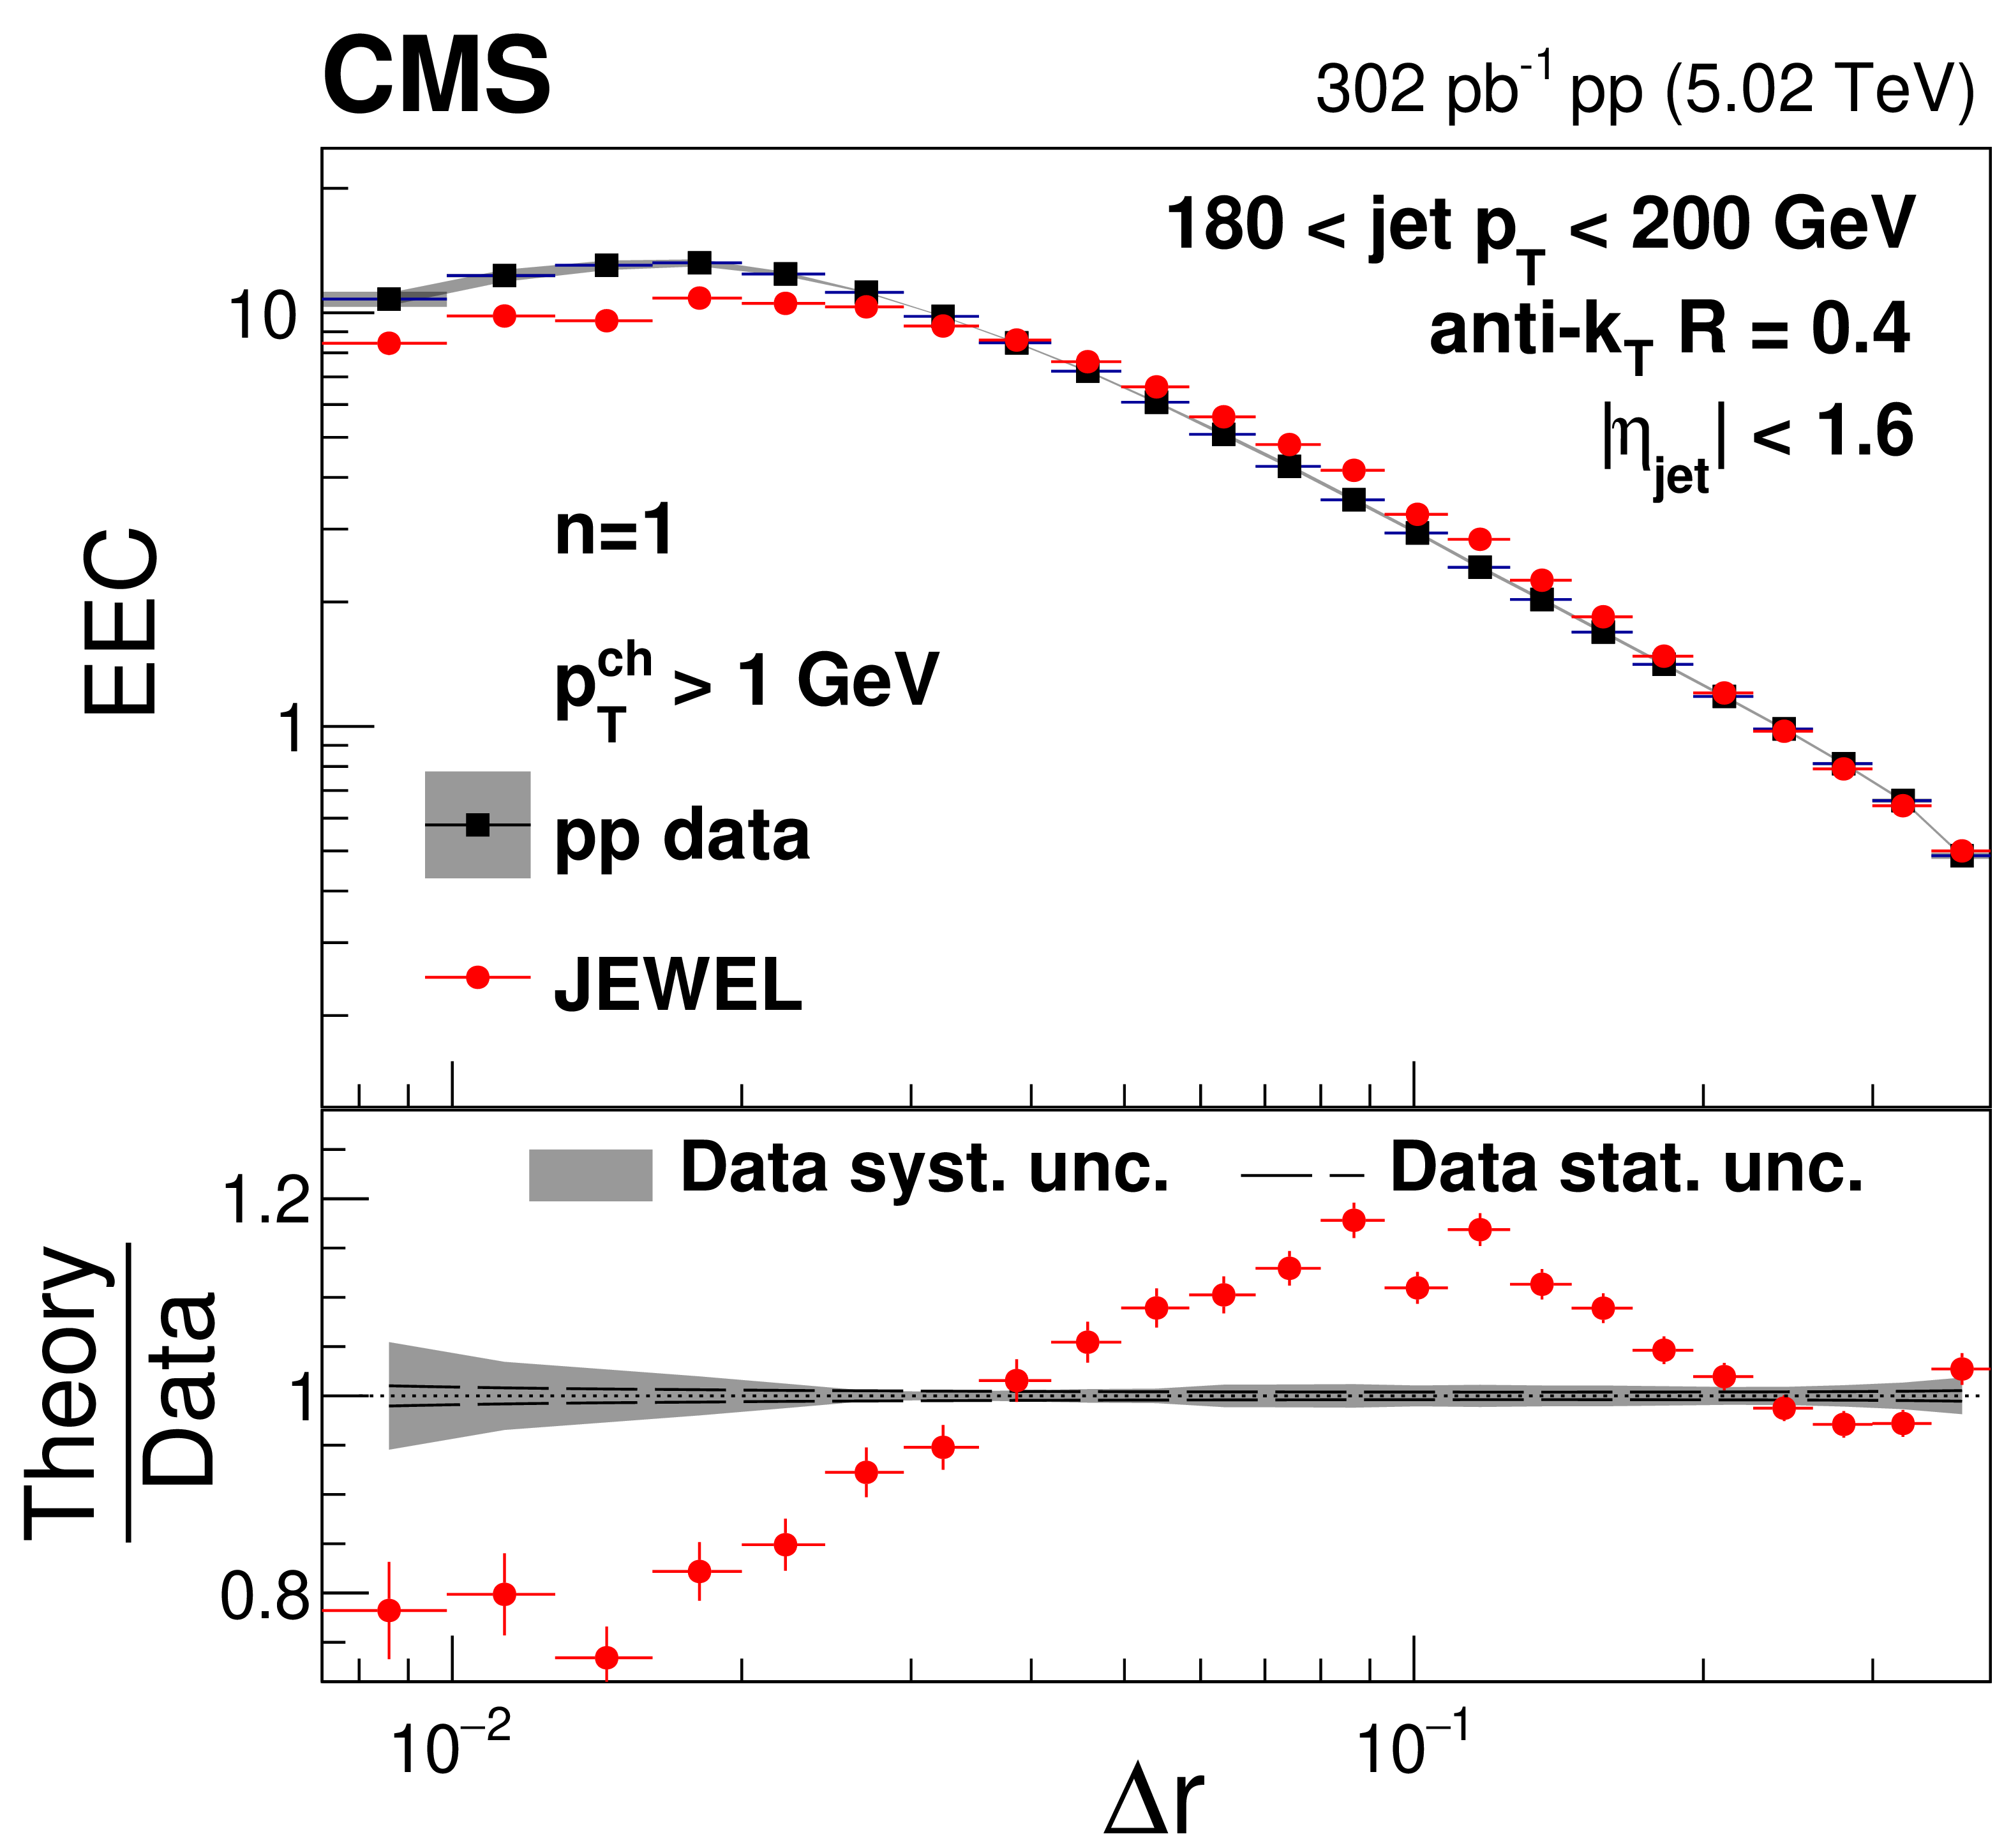
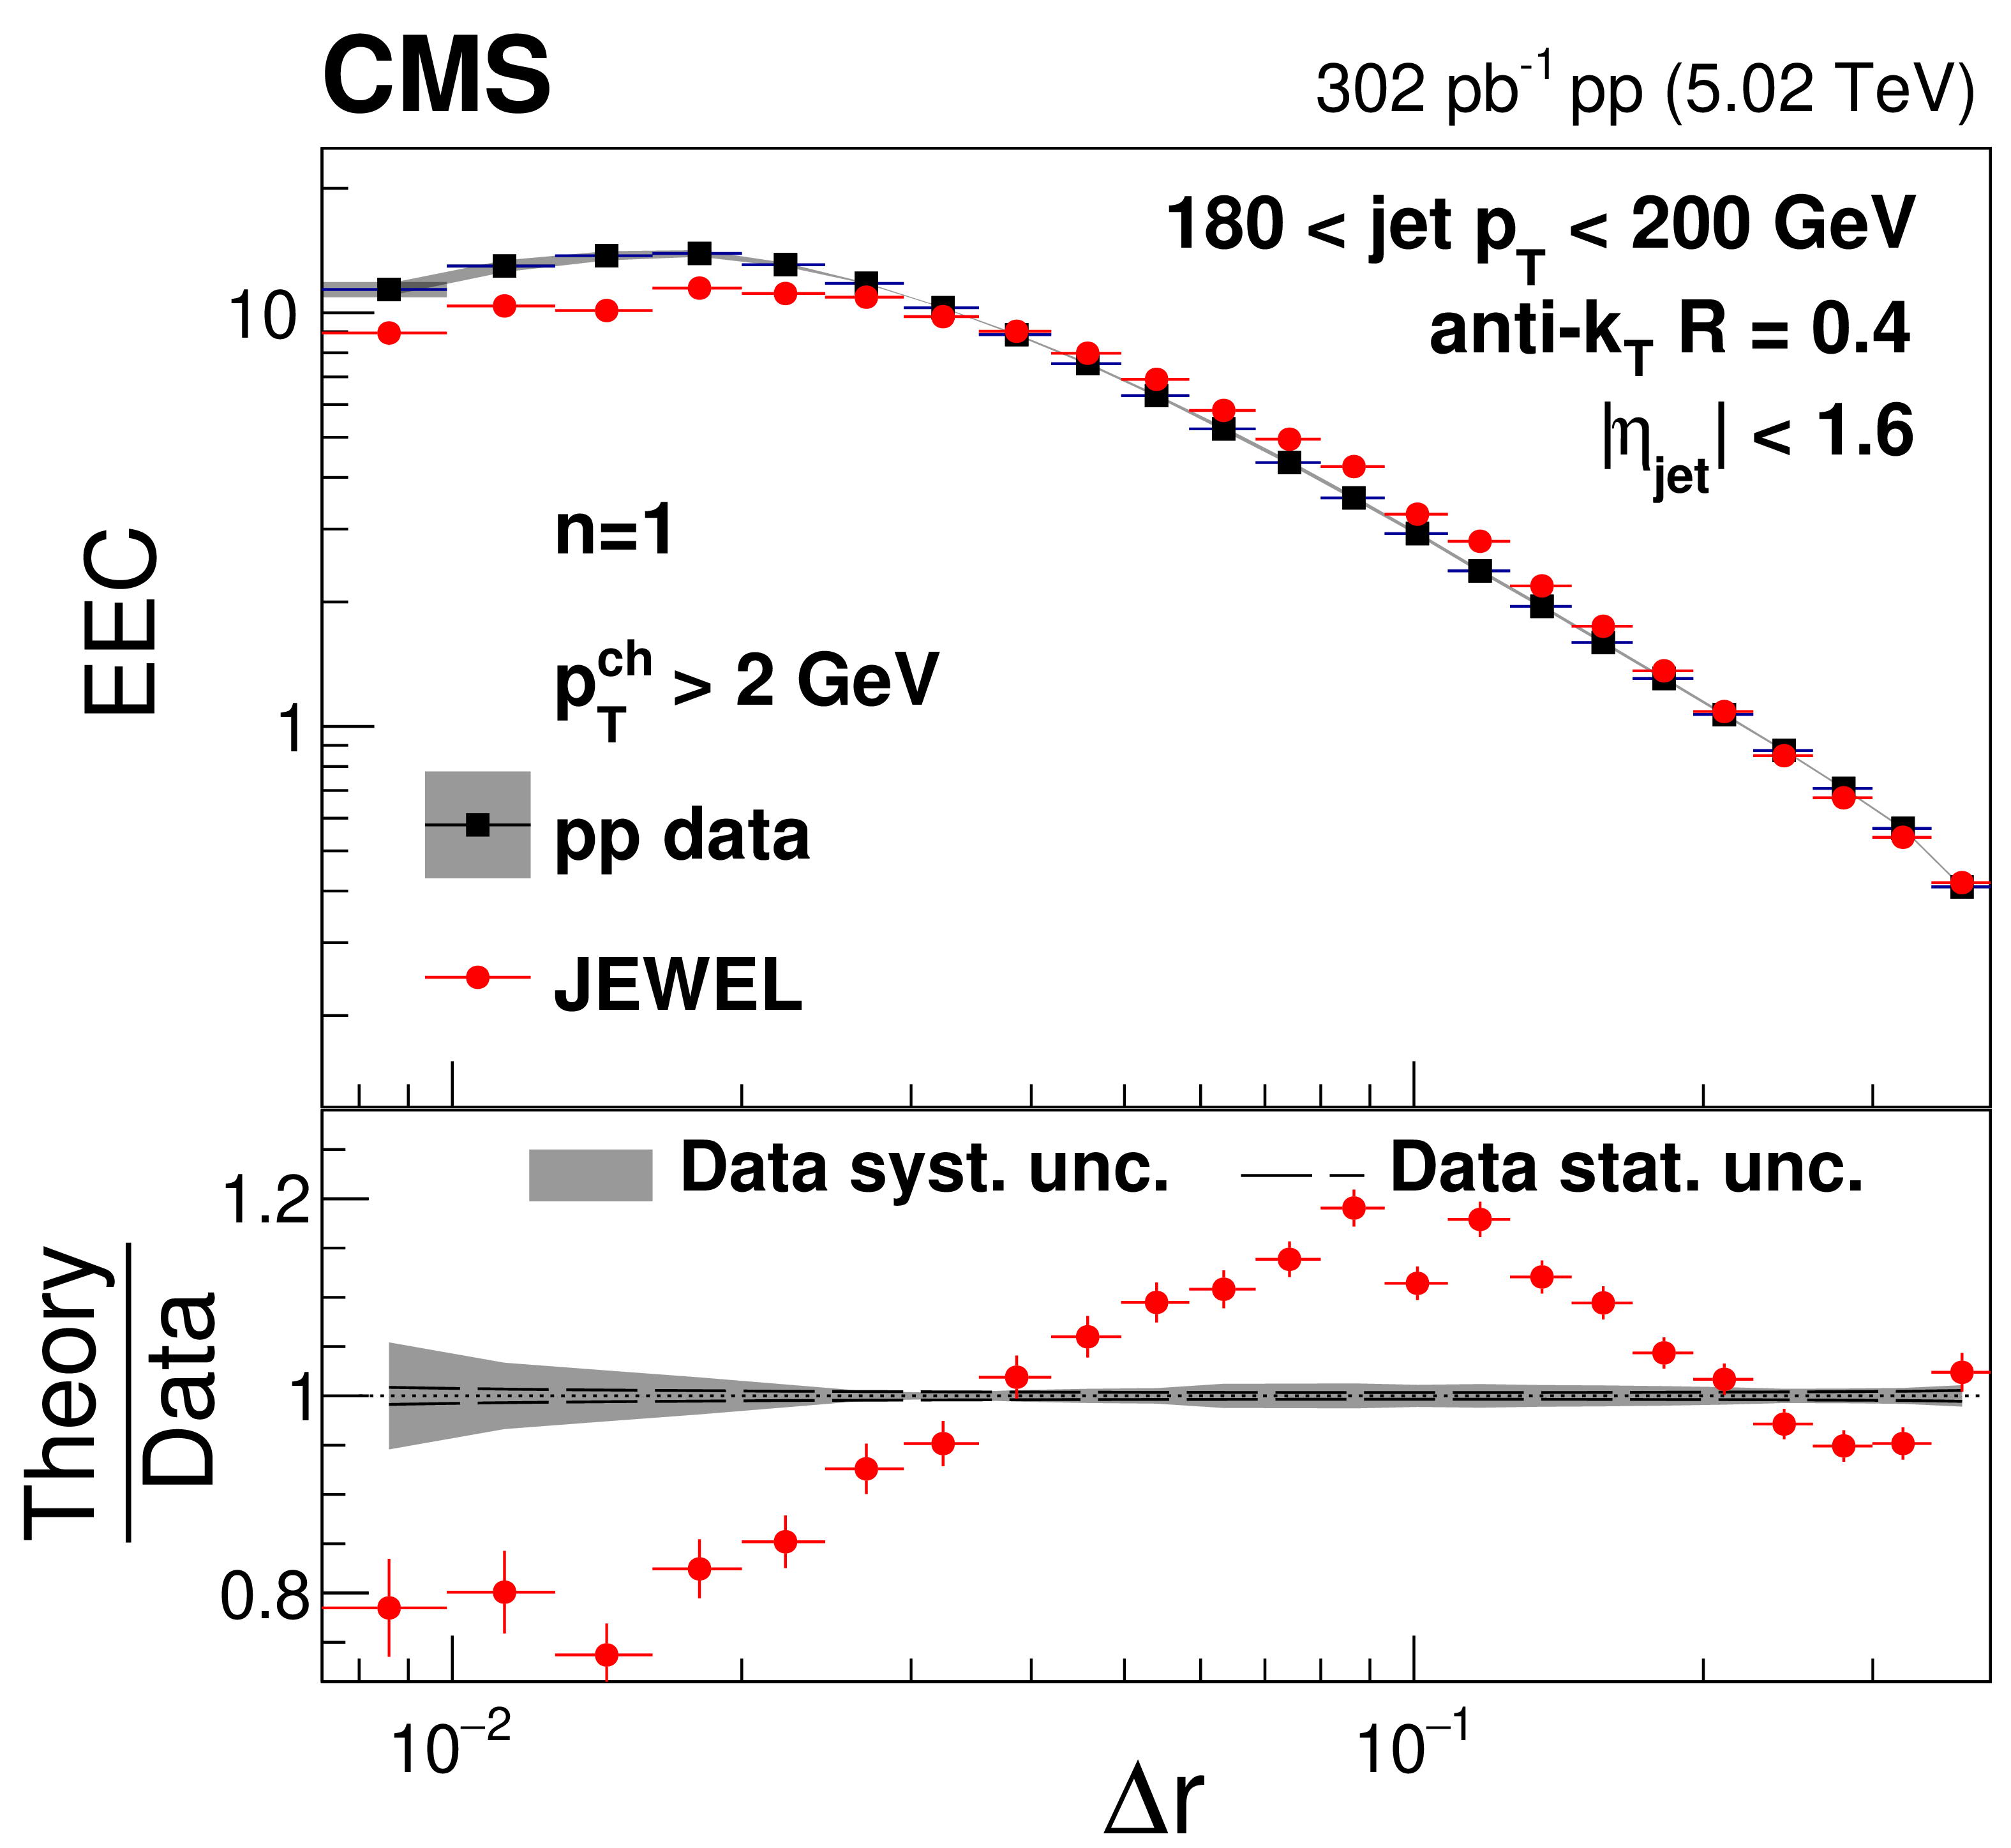
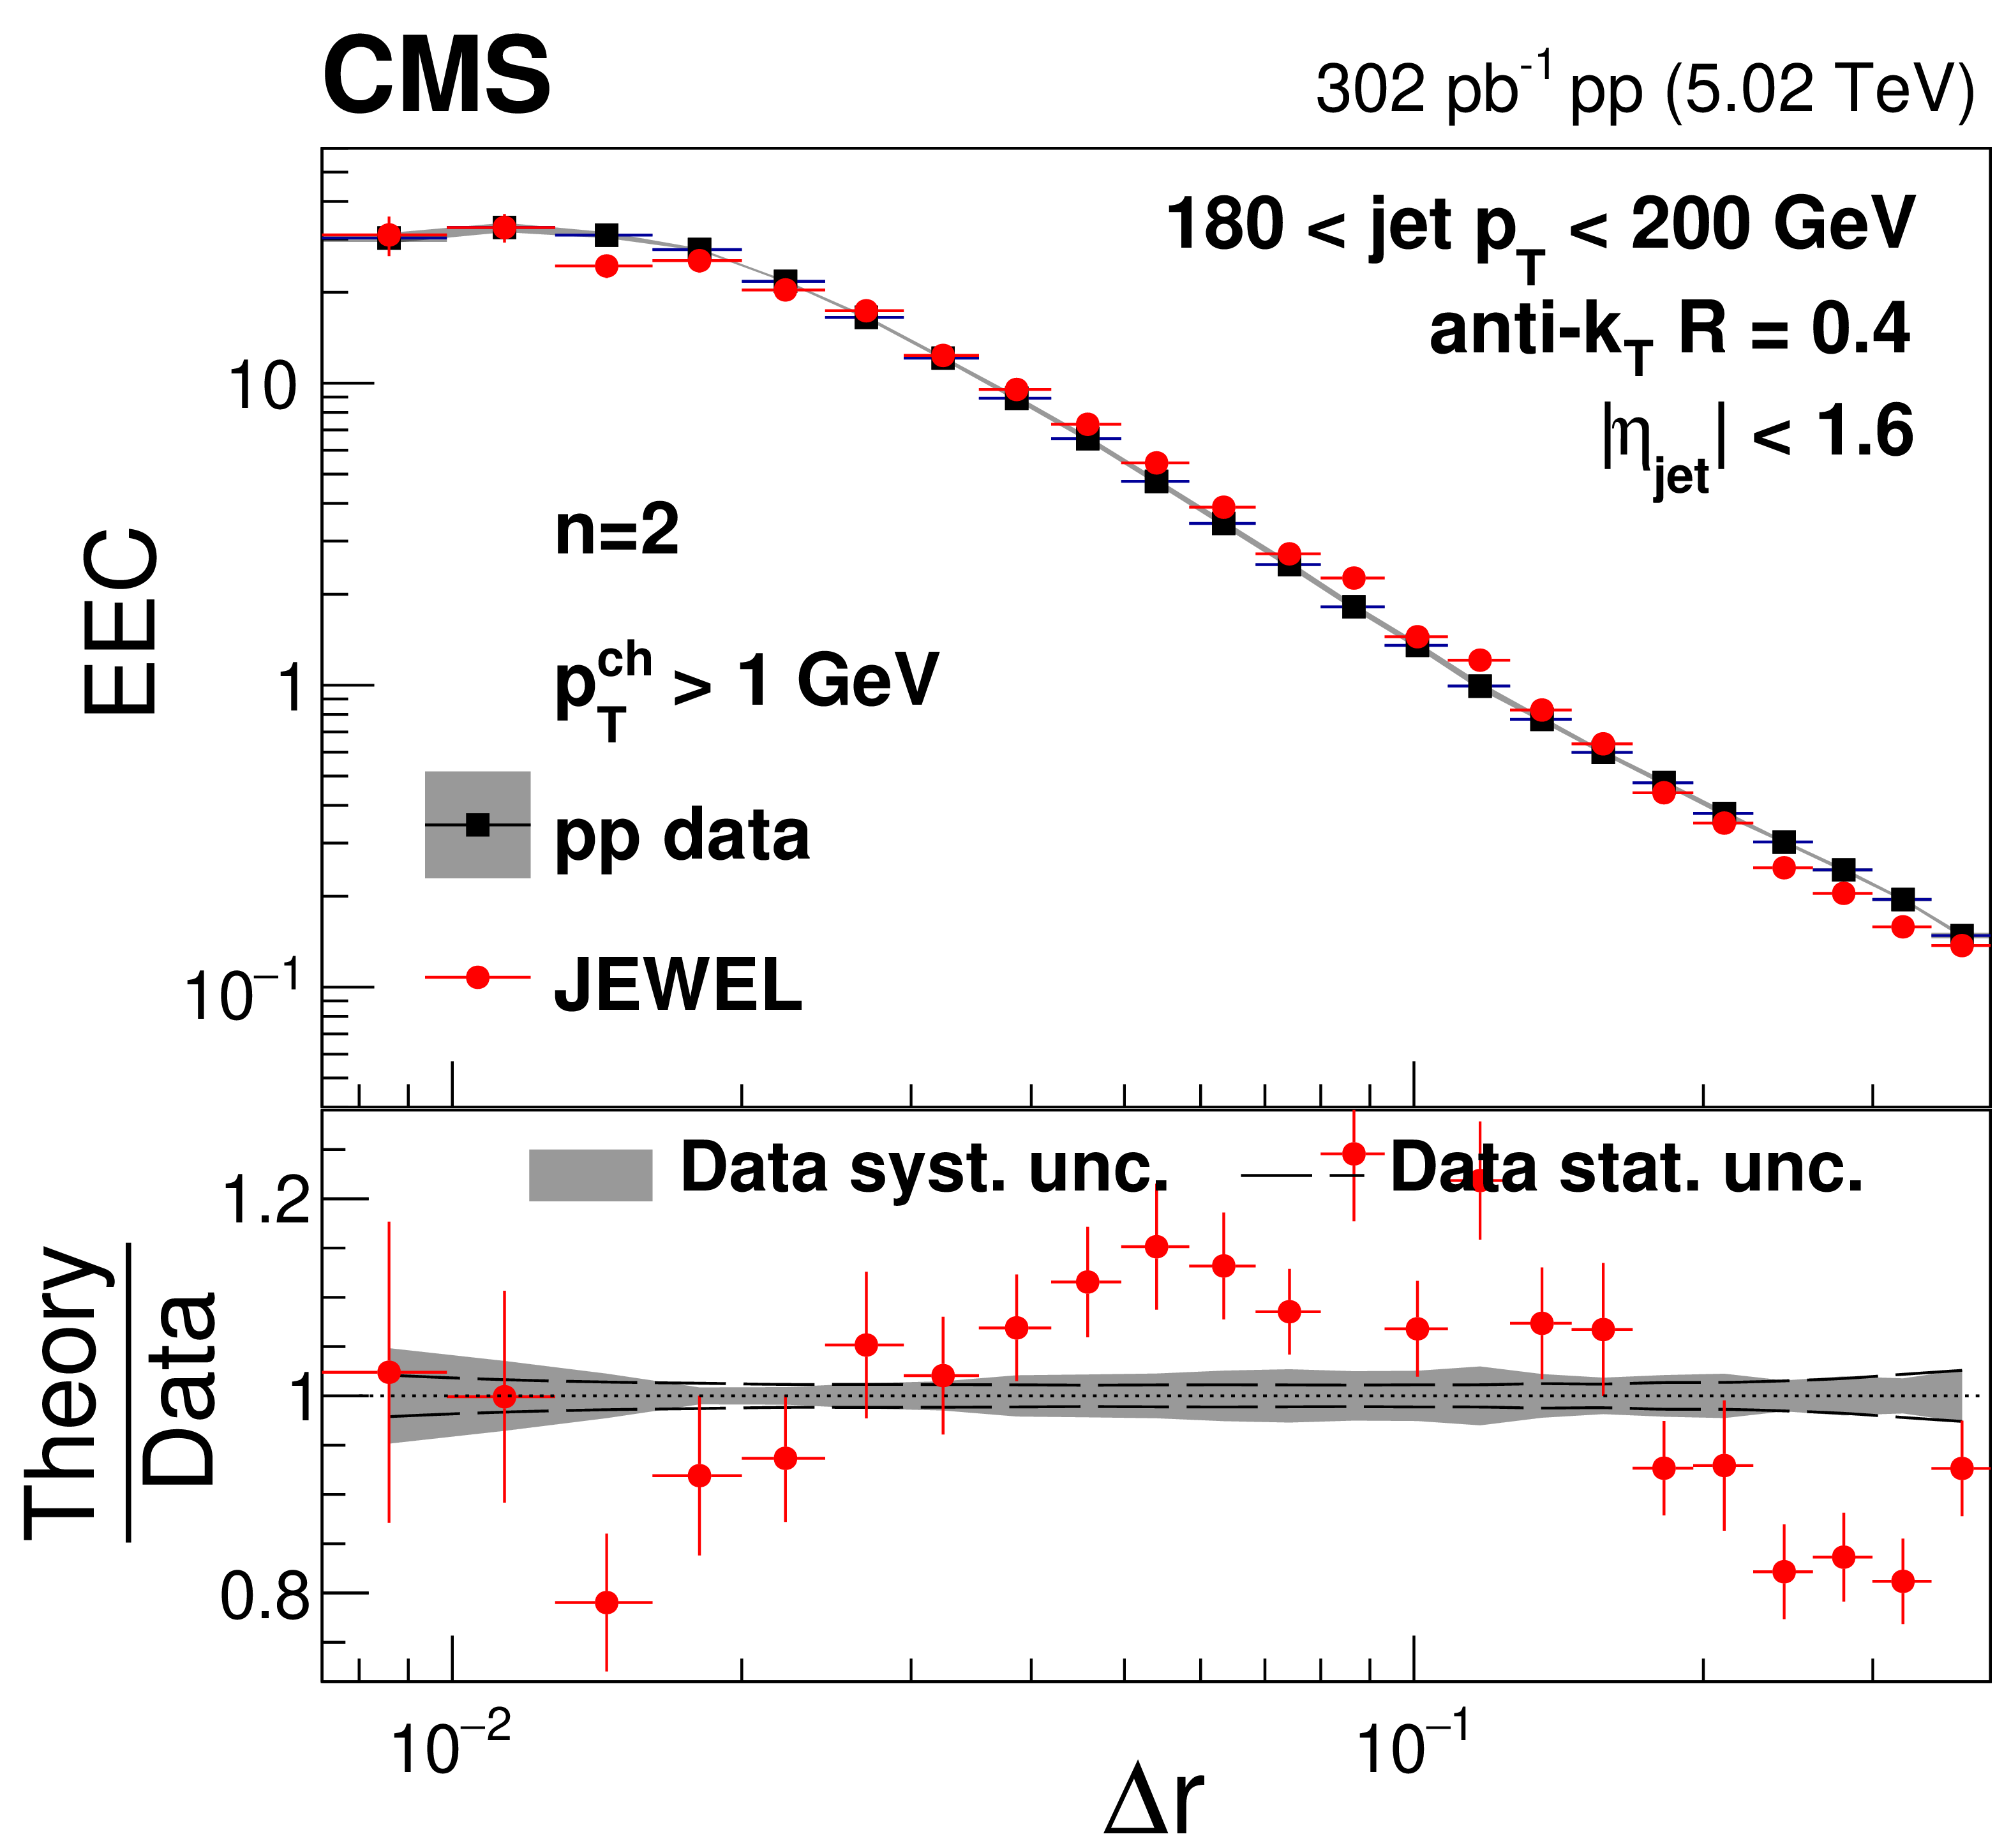
Energy-energy correlator distributions from pp collisions with $ n= $ 1 in different $ p_{\mathrm{T}}^{\text{ch}} $ and $ p_{\text{T,jet}} $ bins compared to prediction from JEWEL. |
png pdf |
Figure 13-a:
Energy-energy correlator distributions from pp collisions with $ n= $ 1 in different $ p_{\mathrm{T}}^{\text{ch}} $ and $ p_{\text{T,jet}} $ bins compared to prediction from JEWEL. |
png pdf |
Figure 13-b:
Energy-energy correlator distributions from pp collisions with $ n= $ 1 in different $ p_{\mathrm{T}}^{\text{ch}} $ and $ p_{\text{T,jet}} $ bins compared to prediction from JEWEL. |

png pdf |
Figure 13-c:
Energy-energy correlator distributions from pp collisions with $ n= $ 1 in different $ p_{\mathrm{T}}^{\text{ch}} $ and $ p_{\text{T,jet}} $ bins compared to prediction from JEWEL. |
png pdf |
Figure 13-d:
Energy-energy correlator distributions from pp collisions with $ n= $ 1 in different $ p_{\mathrm{T}}^{\text{ch}} $ and $ p_{\text{T,jet}} $ bins compared to prediction from JEWEL. |
png pdf |
Figure 13-e:
Energy-energy correlator distributions from pp collisions with $ n= $ 1 in different $ p_{\mathrm{T}}^{\text{ch}} $ and $ p_{\text{T,jet}} $ bins compared to prediction from JEWEL. |
png pdf |
Figure 13-f:
Energy-energy correlator distributions from pp collisions with $ n= $ 1 in different $ p_{\mathrm{T}}^{\text{ch}} $ and $ p_{\text{T,jet}} $ bins compared to prediction from JEWEL. |
png pdf |
Figure 13-g:
Energy-energy correlator distributions from pp collisions with $ n= $ 1 in different $ p_{\mathrm{T}}^{\text{ch}} $ and $ p_{\text{T,jet}} $ bins compared to prediction from JEWEL. |
png pdf |
Figure 13-h:
Energy-energy correlator distributions from pp collisions with $ n= $ 1 in different $ p_{\mathrm{T}}^{\text{ch}} $ and $ p_{\text{T,jet}} $ bins compared to prediction from JEWEL. |
png pdf |
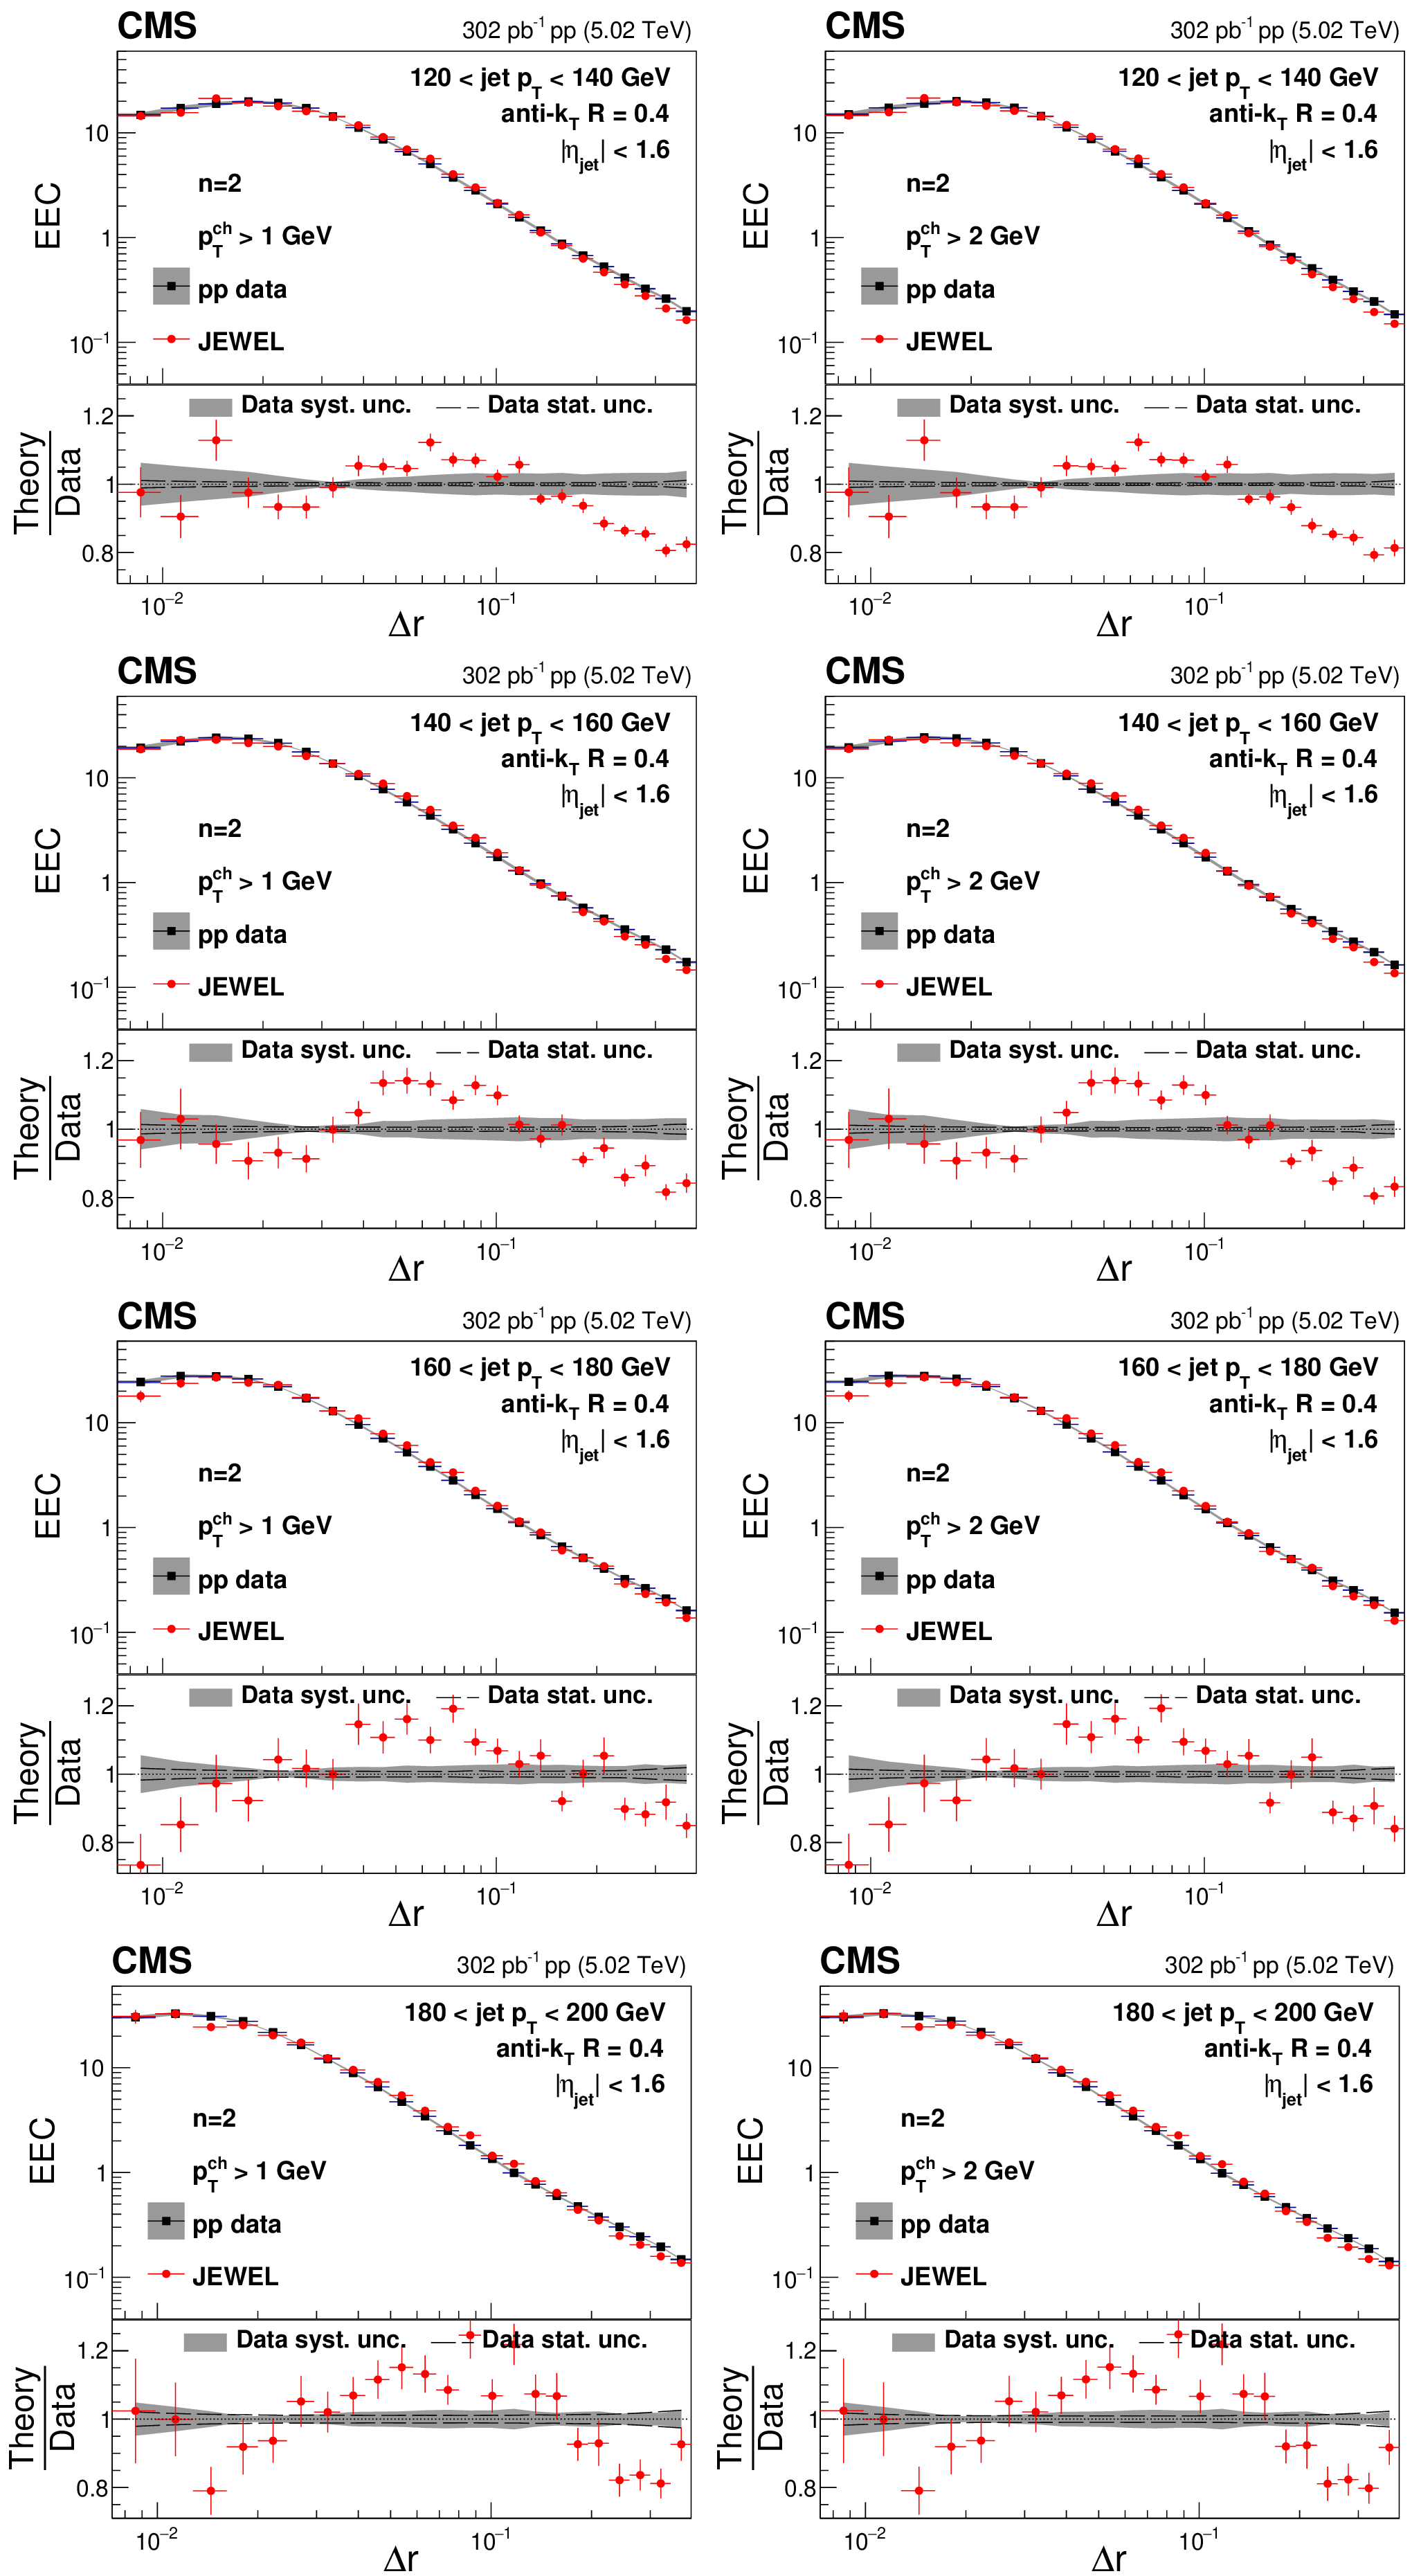
Figure 14:
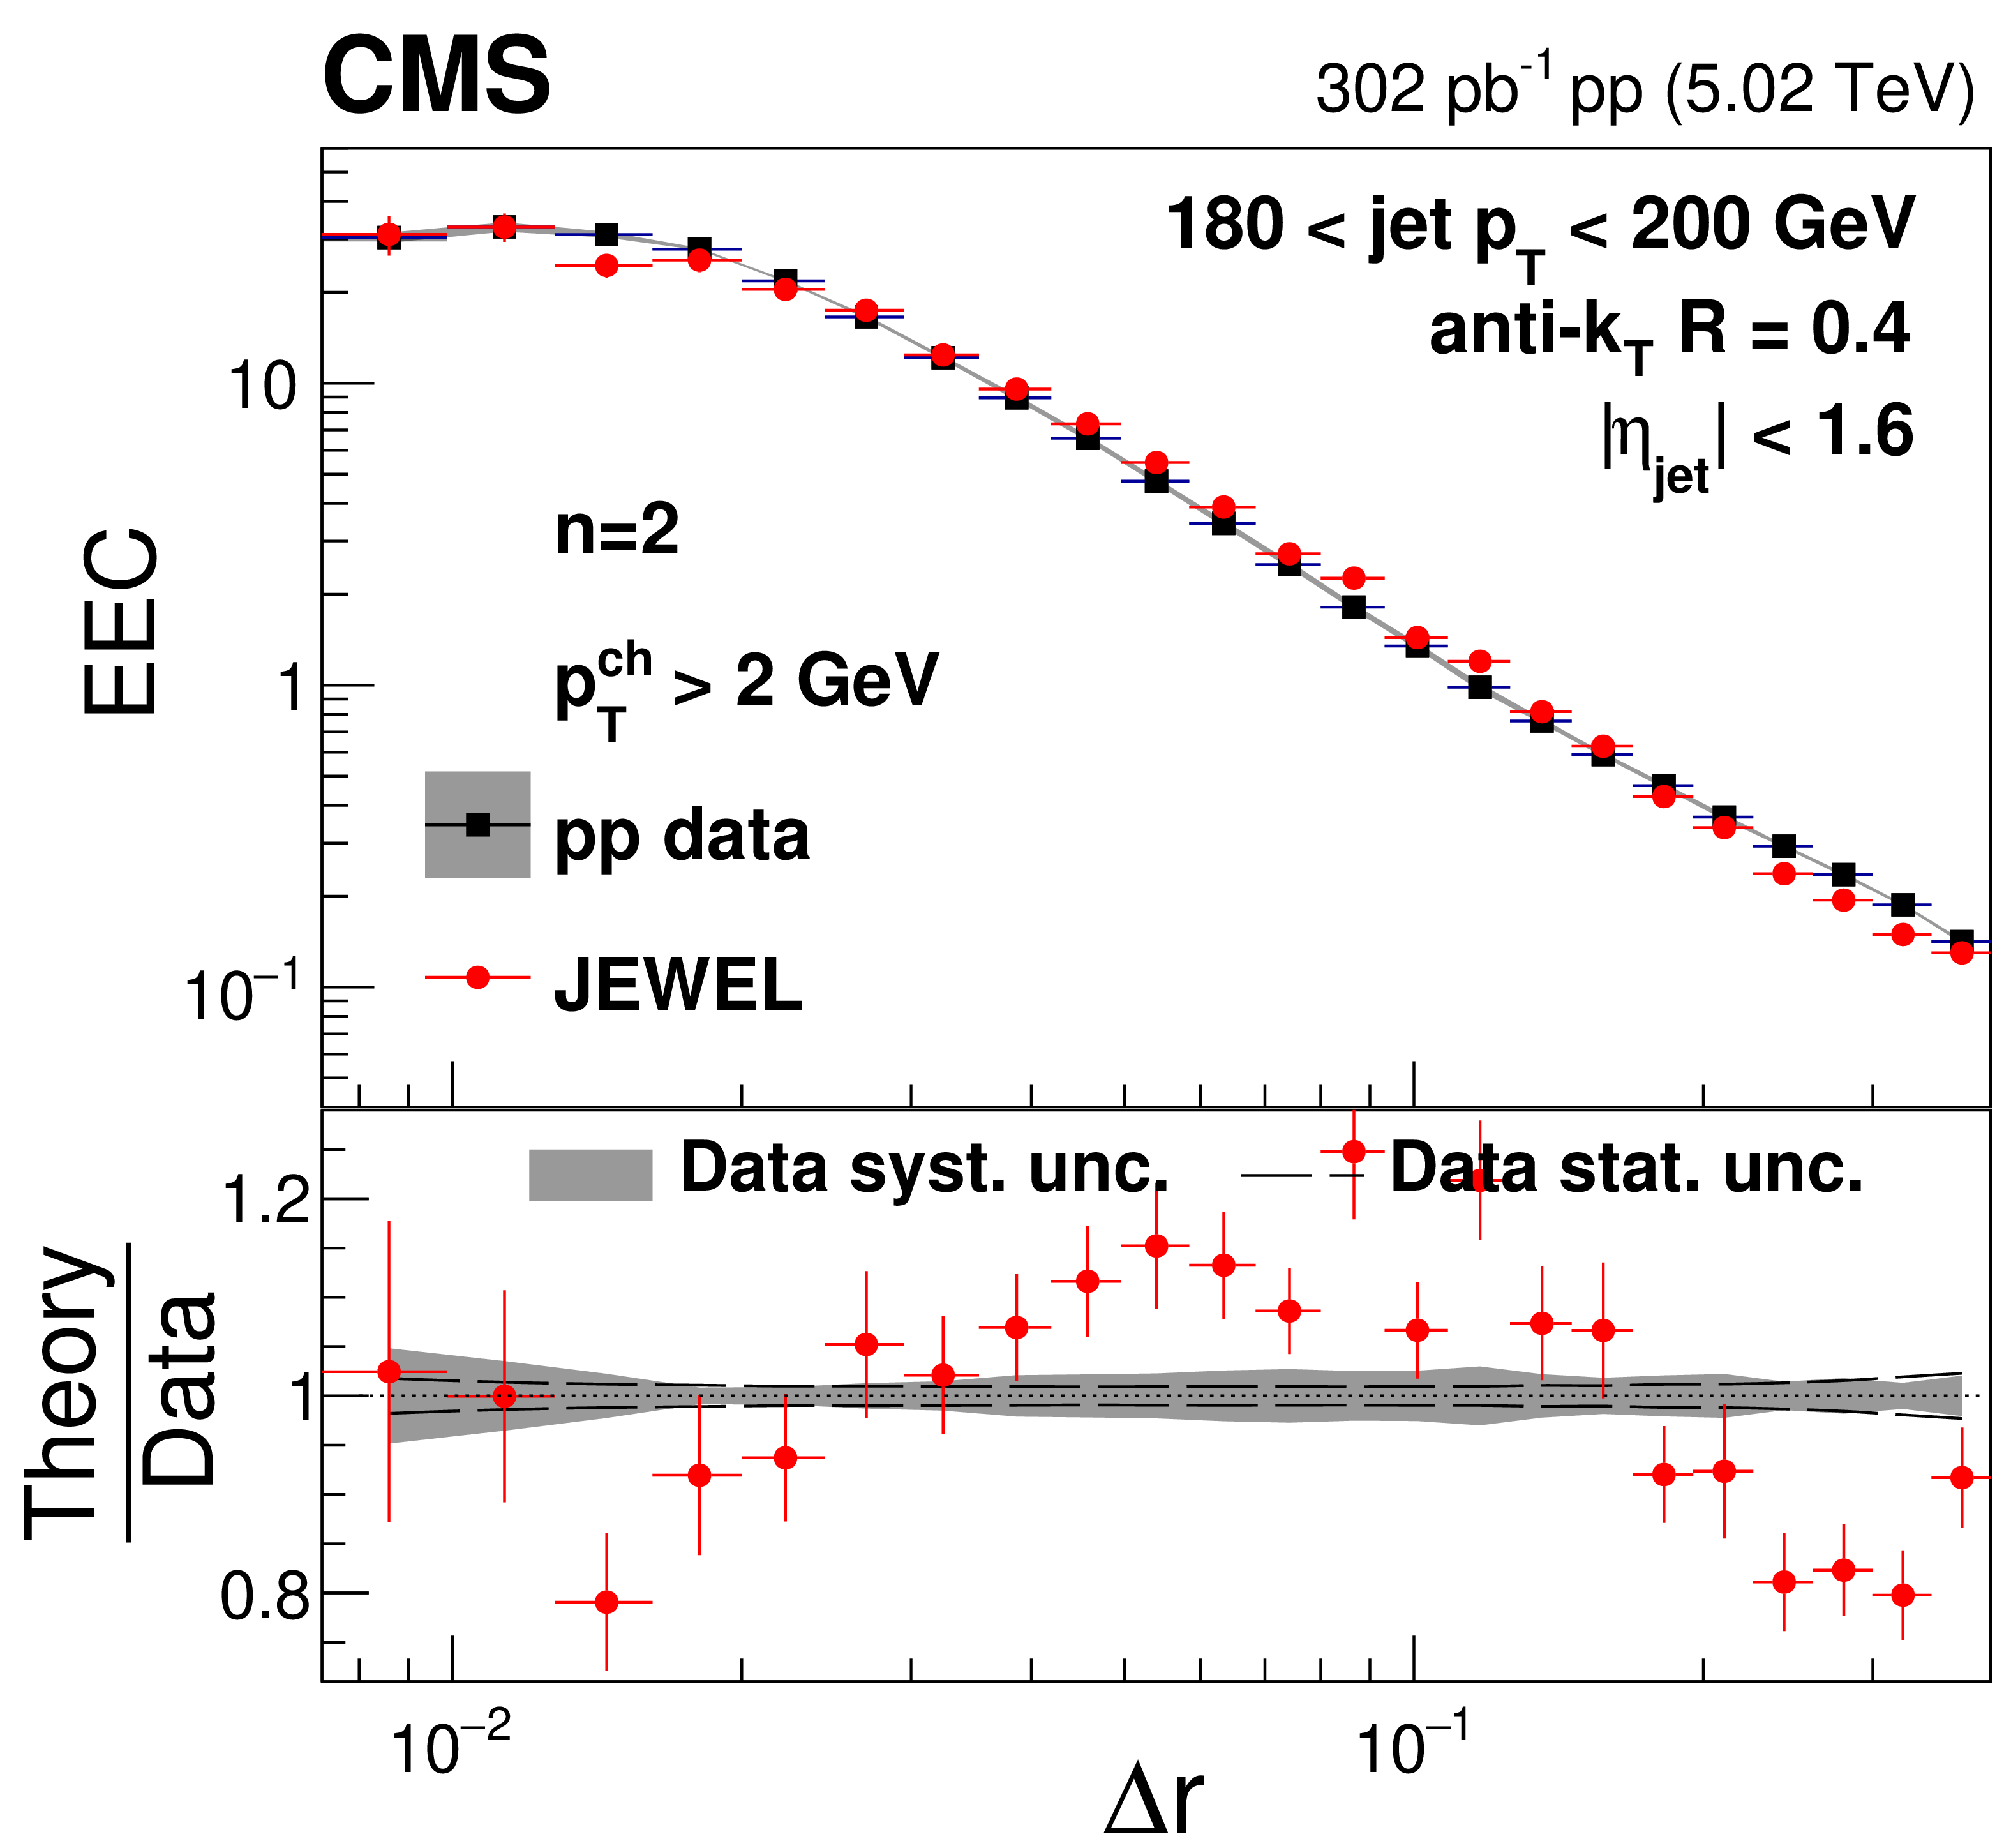
Energy-energy correlator distributions from pp collisions with $ n= $ 2 in different $ p_{\mathrm{T}}^{\text{ch}} $ and $ p_{\text{T,jet}} $ bins compared to predictions from JEWEL. |

png pdf |
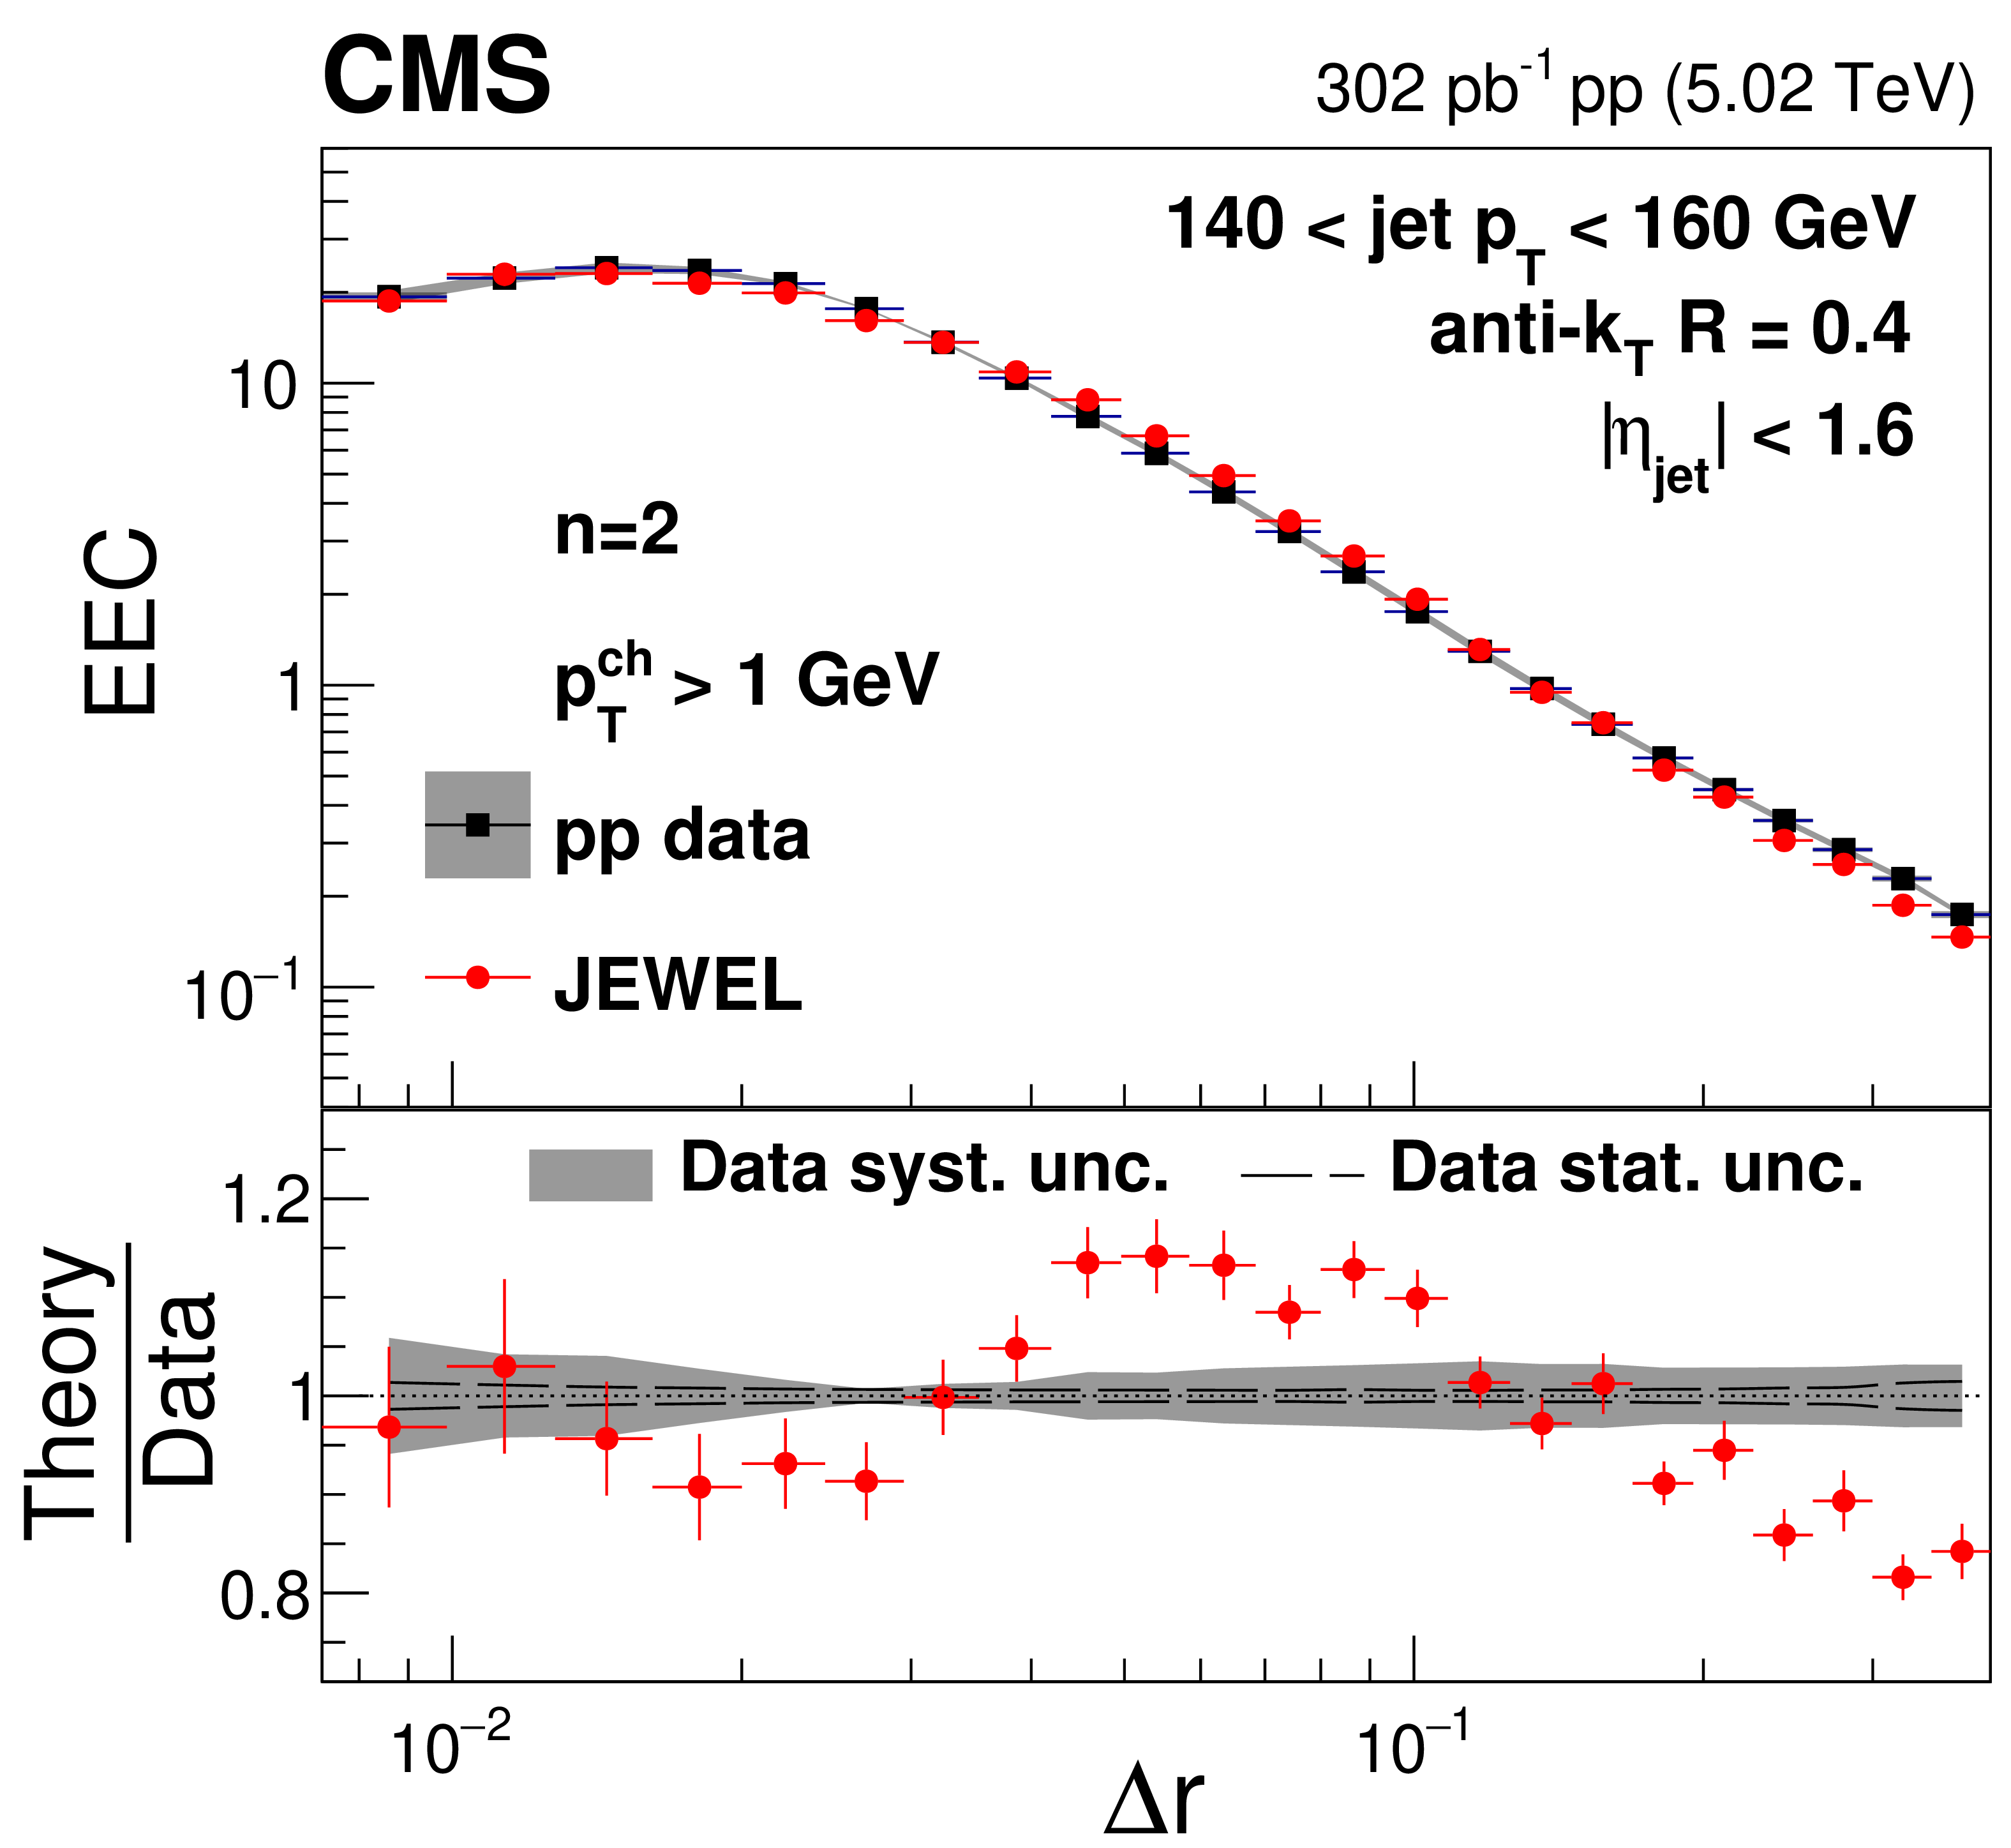
Figure 14-a:
Energy-energy correlator distributions from pp collisions with $ n= $ 2 in different $ p_{\mathrm{T}}^{\text{ch}} $ and $ p_{\text{T,jet}} $ bins compared to predictions from JEWEL. |
png pdf |
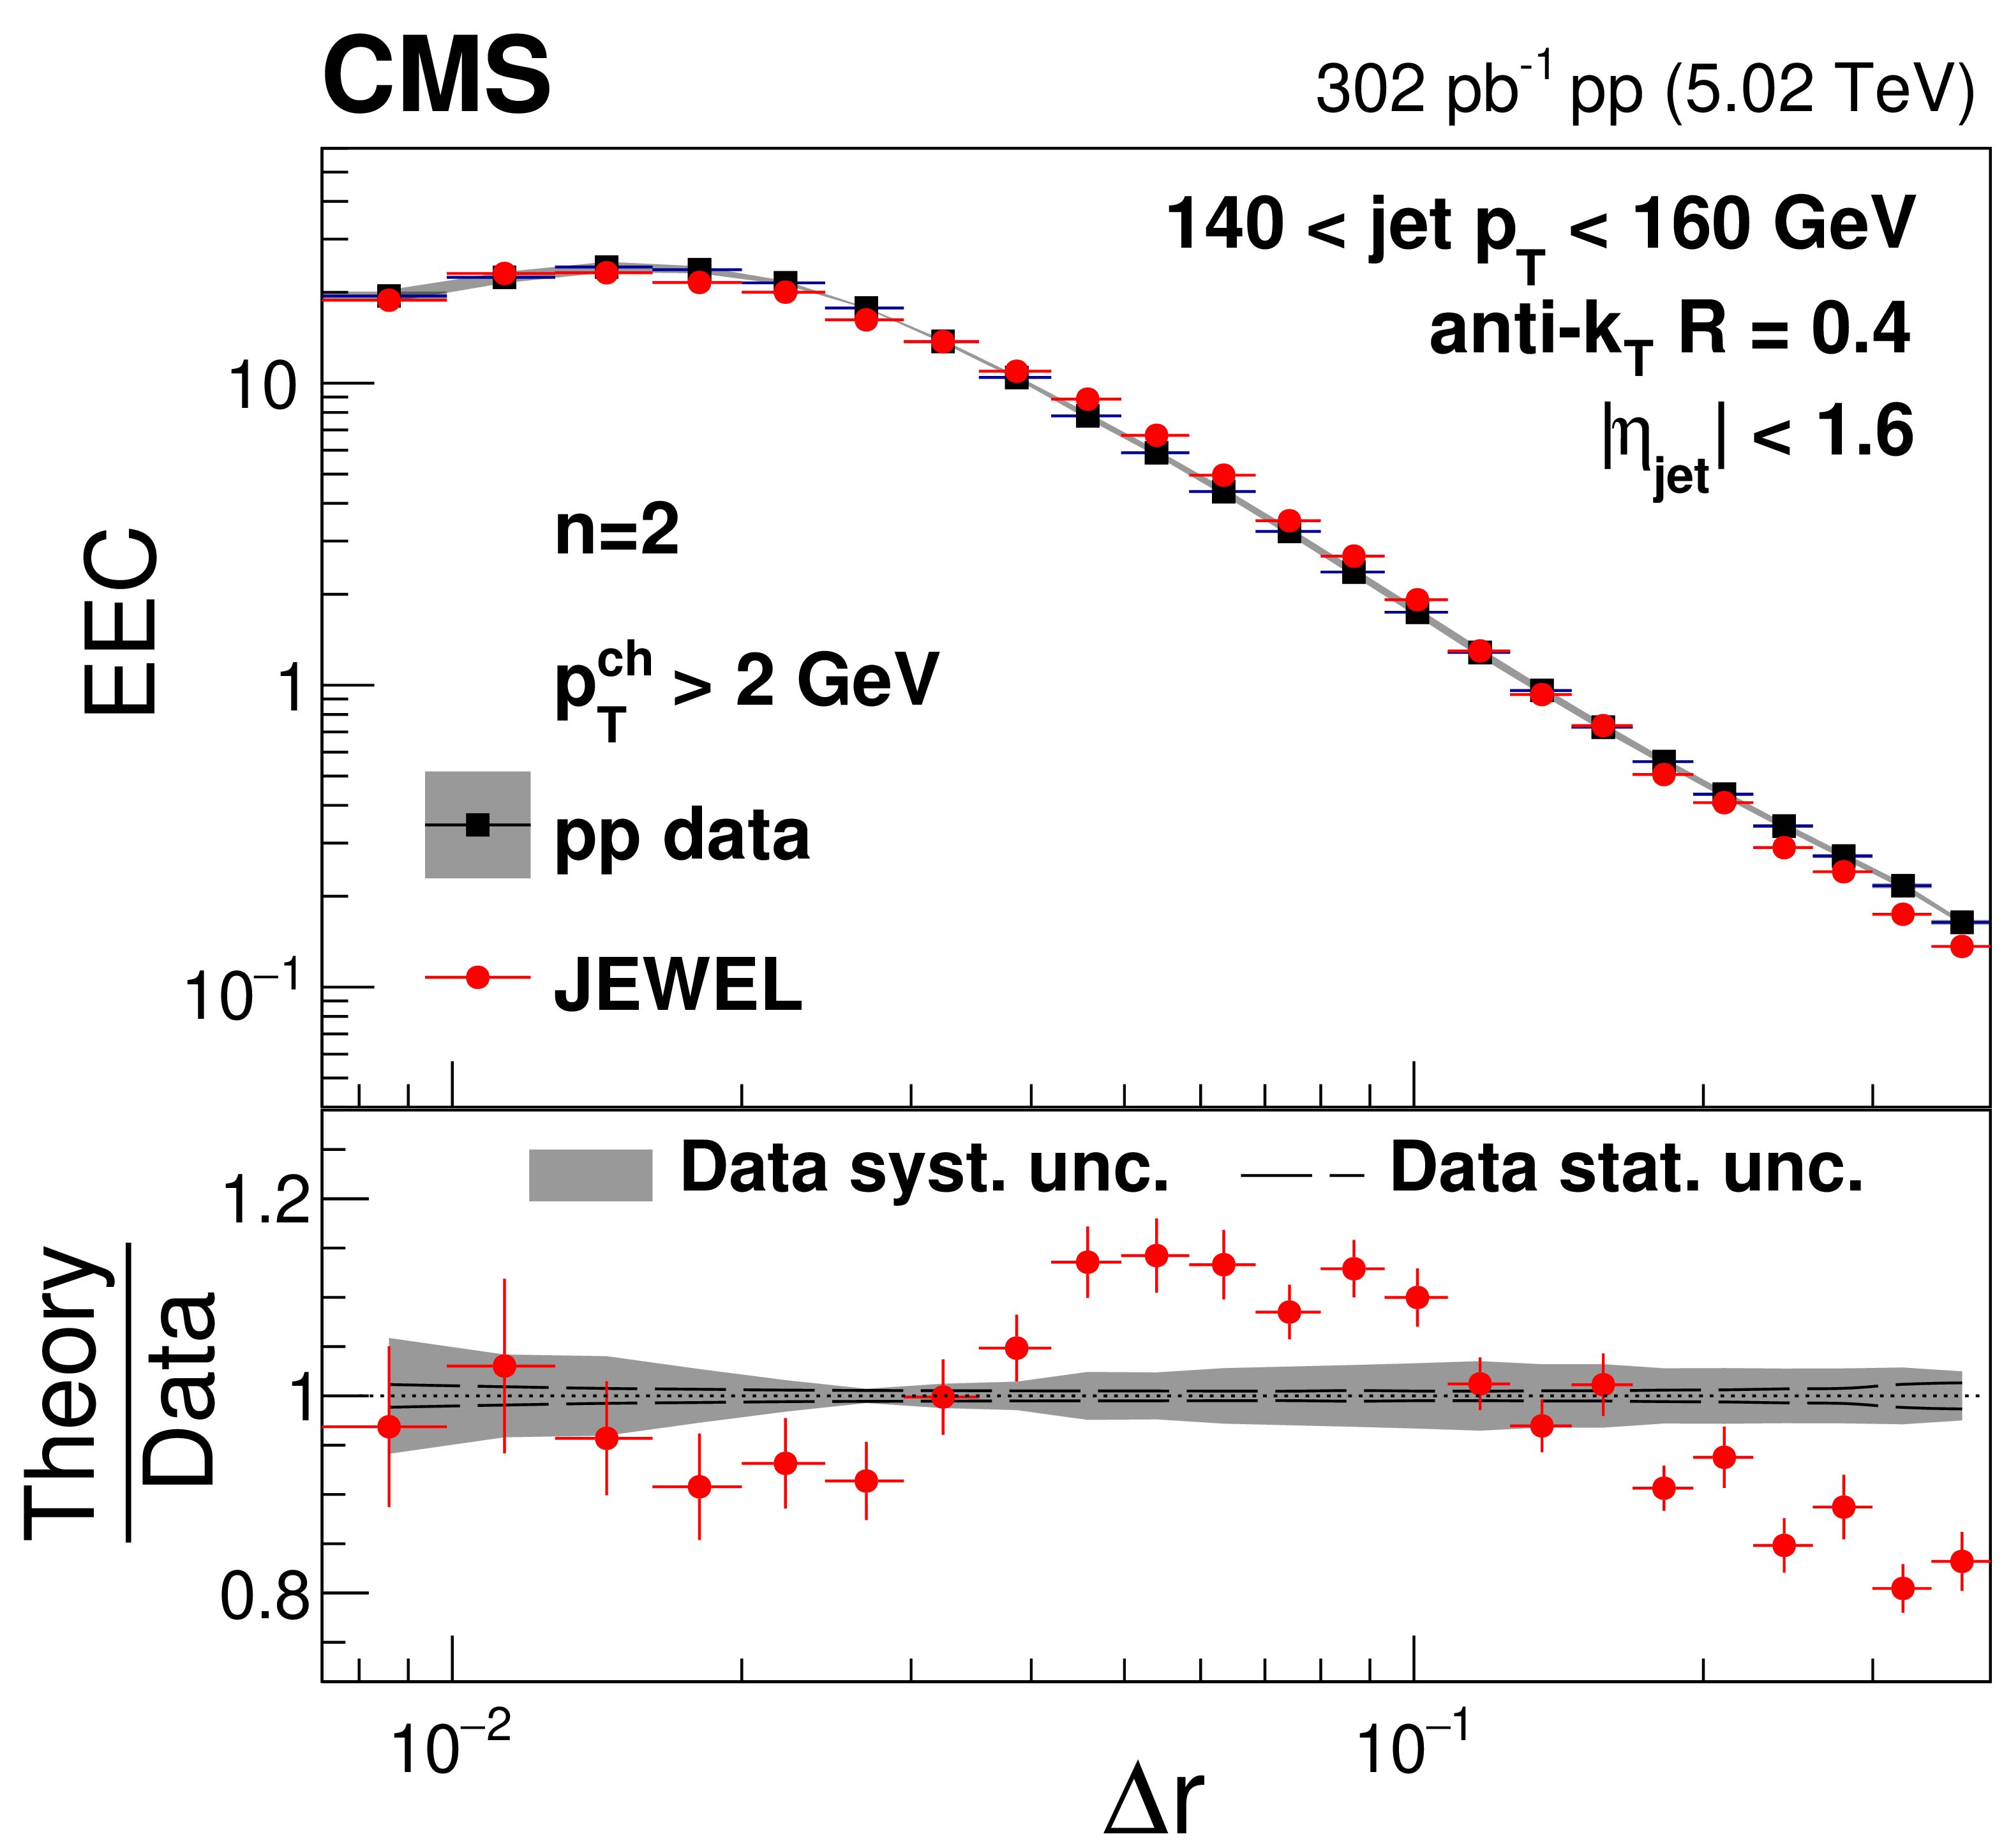
Figure 14-b:
Energy-energy correlator distributions from pp collisions with $ n= $ 2 in different $ p_{\mathrm{T}}^{\text{ch}} $ and $ p_{\text{T,jet}} $ bins compared to predictions from JEWEL. |
png pdf |
Figure 14-c:
Energy-energy correlator distributions from pp collisions with $ n= $ 2 in different $ p_{\mathrm{T}}^{\text{ch}} $ and $ p_{\text{T,jet}} $ bins compared to predictions from JEWEL. |
png pdf |
Figure 14-d:
Energy-energy correlator distributions from pp collisions with $ n= $ 2 in different $ p_{\mathrm{T}}^{\text{ch}} $ and $ p_{\text{T,jet}} $ bins compared to predictions from JEWEL. |

png pdf |
Figure 14-e:
Energy-energy correlator distributions from pp collisions with $ n= $ 2 in different $ p_{\mathrm{T}}^{\text{ch}} $ and $ p_{\text{T,jet}} $ bins compared to predictions from JEWEL. |
png pdf |
Figure 14-f:
Energy-energy correlator distributions from pp collisions with $ n= $ 2 in different $ p_{\mathrm{T}}^{\text{ch}} $ and $ p_{\text{T,jet}} $ bins compared to predictions from JEWEL. |
png pdf |
Figure 14-g:
Energy-energy correlator distributions from pp collisions with $ n= $ 2 in different $ p_{\mathrm{T}}^{\text{ch}} $ and $ p_{\text{T,jet}} $ bins compared to predictions from JEWEL. |
png pdf |
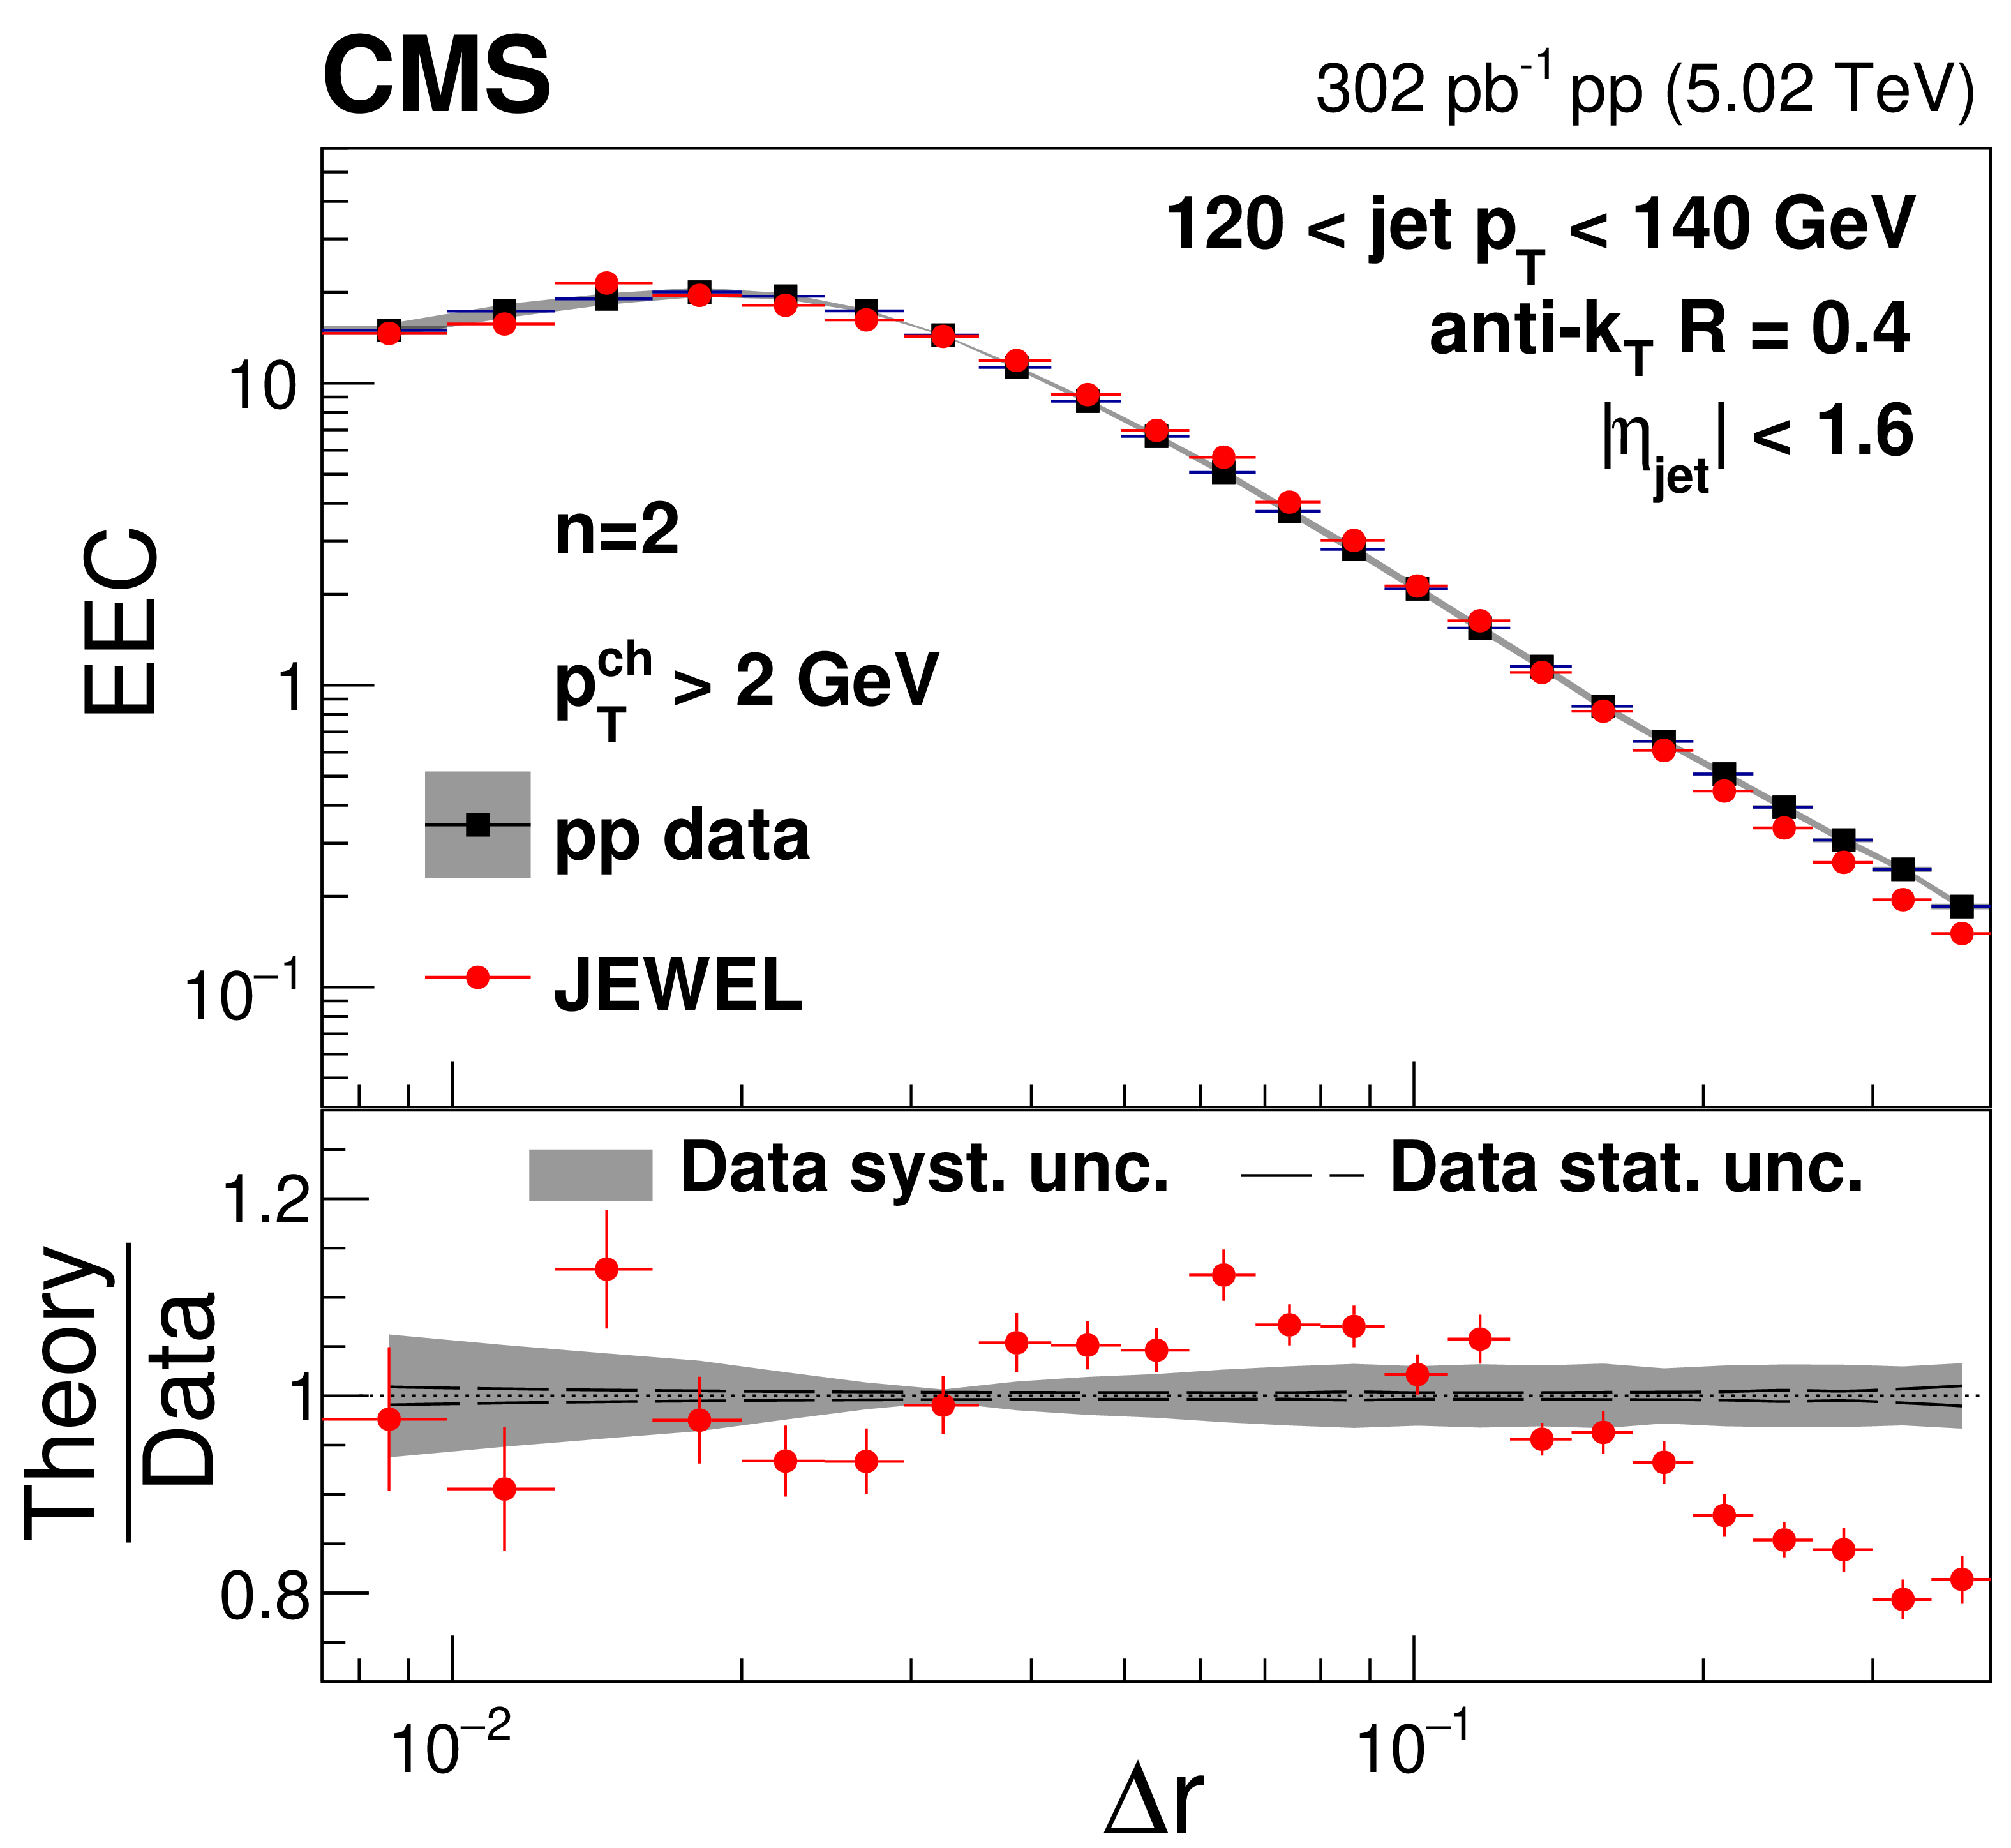
Figure 14-h:
Energy-energy correlator distributions from pp collisions with $ n= $ 2 in different $ p_{\mathrm{T}}^{\text{ch}} $ and $ p_{\text{T,jet}} $ bins compared to predictions from JEWEL. |
png pdf |
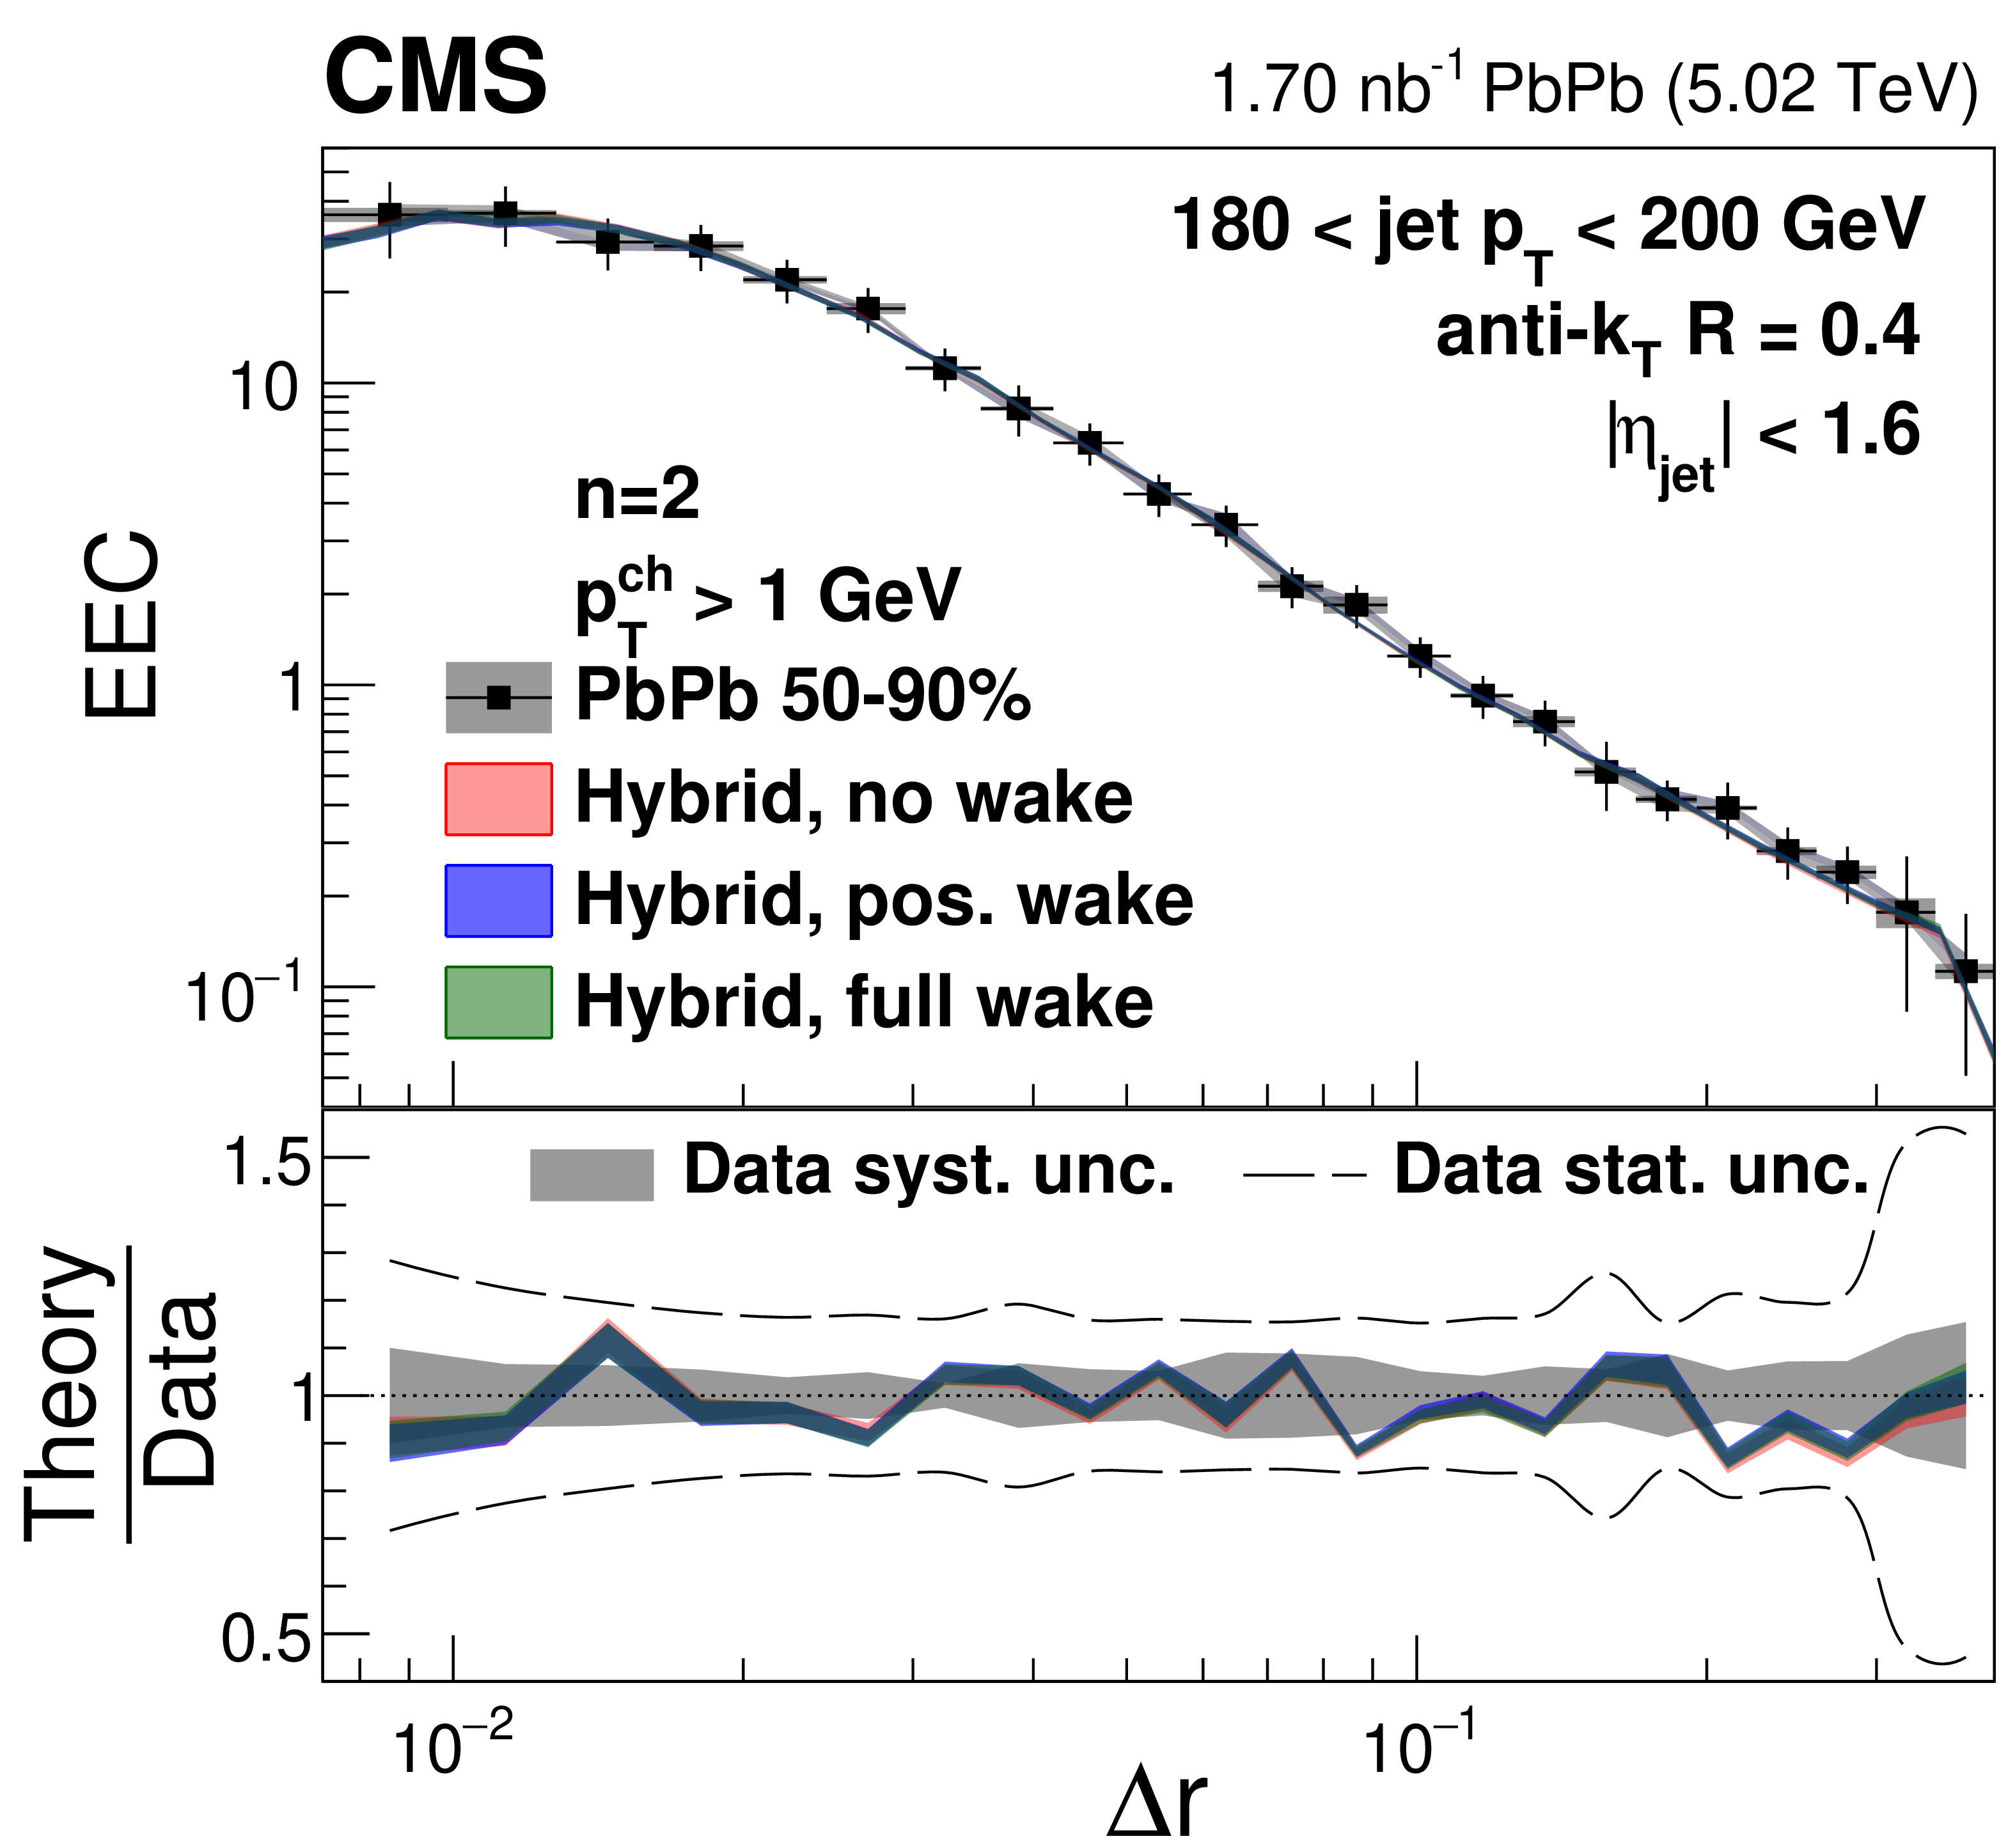
Figure 15:
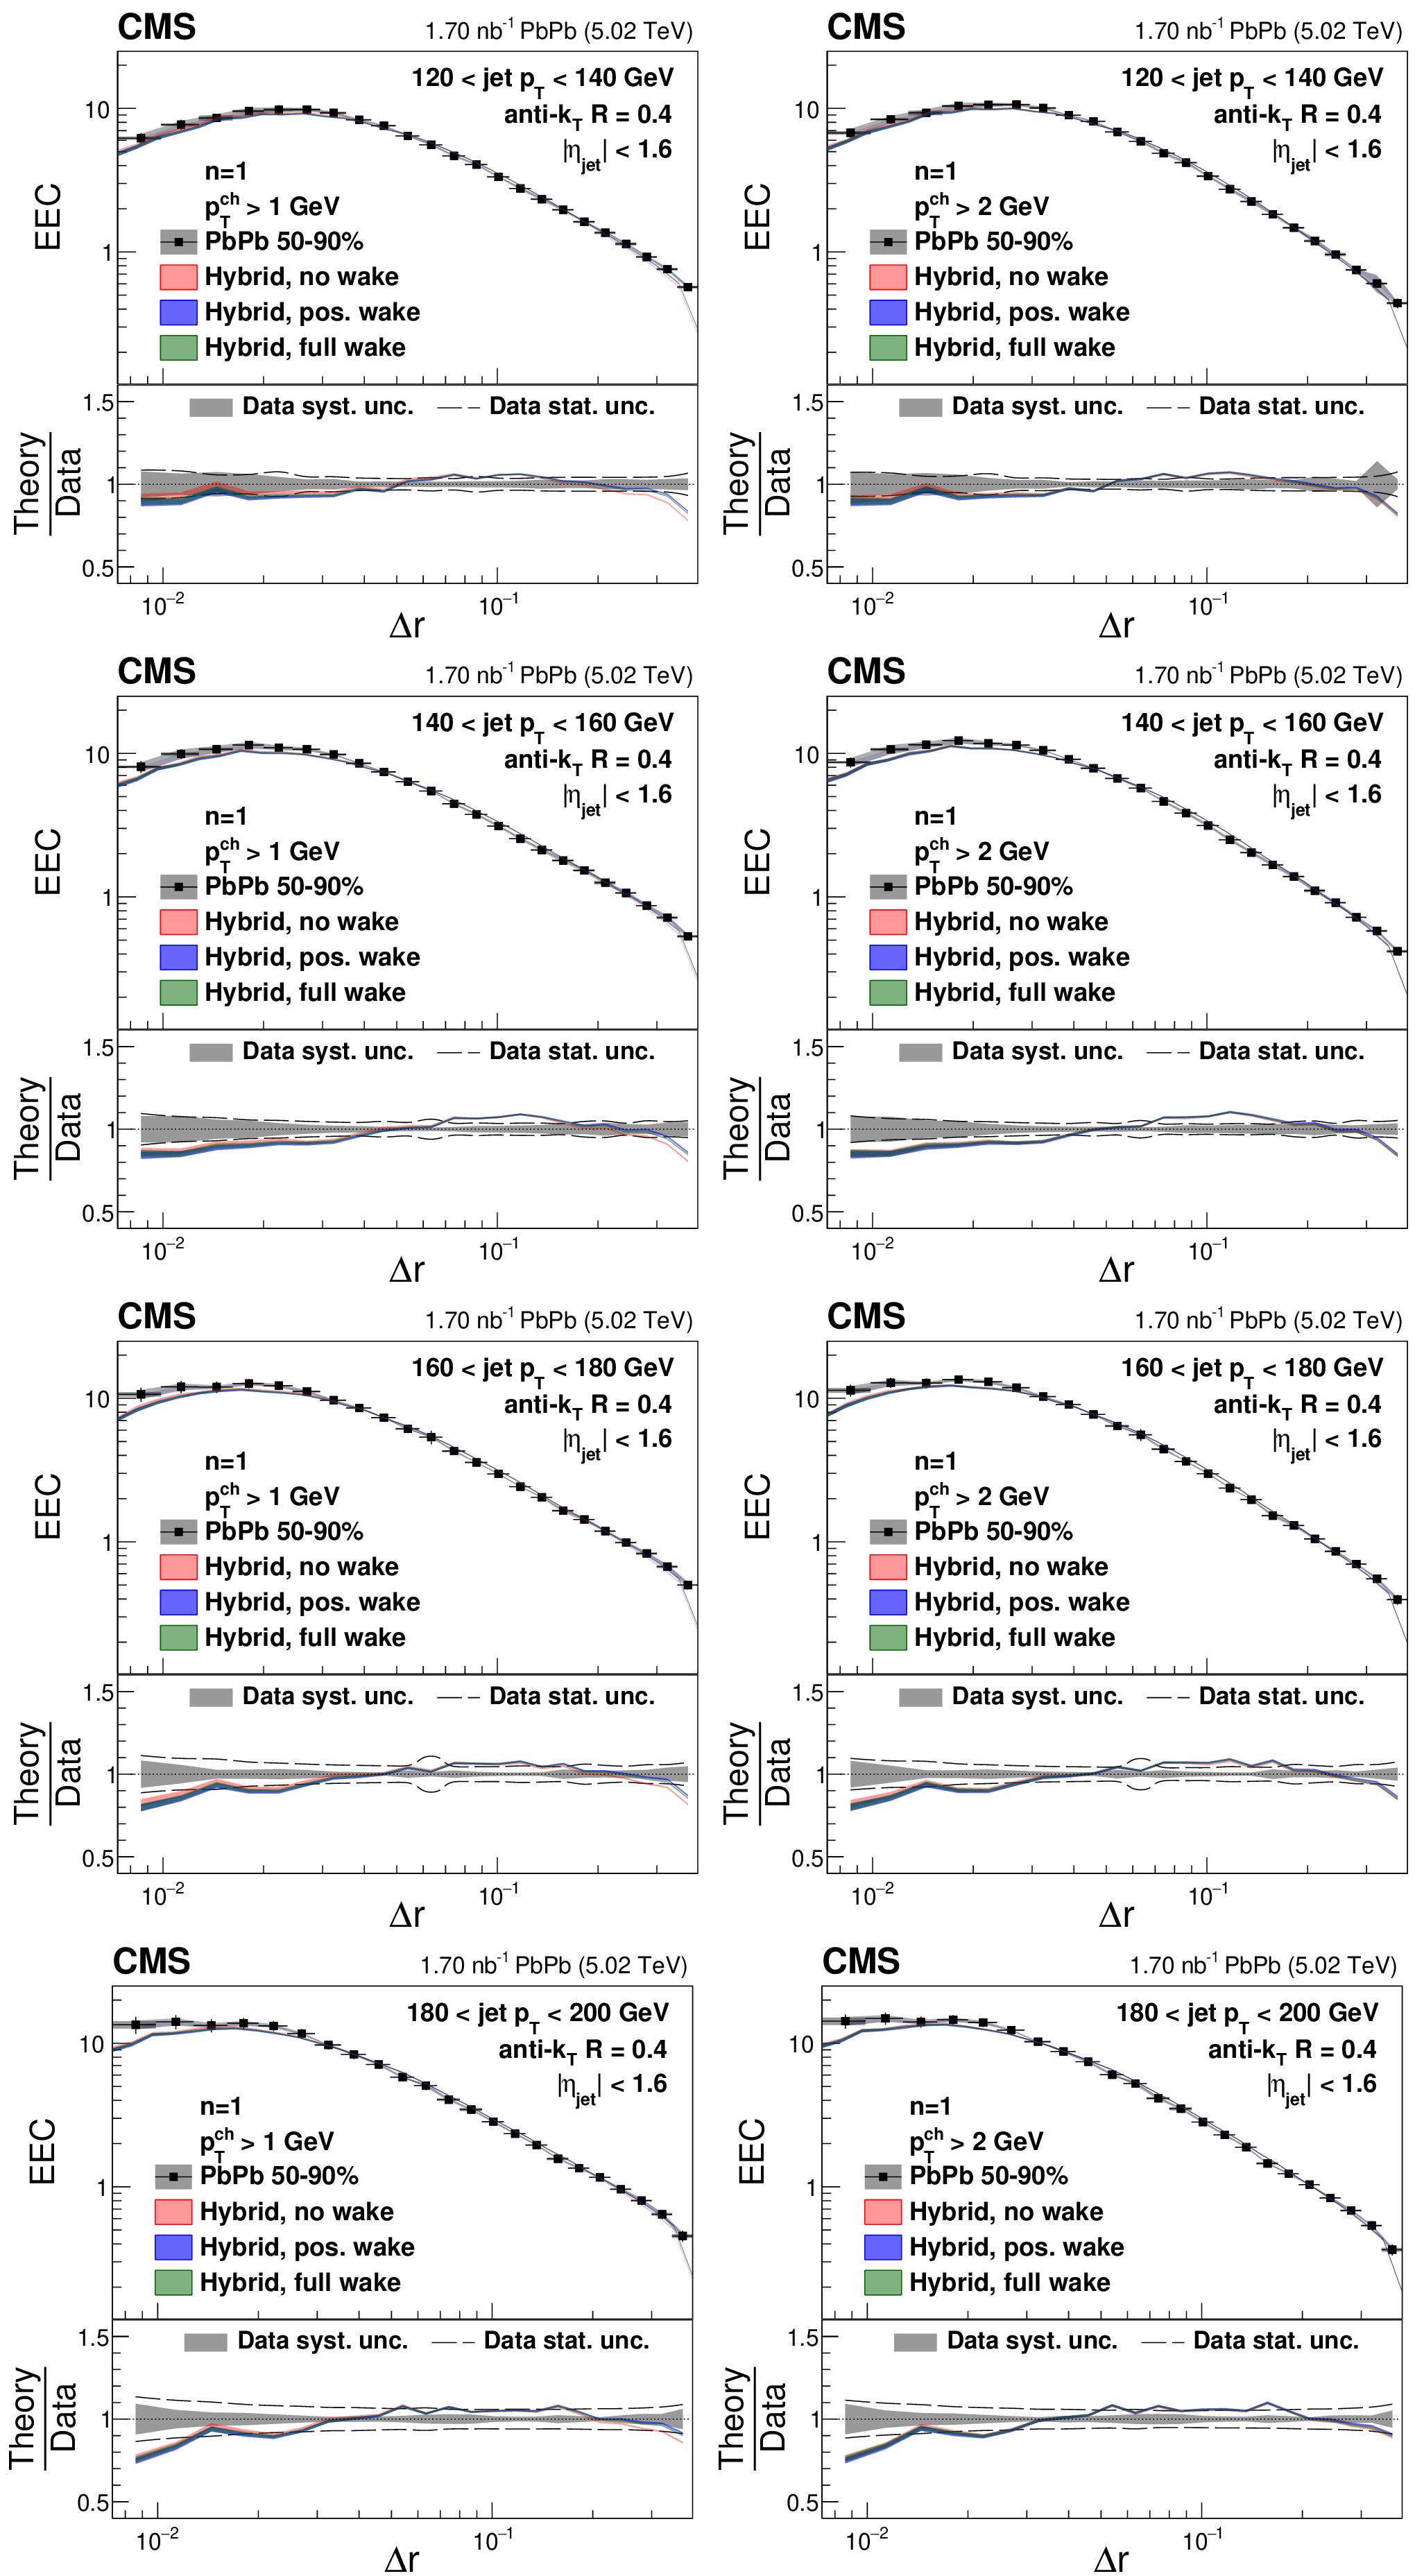
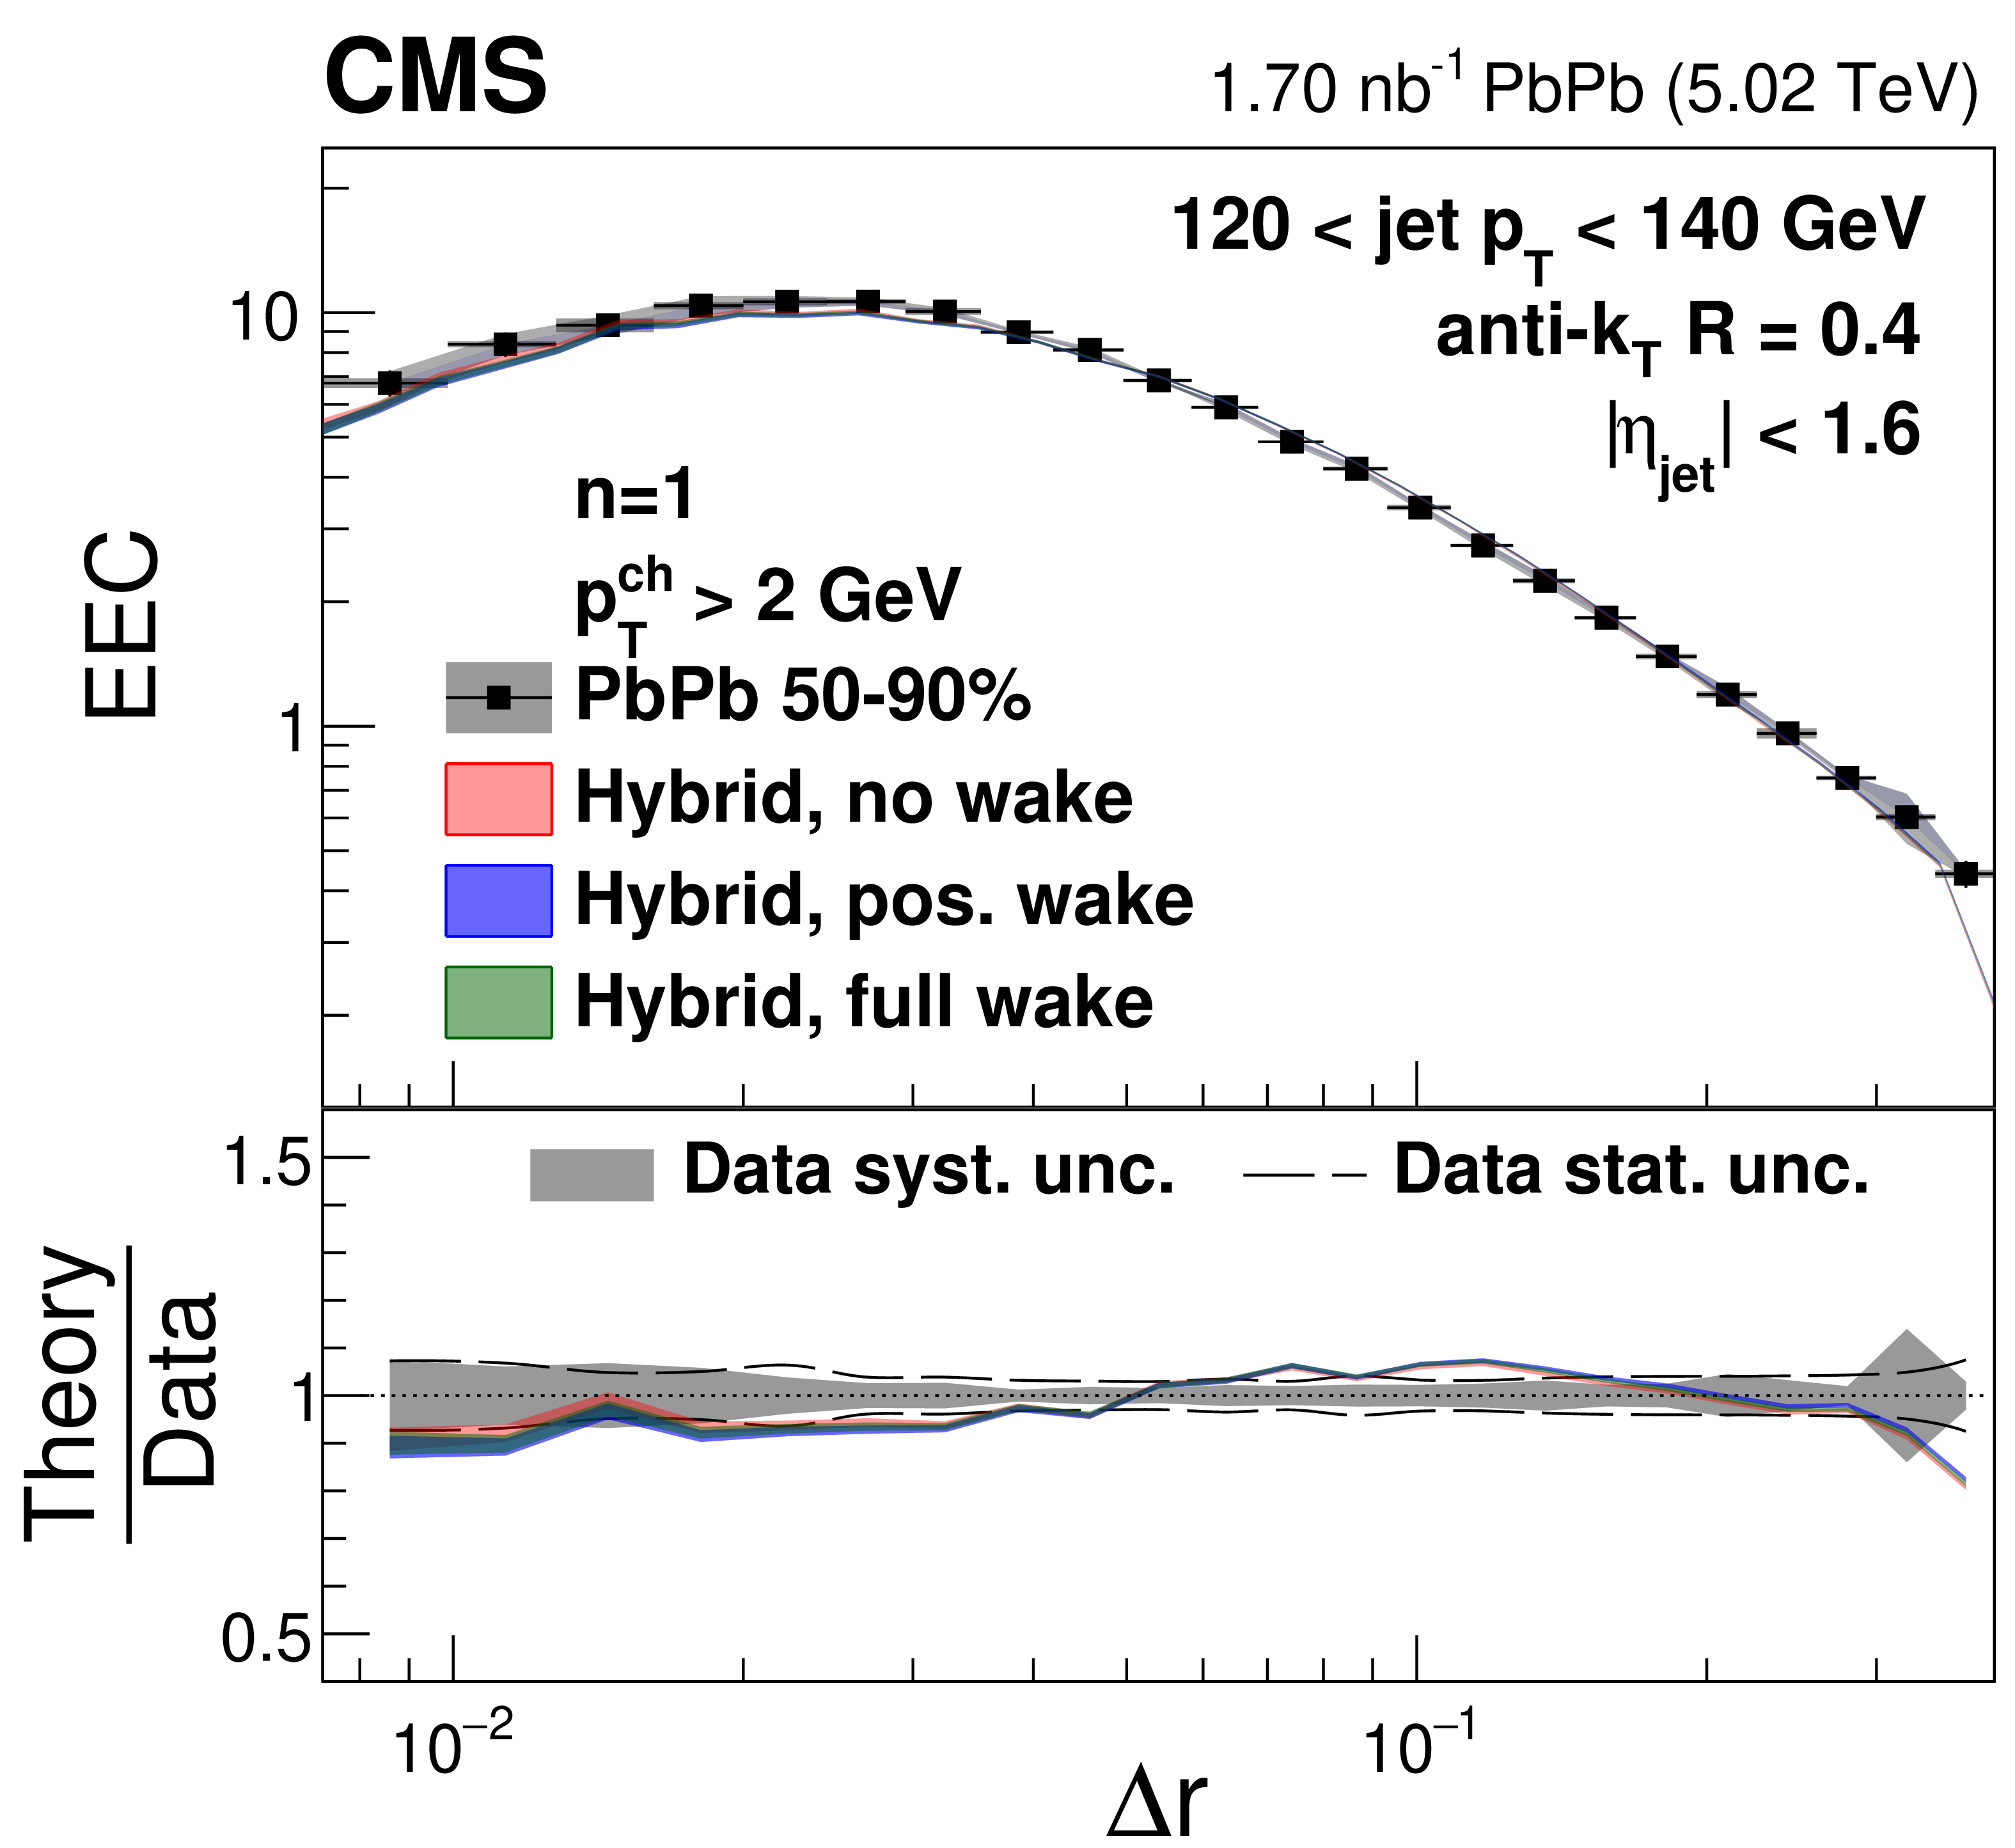
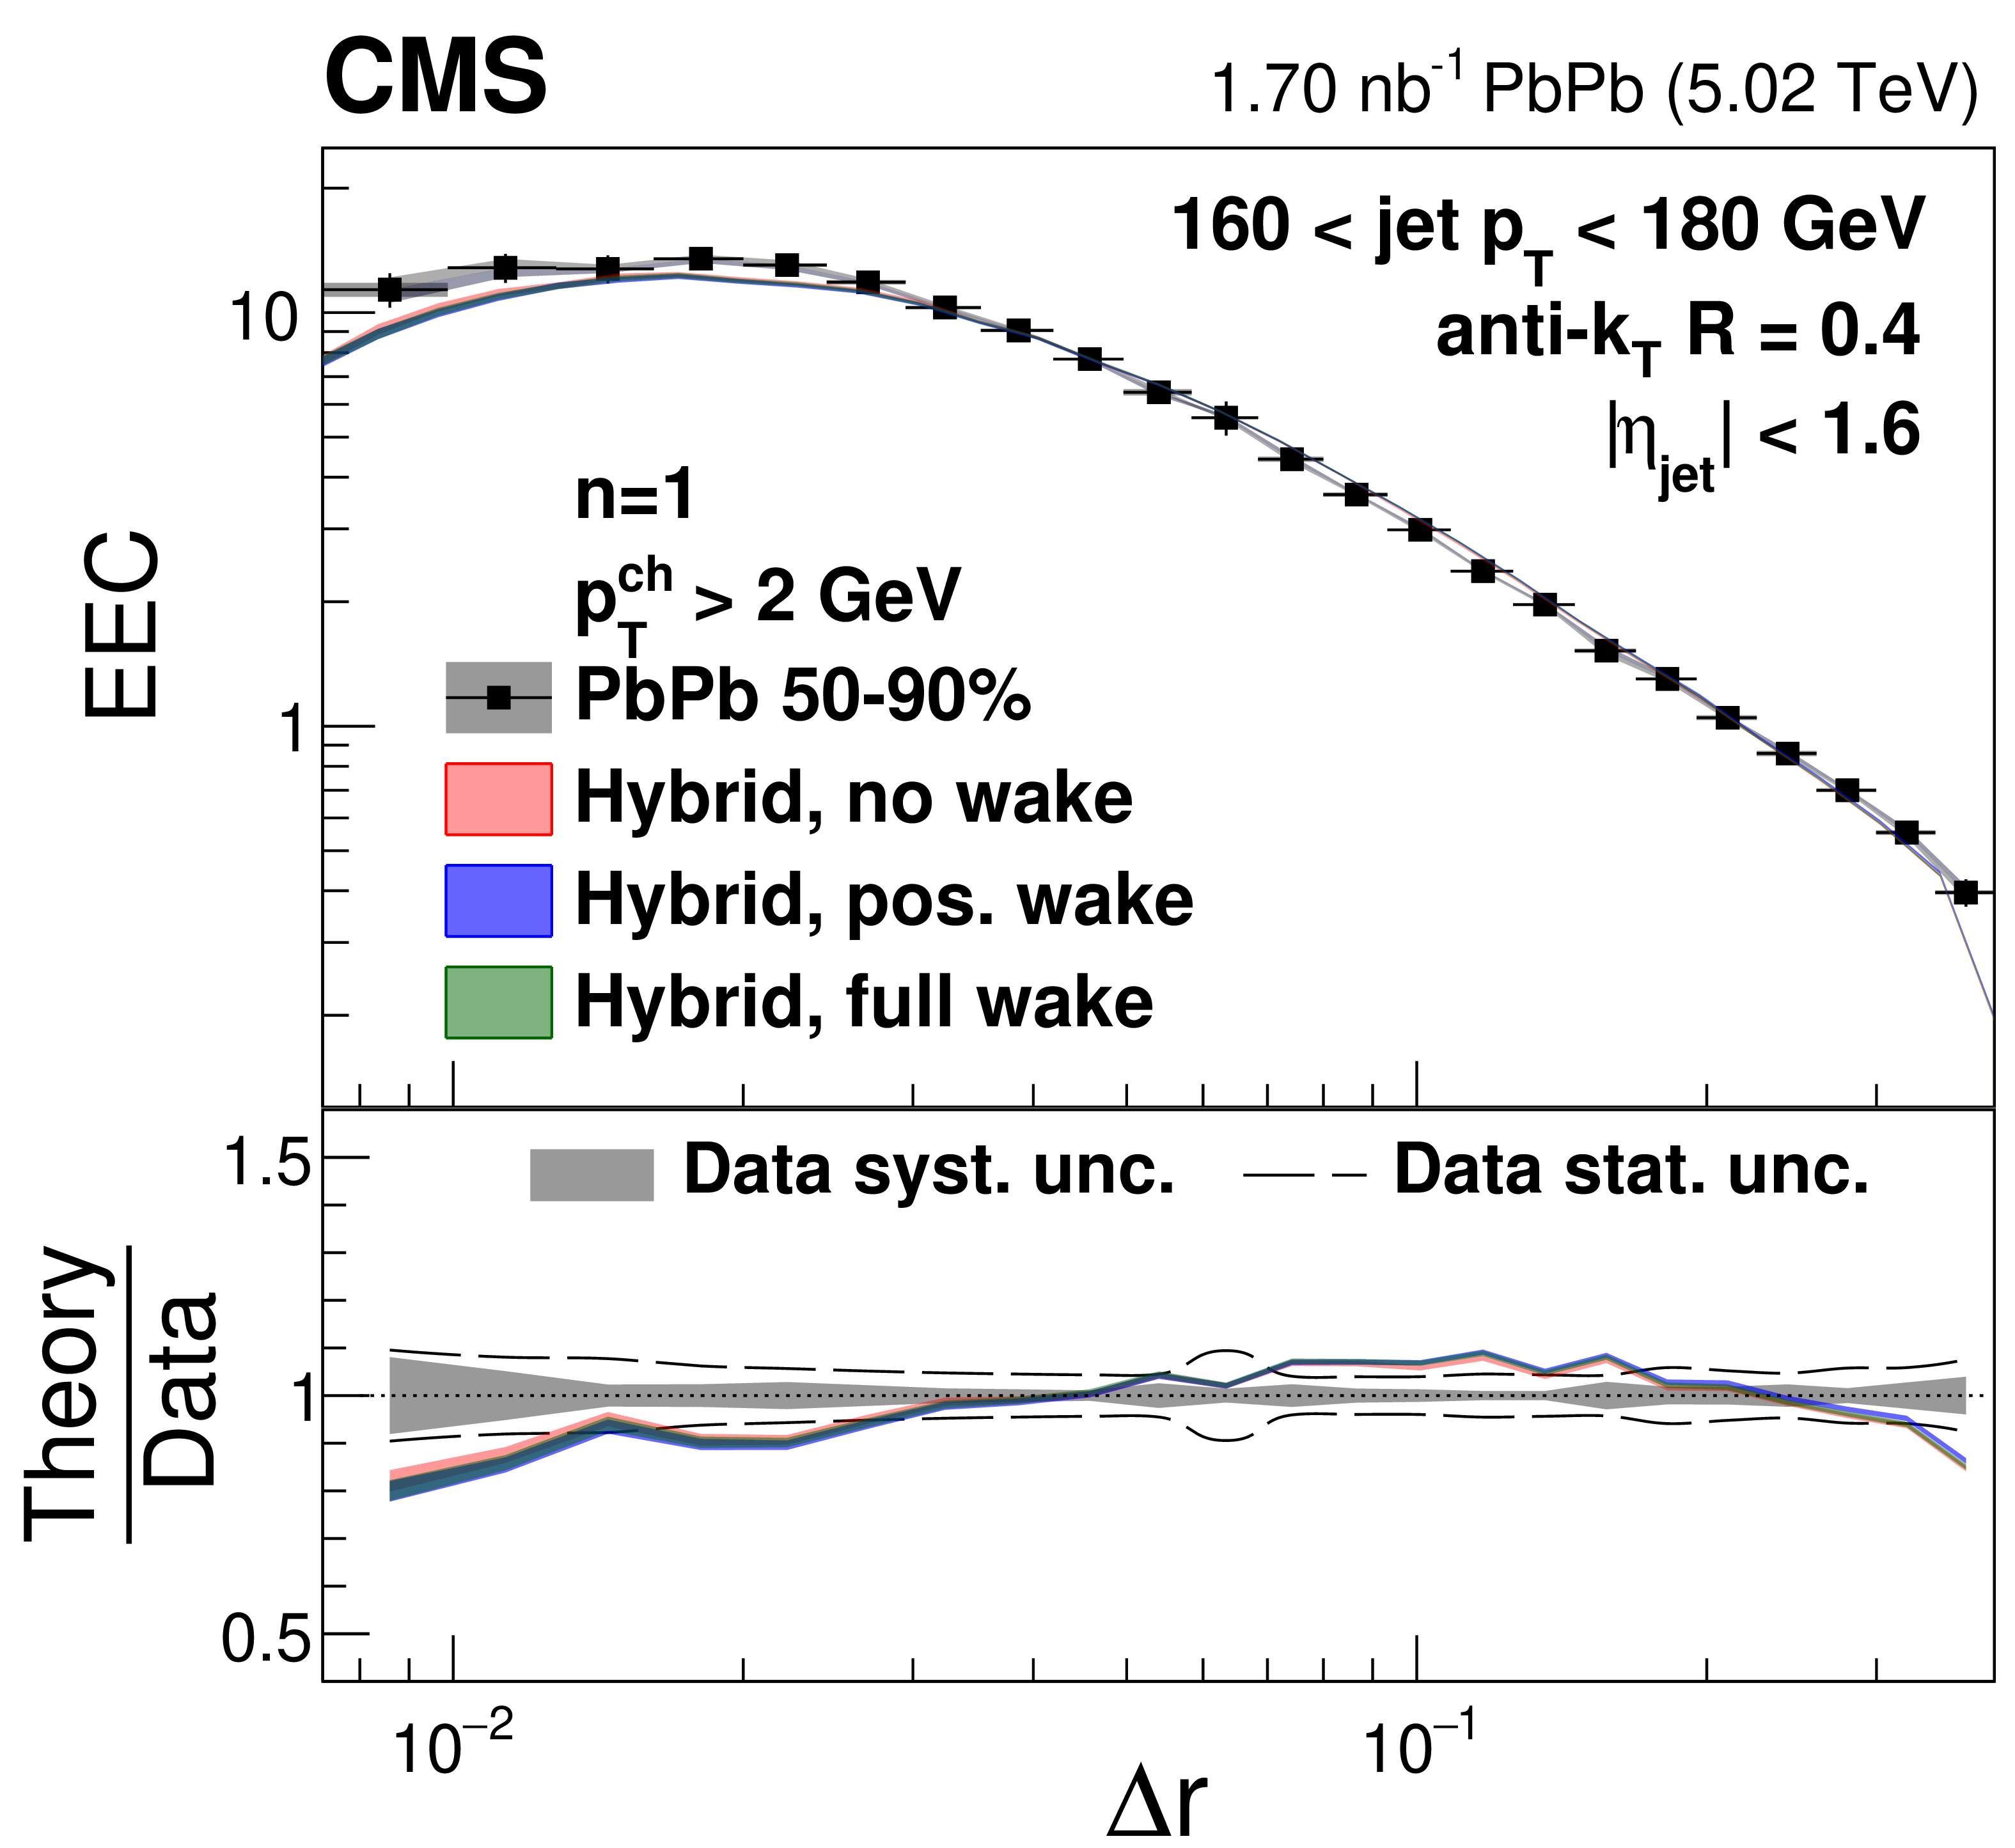
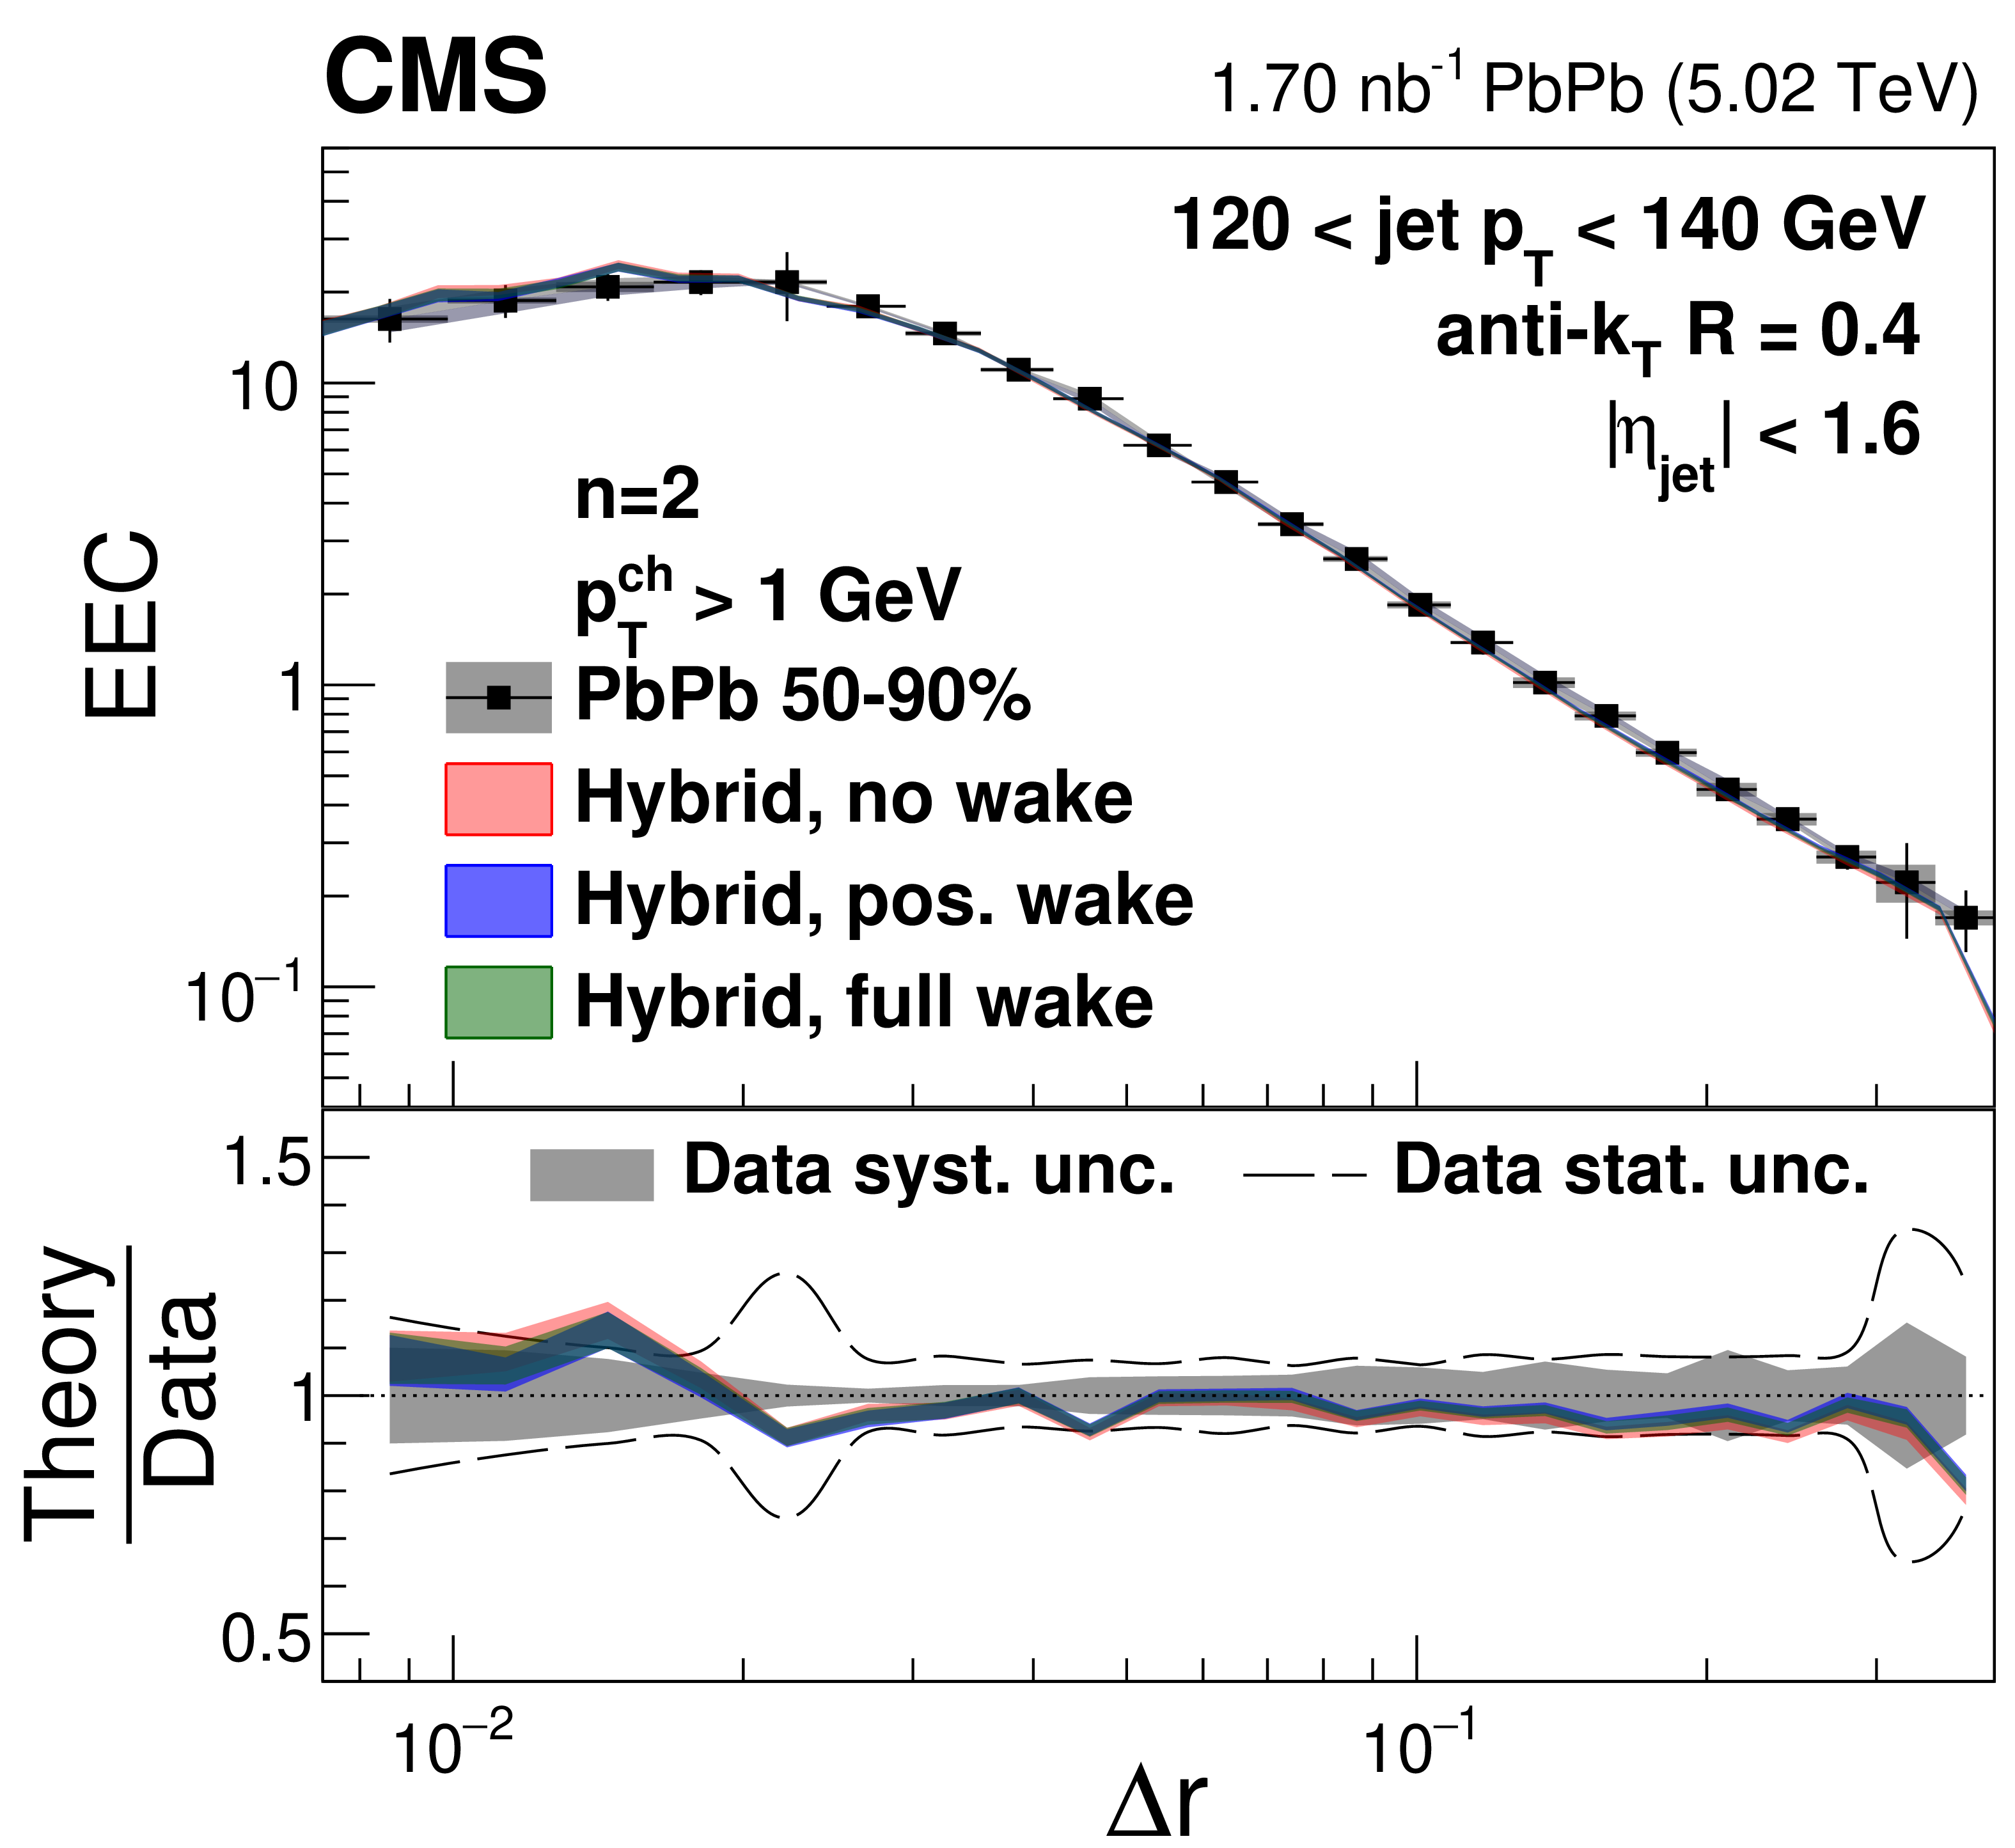
Energy-energy correlator distributions from 50-90% central PbPb collisions with $ n= $ 1 in different $ p_{\mathrm{T}}^{\text{ch}} $ and $ p_{\text{T,jet}} $ bins compared to the hybrid model predictions with different jet wake settings. |
png pdf |
Figure 15-a:
Energy-energy correlator distributions from 50-90% central PbPb collisions with $ n= $ 1 in different $ p_{\mathrm{T}}^{\text{ch}} $ and $ p_{\text{T,jet}} $ bins compared to the hybrid model predictions with different jet wake settings. |
png pdf |
Figure 15-b:
Energy-energy correlator distributions from 50-90% central PbPb collisions with $ n= $ 1 in different $ p_{\mathrm{T}}^{\text{ch}} $ and $ p_{\text{T,jet}} $ bins compared to the hybrid model predictions with different jet wake settings. |

png pdf |
Figure 15-c:
Energy-energy correlator distributions from 50-90% central PbPb collisions with $ n= $ 1 in different $ p_{\mathrm{T}}^{\text{ch}} $ and $ p_{\text{T,jet}} $ bins compared to the hybrid model predictions with different jet wake settings. |

png pdf |
Figure 15-d:
Energy-energy correlator distributions from 50-90% central PbPb collisions with $ n= $ 1 in different $ p_{\mathrm{T}}^{\text{ch}} $ and $ p_{\text{T,jet}} $ bins compared to the hybrid model predictions with different jet wake settings. |

png pdf |
Figure 15-e:
Energy-energy correlator distributions from 50-90% central PbPb collisions with $ n= $ 1 in different $ p_{\mathrm{T}}^{\text{ch}} $ and $ p_{\text{T,jet}} $ bins compared to the hybrid model predictions with different jet wake settings. |
png pdf |
Figure 15-f:
Energy-energy correlator distributions from 50-90% central PbPb collisions with $ n= $ 1 in different $ p_{\mathrm{T}}^{\text{ch}} $ and $ p_{\text{T,jet}} $ bins compared to the hybrid model predictions with different jet wake settings. |

png pdf |
Figure 15-g:
Energy-energy correlator distributions from 50-90% central PbPb collisions with $ n= $ 1 in different $ p_{\mathrm{T}}^{\text{ch}} $ and $ p_{\text{T,jet}} $ bins compared to the hybrid model predictions with different jet wake settings. |

png pdf |
Figure 15-h:
Energy-energy correlator distributions from 50-90% central PbPb collisions with $ n= $ 1 in different $ p_{\mathrm{T}}^{\text{ch}} $ and $ p_{\text{T,jet}} $ bins compared to the hybrid model predictions with different jet wake settings. |
png pdf |
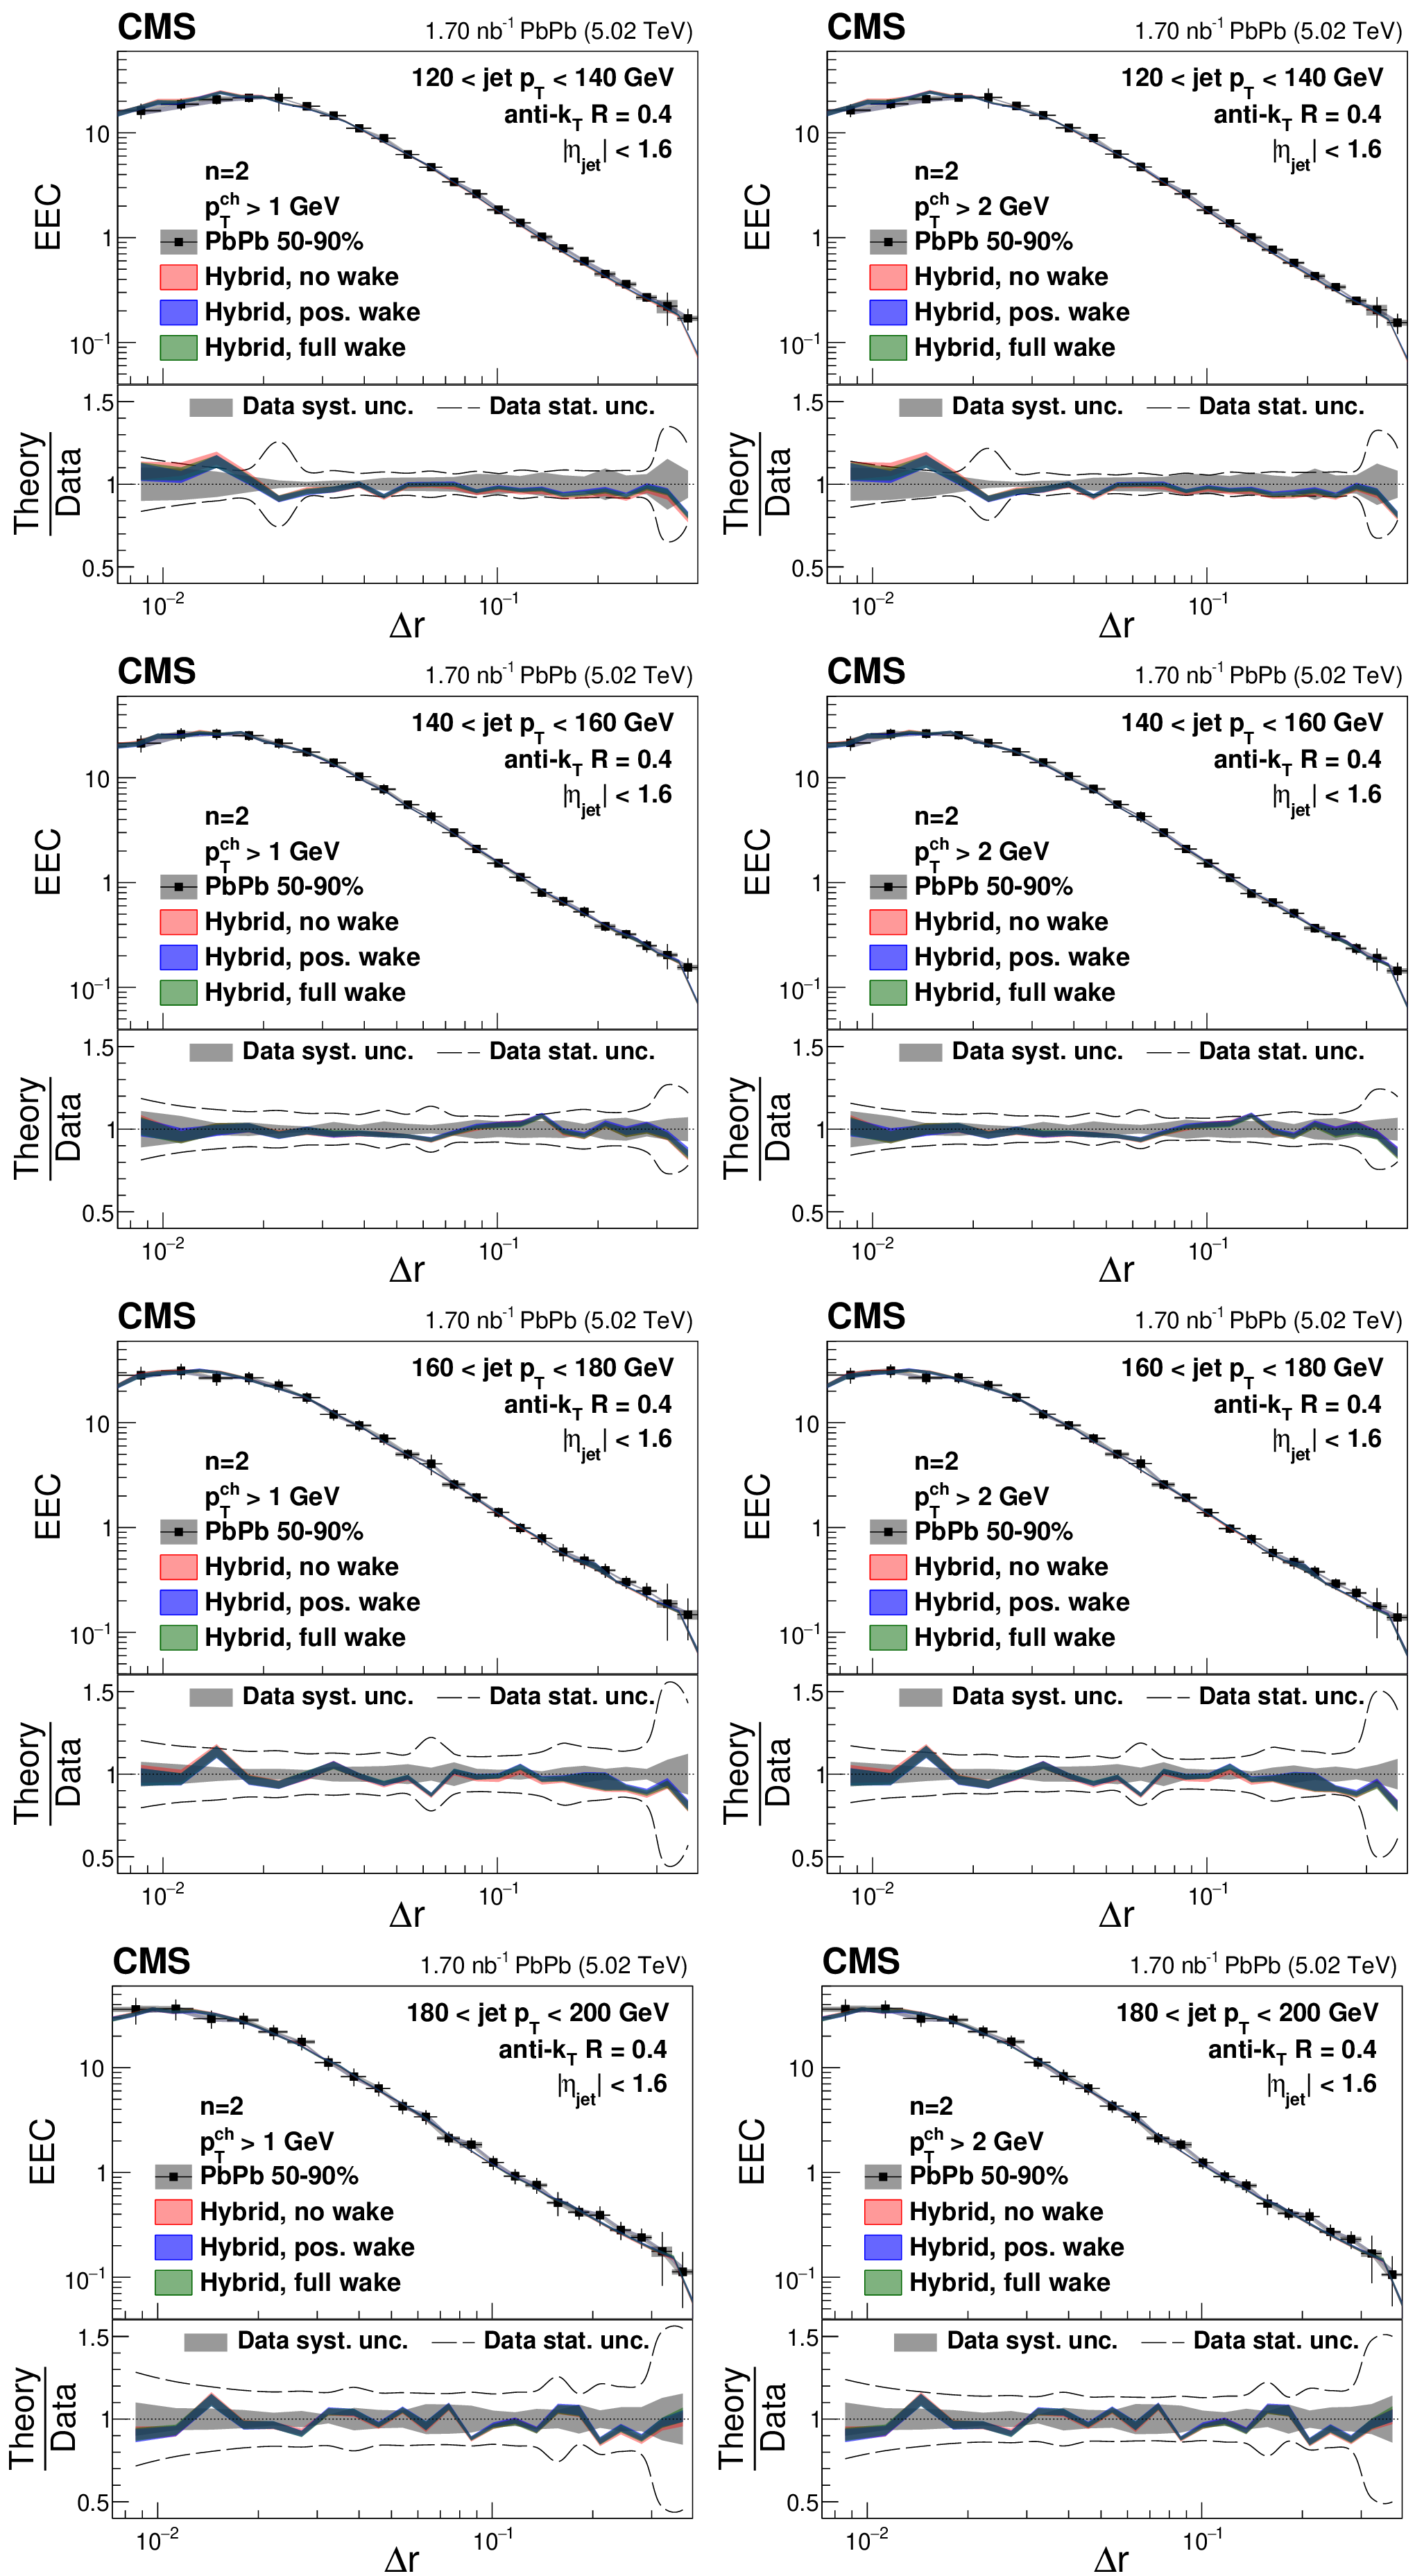
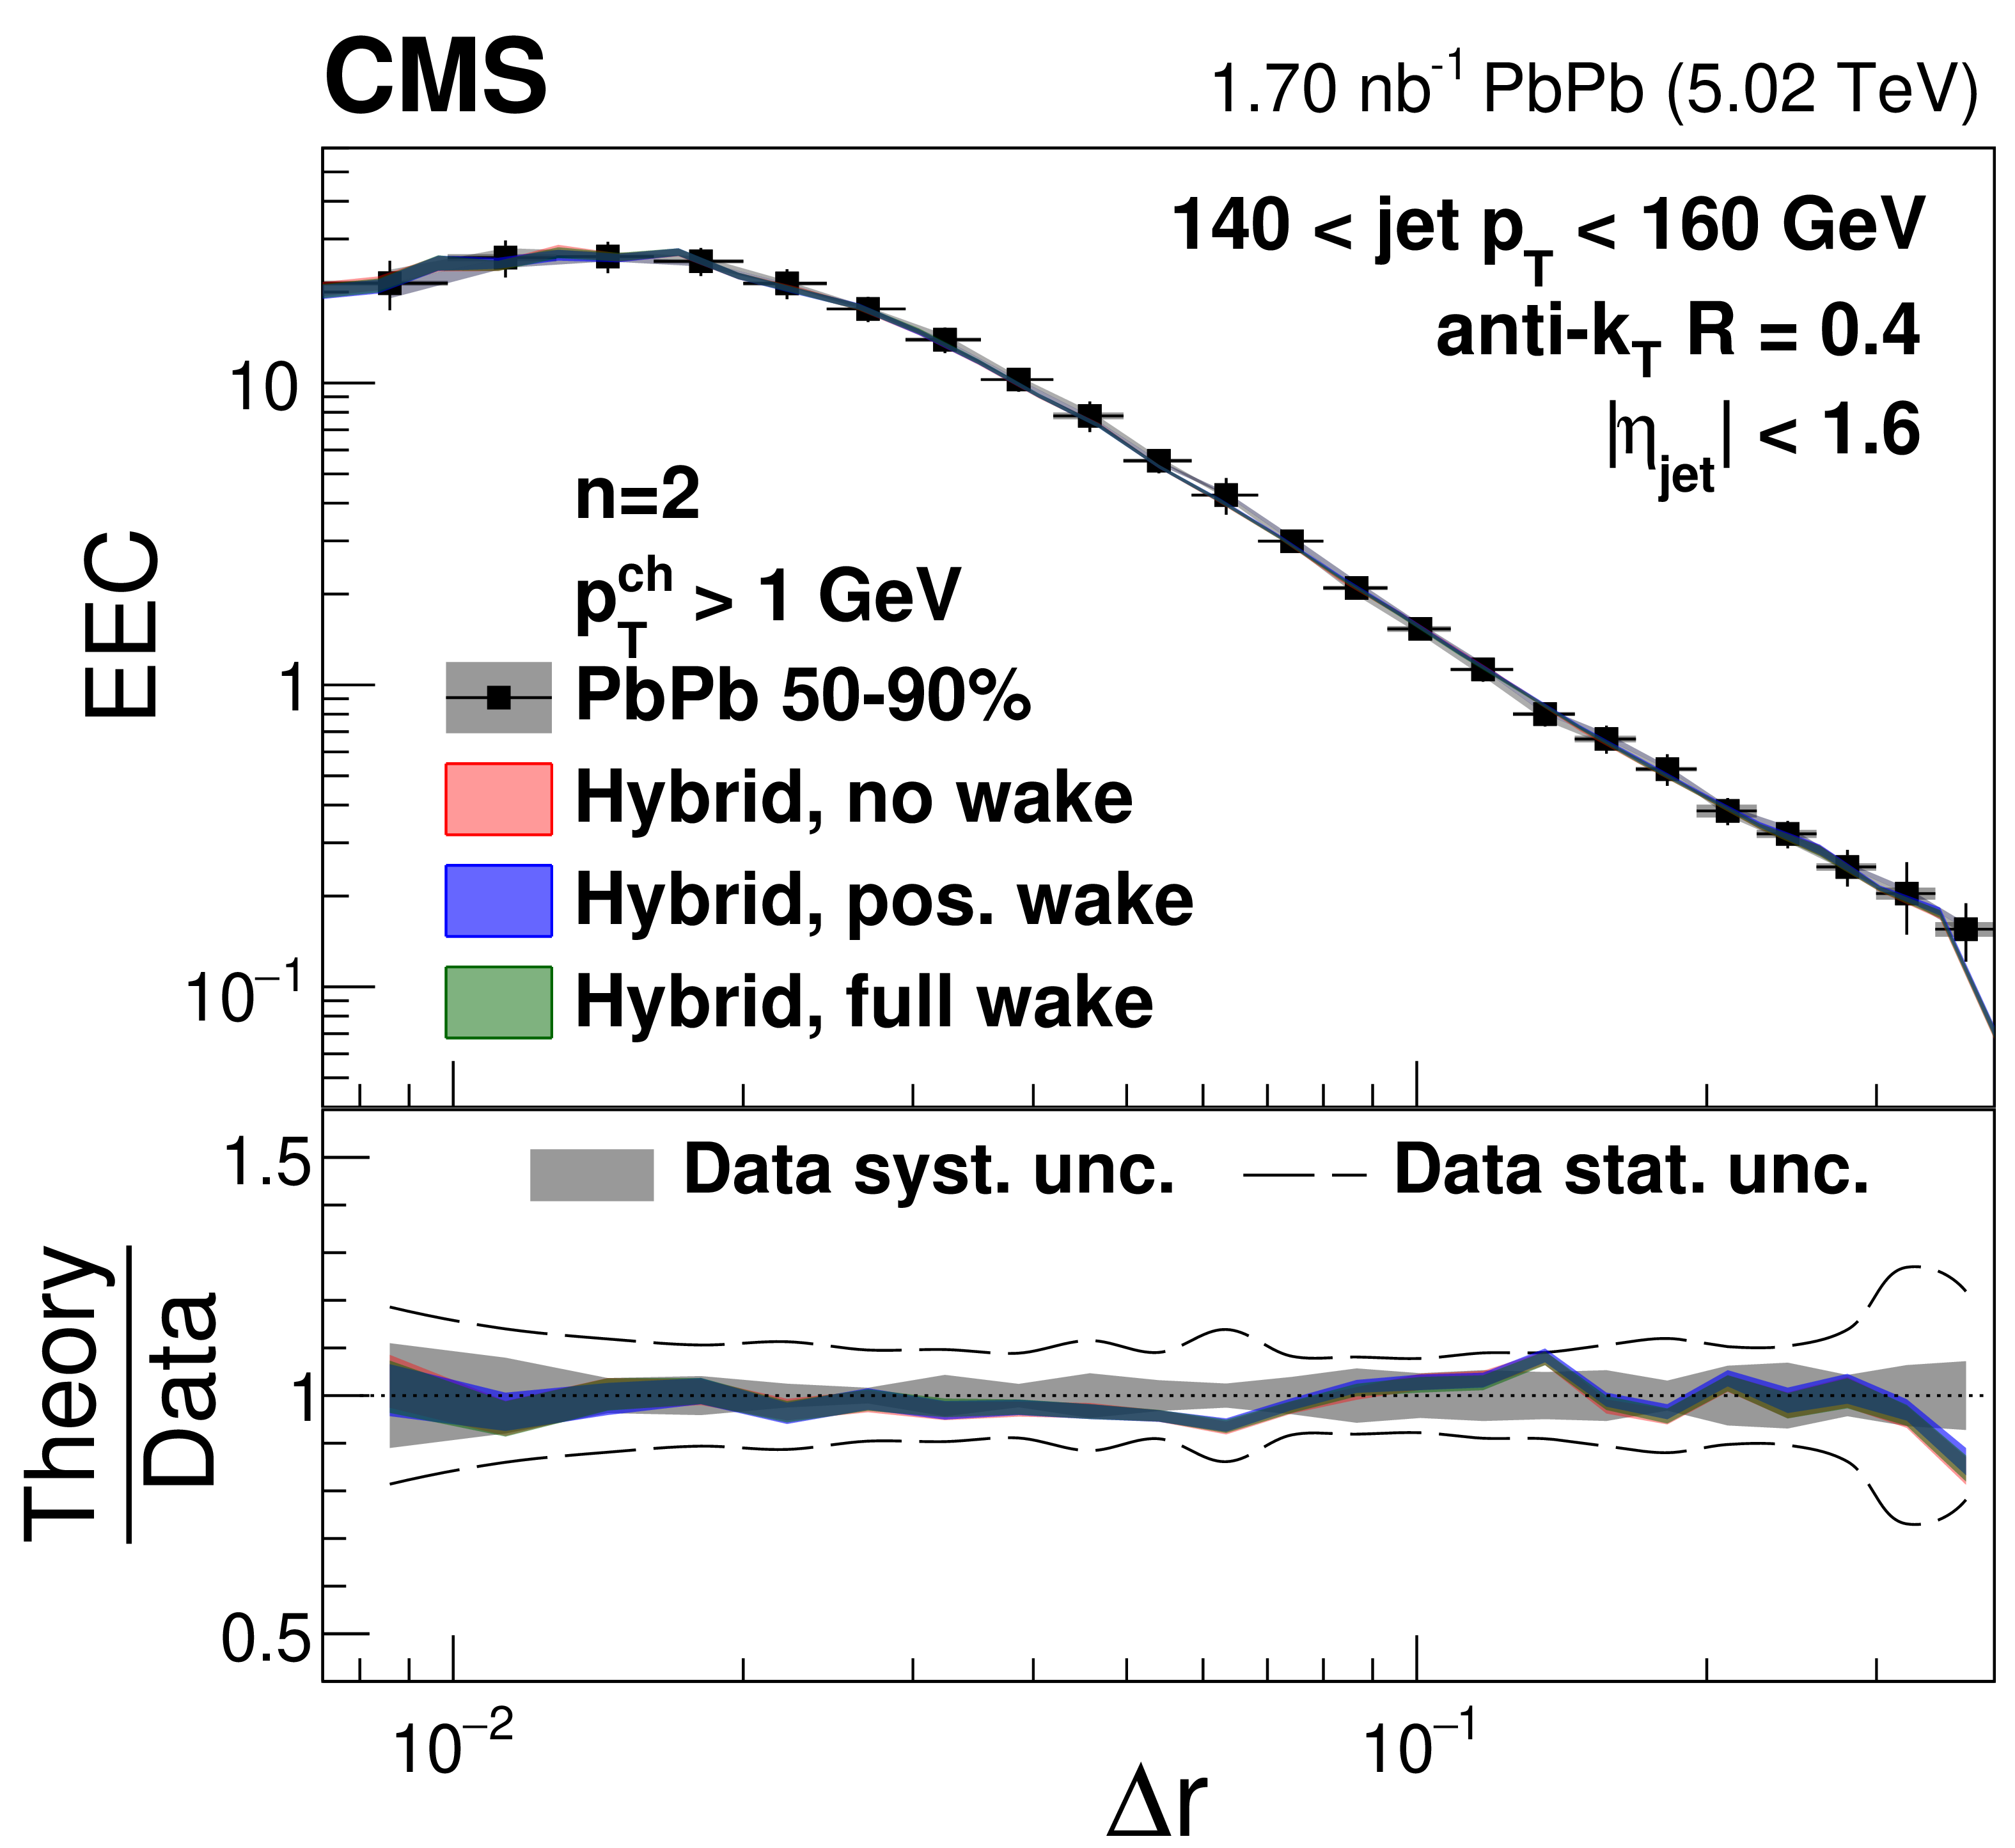
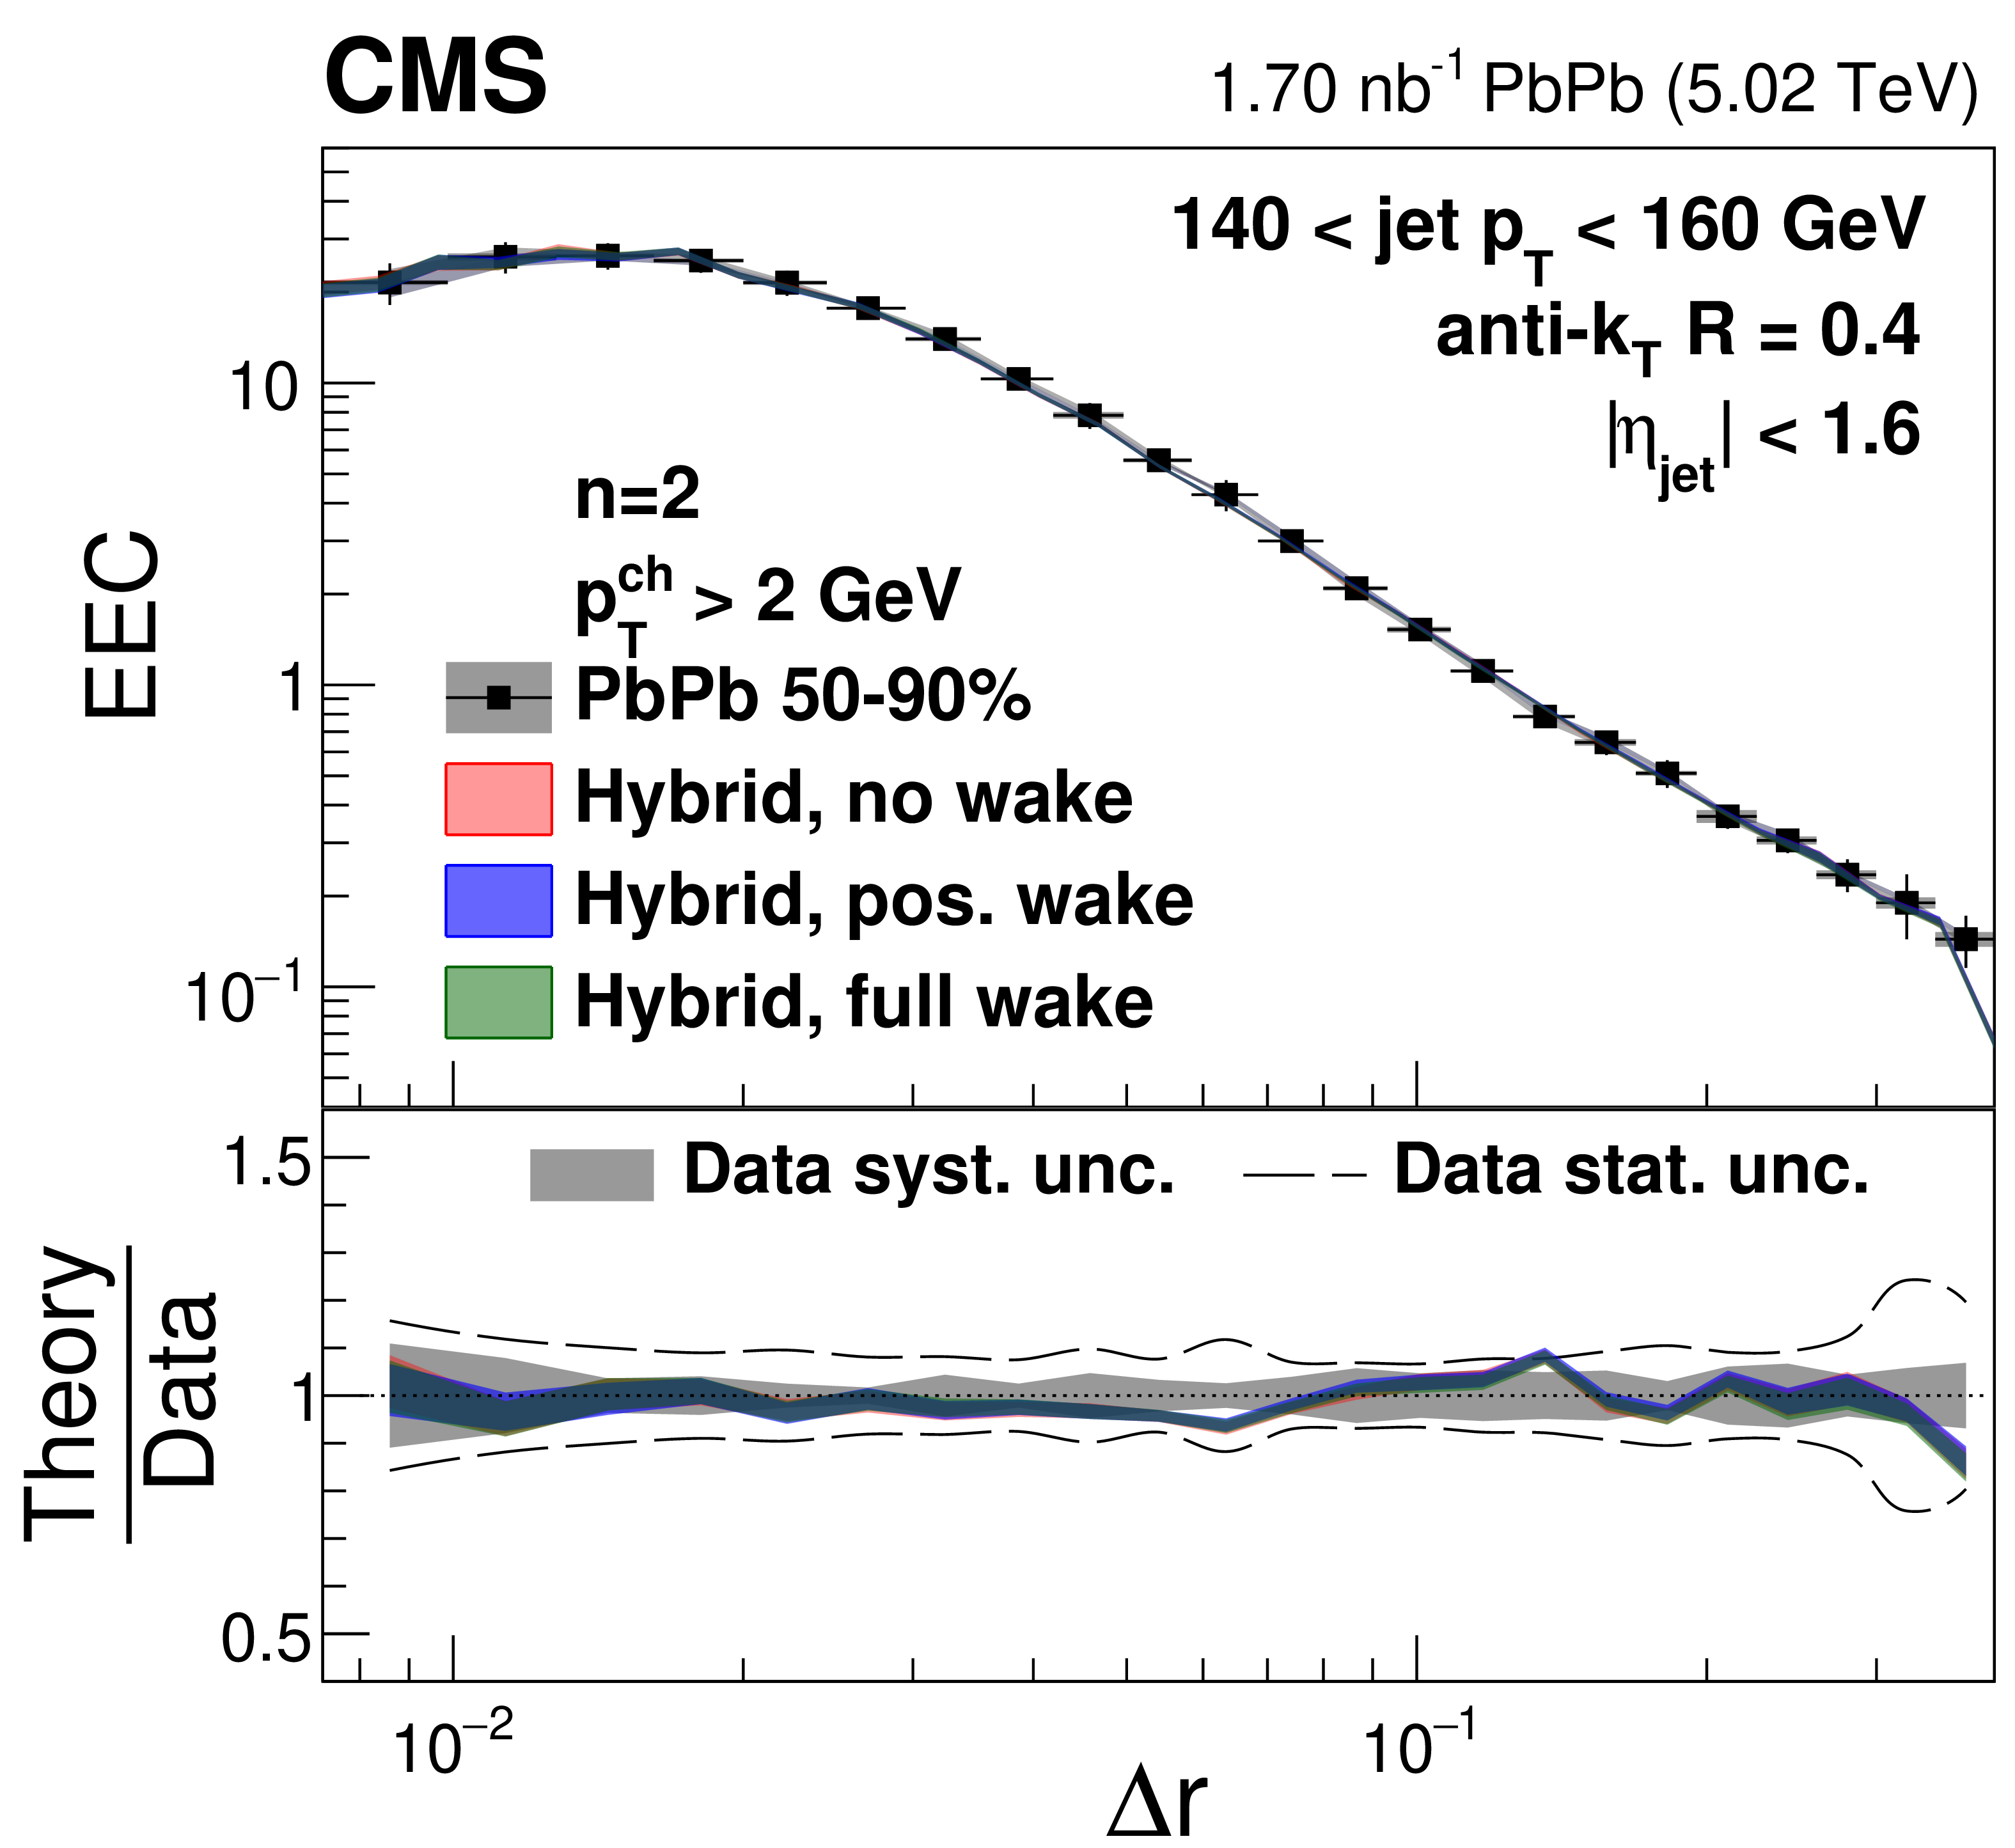
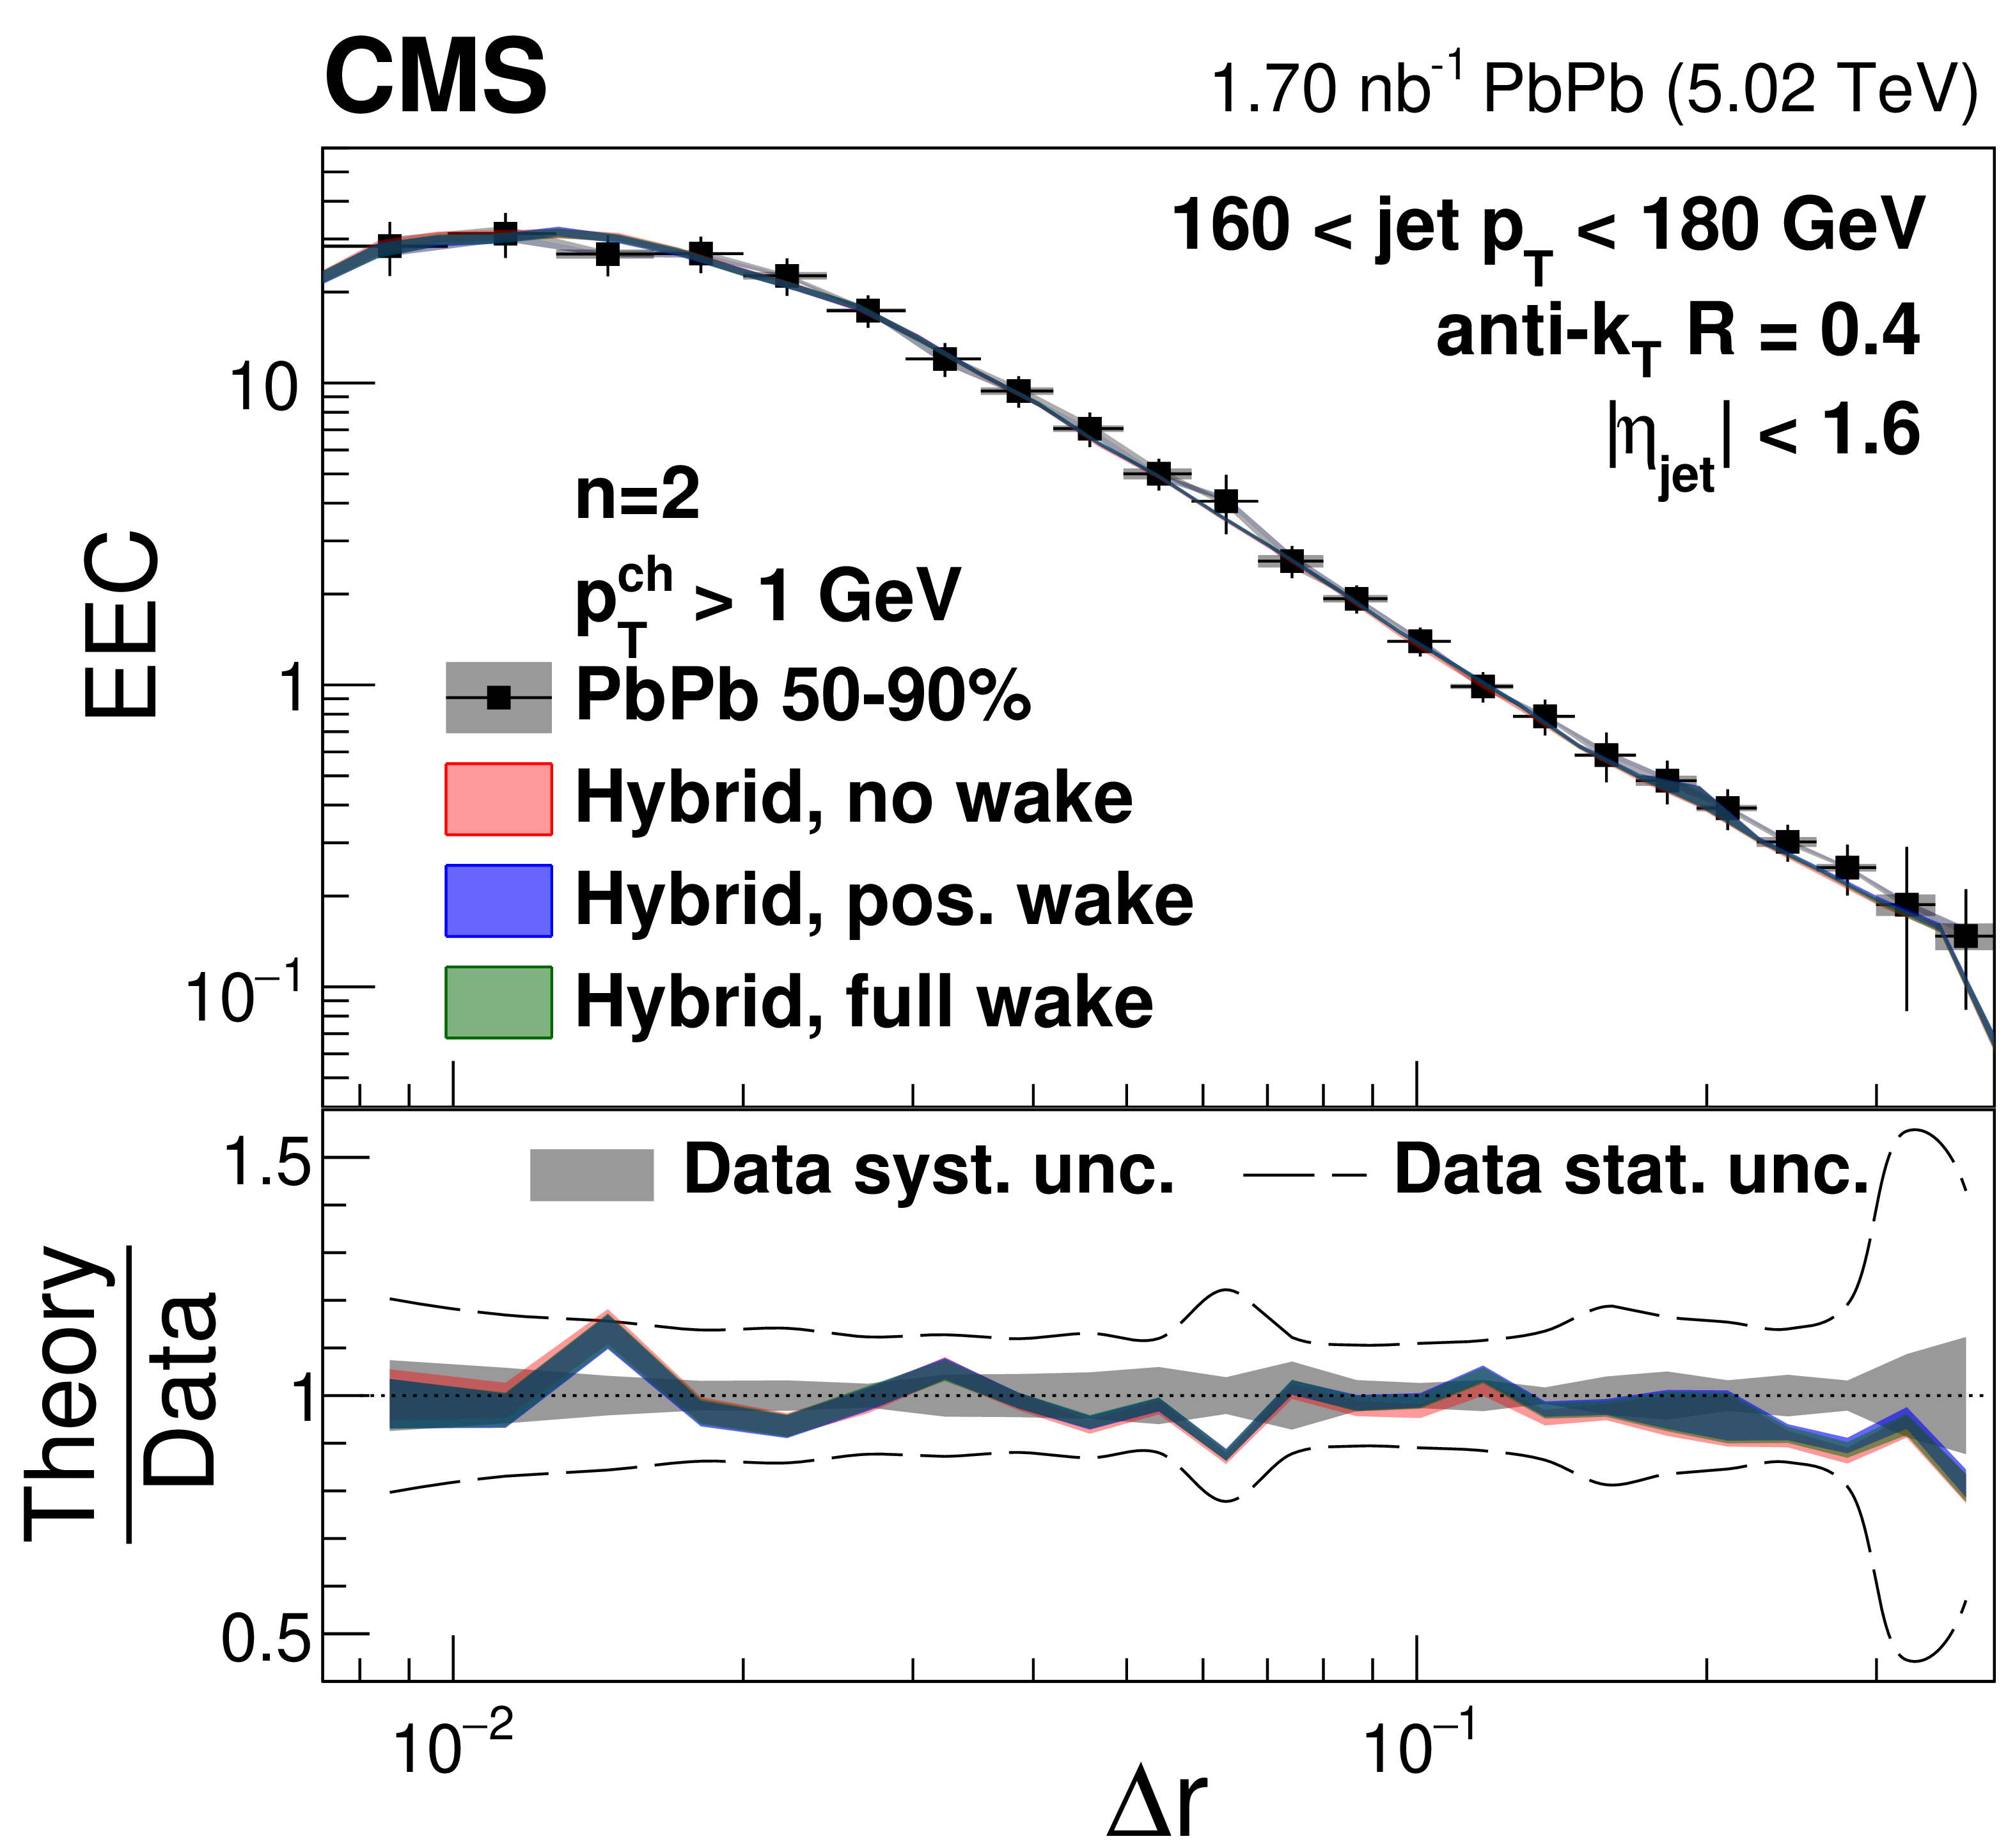
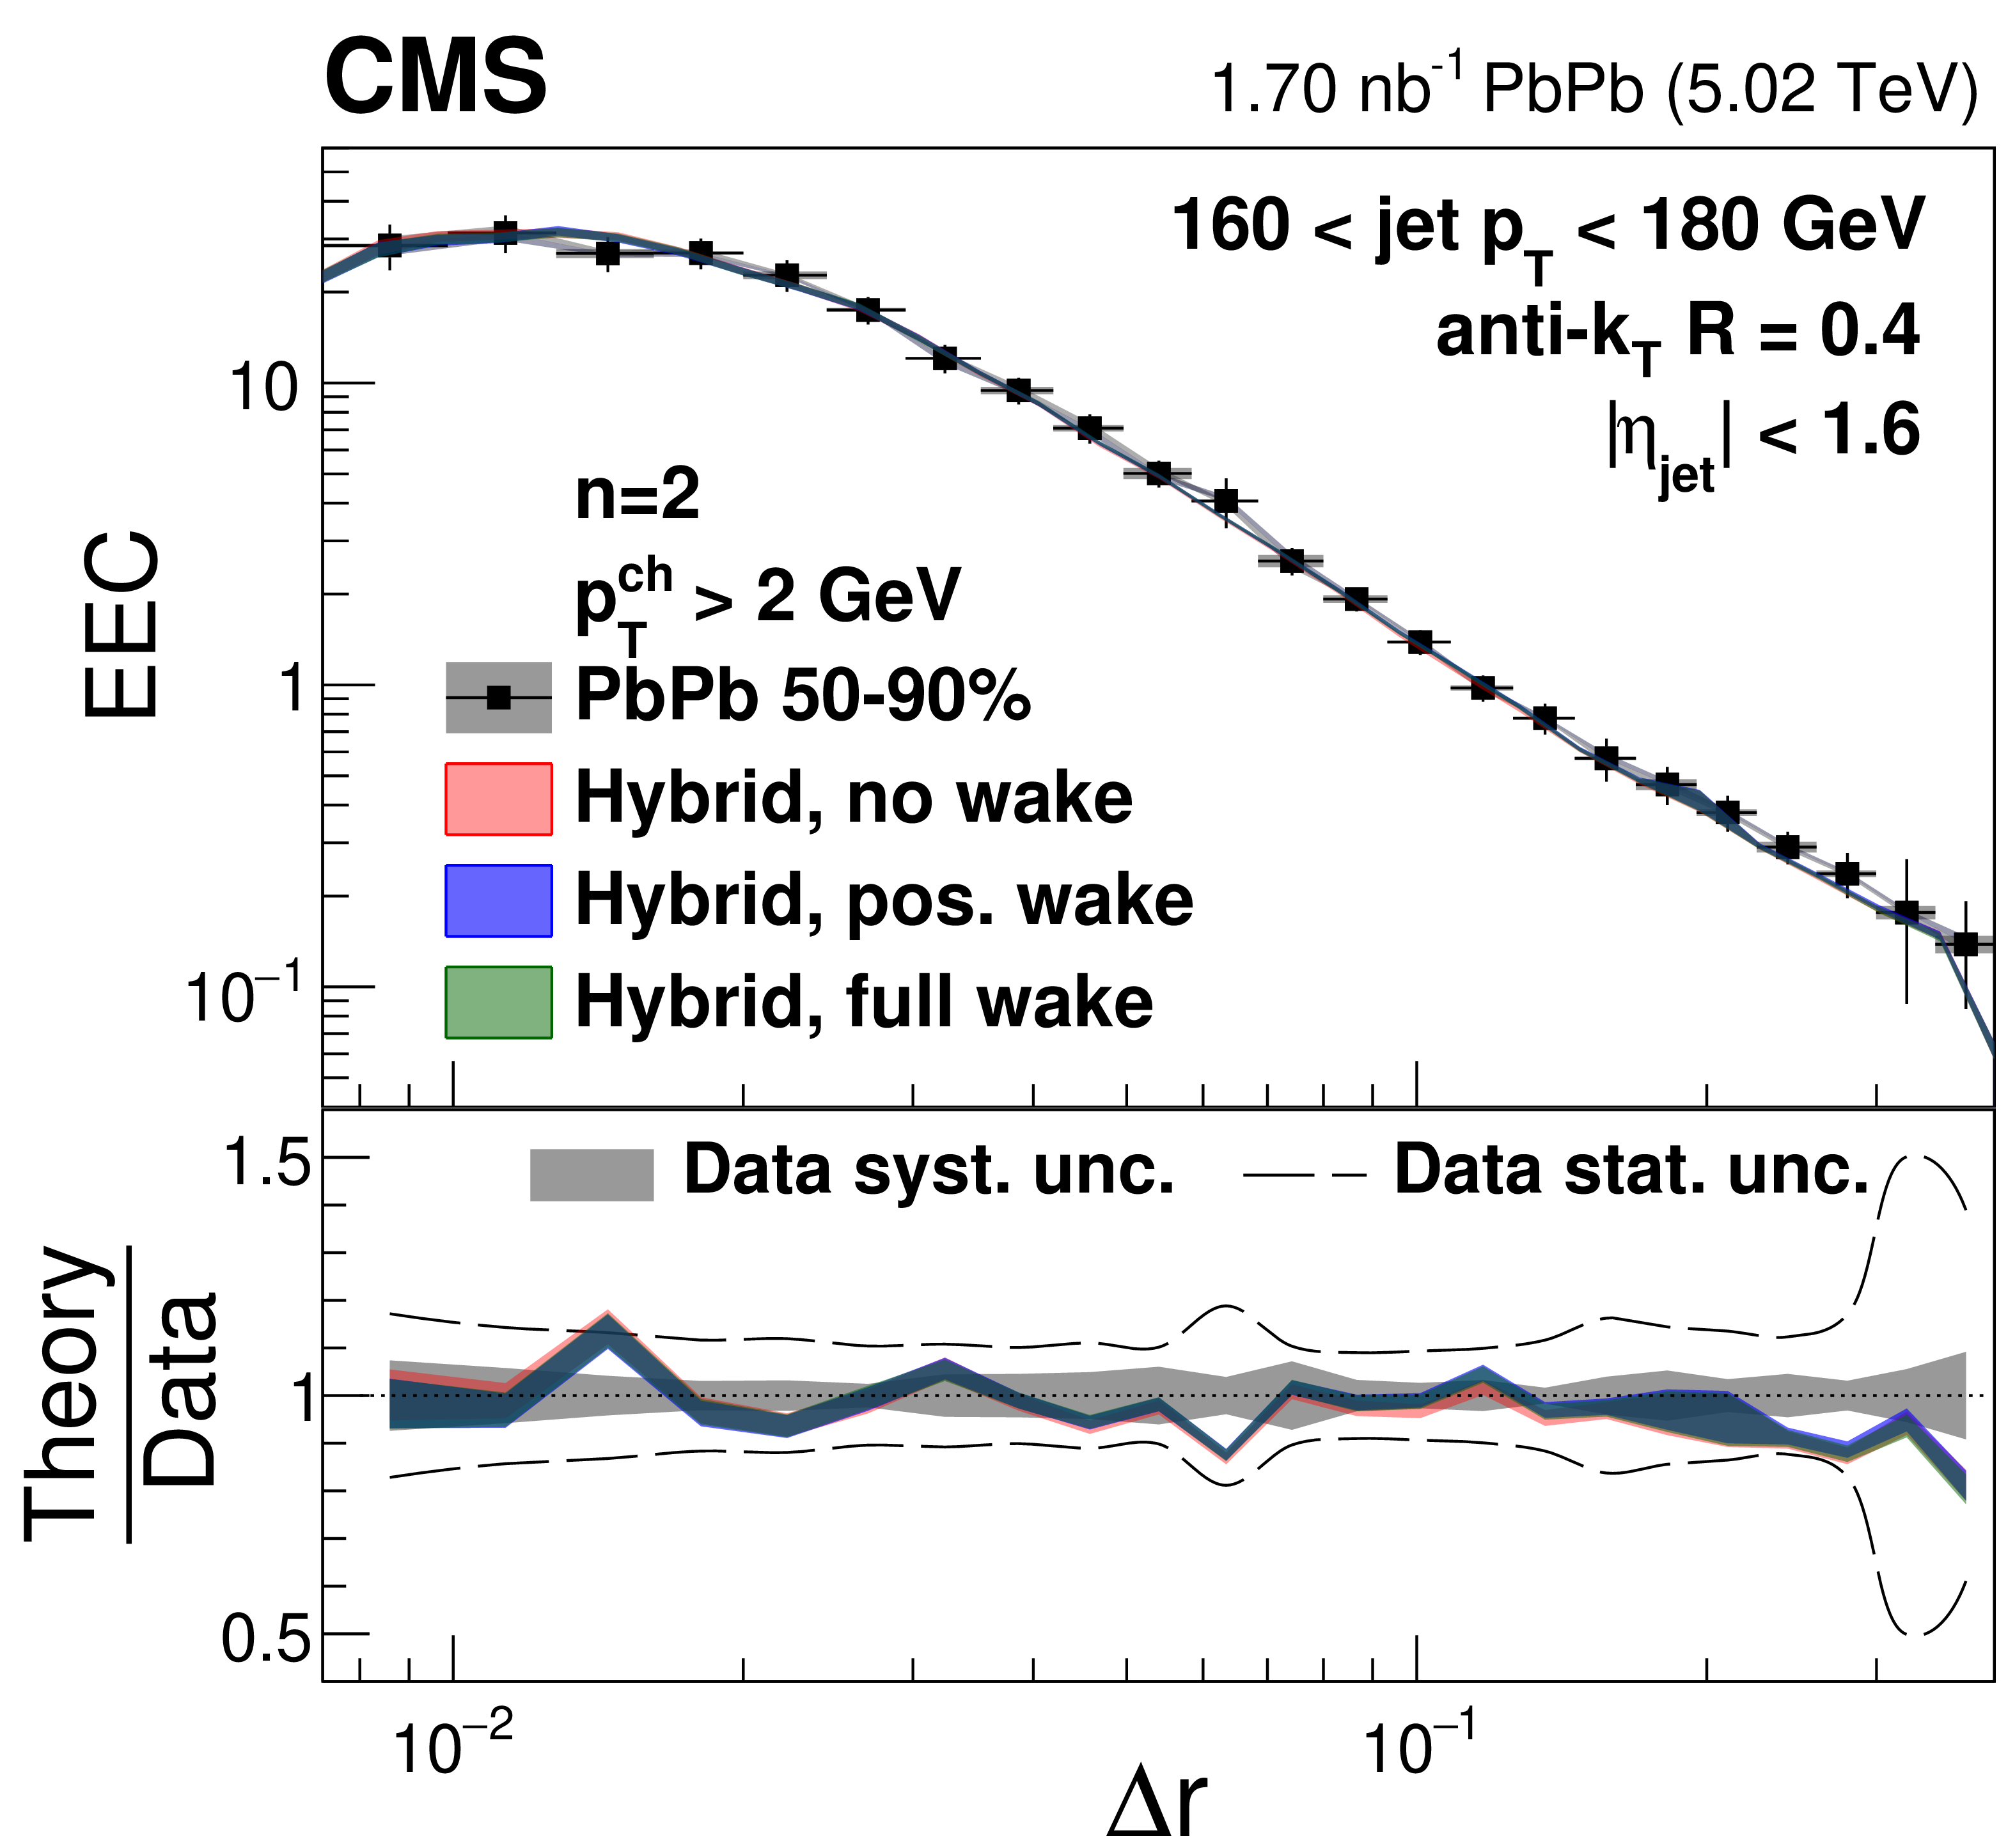
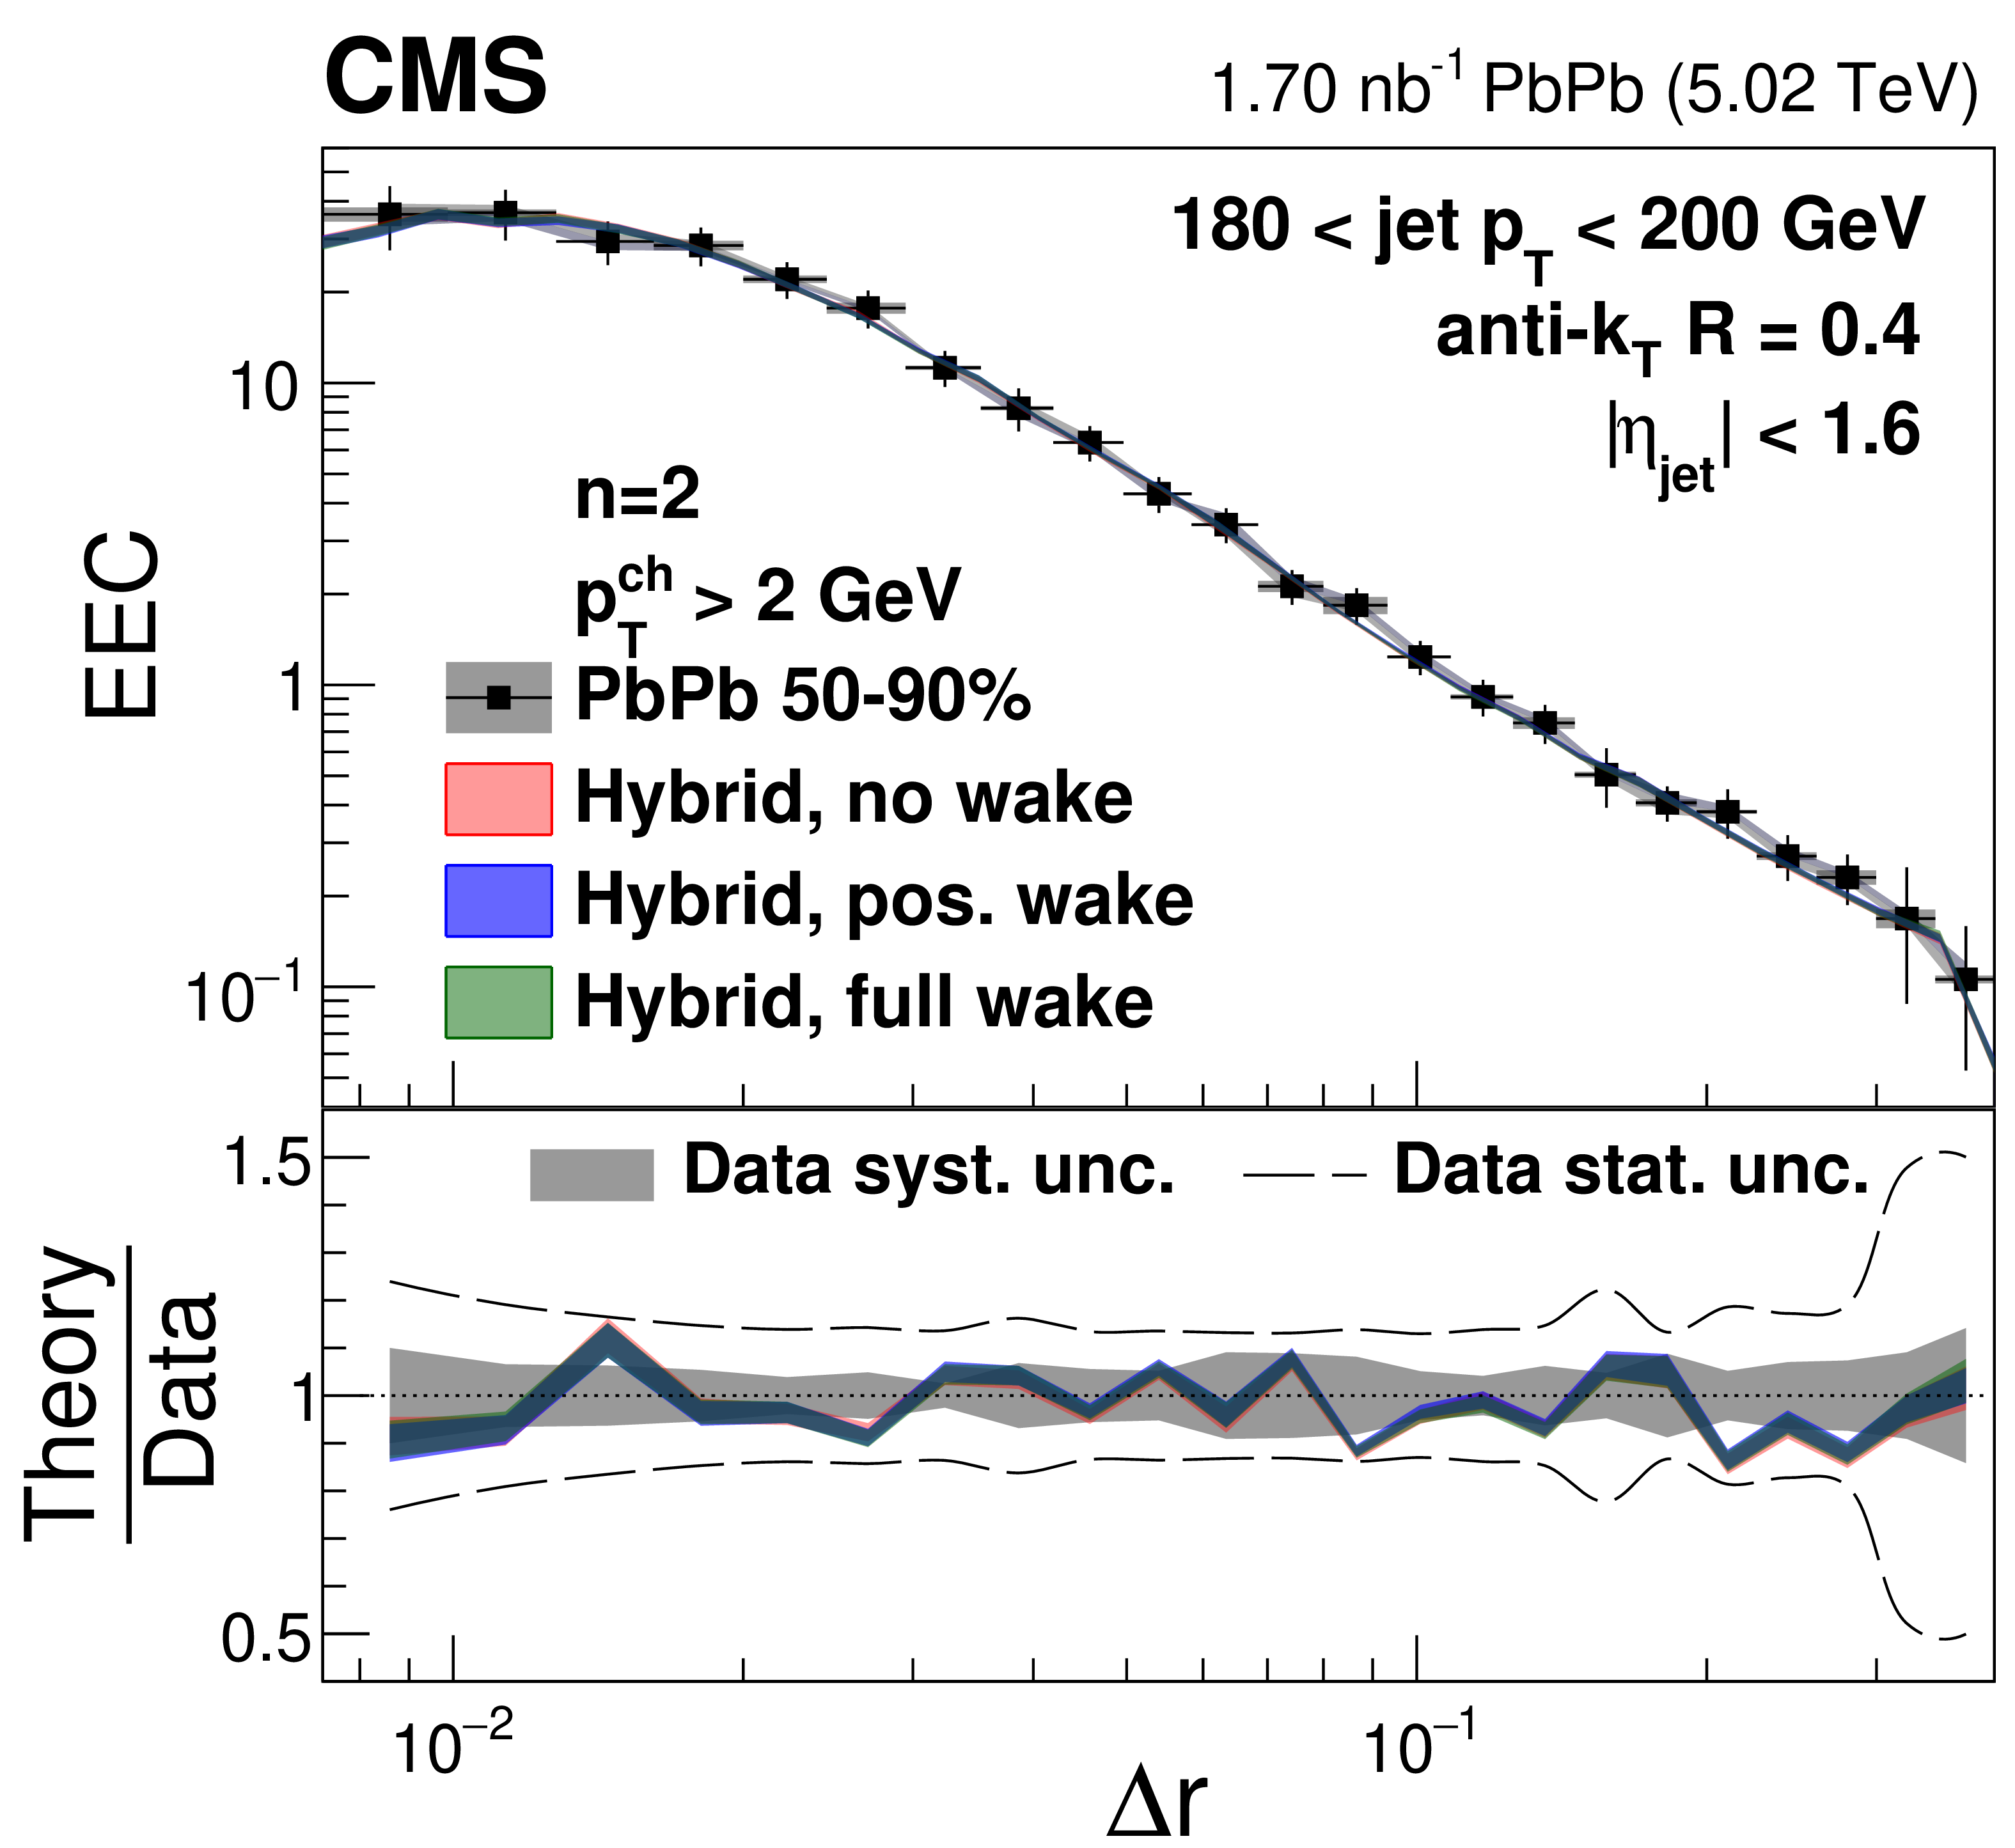
Figure 16:
Energy-energy correlator distributions from 50-90% central PbPb collisions with $ n= $ 2 in different $ p_{\mathrm{T}}^{\text{ch}} $ and $ p_{\text{T,jet}} $ bins compared to the hybrid model predictions with different jet wake settings. |
png pdf |
Figure 16-a:
Energy-energy correlator distributions from 50-90% central PbPb collisions with $ n= $ 2 in different $ p_{\mathrm{T}}^{\text{ch}} $ and $ p_{\text{T,jet}} $ bins compared to the hybrid model predictions with different jet wake settings. |

png pdf |
Figure 16-b:
Energy-energy correlator distributions from 50-90% central PbPb collisions with $ n= $ 2 in different $ p_{\mathrm{T}}^{\text{ch}} $ and $ p_{\text{T,jet}} $ bins compared to the hybrid model predictions with different jet wake settings. |
png pdf |
Figure 16-c:
Energy-energy correlator distributions from 50-90% central PbPb collisions with $ n= $ 2 in different $ p_{\mathrm{T}}^{\text{ch}} $ and $ p_{\text{T,jet}} $ bins compared to the hybrid model predictions with different jet wake settings. |
png pdf |
Figure 16-d:
Energy-energy correlator distributions from 50-90% central PbPb collisions with $ n= $ 2 in different $ p_{\mathrm{T}}^{\text{ch}} $ and $ p_{\text{T,jet}} $ bins compared to the hybrid model predictions with different jet wake settings. |
png pdf |
Figure 16-e:
Energy-energy correlator distributions from 50-90% central PbPb collisions with $ n= $ 2 in different $ p_{\mathrm{T}}^{\text{ch}} $ and $ p_{\text{T,jet}} $ bins compared to the hybrid model predictions with different jet wake settings. |
png pdf |
Figure 16-f:
Energy-energy correlator distributions from 50-90% central PbPb collisions with $ n= $ 2 in different $ p_{\mathrm{T}}^{\text{ch}} $ and $ p_{\text{T,jet}} $ bins compared to the hybrid model predictions with different jet wake settings. |
png pdf |
Figure 16-g:
Energy-energy correlator distributions from 50-90% central PbPb collisions with $ n= $ 2 in different $ p_{\mathrm{T}}^{\text{ch}} $ and $ p_{\text{T,jet}} $ bins compared to the hybrid model predictions with different jet wake settings. |
png pdf |
Figure 16-h:
Energy-energy correlator distributions from 50-90% central PbPb collisions with $ n= $ 2 in different $ p_{\mathrm{T}}^{\text{ch}} $ and $ p_{\text{T,jet}} $ bins compared to the hybrid model predictions with different jet wake settings. |
png pdf |
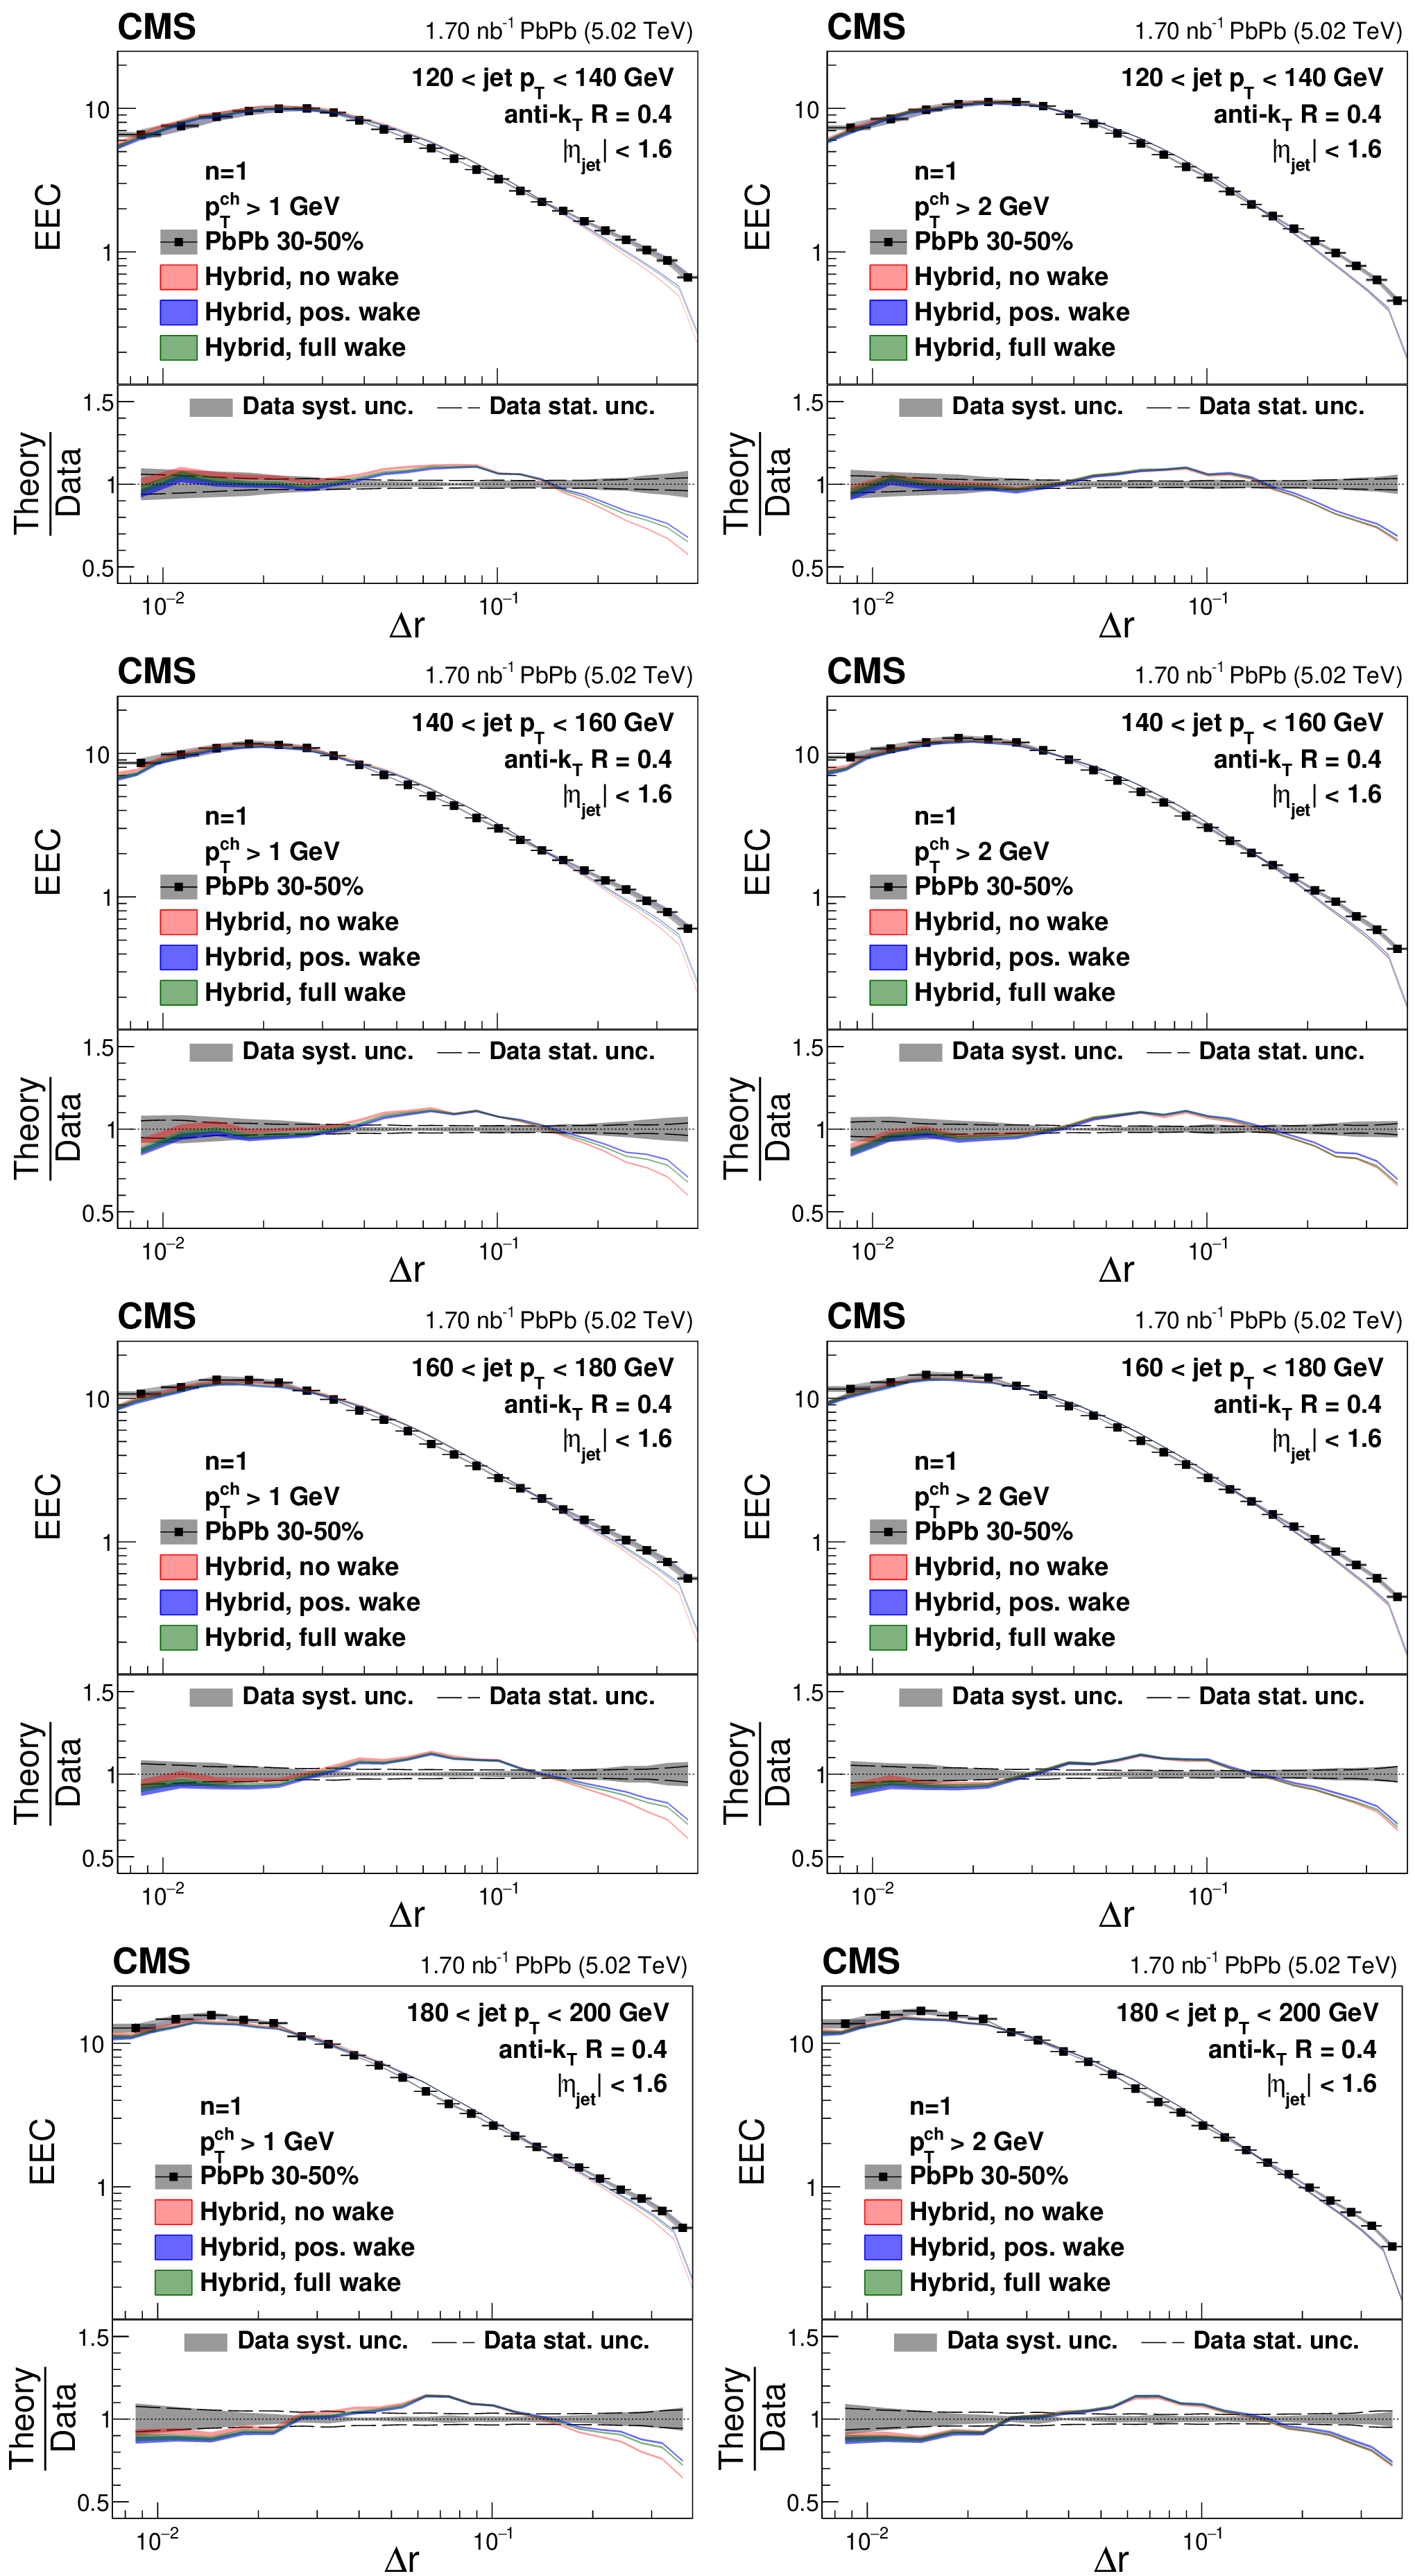
Figure 17:
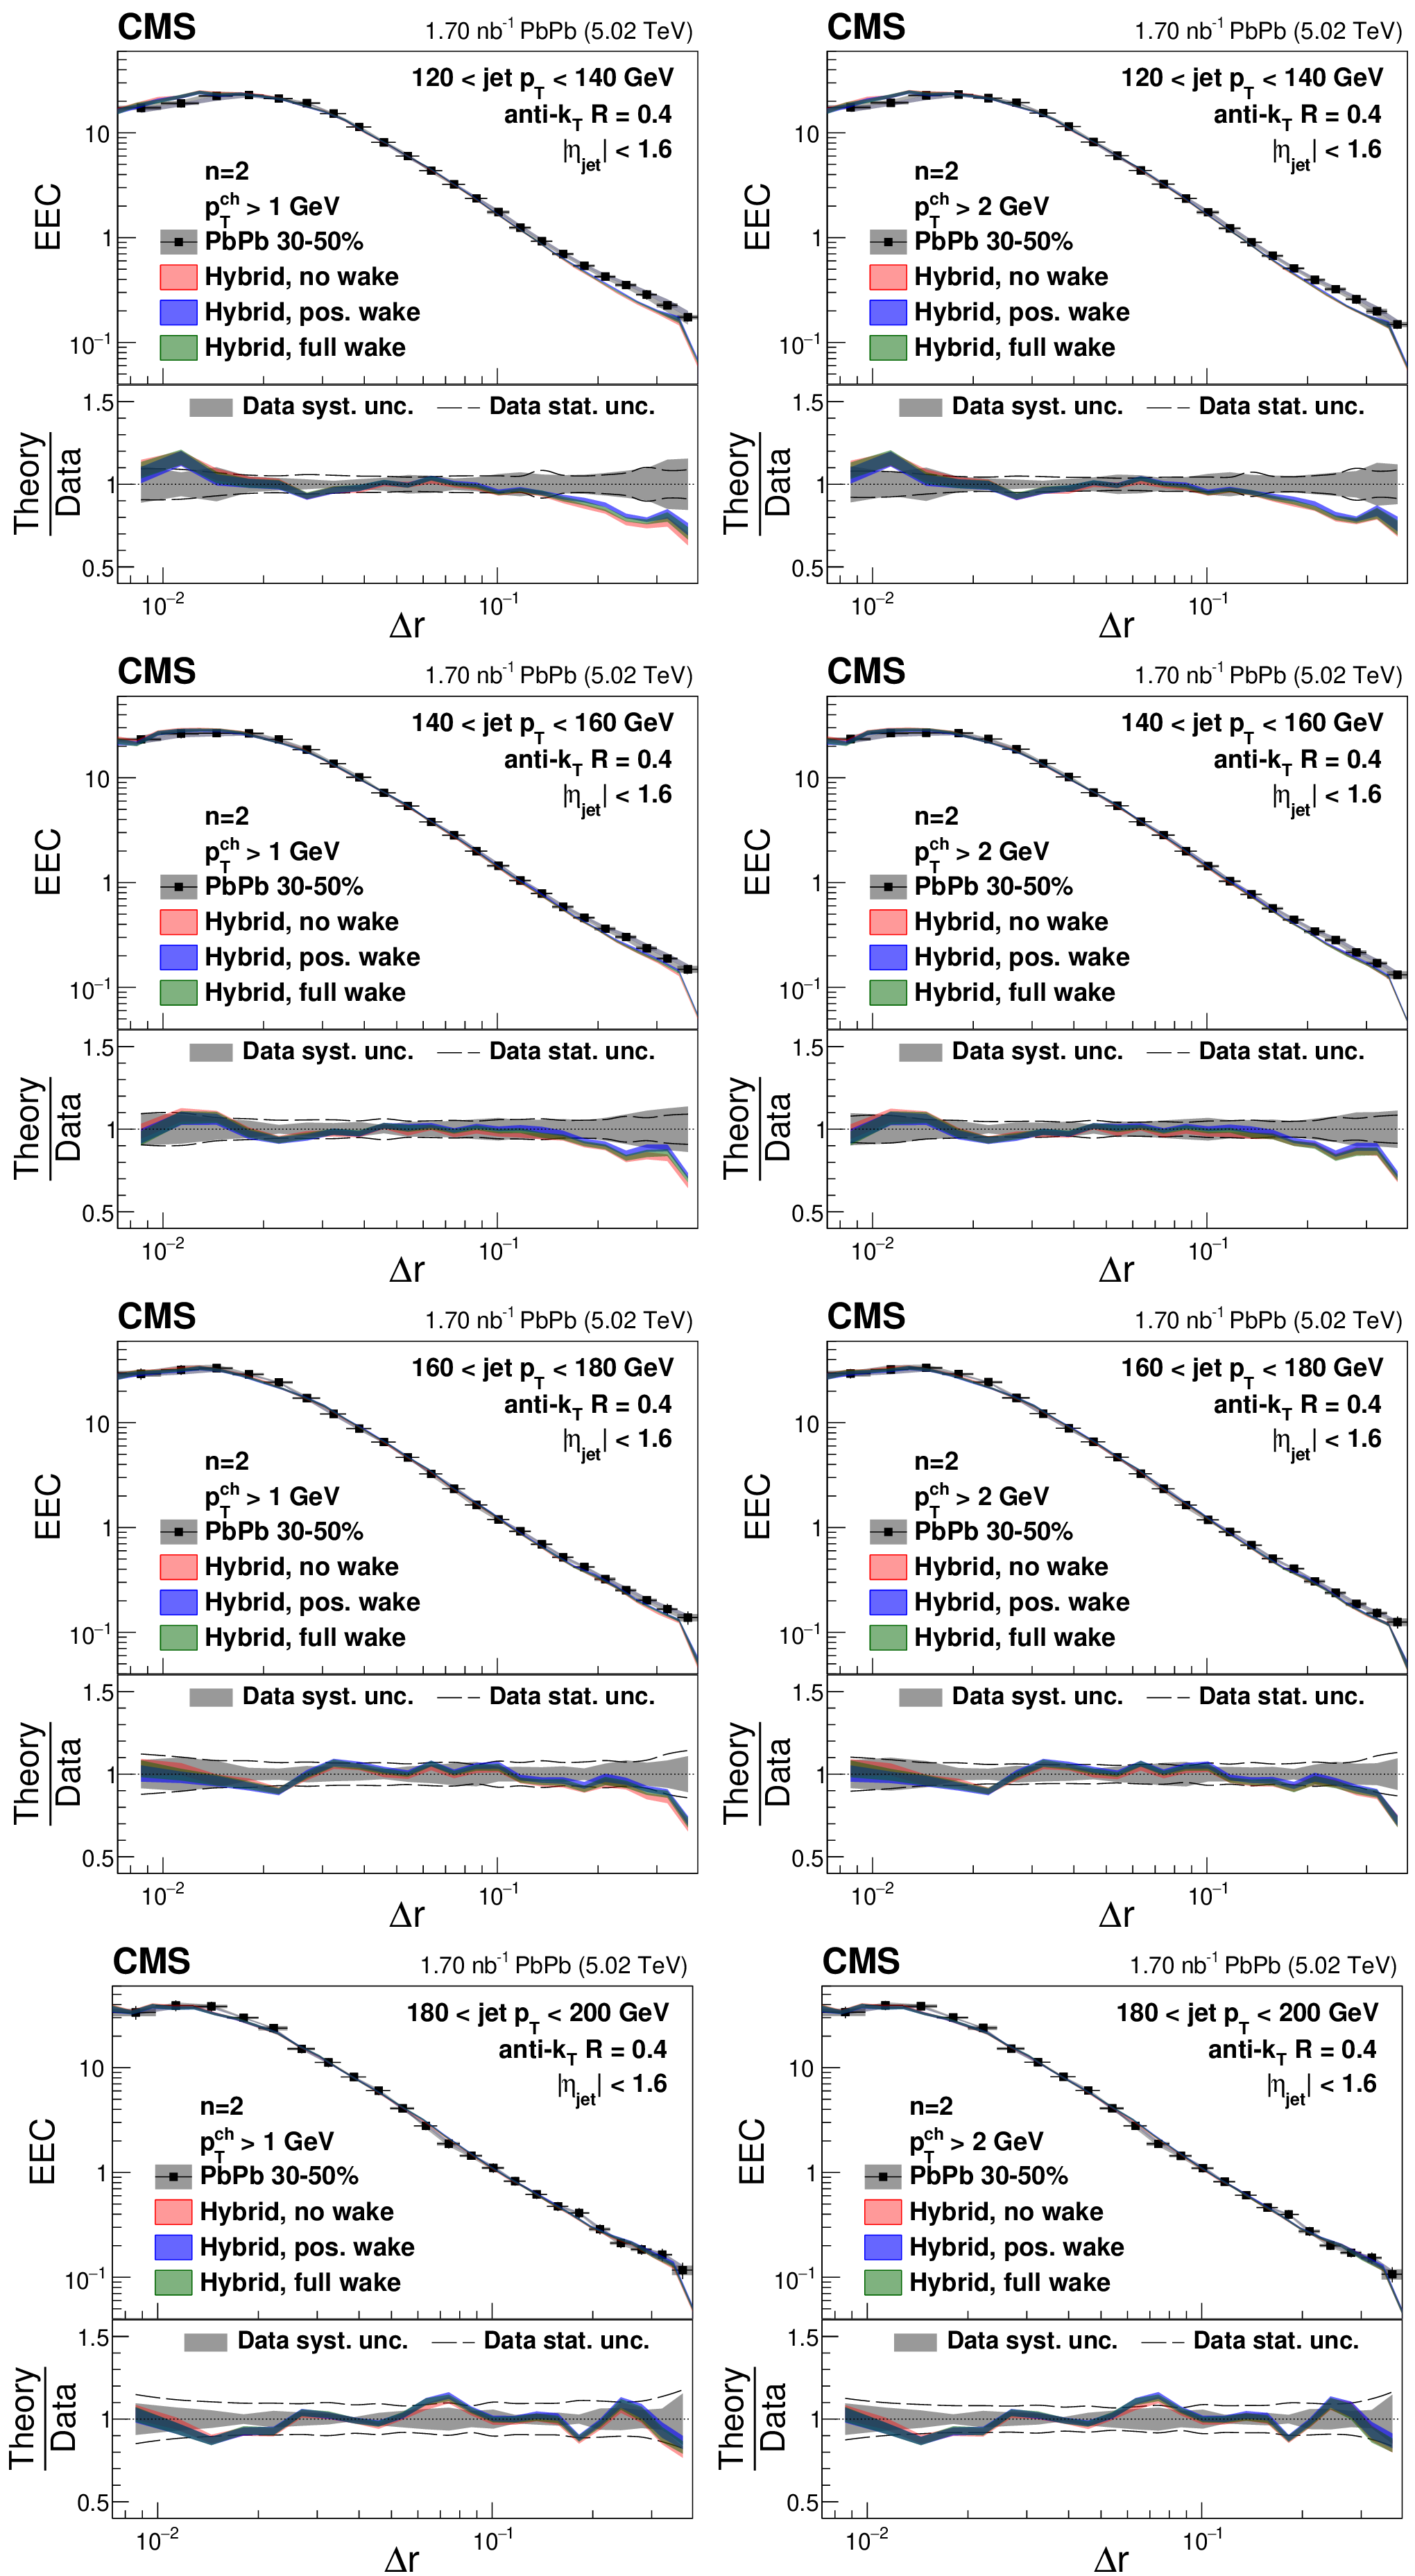
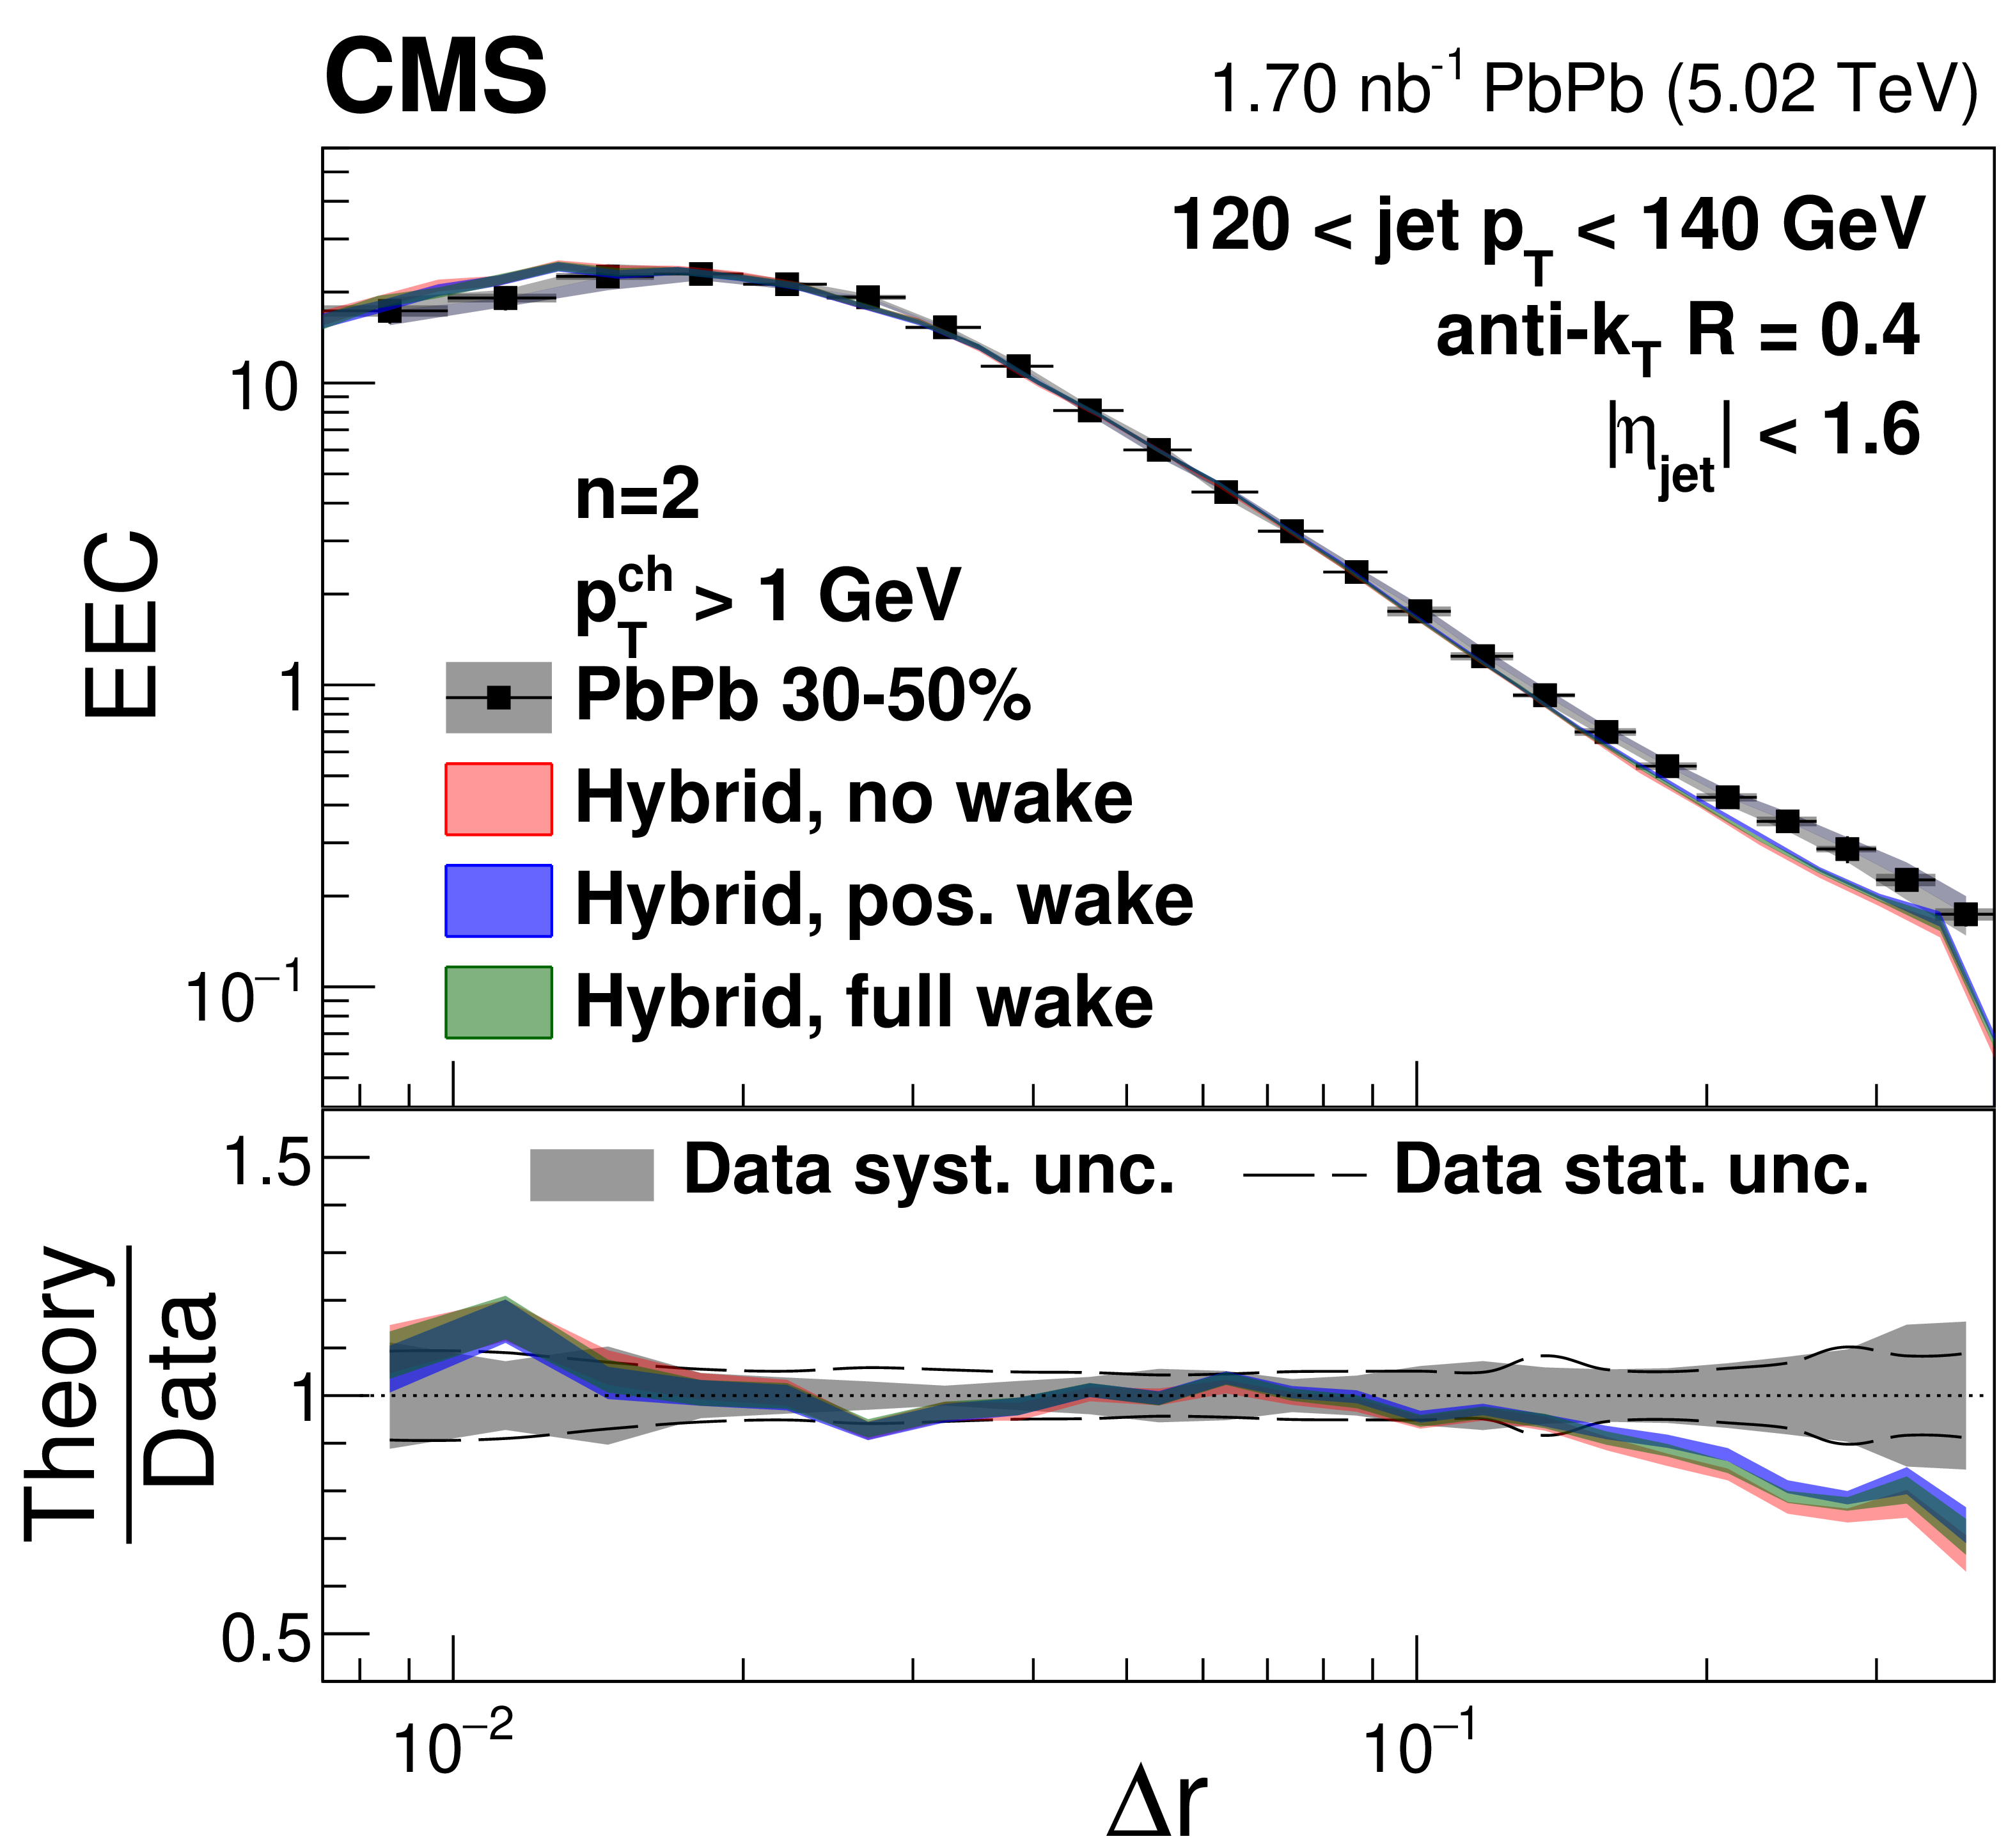
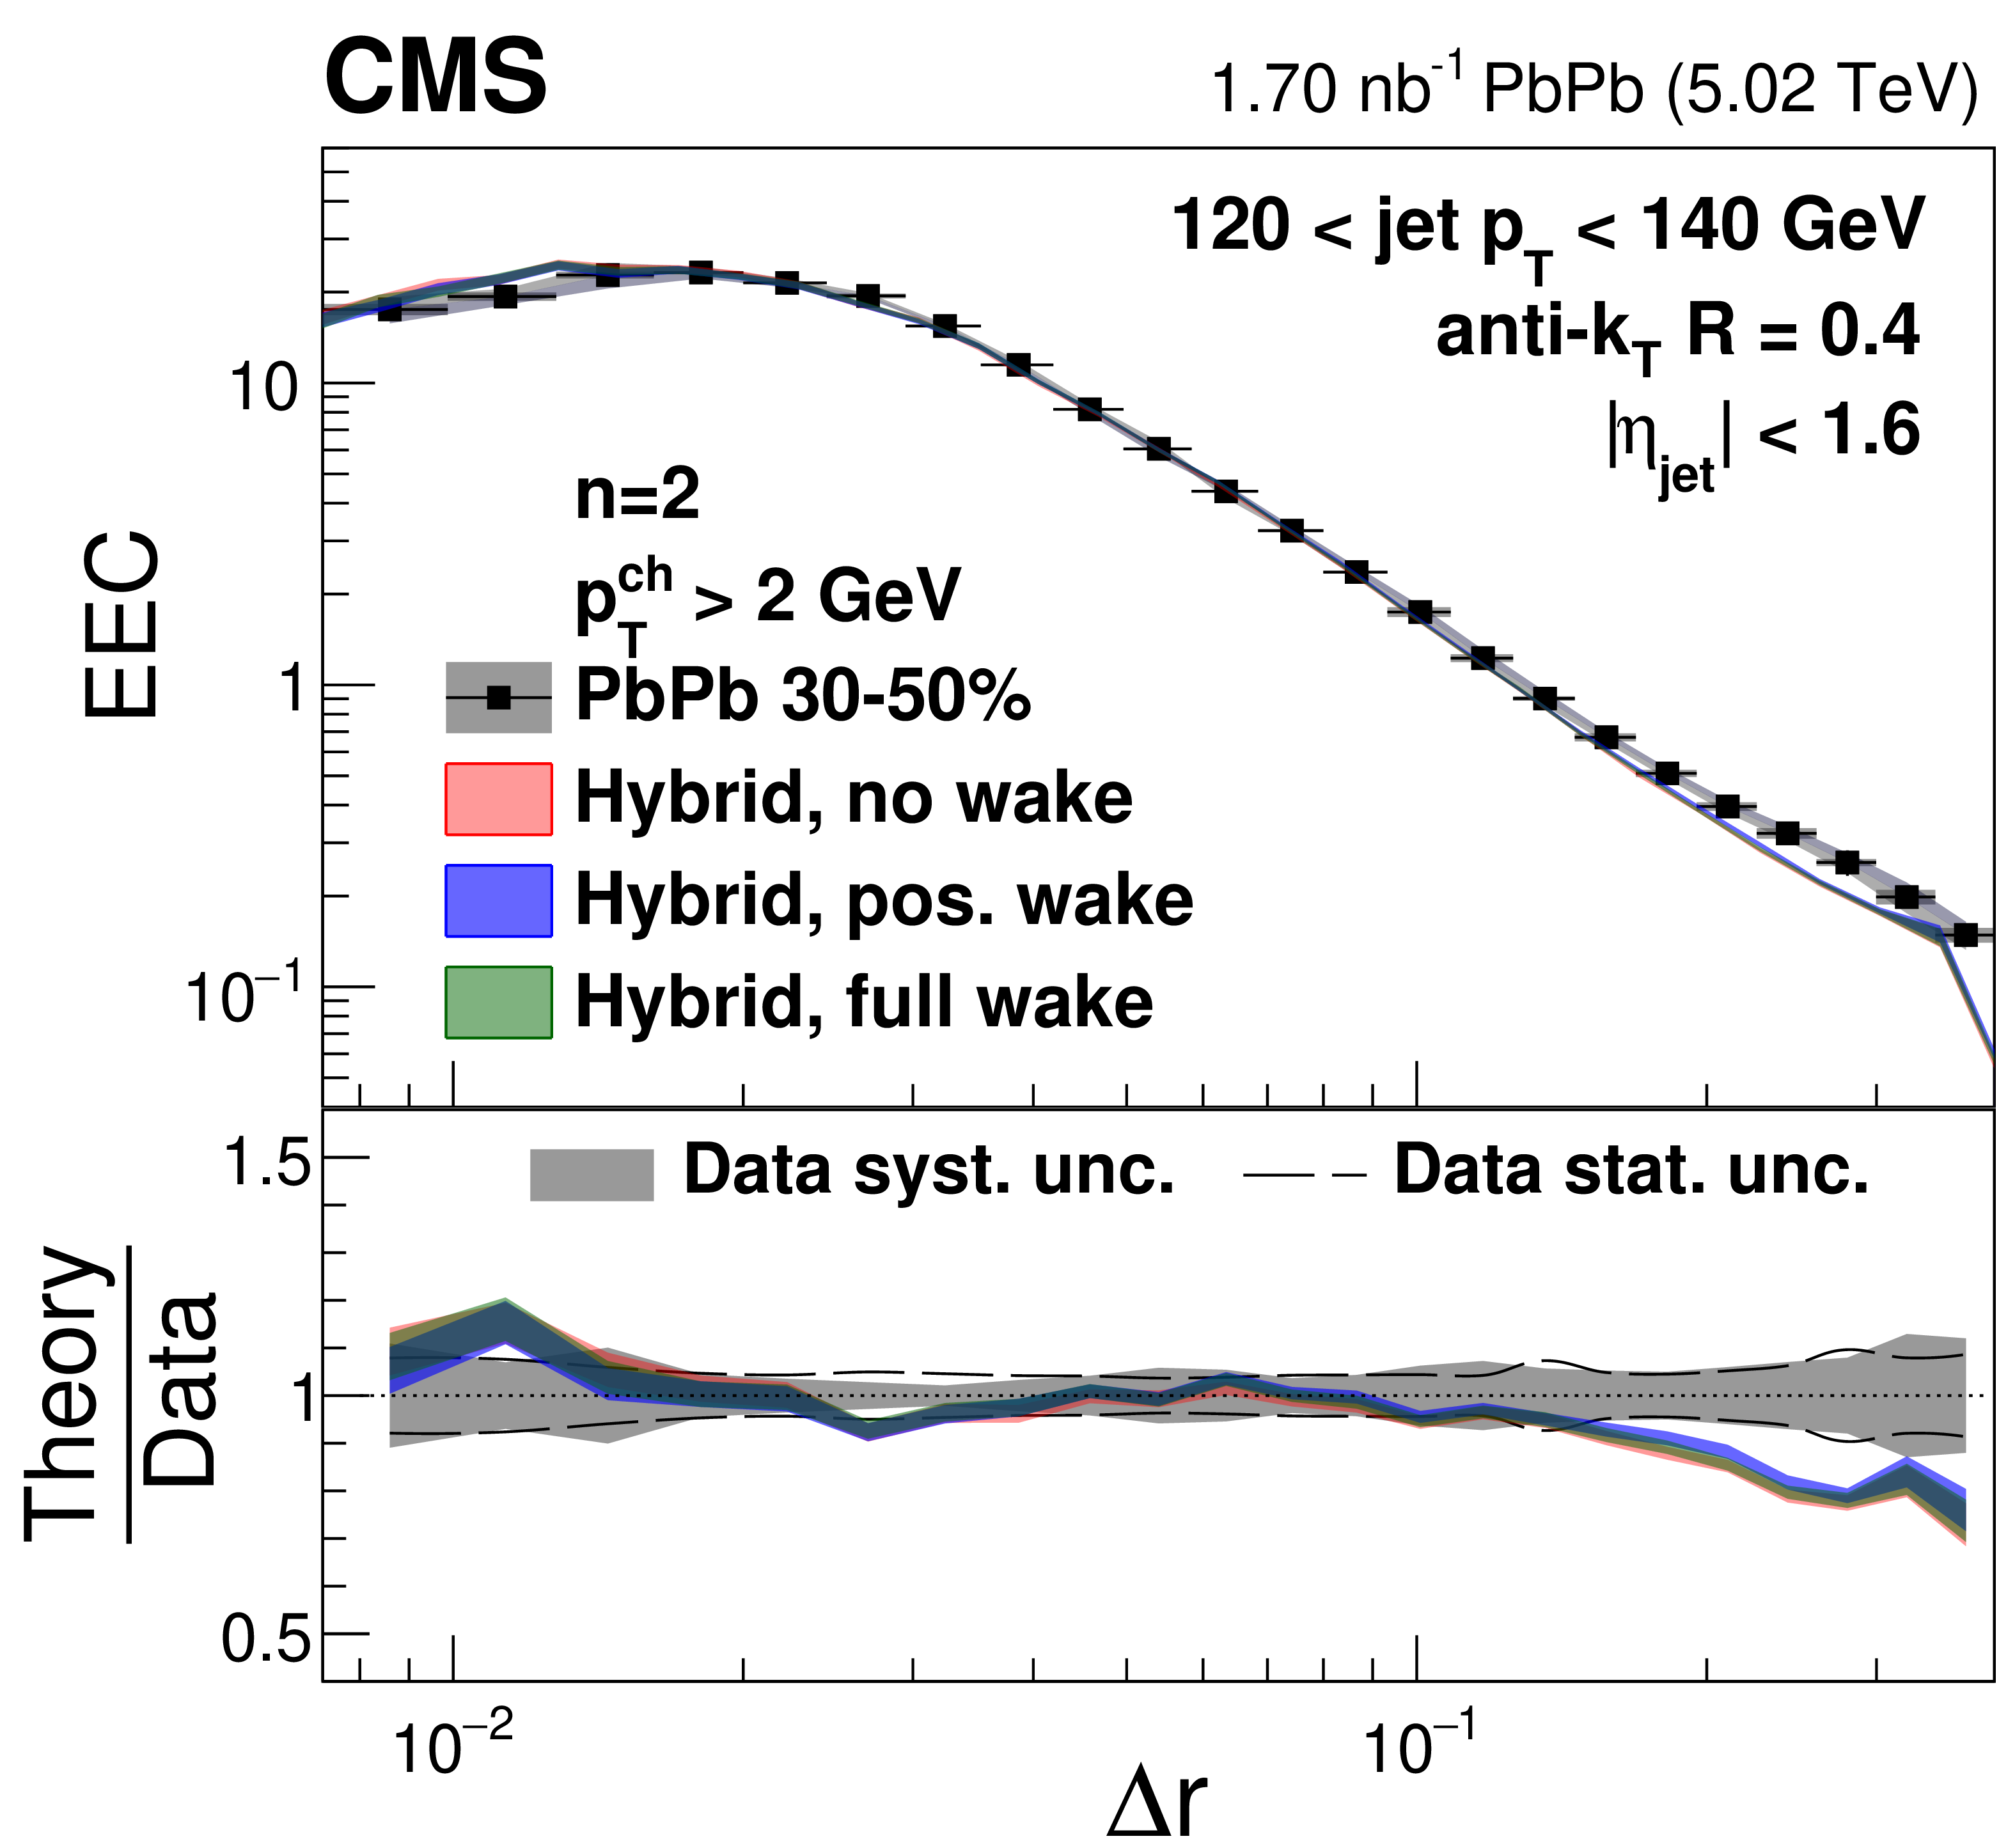
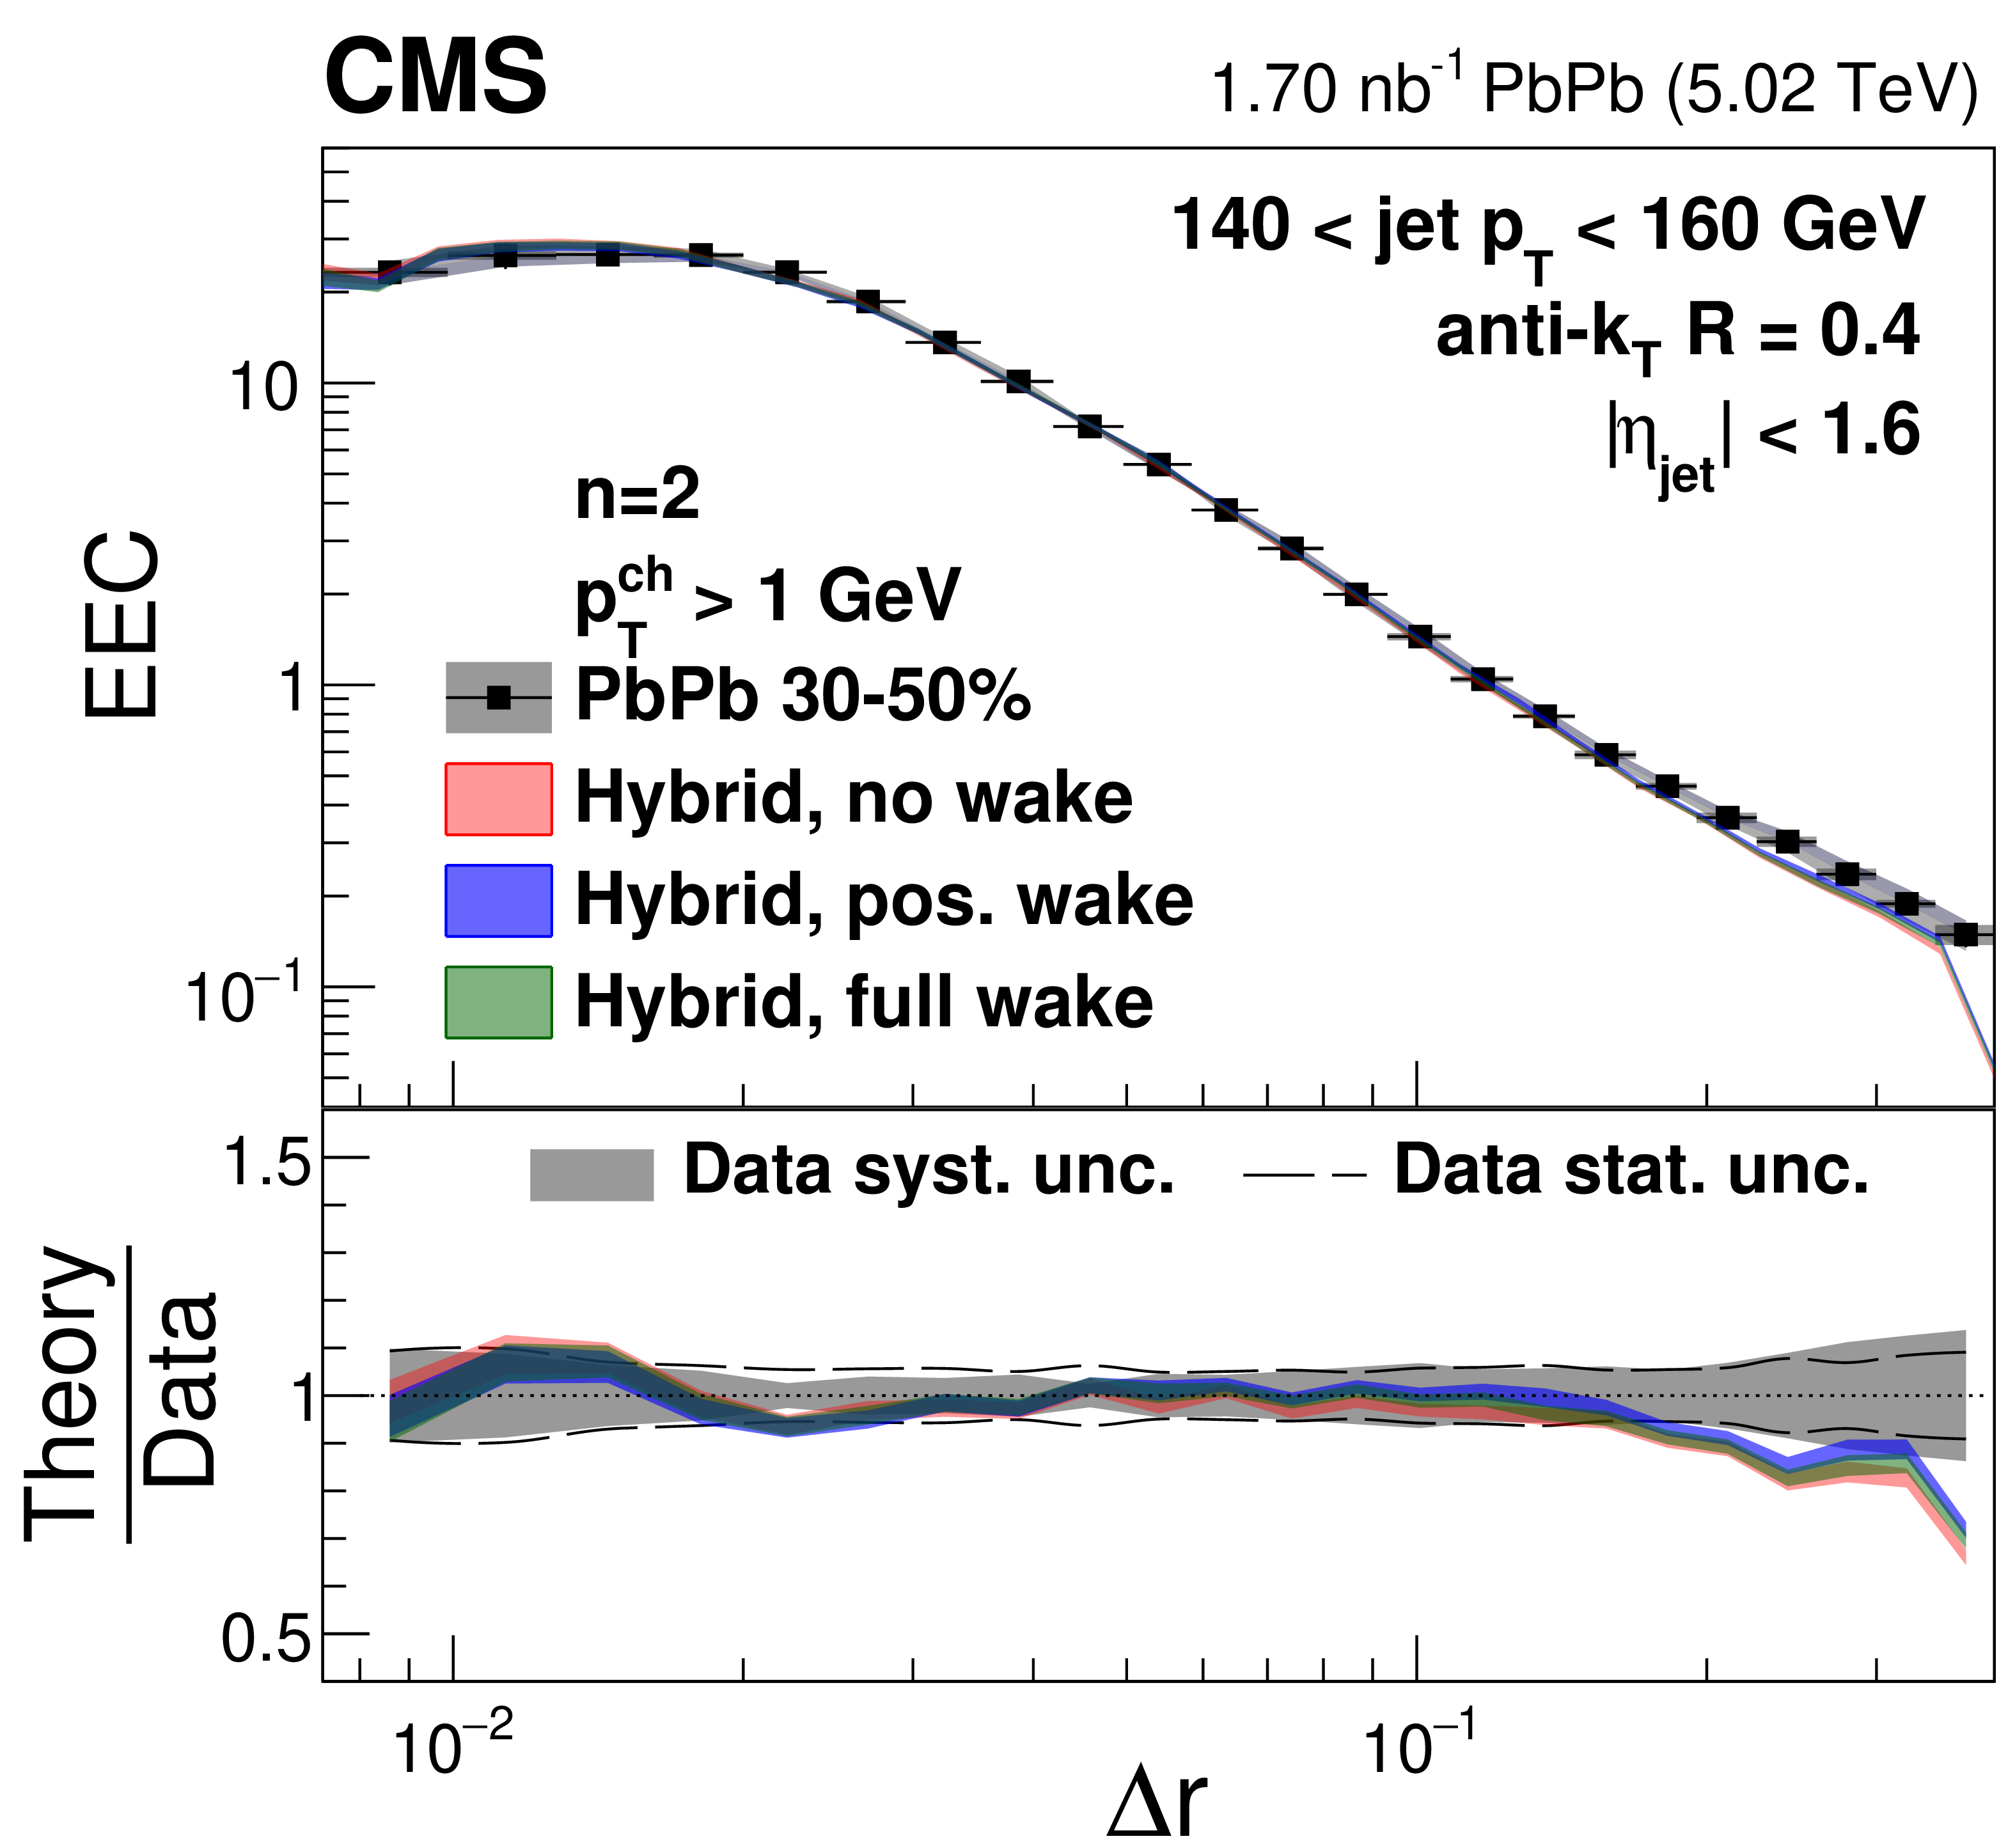
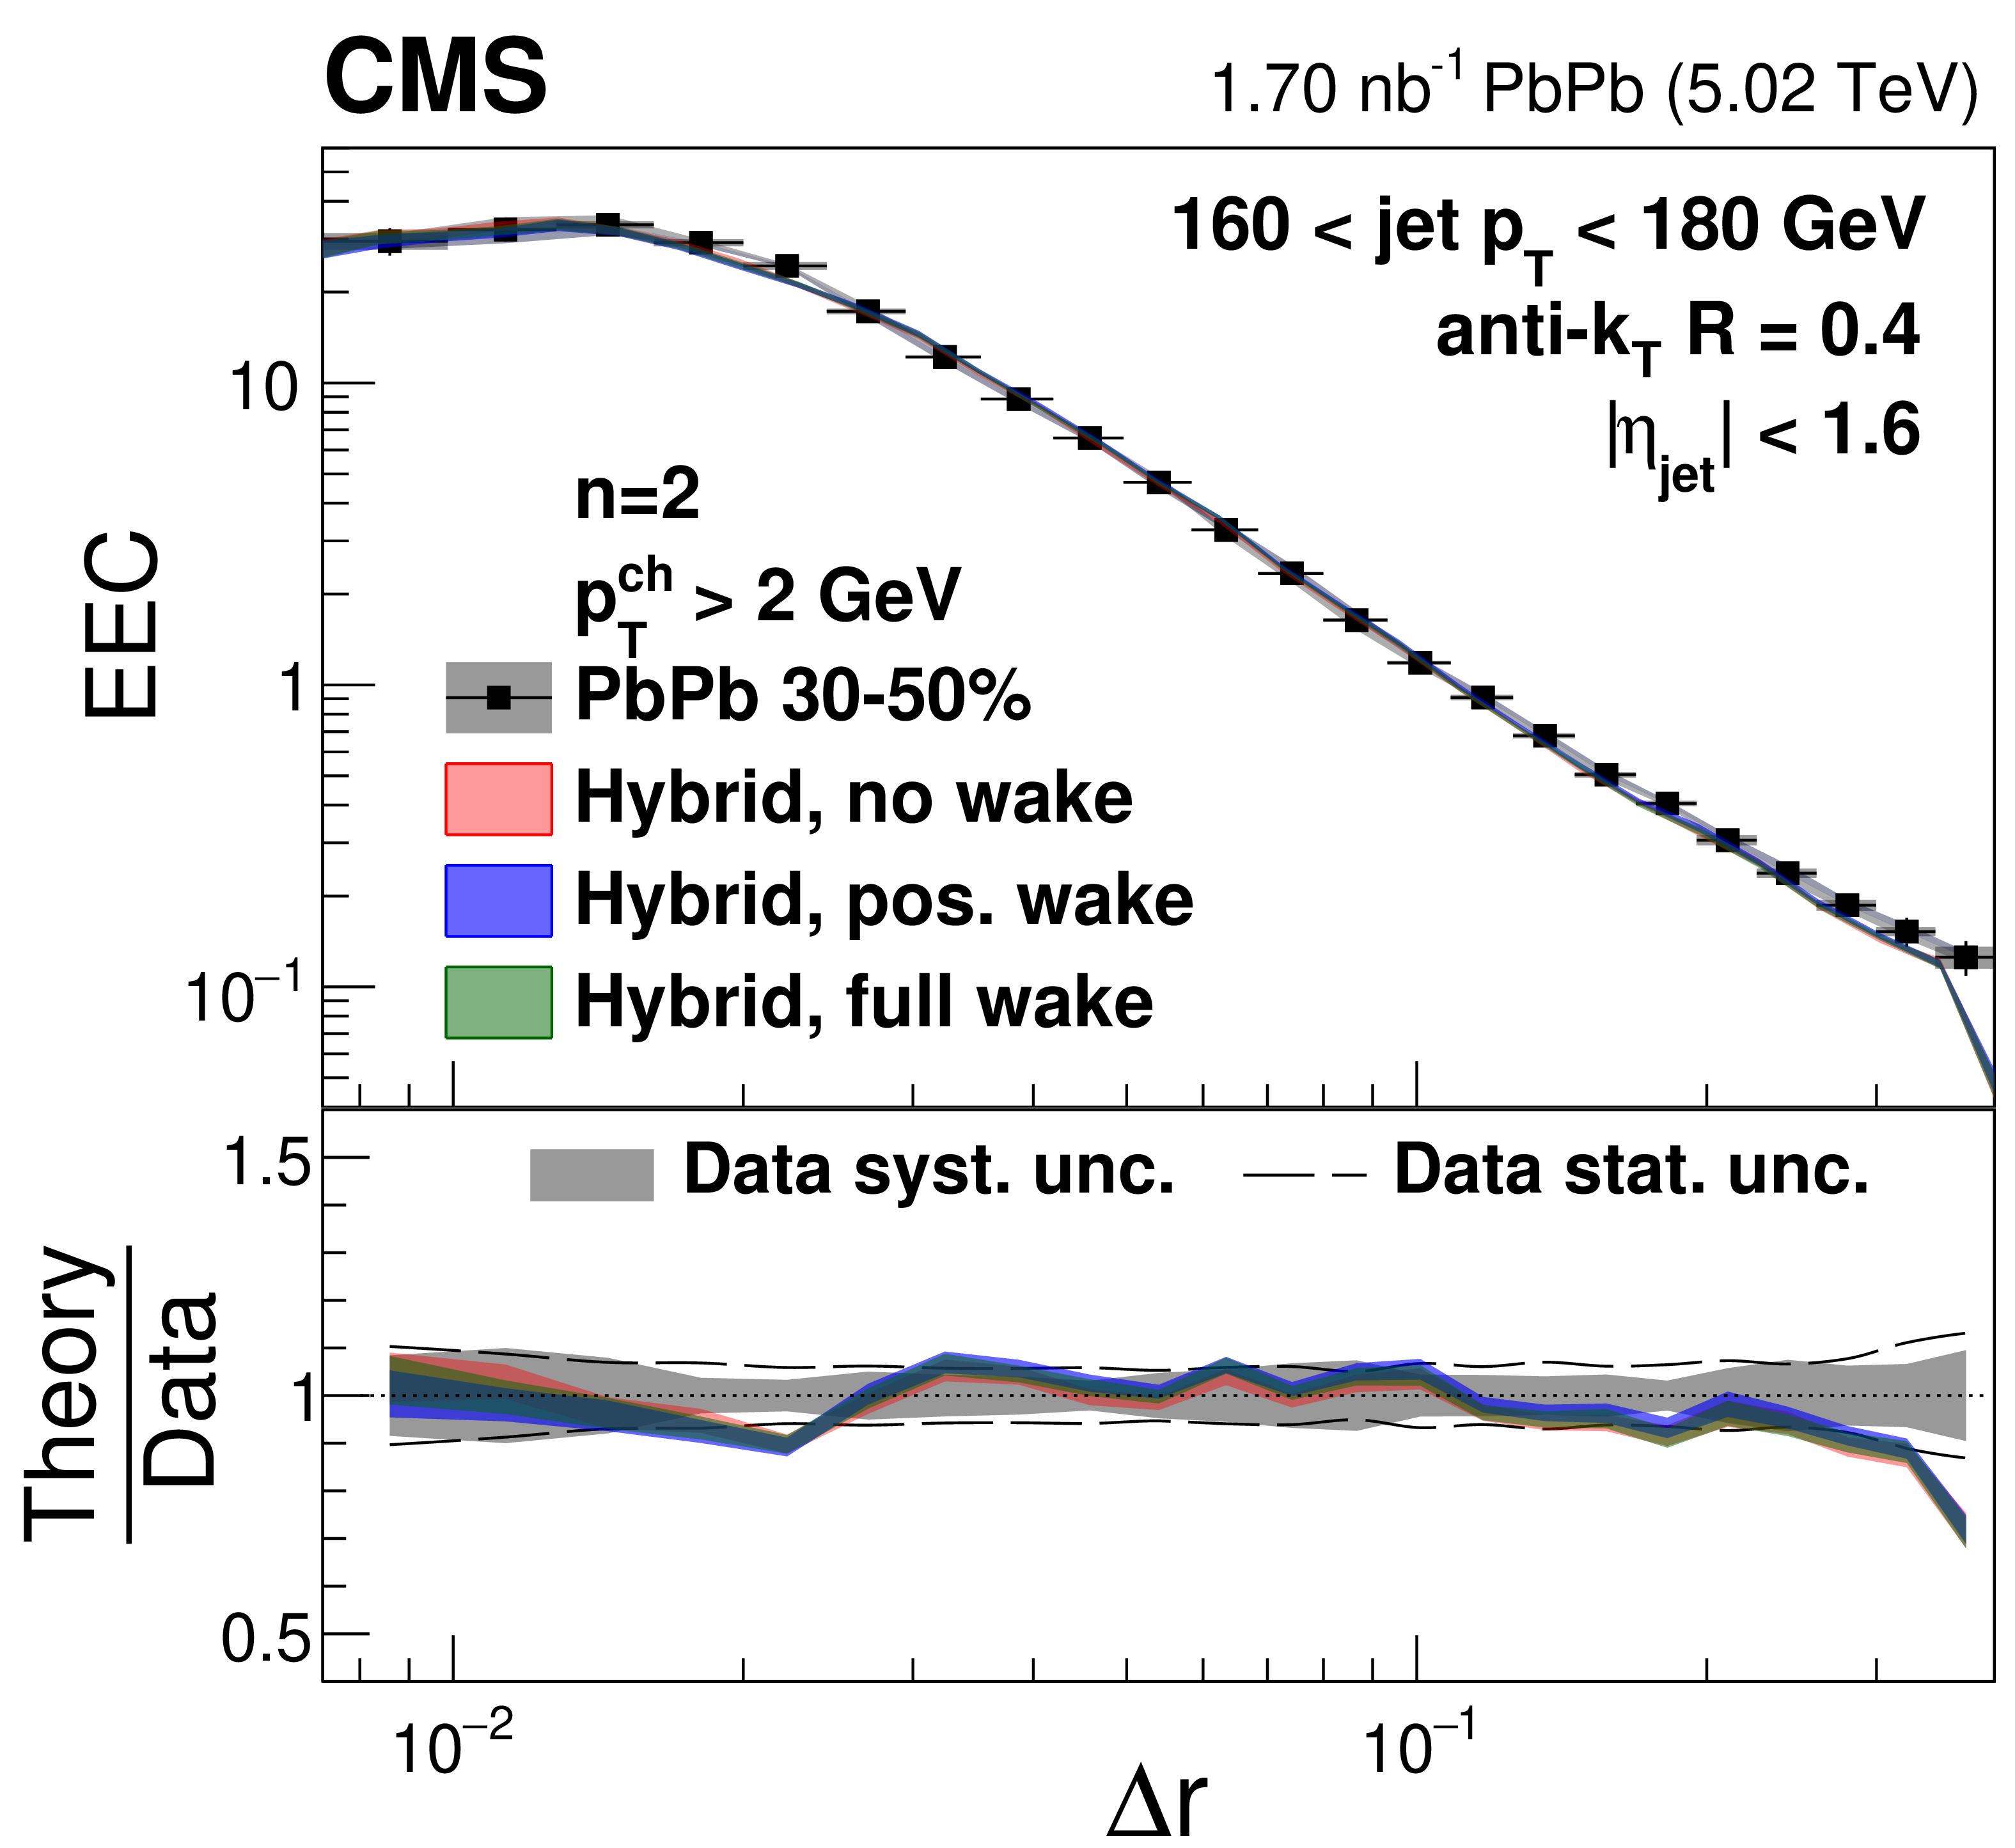
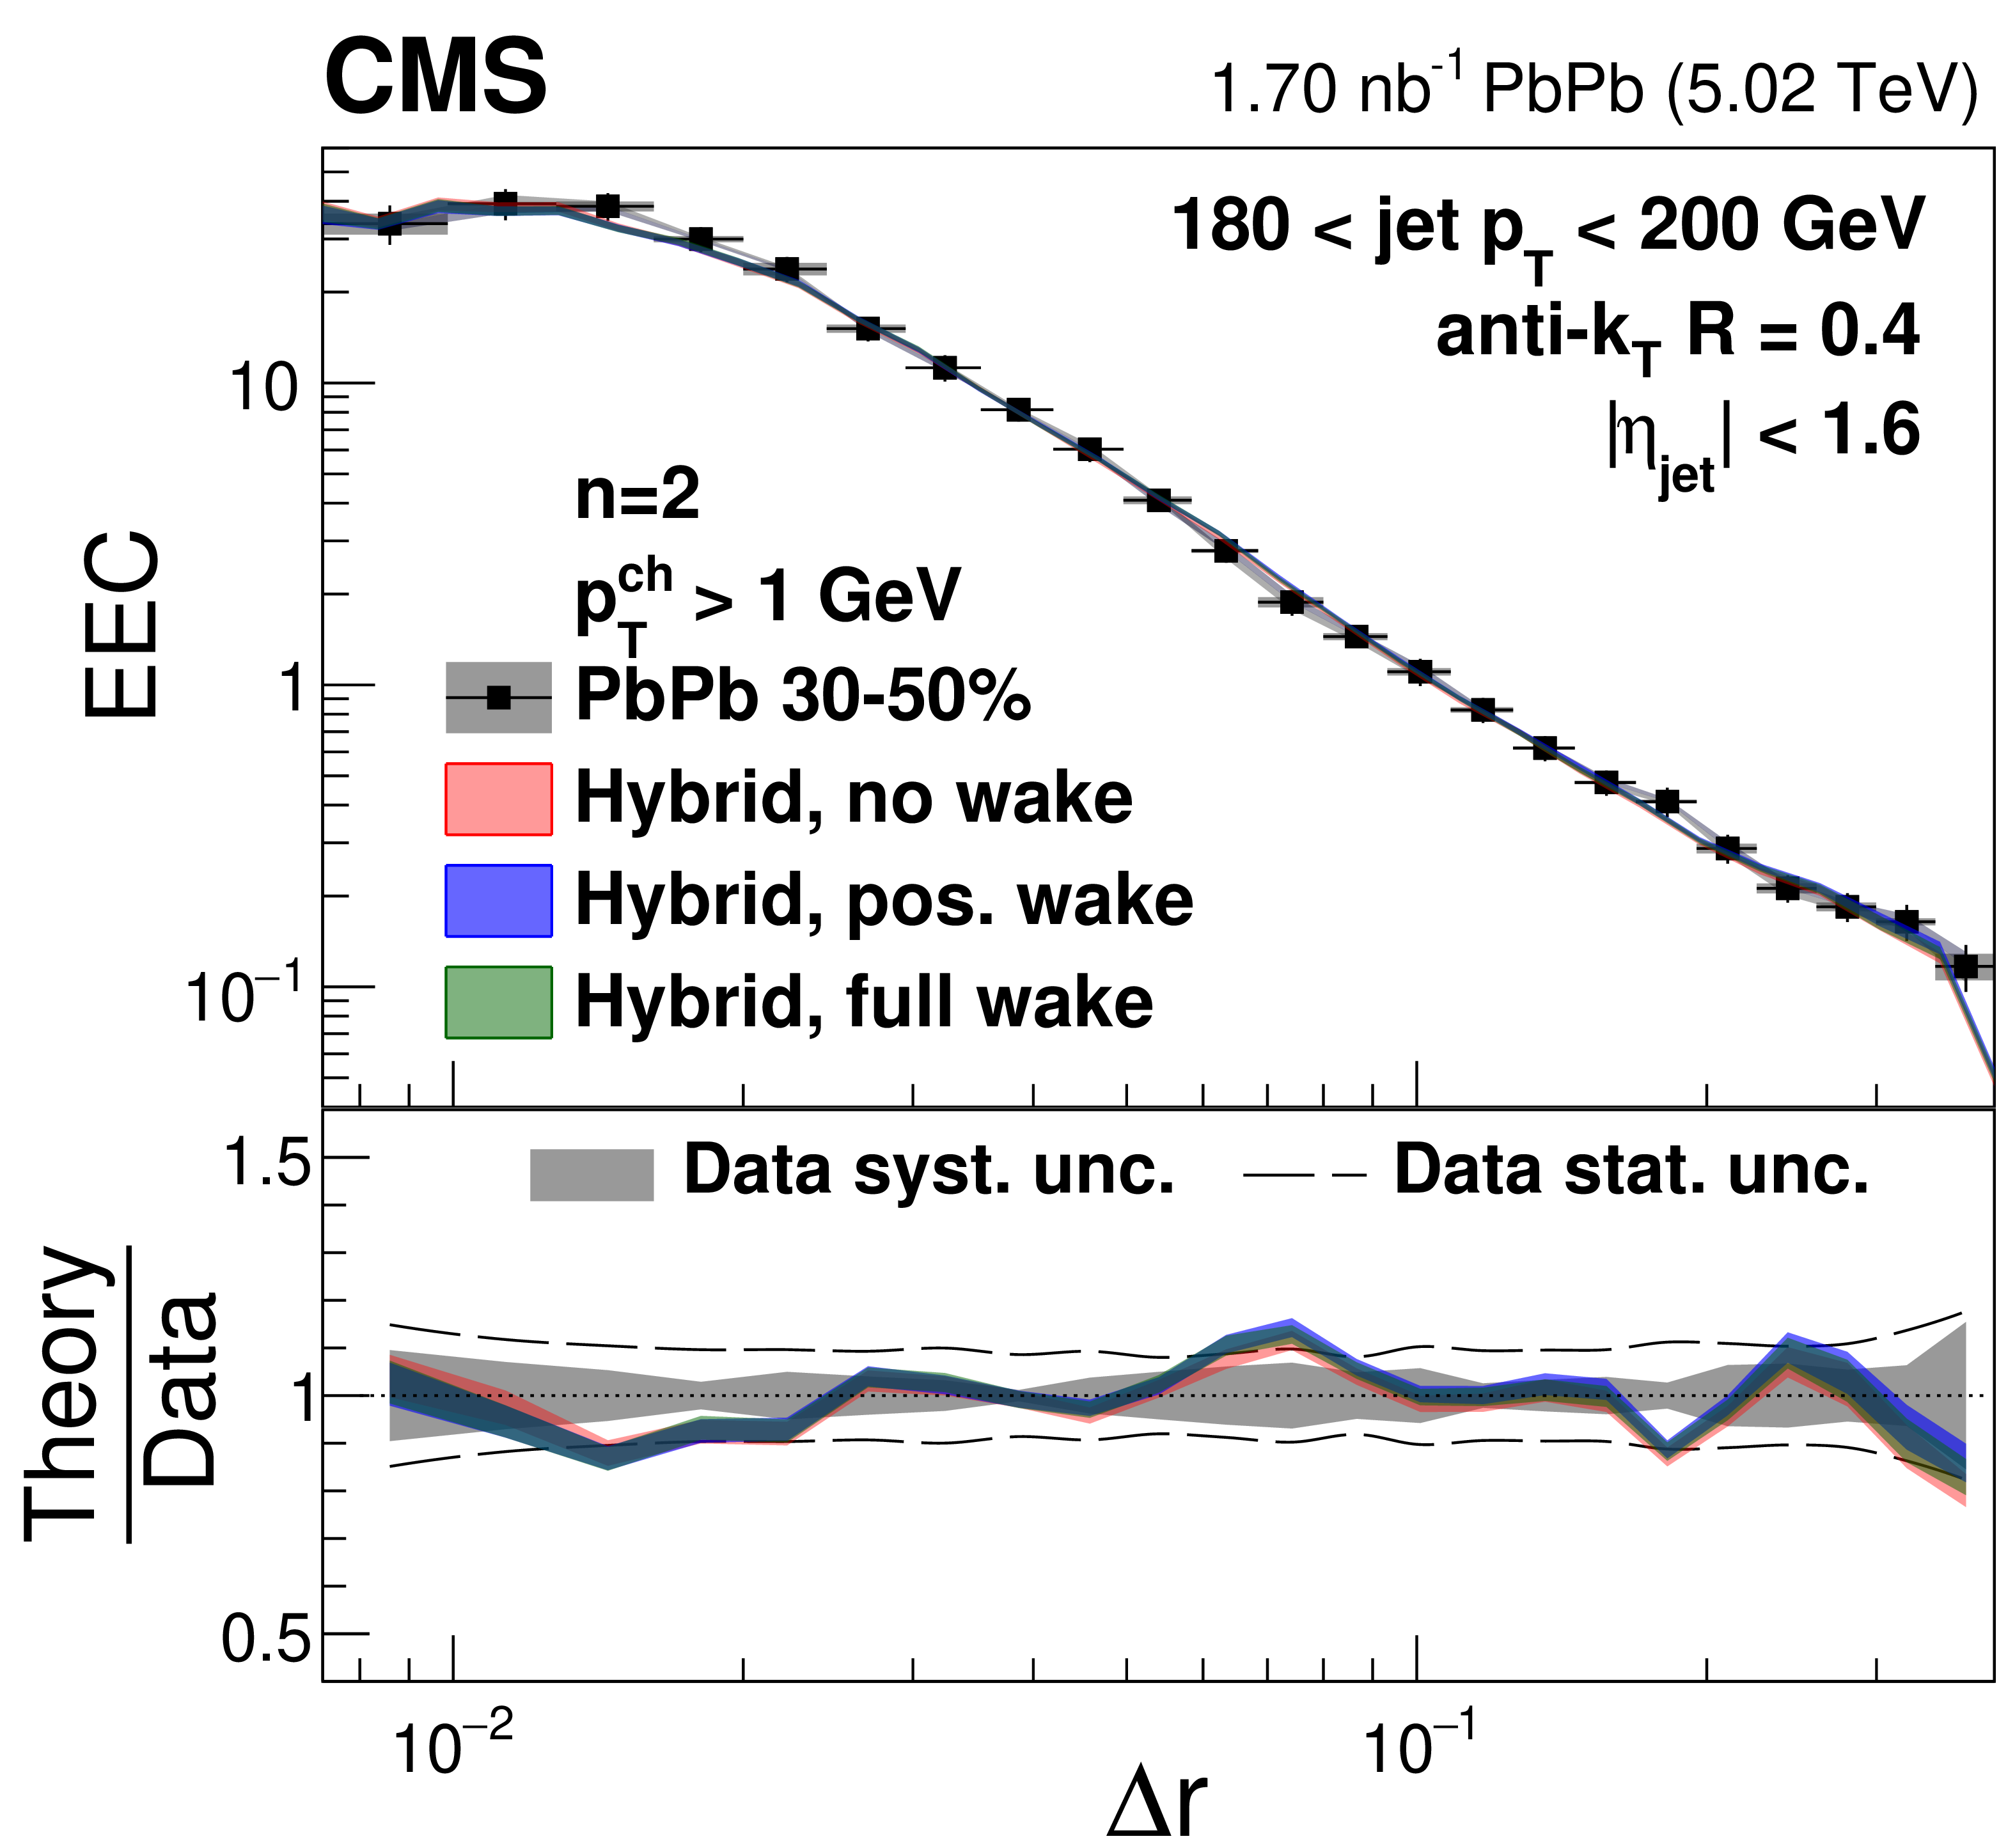
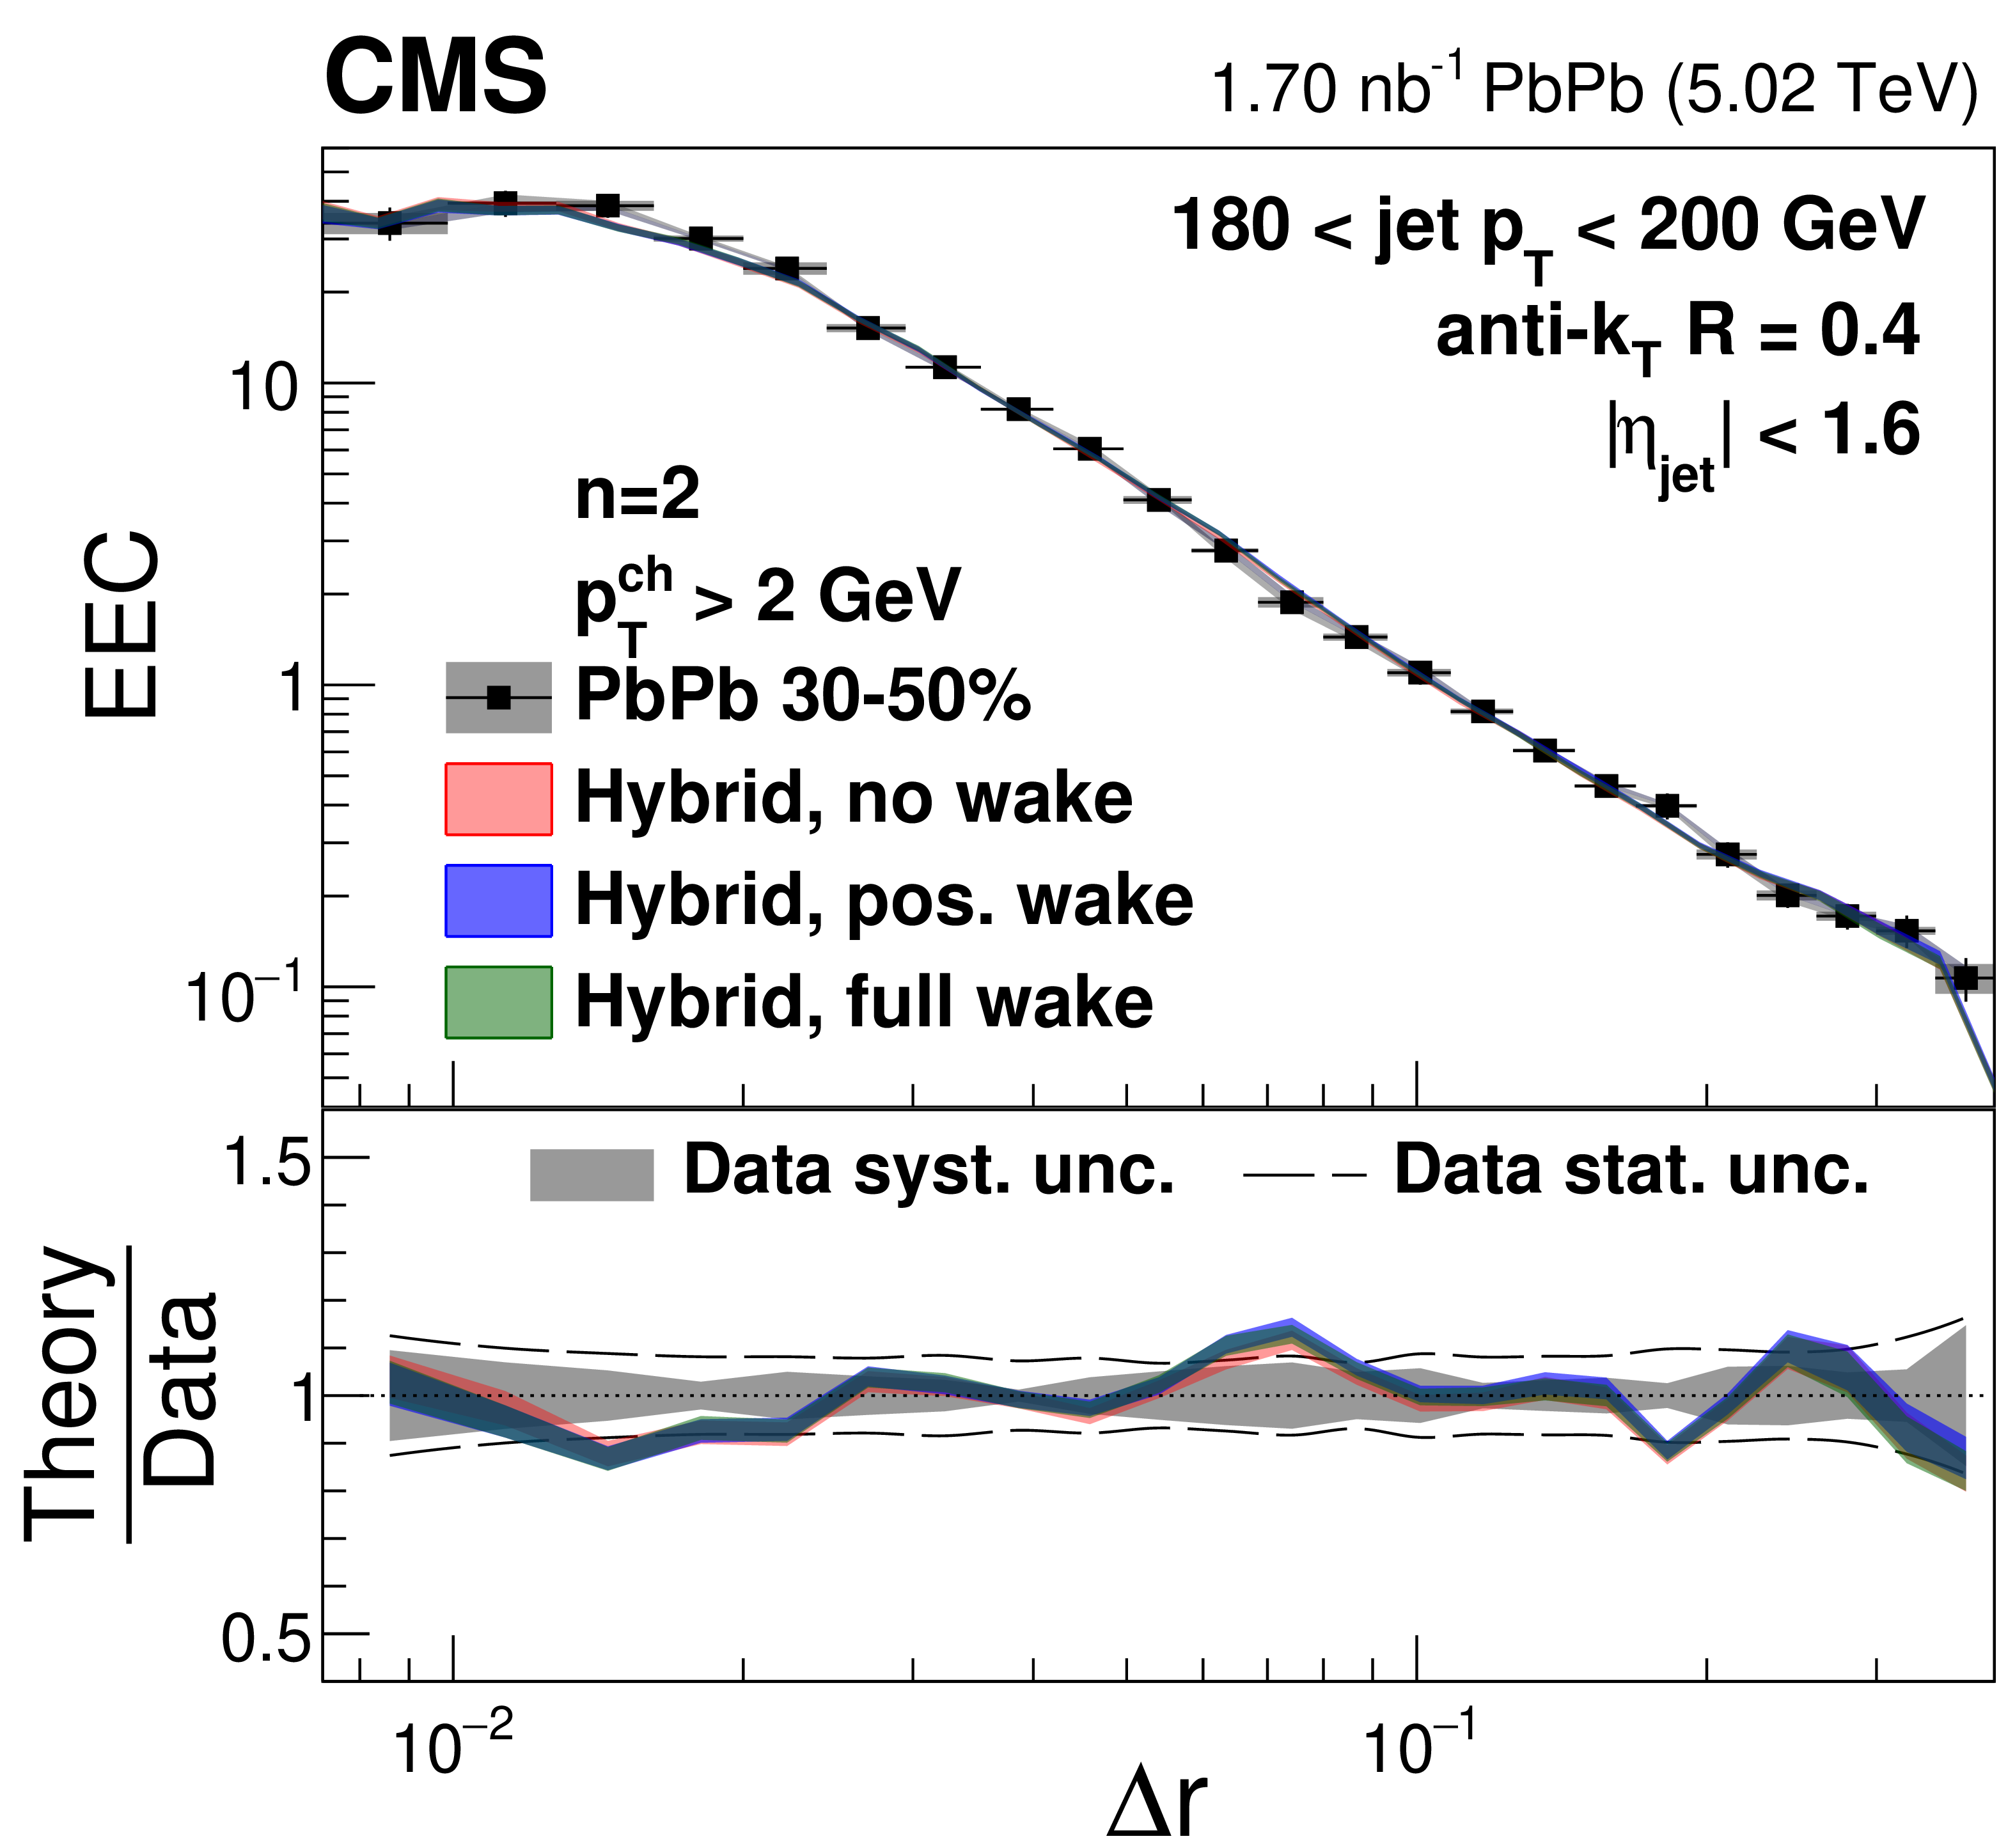
Energy-energy correlator distributions from 30-50% central PbPb collisions with $ n= $ 1 in different $ p_{\mathrm{T}}^{\text{ch}} $ and $ p_{\text{T,jet}} $ bins compared to the hybrid model predictions with different jet wake settings. |
png pdf |
Figure 17-a:
Energy-energy correlator distributions from 30-50% central PbPb collisions with $ n= $ 1 in different $ p_{\mathrm{T}}^{\text{ch}} $ and $ p_{\text{T,jet}} $ bins compared to the hybrid model predictions with different jet wake settings. |
png pdf |
Figure 17-b:
Energy-energy correlator distributions from 30-50% central PbPb collisions with $ n= $ 1 in different $ p_{\mathrm{T}}^{\text{ch}} $ and $ p_{\text{T,jet}} $ bins compared to the hybrid model predictions with different jet wake settings. |
png pdf |
Figure 17-c:
Energy-energy correlator distributions from 30-50% central PbPb collisions with $ n= $ 1 in different $ p_{\mathrm{T}}^{\text{ch}} $ and $ p_{\text{T,jet}} $ bins compared to the hybrid model predictions with different jet wake settings. |
png pdf |
Figure 17-d:
Energy-energy correlator distributions from 30-50% central PbPb collisions with $ n= $ 1 in different $ p_{\mathrm{T}}^{\text{ch}} $ and $ p_{\text{T,jet}} $ bins compared to the hybrid model predictions with different jet wake settings. |

png pdf |
Figure 17-e:
Energy-energy correlator distributions from 30-50% central PbPb collisions with $ n= $ 1 in different $ p_{\mathrm{T}}^{\text{ch}} $ and $ p_{\text{T,jet}} $ bins compared to the hybrid model predictions with different jet wake settings. |

png pdf |
Figure 17-f:
Energy-energy correlator distributions from 30-50% central PbPb collisions with $ n= $ 1 in different $ p_{\mathrm{T}}^{\text{ch}} $ and $ p_{\text{T,jet}} $ bins compared to the hybrid model predictions with different jet wake settings. |
png pdf |
Figure 17-g:
Energy-energy correlator distributions from 30-50% central PbPb collisions with $ n= $ 1 in different $ p_{\mathrm{T}}^{\text{ch}} $ and $ p_{\text{T,jet}} $ bins compared to the hybrid model predictions with different jet wake settings. |
png pdf |
Figure 17-h:
Energy-energy correlator distributions from 30-50% central PbPb collisions with $ n= $ 1 in different $ p_{\mathrm{T}}^{\text{ch}} $ and $ p_{\text{T,jet}} $ bins compared to the hybrid model predictions with different jet wake settings. |
png pdf |
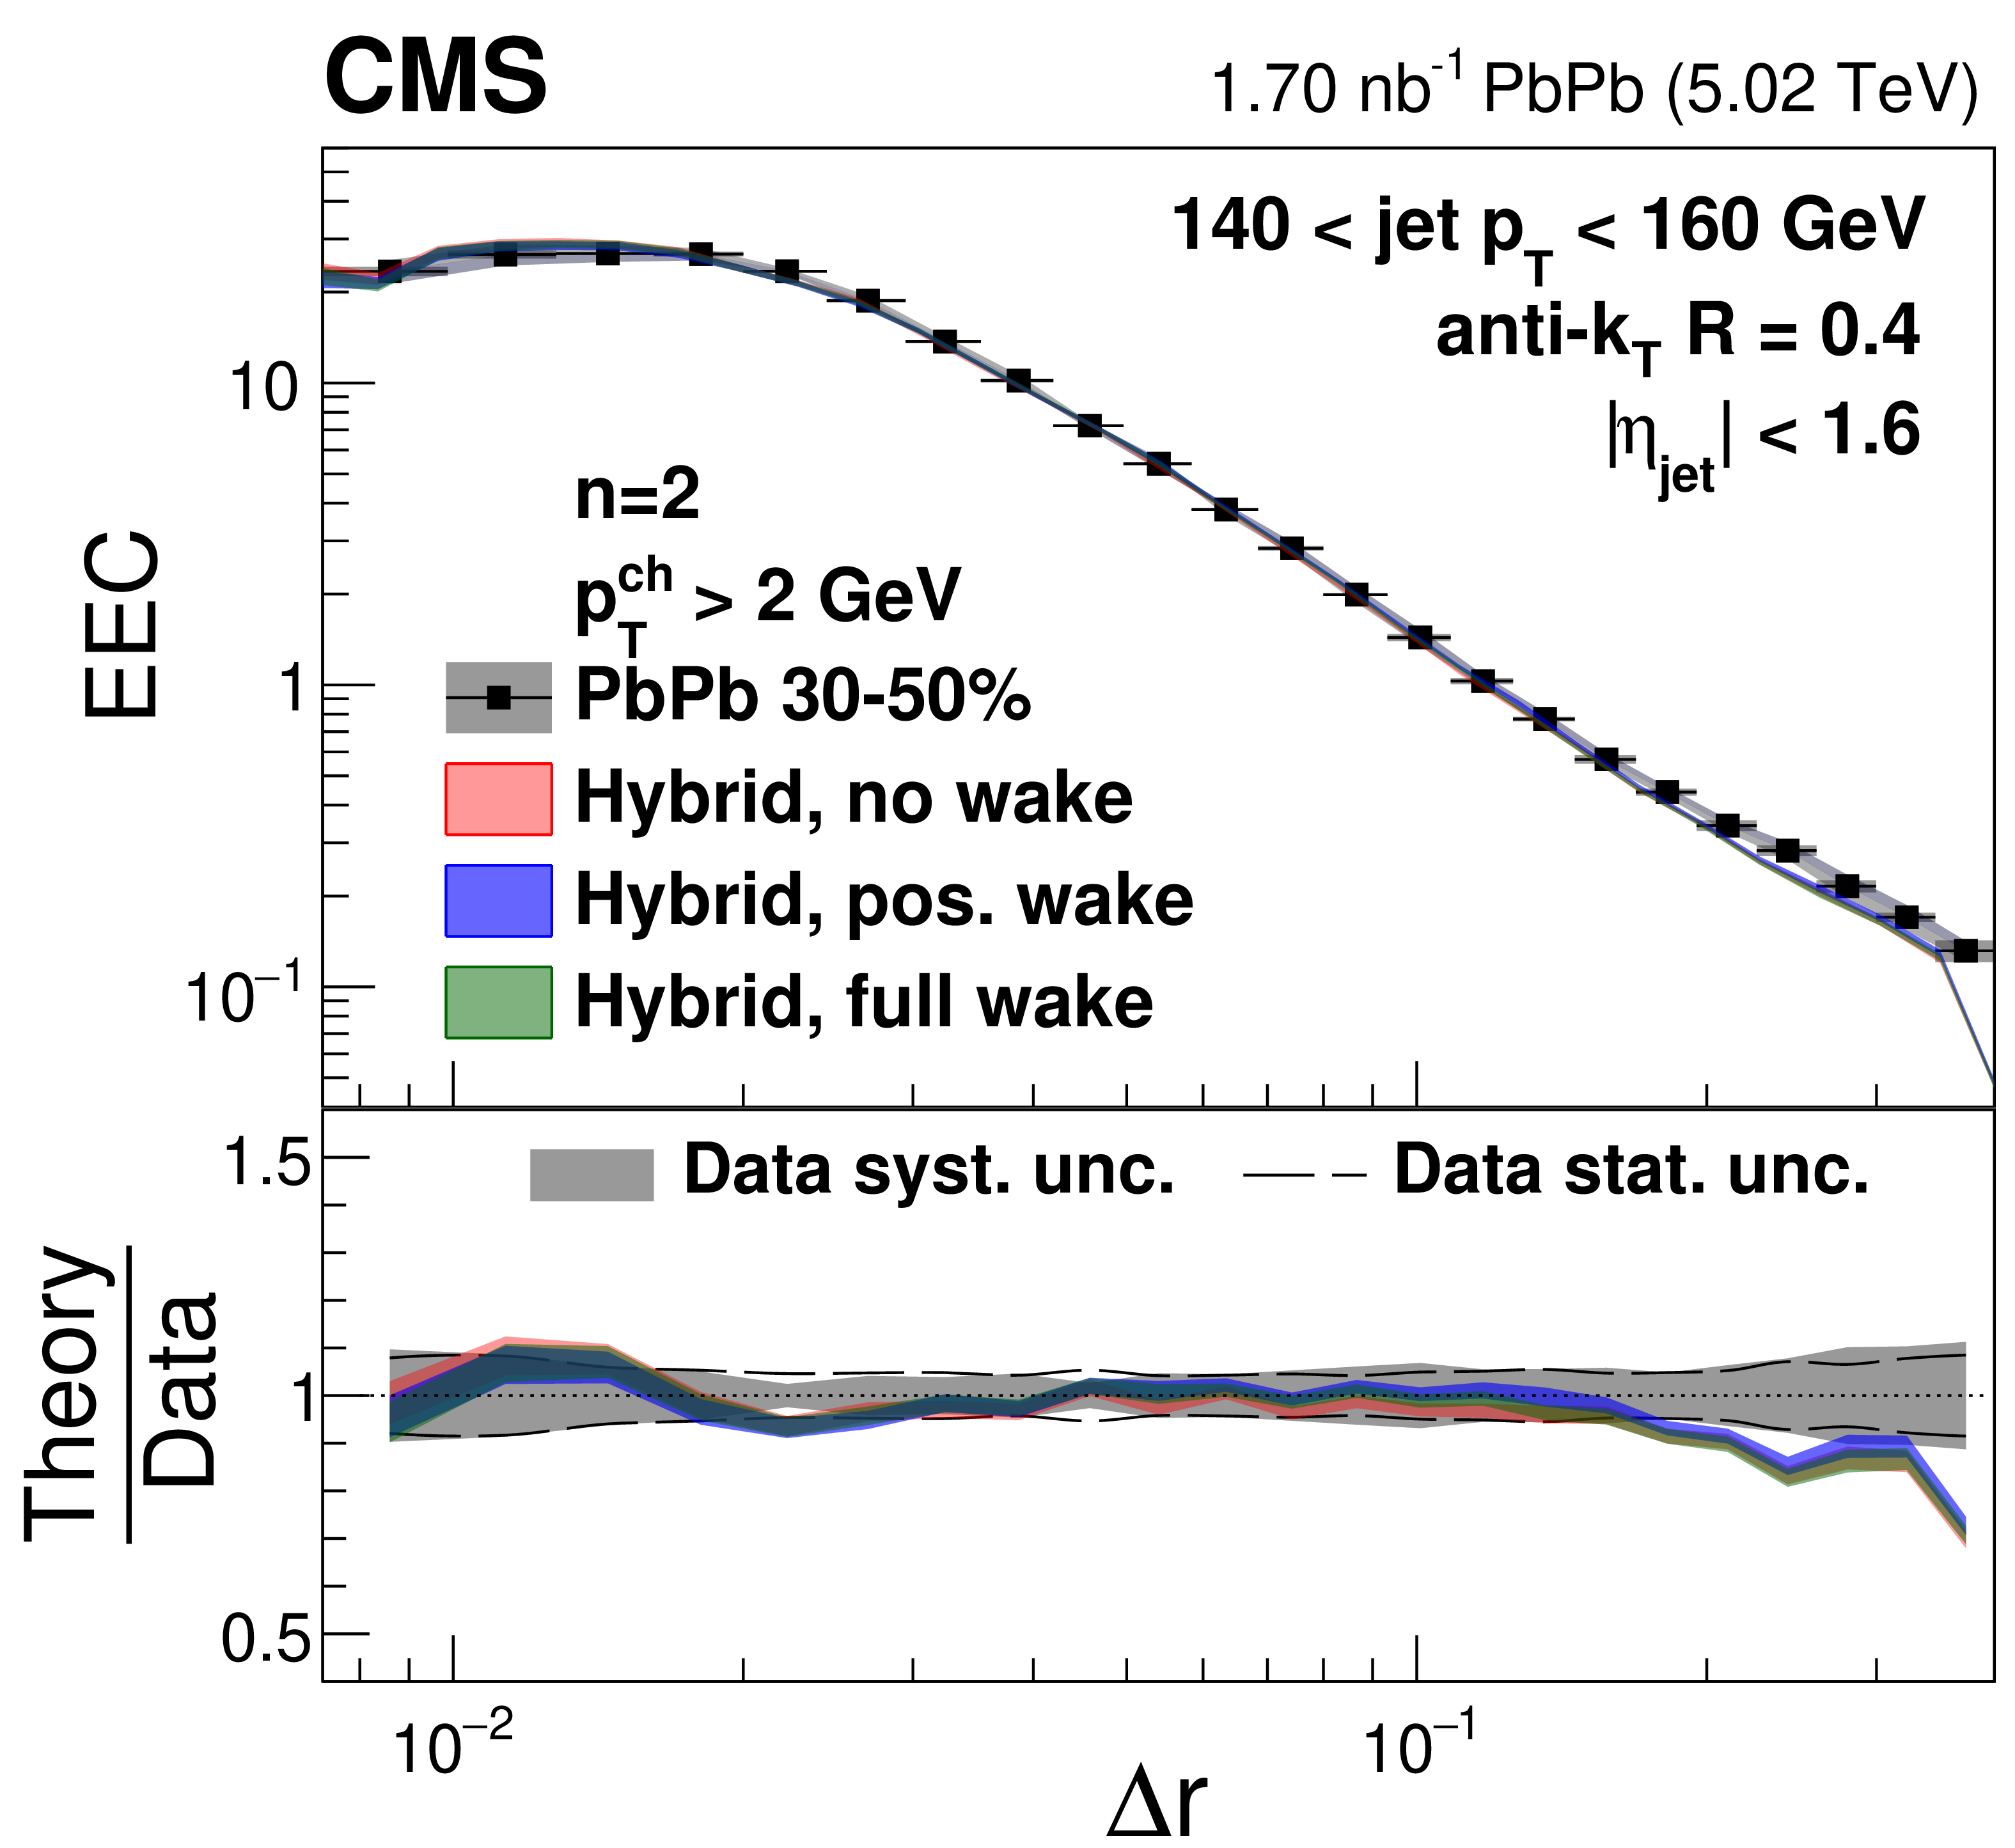
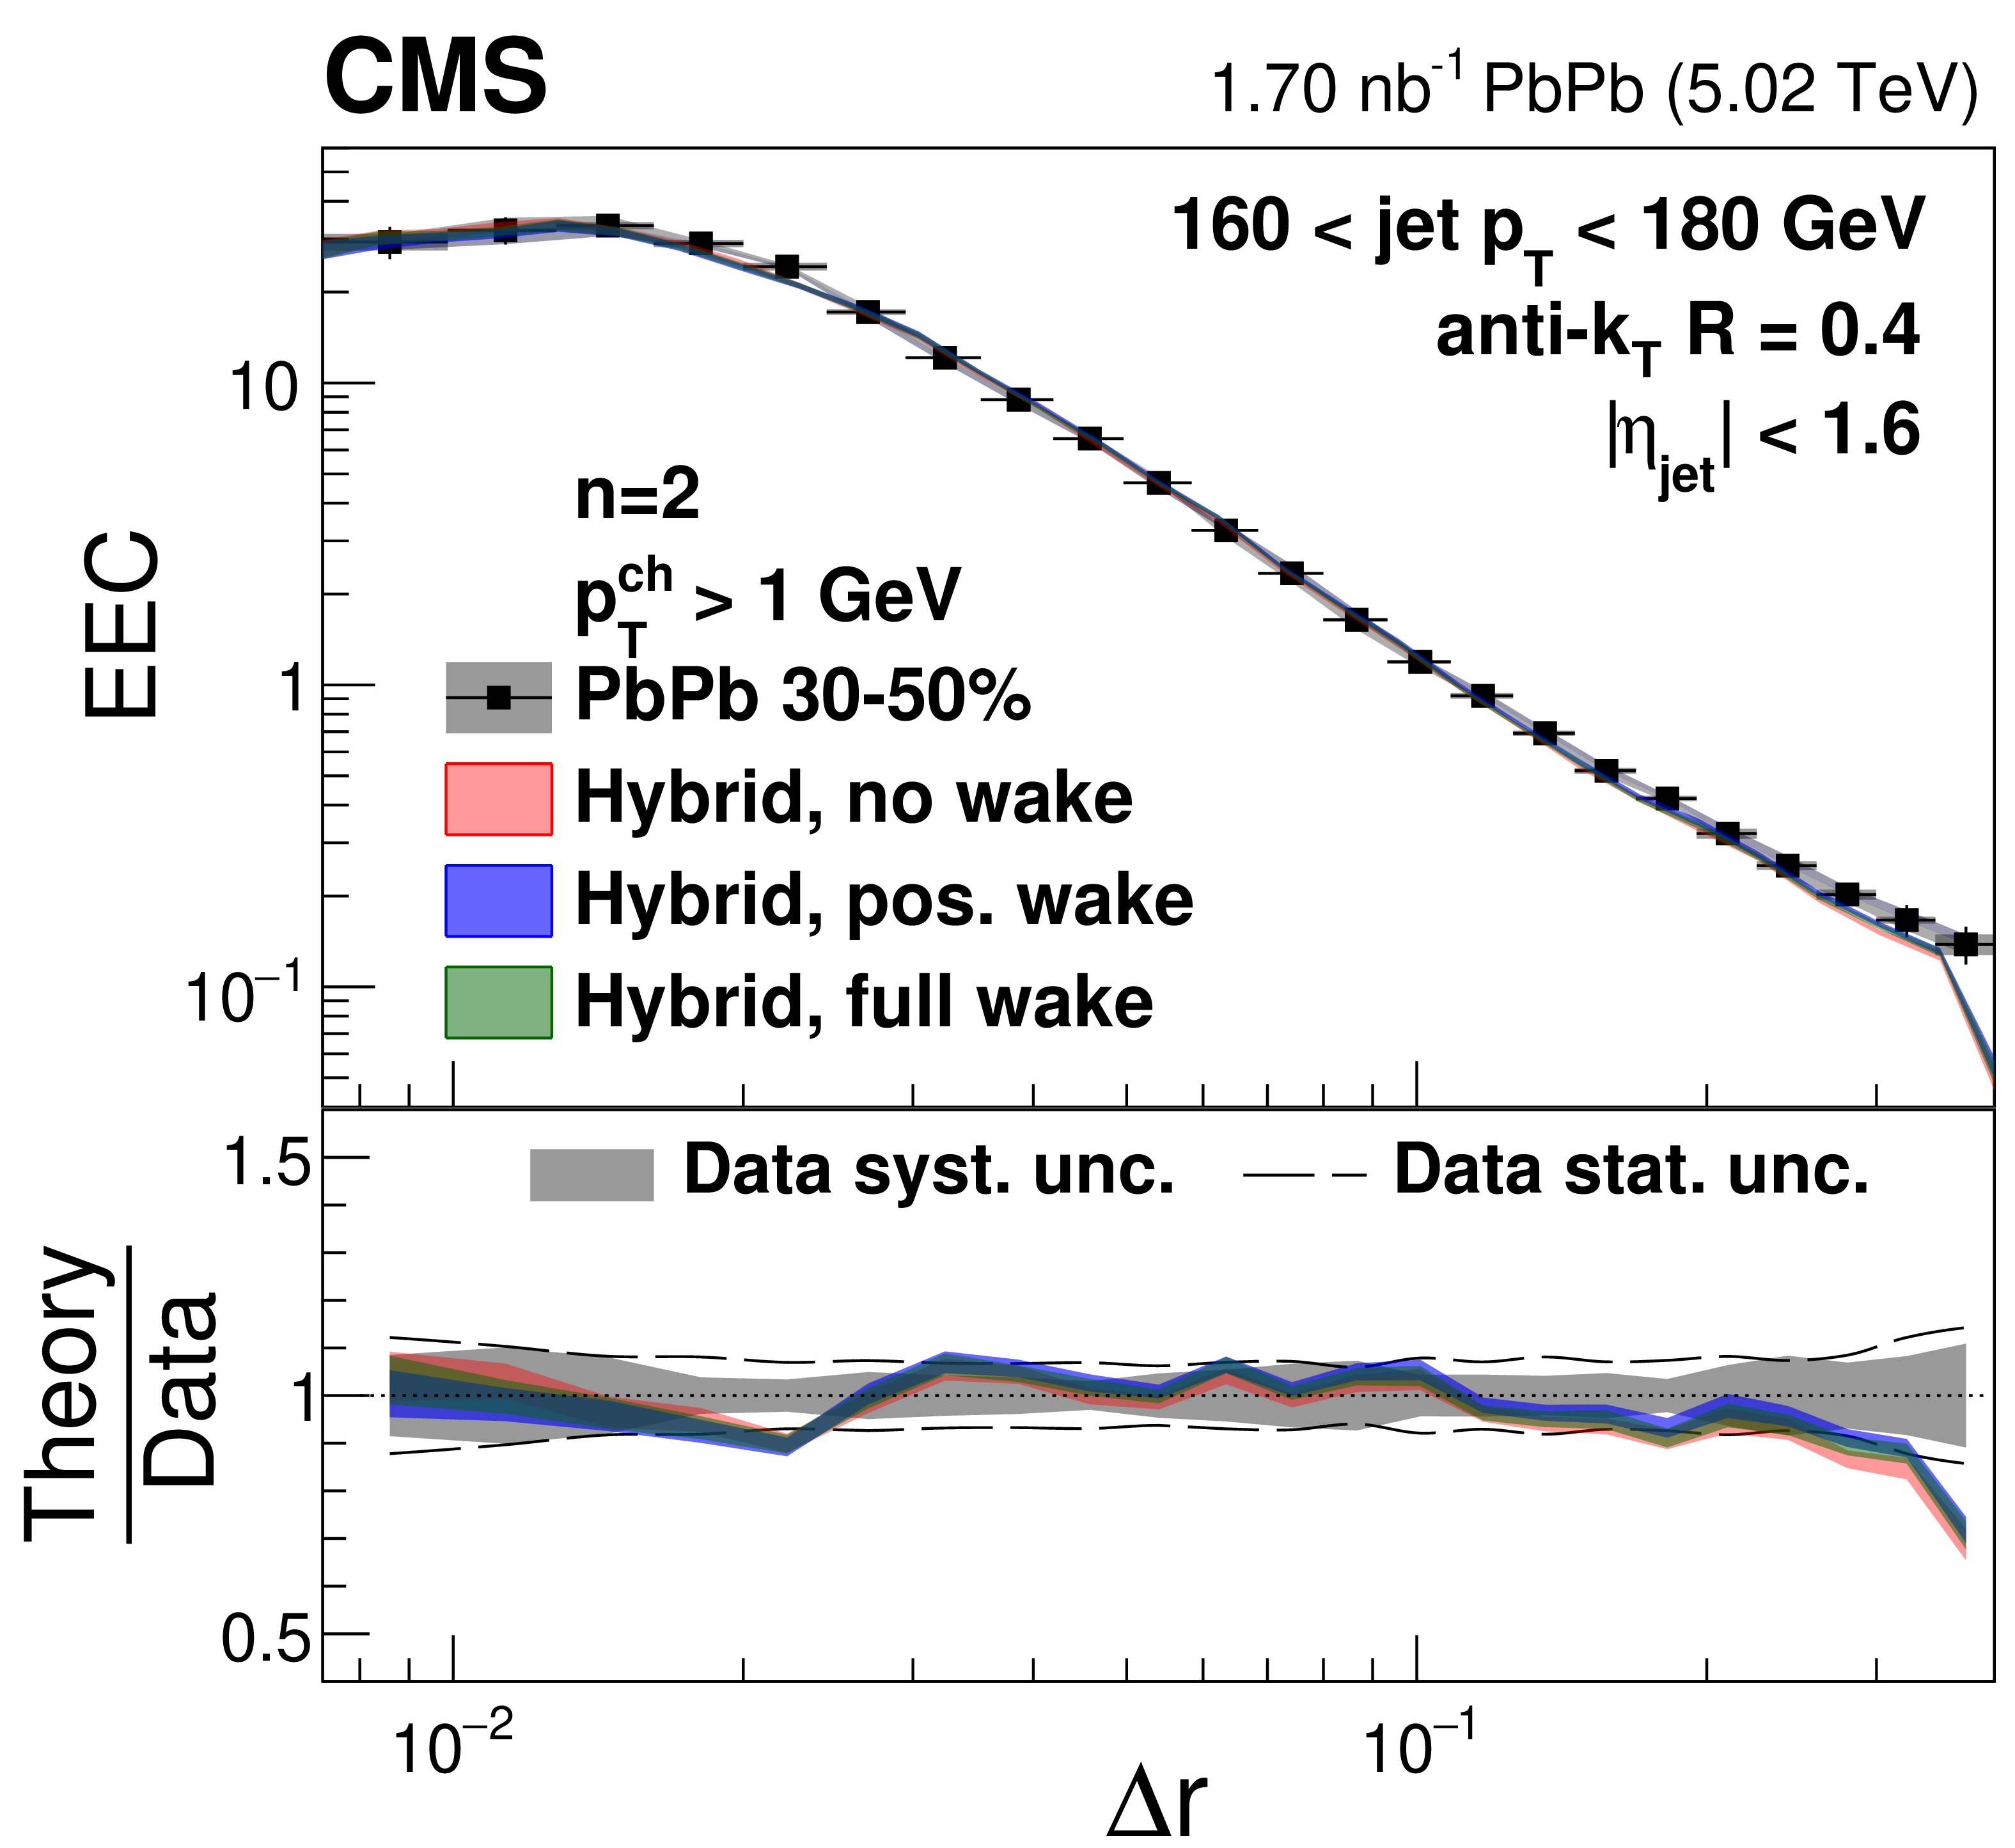
Figure 18:
Energy-energy correlator distributions from 30-50% central PbPb collisions with $ n= $ 2 in different $ p_{\mathrm{T}}^{\text{ch}} $ and $ p_{\text{T,jet}} $ bins compared to the hybrid model predictions with different jet wake settings. |
png pdf |
Figure 18-a:
Energy-energy correlator distributions from 30-50% central PbPb collisions with $ n= $ 2 in different $ p_{\mathrm{T}}^{\text{ch}} $ and $ p_{\text{T,jet}} $ bins compared to the hybrid model predictions with different jet wake settings. |
png pdf |
Figure 18-b:
Energy-energy correlator distributions from 30-50% central PbPb collisions with $ n= $ 2 in different $ p_{\mathrm{T}}^{\text{ch}} $ and $ p_{\text{T,jet}} $ bins compared to the hybrid model predictions with different jet wake settings. |
png pdf |
Figure 18-c:
Energy-energy correlator distributions from 30-50% central PbPb collisions with $ n= $ 2 in different $ p_{\mathrm{T}}^{\text{ch}} $ and $ p_{\text{T,jet}} $ bins compared to the hybrid model predictions with different jet wake settings. |
png pdf |
Figure 18-d:
Energy-energy correlator distributions from 30-50% central PbPb collisions with $ n= $ 2 in different $ p_{\mathrm{T}}^{\text{ch}} $ and $ p_{\text{T,jet}} $ bins compared to the hybrid model predictions with different jet wake settings. |
png pdf |
Figure 18-e:
Energy-energy correlator distributions from 30-50% central PbPb collisions with $ n= $ 2 in different $ p_{\mathrm{T}}^{\text{ch}} $ and $ p_{\text{T,jet}} $ bins compared to the hybrid model predictions with different jet wake settings. |
png pdf |
Figure 18-f:
Energy-energy correlator distributions from 30-50% central PbPb collisions with $ n= $ 2 in different $ p_{\mathrm{T}}^{\text{ch}} $ and $ p_{\text{T,jet}} $ bins compared to the hybrid model predictions with different jet wake settings. |
png pdf |
Figure 18-g:
Energy-energy correlator distributions from 30-50% central PbPb collisions with $ n= $ 2 in different $ p_{\mathrm{T}}^{\text{ch}} $ and $ p_{\text{T,jet}} $ bins compared to the hybrid model predictions with different jet wake settings. |
png pdf |
Figure 18-h:
Energy-energy correlator distributions from 30-50% central PbPb collisions with $ n= $ 2 in different $ p_{\mathrm{T}}^{\text{ch}} $ and $ p_{\text{T,jet}} $ bins compared to the hybrid model predictions with different jet wake settings. |
png pdf |
Figure 19:
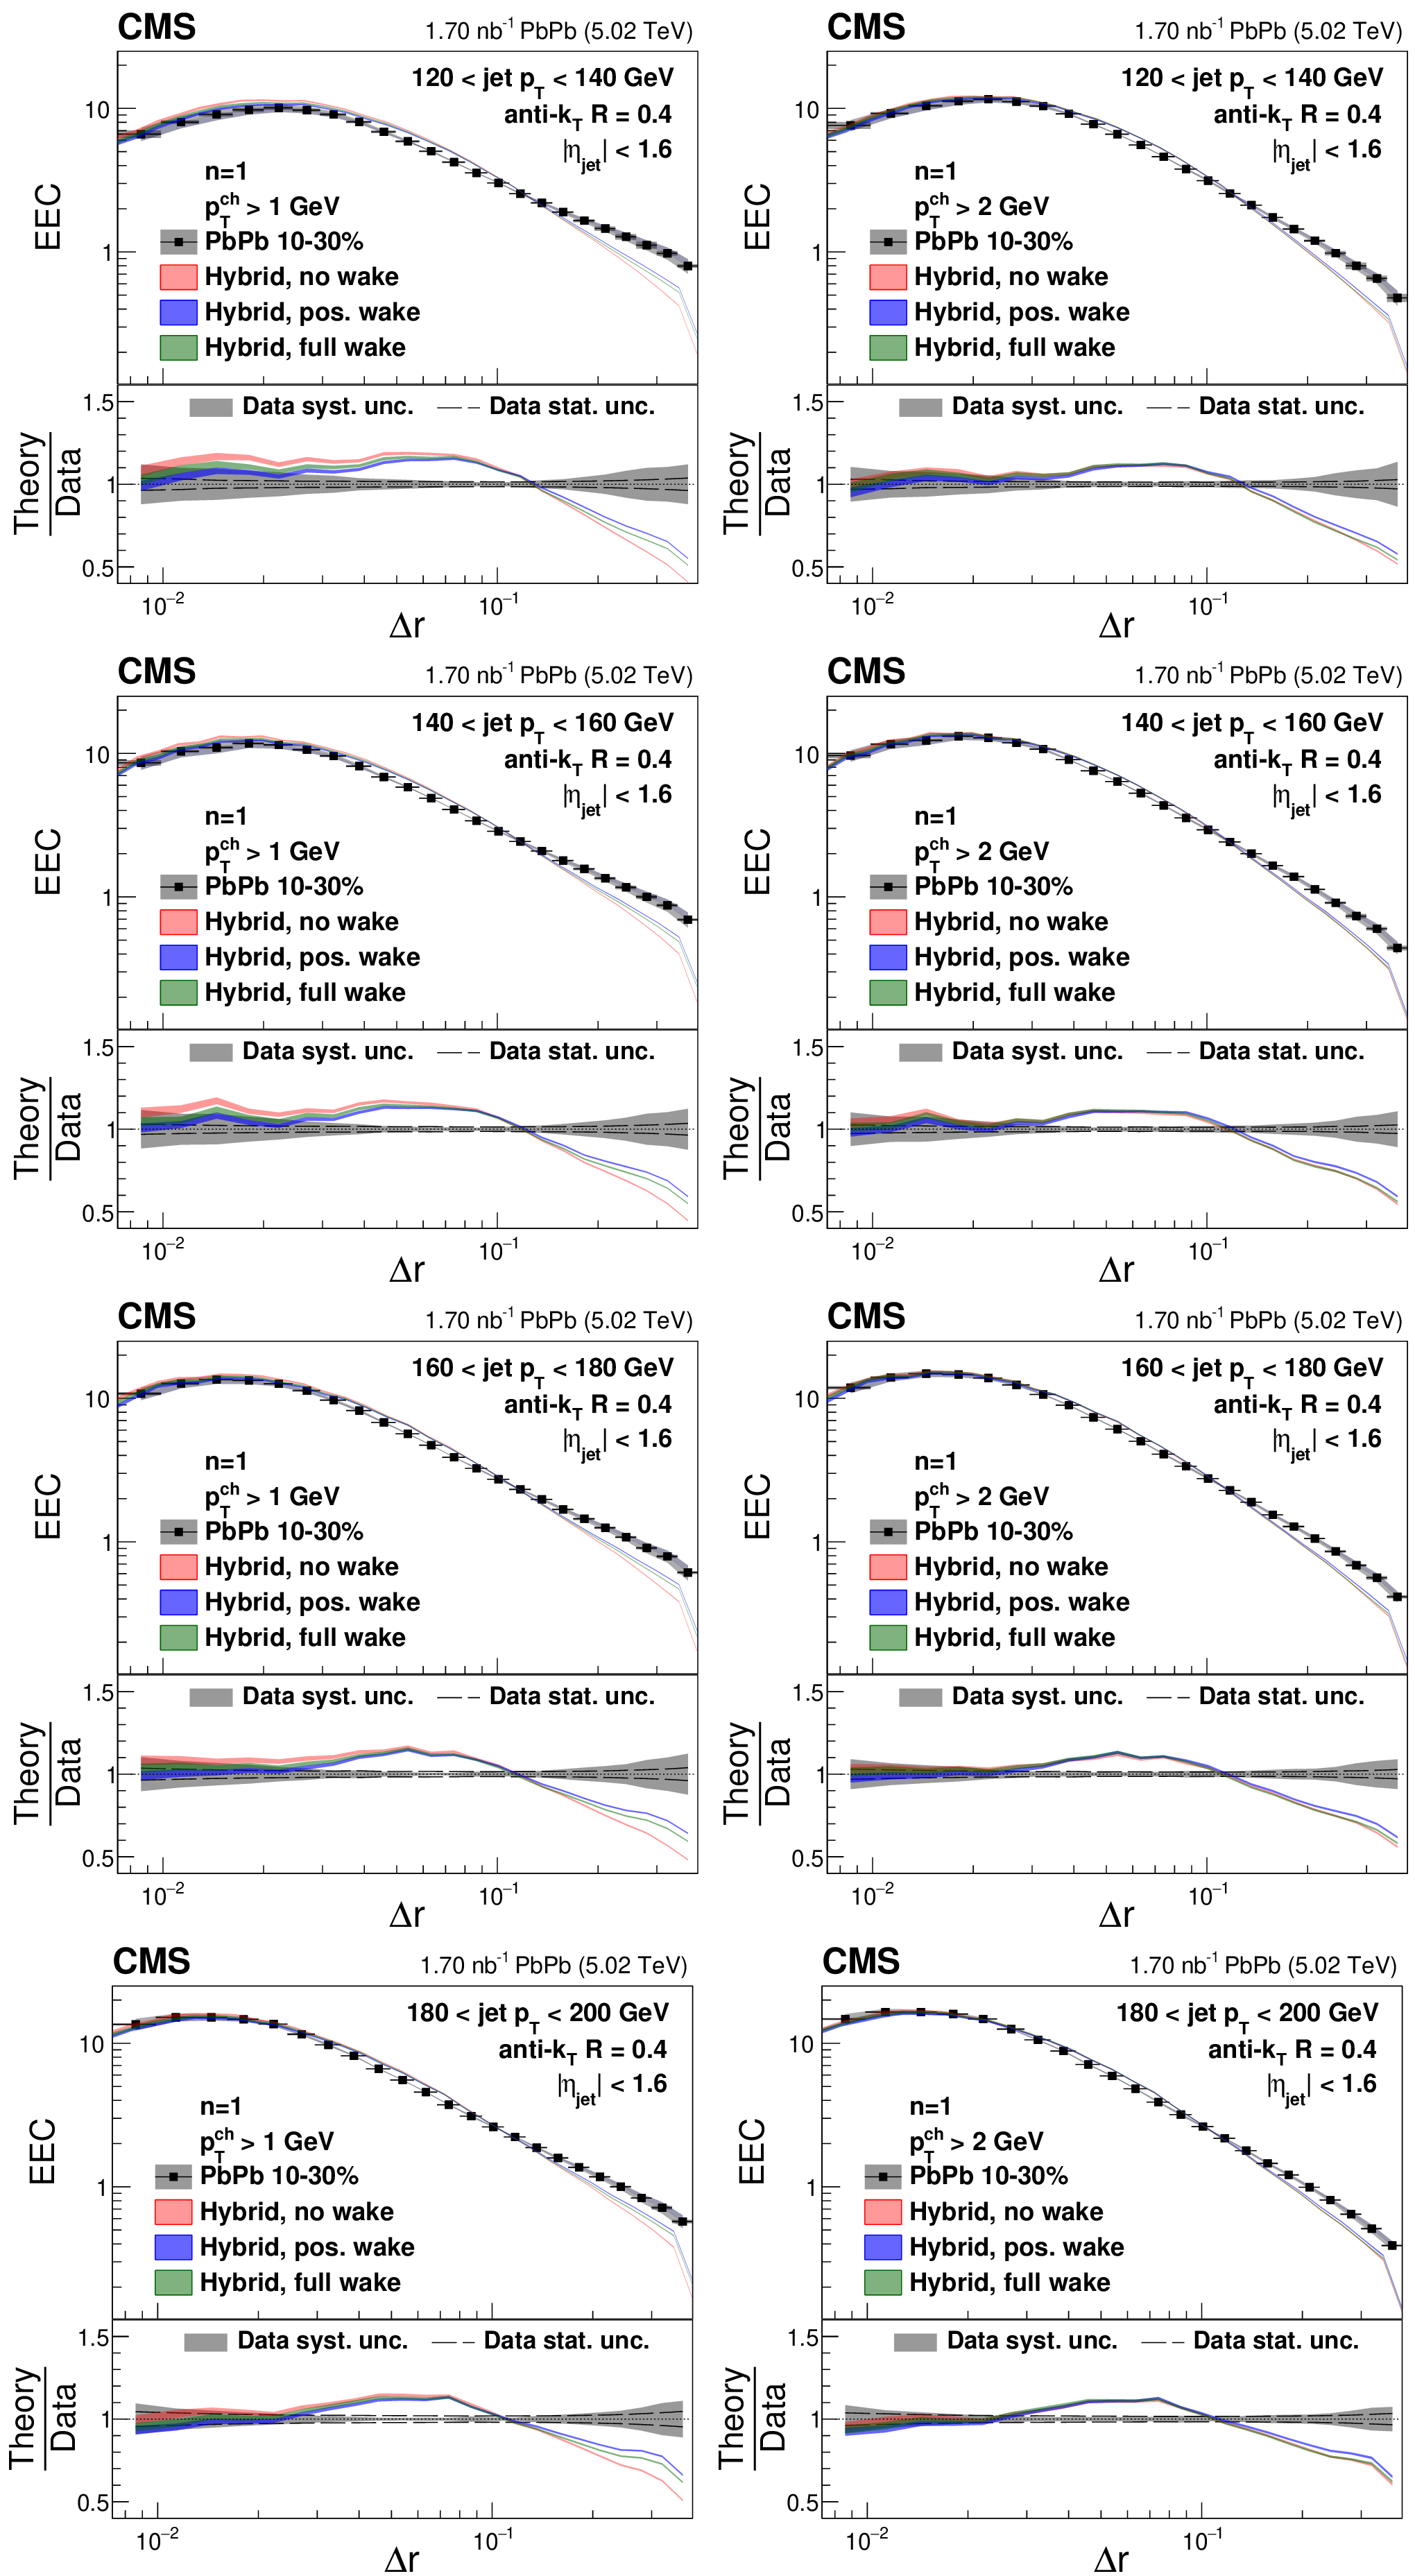
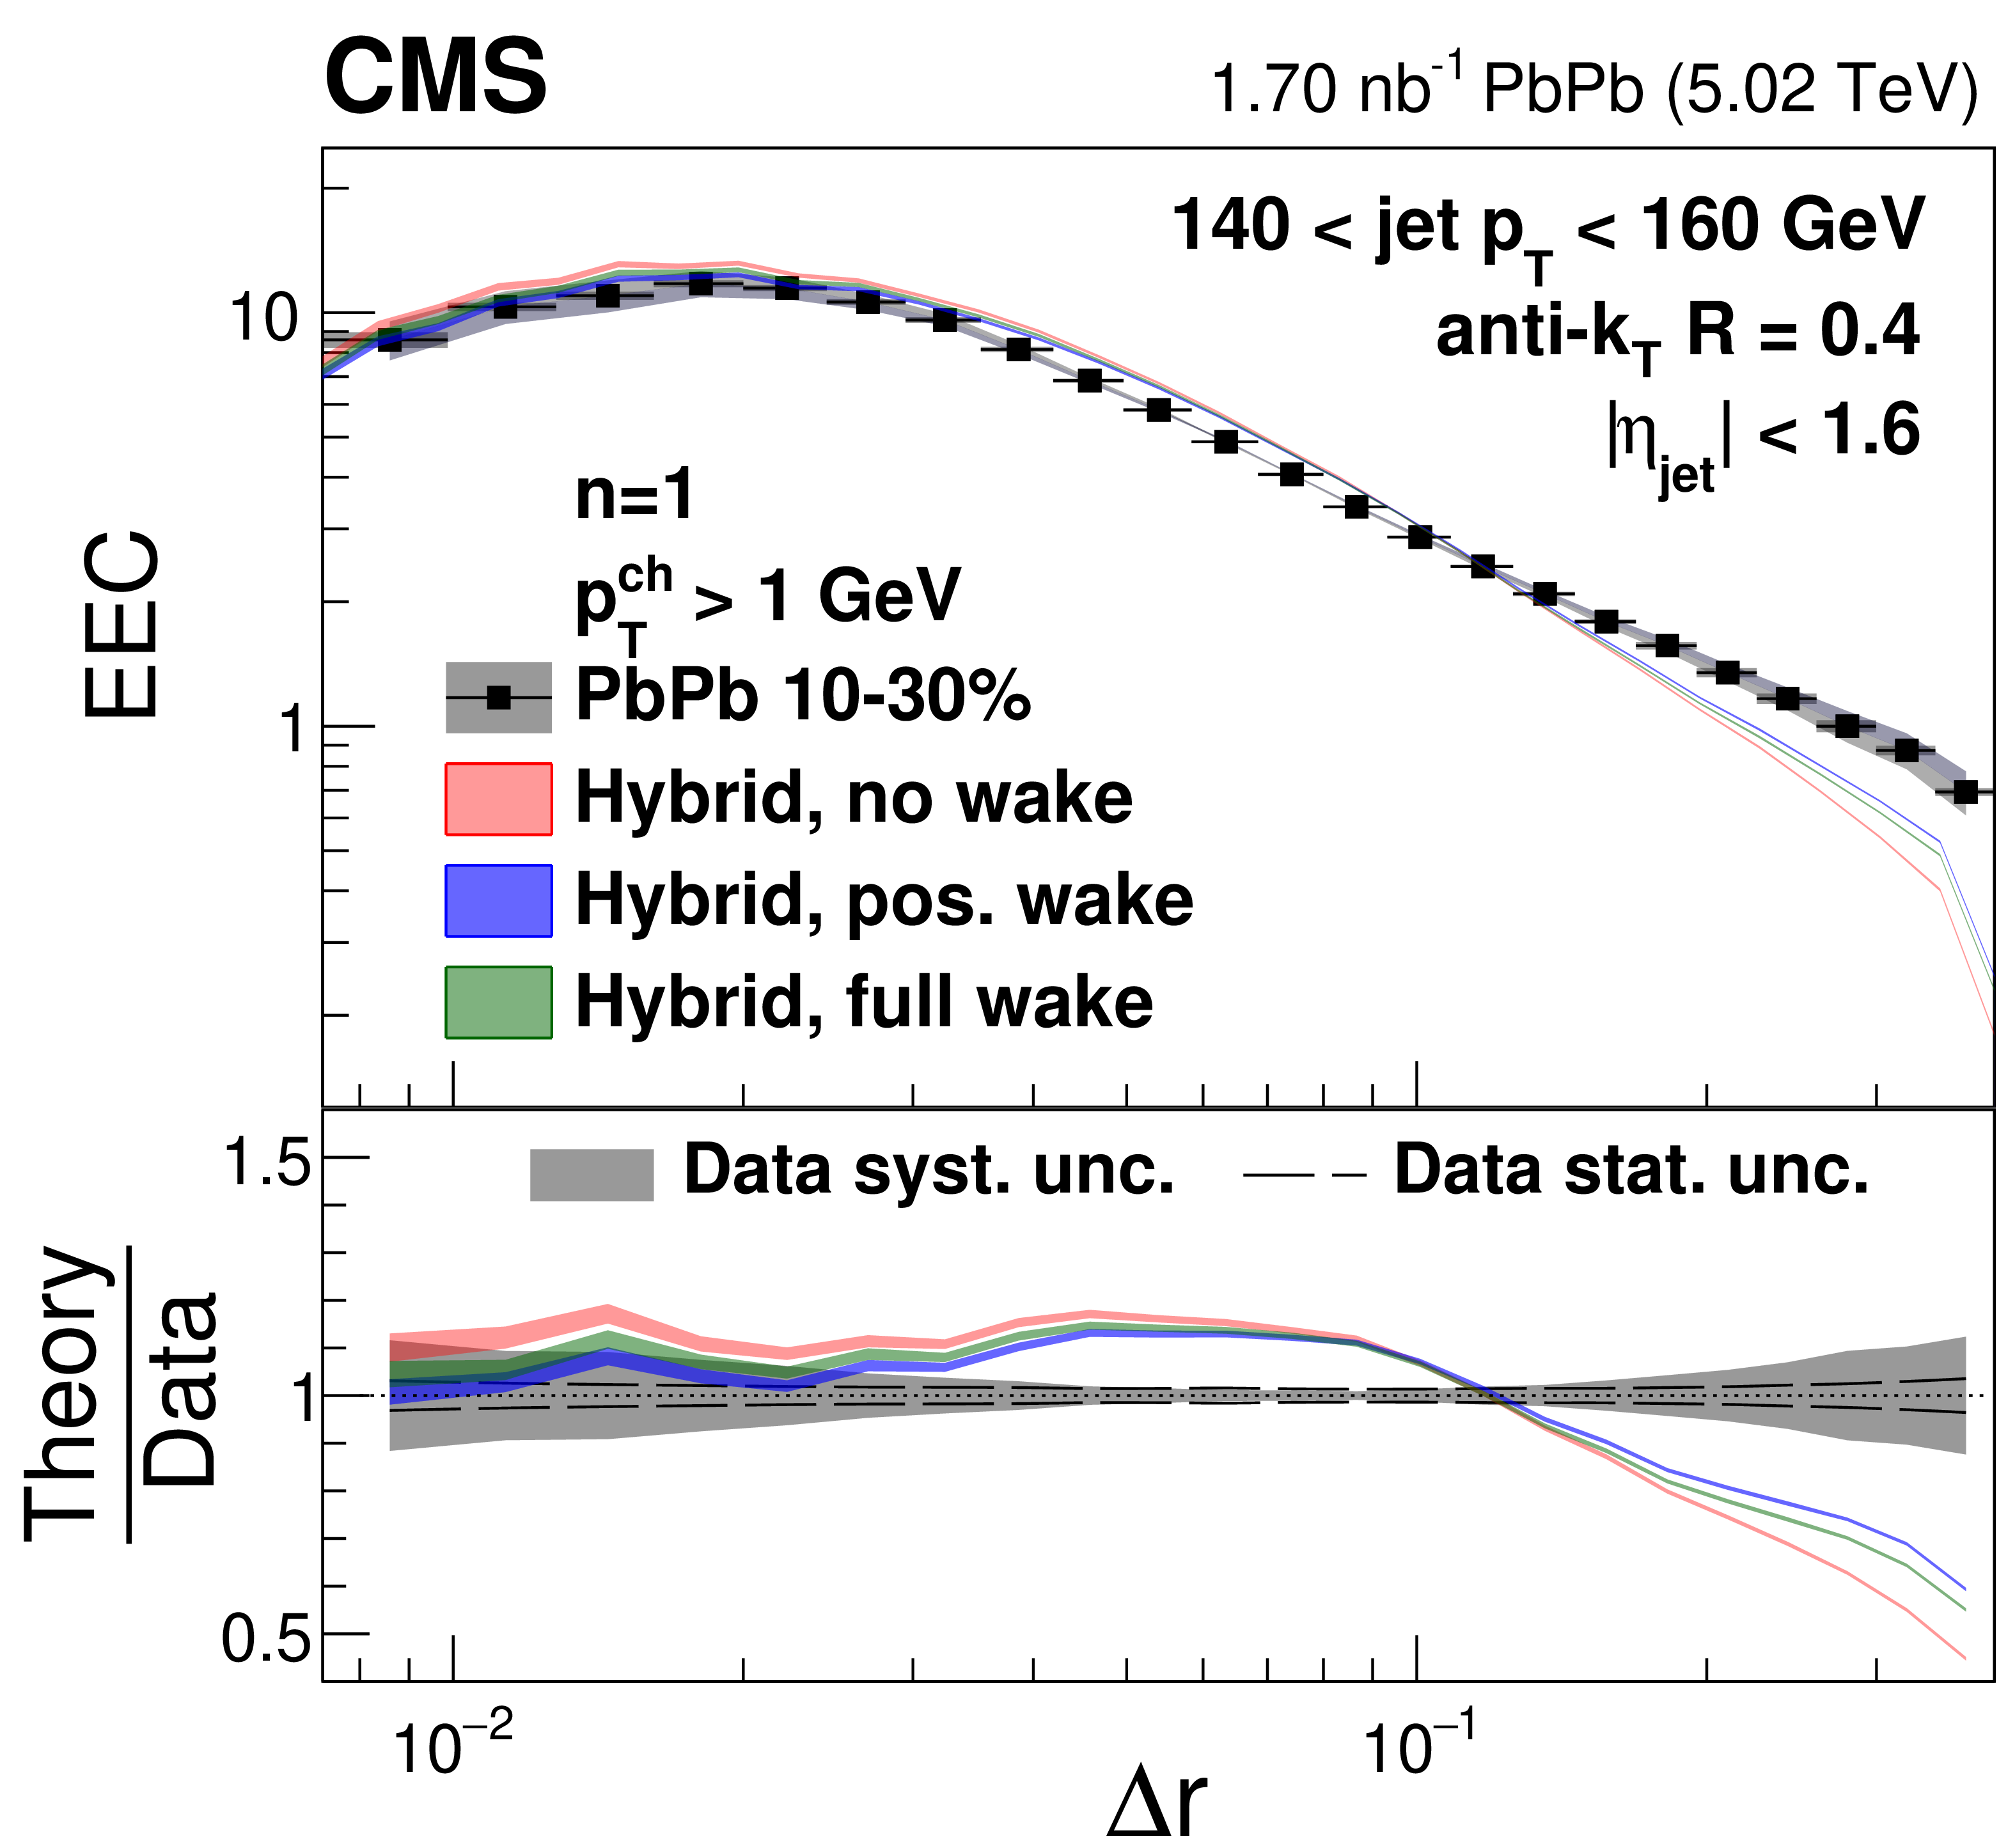
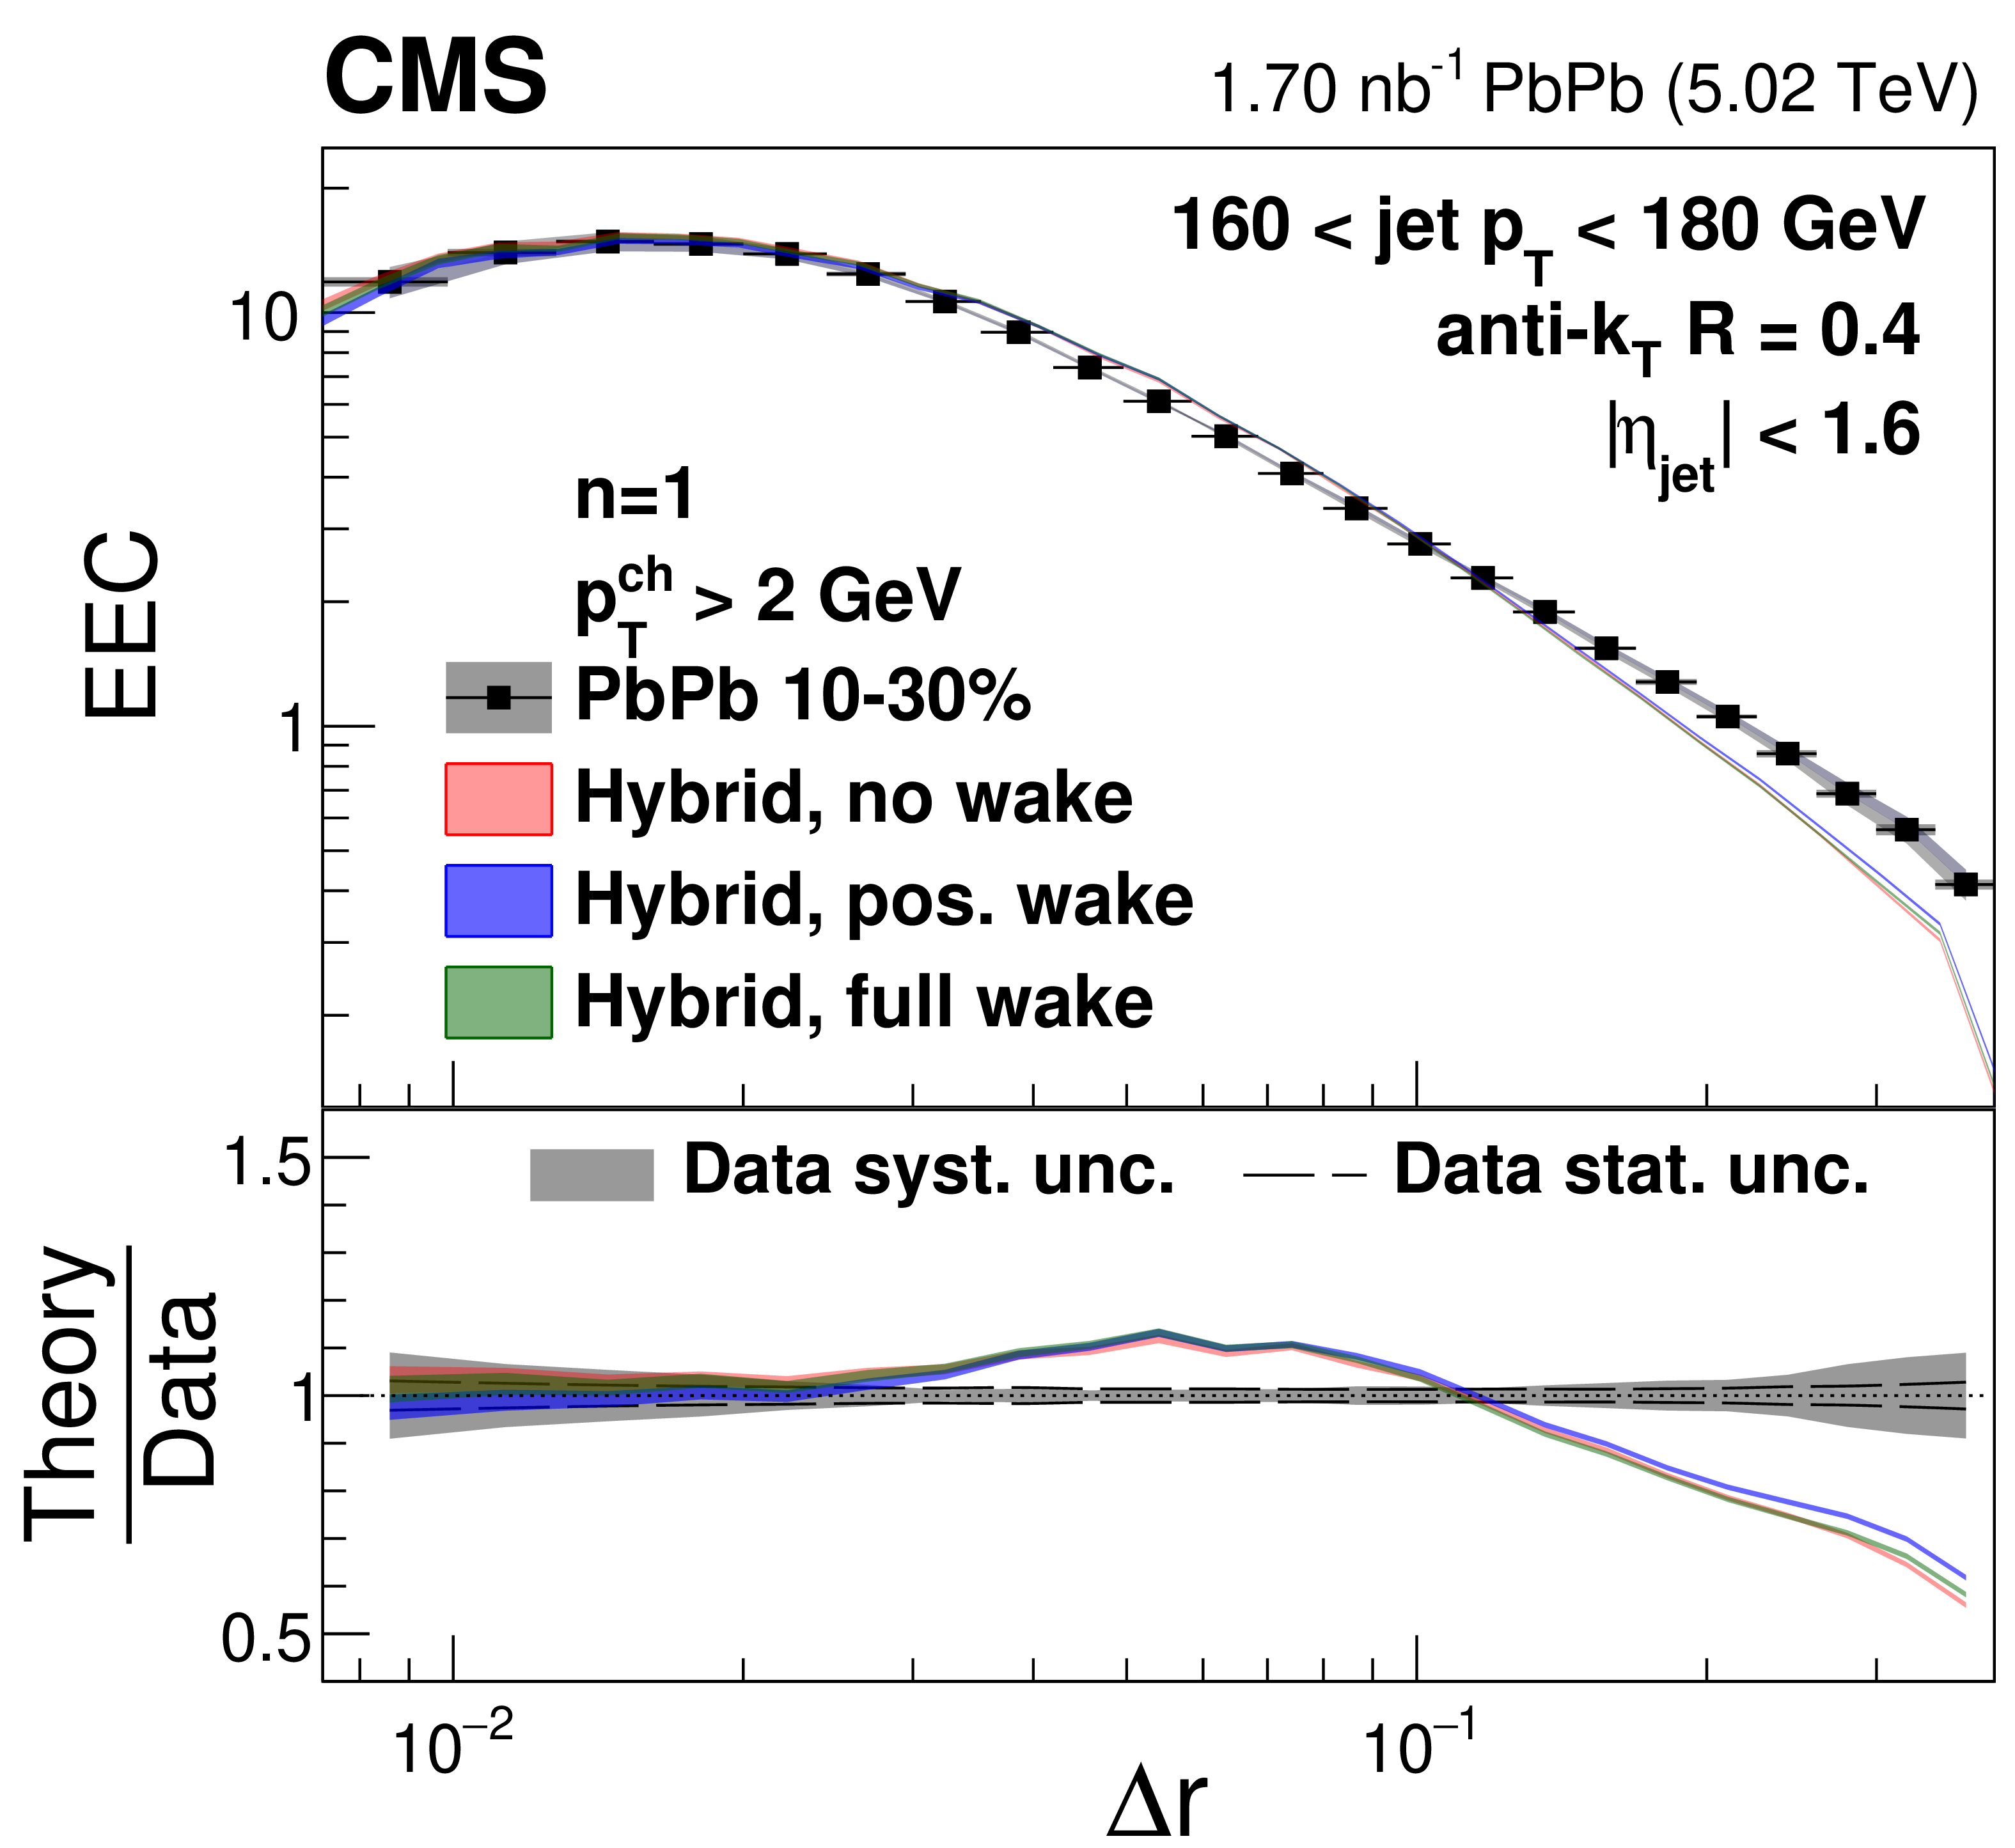
Energy-energy correlator distributions from 10-30% central PbPb collisions with $ n= $ 1 in different $ p_{\mathrm{T}}^{\text{ch}} $ and $ p_{\text{T,jet}} $ bins compared to the hybrid model predictions with different jet wake settings. |
png pdf |
Figure 19-a:
Energy-energy correlator distributions from 10-30% central PbPb collisions with $ n= $ 1 in different $ p_{\mathrm{T}}^{\text{ch}} $ and $ p_{\text{T,jet}} $ bins compared to the hybrid model predictions with different jet wake settings. |

png pdf |
Figure 19-b:
Energy-energy correlator distributions from 10-30% central PbPb collisions with $ n= $ 1 in different $ p_{\mathrm{T}}^{\text{ch}} $ and $ p_{\text{T,jet}} $ bins compared to the hybrid model predictions with different jet wake settings. |
png pdf |
Figure 19-c:
Energy-energy correlator distributions from 10-30% central PbPb collisions with $ n= $ 1 in different $ p_{\mathrm{T}}^{\text{ch}} $ and $ p_{\text{T,jet}} $ bins compared to the hybrid model predictions with different jet wake settings. |

png pdf |
Figure 19-d:
Energy-energy correlator distributions from 10-30% central PbPb collisions with $ n= $ 1 in different $ p_{\mathrm{T}}^{\text{ch}} $ and $ p_{\text{T,jet}} $ bins compared to the hybrid model predictions with different jet wake settings. |

png pdf |
Figure 19-e:
Energy-energy correlator distributions from 10-30% central PbPb collisions with $ n= $ 1 in different $ p_{\mathrm{T}}^{\text{ch}} $ and $ p_{\text{T,jet}} $ bins compared to the hybrid model predictions with different jet wake settings. |
png pdf |
Figure 19-f:
Energy-energy correlator distributions from 10-30% central PbPb collisions with $ n= $ 1 in different $ p_{\mathrm{T}}^{\text{ch}} $ and $ p_{\text{T,jet}} $ bins compared to the hybrid model predictions with different jet wake settings. |

png pdf |
Figure 19-g:
Energy-energy correlator distributions from 10-30% central PbPb collisions with $ n= $ 1 in different $ p_{\mathrm{T}}^{\text{ch}} $ and $ p_{\text{T,jet}} $ bins compared to the hybrid model predictions with different jet wake settings. |

png pdf |
Figure 19-h:
Energy-energy correlator distributions from 10-30% central PbPb collisions with $ n= $ 1 in different $ p_{\mathrm{T}}^{\text{ch}} $ and $ p_{\text{T,jet}} $ bins compared to the hybrid model predictions with different jet wake settings. |
png pdf |
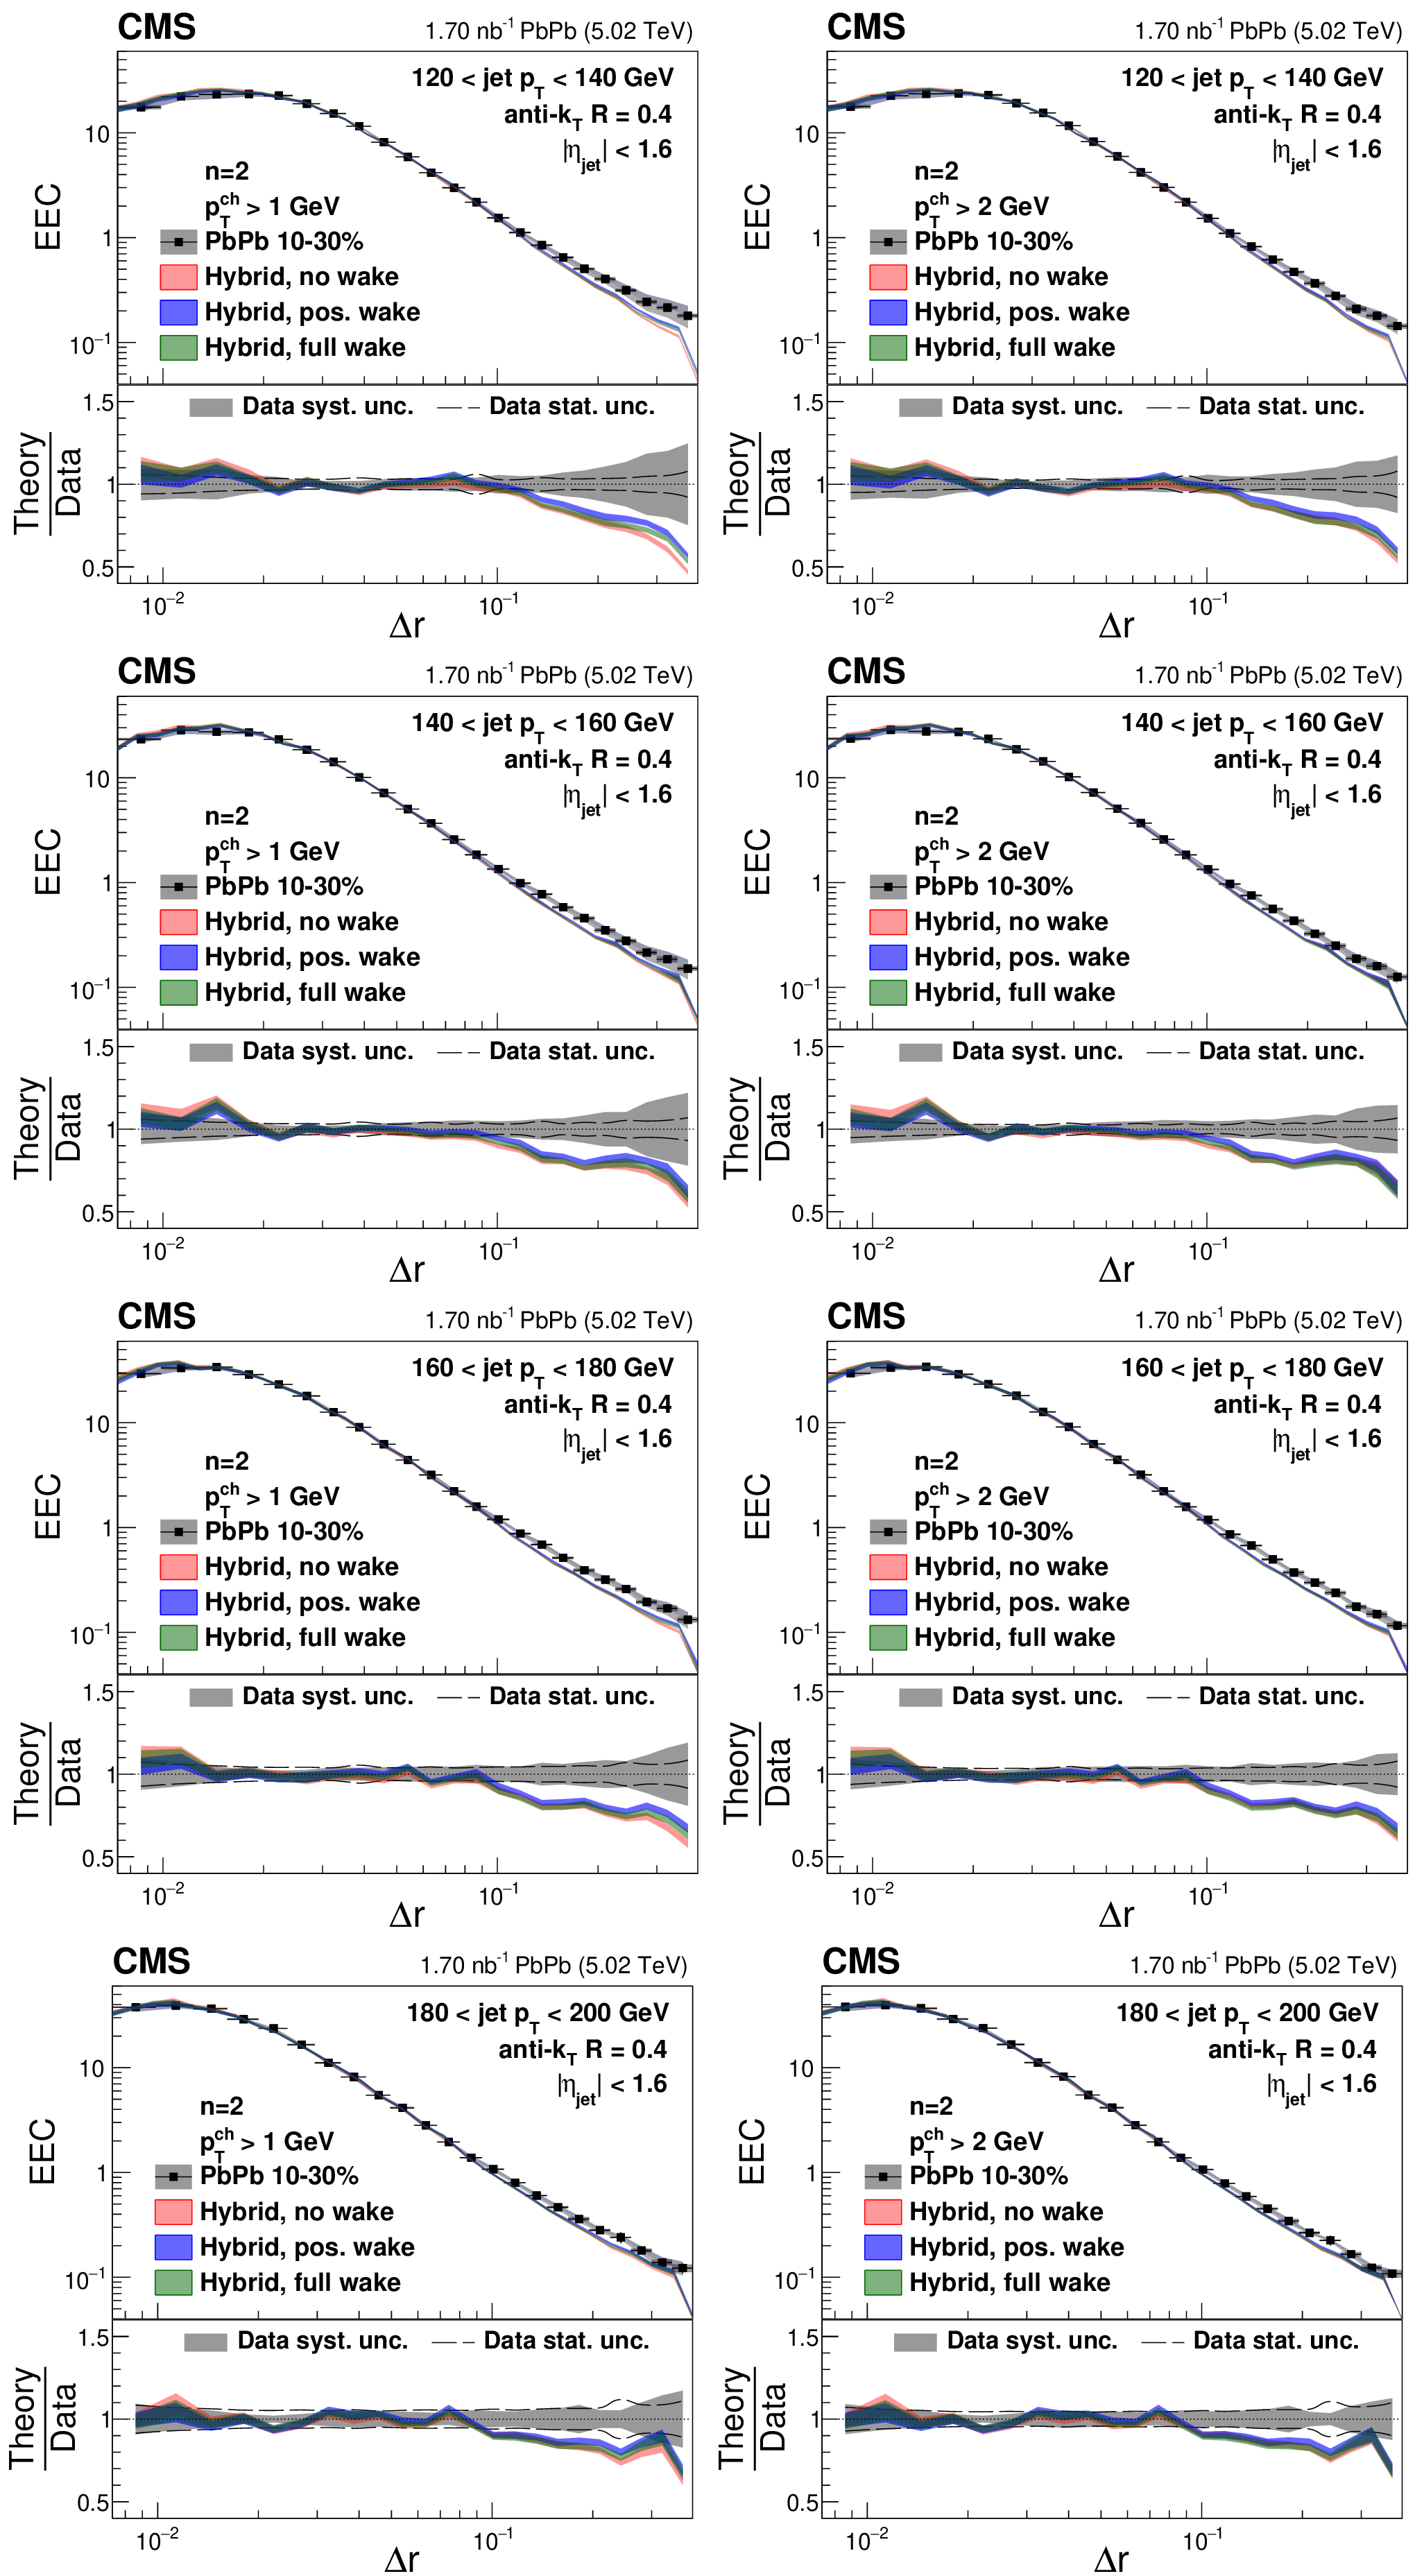
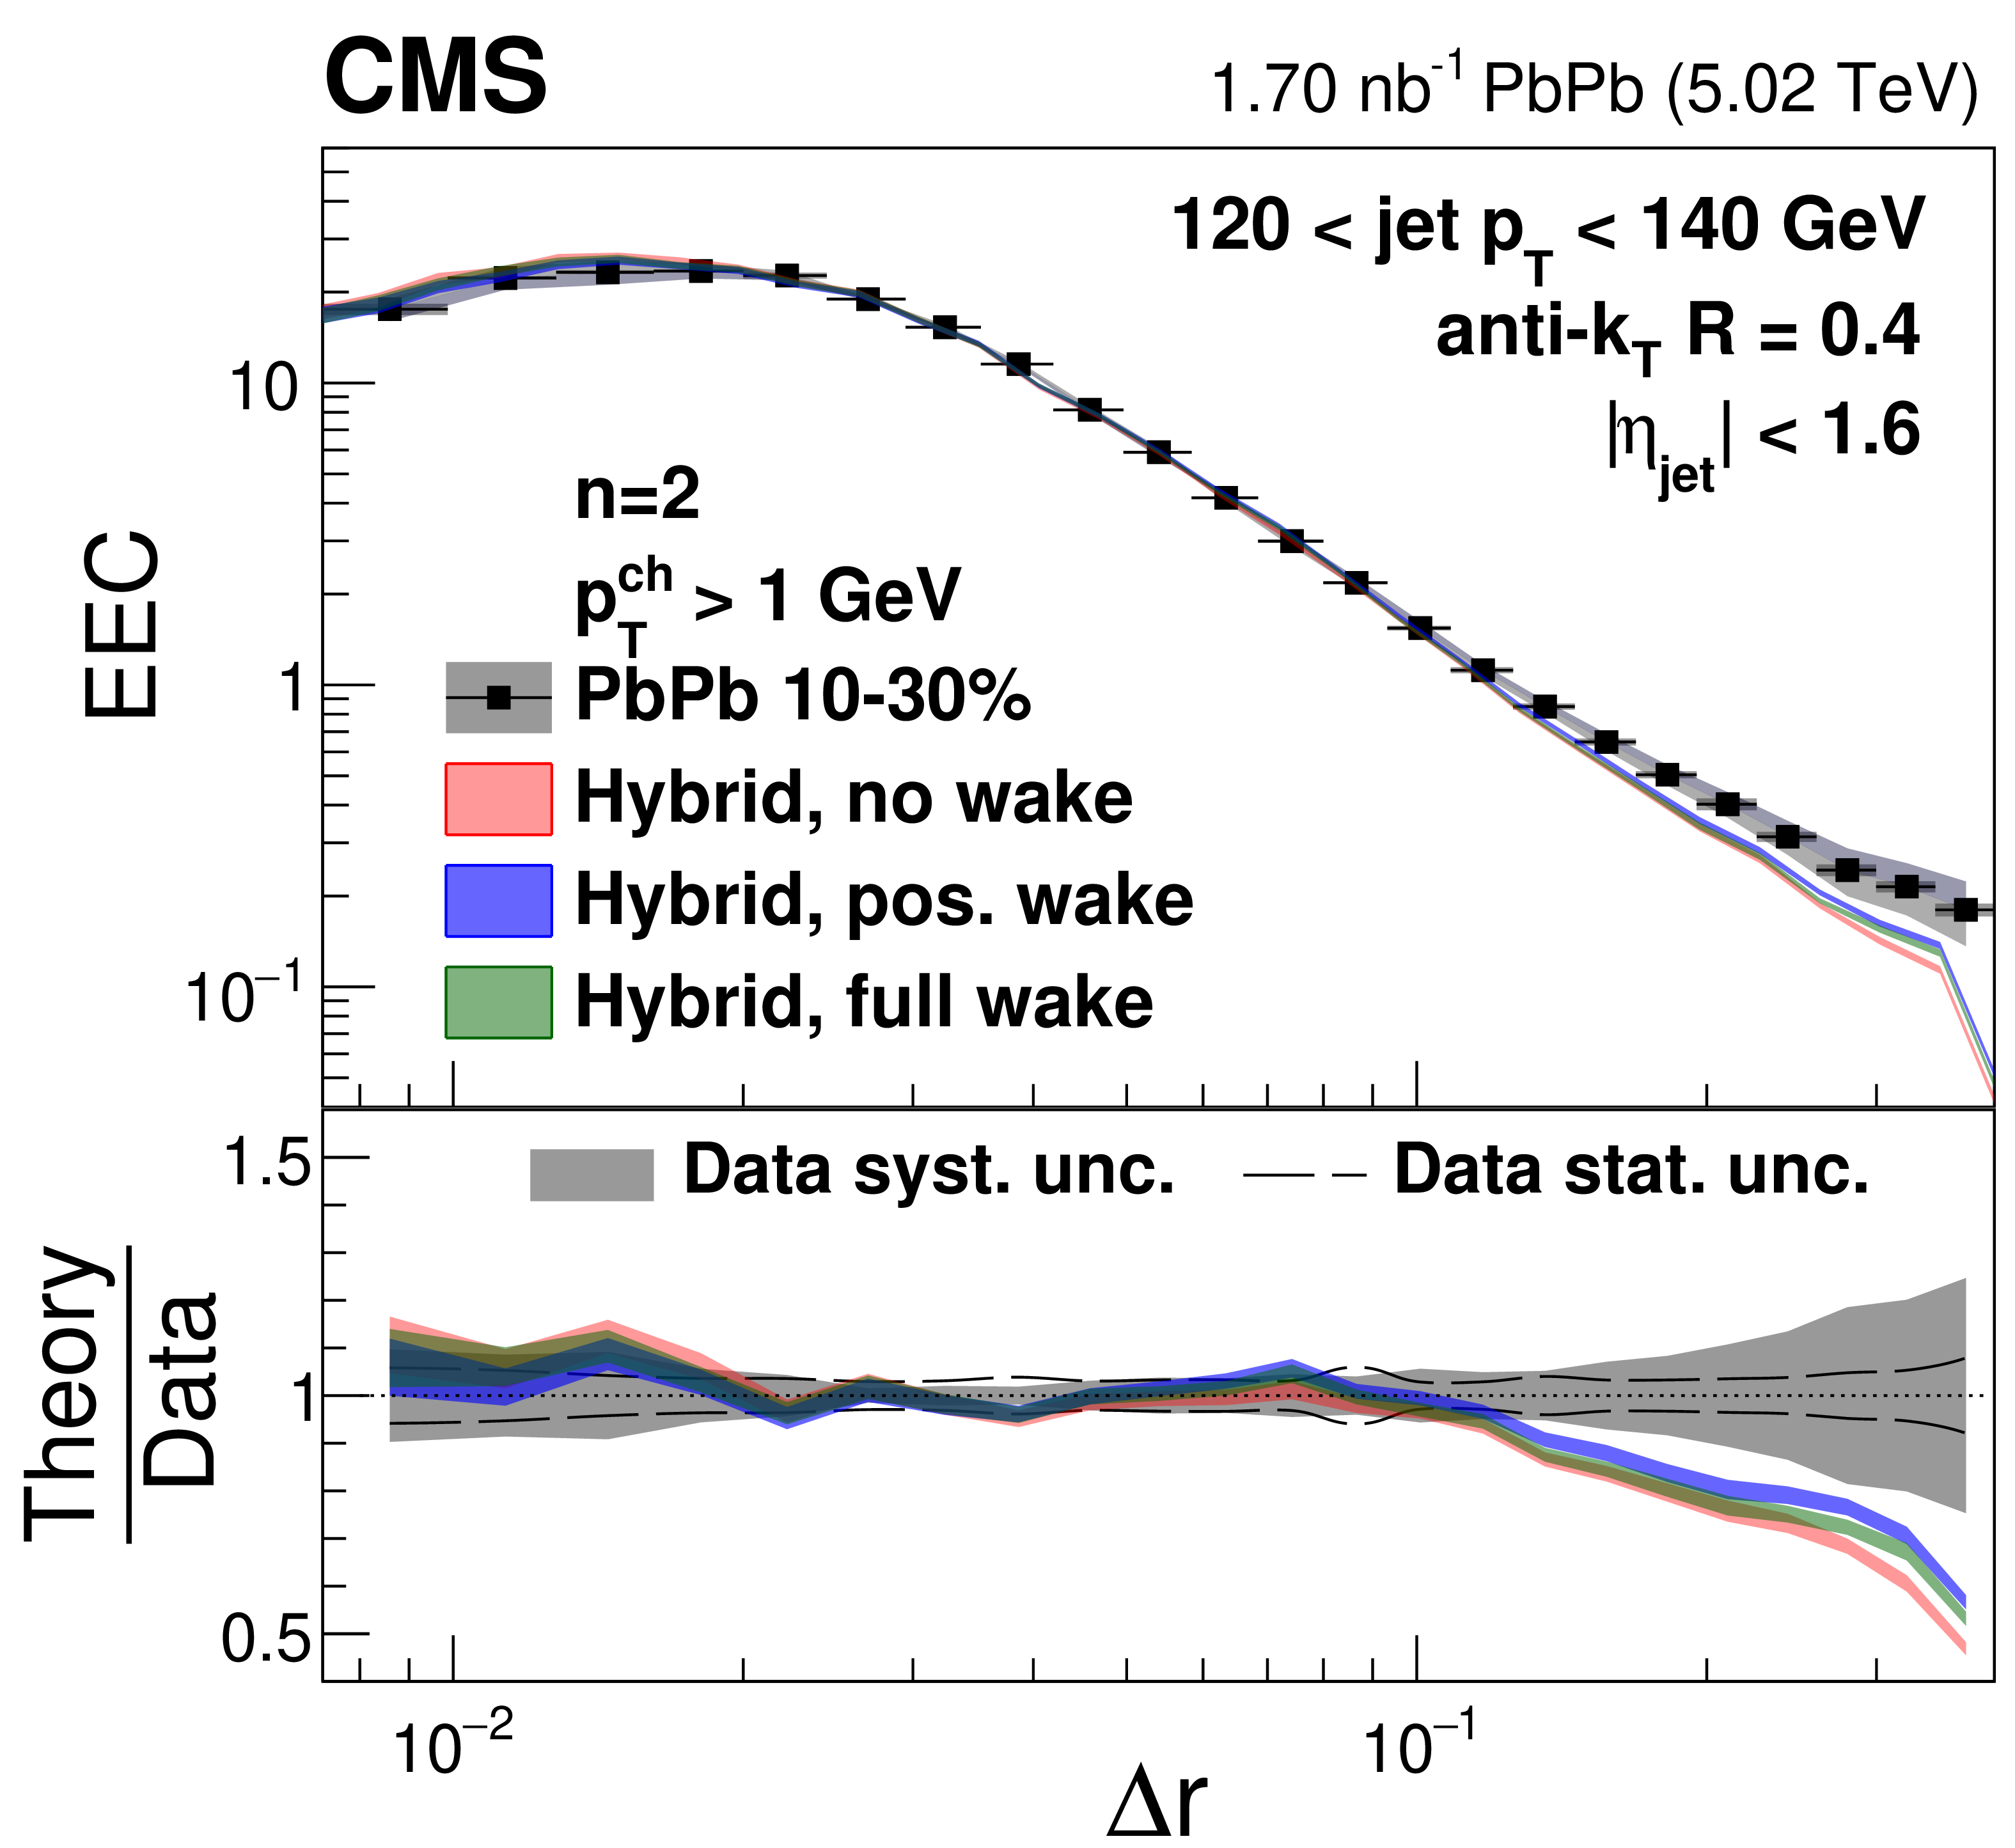
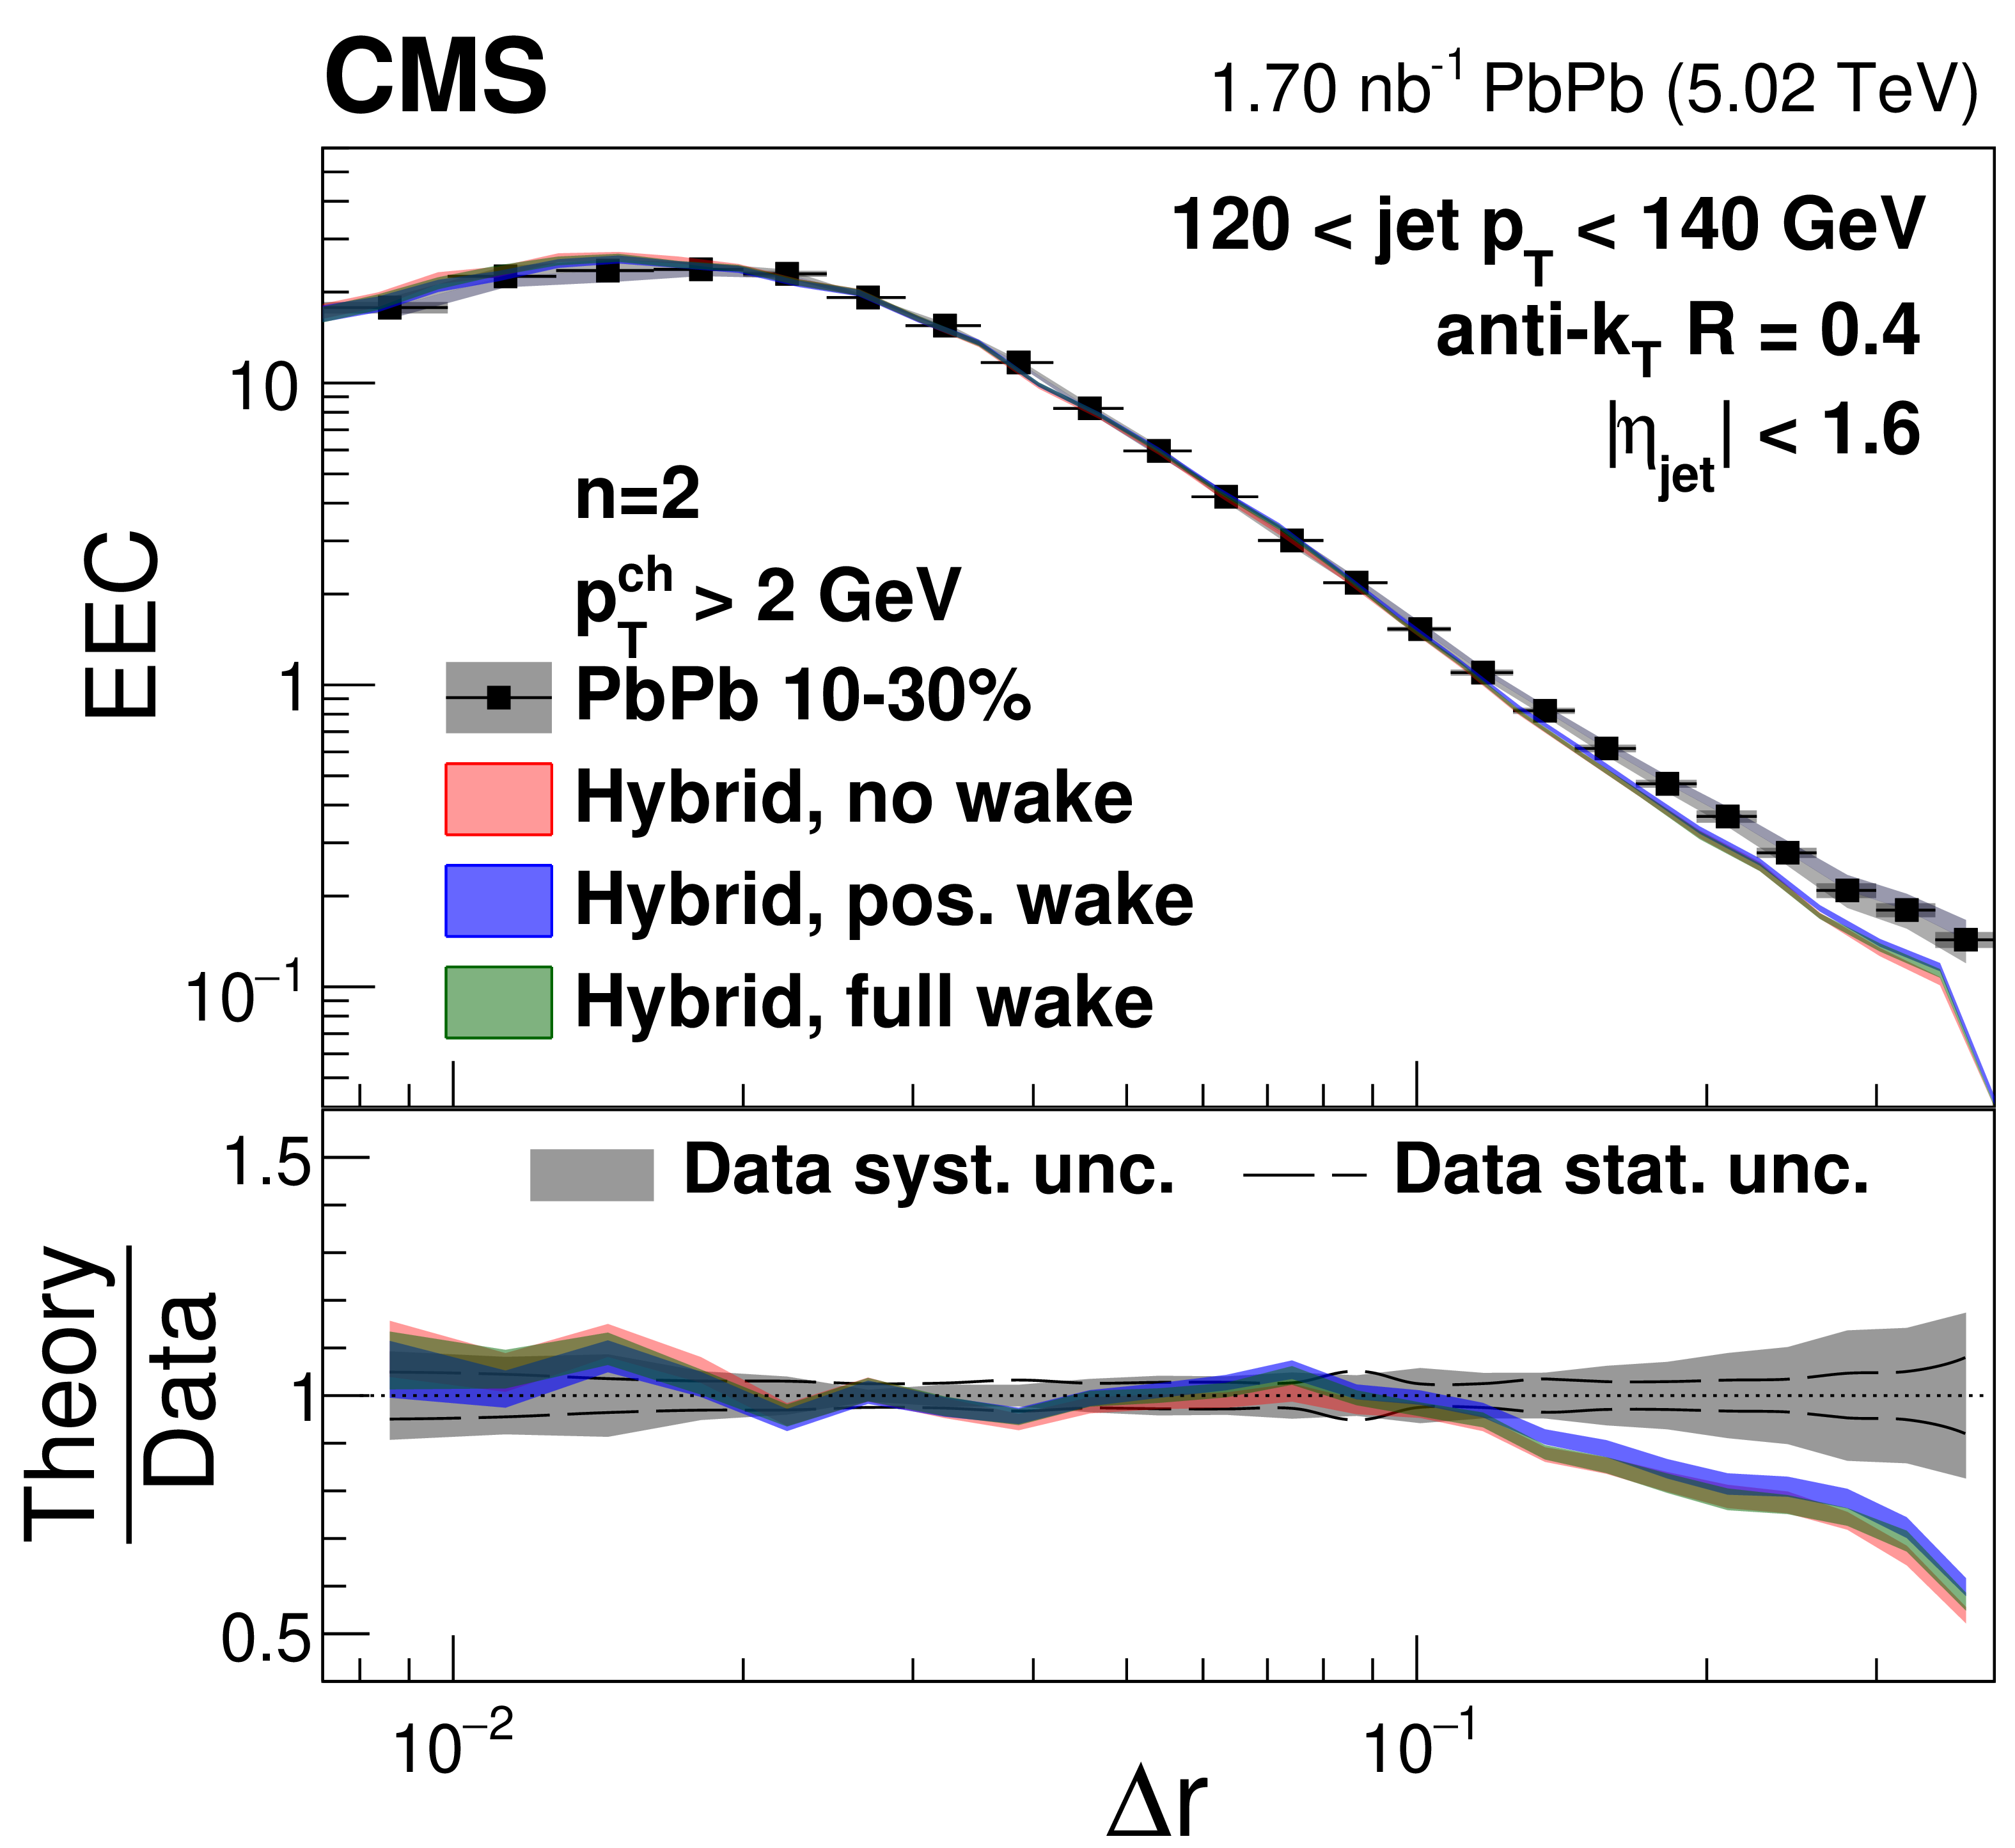
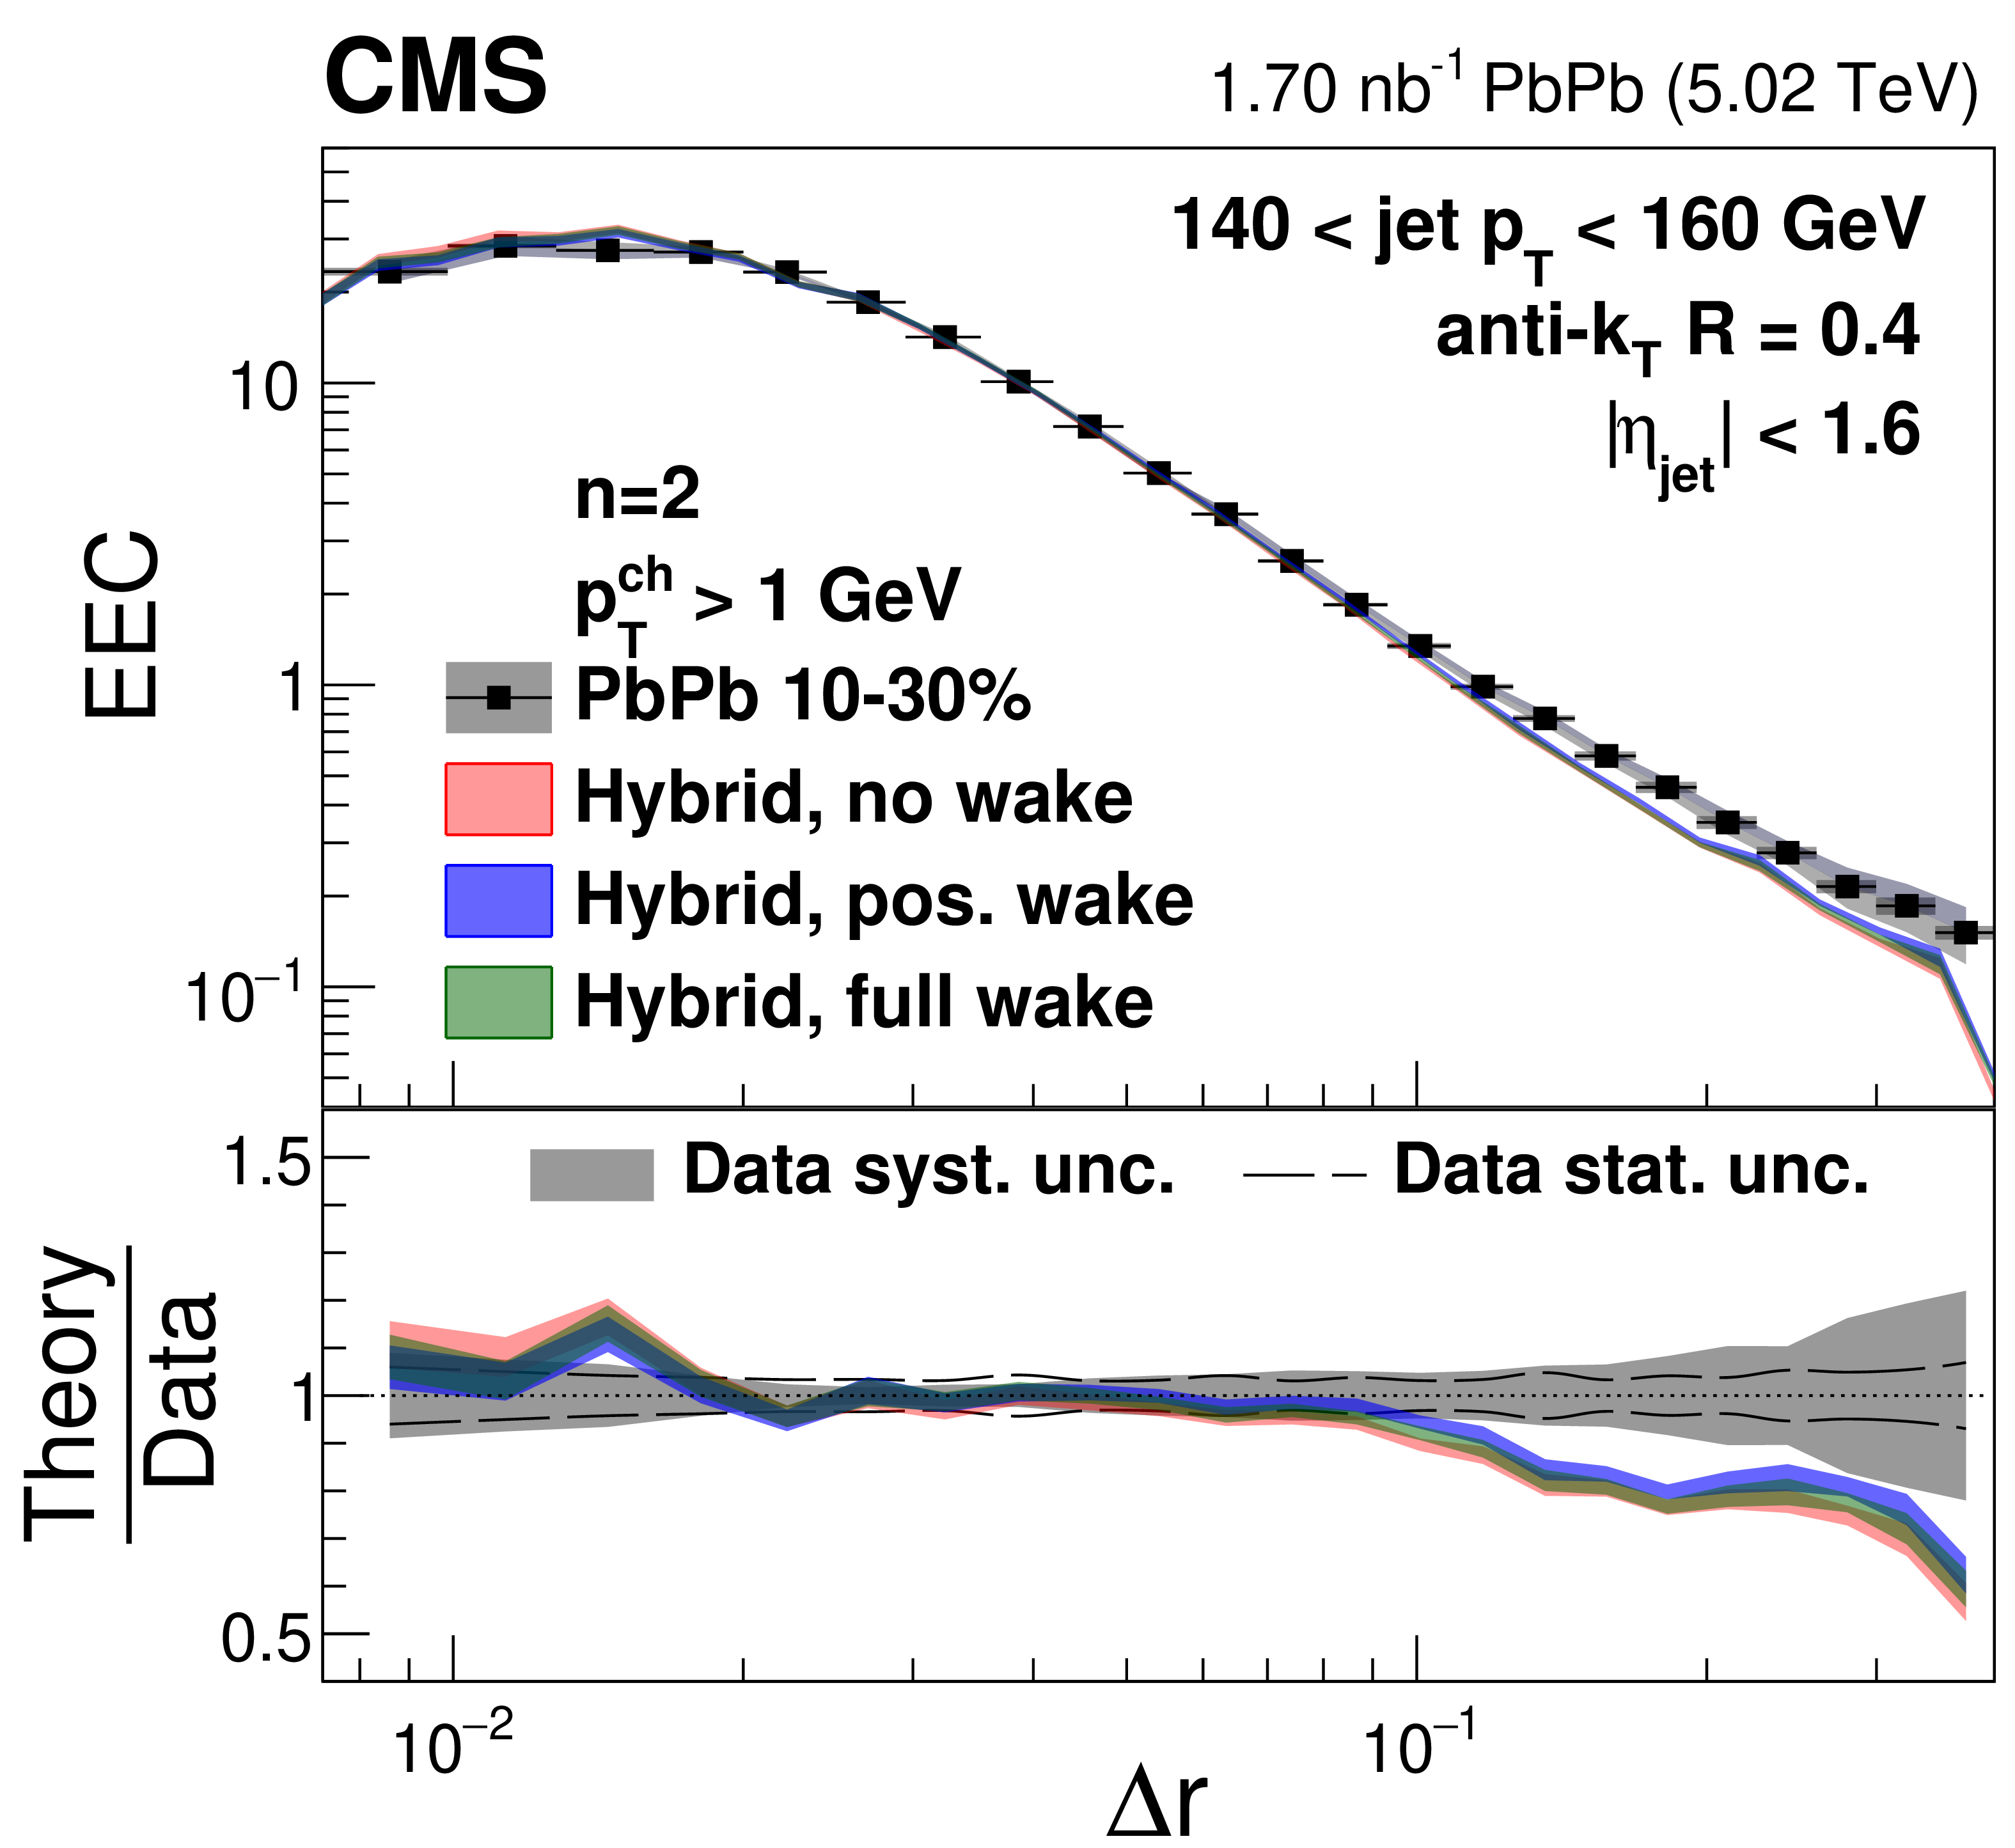
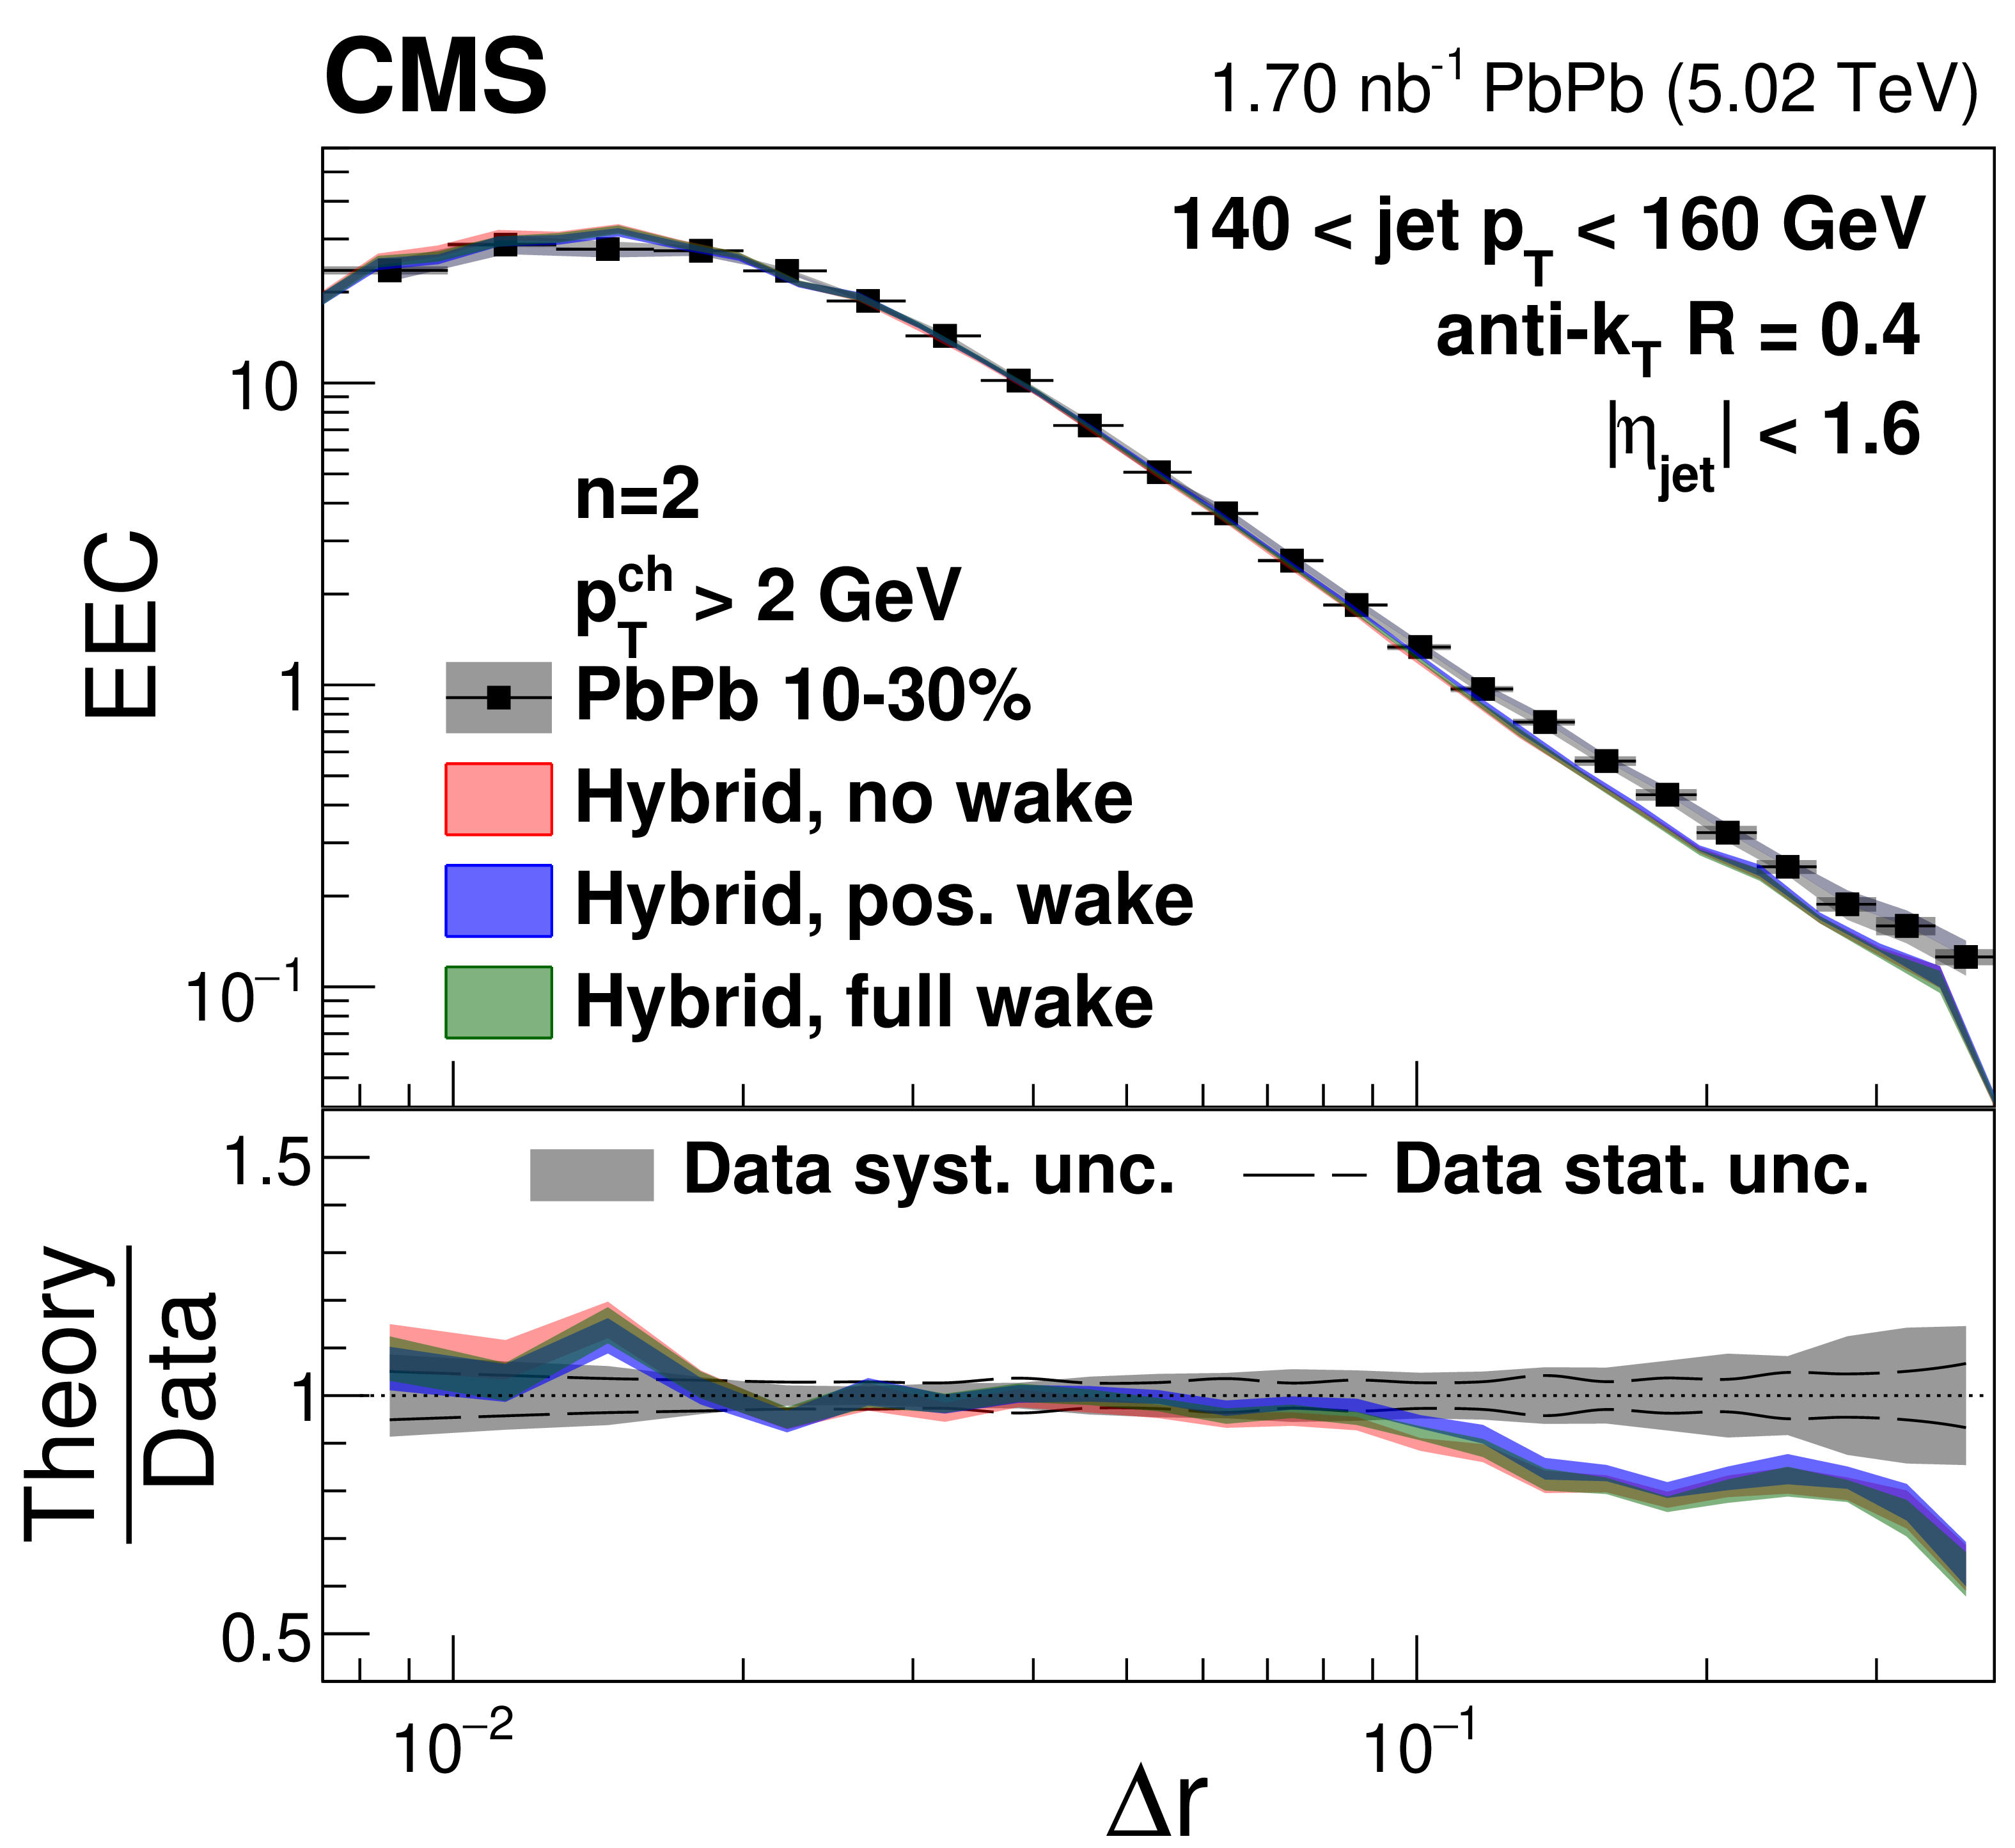
Figure 20:
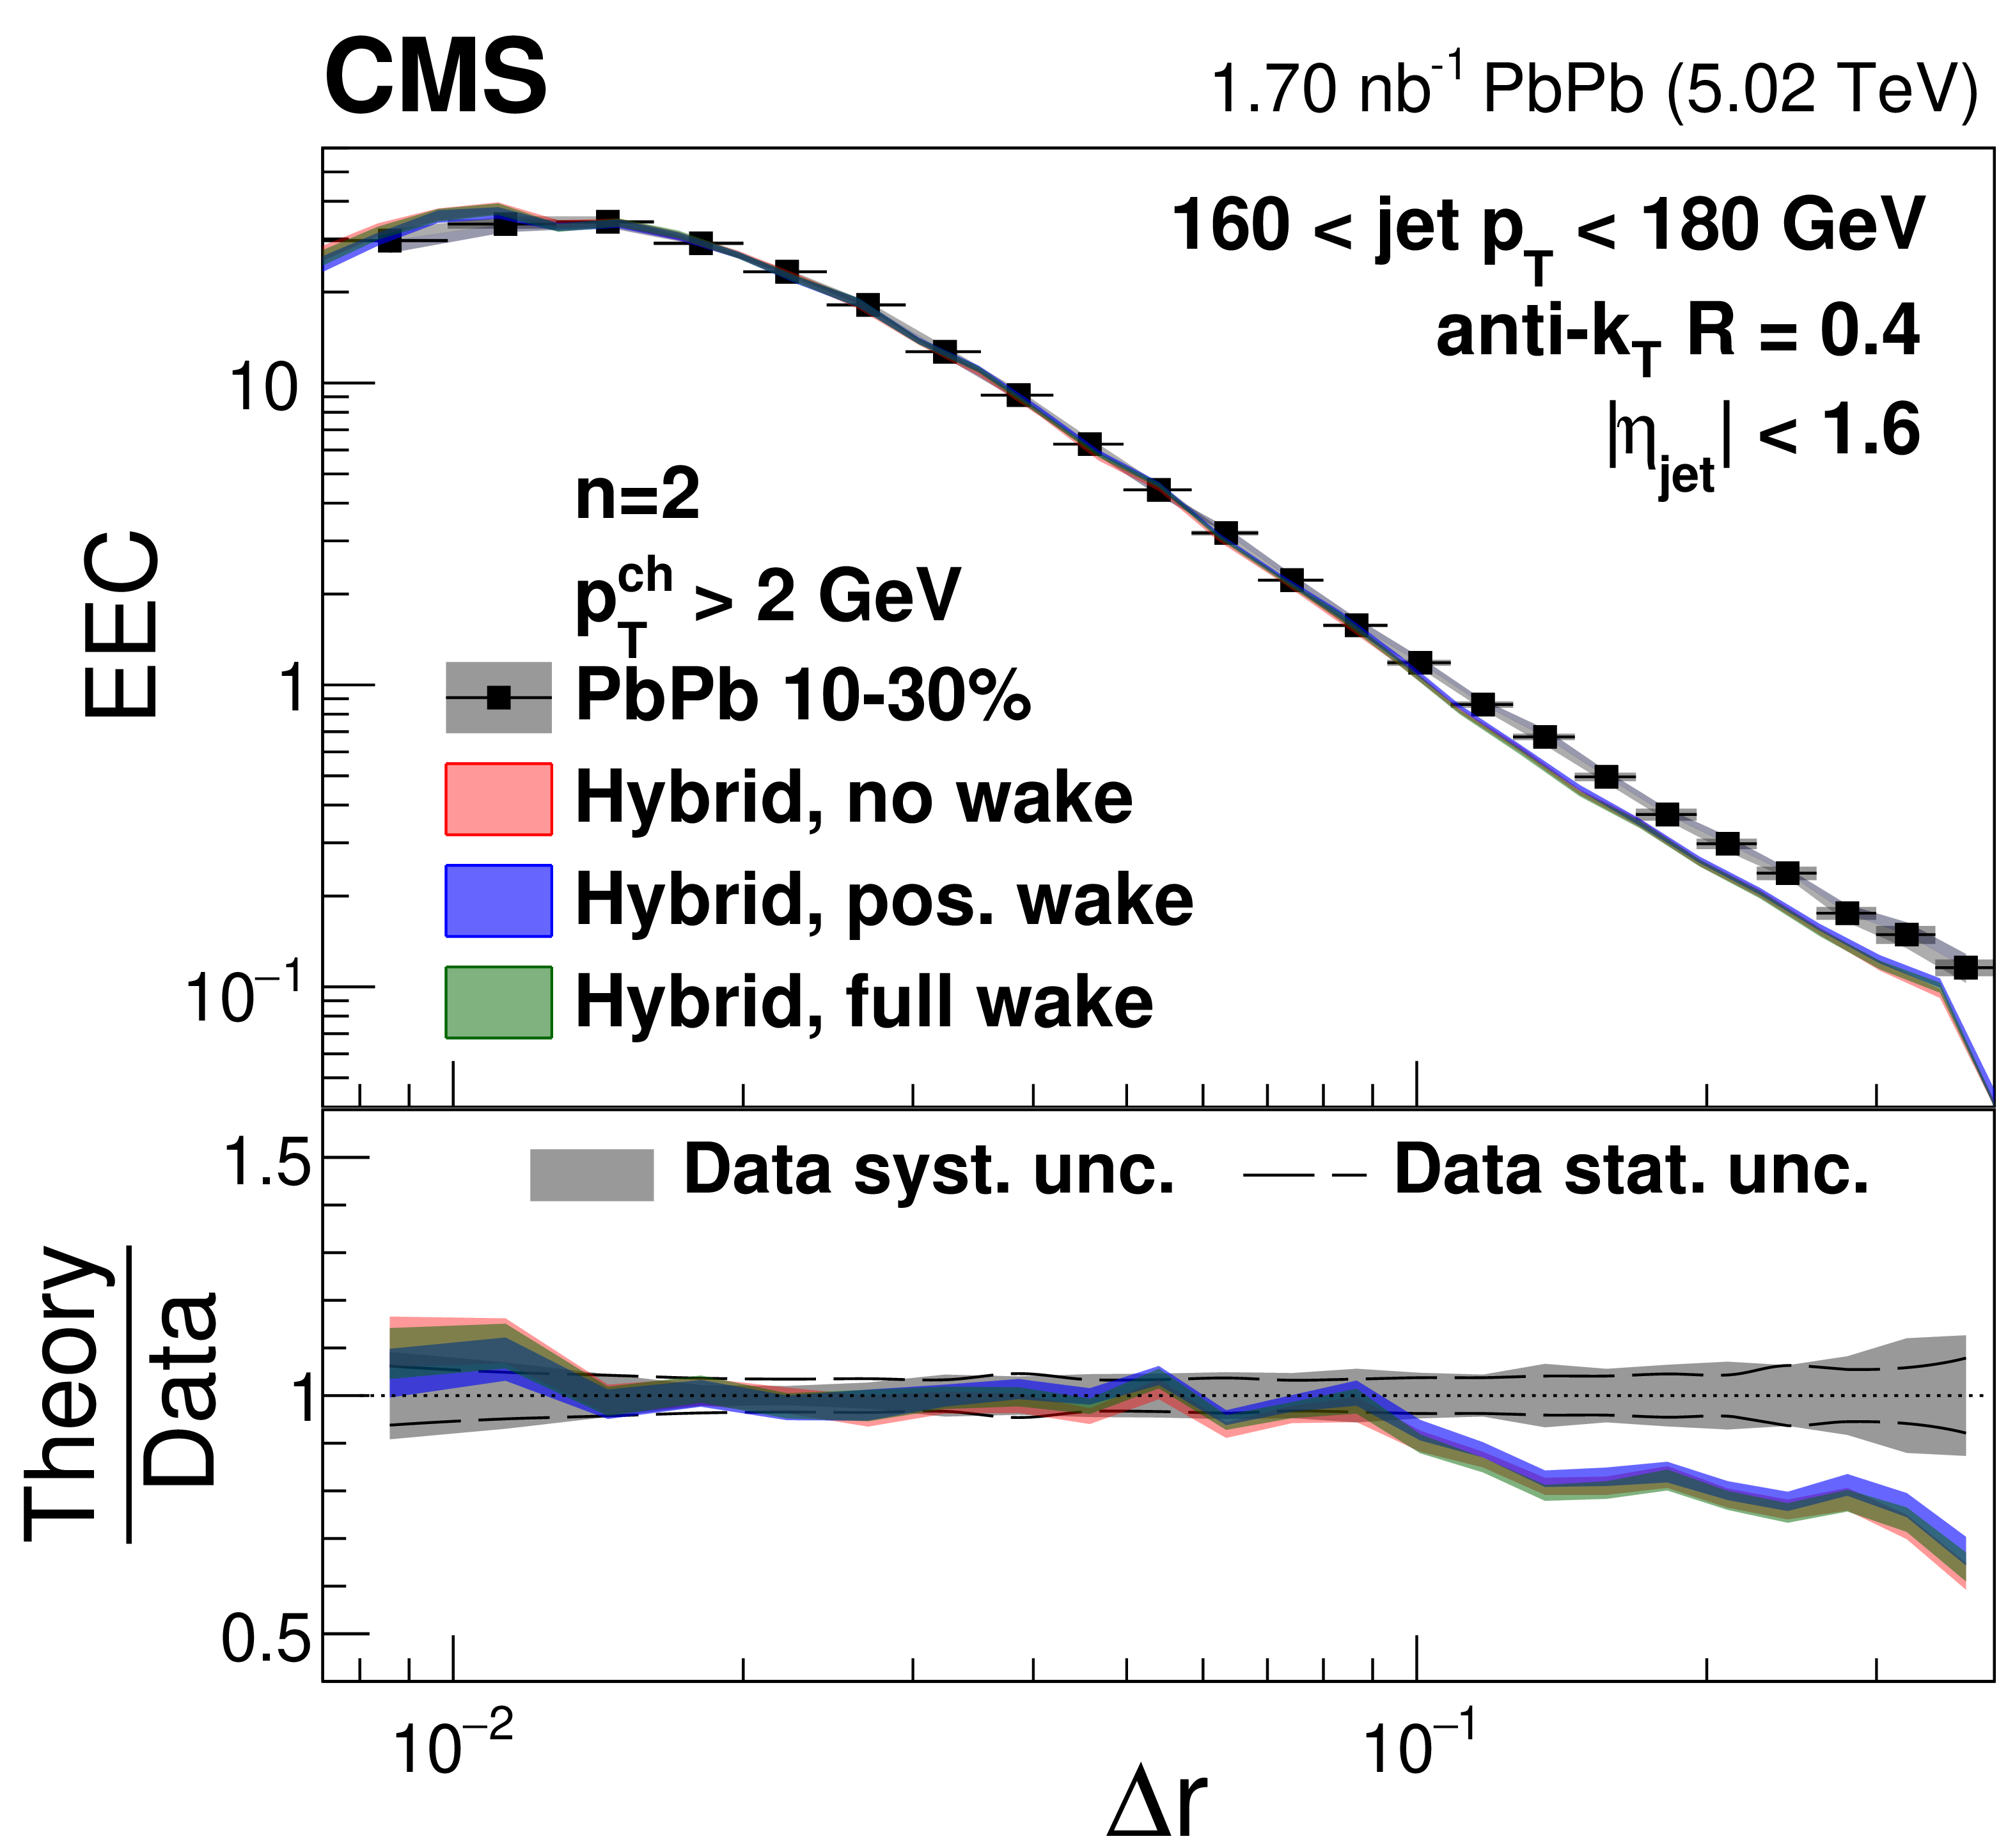
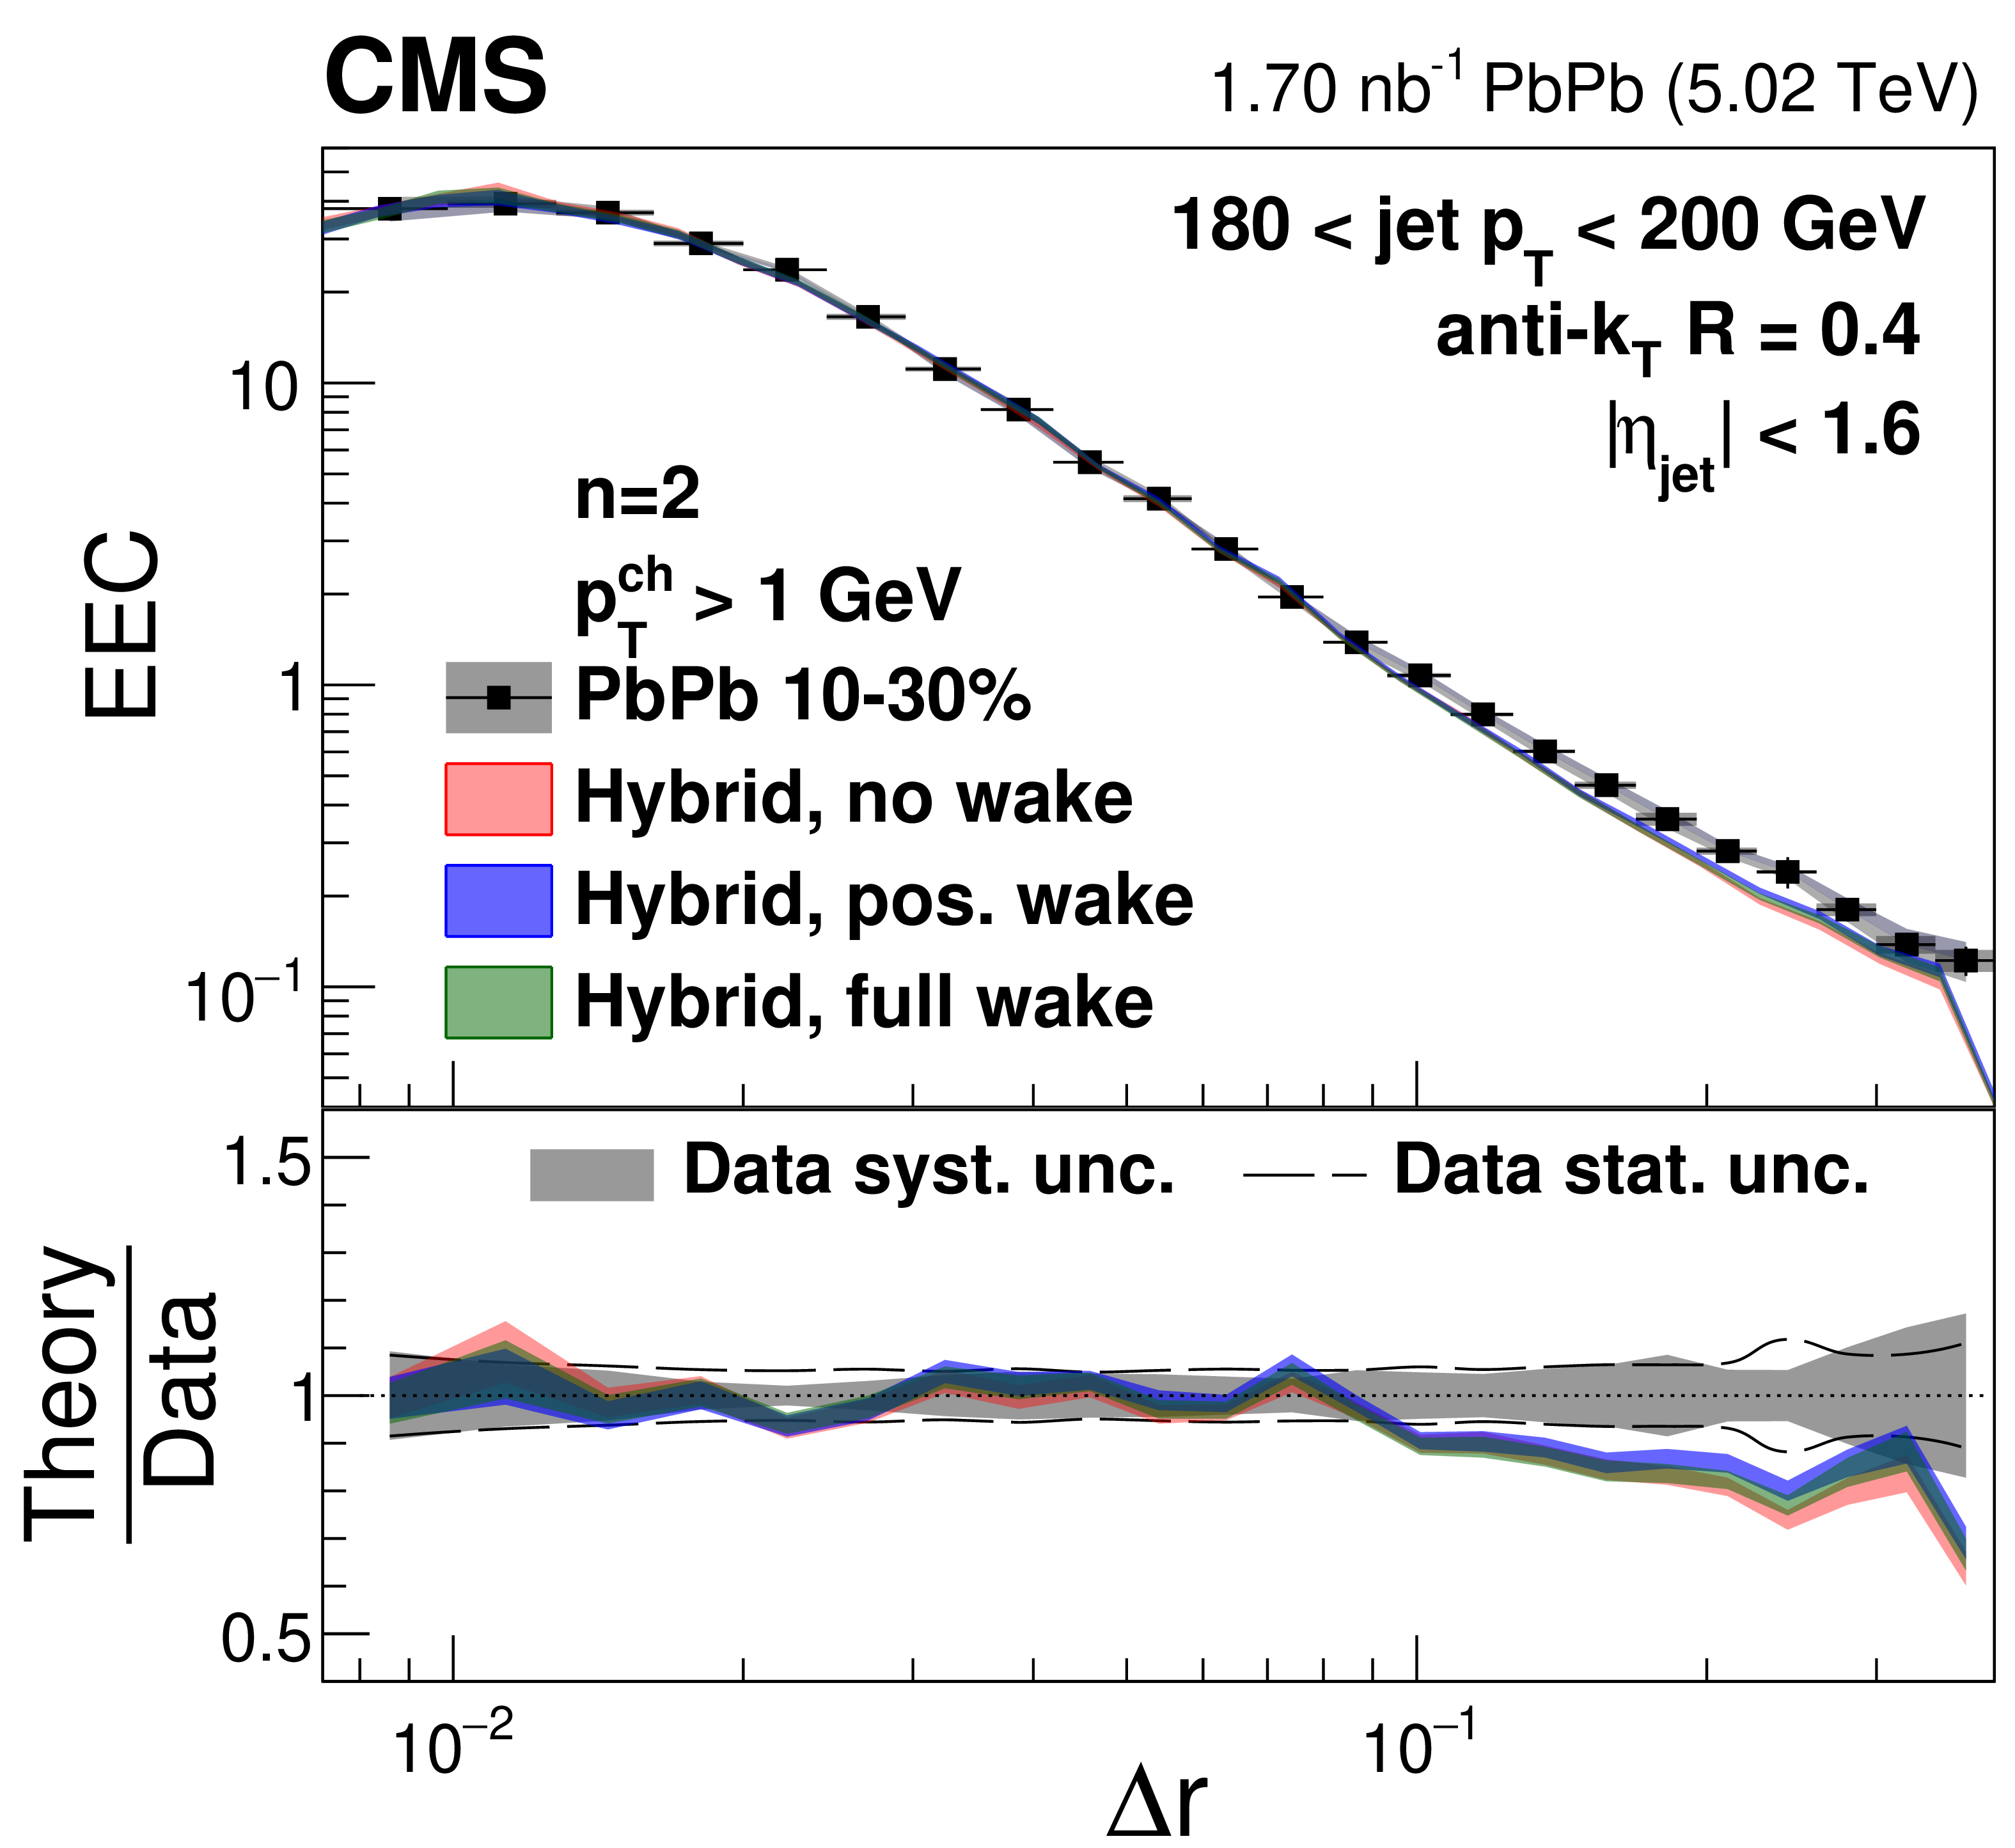
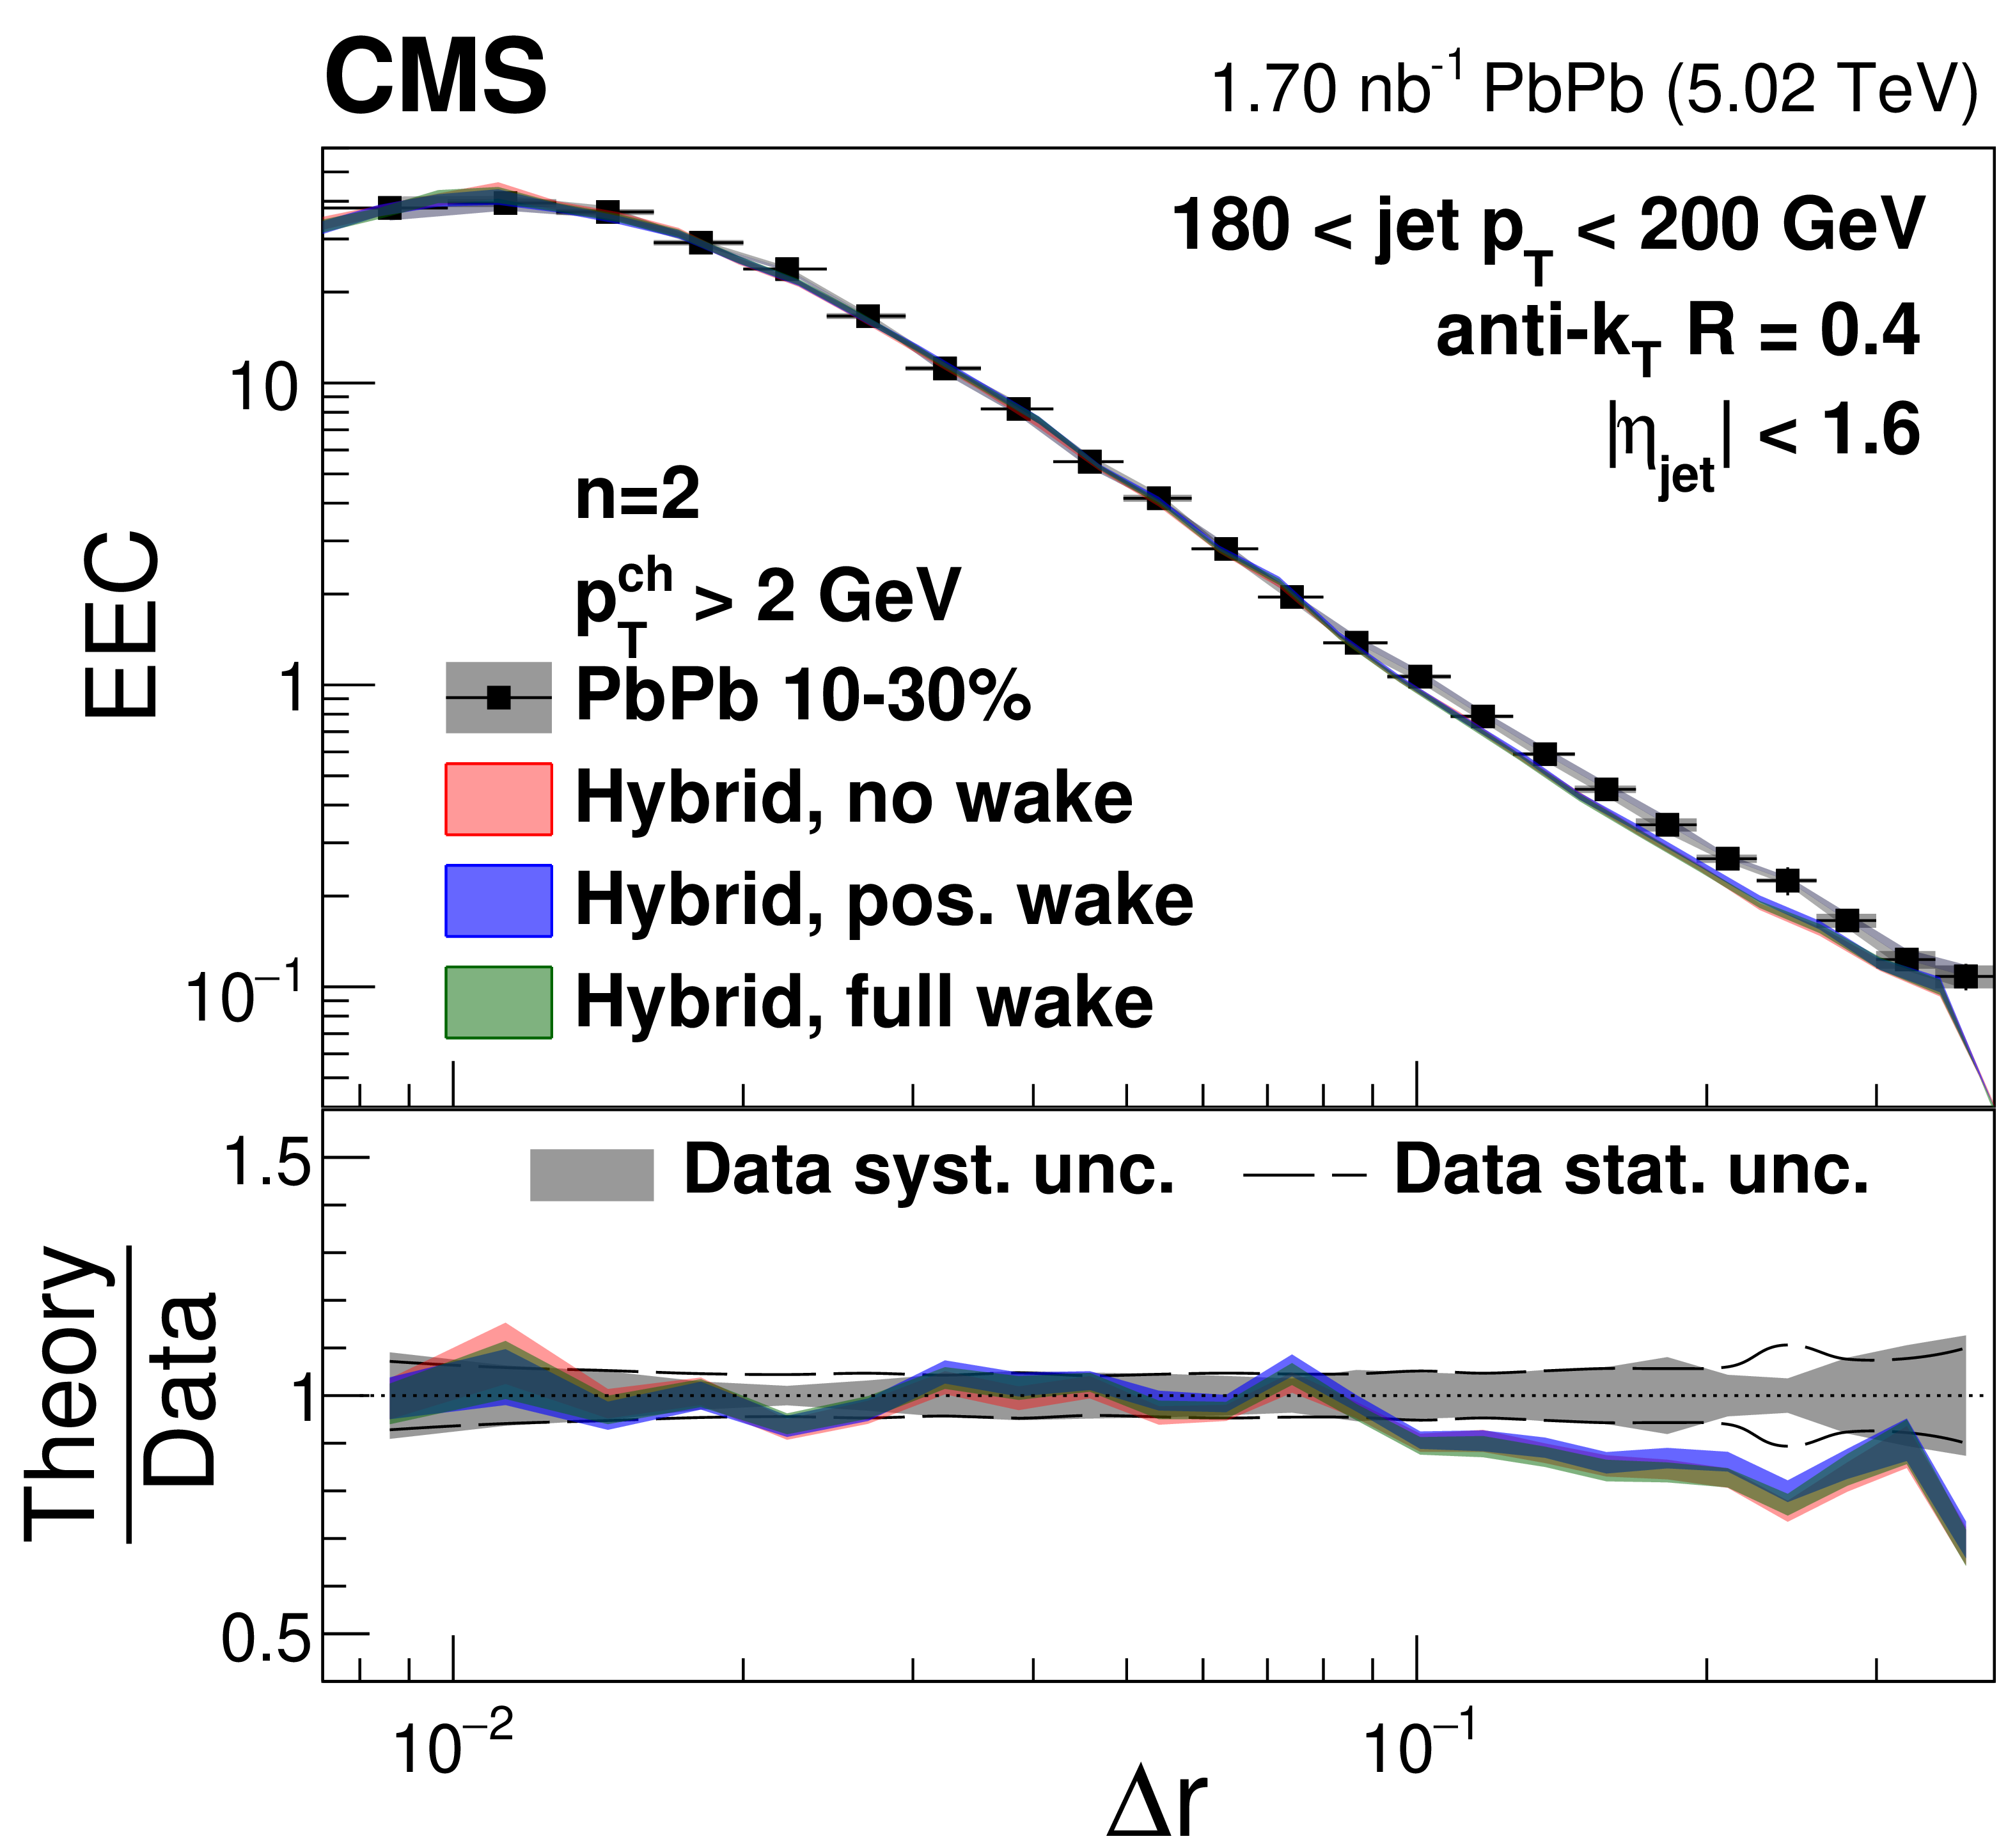
Energy-energy correlator distributions from 10-30% central PbPb collisions with $ n= $ 2 in different $ p_{\mathrm{T}}^{\text{ch}} $ and $ p_{\text{T,jet}} $ bins compared to the hybrid model predictions with different jet wake settings. |
png pdf |
Figure 20-a:
Energy-energy correlator distributions from 10-30% central PbPb collisions with $ n= $ 2 in different $ p_{\mathrm{T}}^{\text{ch}} $ and $ p_{\text{T,jet}} $ bins compared to the hybrid model predictions with different jet wake settings. |
png pdf |
Figure 20-b:
Energy-energy correlator distributions from 10-30% central PbPb collisions with $ n= $ 2 in different $ p_{\mathrm{T}}^{\text{ch}} $ and $ p_{\text{T,jet}} $ bins compared to the hybrid model predictions with different jet wake settings. |
png pdf |
Figure 20-c:
Energy-energy correlator distributions from 10-30% central PbPb collisions with $ n= $ 2 in different $ p_{\mathrm{T}}^{\text{ch}} $ and $ p_{\text{T,jet}} $ bins compared to the hybrid model predictions with different jet wake settings. |
png pdf |
Figure 20-d:
Energy-energy correlator distributions from 10-30% central PbPb collisions with $ n= $ 2 in different $ p_{\mathrm{T}}^{\text{ch}} $ and $ p_{\text{T,jet}} $ bins compared to the hybrid model predictions with different jet wake settings. |
png pdf |
Figure 20-e:
Energy-energy correlator distributions from 10-30% central PbPb collisions with $ n= $ 2 in different $ p_{\mathrm{T}}^{\text{ch}} $ and $ p_{\text{T,jet}} $ bins compared to the hybrid model predictions with different jet wake settings. |
png pdf |
Figure 20-f:
Energy-energy correlator distributions from 10-30% central PbPb collisions with $ n= $ 2 in different $ p_{\mathrm{T}}^{\text{ch}} $ and $ p_{\text{T,jet}} $ bins compared to the hybrid model predictions with different jet wake settings. |
png pdf |
Figure 20-g:
Energy-energy correlator distributions from 10-30% central PbPb collisions with $ n= $ 2 in different $ p_{\mathrm{T}}^{\text{ch}} $ and $ p_{\text{T,jet}} $ bins compared to the hybrid model predictions with different jet wake settings. |
png pdf |
Figure 20-h:
Energy-energy correlator distributions from 10-30% central PbPb collisions with $ n= $ 2 in different $ p_{\mathrm{T}}^{\text{ch}} $ and $ p_{\text{T,jet}} $ bins compared to the hybrid model predictions with different jet wake settings. |
png pdf |
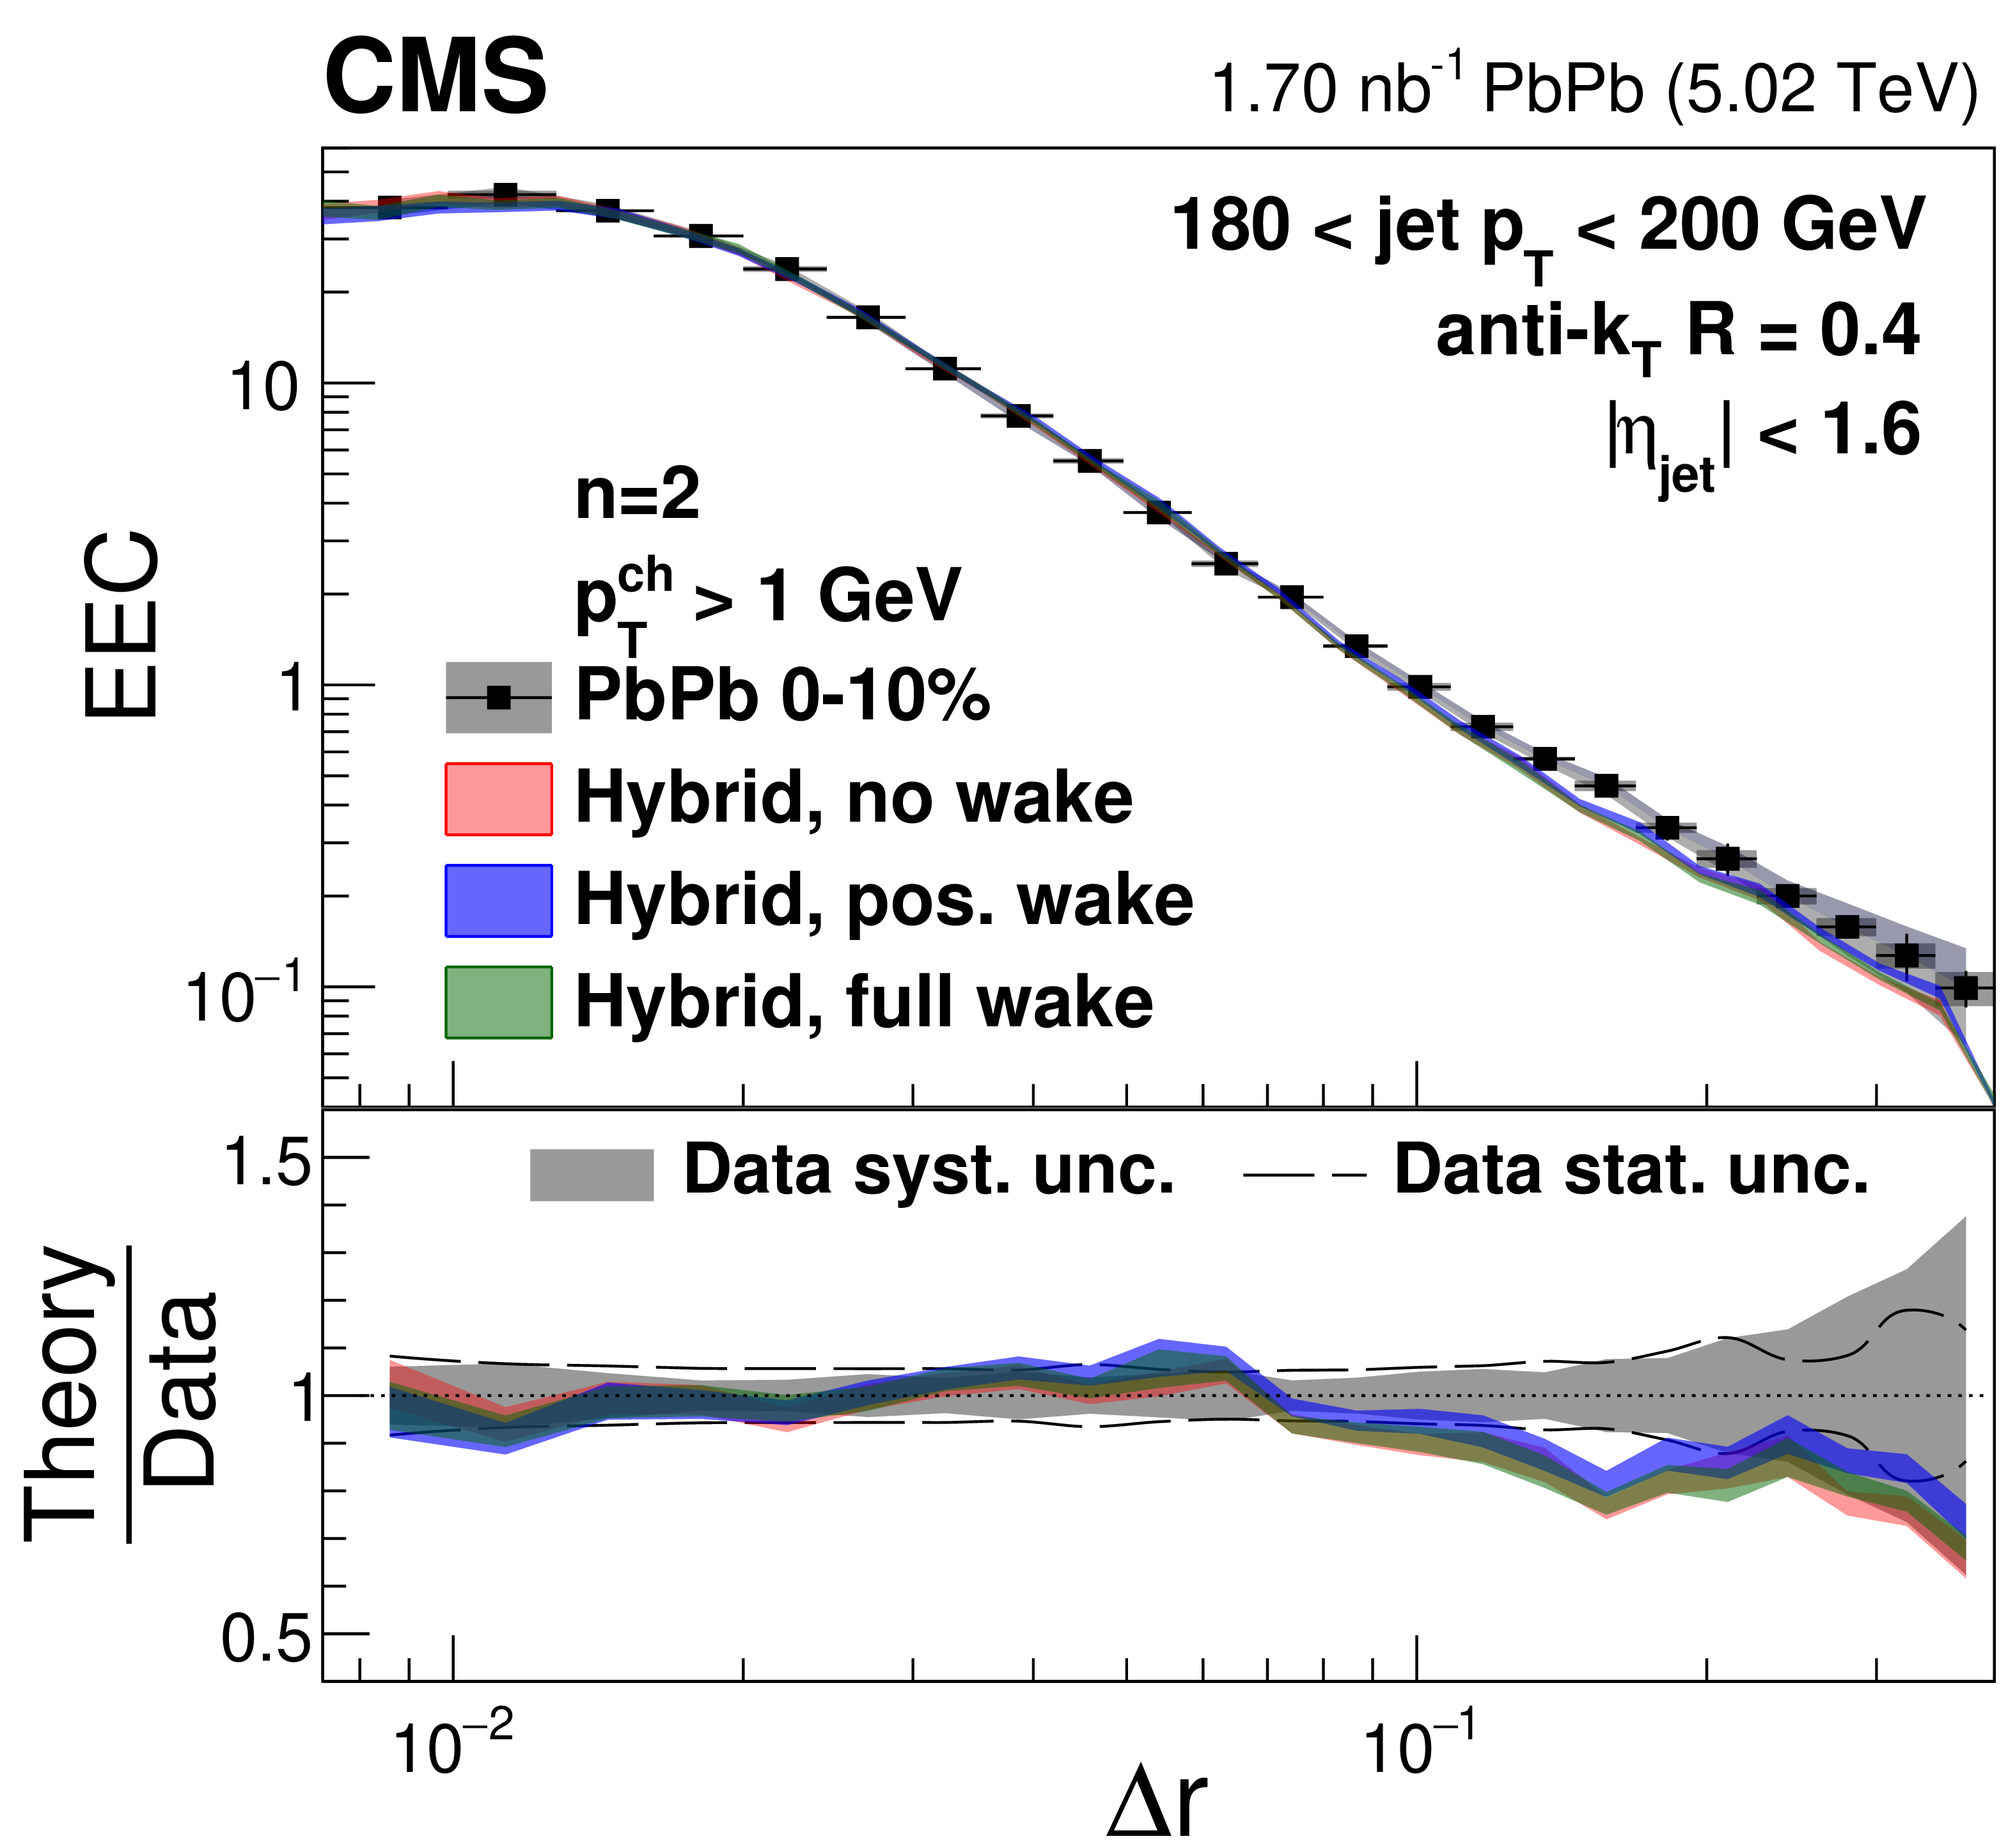
Figure 21:
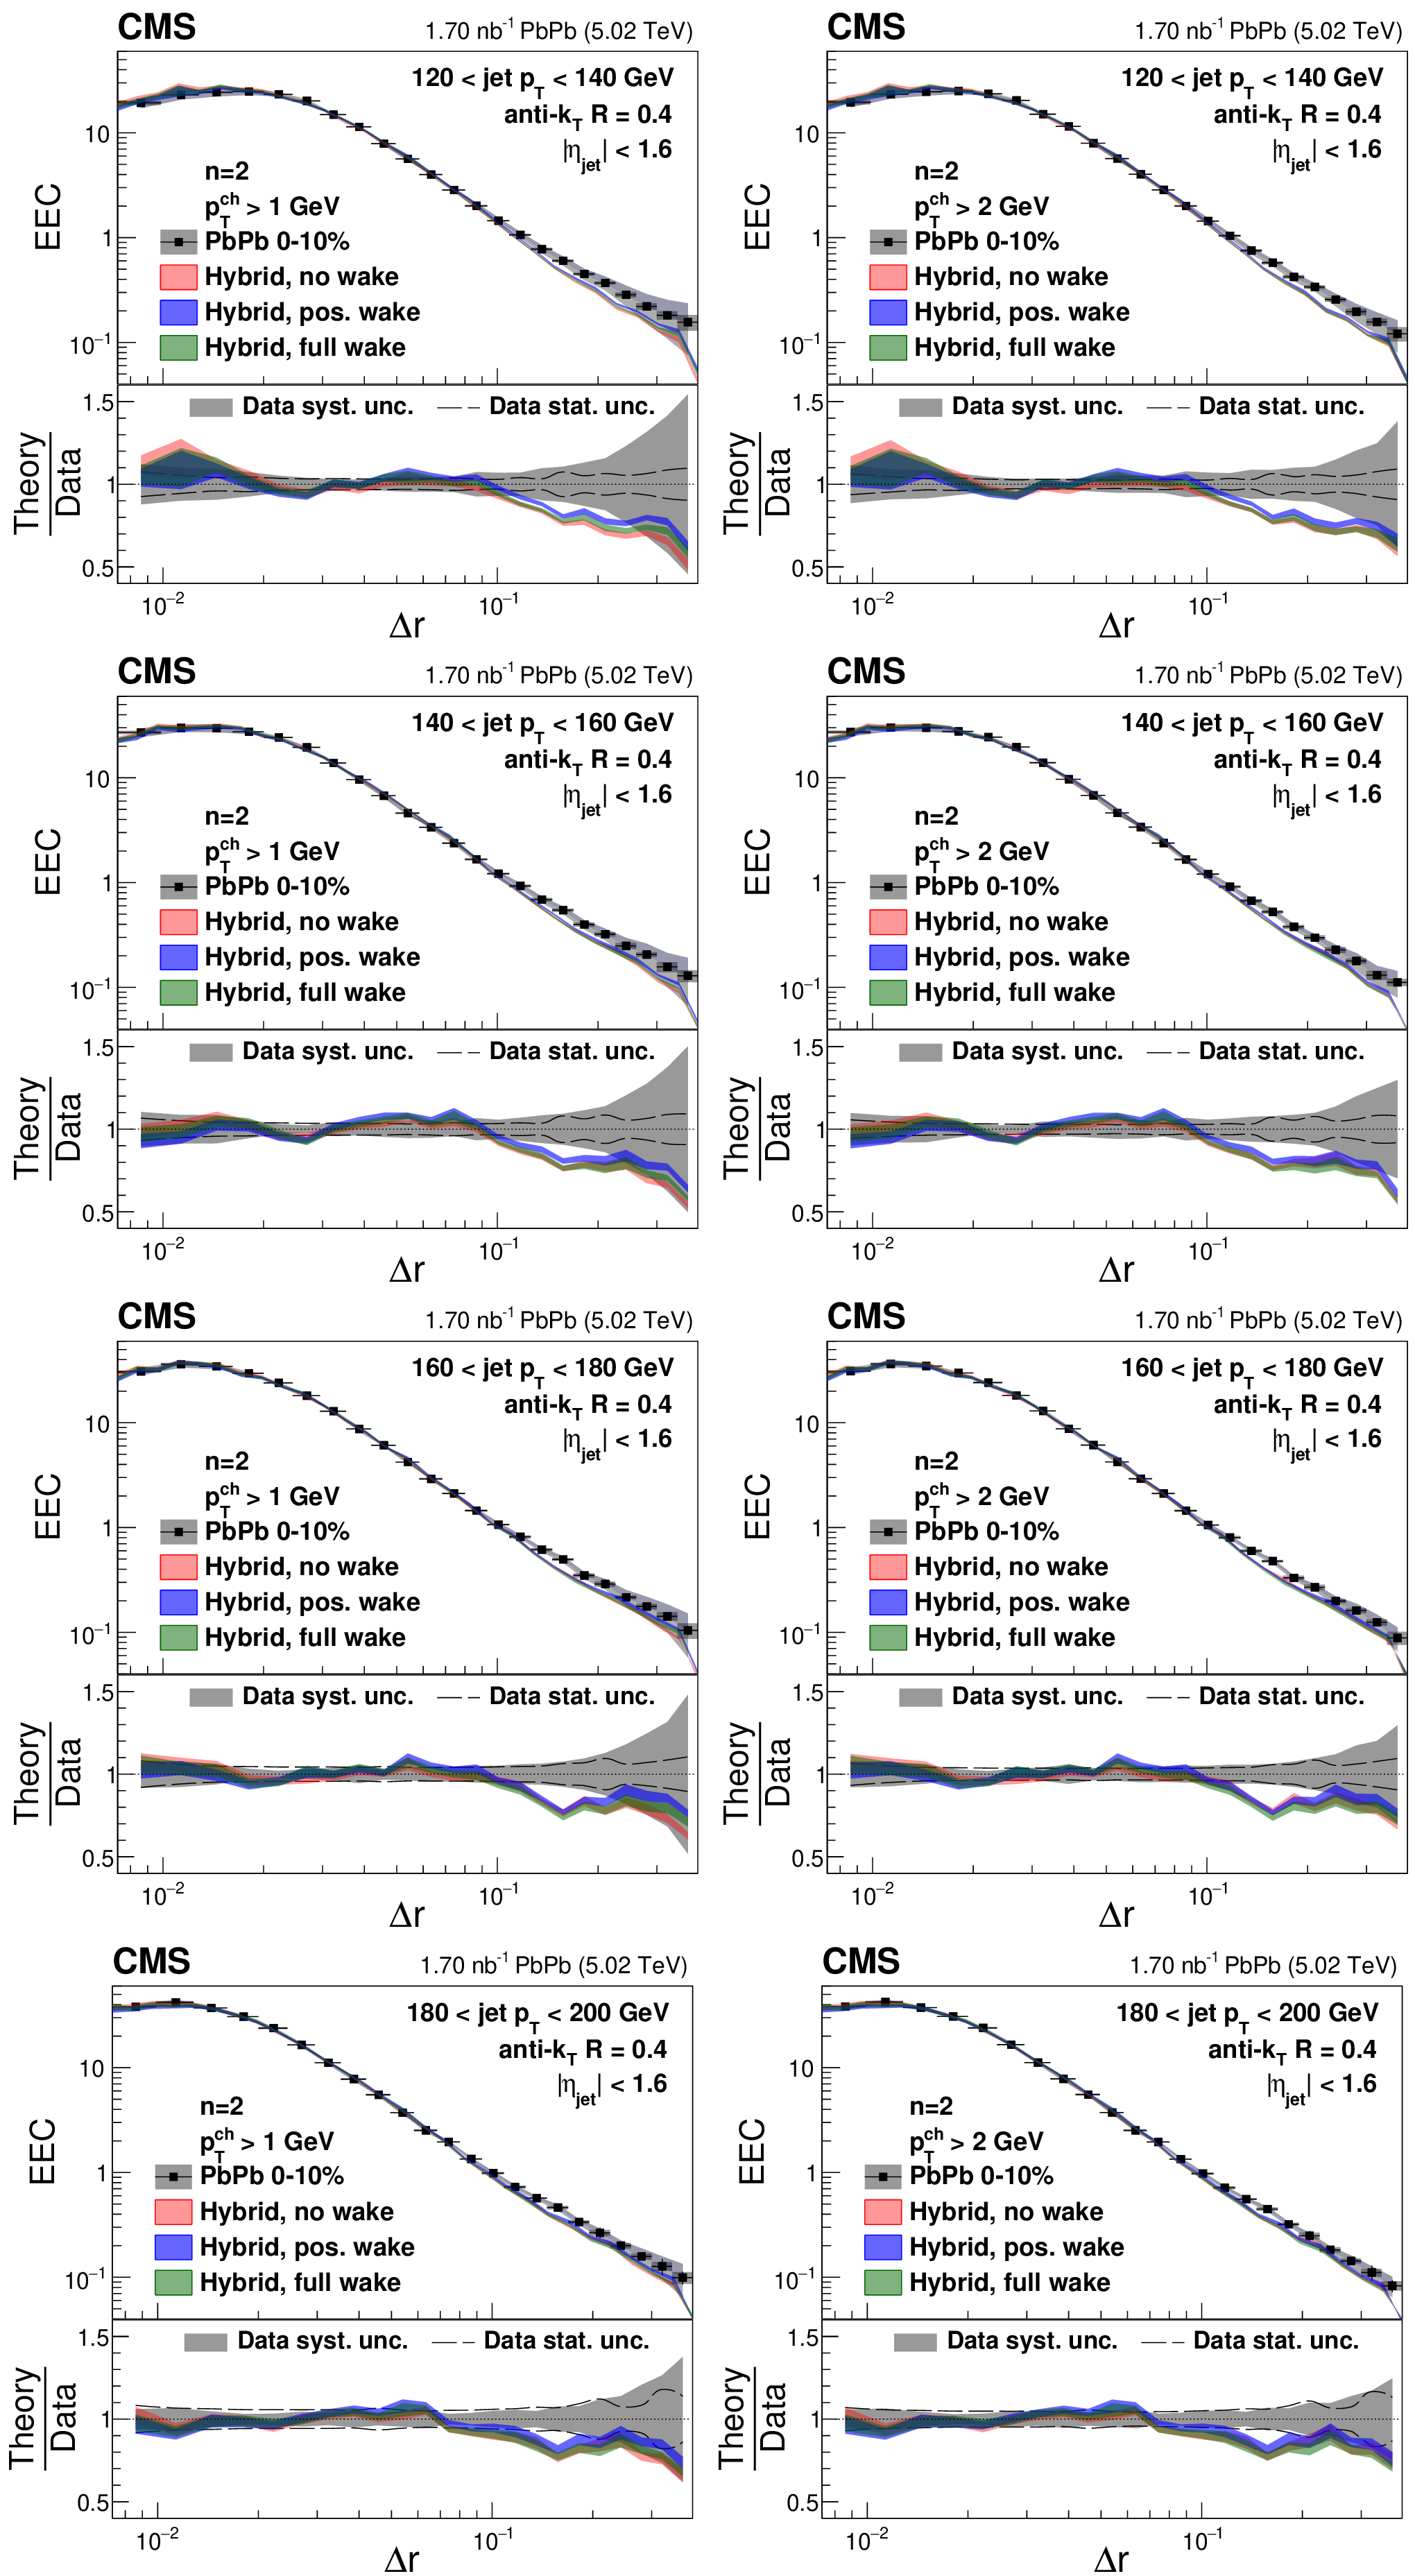
Energy-energy correlator distributions from 0-10% central PbPb collisions with $ n= $ 1 in different $ p_{\mathrm{T}}^{\text{ch}} $ and $ p_{\text{T,jet}} $ bins compared to the hybrid model predictions with different jet wake settings. |
png pdf |
Figure 21-a:
Energy-energy correlator distributions from 0-10% central PbPb collisions with $ n= $ 1 in different $ p_{\mathrm{T}}^{\text{ch}} $ and $ p_{\text{T,jet}} $ bins compared to the hybrid model predictions with different jet wake settings. |
png pdf |
Figure 21-b:
Energy-energy correlator distributions from 0-10% central PbPb collisions with $ n= $ 1 in different $ p_{\mathrm{T}}^{\text{ch}} $ and $ p_{\text{T,jet}} $ bins compared to the hybrid model predictions with different jet wake settings. |
png pdf |
Figure 21-c:
Energy-energy correlator distributions from 0-10% central PbPb collisions with $ n= $ 1 in different $ p_{\mathrm{T}}^{\text{ch}} $ and $ p_{\text{T,jet}} $ bins compared to the hybrid model predictions with different jet wake settings. |
png pdf |
Figure 21-d:
Energy-energy correlator distributions from 0-10% central PbPb collisions with $ n= $ 1 in different $ p_{\mathrm{T}}^{\text{ch}} $ and $ p_{\text{T,jet}} $ bins compared to the hybrid model predictions with different jet wake settings. |

png pdf |
Figure 21-e:
Energy-energy correlator distributions from 0-10% central PbPb collisions with $ n= $ 1 in different $ p_{\mathrm{T}}^{\text{ch}} $ and $ p_{\text{T,jet}} $ bins compared to the hybrid model predictions with different jet wake settings. |

png pdf |
Figure 21-f:
Energy-energy correlator distributions from 0-10% central PbPb collisions with $ n= $ 1 in different $ p_{\mathrm{T}}^{\text{ch}} $ and $ p_{\text{T,jet}} $ bins compared to the hybrid model predictions with different jet wake settings. |

png pdf |
Figure 21-g:
Energy-energy correlator distributions from 0-10% central PbPb collisions with $ n= $ 1 in different $ p_{\mathrm{T}}^{\text{ch}} $ and $ p_{\text{T,jet}} $ bins compared to the hybrid model predictions with different jet wake settings. |
png pdf |
Figure 21-h:
Energy-energy correlator distributions from 0-10% central PbPb collisions with $ n= $ 1 in different $ p_{\mathrm{T}}^{\text{ch}} $ and $ p_{\text{T,jet}} $ bins compared to the hybrid model predictions with different jet wake settings. |
png pdf |
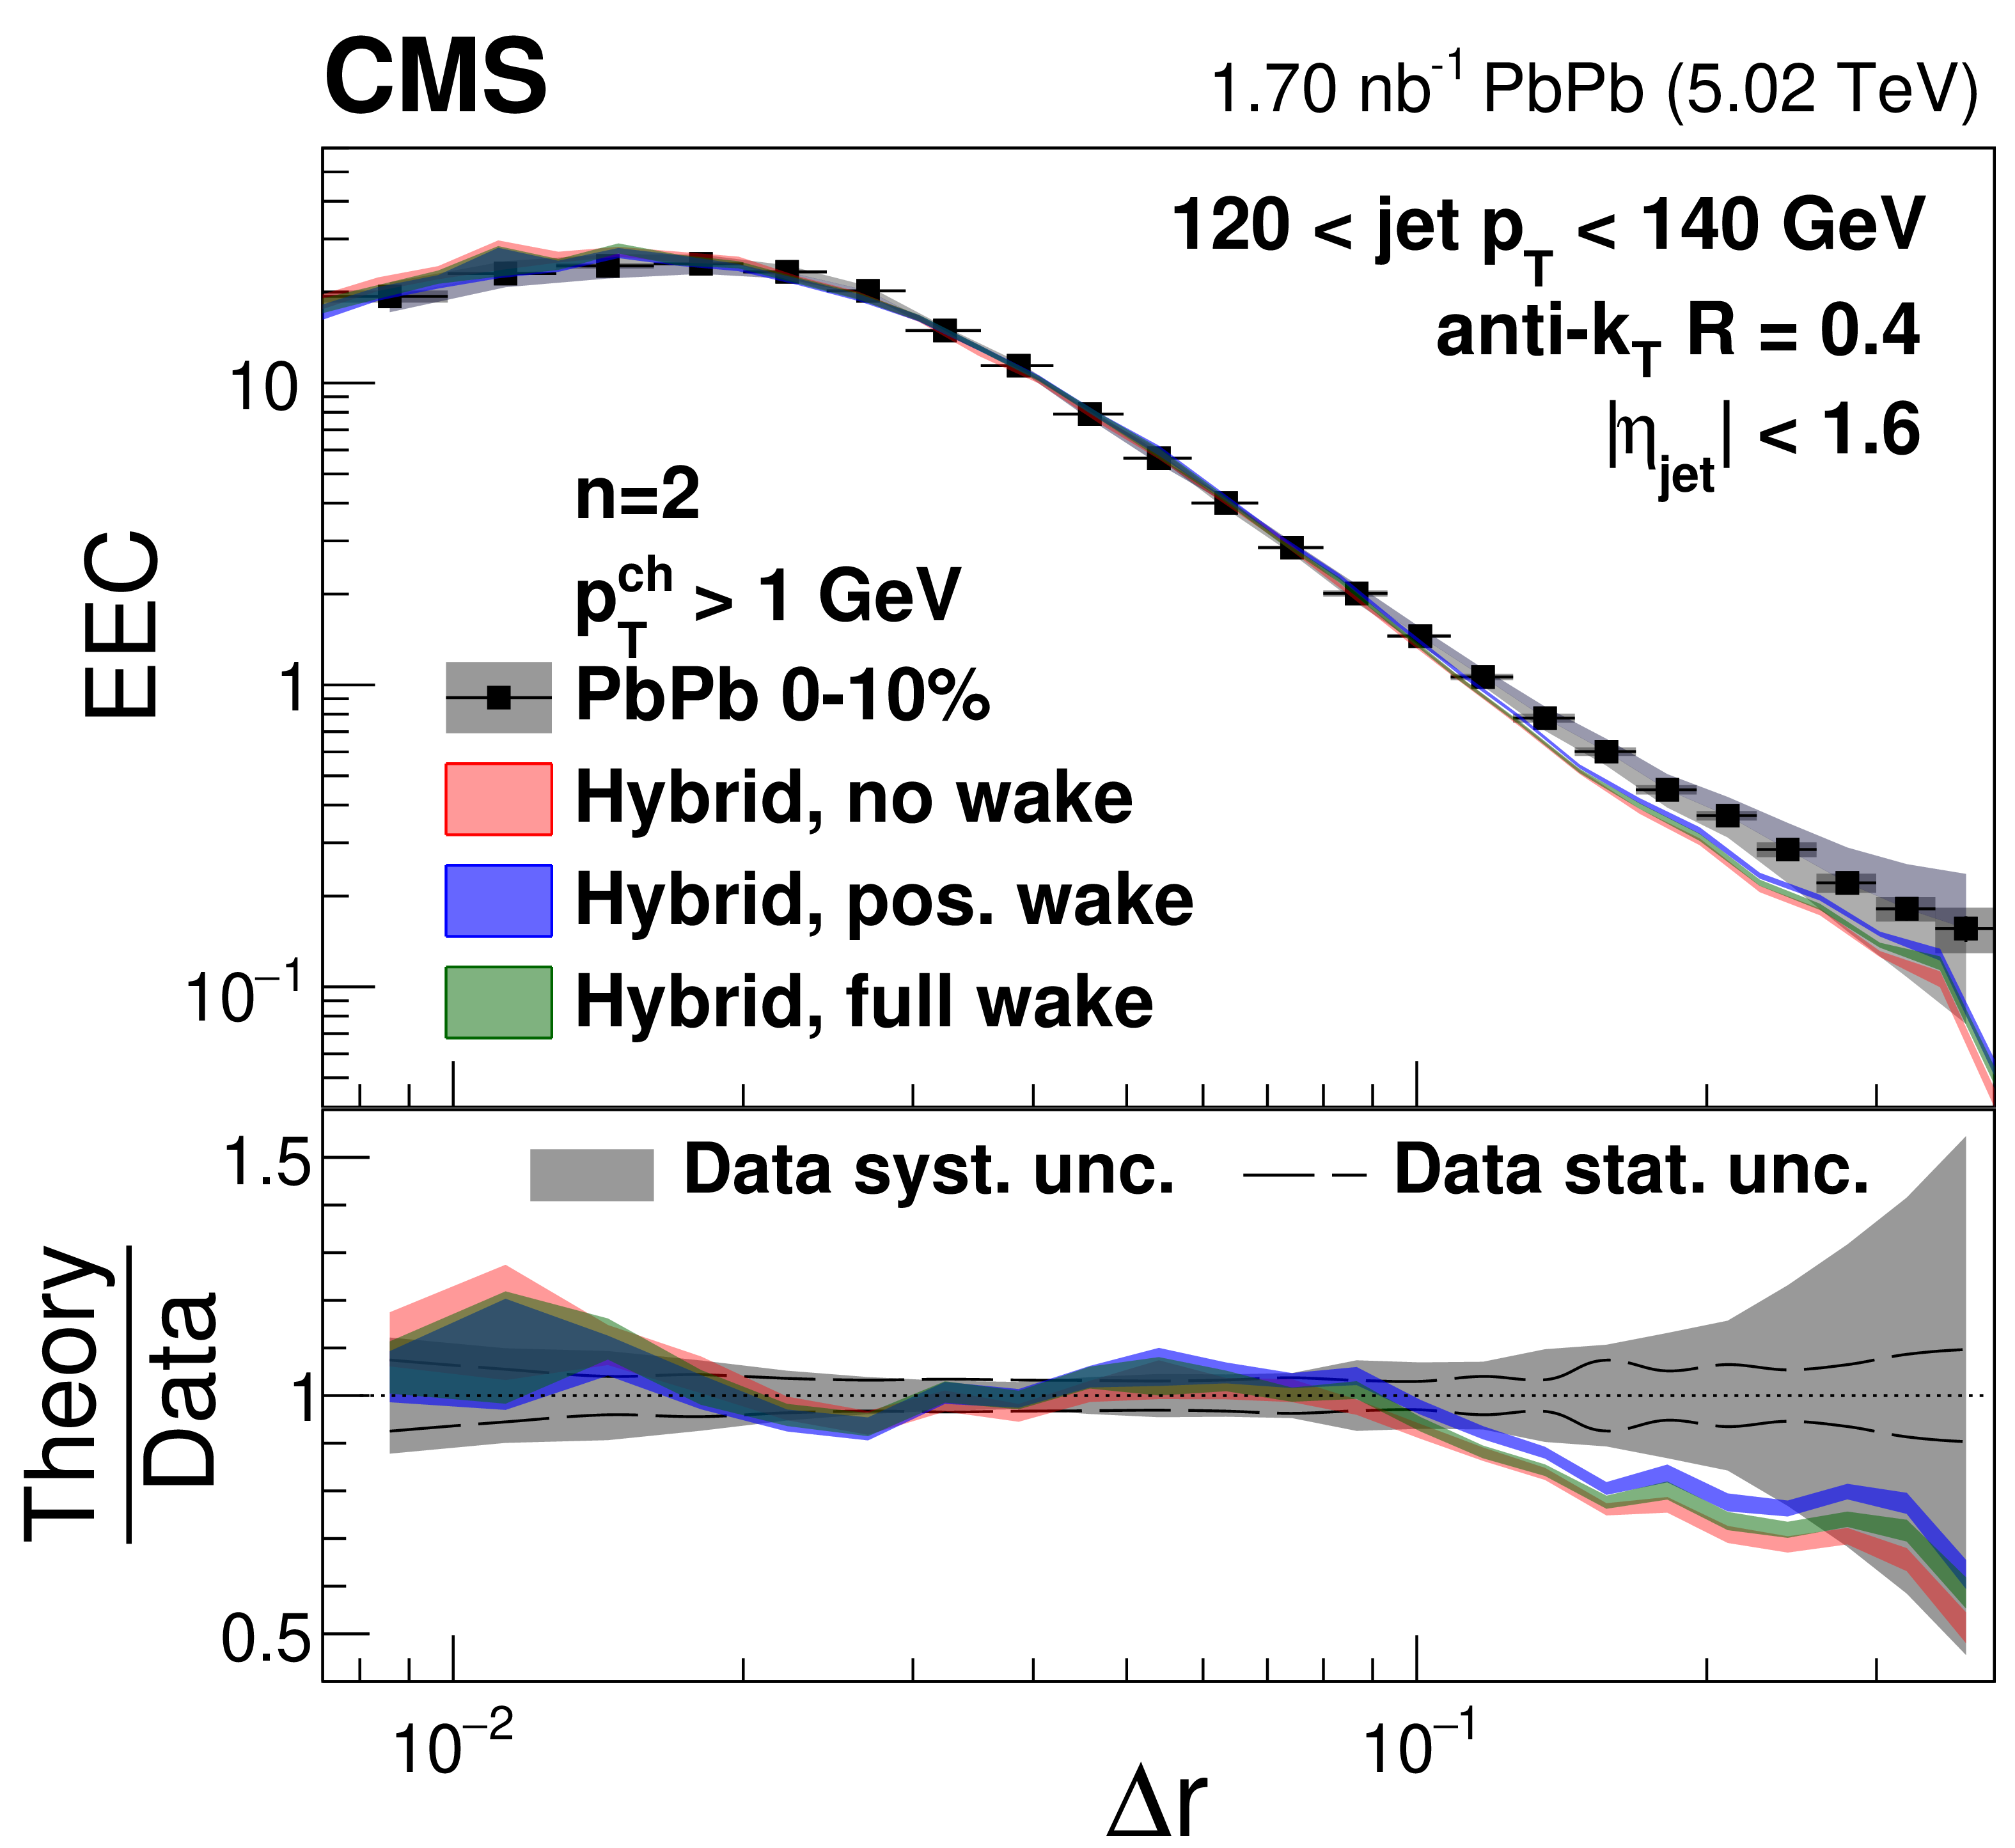
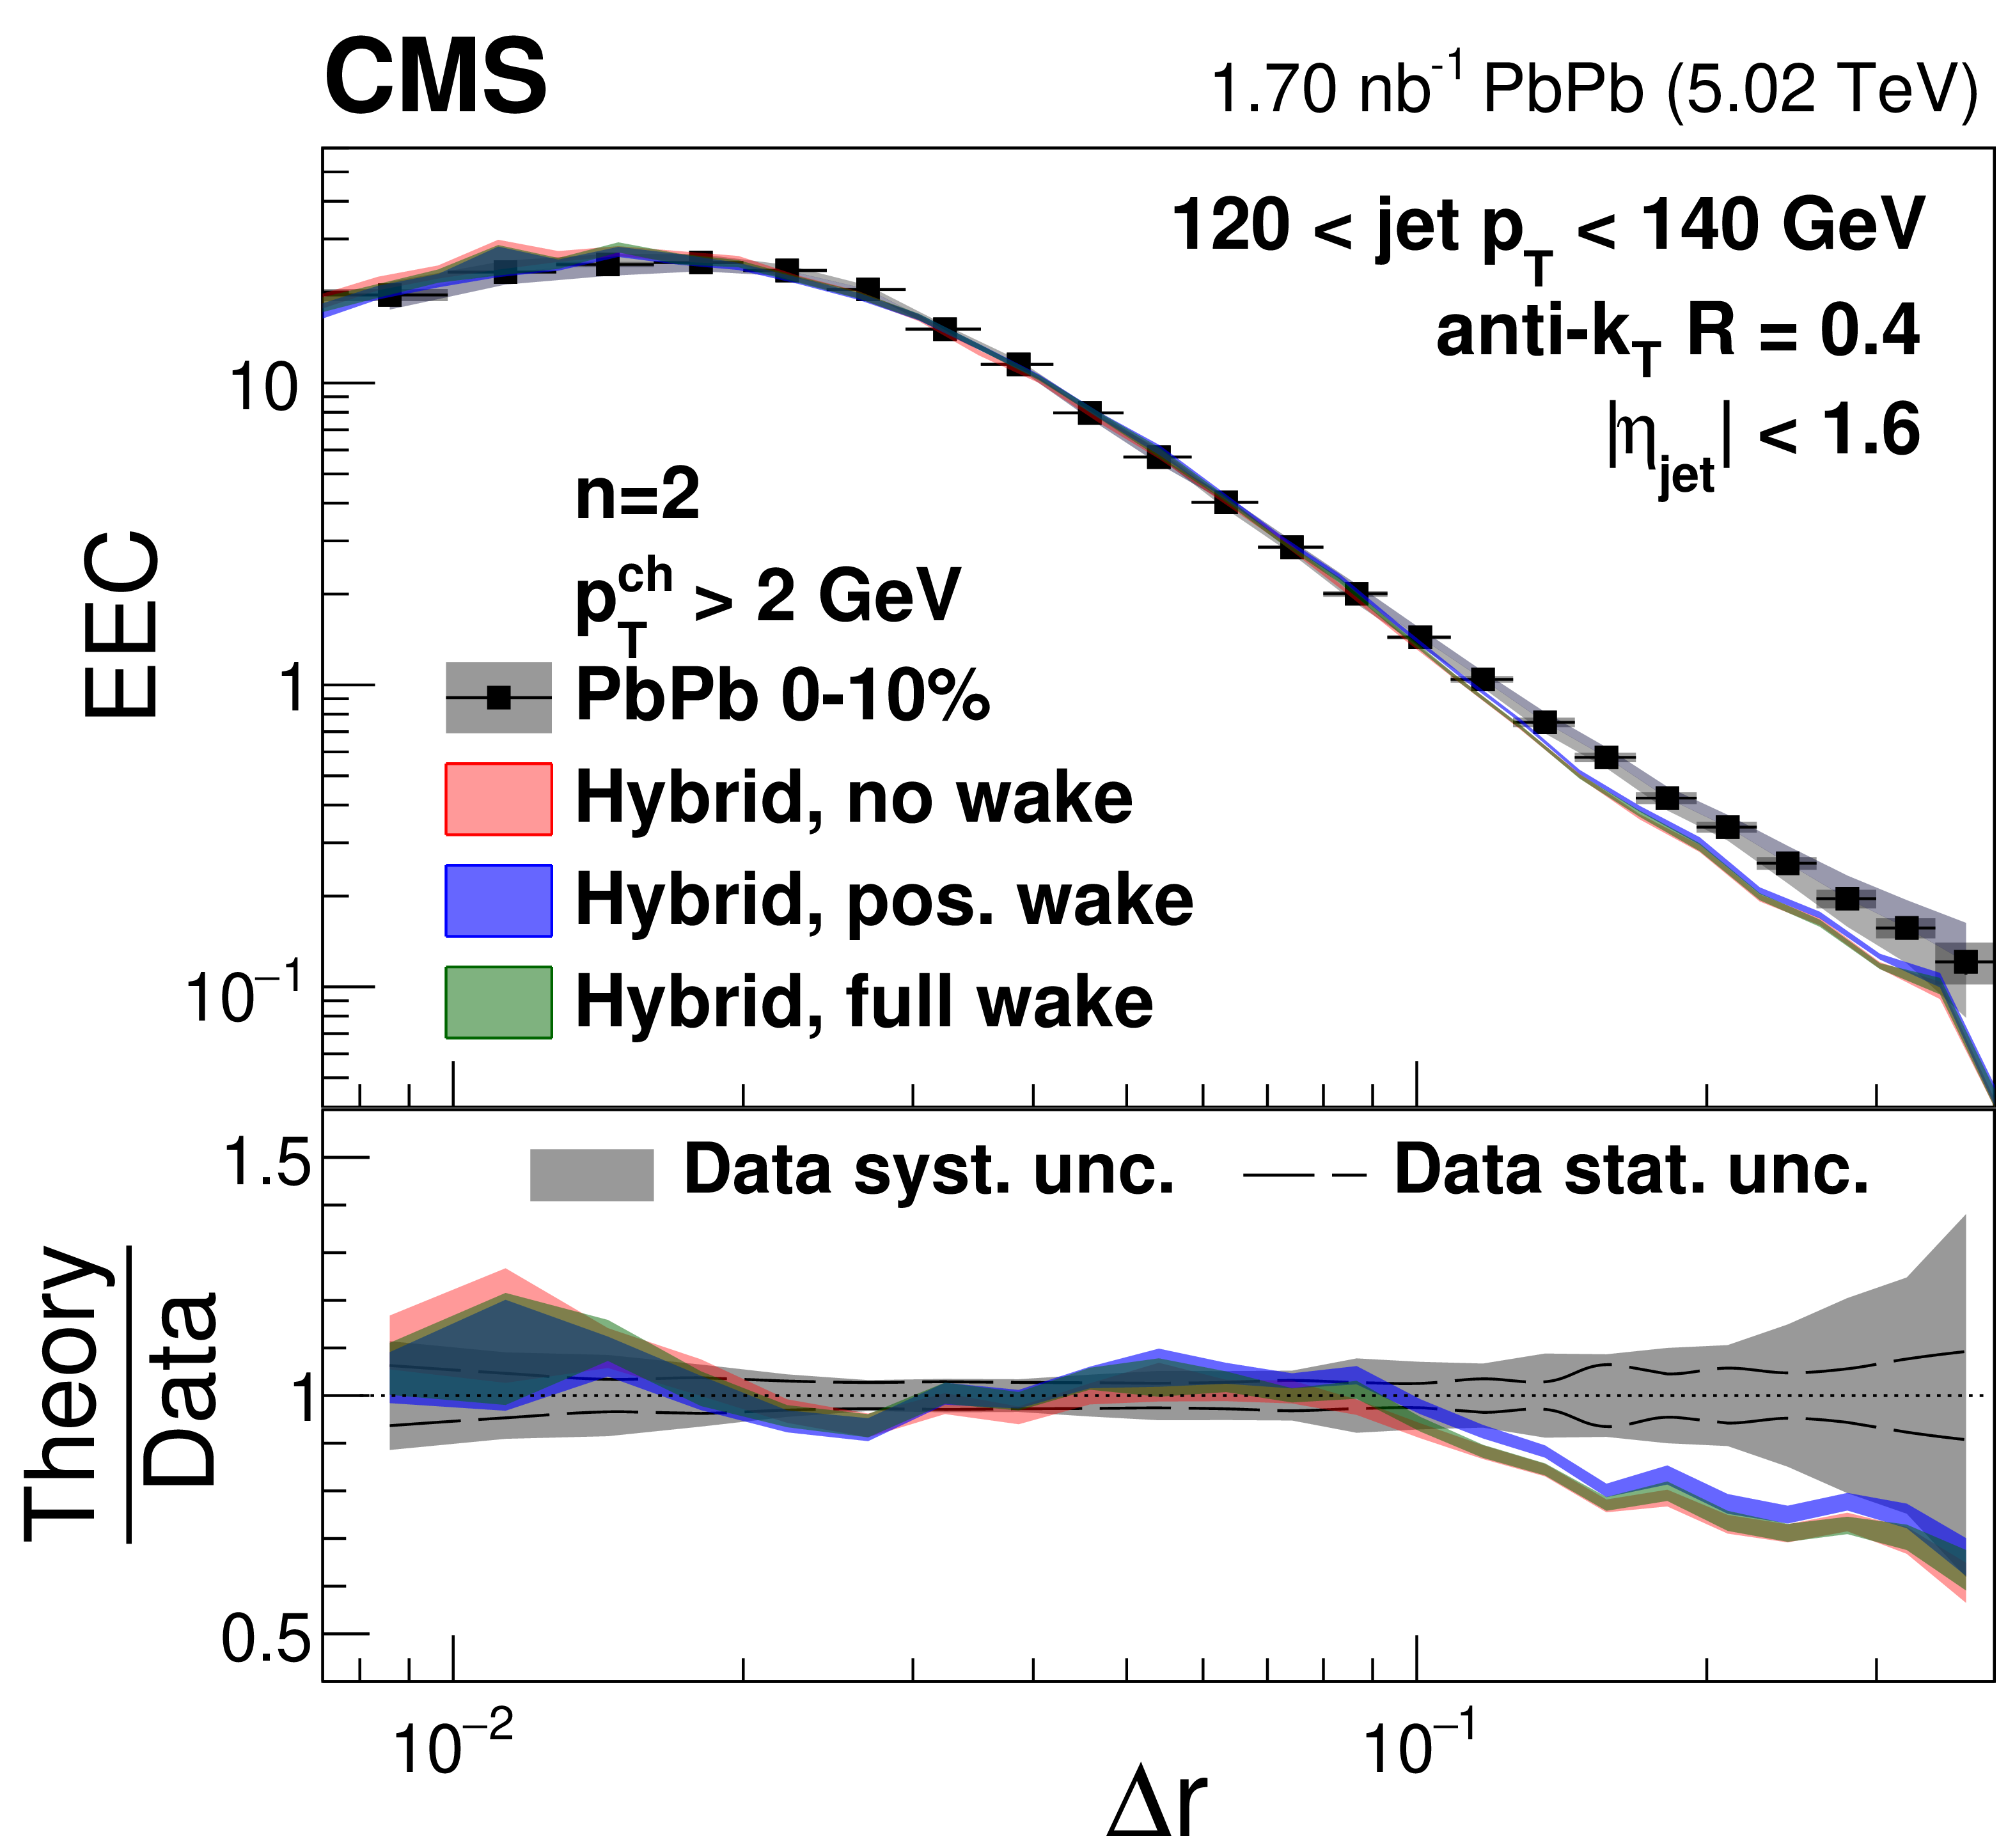
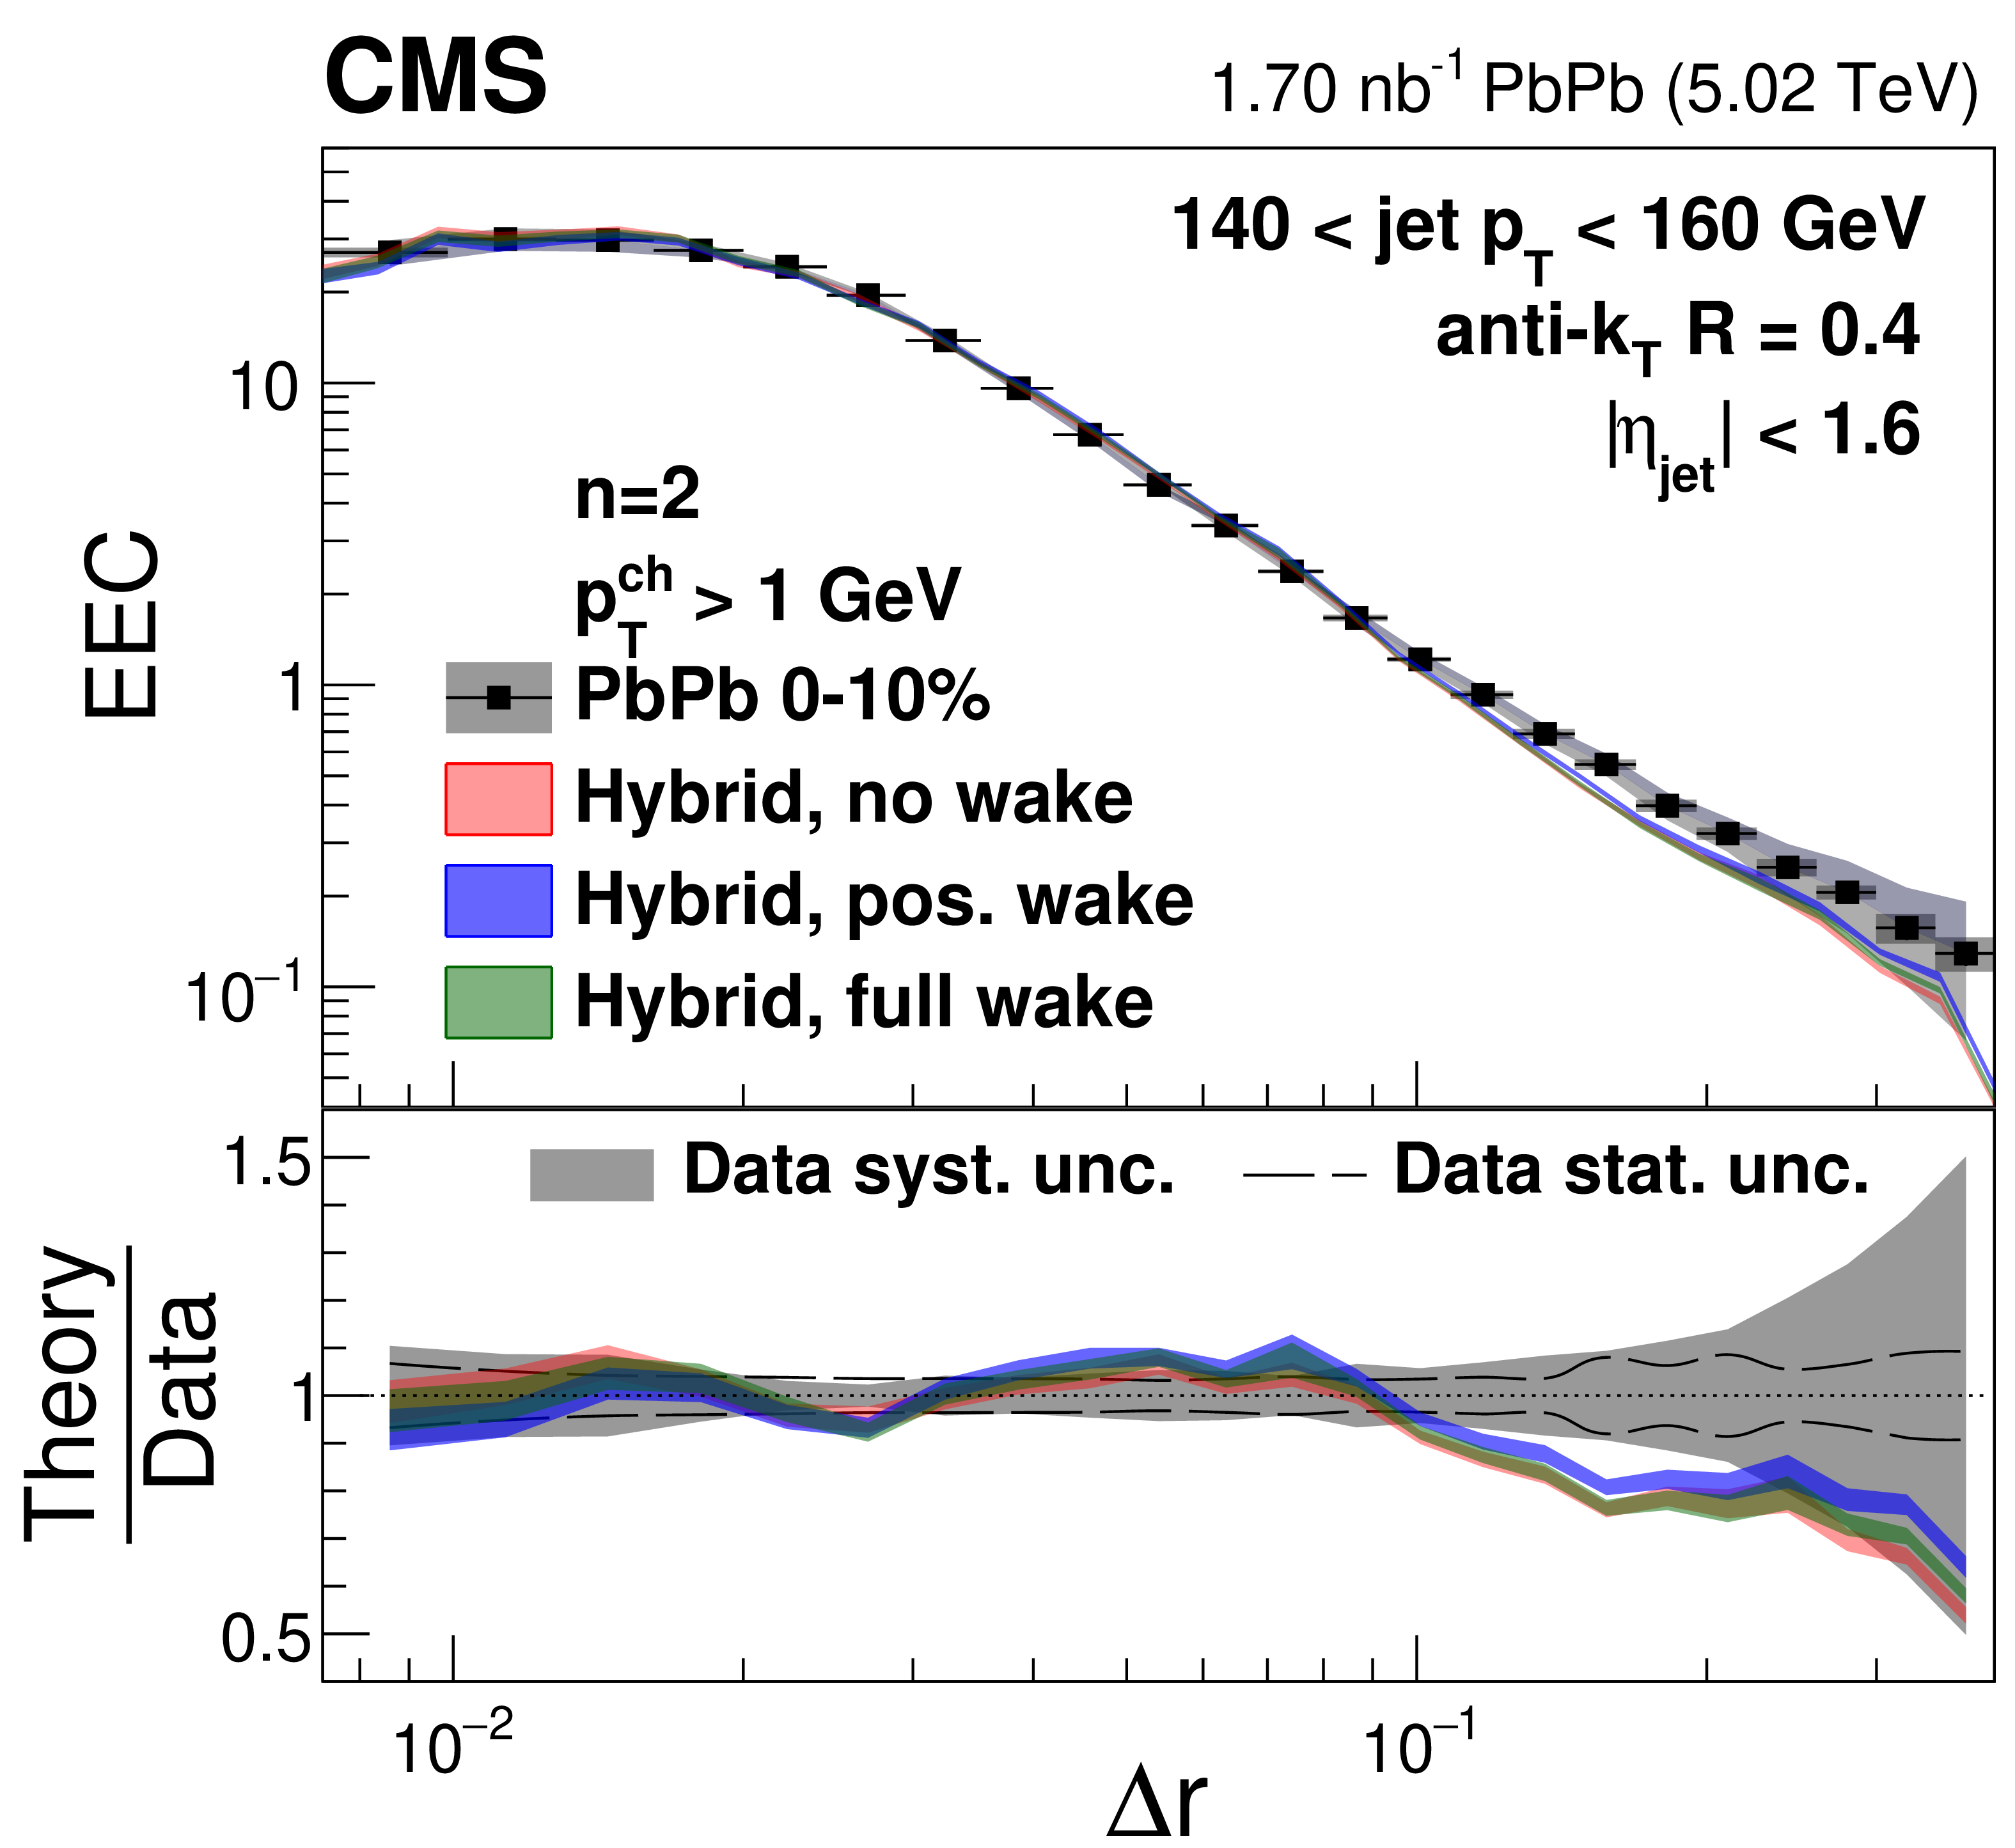
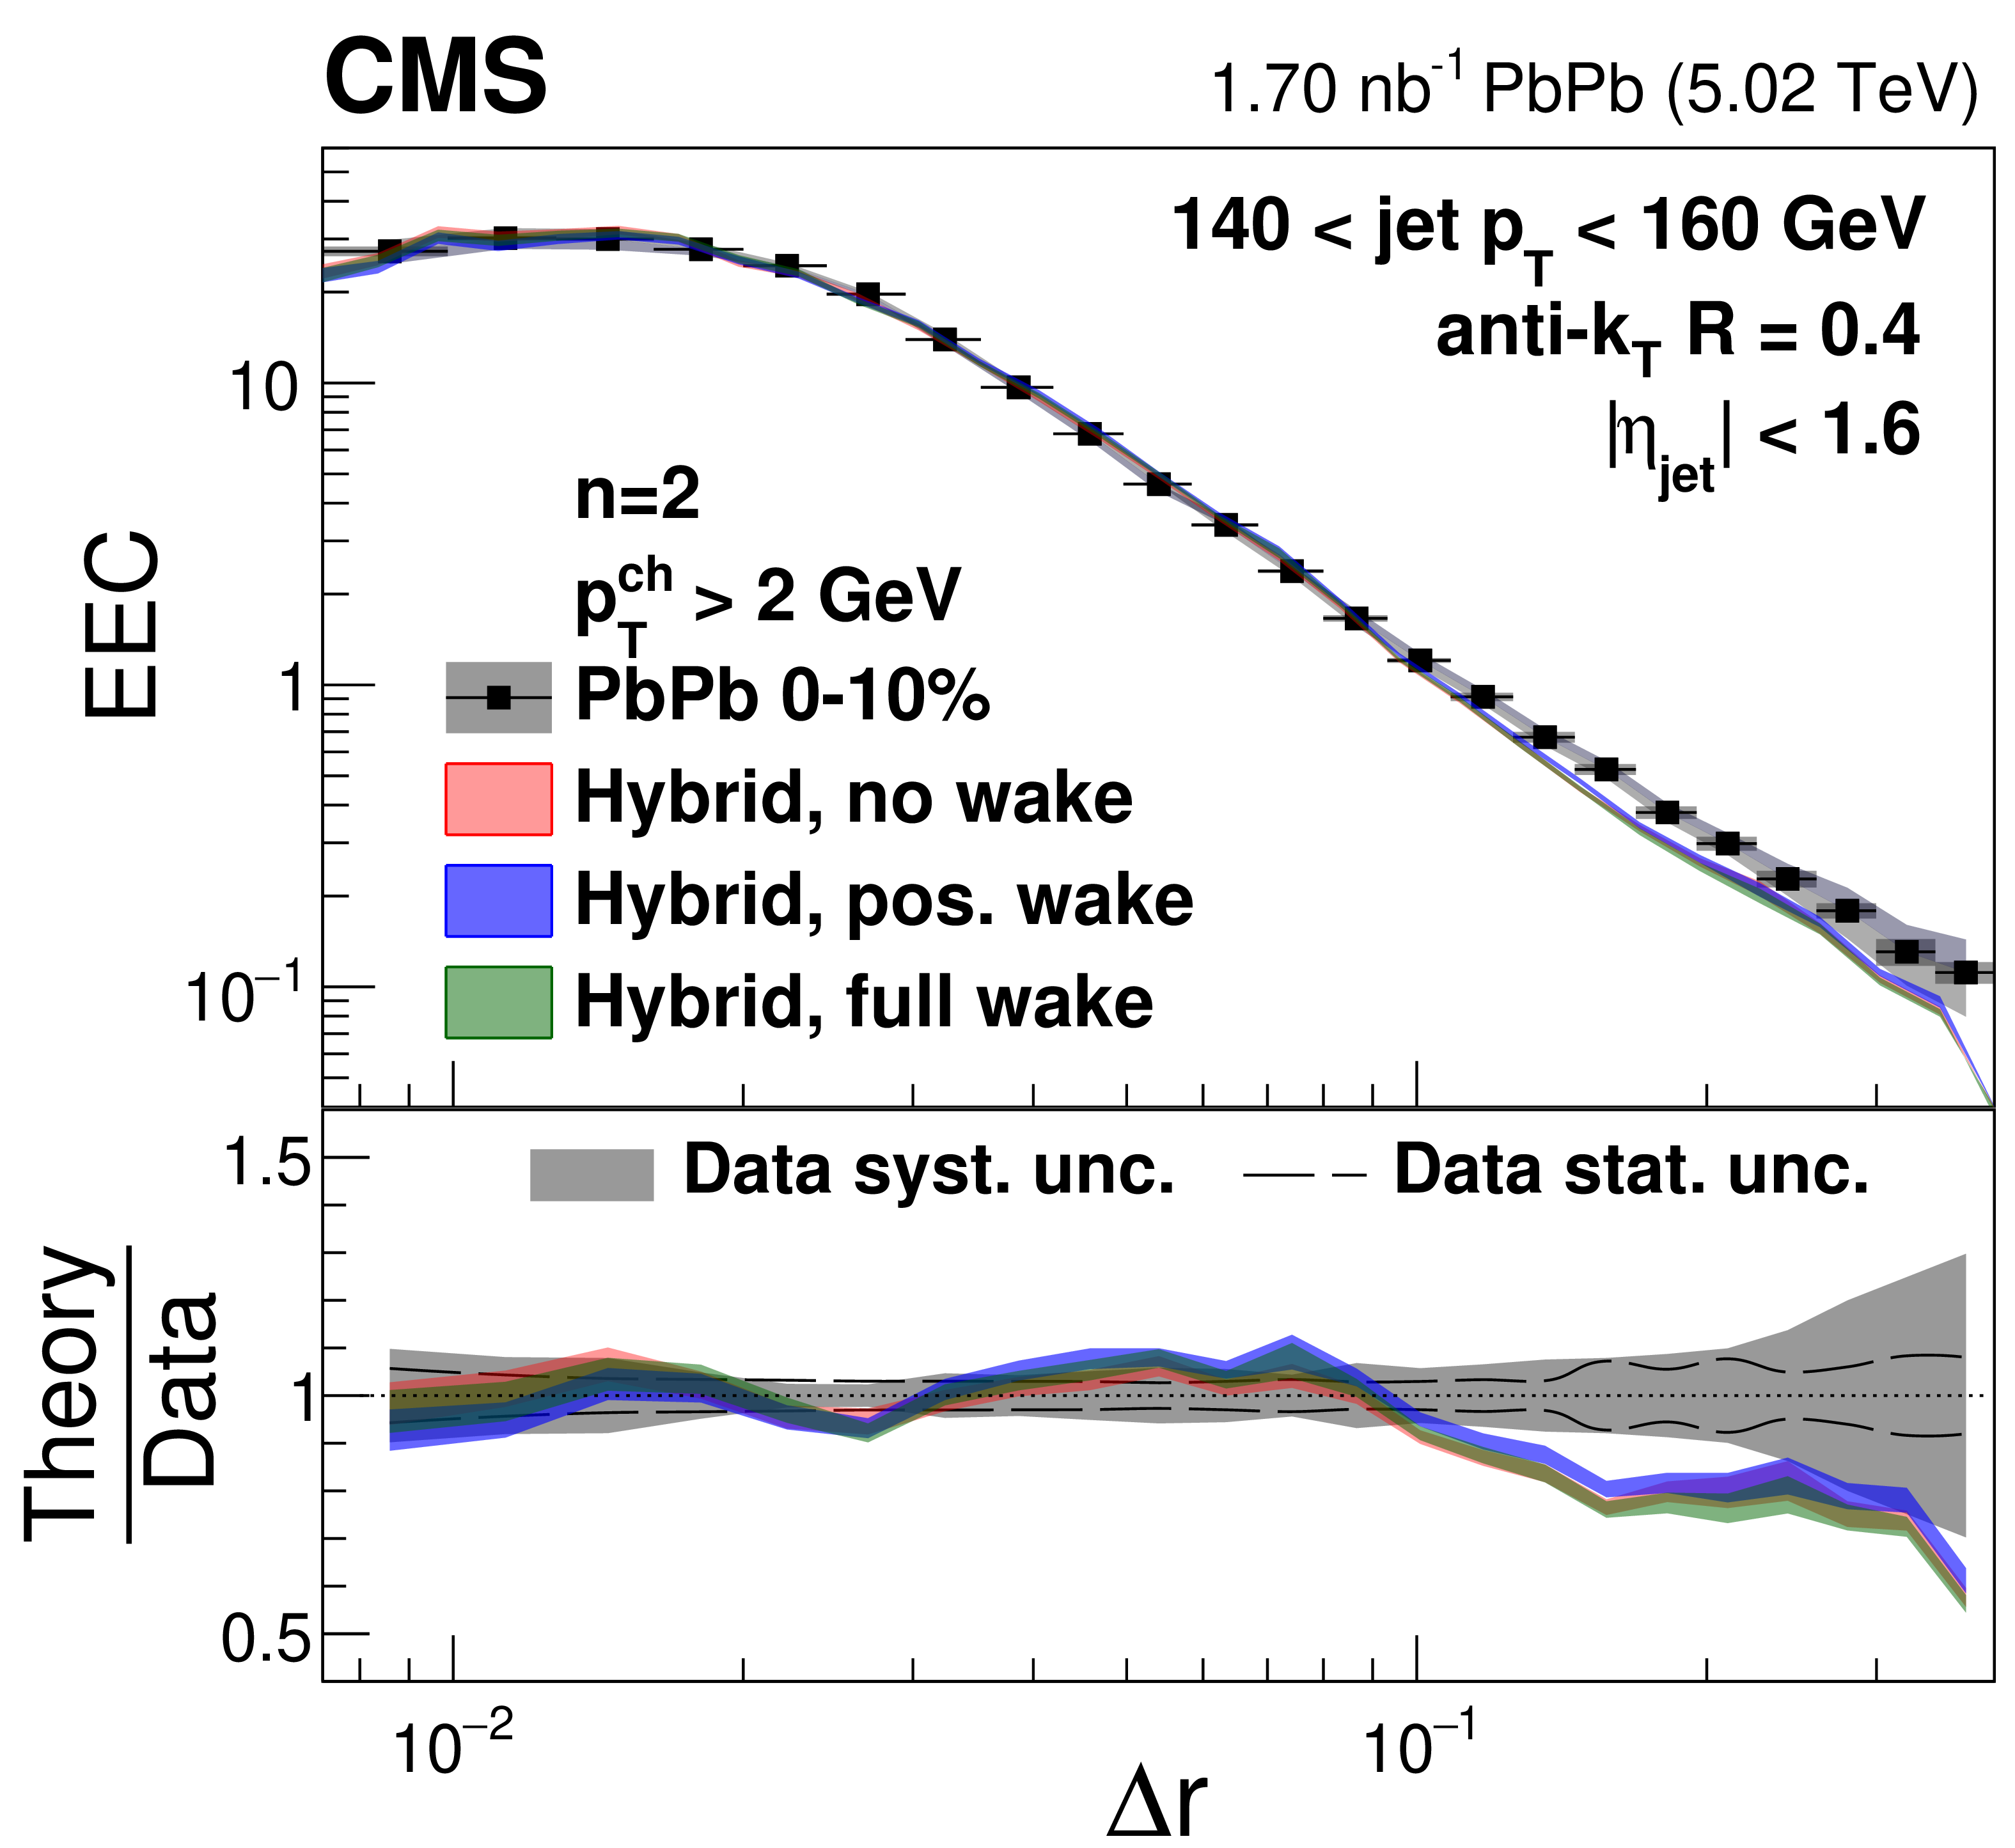
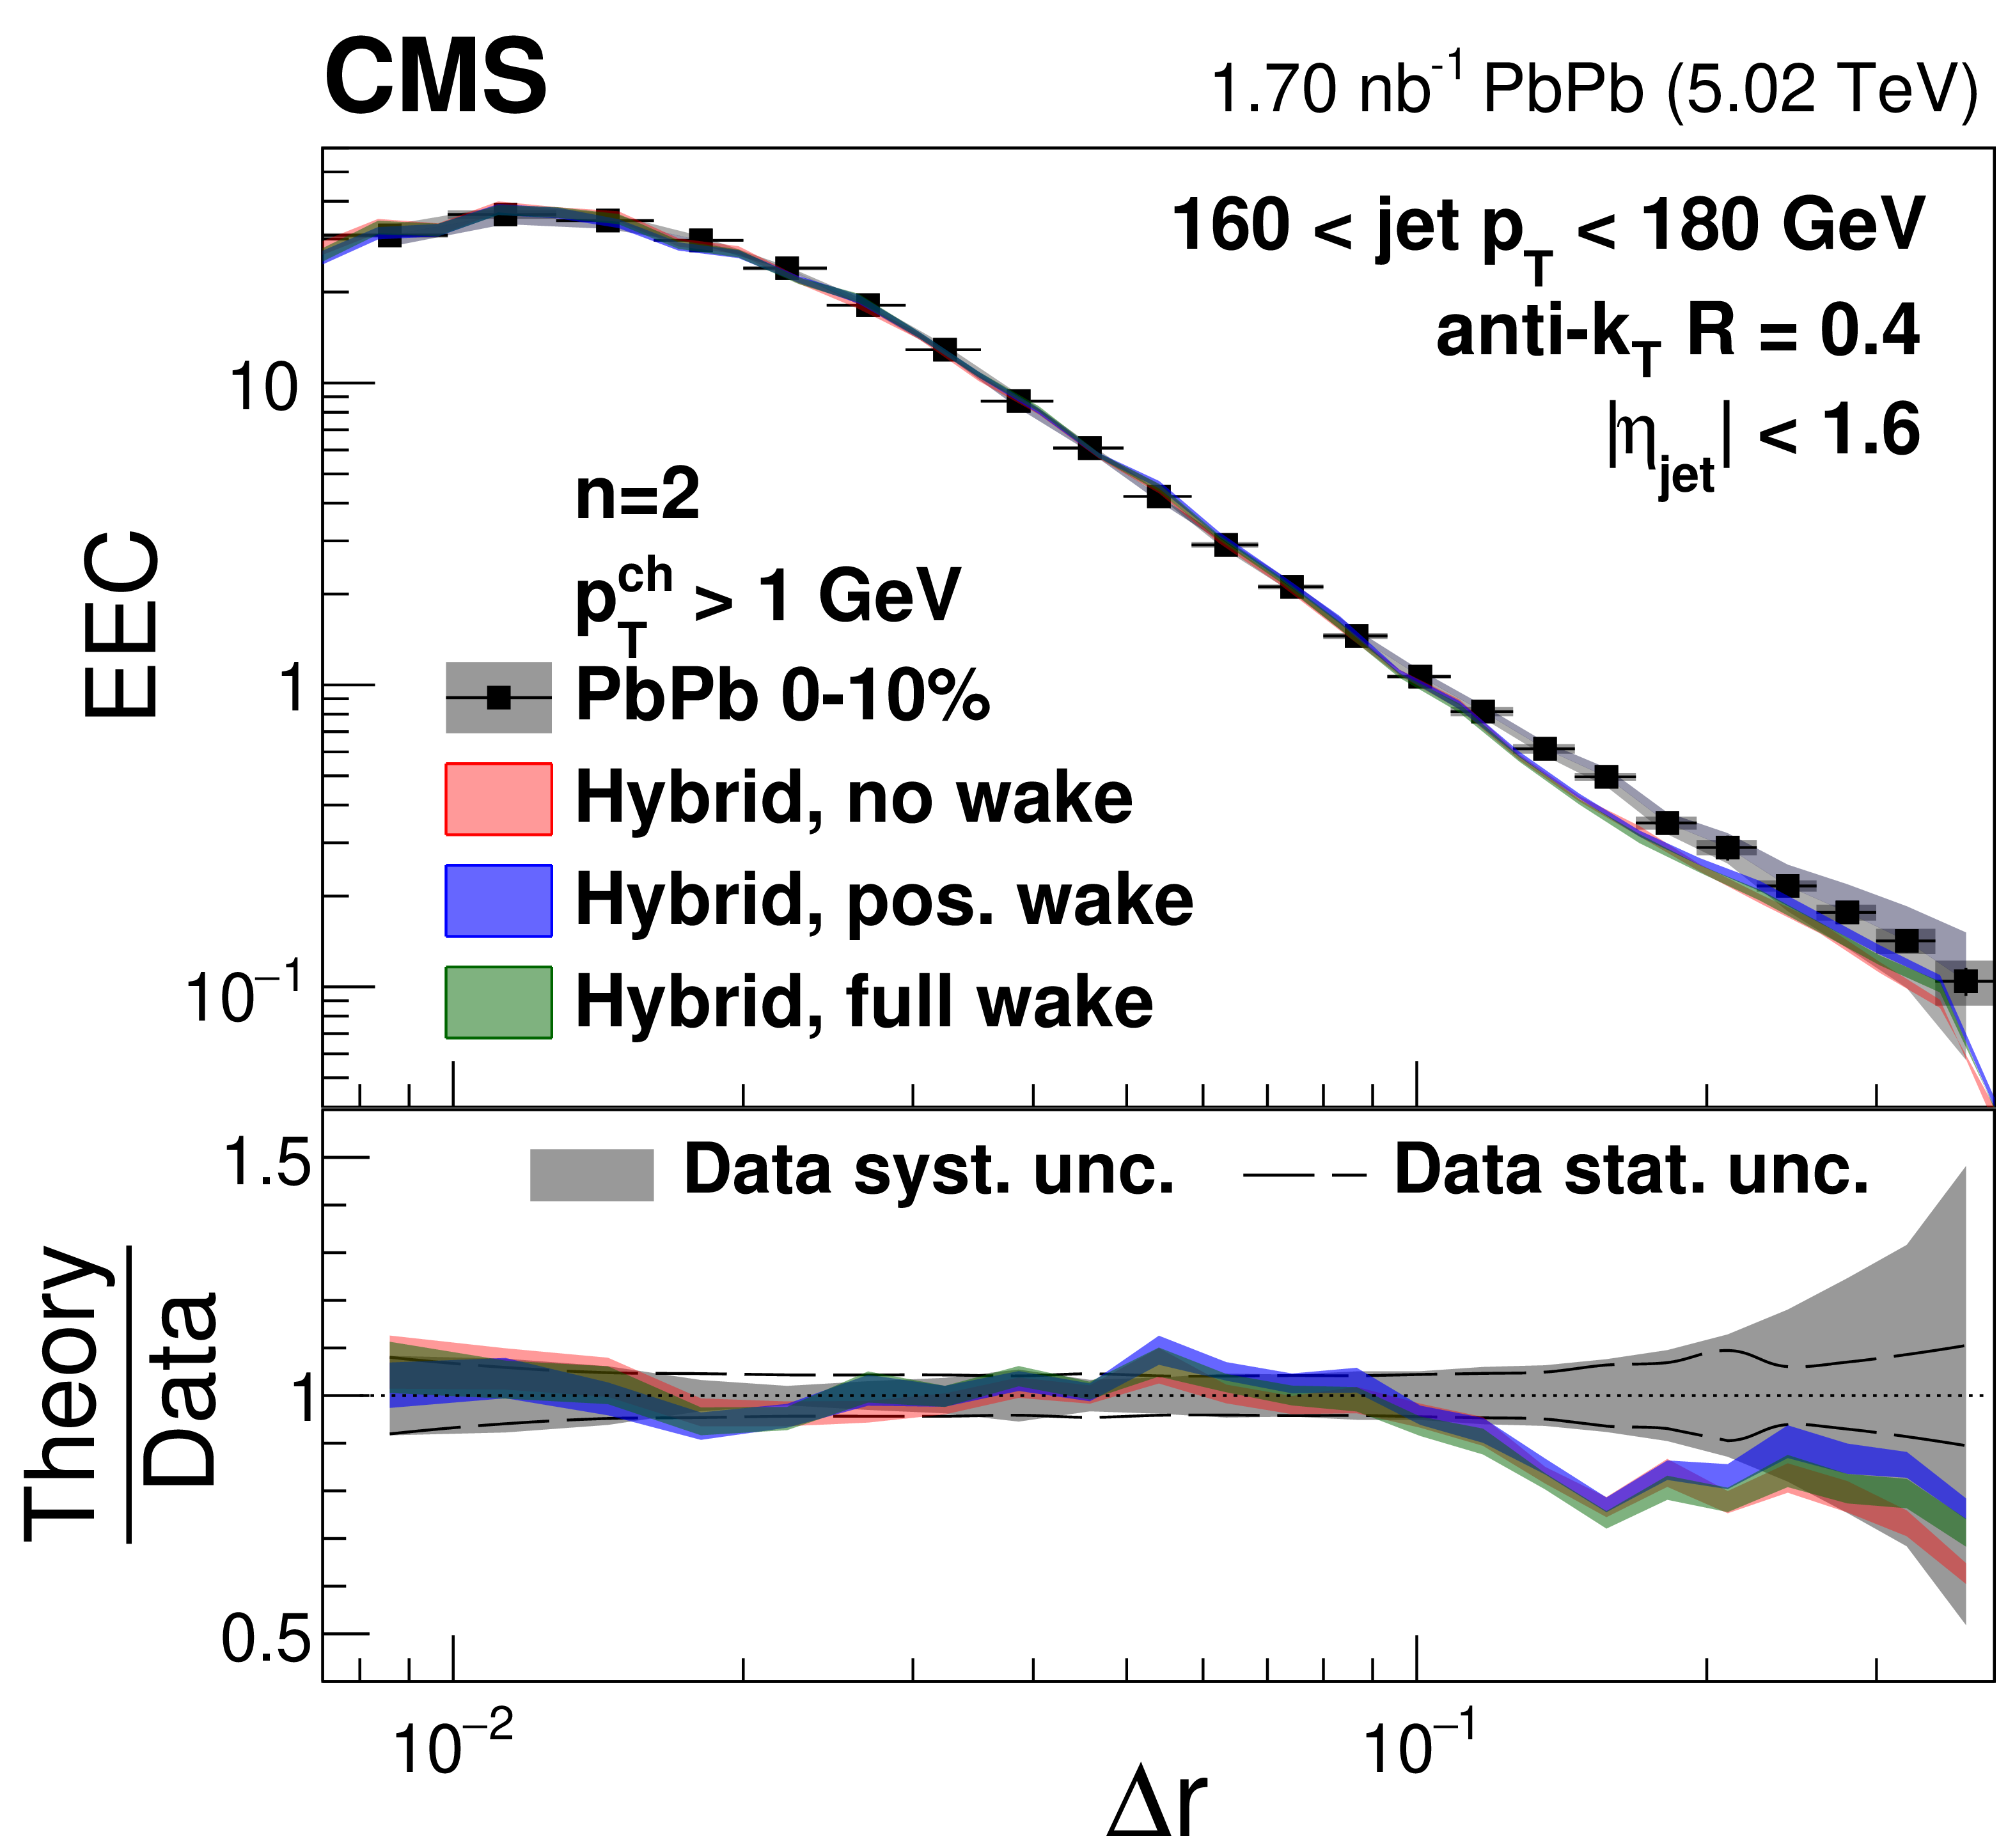
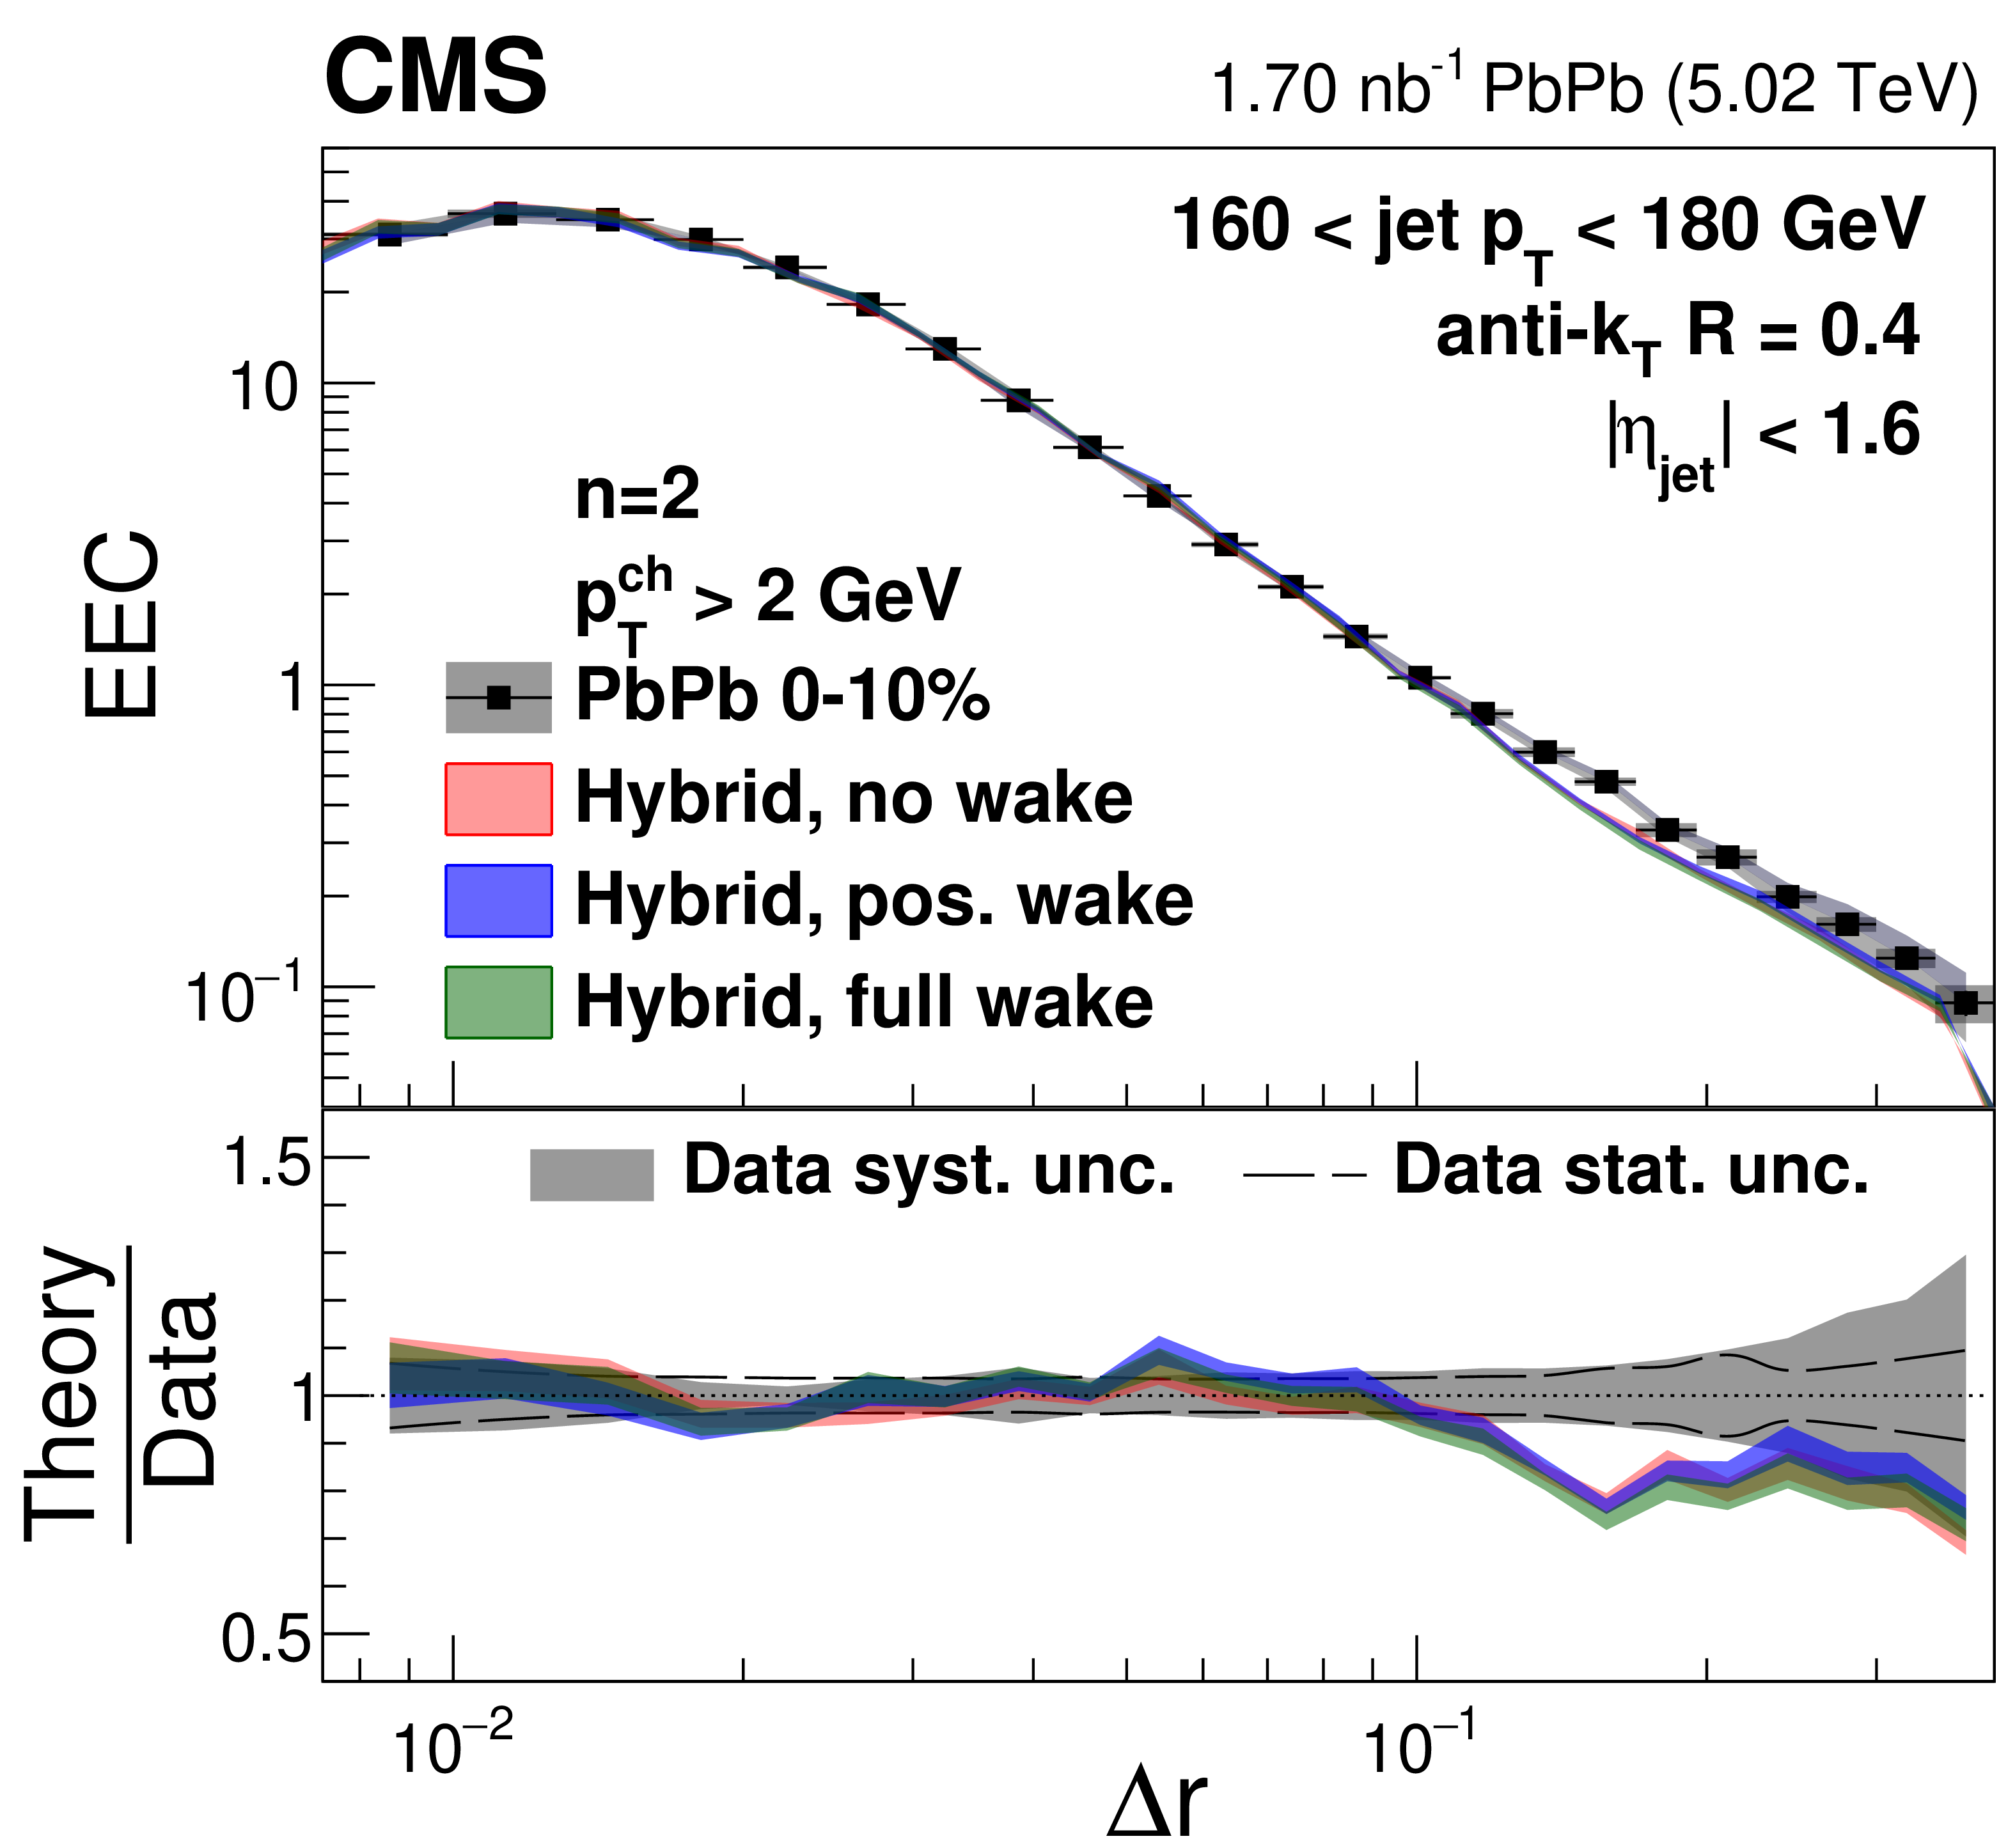
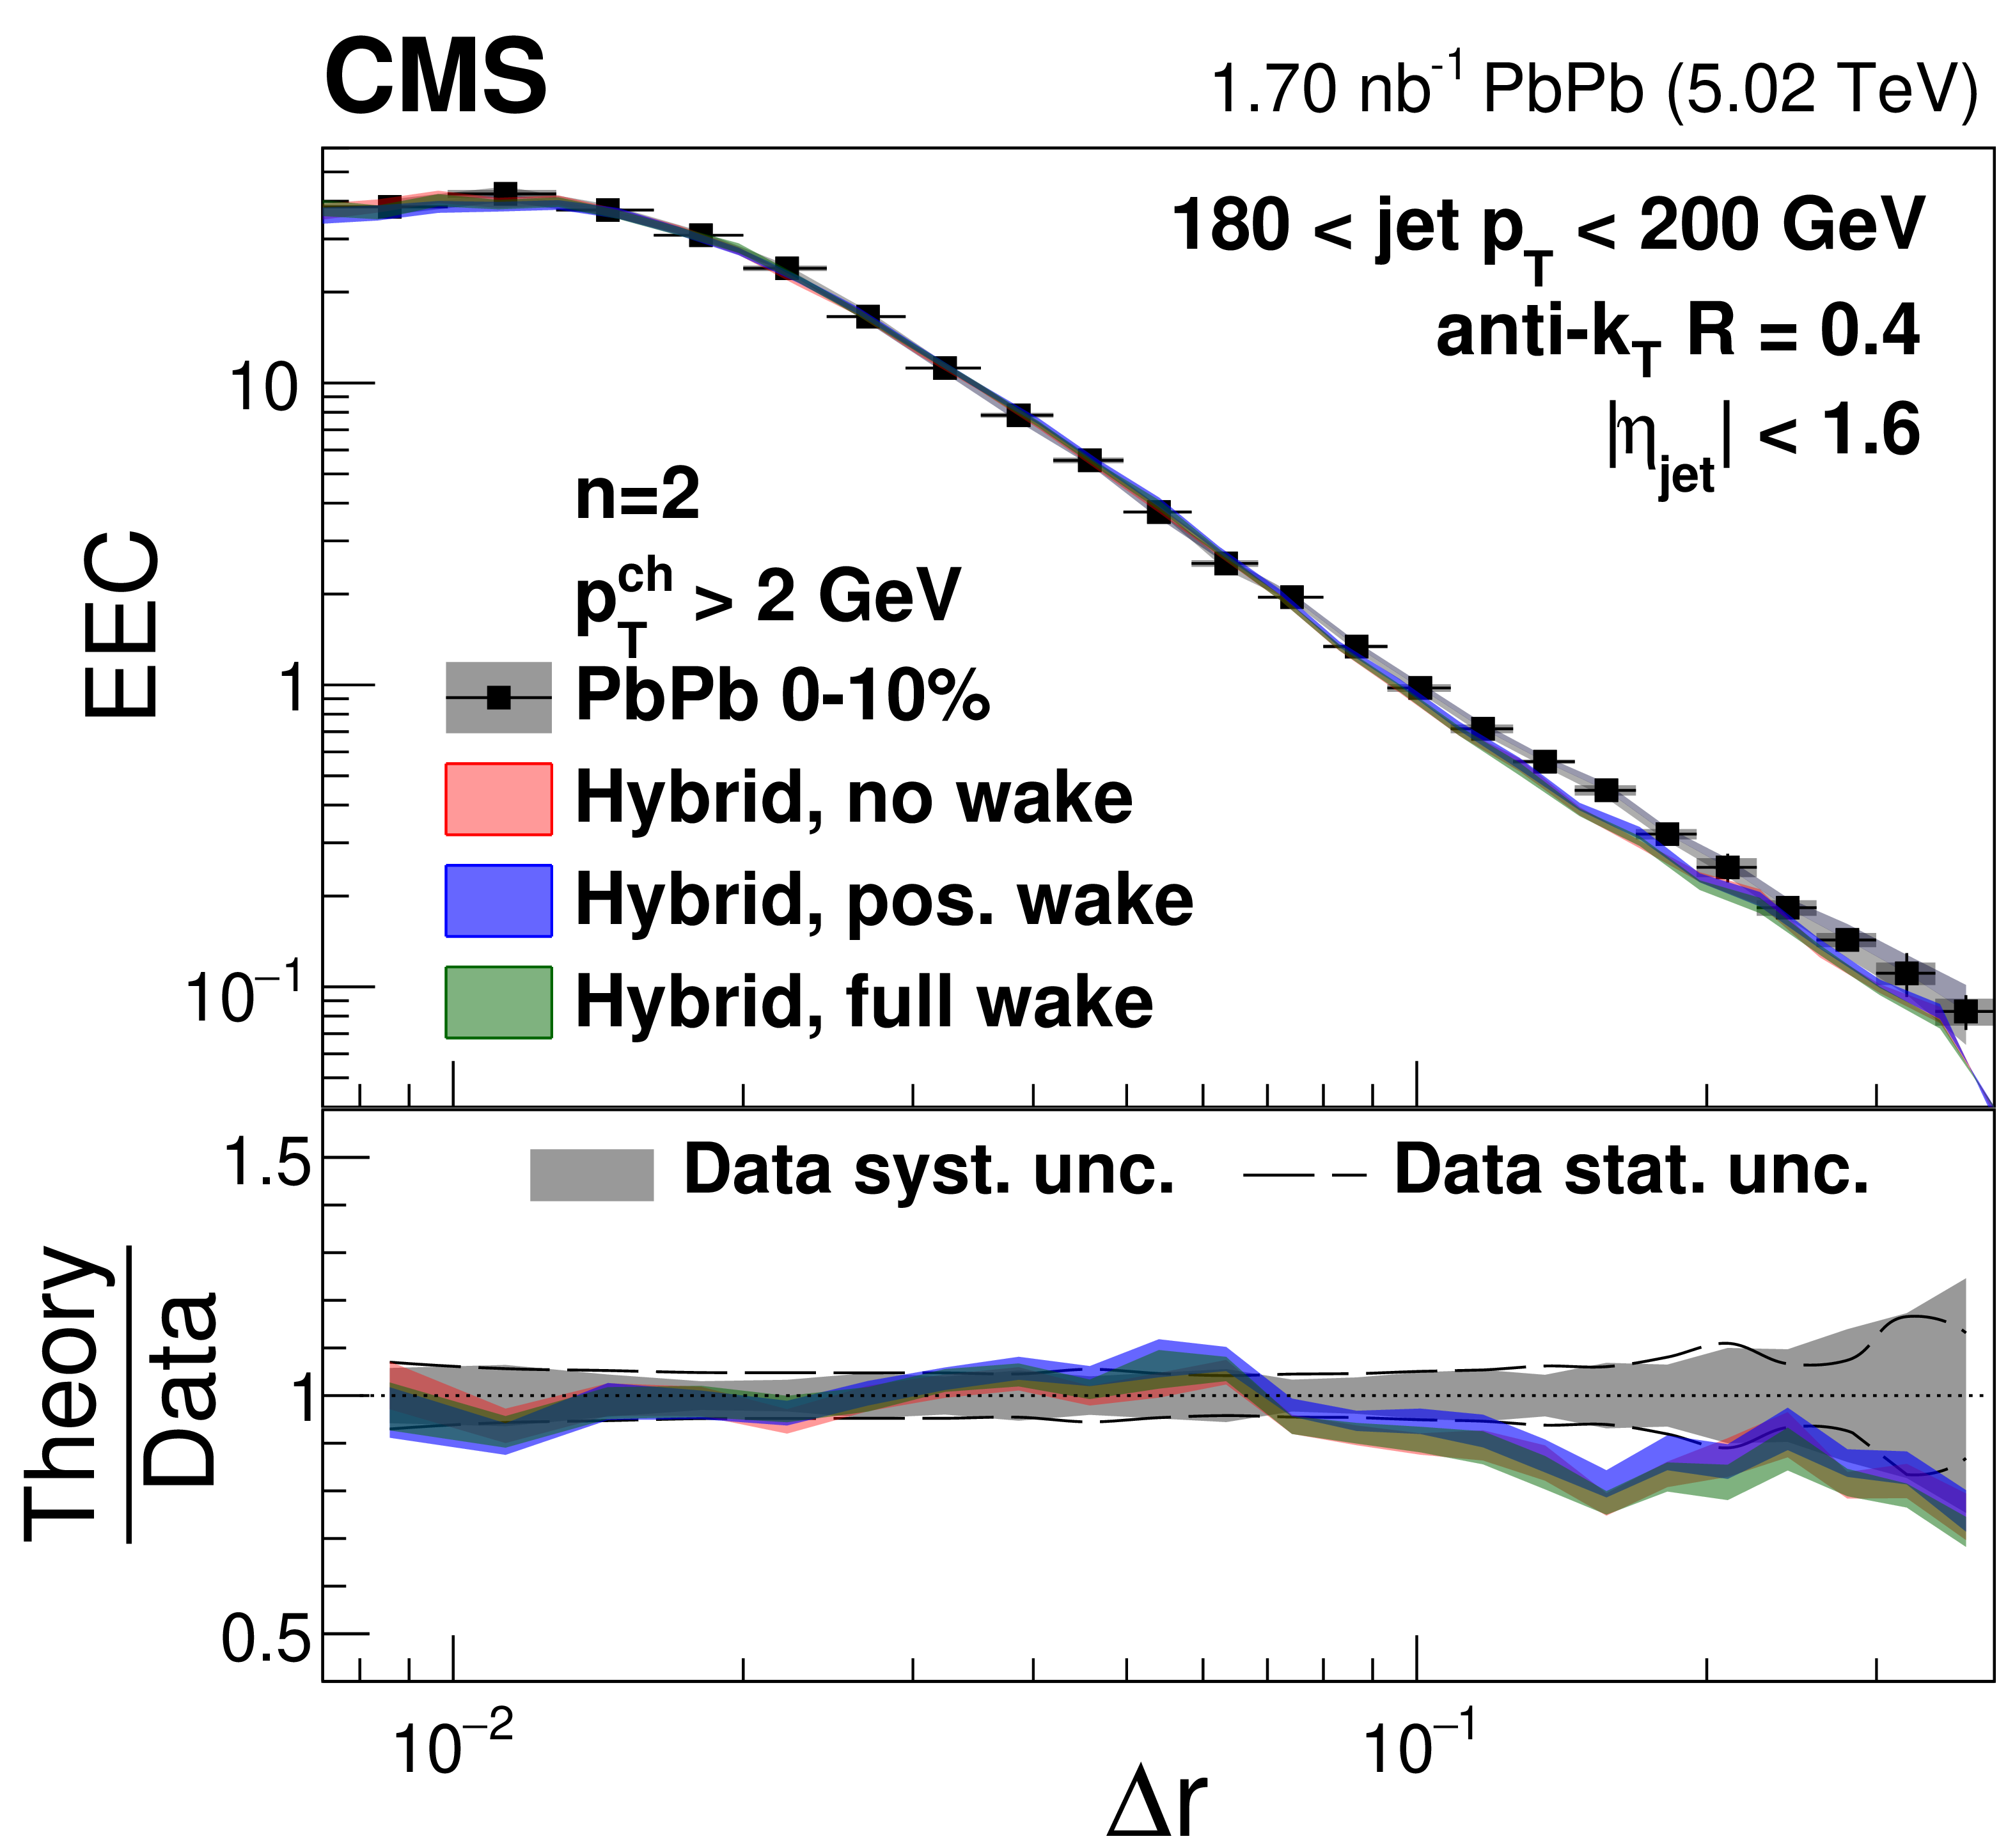
Figure 22:
Energy-energy correlator distributions from 0-10% central PbPb collisions with $ n= $ 2 in different $ p_{\mathrm{T}}^{\text{ch}} $ and $ p_{\text{T,jet}} $ bins compared to the hybrid model predictions with different jet wake settings. |
png pdf |
Figure 22-a:
Energy-energy correlator distributions from 0-10% central PbPb collisions with $ n= $ 2 in different $ p_{\mathrm{T}}^{\text{ch}} $ and $ p_{\text{T,jet}} $ bins compared to the hybrid model predictions with different jet wake settings. |
png pdf |
Figure 22-b:
Energy-energy correlator distributions from 0-10% central PbPb collisions with $ n= $ 2 in different $ p_{\mathrm{T}}^{\text{ch}} $ and $ p_{\text{T,jet}} $ bins compared to the hybrid model predictions with different jet wake settings. |
png pdf |
Figure 22-c:
Energy-energy correlator distributions from 0-10% central PbPb collisions with $ n= $ 2 in different $ p_{\mathrm{T}}^{\text{ch}} $ and $ p_{\text{T,jet}} $ bins compared to the hybrid model predictions with different jet wake settings. |
png pdf |
Figure 22-d:
Energy-energy correlator distributions from 0-10% central PbPb collisions with $ n= $ 2 in different $ p_{\mathrm{T}}^{\text{ch}} $ and $ p_{\text{T,jet}} $ bins compared to the hybrid model predictions with different jet wake settings. |
png pdf |
Figure 22-e:
Energy-energy correlator distributions from 0-10% central PbPb collisions with $ n= $ 2 in different $ p_{\mathrm{T}}^{\text{ch}} $ and $ p_{\text{T,jet}} $ bins compared to the hybrid model predictions with different jet wake settings. |
png pdf |
Figure 22-f:
Energy-energy correlator distributions from 0-10% central PbPb collisions with $ n= $ 2 in different $ p_{\mathrm{T}}^{\text{ch}} $ and $ p_{\text{T,jet}} $ bins compared to the hybrid model predictions with different jet wake settings. |
png pdf |
Figure 22-g:
Energy-energy correlator distributions from 0-10% central PbPb collisions with $ n= $ 2 in different $ p_{\mathrm{T}}^{\text{ch}} $ and $ p_{\text{T,jet}} $ bins compared to the hybrid model predictions with different jet wake settings. |
png pdf |
Figure 22-h:
Energy-energy correlator distributions from 0-10% central PbPb collisions with $ n= $ 2 in different $ p_{\mathrm{T}}^{\text{ch}} $ and $ p_{\text{T,jet}} $ bins compared to the hybrid model predictions with different jet wake settings. |
png pdf |
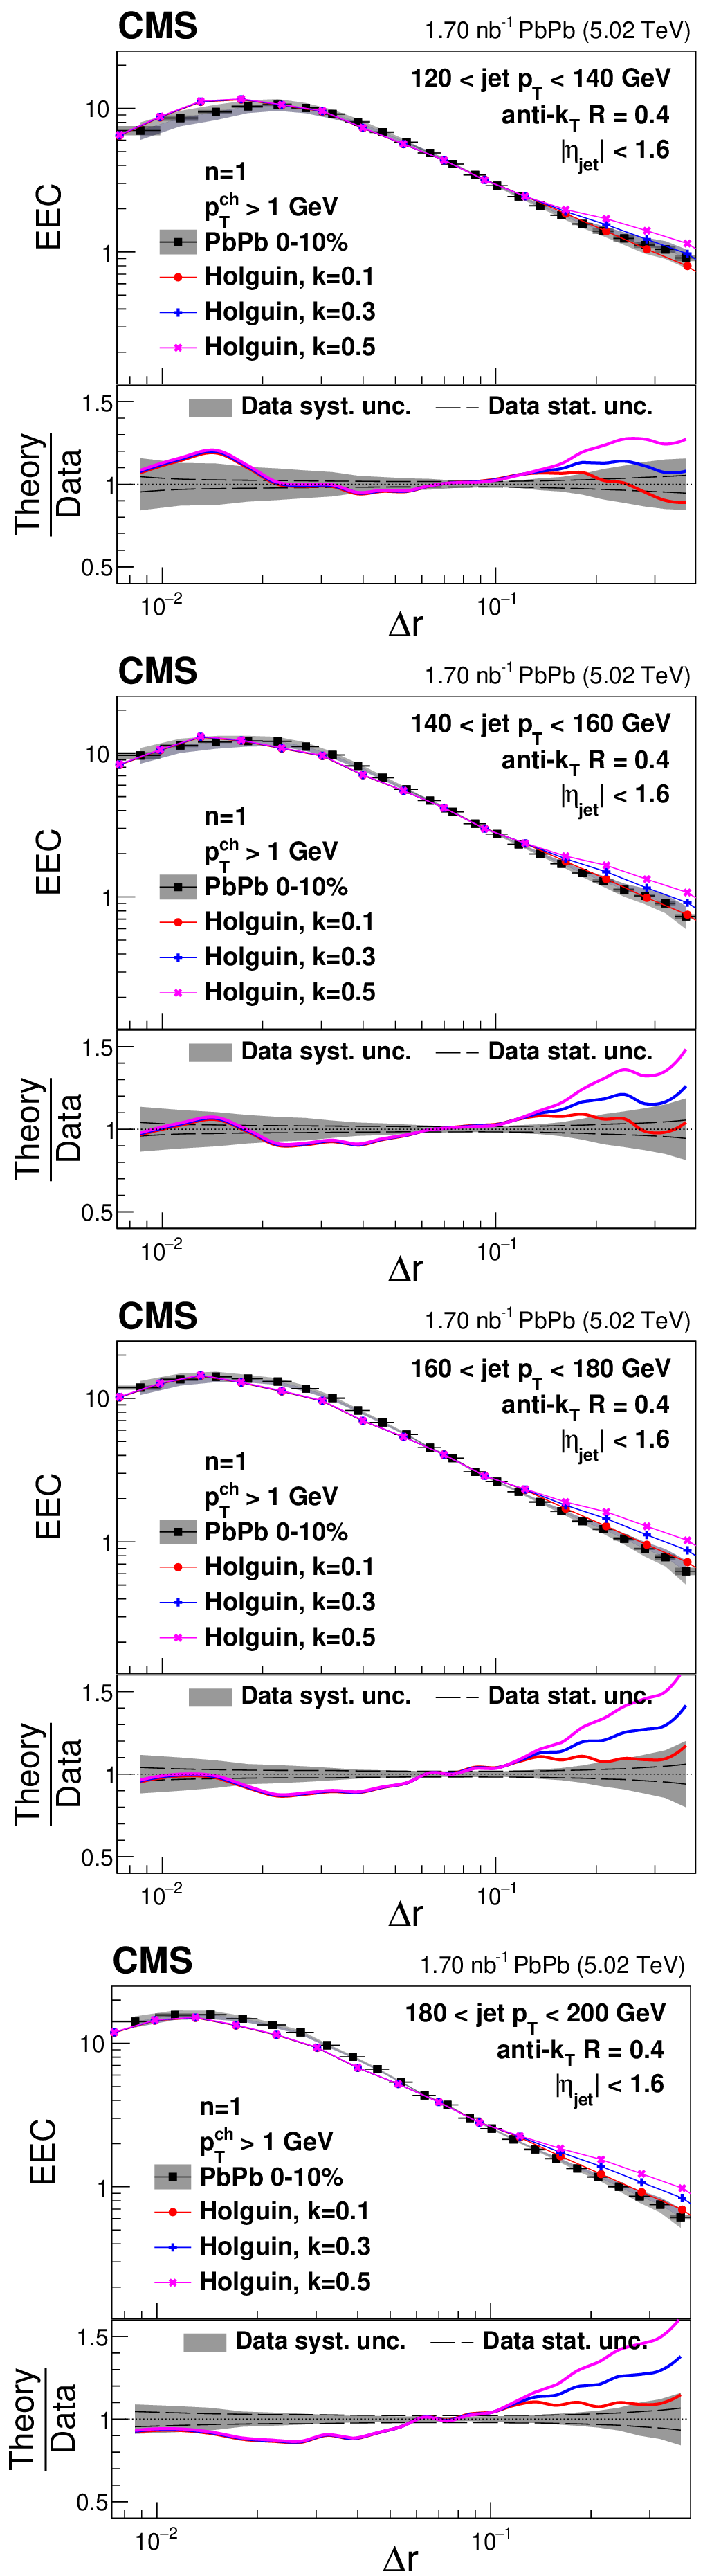
Figure 23:
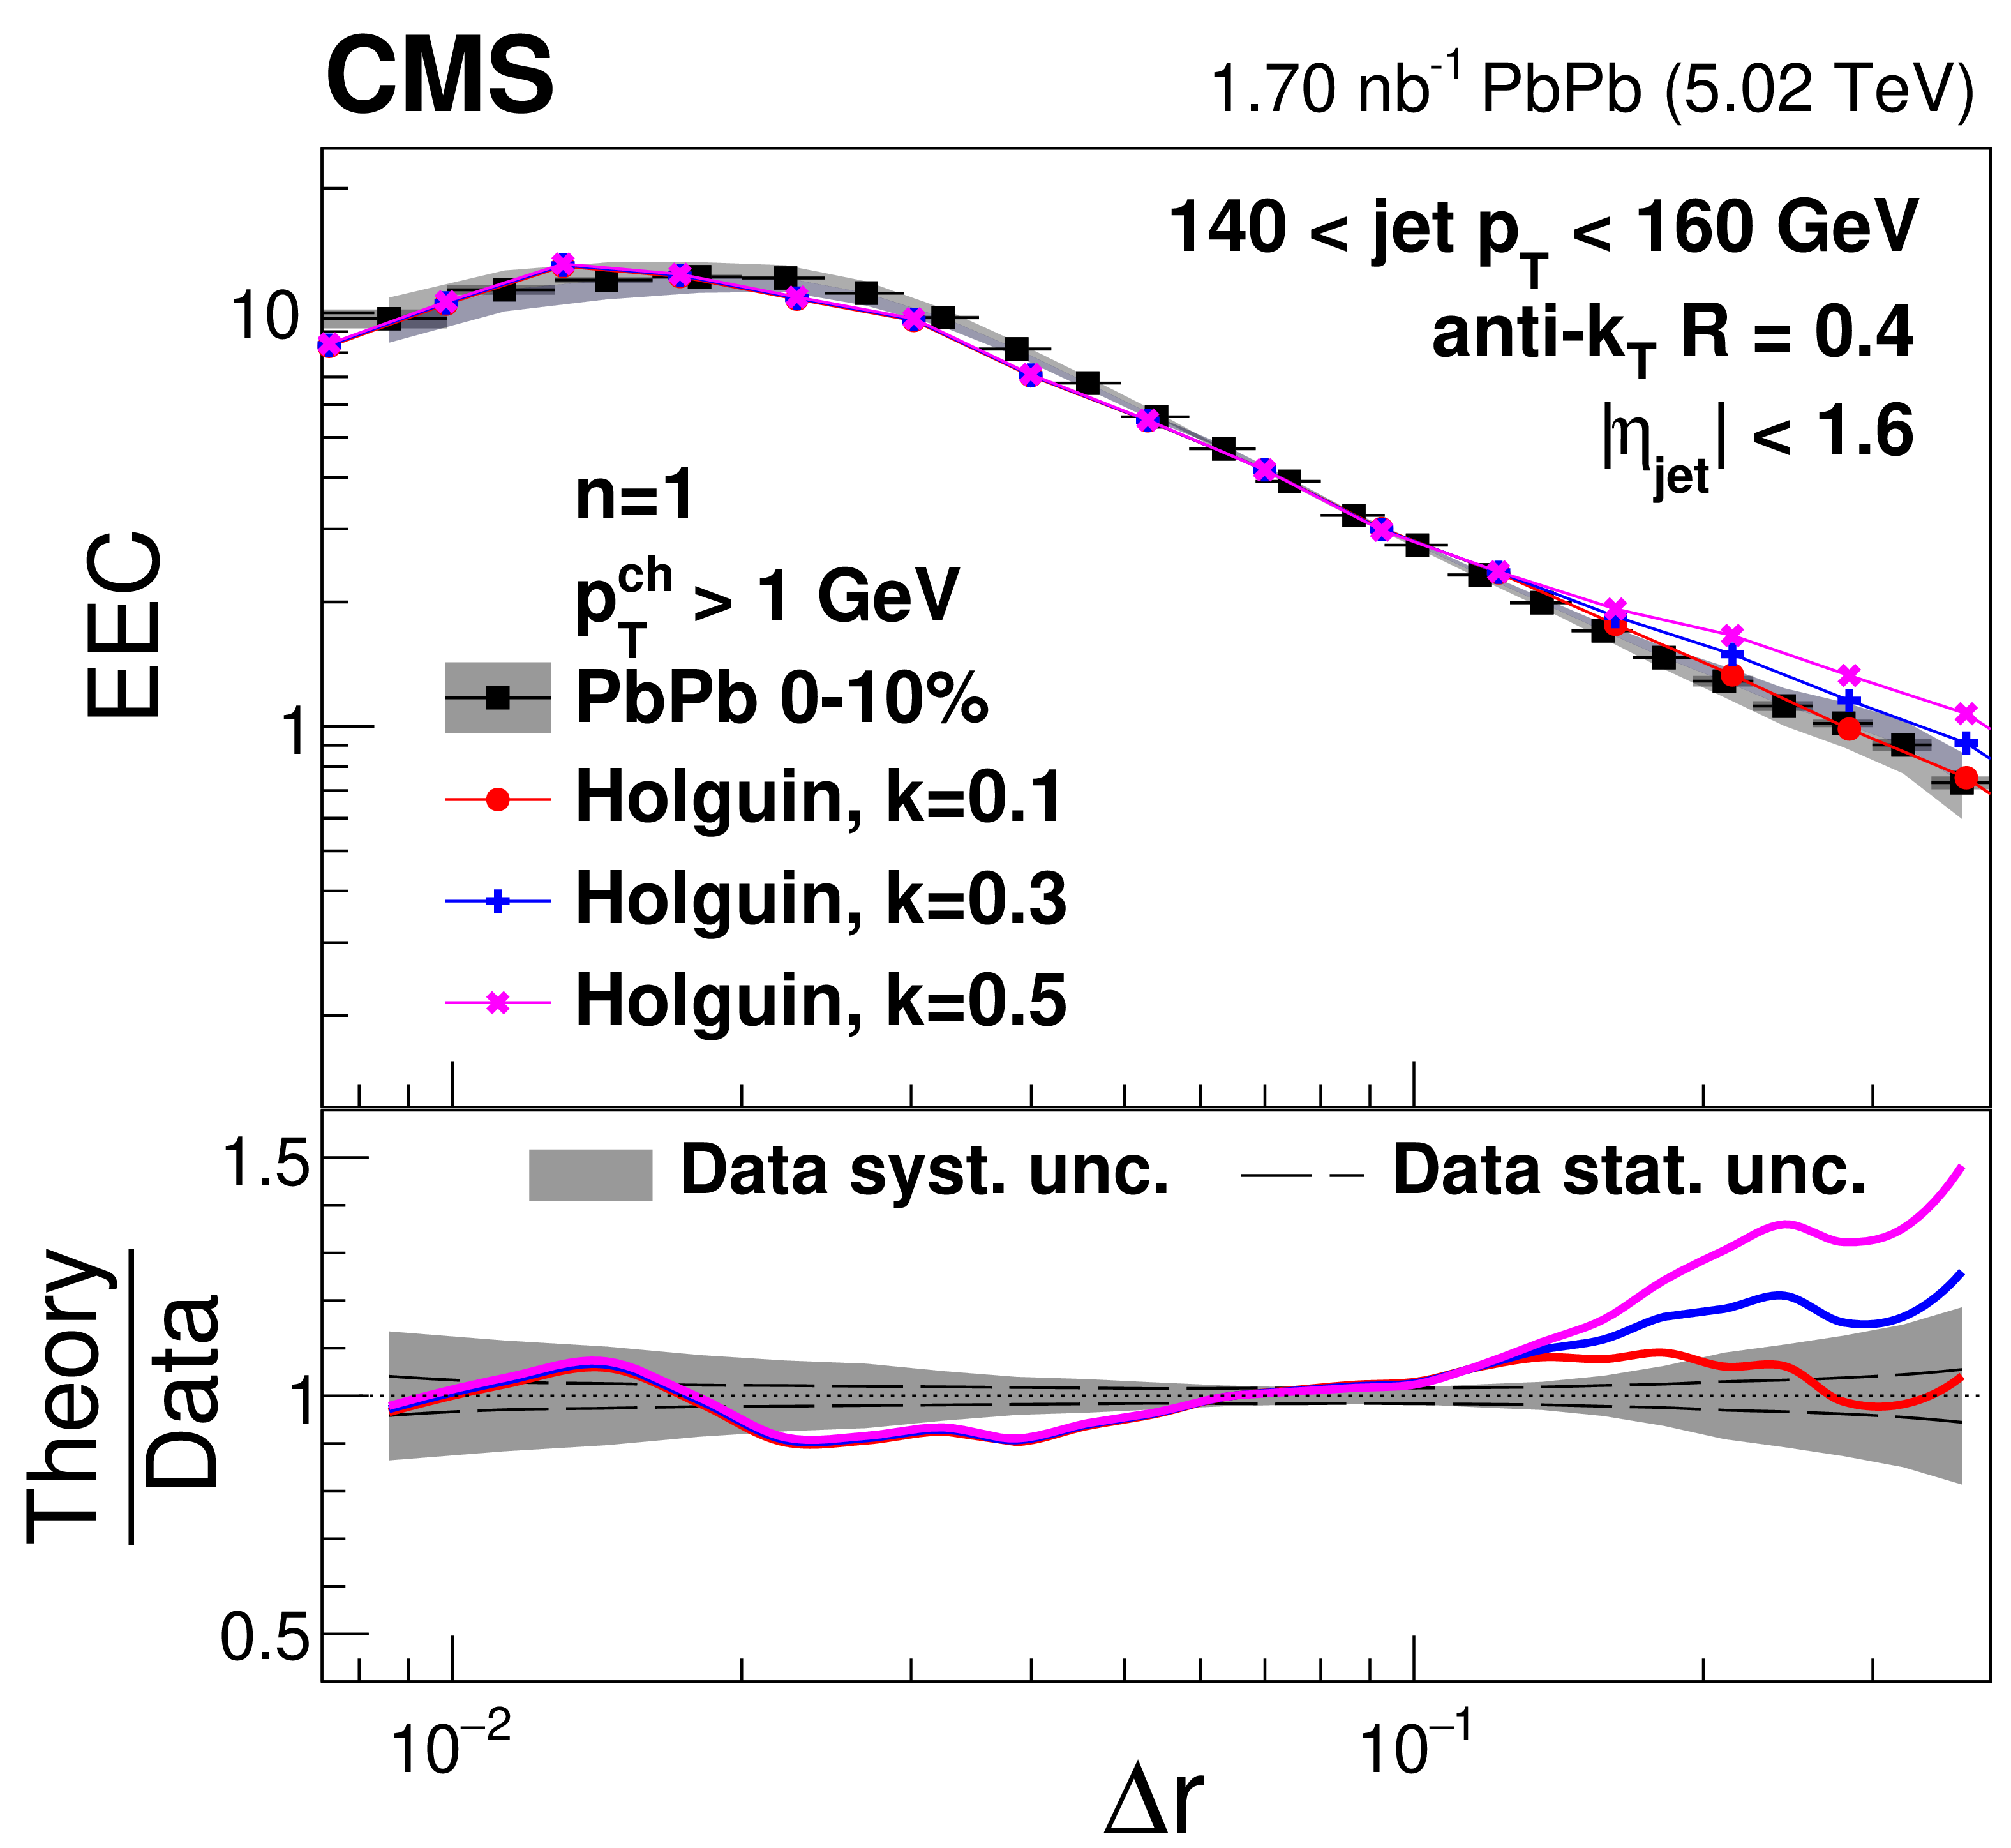
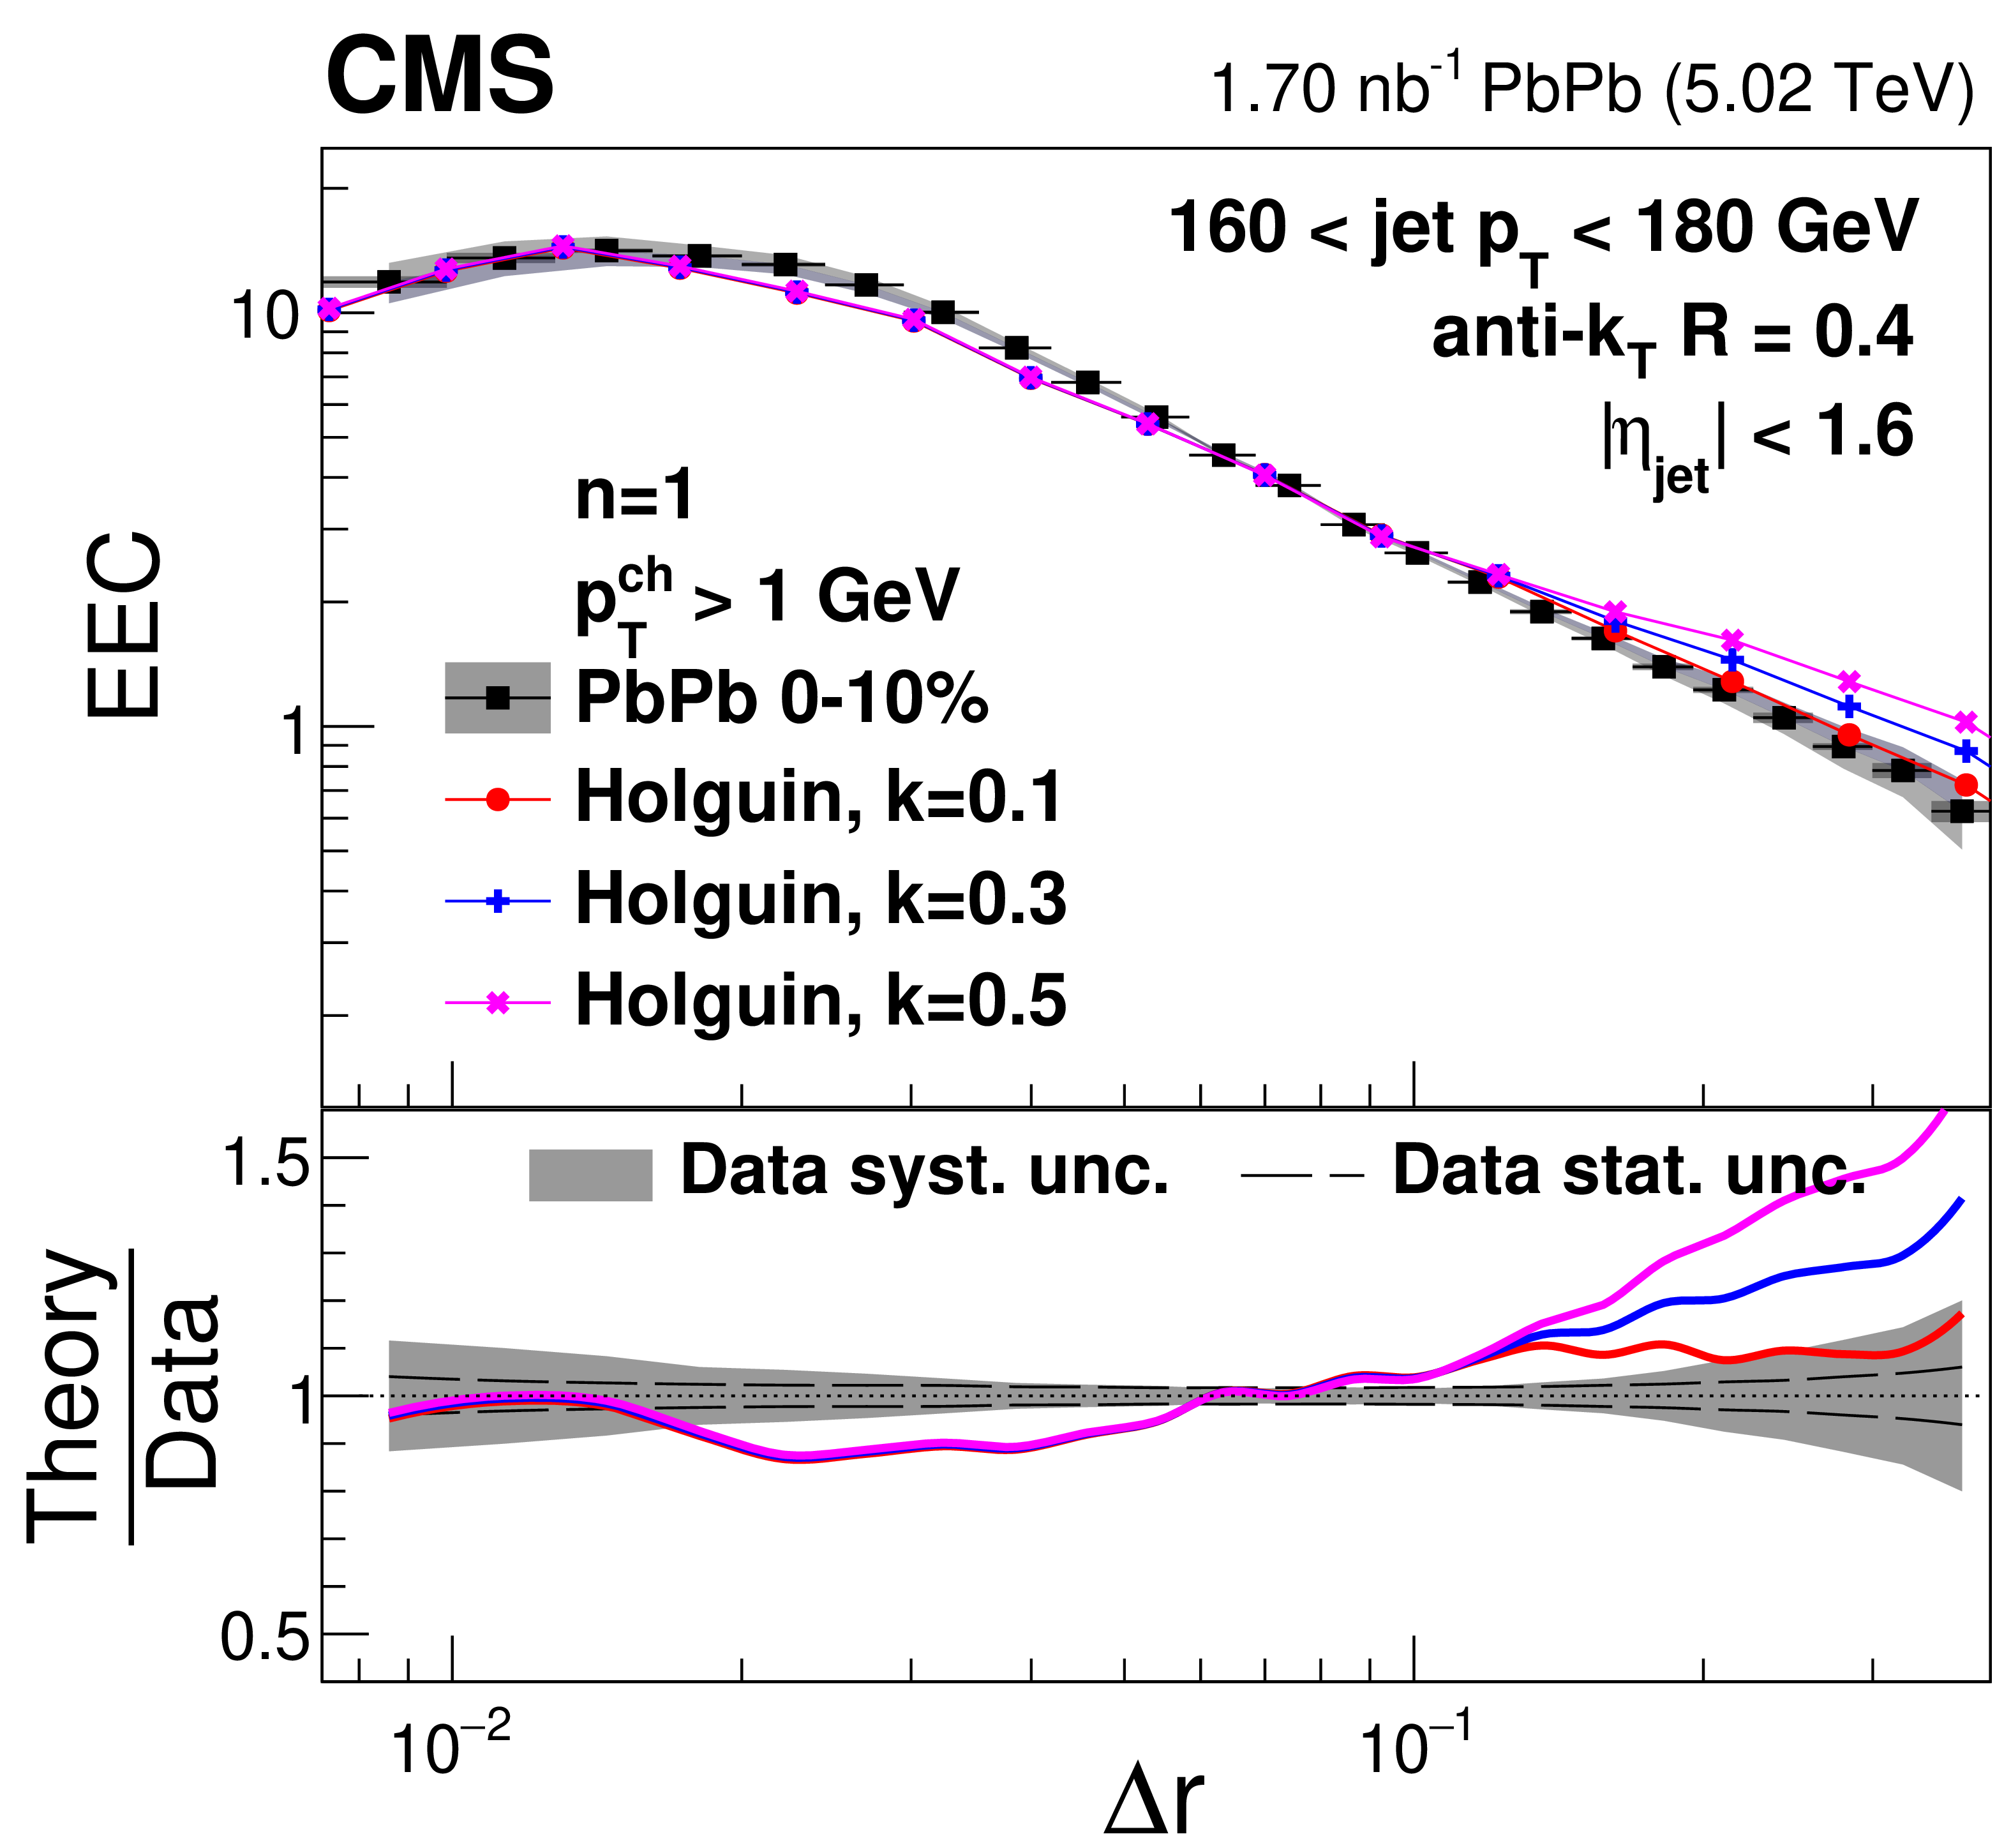
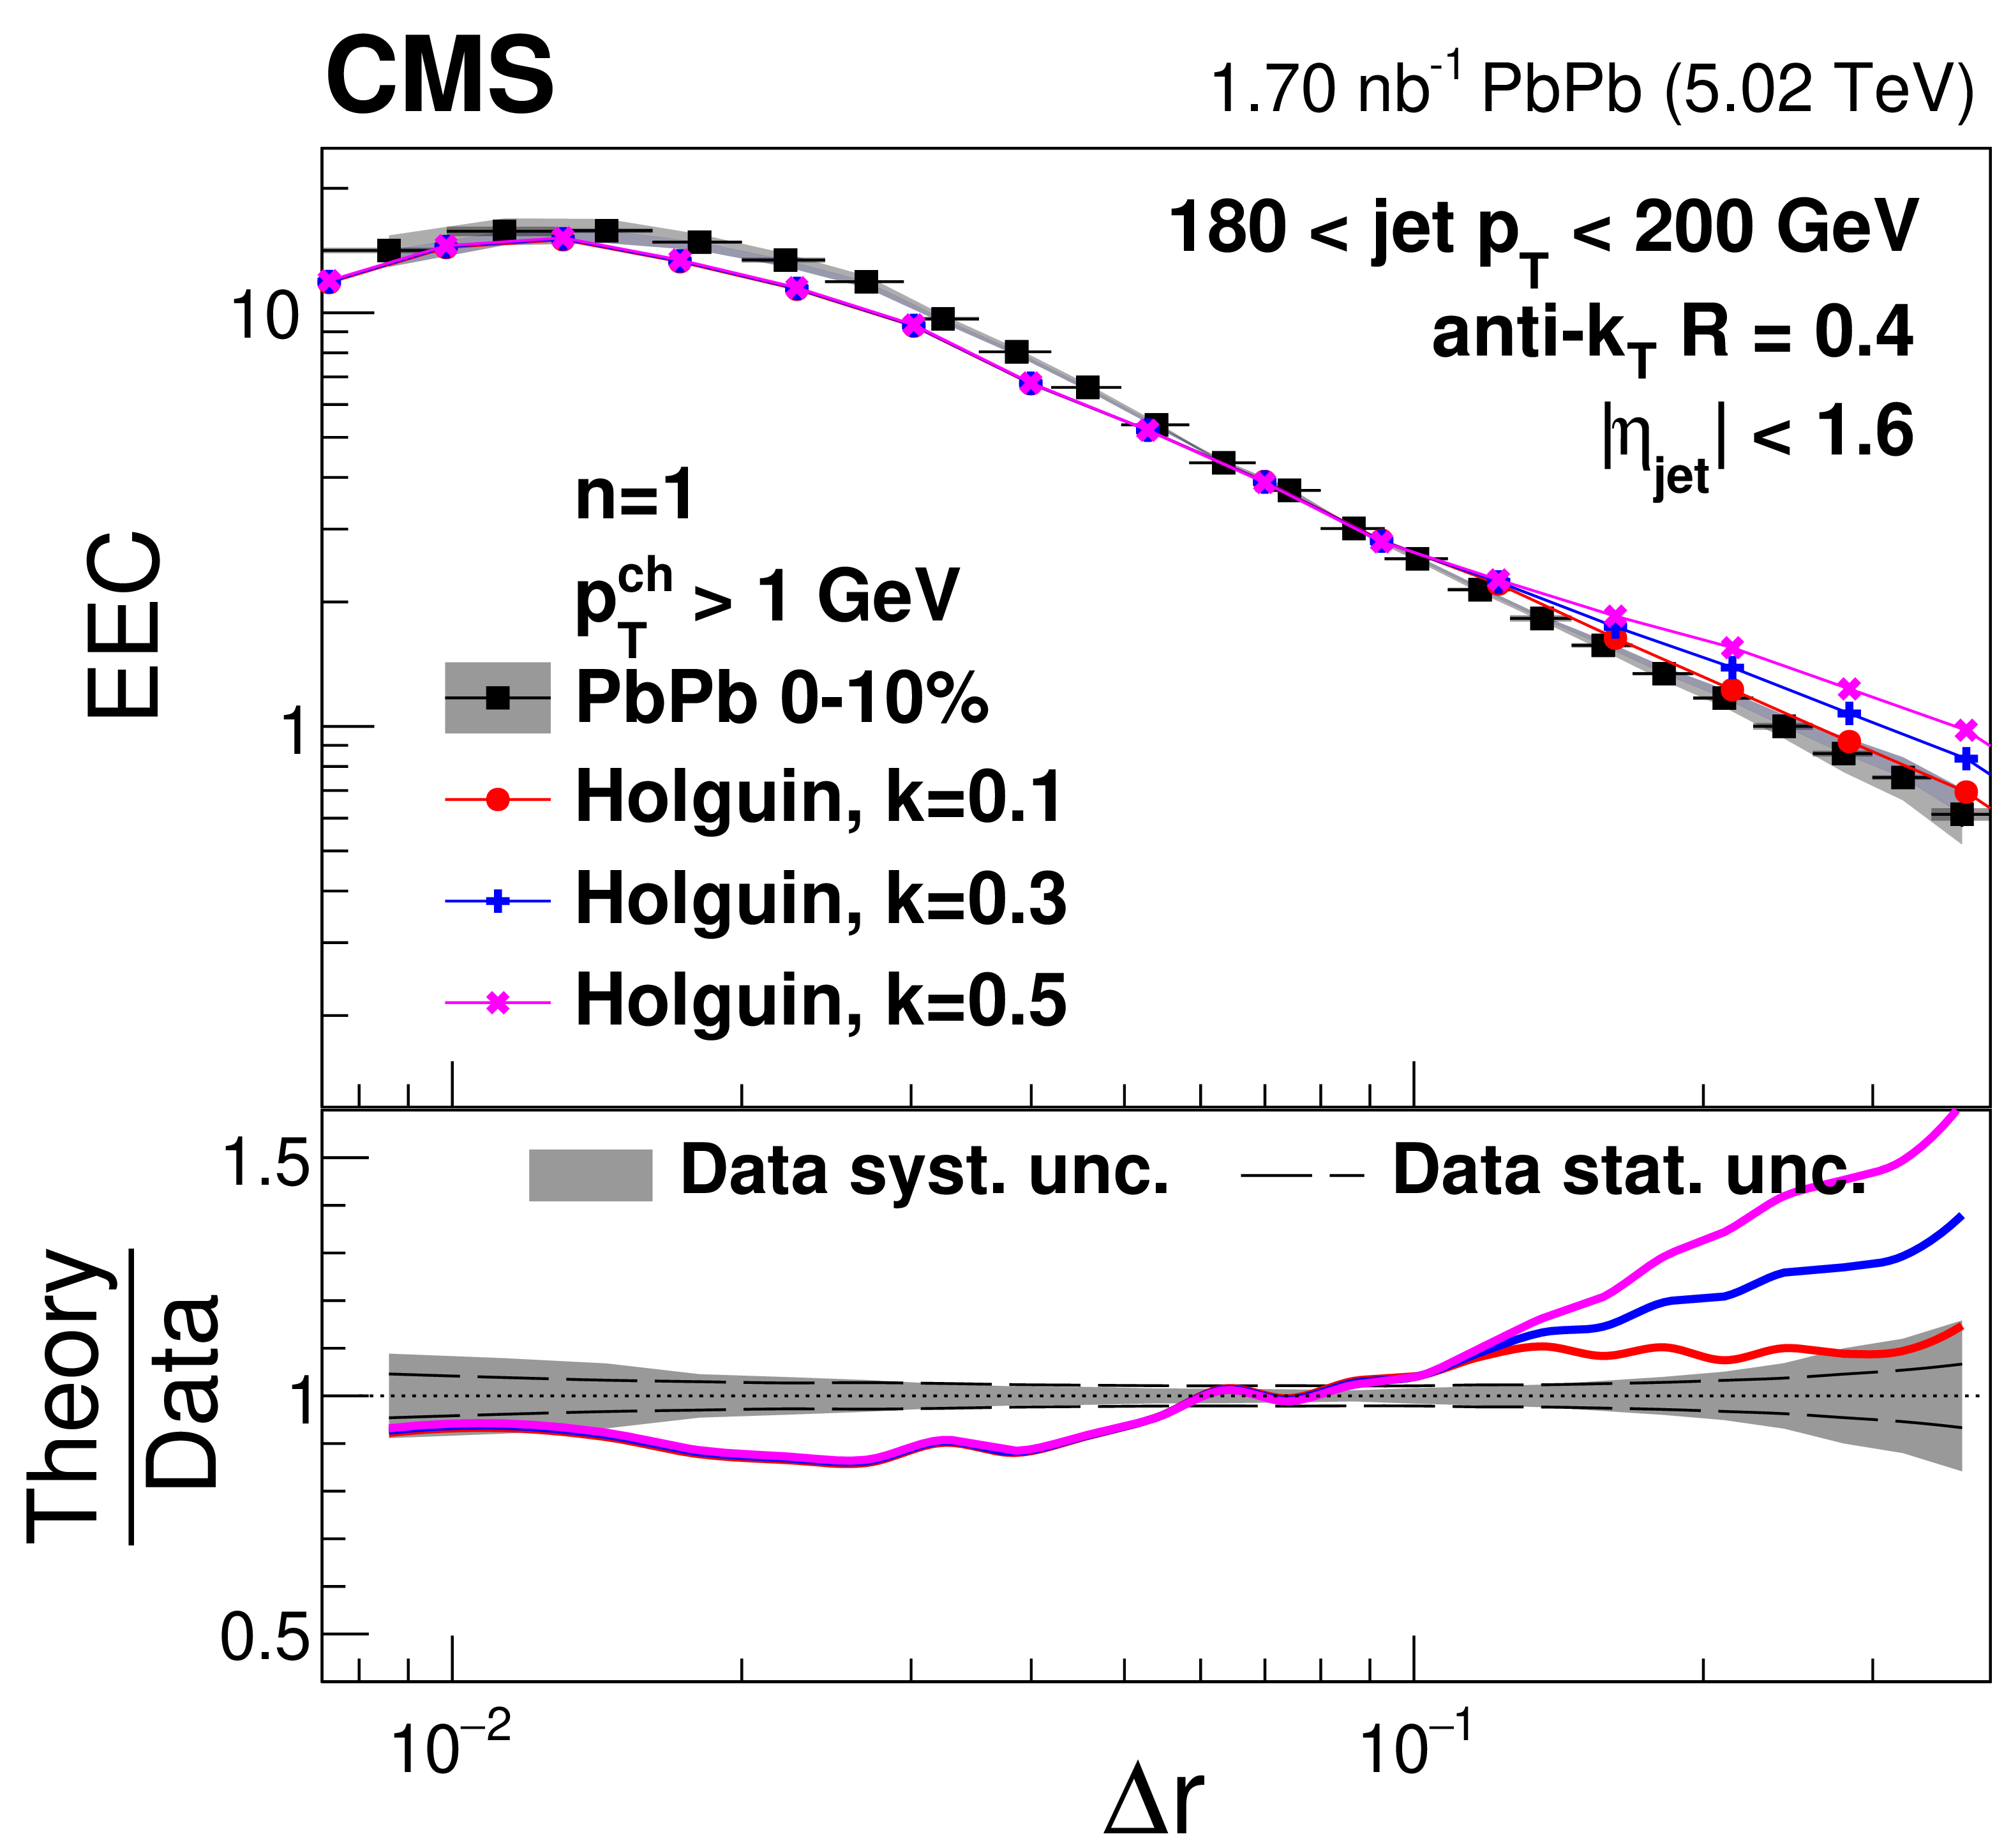
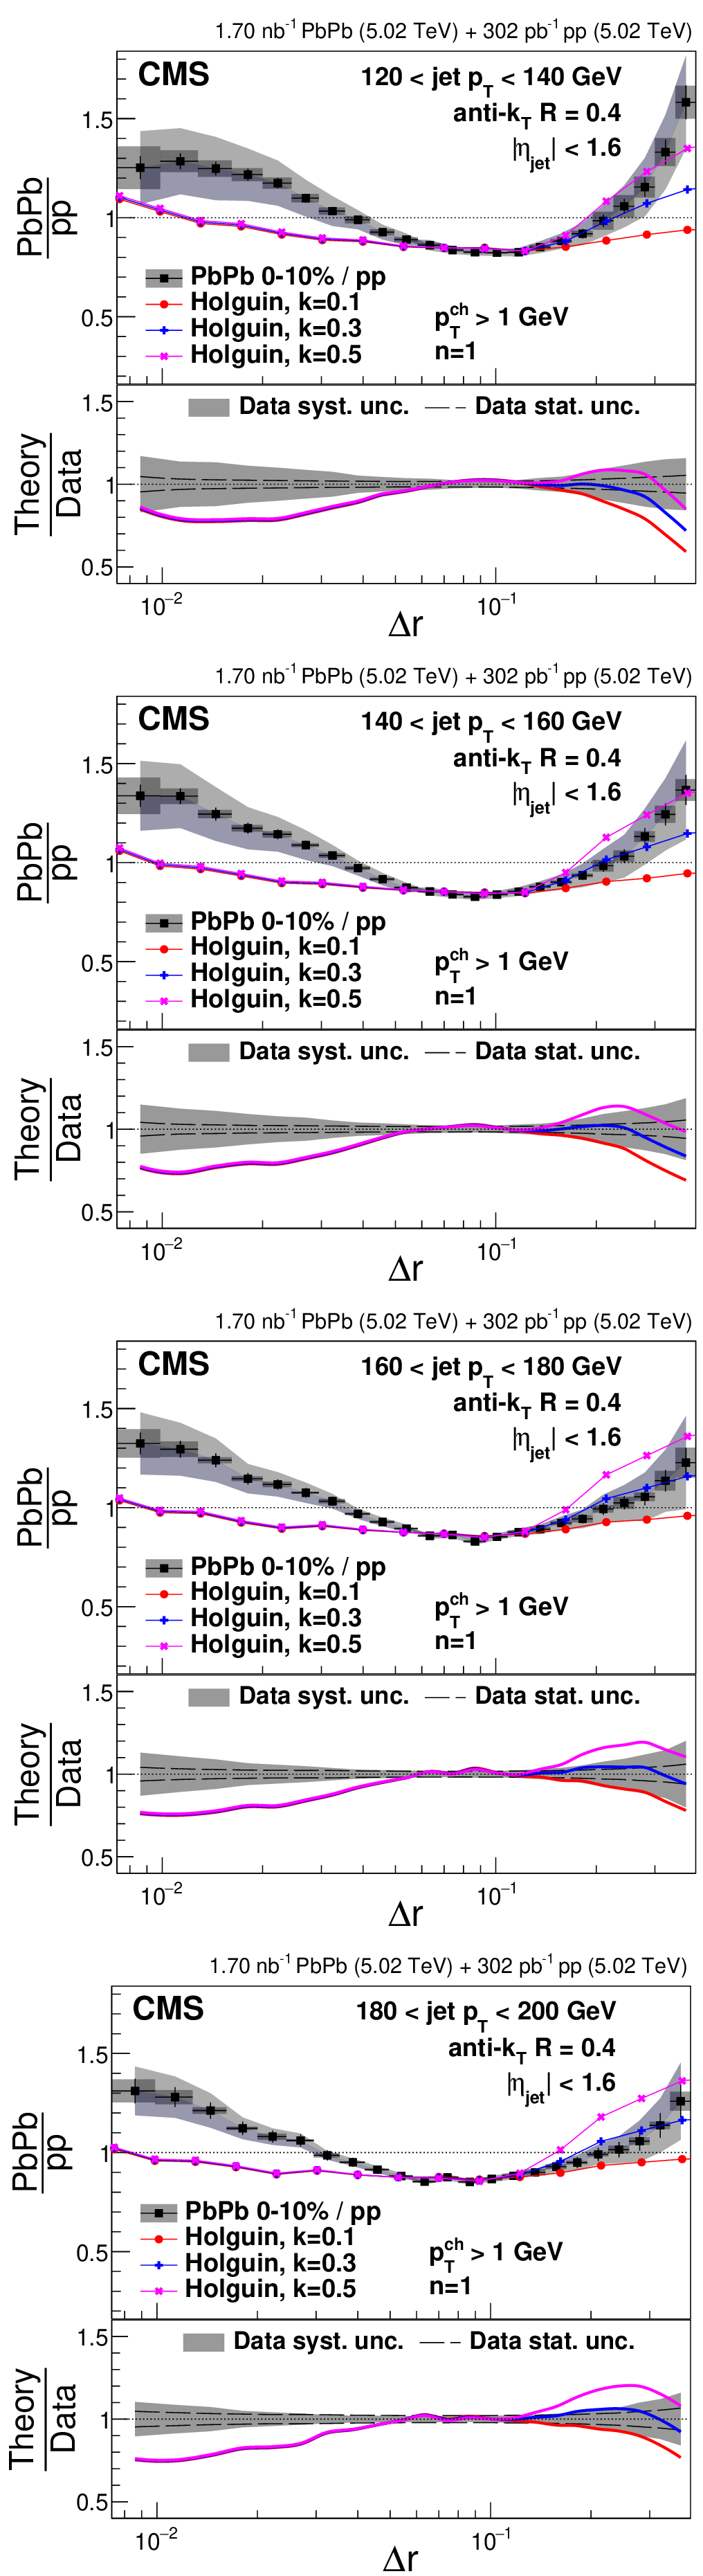
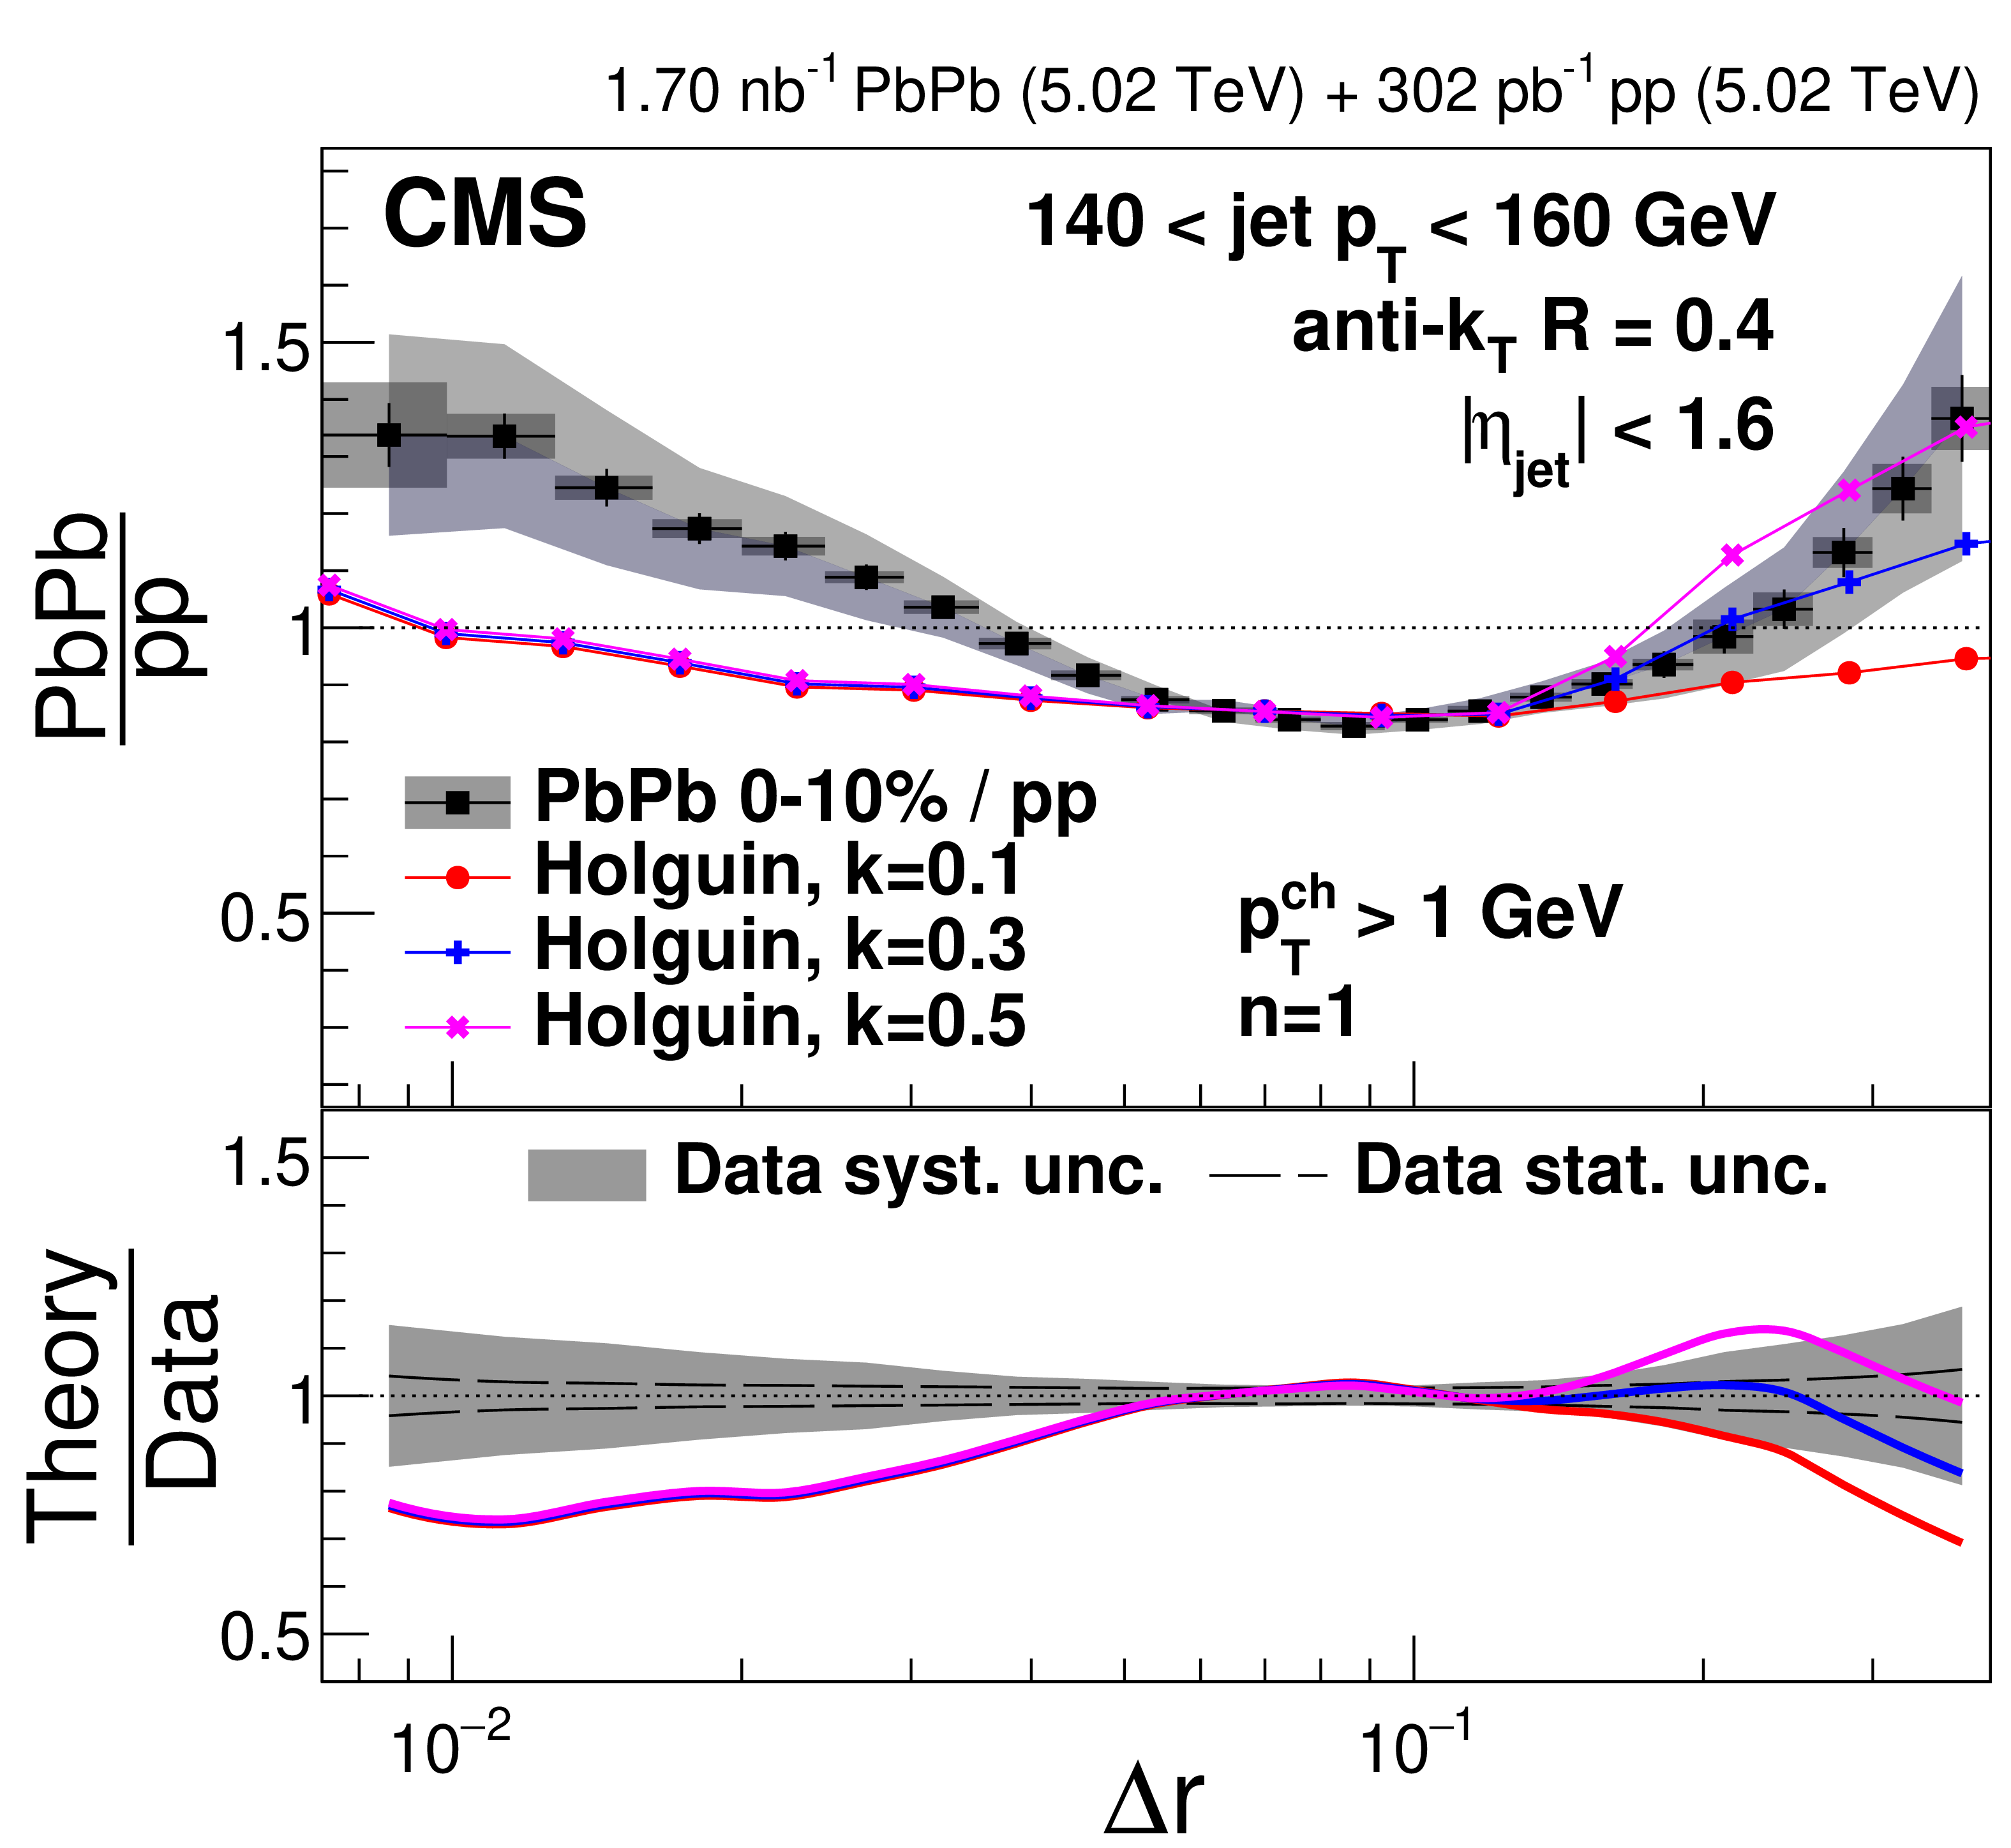
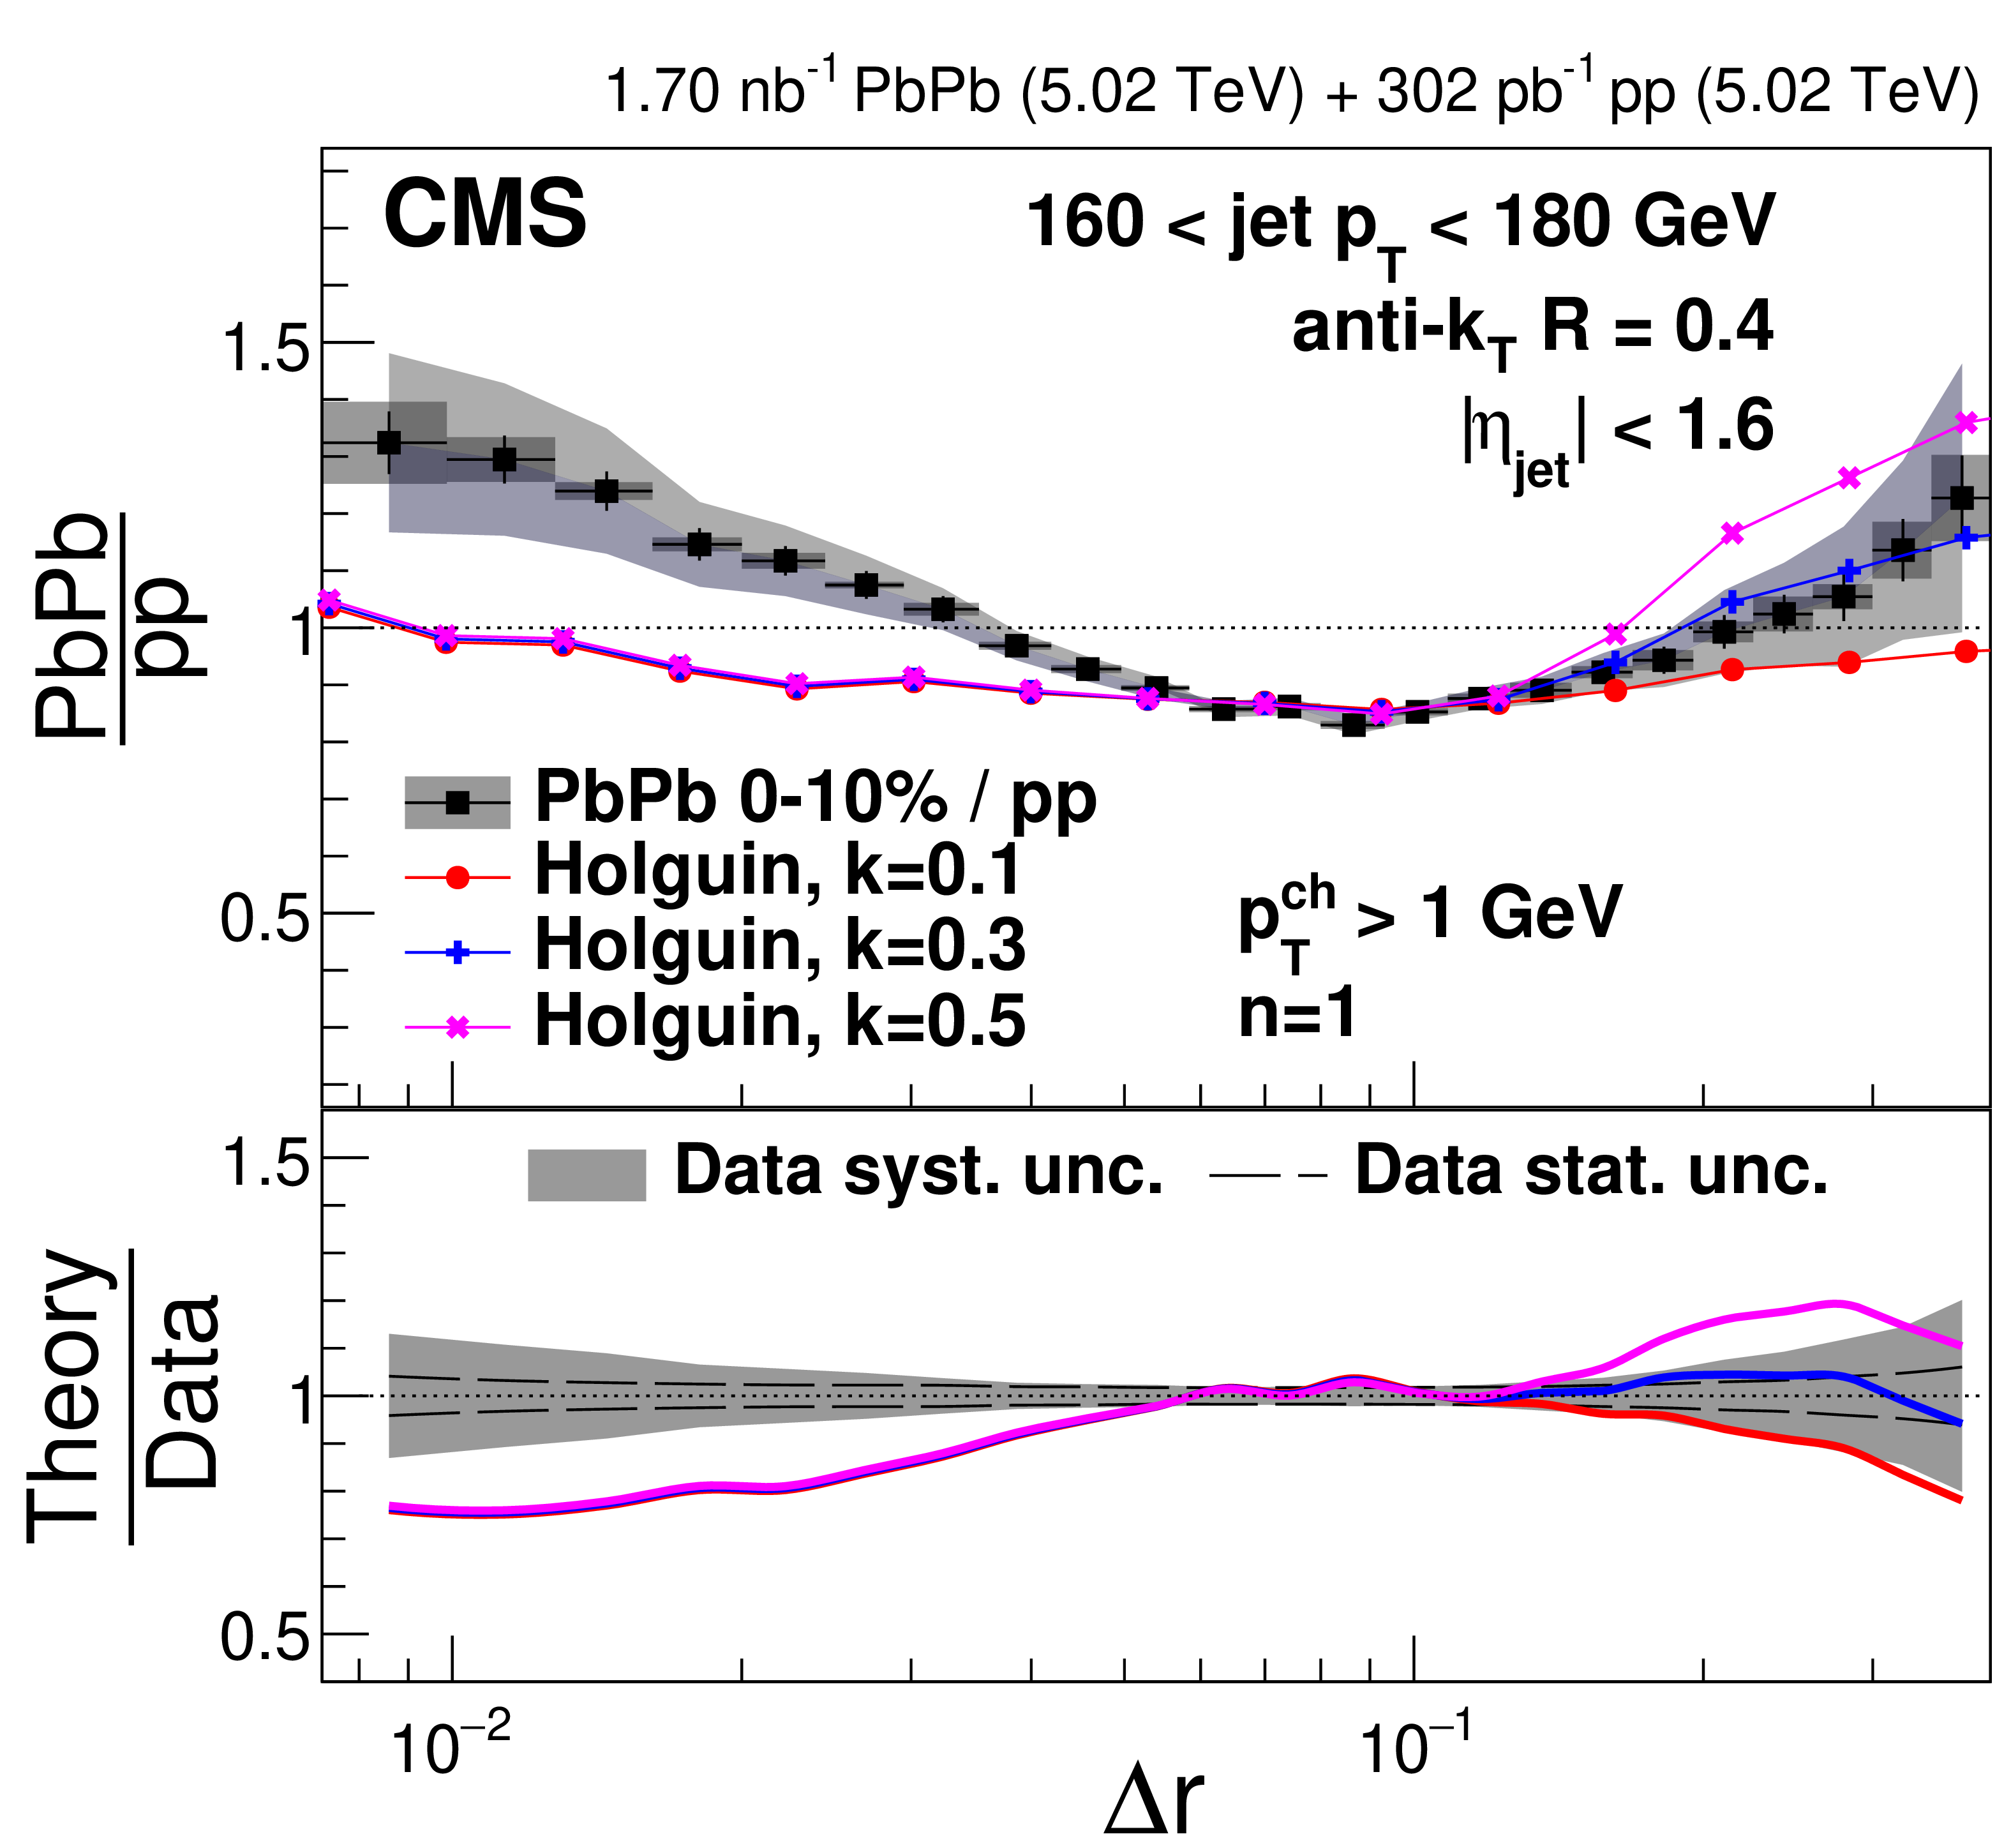
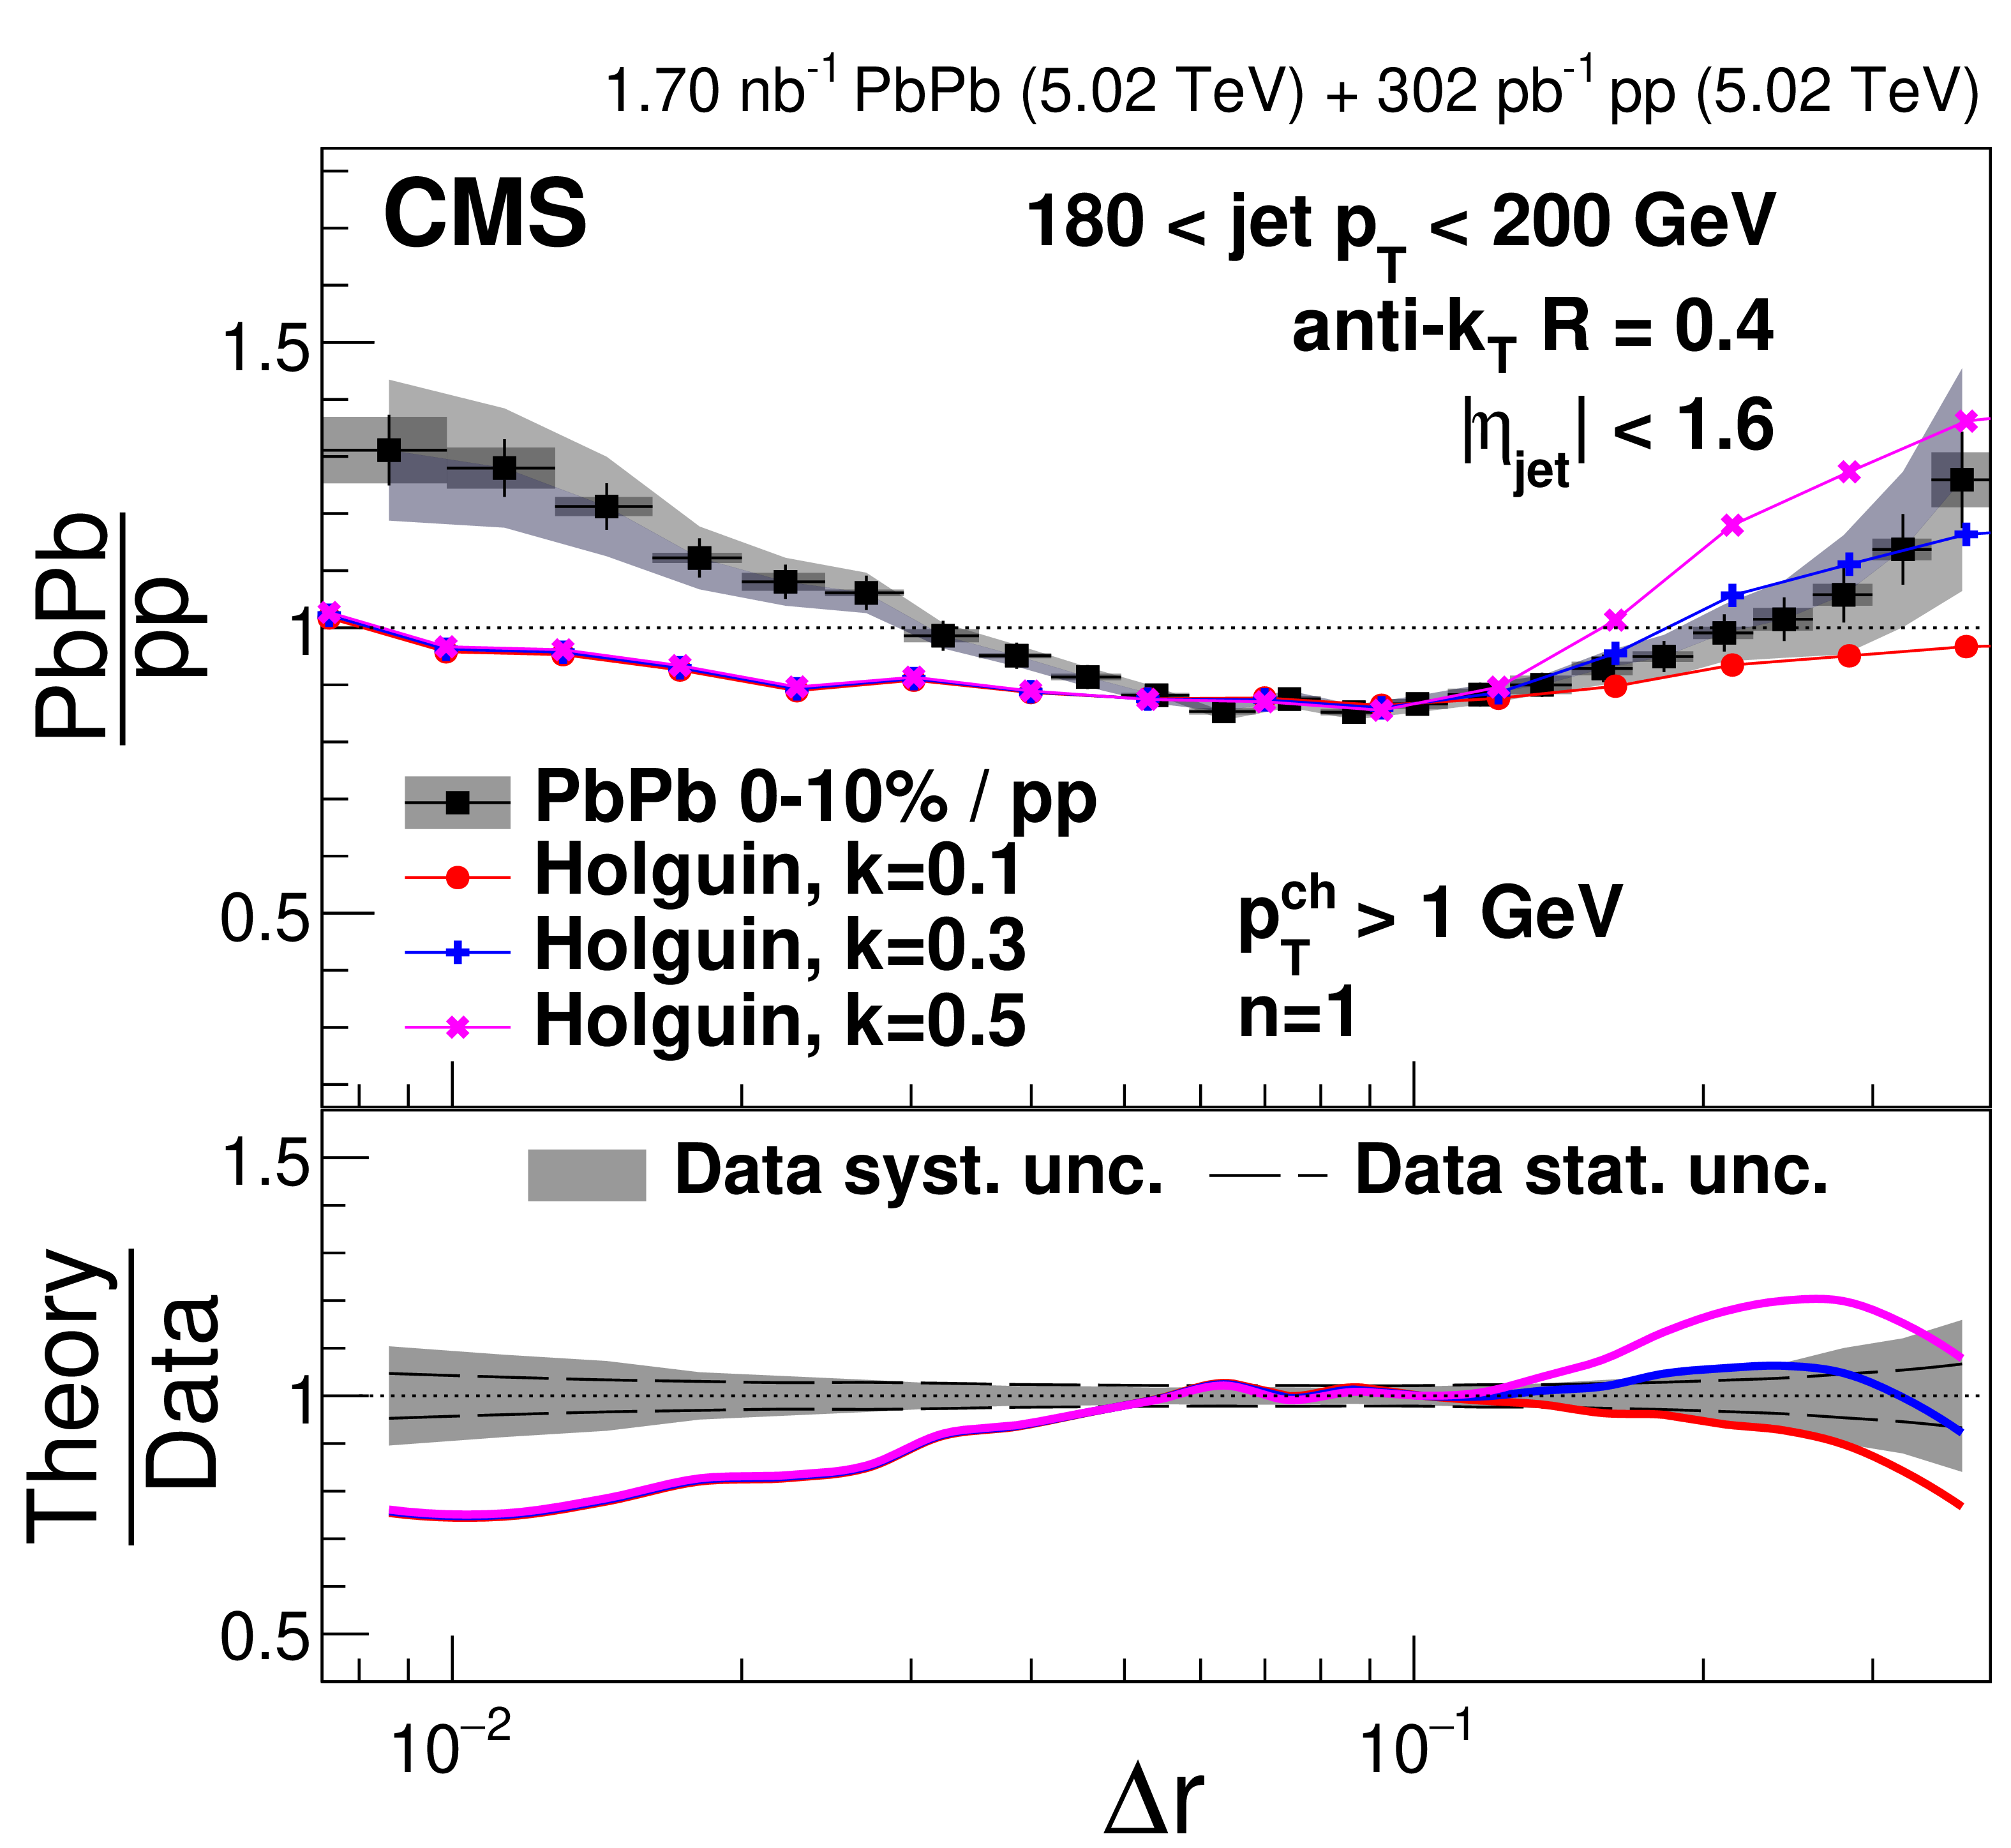
Energy-energy correlator distributions from 0-10% central PbPb collisions with $ n= $ 1 and $ p_{\mathrm{T}}^{\text{ch}} > $ 1 GeV in different $ p_{\text{T,jet}} $ bins compared to predictions from perturbative calculation from Holguin and collaborators with different values of the $ k $-parameter. |
png pdf |
Figure 23-a:
Energy-energy correlator distributions from 0-10% central PbPb collisions with $ n= $ 1 and $ p_{\mathrm{T}}^{\text{ch}} > $ 1 GeV in different $ p_{\text{T,jet}} $ bins compared to predictions from perturbative calculation from Holguin and collaborators with different values of the $ k $-parameter. |
png pdf |
Figure 23-b:
Energy-energy correlator distributions from 0-10% central PbPb collisions with $ n= $ 1 and $ p_{\mathrm{T}}^{\text{ch}} > $ 1 GeV in different $ p_{\text{T,jet}} $ bins compared to predictions from perturbative calculation from Holguin and collaborators with different values of the $ k $-parameter. |
png pdf |
Figure 23-c:
Energy-energy correlator distributions from 0-10% central PbPb collisions with $ n= $ 1 and $ p_{\mathrm{T}}^{\text{ch}} > $ 1 GeV in different $ p_{\text{T,jet}} $ bins compared to predictions from perturbative calculation from Holguin and collaborators with different values of the $ k $-parameter. |
png pdf |
Figure 23-d:
Energy-energy correlator distributions from 0-10% central PbPb collisions with $ n= $ 1 and $ p_{\mathrm{T}}^{\text{ch}} > $ 1 GeV in different $ p_{\text{T,jet}} $ bins compared to predictions from perturbative calculation from Holguin and collaborators with different values of the $ k $-parameter. |
png pdf |
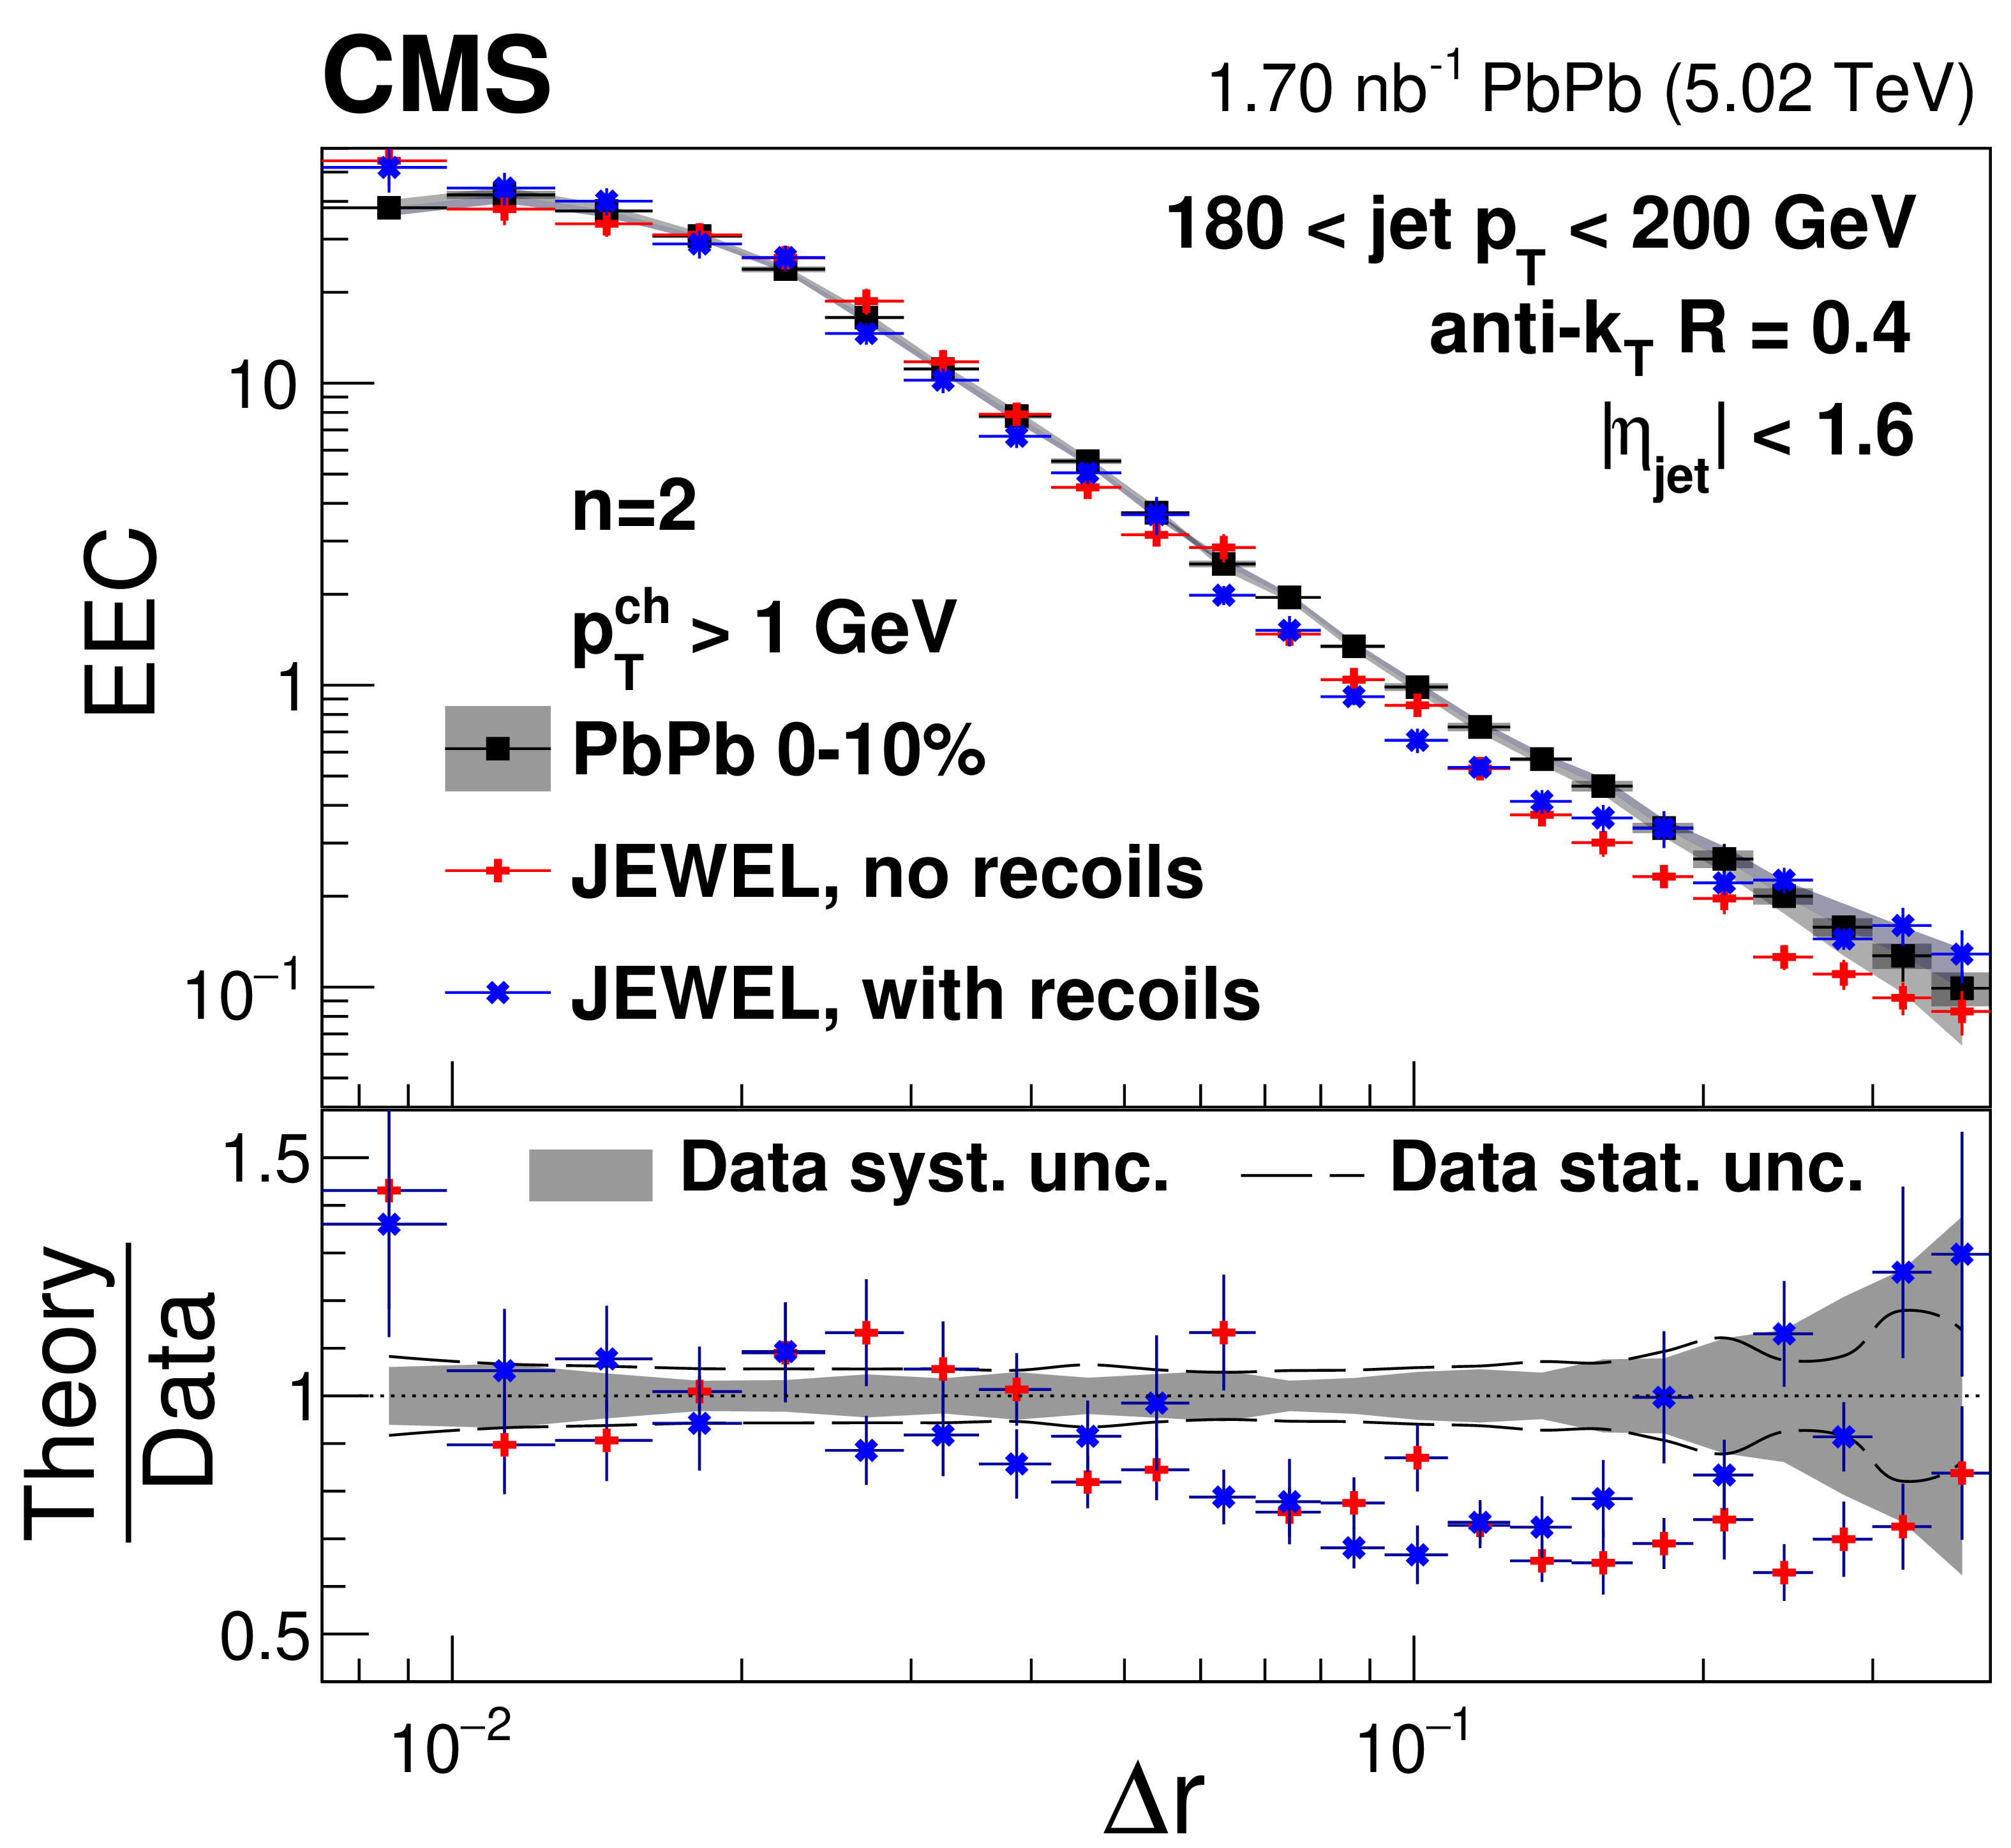
Figure 24:
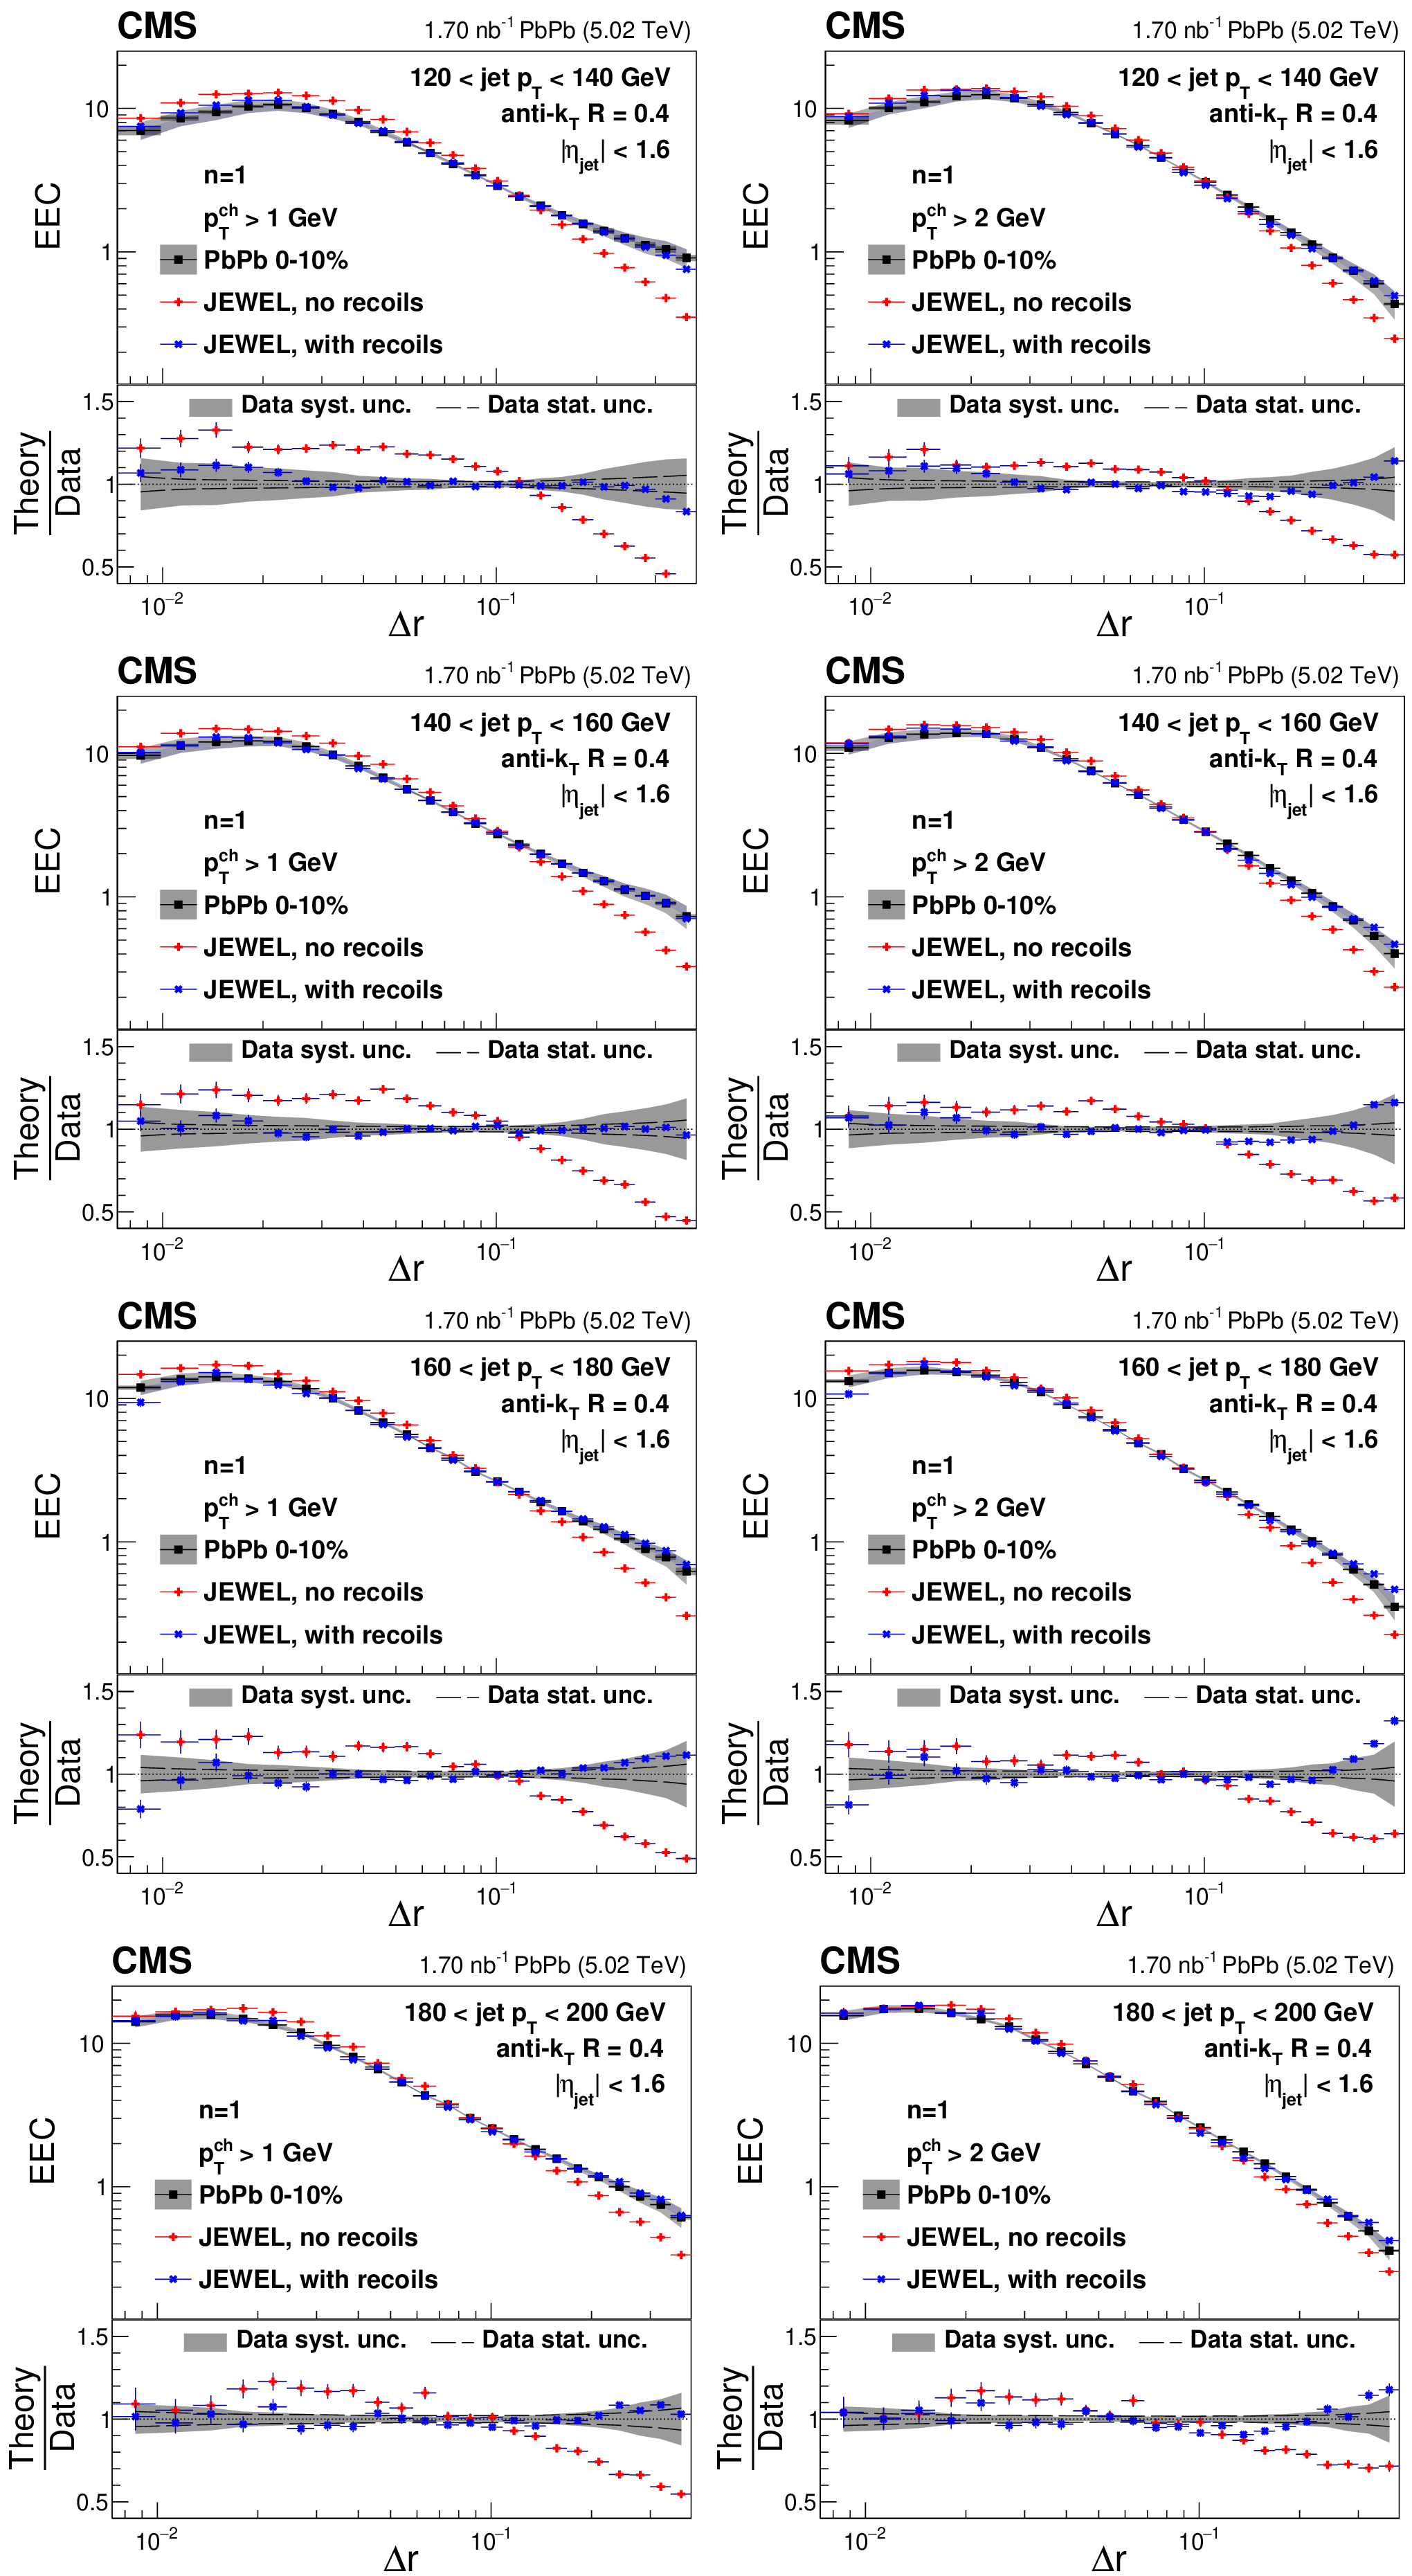
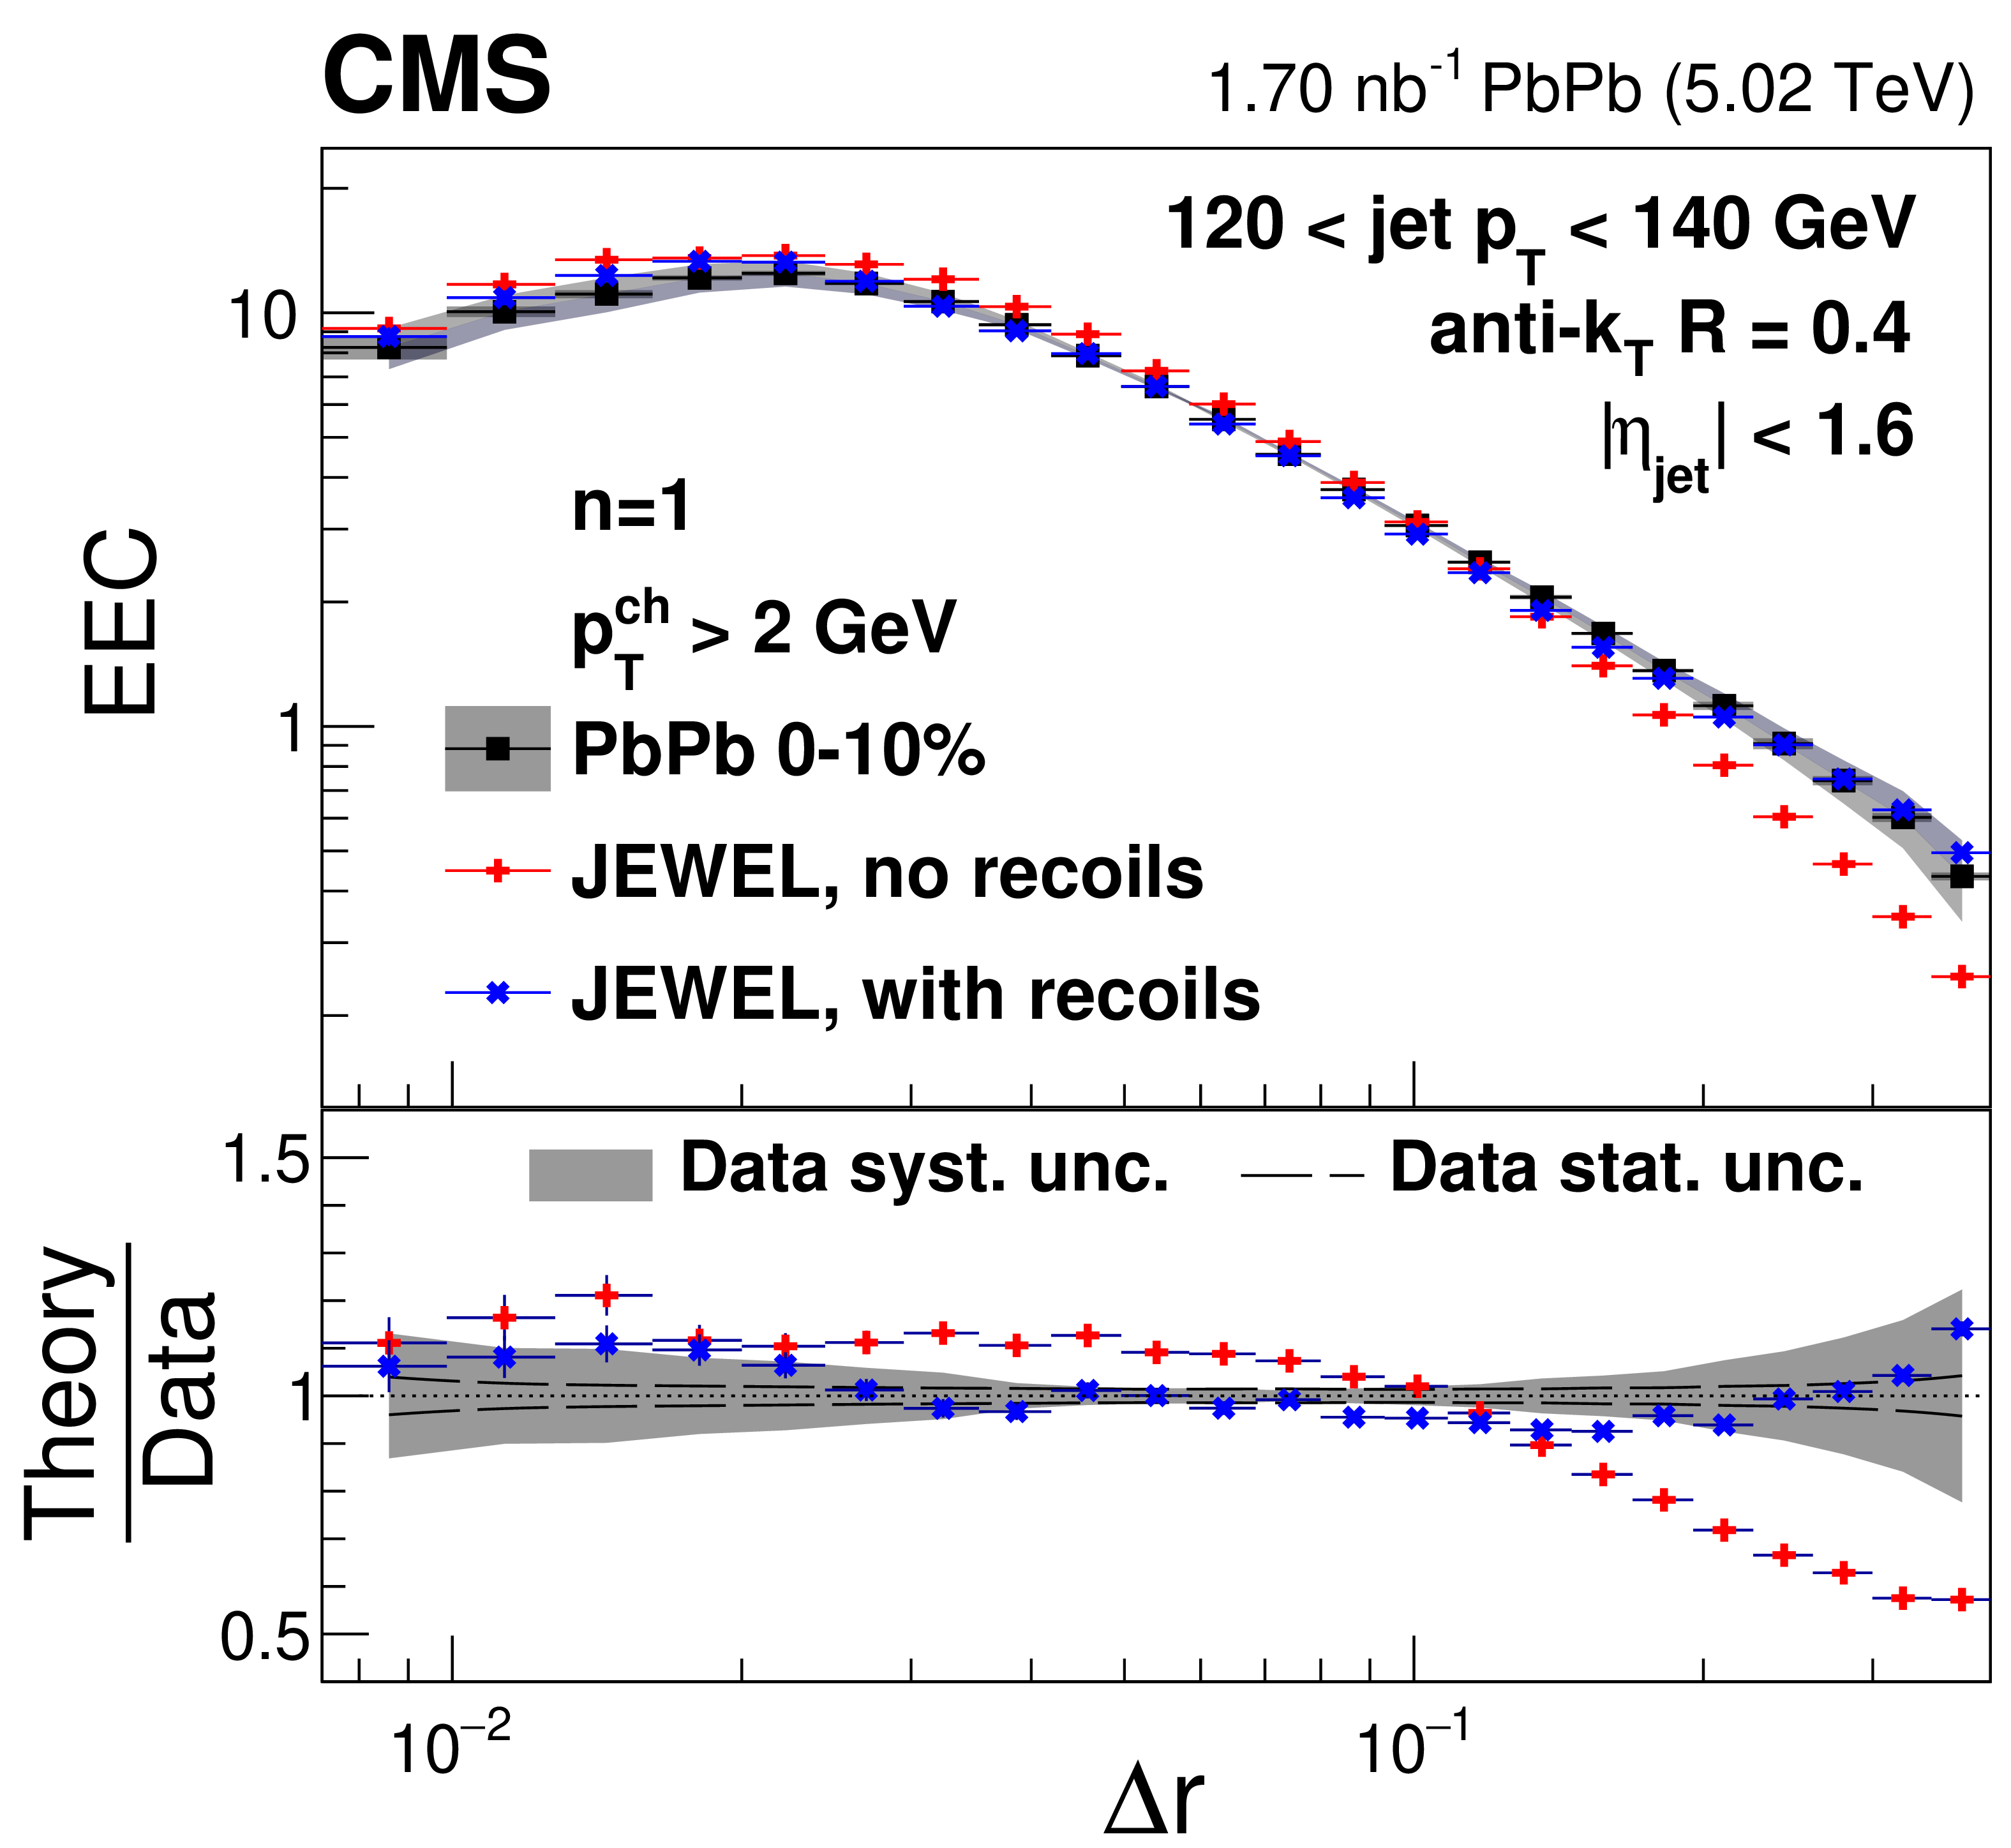
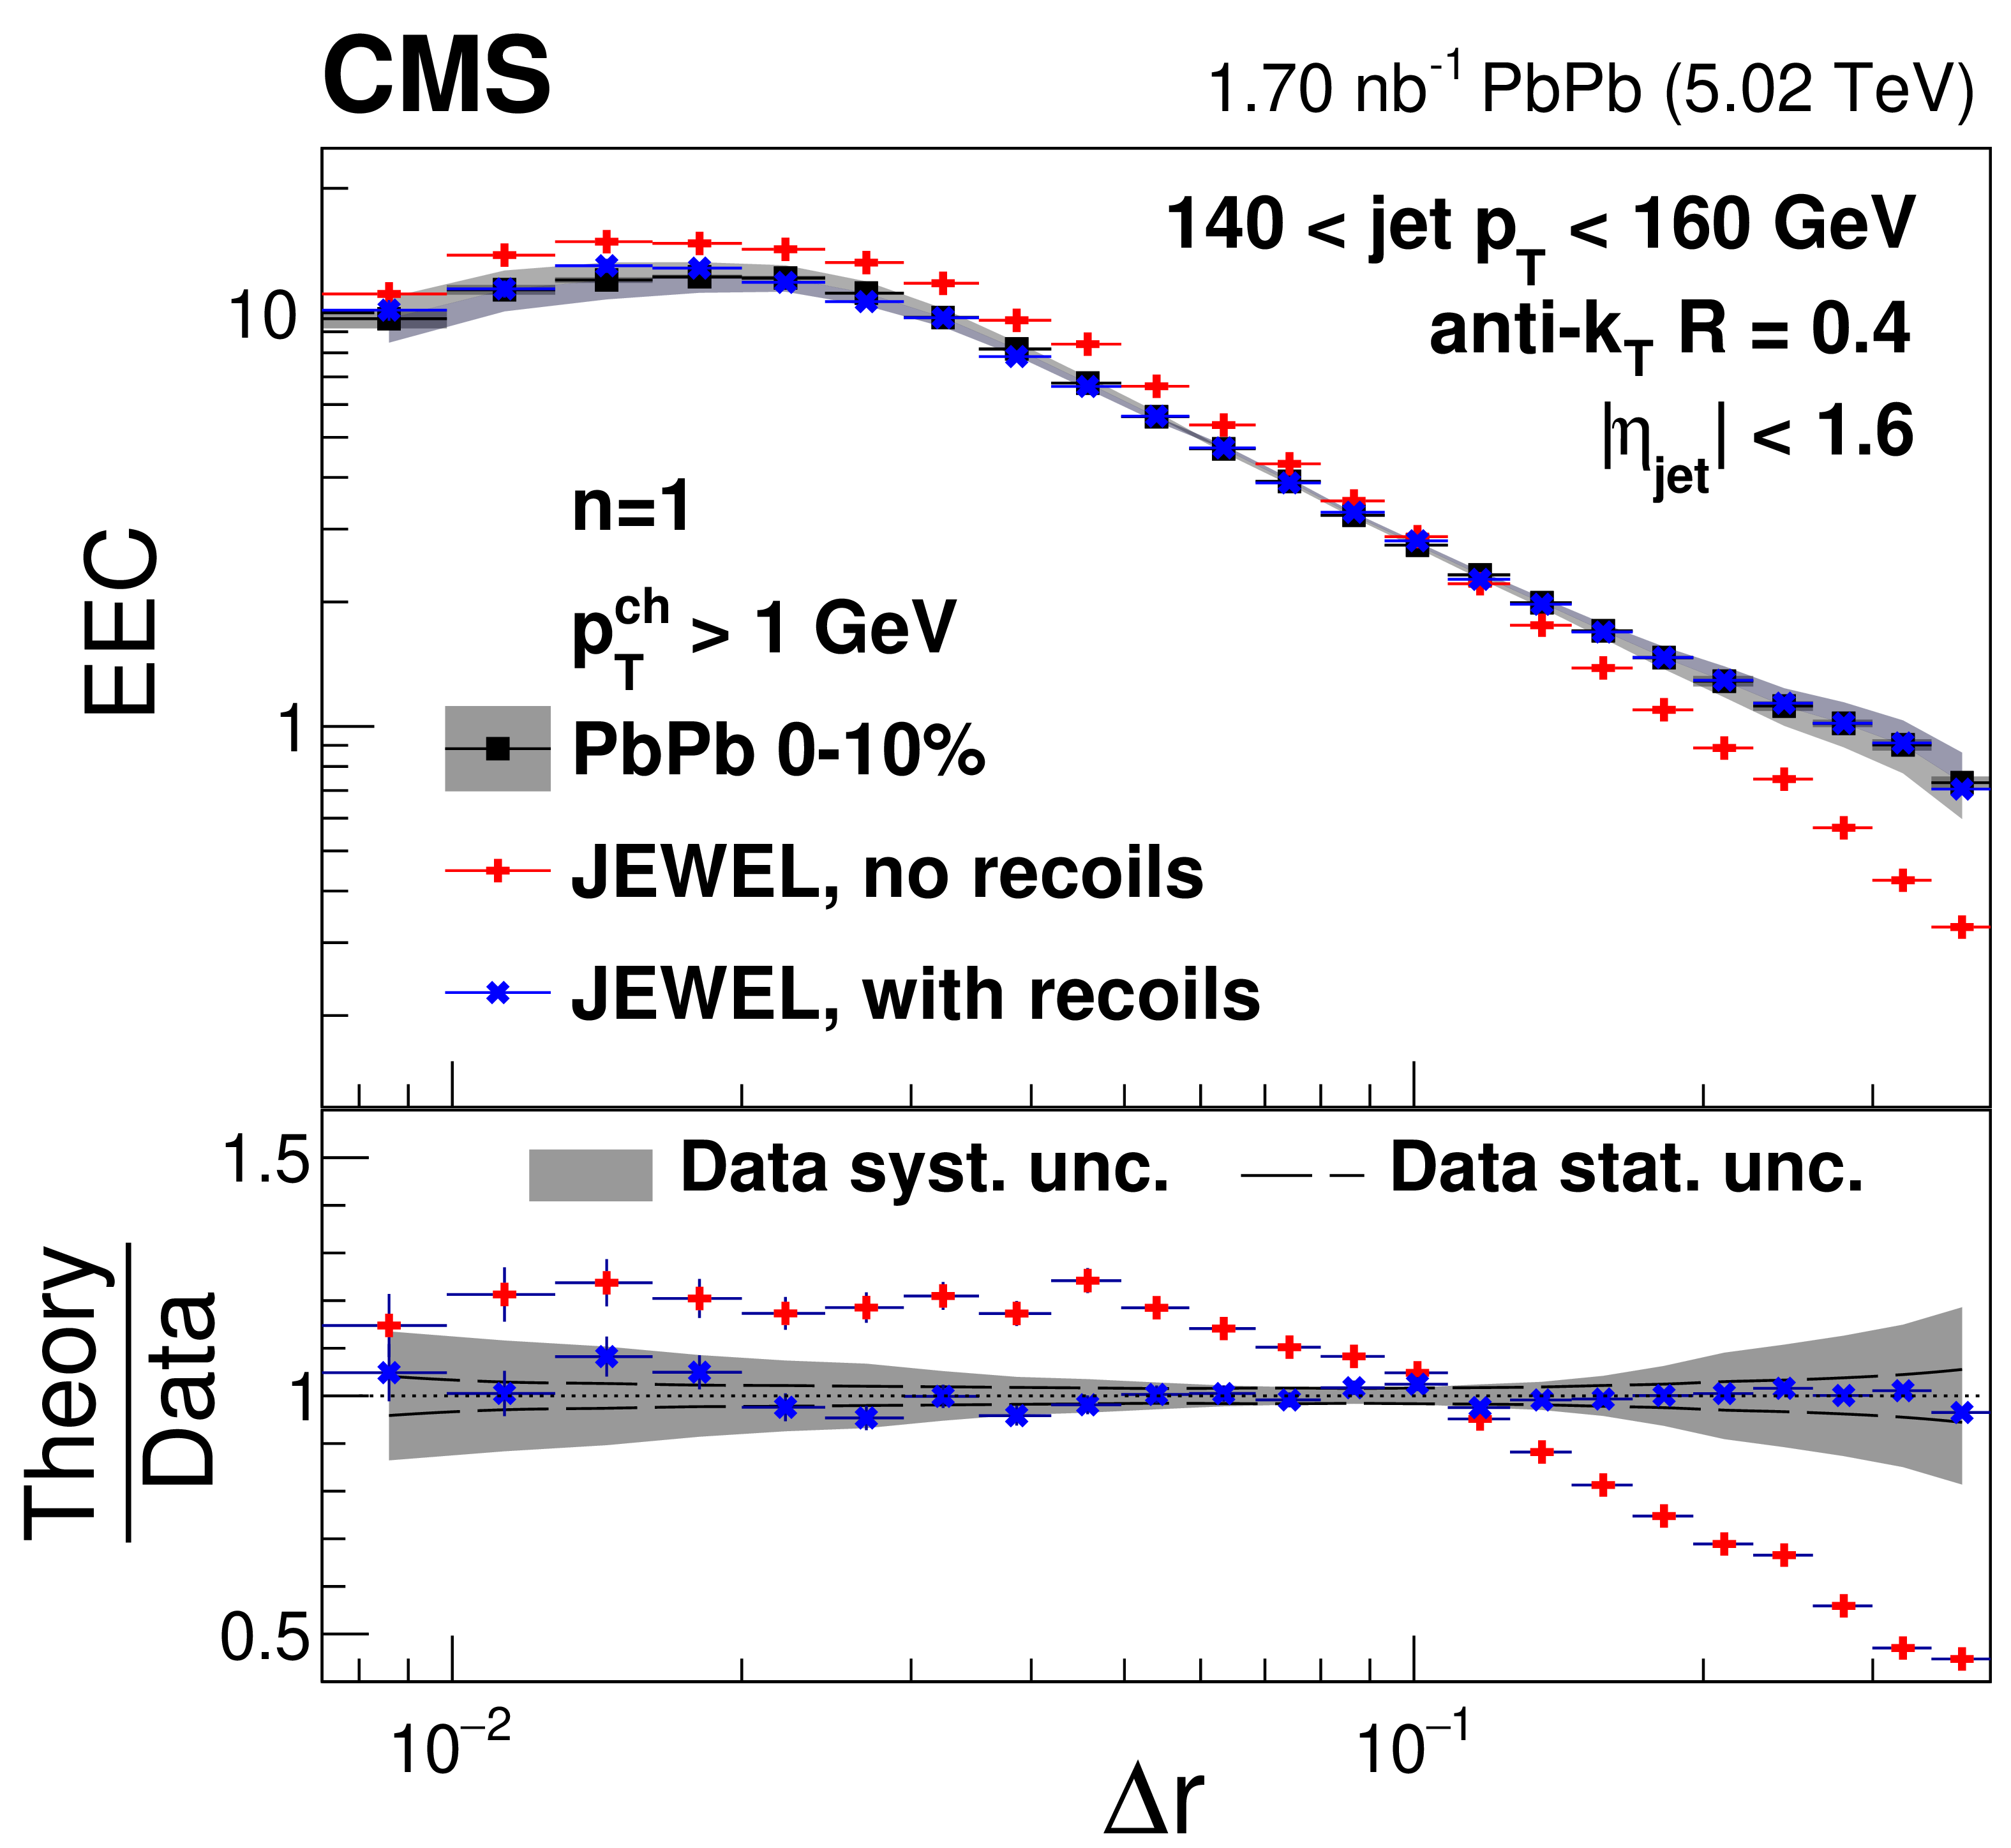
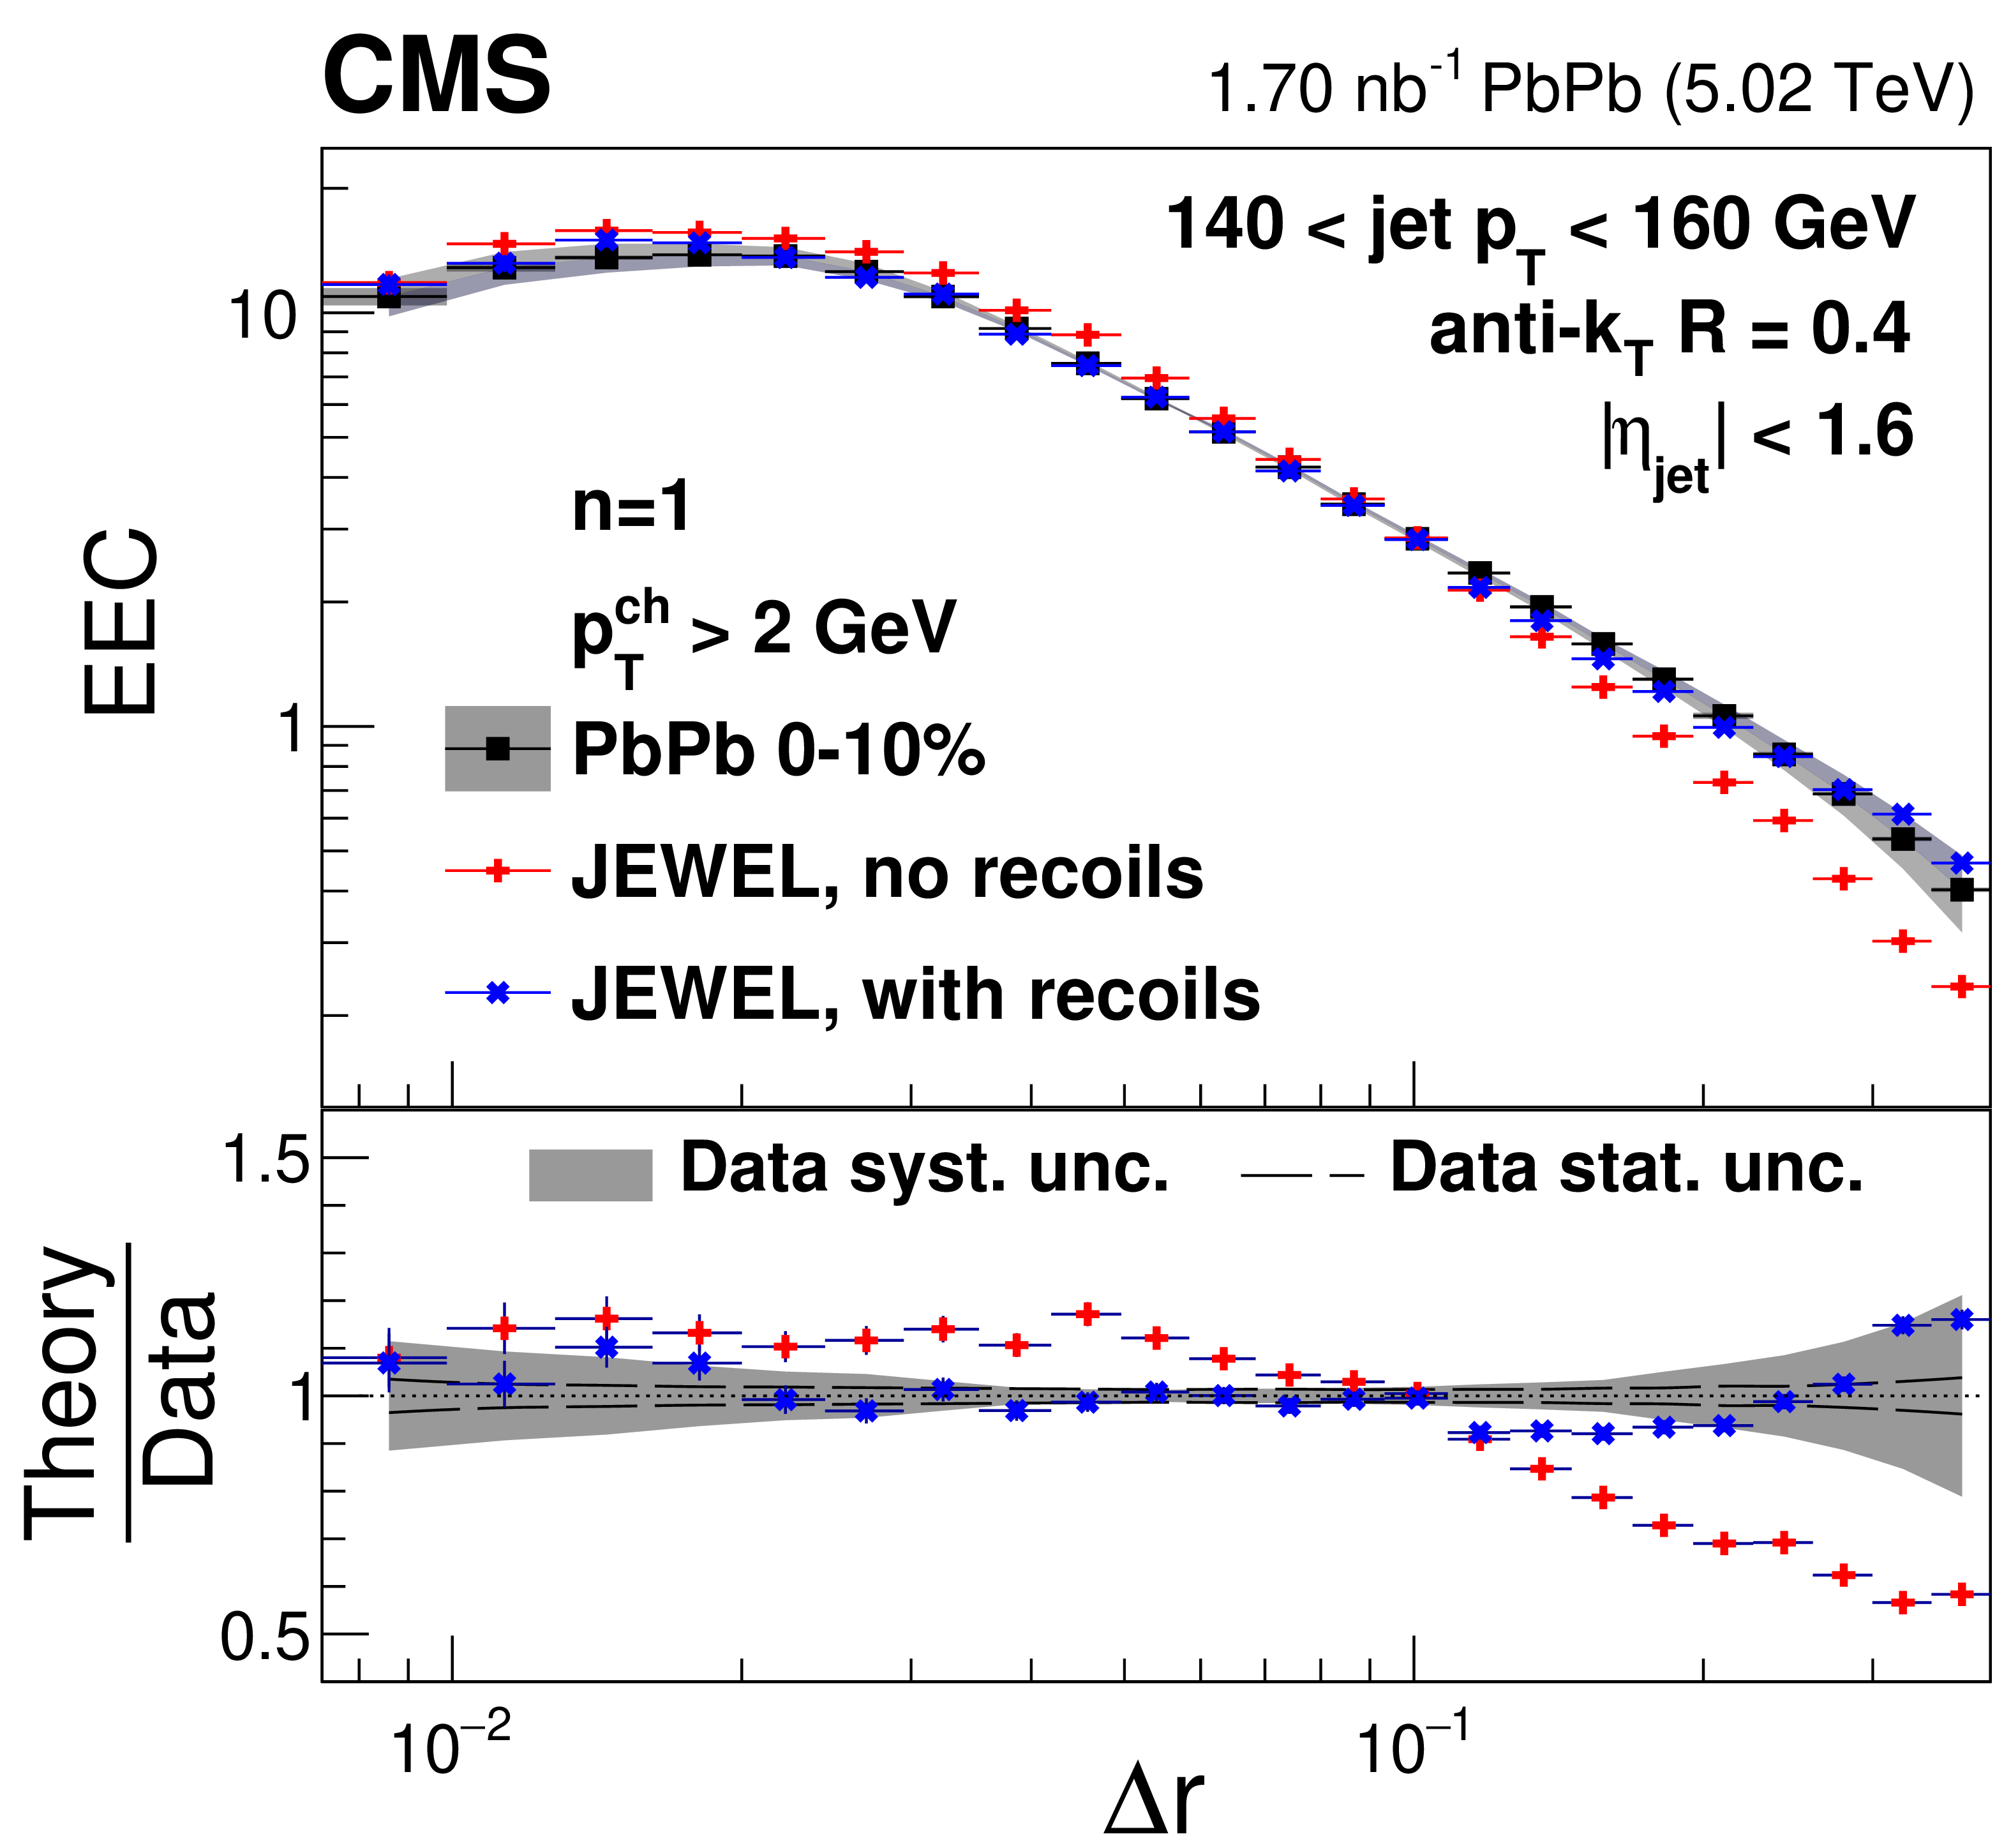
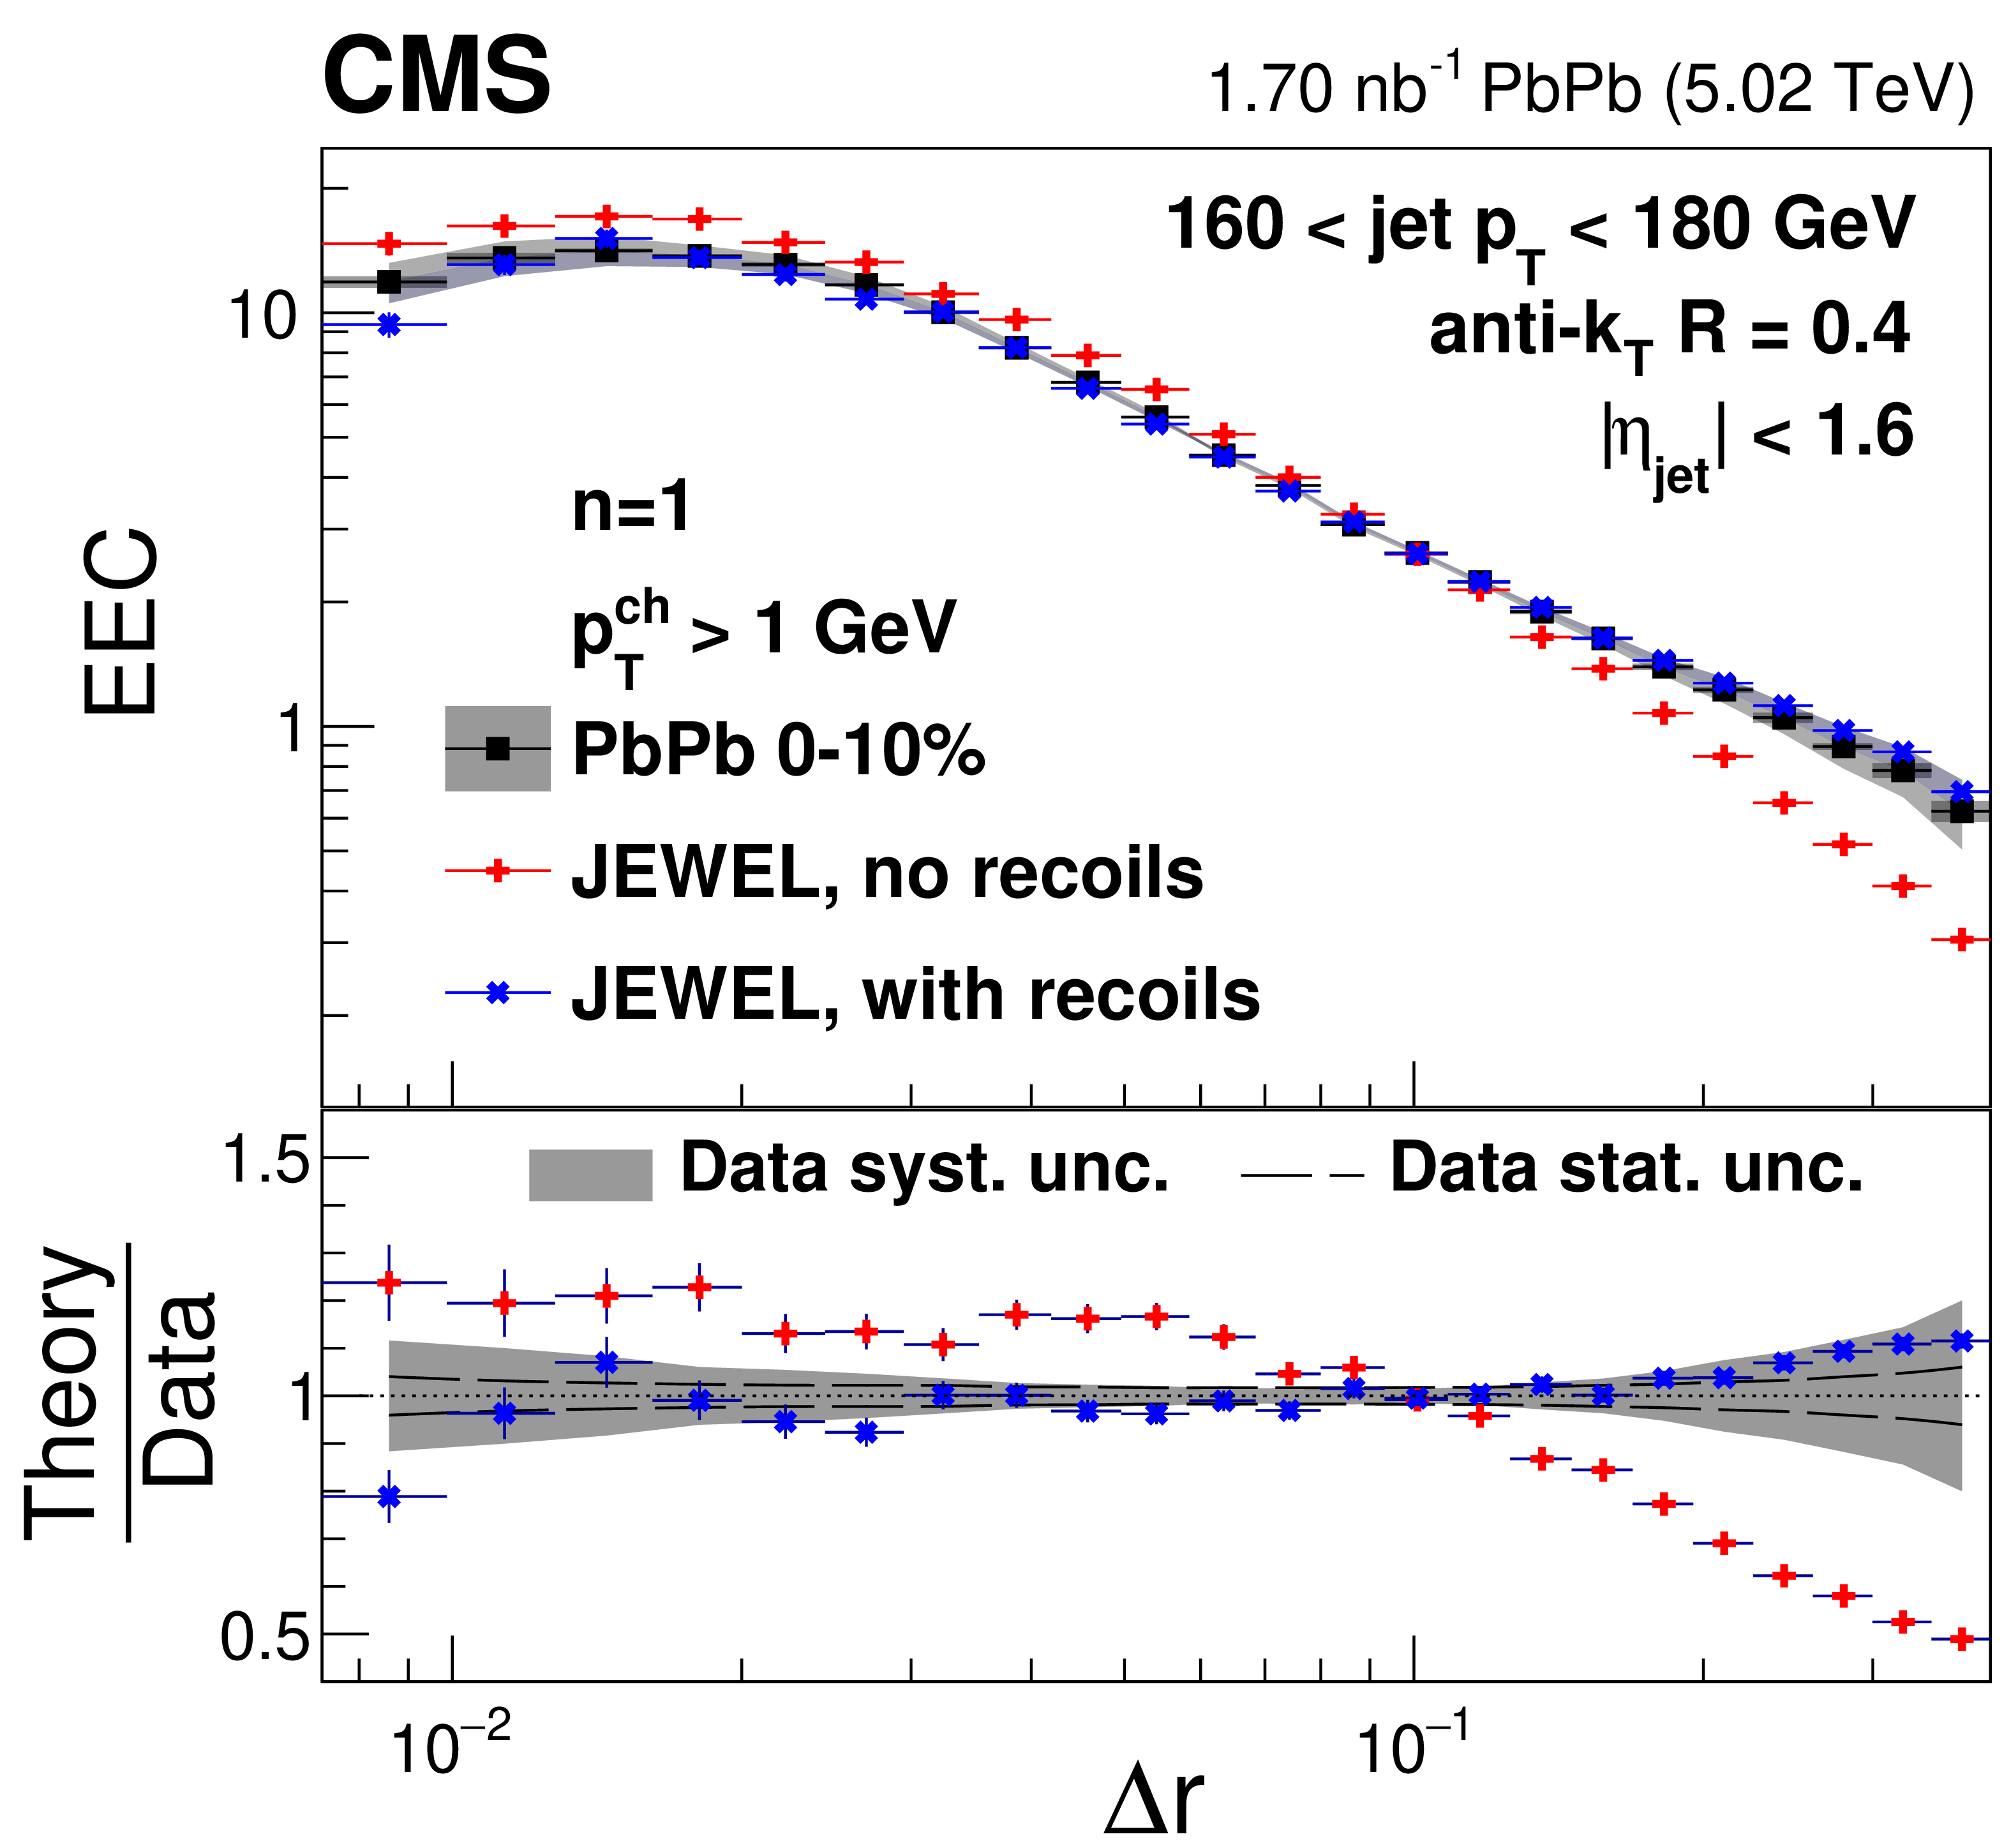
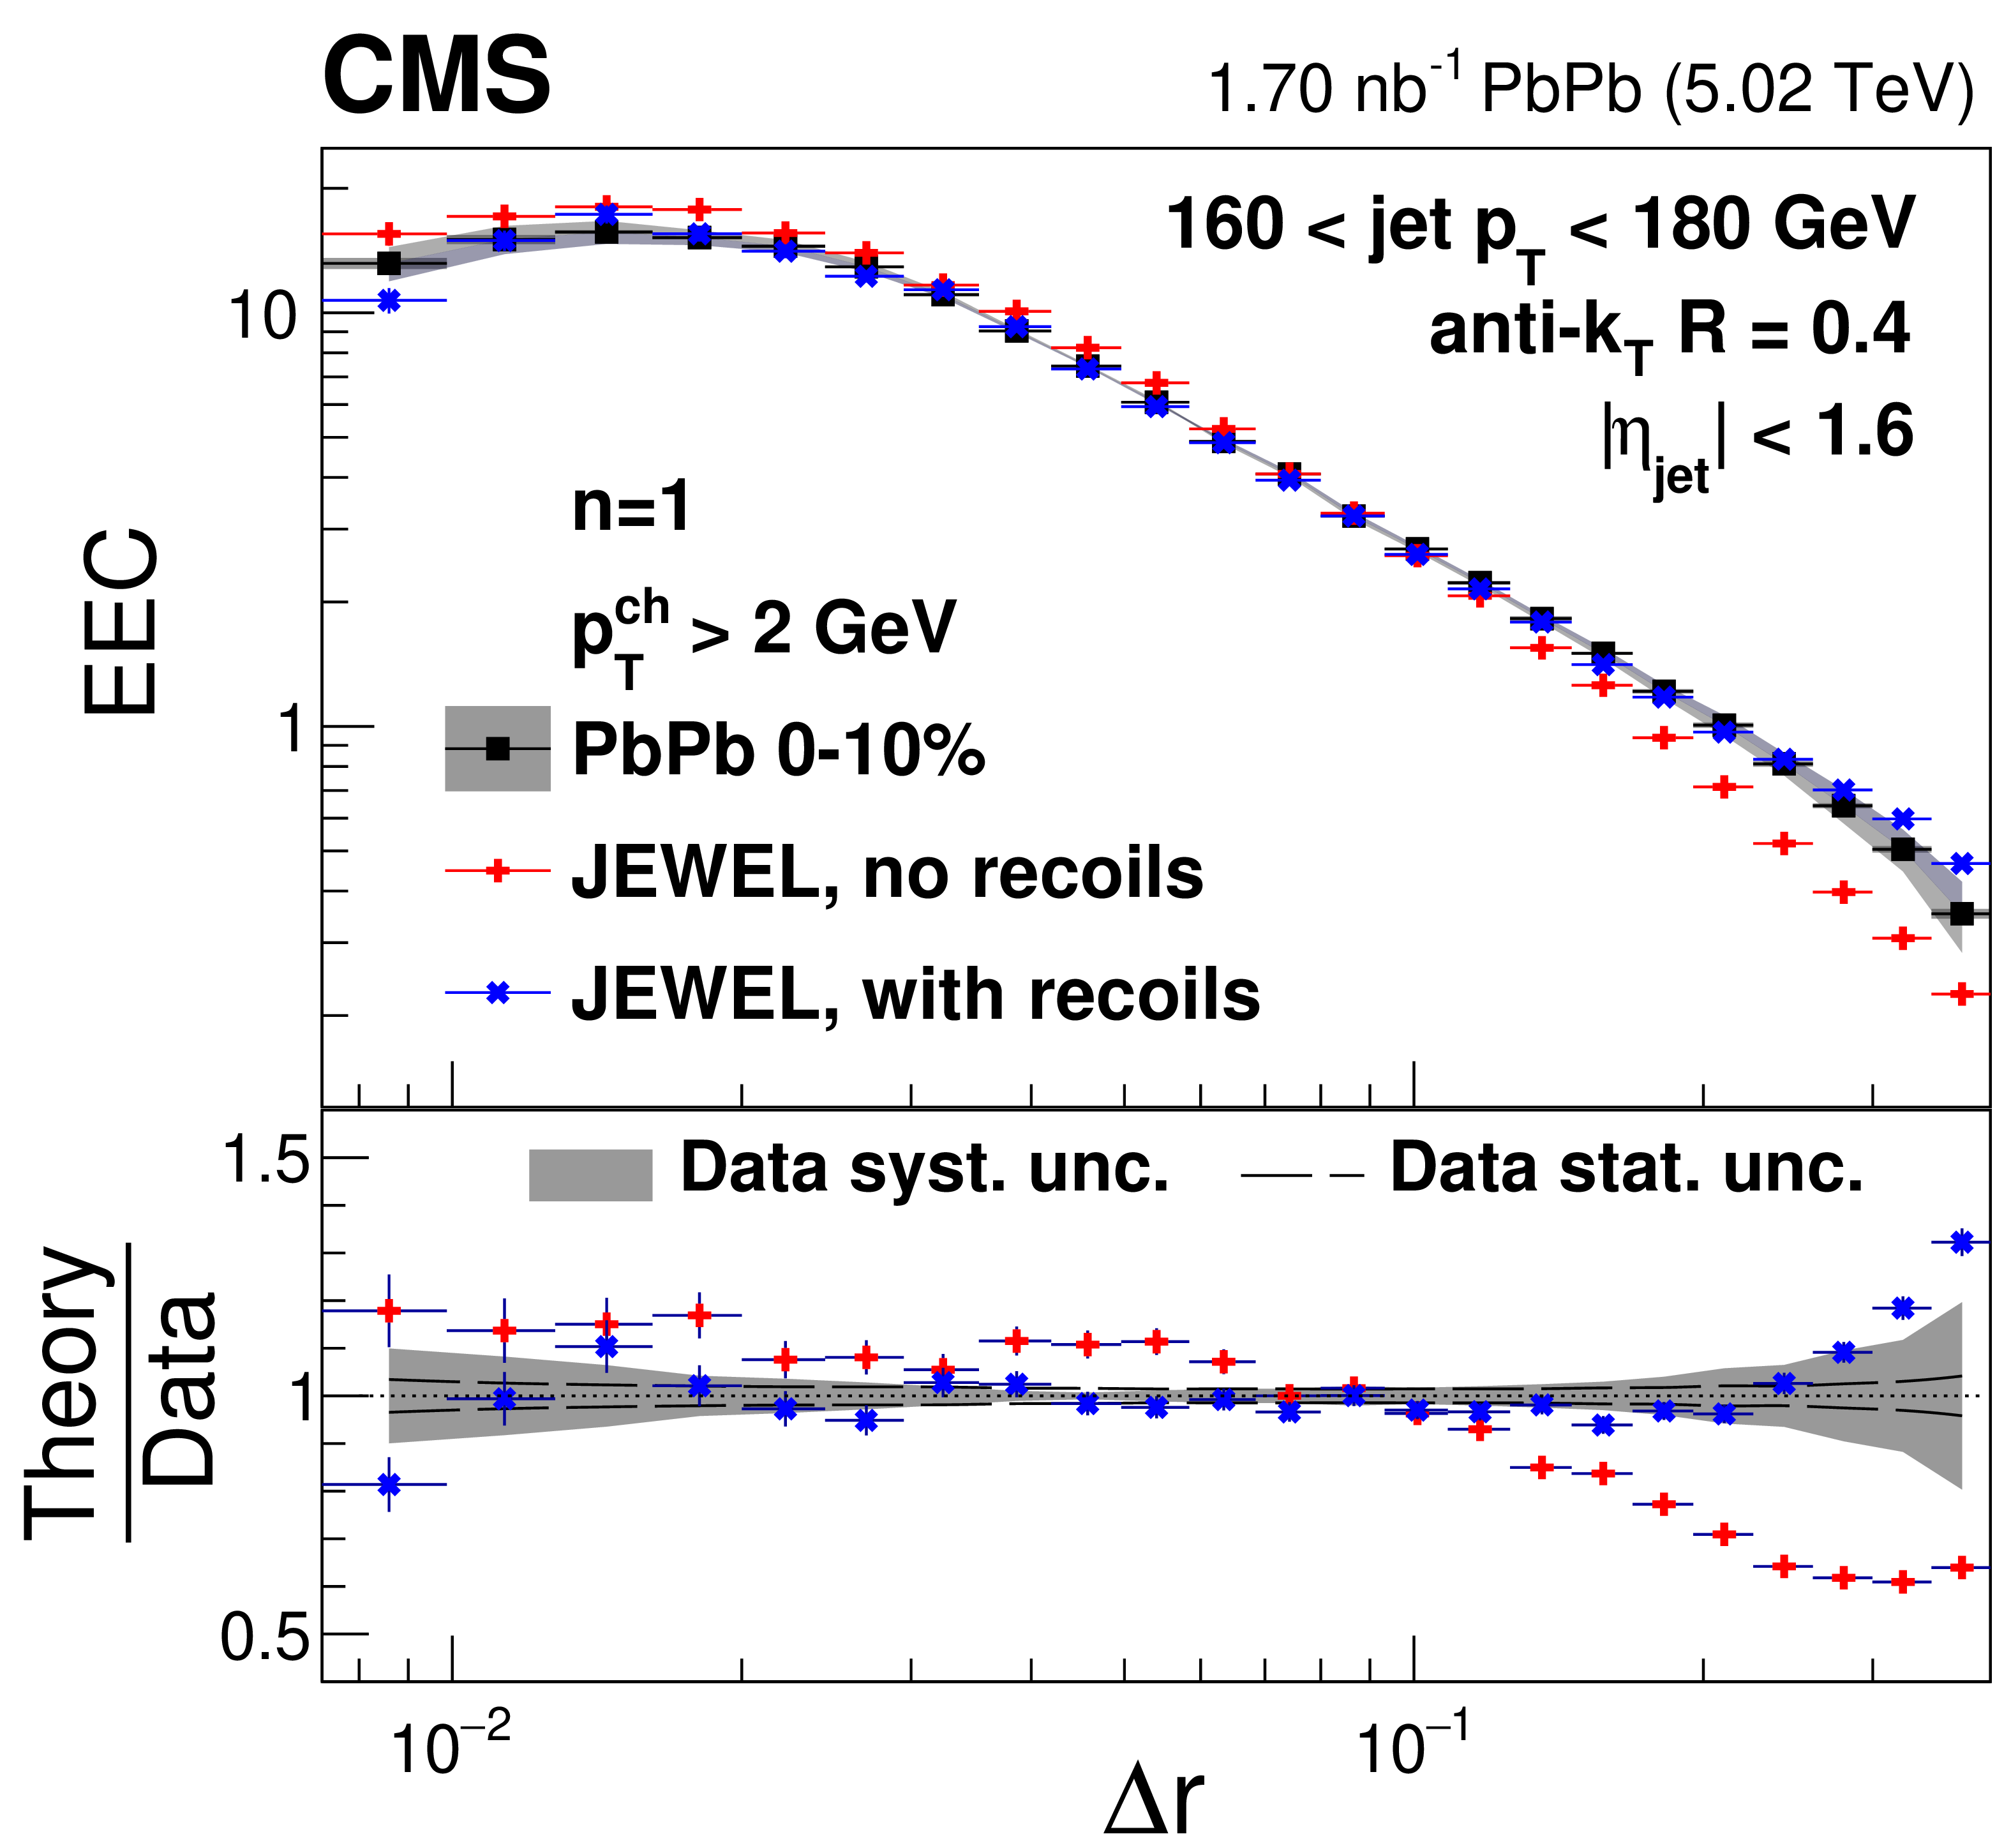
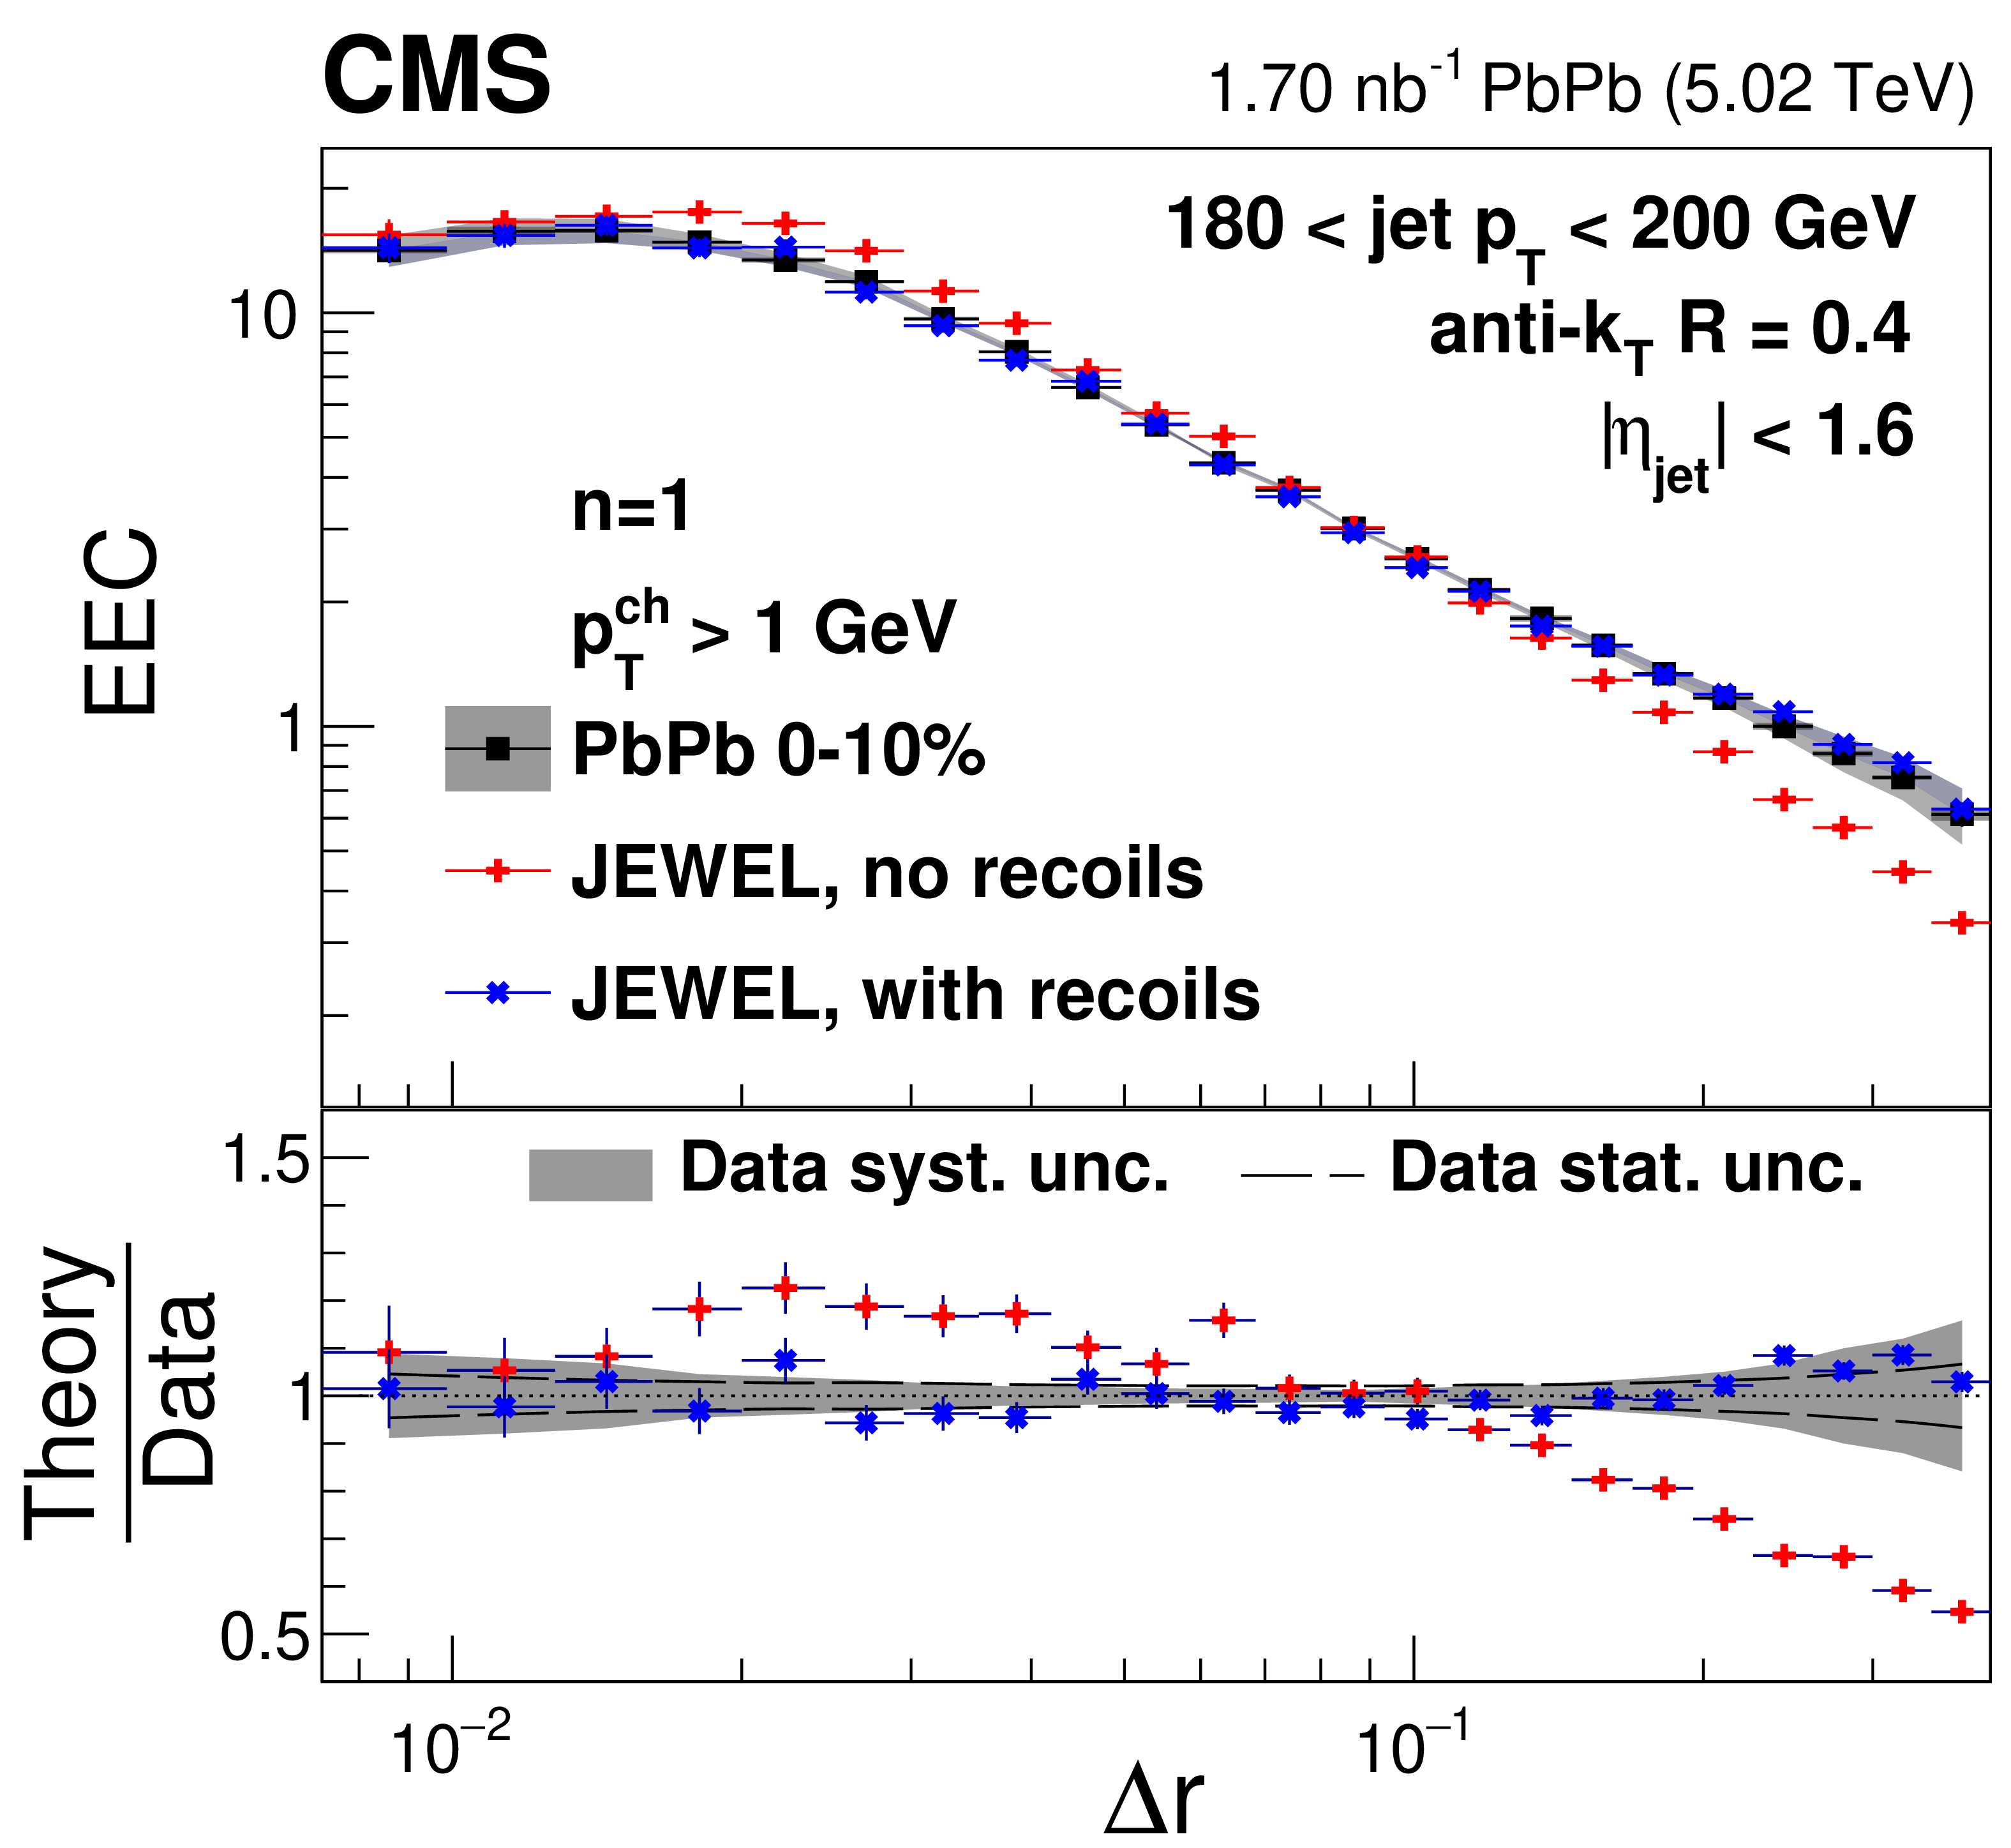
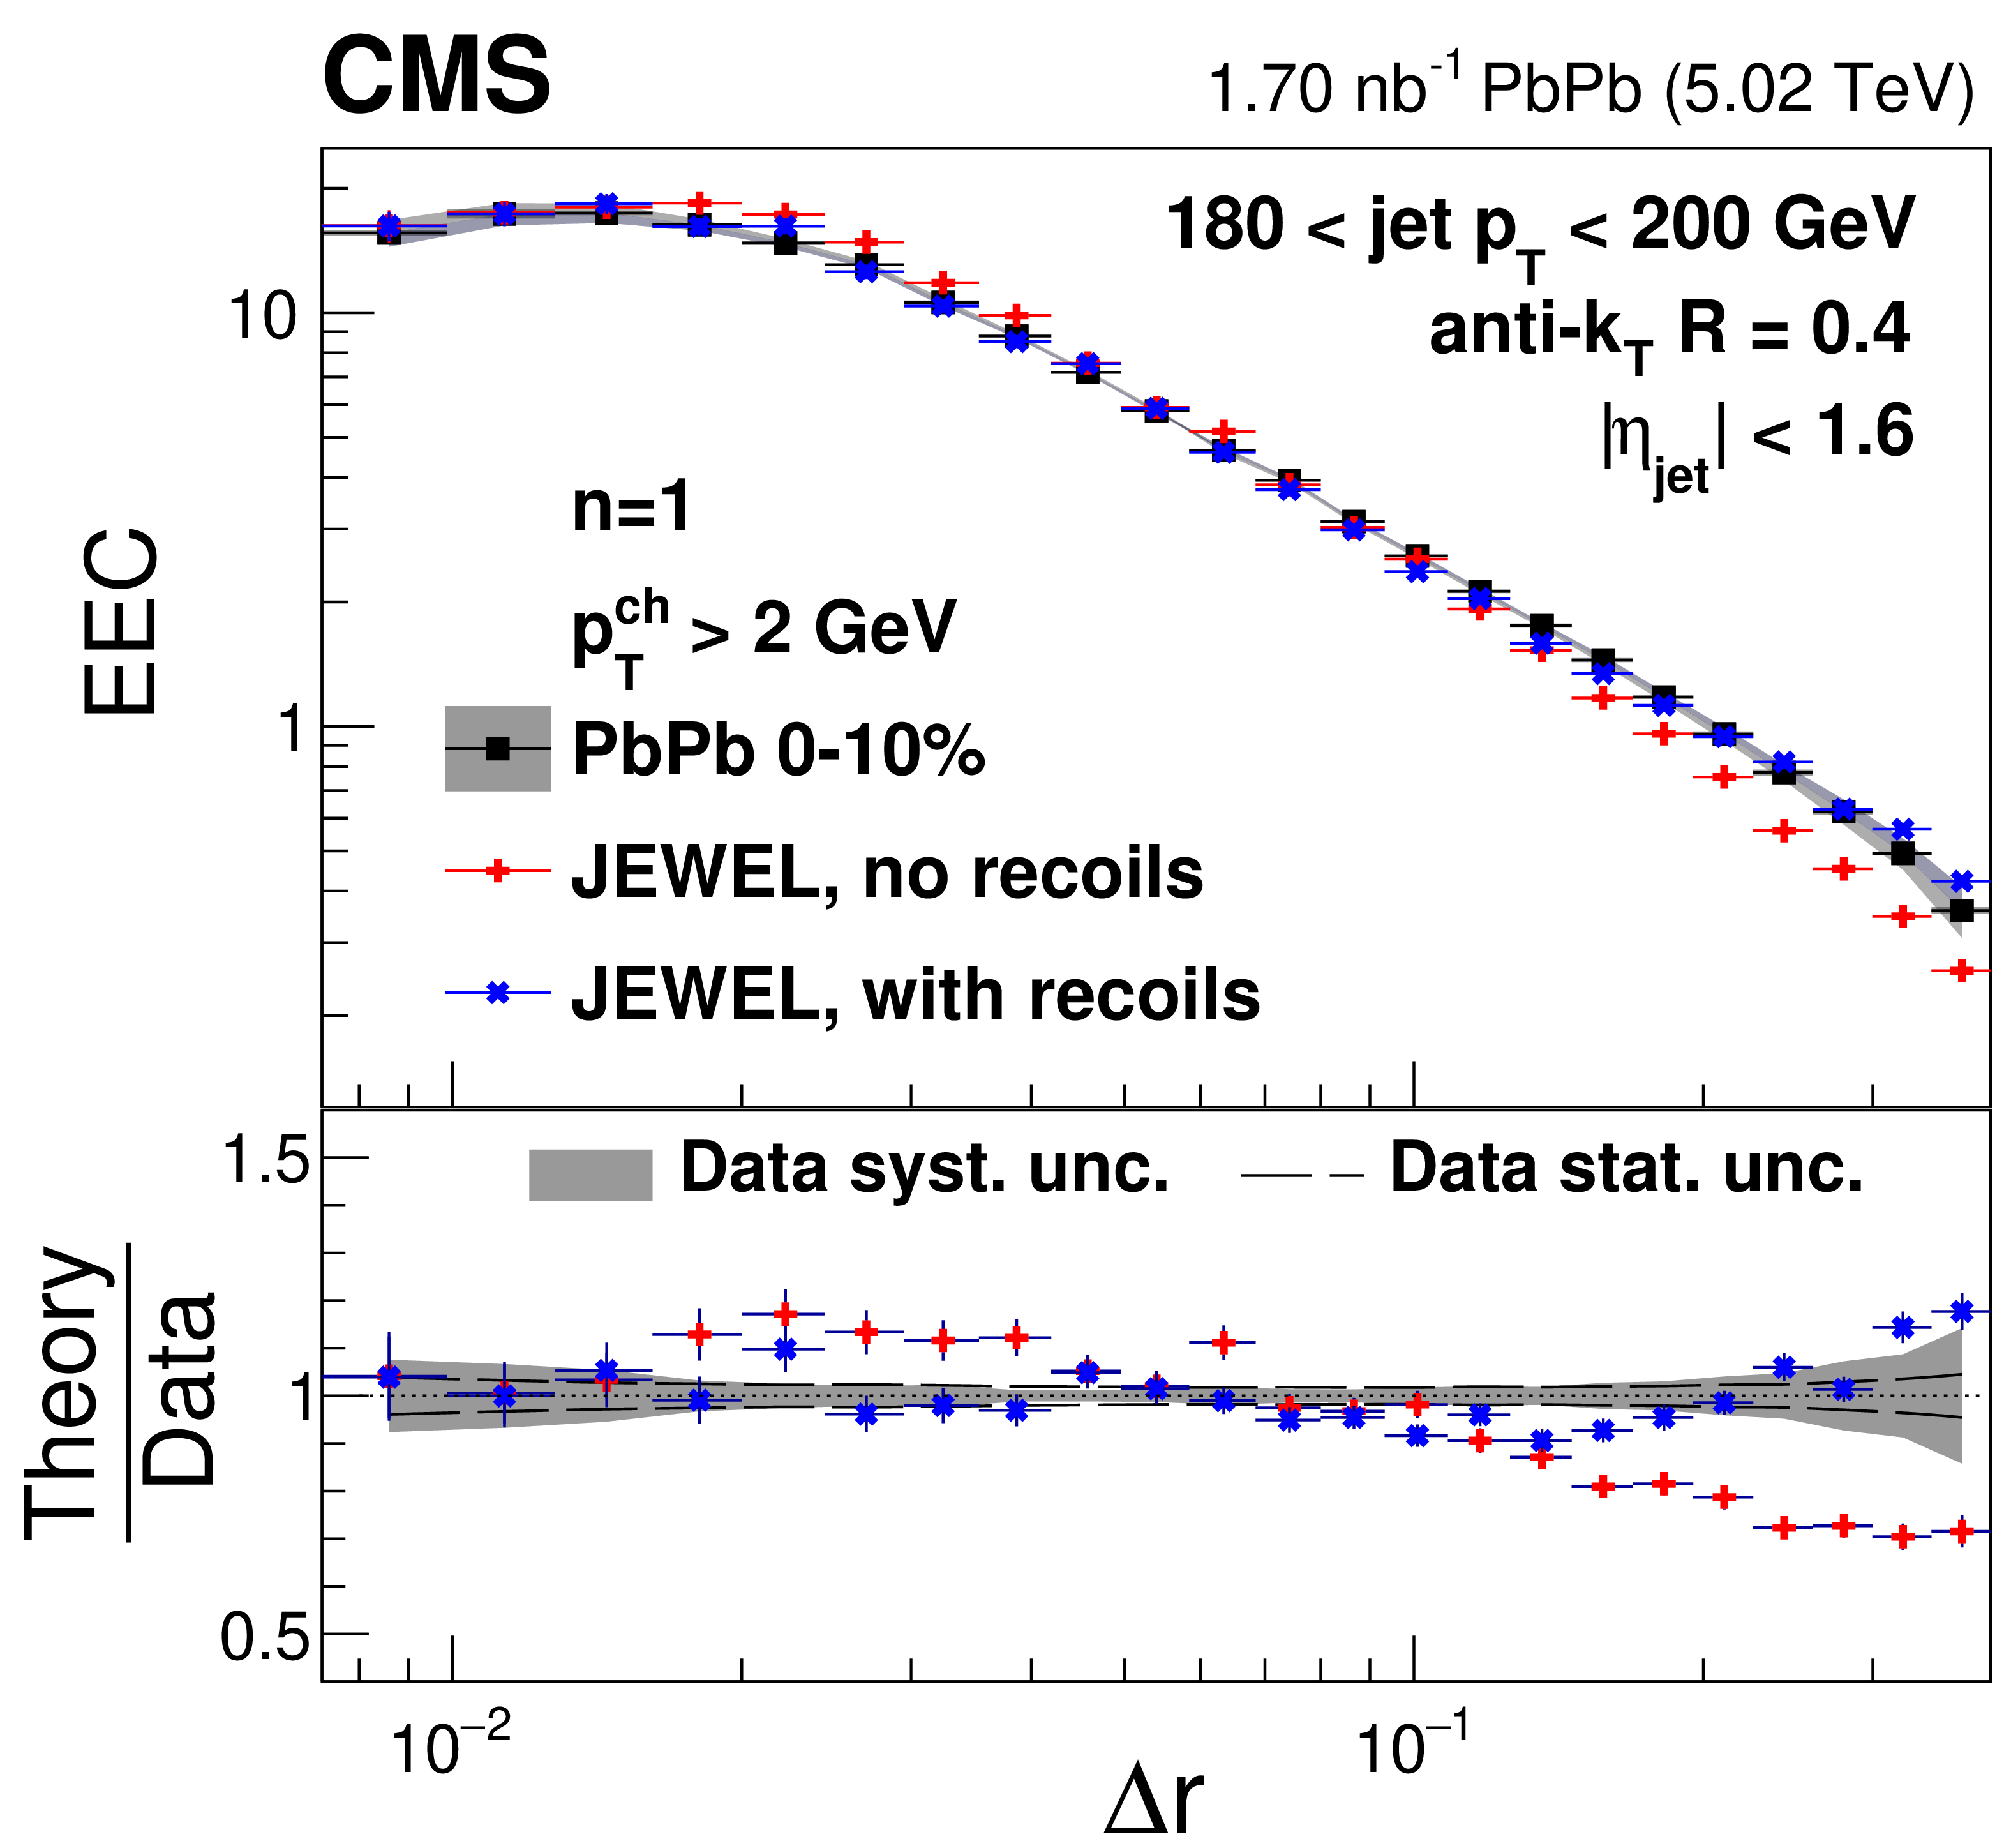
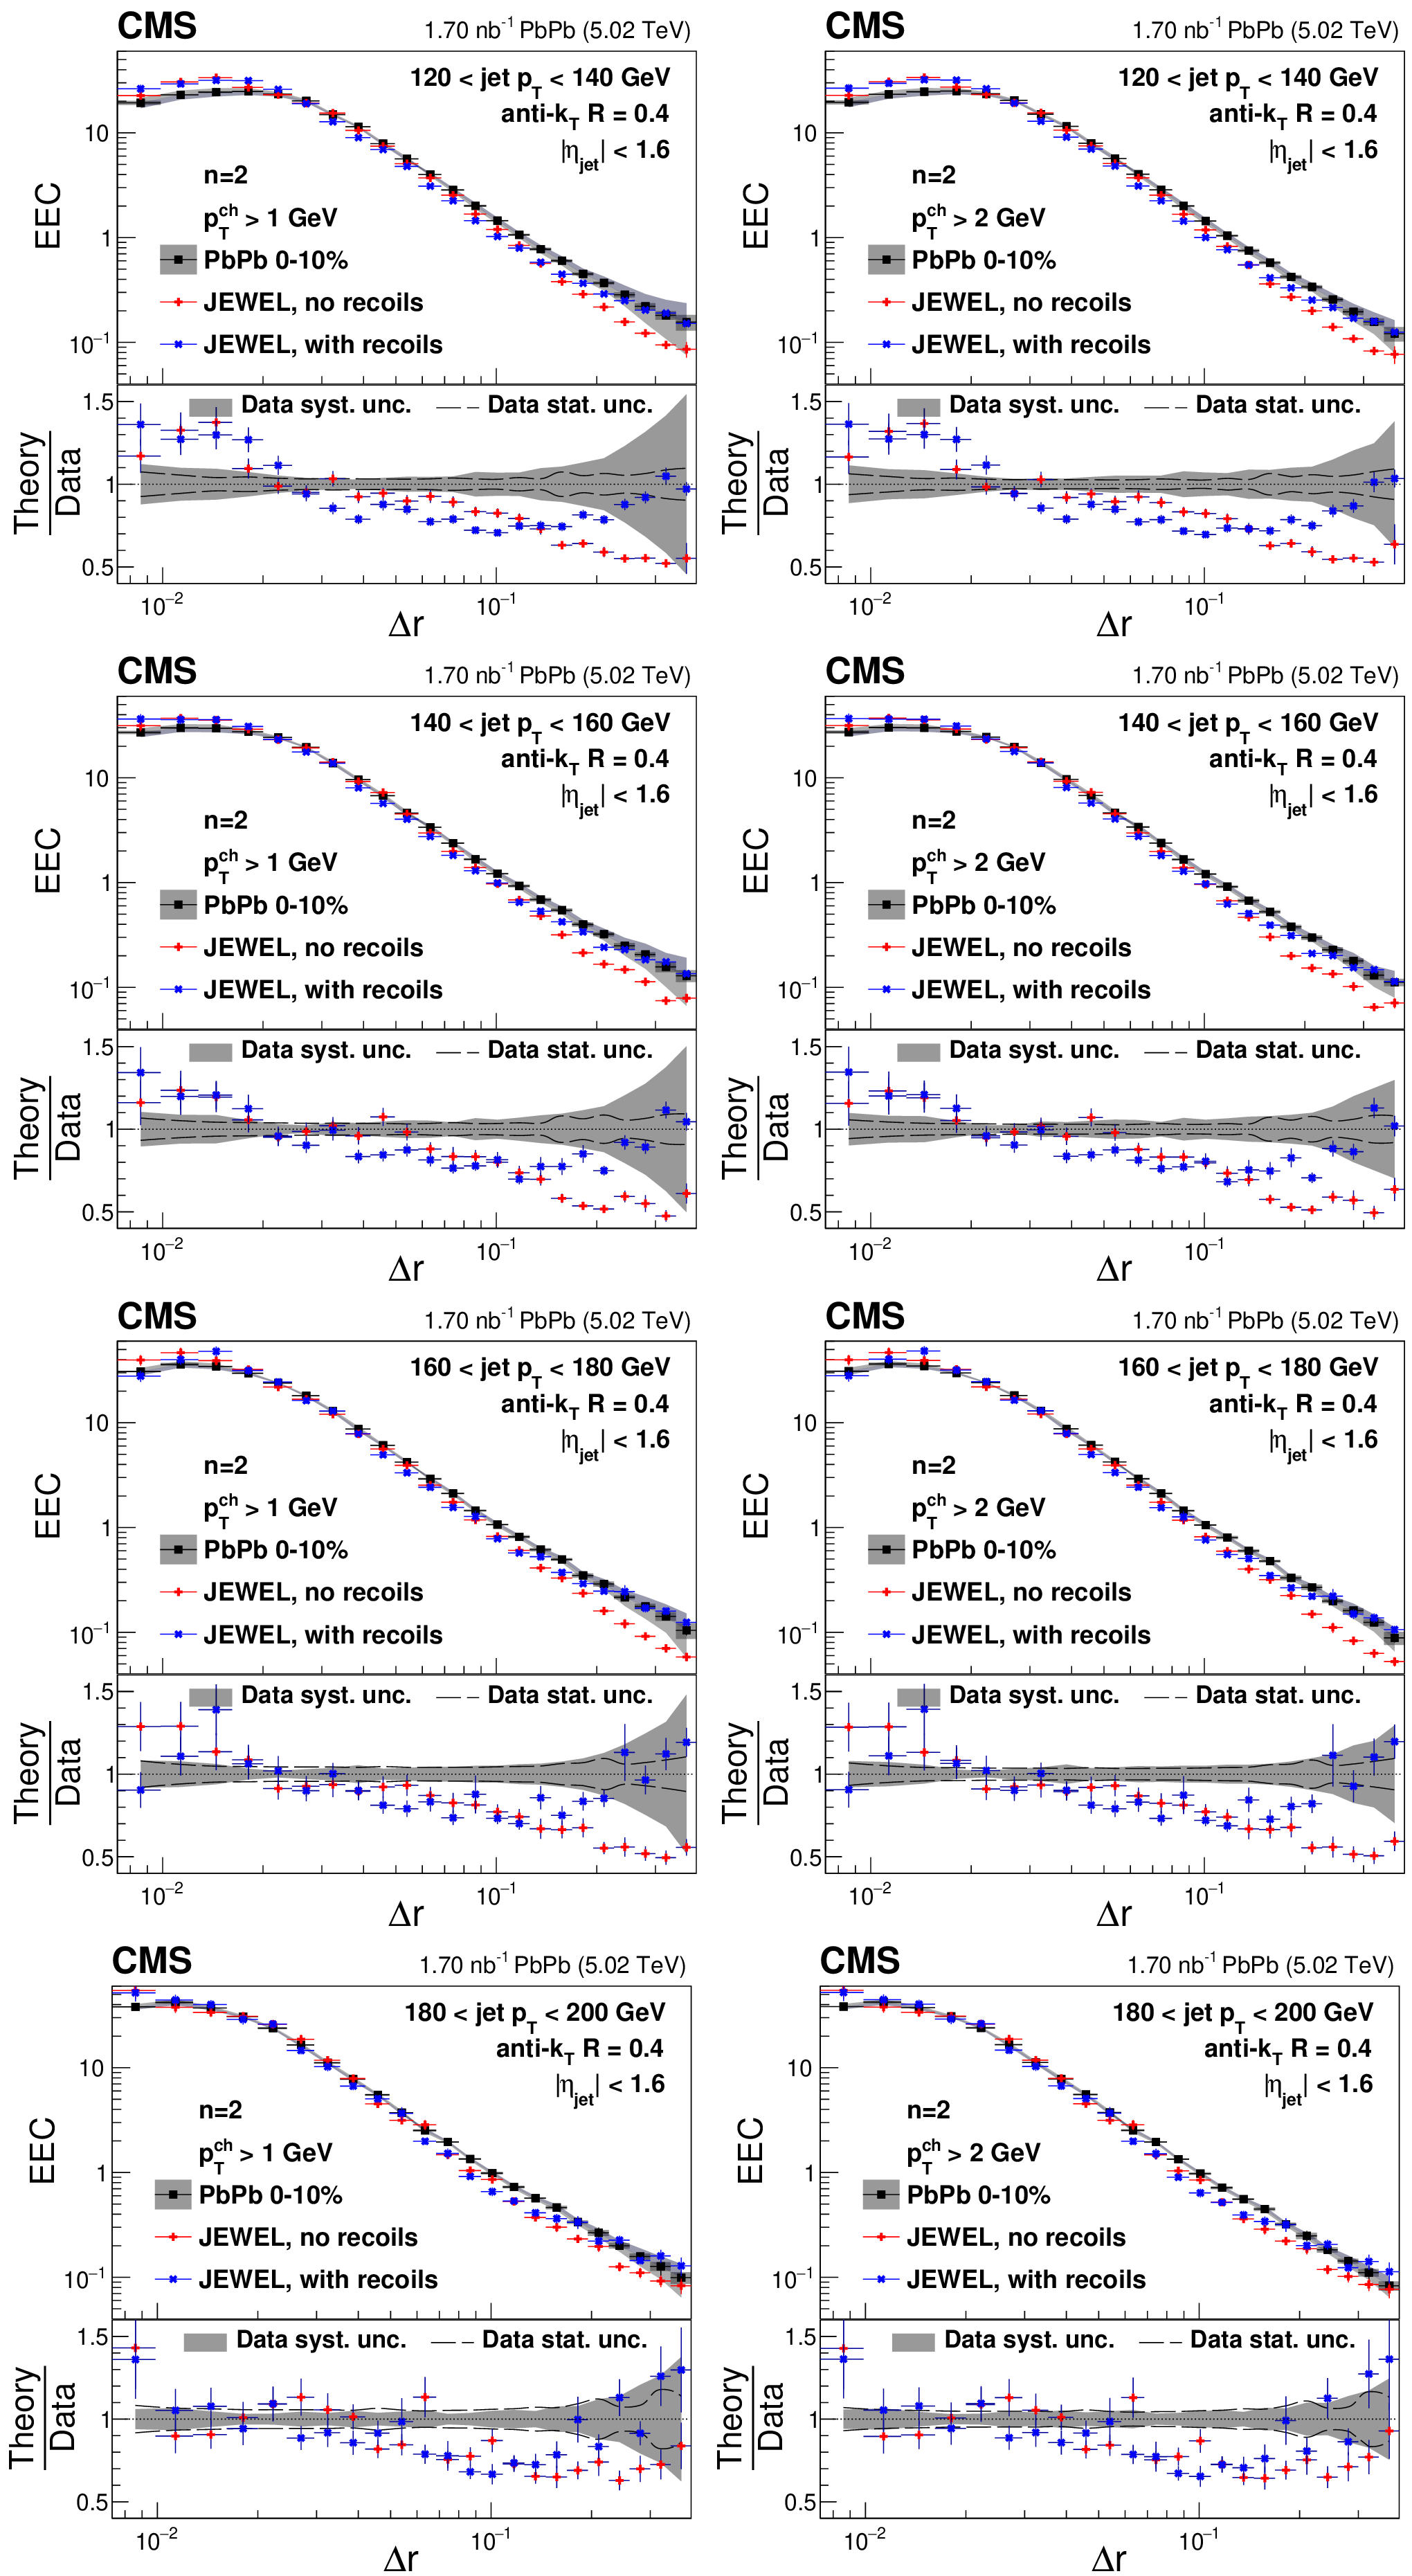
Energy-energy correlator distributions from 0-10% central PbPb collisions with $ n= $ 1 in different $ p_{\mathrm{T}}^{\text{ch}} $ and $ p_{\text{T,jet}} $ bins compared to predictions from JEWEL simulation with and without recoils. |
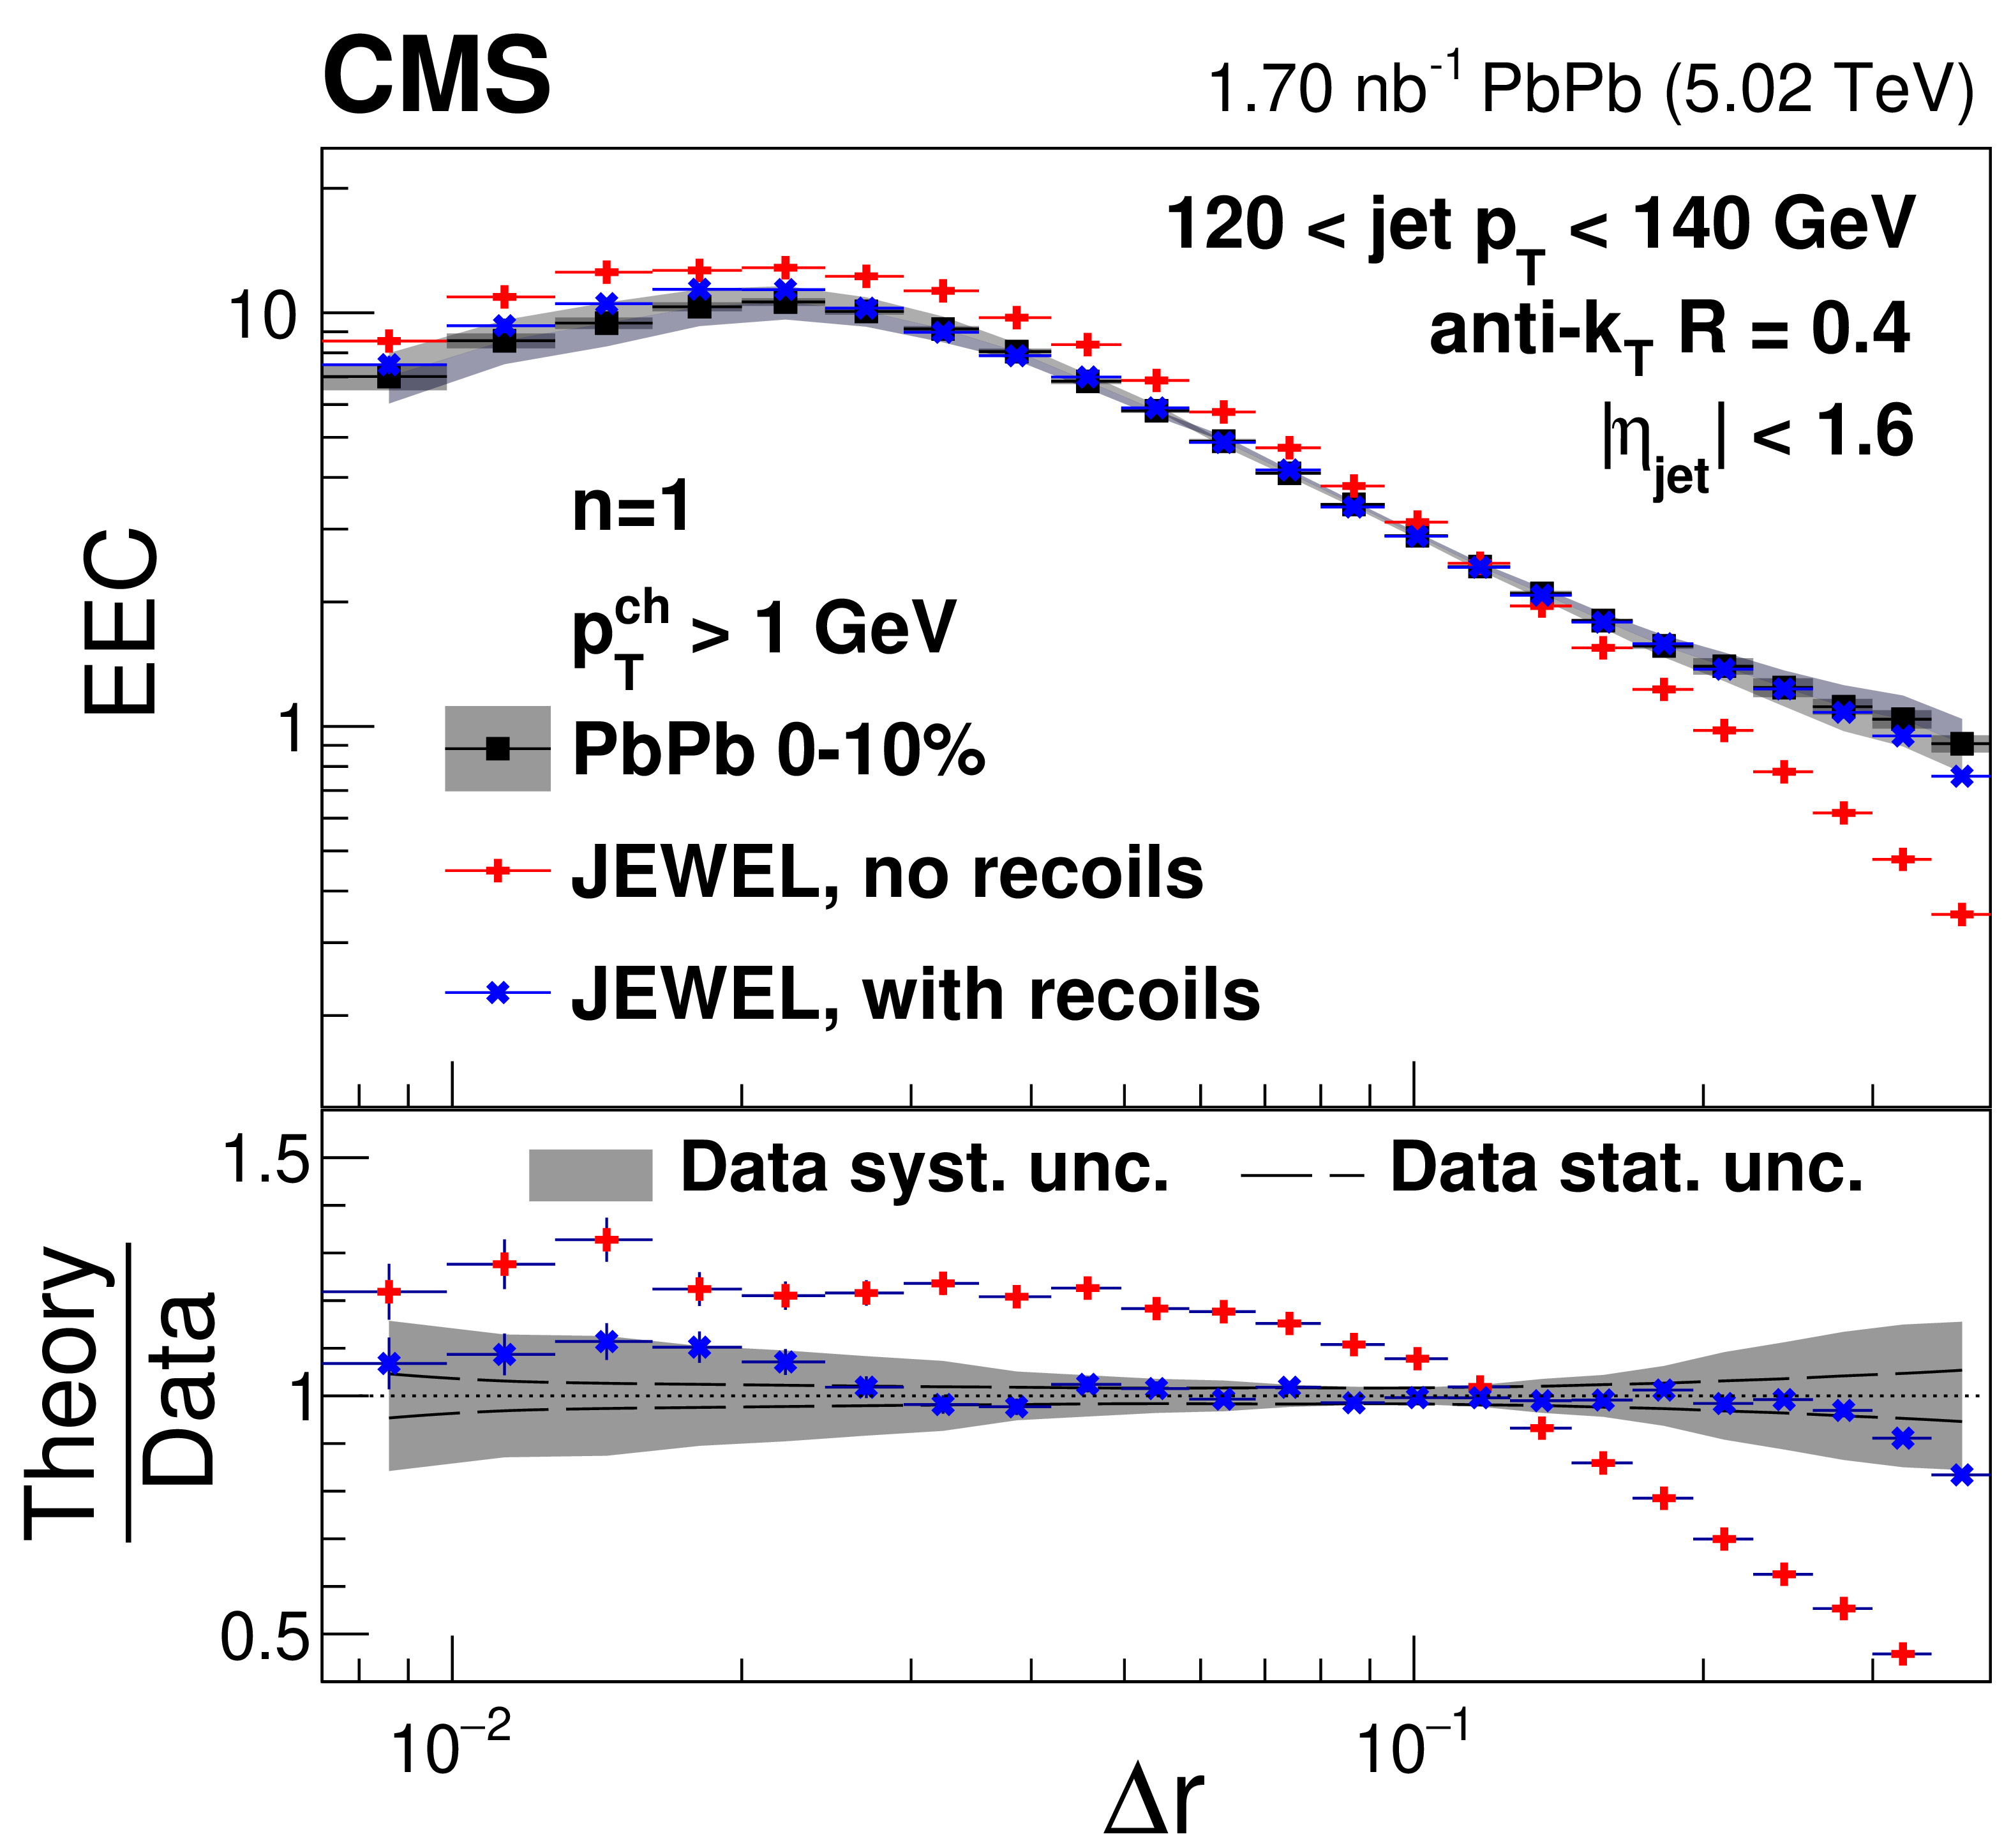
png pdf |
Figure 24-a:
Energy-energy correlator distributions from 0-10% central PbPb collisions with $ n= $ 1 in different $ p_{\mathrm{T}}^{\text{ch}} $ and $ p_{\text{T,jet}} $ bins compared to predictions from JEWEL simulation with and without recoils. |
png pdf |
Figure 24-b:
Energy-energy correlator distributions from 0-10% central PbPb collisions with $ n= $ 1 in different $ p_{\mathrm{T}}^{\text{ch}} $ and $ p_{\text{T,jet}} $ bins compared to predictions from JEWEL simulation with and without recoils. |
png pdf |
Figure 24-c:
Energy-energy correlator distributions from 0-10% central PbPb collisions with $ n= $ 1 in different $ p_{\mathrm{T}}^{\text{ch}} $ and $ p_{\text{T,jet}} $ bins compared to predictions from JEWEL simulation with and without recoils. |
png pdf |
Figure 24-d:
Energy-energy correlator distributions from 0-10% central PbPb collisions with $ n= $ 1 in different $ p_{\mathrm{T}}^{\text{ch}} $ and $ p_{\text{T,jet}} $ bins compared to predictions from JEWEL simulation with and without recoils. |
png pdf |
Figure 24-e:
Energy-energy correlator distributions from 0-10% central PbPb collisions with $ n= $ 1 in different $ p_{\mathrm{T}}^{\text{ch}} $ and $ p_{\text{T,jet}} $ bins compared to predictions from JEWEL simulation with and without recoils. |
png pdf |
Figure 24-f:
Energy-energy correlator distributions from 0-10% central PbPb collisions with $ n= $ 1 in different $ p_{\mathrm{T}}^{\text{ch}} $ and $ p_{\text{T,jet}} $ bins compared to predictions from JEWEL simulation with and without recoils. |
png pdf |
Figure 24-g:
Energy-energy correlator distributions from 0-10% central PbPb collisions with $ n= $ 1 in different $ p_{\mathrm{T}}^{\text{ch}} $ and $ p_{\text{T,jet}} $ bins compared to predictions from JEWEL simulation with and without recoils. |
png pdf |
Figure 24-h:
Energy-energy correlator distributions from 0-10% central PbPb collisions with $ n= $ 1 in different $ p_{\mathrm{T}}^{\text{ch}} $ and $ p_{\text{T,jet}} $ bins compared to predictions from JEWEL simulation with and without recoils. |
png pdf |
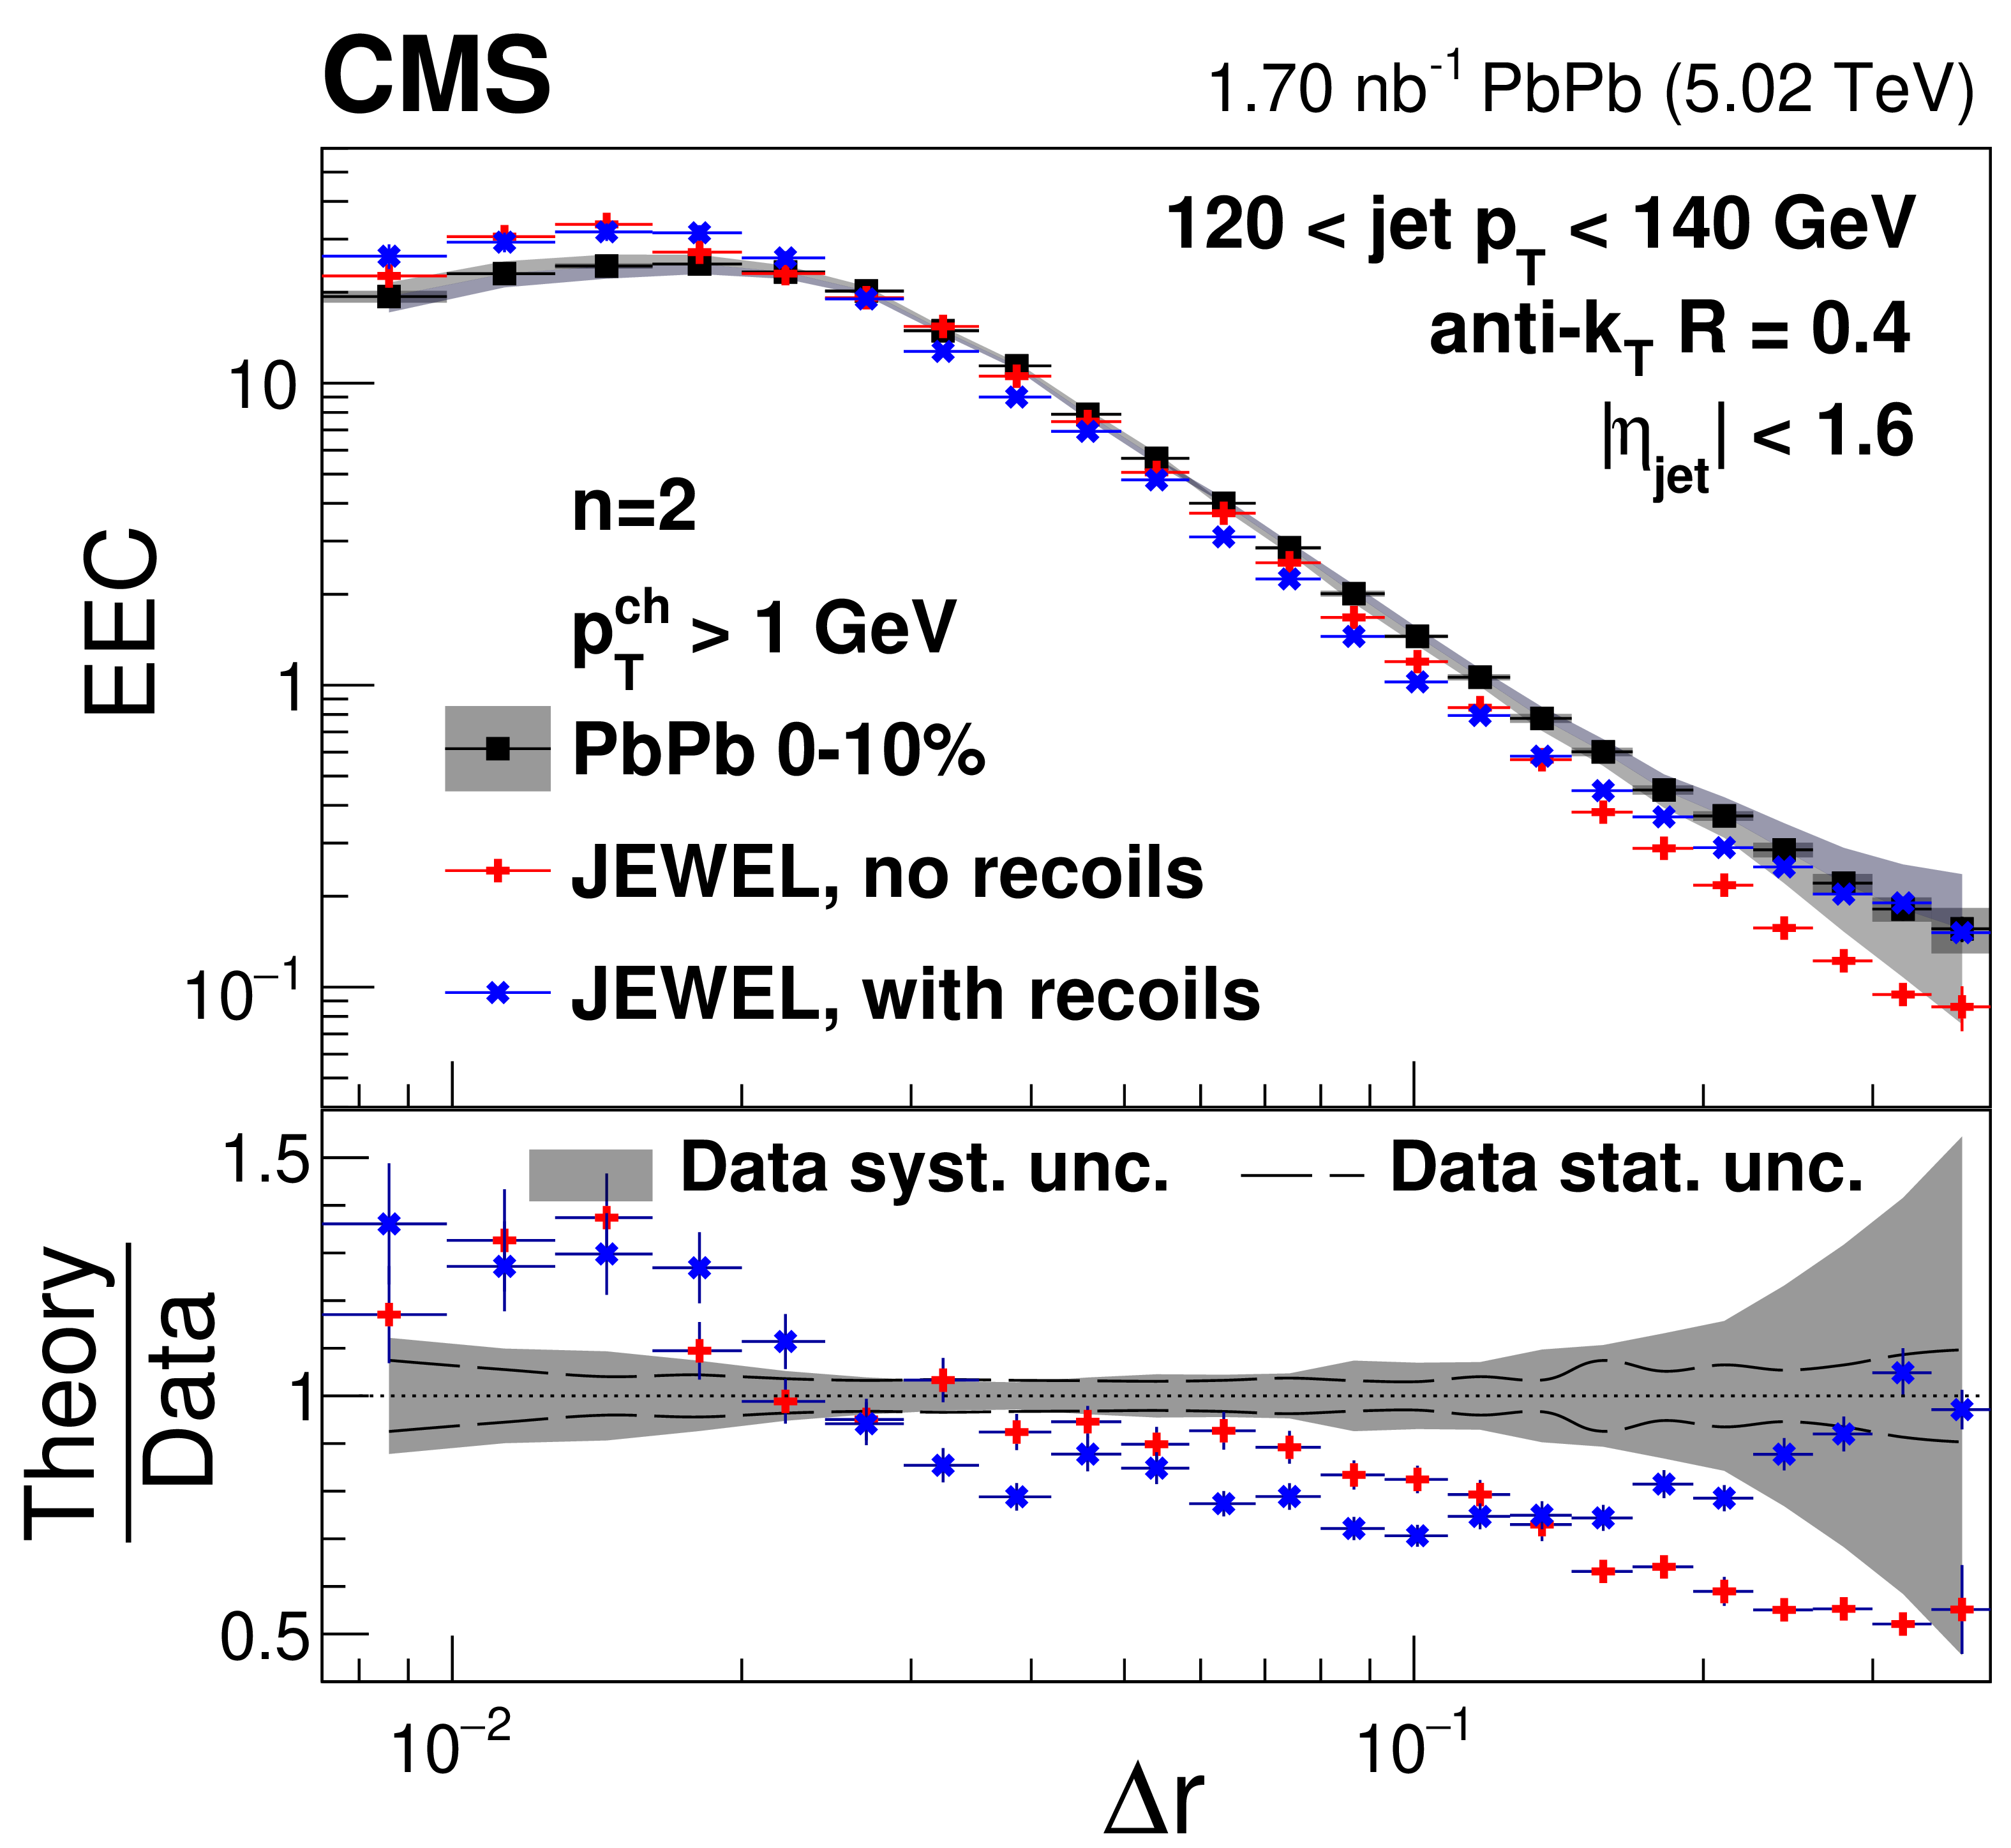
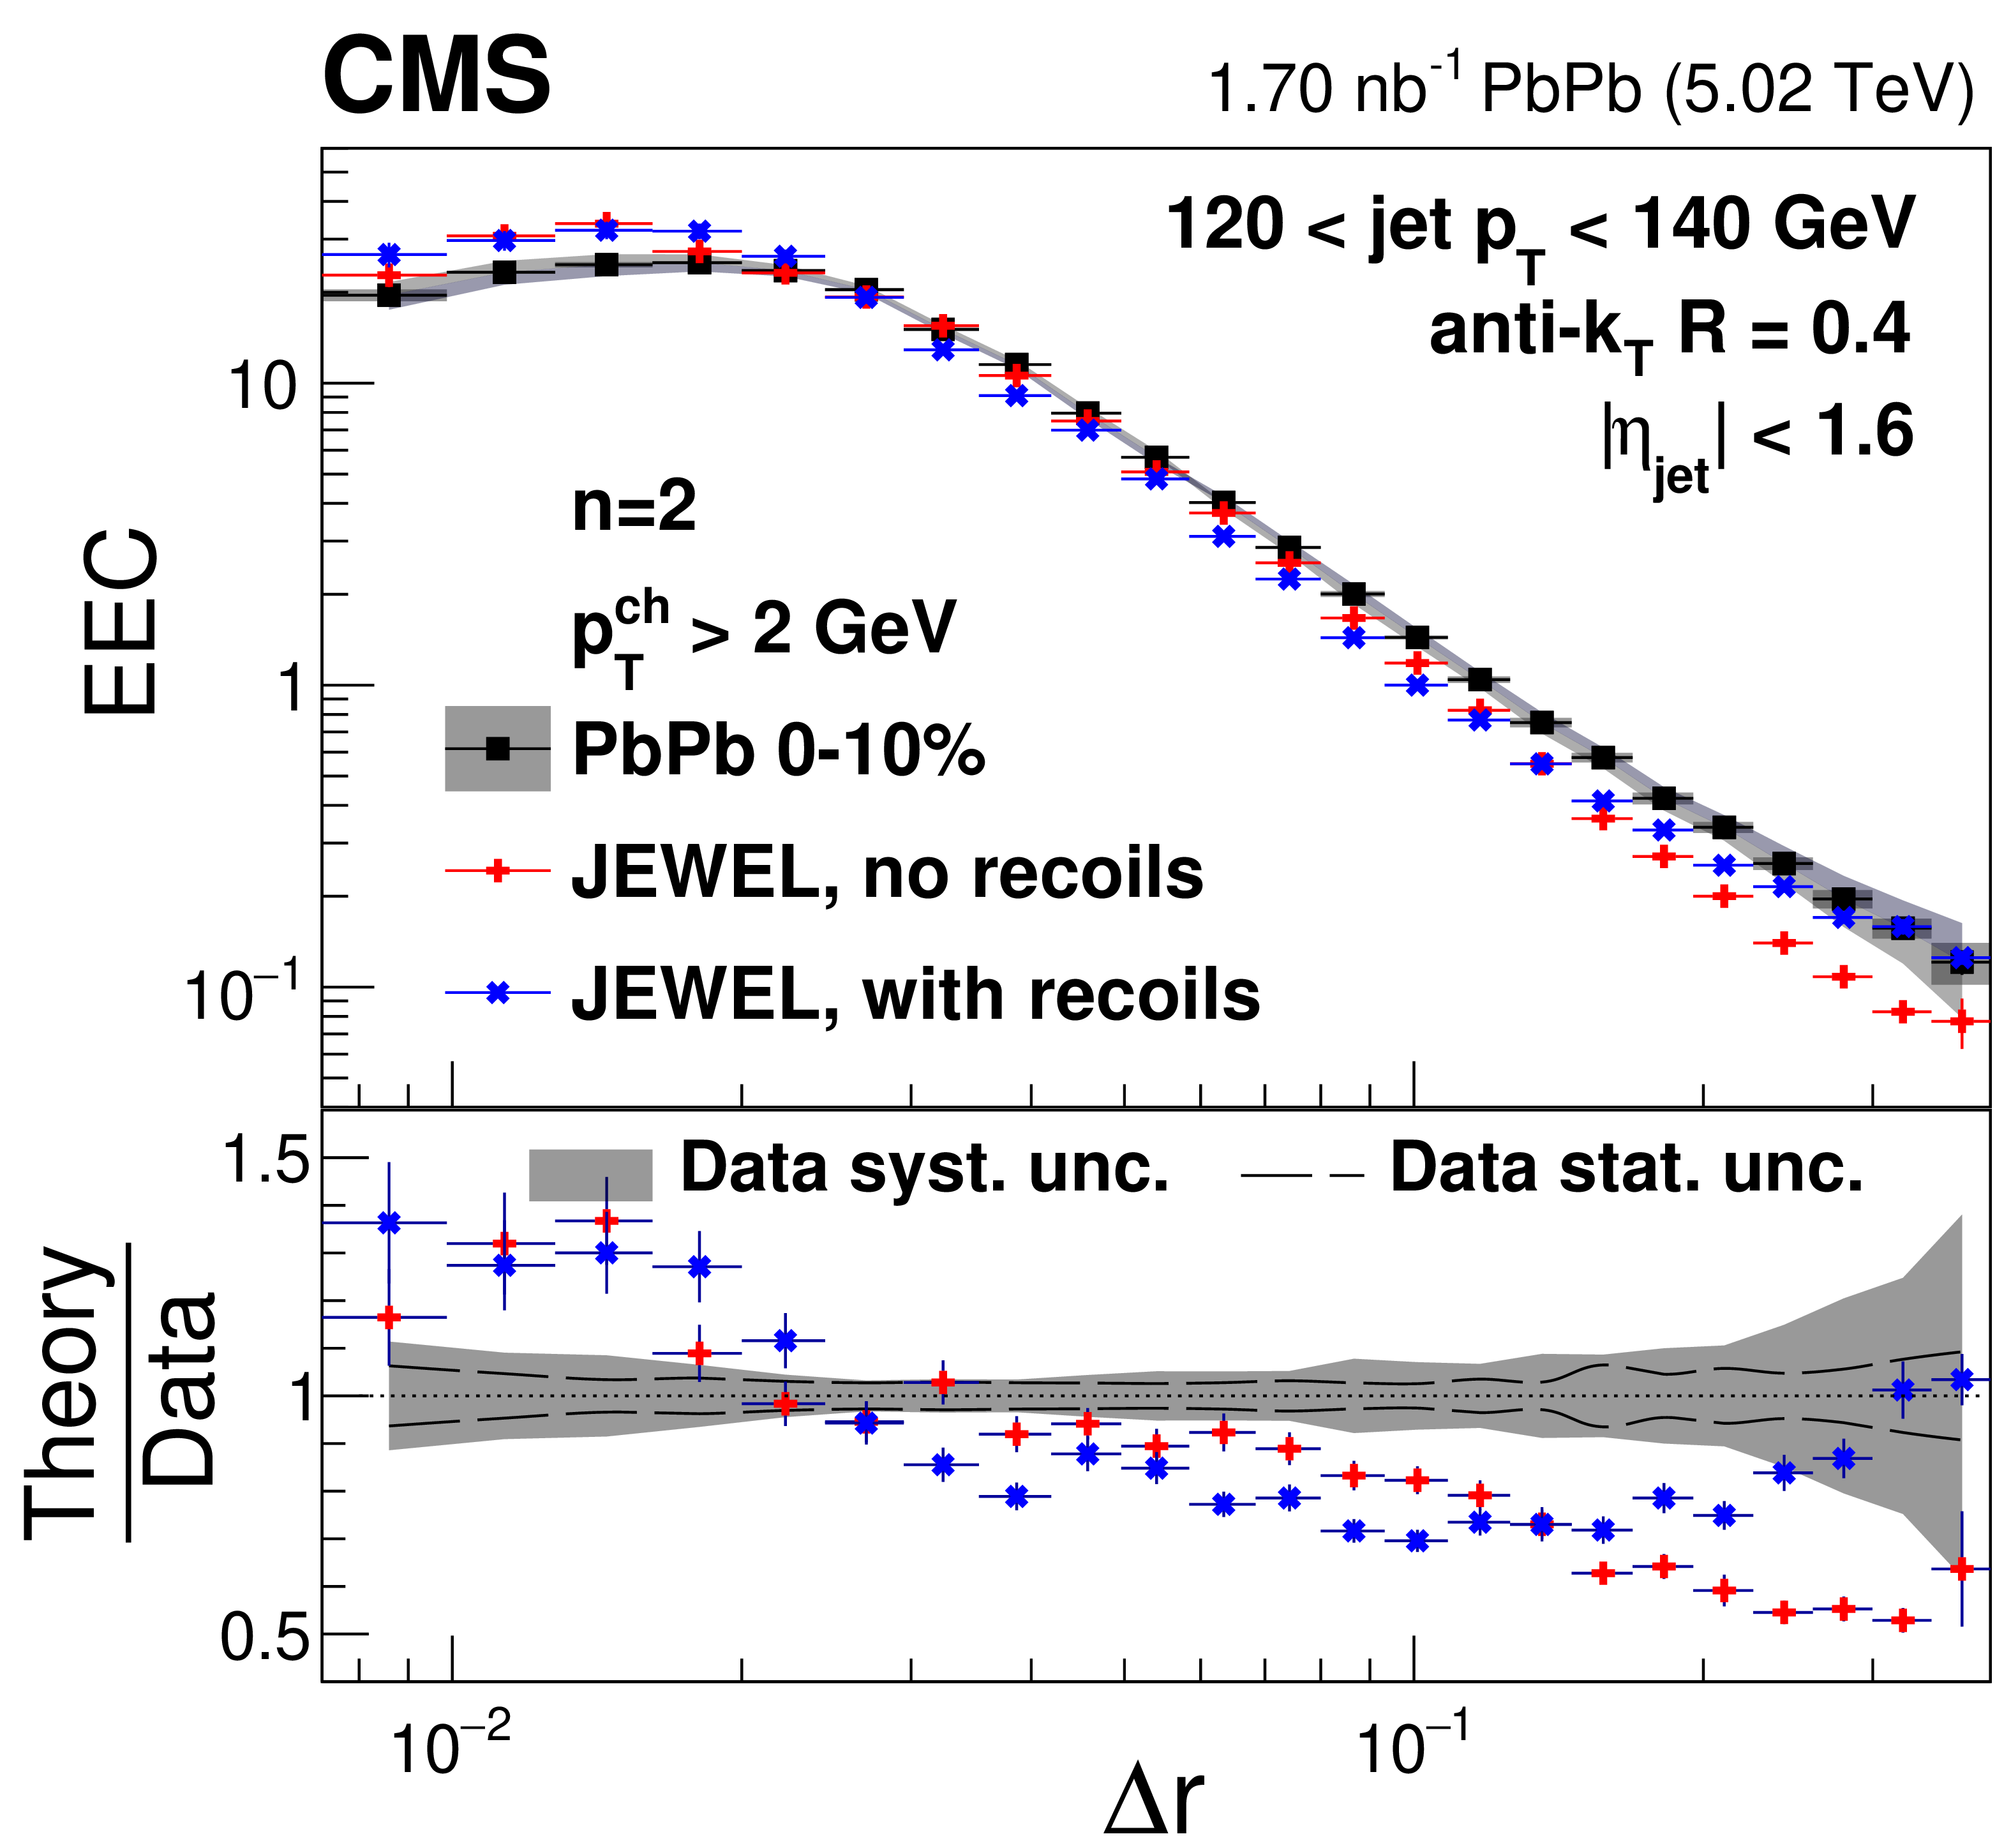
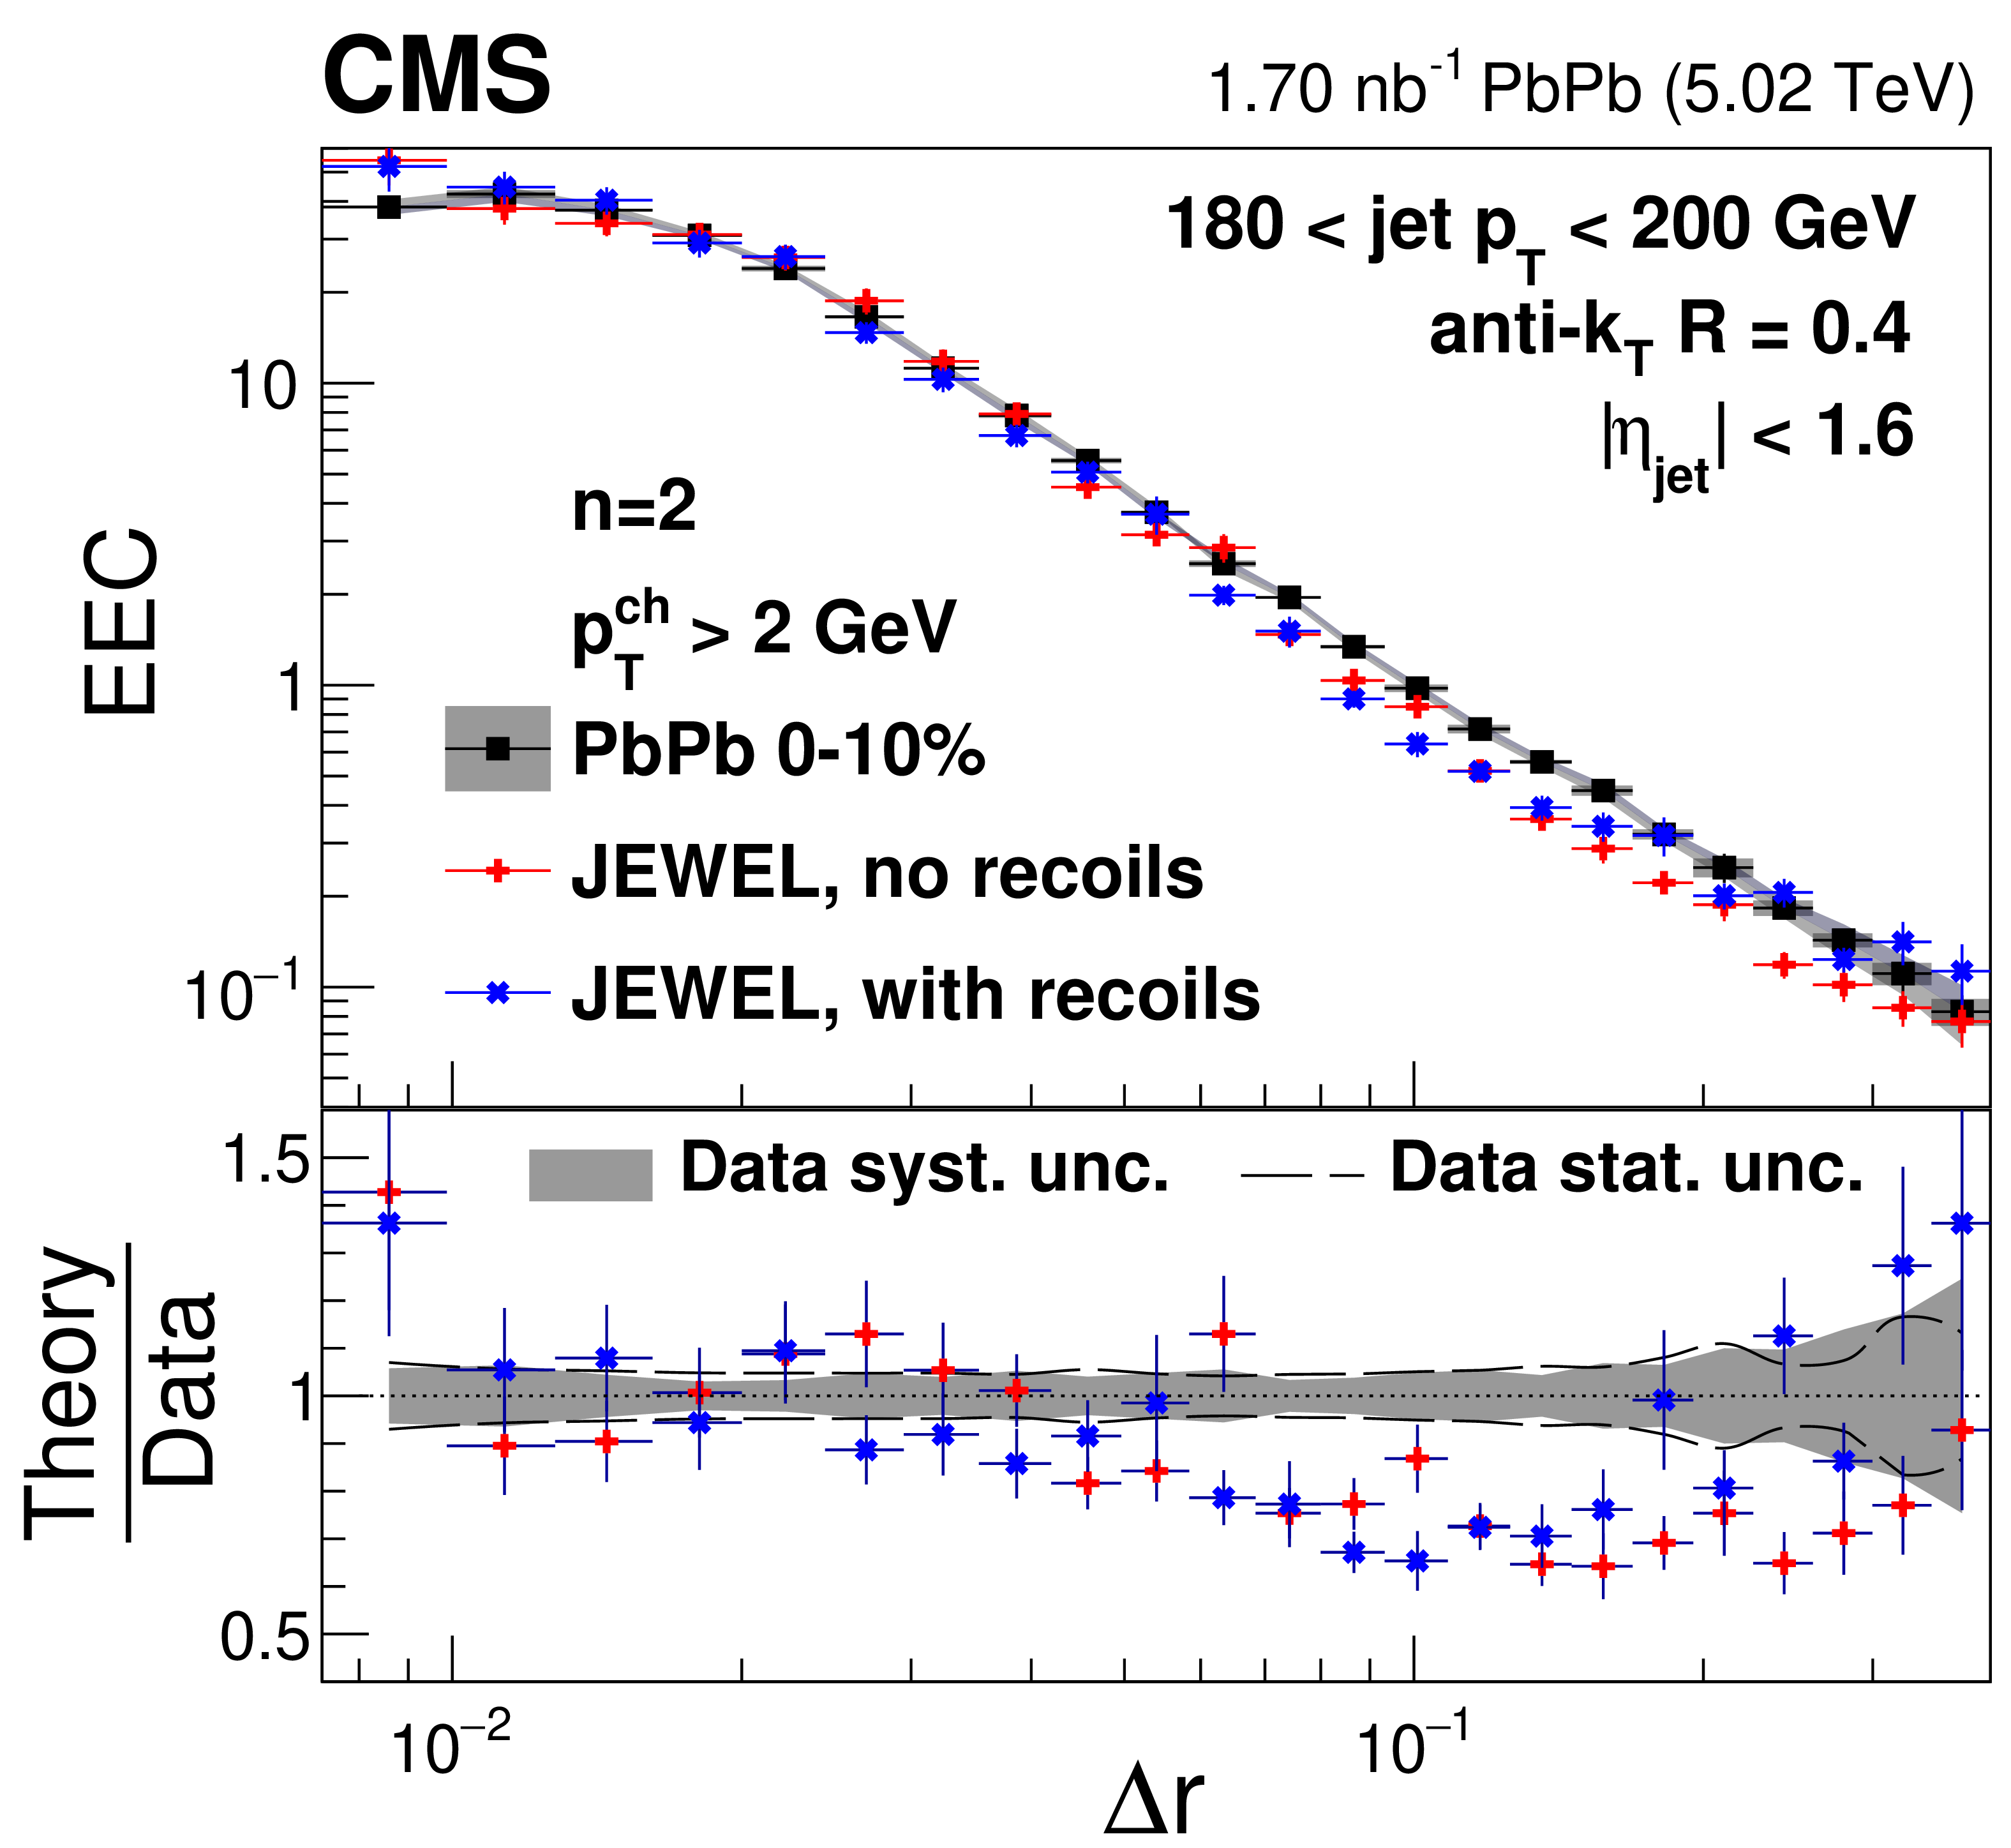
Figure 25:
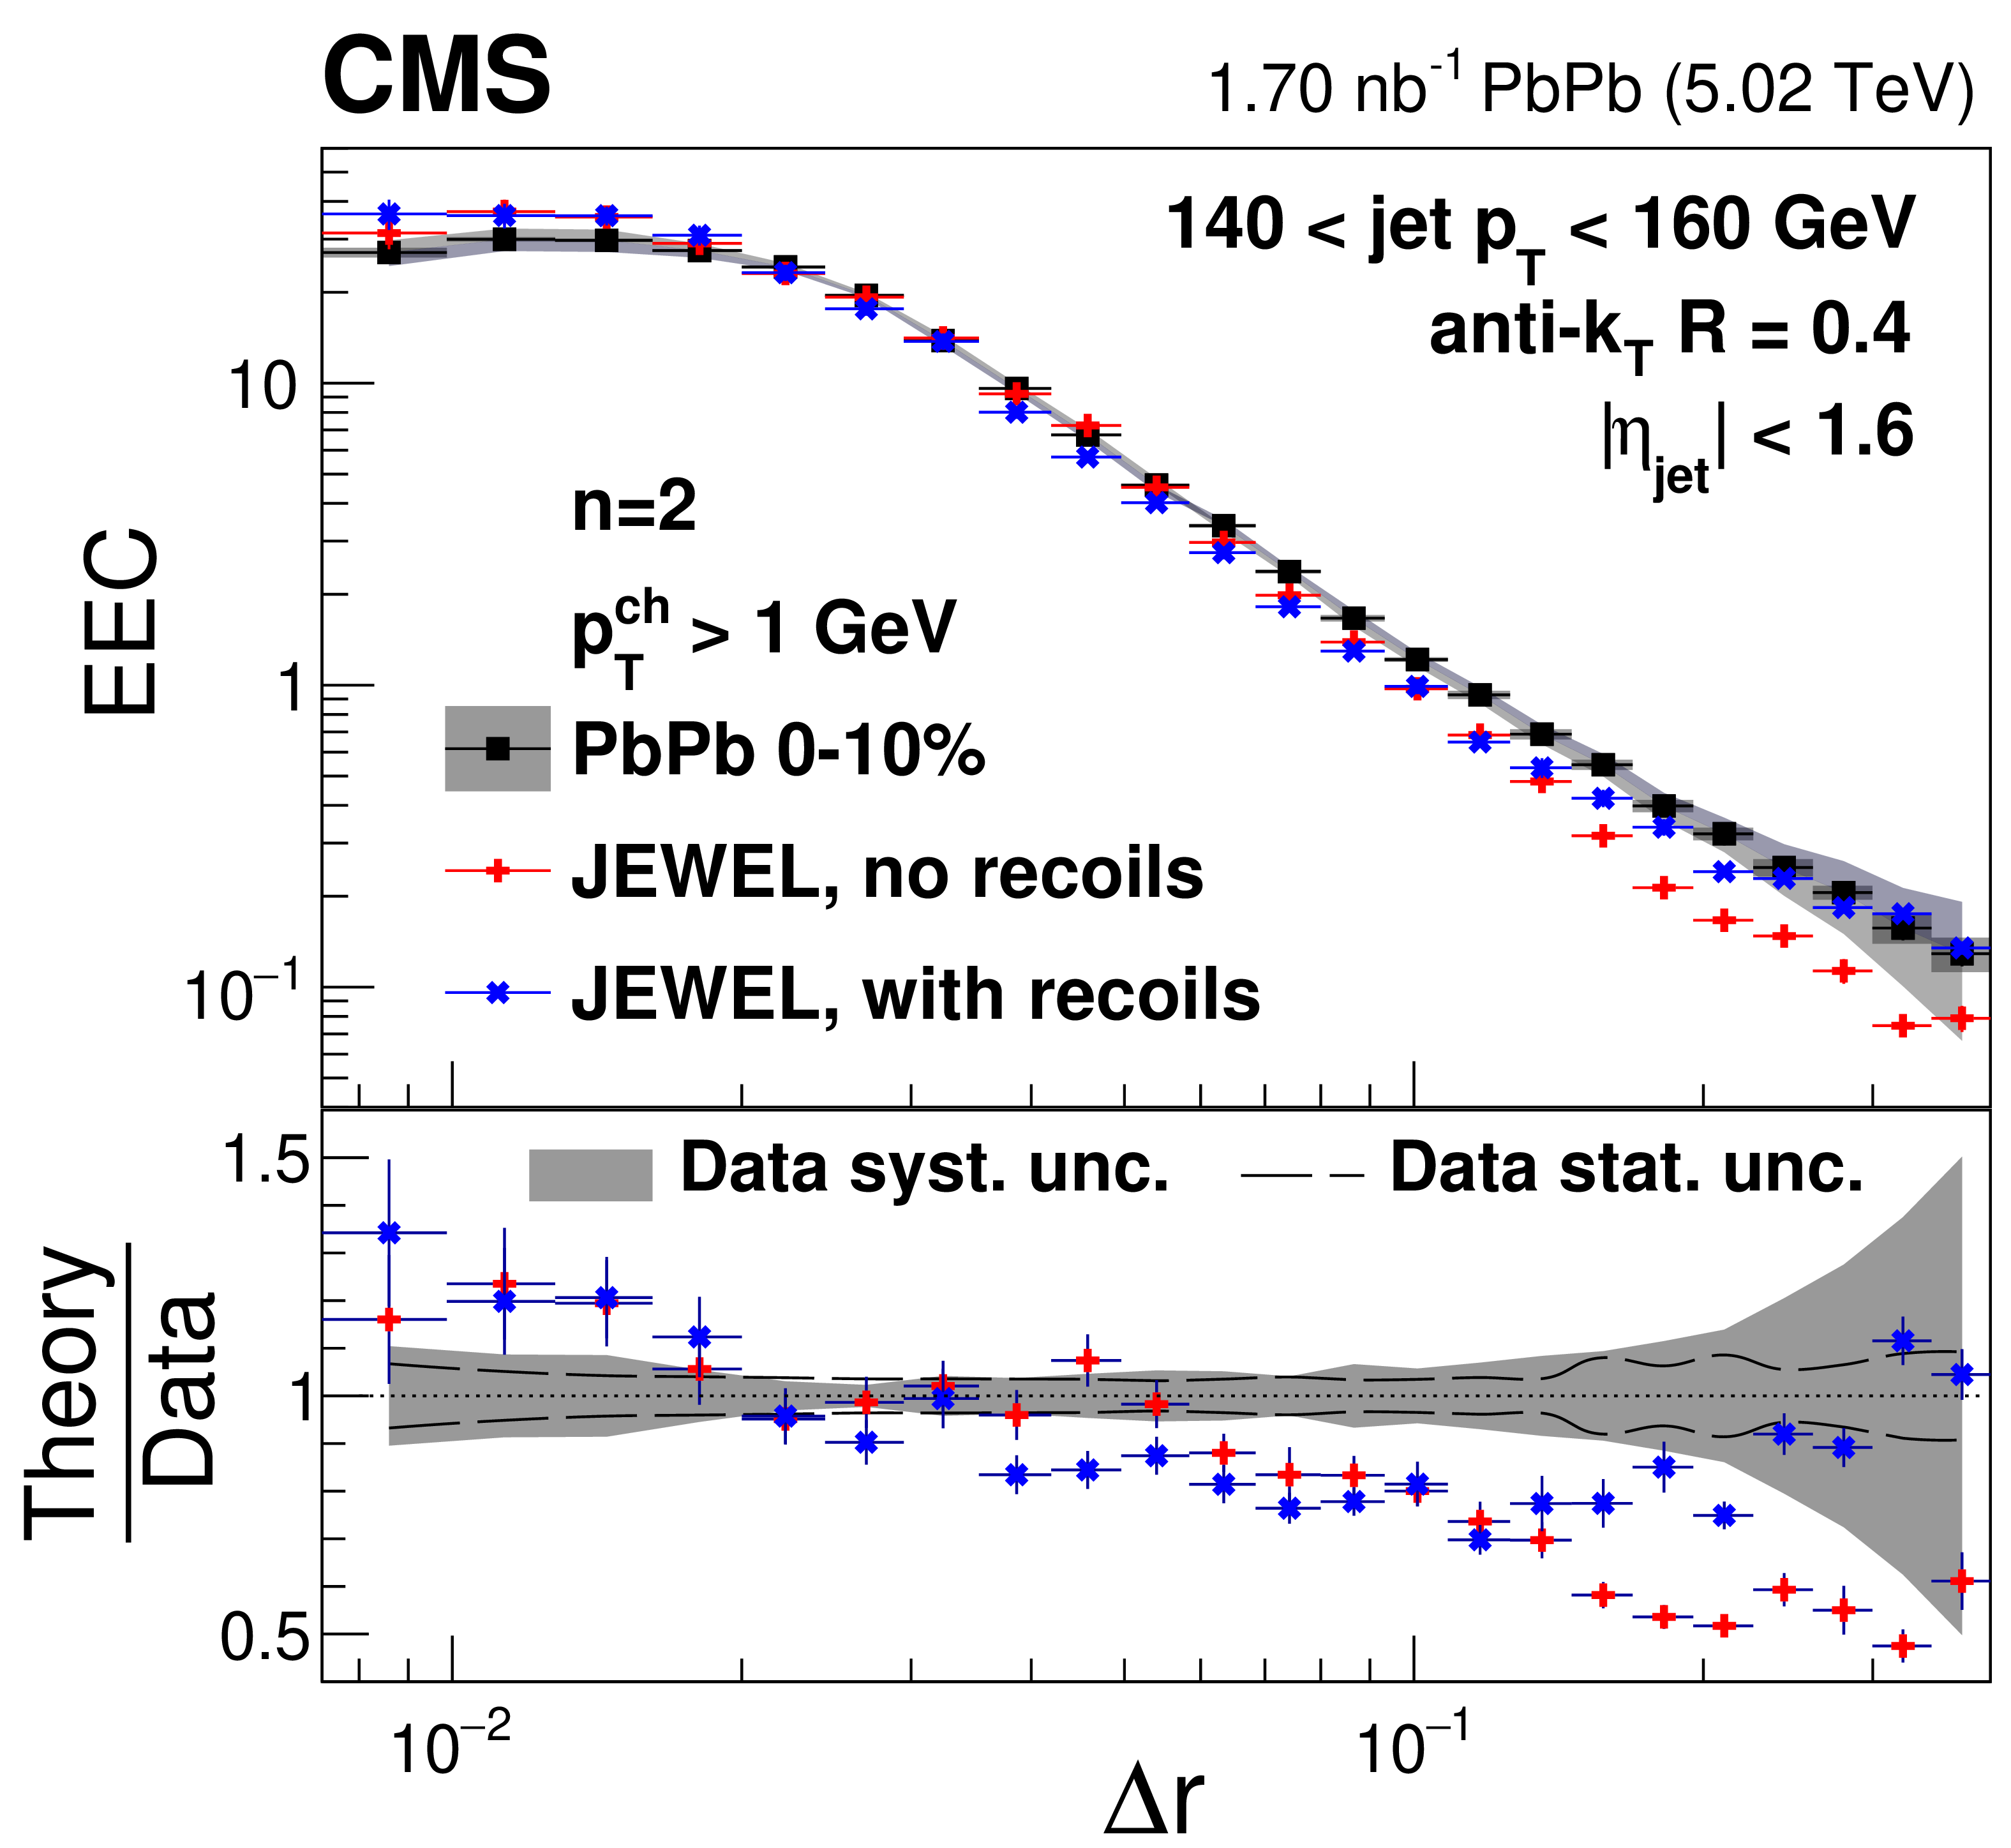
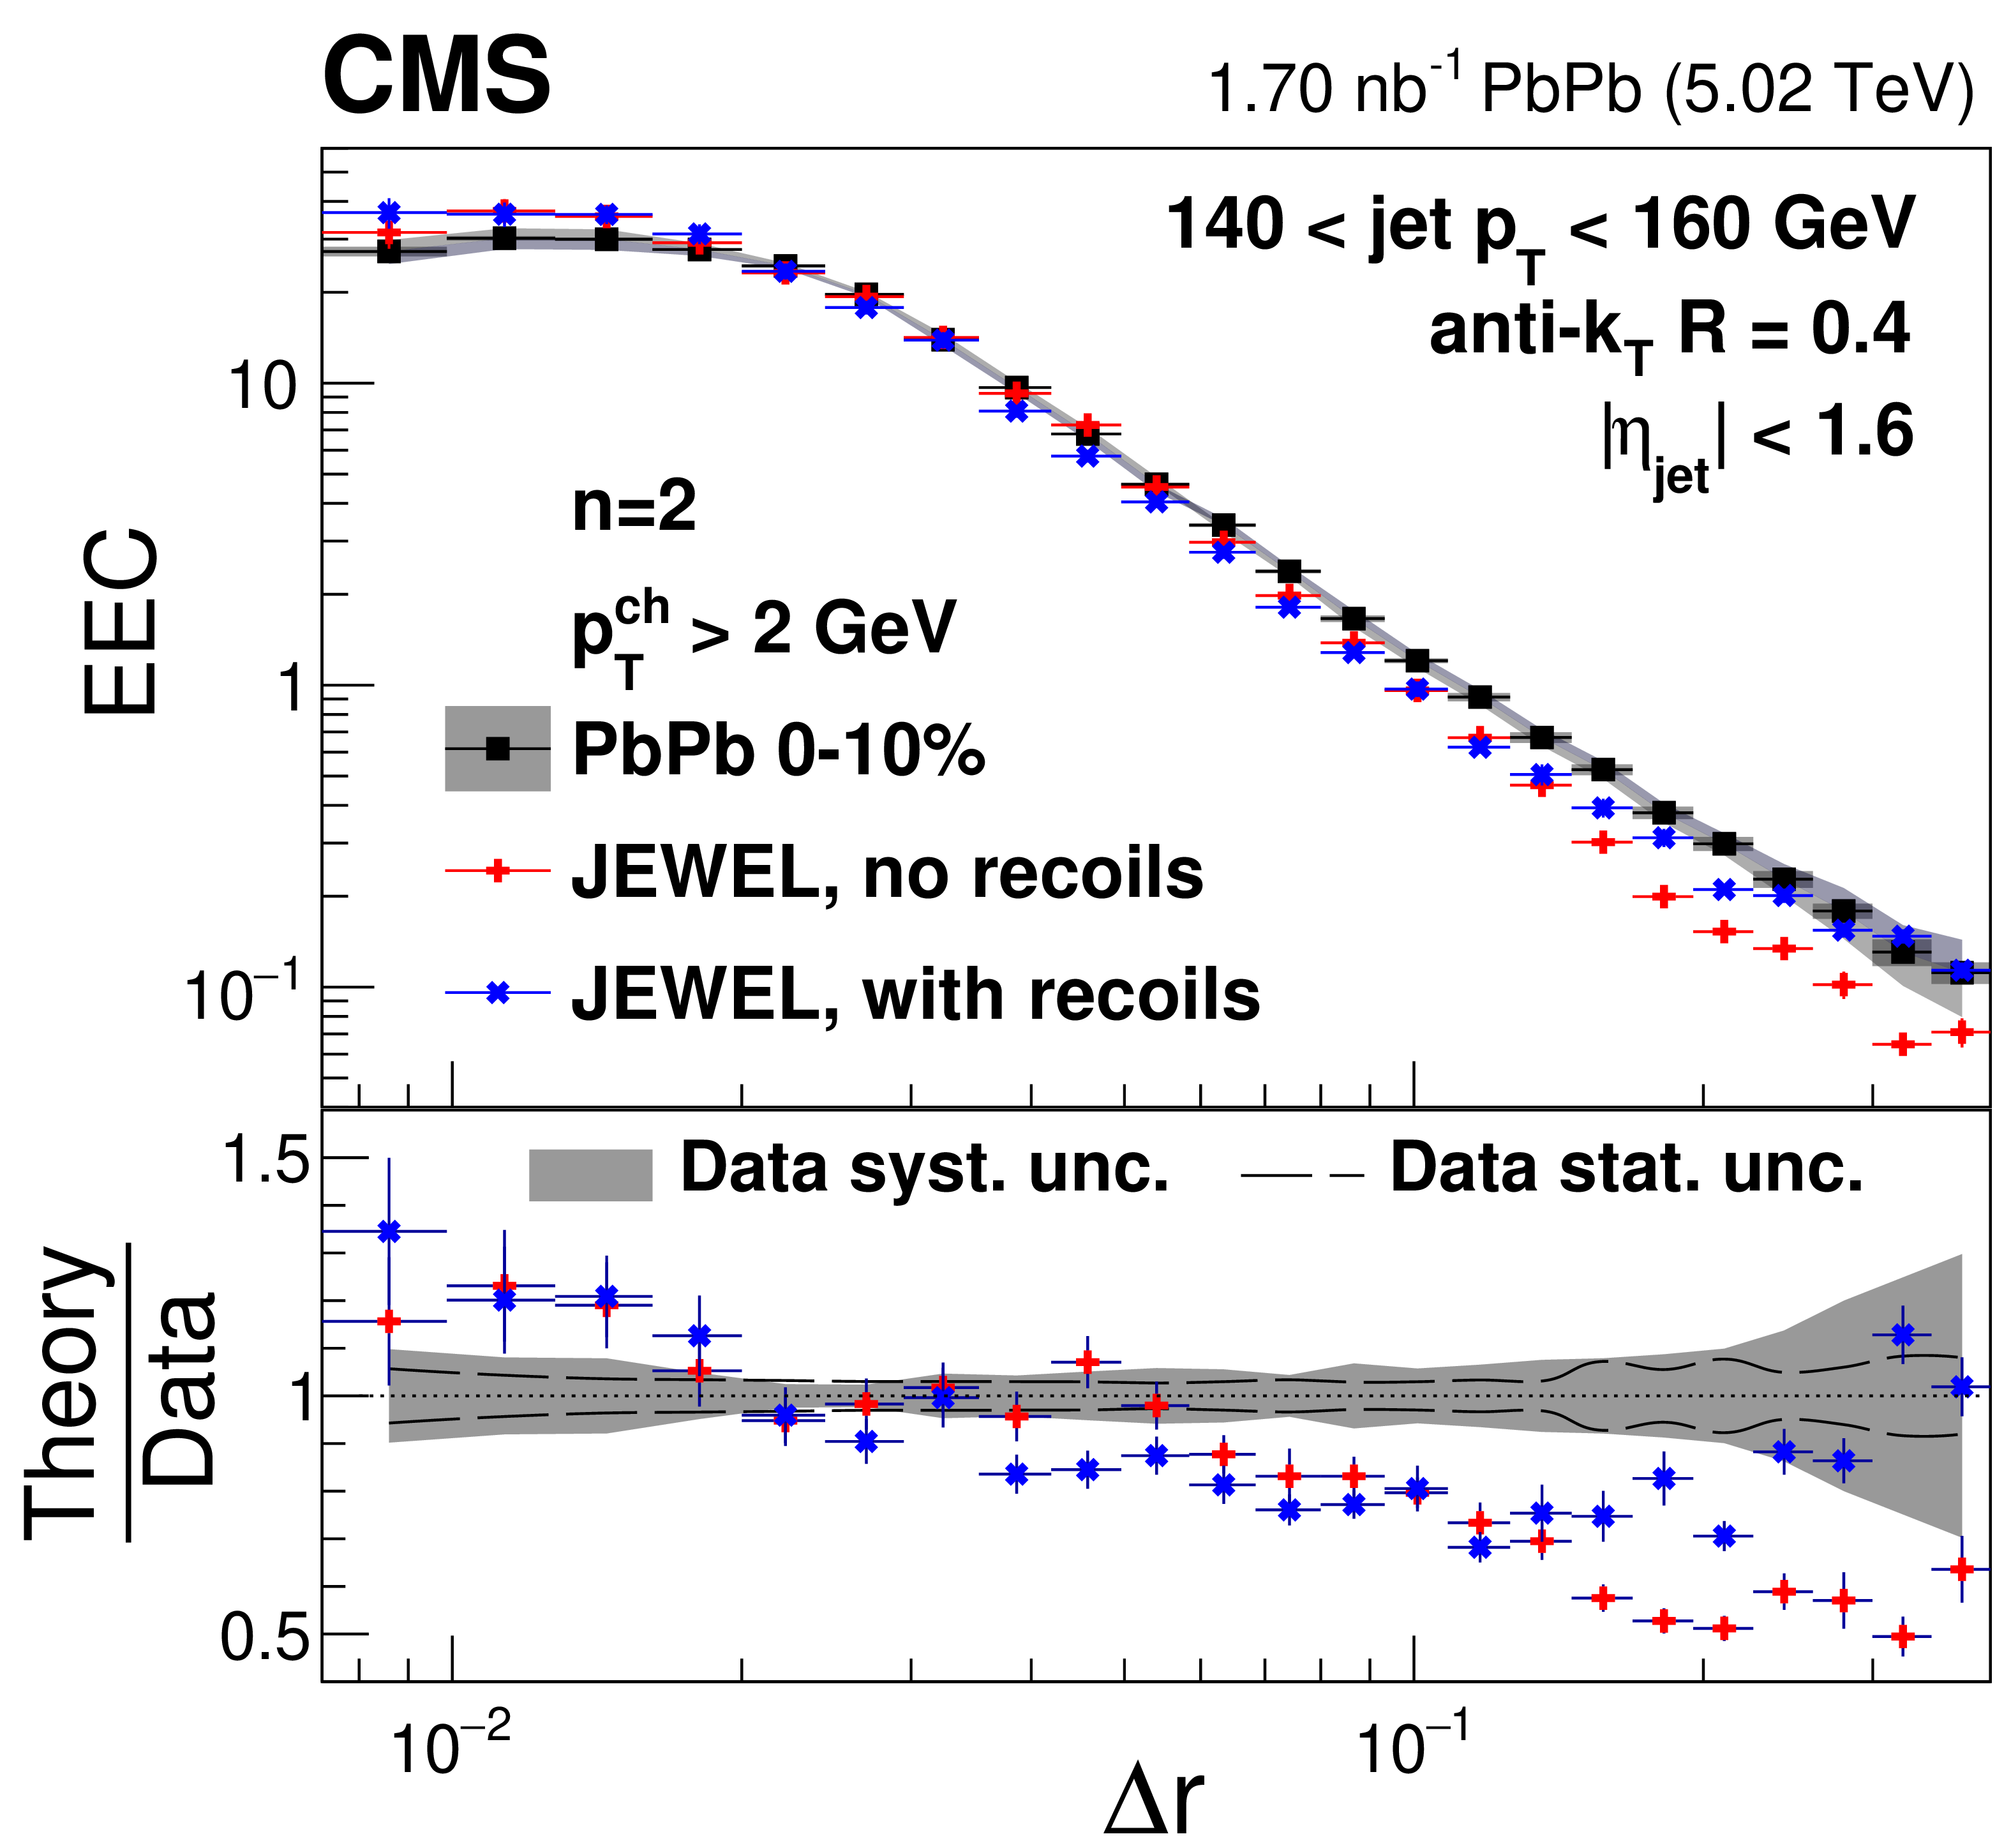
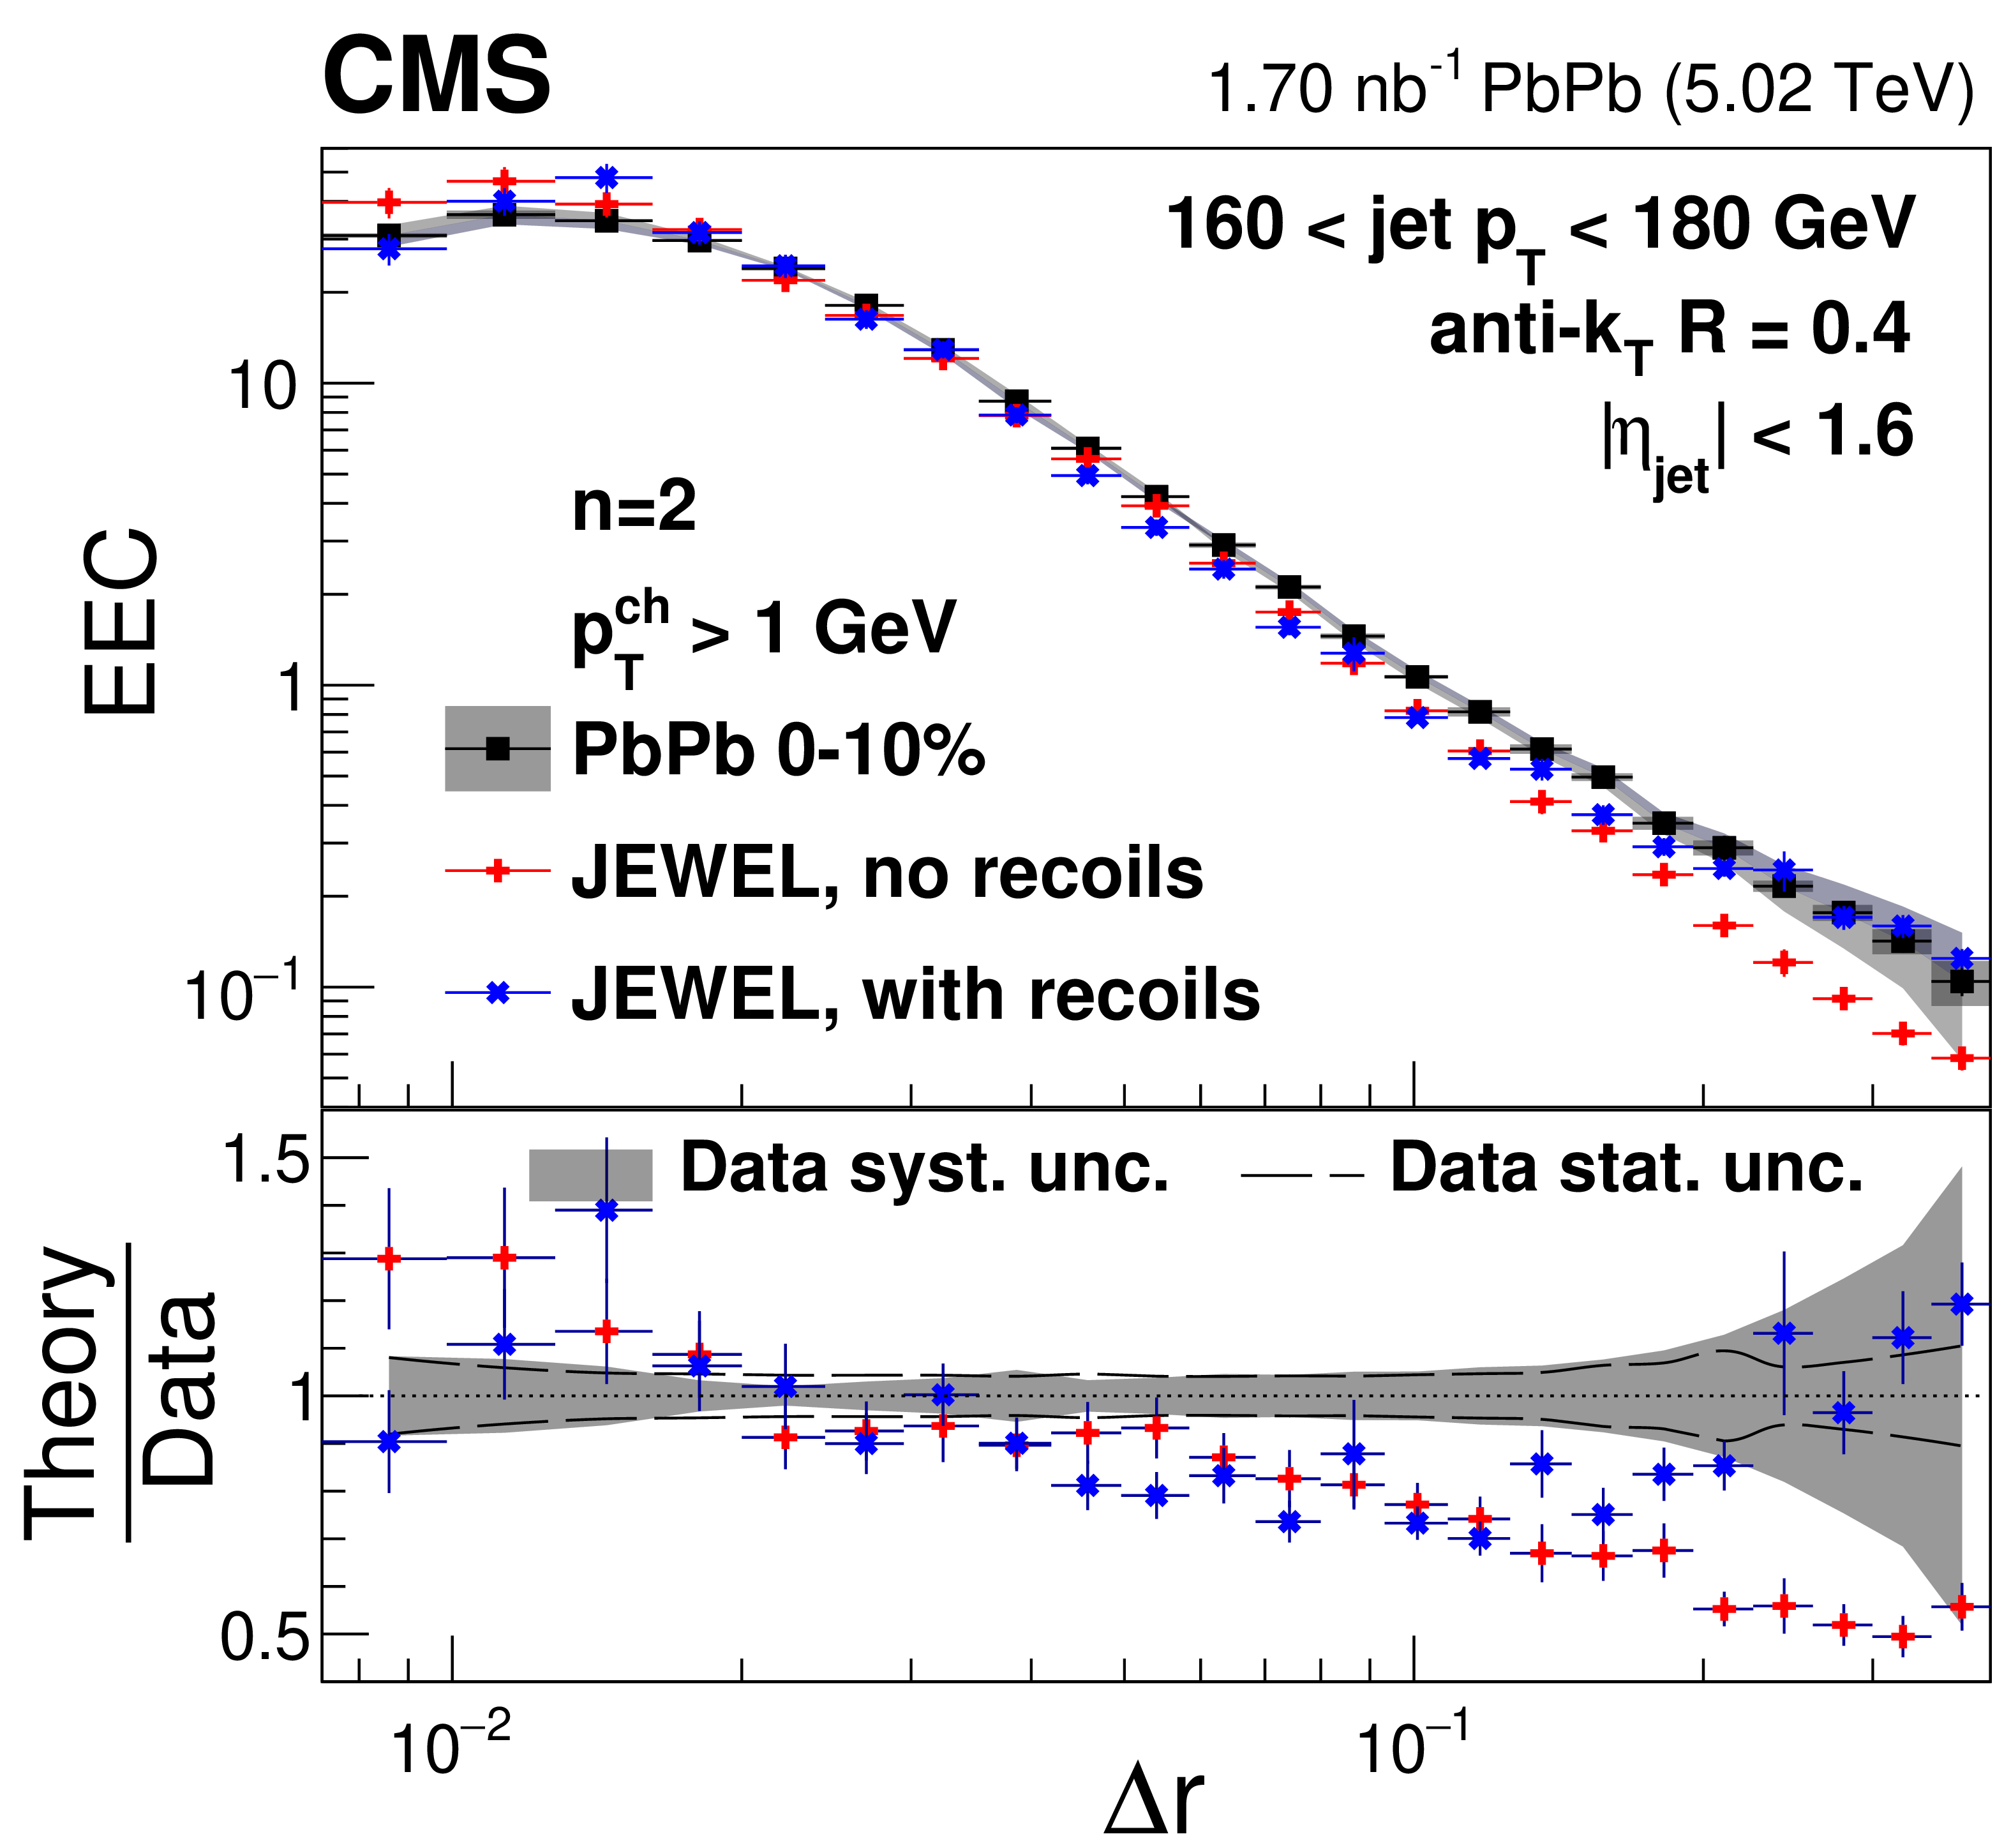
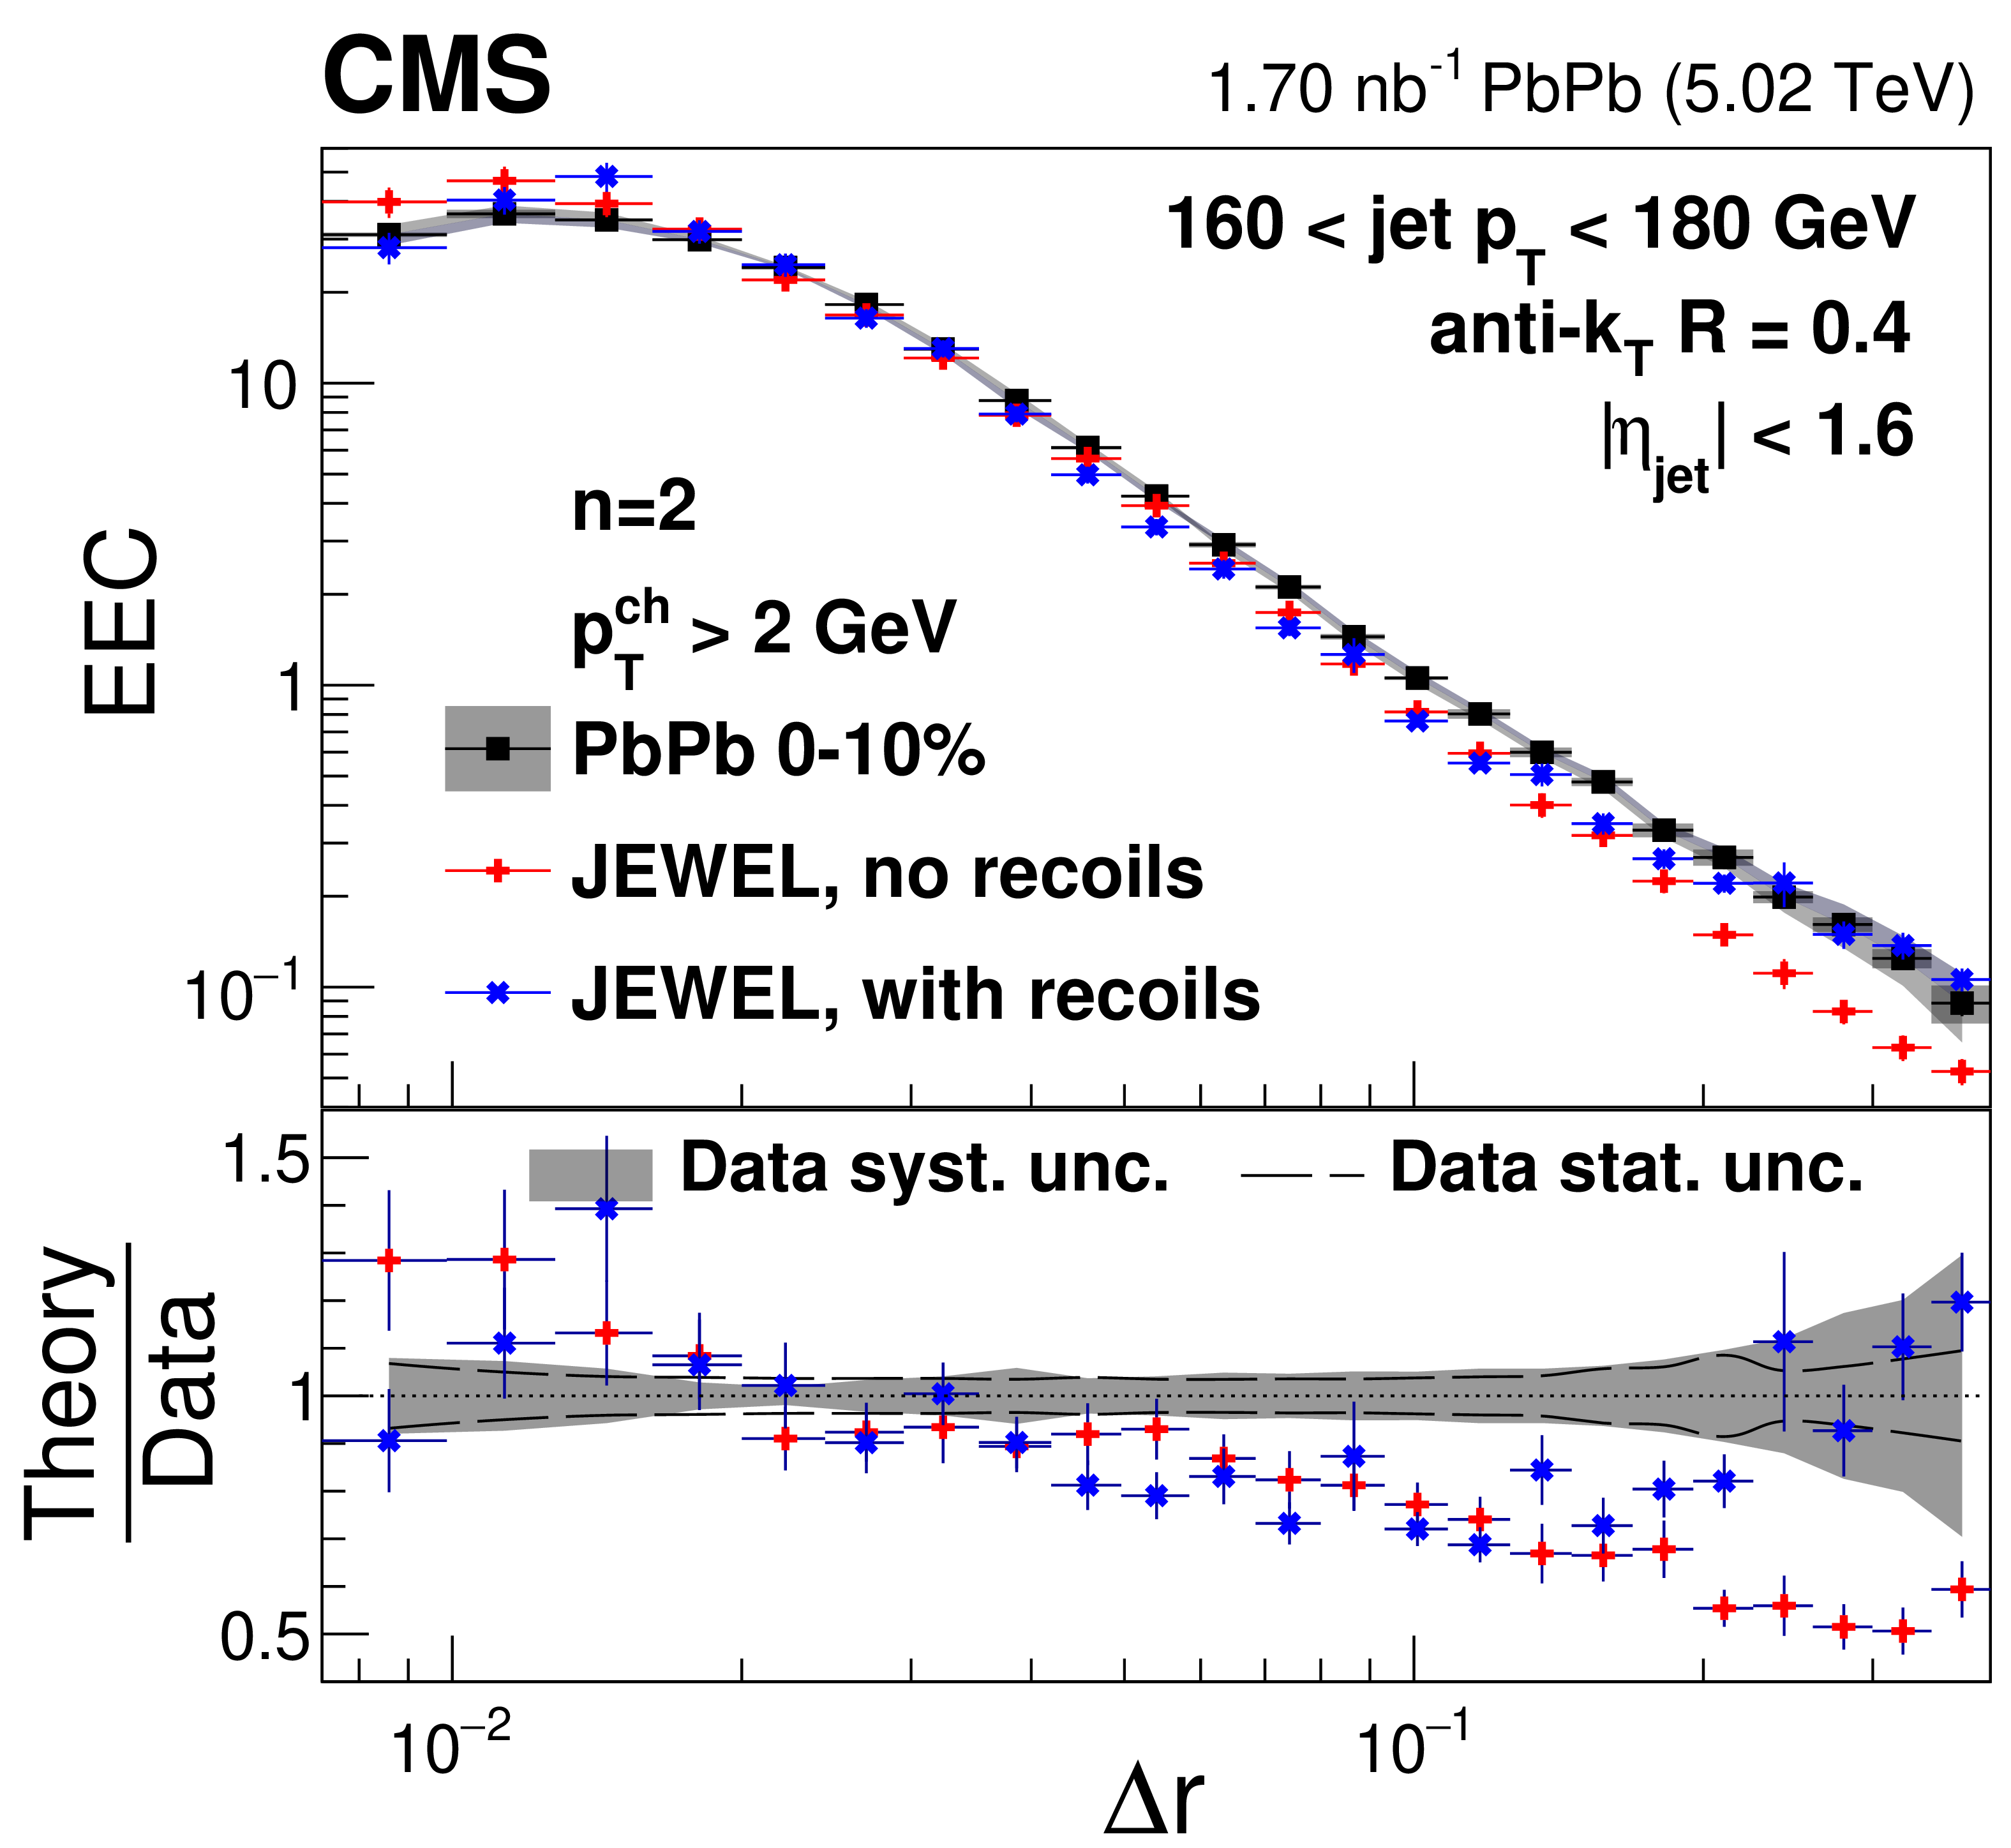
Energy-energy correlator distributions from 0-10% central PbPb collisions with $ n= $ 2 in different $ p_{\mathrm{T}}^{\text{ch}} $ and $ p_{\text{T,jet}} $ bins compared to predictions from JEWEL simulation with and without recoils. |
png pdf |
Figure 25-a:
Energy-energy correlator distributions from 0-10% central PbPb collisions with $ n= $ 2 in different $ p_{\mathrm{T}}^{\text{ch}} $ and $ p_{\text{T,jet}} $ bins compared to predictions from JEWEL simulation with and without recoils. |
png pdf |
Figure 25-b:
Energy-energy correlator distributions from 0-10% central PbPb collisions with $ n= $ 2 in different $ p_{\mathrm{T}}^{\text{ch}} $ and $ p_{\text{T,jet}} $ bins compared to predictions from JEWEL simulation with and without recoils. |
png pdf |
Figure 25-c:
Energy-energy correlator distributions from 0-10% central PbPb collisions with $ n= $ 2 in different $ p_{\mathrm{T}}^{\text{ch}} $ and $ p_{\text{T,jet}} $ bins compared to predictions from JEWEL simulation with and without recoils. |
png pdf |
Figure 25-d:
Energy-energy correlator distributions from 0-10% central PbPb collisions with $ n= $ 2 in different $ p_{\mathrm{T}}^{\text{ch}} $ and $ p_{\text{T,jet}} $ bins compared to predictions from JEWEL simulation with and without recoils. |
png pdf |
Figure 25-e:
Energy-energy correlator distributions from 0-10% central PbPb collisions with $ n= $ 2 in different $ p_{\mathrm{T}}^{\text{ch}} $ and $ p_{\text{T,jet}} $ bins compared to predictions from JEWEL simulation with and without recoils. |
png pdf |
Figure 25-f:
Energy-energy correlator distributions from 0-10% central PbPb collisions with $ n= $ 2 in different $ p_{\mathrm{T}}^{\text{ch}} $ and $ p_{\text{T,jet}} $ bins compared to predictions from JEWEL simulation with and without recoils. |
png pdf |
Figure 25-g:
Energy-energy correlator distributions from 0-10% central PbPb collisions with $ n= $ 2 in different $ p_{\mathrm{T}}^{\text{ch}} $ and $ p_{\text{T,jet}} $ bins compared to predictions from JEWEL simulation with and without recoils. |
png pdf |
Figure 25-h:
Energy-energy correlator distributions from 0-10% central PbPb collisions with $ n= $ 2 in different $ p_{\mathrm{T}}^{\text{ch}} $ and $ p_{\text{T,jet}} $ bins compared to predictions from JEWEL simulation with and without recoils. |

png pdf |
Figure 26:
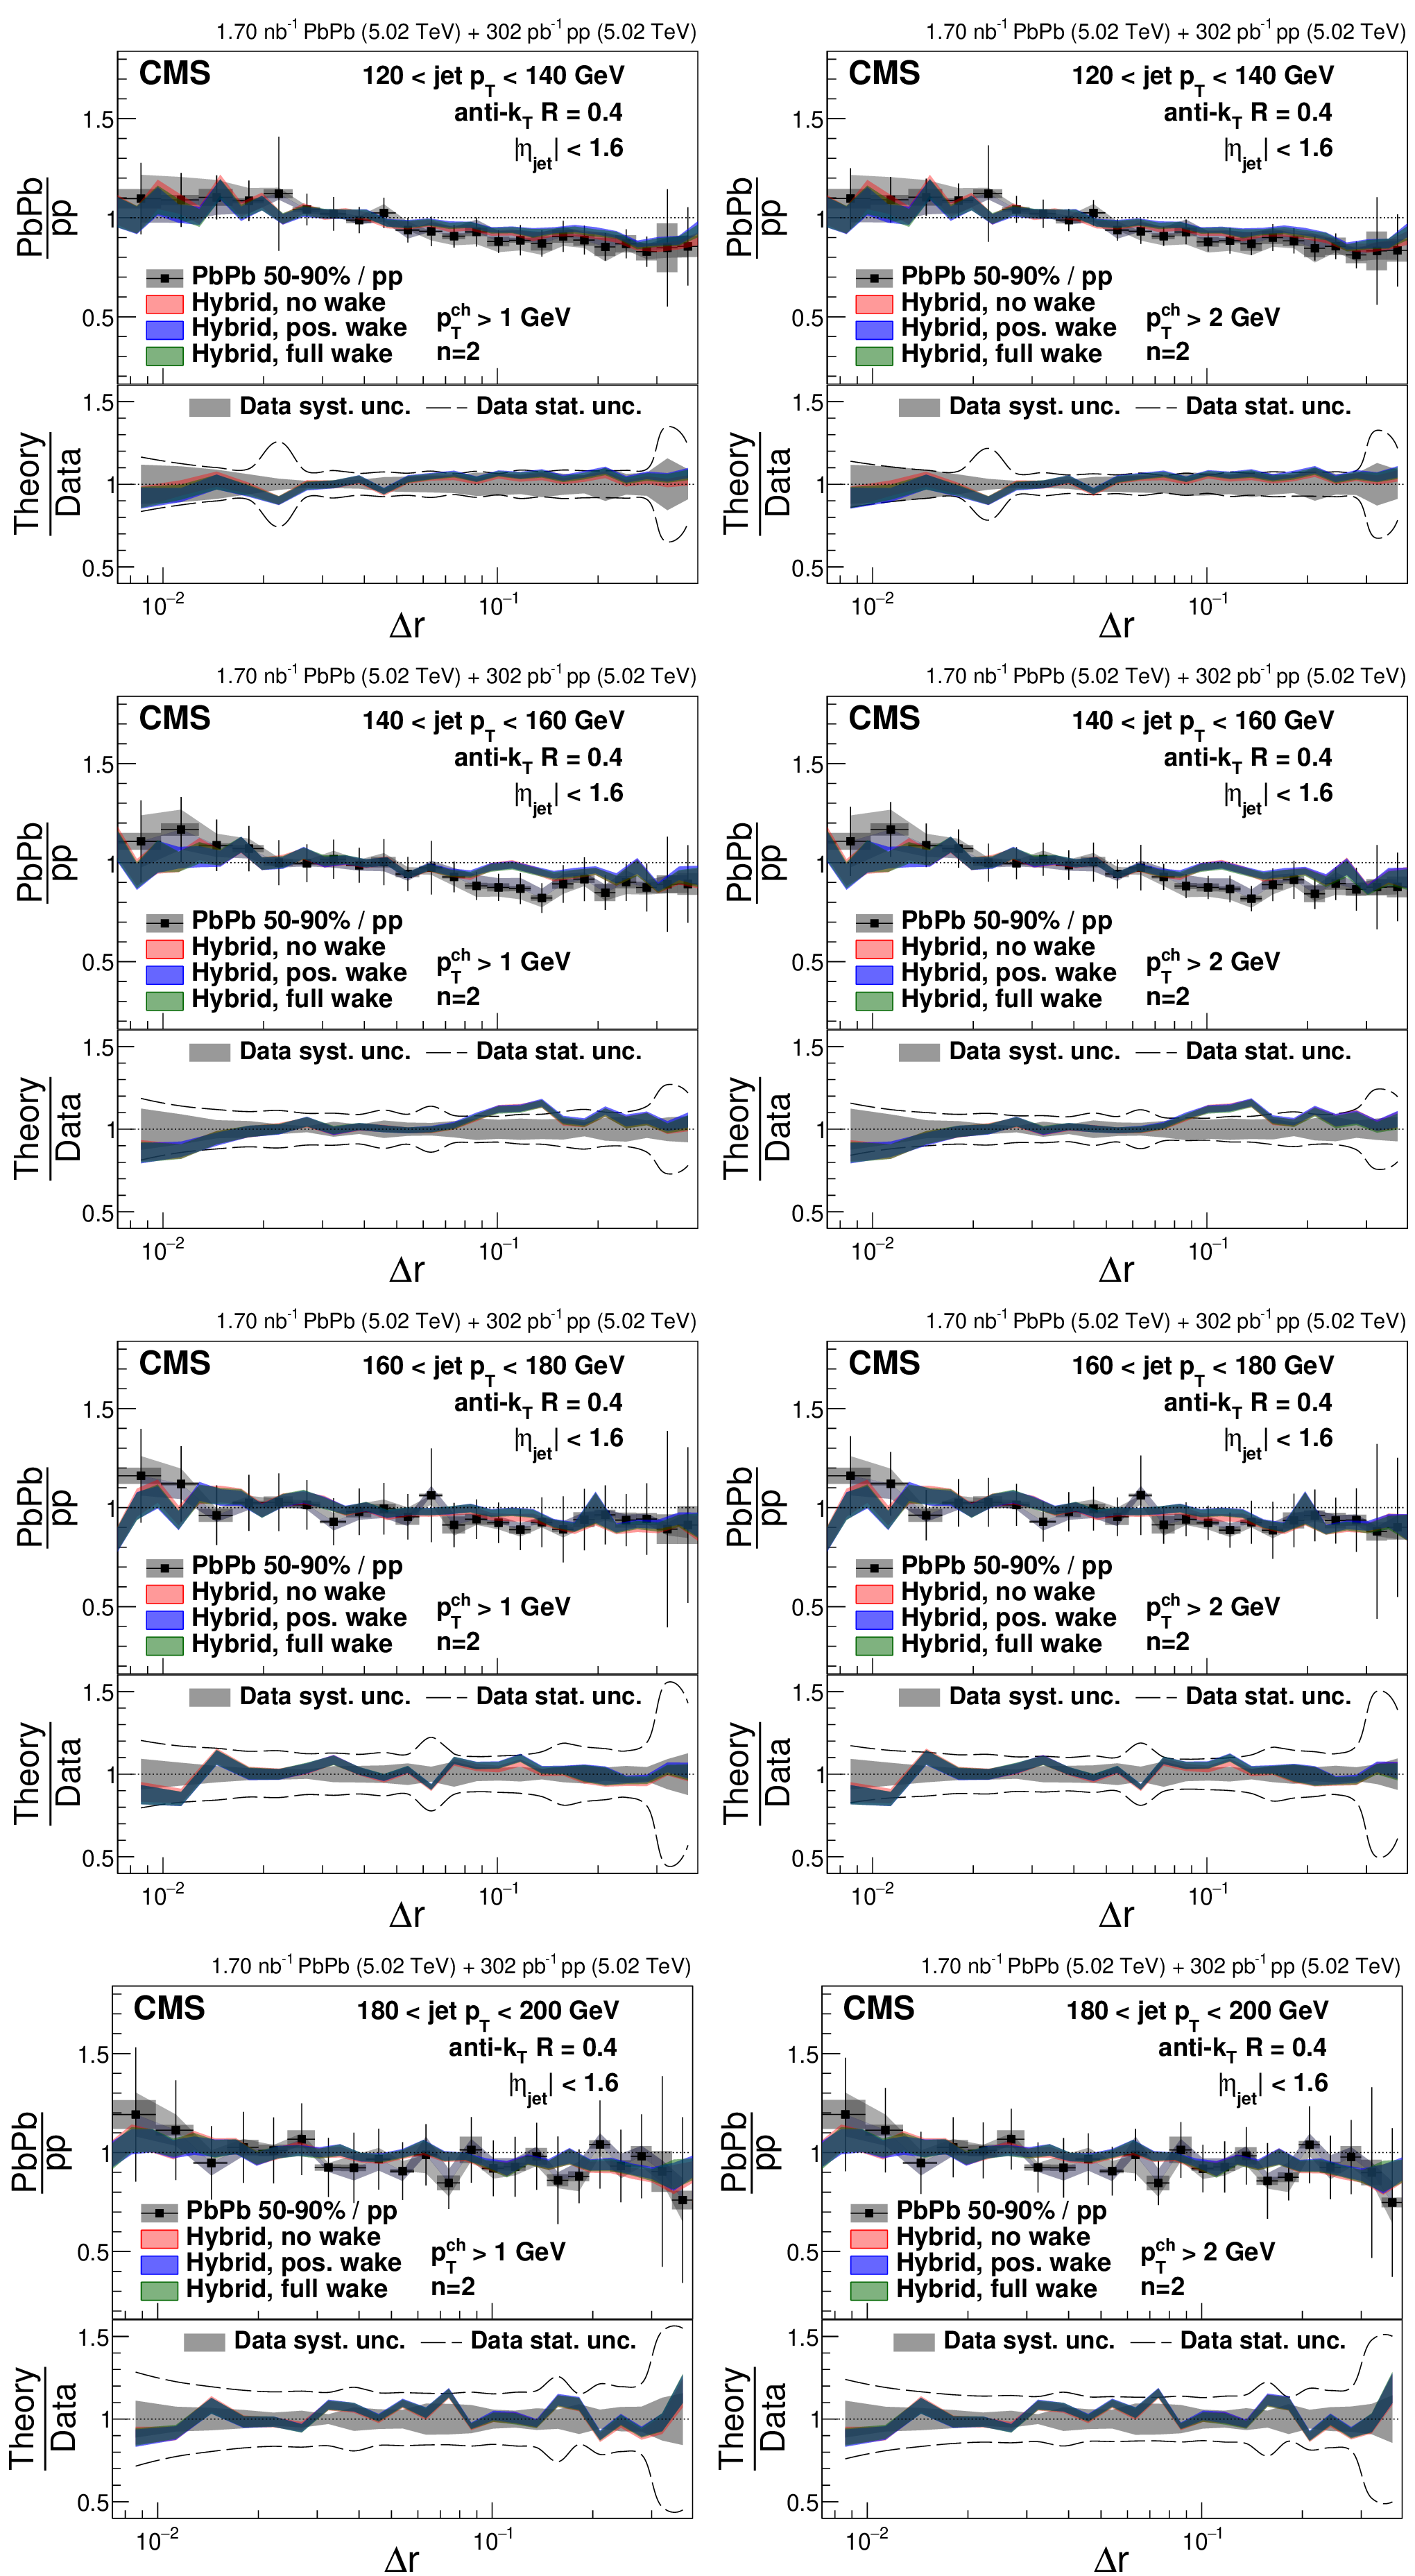
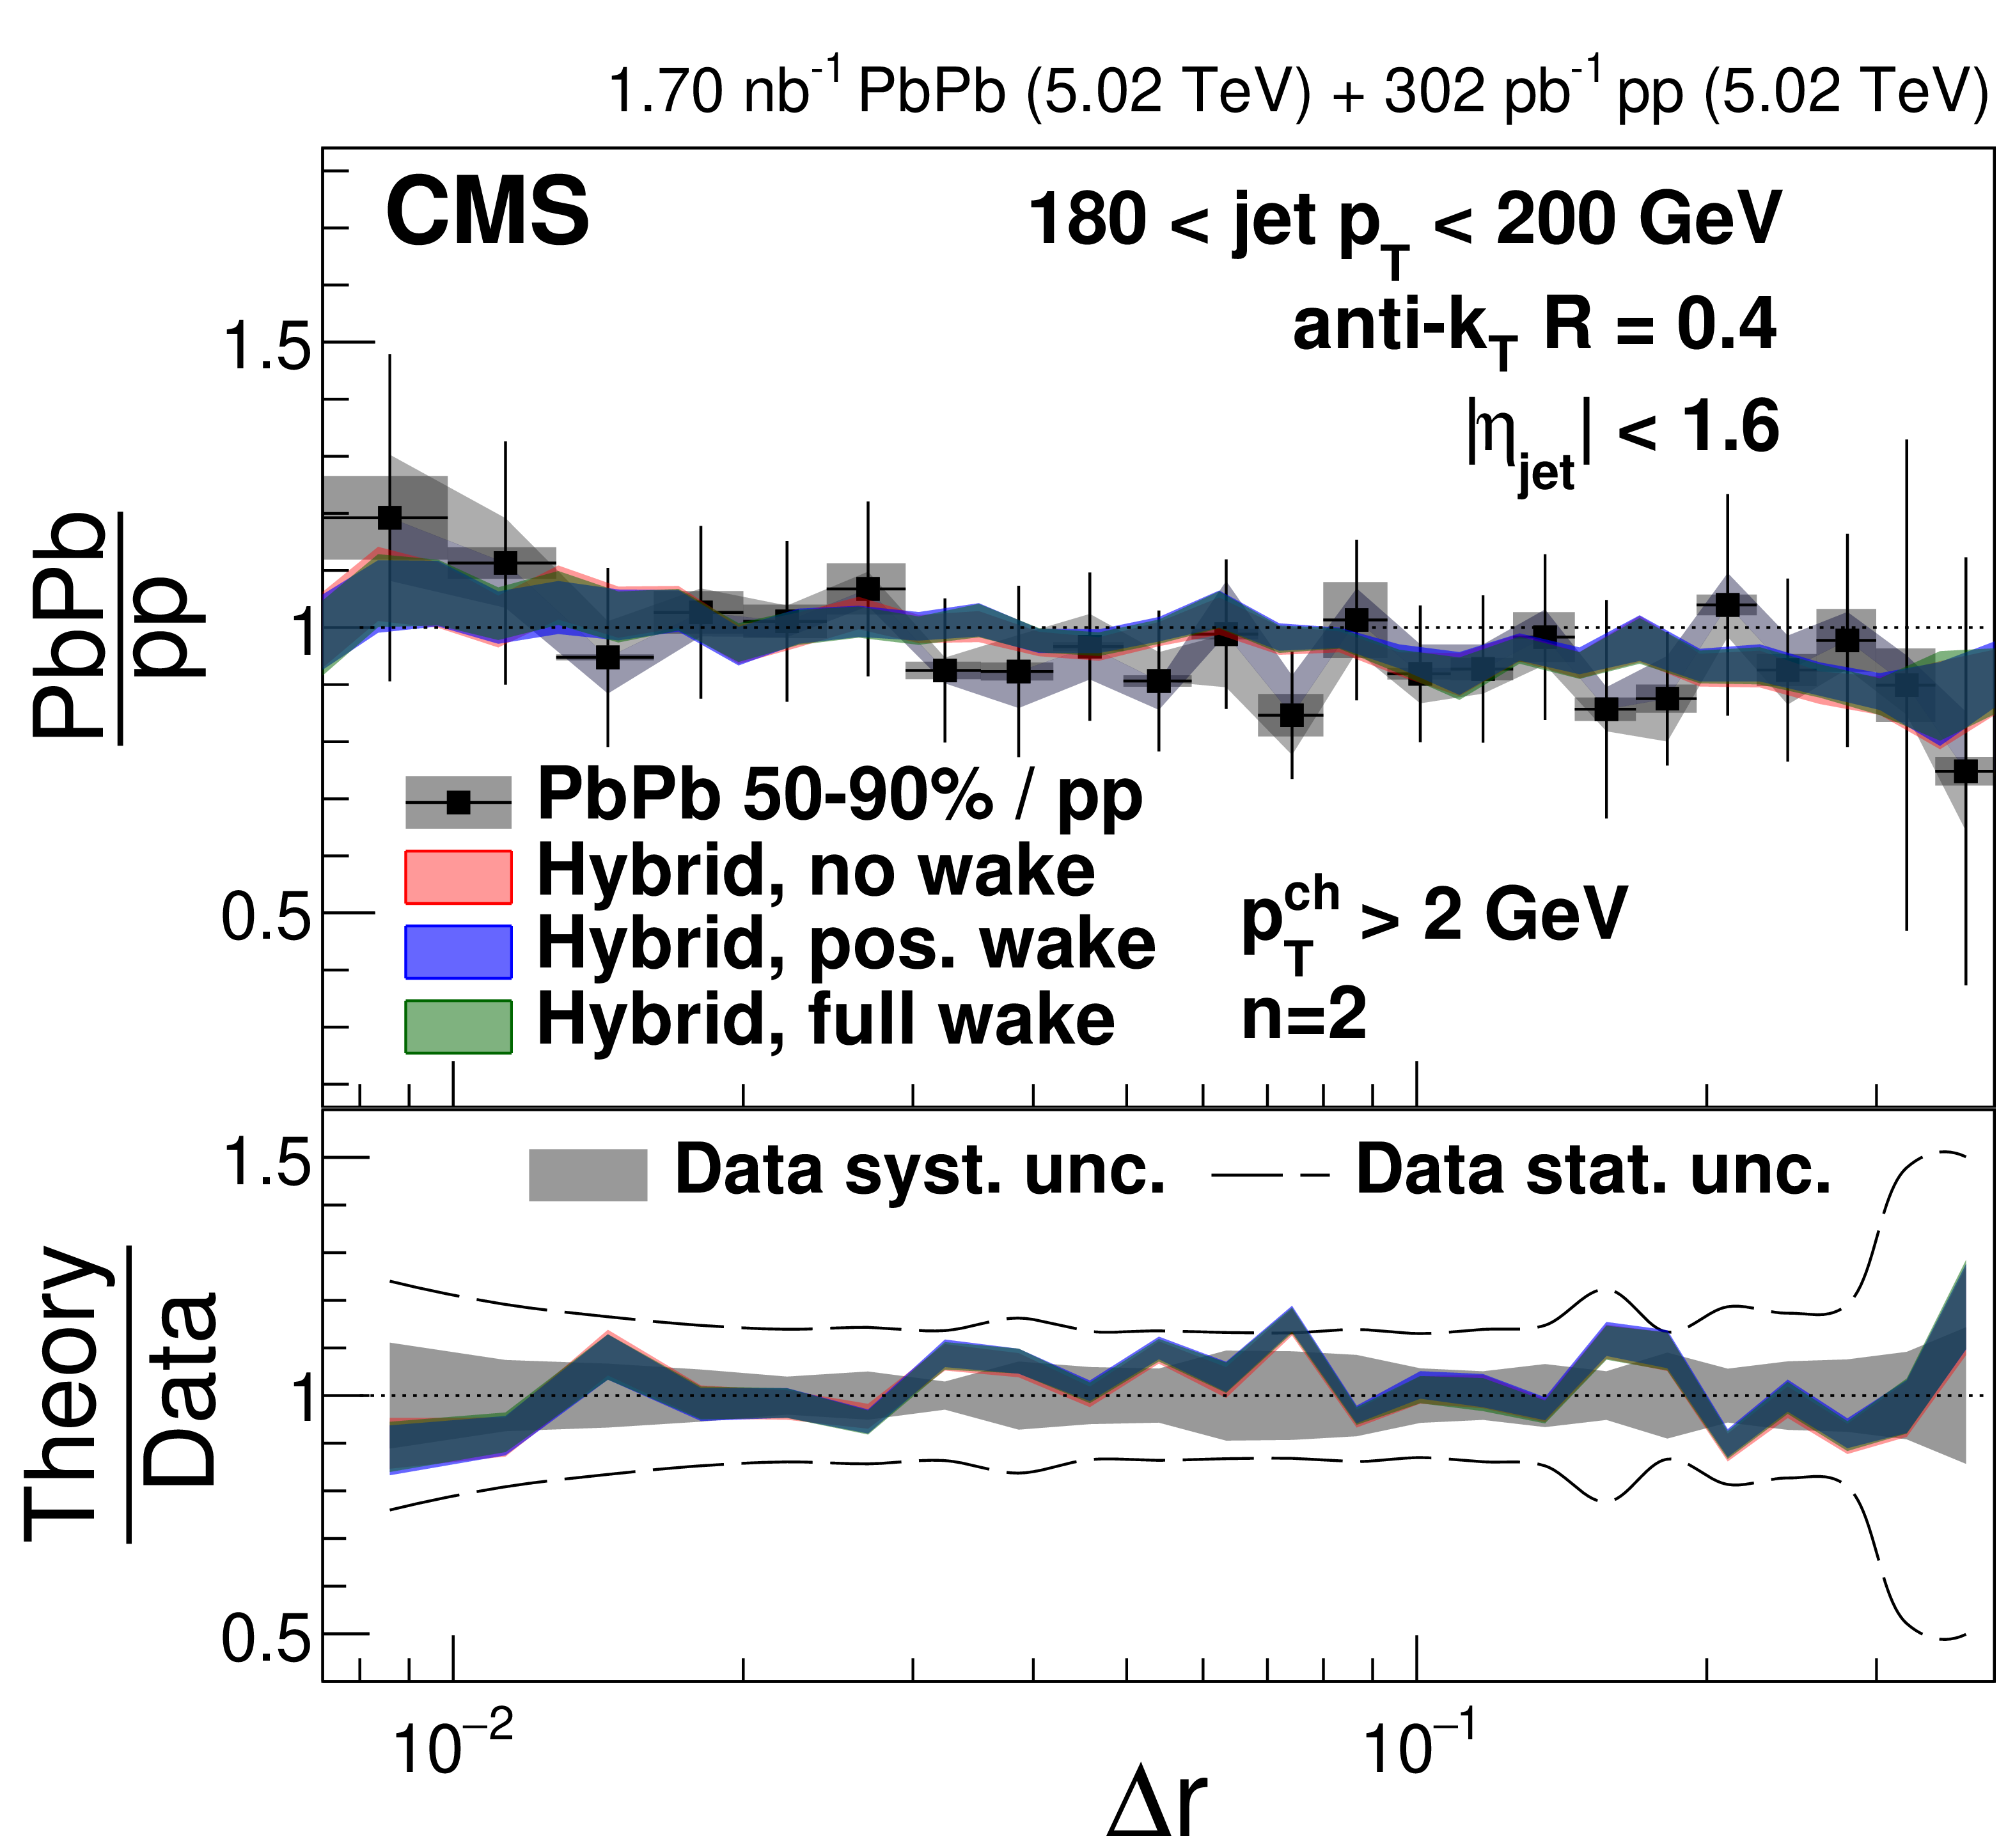
Ratios of 50-90% central PbPb to pp energy-energy correlators with $ n= $ 1 in different $ p_{\mathrm{T}}^{\text{ch}} $ and $ p_{\text{T,jet}} $ bins compared to the hybrid model predictions with different jet wake settings. |

png pdf |
Figure 26-a:
Ratios of 50-90% central PbPb to pp energy-energy correlators with $ n= $ 1 in different $ p_{\mathrm{T}}^{\text{ch}} $ and $ p_{\text{T,jet}} $ bins compared to the hybrid model predictions with different jet wake settings. |

png pdf |
Figure 26-b:
Ratios of 50-90% central PbPb to pp energy-energy correlators with $ n= $ 1 in different $ p_{\mathrm{T}}^{\text{ch}} $ and $ p_{\text{T,jet}} $ bins compared to the hybrid model predictions with different jet wake settings. |

png pdf |
Figure 26-c:
Ratios of 50-90% central PbPb to pp energy-energy correlators with $ n= $ 1 in different $ p_{\mathrm{T}}^{\text{ch}} $ and $ p_{\text{T,jet}} $ bins compared to the hybrid model predictions with different jet wake settings. |
png pdf |
Figure 26-d:
Ratios of 50-90% central PbPb to pp energy-energy correlators with $ n= $ 1 in different $ p_{\mathrm{T}}^{\text{ch}} $ and $ p_{\text{T,jet}} $ bins compared to the hybrid model predictions with different jet wake settings. |

png pdf |
Figure 26-e:
Ratios of 50-90% central PbPb to pp energy-energy correlators with $ n= $ 1 in different $ p_{\mathrm{T}}^{\text{ch}} $ and $ p_{\text{T,jet}} $ bins compared to the hybrid model predictions with different jet wake settings. |
png pdf |
Figure 26-f:
Ratios of 50-90% central PbPb to pp energy-energy correlators with $ n= $ 1 in different $ p_{\mathrm{T}}^{\text{ch}} $ and $ p_{\text{T,jet}} $ bins compared to the hybrid model predictions with different jet wake settings. |

png pdf |
Figure 26-g:
Ratios of 50-90% central PbPb to pp energy-energy correlators with $ n= $ 1 in different $ p_{\mathrm{T}}^{\text{ch}} $ and $ p_{\text{T,jet}} $ bins compared to the hybrid model predictions with different jet wake settings. |
png pdf |
Figure 26-h:
Ratios of 50-90% central PbPb to pp energy-energy correlators with $ n= $ 1 in different $ p_{\mathrm{T}}^{\text{ch}} $ and $ p_{\text{T,jet}} $ bins compared to the hybrid model predictions with different jet wake settings. |
png pdf |
Figure 27:
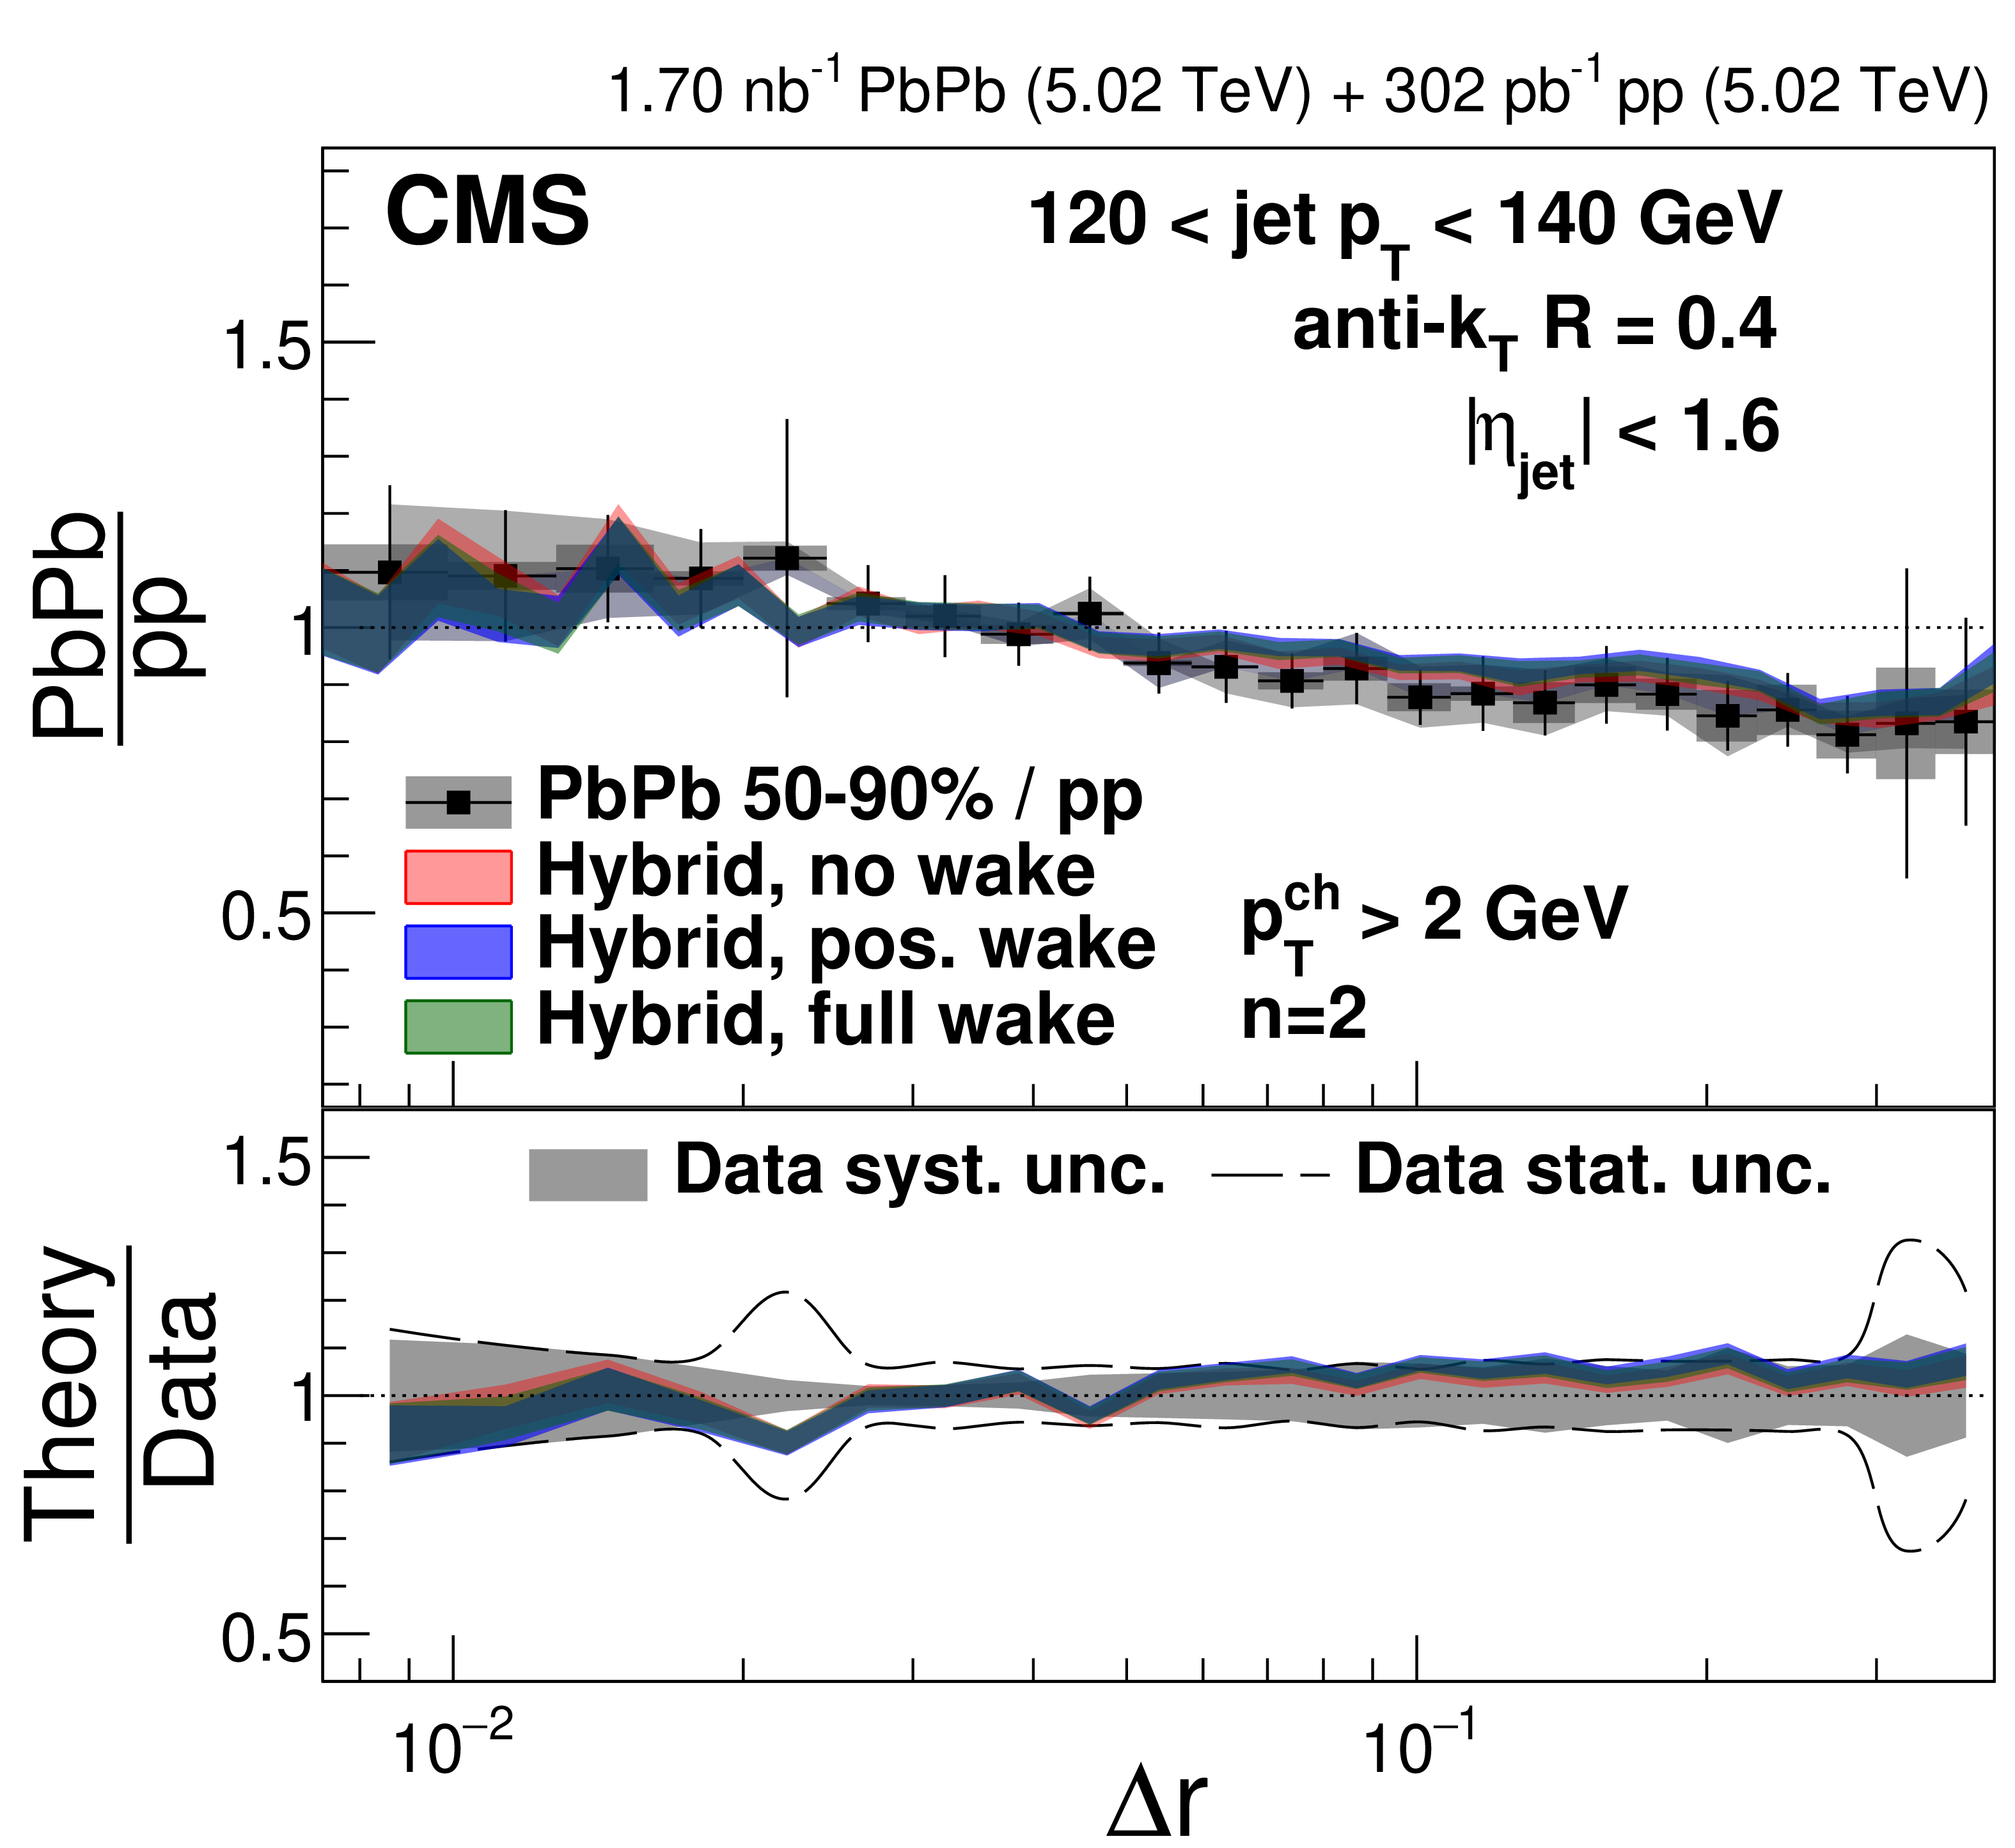
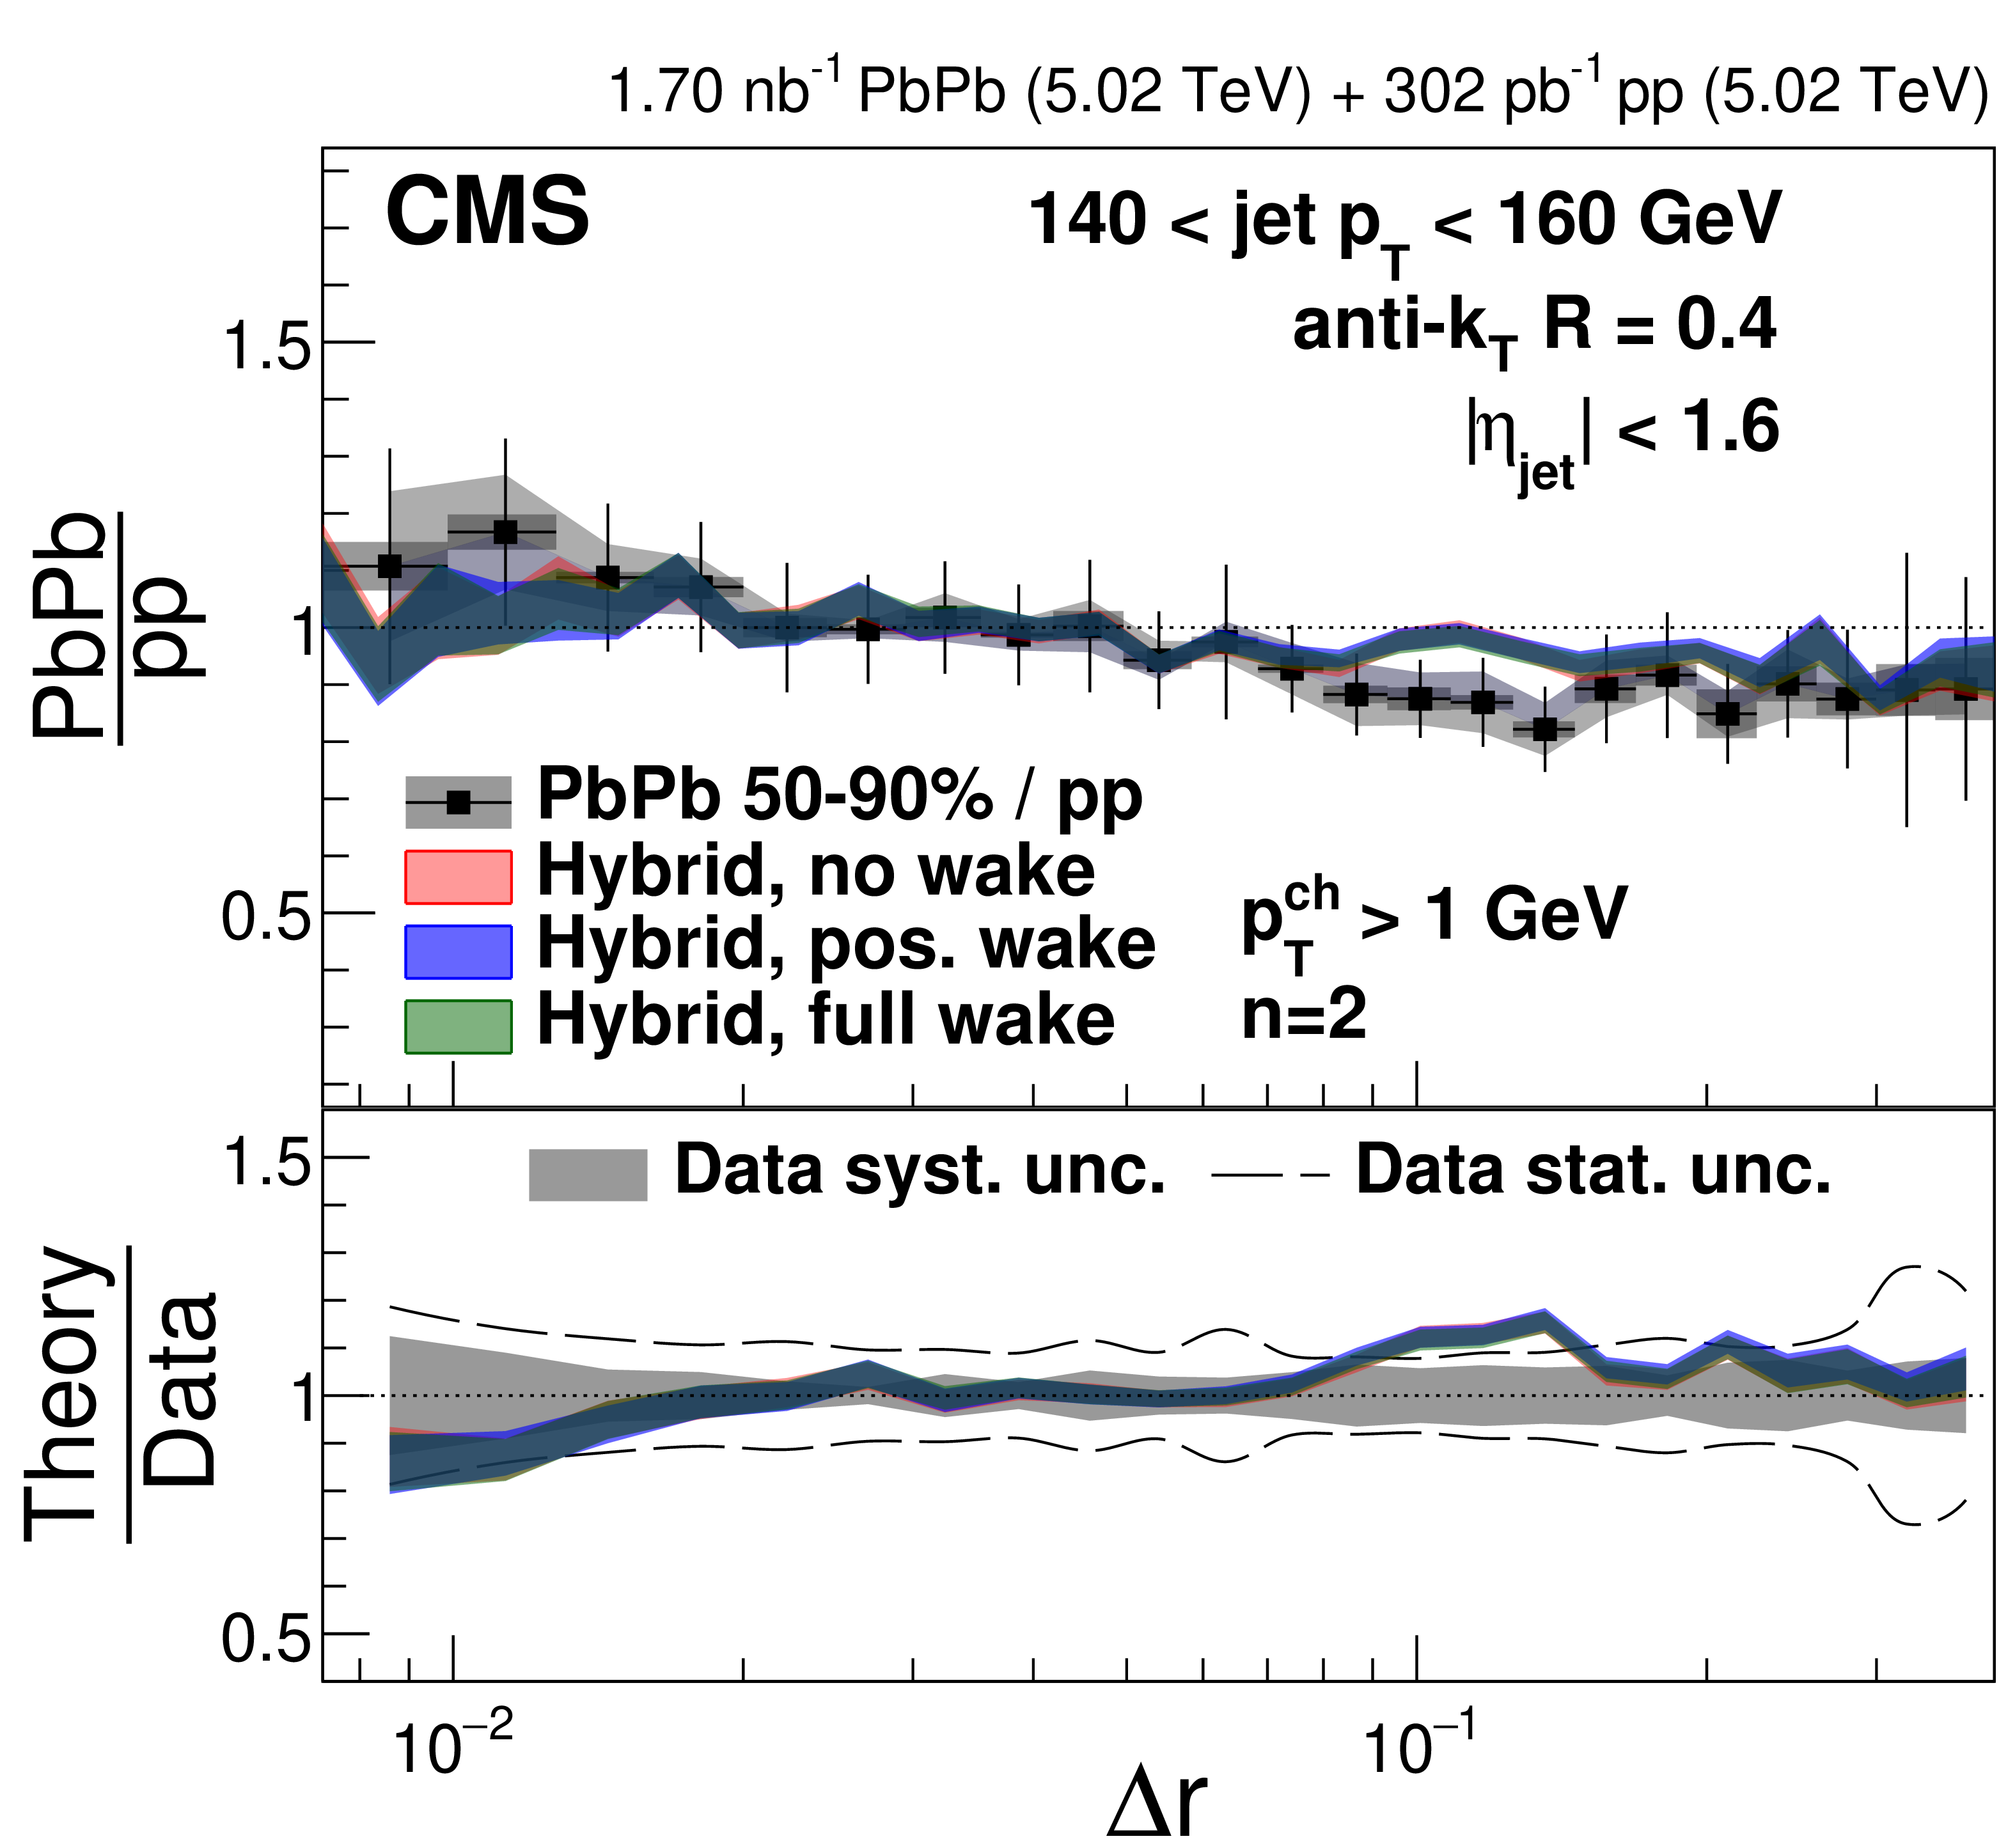
Ratios of 50-90% central PbPb to pp energy-energy correlators with $ n= $ 2 in different $ p_{\mathrm{T}}^{\text{ch}} $ and $ p_{\text{T,jet}} $ bins compared to the hybrid model predictions with different jet wake settings. |

png pdf |
Figure 27-a:
Ratios of 50-90% central PbPb to pp energy-energy correlators with $ n= $ 2 in different $ p_{\mathrm{T}}^{\text{ch}} $ and $ p_{\text{T,jet}} $ bins compared to the hybrid model predictions with different jet wake settings. |
png pdf |
Figure 27-b:
Ratios of 50-90% central PbPb to pp energy-energy correlators with $ n= $ 2 in different $ p_{\mathrm{T}}^{\text{ch}} $ and $ p_{\text{T,jet}} $ bins compared to the hybrid model predictions with different jet wake settings. |
png pdf |
Figure 27-c:
Ratios of 50-90% central PbPb to pp energy-energy correlators with $ n= $ 2 in different $ p_{\mathrm{T}}^{\text{ch}} $ and $ p_{\text{T,jet}} $ bins compared to the hybrid model predictions with different jet wake settings. |
png pdf |
Figure 27-d:
Ratios of 50-90% central PbPb to pp energy-energy correlators with $ n= $ 2 in different $ p_{\mathrm{T}}^{\text{ch}} $ and $ p_{\text{T,jet}} $ bins compared to the hybrid model predictions with different jet wake settings. |

png pdf |
Figure 27-e:
Ratios of 50-90% central PbPb to pp energy-energy correlators with $ n= $ 2 in different $ p_{\mathrm{T}}^{\text{ch}} $ and $ p_{\text{T,jet}} $ bins compared to the hybrid model predictions with different jet wake settings. |
png pdf |
Figure 27-f:
Ratios of 50-90% central PbPb to pp energy-energy correlators with $ n= $ 2 in different $ p_{\mathrm{T}}^{\text{ch}} $ and $ p_{\text{T,jet}} $ bins compared to the hybrid model predictions with different jet wake settings. |
png pdf |
Figure 27-g:
Ratios of 50-90% central PbPb to pp energy-energy correlators with $ n= $ 2 in different $ p_{\mathrm{T}}^{\text{ch}} $ and $ p_{\text{T,jet}} $ bins compared to the hybrid model predictions with different jet wake settings. |
png pdf |
Figure 27-h:
Ratios of 50-90% central PbPb to pp energy-energy correlators with $ n= $ 2 in different $ p_{\mathrm{T}}^{\text{ch}} $ and $ p_{\text{T,jet}} $ bins compared to the hybrid model predictions with different jet wake settings. |
png pdf |
Figure 28:
Ratios of 30-50% central PbPb to pp energy-energy correlators with $ n= $ 1 in different $ p_{\mathrm{T}}^{\text{ch}} $ and $ p_{\text{T,jet}} $ bins compared to the hybrid model predictions with different jet wake settings. |
png pdf |
Figure 28-a:
Ratios of 30-50% central PbPb to pp energy-energy correlators with $ n= $ 1 in different $ p_{\mathrm{T}}^{\text{ch}} $ and $ p_{\text{T,jet}} $ bins compared to the hybrid model predictions with different jet wake settings. |
png pdf |
Figure 28-b:
Ratios of 30-50% central PbPb to pp energy-energy correlators with $ n= $ 1 in different $ p_{\mathrm{T}}^{\text{ch}} $ and $ p_{\text{T,jet}} $ bins compared to the hybrid model predictions with different jet wake settings. |
png pdf |
Figure 28-c:
Ratios of 30-50% central PbPb to pp energy-energy correlators with $ n= $ 1 in different $ p_{\mathrm{T}}^{\text{ch}} $ and $ p_{\text{T,jet}} $ bins compared to the hybrid model predictions with different jet wake settings. |
png pdf |
Figure 28-d:
Ratios of 30-50% central PbPb to pp energy-energy correlators with $ n= $ 1 in different $ p_{\mathrm{T}}^{\text{ch}} $ and $ p_{\text{T,jet}} $ bins compared to the hybrid model predictions with different jet wake settings. |
png pdf |
Figure 28-e:
Ratios of 30-50% central PbPb to pp energy-energy correlators with $ n= $ 1 in different $ p_{\mathrm{T}}^{\text{ch}} $ and $ p_{\text{T,jet}} $ bins compared to the hybrid model predictions with different jet wake settings. |
png pdf |
Figure 28-f:
Ratios of 30-50% central PbPb to pp energy-energy correlators with $ n= $ 1 in different $ p_{\mathrm{T}}^{\text{ch}} $ and $ p_{\text{T,jet}} $ bins compared to the hybrid model predictions with different jet wake settings. |
png pdf |
Figure 28-g:
Ratios of 30-50% central PbPb to pp energy-energy correlators with $ n= $ 1 in different $ p_{\mathrm{T}}^{\text{ch}} $ and $ p_{\text{T,jet}} $ bins compared to the hybrid model predictions with different jet wake settings. |
png pdf |
Figure 28-h:
Ratios of 30-50% central PbPb to pp energy-energy correlators with $ n= $ 1 in different $ p_{\mathrm{T}}^{\text{ch}} $ and $ p_{\text{T,jet}} $ bins compared to the hybrid model predictions with different jet wake settings. |
png pdf |
Figure 29:
Ratios of 30-50% central PbPb to pp energy-energy correlators with $ n= $ 2 in different $ p_{\mathrm{T}}^{\text{ch}} $ and $ p_{\text{T,jet}} $ bins compared to the hybrid model predictions with different jet wake settings. |
png pdf |
Figure 29-a:
Ratios of 30-50% central PbPb to pp energy-energy correlators with $ n= $ 2 in different $ p_{\mathrm{T}}^{\text{ch}} $ and $ p_{\text{T,jet}} $ bins compared to the hybrid model predictions with different jet wake settings. |
png pdf |
Figure 29-b:
Ratios of 30-50% central PbPb to pp energy-energy correlators with $ n= $ 2 in different $ p_{\mathrm{T}}^{\text{ch}} $ and $ p_{\text{T,jet}} $ bins compared to the hybrid model predictions with different jet wake settings. |
png pdf |
Figure 29-c:
Ratios of 30-50% central PbPb to pp energy-energy correlators with $ n= $ 2 in different $ p_{\mathrm{T}}^{\text{ch}} $ and $ p_{\text{T,jet}} $ bins compared to the hybrid model predictions with different jet wake settings. |
png pdf |
Figure 29-d:
Ratios of 30-50% central PbPb to pp energy-energy correlators with $ n= $ 2 in different $ p_{\mathrm{T}}^{\text{ch}} $ and $ p_{\text{T,jet}} $ bins compared to the hybrid model predictions with different jet wake settings. |
png pdf |
Figure 29-e:
Ratios of 30-50% central PbPb to pp energy-energy correlators with $ n= $ 2 in different $ p_{\mathrm{T}}^{\text{ch}} $ and $ p_{\text{T,jet}} $ bins compared to the hybrid model predictions with different jet wake settings. |
png pdf |
Figure 29-f:
Ratios of 30-50% central PbPb to pp energy-energy correlators with $ n= $ 2 in different $ p_{\mathrm{T}}^{\text{ch}} $ and $ p_{\text{T,jet}} $ bins compared to the hybrid model predictions with different jet wake settings. |
png pdf |
Figure 29-g:
Ratios of 30-50% central PbPb to pp energy-energy correlators with $ n= $ 2 in different $ p_{\mathrm{T}}^{\text{ch}} $ and $ p_{\text{T,jet}} $ bins compared to the hybrid model predictions with different jet wake settings. |
png pdf |
Figure 29-h:
Ratios of 30-50% central PbPb to pp energy-energy correlators with $ n= $ 2 in different $ p_{\mathrm{T}}^{\text{ch}} $ and $ p_{\text{T,jet}} $ bins compared to the hybrid model predictions with different jet wake settings. |
png pdf |
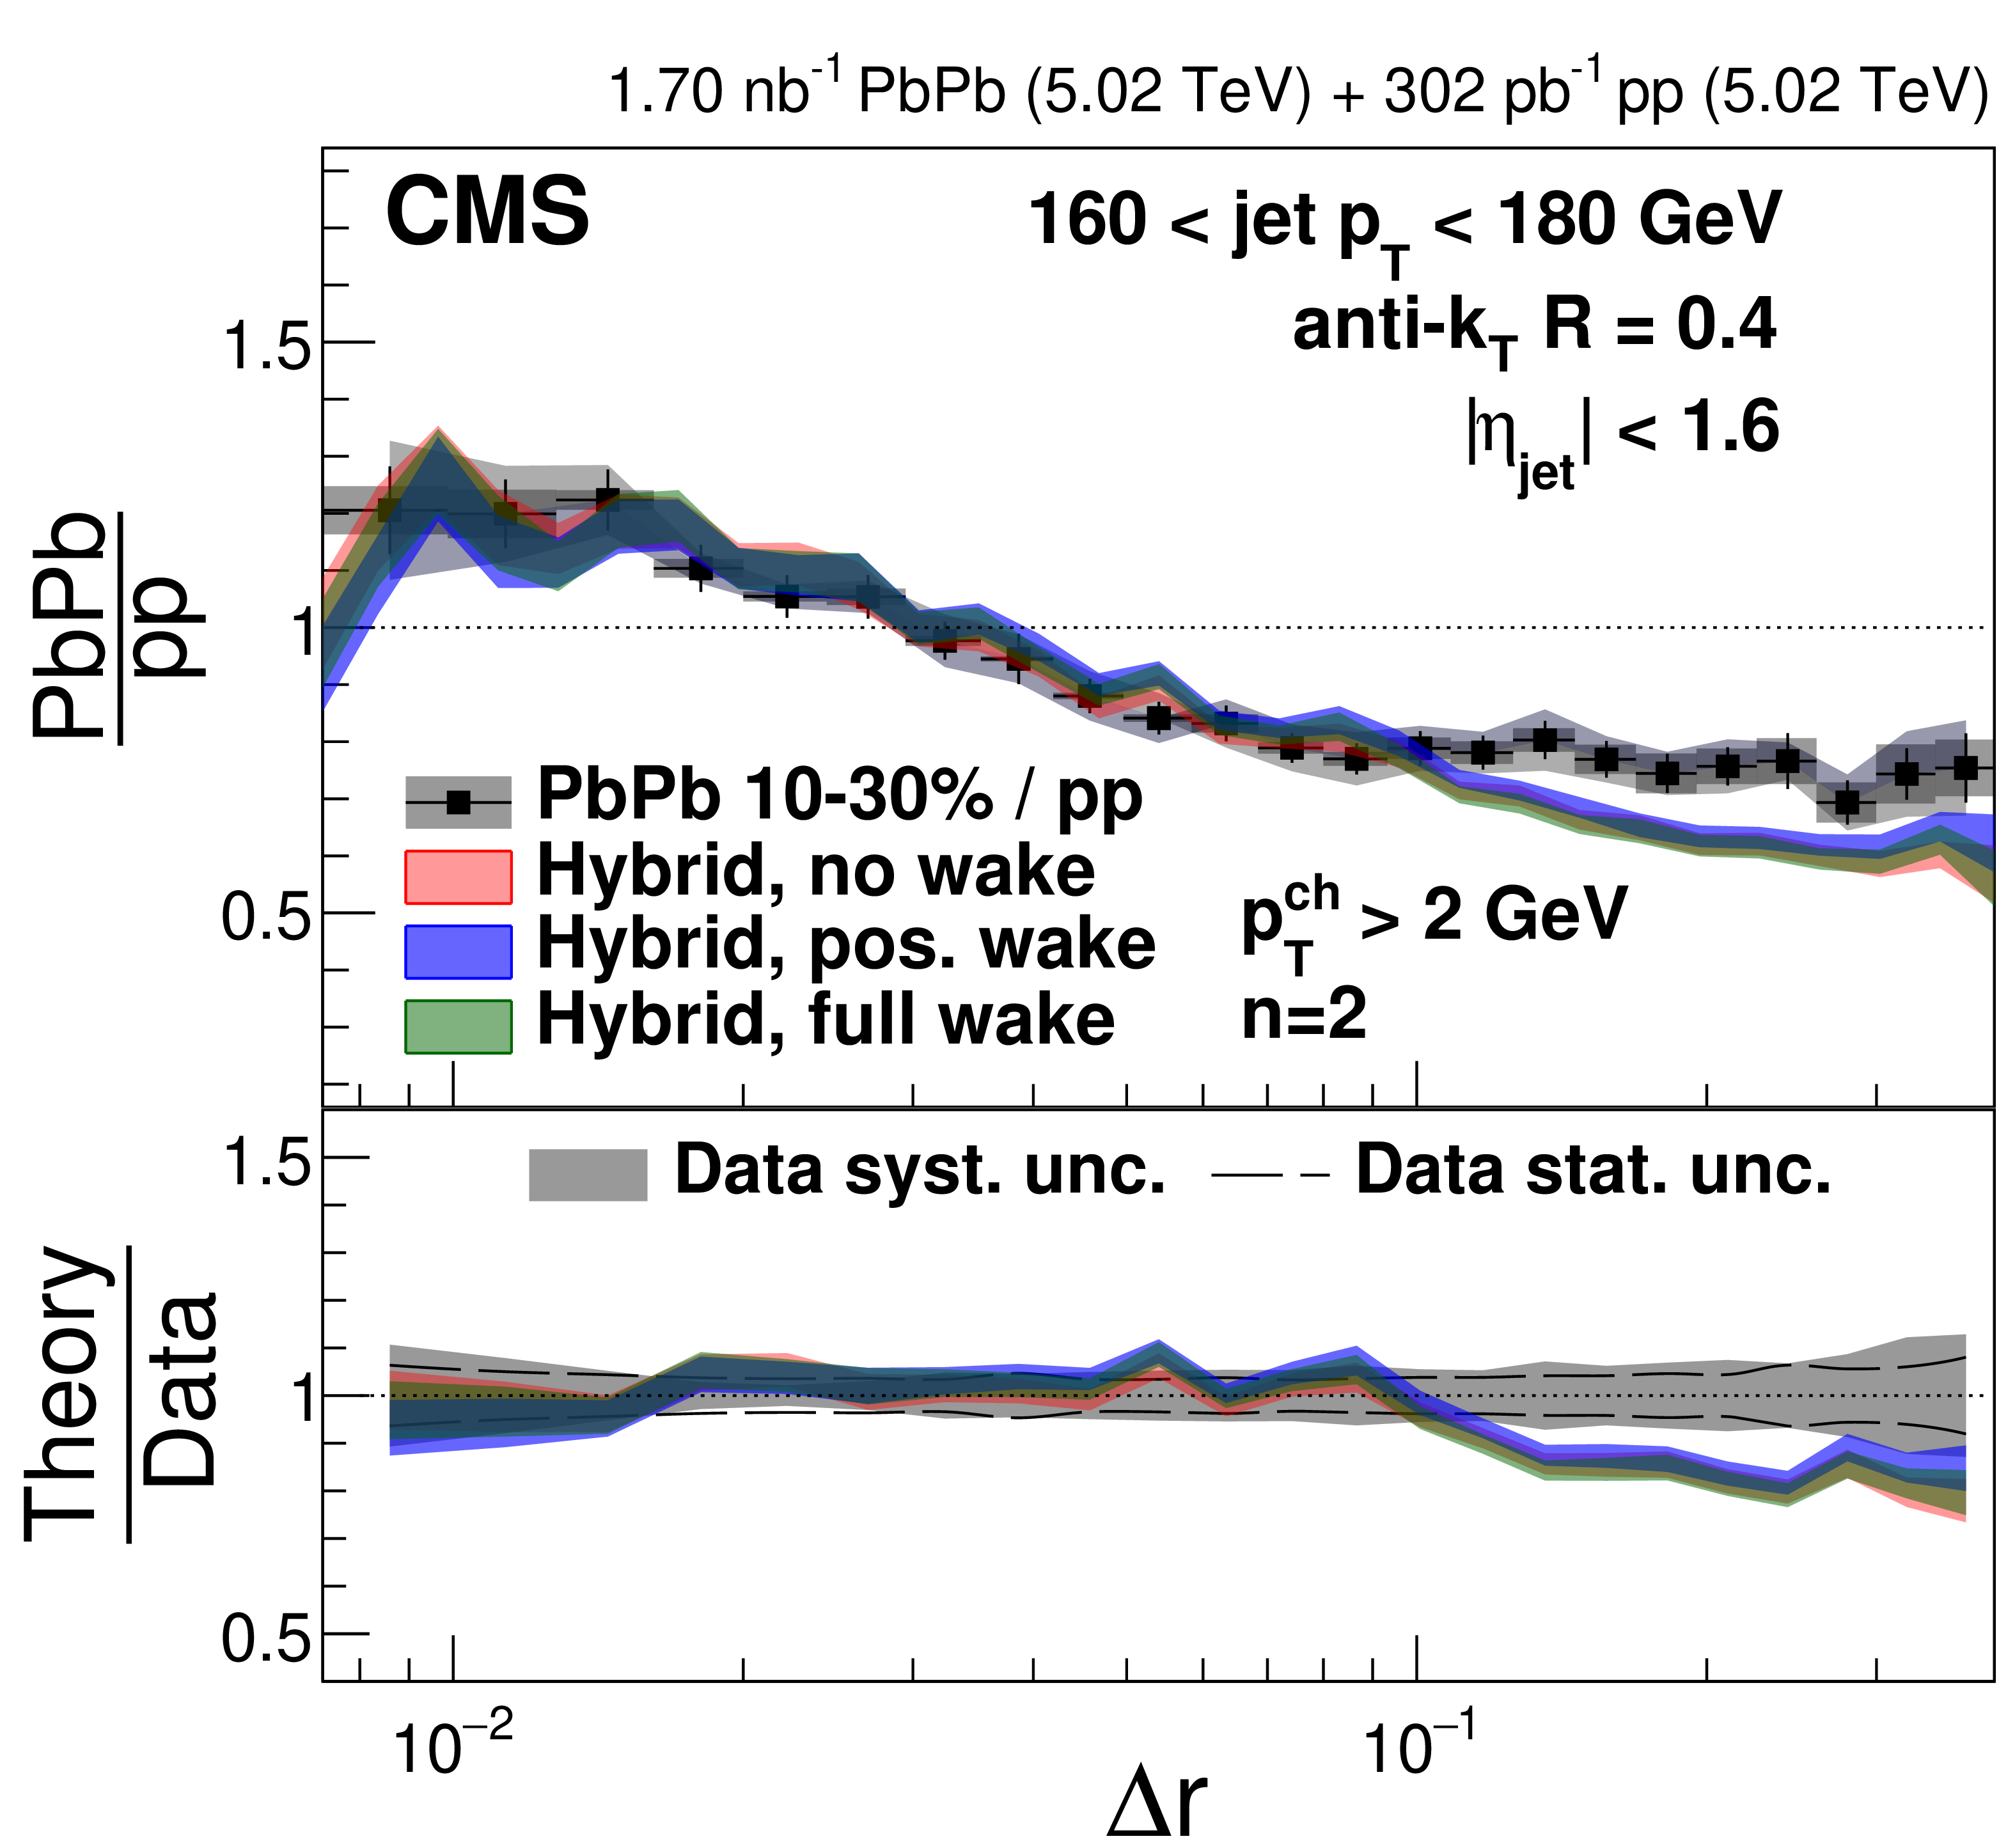
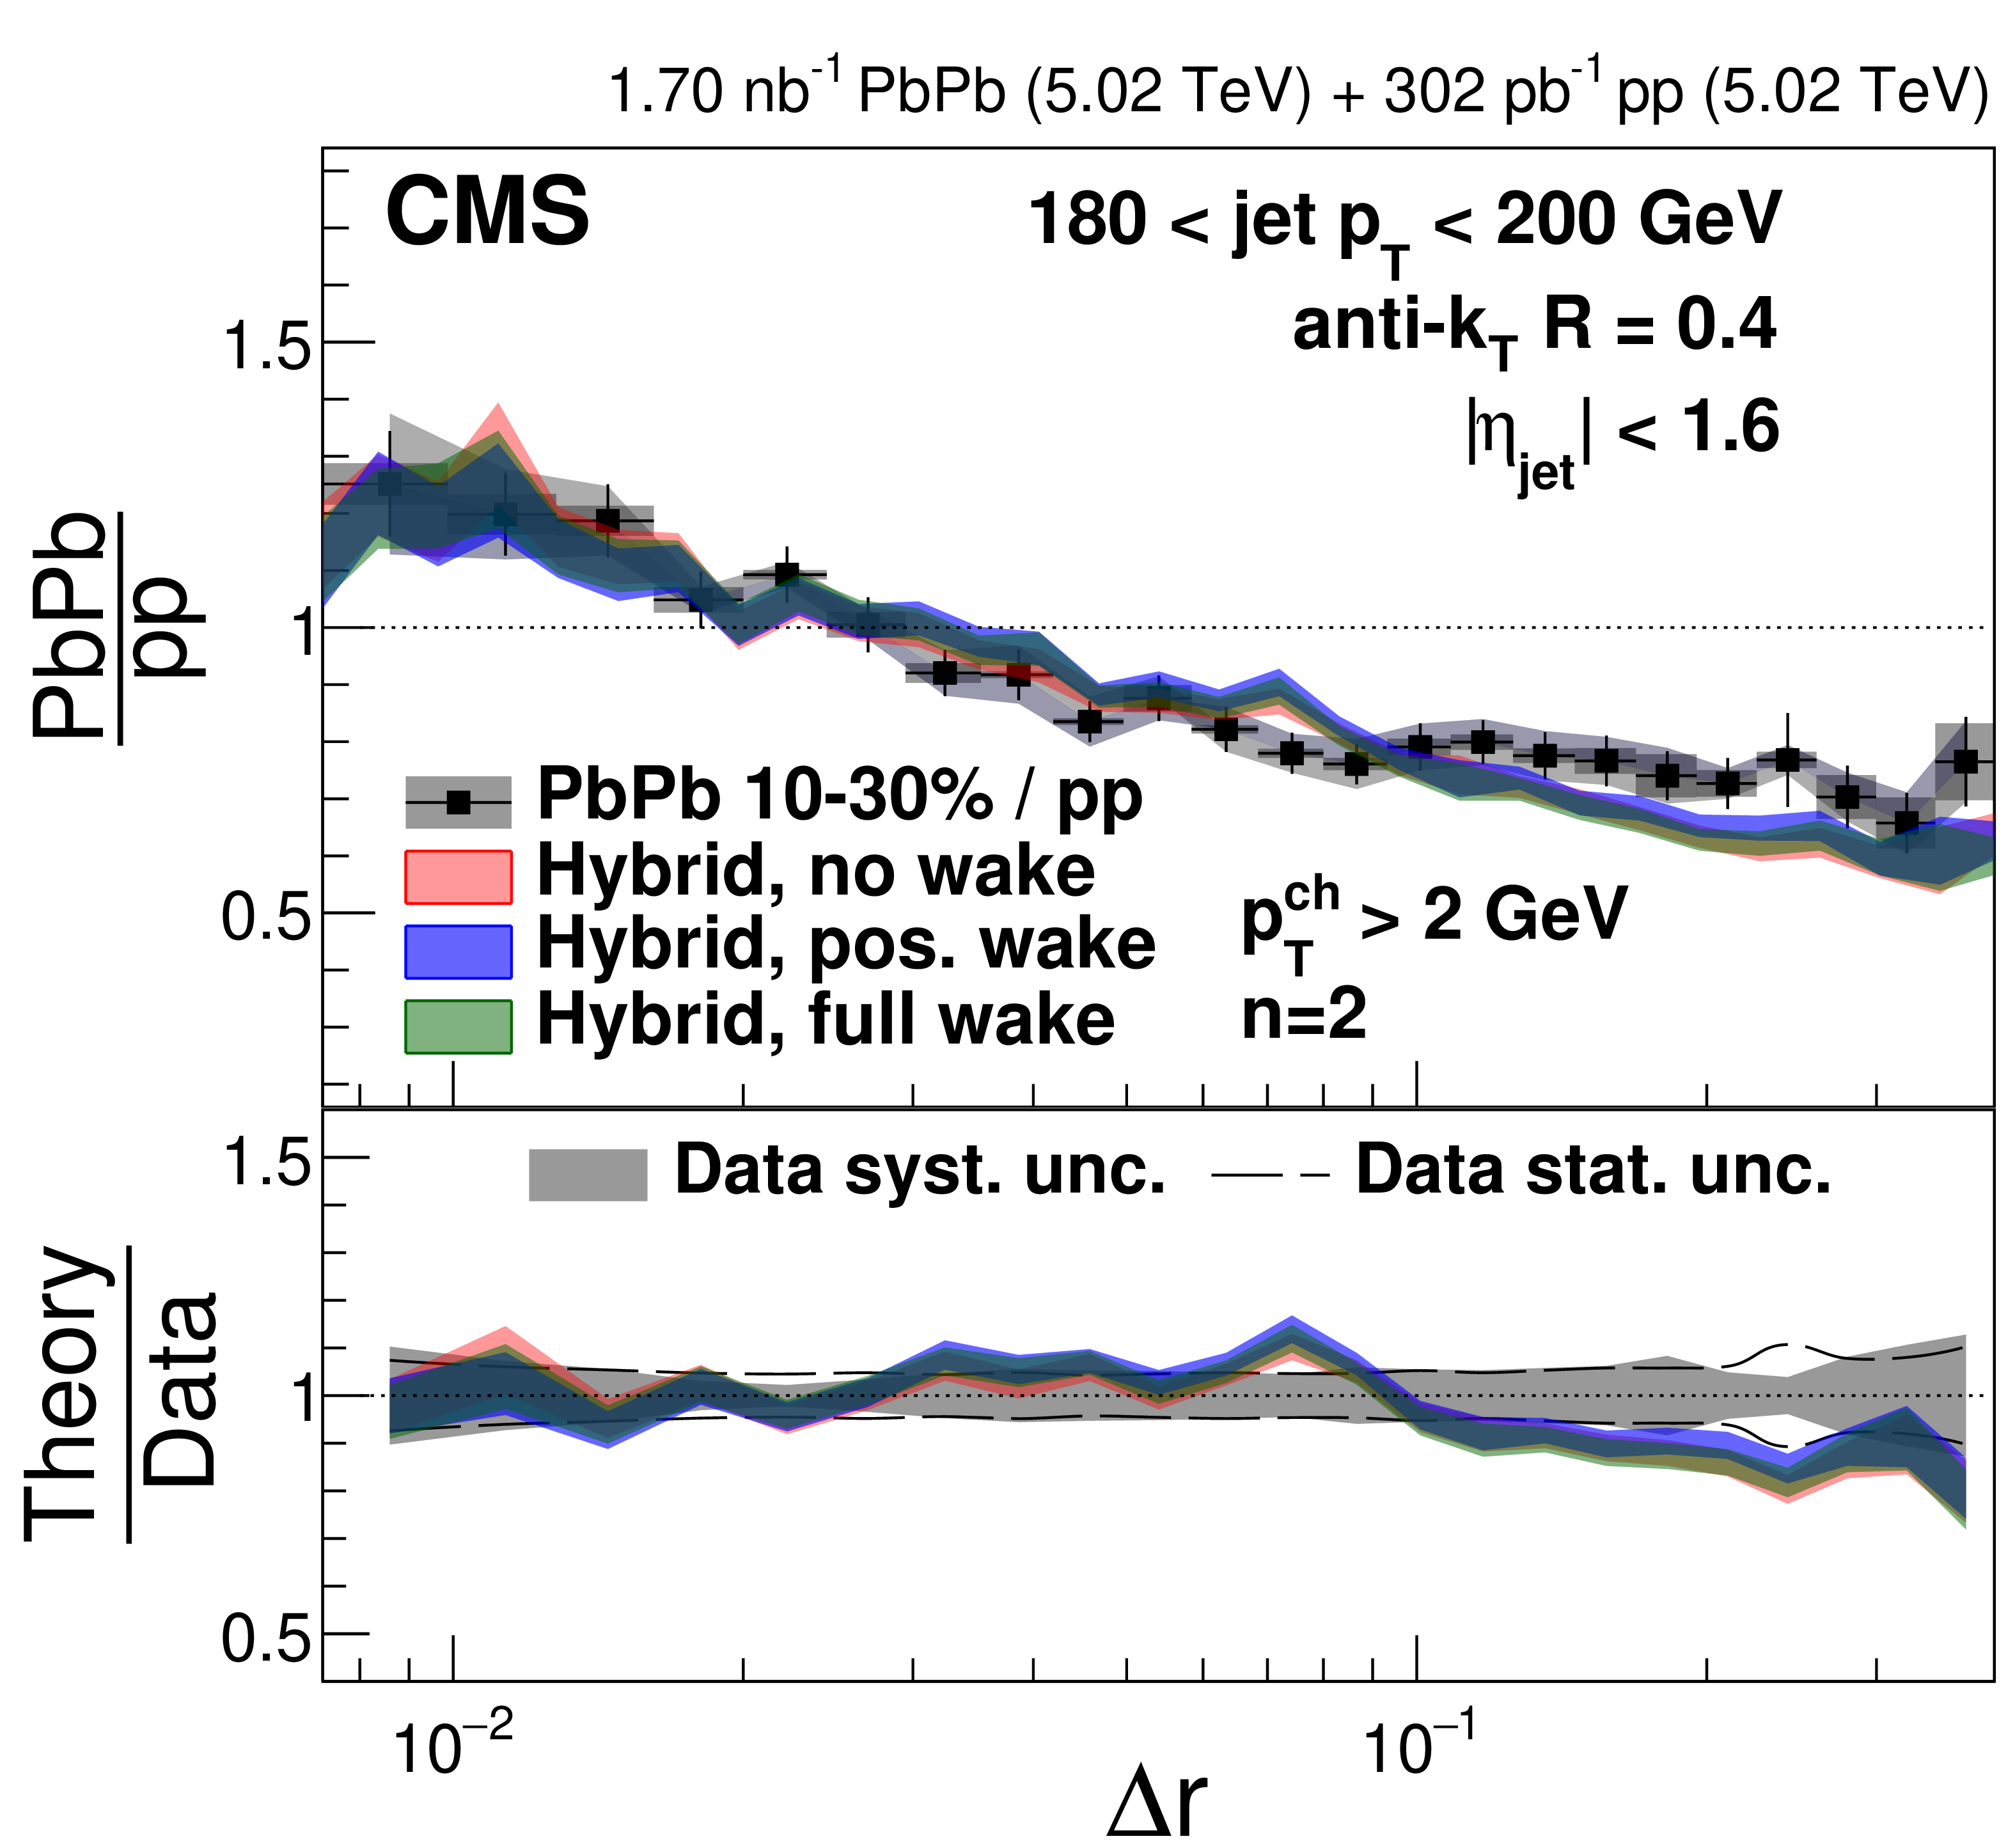
Figure 30:
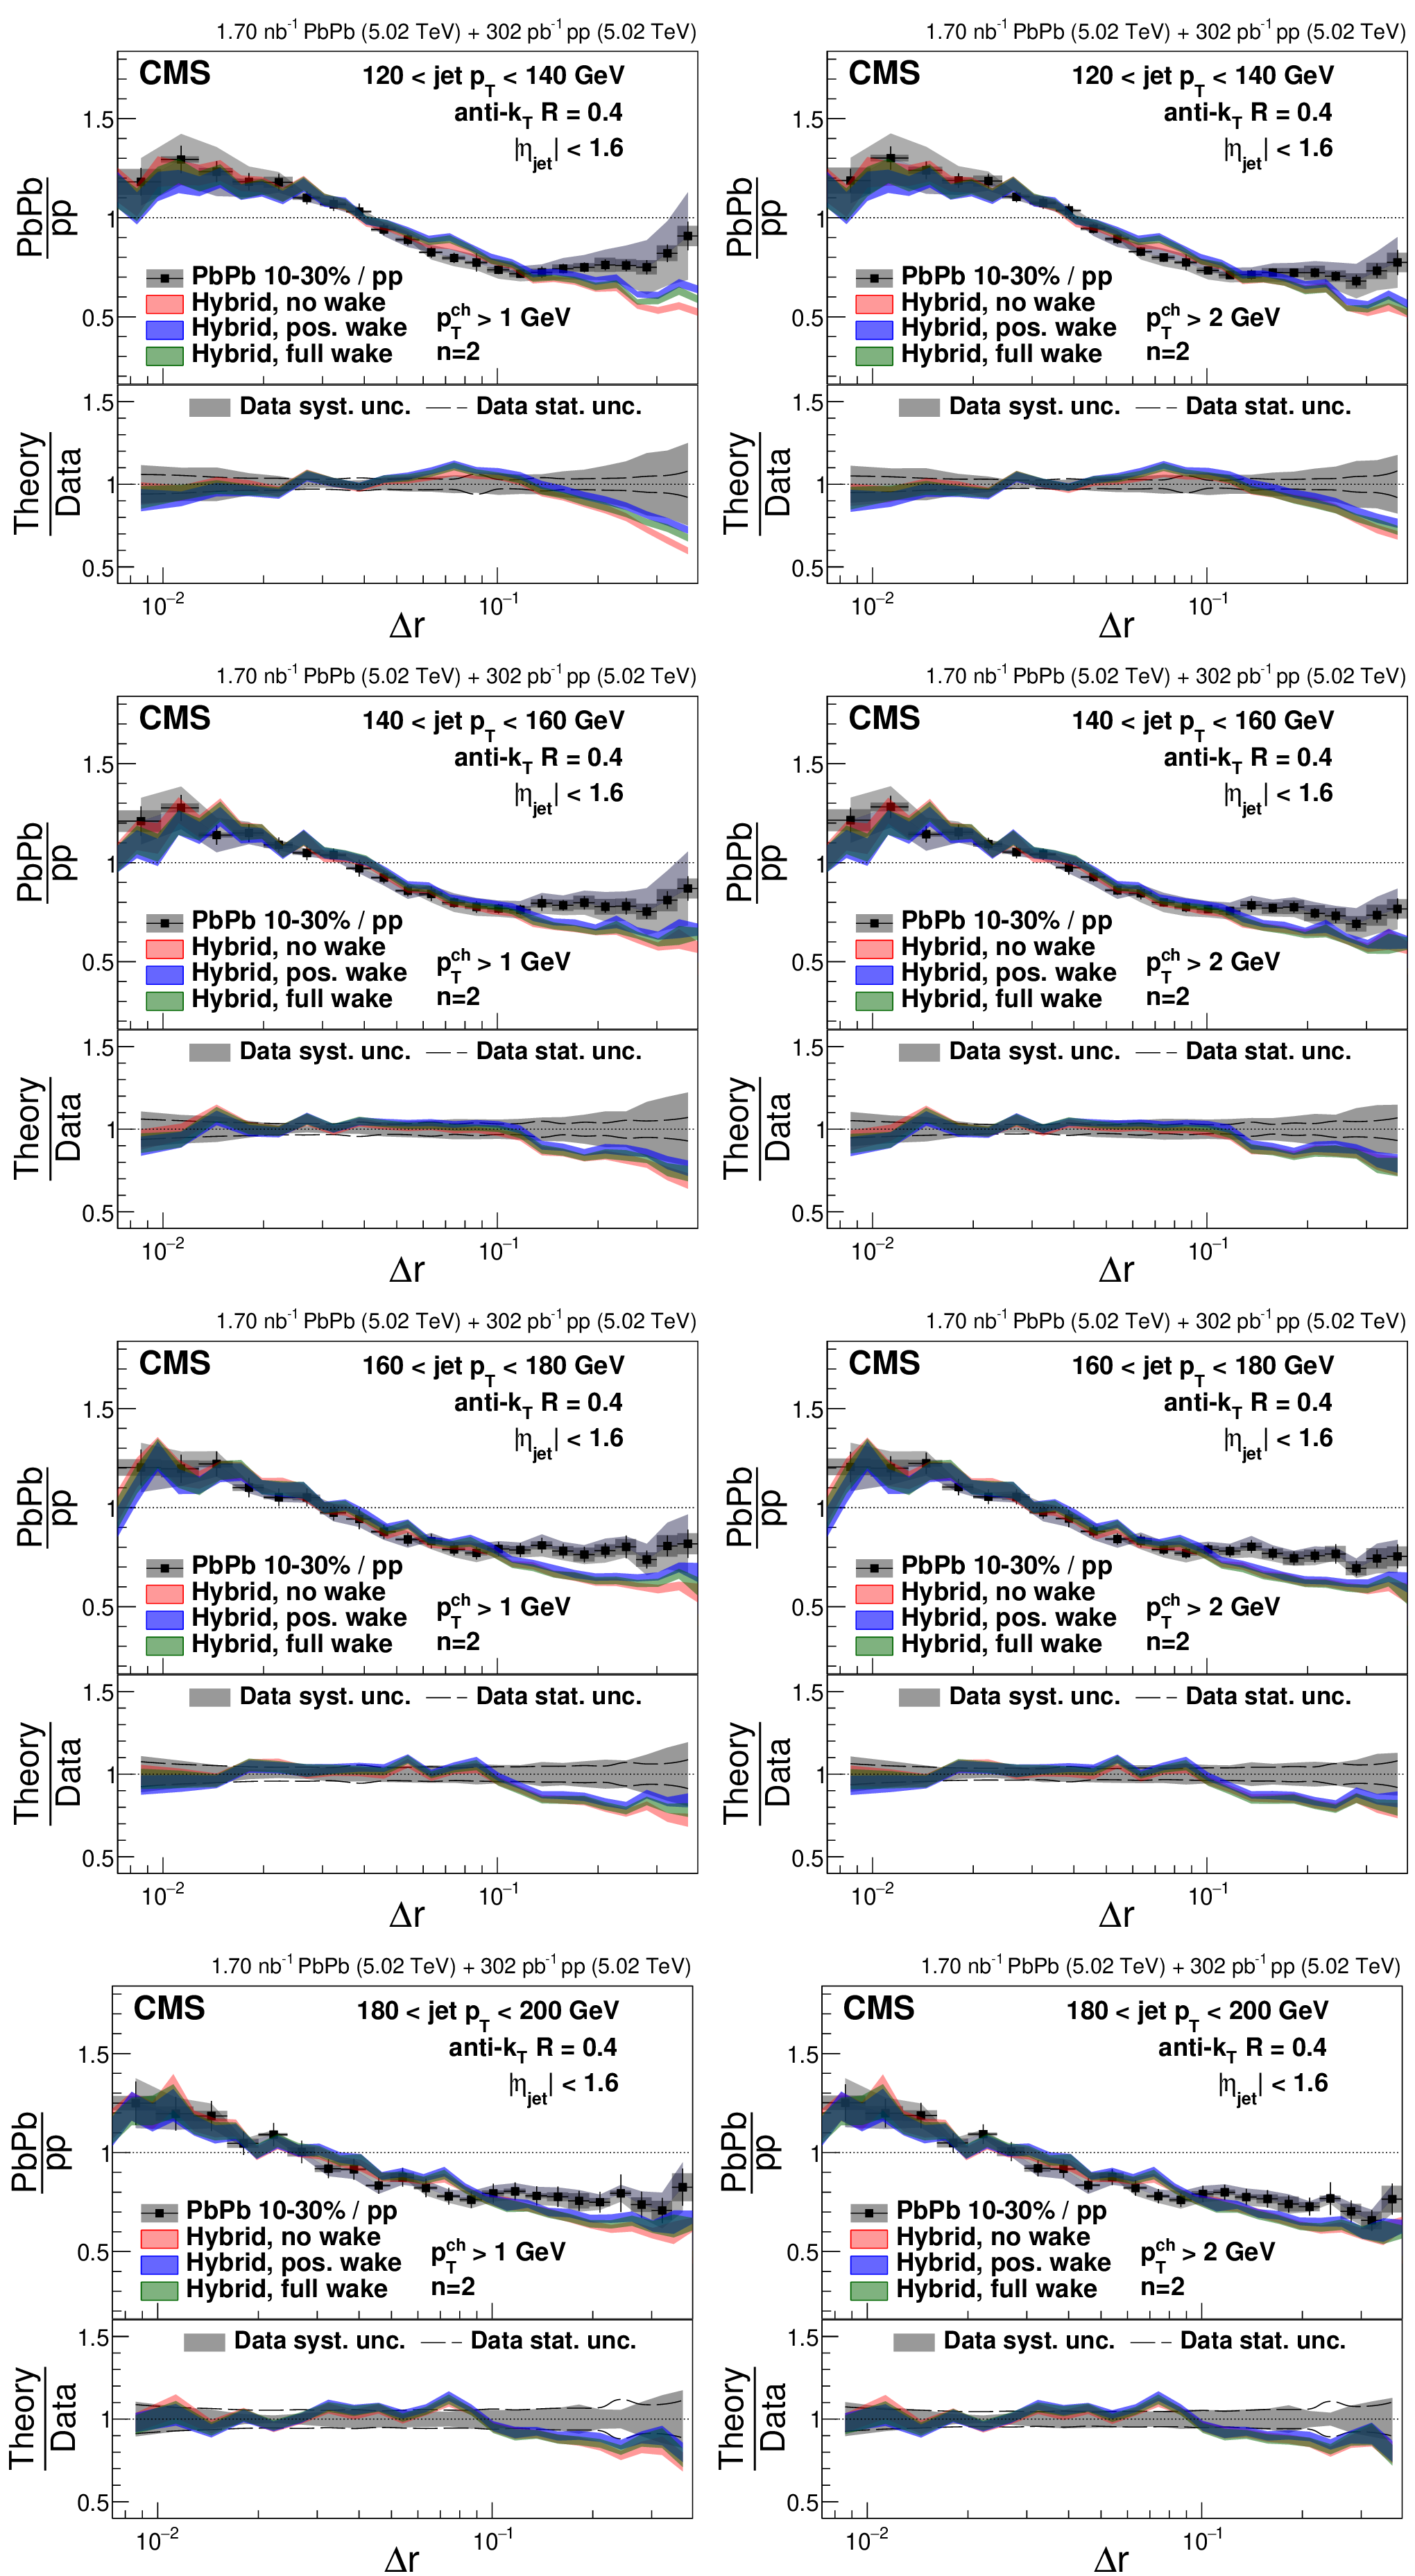
Ratios of 10-30% central PbPb to pp energy-energy correlators with $ n= $ 1 in different $ p_{\mathrm{T}}^{\text{ch}} $ and $ p_{\text{T,jet}} $ bins compared to the hybrid model predictions with different jet wake settings. |
png pdf |
Figure 30-a:
Ratios of 10-30% central PbPb to pp energy-energy correlators with $ n= $ 1 in different $ p_{\mathrm{T}}^{\text{ch}} $ and $ p_{\text{T,jet}} $ bins compared to the hybrid model predictions with different jet wake settings. |
png pdf |
Figure 30-b:
Ratios of 10-30% central PbPb to pp energy-energy correlators with $ n= $ 1 in different $ p_{\mathrm{T}}^{\text{ch}} $ and $ p_{\text{T,jet}} $ bins compared to the hybrid model predictions with different jet wake settings. |
png pdf |
Figure 30-c:
Ratios of 10-30% central PbPb to pp energy-energy correlators with $ n= $ 1 in different $ p_{\mathrm{T}}^{\text{ch}} $ and $ p_{\text{T,jet}} $ bins compared to the hybrid model predictions with different jet wake settings. |
png pdf |
Figure 30-d:
Ratios of 10-30% central PbPb to pp energy-energy correlators with $ n= $ 1 in different $ p_{\mathrm{T}}^{\text{ch}} $ and $ p_{\text{T,jet}} $ bins compared to the hybrid model predictions with different jet wake settings. |
png pdf |
Figure 30-e:
Ratios of 10-30% central PbPb to pp energy-energy correlators with $ n= $ 1 in different $ p_{\mathrm{T}}^{\text{ch}} $ and $ p_{\text{T,jet}} $ bins compared to the hybrid model predictions with different jet wake settings. |
png pdf |
Figure 30-f:
Ratios of 10-30% central PbPb to pp energy-energy correlators with $ n= $ 1 in different $ p_{\mathrm{T}}^{\text{ch}} $ and $ p_{\text{T,jet}} $ bins compared to the hybrid model predictions with different jet wake settings. |
png pdf |
Figure 30-g:
Ratios of 10-30% central PbPb to pp energy-energy correlators with $ n= $ 1 in different $ p_{\mathrm{T}}^{\text{ch}} $ and $ p_{\text{T,jet}} $ bins compared to the hybrid model predictions with different jet wake settings. |
png pdf |
Figure 30-h:
Ratios of 10-30% central PbPb to pp energy-energy correlators with $ n= $ 1 in different $ p_{\mathrm{T}}^{\text{ch}} $ and $ p_{\text{T,jet}} $ bins compared to the hybrid model predictions with different jet wake settings. |
png pdf |
Figure 31:
Ratios of 10-30% central PbPb to pp energy-energy correlators with $ n= $ 2 in different $ p_{\mathrm{T}}^{\text{ch}} $ and $ p_{\text{T,jet}} $ bins compared to the hybrid model predictions with different jet wake settings. |
png pdf |
Figure 31-a:
Ratios of 10-30% central PbPb to pp energy-energy correlators with $ n= $ 2 in different $ p_{\mathrm{T}}^{\text{ch}} $ and $ p_{\text{T,jet}} $ bins compared to the hybrid model predictions with different jet wake settings. |
png pdf |
Figure 31-b:
Ratios of 10-30% central PbPb to pp energy-energy correlators with $ n= $ 2 in different $ p_{\mathrm{T}}^{\text{ch}} $ and $ p_{\text{T,jet}} $ bins compared to the hybrid model predictions with different jet wake settings. |
png pdf |
Figure 31-c:
Ratios of 10-30% central PbPb to pp energy-energy correlators with $ n= $ 2 in different $ p_{\mathrm{T}}^{\text{ch}} $ and $ p_{\text{T,jet}} $ bins compared to the hybrid model predictions with different jet wake settings. |
png pdf |
Figure 31-d:
Ratios of 10-30% central PbPb to pp energy-energy correlators with $ n= $ 2 in different $ p_{\mathrm{T}}^{\text{ch}} $ and $ p_{\text{T,jet}} $ bins compared to the hybrid model predictions with different jet wake settings. |
png pdf |
Figure 31-e:
Ratios of 10-30% central PbPb to pp energy-energy correlators with $ n= $ 2 in different $ p_{\mathrm{T}}^{\text{ch}} $ and $ p_{\text{T,jet}} $ bins compared to the hybrid model predictions with different jet wake settings. |
png pdf |
Figure 31-f:
Ratios of 10-30% central PbPb to pp energy-energy correlators with $ n= $ 2 in different $ p_{\mathrm{T}}^{\text{ch}} $ and $ p_{\text{T,jet}} $ bins compared to the hybrid model predictions with different jet wake settings. |

png pdf |
Figure 31-g:
Ratios of 10-30% central PbPb to pp energy-energy correlators with $ n= $ 2 in different $ p_{\mathrm{T}}^{\text{ch}} $ and $ p_{\text{T,jet}} $ bins compared to the hybrid model predictions with different jet wake settings. |
png pdf |
Figure 31-h:
Ratios of 10-30% central PbPb to pp energy-energy correlators with $ n= $ 2 in different $ p_{\mathrm{T}}^{\text{ch}} $ and $ p_{\text{T,jet}} $ bins compared to the hybrid model predictions with different jet wake settings. |
png pdf |
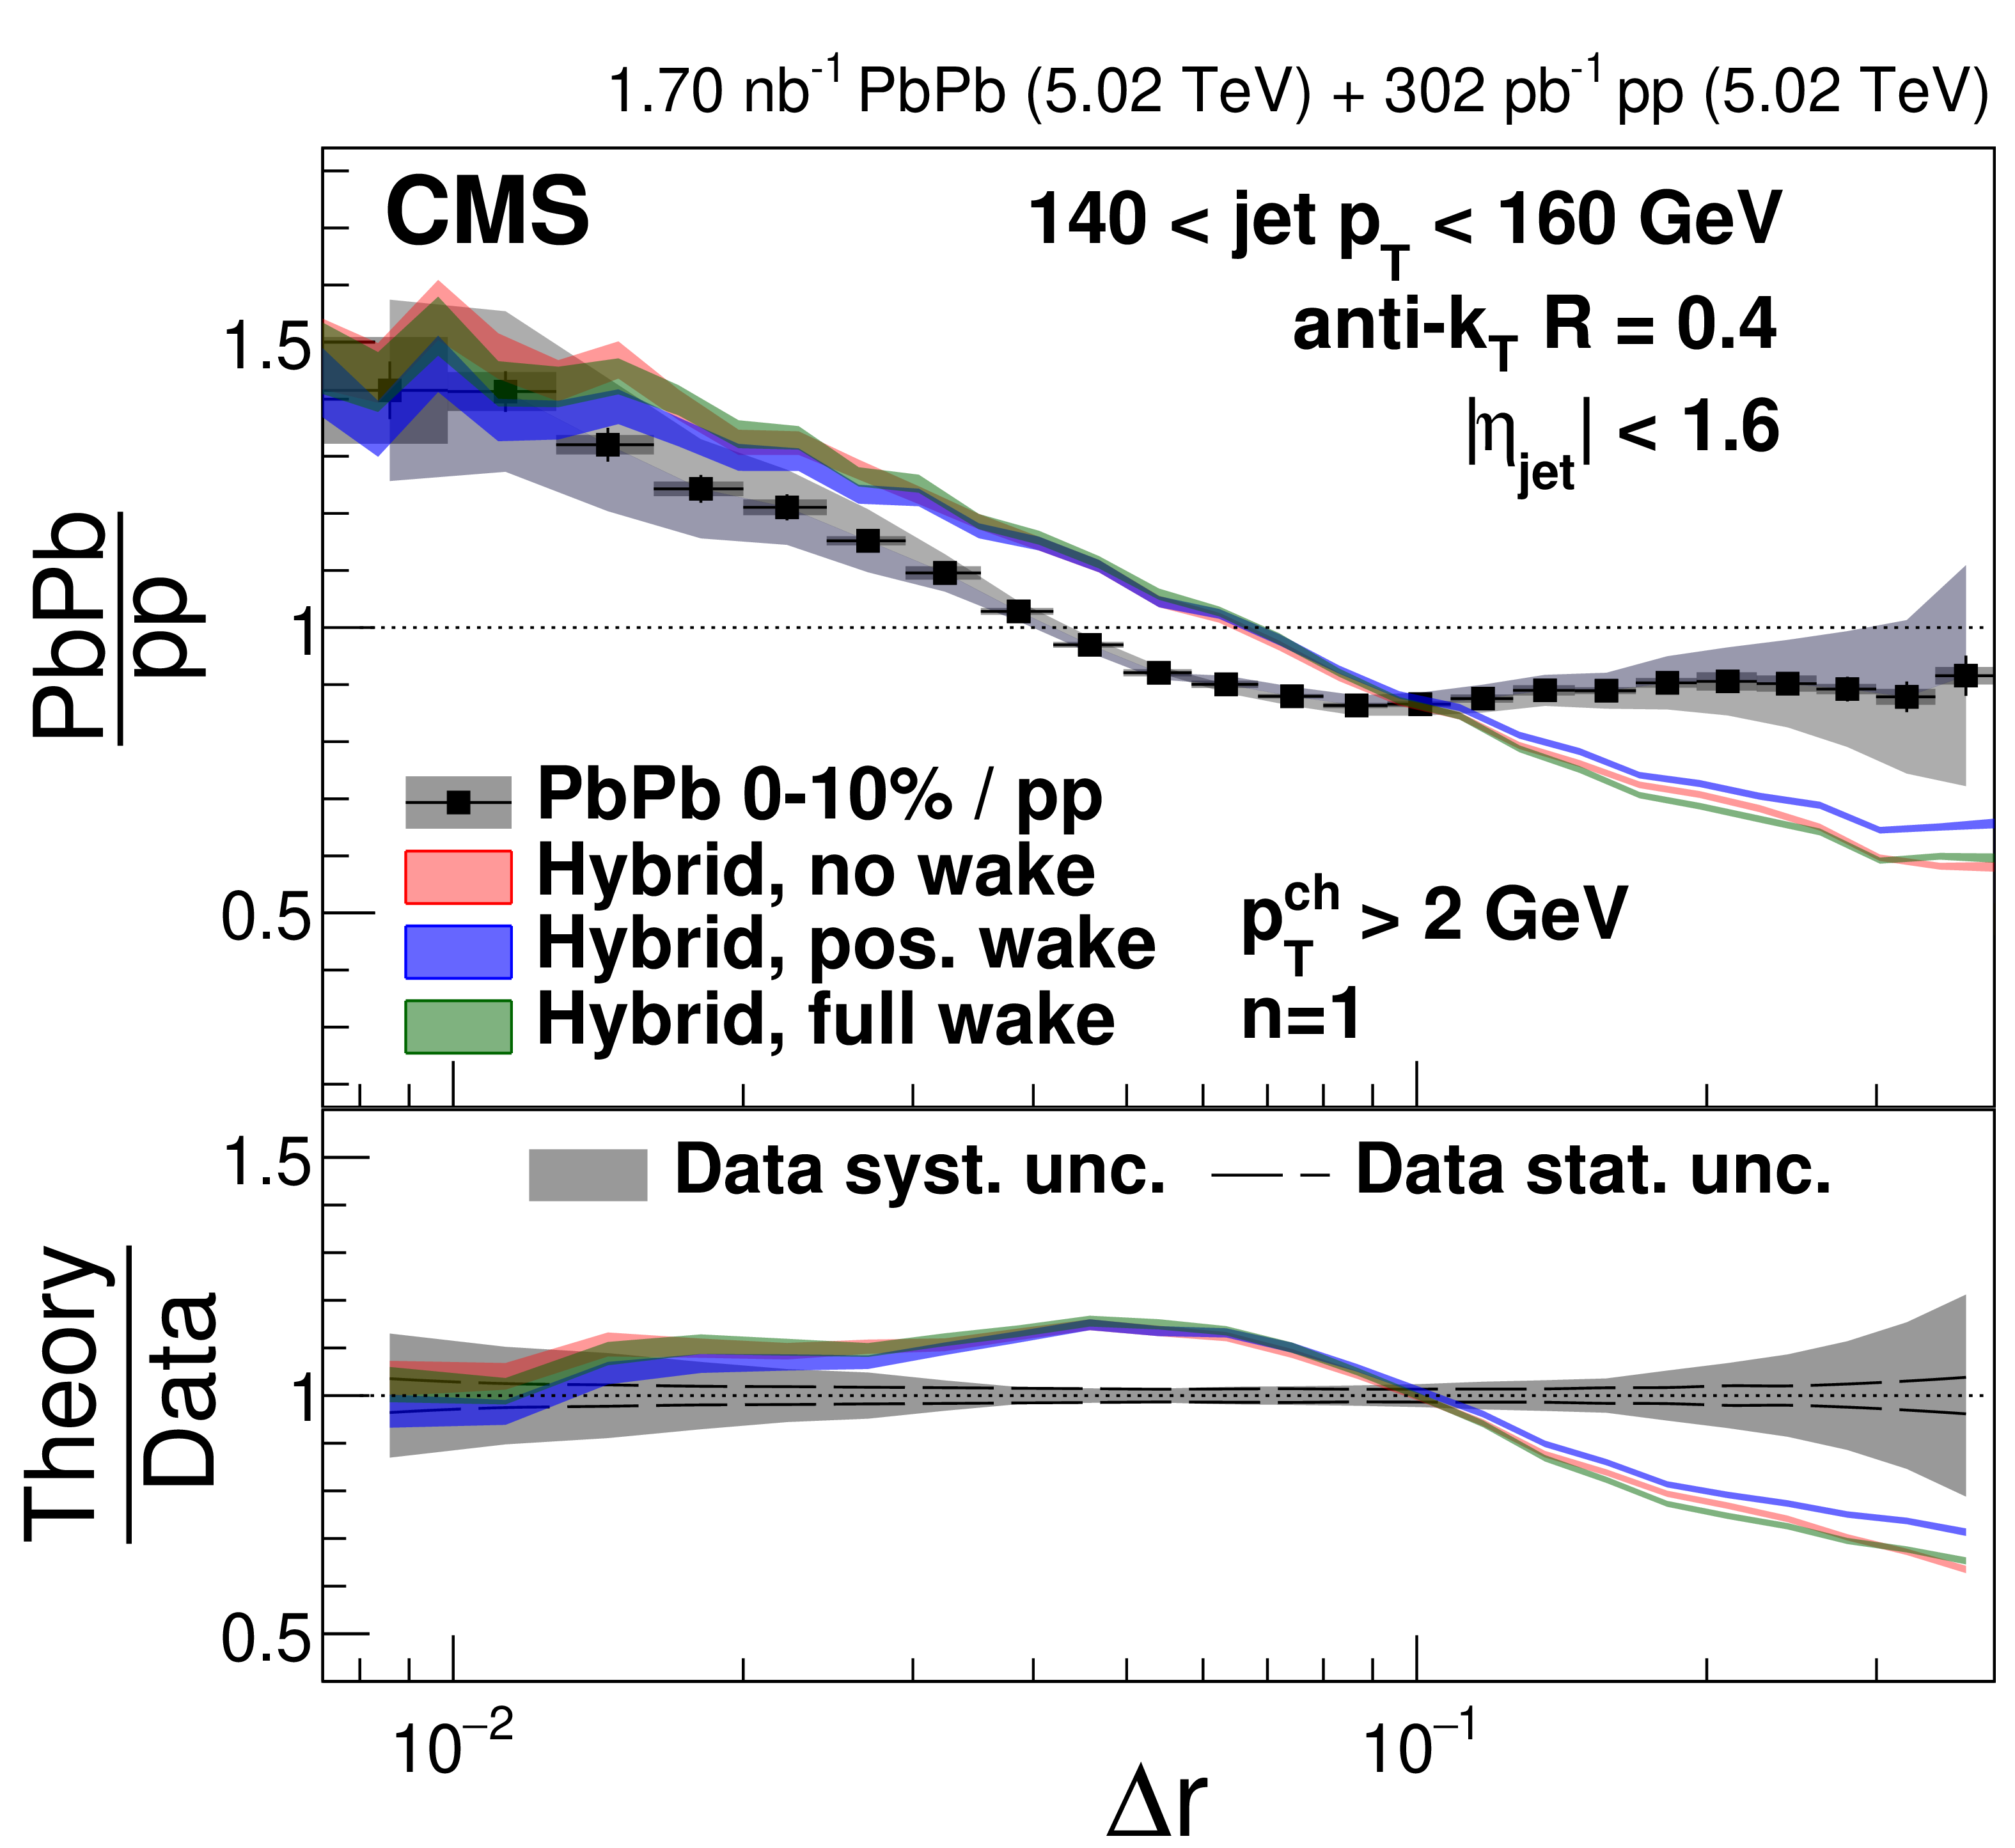
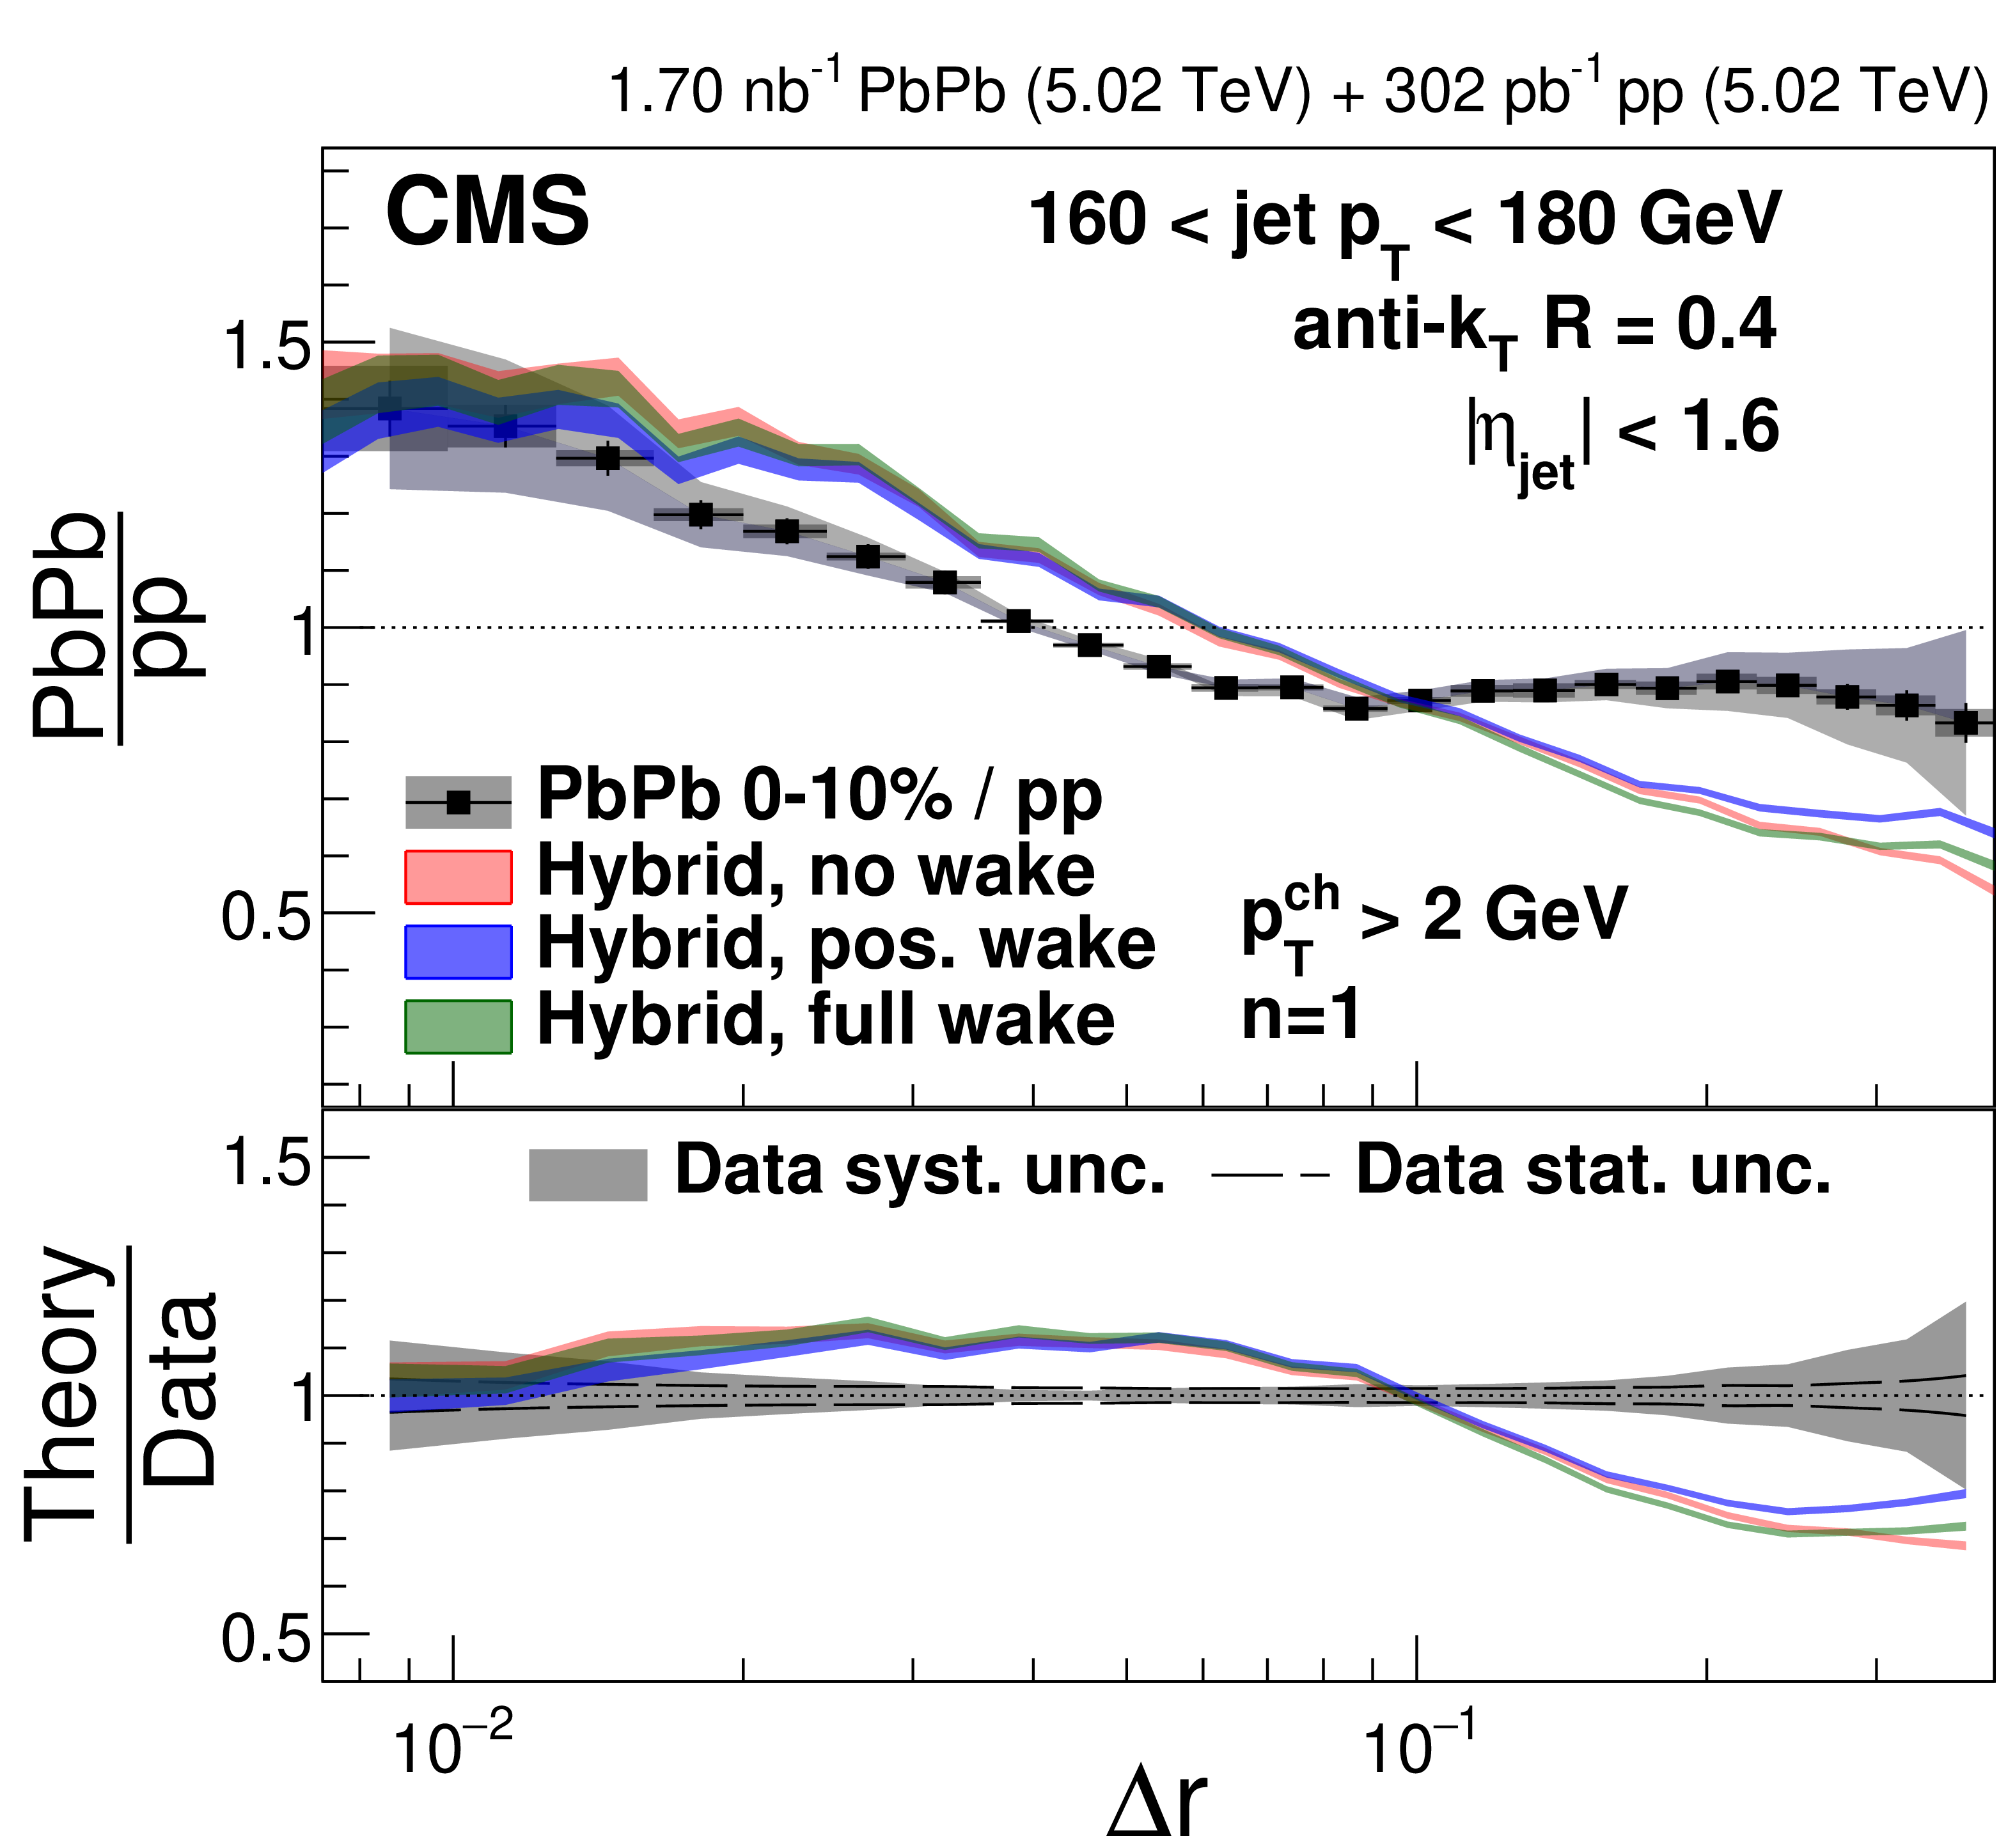
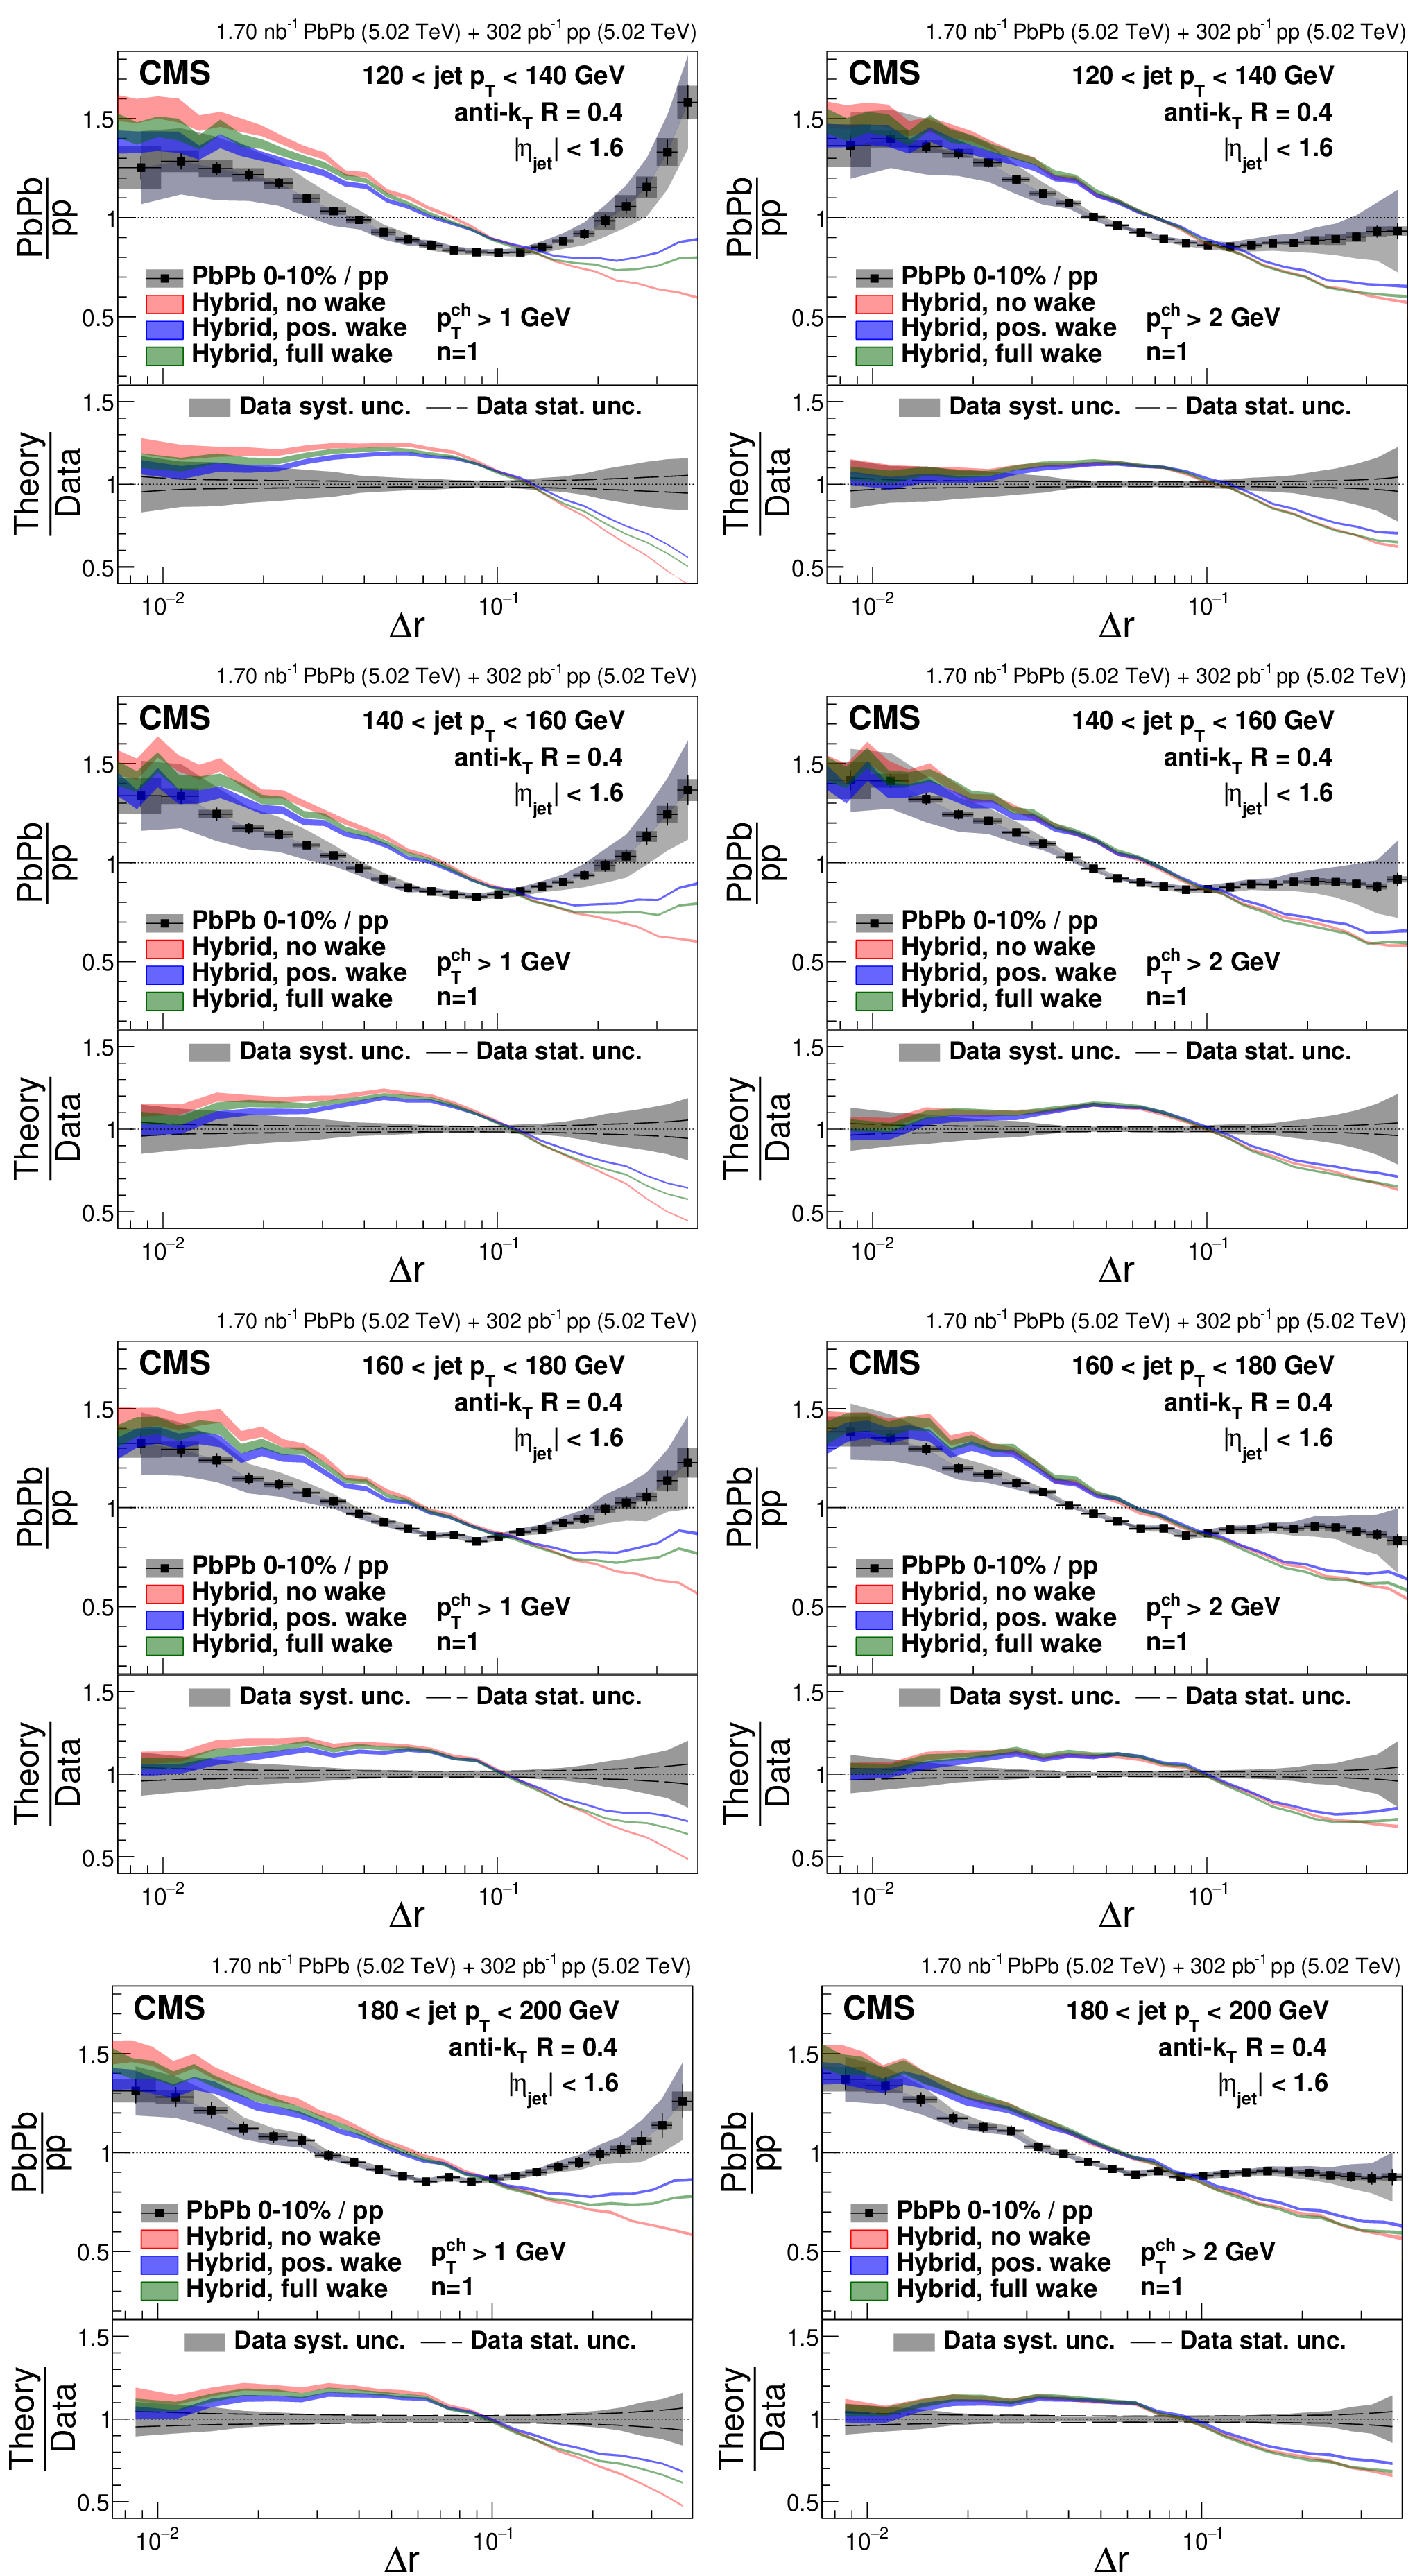
Figure 32:
Ratios of 0-10% central PbPb to pp energy-energy correlators with $ n= $ 1 in different $ p_{\mathrm{T}}^{\text{ch}} $ and $ p_{\text{T,jet}} $ bins compared to the hybrid model predictions with different jet wake settings. |
png pdf |
Figure 32-a:
Ratios of 0-10% central PbPb to pp energy-energy correlators with $ n= $ 1 in different $ p_{\mathrm{T}}^{\text{ch}} $ and $ p_{\text{T,jet}} $ bins compared to the hybrid model predictions with different jet wake settings. |
png pdf |
Figure 32-b:
Ratios of 0-10% central PbPb to pp energy-energy correlators with $ n= $ 1 in different $ p_{\mathrm{T}}^{\text{ch}} $ and $ p_{\text{T,jet}} $ bins compared to the hybrid model predictions with different jet wake settings. |
png pdf |
Figure 32-c:
Ratios of 0-10% central PbPb to pp energy-energy correlators with $ n= $ 1 in different $ p_{\mathrm{T}}^{\text{ch}} $ and $ p_{\text{T,jet}} $ bins compared to the hybrid model predictions with different jet wake settings. |

png pdf |
Figure 32-d:
Ratios of 0-10% central PbPb to pp energy-energy correlators with $ n= $ 1 in different $ p_{\mathrm{T}}^{\text{ch}} $ and $ p_{\text{T,jet}} $ bins compared to the hybrid model predictions with different jet wake settings. |
png pdf |
Figure 32-e:
Ratios of 0-10% central PbPb to pp energy-energy correlators with $ n= $ 1 in different $ p_{\mathrm{T}}^{\text{ch}} $ and $ p_{\text{T,jet}} $ bins compared to the hybrid model predictions with different jet wake settings. |

png pdf |
Figure 32-f:
Ratios of 0-10% central PbPb to pp energy-energy correlators with $ n= $ 1 in different $ p_{\mathrm{T}}^{\text{ch}} $ and $ p_{\text{T,jet}} $ bins compared to the hybrid model predictions with different jet wake settings. |
png pdf |
Figure 32-g:
Ratios of 0-10% central PbPb to pp energy-energy correlators with $ n= $ 1 in different $ p_{\mathrm{T}}^{\text{ch}} $ and $ p_{\text{T,jet}} $ bins compared to the hybrid model predictions with different jet wake settings. |

png pdf |
Figure 32-h:
Ratios of 0-10% central PbPb to pp energy-energy correlators with $ n= $ 1 in different $ p_{\mathrm{T}}^{\text{ch}} $ and $ p_{\text{T,jet}} $ bins compared to the hybrid model predictions with different jet wake settings. |
png pdf |
Figure 33:
Ratios of 0-10% central PbPb to pp energy-energy correlators with $ n= $ 2 in different $ p_{\mathrm{T}}^{\text{ch}} $ and $ p_{\text{T,jet}} $ bins compared to the hybrid model predictions with different jet wake settings. |
png pdf |
Figure 33-a:
Ratios of 0-10% central PbPb to pp energy-energy correlators with $ n= $ 2 in different $ p_{\mathrm{T}}^{\text{ch}} $ and $ p_{\text{T,jet}} $ bins compared to the hybrid model predictions with different jet wake settings. |
png pdf |
Figure 33-b:
Ratios of 0-10% central PbPb to pp energy-energy correlators with $ n= $ 2 in different $ p_{\mathrm{T}}^{\text{ch}} $ and $ p_{\text{T,jet}} $ bins compared to the hybrid model predictions with different jet wake settings. |
png pdf |
Figure 33-c:
Ratios of 0-10% central PbPb to pp energy-energy correlators with $ n= $ 2 in different $ p_{\mathrm{T}}^{\text{ch}} $ and $ p_{\text{T,jet}} $ bins compared to the hybrid model predictions with different jet wake settings. |
png pdf |
Figure 33-d:
Ratios of 0-10% central PbPb to pp energy-energy correlators with $ n= $ 2 in different $ p_{\mathrm{T}}^{\text{ch}} $ and $ p_{\text{T,jet}} $ bins compared to the hybrid model predictions with different jet wake settings. |
png pdf |
Figure 33-e:
Ratios of 0-10% central PbPb to pp energy-energy correlators with $ n= $ 2 in different $ p_{\mathrm{T}}^{\text{ch}} $ and $ p_{\text{T,jet}} $ bins compared to the hybrid model predictions with different jet wake settings. |
png pdf |
Figure 33-f:
Ratios of 0-10% central PbPb to pp energy-energy correlators with $ n= $ 2 in different $ p_{\mathrm{T}}^{\text{ch}} $ and $ p_{\text{T,jet}} $ bins compared to the hybrid model predictions with different jet wake settings. |

png pdf |
Figure 33-g:
Ratios of 0-10% central PbPb to pp energy-energy correlators with $ n= $ 2 in different $ p_{\mathrm{T}}^{\text{ch}} $ and $ p_{\text{T,jet}} $ bins compared to the hybrid model predictions with different jet wake settings. |

png pdf |
Figure 33-h:
Ratios of 0-10% central PbPb to pp energy-energy correlators with $ n= $ 2 in different $ p_{\mathrm{T}}^{\text{ch}} $ and $ p_{\text{T,jet}} $ bins compared to the hybrid model predictions with different jet wake settings. |
png pdf |
Figure 34:
Ratios of 0-10% central PbPb to pp energy-energy correlators with $ n= $ 1 and $ p_{\mathrm{T}}^{\text{ch}} > $ 1 GeV in different $ p_{\text{T,jet}} $ bins compared to predictions from perturbative calculation from Holguin and collaborators with different values of the $ k $-parameter. |

png pdf |
Figure 34-a:
Ratios of 0-10% central PbPb to pp energy-energy correlators with $ n= $ 1 and $ p_{\mathrm{T}}^{\text{ch}} > $ 1 GeV in different $ p_{\text{T,jet}} $ bins compared to predictions from perturbative calculation from Holguin and collaborators with different values of the $ k $-parameter. |
png pdf |
Figure 34-b:
Ratios of 0-10% central PbPb to pp energy-energy correlators with $ n= $ 1 and $ p_{\mathrm{T}}^{\text{ch}} > $ 1 GeV in different $ p_{\text{T,jet}} $ bins compared to predictions from perturbative calculation from Holguin and collaborators with different values of the $ k $-parameter. |
png pdf |
Figure 34-c:
Ratios of 0-10% central PbPb to pp energy-energy correlators with $ n= $ 1 and $ p_{\mathrm{T}}^{\text{ch}} > $ 1 GeV in different $ p_{\text{T,jet}} $ bins compared to predictions from perturbative calculation from Holguin and collaborators with different values of the $ k $-parameter. |
png pdf |
Figure 34-d:
Ratios of 0-10% central PbPb to pp energy-energy correlators with $ n= $ 1 and $ p_{\mathrm{T}}^{\text{ch}} > $ 1 GeV in different $ p_{\text{T,jet}} $ bins compared to predictions from perturbative calculation from Holguin and collaborators with different values of the $ k $-parameter. |
png pdf |
Figure 35:
Ratios of 0-10% central PbPb to pp energy-energy correlators with $ n= $ 1 in different $ p_{\mathrm{T}}^{\text{ch}} $ and $ p_{\text{T,jet}} $ bins compared to JEWEL predictions with and without recoils. |
png pdf |
Figure 35-a:
Ratios of 0-10% central PbPb to pp energy-energy correlators with $ n= $ 1 in different $ p_{\mathrm{T}}^{\text{ch}} $ and $ p_{\text{T,jet}} $ bins compared to JEWEL predictions with and without recoils. |
png pdf |
Figure 35-b:
Ratios of 0-10% central PbPb to pp energy-energy correlators with $ n= $ 1 in different $ p_{\mathrm{T}}^{\text{ch}} $ and $ p_{\text{T,jet}} $ bins compared to JEWEL predictions with and without recoils. |
png pdf |
Figure 35-c:
Ratios of 0-10% central PbPb to pp energy-energy correlators with $ n= $ 1 in different $ p_{\mathrm{T}}^{\text{ch}} $ and $ p_{\text{T,jet}} $ bins compared to JEWEL predictions with and without recoils. |
png pdf |
Figure 35-d:
Ratios of 0-10% central PbPb to pp energy-energy correlators with $ n= $ 1 in different $ p_{\mathrm{T}}^{\text{ch}} $ and $ p_{\text{T,jet}} $ bins compared to JEWEL predictions with and without recoils. |
png pdf |
Figure 35-e:
Ratios of 0-10% central PbPb to pp energy-energy correlators with $ n= $ 1 in different $ p_{\mathrm{T}}^{\text{ch}} $ and $ p_{\text{T,jet}} $ bins compared to JEWEL predictions with and without recoils. |
png pdf |
Figure 35-f:
Ratios of 0-10% central PbPb to pp energy-energy correlators with $ n= $ 1 in different $ p_{\mathrm{T}}^{\text{ch}} $ and $ p_{\text{T,jet}} $ bins compared to JEWEL predictions with and without recoils. |

png pdf |
Figure 35-g:
Ratios of 0-10% central PbPb to pp energy-energy correlators with $ n= $ 1 in different $ p_{\mathrm{T}}^{\text{ch}} $ and $ p_{\text{T,jet}} $ bins compared to JEWEL predictions with and without recoils. |
png pdf |
Figure 35-h:
Ratios of 0-10% central PbPb to pp energy-energy correlators with $ n= $ 1 in different $ p_{\mathrm{T}}^{\text{ch}} $ and $ p_{\text{T,jet}} $ bins compared to JEWEL predictions with and without recoils. |
png pdf |
Figure 36:
Ratios of 0-10% central PbPb to pp energy-energy correlators with $ n= $ 2 in different $ p_{\mathrm{T}}^{\text{ch}} $ and $ p_{\text{T,jet}} $ bins compared to JEWEL predictions with and without recoils. |
png pdf |
Figure 36-a:
Ratios of 0-10% central PbPb to pp energy-energy correlators with $ n= $ 2 in different $ p_{\mathrm{T}}^{\text{ch}} $ and $ p_{\text{T,jet}} $ bins compared to JEWEL predictions with and without recoils. |
png pdf |
Figure 36-b:
Ratios of 0-10% central PbPb to pp energy-energy correlators with $ n= $ 2 in different $ p_{\mathrm{T}}^{\text{ch}} $ and $ p_{\text{T,jet}} $ bins compared to JEWEL predictions with and without recoils. |
png pdf |
Figure 36-c:
Ratios of 0-10% central PbPb to pp energy-energy correlators with $ n= $ 2 in different $ p_{\mathrm{T}}^{\text{ch}} $ and $ p_{\text{T,jet}} $ bins compared to JEWEL predictions with and without recoils. |
png pdf |
Figure 36-d:
Ratios of 0-10% central PbPb to pp energy-energy correlators with $ n= $ 2 in different $ p_{\mathrm{T}}^{\text{ch}} $ and $ p_{\text{T,jet}} $ bins compared to JEWEL predictions with and without recoils. |
png pdf |
Figure 36-e:
Ratios of 0-10% central PbPb to pp energy-energy correlators with $ n= $ 2 in different $ p_{\mathrm{T}}^{\text{ch}} $ and $ p_{\text{T,jet}} $ bins compared to JEWEL predictions with and without recoils. |
png pdf |
Figure 36-f:
Ratios of 0-10% central PbPb to pp energy-energy correlators with $ n= $ 2 in different $ p_{\mathrm{T}}^{\text{ch}} $ and $ p_{\text{T,jet}} $ bins compared to JEWEL predictions with and without recoils. |
png pdf |
Figure 36-g:
Ratios of 0-10% central PbPb to pp energy-energy correlators with $ n= $ 2 in different $ p_{\mathrm{T}}^{\text{ch}} $ and $ p_{\text{T,jet}} $ bins compared to JEWEL predictions with and without recoils. |

png pdf |
Figure 36-h:
Ratios of 0-10% central PbPb to pp energy-energy correlators with $ n= $ 2 in different $ p_{\mathrm{T}}^{\text{ch}} $ and $ p_{\text{T,jet}} $ bins compared to JEWEL predictions with and without recoils. |
png pdf |
Figure 37:
The double ratios of 50-90% central PbPb to pp single ratios with $ p_{\mathrm{T}}^{\text{ch}} > $ 2 GeV and $ p_{\mathrm{T}}^{\text{ch}} > $ 1 GeV for $ n= $ 1 (left) and $ n= $ 2 (right) in different $ p_{\text{T,jet}} $ bins compared to the hybrid model predictions with different jet wake settings. |
png pdf |
Figure 37-a:
The double ratios of 50-90% central PbPb to pp single ratios with $ p_{\mathrm{T}}^{\text{ch}} > $ 2 GeV and $ p_{\mathrm{T}}^{\text{ch}} > $ 1 GeV for $ n= $ 1 (left) and $ n= $ 2 (right) in different $ p_{\text{T,jet}} $ bins compared to the hybrid model predictions with different jet wake settings. |
png pdf |
Figure 37-b:
The double ratios of 50-90% central PbPb to pp single ratios with $ p_{\mathrm{T}}^{\text{ch}} > $ 2 GeV and $ p_{\mathrm{T}}^{\text{ch}} > $ 1 GeV for $ n= $ 1 (left) and $ n= $ 2 (right) in different $ p_{\text{T,jet}} $ bins compared to the hybrid model predictions with different jet wake settings. |
png pdf |
Figure 37-c:
The double ratios of 50-90% central PbPb to pp single ratios with $ p_{\mathrm{T}}^{\text{ch}} > $ 2 GeV and $ p_{\mathrm{T}}^{\text{ch}} > $ 1 GeV for $ n= $ 1 (left) and $ n= $ 2 (right) in different $ p_{\text{T,jet}} $ bins compared to the hybrid model predictions with different jet wake settings. |
png pdf |
Figure 37-d:
The double ratios of 50-90% central PbPb to pp single ratios with $ p_{\mathrm{T}}^{\text{ch}} > $ 2 GeV and $ p_{\mathrm{T}}^{\text{ch}} > $ 1 GeV for $ n= $ 1 (left) and $ n= $ 2 (right) in different $ p_{\text{T,jet}} $ bins compared to the hybrid model predictions with different jet wake settings. |
png pdf |
Figure 37-e:
The double ratios of 50-90% central PbPb to pp single ratios with $ p_{\mathrm{T}}^{\text{ch}} > $ 2 GeV and $ p_{\mathrm{T}}^{\text{ch}} > $ 1 GeV for $ n= $ 1 (left) and $ n= $ 2 (right) in different $ p_{\text{T,jet}} $ bins compared to the hybrid model predictions with different jet wake settings. |

png pdf |
Figure 37-f:
The double ratios of 50-90% central PbPb to pp single ratios with $ p_{\mathrm{T}}^{\text{ch}} > $ 2 GeV and $ p_{\mathrm{T}}^{\text{ch}} > $ 1 GeV for $ n= $ 1 (left) and $ n= $ 2 (right) in different $ p_{\text{T,jet}} $ bins compared to the hybrid model predictions with different jet wake settings. |
png pdf |
Figure 37-g:
The double ratios of 50-90% central PbPb to pp single ratios with $ p_{\mathrm{T}}^{\text{ch}} > $ 2 GeV and $ p_{\mathrm{T}}^{\text{ch}} > $ 1 GeV for $ n= $ 1 (left) and $ n= $ 2 (right) in different $ p_{\text{T,jet}} $ bins compared to the hybrid model predictions with different jet wake settings. |
png pdf |
Figure 37-h:
The double ratios of 50-90% central PbPb to pp single ratios with $ p_{\mathrm{T}}^{\text{ch}} > $ 2 GeV and $ p_{\mathrm{T}}^{\text{ch}} > $ 1 GeV for $ n= $ 1 (left) and $ n= $ 2 (right) in different $ p_{\text{T,jet}} $ bins compared to the hybrid model predictions with different jet wake settings. |
png pdf |
Figure 38:
The double ratios of 30-50% central PbPb to pp single ratios with $ p_{\mathrm{T}}^{\text{ch}} > $ 2 GeV and $ p_{\mathrm{T}}^{\text{ch}} > $ 1 GeV for $ n= $ 1 (left) and $ n= $ 2 (right) in different $ p_{\text{T,jet}} $ bins compared to the hybrid model predictions with different jet wake settings. |
png pdf |
Figure 38-a:
The double ratios of 30-50% central PbPb to pp single ratios with $ p_{\mathrm{T}}^{\text{ch}} > $ 2 GeV and $ p_{\mathrm{T}}^{\text{ch}} > $ 1 GeV for $ n= $ 1 (left) and $ n= $ 2 (right) in different $ p_{\text{T,jet}} $ bins compared to the hybrid model predictions with different jet wake settings. |
png pdf |
Figure 38-b:
The double ratios of 30-50% central PbPb to pp single ratios with $ p_{\mathrm{T}}^{\text{ch}} > $ 2 GeV and $ p_{\mathrm{T}}^{\text{ch}} > $ 1 GeV for $ n= $ 1 (left) and $ n= $ 2 (right) in different $ p_{\text{T,jet}} $ bins compared to the hybrid model predictions with different jet wake settings. |
png pdf |
Figure 38-c:
The double ratios of 30-50% central PbPb to pp single ratios with $ p_{\mathrm{T}}^{\text{ch}} > $ 2 GeV and $ p_{\mathrm{T}}^{\text{ch}} > $ 1 GeV for $ n= $ 1 (left) and $ n= $ 2 (right) in different $ p_{\text{T,jet}} $ bins compared to the hybrid model predictions with different jet wake settings. |
png pdf |
Figure 38-d:
The double ratios of 30-50% central PbPb to pp single ratios with $ p_{\mathrm{T}}^{\text{ch}} > $ 2 GeV and $ p_{\mathrm{T}}^{\text{ch}} > $ 1 GeV for $ n= $ 1 (left) and $ n= $ 2 (right) in different $ p_{\text{T,jet}} $ bins compared to the hybrid model predictions with different jet wake settings. |
png pdf |
Figure 38-e:
The double ratios of 30-50% central PbPb to pp single ratios with $ p_{\mathrm{T}}^{\text{ch}} > $ 2 GeV and $ p_{\mathrm{T}}^{\text{ch}} > $ 1 GeV for $ n= $ 1 (left) and $ n= $ 2 (right) in different $ p_{\text{T,jet}} $ bins compared to the hybrid model predictions with different jet wake settings. |
png pdf |
Figure 38-f:
The double ratios of 30-50% central PbPb to pp single ratios with $ p_{\mathrm{T}}^{\text{ch}} > $ 2 GeV and $ p_{\mathrm{T}}^{\text{ch}} > $ 1 GeV for $ n= $ 1 (left) and $ n= $ 2 (right) in different $ p_{\text{T,jet}} $ bins compared to the hybrid model predictions with different jet wake settings. |
png pdf |
Figure 38-g:
The double ratios of 30-50% central PbPb to pp single ratios with $ p_{\mathrm{T}}^{\text{ch}} > $ 2 GeV and $ p_{\mathrm{T}}^{\text{ch}} > $ 1 GeV for $ n= $ 1 (left) and $ n= $ 2 (right) in different $ p_{\text{T,jet}} $ bins compared to the hybrid model predictions with different jet wake settings. |
png pdf |
Figure 38-h:
The double ratios of 30-50% central PbPb to pp single ratios with $ p_{\mathrm{T}}^{\text{ch}} > $ 2 GeV and $ p_{\mathrm{T}}^{\text{ch}} > $ 1 GeV for $ n= $ 1 (left) and $ n= $ 2 (right) in different $ p_{\text{T,jet}} $ bins compared to the hybrid model predictions with different jet wake settings. |
png pdf |
Figure 39:
The double ratios of 10-30% central PbPb to pp single ratios with $ p_{\mathrm{T}}^{\text{ch}} > $ 2 GeV and $ p_{\mathrm{T}}^{\text{ch}} > $ 1 GeV for $ n= $ 1 (left) and $ n= $ 2 (right) in different $ p_{\text{T,jet}} $ bins compared to the hybrid model predictions with different jet wake settings. |
png pdf |
Figure 39-a:
The double ratios of 10-30% central PbPb to pp single ratios with $ p_{\mathrm{T}}^{\text{ch}} > $ 2 GeV and $ p_{\mathrm{T}}^{\text{ch}} > $ 1 GeV for $ n= $ 1 (left) and $ n= $ 2 (right) in different $ p_{\text{T,jet}} $ bins compared to the hybrid model predictions with different jet wake settings. |
png pdf |
Figure 39-b:
The double ratios of 10-30% central PbPb to pp single ratios with $ p_{\mathrm{T}}^{\text{ch}} > $ 2 GeV and $ p_{\mathrm{T}}^{\text{ch}} > $ 1 GeV for $ n= $ 1 (left) and $ n= $ 2 (right) in different $ p_{\text{T,jet}} $ bins compared to the hybrid model predictions with different jet wake settings. |
png pdf |
Figure 39-c:
The double ratios of 10-30% central PbPb to pp single ratios with $ p_{\mathrm{T}}^{\text{ch}} > $ 2 GeV and $ p_{\mathrm{T}}^{\text{ch}} > $ 1 GeV for $ n= $ 1 (left) and $ n= $ 2 (right) in different $ p_{\text{T,jet}} $ bins compared to the hybrid model predictions with different jet wake settings. |
png pdf |
Figure 39-d:
The double ratios of 10-30% central PbPb to pp single ratios with $ p_{\mathrm{T}}^{\text{ch}} > $ 2 GeV and $ p_{\mathrm{T}}^{\text{ch}} > $ 1 GeV for $ n= $ 1 (left) and $ n= $ 2 (right) in different $ p_{\text{T,jet}} $ bins compared to the hybrid model predictions with different jet wake settings. |
png pdf |
Figure 39-e:
The double ratios of 10-30% central PbPb to pp single ratios with $ p_{\mathrm{T}}^{\text{ch}} > $ 2 GeV and $ p_{\mathrm{T}}^{\text{ch}} > $ 1 GeV for $ n= $ 1 (left) and $ n= $ 2 (right) in different $ p_{\text{T,jet}} $ bins compared to the hybrid model predictions with different jet wake settings. |
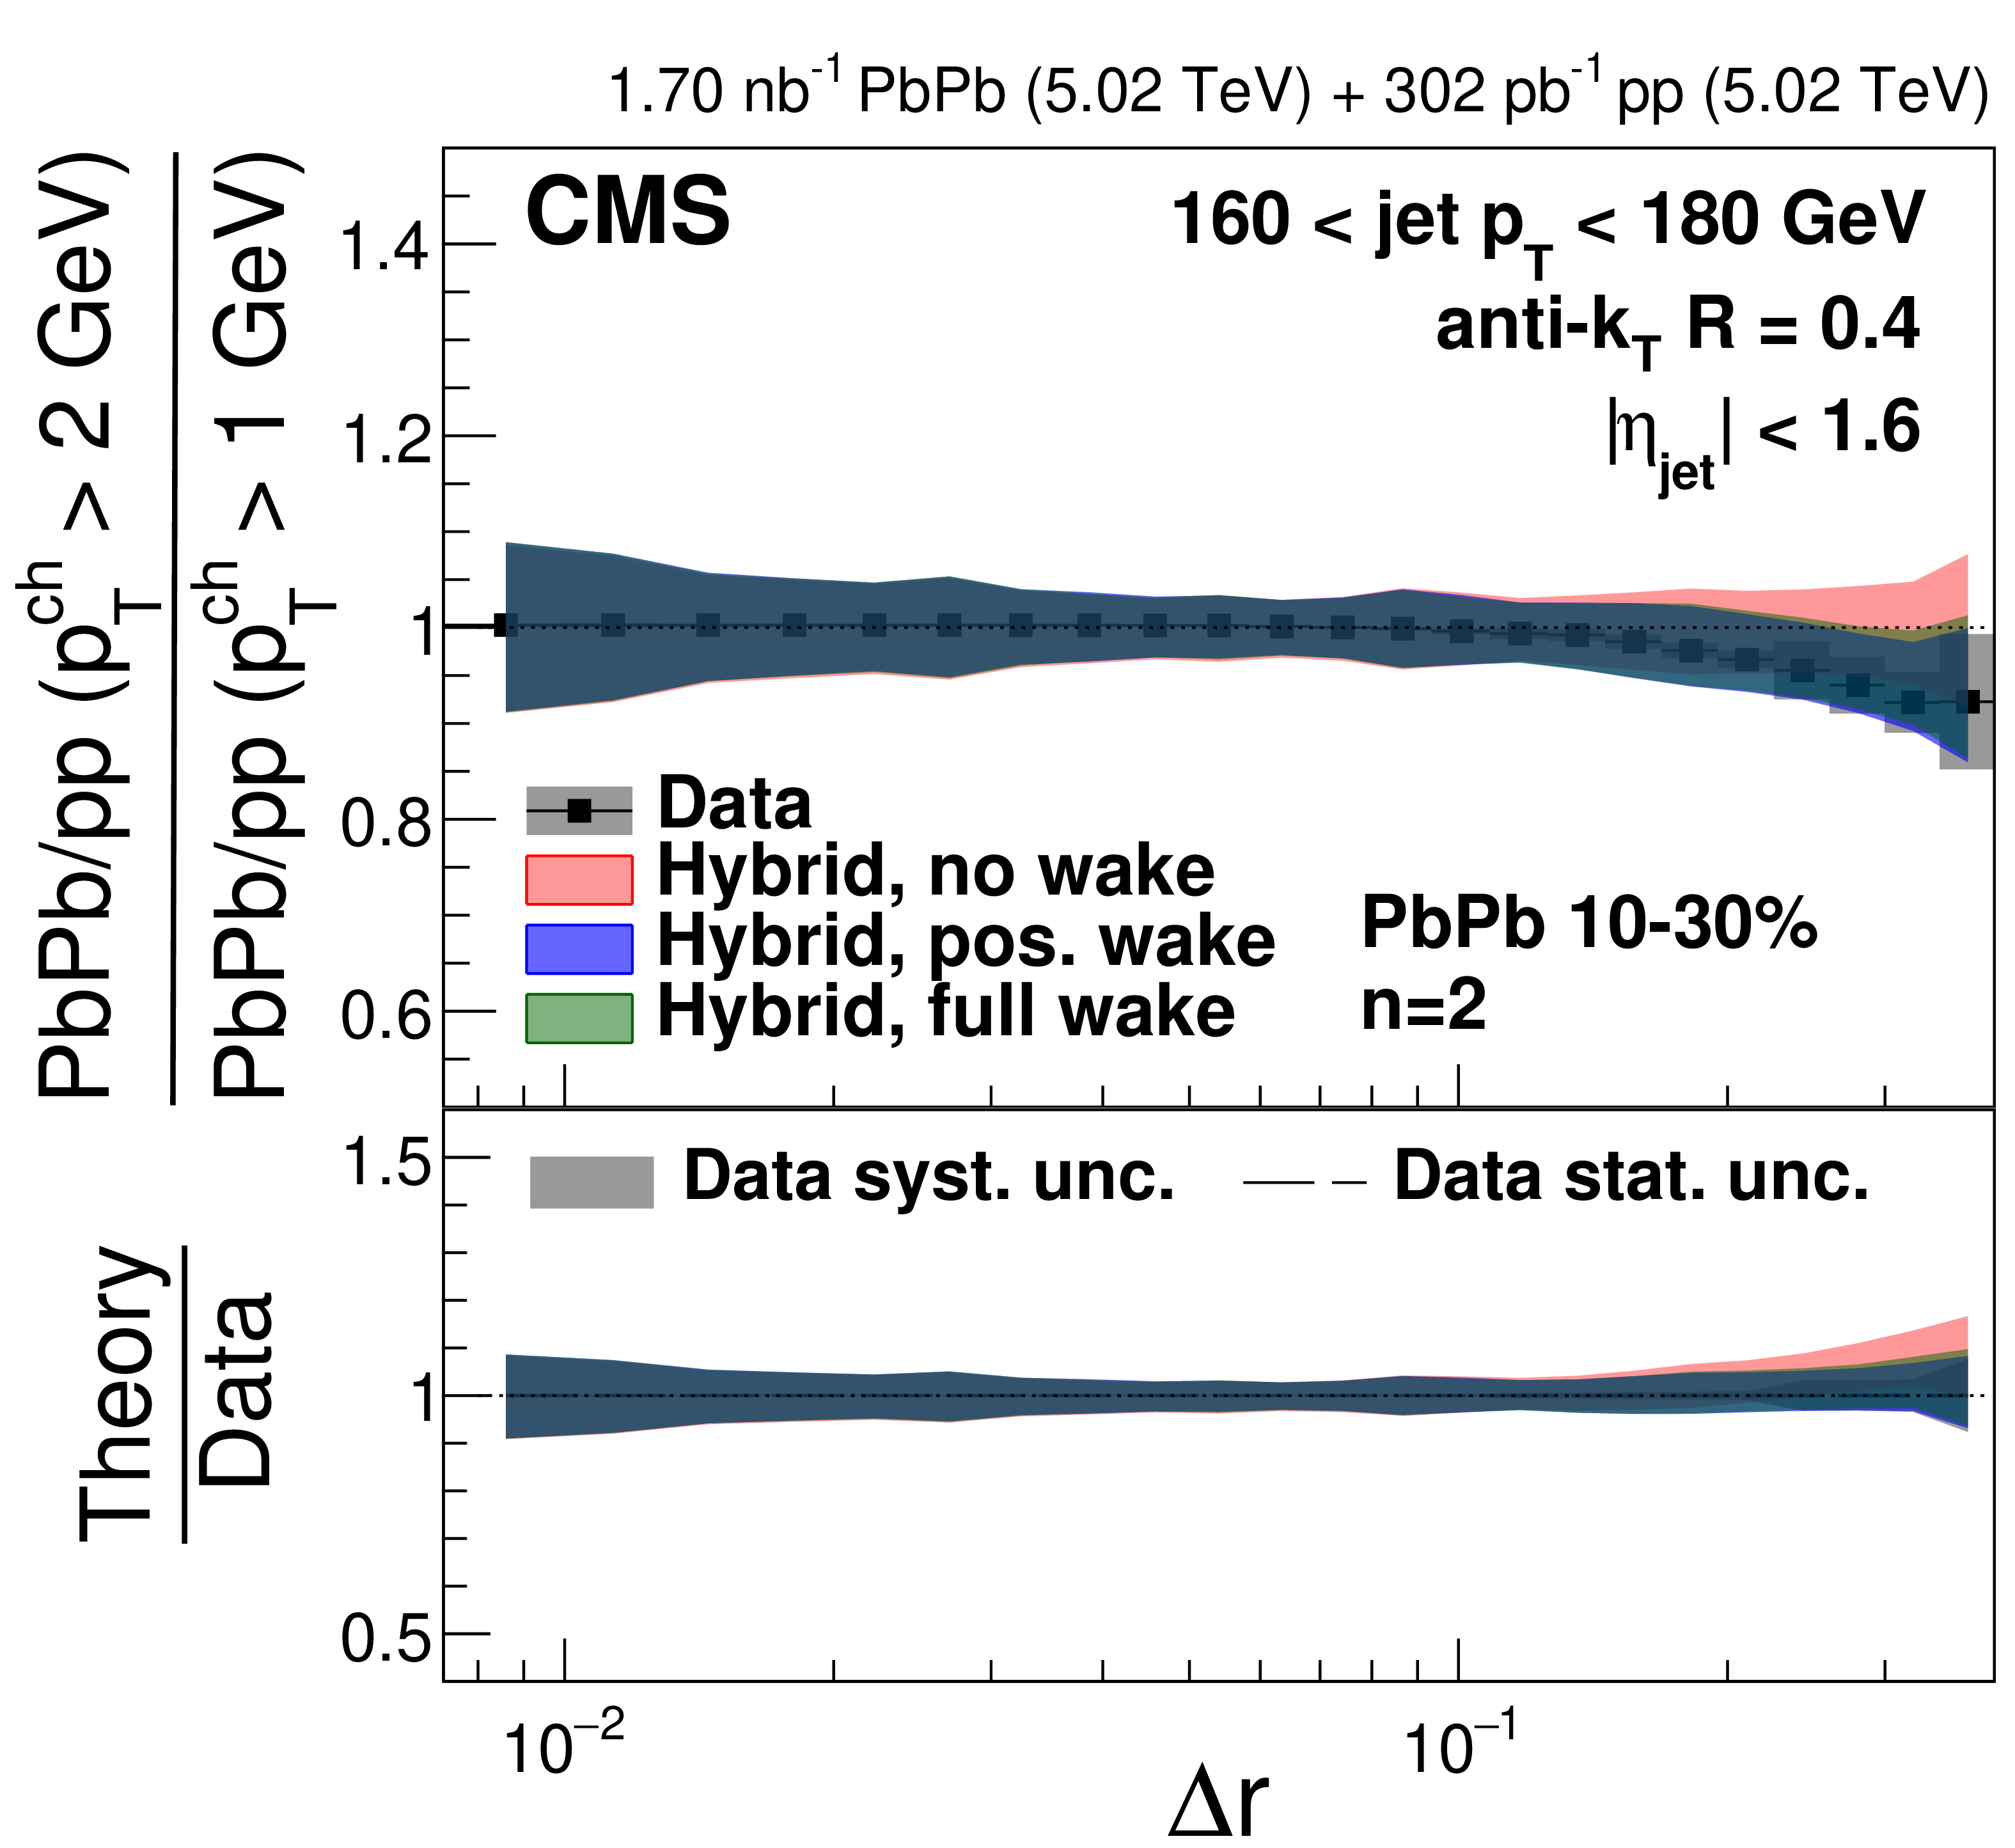
png pdf |
Figure 39-f:
The double ratios of 10-30% central PbPb to pp single ratios with $ p_{\mathrm{T}}^{\text{ch}} > $ 2 GeV and $ p_{\mathrm{T}}^{\text{ch}} > $ 1 GeV for $ n= $ 1 (left) and $ n= $ 2 (right) in different $ p_{\text{T,jet}} $ bins compared to the hybrid model predictions with different jet wake settings. |
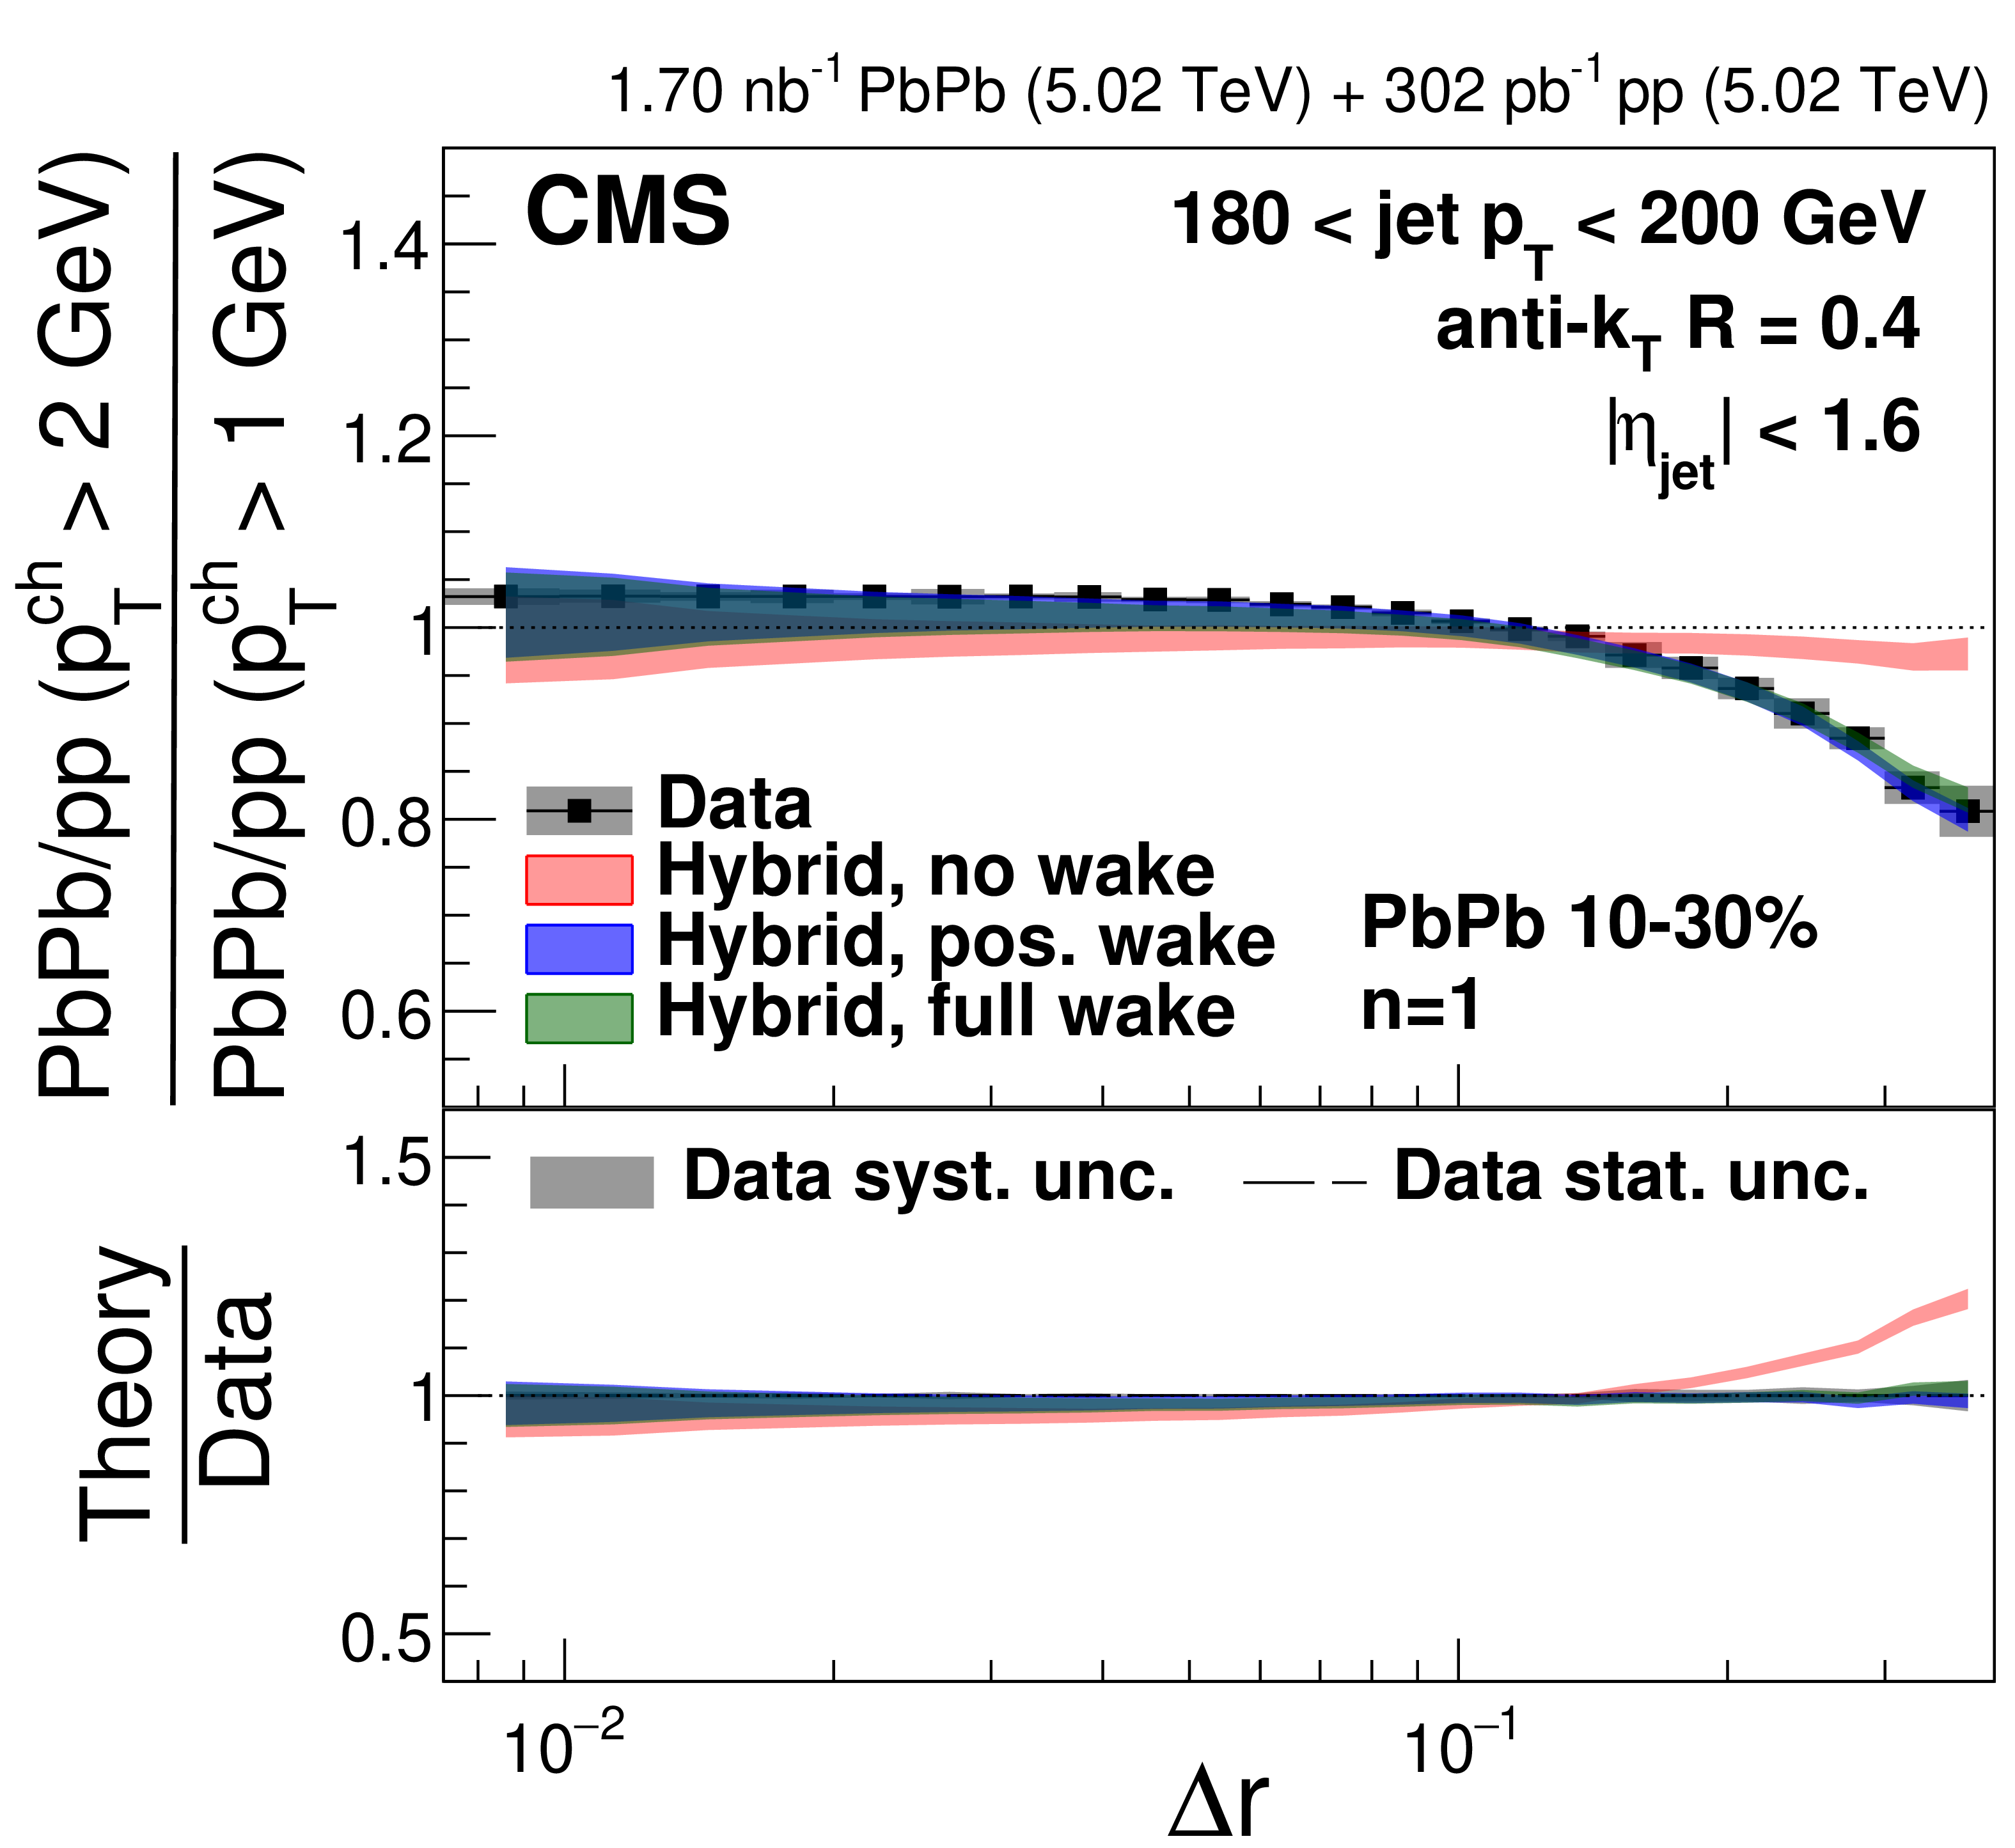
png pdf |
Figure 39-g:
The double ratios of 10-30% central PbPb to pp single ratios with $ p_{\mathrm{T}}^{\text{ch}} > $ 2 GeV and $ p_{\mathrm{T}}^{\text{ch}} > $ 1 GeV for $ n= $ 1 (left) and $ n= $ 2 (right) in different $ p_{\text{T,jet}} $ bins compared to the hybrid model predictions with different jet wake settings. |
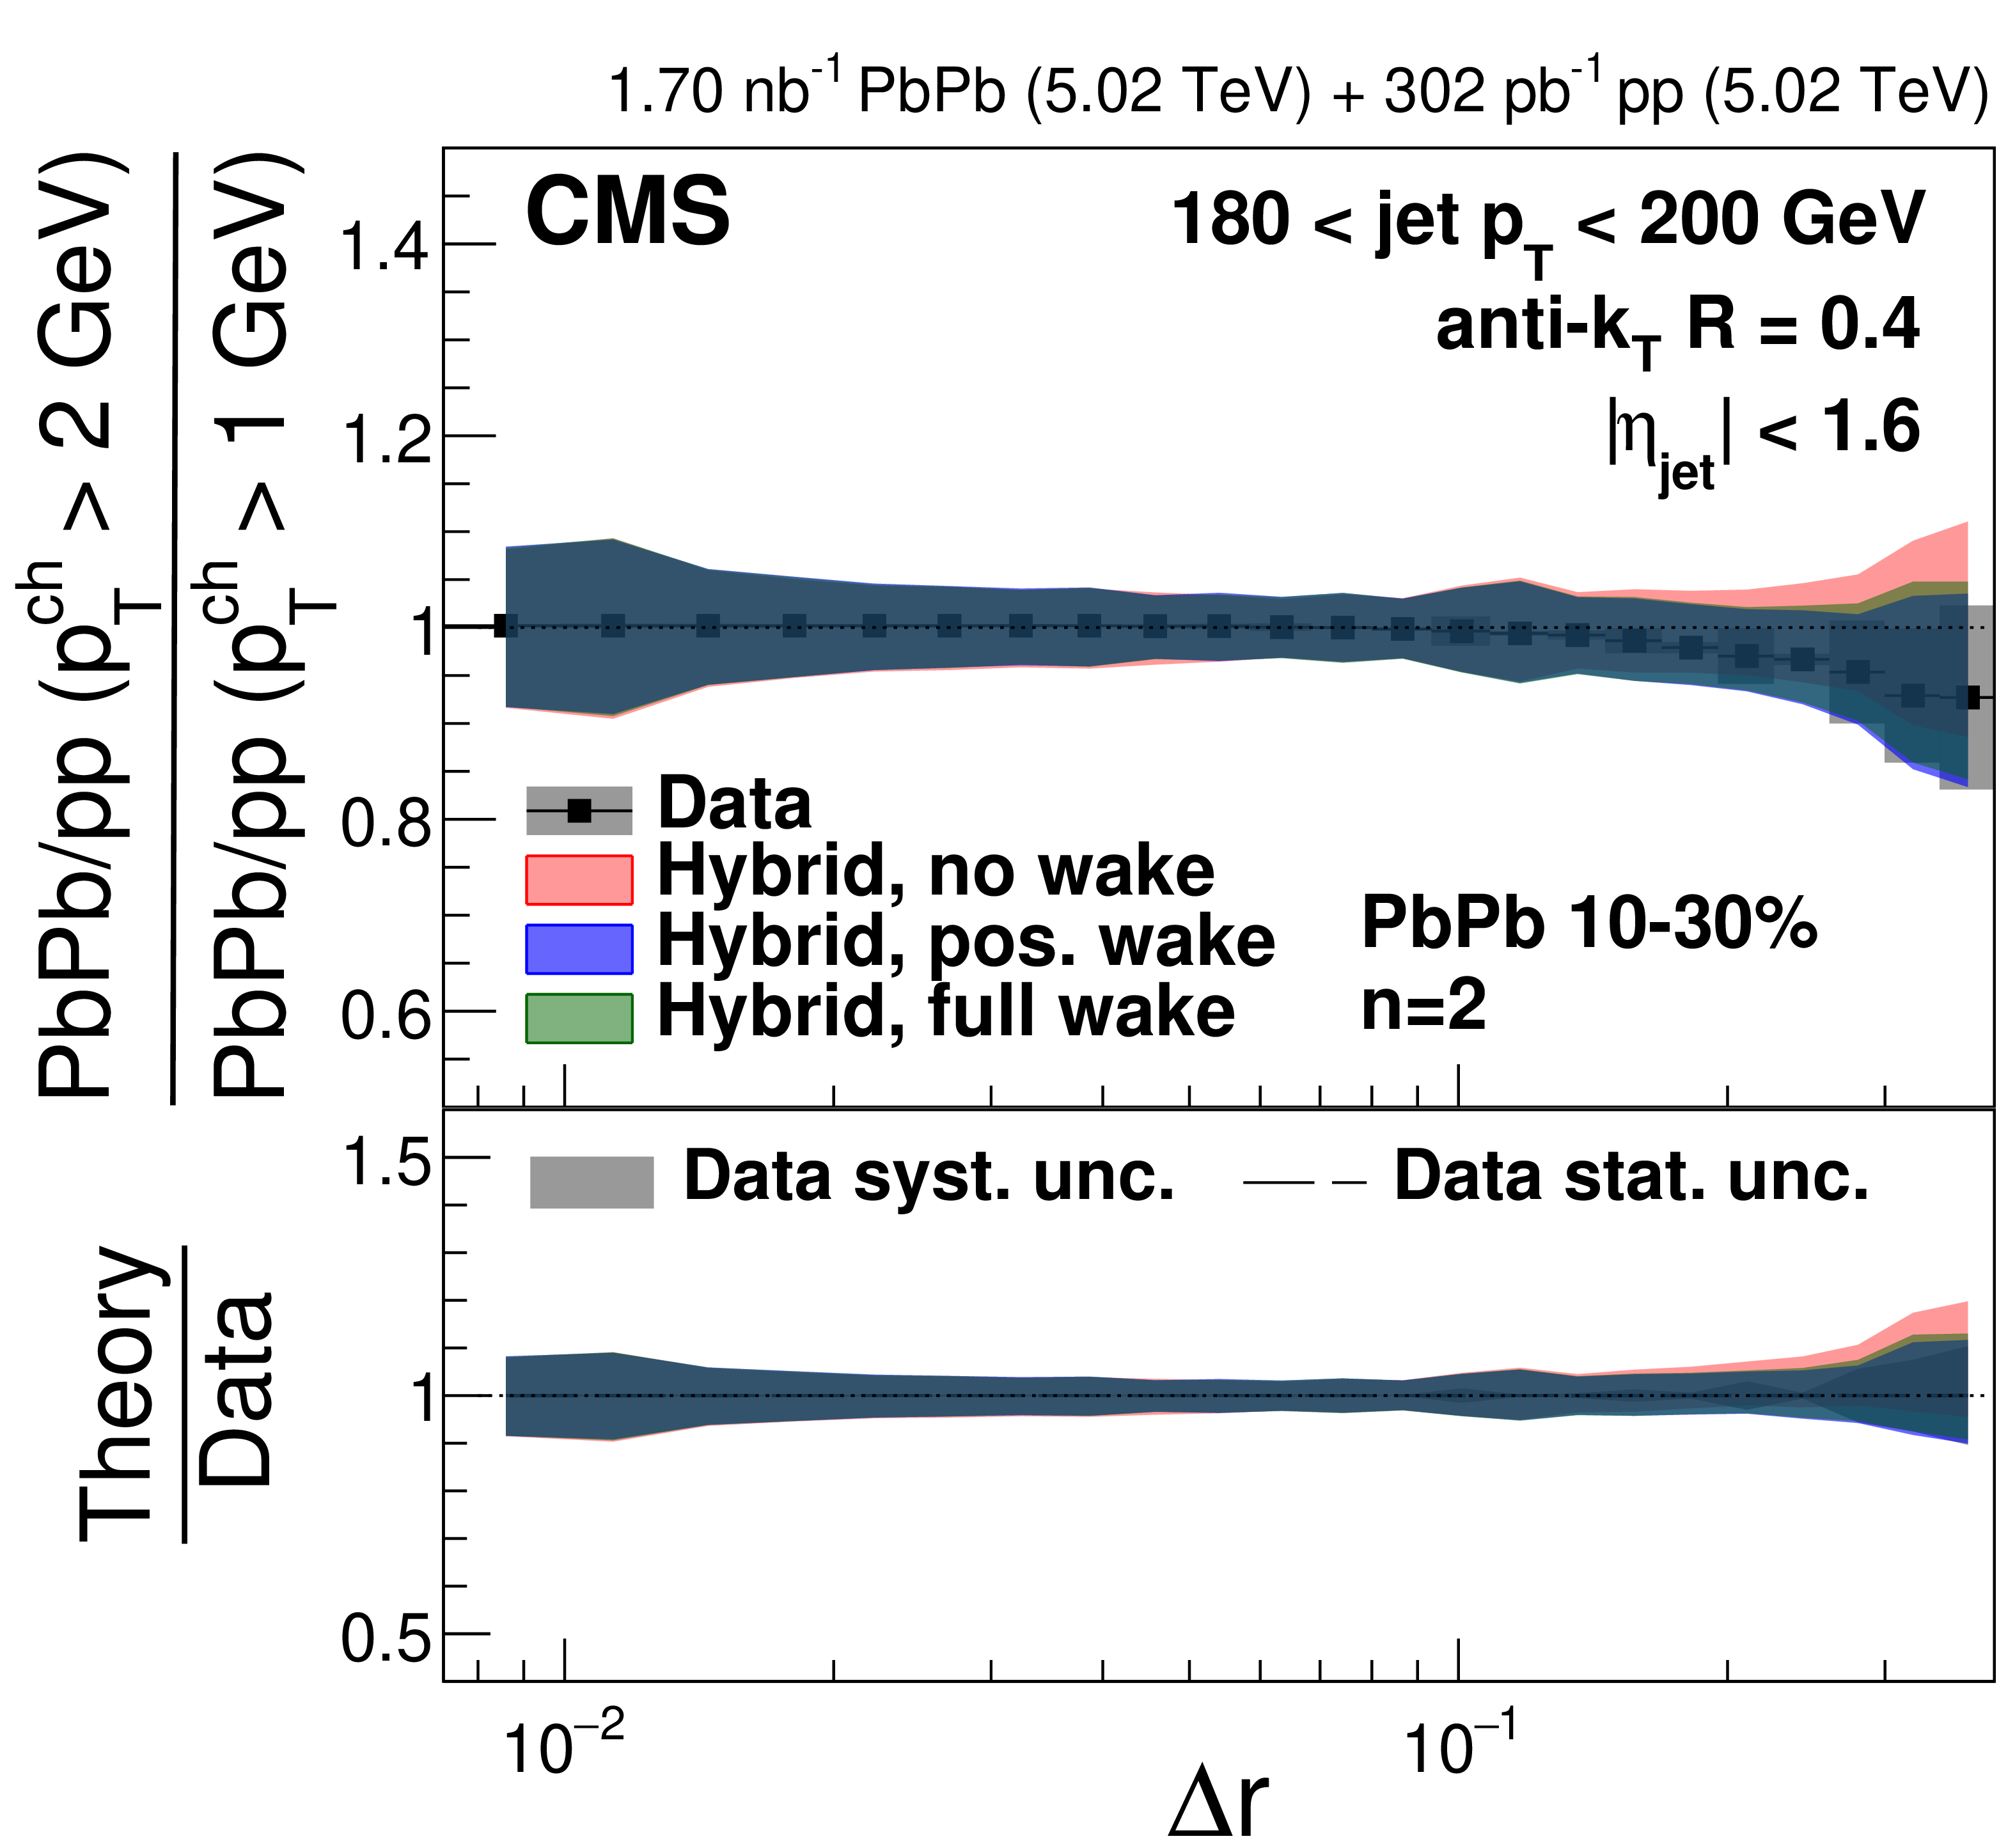
png pdf |
Figure 39-h:
The double ratios of 10-30% central PbPb to pp single ratios with $ p_{\mathrm{T}}^{\text{ch}} > $ 2 GeV and $ p_{\mathrm{T}}^{\text{ch}} > $ 1 GeV for $ n= $ 1 (left) and $ n= $ 2 (right) in different $ p_{\text{T,jet}} $ bins compared to the hybrid model predictions with different jet wake settings. |
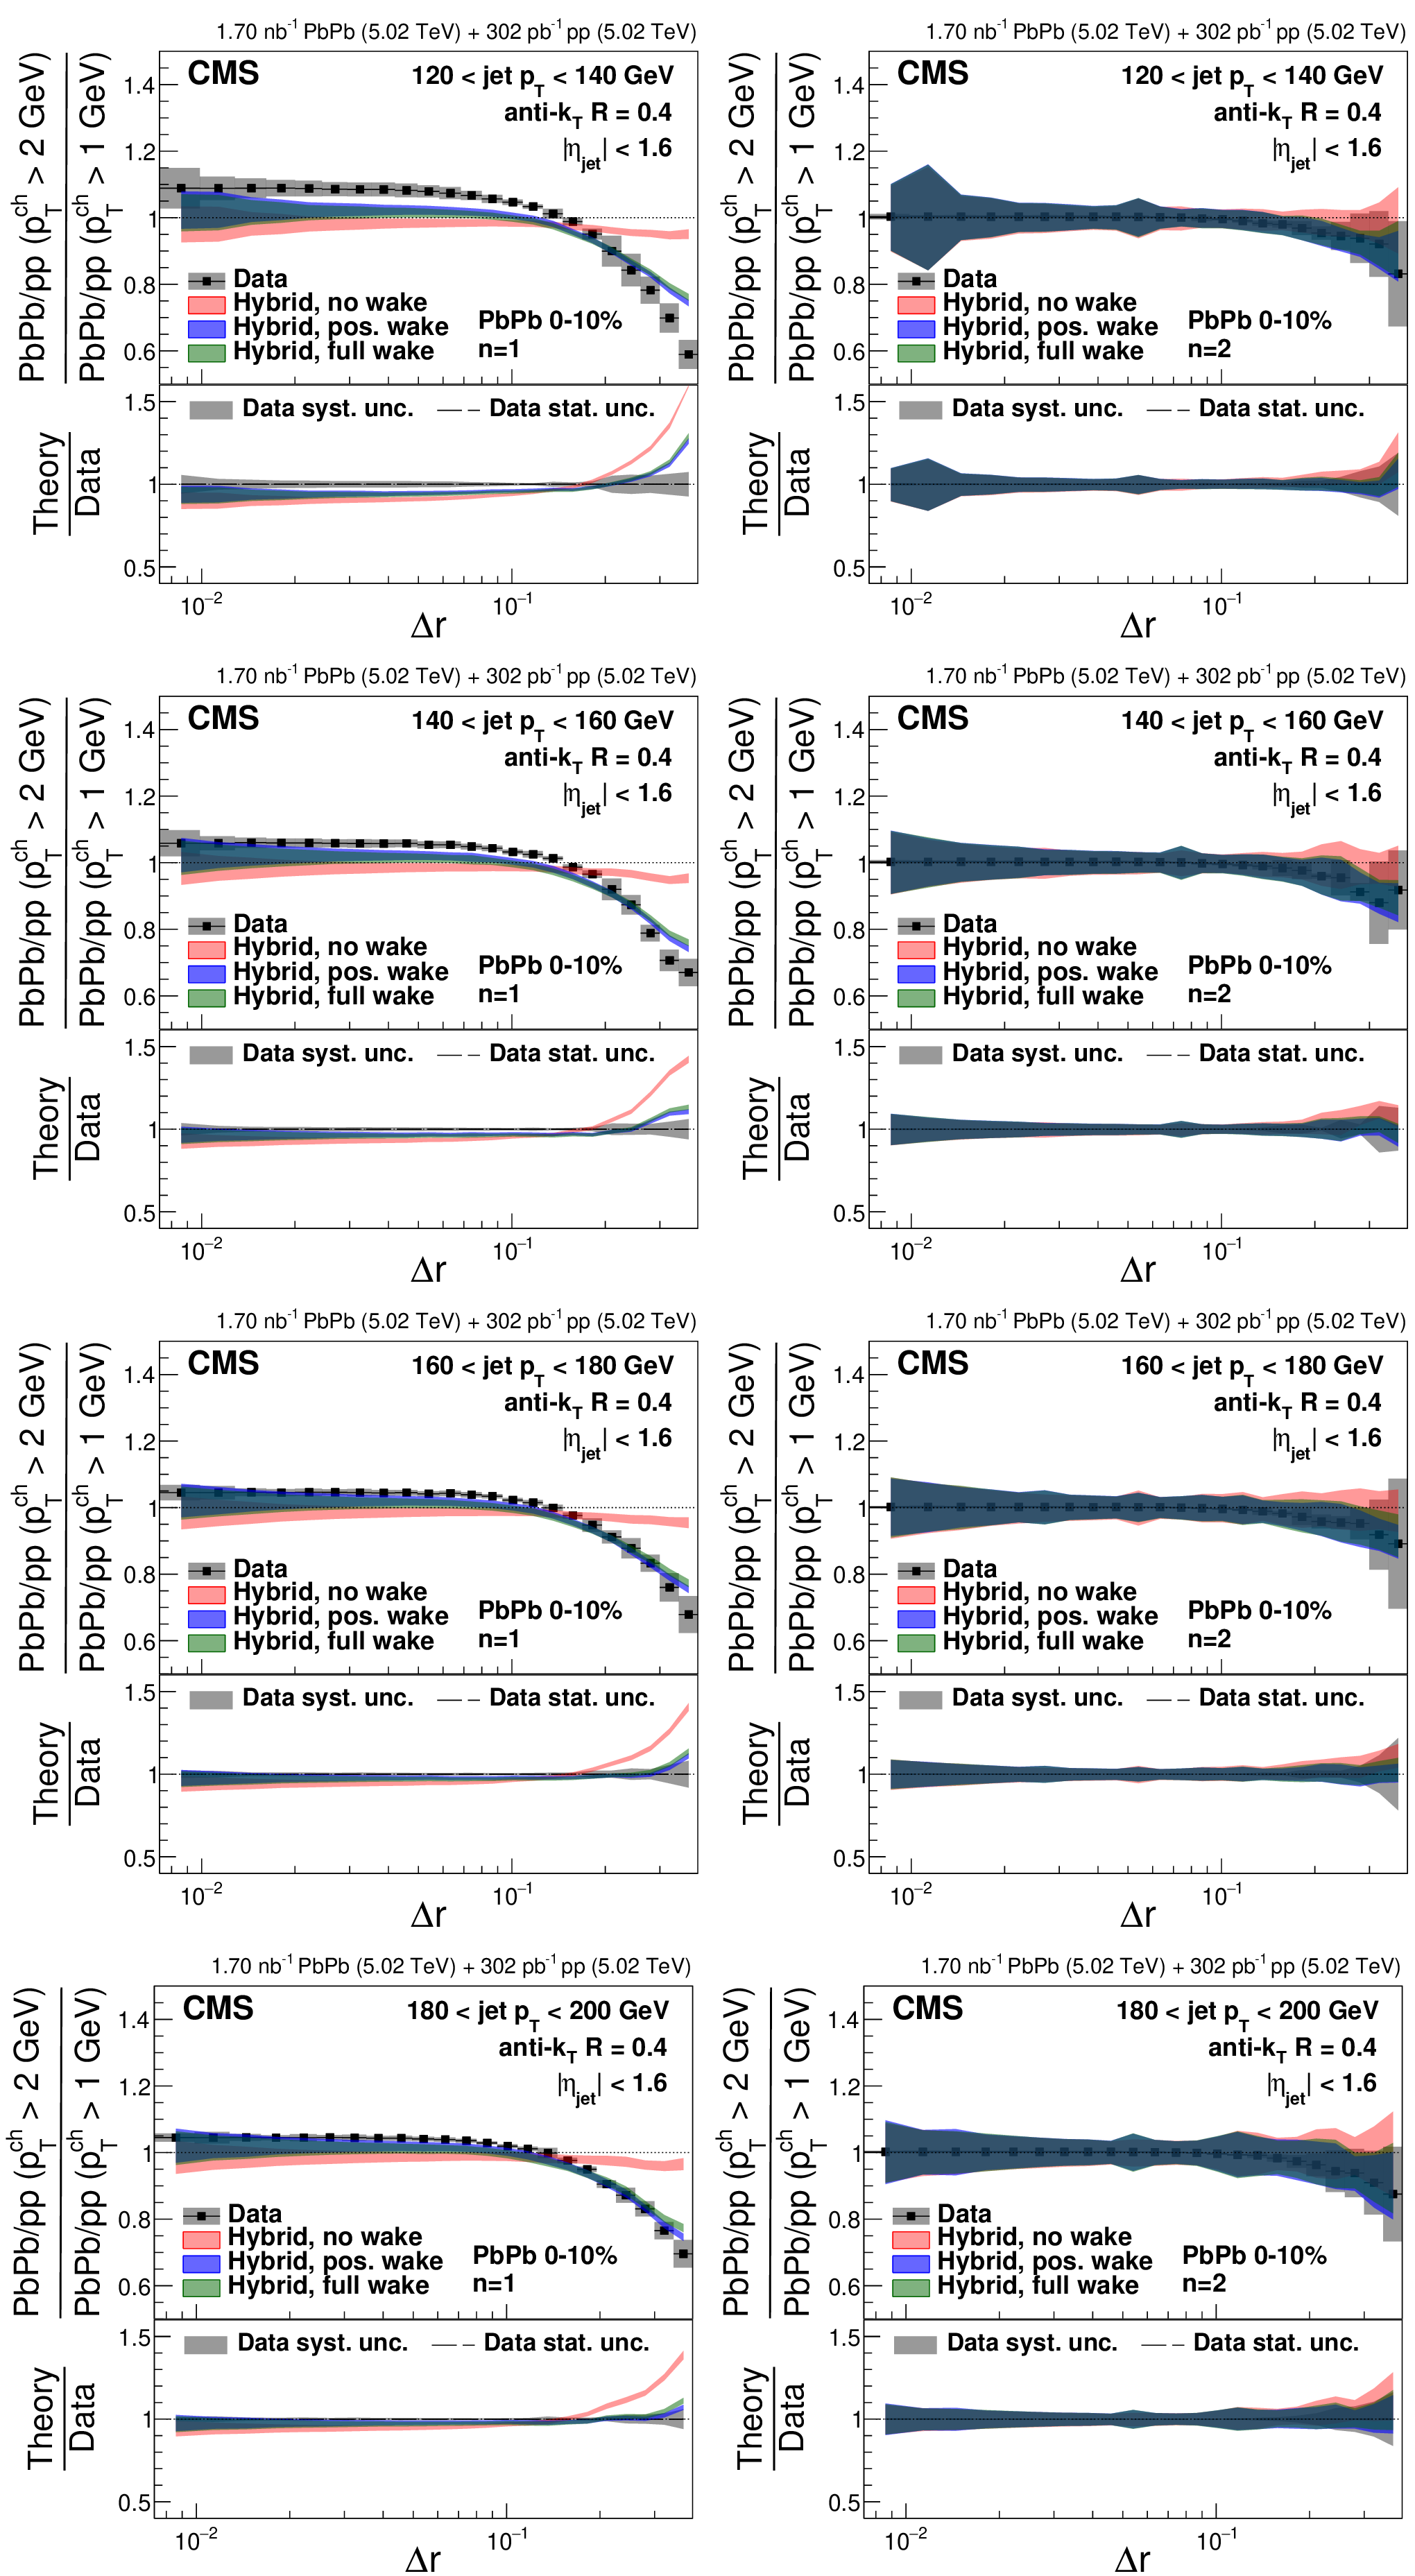
png pdf |
Figure 40:
The double ratios of 0-10% central PbPb to pp single ratios with $ p_{\mathrm{T}}^{\text{ch}} > $ 2 GeV and $ p_{\mathrm{T}}^{\text{ch}} > $ 1 GeV for $ n= $ 1 (left) and $ n= $ 2 (right) in different $ p_{\text{T,jet}} $ bins compared to the hybrid model predictions with different jet wake settings. |
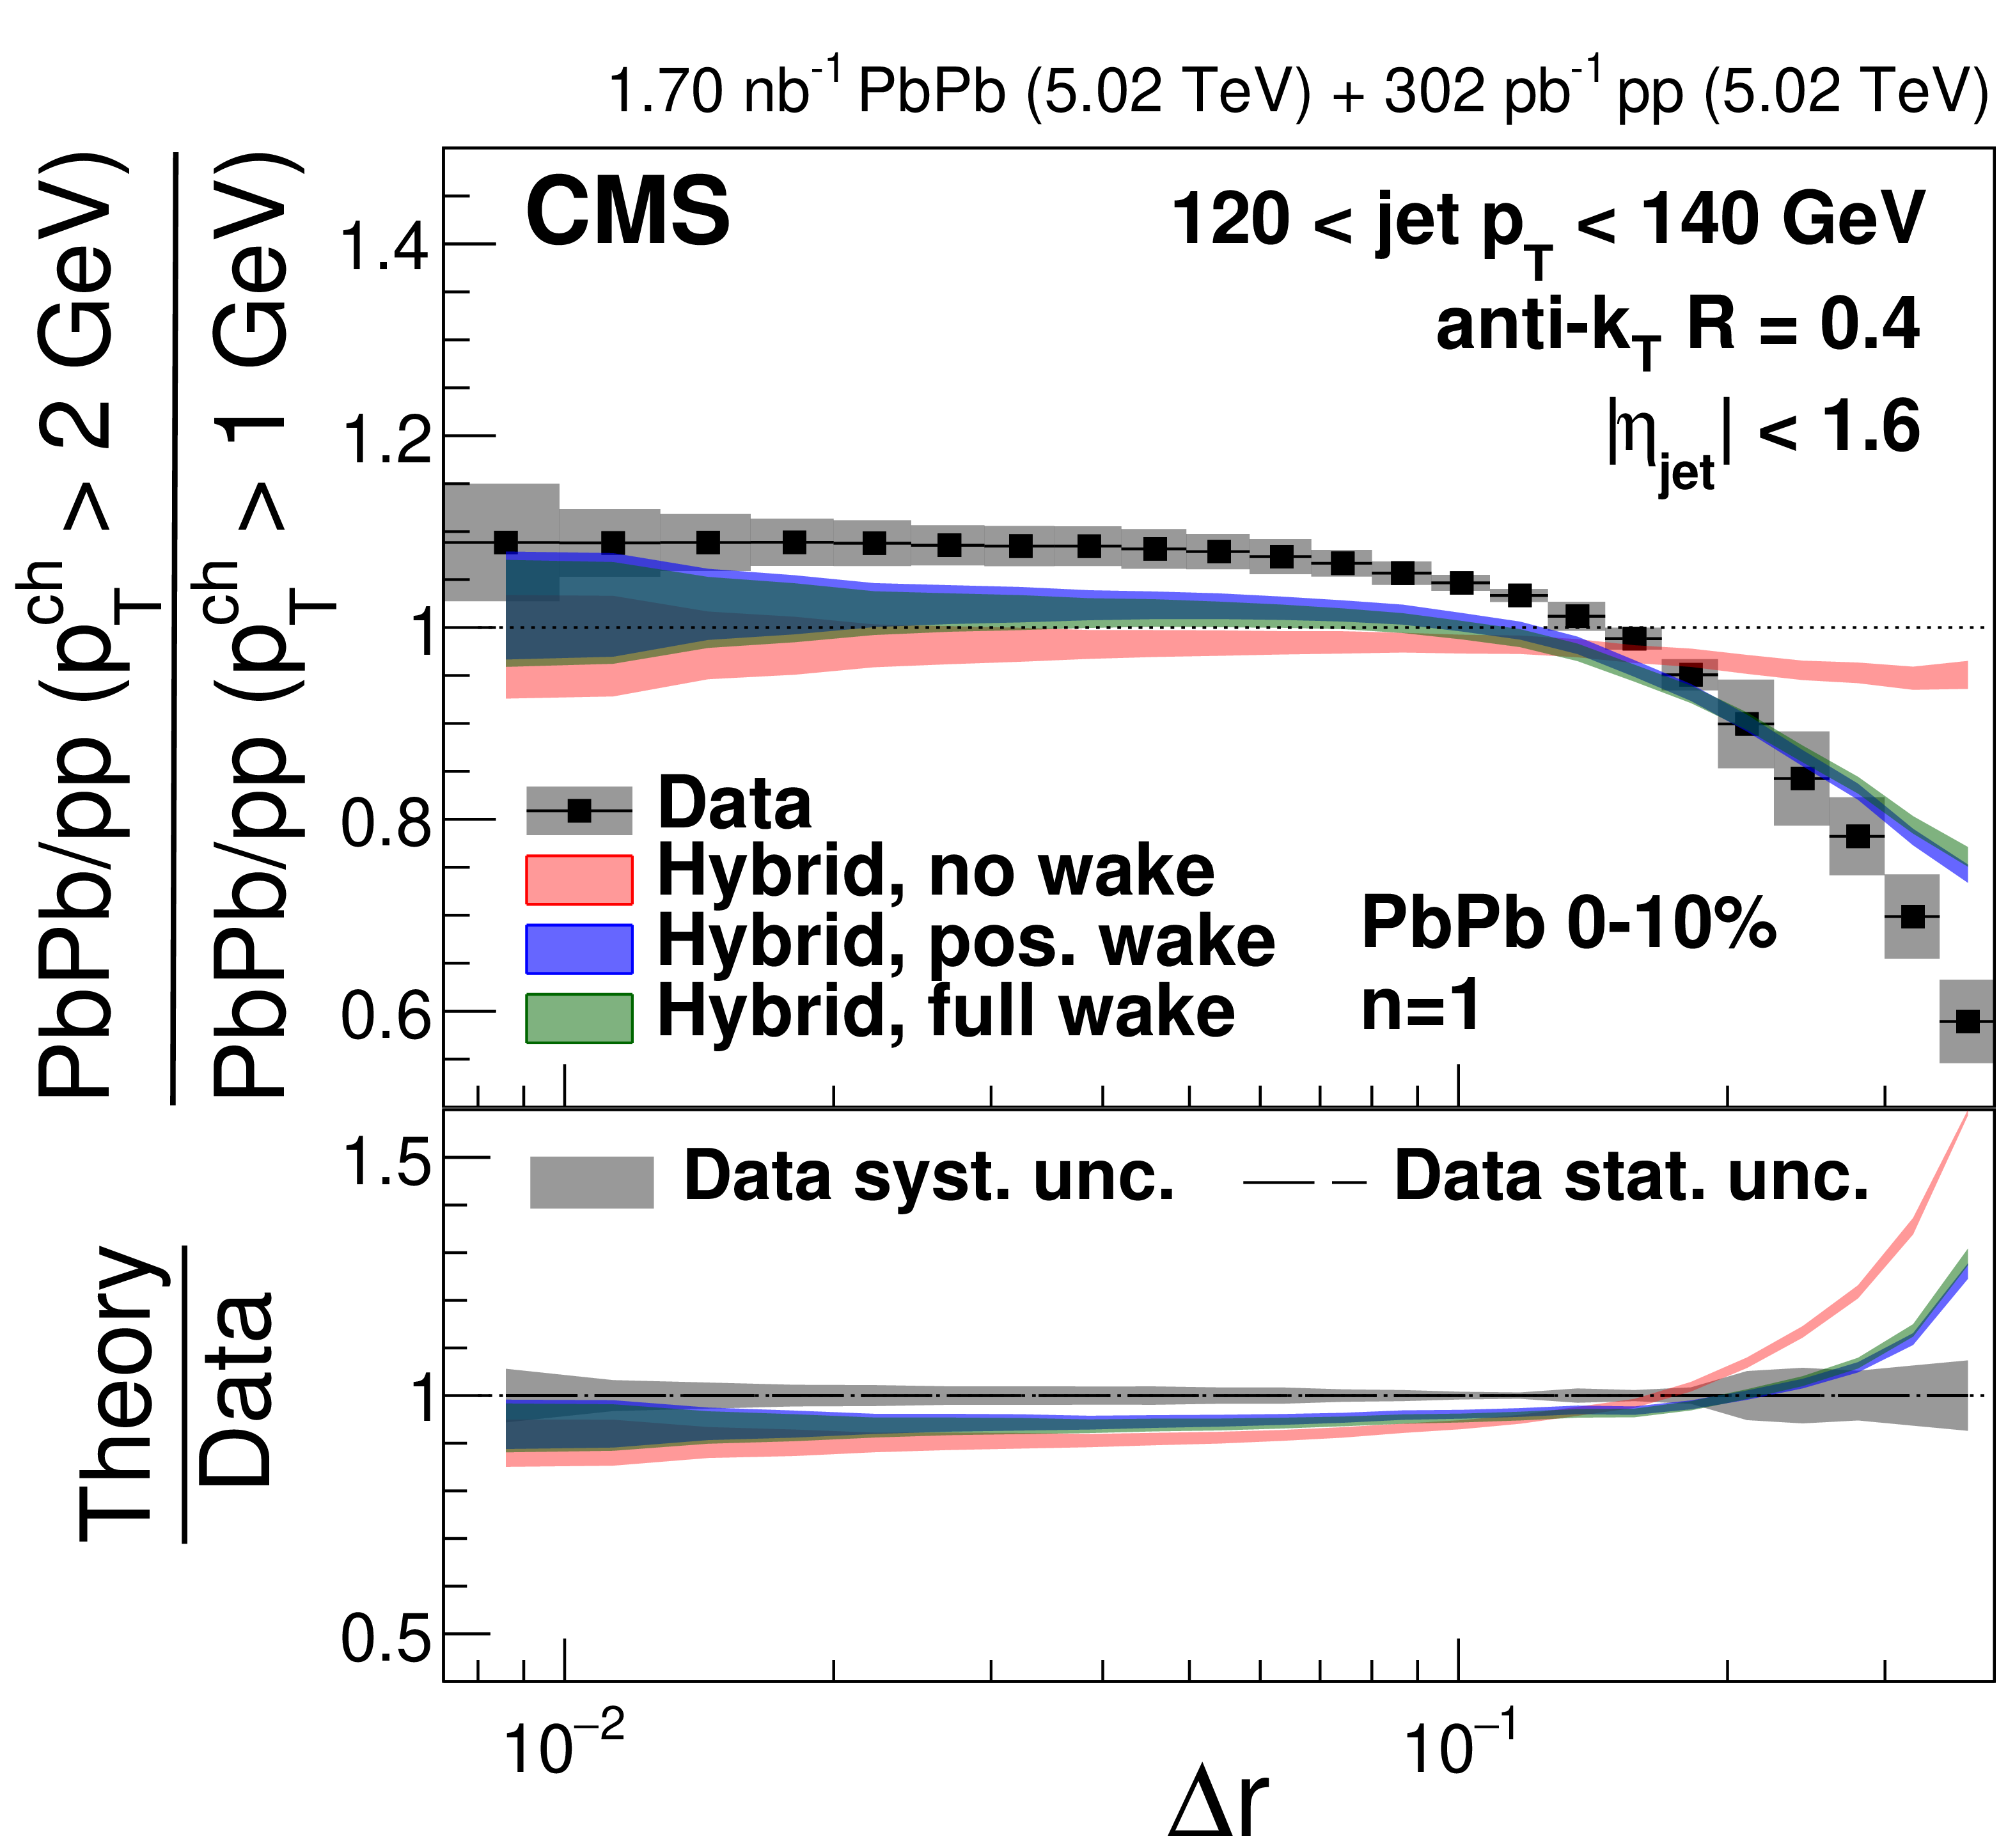
png pdf |
Figure 40-a:
The double ratios of 0-10% central PbPb to pp single ratios with $ p_{\mathrm{T}}^{\text{ch}} > $ 2 GeV and $ p_{\mathrm{T}}^{\text{ch}} > $ 1 GeV for $ n= $ 1 (left) and $ n= $ 2 (right) in different $ p_{\text{T,jet}} $ bins compared to the hybrid model predictions with different jet wake settings. |
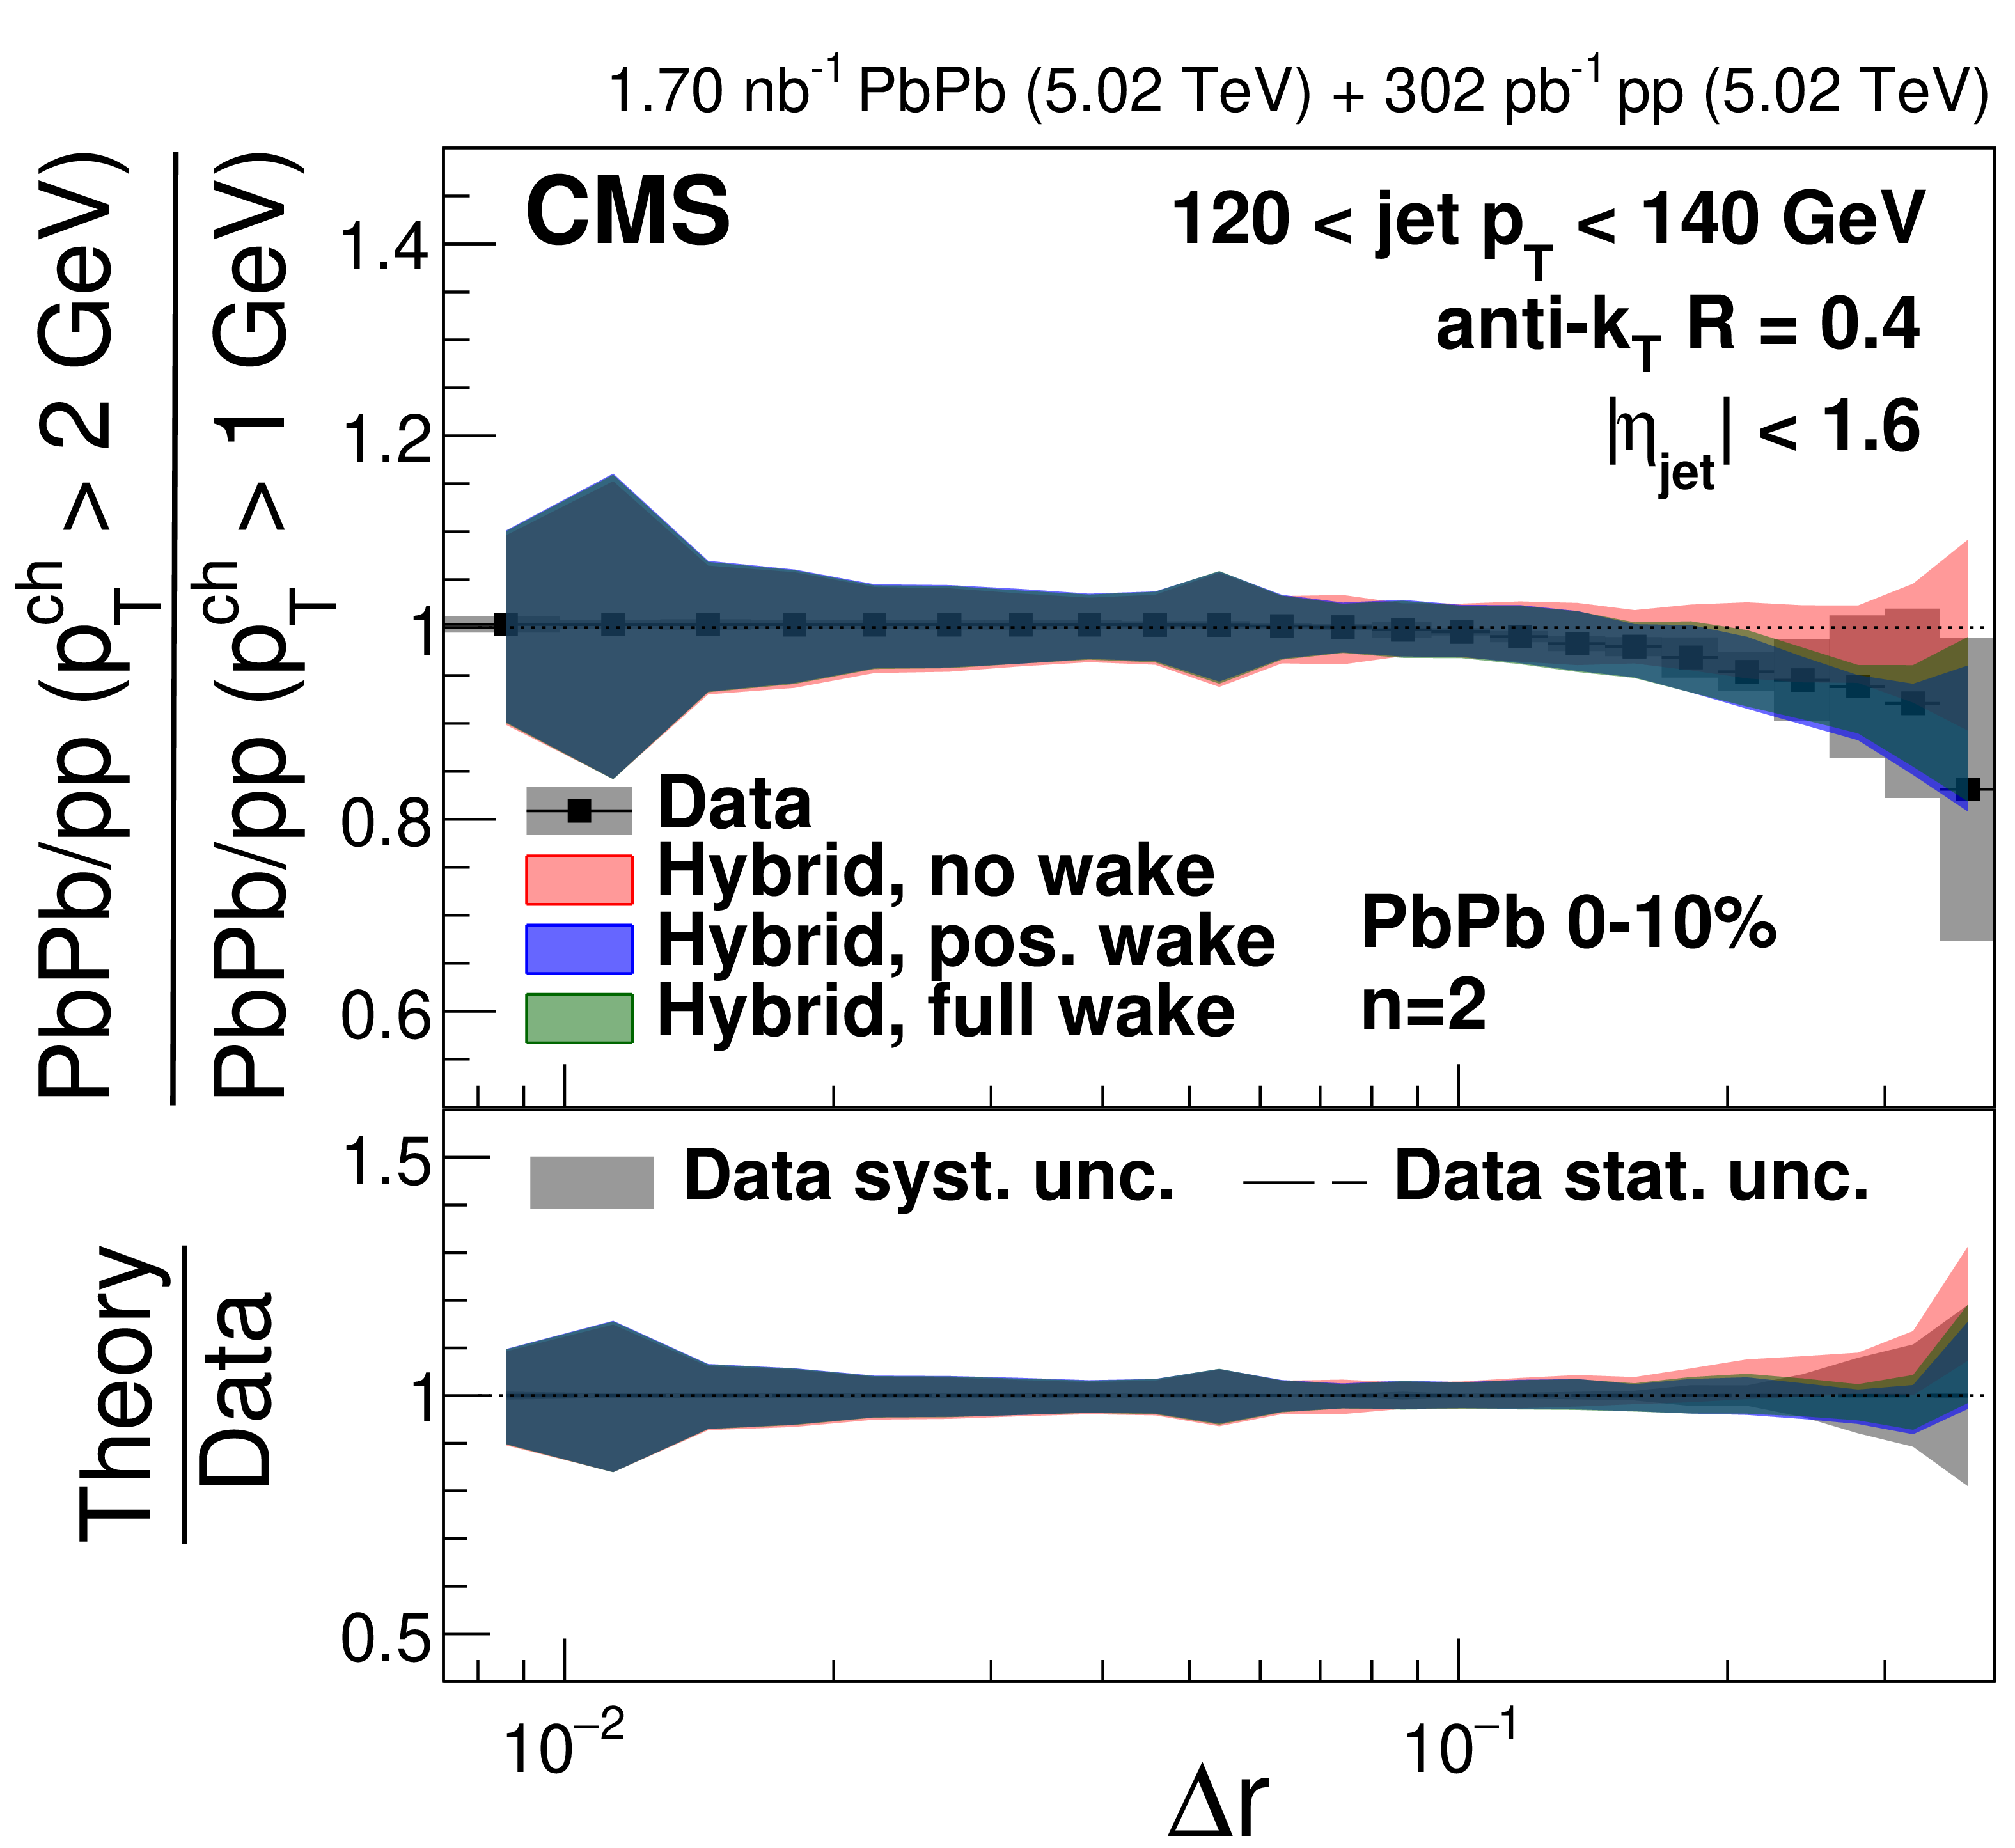
png pdf |
Figure 40-b:
The double ratios of 0-10% central PbPb to pp single ratios with $ p_{\mathrm{T}}^{\text{ch}} > $ 2 GeV and $ p_{\mathrm{T}}^{\text{ch}} > $ 1 GeV for $ n= $ 1 (left) and $ n= $ 2 (right) in different $ p_{\text{T,jet}} $ bins compared to the hybrid model predictions with different jet wake settings. |
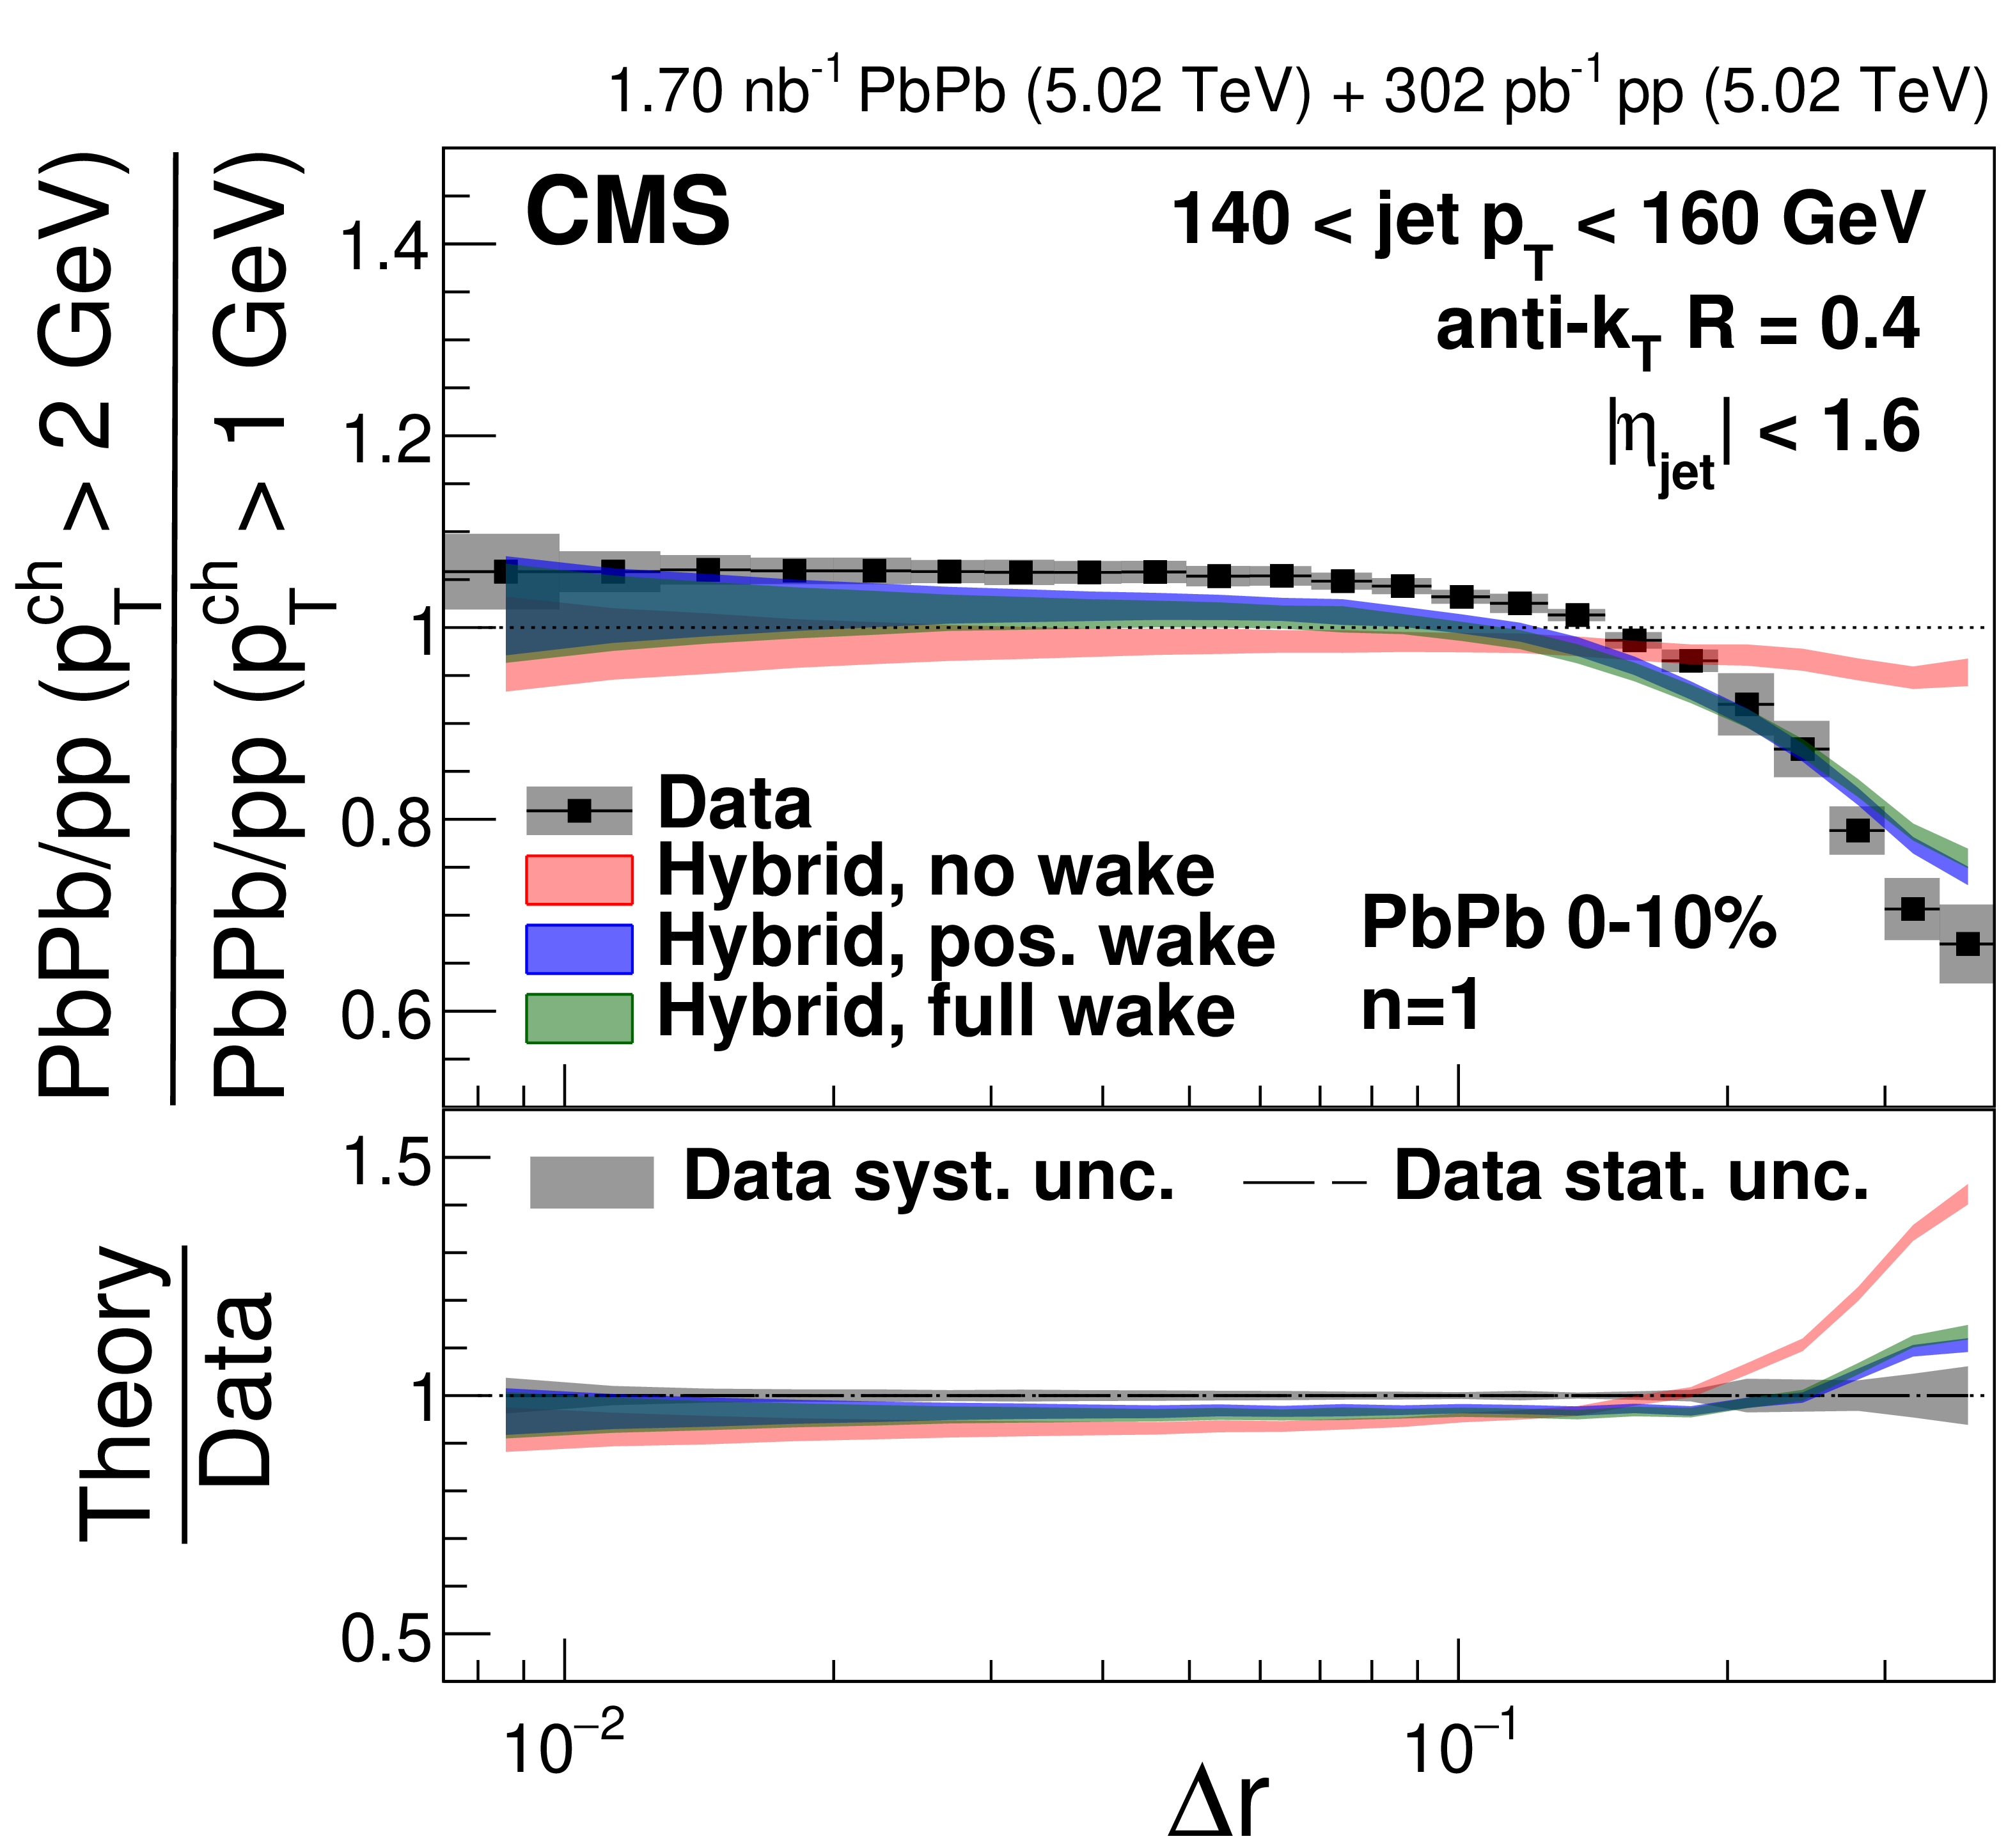
png pdf |
Figure 40-c:
The double ratios of 0-10% central PbPb to pp single ratios with $ p_{\mathrm{T}}^{\text{ch}} > $ 2 GeV and $ p_{\mathrm{T}}^{\text{ch}} > $ 1 GeV for $ n= $ 1 (left) and $ n= $ 2 (right) in different $ p_{\text{T,jet}} $ bins compared to the hybrid model predictions with different jet wake settings. |
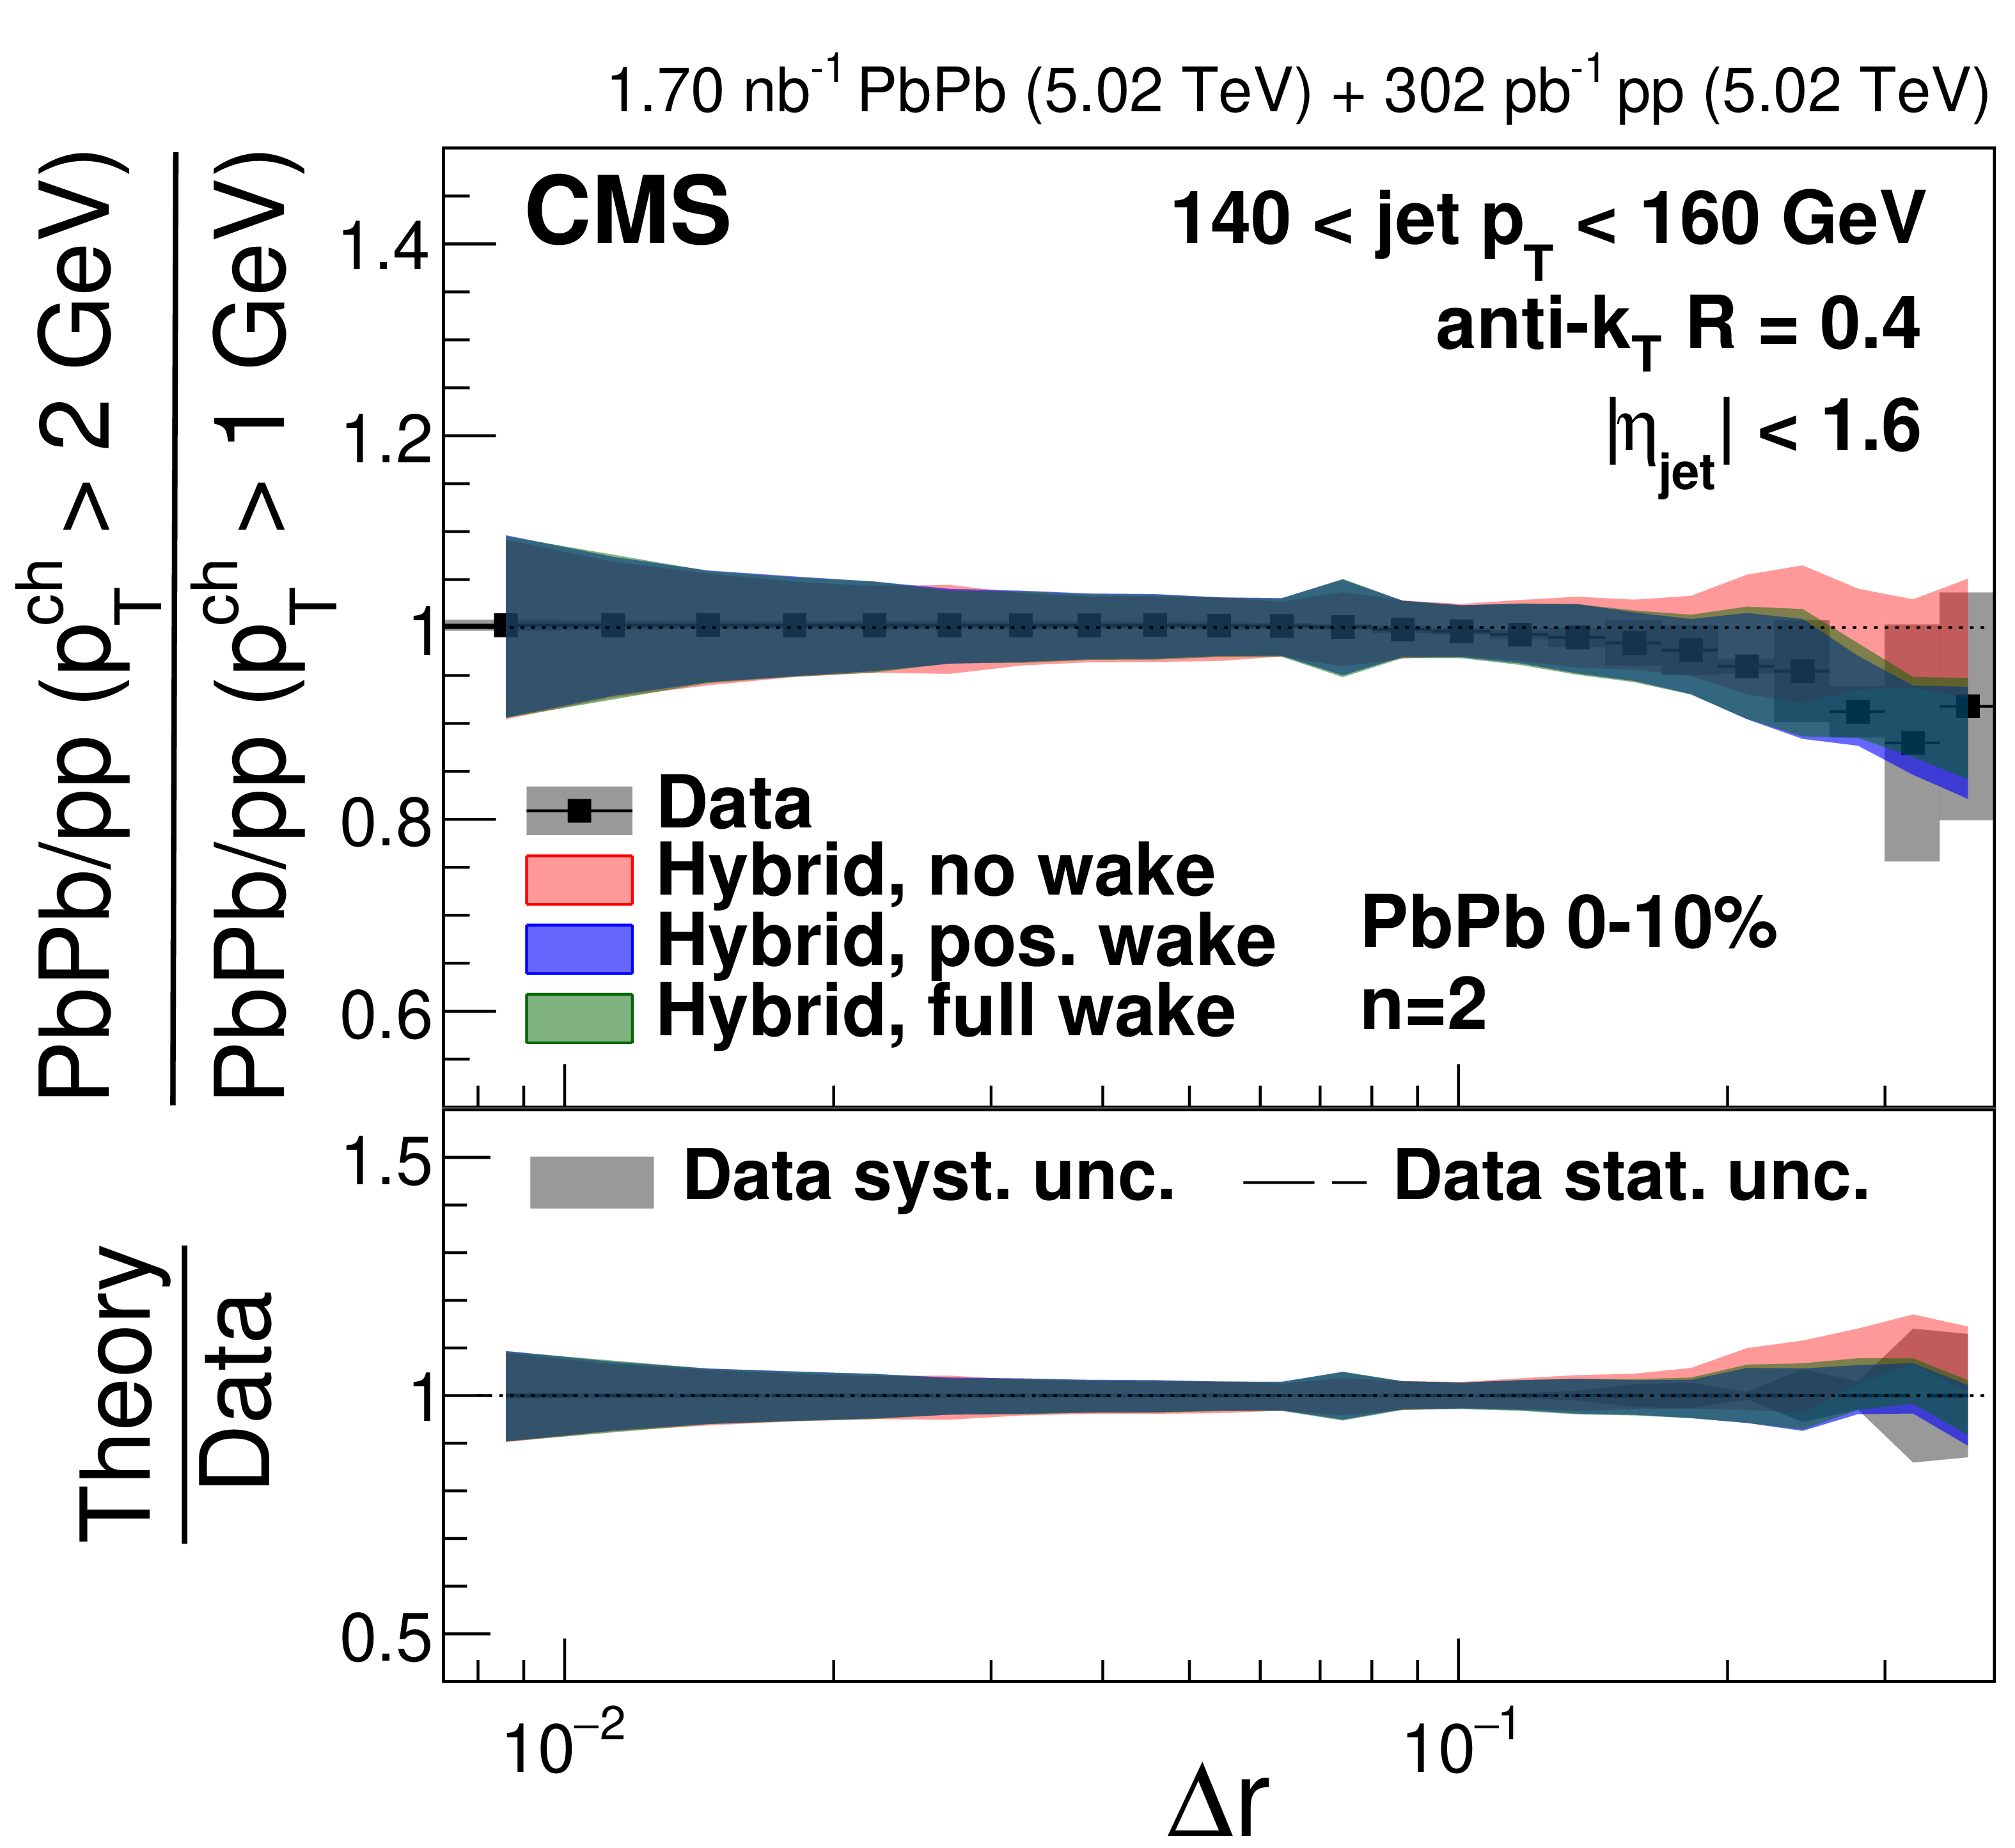
png pdf |
Figure 40-d:
The double ratios of 0-10% central PbPb to pp single ratios with $ p_{\mathrm{T}}^{\text{ch}} > $ 2 GeV and $ p_{\mathrm{T}}^{\text{ch}} > $ 1 GeV for $ n= $ 1 (left) and $ n= $ 2 (right) in different $ p_{\text{T,jet}} $ bins compared to the hybrid model predictions with different jet wake settings. |

png pdf |
Figure 40-e:
The double ratios of 0-10% central PbPb to pp single ratios with $ p_{\mathrm{T}}^{\text{ch}} > $ 2 GeV and $ p_{\mathrm{T}}^{\text{ch}} > $ 1 GeV for $ n= $ 1 (left) and $ n= $ 2 (right) in different $ p_{\text{T,jet}} $ bins compared to the hybrid model predictions with different jet wake settings. |

png pdf |
Figure 40-f:
The double ratios of 0-10% central PbPb to pp single ratios with $ p_{\mathrm{T}}^{\text{ch}} > $ 2 GeV and $ p_{\mathrm{T}}^{\text{ch}} > $ 1 GeV for $ n= $ 1 (left) and $ n= $ 2 (right) in different $ p_{\text{T,jet}} $ bins compared to the hybrid model predictions with different jet wake settings. |

png pdf |
Figure 40-g:
The double ratios of 0-10% central PbPb to pp single ratios with $ p_{\mathrm{T}}^{\text{ch}} > $ 2 GeV and $ p_{\mathrm{T}}^{\text{ch}} > $ 1 GeV for $ n= $ 1 (left) and $ n= $ 2 (right) in different $ p_{\text{T,jet}} $ bins compared to the hybrid model predictions with different jet wake settings. |

png pdf |
Figure 40-h:
The double ratios of 0-10% central PbPb to pp single ratios with $ p_{\mathrm{T}}^{\text{ch}} > $ 2 GeV and $ p_{\mathrm{T}}^{\text{ch}} > $ 1 GeV for $ n= $ 1 (left) and $ n= $ 2 (right) in different $ p_{\text{T,jet}} $ bins compared to the hybrid model predictions with different jet wake settings. |
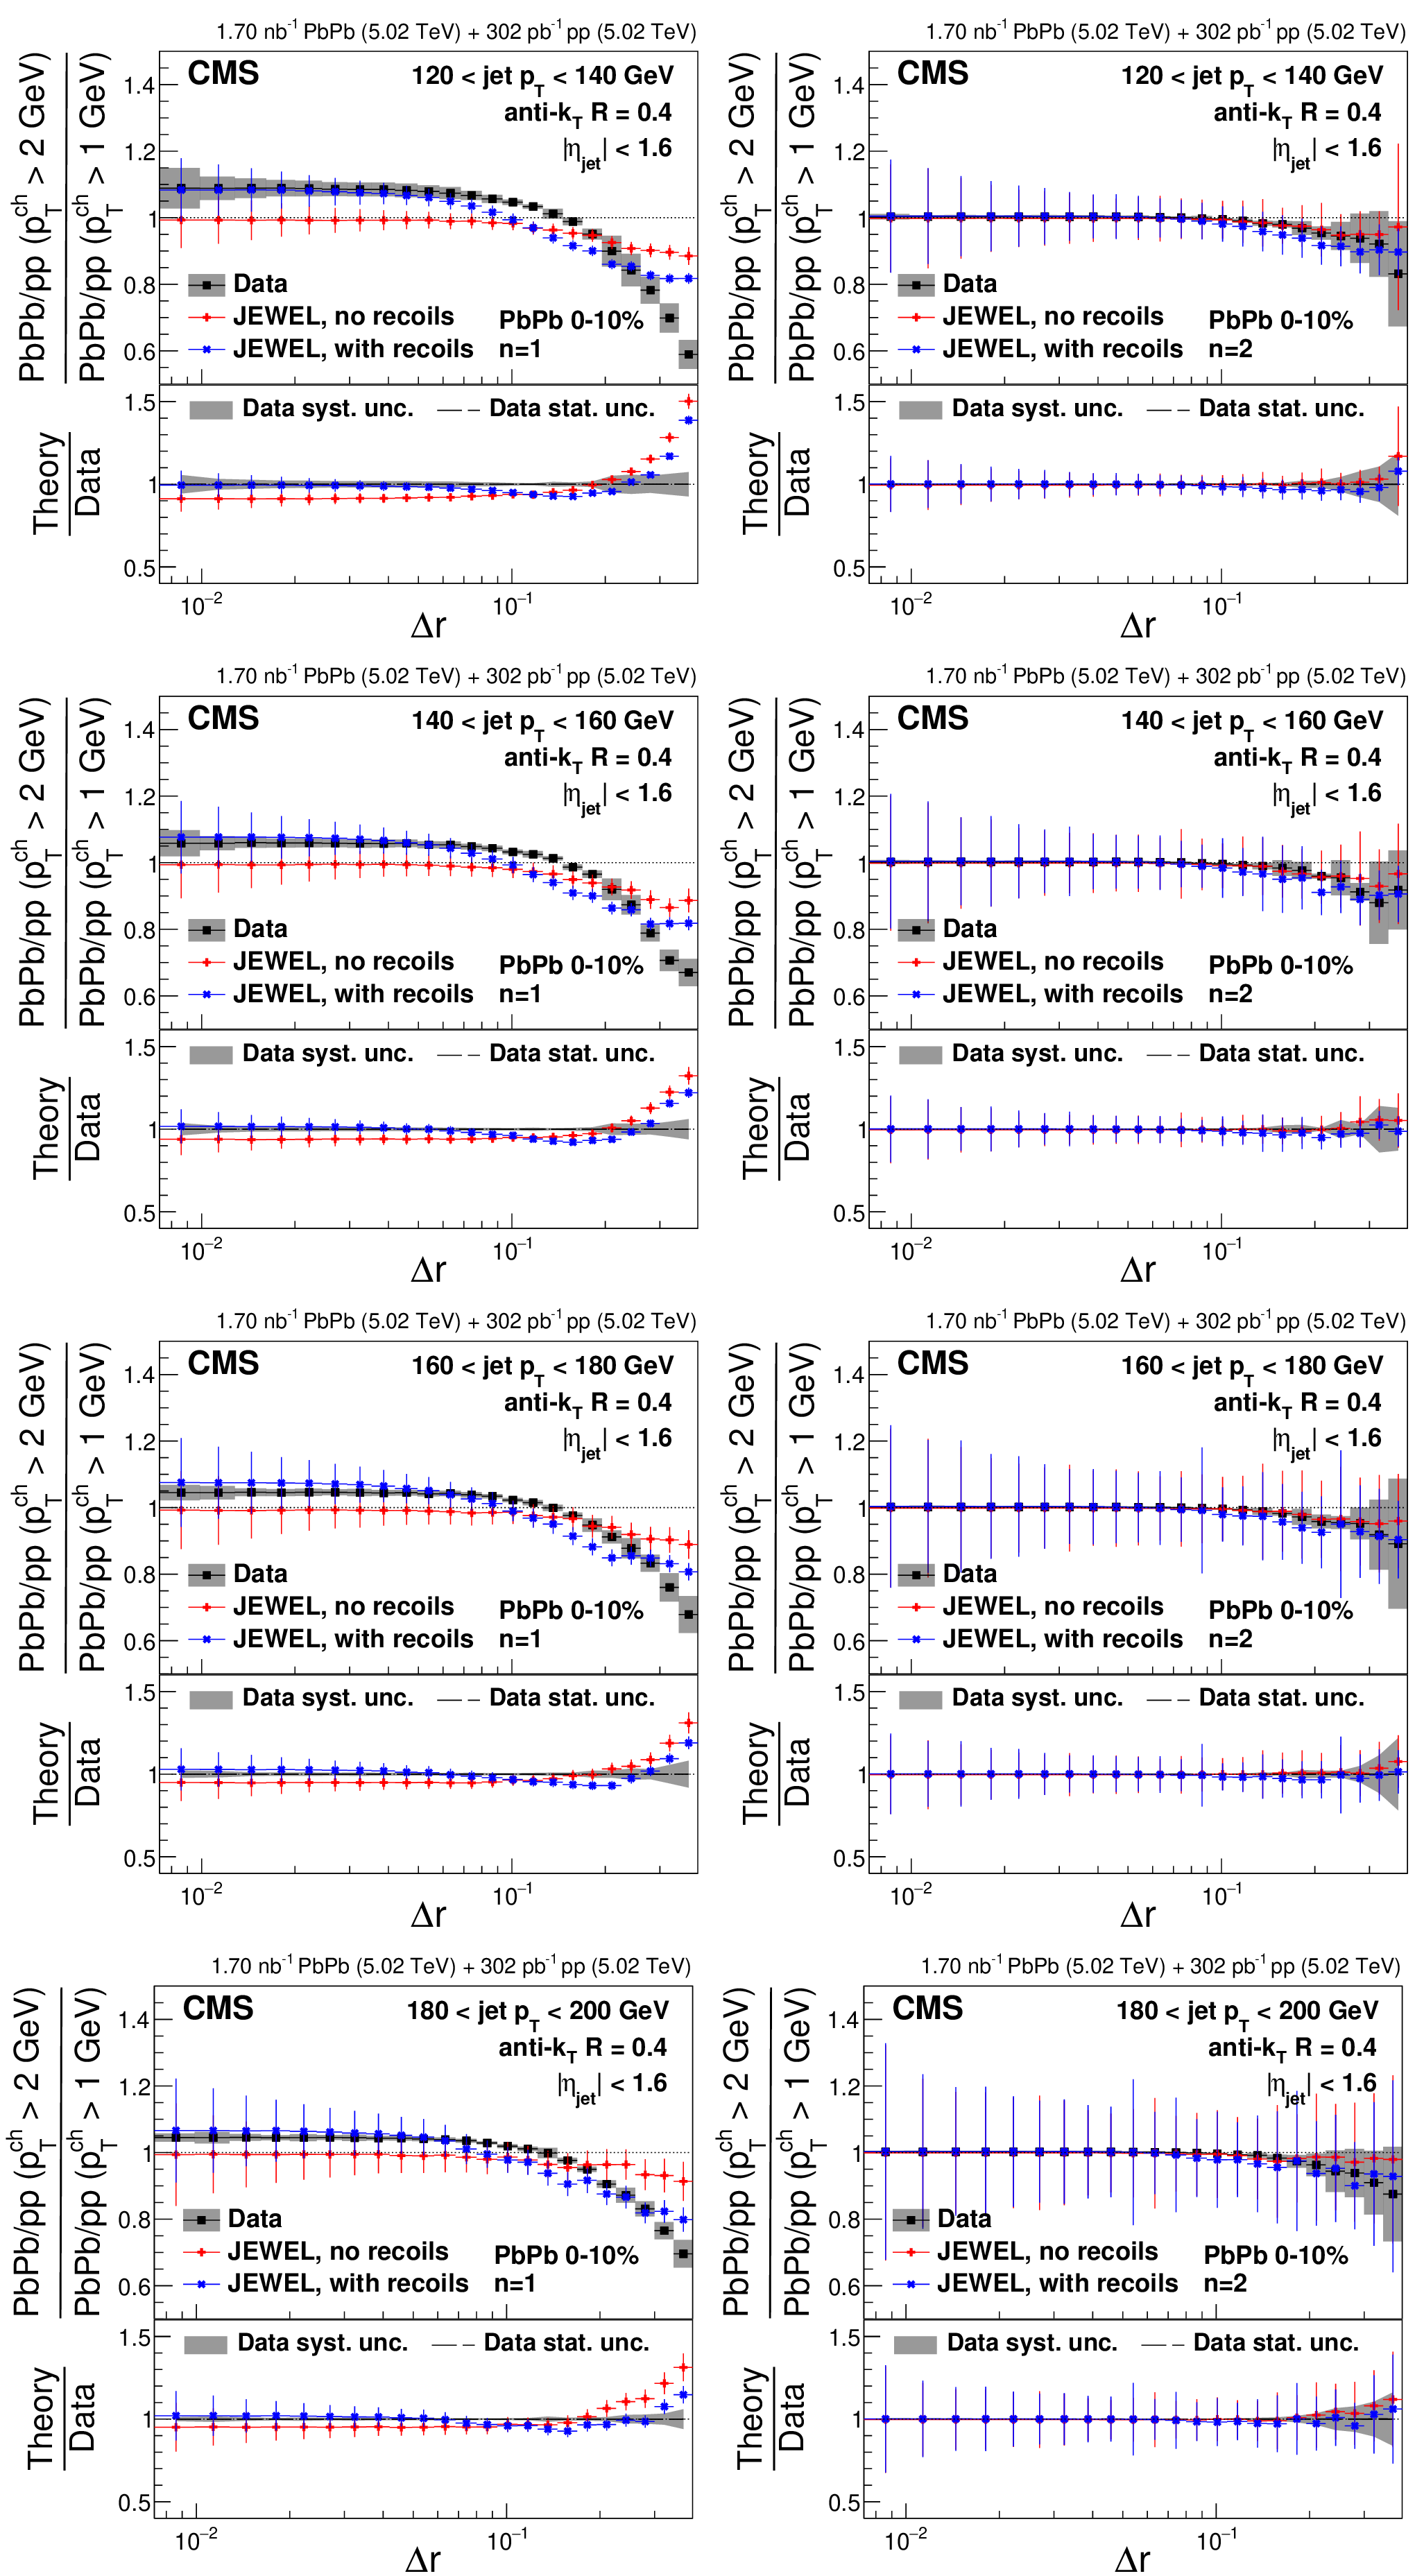
png pdf |
Figure 41:
The double ratios of 0-10% central PbPb to pp single ratios with $ p_{\mathrm{T}}^{\text{ch}} > $ 2 GeV and $ p_{\mathrm{T}}^{\text{ch}} > $ 1 GeV for $ n= $ 1 (left) and $ n= $ 2 (right) in different $ p_{\text{T,jet}} $ bins compared to the JEWEL predictions with different recoil settings. |
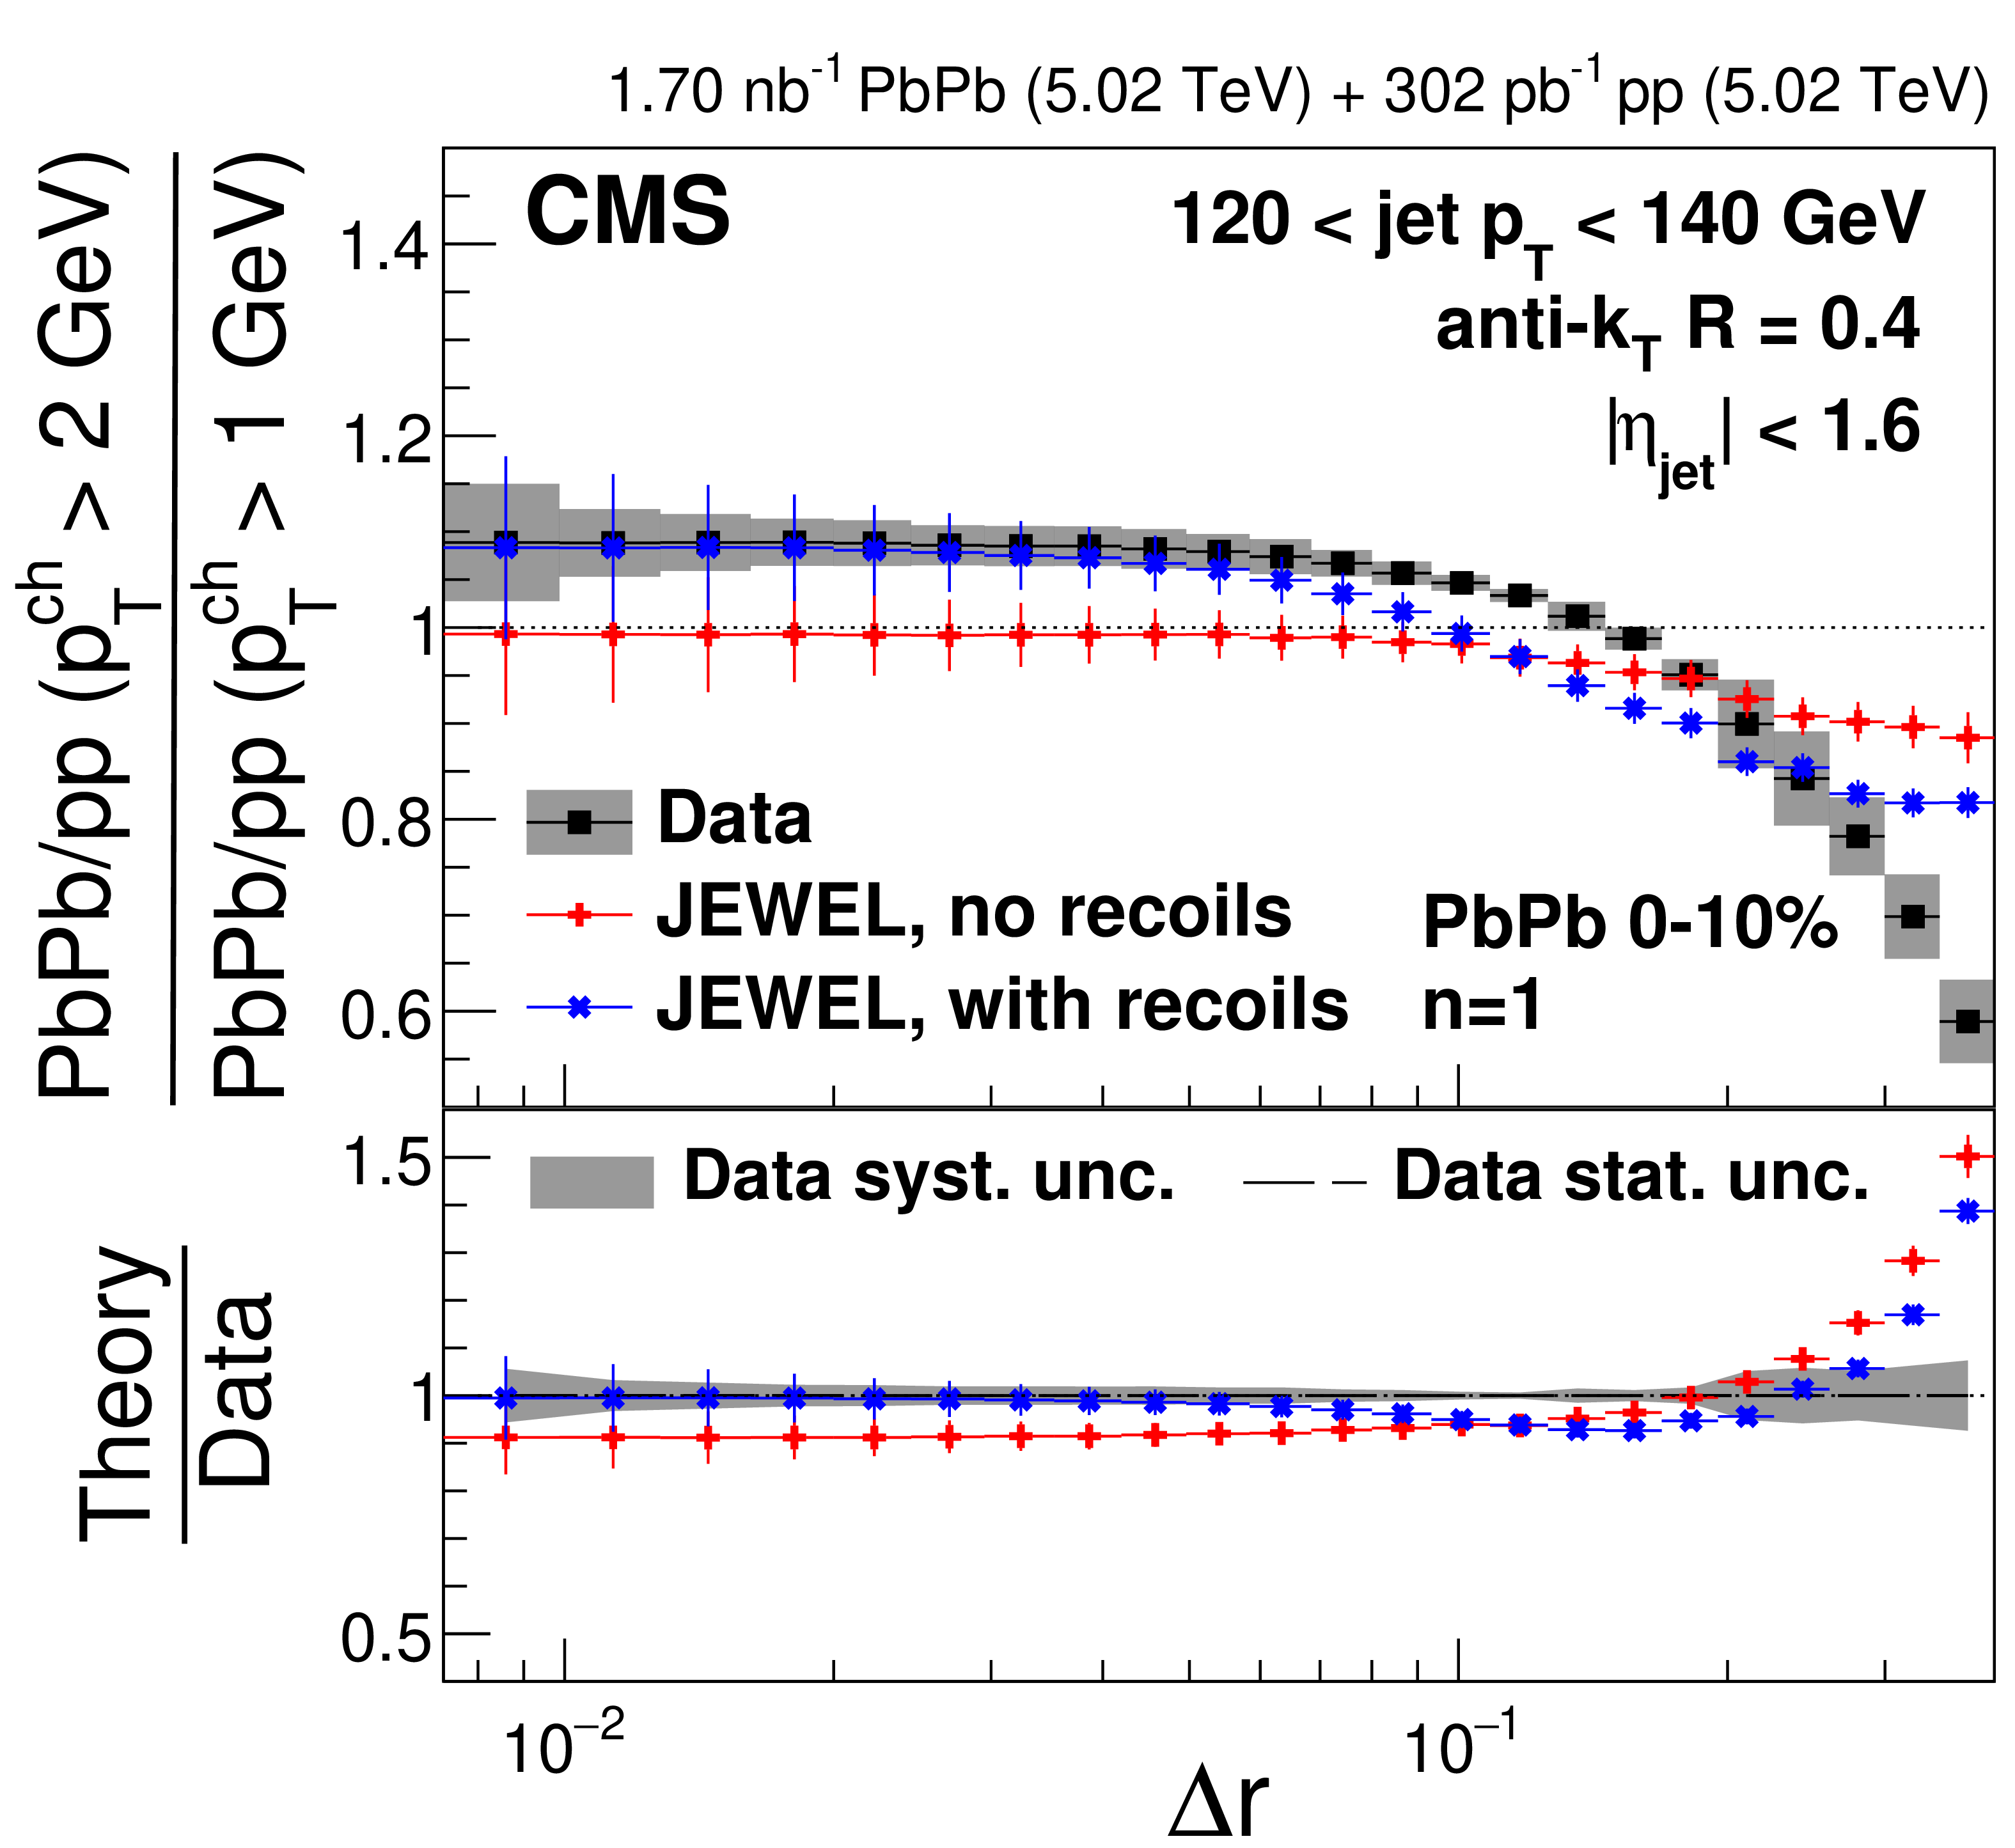
png pdf |
Figure 41-a:
The double ratios of 0-10% central PbPb to pp single ratios with $ p_{\mathrm{T}}^{\text{ch}} > $ 2 GeV and $ p_{\mathrm{T}}^{\text{ch}} > $ 1 GeV for $ n= $ 1 (left) and $ n= $ 2 (right) in different $ p_{\text{T,jet}} $ bins compared to the JEWEL predictions with different recoil settings. |
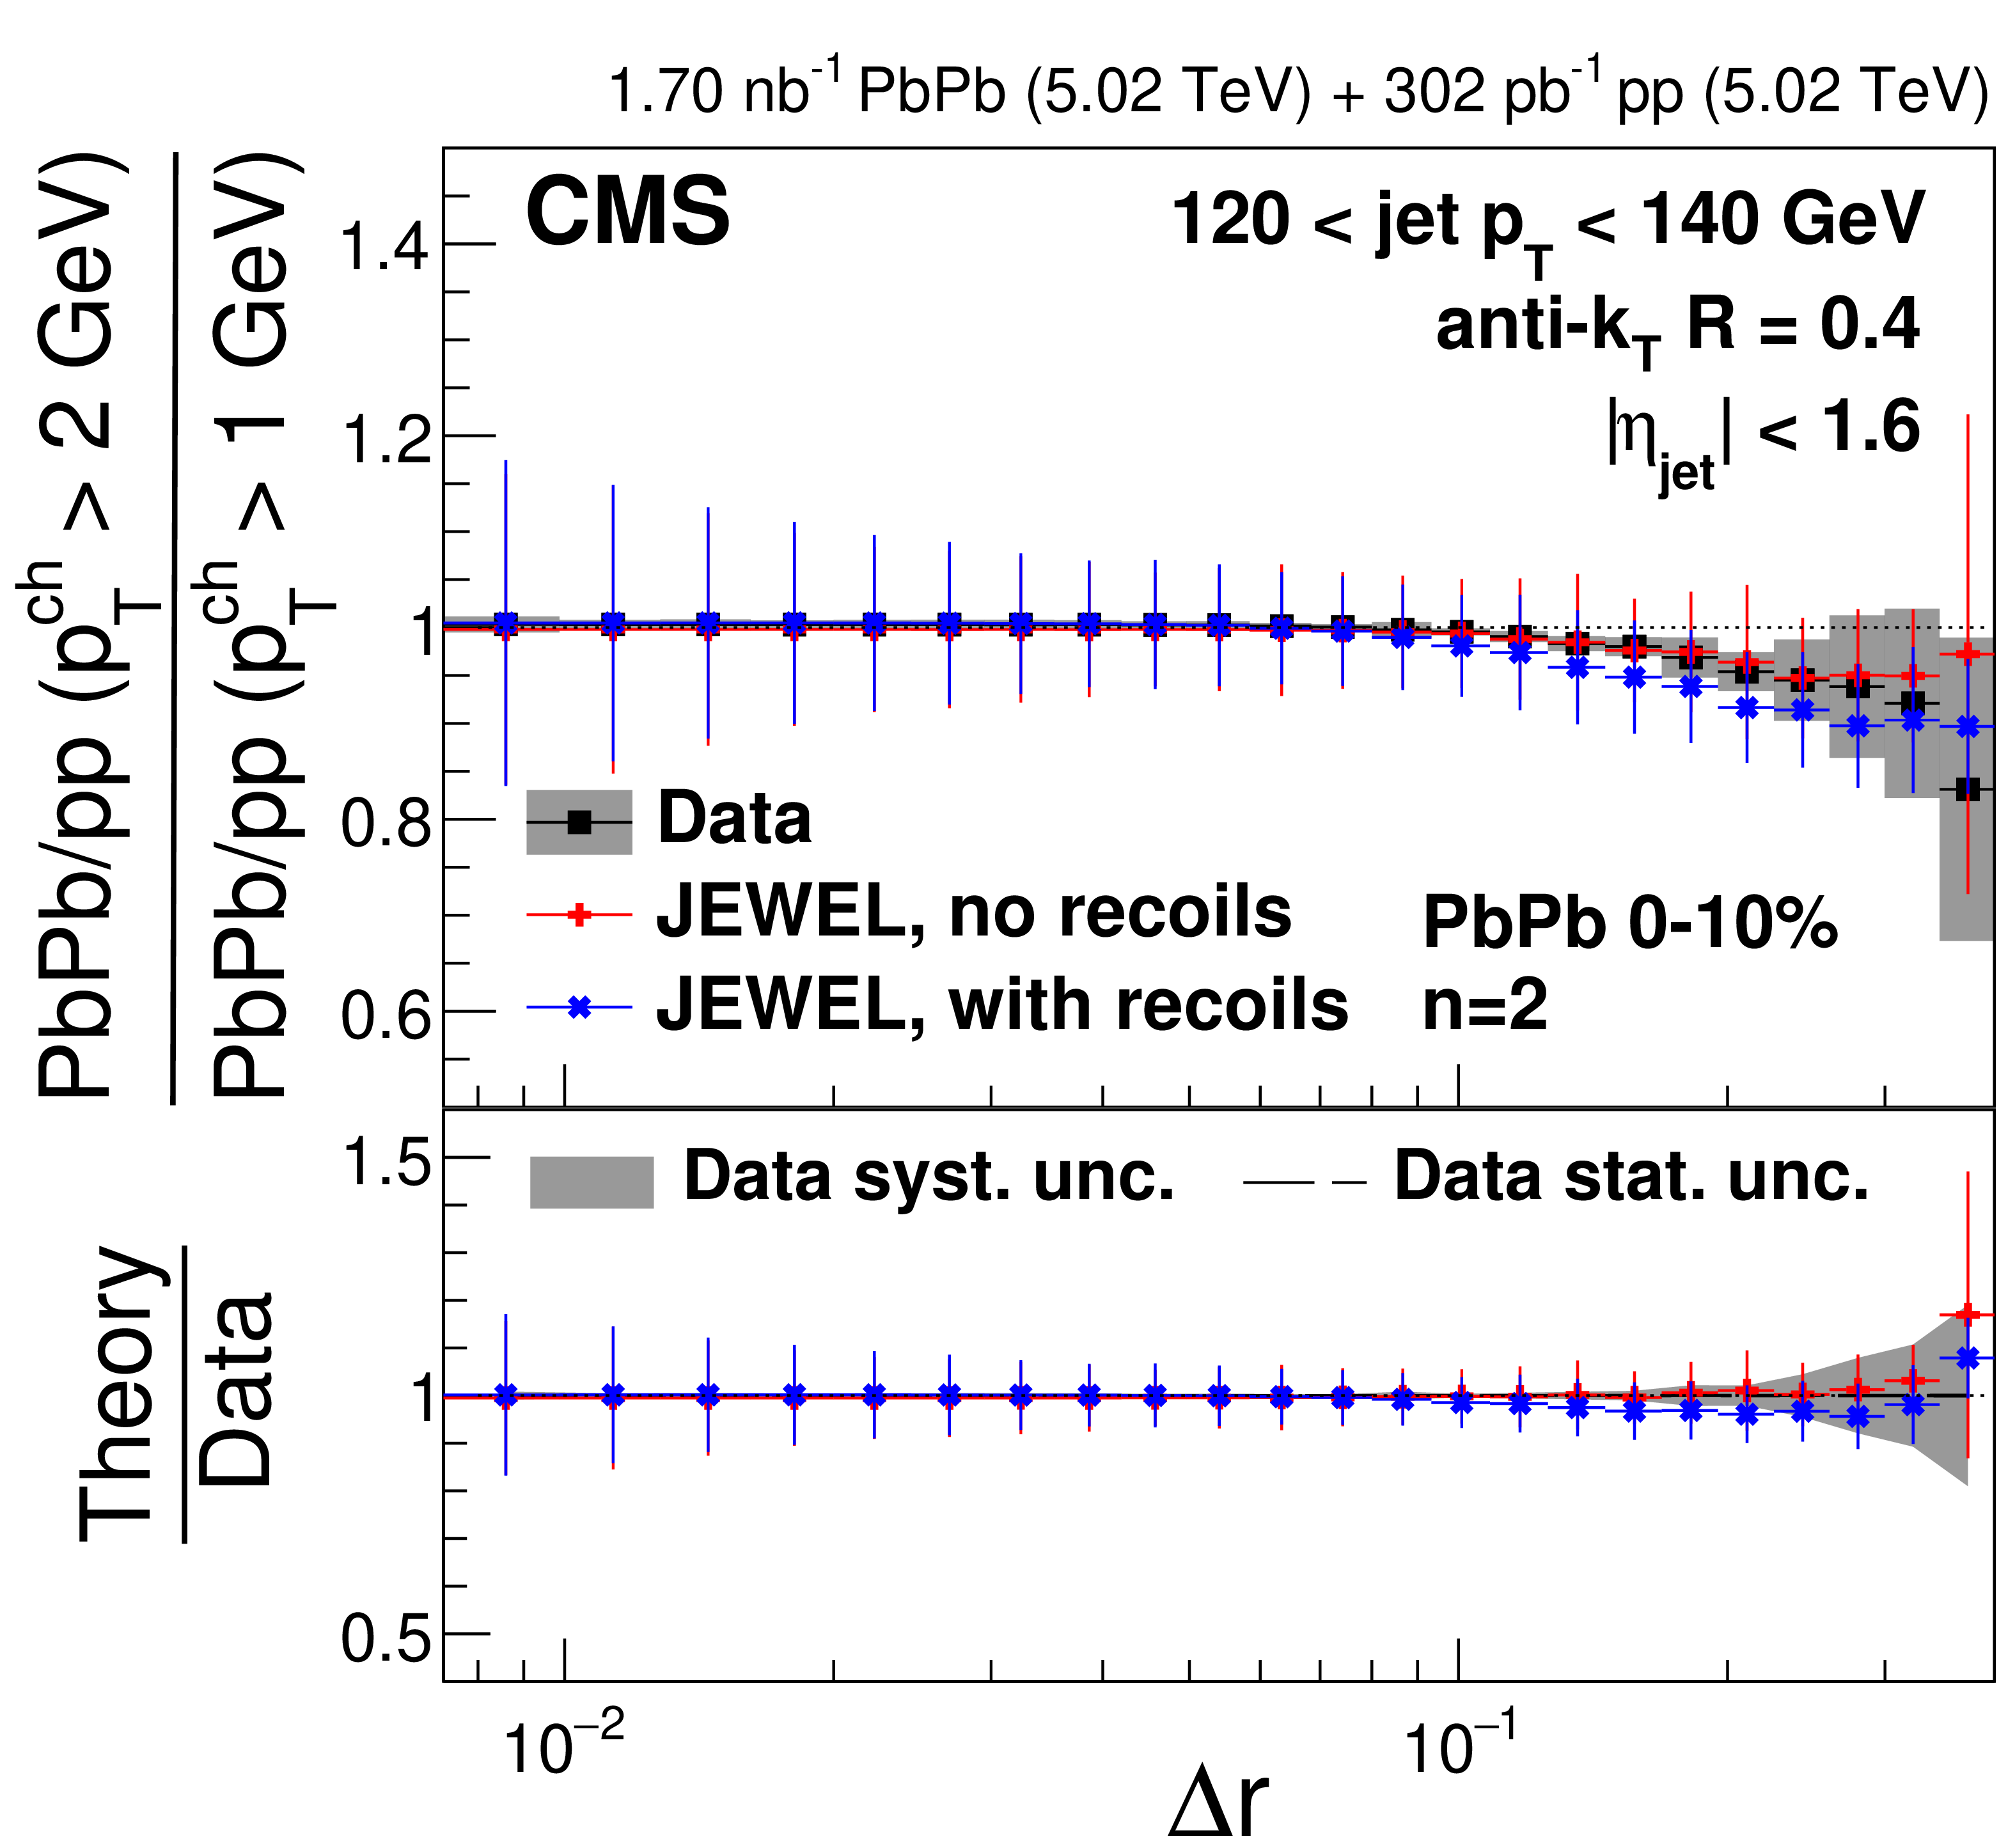
png pdf |
Figure 41-b:
The double ratios of 0-10% central PbPb to pp single ratios with $ p_{\mathrm{T}}^{\text{ch}} > $ 2 GeV and $ p_{\mathrm{T}}^{\text{ch}} > $ 1 GeV for $ n= $ 1 (left) and $ n= $ 2 (right) in different $ p_{\text{T,jet}} $ bins compared to the JEWEL predictions with different recoil settings. |
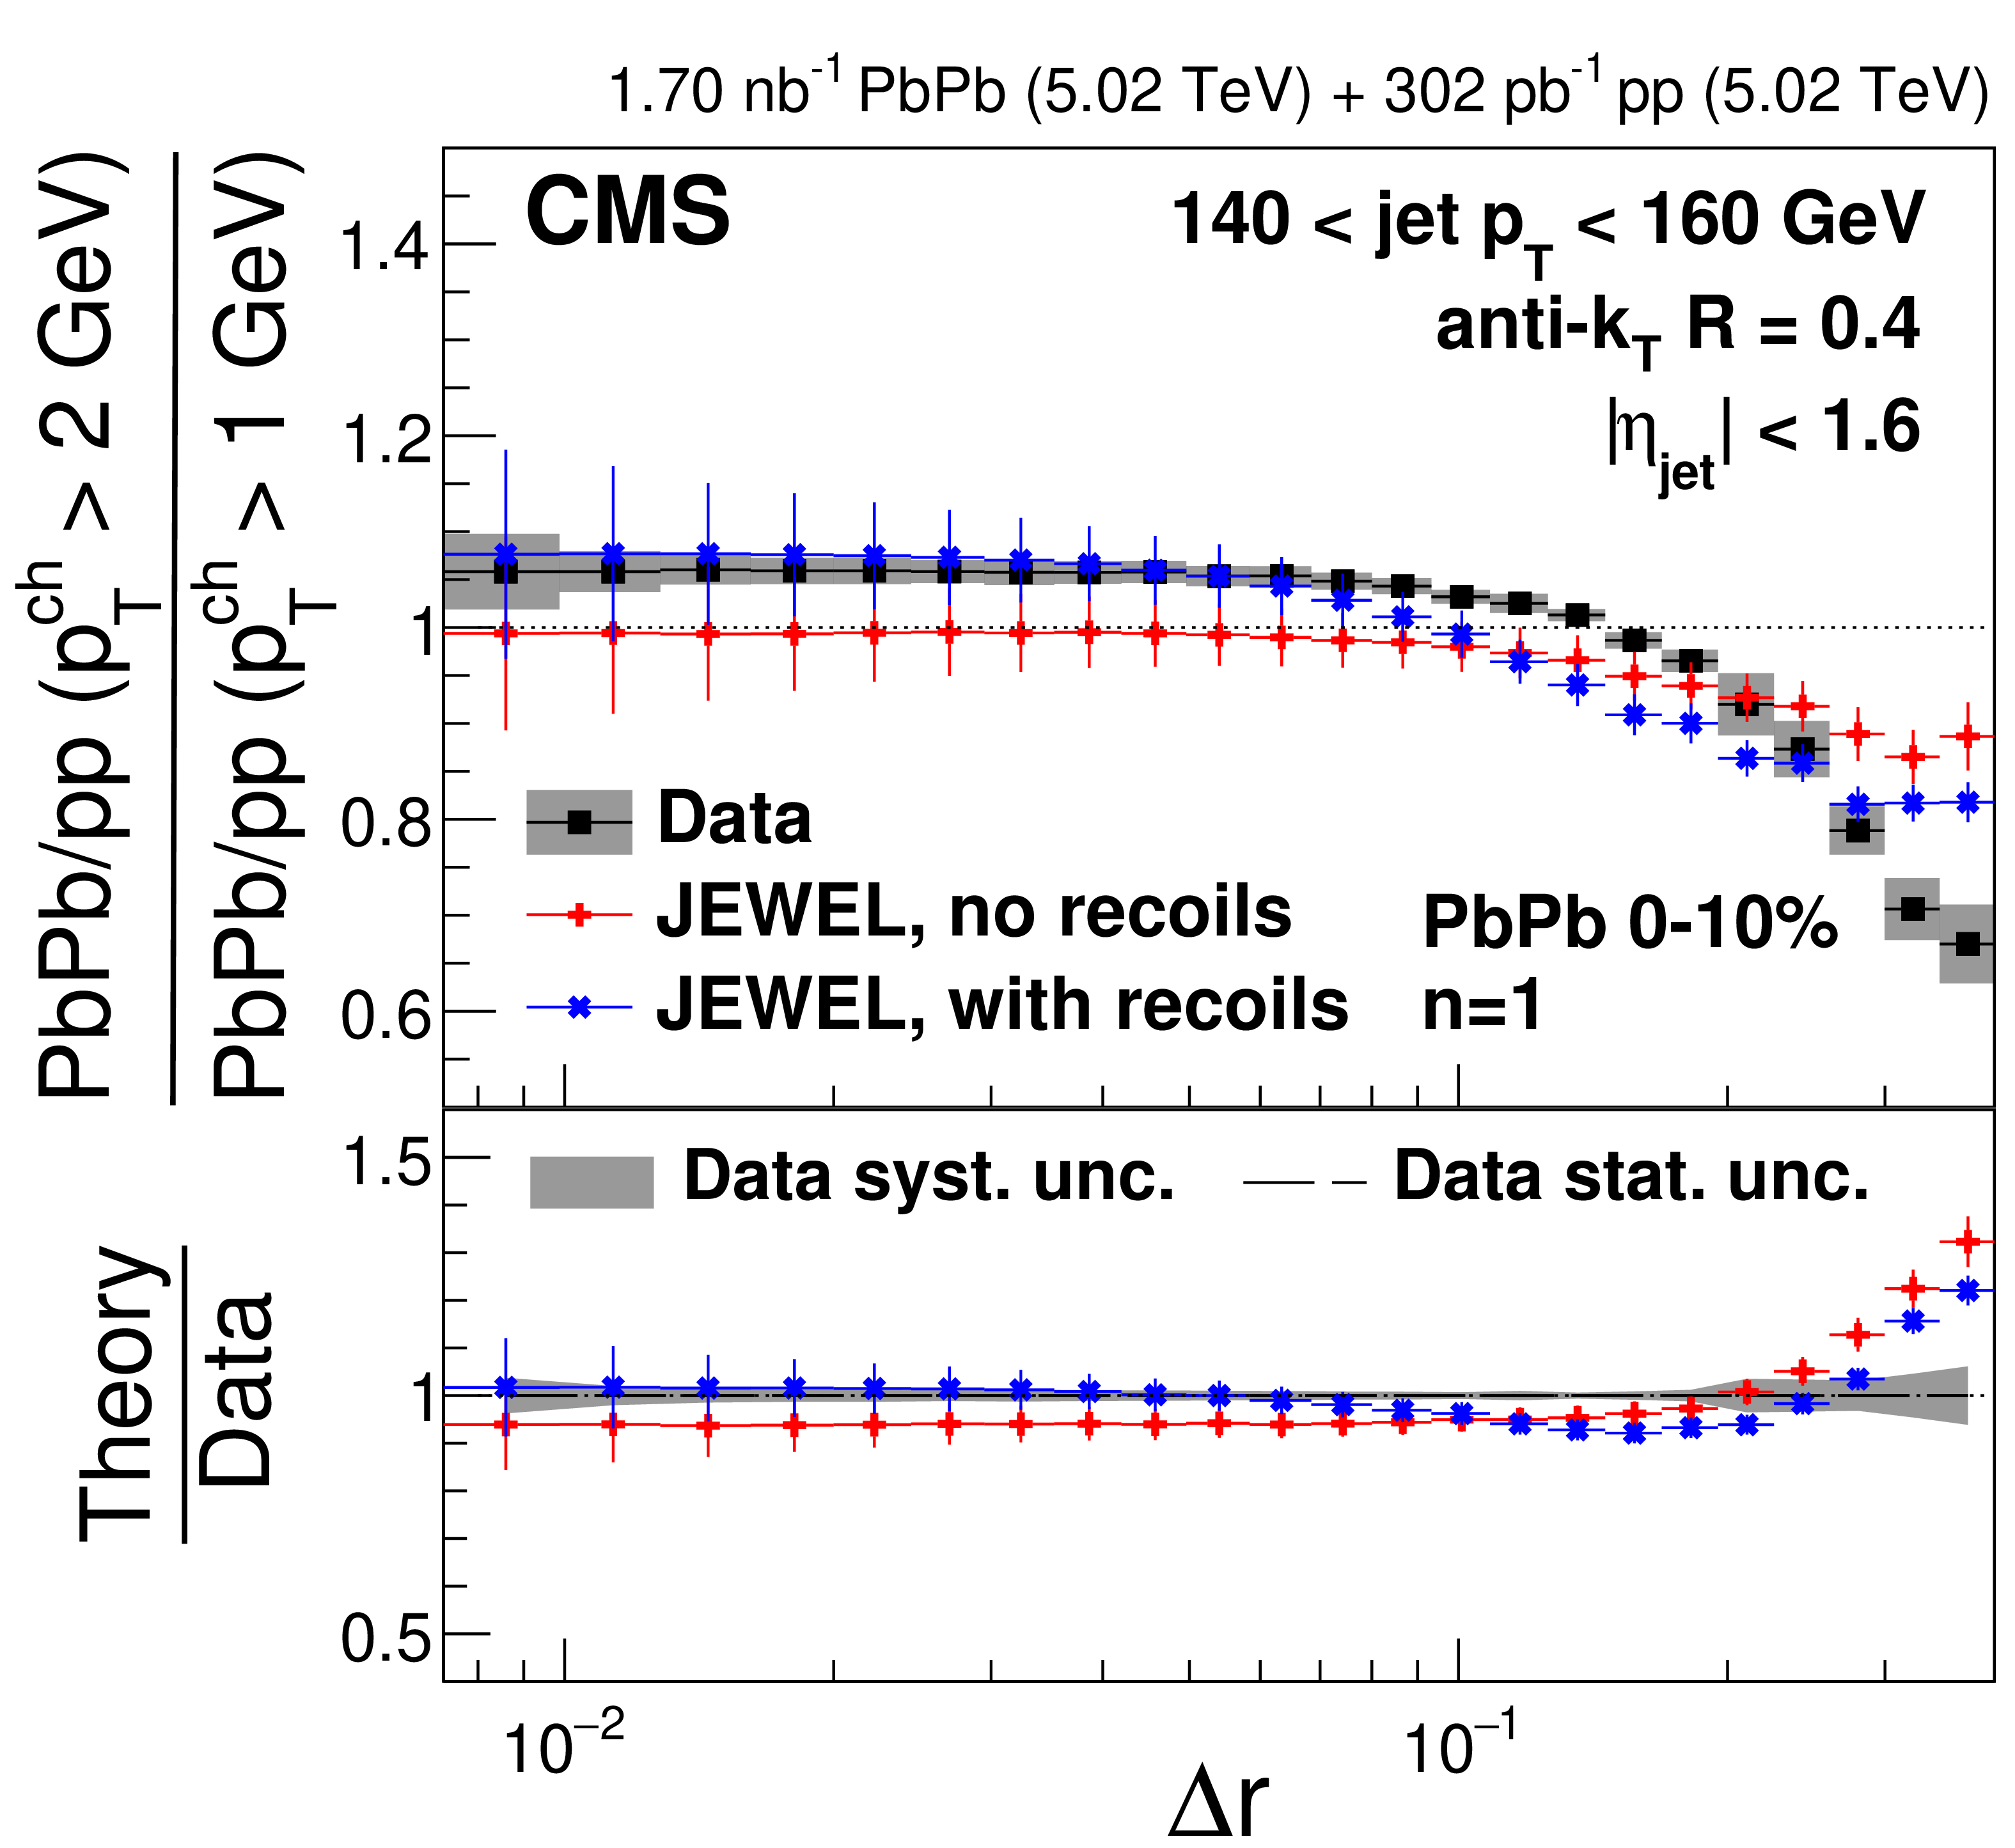
png pdf |
Figure 41-c:
The double ratios of 0-10% central PbPb to pp single ratios with $ p_{\mathrm{T}}^{\text{ch}} > $ 2 GeV and $ p_{\mathrm{T}}^{\text{ch}} > $ 1 GeV for $ n= $ 1 (left) and $ n= $ 2 (right) in different $ p_{\text{T,jet}} $ bins compared to the JEWEL predictions with different recoil settings. |
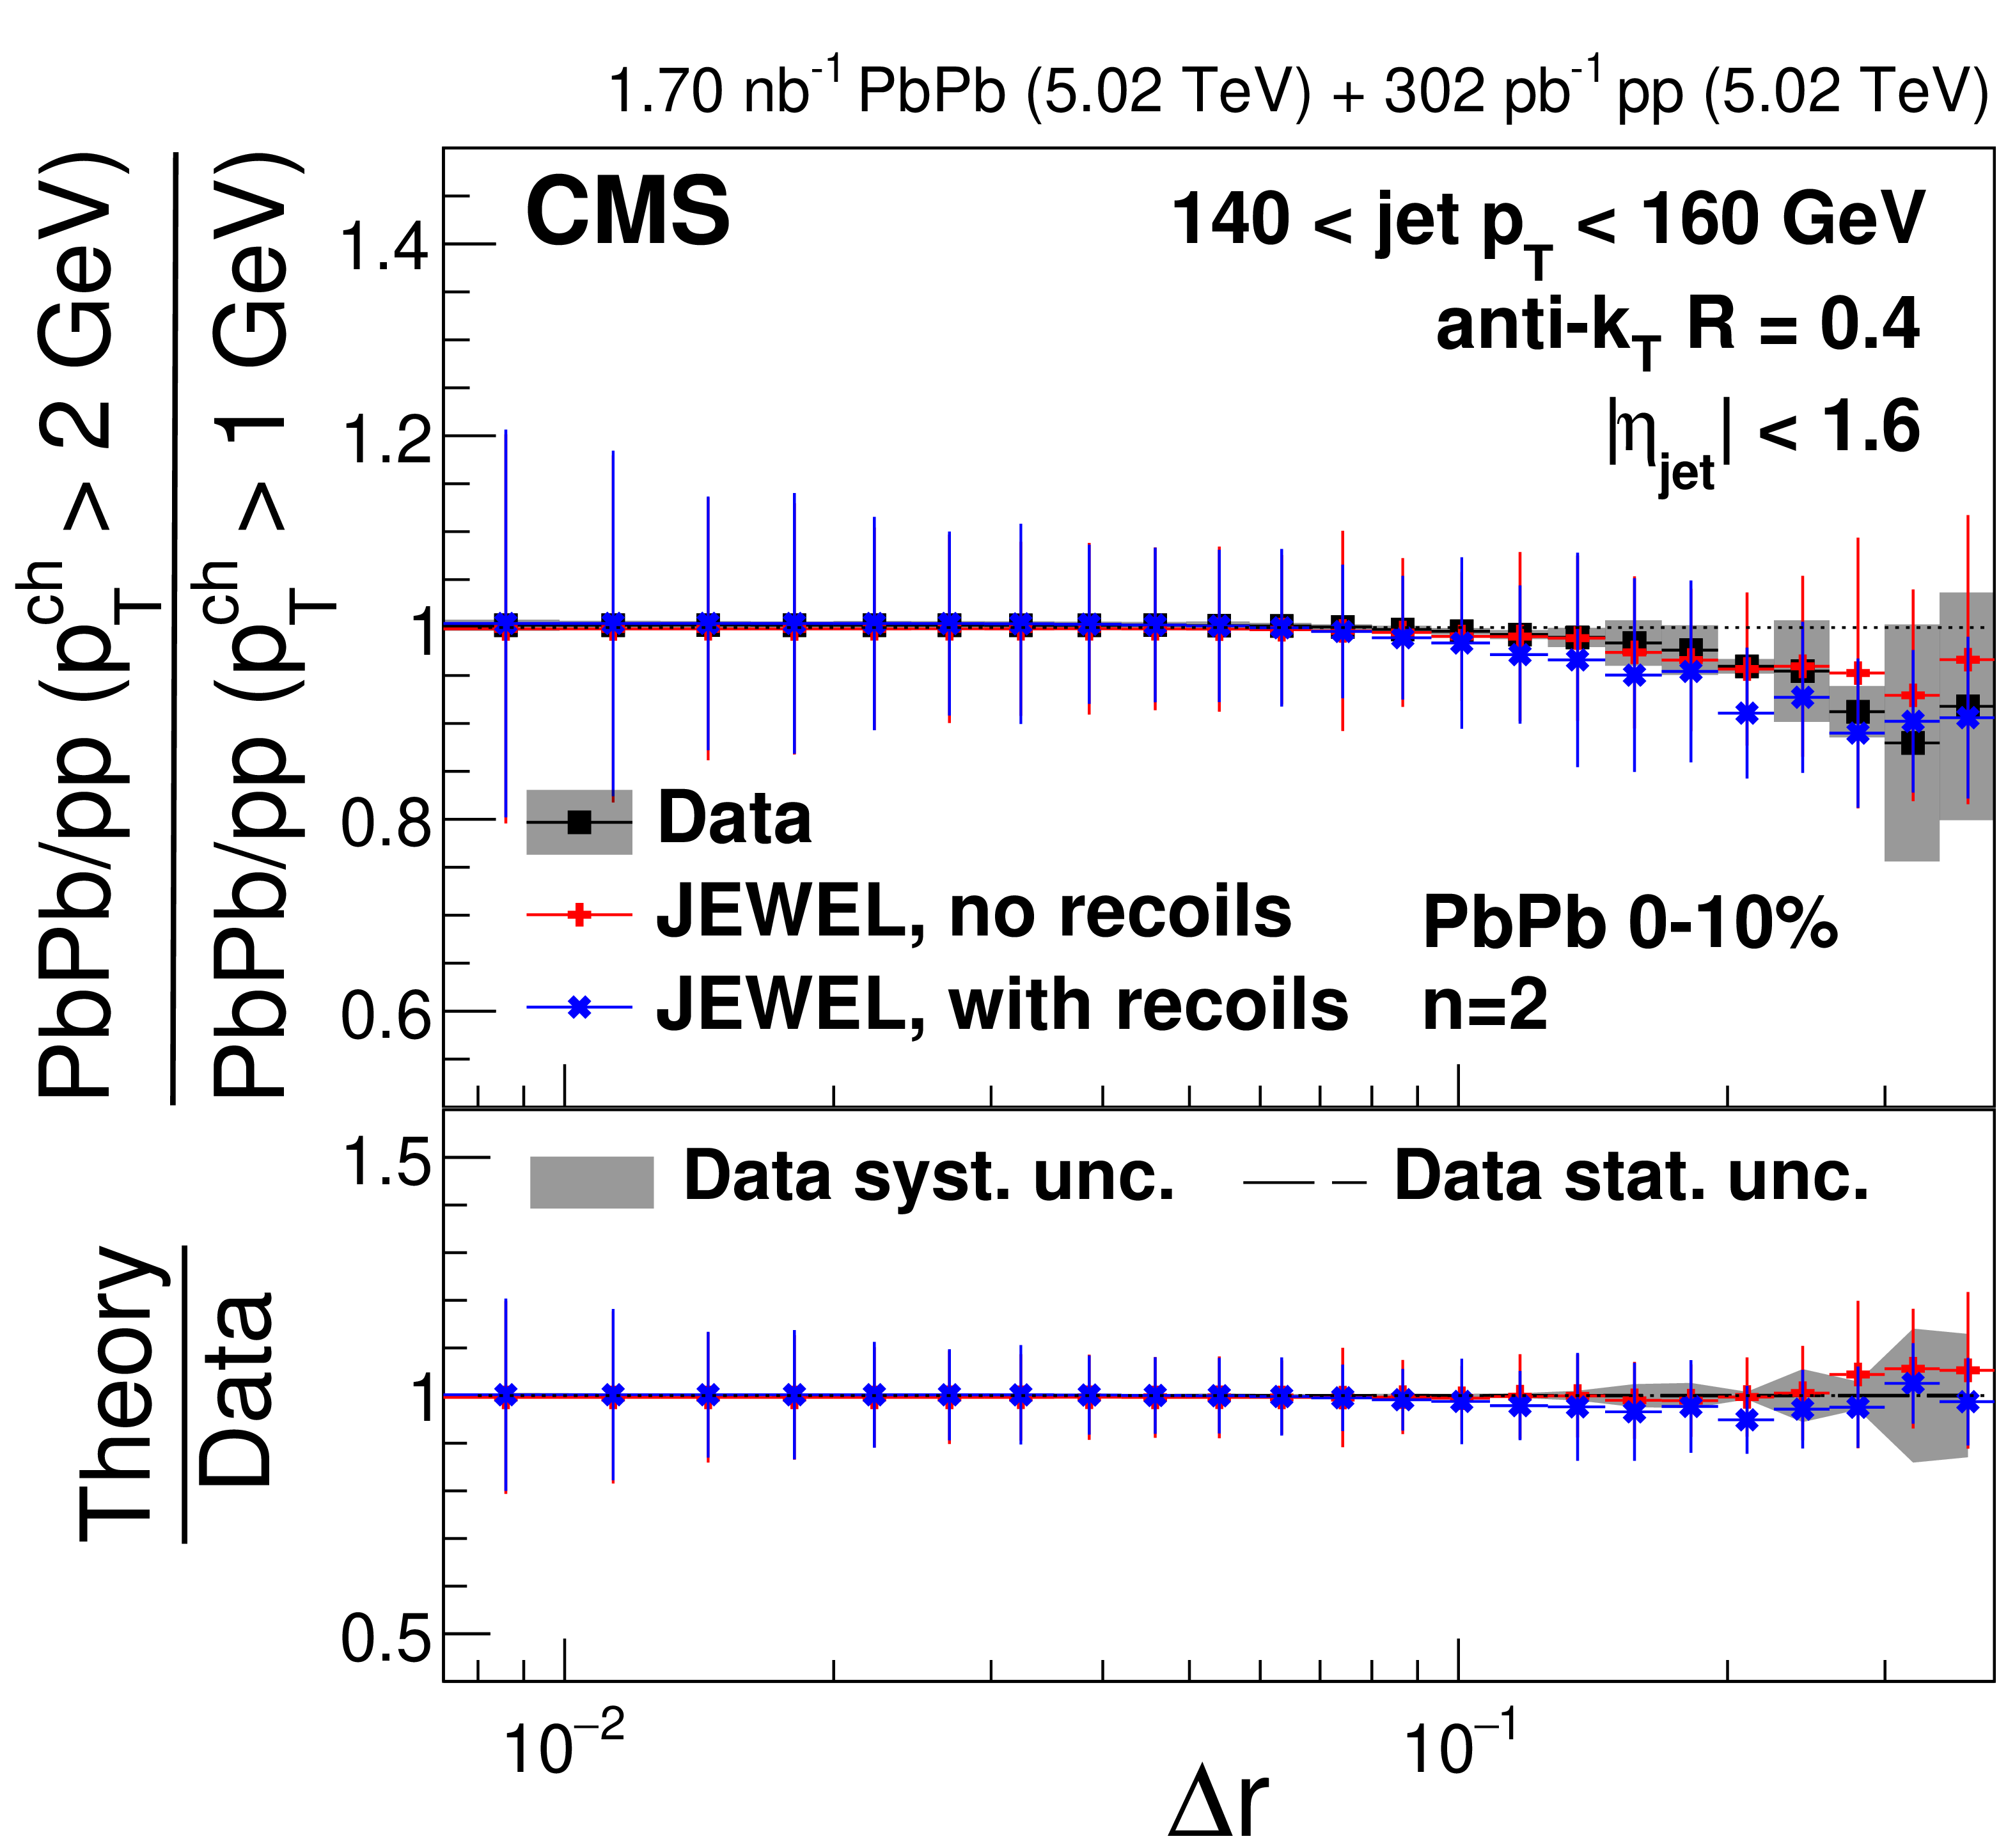
png pdf |
Figure 41-d:
The double ratios of 0-10% central PbPb to pp single ratios with $ p_{\mathrm{T}}^{\text{ch}} > $ 2 GeV and $ p_{\mathrm{T}}^{\text{ch}} > $ 1 GeV for $ n= $ 1 (left) and $ n= $ 2 (right) in different $ p_{\text{T,jet}} $ bins compared to the JEWEL predictions with different recoil settings. |
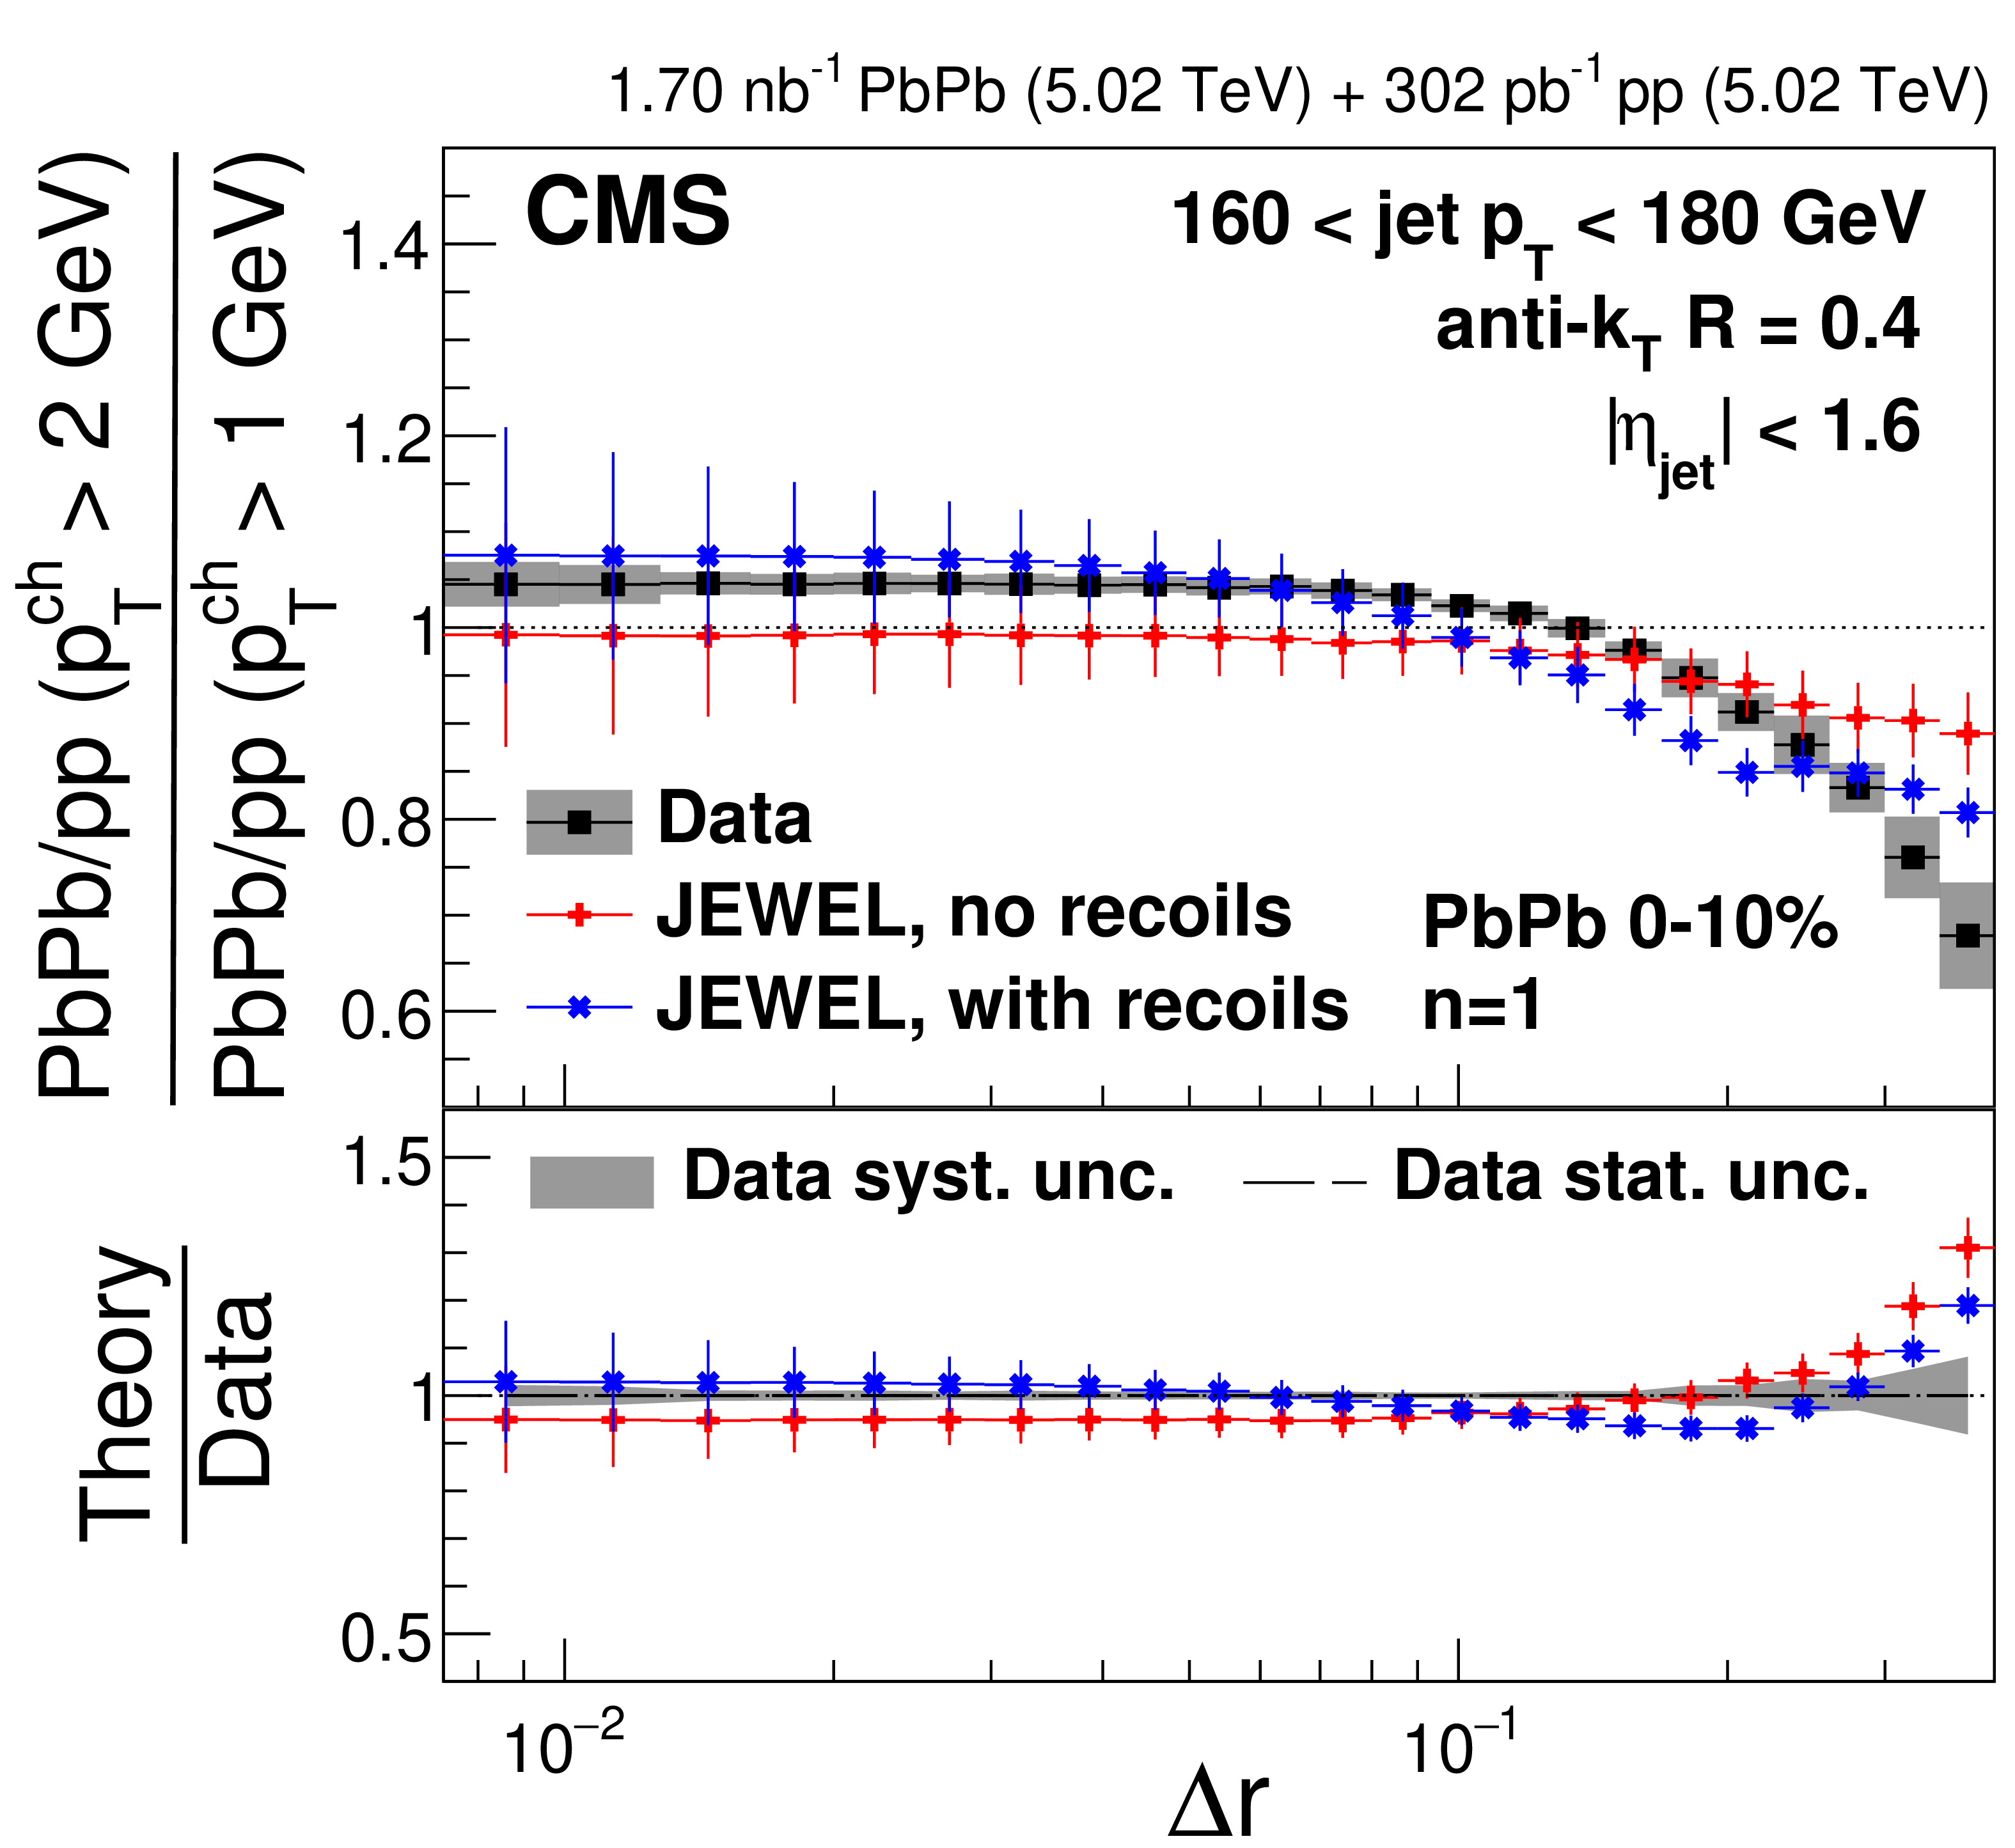
png pdf |
Figure 41-e:
The double ratios of 0-10% central PbPb to pp single ratios with $ p_{\mathrm{T}}^{\text{ch}} > $ 2 GeV and $ p_{\mathrm{T}}^{\text{ch}} > $ 1 GeV for $ n= $ 1 (left) and $ n= $ 2 (right) in different $ p_{\text{T,jet}} $ bins compared to the JEWEL predictions with different recoil settings. |
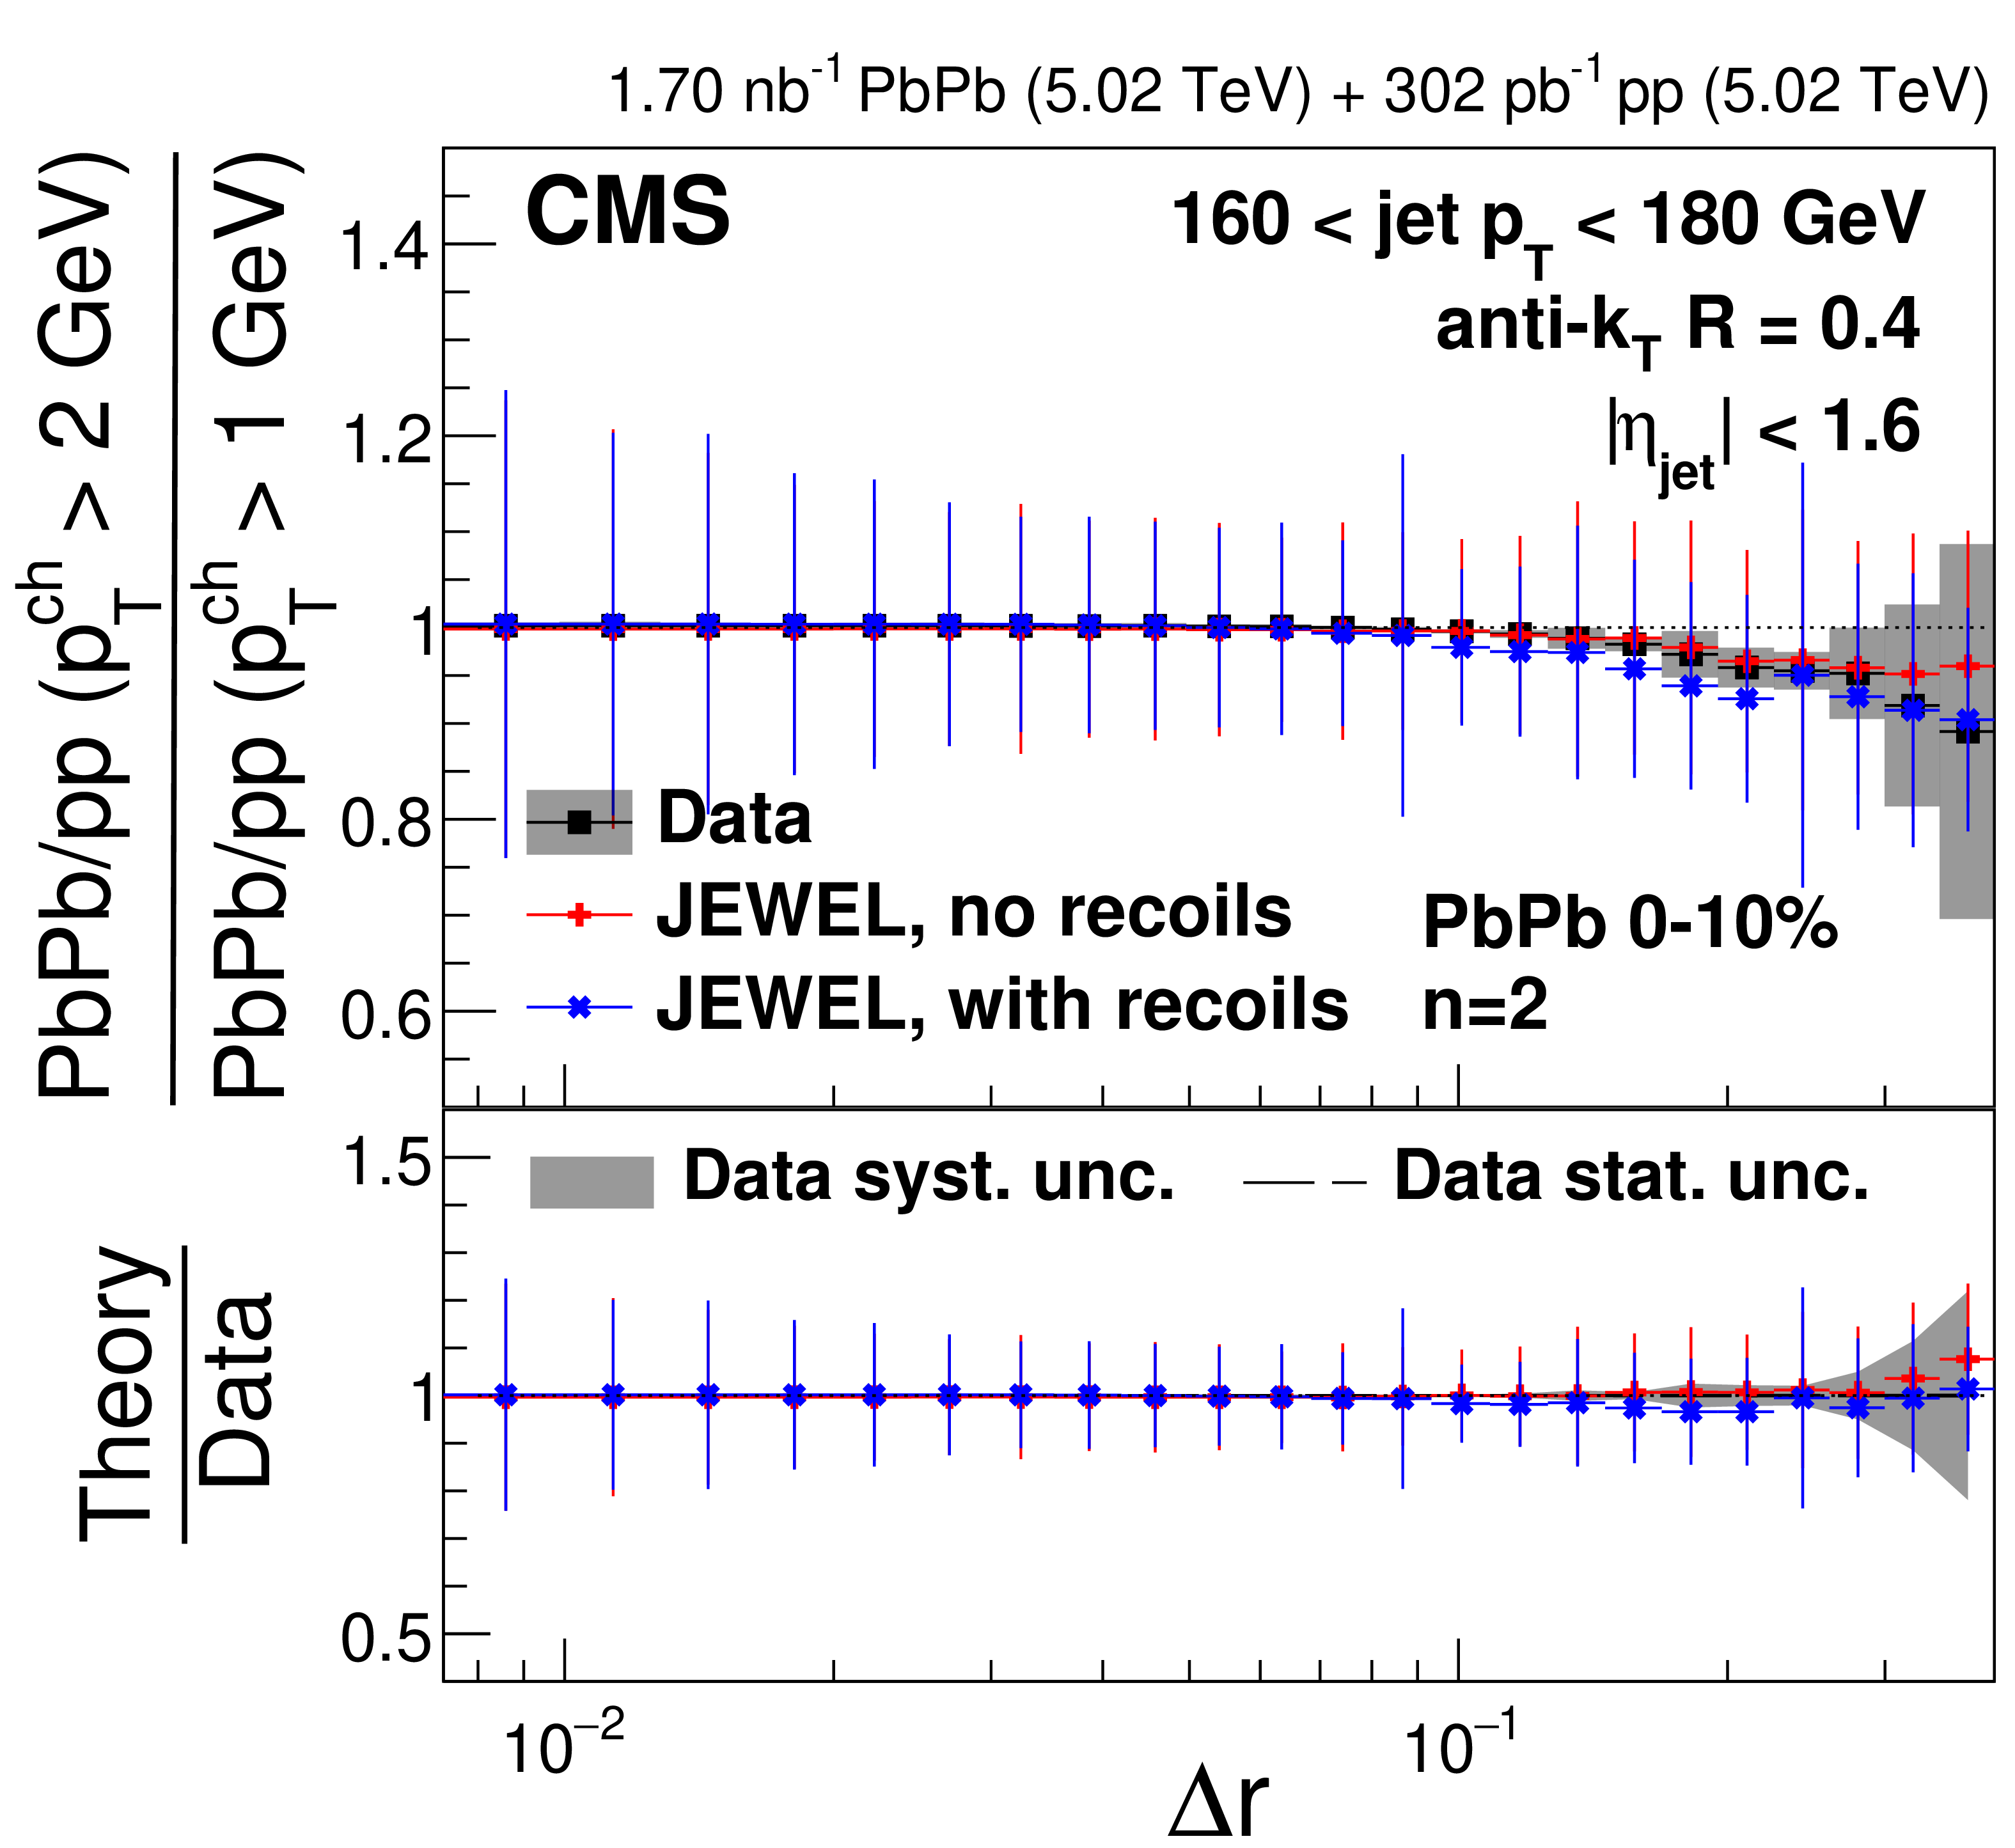
png pdf |
Figure 41-f:
The double ratios of 0-10% central PbPb to pp single ratios with $ p_{\mathrm{T}}^{\text{ch}} > $ 2 GeV and $ p_{\mathrm{T}}^{\text{ch}} > $ 1 GeV for $ n= $ 1 (left) and $ n= $ 2 (right) in different $ p_{\text{T,jet}} $ bins compared to the JEWEL predictions with different recoil settings. |
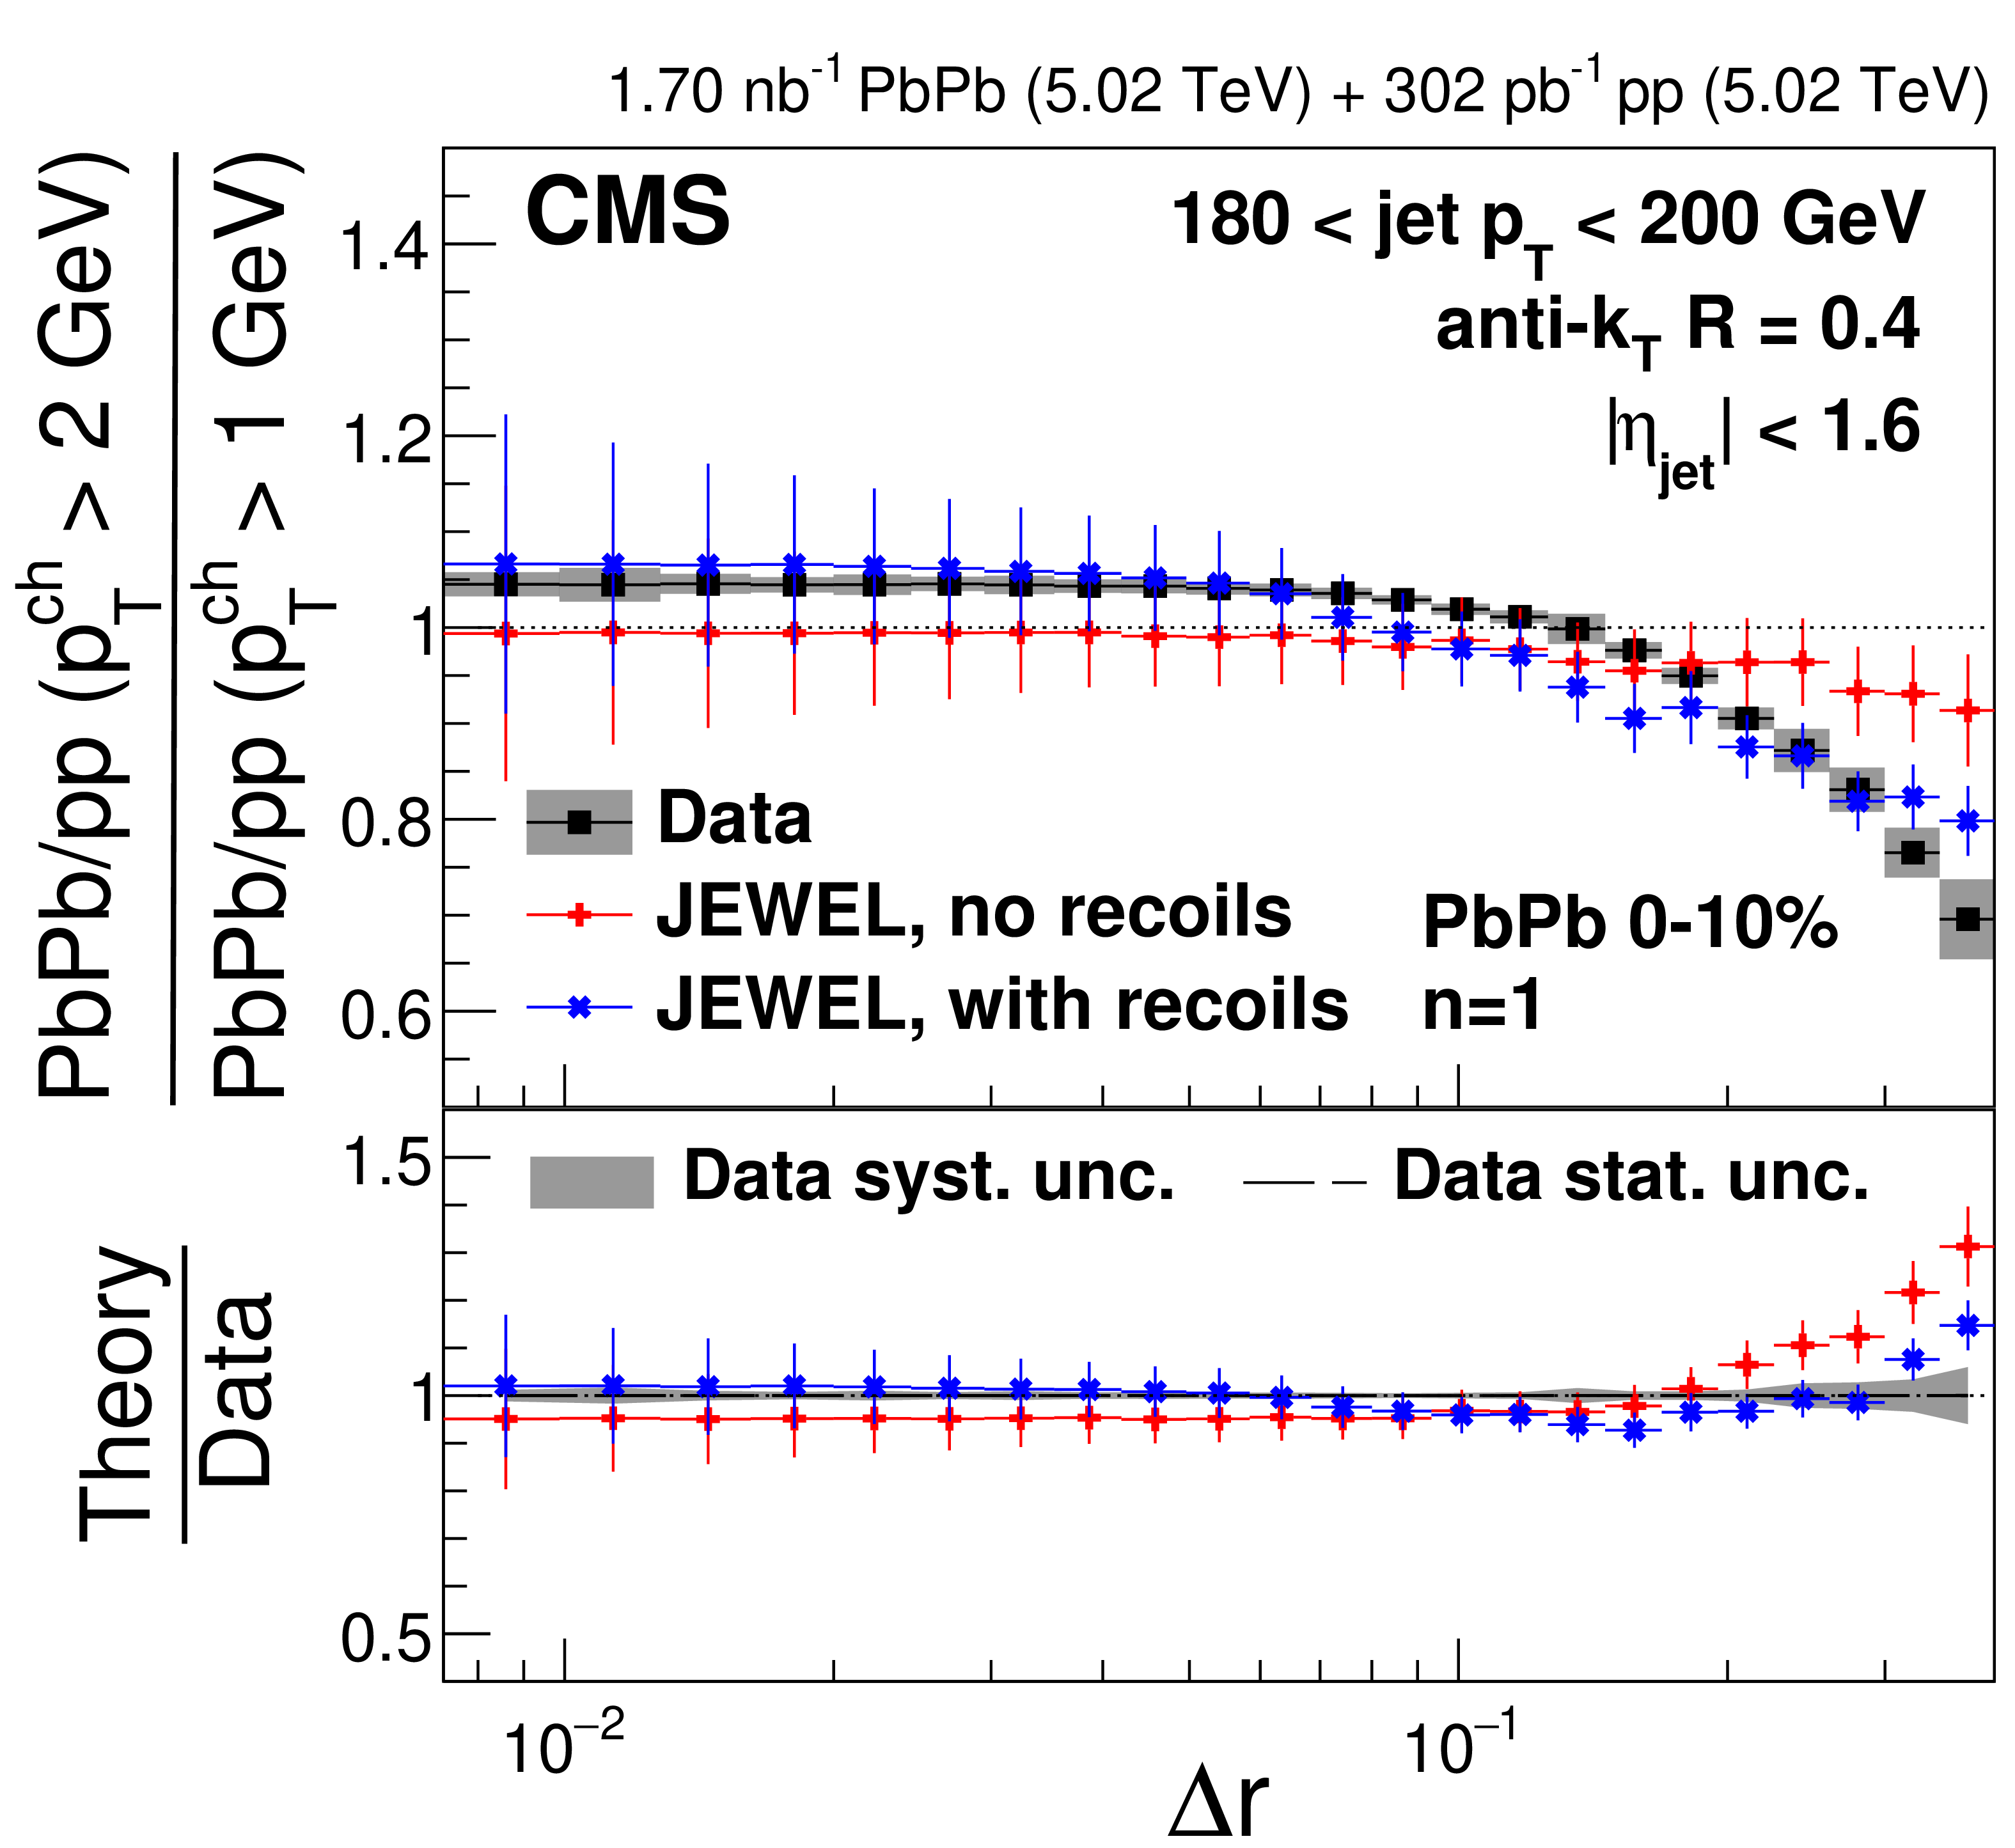
png pdf |
Figure 41-g:
The double ratios of 0-10% central PbPb to pp single ratios with $ p_{\mathrm{T}}^{\text{ch}} > $ 2 GeV and $ p_{\mathrm{T}}^{\text{ch}} > $ 1 GeV for $ n= $ 1 (left) and $ n= $ 2 (right) in different $ p_{\text{T,jet}} $ bins compared to the JEWEL predictions with different recoil settings. |
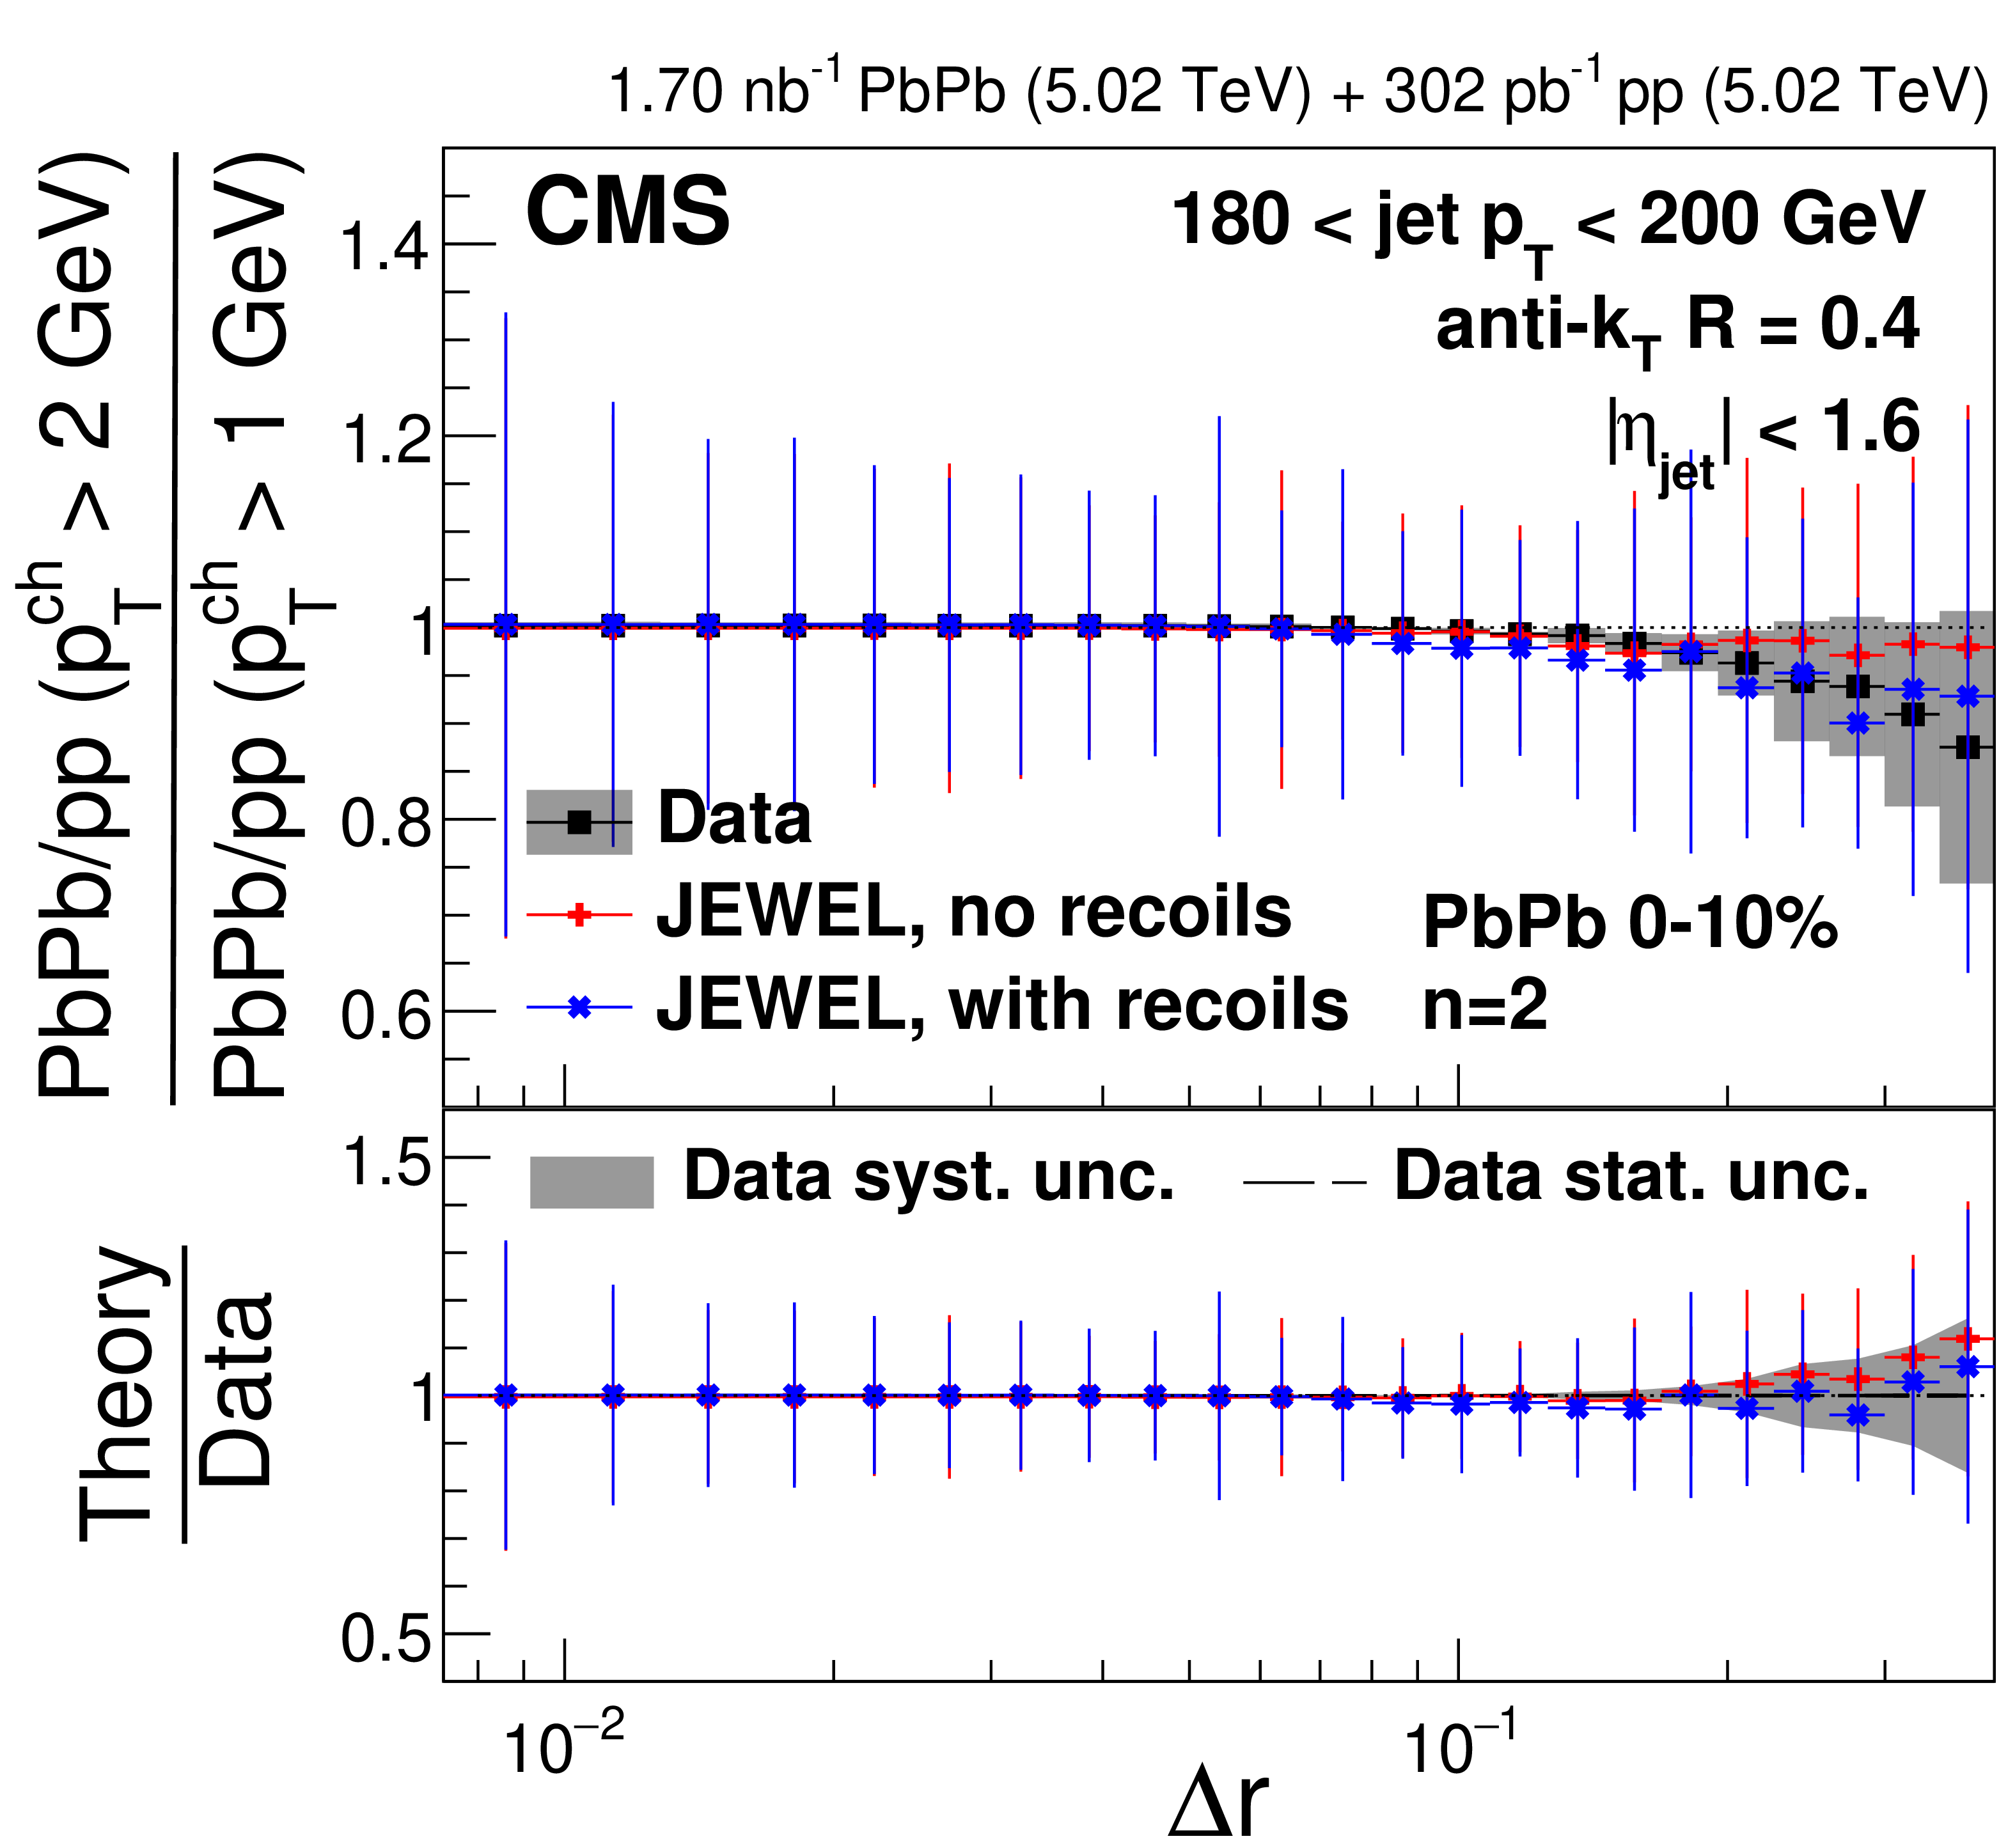
png pdf |
Figure 41-h:
The double ratios of 0-10% central PbPb to pp single ratios with $ p_{\mathrm{T}}^{\text{ch}} > $ 2 GeV and $ p_{\mathrm{T}}^{\text{ch}} > $ 1 GeV for $ n= $ 1 (left) and $ n= $ 2 (right) in different $ p_{\text{T,jet}} $ bins compared to the JEWEL predictions with different recoil settings. |
| Summary |
| For the first time, energy-energy correlators inside high transverse momentum ($ p_{\mathrm{T}} $) jets are measured in heavy ion collisions. The correlators from lead-lead (PbPb) data are compared to those from proton-proton (pp) collisions at the same nucleon-nucleon center-of-mass energy of 5.02 TeV obtained using the CMS detector. A highly differential measurement of the two-point energy correlators is presented as a function of separation in azimuth and pseudorapidity of two charged particles within a jet cone, $ \Delta r $. The time evolution of the jet fragmentation is imprinted in the shapes of the energy-energy correlator distributions. For both PbPb and pp collisions, we see similar large scale trends. There is a negative slope at large $ \Delta r $ in the data, which is interpreted to correspond to the dynamics of the parton shower phase. The positive slope at low $ \Delta r $ is expected to reflect the propagation of noninteracting hadrons. The transition region between these two limits is conjectured to be sensitive to information regarding the hadronization process. Within the same kinematic selections, the transition region in PbPb collisions is shifted to lower $ \Delta r $ values compared to pp collisions, consistent with parton energy loss. A pronounced enhancement at large $ \Delta r $ is observed in the ratio of the PbPb to pp distributions when using a low charged particle $ p_{\mathrm{T}} $ threshold of $ p_{\mathrm{T}}^{\text{ch}} > $ 1 GeV and taking the product of the $ p_{\mathrm{T}}^{\text{ch}} $ of the two particles as the momentum weight. This enhancement disappears if the sensitivity to low-$ p_{\mathrm{T}} $ particles is decreased by increasing the $ p_{\mathrm{T}}^{\text{ch}} $ threshold to 2 GeV or by taking the square of the product as the momentum weight. A comparison of our data to several models suggests that medium response is partially accountable for the observed enhancement for large $ \Delta r $ values. A perturbative calculation with color coherence effects also appears to favor enhancement in this ratio at large $ \Delta r $ values. This measurement establishes a powerful new tool for studying the influence of medium response and color coherence on jet substructure and helps to elucidate how jets are affected by interactions with the quark-gluon plasma. |
| References | ||||
| 1 | C. L. Basham, L. S. Brown, S. D. Ellis, and S. T. Love | Energy correlations in electron-positron annihilation: Testing quantum choromodynamics | PRL 41 (1978) 1585 | |
| 2 | C. L. Basham, L. S. Brown, S. D. Ellis, and S. T. Love | Energy correlations in electron-positron annihilation in quantum chromodynamics: Asymptotically free perturbation theory | PRD 19 (1979) 2018 | |
| 3 | H. Chen et al. | Three point energy correlators in the collinear limit: symmetries, dualities and analytic results | JHEP 08 (2020) 028 | 1912.11050 |
| 4 | H. Chen, I. Moult, X. Zhang, and H. X. Zhu | Rethinking jets with energy correlators: Tracks, resummation, and analytic continuation | PRD 102 (2020) 054012 | 2004.11381 |
| 5 | Y. Li et al. | Extending precision perturbative QCD with track functions | PRL 128 (2022) 182001 | 2108.01674 |
| 6 | E. Craft, K. Lee, B. Meçaj, and I. Moult | Beautiful and charming energy correlators | 2210.09311 | |
| 7 | H. Chen et al. | Collinear parton dynamics beyond Dokshitzer-Gribov-Lipatov-Altarelli-Parisi framework | PRD 111 (2025) 076021 | 2210.10061 |
| 8 | P. T. Komiske, I. Moult, J. Thaler, and H. X. Zhu | Analyzing n-point energy correlators inside jets with CMS open data | PRL 130 (2023) 051901 | 2201.07800 |
| 9 | K. Lee, B. Meçaj, and I. Moult | Conformal collider physics meets LHC data | PRD 111 (2025) L011502 | 2205.03414 |
| 10 | A. H. Mueller | On the multiplicity of hadrons in QCD jets | PLB 104 (1981) 161 | |
| 11 | B. I. Ermolaev and V. S. Fadin | Log - log asymptotic form of exclusive cross-sections in quantum chromodynamics | JETP Lett. 33 (1981) 269 | |
| 12 | A. Bassetto, M. Ciafaloni, G. Marchesini, and A. H. Mueller | Jet multiplicity and soft gluon factorization | NPB 207 (1982) 189 | |
| 13 | Y. L. Dokshitzer, V. A. Khoze, S. I. Troian, and A. H. Mueller | QCD coherence in high-energy reactions | Rev. Mod. Phys. 60 (1988) 373 | |
| 14 | C. Andrés et al. | Simple scaling laws for energy correlators in nuclear matter | 2411.15298 | |
| 15 | ALEPH Collaboration | Measurement of $ \alpha_{s} $ from the structure of particle clusters produced in hadronic Z decays | PLB 257 (1991) 479 | |
| 16 | STAR Collaboration | Measurement of two-point energy correlators within jets in $ p $+$ p $ collisions at $ \sqrt{s} = $ 200 GeV | 2502.15925 | |
| 17 | ALICE Collaboration | Exposing the parton-hadron transition within jets with energy-energy correlators in pp collisions at $ \sqrt{s} = $ 5.02 TeV | 2409.12687 | |
| 18 | CMS Collaboration | Measurement of energy correlators inside jets and determination of the strong coupling $ \alpha_{\mathrm{S}}(m_{\mathrm{Z}}) $ | PRL 133 (2024) 071903 | CMS-SMP-22-015 2402.13864 |
| 19 | CMS Collaboration | Observation and studies of jet quenching in PbPb collisions at $ \sqrt{\smash[b]{s_{_{\mathrm{NN}}}}} = $ 2.76 TeV | Phys. Rev. C 84 (2011) 024906 | CMS-HIN-10-004 1102.1957 |
| 20 | M. Arslandok et al. | Hot QCD white paper | 2303.17254 | |
| 21 | S. Cao and X.-N. Wang | Jet quenching and medium response in high-energy heavy-ion collisions: a review | Rept. Prog. Phys. 84 (2021) 024301 | 2002.04028 |
| 22 | L. Apolinàrio, Y.-J. Lee, and M. Winn | Heavy quarks and jets as probes of the QGP | Prog. Part. Nucl. Phys. 127 (2022) 103990 | 2203.16352 |
| 23 | PHENIX Collaboration | Suppression of hadrons with large transverse momentum in central Au+Au collisions at $ \sqrt{\smash[b]{s_{_{\mathrm{NN}}}}} = $ 130 GeV | PRL 88 (2002) 022301 | nucl-ex/0109003 |
| 24 | STAR Collaboration | Centrality dependence of high $ p_{\mathrm{T}} $ hadron suppression in Au+Au collisions at $ \sqrt{\smash[b]{s_{_{\mathrm{NN}}}}} = $ 130 GeV | PRL 89 (2002) 202301 | nucl-ex/0206011 |
| 25 | CMS Collaboration | Study of high-$ p_{\mathrm{T}} $ charged particle suppression in PbPb compared to pp collisions at $ \sqrt{\smash[b]{s_{_{\mathrm{NN}}}}} = $ 2.76 TeV | EPJC 72 (2012) 1945 | CMS-HIN-10-005 1202.2554 |
| 26 | ATLAS Collaboration | Measurements of the nuclear modification factor for jets in Pb+Pb collisions at $ \sqrt{\smash[b]{s_{_{\mathrm{NN}}}}} = $ 2.76 TeV with the ATLAS detector | PRL 114 (2015) 072302 | 1411.2357 |
| 27 | CMS Collaboration | First measurement of large area jet transverse momentum spectra in heavy-ion collisions | JHEP 05 (2021) 284 | CMS-HIN-18-014 2102.13080 |
| 28 | CMS Collaboration | Modification of jet shapes in PbPb collisions at $ \sqrt{\smash[b]{s_{_{\mathrm{NN}}}}} = $ 2.76 TeV | PLB 730 (2014) 243 | CMS-HIN-12-002 1310.0878 |
| 29 | CMS Collaboration | Jet properties in PbPb and pp collisions at $ \sqrt{\smash[b]{s_{_{\mathrm{NN}}}}} = $ 5.02 TeV | JHEP 05 (2018) 006 | CMS-HIN-16-020 1803.00042 |
| 30 | CMS Collaboration | In-medium modification of dijets in PbPb collisions at $ \sqrt{\smash[b]{s_{_{\mathrm{NN}}}}} = $ 5.02 TeV | JHEP 05 (2021) 116 | CMS-HIN-19-013 2101.04720 |
| 31 | CMS Collaboration | Measurement of jet fragmentation into charged particles in pp and PbPb collisions at $ \sqrt{\smash[b]{s_{_{\mathrm{NN}}}}} = $ 2.76 TeV | JHEP 10 (2012) 087 | CMS-HIN-11-004 1205.5872 |
| 32 | CMS Collaboration | Measurement of the splitting function in pp and PbPb collisions at $ \sqrt{\smash[b]{s_{_{\mathrm{NN}}}}} = $ 5.02 TeV | PRL 120 (2018) 142302 | CMS-HIN-16-006 1708.09429 |
| 33 | CMS Collaboration | Measurement of the groomed jet mass in PbPb and pp collisions at $ \sqrt{\smash[b]{s_{_{\mathrm{NN}}}}} = $ 5.02 TeV | JHEP 10 (2018) 161 | CMS-HIN-16-024 1805.05145 |
| 34 | CMS Collaboration | Measurement of quark- and gluon-like jet fractions using jet charge in PbPb and pp collisions at 5.02 TeV | JHEP 07 (2020) 115 | CMS-HIN-18-018 2004.00602 |
| 35 | ALICE Collaboration | Measurements of the groomed and ungroomed jet angularities in pp collisions at $ \sqrt{\smash[b]{s_{_{\mathrm{NN}}}}} = $ 5.02 TeV | JHEP 05 (2022) 061 | 2107.11303 |
| 36 | ALICE Collaboration | Measurement of the angle between jet axes in Pb--Pb collisions at $ \sqrt{\smash[b]{s_{_{\mathrm{NN}}}}} = $ 5.02 TeV | 2303.13347 | |
| 37 | ATLAS Collaboration | Measurement of substructure-dependent jet suppression in Pb+Pb collisions at 5.02 TeV with the ATLAS detector | Phys. Rev. C 107 (2023) 054909 | 2211.11470 |
| 38 | CMS Collaboration | Overview of high-density QCD studies with the CMS experiment at the LHC | Phys. Rept. 1115 (2025) 219 | CMS-HIN-23-011 2405.10785 |
| 39 | C. Andrés, F. Dominguez, A. V. Sadofyev, and C. A. Salgado | Jet broadening in flowing matter: Resummation | PRD 106 (2022) 074023 | 2207.07141 |
| 40 | C. Andrés et al. | Resolving the scales of the quark-gluon plasma with energy correlators | PRL 130 (2023) 262301 | 2209.11236 |
| 41 | C. Andrés et al. | A coherent view of the quark-gluon plasma from energy correlators | JHEP 09 (2023) 088 | 2303.03413 |
| 42 | J. Barata, X. Mayo López, A. V. Sadofyev, and C. A. Salgado | Medium induced gluon spectrum in dense inhomogeneous matter | PRD 108 (2023) 034018 | 2304.03712 |
| 43 | J. Barata, J.-P. Blaizot, and Y. Mehtar-Tani | Quantum to classical parton dynamics in QCD media | PRD 108 (2023) 014039 | 2305.10476 |
| 44 | J. Barata, P. Caucal, A. Soto-Ontoso, and R. Szafron | Advancing the understanding of energy-energy correlators in heavy-ion collisions | JHEP 11 (2024) 060 | 2312.12527 |
| 45 | Z. Yang, Y. He, I. Moult, and X.-N. Wang | Probing the short-distance structure of the quark-gluon plasma with energy correlators | PRL 132 (2024) 011901 | 2310.01500 |
| 46 | H. Bossi et al. | Imaging the wakes of jets with energy-energy-energy correlators | JHEP 12 (2024) 073 | 2407.13818 |
| 47 | CMS Collaboration | CMS luminosity measurement using nucleus-nucleus collisions at $ \sqrt{\smash[b]{s_{_{\mathrm{NN}}}}} = $ 5.02 TeV in 2018 | CMS Physics Analysis Summary, 2022 CMS-PAS-LUM-18-001 |
CMS-PAS-LUM-18-001 |
| 48 | CMS Collaboration | Precision luminosity measurement in proton-proton collisions at $ \sqrt{s} = $ 13 TeV in 2015 and 2016 at CMS | EPJC 81 (2021) 800 | CMS-LUM-17-003 2104.01927 |
| 49 | CMS Collaboration | HEPData record for this analysis | link | |
| 50 | CMS Collaboration | Jet momentum dependence of jet quenching in PbPb collisions at $ \sqrt{\smash[b]{s_{_{\mathrm{NN}}}}} = $ 2.76 TeV | PLB 712 (2012) 176 | CMS-HIN-11-013 1202.5022 |
| 51 | CMS Collaboration | The CMS experiment at the CERN LHC | JINST 3 (2008) S08004 | |
| 52 | CMS Collaboration | Development of the CMS detector for the CERN LHC Run 3 | JINST 19 (2024) P05064 | CMS-PRF-21-001 2309.05466 |
| 53 | CMS Collaboration | Performance of the CMS level-1 trigger in proton-proton collisions at $ \sqrt{s} = $ 13 TeV | JINST 15 (2020) P10017 | CMS-TRG-17-001 2006.10165 |
| 54 | CMS Collaboration | The CMS trigger system | JINST 12 (2017) P01020 | CMS-TRG-12-001 1609.02366 |
| 55 | M. Cacciari, G. P. Salam, and G. Soyez | The anti-$ k_{\mathrm{T}} $ jet clustering algorithm | JHEP 04 (2008) 063 | 0802.1189 |
| 56 | O. Kodolova, I. Vardanyan, A. Nikitenko, and A. Oulianov | The performance of the jet identification and reconstruction in heavy ions collisions with CMS detector | EPJC 50 (2007) 117 | |
| 57 | CMS Collaboration | Charged-particle nuclear modification factors in PbPb and $ \mathrm{p}\text{Pb} $ collisions at $ \sqrt{\smash[b]{s_{_{\mathrm{NN}}}}} = $ 5.02 TeV | JHEP 04 (2017) 039 | CMS-HIN-15-015 1611.01664 |
| 58 | T. Sjöstrand et al. | An introduction to PYTHIA 8.2 | Comput. Phys. Commun. 191 (2015) 159 | 1410.3012 |
| 59 | CMS Collaboration | Extraction and validation of a new set of CMS PYTHIA8 tunes from underlying-event measurements | EPJC 80 (2020) 4 | CMS-GEN-17-001 1903.12179 |
| 60 | NNPDF Collaboration | Parton distributions from high-precision collider data | EPJC 77 (2017) 663 | 1706.00428 |
| 61 | M. Bähr et al. | Herwig++ physics and manual | EPJC 58 (2008) 639 | 0803.0883 |
| 62 | J. Bellm et al. | Herwig 7.0/Herwig++ 3.0 release note | EPJC 76 (2016) 196 | 1512.01178 |
| 63 | CMS Collaboration | Development and validation of HERWIG 7 tunes from CMS underlying-event measurements | EPJC 81 (2021) 312 | CMS-GEN-19-001 2011.03422 |
| 64 | GEANT4 Collaboration | GEANT 4---a simulation toolkit | NIM A 506 (2003) 250 | |
| 65 | I. P. Lokhtin et al. | Heavy ion event generator HYDJET++ (HYDrodynamics plus JETs) | Comput. Phys. Commun. 180 (2009) 779 | 0809.2708 |
| 66 | CMS Collaboration | Description and performance of track and primary-vertex reconstruction with the CMS tracker | JINST 9 (2014) P10009 | CMS-TRK-11-001 1405.6569 |
| 67 | CMS Collaboration | Particle-flow reconstruction and global event description with the CMS detector | JINST 12 (2017) P10003 | CMS-PRF-14-001 1706.04965 |
| 68 | M. Cacciari, G. P. Salam, and G. Soyez | FastJet user manual | EPJC 72 (2012) 1896 | 1111.6097 |
| 69 | D. Bertolini, T. Chan, and J. Thaler | Jet observables without jet algorithms | JHEP 04 (2014) 013 | 1310.7584 |
| 70 | A. J. Larkoski, D. Neill, and J. Thaler | Jet shapes with the broadening axis | JHEP 04 (2014) 017 | 1401.2158 |
| 71 | P. Berta, M. Spousta, D. W. Miller, and R. Leitner | Particle-level pileup subtraction for jets and jet shapes | JHEP 06 (2014) 092 | 1403.3108 |
| 72 | ALICE Collaboration | Higher harmonic anisotropic flow measurements of charged particles in Pb-Pb collisions at $ \sqrt{\smash[b]{s_{_{\mathrm{NN}}}}} = $ 2.76 TeV | PRL 107 (2011) 032301 | 1105.3865 |
| 73 | G. D'Agostini | A multidimensional unfolding method based on Bayes' theorem | NIM A 362 (1995) 487 | |
| 74 | L. Brenner et al. | Comparison of unfolding methods using RooFitUnfold | Int. J. Mod. Phys. A 35 (2020) 2050145 | 1910.14654 |
| 75 | E. Gross and O. Vitells | Trial factors for the look elsewhere effect in high energy physics | EPJC 70 (2010) 525 | 1005.1891 |
| 76 | CMS Collaboration | Jet energy scale and resolution in the CMS experiment in pp collisions at 8 TeV | JINST 12 (2017) P02014 | CMS-JME-13-004 1607.03663 |
| 77 | Y. Mehtar-Tani, C. A. Salgado, and K. Tywoniuk | Anti-angular ordering of gluon radiation in QCD media | PRL 106 (2011) 122002 | 1009.2965 |
| 78 | S. Domdey et al. | QCD evolution of jets in the quark-gluon plasma | Nucl. Phys. A 808 (2008) 178 | 0802.3282 |
| 79 | ALICE Collaboration | Measurement of the groomed jet radius and momentum splitting fraction in pp and Pb--Pb collisions at $ \sqrt{\smash[b]{s_{_{\mathrm{NN}}}}} = $ 5.02 TeV | PRL 128 (2022) 102001 | 2107.12984 |
| 80 | CMS Collaboration | Girth and groomed radius of jets recoiling against isolated photons in lead-lead and proton-proton collisions at $ \sqrt{\smash[b]{s_{_{\mathrm{NN}}}}} = $ 5.02 TeV | PLB 861 (2025) 139088 | CMS-HIN-23-001 2405.02737 |
| 81 | Y. Mehtar-Tani, D. Pablos, and K. Tywoniuk | Jet suppression and azimuthal anisotropy from RHIC to LHC | PRD 110 (2024) 014009 | 2402.07869 |
| 82 | J. Casalderrey-Solana et al. | A hybrid strong/weak coupling approach to jet quenching | JHEP 10 (2014) 019 | 1405.3864 |
| 83 | J. Casalderrey-Solana et al. | Angular structure of jet quenching within a hybrid strong/weak coupling model | JHEP 03 (2017) 135 | 1609.05842 |
| 84 | J. Casalderrey-Solana et al. | Simultaneous description of hadron and jet suppression in heavy-ion collisions | Phys. Rev. C 99 (2019) 051901 | 1808.07386 |
| 85 | C. Andrés et al. | Towards an interpretation of the first measurements of energy correlators in the quark-gluon plasma | JHEP 03 (2025) 166 | 2407.07936 |
| 86 | K. Zapp et al. | A Monte Carlo model for 'jet quenching' | EPJC 60 (2009) 617 | 0804.3568 |
| 87 | R. Kunnawalkam Elayavalli and K. C. Zapp | Medium response in JEWEL and its impact on jet shape observables in heavy ion collisions | JHEP 07 (2017) 141 | 1707.01539 |
| 88 | W. Chen et al. | Effects of jet-induced medium excitation in $ \gamma $-hadron correlation in A+A collisions | PLB 777 (2018) 86 | 1704.03648 |
| 89 | W. Chen et al. | Medium modification of $ \gamma $-jet fragmentation functions in Pb+Pb collisions at LHC | PLB 810 (2020) 135783 | 2005.09678 |
| 90 | W. Zhao et al. | From hydrodynamics to jet quenching, coalescence, and hadron cascade: A coupled approach to solving the $ R_{\mathrm{AA}} \otimes v_{2} $ puzzle | PRL 128 (2022) 022302 | 2103.14657 |
|
|
Compact Muon Solenoid LHC, CERN |
|

|

|

|

|

|