

Compact Muon Solenoid
LHC, CERN
| CMS-HIG-23-014 ; CERN-EP-2025-067 | ||
| Measurements of inclusive and differential Higgs boson production cross sections at $ \sqrt{s} = $ 13.6 TeV in the $ \mathrm{H}\to\gamma\gamma $ decay channel | ||
| CMS Collaboration | ||
| 24 April 2025 | ||
| JHEP 09 (2025) 070 | ||
| Abstract: Inclusive and differential cross sections for Higgs boson production in proton-proton collisions at a centre-of-mass energy of 13.6 TeV are measured using data collected with the CMS detector at the LHC in 2022, corresponding to an integrated luminosity of 34.7 fb$ ^{-1} $. Events with the diphoton final state are selected, and the measured inclusive fiducial cross section is $ \sigma_{\text{fid}}= $ 74 $ \pm $ 11 (stat) $ ^{+5}_{-4} $ (syst) fb, in agreement with the standard model prediction of 67.8 $ \pm $ 3.8 fb. Differential cross sections are measured as functions of several observables: the Higgs boson transverse momentum and rapidity, the number of associated jets, and the transverse momentum of the leading jet in the event. Within the uncertainties, the differential cross sections agree with the standard model predictions. | ||
| Links: e-print arXiv:2504.17755 [hep-ex] (PDF) ; CDS record ; inSPIRE record ; HepData record ; Physics Briefing ; CADI line (restricted) ; | ||
| Figures & Tables | Summary | Additional Figures | References | CMS Publications |
|---|
| Figures | |
png pdf |
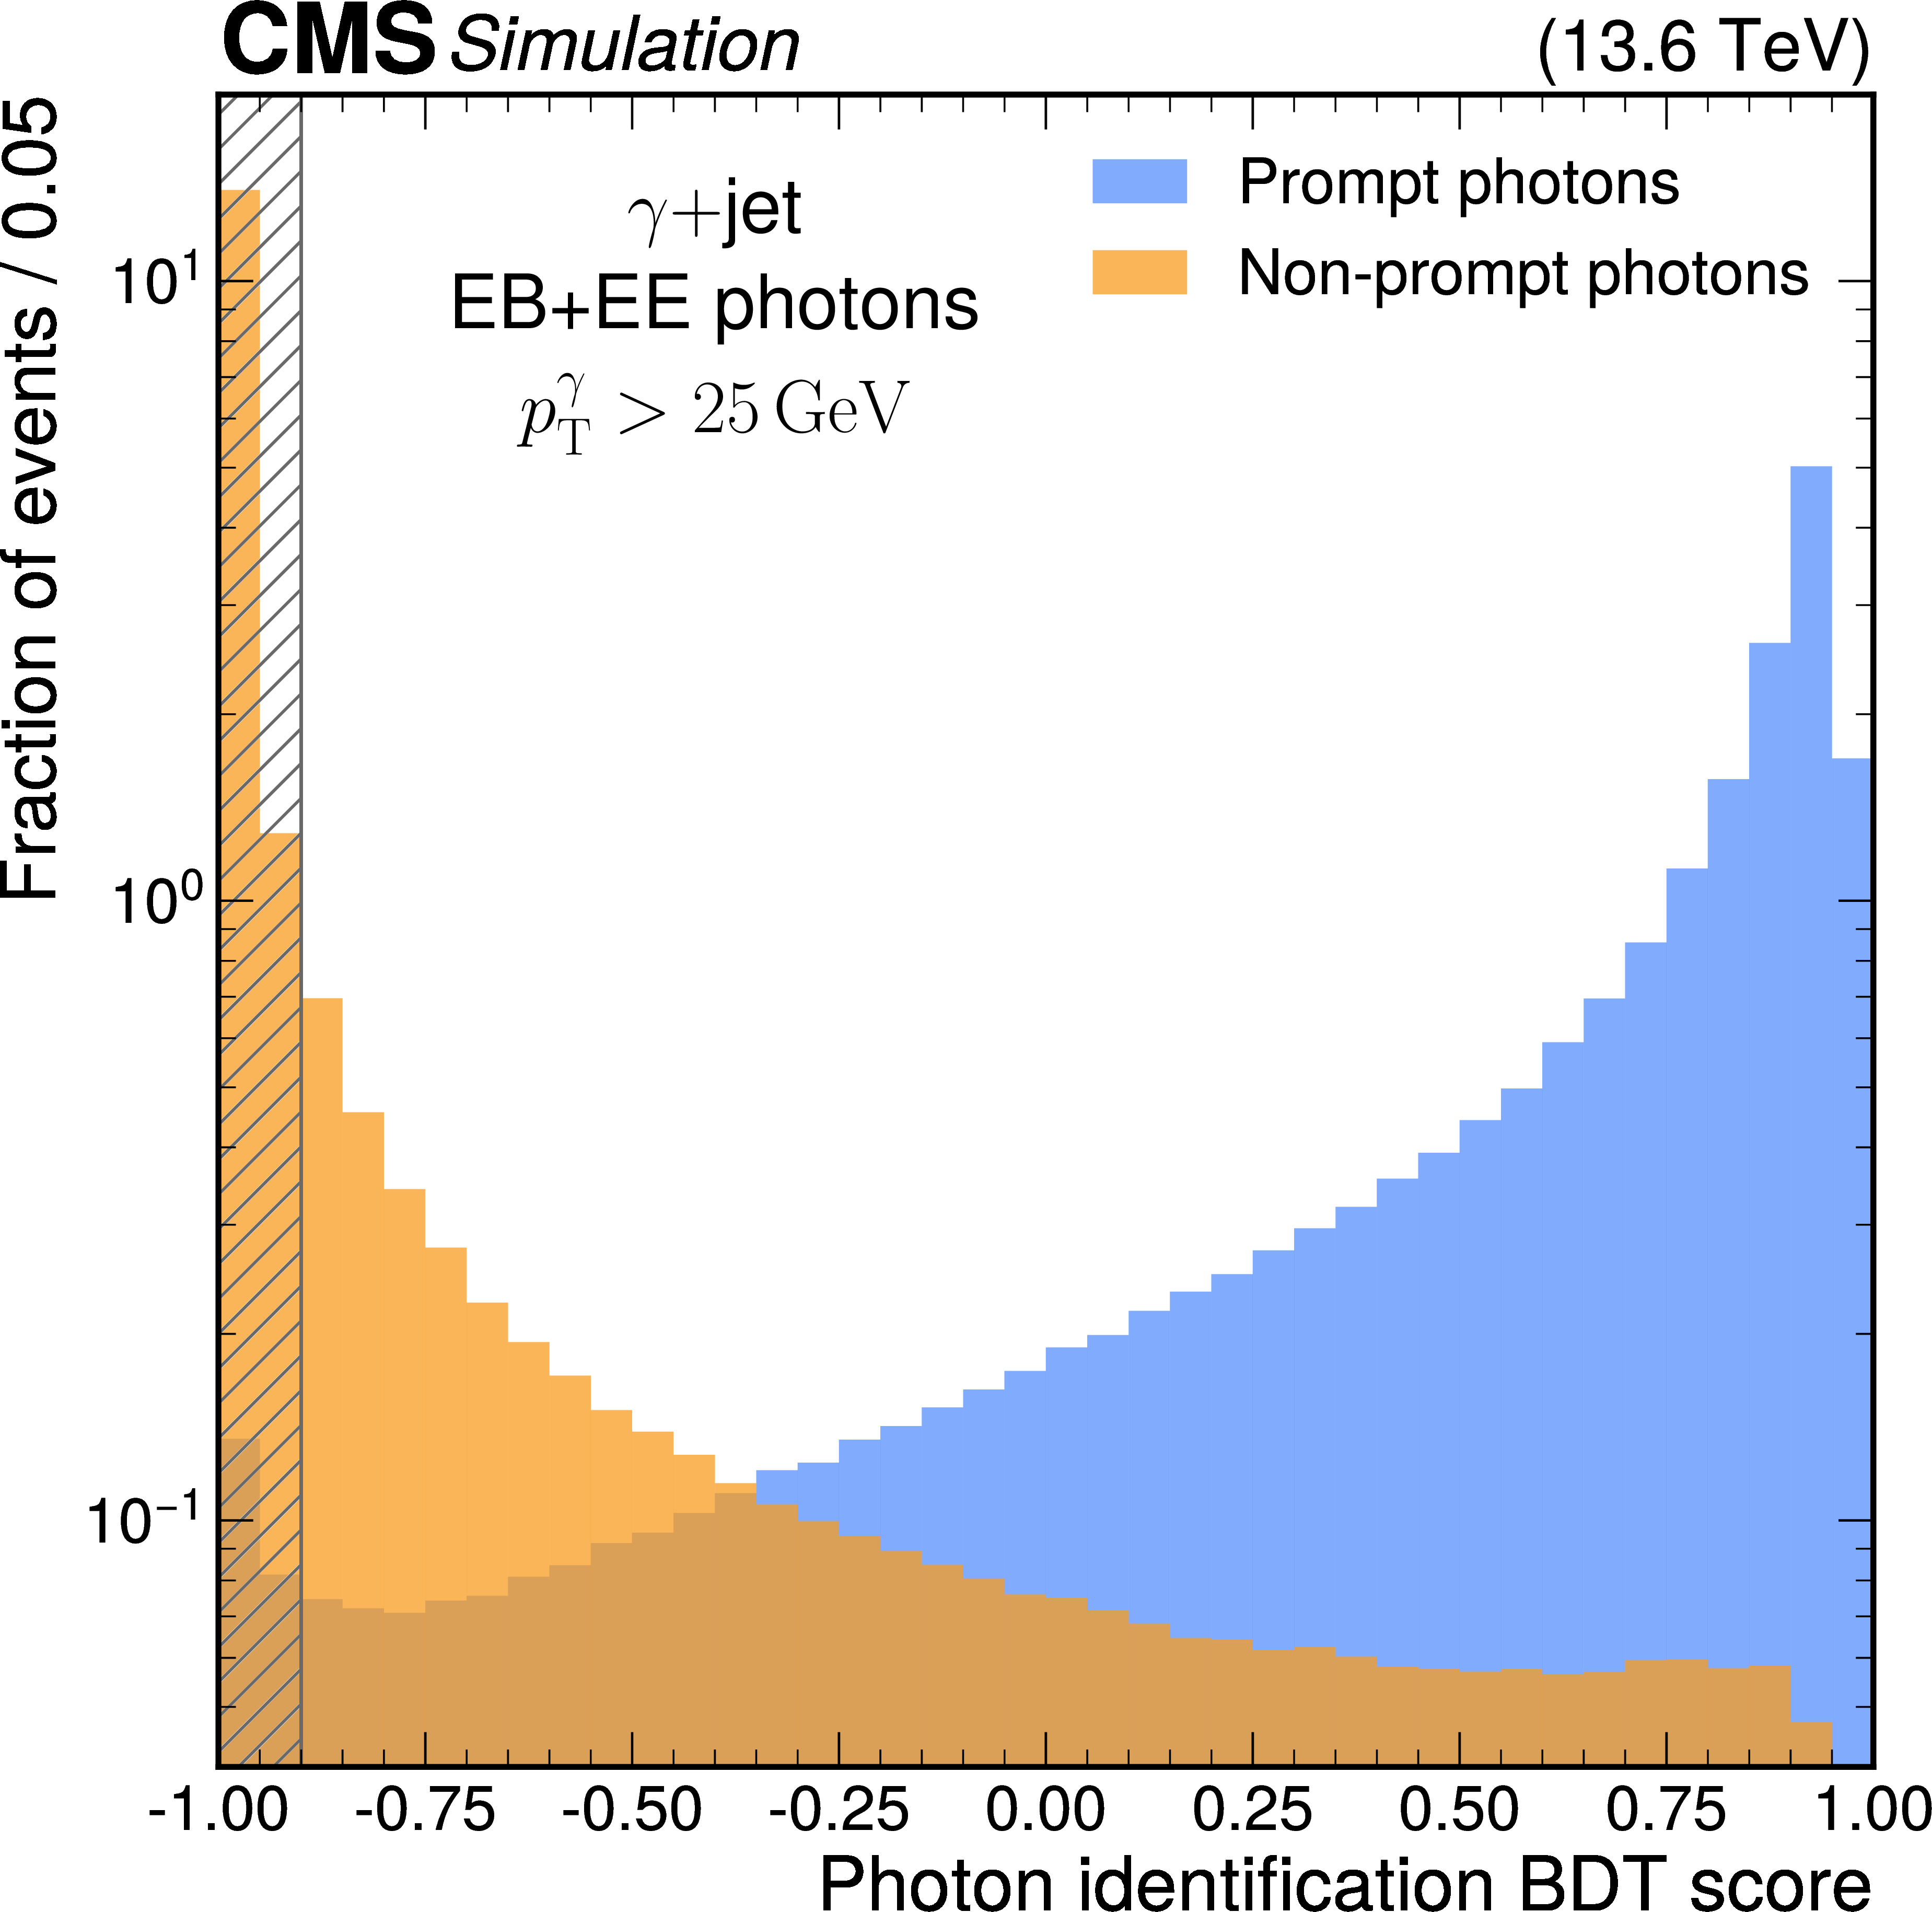
Figure 1:
Normalized distributions of the photon identification BDT scores for prompt (blue) and non-prompt (orange) photons from $ \gamma$ + jet simulated events. The shaded region indicates the photons that are rejected by the photon preselection requirement of $ {>} - $0.9. |
png pdf |
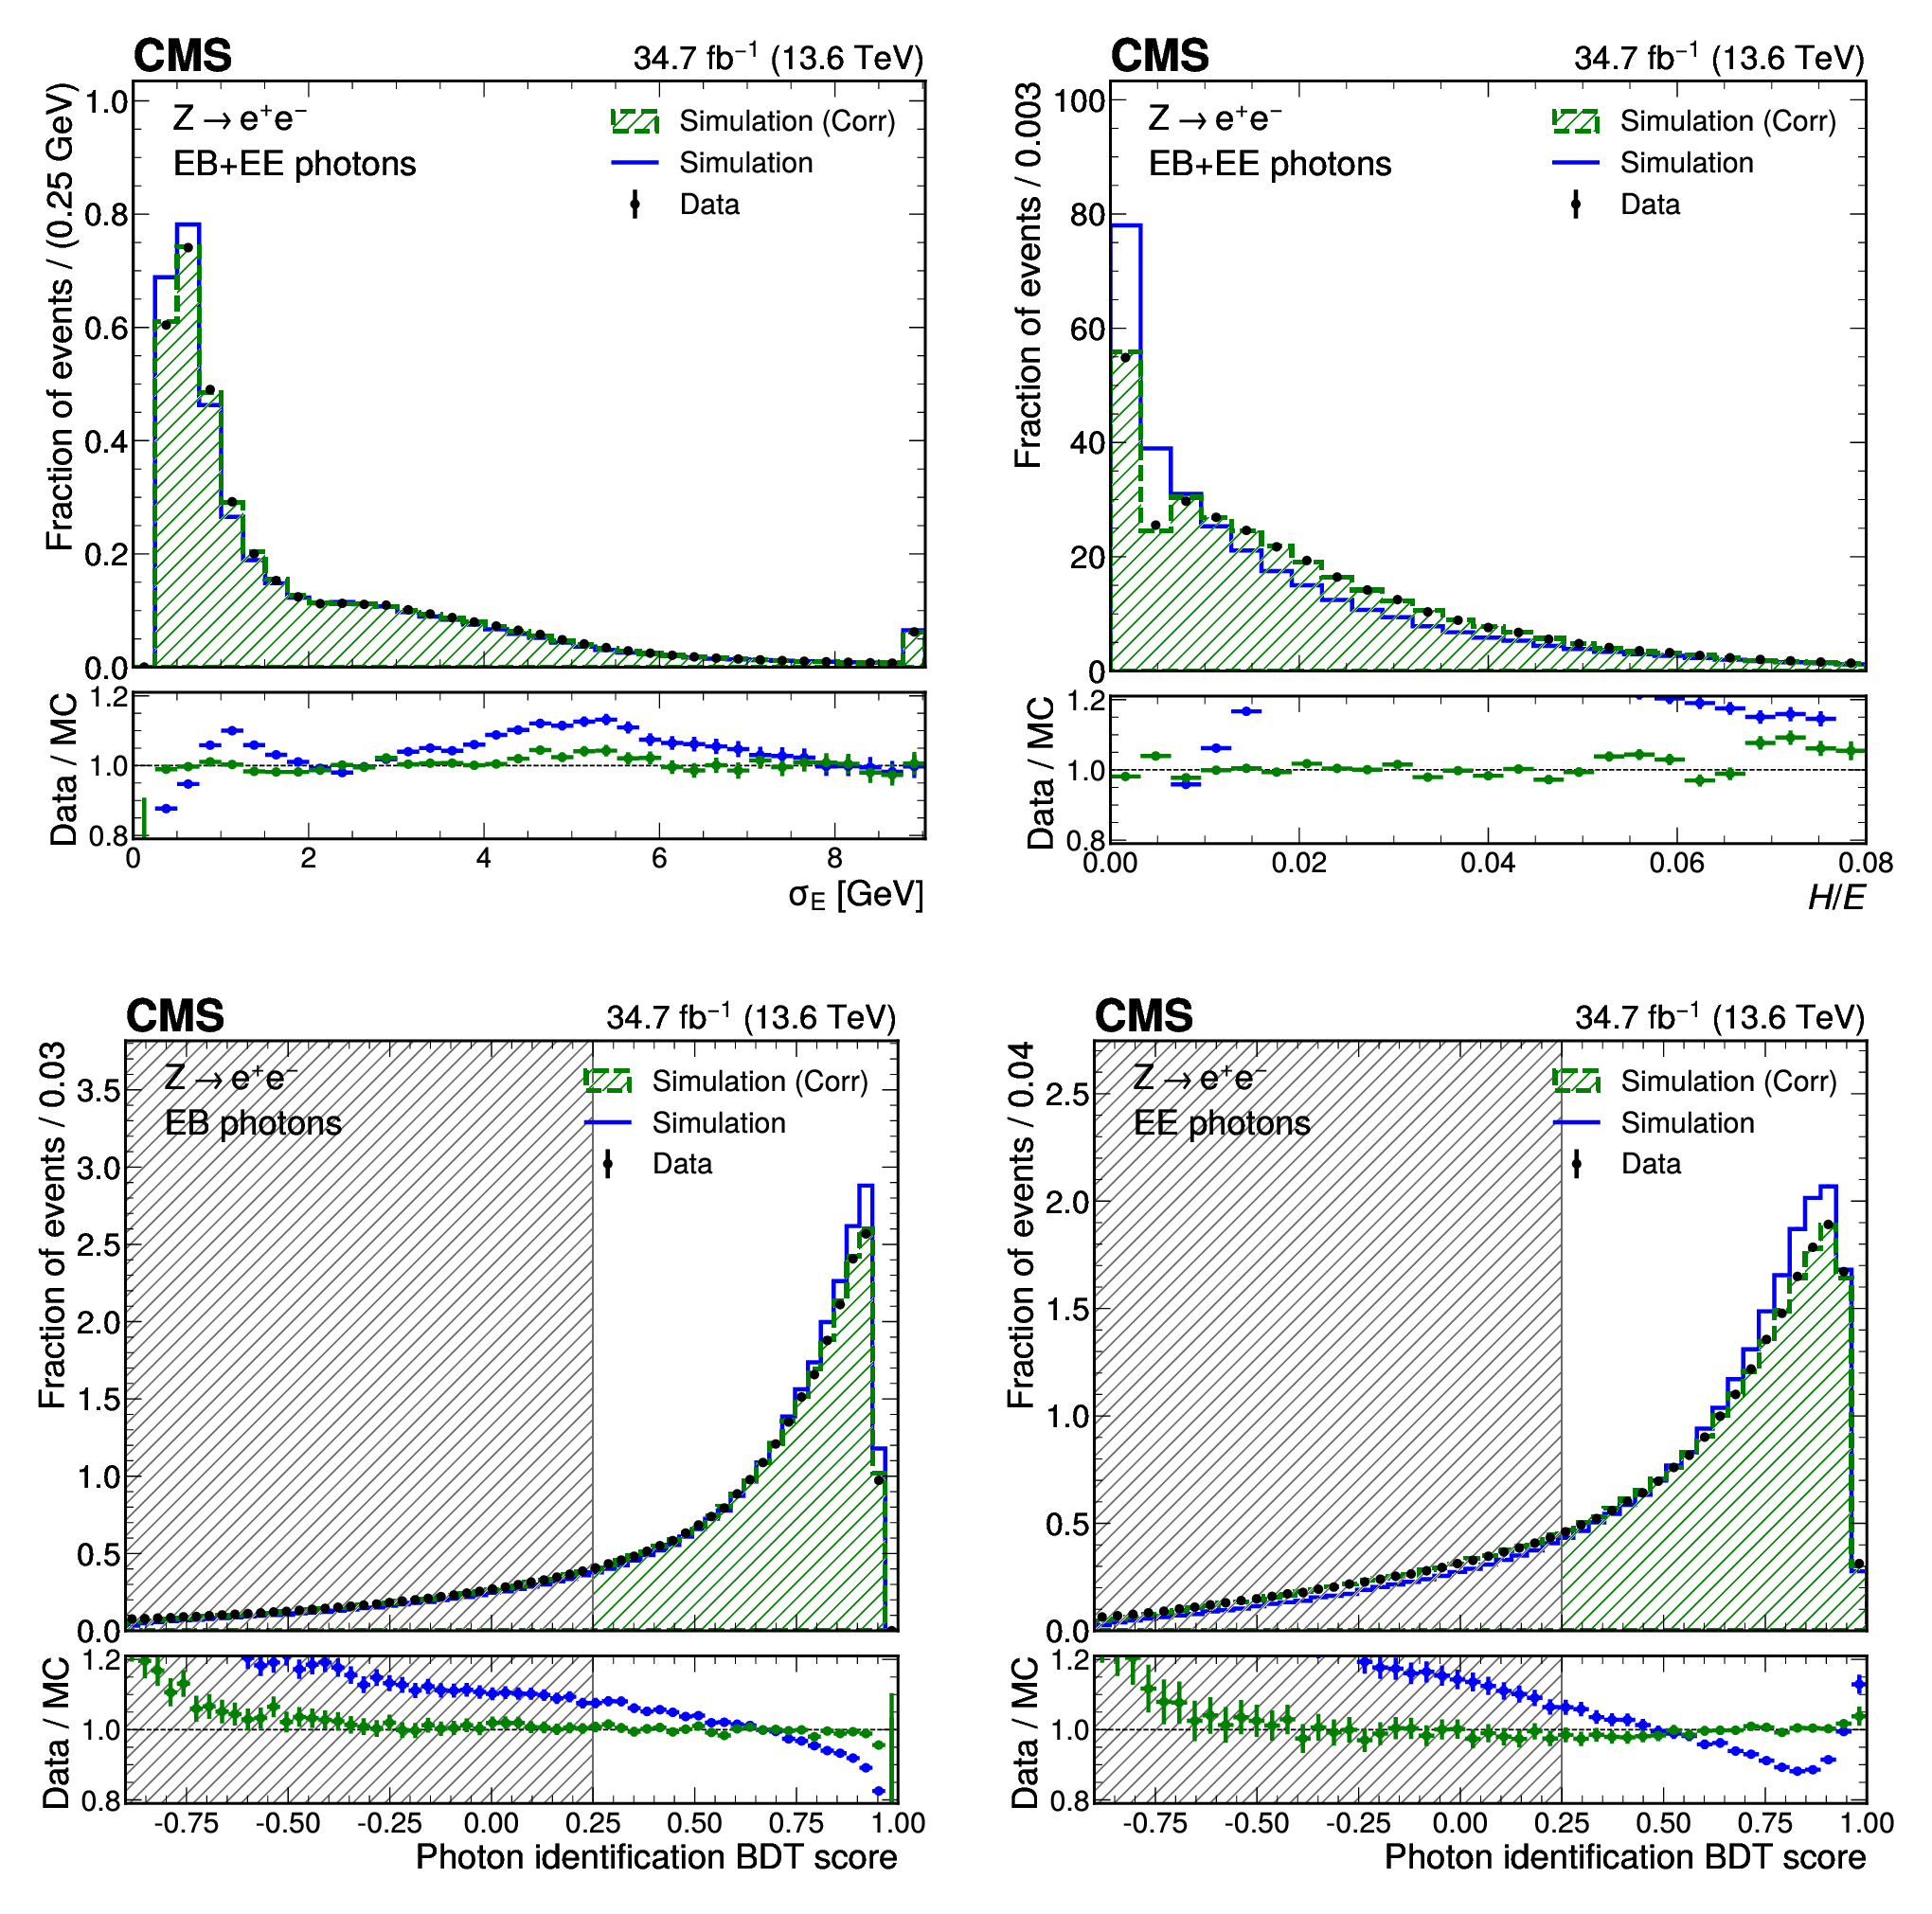
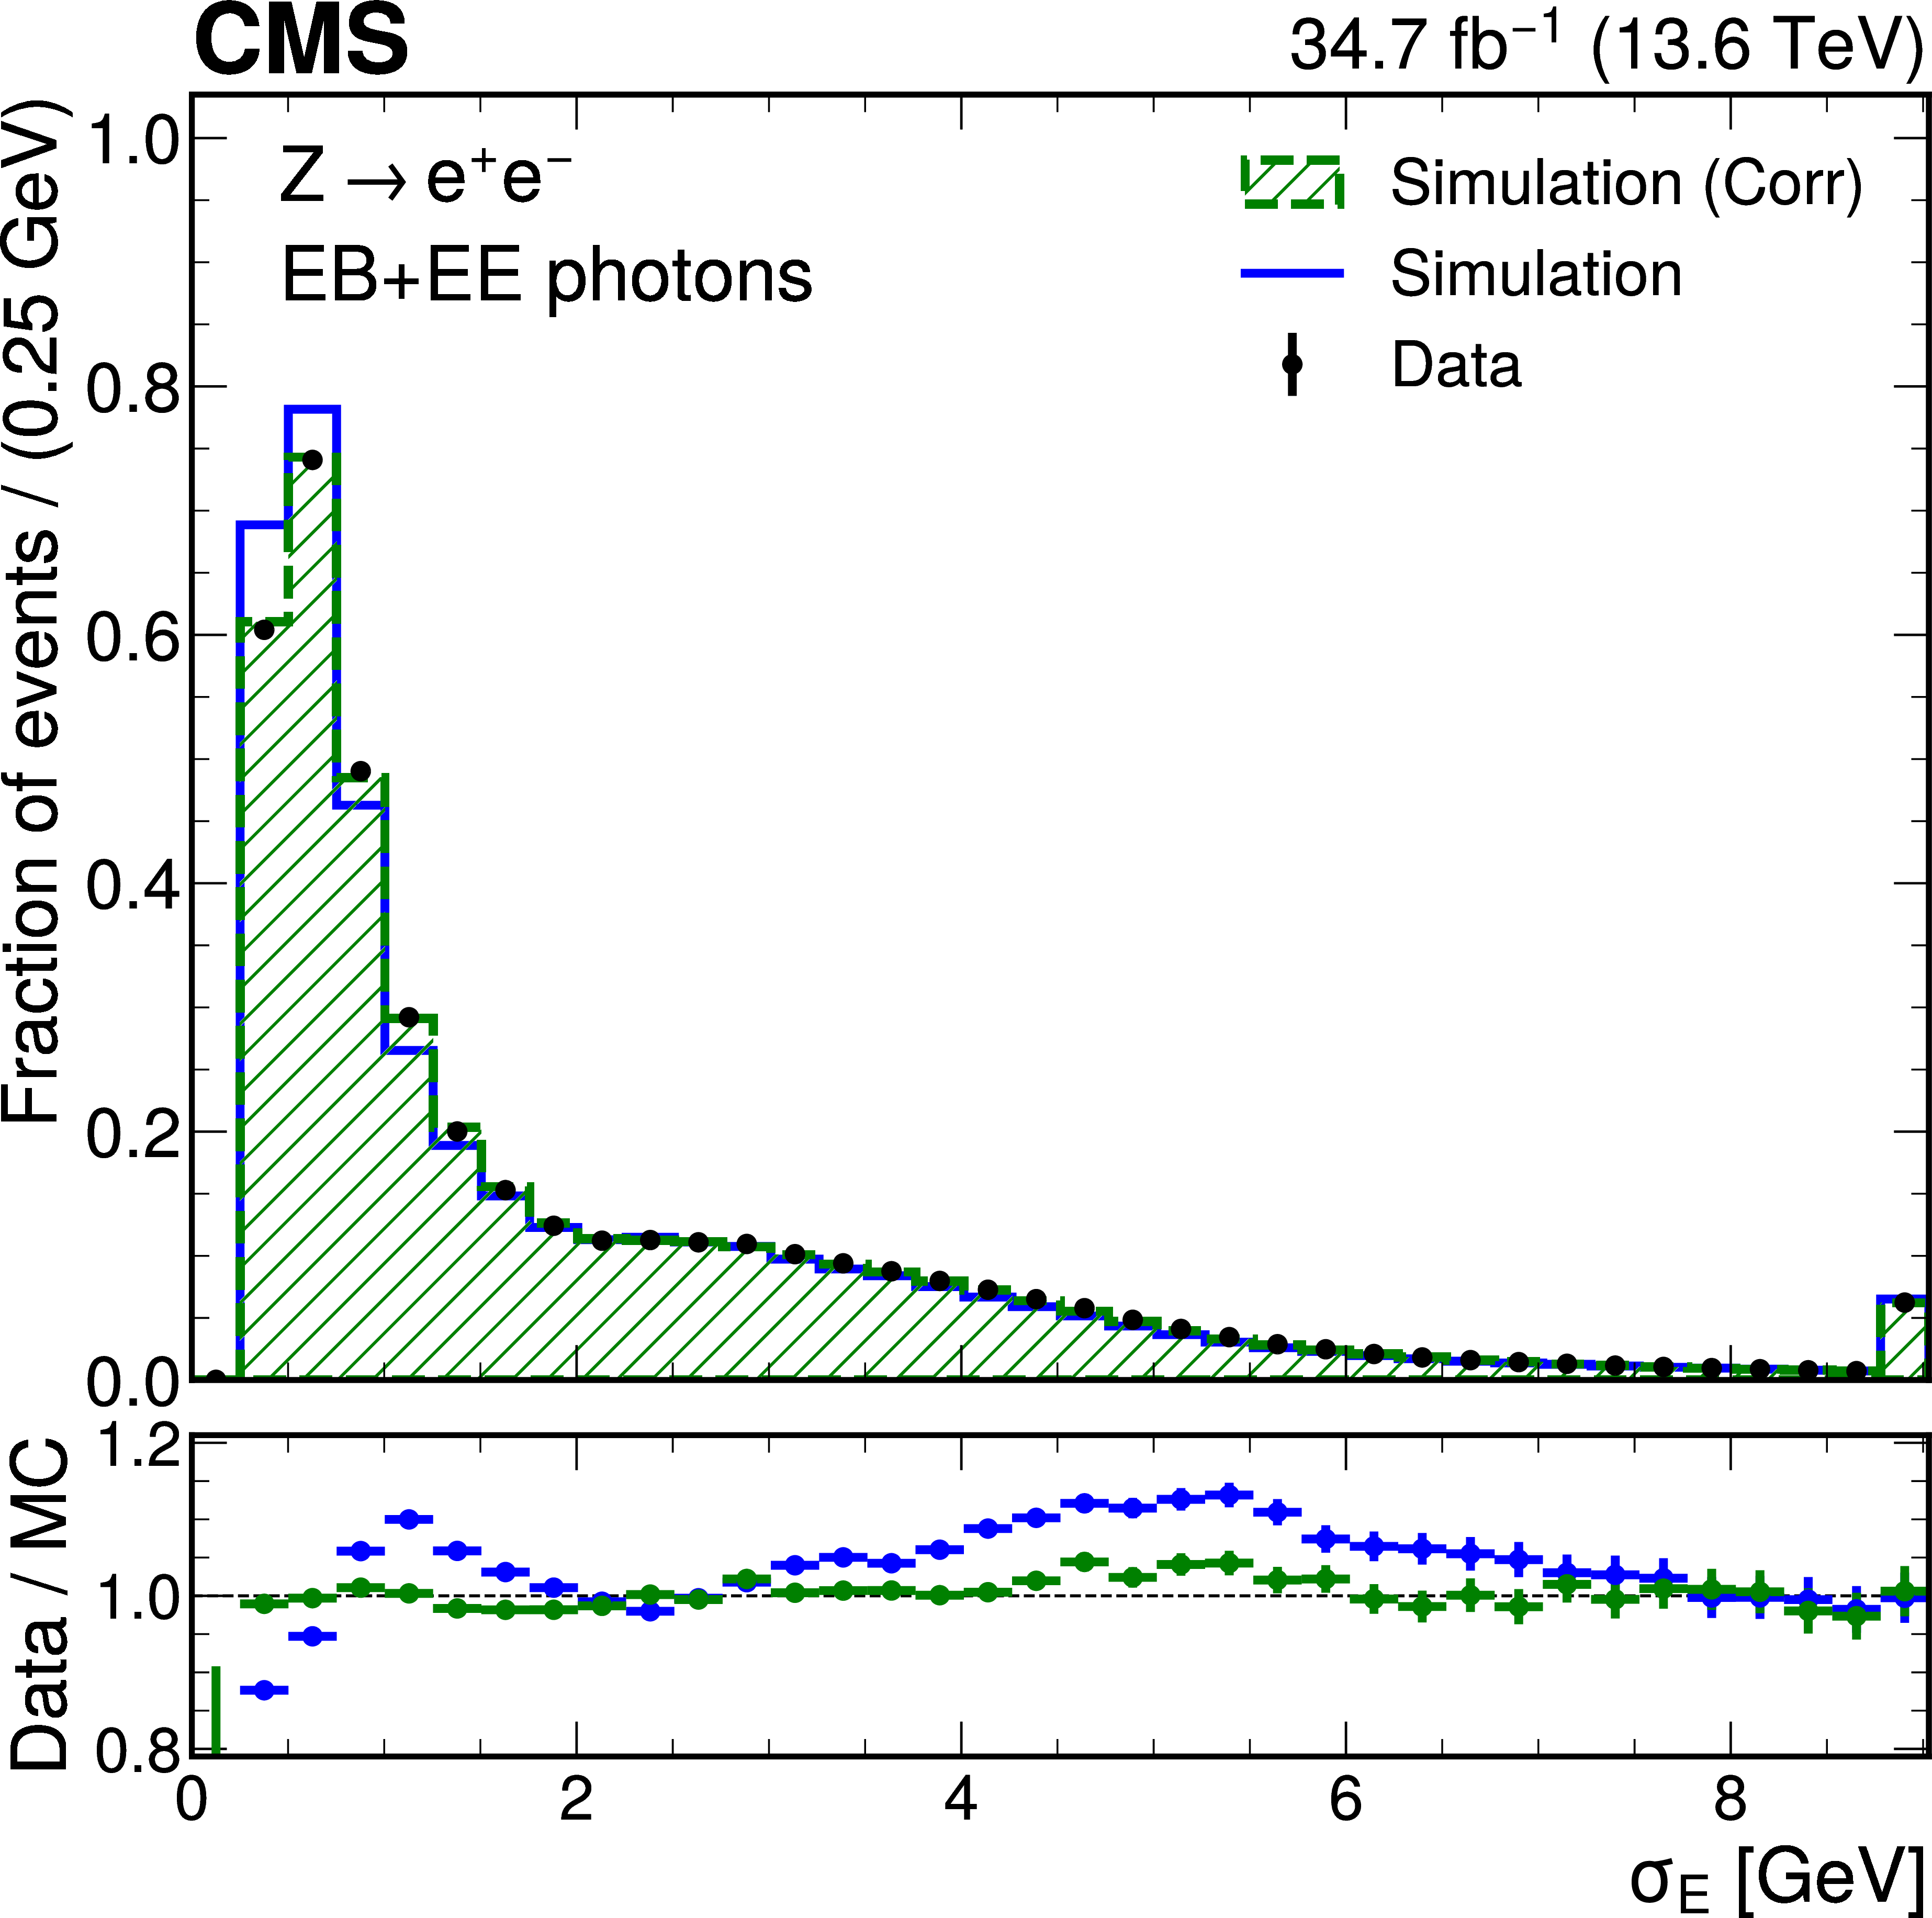
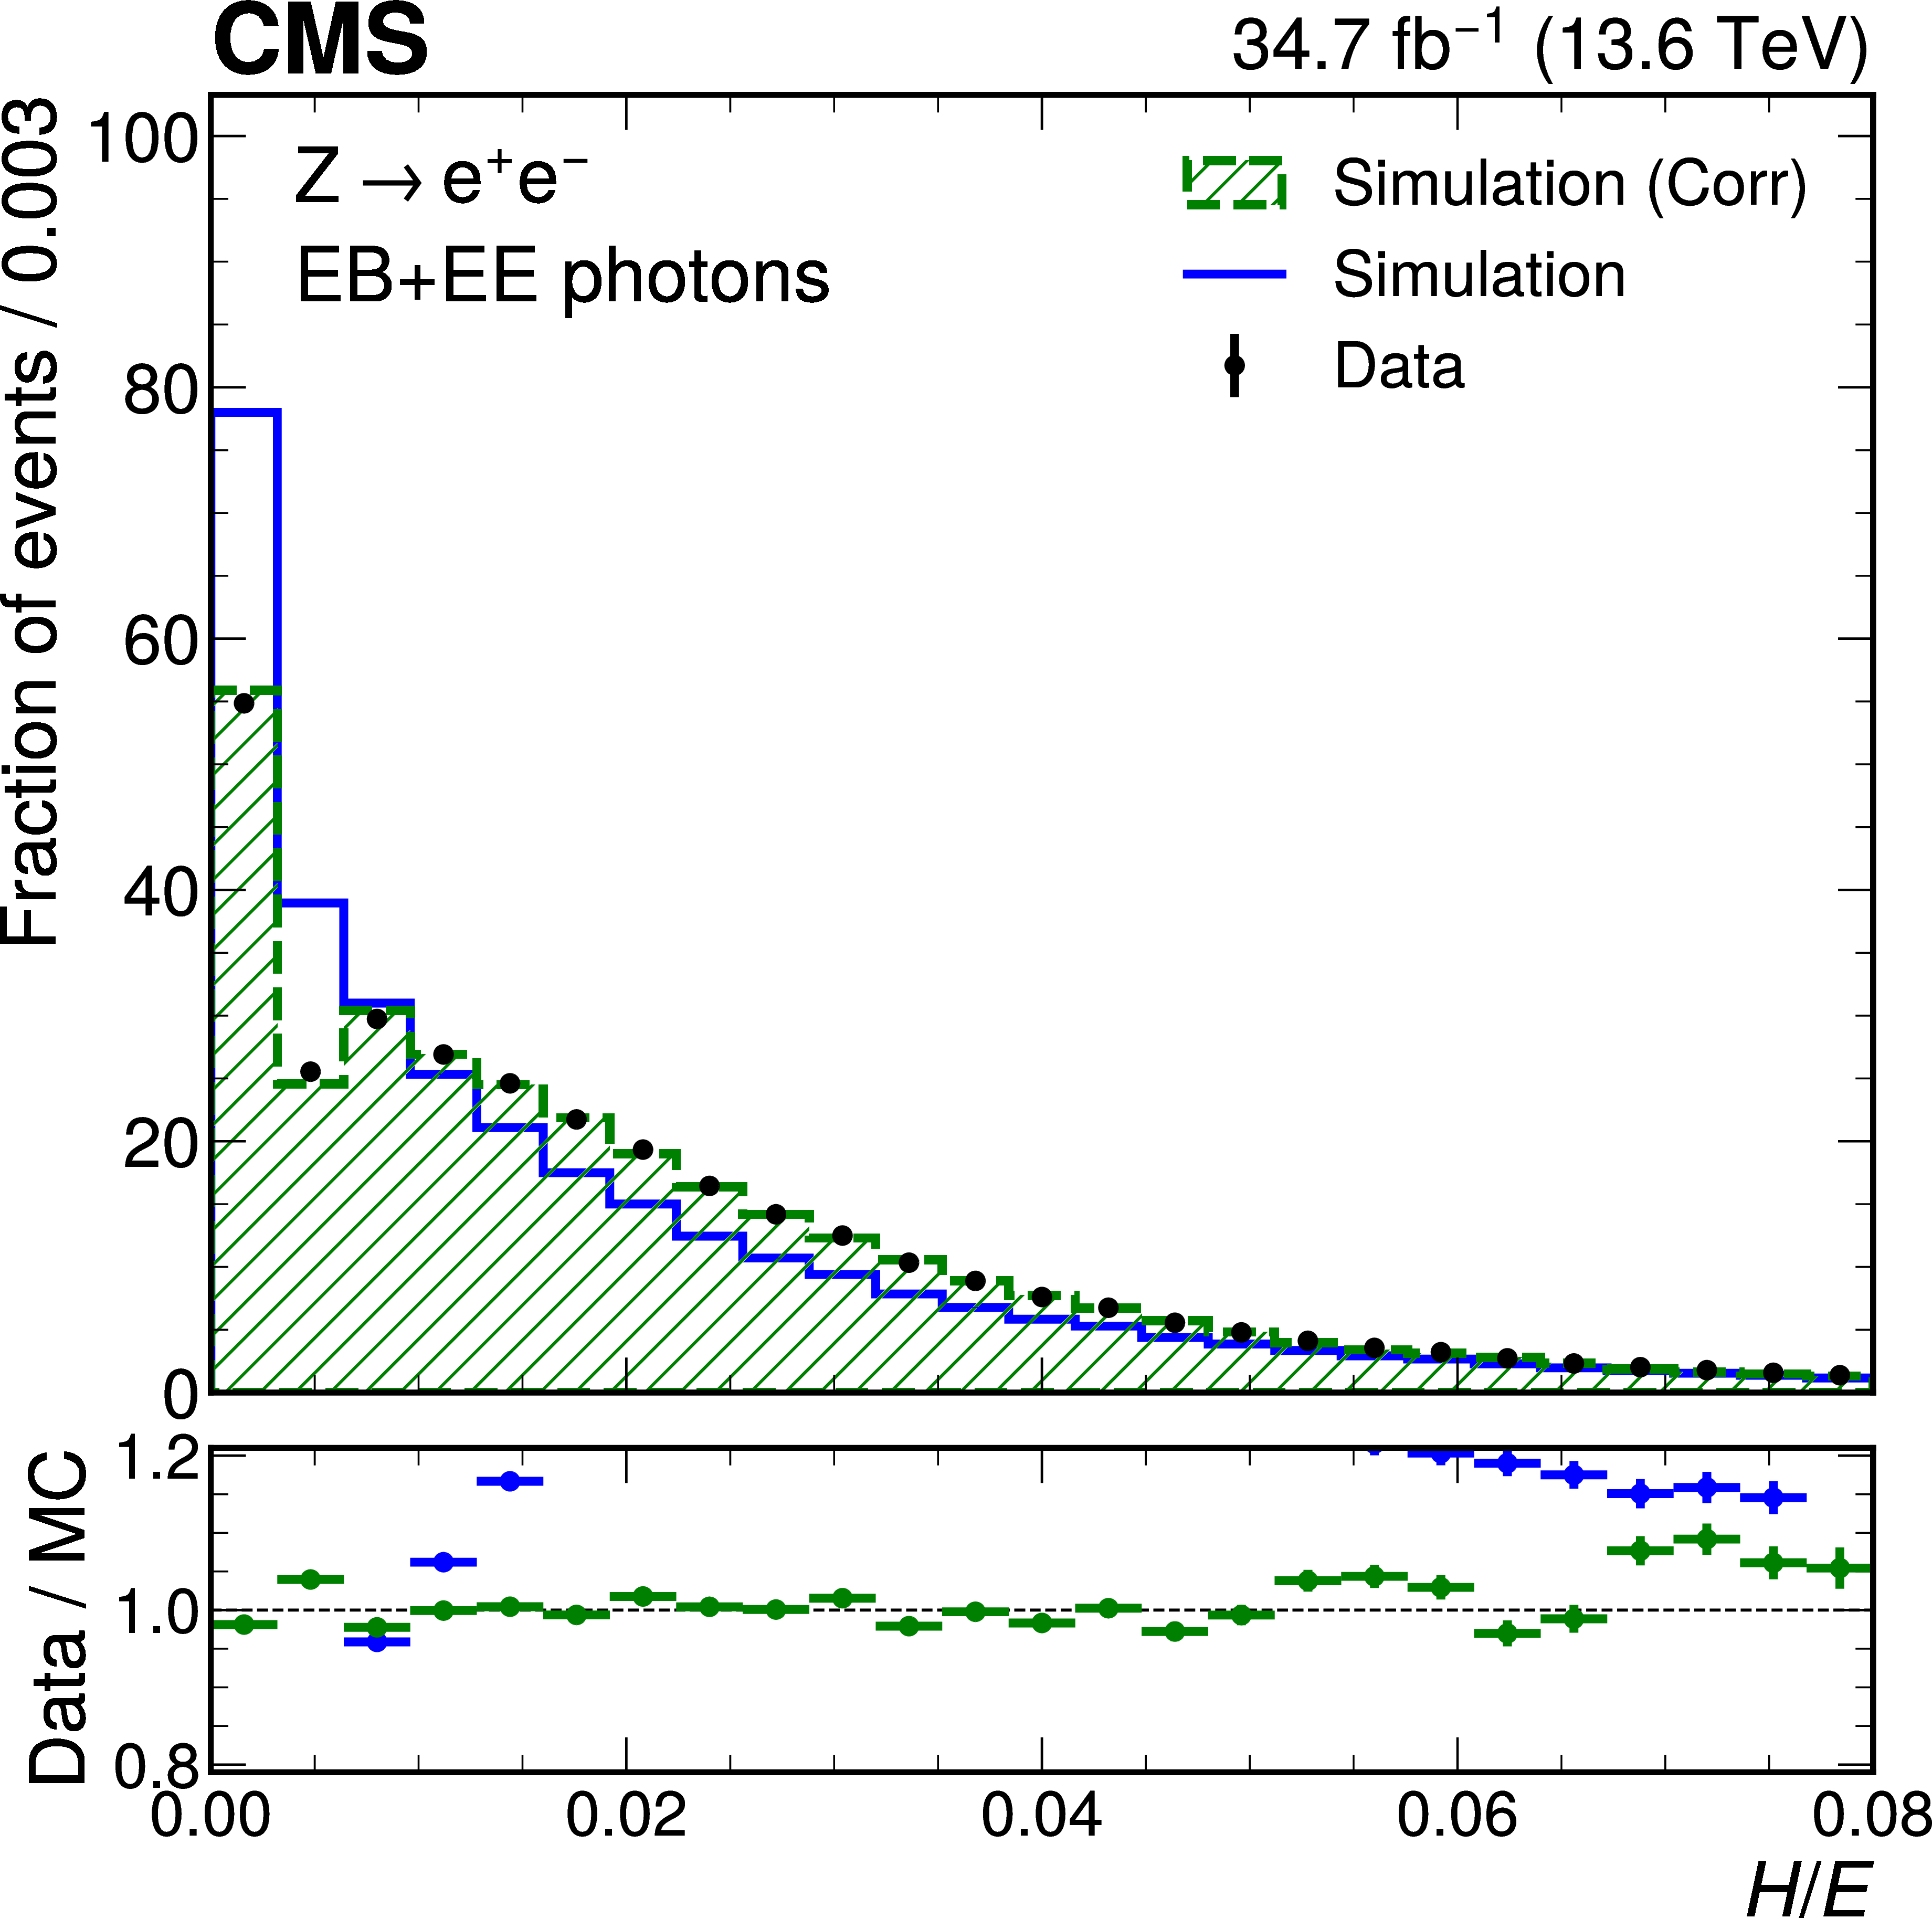
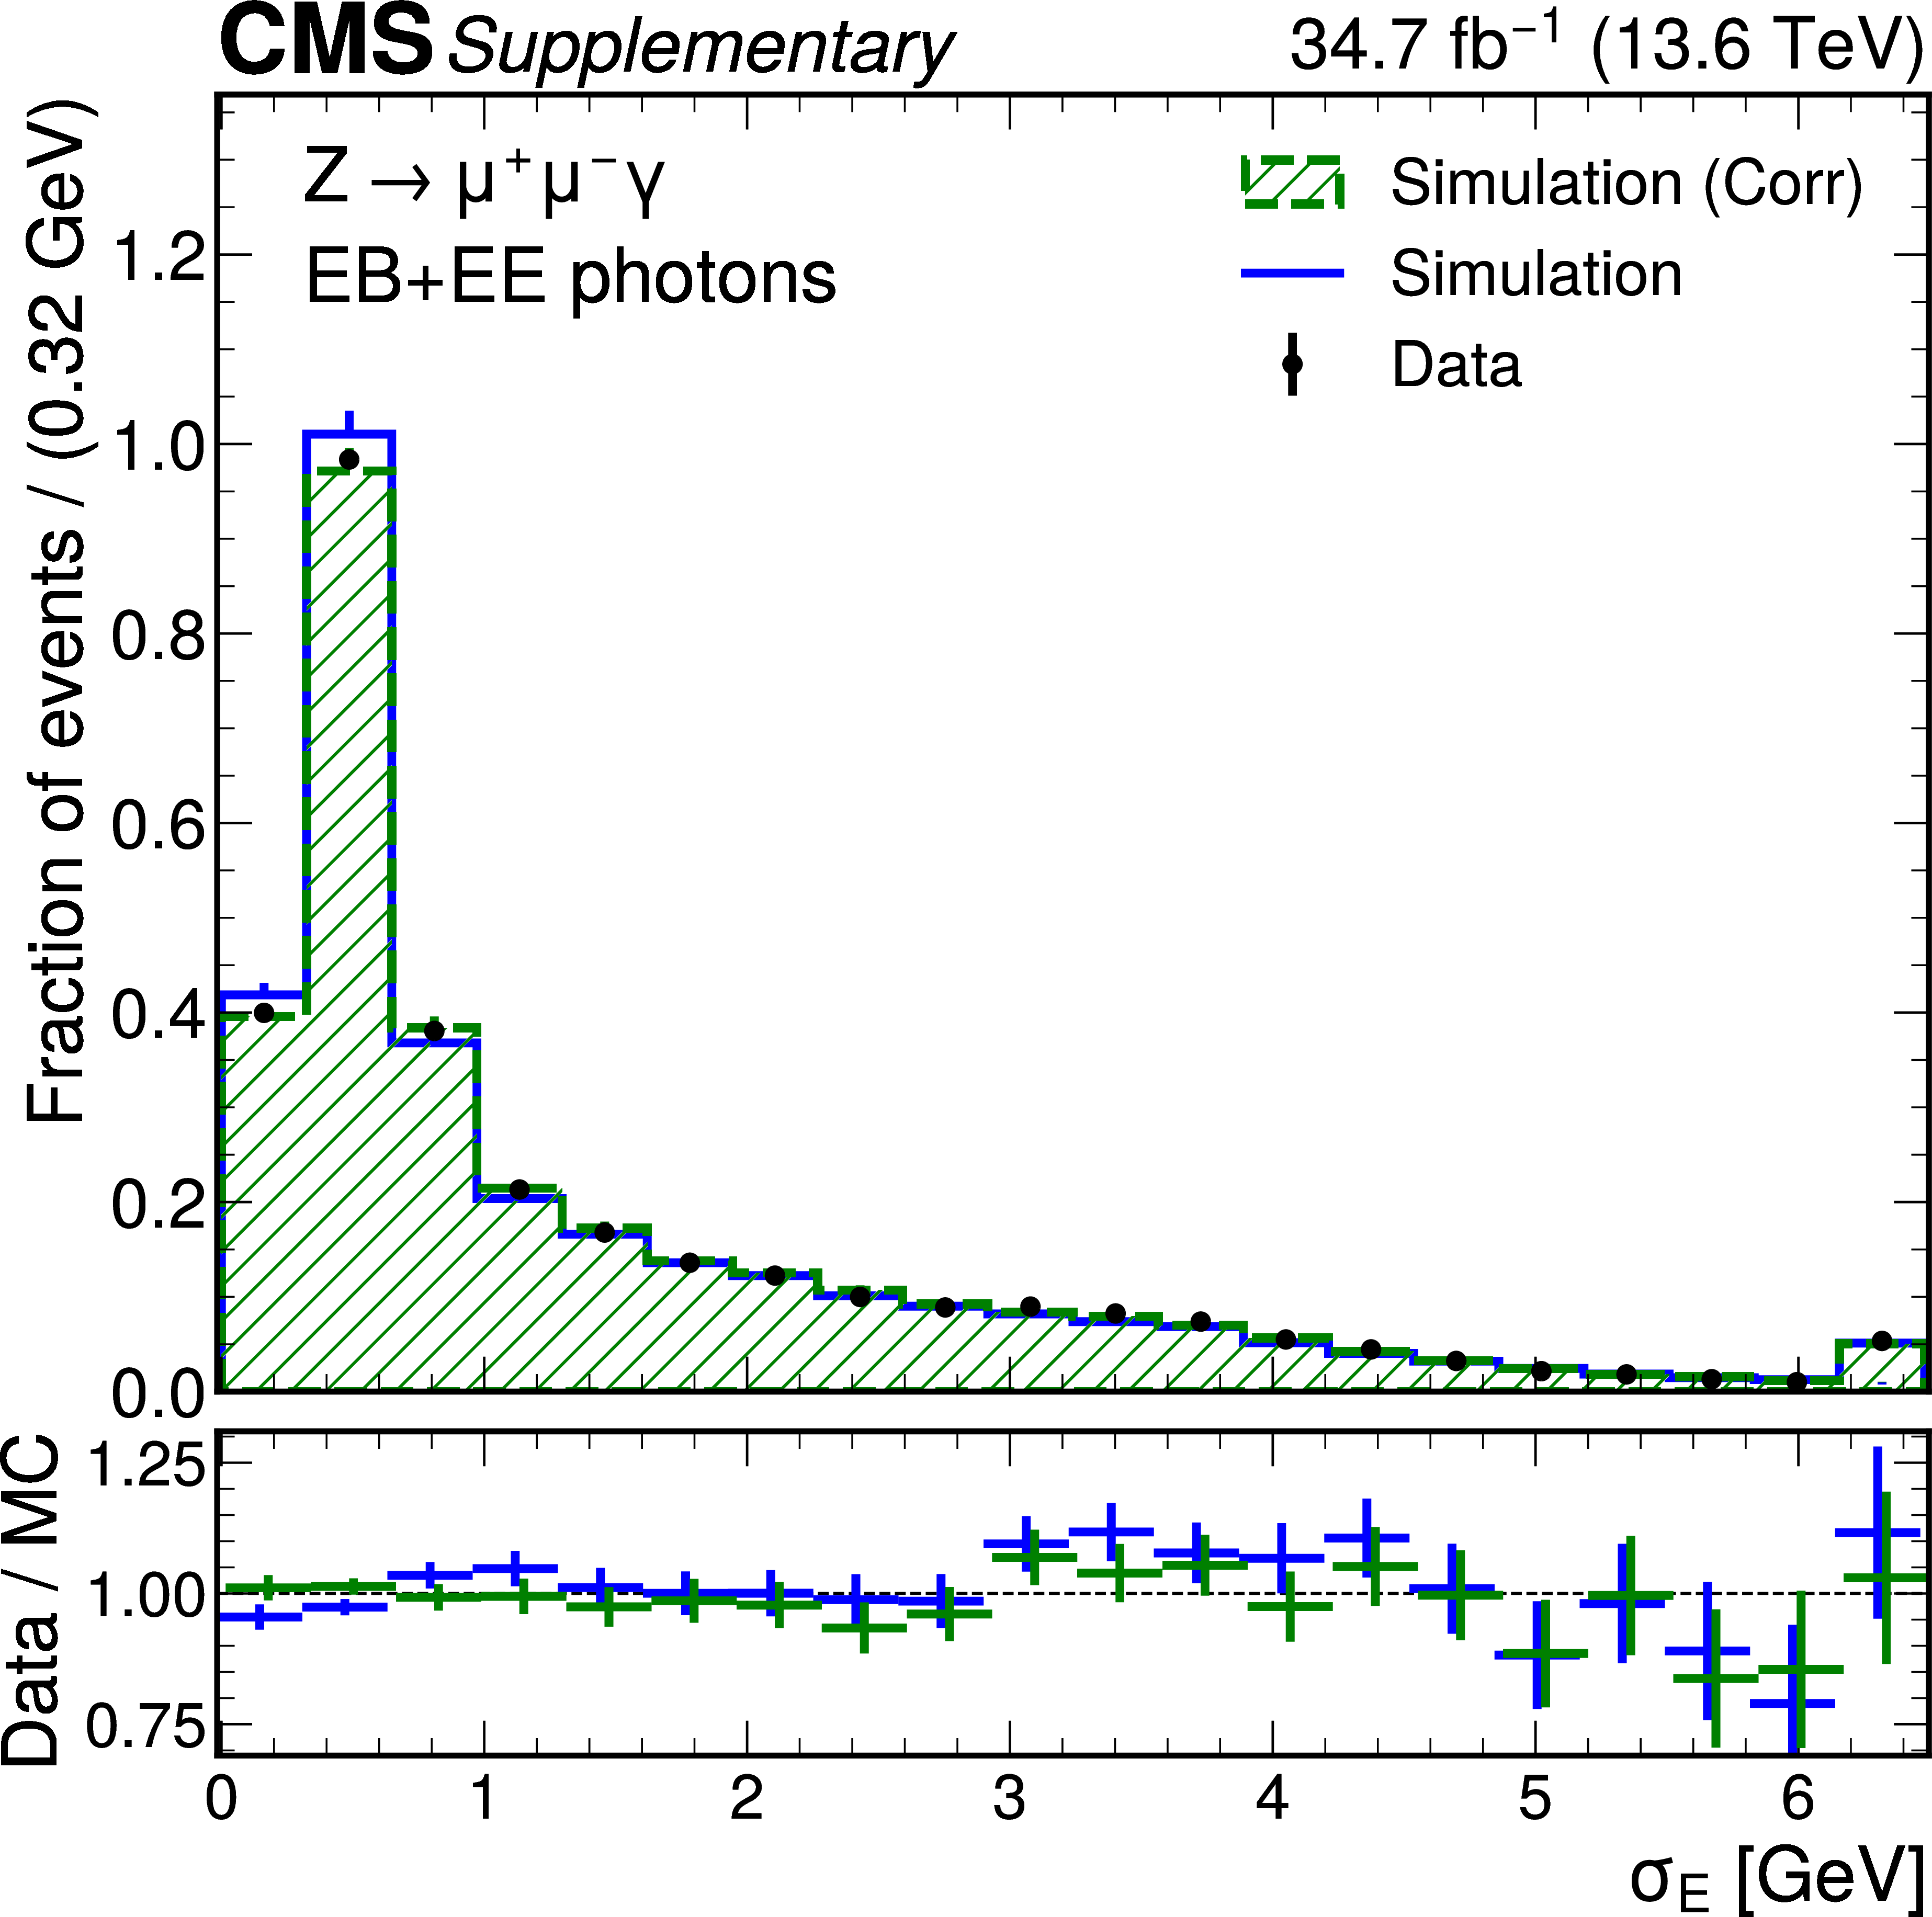
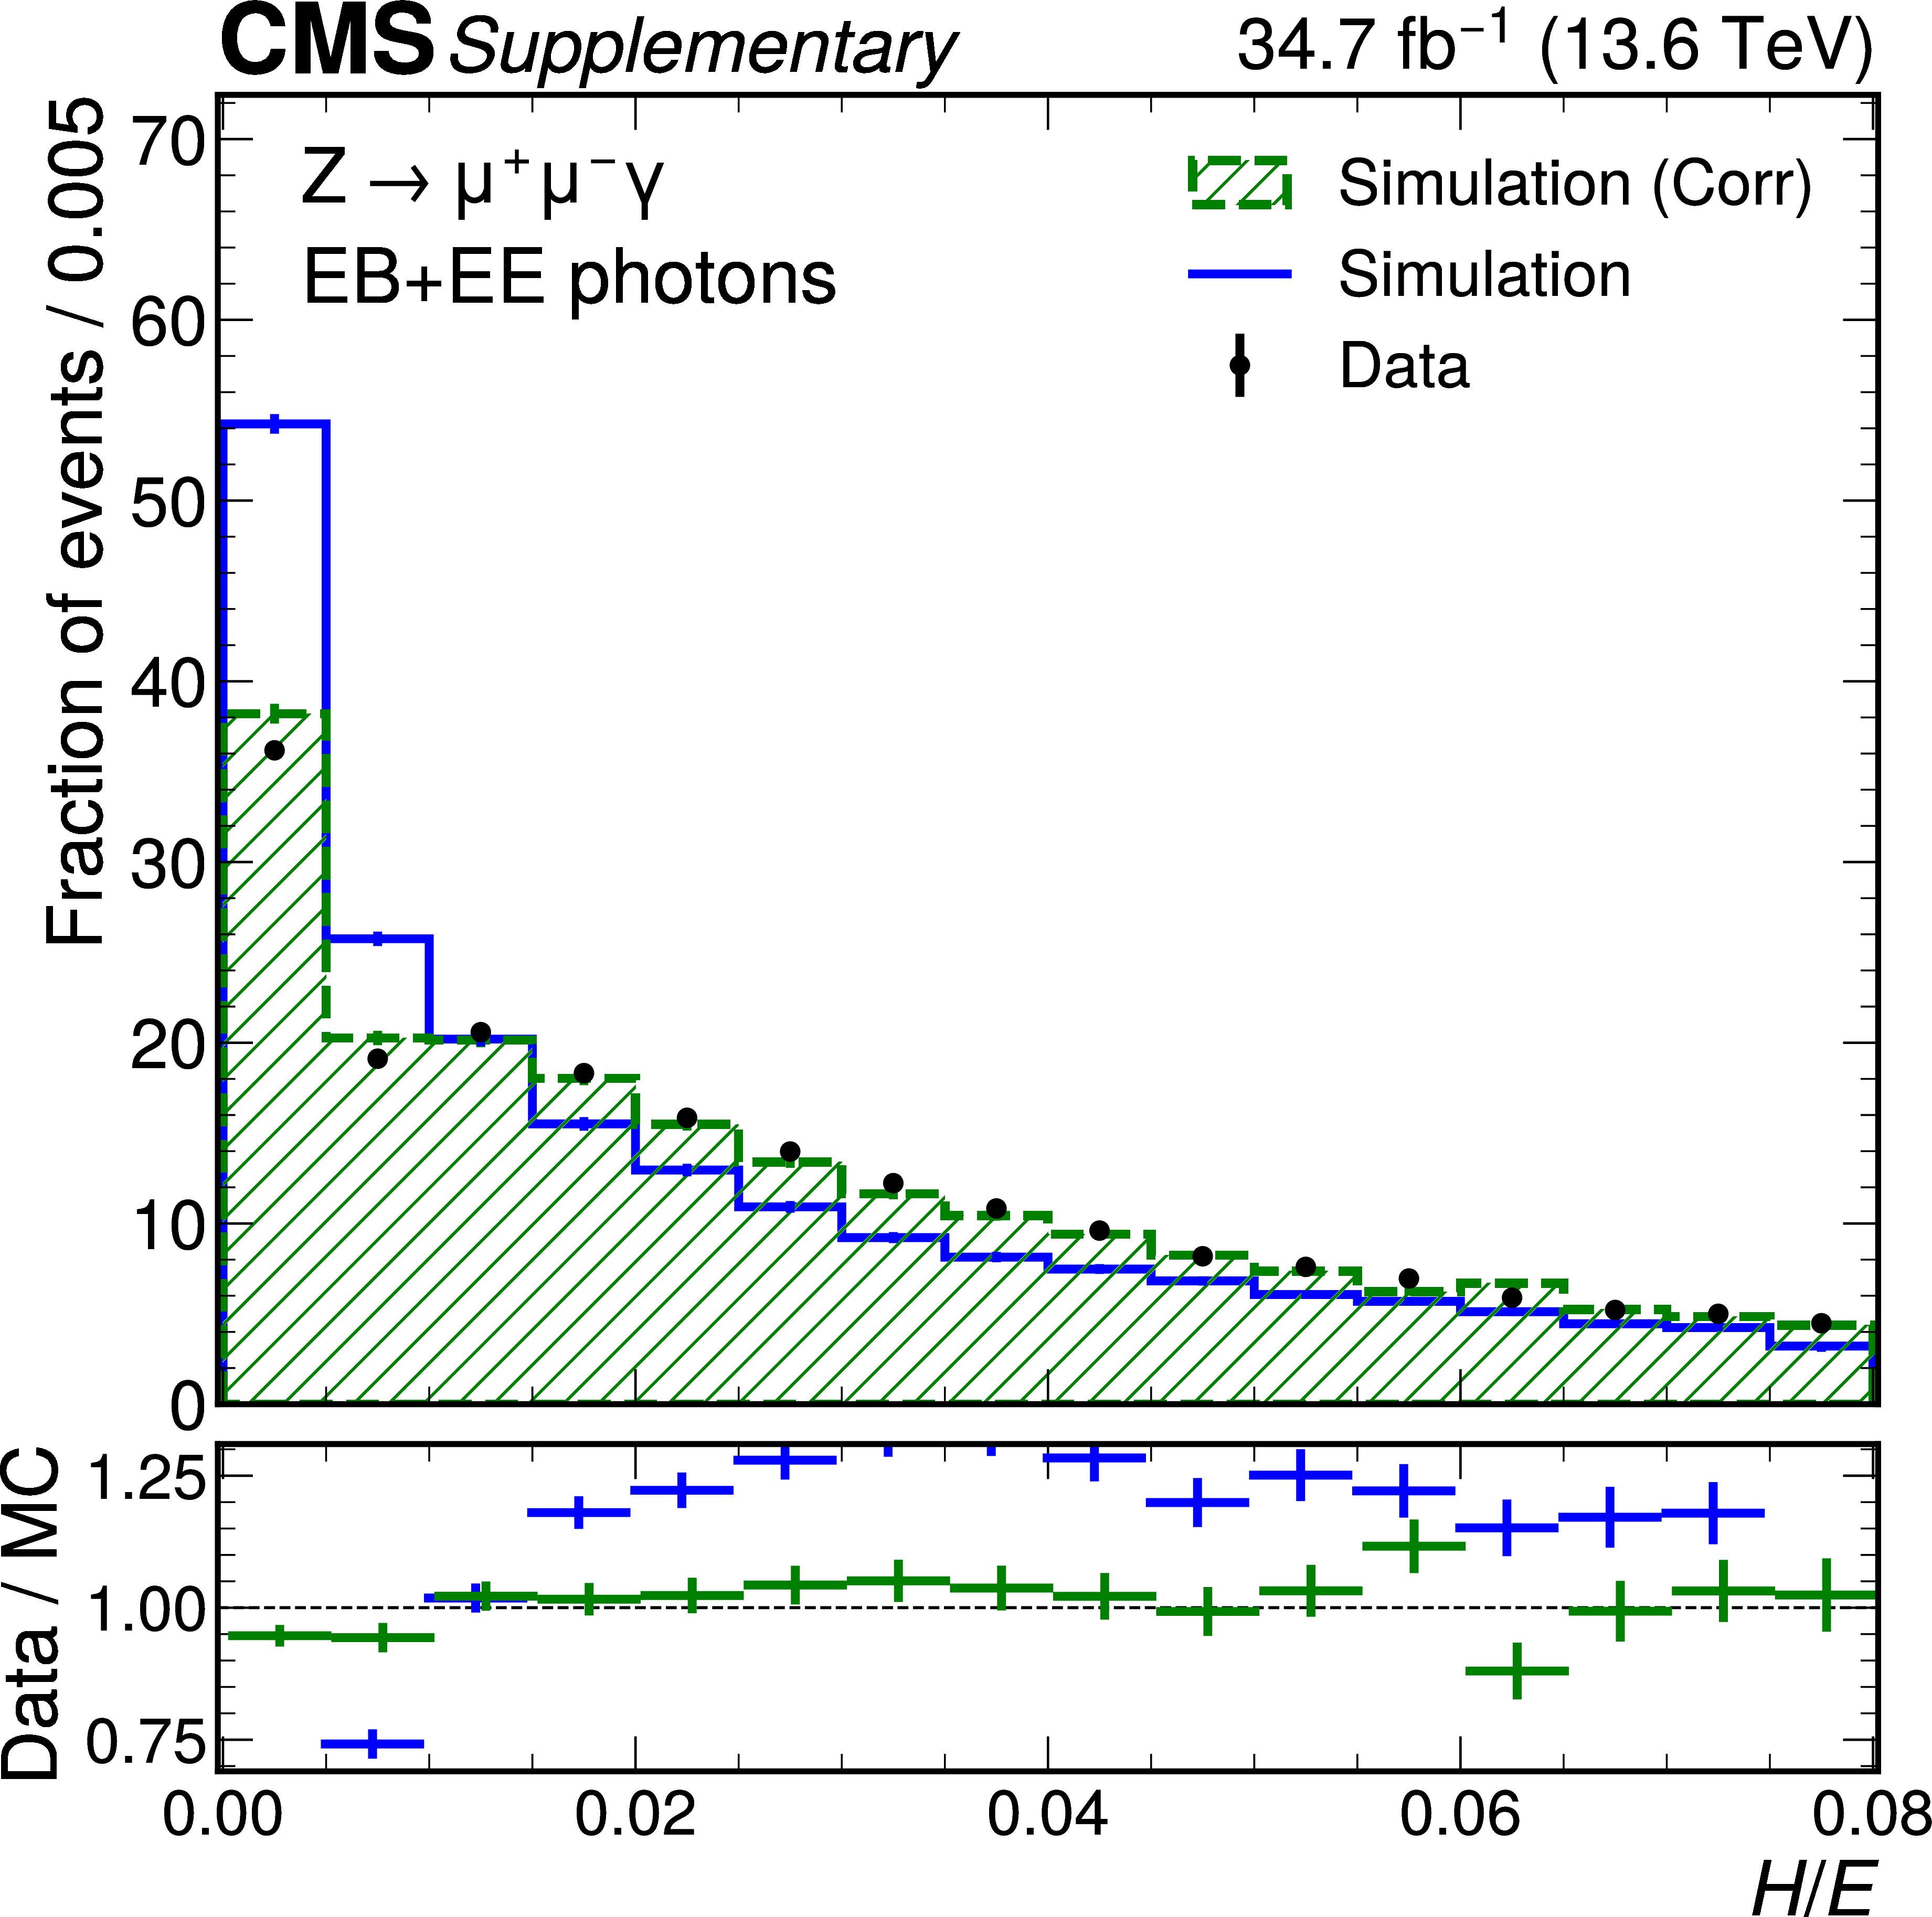
Figure 2:
Data-to-simulation comparison for $ \sigma_{E} $ (upper left), $ H/E $ (upper right), the photon identification BDT score in EB (lower left) and EE (lower right) for electrons from $ \mathrm{Z} \to \mathrm{e}\mathrm{e} $ decays reconstructed as photons. The uncorrected distributions are shown in blue and the corrected distributions from the normalizing flow are shown in green. The error bars in the ratio panels include the statistical uncertainty from the data and the uncertainty from the limited number of simulated events. For the distributions of the photon identification BDT score, the shaded region corresponds to photons with a BDT score $ {<} $ 0.25, which are excluded by the selection applied in the cross section measurements. For the $ \sigma_{E} $ distribution, the last bin contains the overflow. |
png pdf |
Figure 2-a:
Data-to-simulation comparison for $ \sigma_{E} $ (upper left), $ H/E $ (upper right), the photon identification BDT score in EB (lower left) and EE (lower right) for electrons from $ \mathrm{Z} \to \mathrm{e}\mathrm{e} $ decays reconstructed as photons. The uncorrected distributions are shown in blue and the corrected distributions from the normalizing flow are shown in green. The error bars in the ratio panels include the statistical uncertainty from the data and the uncertainty from the limited number of simulated events. For the distributions of the photon identification BDT score, the shaded region corresponds to photons with a BDT score $ {<} $ 0.25, which are excluded by the selection applied in the cross section measurements. For the $ \sigma_{E} $ distribution, the last bin contains the overflow. |
png pdf |
Figure 2-b:
Data-to-simulation comparison for $ \sigma_{E} $ (upper left), $ H/E $ (upper right), the photon identification BDT score in EB (lower left) and EE (lower right) for electrons from $ \mathrm{Z} \to \mathrm{e}\mathrm{e} $ decays reconstructed as photons. The uncorrected distributions are shown in blue and the corrected distributions from the normalizing flow are shown in green. The error bars in the ratio panels include the statistical uncertainty from the data and the uncertainty from the limited number of simulated events. For the distributions of the photon identification BDT score, the shaded region corresponds to photons with a BDT score $ {<} $ 0.25, which are excluded by the selection applied in the cross section measurements. For the $ \sigma_{E} $ distribution, the last bin contains the overflow. |
png pdf |
Figure 2-c:
Data-to-simulation comparison for $ \sigma_{E} $ (upper left), $ H/E $ (upper right), the photon identification BDT score in EB (lower left) and EE (lower right) for electrons from $ \mathrm{Z} \to \mathrm{e}\mathrm{e} $ decays reconstructed as photons. The uncorrected distributions are shown in blue and the corrected distributions from the normalizing flow are shown in green. The error bars in the ratio panels include the statistical uncertainty from the data and the uncertainty from the limited number of simulated events. For the distributions of the photon identification BDT score, the shaded region corresponds to photons with a BDT score $ {<} $ 0.25, which are excluded by the selection applied in the cross section measurements. For the $ \sigma_{E} $ distribution, the last bin contains the overflow. |
png pdf |
Figure 2-d:
Data-to-simulation comparison for $ \sigma_{E} $ (upper left), $ H/E $ (upper right), the photon identification BDT score in EB (lower left) and EE (lower right) for electrons from $ \mathrm{Z} \to \mathrm{e}\mathrm{e} $ decays reconstructed as photons. The uncorrected distributions are shown in blue and the corrected distributions from the normalizing flow are shown in green. The error bars in the ratio panels include the statistical uncertainty from the data and the uncertainty from the limited number of simulated events. For the distributions of the photon identification BDT score, the shaded region corresponds to photons with a BDT score $ {<} $ 0.25, which are excluded by the selection applied in the cross section measurements. For the $ \sigma_{E} $ distribution, the last bin contains the overflow. |
png pdf |
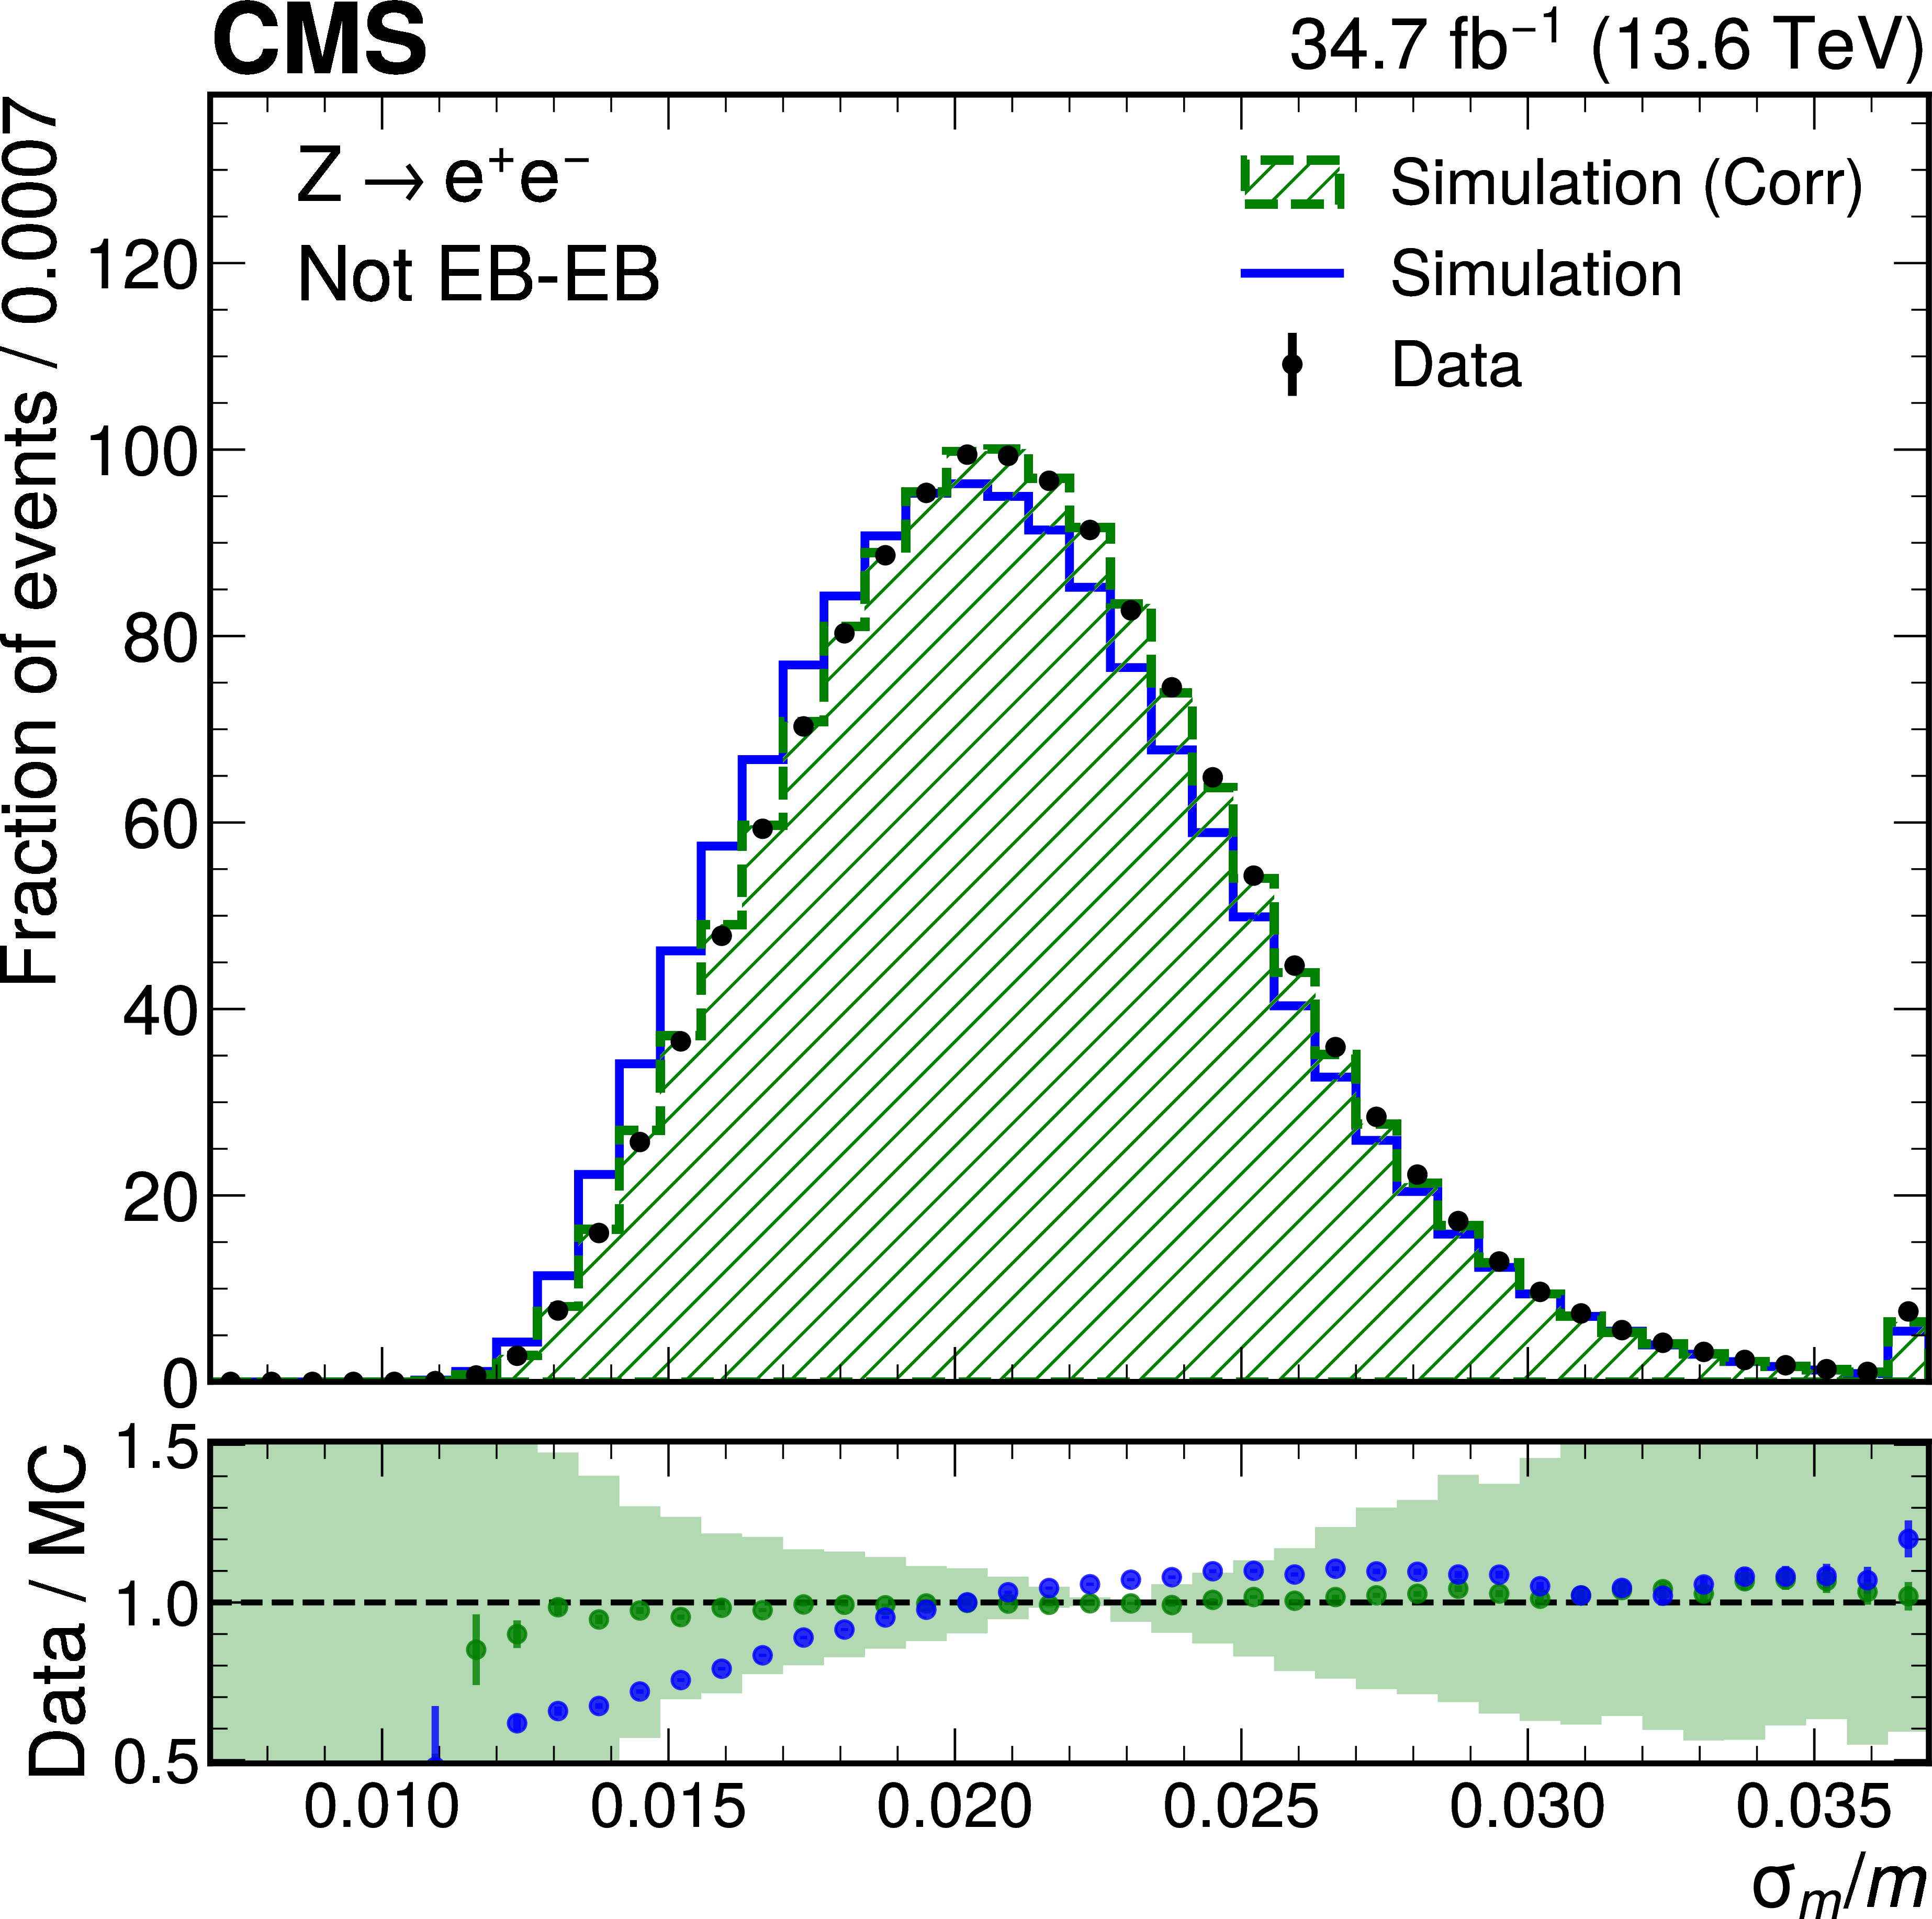
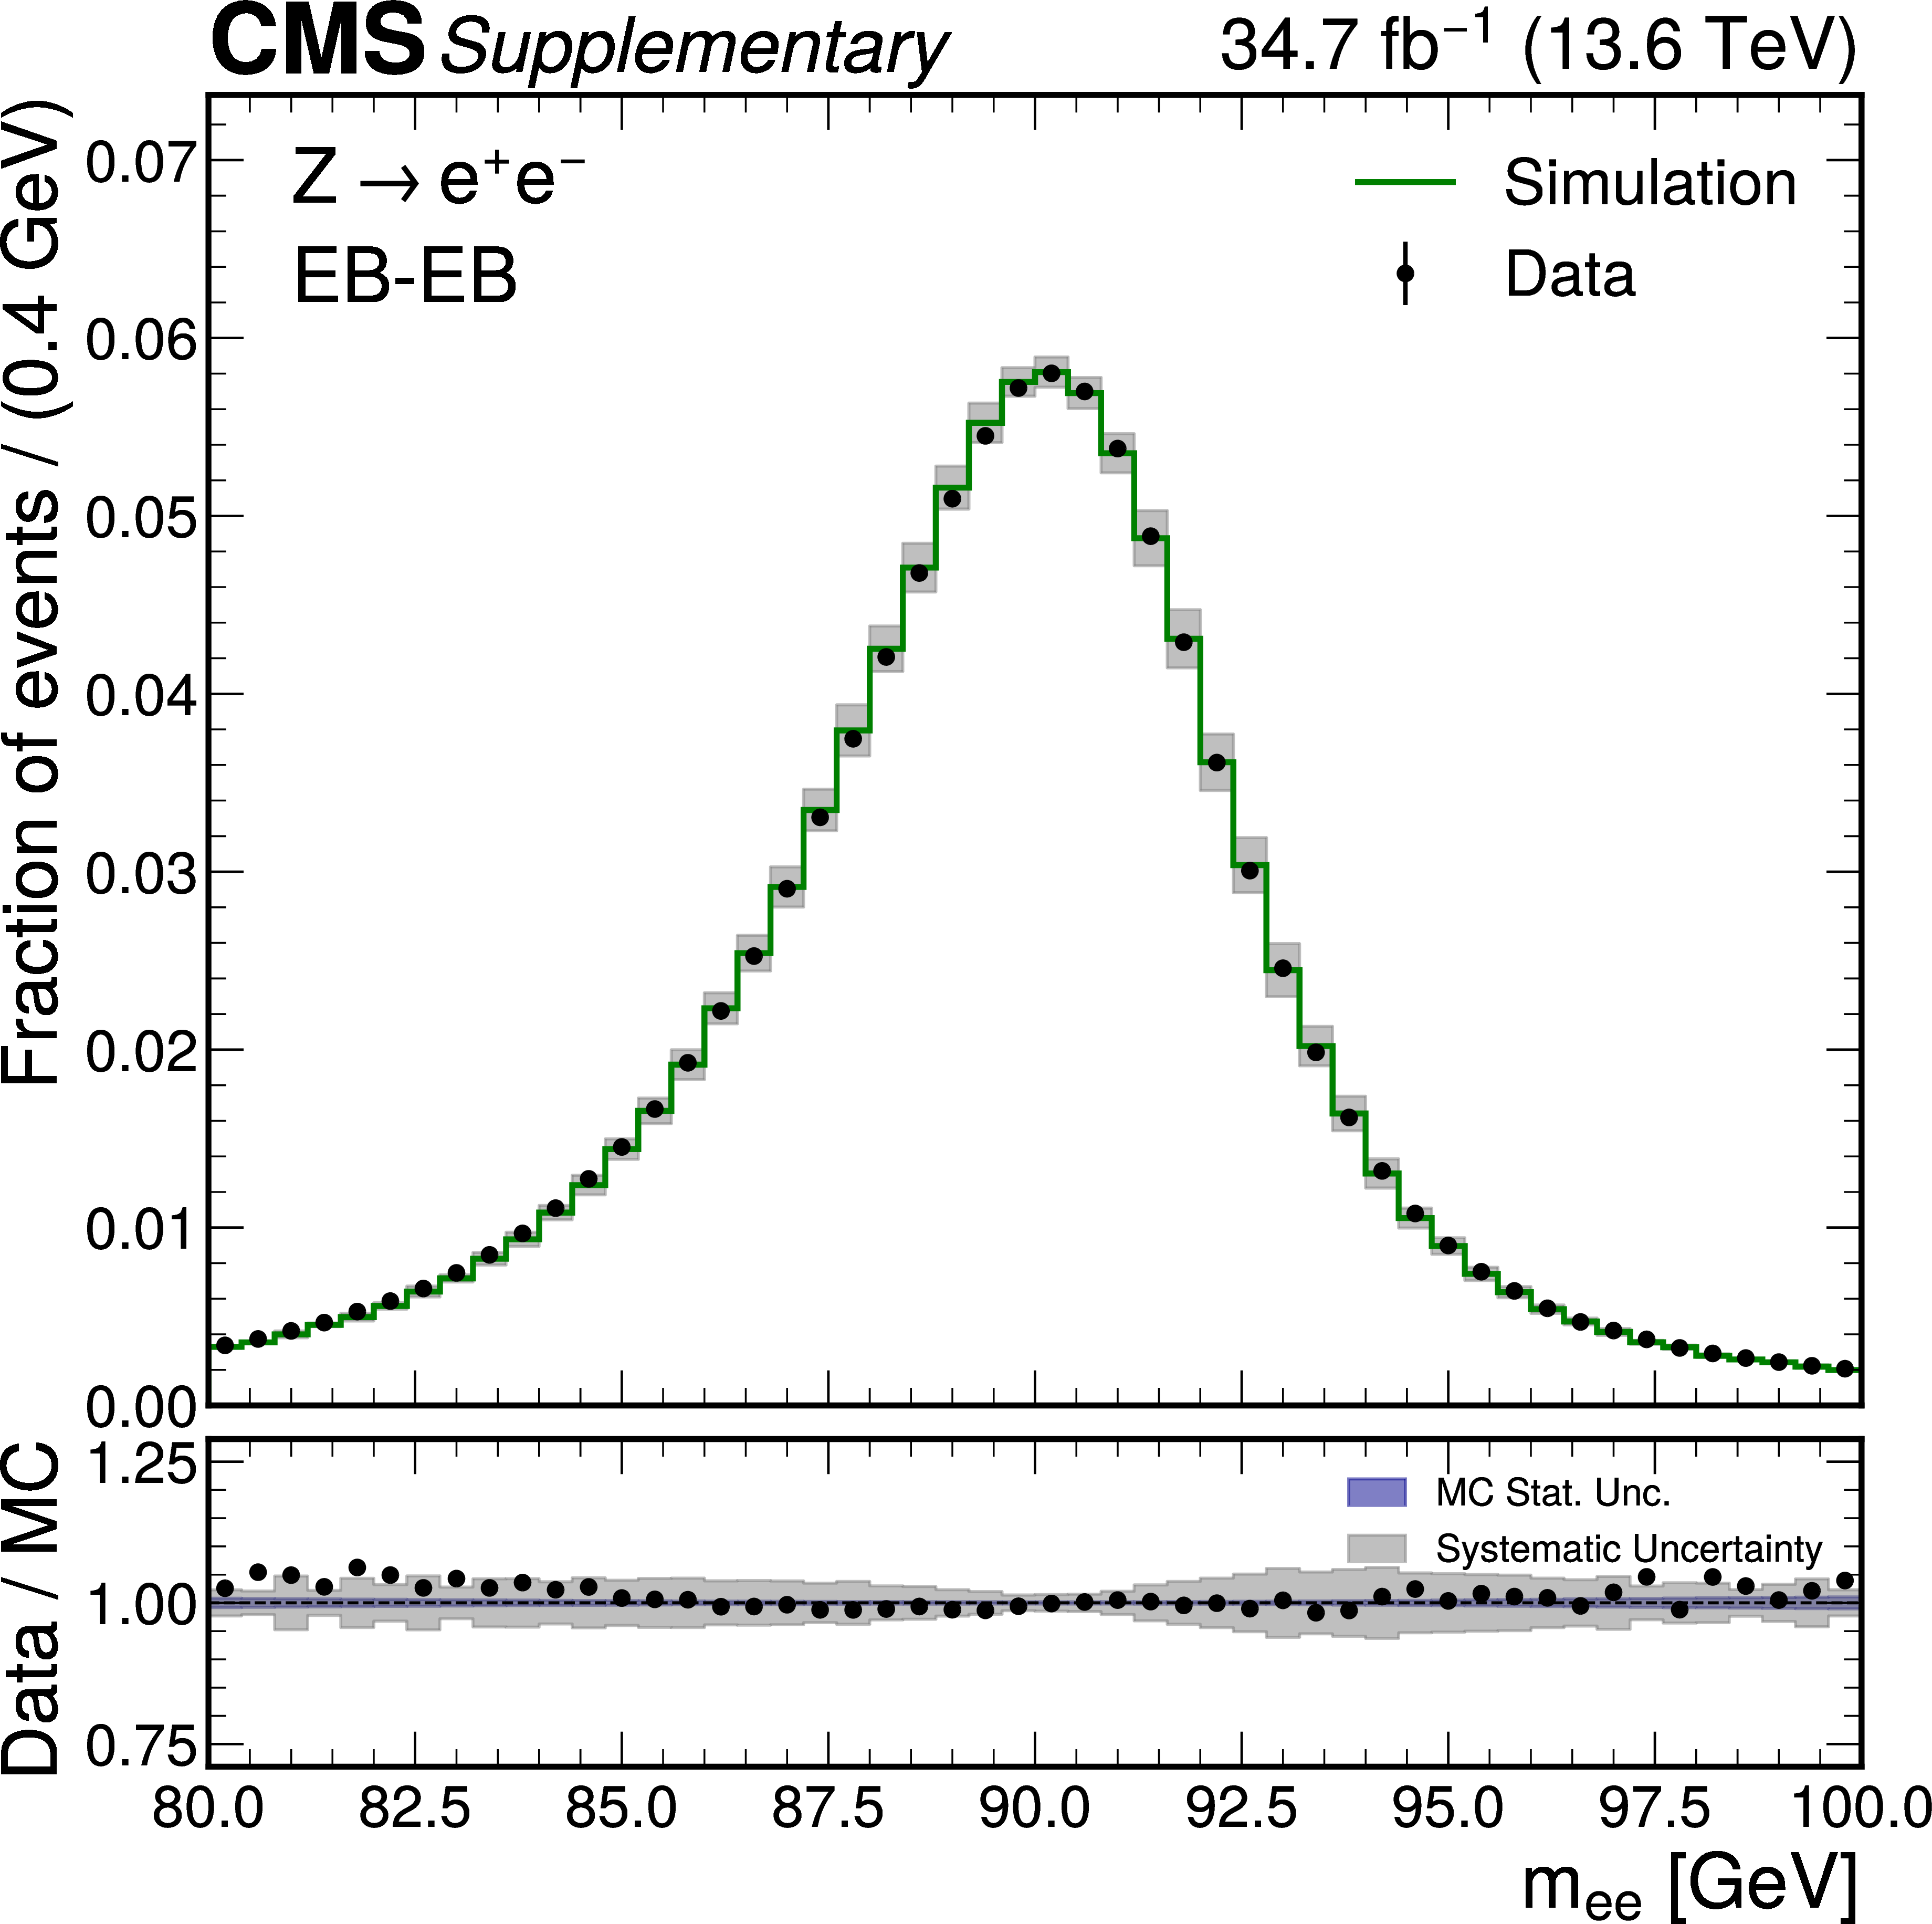
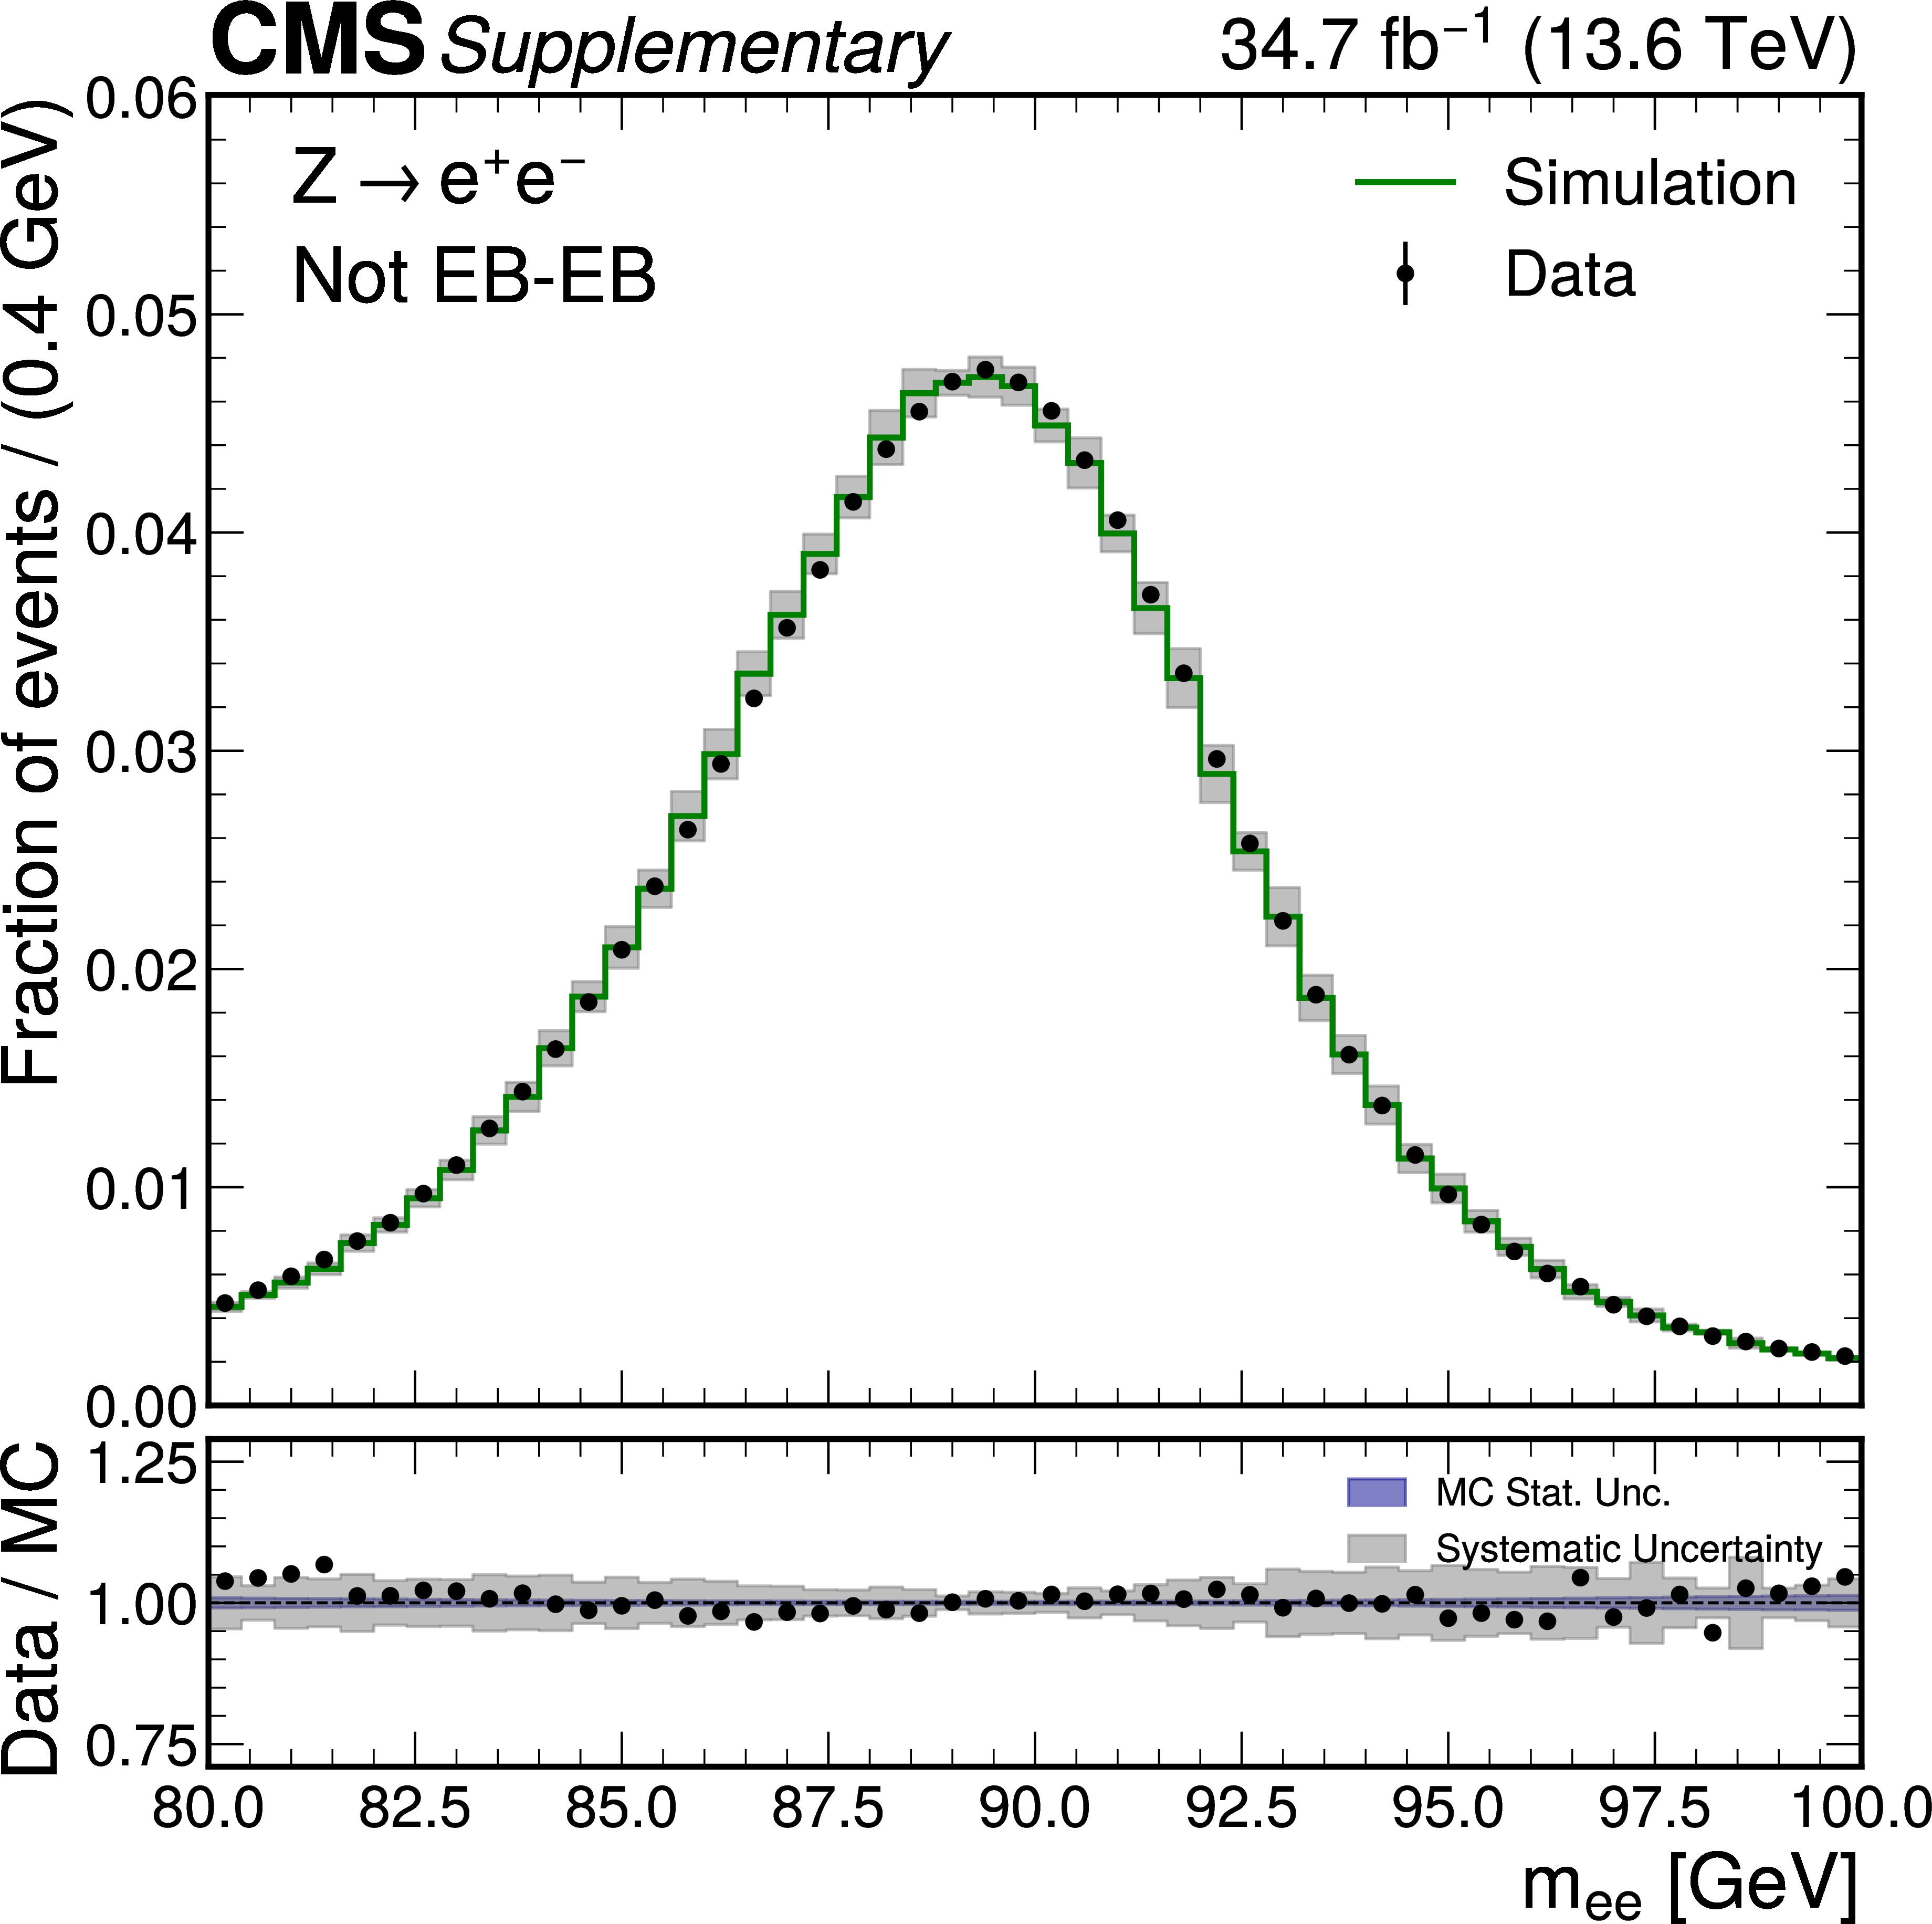
Figure 3:
Data-to-simulation comparison of the per-event decorrelated mass-resolution estimator $ \sigma_m/m $ using $ \mathrm{Z} \to \mathrm{e}\mathrm{e} $ events. Both electrons are reconstructed as photons and categorized either both in the EB (left) or at least one in the EE (right). The uncertainty band in the lower panel represents the systematic uncertainty based on the residual mismodelling of $ \sigma_E/E $ (5%). The error bars on the markers in the lower panels include the statistical uncertainty from data and the uncertainty from a limited number of simulated events. The last bin contains the overflow. |
png pdf |
Figure 3-a:
Data-to-simulation comparison of the per-event decorrelated mass-resolution estimator $ \sigma_m/m $ using $ \mathrm{Z} \to \mathrm{e}\mathrm{e} $ events. Both electrons are reconstructed as photons and categorized either both in the EB (left) or at least one in the EE (right). The uncertainty band in the lower panel represents the systematic uncertainty based on the residual mismodelling of $ \sigma_E/E $ (5%). The error bars on the markers in the lower panels include the statistical uncertainty from data and the uncertainty from a limited number of simulated events. The last bin contains the overflow. |
png pdf |
Figure 3-b:
Data-to-simulation comparison of the per-event decorrelated mass-resolution estimator $ \sigma_m/m $ using $ \mathrm{Z} \to \mathrm{e}\mathrm{e} $ events. Both electrons are reconstructed as photons and categorized either both in the EB (left) or at least one in the EE (right). The uncertainty band in the lower panel represents the systematic uncertainty based on the residual mismodelling of $ \sigma_E/E $ (5%). The error bars on the markers in the lower panels include the statistical uncertainty from data and the uncertainty from a limited number of simulated events. The last bin contains the overflow. |
png pdf |
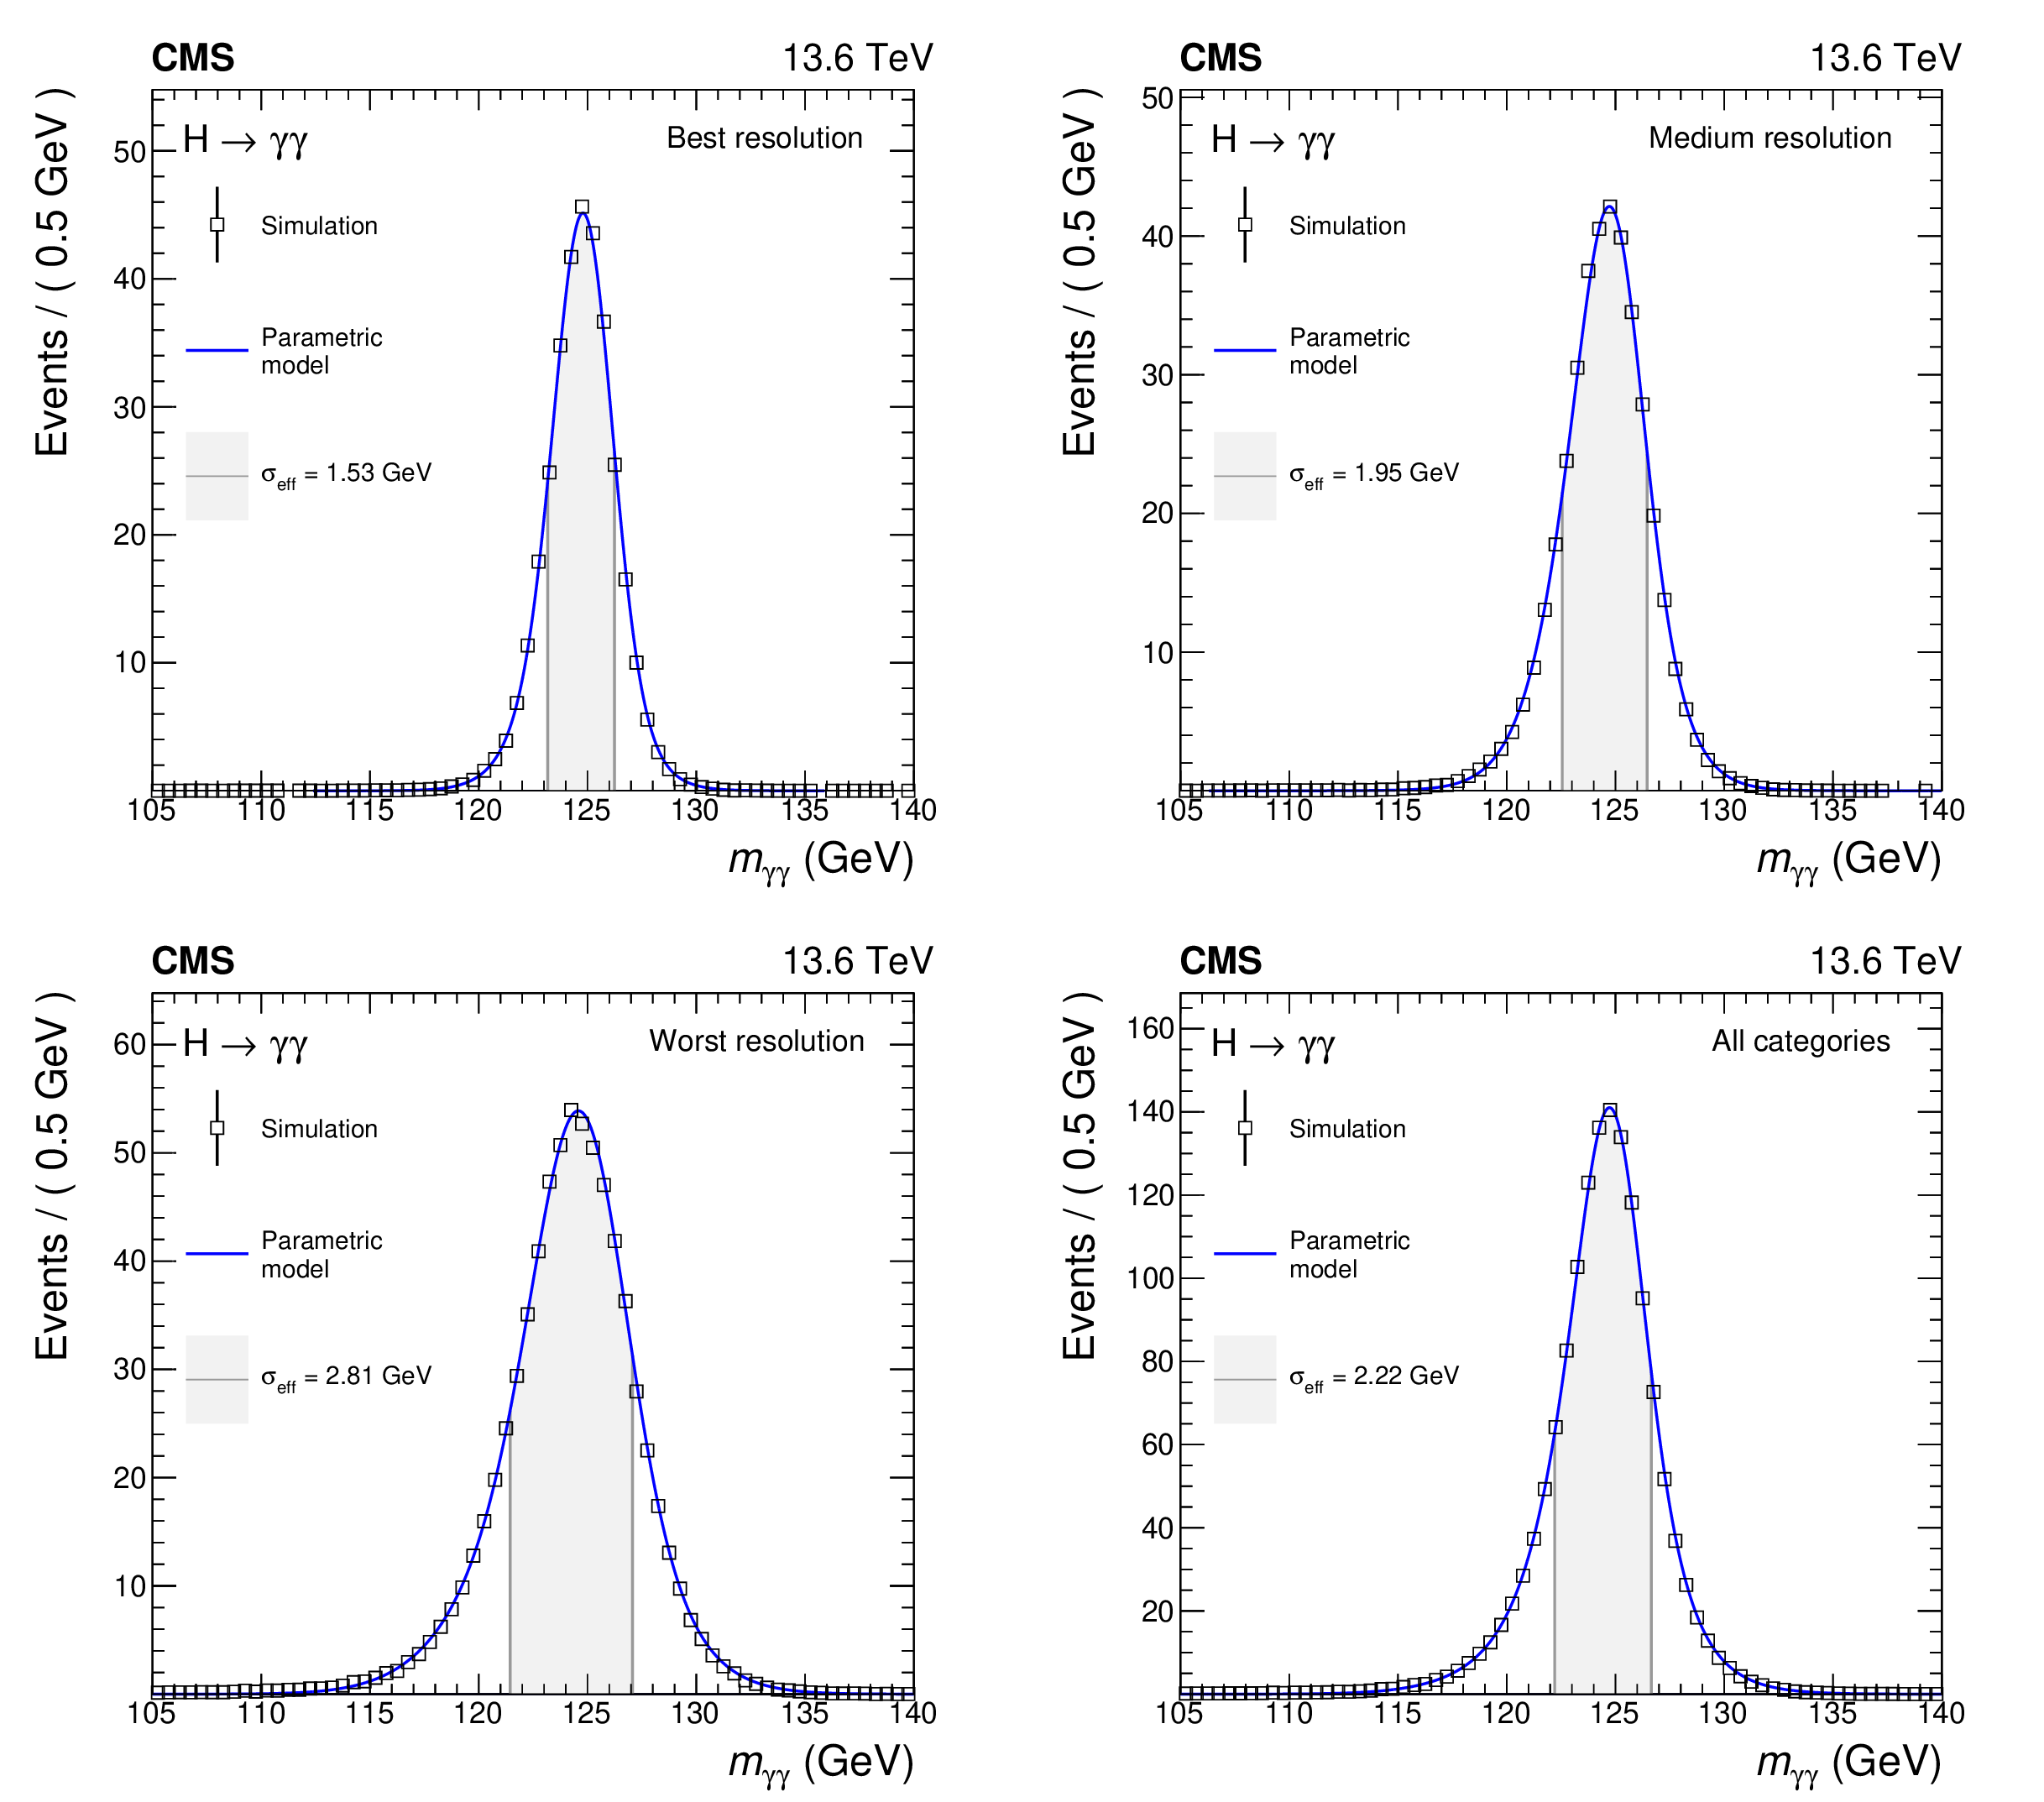
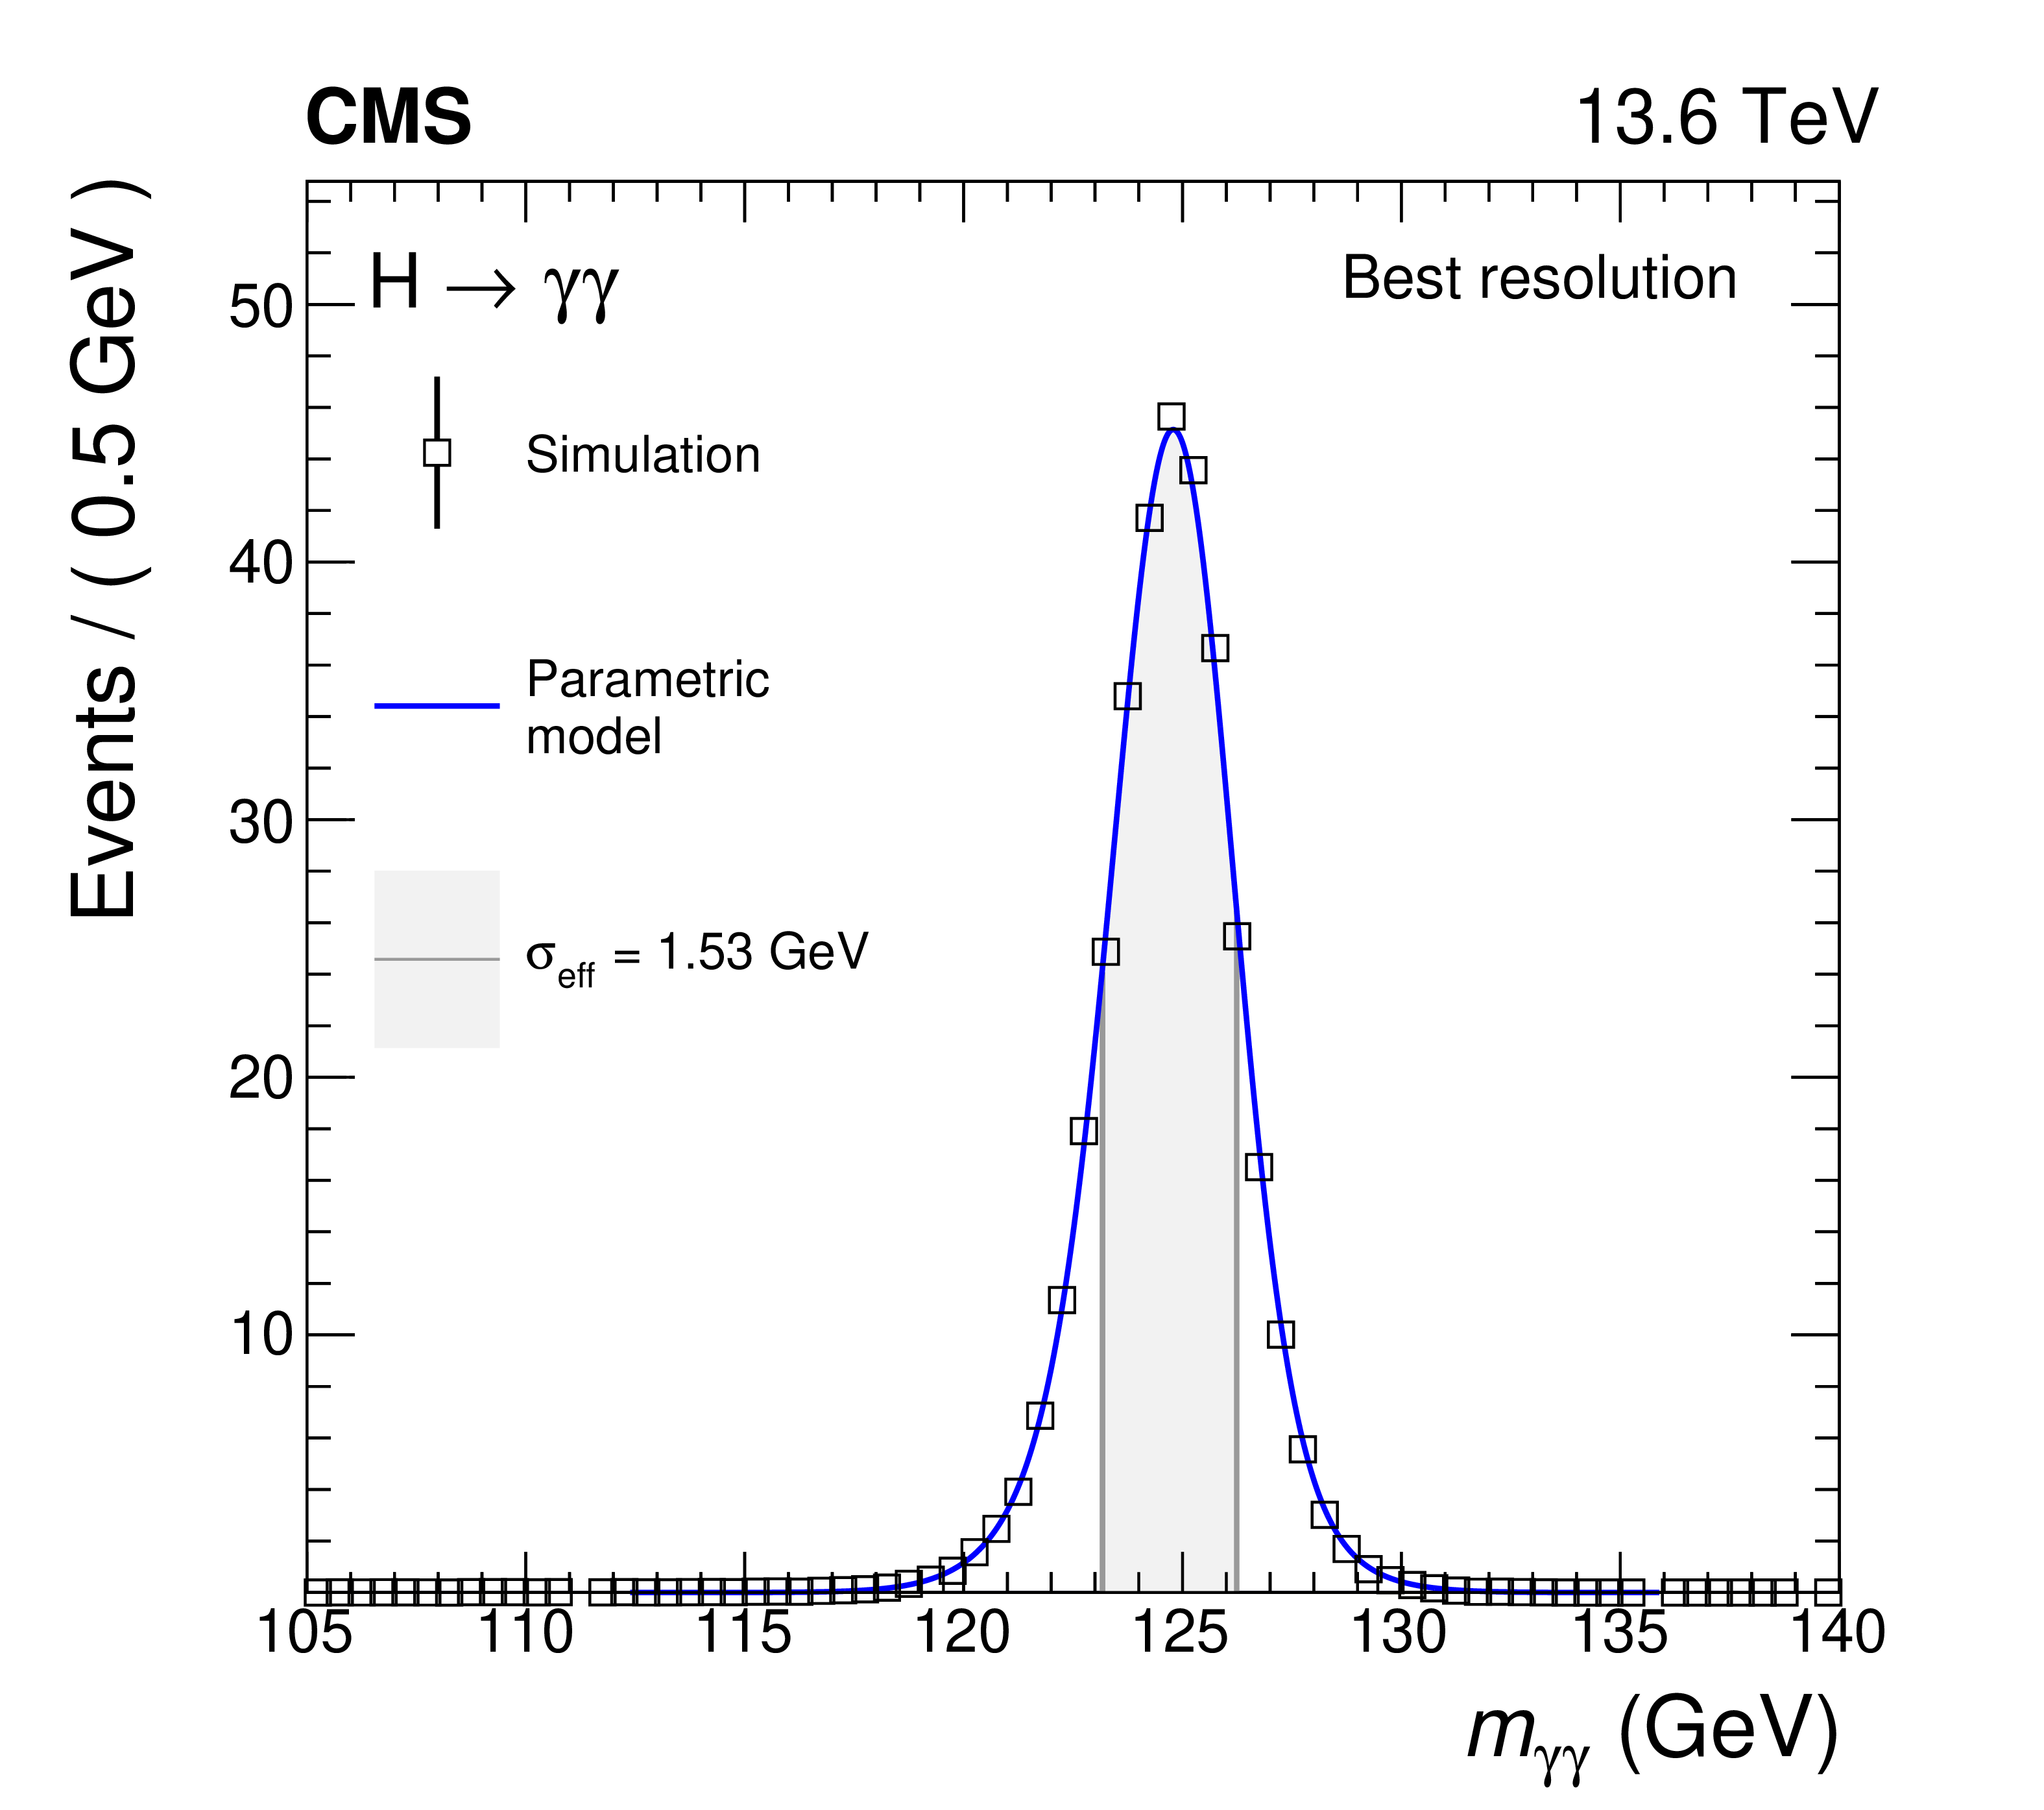
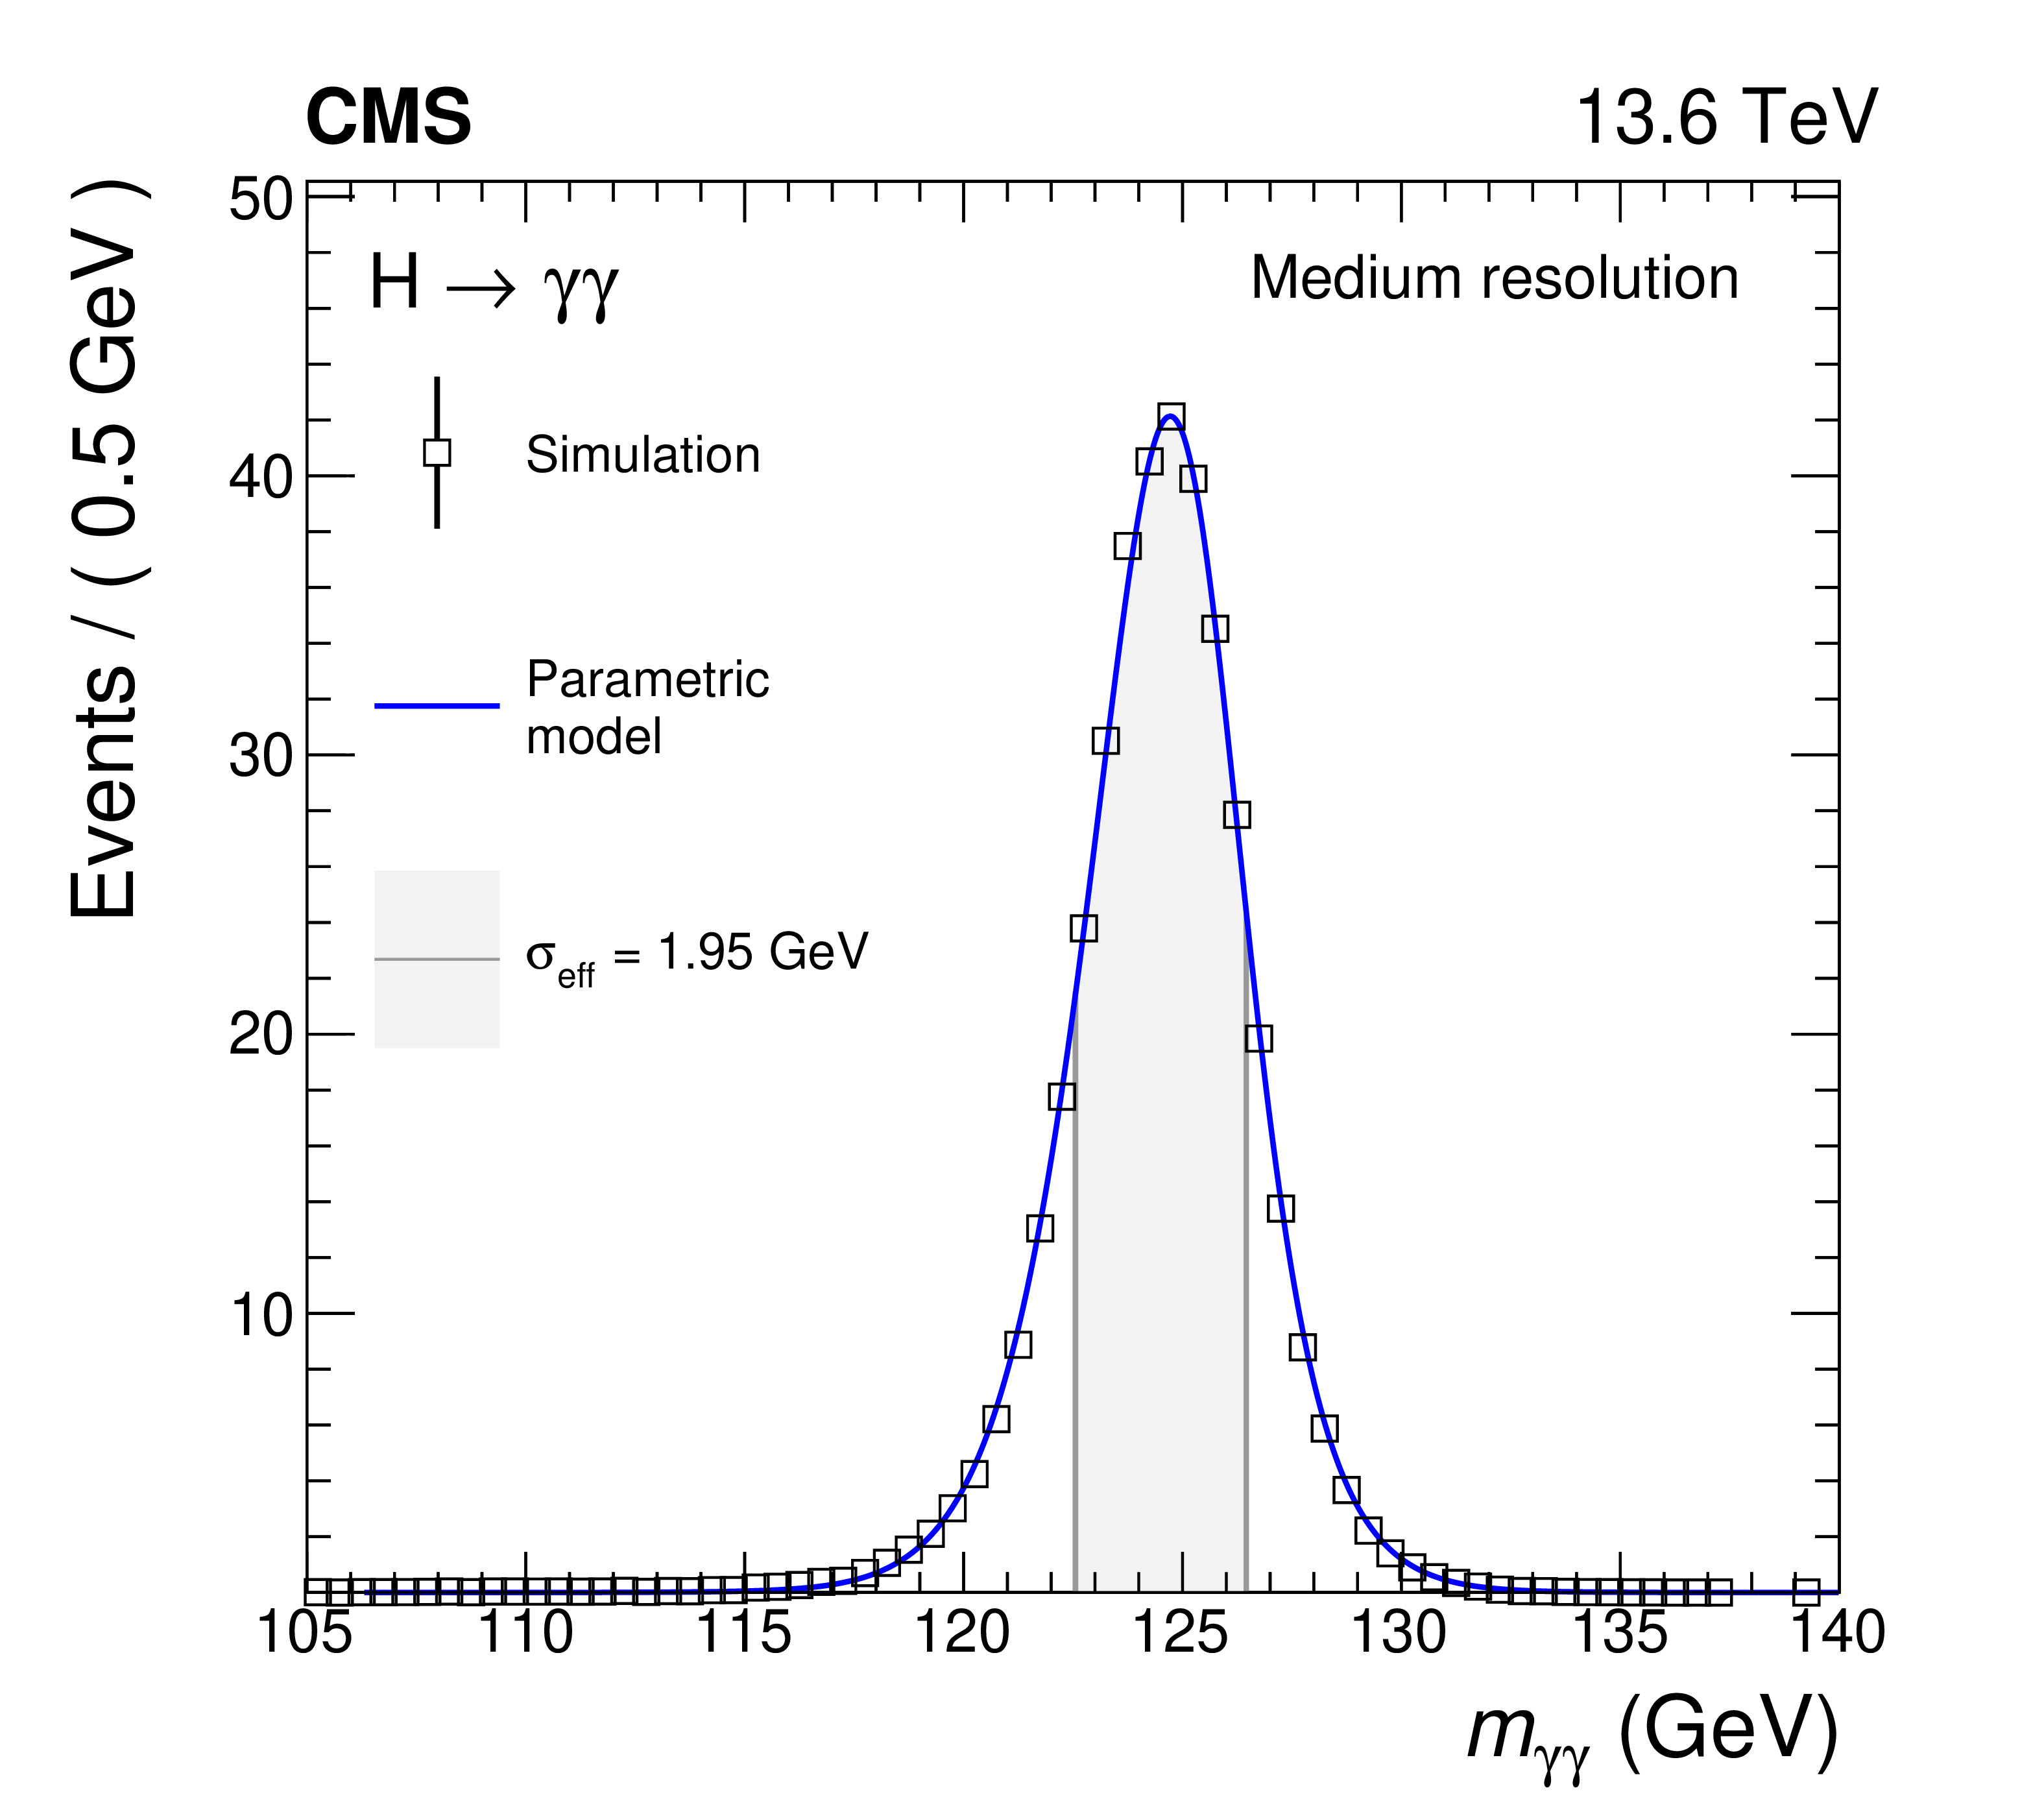
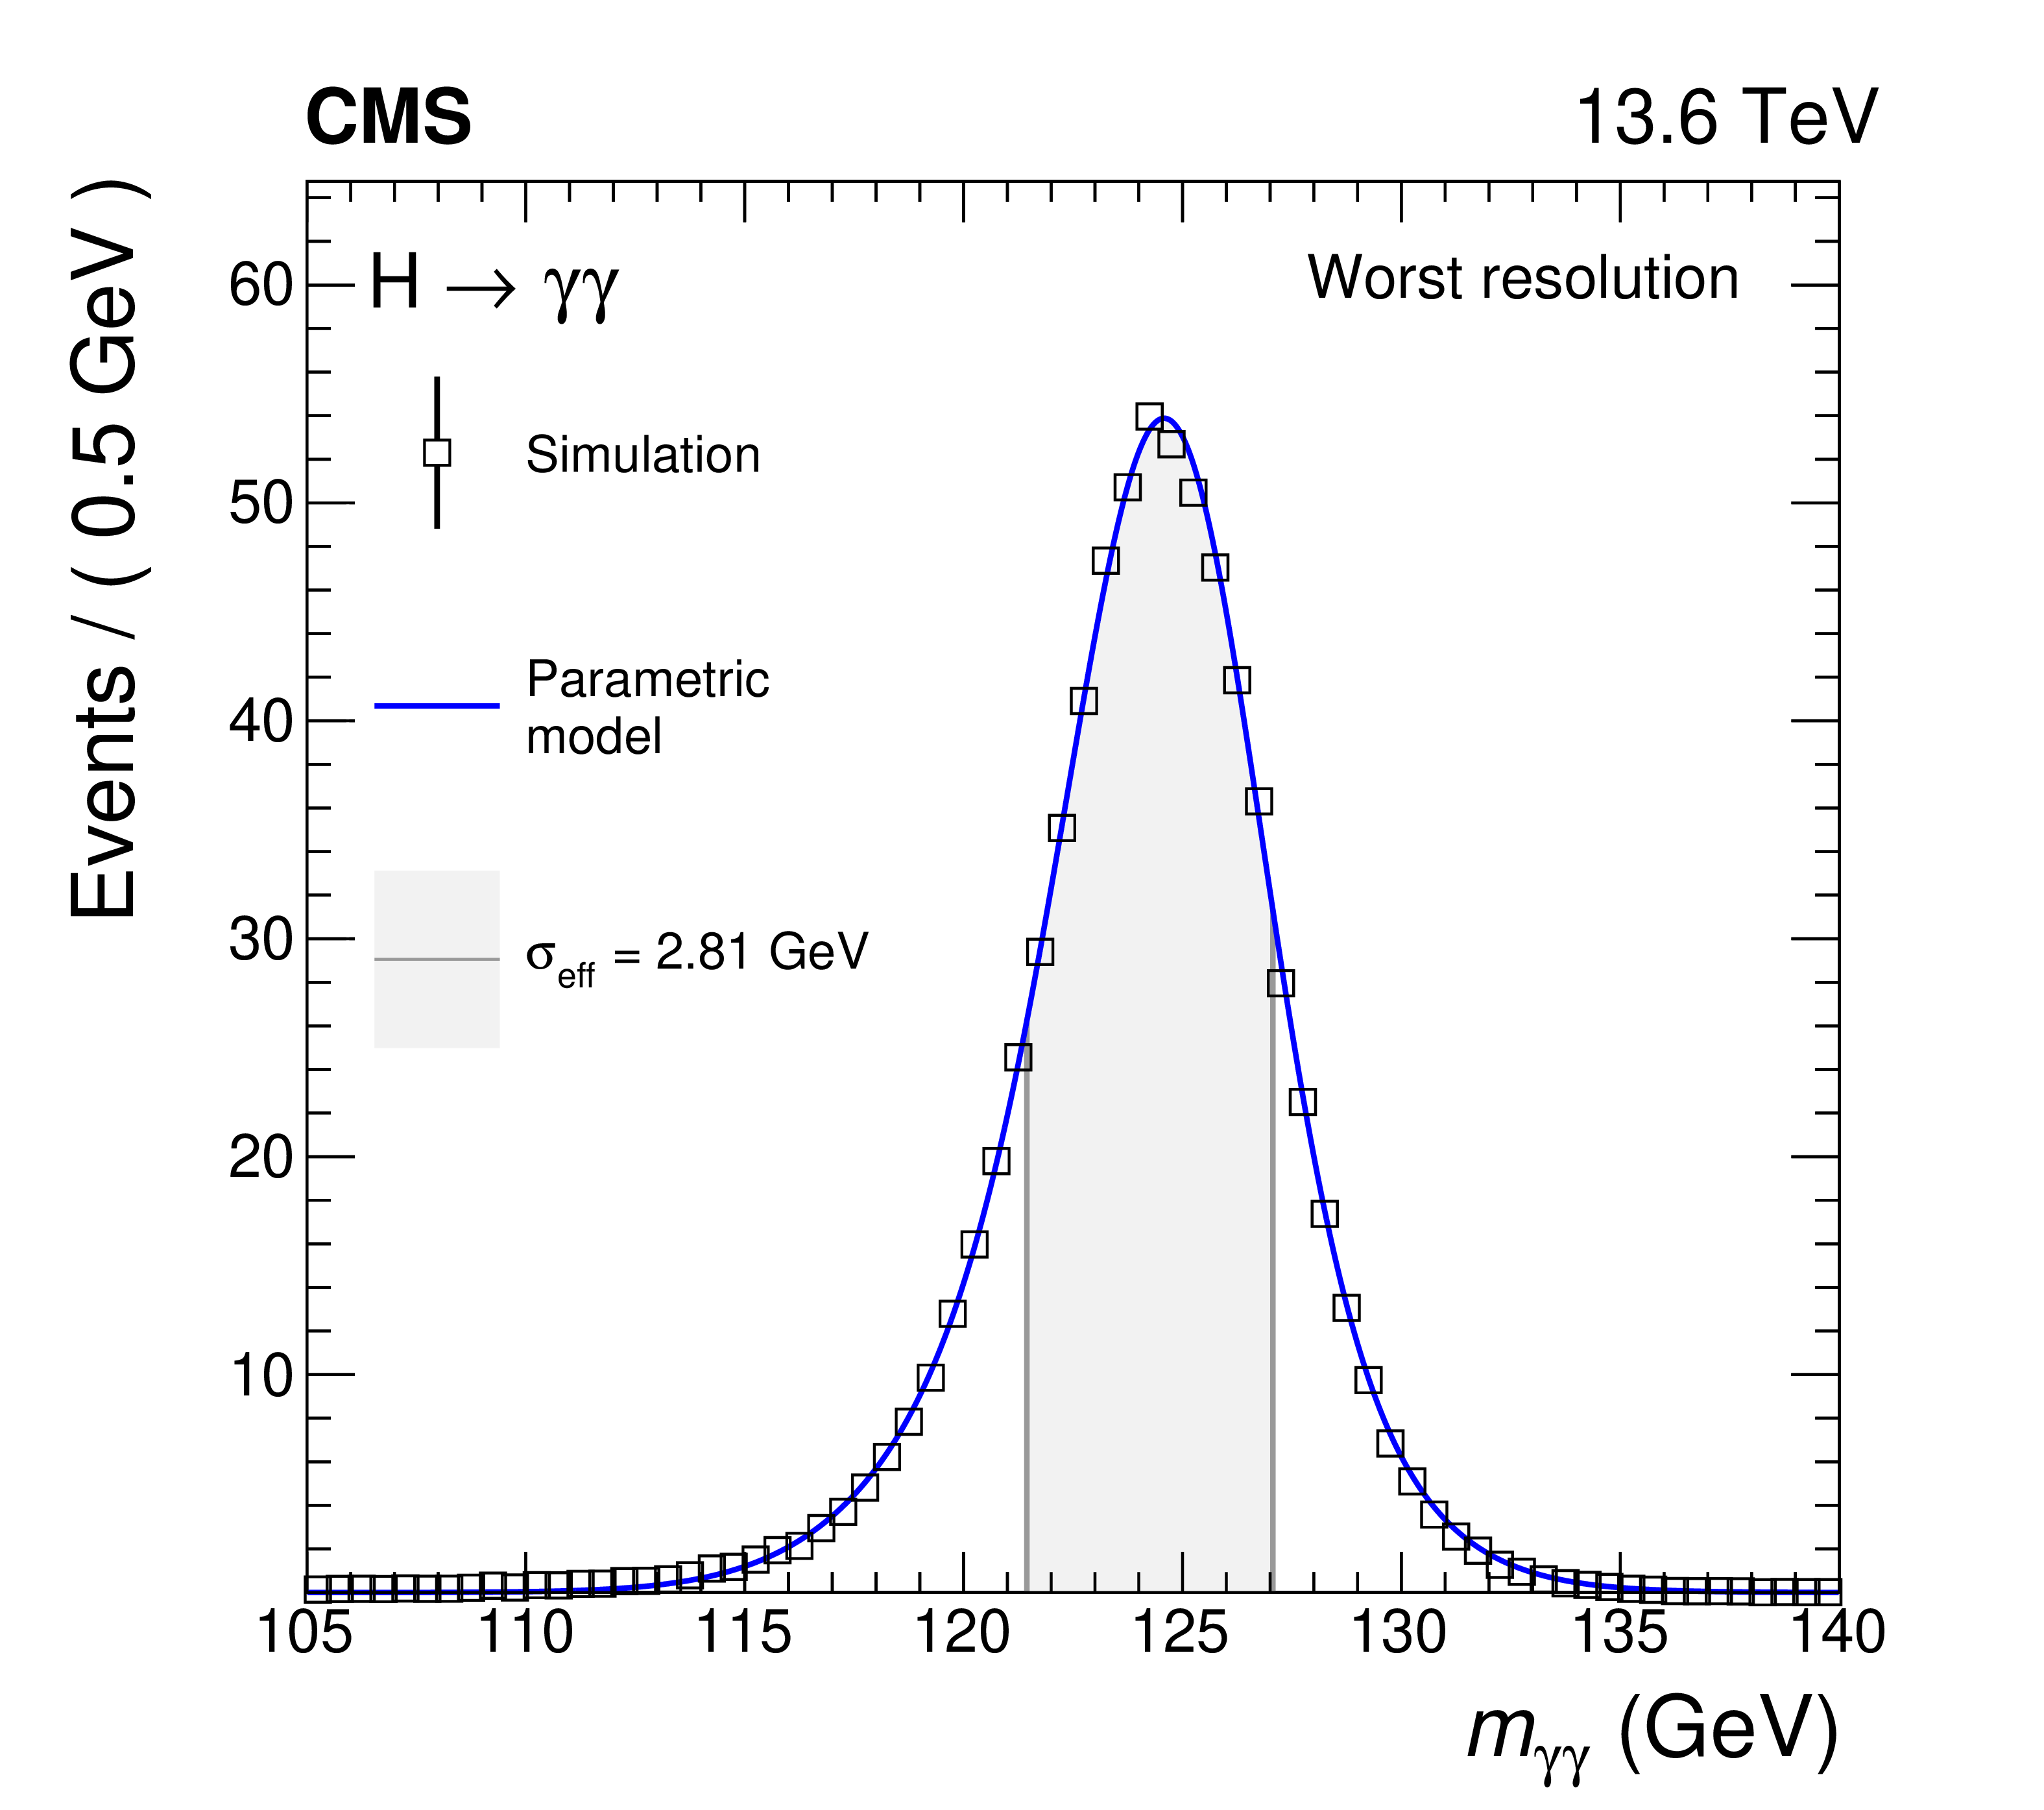
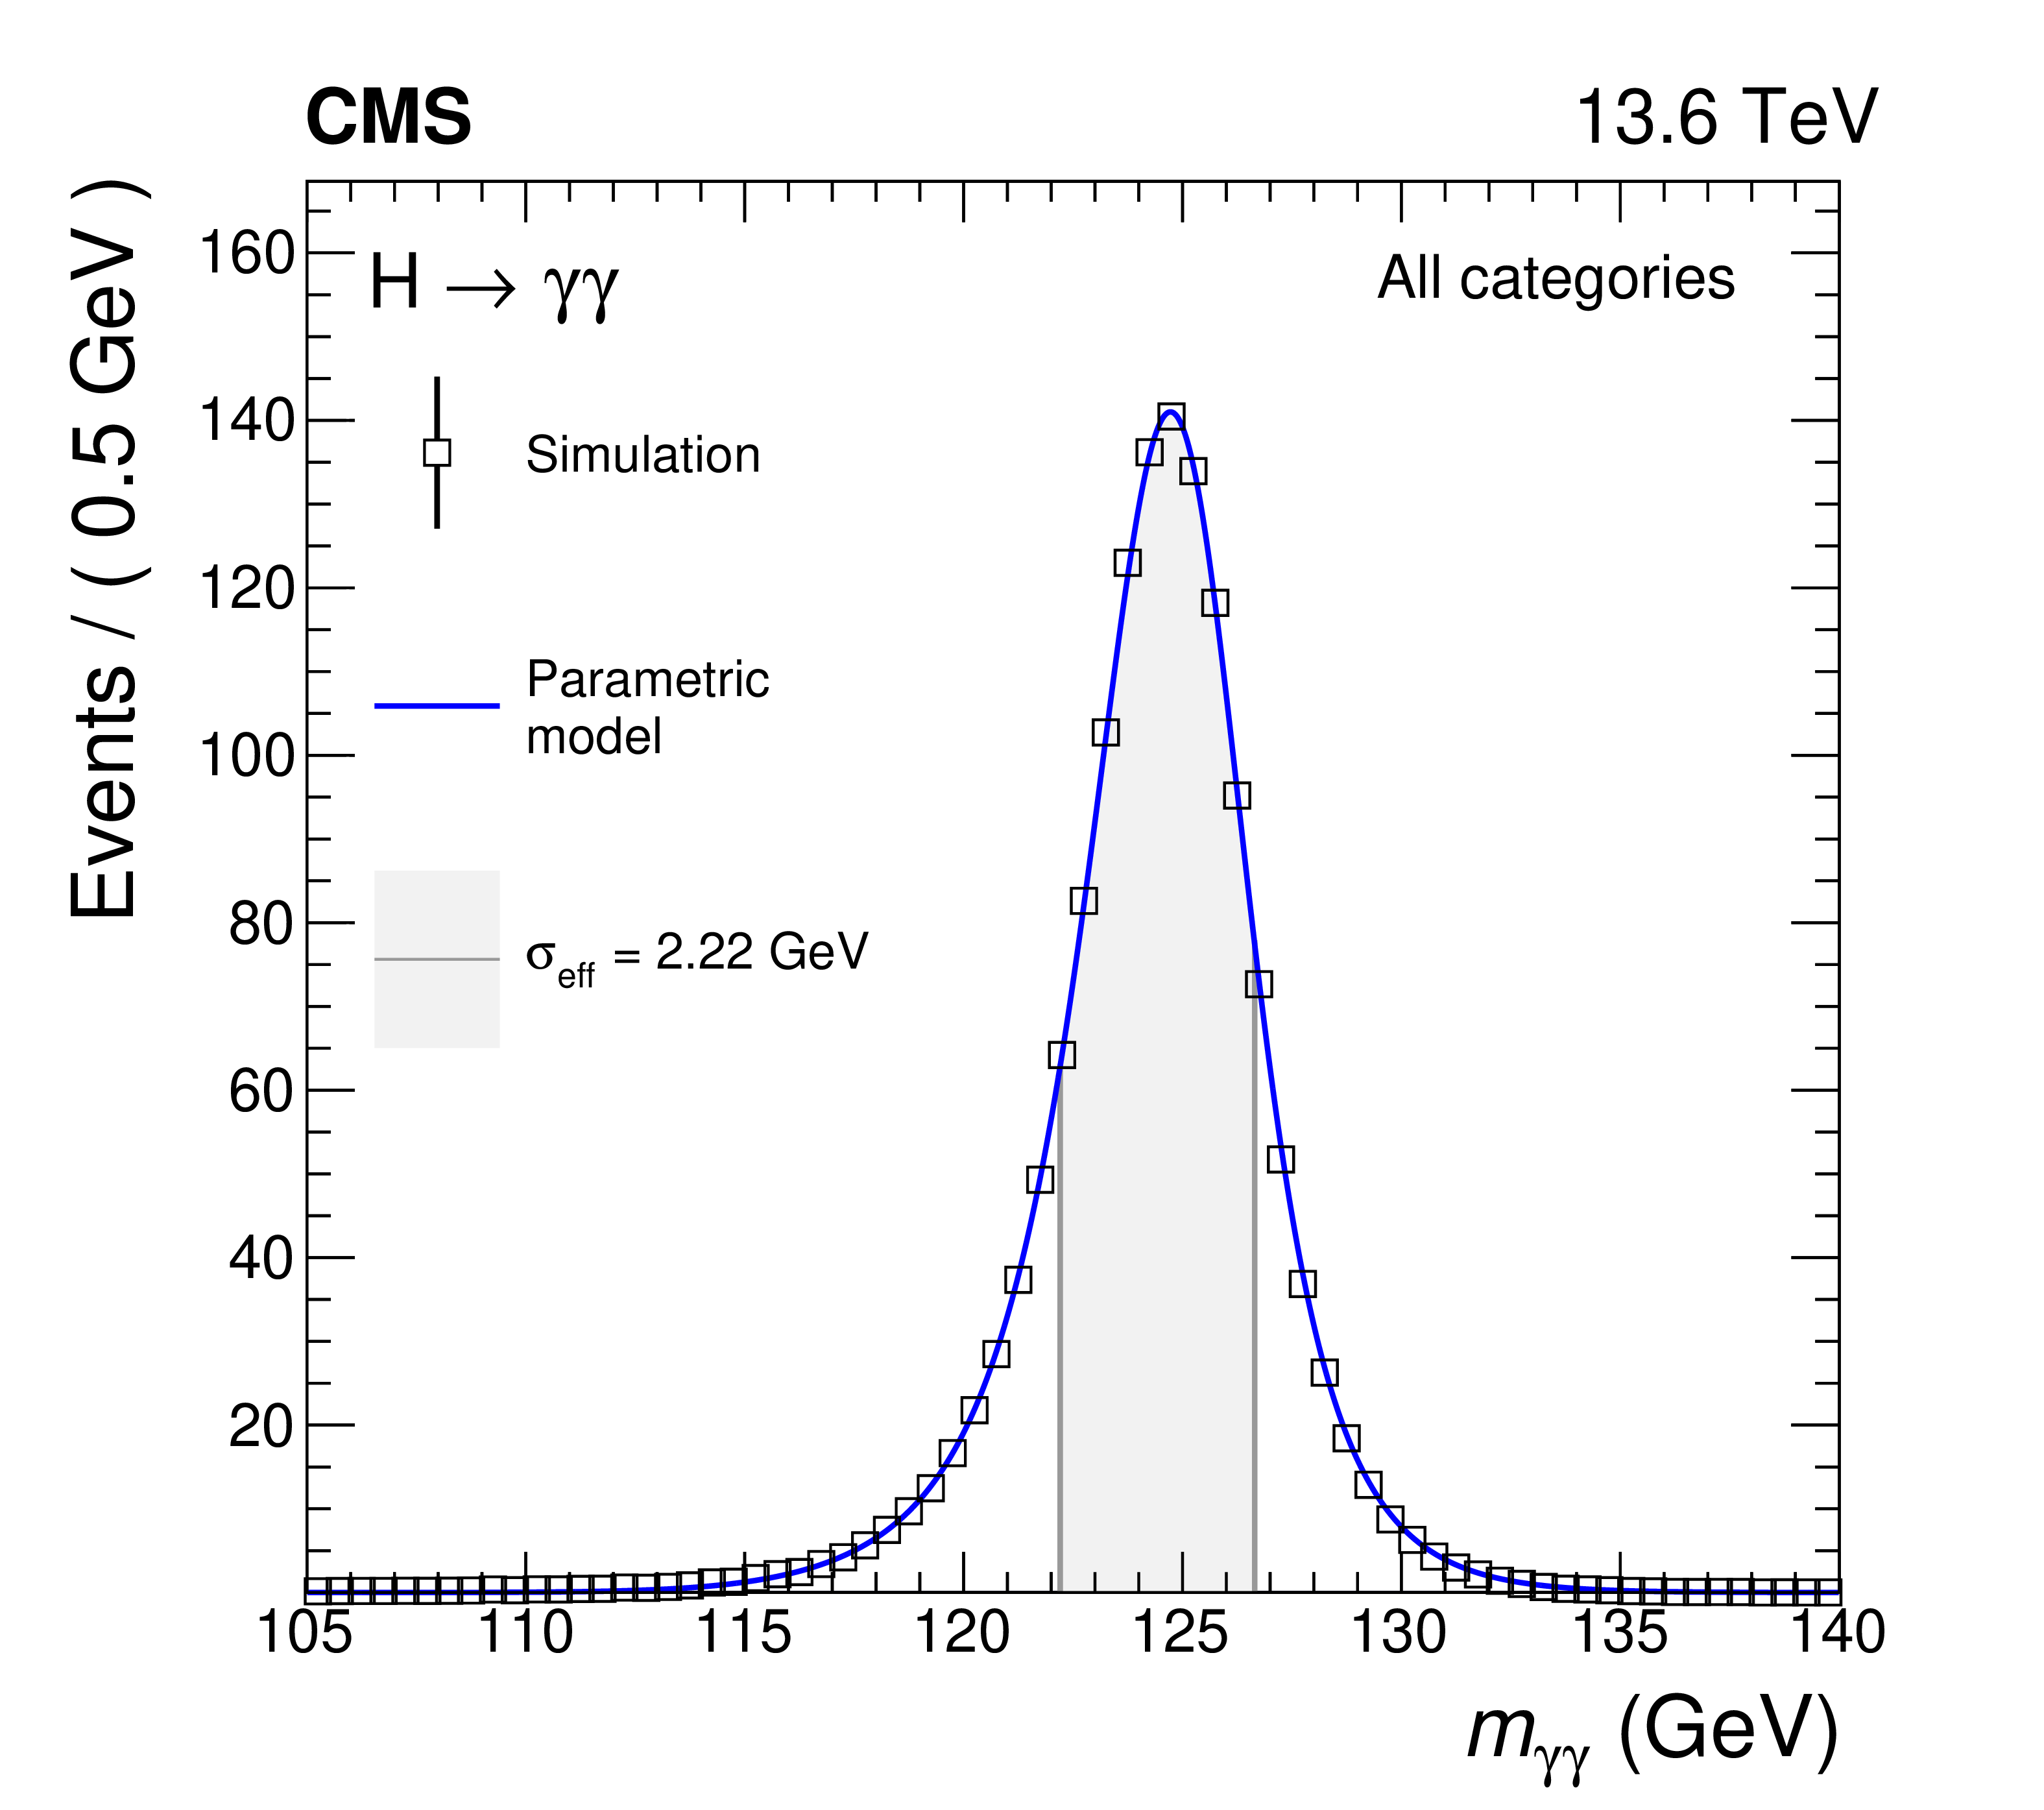
Figure 4:
Combined parametrized signal shapes per category and for the sum of all categories for the measurement of the inclusive cross section. The open squares denote the expectation from the simulation and the blue lines show the parametric models that describe the simulations. The uncertainty bars for the expectation from the simulation due to the limited number of simulated events are smaller than the marker size. The normalization of the histograms corresponds to the expected number of events, taking into account the cross sections of the considered production modes, the efficiency of the selection, and the integrated luminosity of 34.7 fb$ ^{-1} $. The effective mass resolution $ \sigma_{\text{eff}} $ (defined as half of the width of the smallest interval containing 68.3% of the area of the distribution) for each combined signal model is indicated in the grey area. |
png pdf |
Figure 4-a:
Combined parametrized signal shapes per category and for the sum of all categories for the measurement of the inclusive cross section. The open squares denote the expectation from the simulation and the blue lines show the parametric models that describe the simulations. The uncertainty bars for the expectation from the simulation due to the limited number of simulated events are smaller than the marker size. The normalization of the histograms corresponds to the expected number of events, taking into account the cross sections of the considered production modes, the efficiency of the selection, and the integrated luminosity of 34.7 fb$ ^{-1} $. The effective mass resolution $ \sigma_{\text{eff}} $ (defined as half of the width of the smallest interval containing 68.3% of the area of the distribution) for each combined signal model is indicated in the grey area. |
png pdf |
Figure 4-b:
Combined parametrized signal shapes per category and for the sum of all categories for the measurement of the inclusive cross section. The open squares denote the expectation from the simulation and the blue lines show the parametric models that describe the simulations. The uncertainty bars for the expectation from the simulation due to the limited number of simulated events are smaller than the marker size. The normalization of the histograms corresponds to the expected number of events, taking into account the cross sections of the considered production modes, the efficiency of the selection, and the integrated luminosity of 34.7 fb$ ^{-1} $. The effective mass resolution $ \sigma_{\text{eff}} $ (defined as half of the width of the smallest interval containing 68.3% of the area of the distribution) for each combined signal model is indicated in the grey area. |
png pdf |
Figure 4-c:
Combined parametrized signal shapes per category and for the sum of all categories for the measurement of the inclusive cross section. The open squares denote the expectation from the simulation and the blue lines show the parametric models that describe the simulations. The uncertainty bars for the expectation from the simulation due to the limited number of simulated events are smaller than the marker size. The normalization of the histograms corresponds to the expected number of events, taking into account the cross sections of the considered production modes, the efficiency of the selection, and the integrated luminosity of 34.7 fb$ ^{-1} $. The effective mass resolution $ \sigma_{\text{eff}} $ (defined as half of the width of the smallest interval containing 68.3% of the area of the distribution) for each combined signal model is indicated in the grey area. |
png pdf |
Figure 4-d:
Combined parametrized signal shapes per category and for the sum of all categories for the measurement of the inclusive cross section. The open squares denote the expectation from the simulation and the blue lines show the parametric models that describe the simulations. The uncertainty bars for the expectation from the simulation due to the limited number of simulated events are smaller than the marker size. The normalization of the histograms corresponds to the expected number of events, taking into account the cross sections of the considered production modes, the efficiency of the selection, and the integrated luminosity of 34.7 fb$ ^{-1} $. The effective mass resolution $ \sigma_{\text{eff}} $ (defined as half of the width of the smallest interval containing 68.3% of the area of the distribution) for each combined signal model is indicated in the grey area. |
png pdf |
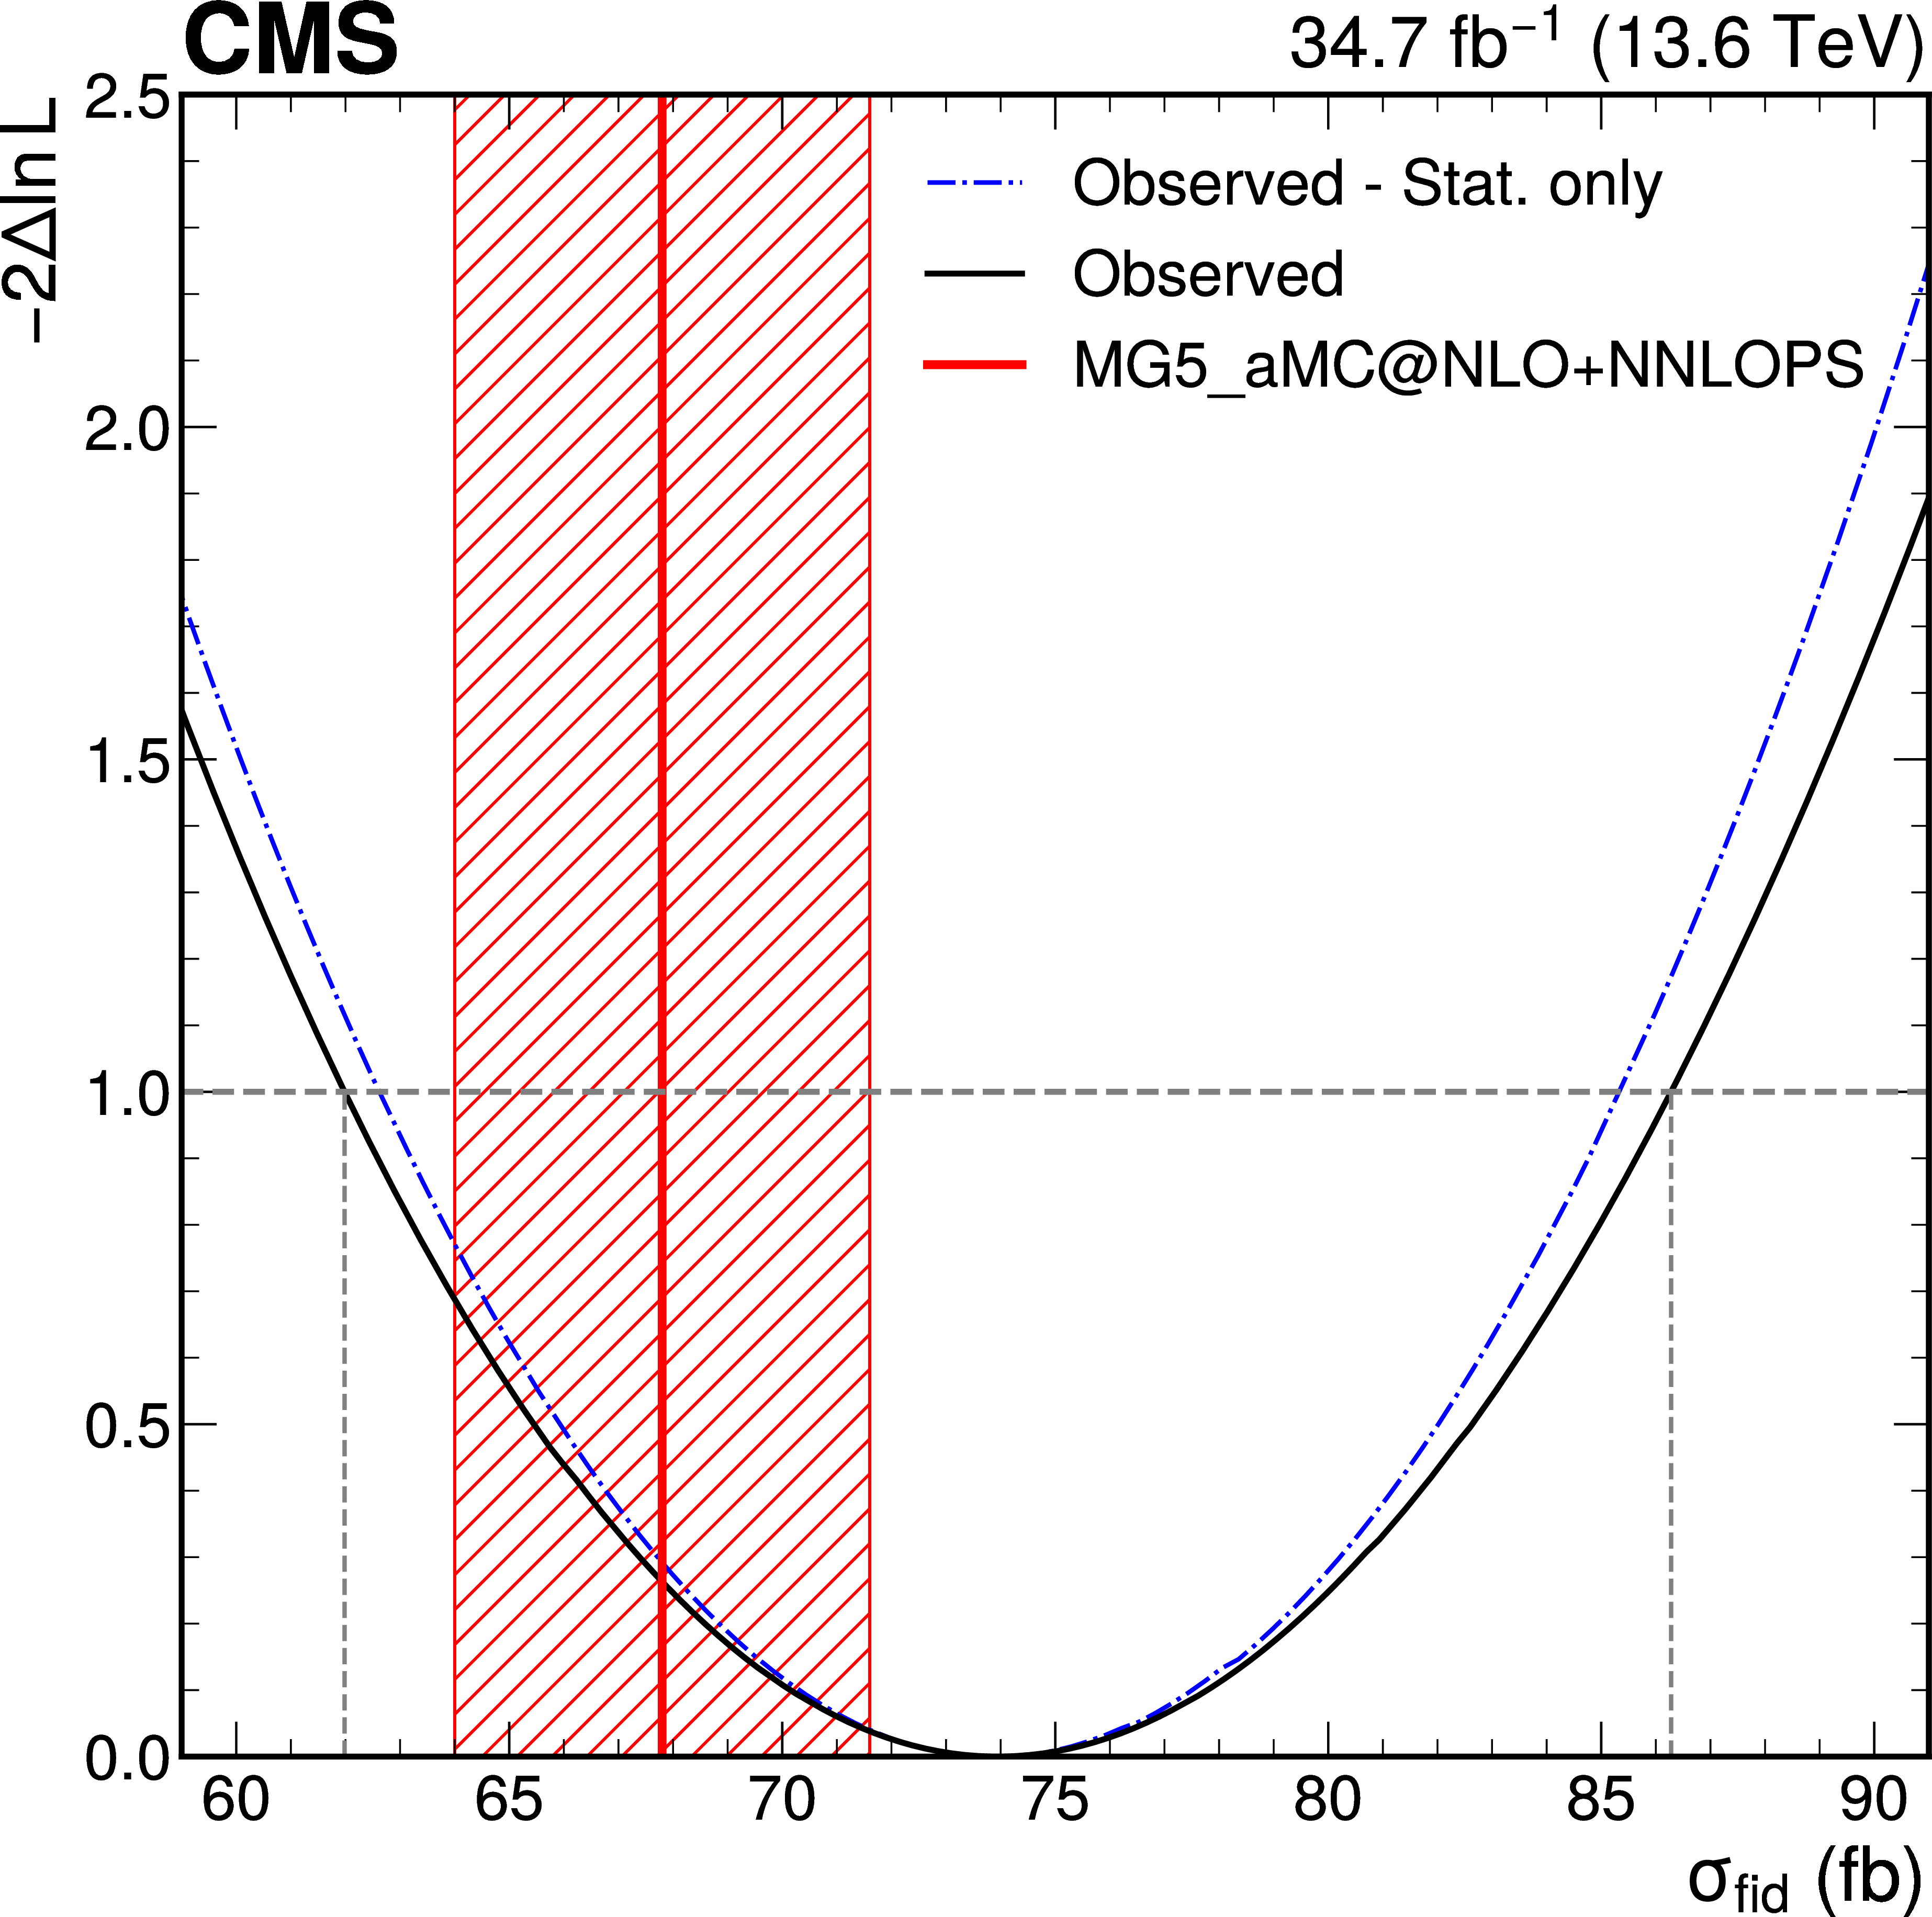
Figure 5:
Likelihood scans for the inclusive fiducial cross section measurement. The black line corresponds to considering both the statistical and systematic uncertainties. The blue dash-dotted line corresponds to considering only the statistical uncertainty, including the discrete profiling method for the background modelling uncertainty. The theoretical prediction from MadGraph-5_aMC@NLO, including the NNLOPS reweighting for the ggH component, is shown in red. The shaded theory uncertainty band includes the uncertainties in the renormalization and factorization scales, in the parton distribution functions, in $ \alpha_\mathrm{S} $, in the $ \mathcal{B}(\mathrm{H}\to\gamma\gamma) $, and in the fiducial acceptance. |

png pdf |
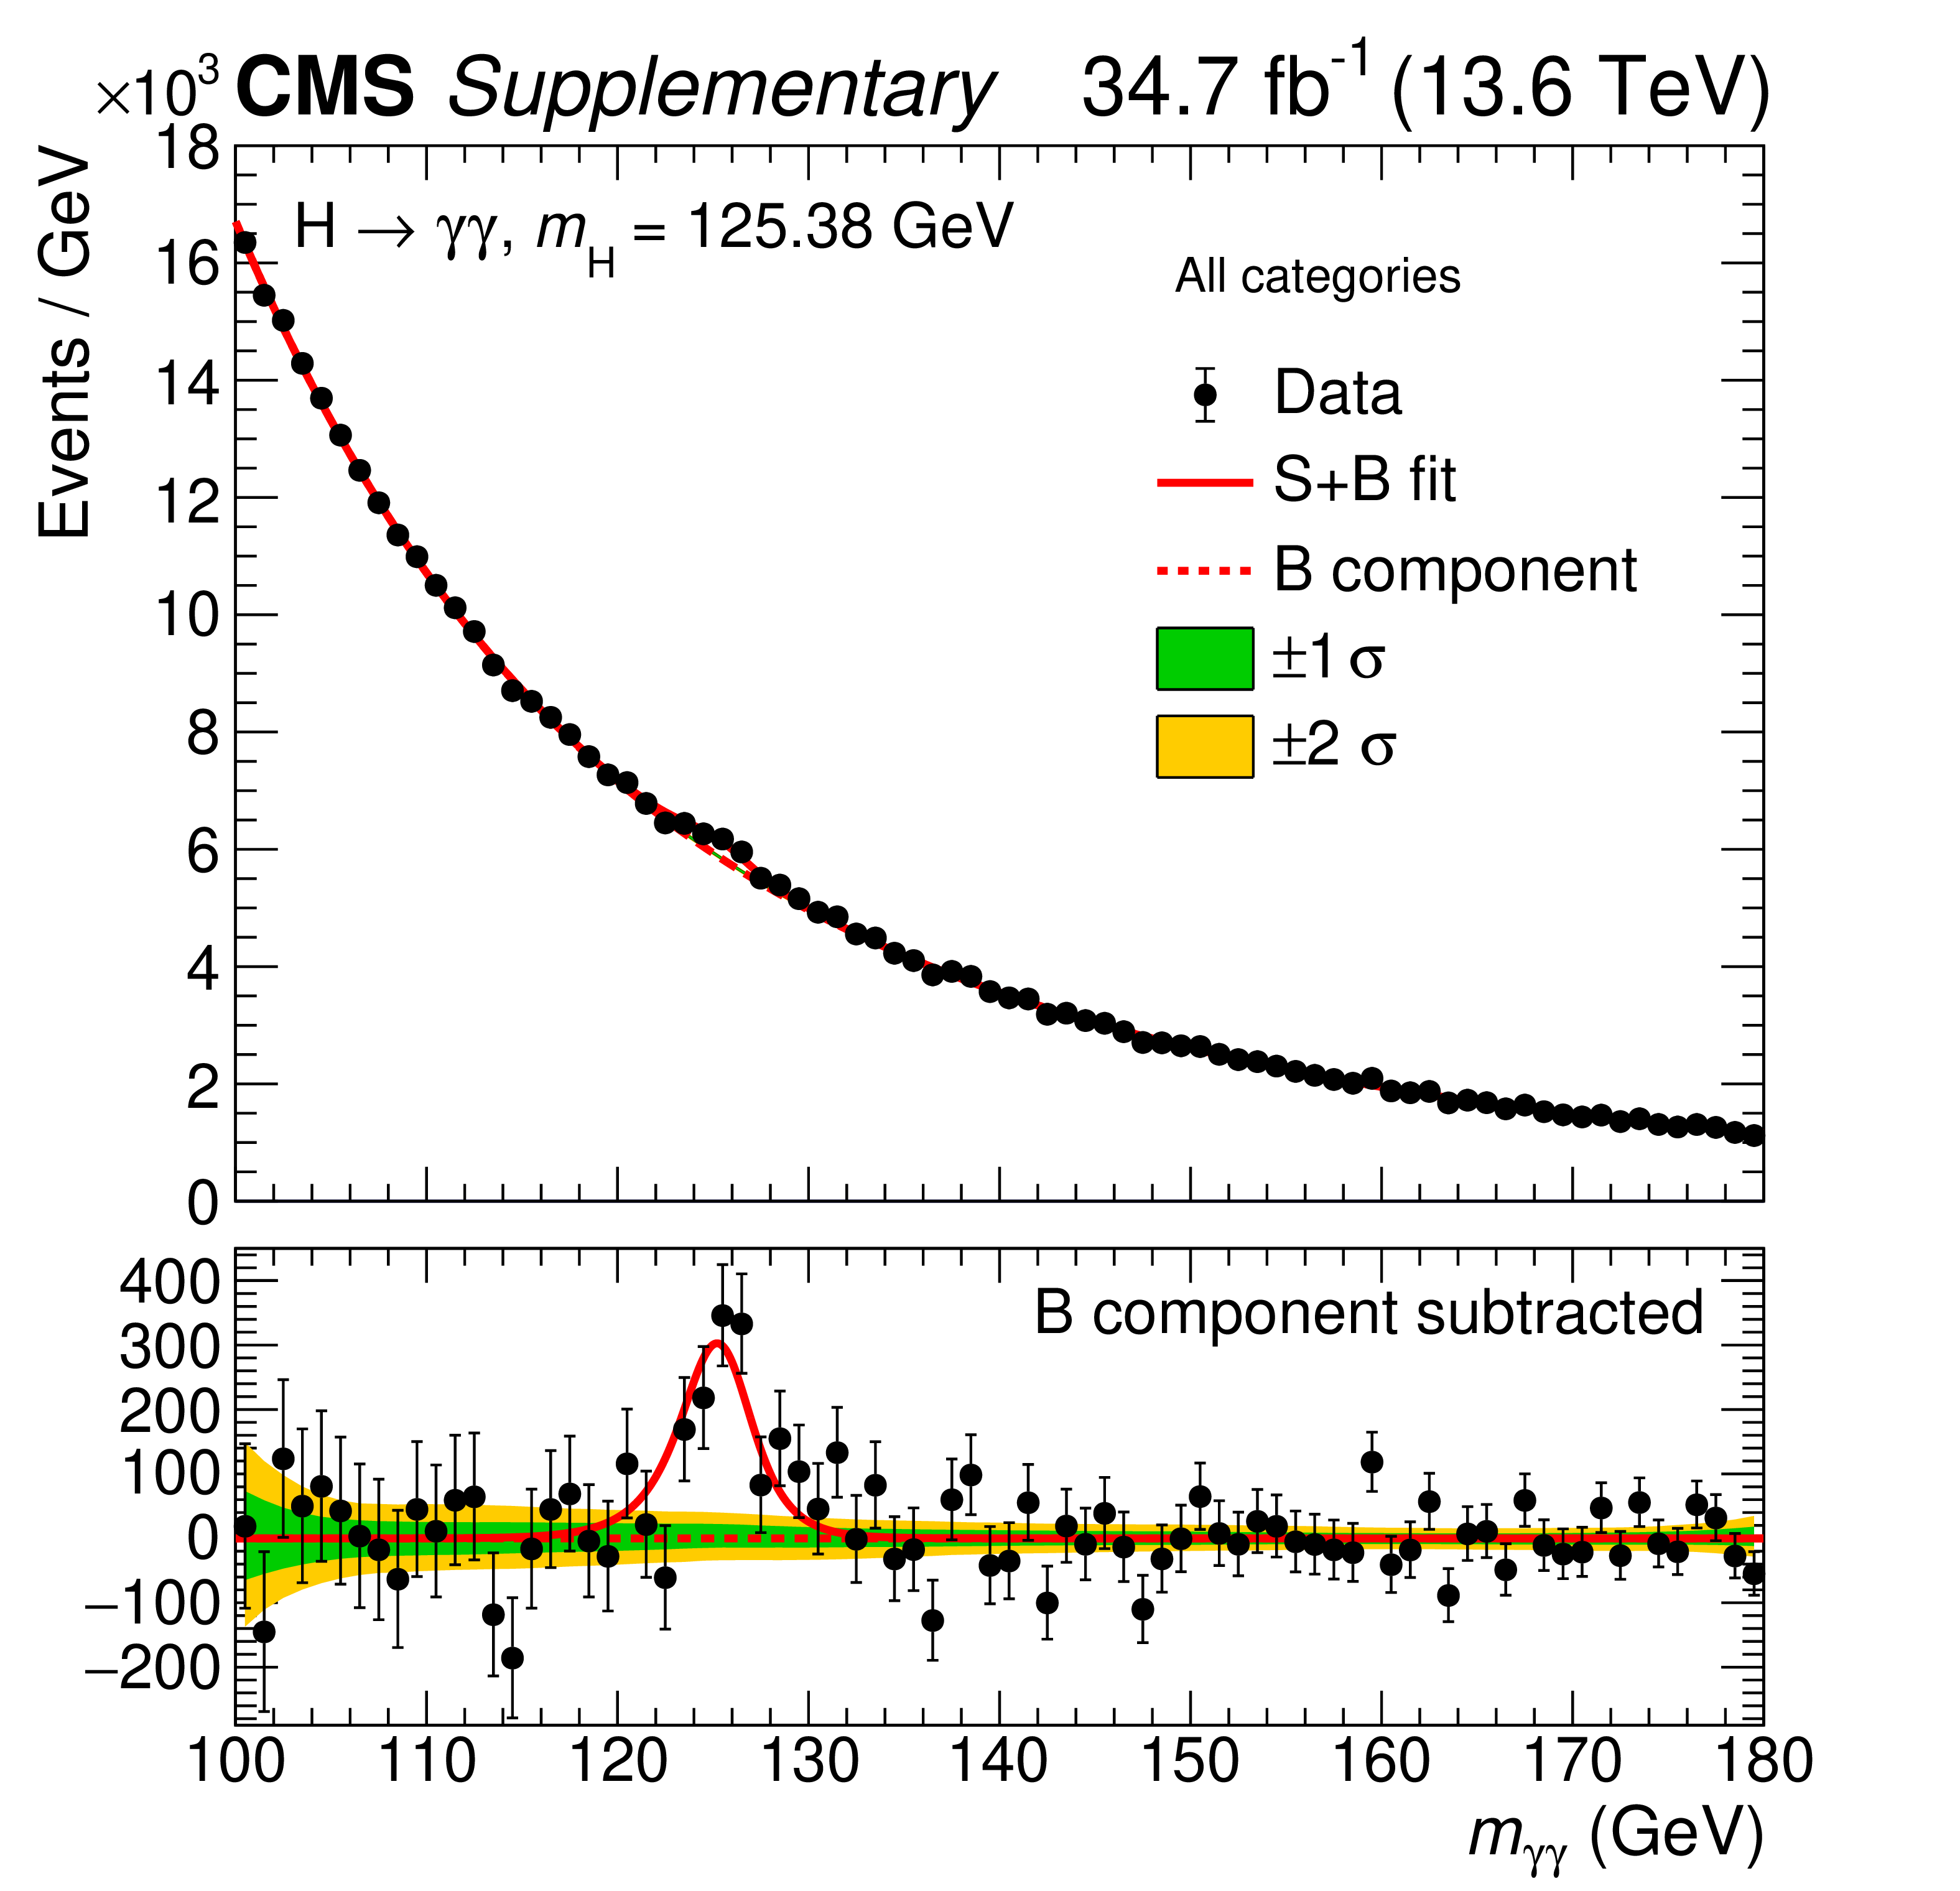
Figure 6:
Diphoton invariant mass distribution in the inclusive fiducial measurement, weighted by $ S/(S+B) $ for the different mass-resolution categories. The distribution is shown together with the signal$ + $background fit (red line) and the background-only component (dashed line). In the lower panel, the signal component is shown, estimated by subtracting the background component from the signal$ + $background fit. The green (yellow) bands indicate the $ \pm1\sigma $ ($ \pm2\sigma $) uncertainties in the background component. They are derived from pseudoexperiments using the best-fit background function from the signal+background fit. |
png pdf |
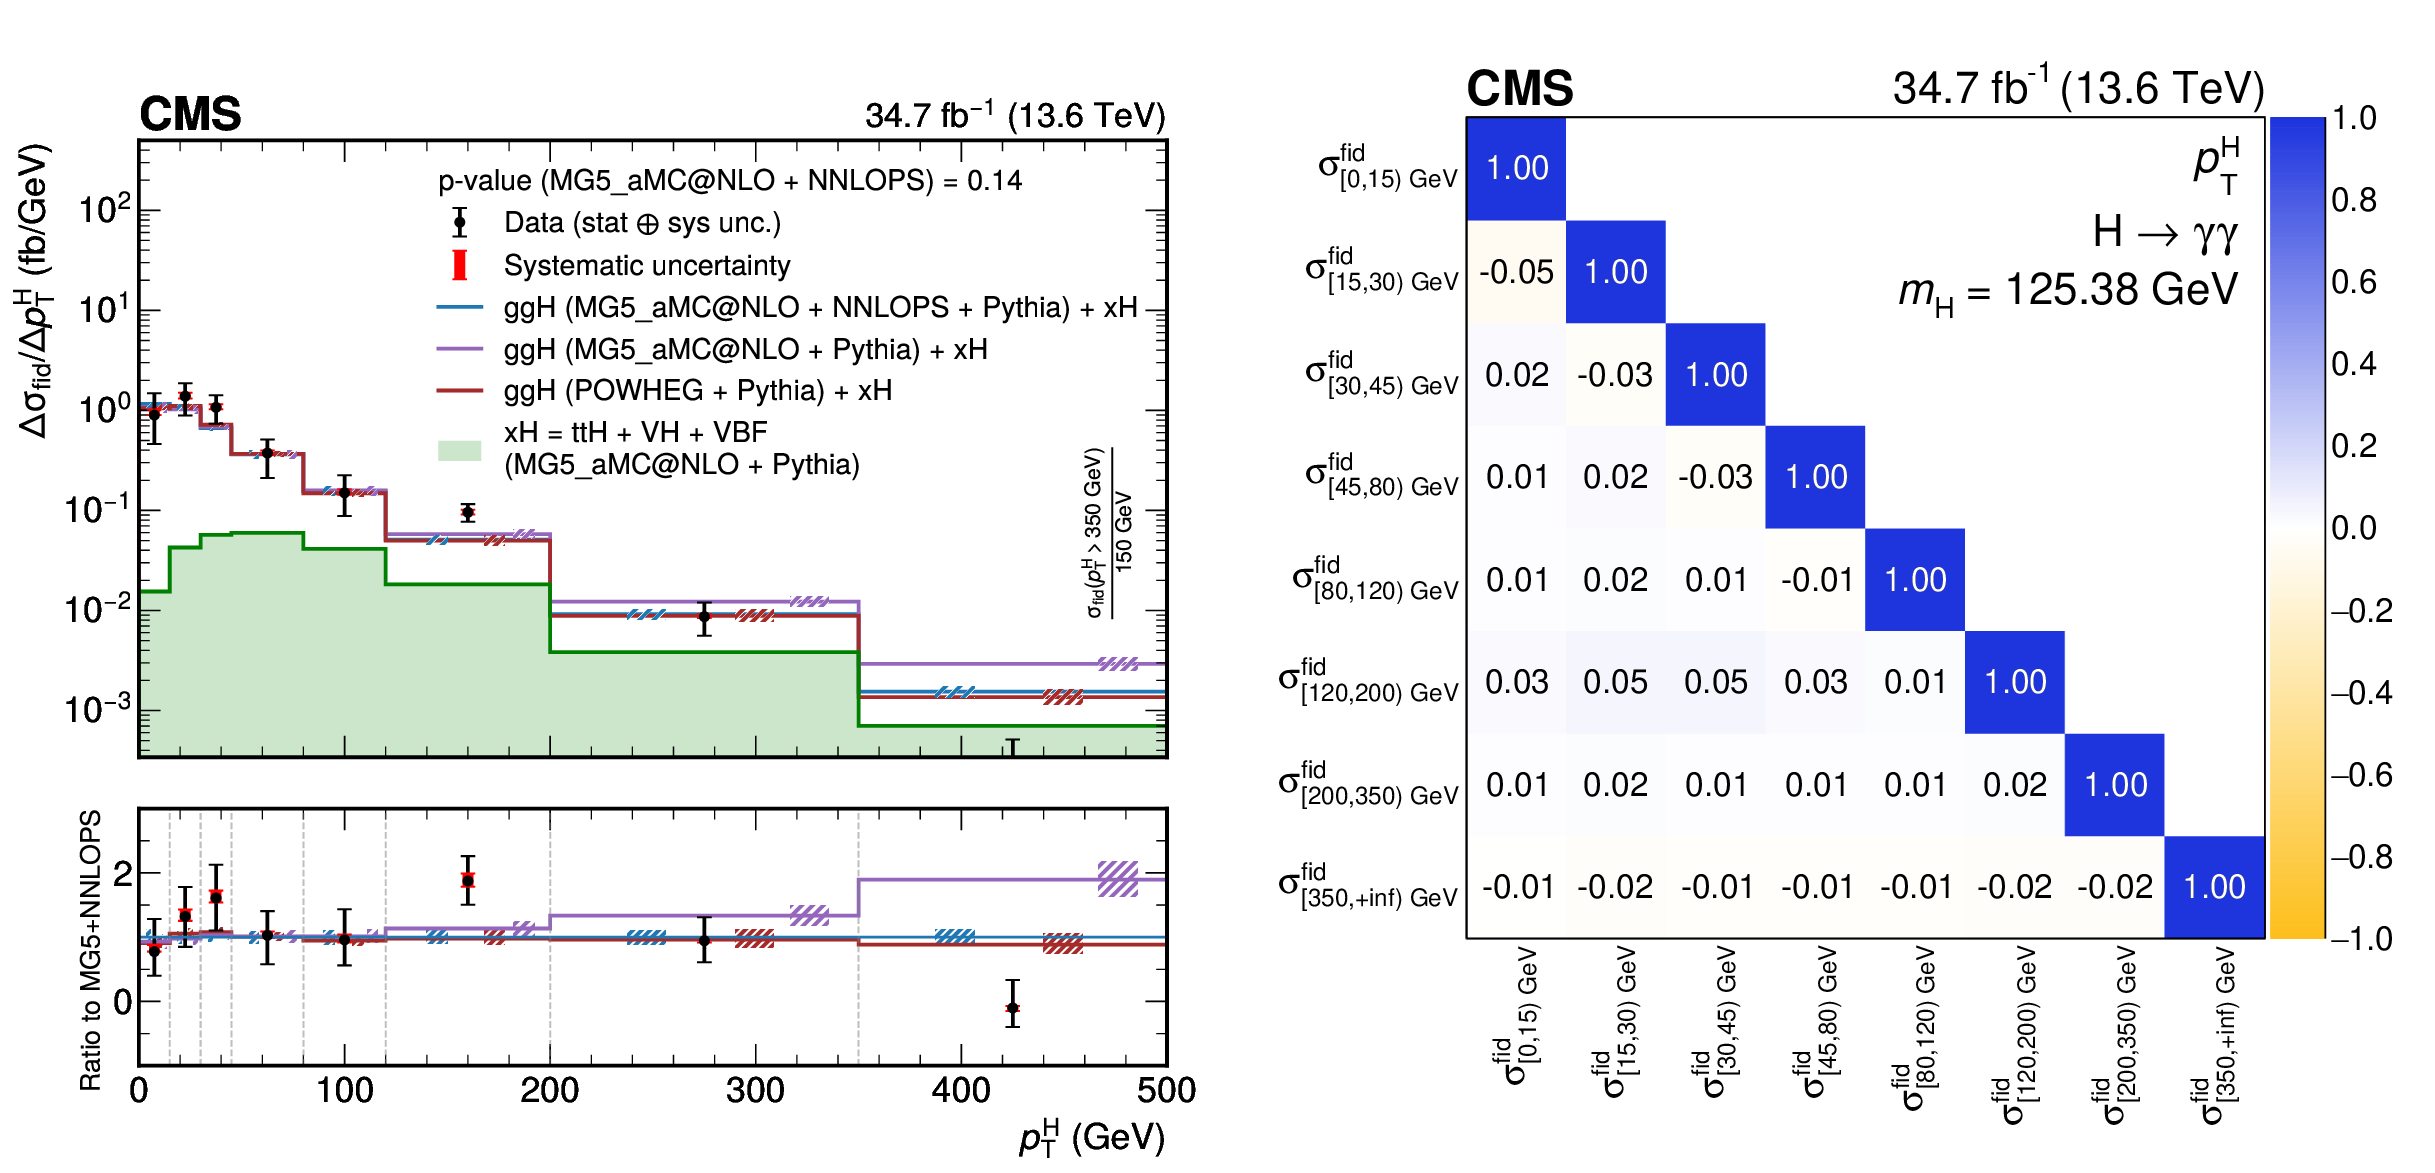
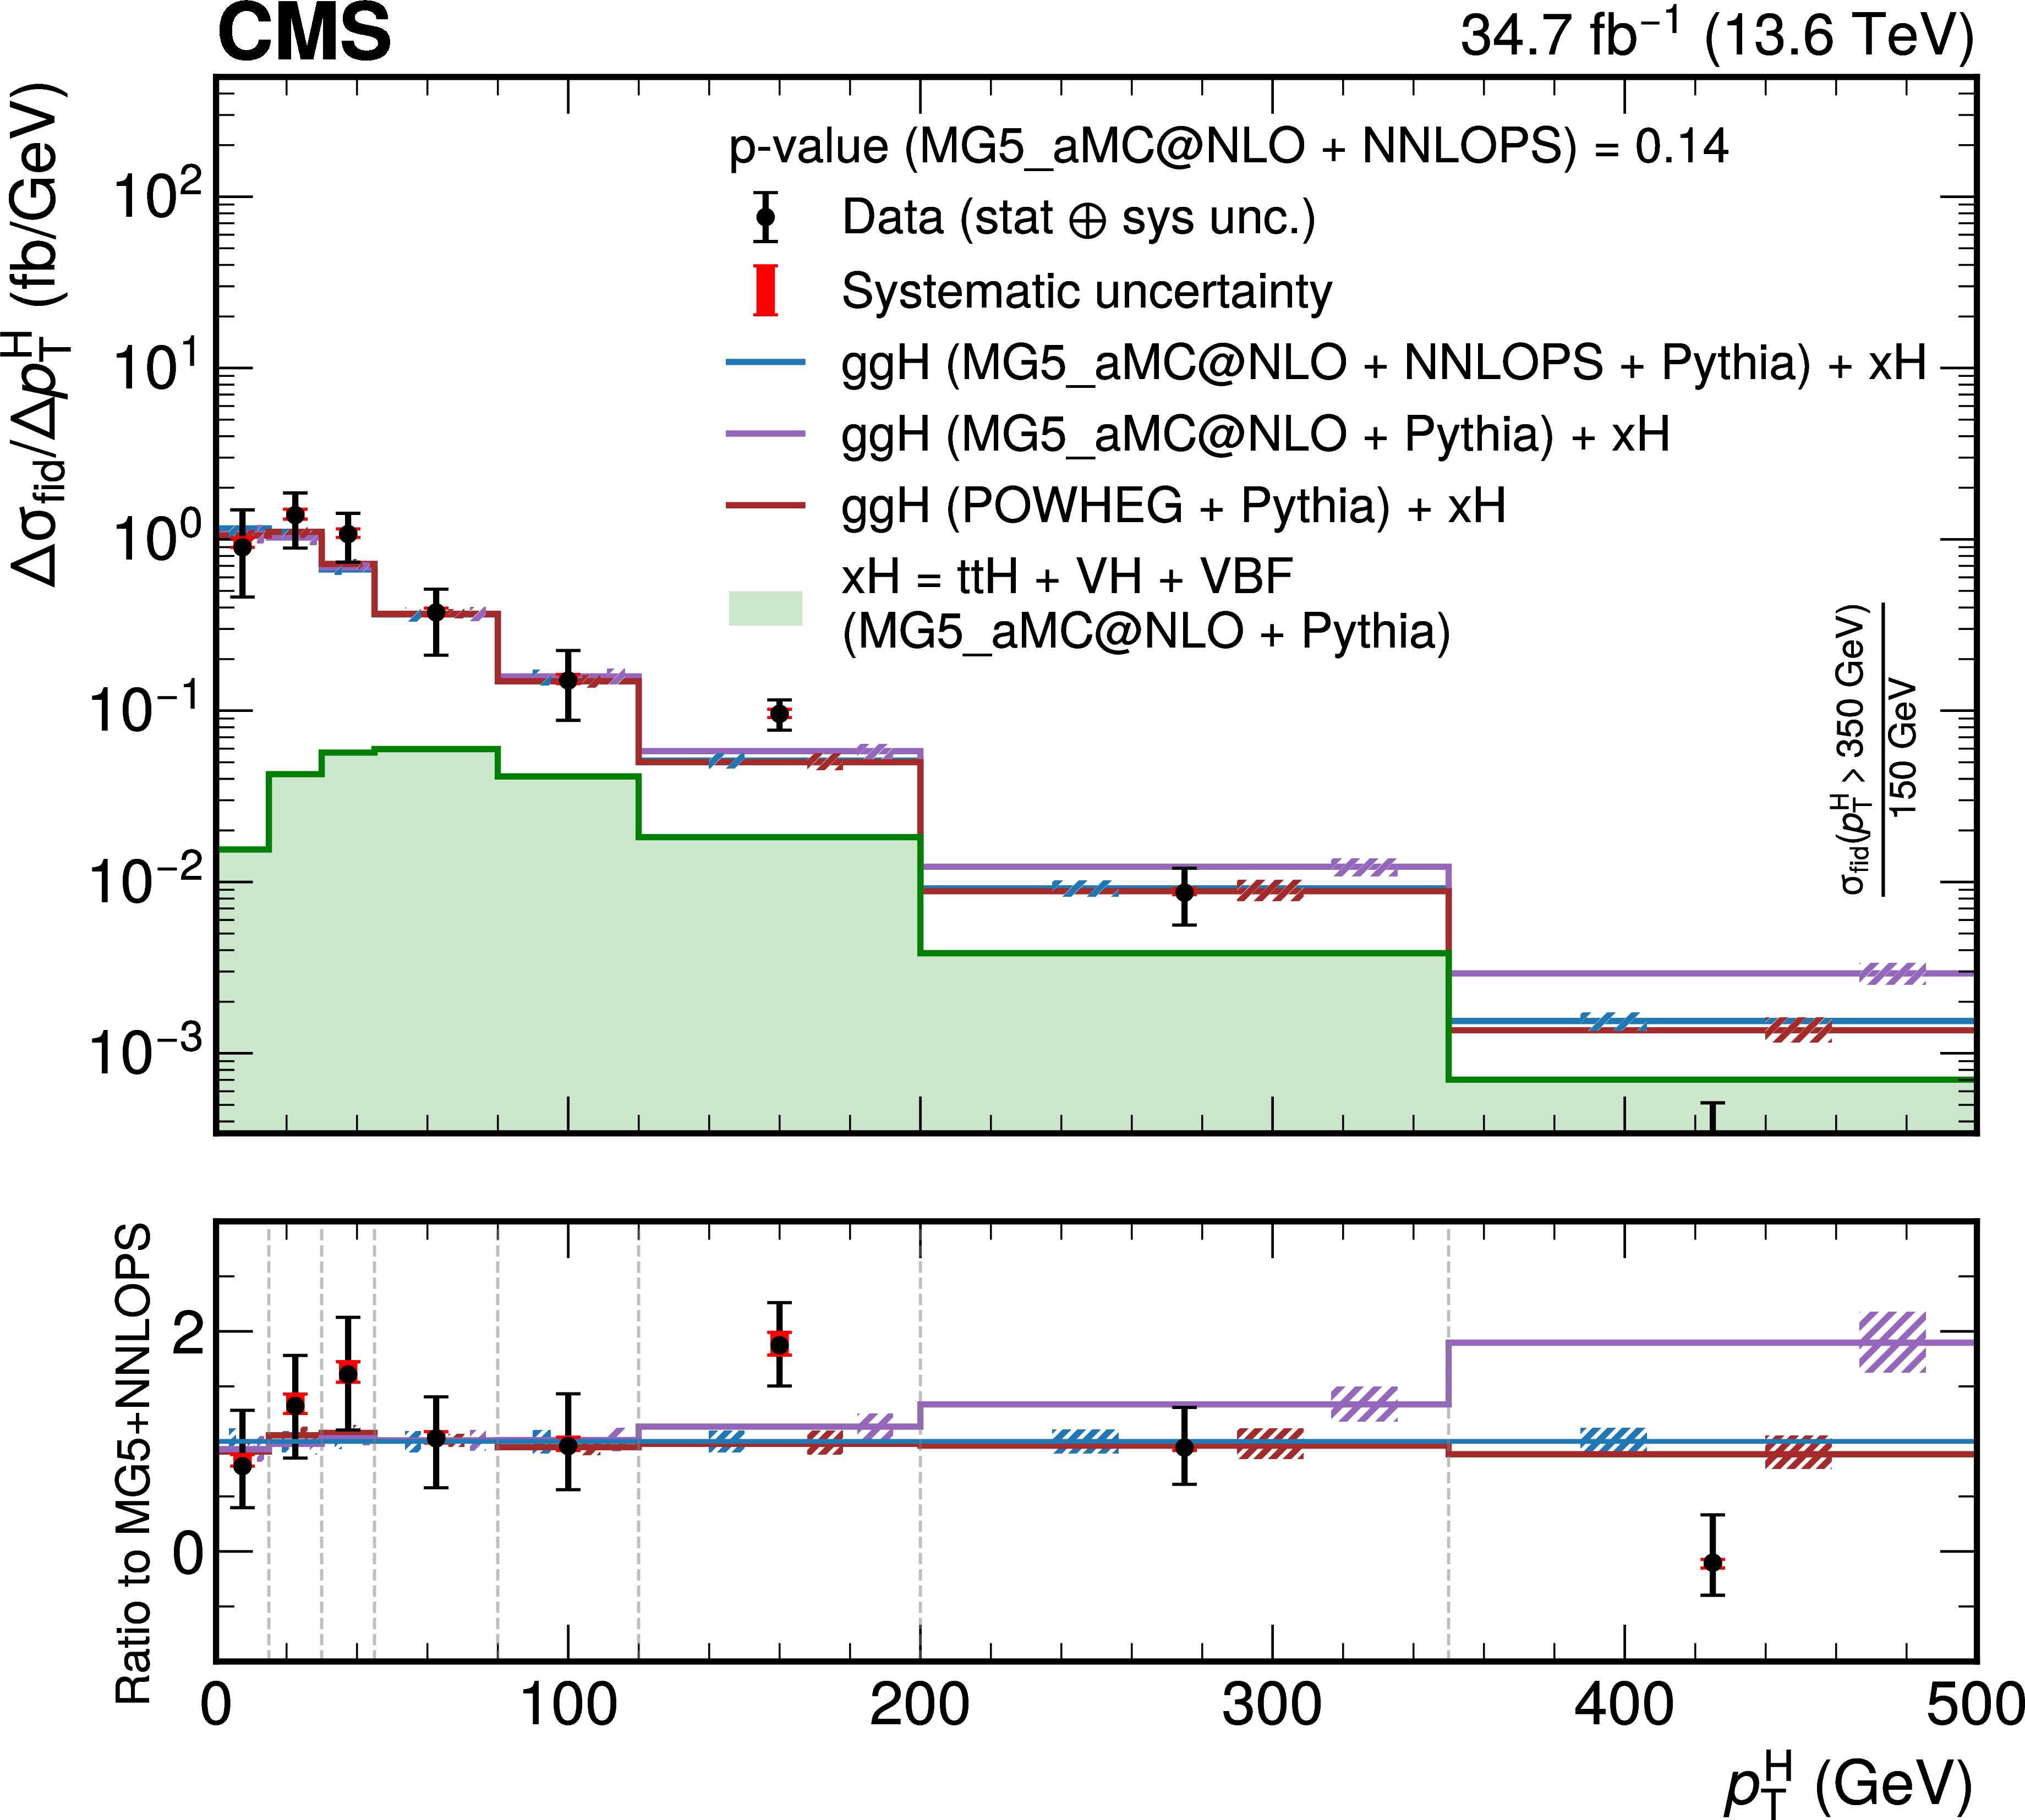
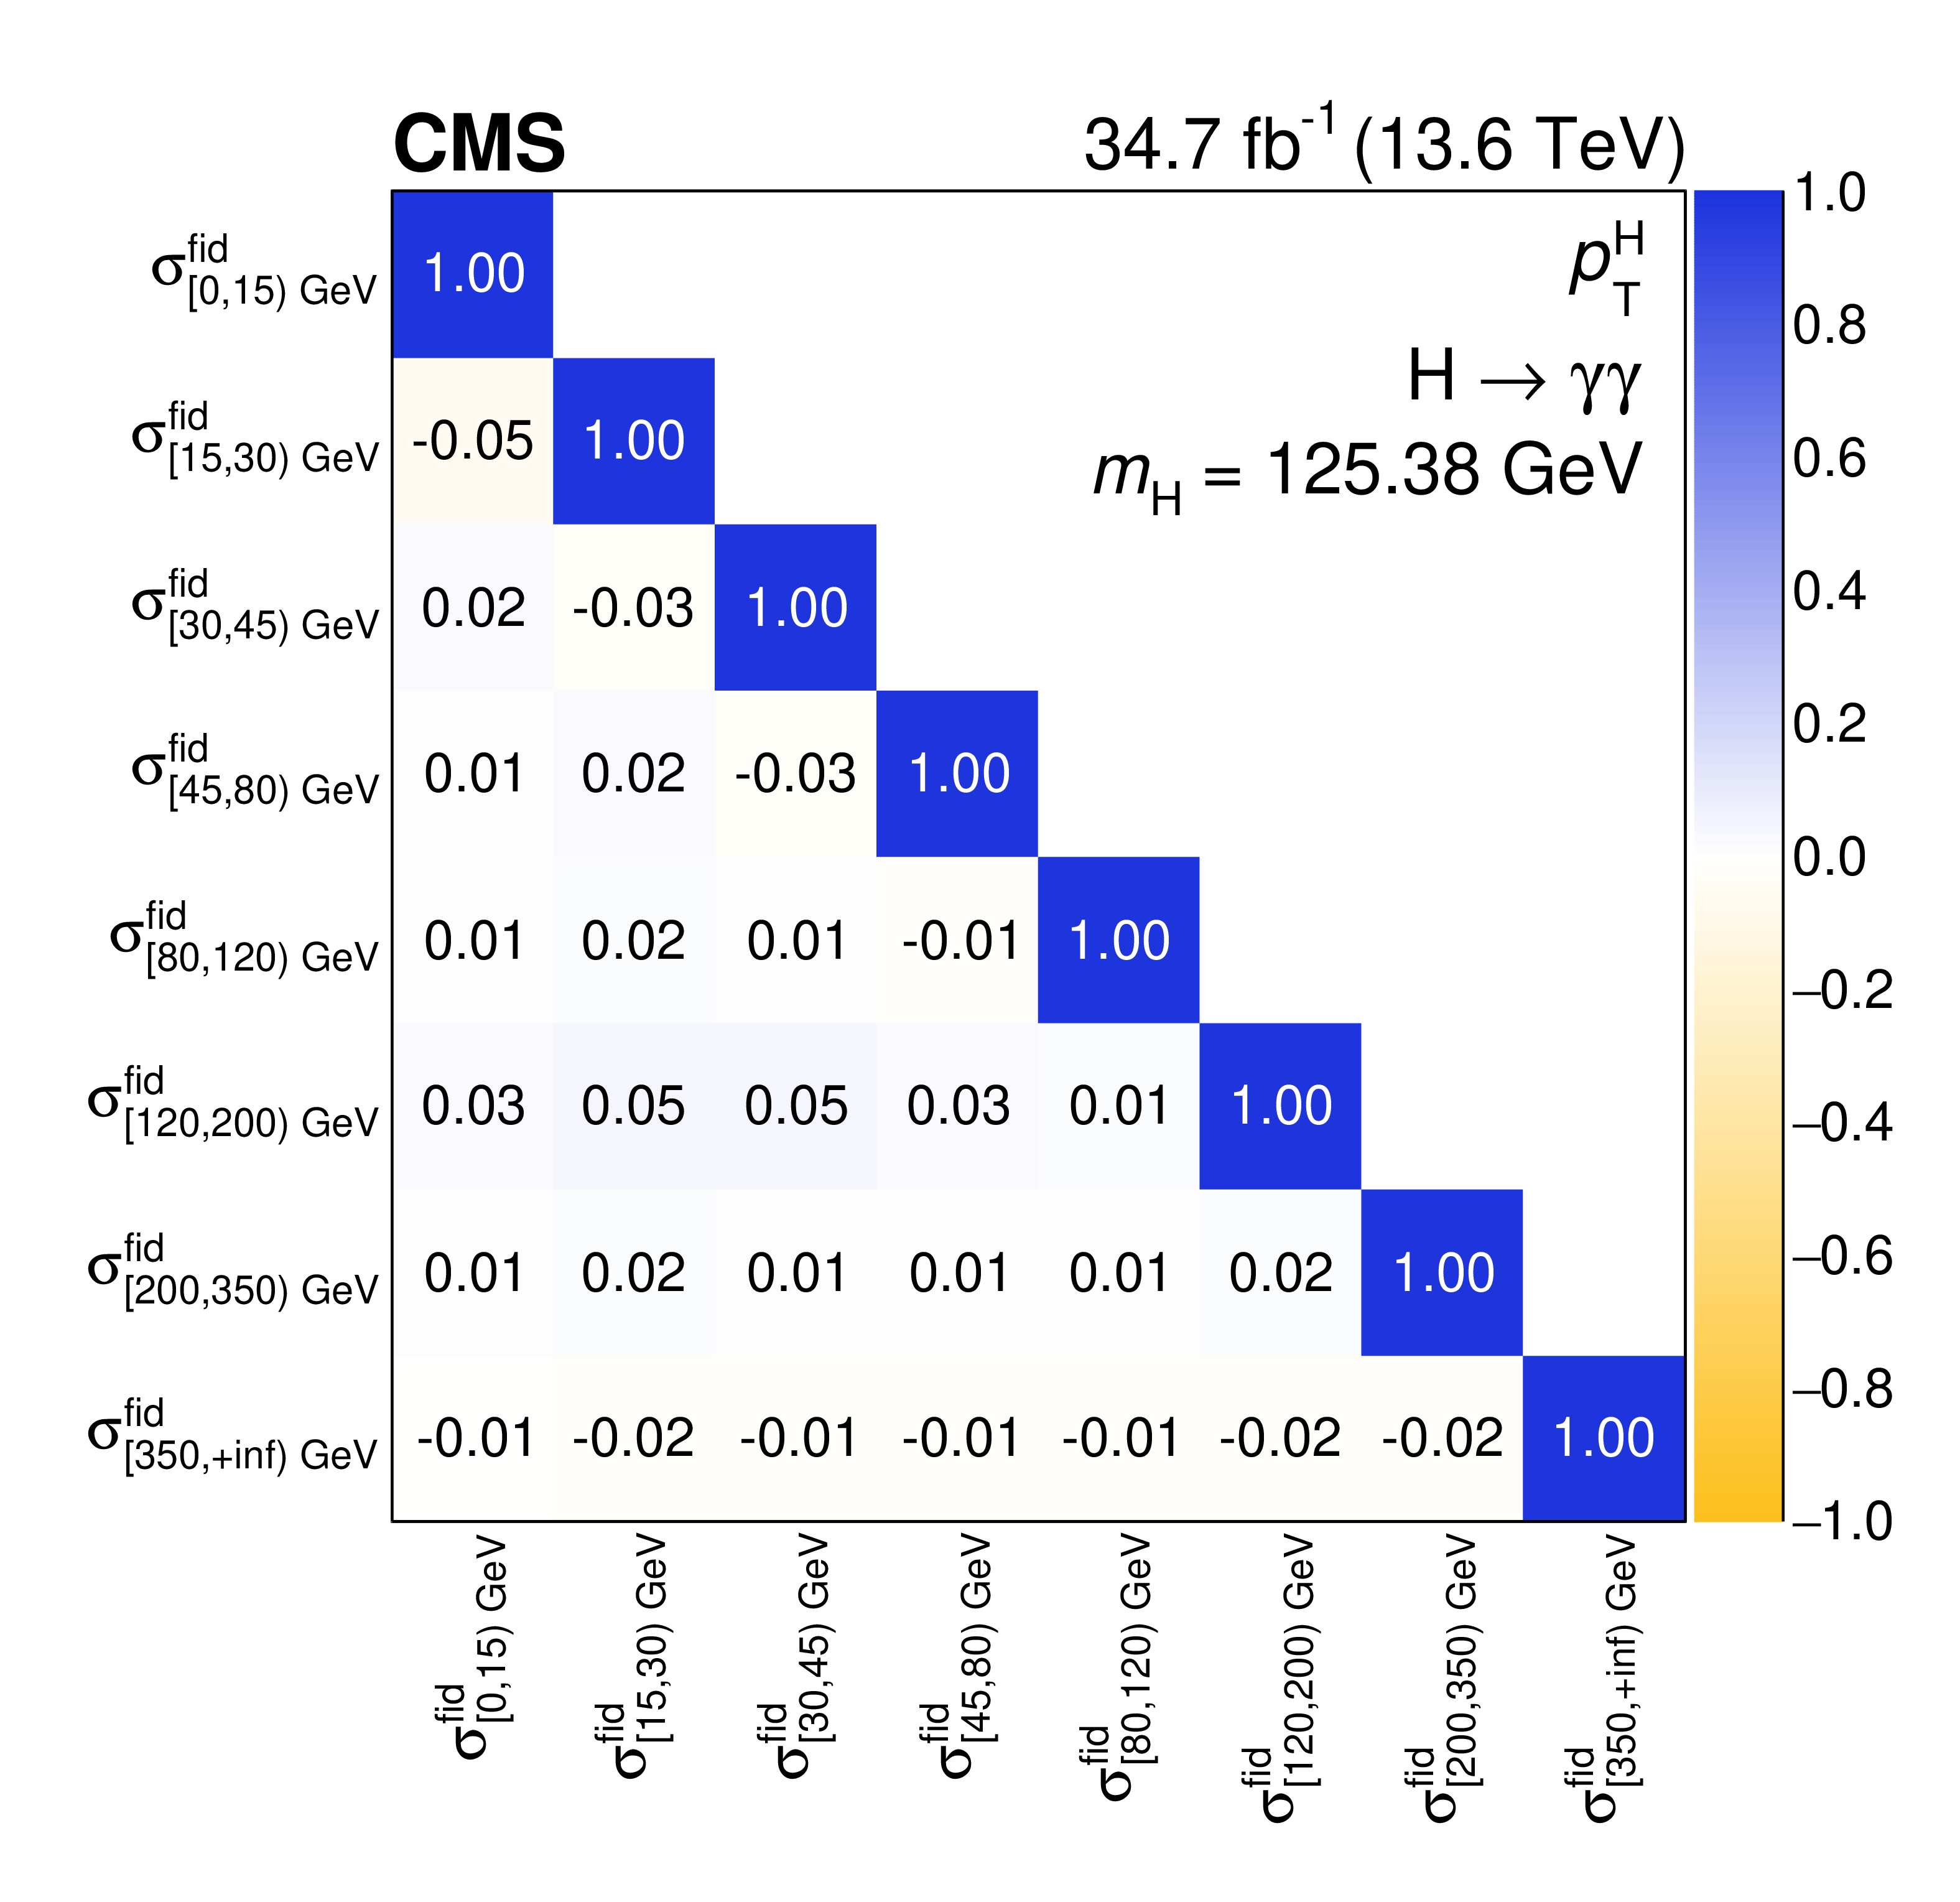
Figure 7:
Differential fiducial cross sections for $ p_{\mathrm{T}}^{\mathrm{H}} $ (left) and the corresponding correlation matrix (right). The measured cross section in each bin is divided by the corresponding bin width. The coloured lines denote the predictions from different event generation setups, explained in the legend and in the text. The dashed boxes show the uncertainties in theoretical predictions on both the ggH and $ \mathrm{x\mathrm{H}} $ components. The $ p $-value is calculated for the nominal SM prediction, which is MadGraph-5_aMC@NLO with NNLOPS (MG5_aMC@NLO + NNLOPS) reweighting. The lower panel in the left plot shows the ratio to the nominal SM prediction. The last bin extends to infinity and the normalization of the bin is indicated in the plot. |
png pdf |
Figure 7-a:
Differential fiducial cross sections for $ p_{\mathrm{T}}^{\mathrm{H}} $ (left) and the corresponding correlation matrix (right). The measured cross section in each bin is divided by the corresponding bin width. The coloured lines denote the predictions from different event generation setups, explained in the legend and in the text. The dashed boxes show the uncertainties in theoretical predictions on both the ggH and $ \mathrm{x\mathrm{H}} $ components. The $ p $-value is calculated for the nominal SM prediction, which is MadGraph-5_aMC@NLO with NNLOPS (MG5_aMC@NLO + NNLOPS) reweighting. The lower panel in the left plot shows the ratio to the nominal SM prediction. The last bin extends to infinity and the normalization of the bin is indicated in the plot. |
png pdf |
Figure 7-b:
Differential fiducial cross sections for $ p_{\mathrm{T}}^{\mathrm{H}} $ (left) and the corresponding correlation matrix (right). The measured cross section in each bin is divided by the corresponding bin width. The coloured lines denote the predictions from different event generation setups, explained in the legend and in the text. The dashed boxes show the uncertainties in theoretical predictions on both the ggH and $ \mathrm{x\mathrm{H}} $ components. The $ p $-value is calculated for the nominal SM prediction, which is MadGraph-5_aMC@NLO with NNLOPS (MG5_aMC@NLO + NNLOPS) reweighting. The lower panel in the left plot shows the ratio to the nominal SM prediction. The last bin extends to infinity and the normalization of the bin is indicated in the plot. |
png pdf |
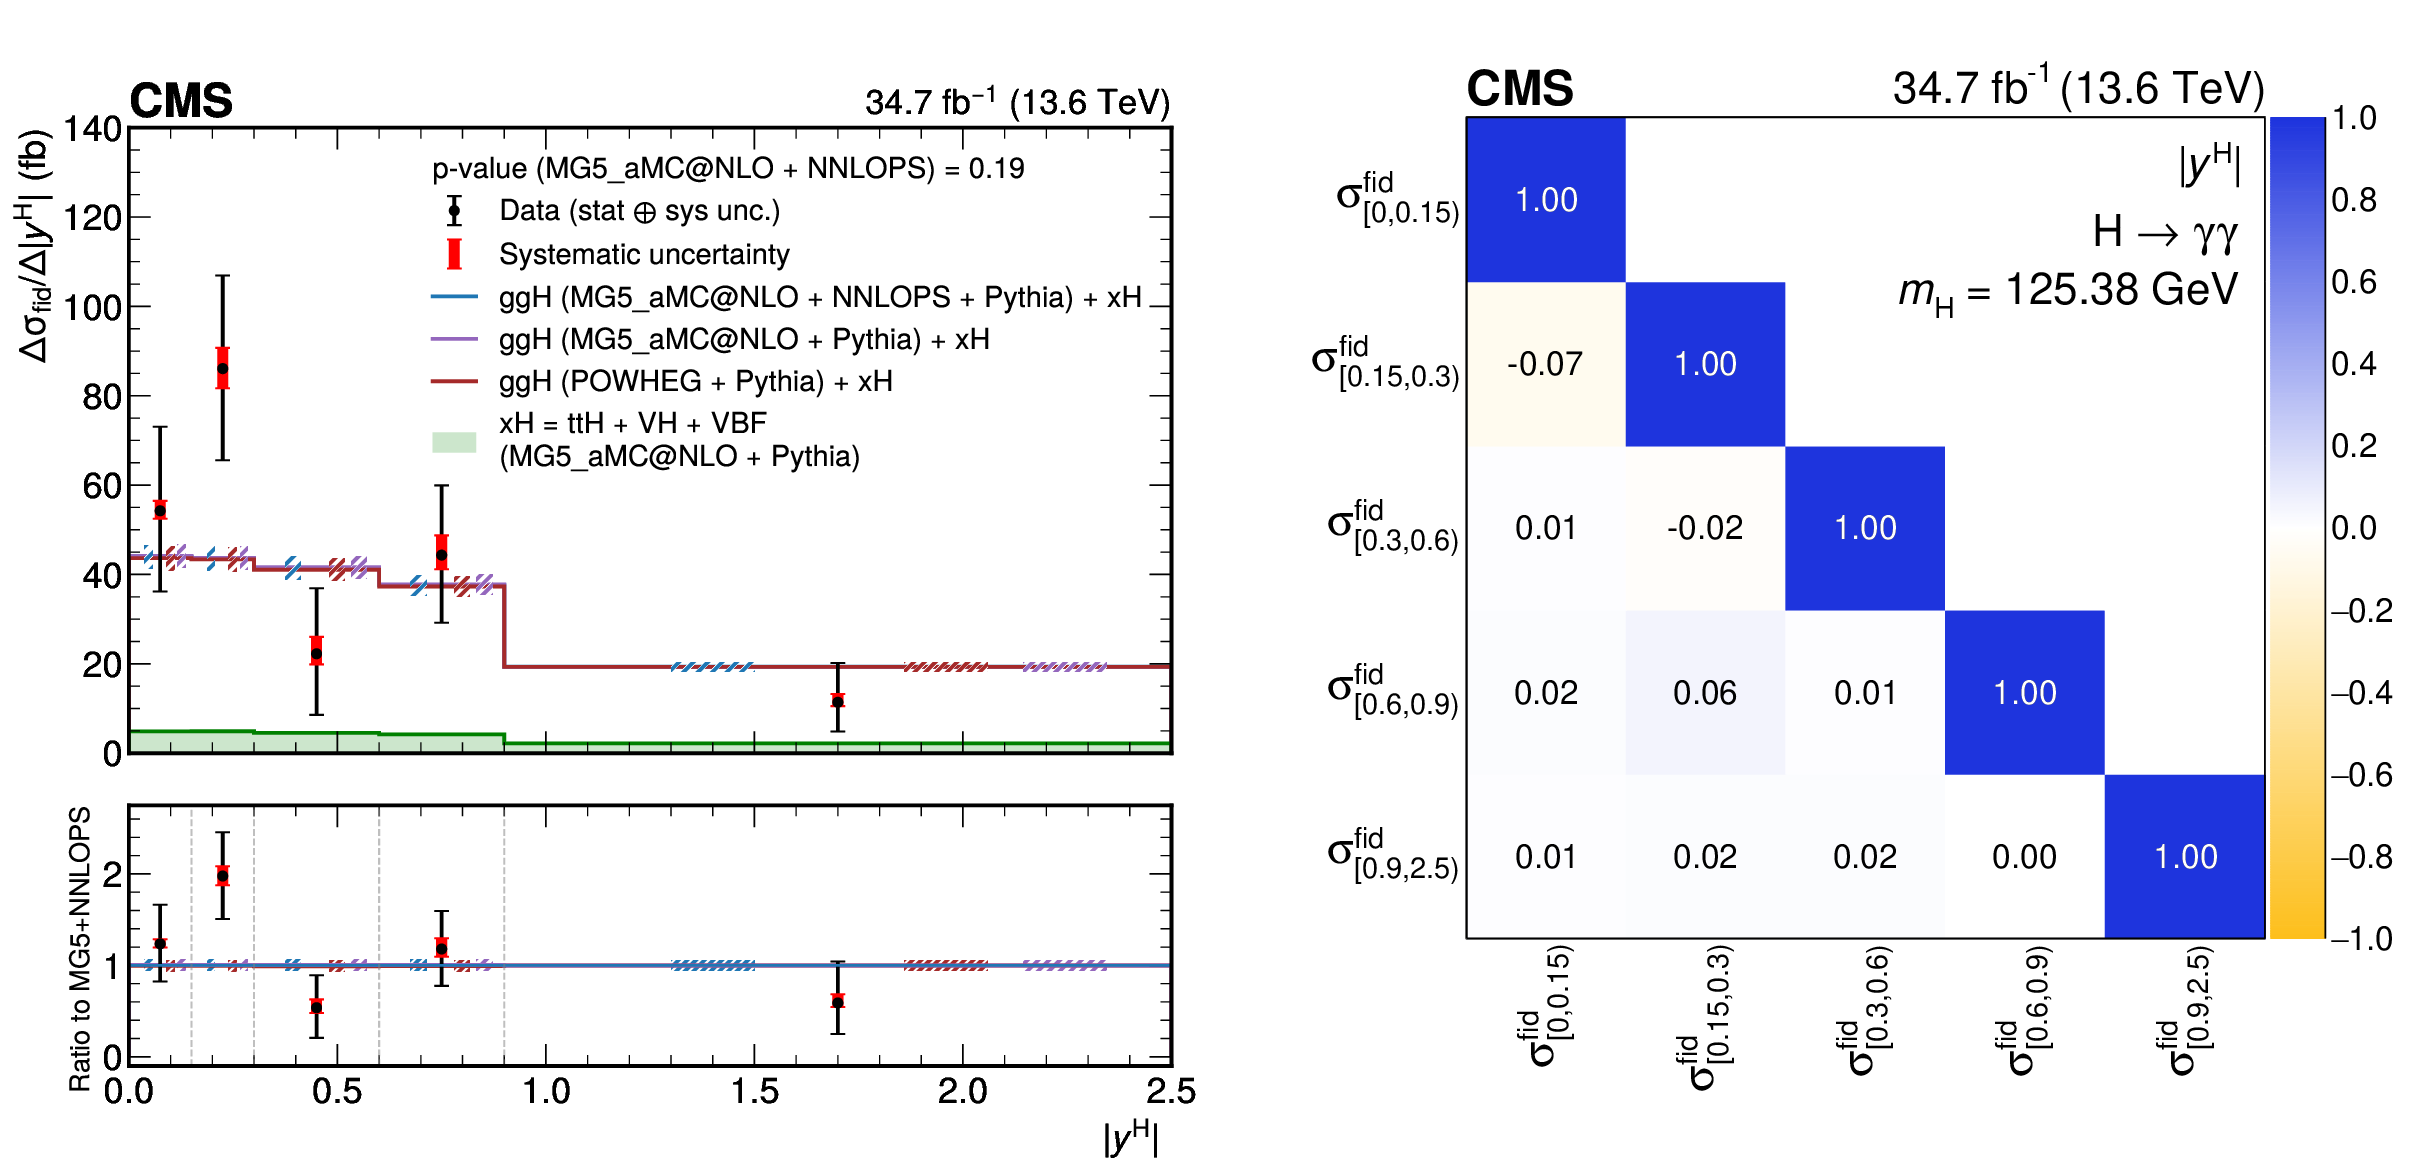
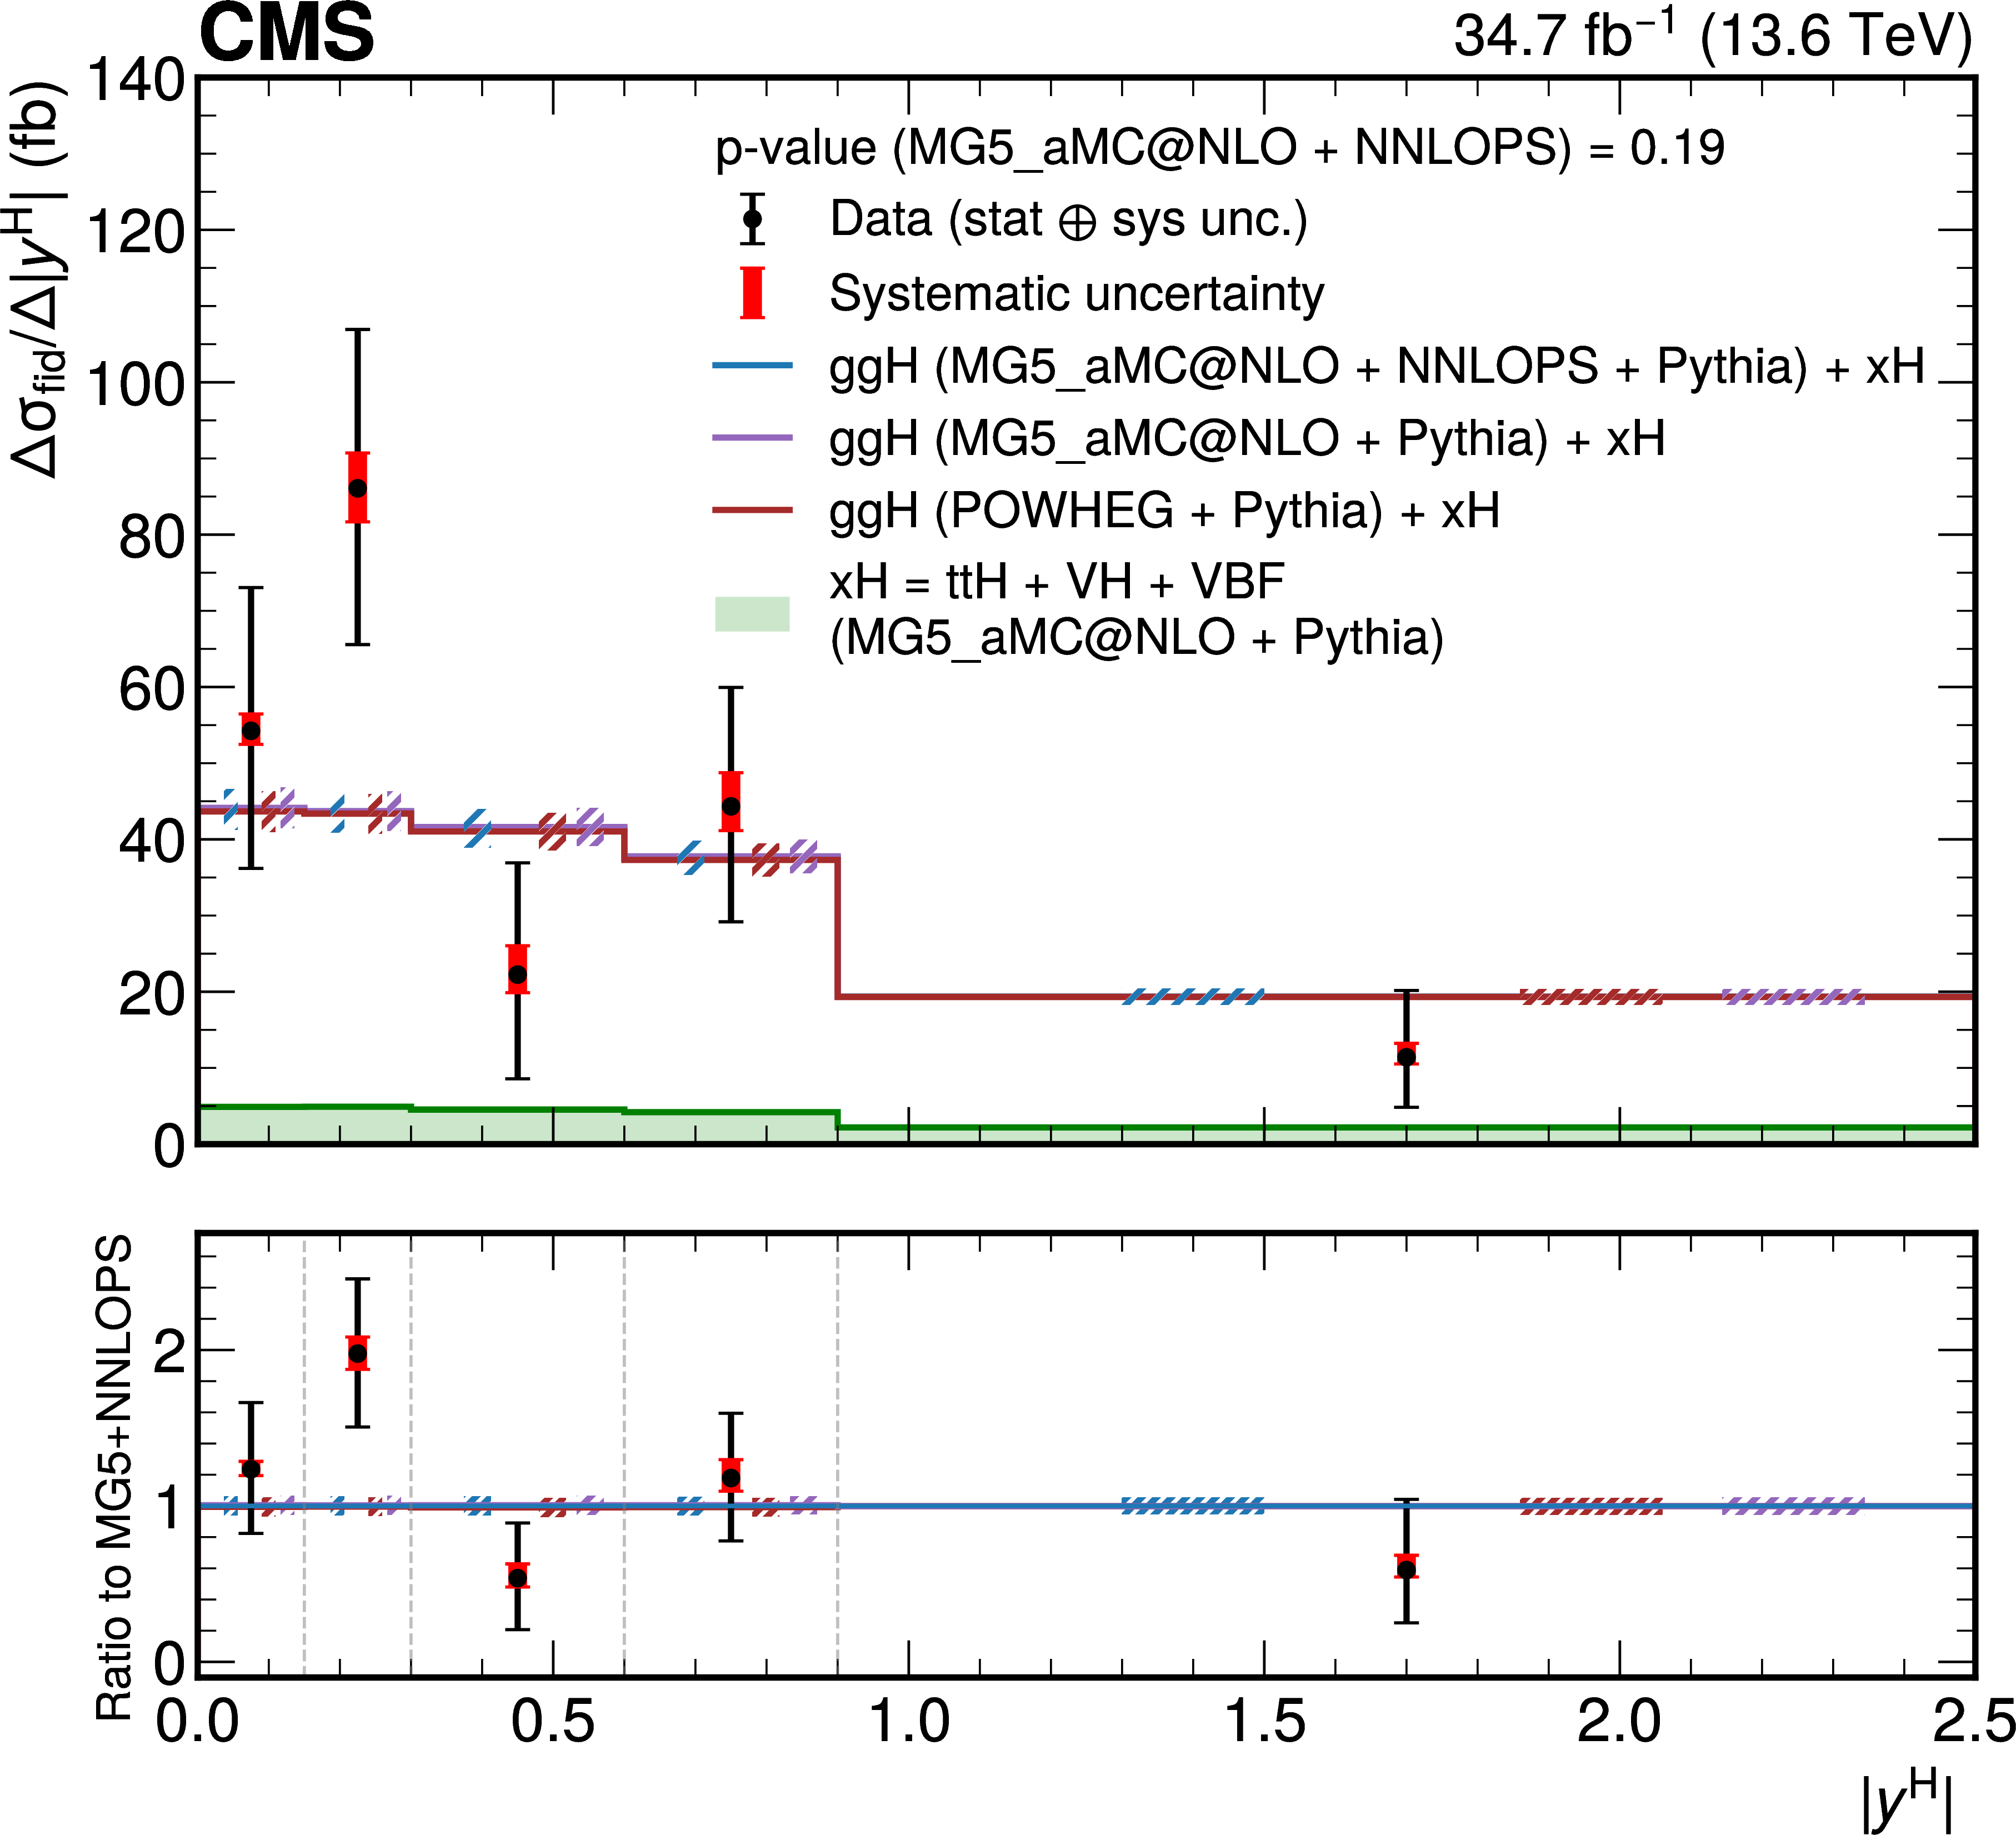
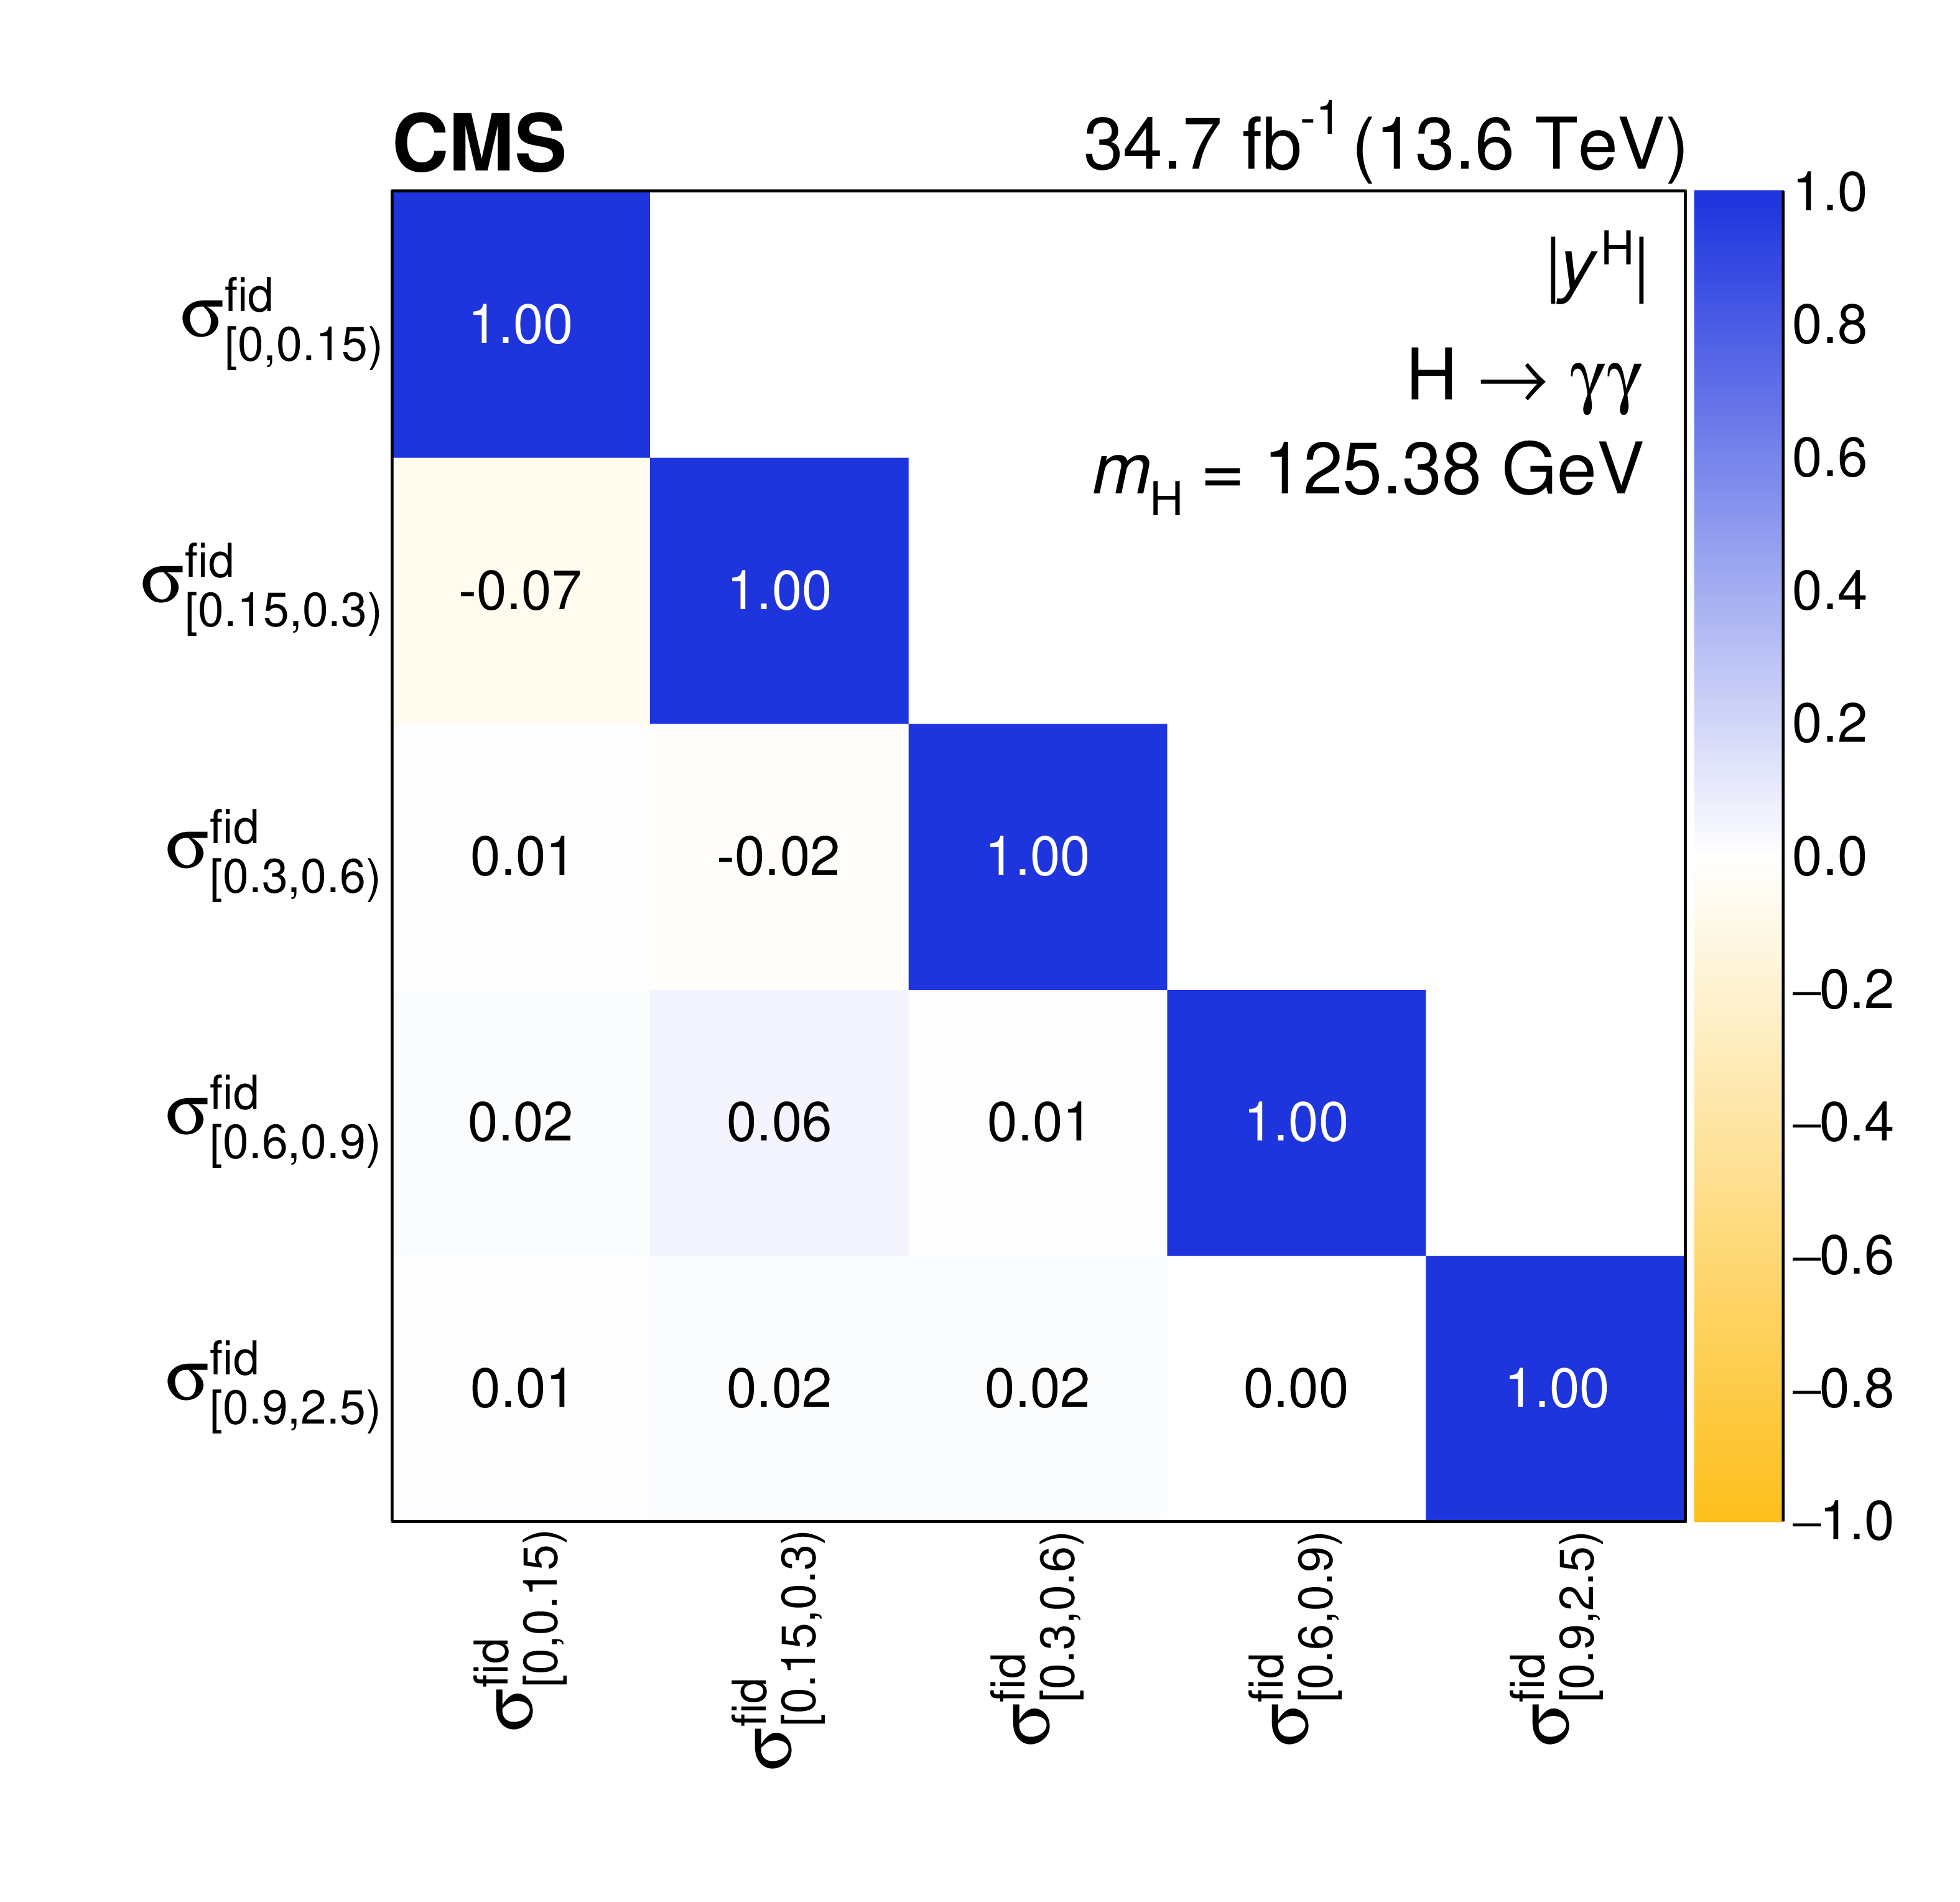
Figure 8:
Differential fiducial cross sections for $ |y^\mathrm{H}| $ (left) and the corresponding correlation matrix (right). Other details as for the caption of Fig. 7. In this case, the last bin does not extend to infinity, but it is limited to 2.5. |
png pdf |
Figure 8-a:
Differential fiducial cross sections for $ |y^\mathrm{H}| $ (left) and the corresponding correlation matrix (right). Other details as for the caption of Fig. 7. In this case, the last bin does not extend to infinity, but it is limited to 2.5. |
png pdf |
Figure 8-b:
Differential fiducial cross sections for $ |y^\mathrm{H}| $ (left) and the corresponding correlation matrix (right). Other details as for the caption of Fig. 7. In this case, the last bin does not extend to infinity, but it is limited to 2.5. |
png pdf |
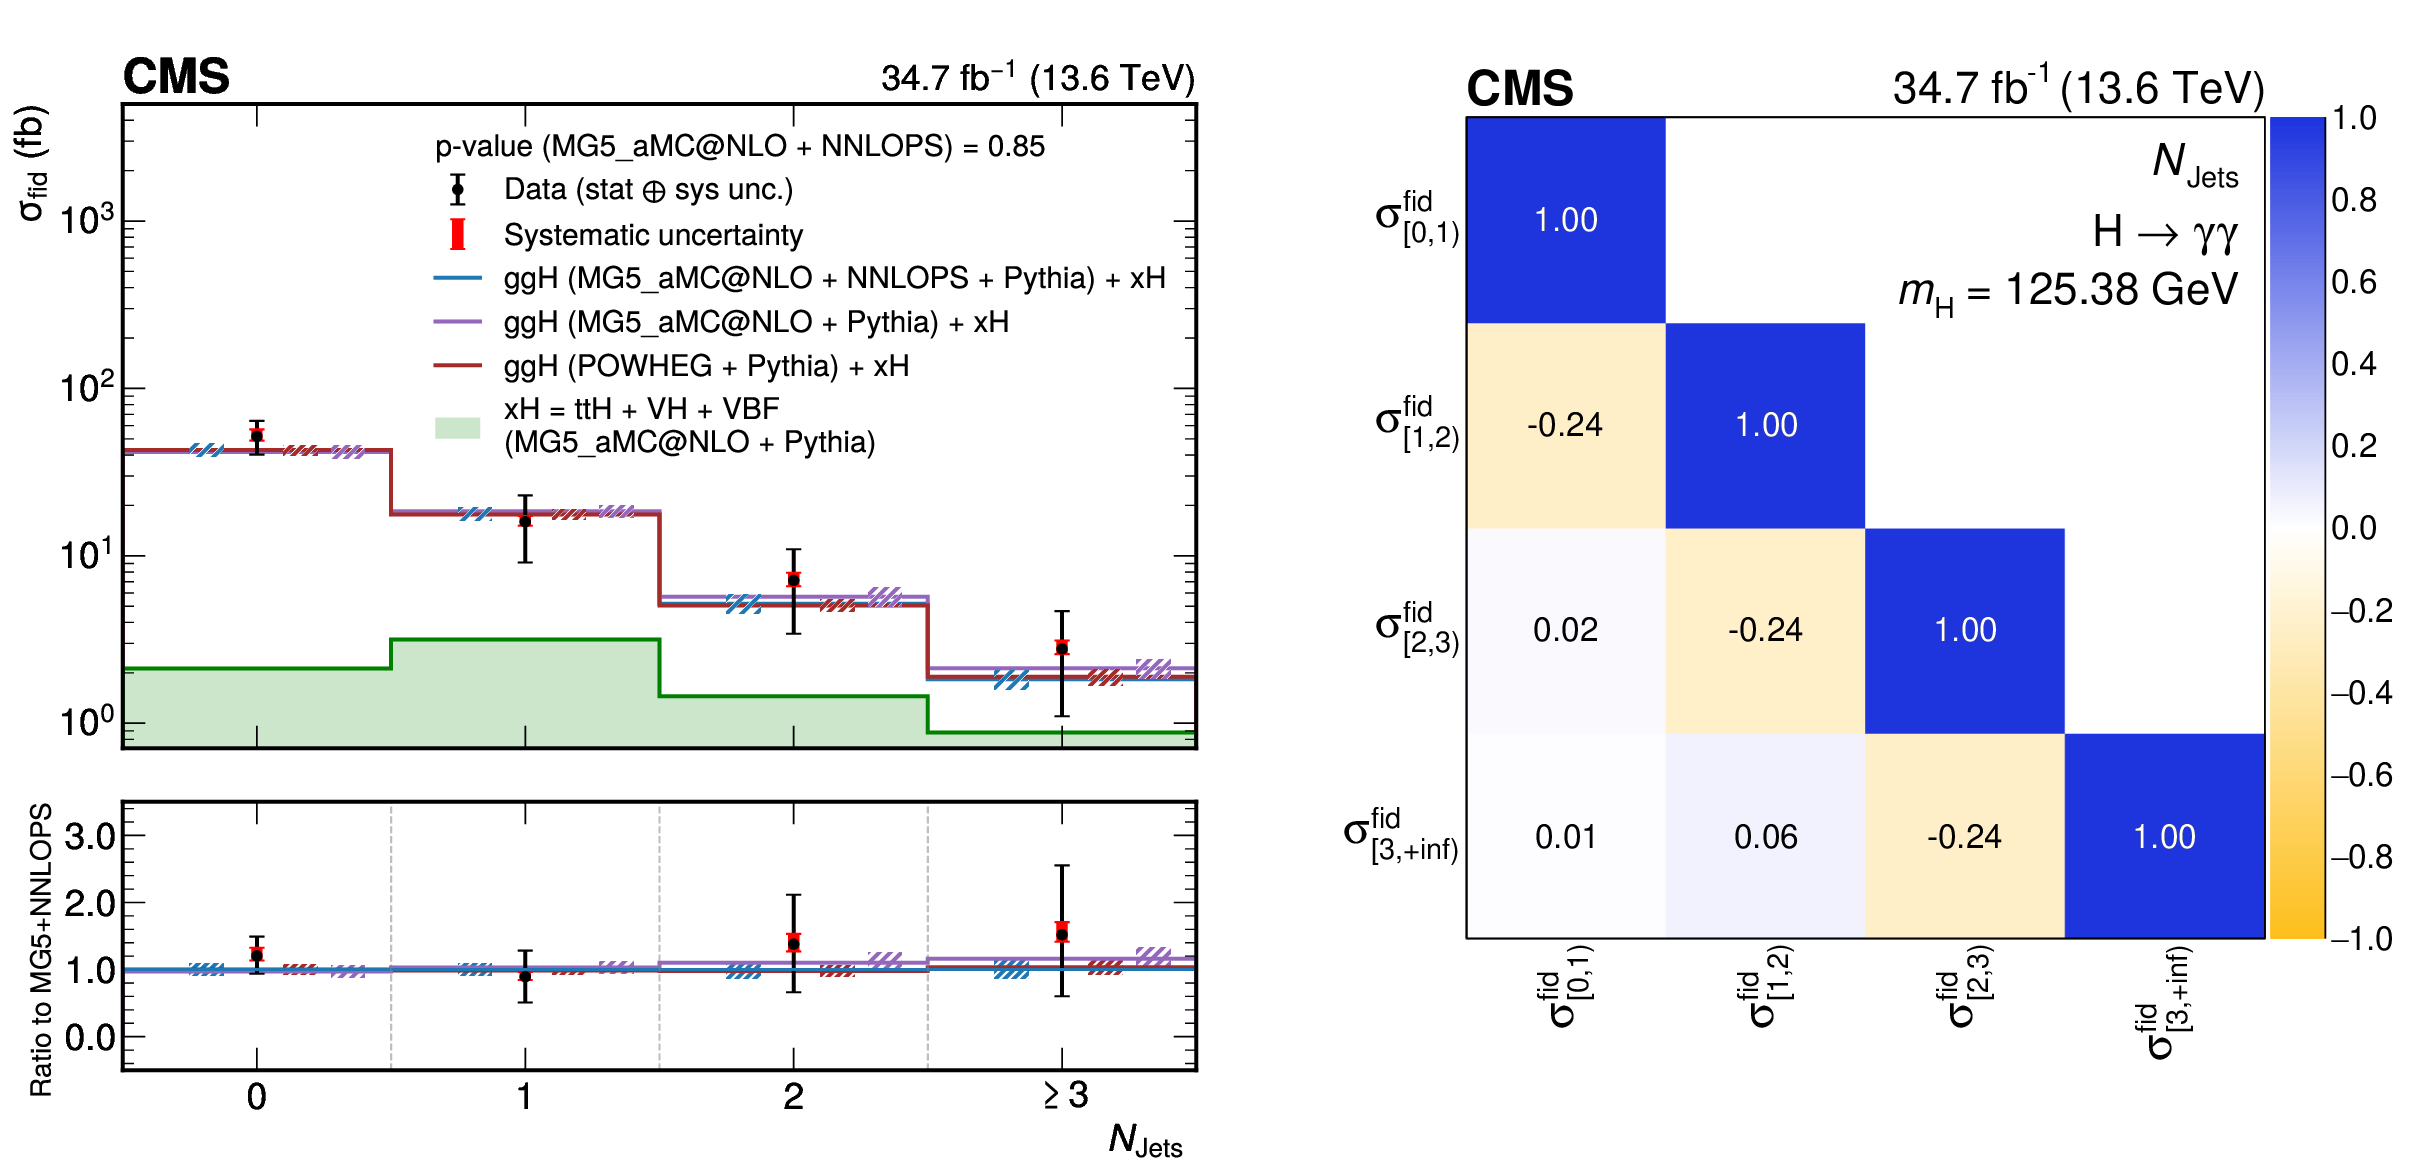
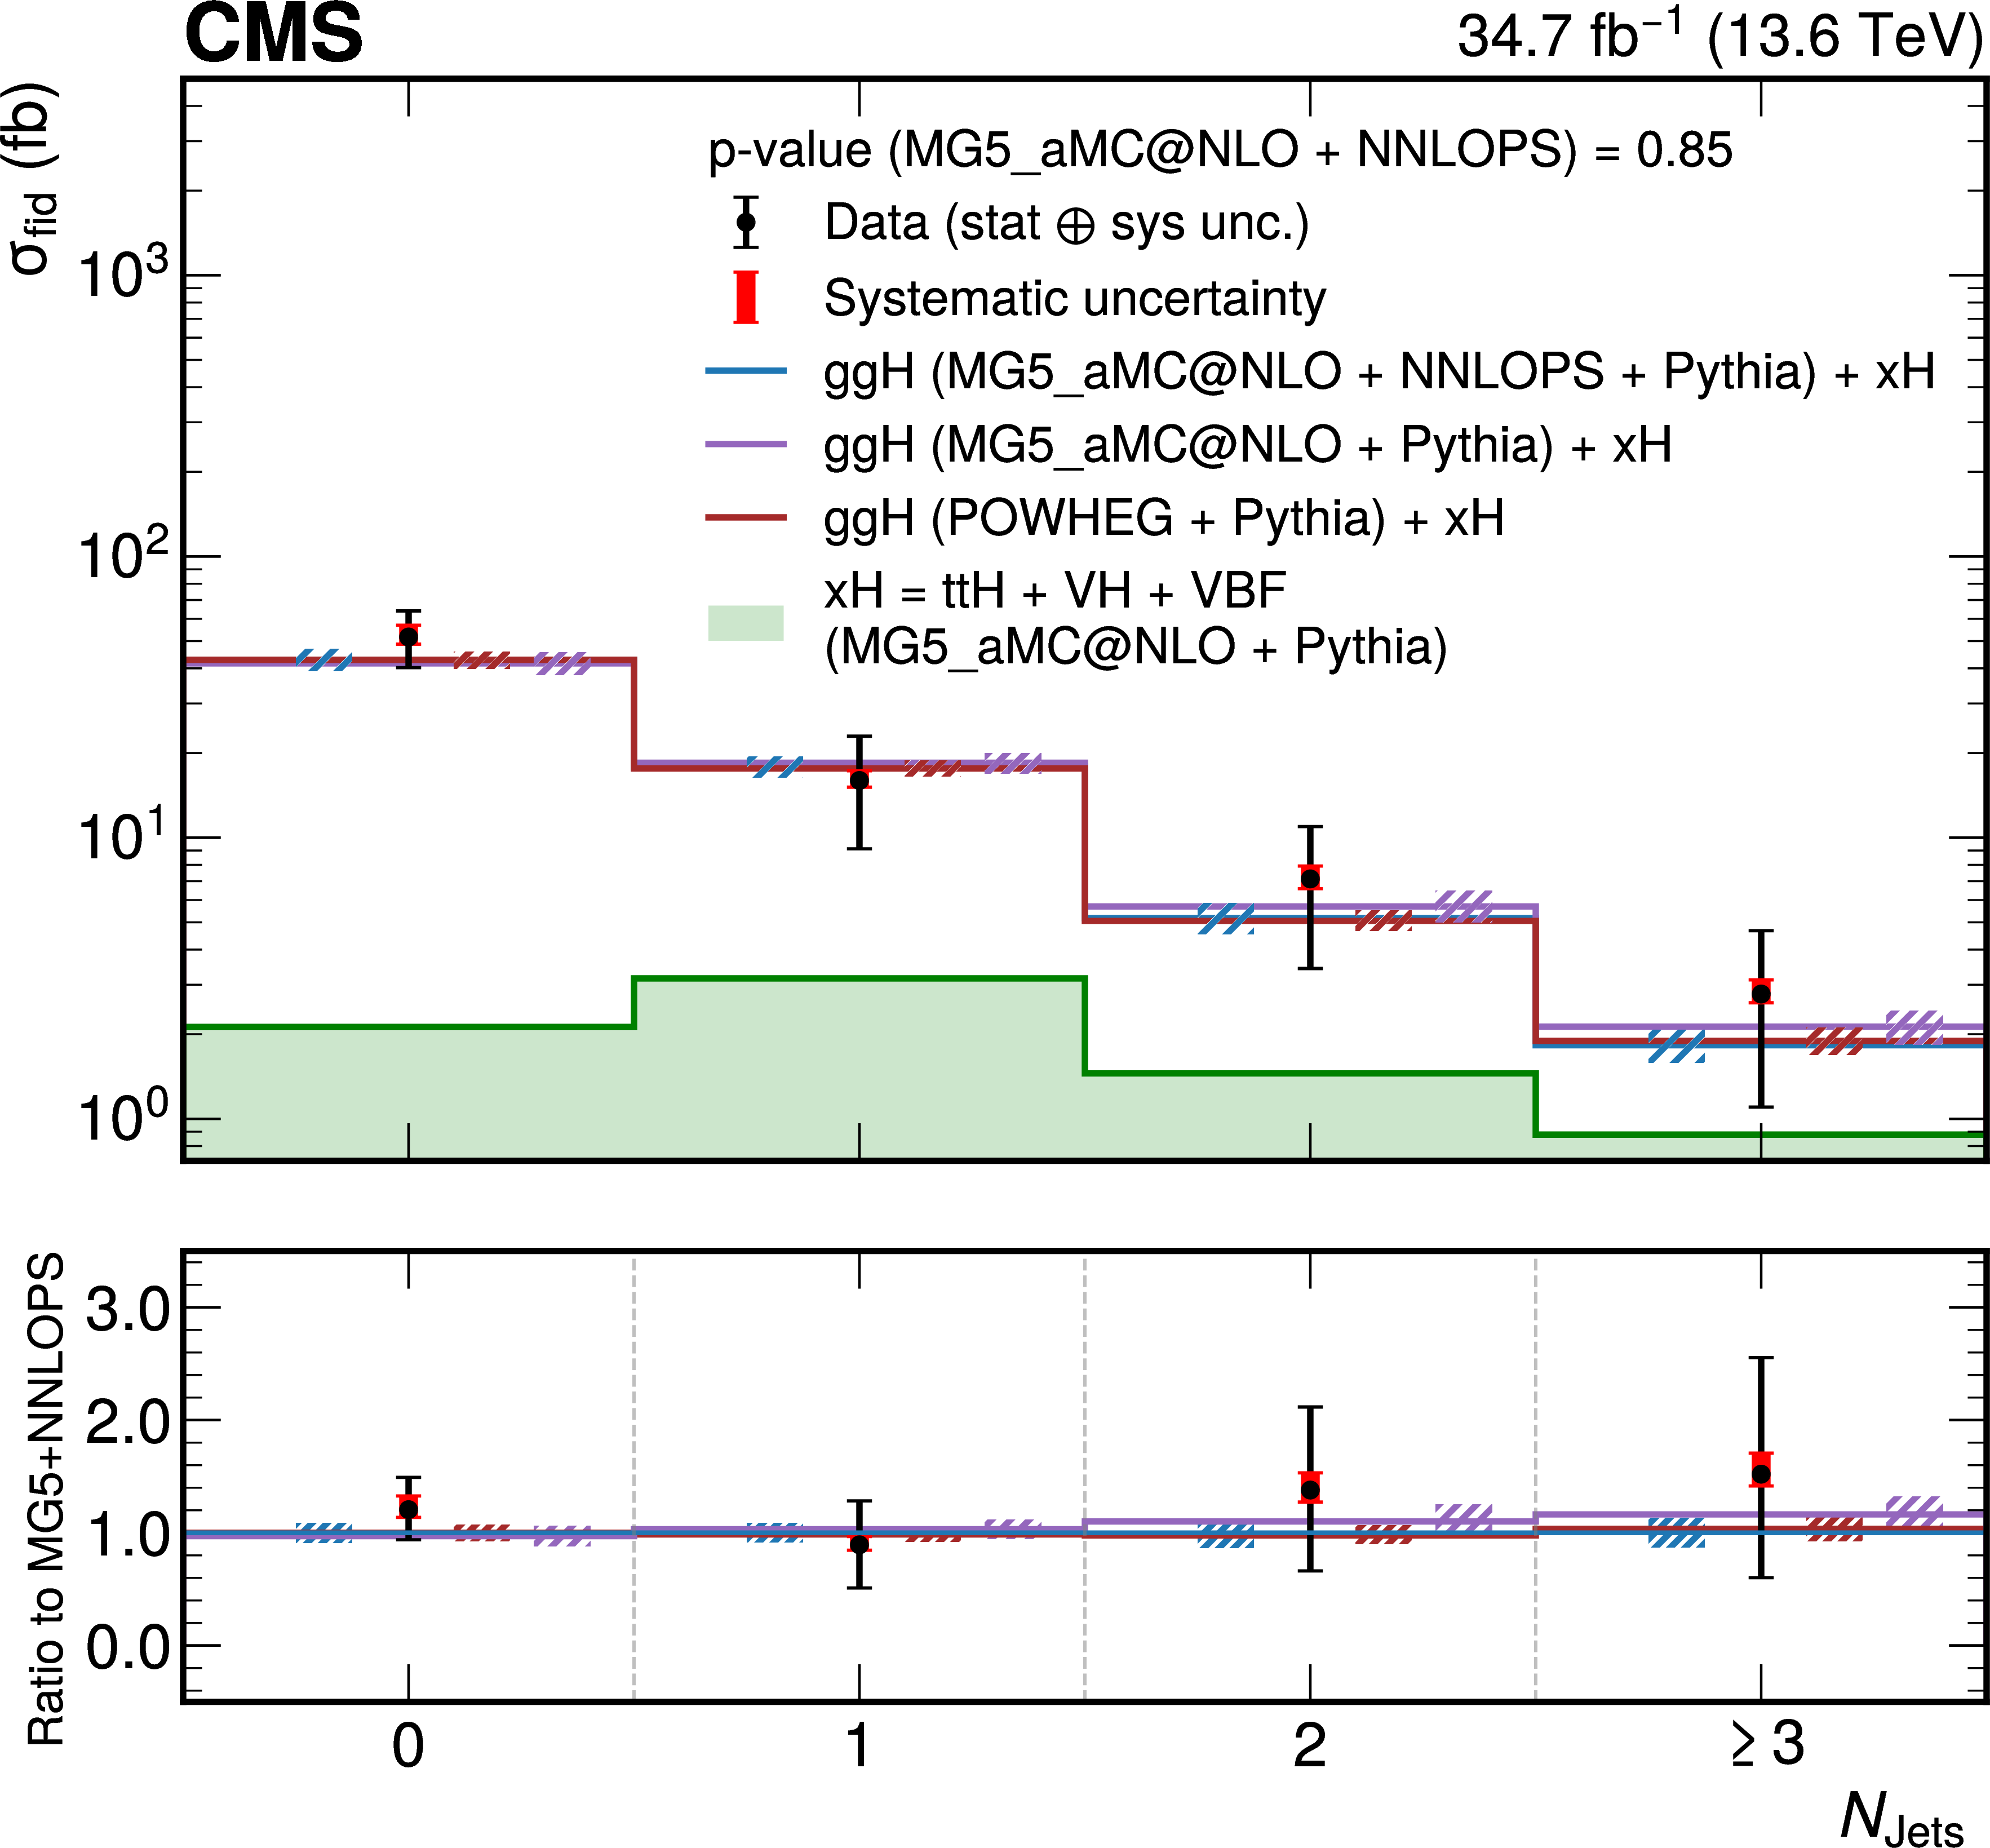
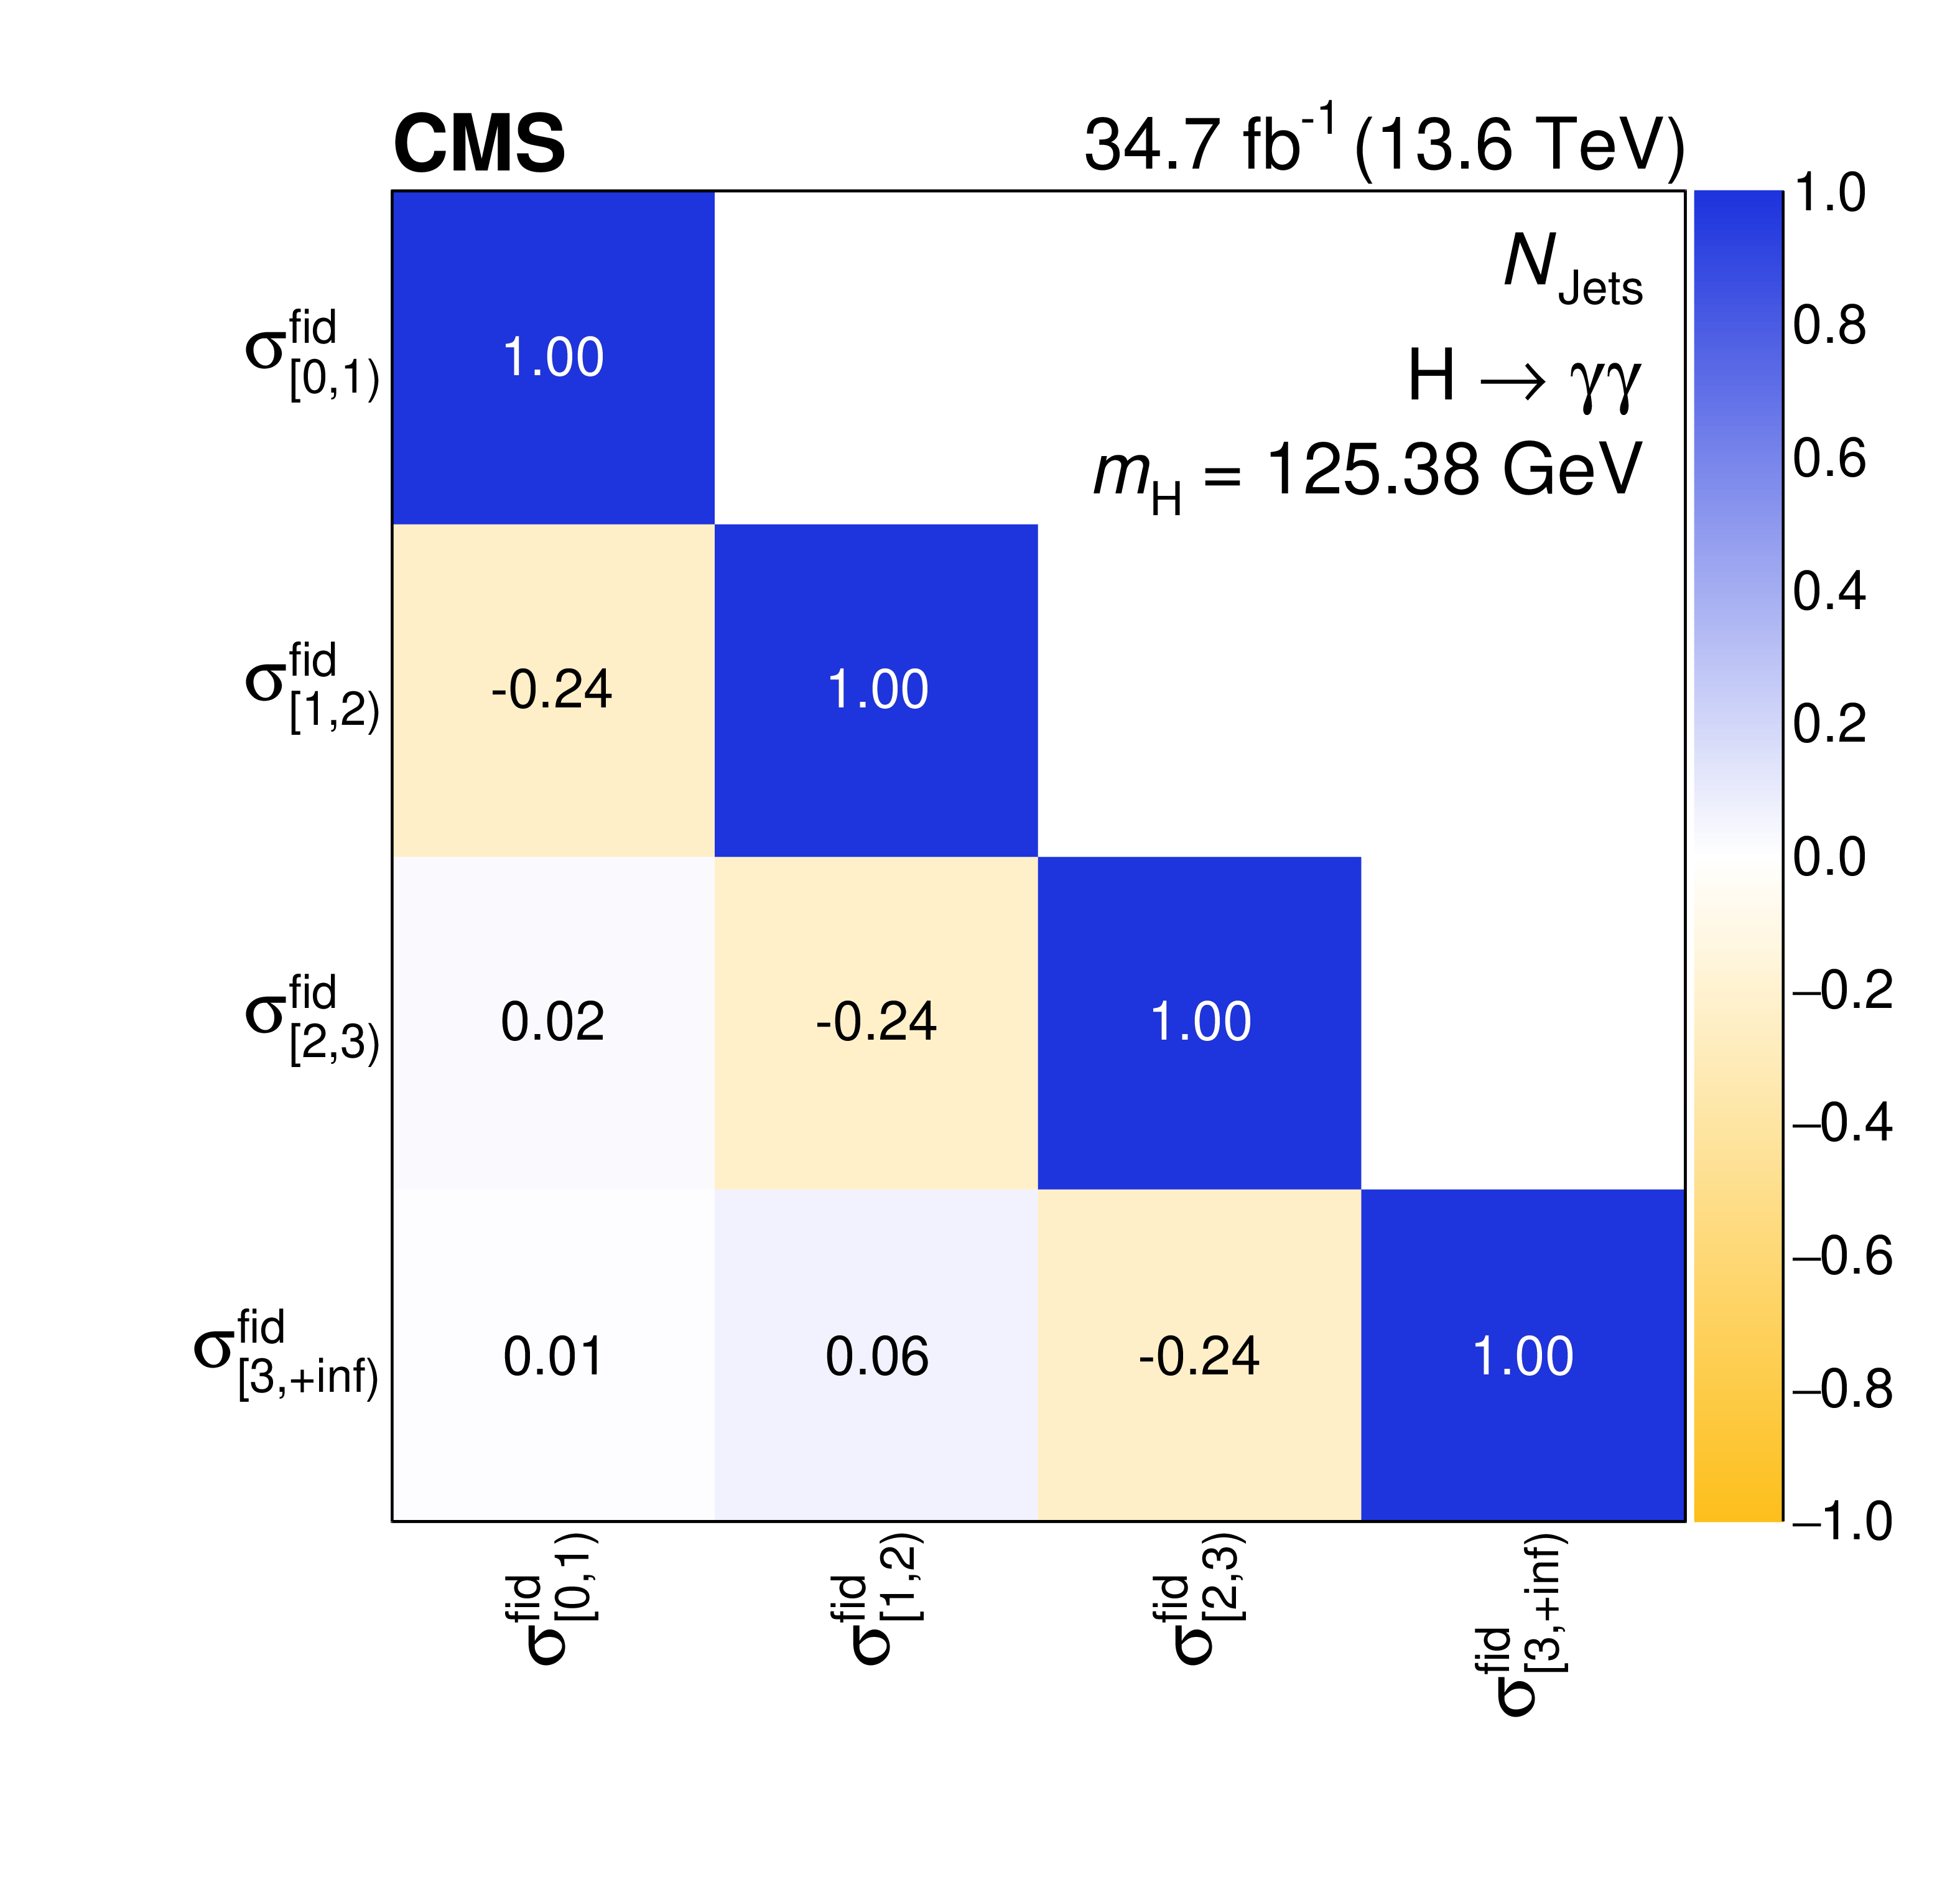
Figure 9:
Differential fiducial cross sections for $ N_{\text{Jets}} $ (left) and the corresponding correlation matrix (right). Other details as for the caption of Fig. 7. |
png pdf |
Figure 9-a:
Differential fiducial cross sections for $ N_{\text{Jets}} $ (left) and the corresponding correlation matrix (right). Other details as for the caption of Fig. 7. |
png pdf |
Figure 9-b:
Differential fiducial cross sections for $ N_{\text{Jets}} $ (left) and the corresponding correlation matrix (right). Other details as for the caption of Fig. 7. |
png pdf |
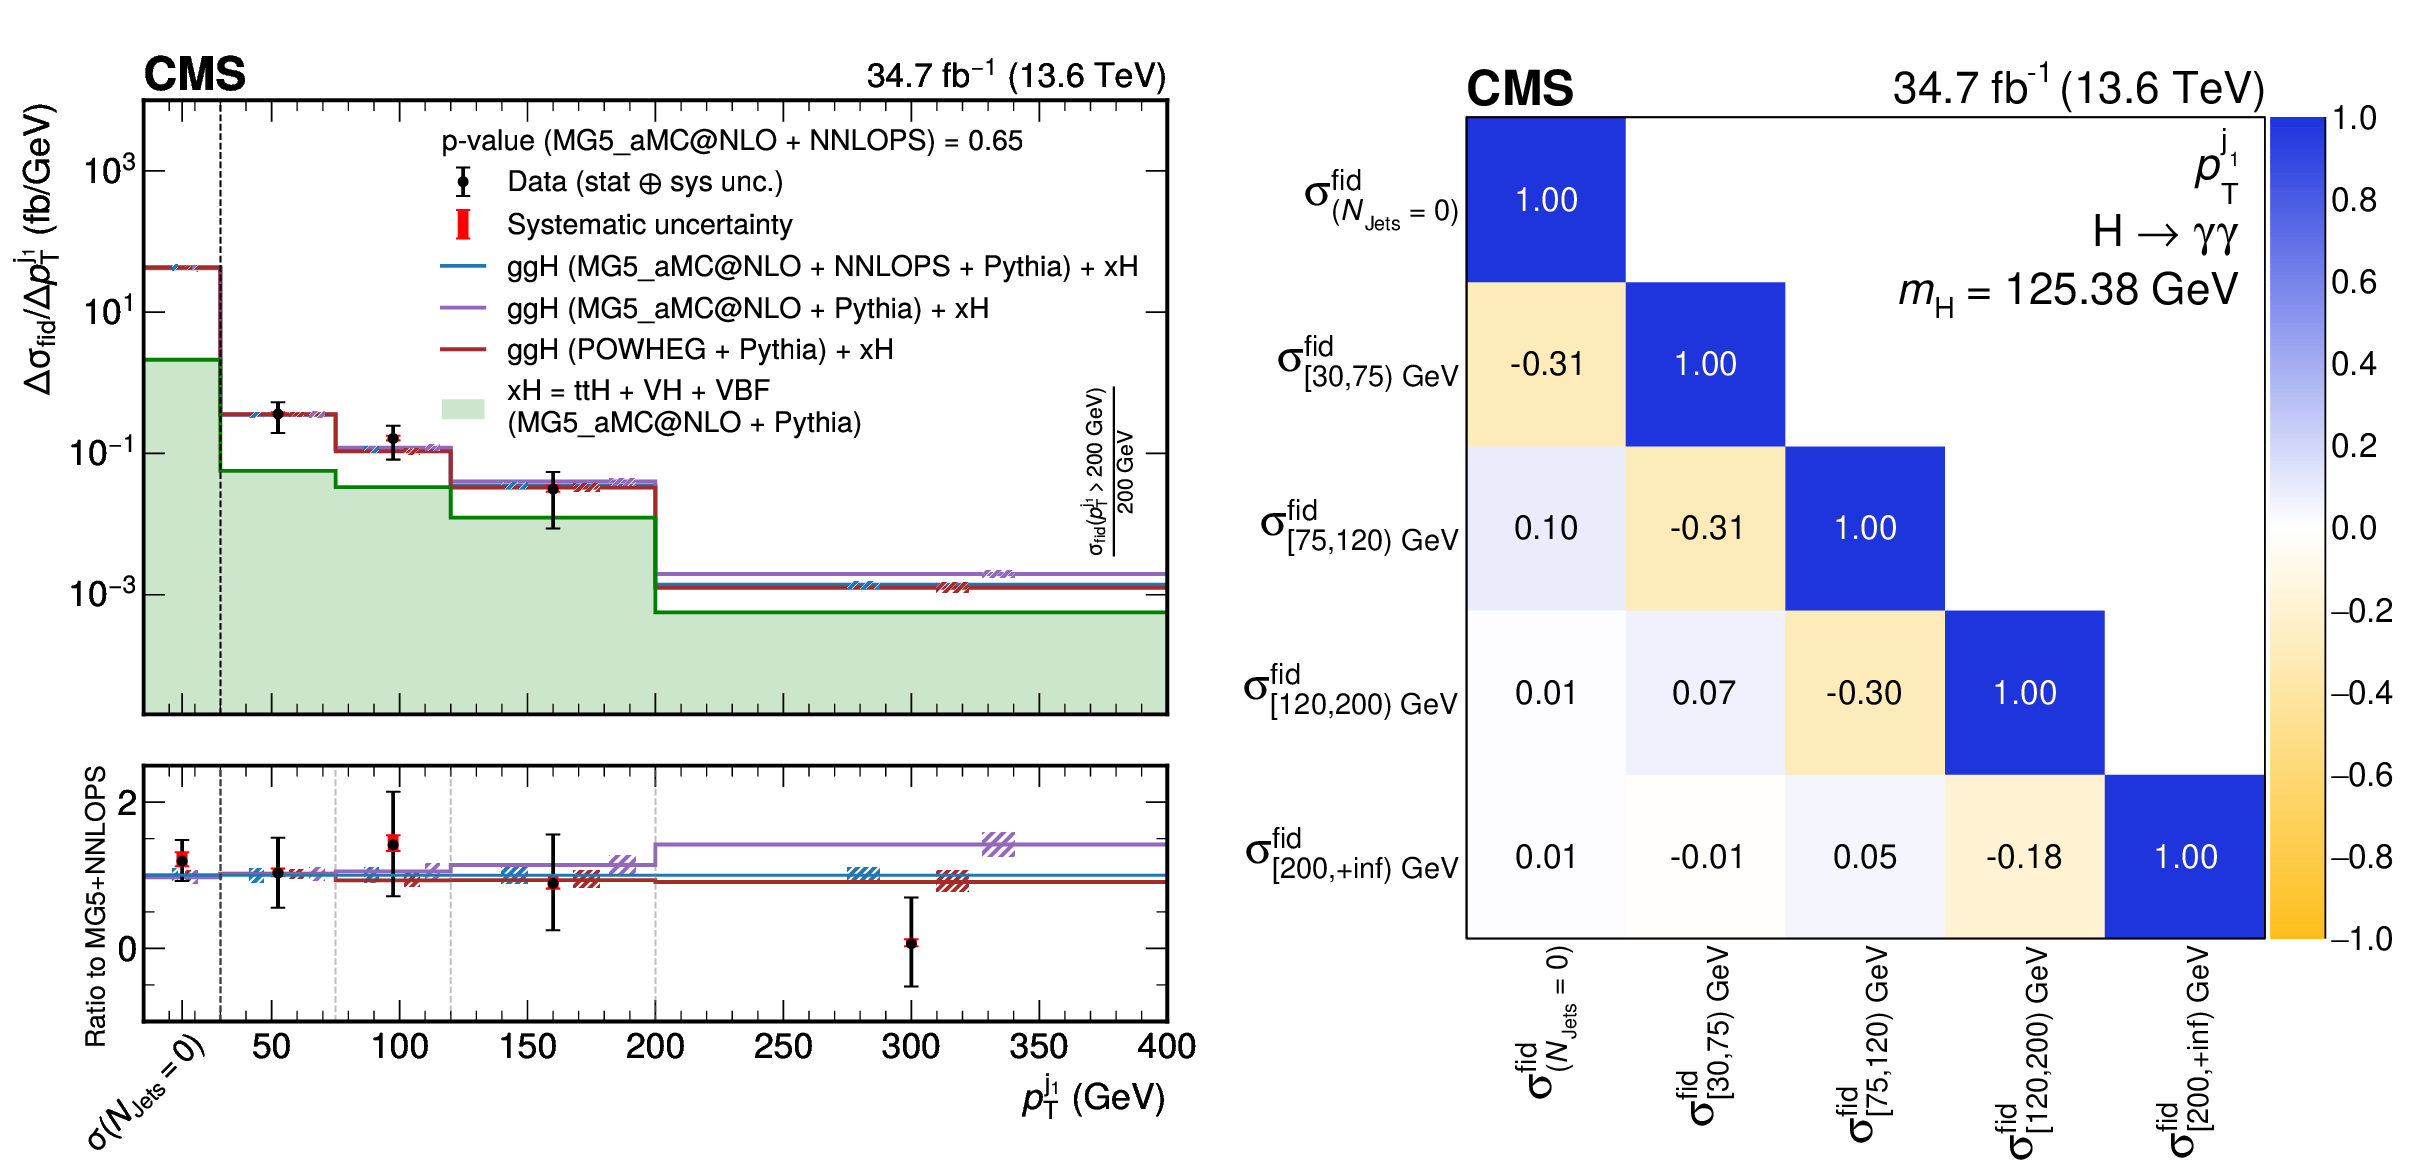
Figure 10:
Differential fiducial cross sections for $ p_{\mathrm{T}}^{\mathrm{j}_1} $ (left) and the corresponding correlation matrix (right). Other details as for the caption of Fig. 7. |
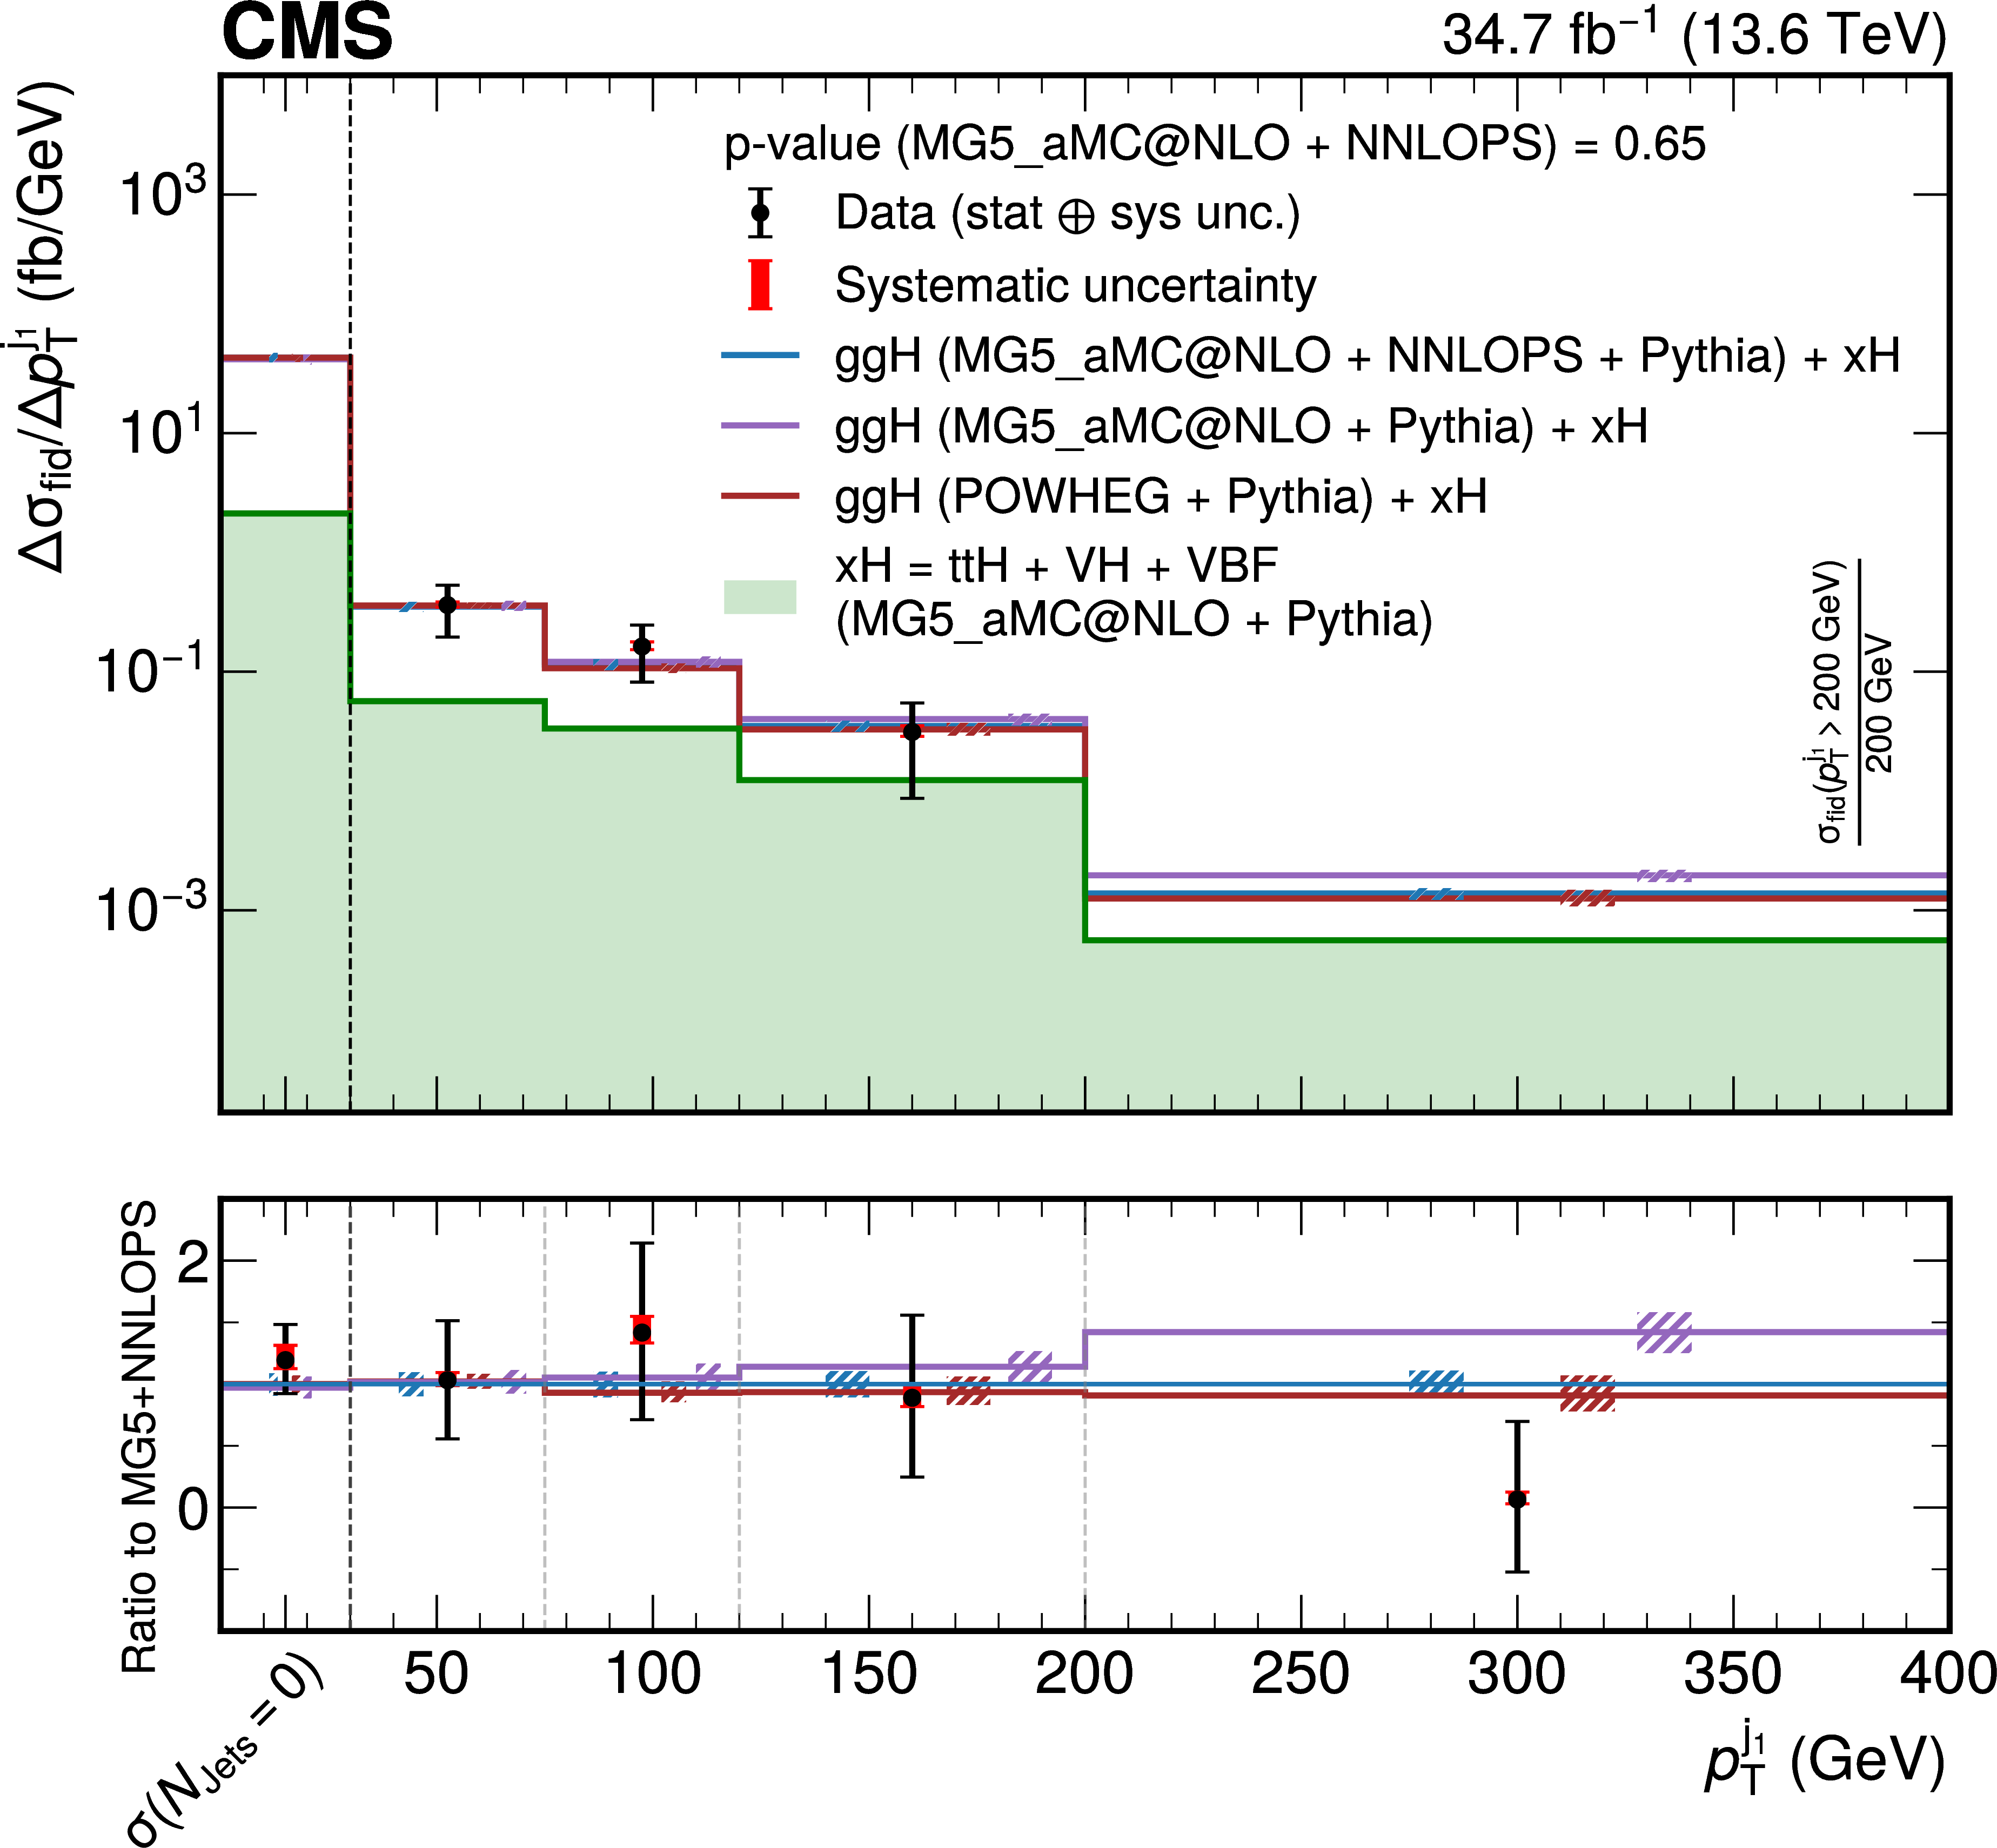
png pdf |
Figure 10-a:
Differential fiducial cross sections for $ p_{\mathrm{T}}^{\mathrm{j}_1} $ (left) and the corresponding correlation matrix (right). Other details as for the caption of Fig. 7. |
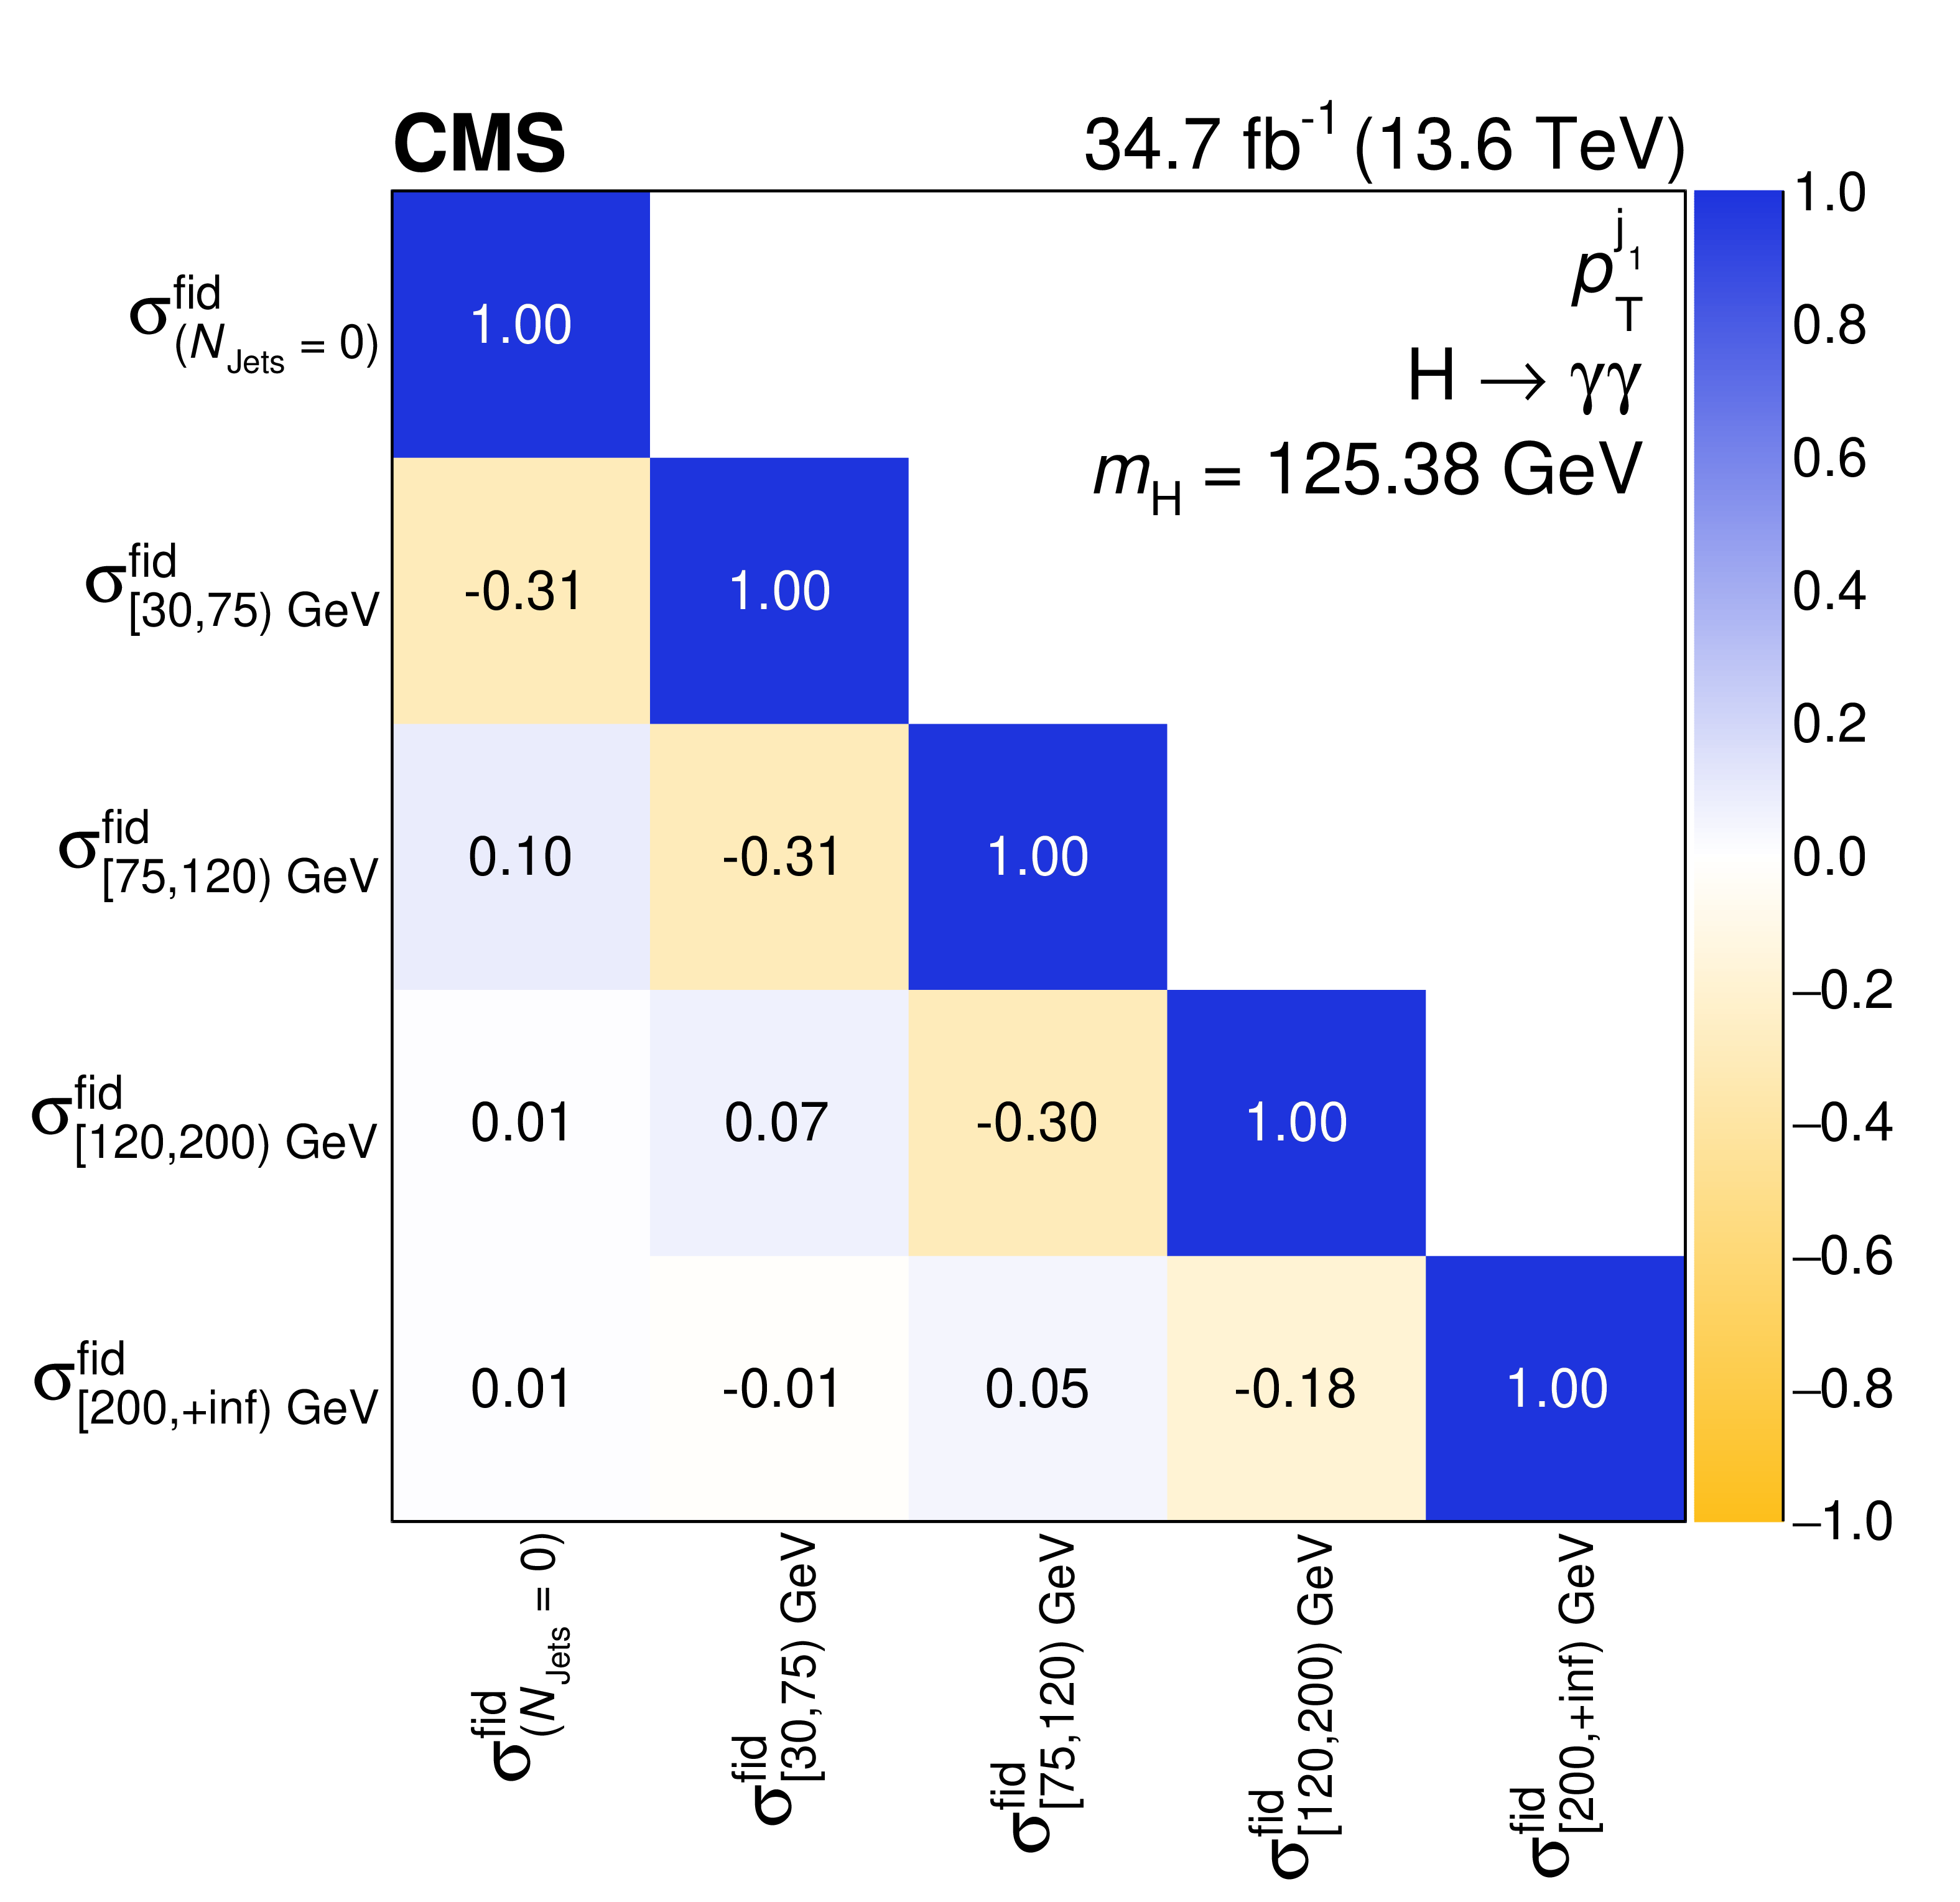
png pdf |
Figure 10-b:
Differential fiducial cross sections for $ p_{\mathrm{T}}^{\mathrm{j}_1} $ (left) and the corresponding correlation matrix (right). Other details as for the caption of Fig. 7. |
| Tables | |

png pdf |
Table 1:
Bin boundaries for the differential cross section measurement. The first $ p_{\mathrm{T}}^{\mathrm{j}_1} $ bin corresponds to events without jets. For the $ N_{\text{Jets}} $ binning, the right boundary should be considered as not included in the bin, i.e., [lower, upper). |
png pdf |
Table 2:
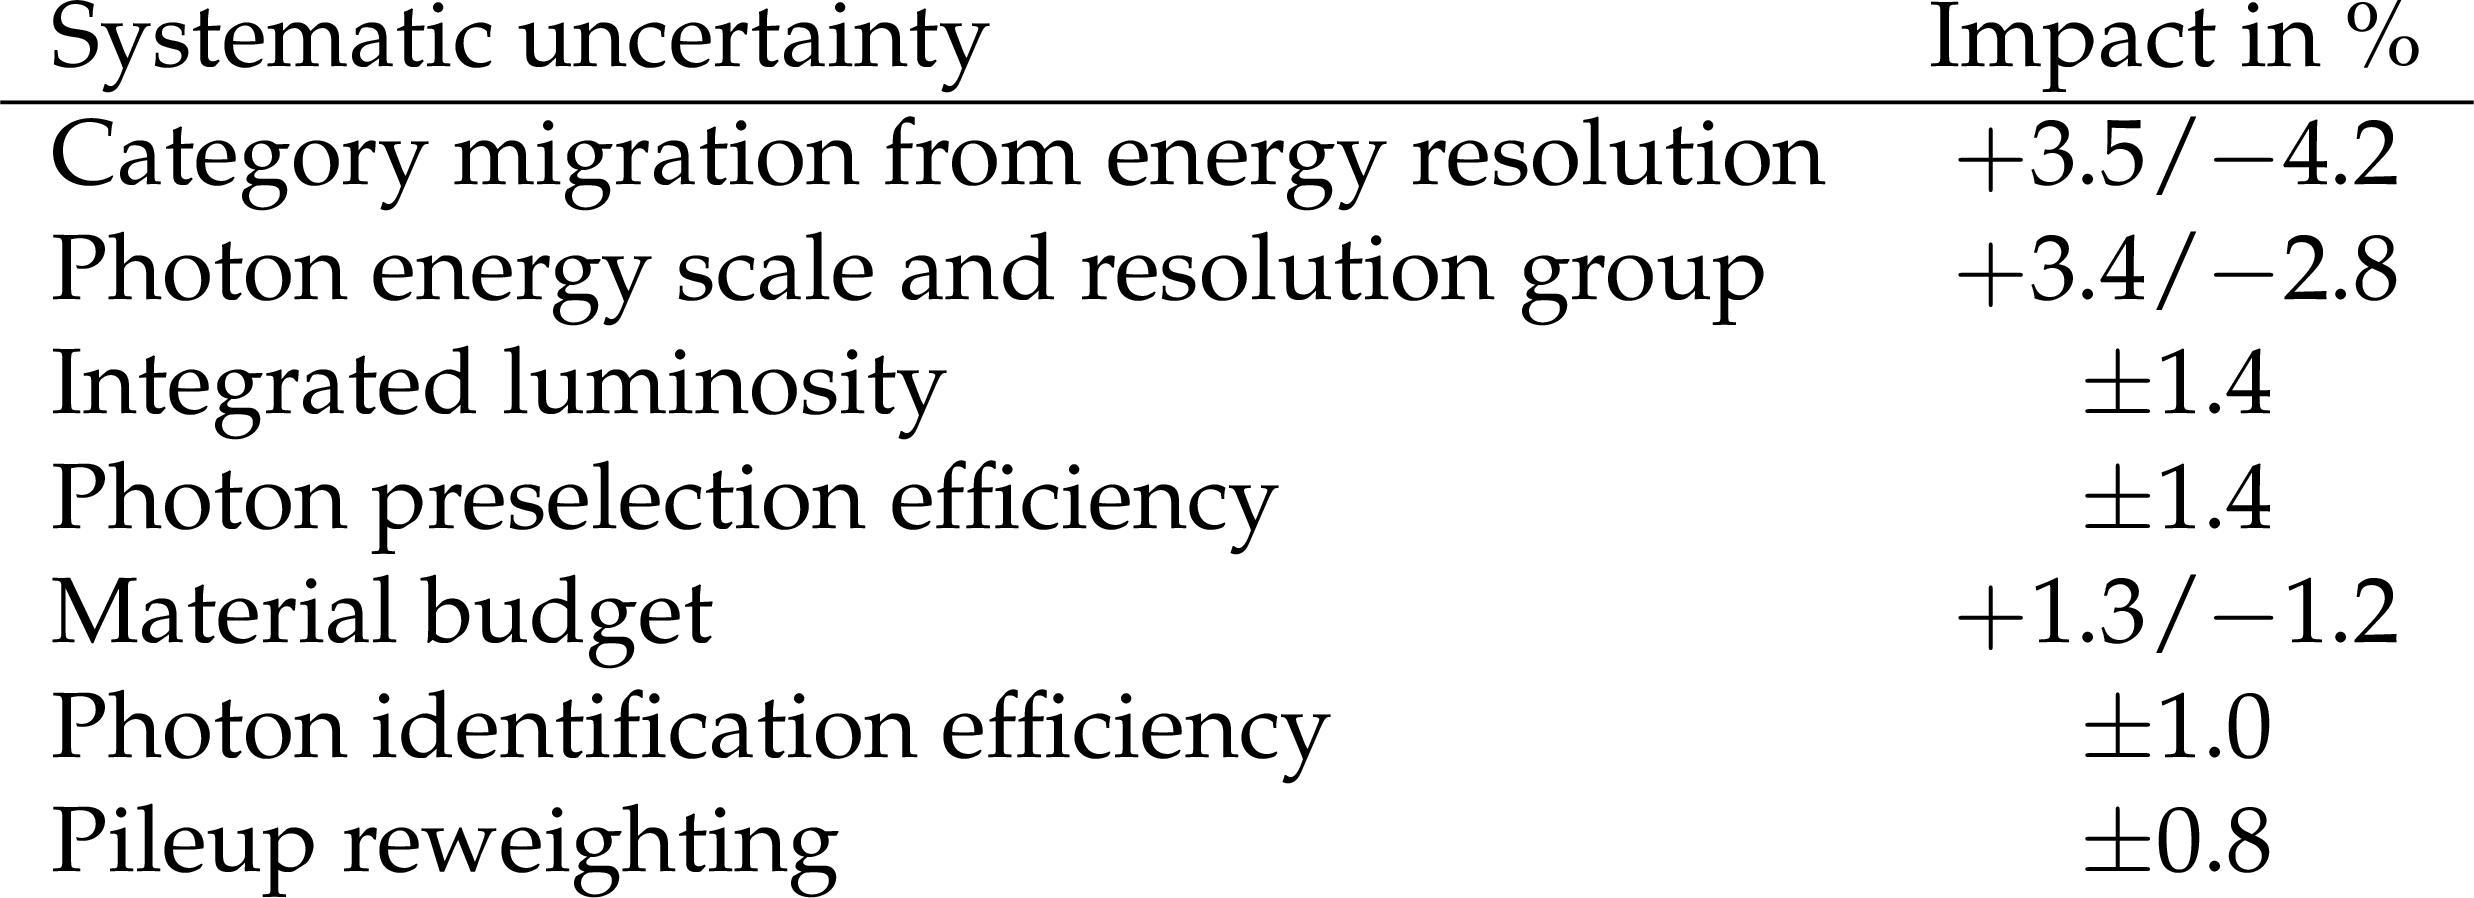
Magnitude of the systematic uncertainties (Impact) in the inclusive fiducial cross section measurement. The magnitude of the uncertainty from the photon energy scale and resolution is extracted by performing a fit with the corresponding group of nuisance parameters frozen to their best-fit values. The obtained confidence interval is then subtracted in quadrature from the total confidence interval from the fit where all nuisance parameters are profiled. The magnitudes of the other sources of systematic uncertainty are obtained by varying the corresponding nuisance parameter by one standard deviation, keeping the other nuisance parameters at their best-fit values. |
| Summary |
| The fiducial inclusive cross section for Higgs boson production in proton-proton collisions has been measured at a centre-of-mass energy of 13.6 TeV using the $ \mathrm{H}\to\gamma\gamma $ decay channel. The data were collected with the CMS detector at the LHC and correspond to an integrated luminosity of 34.7 fb$ ^{-1} $. A new normalizing-flow-based method is applied to correct the imperfect modelling of reconstructed photon variables in the simulation and to reduce the associated systematic uncertainties. The fiducial phase space is defined at the particle level and requires two isolated photons within the pseudorapidity $ |\eta| < $ 2.5 and not within 1.4442 $ < |\eta| < $ 1.5660. These photons must fulfil a requirement on the geometric mean of their transverse momenta scaled by their invariant mass, $ \sqrt{\smash[b]{p_{\mathrm{T}}^{\gamma_1} p_{\mathrm{T}}^{\gamma_2}}} / m_{\gamma\gamma} > 1/ $ 3, which improves the perturbative convergence of the theoretical predictions, as well as the requirement $ p_{\mathrm{T}}^{\gamma_2} / m_{\gamma\gamma} > 1/ $ 4. The measured inclusive fiducial cross section is $ \sigma_{\text{fid}} = $ 74 $ \pm $ 11 (stat) $ ^{+5}_{-4} $ (syst) fb and is in agreement with the standard-model (SM) expectation of 67.8 $ \pm $ 3.8 fb. Differential cross sections are measured as functions of the Higgs boson transverse momentum, rapidity, the number of associated jets, and the transverse momentum of the leading jet in the event. Within the uncertainties, the differential cross sections agree with the SM predictions. |
| Additional Figures | |
png pdf |
Additional Figure 1:
Comparison between data (black points) and simulation (green) for the invariant mass distribution of electron pairs from Drell-Yan production reconstructed as photons. Both reconstructed photons are in the barrel region $ \lvert \eta \rvert < $ 1.4442 of the electromagnetic calorimeter. The transverse momentum of the leading (subleading) photon is required to be larger than 35 (25) GeV and loose identification criteria are applied. Scale calibrations and resolution corrections are applied to the photons in data and simulation, respectively. The error bands in the ratio panel include the uncertainty from the limited number of simulated events (blue) and the uncertainty in the energy scale and resolution of the photons (black). The statistical uncertainty on the data is smaller than the marker size. |
png pdf |
Additional Figure 2:
Comparison between data (black points) and simulation (green) for the invariant mass distribution of electron pairs from Drell-Yan production reconstructed as photons. At least one of the two reconstructed photons is in the endcap region 1.566 $ < \lvert \eta \rvert < $ 2.5 of the electromagnetic calorimeter. The transverse momentum of the leading (subleading) photon is required to be larger than 35 (25) GeV and loose identification criteria are applied. Scale calibrations and resolution corrections are applied to photons in data and simulation, respectively. The error bands in the ratio panel include the uncertainty from the limited number of simulated events (blue) and the uncertainty in the energy scale and resolution of the photons (black). The statistical uncertainty on the data is smaller than the marker size. |
png pdf |
Additional Figure 3:
Data-simulation comparison for $ \sigma_{E} $ for photons from $ Z \to \mu \mu \gamma $ decays. The uncorrected distribution is shown in blue and the corrected distribution from the normalizing flow are shown in green. The error bars in the ratio panel include the statistical uncertainty from the data and the uncertainty from the limited number of simulated events. The bars in the ratio panel are offset for visibility only. The last bin contains the overflow. |
png pdf |
Additional Figure 4:
Data-simulation comparison for $ H/E $ for photons from $ Z \to \mu \mu \gamma $ decays. The uncorrected distribution is shown in blue and the corrected distribution from the normalizing flow are shown in green. The error bars in the ratio panel include the statistical uncertainty from the data and the uncertainty from the limited number of simulated events. The bars in the ratio panel are offset for visibility only. |
png pdf |
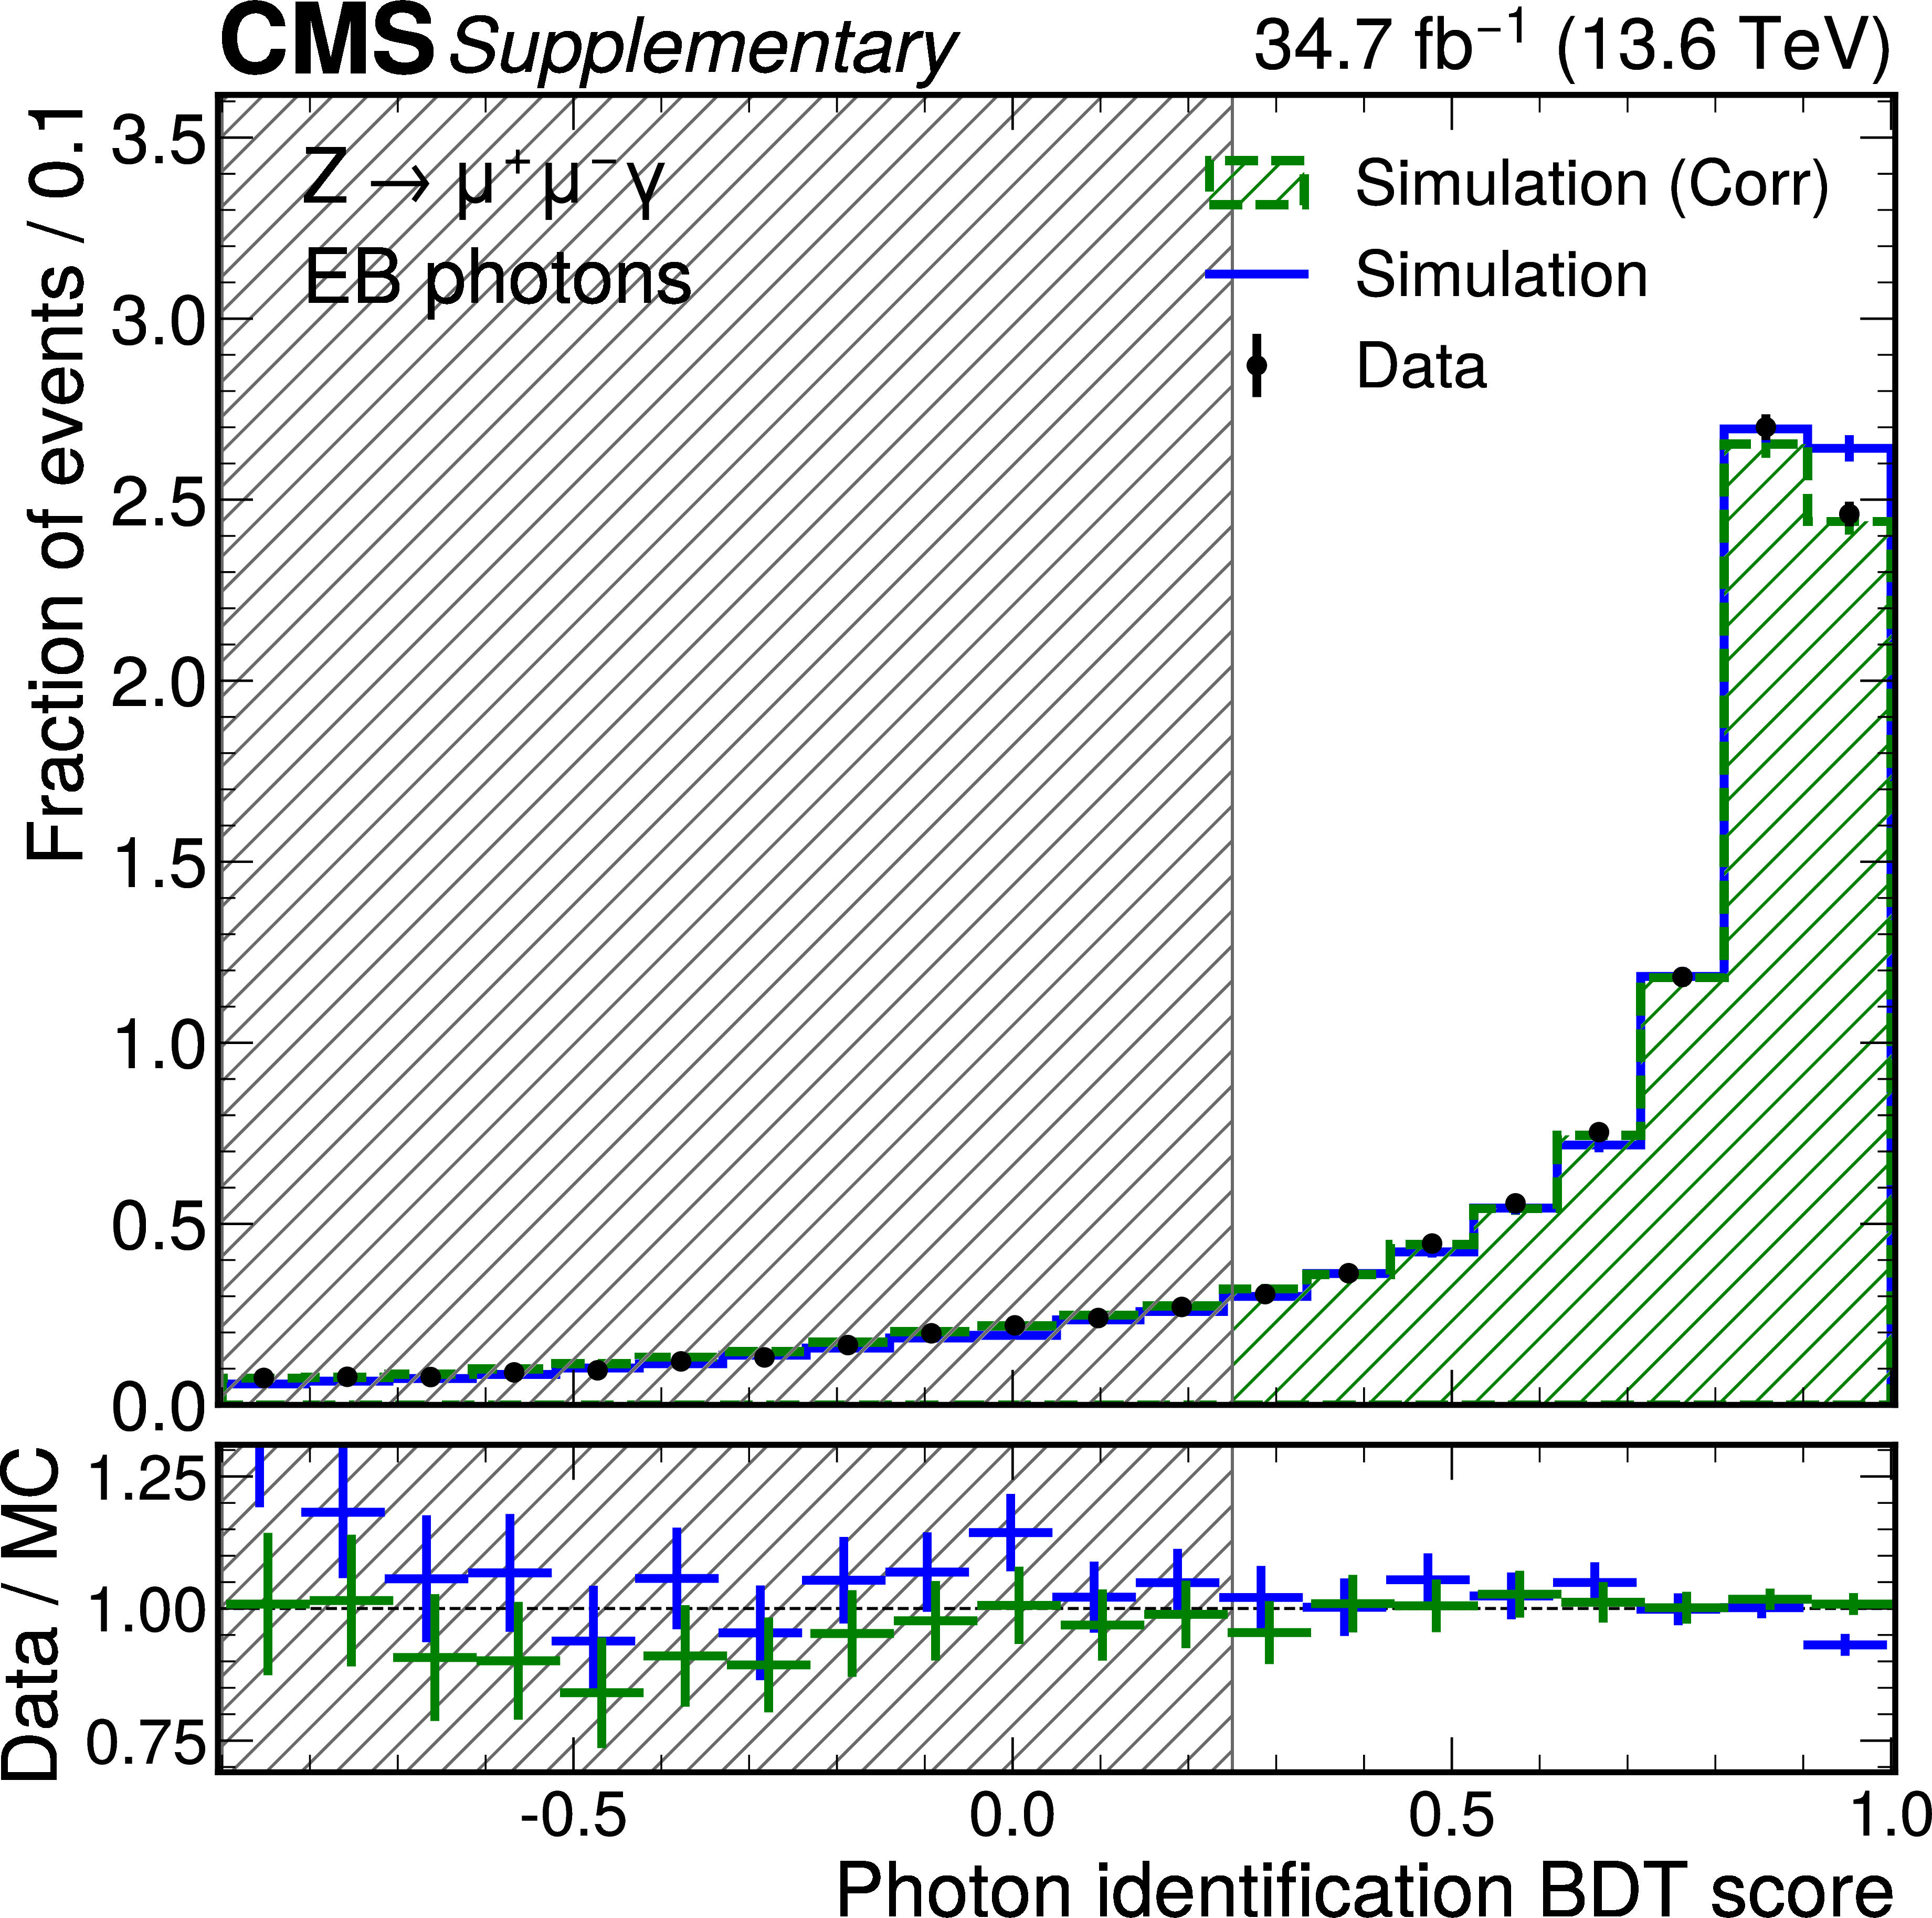
Additional Figure 5:
Data-simulation comparison for the photon identification BDT score in EB for photons from $ Z \to \mu \mu \gamma $ decays. The uncorrected distribution is shown in blue and the corrected distribution from the normalizing flow are shown in green. The error bars in the ratio panel include the statistical uncertainty from the data and the uncertainty from the limited number of simulated events. The bars in the ratio panel are offset for visibility only. The shaded region indicates photons that would not pass the selection used in the cross section measurements, for which a requirement of $ > $ 0.25 is applied. |
png pdf |
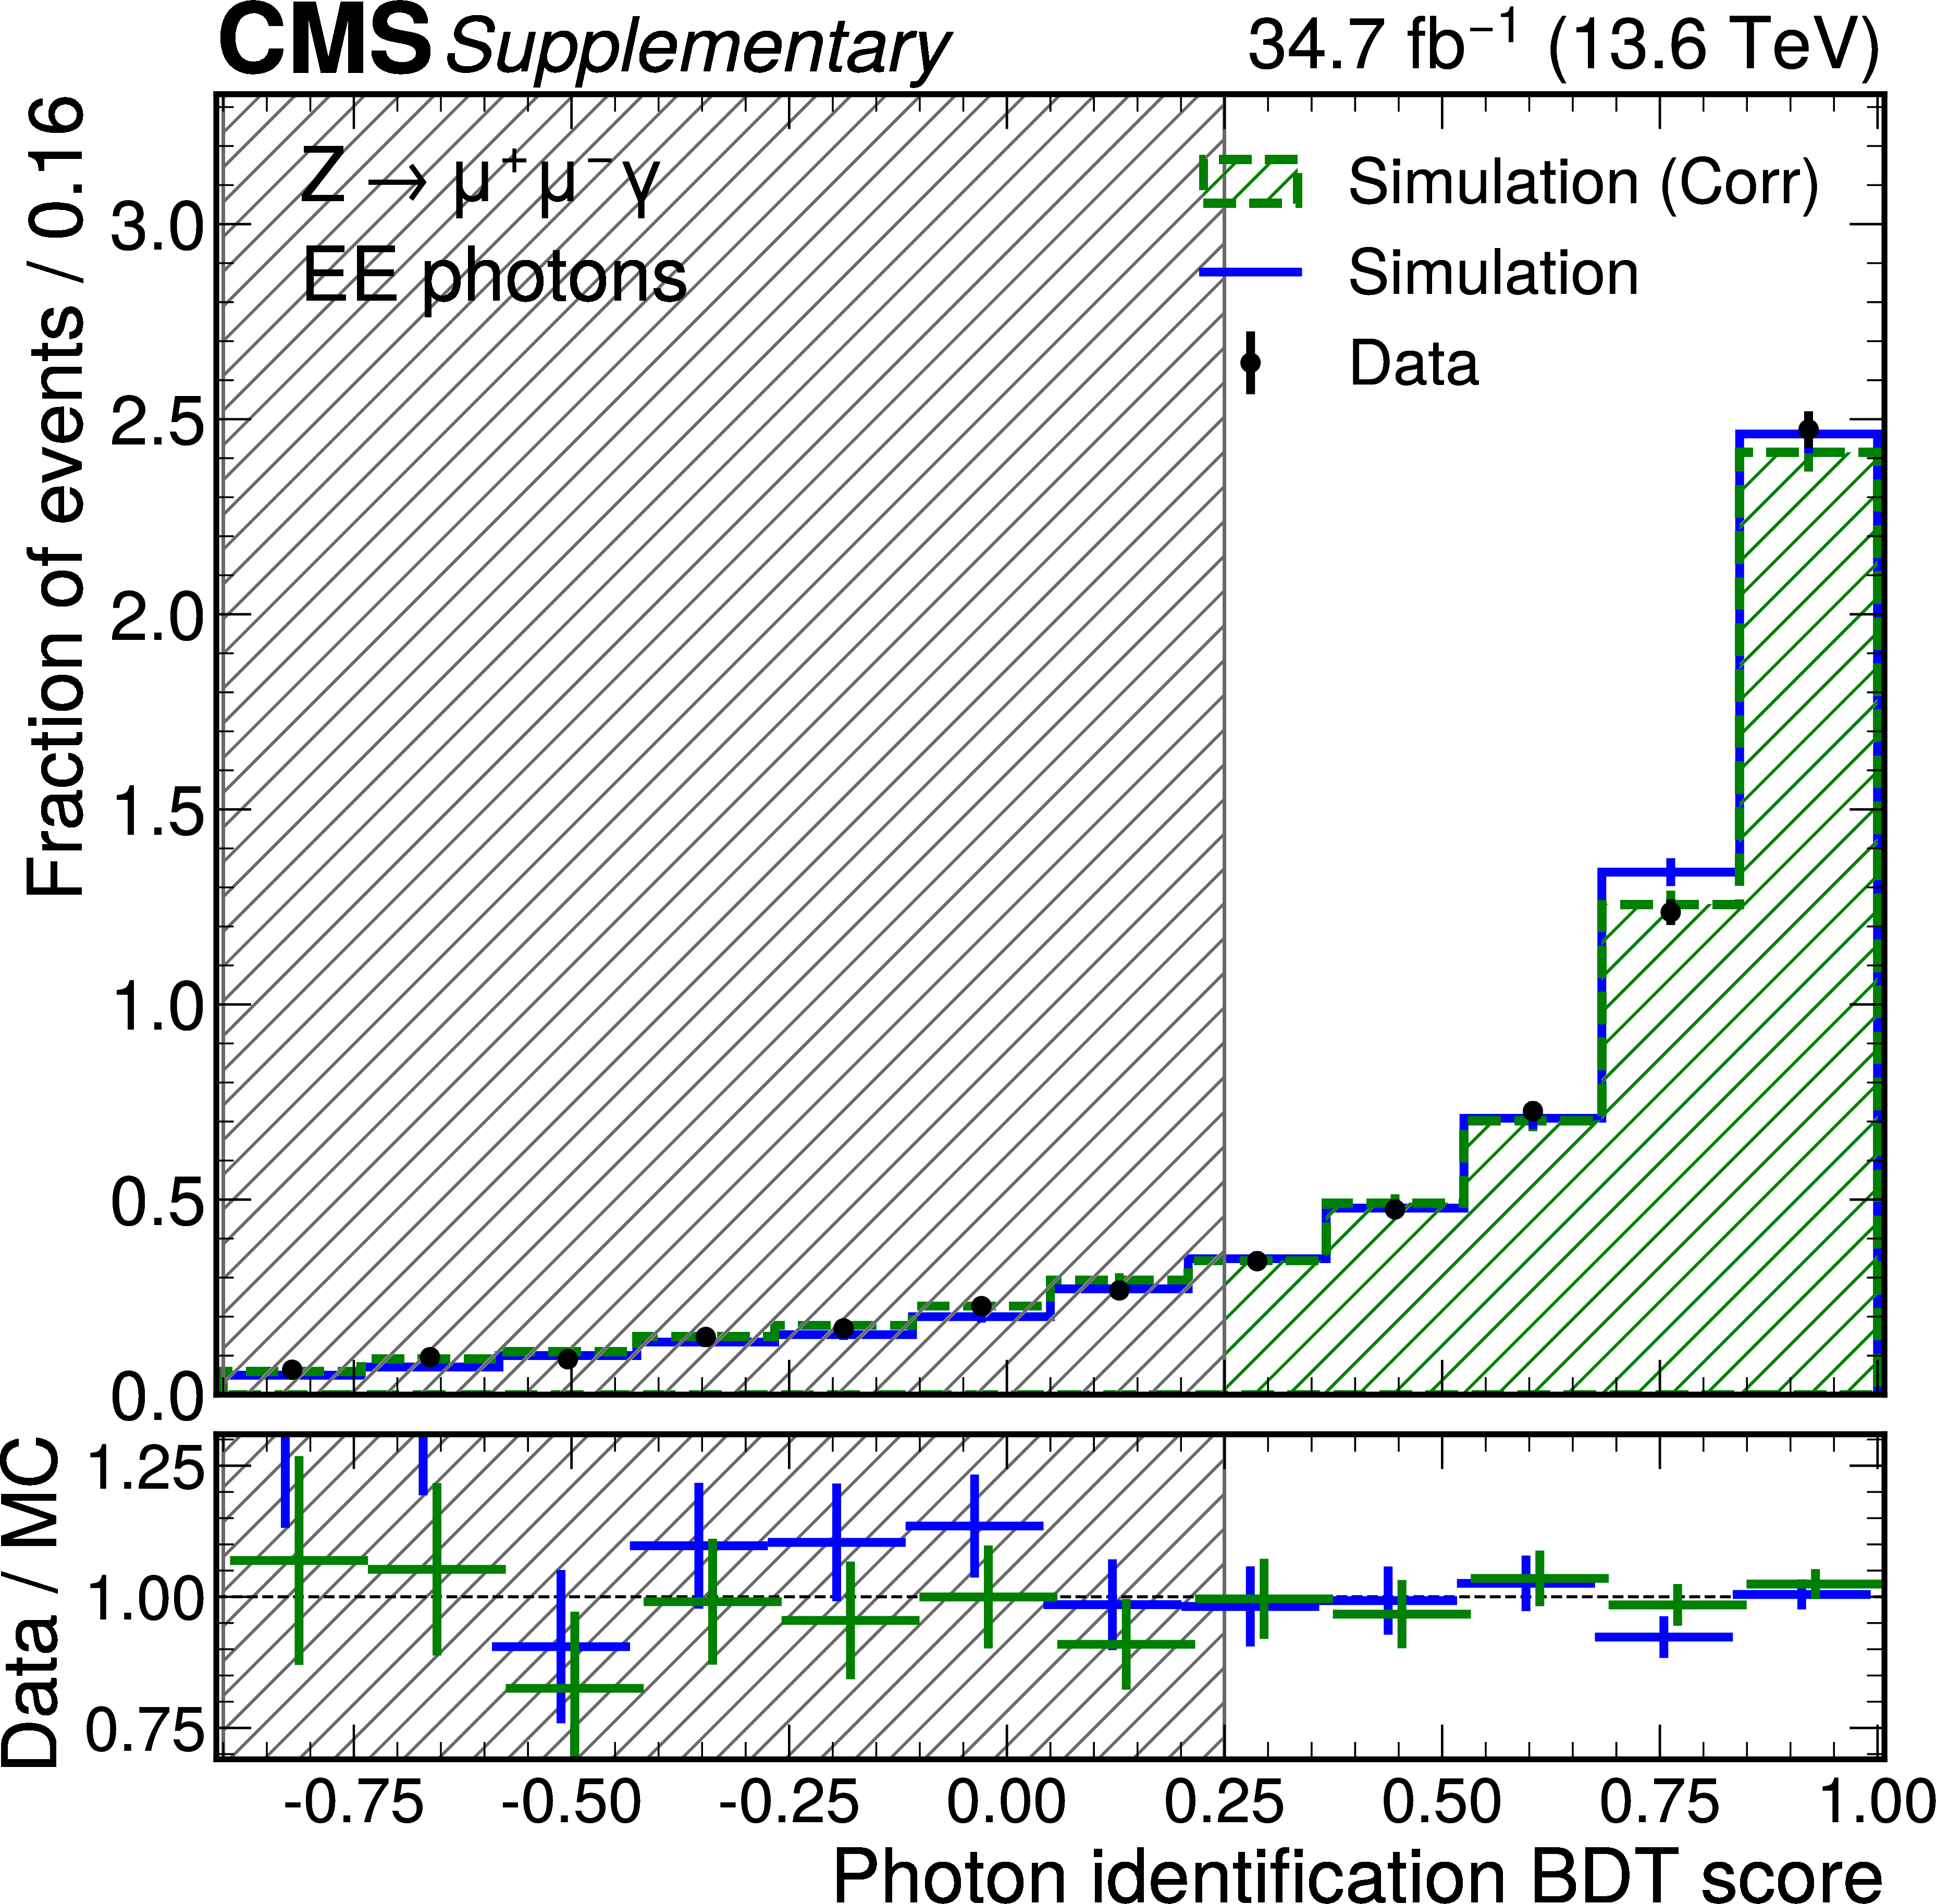
Additional Figure 6:
Data-simulation comparison for the photon identification BDT score in EE for photons from $ Z \to \mu \mu \gamma $ decays. The uncorrected distribution is shown in blue and the corrected distribution from the normalizing flow are shown in green. The error bars in the ratio panel include the statistical uncertainty from the data and the uncertainty from the limited number of simulated events. The bars in the ratio panel are offset for visibility only. The shaded region indicates photons that would not pass the selection used in the cross section measurements, for which a requirement of $ > $ 0.25 is applied. |
png pdf |
Additional Figure 7:
Diphoton invariant mass distribution in the inclusive fiducial measurement when combining the three mass resolution categories. The \mgg\ histogram is shown together with the signal+background fit (red line) and the background-only component (dashed line). In the lower panel, the signal component is shown, estimated by subtracting the background component from the signal+background fit. The green (yellow) bands indicate the $ \pm1\sigma $ ($ \pm2\sigma $) uncertainties in the background component. They are derived from pseudoexperiments using the best-fit background function from the signal+background fit. |
png pdf |
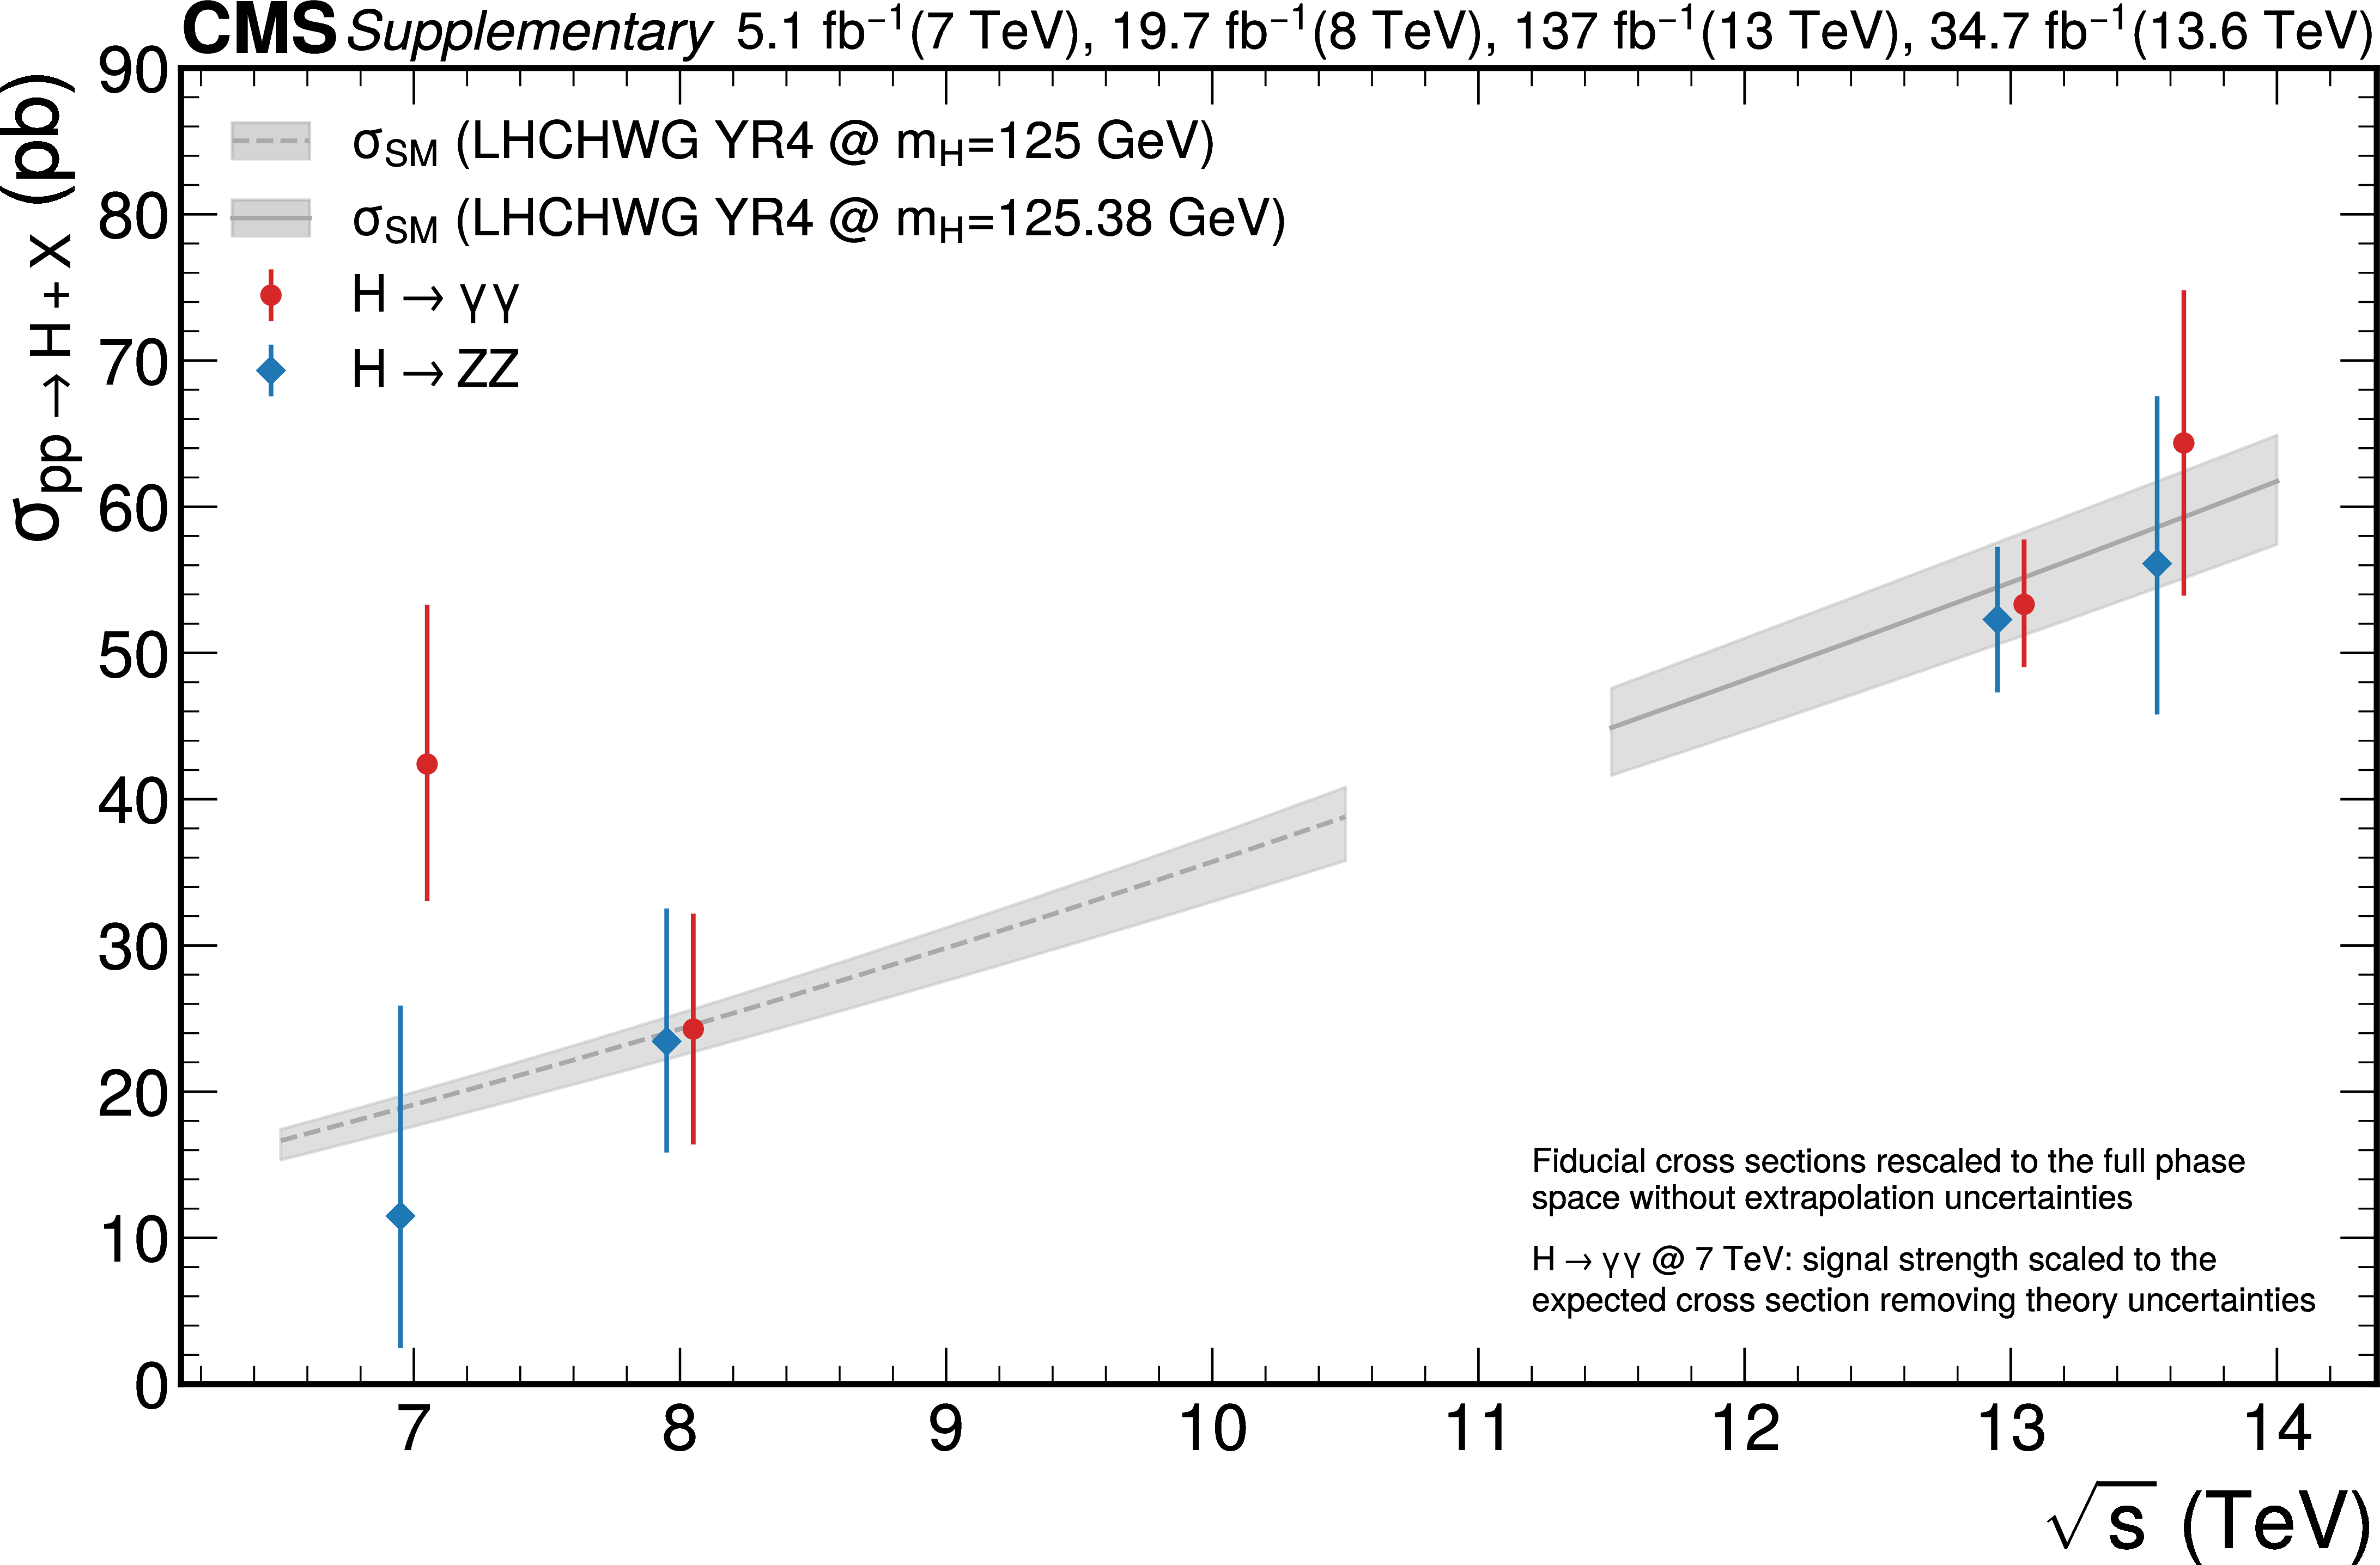
Additional Figure 8:
Values of the Higgs boson production cross section $ \sigma(\rm pp\rightarrow \mathrm{H} + X) $ measured in the $ \mathrm{H}\rightarrow\gamma\gamma $ and $ \mathrm{H}\rightarrow \mathrm{Z} \mathrm{Z} $ final states as a function of the pp centre-of-mass energy. The fiducial cross sections measured in this analysis and other CMS publications [9,11,16,13] are extrapolated to the entire phase space without considering extrapolation uncertainties. The point at $ \sqrt{s}= $ 7 TeV for the $ \mathrm{H}\rightarrow\gamma\gamma $ channel is obtained from the signal strength modifier measured in Ref. [107], which is scaled to the theoretical cross section removing theoretical uncertainties. The theoretical predictions with the corresponding uncertainties are taken from Ref. [7]. |
png pdf |
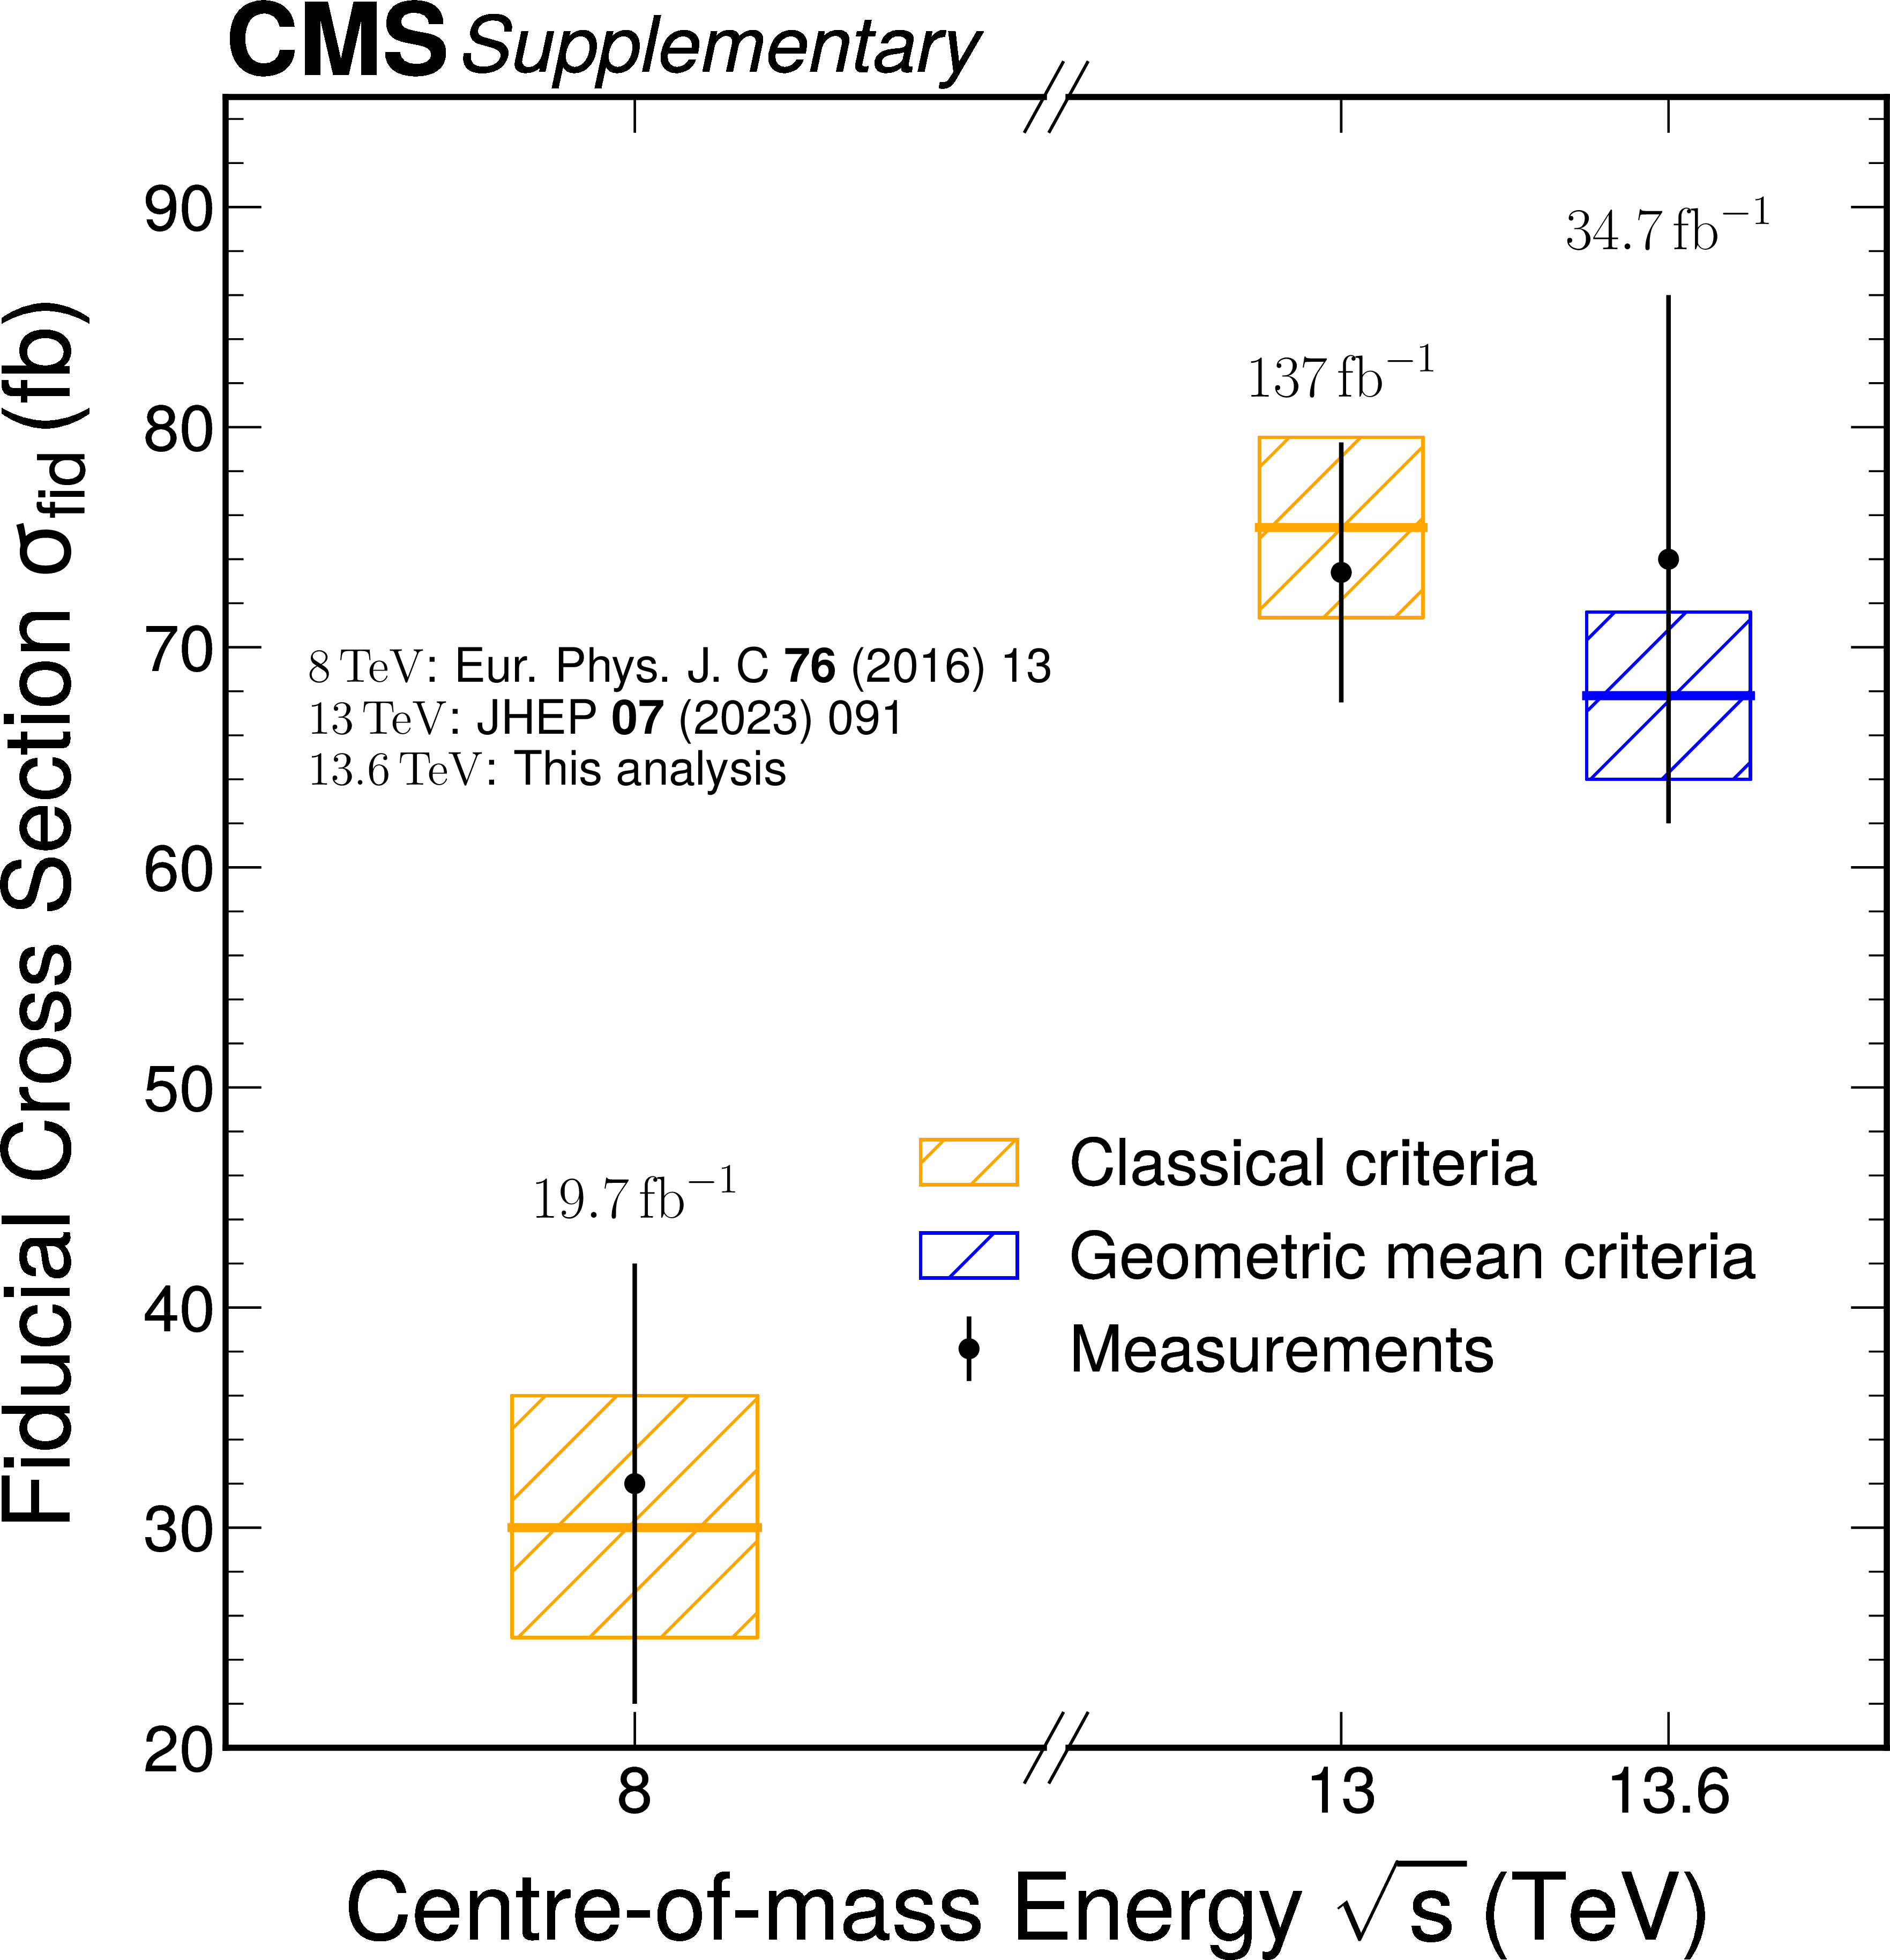
Additional Figure 9:
Values of the fiducial inclusive Higgs boson production cross section measured in the $ \mathrm{H}\rightarrow\gamma\gamma $ final state. More information on the fiducial selections and the theoretical predictions are given in the indicated references. |
| References | ||||
| 1 | ATLAS Collaboration | Observation of a new particle in the search for the standard model Higgs boson with the ATLAS detector at the LHC | PLB 716 (2012) 1 | 1207.7214 |
| 2 | CMS Collaboration | Observation of a new boson at a mass of 125 GeV with the CMS experiment at the LHC | PLB 716 (2012) 30 | CMS-HIG-12-028 1207.7235 |
| 3 | CMS Collaboration | Observation of a new boson with mass near 125 GeV in pp collisions at $ \sqrt{s} = $ 7 and 8 TeV | JHEP 06 (2013) 081 | CMS-HIG-12-036 1303.4571 |
| 4 | L. Evans and P. Bryant (editors) | LHC machine | JINST 3 (2008) S08001 | |
| 5 | ATLAS Collaboration | A detailed map of Higgs boson interactions by the ATLAS experiment ten years after the discovery | Nature 607 (2022) 52 | 2207.00092 |
| 6 | CMS Collaboration | A portrait of the Higgs boson by the CMS experiment ten years after the discovery. | Nature 607 (2022) 60 | CMS-HIG-22-001 2207.00043 |
| 7 | LHC Higgs Cross Section Working Group | Handbook of LHC Higgs cross sections: 4. deciphering the nature of the Higgs sector | 1610.07922 | |
| 8 | ATLAS Collaboration | Measurements of fiducial and differential cross sections for Higgs boson production in the diphoton decay channel at $ \sqrt{s}= $ 8 TeV with ATLAS | JHEP 09 (2014) 112 | 1407.4222 |
| 9 | CMS Collaboration | Measurement of differential cross sections for Higgs boson production in the diphoton decay channel in pp collisions at $ \sqrt{s} = $ 8 teV | EPJC 76 (2016) 13 | CMS-HIG-14-016 1508.07819 |
| 10 | ATLAS Collaboration | Measurements of the Higgs boson inclusive and differential fiducial cross-sections in the diphoton decay channel with pp collisions at $ \sqrt{s} = $ 13 TeV with the ATLAS detector | JHEP 08 (2022) 027 | 2202.00487 |
| 11 | CMS Collaboration | Measurement of the Higgs boson inclusive and differential fiducial production cross sections in the diphoton decay channel with pp collisions at $ \sqrt{s} = $ 13 TeV | JHEP 07 (2023) 091 | CMS-HIG-19-016 2208.12279 |
| 12 | ATLAS Collaboration | Fiducial and differential cross sections of Higgs boson production measured in the four-lepton decay channel in pp collisions at $ \sqrt{s} = $ 8 TeV with the ATLAS detector | PLB 738 (2014) 234 | 1408.3226 |
| 13 | CMS Collaboration | Measurement of differential and integrated fiducial cross sections for higgs boson production in the four-lepton decay channel in pp collisions at $ \sqrt{s}= $ 7 and 8 TeV | JHEP 04 (2016) 005 | CMS-HIG-14-028 1512.08377 |
| 14 | ATLAS Collaboration | Measurements of the Higgs boson inclusive and differential fiducial cross sections in the 4$ \ell $ decay channel at $ \sqrt{s} = $ 13 TeV | EPJC 80 (2020) 942 | 2004.03969 |
| 15 | CMS Collaboration | Measurements of inclusive and differential cross sections for the Higgs boson production and decay to four-leptons in proton-proton collisions at $ \sqrt{s} = $ 13 TeV | JHEP 08 (2023) 040 | CMS-HIG-21-009 2305.07532 |
| 16 | ATLAS Collaboration | Measurement of fiducial differential cross sections of gluon-fusion production of higgs bosons decaying to $ \mathrm{W}\mathrm{W}^*\rightarrow \mathrm{e} \nu \mu \nu $ with the ATLAS detector at $ \sqrt{s}= $ 8 TeV | JHEP 08 (2016) 104 | 1604.02997 |
| 17 | CMS Collaboration | Measurement of the transverse momentum spectrum of the Higgs boson produced in pp collisions at $ \sqrt{s}= $ 8 TeV using $ \mathrm{H} \to \mathrm{W} \mathrm{W} $ decays | JHEP 03 (2017) 032 | CMS-HIG-15-010 1606.01522 |
| 18 | ATLAS Collaboration | Measurements of differential cross sections of Higgs boson production through gluon fusion in the $ H\rightarrow WW^{*}\rightarrow e\nu \mu \nu $ final state at $ \sqrt{s} = $ 13 TeV with the ATLAS detector | EPJC 83 (2023) 774 | 2301.06822 |
| 19 | ATLAS Collaboration | Fiducial and differential cross-section measurements for the vector-boson-fusion production of the Higgs boson in the $ \mathrm{H} \rightarrow \mathrm{W}\mathrm{W}^*\rightarrow \mathrm{e} \nu \mu \nu $ decay channel at 13 TeV with the ATLAS detector | PRD 108 (2023) 072003 | 2304.03053 |
| 20 | CMS Collaboration | Measurement of the inclusive and differential Higgs boson production cross sections in the leptonic WW decay mode at $ \sqrt{s} = $ 13 TeV | JHEP 03 (2021) 003 | CMS-HIG-19-002 2007.01984 |
| 21 | CMS Collaboration | Measurement of the inclusive and differential Higgs boson production cross sections in the decay mode to a pair of $ \tau $ leptons in pp collisions at $ \sqrt{s} = $ 13 TeV | PRL 128 (2022) 081805 | CMS-HIG-20-015 2107.11486 |
| 22 | ATLAS Collaboration | Differential cross-section measurements of Higgs boson production in the $ \mathrm{H} \to \tau^{+} \tau^{+} $ decay channel in pp collisions at $ \sqrt{s}= $ 13 TeV with the ATLAS detector | JHEP 03 (2025) 010 | 2407.16320 |
| 23 | ATLAS Collaboration | Measurements of Higgs boson production by gluon-gluon fusion and vector-boson fusion using $ \mathrm{H} \rightarrow \mathrm{W}\mathrm{W}^*\rightarrow \mathrm{e} \nu \mu \nu $ decays in $ pp $ collisions at $ \sqrt{s}= $ 13 TeV with the ATLAS detector | PRD 108 (2023) 032005 | 2207.00338 |
| 24 | ATLAS Collaboration | Measurement of the total and differential Higgs boson production cross-sections at $ \sqrt{s} = $ 13 TeV with the ATLAS detector by combining the $ \mathrm{H} \to \mathrm{Z} \mathrm{Z}^{*}\to 4\ell $ and $ \mathrm{H} \to \gamma \gamma $ decay channels | JHEP 05 (2023) 028 | 2207.08615 |
| 25 | ATLAS Collaboration | Measurement of the $ \mathrm{H} \rightarrow \gamma \gamma $ and $ \mathrm{H} \rightarrow \mathrm{Z} \mathrm{Z}^* \rightarrow 4 \ell $ cross-sections in pp collisions at $ \sqrt{s}= $ 13.6 TeV with the ATLAS detector | EPJC 84 (2024) 78 | 2306.11379 |
| 26 | CMS Collaboration | Measurements of Higgs boson production cross section in the four-lepton final state in proton-proton collisions at $ \sqrt{s} = $ 13.6 TeV | Accepted by JHEP, 2025 | CMS-HIG-24-013 2501.14849 |
| 27 | CMS Collaboration | The CMS experiment at the CERN LHC | JINST 3 (2008) S08004 | |
| 28 | CMS Collaboration | Development of the CMS detector for the CERN LHC Run 3 | JINST 19 (2024) P05064 | CMS-PRF-21-001 2309.05466 |
| 29 | G. P. Salam and E. Slade | Cuts for two-body decays at colliders | JHEP 11 (2021) 220 | 2106.08329 |
| 30 | CMS Collaboration | Measurement of inclusive and differential Higgs boson production cross sections in the diphoton decay channel in proton-proton collisions at $ \sqrt{s}= $ 13 TeV | JHEP 01 (2019) 183 | CMS-HIG-17-025 1807.03825 |
| 31 | CMS Collaboration | HEPData record for this analysis | link | |
| 32 | CMS Collaboration | Performance of the CMS Level-1 trigger in proton-proton collisions at $ \sqrt{s} = $ 13 TeV | JINST 15 (2020) P10017 | CMS-TRG-17-001 2006.10165 |
| 33 | CMS Collaboration | The CMS trigger system | JINST 12 (2017) P01020 | CMS-TRG-12-001 1609.02366 |
| 34 | CMS Collaboration | Performance of the CMS high-level trigger during LHC Run 2 | JINST 19 (2024) P11021 | CMS-TRG-19-001 2410.17038 |
| 35 | CMS Collaboration | Luminosity measurement in proton-proton collisions at 13.6 TeV in 2022 at CMS | CMS Physics Analysis Summary, 2024 CMS-PAS-LUM-22-001 |
CMS-PAS-LUM-22-001 |
| 36 | CMS Collaboration | Electron and photon reconstruction and identification with the CMS experiment at the CERN LHC | JINST 16 (2021) P05014 | CMS-EGM-17-001 2012.06888 |
| 37 | J. Alwall et al. | The automated computation of tree-level and next-to-leading order differential cross sections, and their matching to parton shower simulations | JHEP 07 (2014) 079 | 1405.0301 |
| 38 | NNPDF Collaboration | Parton distributions from high-precision collider data | EPJC 77 (2017) 663 | 1706.00428 |
| 39 | R. Frederix and S. Frixione | Merging meets matching in MC@NLO | JHEP 12 (2012) 061 | 1209.6215 |
| 40 | K. Hamilton, P. Nason, E. Re, and G. Zanderighi | NNLOPS simulation of Higgs boson production | JHEP 10 (2013) 222 | 1309.0017 |
| 41 | K. Hamilton, P. Nason, and G. Zanderighi | MINLO: Multi-scale improved NLO | JHEP 10 (2012) 155 | 1206.3572 |
| 42 | A. Kardos, P. Nason, and C. Oleari | Three-jet production in POWHEG | JHEP 04 (2014) 043 | 1402.4001 |
| 43 | A. Karlberg et al. | Ad interim recommendations for the Higgs boson production cross sections at $ \sqrt{s} = $ 13.6 TeV | 2402.09955 | |
| 44 | C. Anastasiou et al. | Higgs boson gluon-fusion production in QCD at three loops | PRL 114 (2015) 212001 | 1503.06056 |
| 45 | C. Anastasiou et al. | High precision determination of the gluon fusion Higgs boson cross-section at the LHC | JHEP 05 (2016) 58 | 1602.00695 |
| 46 | M. Ciccolini, A. Denner, and S. Dittmaier | Strong and electroweak corrections to the production of a Higgs boson+2 jets via weak interactions at the Large Hadron Collider | PRL 99 (2007) 161803 | 0707.0381 |
| 47 | M. Ciccolini, A. Denner, and S. Dittmaier | Electroweak and QCD corrections to Higgs production via vector-boson fusion at the LHC | PRD 77 (2008) 013002 | 0710.4749 |
| 48 | P. Bolzoni, F. Maltoni, S.-O. Moch, and M. Zaro | Higgs production via vector-boson fusion at NNLO in QCD | PRL 105 (2010) 011801 | 1003.4451 |
| 49 | P. Bolzoni, F. Maltoni, S.-O. Moch, and M. Zaro | Vector boson fusion at next-to-next-to-leading order in QCD: Standard model Higgs boson and beyond | PRD 85 (2012) 035002 | 1109.3717 |
| 50 | O. Brein, A. Djouadi, and R. Harlander | NNLO QCD corrections to the Higgs-strahlung processes at hadron colliders | PLB 579 (2004) 149 | hep-ph/0307206 |
| 51 | M. L. Ciccolini, S. Dittmaier, and M. Kr ä mer | Electroweak radiative corrections to associated WH and ZH production at hadron colliders | PRD 68 (2003) 073003 | hep-ph/0306234 |
| 52 | W. Beenakker et al. | Higgs radiation off top quarks at the Tevatron and the LHC | PRL 87 (2001) 201805 | hep-ph/0107081 |
| 53 | W. Beenakker et al. | NLO QCD corrections to $ {\mathrm{t}\overline{\mathrm{t}}} $H production in hadron collisions. | NPB 653 (2003) 151 | hep-ph/0211352 |
| 54 | S. Dawson, L. H. Orr, L. Reina, and D. Wackeroth | Associated top quark Higgs boson production at the LHC | PRD 67 (2003) 071503 | hep-ph/0211438 |
| 55 | S. Dawson et al. | Associated Higgs production with top quarks at the Large Hadron Collider: NLO QCD corrections | PRD 68 (2003) 034022 | hep-ph/0305087 |
| 56 | Z. Yu et al. | QCD NLO and EW NLO corrections to $ {\mathrm{t}\overline{\mathrm{t}}} $H production with top quark decays at hadron collider | PLB 738 (2014) 1 | 1407.1110 |
| 57 | S. S. Frixione et al. | Weak corrections to Higgs hadroproduction in association with a top-quark pair | JHEP 09 (2014) 65 | 1407.0823 |
| 58 | F. Demartin, F. Maltoni, K. Mawatari, and M. Zaro | Higgs production in association with a single top quark at the LHC | EPJC 75 (2015) 267 | 1504.0611 |
| 59 | F. Demartin et al. | tWH associated production at the LHC | EPJC 77 (2017) 34 | 1607.05862 |
| 60 | A. Denner et al. | Standard model Higgs-boson branching ratios with uncertainties | EPJC 71 (2011) 1753 | 1107.5909 |
| 61 | A. Djouadi, J. Kalinowski, M. Muehlleitner, and M. Spira | HDECAY: Twenty$ _{++} $ years after | Comput. Phys. Commun. 238 (2019) 214 | 1801.09506 |
| 62 | A. Bredenstein, A. Denner, S. Dittmaier, and M. M. Weber | Precise predictions for the Higgs-boson decay H $ \rightarrow $ WW/ZZ $ \rightarrow $ 4 leptons | PRD 74 (2006) 013004 | hep-ph/0604011 |
| 63 | A. Bredenstein, A. Denner, S. Dittmaier, and M. M. Weber | Radiative corrections to the semileptonic and hadronic Higgs-boson decays H $ \rightarrow $WW/ZZ$ \rightarrow $ 4 fermions | JHEP 02 (2007) 80 | hep-ph/0611234 |
| 64 | S. Boselli et al. | Higgs boson decay into four leptons at NLOPS electroweak accuracy | JHEP 06 (2015) 23 | 1503.07394 |
| 65 | S. Actis, G. Passarino, C. Sturm, and S. Uccirati | NNLO computational techniques: the cases $ \mathrm{H} \to \gamma \gamma $ and $ \mathrm{H} \to \mathrm{g} \mathrm{g} $ | NPB 811 (2009) 182 | 0809.3667 |
| 66 | Sherpa Collaboration | Event generation with Sherpa 2.2 | SciPost Phys. 7 (2019) 034 | 1905.09127 |
| 67 | C. Bierlich et al. | A comprehensive guide to the physics and usage of PYTHIA 8.3 | SciPost Phys. Codeb. 2022 (2022) 8 | 2203.11601 |
| 68 | CMS Collaboration | Performance of the CMS muon trigger system in proton-proton collisions at $ \sqrt{s} = $ 13 TeV | JINST 16 (2021) P07001 | CMS-MUO-19-001 2102.04790 |
| 69 | CMS Collaboration | Extraction and validation of a new set of CMS PYTHIA8 tunes from underlying-event measurements | EPJC 80 (2020) 4 | CMS-GEN-17-001 1903.12179 |
| 70 | GEANT4 Collaboration | GEANT4 -- a simulation toolkit | NIM A 506 (2003) 250 | |
| 71 | CMS Collaboration | Technical proposal for the Phase-II upgrade of the Compact Muon Solenoid | CMS Technical Proposal CERN-LHCC-2015-010, CMS-TDR-15-02, 2015 CDS |
|
| 72 | CMS Collaboration | Particle-flow reconstruction and global event description with the CMS detector | JINST 12 (2017) P10003 | CMS-PRF-14-001 1706.04965 |
| 73 | CMS Collaboration | Electron and photon reconstruction and identification performance at CMS in 2022 and 2023 | CMS Detector Performance Note CMS-DP-2024-052, 2024 CDS |
|
| 74 | CMS Collaboration | A measurement of the Higgs boson mass in the diphoton decay channel | PLB 805 (2020) 135425 | CMS-HIG-19-004 2002.06398 |
| 75 | CMS Collaboration | The CMS electromagnetic calorimeter project: Technical design report | CMS Technical Design Report CERN-LHCC-97-033, CMS-TDR-4, 1997 CDS |
|
| 76 | T. Chen and C. Guestrin | XGBoost: A scalable tree boosting system | in nd ACM SIGKDD Int. Conf. Know. Discov. Data Min, 2016 Proc. 2 (2016) 785 |
|
| 77 | CMS Collaboration | Performance of photon reconstruction and identification with the CMS detector in proton-proton collisions at $ \sqrt{s} = $ 8 TeV | JINST 10 (2015) P08010 | CMS-EGM-14-001 1502.02702 |
| 78 | CMS Collaboration | Measurements of inclusive W and Z cross sections in pp collisions at $ \sqrt{s}= $ 7 TeV | JHEP 01 (2011) 080 | CMS-EWK-10-002 1012.2466 |
| 79 | G. Papamakarios et al. | Normalizing flows for probabilistic modeling and inference | J. Mach. Learn. Res. 22 (2021) 1 | 1912.02762 |
| 80 | C. Daumann et al. | One flow to correct them all: Improving simulations in high-energy physics with a single normalising flow and a switch | Comput. Softw. Big. Sci. 8 (2024) 15 | 2403.18582 |
| 81 | G. Papamakarios, T. Pavlakou, and I. Murray | Masked autoregressive flow for density estimation | link | 1705.07057 |
| 82 | C. Durkan, A. Bekasov, I. Murray, and G. Papamakarios | Neural spline flows | link | 1906.04032 |
| 83 | A. Paszke et al. | \textscPyTorch: An imperative style, high-performance deep learning library | in Proc. 33rd Conference on Neural Information Processing Systems (NeurIPS ): Vancouver, Canada, 2019 link |
1912.01703 |
| 84 | F. Rozet, F. Divo, and S. Schnake | Zuko: Normalizing flows in PyTorch | link | |
| 85 | CMS Collaboration | Performance of the CMS muon detector and muon reconstruction with proton-proton collisions at $ \sqrt{s}= $ 13 TeV | JINST 13 (2018) P06015 | CMS-MUO-16-001 1804.04528 |
| 86 | M. Cacciari, G. P. Salam, and G. Soyez | The anti-$ k_{\mathrm{T}} $ jet clustering algorithm | JHEP 04 (2008) 063 | 0802.1189 |
| 87 | M. Cacciari, G. P. Salam, and G. Soyez | Fastjet user manual | EPJC 72 (2012) 1896 | 1111.6097 |
| 88 | CMS Collaboration | Pileup mitigation at CMS in 13 TeV data | JINST 15 (2020) P09018 | CMS-JME-18-001 2003.00503 |
| 89 | CMS Collaboration | Jet energy scale and resolution in the CMS experiment in pp collisions at 8 TeV | JINST 12 (2017) P02014 | CMS-JME-13-004 1607.03663 |
| 90 | CMS Collaboration | Measurements of Higgs boson properties in the diphoton decay channel in proton-proton collisions at $ \sqrt{s} = $ 13 TeV | JHEP 11 (2018) 185 | CMS-HIG-16-040 1804.02716 |
| 91 | CMS Collaboration | Measurements of Higgs boson production cross sections and couplings in the diphoton decay channel at $ \sqrt{\mathrm{s}} = $ 13 TeV | JHEP 07 (2021) 027 | CMS-HIG-19-015 2103.06956 |
| 92 | CMS Collaboration | The CMS statistical analysis and combination tool: \textscCombine | Comput. Softw. Big Sci. 8 (2024) 19 | CMS-CAT-23-001 2404.06614 |
| 93 | J. Campbell, M. Carena, R. Harnik, and Z. Liu | Interference in the $ \mathrm{g} \mathrm{g} \rightarrow \mathrm{h} \rightarrow \gamma \gamma $ on-shell rate and the Higgs boson total width | PRL 119 (2017) 181801 | 1704.08259 |
| 94 | P. D. Dauncey, M. Kenzie, N. Wardle, and G. J. Davies | Handling uncertainties in background shapes: the discrete profiling method | JINST 10 (2015) P04015 | 1408.6865 |
| 95 | R. A. Fisher | On the interpretation of $ \chi^2 $ from contingency tables, and the calculation of p | J. R. Stat. Soc. 85 (1922) 87 | |
| 96 | R. J. Barlow and C. Beeston | Fitting using finite Monte Carlo samples | Comput. Phys. Commun. 77 (1993) 219 | |
| 97 | J. S. Conway | Incorporating nuisance parameters in likelihoods for multisource spectra | Proc. PHYSTAT 201 (2011) 115 | 1103.0354 |
| 98 | T. Sjöstrand et al. | An introduction to PYTHIA 8.2 | Comput. Phys. Commun. 191 (2015) 159 | 1410.3012 |
| 99 | P. Nason | A new method for combining NLO QCD with shower Monte Carlo algorithms | JHEP 11 (2004) 040 | hep-ph/0409146 |
| 100 | S. Frixione, P. Nason, and C. Oleari | Matching NLO QCD computations with parton shower simulations: the POWHEG method | JHEP 11 (2007) 070 | 0709.2092 |
| 101 | S. Alioli, P. Nason, C. Oleari, and E. Re | A general framework for implementing NLO calculations in shower Monte Carlo programs: the POWHEG BOX | JHEP 06 (2010) 043 | 1002.2581 |
| 102 | E. Bagnaschi, G. Degrassi, P. Slavich, and A. Vicini | Higgs production via gluon fusion in the POWHEG approach in the SM and in the MSSM | JHEP 02 (2012) 088 | 1111.2854 |
| 103 | G. Cowan, K. Cranmer, E. Gross, and O. Vitells | Asymptotic formulae for likelihood-based tests of new physics | EPJC 71 (2011) 1554 | 1007.1727 |
|
|
Compact Muon Solenoid LHC, CERN |
|

|

|

|

|

|