

Compact Muon Solenoid
LHC, CERN
| CMS-EXO-22-024 ; CERN-EP-2024-109 | ||
| Search for new physics in high-mass diphoton events from proton-proton collisions at $ \sqrt{s}= $ 13 TeV | ||
| CMS Collaboration | ||
| 15 May 2024 | ||
| JHEP 08 (2024) 215 | ||
| Abstract: Results are presented from a search for new physics in high-mass diphoton events from proton-proton collisions at $ \sqrt{s}= $ 13 TeV. The data set was collected in 2016-2018 with the CMS detector at the LHC and corresponds to an integrated luminosity of 138 fb$ ^{-1} $. Events with a diphoton invariant mass greater than 500 GeV are considered. Two different techniques are used to predict the standard model backgrounds: parametric fits to the smoothly-falling background and a first-principles calculation of the standard model diphoton spectrum at next-to-next-to-leading order in perturbative quantum chromodynamics calculations. The first technique is sensitive to resonant excesses while the second technique can identify broad differences in the invariant mass shape. The data are used to constrain the production of heavy Higgs bosons, Randall-Sundrum gravitons, the large extra dimensions model of Arkani-Hamed, Dimopoulos, and Dvali (ADD), and the continuum clockwork mechanism. No statistically significant excess is observed. The present results are the strongest limits to date on ADD extra dimensions and RS gravitons with a coupling parameter greater than 0.1. | ||
| Links: e-print arXiv:2405.09320 [hep-ex] (PDF) ; CDS record ; inSPIRE record ; HepData record ; CADI line (restricted) ; | ||
| Figures | |
png pdf |
Figure 1:
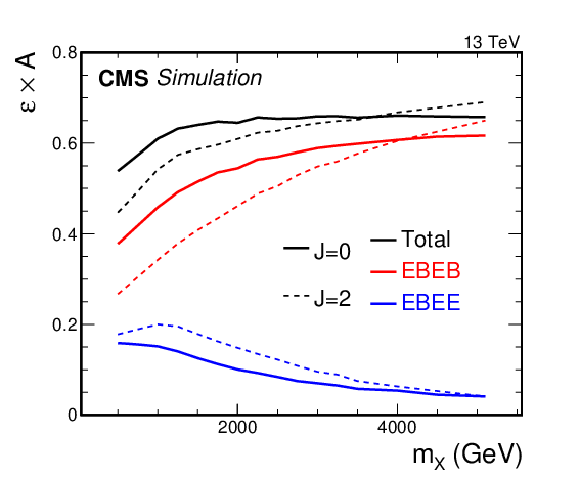
The product of the acceptance ($ A $) and the event selection efficiency ($ \epsilon $) is shown as a function of the signal resonance mass $ m_{\mathrm{X}} $ for the narrow signal width hypothesis ($ \Gamma_{\mathrm{X}}/m_{\mathrm{X}}=$ 1.4 $\times$ 10$^{-4} $ for $ J= $ 0 and $ \tilde{k}= $ 0.01 for $ J= $ 2). The total (black), EBEB (red), and EBEE (blue) curves are shown for spin hypotheses $ J= $ 0 (solid) and $ J= $ 2 (dashed). |
png pdf |
Figure 2:
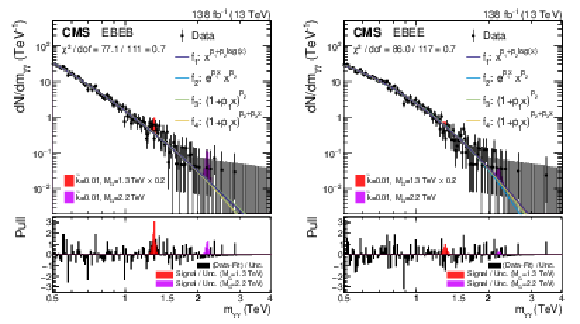
Observed diphoton invariant mass spectra for the EBEB (left) and EBEE (right) categories for the 2016-2018 data are shown. Also shown are the results of a likelihood fit to the background-only hypothesis. The black, blue, green, and yellow lines indicate the result of the fit functions $ f_1 $, $ f_2 $, $ f_3 $, and $ f_4 $, respectively. The predicted excesses from narrow RS gravitons at masses 1.3 and 2.2 TeV are shown based on the theoretical LO cross sections, with the 1.3 TeV signal scaled by an additional factor of 0.2. The lower panels show the difference between the data and the $ f_1 $ fit, divided by the statistical uncertainty in the data points. The indicated $ \chi^2 $ in the plot is also given with respect to the $ f_1 $ fit. |
png pdf |
Figure 2-a:
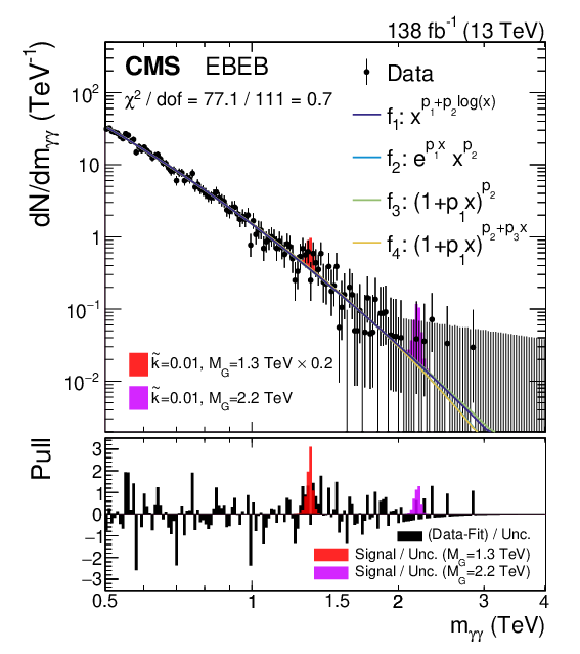
Observed diphoton invariant mass spectra for the EBEB (left) and EBEE (right) categories for the 2016-2018 data are shown. Also shown are the results of a likelihood fit to the background-only hypothesis. The black, blue, green, and yellow lines indicate the result of the fit functions $ f_1 $, $ f_2 $, $ f_3 $, and $ f_4 $, respectively. The predicted excesses from narrow RS gravitons at masses 1.3 and 2.2 TeV are shown based on the theoretical LO cross sections, with the 1.3 TeV signal scaled by an additional factor of 0.2. The lower panels show the difference between the data and the $ f_1 $ fit, divided by the statistical uncertainty in the data points. The indicated $ \chi^2 $ in the plot is also given with respect to the $ f_1 $ fit. |
png pdf |
Figure 2-b:
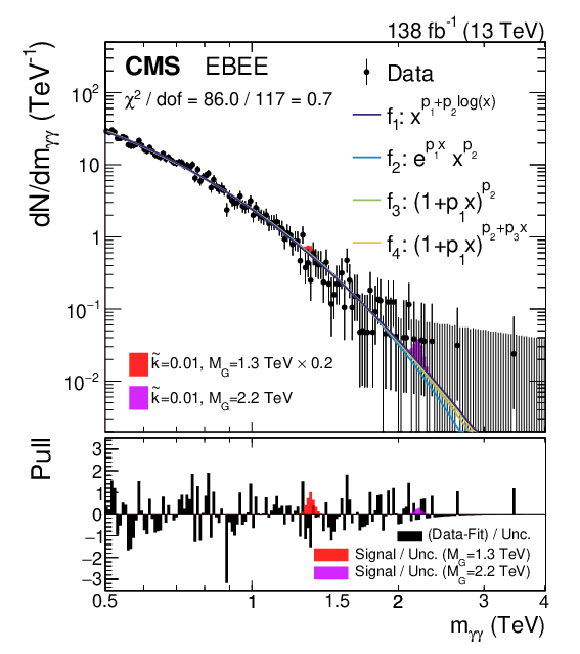
Observed diphoton invariant mass spectra for the EBEB (left) and EBEE (right) categories for the 2016-2018 data are shown. Also shown are the results of a likelihood fit to the background-only hypothesis. The black, blue, green, and yellow lines indicate the result of the fit functions $ f_1 $, $ f_2 $, $ f_3 $, and $ f_4 $, respectively. The predicted excesses from narrow RS gravitons at masses 1.3 and 2.2 TeV are shown based on the theoretical LO cross sections, with the 1.3 TeV signal scaled by an additional factor of 0.2. The lower panels show the difference between the data and the $ f_1 $ fit, divided by the statistical uncertainty in the data points. The indicated $ \chi^2 $ in the plot is also given with respect to the $ f_1 $ fit. |
png pdf |
Figure 3:
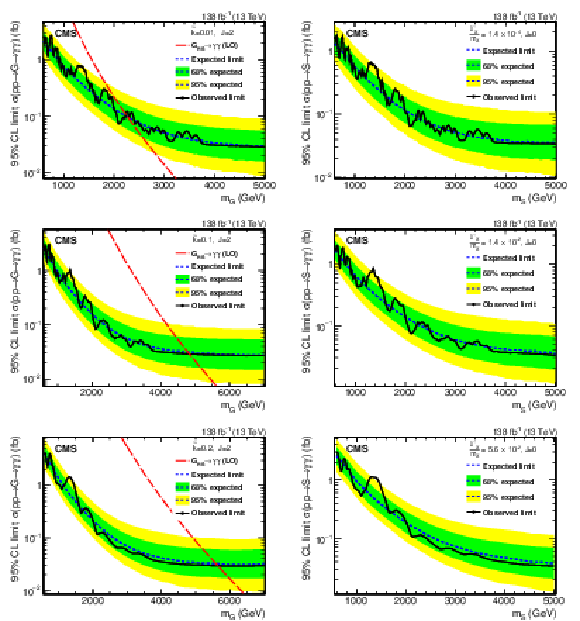
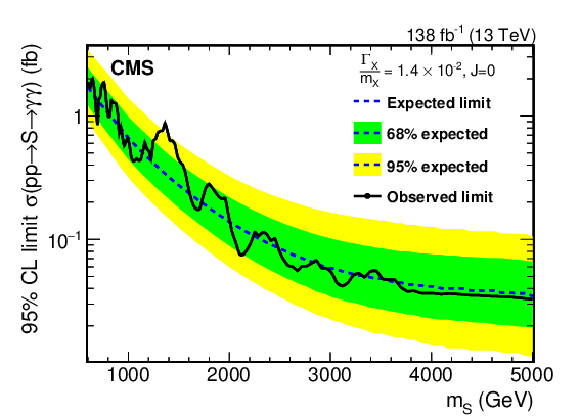
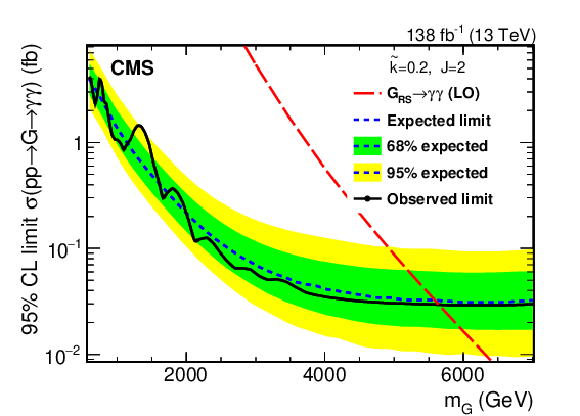
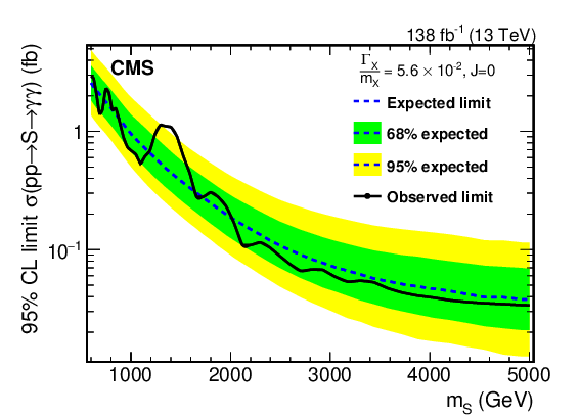
Expected and observed 95% CL upper limits on the product of the production cross section and branching fraction as a function of the RS graviton mass $ m_{\mathrm{G}} $ (left) and heavy Higgs boson mass $ m_{\text{S}} $ (right) for the full Run 2 data set. The dotted red line is the LO theoretical cross section for the RS graviton. The rows correspond to different resonance widths. Expected 68% and 95% limit bands are shown in green and yellow, respectively. |
png pdf |
Figure 3-a:
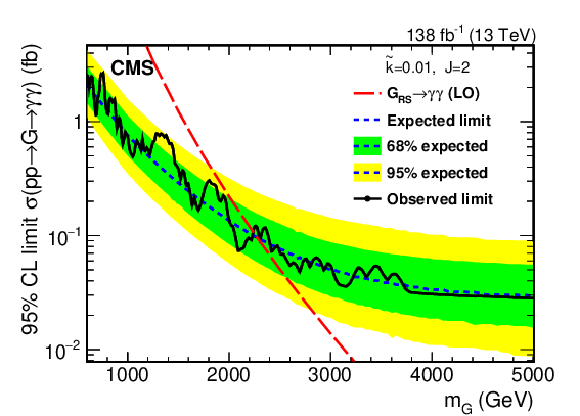
Expected and observed 95% CL upper limits on the product of the production cross section and branching fraction as a function of the RS graviton mass $ m_{\mathrm{G}} $ (left) and heavy Higgs boson mass $ m_{\text{S}} $ (right) for the full Run 2 data set. The dotted red line is the LO theoretical cross section for the RS graviton. The rows correspond to different resonance widths. Expected 68% and 95% limit bands are shown in green and yellow, respectively. |
png pdf |
Figure 3-b:
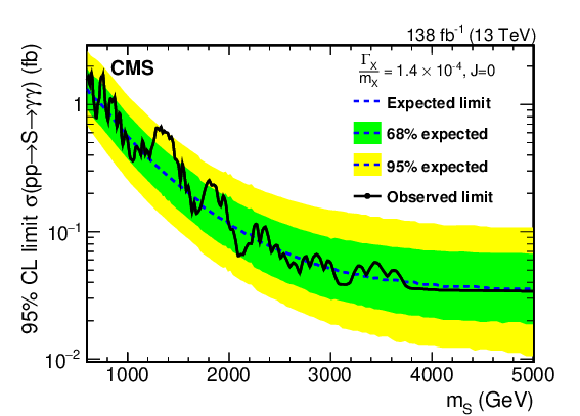
Expected and observed 95% CL upper limits on the product of the production cross section and branching fraction as a function of the RS graviton mass $ m_{\mathrm{G}} $ (left) and heavy Higgs boson mass $ m_{\text{S}} $ (right) for the full Run 2 data set. The dotted red line is the LO theoretical cross section for the RS graviton. The rows correspond to different resonance widths. Expected 68% and 95% limit bands are shown in green and yellow, respectively. |
png pdf |
Figure 3-c:
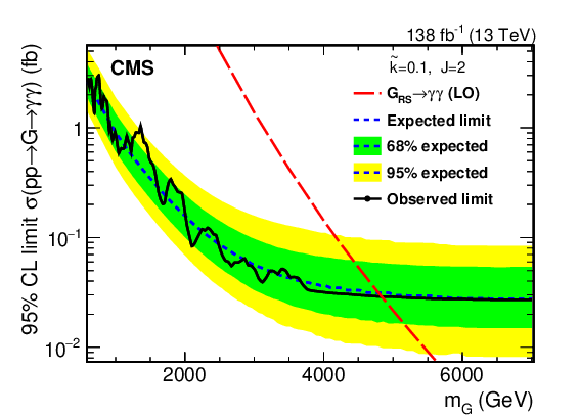
Expected and observed 95% CL upper limits on the product of the production cross section and branching fraction as a function of the RS graviton mass $ m_{\mathrm{G}} $ (left) and heavy Higgs boson mass $ m_{\text{S}} $ (right) for the full Run 2 data set. The dotted red line is the LO theoretical cross section for the RS graviton. The rows correspond to different resonance widths. Expected 68% and 95% limit bands are shown in green and yellow, respectively. |
png pdf |
Figure 3-d:
Expected and observed 95% CL upper limits on the product of the production cross section and branching fraction as a function of the RS graviton mass $ m_{\mathrm{G}} $ (left) and heavy Higgs boson mass $ m_{\text{S}} $ (right) for the full Run 2 data set. The dotted red line is the LO theoretical cross section for the RS graviton. The rows correspond to different resonance widths. Expected 68% and 95% limit bands are shown in green and yellow, respectively. |
png pdf |
Figure 3-e:
Expected and observed 95% CL upper limits on the product of the production cross section and branching fraction as a function of the RS graviton mass $ m_{\mathrm{G}} $ (left) and heavy Higgs boson mass $ m_{\text{S}} $ (right) for the full Run 2 data set. The dotted red line is the LO theoretical cross section for the RS graviton. The rows correspond to different resonance widths. Expected 68% and 95% limit bands are shown in green and yellow, respectively. |
png pdf |
Figure 3-f:
Expected and observed 95% CL upper limits on the product of the production cross section and branching fraction as a function of the RS graviton mass $ m_{\mathrm{G}} $ (left) and heavy Higgs boson mass $ m_{\text{S}} $ (right) for the full Run 2 data set. The dotted red line is the LO theoretical cross section for the RS graviton. The rows correspond to different resonance widths. Expected 68% and 95% limit bands are shown in green and yellow, respectively. |
png pdf |
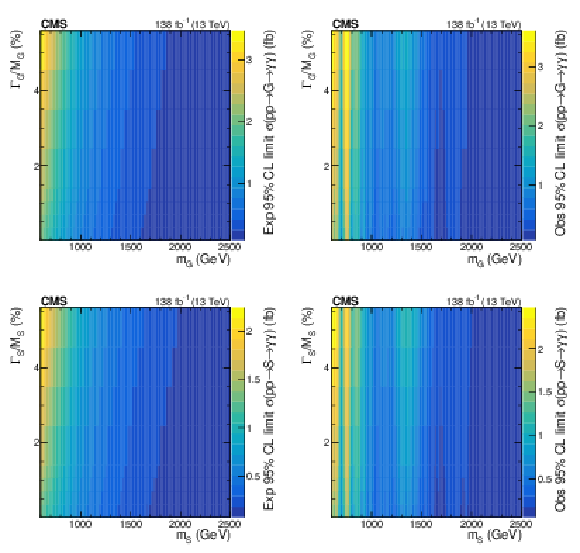
Figure 4:
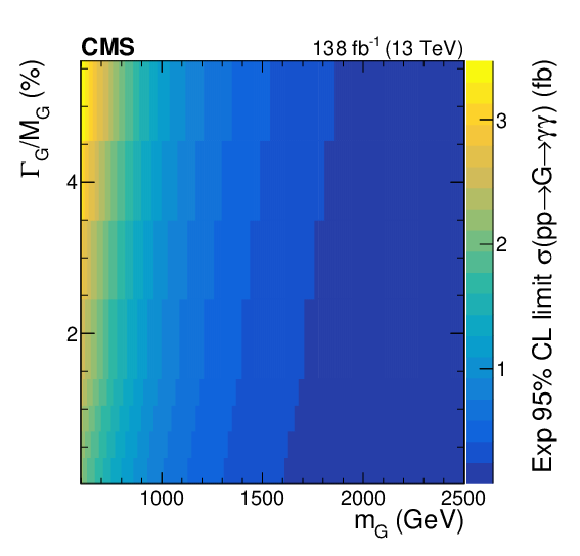
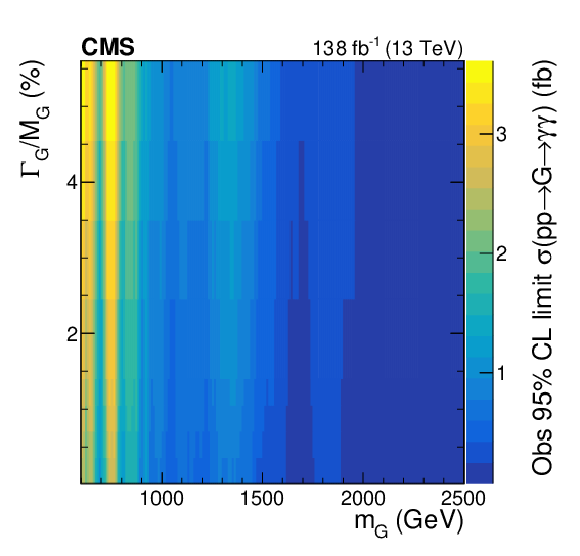
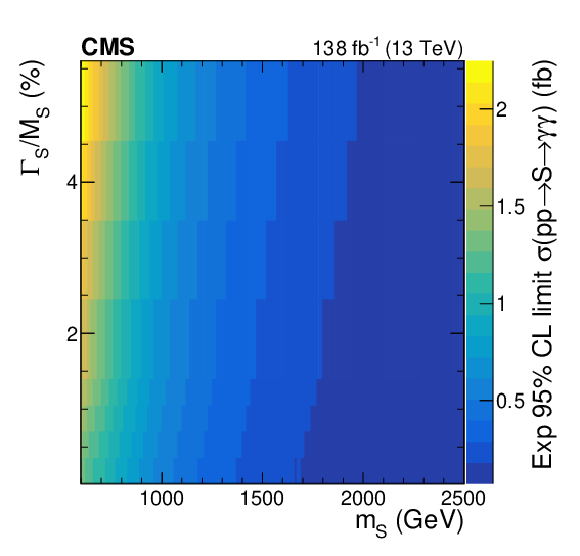
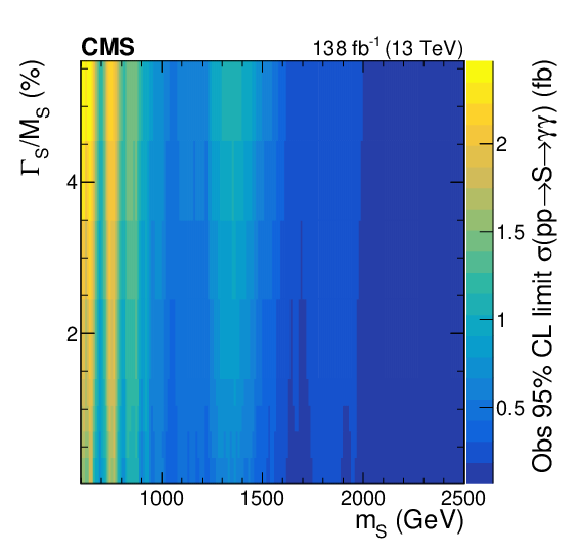
Expected (left) and observed (right) 95% CL upper limits on the product of the cross section and branching fraction as a function of the RS graviton mass $ m_{\mathrm{G}} $ (upper) and heavy Higgs boson mass $ m_{\text{S}} $ (lower) versus the resonance width for the 2016-2018 data. |
png pdf |
Figure 4-a:
Expected (left) and observed (right) 95% CL upper limits on the product of the cross section and branching fraction as a function of the RS graviton mass $ m_{\mathrm{G}} $ (upper) and heavy Higgs boson mass $ m_{\text{S}} $ (lower) versus the resonance width for the 2016-2018 data. |
png pdf |
Figure 4-b:
Expected (left) and observed (right) 95% CL upper limits on the product of the cross section and branching fraction as a function of the RS graviton mass $ m_{\mathrm{G}} $ (upper) and heavy Higgs boson mass $ m_{\text{S}} $ (lower) versus the resonance width for the 2016-2018 data. |
png pdf |
Figure 4-c:
Expected (left) and observed (right) 95% CL upper limits on the product of the cross section and branching fraction as a function of the RS graviton mass $ m_{\mathrm{G}} $ (upper) and heavy Higgs boson mass $ m_{\text{S}} $ (lower) versus the resonance width for the 2016-2018 data. |
png pdf |
Figure 4-d:
Expected (left) and observed (right) 95% CL upper limits on the product of the cross section and branching fraction as a function of the RS graviton mass $ m_{\mathrm{G}} $ (upper) and heavy Higgs boson mass $ m_{\text{S}} $ (lower) versus the resonance width for the 2016-2018 data. |
png pdf |
Figure 5:
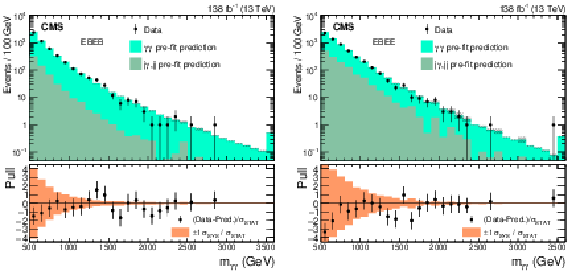
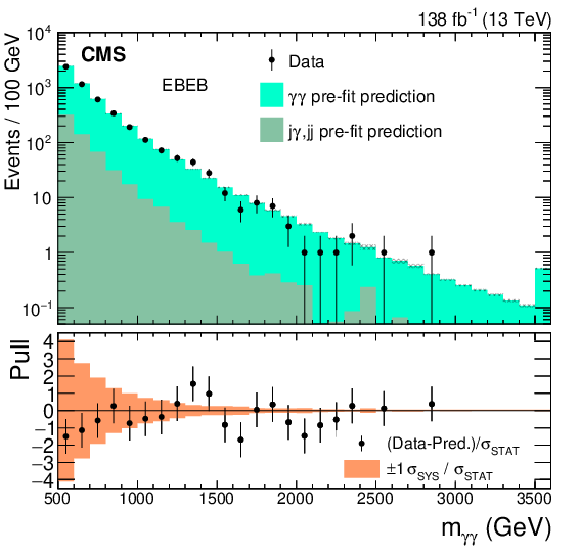
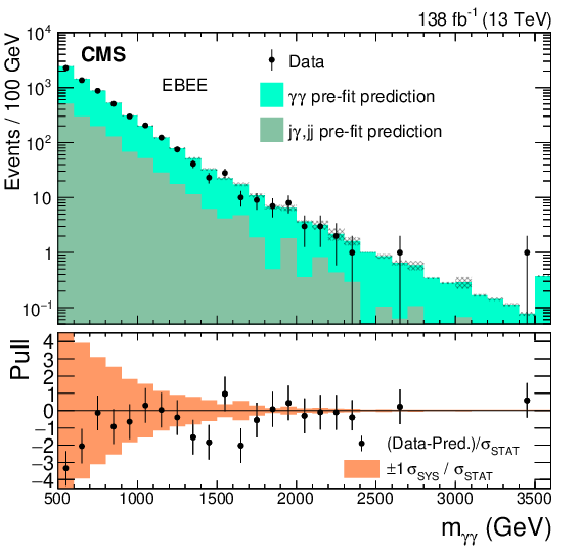
The $ m_{\gamma\gamma} $ spectra and the background estimate before nuisance parameter marginalization (``pre-fit'') due to SM diphoton production ($ {\gamma\gamma} $) and misidentified photon production (j$ \gamma $, jj) for the EBEB (left) and EBEE (right) cases, combining the 2016, 2017, and 2018 data sets. The pull distributions, defined as the data minus prediction divided by the statistical uncertainty, are shown in the lower panel. The shaded bands show the systematic uncertainties, neglecting the normalization of the diphoton prediction. The last bin contains the overflow of events with $ m_{\gamma\gamma} > $ 3.5 TeV. |
png pdf |
Figure 5-a:
The $ m_{\gamma\gamma} $ spectra and the background estimate before nuisance parameter marginalization (``pre-fit'') due to SM diphoton production ($ {\gamma\gamma} $) and misidentified photon production (j$ \gamma $, jj) for the EBEB (left) and EBEE (right) cases, combining the 2016, 2017, and 2018 data sets. The pull distributions, defined as the data minus prediction divided by the statistical uncertainty, are shown in the lower panel. The shaded bands show the systematic uncertainties, neglecting the normalization of the diphoton prediction. The last bin contains the overflow of events with $ m_{\gamma\gamma} > $ 3.5 TeV. |
png pdf |
Figure 5-b:
The $ m_{\gamma\gamma} $ spectra and the background estimate before nuisance parameter marginalization (``pre-fit'') due to SM diphoton production ($ {\gamma\gamma} $) and misidentified photon production (j$ \gamma $, jj) for the EBEB (left) and EBEE (right) cases, combining the 2016, 2017, and 2018 data sets. The pull distributions, defined as the data minus prediction divided by the statistical uncertainty, are shown in the lower panel. The shaded bands show the systematic uncertainties, neglecting the normalization of the diphoton prediction. The last bin contains the overflow of events with $ m_{\gamma\gamma} > $ 3.5 TeV. |
png pdf |
Figure 6:
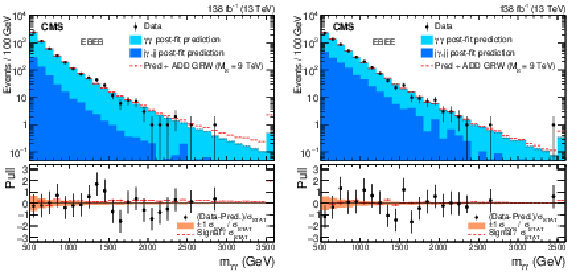
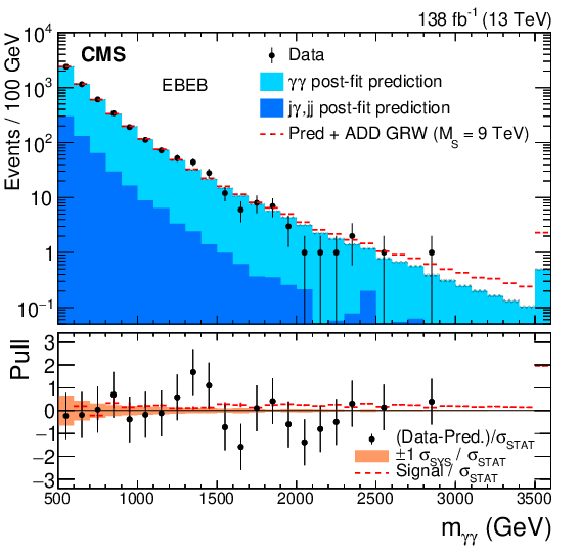
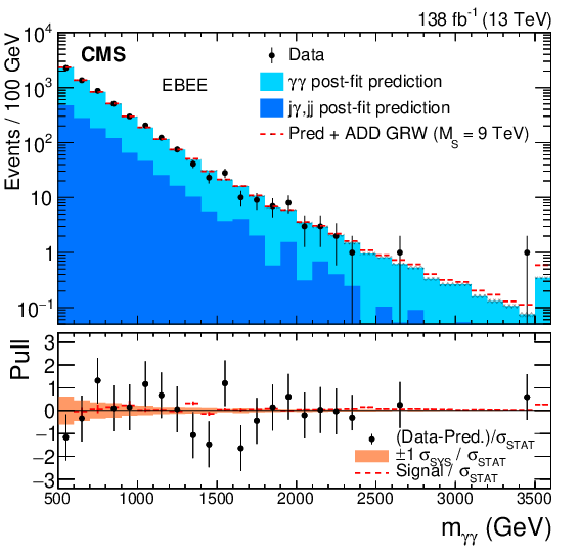
The $ m_{\gamma\gamma} $ spectra and background prediction after nuisance parameter marginalization (``post-fit'') due to SM diphoton production ($ {\gamma\gamma} $) and misidentified photon production (j$ \gamma $, jj) for the EBEB (left) and EBEE (right) cases, combining the 2016, 2017, and 2018 data sets. The prediction with an ADD signal (GRW convention with $ M_{\mathrm{S}}= $ 6 TeV) is also shown. The pull distributions, defined as the data minus prediction divided by the statistical uncertainty, are shown in the lower panel. The shaded bands show the systematic uncertainties, neglecting the normalization of the diphoton prediction. The last bin contains the overflow of events with $ m_{\gamma\gamma} > $ 3.5 TeV. |
png pdf |
Figure 6-a:
The $ m_{\gamma\gamma} $ spectra and background prediction after nuisance parameter marginalization (``post-fit'') due to SM diphoton production ($ {\gamma\gamma} $) and misidentified photon production (j$ \gamma $, jj) for the EBEB (left) and EBEE (right) cases, combining the 2016, 2017, and 2018 data sets. The prediction with an ADD signal (GRW convention with $ M_{\mathrm{S}}= $ 6 TeV) is also shown. The pull distributions, defined as the data minus prediction divided by the statistical uncertainty, are shown in the lower panel. The shaded bands show the systematic uncertainties, neglecting the normalization of the diphoton prediction. The last bin contains the overflow of events with $ m_{\gamma\gamma} > $ 3.5 TeV. |
png pdf |
Figure 6-b:
The $ m_{\gamma\gamma} $ spectra and background prediction after nuisance parameter marginalization (``post-fit'') due to SM diphoton production ($ {\gamma\gamma} $) and misidentified photon production (j$ \gamma $, jj) for the EBEB (left) and EBEE (right) cases, combining the 2016, 2017, and 2018 data sets. The prediction with an ADD signal (GRW convention with $ M_{\mathrm{S}}= $ 6 TeV) is also shown. The pull distributions, defined as the data minus prediction divided by the statistical uncertainty, are shown in the lower panel. The shaded bands show the systematic uncertainties, neglecting the normalization of the diphoton prediction. The last bin contains the overflow of events with $ m_{\gamma\gamma} > $ 3.5 TeV. |
png pdf |
Figure 7:
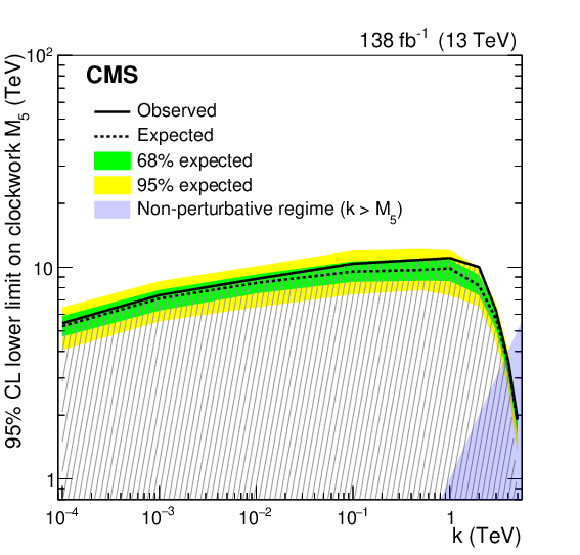
The exclusion limit for the clockwork framework over the $ k $-$ M_{5} $ parameter space. The darker shaded region denotes where the theory becomes nonperturbative. The region below the solid line constitutes the excluded region. Expected 68% and 95% limit bands are shown in green and yellow, respectively. |
| Tables | |

png pdf |
Table 1:
The observed and expected lower limits on $ M_{\mathrm{S}} $ in TeV at the 95% CL for different theoretical conventions of the ADD extra dimension model. |
| Summary |
| A search has been performed for new physics in high-mass diphoton events from proton-proton collisions at a center-of-mass energy of 13 TeV. The data used correspond to an integrated luminosity of 138 fb$ ^{-1} $ collected with the CMS detector in 2016-2018. No statistically significant excess, either resonant or nonresonant, is observed in the spectra. Masses below 2.2 to 5.6 TeV are excluded at the 95% confidence level for the excited state of the Randall-Sundrum (RS) graviton, for coupling parameters between 0.01 $ < \tilde{k} < $ 0.2. Limits are also set on the production of scalar Higgs boson like resonances. In the model with large extra spatial dimensions by Arkani-Hamed, Dimopoulos, and Dvali (ADD), exclusion limits on the mass scale $ M_{\mathrm{S}} $ range between 7.1 to 11.1 TeV, depending on the specific convention. Additionally, exclusion limits are set in the two-dimensional space of the continuum clockwork model, with the fundamental scale $ M_{5} $ excluded at the 95% confidence level below 8.0 TeV for $ k $ values between 0.2 GeV and 2.0 TeV. The present results are the strongest limits to date on ADD extra dimensions and RS gravitons with $ \tilde{k} \ge $ 0.1. |
| References | ||||
| 1 | S. Weinberg | Implications of dynamical symmetry breaking | PRD 13 (1976) 974 | |
| 2 | L. Susskind | Dynamics of spontaneous symmetry breaking in the Weinberg-Salam theory | PRD 20 (1979) 2619 | |
| 3 | N. Arkani-Hamed, S. Dimopoulos, and G. R. Dvali | The hierarchy problem and new dimensions at a millimeter | PLB 429 (1998) 263 | hep-ph/9803315 |
| 4 | I. Antoniadis, N. Arkani-Hamed, S. Dimopoulos, and G. R. Dvali | New dimensions at a millimeter to a fermi and superstrings at a TeV | PLB 436 (1998) 257 | hep-ph/9804398 |
| 5 | N. Arkani-Hamed, S. Dimopoulos, and G. R. Dvali | Phenomenology, astrophysics and cosmology of theories with submillimeter dimensions and TeV scale quantum gravity | PRD 59 (1999) 086004 | hep-ph/9807344 |
| 6 | L. Randall and R. Sundrum | A large mass hierarchy from a small extra dimension | PRL 83 (1999) 3370 | hep-ph/9905221 |
| 7 | L. Randall and R. Sundrum | An alternative to compactification | PRL 83 (1999) 4690 | hep-th/9906064 |
| 8 | G. F. Giudice and M. McCullough | A clockwork theory | JHEP 02 (2017) 036 | 1610.07962 |
| 9 | M. Baryakhtar | Graviton phenomenology of linear dilaton geometries | PRD 85 (2012) 125019 | 1202.6674 |
| 10 | G. F. Giudice et al. | Clockwork / linear dilaton: structure and phenomenology | JHEP 06 (2018) 009 | 1711.08437 |
| 11 | G. F. Giudice and A. Strumia | Constraints on extra-dimensional theories from virtual-graviton exchange | NPB 663 (2003) 377 | hep-ph/0301232 |
| 12 | G. F. Giudice, T. Plehn, and A. Strumia | Graviton collider effects in one and more large extra dimensions | NPB 706 (2005) 455 | hep-ph/0408320 |
| 13 | R. Franceschini et al. | LHC bounds on large extra dimensions | JHEP 05 (2011) 092 | 1101.4919 |
| 14 | G. C. Branco et al. | Theory and phenomenology of two-Higgs-doublet models | Phys. Rept. 516 (2012) 1 | 1106.0034 |
| 15 | T. D. Lee | A theory of spontaneous $ T $ violation | PRD 8 (1973) 1226 | |
| 16 | N. Craig, J. Galloway, and S. Thomas | Searching for signs of the second Higgs doublet | 1305.2424 | |
| 17 | ATLAS Collaboration | Search for periodic signals in the dielectron and diphoton invariant mass spectra using 139 fb$ ^{-1} $ of pp collisions at $ \sqrt{s} = $ 13 TeV with the ATLAS detector | JHEP 10 (2023) 079 | 2305.10894 |
| 18 | CMS Collaboration | Search for physics beyond the standard model in high-mass diphoton events from proton-proton collisions at $ \sqrt{s} = $ 13 TeV | PRD 98 (2018) 092001 | CMS-EXO-17-017 1809.00327 |
| 19 | ATLAS Collaboration | Search for resonances decaying into photon pairs in 139 fb$ ^{-1} $ of pp collisions at $ \sqrt{s} = $ 13 TeV with the ATLAS detector | PLB 822 (2021) 136651 | 2102.13405 |
| 20 | ATLAS Collaboration | Search for new phenomena in high-mass diphoton final states using 37 fb$ ^{-1} $ of proton-proton collisions collected at $ \sqrt{s}= $ 13 TeV with the ATLAS detector | PLB 775 (2017) 105 | 1707.04147 |
| 21 | CMS Collaboration | Search for high-mass diphoton resonances in proton-proton collisions at 13 TeV and combination with 8 TeV search | PLB 767 (2017) 147 | CMS-EXO-16-027 1609.02507 |
| 22 | ATLAS Collaboration | Search for resonances in diphoton events at $ \sqrt{s} = $ 13 TeV with the ATLAS detector | JHEP 09 (2016) 001 | 1606.03833 |
| 23 | CMS Collaboration | Search for resonant production of high-mass photon pairs in proton-proton collisions at $ \sqrt{s}= $ 8 and 13 TeV | PRL 117 (2016) 051802 | CMS-EXO-16-018 1606.04093 |
| 24 | ATLAS Collaboration | Search for high-mass diphoton resonances in pp collisions at $ \sqrt{s}= $ 8 TeV with the ATLAS detector | PRD 92 (2015) 032004 | 1504.05511 |
| 25 | CMS Collaboration | Search for diphoton resonances in the mass range from 150 to 850 GeV in pp collisions at $ \sqrt{s} = $ 8 TeV | PLB 750 (2015) 494 | CMS-HIG-14-006 1506.02301 |
| 26 | ATLAS Collaboration | Search for extra dimensions in diphoton events using proton-proton collisions recorded at $ \sqrt{s}= $ 7 TeV with the ATLAS detector at the LHC | New J. Phys. 15 (2013) 043007 | 1210.8389 |
| 27 | CMS Collaboration | Search for signatures of extra dimensions in the diphoton mass spectrum at the Large Hadron Collider | PRL 108 (2012) 111801 | CMS-EXO-11-038 1112.0688 |
| 28 | CMS Collaboration | Search for large extra dimensions in the diphoton final state at the Large Hadron Collider | JHEP 05 (2011) 085 | CMS-EXO-10-026 1103.4279 |
| 29 | CDF Collaboration | Search for new dielectron resonances and Randall-Sundrum gravitons at the Collider Detector at Fermilab | PRL 107 (2011) 051801 | 1103.4650 |
| 30 | CDF Collaboration | Limits on extra dimensions and new particle production in the exclusive photon and missing energy signature in $ p\bar{p} $ collisions at $ \sqrt{s} = $ 1.8 TeV | PRL 89 (2002) 281801 | hep-ex/0205057 |
| 31 | CDF Collaboration | Search for Randall-Sundrum gravitons in the diphoton channel at CDF | PRD 83 (2011) 011102 | 1012.2795 |
| 32 | D0 Collaboration | Search for Randall-Sundrum gravitons in the dielectron and diphoton final states with 5.4 fb$ ^{-1} $ of data from $ {\rm p} \bar{\rm p} $ collisions at $ \sqrt{s}= $ 1.96 TeV | PRL 104 (2010) 241802 | 1004.1826 |
| 33 | D0 Collaboration | Search for large extra dimensions in dielectron and diphoton production | PRL 86 (2001) 1156 | hep-ex/0008065 |
| 34 | D0 Collaboration | Search for large extra spatial dimensions in the dielectron and diphoton channels in $ p \bar{p} $ collisions at $ \sqrt{s} = $ 1.96 TeV | PRL 102 (2009) 051601 | 0809.2813 |
| 35 | D0 Collaboration | Search for Randall-Sundrum gravitons in dilepton and diphoton final states | PRL 95 (2005) 091801 | hep-ex/0505018 |
| 36 | CMS Collaboration | HEPData record for this analysis | link | |
| 37 | CMS Collaboration | The CMS experiment at the CERN LHC | JINST 3 (2008) S08004 | |
| 38 | CMS Collaboration | Performance of the CMS Level-1 trigger in proton-proton collisions at $ \sqrt{s} = $ 13 TeV | JINST 15 (2020) P10017 | CMS-TRG-17-001 2006.10165 |
| 39 | CMS Collaboration | The CMS trigger system | JINST 12 (2017) P01020 | CMS-TRG-12-001 1609.02366 |
| 40 | CMS Collaboration | Electron and photon reconstruction and identification with the CMS experiment at the CERN LHC | JINST 16 (2021) P05014 | CMS-EGM-17-001 2012.06888 |
| 41 | CMS Collaboration | Performance of the CMS muon detector and muon reconstruction with proton-proton collisions at $ \sqrt{s}= $ 13 TeV | JINST 13 (2018) P06015 | CMS-MUO-16-001 1804.04528 |
| 42 | CMS Collaboration | Description and performance of track and primary-vertex reconstruction with the CMS tracker | JINST 9 (2014) P10009 | CMS-TRK-11-001 1405.6569 |
| 43 | CMS Collaboration | Particle-flow reconstruction and global event description with the CMS detector | JINST 12 (2017) P10003 | CMS-PRF-14-001 1706.04965 |
| 44 | CMS Collaboration | Performance of reconstruction and identification of $ \tau $ leptons decaying to hadrons and $ \nu_\tau $ in pp collisions at $ \sqrt{s}= $ 13 TeV | JINST 13 (2018) P10005 | CMS-TAU-16-003 1809.02816 |
| 45 | CMS Collaboration | Jet energy scale and resolution in the CMS experiment in pp collisions at 8 TeV | JINST 12 (2017) P02014 | CMS-JME-13-004 1607.03663 |
| 46 | CMS Collaboration | Performance of missing transverse momentum reconstruction in proton-proton collisions at $ \sqrt{s} = $ 13 TeV using the CMS detector | JINST 14 (2019) P07004 | CMS-JME-17-001 1903.06078 |
| 47 | CMS Collaboration | Performance of photon reconstruction and identification with the CMS detector in proton-proton collisions at $ \sqrt{s}= $ 8 TeV | JINST 10 (2015) P08010 | CMS-EGM-14-001 1502.02702 |
| 48 | CMS Collaboration | A measurement of the Higgs boson mass in the diphoton decay channel | PLB 805 (2020) 135425 | CMS-HIG-19-004 2002.06398 |
| 49 | CMS Collaboration | Precision luminosity measurement in proton-proton collisions at $ \sqrt{s} = $ 13 TeV in 2015 and 2016 at CMS | EPJC 81 (2021) 800 | CMS-LUM-17-003 2104.01927 |
| 50 | CMS Collaboration | CMS luminosity measurement for the 2017 data-taking period at $ \sqrt{s} = $ 13 TeV | CMS Physics Analysis Summary, 2018 link |
CMS-PAS-LUM-17-004 |
| 51 | CMS Collaboration | CMS luminosity measurement for the 2018 data-taking period at $ \sqrt{s} = $ 13 TeV | CMS Physics Analysis Summary, 2019 link |
CMS-PAS-LUM-18-002 |
| 52 | CMS Collaboration | Observation of the diphoton decay of the Higgs boson and measurement of its properties | EPJC 74 (2014) 3076 | CMS-HIG-13-001 1407.0558 |
| 53 | CMS Collaboration | Measurements of Higgs boson properties in the diphoton decay channel in proton-proton collisions at $ \sqrt{s}= $ 13 TeV | JHEP 11 (2018) 185 | CMS-HIG-16-040 1804.02716 |
| 54 | T. Sjöstrand et al. | An introduction to PYTHIA 8.2 | Comput. Phys. Commun. 191 (2015) 159 | 1410.3012 |
| 55 | GEANT4 Collaboration | GEANT 4--a simulation toolkit | NIM A 506 (2003) 250 | |
| 56 | NNPDF Collaboration | Parton distributions with LHC data | NPB 867 (2012) 2 | 1207.1303 |
| 57 | CMS collaboration | Event generator tunes obtained from underlying event and multiparton scattering measurements | EPJC 76 (2015) 155 | 1512.00815 |
| 58 | NNPDF Collaboration | Parton distributions for the LHC Run II | JHEP 04 (2015) 040 | 1410.8849 |
| 59 | CMS Collaboration | Extraction and validation of a new set of CMS PYTHIA8 tunes from underlying-event measurements | EPJC 80 (2020) 4 | CMS-GEN-17-001 1903.12179 |
| 60 | CMS Collaboration | Pileup mitigation at CMS in 13 TeV data | JINST 15 (2020) P09018 | CMS-JME-18-001 2003.00503 |
| 61 | G. F. Giudice, R. Rattazzi, and J. D. Wells | Quantum gravity and extra dimensions at high-energy colliders | NPB 544 (1999) 3 | hep-ph/9811291 |
| 62 | J. L. Hewett | Indirect collider signals for extra dimensions | PRL 82 (1999) 4765 | hep-ph/9811356 |
| 63 | T. Han, J. D. Lykken, and R.-J. Zhang | Kaluza-Klein states from large extra dimensions | PRD 59 (1999) 105006 | hep-ph/9811350 |
| 64 | E. Bothmann et al. | Event generation with Sherpa 2.2 | SciPost Phys. 7 (2019) 034 | 1905.09127 |
| 65 | J. M. Campbell, R. K. Ellis, Y. Li, and C. Williams | Predictions for diphoton production at the LHC through NNLO in QCD | JHEP 07 (2016) 148 | 1603.02663 |
| 66 | CMS Collaboration | Measurement of the inelastic proton-proton cross section at $ \sqrt{s}= $ 13 TeV | JHEP 18 (2018) 161 | CMS-FSQ-15-005 1802.02613 |
| 67 | ATLAS and CMS Collaborations, and LHC Higgs Combination Group | Procedure for the LHC Higgs boson search combination in Summer 2011 | Technical Report CMS-NOTE-2011-005, ATL-PHYS-PUB-2011-11, 2011 | |
| 68 | G. Cowan, K. Cranmer, E. Gross, and O. Vitells | Asymptotic formulae for likelihood-based tests of new physics | EPJC 71 (2011) 1554 | 1007.1727 |
| 69 | N. Metropolis et al. | Equation of state calculations by fast computing machines | J. Chem. Phys. 21 (1953) 1087 | |

|
Compact Muon Solenoid LHC, CERN |

|

|

|

|

|

|