

Compact Muon Solenoid
LHC, CERN
| CMS-EXO-18-002 ; CERN-EP-2024-254 | ||
| Search for heavy long-lived charged particles with large ionization energy loss in proton-proton collisions at $ \sqrt{s} = $ 13 TeV | ||
| CMS Collaboration | ||
| 11 October 2024 | ||
| JHEP 04 (2025) 109 | ||
| Abstract: A search for heavy, long-lived, charged particles with large ionization energy loss within the silicon tracker of the CMS experiment is presented. A data set of proton-proton collisions at a center of mass energy at $ \sqrt{s} = $ 13 TeV, collected in 2017 and 2018 at the CERN LHC, corresponding to an integrated luminosity of 101 fb$ ^{-1} $, is used in this analysis. Two different approaches for the search are taken. A new method exploits the independence of the silicon pixel and strips measurements, while the second method improves on previous techniques using ionization to determine a mass selection. No significant excess of events above the background expectation is observed. The results are interpreted in the context of the pair production of supersymmetric particles, namely gluinos, top squarks, and tau sleptons, and of the Drell--Yan pair production of fourth generation ($ \tau' $) leptons with an electric charge equal to or twice the absolute value of the electron charge ($ e $). An interpretation of a Z' boson decaying to two $ \tau' $ leptons with an electric charge equal to 2$ e $ is presented for the first time. The 95% confidence upper limits on the production cross section are extracted for each of these hypothetical particles. | ||
| Links: e-print arXiv:2410.09164 [hep-ex] (PDF) ; CDS record ; inSPIRE record ; HepData record ; CADI line (restricted) ; | ||
| Figures & Tables | Summary | Additional Figures | References | CMS Publications |
|---|
| Figures | |
png pdf |
Figure 1:
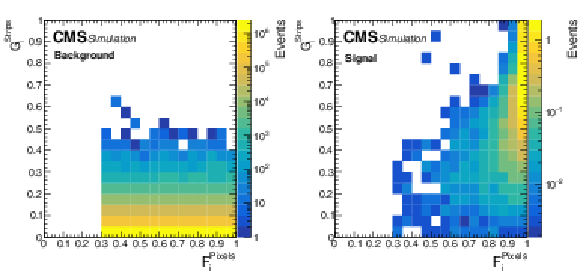
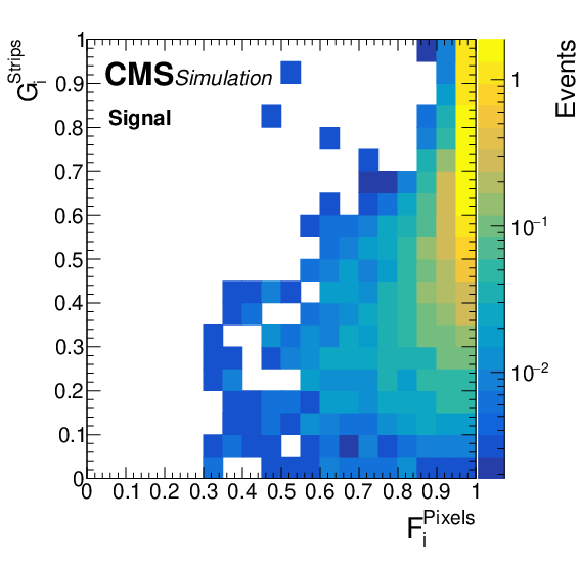
The simulated $ F_{\text{i}}^{\text{Pixels}} $ vs. $ G_{\text{i}}^{\text{Strips}} $ distribution for the SM background (left), and an 1800 GeV $ \mathrm{\widetilde{g}} $ R-hadron (right), for events that pass the selection criteria listed in Table 2. |

png pdf |
Figure 1-a:
The simulated $ F_{\text{i}}^{\text{Pixels}} $ vs. $ G_{\text{i}}^{\text{Strips}} $ distribution for the SM background (left), and an 1800 GeV $ \mathrm{\widetilde{g}} $ R-hadron (right), for events that pass the selection criteria listed in Table 2. |
png pdf |
Figure 1-b:
The simulated $ F_{\text{i}}^{\text{Pixels}} $ vs. $ G_{\text{i}}^{\text{Strips}} $ distribution for the SM background (left), and an 1800 GeV $ \mathrm{\widetilde{g}} $ R-hadron (right), for events that pass the selection criteria listed in Table 2. |

png pdf |
Figure 2:
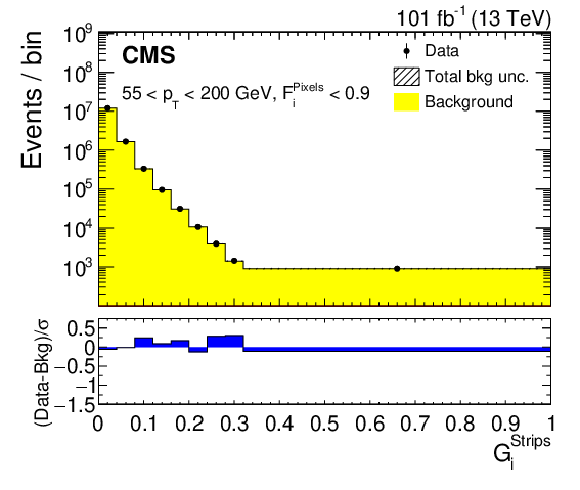
The $ G_{\text{i}}^{\text{Strips}} $ distribution in the FAIL (left) and PASS (right) regions for events passing the event selection and with 55 $ < p_{\mathrm{T}} < $ 200 GeV. The data are represented by black markers. The background predicted by the ionization method is shown in yellow, with the shaded area indicating the scarcely visible background uncertainty. The lower panel displays the pulls, defined as the difference between the data and the estimated background, divided by the associated uncertainty. |
png pdf |
Figure 2-a:
The $ G_{\text{i}}^{\text{Strips}} $ distribution in the FAIL (left) and PASS (right) regions for events passing the event selection and with 55 $ < p_{\mathrm{T}} < $ 200 GeV. The data are represented by black markers. The background predicted by the ionization method is shown in yellow, with the shaded area indicating the scarcely visible background uncertainty. The lower panel displays the pulls, defined as the difference between the data and the estimated background, divided by the associated uncertainty. |

png pdf |
Figure 2-b:
The $ G_{\text{i}}^{\text{Strips}} $ distribution in the FAIL (left) and PASS (right) regions for events passing the event selection and with 55 $ < p_{\mathrm{T}} < $ 200 GeV. The data are represented by black markers. The background predicted by the ionization method is shown in yellow, with the shaded area indicating the scarcely visible background uncertainty. The lower panel displays the pulls, defined as the difference between the data and the estimated background, divided by the associated uncertainty. |
png pdf |
Figure 3:
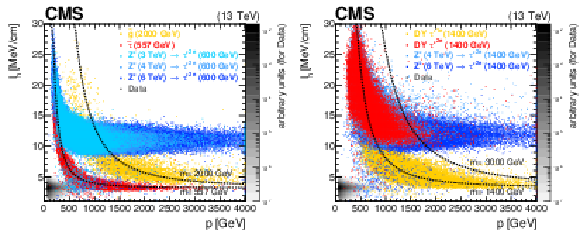
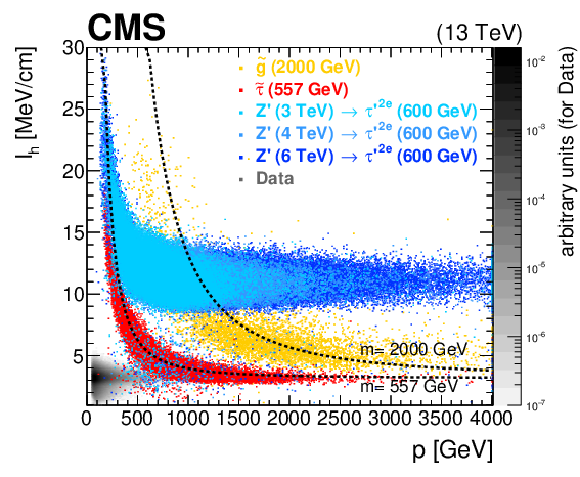
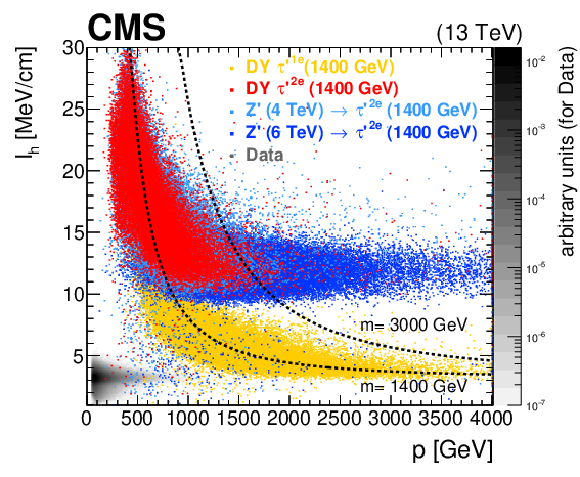
Distribution of $ I_{\text{h}} $ as a function of $ p $ for the HSCP candidates passing the preselection. The colored scatter plots highlight the differences between select HSCP models with various masses and charges. For illustrative purposes, observed data are displayed using the gray density distribution, normalized to unit area. The two dashed lines based on Eq. ( 4) correspond to a particle mass of 557 and 2000 GeV on the left, and 1400 and 3000 GeV on the right. The momentum is measured assuming a charge 1$ e $. |
png pdf |
Figure 3-a:
Distribution of $ I_{\text{h}} $ as a function of $ p $ for the HSCP candidates passing the preselection. The colored scatter plots highlight the differences between select HSCP models with various masses and charges. For illustrative purposes, observed data are displayed using the gray density distribution, normalized to unit area. The two dashed lines based on Eq. ( 4) correspond to a particle mass of 557 and 2000 GeV on the left, and 1400 and 3000 GeV on the right. The momentum is measured assuming a charge 1$ e $. |
png pdf |
Figure 3-b:
Distribution of $ I_{\text{h}} $ as a function of $ p $ for the HSCP candidates passing the preselection. The colored scatter plots highlight the differences between select HSCP models with various masses and charges. For illustrative purposes, observed data are displayed using the gray density distribution, normalized to unit area. The two dashed lines based on Eq. ( 4) correspond to a particle mass of 557 and 2000 GeV on the left, and 1400 and 3000 GeV on the right. The momentum is measured assuming a charge 1$ e $. |
png pdf |
Figure 4:
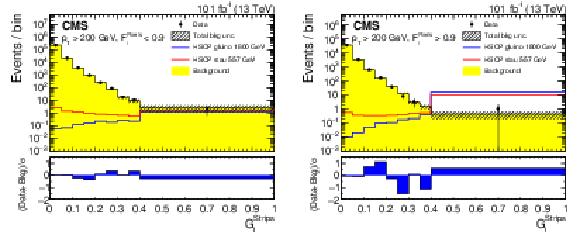
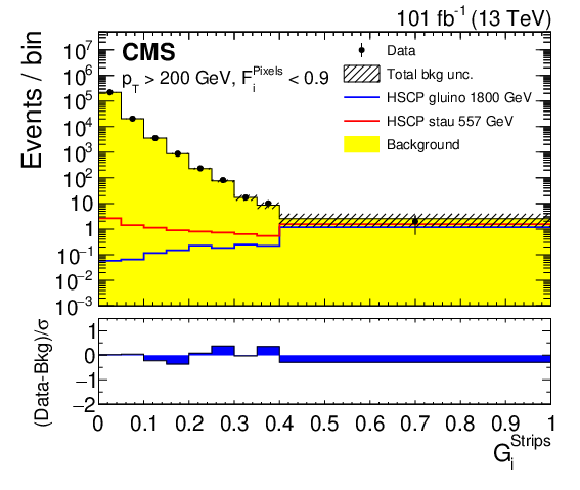
The $ G_{\text{i}}^{\text{Strips}} $ distribution in the FAIL (left) and PASS (right) regions for events passing the event selection and with $ p_{\mathrm{T}} > $ 200 GeV. The data are represented by black dots. The background predicted by the ionization method is shown in yellow, with the hatched area indicating the background uncertainty. As examples, the blue line shows the 1800 GeV $ \mathrm{\widetilde{g}} $ signal distribution and the red line shows the 557 GeV $ \tilde{\tau} $ signal distribution. The lower panel displays the pulls, defined as the difference between the data and the estimated background, divided by the associated uncertainty. |
png pdf |
Figure 4-a:
The $ G_{\text{i}}^{\text{Strips}} $ distribution in the FAIL (left) and PASS (right) regions for events passing the event selection and with $ p_{\mathrm{T}} > $ 200 GeV. The data are represented by black dots. The background predicted by the ionization method is shown in yellow, with the hatched area indicating the background uncertainty. As examples, the blue line shows the 1800 GeV $ \mathrm{\widetilde{g}} $ signal distribution and the red line shows the 557 GeV $ \tilde{\tau} $ signal distribution. The lower panel displays the pulls, defined as the difference between the data and the estimated background, divided by the associated uncertainty. |
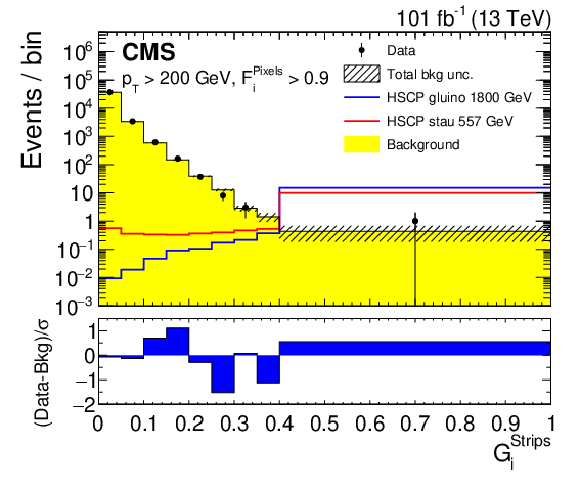
png pdf |
Figure 4-b:
The $ G_{\text{i}}^{\text{Strips}} $ distribution in the FAIL (left) and PASS (right) regions for events passing the event selection and with $ p_{\mathrm{T}} > $ 200 GeV. The data are represented by black dots. The background predicted by the ionization method is shown in yellow, with the hatched area indicating the background uncertainty. As examples, the blue line shows the 1800 GeV $ \mathrm{\widetilde{g}} $ signal distribution and the red line shows the 557 GeV $ \tilde{\tau} $ signal distribution. The lower panel displays the pulls, defined as the difference between the data and the estimated background, divided by the associated uncertainty. |
png pdf |
Figure 5:
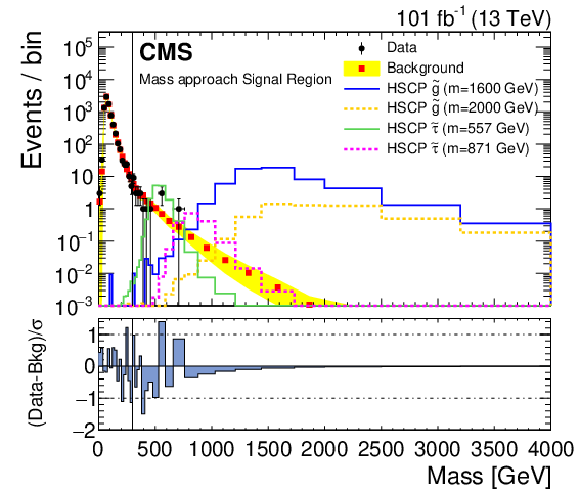
Mass spectrum predicted in the signal region defined by $ G_{\text{i}}^{\text{Strips}} > $ 0.22 and $ p_{\mathrm{T}} > $ 70 GeV. The data are represented by black dots. The data-driven background estimate is displayed as red markers with the yellow envelope representing the quadratic sum of the statistical and the systematic uncertainties. Several signal scenarios are displayed. The last bin includes the overflow. The lower panel displays the pulls, defined as the difference between the data and the estimated background, divided by the associated uncertainty. |
png pdf |
Figure 6:
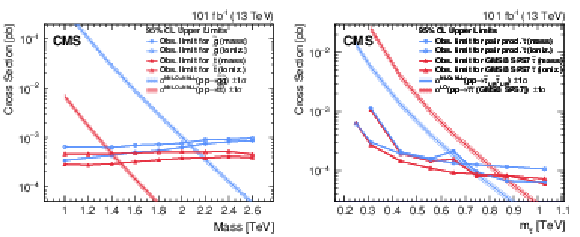
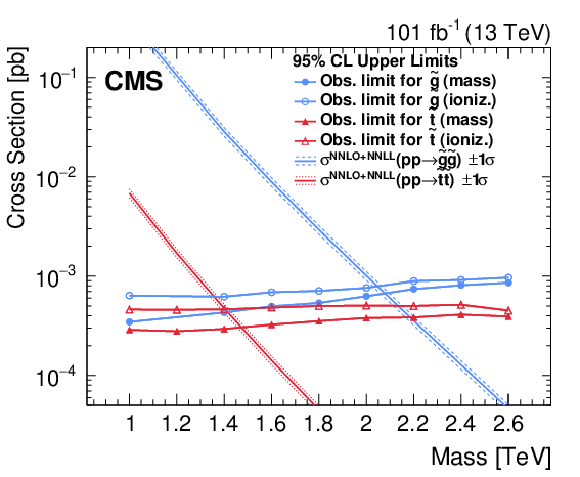
Cross section limits for $ \mathrm{\widetilde{g}} $ (blue circles) and $ \tilde{\mathrm{t}} $ R-hadrons (red triangles) on the left and for the DY pair production of $ \tilde{\tau} $ (blue circles) and within the GMSB SPS7 model (red triangles) on the right. The results obtained with the ionization method are displayed with open symbols, while the symbols for the mass method are filled. Corresponding theoretical predictions are shown using the same color code. |
png pdf |
Figure 6-a:
Cross section limits for $ \mathrm{\widetilde{g}} $ (blue circles) and $ \tilde{\mathrm{t}} $ R-hadrons (red triangles) on the left and for the DY pair production of $ \tilde{\tau} $ (blue circles) and within the GMSB SPS7 model (red triangles) on the right. The results obtained with the ionization method are displayed with open symbols, while the symbols for the mass method are filled. Corresponding theoretical predictions are shown using the same color code. |
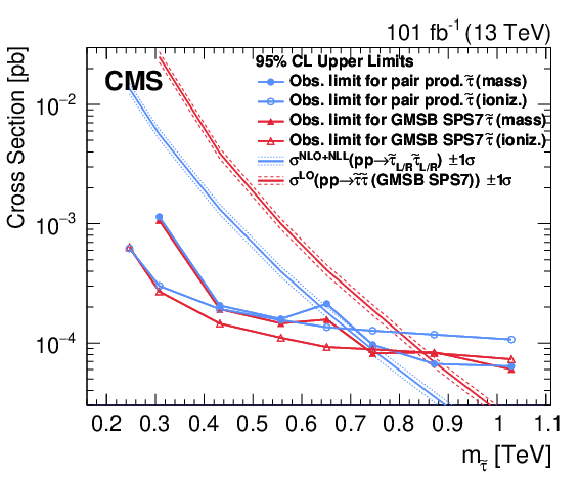
png pdf |
Figure 6-b:
Cross section limits for $ \mathrm{\widetilde{g}} $ (blue circles) and $ \tilde{\mathrm{t}} $ R-hadrons (red triangles) on the left and for the DY pair production of $ \tilde{\tau} $ (blue circles) and within the GMSB SPS7 model (red triangles) on the right. The results obtained with the ionization method are displayed with open symbols, while the symbols for the mass method are filled. Corresponding theoretical predictions are shown using the same color code. |
png pdf |
Figure 7:
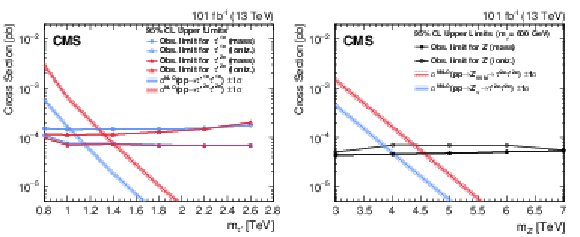
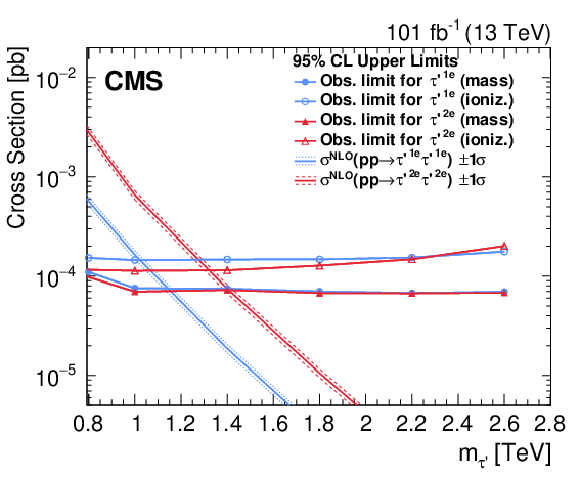
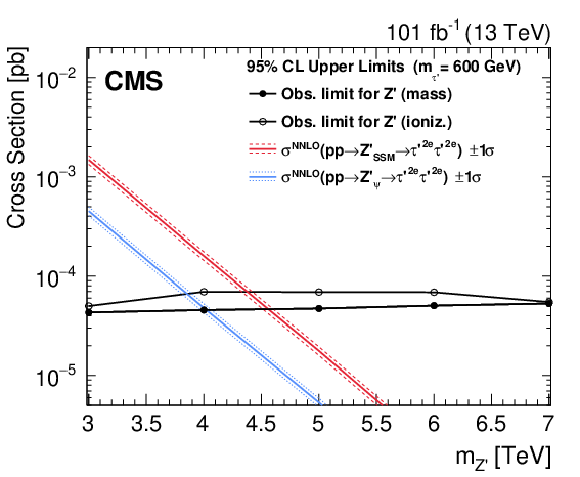
Cross section limits on the left for the DY-produced $ \tau' $ fermions with $ {Q} = $1$e $ (blue circles) and $ {Q} = $2$e $ (red triangles), and on the right for the production of Z' boson decaying into a pair of $ \tau' $ fermions of charge 2$ e $ (black circles). The results obtained with the ionization method are displayed with open symbols, while the symbols for the mass method are filled. The corresponding theoretical predictions for the two DY-productions are shown using the same color code as for the limits, depending on the $ \tau' $ charge. For the Z' production, all the samples assume a narrow width. The branching fraction for the Z' boson decay to $ \tau'\tau' $ is 1 and a fixed $ \tau' $ mass of 600 GeV is used. The blue (red) curves on the right plot shows the theoretical production cross section for a $\mathrm{Z}'_{\psi}$ ($\mathrm{Z}'_{\mathrm{SSM}}$ boson [83] ( [84]). |
png pdf |
Figure 7-a:
Cross section limits on the left for the DY-produced $ \tau' $ fermions with $ {Q} = $1$e $ (blue circles) and $ {Q} = $2$e $ (red triangles), and on the right for the production of Z' boson decaying into a pair of $ \tau' $ fermions of charge 2$ e $ (black circles). The results obtained with the ionization method are displayed with open symbols, while the symbols for the mass method are filled. The corresponding theoretical predictions for the two DY-productions are shown using the same color code as for the limits, depending on the $ \tau' $ charge. For the Z' production, all the samples assume a narrow width. The branching fraction for the Z' boson decay to $ \tau'\tau' $ is 1 and a fixed $ \tau' $ mass of 600 GeV is used. The blue (red) curves on the right plot shows the theoretical production cross section for a $\mathrm{Z}'_{\psi}$ ($\mathrm{Z}'_{\mathrm{SSM}}$ boson [83] ( [84]). |
png pdf |
Figure 7-b:
Cross section limits on the left for the DY-produced $ \tau' $ fermions with $ {Q} = $1$e $ (blue circles) and $ {Q} = $2$e $ (red triangles), and on the right for the production of Z' boson decaying into a pair of $ \tau' $ fermions of charge 2$ e $ (black circles). The results obtained with the ionization method are displayed with open symbols, while the symbols for the mass method are filled. The corresponding theoretical predictions for the two DY-productions are shown using the same color code as for the limits, depending on the $ \tau' $ charge. For the Z' production, all the samples assume a narrow width. The branching fraction for the Z' boson decay to $ \tau'\tau' $ is 1 and a fixed $ \tau' $ mass of 600 GeV is used. The blue (red) curves on the right plot shows the theoretical production cross section for a $\mathrm{Z}'_{\psi}$ ($\mathrm{Z}'_{\mathrm{SSM}}$ boson [83] ( [84]). |
png pdf |
Figure 8:
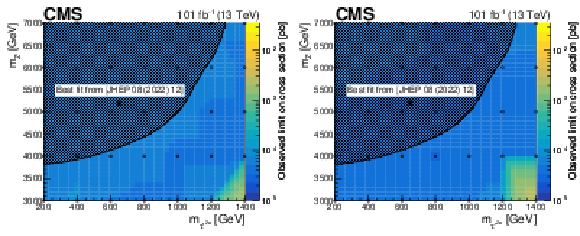
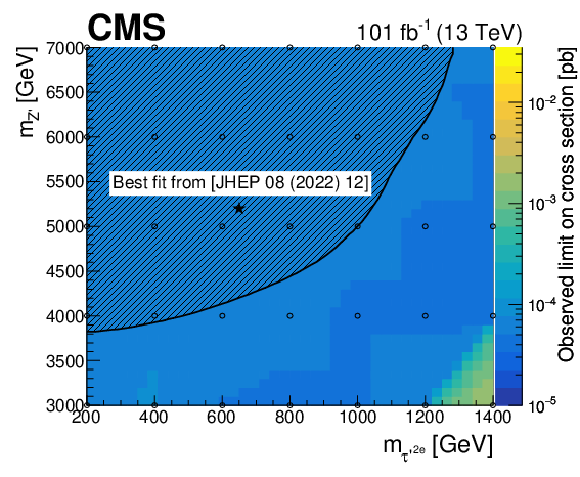
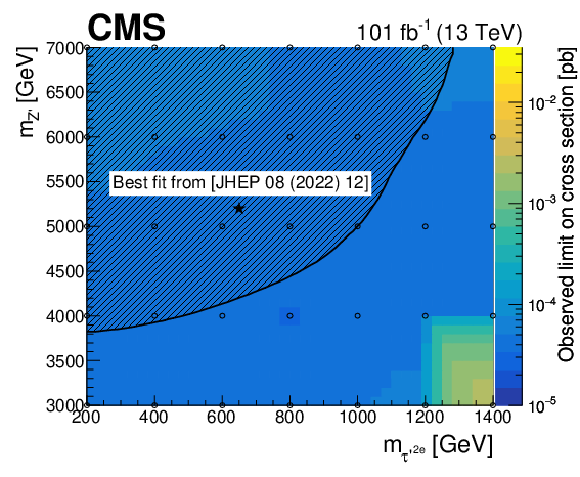
The two-dimensional exclusion showing the observed cross section limit as a function of the masses of the $ \tau' $ (on the $ x $ axis) and of the Z' boson (on the $ y $ axis), for the ionization method on the left and for the mass method on the right. The area above the black solid line corresponds to the region that is compatible with the ATLAS excess from Ref. [59] and the black star corresponds to the best fit of the ATLAS excess with this model. The empty circles correspond to the 35 simulated mass points. |
png pdf |
Figure 8-a:
The two-dimensional exclusion showing the observed cross section limit as a function of the masses of the $ \tau' $ (on the $ x $ axis) and of the Z' boson (on the $ y $ axis), for the ionization method on the left and for the mass method on the right. The area above the black solid line corresponds to the region that is compatible with the ATLAS excess from Ref. [59] and the black star corresponds to the best fit of the ATLAS excess with this model. The empty circles correspond to the 35 simulated mass points. |
png pdf |
Figure 8-b:
The two-dimensional exclusion showing the observed cross section limit as a function of the masses of the $ \tau' $ (on the $ x $ axis) and of the Z' boson (on the $ y $ axis), for the ionization method on the left and for the mass method on the right. The area above the black solid line corresponds to the region that is compatible with the ATLAS excess from Ref. [59] and the black star corresponds to the best fit of the ATLAS excess with this model. The empty circles correspond to the 35 simulated mass points. |
| Tables | |

png pdf |
Table 1:
Summary of $ K $ and $ C $ values for data, and simulation. |
png pdf |
Table 2:
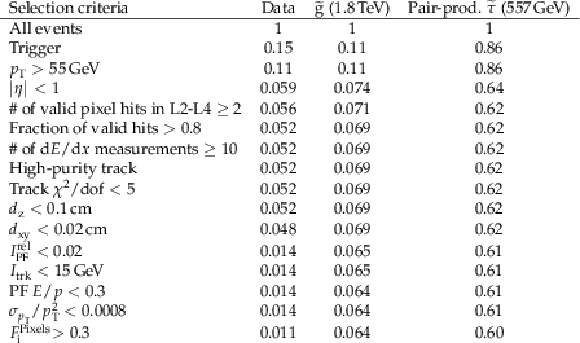
Cumulative selection efficiency for the data and for two signal hypotheses. |
png pdf |
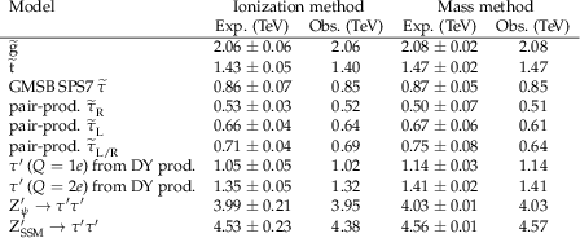
Table 3:
Expected and observed mass limits obtained for various HSCP candidate models, for the two background estimate methods. |
| Summary |
| A dedicated search for heavy long-lived charged particles produced in proton-proton collisions at $ \sqrt{s} = $ 13 TeV using the CMS detector has been presented. Since the experimental signature is a highly ionizing isolated track of high $ p_{\mathrm{T}} $, the analysis is based on anomalous d$E$/d$x$ deposits in the silicon tracker. The data, corresponding to an integrated luminosity of 101 fb$ ^{-1} $, are compatible with the background predictions obtained with two different methods. The ionization method is based on the newly introduced ionization variable $ F_{\text{i}}^{\text{Pixels}} $ which uses only pixel detector information, and the $ G_{\text{i}}^{\text{Strips}} $ discriminant, which uses charges collected in the silicon strip detector. The mass method is based on the reconstruction of mass using the ionization variable $ I_{\text{h}} $, providing an estimate of the most probable value of d$E$/d$x$ of the track, and the momentum of the candidate. The two methods lead to similar sensitivity. Cross section limits are set in the context of several models predicting the pair production of gluino R-hadrons, top squark R-hadrons, tau sleptons, and $ \tau' $ leptons with an electric charge equal to 1$ e $ or 2$ e $. Gluino R-hadrons are excluded at the 95% CL with a mass up to 2.08 TeV, top squark R-hadrons up to 1.47 TeV, pair produced $\tilde{\tau}_{\mathrm{L/R}}$ up to 0.69 TeV, and $ \tau' $ fermions with an electric charge equal to 1$ e $ (2$ e $) up to 1.14 (1.41) TeV. The model predicting a pair of doubly-charged $ \tau' $ fermions from the Z' boson decay motivated by an excess reported by the ATLAS Collaboration [34] is directly addressed, and no significant deviation from the SM is observed. Cross section limits are extracted as a function of the Z' and $ \tau' $ masses. For a $ \tau' $ mass of 600 GeV, $\mathrm{Z}'_{\psi}$ ($\mathrm{Z}'_{\mathrm{SSM}}$) bosons are excluded at 95% CL with a mass up to 4.03 (4.57) TeV. The observed limits for stable pair produced tau sleptons, stable gluinos, and stable top squarks, as well as the Drell-Yan $ \tau' $ and $ \mathrm{Z}'\to\tau'\tau' $ signals are the best published to date. |
| Additional Figures | |
png pdf |
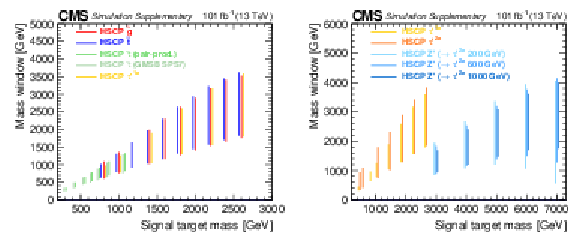
Additional Figure 1:
Mass windows used in the mass method as a function of the signal target mass, on the left for the samples assuming a charge of 1$ e $, on the right for some of the $ \tau^\prime $ and Z' signals. To improve visibility, the signal target masses have been shifted by $-$30 GeV for $ \widetilde{t} $, $-$25 GeV for all masses of GMSB SPS7 $ \widetilde{\tau} $ except for the highest mass with $ + $50 GeV, +25 GeV for the highest mass point for pair-prod. $ \widetilde{\tau} $, $ + $25 GeV for $ \tau^\prime $(1$ e $) and $ + $75 GeV for $ \tau^\prime $(2$ e $). In the case of the Z' signals, the mass of the Z' boson have been shifted, respectively, by-50 and $ + $50 GeV for the samples with $ m_{\tau^\prime(2e)}= $ 200 GeV and 1000 GeV. The mass windows for the Z' signals do not depend on the $ \tau^\prime $ mass, because the $ \tau^\prime $ fermions are produced at large $ p $ value. |

png pdf |
Additional Figure 1-a:
Mass windows used in the mass method as a function of the signal target mass, on the left for the samples assuming a charge of 1$ e $, on the right for some of the $ \tau^\prime $ and Z' signals. To improve visibility, the signal target masses have been shifted by $-$30 GeV for $ \widetilde{t} $, $-$25 GeV for all masses of GMSB SPS7 $ \widetilde{\tau} $ except for the highest mass with $ + $50 GeV, +25 GeV for the highest mass point for pair-prod. $ \widetilde{\tau} $, $ + $25 GeV for $ \tau^\prime $(1$ e $) and $ + $75 GeV for $ \tau^\prime $(2$ e $). In the case of the Z' signals, the mass of the Z' boson have been shifted, respectively, by-50 and $ + $50 GeV for the samples with $ m_{\tau^\prime(2e)}= $ 200 GeV and 1000 GeV. The mass windows for the Z' signals do not depend on the $ \tau^\prime $ mass, because the $ \tau^\prime $ fermions are produced at large $ p $ value. |

png pdf |
Additional Figure 1-b:
Mass windows used in the mass method as a function of the signal target mass, on the left for the samples assuming a charge of 1$ e $, on the right for some of the $ \tau^\prime $ and Z' signals. To improve visibility, the signal target masses have been shifted by $-$30 GeV for $ \widetilde{t} $, $-$25 GeV for all masses of GMSB SPS7 $ \widetilde{\tau} $ except for the highest mass with $ + $50 GeV, +25 GeV for the highest mass point for pair-prod. $ \widetilde{\tau} $, $ + $25 GeV for $ \tau^\prime $(1$ e $) and $ + $75 GeV for $ \tau^\prime $(2$ e $). In the case of the Z' signals, the mass of the Z' boson have been shifted, respectively, by-50 and $ + $50 GeV for the samples with $ m_{\tau^\prime(2e)}= $ 200 GeV and 1000 GeV. The mass windows for the Z' signals do not depend on the $ \tau^\prime $ mass, because the $ \tau^\prime $ fermions are produced at large $ p $ value. |
png pdf |
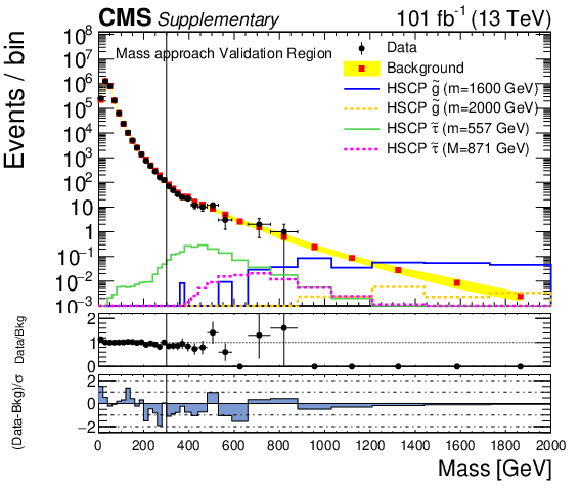
Additional Figure 2:
Mass spectrum predicted in the validation region defined by 0.018 $ < G_{\text{i}}^{\text{Strips}} < $ 0.057 and $ p > $ 70 GeV (the thresholds used in the $ G_{\text{i}}^{\text{Strips}} $ requirement represent the 50% and 90% quantile of the distribution). The data are represented by black dots. The data-driven background estimate is displayed as red markers with the yellow envelope representing the quadratic sum of the statistical and the systematic uncertainty. Several signal scenarios are also displayed. The last bin includes the overflow. The first lower panel shows the ratio of the observed (Data) and predicted (Bkg) yields, while the second lower panel shows the pulls, defined as the difference between Data and Bkg divided by the associated uncertainty ($ \sigma $). |
png pdf |
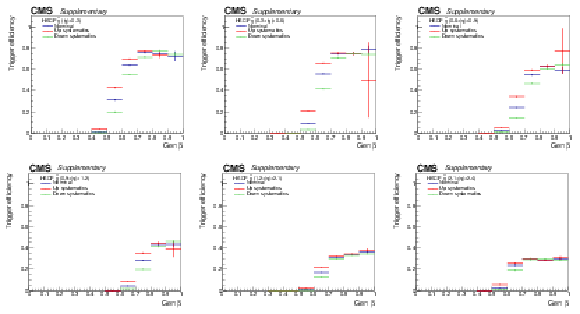
Additional Figure 3:
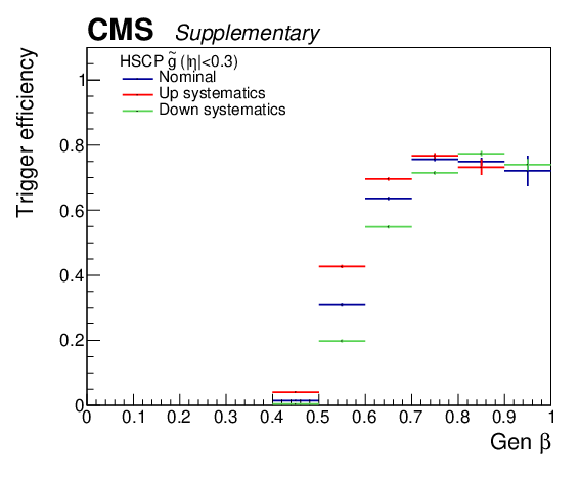
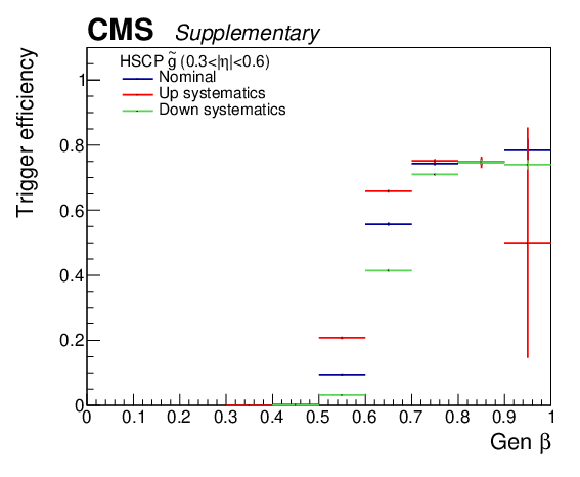
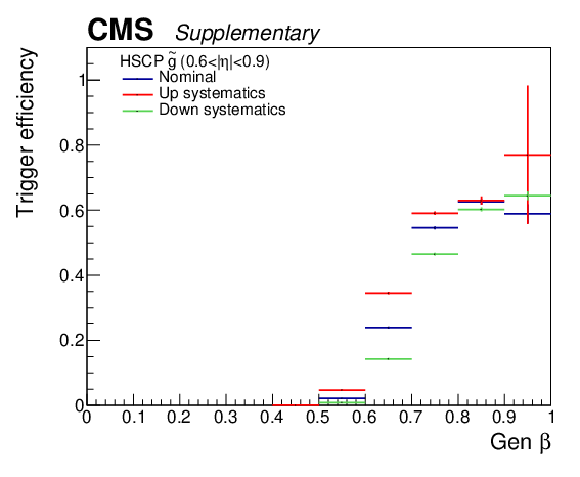
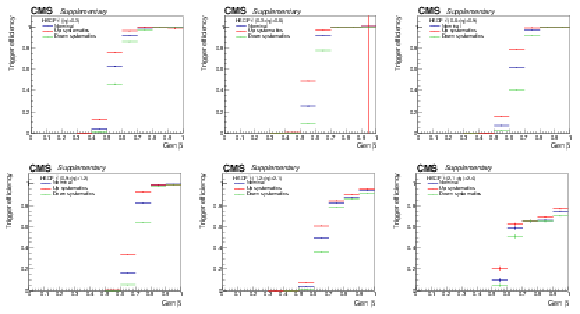
Trigger efficiency for the $ \mathrm{\widetilde{g}} $ signals as a function of $ \beta $ in different $ |\eta| $ bins, from top left to bottom right: $ |\eta| < $ 0.3, 0.3 $ < |\eta| < $ 0.6, 0.6 $ < |\eta| < $ 0.9, 0.9 $ < |\eta| < $ 1.2, 1.2$ < |\eta| < $ 2.1, 2.1$ < |\eta| < $ 2.4. The nominal values are represented in blue, while the red and green points correspond to up and down variations conservatively estimated assuming a delay of 1.5 ns in the muon chambers (equivalent to the time resolution of the chambers) and are used to evaluate the signal systematic uncertainties. |
png pdf |
Additional Figure 3-a:
Trigger efficiency for the $ \mathrm{\widetilde{g}} $ signals as a function of $ \beta $ in different $ |\eta| $ bins, from top left to bottom right: $ |\eta| < $ 0.3, 0.3 $ < |\eta| < $ 0.6, 0.6 $ < |\eta| < $ 0.9, 0.9 $ < |\eta| < $ 1.2, 1.2$ < |\eta| < $ 2.1, 2.1$ < |\eta| < $ 2.4. The nominal values are represented in blue, while the red and green points correspond to up and down variations conservatively estimated assuming a delay of 1.5 ns in the muon chambers (equivalent to the time resolution of the chambers) and are used to evaluate the signal systematic uncertainties. |
png pdf |
Additional Figure 3-b:
Trigger efficiency for the $ \mathrm{\widetilde{g}} $ signals as a function of $ \beta $ in different $ |\eta| $ bins, from top left to bottom right: $ |\eta| < $ 0.3, 0.3 $ < |\eta| < $ 0.6, 0.6 $ < |\eta| < $ 0.9, 0.9 $ < |\eta| < $ 1.2, 1.2$ < |\eta| < $ 2.1, 2.1$ < |\eta| < $ 2.4. The nominal values are represented in blue, while the red and green points correspond to up and down variations conservatively estimated assuming a delay of 1.5 ns in the muon chambers (equivalent to the time resolution of the chambers) and are used to evaluate the signal systematic uncertainties. |
png pdf |
Additional Figure 3-c:
Trigger efficiency for the $ \mathrm{\widetilde{g}} $ signals as a function of $ \beta $ in different $ |\eta| $ bins, from top left to bottom right: $ |\eta| < $ 0.3, 0.3 $ < |\eta| < $ 0.6, 0.6 $ < |\eta| < $ 0.9, 0.9 $ < |\eta| < $ 1.2, 1.2$ < |\eta| < $ 2.1, 2.1$ < |\eta| < $ 2.4. The nominal values are represented in blue, while the red and green points correspond to up and down variations conservatively estimated assuming a delay of 1.5 ns in the muon chambers (equivalent to the time resolution of the chambers) and are used to evaluate the signal systematic uncertainties. |

png pdf |
Additional Figure 3-d:
Trigger efficiency for the $ \mathrm{\widetilde{g}} $ signals as a function of $ \beta $ in different $ |\eta| $ bins, from top left to bottom right: $ |\eta| < $ 0.3, 0.3 $ < |\eta| < $ 0.6, 0.6 $ < |\eta| < $ 0.9, 0.9 $ < |\eta| < $ 1.2, 1.2$ < |\eta| < $ 2.1, 2.1$ < |\eta| < $ 2.4. The nominal values are represented in blue, while the red and green points correspond to up and down variations conservatively estimated assuming a delay of 1.5 ns in the muon chambers (equivalent to the time resolution of the chambers) and are used to evaluate the signal systematic uncertainties. |

png pdf |
Additional Figure 3-e:
Trigger efficiency for the $ \mathrm{\widetilde{g}} $ signals as a function of $ \beta $ in different $ |\eta| $ bins, from top left to bottom right: $ |\eta| < $ 0.3, 0.3 $ < |\eta| < $ 0.6, 0.6 $ < |\eta| < $ 0.9, 0.9 $ < |\eta| < $ 1.2, 1.2$ < |\eta| < $ 2.1, 2.1$ < |\eta| < $ 2.4. The nominal values are represented in blue, while the red and green points correspond to up and down variations conservatively estimated assuming a delay of 1.5 ns in the muon chambers (equivalent to the time resolution of the chambers) and are used to evaluate the signal systematic uncertainties. |

png pdf |
Additional Figure 3-f:
Trigger efficiency for the $ \mathrm{\widetilde{g}} $ signals as a function of $ \beta $ in different $ |\eta| $ bins, from top left to bottom right: $ |\eta| < $ 0.3, 0.3 $ < |\eta| < $ 0.6, 0.6 $ < |\eta| < $ 0.9, 0.9 $ < |\eta| < $ 1.2, 1.2$ < |\eta| < $ 2.1, 2.1$ < |\eta| < $ 2.4. The nominal values are represented in blue, while the red and green points correspond to up and down variations conservatively estimated assuming a delay of 1.5 ns in the muon chambers (equivalent to the time resolution of the chambers) and are used to evaluate the signal systematic uncertainties. |
png pdf |
Additional Figure 4:
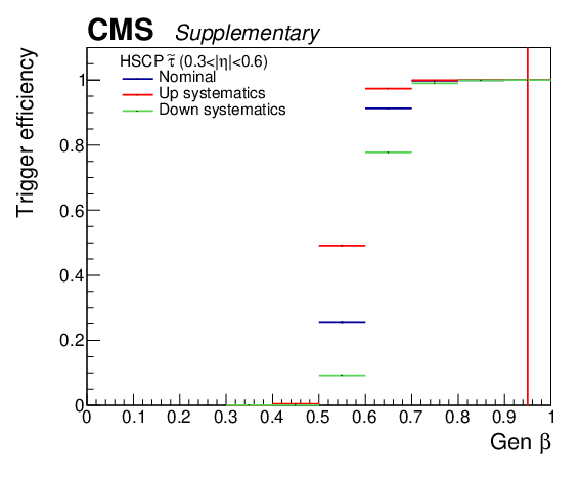
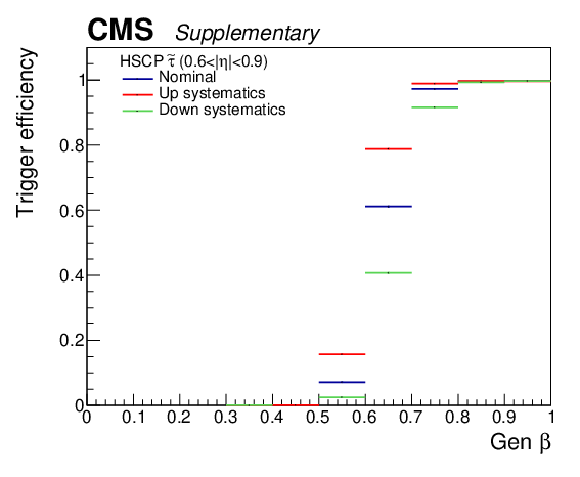
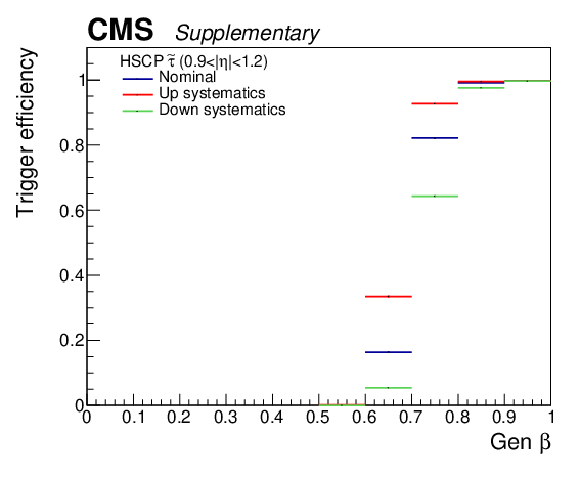
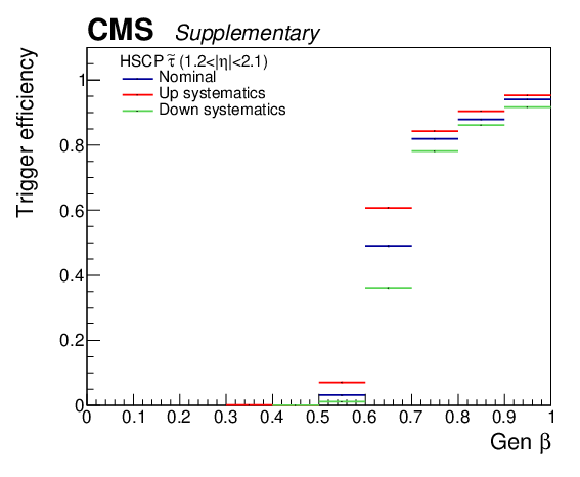
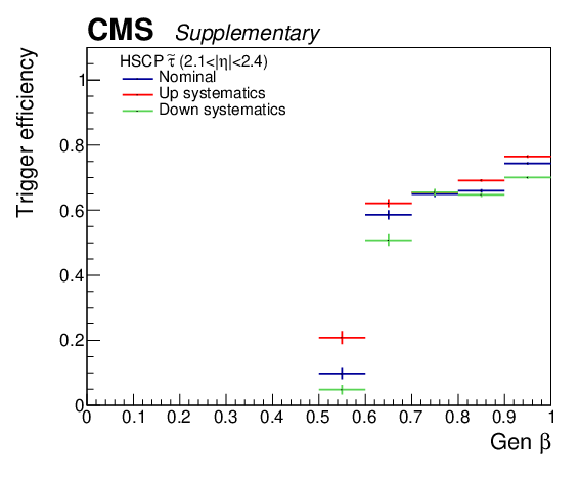
Trigger efficiency for the $ \widetilde{\tau} $ signals as a function of $ \beta $ in different $ |\eta| $ bins, from top left to bottom right: $ |\eta| < $ 0.3, 0.3 $ < |\eta| < $ 0.6, 0.6 $ < |\eta| < $ 0.9, 0.9 $ < |\eta| < $ 1.2, 1.2$ < |\eta| < $ 2.1, 2.1$ < |\eta| < $ 2.4. The nominal values are represented in blue, while the red and green points correspond to up and down variations conservatively estimated assuming a delay of 1.5 ns in the muon chambers (equivalent to the time resolution of the chambers) and are used to evaluate the signal systematic uncertainties. |

png pdf |
Additional Figure 4-a:
Trigger efficiency for the $ \widetilde{\tau} $ signals as a function of $ \beta $ in different $ |\eta| $ bins, from top left to bottom right: $ |\eta| < $ 0.3, 0.3 $ < |\eta| < $ 0.6, 0.6 $ < |\eta| < $ 0.9, 0.9 $ < |\eta| < $ 1.2, 1.2$ < |\eta| < $ 2.1, 2.1$ < |\eta| < $ 2.4. The nominal values are represented in blue, while the red and green points correspond to up and down variations conservatively estimated assuming a delay of 1.5 ns in the muon chambers (equivalent to the time resolution of the chambers) and are used to evaluate the signal systematic uncertainties. |
png pdf |
Additional Figure 4-b:
Trigger efficiency for the $ \widetilde{\tau} $ signals as a function of $ \beta $ in different $ |\eta| $ bins, from top left to bottom right: $ |\eta| < $ 0.3, 0.3 $ < |\eta| < $ 0.6, 0.6 $ < |\eta| < $ 0.9, 0.9 $ < |\eta| < $ 1.2, 1.2$ < |\eta| < $ 2.1, 2.1$ < |\eta| < $ 2.4. The nominal values are represented in blue, while the red and green points correspond to up and down variations conservatively estimated assuming a delay of 1.5 ns in the muon chambers (equivalent to the time resolution of the chambers) and are used to evaluate the signal systematic uncertainties. |
png pdf |
Additional Figure 4-c:
Trigger efficiency for the $ \widetilde{\tau} $ signals as a function of $ \beta $ in different $ |\eta| $ bins, from top left to bottom right: $ |\eta| < $ 0.3, 0.3 $ < |\eta| < $ 0.6, 0.6 $ < |\eta| < $ 0.9, 0.9 $ < |\eta| < $ 1.2, 1.2$ < |\eta| < $ 2.1, 2.1$ < |\eta| < $ 2.4. The nominal values are represented in blue, while the red and green points correspond to up and down variations conservatively estimated assuming a delay of 1.5 ns in the muon chambers (equivalent to the time resolution of the chambers) and are used to evaluate the signal systematic uncertainties. |
png pdf |
Additional Figure 4-d:
Trigger efficiency for the $ \widetilde{\tau} $ signals as a function of $ \beta $ in different $ |\eta| $ bins, from top left to bottom right: $ |\eta| < $ 0.3, 0.3 $ < |\eta| < $ 0.6, 0.6 $ < |\eta| < $ 0.9, 0.9 $ < |\eta| < $ 1.2, 1.2$ < |\eta| < $ 2.1, 2.1$ < |\eta| < $ 2.4. The nominal values are represented in blue, while the red and green points correspond to up and down variations conservatively estimated assuming a delay of 1.5 ns in the muon chambers (equivalent to the time resolution of the chambers) and are used to evaluate the signal systematic uncertainties. |
png pdf |
Additional Figure 4-e:
Trigger efficiency for the $ \widetilde{\tau} $ signals as a function of $ \beta $ in different $ |\eta| $ bins, from top left to bottom right: $ |\eta| < $ 0.3, 0.3 $ < |\eta| < $ 0.6, 0.6 $ < |\eta| < $ 0.9, 0.9 $ < |\eta| < $ 1.2, 1.2$ < |\eta| < $ 2.1, 2.1$ < |\eta| < $ 2.4. The nominal values are represented in blue, while the red and green points correspond to up and down variations conservatively estimated assuming a delay of 1.5 ns in the muon chambers (equivalent to the time resolution of the chambers) and are used to evaluate the signal systematic uncertainties. |
png pdf |
Additional Figure 4-f:
Trigger efficiency for the $ \widetilde{\tau} $ signals as a function of $ \beta $ in different $ |\eta| $ bins, from top left to bottom right: $ |\eta| < $ 0.3, 0.3 $ < |\eta| < $ 0.6, 0.6 $ < |\eta| < $ 0.9, 0.9 $ < |\eta| < $ 1.2, 1.2$ < |\eta| < $ 2.1, 2.1$ < |\eta| < $ 2.4. The nominal values are represented in blue, while the red and green points correspond to up and down variations conservatively estimated assuming a delay of 1.5 ns in the muon chambers (equivalent to the time resolution of the chambers) and are used to evaluate the signal systematic uncertainties. |

png pdf |
Additional Figure 5:
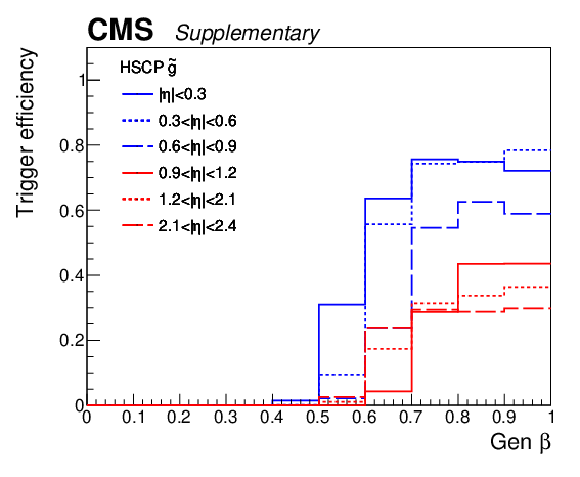
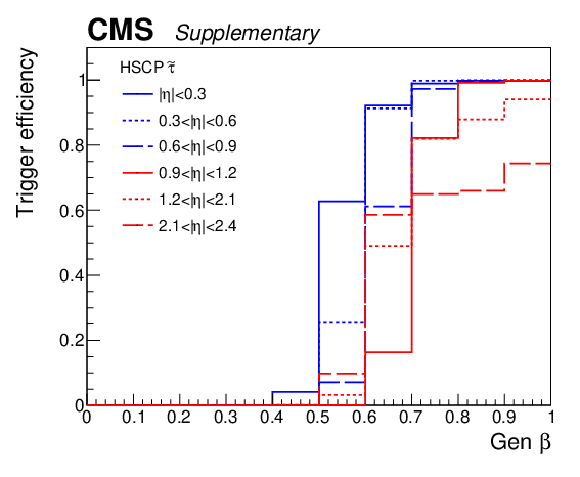
Trigger efficiency as a function of $ \beta $, for the $ \mathrm{\widetilde{g}} $ signals on the left and for the $ \widetilde{\tau} $ signals on the right. The different histograms are related to different $ |\eta| $ bins. |
png pdf |
Additional Figure 5-a:
Trigger efficiency as a function of $ \beta $, for the $ \mathrm{\widetilde{g}} $ signals on the left and for the $ \widetilde{\tau} $ signals on the right. The different histograms are related to different $ |\eta| $ bins. |
png pdf |
Additional Figure 5-b:
Trigger efficiency as a function of $ \beta $, for the $ \mathrm{\widetilde{g}} $ signals on the left and for the $ \widetilde{\tau} $ signals on the right. The different histograms are related to different $ |\eta| $ bins. |
png pdf |
Additional Figure 6:
Cross section limits for $ \mathrm{\widetilde{g}} $ R-hadrons obtained with the ionization method on the left and with the mass method on the right. The numerical values corresponding to the expected and observed mass limits are written vertically on the plot in light and dark grey, respectively. |
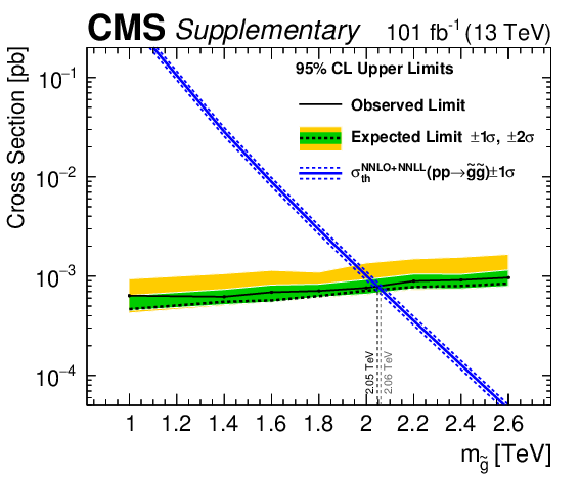
png pdf |
Additional Figure 6-a:
Cross section limits for $ \mathrm{\widetilde{g}} $ R-hadrons obtained with the ionization method on the left and with the mass method on the right. The numerical values corresponding to the expected and observed mass limits are written vertically on the plot in light and dark grey, respectively. |
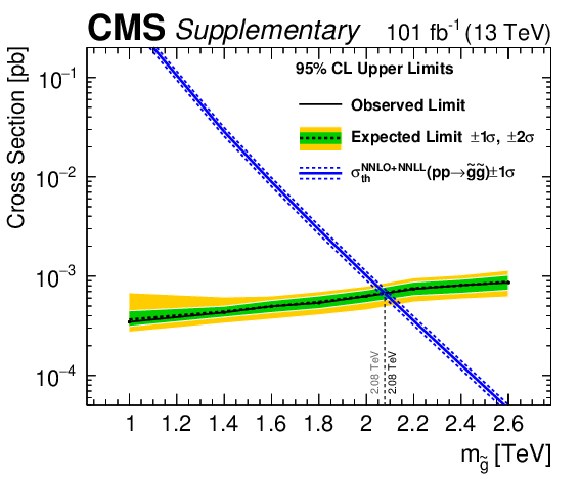
png pdf |
Additional Figure 6-b:
Cross section limits for $ \mathrm{\widetilde{g}} $ R-hadrons obtained with the ionization method on the left and with the mass method on the right. The numerical values corresponding to the expected and observed mass limits are written vertically on the plot in light and dark grey, respectively. |
png pdf |
Additional Figure 7:
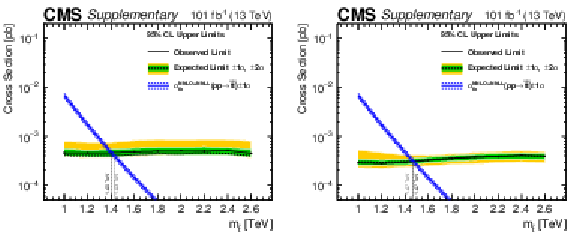
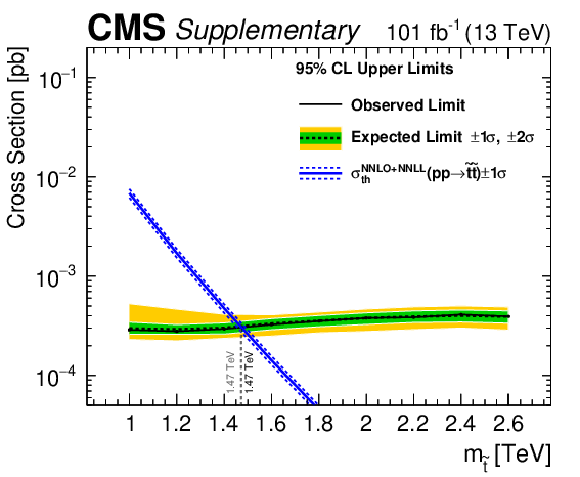
Cross section limits for $ \widetilde{t} $ R-hadrons obtained with the ionization method on the left and with the mass method on the right. |
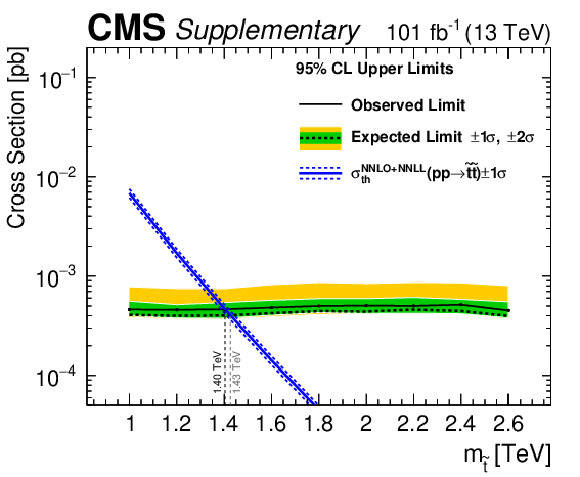
png pdf |
Additional Figure 7-a:
Cross section limits for $ \widetilde{t} $ R-hadrons obtained with the ionization method on the left and with the mass method on the right. |
png pdf |
Additional Figure 7-b:
Cross section limits for $ \widetilde{t} $ R-hadrons obtained with the ionization method on the left and with the mass method on the right. |

png pdf |
Additional Figure 8:
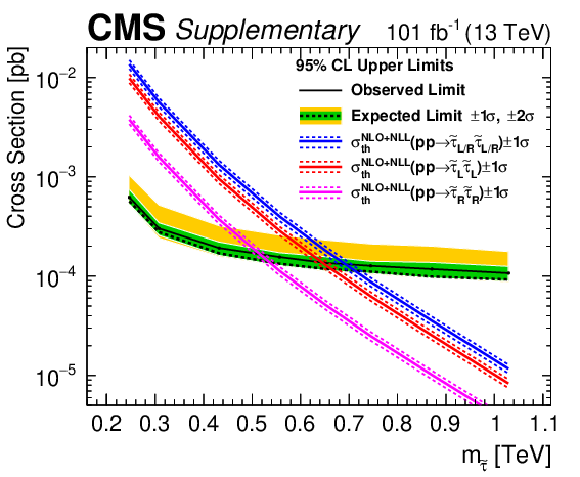
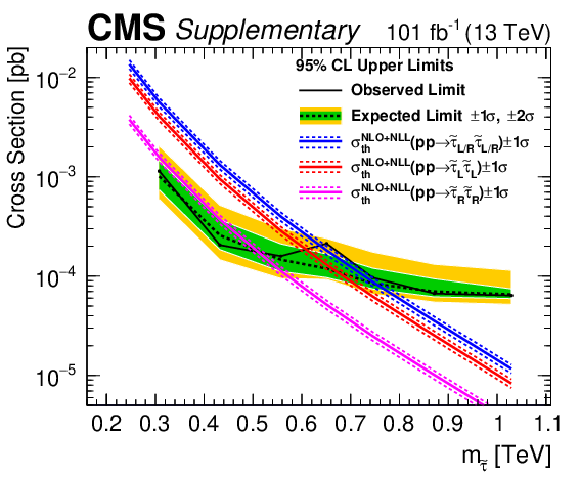
Cross section limits for the direct pair-production of $ \widetilde{\tau} $ obtained with the ionization method (left) and the mass method (right). Three red, pink, and blue curves show the theoretical cross sections for three different handedness configurations. |
png pdf |
Additional Figure 8-a:
Cross section limits for the direct pair-production of $ \widetilde{\tau} $ obtained with the ionization method (left) and the mass method (right). Three red, pink, and blue curves show the theoretical cross sections for three different handedness configurations. |
png pdf |
Additional Figure 8-b:
Cross section limits for the direct pair-production of $ \widetilde{\tau} $ obtained with the ionization method (left) and the mass method (right). Three red, pink, and blue curves show the theoretical cross sections for three different handedness configurations. |

png pdf |
Additional Figure 9:
Cross section limits for the $ \widetilde{\tau} $ production within the GMSB SPS7 model, obtained with the ionization method (left) and the mass method (right). |

png pdf |
Additional Figure 9-a:
Cross section limits for the $ \widetilde{\tau} $ production within the GMSB SPS7 model, obtained with the ionization method (left) and the mass method (right). |

png pdf |
Additional Figure 9-b:
Cross section limits for the $ \widetilde{\tau} $ production within the GMSB SPS7 model, obtained with the ionization method (left) and the mass method (right). |

png pdf |
Additional Figure 10:
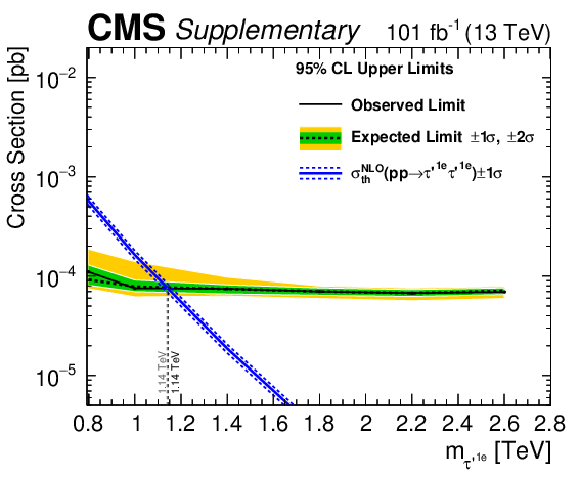
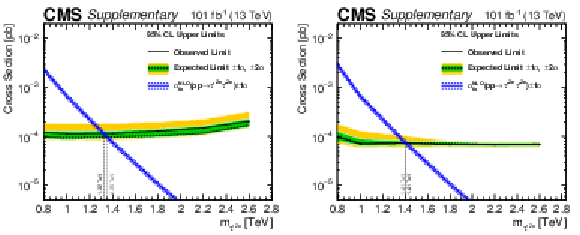
Cross section limits for the DY-produced $ \tau^\prime $ fermions with $ |Q| = 1e $ for the ionization method (left) and the mass method (right). |

png pdf |
Additional Figure 10-a:
Cross section limits for the DY-produced $ \tau^\prime $ fermions with $ |Q| = 1e $ for the ionization method (left) and the mass method (right). |
png pdf |
Additional Figure 10-b:
Cross section limits for the DY-produced $ \tau^\prime $ fermions with $ |Q| = 1e $ for the ionization method (left) and the mass method (right). |
png pdf |
Additional Figure 11:
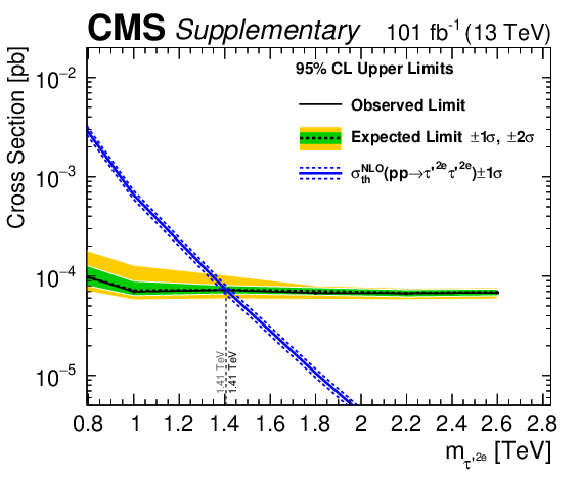
Cross section limits for the DY-produced $ \tau^\prime $ fermions with $ |Q| = 2e $ for the ionization method (left) and the mass method (right). |

png pdf |
Additional Figure 11-a:
Cross section limits for the DY-produced $ \tau^\prime $ fermions with $ |Q| = 2e $ for the ionization method (left) and the mass method (right). |
png pdf |
Additional Figure 11-b:
Cross section limits for the DY-produced $ \tau^\prime $ fermions with $ |Q| = 2e $ for the ionization method (left) and the mass method (right). |
png pdf |
Additional Figure 12:
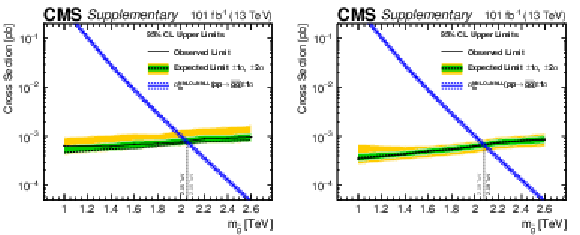
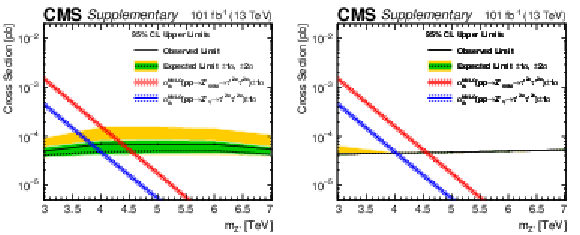
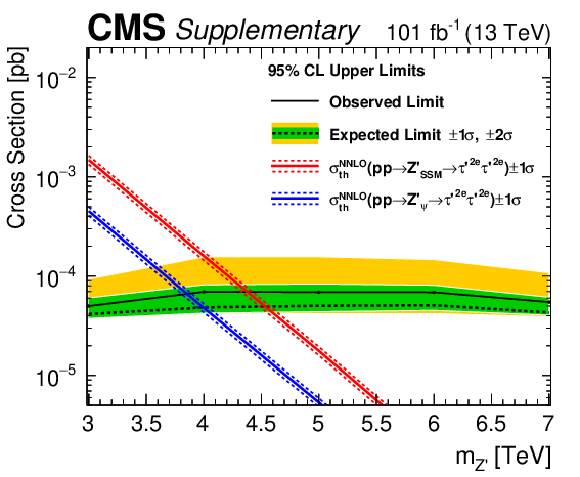
Cross section limits for the production of Z' boson decaying into a pair of $ \tau^\prime $ fermions of charge 2$ e $ (with a branching fraction equal to 1 and a fixed $ \tau^\prime $ mass of 600 GeV), obtained with the ionization method (left) and the mass method (right). All the Z' samples are assuming a narrow width. The blue (red) curves shows the theoretical cross section of production of a $ \text{Z}^\prime_\psi $ ($ \text{Z}^\prime_{\text{SSM}} $) boson. |
png pdf |
Additional Figure 12-a:
Cross section limits for the production of Z' boson decaying into a pair of $ \tau^\prime $ fermions of charge 2$ e $ (with a branching fraction equal to 1 and a fixed $ \tau^\prime $ mass of 600 GeV), obtained with the ionization method (left) and the mass method (right). All the Z' samples are assuming a narrow width. The blue (red) curves shows the theoretical cross section of production of a $ \text{Z}^\prime_\psi $ ($ \text{Z}^\prime_{\text{SSM}} $) boson. |

png pdf |
Additional Figure 12-b:
Cross section limits for the production of Z' boson decaying into a pair of $ \tau^\prime $ fermions of charge 2$ e $ (with a branching fraction equal to 1 and a fixed $ \tau^\prime $ mass of 600 GeV), obtained with the ionization method (left) and the mass method (right). All the Z' samples are assuming a narrow width. The blue (red) curves shows the theoretical cross section of production of a $ \text{Z}^\prime_\psi $ ($ \text{Z}^\prime_{\text{SSM}} $) boson. |
png pdf |
Additional Figure 13:
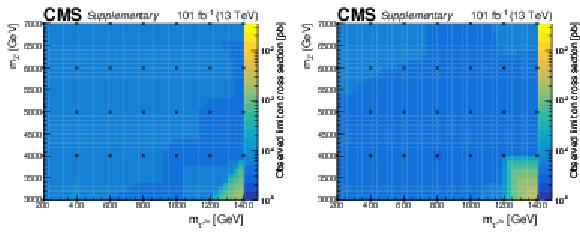
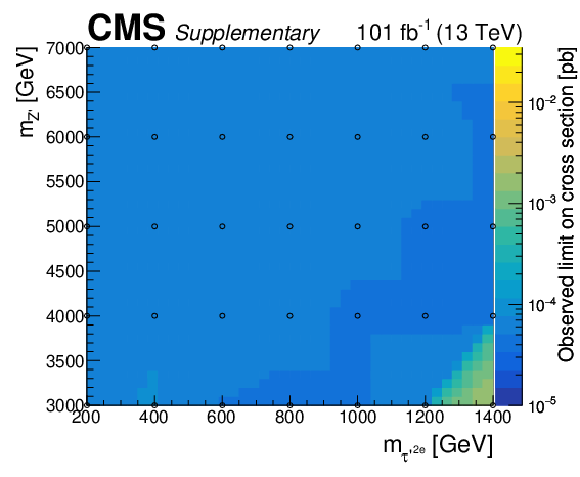
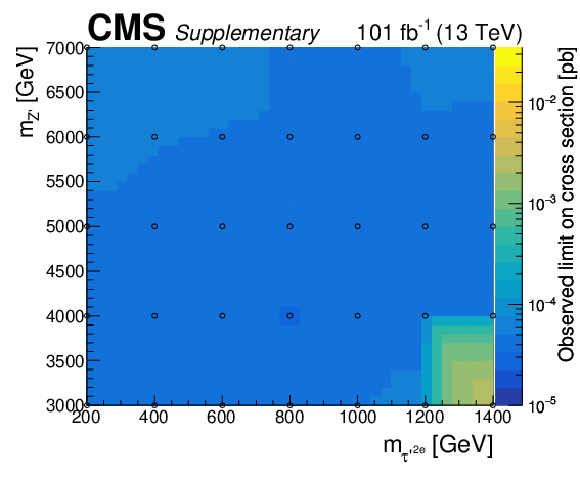
Two-dimensional exclusion showing the observed cross section limit as a function of the masses of the $ \tau^\prime $ (on the $ x $ axis) and of the Z' boson (on the $ y $ axis), for the ionization method on the left and for the mass method on the right. |
png pdf |
Additional Figure 13-a:
Two-dimensional exclusion showing the observed cross section limit as a function of the masses of the $ \tau^\prime $ (on the $ x $ axis) and of the Z' boson (on the $ y $ axis), for the ionization method on the left and for the mass method on the right. |
png pdf |
Additional Figure 13-b:
Two-dimensional exclusion showing the observed cross section limit as a function of the masses of the $ \tau^\prime $ (on the $ x $ axis) and of the Z' boson (on the $ y $ axis), for the ionization method on the left and for the mass method on the right. |
png pdf |
Additional Figure 14:
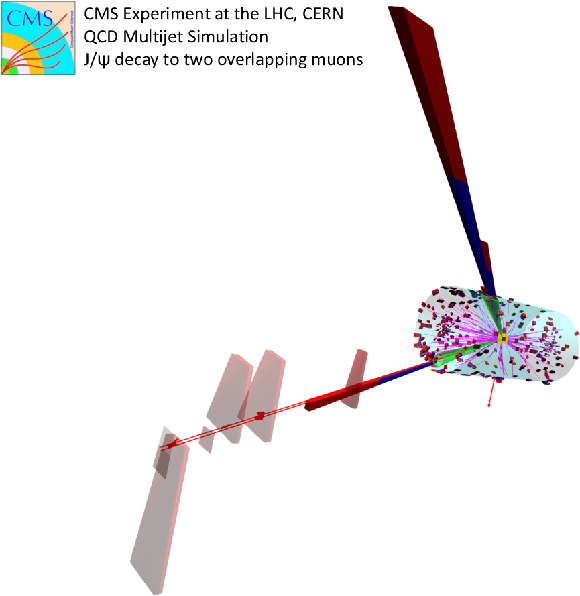
Event display of a simulated typical background event where a Lorentz boosted $ \mathrm{J}/\psi $ decays into di-leptons. While the two muons appear very close to each other in the muon chambers, their tracks overlap in the tracker detectors and thus make a highly ionizing signal. |
png pdf |
Additional Figure 15:
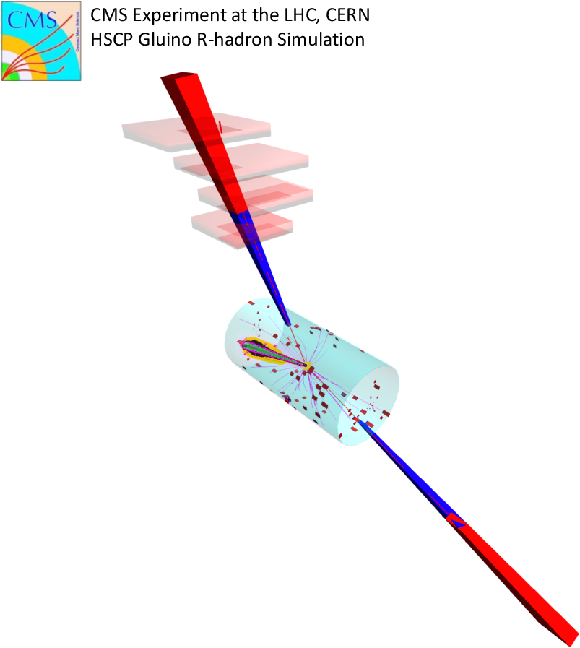
Event display of a simulated R-hadron event where both of the charged R-hadrons are reconstructed as muons. |
png pdf |
Additional Figure 16:
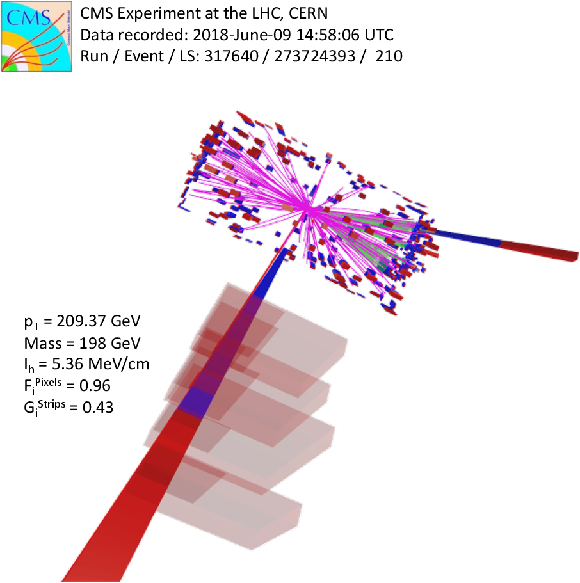
Event display of the highest ionization event in the signal region in the data recorded during the 2017-2018 data-taking period. |
| References | ||||
| 1 | M. Drees and X. Tata | Signals for heavy exotics at hadron colliders and supercolliders | PLB 252 (1990) 695 | |
| 2 | M. Fairbairn et al. | Stable massive particles at colliders | Phys. Rept. 438 (2007) 1 | hep-ph/0611040 |
| 3 | C. W. Bauer et al. | Supermodels for early LHC | PLB 690 (2010) 280 | 0909.5213 |
| 4 | A. Kusenko and M. E. Shaposhnikov | Supersymmetric Q-balls as dark matter | PLB 418 (1998) 46 | hep-ph/9709492 |
| 5 | B. Koch, M. Bleicher, and H. Stoecker | Black holes at LHC? | JPG 34 (2007) S535 | hep-ph/0702187 |
| 6 | J. S. Schwinger | Magnetic charge and quantum field theory | PR 144 (1966) 1087 | |
| 7 | D. Fargion, M. Khlopov, and C. A. Stephan | Cold dark matter by heavy double charged leptons? | Class. Quant. Grav. 23 (2006) 7305 | astro-ph/0511789 |
| 8 | J. Alimena et al. | Searching for long-lived particles beyond the Standard Model at the Large Hadron Collider | JPG 47 (2020) 090501 | 1903.04497 |
| 9 | L. Lee, C. Ohm, A. Soffer, and T.-T. Yu | Collider searches for long-lived particles beyond the Standard Model | Prog. Part. Nucl. Phys. 106 (2019) 210 | 1810.12602 |
| 10 | Particle Data Group | Review of particle physics | PRD 110 (2024) 030001 | |
| 11 | ALEPH Collaboration | Search for pair-production of long-lived heavy charged particles in $ \rm{e}^+ \rm{e}^- $ annihilation | PLB 405 (1997) 379 | hep-ex/9706013 |
| 12 | DELPHI Collaboration | Search for heavy stable and long-lived particles in $ \rm{e}^+ \rm{e}^- $ collisions at $ \sqrt{s} = $ 189 GeV | PLB 478 (2000) 65 | hep-ex/0103038 |
| 13 | L3 Collaboration | Search for heavy neutral and charged leptons in $ \rm{e}^{+} \rm{e}^{-} $ annihilation at LEP | PLB 517 (2001) 75 | hep-ex/0107015 |
| 14 | OPAL Collaboration | Search for stable and long-lived massive charged particles in $ \rm{e}^+ \rm{e}^- $ collisions at $ \sqrt{s} = $ 130 GeV to 209 GeV | PLB 572 (2003) 8 | hep-ex/0305031 |
| 15 | H1 Collaboration | Measurement of anti-deuteron photoproduction and a search for heavy stable charged particles at HERA | EPJC 36 (2004) 413 | hep-ex/0403056 |
| 16 | CDF Collaboration | Search for long-lived massive charged particles in 1.96 TeV $ \rm{\bar{p}p} $ collisions | PRL 103 (2009) 021802 | 0902.1266 |
| 17 | D0 Collaboration | Search for long-lived charged massive particles with the D0 detector | PRL 102 (2009) 161802 | 0809.4472 |
| 18 | D0 Collaboration | A search for charged massive long-lived particles | PRL 108 (2012) 121802 | 1110.3302 |
| 19 | D0 Collaboration | Search for charged massive long-lived particles at $ \sqrt{s} = $ 1.96 TeV | PRD 87 (2013) 052011 | 1211.2466 |
| 20 | ATLAS Collaboration | Search for heavy long-lived charged particles with the ATLAS detector in pp collisions at $ \sqrt{s} = $ 7 TeV | PLB 703 (2011) 428 | 1106.4495 |
| 21 | ATLAS Collaboration | Search for stable hadronising squarks and gluinos with the ATLAS experiment at the LHC | PLB 701 (2011) 1 | 1103.1984 |
| 22 | ATLAS Collaboration | Search for massive long-lived highly ionising particles with the ATLAS detector at the LHC | PLB 698 (2011) 353 | 1102.0459 |
| 23 | ATLAS Collaboration | Searches for heavy long-lived sleptons and R-hadrons with the ATLAS detector in pp collisions at $ \sqrt{s}= $ 7 TeV | PLB 720 (2013) 277 | 1211.1597 |
| 24 | ATLAS Collaboration | Search for long-lived, multi-charged particles in pp collisions at $ \sqrt{s}= $ 7 TeV using the ATLAS detector | PLB 722 (2013) 305 | 1301.5272 |
| 25 | ATLAS Collaboration | Searches for heavy long-lived charged particles with the ATLAS detector in proton-proton collisions at $ \sqrt{s}= $ 8 TeV | JHEP 01 (2015) 068 | 1411.6795 |
| 26 | ATLAS Collaboration | Search for heavy long-lived multi-charged particles in pp collisions at $ \sqrt{s}= $ 8 TeV using the ATLAS detector | EPJC 75 (2015) 362 | 1504.04188 |
| 27 | ATLAS Collaboration | Search for metastable heavy charged particles with large ionisation energy loss in pp collisions at $ \sqrt{s} = $ 8 TeV using the ATLAS experiment | EPJC 75 (2015) 407 | 1506.05332 |
| 28 | ATLAS Collaboration | Search for metastable heavy charged particles with large ionization energy loss in pp collisions at $ \sqrt{s} = $ 13 TeV using the ATLAS experiment | PRD 93 (2016) 112015 | 1604.04520 |
| 29 | ATLAS Collaboration | Search for heavy long-lived charged R-hadrons with the ATLAS detector in 3.2 fb$ ^{-1} $ of proton--proton collision data at $ \sqrt{s} = $ 13 TeV | PLB 760 (2016) 647 | 1606.05129 |
| 30 | CMS Collaboration | Search for heavy stable charged particles in pp collisions at $ \sqrt{s}= $ 7 TeV | JHEP 03 (2011) 024 | CMS-EXO-10-011 1101.1645 |
| 31 | CMS Collaboration | Search for fractionally charged particles in pp collisions at $ \sqrt{s}= $ 7 TeV | PRD 87 (2013) 092008 | CMS-EXO-11-074 1210.2311 |
| 32 | CMS Collaboration | Search for heavy long-lived charged particles in pp collisions at $ \sqrt{s}= $ 7 TeV | PLB 713 (2012) 408 | CMS-EXO-11-022 1205.0272 |
| 33 | CMS Collaboration | Search for long-lived charged particles in proton-proton collisions at $ \sqrt s= $ 13 TeV | PRD 94 (2016) 112004 | CMS-EXO-15-010 1609.08382 |
| 34 | ATLAS Collaboration | Search for heavy, long-lived, charged particles with large ionisation energy loss in pp collisions at$ \sqrt{s} = $ 13 TeV using the ATLAS experiment and the full Run 2 dataset | Associated HEPData record HEPData record, 2023, JHEP 06 (2023) 158 |
2205.06013 |
| 35 | Tracker Group of the CMS Collaboration | The CMS phase-1 pixel detector upgrade | JINST 16 (2021) P02027 | 2012.14304 |
| 36 | CMS Collaboration | HEPData record for this analysis | link | |
| 37 | CMS Collaboration | The CMS experiment at the CERN LHC | JINST 3 (2008) S08004 | |
| 38 | CMS Collaboration | Description and performance of track and primary-vertex reconstruction with the CMS tracker | JINST 9 (2014) P10009 | CMS-TRK-11-001 1405.6569 |
| 39 | CMS Collaboration | Technical proposal for the Phase-II upgrade of the Compact Muon Solenoid | CMS Technical Proposal CERN-LHCC-2015-010, CMS-TDR-15-02, CMS, 2015 CDS |
|
| 40 | CMS Collaboration | Performance of the CMS level-1 trigger in proton-proton collisions at $ \sqrt{s} = $ 13 TeV | JINST 15 (2020) P10017 | CMS-TRG-17-001 2006.10165 |
| 41 | CMS Collaboration | The CMS trigger system | JINST 12 (2017) P01020 | CMS-TRG-12-001 1609.02366 |
| 42 | CMS Collaboration | Particle-flow reconstruction and global event description with the CMS detector | JINST 12 (2017) P10003 | CMS-PRF-14-001 1706.04965 |
| 43 | T. Sjöstrand et al. | An introduction to PYTHIA 8.2 | Comput. Phys. Commun. 191 (2015) 159 | 1410.3012 |
| 44 | CMS Collaboration | Extraction and validation of a new set of CMS PYTHIA8 tunes from underlying-event measurements | EPJC 80 (2020) 4 | CMS-GEN-17-001 1903.12179 |
| 45 | NNPDF Collaboration | Parton distributions from high-precision collider data | EPJC 77 (2017) 663 | 1706.00428 |
| 46 | A. Arvanitaki, N. Craig, S. Dimopoulos, and G. Villadoro | Mini-split | JHEP 02 (2013) 126 | 1210.0555 |
| 47 | G. F. Giudice and A. Romanino | Split supersymmetry | NPB 699 (2004) 65 | hep-ph/0406088 |
| 48 | N. Arkani-Hamed, S. Dimopoulos, G. F. Giudice, and A. Romanino | Aspects of split supersymmetry | NPB 709 (2005) 3 | hep-ph/0409232 |
| 49 | J. L. Hewett, B. Lillie, M. Masip, and T. G. Rizzo | Signatures of long-lived gluinos in split supersymmetry | JHEP 09 (2004) 070 | hep-ph/0408248 |
| 50 | W. Kilian, T. Plehn, P. Richardson, and E. Schmidt | Split supersymmetry at colliders | EPJC 39 (2005) 229 | hep-ph/0408088 |
| 51 | C. Csáki, E. Kuflik, and T. Volansky | Dynamical R-Parity violation | PRL 112 (2014) | |
| 52 | R. Barbier et al. | R-Parity-violating supersymmetry | Phys. Rep. 420 (2005) 1 | |
| 53 | A. C. Kraan | Interactions of heavy stable hadronizing particles | EPJC 37 (2004) 91 | hep-ex/0404001 |
| 54 | R. Mackeprang and A. Rizzi | Interactions of coloured heavy stable particles in matter | EPJC 50 (2007) 353 | hep-ph/0612161 |
| 55 | G. F. Giudice and R. Rattazzi | Theories with gauge mediated supersymmetry breaking | Phys. Rept. 322 (1999) 419 | hep-ph/9801271 |
| 56 | P. Meade, N. Seiberg, and D. Shih | General gauge mediation | Prog. Theor. Phys. Suppl. 177 (2009) 143 | 0801.3278 |
| 57 | B. C. Allanach et al. | The Snowmass points and slopes: Benchmarks for SUSY searches | EPJC 25 (2002) 113 | hep-ph/0202233 |
| 58 | H. Baer, F. E. Paige, S. D. Protopescu, and X. Tata | ISAJET 7.69: A Monte Carlo event generator for pp, anti-p p, and $ \rm{e}^{+} \rm{e}^{-} $ reactions | link | hep-ph/0312045 |
| 59 | G. F. Giudice, M. McCullough, and D. Teresi | dE/dx from boosted long-lived particles | JHEP 08 (2022) 012 | 2205.04473 |
| 60 | Geant4 Collaboration | Geant4: A simulation toolkit | NIM A 506 (2003) 250 | |
| 61 | D. Lange et al. | Upgrades for the CMS simulation | J. Phys.: Conf. Ser. 608 (2015) 012056 | |
| 62 | CMS Collaboration | CMS tracking performance results from early LHC operation | EPJC 70 (2010) 1165 | CMS-TRK-10-001 1007.1988 |
| 63 | CMS Collaboration | Searches for long-lived charged particles in pp collisions at $ \sqrt{s} = $ 7 and 8 TeV | JHEP 07 (2013) 122 | CMS-EXO-12-026 1305.0491 |
| 64 | V. Chiochia et al. | Simulation of the CMS prototype silicon pixel sensors and comparison with test beam measurements | IEEE Trans. Nucl. Sci. 52 (2005) 1067 | physics/0411143 |
| 65 | ISE Integrated Systems Engineering AG | ISE TCAD Release 9.0 | , Z\"urich, Switzerland, 2003 | |
| 66 | CMS Collaboration | Performance of the CMS muon detector and muon reconstruction with proton-proton collisions at $ \sqrt{s}= $ 13 TeV | JINST 13 (2018) P06015 | CMS-MUO-16-001 1804.04528 |
| 67 | K. Rehermann and B. T. Tweedie | Efficient identification of boosted semileptonic top quarks at the LHC | JHEP 03 (2011) 59 | 1007.2221 |
| 68 | R. A. Fisher | On the interpretation of $ \chi^2 $ from contingency tables, and the calculation of p | J. Roy. Stat. Soc. 85 (1922) 87 | |
| 69 | S. Baker and R. D. Cousins | Clarification of the use of chi-square and likelihood functions in fits to histograms | NIM 221 (1984) 437 | |
| 70 | CMS Collaboration | Precision luminosity measurement in proton-proton collisions at $ \sqrt{s} = $ 13 TeV in 2015 and 2016 at CMS | EPJC 81 (2021) 800 | CMS-LUM-17-003 2104.01927 |
| 71 | CMS Collaboration | CMS luminosity measurement for the 2017 data-taking period at $ \sqrt{s} = $ 13 TeV | CMS Physics Analysis Summary , CMS, 2018 link |
CMS-PAS-LUM-17-004 |
| 72 | CMS Collaboration | CMS luminosity measurement for the 2018 data-taking period at $ \sqrt{s} = $ 13 TeV | CMS Physics Analysis Summary , CMS, 2019 link |
CMS-PAS-LUM-18-002 |
| 73 | CMS Collaboration | Measurement of the inelastic proton-proton cross section at $ \sqrt s= $ 13 TeV | JHEP 07 (2018) 161 | CMS-FSQ-15-005 1802.02613 |
| 74 | T. Junk | Confidence level computation for combining searches with small statistics | NIM A 434 (1999) 435 | hep-ex/9902006 |
| 75 | A. L. Read | Presentation of search results: the $ CL_s $ technique | JPG 28 (2002) 2693 | |
| 76 | G. Cowan, K. Cranmer, E. Gross, and O. Vitells | Asymptotic formulae for likelihood-based tests of new physics | EPJC 71 (2011) 1554 | 1007.1727 |
| 77 | CMS Collaboration | The CMS statistical analysis and combination tool: Combine | Submitted to Comput. Softw. Big Sci. (in press), 2024 | CMS-CAT-23-001 2404.06614 |
| 78 | W. Verkerke and D. P. Kirkby | The RooFit toolkit for data modeling | Statistical Problems in Particle Physics, 2006 Astrophysics and Cosmology 18 (2006) 6 |
physics/0306116 |
| 79 | L. Moneta et al. | The RooStats Project | PoS ACAT 057, 2010 link |
1009.1003 |
| 80 | W. Beenakker et al. | NNLL-fast: predictions for coloured supersymmetric particle production at the LHC with threshold and Coulomb resummation | JHEP 12 (2016) 133 | 1607.07741 |
| 81 | C. Borschensky et al. | Squark and gluino production cross sections in pp collisions at $ \sqrt{s} = $ 13, 14, 33 and 100 TeV | EPJC 74 (2014) 3174 | 1407.5066 |
| 82 | J. Butterworth et al. | PDF4LHC recommendations for LHC Run II | JPG 43 (2016) 023001 | 1510.03865 |
| 83 | E. Accomando et al. | Z' physics with early LHC data | PRD 83 (2011) 075012 | 1010.6058 |
| 84 | J. L. Hewett and T. G. Rizzo | Low-energy phenomenology of superstring-inspired E6 models | Phys. Rept. 183 (1989) 193 | |
| 85 | ATLAS Collaboration | Search for new high-mass phenomena in the dilepton final state using 36 fb$ ^{-1} $ of proton-proton collision data at $ \sqrt{s}= $ 13 TeV with the ATLAS detector | JHEP 10 (2017) 182 | 1707.02424 |

|
Compact Muon Solenoid LHC, CERN |

|

|

|

|

|

|