

Compact Muon Solenoid
LHC, CERN
| CMS-B2G-23-008 ; CERN-EP-2024-214 | ||
| Search for a heavy resonance decaying into a Z and a Higgs boson in events with an energetic jet and two electrons, two muons, or missing transverse momentum in proton-proton collisions at $ \sqrt{s}= $ 13 TeV | ||
| CMS Collaboration | ||
| 31 October 2024 | ||
| JHEP 02 (2025) 089 | ||
| Abstract: A search is presented for a heavy resonance decaying into a Z boson and a Higgs (H) boson. The analysis is based on data from proton-proton collisions at a centre-of-mass energy of 13 TeV corresponding to an integrated luminosity of 138 fb$ ^{-1} $, recorded with the CMS experiment in the years 2016-2018. Resonance masses between 1.4 and 5 TeV are considered, resulting in large transverse momenta of the Z and H bosons. Final states that result from Z boson decays to pairs of electrons, muons, or neutrinos are considered. The H boson is reconstructed as a single large-radius jet, recoiling against the Z boson. Machine-learning flavour-tagging techniques are employed to identify decays of a Lorentz-boosted H boson into pairs of charm or bottom quarks, or into four quarks via the intermediate $ \mathrm{H}\to\mathrm{W}{\mathrm{W}^{*}} $ and $ \mathrm{Z}\mathrm{Z}^{*} $ decays. The analysis targets H boson decays that were not generally included in previous searches using the $ \mathrm{H}\to\mathrm{b}\overline{\mathrm{b}} $ channel. Compared with previous analyses, the sensitivity for high resonance masses is improved significantly in the channel where at most one b quark is tagged. | ||
| Links: e-print arXiv:2411.00202 [hep-ex] (PDF) ; CDS record ; inSPIRE record ; HepData record ; CADI line (restricted) ; | ||
| Figures | |
png pdf |
Figure 1:
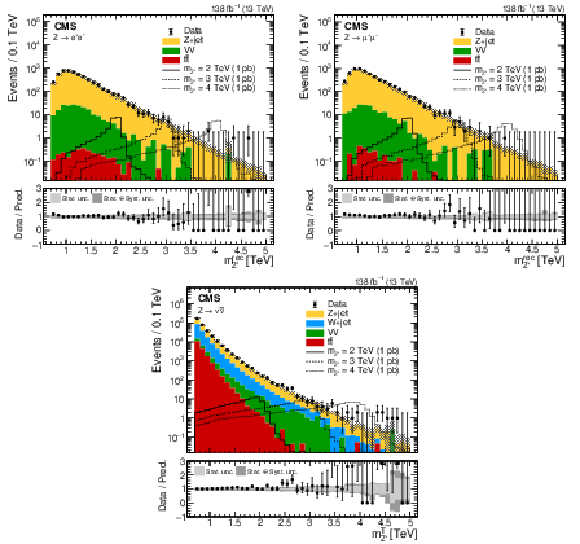
Distributions in $ m_{\mathrm{Z}^{'}}^{\text{rec}} $ for the dielectron (upper left), dimuon (upper right), and in $ m_{\mathrm{Z}^{'}}^{\mathrm{T}} $ for the neutrino (lower) channels, after the kinematic selections. The data are compared with simulation. The ratios of the data to the total SM background are shown in the lower panels, where the statistical and total uncertainties are displayed as grey regions. The signal distributions are shown for an arbitrary cross section of 1 pb. |
png pdf |
Figure 1-a:
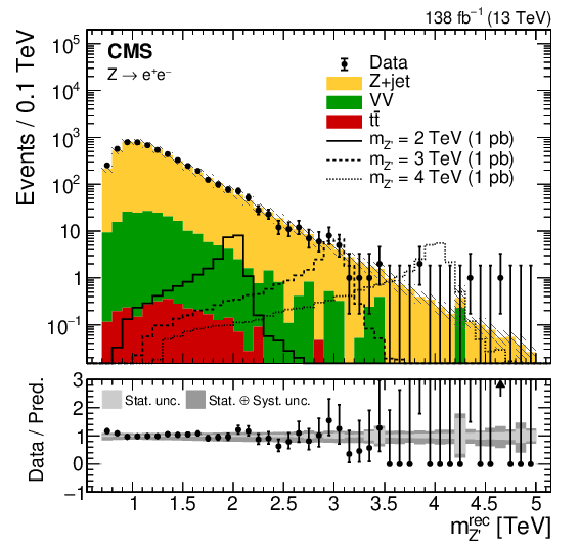
Distributions in $ m_{\mathrm{Z}^{'}}^{\text{rec}} $ for the dielectron (upper left), dimuon (upper right), and in $ m_{\mathrm{Z}^{'}}^{\mathrm{T}} $ for the neutrino (lower) channels, after the kinematic selections. The data are compared with simulation. The ratios of the data to the total SM background are shown in the lower panels, where the statistical and total uncertainties are displayed as grey regions. The signal distributions are shown for an arbitrary cross section of 1 pb. |
png pdf |
Figure 1-b:
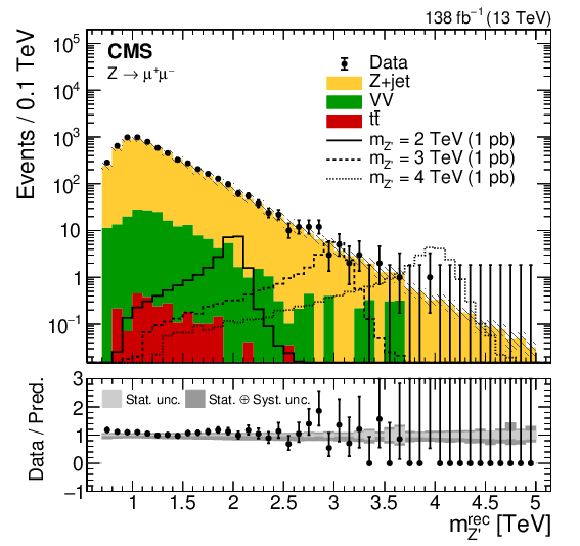
Distributions in $ m_{\mathrm{Z}^{'}}^{\text{rec}} $ for the dielectron (upper left), dimuon (upper right), and in $ m_{\mathrm{Z}^{'}}^{\mathrm{T}} $ for the neutrino (lower) channels, after the kinematic selections. The data are compared with simulation. The ratios of the data to the total SM background are shown in the lower panels, where the statistical and total uncertainties are displayed as grey regions. The signal distributions are shown for an arbitrary cross section of 1 pb. |
png pdf |
Figure 1-c:
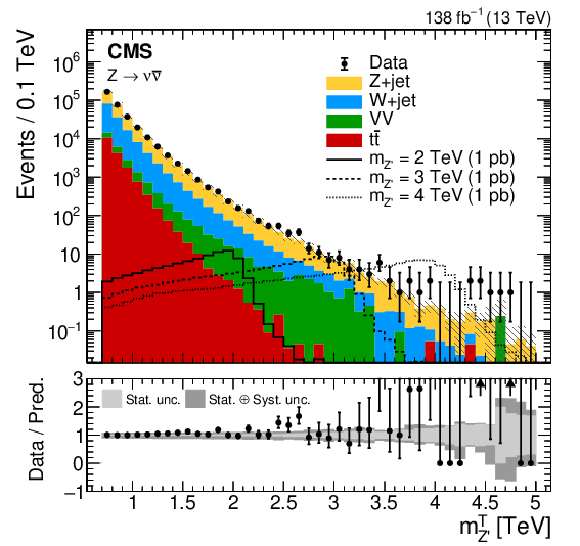
Distributions in $ m_{\mathrm{Z}^{'}}^{\text{rec}} $ for the dielectron (upper left), dimuon (upper right), and in $ m_{\mathrm{Z}^{'}}^{\mathrm{T}} $ for the neutrino (lower) channels, after the kinematic selections. The data are compared with simulation. The ratios of the data to the total SM background are shown in the lower panels, where the statistical and total uncertainties are displayed as grey regions. The signal distributions are shown for an arbitrary cross section of 1 pb. |
png pdf |
Figure 2:
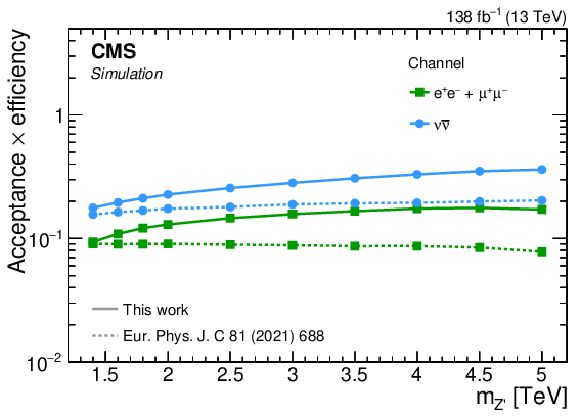
The product of signal acceptance and efficiency for signal events as a function of $ m_{\mathrm{Z}^{'}} $ for the charged-lepton and neutrino channels in the SR. The efficiency is calculated with respect to Z boson decays to charged leptons and neutrinos for the charged-lepton and neutrino channels, respectively. For comparison, the results from the ${\leq}$1b category of the previous CMS search in the ZH channel [16] are shown as dashed lines. |
png pdf |
Figure 3:
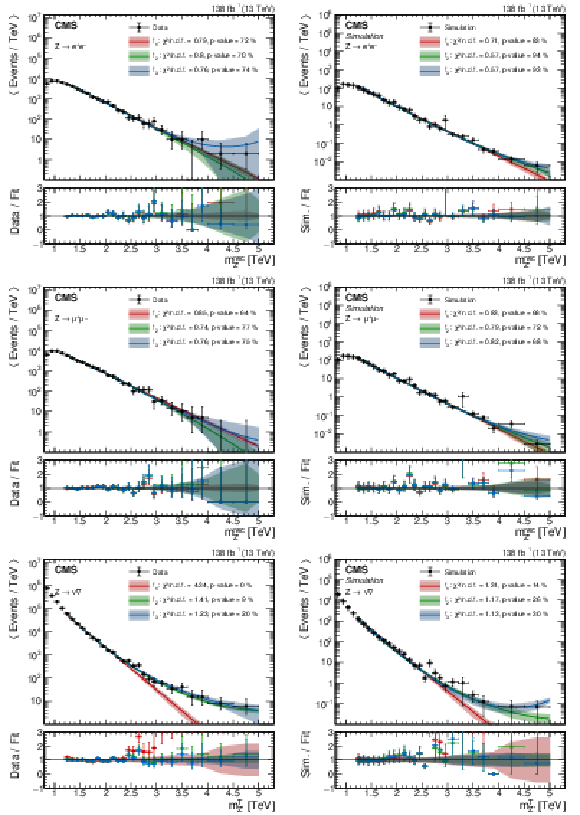
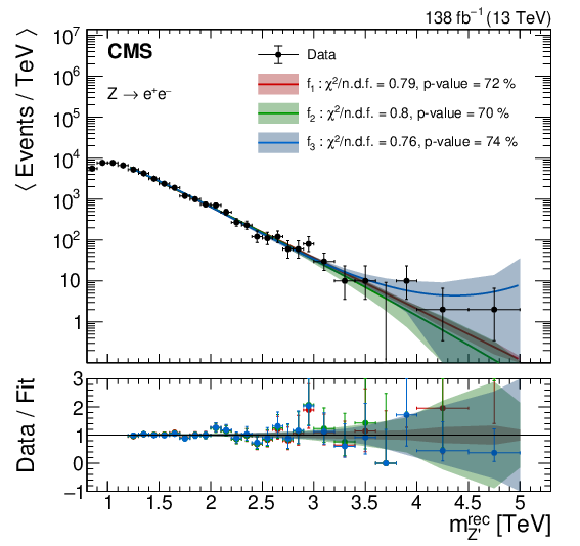
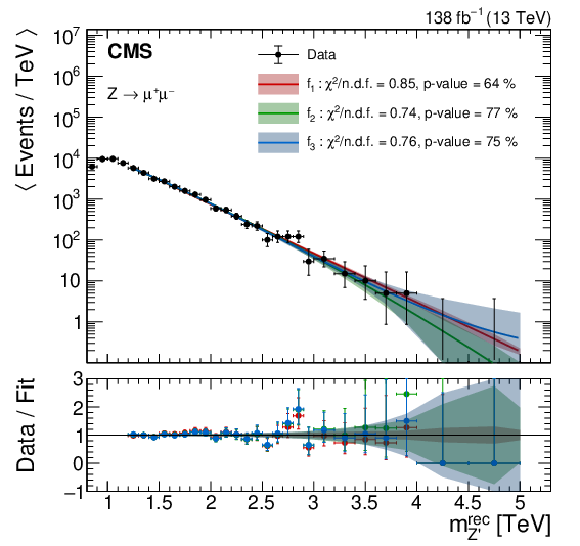
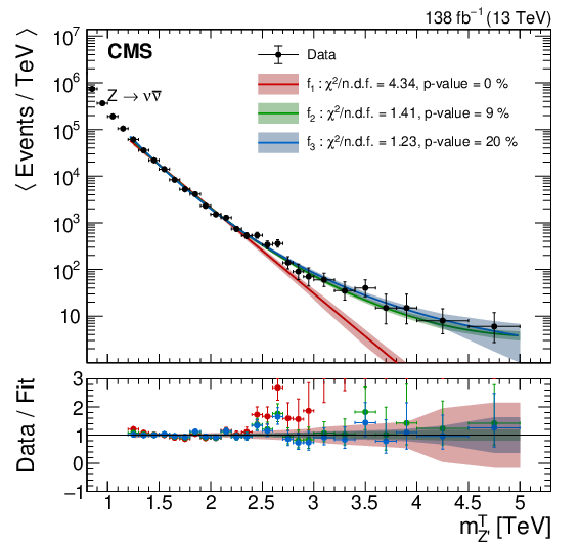
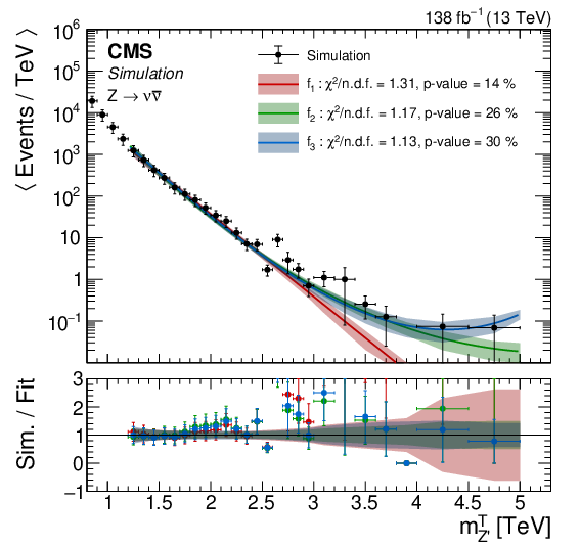
Fits of the background functions to the $ m_{\mathrm{Z}^{'}} $ and $ m_{\mathrm{Z}^{'}}^{\mathrm{T}} $ distributions in data in the VRs (left) and simulation in the SRs (right) for the electron (upper), muon (middle), and neutrino (lower) channels. The number of events in each bin is divided by the bin width. The fit range excludes the kinematic turn-on, created by the selection criteria. In the panels below the distributions, the ratios of data to the background functions are displayed. The ratios to the functions $ f_1 $, $ f_2 $, and $ f_3 $, are shown by red, green, and blue points, respectively. The shaded colored areas represent the statistical uncertainty from the fit. The $ \chi^{2} $ values per number of degrees of freedom ($ \chi^{2} $/n.d.f.) and the corresponding $ p $-values are provided for each fit. |
png pdf |
Figure 3-a:
Fits of the background functions to the $ m_{\mathrm{Z}^{'}} $ and $ m_{\mathrm{Z}^{'}}^{\mathrm{T}} $ distributions in data in the VRs (left) and simulation in the SRs (right) for the electron (upper), muon (middle), and neutrino (lower) channels. The number of events in each bin is divided by the bin width. The fit range excludes the kinematic turn-on, created by the selection criteria. In the panels below the distributions, the ratios of data to the background functions are displayed. The ratios to the functions $ f_1 $, $ f_2 $, and $ f_3 $, are shown by red, green, and blue points, respectively. The shaded colored areas represent the statistical uncertainty from the fit. The $ \chi^{2} $ values per number of degrees of freedom ($ \chi^{2} $/n.d.f.) and the corresponding $ p $-values are provided for each fit. |

png pdf |
Figure 3-b:
Fits of the background functions to the $ m_{\mathrm{Z}^{'}} $ and $ m_{\mathrm{Z}^{'}}^{\mathrm{T}} $ distributions in data in the VRs (left) and simulation in the SRs (right) for the electron (upper), muon (middle), and neutrino (lower) channels. The number of events in each bin is divided by the bin width. The fit range excludes the kinematic turn-on, created by the selection criteria. In the panels below the distributions, the ratios of data to the background functions are displayed. The ratios to the functions $ f_1 $, $ f_2 $, and $ f_3 $, are shown by red, green, and blue points, respectively. The shaded colored areas represent the statistical uncertainty from the fit. The $ \chi^{2} $ values per number of degrees of freedom ($ \chi^{2} $/n.d.f.) and the corresponding $ p $-values are provided for each fit. |
png pdf |
Figure 3-c:
Fits of the background functions to the $ m_{\mathrm{Z}^{'}} $ and $ m_{\mathrm{Z}^{'}}^{\mathrm{T}} $ distributions in data in the VRs (left) and simulation in the SRs (right) for the electron (upper), muon (middle), and neutrino (lower) channels. The number of events in each bin is divided by the bin width. The fit range excludes the kinematic turn-on, created by the selection criteria. In the panels below the distributions, the ratios of data to the background functions are displayed. The ratios to the functions $ f_1 $, $ f_2 $, and $ f_3 $, are shown by red, green, and blue points, respectively. The shaded colored areas represent the statistical uncertainty from the fit. The $ \chi^{2} $ values per number of degrees of freedom ($ \chi^{2} $/n.d.f.) and the corresponding $ p $-values are provided for each fit. |

png pdf |
Figure 3-d:
Fits of the background functions to the $ m_{\mathrm{Z}^{'}} $ and $ m_{\mathrm{Z}^{'}}^{\mathrm{T}} $ distributions in data in the VRs (left) and simulation in the SRs (right) for the electron (upper), muon (middle), and neutrino (lower) channels. The number of events in each bin is divided by the bin width. The fit range excludes the kinematic turn-on, created by the selection criteria. In the panels below the distributions, the ratios of data to the background functions are displayed. The ratios to the functions $ f_1 $, $ f_2 $, and $ f_3 $, are shown by red, green, and blue points, respectively. The shaded colored areas represent the statistical uncertainty from the fit. The $ \chi^{2} $ values per number of degrees of freedom ($ \chi^{2} $/n.d.f.) and the corresponding $ p $-values are provided for each fit. |
png pdf |
Figure 3-e:
Fits of the background functions to the $ m_{\mathrm{Z}^{'}} $ and $ m_{\mathrm{Z}^{'}}^{\mathrm{T}} $ distributions in data in the VRs (left) and simulation in the SRs (right) for the electron (upper), muon (middle), and neutrino (lower) channels. The number of events in each bin is divided by the bin width. The fit range excludes the kinematic turn-on, created by the selection criteria. In the panels below the distributions, the ratios of data to the background functions are displayed. The ratios to the functions $ f_1 $, $ f_2 $, and $ f_3 $, are shown by red, green, and blue points, respectively. The shaded colored areas represent the statistical uncertainty from the fit. The $ \chi^{2} $ values per number of degrees of freedom ($ \chi^{2} $/n.d.f.) and the corresponding $ p $-values are provided for each fit. |
png pdf |
Figure 3-f:
Fits of the background functions to the $ m_{\mathrm{Z}^{'}} $ and $ m_{\mathrm{Z}^{'}}^{\mathrm{T}} $ distributions in data in the VRs (left) and simulation in the SRs (right) for the electron (upper), muon (middle), and neutrino (lower) channels. The number of events in each bin is divided by the bin width. The fit range excludes the kinematic turn-on, created by the selection criteria. In the panels below the distributions, the ratios of data to the background functions are displayed. The ratios to the functions $ f_1 $, $ f_2 $, and $ f_3 $, are shown by red, green, and blue points, respectively. The shaded colored areas represent the statistical uncertainty from the fit. The $ \chi^{2} $ values per number of degrees of freedom ($ \chi^{2} $/n.d.f.) and the corresponding $ p $-values are provided for each fit. |
png pdf |
Figure 4:
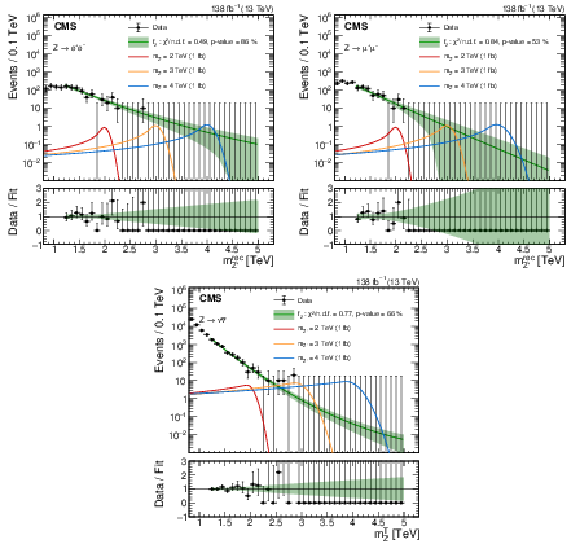
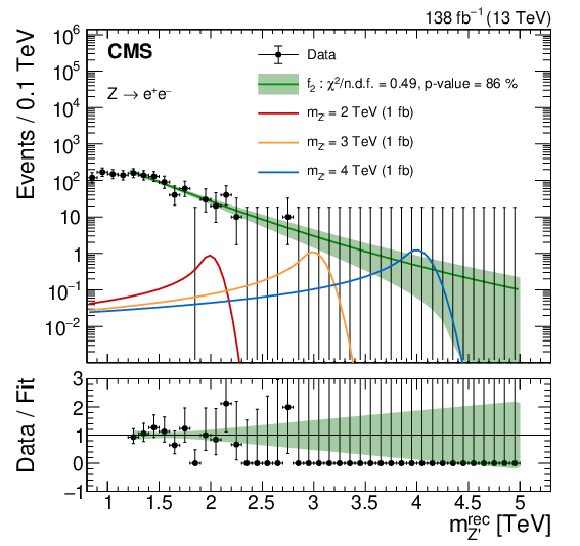
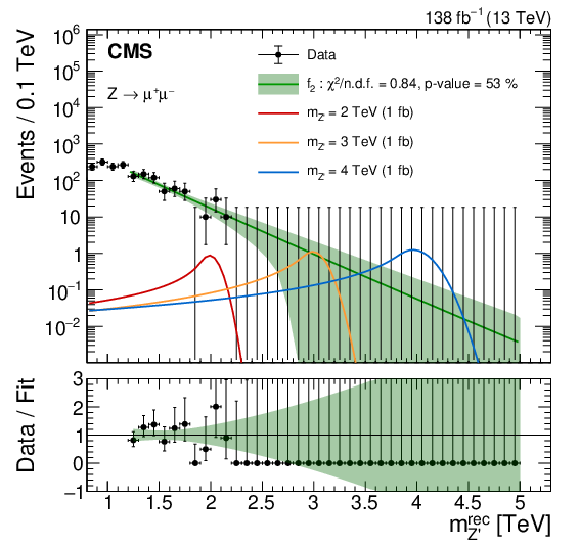
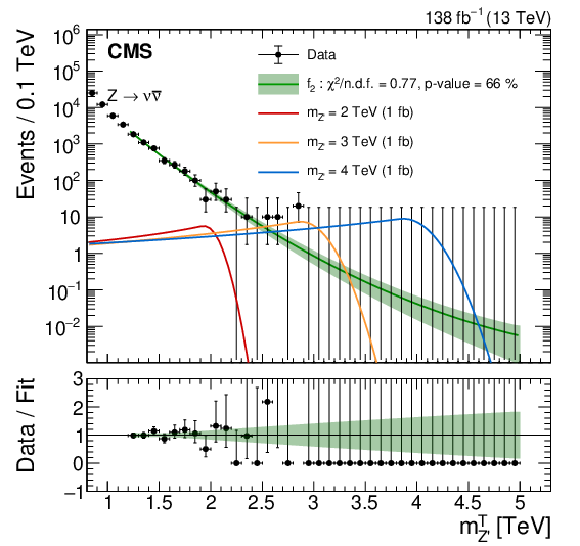
Distributions in $ m_{\mathrm{Z}^{'}}^{\text{rec}} $ and $ m_{\mathrm{Z}^{'}}^{\mathrm{T}} $ for data in the SRs, together with fits of the background functions under the background-only hypothesis for the electron (upper left), muon (upper right), and neutrino (lower) channels. The signal predictions are shown for different $ \mathrm{Z}^{'} $ boson masses, normalized to an arbitrary cross section of 1 fb. In the panels below the distributions, the ratios of data to the background function are displayed. The shaded green areas represent the statistical uncertainty from the fit. The $ \chi^{2} $ values per number of degrees of freedom ($ \chi^{2} $/n.d.f.) and the corresponding $ p $-values are provided for each fit. |
png pdf |
Figure 4-a:
Distributions in $ m_{\mathrm{Z}^{'}}^{\text{rec}} $ and $ m_{\mathrm{Z}^{'}}^{\mathrm{T}} $ for data in the SRs, together with fits of the background functions under the background-only hypothesis for the electron (upper left), muon (upper right), and neutrino (lower) channels. The signal predictions are shown for different $ \mathrm{Z}^{'} $ boson masses, normalized to an arbitrary cross section of 1 fb. In the panels below the distributions, the ratios of data to the background function are displayed. The shaded green areas represent the statistical uncertainty from the fit. The $ \chi^{2} $ values per number of degrees of freedom ($ \chi^{2} $/n.d.f.) and the corresponding $ p $-values are provided for each fit. |
png pdf |
Figure 4-b:
Distributions in $ m_{\mathrm{Z}^{'}}^{\text{rec}} $ and $ m_{\mathrm{Z}^{'}}^{\mathrm{T}} $ for data in the SRs, together with fits of the background functions under the background-only hypothesis for the electron (upper left), muon (upper right), and neutrino (lower) channels. The signal predictions are shown for different $ \mathrm{Z}^{'} $ boson masses, normalized to an arbitrary cross section of 1 fb. In the panels below the distributions, the ratios of data to the background function are displayed. The shaded green areas represent the statistical uncertainty from the fit. The $ \chi^{2} $ values per number of degrees of freedom ($ \chi^{2} $/n.d.f.) and the corresponding $ p $-values are provided for each fit. |
png pdf |
Figure 4-c:
Distributions in $ m_{\mathrm{Z}^{'}}^{\text{rec}} $ and $ m_{\mathrm{Z}^{'}}^{\mathrm{T}} $ for data in the SRs, together with fits of the background functions under the background-only hypothesis for the electron (upper left), muon (upper right), and neutrino (lower) channels. The signal predictions are shown for different $ \mathrm{Z}^{'} $ boson masses, normalized to an arbitrary cross section of 1 fb. In the panels below the distributions, the ratios of data to the background function are displayed. The shaded green areas represent the statistical uncertainty from the fit. The $ \chi^{2} $ values per number of degrees of freedom ($ \chi^{2} $/n.d.f.) and the corresponding $ p $-values are provided for each fit. |
png pdf |
Figure 5:
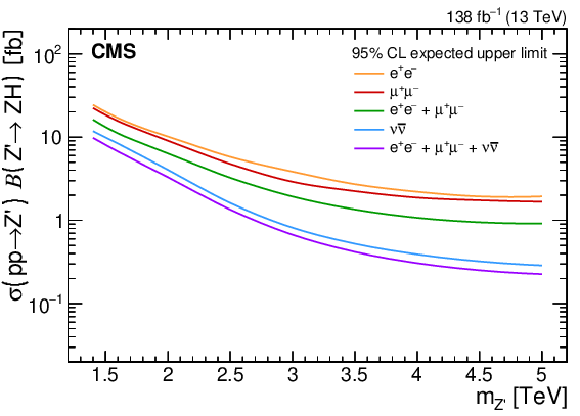
Expected upper limits at 95% CL on the product of the production cross section $ \sigma\left(\mathrm{p}\mathrm{p}\to\mathrm{Z}^{'}\right) $ and branching fraction $ \mathcal{B}\left(\mathrm{Z}^{'}\to\mathrm{Z}\mathrm{H}\right) $ as functions of the $ \mathrm{Z}^{'} $ boson mass. The lines correspond to the three different final states and their combinations. |

png pdf |
Figure 6:
Expected and observed upper limits at 95% CL on the product of the production cross section $ \sigma\left(\mathrm{p}\mathrm{p}\to\mathrm{Z}^{'}\right) $ and branching fraction $ \mathcal{B}\left(\mathrm{Z}^{'}\to\mathrm{Z}\mathrm{H}\right) $ as functions of the $ \mathrm{Z}^{'} $ boson mass from the combination of all final states. The limits are compared with the predictions of the HVT model and the expected limits (shown by red curves) from a previous analysis [16]. |
png pdf |
Figure 7:
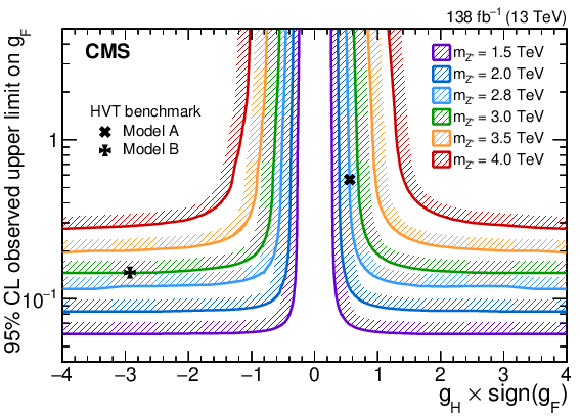
Observed upper limits at 95% CL on $ g_{\mathrm{F}} $ for different $ \mathrm{Z}^{'} $ boson masses as functions of the product of $ g_{\mathrm{H}} $ with the sign of $ g_{\mathrm{F}} $. The two benchmark scenarios of the HVT model are shown by the black markers. |
| Tables | |

png pdf |
Table 1:
Sources of signal systematic uncertainties considered in this analysis, and their effect on the signal normalization. The uncertainty ranges correspond to different signal masses. These uncertainties are subleading compared with those in the background predictions. |
| Summary |
| A search has been presented for the production of a heavy resonance with mass in the range of 1.4-5 TeV that decays into a Z and a Higgs (H) boson. The analysis is performed using data recorded with the CMS detector at a centre-of-mass energy of 13 TeV, corresponding to an integrated luminosity of 138 fb$ ^{-1} $. Exclusion limits at 95% confidence level are set on both the mass of a heavy resonance and the couplings to fermions and bosons in the heavy vector triplet model. Resonances with masses below 3 TeV are excluded. The analysis focuses on Z boson decays into a pair of electrons, muons, or neutrinos, and the hadronic decays of the H boson reconstructed as a single large-radius jet. A novel approach analyzing the flavour content and substructure of the H boson jet is deployed to improve the sensitivity for high resonance masses. This analysis employs state-of-the-art algorithms to identify hadronic H boson decays. The use of these advanced taggers significantly improves the signal-to-background ratio for H boson jets with less than two b-tagged subjets. The signal H boson jets comprise about 60, 20, and 15% $ \mathrm{H}\to\mathrm{b}\overline{\mathrm{b}} $, $ \mathrm{q}\overline{\mathrm{q}}\mathrm{q}\overline{\mathrm{q}} $, and $ \mathrm{c} \overline{\mathrm{c}} $ decays, respectively, where the $ \mathrm{H}\to\mathrm{b}\overline{\mathrm{b}} $ decays correspond to jets that are rejected by a selection based on two b-tagged subjets and are recovered by this analysis. A significantly improved sensitivity for high resonance masses in the ZH channel is provided by the new techniques employed by this analysis. |
| References | ||||
| 1 | S. Rappoccio | The experimental status of direct searches for exotic physics beyond the standard model at the Large Hadron Collider | Rev. Phys. 4 (2019) 100027 | 1810.10579 |
| 2 | ATLAS Collaboration | Exploration at the high-energy frontier: ATLAS Run 2 searches investigating the exotic jungle beyond the standard model | Submitted to Phys. Rep. In press link |
2403.09292 |
| 3 | CMS Collaboration | Dark sector searches with the CMS experiment | Submitted to Phys. Rep. In press link |
CMS-EXO-23-005 2405.13778 |
| 4 | D. Pappadopulo, A. Thamm, R. Torre, and A. Wulzer | Heavy vector triplets: Bridging theory and data | JHEP 09 (2014) 060 | 1402.4431 |
| 5 | V. D. Barger, W. Keung, and E. Ma | A gauge model with light W and Z bosons | PRD 22 (1980) 727 | 0801.1345 |
| 6 | G. Altarelli, B. Mele, and M. Ruiz-Altaba | Searching for new heavy vector bosons in $ \mathrm{p}\overline{\mathrm{p}} $ colliders | Z. Phys. C 45 (1989) 109 | |
| 7 | E. Salvioni, G. Villadoro, and F. Zwirner | Minimal $ \mathrm{Z}^{'} $ models: Present bounds and early LHC reach | JHEP 11 (2009) 068 | 0909.1320 |
| 8 | C. Grojean, E. Salvioni, and R. Torre | A weakly constrained $ \mathrm{W^{'}} $ at the early LHC | JHEP 07 (2011) 002 | 1103.2761 |
| 9 | M. Schmaltz and D. Tucker-Smith | Little Higgs review | Ann. Rev. Nucl. Part. Sci. 55 (2005) 229 | hep-ph/0502182 |
| 10 | N. Arkani-Hamed, A. G. Cohen, E. Katz, and A. E. Nelson | The littlest Higgs | JHEP 07 (2002) 034 | hep-ph/0206021 |
| 11 | R. Contino, D. Marzocca, D. Pappadopulo, and R. Rattazzi | On the effect of resonances in composite Higgs phenomenology | JHEP 10 (2011) 081 | 1109.1570 |
| 12 | D. Marzocca, M. Serone, and J. Shu | General composite Higgs models | JHEP 08 (2012) 013 | 1205.0770 |
| 13 | B. Bellazzini, C. Csáki, and J. Serra | Composite Higgses | EPJC 74 (2014) 2766 | 1401.2457 |
| 14 | D. Greco and D. Liu | Hunting composite vector resonances at the LHC: Naturalness facing data | JHEP 12 (2014) 126 | 1410.2883 |
| 15 | K. Lane and L. Pritchett | The light composite Higgs boson in strong extended technicolor | JHEP 06 (2017) 140 | 1604.07085 |
| 16 | CMS Collaboration | Search for heavy resonances decaying into a vector boson and a Higgs boson in final states with charged leptons, neutrinos and b quarks at $ \sqrt{s}= $ 13 TeV | JHEP 11 (2018) 172 | 1807.02826 |
| 17 | CMS Collaboration | Search for heavy resonances decaying to ZZ or ZW and axion-like particles mediating nonresonant ZZ or ZH production at $ \sqrt{s}= $ 13 TeV | JHEP 04 (2022) 087 | 2111.13669 |
| 18 | CMS Collaboration | Search for a heavy vector resonance decaying to a Z boson and a Higgs boson in proton--proton collisions at $ \sqrt{s}= $ 13 TeV | EPJC 81 (2021) 688 | 2102.08198 |
| 19 | CMS Collaboration | Search for heavy resonances decaying to WW, WZ, or WH boson pairs in the lepton plus merged jet final state in proton-proton collisions at $ \sqrt{s}= $ 13 TeV | PRD 105 (2022) 032008 | 2109.06055 |
| 20 | CMS Collaboration | Search for heavy resonances decaying to $ \mathrm{Z}(\nu\overline{\nu})\mathrm{V}(\mathrm{q}\overline{\mathrm{q}}^{\prime}) $ in proton--proton collisions at $ \sqrt{s}= $ 13 TeV | PRD 106 (2022) 012004 | 2109.08268 |
| 21 | ATLAS Collaboration | Search for heavy diboson resonances in semileptonic final states in pp collisions at $ \sqrt{s}= $ 13 TeV with the ATLAS detector | EPJC 80 (2020) 1165 | 2004.14636 |
| 22 | ATLAS Collaboration | Search for heavy resonances decaying into a Z or W boson and a Higgs boson in final states with leptons and b-jets in 139 fb$ ^{-1} $ of pp collisions at $ \sqrt{s}= $ 13 TeV with the ATLAS detector | JHEP 06 (2023) 016 | 2207.00230 |
| 23 | ATLAS Collaboration | Combination of searches for heavy spin-1 resonances using 139 fb$ ^{-1} $ of proton-proton collision data at $ \sqrt{s} = $ 13 TeV with the ATLAS detector | JHEP 04 (2024) 118 | 2402.10607 |
| 24 | ATLAS Collaboration | Search for resonances decaying into a weak vector boson and a Higgs boson in the fully hadronic final state produced in proton--proton collisions at $ \sqrt{s}= $ 13 TeV with the ATLAS detector | PRD 102 (2020) 112008 | 2007.05293 |
| 25 | CMS Collaboration | Search for new heavy resonances decaying to WW, WZ, ZZ, WH, or ZH boson pairs in the all-jets final state in proton--proton collisions at $ \sqrt{s}= $ 13 TeV | PLB 844 (2023) 137813 | 2210.00043 |
| 26 | CMS Collaboration | Searches for Higgs boson production through decays of heavy resonances | 2403.16926 | |
| 27 | A. J. Larkoski, I. Moult, and B. Nachman | Jet substructure at the Large Hadron Collider: A review of recent advances in theory and machine learning | Phys. Rept. 841 (2020) 1 | 1709.04464 |
| 28 | R. Kogler, B. Nachman, A. Schmidt (editors) et al. | Jet substructure at the Large Hadron Collider | Rev. Mod. Phys. 91 (2019) 045003 | 1803.06991 |
| 29 | R. Kogler | Advances in jet substructure at the LHC: Algorithms, measurements and searches for new physical phenomena | volume 284 of Springer Tracts Mod. Phys. Springer, ISBN 978-3-030-72857-1, 978-3-030-72858-8, 2021 link |
|
| 30 | CMS Collaboration | HEPData record for this analysis | link | |
| 31 | CMS Collaboration | The CMS experiment at the CERN LHC | JINST 3 (2008) S08004 | |
| 32 | CMS Collaboration | Development of the CMS detector for the CERN LHC Run 3 | JINST 19 (2024) P05064 | CMS-PRF-21-001 2309.05466 |
| 33 | CMS Collaboration | The CMS trigger system | JINST 12 (2017) P01020 | CMS-TRG-12-001 1609.02366 |
| 34 | CMS Collaboration | Performance of the CMS Level-1 trigger in proton--proton collisions at $ \sqrt{s}= $ 13 TeV | JINST 15 (2020) P10017 | CMS-TRG-17-001 2006.10165 |
| 35 | CMS Collaboration | Particle-flow reconstruction and global event description with the CMS detector | JINST 12 (2017) P10003 | CMS-PRF-14-001 1706.04965 |
| 36 | CMS Collaboration | Electron and photon reconstruction and identification with the CMS experiment at the CERN LHC | JINST 16 (2021) P05014 | CMS-EGM-17-001 2012.06888 |
| 37 | CMS Collaboration | Performance of the CMS muon detector and muon reconstruction with proton--proton collisions at $ \sqrt{s}= $ 13 TeV | JINST 13 (2018) P06015 | CMS-MUO-16-001 1804.04528 |
| 38 | CMS Collaboration | Pileup mitigation at CMS in 13 TeV data | JINST 15 (2020) P09018 | CMS-JME-18-001 2003.00503 |
| 39 | D. Bertolini, P. Harris, M. Low, and N. Tran | Pileup per particle identification | JHEP 10 (2014) 059 | 1407.6013 |
| 40 | M. Cacciari, G. P. Salam, and G. Soyez | FastJet user manual | EPJC 72 (2012) 1896 | 1111.6097 |
| 41 | M. Cacciari, G. P. Salam, and G. Soyez | The anti-$ k_{\mathrm{T}} $ jet clustering algorithm | JHEP 04 (2008) 063 | 0802.1189 |
| 42 | A. J. Larkoski, S. Marzani, G. Soyez, and J. Thaler | Soft drop | JHEP 05 (2014) 146 | 1402.2657 |
| 43 | M. Dasgupta, A. Fregoso, S. Marzani, and G. P. Salam | Towards an understanding of jet substructure | JHEP 09 (2013) 029 | 1307.0007 |
| 44 | Y. L. Dokshitzer, G. D. Leder, S. Moretti, and B. R. Webber | Better jet clustering algorithms | JHEP 08 (1997) 001 | hep-ph/9707323 |
| 45 | M. Wobisch and T. Wengler | Hadronization corrections to jet cross-sections in deep inelastic scattering | in Proc. of the Workshop on Monte Carlo Generators for HERA Physics, Hamburg, Germany, 1998 link |
hep-ph/9907280 |
| 46 | CMS Collaboration | Jet energy scale and resolution in the CMS experiment in pp collisions at 8 TeV | JINST 12 (2017) P02014 | CMS-JME-13-004 1607.03663 |
| 47 | CMS Collaboration | Performance of missing transverse momentum reconstruction in proton-proton collisions at $ \sqrt{s} = $ 13 TeV using the CMS detector | JINST 14 (2019) P07004 | CMS-JME-17-001 1903.06078 |
| 48 | J. Alwall et al. | Comparative study of various algorithms for the merging of parton showers and matrix elements in hadronic collisions | EPJC 53 (2008) 473 | 0706.2569 |
| 49 | J. Alwall et al. | The automated computation of tree-level and next-to-leading order differential cross sections, and their matching to parton shower simulations | JHEP 07 (2014) 079 | 1405.0301 |
| 50 | T. Sjöstrand et al. | An introduction to PYTHIA 8.2 | Comput. Phys. Commun. 191 (2015) 159 | 1410.3012 |
| 51 | P. Nason | A new method for combining NLO QCD with shower Monte Carlo algorithms | JHEP 11 (2004) 040 | hep-ph/0409146 |
| 52 | S. Frixione, P. Nason, and C. Oleari | Matching NLO QCD computations with parton shower simulations: The POWHEG method | JHEP 11 (2007) 070 | 0709.2092 |
| 53 | S. Frixione, P. Nason, and G. Ridolfi | A positive-weight next-to-leading-order Monte Carlo for heavy flavour hadroproduction | JHEP 09 (2007) 126 | 0707.3088 |
| 54 | S. Alioli, P. Nason, C. Oleari, and E. Re | A general framework for implementing NLO calculations in shower Monte Carlo programs: The POWHEG BOX | JHEP 06 (2010) 043 | 1002.2581 |
| 55 | E. Re | Single-top $ {\mathrm{W}}{\mathrm{t}} $-channel production matched with parton showers using the POWHEG method | EPJC 71 (2011) 1547 | 1009.2450 |
| 56 | M. Czakon and A. Mitov | Top++: A program for the calculation of the top-pair cross-section at hadron colliders | Comput. Phys. Commun. 185 (2014) 2930 | 1112.5675 |
| 57 | CMS Collaboration | Extraction and validation of a new set of CMS PYTHIA8 tunes from underlying-event measurements | EPJC 80 (2020) 4 | CMS-GEN-17-001 1903.12179 |
| 58 | NNPDF Collaboration | Parton distributions from high-precision collider data | EPJC 77 (2017) 663 | 1706.00428 |
| 59 | GEANT4 Collaboration | GEANT 4 --- A simulation toolkit | NIM A 506 (2003) 250 | |
| 60 | CMS Collaboration | Measurement of the inelastic proton-proton cross section at $ \sqrt{s}= $ 13 TeV | JHEP 07 (2018) 161 | CMS-FSQ-15-005 1802.02613 |
| 61 | CMS Collaboration | Identification of heavy-flavour jets with the CMS detector in pp collisions at 13 TeV | JINST 13 (2018) P05011 | CMS-BTV-16-002 1712.07158 |
| 62 | H. Qu and L. Gouskos | ParticleNet: Jet tagging via particle clouds | PRD 101 (2020) 056019 | 1902.08570 |
| 63 | CMS Collaboration | Performance of heavy-flavour jet identification in boosted topologies in proton-proton collisions at $ \sqrt{s} = $ 13 TeV | CMS Physics Analysis Summary, 2023 CMS-PAS-BTV-22-001 |
CMS-PAS-BTV-22-001 |
| 64 | J. Dolen et al. | Thinking outside the ROCs: Designing decorrelated taggers (DDT) for jet substructure | JHEP 05 (2016) 156 | 1603.00027 |
| 65 | CMS Collaboration | Identification of heavy, energetic, hadronically decaying particles using machine-learning techniques | JINST 15 (2020) P06005 | CMS-JME-18-002 2004.08262 |
| 66 | A. M. Mood, F. A. Graybill, and D. C. Boes | Introduction to the theory of statistics | McGraw-Hill, 1973 | |
| 67 | M. Oreglia | A Study of the Reactions $ \psi^\prime \to \gamma \gamma \psi $ | PhD thesis, SLAC, 1980 | |
| 68 | J. E. Gaiser | Charmonium spectroscopy from radiative decays of the $ J/\psi $ and $ \psi^\prime $ | PhD thesis, Stanford University, SLAC-R-255, 1982 | |
| 69 | T. Skwarnicki | A study of the radiative CASCADE transitions between the Upsilon-Prime and Upsilon resonances | PhD thesis, Cracow, INP and DESY, 1986 | |
| 70 | CMS Collaboration | Precision luminosity measurement in proton--proton collisions at $ \sqrt{s}= $13 TeV in 2015 and 2016 at CMS | EPJC 81 (2021) 800 | CMS-LUM-17-003 2104.01927 |
| 71 | CMS Collaboration | CMS luminosity measurement for the 2017 data-taking period at $ \sqrt{s}= $ 13 TeV | CMS Physics Analysis Summary, 2018 CMS-PAS-LUM-17-004 |
CMS-PAS-LUM-17-004 |
| 72 | CMS Collaboration | CMS luminosity measurement for the 2018 data-taking period at $ \sqrt{s}= $ 13 TeV | CMS Physics Analysis Summary, 2019 CMS-PAS-LUM-18-002 |
CMS-PAS-LUM-18-002 |
| 73 | J. Butterworth et al. | PDF4LHC recommendations for LHC Run II | JPG 43 (2016) 023001 | 1510.03865 |
| 74 | ATLAS and CMS Collaborations, and LHC Higgs Combination Group | Procedure for the LHC Higgs boson search combination in Summer 2011 | CMS Note CMS-NOTE-2011-005, ATL-PHYS-PUB-2011-11, 2011 | |
| 75 | T. Junk | Confidence level computation for combining searches with small statistics | NIM A 434 (1999) 435 | hep-ex/9902006 |
| 76 | A. L. Read | Presentation of search results: The CL$ _{\text{s}} $ technique | JPG 28 (2002) 2693 | |
| 77 | G. Cowan, K. Cranmer, E. Gross, and O. Vitells | Asymptotic formulae for likelihood-based tests of new physics | EPJC 71 (2011) 1554 | 1007.1727 |
| 78 | CMS Collaboration | The CMS statistical analysis and combination tool: Combine | Accepted by Comput. Softw. Big Sci, 2024 | CMS-CAT-23-001 2404.06614 |
| 79 | W. Verkerke and D. P. Kirkby | The RooFit toolkit for data modeling | in Proc. Int. Conf. on Computing in High Energy and Nuclear Physics (CHEP03), L. Lyons and M. Karagoz, eds., p. MOLT007, 2003 | physics/0306116 |
| 80 | L. Moneta et al. | The RooStats project | in Proc. 13th Int. Workshop on Advanced Computing and Analysis Techniques in Physics Research, T. Speer et al., eds., volume ACAT, 2010 link |
1009.1003 |

|
Compact Muon Solenoid LHC, CERN |

|

|

|

|

|

|