

Compact Muon Solenoid
LHC, CERN
 Visit us: CMS Public Website, CMS Physics ;
Contact us: CMS Publications Committee
Visit us: CMS Public Website, CMS Physics ;
Contact us: CMS Publications Committee
| CMS-PAS-SMP-25-009 | ||
| Measurement of four-point energy-energy correlator subspaces in Z+jets events | ||
| CMS Collaboration | ||
| 2026-08-06 | ||
| Abstract: We present the first measurement of the resolved structure of four-point energy-energy correlators using the CMS detector at the LHC. Three geometrically distinct subspaces of the five-dimensional four-point configuration space - the tee, dipole, and right-triangle configurations - are measured in jets produced in association with a $ Z $ boson in proton-proton collisions at $ \sqrt{s} = $ 13 TeV, corresponding to 59.5 fb$ ^{-1} $ of data recorded in 2018. Results are unfolded to particle level and compared to predictions from Pythia 8 and Herwig 7. Herwig provides a systematically better description in the small-angle collinear and hadronization-sensitive regions, while Pythia describes the behavior at larger angular separations more accurately. These results constitute the first experimental probe of the resolved multipoint energy correlation structure of QCD jets at a hadron collider. | ||
| Links: CDS record (PDF) ; CADI line (restricted) ; | ||
| Figures | |
png pdf |
Figure 1:
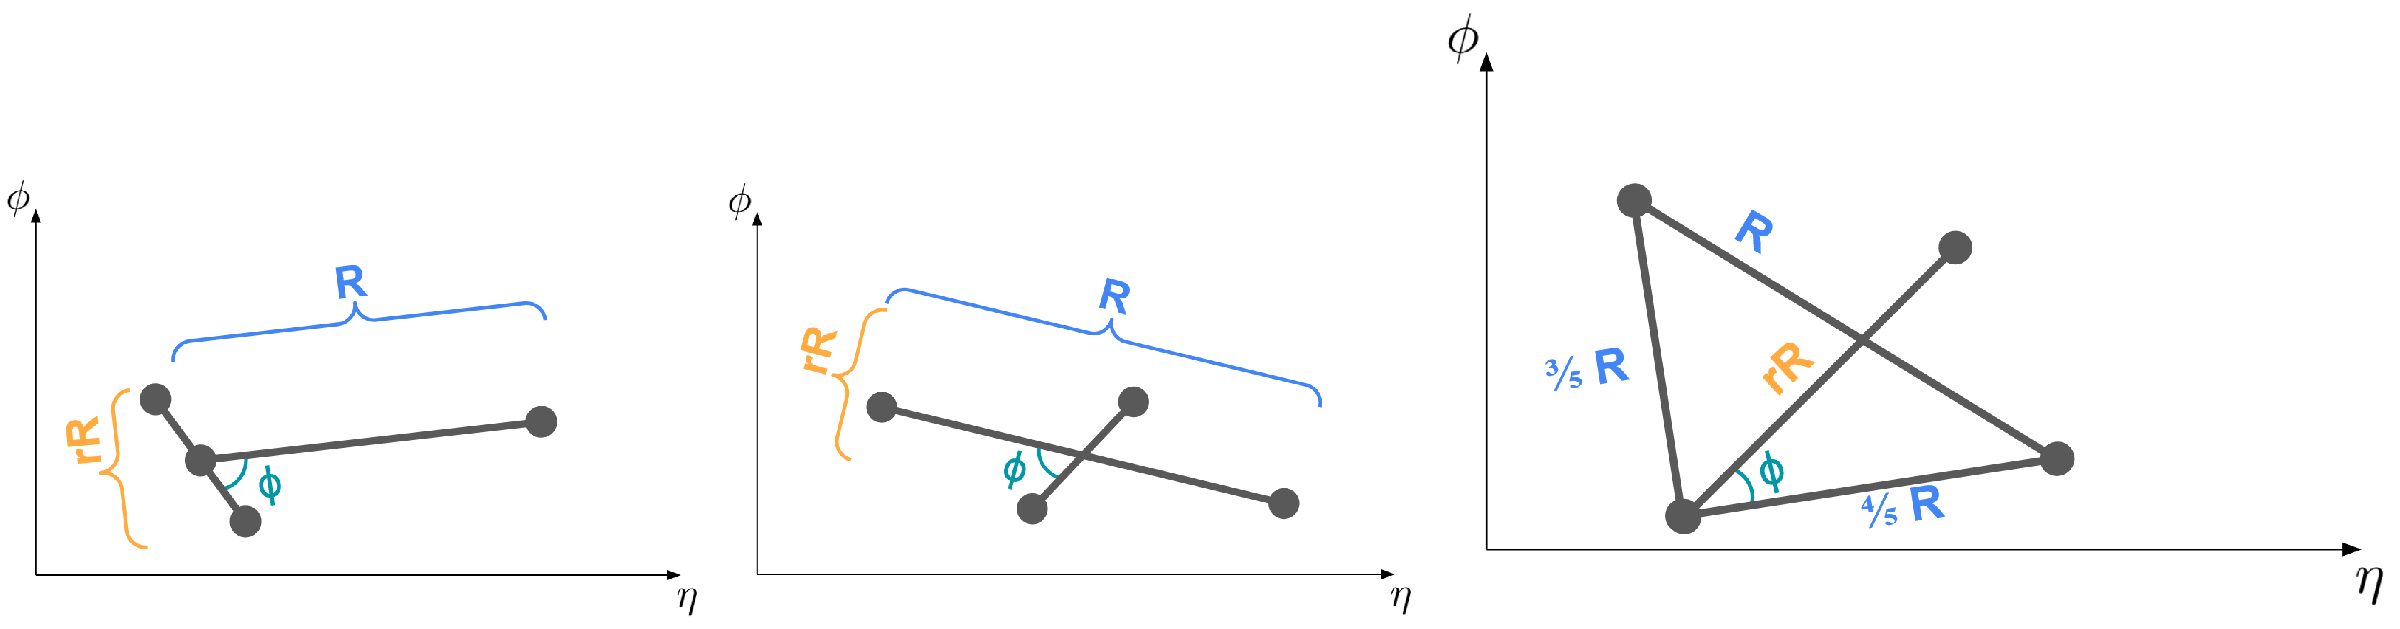
The three four-point EEC configurations: tee (left), dipole (center), and right-triangle (right). In each case the overall angular scale is $ R $, the secondary scale is parameterized by $ r $, and $ \phi $ gives the relative orientation. |
png |
Figure 1-a:
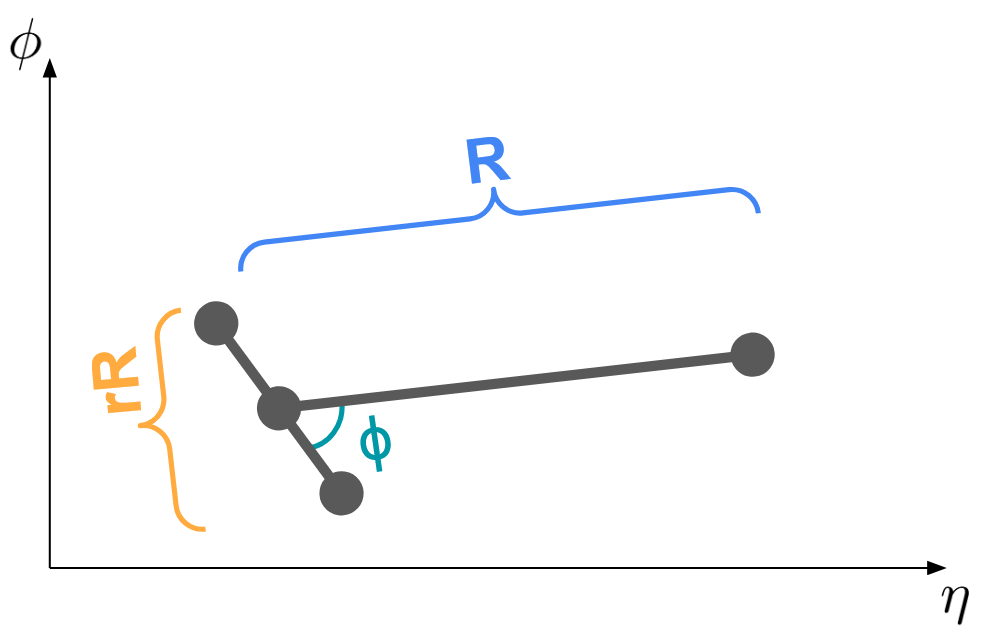
The three four-point EEC configurations: tee (left), dipole (center), and right-triangle (right). In each case the overall angular scale is $ R $, the secondary scale is parameterized by $ r $, and $ \phi $ gives the relative orientation. |
png |
Figure 1-b:
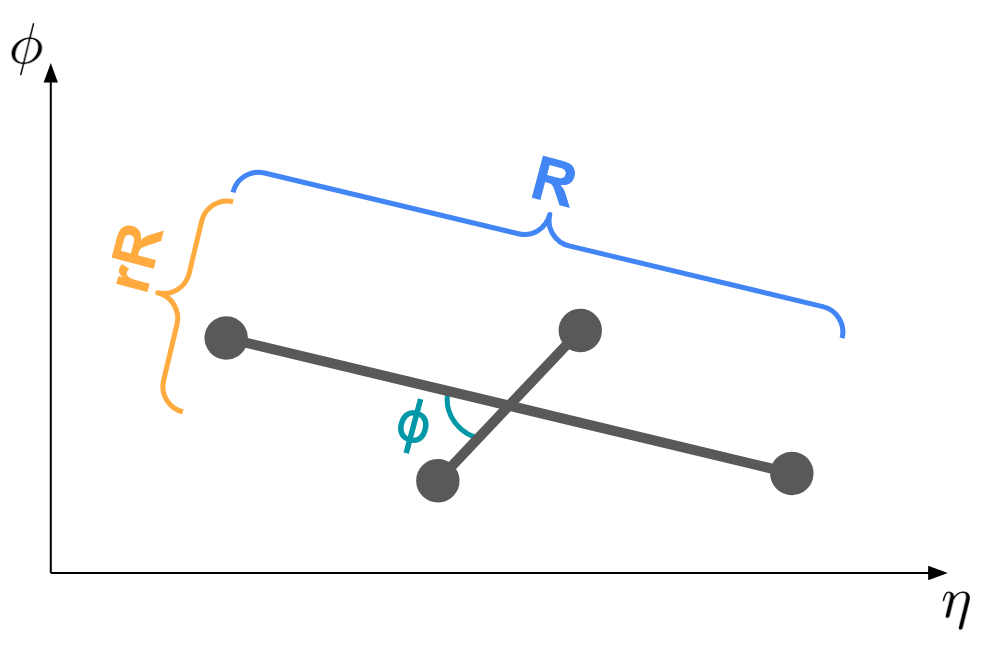
The three four-point EEC configurations: tee (left), dipole (center), and right-triangle (right). In each case the overall angular scale is $ R $, the secondary scale is parameterized by $ r $, and $ \phi $ gives the relative orientation. |
png |
Figure 1-c:
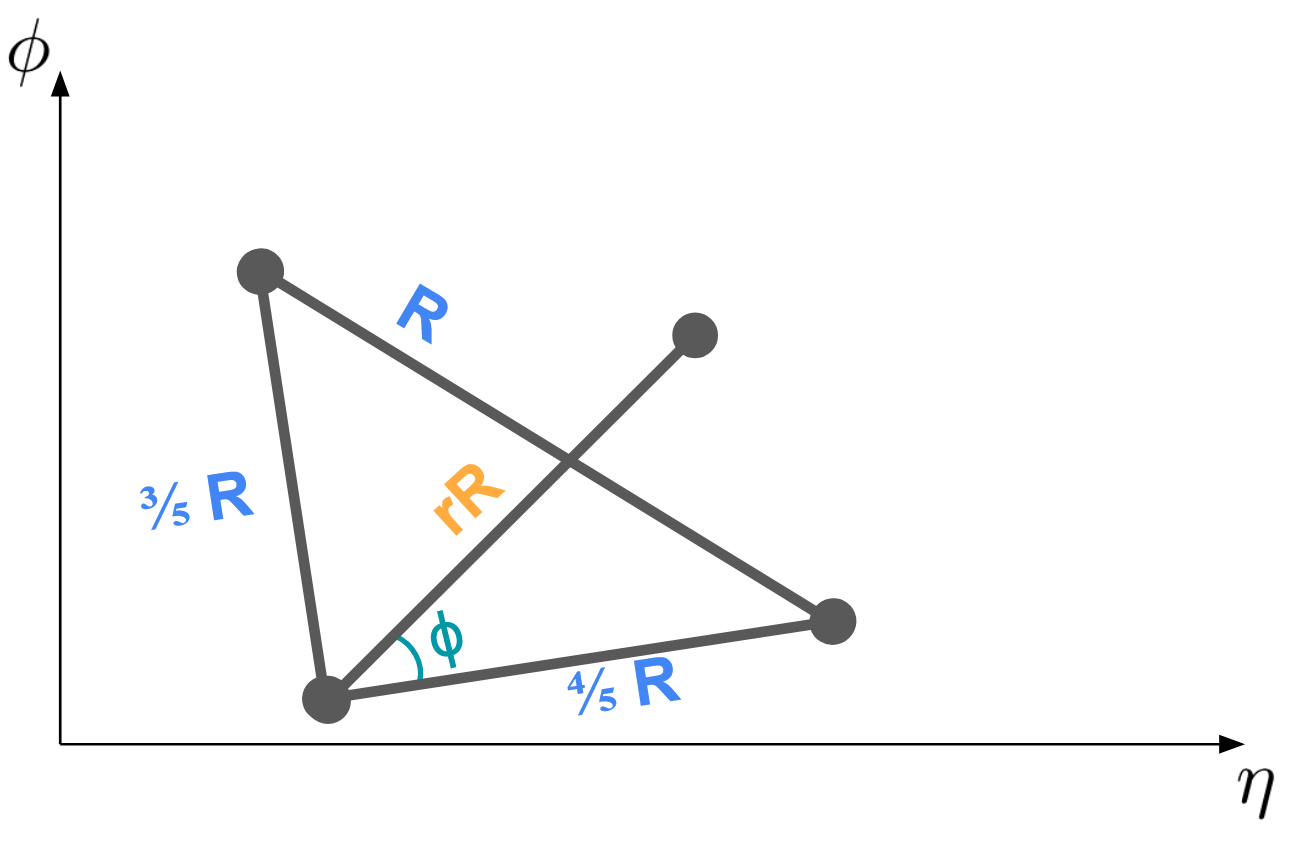
The three four-point EEC configurations: tee (left), dipole (center), and right-triangle (right). In each case the overall angular scale is $ R $, the secondary scale is parameterized by $ r $, and $ \phi $ gives the relative orientation. |
png pdf |
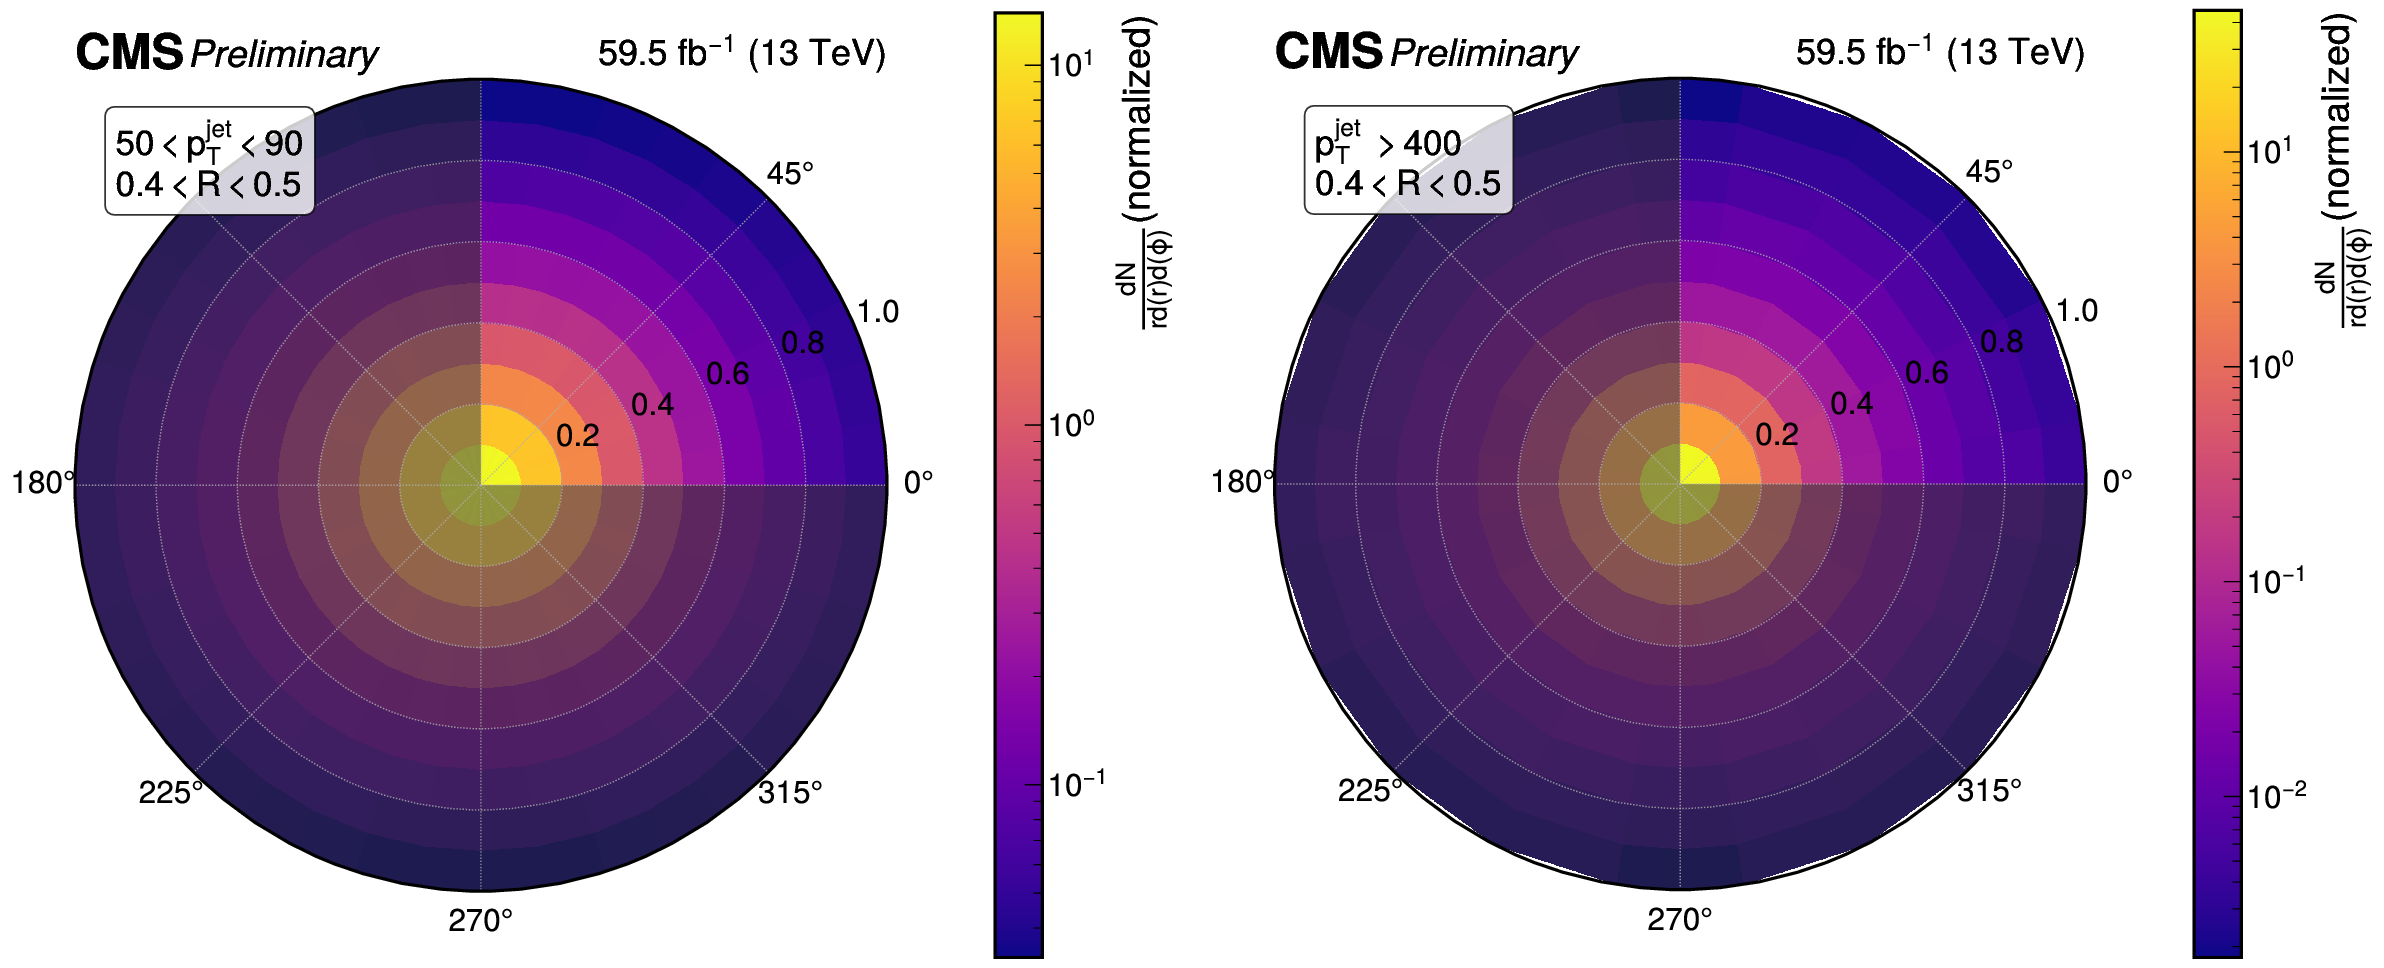
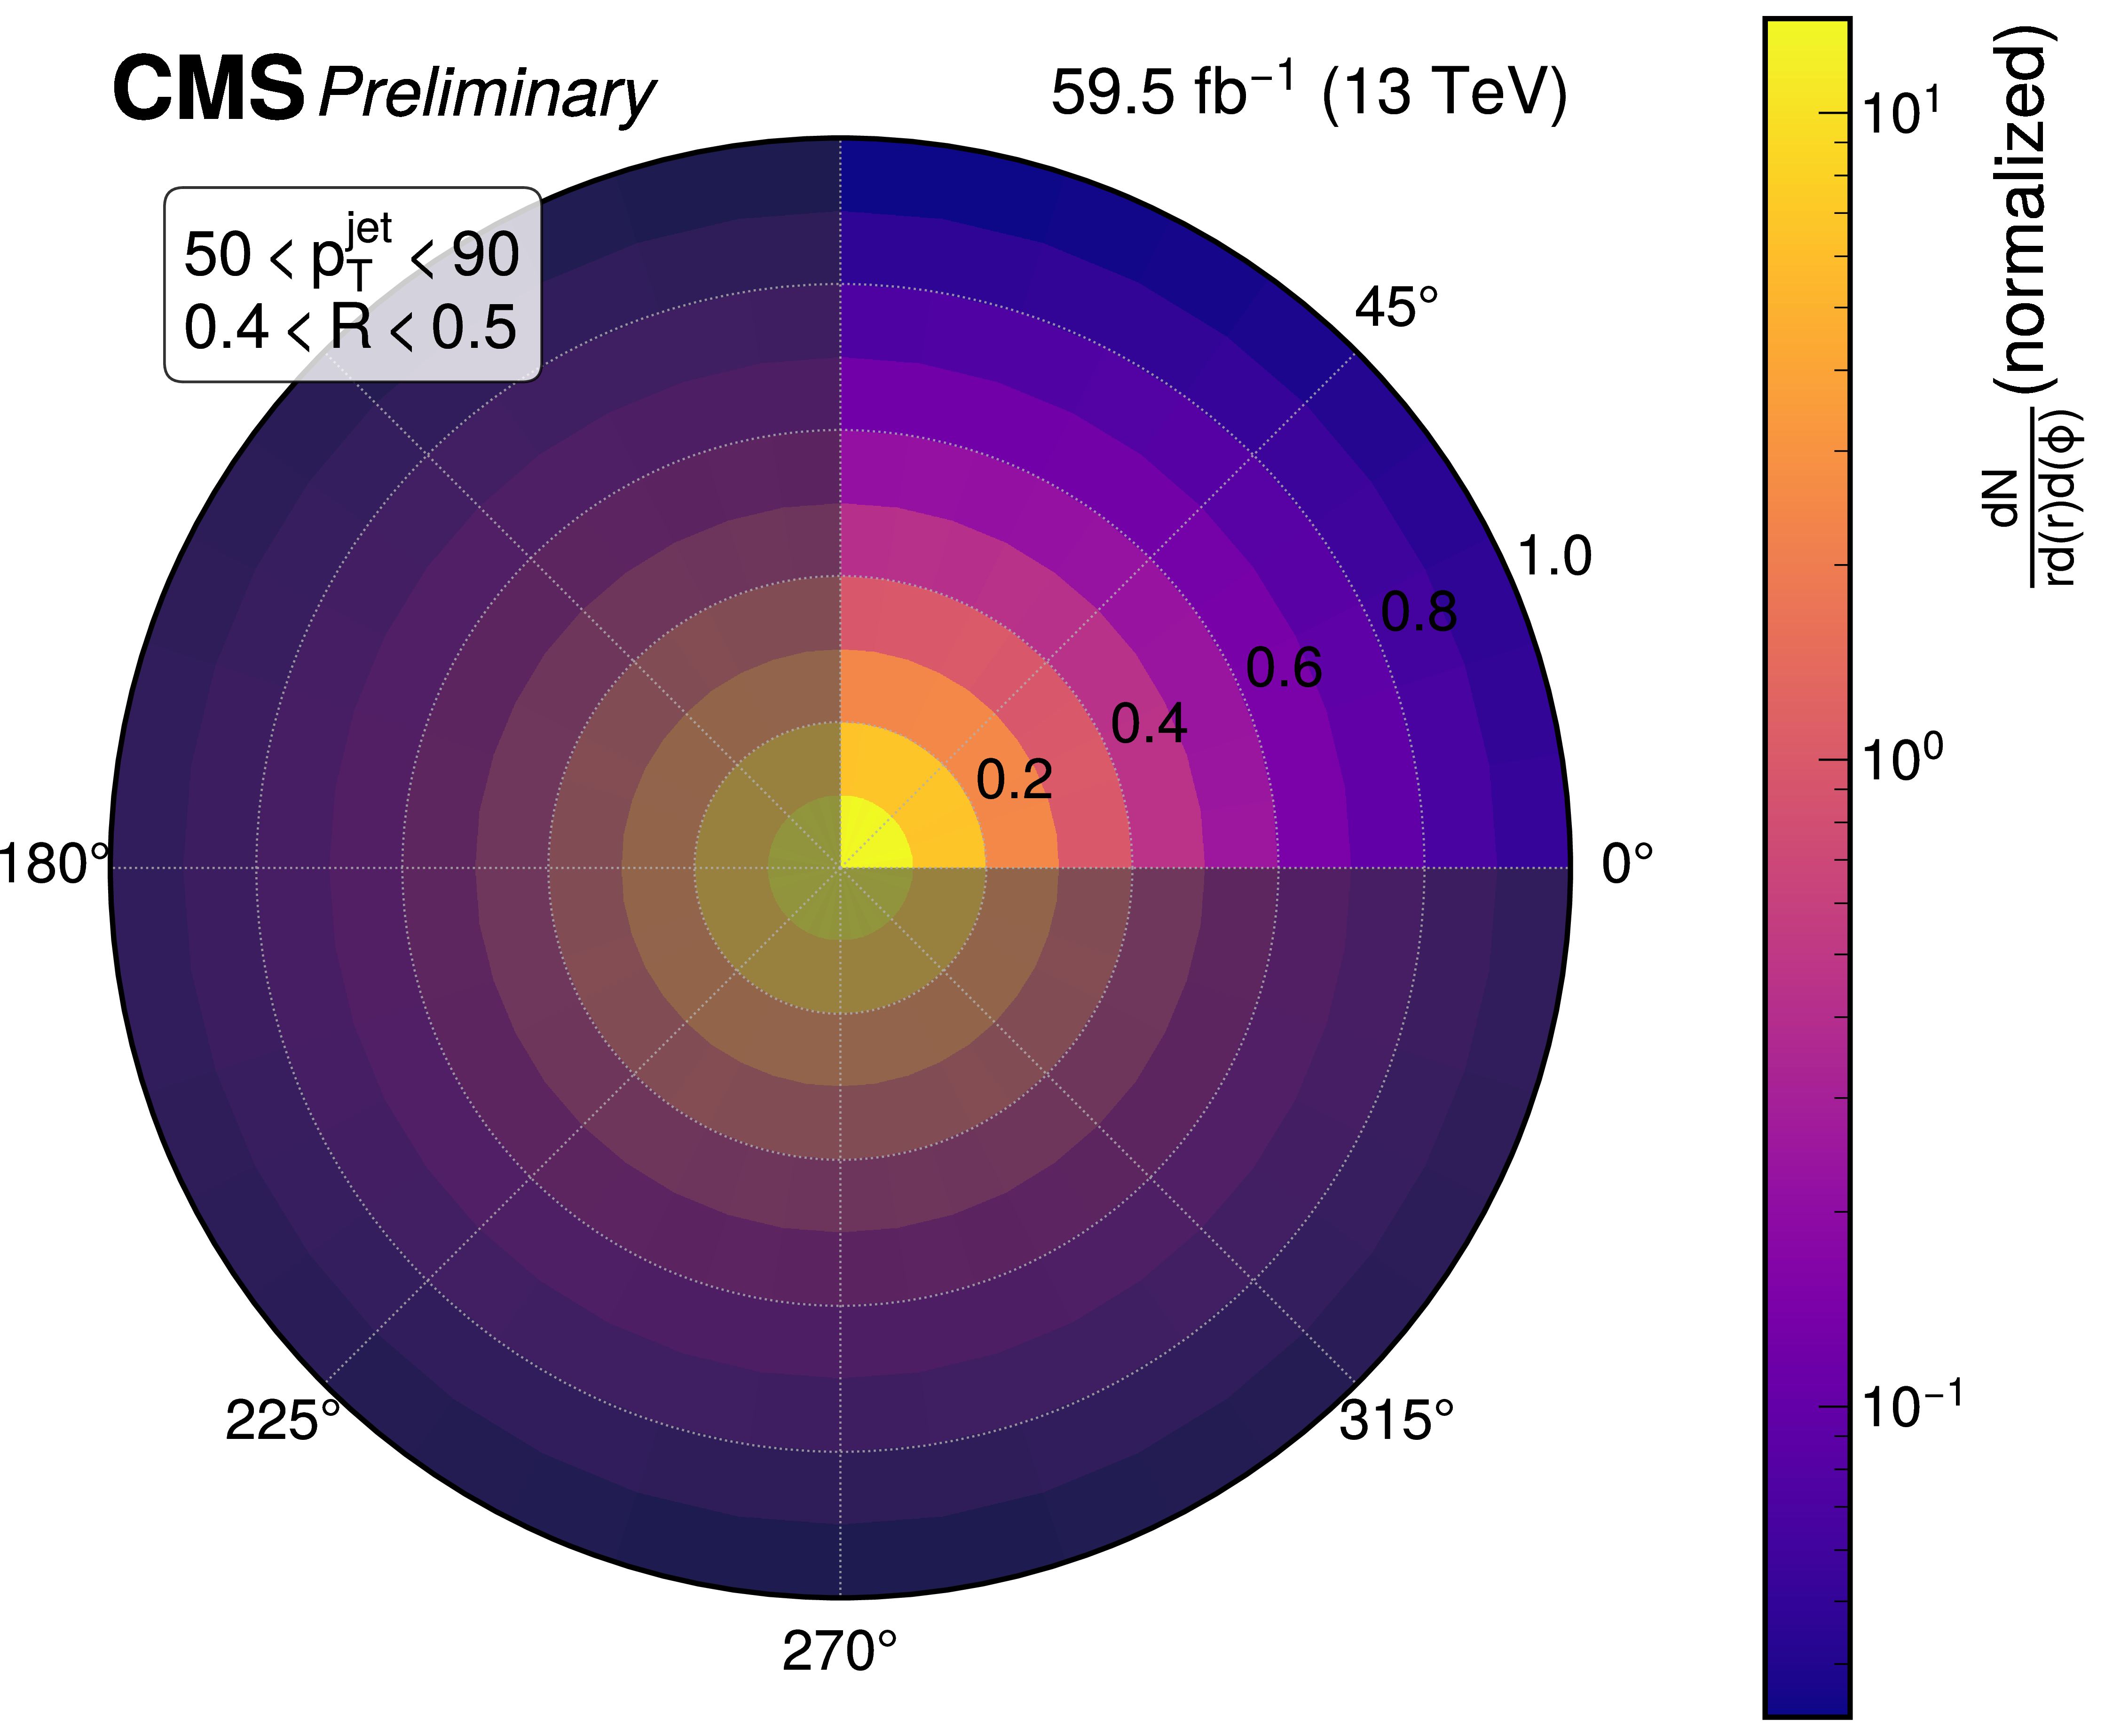
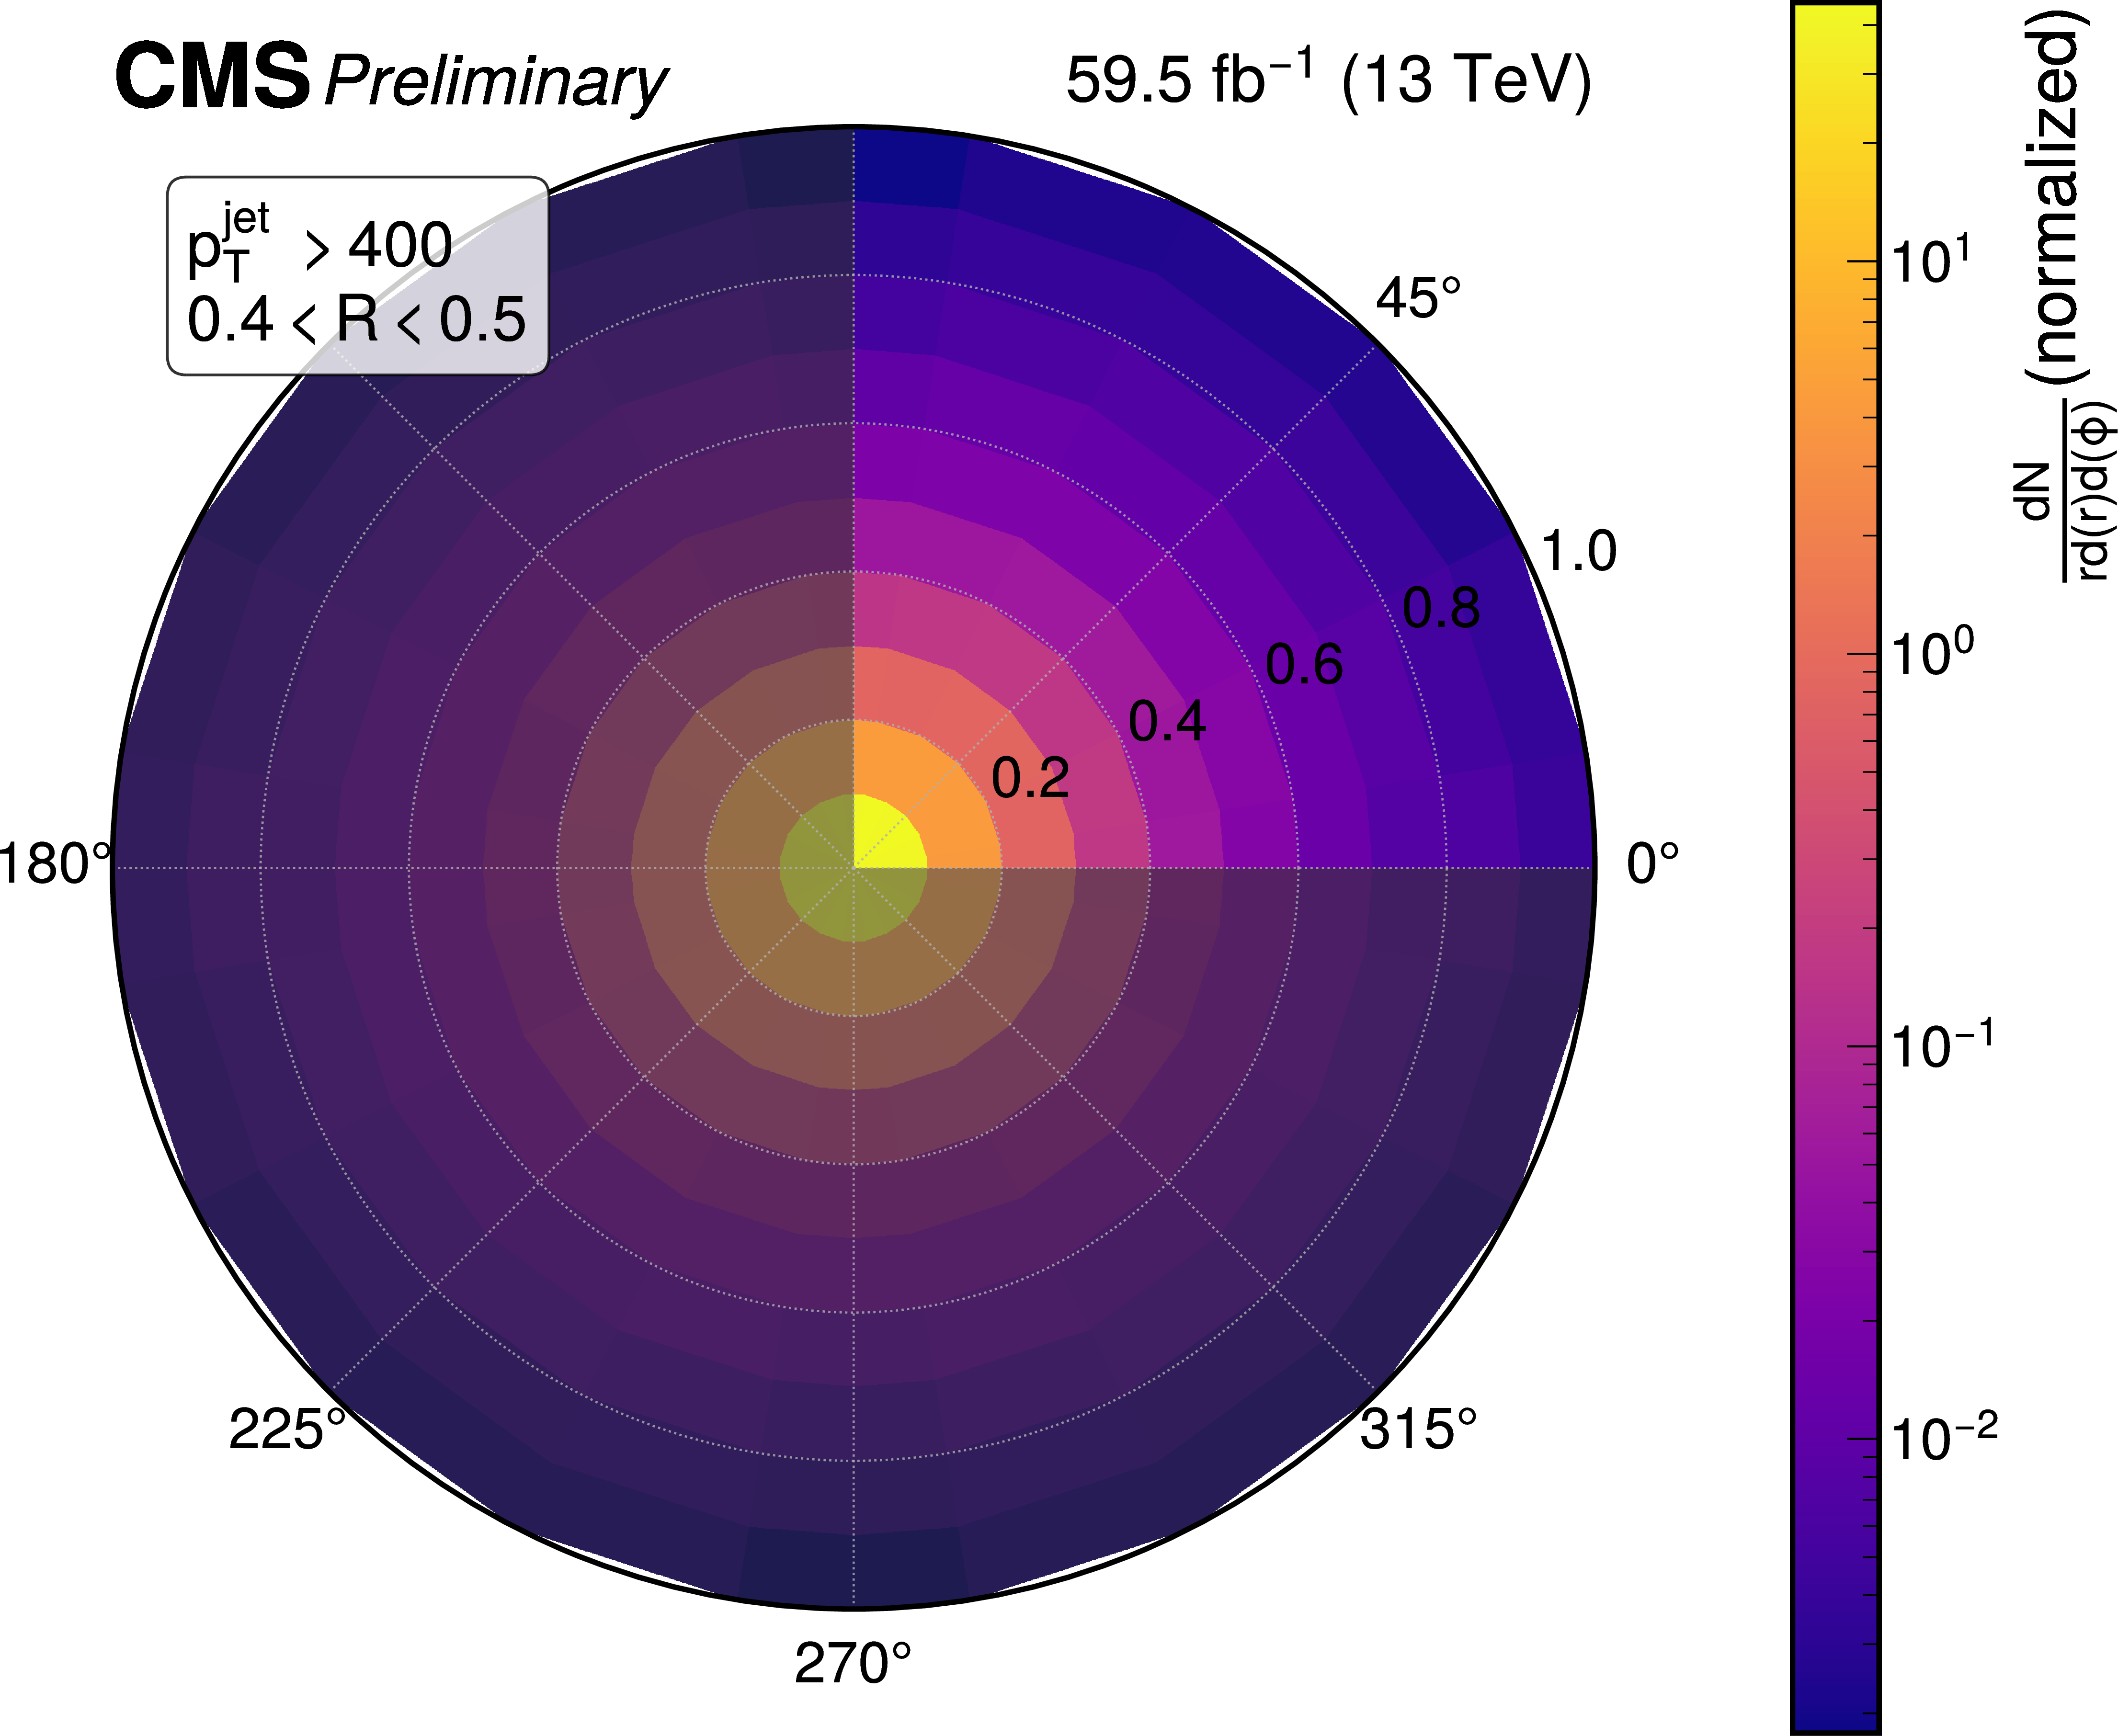
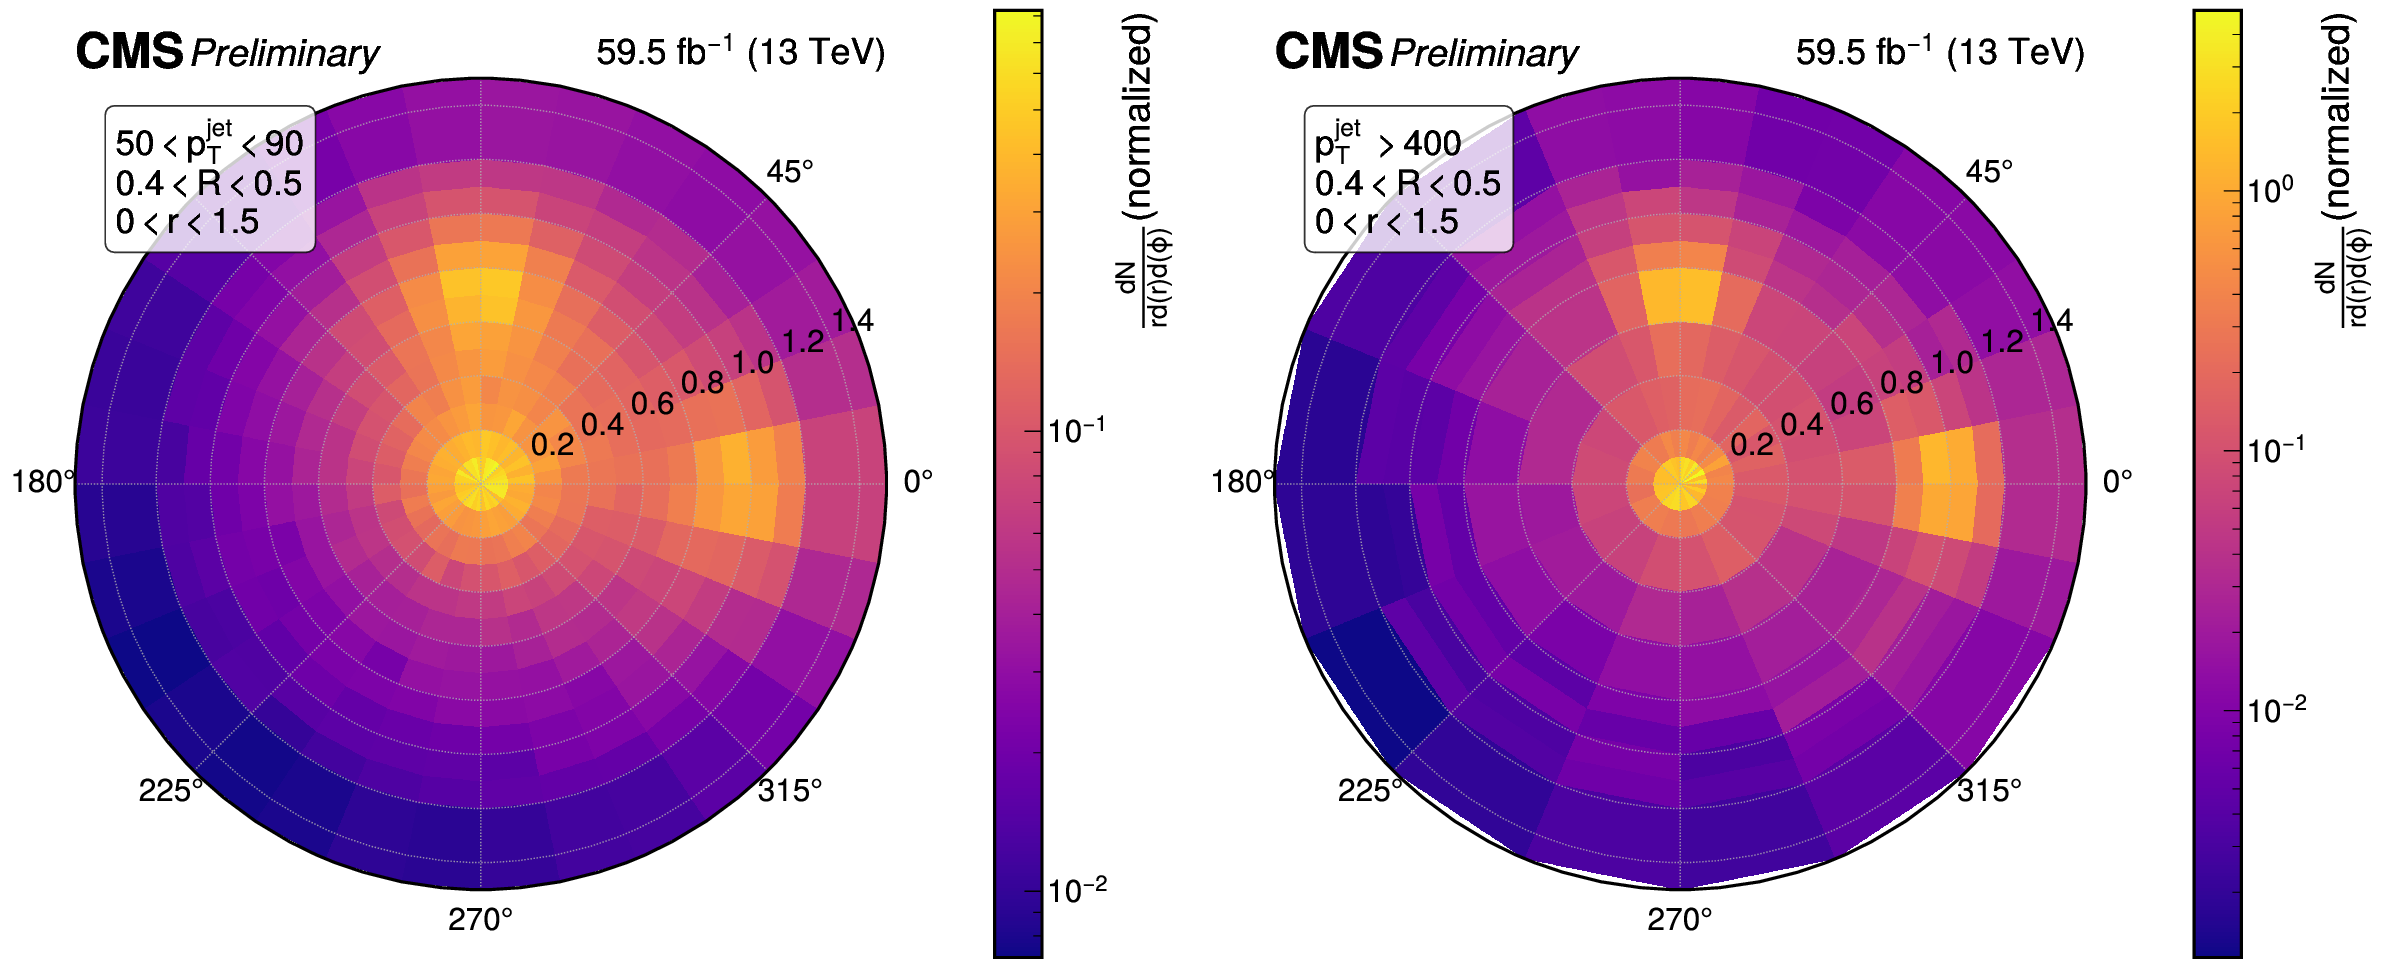
Figure 2:
Unfolded tee-configuration distributions in the lowest (left) and highest (right) bins of the jet $ p_{\mathrm{T}} $. The measurement is only in the first quadrant, but has been replicated three times to make a full disk for ease of visualization. |
png pdf |
Figure 2-a:
Unfolded tee-configuration distributions in the lowest (left) and highest (right) bins of the jet $ p_{\mathrm{T}} $. The measurement is only in the first quadrant, but has been replicated three times to make a full disk for ease of visualization. |
png pdf |
Figure 2-b:
Unfolded tee-configuration distributions in the lowest (left) and highest (right) bins of the jet $ p_{\mathrm{T}} $. The measurement is only in the first quadrant, but has been replicated three times to make a full disk for ease of visualization. |
png pdf |
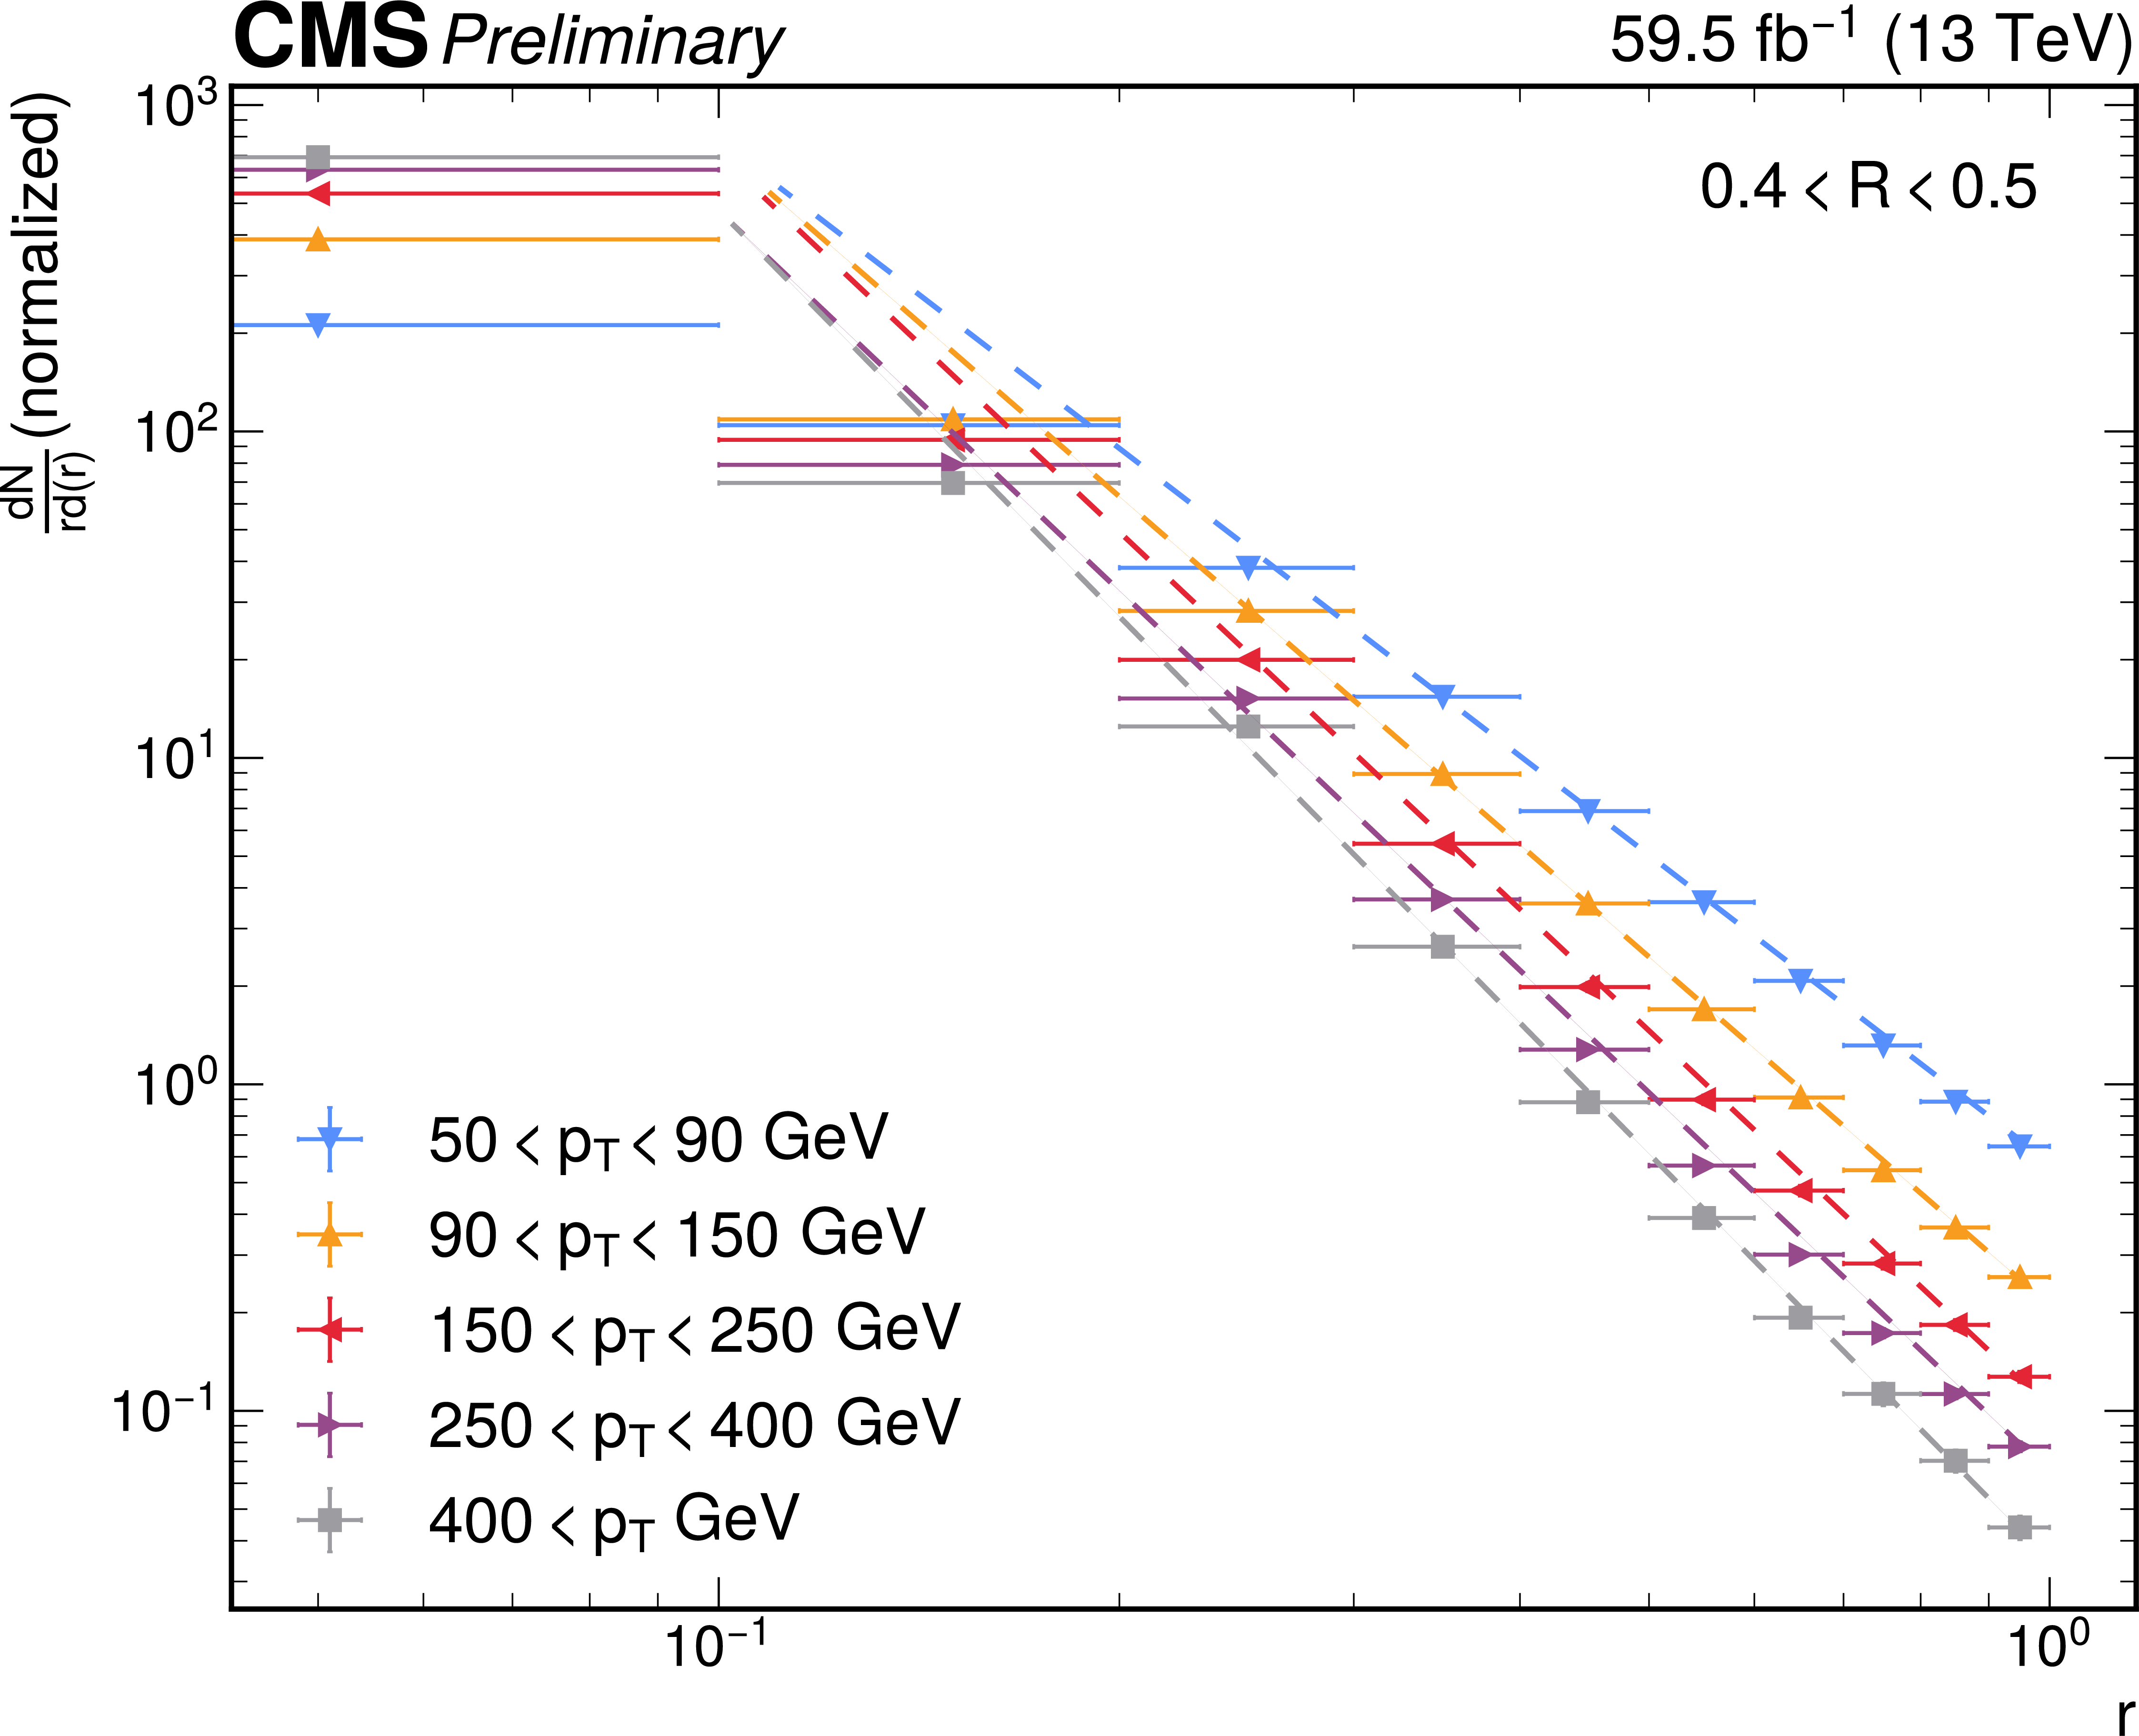
Figure 3:
Radial profile of the unfolded tee-configuration distributions, obtained by integrating over $ \phi $. Dashed lines illustrate the power-law scaling of the distributions in the perturbative region, with slopes that run with the jet $ p_{\mathrm{T}} $. At sufficiently small $ r $ the distributions flatten, indicating the onset of nonperturbative hadronization effects. The scale at which this flattening occurs is inversely proportional to the jet $ p_{\mathrm{T}} $. |
png pdf |
Figure 4:
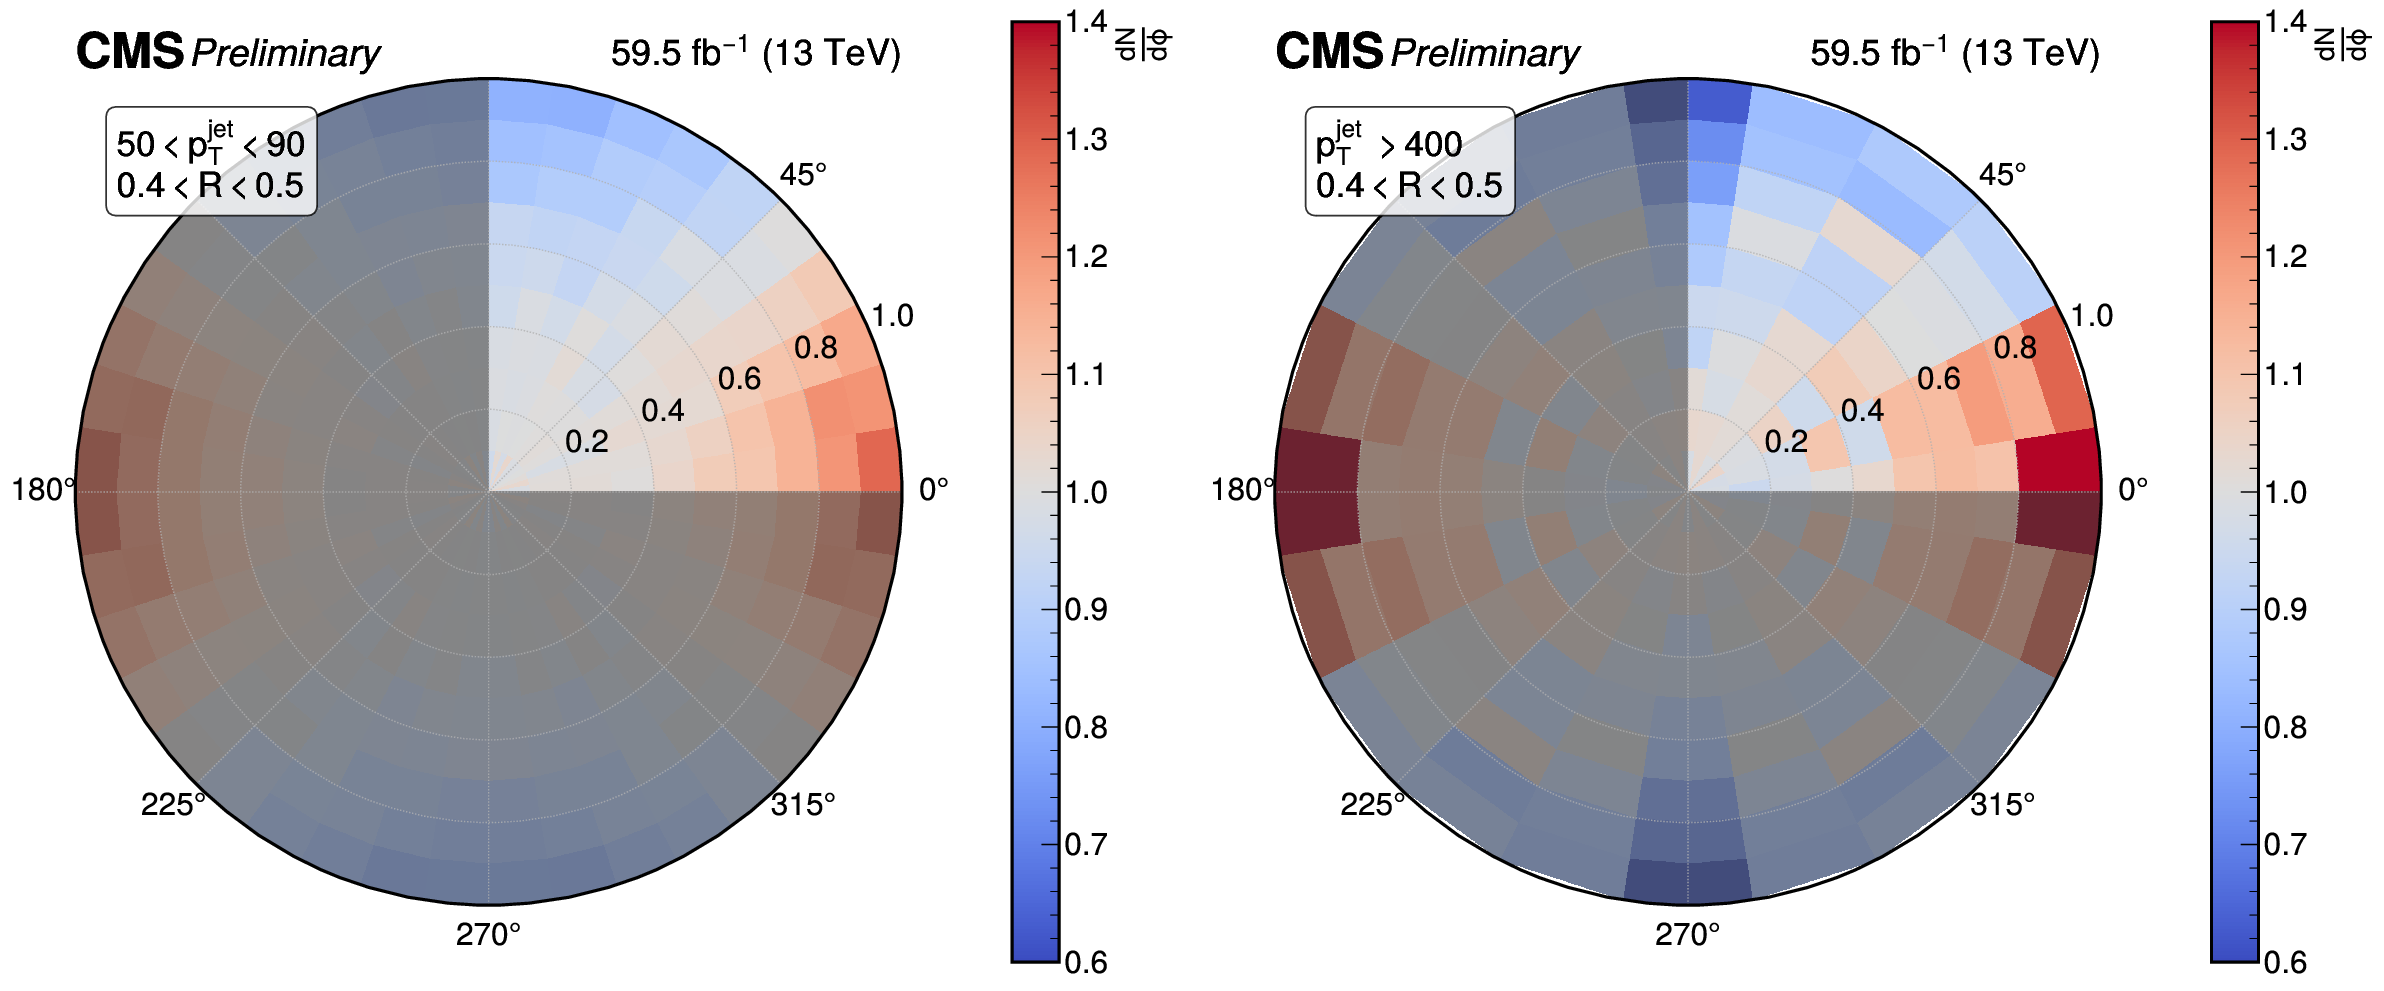
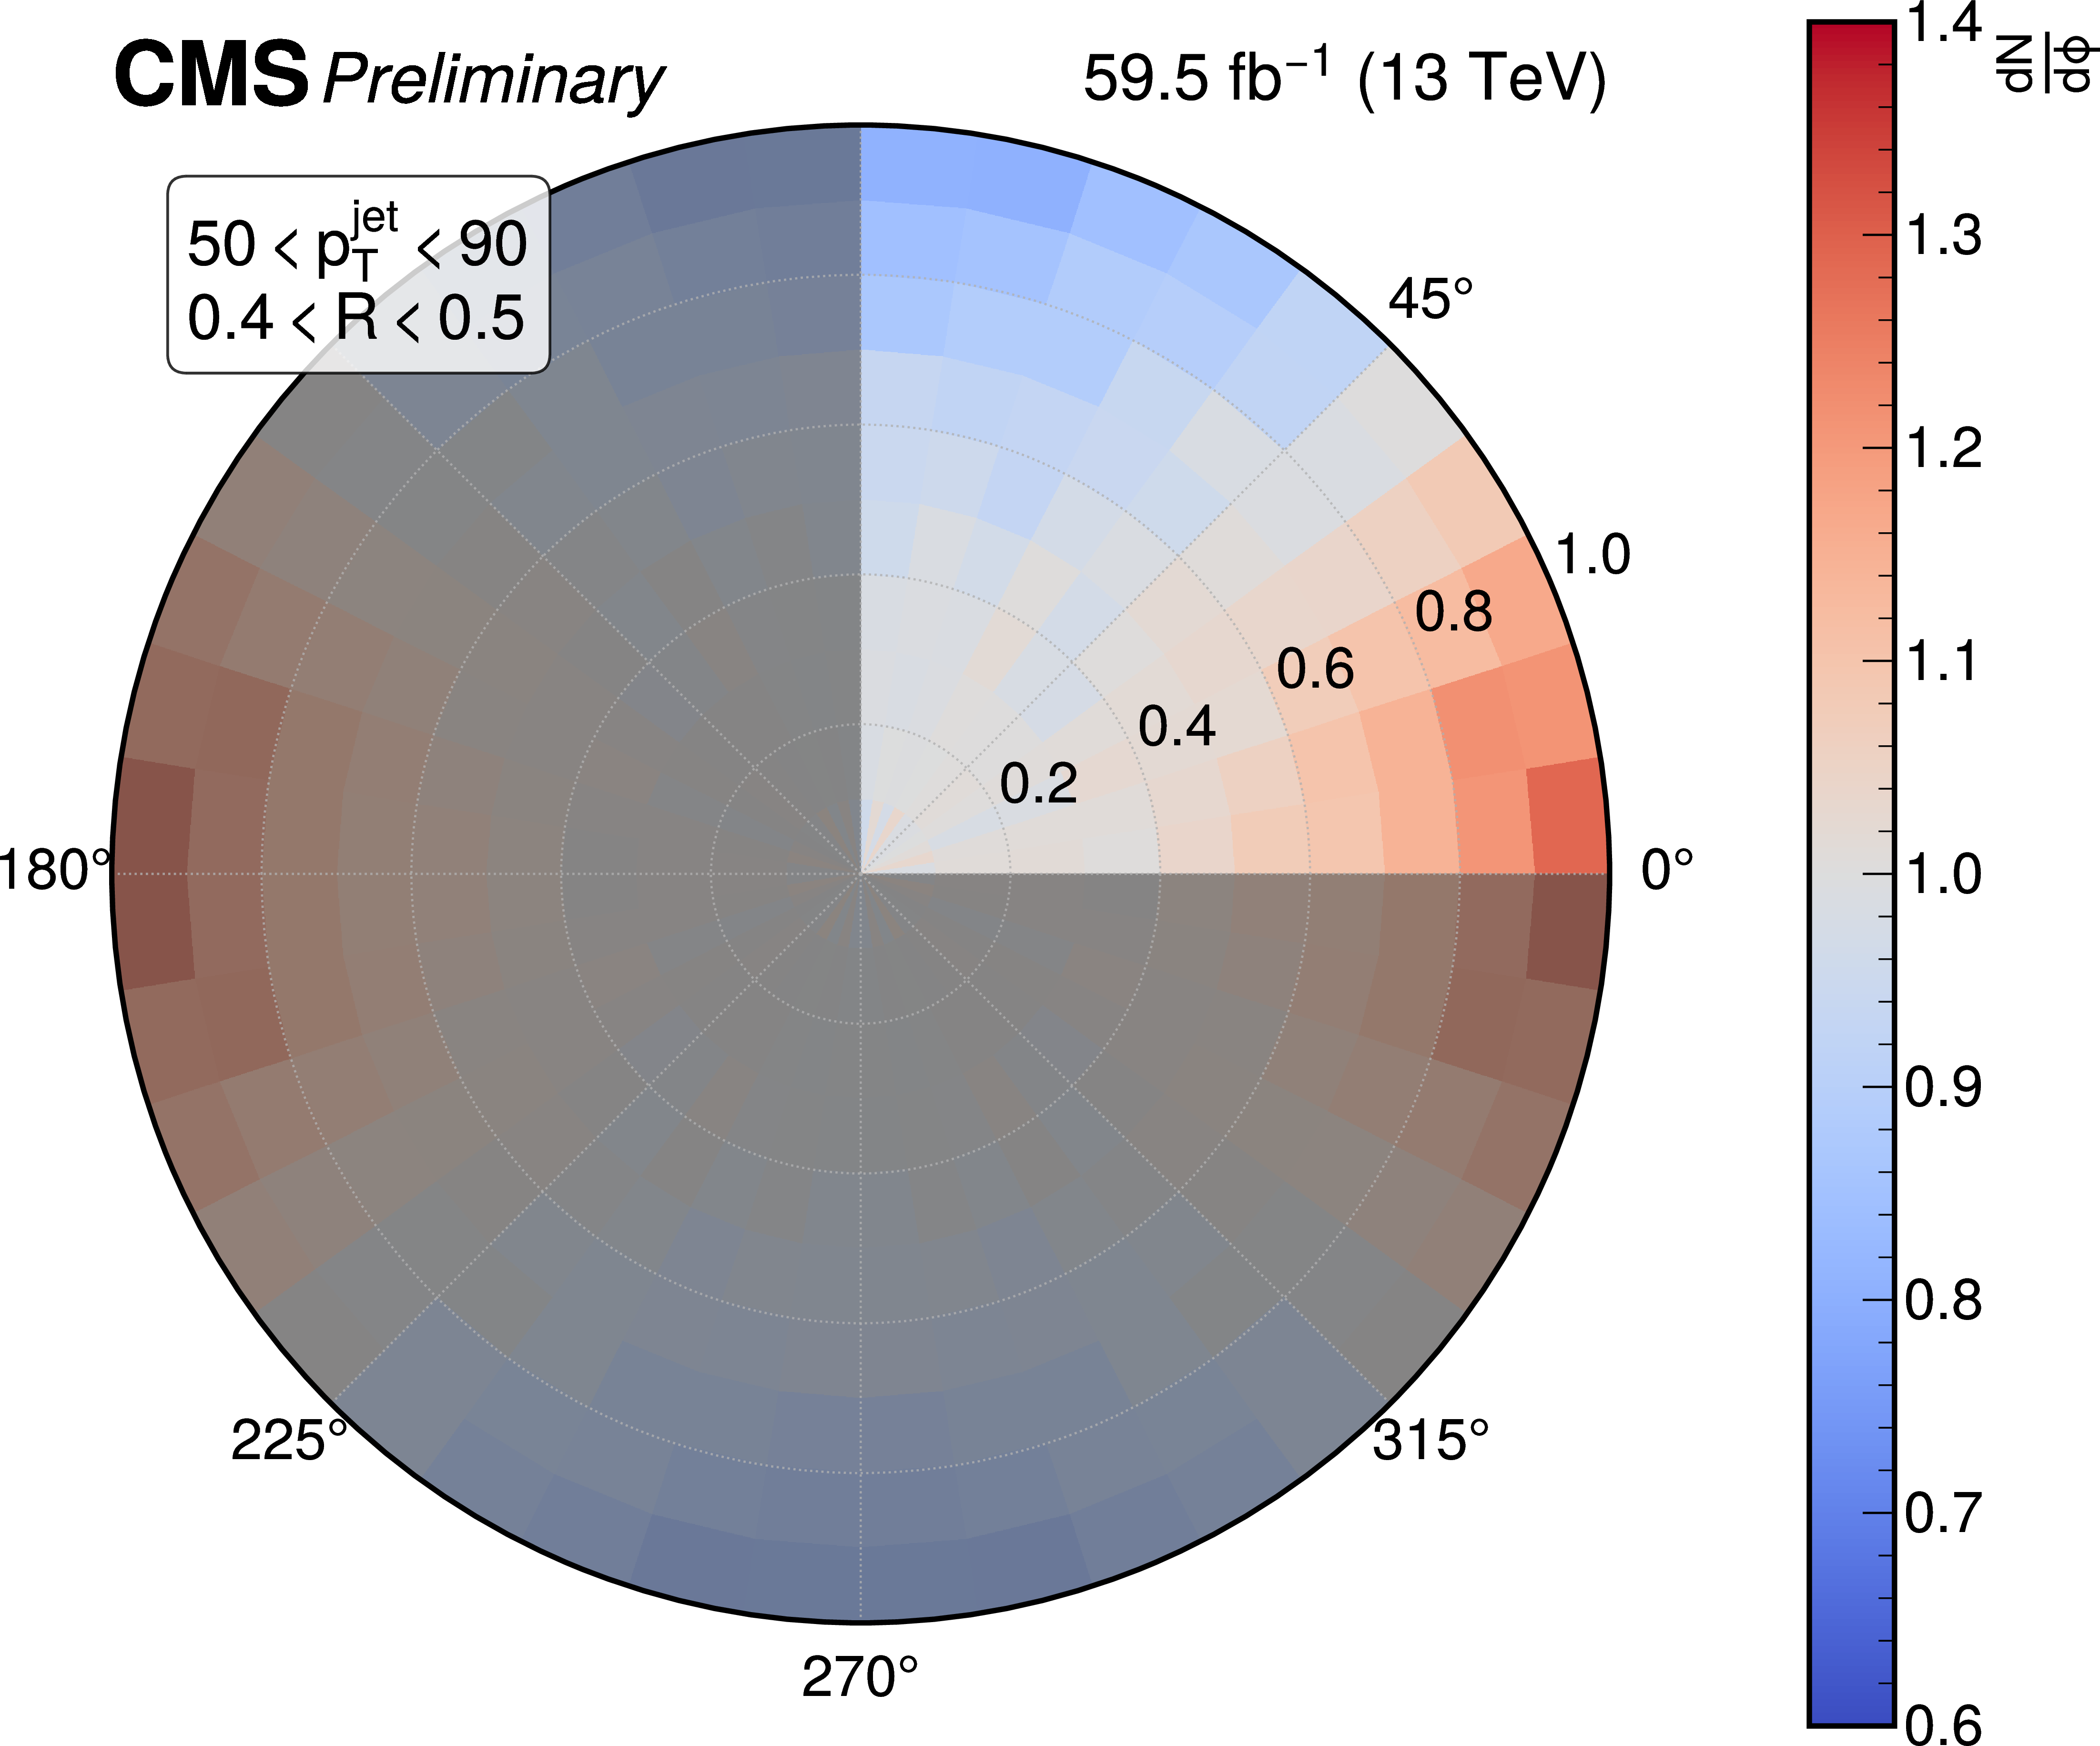
Unfolded tee-configuration distributions in the lowest (left) and highest (right) bins of the jet $ p_{\mathrm{T}} $, with the bulk radial dependence factored out to reveal the angular structure as a function of $ \phi $. The measurement is only in the first quadrant, but has been replicated three times to make a full disk for ease of visualization. |
png pdf |
Figure 4-a:
Unfolded tee-configuration distributions in the lowest (left) and highest (right) bins of the jet $ p_{\mathrm{T}} $, with the bulk radial dependence factored out to reveal the angular structure as a function of $ \phi $. The measurement is only in the first quadrant, but has been replicated three times to make a full disk for ease of visualization. |
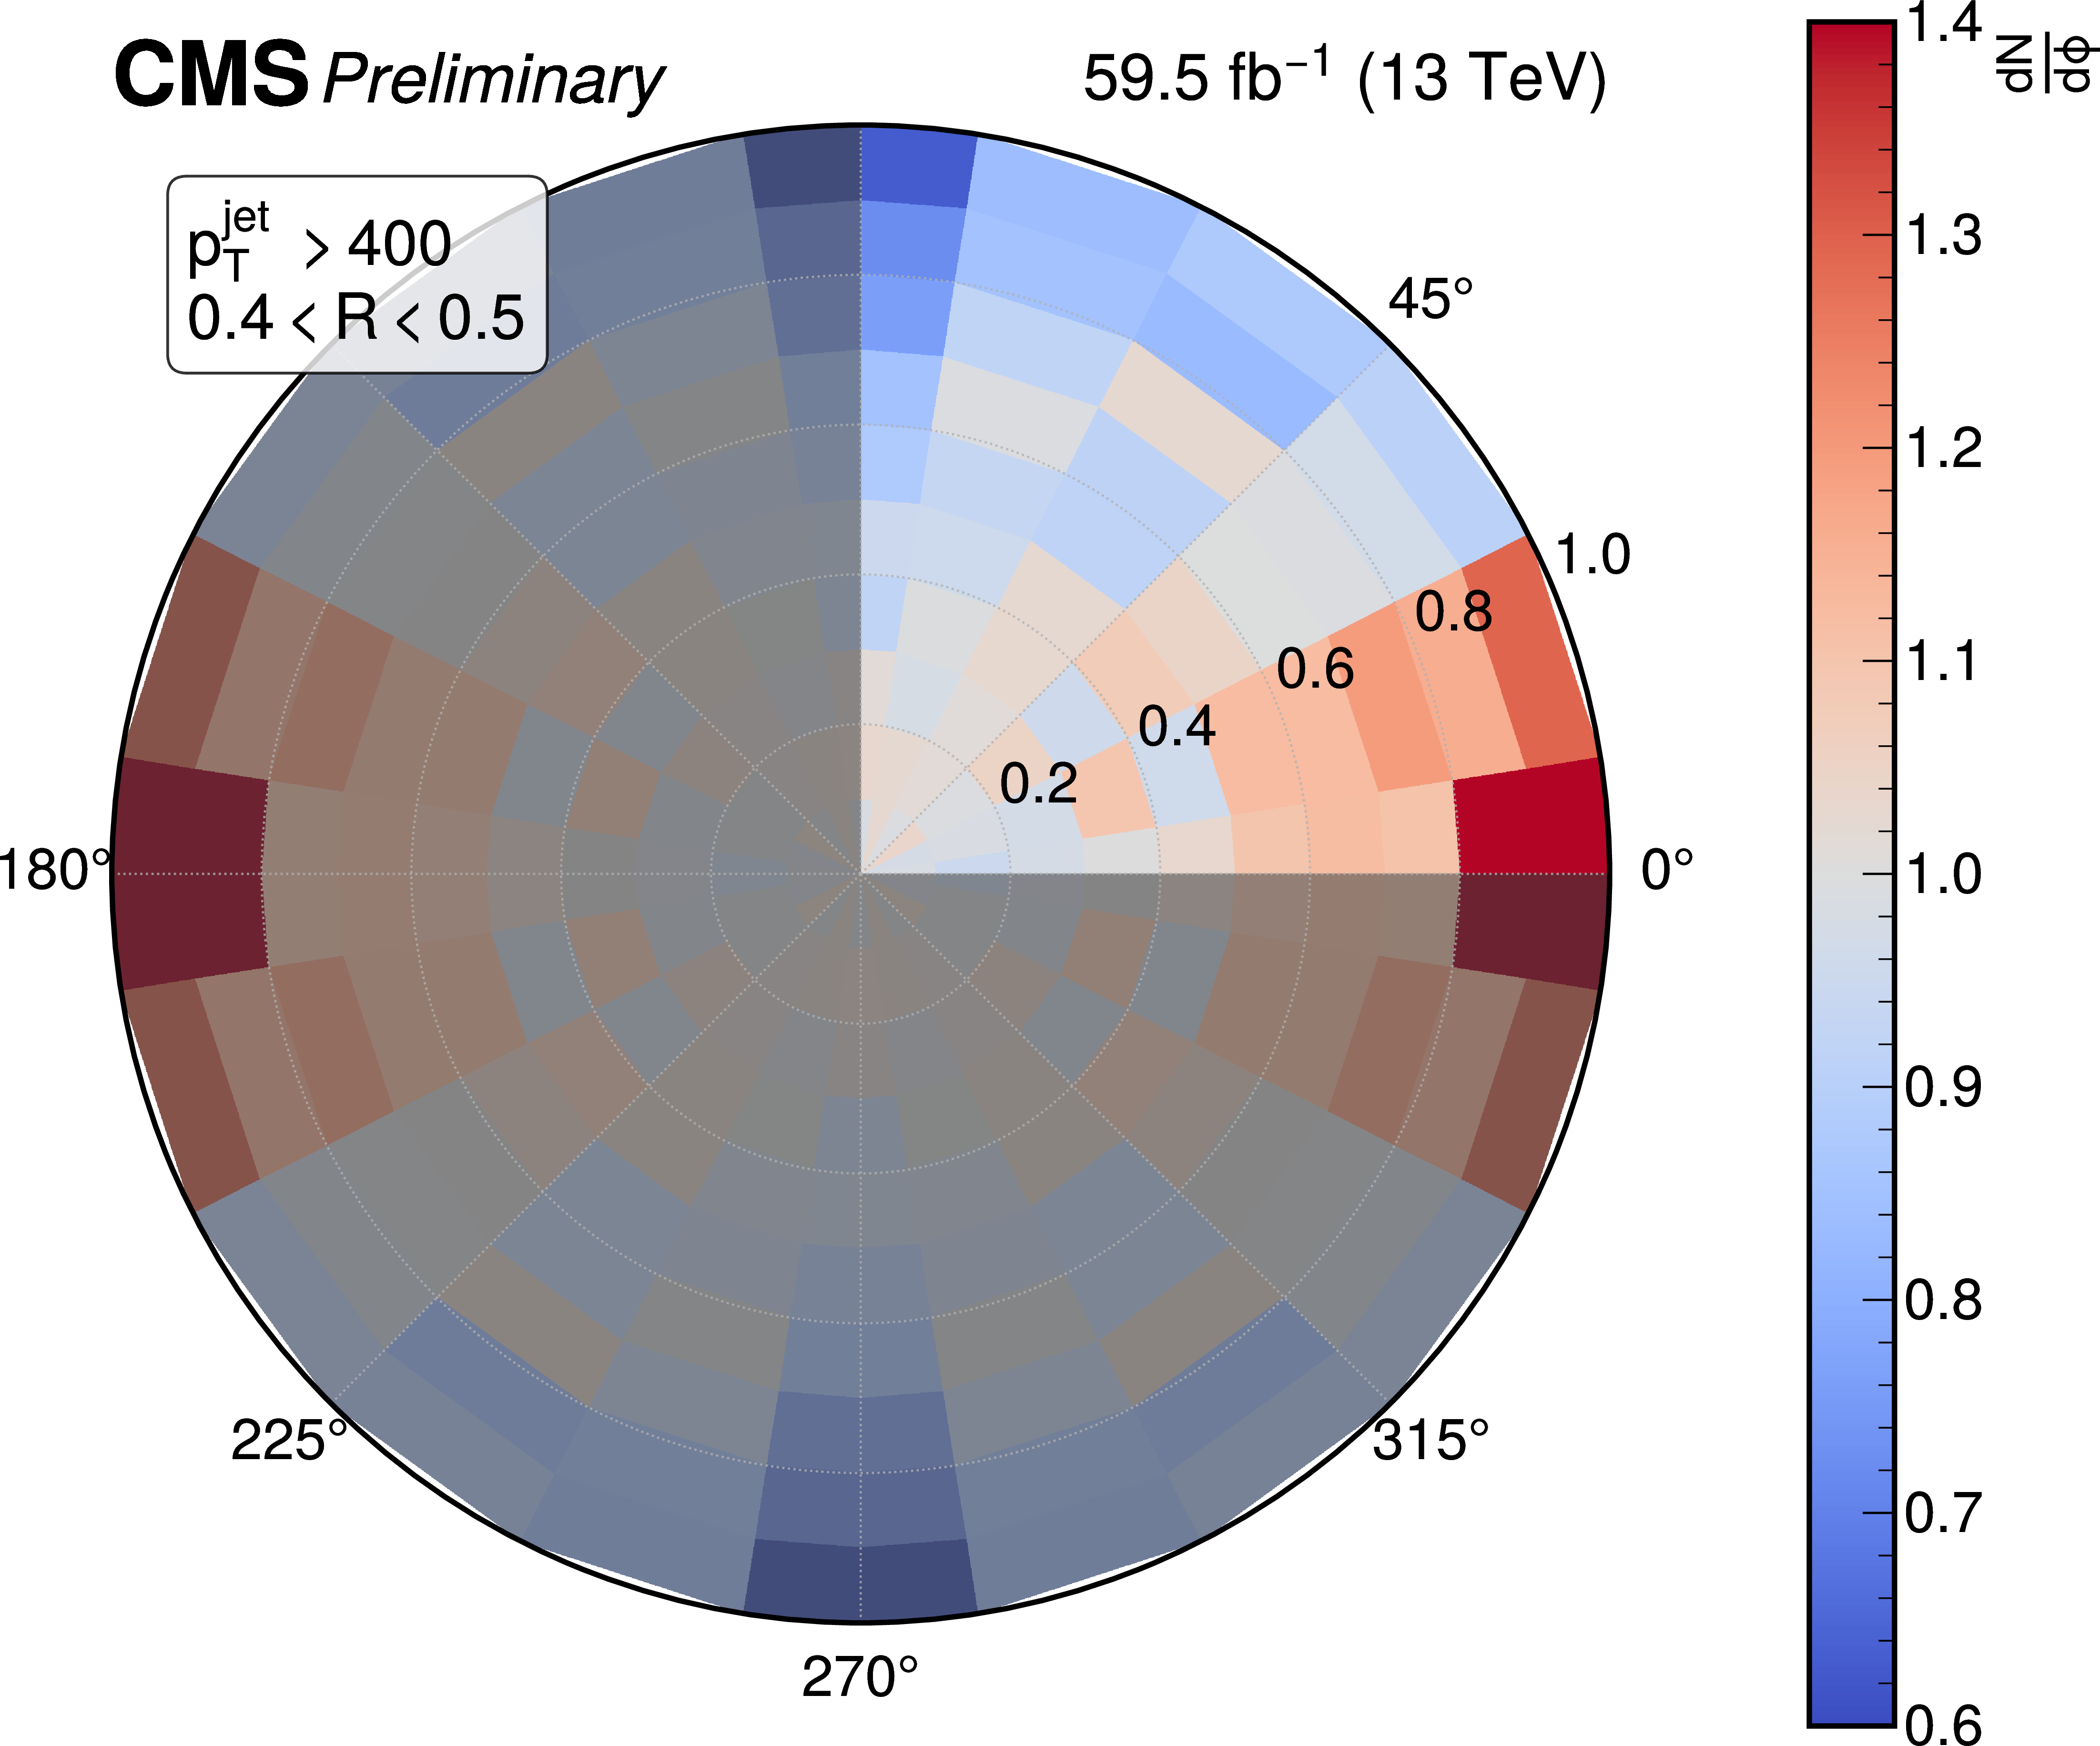
png pdf |
Figure 4-b:
Unfolded tee-configuration distributions in the lowest (left) and highest (right) bins of the jet $ p_{\mathrm{T}} $, with the bulk radial dependence factored out to reveal the angular structure as a function of $ \phi $. The measurement is only in the first quadrant, but has been replicated three times to make a full disk for ease of visualization. |
png pdf |
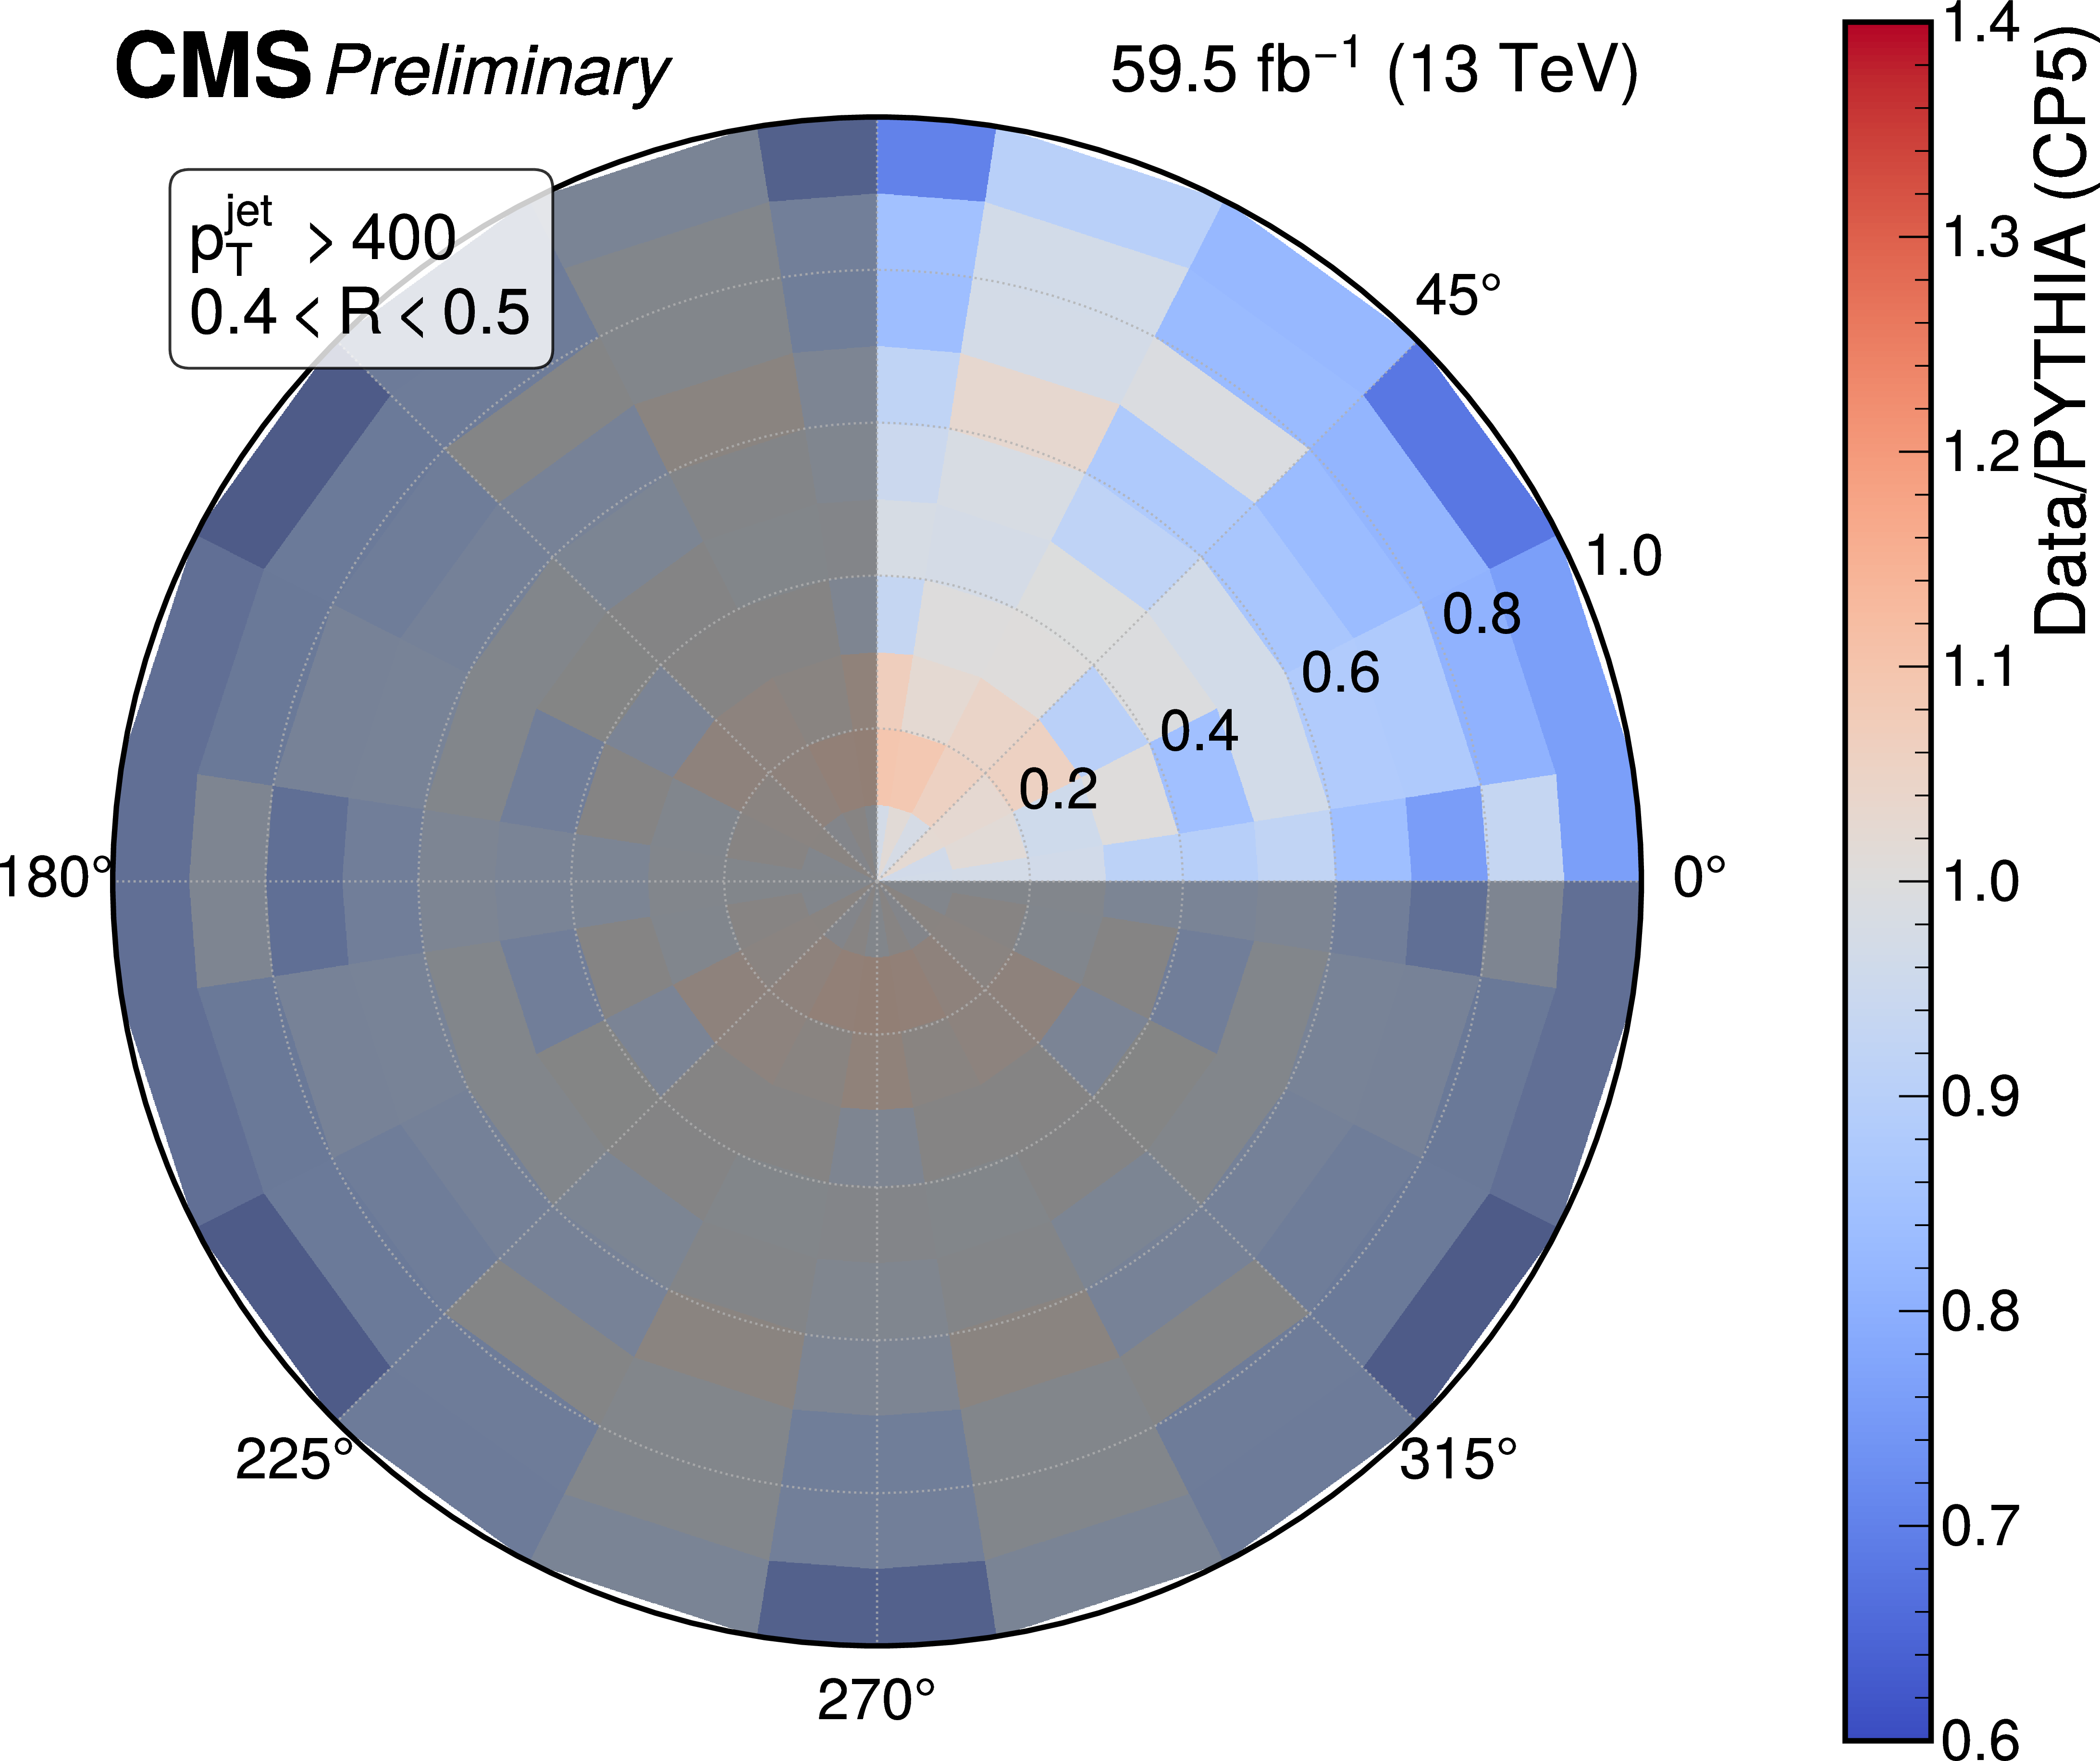
Figure 5:
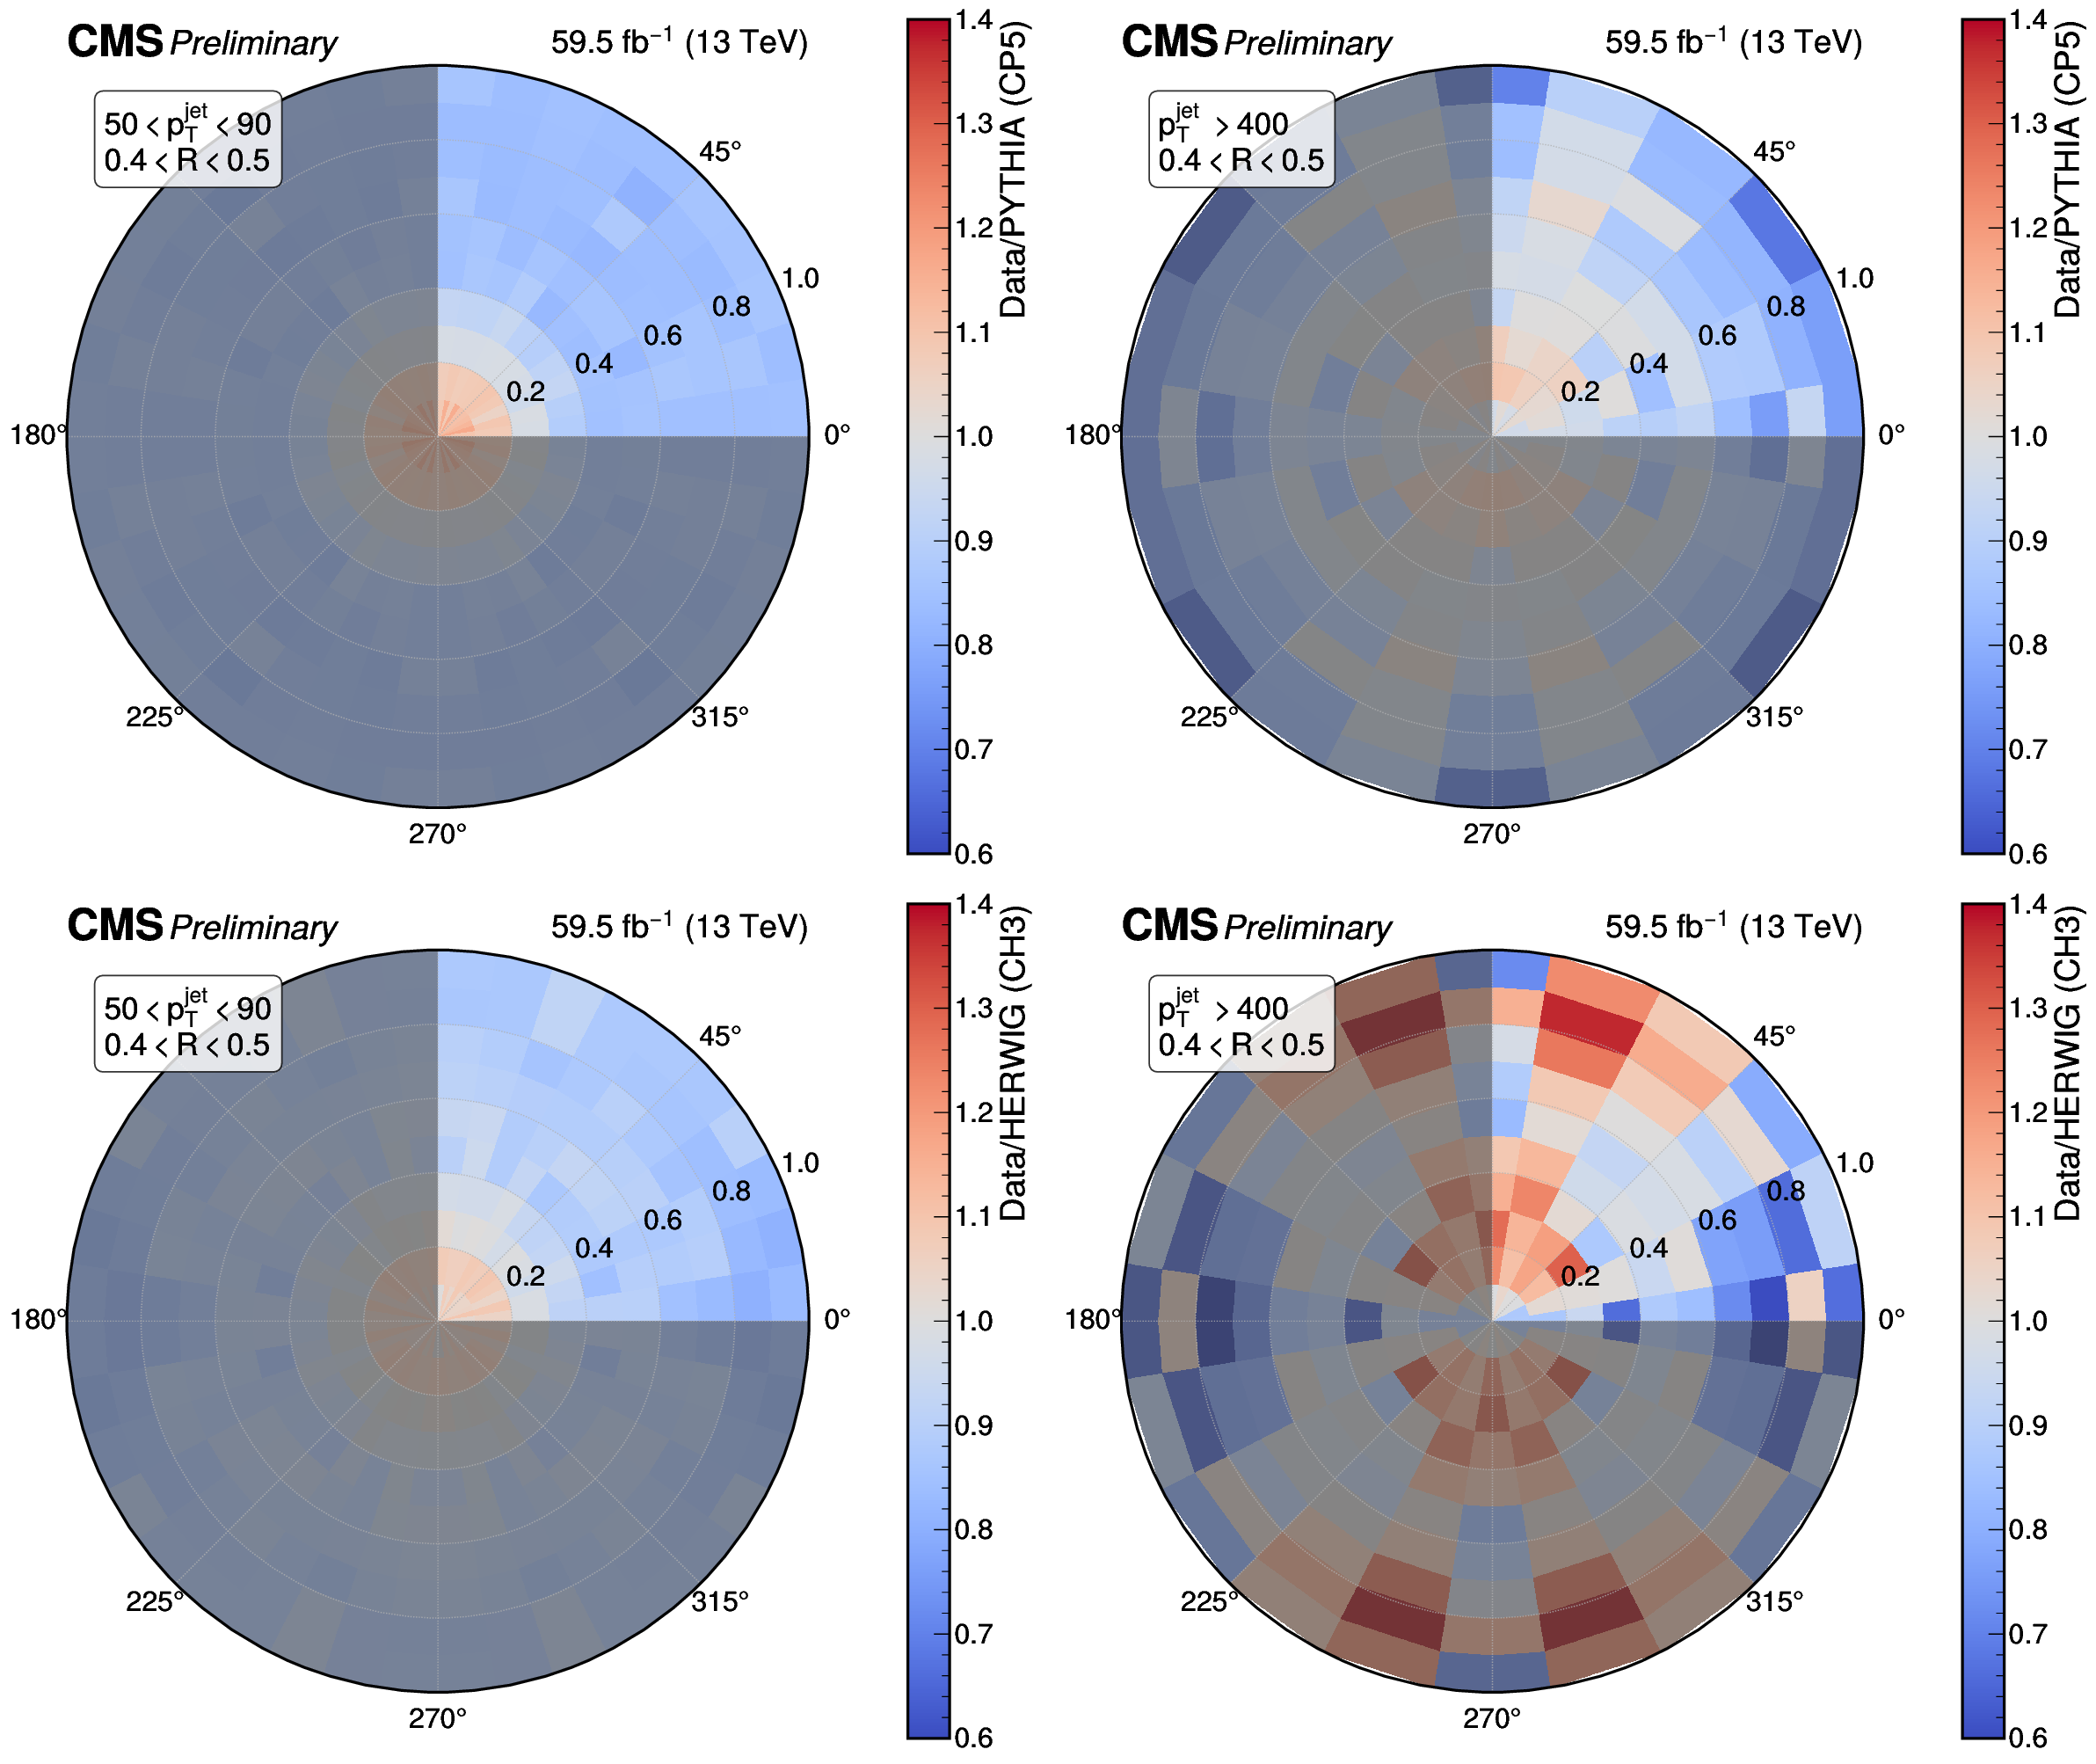
Ratio of unfolded data to MC prediction for the tee configuration. Top: Data vs Pythia. Bottom: Data vs Herwig. Left: 50 $ < p_{\mathrm{T}}^{\text{jet}} < $ 90 GeV. Right: $ p_{\mathrm{T}}^{\text{jet}} > $ 400 GeV. |
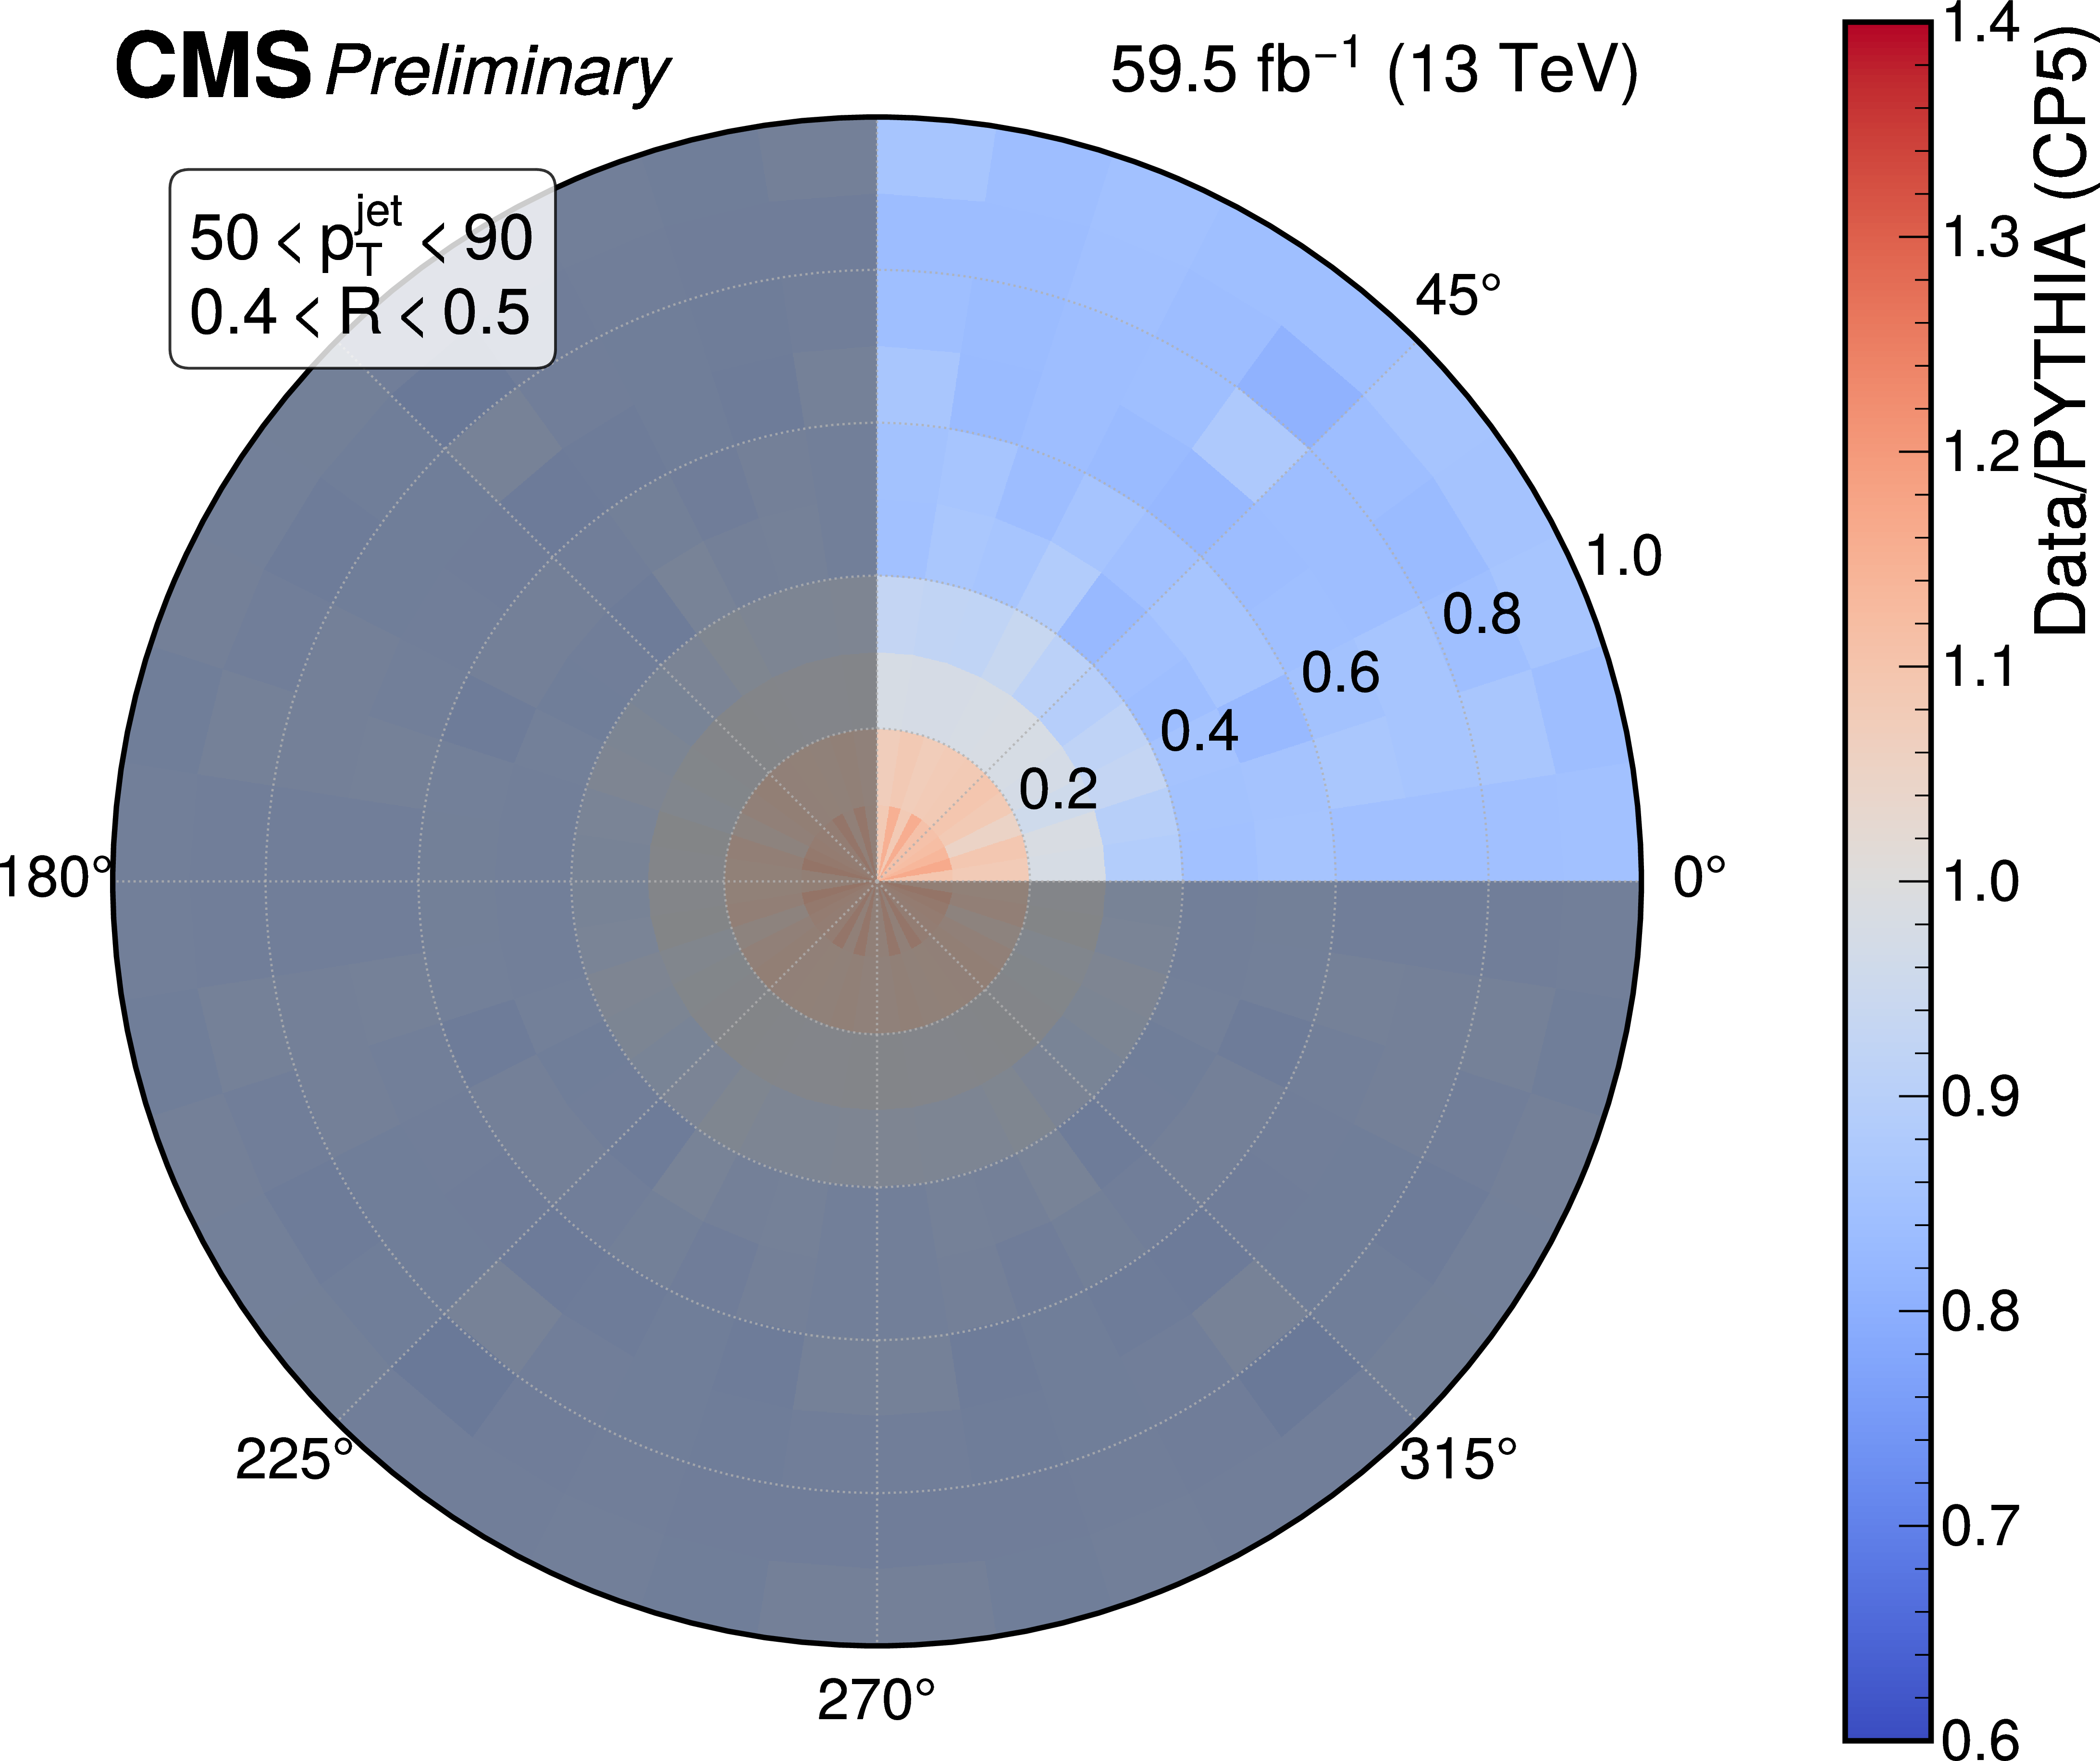
png pdf |
Figure 5-a:
Ratio of unfolded data to MC prediction for the tee configuration. Top: Data vs Pythia. Bottom: Data vs Herwig. Left: 50 $ < p_{\mathrm{T}}^{\text{jet}} < $ 90 GeV. Right: $ p_{\mathrm{T}}^{\text{jet}} > $ 400 GeV. |
png pdf |
Figure 5-b:
Ratio of unfolded data to MC prediction for the tee configuration. Top: Data vs Pythia. Bottom: Data vs Herwig. Left: 50 $ < p_{\mathrm{T}}^{\text{jet}} < $ 90 GeV. Right: $ p_{\mathrm{T}}^{\text{jet}} > $ 400 GeV. |
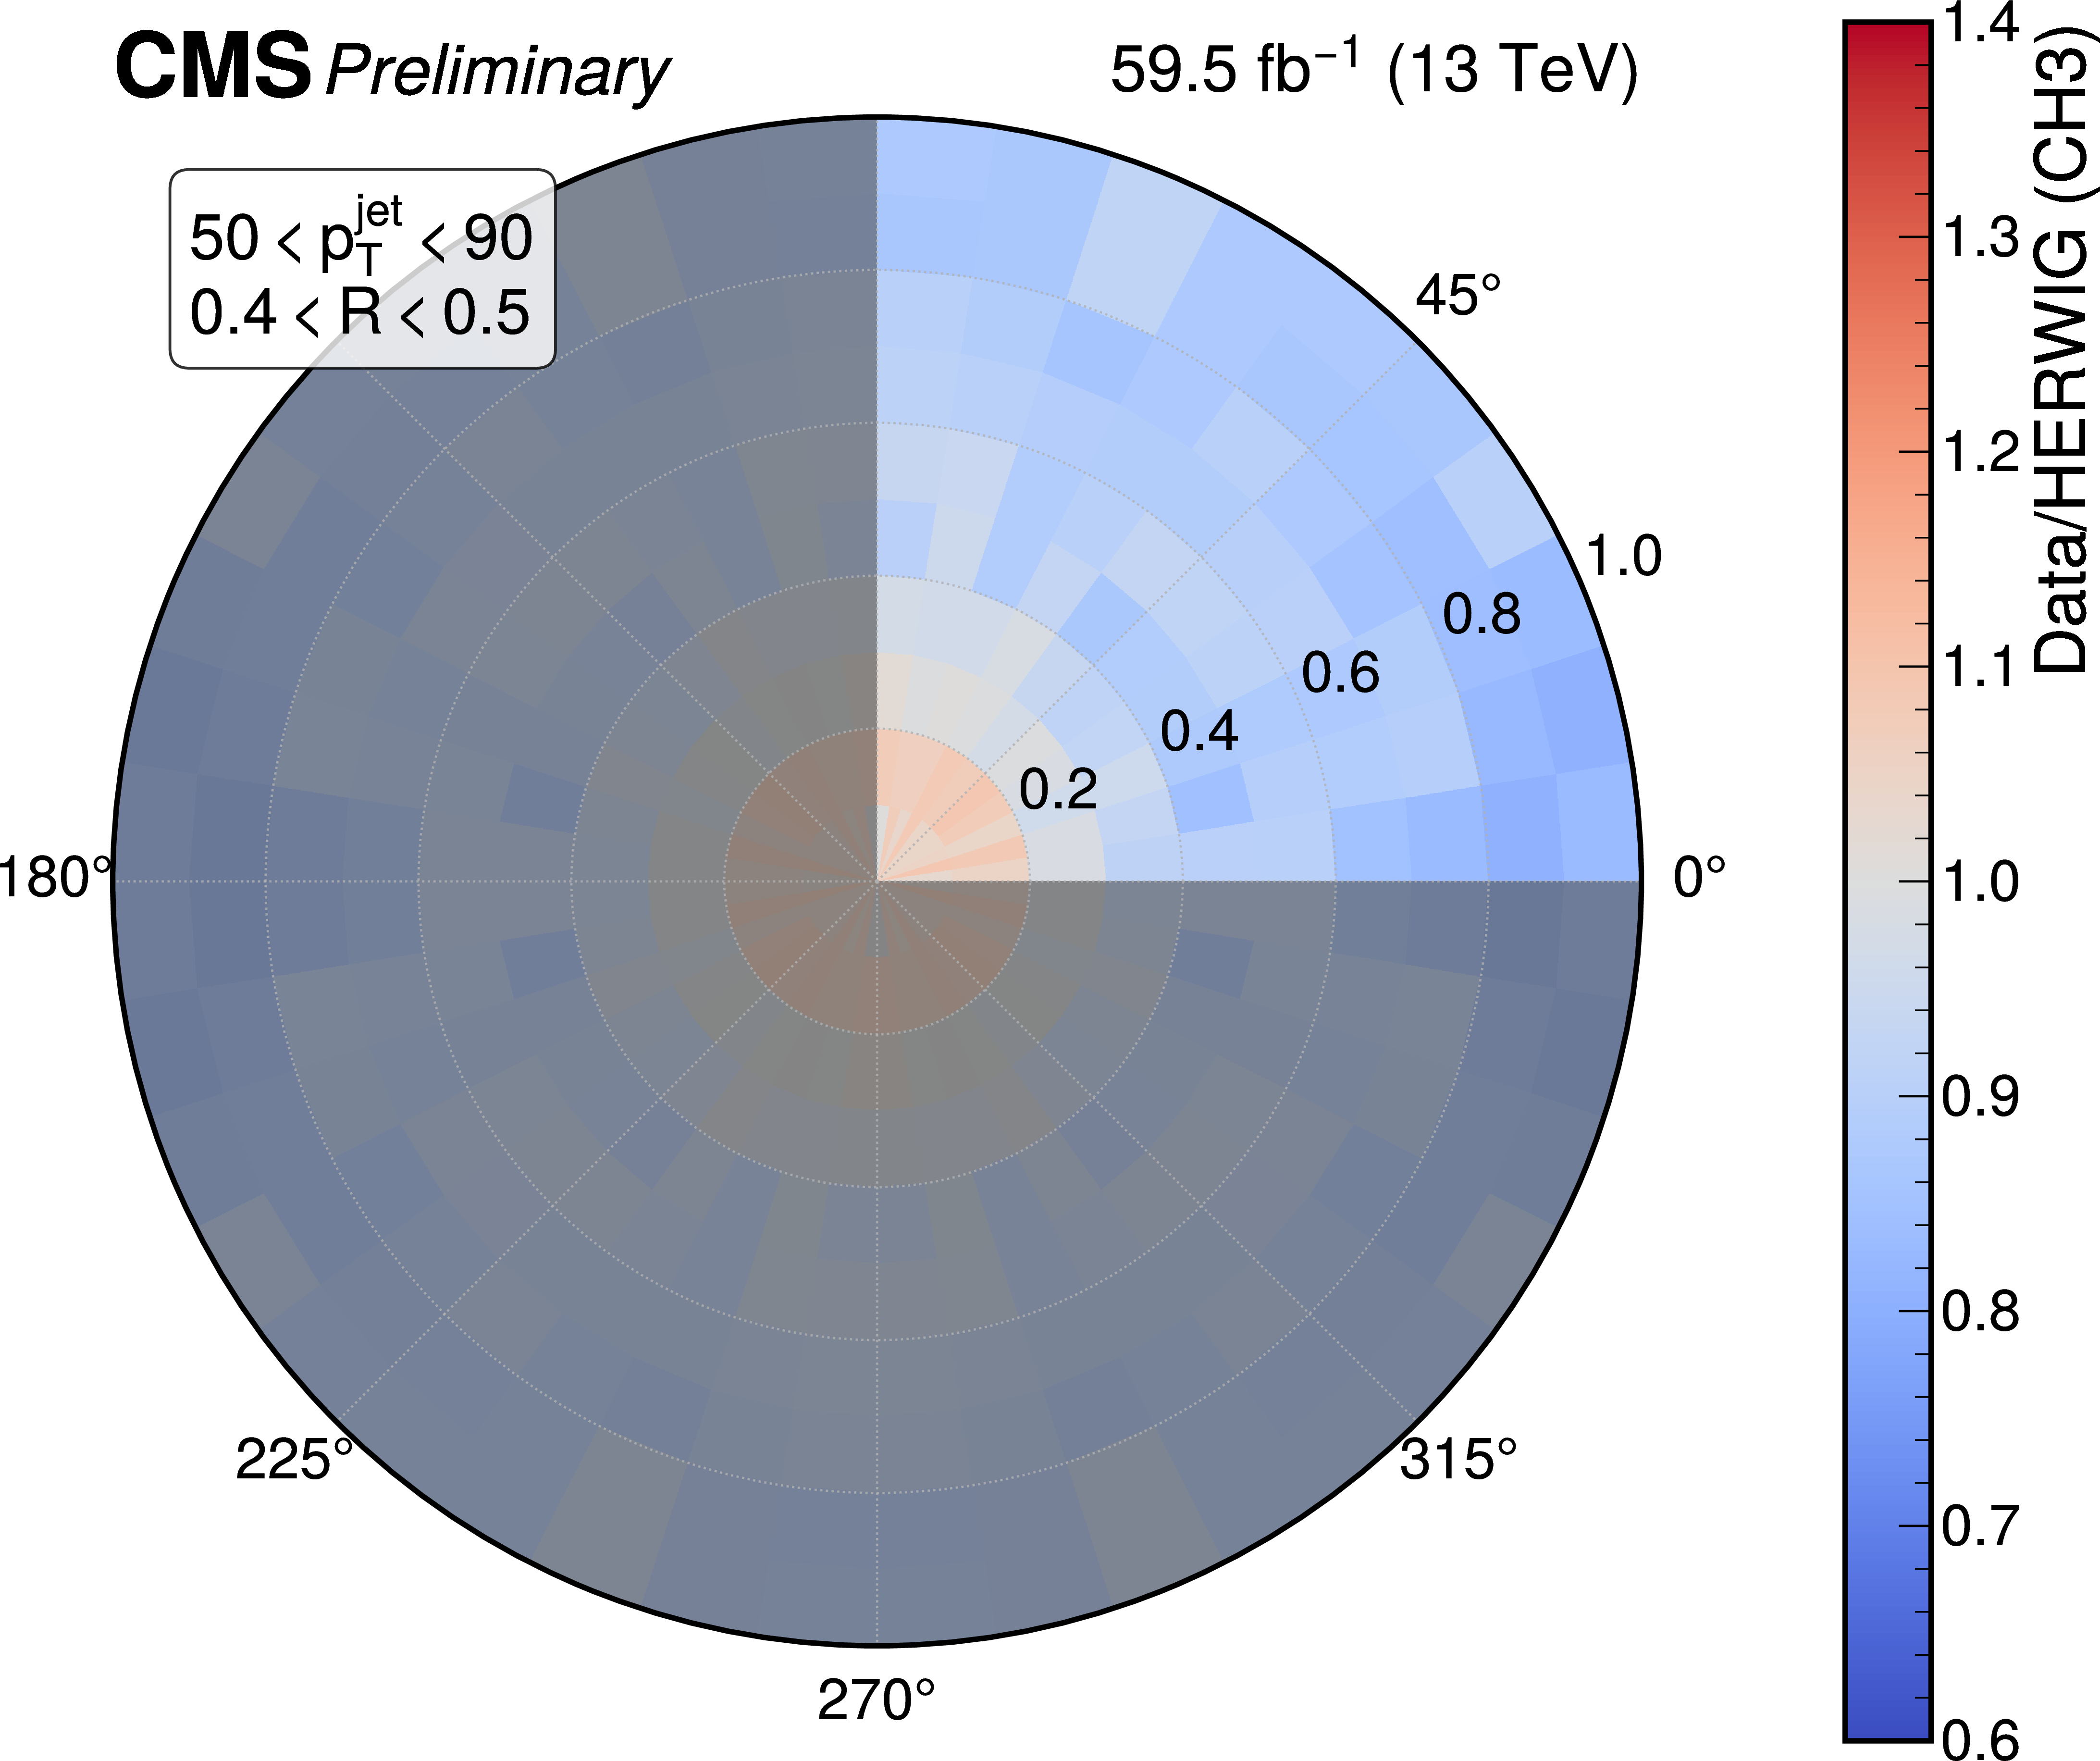
png pdf |
Figure 5-c:
Ratio of unfolded data to MC prediction for the tee configuration. Top: Data vs Pythia. Bottom: Data vs Herwig. Left: 50 $ < p_{\mathrm{T}}^{\text{jet}} < $ 90 GeV. Right: $ p_{\mathrm{T}}^{\text{jet}} > $ 400 GeV. |
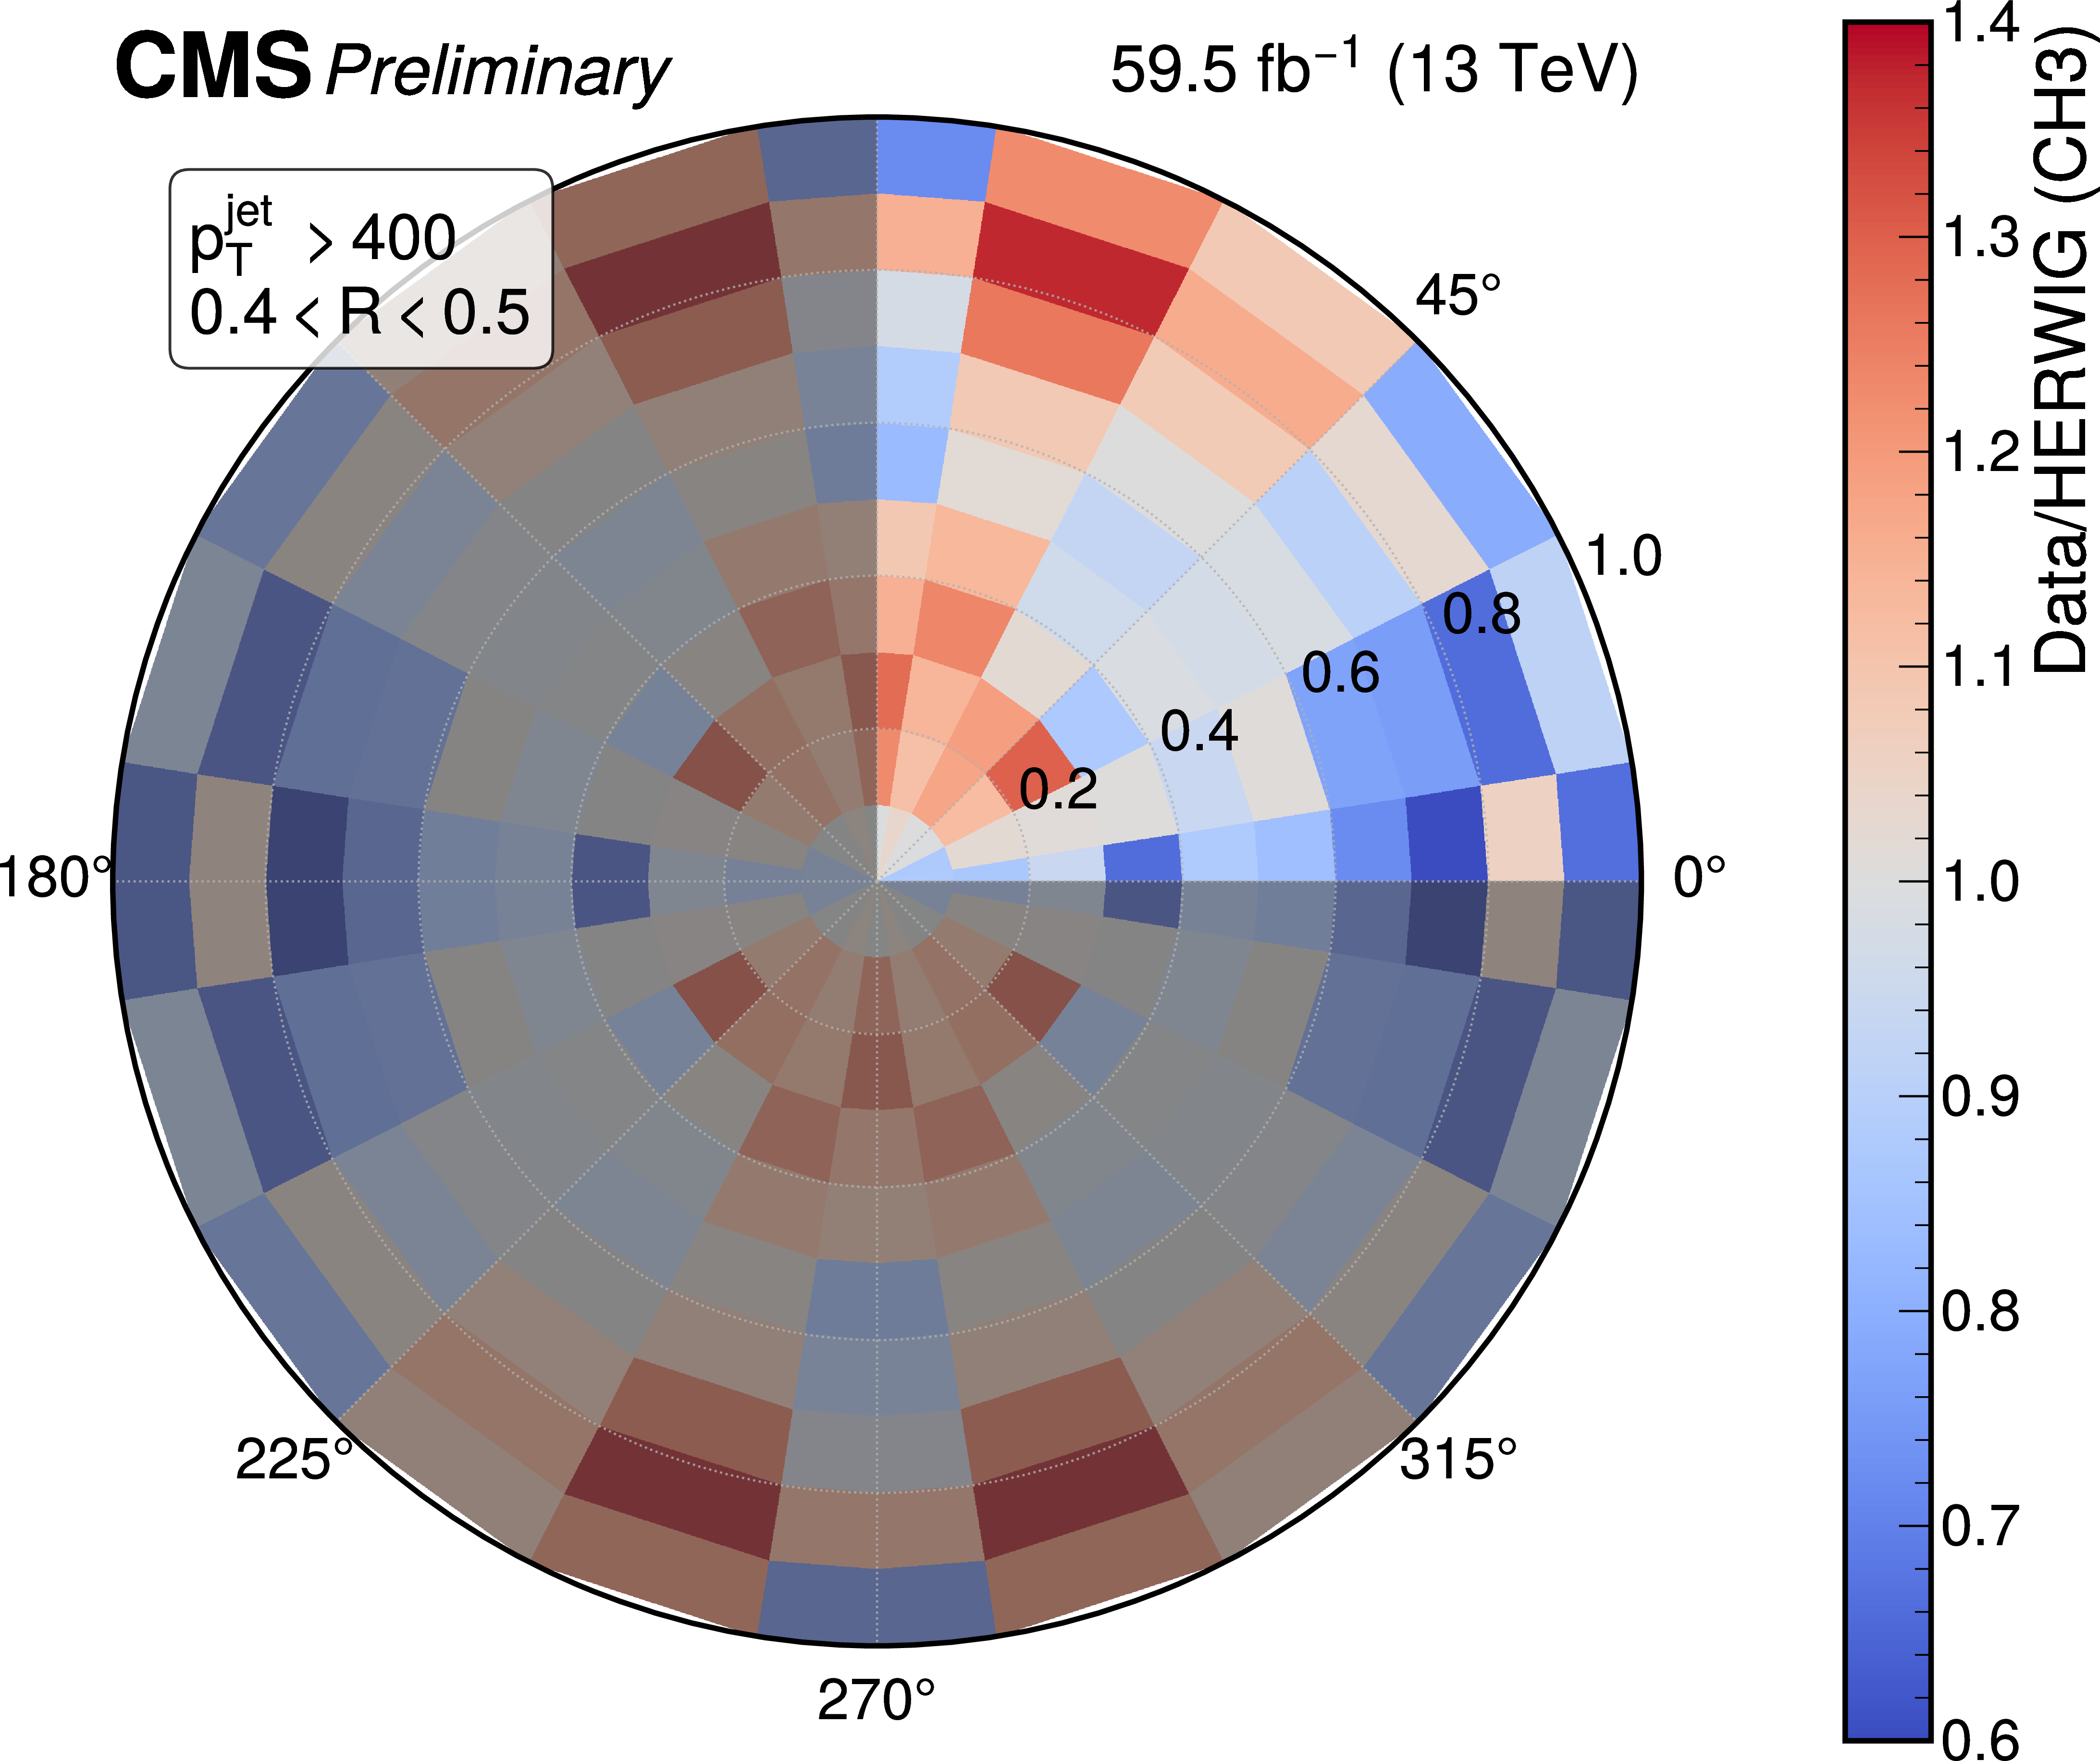
png pdf |
Figure 5-d:
Ratio of unfolded data to MC prediction for the tee configuration. Top: Data vs Pythia. Bottom: Data vs Herwig. Left: 50 $ < p_{\mathrm{T}}^{\text{jet}} < $ 90 GeV. Right: $ p_{\mathrm{T}}^{\text{jet}} > $ 400 GeV. |
png pdf |
Figure 6:
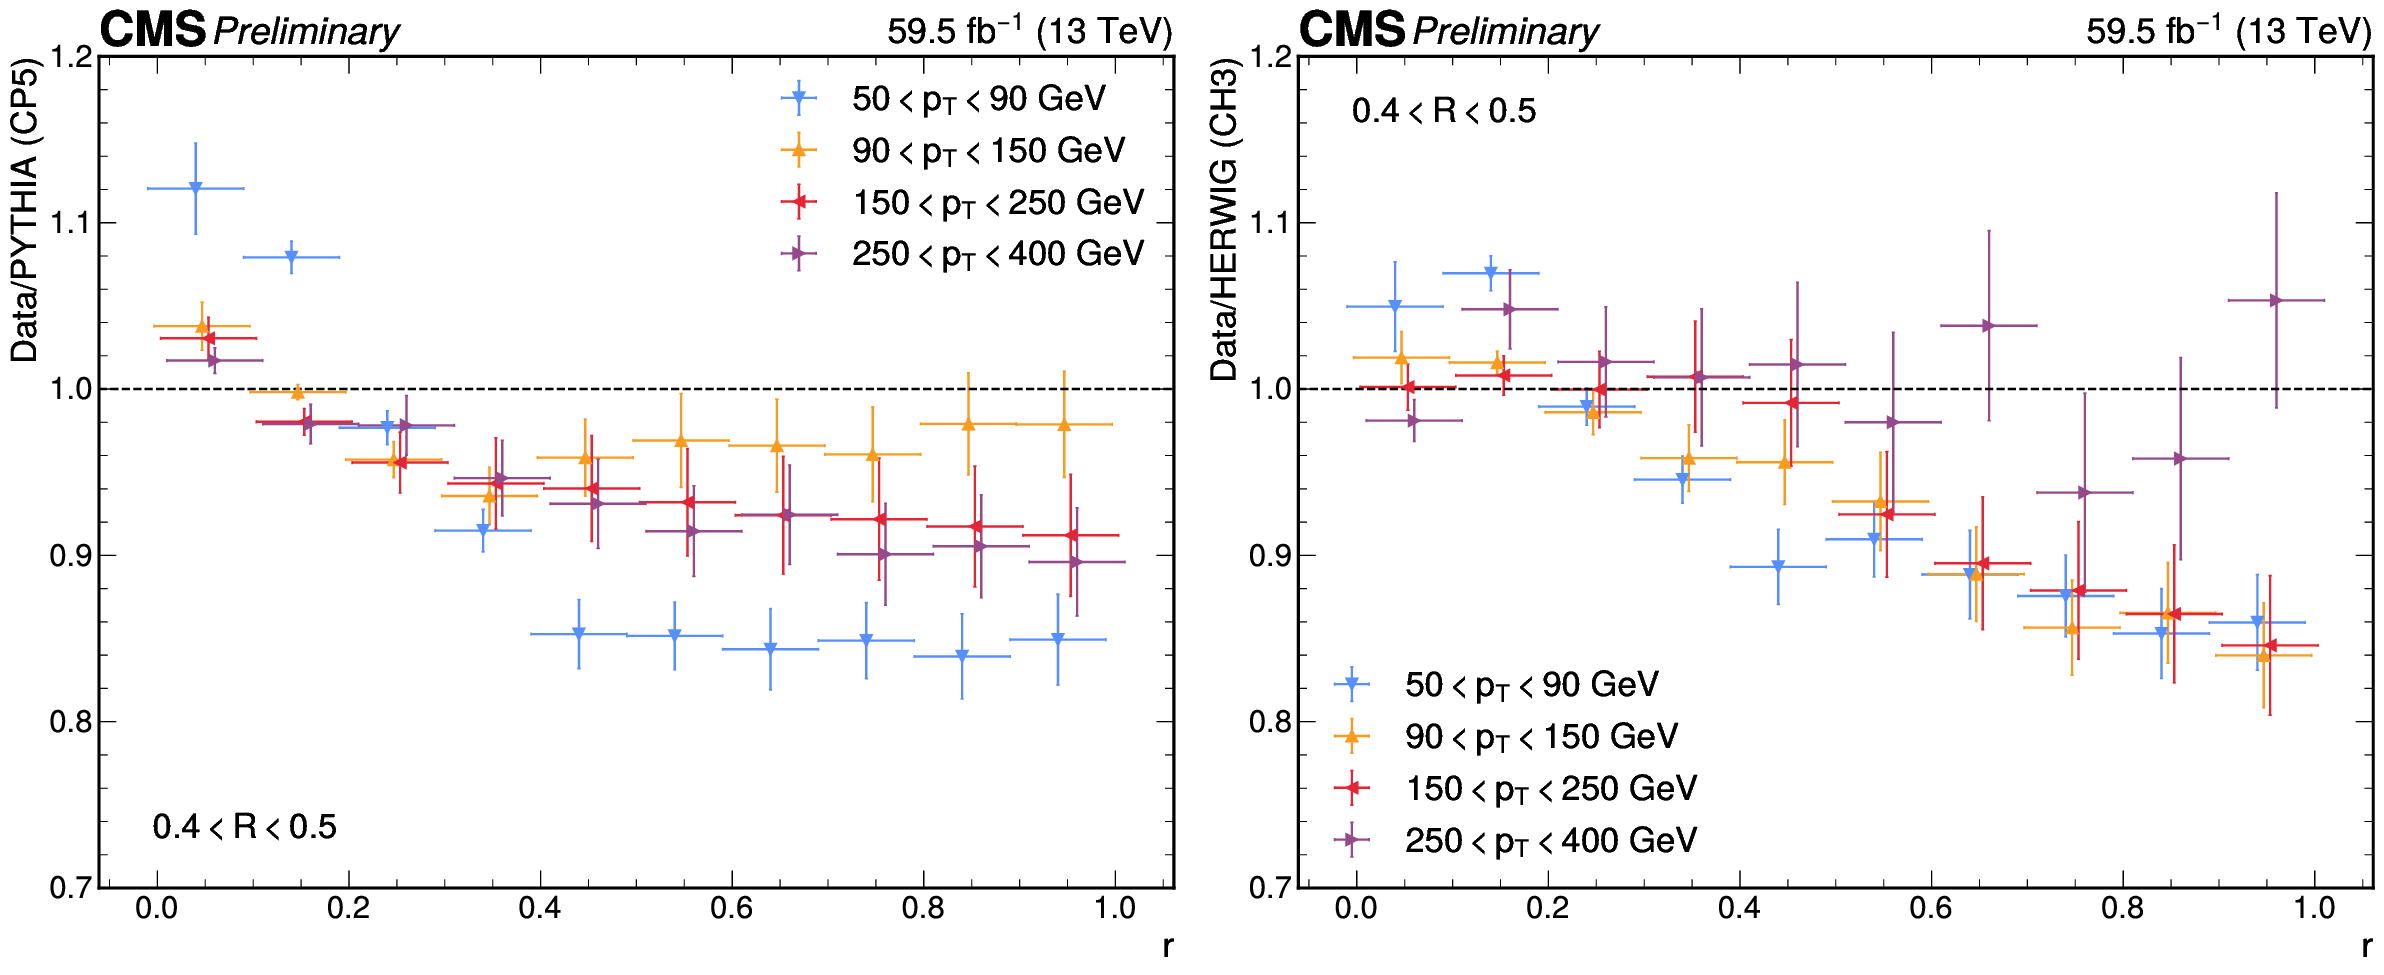
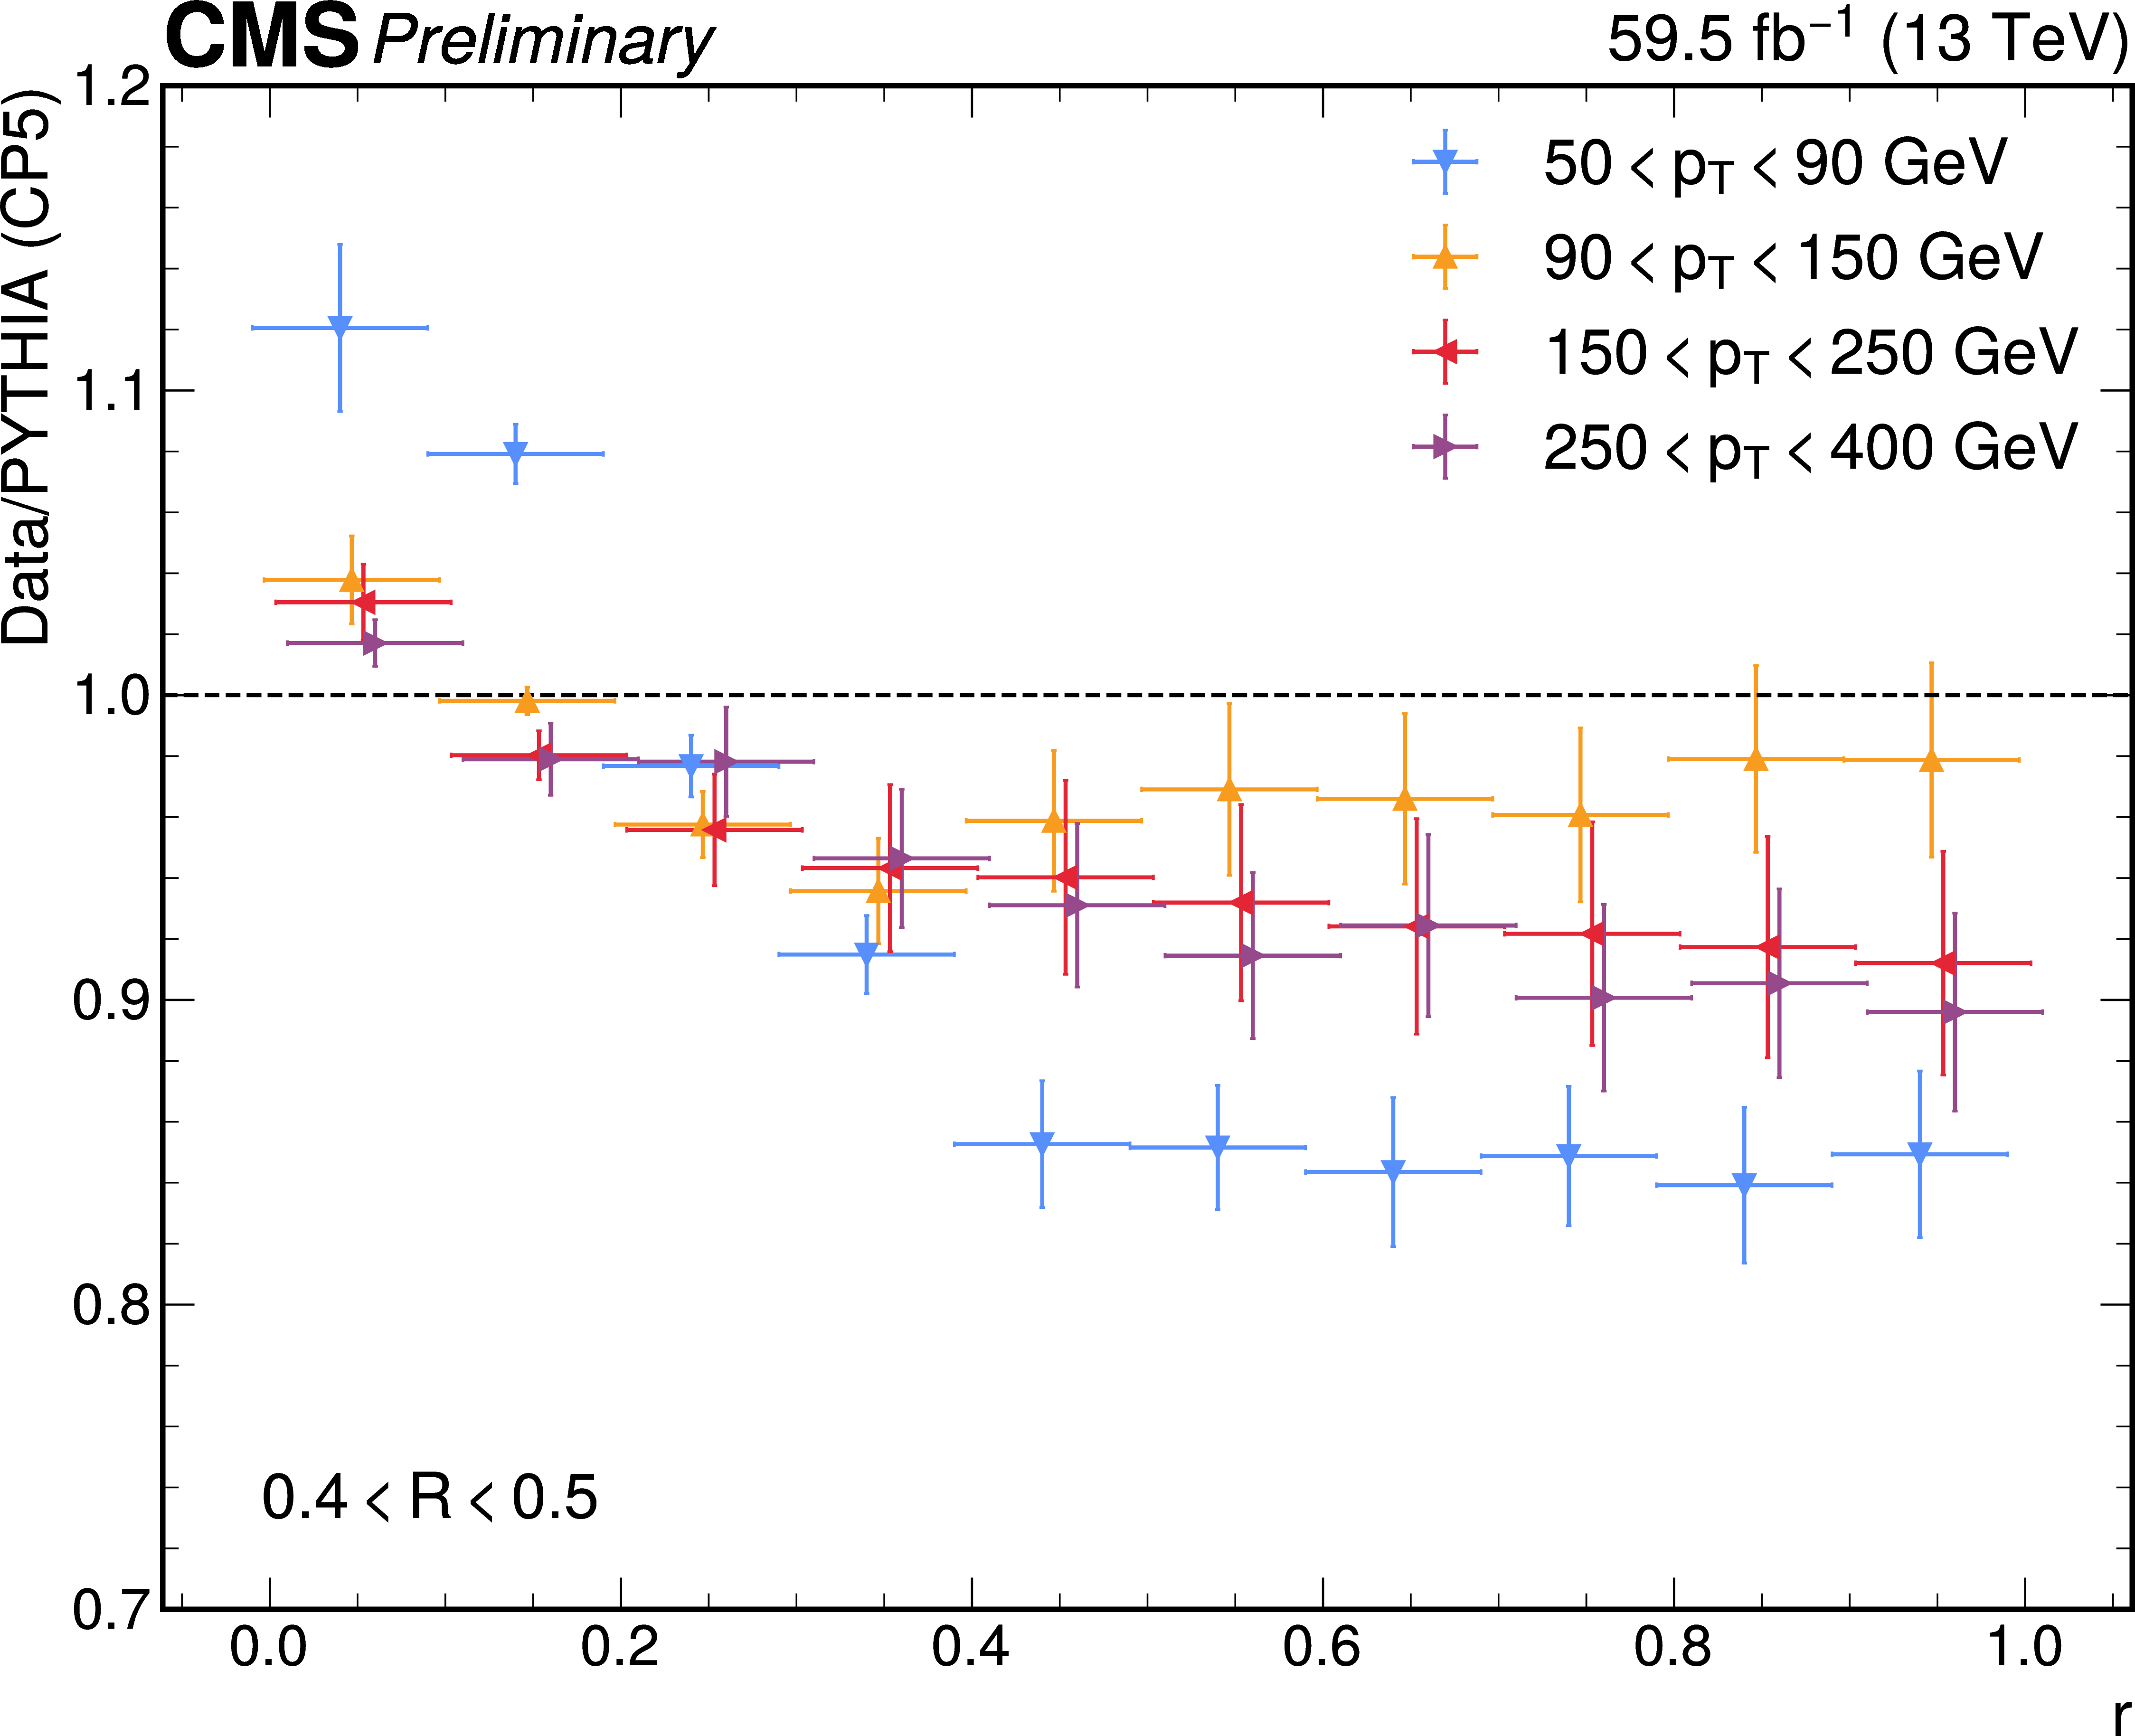
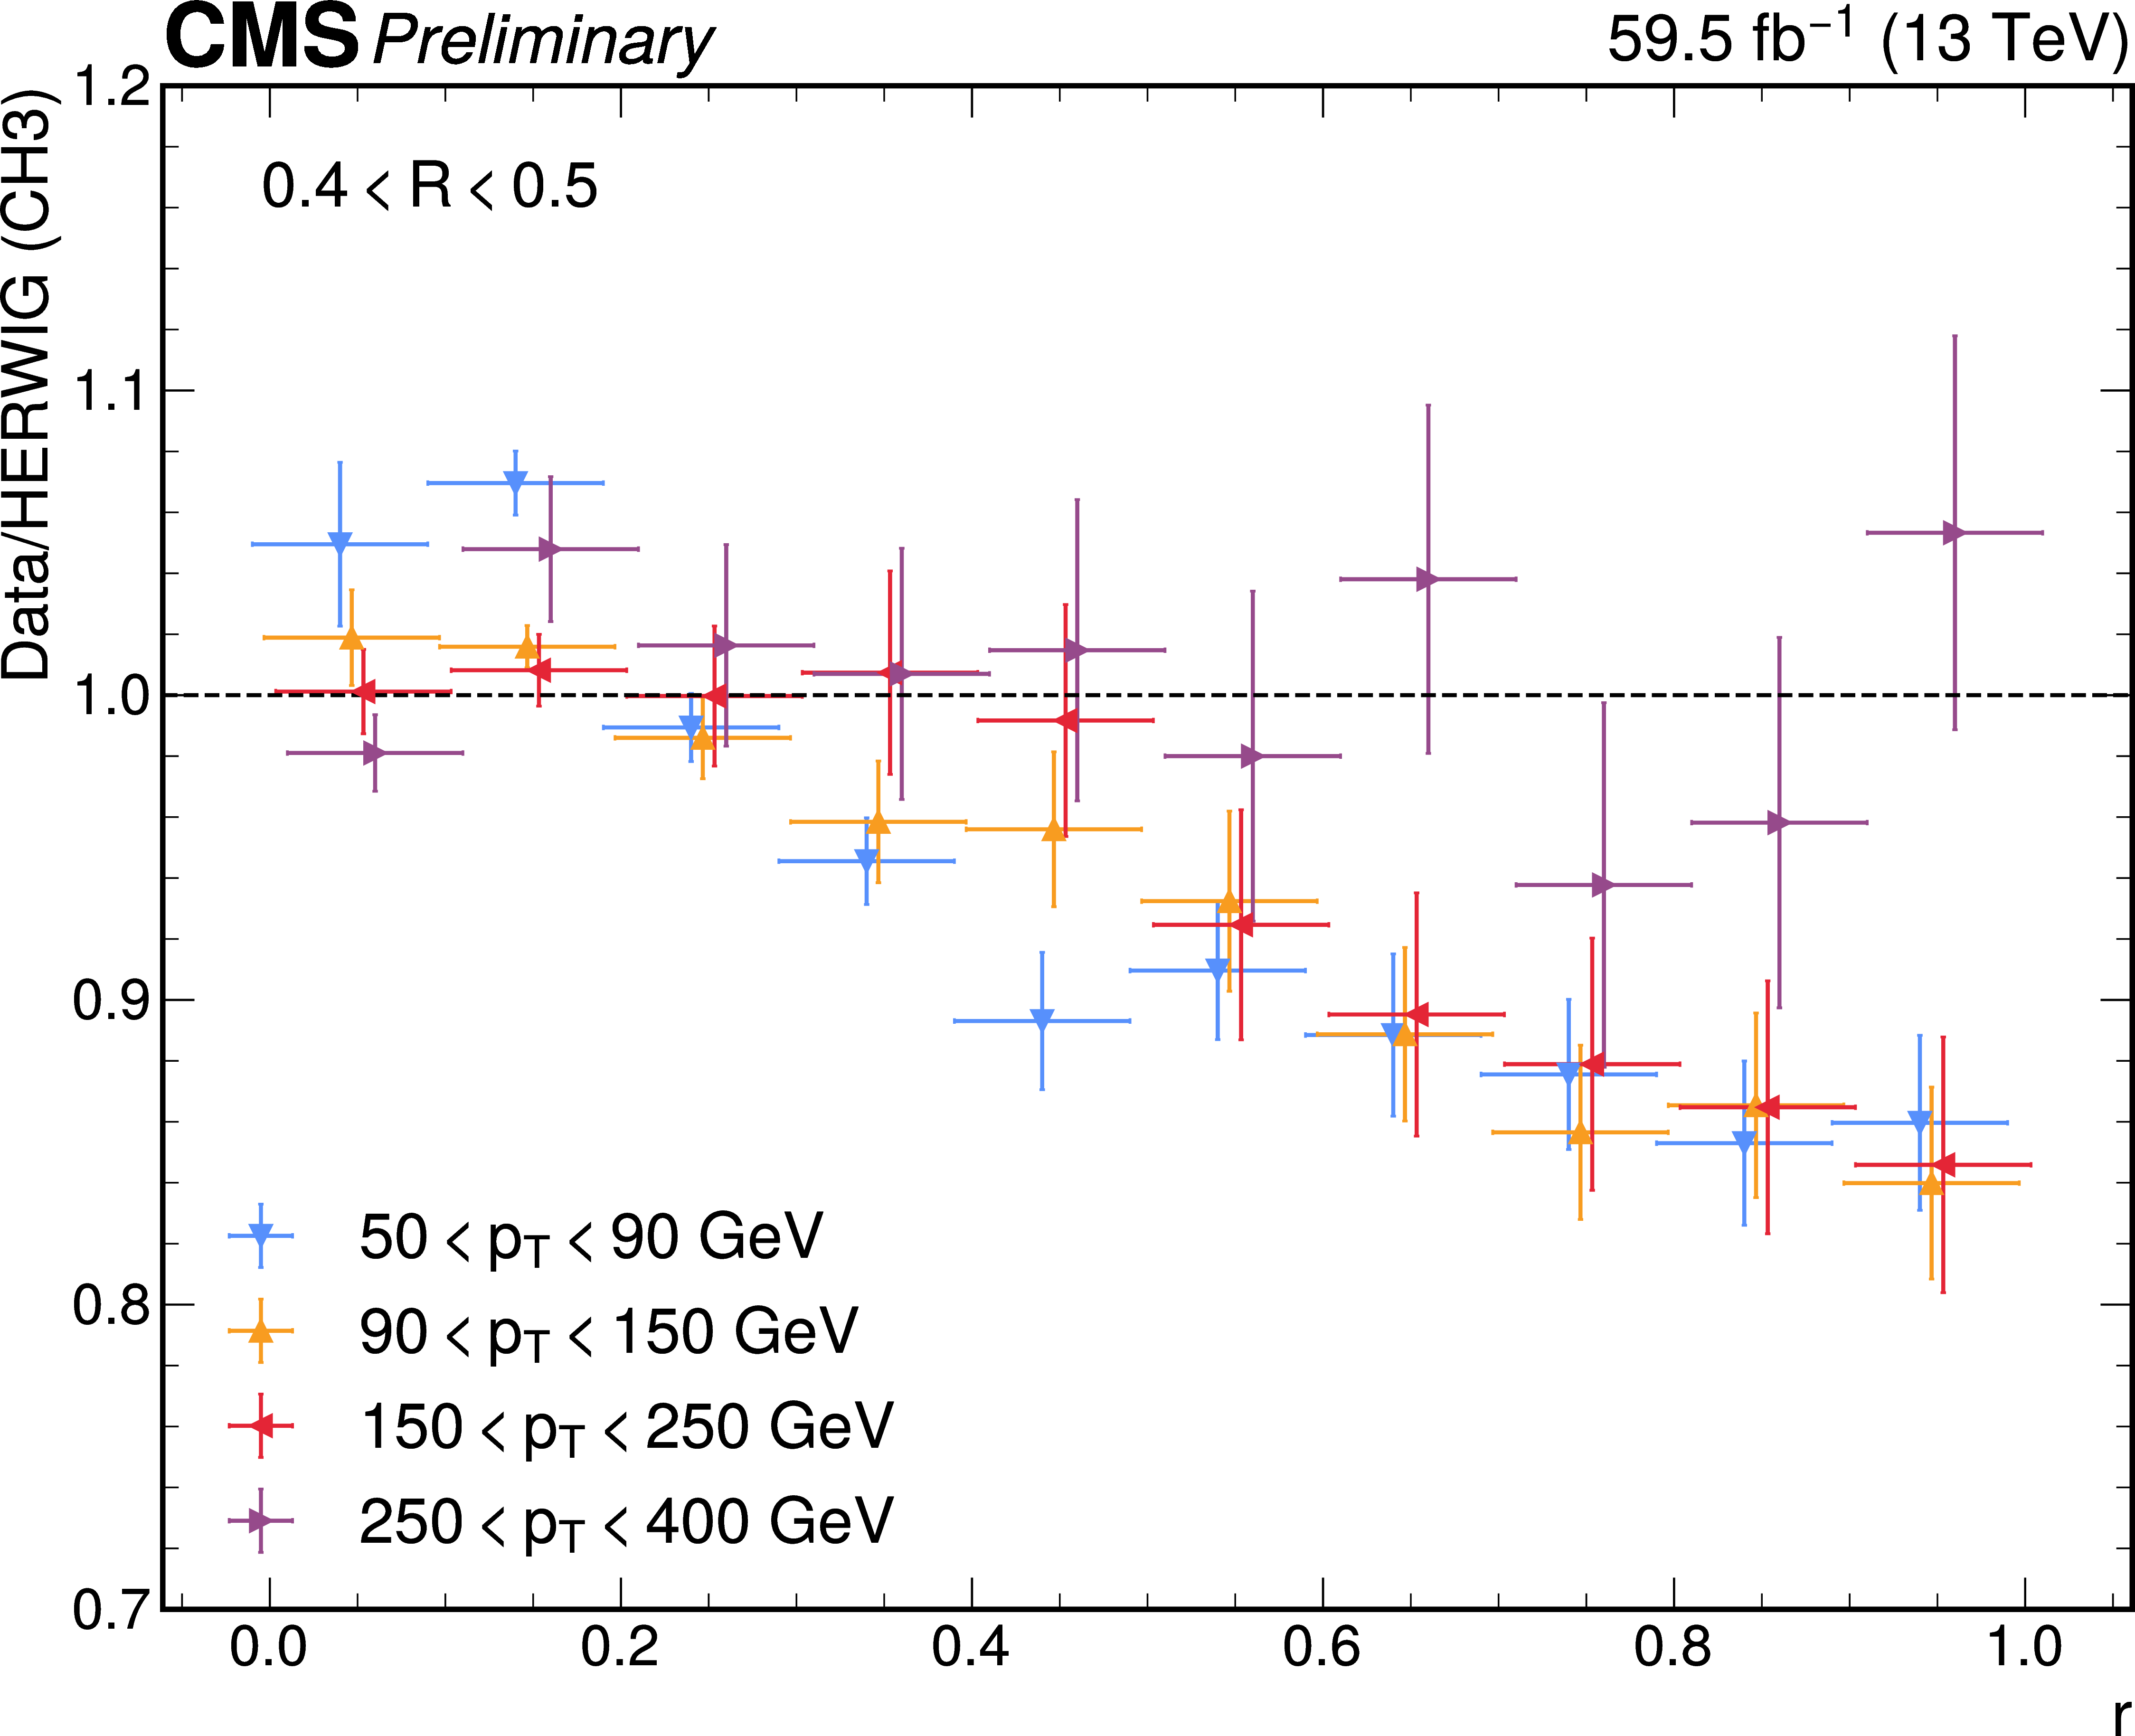
Ratio of unfolded data to MC prediction for the tee configuration, integrated over $ \phi $. Left: Data vs Pythia. Right: Data vs Herwig. Uncertainties represent the total statistical and systematic uncertainty in the unfolded data, as well as the statistical uncertainty in the MC prediction. Data points are offset slightly in $ r $ for visibility. |
png pdf |
Figure 6-a:
Ratio of unfolded data to MC prediction for the tee configuration, integrated over $ \phi $. Left: Data vs Pythia. Right: Data vs Herwig. Uncertainties represent the total statistical and systematic uncertainty in the unfolded data, as well as the statistical uncertainty in the MC prediction. Data points are offset slightly in $ r $ for visibility. |
png pdf |
Figure 6-b:
Ratio of unfolded data to MC prediction for the tee configuration, integrated over $ \phi $. Left: Data vs Pythia. Right: Data vs Herwig. Uncertainties represent the total statistical and systematic uncertainty in the unfolded data, as well as the statistical uncertainty in the MC prediction. Data points are offset slightly in $ r $ for visibility. |
png pdf |
Figure 7:
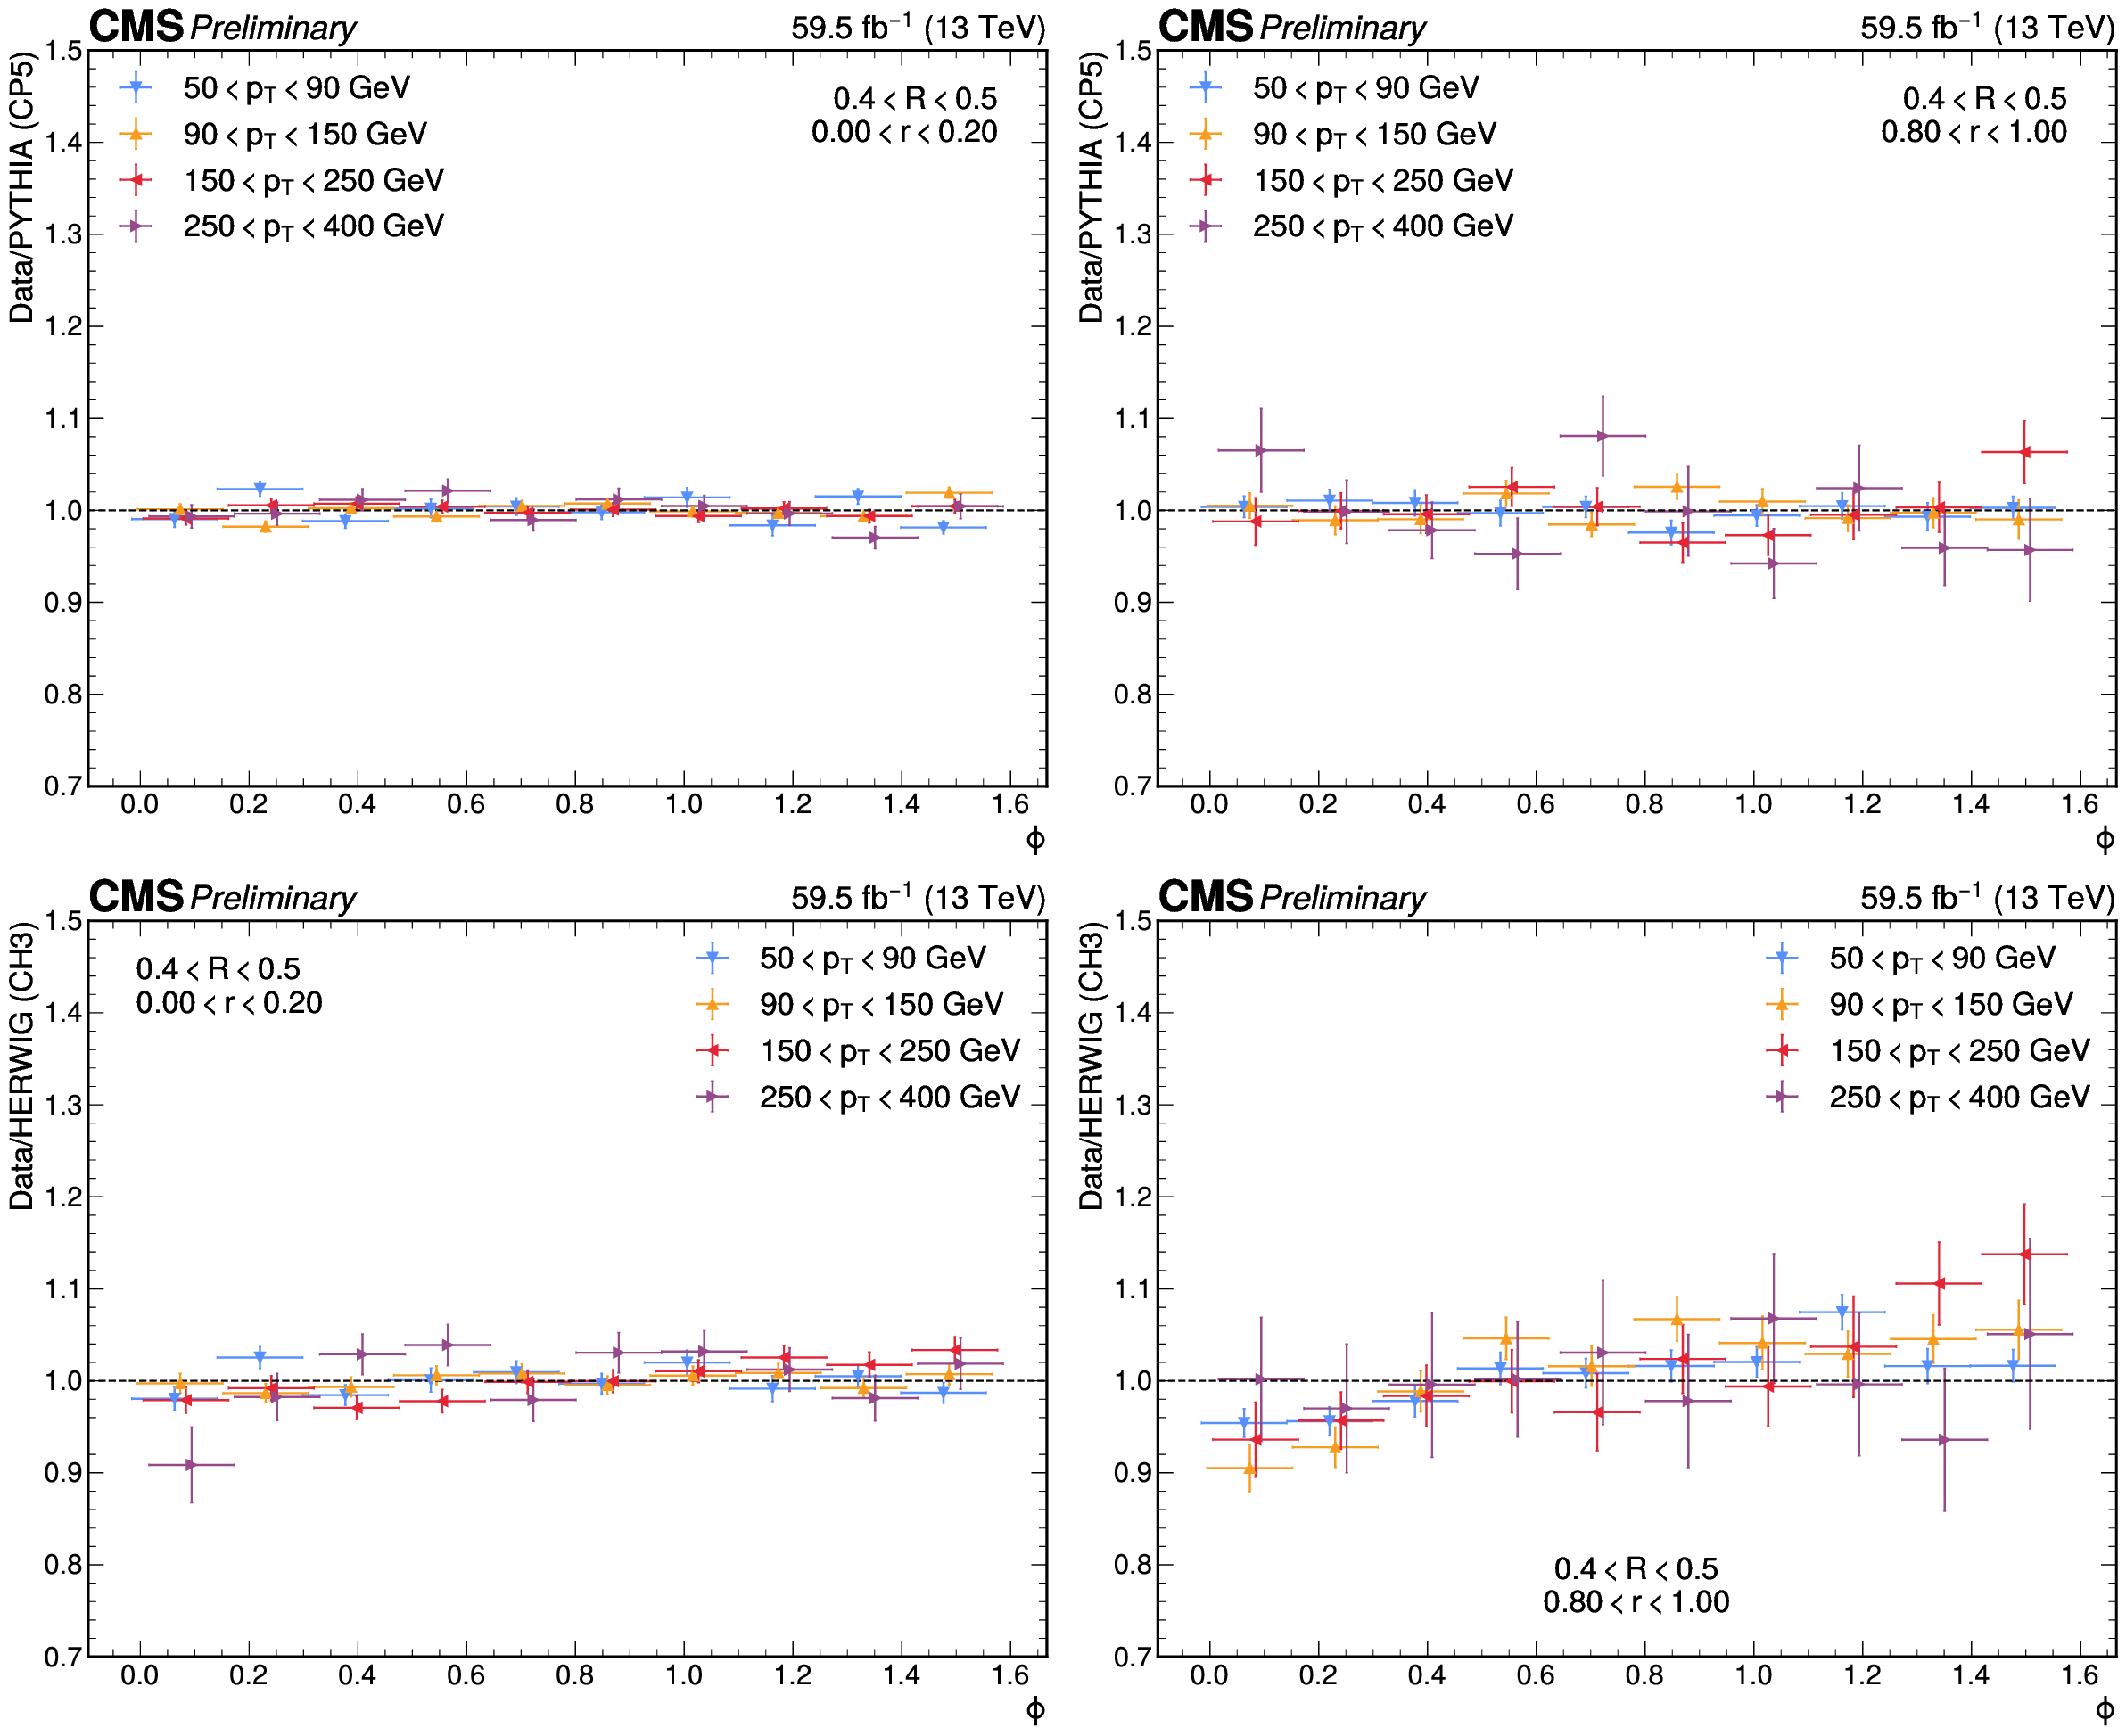
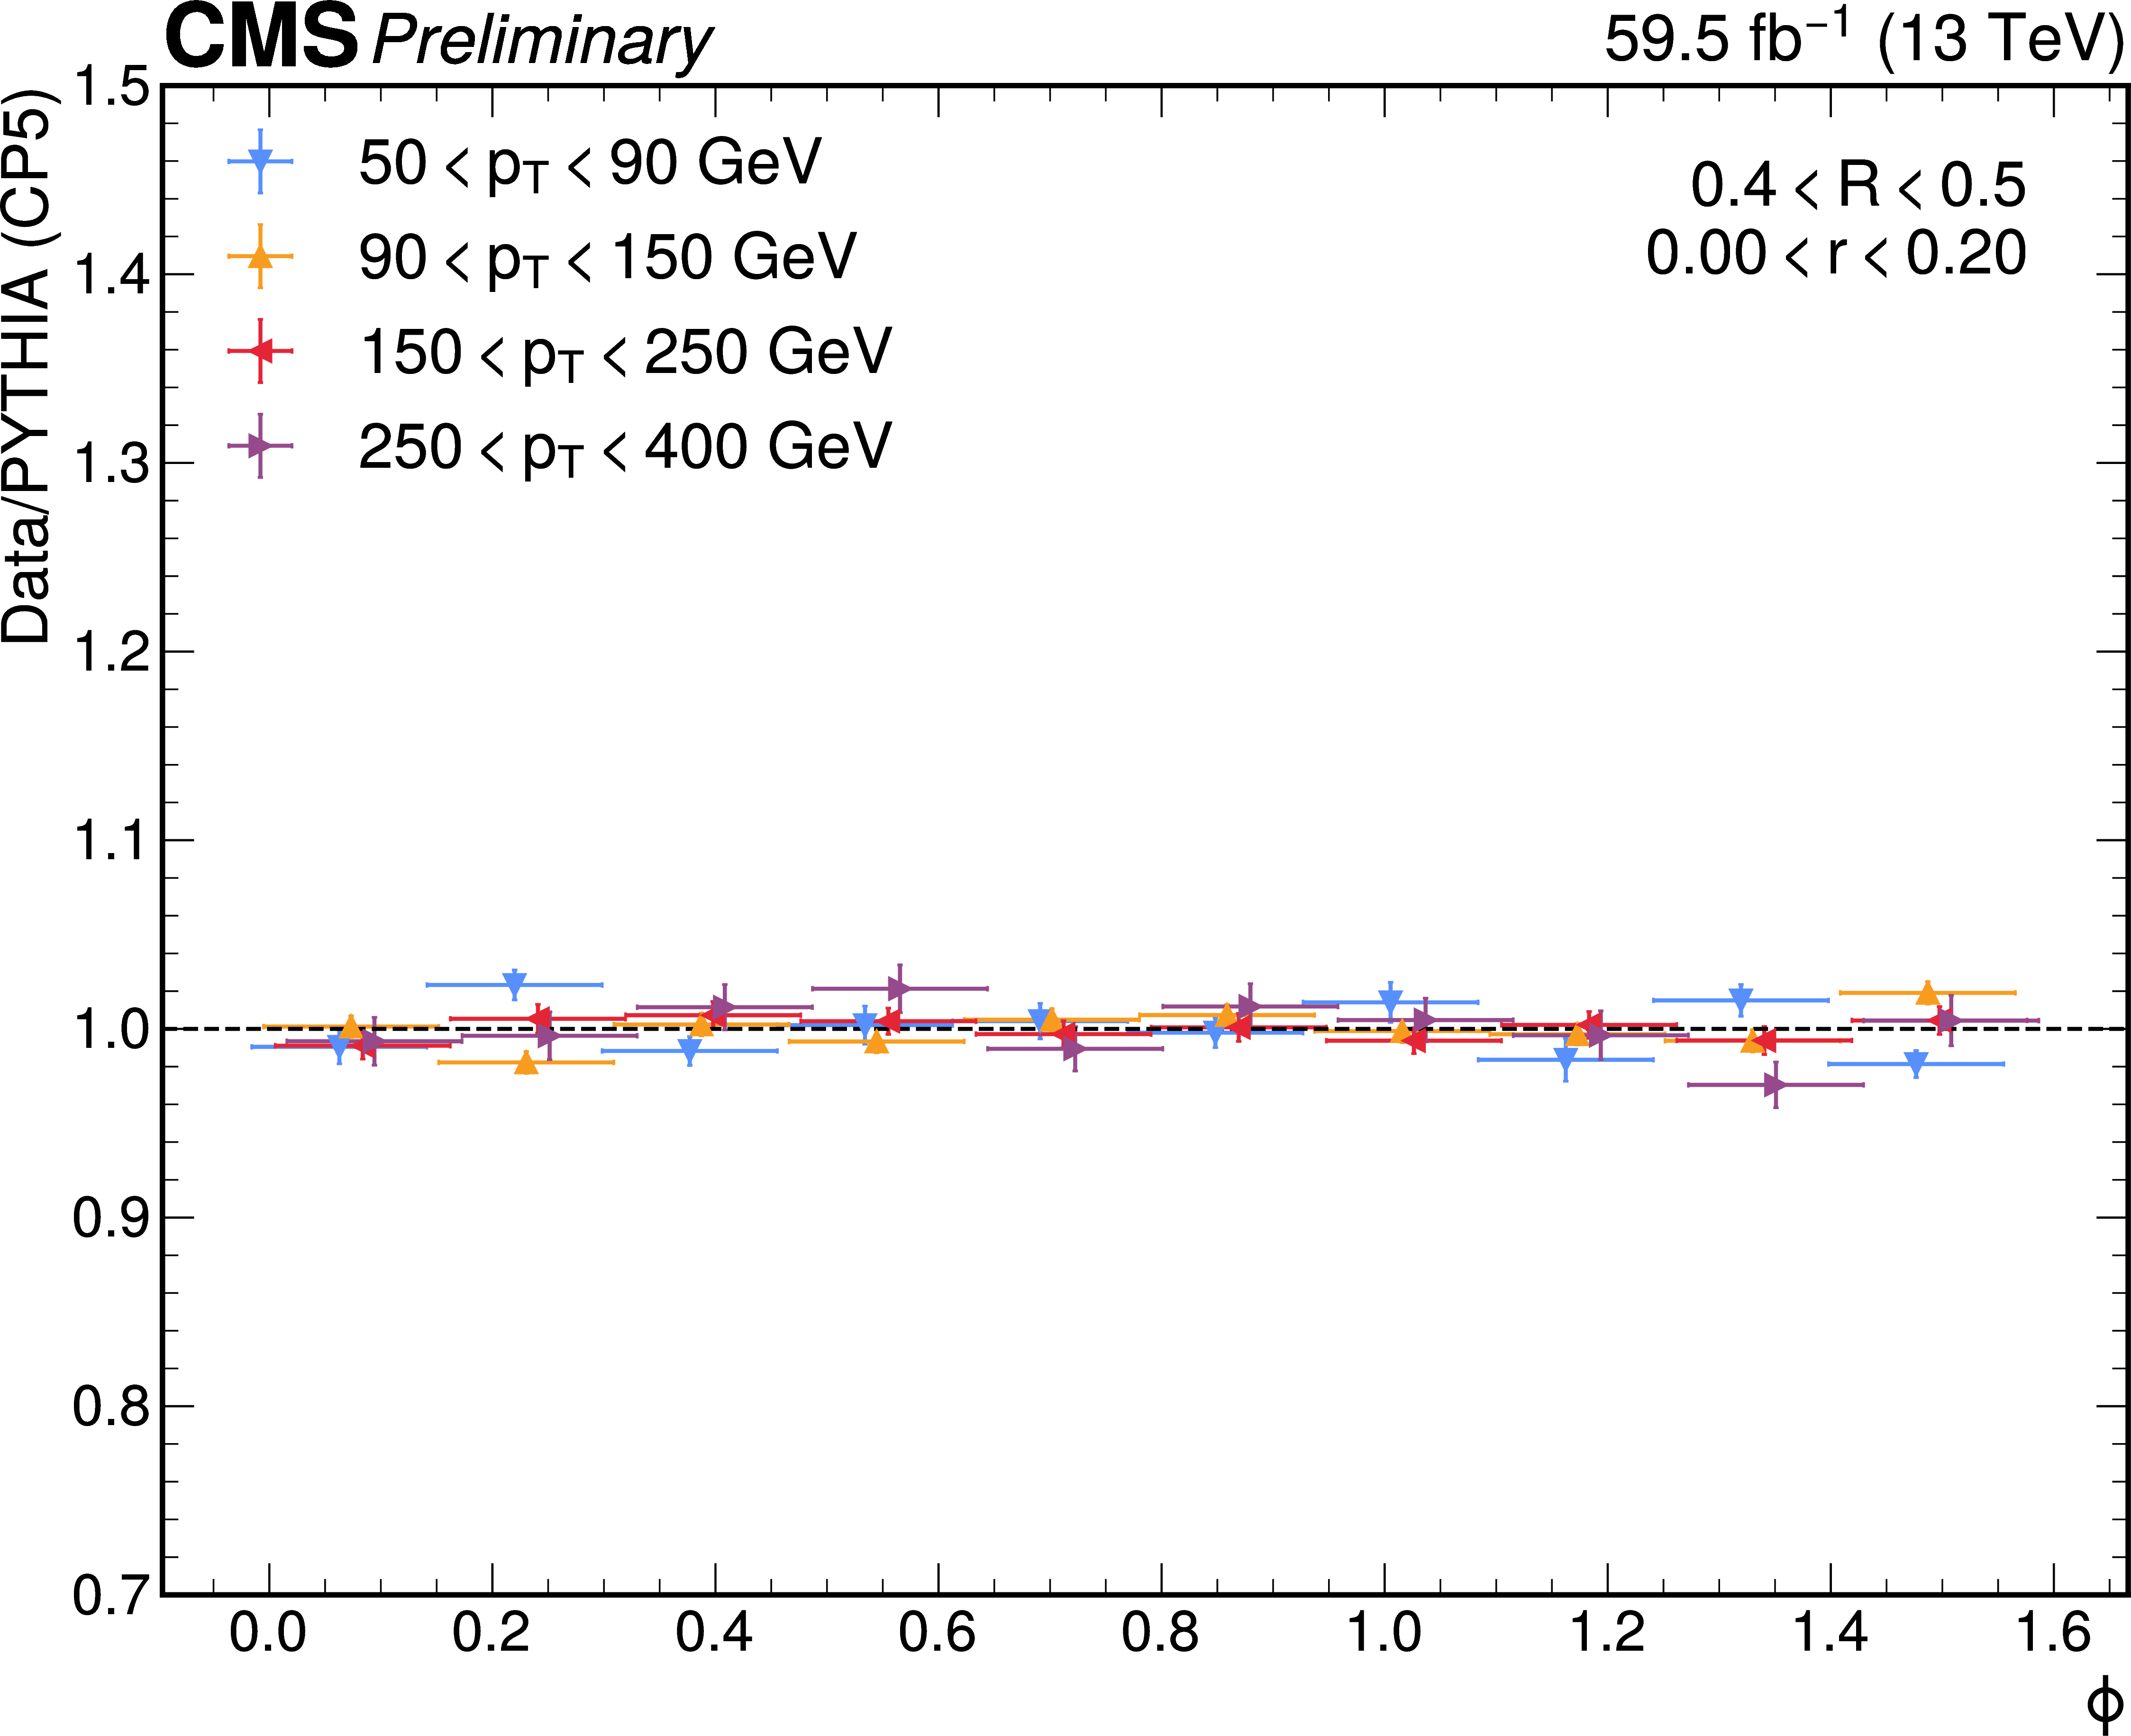
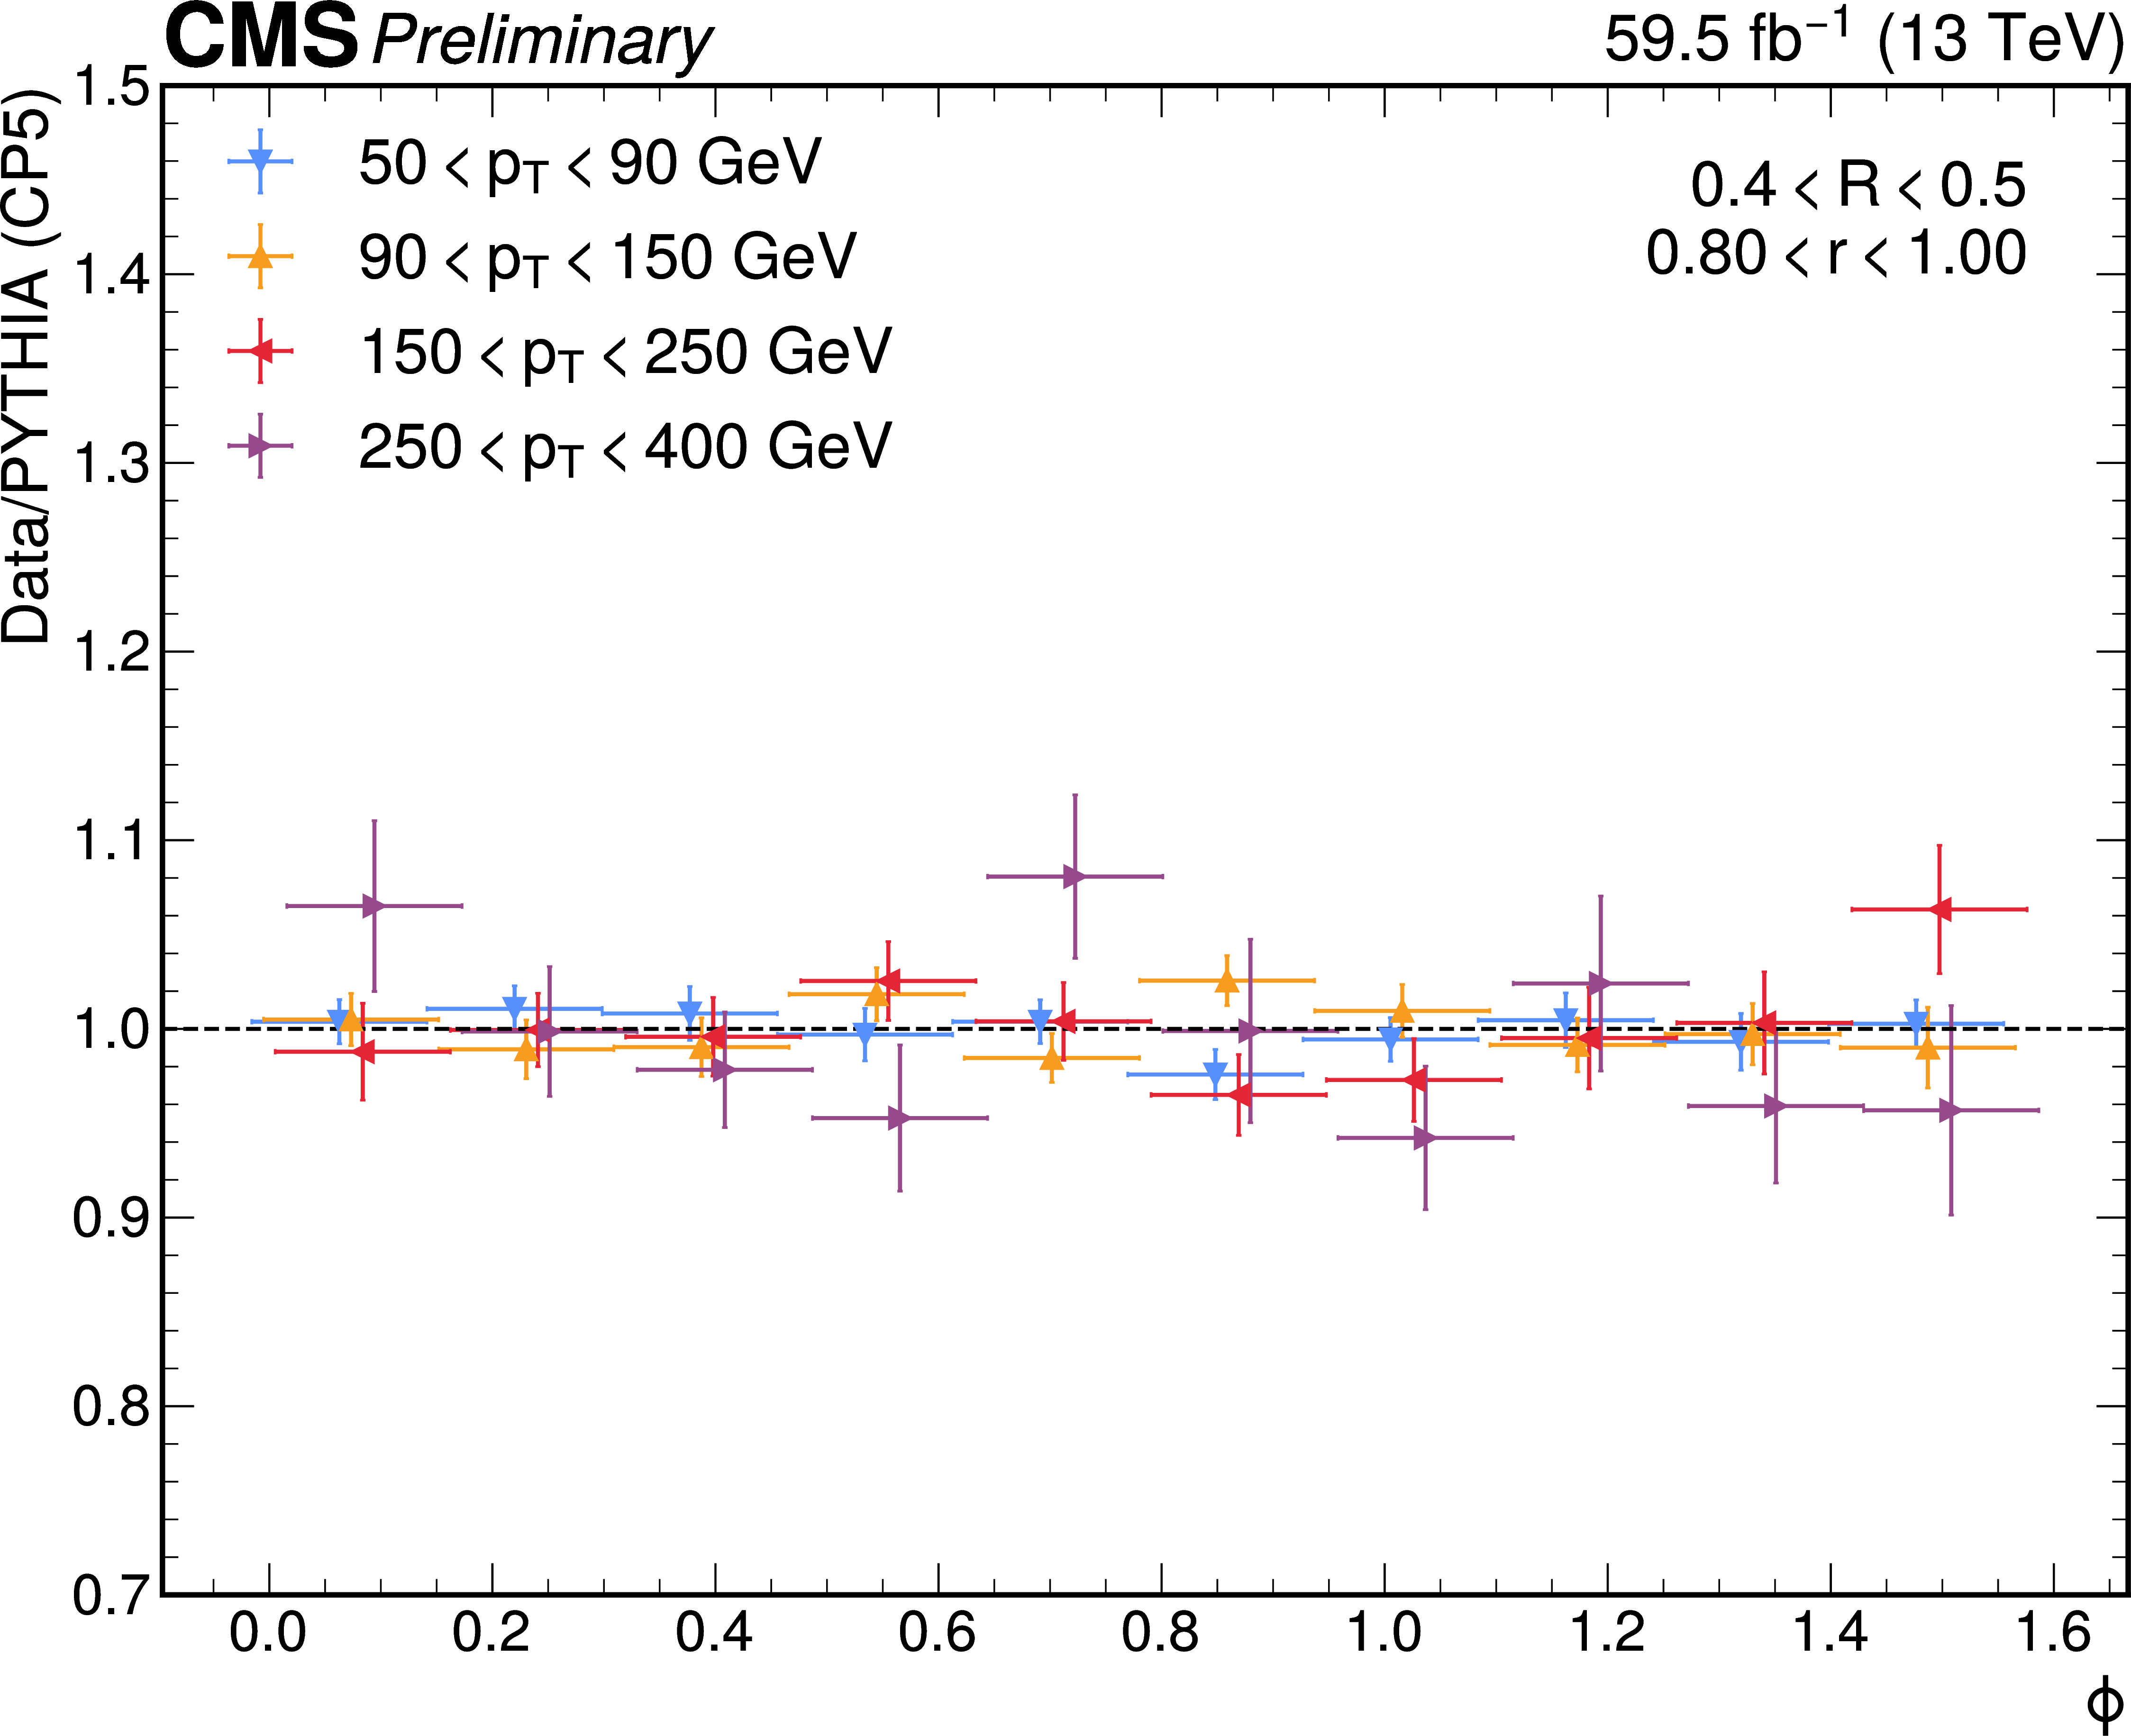
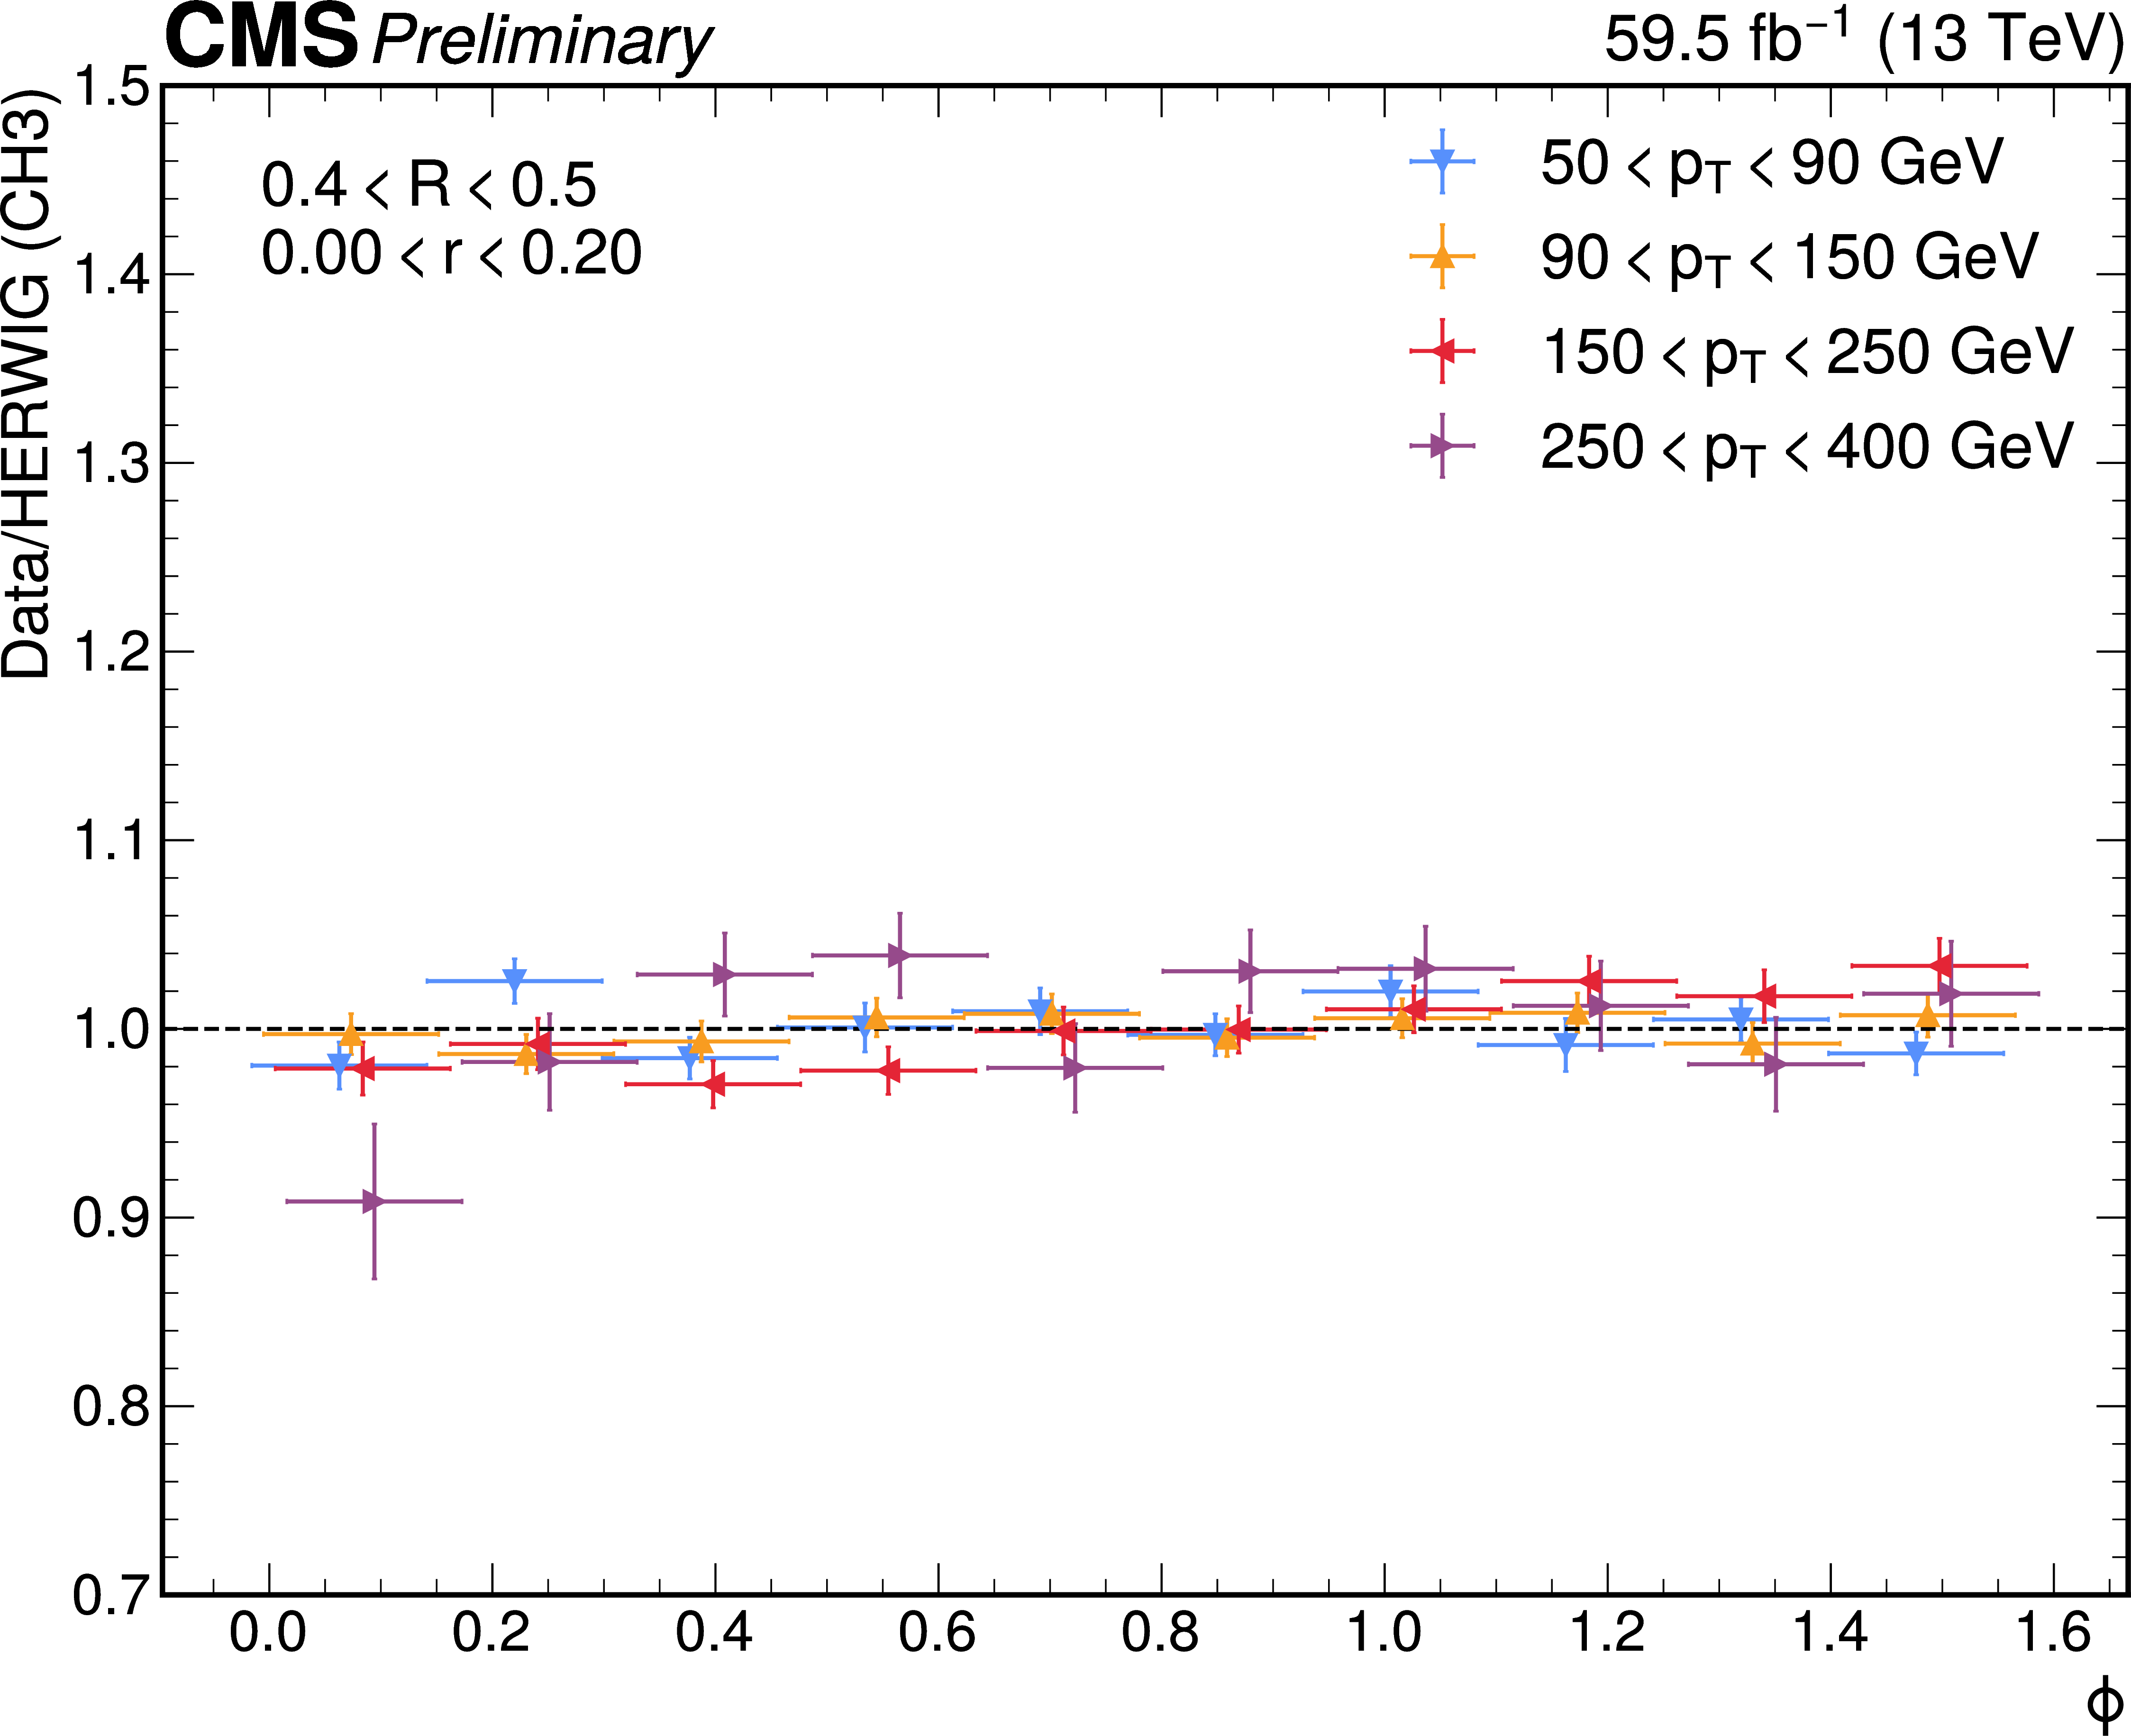
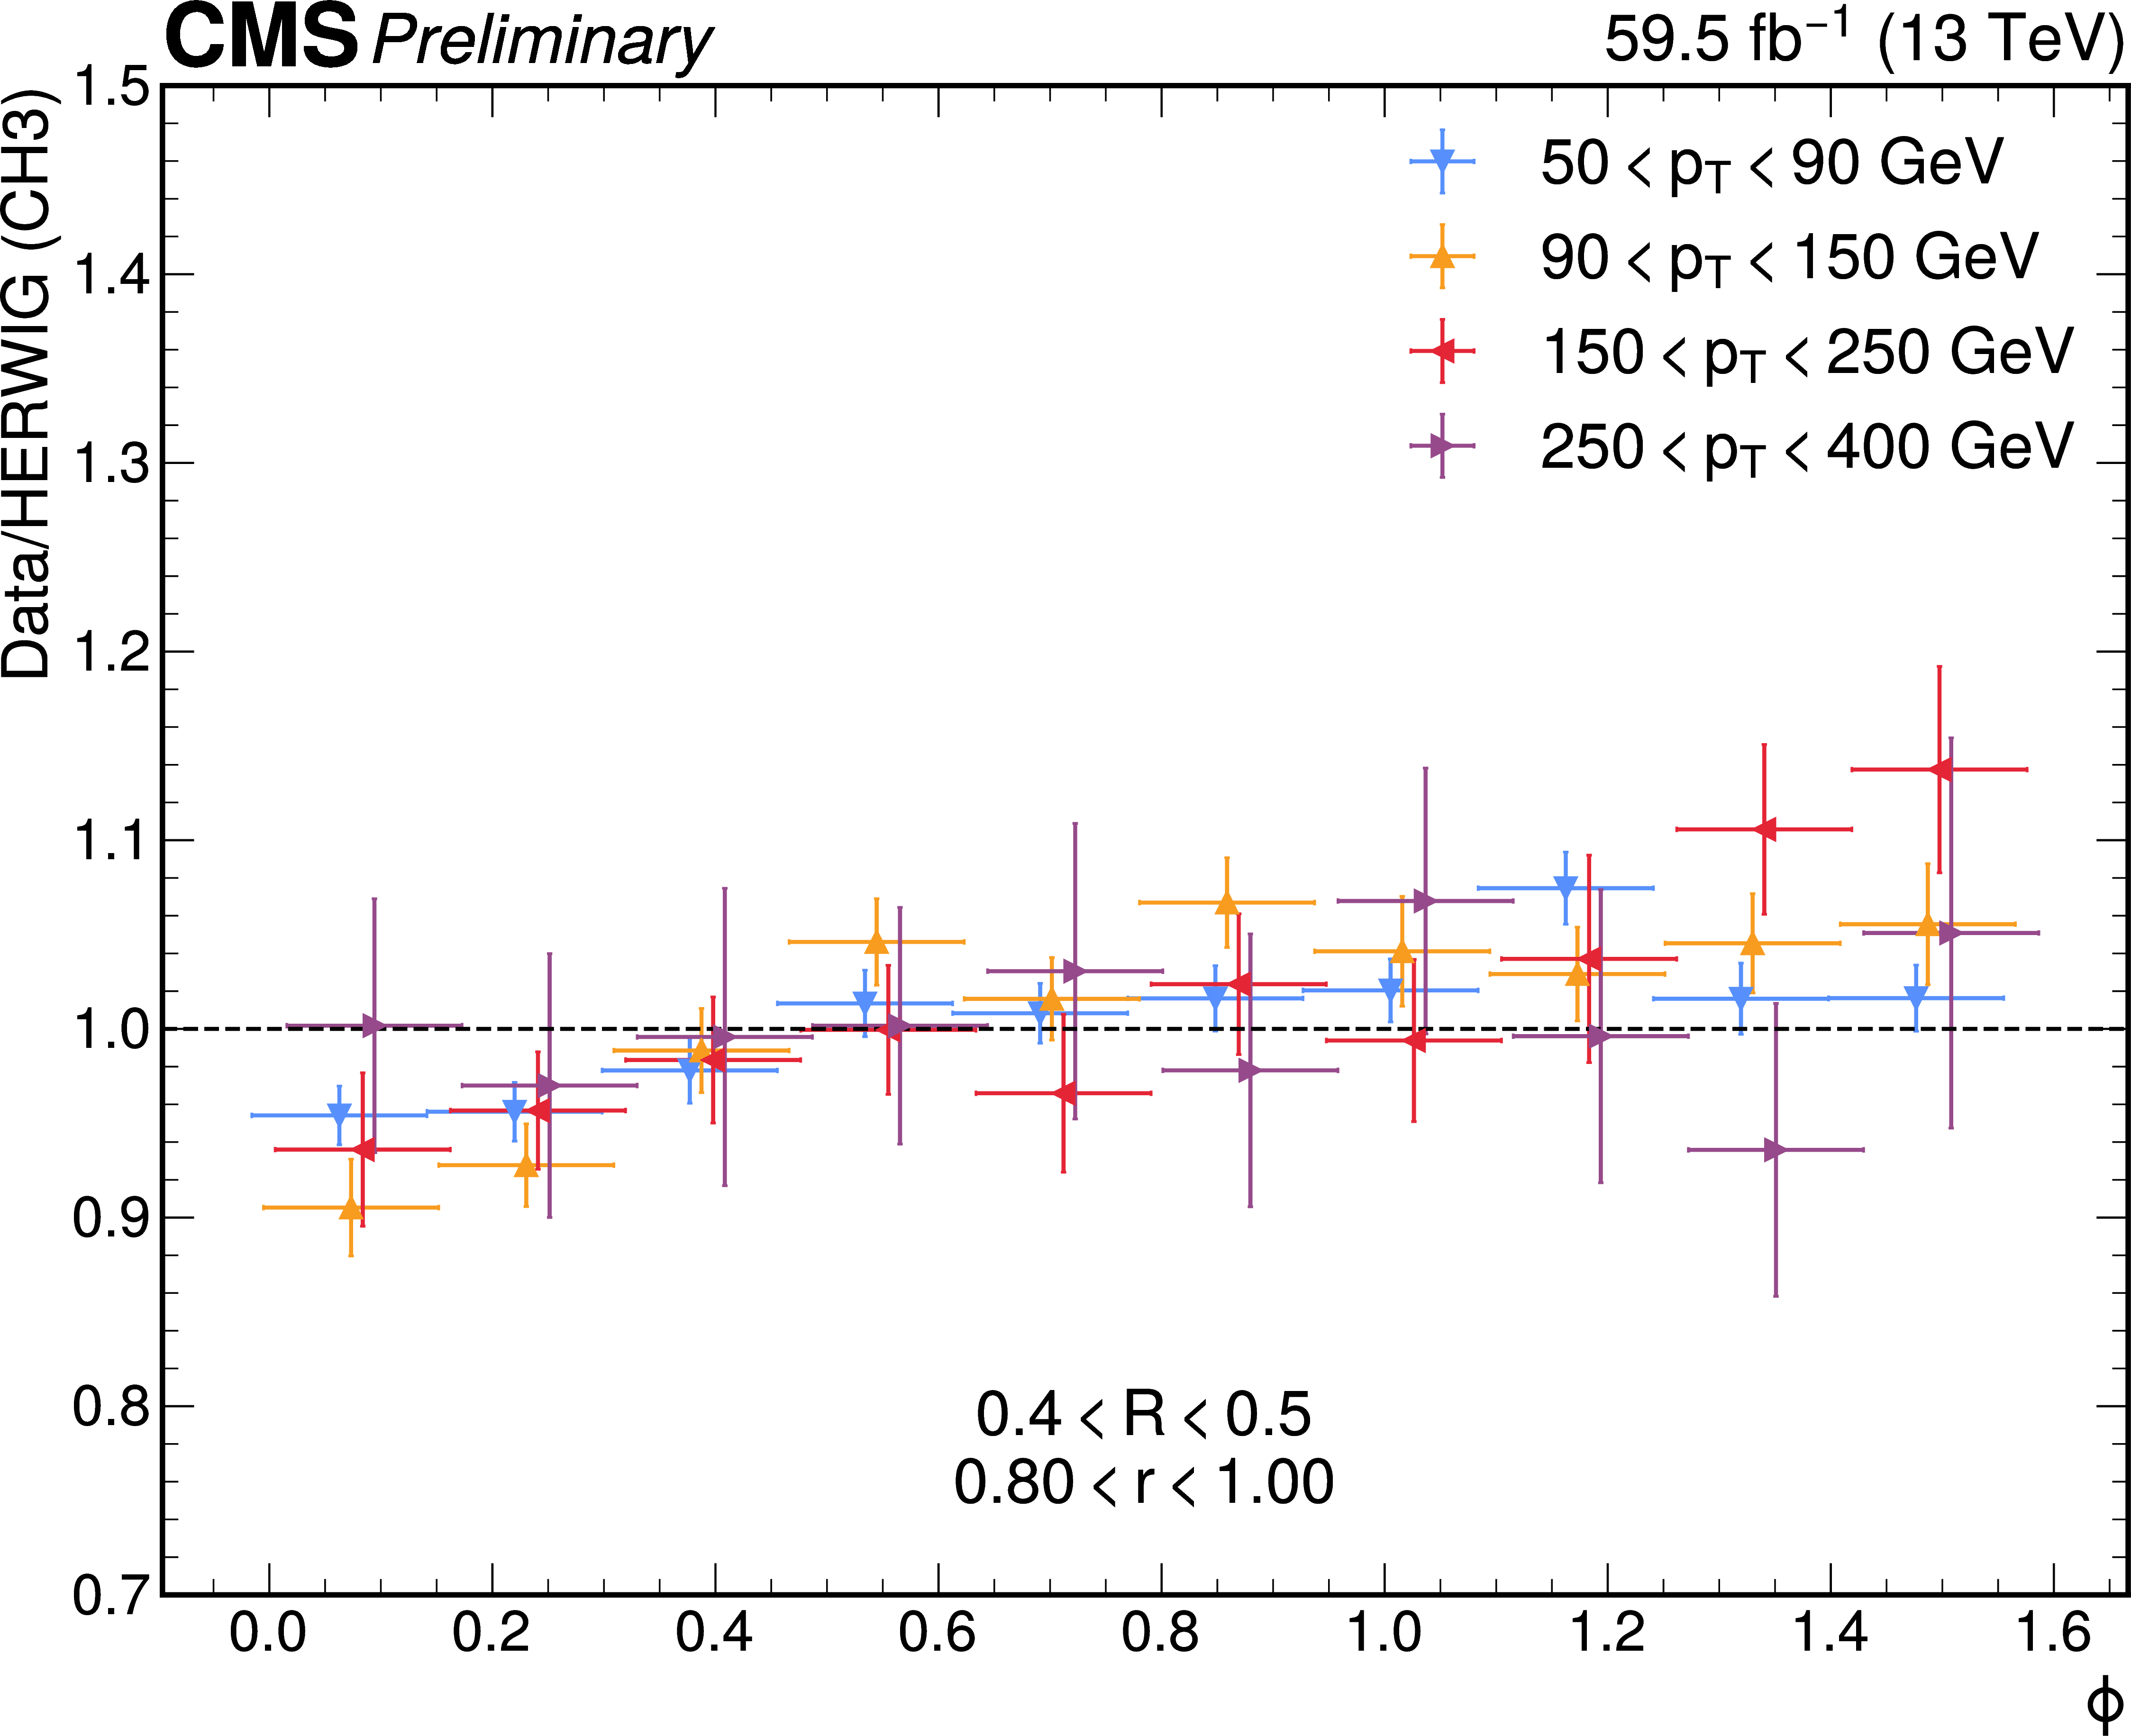
Ratio of unfolded data to MC prediction for the tee configuration as a function of $ \phi $. Top: Data vs Pythia. Bottom: Data vs Herwig. Left: 0 $ < R < $ 0.2. Right: 0.8 $ < R < $ 1.0. Uncertainties represent the total statistical and systematic uncertainty in the unfolded data, as well as the statistical uncertainty in the MC prediction. Data points are offset slightly in $ \phi $ for visibility. |
png pdf |
Figure 7-a:
Ratio of unfolded data to MC prediction for the tee configuration as a function of $ \phi $. Top: Data vs Pythia. Bottom: Data vs Herwig. Left: 0 $ < R < $ 0.2. Right: 0.8 $ < R < $ 1.0. Uncertainties represent the total statistical and systematic uncertainty in the unfolded data, as well as the statistical uncertainty in the MC prediction. Data points are offset slightly in $ \phi $ for visibility. |
png pdf |
Figure 7-b:
Ratio of unfolded data to MC prediction for the tee configuration as a function of $ \phi $. Top: Data vs Pythia. Bottom: Data vs Herwig. Left: 0 $ < R < $ 0.2. Right: 0.8 $ < R < $ 1.0. Uncertainties represent the total statistical and systematic uncertainty in the unfolded data, as well as the statistical uncertainty in the MC prediction. Data points are offset slightly in $ \phi $ for visibility. |
png pdf |
Figure 7-c:
Ratio of unfolded data to MC prediction for the tee configuration as a function of $ \phi $. Top: Data vs Pythia. Bottom: Data vs Herwig. Left: 0 $ < R < $ 0.2. Right: 0.8 $ < R < $ 1.0. Uncertainties represent the total statistical and systematic uncertainty in the unfolded data, as well as the statistical uncertainty in the MC prediction. Data points are offset slightly in $ \phi $ for visibility. |
png pdf |
Figure 7-d:
Ratio of unfolded data to MC prediction for the tee configuration as a function of $ \phi $. Top: Data vs Pythia. Bottom: Data vs Herwig. Left: 0 $ < R < $ 0.2. Right: 0.8 $ < R < $ 1.0. Uncertainties represent the total statistical and systematic uncertainty in the unfolded data, as well as the statistical uncertainty in the MC prediction. Data points are offset slightly in $ \phi $ for visibility. |
png pdf |
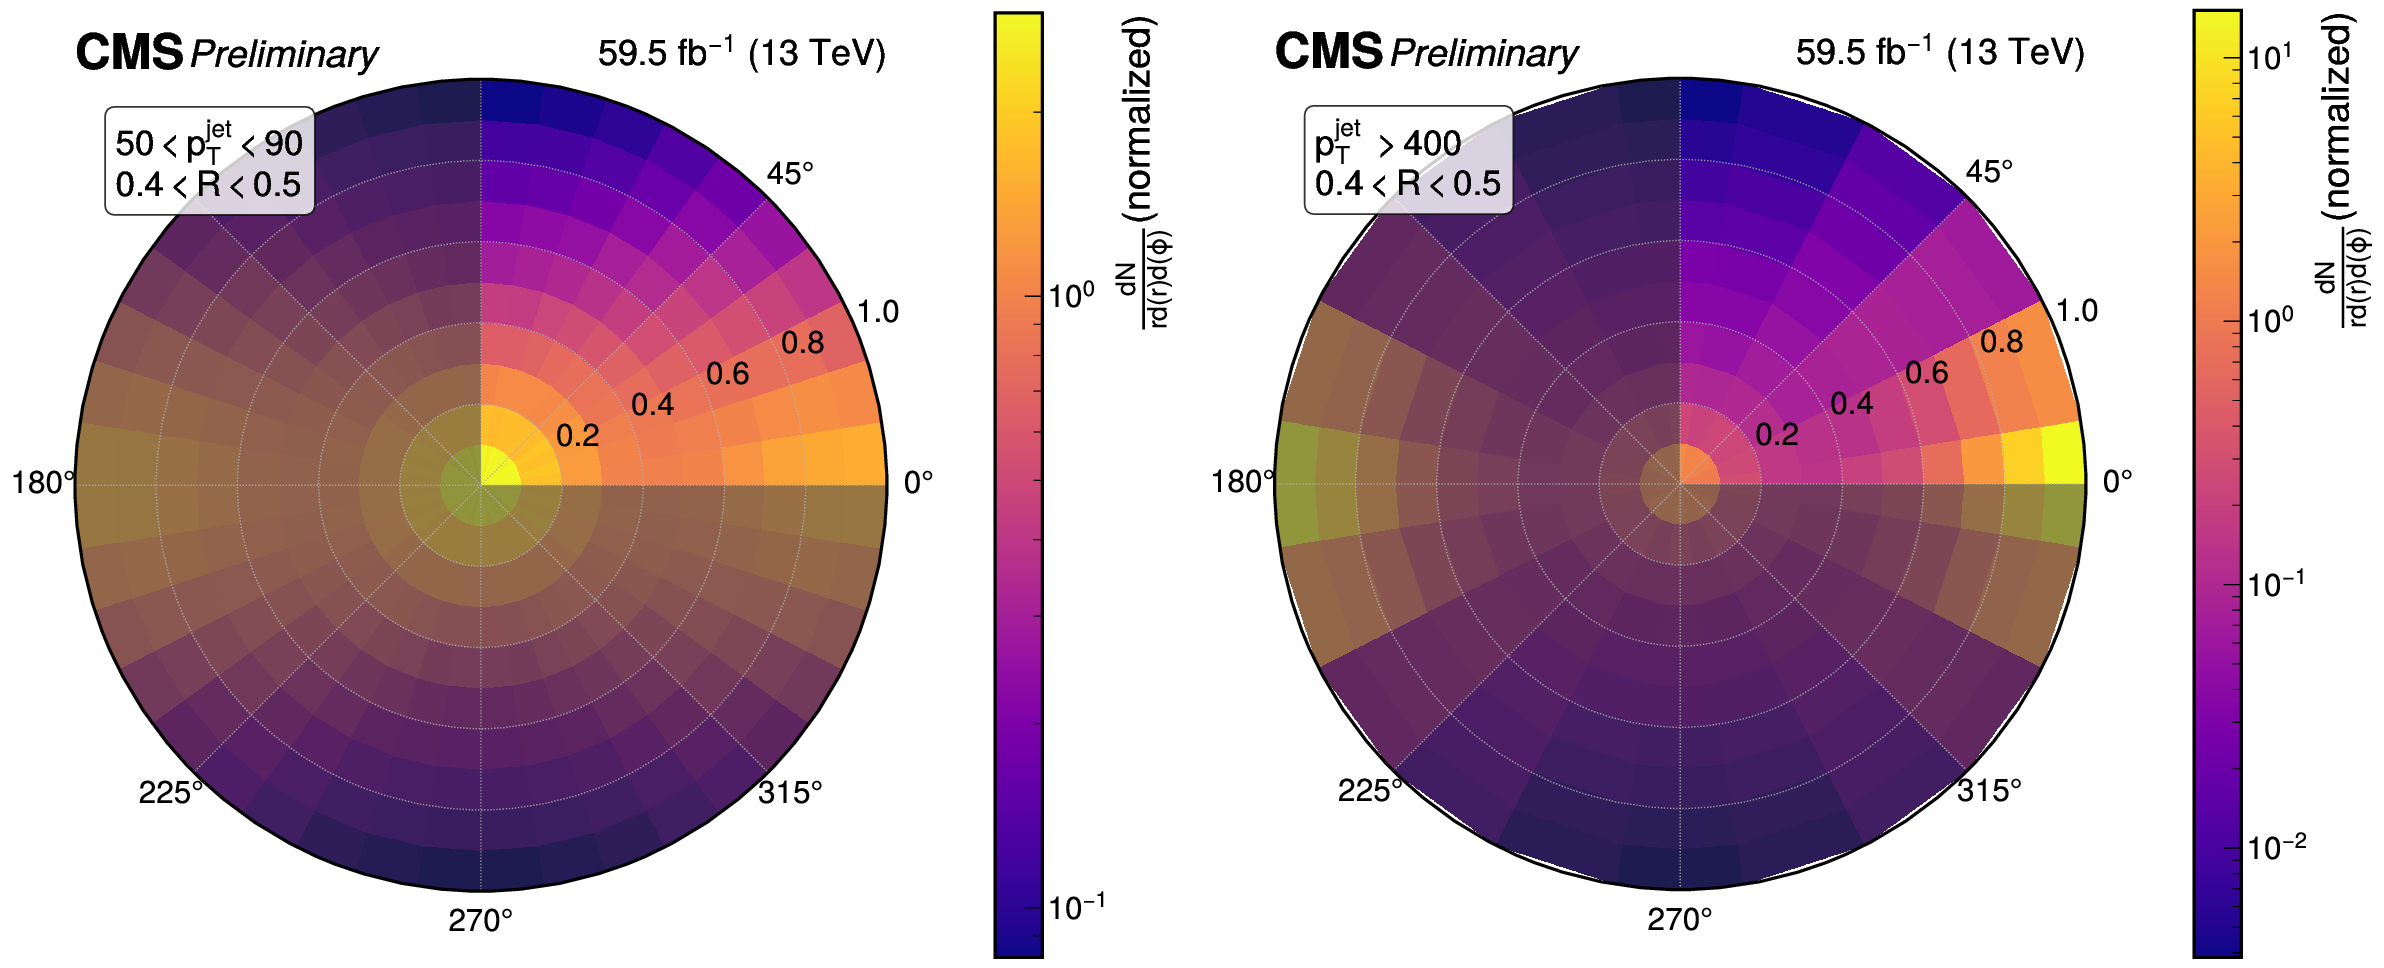
Figure 8:
Unfolded dipole-configuration distributions in the lowest (left) and highest (right) bins of jet $ p_{\mathrm{T}} $. The measurement is only in the first quadrant, but has been replicated three times to make a full disk for ease of visualization. |
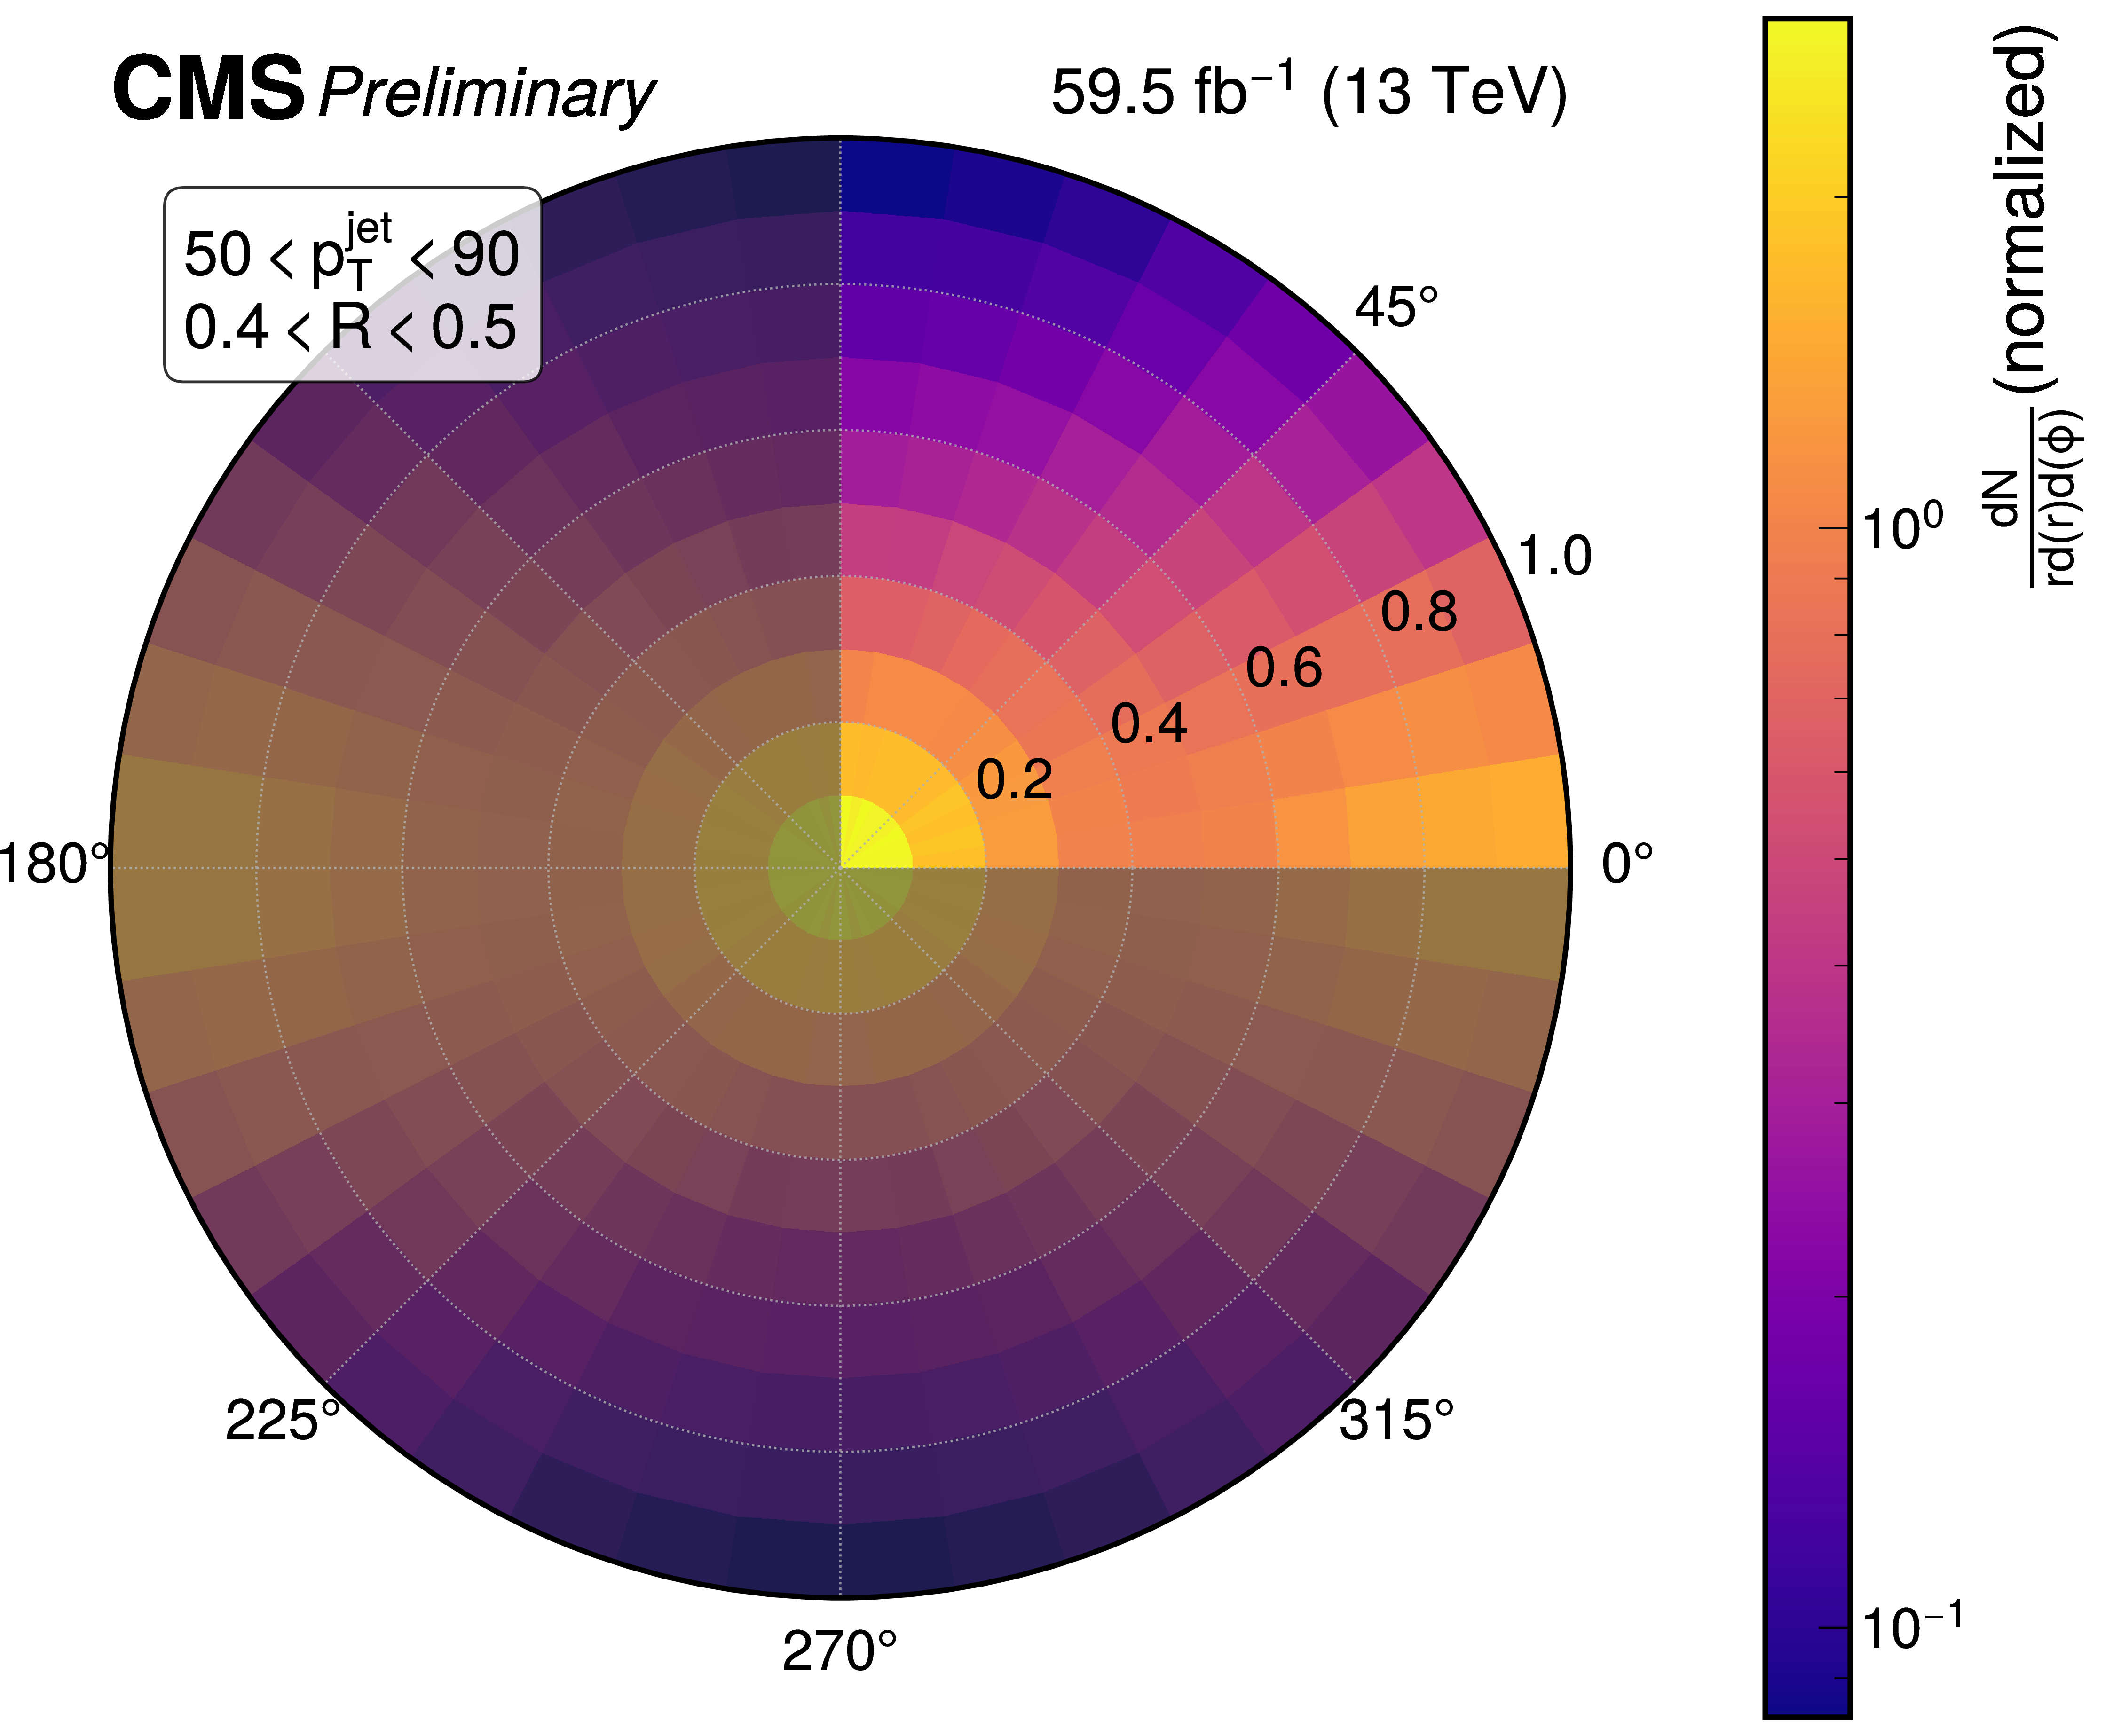
png pdf |
Figure 8-a:
Unfolded dipole-configuration distributions in the lowest (left) and highest (right) bins of jet $ p_{\mathrm{T}} $. The measurement is only in the first quadrant, but has been replicated three times to make a full disk for ease of visualization. |
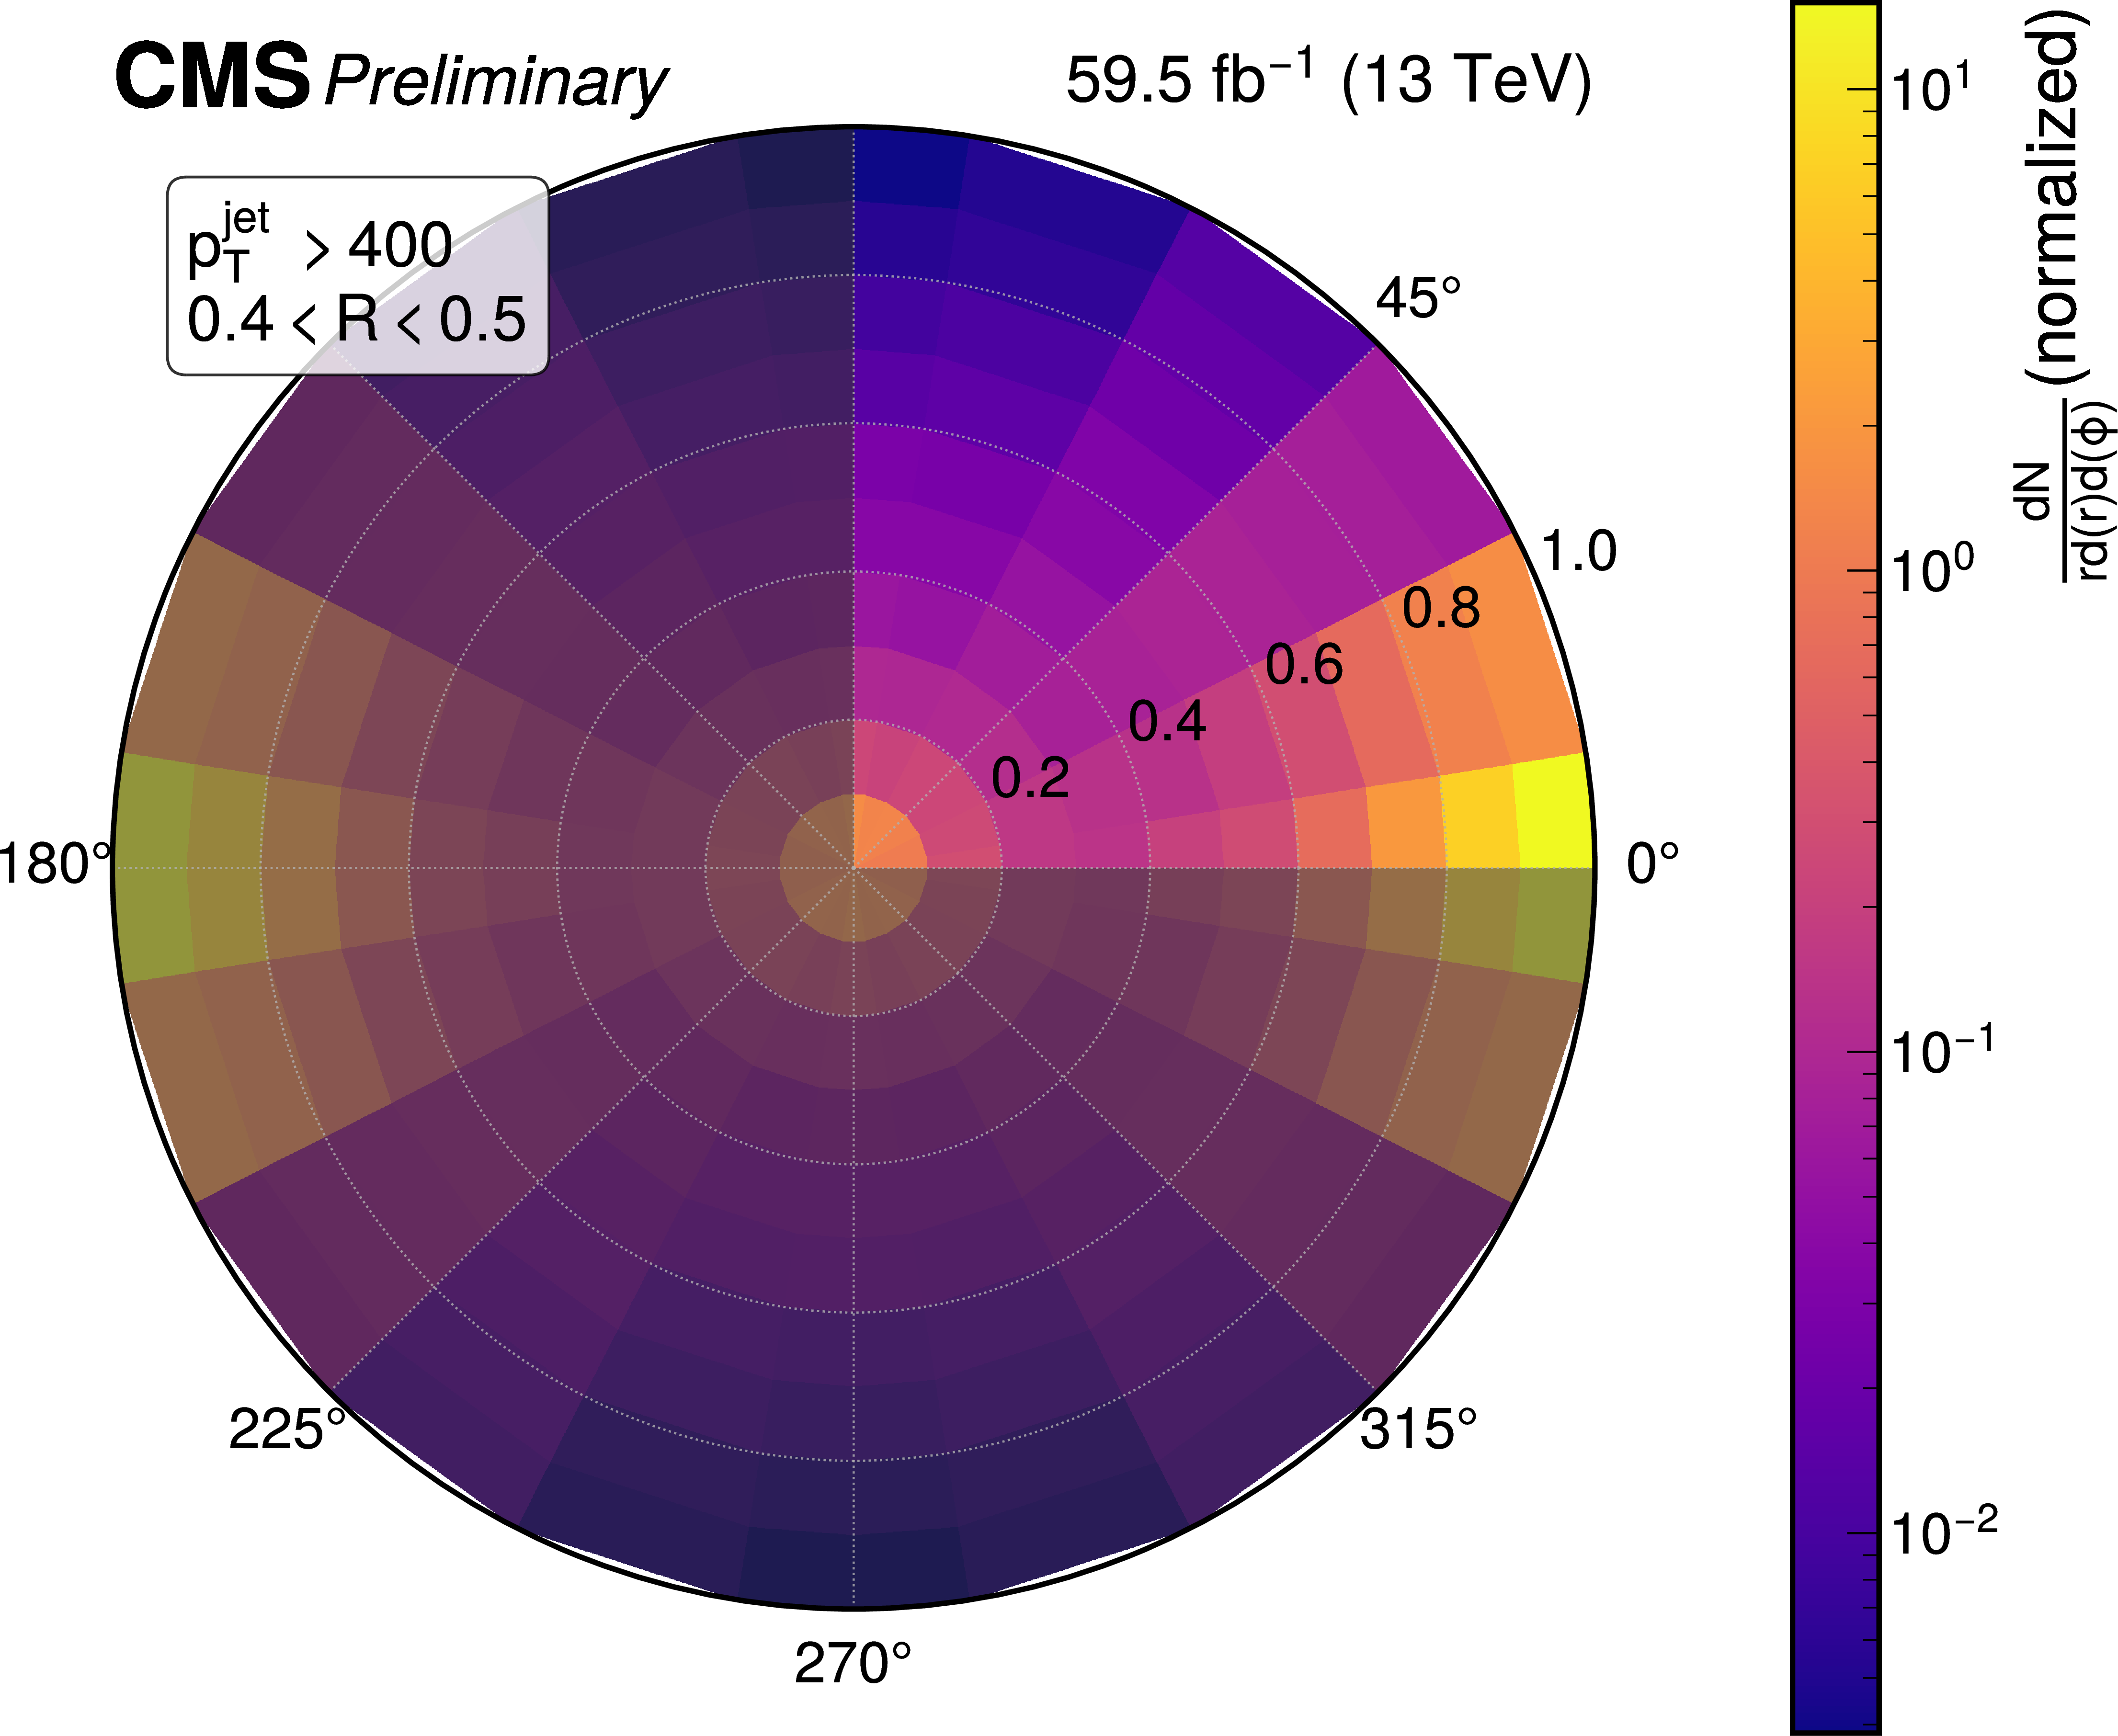
png pdf |
Figure 8-b:
Unfolded dipole-configuration distributions in the lowest (left) and highest (right) bins of jet $ p_{\mathrm{T}} $. The measurement is only in the first quadrant, but has been replicated three times to make a full disk for ease of visualization. |
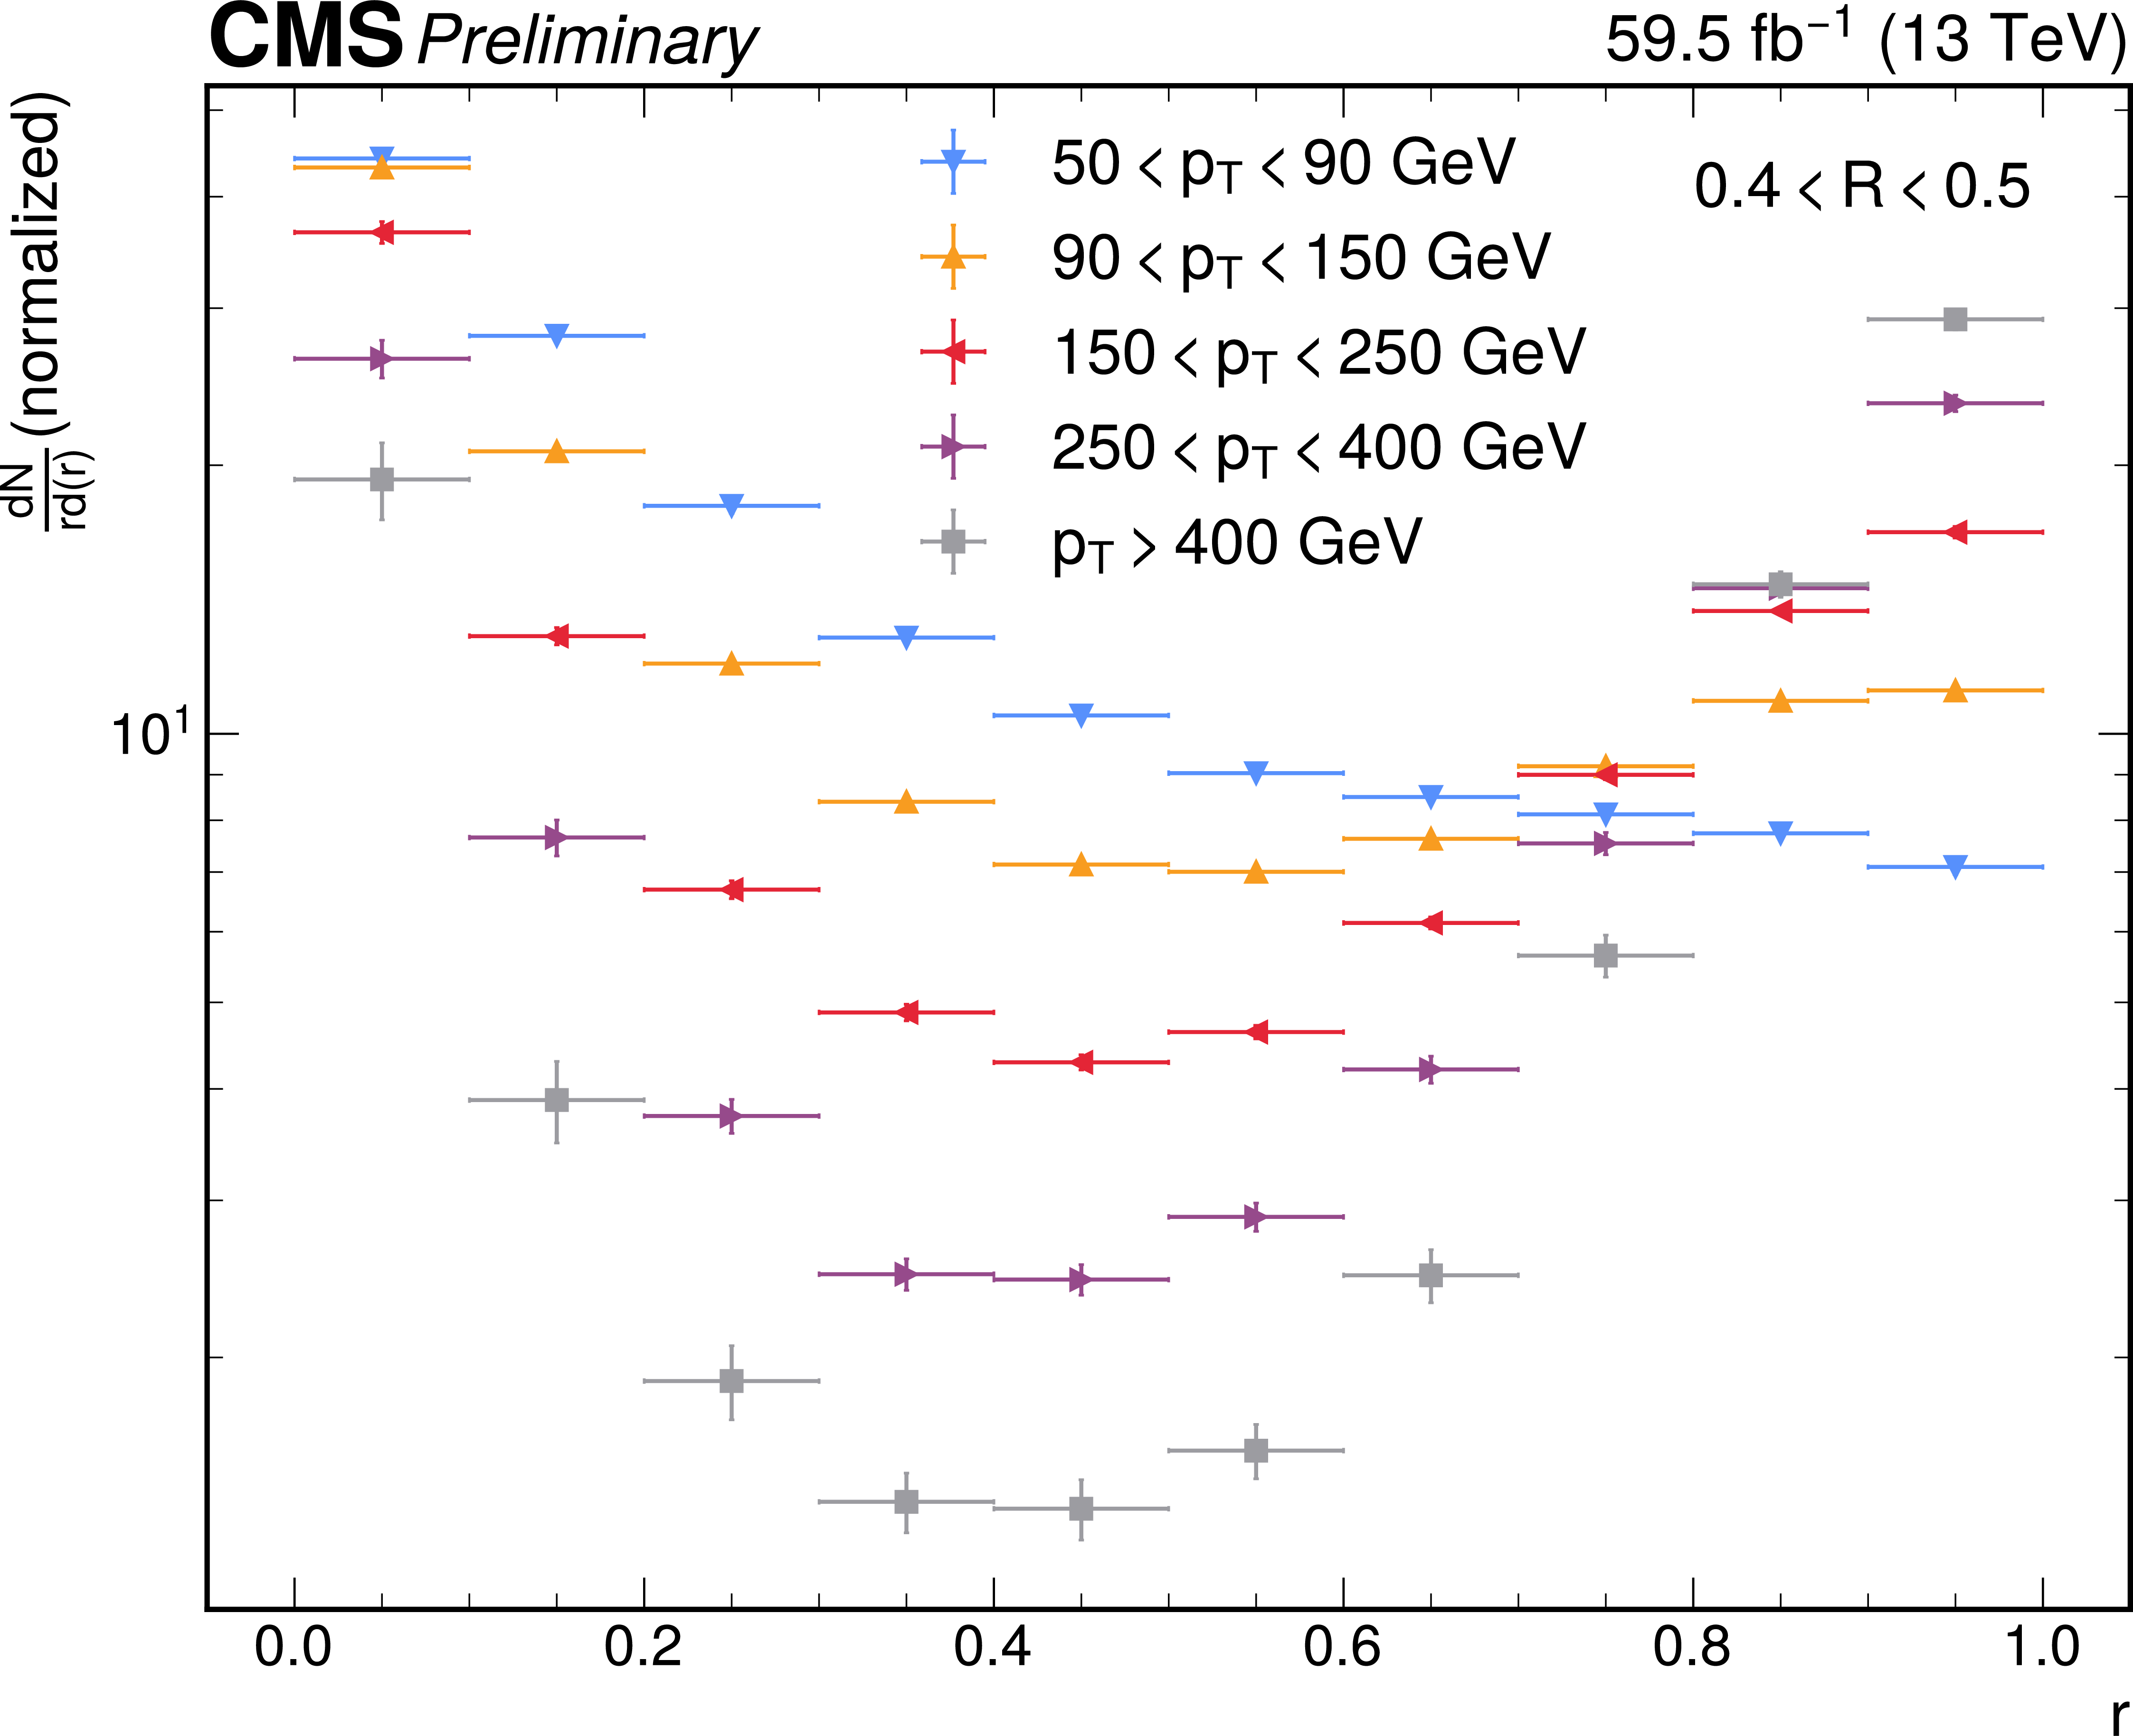
png pdf |
Figure 9:
Radial profile of the unfolded dipole configuration distributions, obtained by integrating over $ \phi $. The two collinear singularities at $ r \to $ 0 and $ r \to $ 1 are visible, and exhibit different scaling behavior as a function of $ r $, with the $ r \to $ 0 singularity narrower than the $ r \to $ 1 singularity. The relative magnitude of the two singularities changes with the jet $ p_{\mathrm{T}} $, with the $ r \to $ 1 singularity becoming more pronounced at higher momentum. |
png pdf |
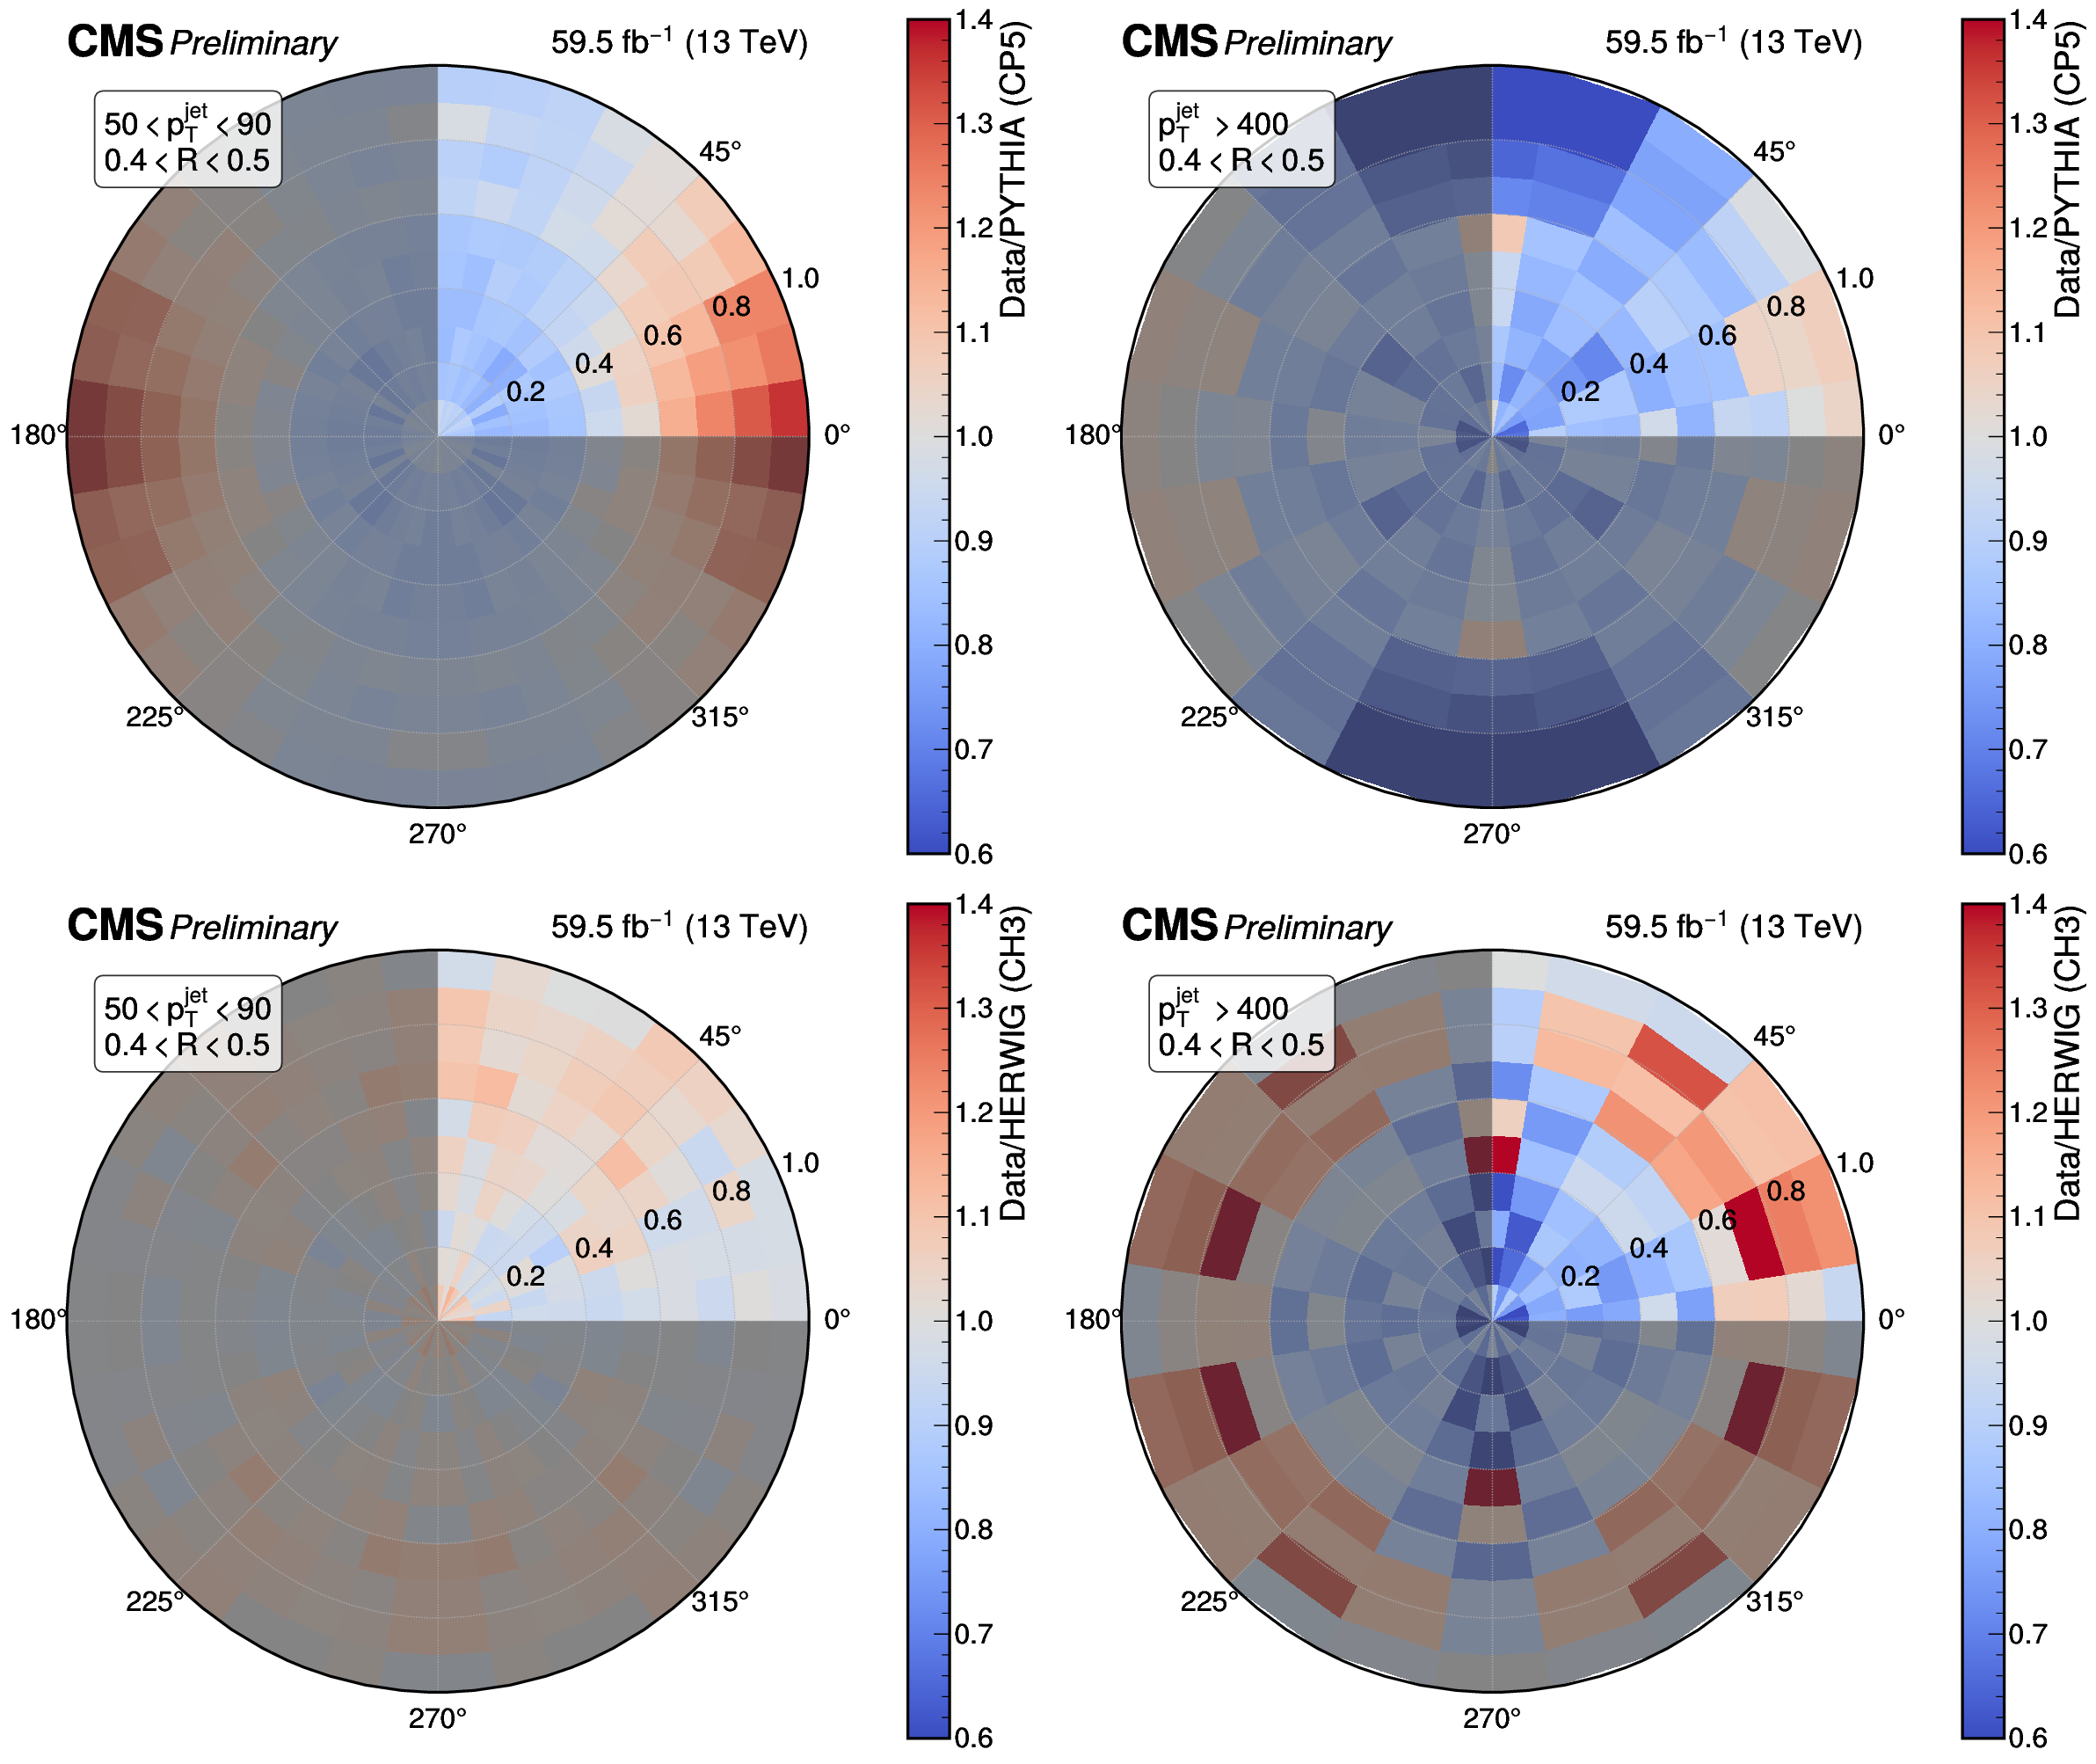
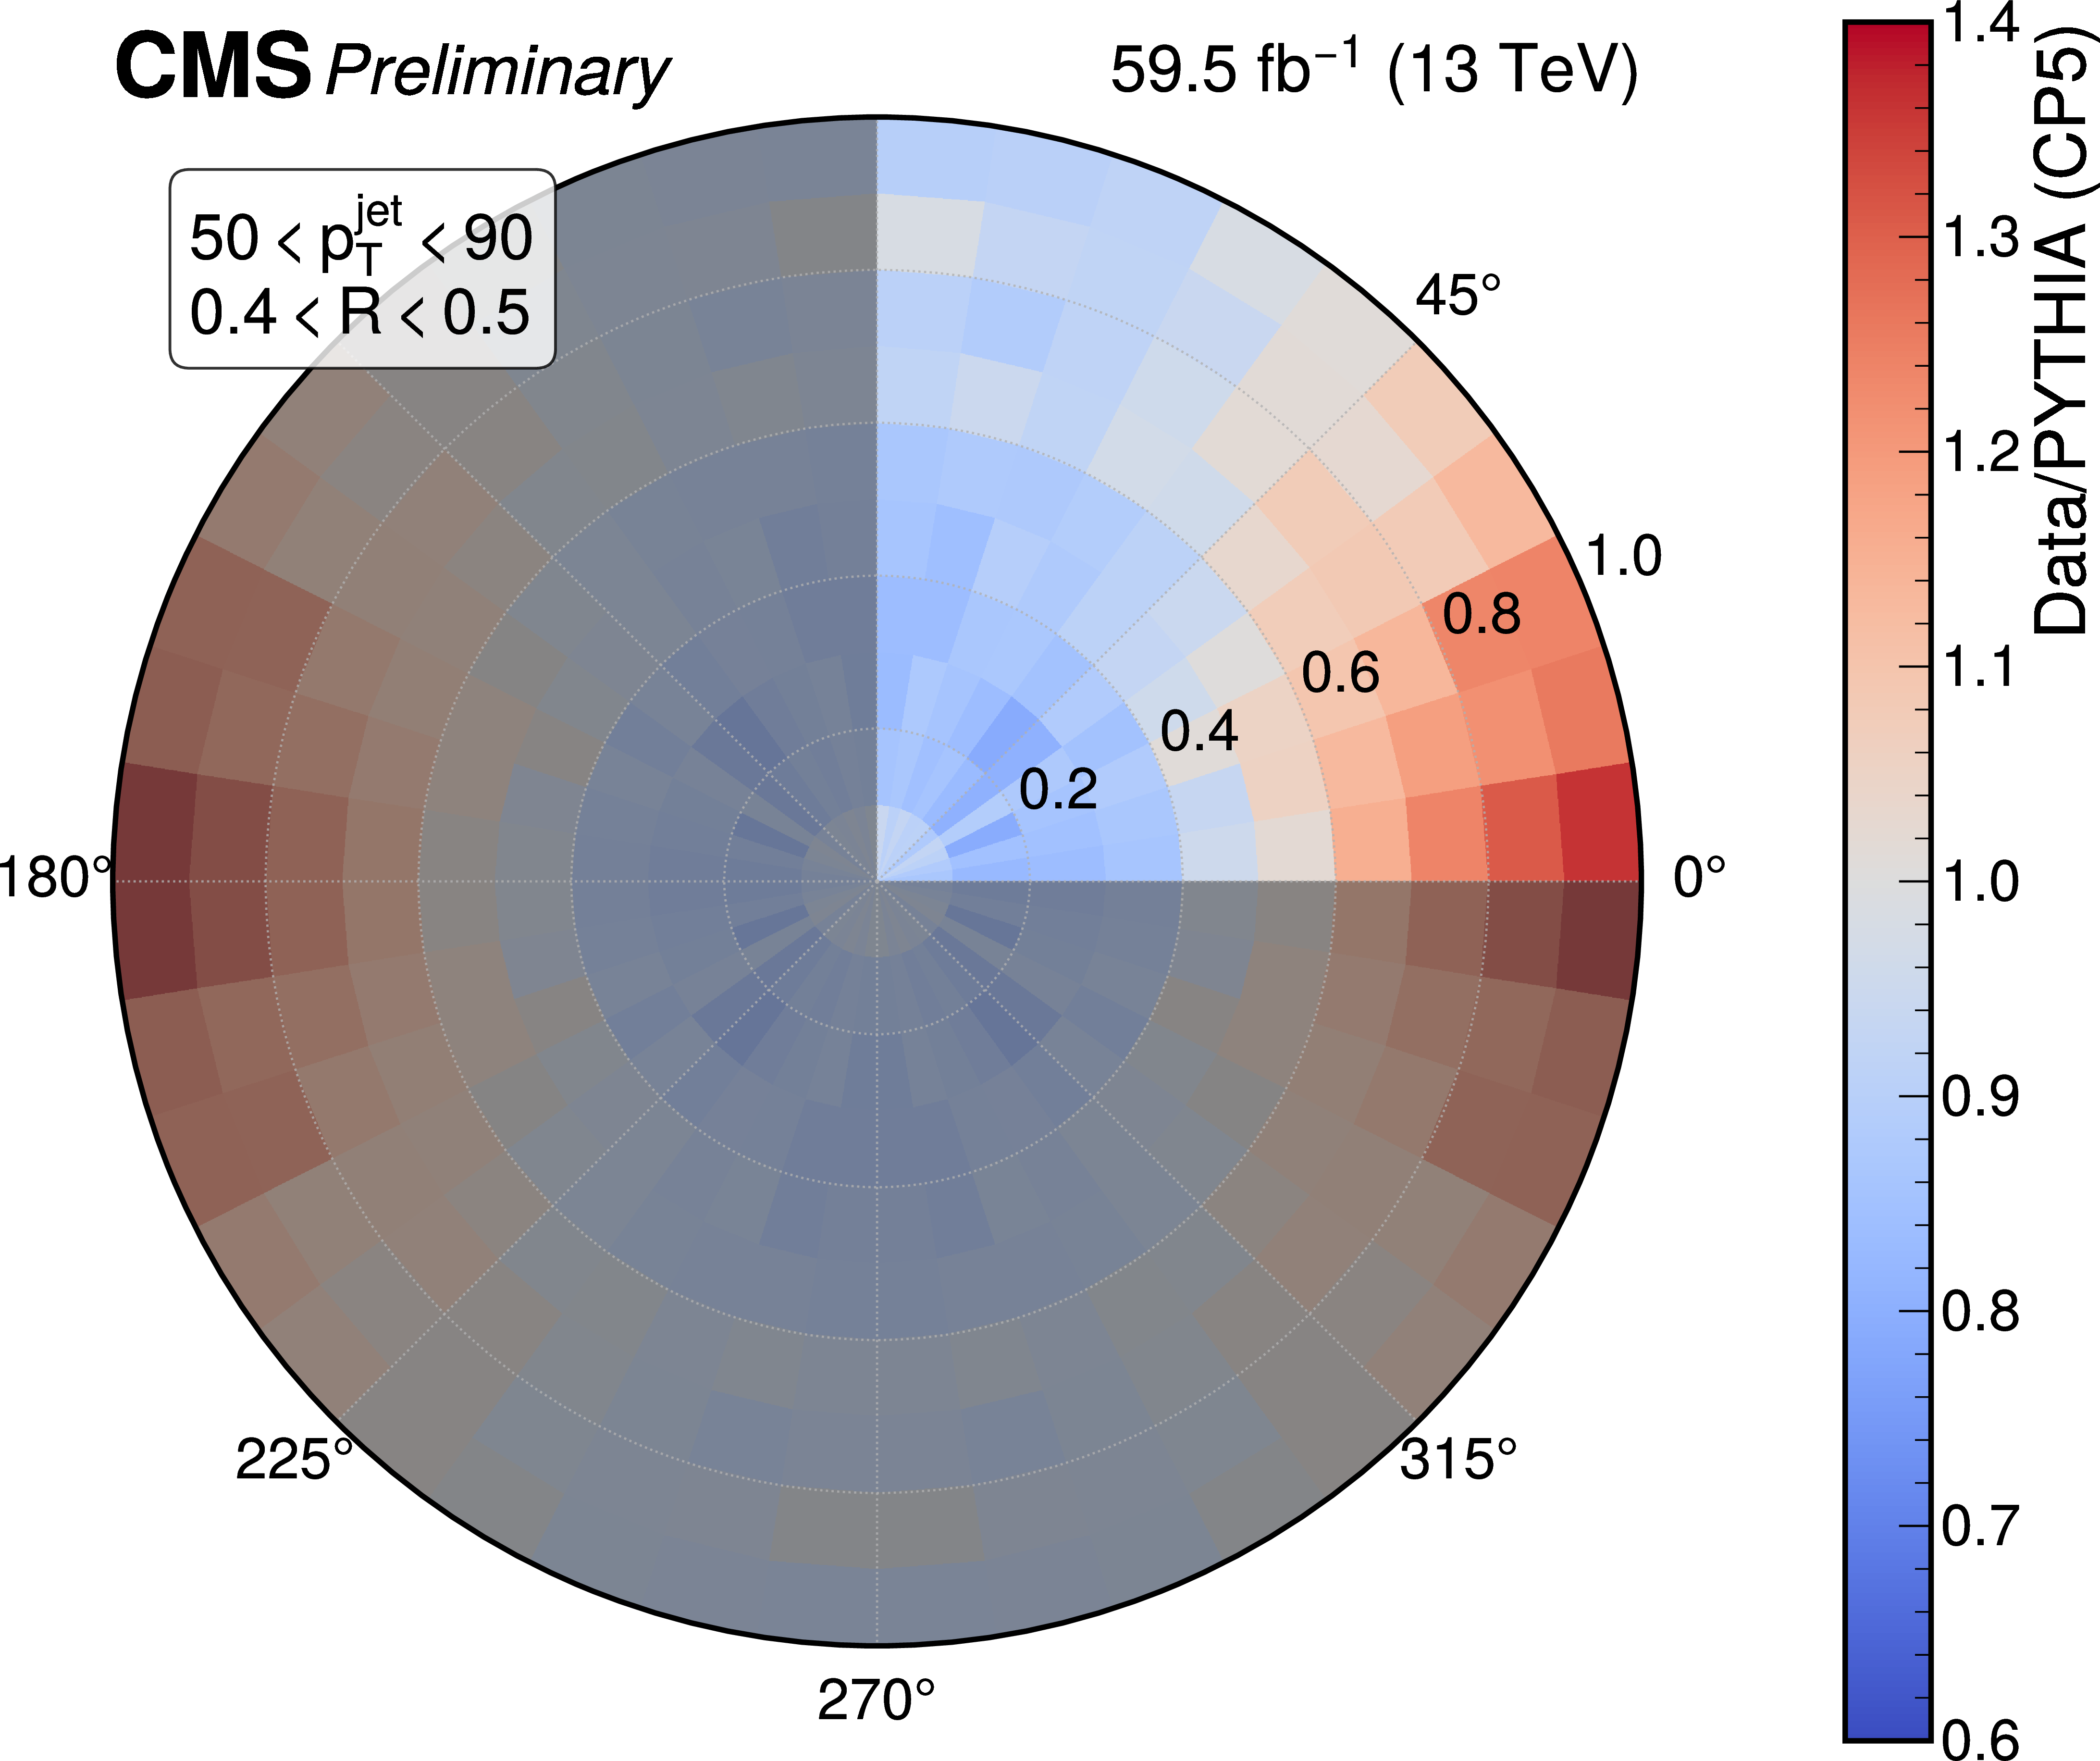
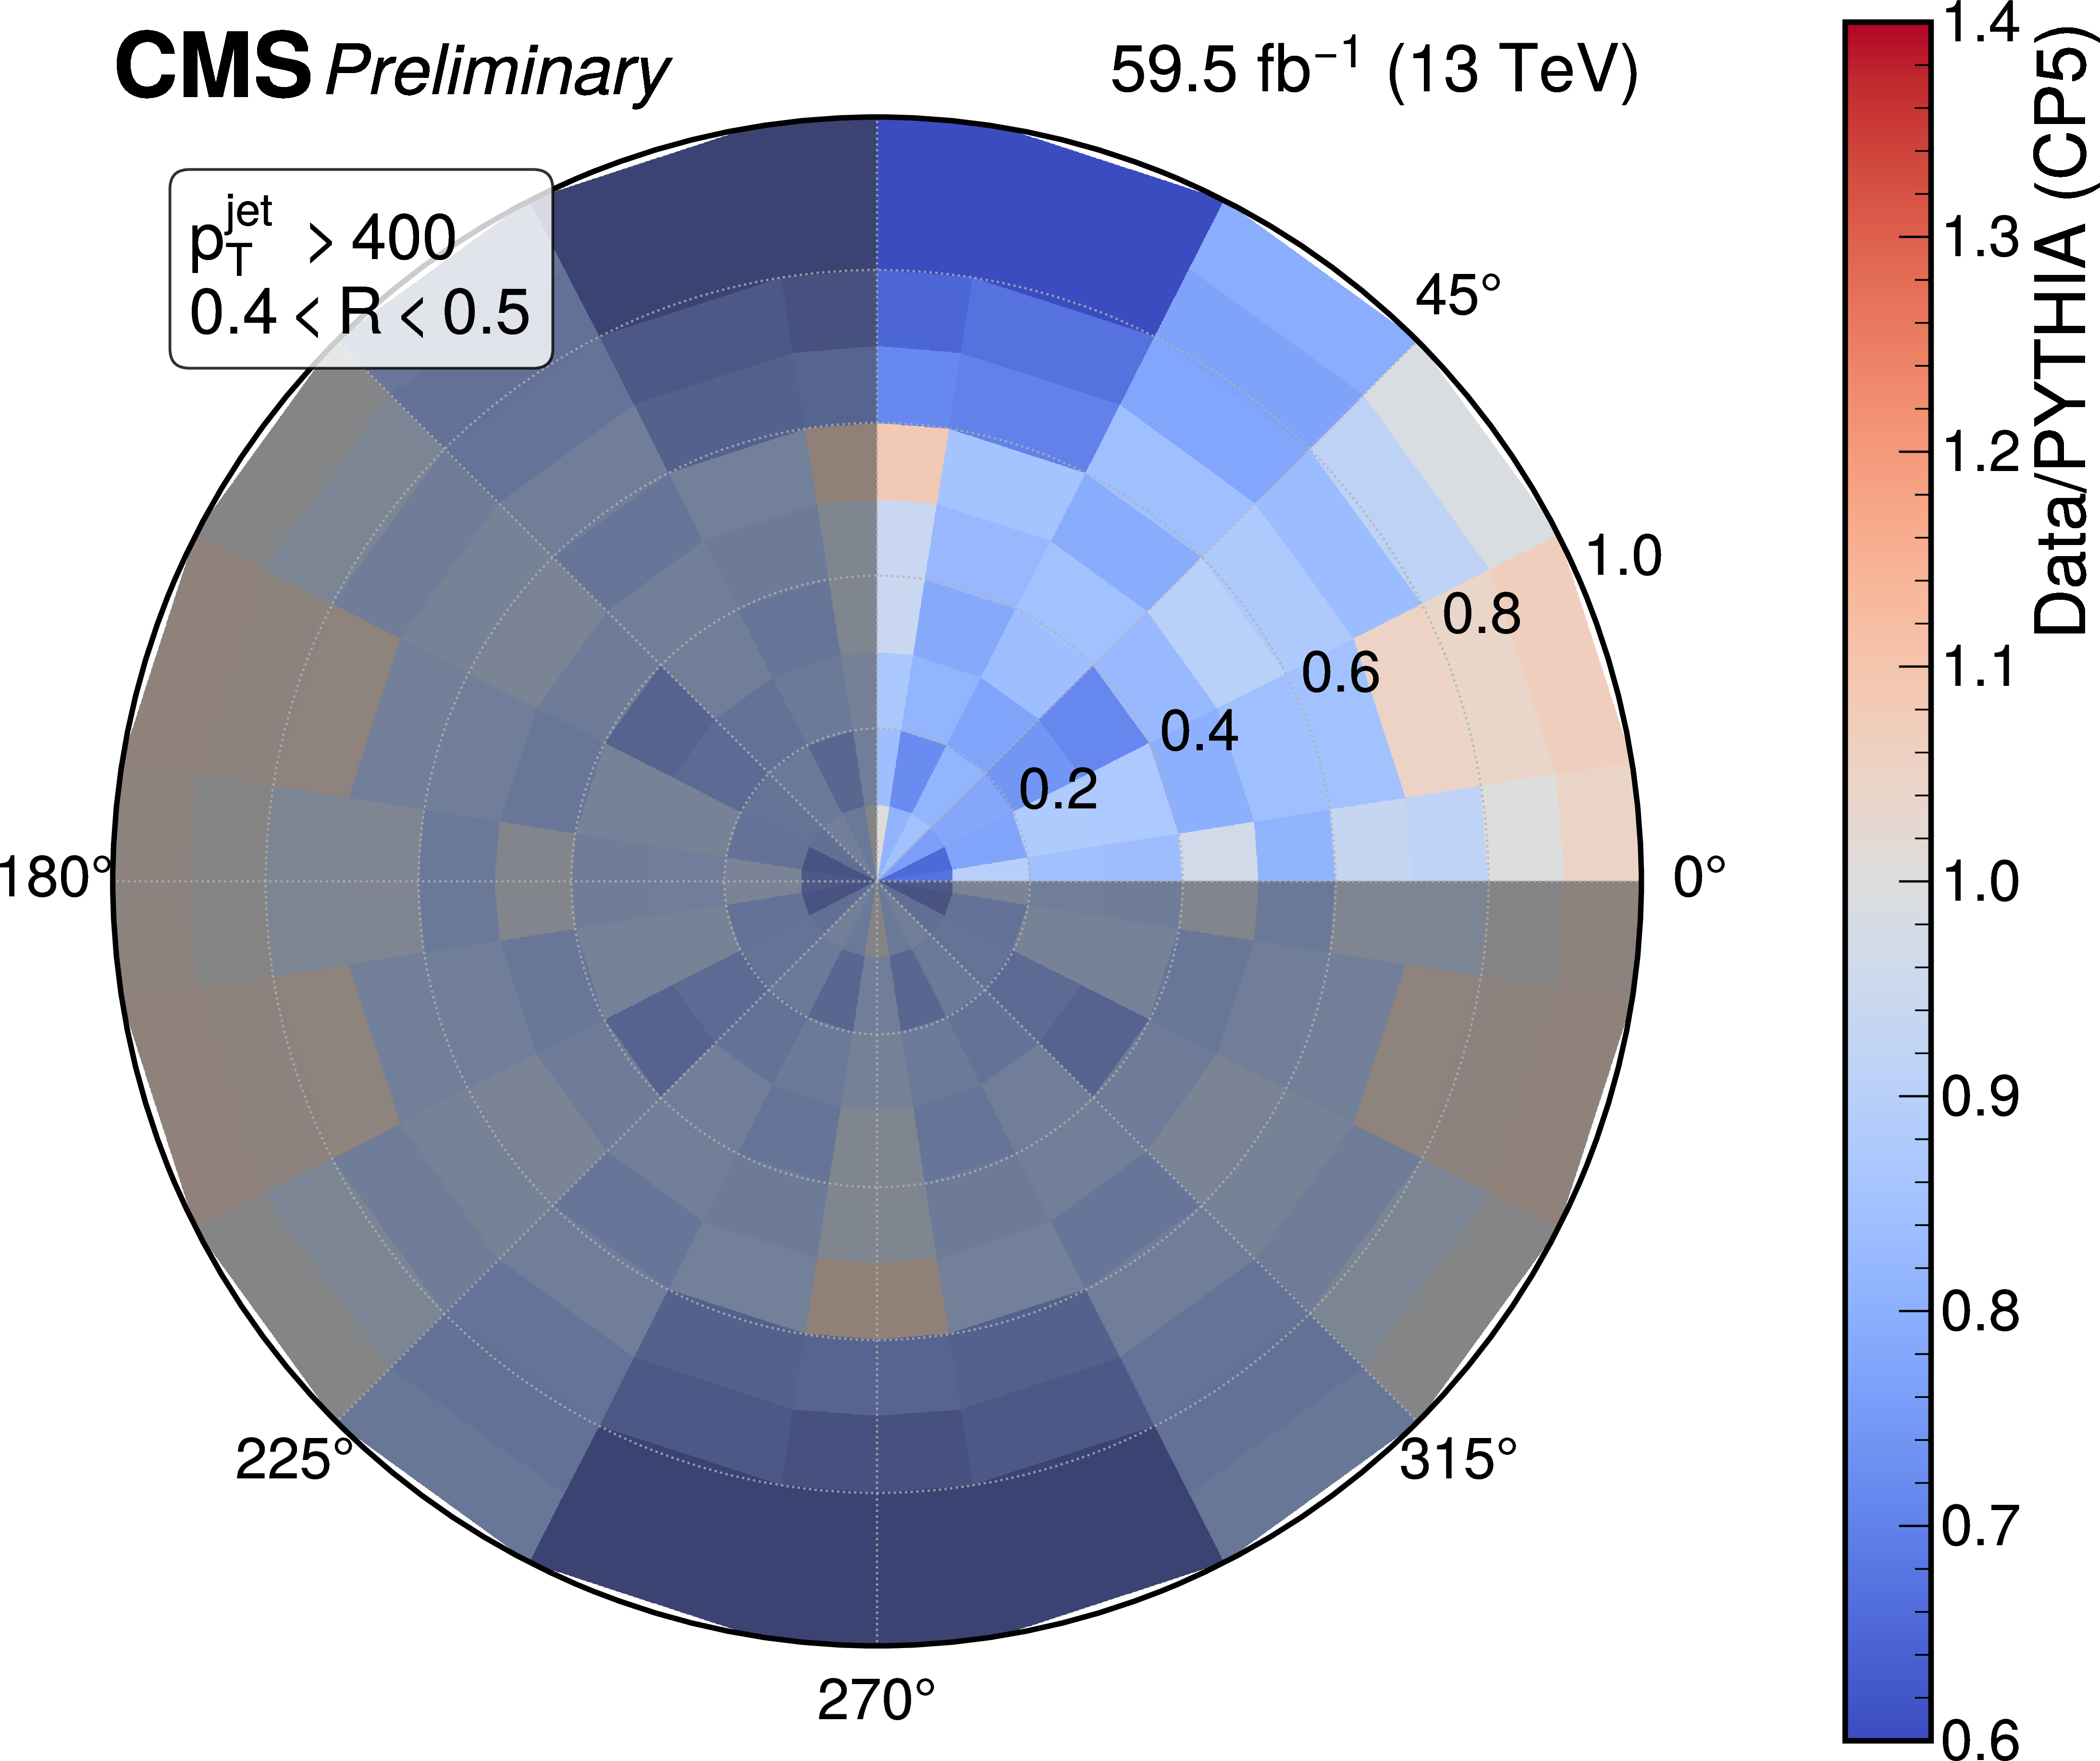
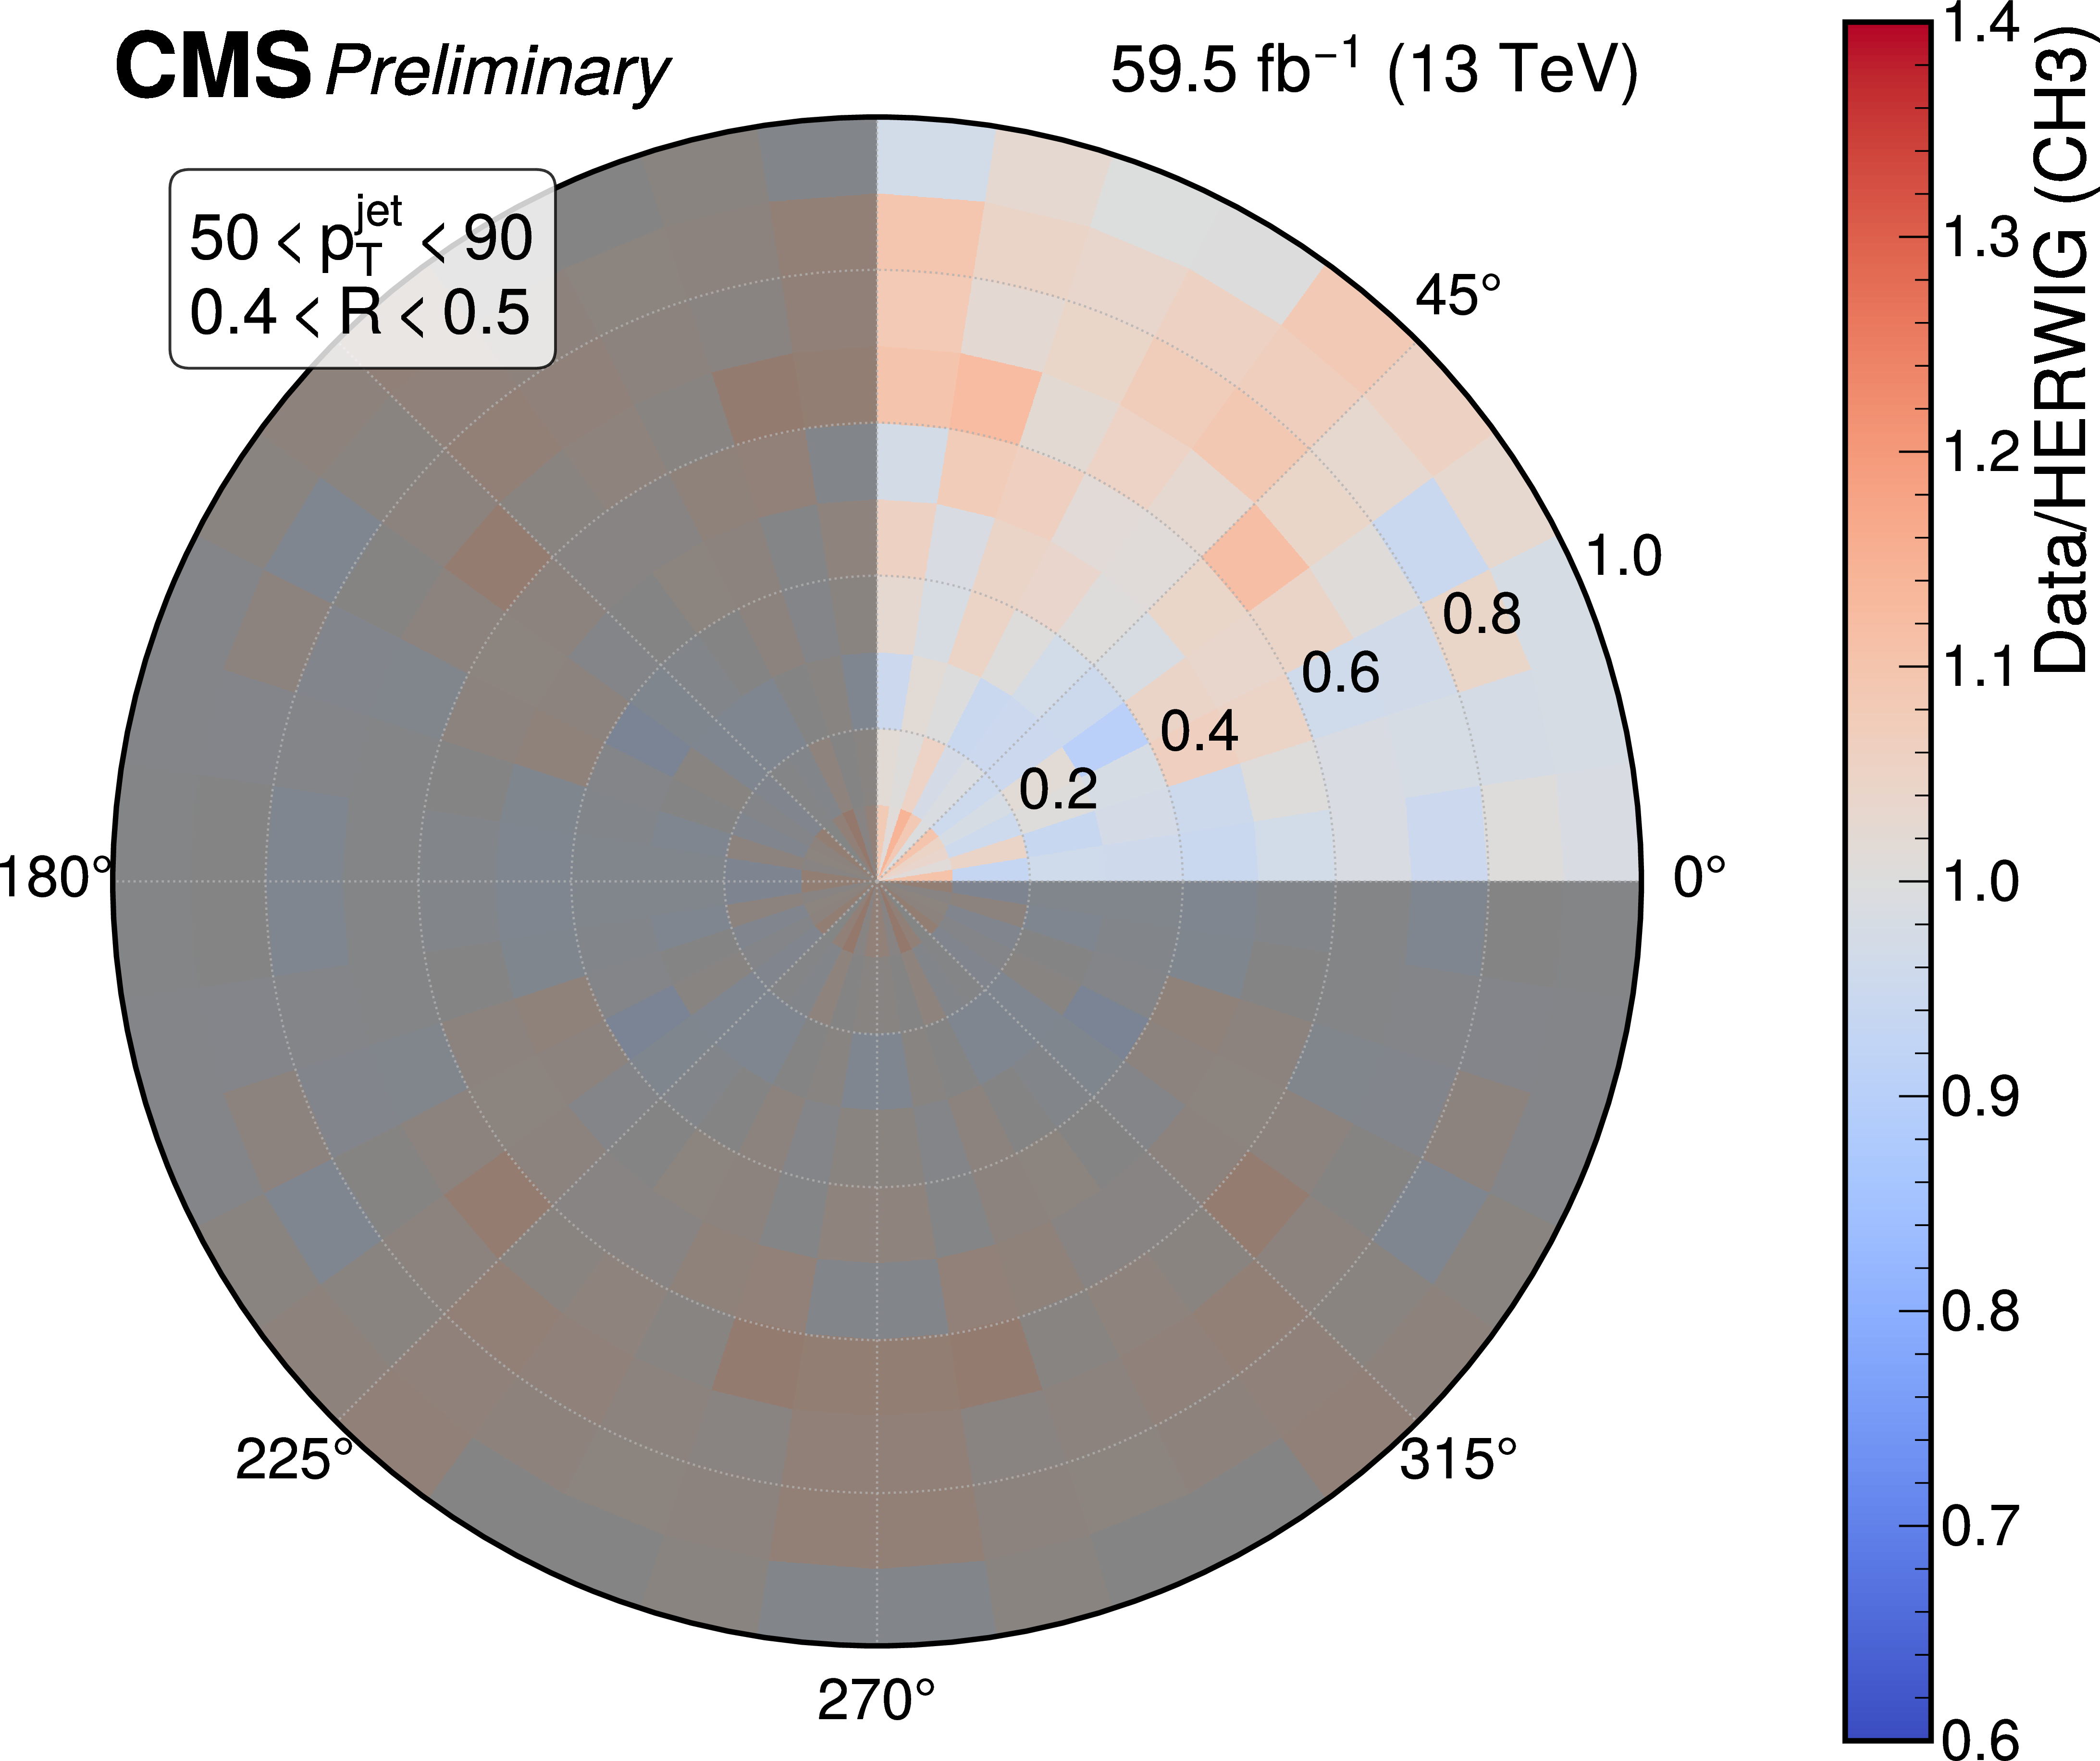
Figure 10:
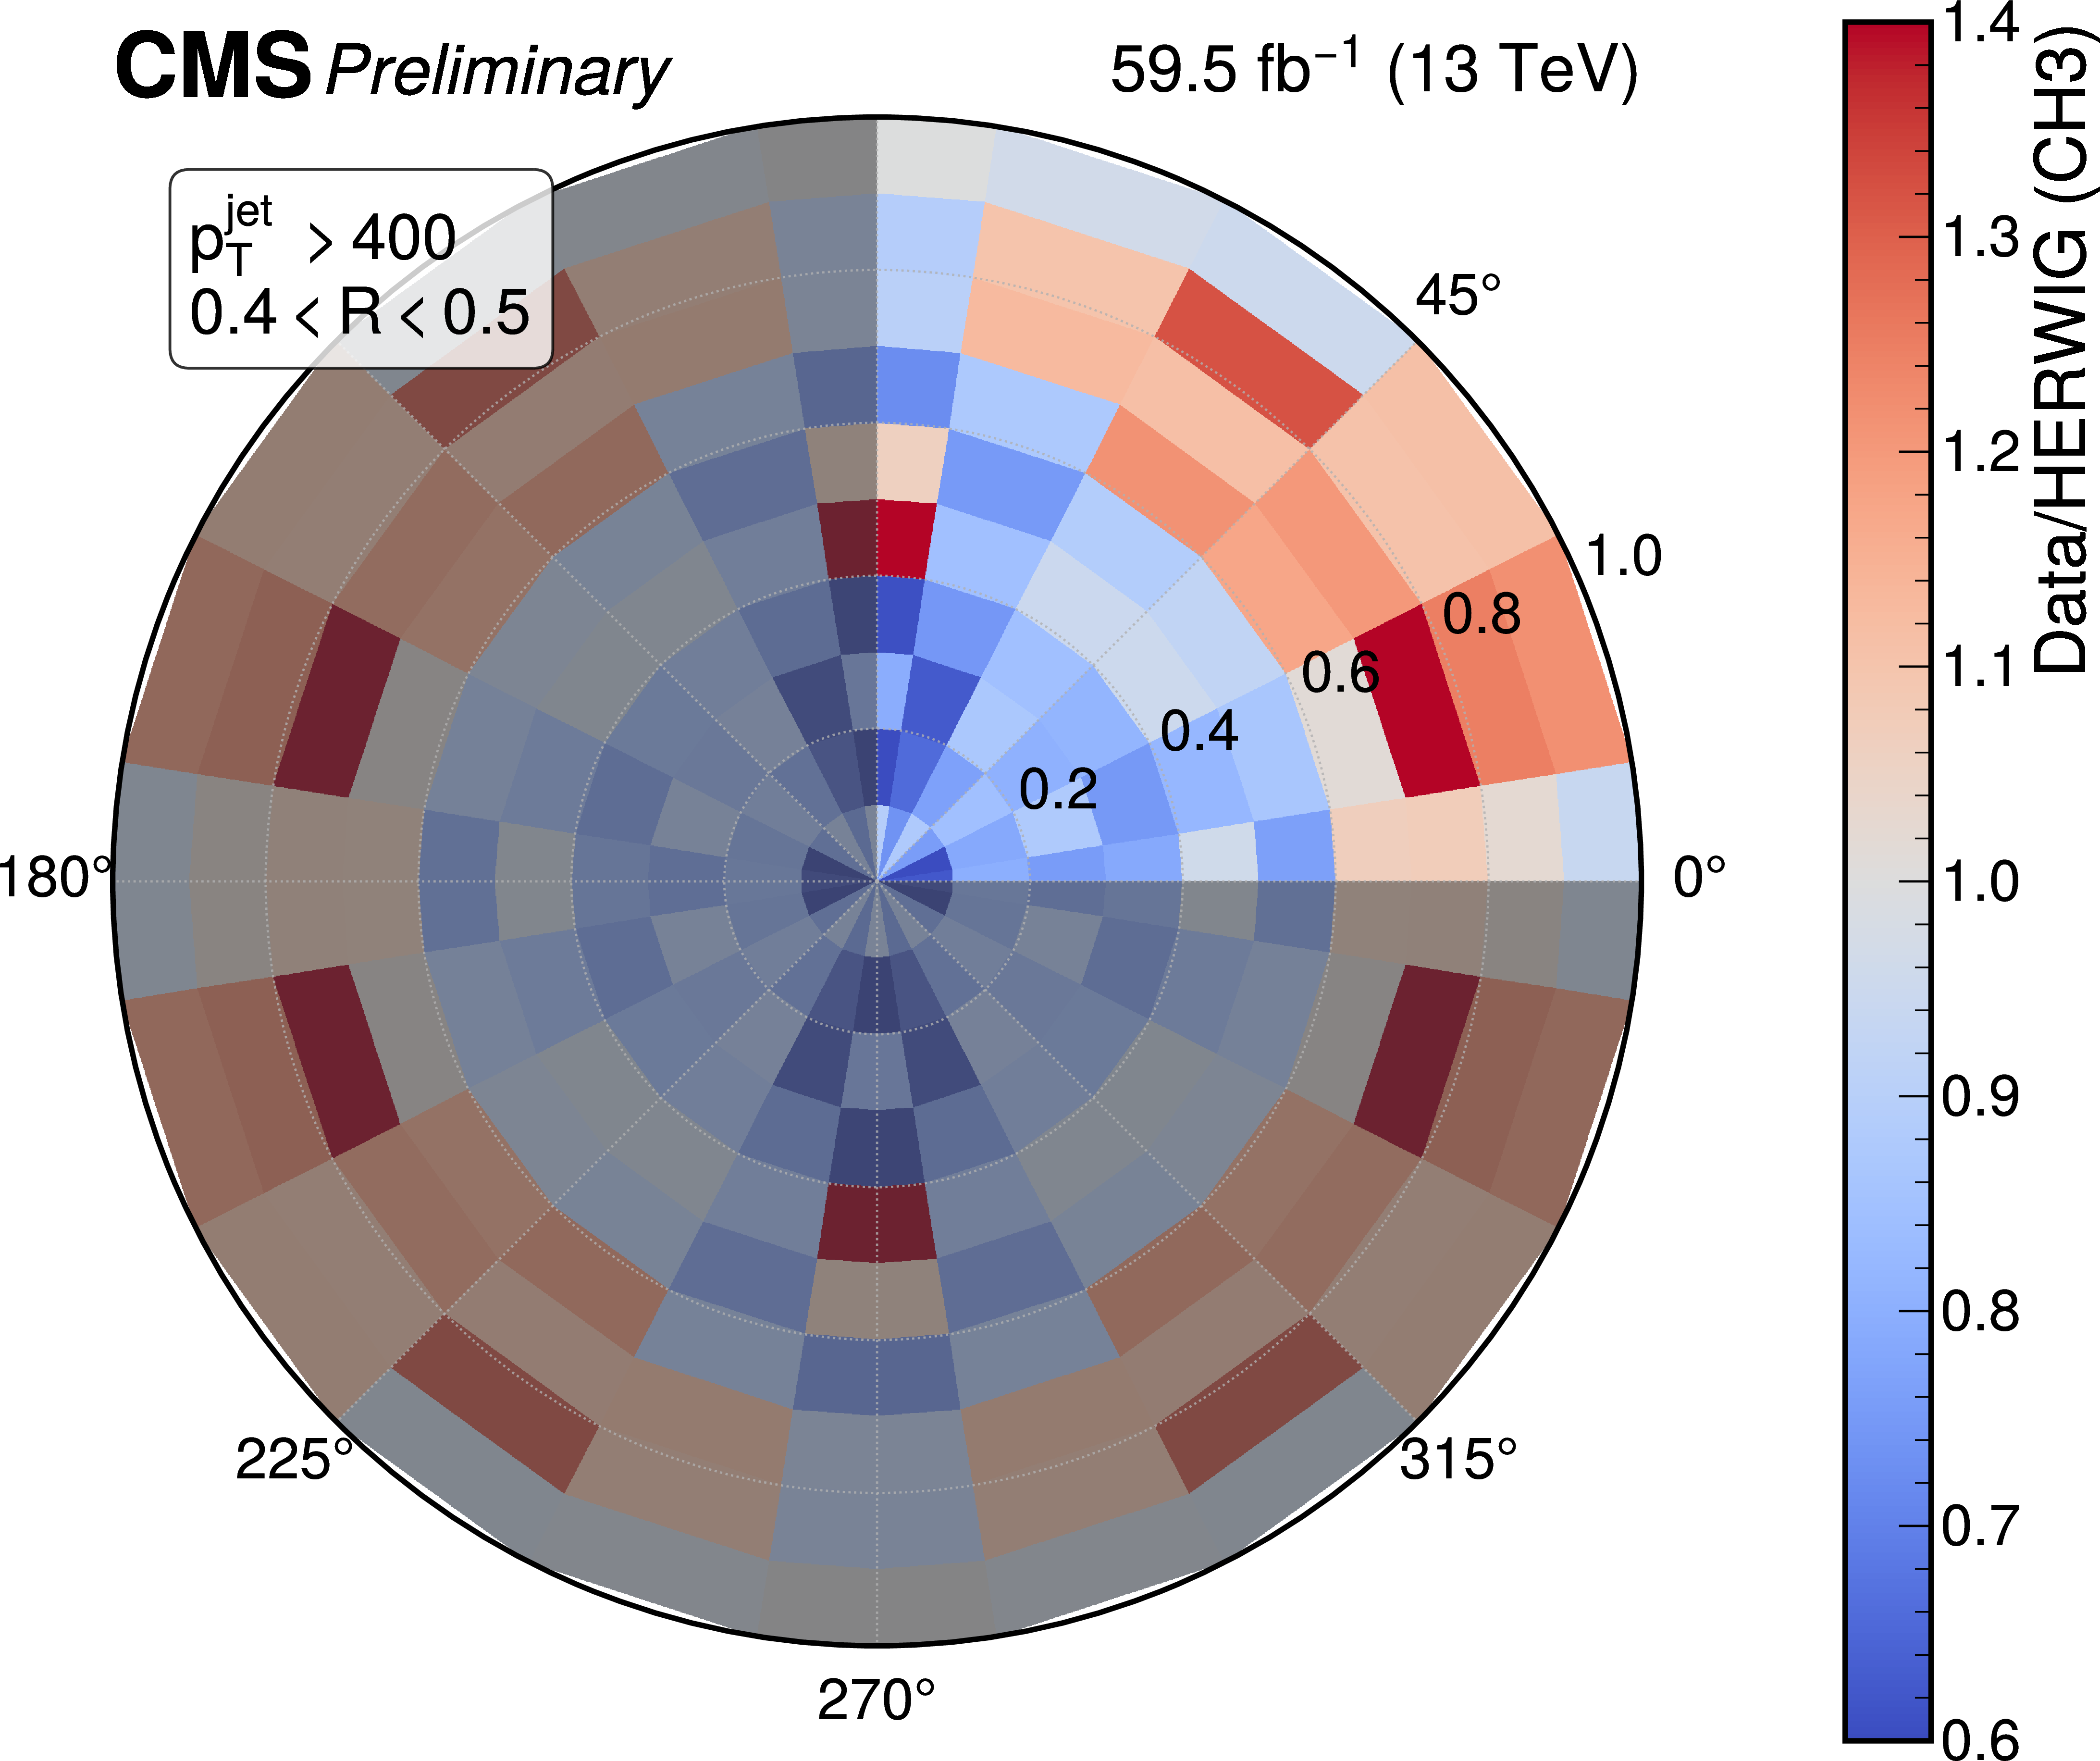
Ratio of unfolded data to MC predictions for the dipole configuration. Top: Data vs Pythia. Bottom: Data vs Herwig. Left: 50 $ < p_{\mathrm{T}}^{\text{jet}} < $ 90 GeV. Right: $ p_{\mathrm{T}}^{\text{jet}} > $ 400 GeV. The measurement is only in the first quadrant, but has been replicated three times to make a full disk for ease of visualization. |
png pdf |
Figure 10-a:
Ratio of unfolded data to MC predictions for the dipole configuration. Top: Data vs Pythia. Bottom: Data vs Herwig. Left: 50 $ < p_{\mathrm{T}}^{\text{jet}} < $ 90 GeV. Right: $ p_{\mathrm{T}}^{\text{jet}} > $ 400 GeV. The measurement is only in the first quadrant, but has been replicated three times to make a full disk for ease of visualization. |
png pdf |
Figure 10-b:
Ratio of unfolded data to MC predictions for the dipole configuration. Top: Data vs Pythia. Bottom: Data vs Herwig. Left: 50 $ < p_{\mathrm{T}}^{\text{jet}} < $ 90 GeV. Right: $ p_{\mathrm{T}}^{\text{jet}} > $ 400 GeV. The measurement is only in the first quadrant, but has been replicated three times to make a full disk for ease of visualization. |
png pdf |
Figure 10-c:
Ratio of unfolded data to MC predictions for the dipole configuration. Top: Data vs Pythia. Bottom: Data vs Herwig. Left: 50 $ < p_{\mathrm{T}}^{\text{jet}} < $ 90 GeV. Right: $ p_{\mathrm{T}}^{\text{jet}} > $ 400 GeV. The measurement is only in the first quadrant, but has been replicated three times to make a full disk for ease of visualization. |
png pdf |
Figure 10-d:
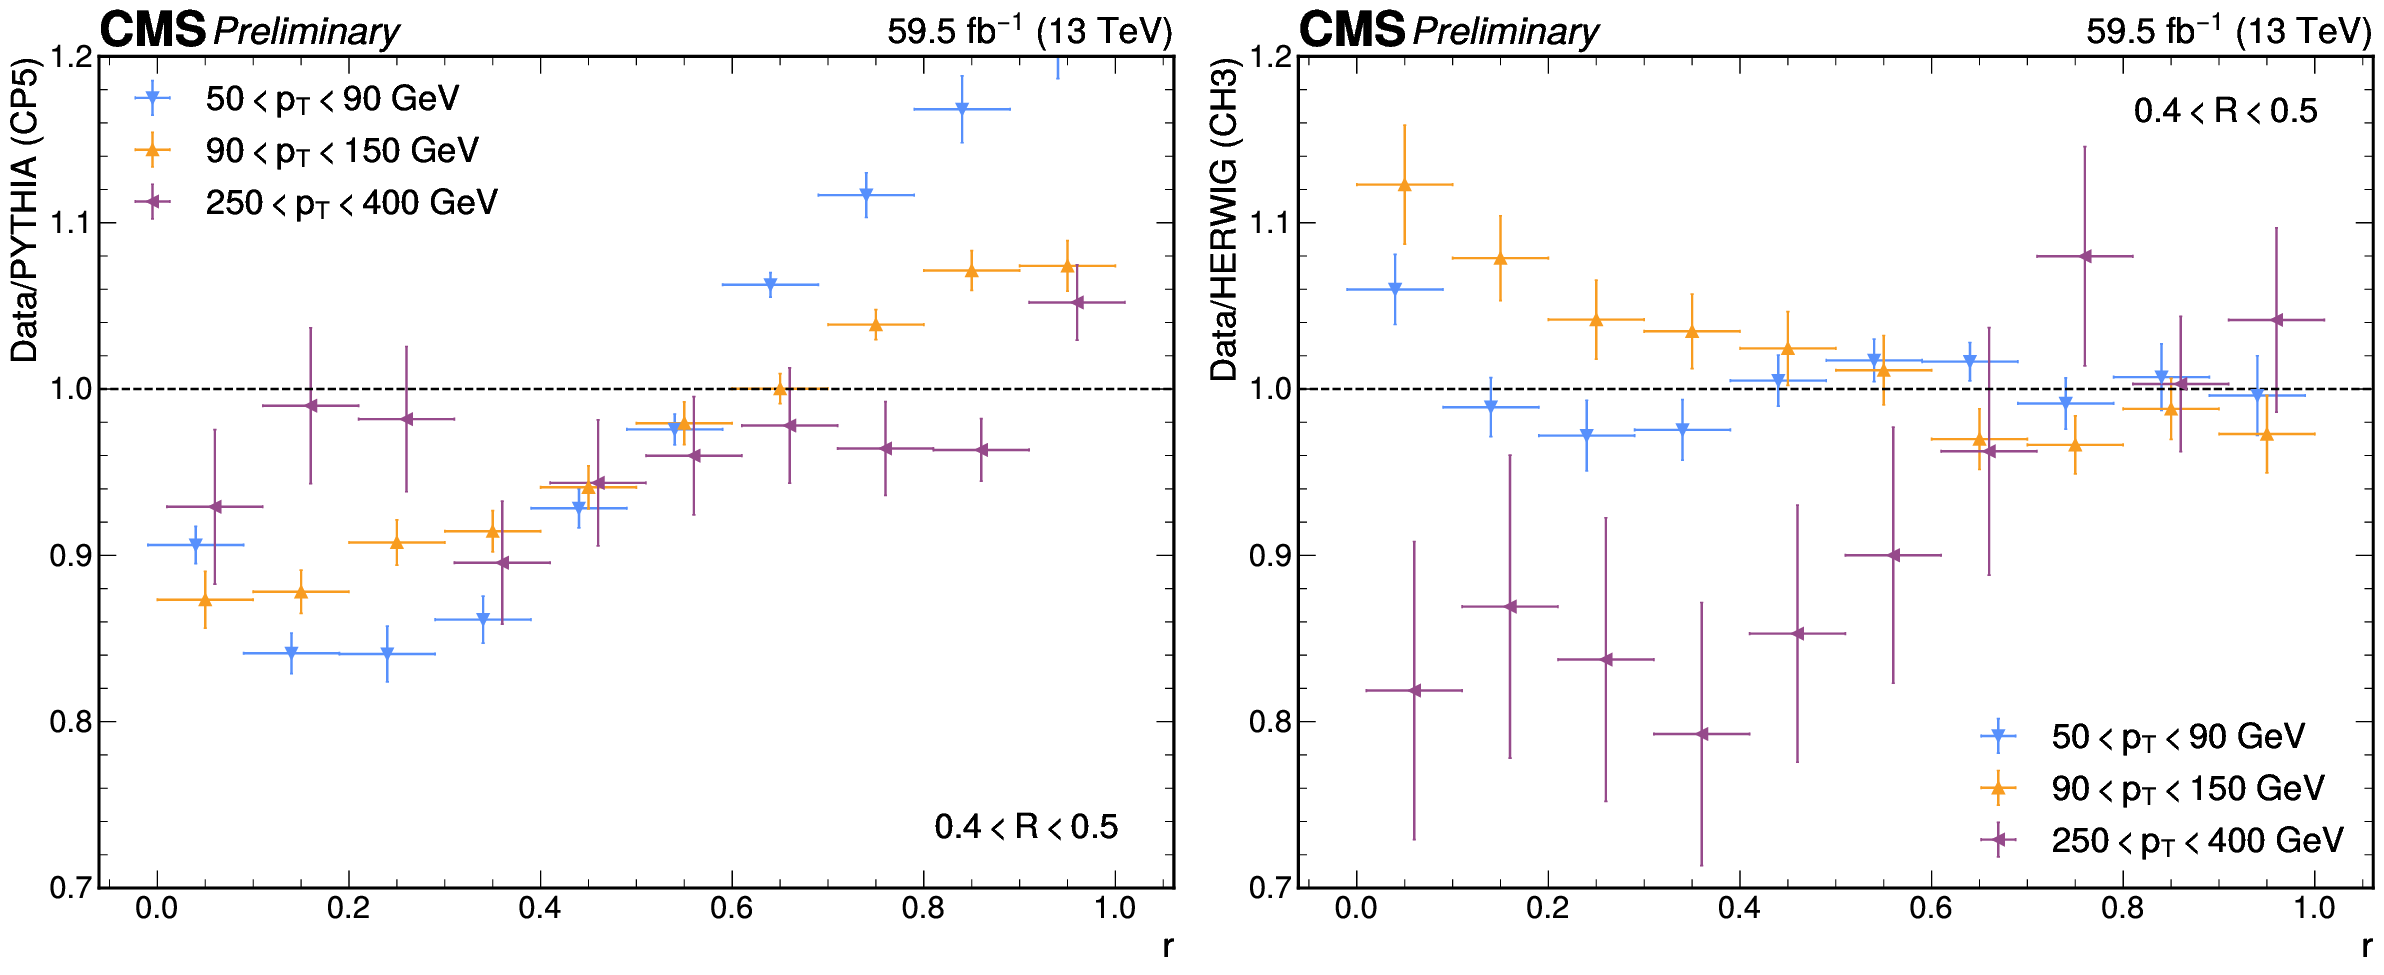
Ratio of unfolded data to MC predictions for the dipole configuration. Top: Data vs Pythia. Bottom: Data vs Herwig. Left: 50 $ < p_{\mathrm{T}}^{\text{jet}} < $ 90 GeV. Right: $ p_{\mathrm{T}}^{\text{jet}} > $ 400 GeV. The measurement is only in the first quadrant, but has been replicated three times to make a full disk for ease of visualization. |
png pdf |
Figure 11:
Ratio of unfolded data to MC predictions for the dipole configuration, integrated over $ \phi $. Left: Data vs Pythia. Right: Data vs Herwig. Uncertainties represent the total statistical and systematic uncertainty in the unfolded data, as well as the statistical uncertainty in the MC prediction. Data points are offset slightly in $ r $ for visibility. |
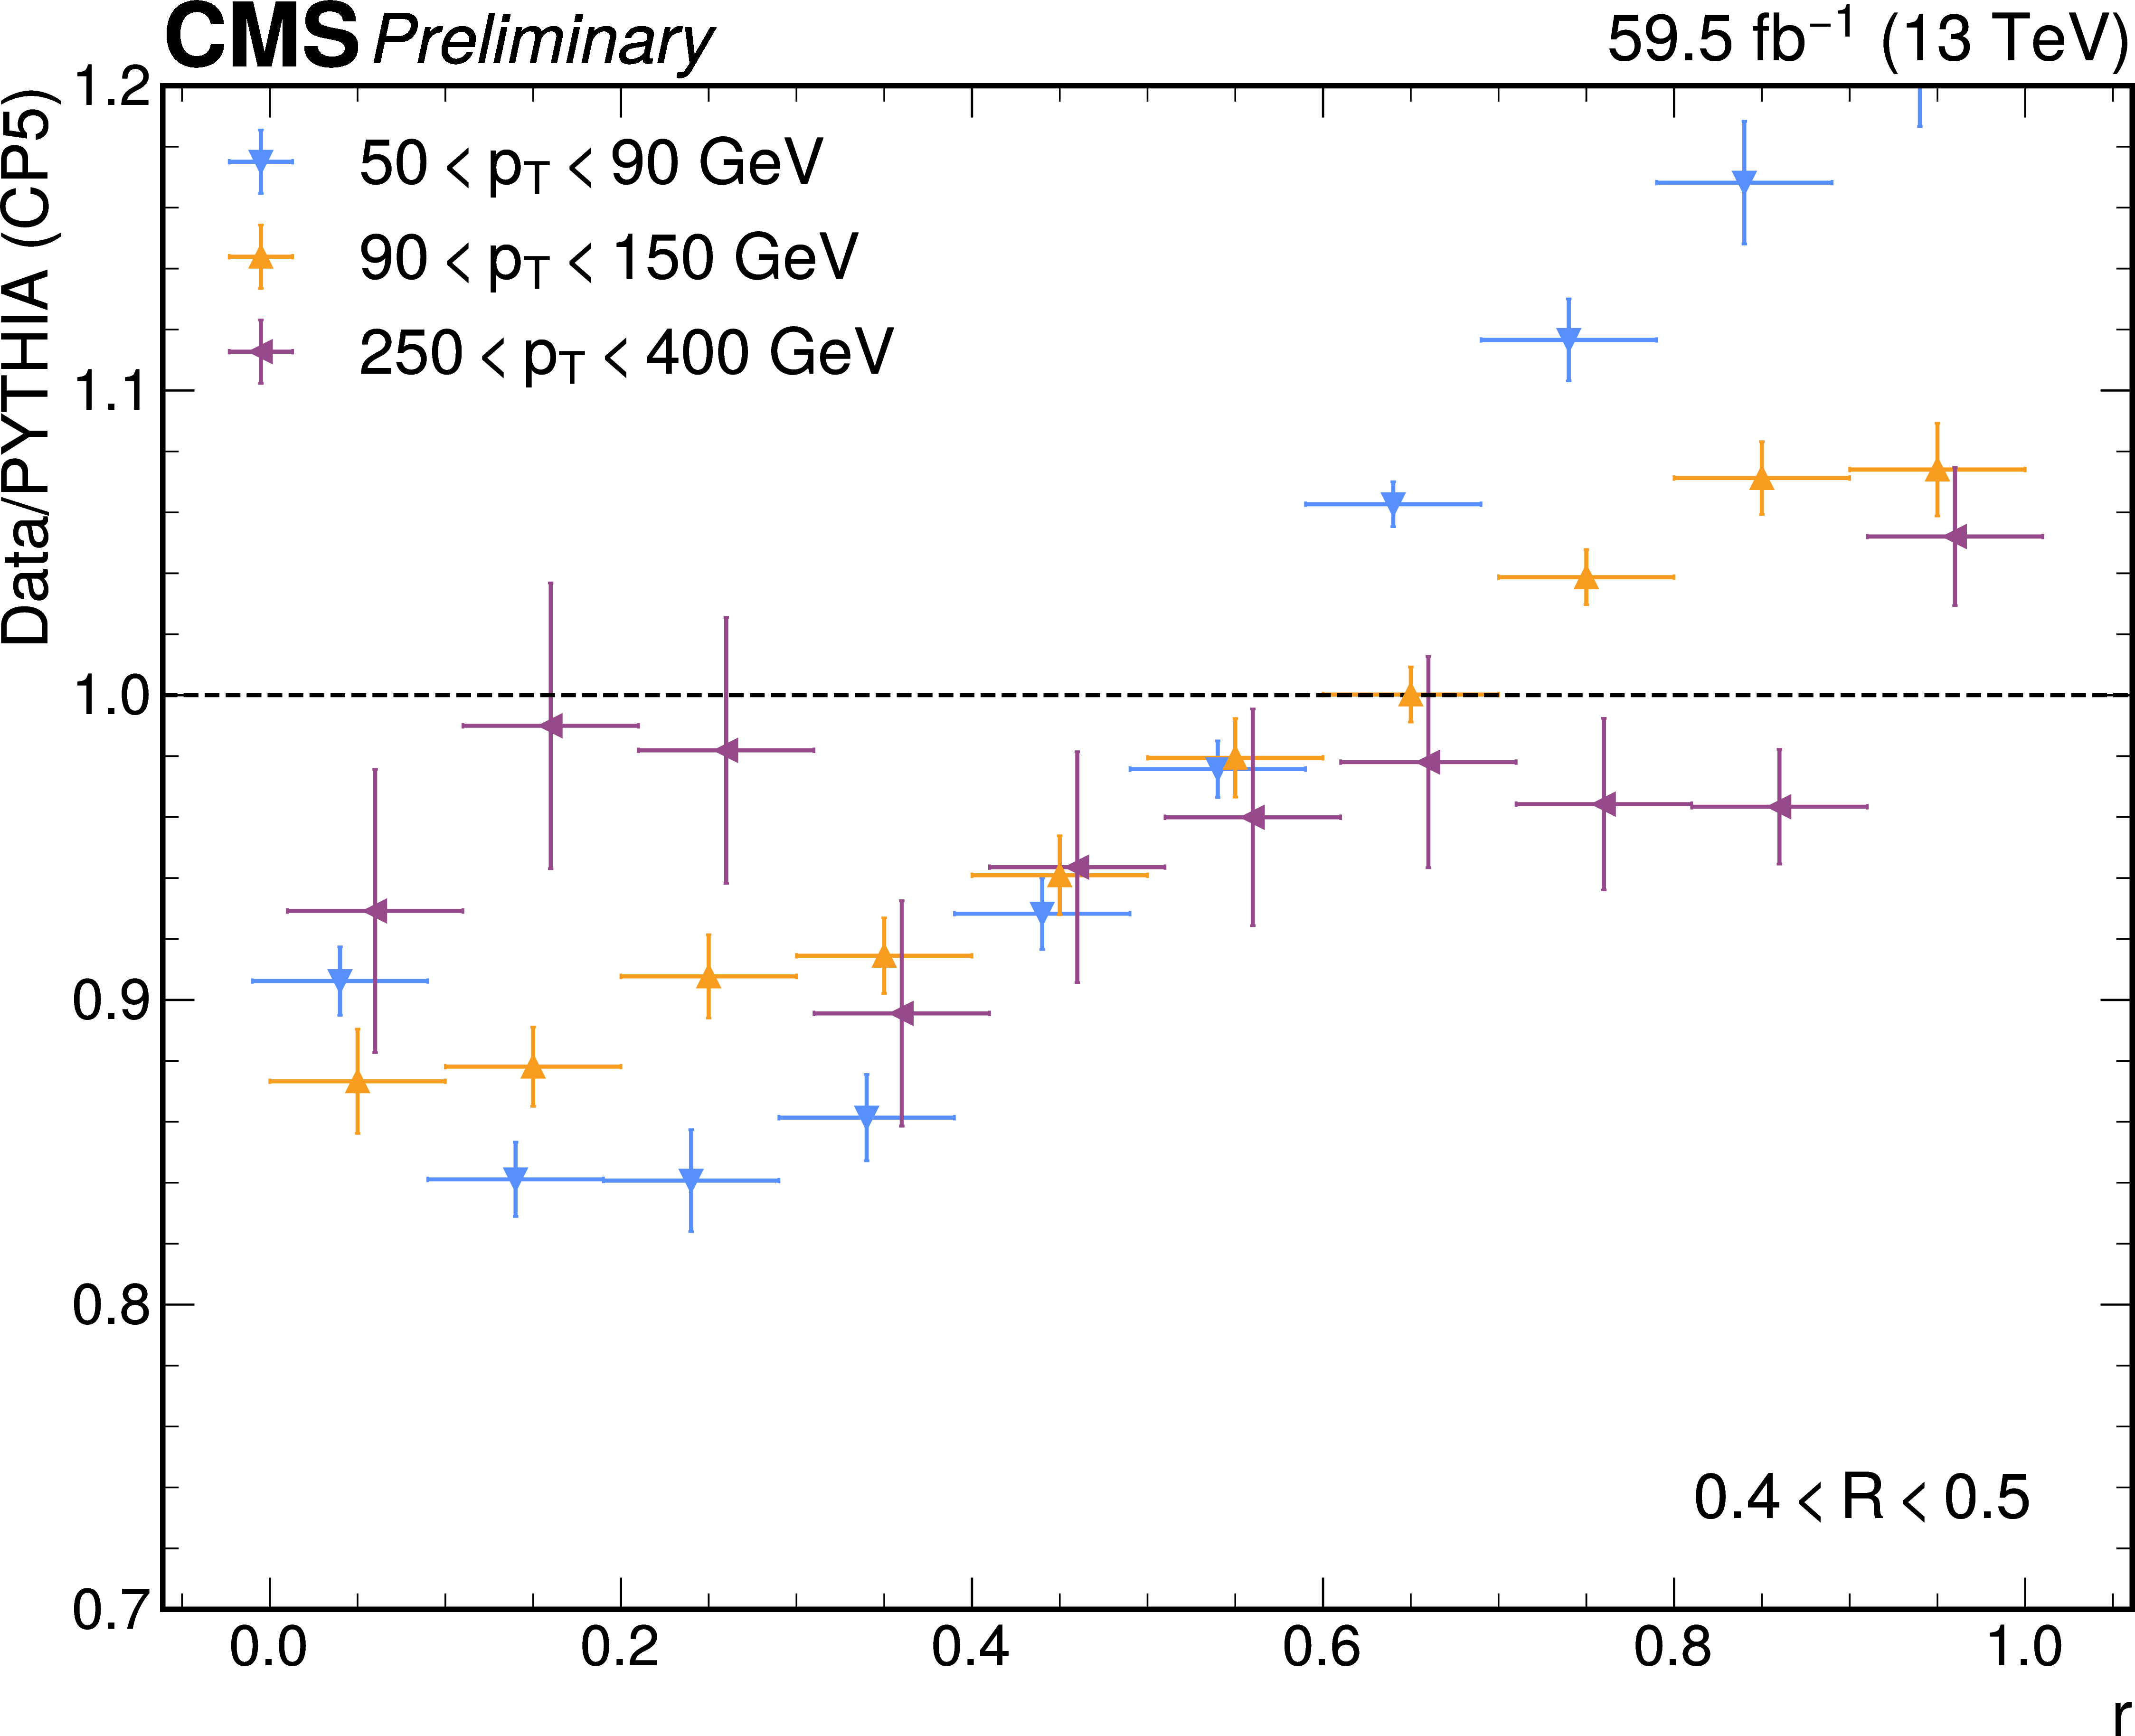
png pdf |
Figure 11-a:
Ratio of unfolded data to MC predictions for the dipole configuration, integrated over $ \phi $. Left: Data vs Pythia. Right: Data vs Herwig. Uncertainties represent the total statistical and systematic uncertainty in the unfolded data, as well as the statistical uncertainty in the MC prediction. Data points are offset slightly in $ r $ for visibility. |
png pdf |
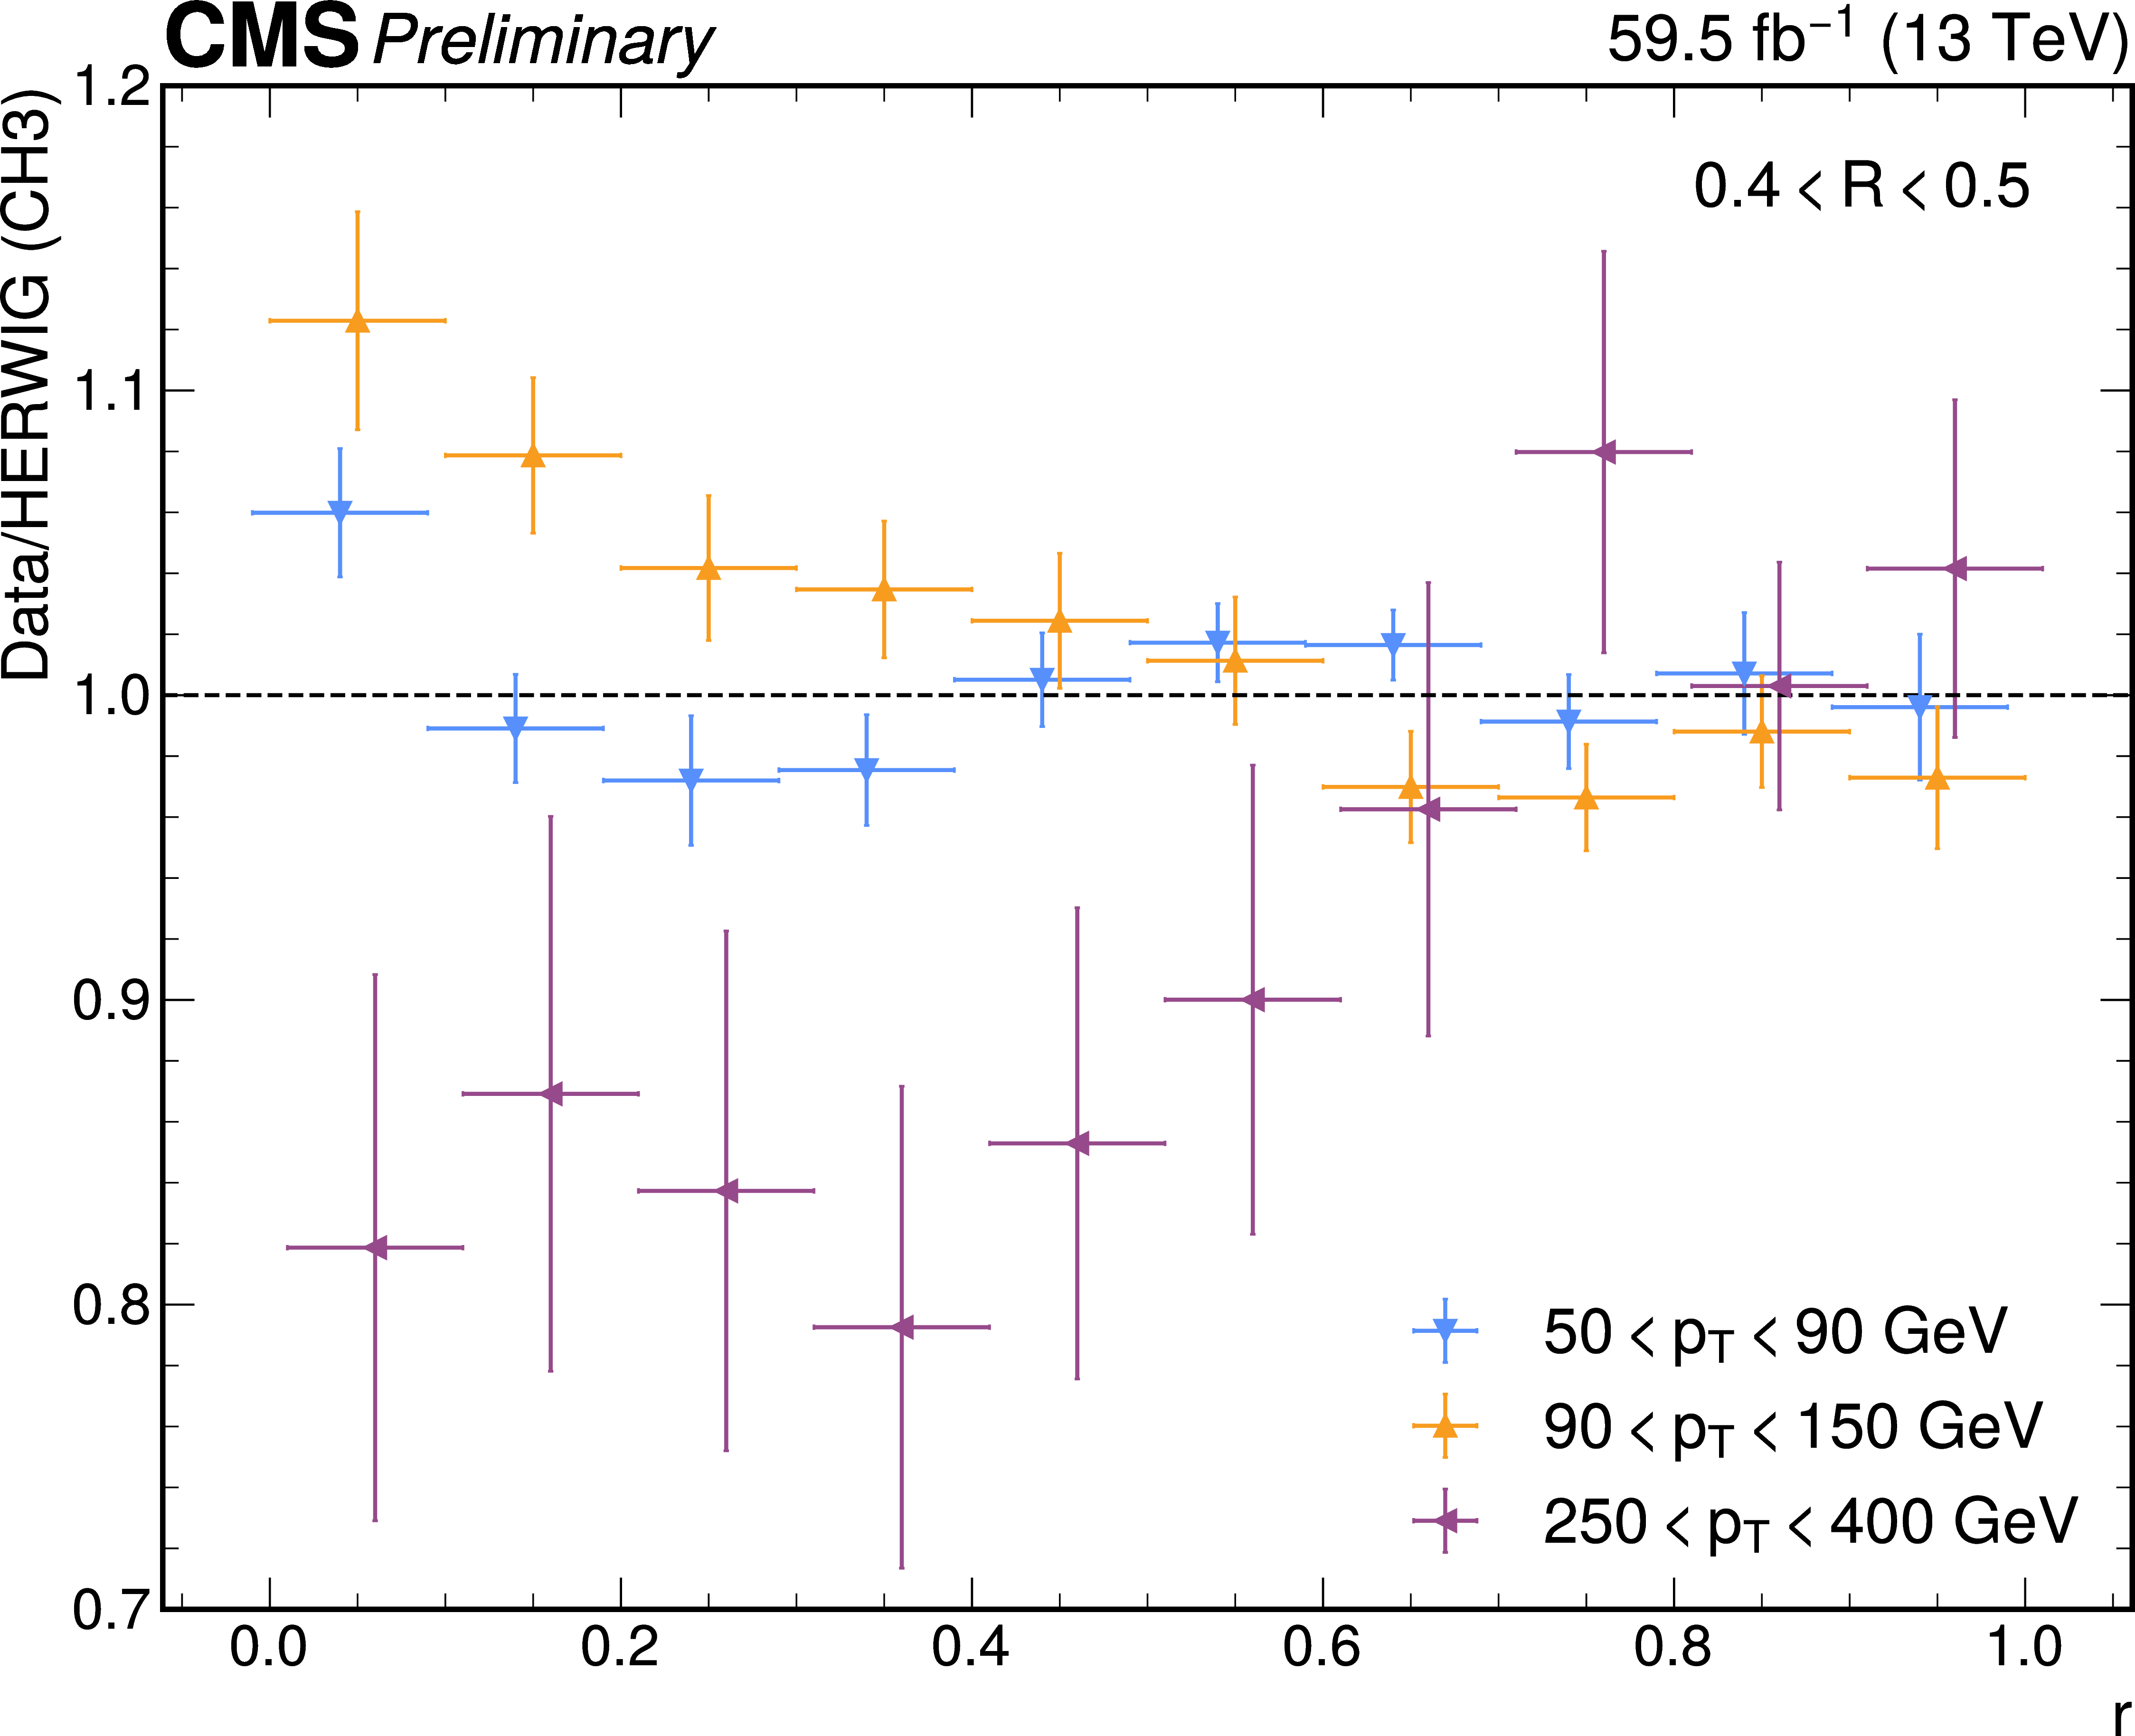
Figure 11-b:
Ratio of unfolded data to MC predictions for the dipole configuration, integrated over $ \phi $. Left: Data vs Pythia. Right: Data vs Herwig. Uncertainties represent the total statistical and systematic uncertainty in the unfolded data, as well as the statistical uncertainty in the MC prediction. Data points are offset slightly in $ r $ for visibility. |
png pdf |
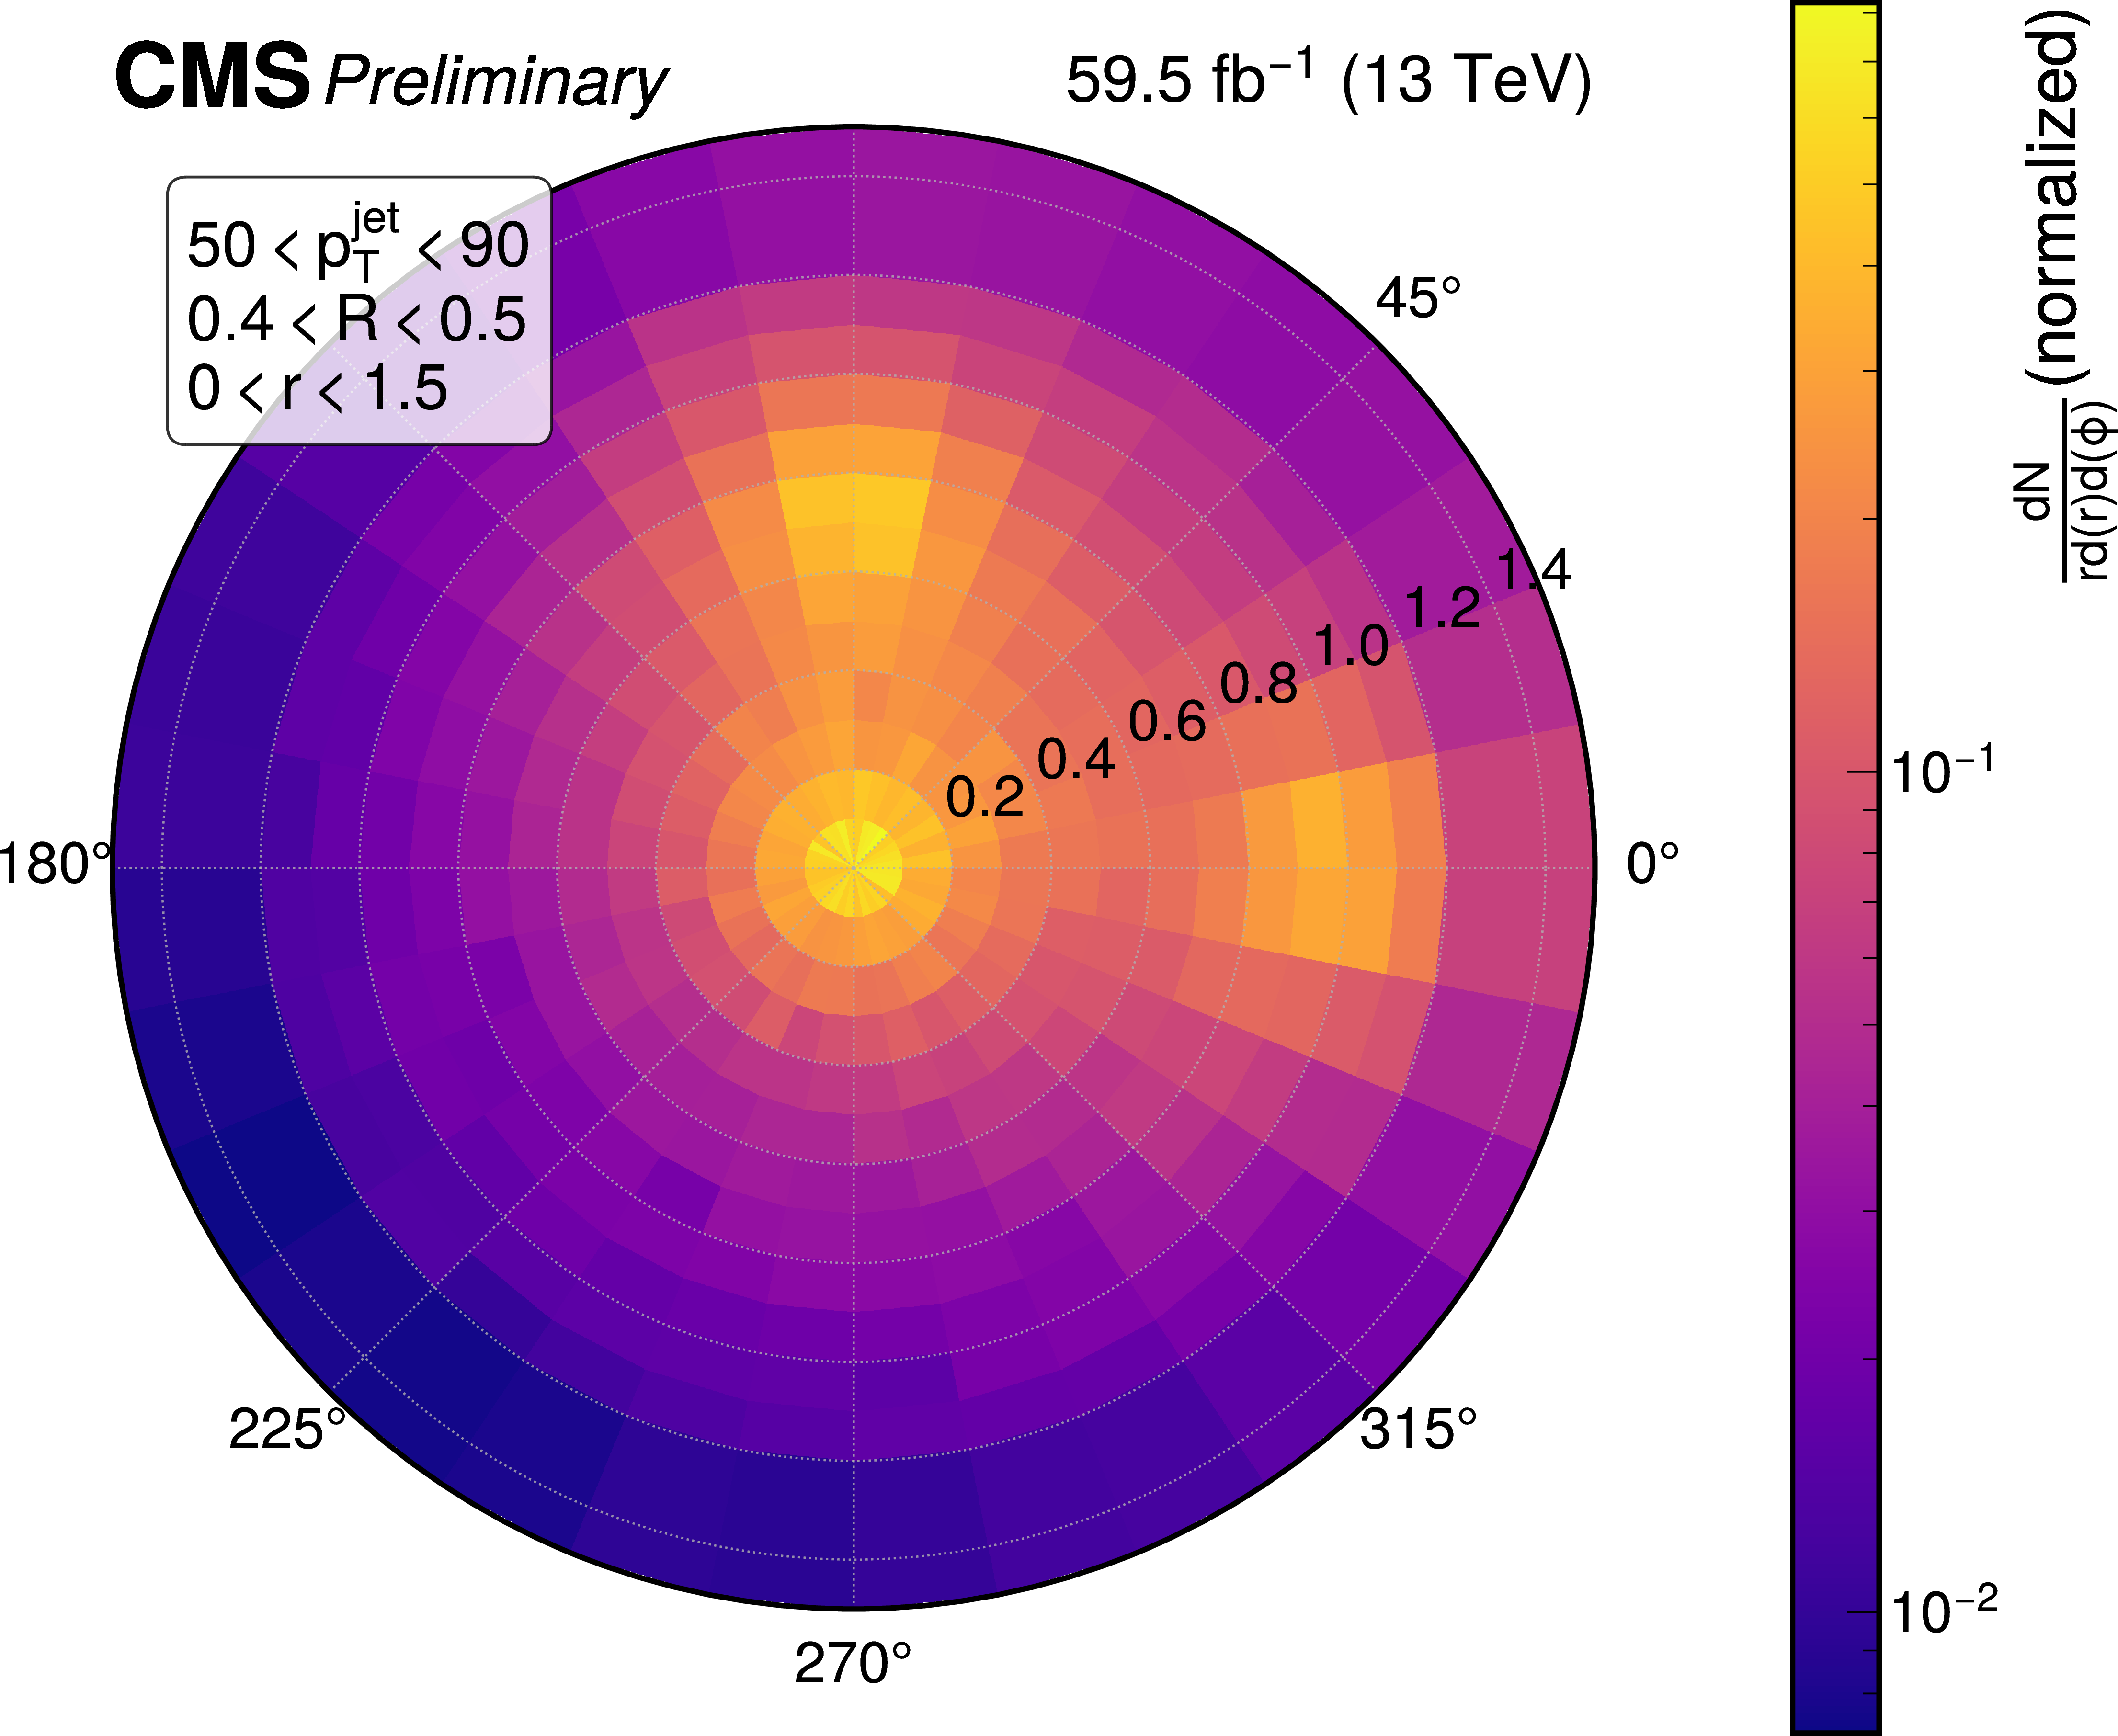
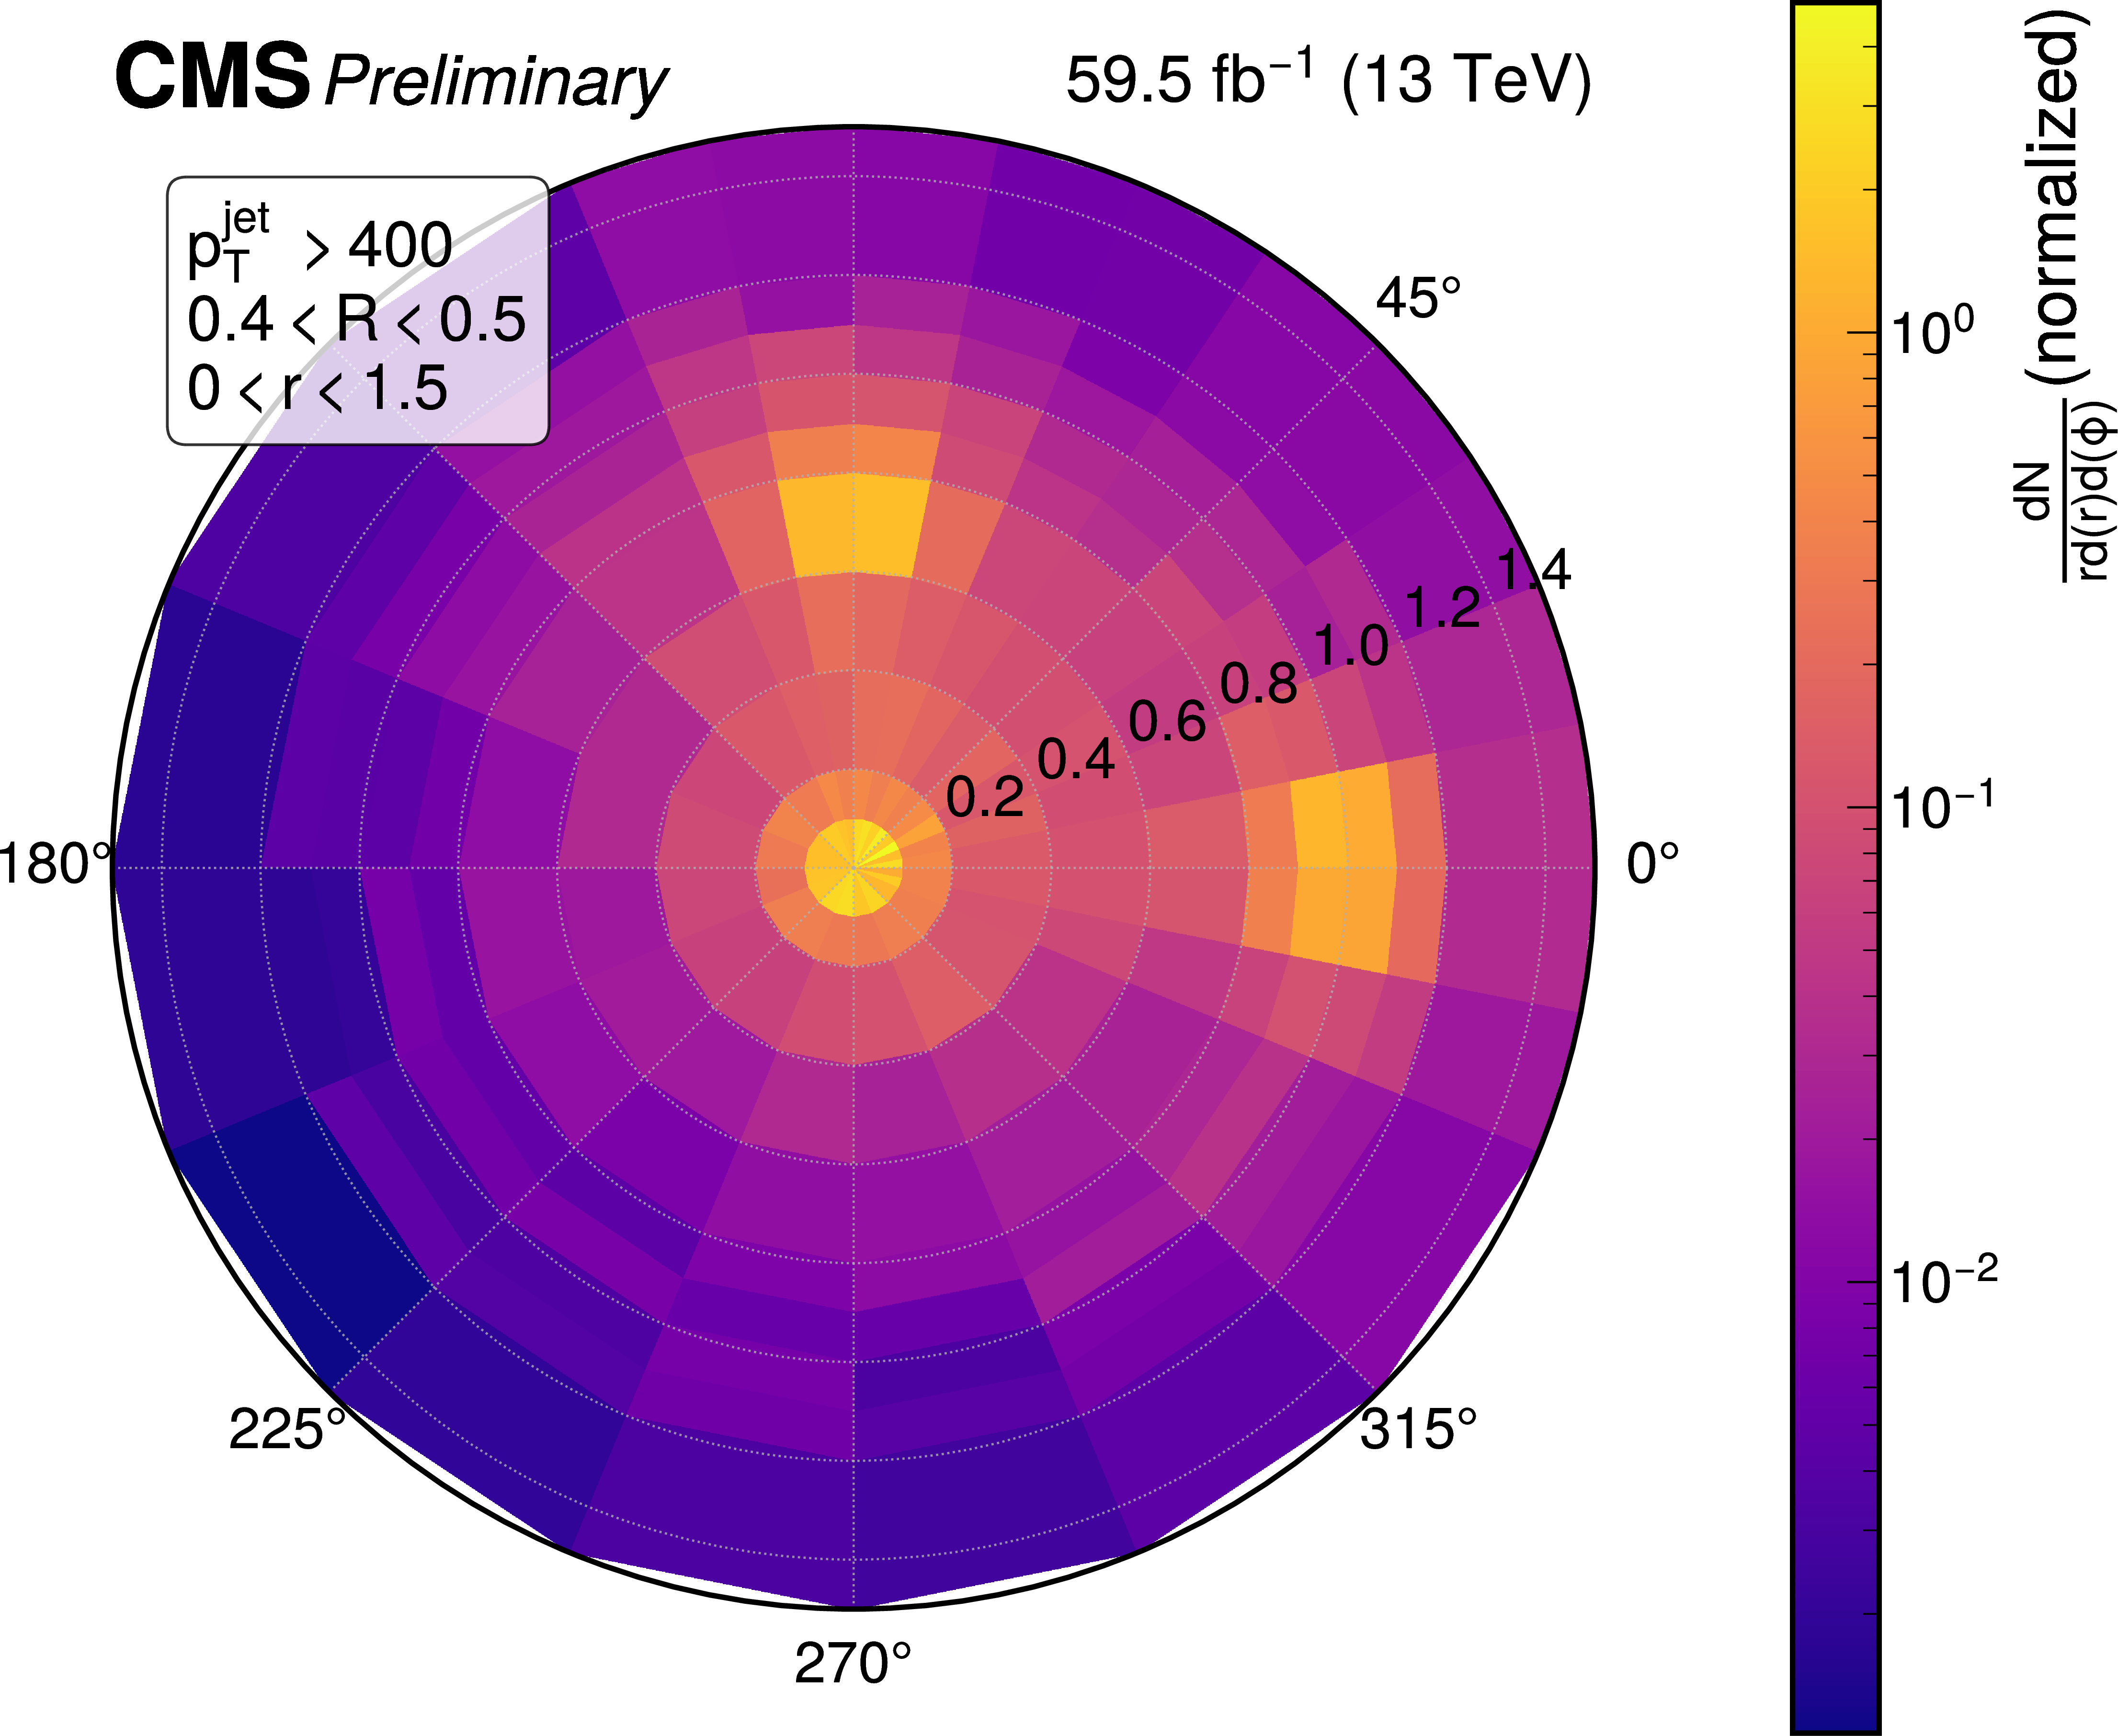
Figure 12:
Unfolded triangle-configuration distributions as a function of jet $ p_{\mathrm{T}} $. The full $ \phi \in [0,2\pi) $ range is shown; the three corners of the 3-4-5 triangle are visible as collinear enhancements where the floating particle comes close to the fixed triangle vertices. |
png pdf |
Figure 12-a:
Unfolded triangle-configuration distributions as a function of jet $ p_{\mathrm{T}} $. The full $ \phi \in [0,2\pi) $ range is shown; the three corners of the 3-4-5 triangle are visible as collinear enhancements where the floating particle comes close to the fixed triangle vertices. |
png pdf |
Figure 12-b:
Unfolded triangle-configuration distributions as a function of jet $ p_{\mathrm{T}} $. The full $ \phi \in [0,2\pi) $ range is shown; the three corners of the 3-4-5 triangle are visible as collinear enhancements where the floating particle comes close to the fixed triangle vertices. |
| Tables | |
png pdf |
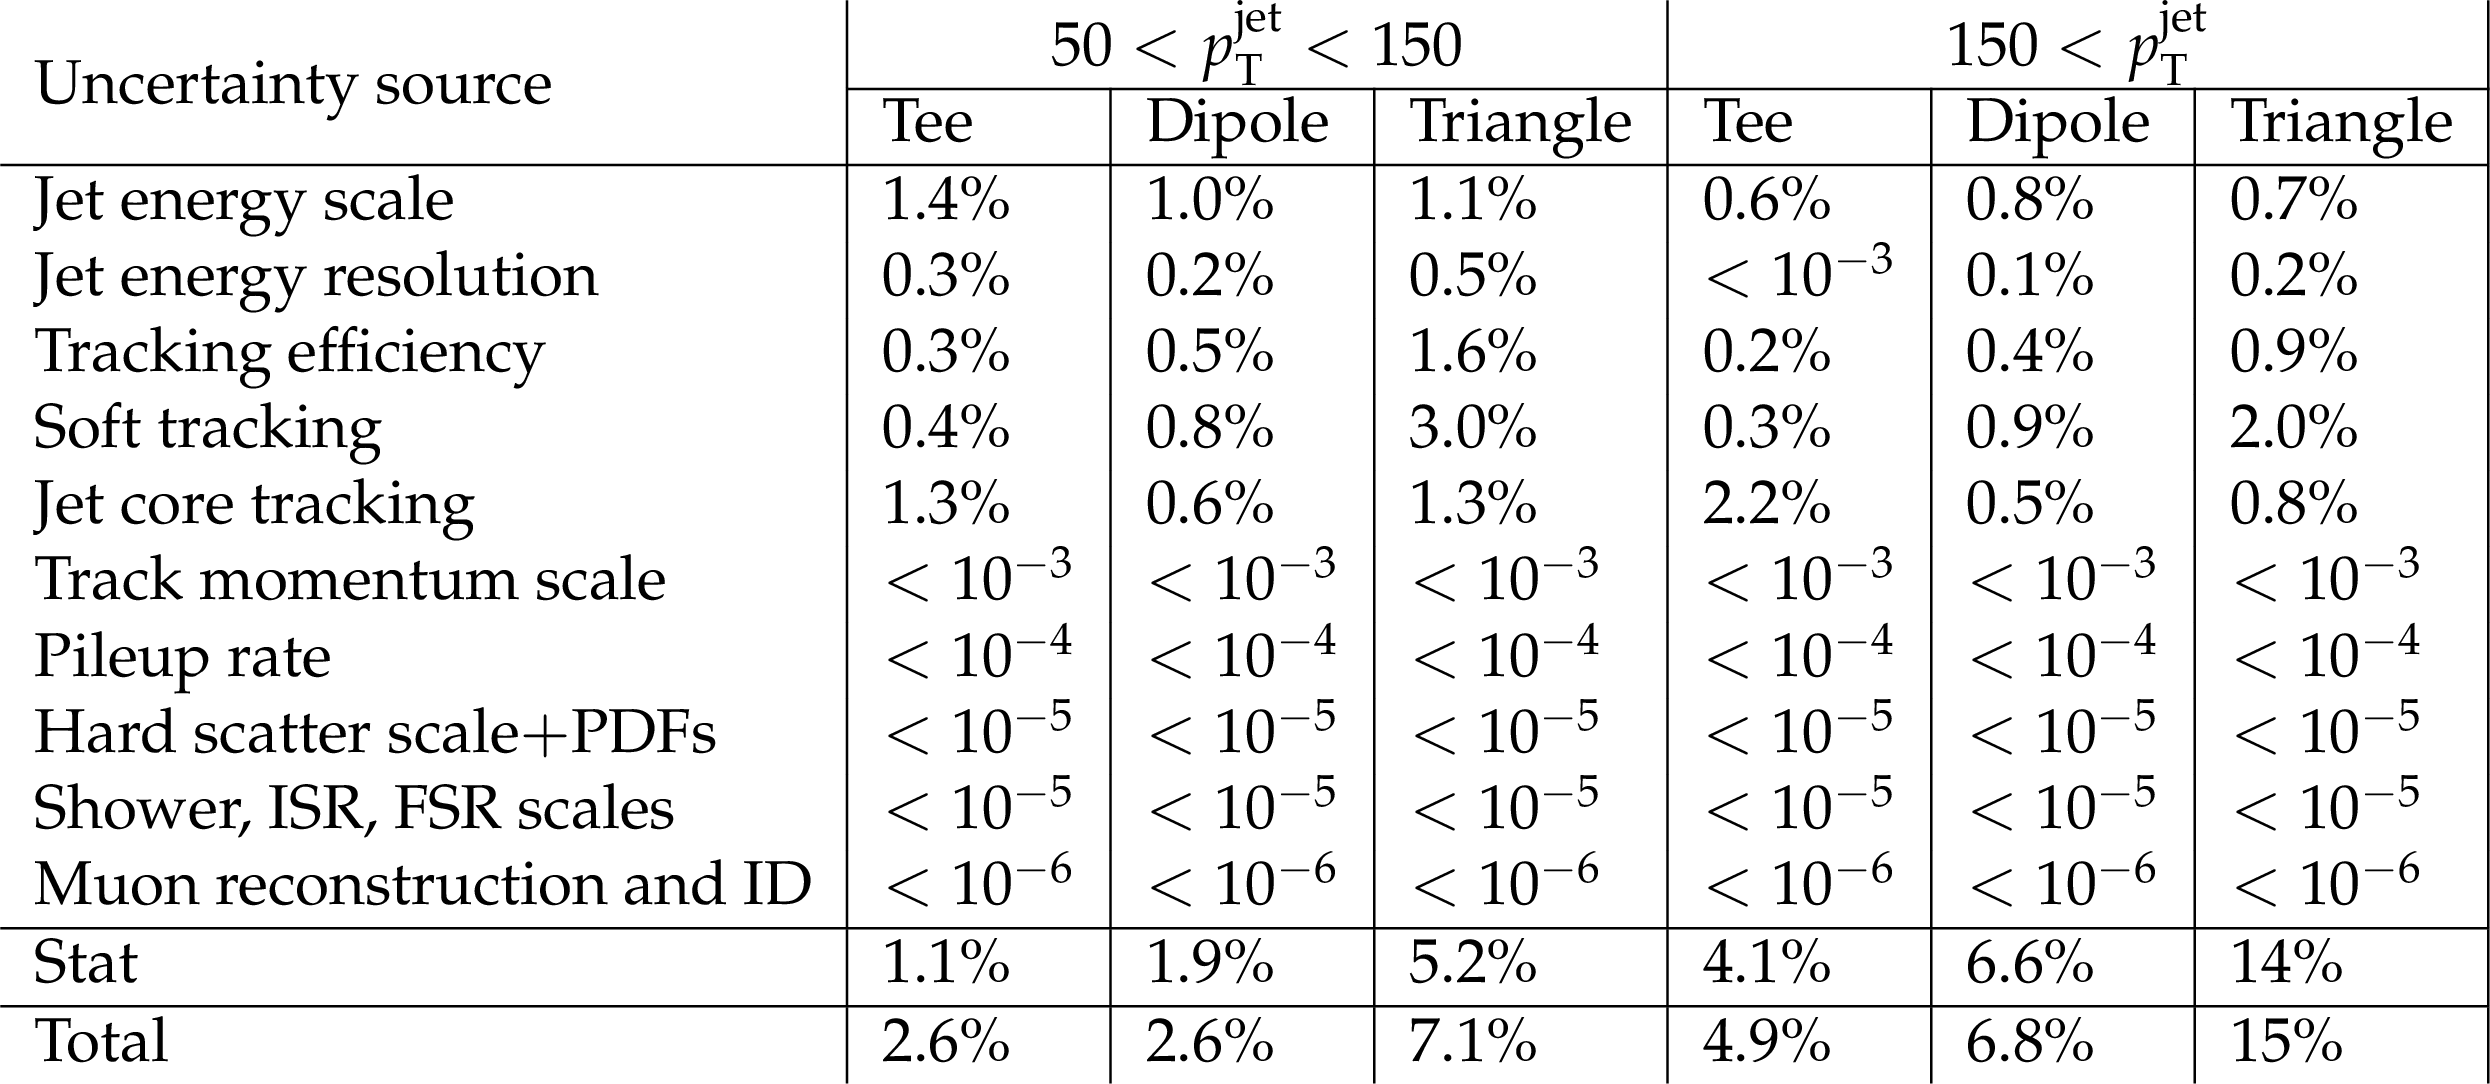
Table 1:
Bin-averaged uncertainty breakdown for the three configurations. Systematic uncertainties dominate at low jet $ p_{\mathrm{T}} $, while statistical uncertainties dominate at high momentum. Quoted uncertainties are with respect to normalized distributions per each bin of jet $ p_T $. |

png pdf |
Table 2:
Closure tests of the unfolding procedure, validating the modeling uncertainty. The event kinematics closure attempts to unfold the nominal PYTHIA 8 simulation with a detector model reweighted to match the $ Z $ boson kinematics in data, while the parton shower & hadronization closure attempts to unfold the HERWIG 7 simulation with the nominal PYTHIA 8 detector model. The $ \Delta \chi^2 $ values are computed as the $ \chi^2 $ between the unfolded and truth-level distributions in the closure test, minus the $ \chi^2 $ between the unfolded and truth-level distributions in the nominal simulation (which is nearly zero). All $ \chi^2 $ values are computed only in the signal bins (i.e., excluding overflow/underflow bins), and using the full covariance matrix of the unfolded distribution including both statistical and systematic uncertainties (and all correlations). |
png pdf |
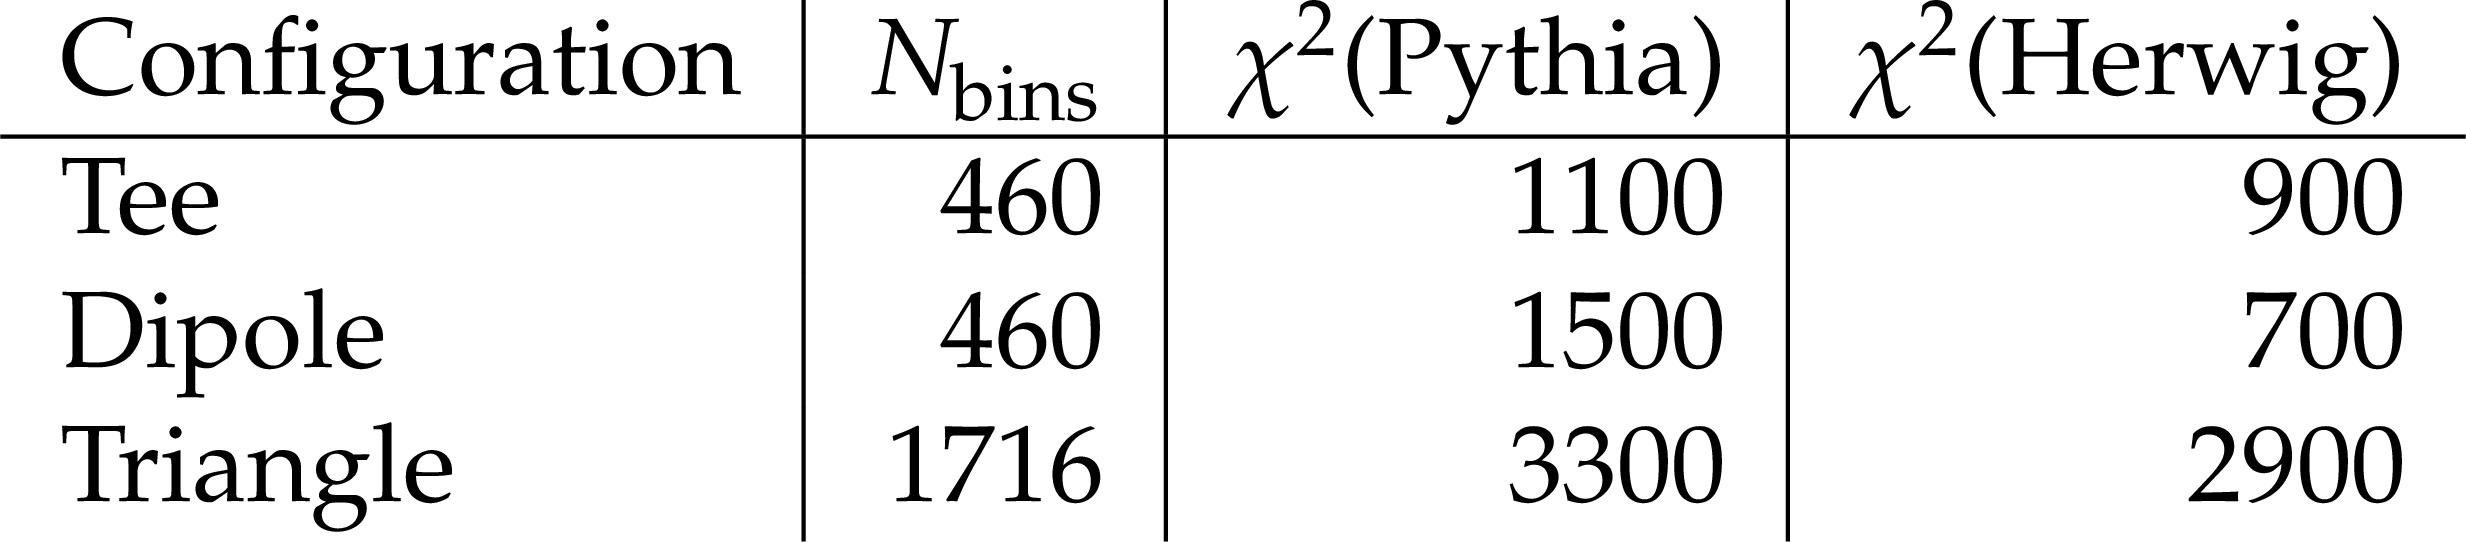
Table 3:
$ \chi^2 $ between the unfolded data and generator-level Pythia and Herwig predictions, in the analysis bins 0.4 $ < R < $ 0.5 and $ p_{\mathrm{T}} > $ 50 GeV, taking into account the full covariance matrix of the unfolded data (including both statistical and systematic uncertainties, and all correlations) as well as the statistical covariance matrix of the MC predictions. |
| Summary |
| We have presented the first measurement of the resolved structure of the four-point energy-energy correlators in hadronic jets, using 59.5 fb$ ^{-1} $ of $ Z $+jets data collected by the CMS experiment at $ \sqrt{s} = $ 13 TeV. Three subspaces of the five-dimensional four-point configuration space covering the tee, dipole, and right-triangle configurations are measured over a broad range of jet momenta and unfolded to particle level using a GPU-accelerated likelihood-based framework. The measurements reveal a rich angular structure in the four-point EEC that is qualitatively distinct from the previously measured bulk scaling properties of the two-point and 1D projected three-point correlators. These results represent a rigorous test of QCD factorization and the underlying parton shower dynamics, and provide a new class of precision jet substructure observables that can be used to constrain the modeling of QCD in the perturbative and nonperturbative regimes. Comparing to state-of-the-art parton shower predictions, we find that both PYTHIA8 (CP5 tune) and HERWIG 7 (CH3 tune) are strongly disfavored by the data in all three configurations. The two generators disagree with each other in characteristic ways that reveal the physical differences in their underlying shower and hadronization models. Detailed analysis of the data/MC for the tee configuration reveals that both showers fail to capture the correct slope of the collinear singularity in the perturbative region (with Herwig disagreeing more strongly with the data than Pythia), while Herwig's hadronization model appears to better capture the nonperturbative behavior in the $ r \to $ 0 region. This is likely to be related to the fact that Herwig's angular-ordered shower emphasizes color-coherence, which is critical in the collinear limit. Pythia, by contrast, provides a better description of the distributions at larger values of $ r $, corresponding to more widely-separated multi-parton configurations. In these regions, where the four particles span a larger fraction of the jet radius and the angular correlations are less dominated by the collinear singularity, Pythia's $ p_{\mathrm{T}} $-ordered shower captures more of the relevant dynamics. The complementary nature of these discrepancies shows that current parton shower models embody qualitatively different assumptions about color coherence and the ordering of emissions, and neither the angular-ordered nor the $ p_{\mathrm{T}} $-ordered approach is adequate. The four-point EEC measurements presented here provide the first precise, multi-dimensional experimental input that can directly discriminate between these models at the level of the four-parton correlation structure. These results establish resolved multi-point EECs as a new class of precision jet substructure observables at the LHC. |
| References | ||||
| 1 | R. Kogler et al. | Jet Substructure at the Large Hadron Collider: Experimental Review | Rev. Mod. Phys. 91 (2019) 045003 | 1803.06991 |
| 2 | A. J. Larkoski, I. Moult, and B. Nachman | Jet Substructure at the Large Hadron Collider: A Review of Recent Advances in Theory and Machine Learning | Phys. Rept. 841 (2020) 1 | 1709.04464 |
| 3 | H. Chen, I. Moult, X. Zhang, and H. X. Zhu | Rethinking jets with energy correlators: Tracks, resummation, and analytic continuation | PRD 102 (2020) 054012 | |
| 4 | CMS Collaboration | Measurement of Energy Correlators inside Jets and Determination of the Strong Coupling \ensuremath\alphaS(mZ) | PRL 133 (2024) 071903 | CMS-SMP-22-015 2402.13864 |
| 5 | ALICE Collaboration | Energy-energy correlators in charm-tagged jets in proton-proton collisions at $ \mathbf{\sqrt{s} = 13} $ TeV | 2504.03431 | |
| 6 | S. Acharya et al. | Exposing the parton-hadron transition within jets with energy-energy correlators in pp collisions at $ \sqrt{s}= $ 5.02 TeV | Phys. Rev. D, 2026 link |
|
| 7 | STAR Collaboration | Measurement of Two-Point Energy Correlators within Jets in p+p Collisions at s=200 GeV | PRL 135 (2025) 111901 | 2502.15925 |
| 8 | Tamis, Andrew | Exploiting two- and three-point charge-energy correlators at STAR as probes of jet evolution | in EPJ Web Conf., volume 339, 2002 link |
|
| 9 | H. Chen, I. Moult, and H. X. Zhu | Quantum interference in jet substructure from spinning gluons | PRL 126 (2021) | |
| 10 | A. Karlberg, G. P. Salam, L. Scyboz, and R. Verheyen | Spin correlations in final-state parton showers and jet observables | EPJC 81 (2021) | |
| 11 | C.-H. Chang and D. Simmons-Duffin | Three-point energy correlators and the celestial block expansion | JHEP 2023 (2023) | |
| 12 | M. Gonzalez et al. | Dissecting Parton Showers with Multi-Point Energy Correlators | 2607.07792 | |
| 13 | CMS Collaboration | The CMS experiment at the CERN LHC | JINST 3 (2008) S08004 | |
| 14 | CMS Collaboration | Development of the CMS detector for the CERN LHC Run 3 | JINST 19 (2024) P05064 | CMS-PRF-21-001 2309.05466 |
| 15 | CMS Collaboration | Performance of the CMS Level-1 trigger in proton-proton collisions at $ \sqrt{s} = $ 13 TeV | JINST 15 (2020) P10017 | CMS-TRG-17-001 2006.10165 |
| 16 | CMS Collaboration | The CMS trigger system | JINST 12 (2017) P01020 | CMS-TRG-12-001 1609.02366 |
| 17 | CMS Collaboration | Performance of the CMS high-level trigger during LHC Run 2 | JINST 19 (2024) P11021 | CMS-TRG-19-001 2410.17038 |
| 18 | CMS Collaboration | Electron and photon reconstruction and identification with the CMS experiment at the CERN LHC | JINST 16 (2021) P05014 | CMS-EGM-17-001 2012.06888 |
| 19 | CMS Collaboration | Performance of the CMS muon detector and muon reconstruction with proton-proton collisions at $ \sqrt{s} = $ 13 TeV | JINST 13 (2018) P06015 | |
| 20 | CMS Collaboration | Description and Performance of Track and Primary-Vertex Reconstruction with the CMS Tracker | JINST 9 (2014) P10009 | CMS-TRK-11-001 1405.6569 |
| 21 | CMS Collaboration | Particle-flow reconstruction and global event description with the CMS detector | JINST 12 (2017) P10003 | CMS-PRF-14-001 1706.04965 |
| 22 | CMS Collaboration | Performance of reconstruction and identification of $ \tau $ leptons decaying to hadrons and $ \nu_\tau $ in pp collisions at $ \sqrt{s}= $ 13 TeV | JINST 13 (2018) P10005 | CMS-TAU-16-003 1809.02816 |
| 23 | CMS Collaboration | Jet energy scale and resolution in the CMS experiment in pp collisions at 8 TeV | JINST 12 (2017) P02014 | CMS-JME-13-004 1607.03663 |
| 24 | CMS Collaboration | Performance of missing transverse momentum reconstruction in proton-proton collisions at $ \sqrt{s} = $ 13 TeV using the CMS detector | JINST 14 (2019) P07004 | CMS-JME-17-001 1903.06078 |
| 25 | CMS Collaboration | Pileup mitigation at CMS in 13 TeV data | JINST 15 (2020) P09018 | CMS-JME-18-001 2003.00503 |
| 26 | D. Bertolini, P. Harris, M. Low, and N. Tran | Pileup per particle identification | JHEP 10 (2014) 059 | 1407.6013 |
| 27 | CMS Collaboration | CMS luminosity measurement for the 2018 data-taking period at $ \sqrt{s} = $ 13 TeV | Technical Report, CERN, Geneva, 2019 CMS-PAS-LUM-18-002 |
CMS-PAS-LUM-18-002 |
| 28 | Particle Data Group Collaboration | Review of particle physics | PRD 110 (2024) 030001 | |
| 29 | CMS Collaboration | Identification of heavy-flavour jets with the CMS detector in pp collisions at 13 TeV | JINST 13 (2018) P05011 | CMS-BTV-16-002 1712.07158 |
| 30 | CMS Collaboration | Performance of the DeepJet b tagging algorithm using 41.9/fb of data from proton-proton collisions at 13 TeV with Phase 1 CMS detector | CMS Detector Performance Note CMS-DP-2018-058, 2018 CDS |
|
| 31 | E. Bols et al. | Jet flavour classification using DeepJet | JINST 15 (2020) P12012 | 2008.10519 |
| 32 | J. Alwall et al. | Madgraph 5: going beyond | JHEP 2011 (2011) | |
| 33 | T. Sjöstrand et al. | An introduction to PYTHIA 8.2 | Comput. Phys. Commun. 191 (2015) 159 | 1410.3012 |
| 34 | CMS Collaboration | Extraction and validation of a new set of CMS PYTHIA8 tunes from underlying-event measurements | EPJC 80 (2020) 4 | CMS-GEN-17-001 1903.12179 |
| 35 | J. Bellm et al. | Herwig 7.2 release note | EPJC 80 (2020) 452 | 1912.06509 |
| 36 | CMS Collaboration | Development and validation of HERWIG 7 tunes from CMS underlying-event measurements | EPJC 81 (2021) 312 | CMS-GEN-19-001 2011.03422 |
| 37 | J. Alwall et al. | Comparative study of various algorithms for the merging of parton showers and matrix elements in hadronic collisions | EPJC 53 (2007) 473 | |
| 38 | J. M. Lindert et al. | Precise predictions for $ V+ $ jets dark matter backgrounds | EPJC 77 (2017) 829 | 1705.04664 |
| 39 | NNPDF Collaboration | Parton distributions for the LHC Run II | JHEP 04 (2015) 040 | 1410.8849 |
| 40 | GEANT4 Collaboration | GEANT 4---a simulation toolkit | NIM A 506 (2003) 250 | |
| 41 | M. Cacciari, G. P. Salam, and G. Soyez | FastJet user manual | EPJC 72 (2012) 1896 | 1111.6097 |
| 42 | M. Cacciari, G. P. Salam, and G. Soyez | The anti-$ k_{\mathrm{T}} $ jet clustering algorithm | JHEP 2008 (2008) 063 | |
| 43 | CMS Collaboration | Jet algorithms performance in 13 TeV data | CMS Physics Analysis Summary, CERN, 2017 CMS-PAS-JME-16-003 |
CMS-PAS-JME-16-003 |
| 44 | R. Feinman | Pytorch-minimize: a library for numerical optimization with autograd | https://github.com/rfeinman/pytorch-minimize, 2021 link |
|
| 45 | J. Ansel et al. | Pytorch 2: Faster machine learning through dynamic python bytecode transformation and graph compilation | in the ACM International Conference on Architectural Support for Programming Languages and Operating Systems, Volume 2, ASPLOS '24, Association for Computing Machinery, New York, NY, USA, 2024 Proceedings of the 2 (2024) 929 |
|
| 46 | CMS Collaboration | Tracking performances for charged pions with Run2 Legacy data | CMS Detector Performance Summary CMS-DP-2022-012, CERN, 2022 CDS |
|
| 47 | CMS Collaboration | High $ p_{\mathrm{T}} $ jets tracking | CMS Detector Performance Summary CMS-DP-2014-032, CERN, 2014 link |
|
|
|
Compact Muon Solenoid LHC, CERN |

|

|

|

|

|

|