

Compact Muon Solenoid
LHC, CERN
 Visit us: CMS Public Website, CMS Physics ;
Contact us: CMS Publications Committee
Visit us: CMS Public Website, CMS Physics ;
Contact us: CMS Publications Committee
| CMS-PAS-SMP-25-004 | ||
| Measurement of the differential cross section for inclusive isolated photon production in proton-proton collisions at $ \sqrt{s}= $ 13.6 TeV | ||
| CMS Collaboration | ||
| 2026-07-30 | ||
| Abstract: A measurement of the differential cross section for inclusive isolated photon production in proton-proton collisions at $ \sqrt{s}= $ 13.6 TeV is presented. The analysis uses data collected by the CMS experiment in 2022, corresponding to an integrated luminosity of 27 fb$ ^{-1} $. The cross section is measured as a function of the photon transverse momentum and pseudorapidity in a fiducial region. The results are compared with predictions from next-to-leading-order perturbative QCD. | ||
| Links: CDS record (PDF) ; CADI line (restricted) ; | ||
| Figures | |
png pdf |
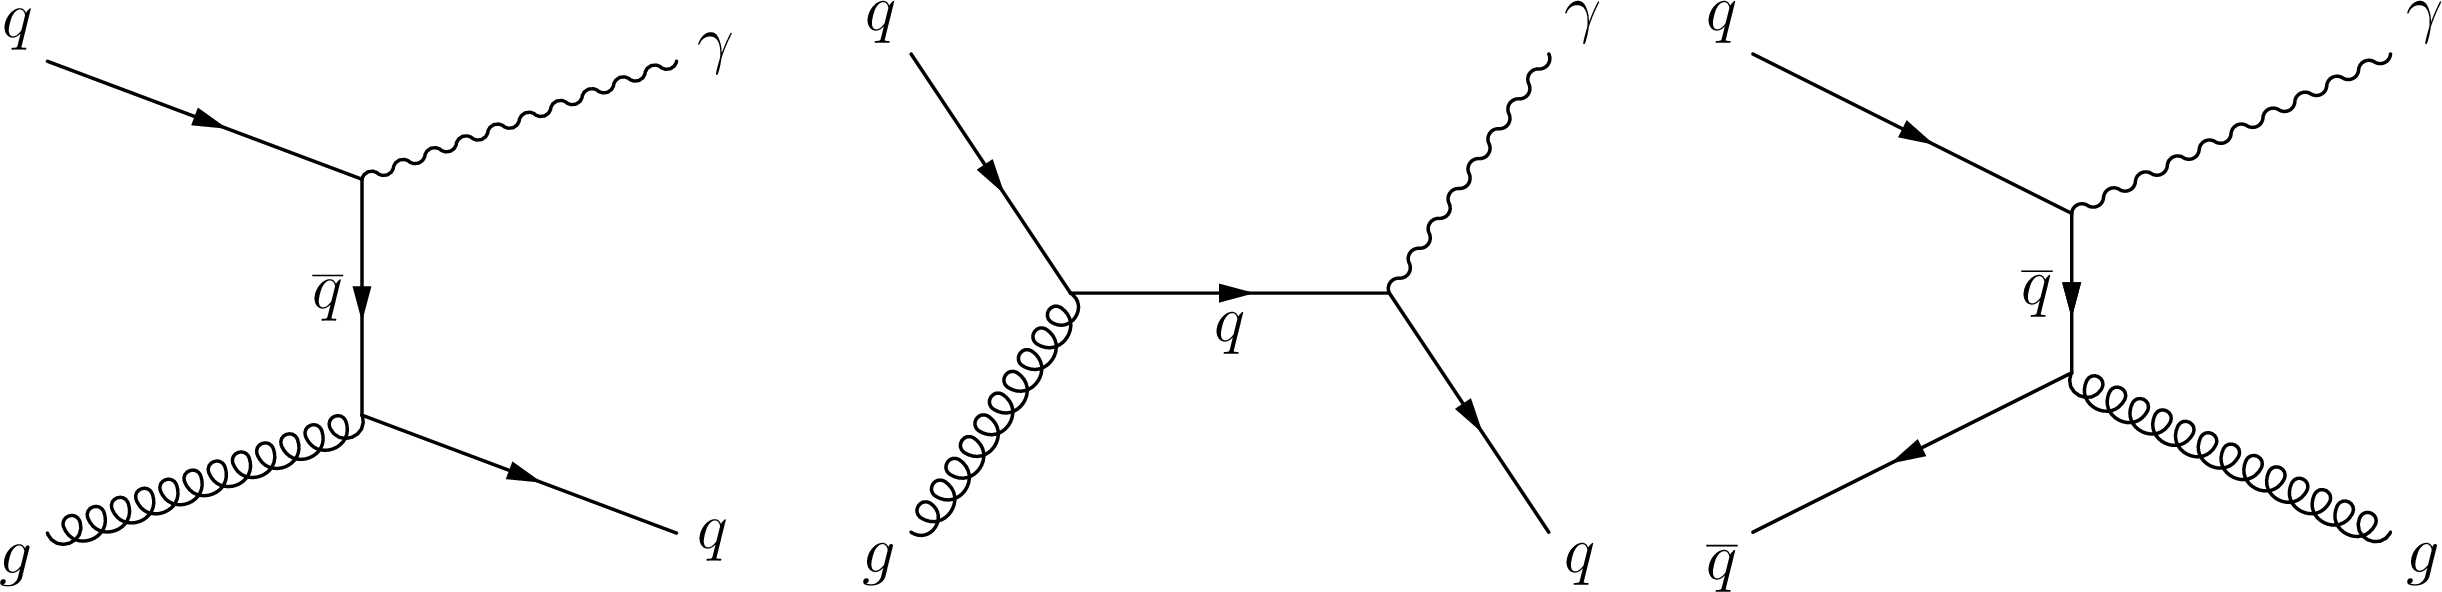
Figure 1:
Feynman diagrams for single photon production. The left and middle diagrams represent quark-gluon Compton scattering and the right diagram represents the quark-antiquark annihilation process. |
png pdf |
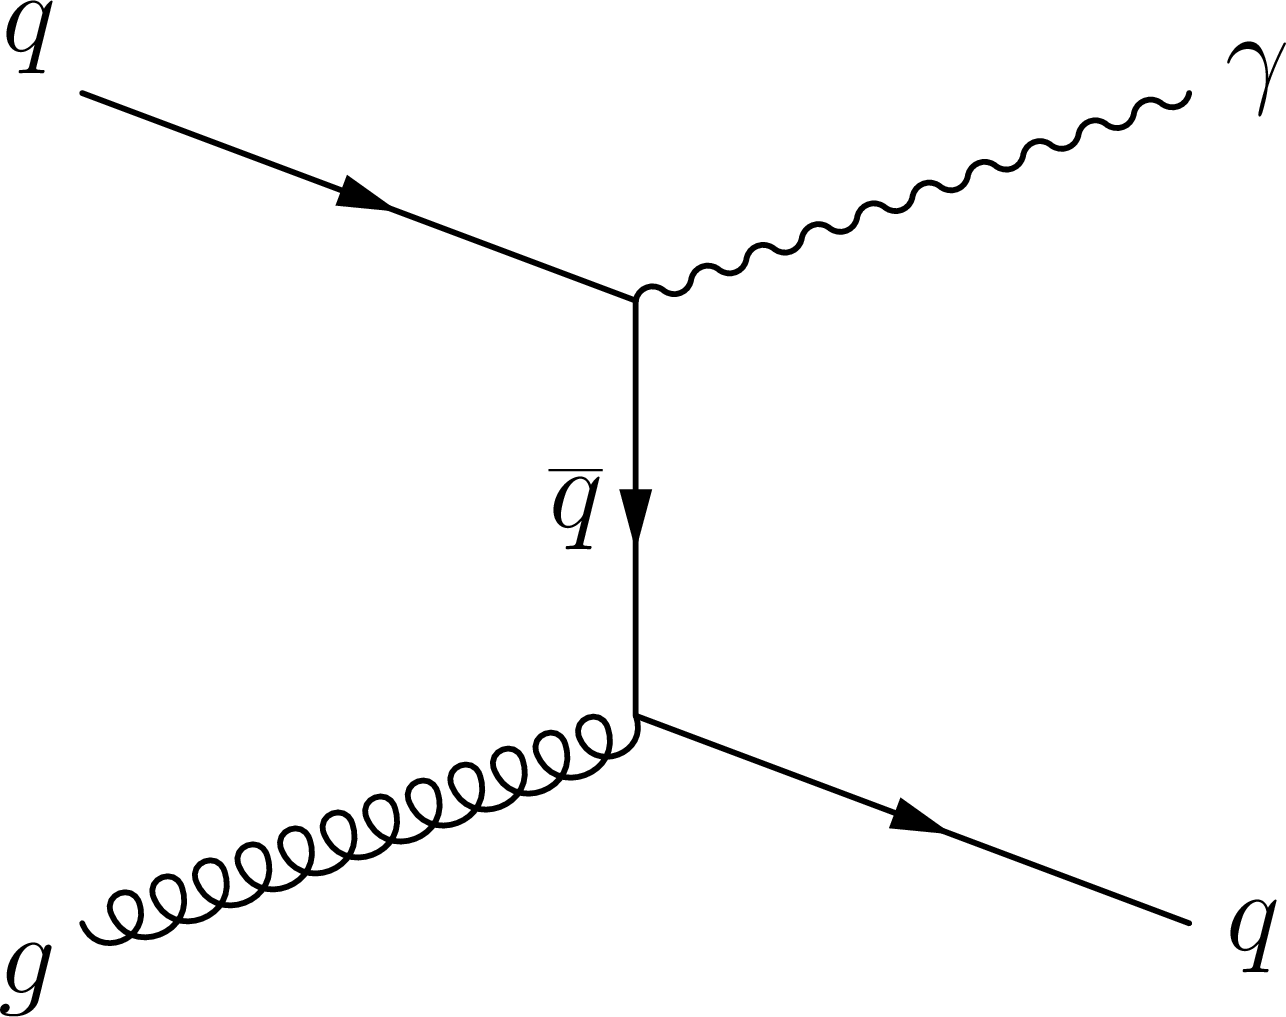
Figure 1-a:
Feynman diagrams for single photon production. The left and middle diagrams represent quark-gluon Compton scattering and the right diagram represents the quark-antiquark annihilation process. |
png pdf |
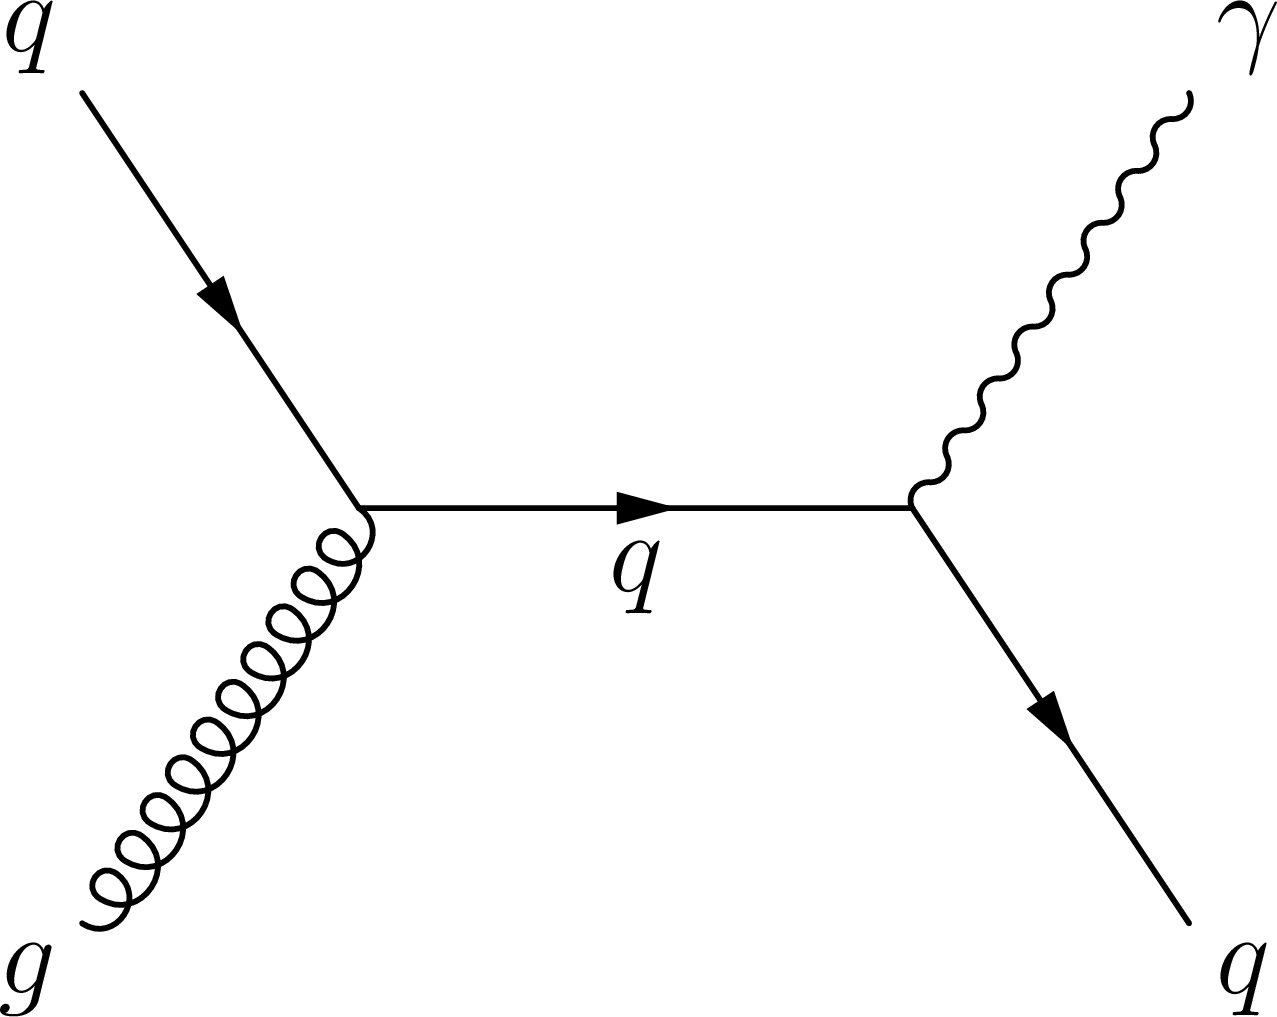
Figure 1-b:
Feynman diagrams for single photon production. The left and middle diagrams represent quark-gluon Compton scattering and the right diagram represents the quark-antiquark annihilation process. |
png pdf |
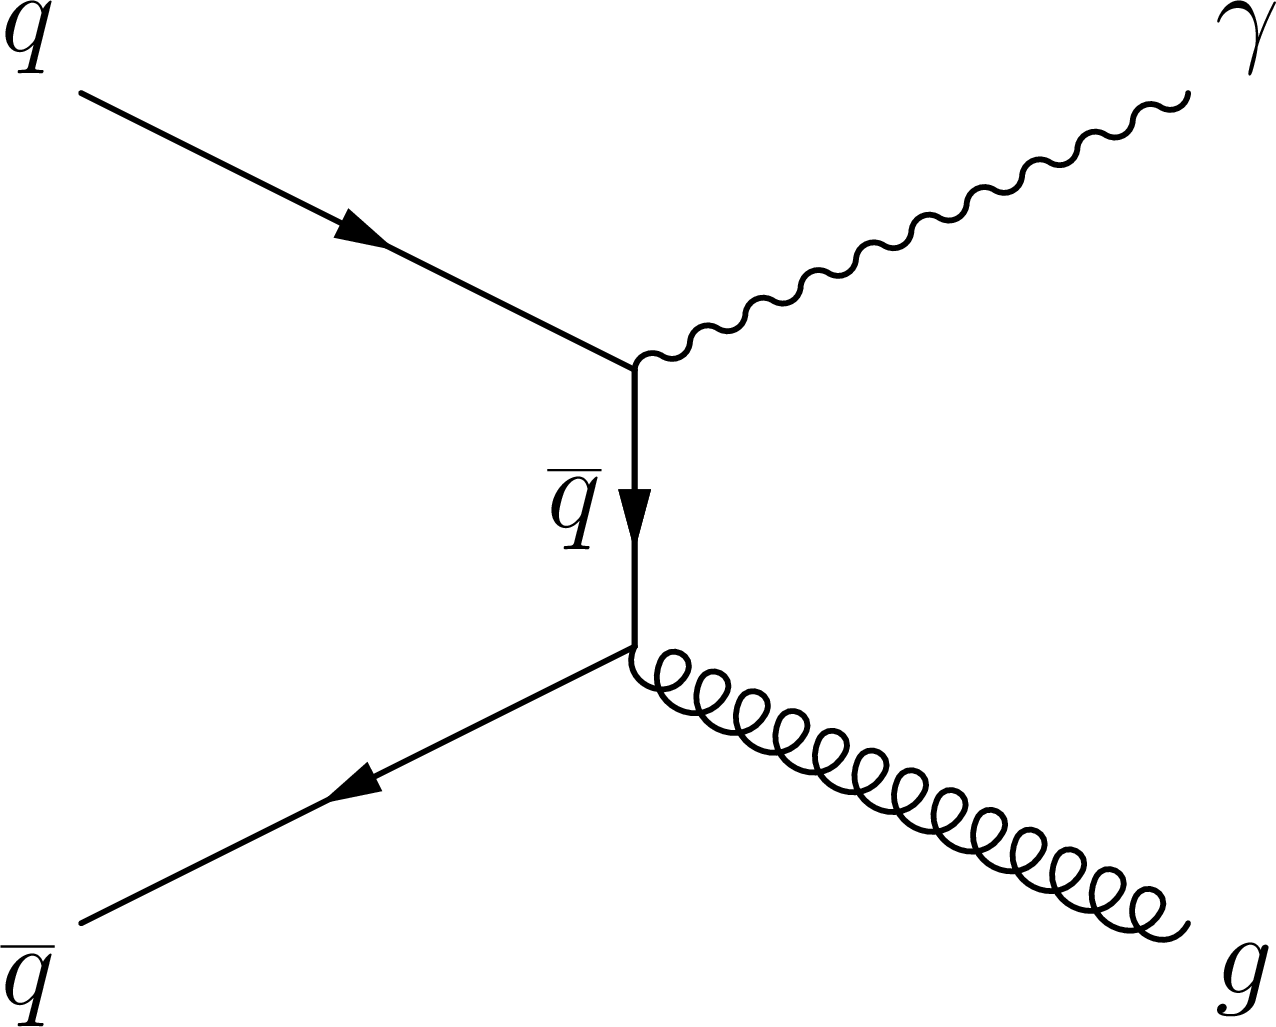
Figure 1-c:
Feynman diagrams for single photon production. The left and middle diagrams represent quark-gluon Compton scattering and the right diagram represents the quark-antiquark annihilation process. |
png pdf |
Figure 2:
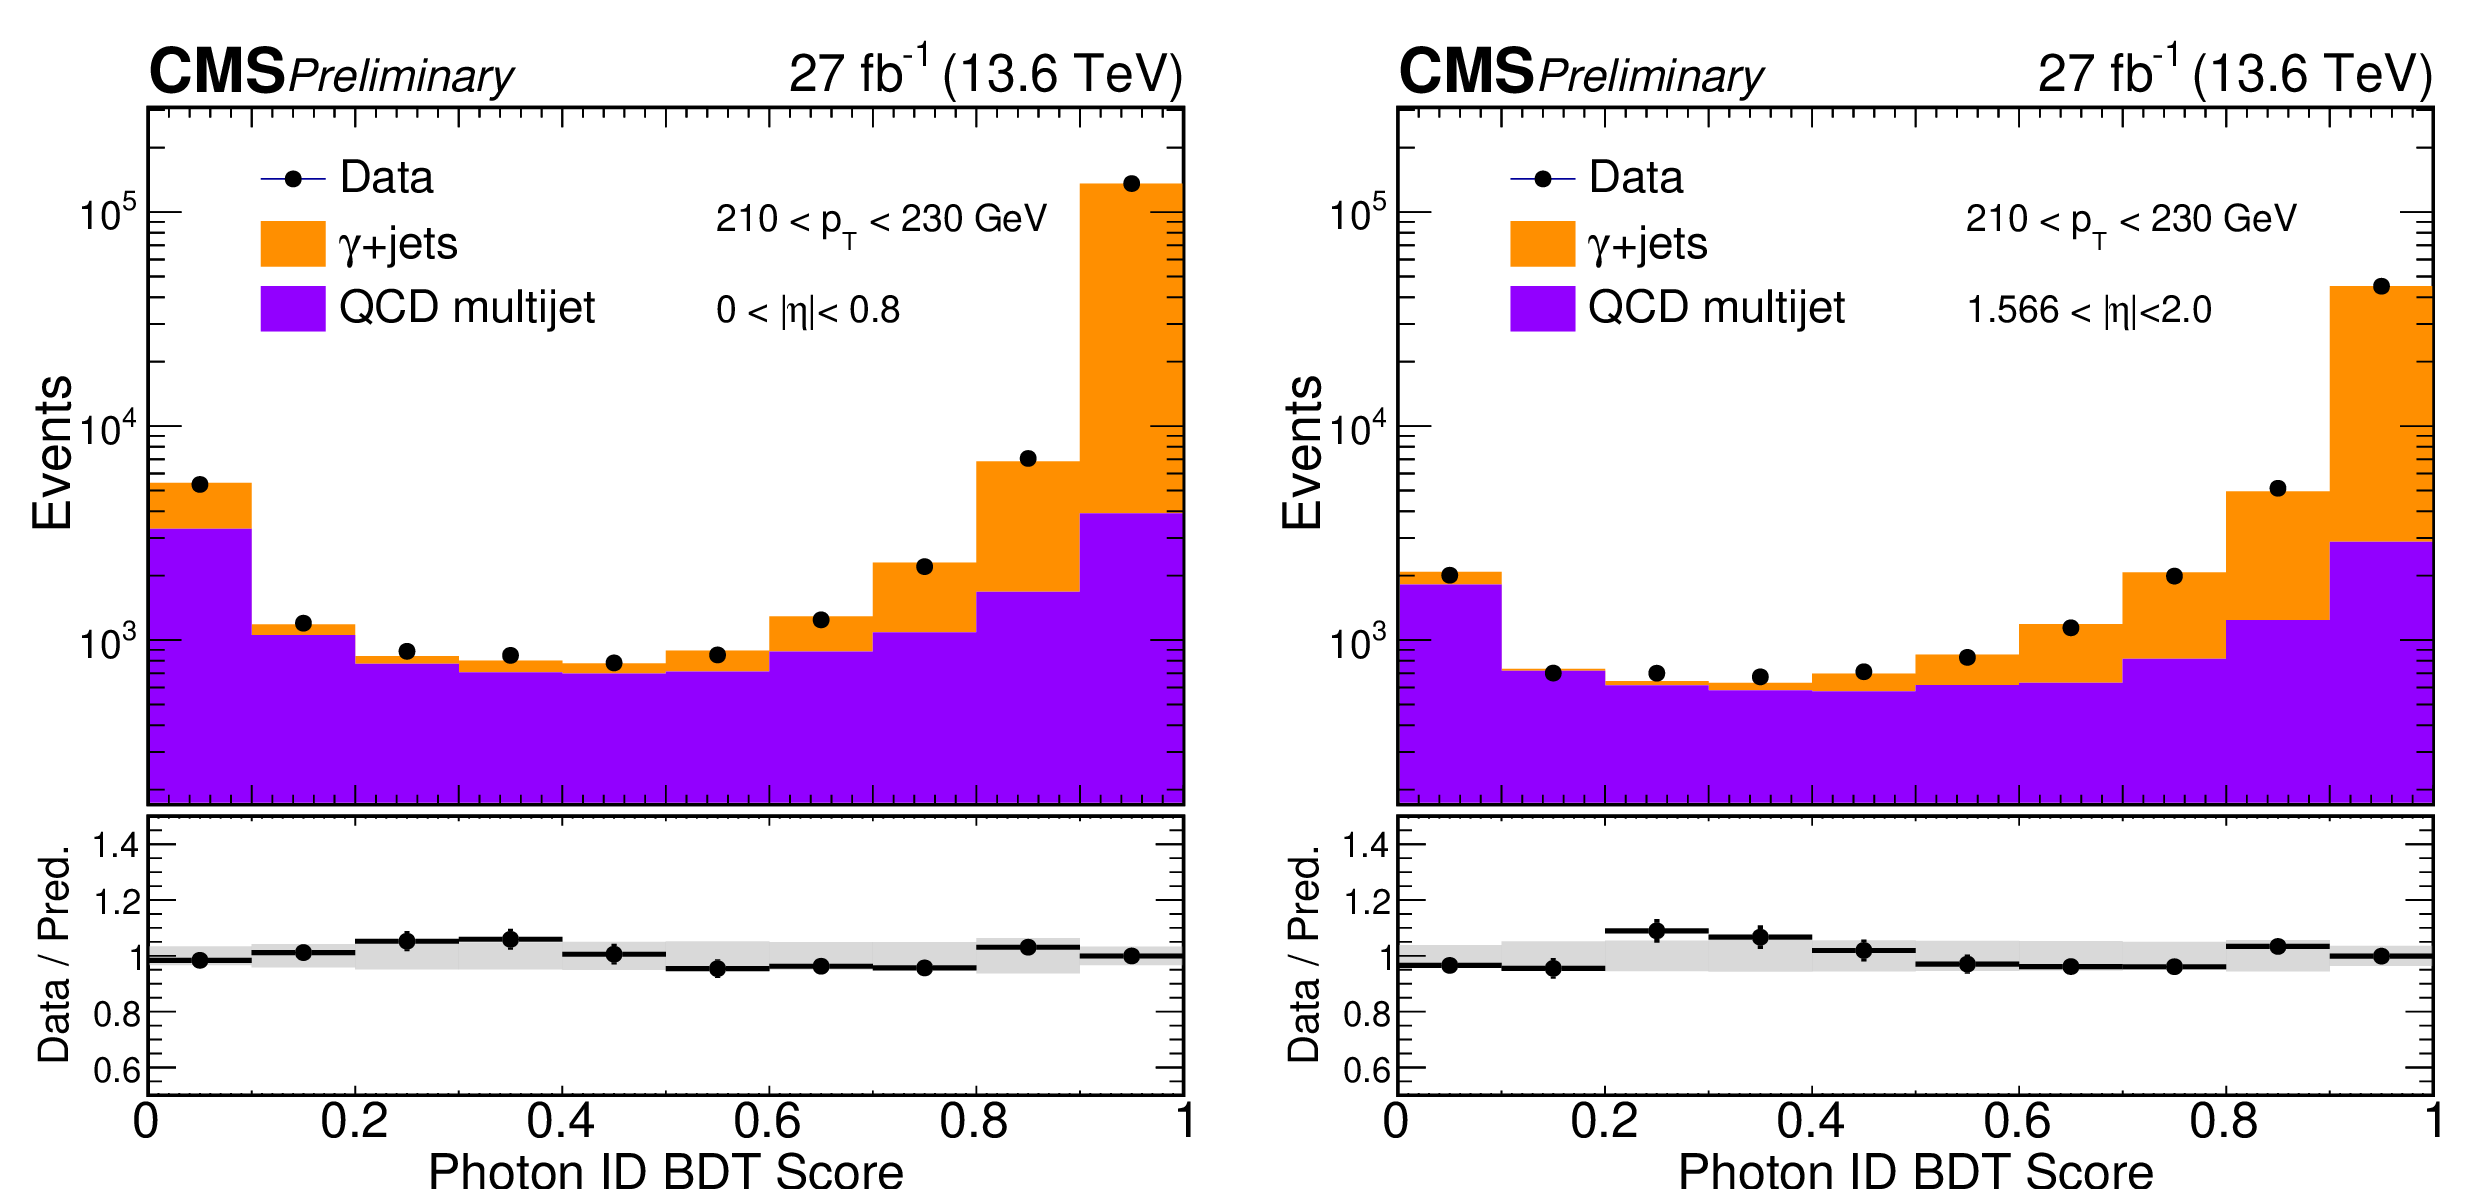
Comparison of the BDT output distribution between data and the fitted signal and background predictions. The lower panel shows the ratio of data to the total prediction, where the gray band represents the total uncertainty, obtained by combining statistical and experimental contributions in quadrature. |
png pdf |
Figure 2-a:
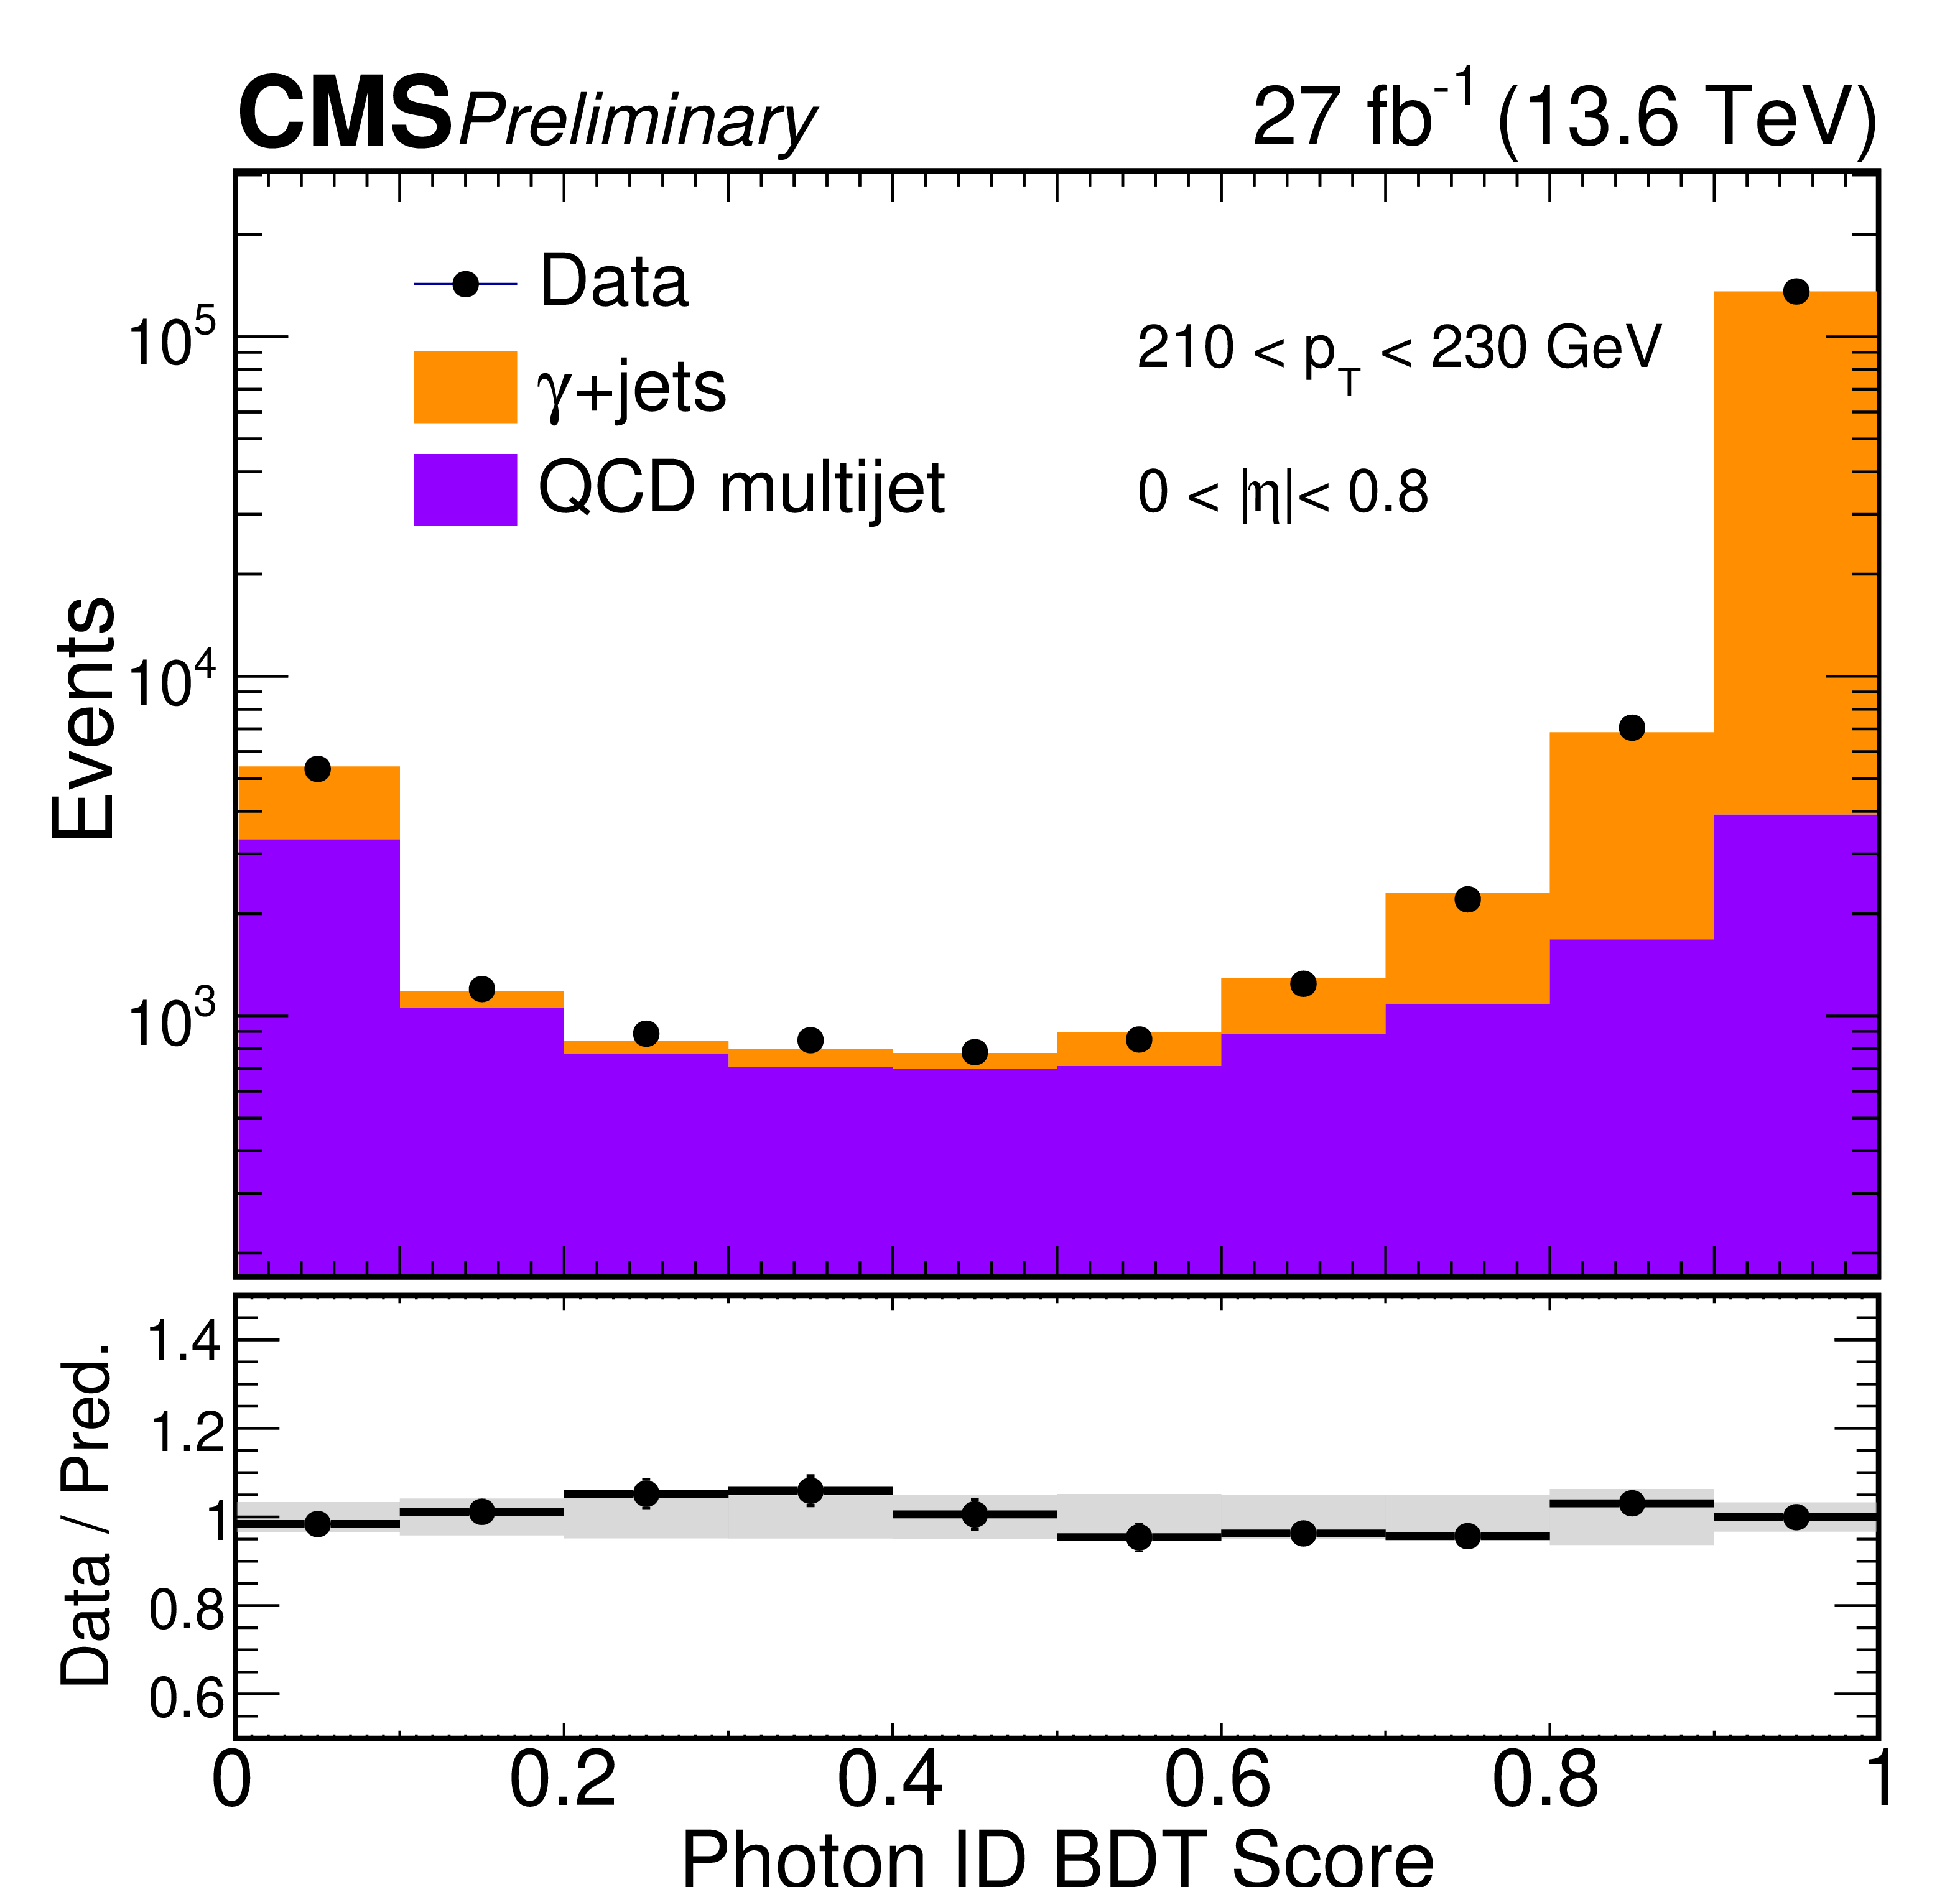
Comparison of the BDT output distribution between data and the fitted signal and background predictions. The lower panel shows the ratio of data to the total prediction, where the gray band represents the total uncertainty, obtained by combining statistical and experimental contributions in quadrature. |
png pdf |
Figure 2-b:
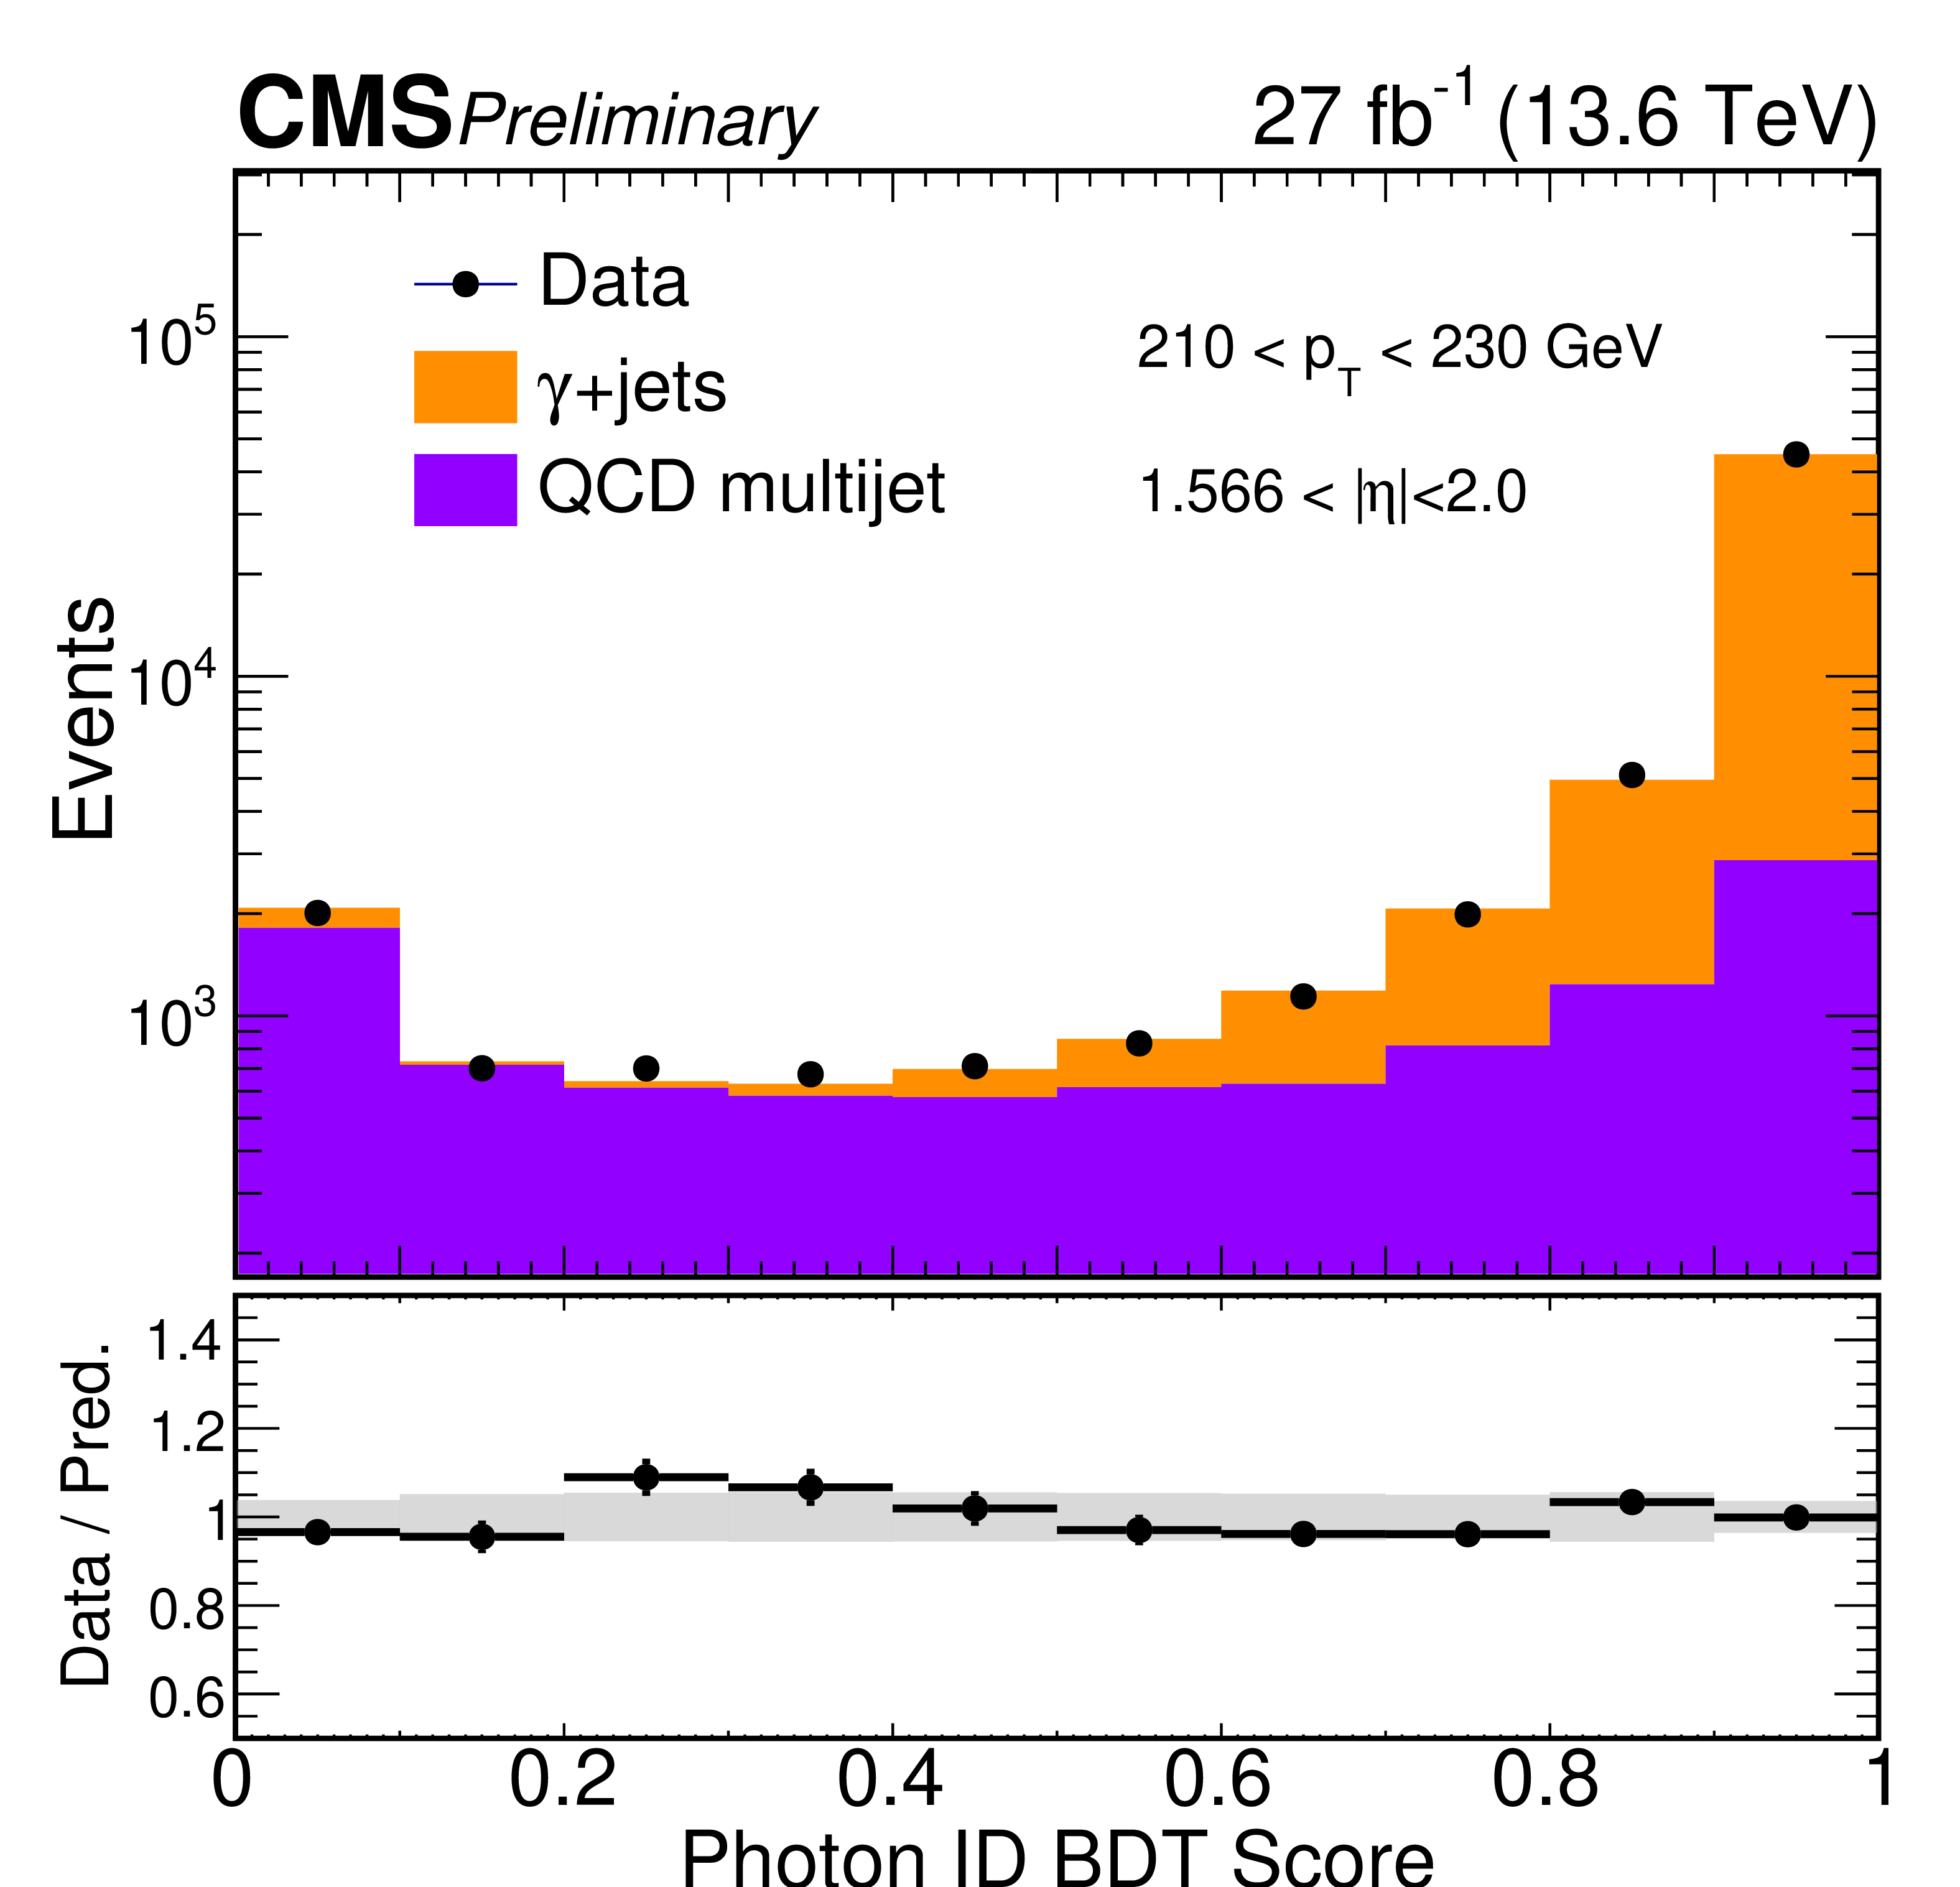
Comparison of the BDT output distribution between data and the fitted signal and background predictions. The lower panel shows the ratio of data to the total prediction, where the gray band represents the total uncertainty, obtained by combining statistical and experimental contributions in quadrature. |
png pdf |
Figure 3:
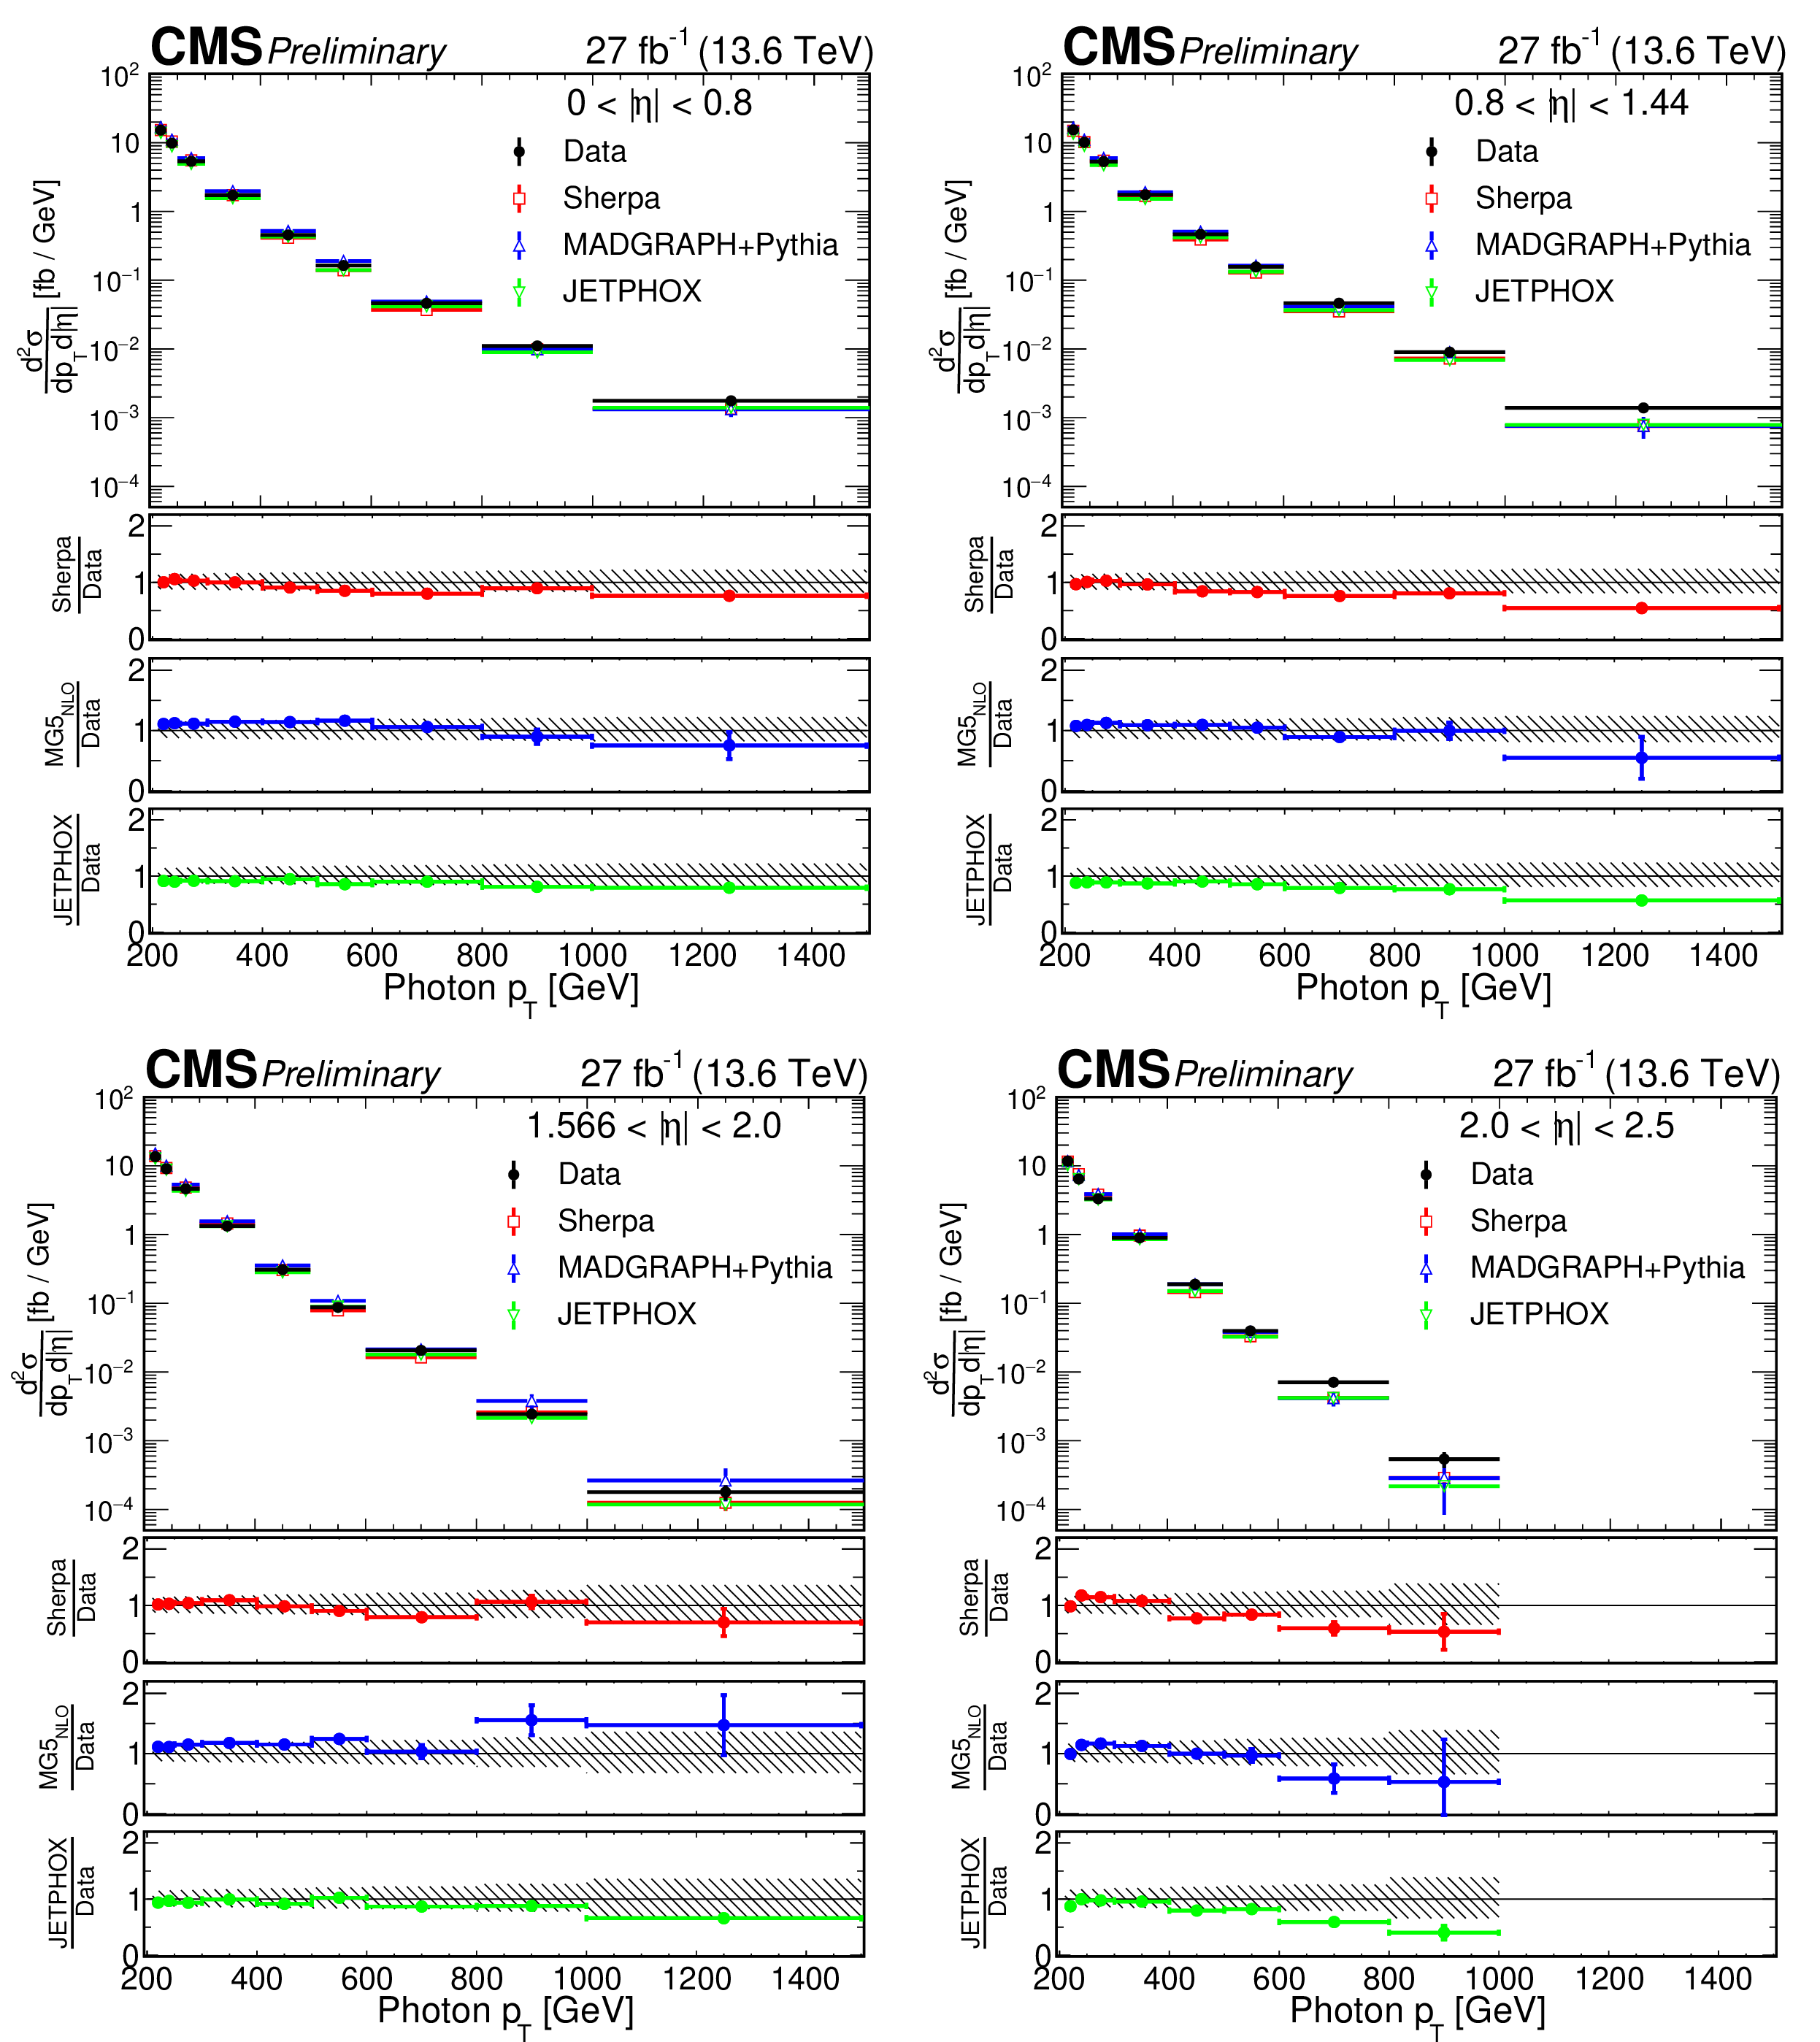
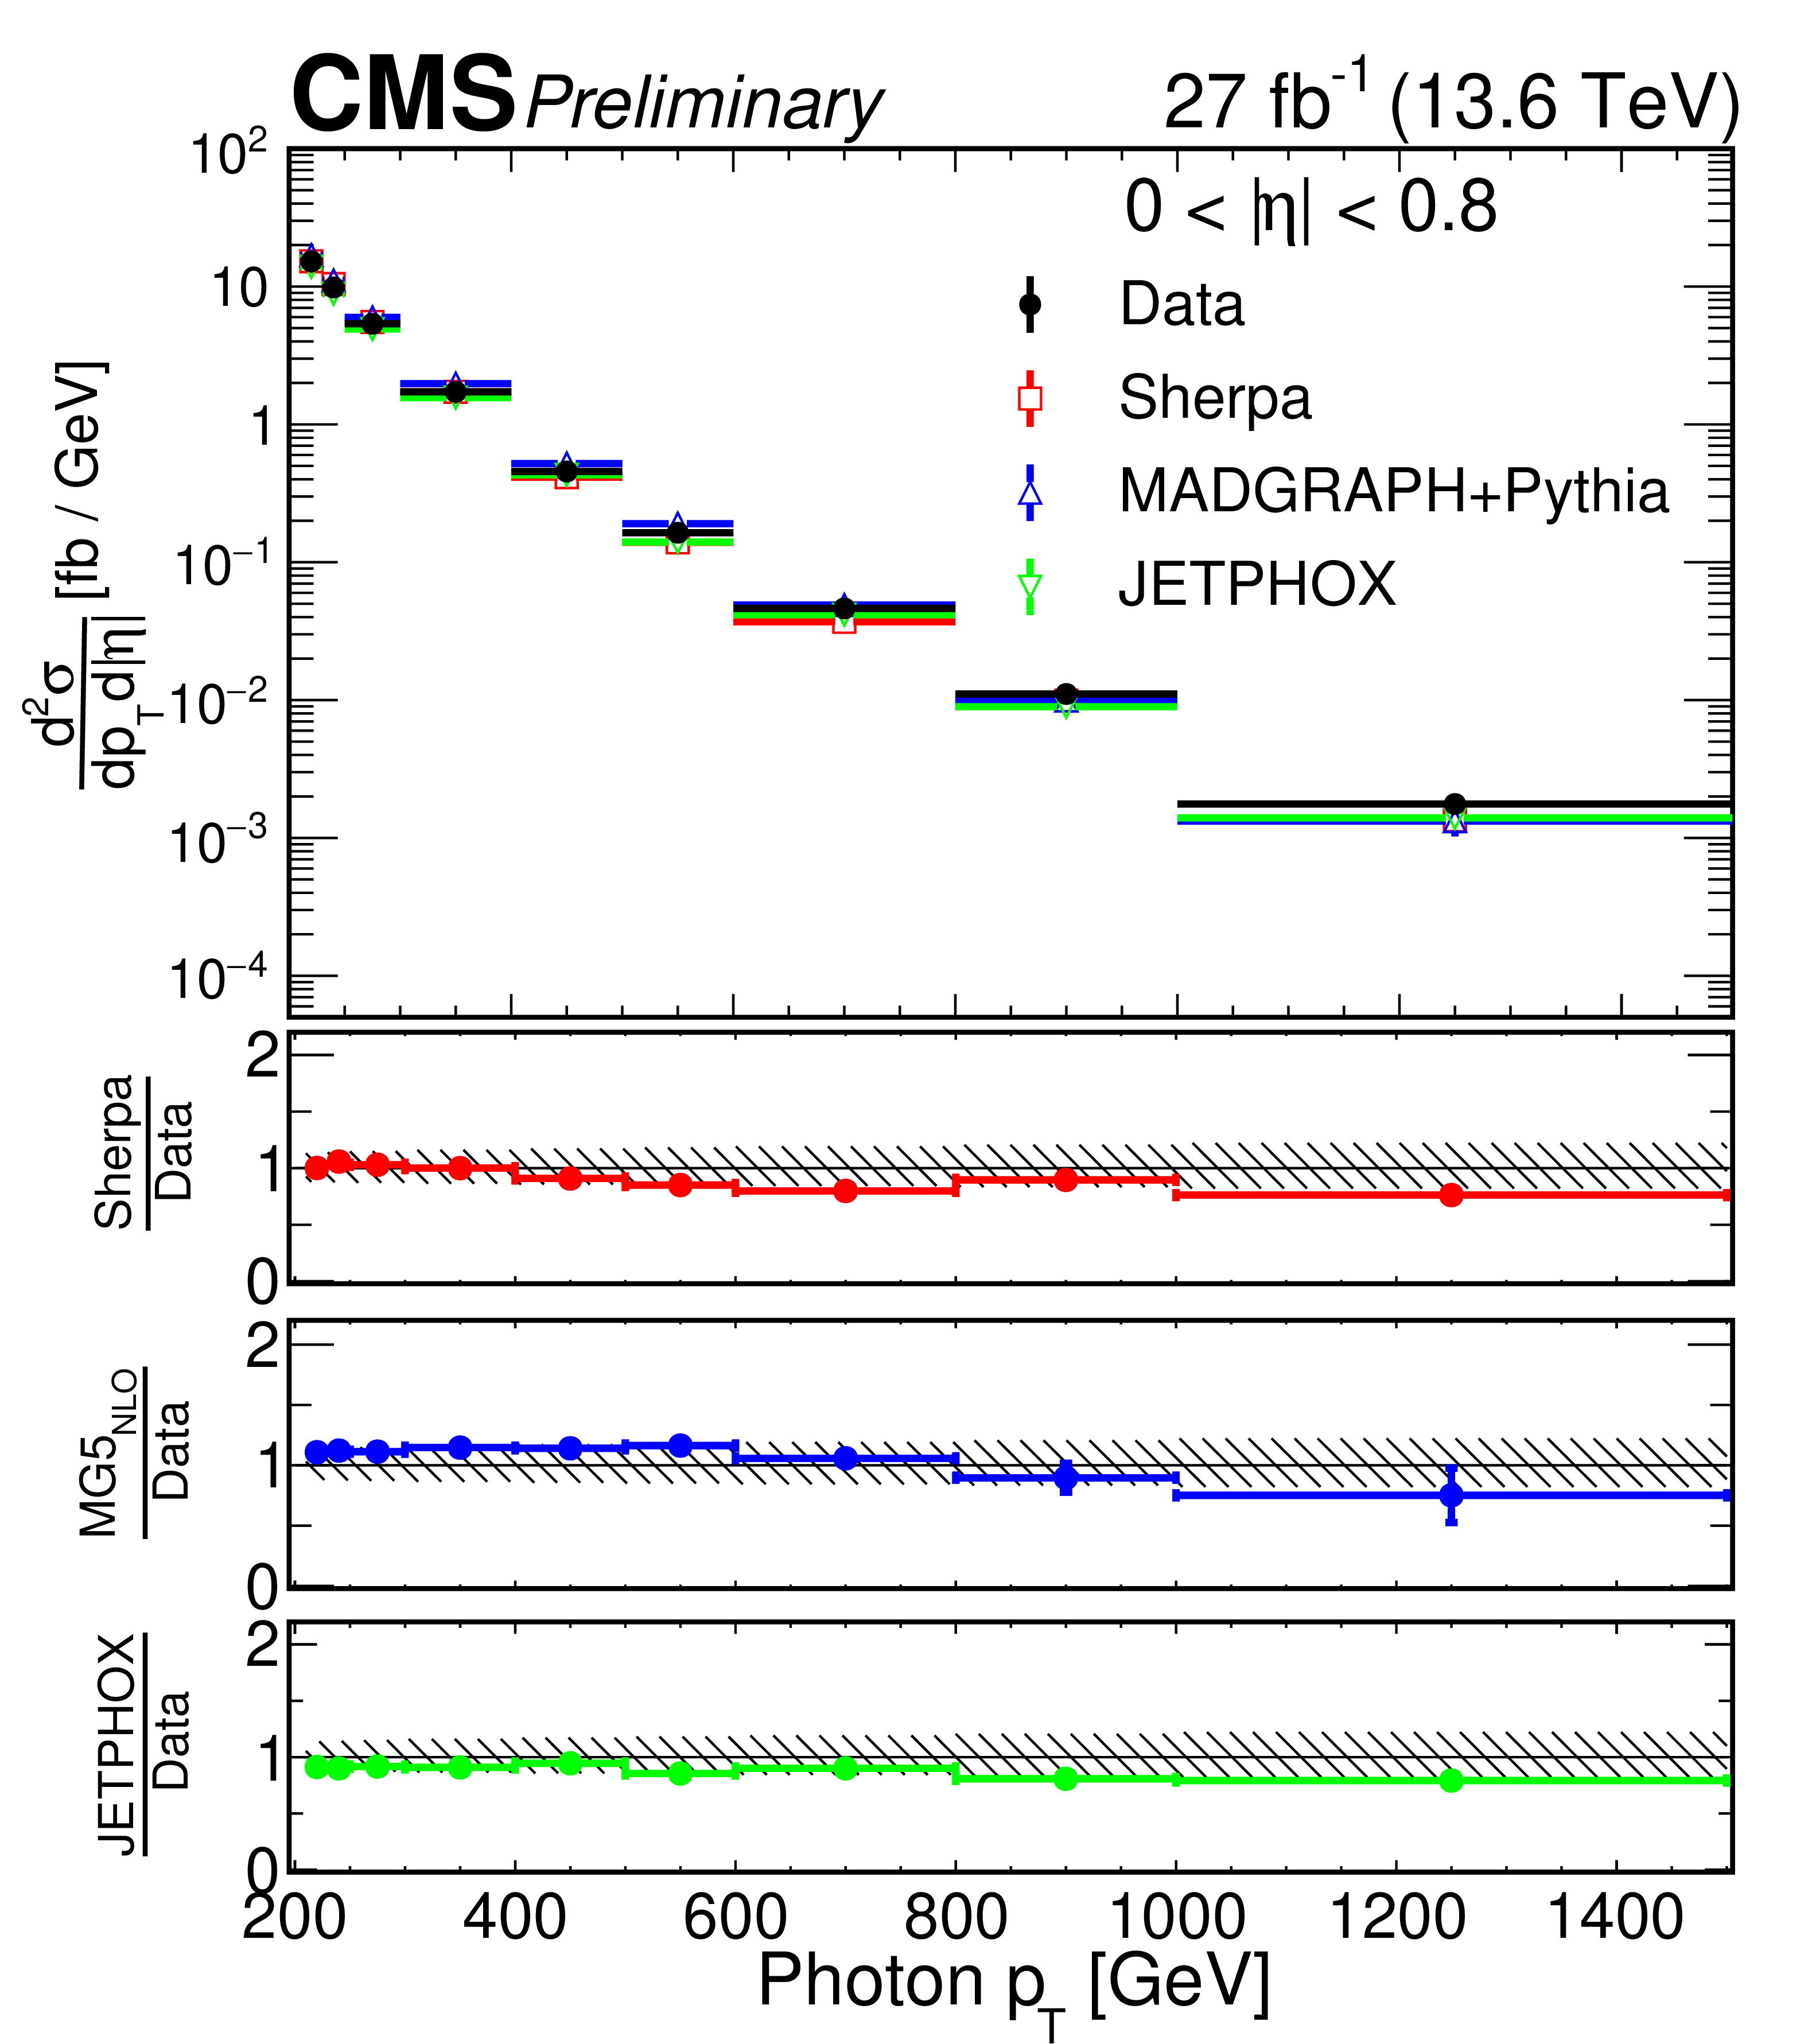
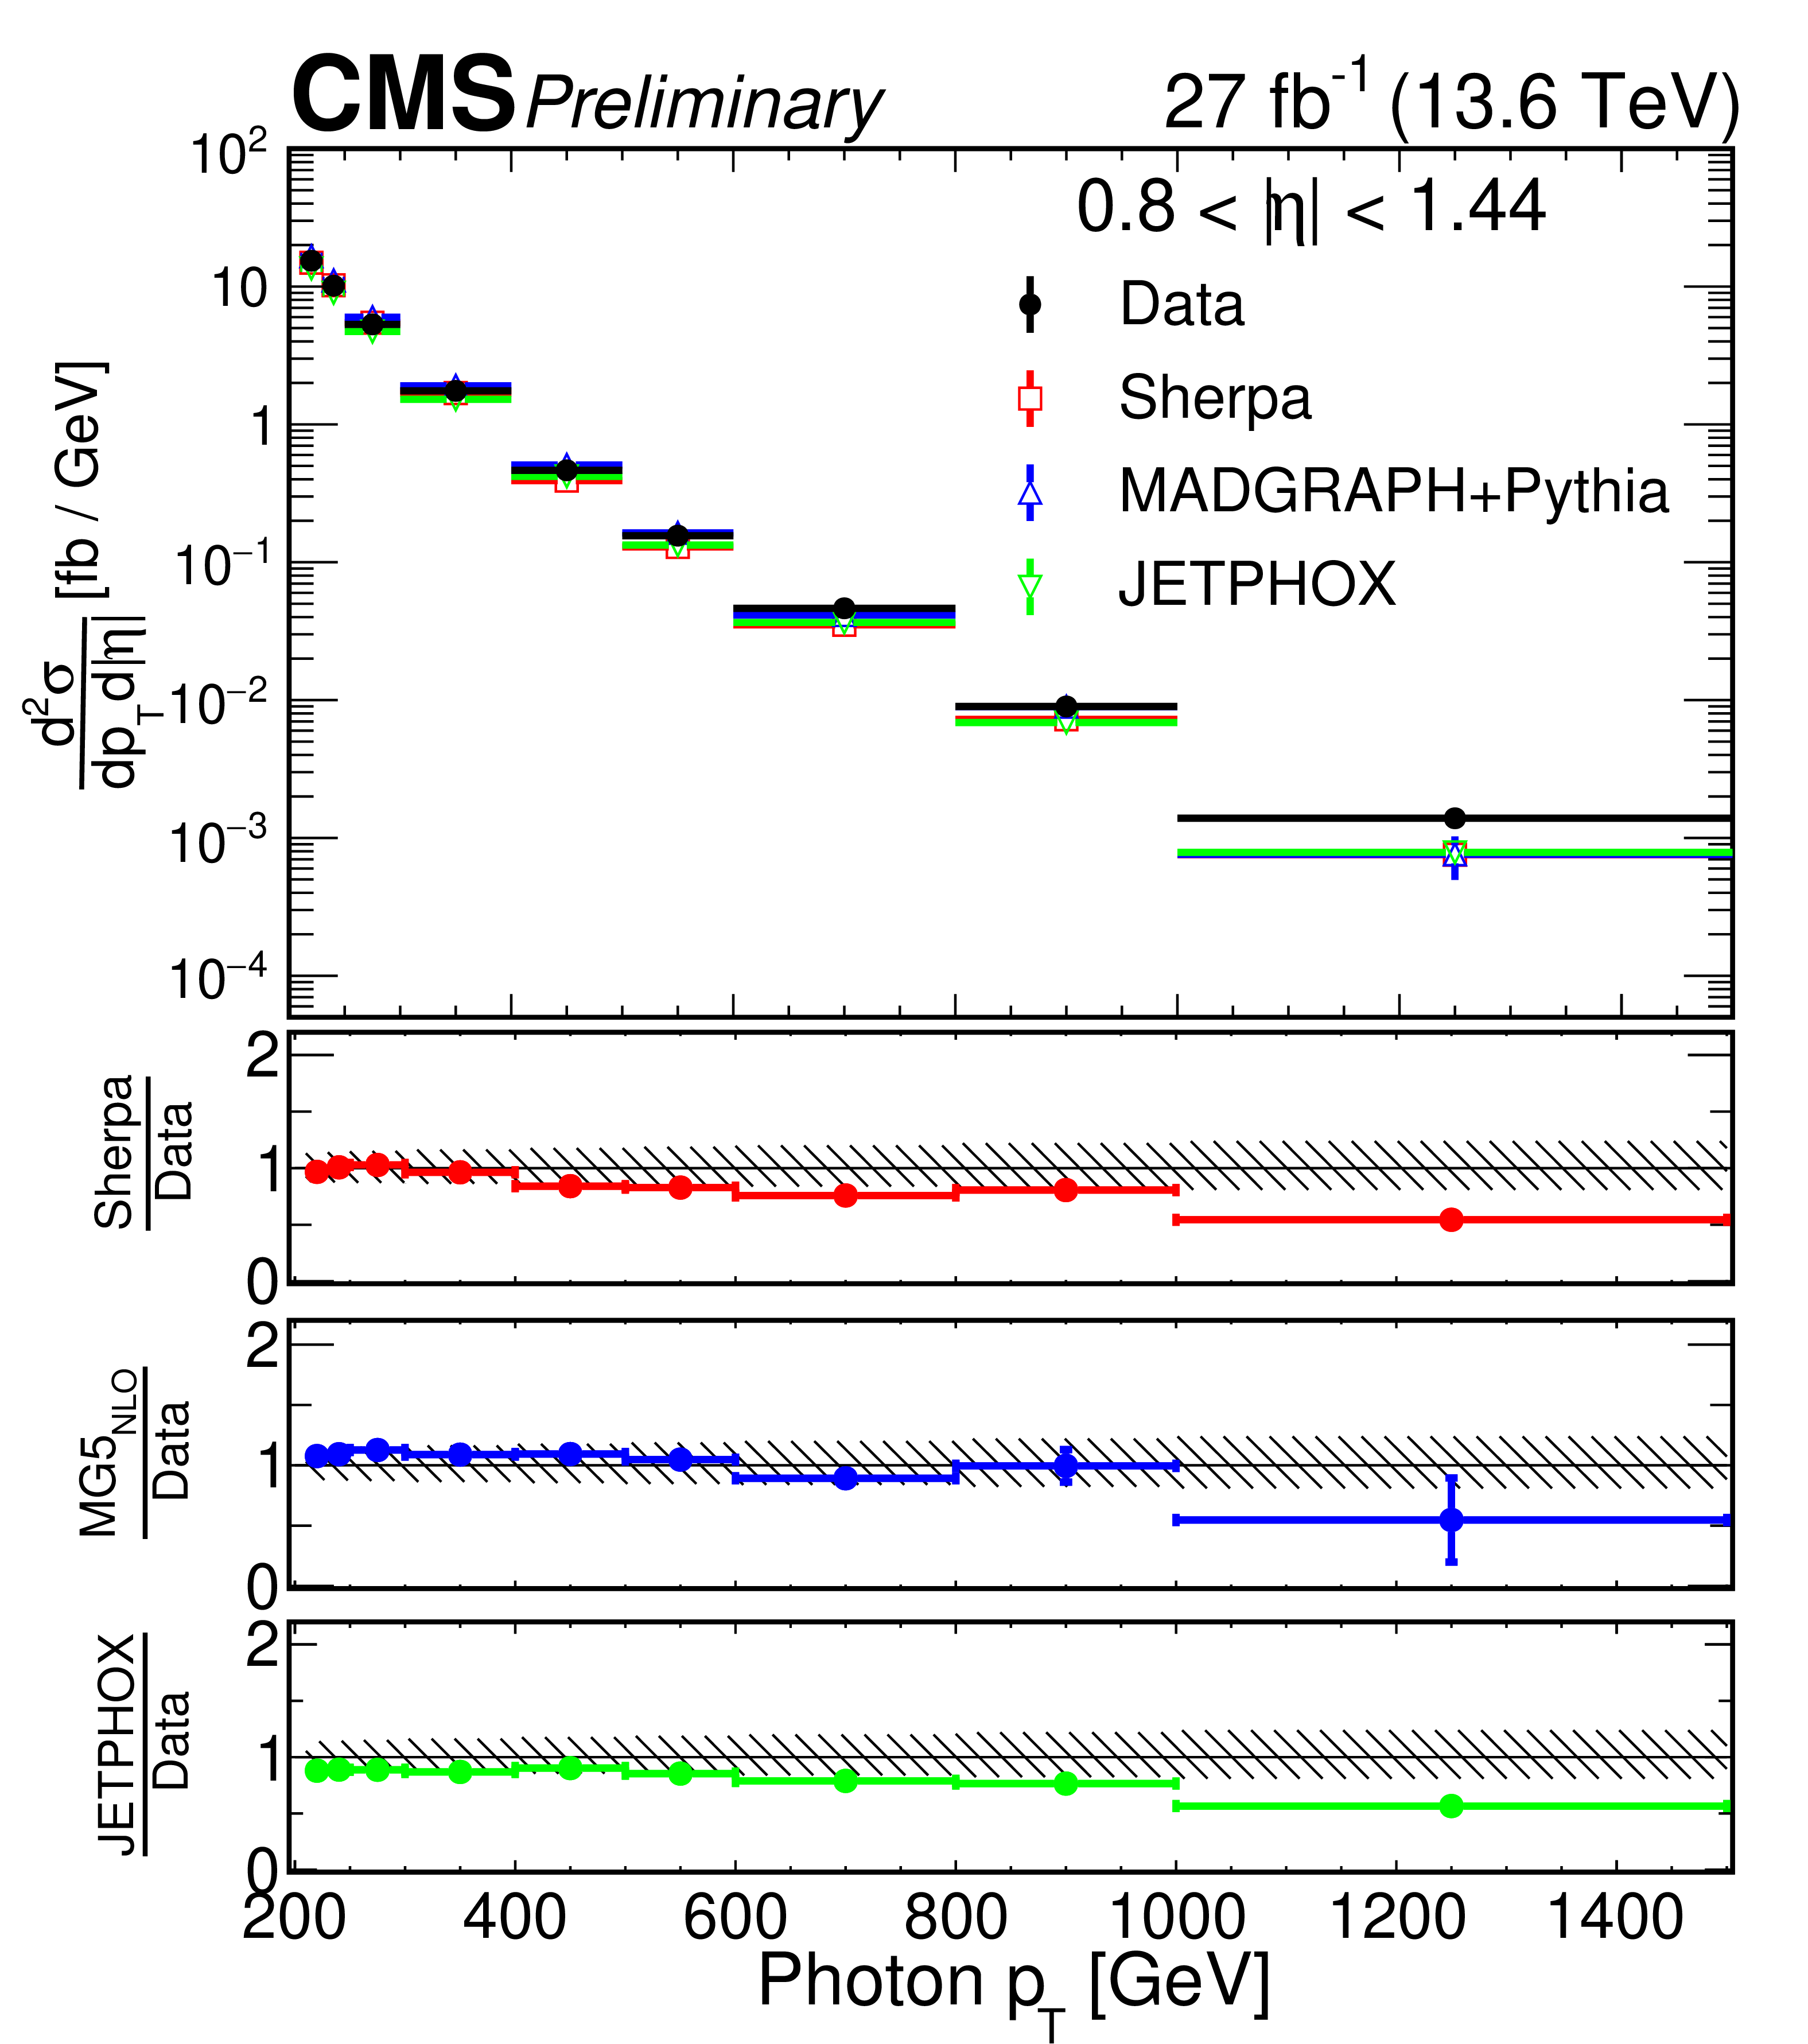
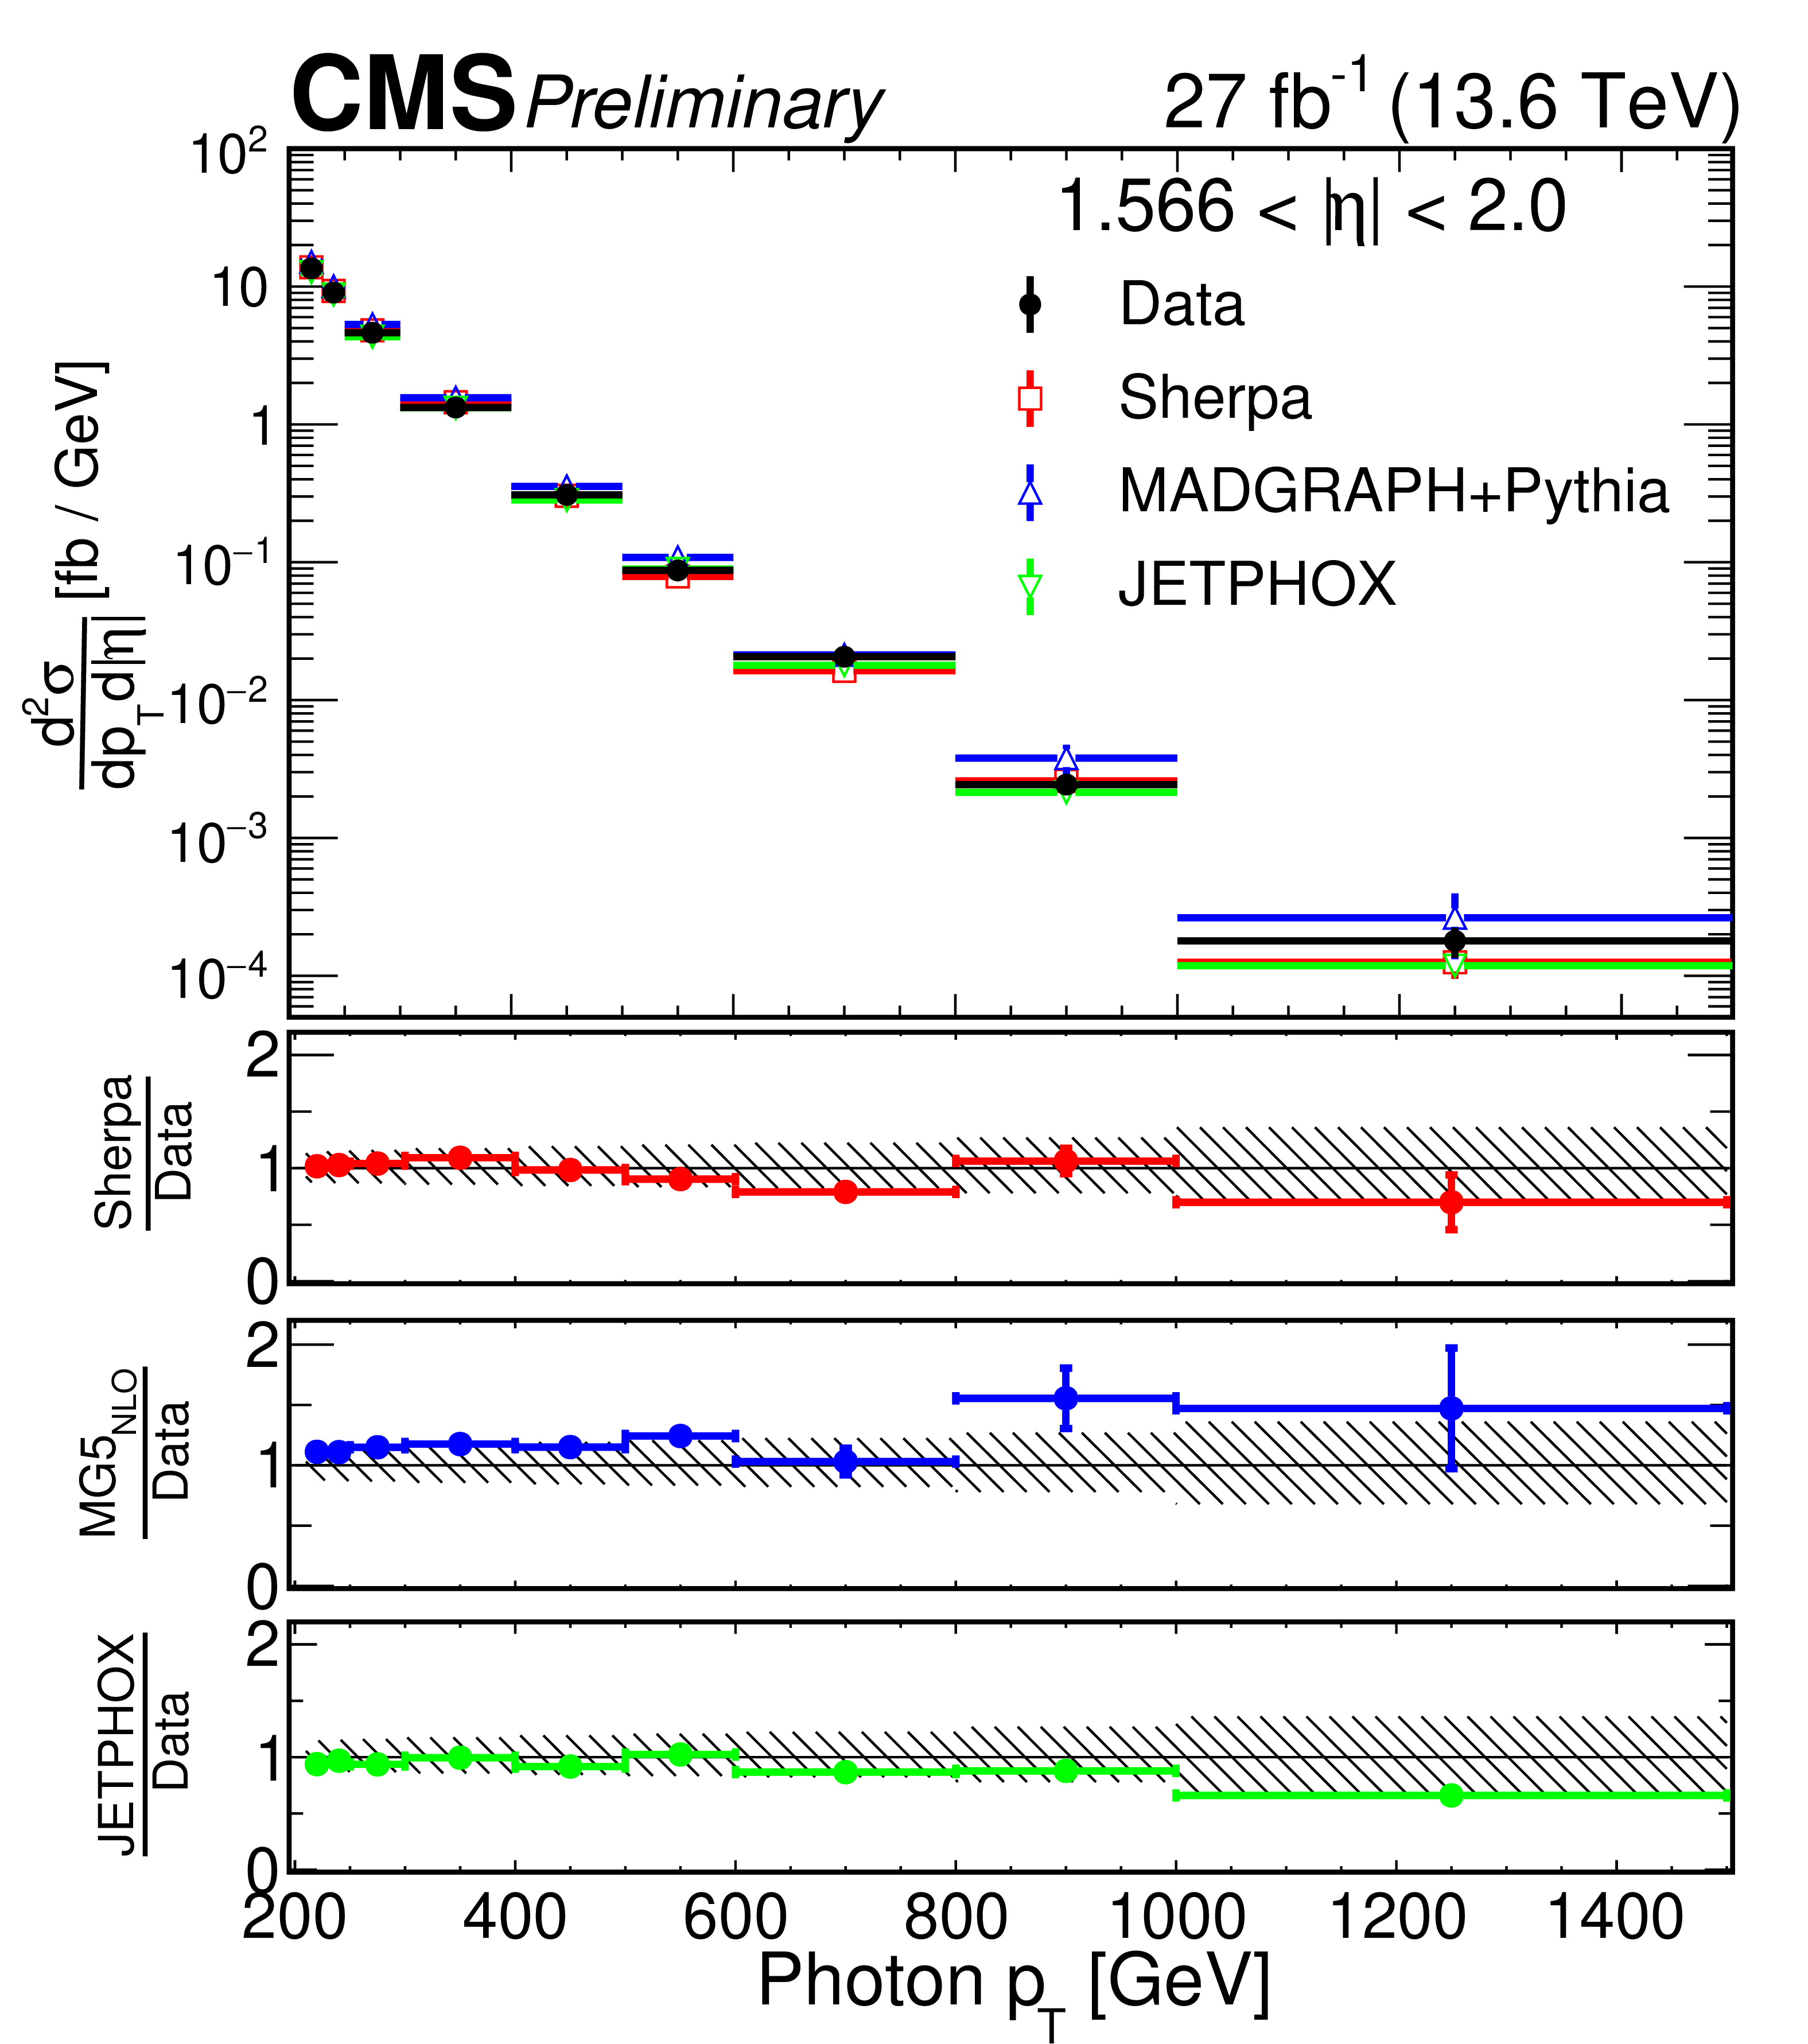
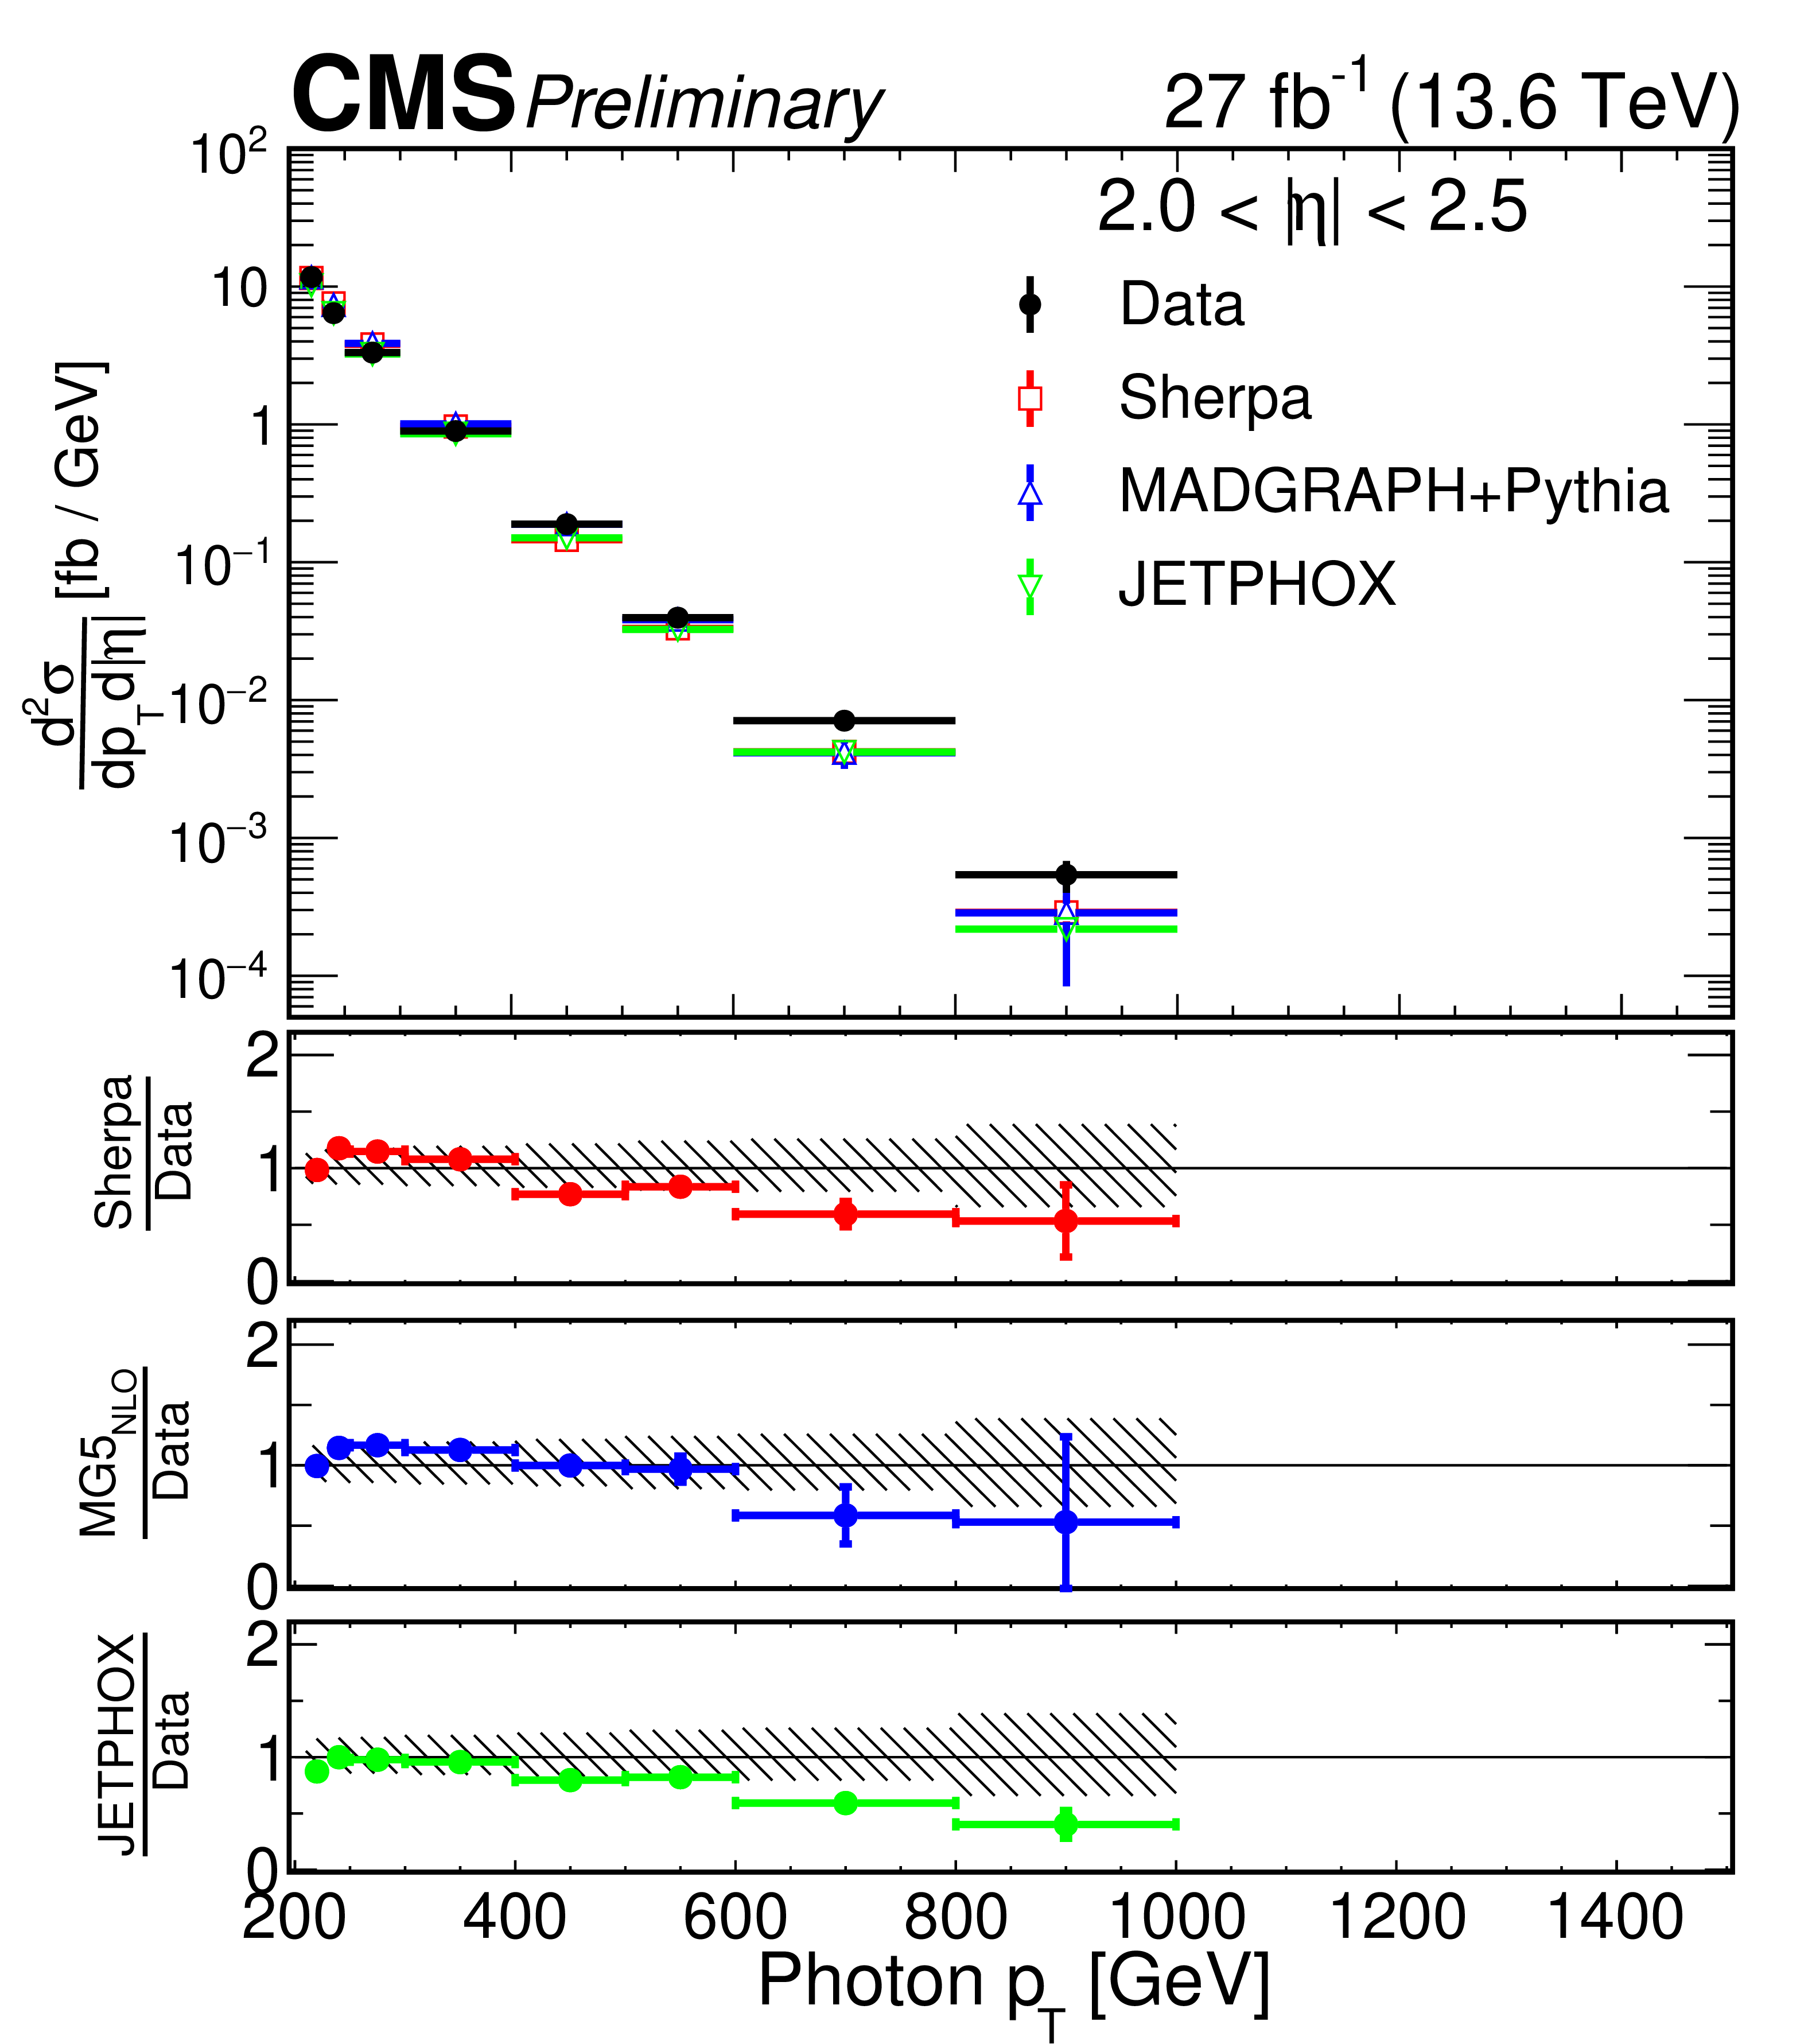
The double-differential cross section for inclusive photon production in four $ |\eta| $ bins, where the topmost panel for each figure shows the double-differential cross section for inclusive photon production measured in data as well as the predictions from several event generators and the error bars contains only the statistical uncertainty. The bottom panels show the ratio of the theoretical predictions to the measurement. The gray band represents the total uncertainty ($ \text{statistical} \oplus \text{systematic} $) in the measurement, whereas the colored lines show the predictions from the different generators with statistical error bars. |
png pdf |
Figure 3-a:
The double-differential cross section for inclusive photon production in four $ |\eta| $ bins, where the topmost panel for each figure shows the double-differential cross section for inclusive photon production measured in data as well as the predictions from several event generators and the error bars contains only the statistical uncertainty. The bottom panels show the ratio of the theoretical predictions to the measurement. The gray band represents the total uncertainty ($ \text{statistical} \oplus \text{systematic} $) in the measurement, whereas the colored lines show the predictions from the different generators with statistical error bars. |
png pdf |
Figure 3-b:
The double-differential cross section for inclusive photon production in four $ |\eta| $ bins, where the topmost panel for each figure shows the double-differential cross section for inclusive photon production measured in data as well as the predictions from several event generators and the error bars contains only the statistical uncertainty. The bottom panels show the ratio of the theoretical predictions to the measurement. The gray band represents the total uncertainty ($ \text{statistical} \oplus \text{systematic} $) in the measurement, whereas the colored lines show the predictions from the different generators with statistical error bars. |
png pdf |
Figure 3-c:
The double-differential cross section for inclusive photon production in four $ |\eta| $ bins, where the topmost panel for each figure shows the double-differential cross section for inclusive photon production measured in data as well as the predictions from several event generators and the error bars contains only the statistical uncertainty. The bottom panels show the ratio of the theoretical predictions to the measurement. The gray band represents the total uncertainty ($ \text{statistical} \oplus \text{systematic} $) in the measurement, whereas the colored lines show the predictions from the different generators with statistical error bars. |
png pdf |
Figure 3-d:
The double-differential cross section for inclusive photon production in four $ |\eta| $ bins, where the topmost panel for each figure shows the double-differential cross section for inclusive photon production measured in data as well as the predictions from several event generators and the error bars contains only the statistical uncertainty. The bottom panels show the ratio of the theoretical predictions to the measurement. The gray band represents the total uncertainty ($ \text{statistical} \oplus \text{systematic} $) in the measurement, whereas the colored lines show the predictions from the different generators with statistical error bars. |
png pdf |
Figure 4:
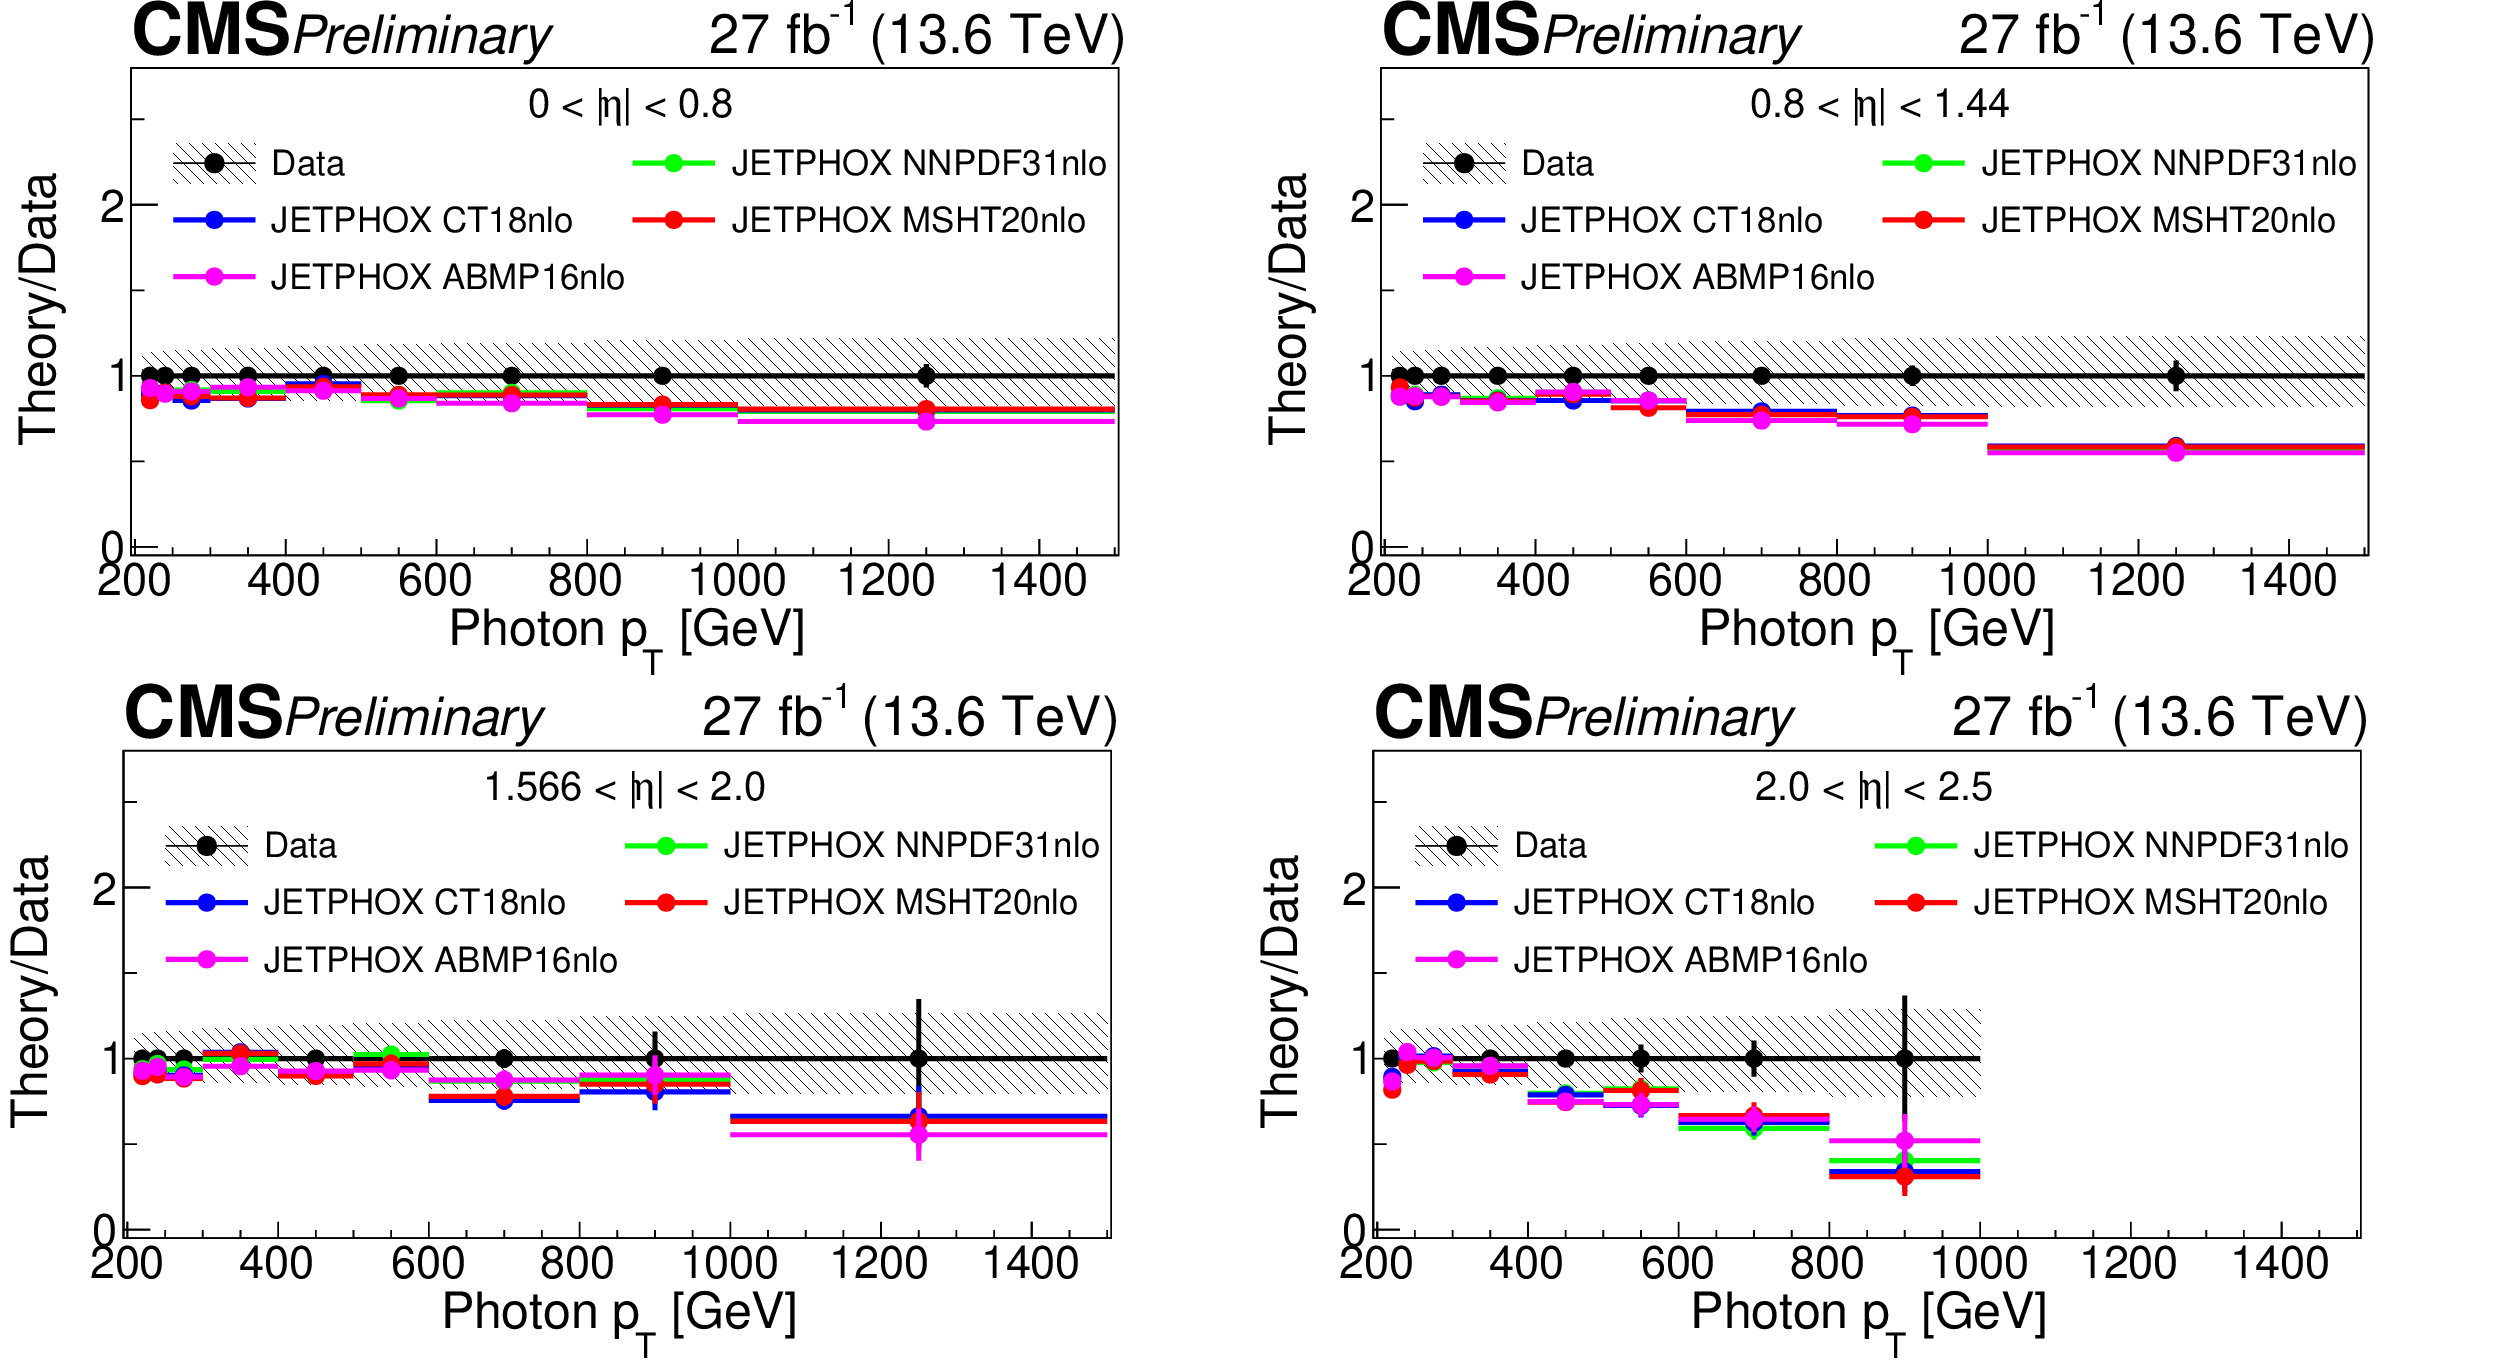
The ratio of the theoretical prediction obtained with the JETPHOX generator to the differential inclusive photon production cross section measured in data for four $ |\eta| $ regions and several PDF sets. The gray band represents the total systematic uncertainty in the measurement from various experimental and theoretical sources. The gray error bars represent the statistical uncertainties on the data, while the colored error bars represent the statistical uncertainties on the JETPHOX predictions obtained with different PDF sets.. |
png pdf |
Figure 4-a:
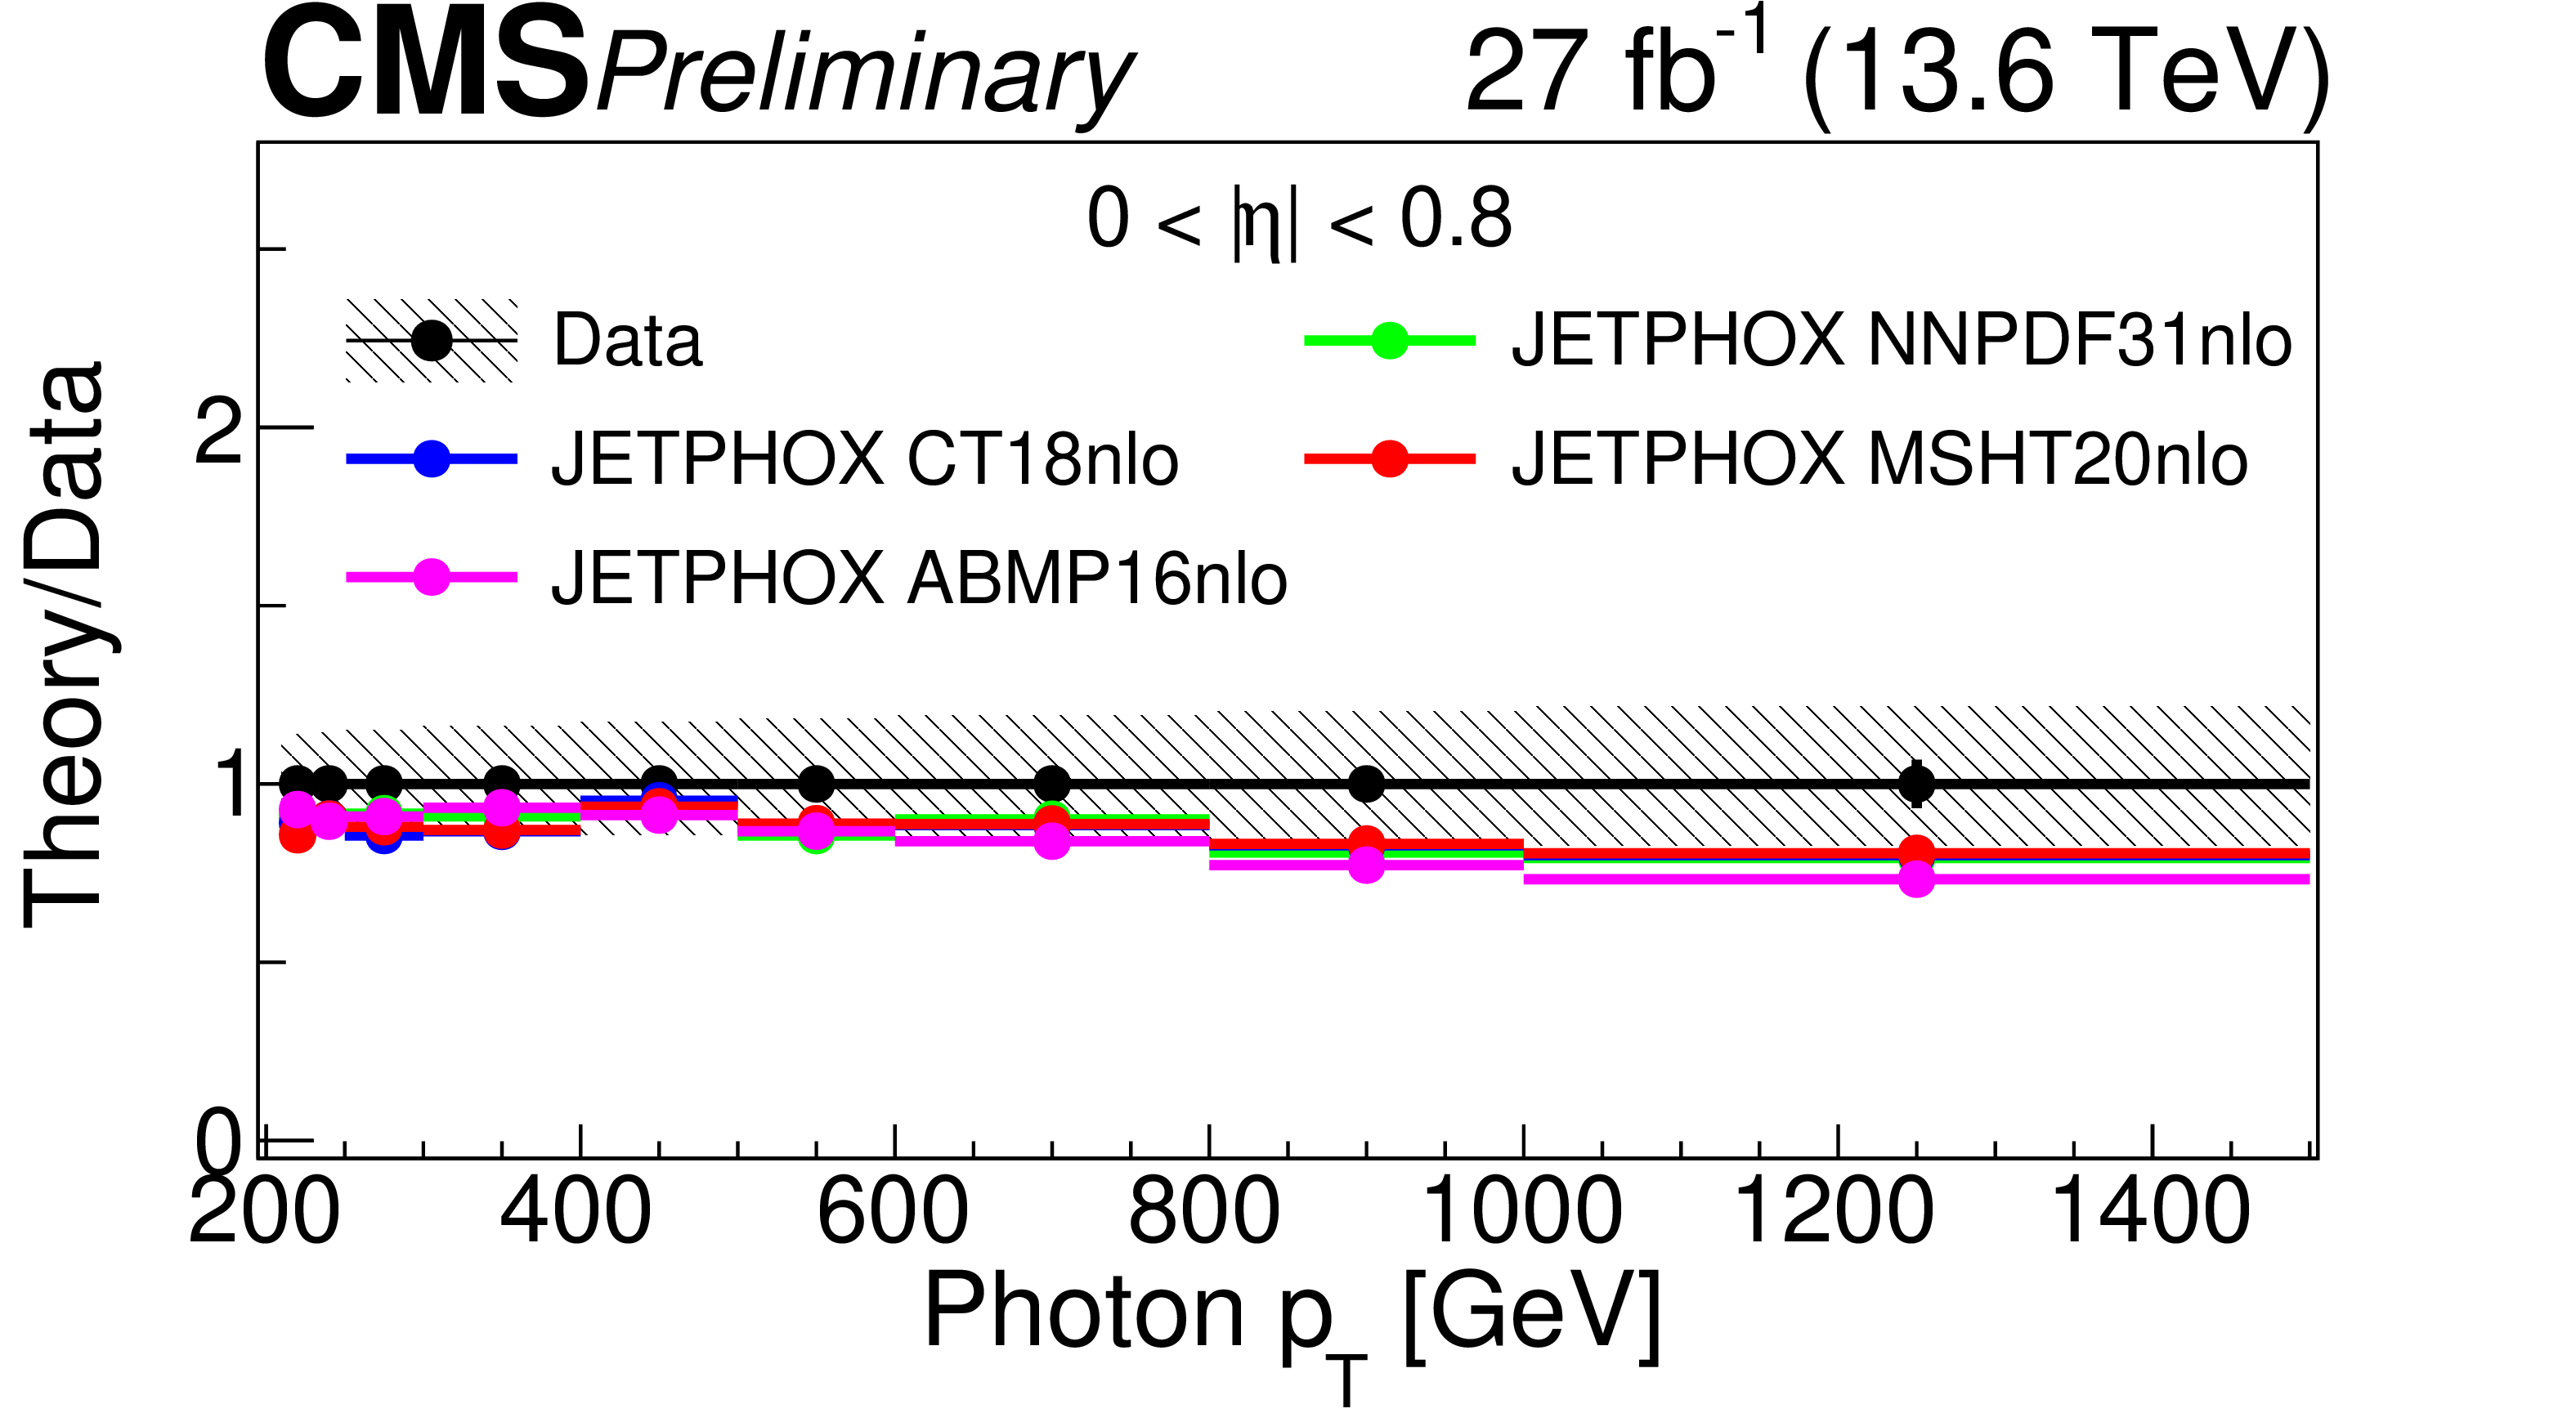
The ratio of the theoretical prediction obtained with the JETPHOX generator to the differential inclusive photon production cross section measured in data for four $ |\eta| $ regions and several PDF sets. The gray band represents the total systematic uncertainty in the measurement from various experimental and theoretical sources. The gray error bars represent the statistical uncertainties on the data, while the colored error bars represent the statistical uncertainties on the JETPHOX predictions obtained with different PDF sets.. |
png pdf |
Figure 4-b:
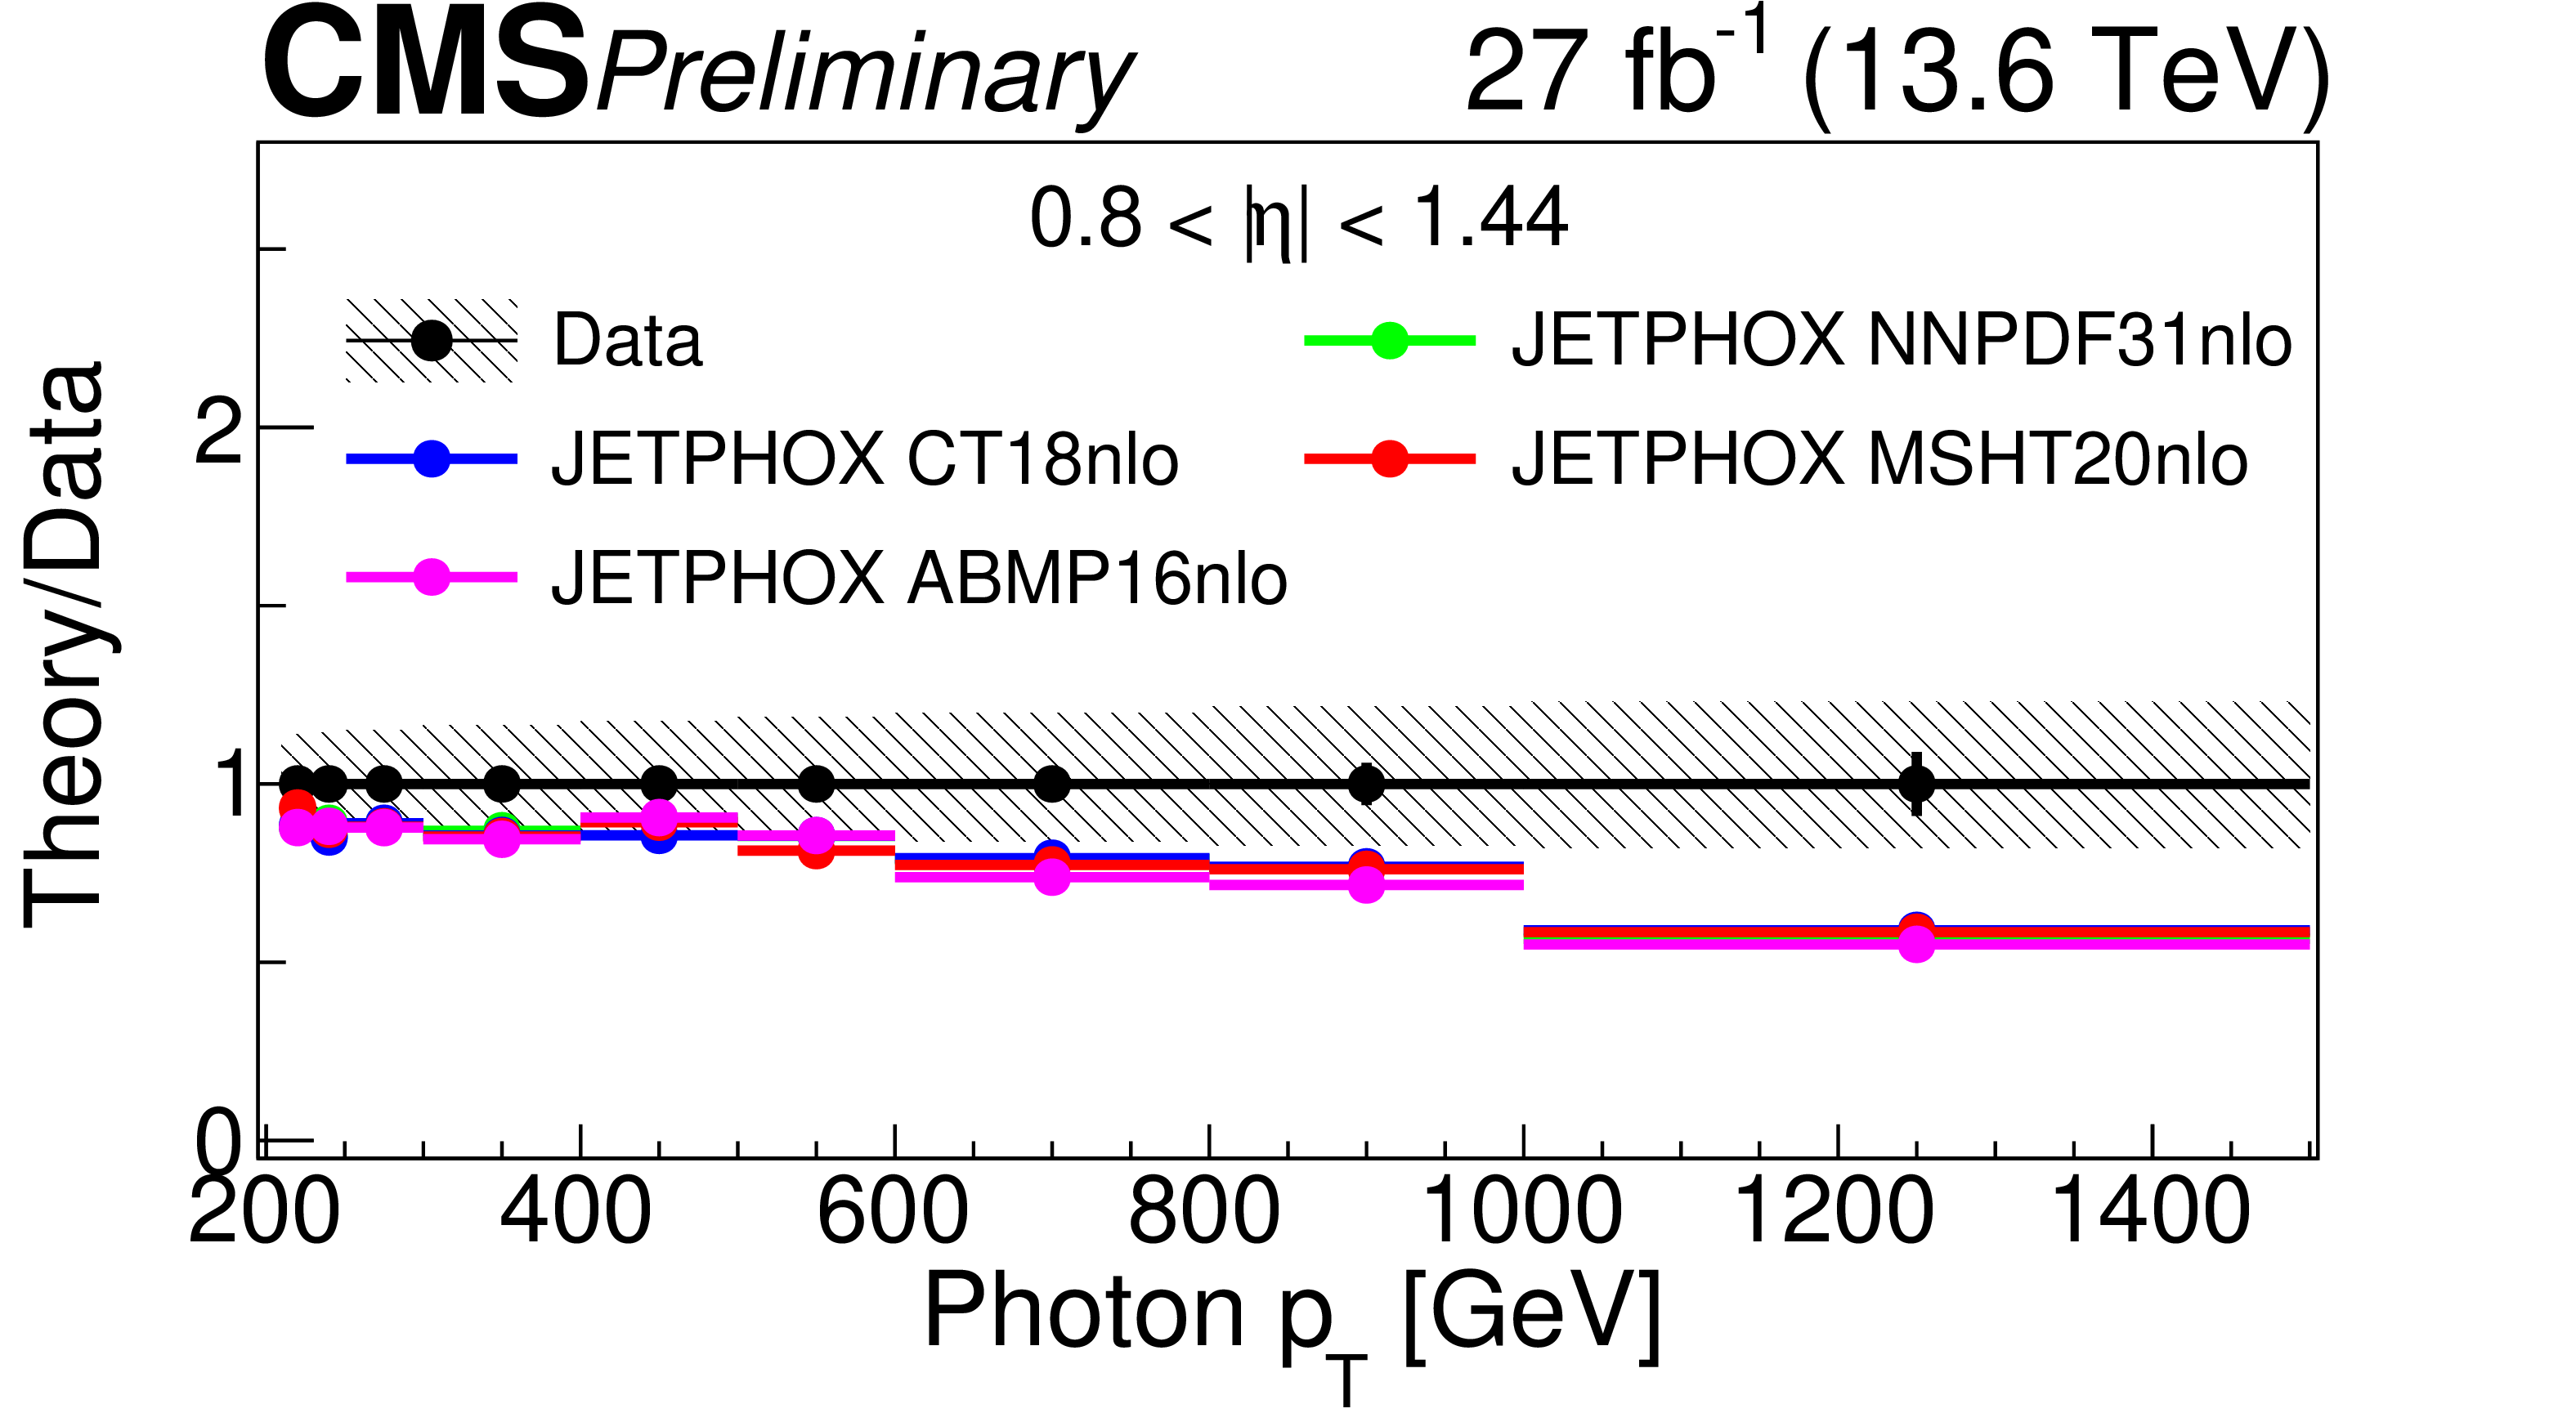
The ratio of the theoretical prediction obtained with the JETPHOX generator to the differential inclusive photon production cross section measured in data for four $ |\eta| $ regions and several PDF sets. The gray band represents the total systematic uncertainty in the measurement from various experimental and theoretical sources. The gray error bars represent the statistical uncertainties on the data, while the colored error bars represent the statistical uncertainties on the JETPHOX predictions obtained with different PDF sets.. |
png pdf |
Figure 4-c:
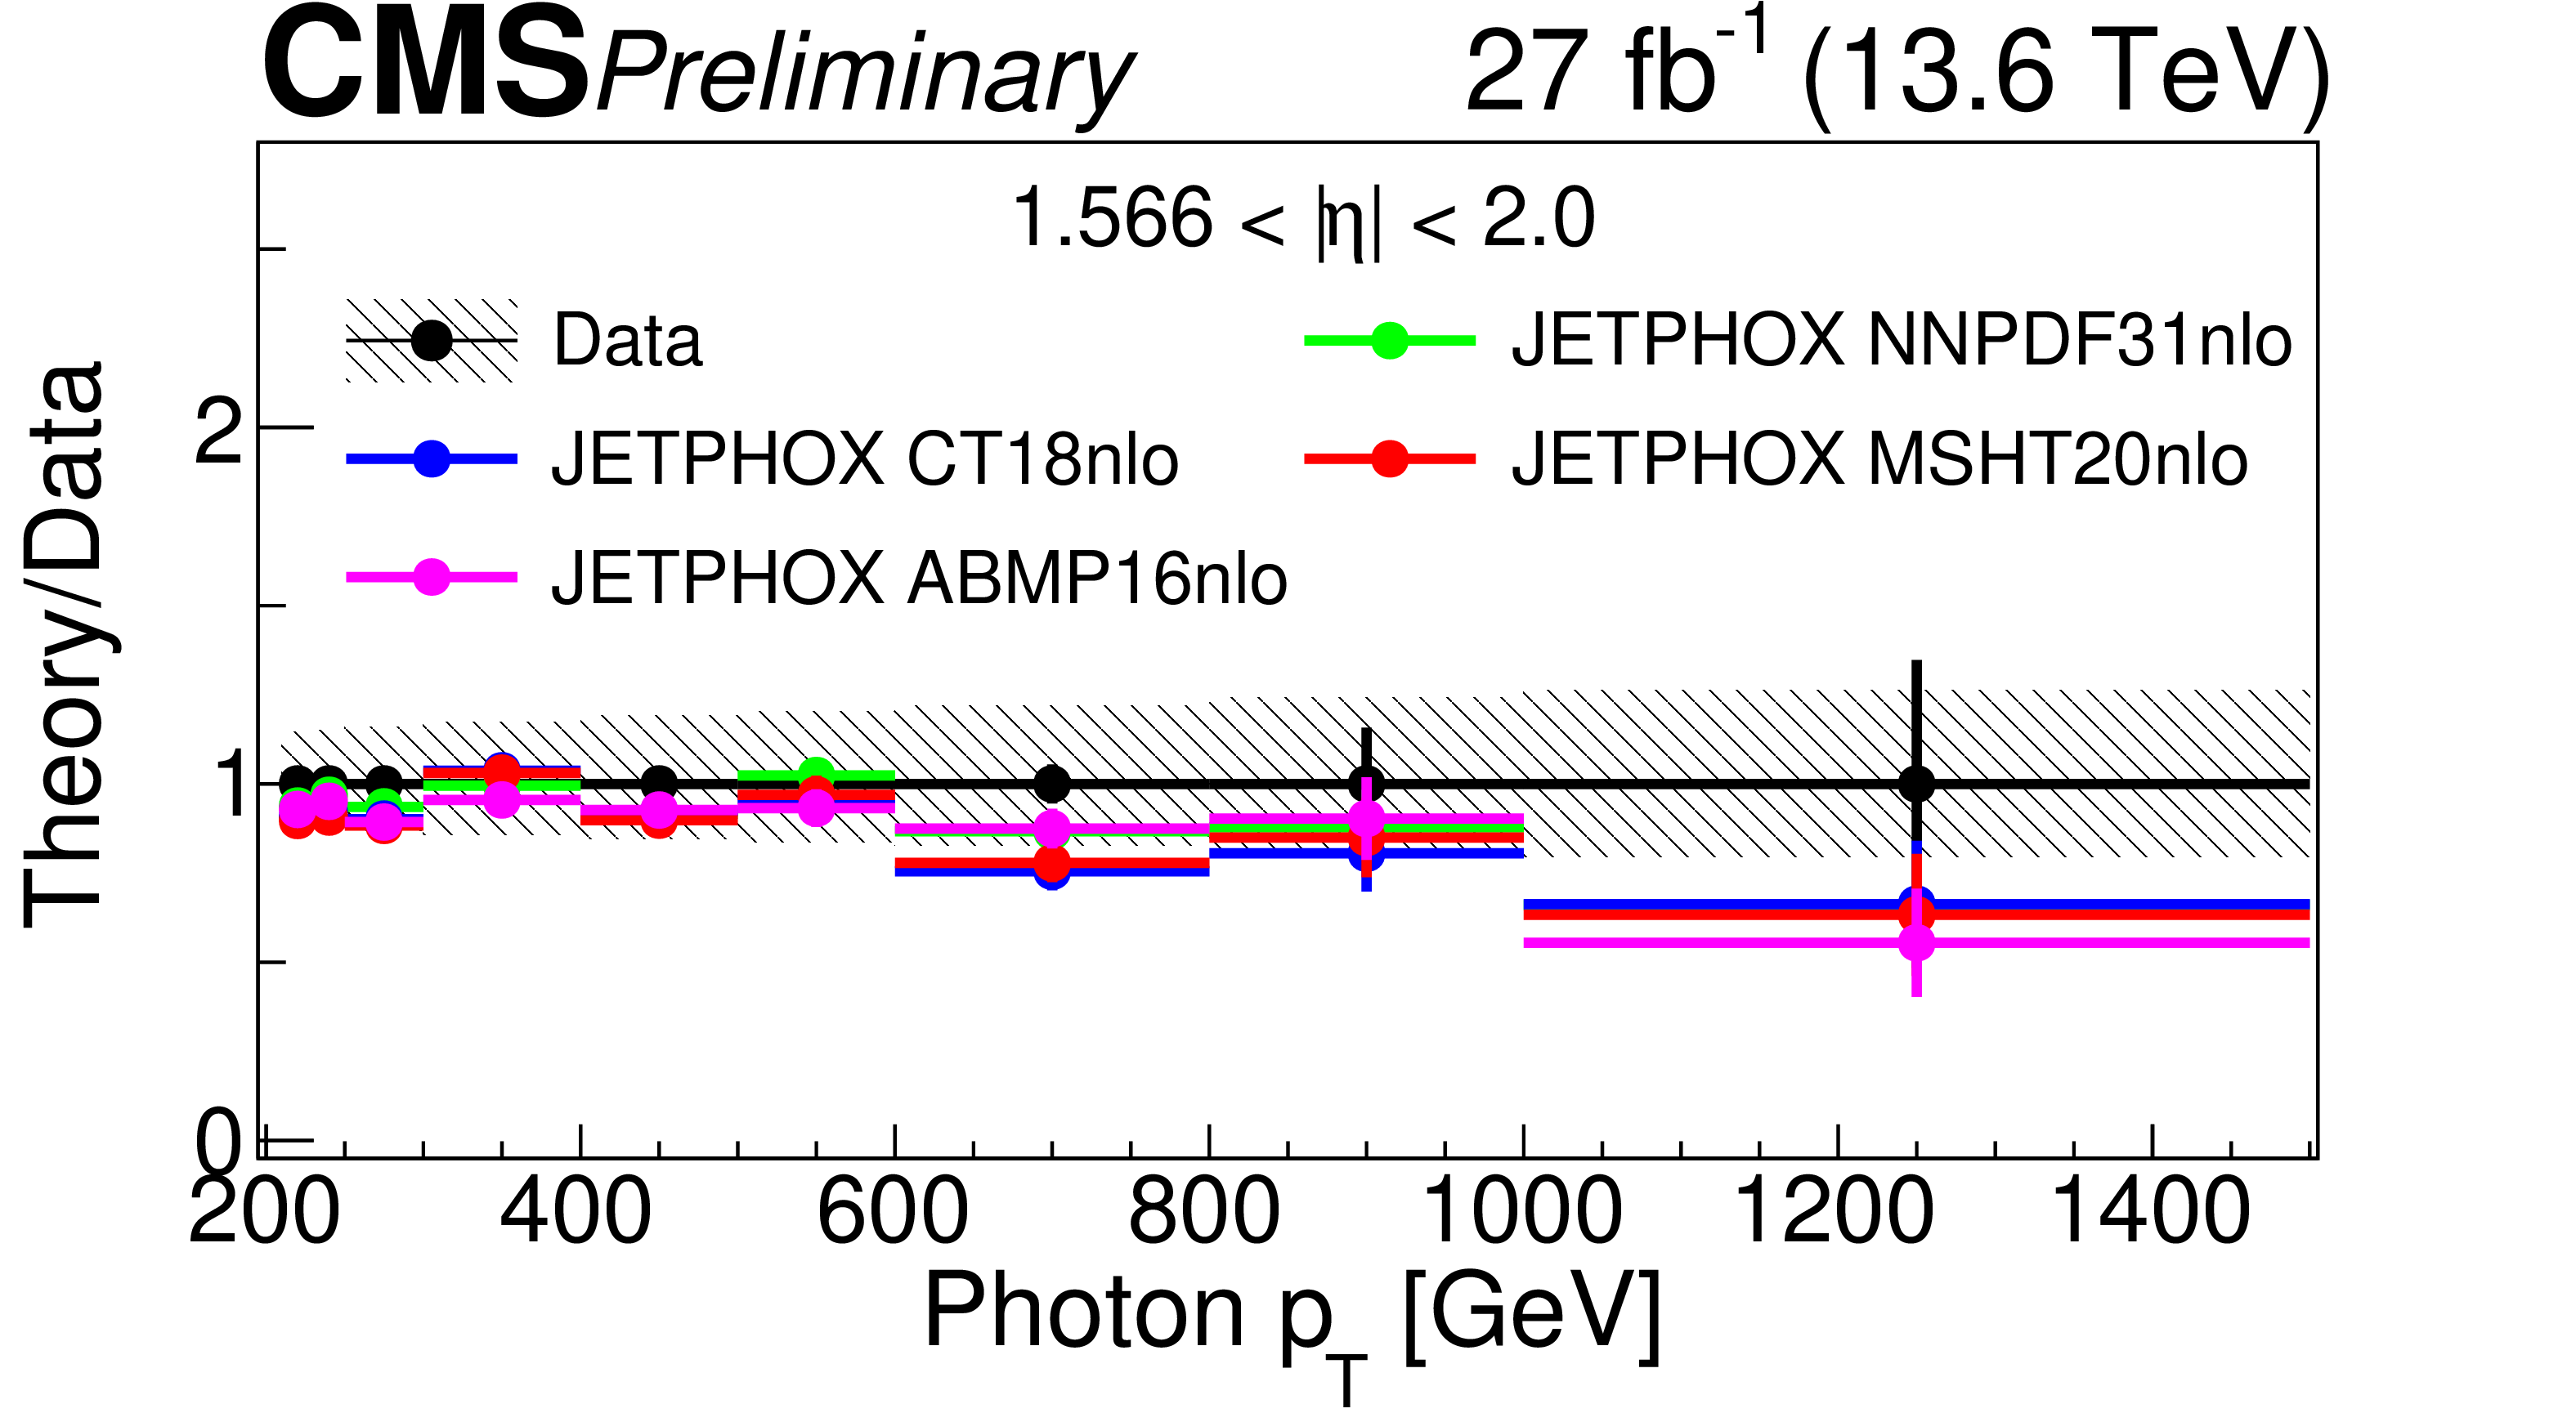
The ratio of the theoretical prediction obtained with the JETPHOX generator to the differential inclusive photon production cross section measured in data for four $ |\eta| $ regions and several PDF sets. The gray band represents the total systematic uncertainty in the measurement from various experimental and theoretical sources. The gray error bars represent the statistical uncertainties on the data, while the colored error bars represent the statistical uncertainties on the JETPHOX predictions obtained with different PDF sets.. |
png pdf |
Figure 4-d:
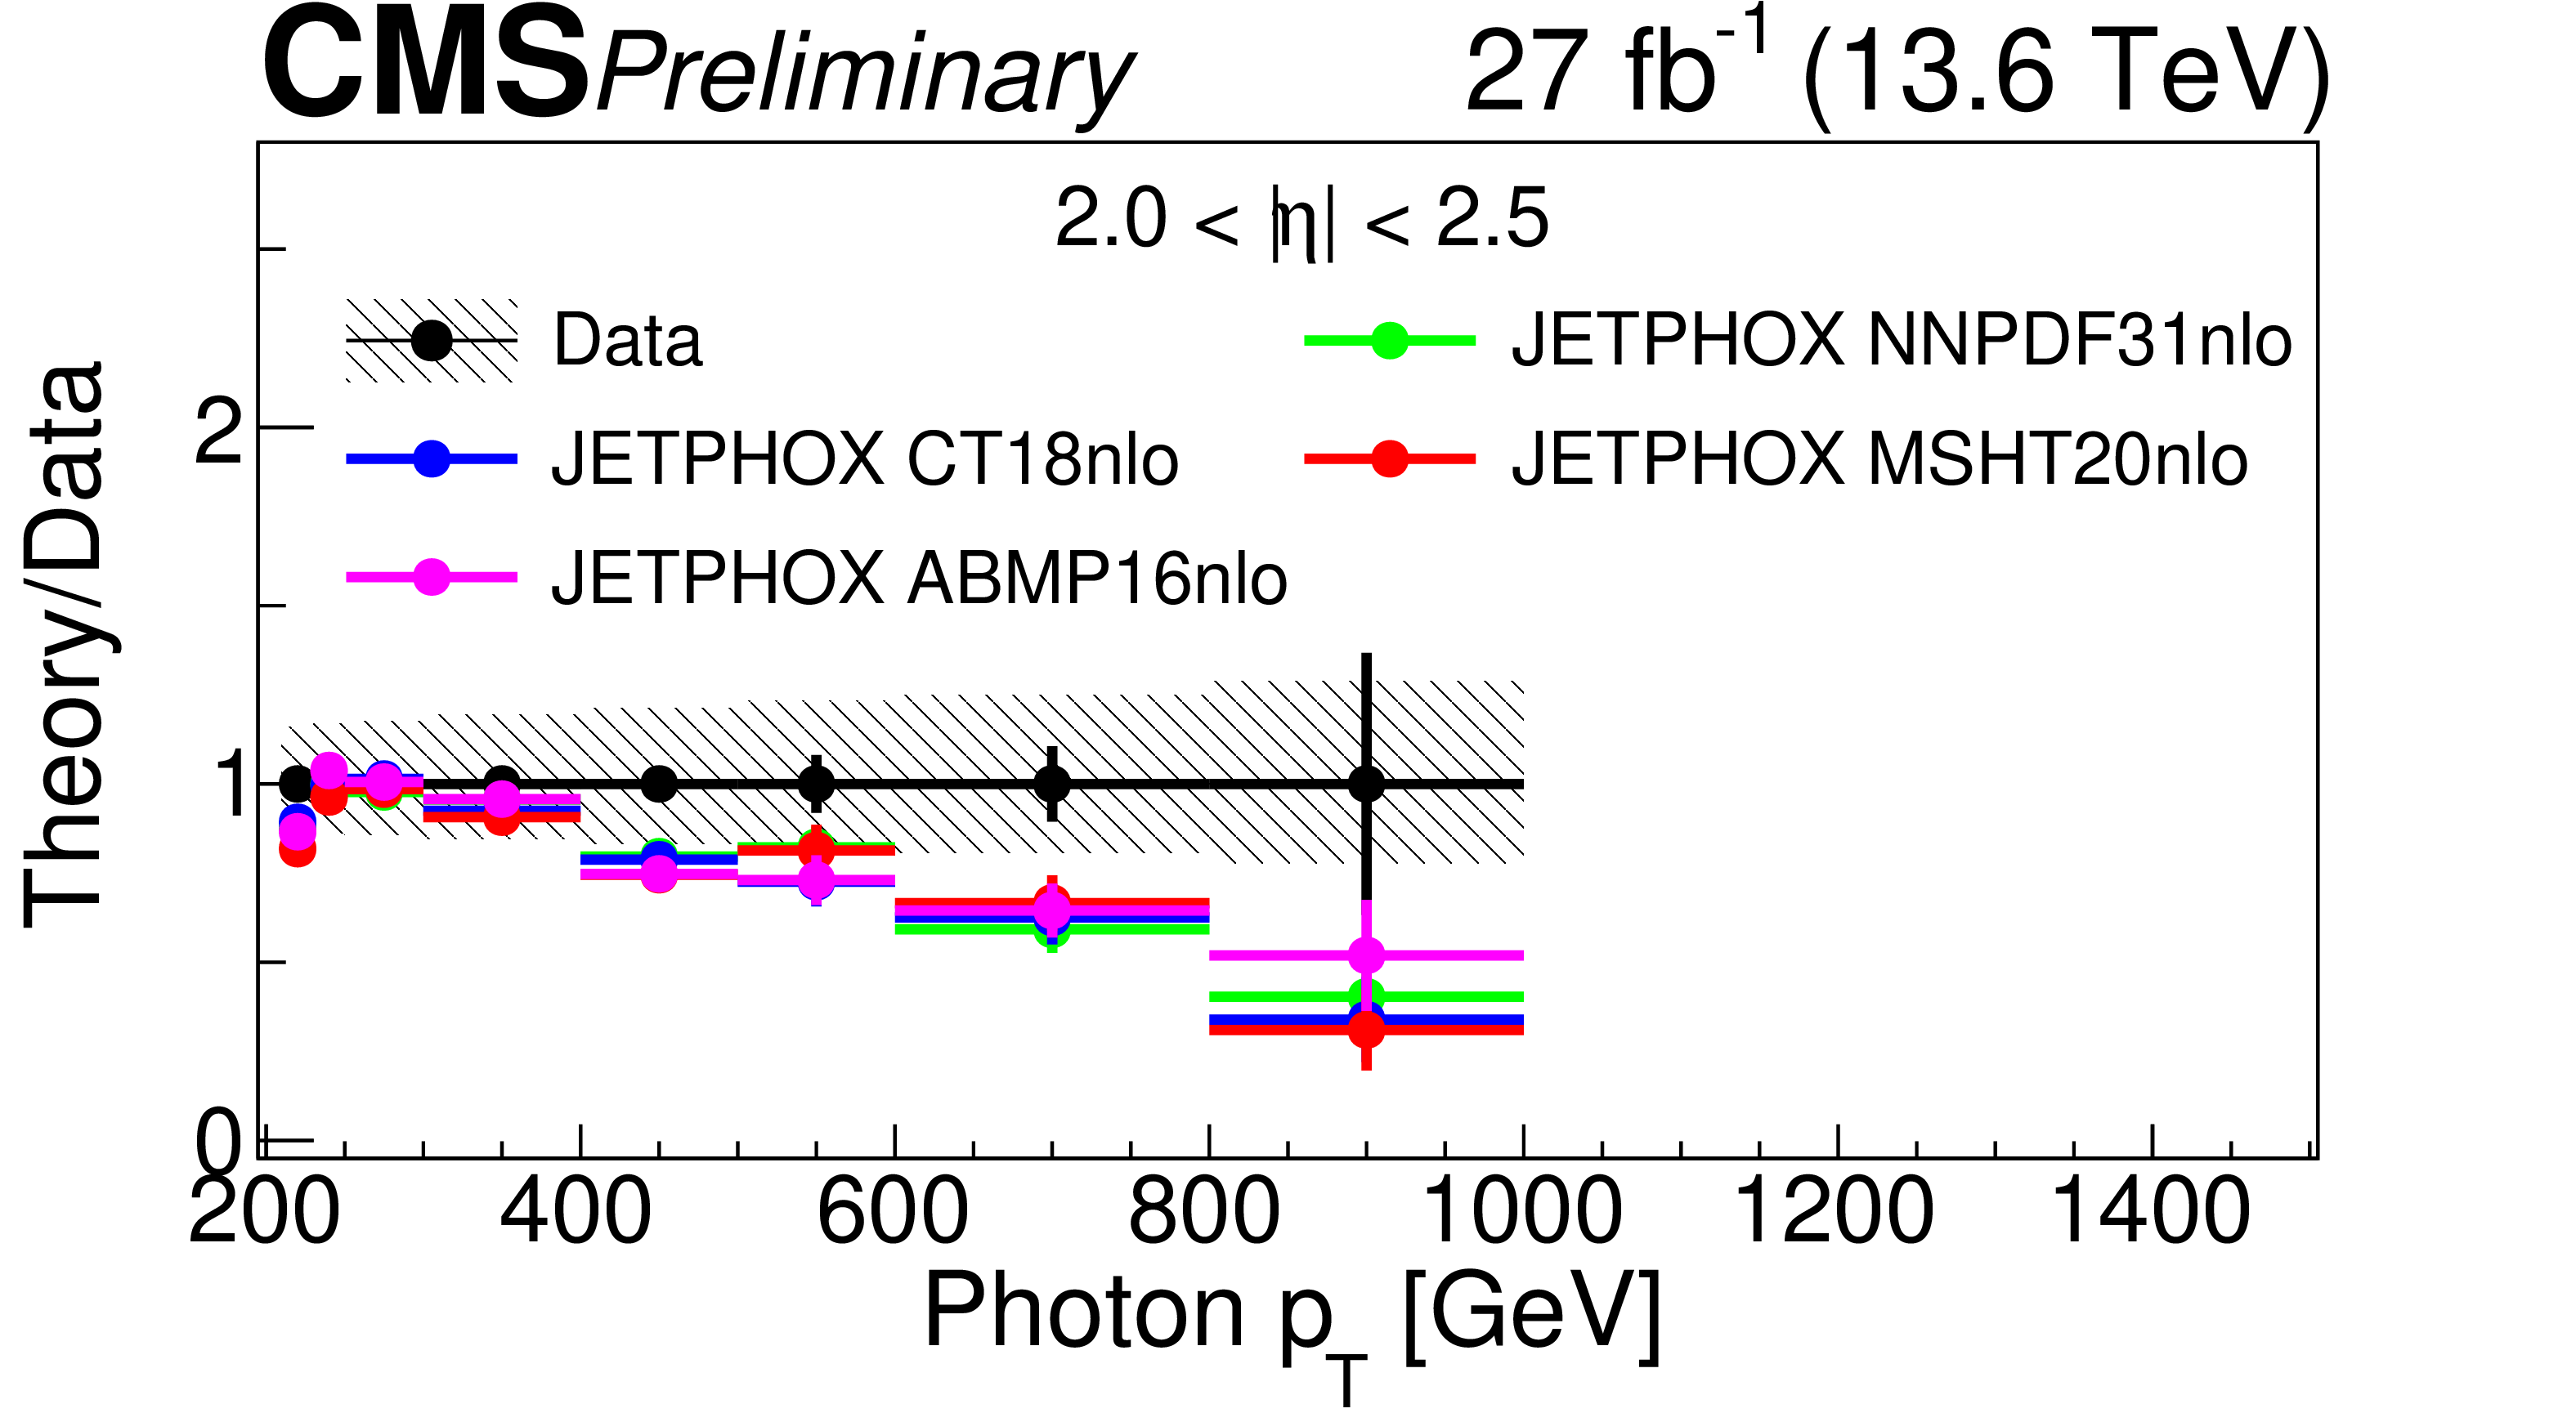
The ratio of the theoretical prediction obtained with the JETPHOX generator to the differential inclusive photon production cross section measured in data for four $ |\eta| $ regions and several PDF sets. The gray band represents the total systematic uncertainty in the measurement from various experimental and theoretical sources. The gray error bars represent the statistical uncertainties on the data, while the colored error bars represent the statistical uncertainties on the JETPHOX predictions obtained with different PDF sets.. |
| Tables | |

png pdf |
Table 1:
Fiducial phase space definition for generator level photons. |
png pdf |
Table 2:
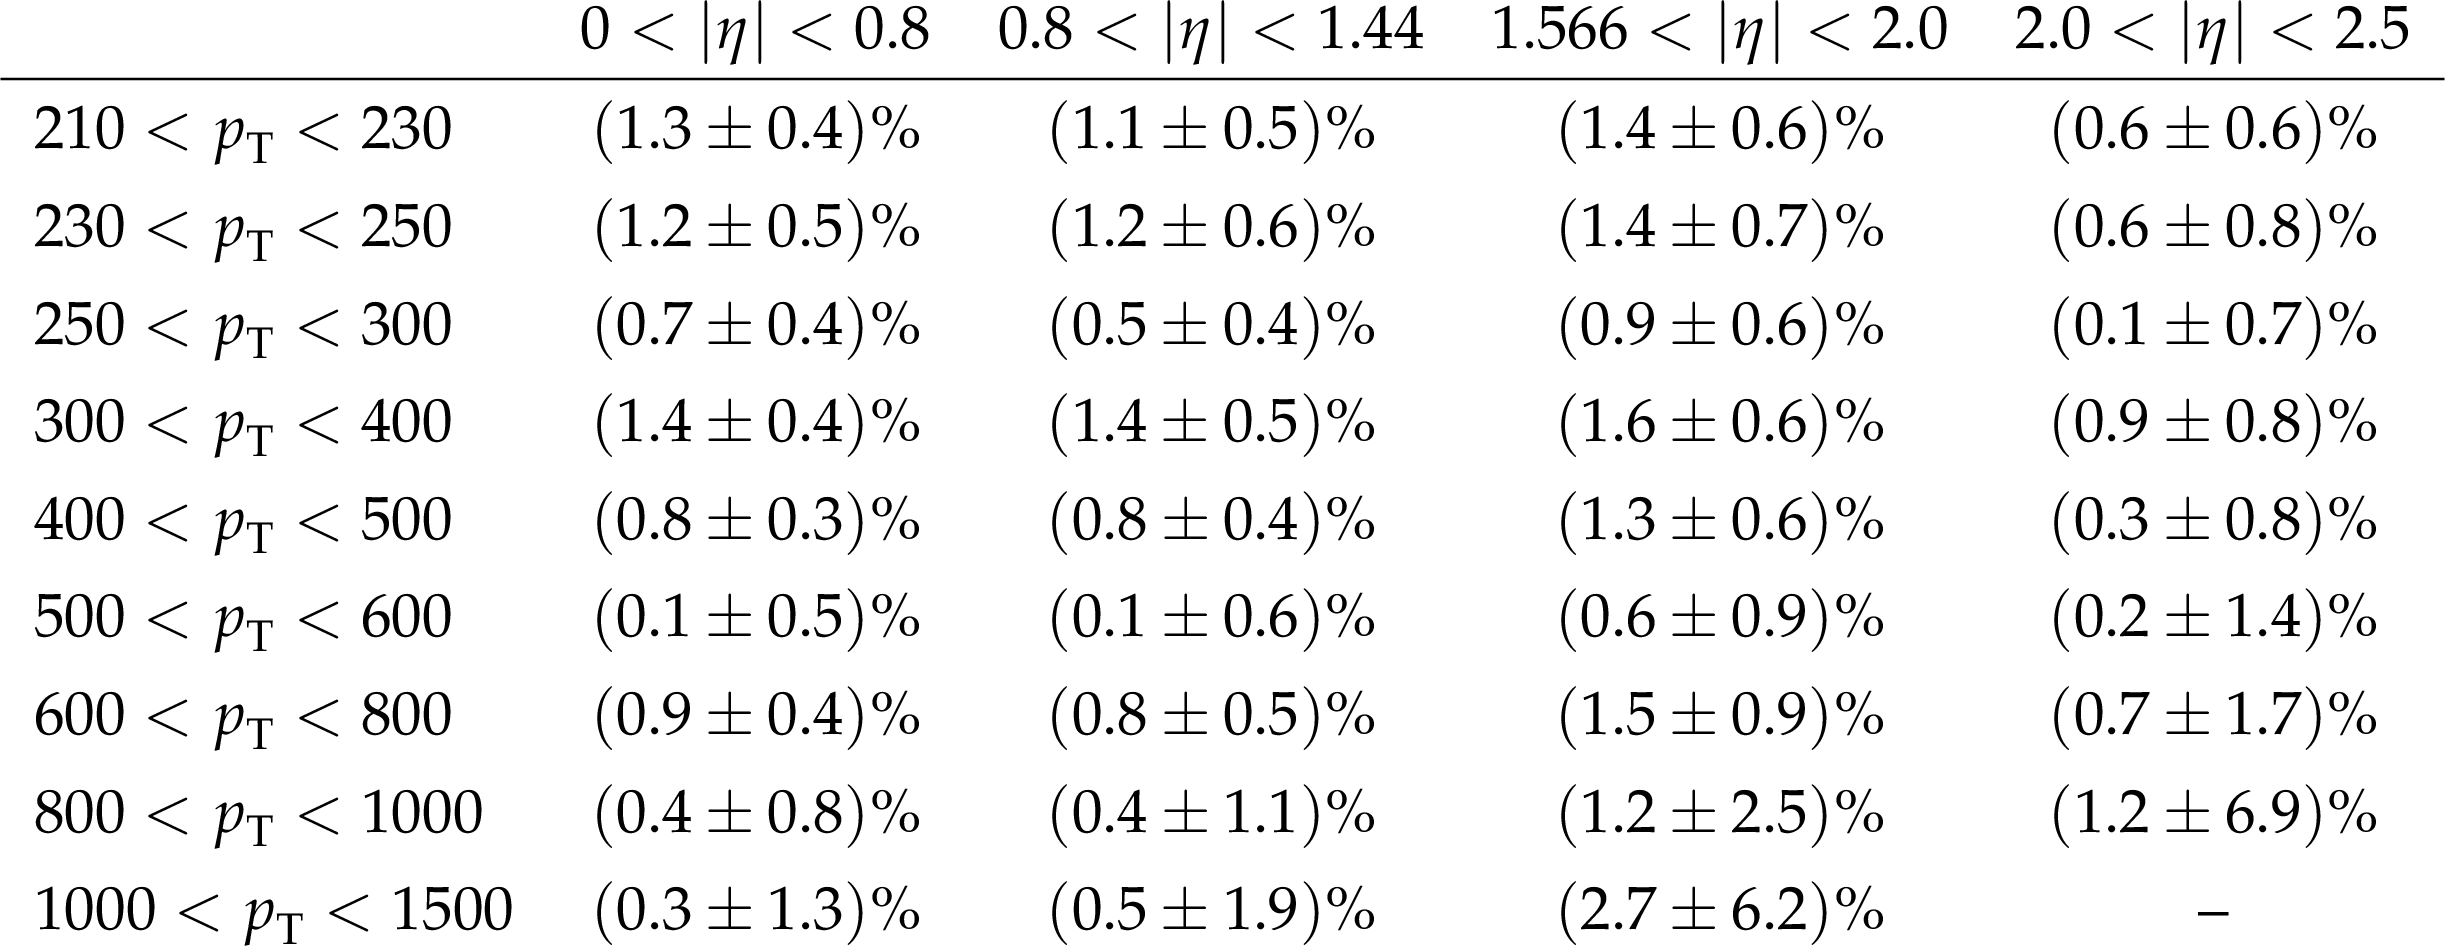
The fraction of events falling outside the fiducial phase space in different photon $ p_{\mathrm{T}} $ and $ |\eta| $ bins estimated using simulated $ \gamma $ + jet events. The uncertainties are only those arising from the finite size of the simulated event sample. |
png pdf |
Table 3:
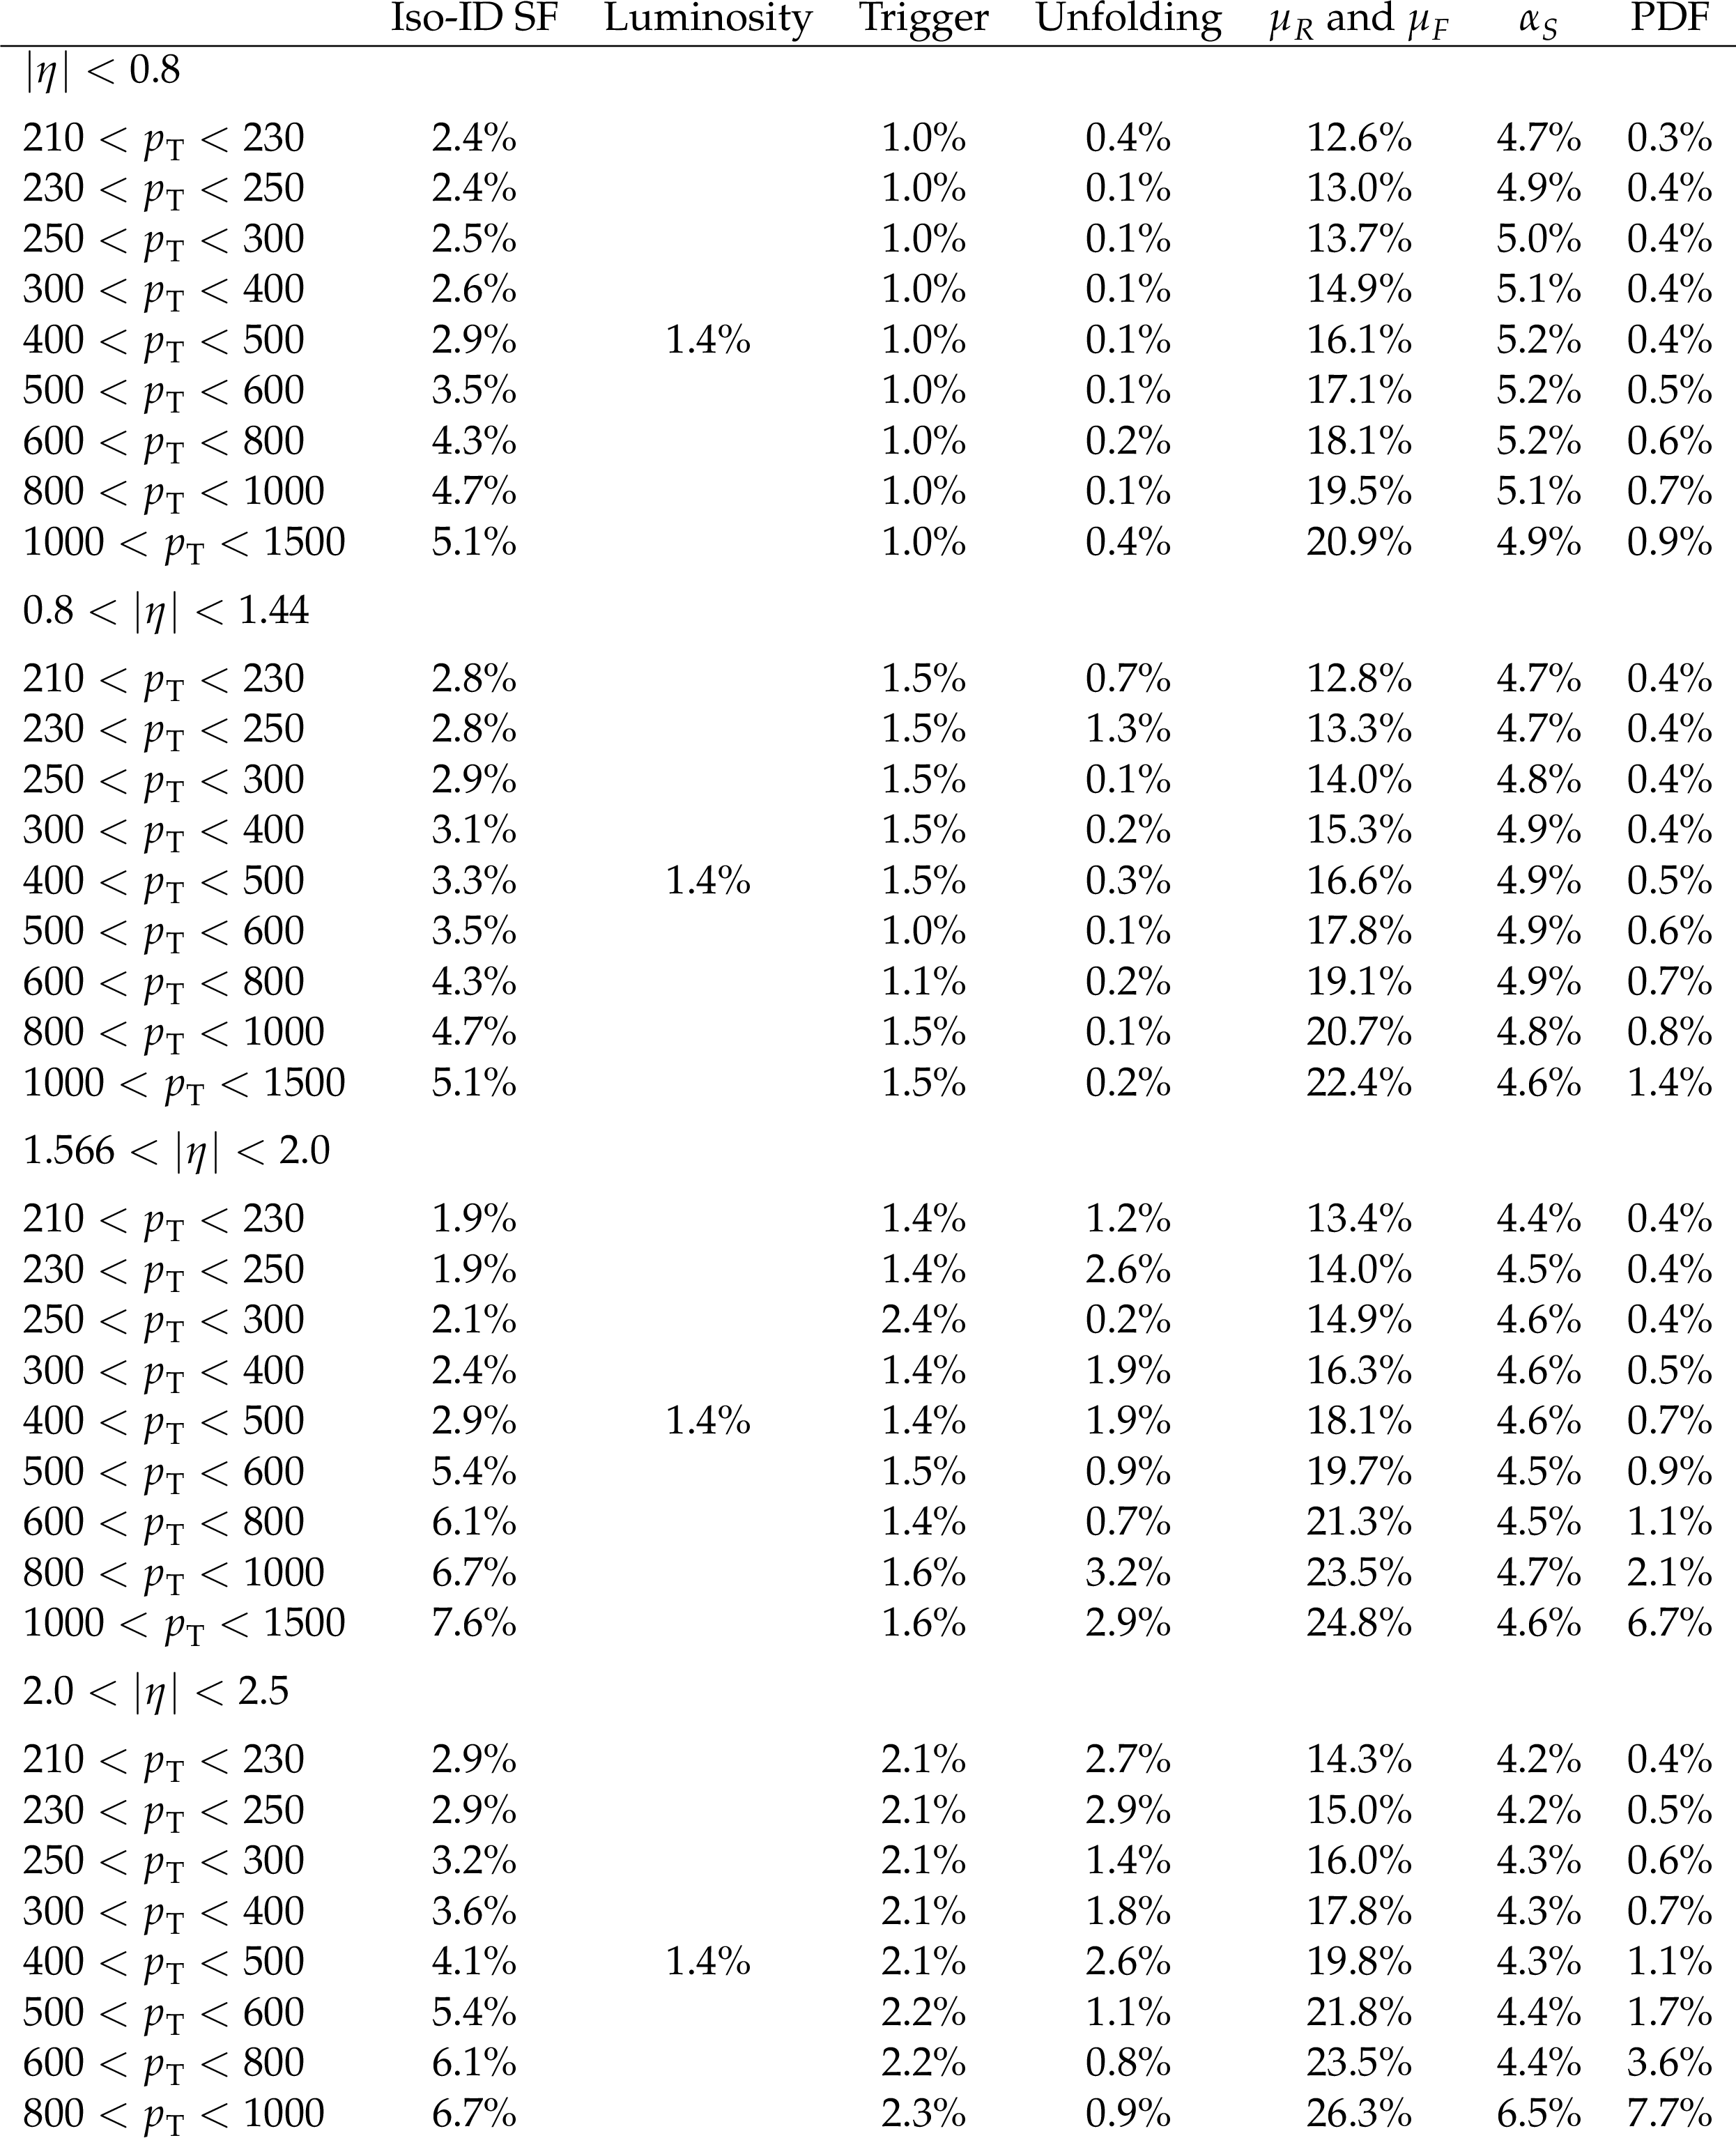
The dominant uncertainties arising from various experimental and theoretical sources. The photon $ p_{\mathrm{T}} $ ranges are given in GeV. |
png pdf |
Table 4:
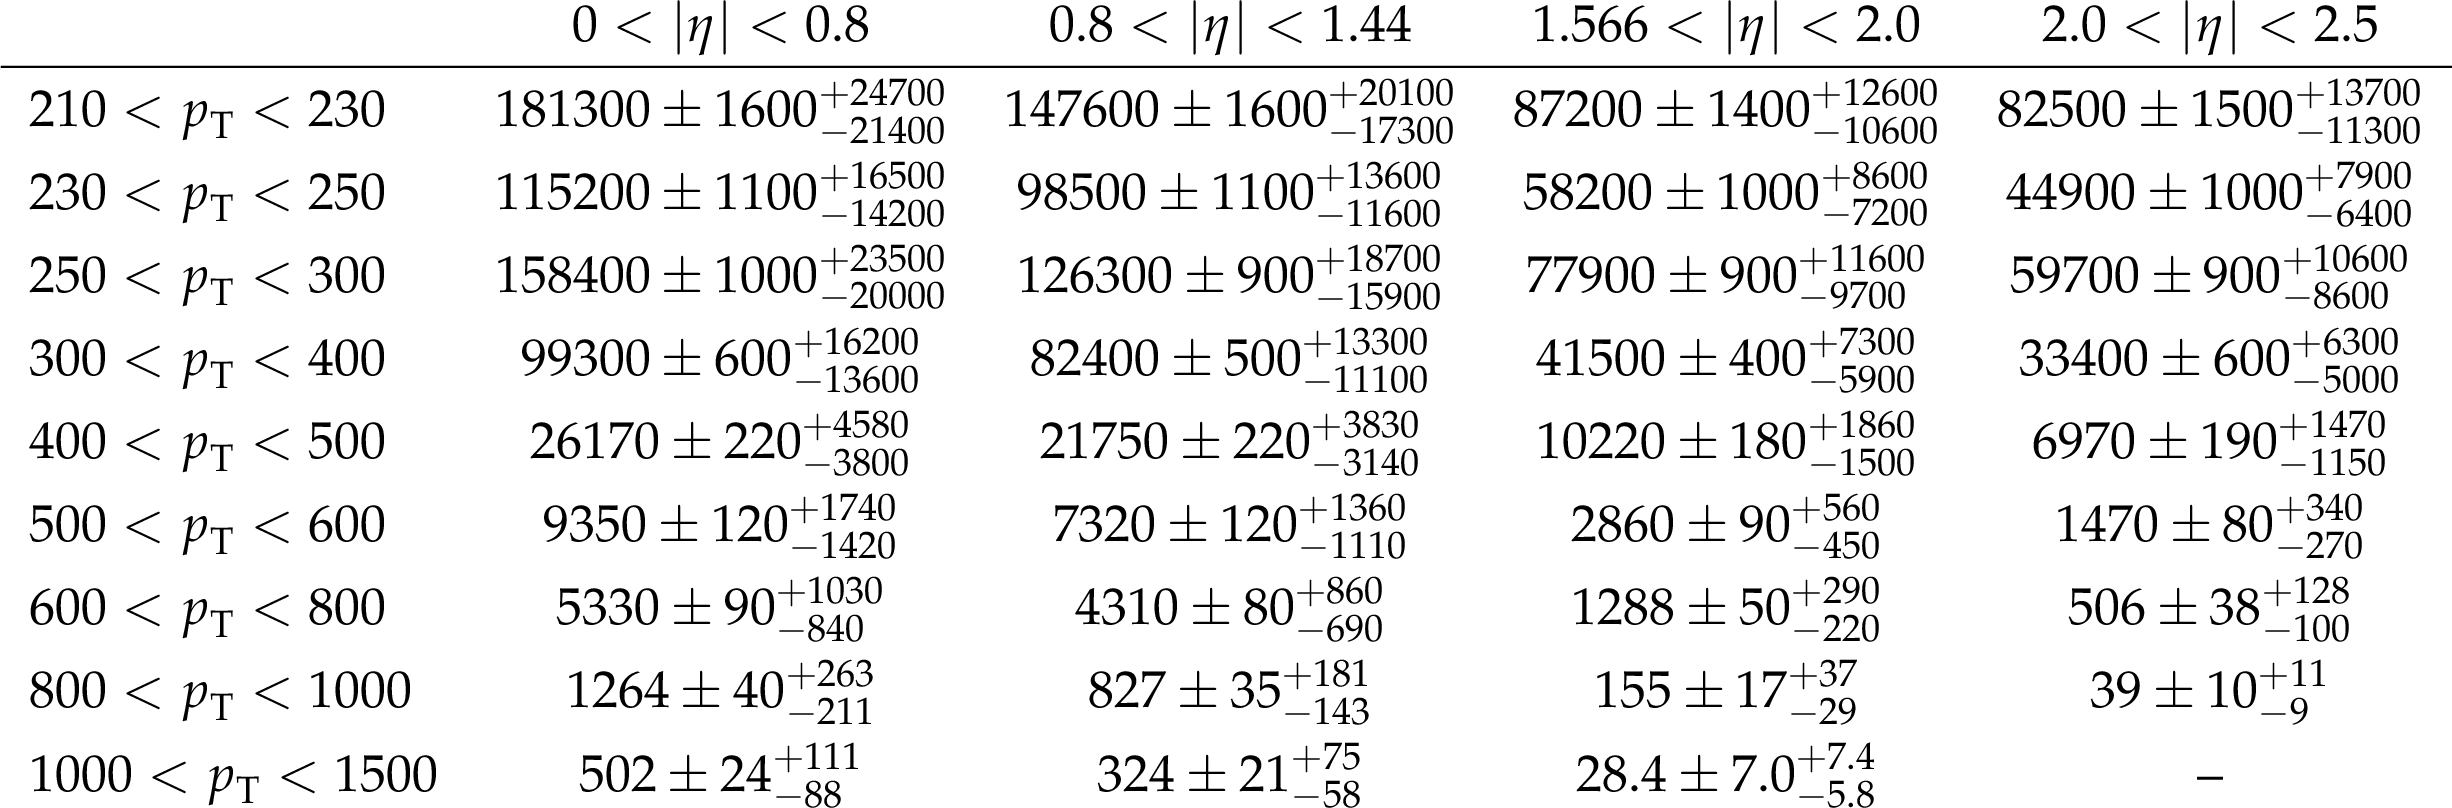
Total signal yields after efficiency correction and unfolding in each $ p_{\mathrm{T}} $ and $ |\eta| $ bins for 27 fb$ ^{-1} $ of data. The first uncertainty is the statistical and the second one is total systematic uncertainty arising from different experimental and theoretical sources. The photon $ p_{\mathrm{T}} $ ranges are given in GeV. |
| Summary |
| The measurement of the double-differential cross section for inclusive photon production as a function of photon transverse momentum ($ p_{\mathrm{T}} $) and absolute pseudorapidity is reported. The measurement is performed for photon $ p_{\mathrm{T}} > $ 210 GeV using the data collected by the CMS detector during the 2022 data taking period, corresponding to a total integrated luminosity of 27 fb$ ^{-1} $. After correcting for detector effects, the measured cross section is compared with the next-to-leading order predictions from three different event generators: JETPHOX, SHERPA, and MadGraph-5\_aMC@NLO+ PYTHIA8.3 with the NNPDF 3.1 NLO PDF set. A comparison is also performed for different PDF sets using the JETPHOX generator. The measured cross section is consistent with the theory predictions within the uncertainties in most of the bins. A discrepancy is observed in the high photon $ p_{\mathrm{T}} $ region for all the generators considered in this study. |
| References | ||||
| 1 | L. Carminati et al. | Sensitivity of the LHC isolated-gamma+jet data to the parton distribution functions of the proton | EPL 101 (2013) 61002 | 1212.5511 |
| 2 | CMS Collaboration | Search for new physics in the final state with a single photon and large missing transverse momentum in proton-proton collisions at $ \sqrt{s}= $ 13 TeV | PRD 113 (2026) 072020 | CMS-SUS-23-016 2511.17310 |
| 3 | CMS Collaboration | Search for new physics in the monophoton final state in proton-proton collisions at $ \sqrt{s}= $ 13 TeV | JHEP 10 (2017) 073 | CMS-EXO-16-039 1706.03794 |
| 4 | ATLAS Collaboration | Search for dark matter in association with an energetic photon in pp collisions at $ \sqrt{s} = $ 13 TeV with the ATLAS detector | JHEP 02 (2021) 226 | 2011.05259 |
| 5 | CMS Collaboration | Measurement of the isolated prompt photon production cross section in pp Collisions at $ \sqrt{s} = $ 7 TeV | PRL 106 (2011) 082001 | CMS-QCD-10-019 1012.0799 |
| 6 | CMS Collaboration | Measurement of the differential cross section for isolated prompt photon production in pp Collisions at 7 TeV | PRD 84 (2011) 052011 | CMS-QCD-10-037 1108.2044 |
| 7 | CMS Collaboration | Measurement of isolated photon production in pp and PbPb Collisions at $ \sqrt {\smash [b]{s_{_{\mathrm {NN}}}}}= $ 2.76 TeV | PLB 710 (2012) 256 | CMS-HIN-11-002 1201.3093 |
| 8 | CMS Collaboration | Measurements of triple-differential cross sections for inclusive isolated-photon+jet events in pp collisions at $ \sqrt{s} = 8 \text {TeV} $ | EPJC 79 (2019) 969 | CMS-SMP-16-016 1907.08155 |
| 9 | CMS Collaboration | Measurement of differential cross sections for inclusive isolated-photon and photon+jets production in proton-proton collisions at $ \sqrt{s} = $ 13 TeV | EPJC 79 (2019) 20 | CMS-SMP-16-003 1807.00782 |
| 10 | ATLAS Collaboration | Measurement of the inclusive isolated prompt photon cross section in pp collisions at $ \sqrt{s}= $ 7 TeV with the ATLAS detector | PRD 83 (2011) 052005 | 1012.4389 |
| 11 | ATLAS Collaboration | Measurement of the inclusive isolated prompt photon cross-section in pp collisions at $ \sqrt{s}= $ 7 TeV using 35 pb$ ^{-1} $ of ATLAS data | PLB 706 (2011) 150 | 1108.0253 |
| 12 | ATLAS Collaboration | Measurement of the inclusive isolated prompt photons cross section in pp collisions at $ \sqrt{s}= $ 7 TeV with the ATLAS detector using 4.6 fb$ ^{-1} $ | PRD 89 (2014) 052004 | 1311.1440 |
| 13 | ATLAS Collaboration | Measurement of the inclusive isolated prompt photon cross section in pp collisions at $ \sqrt{s}= $ 8 TeV with the ATLAS detector | JHEP 08 (2016) 005 | 1605.03495 |
| 14 | ATLAS Collaboration | Measurement of the cross section for inclusive isolated-photon production in pp collisions at $ \sqrt s= $ 13 TeV using the ATLAS detector | PLB 770 (2017) 473 | 1701.06882 |
| 15 | S. Catani, M. Fontannaz, J. P. Guillet, and E. Pilon | Cross-section of isolated prompt photons in hadron hadron collisions | JHEP 05 (2002) 028 | hep-ph/0204023 |
| 16 | T. Gleisberg et al. | Event generation with SHERPA 1.1 | JHEP 02 (2009) 007 | 0811.4622 |
| 17 | Sherpa Collaboration | Event Generation with SHERPA 2.2 | SciPost Phys. 7 (2019) 034 | 1905.09127 |
| 18 | S. Schumann and F. Krauss | A parton shower algorithm based on Catani-Seymour dipole factorisation | JHEP 03 (2008) 038 | 0709.1027 |
| 19 | J. Alwall et al. | The automated computation of tree-level and next-to-leading order differential cross sections, and their matching to parton shower simulations | JHEP 07 (2014) 079 | 1405.0301 |
| 20 | R. Frederix et al. | The automation of next-to-leading order electroweak calculations | JHEP 07 (2018) 185 | 1804.10017 |
| 21 | C. Bierlich et al. | A comprehensive guide to the physics and usage of PYTHIA 8.3 | SciPost Phys. Codeb. 2022 (2022) 8 | 2203.11601 |
| 22 | CMS Collaboration | The CMS experiment at the CERN LHC | JINST 3 (2008) S08004 | |
| 23 | CMS Collaboration | The CMS trigger system | JINST 12 (2017) P01020 | CMS-TRG-12-001 1609.02366 |
| 24 | J. Alwall et al. | Comparative study of various algorithms for the merging of parton showers and matrix elements in hadronic collisions | EPJC 53 (2008) 473 | 0706.2569 |
| 25 | NNPDF Collaboration | Parton distributions from high-precision collider data | EPJC 77 (2017) 663 | 1706.00428 |
| 26 | CMS Collaboration | Extraction and validation of a new set of CMS PYTHIAviii tunes from underlying-event measurements | EPJC 80 (2020) 4 | CMS-GEN-17-001 1903.12179 |
| 27 | GEANT4 Collaboration | GEANT 4--a simulation toolkit | NIM A 506 (2003) 250 | |
| 28 | CMS Collaboration | Electron and photon reconstruction and identification with the CMS experiment at the CERN LHC | JINST 16 (2021) P05014 | CMS-EGM-17-001 2012.06888 |
| 29 | TMVA Collaboration | TMVA - toolkit for multivariate data analysis | Technical Report CERN-OPEN-2007-007, CERN, 2007 | physics/0703039 |
| 30 | CMS Collaboration | Measurements of Higgs boson properties in the diphoton decay channel in proton-proton collisions at $ \sqrt{s} = $ 13 TeV | JHEP 11 (2018) 185 | CMS-HIG-16-040 1804.02716 |
| 31 | S. Schmitt | TUnfold: an algorithm for correcting migration effects in high energy physics | JINST 7 (2012) T10003 | 1205.6201 |
| 32 | A. Buckley and J. Ferrando | LHAPDF6: parton density access in the LHC precision era | EPJC 75 (2015) 132 | 1412.7420 |
| 33 | L. Bourhis, M. Fontannaz, and J. P. Guillet | Quark and gluon fragmentation functions into photons | Eur. Phys. J. 2 (1998) 529 | hep-ph/9704447 |
| 34 | T. Gleisberg and S. Hoeche | Comix, a new matrix element generator | JHEP 12 (2008) 039 | 0808.3674 |
| 35 | F. Krauss, R. Kuhn, and G. Soff | Amegic++ 1.0: A Matrix element generator in C++ | JHEP 02 (2002) 044 | hep-ph/0109036 |
| 36 | F. Buccioni and J.-N. Lang | OpenLoops 2 | EPJC 79 (2019) 866 | 1907.13071 |
| 37 | S. Frixione | Isolated photons in perturbative QCD | PLB 429 (1998) 369 | hep-ph/9801442 |
| 38 | R. Frederix and S. Frixione | Merging meets matching in MC@NLO | JHEP 12 (2012) 061 | 1209.6215 |
| 39 | ATLAS Collaboration | Measurement of the Inelastic Proton-Proton Cross Section at $ \sqrt{s} = $ 13 TeV with the ATLAS Detector at the LHC | PRL 117 (2016) 182002 | 1606.02625 |
| 40 | CMS Collaboration | Luminosity measurement in proton-proton collisions at 13.6 TeV in 2022 at CMS | CMS Physics Analysis Summary, 2024 CMS-PAS-LUM-22-001 |
CMS-PAS-LUM-22-001 |
| 41 | J. Butterworth et al. | PDF4LHC recommendations for LHC Run II | JPG 43 (2016) 023001 | 1510.03865 |
| 42 | T.-J. Hou et al. | New CTEQ global analysis of quantum chromodynamics with high-precision data from the LHC | PRD 103 (2021) 014013 | 1912.10053 |
| 43 | S. Bailey et al. | Parton distributions from LHC, HERA, Tevatron and fixed target data: MSHT20 PDFs | EPJC 81 (2021) 341 | 2012.04684 |
| 44 | S. Alekhin, J. Bl$\mathrm \ddot u $mlein, and S. Moch | NLO PDFs from the ABMP16 fit | EPJC 78 (2018) 477 | 1803.07537 |
|
|
Compact Muon Solenoid LHC, CERN |

|

|

|

|

|

|