

Compact Muon Solenoid
LHC, CERN
| CMS-SMP-16-016 ; CERN-EP-2019-127 | ||
| Measurements of triple-differential cross sections for inclusive isolated-photon+jet events in pp collisions at $\sqrt{s} = $ 8 TeV | ||
| CMS Collaboration | ||
| 18 July 2019 | ||
| Eur. Phys. J. C 79 (2019) 969 | ||
| Abstract: Measurements are presented of the triple-differential cross section for inclusive isolated-photon+jet events in pp collisions at $\sqrt{s} = $ 8 TeV as a function of photon transverse momentum (${p_{\mathrm{T}}^{\gamma}}$), photon pseudorapidity (${\eta^{\gamma}}$), and jet pseudorapidity (${\eta^{\text{jet}}}$). The data correspond to an integrated luminosity of 19.7 fb$^{-1}$ that probe a broad range of the available phase space, for $ | {\eta^{\gamma}} | < $ 1.44 and 1.57 $ < | {\eta^{\gamma}} | < $ 2.50, $ | {\eta^{\text{jet}}} | < $ 2.5, 40 $ < {p_{\mathrm{T}}^{\gamma}} < $ 1000 GeV, and jet transverse momentum, $p_{\mathrm{T}}^{\text{jet}}$, $ > $ 25 GeV. The measurements are compared to next-to-leading order perturbative quantum chromodynamics calculations, which reproduce the data within uncertainties. | ||
| Links: e-print arXiv:1907.08155 [hep-ex] (PDF) ; CDS record ; inSPIRE record ; HepData record ; CADI line (restricted) ; | ||
| Figures | |
png pdf |
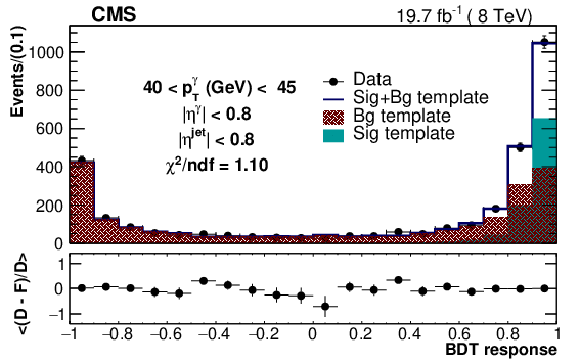
Figure 1:
An example fit of candidate boosted-decision-tree distribution with a composite template (blue histogram). The signal (background) template is shown by the green (red) solid (hatched) region. The bottom panel shows the mean of the fit values for 500 templates varied within the signal and background shape uncertainties (F) subtracted from data (D) divided by the data. |
png pdf |
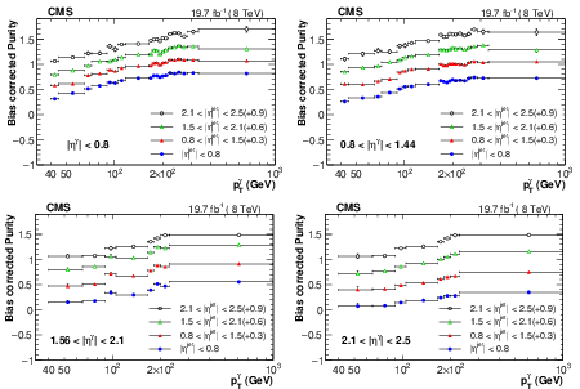
Figure 2:
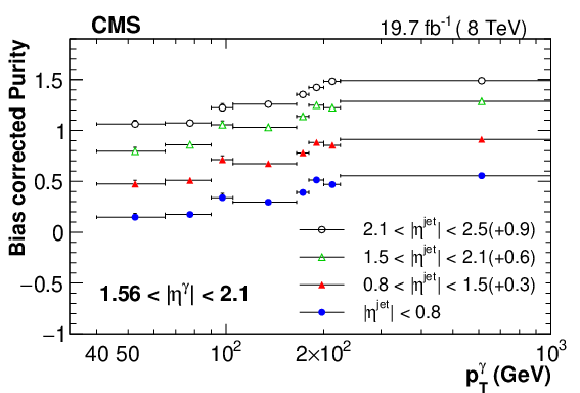
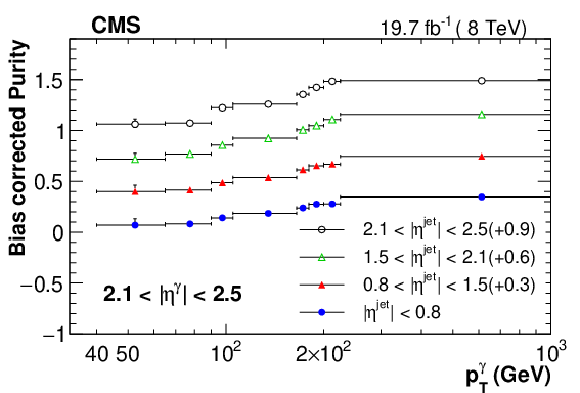
Purity estimates as a function of $ {p_{\mathrm {T}}} ^\gamma $ for different photon and jet pseudorapidity regions. The values are offset by 0.3, 0.6 and 0.9 for 0.8 $ < {{| \eta ^{\text {jet}} |}} < $ 1.5, 1.5 $ < {{| \eta ^{\text {jet}} |}} < $ 2.1, and 2.1 $ < {{| \eta ^{\text {jet}} |}} < $ 2.5 respectively. The total uncertainties are shown as error bars. |
png pdf |
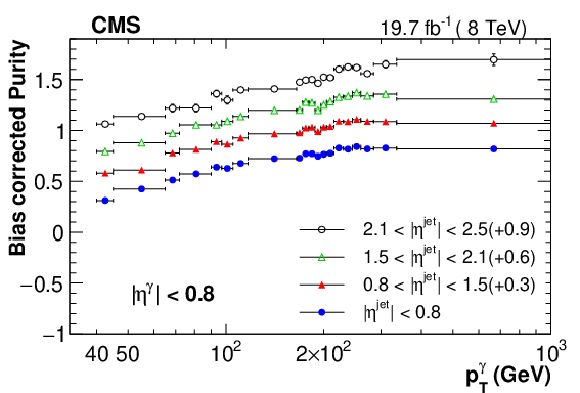
Figure 2-a:
Purity estimates as a function of $ {p_{\mathrm {T}}} ^\gamma $ for $ < | {\eta^{\gamma}} | < $ 0.8 and different jet pseudorapidity regions. The values are offset by 0.3, 0.6 and 0.9 for 0.8 $ < {{| \eta ^{\text {jet}} |}} < $ 1.5, 1.5 $ < {{| \eta ^{\text {jet}} |}} < $ 2.1, and 2.1 $ < {{| \eta ^{\text {jet}} |}} < $ 2.5 respectively. The total uncertainties are shown as error bars. |
png pdf |
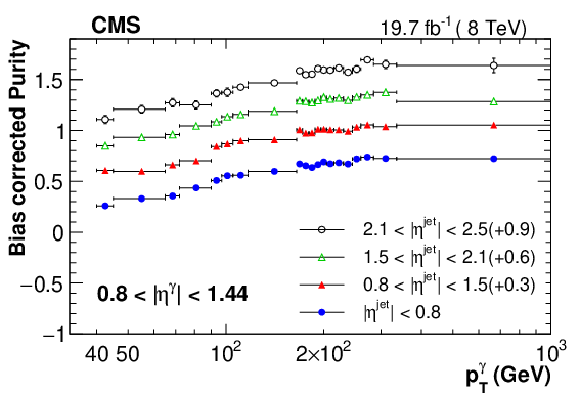
Figure 2-b:
Purity estimates as a function of $ {p_{\mathrm {T}}} ^\gamma $ for 0.8 $ < | {\eta^{\gamma}} | < $ 1.44 and different jet pseudorapidity regions. The values are offset by 0.3, 0.6 and 0.9 for 0.8 $ < {{| \eta ^{\text {jet}} |}} < $ 1.5, 1.5 $ < {{| \eta ^{\text {jet}} |}} < $ 2.1, and 2.1 $ < {{| \eta ^{\text {jet}} |}} < $ 2.5 respectively. The total uncertainties are shown as error bars. |
png pdf |
Figure 2-c:
Purity estimates as a function of $ {p_{\mathrm {T}}} ^\gamma $ for 1.56 $ < | {\eta^{\gamma}} | < $ 2.1 and different jet pseudorapidity regions. The values are offset by 0.3, 0.6 and 0.9 for 0.8 $ < {{| \eta ^{\text {jet}} |}} < $ 1.5, 1.5 $ < {{| \eta ^{\text {jet}} |}} < $ 2.1, and 2.1 $ < {{| \eta ^{\text {jet}} |}} < $ 2.5 respectively. The total uncertainties are shown as error bars. |
png pdf |
Figure 2-d:
Purity estimates as a function of $ {p_{\mathrm {T}}} ^\gamma $ for 2.1 $ < | {\eta^{\gamma}} | < $ 2.5 and different jet pseudorapidity regions. The values are offset by 0.3, 0.6 and 0.9 for 0.8 $ < {{| \eta ^{\text {jet}} |}} < $ 1.5, 1.5 $ < {{| \eta ^{\text {jet}} |}} < $ 2.1, and 2.1 $ < {{| \eta ^{\text {jet}} |}} < $ 2.5 respectively. The total uncertainties are shown as error bars. |
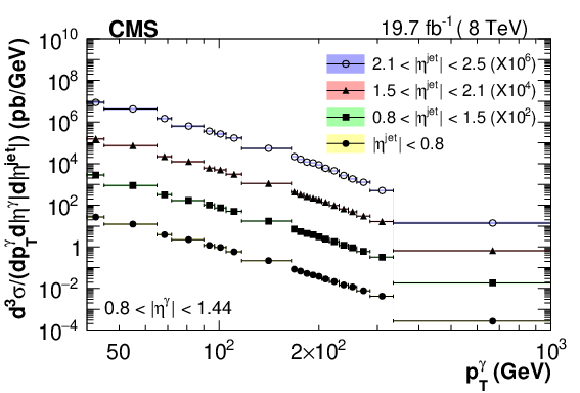
png pdf |
Figure 3:
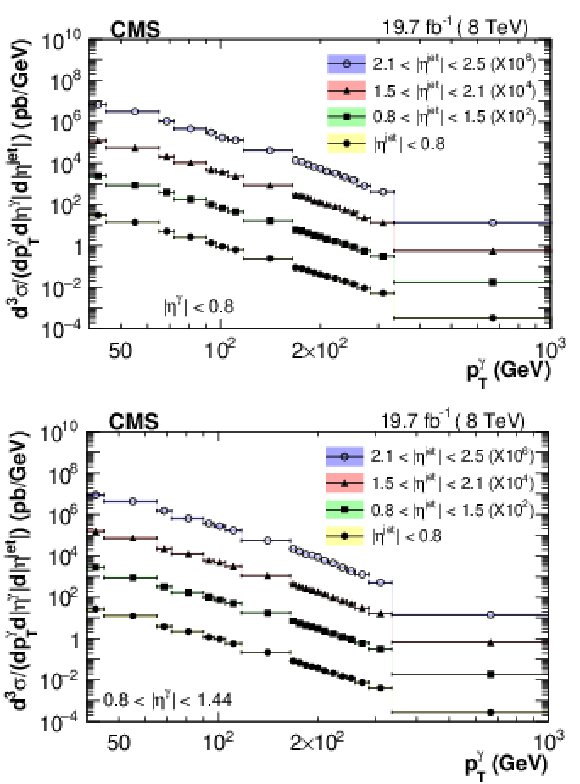
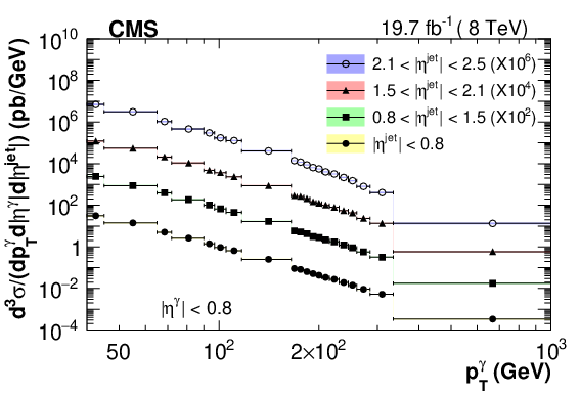
Measured triple-differential cross section distributions as a function of $ {p_{\mathrm {T}}} ^\gamma $ in different bins of $ {{| \eta ^{\text {jet}} |}}$ for photons in the barrel region. Note that the distributions are multiplied by a factor of $10^2$, $10^4$ and $10^6$ for 0.8 $ < {{| \eta ^{\text {jet}} |}} < $ 1.5, 1.5 $ < {{| \eta ^{\text {jet}} |}} < $ 2.1, and 2.1 $ < {{| \eta ^{\text {jet}} |}} < $ 2.5 respectively. The statistical (systematic) uncertainties are shown as error bars (color bands). |
png pdf |
Figure 3-a:
Measured triple-differential cross section distributions as a function of $ {p_{\mathrm {T}}} ^\gamma $ for $ < | {\eta^{\gamma}} | < $ 0.8. Note that the distributions are multiplied by a factor of $10^2$, $10^4$ and $10^6$ for 0.8 $ < {{| \eta ^{\text {jet}} |}} < $ 1.5, 1.5 $ < {{| \eta ^{\text {jet}} |}} < $ 2.1, and 2.1 $ < {{| \eta ^{\text {jet}} |}} < $ 2.5 respectively. The statistical (systematic) uncertainties are shown as error bars (color bands). |
png pdf |
Figure 3-b:
Measured triple-differential cross section distributions as a function of $ {p_{\mathrm {T}}} ^\gamma $ for 0.8 $ < | {\eta^{\gamma}} | < $ 1.44. Note that the distributions are multiplied by a factor of $10^2$, $10^4$ and $10^6$ for 0.8 $ < {{| \eta ^{\text {jet}} |}} < $ 1.5, 1.5 $ < {{| \eta ^{\text {jet}} |}} < $ 2.1, and 2.1 $ < {{| \eta ^{\text {jet}} |}} < $ 2.5 respectively. The statistical (systematic) uncertainties are shown as error bars (color bands). |
png pdf |
Figure 4:
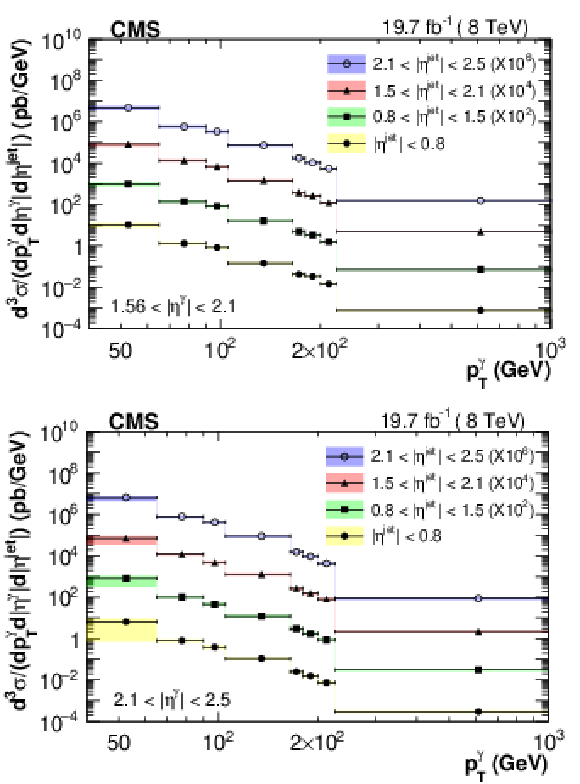
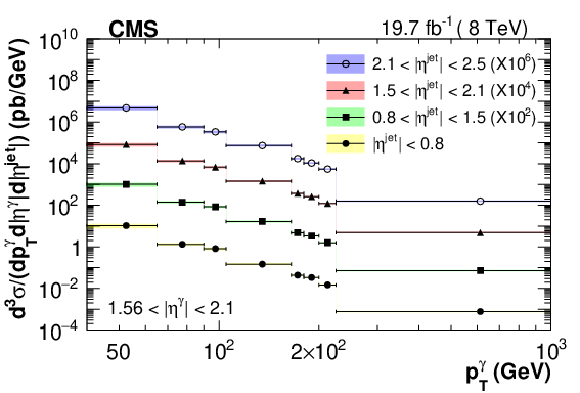
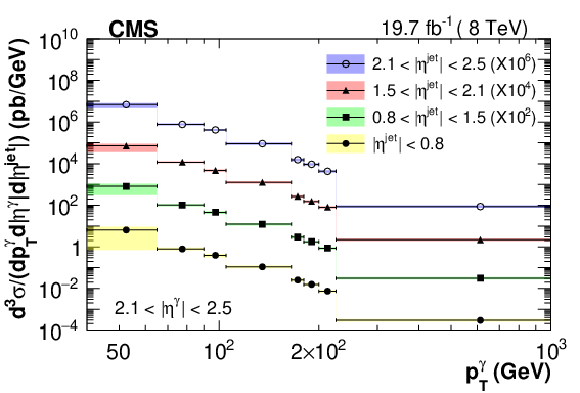
Measured triple-differential cross section distributions as a function of $ {p_{\mathrm {T}}} ^\gamma $ in different bins of $ {{| \eta ^{\text {jet}} |}}$ for photons in the endcap region. Note that the distributions are multiplied by a factor of $10^2$, $10^4$ and $10^6$ for 0.8 $ < {{| \eta ^{\text {jet}} |}} < $ 1.5, 1.5 $ < {{| \eta ^{\text {jet}} |}} < $ 2.1, and 2.1 $ < {{| \eta ^{\text {jet}} |}} < $ 2.5 respectively. The statistical (systematic) uncertainties are shown as error bars (color bands). |
png pdf |
Figure 4-a:
Measured triple-differential cross section distributions as a function of $ {p_{\mathrm {T}}} ^\gamma $ in different bins of $ {{| \eta ^{\text {jet}} |}}$ for 1.56 $ < | {\eta^{\gamma}} | < $ 2.1. Note that the distributions are multiplied by a factor of $10^2$, $10^4$ and $10^6$ for 0.8 $ < {{| \eta ^{\text {jet}} |}} < $ 1.5, 1.5 $ < {{| \eta ^{\text {jet}} |}} < $ 2.1, and 2.1 $ < {{| \eta ^{\text {jet}} |}} < $ 2.5 respectively. The statistical (systematic) uncertainties are shown as error bars (color bands). |
png pdf |
Figure 4-b:
Measured triple-differential cross section distributions as a function of $ {p_{\mathrm {T}}} ^\gamma $ in different bins of $ {{| \eta ^{\text {jet}} |}}$ for 2.1 $ < | {\eta^{\gamma}} | < $ 2.5. Note that the distributions are multiplied by a factor of $10^2$, $10^4$ and $10^6$ for 0.8 $ < {{| \eta ^{\text {jet}} |}} < $ 1.5, 1.5 $ < {{| \eta ^{\text {jet}} |}} < $ 2.1, and 2.1 $ < {{| \eta ^{\text {jet}} |}} < $ 2.5 respectively. The statistical (systematic) uncertainties are shown as error bars (color bands). |
png pdf |
Figure 5:
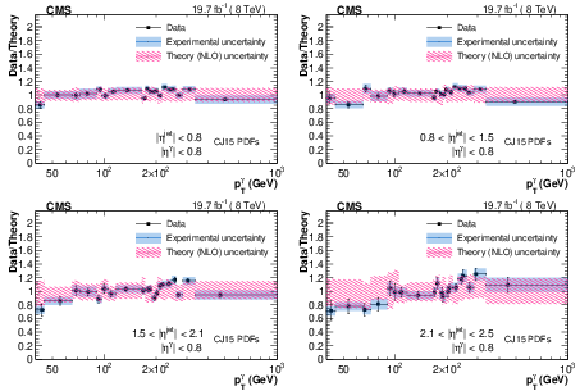
Ratio of triple-differential cross sections as a function of $ {p_{\mathrm {T}}} ^\gamma $ measured in data over the corresponding GamJet NLO theoretical prediction (obtained with the CJ15 PDFs) in different bins of $ {{| \eta ^{\text {jet}} |}}$ for $ {| \eta ^\gamma |} < $ 0.8. Error bars on the data are statistical uncertainties, and blue bands represent the systematic uncertainties. |
png pdf |
Figure 5-a:
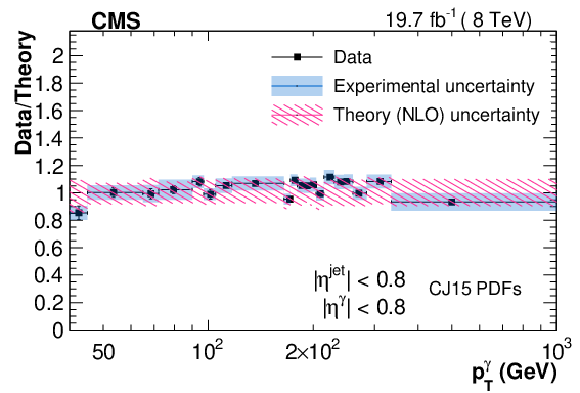
Ratio of triple-differential cross sections as a function of $ {p_{\mathrm {T}}} ^\gamma $ measured in data over the corresponding GamJet NLO theoretical prediction (obtained with the CJ15 PDFs) for $ {{| \eta ^{\text {jet}} |}} < $ 0.8 and $ {| \eta ^\gamma |} < $ 0.8. Error bars on the data are statistical uncertainties, and blue bands represent the systematic uncertainties. |
png pdf |
Figure 5-b:
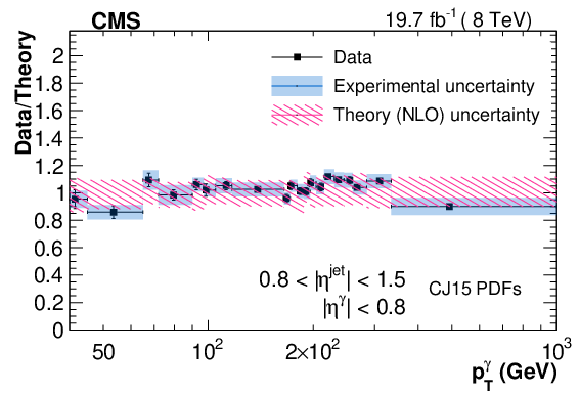
Ratio of triple-differential cross sections as a function of $ {p_{\mathrm {T}}} ^\gamma $ measured in data over the corresponding GamJet NLO theoretical prediction (obtained with the CJ15 PDFs) for 0.8 $ < {{| \eta ^{\text {jet}} |}} < $ 1.5 and $ {| \eta ^\gamma |} < $ 0.8. Error bars on the data are statistical uncertainties, and blue bands represent the systematic uncertainties. |
png pdf |
Figure 5-c:
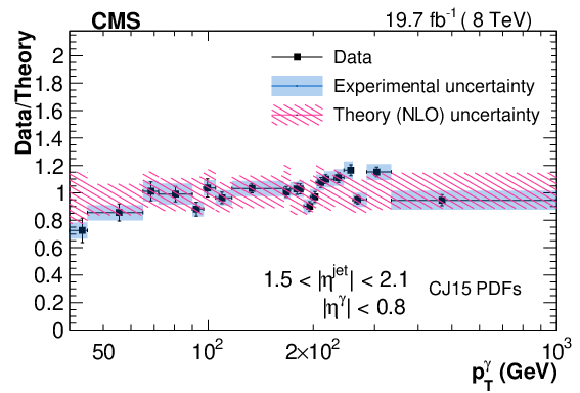
Ratio of triple-differential cross sections as a function of $ {p_{\mathrm {T}}} ^\gamma $ measured in data over the corresponding GamJet NLO theoretical prediction (obtained with the CJ15 PDFs) for 1.5 $ < {{| \eta ^{\text {jet}} |}} < $ 2.1 and $ {| \eta ^\gamma |} < $ 0.8. Error bars on the data are statistical uncertainties, and blue bands represent the systematic uncertainties. |
png pdf |
Figure 5-d:
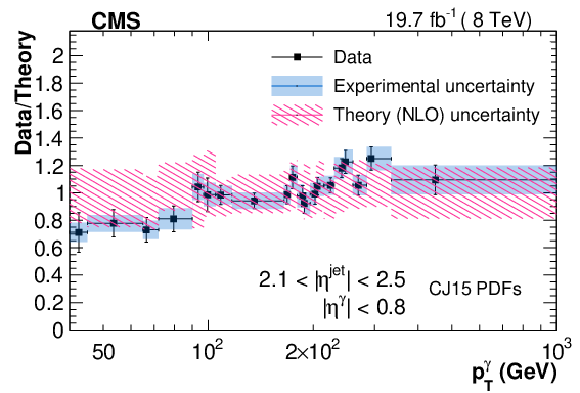
Ratio of triple-differential cross sections as a function of $ {p_{\mathrm {T}}} ^\gamma $ measured in data over the corresponding GamJet NLO theoretical prediction (obtained with the CJ15 PDFs) for 2.1 $ < {{| \eta ^{\text {jet}} |}} < $ 2.5 and $ {| \eta ^\gamma |} < $ 0.8. Error bars on the data are statistical uncertainties, and blue bands represent the systematic uncertainties. |
png pdf |
Figure 6:
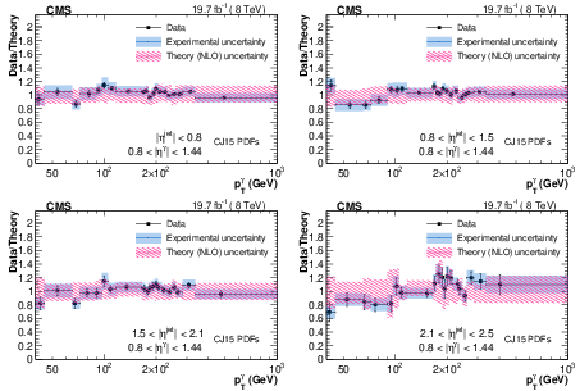
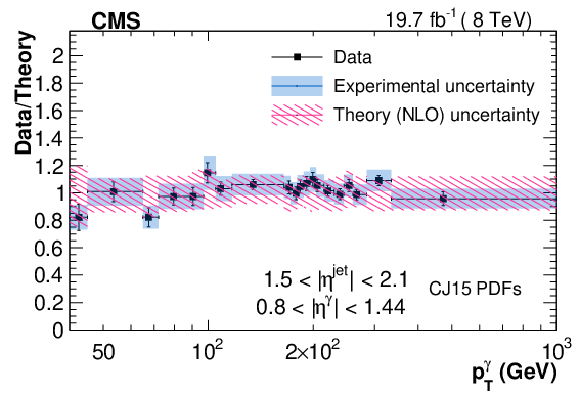
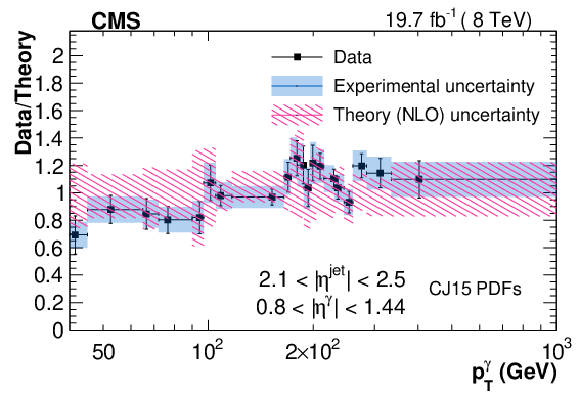
Ratio of triple-differential cross sections as a function of $ {p_{\mathrm {T}}} ^\gamma $ measured in data over the corresponding GamJet NLO theoretical prediction (obtained with the CJ15 PDFs) in different bins of $ {{| \eta ^{\text {jet}} |}}$ for 0.80 $ < {| \eta ^\gamma |} < $ 1.44. Error bars on the data are statistical uncertainties, and blue bands represent the systematic uncertainties. |
png pdf |
Figure 6-a:
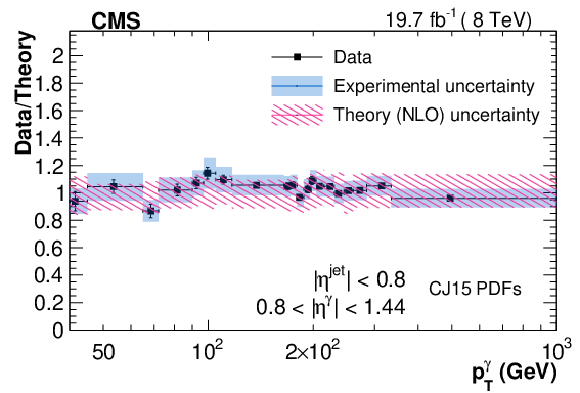
Ratio of triple-differential cross sections as a function of $ {p_{\mathrm {T}}} ^\gamma $ measured in data over the corresponding GamJet NLO theoretical prediction (obtained with the CJ15 PDFs) for $ {{| \eta ^{\text {jet}} |}} < $ 0.8 and 0.80 $ < {| \eta ^\gamma |} < $ 1.44. Error bars on the data are statistical uncertainties, and blue bands represent the systematic uncertainties. |
png pdf |
Figure 6-b:
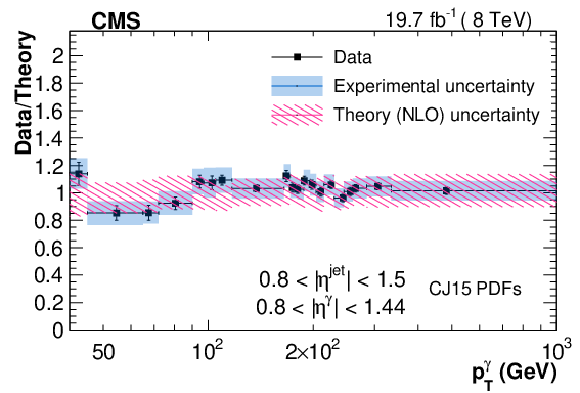
Ratio of triple-differential cross sections as a function of $ {p_{\mathrm {T}}} ^\gamma $ measured in data over the corresponding GamJet NLO theoretical prediction (obtained with the CJ15 PDFs) for 0.8 $ < {{| \eta ^{\text {jet}} |}} < $ 1.5 and 0.80 $ < {| \eta ^\gamma |} < $ 1.44. Error bars on the data are statistical uncertainties, and blue bands represent the systematic uncertainties. |
png pdf |
Figure 6-c:
Ratio of triple-differential cross sections as a function of $ {p_{\mathrm {T}}} ^\gamma $ measured in data over the corresponding GamJet NLO theoretical prediction (obtained with the CJ15 PDFs) for 1.5 $ < {{| \eta ^{\text {jet}} |}} < $ 2.1 and 0.80 $ < {| \eta ^\gamma |} < $ 1.44. Error bars on the data are statistical uncertainties, and blue bands represent the systematic uncertainties. |
png pdf |
Figure 6-d:
Ratio of triple-differential cross sections as a function of $ {p_{\mathrm {T}}} ^\gamma $ measured in data over the corresponding GamJet NLO theoretical prediction (obtained with the CJ15 PDFs) for 2.1 $ < {{| \eta ^{\text {jet}} |}} < $ 2.5 and 0.80 $ < {| \eta ^\gamma |} < $ 1.44. Error bars on the data are statistical uncertainties, and blue bands represent the systematic uncertainties. |
png pdf |
Figure 7:
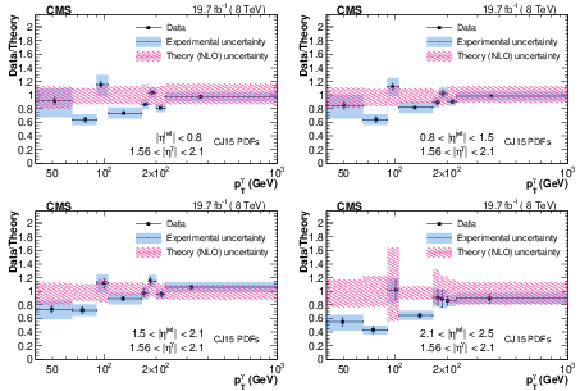
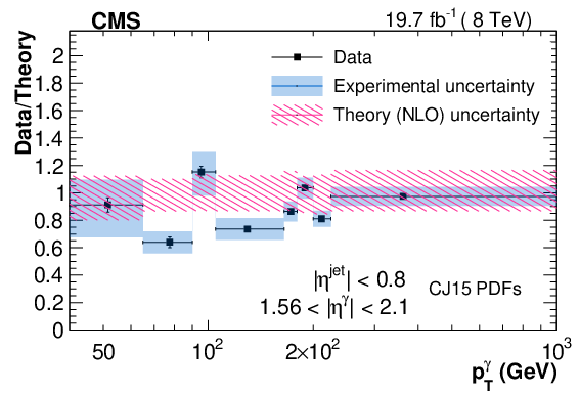
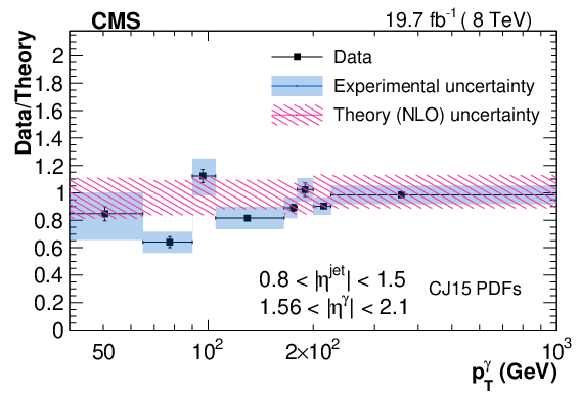
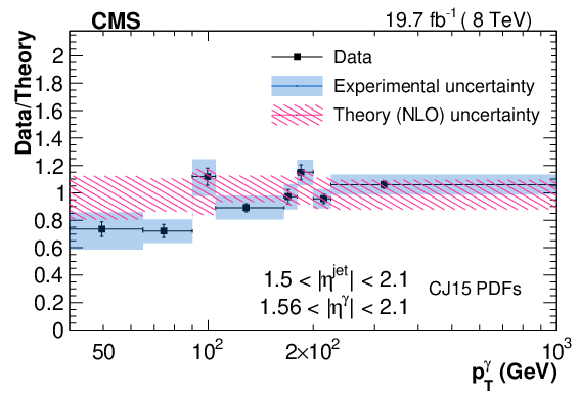
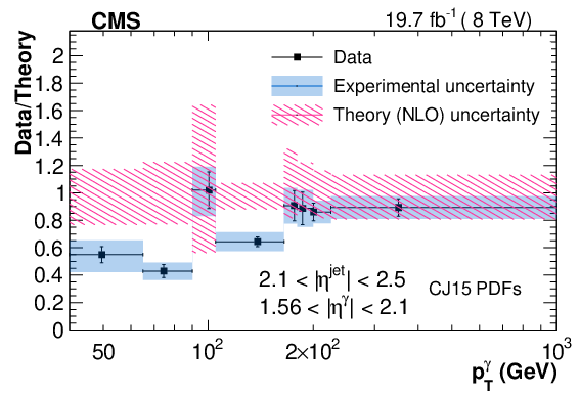
Ratio of triple-differential cross sections as a function of $ {p_{\mathrm {T}}} ^\gamma $ measured in data over the corresponding GamJet NLO theoretical prediction (obtained with the CJ15 PDFs) in different bins of $ {{| \eta ^{\text {jet}} |}}$ for 1.56 $ < {| \eta ^\gamma |} < $ 2.10. Error bars on the data are statistical uncertainties, and blue bands represent the systematic uncertainties. |
png pdf |
Figure 7-a:
Ratio of triple-differential cross sections as a function of $ {p_{\mathrm {T}}} ^\gamma $ measured in data over the corresponding GamJet NLO theoretical prediction (obtained with the CJ15 PDFs) for $ {{| \eta ^{\text {jet}} |}} < $ 0.8 and1.56 $ < {| \eta ^\gamma |} < $ 2.10. Error bars on the data are statistical uncertainties, and blue bands represent the systematic uncertainties. |
png pdf |
Figure 7-b:
Ratio of triple-differential cross sections as a function of $ {p_{\mathrm {T}}} ^\gamma $ measured in data over the corresponding GamJet NLO theoretical prediction (obtained with the CJ15 PDFs) for 0.8 $ < {{| \eta ^{\text {jet}} |}} < $ 1.5 and1.56 $ < {| \eta ^\gamma |} < $ 2.10. Error bars on the data are statistical uncertainties, and blue bands represent the systematic uncertainties. |
png pdf |
Figure 7-c:
Ratio of triple-differential cross sections as a function of $ {p_{\mathrm {T}}} ^\gamma $ measured in data over the corresponding GamJet NLO theoretical prediction (obtained with the CJ15 PDFs) for 1.5 $ < {{| \eta ^{\text {jet}} |}} < $ 2.1 and1.56 $ < {| \eta ^\gamma |} < $ 2.10. Error bars on the data are statistical uncertainties, and blue bands represent the systematic uncertainties. |
png pdf |
Figure 7-d:
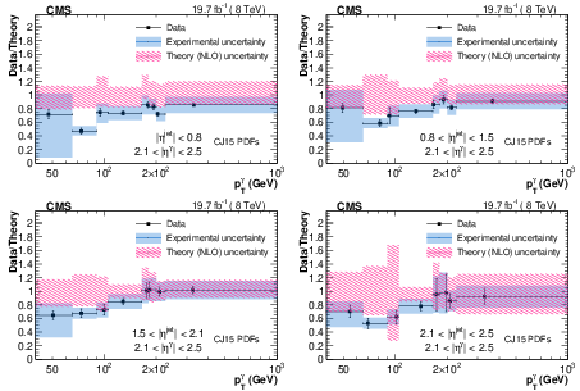
Ratio of triple-differential cross sections as a function of $ {p_{\mathrm {T}}} ^\gamma $ measured in data over the corresponding GamJet NLO theoretical prediction (obtained with the CJ15 PDFs) for 2.1 $ < {{| \eta ^{\text {jet}} |}} < $ 2.5 and1.56 $ < {| \eta ^\gamma |} < $ 2.10. Error bars on the data are statistical uncertainties, and blue bands represent the systematic uncertainties. |
png pdf |
Figure 8:
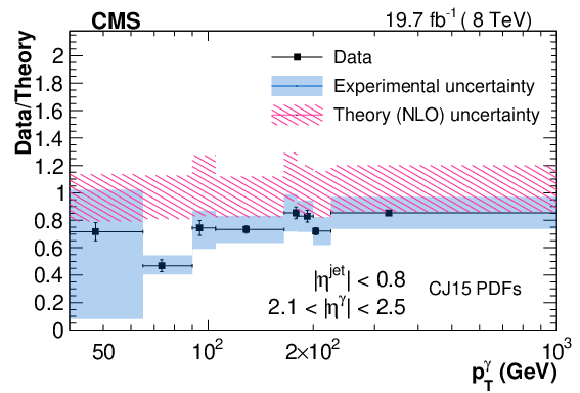
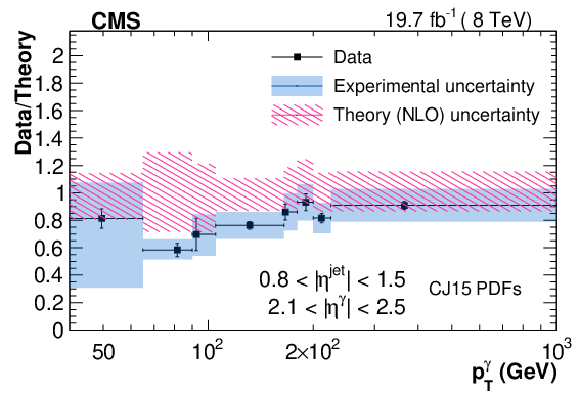
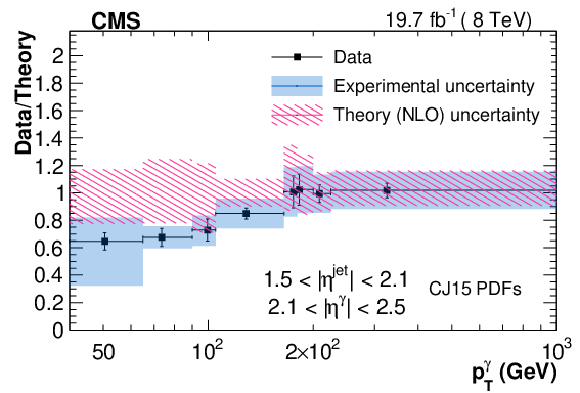
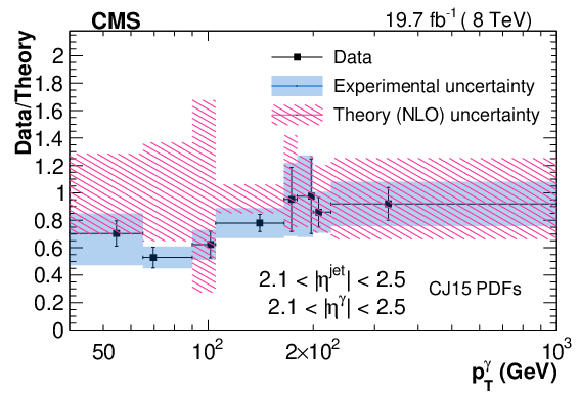
Ratio of triple-differential cross sections as a function of $ {p_{\mathrm {T}}} ^\gamma $ measured in data over the corresponding GamJet NLO theoretical prediction (obtained with the CJ15 PDFs) in different bins of $ {{| \eta ^{\text {jet}} |}}$ for 2.1 $ < {| \eta ^\gamma |} < $ 2.5. Error bars on the data are statistical uncertainties, and blue bands represent the systematic uncertainties. |
png pdf |
Figure 8-a:
Ratio of triple-differential cross sections as a function of $ {p_{\mathrm {T}}} ^\gamma $ measured in data over the corresponding GamJet NLO theoretical prediction (obtained with the CJ15 PDFs) for $ {{| \eta ^{\text {jet}} |}} < $ 0.8 and 2.1 $ < {| \eta ^\gamma |} < $ 2.5. Error bars on the data are statistical uncertainties, and blue bands represent the systematic uncertainties. |
png pdf |
Figure 8-b:
Ratio of triple-differential cross sections as a function of $ {p_{\mathrm {T}}} ^\gamma $ measured in data over the corresponding GamJet NLO theoretical prediction (obtained with the CJ15 PDFs) for 0.8 $ < {{| \eta ^{\text {jet}} |}} < $ 1.5 and 2.1 $ < {| \eta ^\gamma |} < $ 2.5. Error bars on the data are statistical uncertainties, and blue bands represent the systematic uncertainties. |
png pdf |
Figure 8-c:
Ratio of triple-differential cross sections as a function of $ {p_{\mathrm {T}}} ^\gamma $ measured in data over the corresponding GamJet NLO theoretical prediction (obtained with the CJ15 PDFs) for 1.5 $ < {{| \eta ^{\text {jet}} |}} < $ 2.1 and 2.1 $ < {| \eta ^\gamma |} < $ 2.5. Error bars on the data are statistical uncertainties, and blue bands represent the systematic uncertainties. |
png pdf |
Figure 8-d:
Ratio of triple-differential cross sections as a function of $ {p_{\mathrm {T}}} ^\gamma $ measured in data over the corresponding GamJet NLO theoretical prediction (obtained with the CJ15 PDFs) for 2.1 $ < {{| \eta ^{\text {jet}} |}} < $ 2.5 and 2.1 $ < {| \eta ^\gamma |} < $ 2.5. Error bars on the data are statistical uncertainties, and blue bands represent the systematic uncertainties. |
| Tables | |

png pdf |
Table 1:
Summary of uncertainties in the estimated purity for photons in the barrel (endcap) region. |
png pdf |
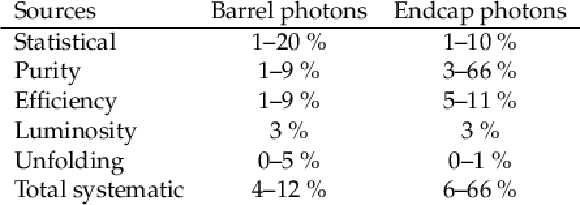
Table 2:
Summary of the uncertainties in the measured cross section values for photons in the barrel (endcap) region. |
| Summary |
| Measurements of the triple-differential inclusive isolated-photon+jet cross section were performed as a function of photon transverse momentum (${p_{\mathrm{T}}^{\gamma}}$), photon pseudorapidity (${\eta^{\gamma}}$), and jet pseudorapidity (${\eta^{\text{jet}}}$). The measurements were carried out in pp collisions at $\sqrt{s} = $ 8 TeV using 19.7 fb$^{-1}$ of data collected by the CMS detector covering a kinematic range of $| {\eta^{\gamma}} | < $ 1.44 and 1.57 $ < | {\eta^{\gamma}} | < $ 2.50, $| {\eta^{\text{jet}}} | < $ 2.5, 40 $ < {p_{\mathrm{T}}^{\gamma}} < $ 1000 GeV, and jet transverse momentum, $p_{\mathrm{T}}^{\text{jet}}$, $ > $25 GeV. The photon purity was estimated using a combination of templates from data and simulation, based on a multivariate technique. The measured cross sections are in good agreement with the next-to-leading order perturbative quantum chromodynamics (pQCD) prediction, and the experimental uncertainties are comparable or smaller than the theoretical ones. These measured cross sections, in different combinations of photon and jet pseudorapidities, probe pQCD over a wide range of parton momentum fractions. Inclusion of such gluon-sensitive data into the global parton distribution function (PDF) fit analyses has the potential to constrain the gluon PDFs, particularly in the regions where the measured uncertainties are smaller than the uncertainty bands of theoretical predictions. |
| References | ||||
| 1 | J. M. Campbell, R. K. Ellis, and C. Williams | Direct photon production at next-to-next-to-leading order | PRL 118 (2017) 222001 | 1612.04333 |
| 2 | X. Chen et al. | Isolated photon and photon+jet production at NNLO QCD accuracy | Submitted to: JHEP (2019) | 1904.01044 |
| 3 | D. d'Enterria and J. Rojo | Quantitative constraints on the gluon distribution function in the proton from collider isolated-photon data | NPB 860 (2012) 311 | 1202.1762 |
| 4 | L. Carminati et al. | Sensitivity of the LHC isolated-gamma+jet data to the parton distribution functions of the proton | EPL 101 (2013) 61002 | 1212.5511 |
| 5 | J. M. Campbell, J. Rojo, E. Slade, and C. Williams | Direct photon production and PDF fits reloaded | EPJC 78 (2018) 470 | 1802.03021 |
| 6 | ATLAS Collaboration | Measurement of the inclusive isolated prompt photon cross section in pp collisions at $ \sqrt{s}= $ 8 TeV with the ATLAS detector | JHEP 08 (2016) 005 | 1605.03495 |
| 7 | ATLAS Collaboration | Dynamics of isolated-photon plus jet production in pp collisions at $ \sqrt{s} = $ 7 TeV with the ATLAS detector | NPB 875 (2013) 483 | 1307.6795 |
| 8 | CMS Collaboration | Measurement of the triple-differential cross section for photon+jets production in proton-proton collisions at $ \sqrt{s} = $ 7 TeV | JHEP 06 (2014) 009 | CMS-QCD-11-005 1311.6141 |
| 9 | D0 Collaboration | Measurement of the differential cross section of photon plus jet production in $ \mathrm{p\bar{p}} $ collisions at $ \sqrt{s} = $ 1.96 TeV | PRD 88 (2013) 072008 | 1308.2708 |
| 10 | ATLAS Collaboration | Measurement of the production cross section of an isolated photon associated with jets in proton-proton collisions at $ \sqrt{s}= $ 7 TeV with the ATLAS detector | PRD 85 (2012) 092014 | 1203.3161 |
| 11 | D0 Collaboration | Measurement of the differential cross section for the production of an isolated photon with associated jet in $ \mathrm{p\bar{p}} $ collisions at $ \sqrt{s} = $ 1.96 TeV | PLB 666 (2008) 435 | 0804.1107 |
| 12 | CMS Collaboration | The CMS experiment at the CERN LHC | JINST 3 (2008) S08004 | CMS-00-001 |
| 13 | CMS Collaboration | Particle-flow reconstruction and global event description with the CMS detector | JINST 12 (2017) P10003 | CMS-PRF-14-001 1706.04965 |
| 14 | M. Cacciari, G. P. Salam, and G. Soyez | The anti-$ k_\mathrm{T} $ jet clustering algorithm | JHEP 04 (2008) 063 | 0802.1189 |
| 15 | CMS Collaboration | Jet energy scale and resolution in the CMS experiment in pp collisions at 8 TeV | JINST 12 (2017) P02014 | CMS-JME-13-004 1607.03663 |
| 16 | CMS Collaboration | Jet algorithms performance in 13 TeV data | CMS-PAS-JME-16-003 | CMS-PAS-JME-16-003 |
| 17 | CMS Collaboration | Performance of photon reconstruction and identification with the CMS detector in proton-proton collisions at $ \sqrt{s} = $ 8 TeV | JINST 10 (2015) P08010 | CMS-EGM-14-001 1502.02702 |
| 18 | CMS Collaboration | Performance of CMS muon reconstruction in pp collision events at $ \sqrt{s}= $ 7 TeV | JINST 7 (2012) P10002 | CMS-MUO-10-004 1206.4071 |
| 19 | CMS Collaboration | The CMS trigger system | JINST 12 (2017) P01020 | CMS-TRG-12-001 1609.02366 |
| 20 | T. Sjostrand, S. Mrenna, and P. Skands | pythia 6.4 physics and manual | JHEP 05 (2006) 026 | hep-ph/0603175 |
| 21 | GEANT4 Collaboration | GEANT4--a simulation toolkit | NIMA 506 (2003) 250 | |
| 22 | F. Maltoni and T. Stelzer | MadEvent: automatic event generation with MadGraph | JHEP 02 (2003) 027 | hep-ph/0208156 |
| 23 | J. Pumplin et al. | New generation of parton distributions with uncertainties from global QCD analysis | JHEP 07 (2002) 012 | hep-ph/0201195 |
| 24 | CMS Collaboration | Study of the underlying event at forward rapidity in pp collisions at $ \sqrt{s} = $ 0.9, 2.76, and 7 TeV | JHEP 04 (2013) 072 | |
| 25 | B. P. Roe et al. | Boosted decision trees as an alternative to artificial neural networks for particle identification | NIM543 (2005) 577 | |
| 26 | W. Verkerke and D. P. Kirkby | The RooFit toolkit for data modeling | in Computing in High Energy and Nuclear Physics (CHEP03): Proceedings, La Jolla, USA, 2003 | physics/0306116 |
| 27 | G. D'Agostini | Probability and measurement uncertainty in physics: A Bayesian primer | hep-ph/9512295 | |
| 28 | H. Baer, J. Ohnemus, and J. F. Owens | A calculation of the direct photon plus jet cross section in the next-to-leading-logarithm approximation | PLB 234 (1990) 127 | |
| 29 | H. Baer, J. Ohnemus, and J. F. Owens | Next-to-leading-logarithm calculation of direct photon production | PRD 42 (1990) 61 | |
| 30 | A. Accardi et al. | Constraints on large-$ x $ parton distributions from new weak boson production and deep-inelastic scattering data | PRD 93 (2016) 114017 | 1602.03154 |
| 31 | L. Bourhis, M. Fontannaz, and J. P. Guillet | Quarks and gluon fragmentation functions into photons | EPJC 2 (1998) 529 | hep-ph/9704447 |

|
Compact Muon Solenoid LHC, CERN |

|

|

|

|

|

|