

Compact Muon Solenoid
LHC, CERN
| CMS-SUS-23-016 ; CERN-EP-2025-219 | ||
| Search for new physics in the final state with a single photon and large missing transverse momentum in proton-proton collisions at $ \sqrt{s} = $ 13 TeV | ||
| CMS Collaboration | ||
| 21 November 2025 | ||
| Phys. Rev. D 113, 072020 | ||
| Abstract: A search for new physics in events featuring a single photon and missing transverse momentum is presented, using proton-proton $ \sqrt{s} = $ 13 TeV collision data corresponding to an integrated luminosity of 101 fb$ ^{-1} $ collected by the CMS experiment at the CERN LHC between 2017 and 2018. This analysis, combined with a previous study of 36 fb$ ^{-1} $ of 2016 data (totaling 137 fb$ ^{-1} $), reveals no significant deviations from standard model expectations. The results are then used to establish 95% confidence level limits on parameters in theoretical models involving dark matter and large extra dimensions. Compared to the 2016-only analysis, this search achieves up to a 14% improvement in exclusion reach for mediator masses in simplified dark matter models, along with 11% and 10% enhancements in the limits on the effective field theory suppression scale and the fundamental Planck scale, respectively. These results are the most stringent constraints on these parameters to date. | ||
| Links: e-print arXiv:2511.17310 [hep-ex] (PDF) ; CDS record ; inSPIRE record ; Physics Briefing ; CADI line (restricted) ; | ||
| Figures | |
png pdf |
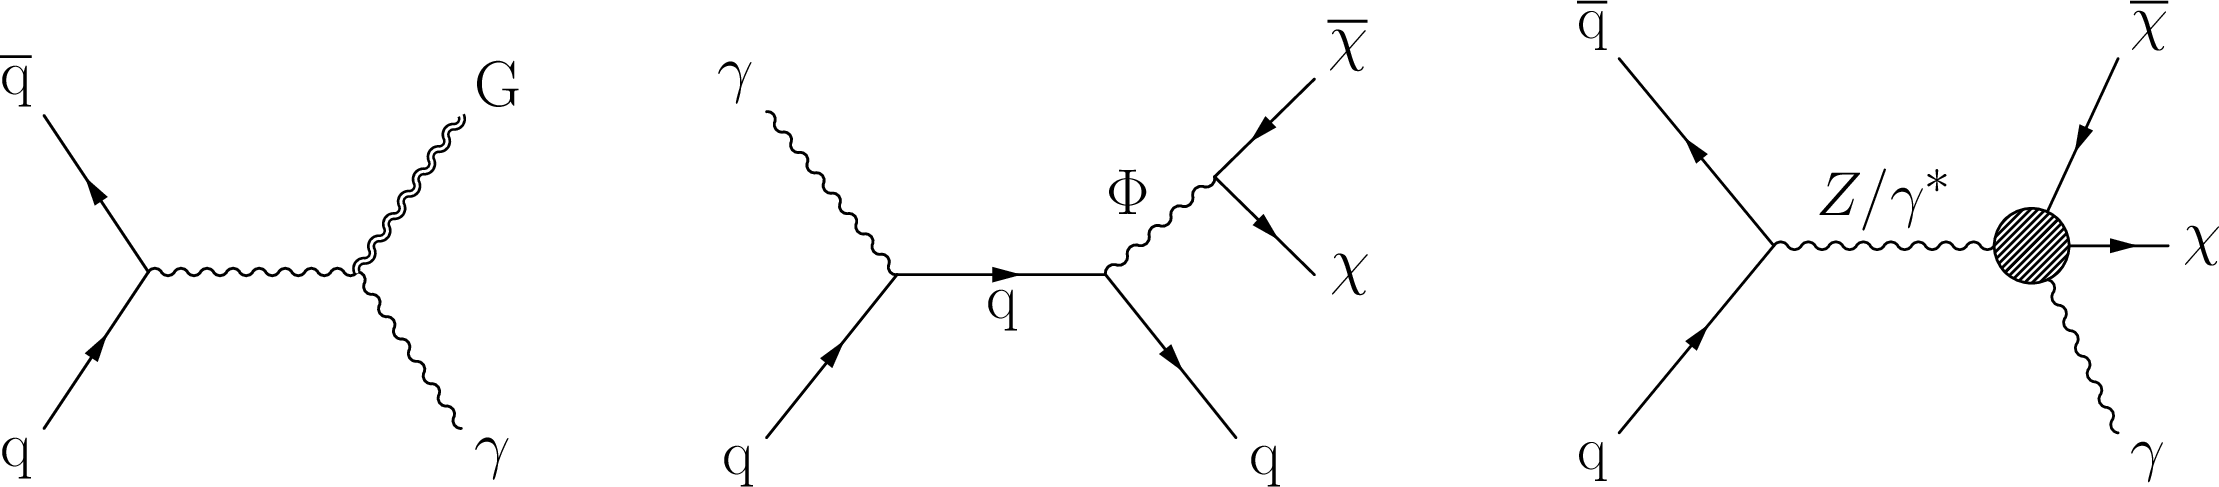
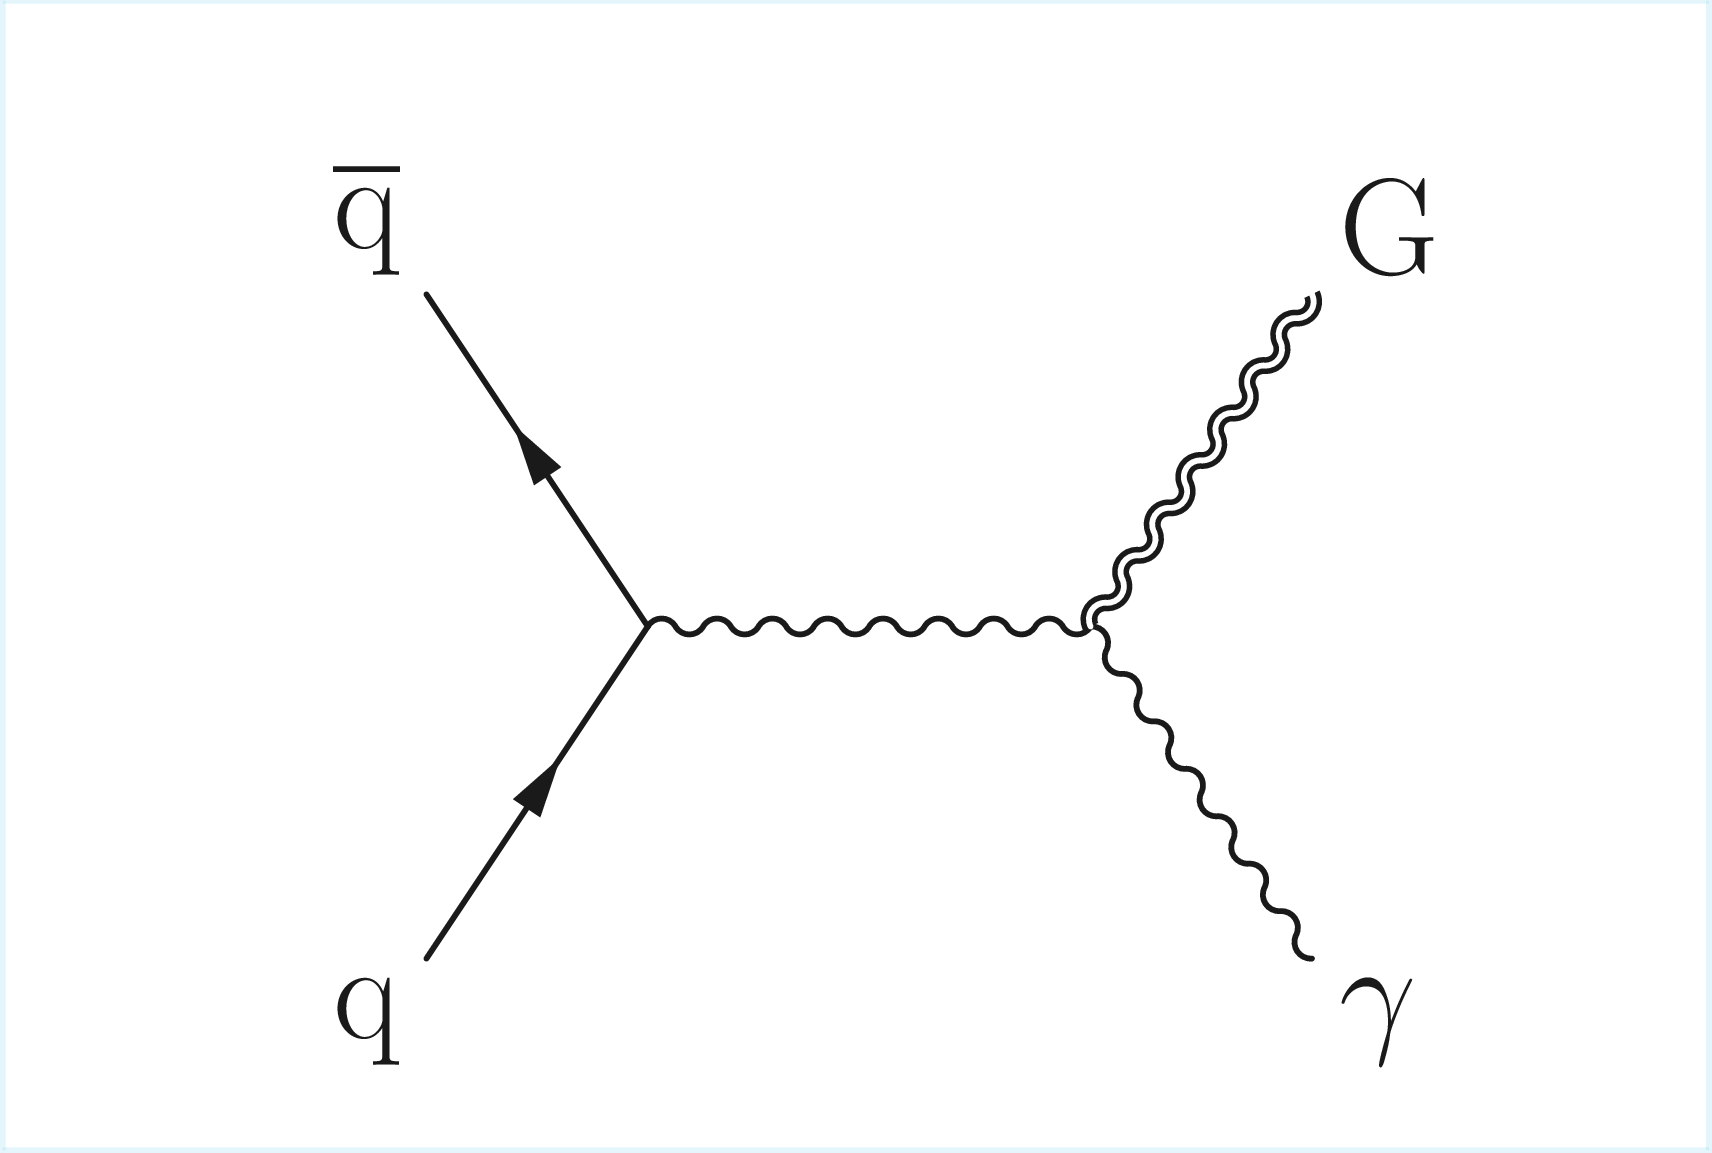
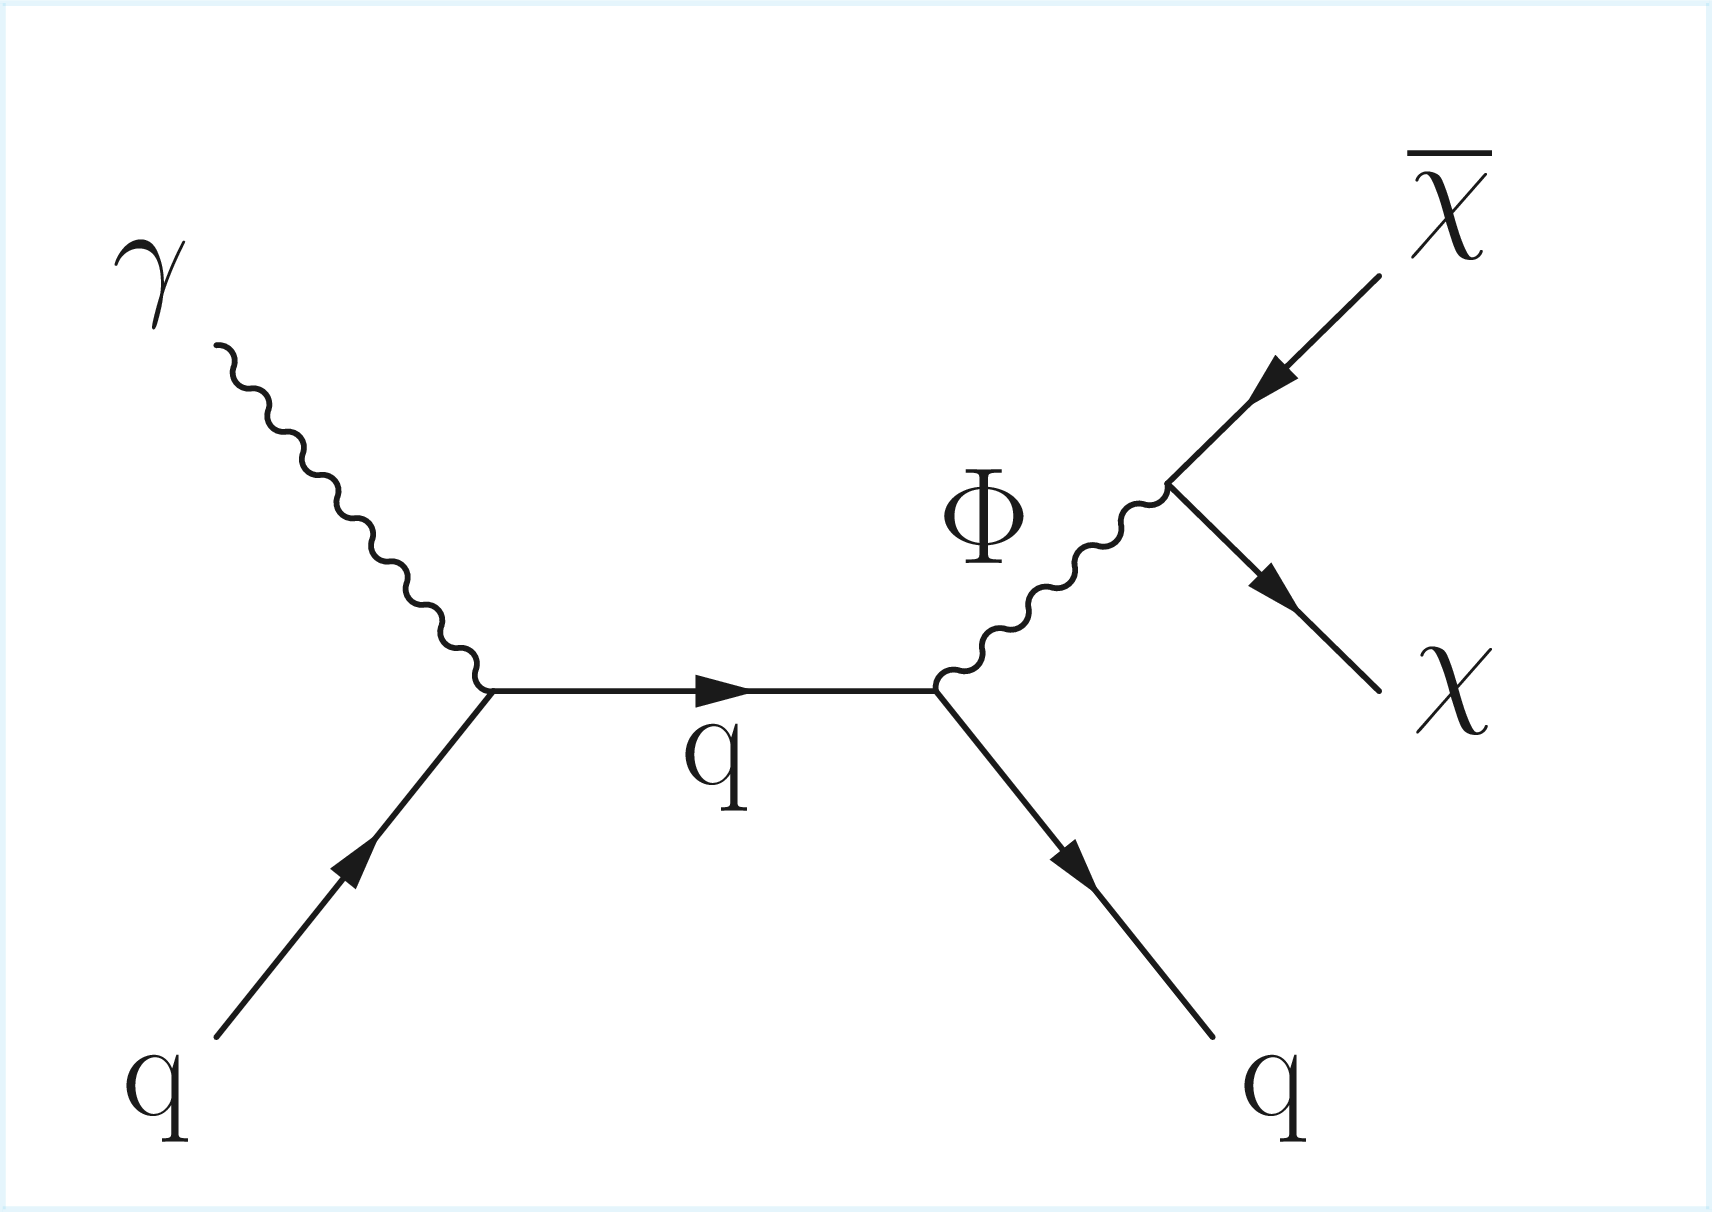
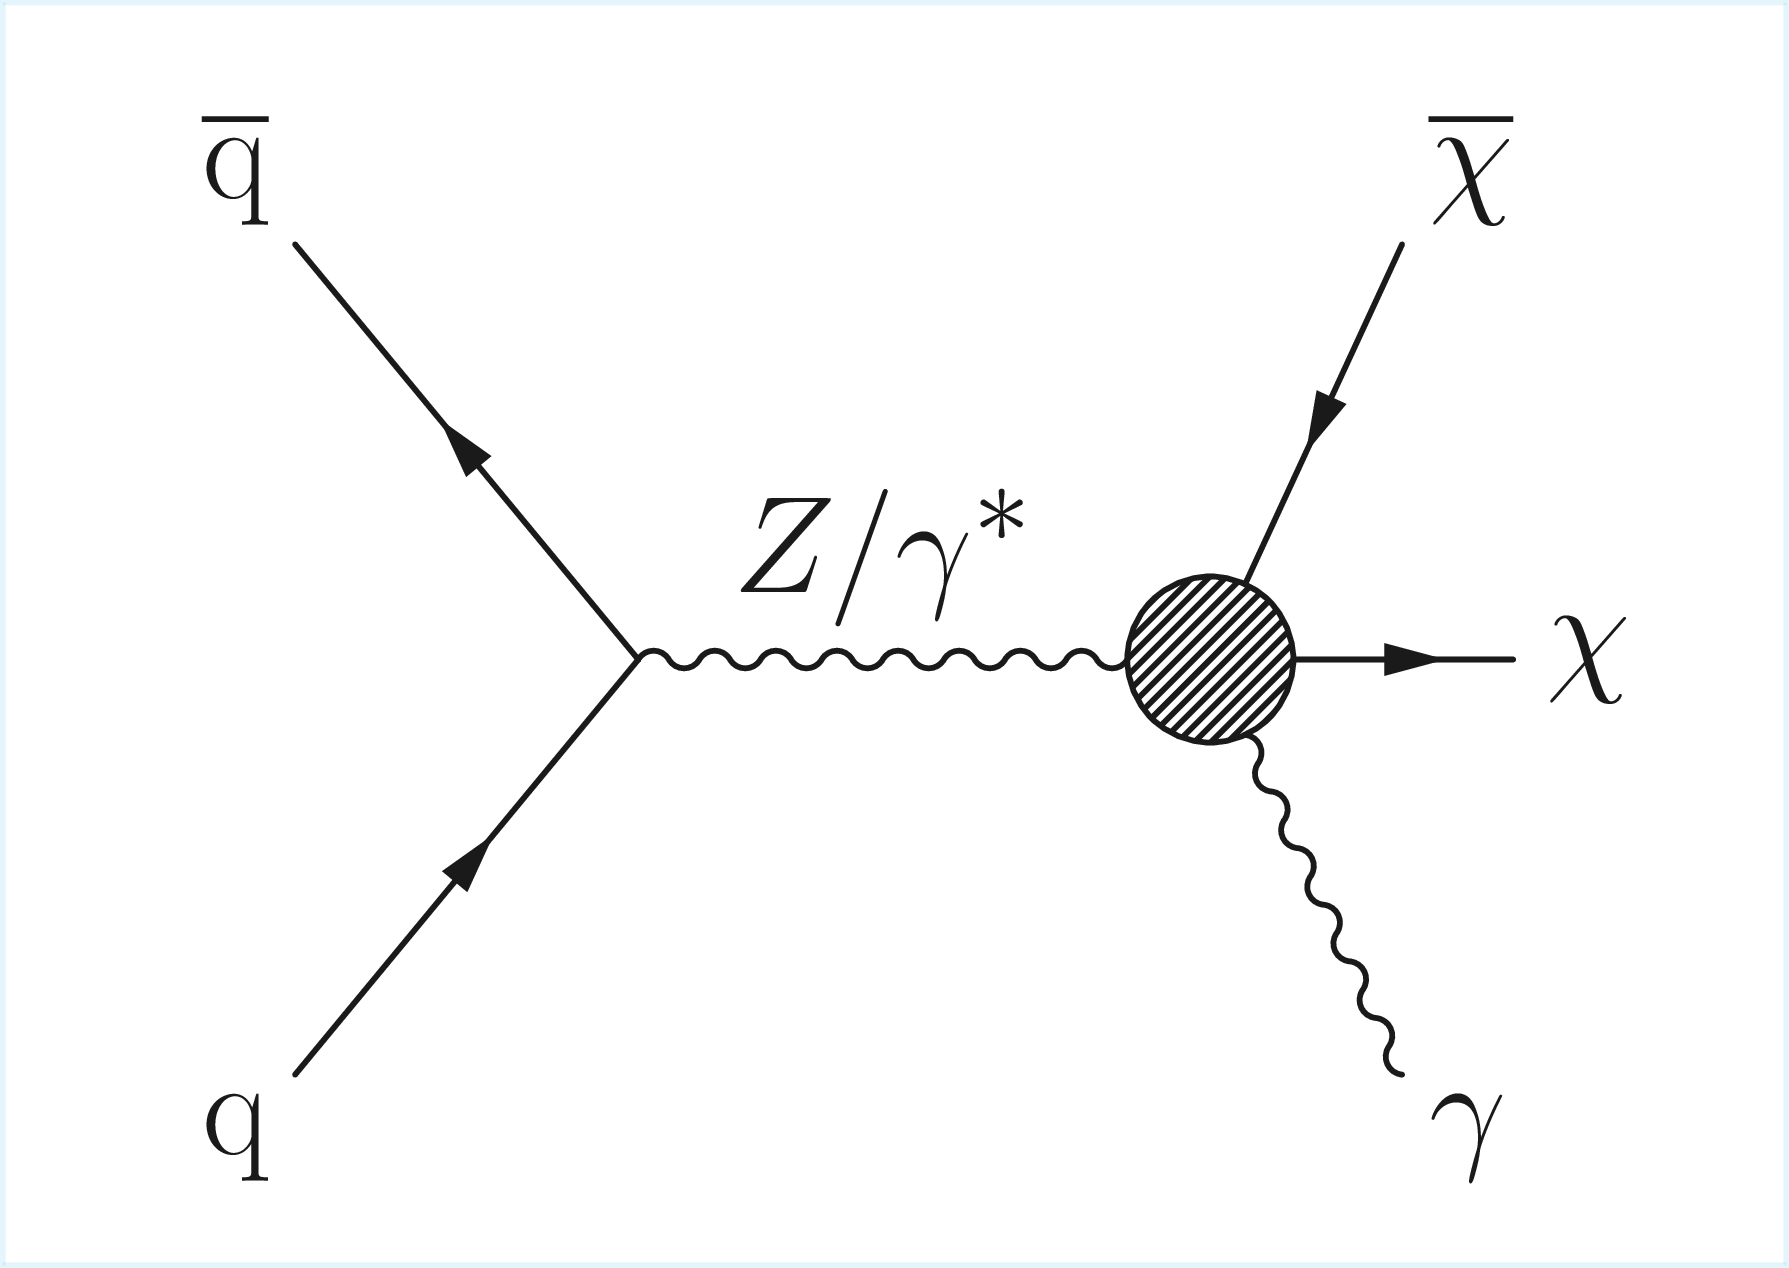
Figure 1:
Leading-order diagrams of graviton production in the ADD model (left), simplified DM model (center), and EW-DM effective interaction (right), with a final state comprising a photon and large $ p_{\mathrm{T}}^\text{miss} $. Particles $ \chi $ and $ \bar{\chi} $ are the DM and its antiparticle, and $ \Phi $ in the simplified DM model represents a vector or axial-vector mediator. |
png pdf |
Figure 1-a:
Leading-order diagrams of graviton production in the ADD model (left), simplified DM model (center), and EW-DM effective interaction (right), with a final state comprising a photon and large $ p_{\mathrm{T}}^\text{miss} $. Particles $ \chi $ and $ \bar{\chi} $ are the DM and its antiparticle, and $ \Phi $ in the simplified DM model represents a vector or axial-vector mediator. |
png pdf |
Figure 1-b:
Leading-order diagrams of graviton production in the ADD model (left), simplified DM model (center), and EW-DM effective interaction (right), with a final state comprising a photon and large $ p_{\mathrm{T}}^\text{miss} $. Particles $ \chi $ and $ \bar{\chi} $ are the DM and its antiparticle, and $ \Phi $ in the simplified DM model represents a vector or axial-vector mediator. |
png pdf |
Figure 1-c:
Leading-order diagrams of graviton production in the ADD model (left), simplified DM model (center), and EW-DM effective interaction (right), with a final state comprising a photon and large $ p_{\mathrm{T}}^\text{miss} $. Particles $ \chi $ and $ \bar{\chi} $ are the DM and its antiparticle, and $ \Phi $ in the simplified DM model represents a vector or axial-vector mediator. |
png pdf |
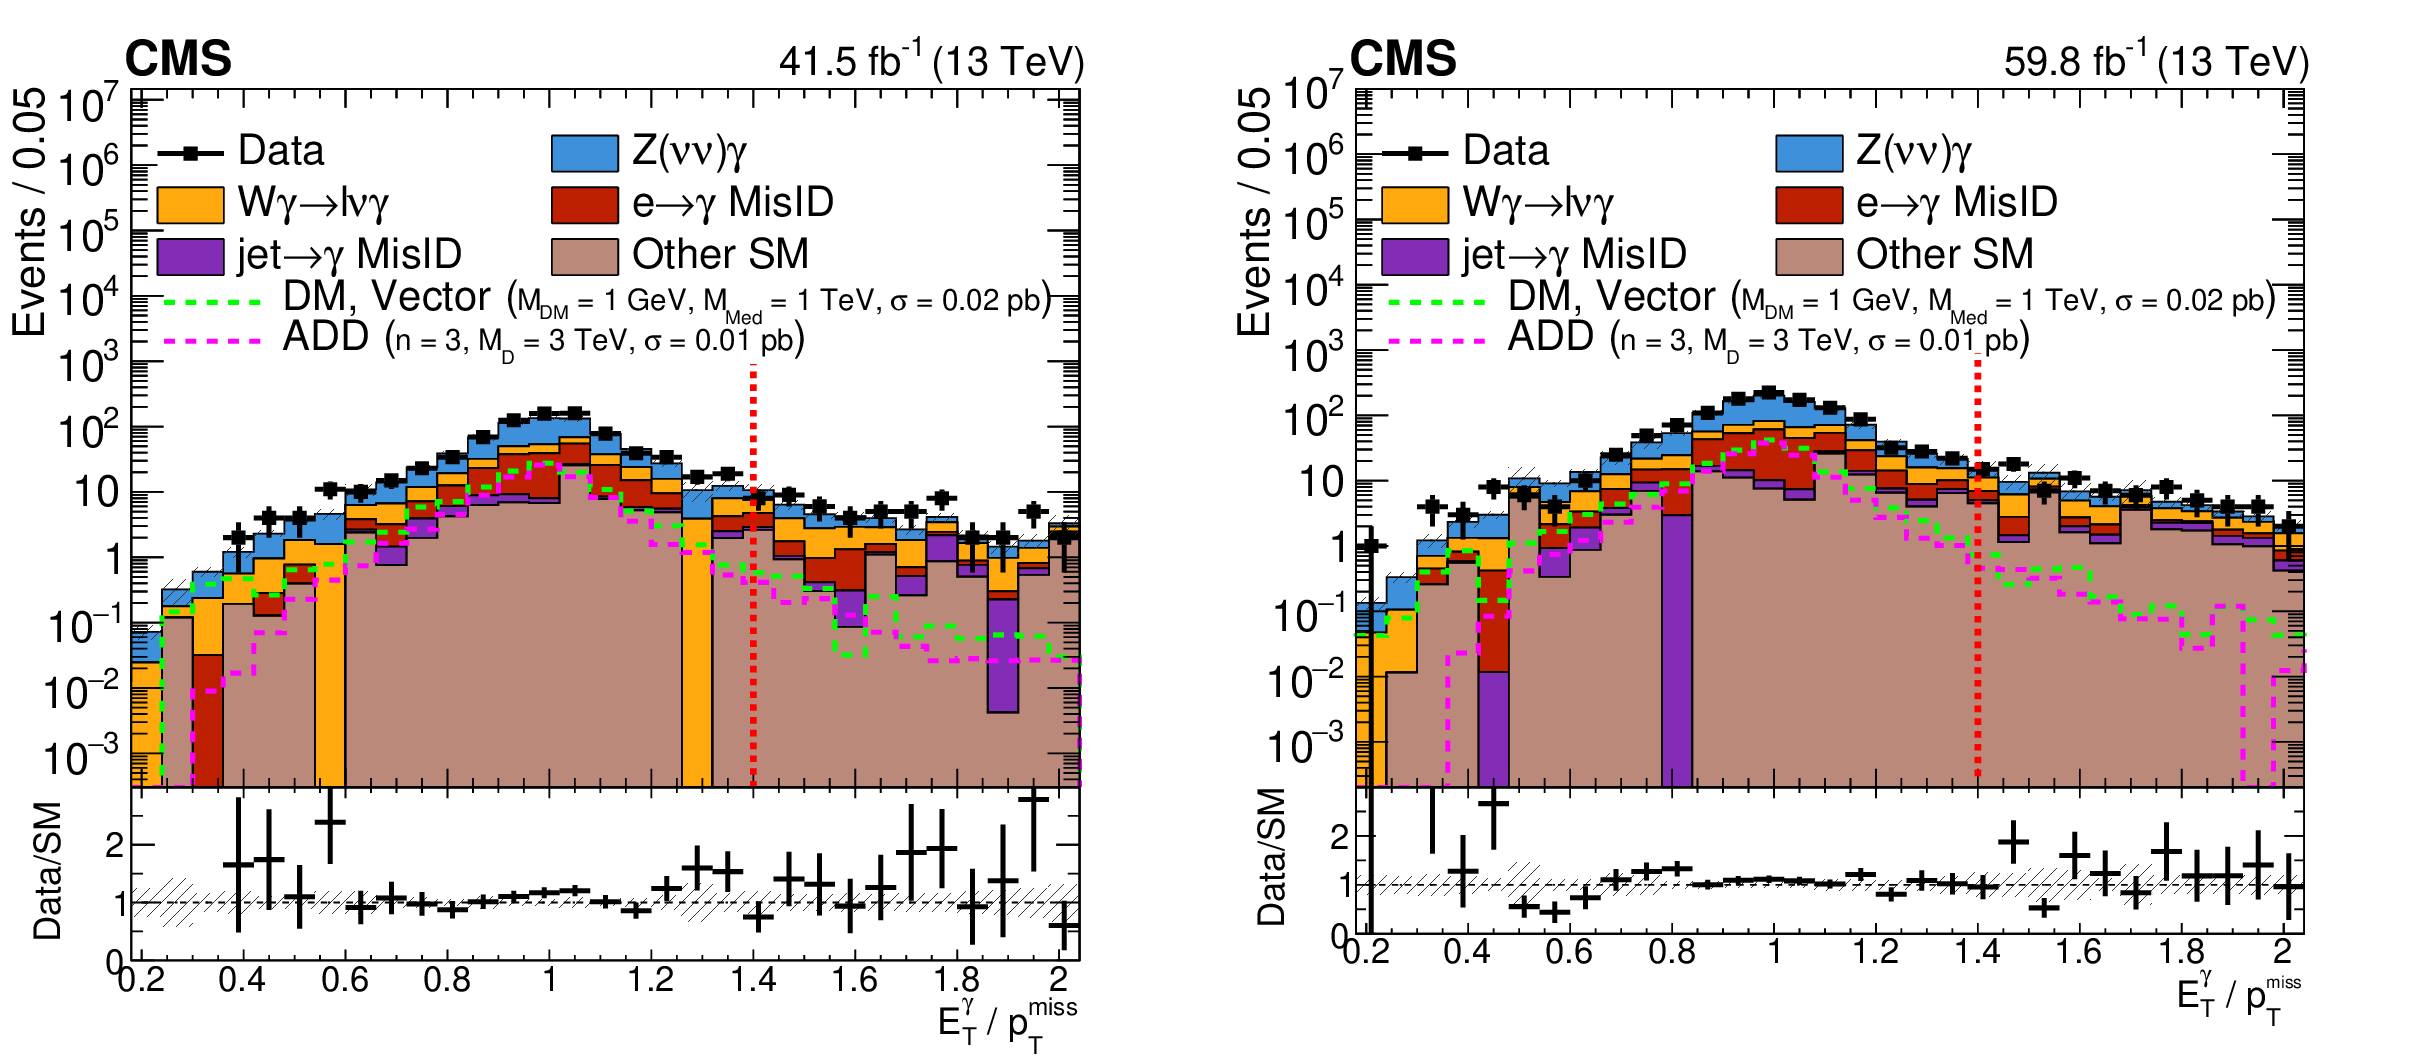
Figure 2:
Distribution of $ E_{\mathrm{T}}^{\gamma} $/$ p_{\mathrm{T}}^\text{miss} $ for the 2017 (left) and 2018 (right) data sets. Templates for signal hypotheses are shown overlaid as light green and magenta dashed lines along with their cross section values. The cross hatched band represents the total systematic and statistical uncertainties. Events to the right of the red dashed vertical line are excluded. |
png pdf |
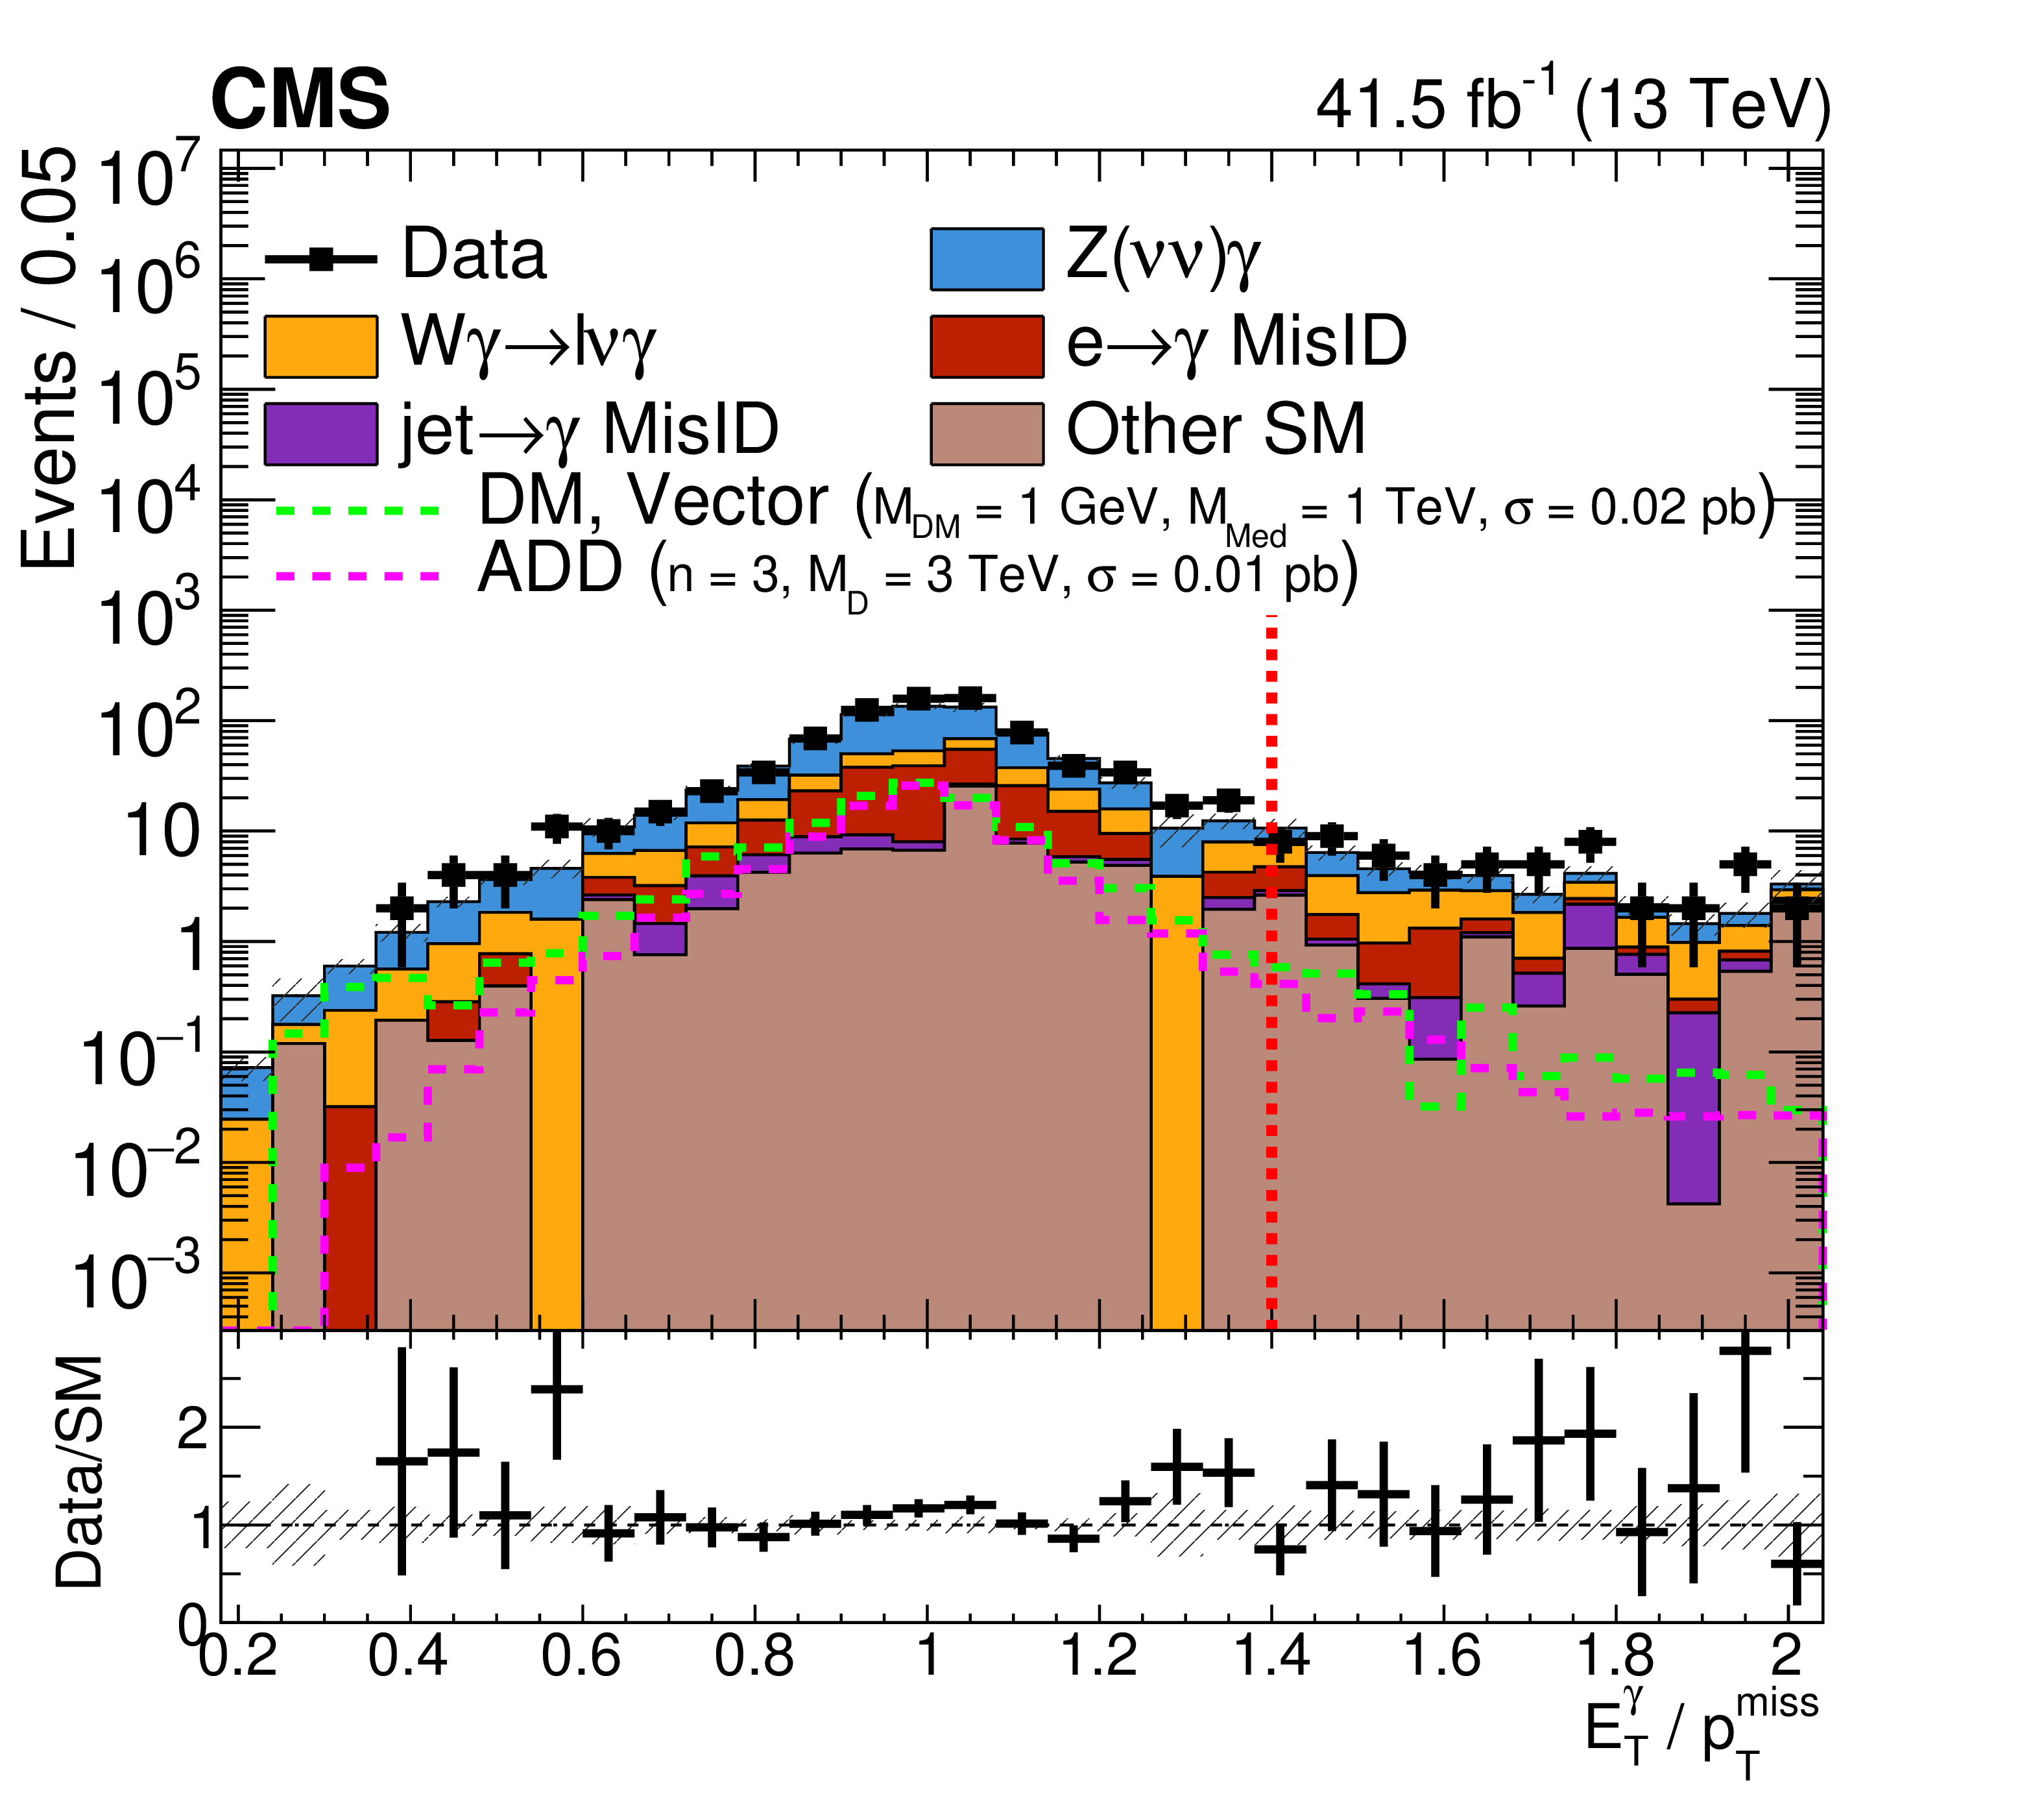
Figure 2-a:
Distribution of $ E_{\mathrm{T}}^{\gamma} $/$ p_{\mathrm{T}}^\text{miss} $ for the 2017 (left) and 2018 (right) data sets. Templates for signal hypotheses are shown overlaid as light green and magenta dashed lines along with their cross section values. The cross hatched band represents the total systematic and statistical uncertainties. Events to the right of the red dashed vertical line are excluded. |
png pdf |
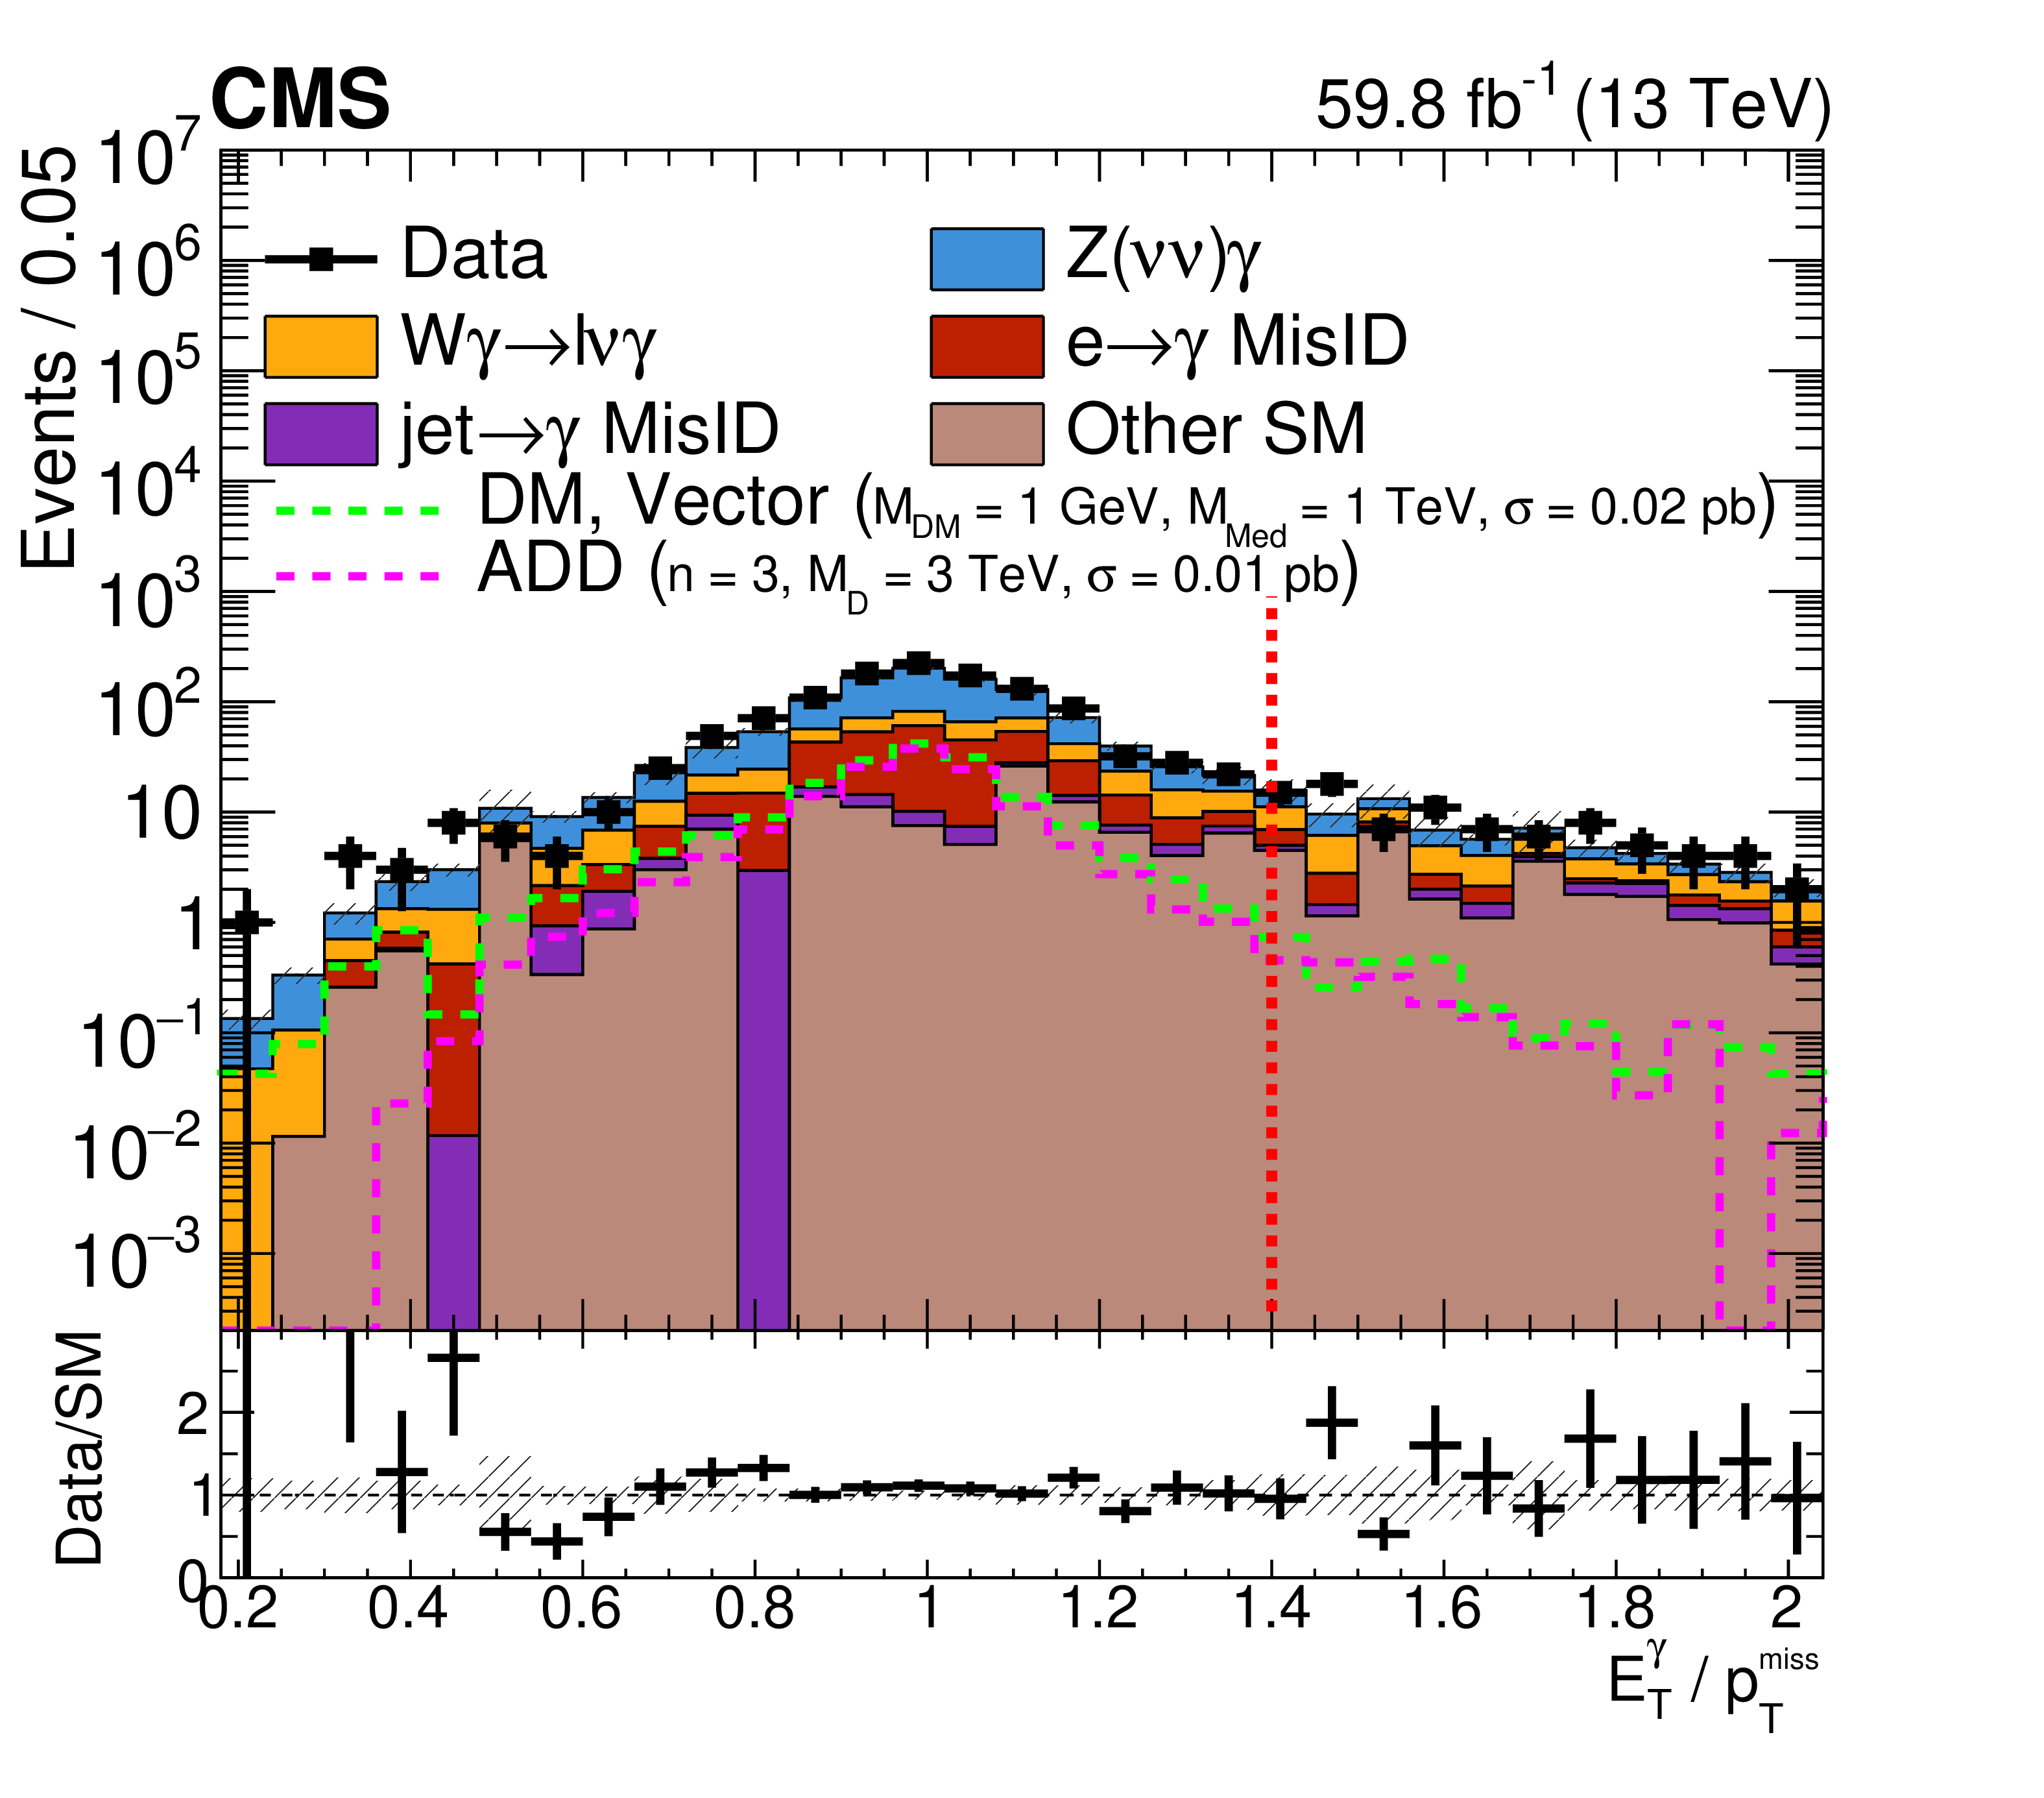
Figure 2-b:
Distribution of $ E_{\mathrm{T}}^{\gamma} $/$ p_{\mathrm{T}}^\text{miss} $ for the 2017 (left) and 2018 (right) data sets. Templates for signal hypotheses are shown overlaid as light green and magenta dashed lines along with their cross section values. The cross hatched band represents the total systematic and statistical uncertainties. Events to the right of the red dashed vertical line are excluded. |
png pdf |
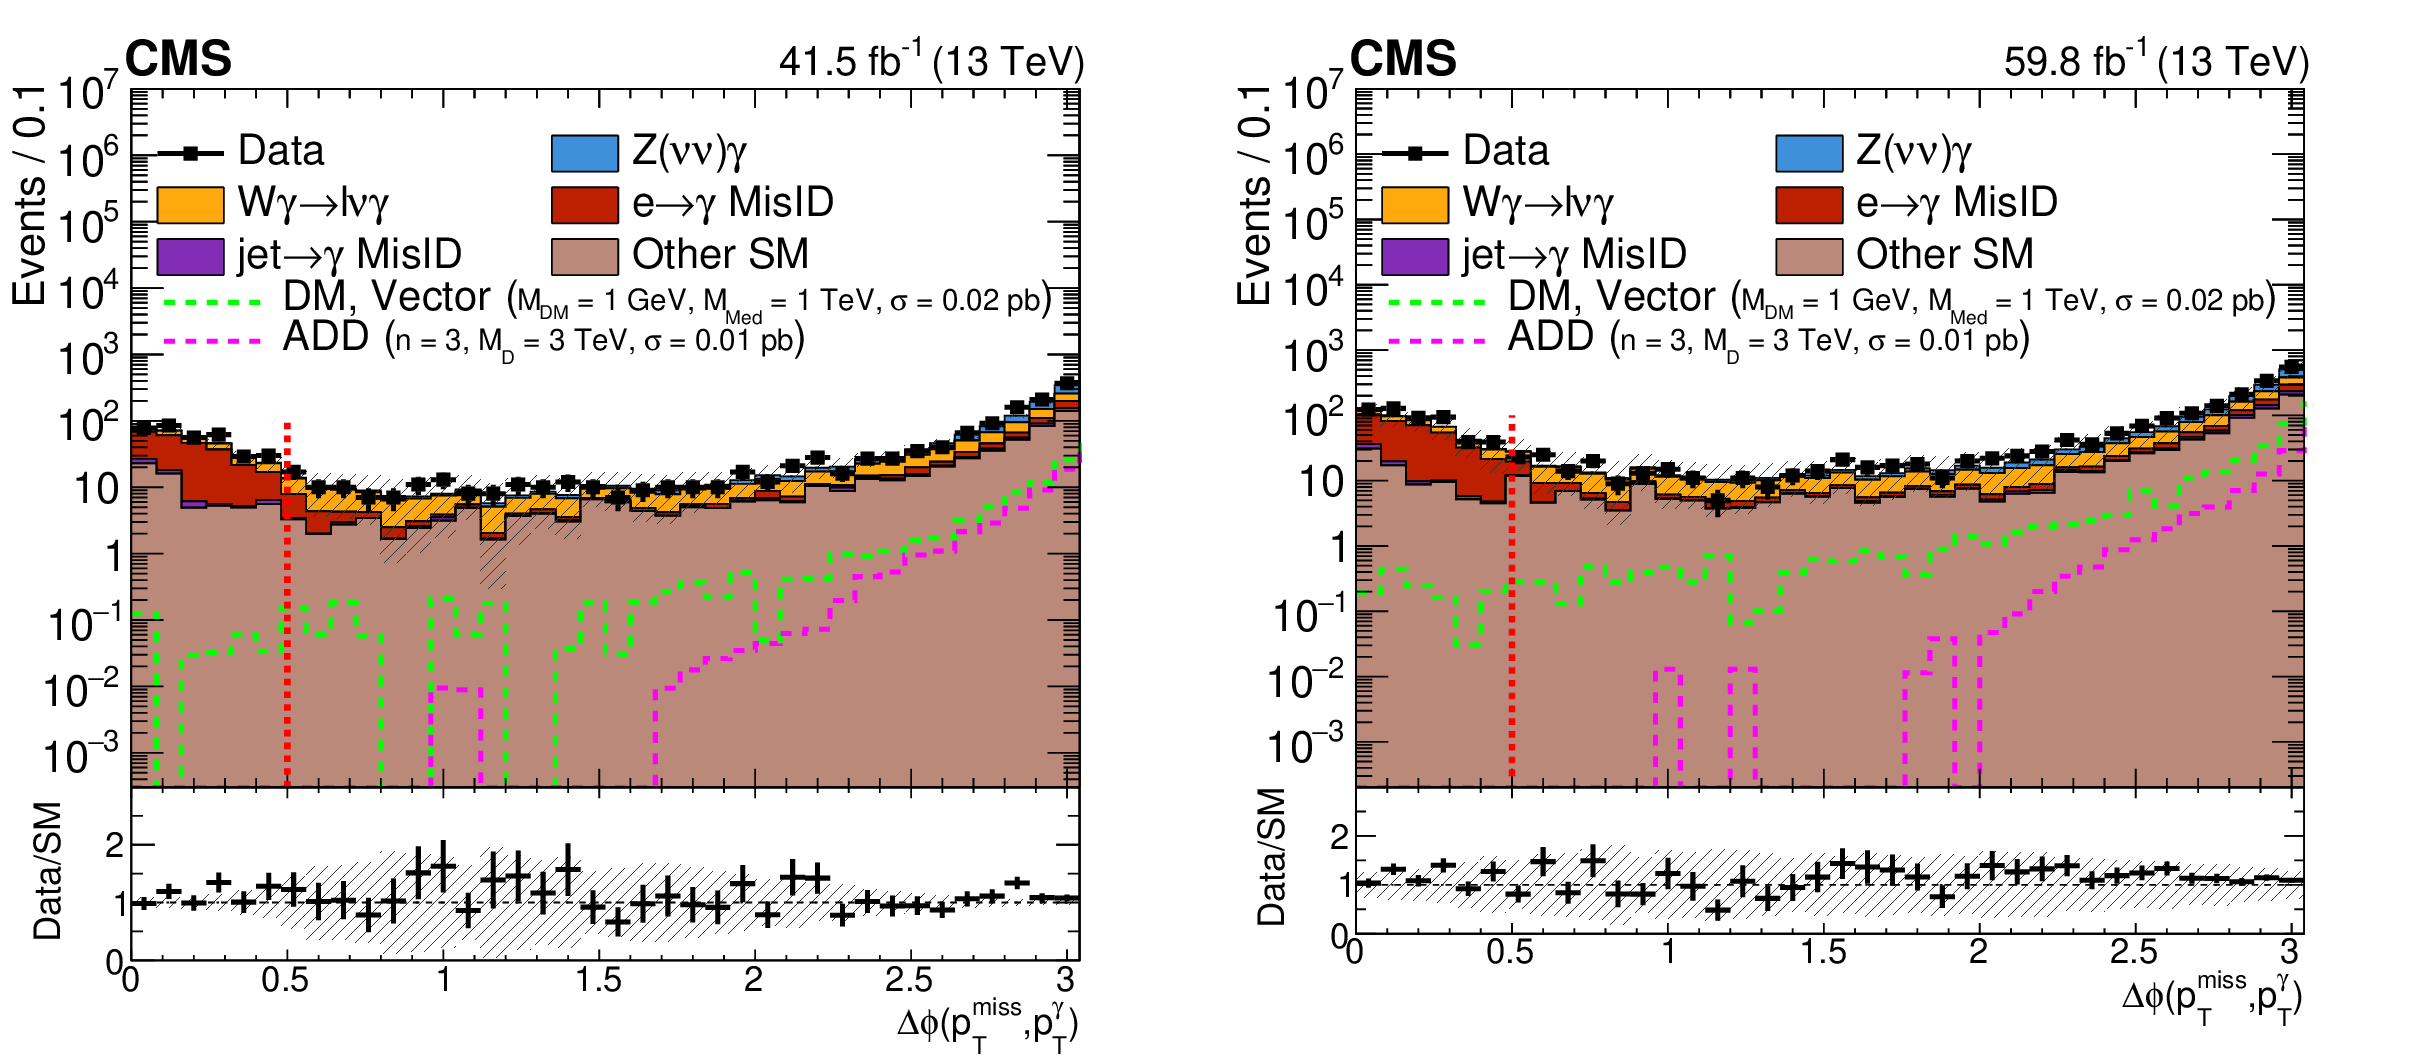
Figure 3:
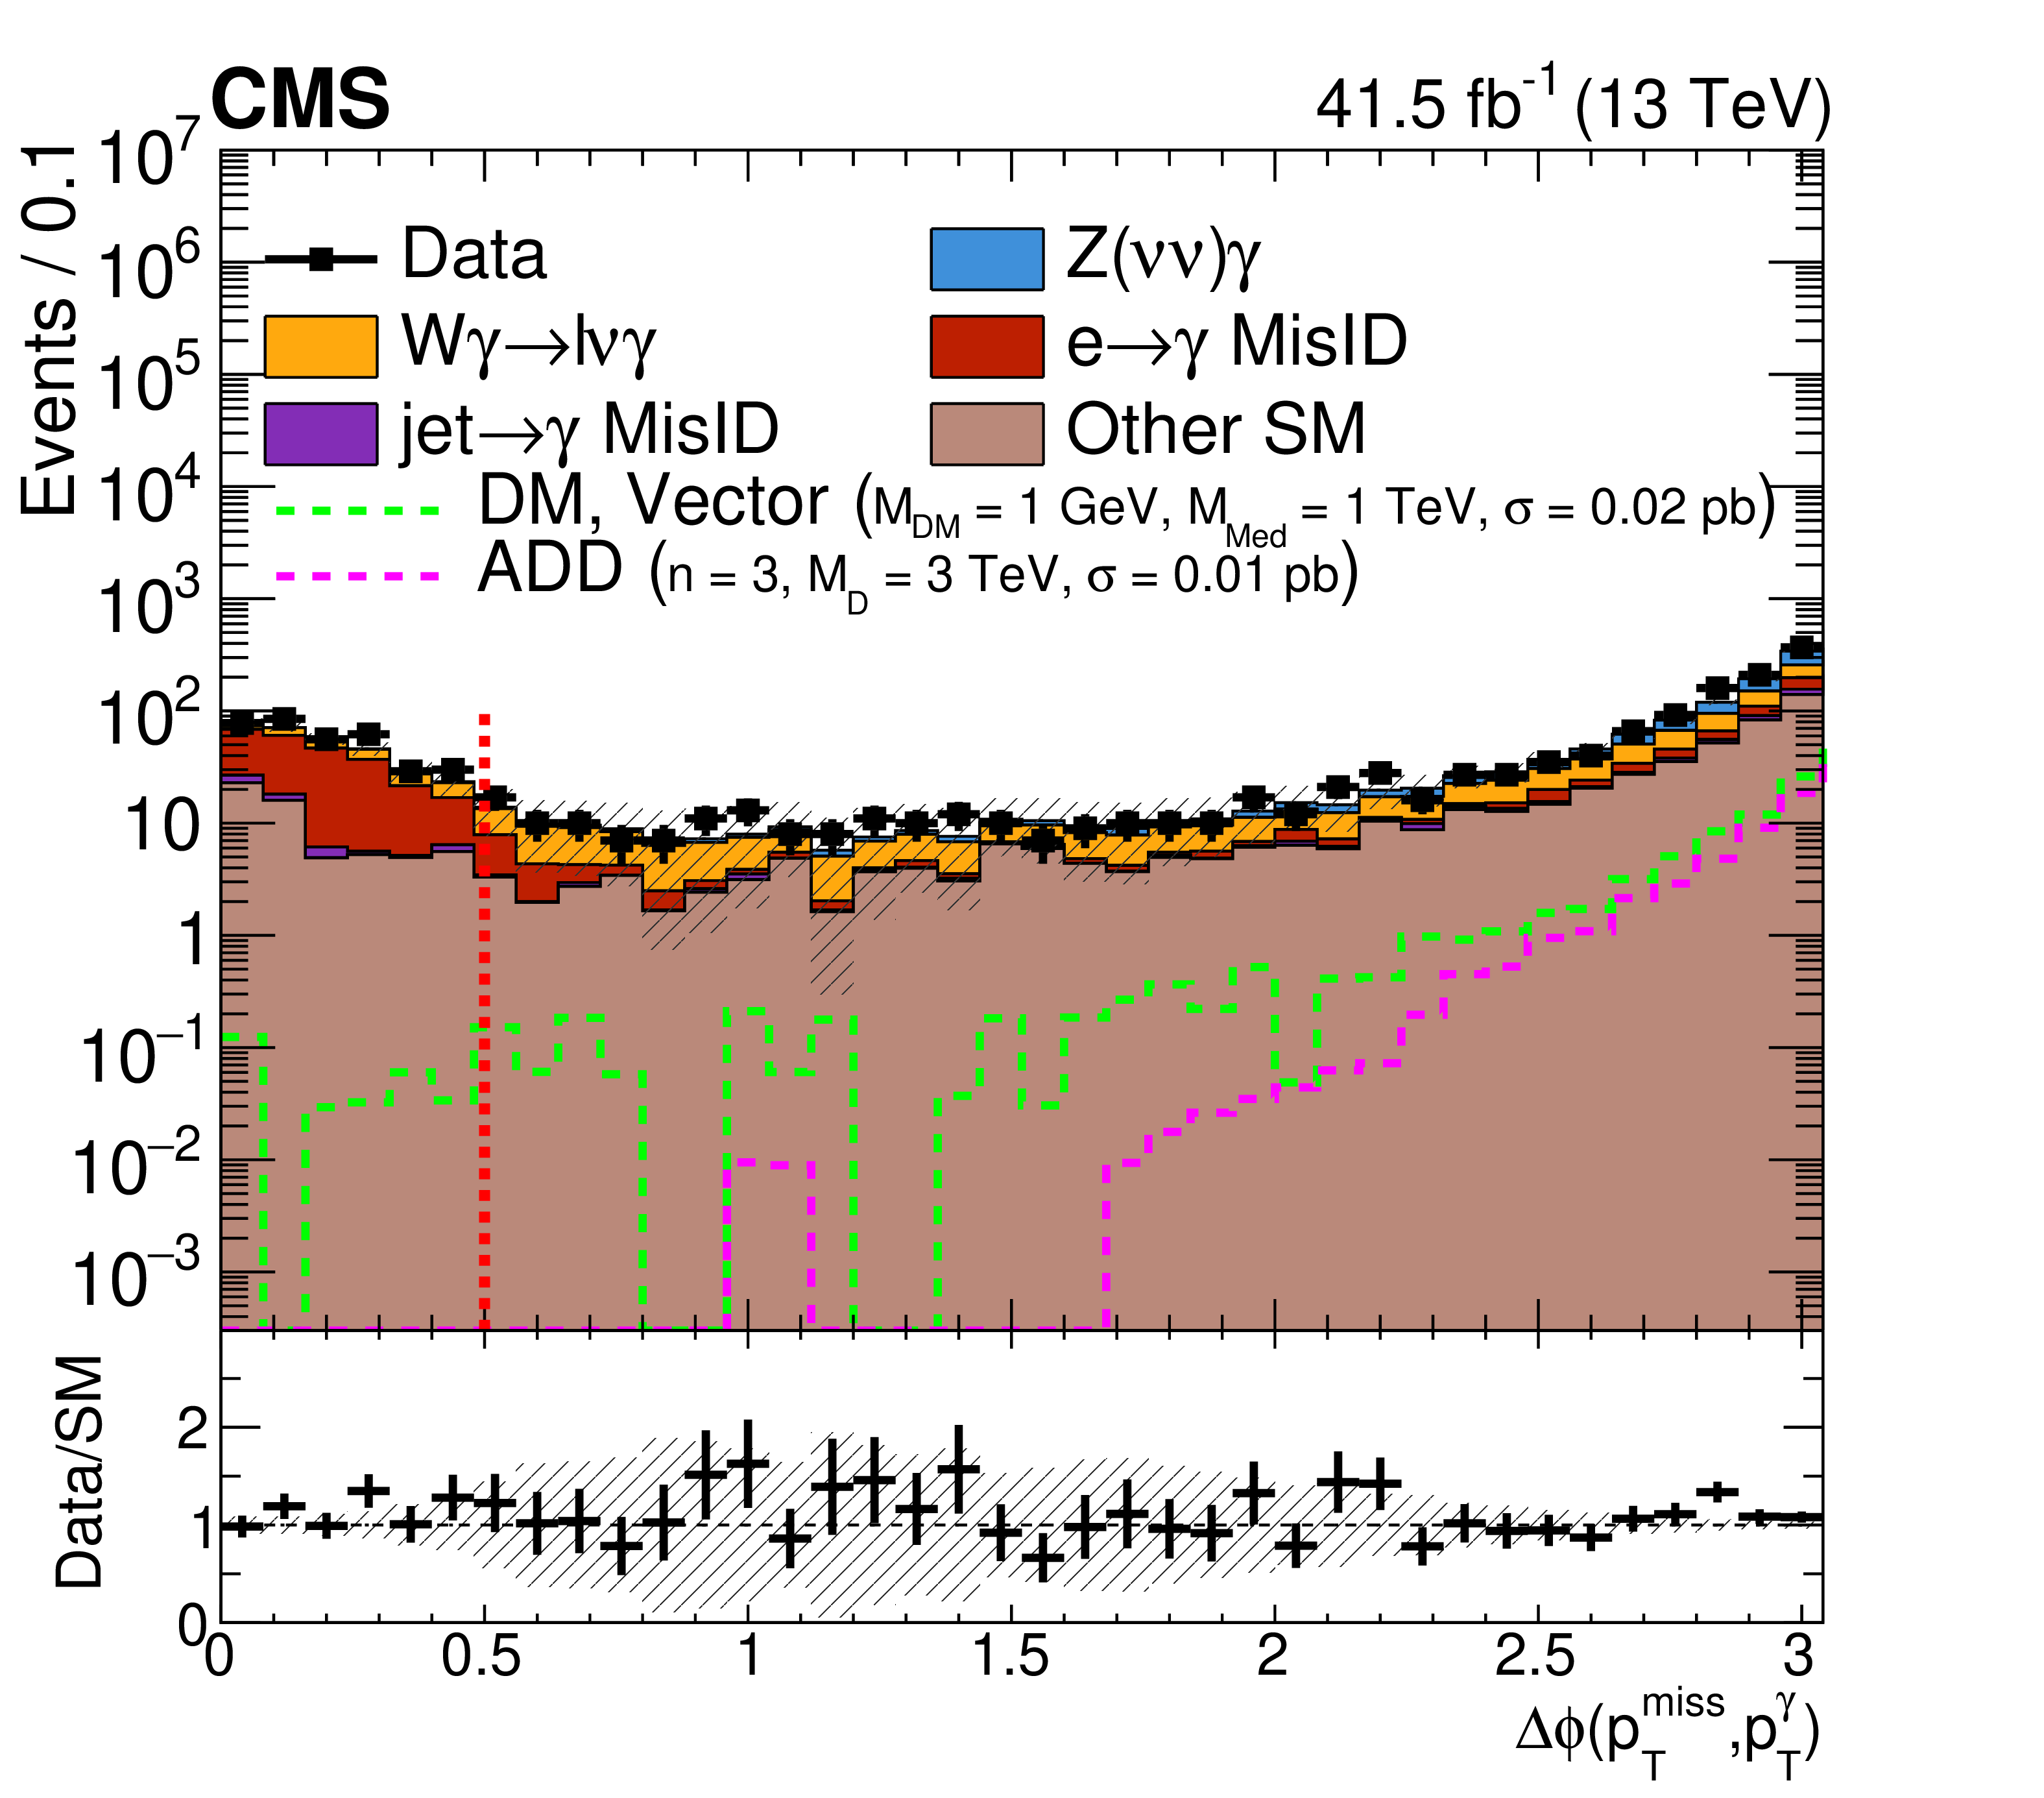
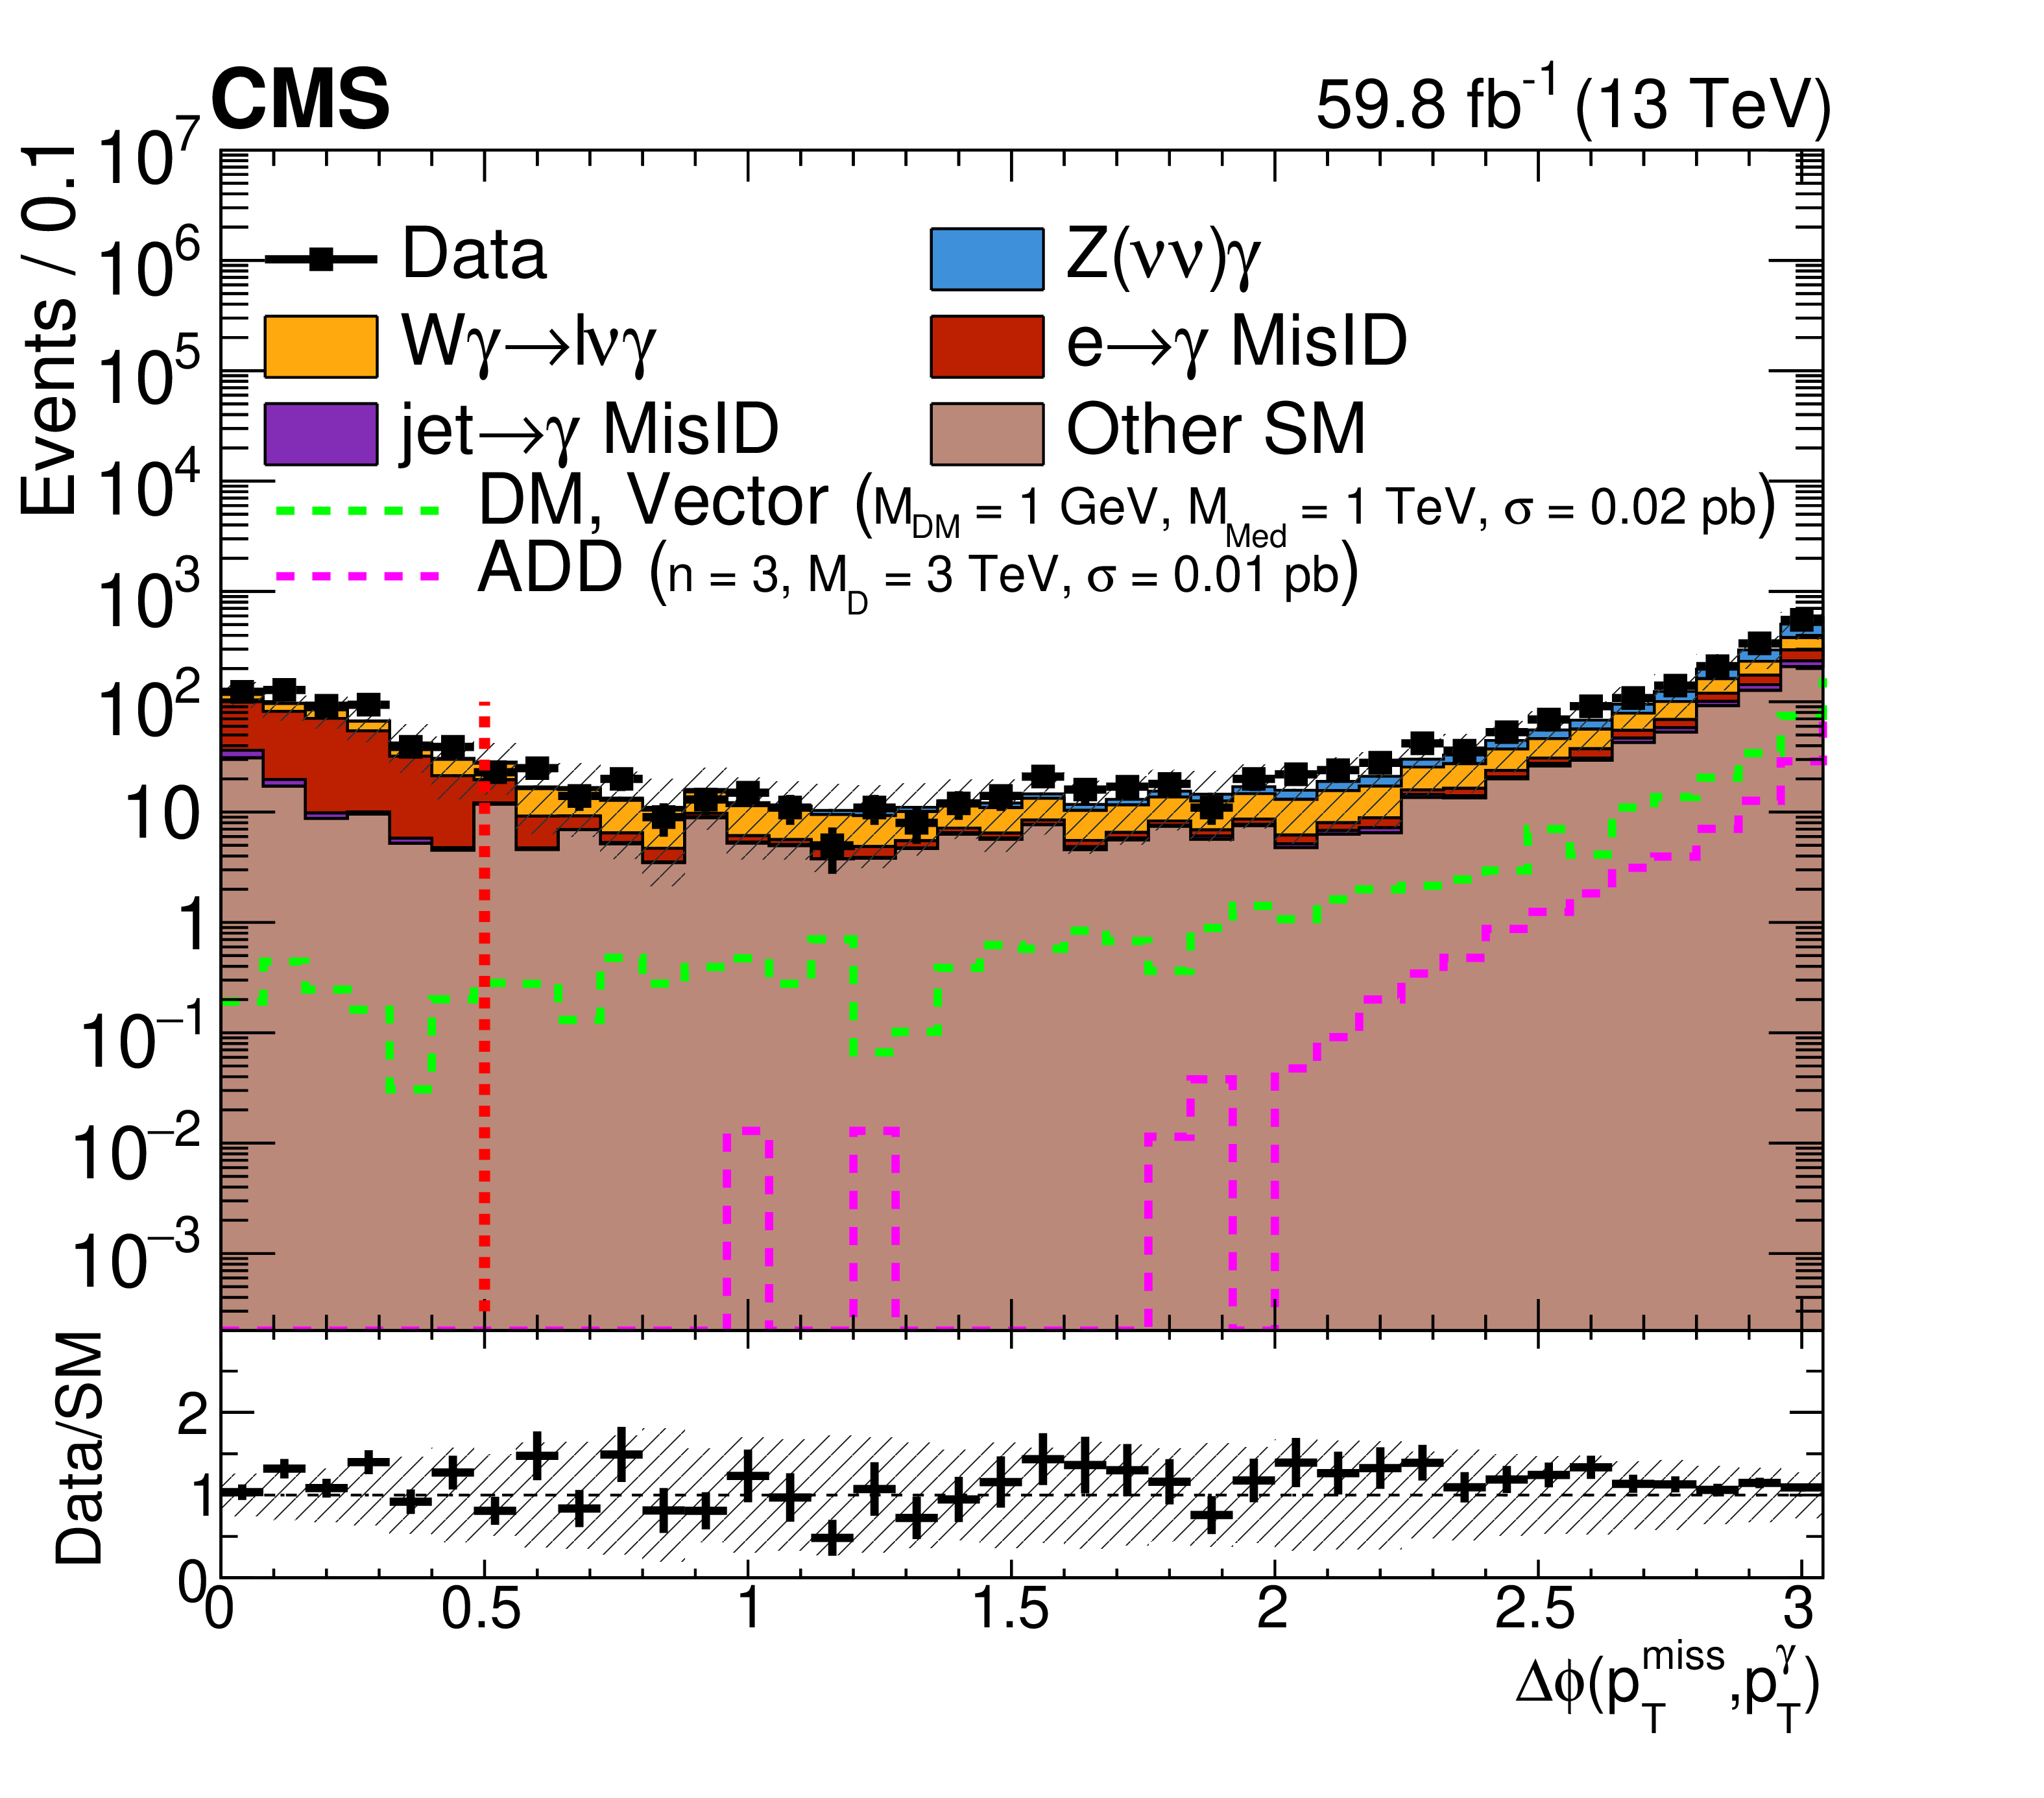
Distribution of $ \Delta\phi(\vec{p}_T^{\text{miss}}, \vec{p}_{\mathrm{T}}^{\gamma}) $ for the 2017 (left) and 2018 (right) data sets. Templates for signal hypotheses are shown overlaid as light green and magenta dashed lines along with their cross section values. The cross hatched band represents the total systematic and statistical uncertainties. Events to the left of the red dashed vertical line are excluded. |
png pdf |
Figure 3-a:
Distribution of $ \Delta\phi(\vec{p}_T^{\text{miss}}, \vec{p}_{\mathrm{T}}^{\gamma}) $ for the 2017 (left) and 2018 (right) data sets. Templates for signal hypotheses are shown overlaid as light green and magenta dashed lines along with their cross section values. The cross hatched band represents the total systematic and statistical uncertainties. Events to the left of the red dashed vertical line are excluded. |
png pdf |
Figure 3-b:
Distribution of $ \Delta\phi(\vec{p}_T^{\text{miss}}, \vec{p}_{\mathrm{T}}^{\gamma}) $ for the 2017 (left) and 2018 (right) data sets. Templates for signal hypotheses are shown overlaid as light green and magenta dashed lines along with their cross section values. The cross hatched band represents the total systematic and statistical uncertainties. Events to the left of the red dashed vertical line are excluded. |
png pdf |
Figure 4:
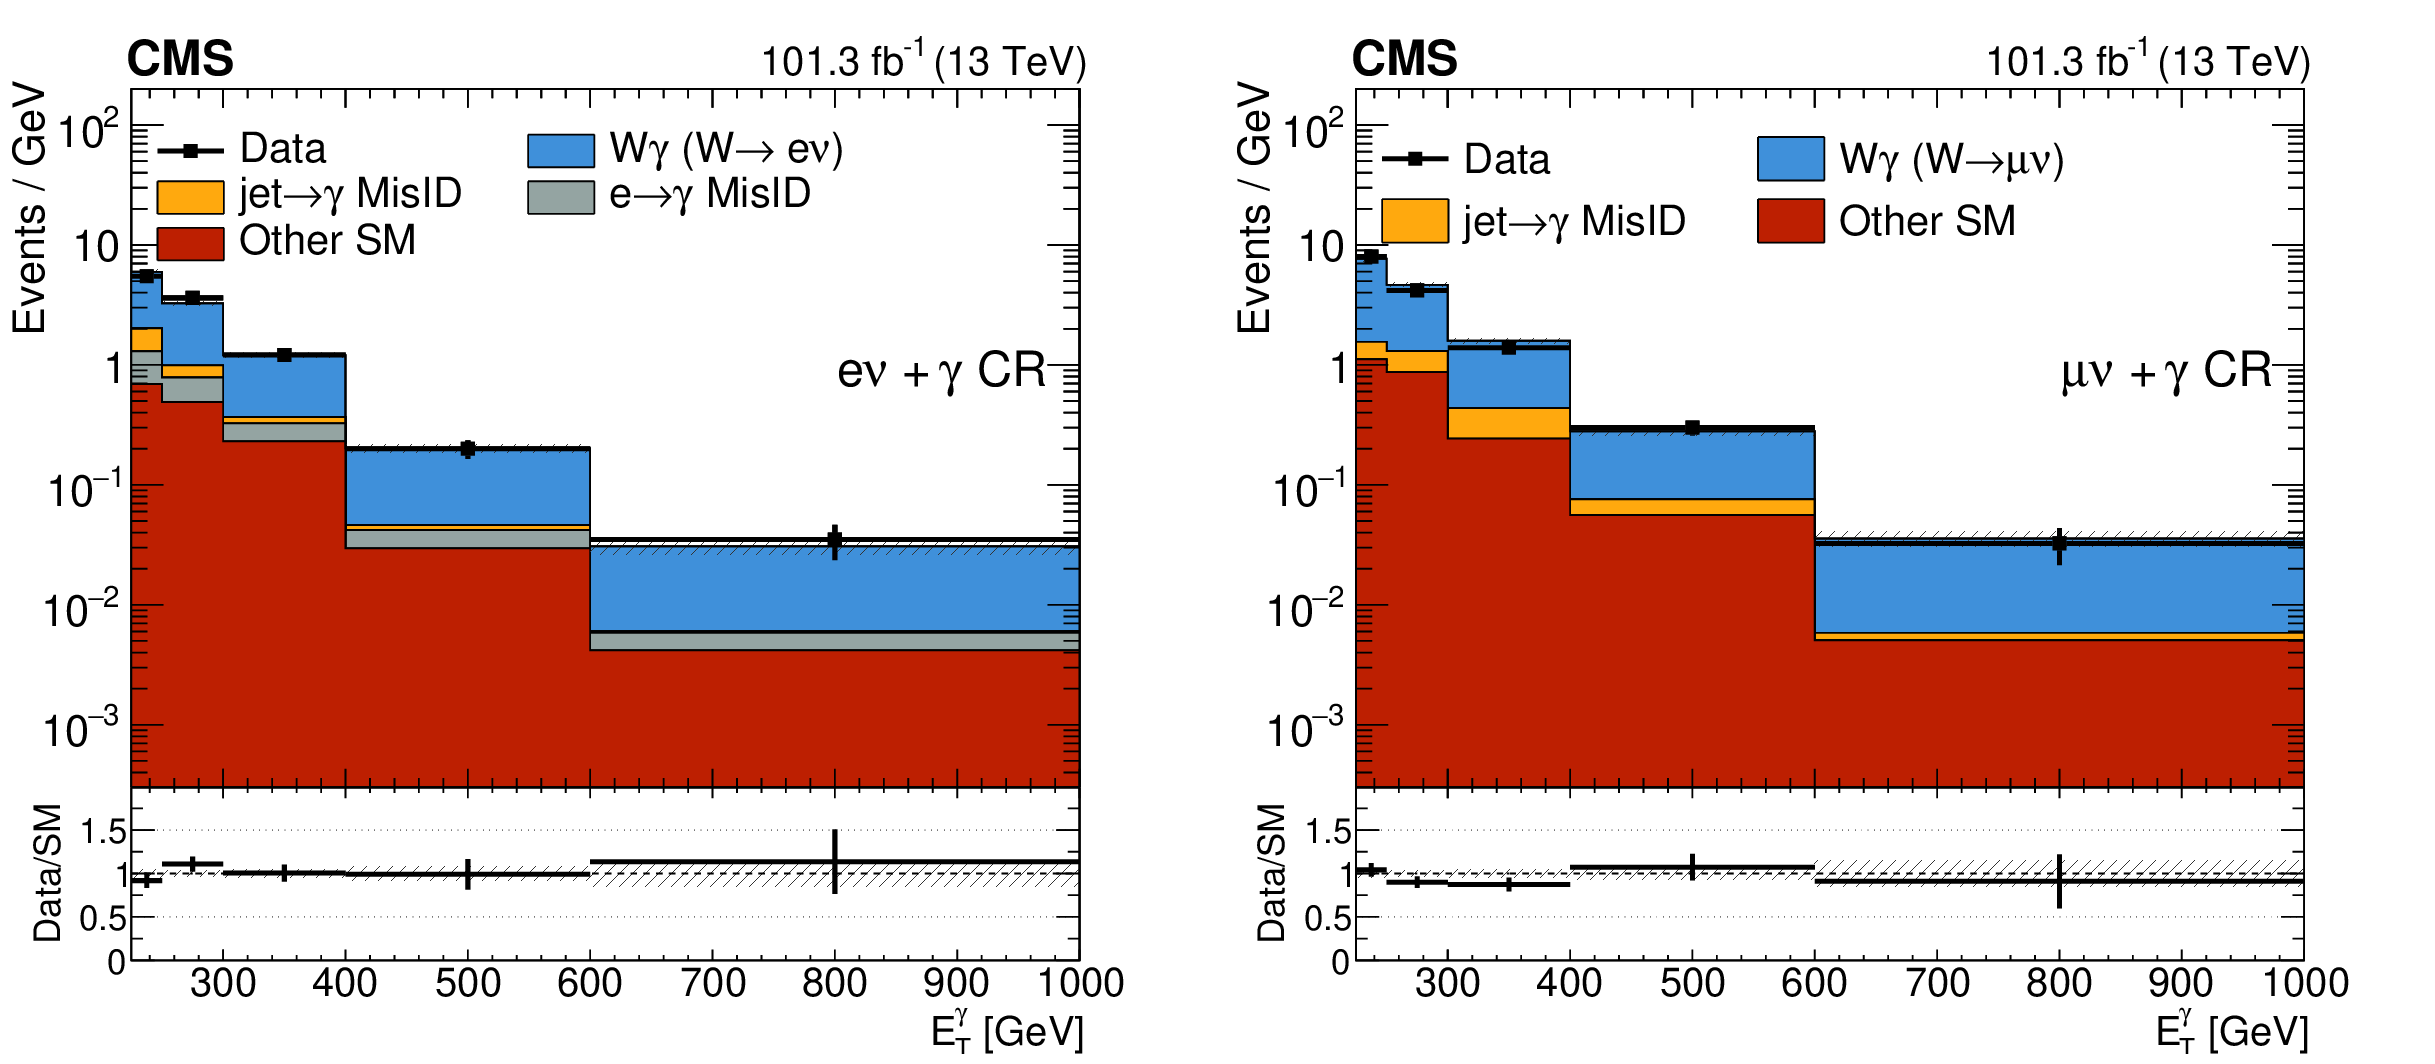
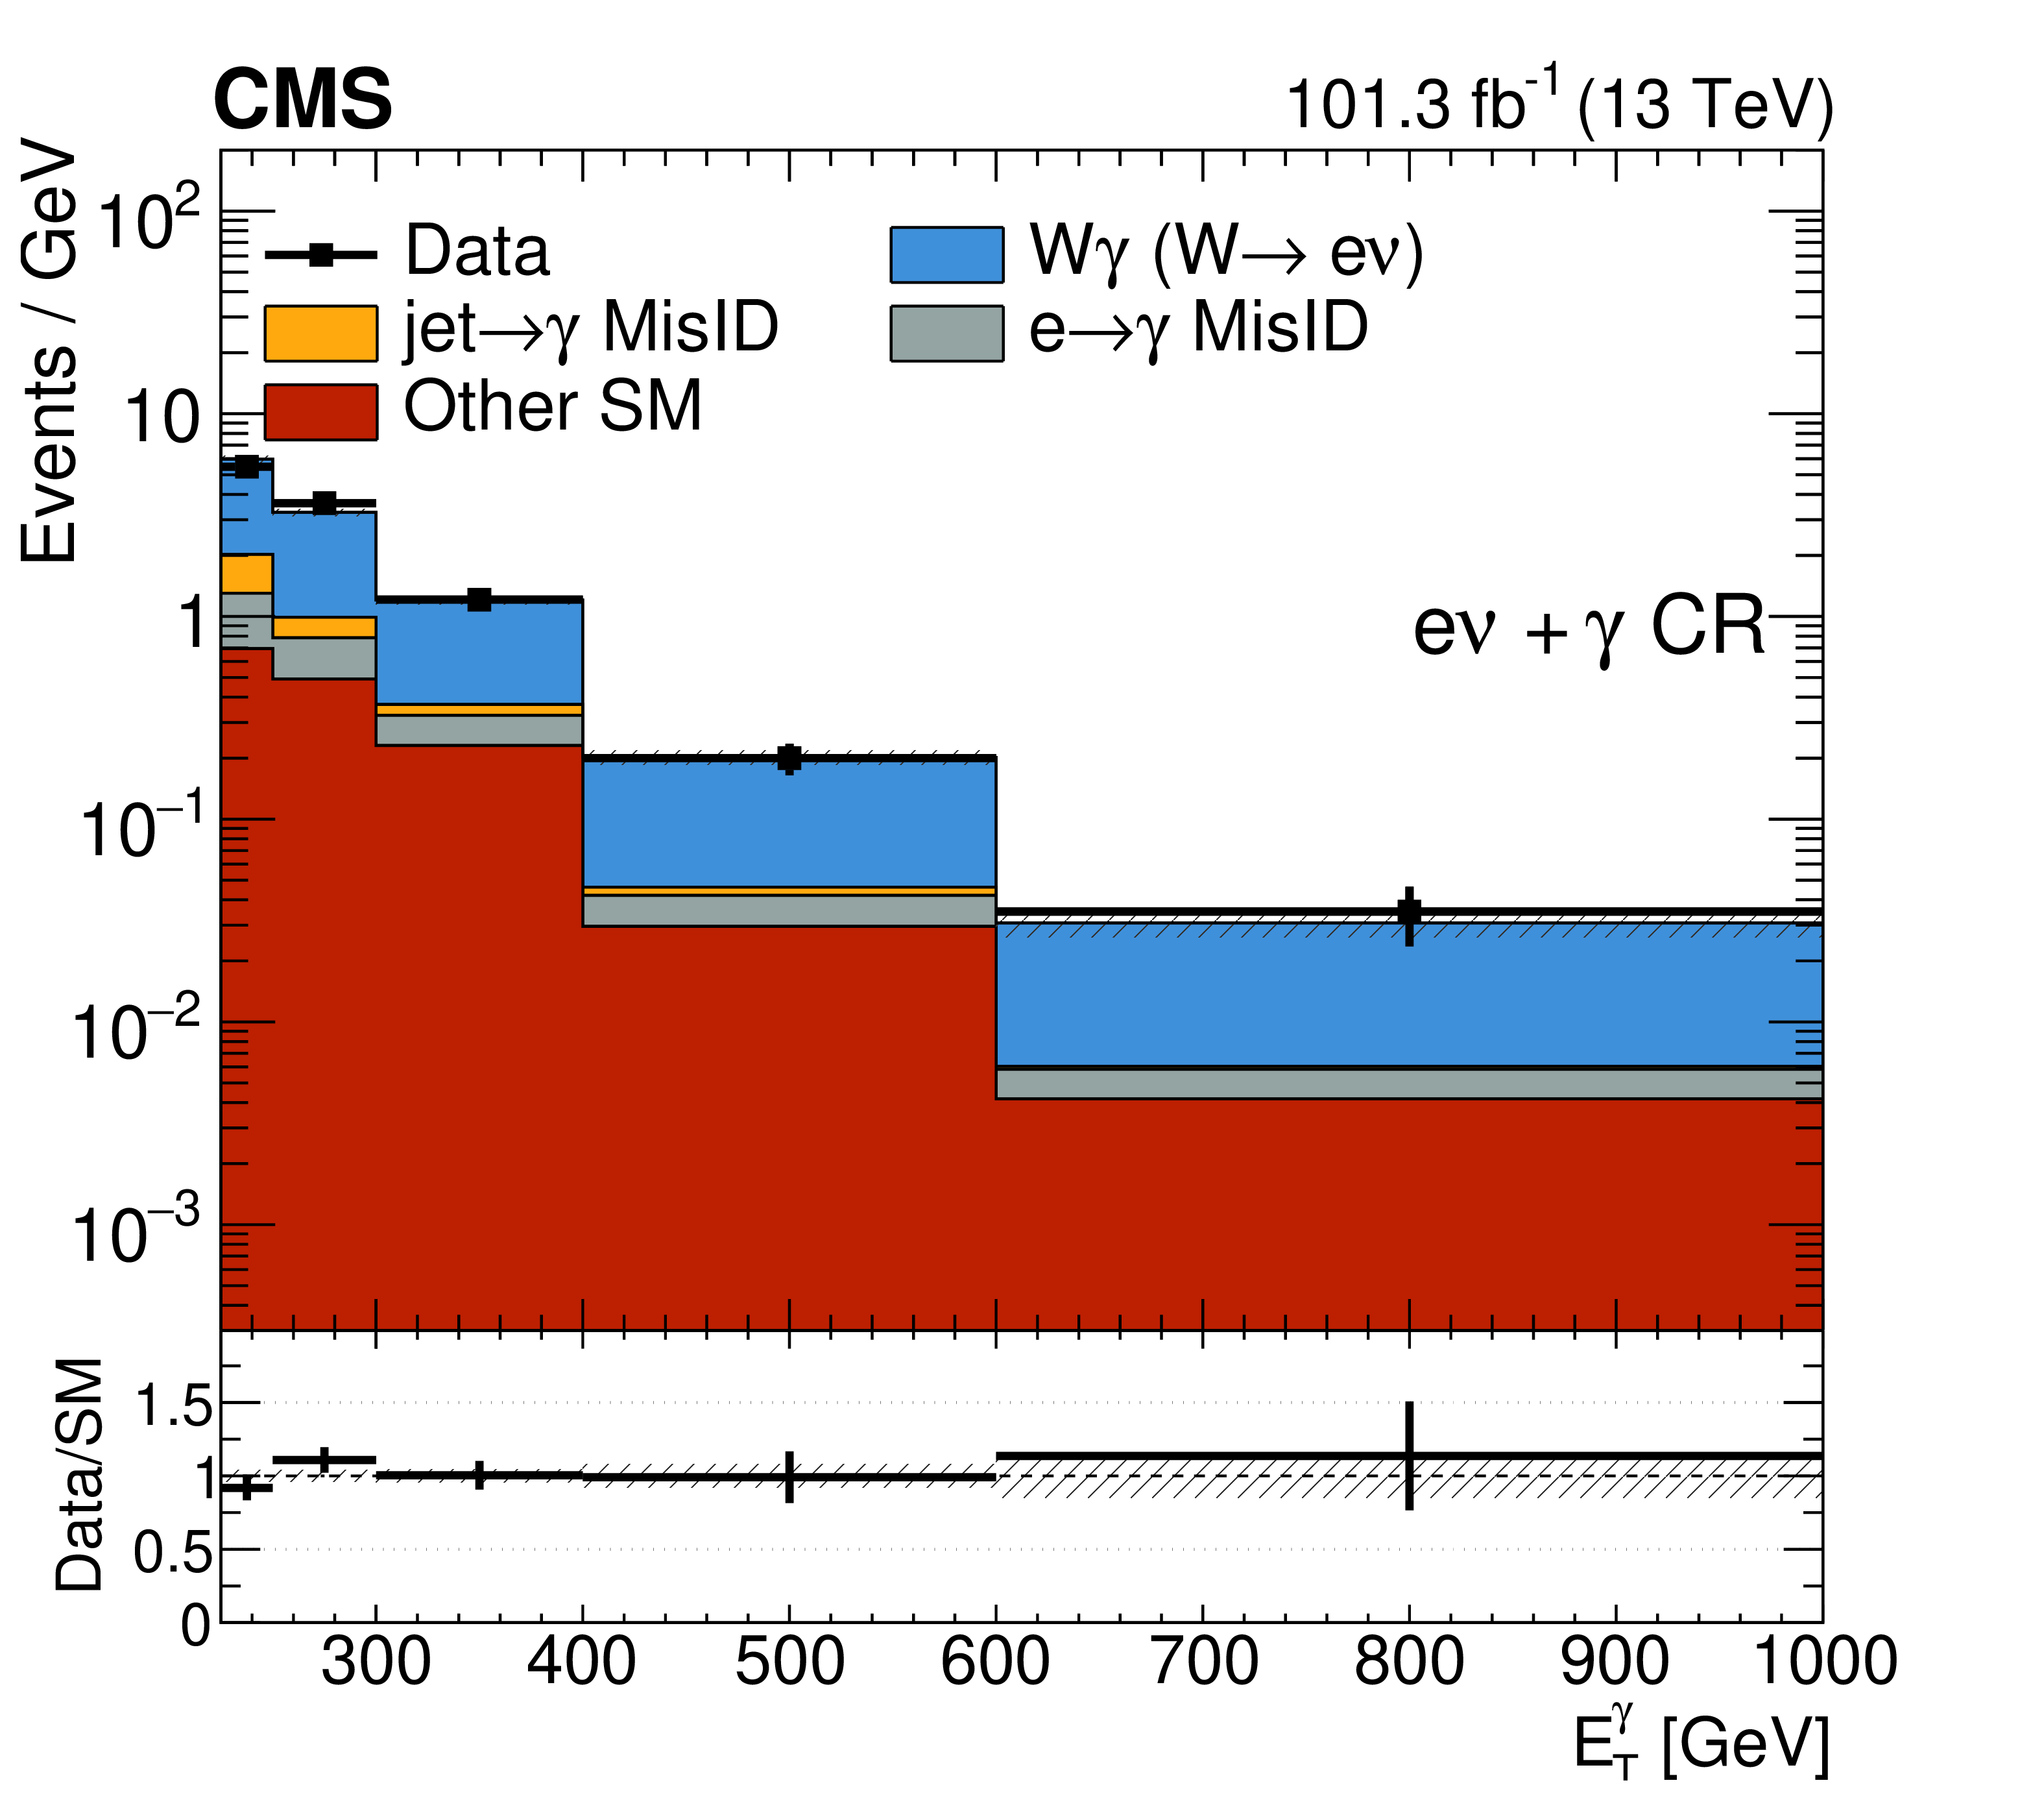
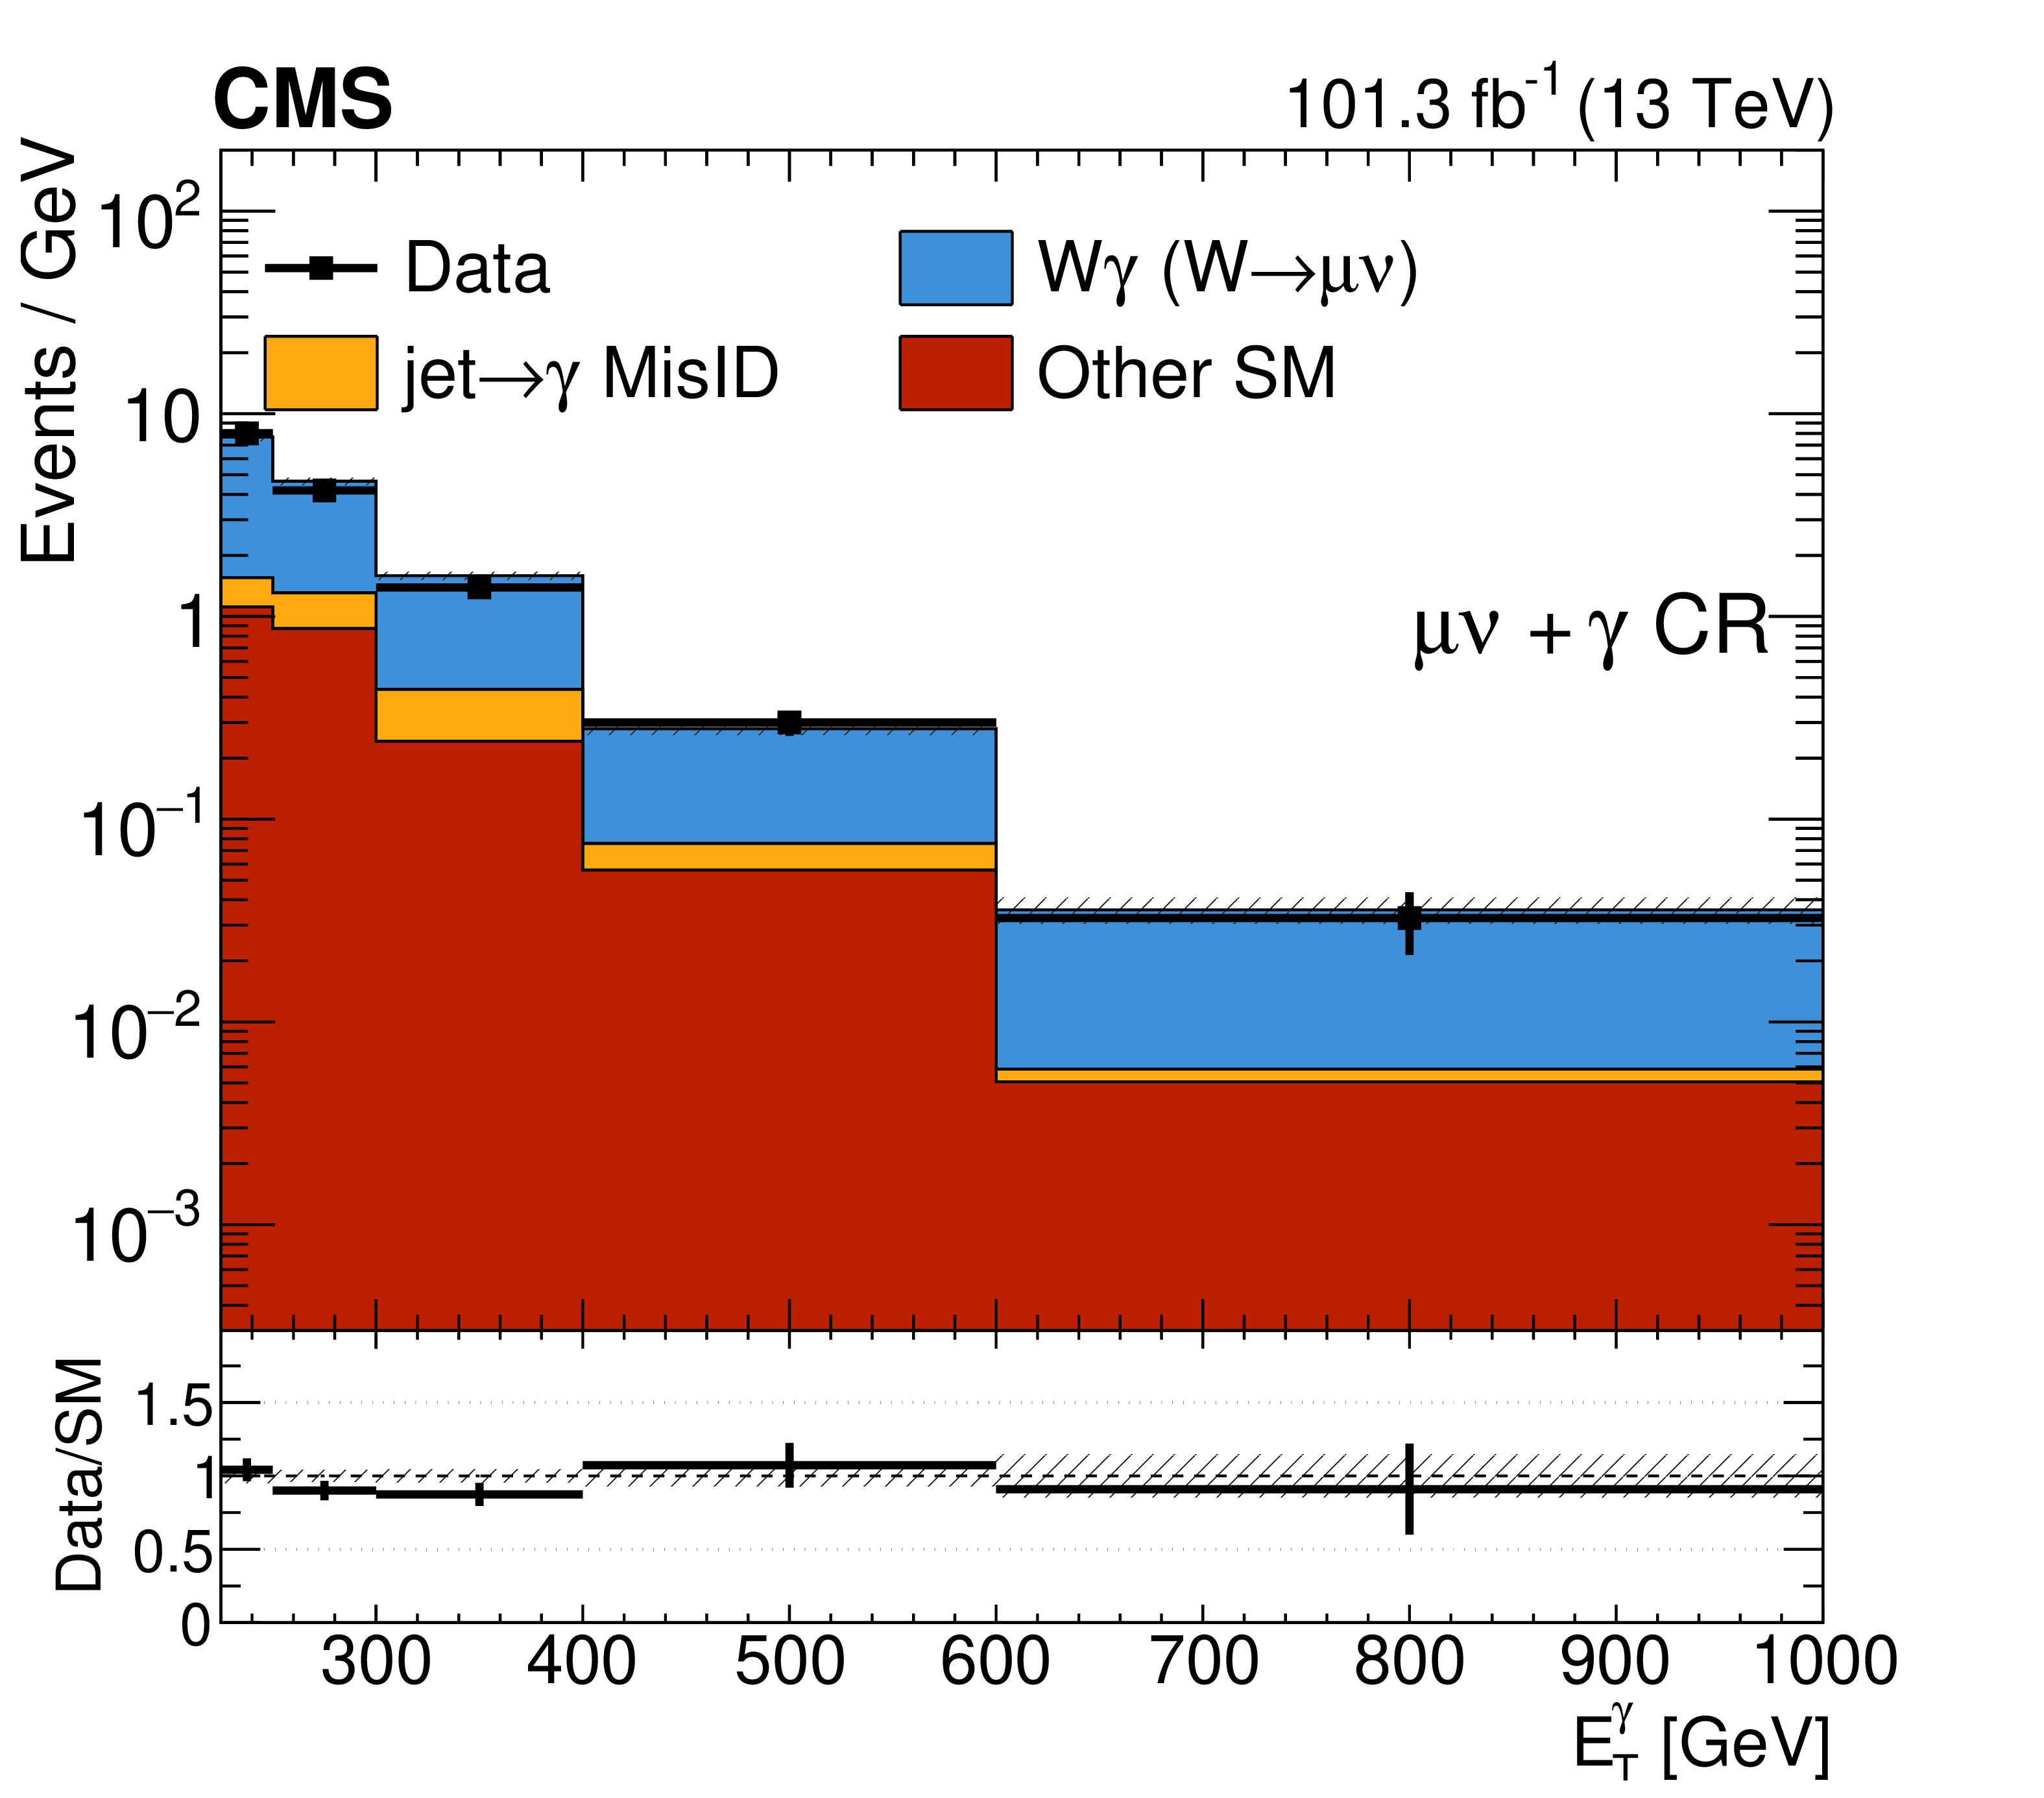
Comparison of data and background post-fit distributions in the $ \mathrm{e} \nu + \gamma $ (left) and $ \mu \nu +\gamma $ (right) CRs for the combination of 2017 and 2018 data sets. The last bin of the distribution includes the overflow events. The ratios of data to the background predictions are shown in the lower panels, with the cross hatched uncertainty bands including the combination of all systematic uncertainties. |
png pdf |
Figure 4-a:
Comparison of data and background post-fit distributions in the $ \mathrm{e} \nu + \gamma $ (left) and $ \mu \nu +\gamma $ (right) CRs for the combination of 2017 and 2018 data sets. The last bin of the distribution includes the overflow events. The ratios of data to the background predictions are shown in the lower panels, with the cross hatched uncertainty bands including the combination of all systematic uncertainties. |
png pdf |
Figure 4-b:
Comparison of data and background post-fit distributions in the $ \mathrm{e} \nu + \gamma $ (left) and $ \mu \nu +\gamma $ (right) CRs for the combination of 2017 and 2018 data sets. The last bin of the distribution includes the overflow events. The ratios of data to the background predictions are shown in the lower panels, with the cross hatched uncertainty bands including the combination of all systematic uncertainties. |
png pdf |
Figure 5:
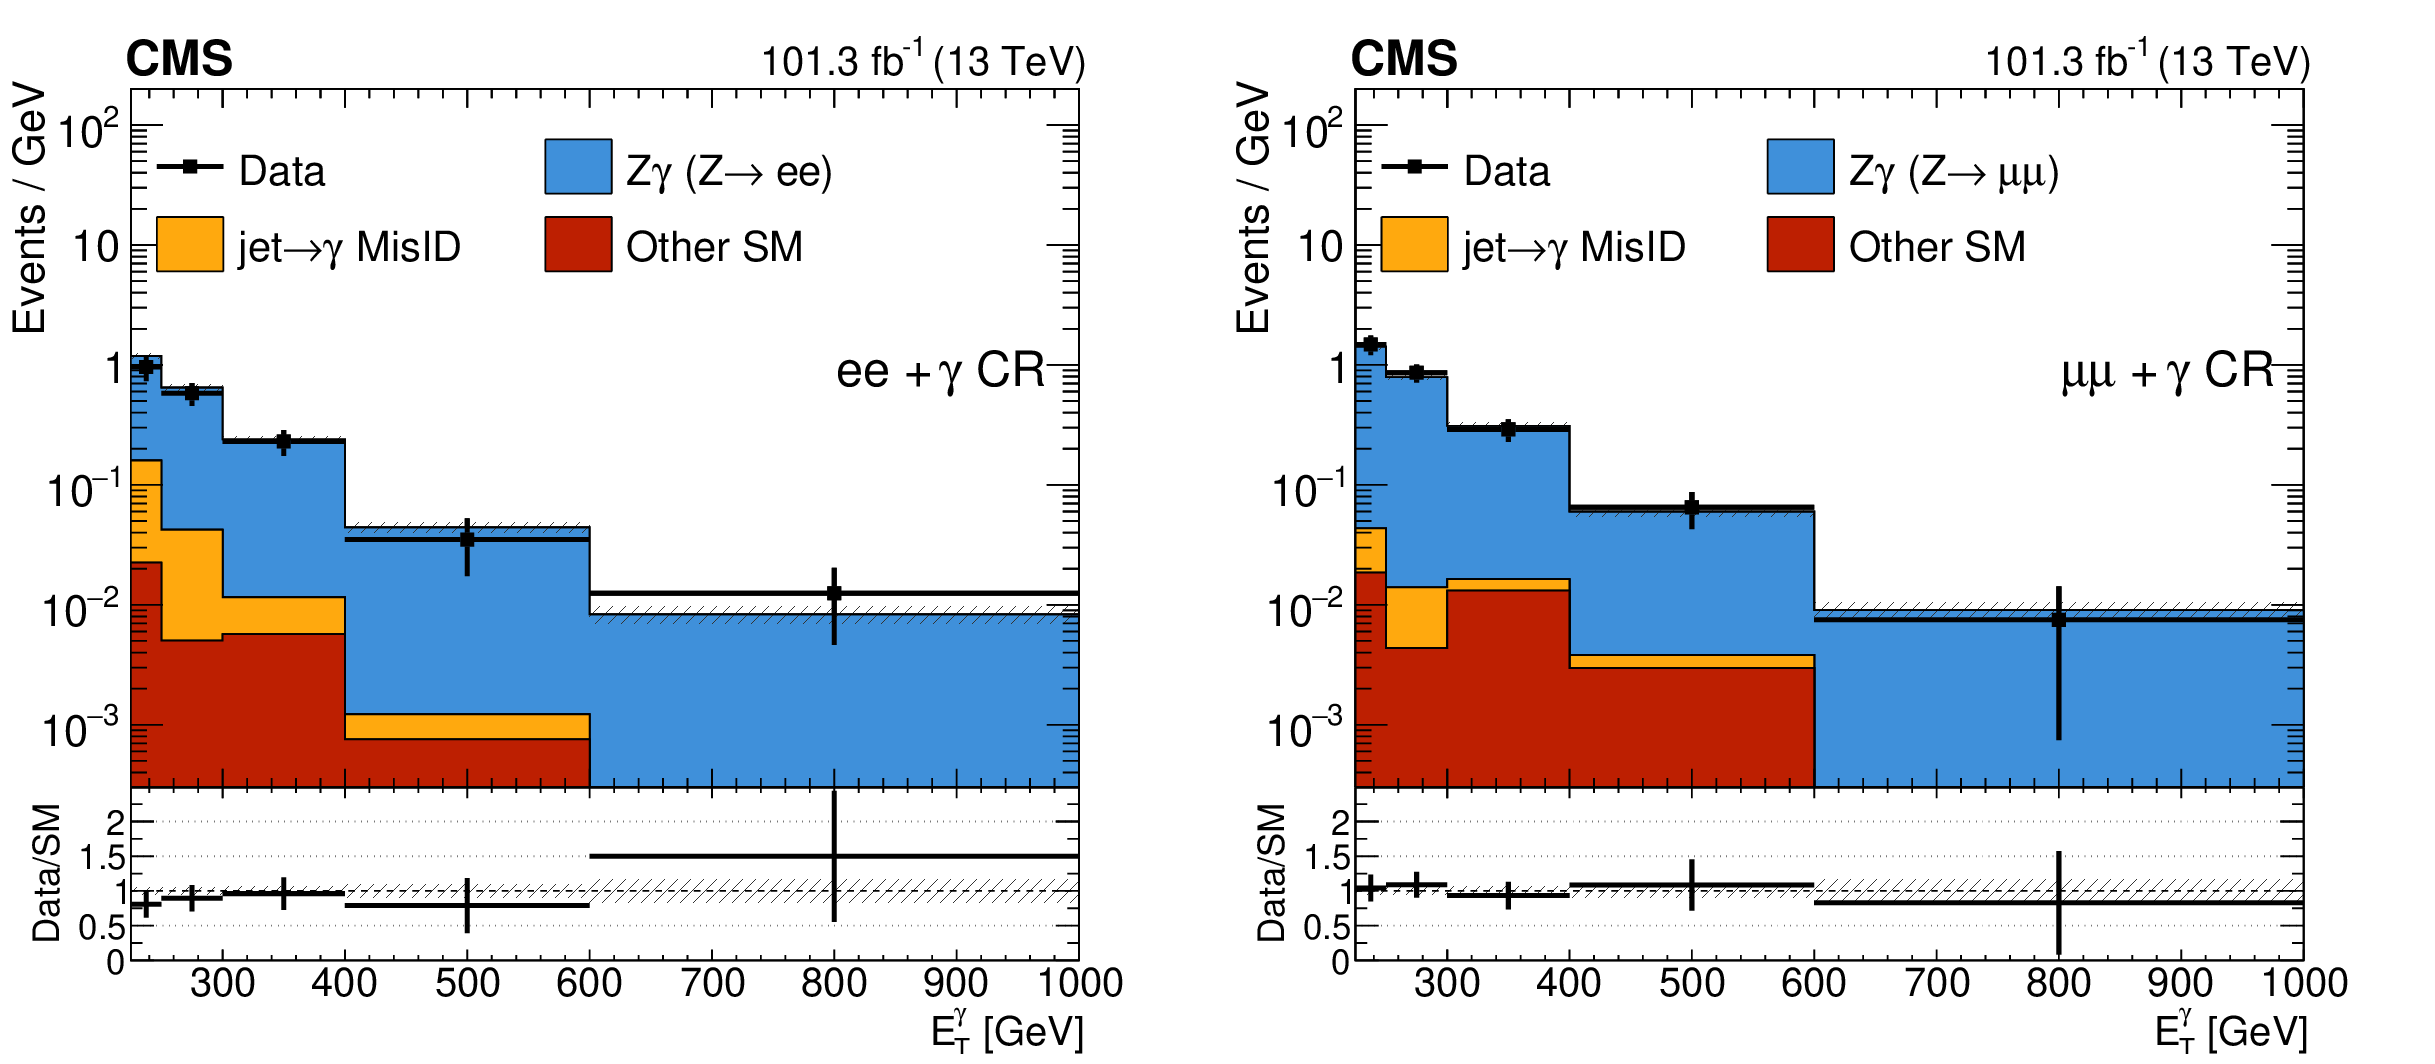
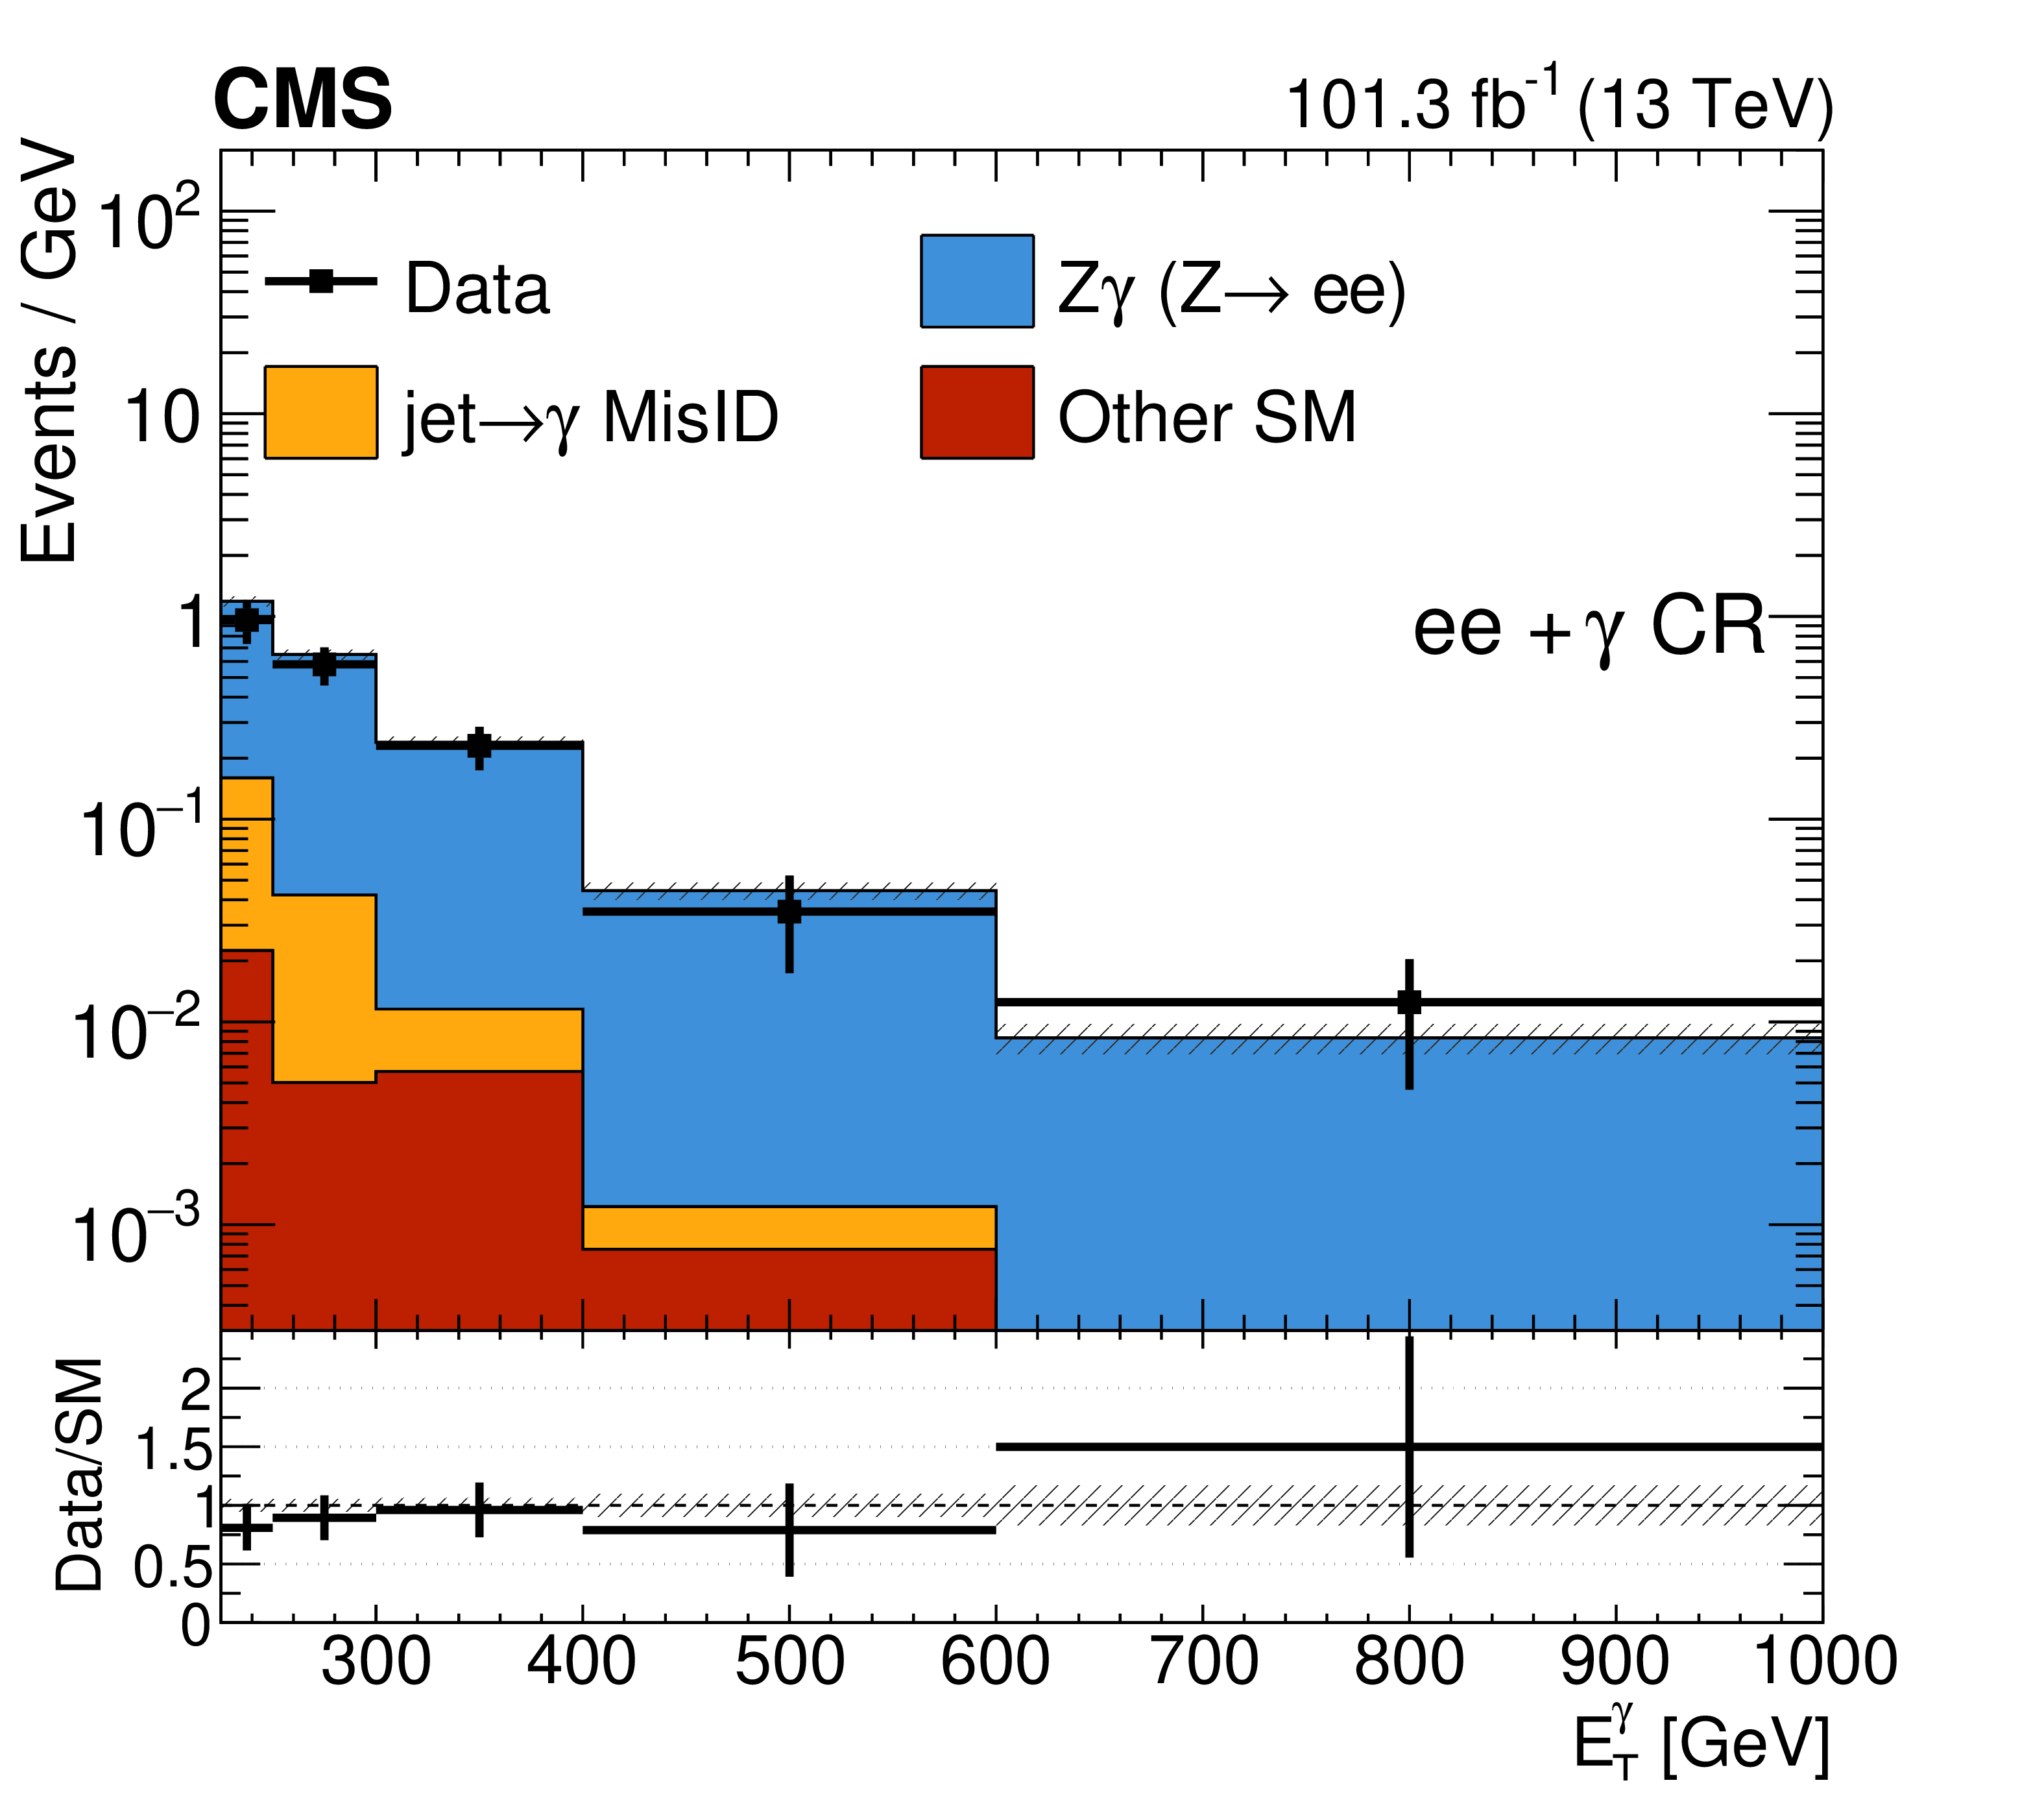
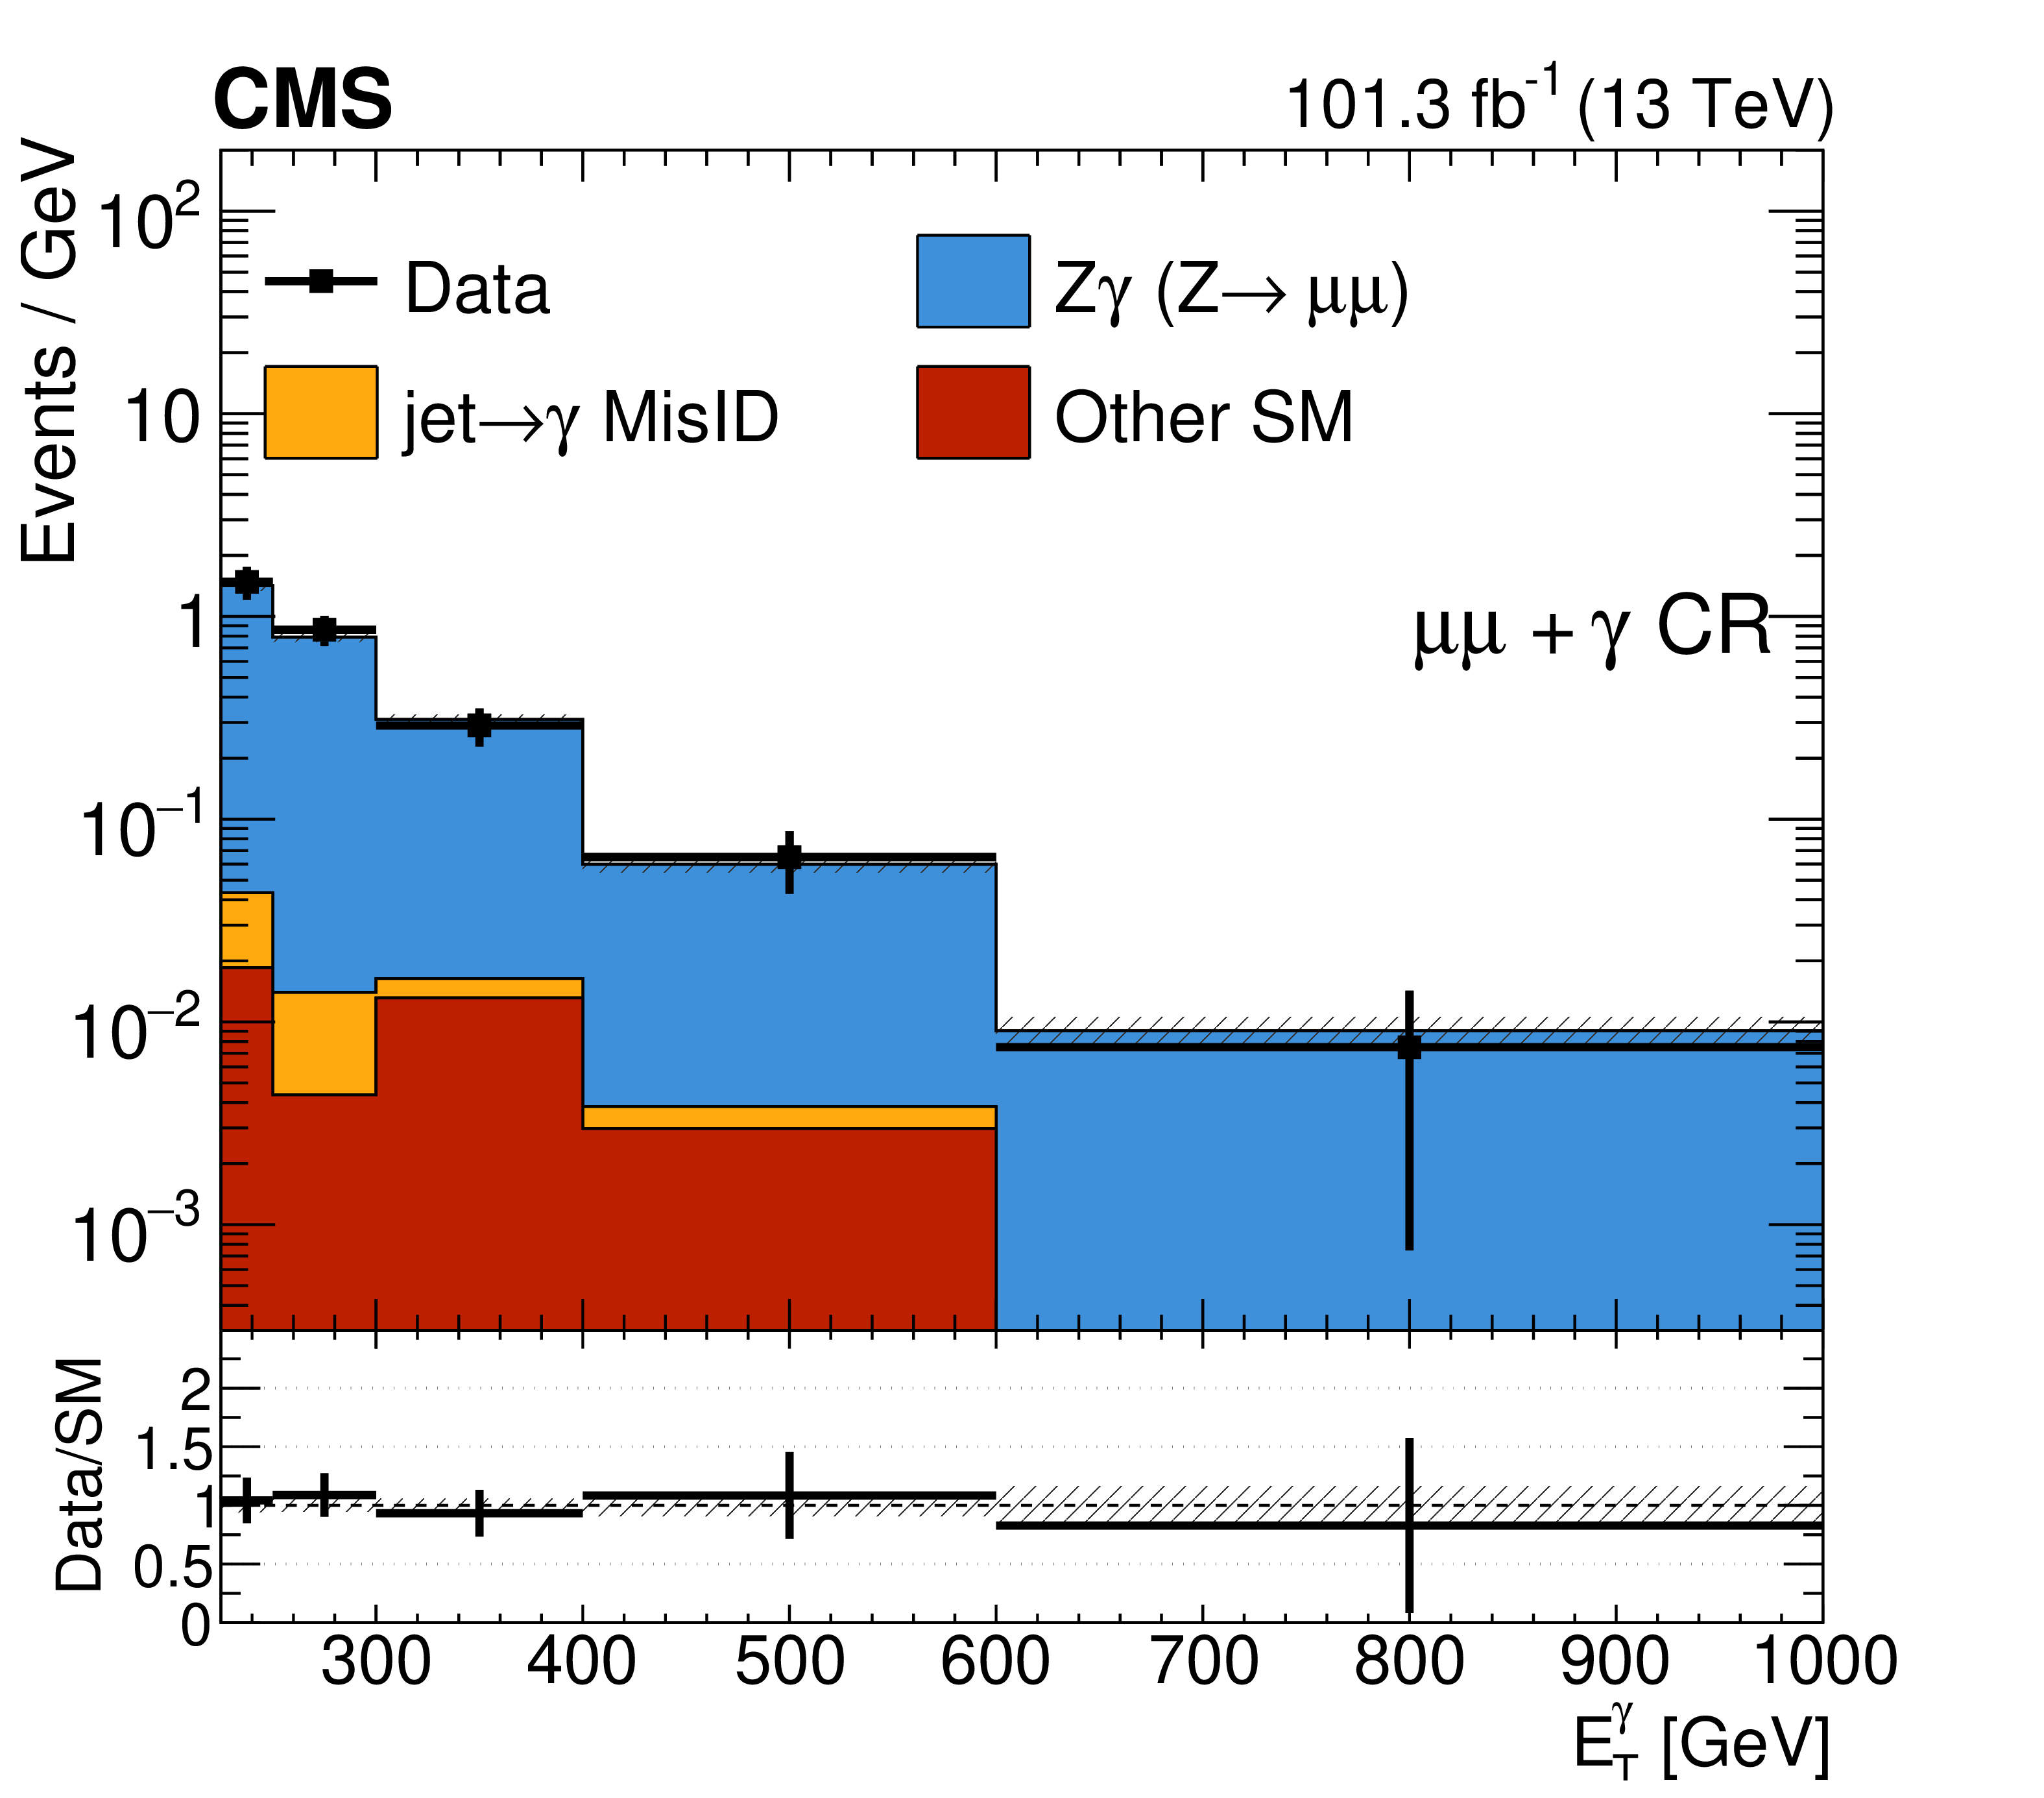
Comparison of data and background post-fit distributions in the $ \mathrm{e}\mathrm{e} + \gamma $ (left) and $ \mu\mu+ \gamma $ (right) CRs for the combination of 2017 and 2018 data sets. The last bin of the distribution includes the overflow events. The ratios of data to the background predictions are shown in the lower panels, with the cross hatched uncertainty bands including the combination of all systematic uncertainties. |
png pdf |
Figure 5-a:
Comparison of data and background post-fit distributions in the $ \mathrm{e}\mathrm{e} + \gamma $ (left) and $ \mu\mu+ \gamma $ (right) CRs for the combination of 2017 and 2018 data sets. The last bin of the distribution includes the overflow events. The ratios of data to the background predictions are shown in the lower panels, with the cross hatched uncertainty bands including the combination of all systematic uncertainties. |
png pdf |
Figure 5-b:
Comparison of data and background post-fit distributions in the $ \mathrm{e}\mathrm{e} + \gamma $ (left) and $ \mu\mu+ \gamma $ (right) CRs for the combination of 2017 and 2018 data sets. The last bin of the distribution includes the overflow events. The ratios of data to the background predictions are shown in the lower panels, with the cross hatched uncertainty bands including the combination of all systematic uncertainties. |
png pdf |
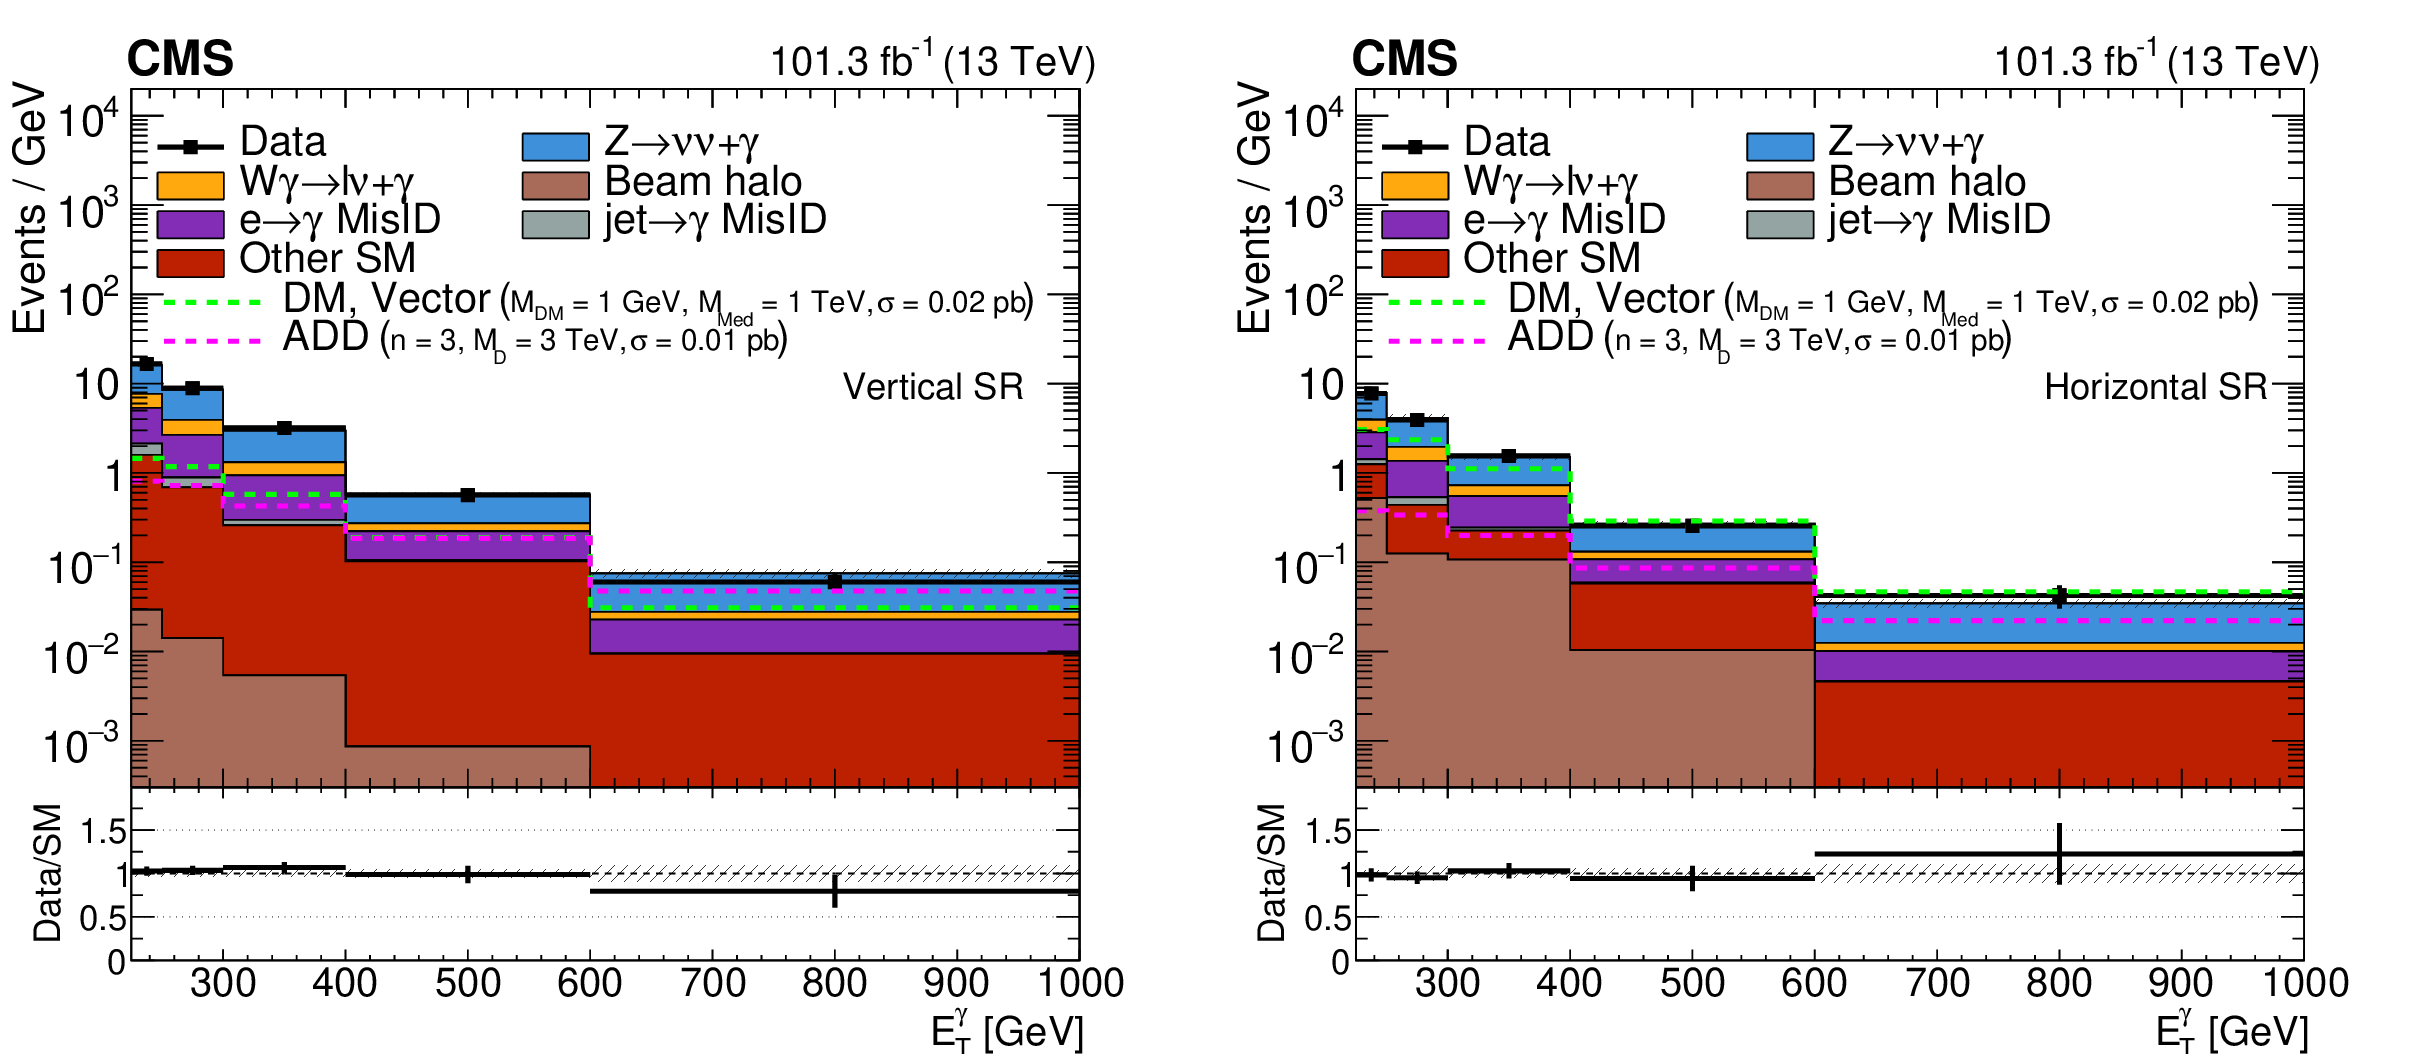
Figure 6:
Comparison of data and background post-fit distributions for the vertical (left) and horizontal (right) regions for the combination of 2017 and 2018 data sets. Templates for signal hypotheses are shown overlaid as light green and magenta dashed lines along with their cross section values. The last bin of the distribution includes the overflow events. |
png pdf |
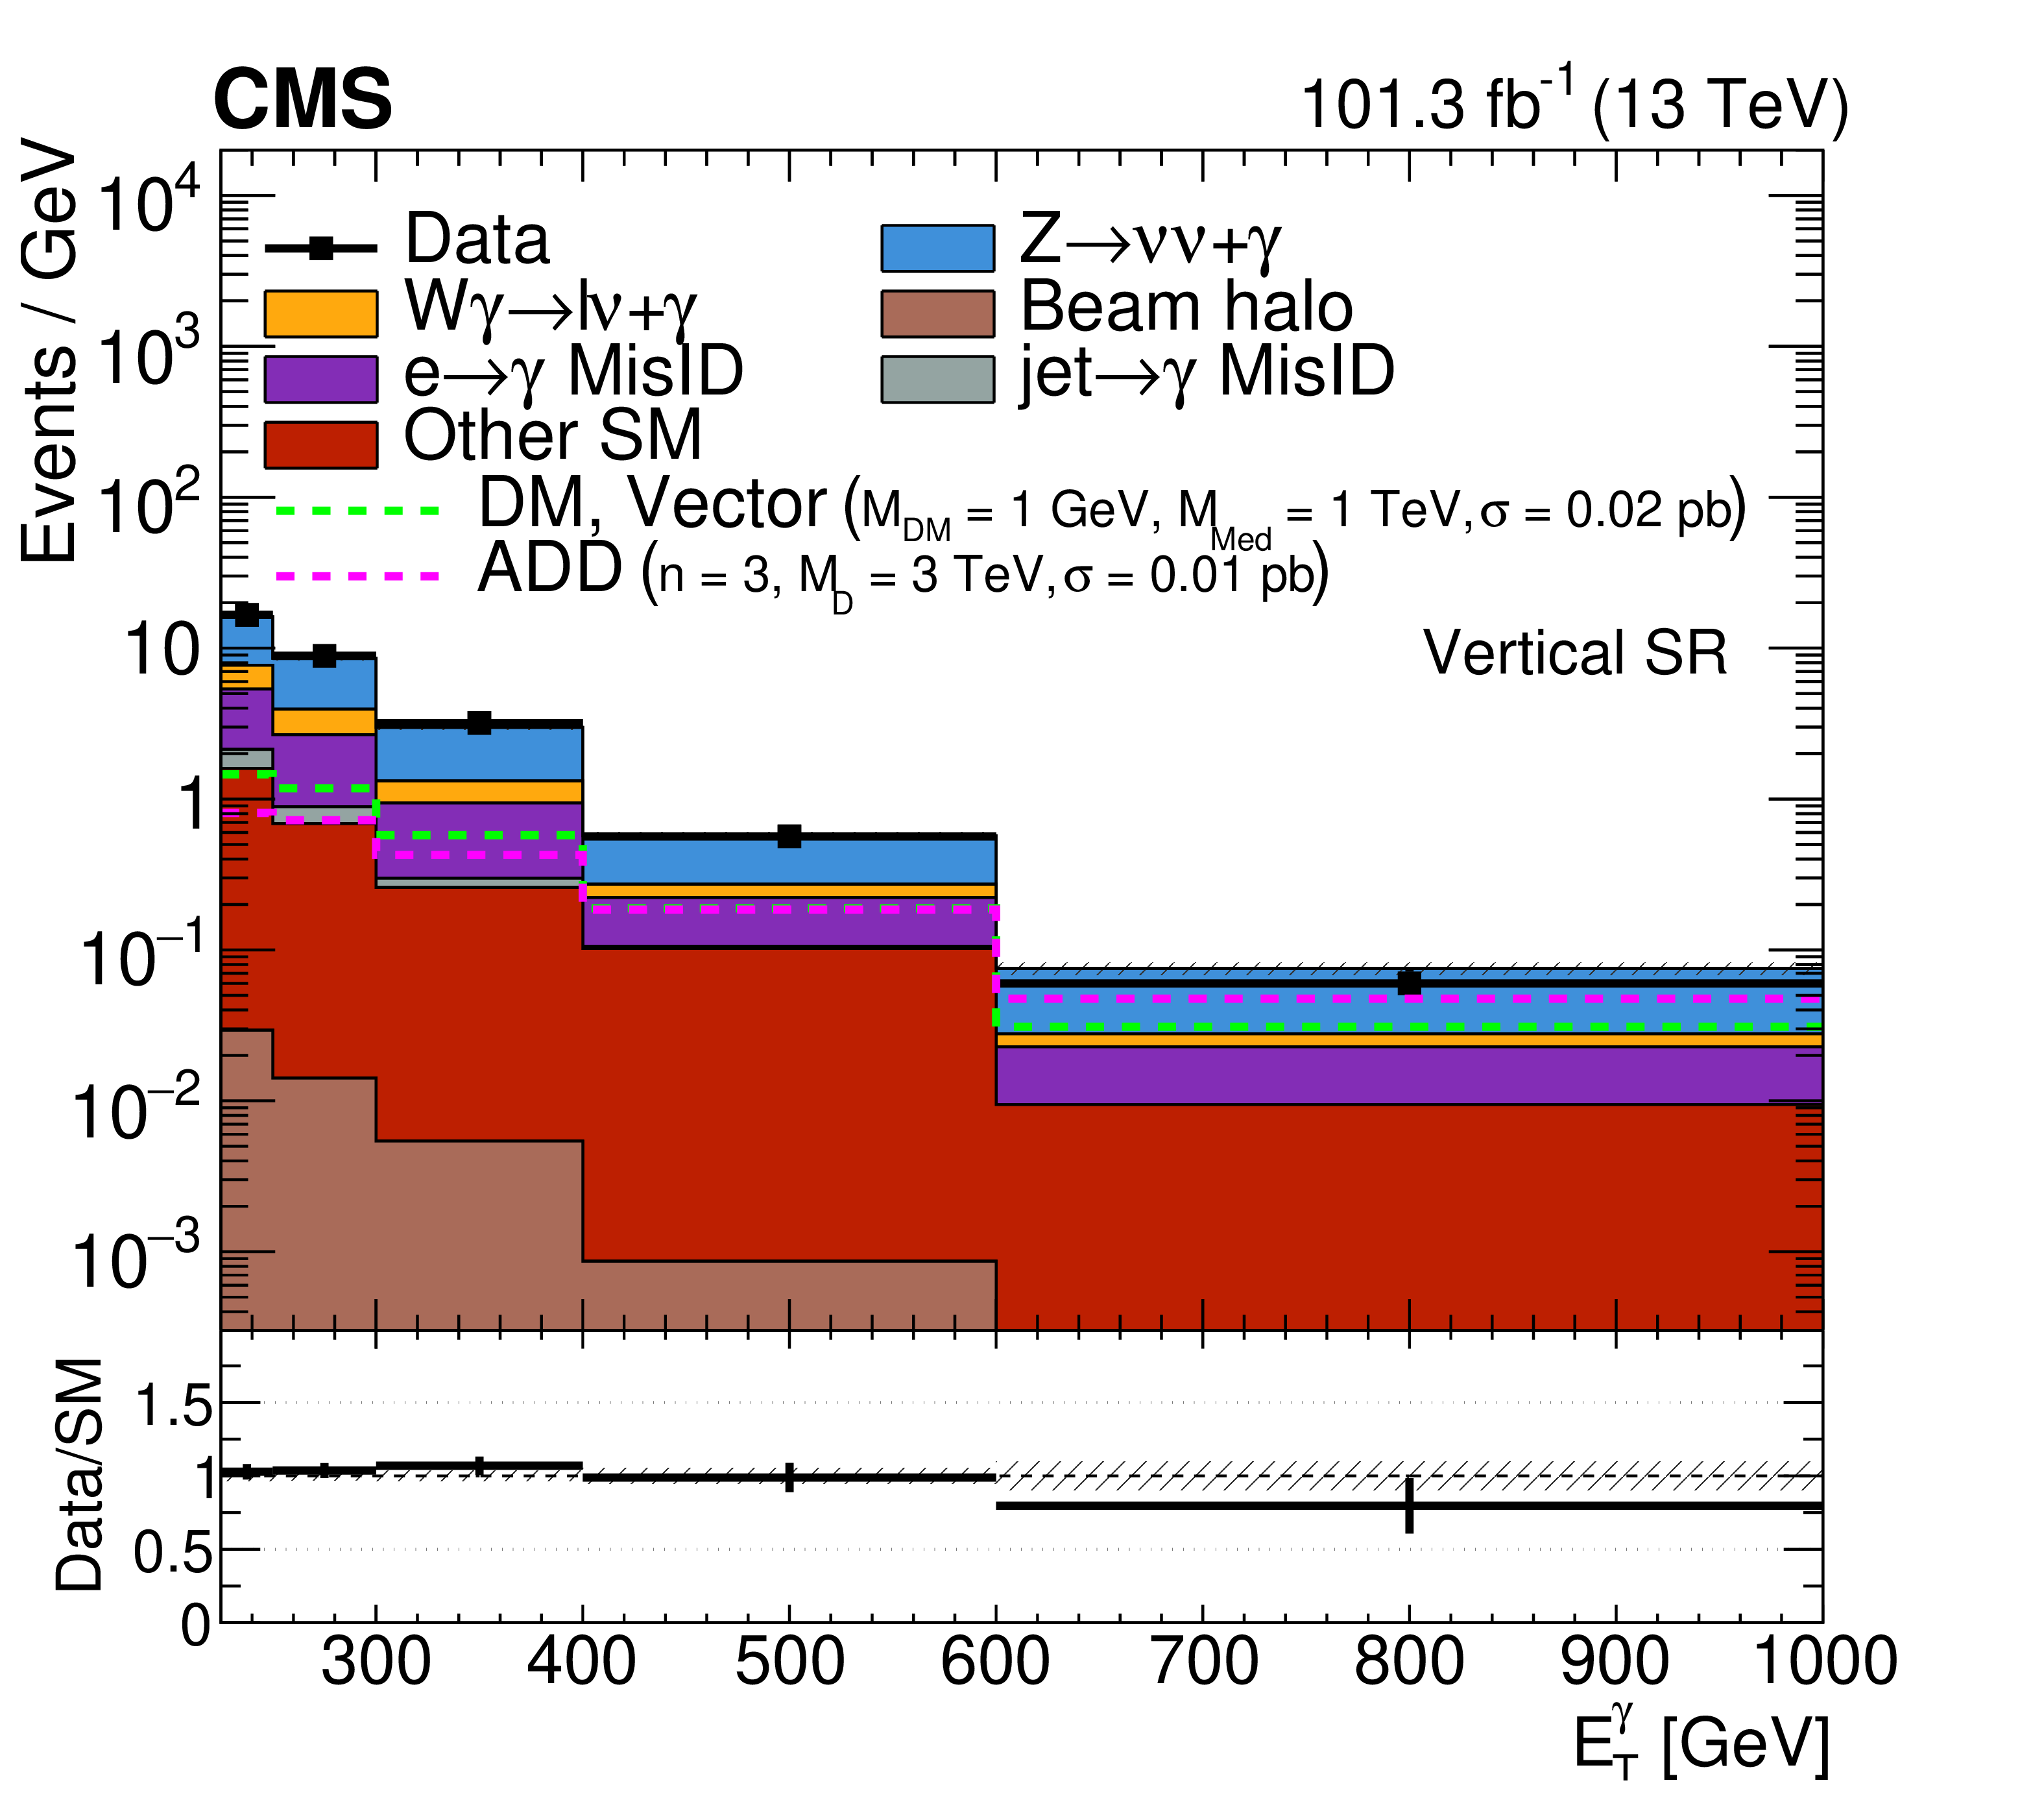
Figure 6-a:
Comparison of data and background post-fit distributions for the vertical (left) and horizontal (right) regions for the combination of 2017 and 2018 data sets. Templates for signal hypotheses are shown overlaid as light green and magenta dashed lines along with their cross section values. The last bin of the distribution includes the overflow events. |
png pdf |
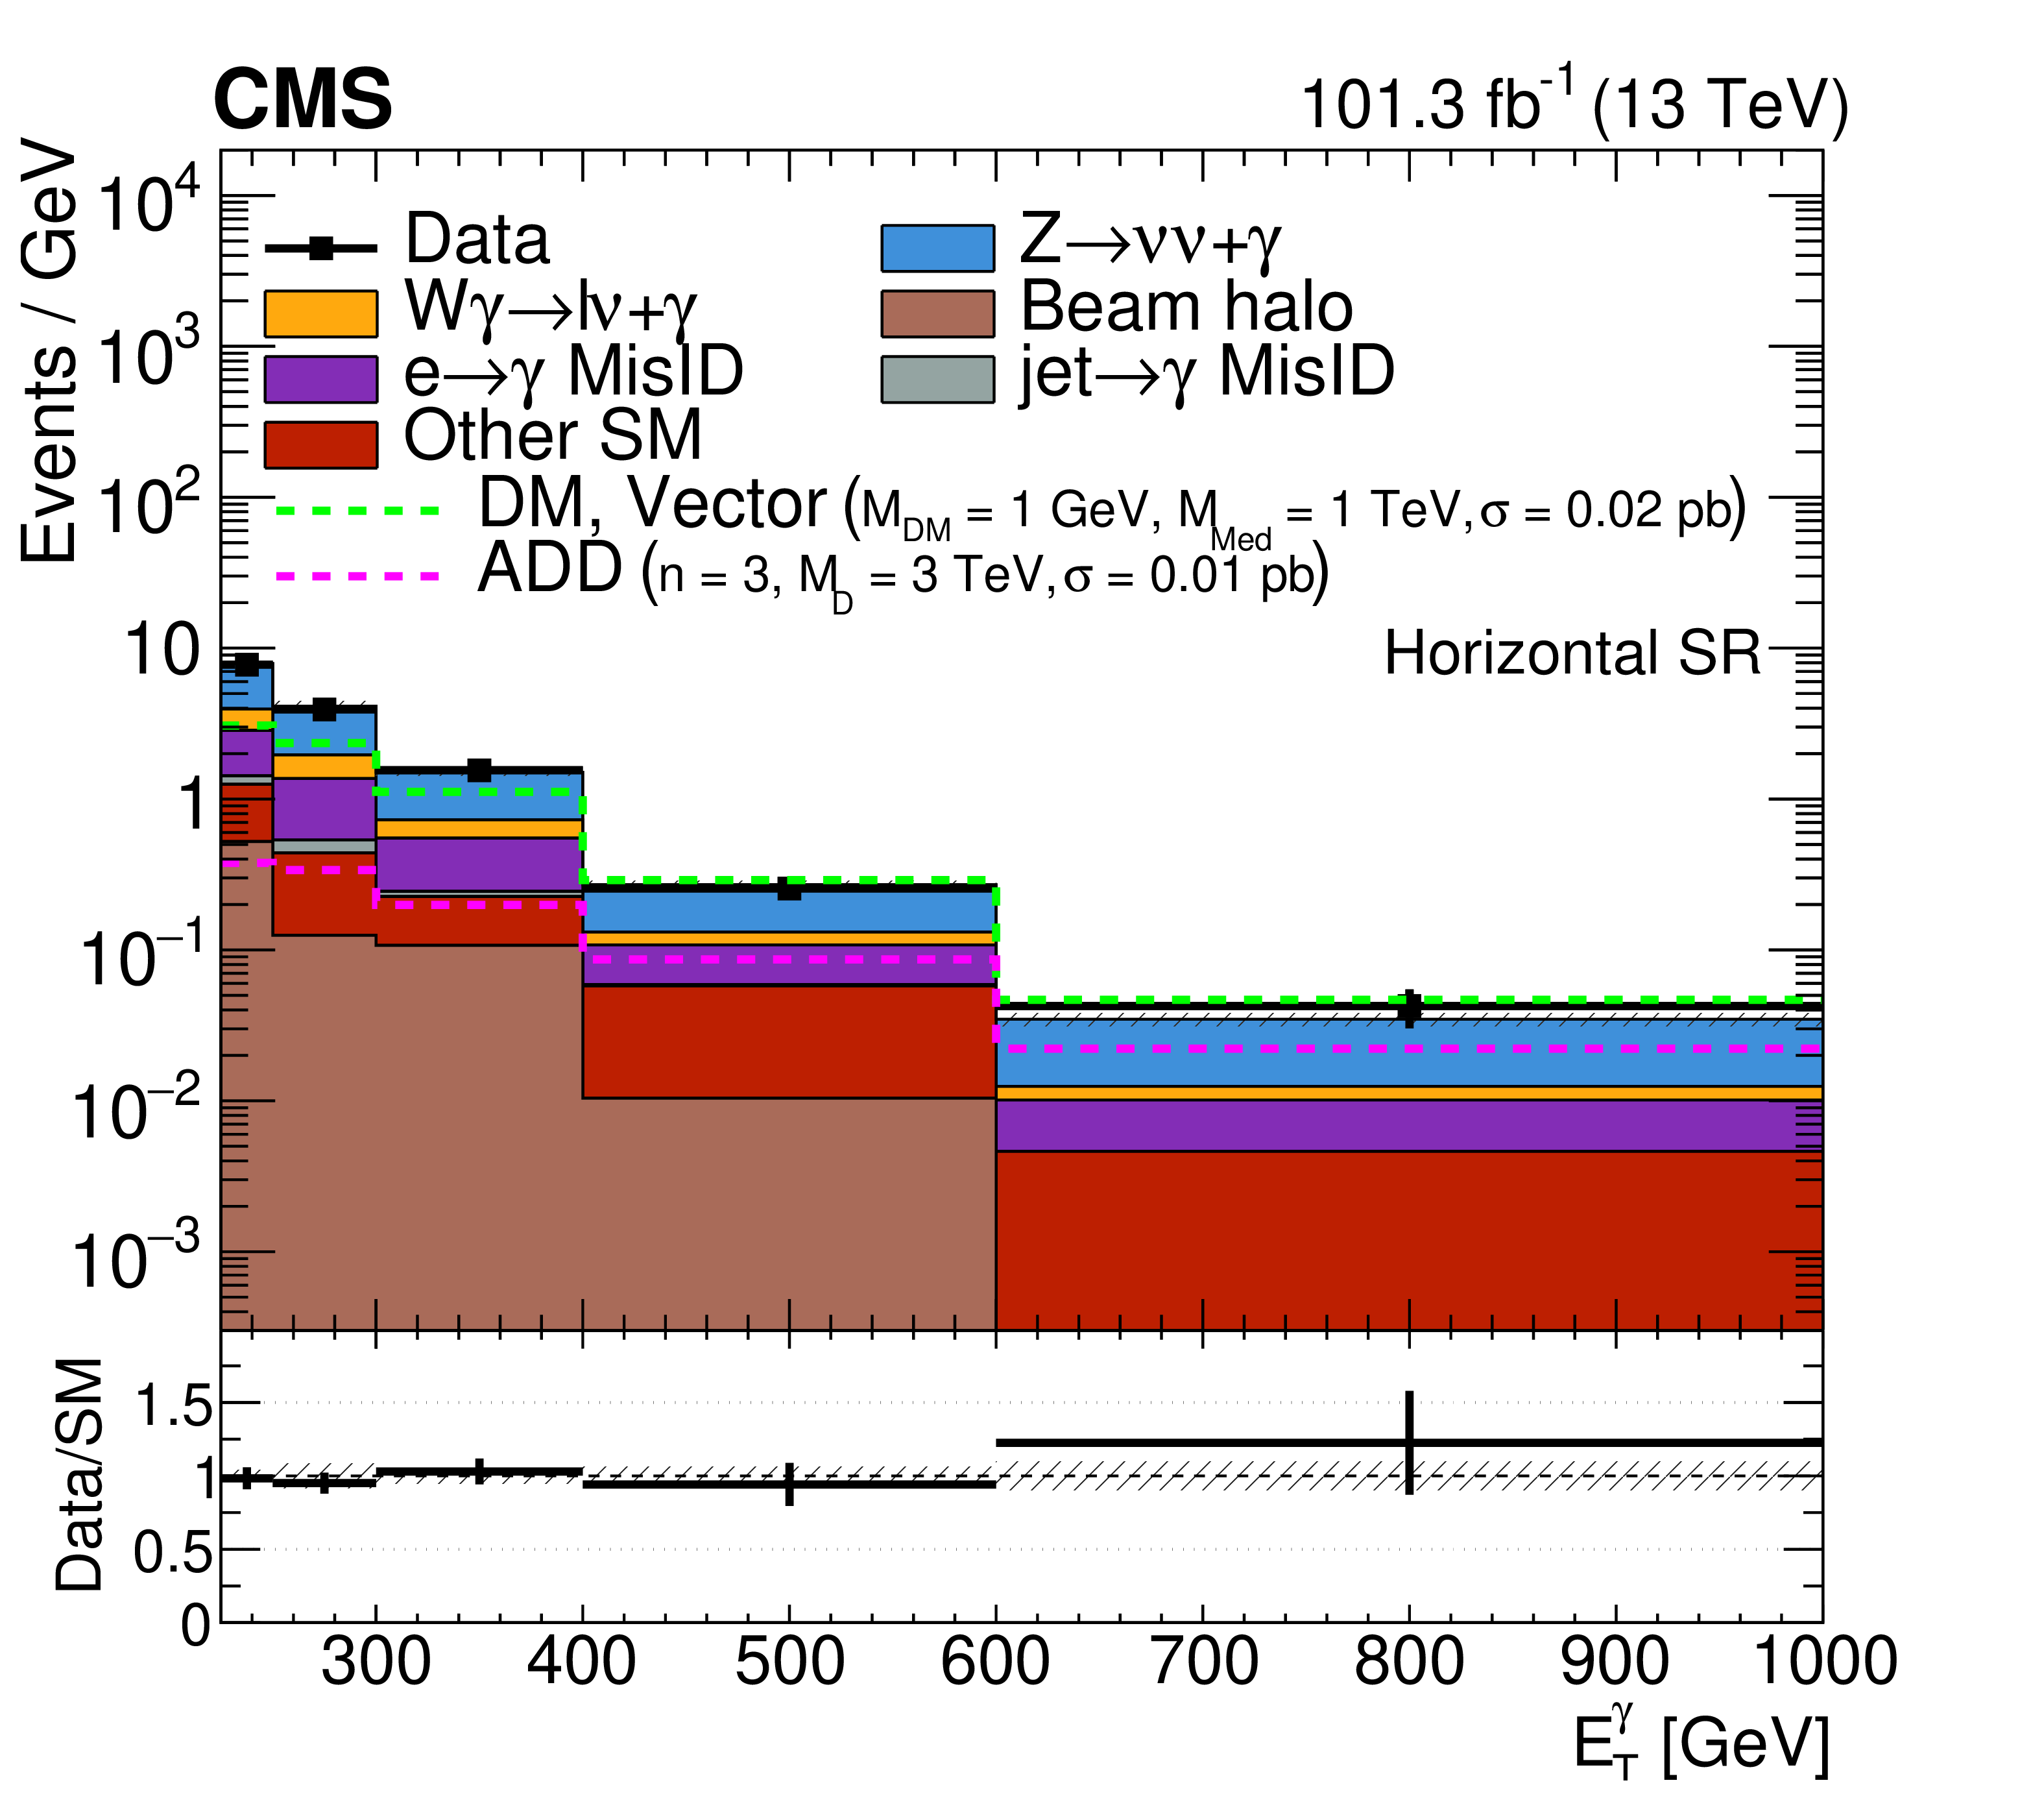
Figure 6-b:
Comparison of data and background post-fit distributions for the vertical (left) and horizontal (right) regions for the combination of 2017 and 2018 data sets. Templates for signal hypotheses are shown overlaid as light green and magenta dashed lines along with their cross section values. The last bin of the distribution includes the overflow events. |
png pdf |
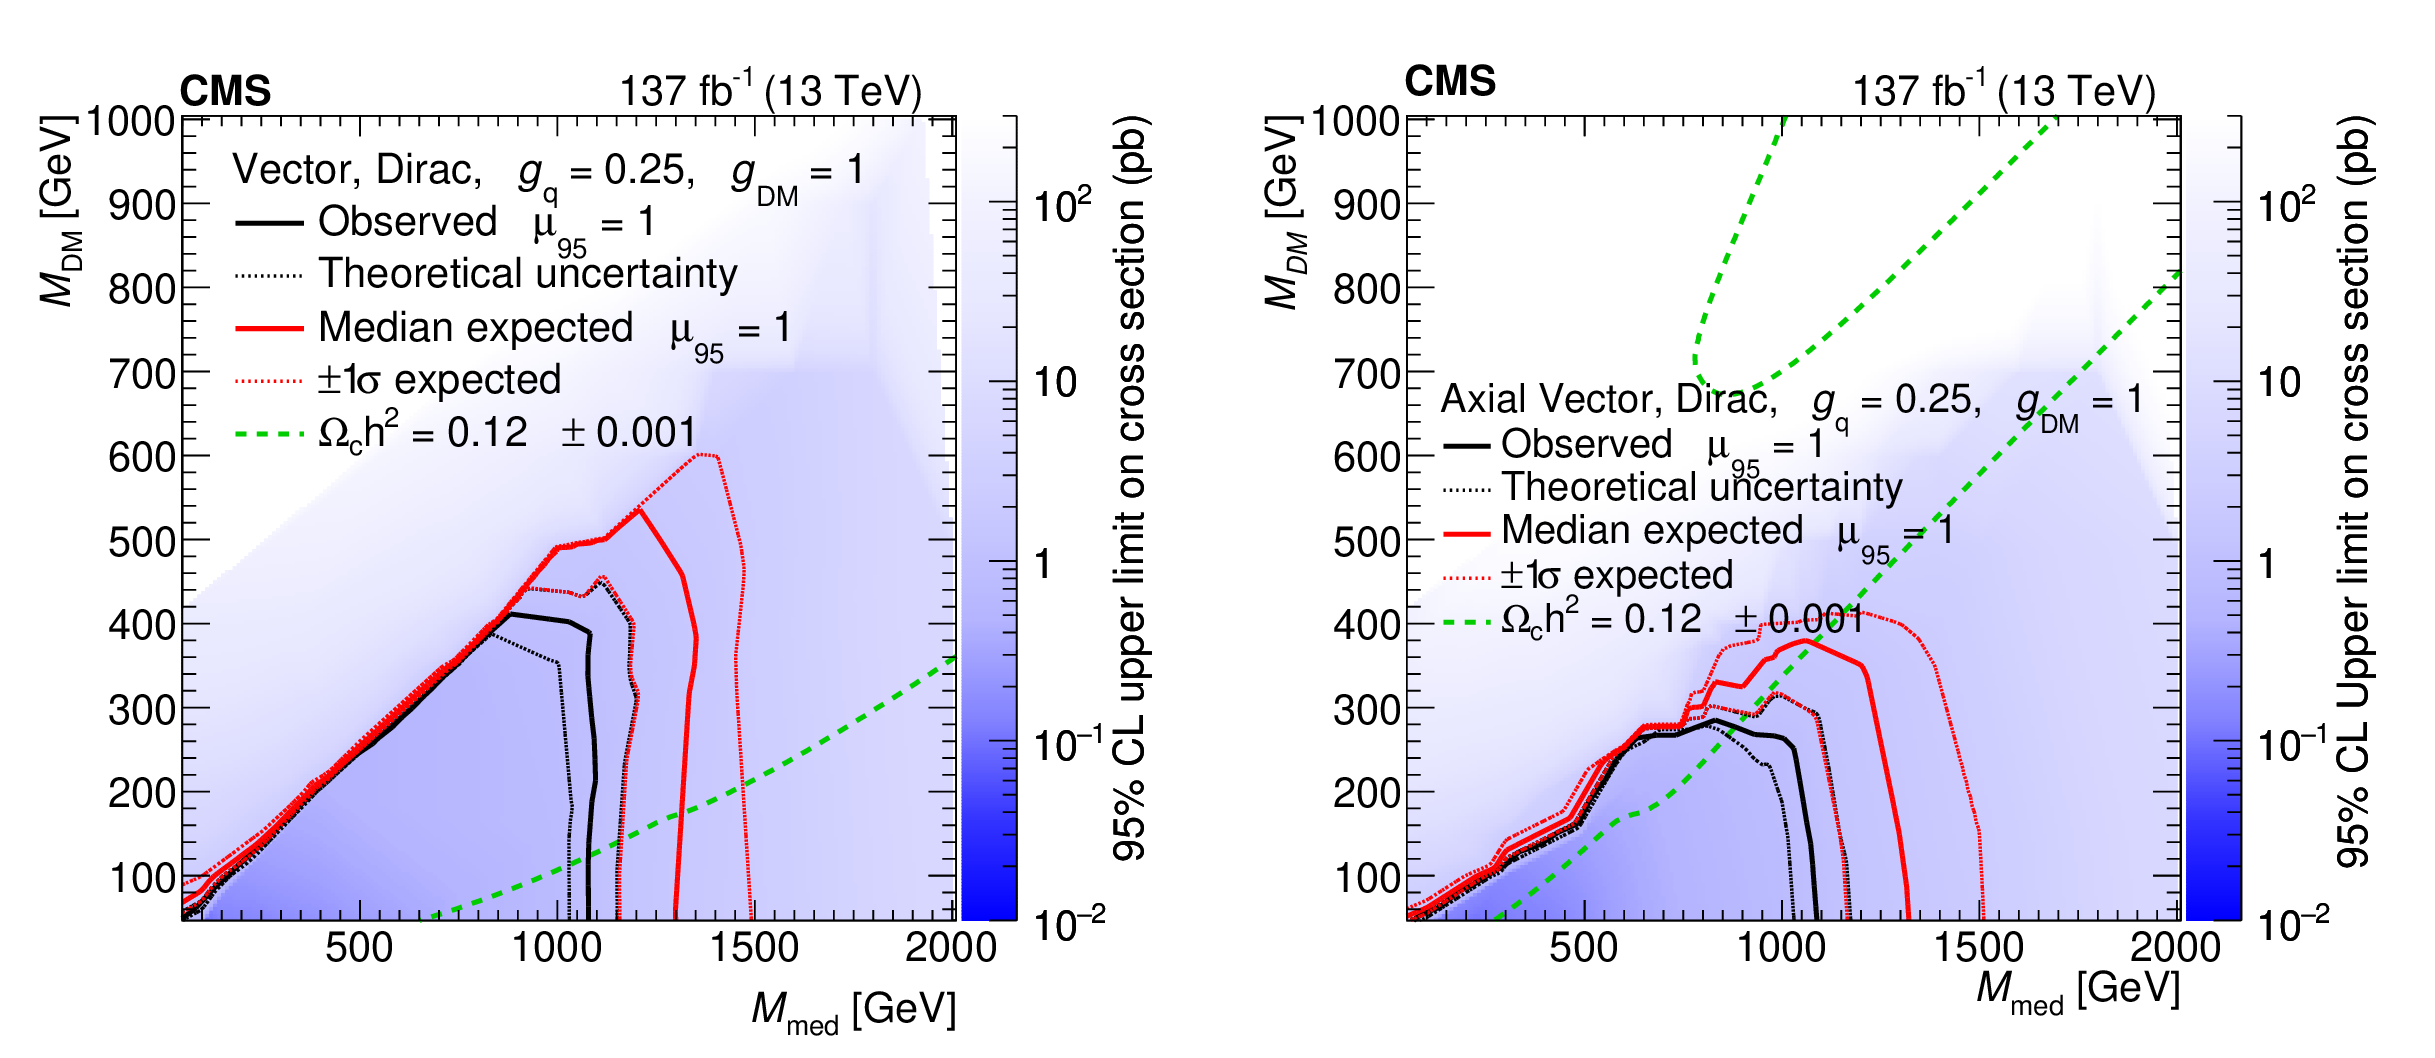
Figure 7:
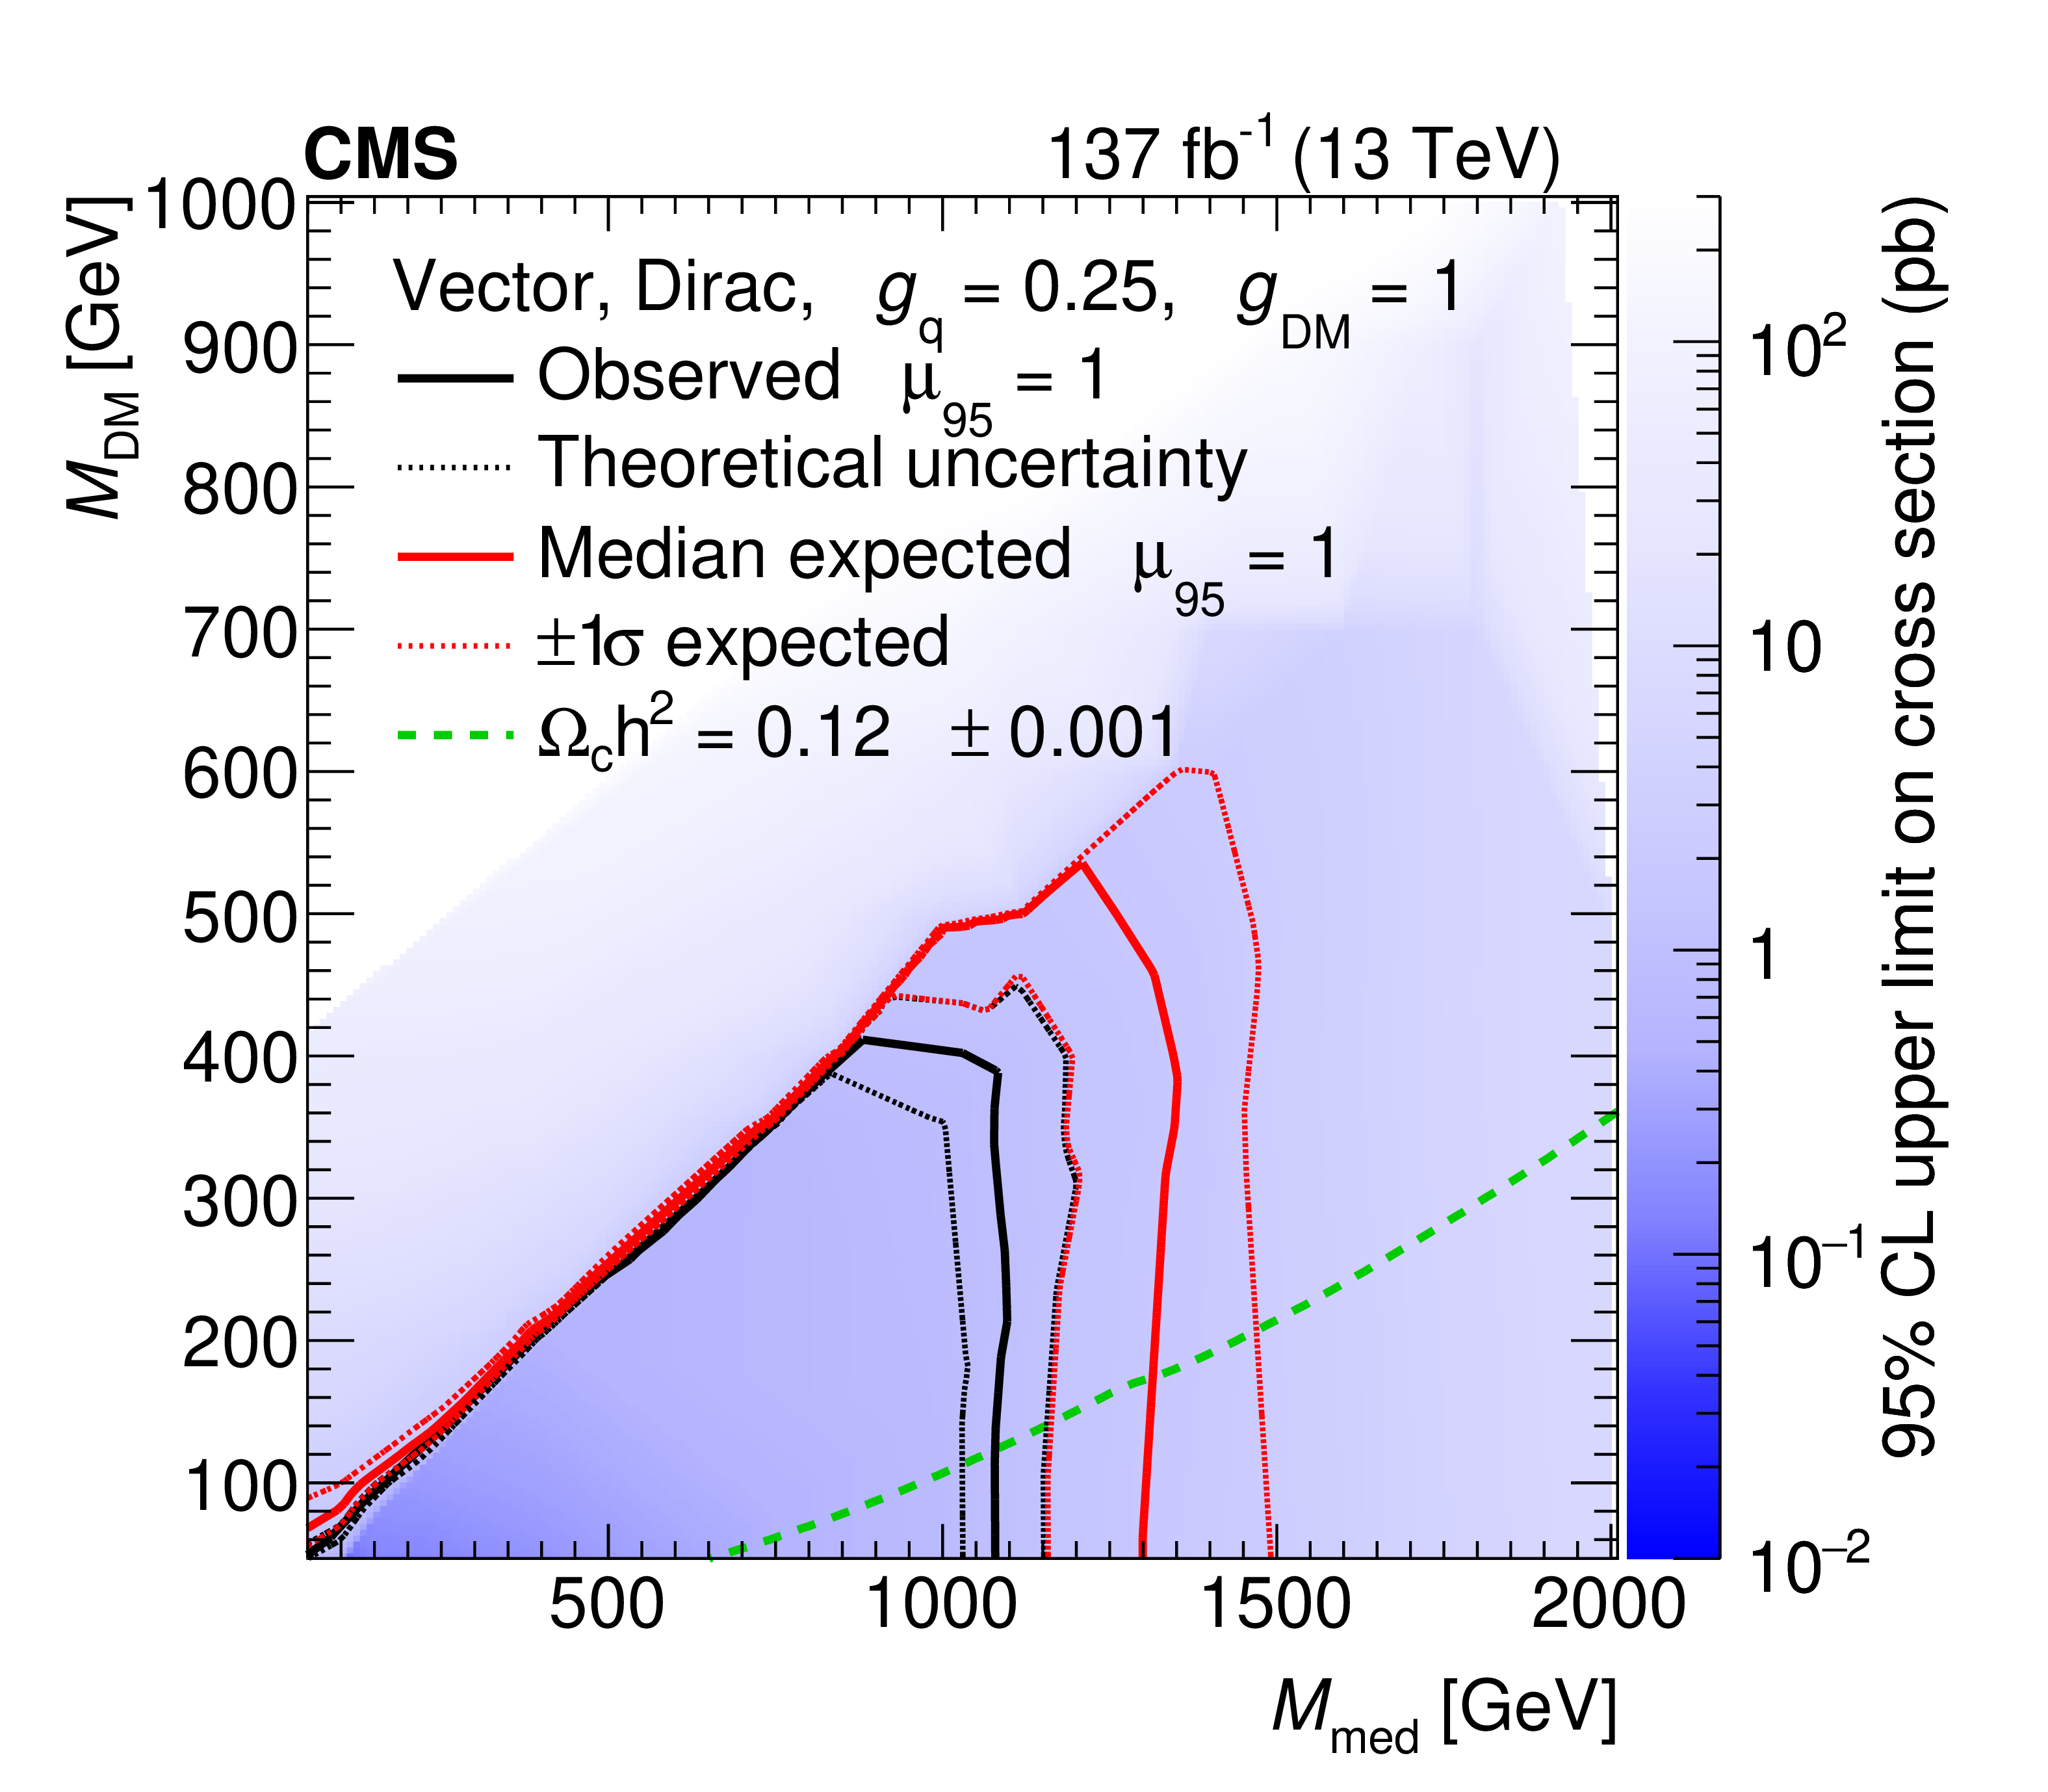
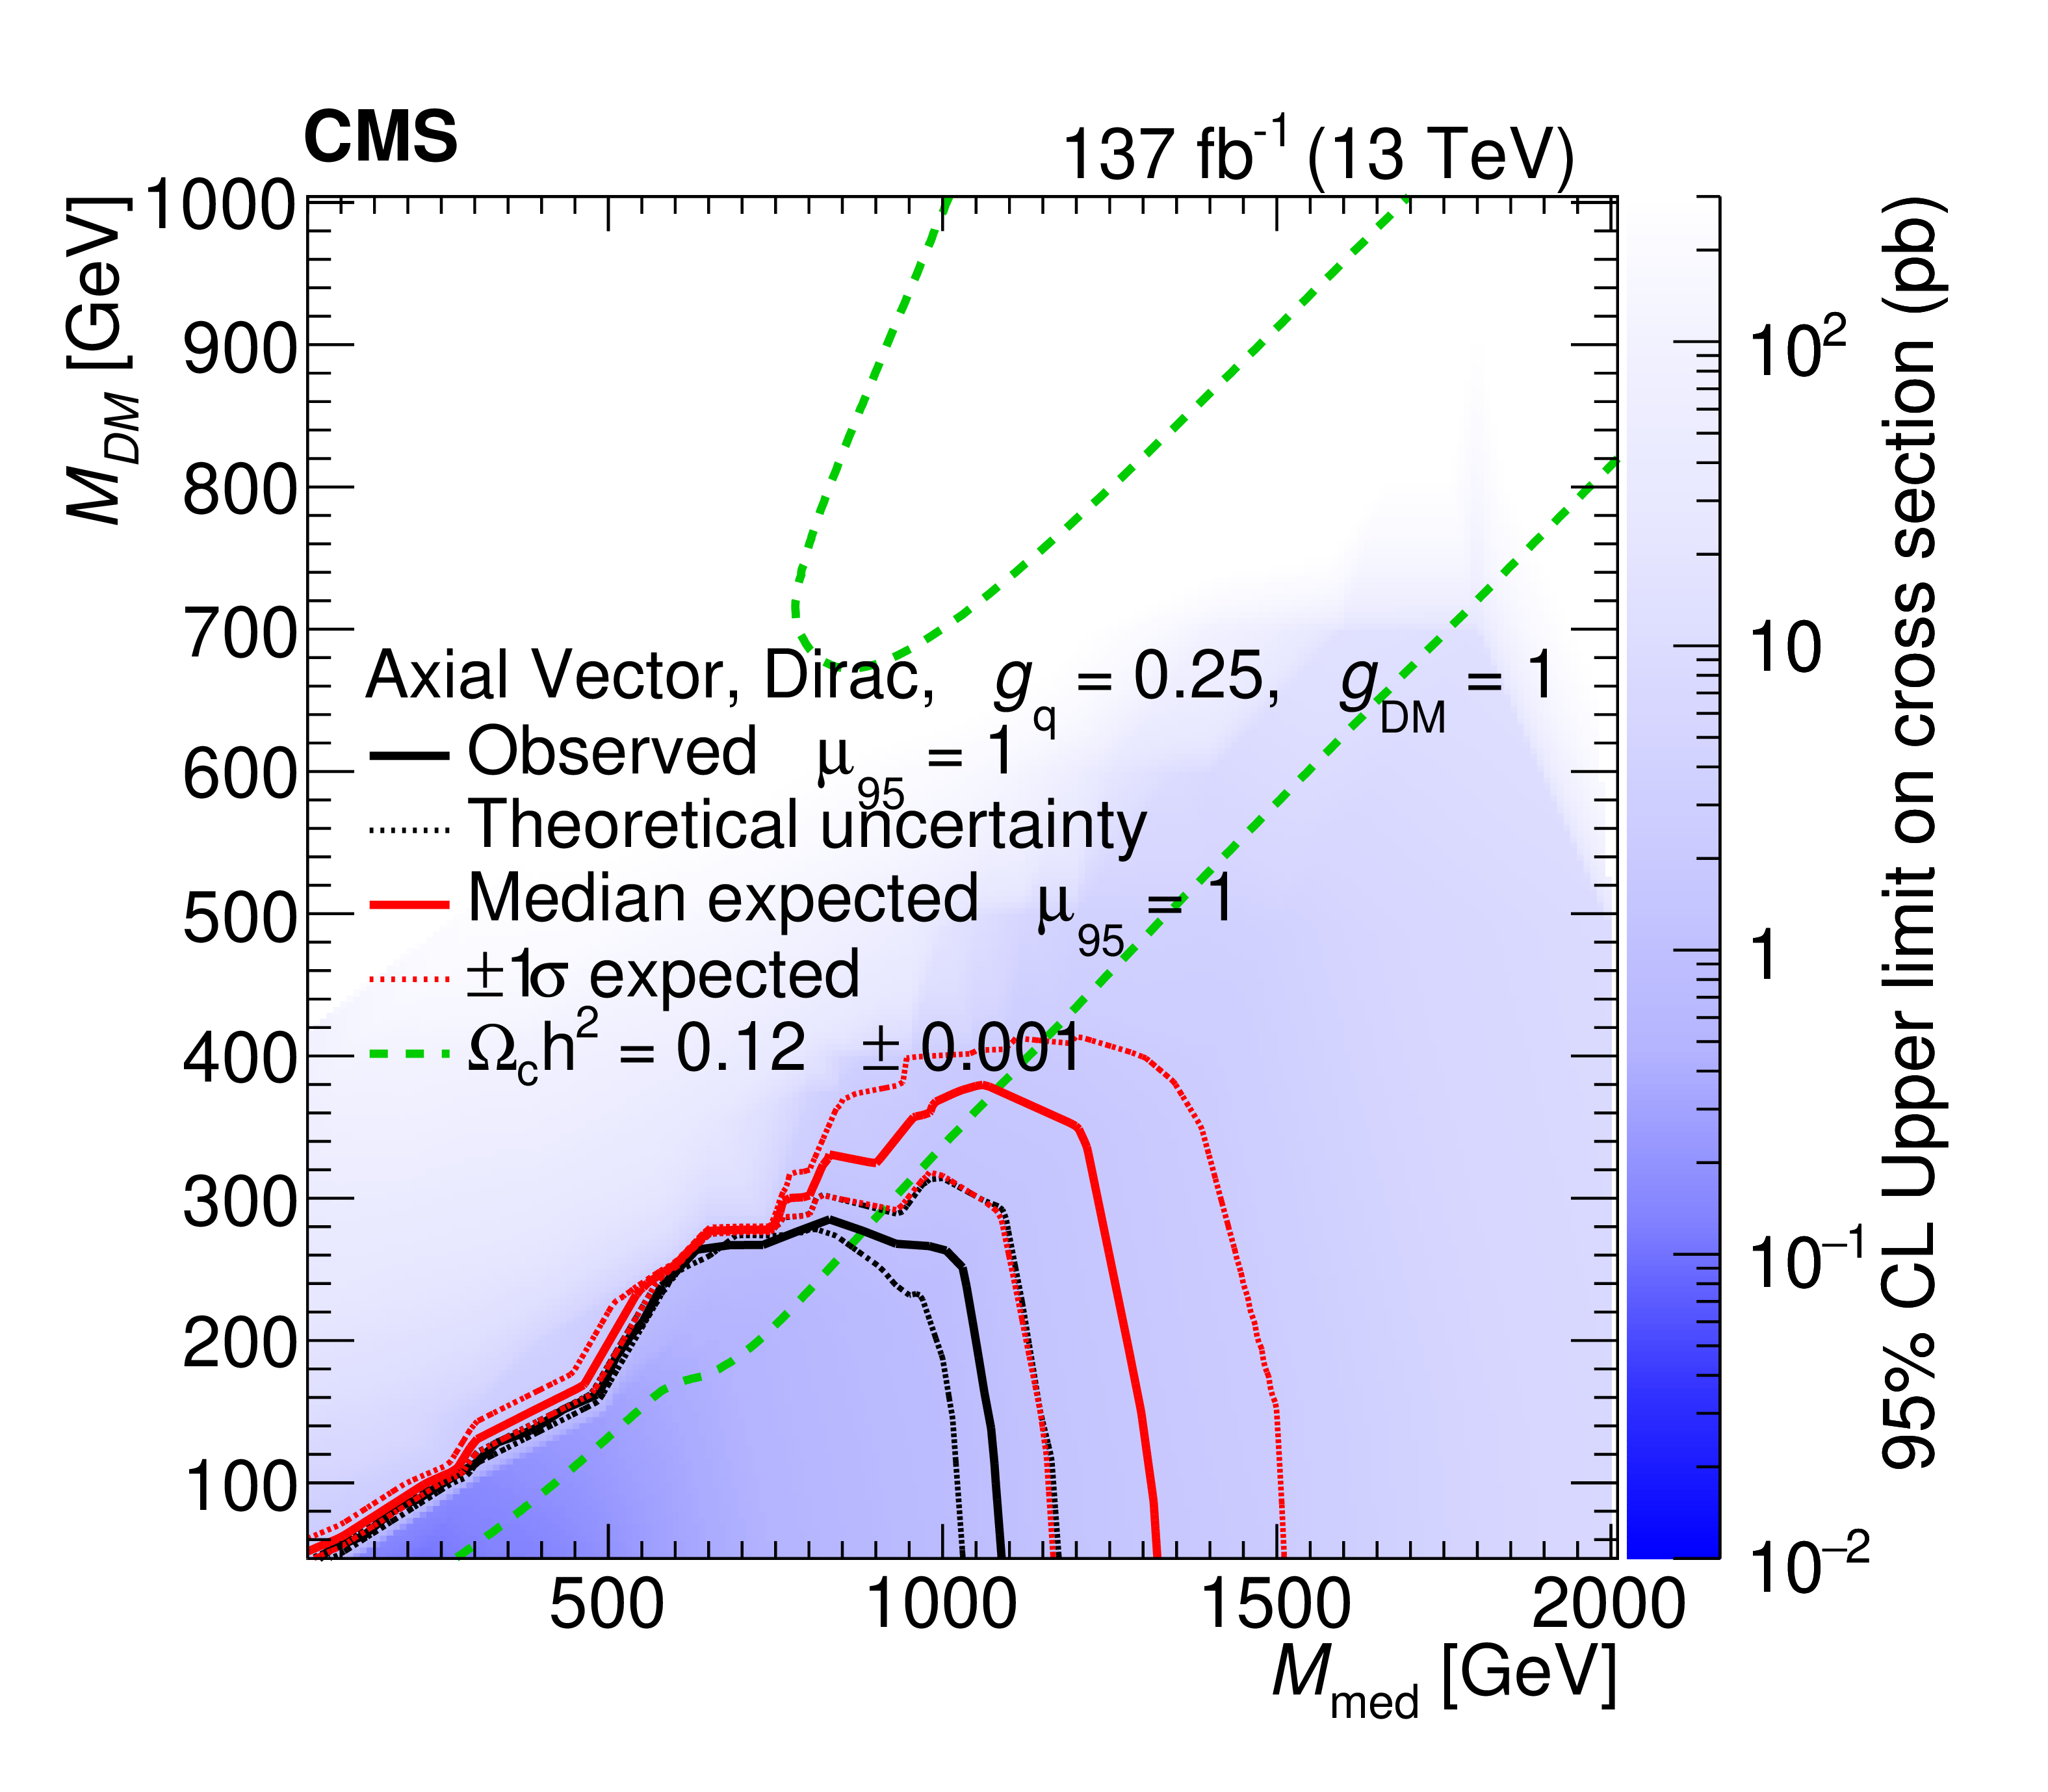
The ratio of 95% CL upper cross section limits to the theoretical cross section ($ \mu_{95} $), for simplified DM models with vector (left) and axial-vector (right) mediators, using the full 2016-2018 data set corresponding to an integrated luminosity of 137 fb$ ^{-1} $, assuming $ g_{\mathrm{q}} = $ 0.25 and $ g_\text{DM} = $ 1. Expected $ \mu_{95} = $ 1 contours are overlaid in red. The region below and to the left of the observed contour is excluded. For simplified DM model parameters in the region below the lower green dash contour, and also above the corresponding upper contour in the right hand plot, cosmological DM abundance exceeds the density observed by the Planck satellite experiment. |
png pdf |
Figure 7-a:
The ratio of 95% CL upper cross section limits to the theoretical cross section ($ \mu_{95} $), for simplified DM models with vector (left) and axial-vector (right) mediators, using the full 2016-2018 data set corresponding to an integrated luminosity of 137 fb$ ^{-1} $, assuming $ g_{\mathrm{q}} = $ 0.25 and $ g_\text{DM} = $ 1. Expected $ \mu_{95} = $ 1 contours are overlaid in red. The region below and to the left of the observed contour is excluded. For simplified DM model parameters in the region below the lower green dash contour, and also above the corresponding upper contour in the right hand plot, cosmological DM abundance exceeds the density observed by the Planck satellite experiment. |
png pdf |
Figure 7-b:
The ratio of 95% CL upper cross section limits to the theoretical cross section ($ \mu_{95} $), for simplified DM models with vector (left) and axial-vector (right) mediators, using the full 2016-2018 data set corresponding to an integrated luminosity of 137 fb$ ^{-1} $, assuming $ g_{\mathrm{q}} = $ 0.25 and $ g_\text{DM} = $ 1. Expected $ \mu_{95} = $ 1 contours are overlaid in red. The region below and to the left of the observed contour is excluded. For simplified DM model parameters in the region below the lower green dash contour, and also above the corresponding upper contour in the right hand plot, cosmological DM abundance exceeds the density observed by the Planck satellite experiment. |
png pdf |
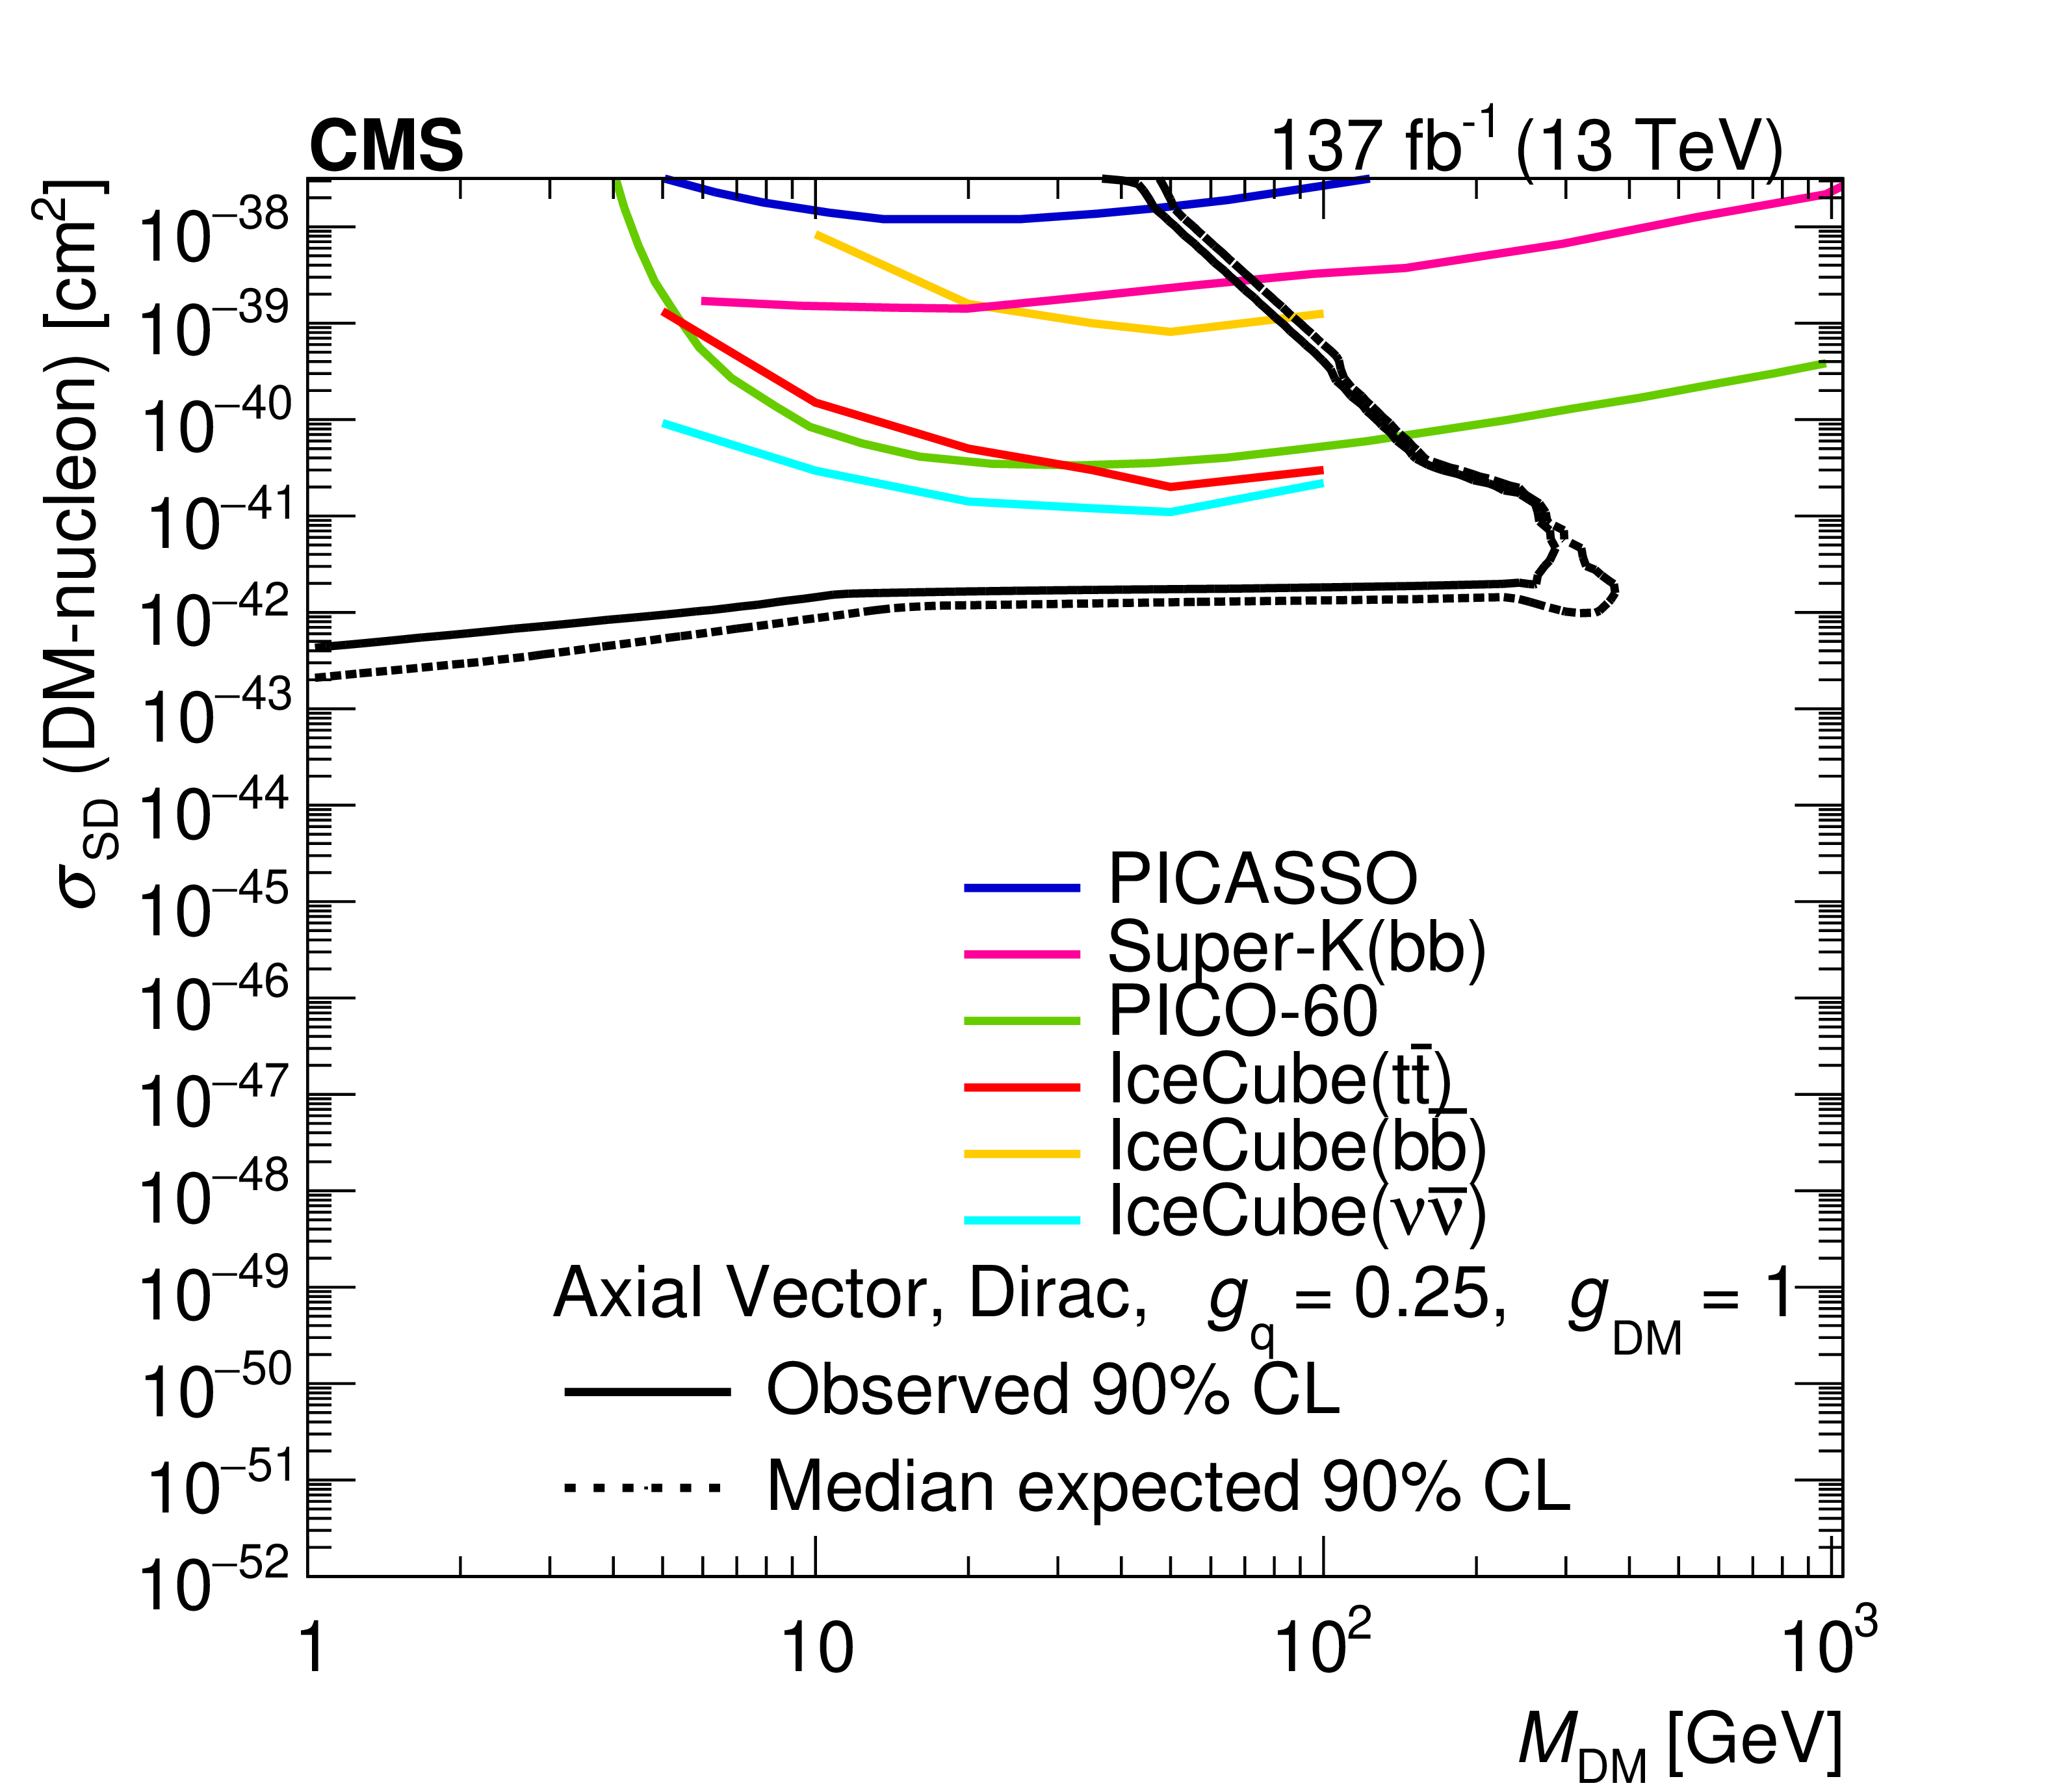
Figure 8:
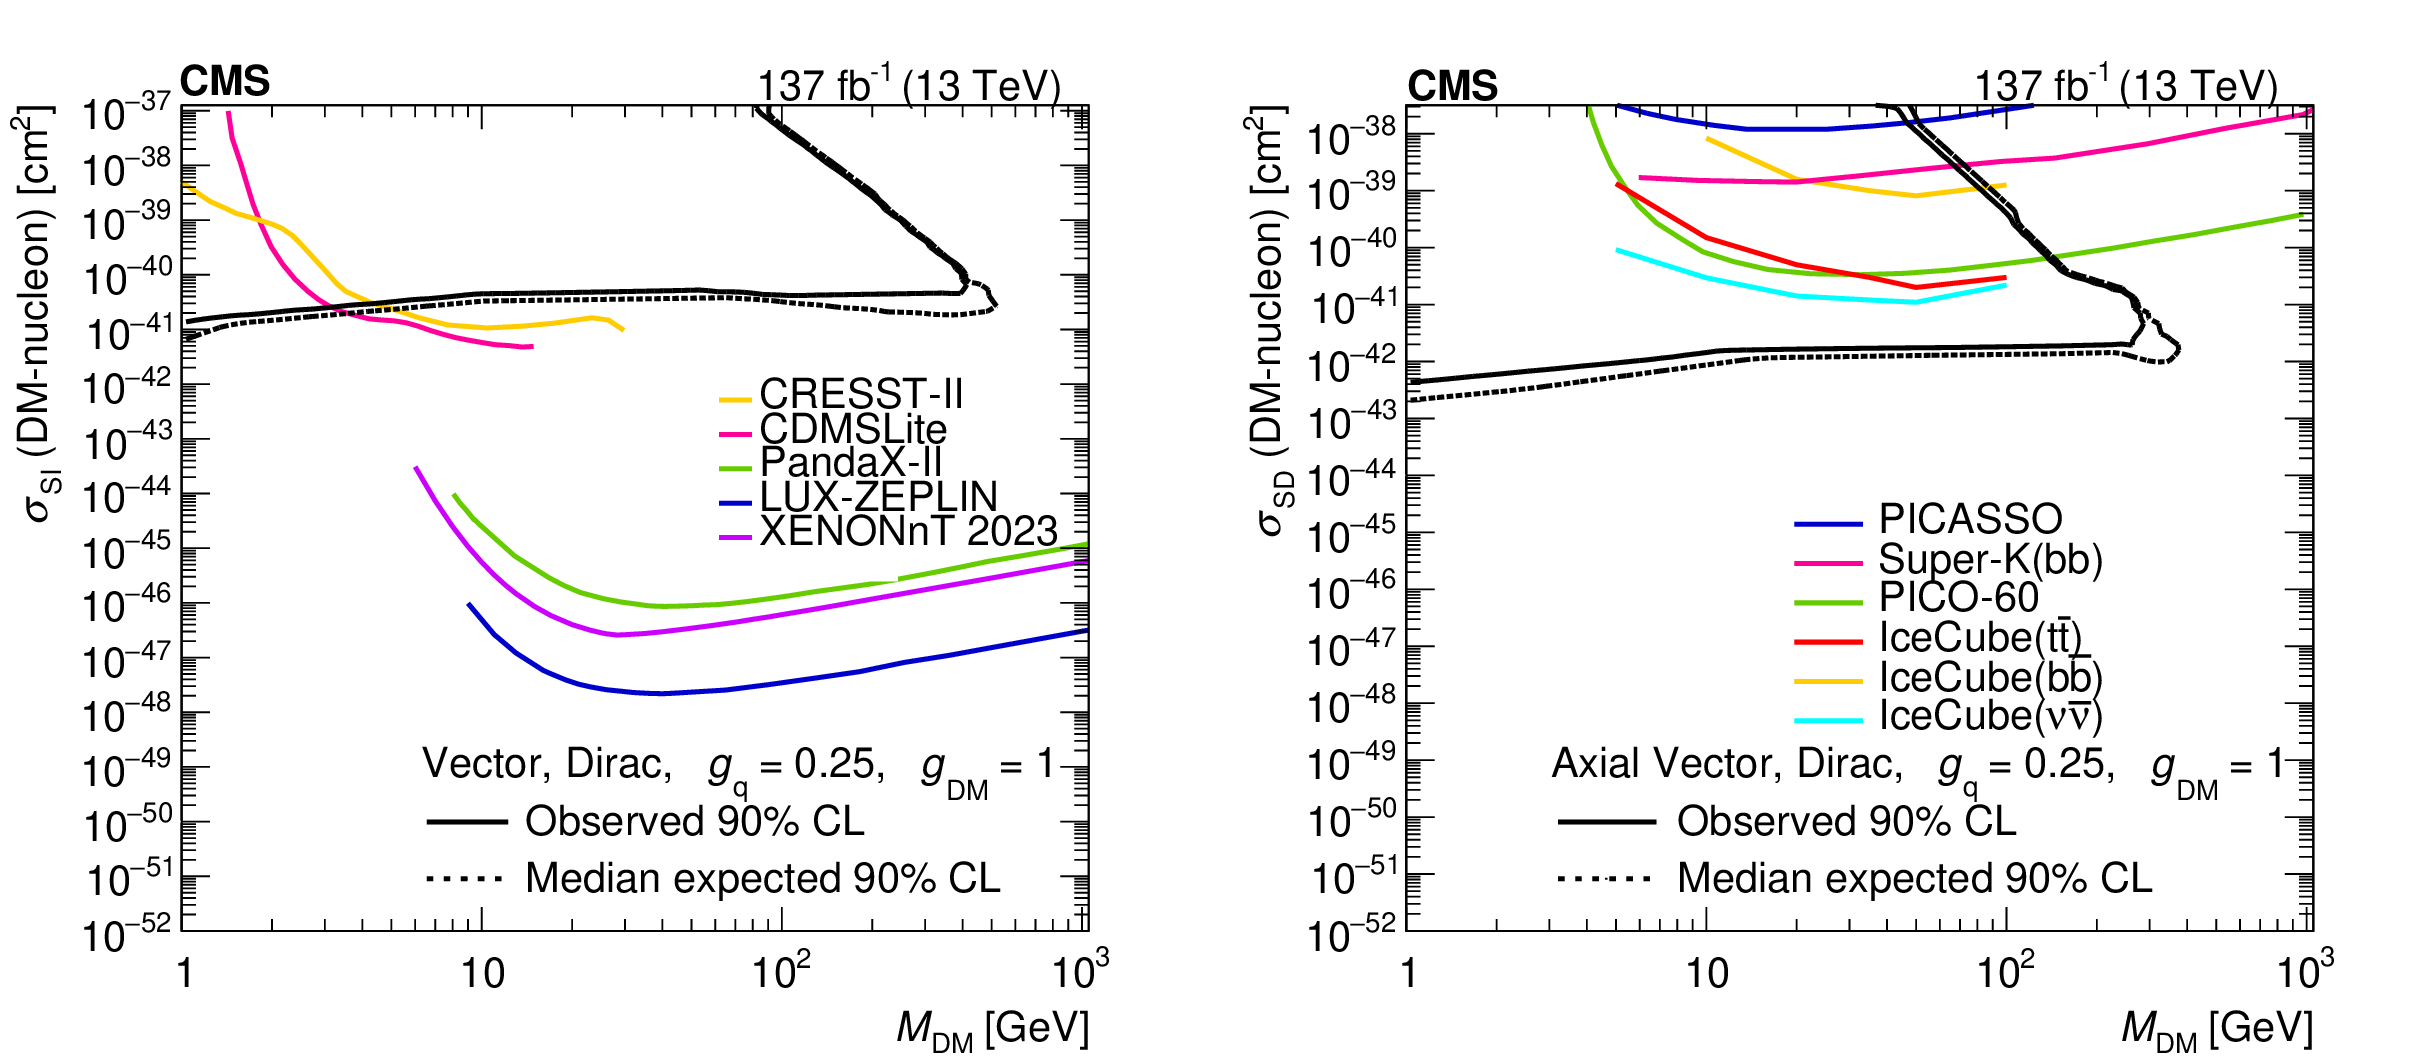
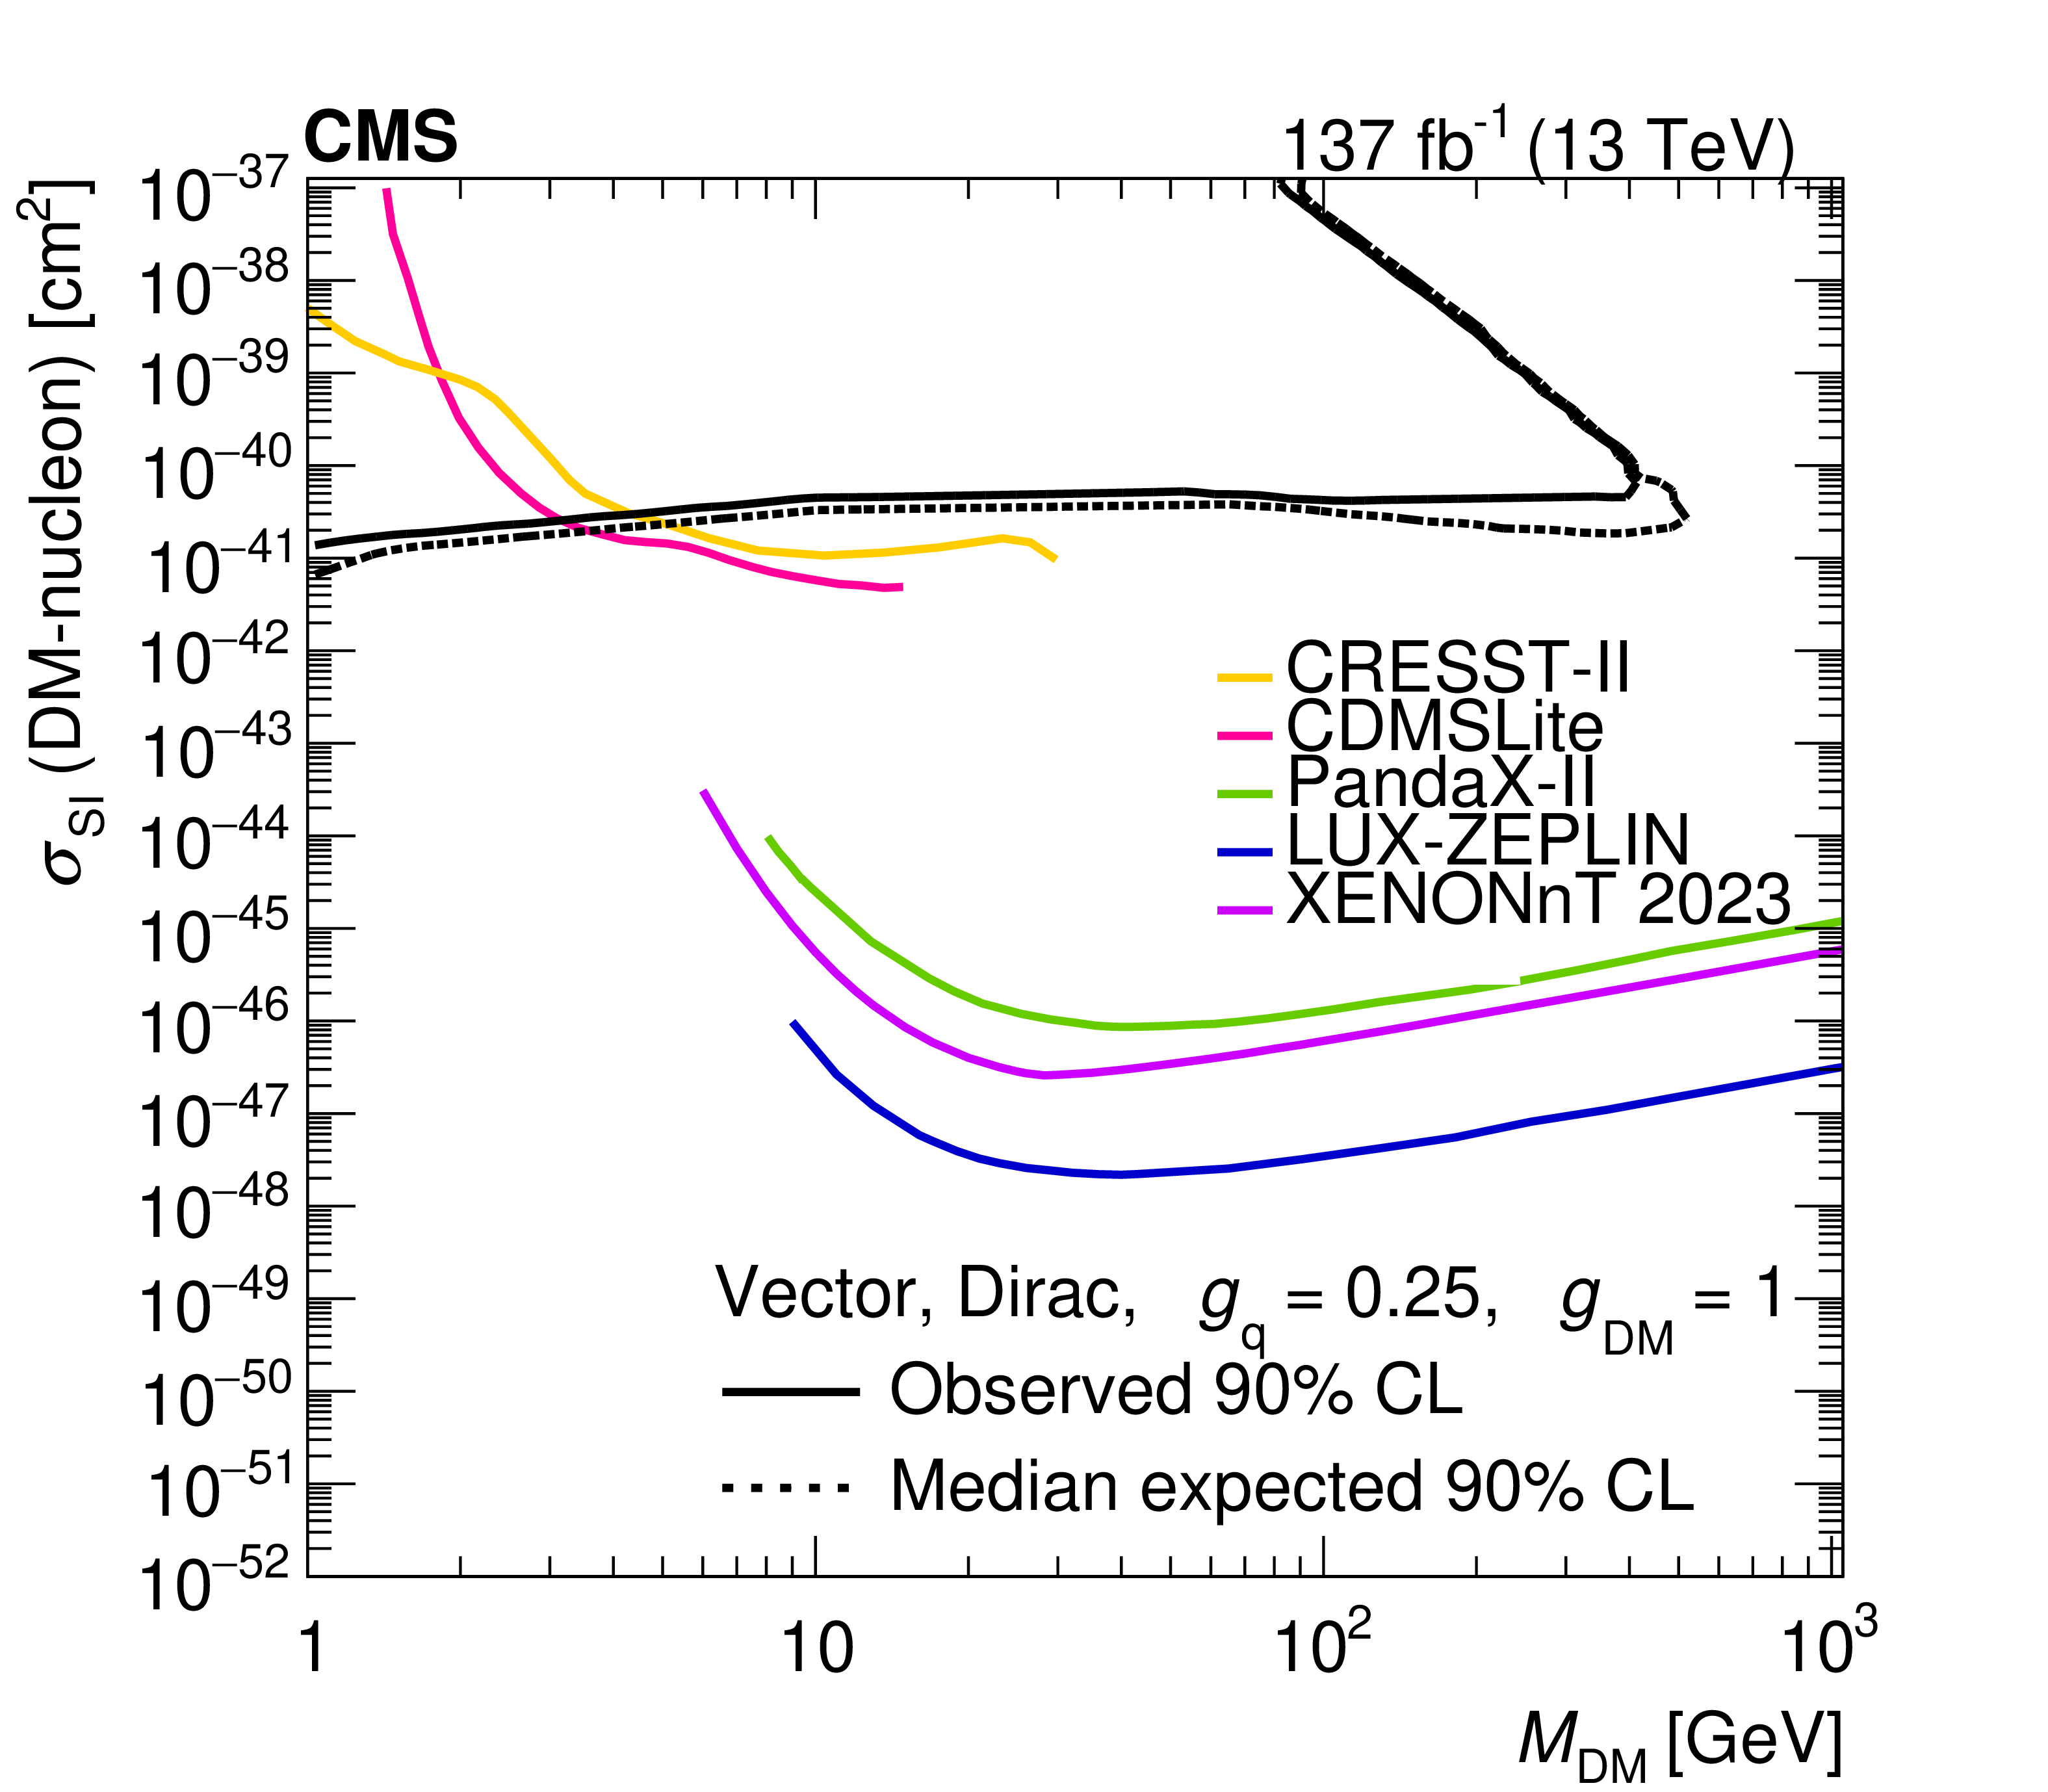
The 90% CL exclusion limits on the $ \chi $-nucleon spin-independent (left) and spin-dependent (right) scattering cross sections involving vector and axial-vector operators, respectively, are shown as a function of $ M_{\text{DM}} $, using the 2016-2018 data set. Simplified model DM parameters $ g_{\mathrm{q}} = $ 0.25 and $ g_\text{DM} = $ 1 are assumed. Also shown are corresponding exclusion contours, where regions above the curves are excluded, from recent results by the CDMSLite [52], LUX-ZEPLIN [53], PandaX-II [54], XENONnT [55], CRESST-II [56], PICO-60 [57], IceCube [58], PICASSO [59], and Super-Kamiokande [60] Collaborations. |
png pdf |
Figure 8-a:
The 90% CL exclusion limits on the $ \chi $-nucleon spin-independent (left) and spin-dependent (right) scattering cross sections involving vector and axial-vector operators, respectively, are shown as a function of $ M_{\text{DM}} $, using the 2016-2018 data set. Simplified model DM parameters $ g_{\mathrm{q}} = $ 0.25 and $ g_\text{DM} = $ 1 are assumed. Also shown are corresponding exclusion contours, where regions above the curves are excluded, from recent results by the CDMSLite [52], LUX-ZEPLIN [53], PandaX-II [54], XENONnT [55], CRESST-II [56], PICO-60 [57], IceCube [58], PICASSO [59], and Super-Kamiokande [60] Collaborations. |
png pdf |
Figure 8-b:
The 90% CL exclusion limits on the $ \chi $-nucleon spin-independent (left) and spin-dependent (right) scattering cross sections involving vector and axial-vector operators, respectively, are shown as a function of $ M_{\text{DM}} $, using the 2016-2018 data set. Simplified model DM parameters $ g_{\mathrm{q}} = $ 0.25 and $ g_\text{DM} = $ 1 are assumed. Also shown are corresponding exclusion contours, where regions above the curves are excluded, from recent results by the CDMSLite [52], LUX-ZEPLIN [53], PandaX-II [54], XENONnT [55], CRESST-II [56], PICO-60 [57], IceCube [58], PICASSO [59], and Super-Kamiokande [60] Collaborations. |
png pdf |
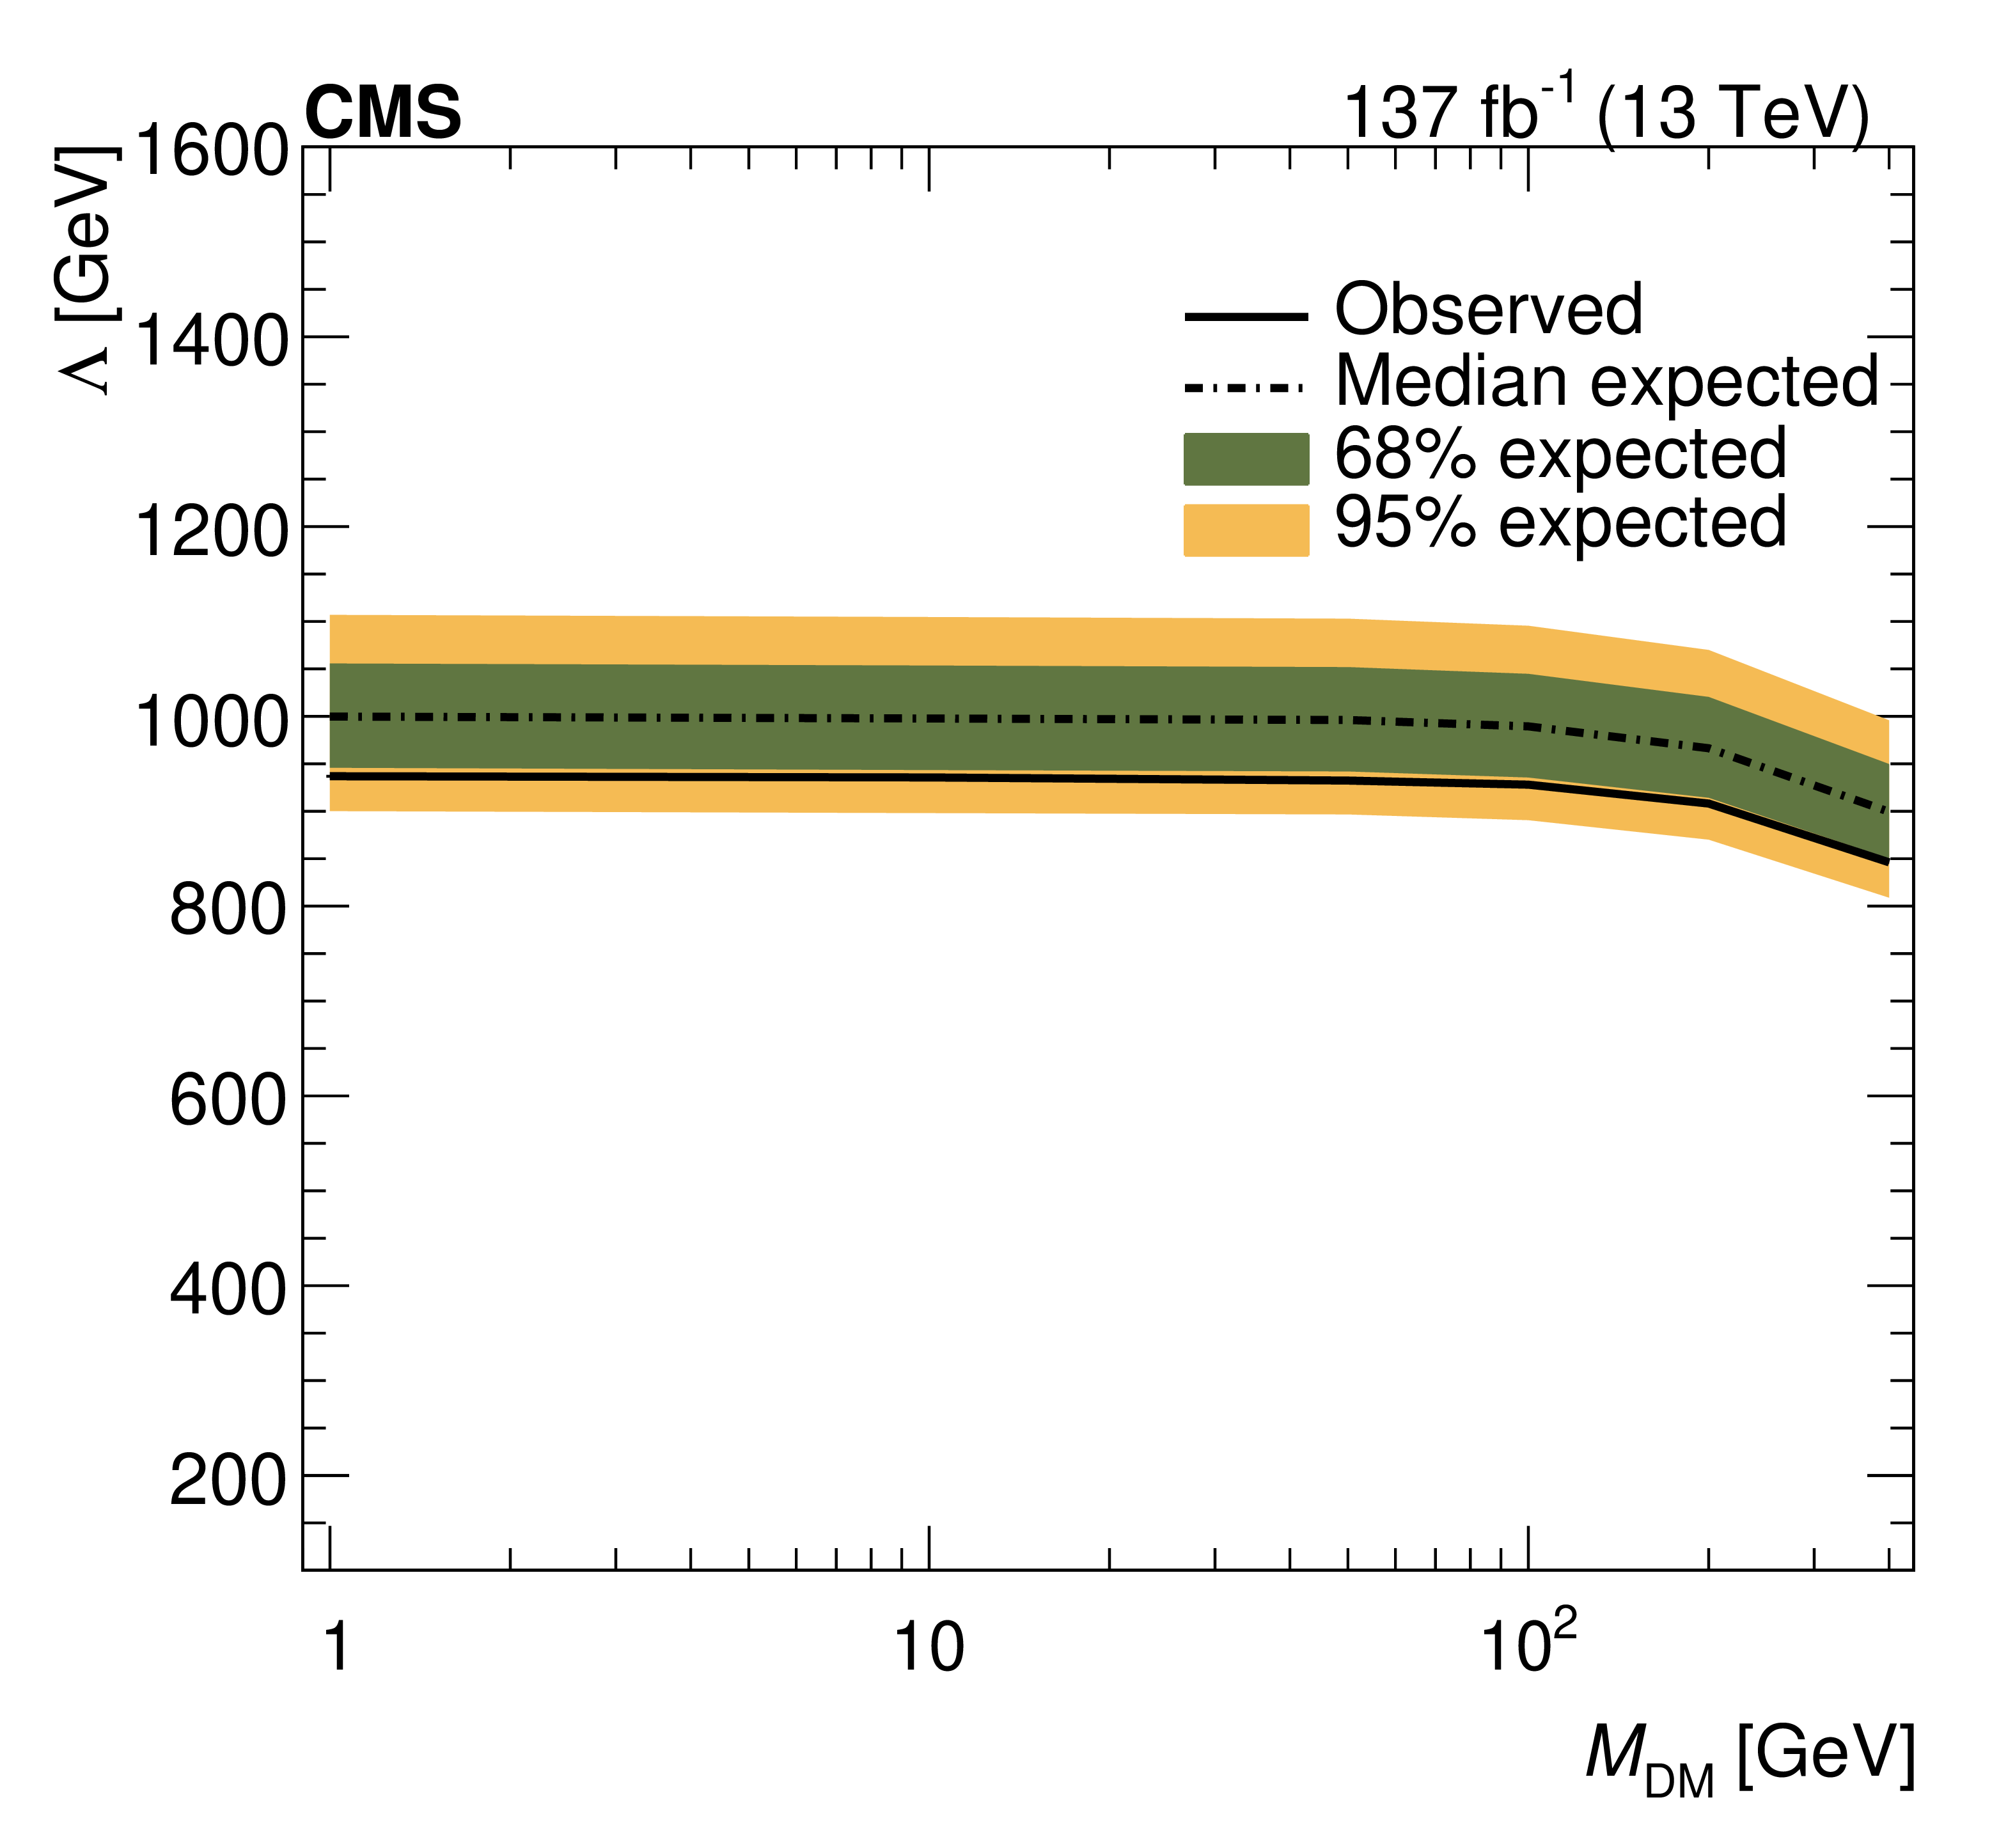
Figure 9:
The 95% CL observed and expected lower limits on $ \Lambda $ for an effective EW-DM contact interaction, as a function of $ M_{\text{DM}} $ using the 2016-2018 data set corresponding to an integrated luminosity of 137 fb$ ^{-1} $. |
png pdf |
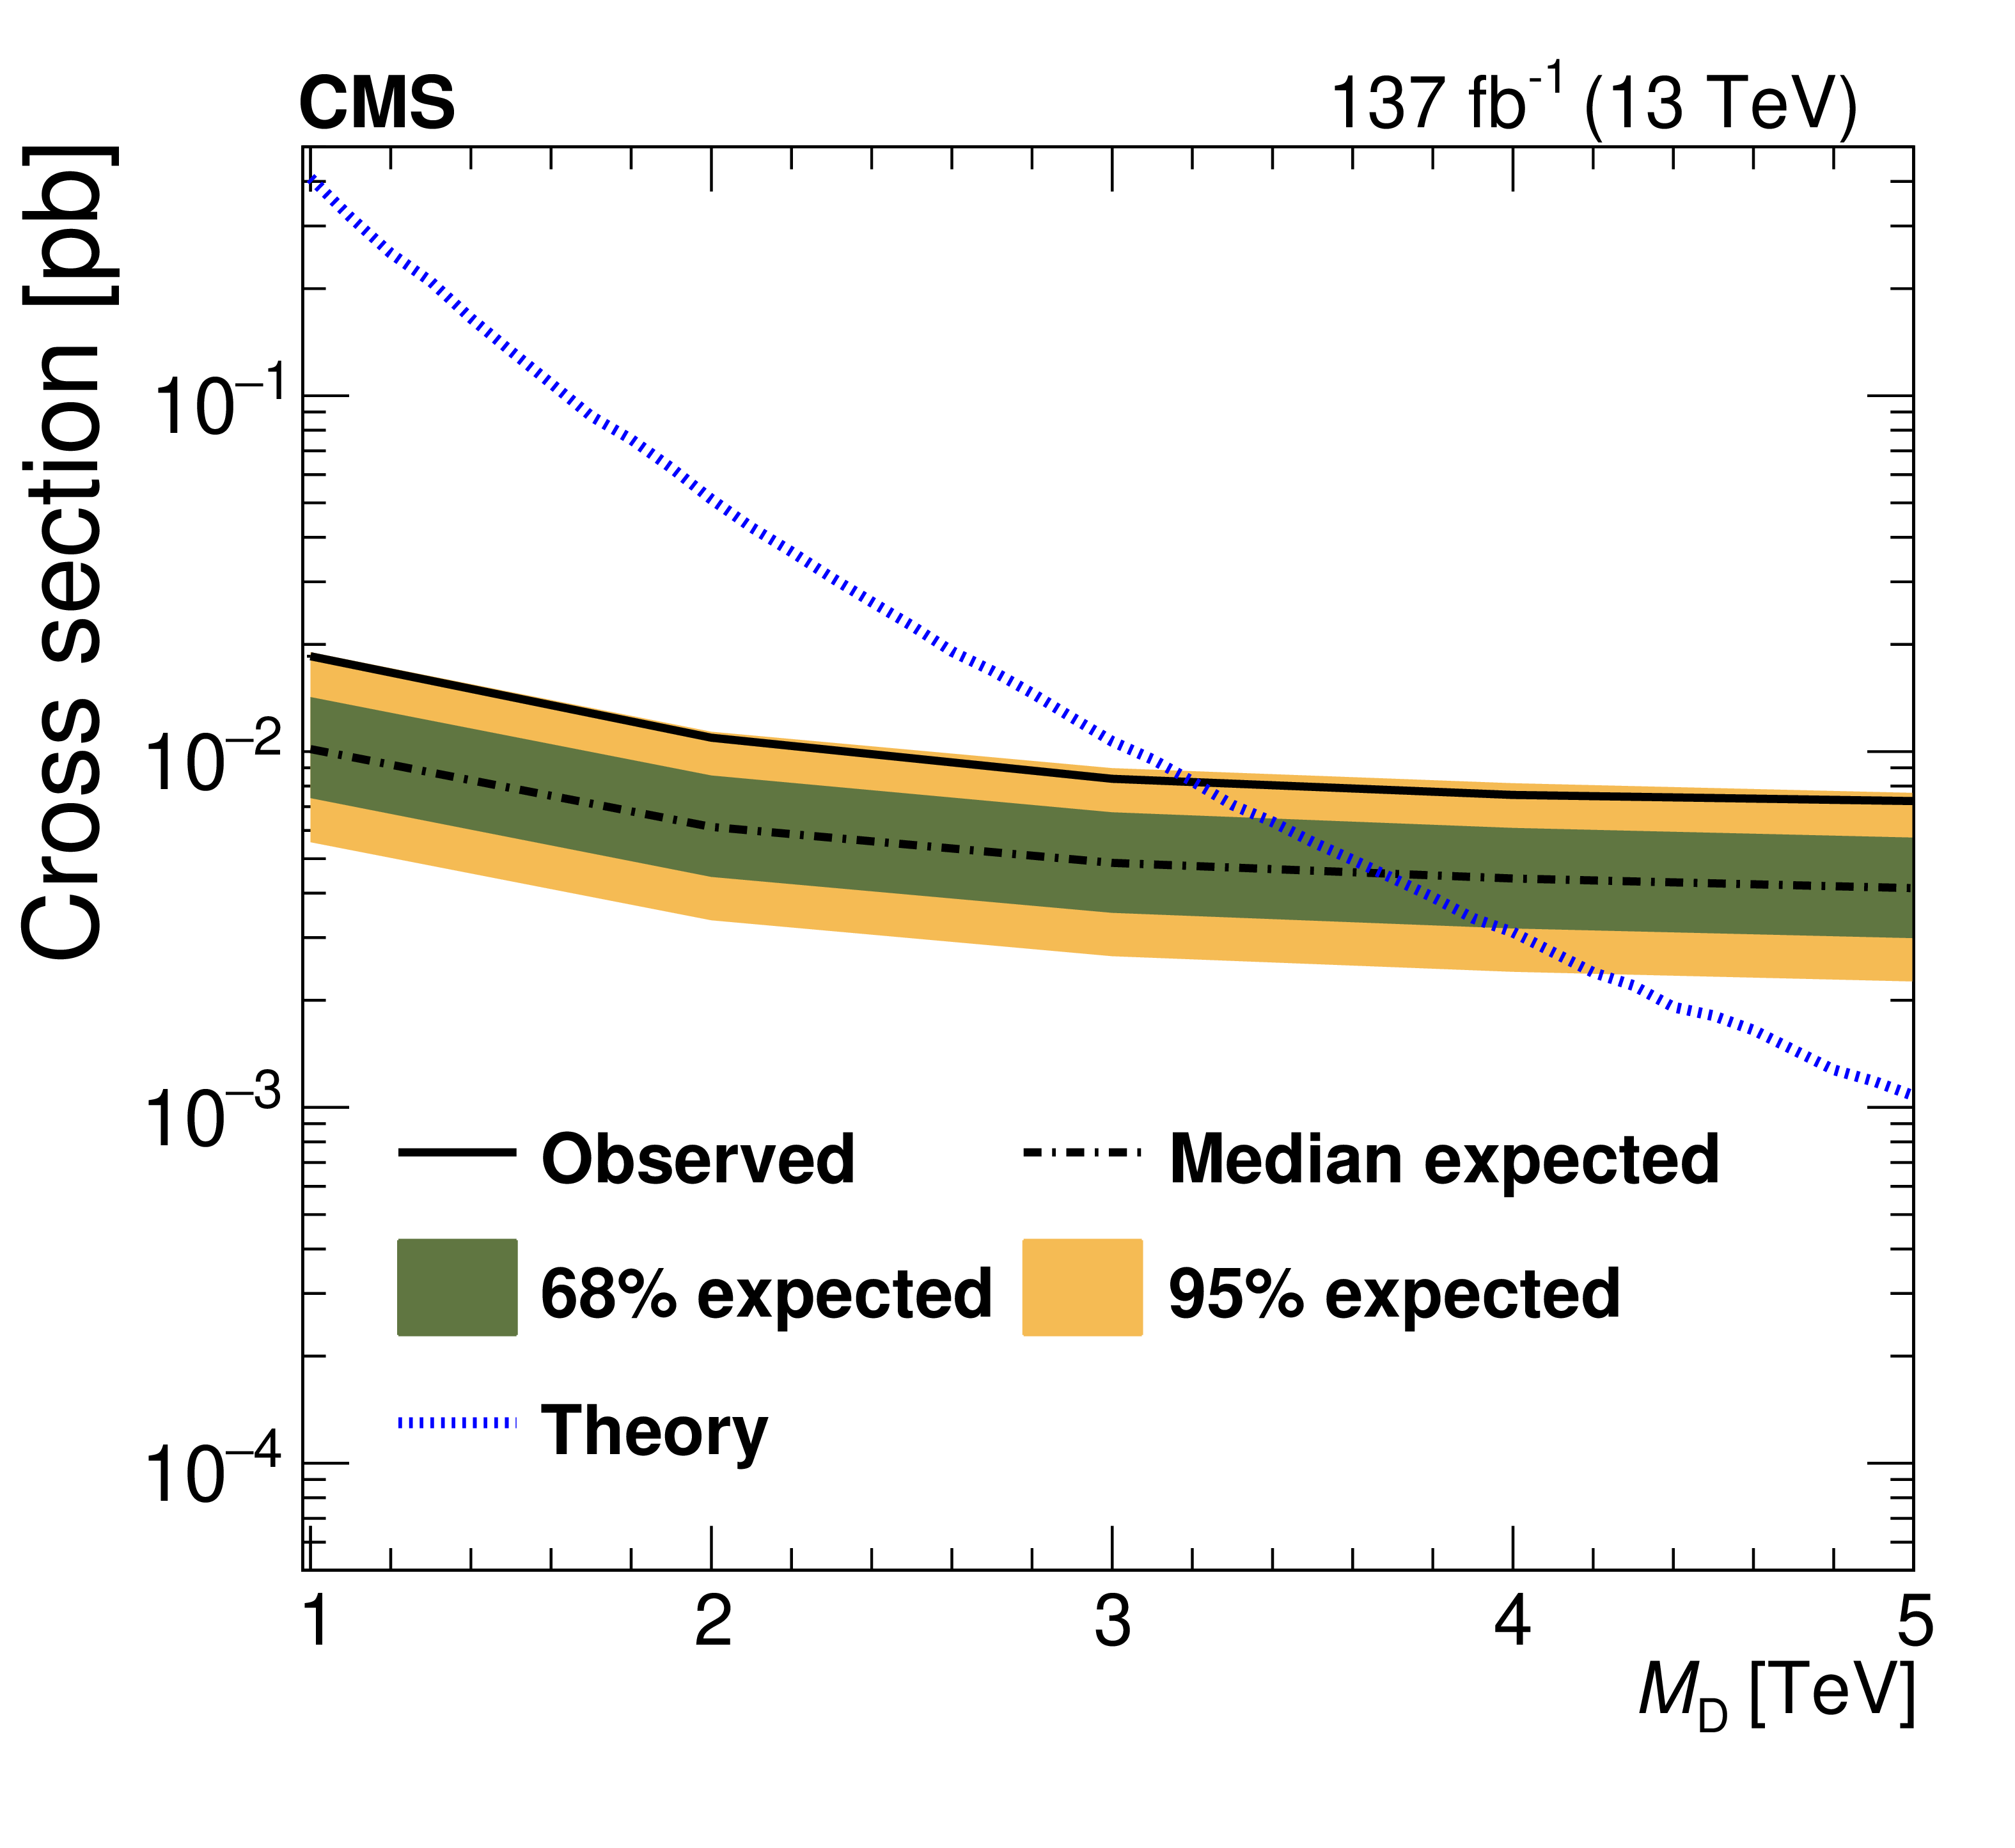
Figure 10:
The 95% CL upper limits on the ADD graviton production cross section as a function of $ M_\text{D} $, for $ n= $ 3 extra dimensions. |
png pdf |
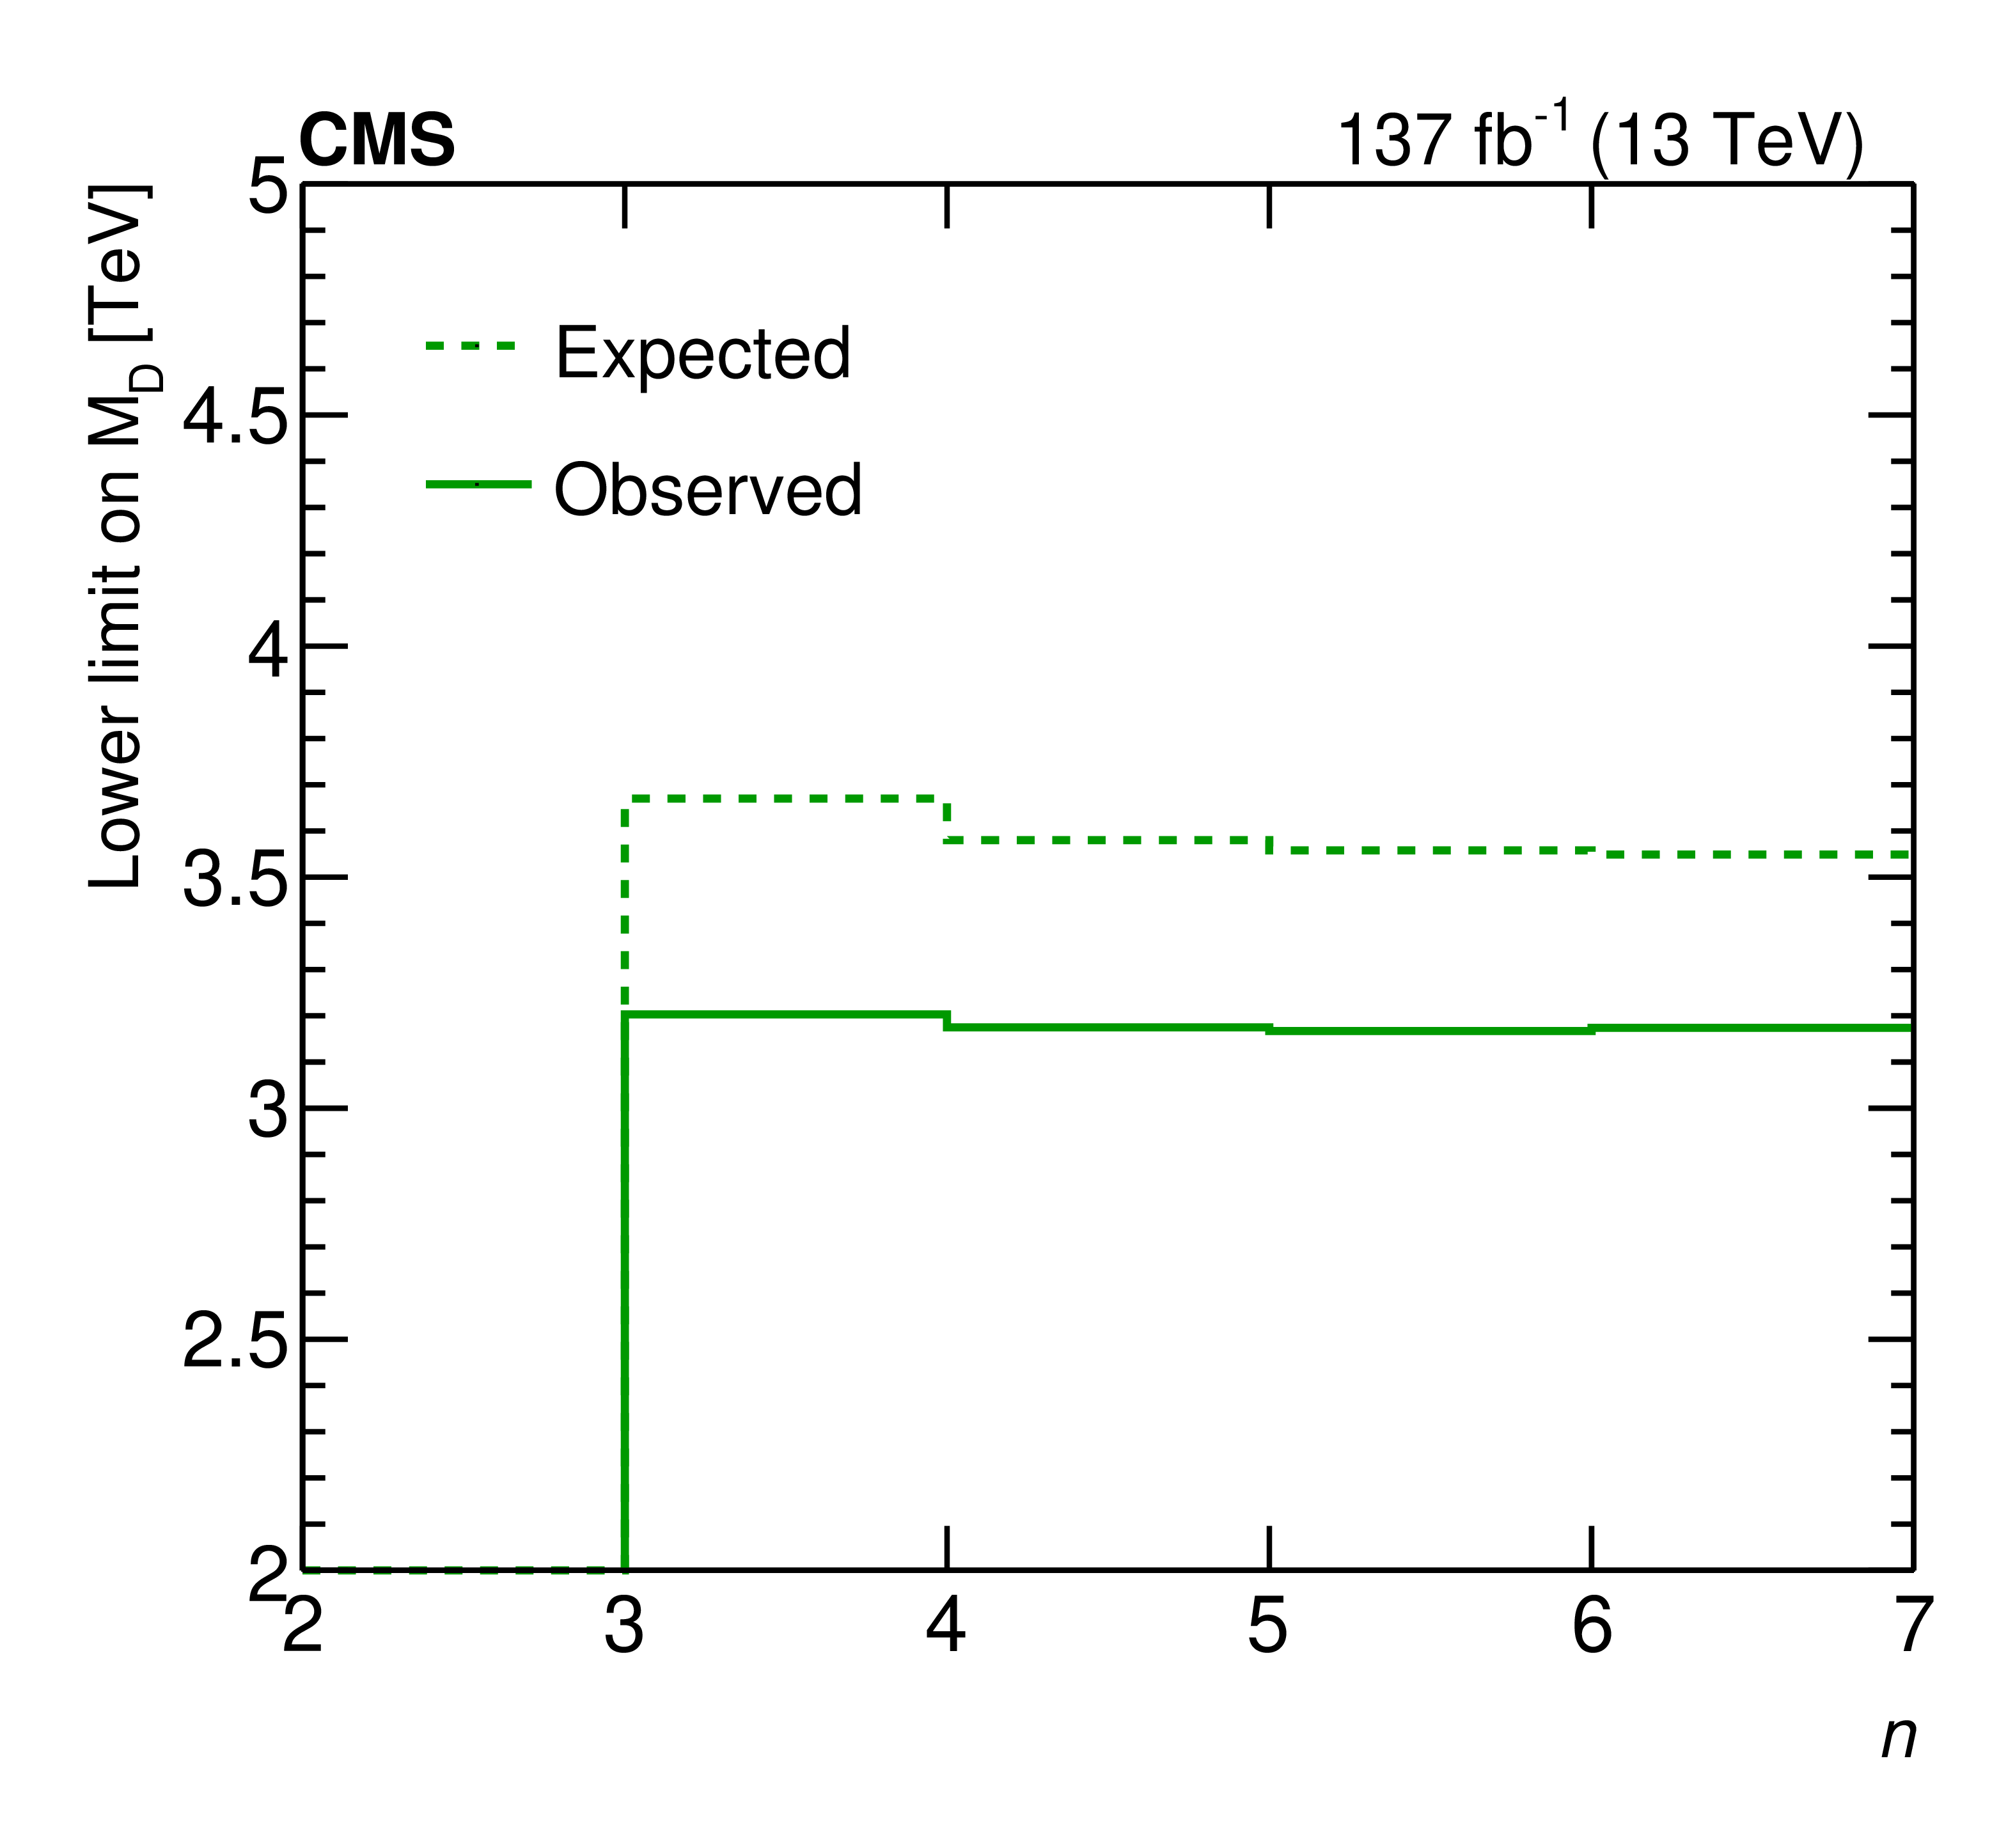
Figure 11:
Lower limit on the fundamental Planck scale $ M_\text{D} $ as a function of the number of extra dimensions $ n $, using the 2016-2018 data sets with an integrated luminosity of 137 fb$ ^{-1} $. |
| Tables | |
png pdf |
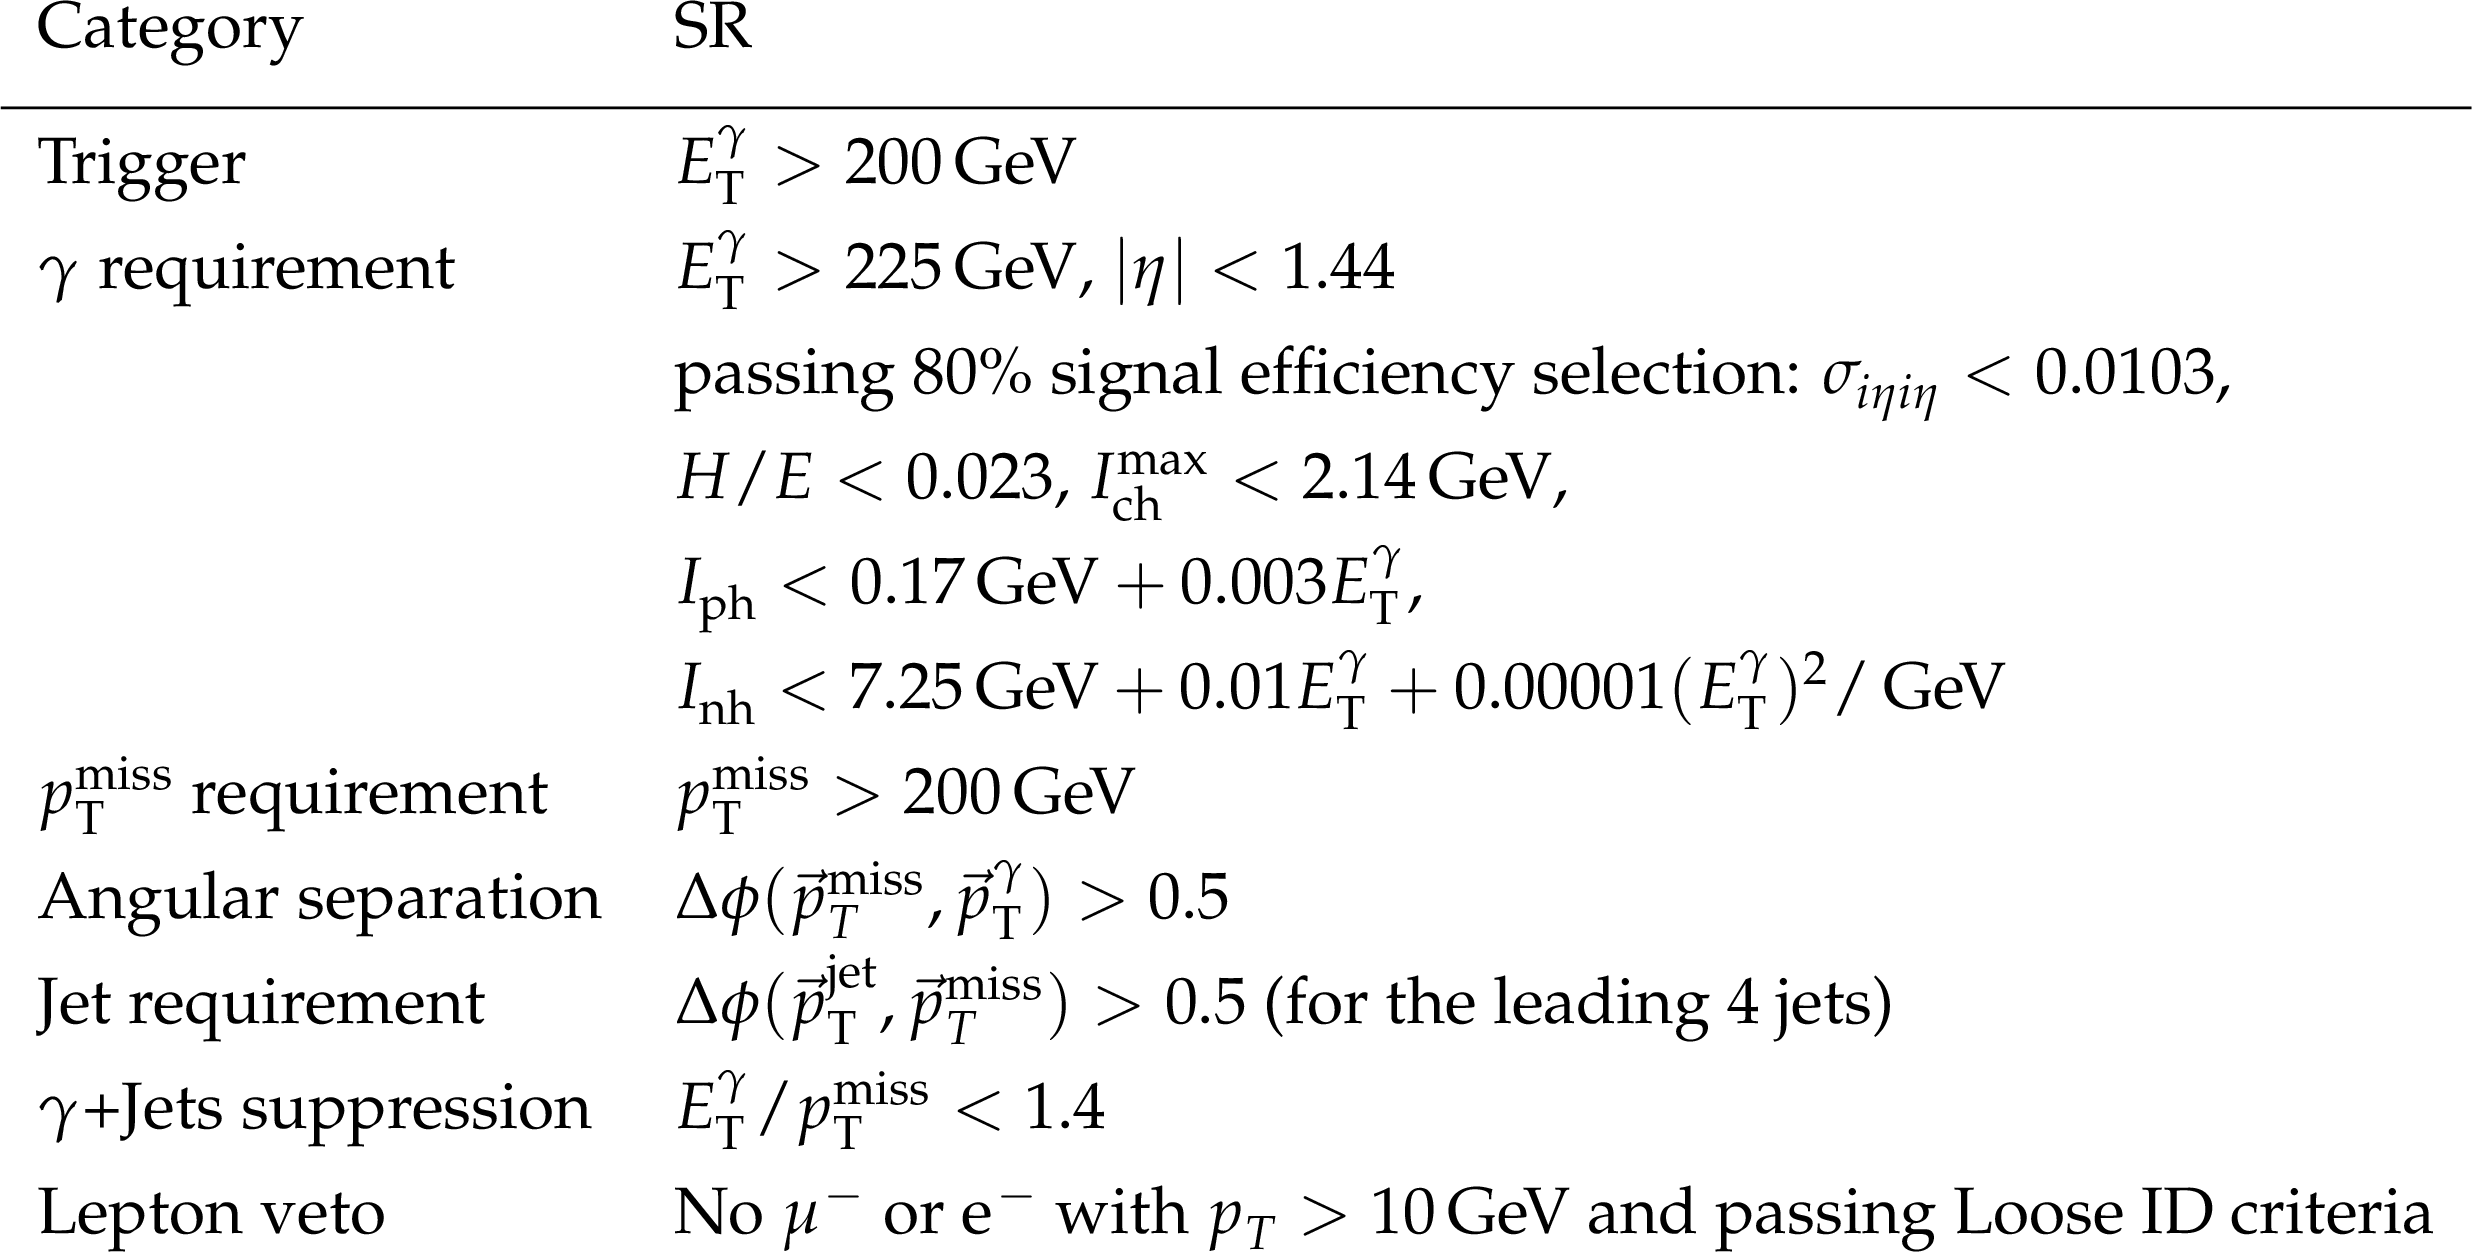
Table 1:
Event selection criteria for the SR. The requirements on the trigger, photon identification, and $ \Delta\phi $ are listed. |
png pdf |
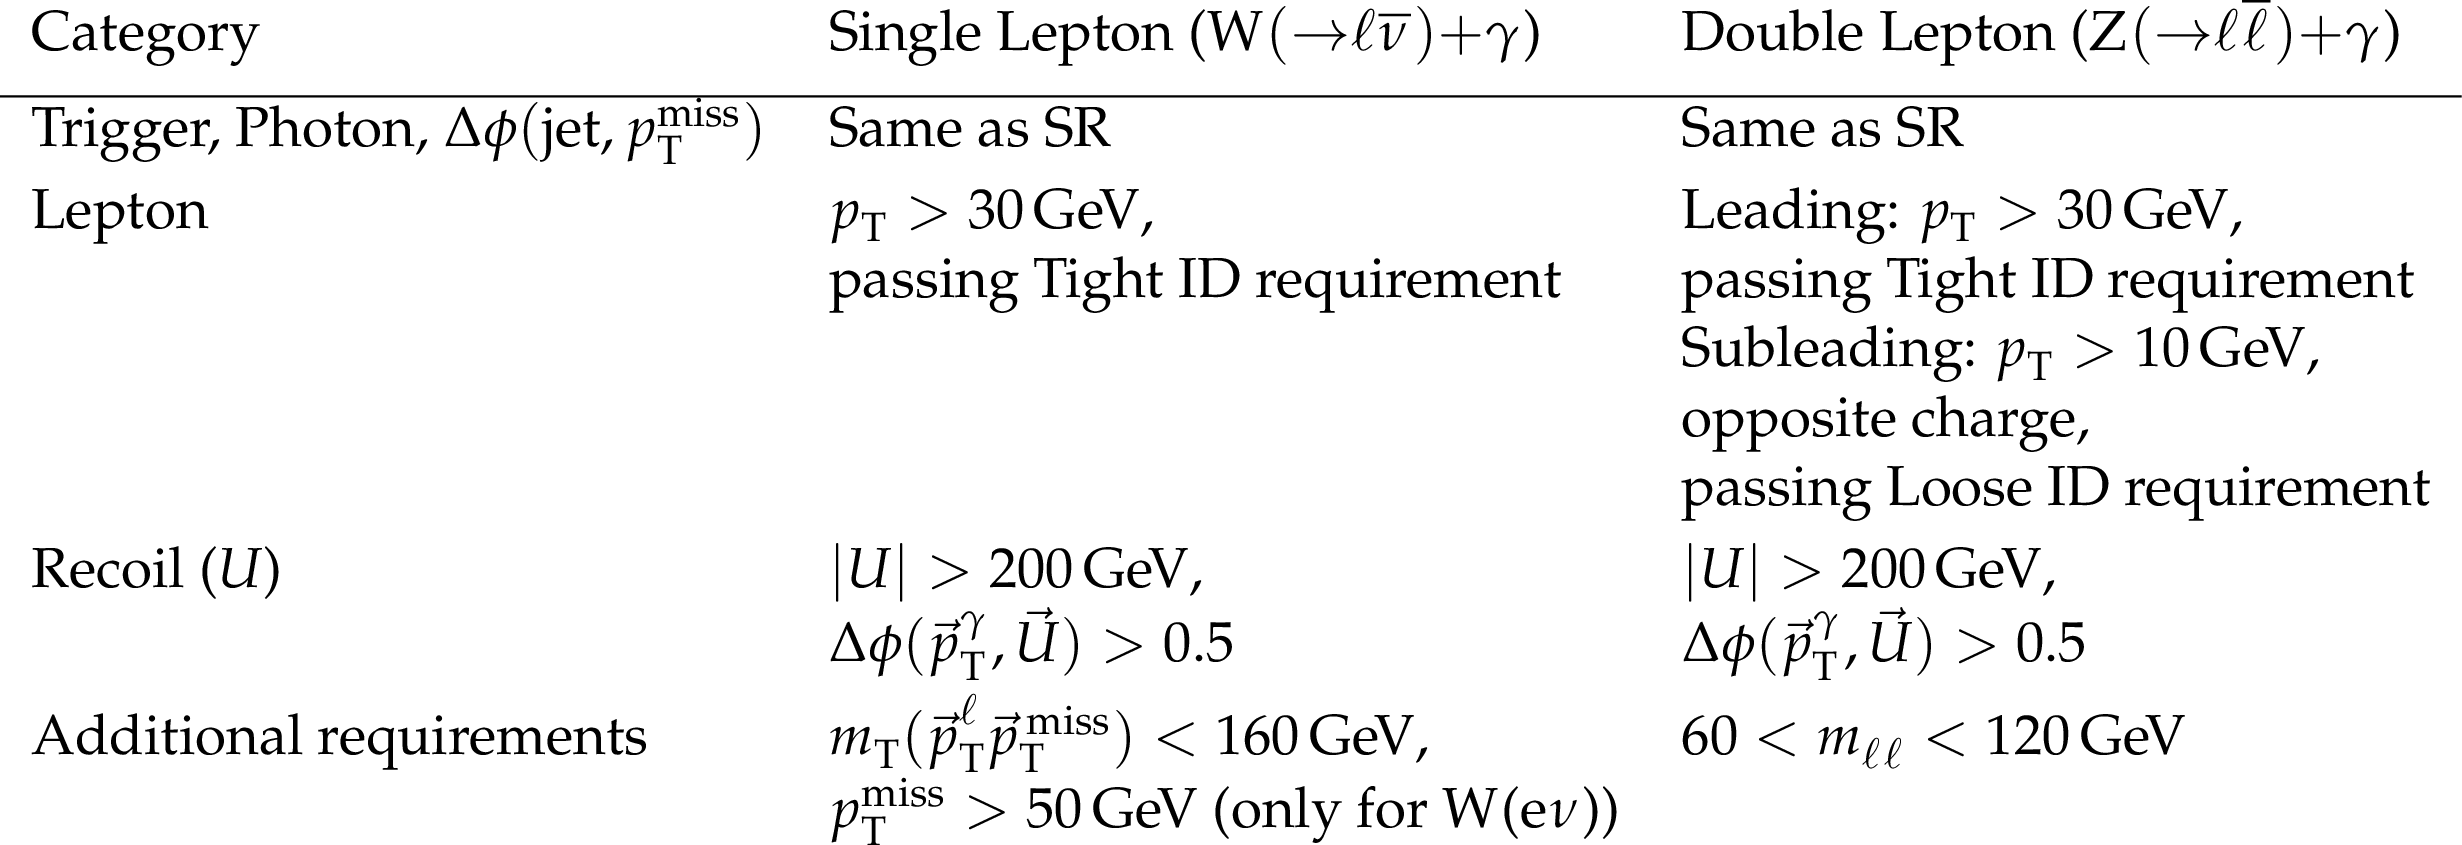
Table 2:
Event selection in the CRs. |
png pdf |
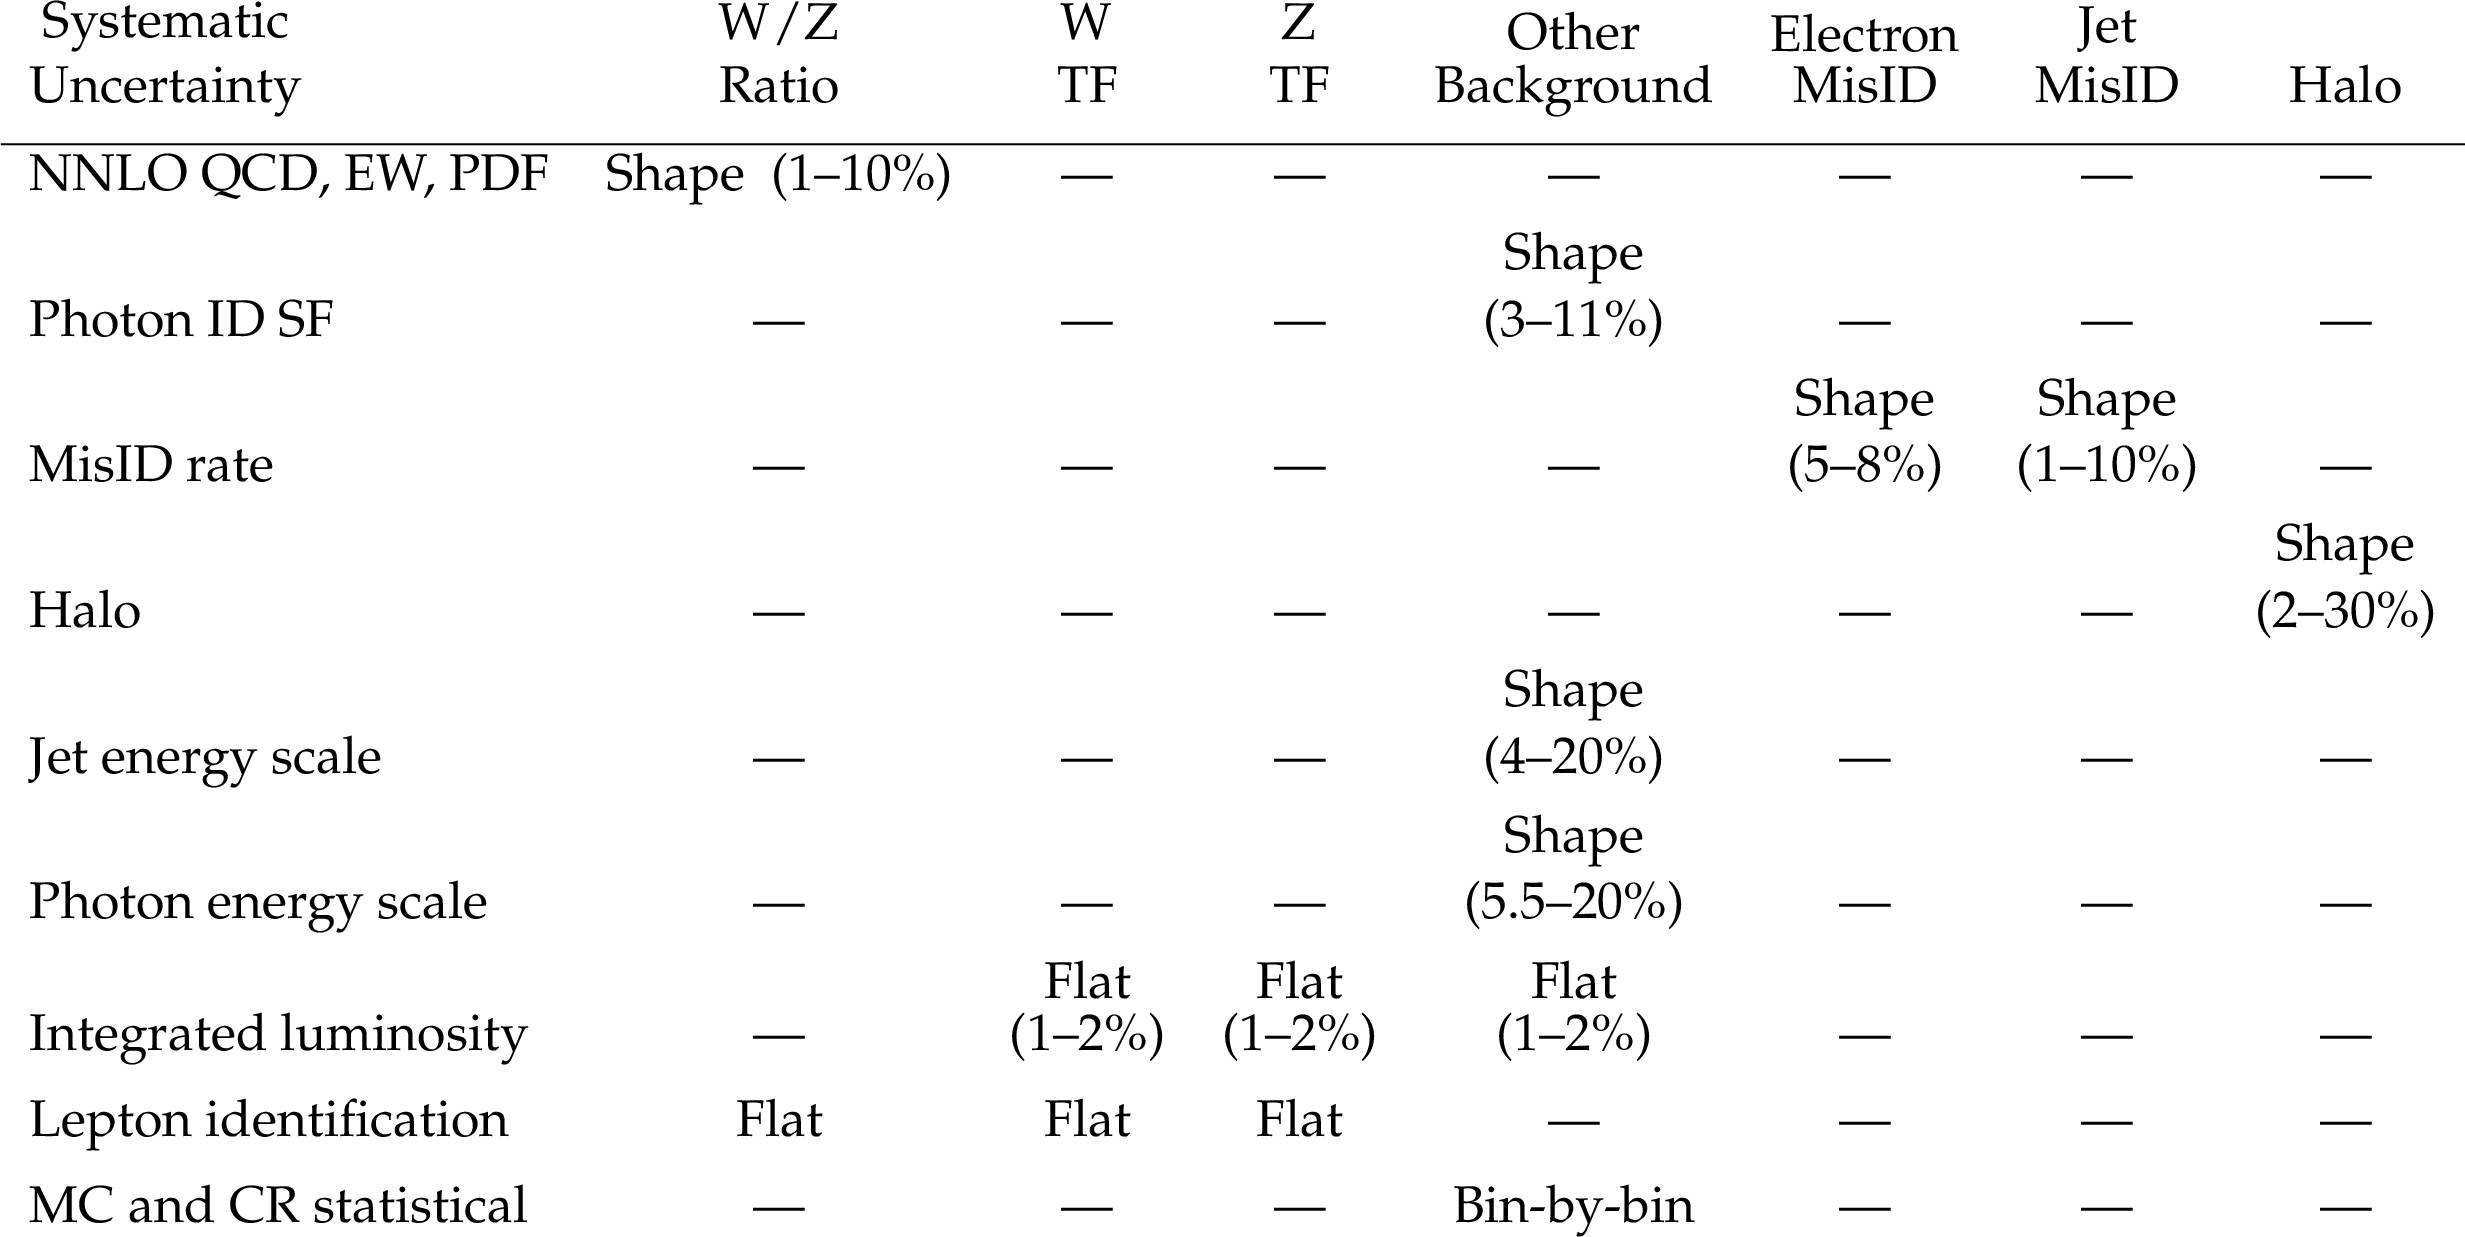
Table 3:
Summary of systematic uncertainties considered in the analysis. `W/Z Ratio' refers to correlated uncertainties propagated from $ \mathrm{W}({\to}\ell\overline{\nu}){+}\gamma $ to $ \mathrm{Z}({\to}\nu\overline{\nu}){+}\gamma $ background estimation (due to higher-order corrections and PDFs), `TF' denotes transfer factors, `MisID' represents misidentification backgrounds (electrons or jets misidentified as photons), and `Other' includes additional minor backgrounds. |
png pdf |
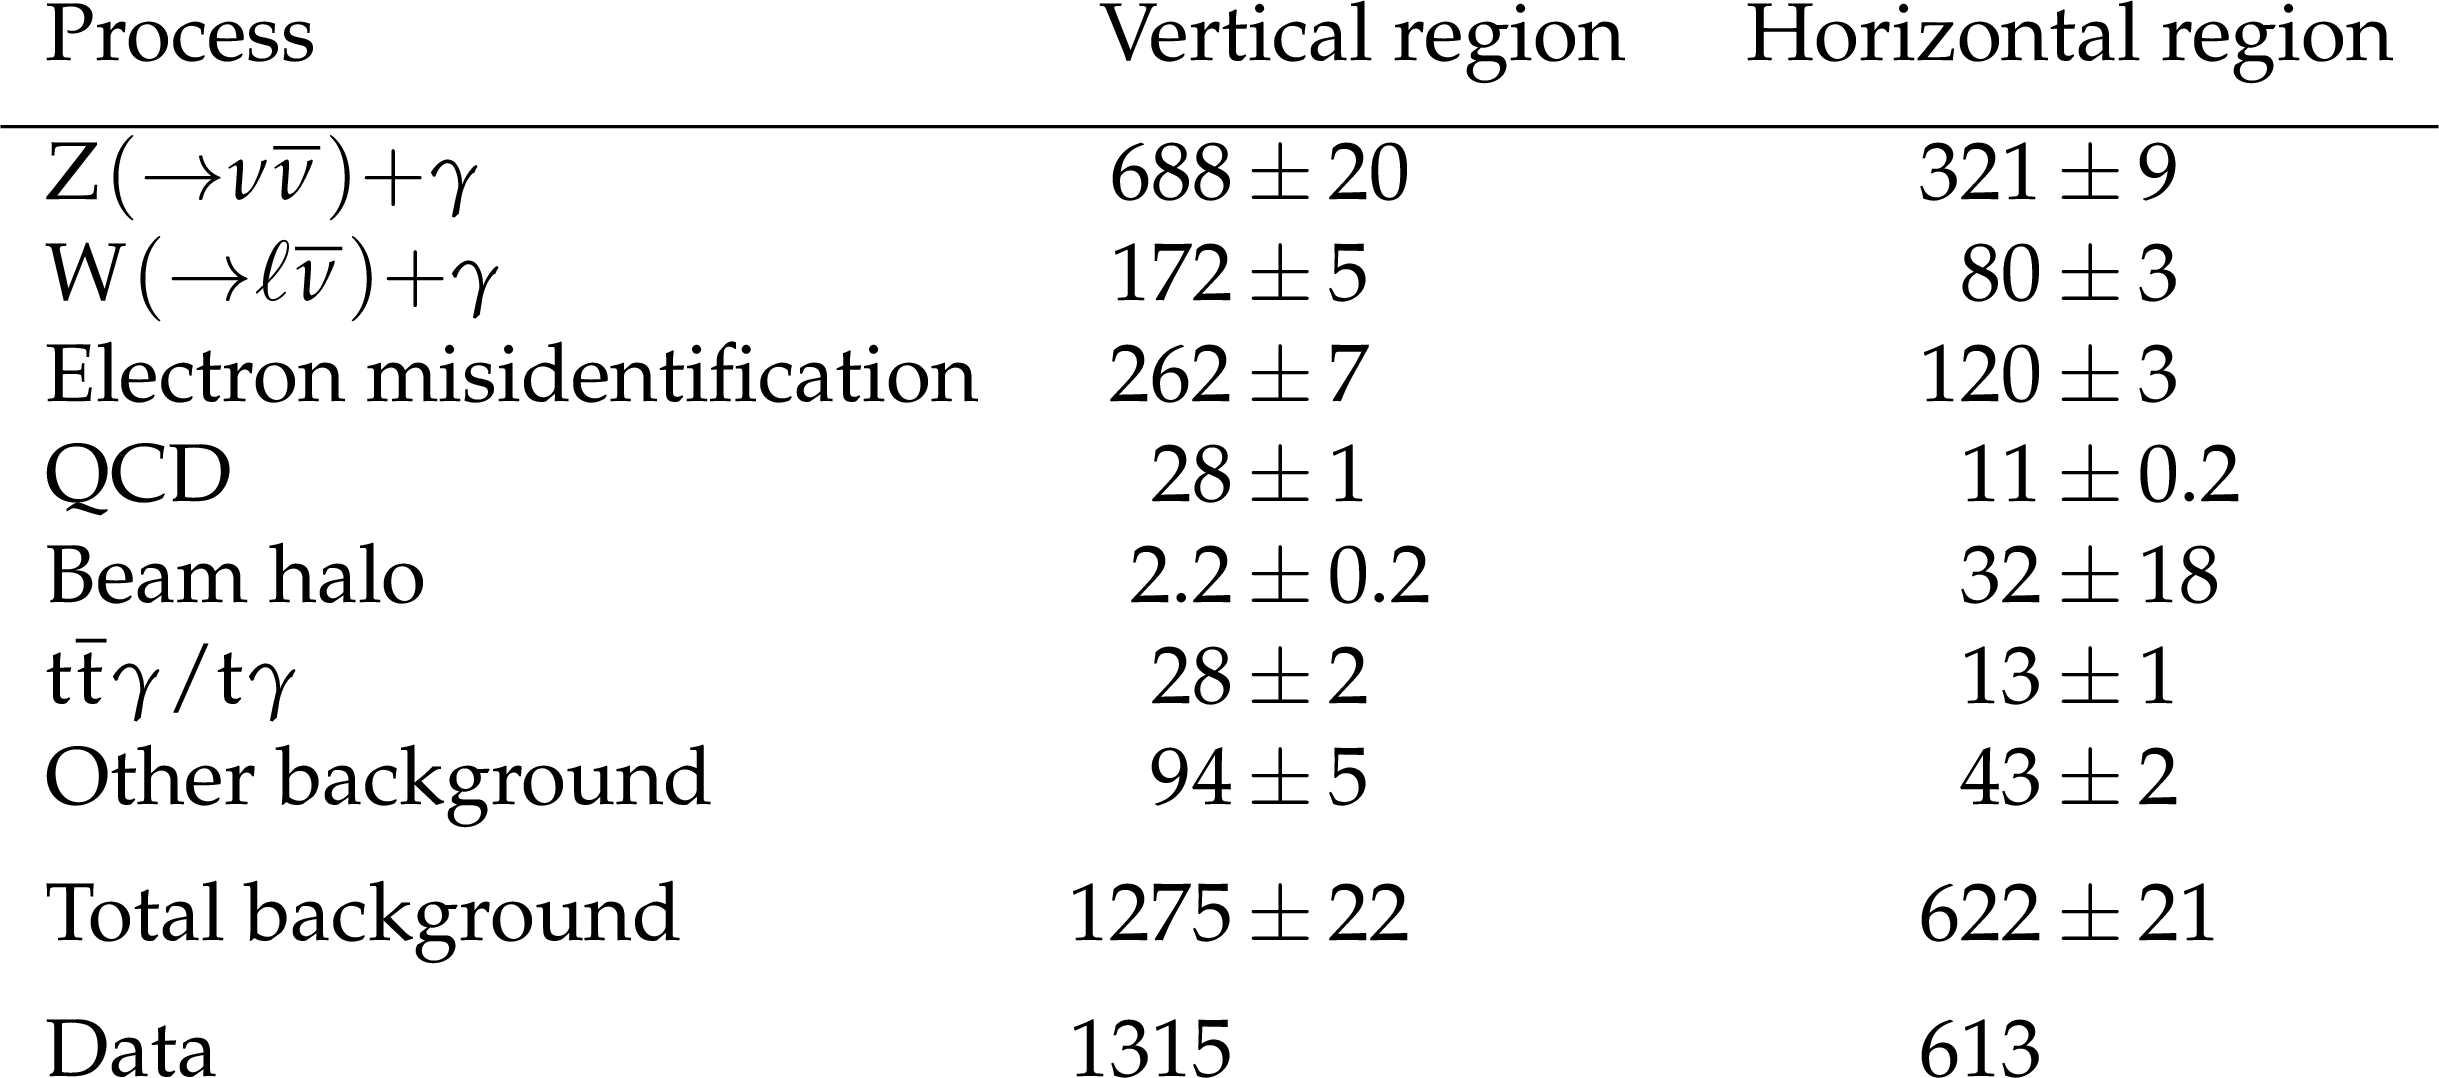
Table 4:
Total yield in vertical and horizontal regions using the combined 2017 and 2018 data set. |
| Summary |
| Proton-proton collisions producing a high transverse momentum photon and large missing transverse momentum have been investigated to search for new phenomena, using a data set corresponding to 137 fb$ ^{-1} $ of integrated luminosity recorded at $ \sqrt{s} = $ 13 TeV at the LHC. No deviations from the standard model predictions are observed. For the simplified dark matter production models considered, the observed (expected) lower limit on the mediator mass is 1085 (1300) GeV in both cases for a 1 GeV dark matter particle mass. For an effective electroweak dark matter contact interaction, the observed (expected) lower limit on the suppression parameter $ \Lambda $ is 940 (1000) GeV, which is an improvement of 10% (5%) over the 2016 analysis, while for the model with extra spatial dimensions, values of the effective Planck scale $ M_\text{D} $ up to 3.2 TeV are excluded between 3 and 6 extra dimensions, improving upon the 2016 results by 10% (11%). These results set the most stringent limits to date on these parameters of the electroweak contact interaction and extra dimension models in the monophoton final state. |
| References | ||||
| 1 | N. Arkani-Hamed, S. Dimopoulos, and G. Dvali | The hierarchy problem and new dimensions at a millimeter | PLB 429 (1998) 263 | hep-ph/9803315 |
| 2 | N. Arkani-Hamed, S. Dimopoulos, and G. Dvali | Phenomenology, astrophysics, and cosmology of theories with submillimeter dimensions and TeV scale quantum gravity | PRD 59 (1999) 086004 | hep-ph/9807344 |
| 3 | N. Arkani-Hamed, S. Dimopoulos, G. R. Dvali, and N. Kaloper | Infinitely large new dimensions | PRL 84 (2000) 586 | hep-th/9907209 |
| 4 | M. Beltran et al. | Maverick dark matter at colliders | JHEP 09 (2010) 037 | 1002.4137 |
| 5 | J. Goodman et al. | Constraints on dark matter from colliders | PRD 82 (2010) 116010 | 1008.1783 |
| 6 | P. J. Fox, R. Harnik, J. Kopp, and Y. Tsai | Missing energy signatures of dark matter at the LHC | PRD 85 (2012) 056011 | 1109.4398 |
| 7 | D. Abercrombie | Dark matter benchmark models for early LHC run-2 searches: Report of the ATLAS/CMS dark matter forum | Phys. Dark Univ. 27 (2020) 100371 | 1507.00966 |
| 8 | A. Boveia et al. | Recommendations on presenting LHC searches for missing transverse energy signals using simplified $ s $-channel models of dark matter | Phys. Dark Univ. 27 (2020) 100365 | 1603.04156 |
| 9 | A. Nelson et al. | Confronting the Fermi line with LHC data: An effective theory of dark matter interaction with photons | PRD 89 (2014) 056011 | 1307.5064 |
| 10 | CMS Collaboration | Search for new physics in final states with a single photon and missing transverse momentum in proton-proton collisions at $ \sqrt{s} = $ 13 TeV | JHEP 02 (2019) 074 | CMS-EXO-16-053 1810.00196 |
| 11 | ATLAS Collaboration | Search for dark matter in association with an energetic photon in $ pp $ collisions at $ \sqrt{s} = $ 13 TeV with the ATLAS detector | JHEP 02 (2021) 226 | 2011.05259 |
| 12 | CMS Collaboration | HEPData record for this analysis | link | |
| 13 | CMS Collaboration | The CMS experiment at the CERN LHC | JINST 3 (2008) S08004 | |
| 14 | CMS Collaboration | Development of the CMS detector for the CERN LHC Run 3 | JINST 19 (2024) P05064 | |
| 15 | CMS Collaboration | Electron and photon reconstruction and identification with the CMS experiment at the CERN LHC | JINST 16 (2021) P05014 | CMS-EGM-17-001 2012.06888 |
| 16 | CMS Collaboration | Performance of the CMS muon detector and muon reconstruction with proton-proton collisions at $ \sqrt{s}= $ 13 TeV | JINST 13 (2018) P06015 | CMS-MUO-16-001 1804.04528 |
| 17 | CMS Collaboration | Description and performance of track and primary-vertex reconstruction with the CMS tracker | JINST 9 (2014) P10009 | CMS-TRK-11-001 1405.6569 |
| 18 | CMS Collaboration | Performance of the CMS level-1 trigger in proton-proton collisions at $ \sqrt{s} = $ 13 TeV | JINST 15 (2020) P10017 | CMS-TRG-17-001 2006.10165 |
| 19 | CMS Collaboration | The CMS trigger system | JINST 12 (2017) P01020 | CMS-TRG-12-001 1609.02366 |
| 20 | CMS Collaboration | Performance of the CMS high-level trigger during LHC run 2 | JINST 19 (2024) P11021 | CMS-TRG-19-001 2410.17038 |
| 21 | CMS Collaboration | Technical proposal for the phase-ii upgrade of the CMS detector | technical report, CERN, 2015 link |
|
| 22 | CMS Collaboration | Particle-flow reconstruction and global event description with the CMS detector | JINST 12 (2017) P10003 | CMS-PRF-14-001 1706.04965 |
| 23 | M. Cacciari, G. P. Salam, and G. Soyez | The anti-$ k_{\mathrm{T}} $ jet clustering algorithm | JHEP 04 (2008) 063 | 0802.1189 |
| 24 | M. Cacciari, G. P. Salam, and G. Soyez | Fastjet user manual | EPJC 72 (2012) 1896 | 1111.6097 |
| 25 | CMS Collaboration | Jet energy scale and resolution in the CMS experiment in pp collisions at 8 TeV | JINST 12 (2017) P02014 | CMS-JME-13-004 1607.03663 |
| 26 | CMS Collaboration | Performance of missing transverse momentum reconstruction in proton-proton collisions at $ \sqrt{s} = $ 13 TeV using the CMS detector | JINST 14 (2019) P07004 | CMS-JME-17-001 1903.06078 |
| 27 | CMS Collaboration | Jet algorithms performance in 13 TeV data | CMS Physics Analysis Summary, CERN, 2017 CMS-PAS-JME-16-003 |
CMS-PAS-JME-16-003 |
| 28 | CMS Collaboration | Performance of photon reconstruction and identification with the CMS detector in proton-proton collisions at $ \sqrt{s}= $ 8 TeV | JINST 10 (2015) P08010 | CMS-EGM-14-001 1502.02702 |
| 29 | CMS Collaboration | Performance of the reconstruction and identification of high-momentum muons in proton-proton collisions at $ \sqrt{s} = $ 13 TeV | JINST 15 (2020) P02027 | CMS-MUO-17-001 1912.03516 |
| 30 | NNPDF Collaboration | Parton distributions from high-precision collider data | EPJC 77 (2017) 663 | 1706.00428 |
| 31 | J. Alwall et al. | The automated computation of tree-level and next-to-leading order differential cross sections, and their matching to parton shower simulations | JHEP 07 (2014) 079 | 1405.0301 |
| 32 | T. Sjostrand et al. | An introduction to PYTHIA 8.2 | Comput. Phys. Commun. 191 (2015) 159 | 1410.3012 |
| 33 | CMS Collaboration | Event generator tunes obtained from underlying event and multiparton scattering measurements | EPJC 76 (2016) 155 | CMS-GEN-14-001 1512.00815 |
| 34 | GEANT4 Collaboration | GEANT 4---a simulation toolkit | NIM A 506 (2003) 250 | |
| 35 | J. Allison | GEANT 4 developments and applications | IEEE Trans. Nucl. Sci 53 (2006) 270 | |
| 36 | S. Orfanelli et al. | A novel beam halo monitor for the CMS experiment at the LHC | JINST 10 (2015) P11011 | |
| 37 | S. Catani, D. de Florian, G. Ferrera, and M. Grazzini | Vector boson production at hadron colliders: transverse-momentum resummation and leptonic decay | JHEP 12 (2015) 047 | 1507.06937 |
| 38 | A. Denner, S. Dittmaier, M. Hecht, and C. Pasold | NLO QCD and electroweak corrections to $ W{+}\gamma $ production with leptonic $ W $-boson decays | JHEP 04 (2015) 018 | 1412.7421 |
| 39 | A. Denner, S. Dittmaier, M. Hecht, and C. Pasold | NLO QCD and electroweak corrections to $ Z{+}\gamma $ production with leptonic $ Z $-boson decays | JHEP 02 (2016) 057 | 1510.08742 |
| 40 | A. V. Manohar, P. Nason, G. P. Salam, and G. Zanderighi | The photon content of the proton | JHEP 12 (2017) 046 | 1708.01256 |
| 41 | CMS Collaboration | Measurement of the inclusive $ W $ and $ Z $ production cross sections in pp collisions at $ \sqrt{s} = $ 7 TeV with the CMS experiment | JHEP 10 (2011) 132 | CMS-EWK-10-005 1107.4789 |
| 42 | J. M. Lindert et al. | Precise predictions for V+jets dark matter backgrounds | EPJC 77 (2017) 829 | 1705.04664 |
| 43 | CMS Collaboration | Precision luminosity measurement in proton-proton collisions at $ \sqrt{s} = $ 13 TeV in 2015 and 2016 at CMS | EPJC 81 (2021) 800 | CMS-LUM-17-003 2104.01927 |
| 44 | CMS Collaboration | CMS luminosity measurement for the 2017 data-taking period at $ \sqrt{s}= $ 13 TeV | CMS Physics Analysis Summary, CERN, 2018 CMS-PAS-LUM-17-004 |
CMS-PAS-LUM-17-004 |
| 45 | CMS Collaboration | CMS luminosity measurement for the 2018 data-taking period at $ \sqrt{s}= $ 13 TeV | CMS Physics Analysis Summary, CERN, 2019 CMS-PAS-LUM-18-002 |
CMS-PAS-LUM-18-002 |
| 46 | CMS Collaboration | The CMS statistical analysis and combination tool: Combine | Comput. Softw. Big Sci. 8 (2024) 19 | CMS-CAT-23-001 2404.06614 |
| 47 | T. Junk | Confidence level computation for combining searches with small statistics | NIM A 434 (1999) 435 | hep-ex/9902006 |
| 48 | A. L. Read | Presentation of search results: The $ cl_s $ technique | JPG 28 (2002) 2693 | |
| 49 | G. Cowan, K. Cranmer, E. Gross, and O. Vitells | Asymptotic formulae for likelihood-based tests of new physics | EPJC 71 (2011) 1554 | 1007.1727 |
| 50 | Planck Collaboration | Planck 2015 results. XIII. Cosmological parameters | Astron. Astrophys. 594 (2016) A13 | 1502.01589 |
| 51 | M. Backovic, K. Kong, and M. McCaskey | MadDM v.1.0: Computation of dark matter relic abundance using MadGraph5 | Physics of the Dark Universe 5-6 18, 2014 link |
1308.4955 |
| 52 | SuperCDMS Collaboration | New results from the search for low-mass weakly interacting massive particles with the CDMS low ionization threshold experiment | PRL 116 (2016) 071301 | 1509.02448 |
| 53 | LZ Collaboration | Dark matter search results from 4.2 tonne-years of exposure of the LUX-ZEPLIN (LZ) experiment | PRL 135 (2025) 011802 | 2410.17036 |
| 54 | PandaX-II Collaboration | Dark matter results from 54-ton-day exposure of the PandaX-II experiment | PRL 119 (2017) 181302 | 1708.06917 |
| 55 | XENON Collaboration | First dark matter search with nuclear recoils from the XENONnT experiment | PRL 131 (2023) 041003 | 2303.14729 |
| 56 | CRESST Collaboration | Results on light dark matter particles with a low-threshold CRESST-II detector | EPJC 76 (2016) 25 | 1509.01515 |
| 57 | PICO Collaboration | Dark matter search results from the PICO-60 c$ _3 $f$ _8 $ bubble chamber | PRL 118 (2017) 251301 | 1702.07666 |
| 58 | IceCube Collaboration | Search for gev-scale dark matter annihilation in the Sun with IceCube DeepCore | PRD 105 (2022) 062004 | 2111.09970 |
| 59 | E. Behnke et al. | Final results of the PICASSO dark matter search experiment | Astropart. Phys. 90 (2017) 85 | 1611.01499 |
| 60 | Super-Kamiokande Collaboration | Search for neutrinos from annihilation of captured low-mass dark matter particles in the Sun by Super-Kamiokande | PRL 114 (2015) 141301 | 1503.04858 |
|
|
Compact Muon Solenoid LHC, CERN |
|

|

|

|

|

|