

Compact Muon Solenoid
LHC, CERN
| CMS-PAS-HIN-24-008 | ||
| Jet shapes based on two-particle angular correlations in PbPb collisions at $ \sqrt{\smash[b]{s_{_{\mathrm{NN}}}}} = $ 5.02 TeV | ||
| CMS Collaboration | ||
| 8 October 2024 | ||
| Abstract: In ultrarelativistic heavy ion collisions, long- and short-range correlations can be studied by forming two-dimensional histograms of the separations in pseudorapidity and azimuth of each particle in an event with every other particle in that event, with the two particles forming a pair selected in specified transverse-momentum ranges. Averaged over many events, jets result in a well defined peak structure centered at zero separation in pseudorapidity and azimuth. This note explores the evolution of the two-particle jet peak shape with the pair transverse momentum ranges, the collision centrality, and the pseudorapidity of the jet peak. Lead-lead collision results at a center-of-mass energy per nucleon pair of 5.02 TeV are presented. The data were obtained using the CMS detector and correspond to an integrated luminosity of 0.607 nb$^{-1}$. Proton-proton collision data at the same nucleon-nucleon collision energy and corresponding to 252 nb$^{-1}$ are also presented to provide a vacuum reference. The results are discussed in terms of the boost invariance of the two-particle correlation jet peak shape. | ||
| Links: CDS record (PDF) ; CADI line (restricted) ; | ||
| Figures | |

png pdf |
Figure 1:
Signal distribution (left), mixed event distribution (middle), correlation function (right) for 0-10% centrality, 3.0 $ < p_\mathrm{T,trig} < $ 4.0 GeV and 2.0 $ < p_\mathrm{T,asso} < $ 3.0 GeV in PbPb collisions data at 5.02 TeV. |
png pdf |
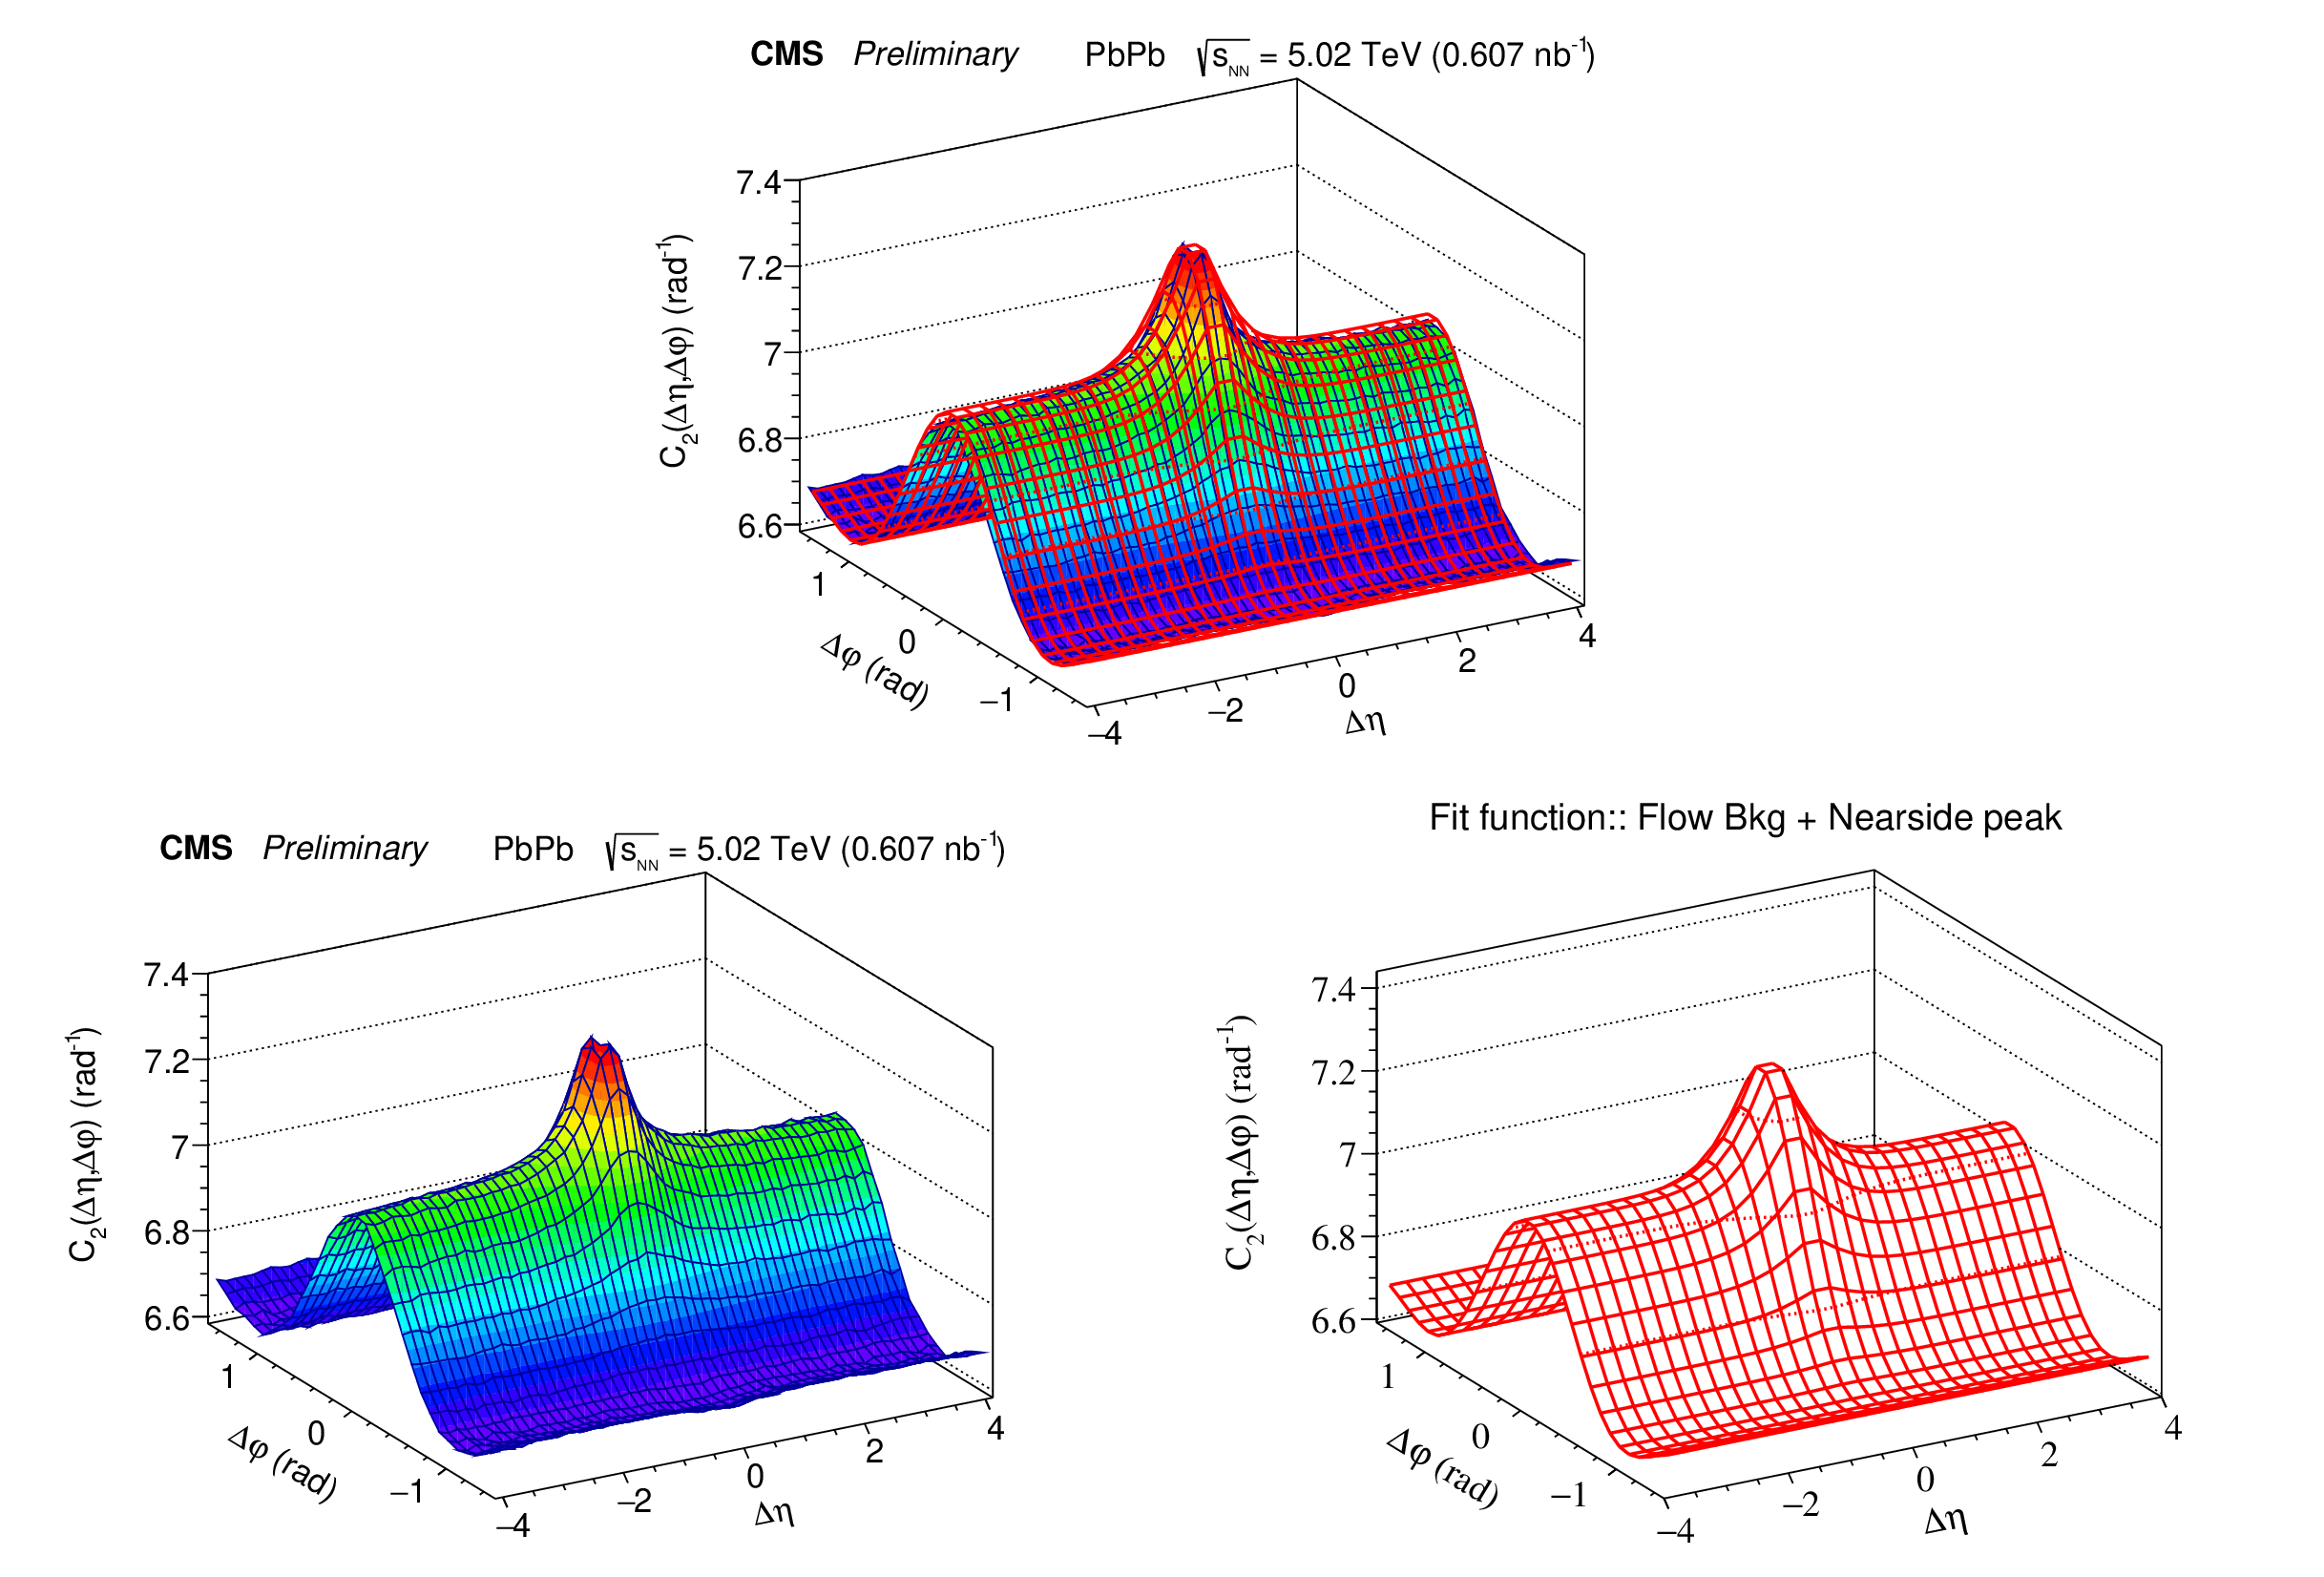
Figure 2:
2D correlations + 2D Fit functions (upper panel), 2D correlations (lower panel: left), 2D Fit function (lower panel: right) for 0-10% centrality, 3.0 $ < p_\mathrm{T,trig} < $ 4.0 GeV and 2.0 $ < p_\mathrm{T,asso} < $ 3.0 GeV in PbPb collisions data at 5.02 TeV. |

png pdf |
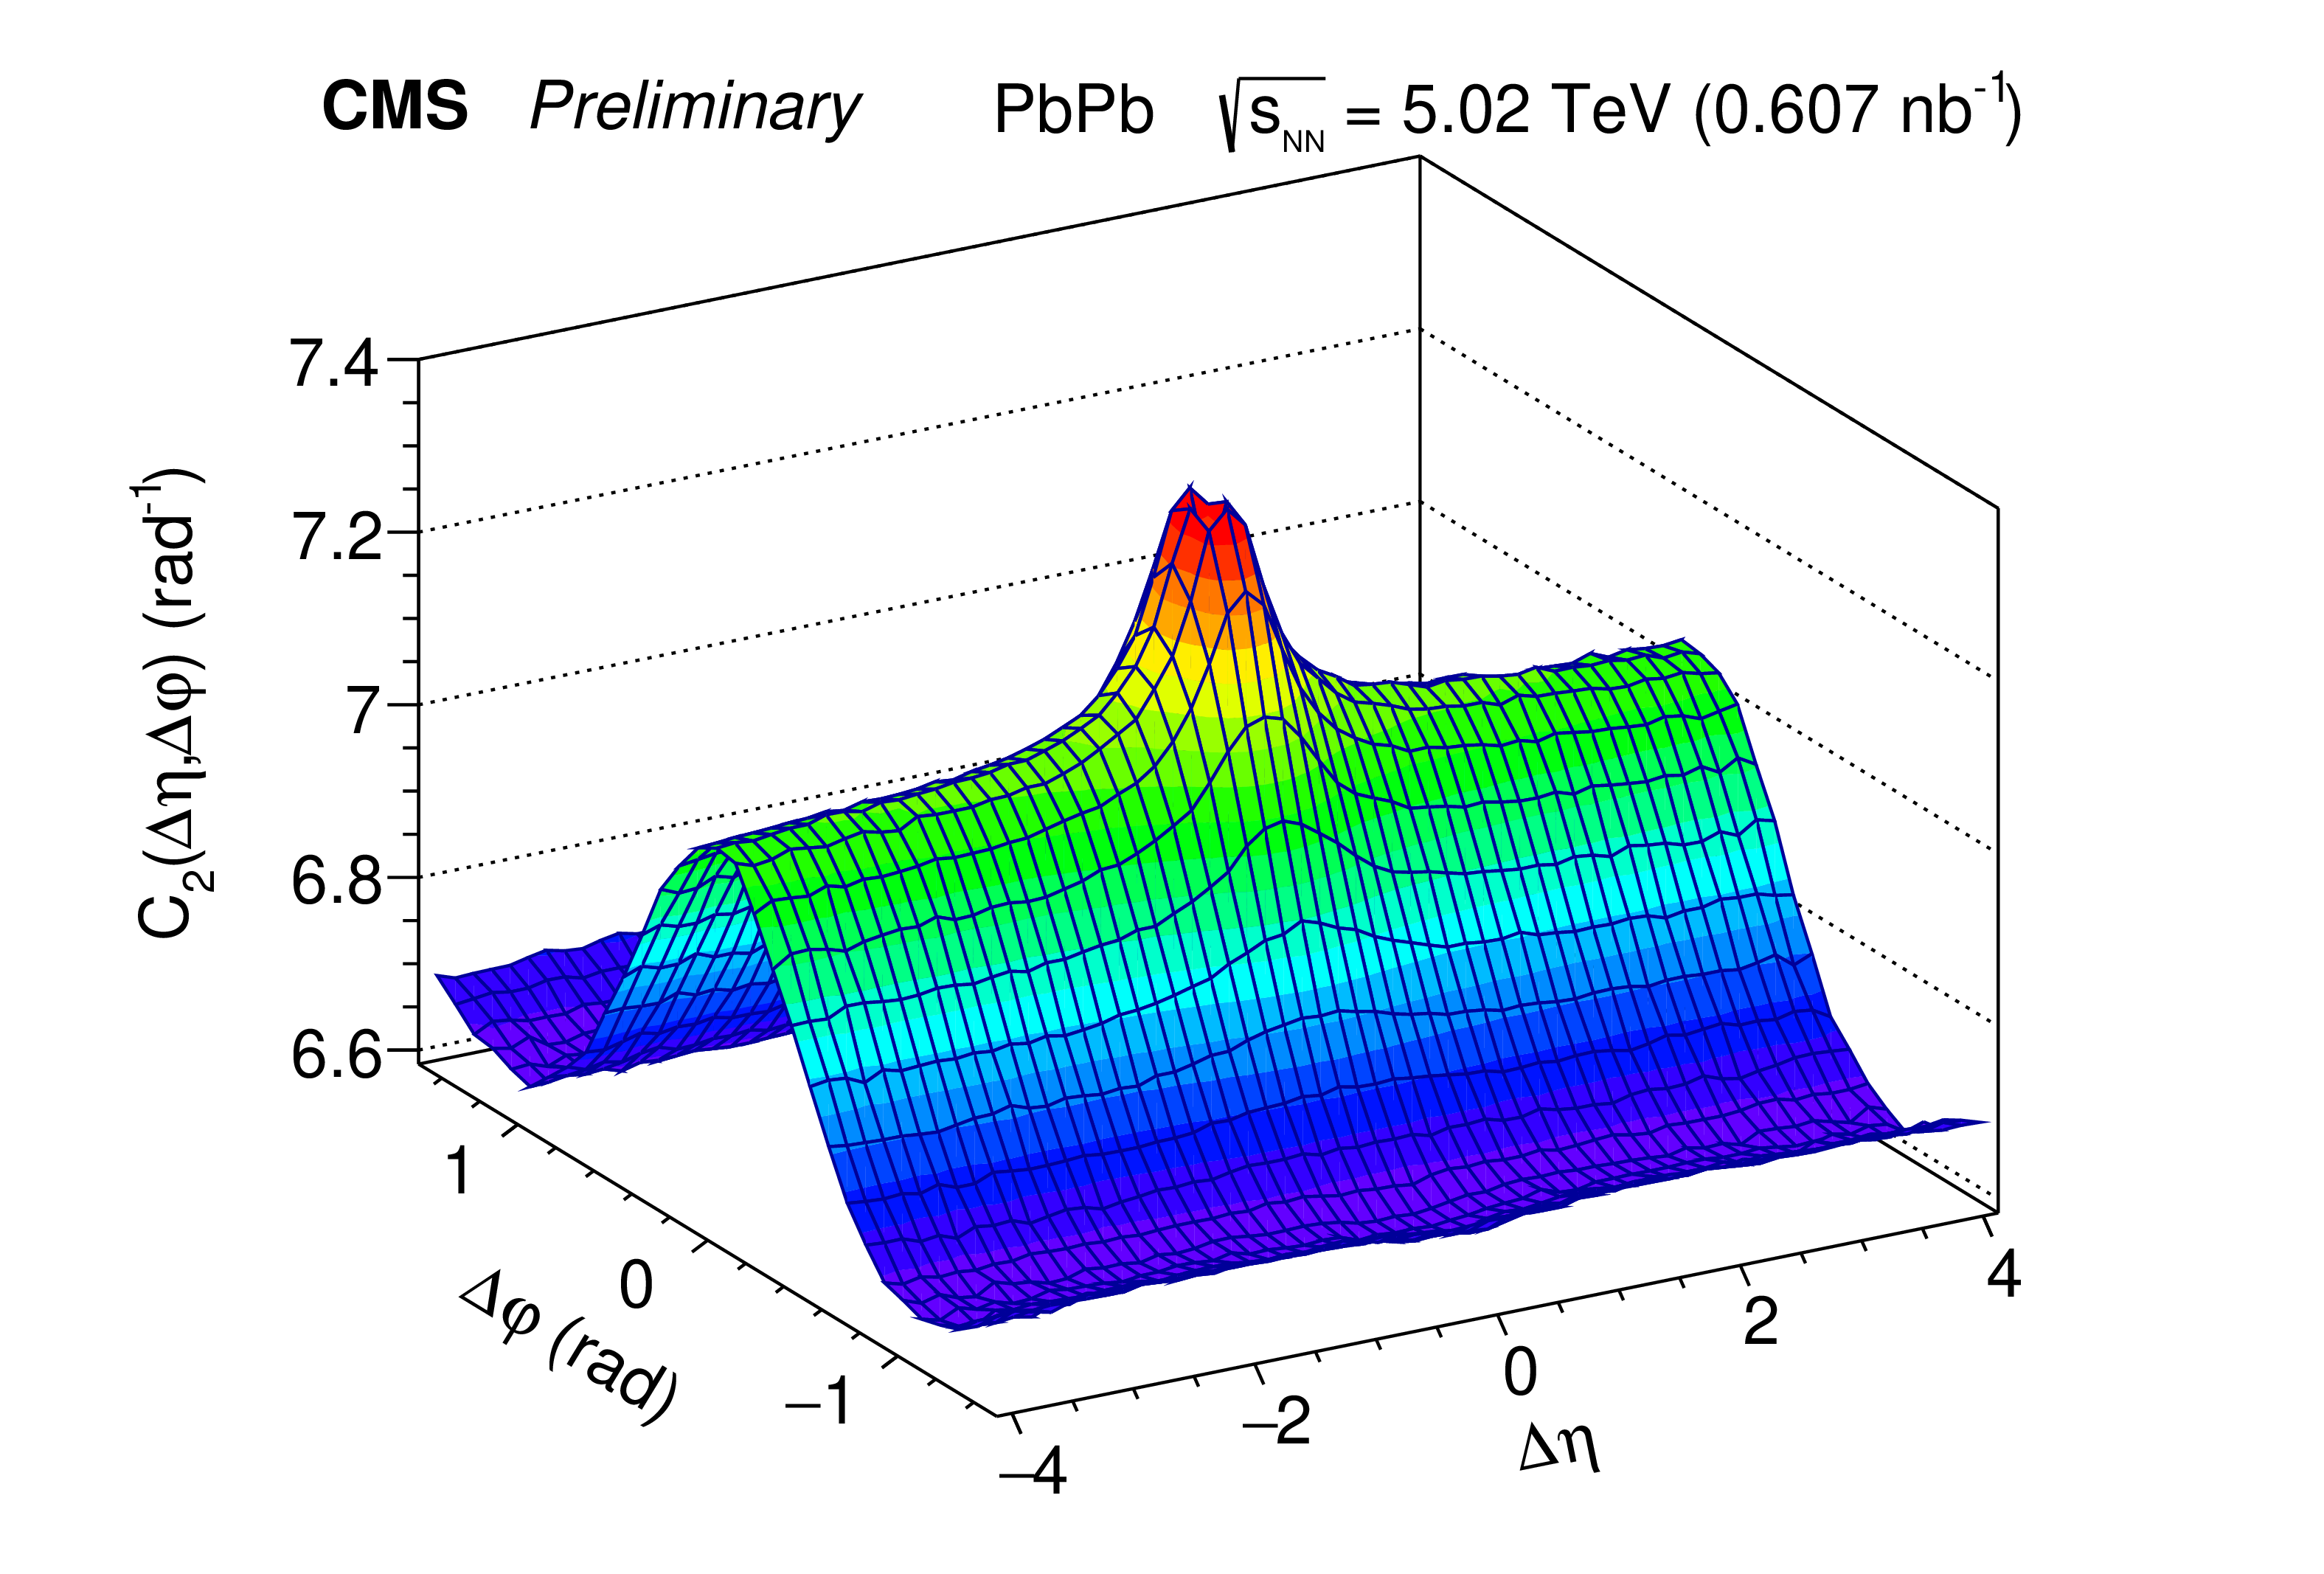
Figure 2-a:
2D correlations + 2D Fit functions (upper panel), 2D correlations (lower panel: left), 2D Fit function (lower panel: right) for 0-10% centrality, 3.0 $ < p_\mathrm{T,trig} < $ 4.0 GeV and 2.0 $ < p_\mathrm{T,asso} < $ 3.0 GeV in PbPb collisions data at 5.02 TeV. |
png pdf |
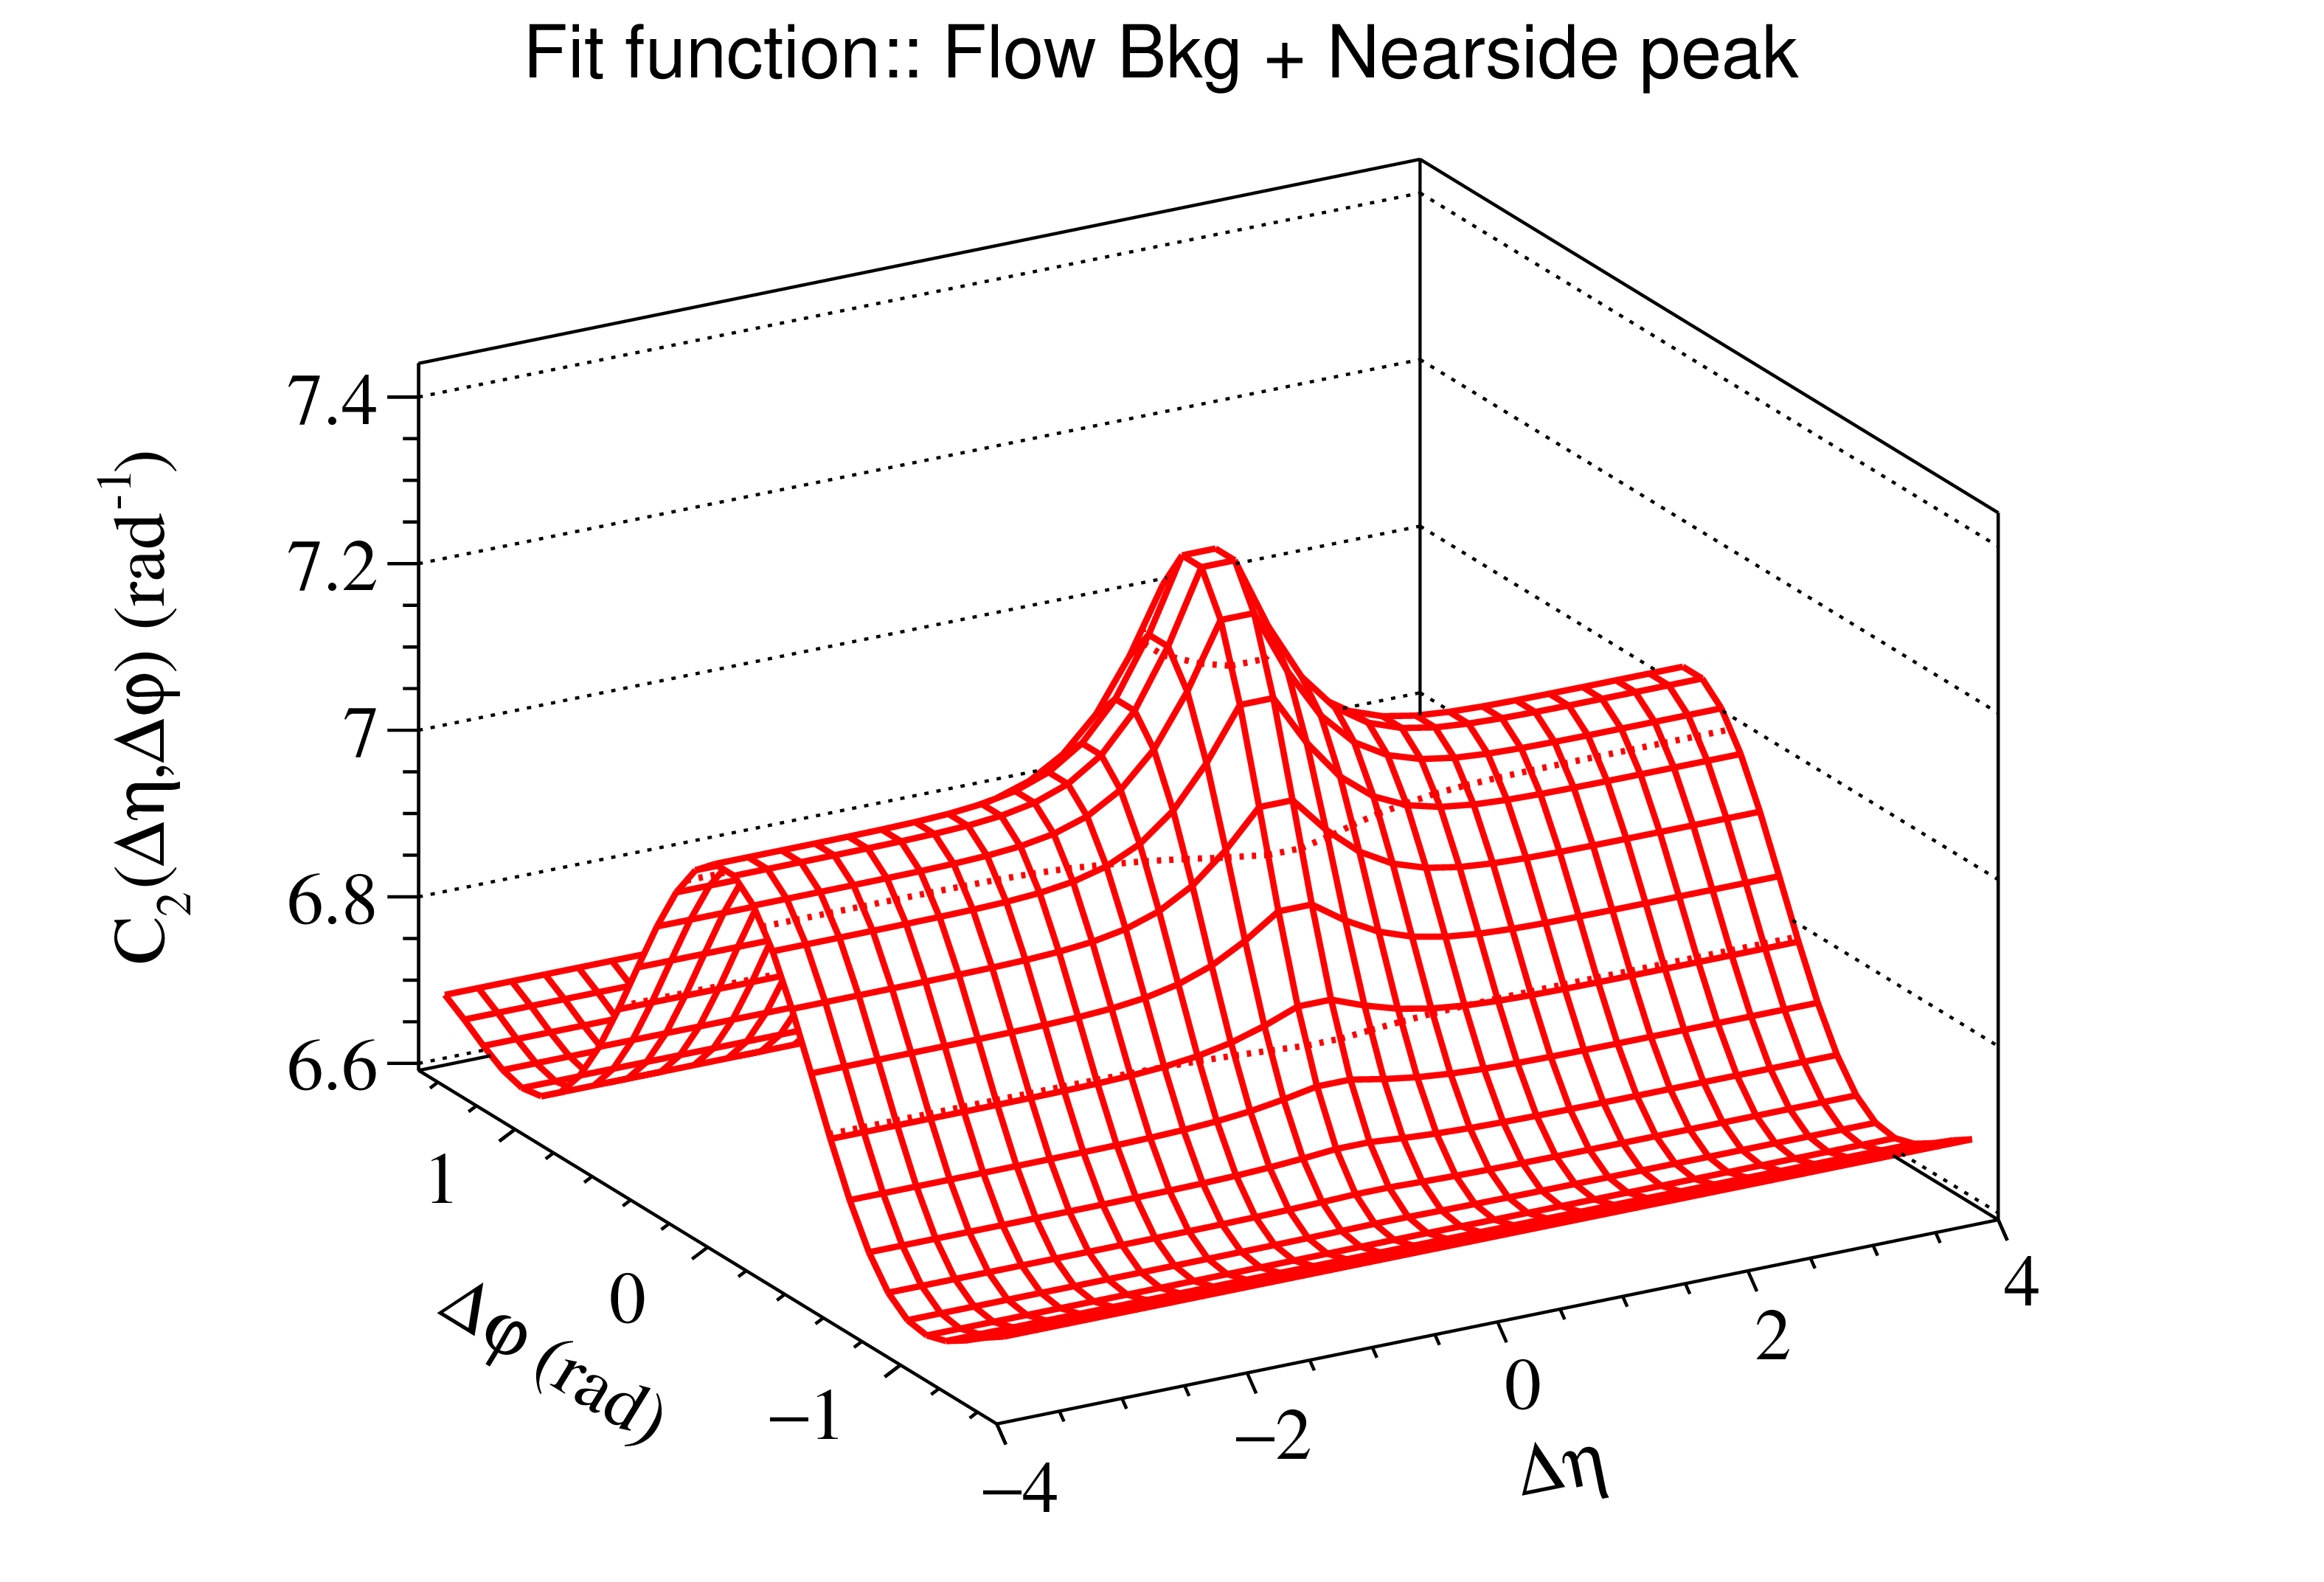
Figure 2-b:
2D correlations + 2D Fit functions (upper panel), 2D correlations (lower panel: left), 2D Fit function (lower panel: right) for 0-10% centrality, 3.0 $ < p_\mathrm{T,trig} < $ 4.0 GeV and 2.0 $ < p_\mathrm{T,asso} < $ 3.0 GeV in PbPb collisions data at 5.02 TeV. |
png pdf |
Figure 2-c:
2D correlations + 2D Fit functions (upper panel), 2D correlations (lower panel: left), 2D Fit function (lower panel: right) for 0-10% centrality, 3.0 $ < p_\mathrm{T,trig} < $ 4.0 GeV and 2.0 $ < p_\mathrm{T,asso} < $ 3.0 GeV in PbPb collisions data at 5.02 TeV. |
png pdf |
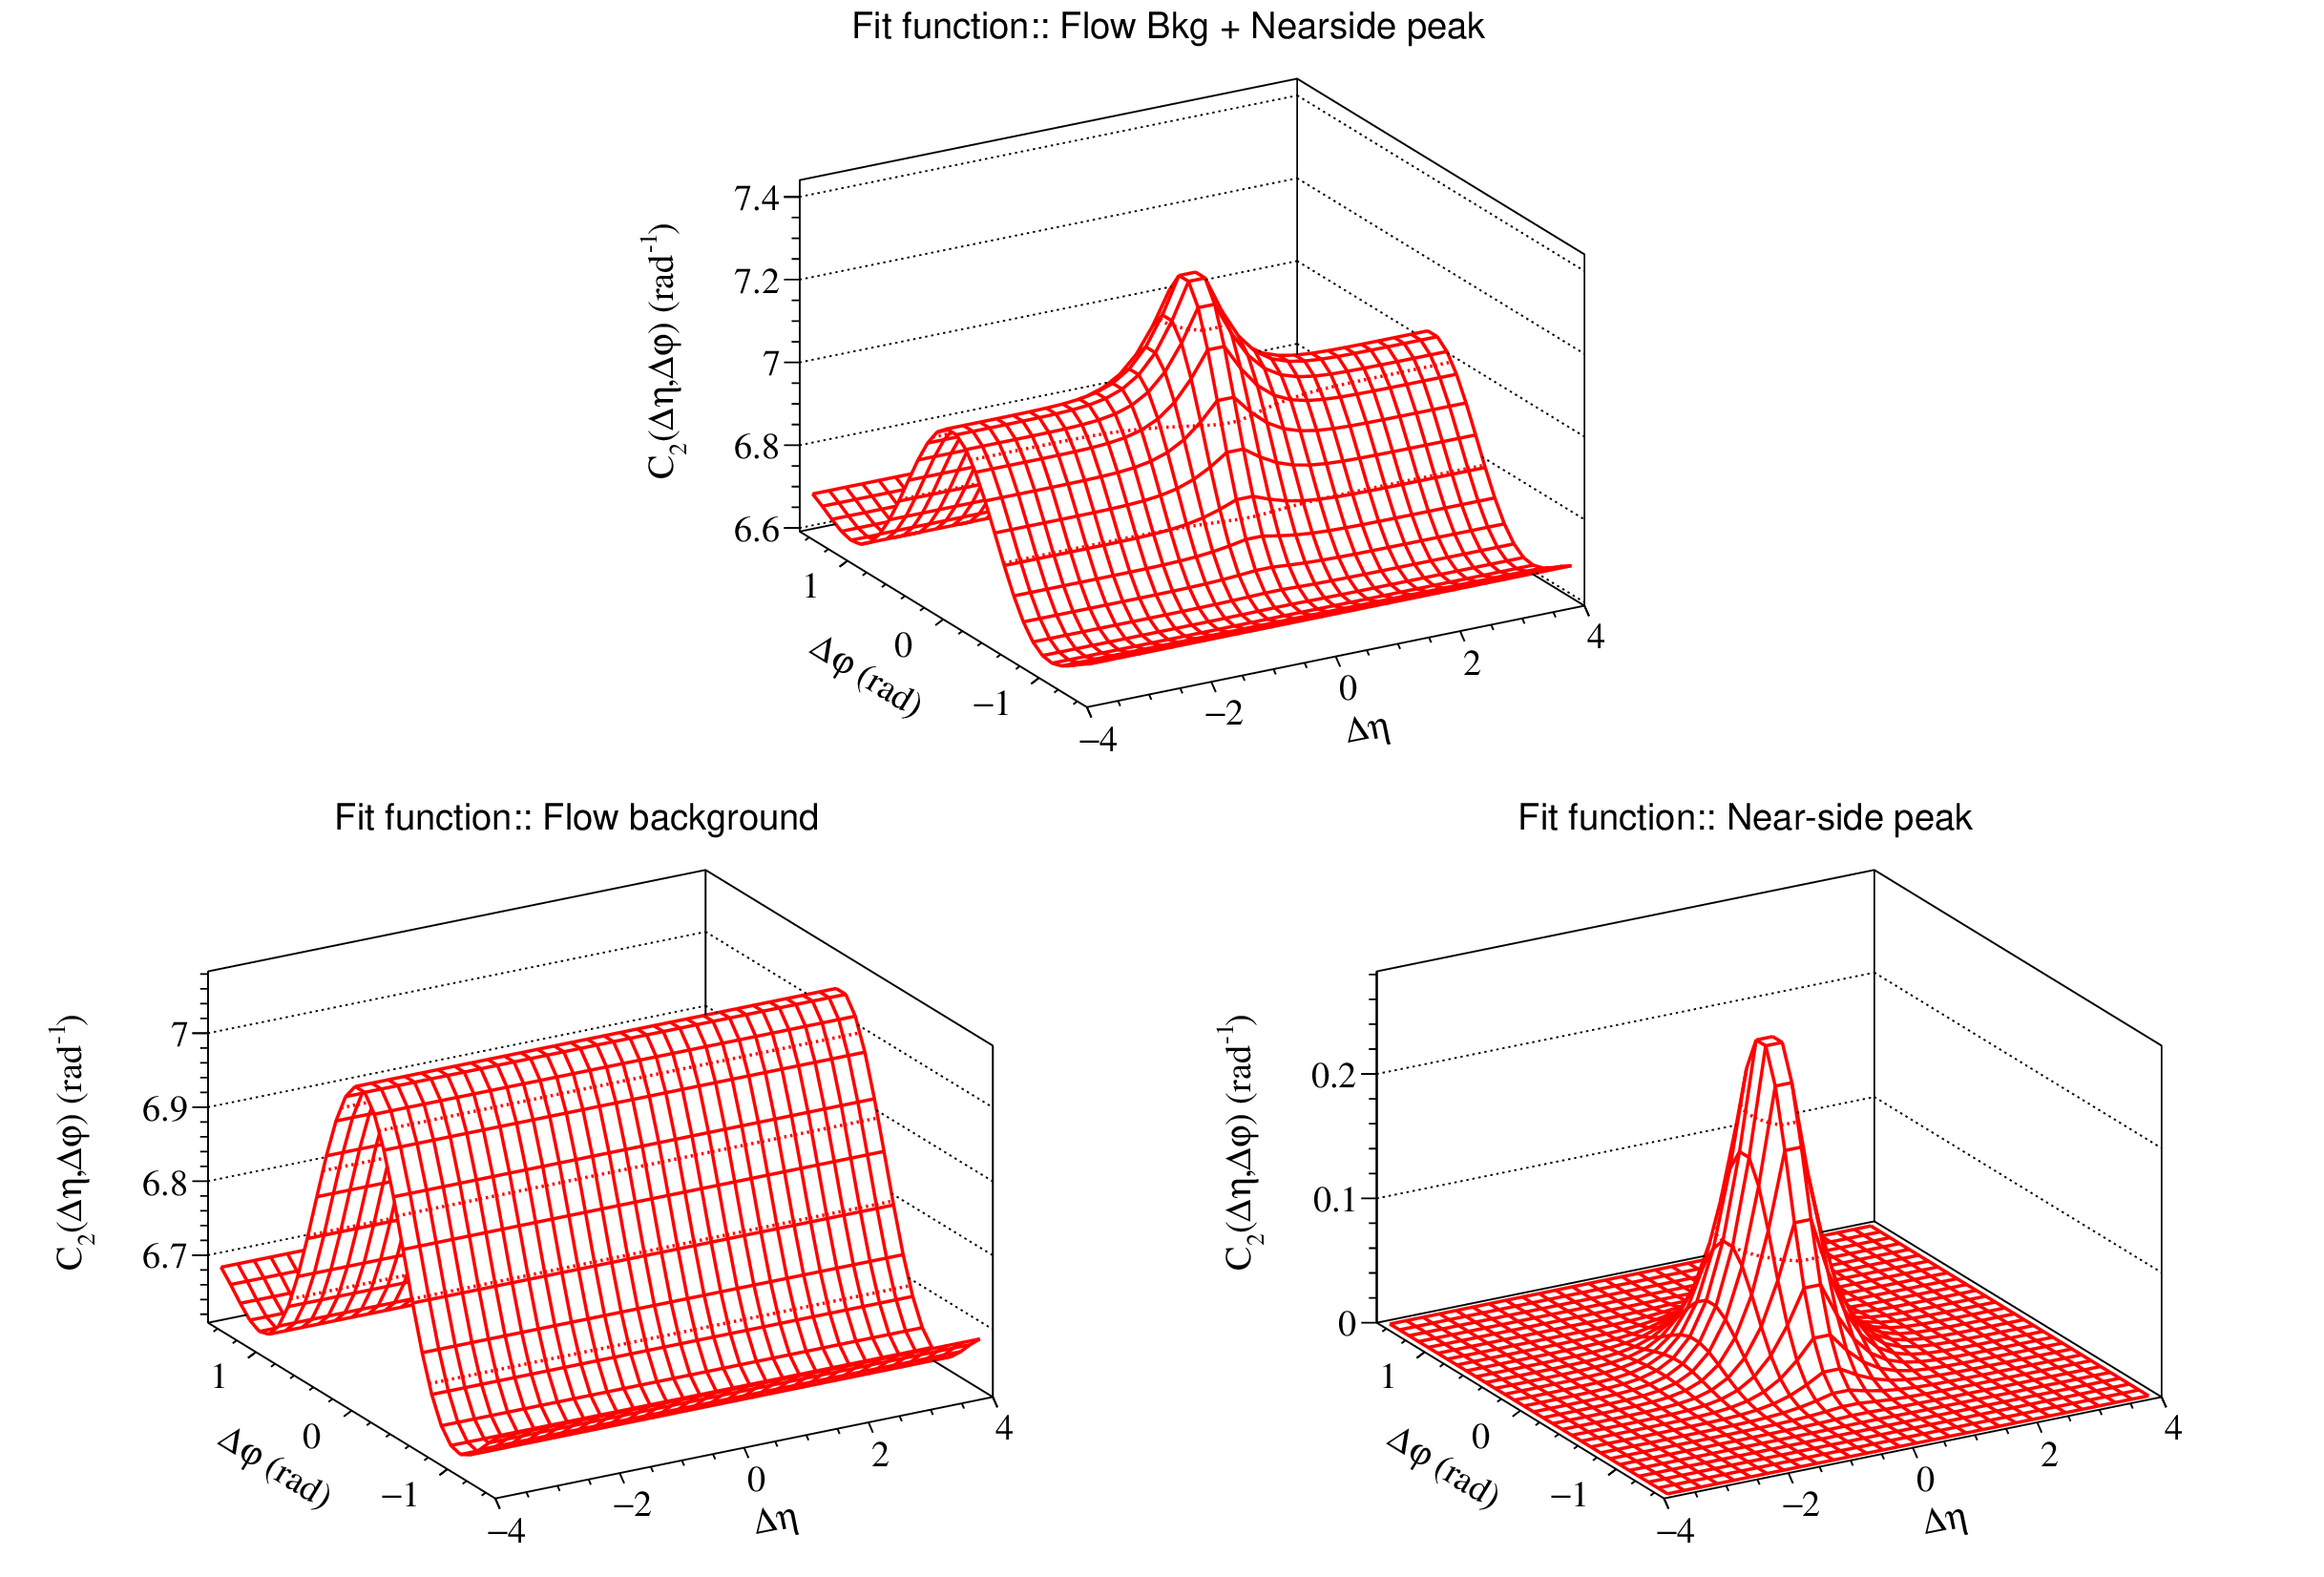
Figure 3:
2D Fit functions (upper panel), Flow background fit (lower panel: left), Near-side 2D peak fit (lower panel: right) for 0-10% centrality, 3.0 $ < p_\mathrm{T,trig} < $ 4.0 GeV and 2.0 $ < p_\mathrm{T,asso} < $ 3.0 GeV in PbPb collisions. |
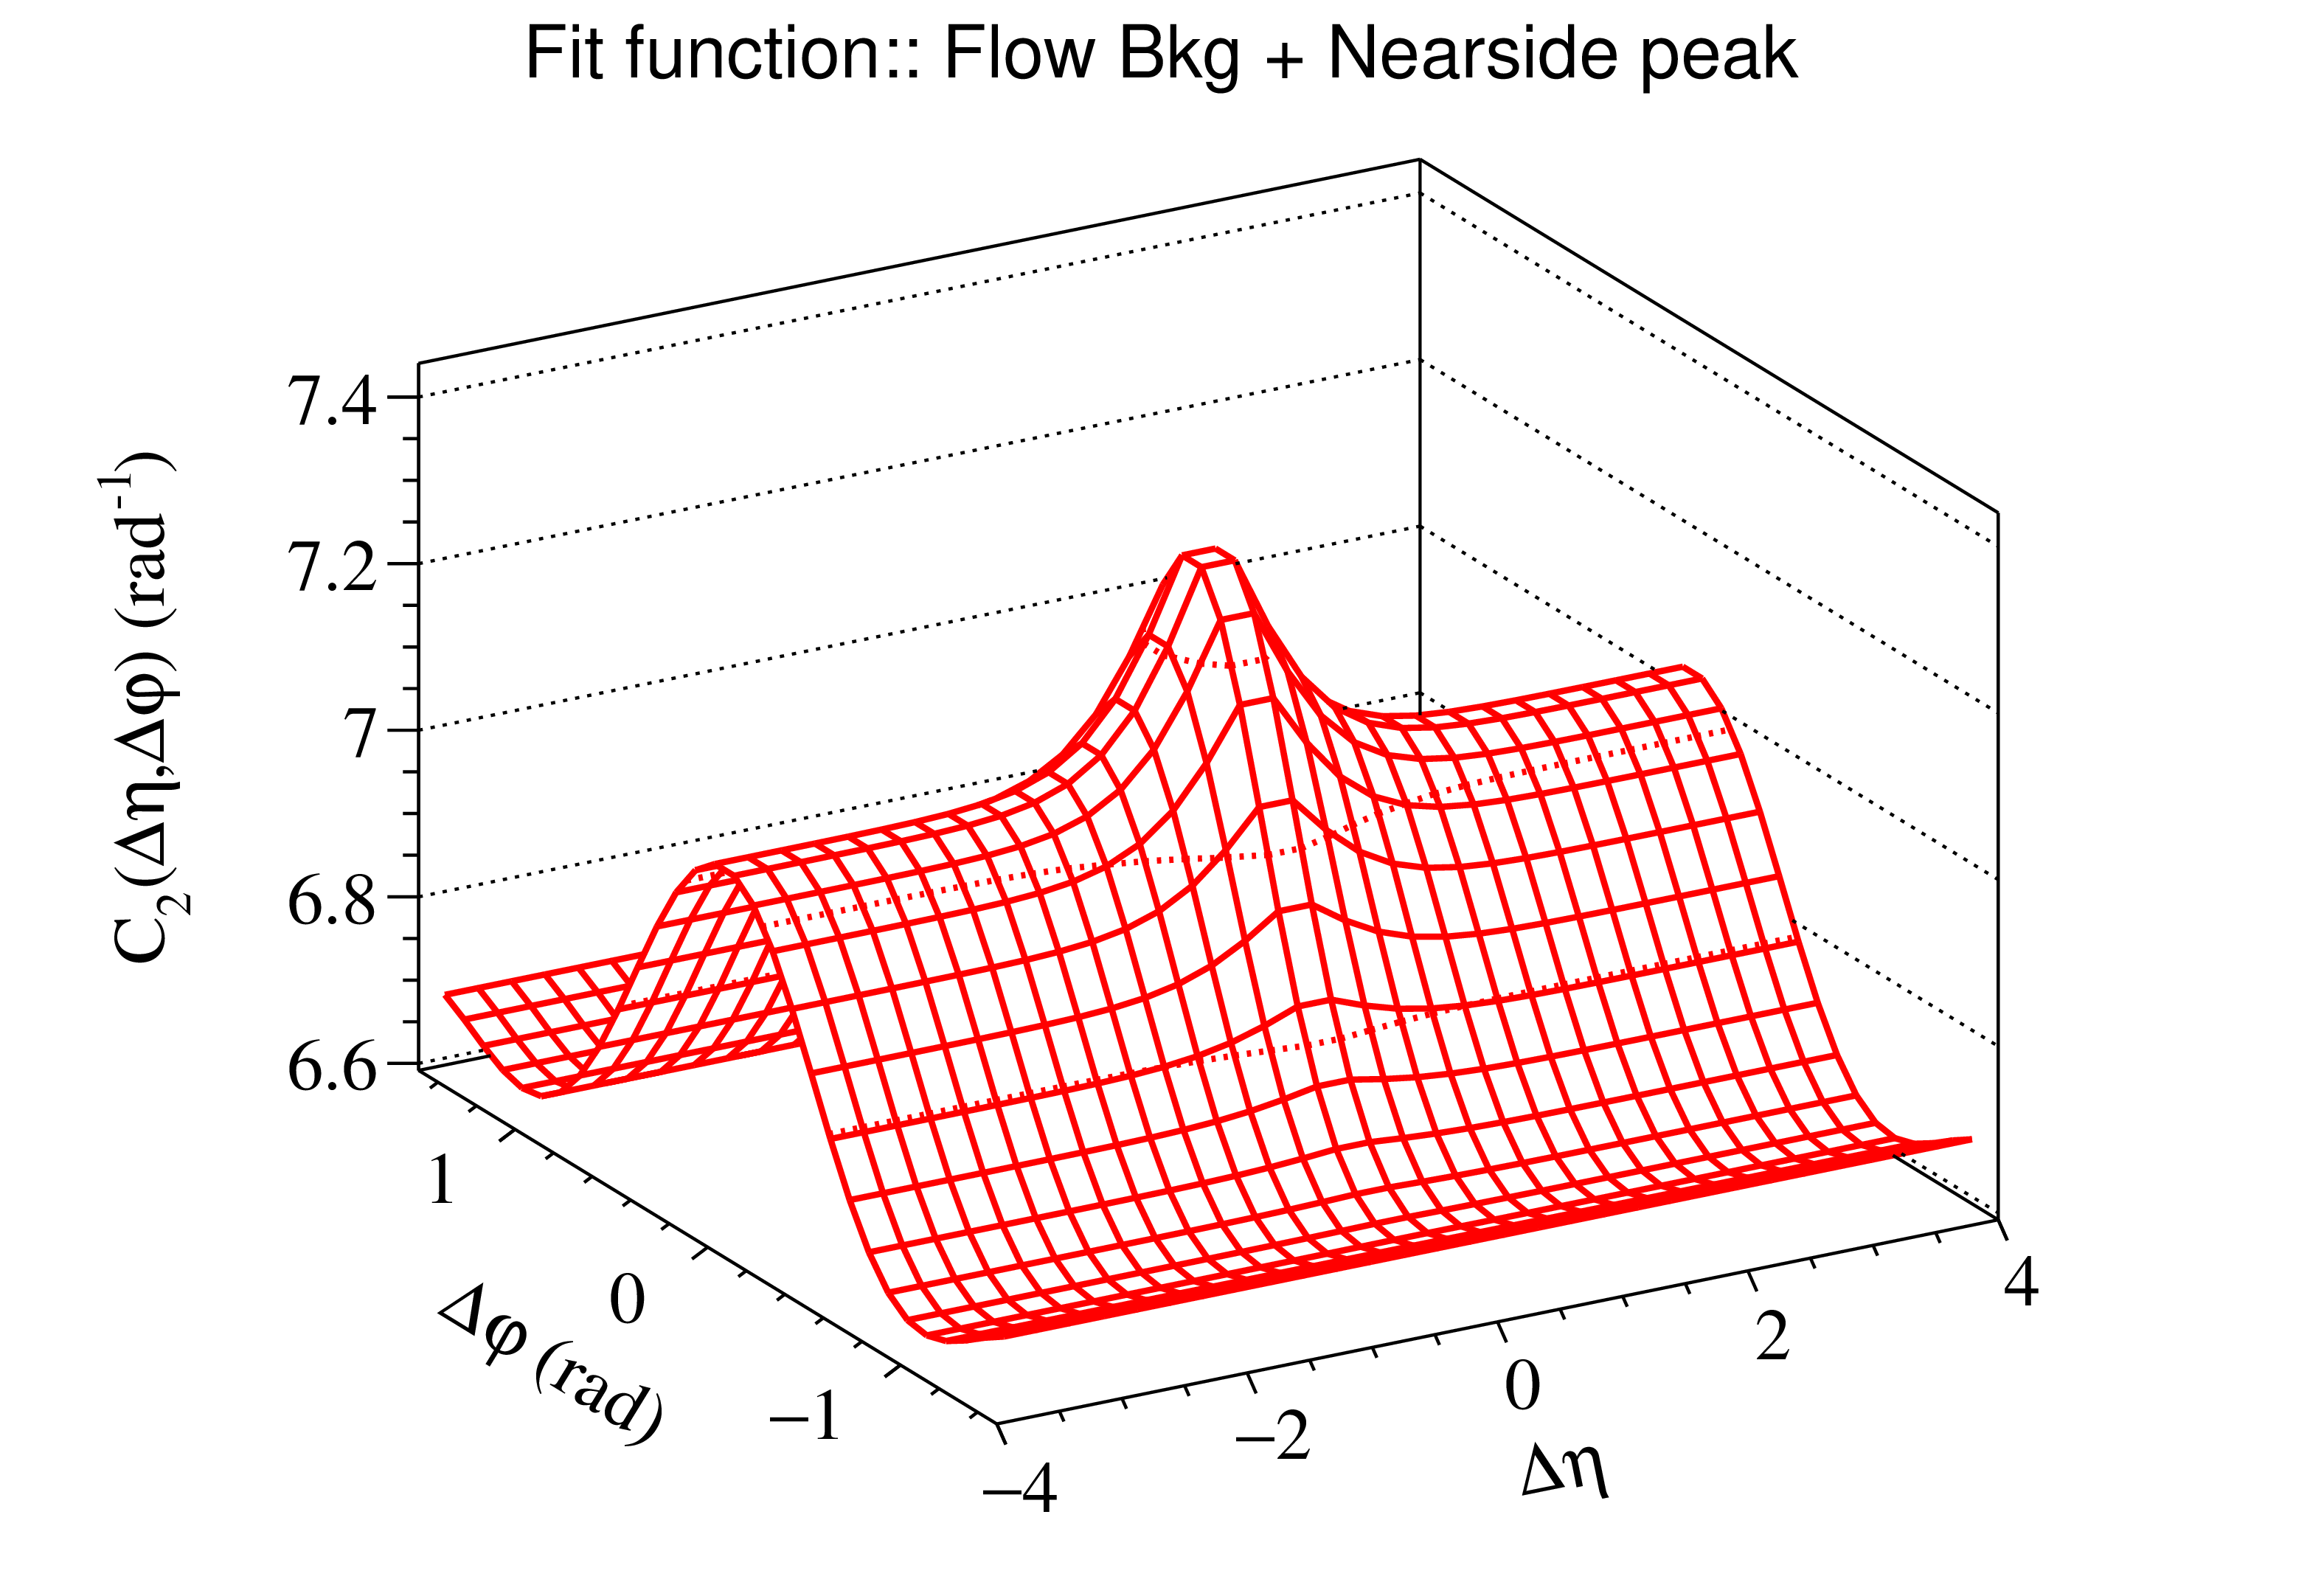
png pdf |
Figure 3-a:
2D Fit functions (upper panel), Flow background fit (lower panel: left), Near-side 2D peak fit (lower panel: right) for 0-10% centrality, 3.0 $ < p_\mathrm{T,trig} < $ 4.0 GeV and 2.0 $ < p_\mathrm{T,asso} < $ 3.0 GeV in PbPb collisions. |
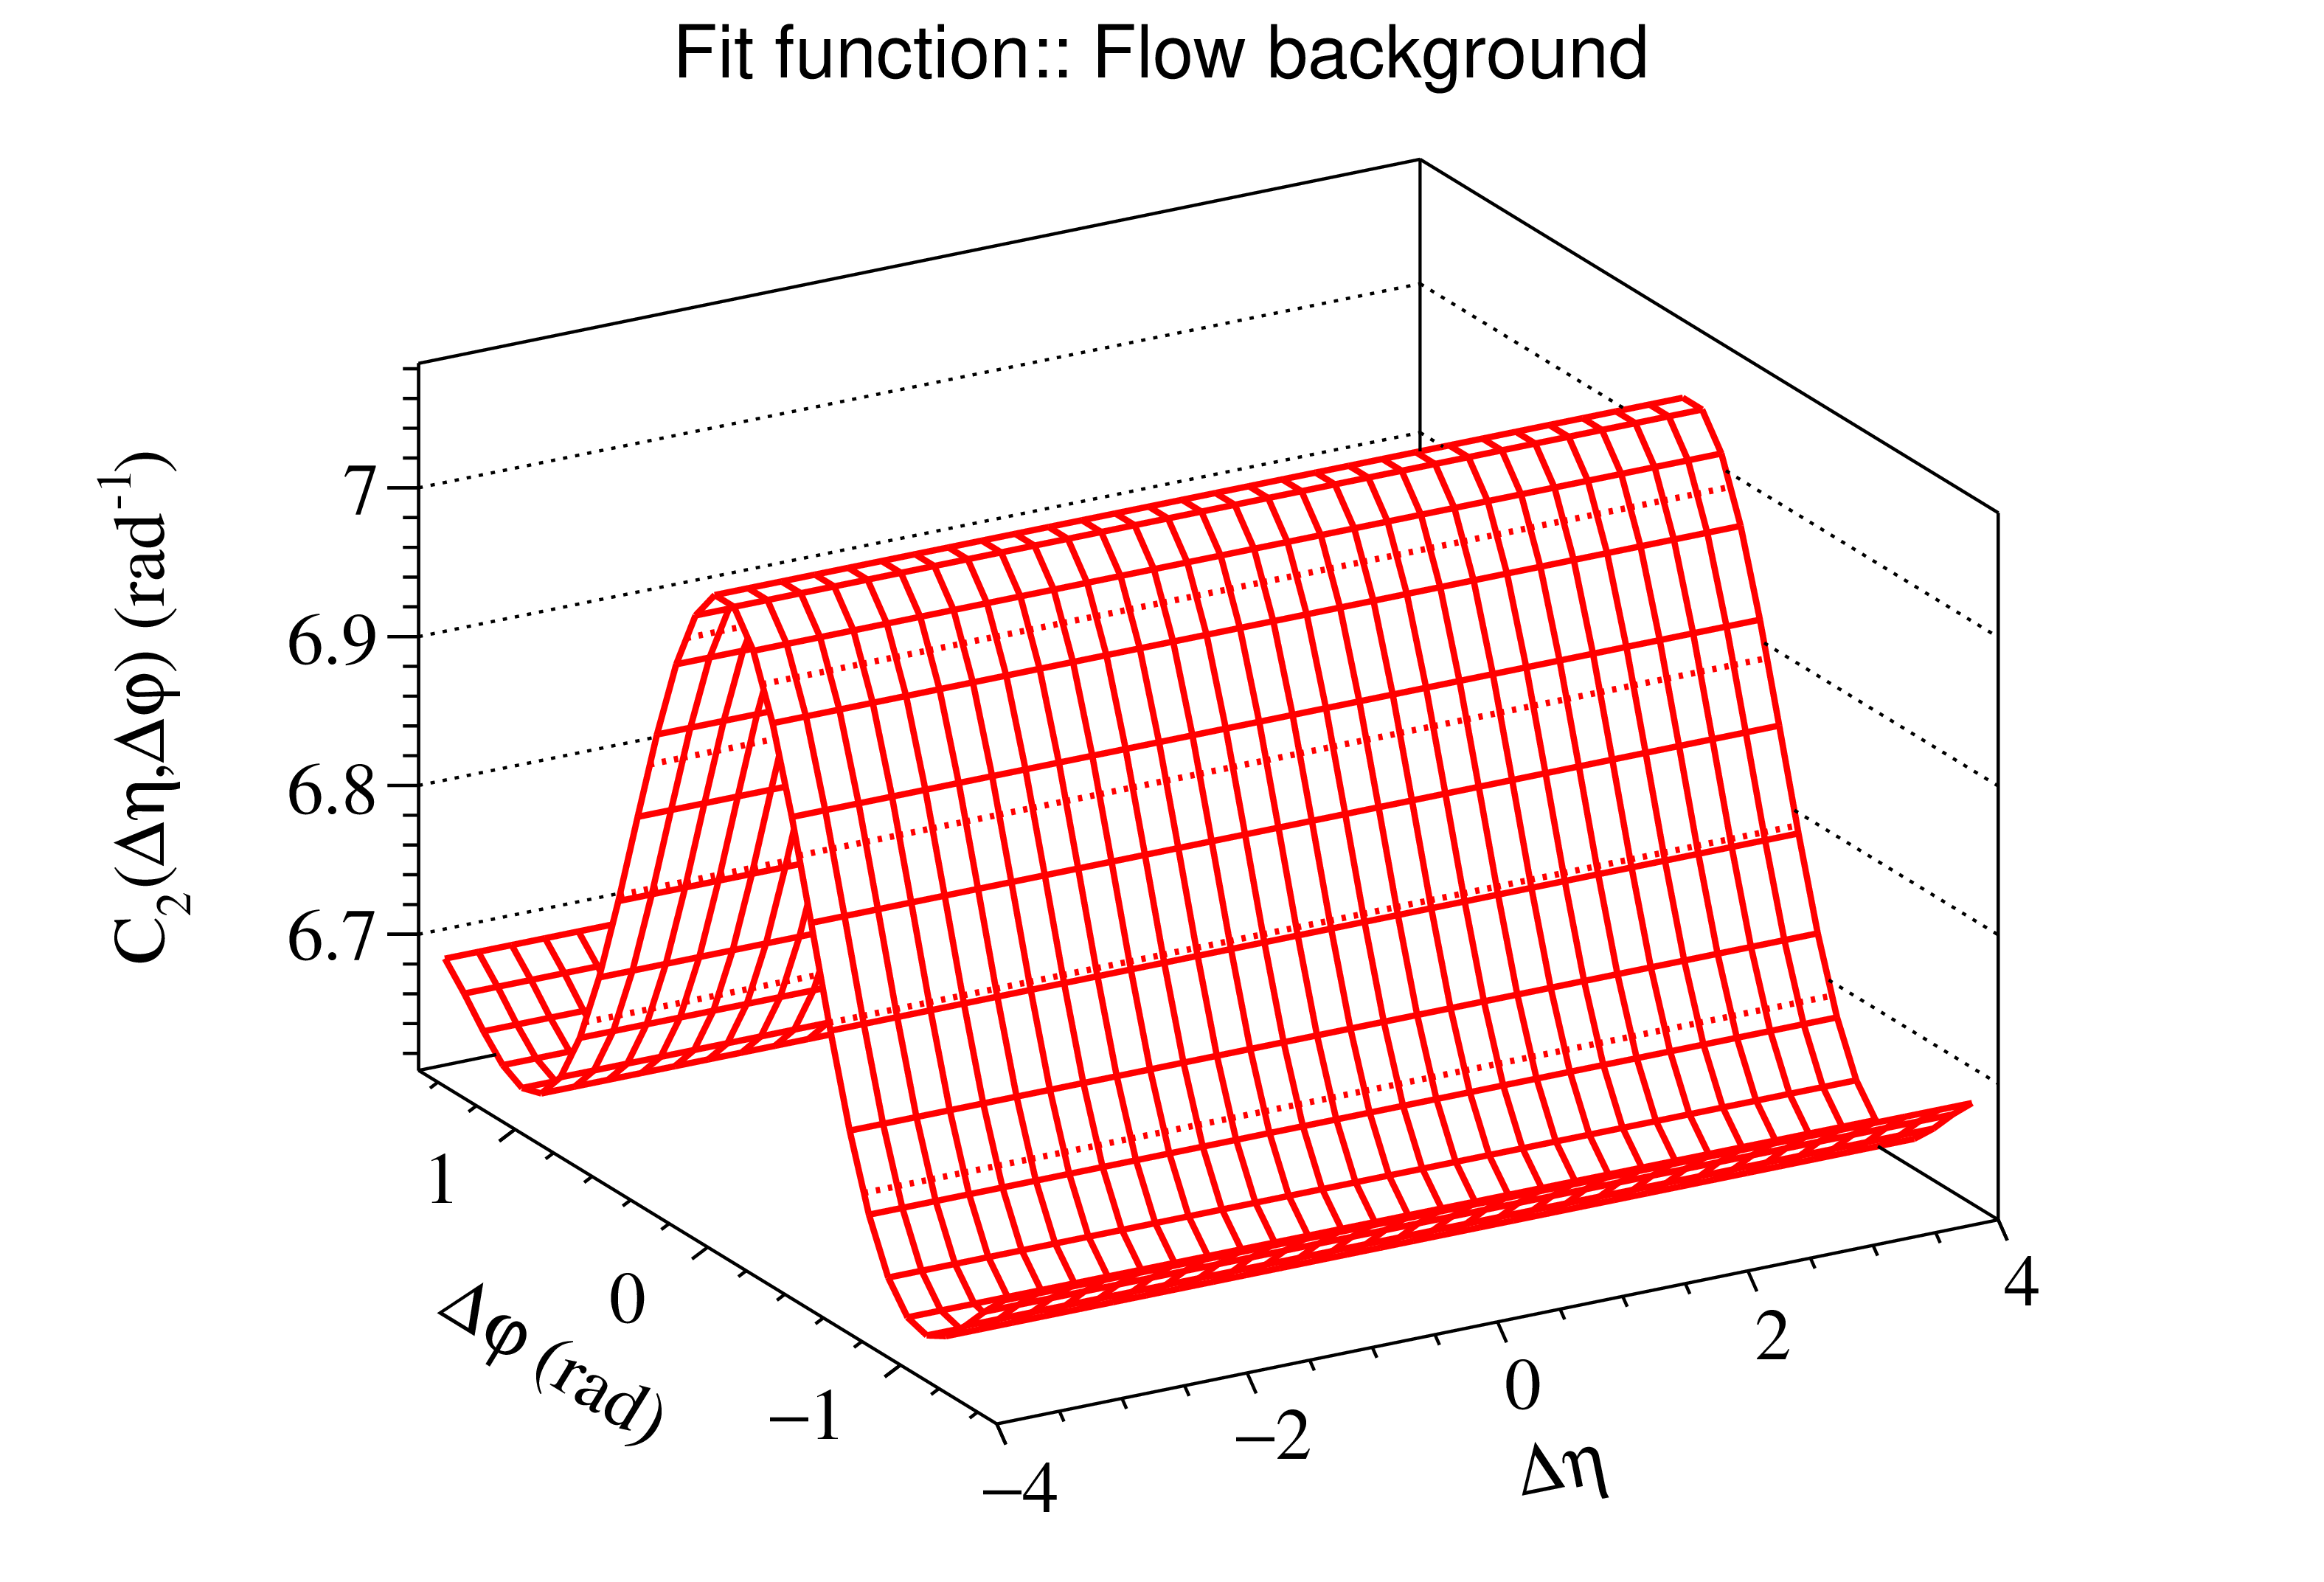
png pdf |
Figure 3-b:
2D Fit functions (upper panel), Flow background fit (lower panel: left), Near-side 2D peak fit (lower panel: right) for 0-10% centrality, 3.0 $ < p_\mathrm{T,trig} < $ 4.0 GeV and 2.0 $ < p_\mathrm{T,asso} < $ 3.0 GeV in PbPb collisions. |
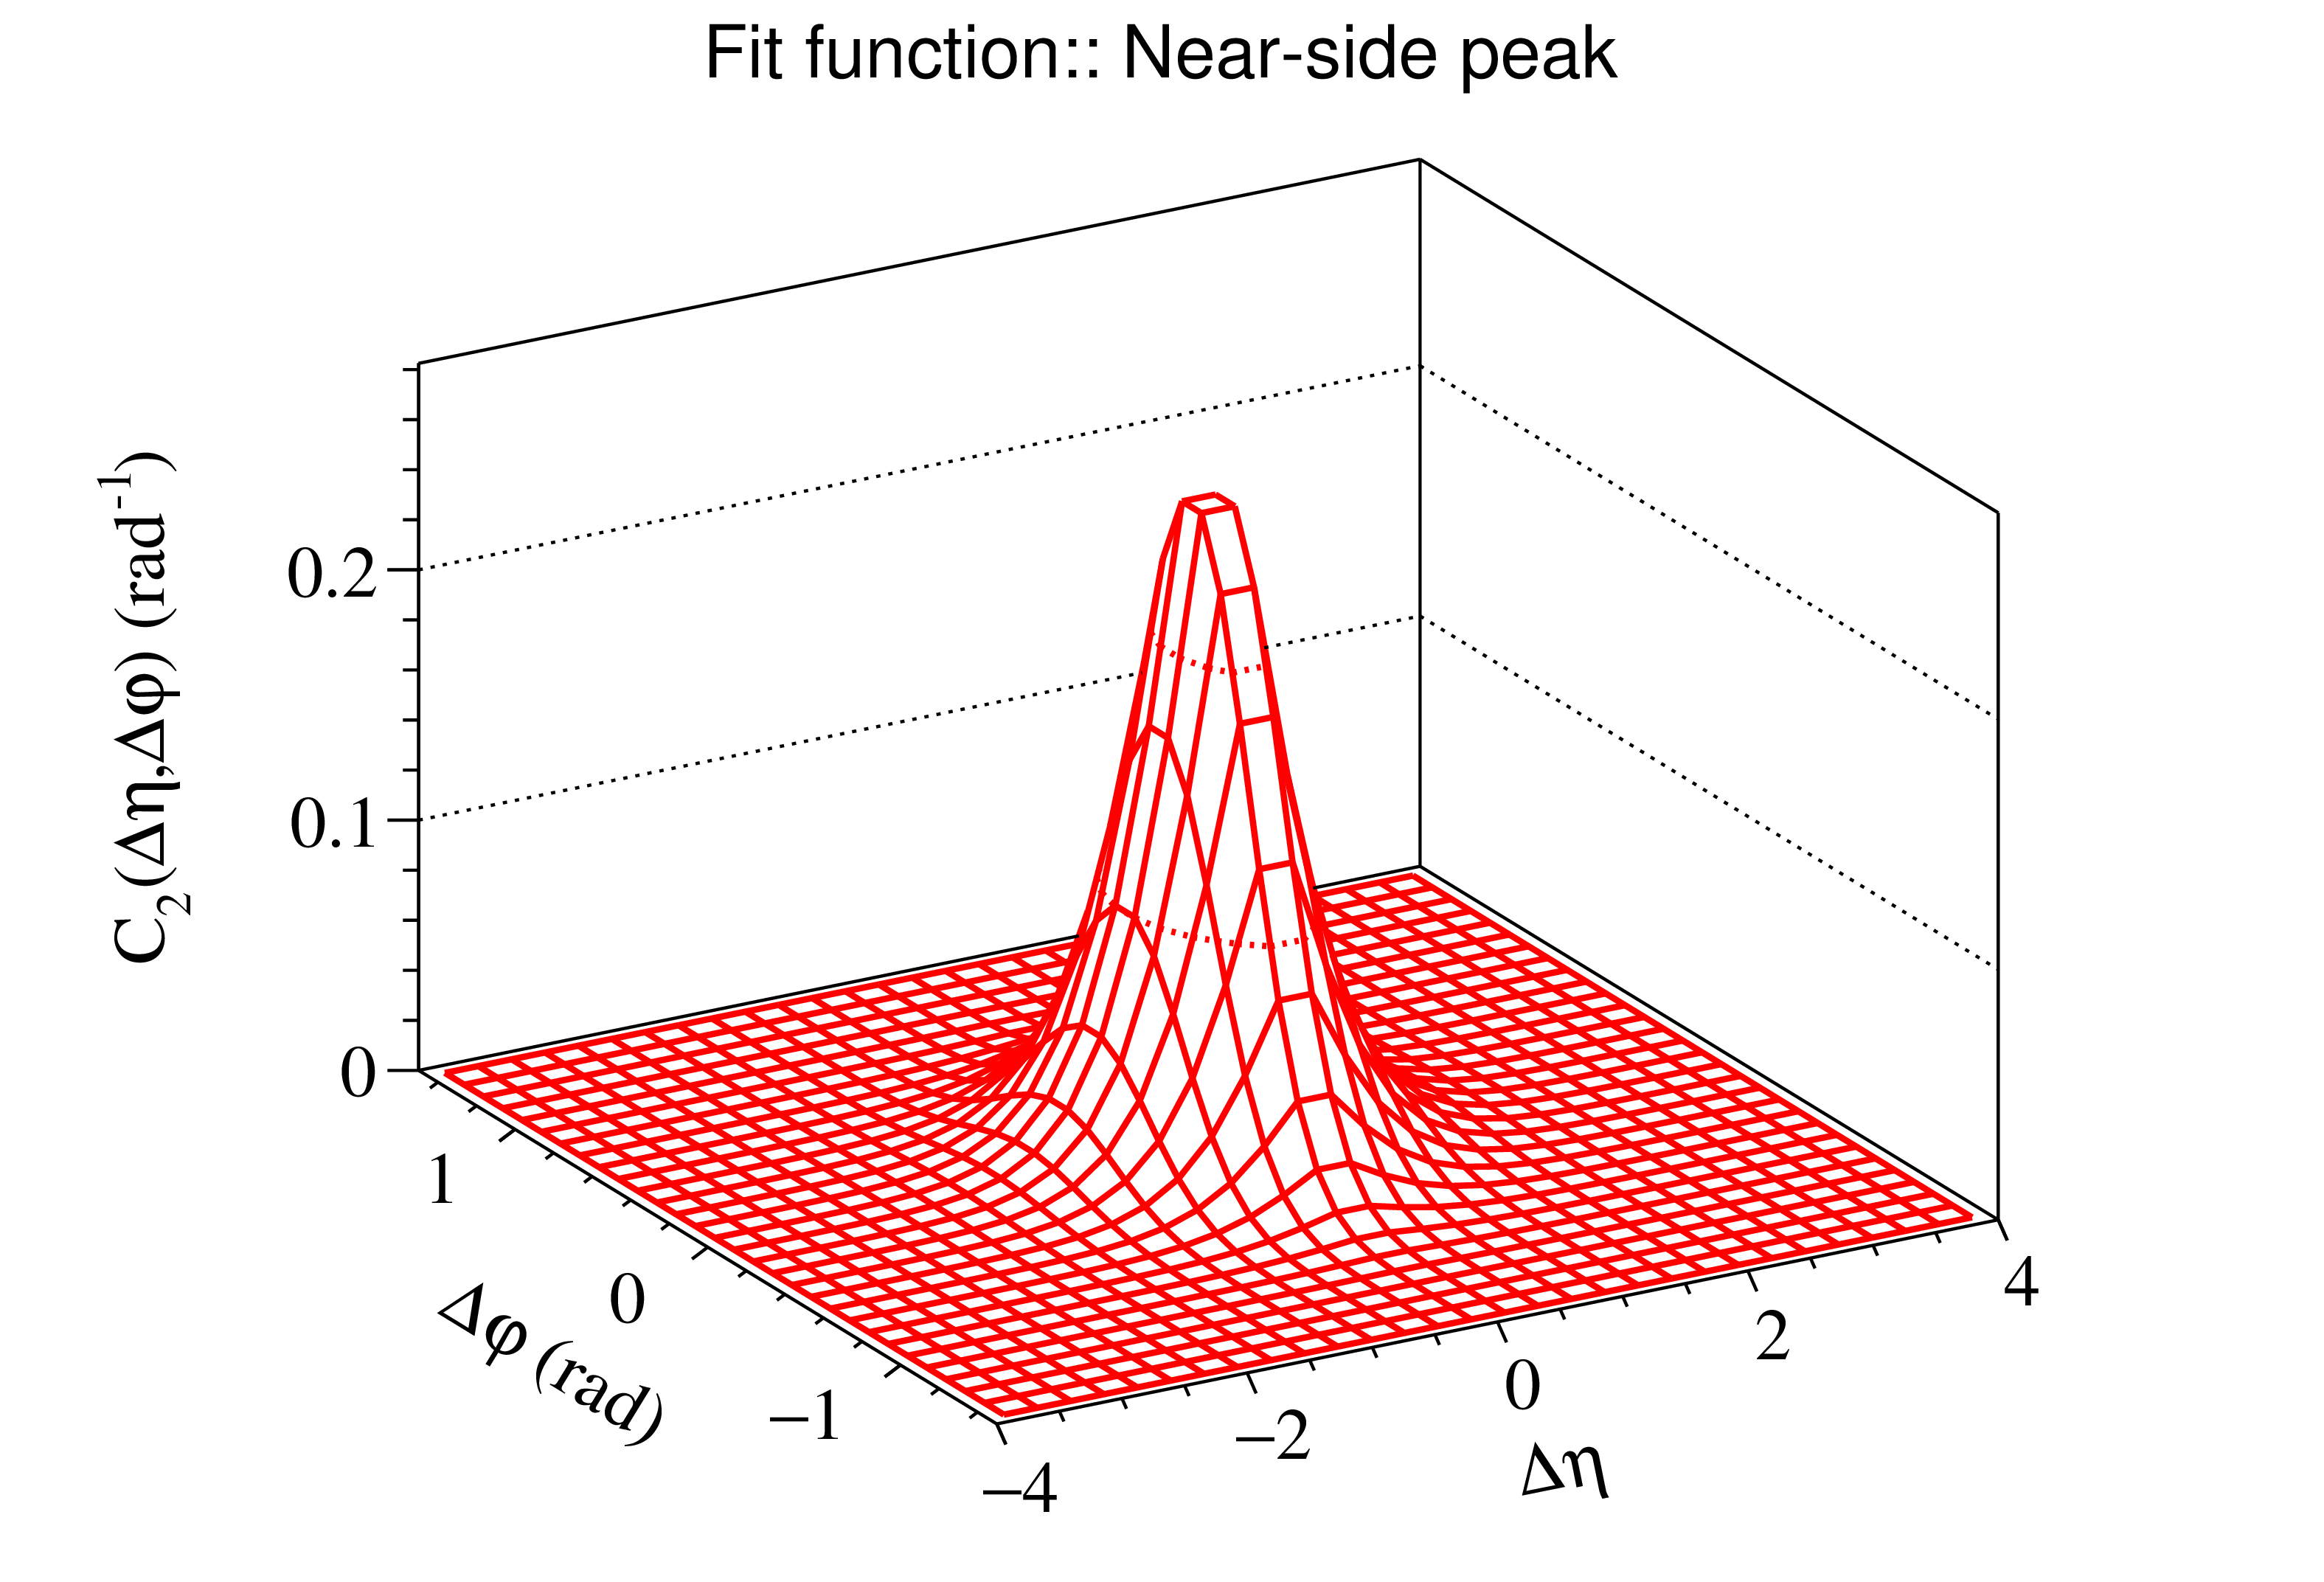
png pdf |
Figure 3-c:
2D Fit functions (upper panel), Flow background fit (lower panel: left), Near-side 2D peak fit (lower panel: right) for 0-10% centrality, 3.0 $ < p_\mathrm{T,trig} < $ 4.0 GeV and 2.0 $ < p_\mathrm{T,asso} < $ 3.0 GeV in PbPb collisions. |
png pdf |
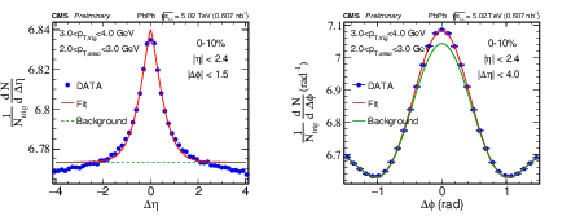
Figure 4:
1D $ \Delta\eta $(left) and $ \Delta\phi $(right) projection fit. |

png pdf |
Figure 4-a:
1D $ \Delta\eta $(left) and $ \Delta\phi $(right) projection fit. |

png pdf |
Figure 4-b:
1D $ \Delta\eta $(left) and $ \Delta\phi $(right) projection fit. |
png pdf |
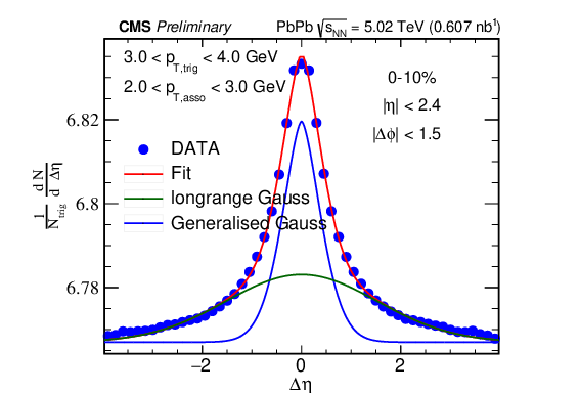
Figure 5:
1D fit of $ \Delta\eta $ including one generalized Gaussian (blue) and a standard Gaussian (green) in the range $ |\Delta\eta| < $ 4.0. |

png pdf |
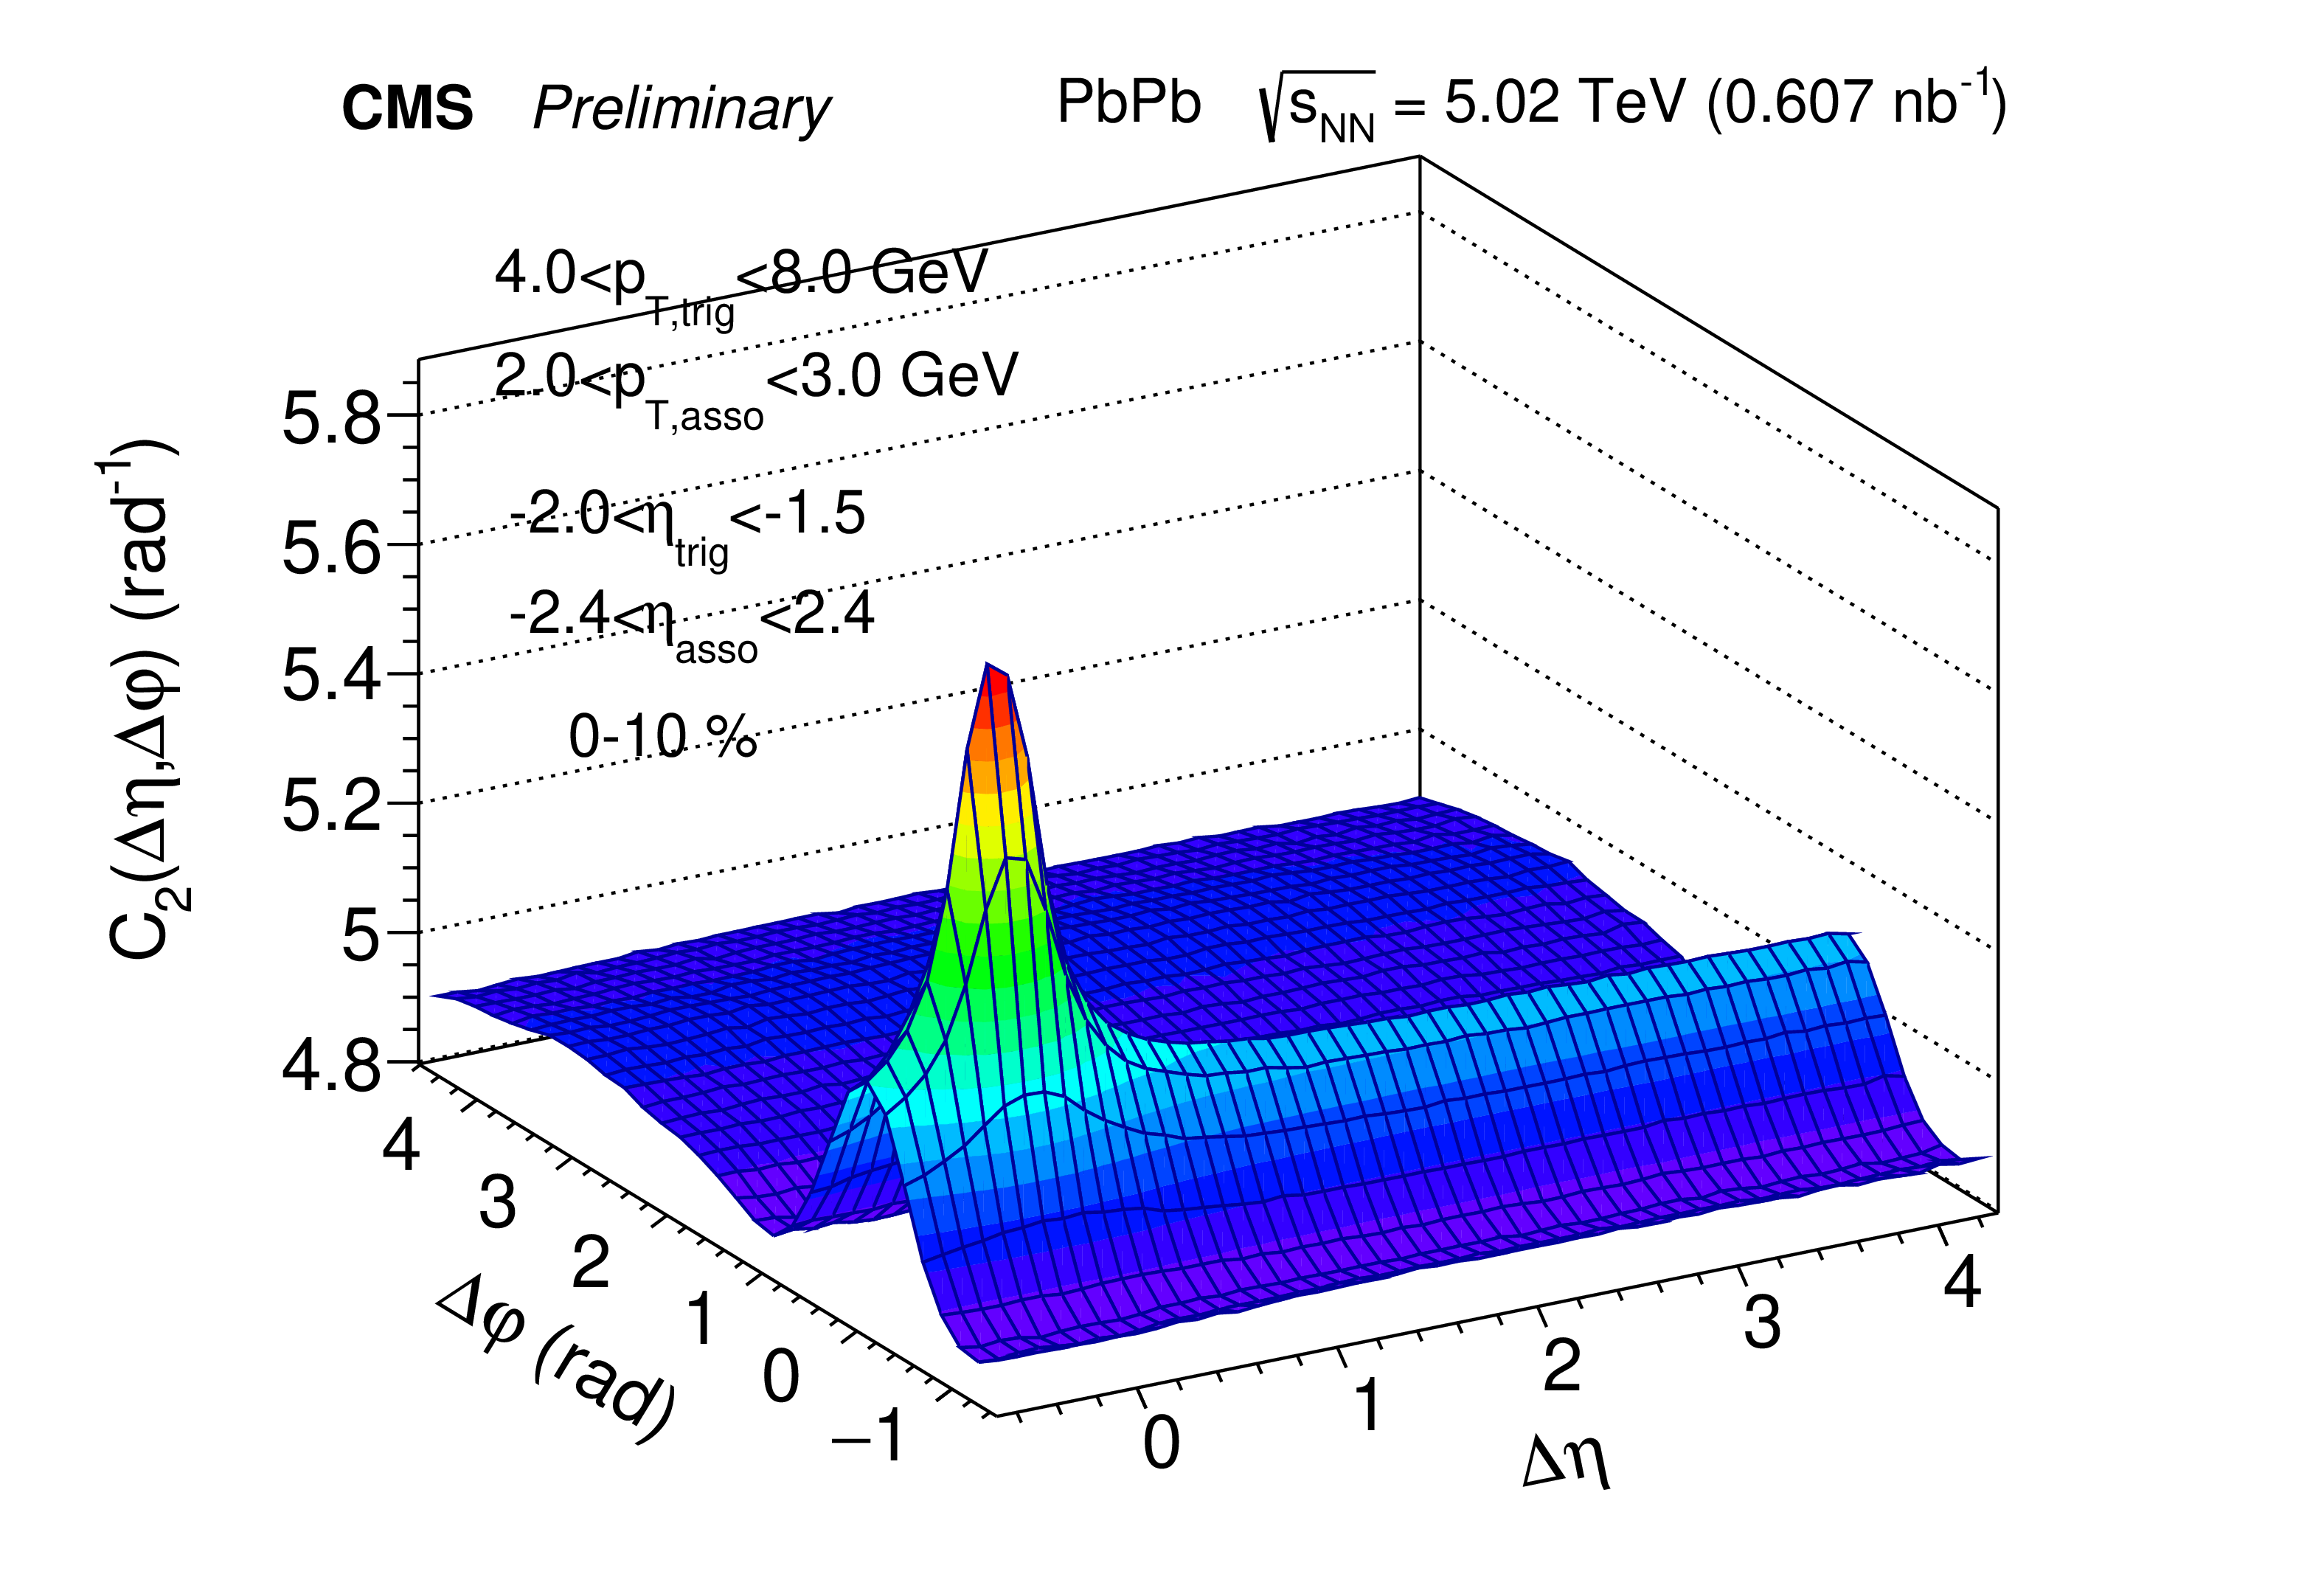
Figure 6:
2D correlation of 1.5 $ < |\eta_\mathrm{trig}| < $ 2.0. In upper panel: the left plot (first) corresponds to $ -$2.0 $ < \eta_\mathrm{trig} < - $1.5, the right plot (second) is the mirror image of the first. In lower panel: the left plot (third) is for 1.5 $ < \eta_\mathrm{trig} < $ 2.0, and the right plot (fourth) is the average of the second and the third plots. |
png pdf |
Figure 6-a:
2D correlation of 1.5 $ < |\eta_\mathrm{trig}| < $ 2.0. In upper panel: the left plot (first) corresponds to $ -$2.0 $ < \eta_\mathrm{trig} < - $1.5, the right plot (second) is the mirror image of the first. In lower panel: the left plot (third) is for 1.5 $ < \eta_\mathrm{trig} < $ 2.0, and the right plot (fourth) is the average of the second and the third plots. |

png pdf |
Figure 6-b:
2D correlation of 1.5 $ < |\eta_\mathrm{trig}| < $ 2.0. In upper panel: the left plot (first) corresponds to $ -$2.0 $ < \eta_\mathrm{trig} < - $1.5, the right plot (second) is the mirror image of the first. In lower panel: the left plot (third) is for 1.5 $ < \eta_\mathrm{trig} < $ 2.0, and the right plot (fourth) is the average of the second and the third plots. |

png pdf |
Figure 6-c:
2D correlation of 1.5 $ < |\eta_\mathrm{trig}| < $ 2.0. In upper panel: the left plot (first) corresponds to $ -$2.0 $ < \eta_\mathrm{trig} < - $1.5, the right plot (second) is the mirror image of the first. In lower panel: the left plot (third) is for 1.5 $ < \eta_\mathrm{trig} < $ 2.0, and the right plot (fourth) is the average of the second and the third plots. |
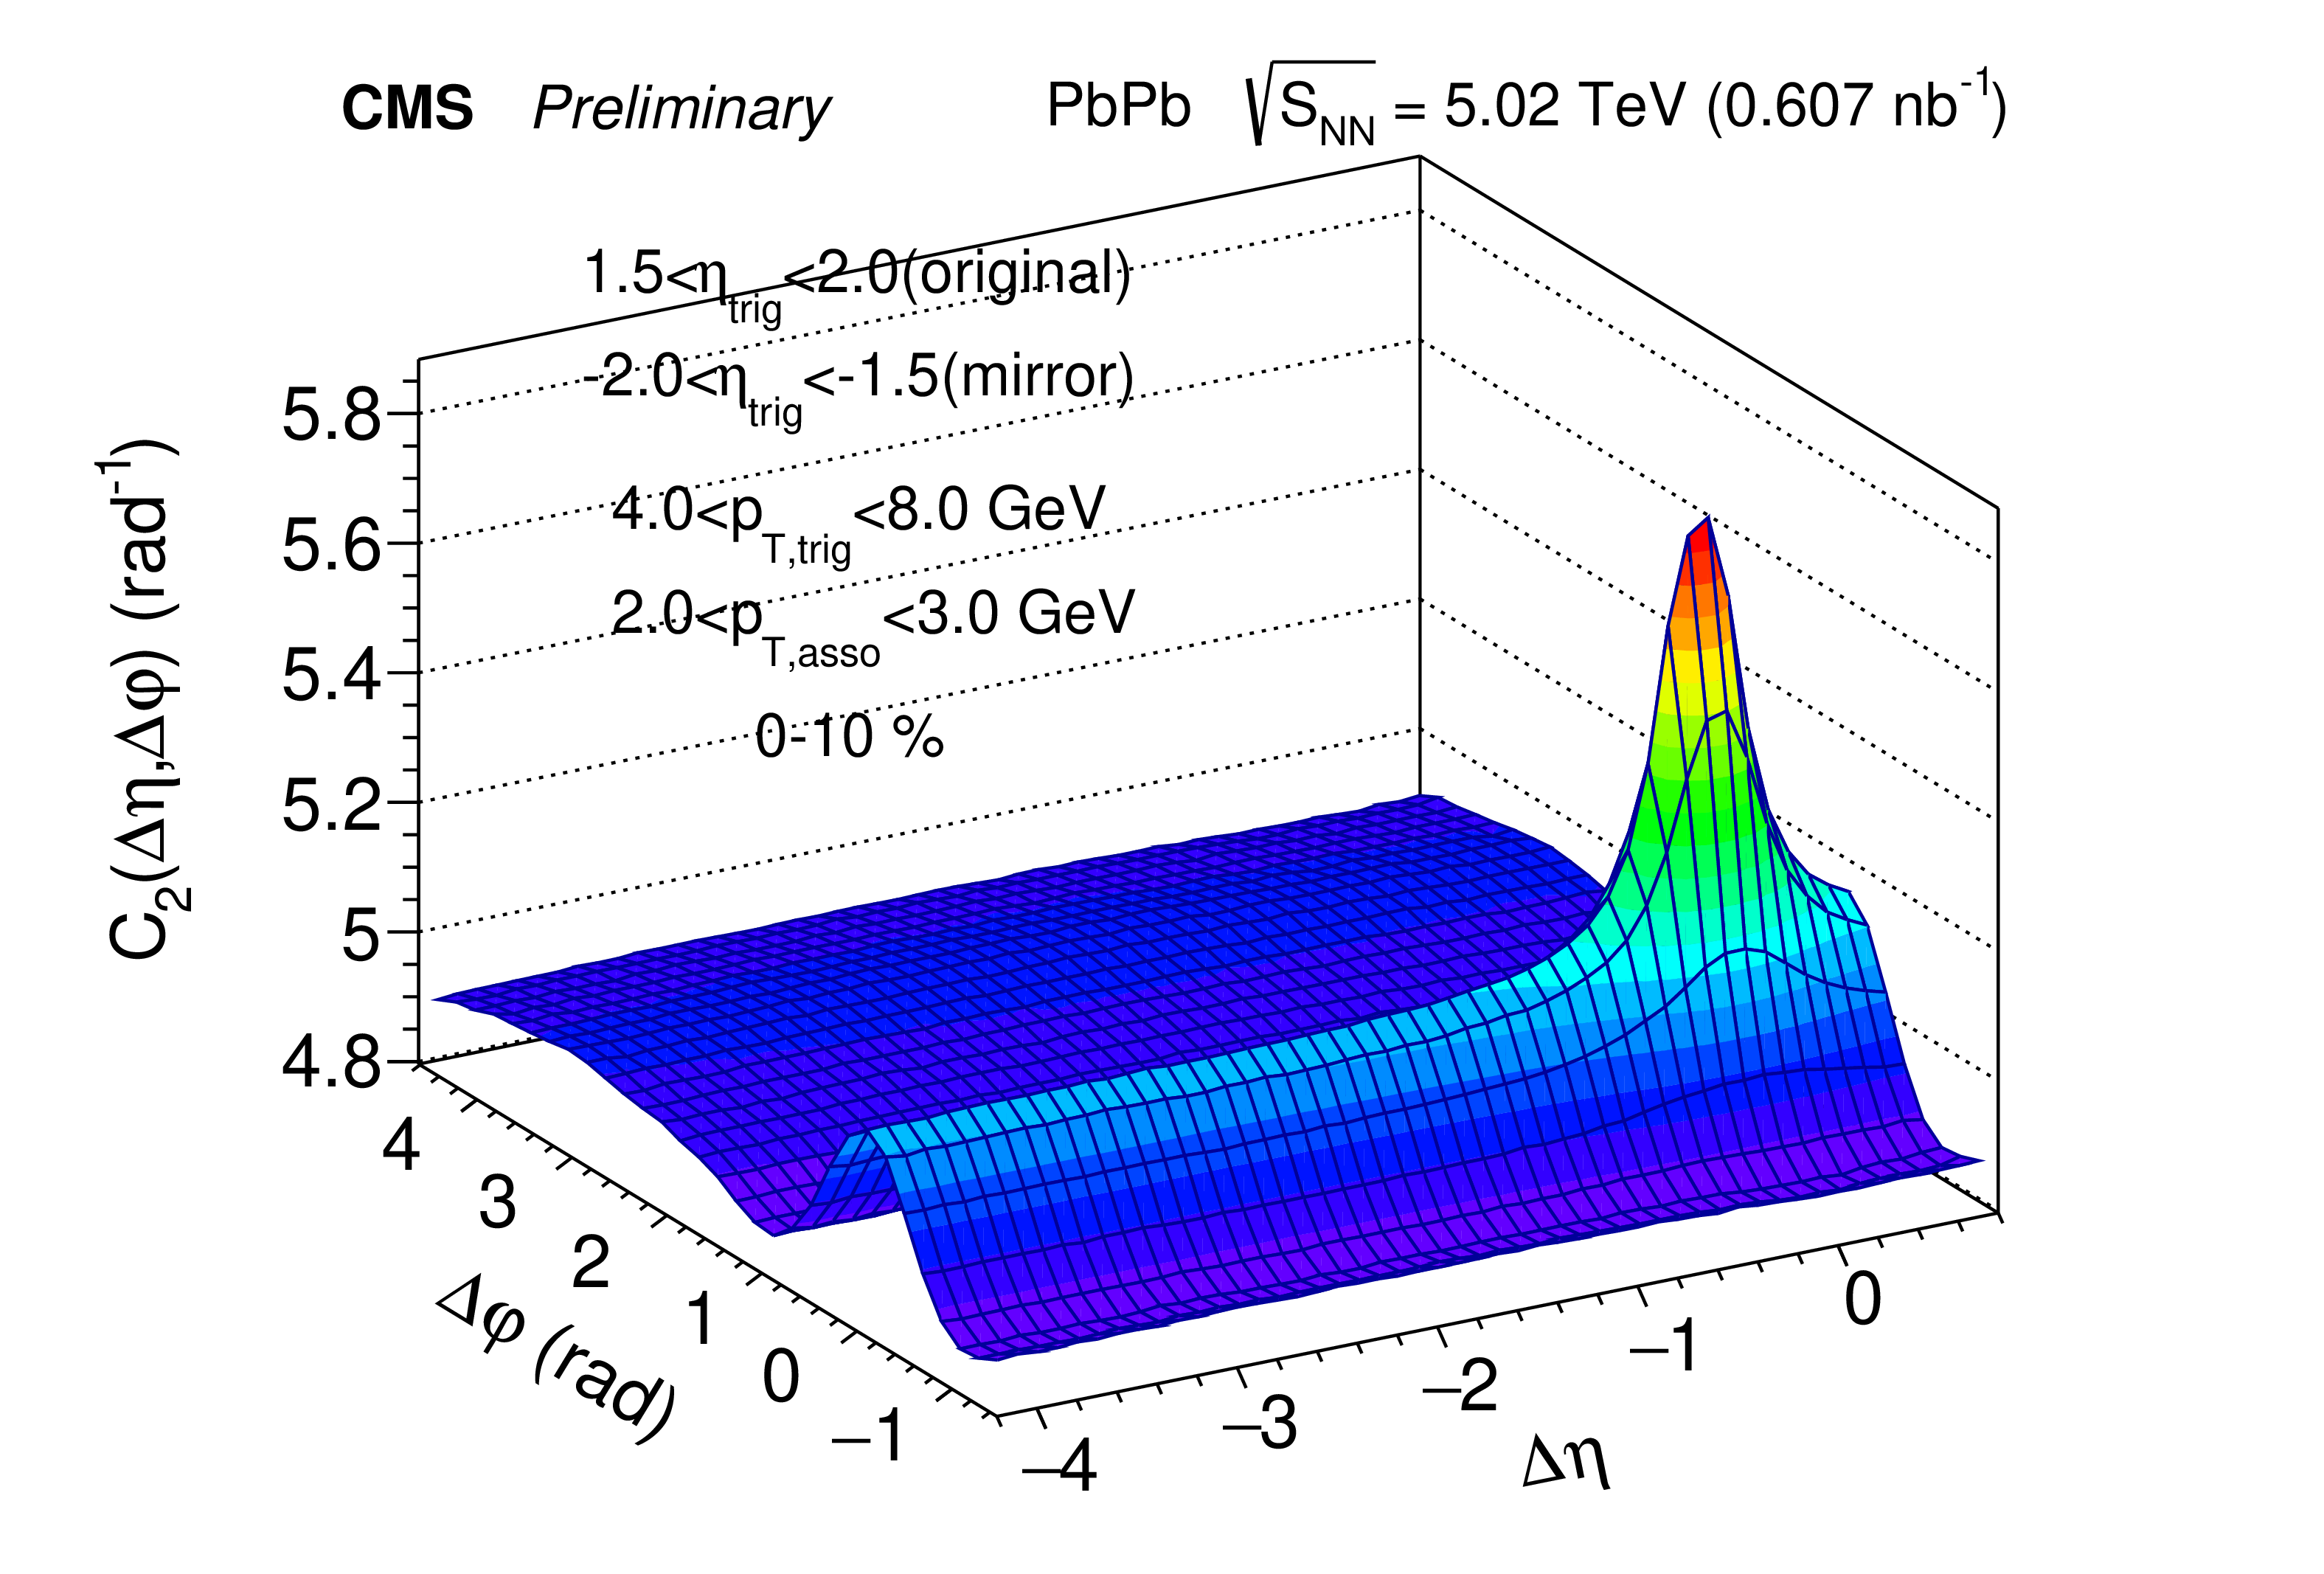
png pdf |
Figure 6-d:
2D correlation of 1.5 $ < |\eta_\mathrm{trig}| < $ 2.0. In upper panel: the left plot (first) corresponds to $ -$2.0 $ < \eta_\mathrm{trig} < - $1.5, the right plot (second) is the mirror image of the first. In lower panel: the left plot (third) is for 1.5 $ < \eta_\mathrm{trig} < $ 2.0, and the right plot (fourth) is the average of the second and the third plots. |

png pdf |
Figure 7:
1D $ \Delta\eta $ projection from the averaged 2D correlation, combining 1.5 $ < \eta_\mathrm{trig} < $ 2.0 (original) and $ -$2.0 $ < \eta_\mathrm{trig} < - $1.5 (mirror). |

png pdf |
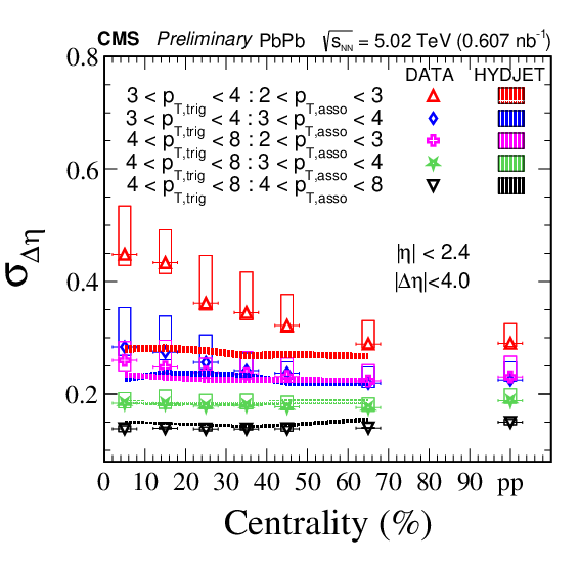
Figure 8:
Longitudinal width $ \sigma_{\Delta\eta} $ (left panel) and transverse width $ \sigma_{\Delta\phi} $ (right panel) as a function of centrality in different $ p_{\mathrm{T}} $ ranges for PbPb collisions and pp collisions (rightmost points in each panel). The statistical uncertainties of the data points are smaller than the marker size, and rectangular boxes indicate the systematic uncertainties. The dashed lines represent the expectation from the HYDJET 1.9 Monte Carlo event generator. |
png pdf |
Figure 8-a:
Longitudinal width $ \sigma_{\Delta\eta} $ (left panel) and transverse width $ \sigma_{\Delta\phi} $ (right panel) as a function of centrality in different $ p_{\mathrm{T}} $ ranges for PbPb collisions and pp collisions (rightmost points in each panel). The statistical uncertainties of the data points are smaller than the marker size, and rectangular boxes indicate the systematic uncertainties. The dashed lines represent the expectation from the HYDJET 1.9 Monte Carlo event generator. |

png pdf |
Figure 8-b:
Longitudinal width $ \sigma_{\Delta\eta} $ (left panel) and transverse width $ \sigma_{\Delta\phi} $ (right panel) as a function of centrality in different $ p_{\mathrm{T}} $ ranges for PbPb collisions and pp collisions (rightmost points in each panel). The statistical uncertainties of the data points are smaller than the marker size, and rectangular boxes indicate the systematic uncertainties. The dashed lines represent the expectation from the HYDJET 1.9 Monte Carlo event generator. |
png pdf |
Figure 9:
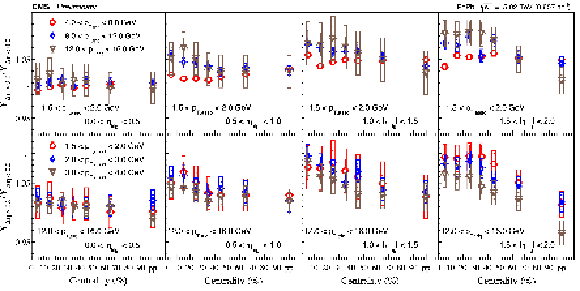
Associated yield ratios between $ \Delta\eta > $ 0.0 and $ \Delta\eta < $ 0.0 within the range of 0.0 $ < |\Delta\eta| < $ 0.7 as a function of centrality in different $ p_{\mathrm{T}} $ and $ \eta_\mathrm{trig} $ ranges for PbPb collisions and pp collisions (rightmost bin) are presented in the upper two panels. Each panel (upper and lower) consists of four plots, each corresponding to a different value of $ \eta_\mathrm{trig} $. In the top panel, each plot consists of three colored markers representing different $ p_\mathrm{T,trig} $ values (4 $ < p_\mathrm{T,trig} < $ 8, 8 $ < p_\mathrm{T,trig} < $ 12, 12 $ < p_\mathrm{T,trig} < $ 16 GeV), while $ p_\mathrm{T,asso} $ is fixed (1.5 $ < p_\mathrm{T,asso} < $ 2 GeV). In the bottom panel, each plot consists of three colored markers representing different $ p_\mathrm{T,asso} $ values (1.5 $ < p_\mathrm{T,asso} < $ 2, 2 $ < p_\mathrm{T,asso} < $ 3, 3 $ < p_\mathrm{T,asso} < $ 4 GeV), while $ p_\mathrm{T,trig} $ is fixed (12 $ < p_\mathrm{T,trig} < $ 16 GeV). The rectangular open boxes represent the systematic uncertainties, while the vertical bars indicate the statistical uncertainties. |
png pdf |
Figure 10:
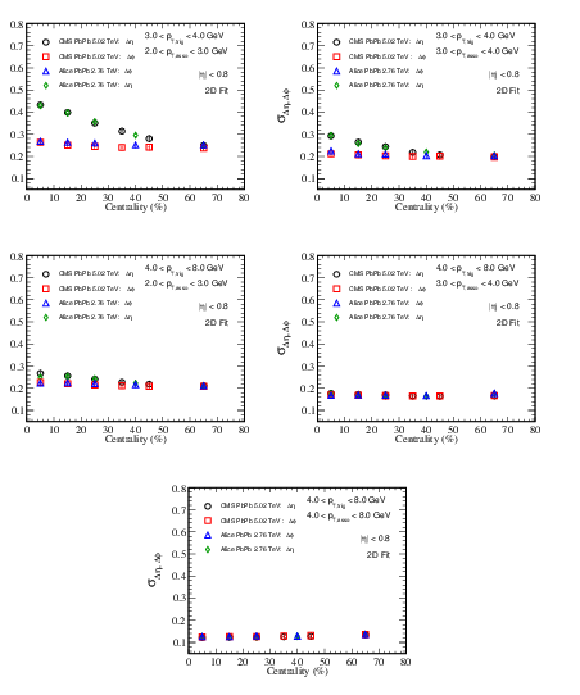
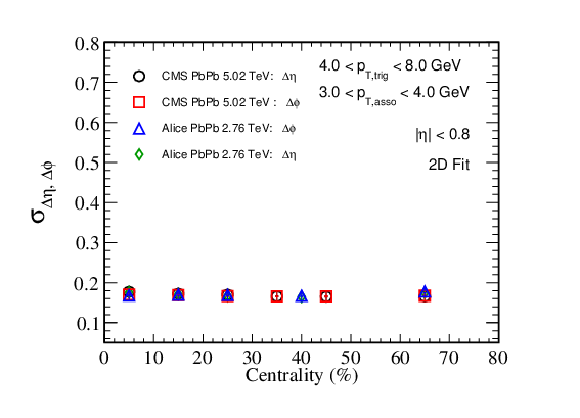
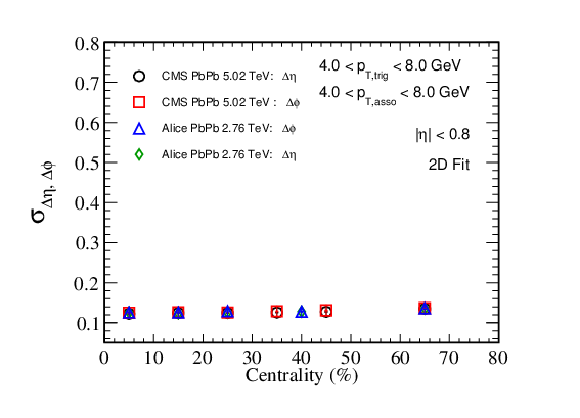
Cross-check of longitudinal width ($ \sigma_{\Delta\eta} $) and transverse width ($ \sigma_{\Delta\phi} $) of the near side peak with ALICE results [34]. |
png pdf |
Figure 10-a:
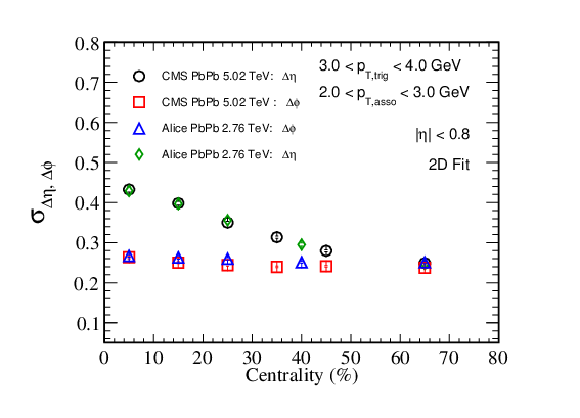
Cross-check of longitudinal width ($ \sigma_{\Delta\eta} $) and transverse width ($ \sigma_{\Delta\phi} $) of the near side peak with ALICE results [34]. |
png pdf |
Figure 10-b:
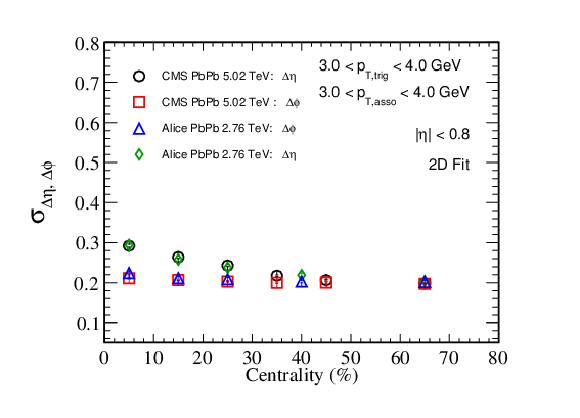
Cross-check of longitudinal width ($ \sigma_{\Delta\eta} $) and transverse width ($ \sigma_{\Delta\phi} $) of the near side peak with ALICE results [34]. |

png pdf |
Figure 10-c:
Cross-check of longitudinal width ($ \sigma_{\Delta\eta} $) and transverse width ($ \sigma_{\Delta\phi} $) of the near side peak with ALICE results [34]. |
png pdf |
Figure 10-d:
Cross-check of longitudinal width ($ \sigma_{\Delta\eta} $) and transverse width ($ \sigma_{\Delta\phi} $) of the near side peak with ALICE results [34]. |
png pdf |
Figure 10-e:
Cross-check of longitudinal width ($ \sigma_{\Delta\eta} $) and transverse width ($ \sigma_{\Delta\phi} $) of the near side peak with ALICE results [34]. |
png pdf |
Figure 11:
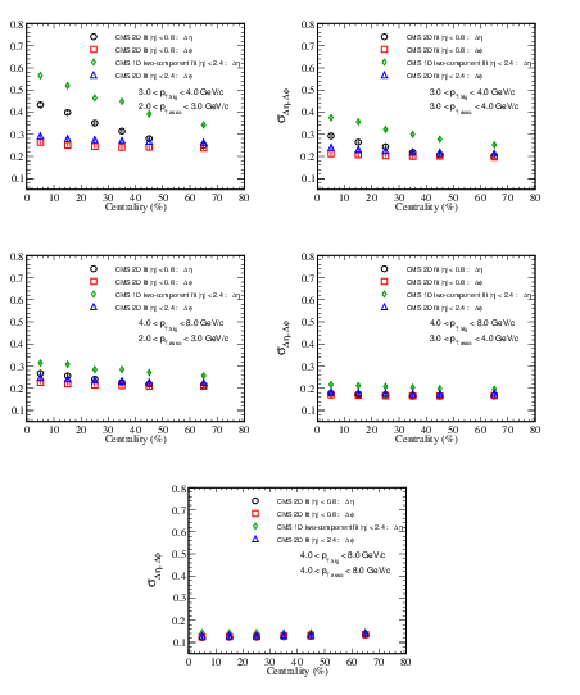
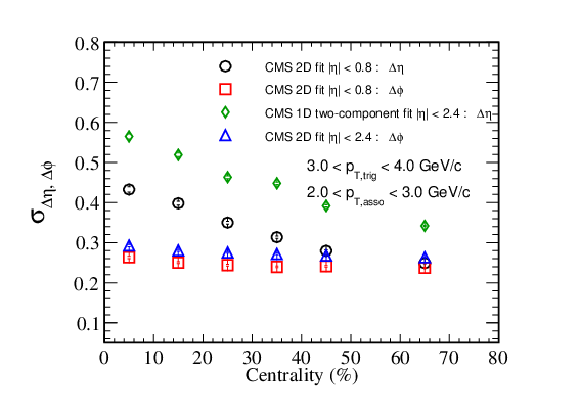
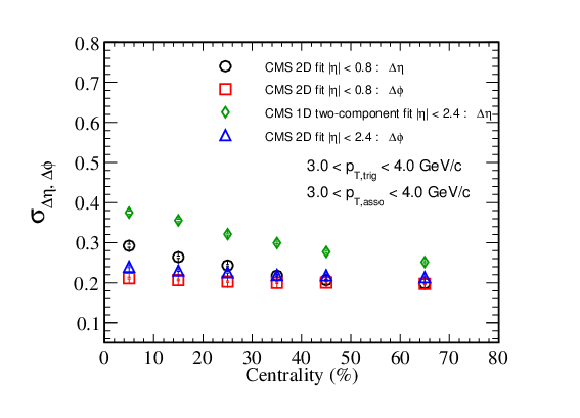
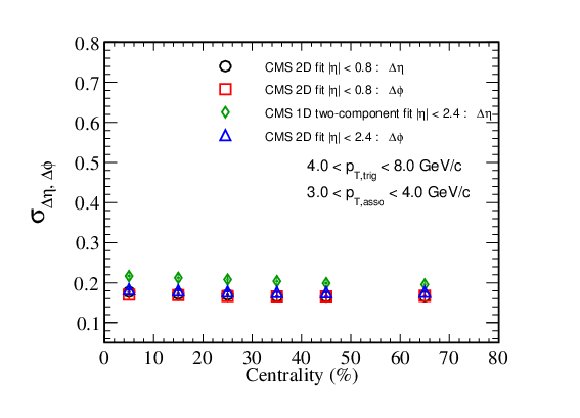
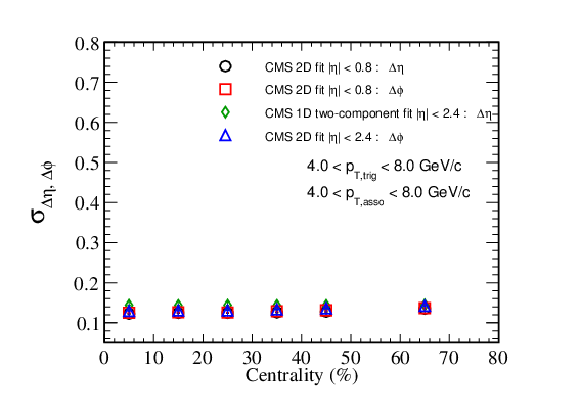
Comparisons of longitudinal width ($ \sigma_{\Delta\eta} $) and transverse width ($ \sigma_{\Delta\phi} $) of the near side peak between CMS $ \eta < $ 0.8 and CMS $ \eta < $ 2.4 (sideband fit). |
png pdf |
Figure 11-a:
Comparisons of longitudinal width ($ \sigma_{\Delta\eta} $) and transverse width ($ \sigma_{\Delta\phi} $) of the near side peak between CMS $ \eta < $ 0.8 and CMS $ \eta < $ 2.4 (sideband fit). |
png pdf |
Figure 11-b:
Comparisons of longitudinal width ($ \sigma_{\Delta\eta} $) and transverse width ($ \sigma_{\Delta\phi} $) of the near side peak between CMS $ \eta < $ 0.8 and CMS $ \eta < $ 2.4 (sideband fit). |

png pdf |
Figure 11-c:
Comparisons of longitudinal width ($ \sigma_{\Delta\eta} $) and transverse width ($ \sigma_{\Delta\phi} $) of the near side peak between CMS $ \eta < $ 0.8 and CMS $ \eta < $ 2.4 (sideband fit). |
png pdf |
Figure 11-d:
Comparisons of longitudinal width ($ \sigma_{\Delta\eta} $) and transverse width ($ \sigma_{\Delta\phi} $) of the near side peak between CMS $ \eta < $ 0.8 and CMS $ \eta < $ 2.4 (sideband fit). |
png pdf |
Figure 11-e:
Comparisons of longitudinal width ($ \sigma_{\Delta\eta} $) and transverse width ($ \sigma_{\Delta\phi} $) of the near side peak between CMS $ \eta < $ 0.8 and CMS $ \eta < $ 2.4 (sideband fit). |
| Tables | |
png pdf |
Table 1:
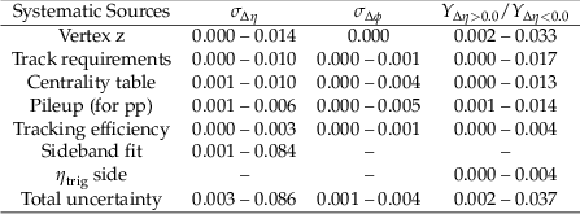
Summary of the absolute systematic uncertainties for $ \sigma_{\Delta\eta} $, $ \sigma_{\Delta\phi} $, and the associated yield ratio. The leftmost column lists all systematic sources, while the other columns show the range of systematic uncertainties across all centrality bins in PbPb and pp MB. |
| Summary |
| The centrality and pseudorapidity dependencies of jet peak shapes are explored using two-particle correlations. Lead-lead collision data at a center-of-mass energy per nucleon pair of 5.02 TeV were obtained using the CMS detector. These minimum-bias data correspond to an integrated luminosity of 0.607 nb$^{-1}$. Proton-proton collision data at the same nucleon-nucleon collisions energy are also shown to provide a vacuum reference. Particles detected in one transverse-momentum range are correlated with all particles in an event within a second range. The separations in pseudorapidity and azimuth of particles within each two-particle pair are then averaged over all events. Jets result in a peak shaped structure corresponding to pairs where there is a minimal separation of particles. The widths in pseudorapidity and azimuth of the jet peak shape are presented as functions of centrality and pseudorapidity. The skewness of the jet peak shape as a function of pseudorapidity is also explored by taking ratios of yields on the two sides of the peak. For PbPb collisions, the widths of the jet peak azimuth distributions are found to be nearly independent of collision centrality, and are comparable to those in the pp reference distribution. Similarly, when one of the particles in each PbPb collision pair has a high transverse momentum, with $ p_{\mathrm{T}} > $ 4 GeV, the jet peak pseudorapidity distributions also show little dependence on centrality and remain consistent with the pp reference distribution. However, when the high-$ p_{\mathrm{T}} $ particle in each PbPb pair is restricted to a relatively low momentum range of 3 $ < p_{\mathrm{T}} < $ 4 GeV, an enhancement is found in the pseudorapidity width that increases as collisions become more central. In this case, the pseudorapidity width only agrees with the pp reference for the most peripheral events. These results might be explained either by the influence of longitudinal hydrodynamic flow on the pseudorapidity width or by the progenitor parton losing energy while passing through the medium. The skewness of the jet peak distribution in the particle pseudorapidity difference is studied by taking the ratio of yields on either side of the jet peaks. This ratio is determined in different, non-overlapping pseudorapidity ranges for the higher $ p_{\mathrm{T}} $ particle in each pair. The observed ratios increase as the average pseudorapidity increases. For a given pseudorapidity, the ratios tend to remain relatively constant as a function of centrality, and typically higher than the pp reference except for the most peripheral PbPb events. These results might again reflect the influence of longitudinal hydrodynamic flow. |
| References | ||||
| 1 | R. Pasechnik and M. Sumbera | Phenomenological review on quark-gluon plasma: Concepts vs. observations | Universe 3 (2017) 7 | 1611.01533 |
| 2 | W. Busza, K. Rajagopal, and W. van der Schee | Heavy ion collisions: The big picture and the big questions | Ann. Rev. of Nucl. and Par. Sci. 68 (2018) 339 | 1802.04801 |
| 3 | J. Casalderrey-Solana and C. A. Salgado | Introductory lectures on jet quenching in heavy ion collisions | Acta Phys. Polon. B 38 (2007) 3731 | 0712.3443 |
| 4 | PHENIX Collaboration | Suppressed $ \pi^0 $ production at large transverse momentum in central Au+Au collisions at $ \sqrt{\smash[b]{s_{_{\mathrm{NN}}}}}= $ 200 GeV | PRL 91 (2003) 072301 | nucl-ex/0304022 |
| 5 | STAR Collaboration | Direct observation of dijets in central Au+Au collisions at $ \sqrt{\smash[b]{s_{_{\mathrm{NN}}}}}= $ 200 GeV | PRL 97 (2006) 162301 | nucl-ex/0604018 |
| 6 | CMS Collaboration | Overview of high-density QCD studies with the CMS experiment at the LHC | CMS-HIN-23-011 2405.10785 |
|
| 7 | ATLAS Collaboration | Observation of a centrality-dependent dijet asymmetry in lead-lead collisions at $ \sqrt{\smash[b]{s_{_{\mathrm{NN}}}}} = $ 2.76 TeV with the ATLAS detector at the LHC | PRL 105 (2010) 252303 | 1011.6182 |
| 8 | CMS Collaboration | Observation and studies of jet quenching in PbPb collisions at $ \sqrt{\smash[b]{s_{_{\mathrm{NN}}}}}= $ 2.76 TeV | Phys. Rev. C 84 (2011) 024906 | CMS-HIN-10-004 1102.1957 |
| 9 | ALICE Collaboration | Measurement of jet suppression in central PbPb collisions at $ \sqrt{\smash[b]{s_{_{\mathrm{NN}}}}}= $ 2.76 TeV | PLB 746 (2015) 1 | 1502.01689 |
| 10 | ALICE Collaboration | Particle-yield modification in jetlike azimuthal dihadron correlations in Pb-Pb collisions at $ \sqrt{\smash[b]{s_{_{\mathrm{NN}}}}}= $ 2.76 TeV | Phys. Rev. Lett 108 (2012) 092301 | 1110.0121 |
| 11 | CMS Collaboration | Centrality dependence of dihadron correlations and azimuthal anisotropy harmonics in PbPb collisions at $ \sqrt{\smash[b]{s_{_{\mathrm{NN}}}}}= $ 2.76 TeV | EPJC 72 (2012) 10052 | CMS-HIN-11-006 1201.3158 |
| 12 | CMS Collaboration | Correlations between jets and charged particles in PbPb and pp collisions at $ \sqrt{\smash[b]{s_{_{\mathrm{NN}}}}}= $ 2.76 TeV | JHEP 02 (2016) 156 | CMS-HIN-14-016 1601.00079 |
| 13 | CMS Collaboration | Pseudorapidity distributions of charged hadrons in lead-lead collisions at $ \sqrt{\smash[b]{s_{_{\mathrm{NN}}}}}= $ 5.36 TeV | 2409.00838 | |
| 14 | CMS Collaboration | Description and performance of track and primary-vertex reconstruction with the CMS tracker | JINST 9 (2014) P10009 | CMS-TRK-11-001 1405.6569 |
| 15 | CMS Collaboration | Track impact parameter resolution for the full pseudo rapidity coverage in the 2017 dataset with the CMS phase-1 pixel detector | CMS Detector Performance Note CMS-DP-2020-049, 2020 CDS |
|
| 16 | CMS Tracker Group Collaboration | The CMS Phase-1 pixel detector upgrade | JINST 16 (2021) P02027 | 2012.14304 |
| 17 | CMS Collaboration | The CMS experiment at the CERN LHC | JINST 3 (2008) S08004 | |
| 18 | CMS Collaboration | CMS luminosity measurement using nucleus-nucleus collisions at $ {\sqrt{\smash[b]{s_{_{\mathrm{NN}}}}}}= $ 5.02 TeV in 2018 | CMS Physics Analysis Summary, 2022 CMS-PAS-LUM-18-001 |
CMS-PAS-LUM-18-001 |
| 19 | CMS Collaboration | Precision luminosity measurement in proton-proton collisions at $ \sqrt{s}= $ 13 TeV in 2015 and 2016 at CMS | EPJC 81 (2021) 800 | CMS-LUM-17-003 2104.01927 |
| 20 | CMS Collaboration | Performance of the CMS Level-1 trigger in proton-proton collisions at $ \sqrt{s} = $ 13 TeV | JINST 15 (2020) P10017 | CMS-TRG-17-001 2006.10165 |
| 21 | CMS Collaboration | The CMS trigger system | JINST 12 (2017) P01020 | CMS-TRG-12-001 1609.02366 |
| 22 | CMS Collaboration | Strange hadron collectivity in pPb and PbPb collisions | JHEP 05 (2023) 007 | CMS-HIN-19-004 2205.00080 |
| 23 | CMS Collaboration | Technical proposal for the Phase-II upgrade of the Compact Muon Solenoid | CMS Technical Proposal CERN-LHCC-2015-010, CMS-TDR-15-02, 2015 CDS |
|
| 24 | T. Sjöstrand et al. | An introduction to PYTHIA 8.2 | Comput. Phys. Commun. 191 (2015) 159 | 1410.3012 |
| 25 | CMS Collaboration | Extraction and validation of a new set of CMS PYTHIA8 tunes from underlying-event measurements | EPJC 80 (2020) 4 | CMS-GEN-17-001 1903.12179 |
| 26 | I. P. Lokhtin and A. M. Snigirev | A model of jet quenching in ultrarelativistic heavy ion collisions and high-$ p_{\mathrm{T}} $ hadron spectra at RHIC | EPJC 45 (2006) 211 | hep-ph/0506189 |
| 27 | GEANT4 Collaboration | GEANT 4---a simulation toolkit | Nucl. Instrum. and Meth. A 506 (2003) 250 | |
| 28 | CMS Collaboration | Multiplicity and transverse momentum dependence of charge balance function in pPb and PbPb collisions | JHEP 08 (2024) 148 | CMS-HIN-21-017 2307.11185 |
| 29 | CMS Collaboration | Observation of long-range, near-side angular correlations in pPb collisions at the LHC | PLB 718 (2013) 795 | CMS-HIN-12-015 1210.5482 |
| 30 | CMS Collaboration | Measurement of long-range near-side two-particle angular correlations in pp collisions at $ \sqrt{\smash[b]{s_{_{\mathrm{NN}}}}}= $ 13 TeV | Phys. Rev. Lett 116 (2016) 172302 | CMS-FSQ-15-002 1510.03068 |
| 31 | ALICE Collaboration | Evolution of the longitudinal and azimuthal structure of the near-side jet peak in Pb-Pb collisions at $ \sqrt{\smash[b]{s_{_{\mathrm{NN}}}}}= $ 2.76 TeV | Phys. Rev. C 96 (2017) 034904 | 1609.06667 |
| 32 | STAR Collaboration | System size and energy dependence of near-side dihadron correlations | Phys. Rev. C 85 (2012) 014903 | 1110.5800 |
| 33 | CMS Collaboration | Long-range two-particle correlations of strange hadrons with charged particles in pPb and PbPb collisions at lhc energies | PLB 742 (2015) 200 | CMS-HIN-14-002 1409.3392 |
| 34 | ALICE Collaboration | Anomalous evolution of the near-side jet peak shape in Pb-Pb collisions at $ \sqrt{\smash[b]{s_{_{\mathrm{NN}}}}}= $ 2.76 TeV | Phys. Rev. Lett 119 (2017) 102301 | 1609.06643 |
| 35 | G. Kasza and T. Csorgo | Scaling behaviour of $ dn/dy $ in high-energy collisions | Universe 10 (2024) 45 | 2311.18678 |

|
Compact Muon Solenoid LHC, CERN |

|

|

|

|

|

|