

Compact Muon Solenoid
LHC, CERN
| CMS-PAS-TOP-21-010 | ||
| Measurement of inclusive and differential cross sections for single top quark production in association with a W boson at $\sqrt{s}= $ 13 TeV | ||
| CMS Collaboration | ||
| May 2022 | ||
| Abstract: Measurements of the inclusive and normalised differential cross sections are presented for the production of single top quarks in association with a W boson, in proton-proton collisions at a centre-of-mass energy of 13 TeV. The data were recorded with the CMS detector at the LHC and correspond to an integrated luminosity of 138 fb$^{-1}$. Events containing one muon and one electron in the final state are analysed. For the inclusive measurement, a multivariate discriminant, exploiting the kinematic properties of the events, is used to separate the signal from the dominant $\mathrm{t\bar{t}}$ background. A measured cross section of 79.2 $\pm$ 0.8 (stat) $^{+7.0}_{-7.2}$ (syst) $\pm$ 1.1 (lumi) pb is obtained, consistent with predictions of the standard model. For the differential measurements, a fiducial region is defined according to the detector acceptance and the requirement of exactly one b-tagged jet. The resulting distributions are unfolded to particle level and compared with predictions at next-to-leading order in perturbative quantum chromodynamics, with which they agree within uncertainties. | ||
|
Links:
CDS record (PDF) ;
CADI line (restricted) ;
These preliminary results are superseded in this paper, Submitted to JHEP. The superseded preliminary plots can be found here. |
||
| Figures | |
png pdf |
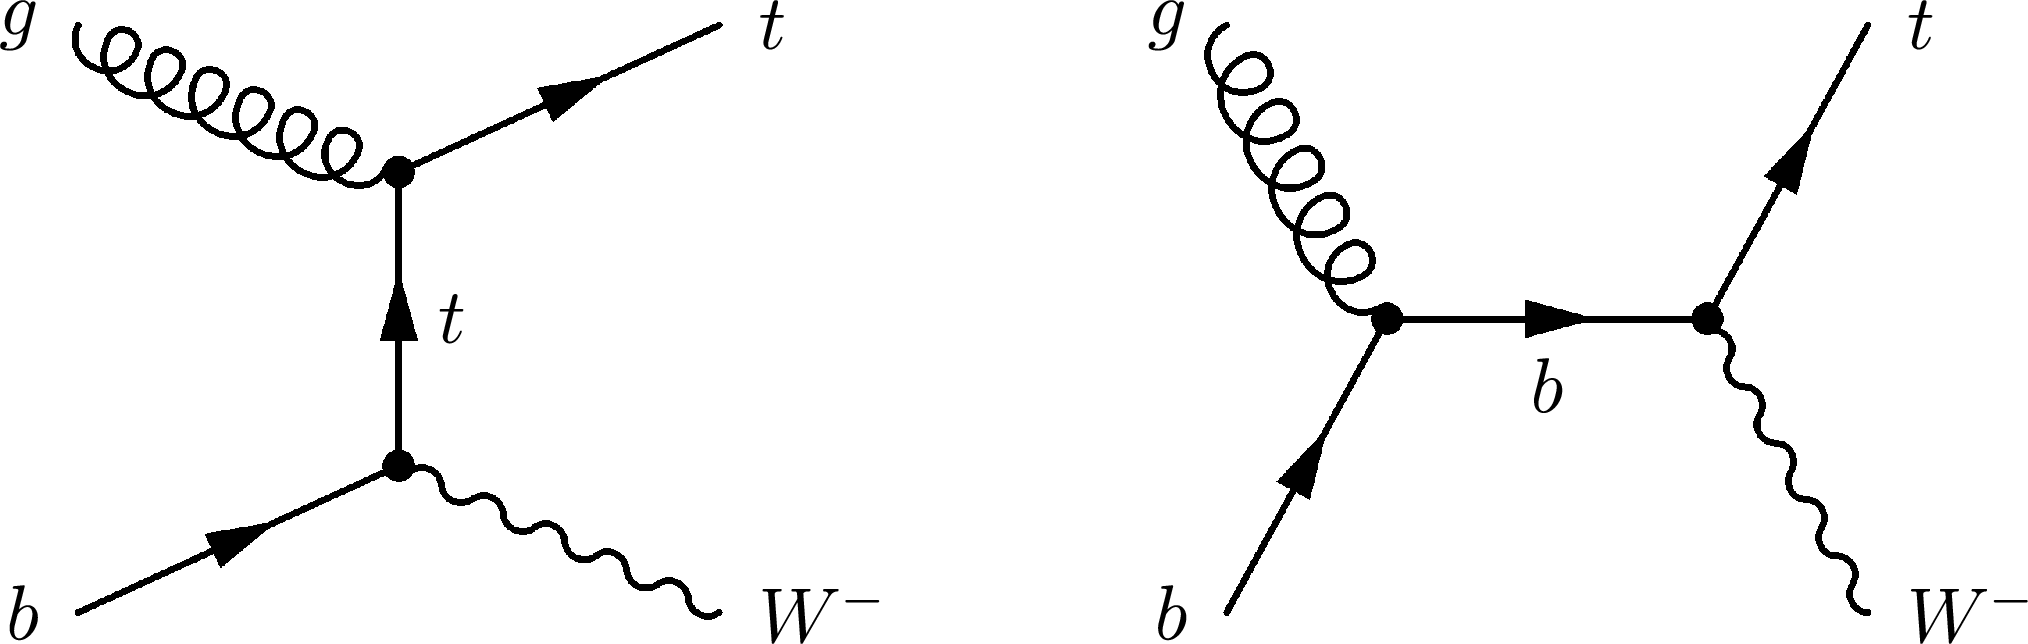
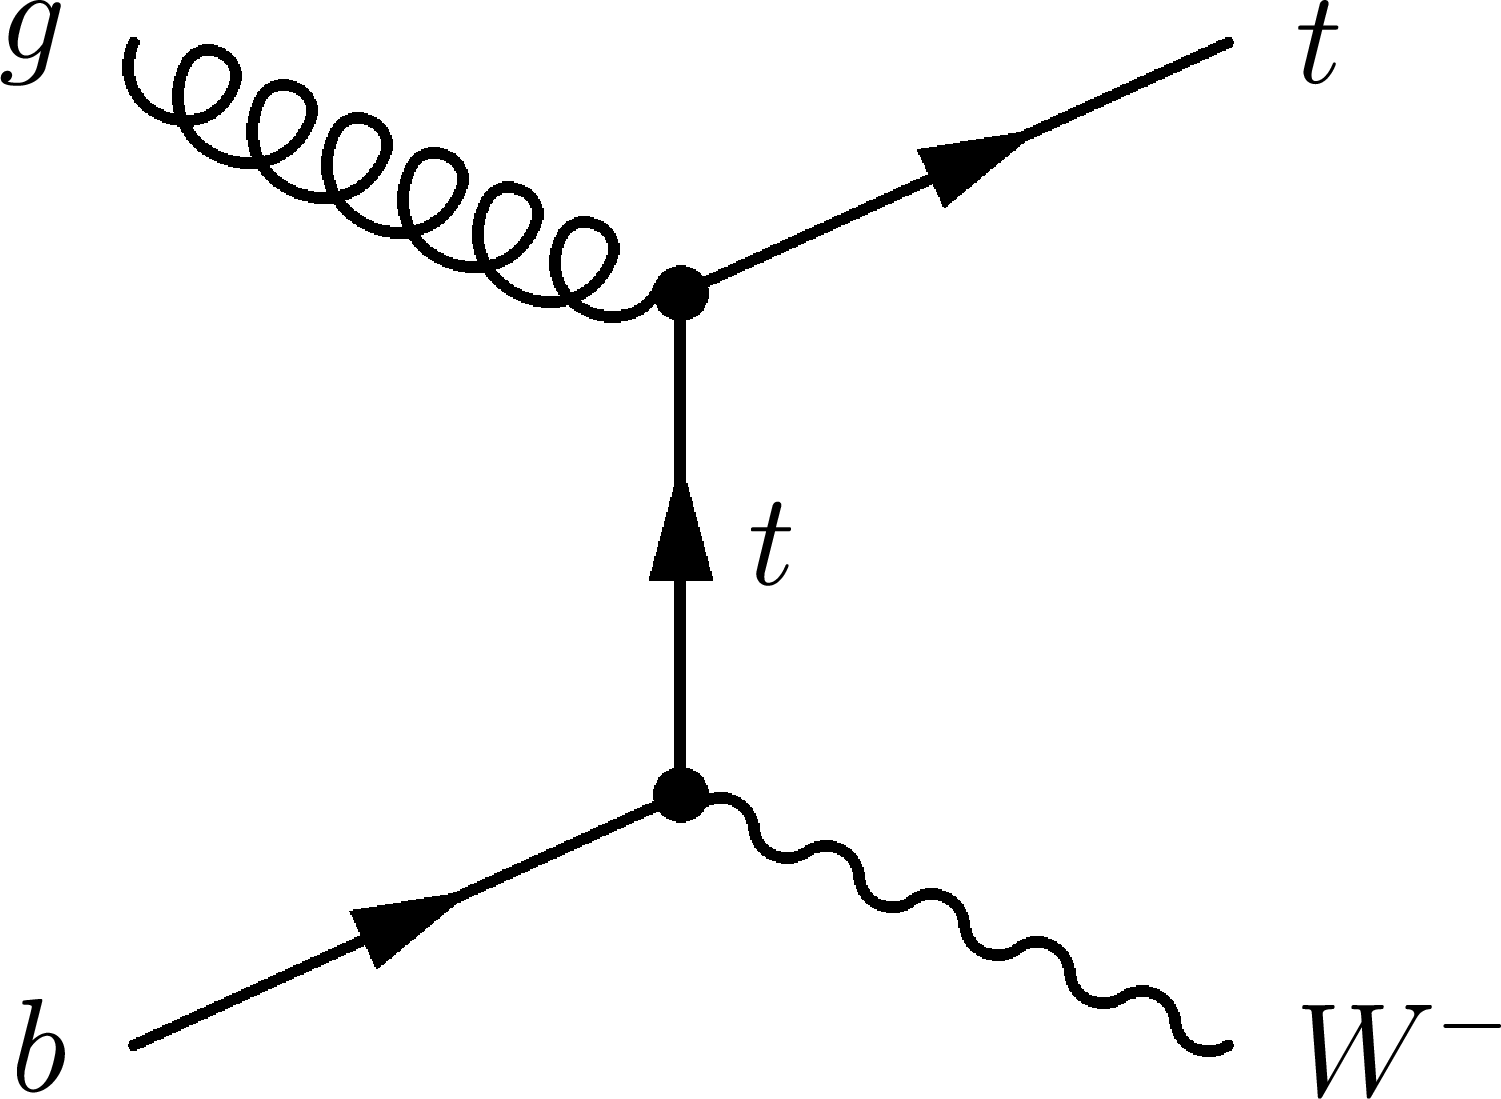
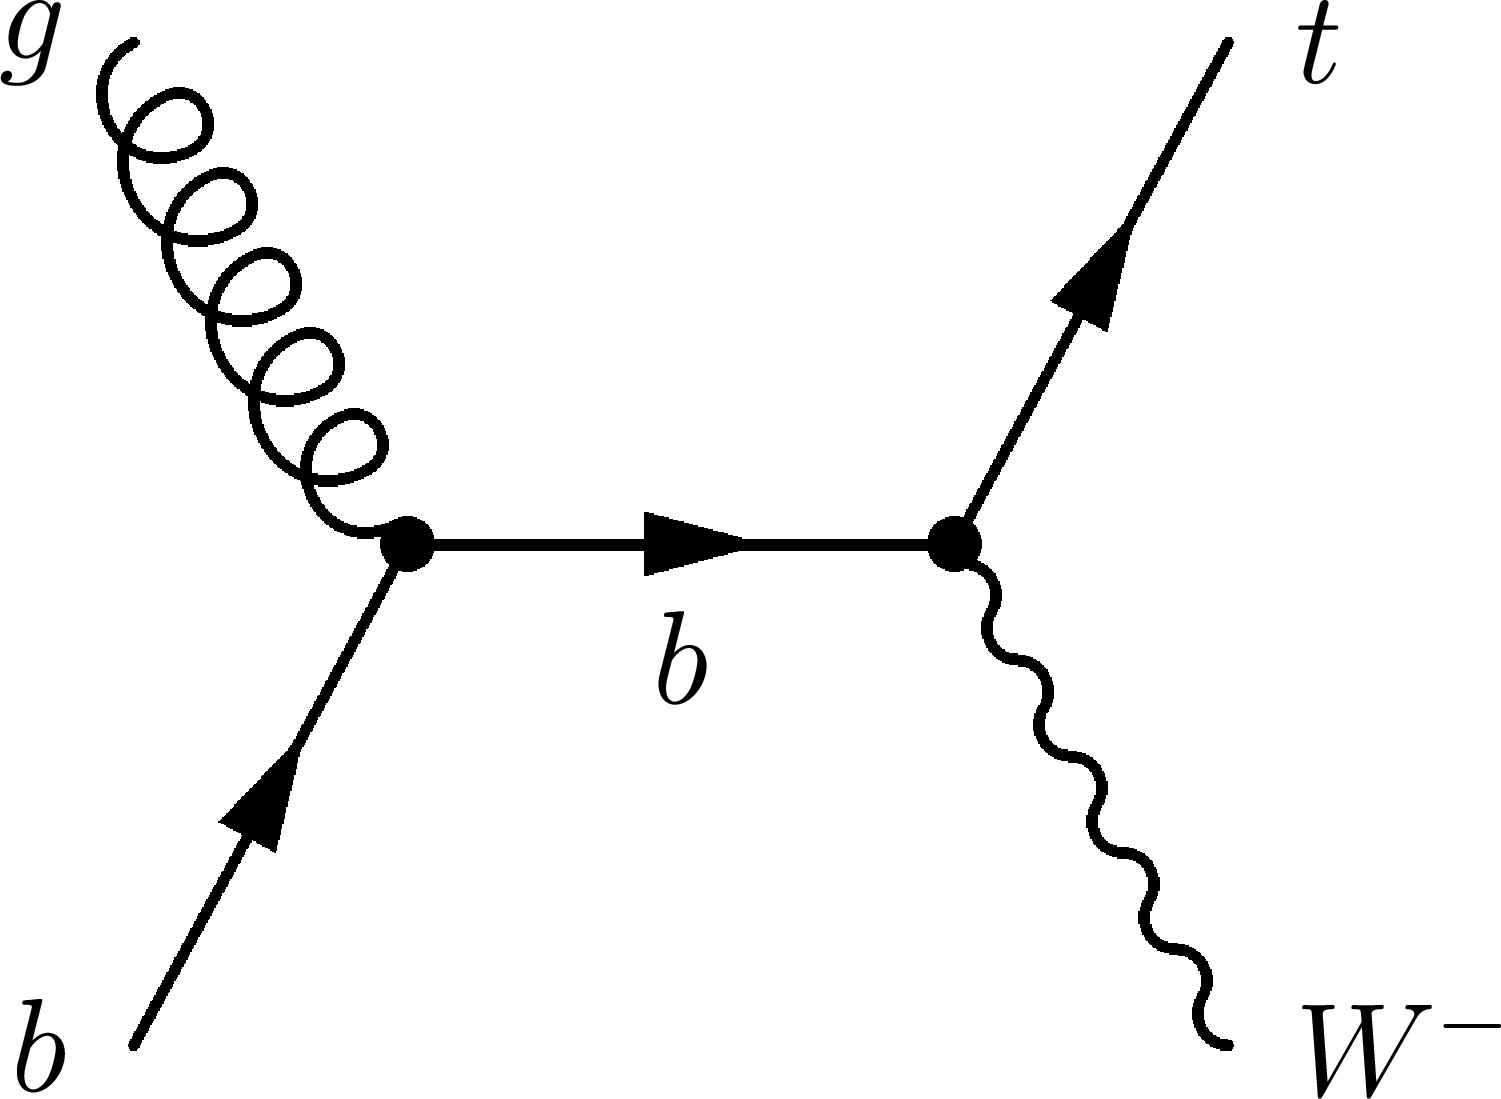
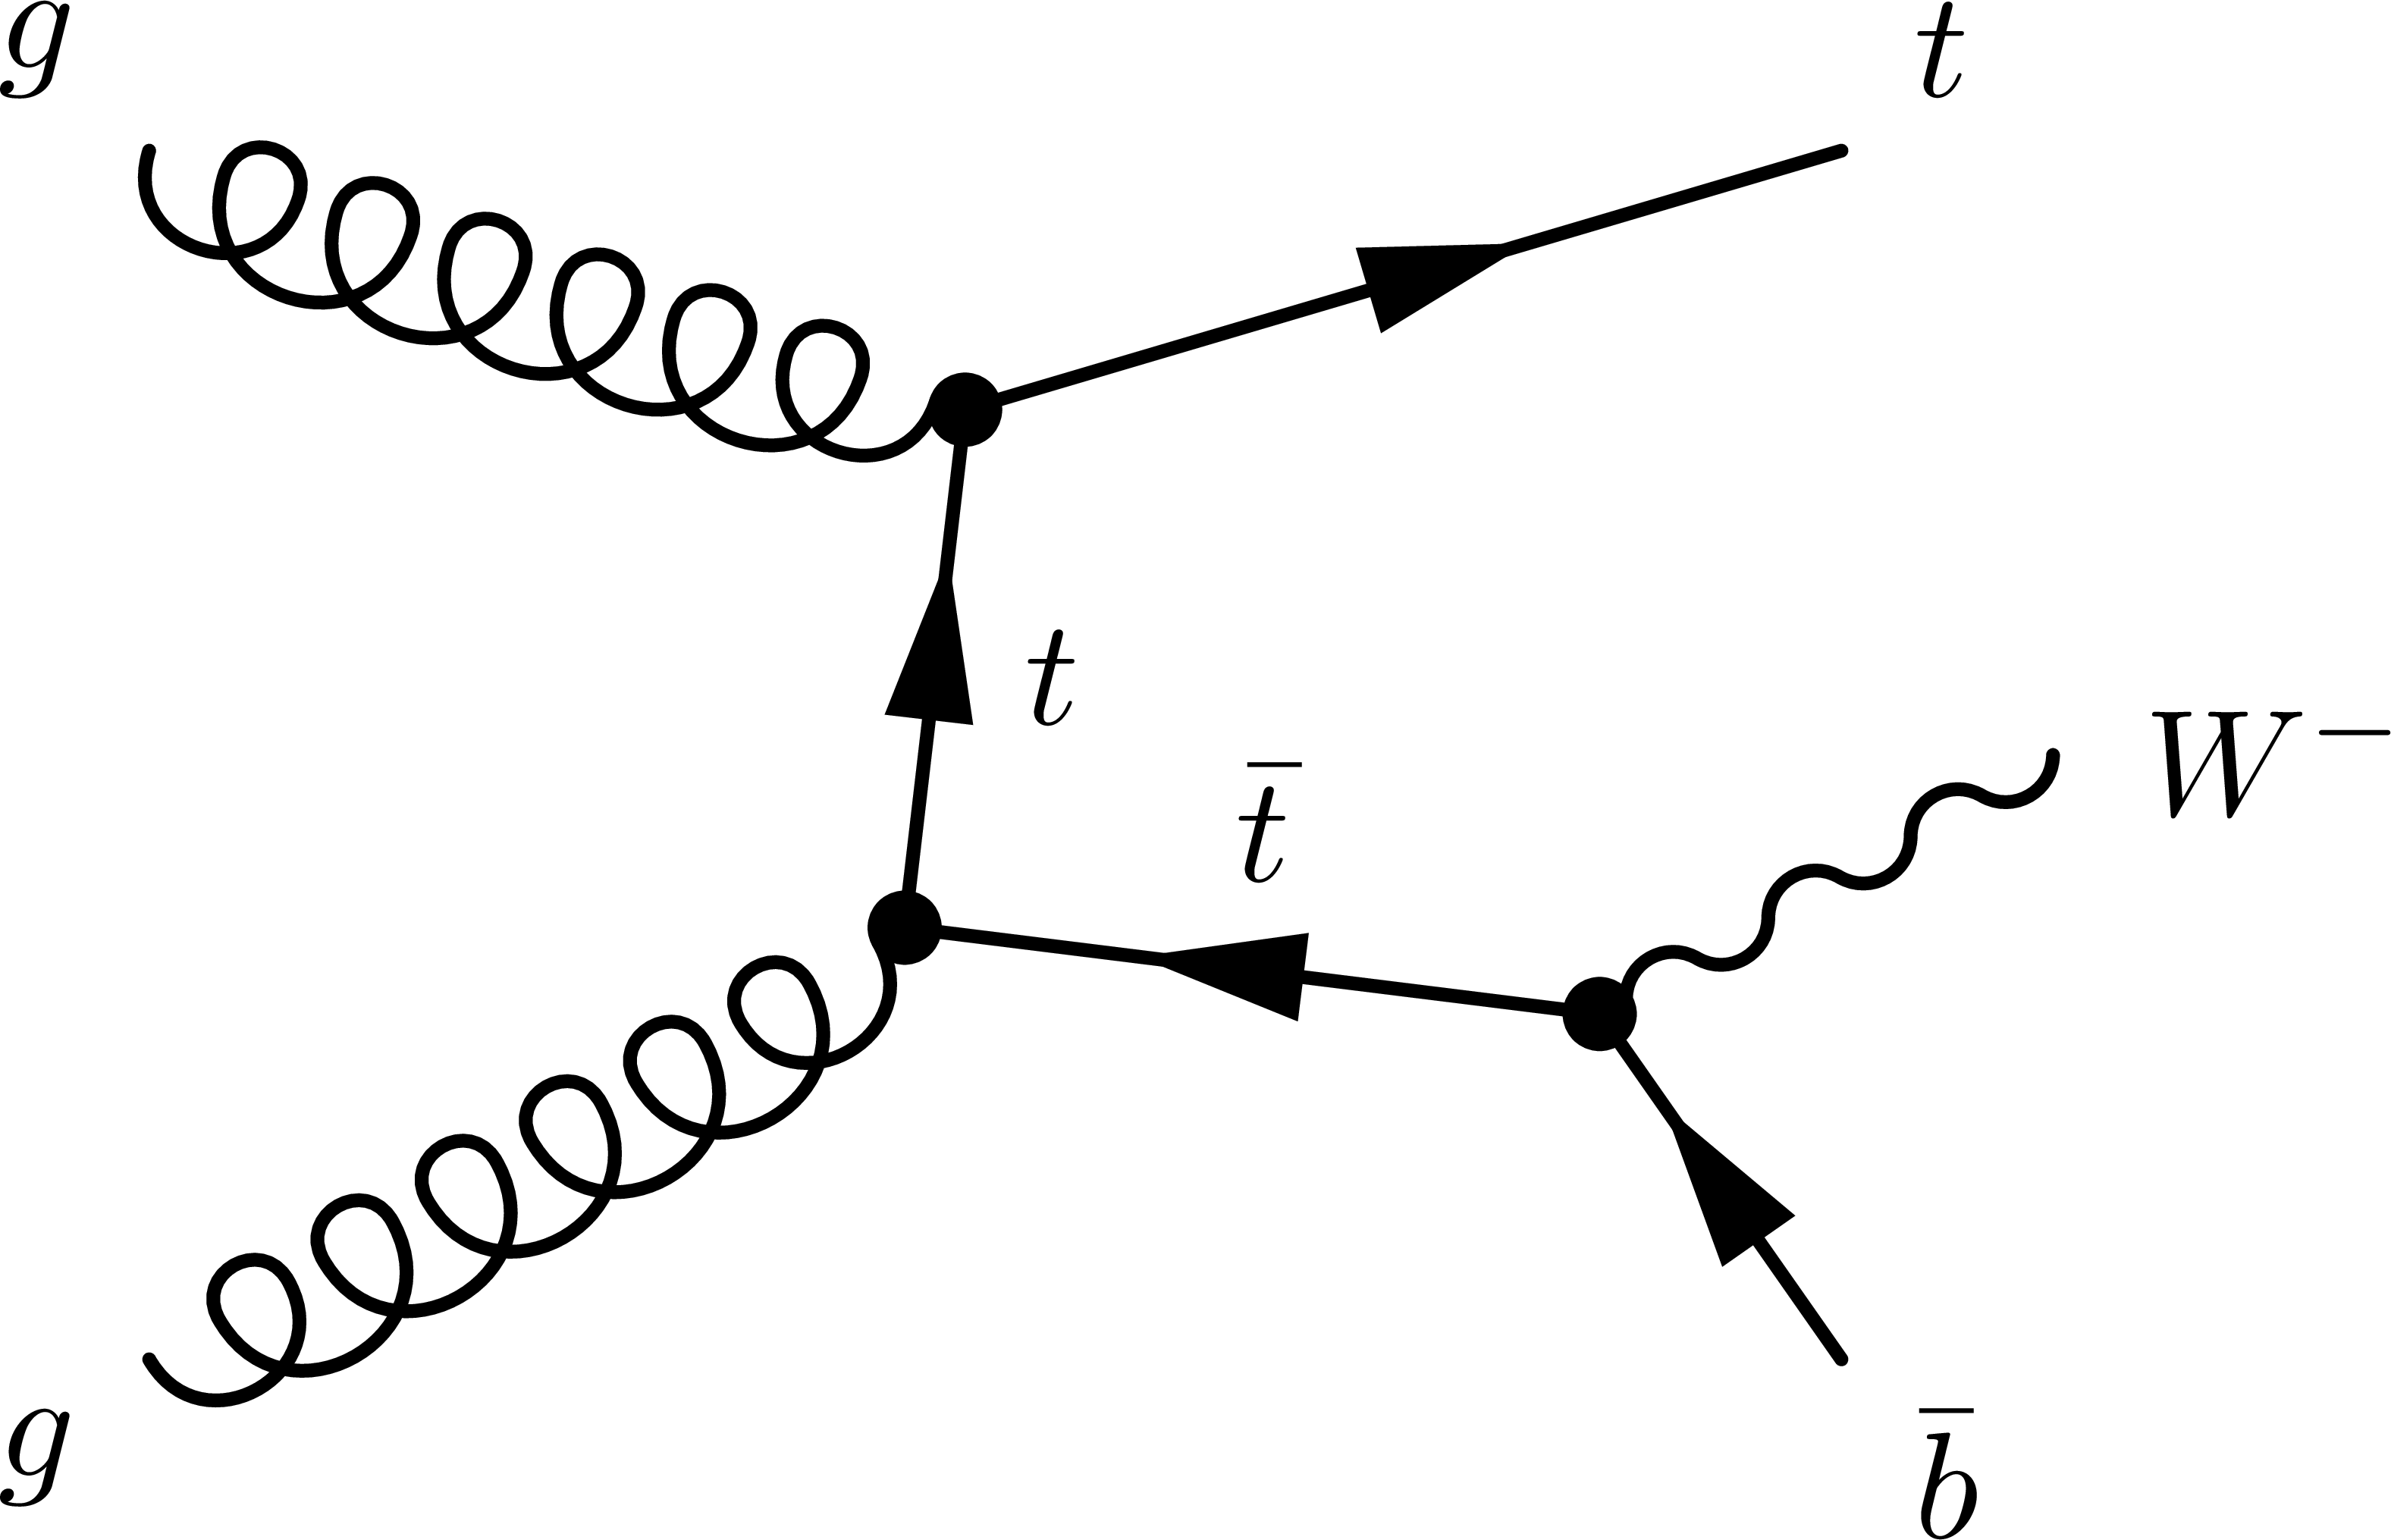
Figure 1:
LO Feynman diagrams for single top quark production in the tW mode, the charge-conjugate modes are implicitly included. |
png pdf |
Figure 1-a:
LO Feynman diagrams for single top quark production in the tW mode, the charge-conjugate modes are implicitly included. |
png pdf |
Figure 1-b:
LO Feynman diagrams for single top quark production in the tW mode, the charge-conjugate modes are implicitly included. |
png pdf |
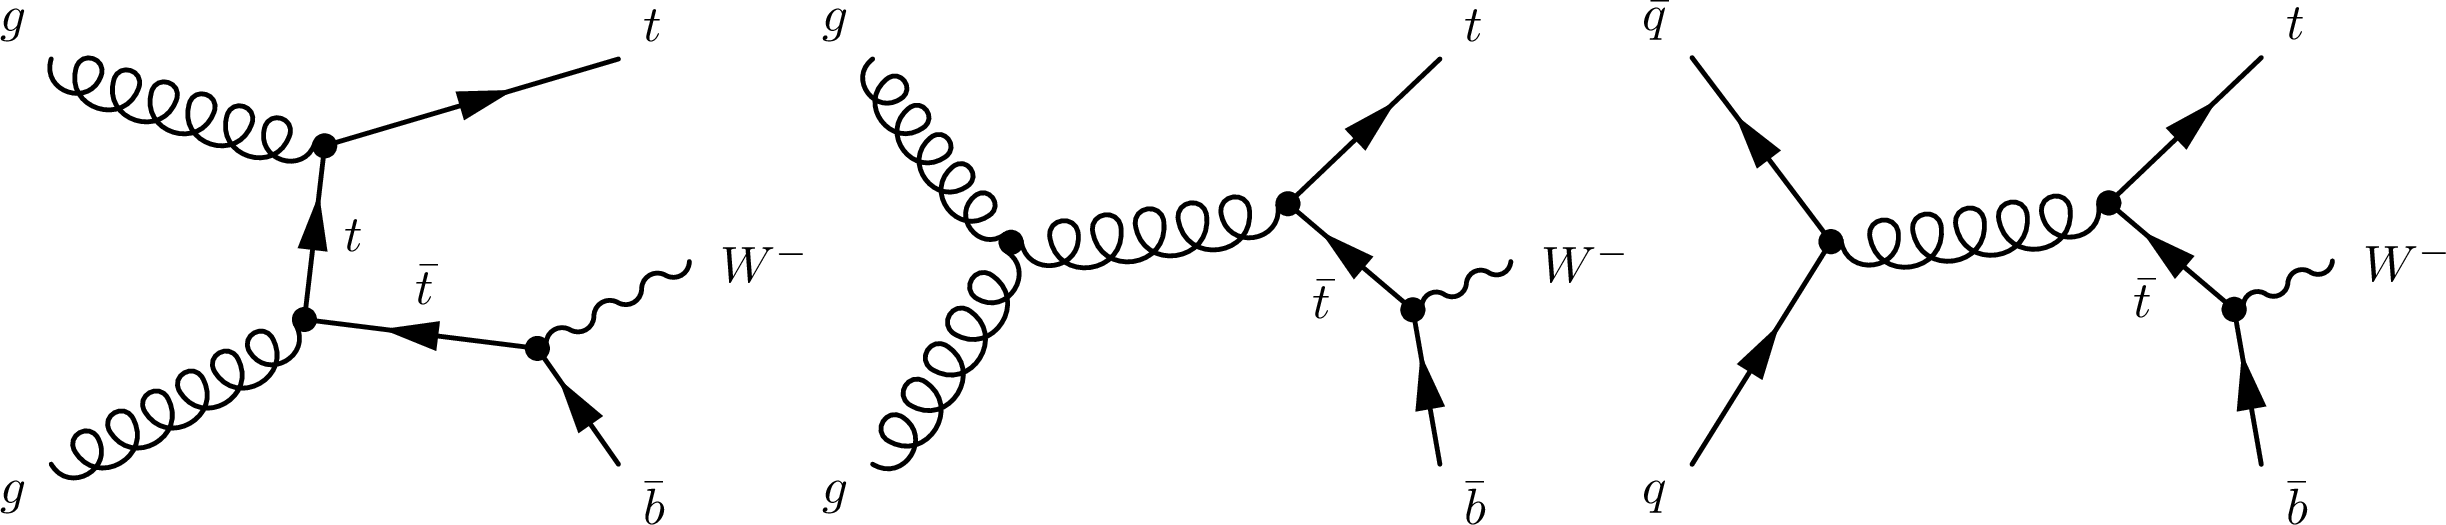
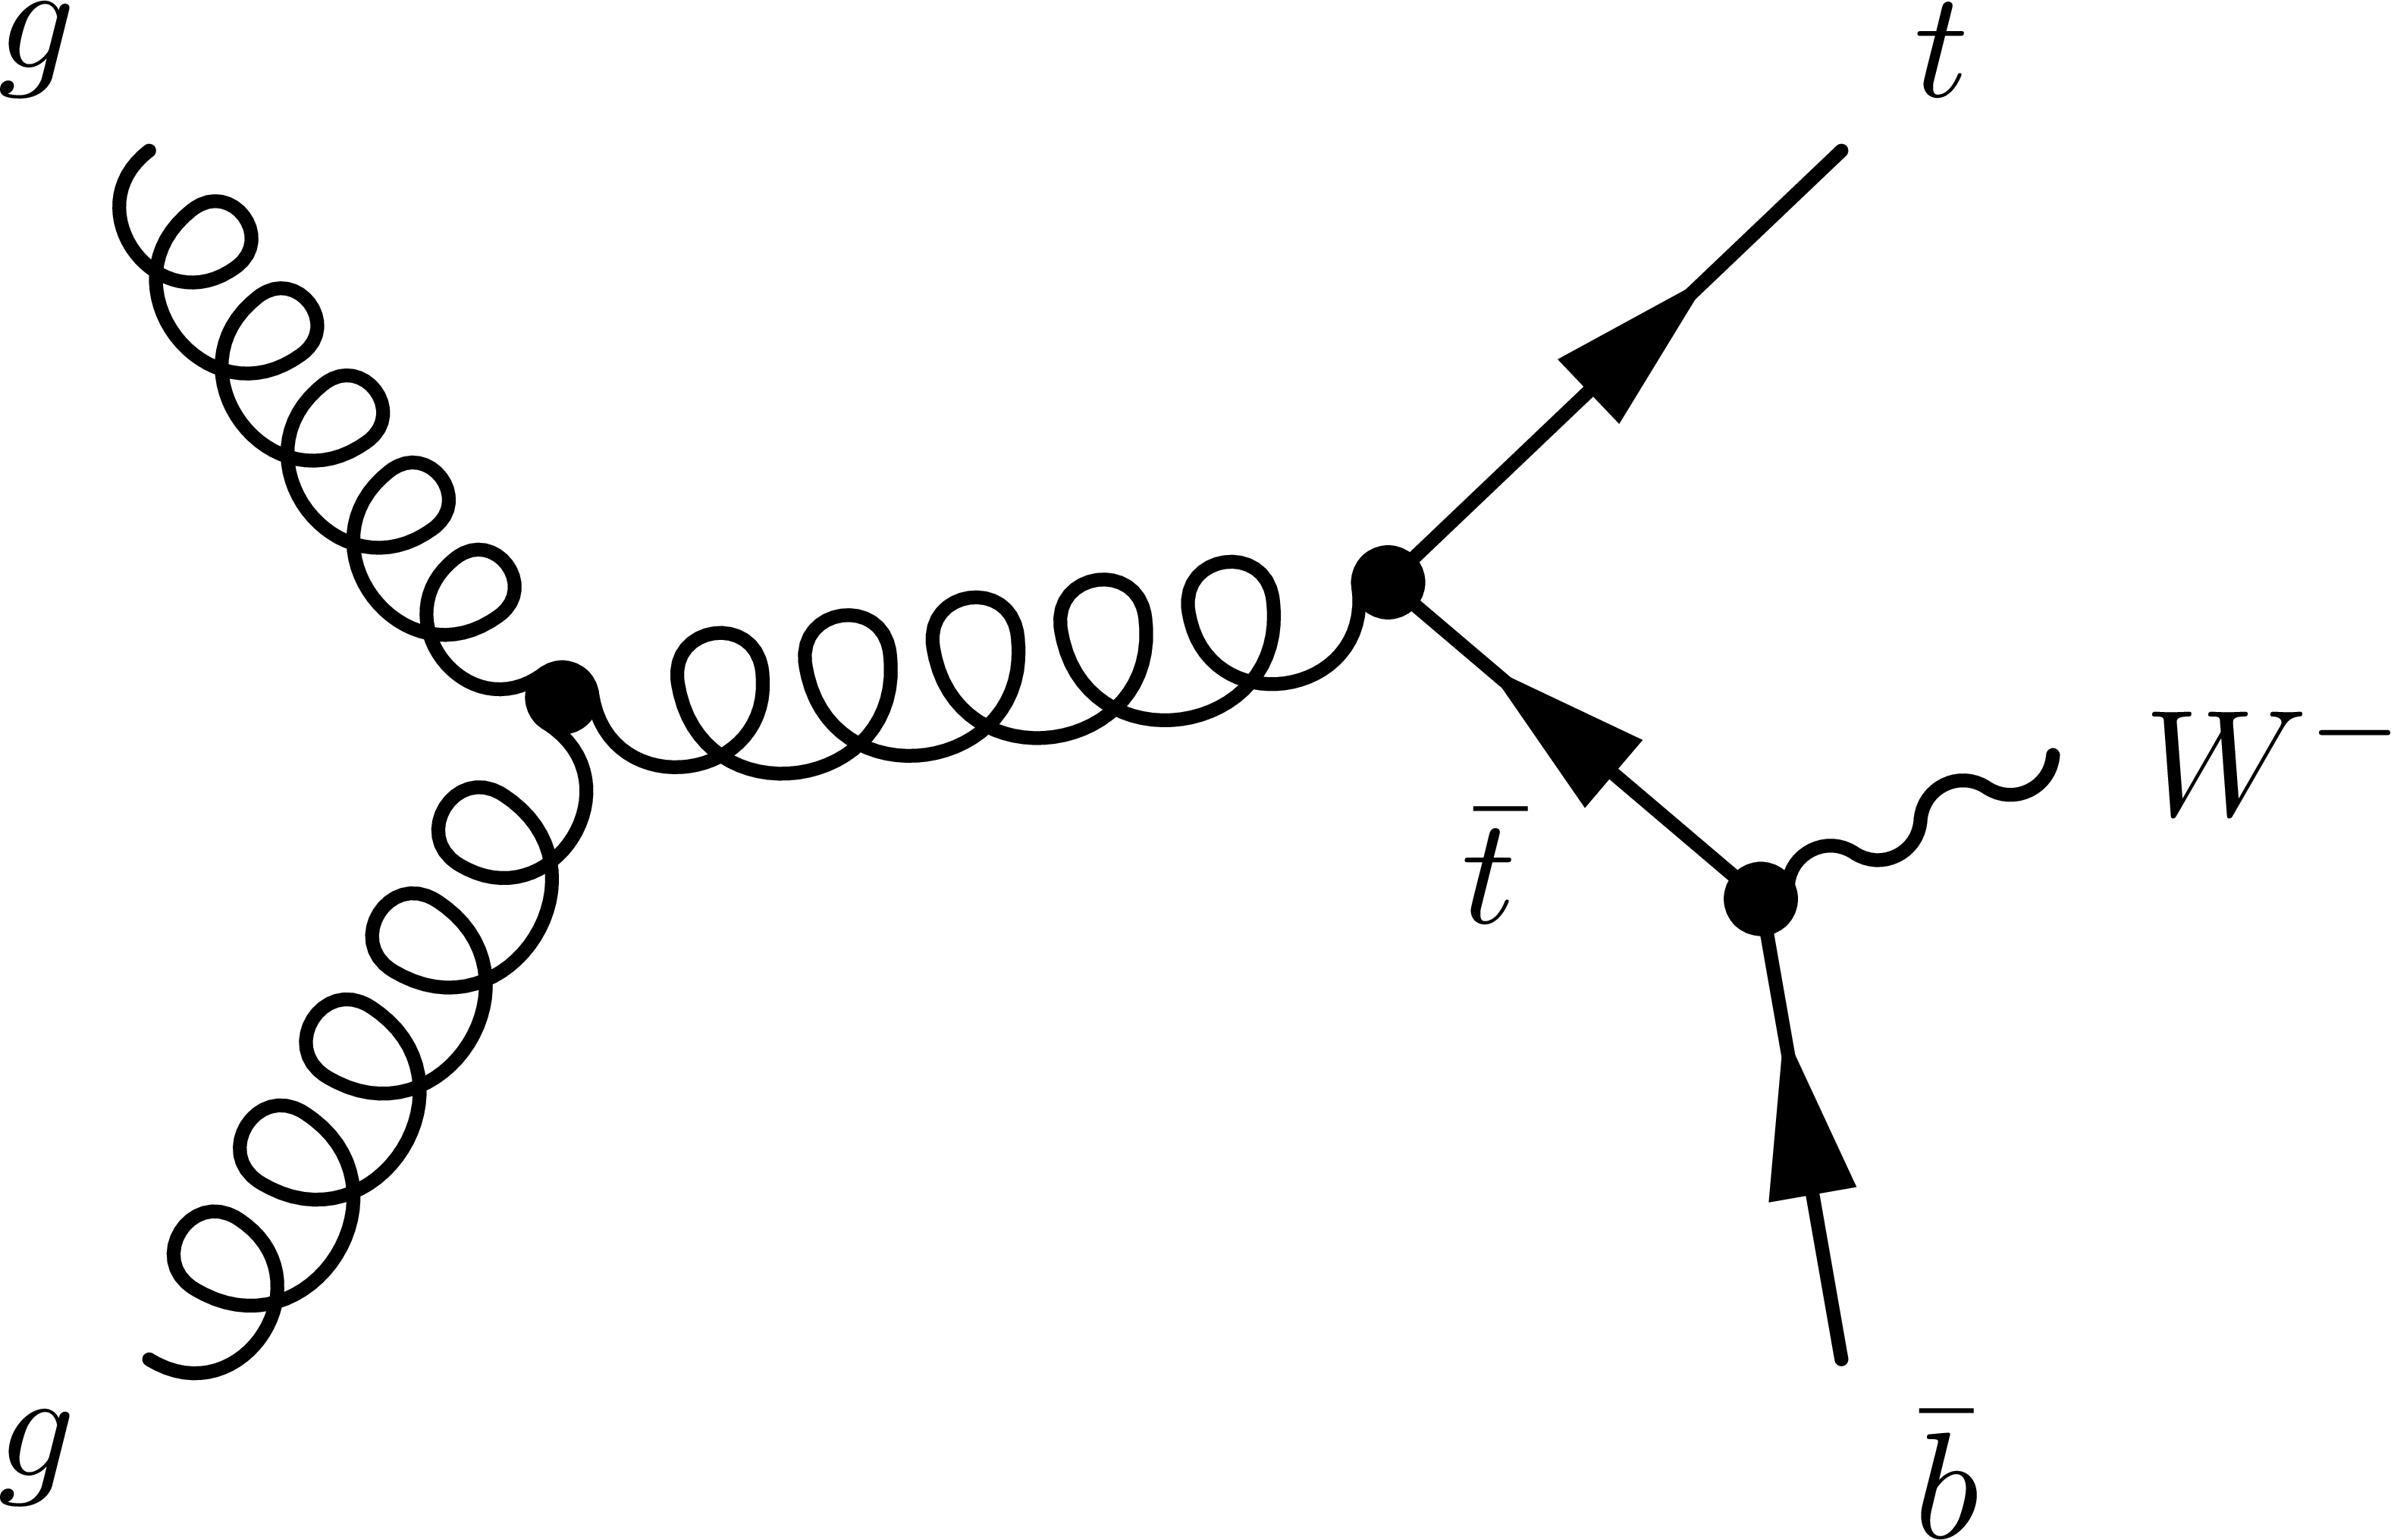
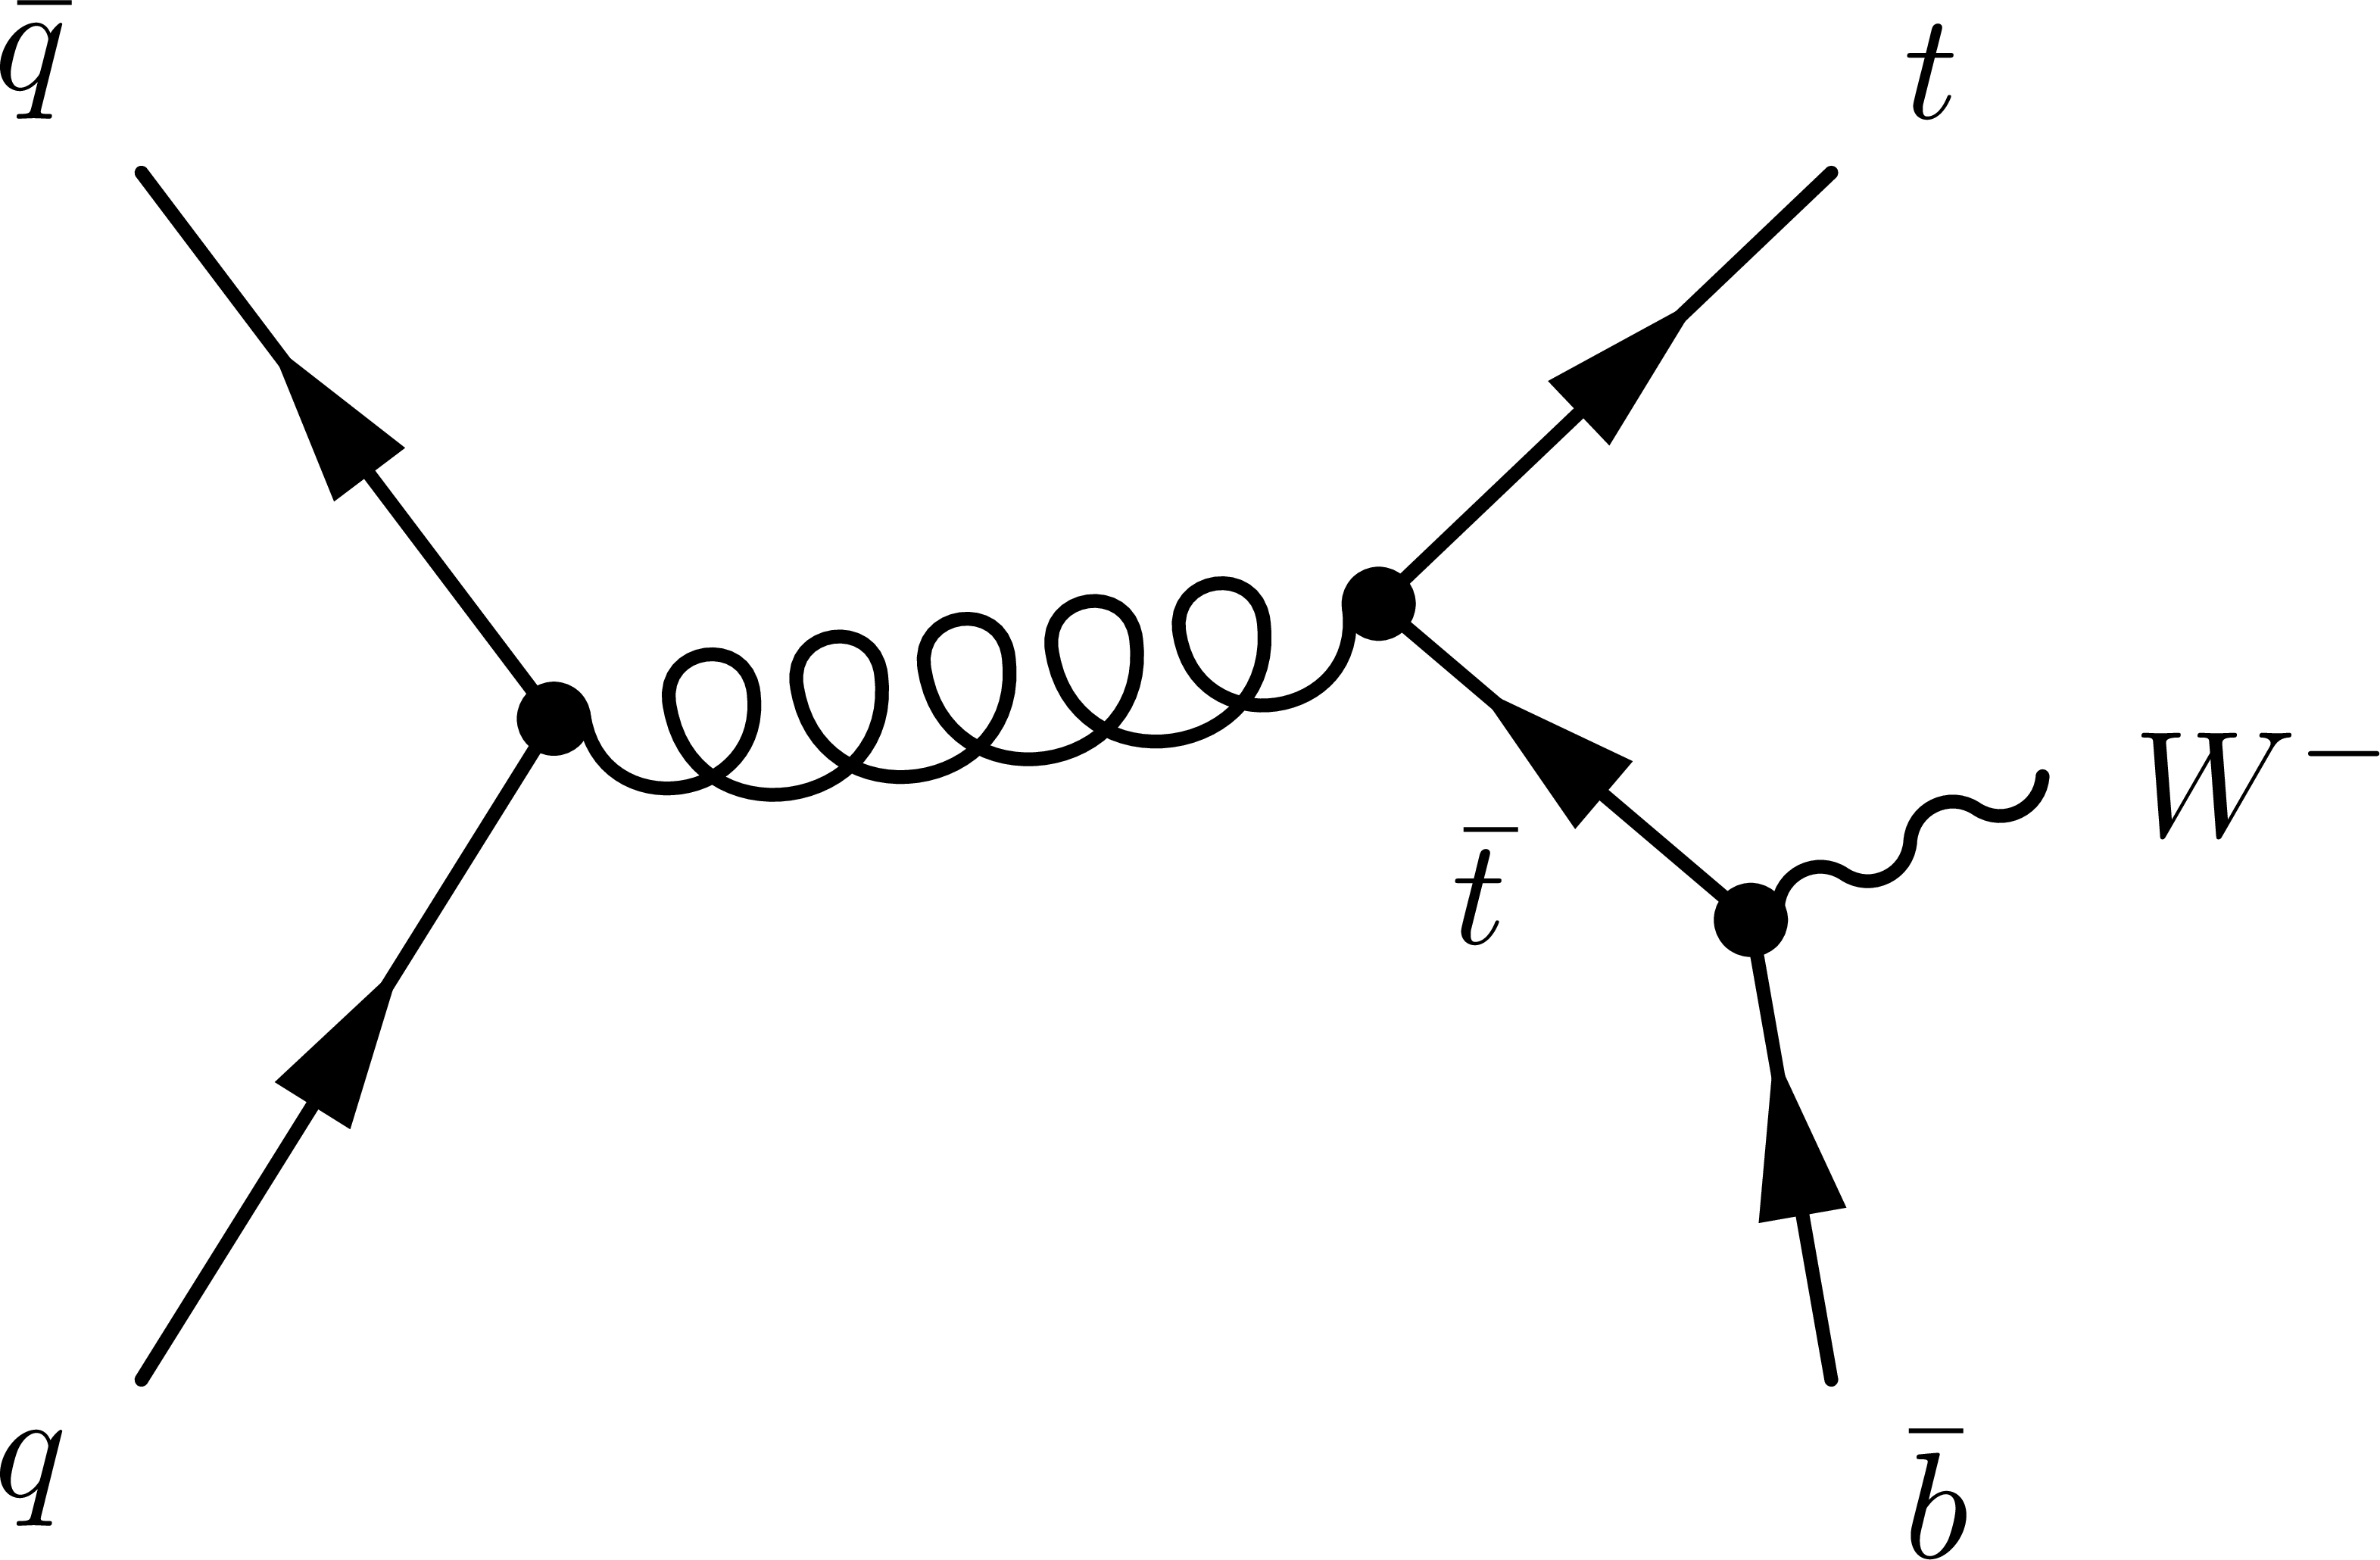
Figure 2:
Feynman diagrams for tW single top quark production at NLO that are removed from the signal definition in the DR scheme, the charge-conjugate modes are implicitly included. |
png pdf |
Figure 2-a:
Feynman diagrams for tW single top quark production at NLO that are removed from the signal definition in the DR scheme, the charge-conjugate modes are implicitly included. |
png pdf |
Figure 2-b:
Feynman diagrams for tW single top quark production at NLO that are removed from the signal definition in the DR scheme, the charge-conjugate modes are implicitly included. |
png pdf |
Figure 2-c:
Feynman diagrams for tW single top quark production at NLO that are removed from the signal definition in the DR scheme, the charge-conjugate modes are implicitly included. |
png pdf |
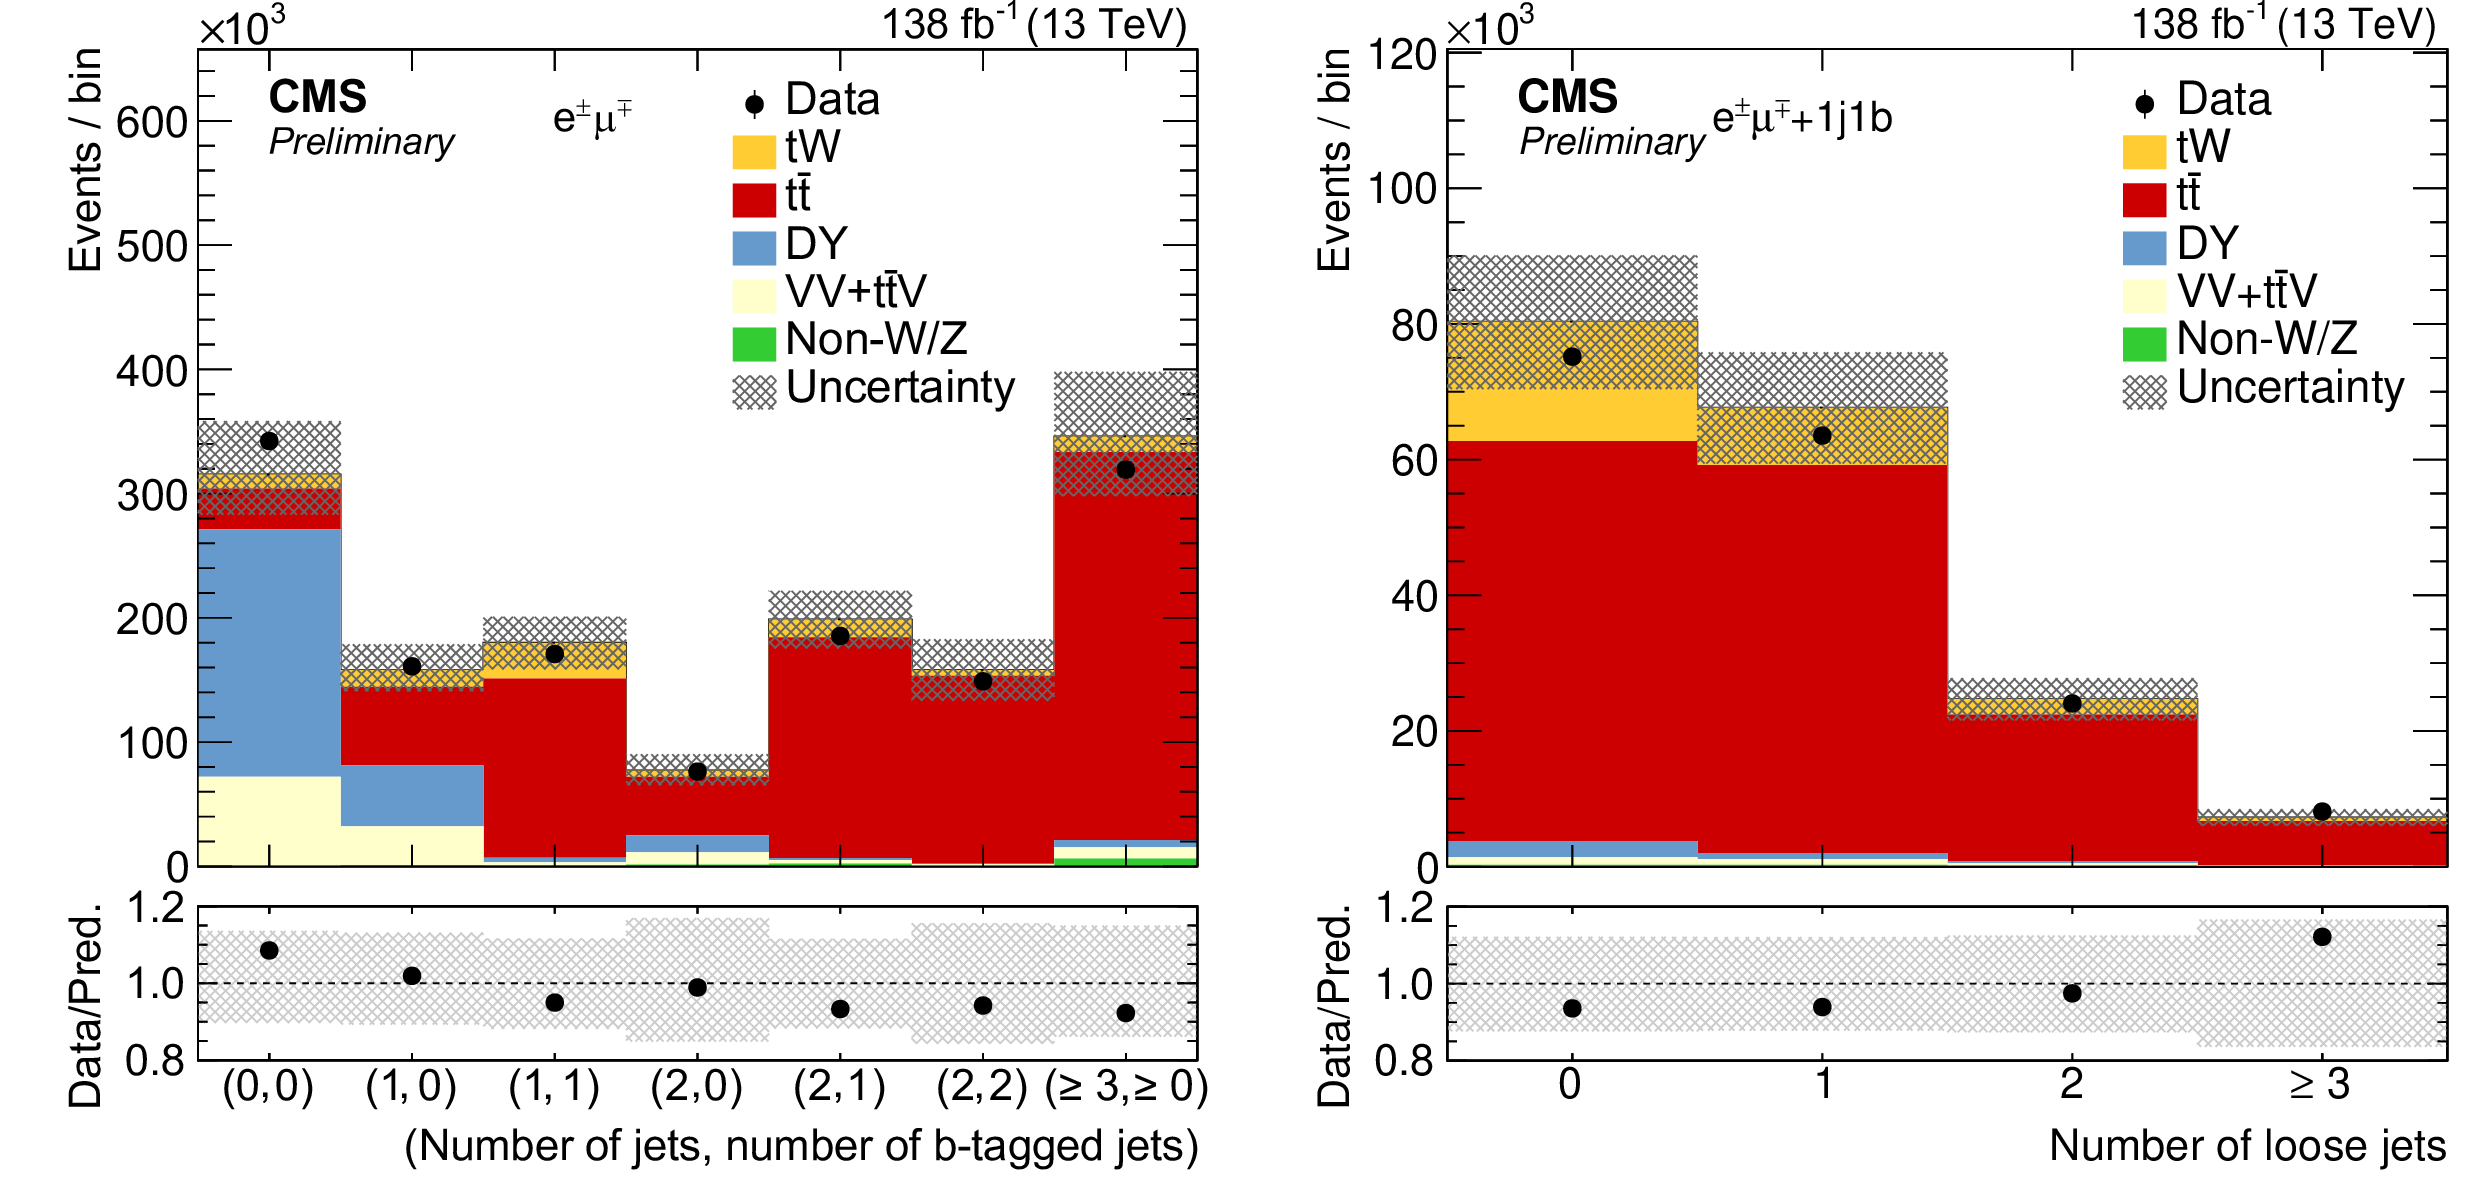
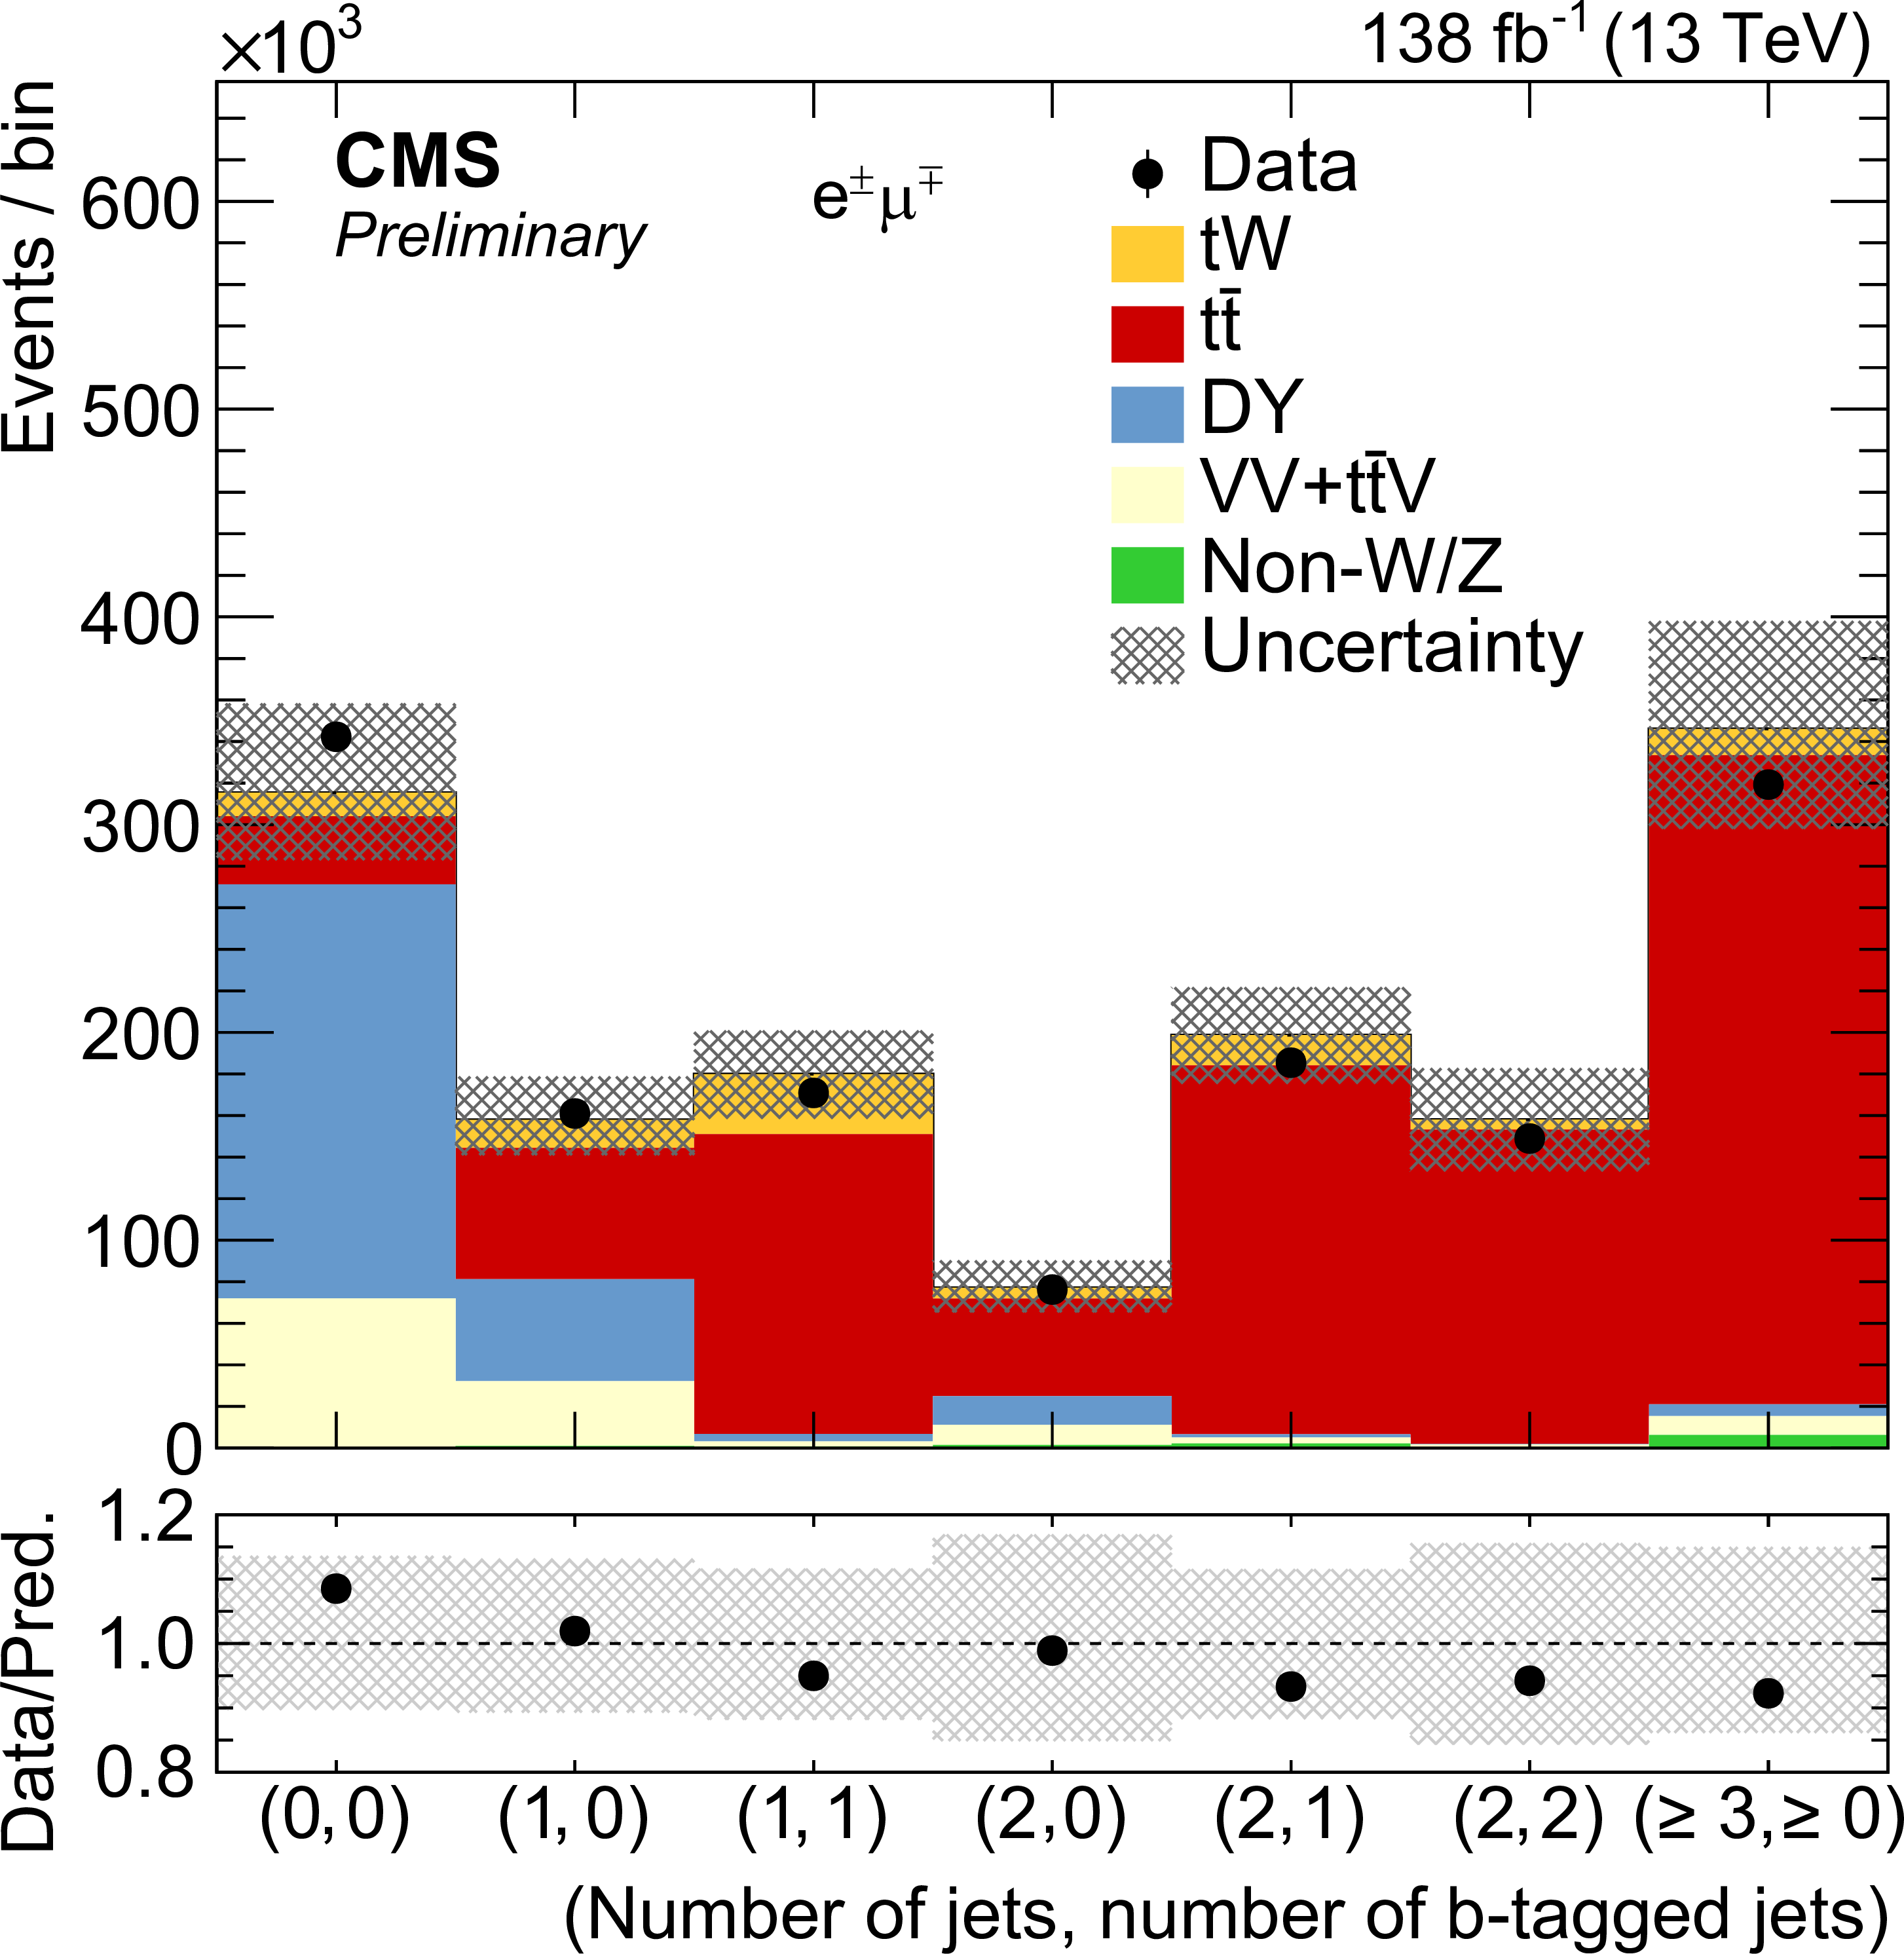
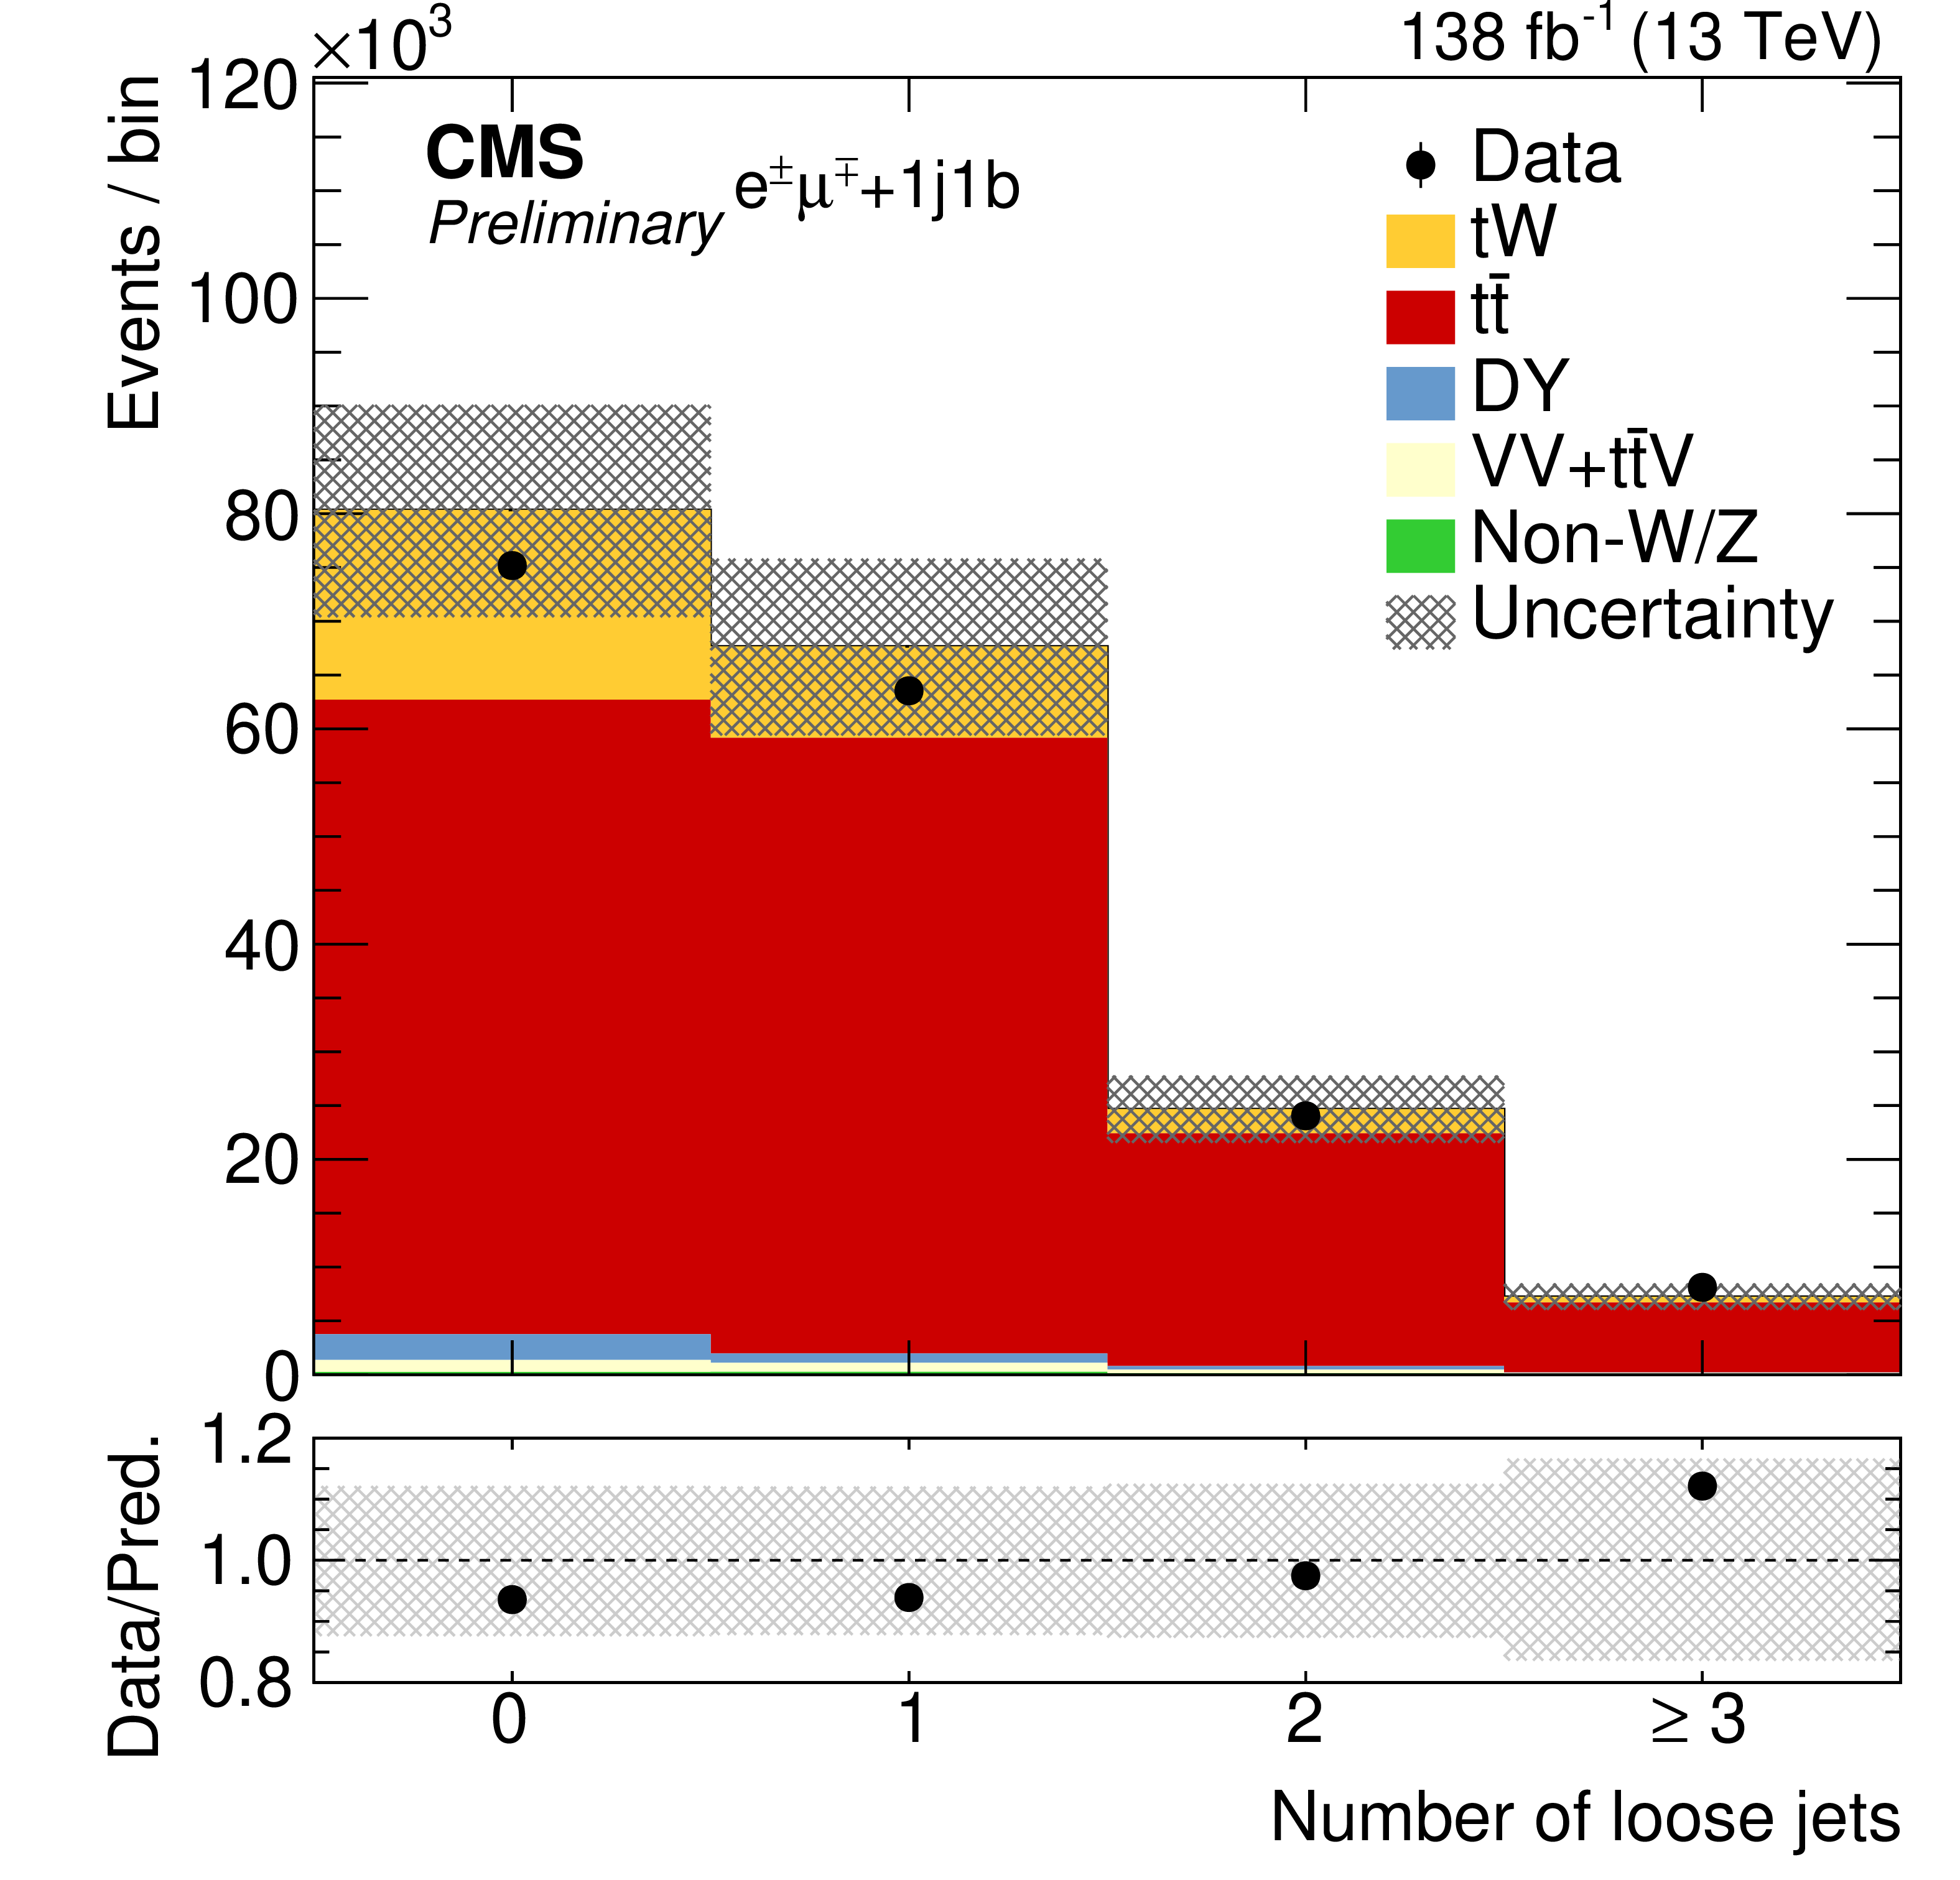
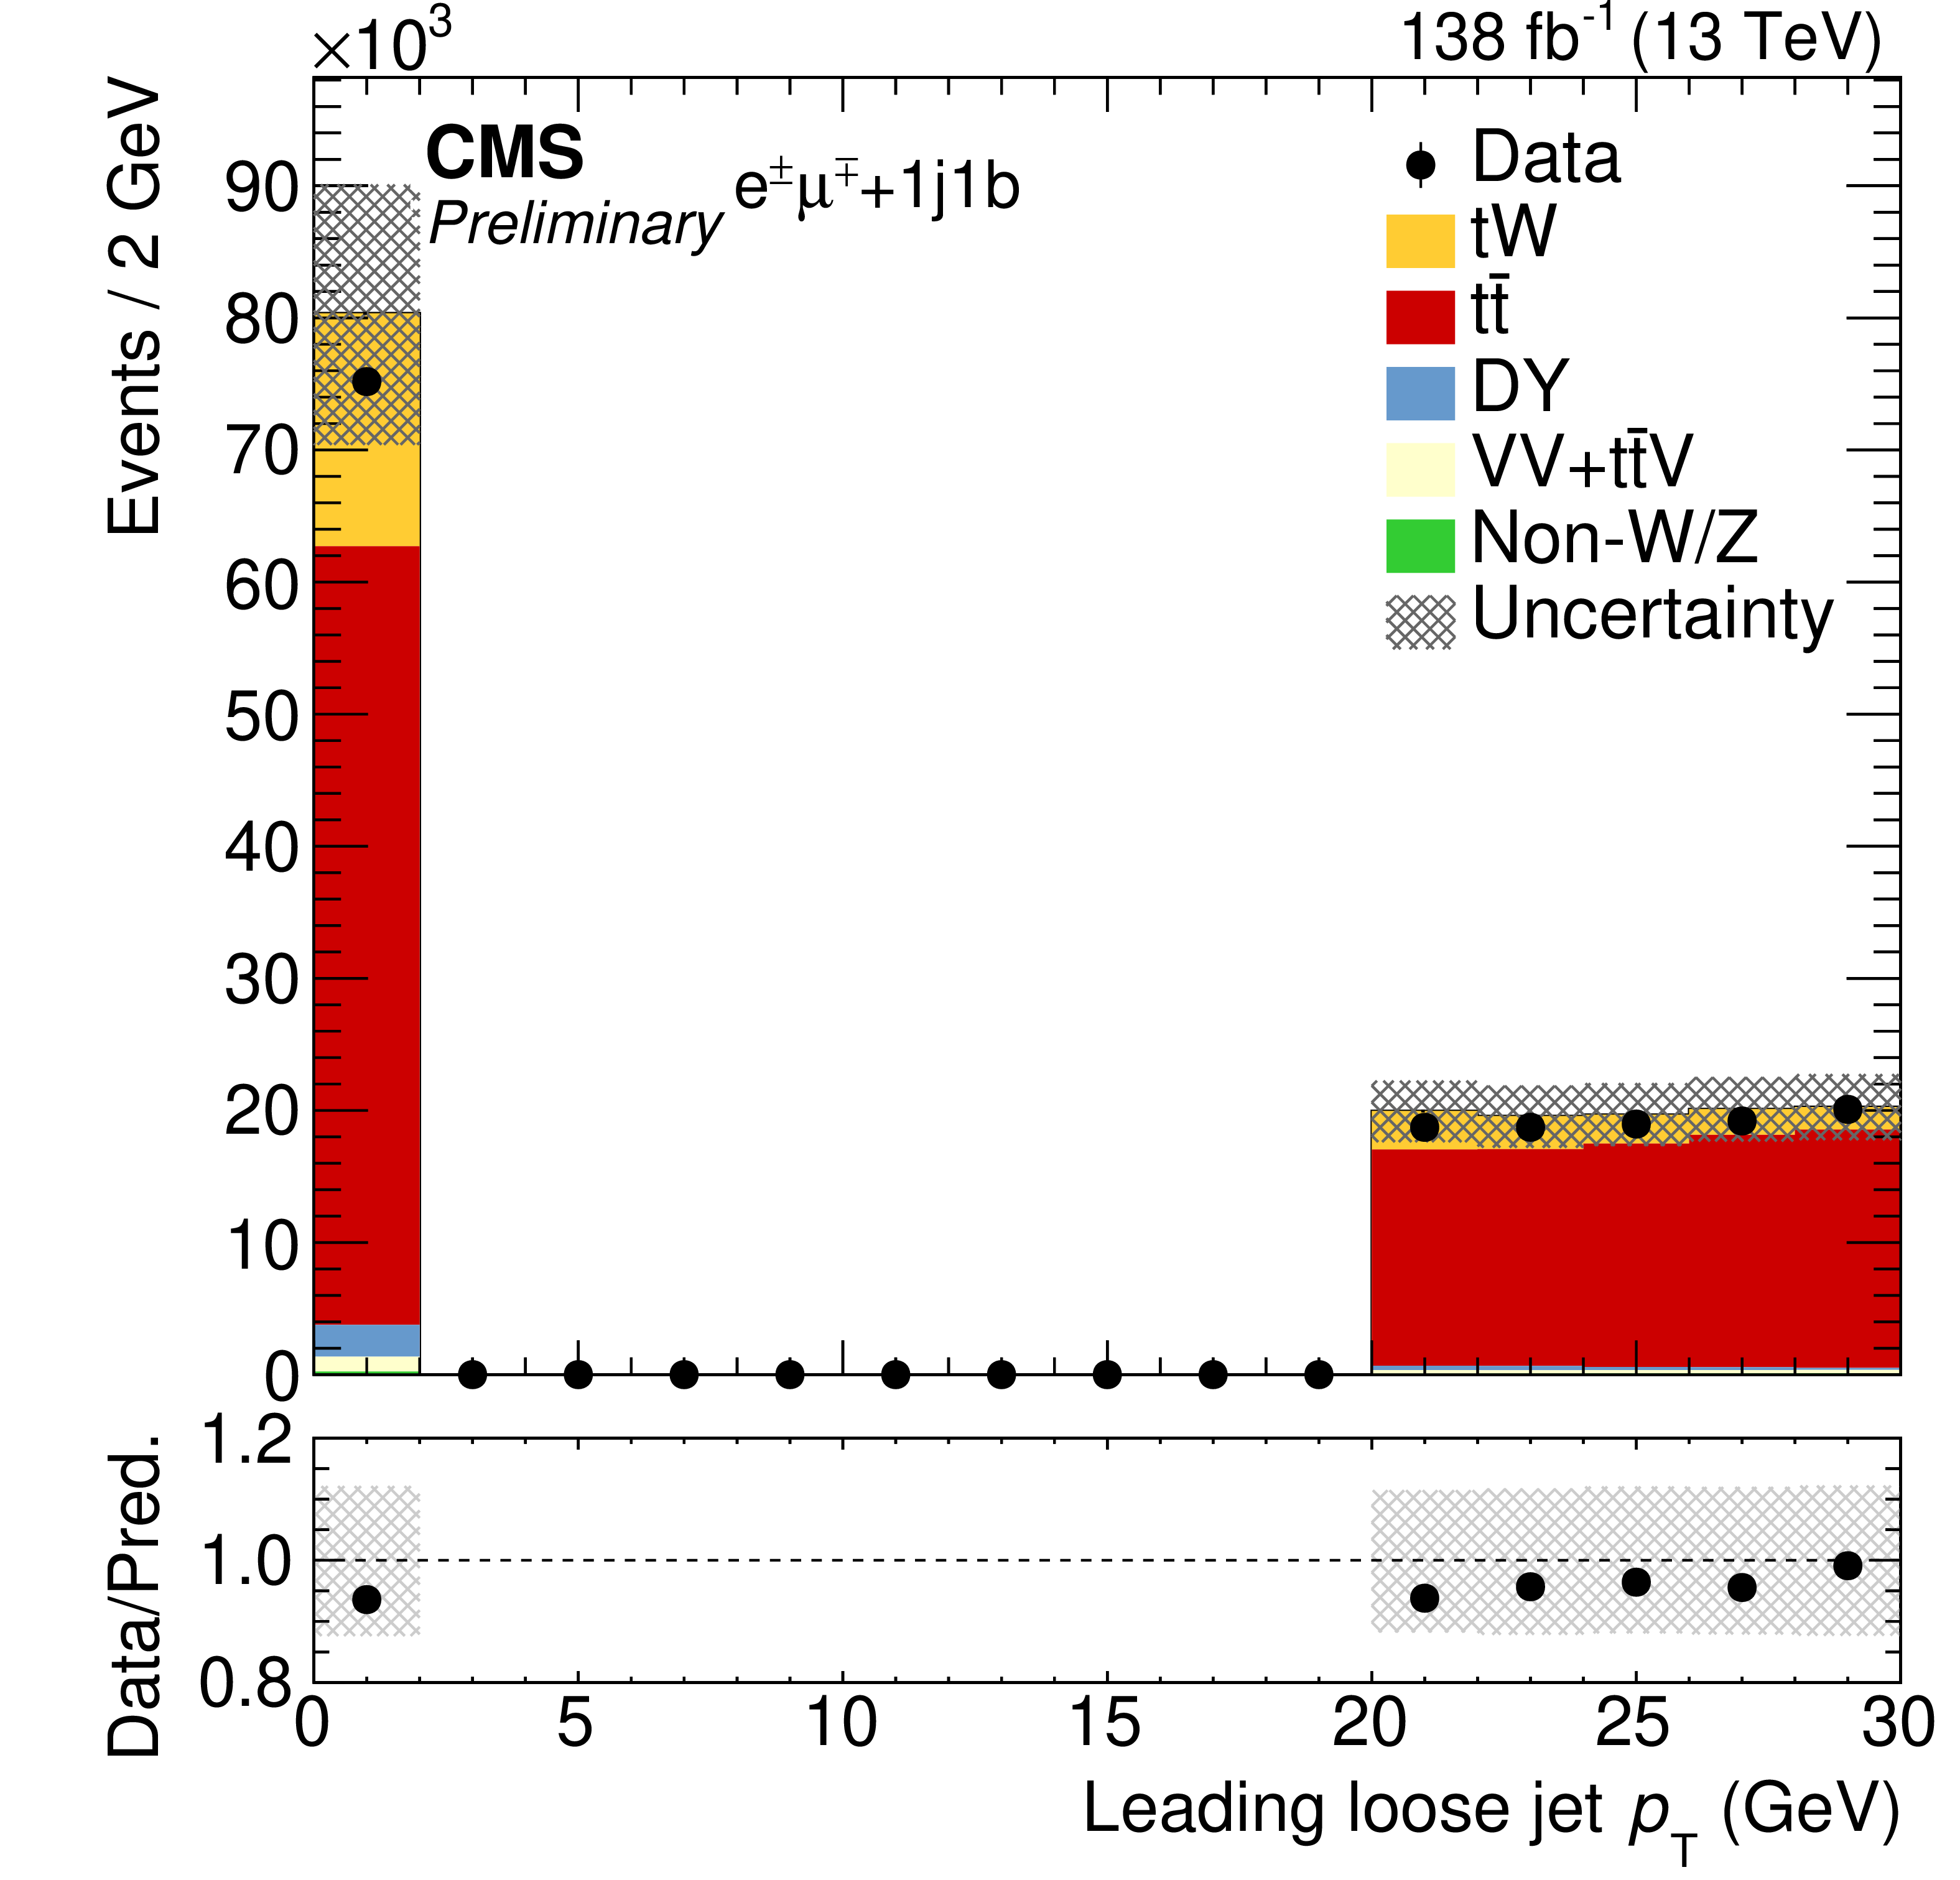
Figure 3:
Left: yields observed in data, compared with those expected from simulation, as a function of the number of jets and number of b-tagged jets for events passing the e$\mu$ selection. Right: yields observed in data, compared with those expected from simulation, as a function of the number of loose jets for events passing the e$\mu$ selection in the 1j1b region. The hatched band includes the statistical and all systematic uncertainties. The bottom panel shows the ratio of data to the sum of the expected yields. |
png pdf |
Figure 3-a:
Left: yields observed in data, compared with those expected from simulation, as a function of the number of jets and number of b-tagged jets for events passing the e$\mu$ selection. Right: yields observed in data, compared with those expected from simulation, as a function of the number of loose jets for events passing the e$\mu$ selection in the 1j1b region. The hatched band includes the statistical and all systematic uncertainties. The bottom panel shows the ratio of data to the sum of the expected yields. |
png pdf |
Figure 3-b:
Left: yields observed in data, compared with those expected from simulation, as a function of the number of jets and number of b-tagged jets for events passing the e$\mu$ selection. Right: yields observed in data, compared with those expected from simulation, as a function of the number of loose jets for events passing the e$\mu$ selection in the 1j1b region. The hatched band includes the statistical and all systematic uncertainties. The bottom panel shows the ratio of data to the sum of the expected yields. |
png pdf |
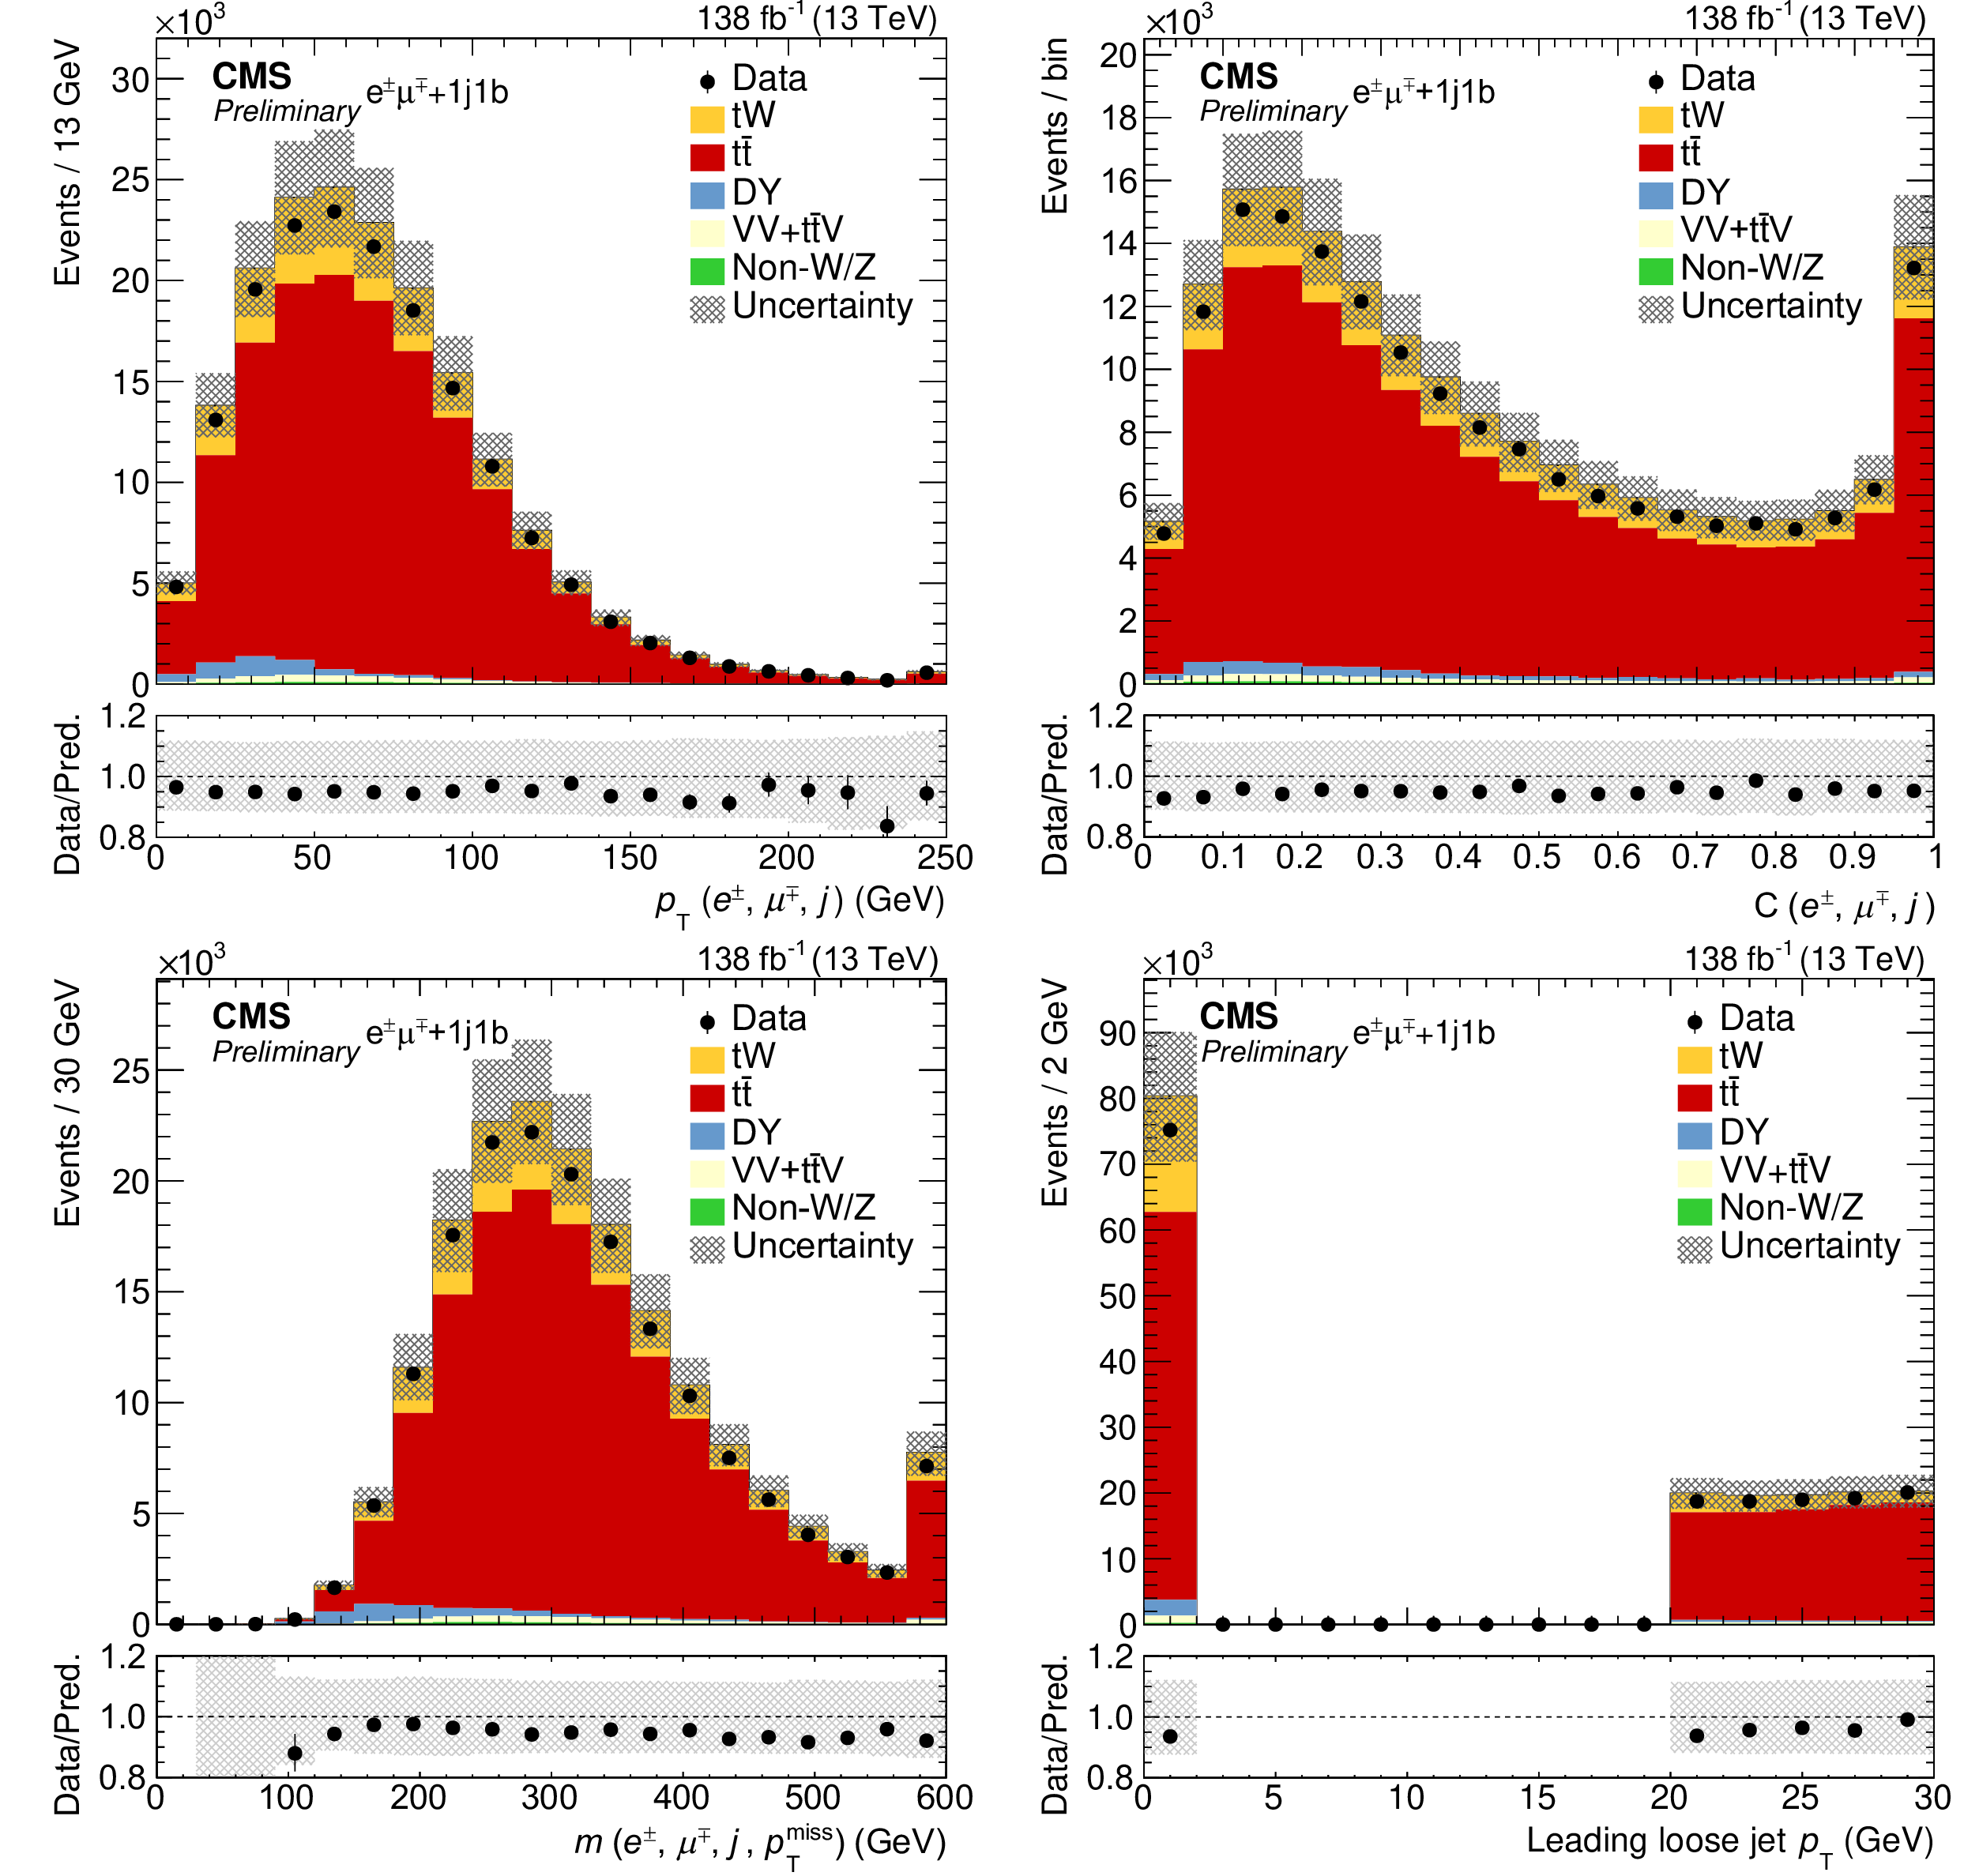
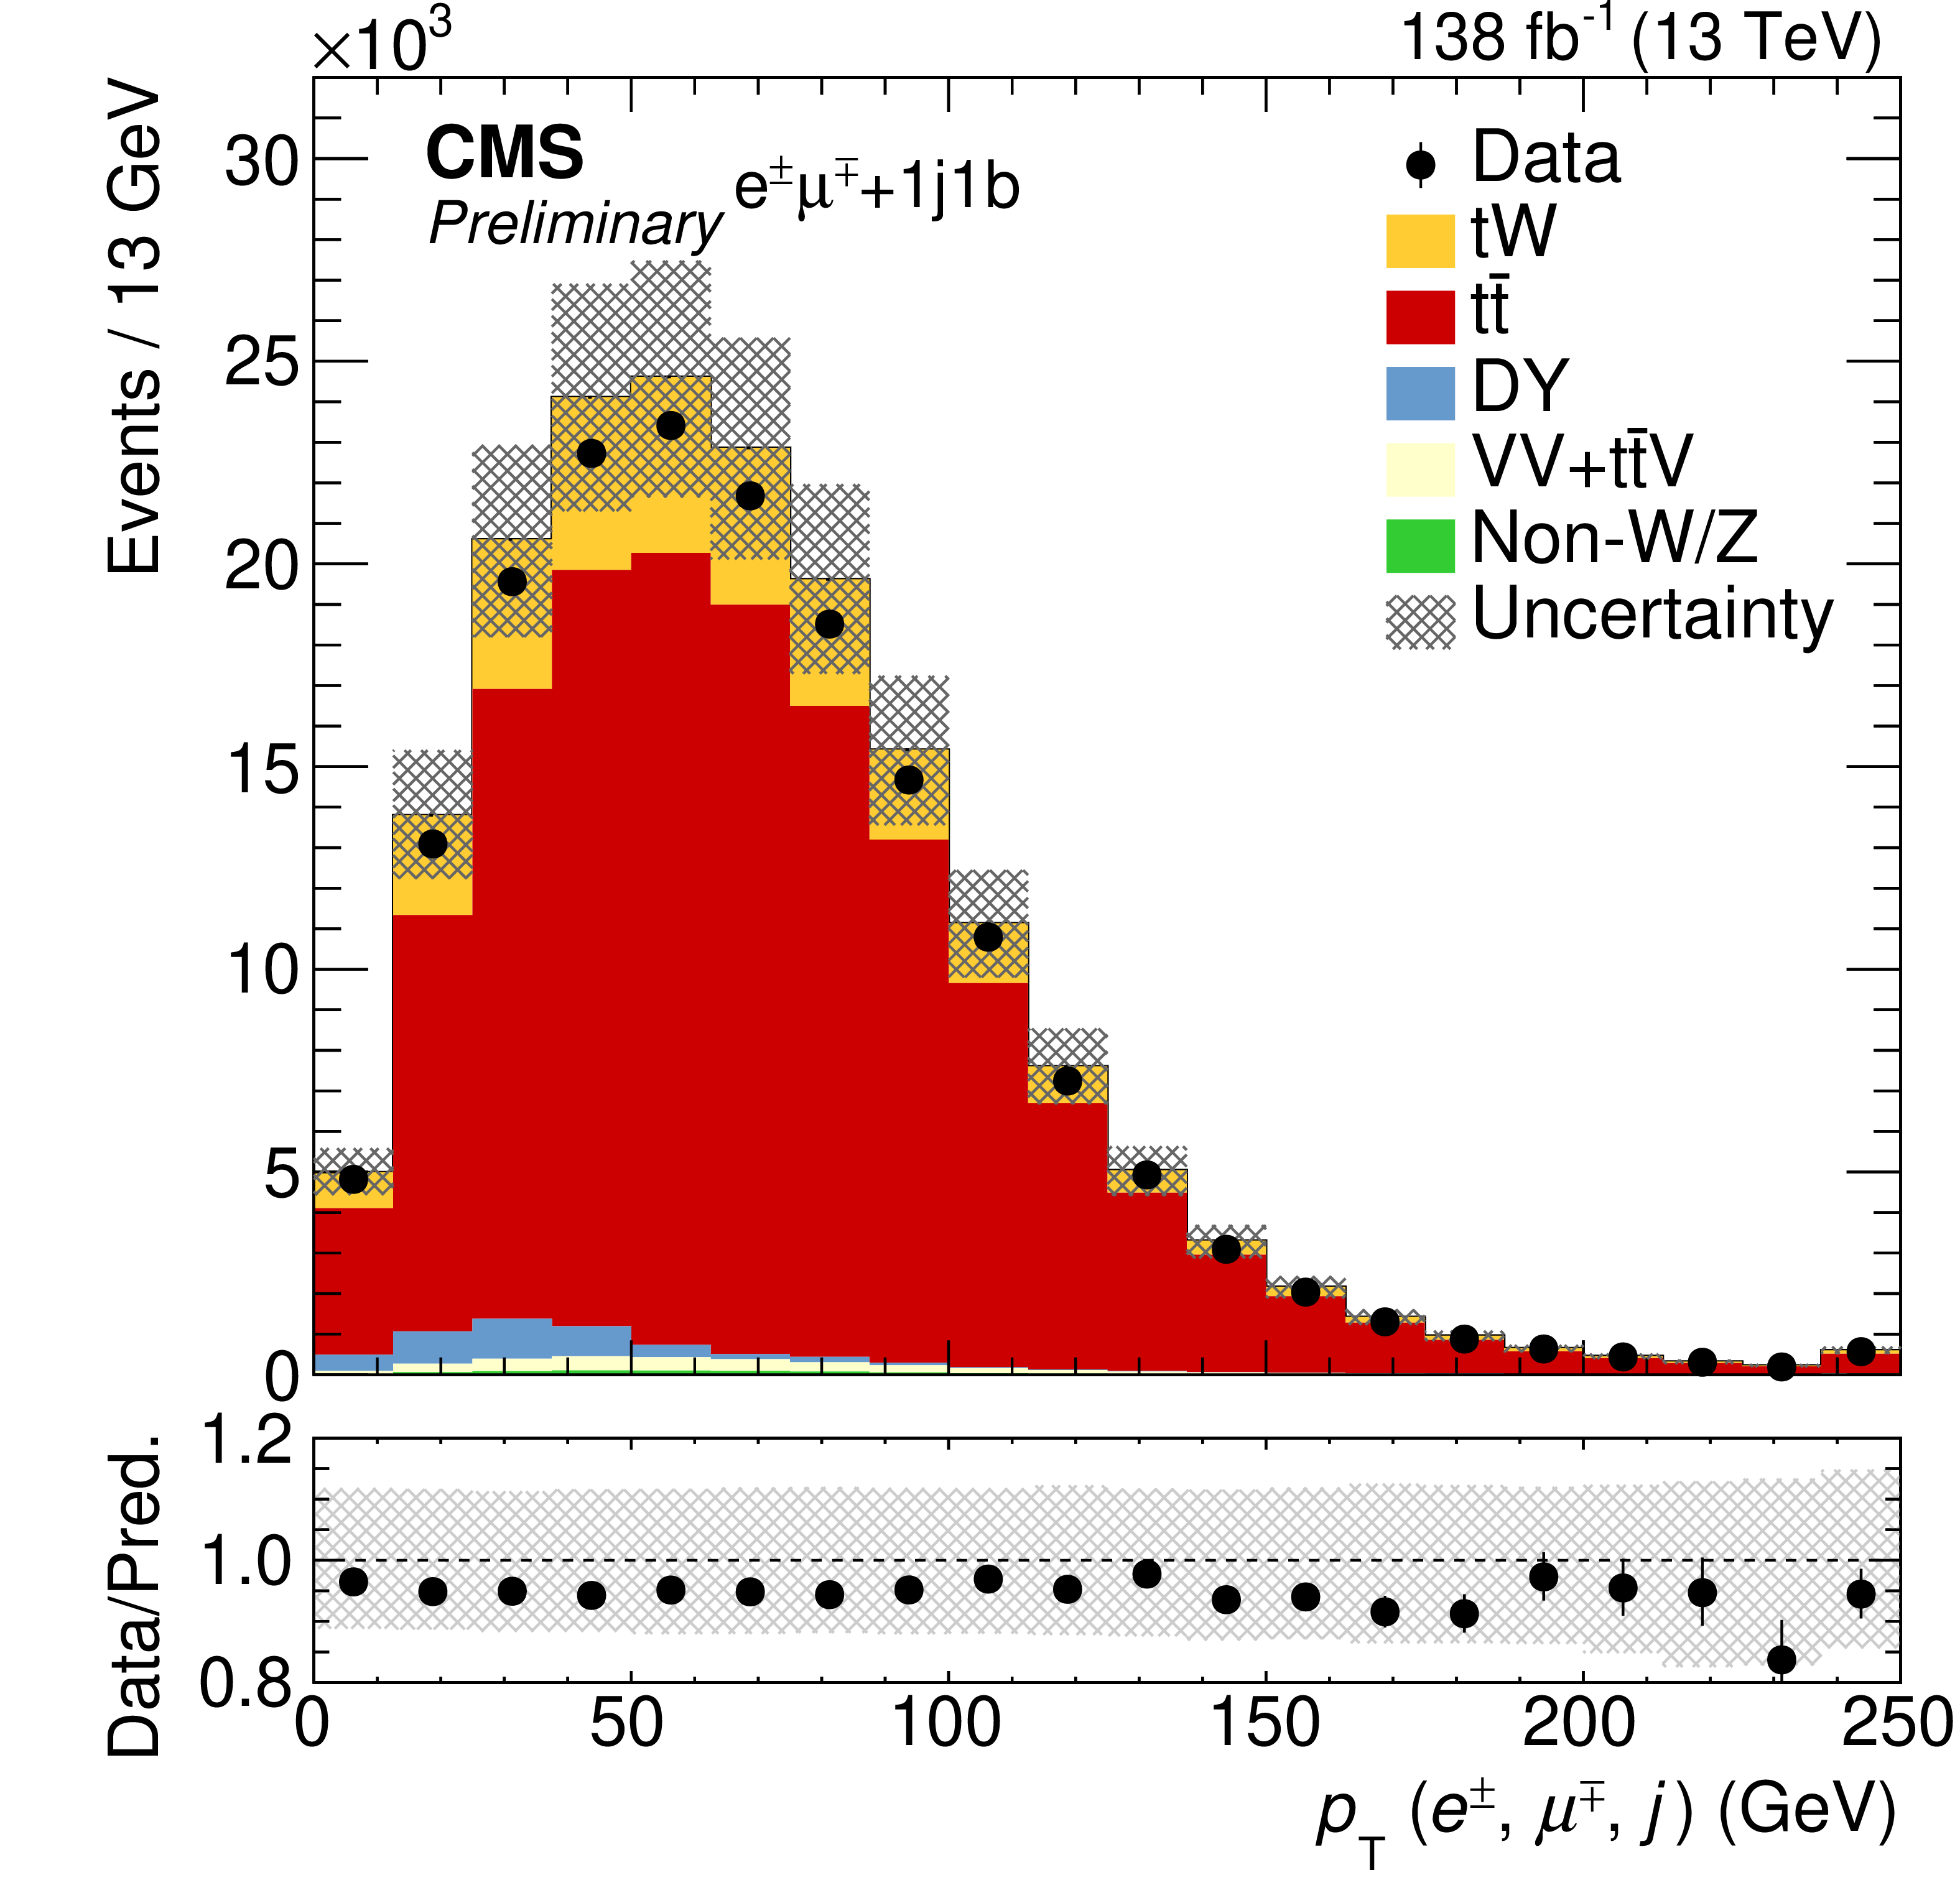
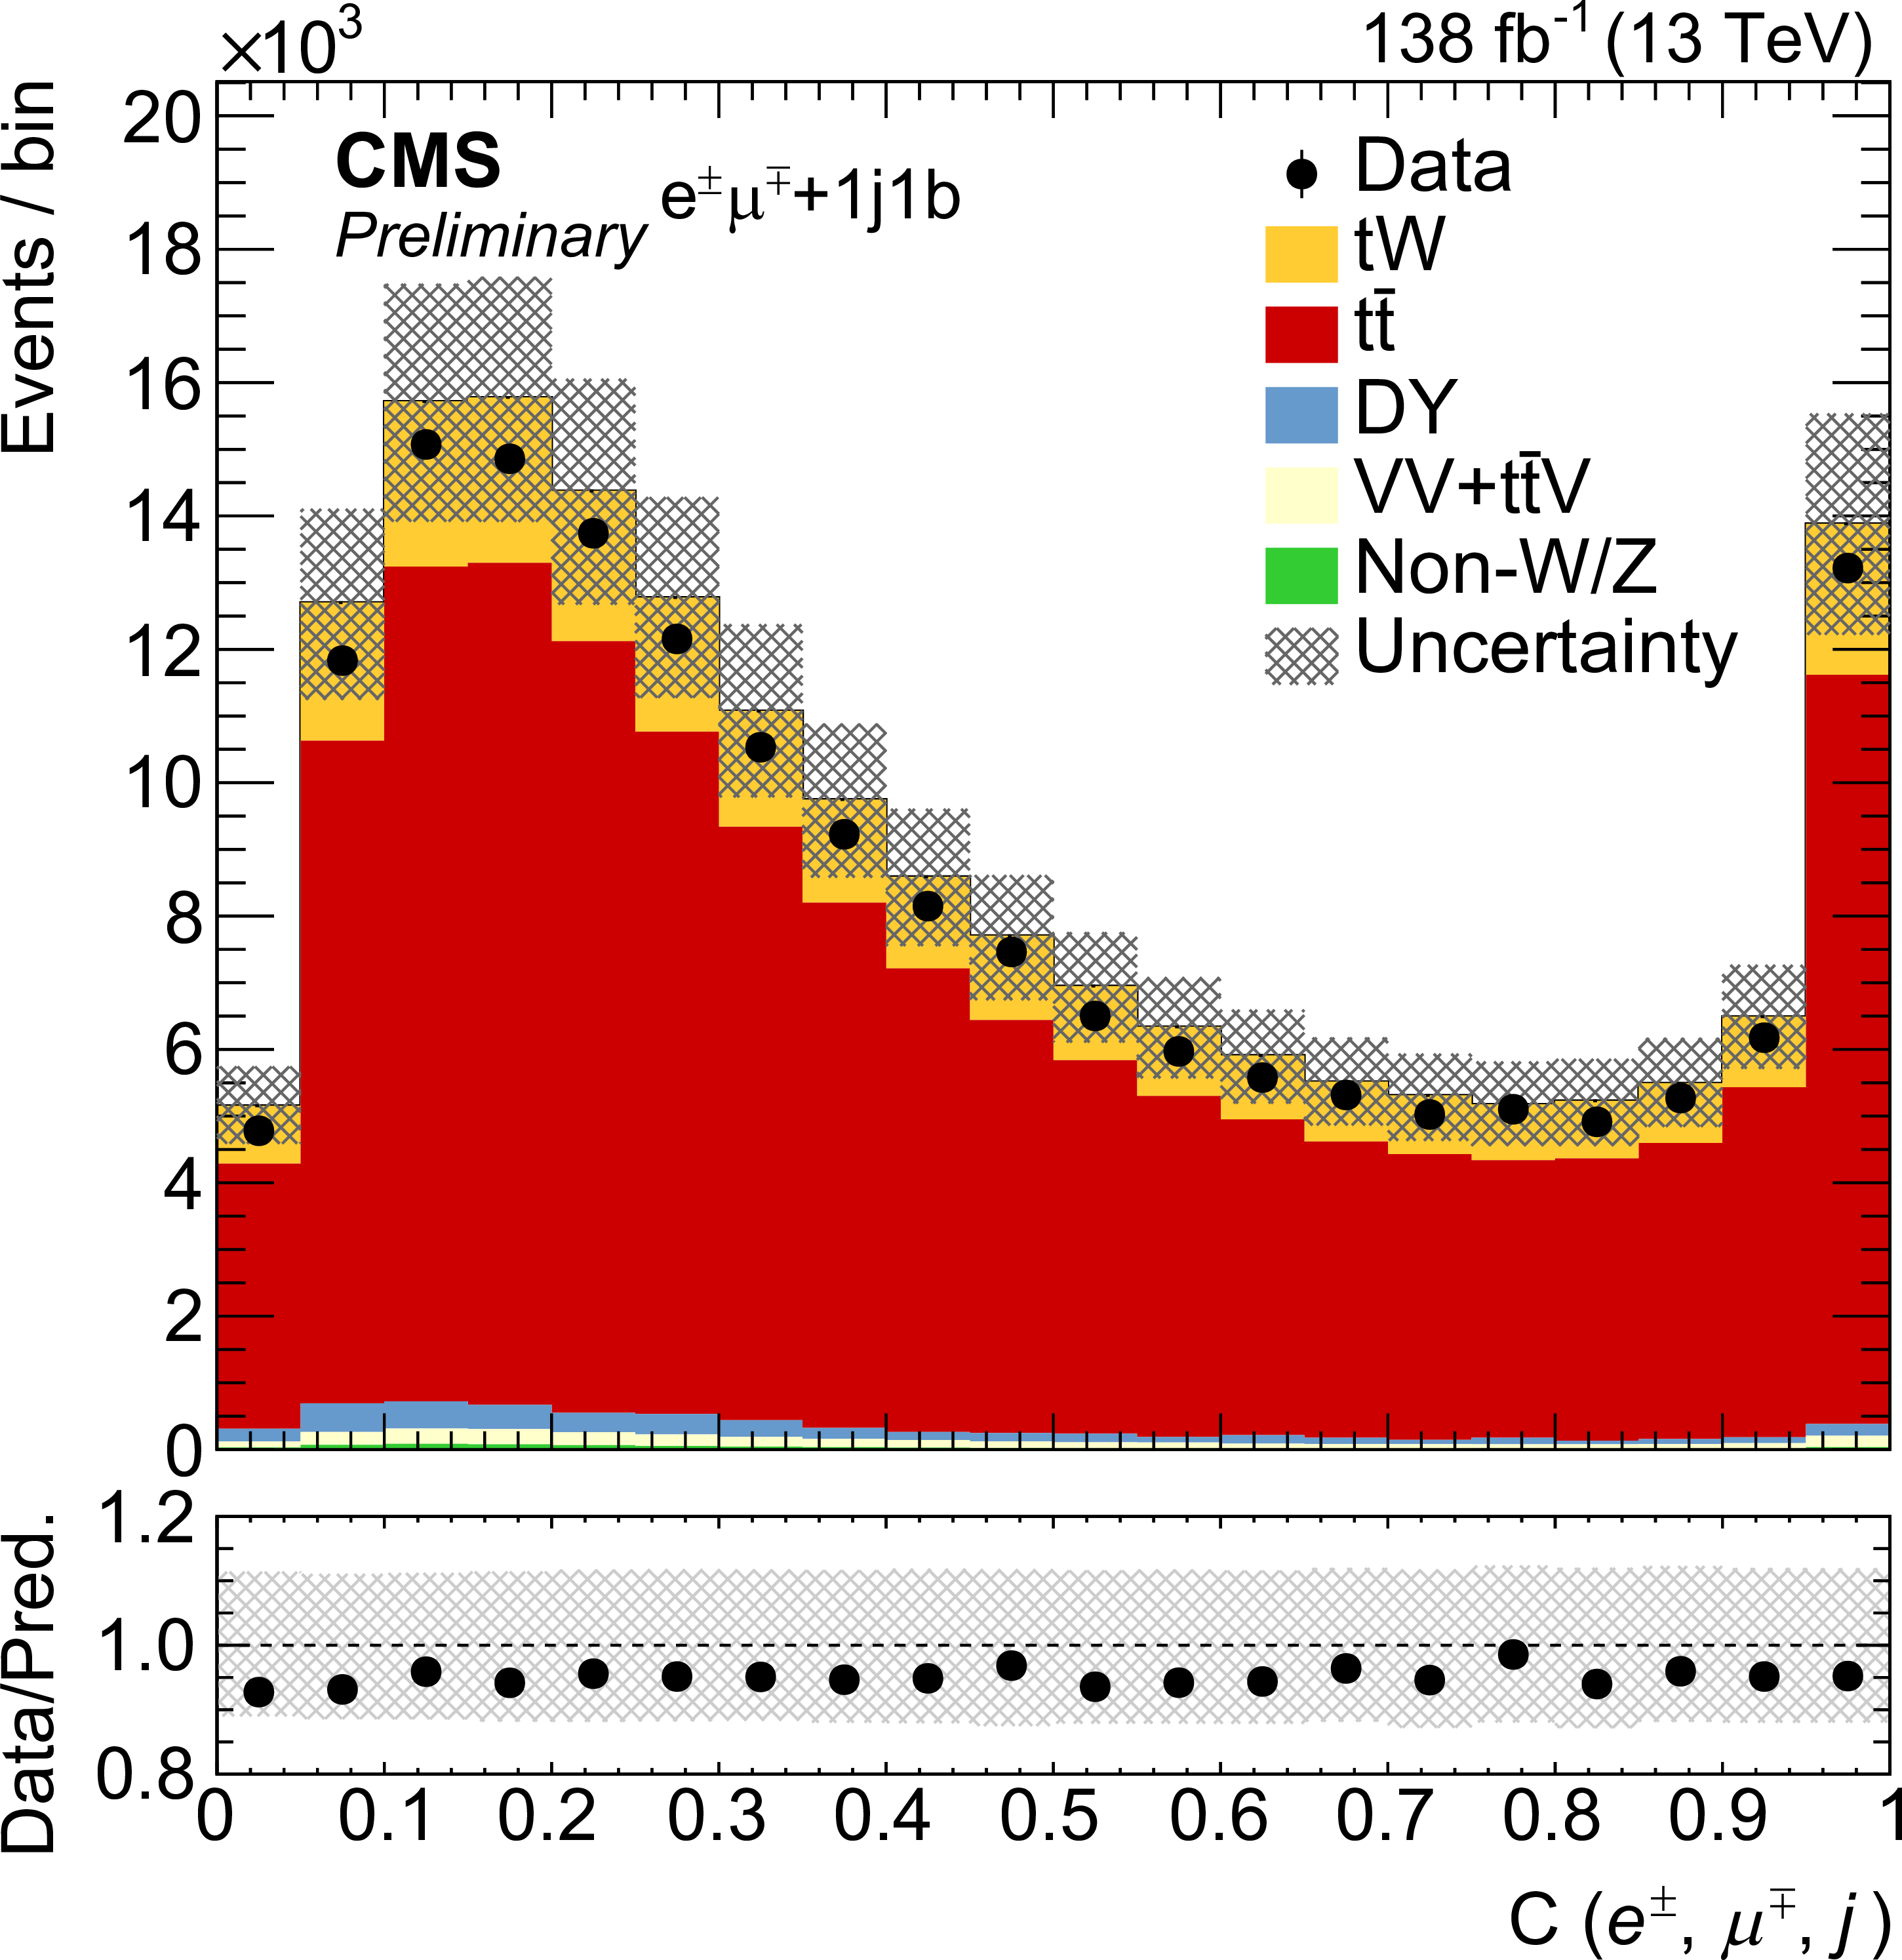
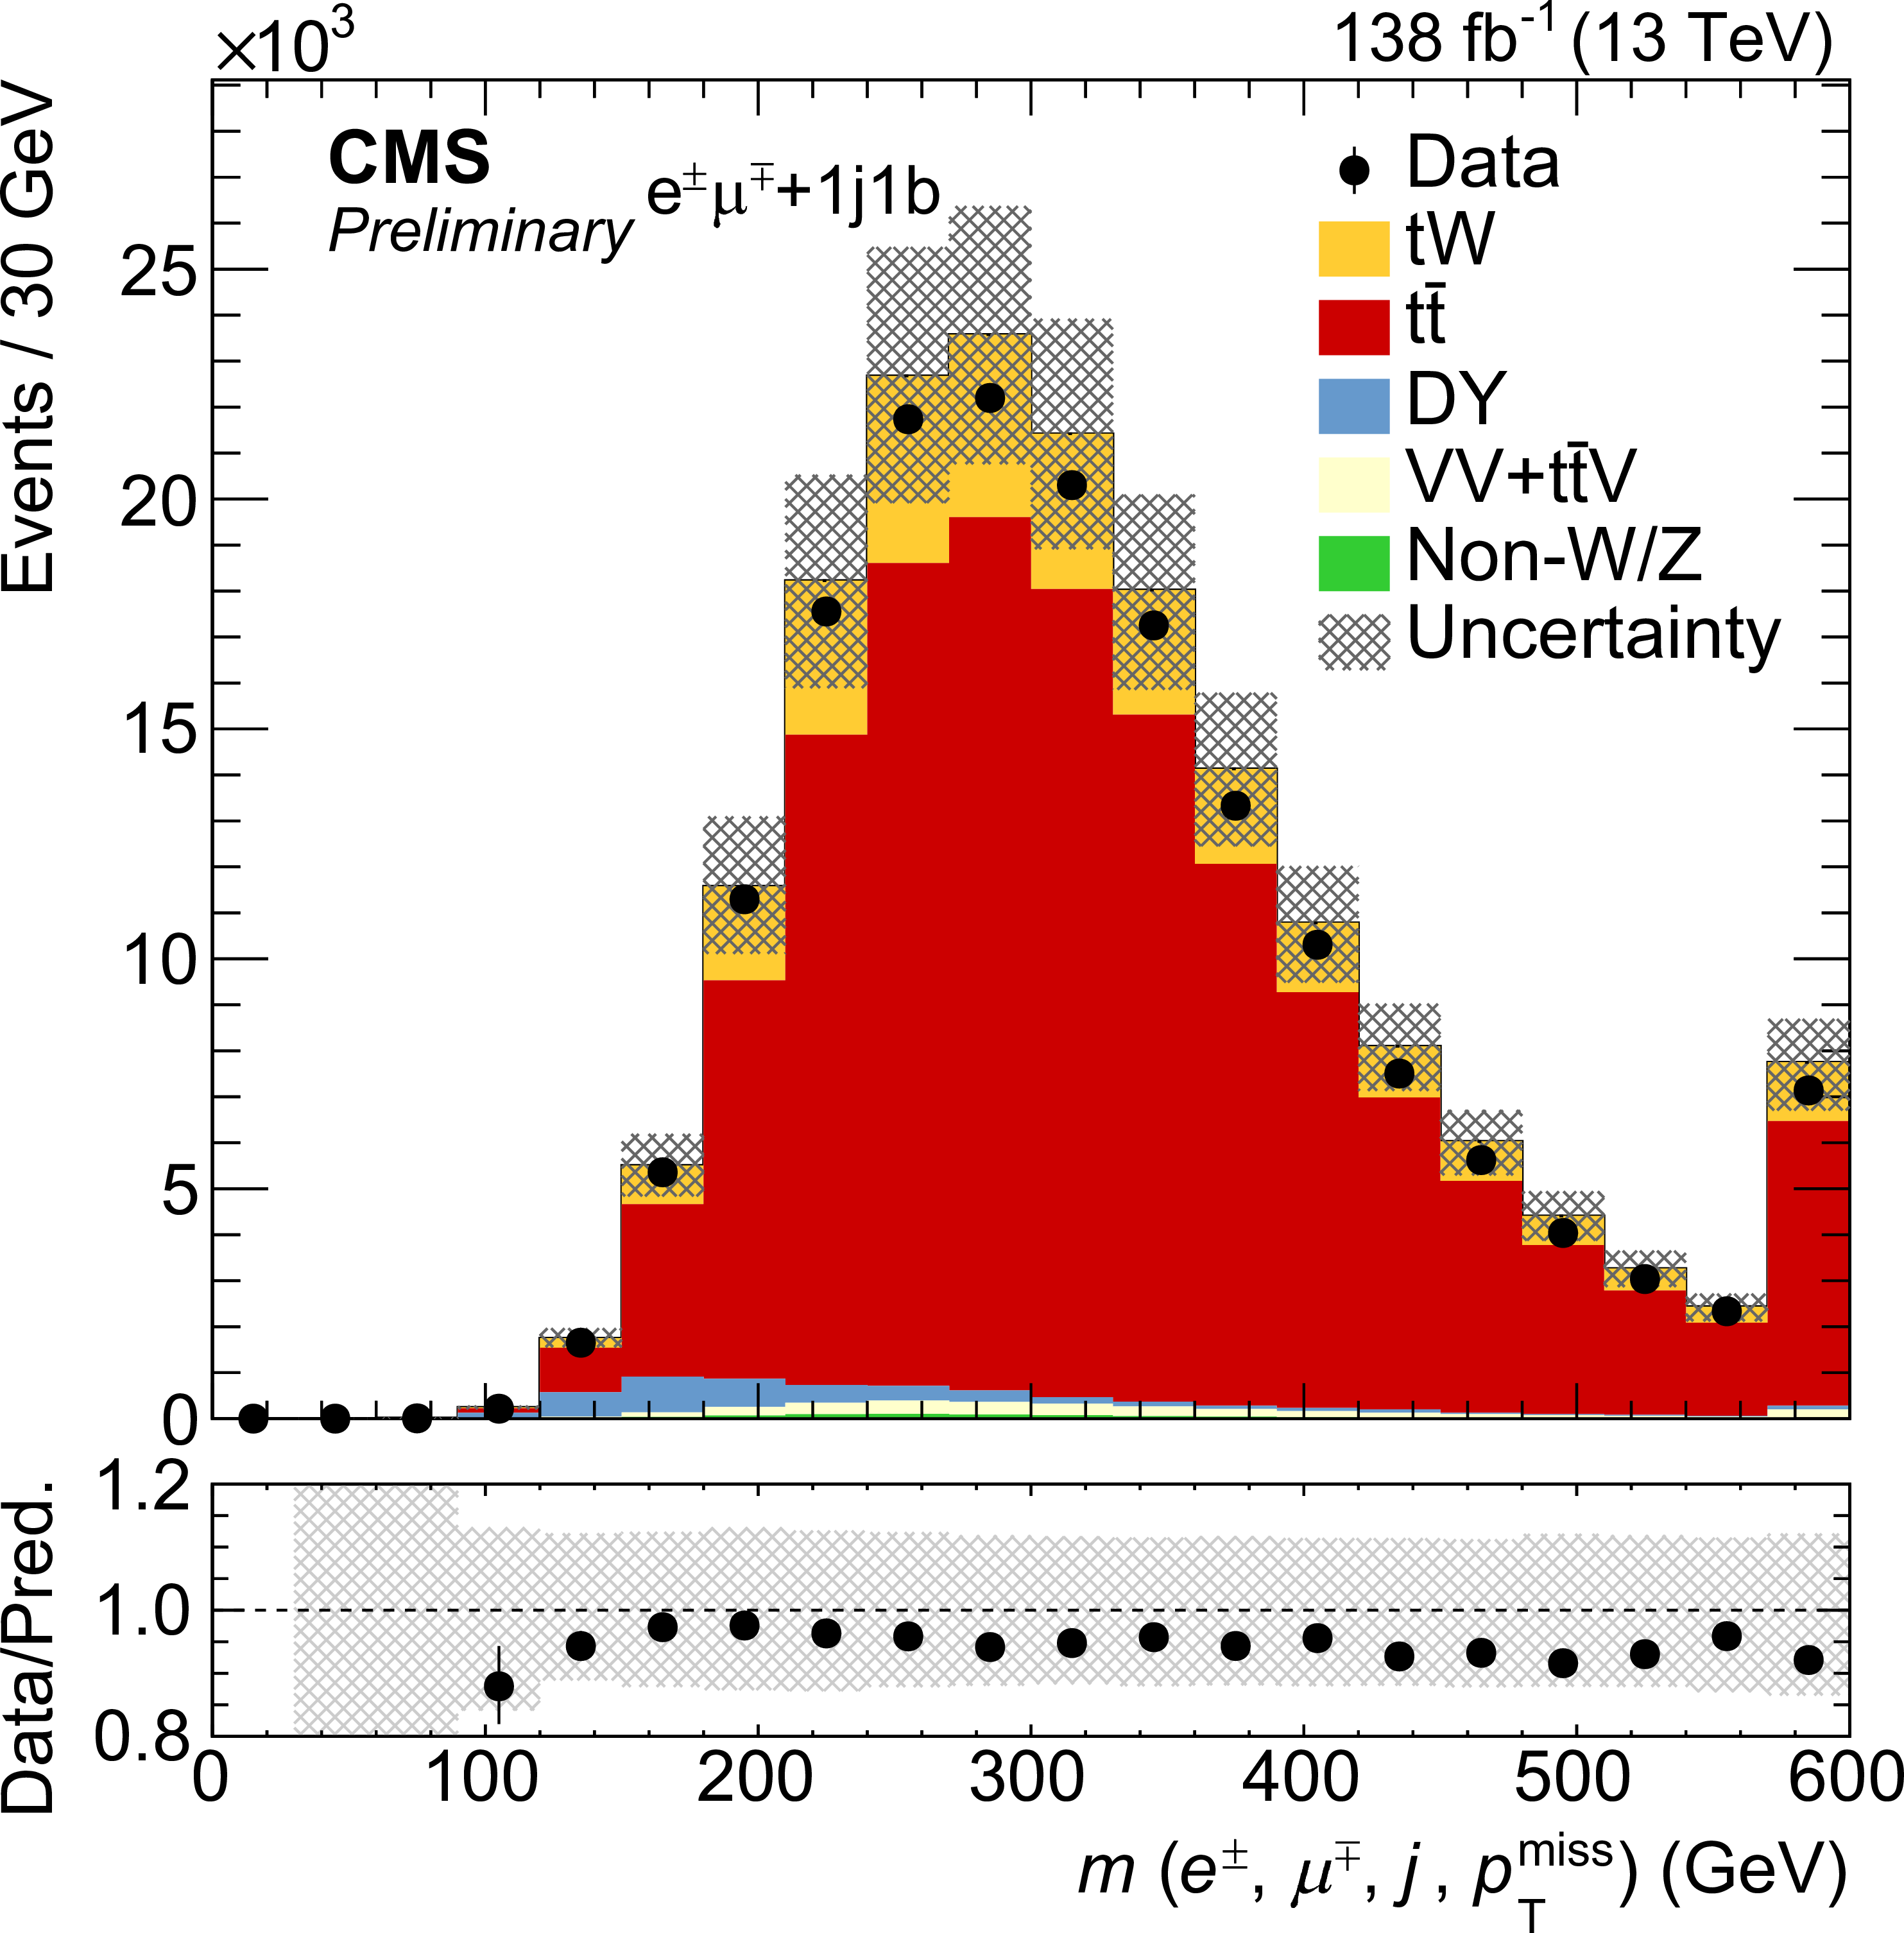
Figure 4:
Yields observed in data, compared with those expected from simulation, as a function of the first four most discriminating variables used for the training of the BDT in the 1j1b category. The last bin includes overflow events. The error band includes the statistical and all systematic uncertainties. The bottom panel shows the ratios of data to the sum of the expected yields. |
png pdf |
Figure 4-a:
Yields observed in data, compared with those expected from simulation, as a function of the first four most discriminating variables used for the training of the BDT in the 1j1b category. The last bin includes overflow events. The error band includes the statistical and all systematic uncertainties. The bottom panel shows the ratios of data to the sum of the expected yields. |
png pdf |
Figure 4-b:
Yields observed in data, compared with those expected from simulation, as a function of the first four most discriminating variables used for the training of the BDT in the 1j1b category. The last bin includes overflow events. The error band includes the statistical and all systematic uncertainties. The bottom panel shows the ratios of data to the sum of the expected yields. |
png pdf |
Figure 4-c:
Yields observed in data, compared with those expected from simulation, as a function of the first four most discriminating variables used for the training of the BDT in the 1j1b category. The last bin includes overflow events. The error band includes the statistical and all systematic uncertainties. The bottom panel shows the ratios of data to the sum of the expected yields. |
png pdf |
Figure 4-d:
Yields observed in data, compared with those expected from simulation, as a function of the first four most discriminating variables used for the training of the BDT in the 1j1b category. The last bin includes overflow events. The error band includes the statistical and all systematic uncertainties. The bottom panel shows the ratios of data to the sum of the expected yields. |
png pdf |
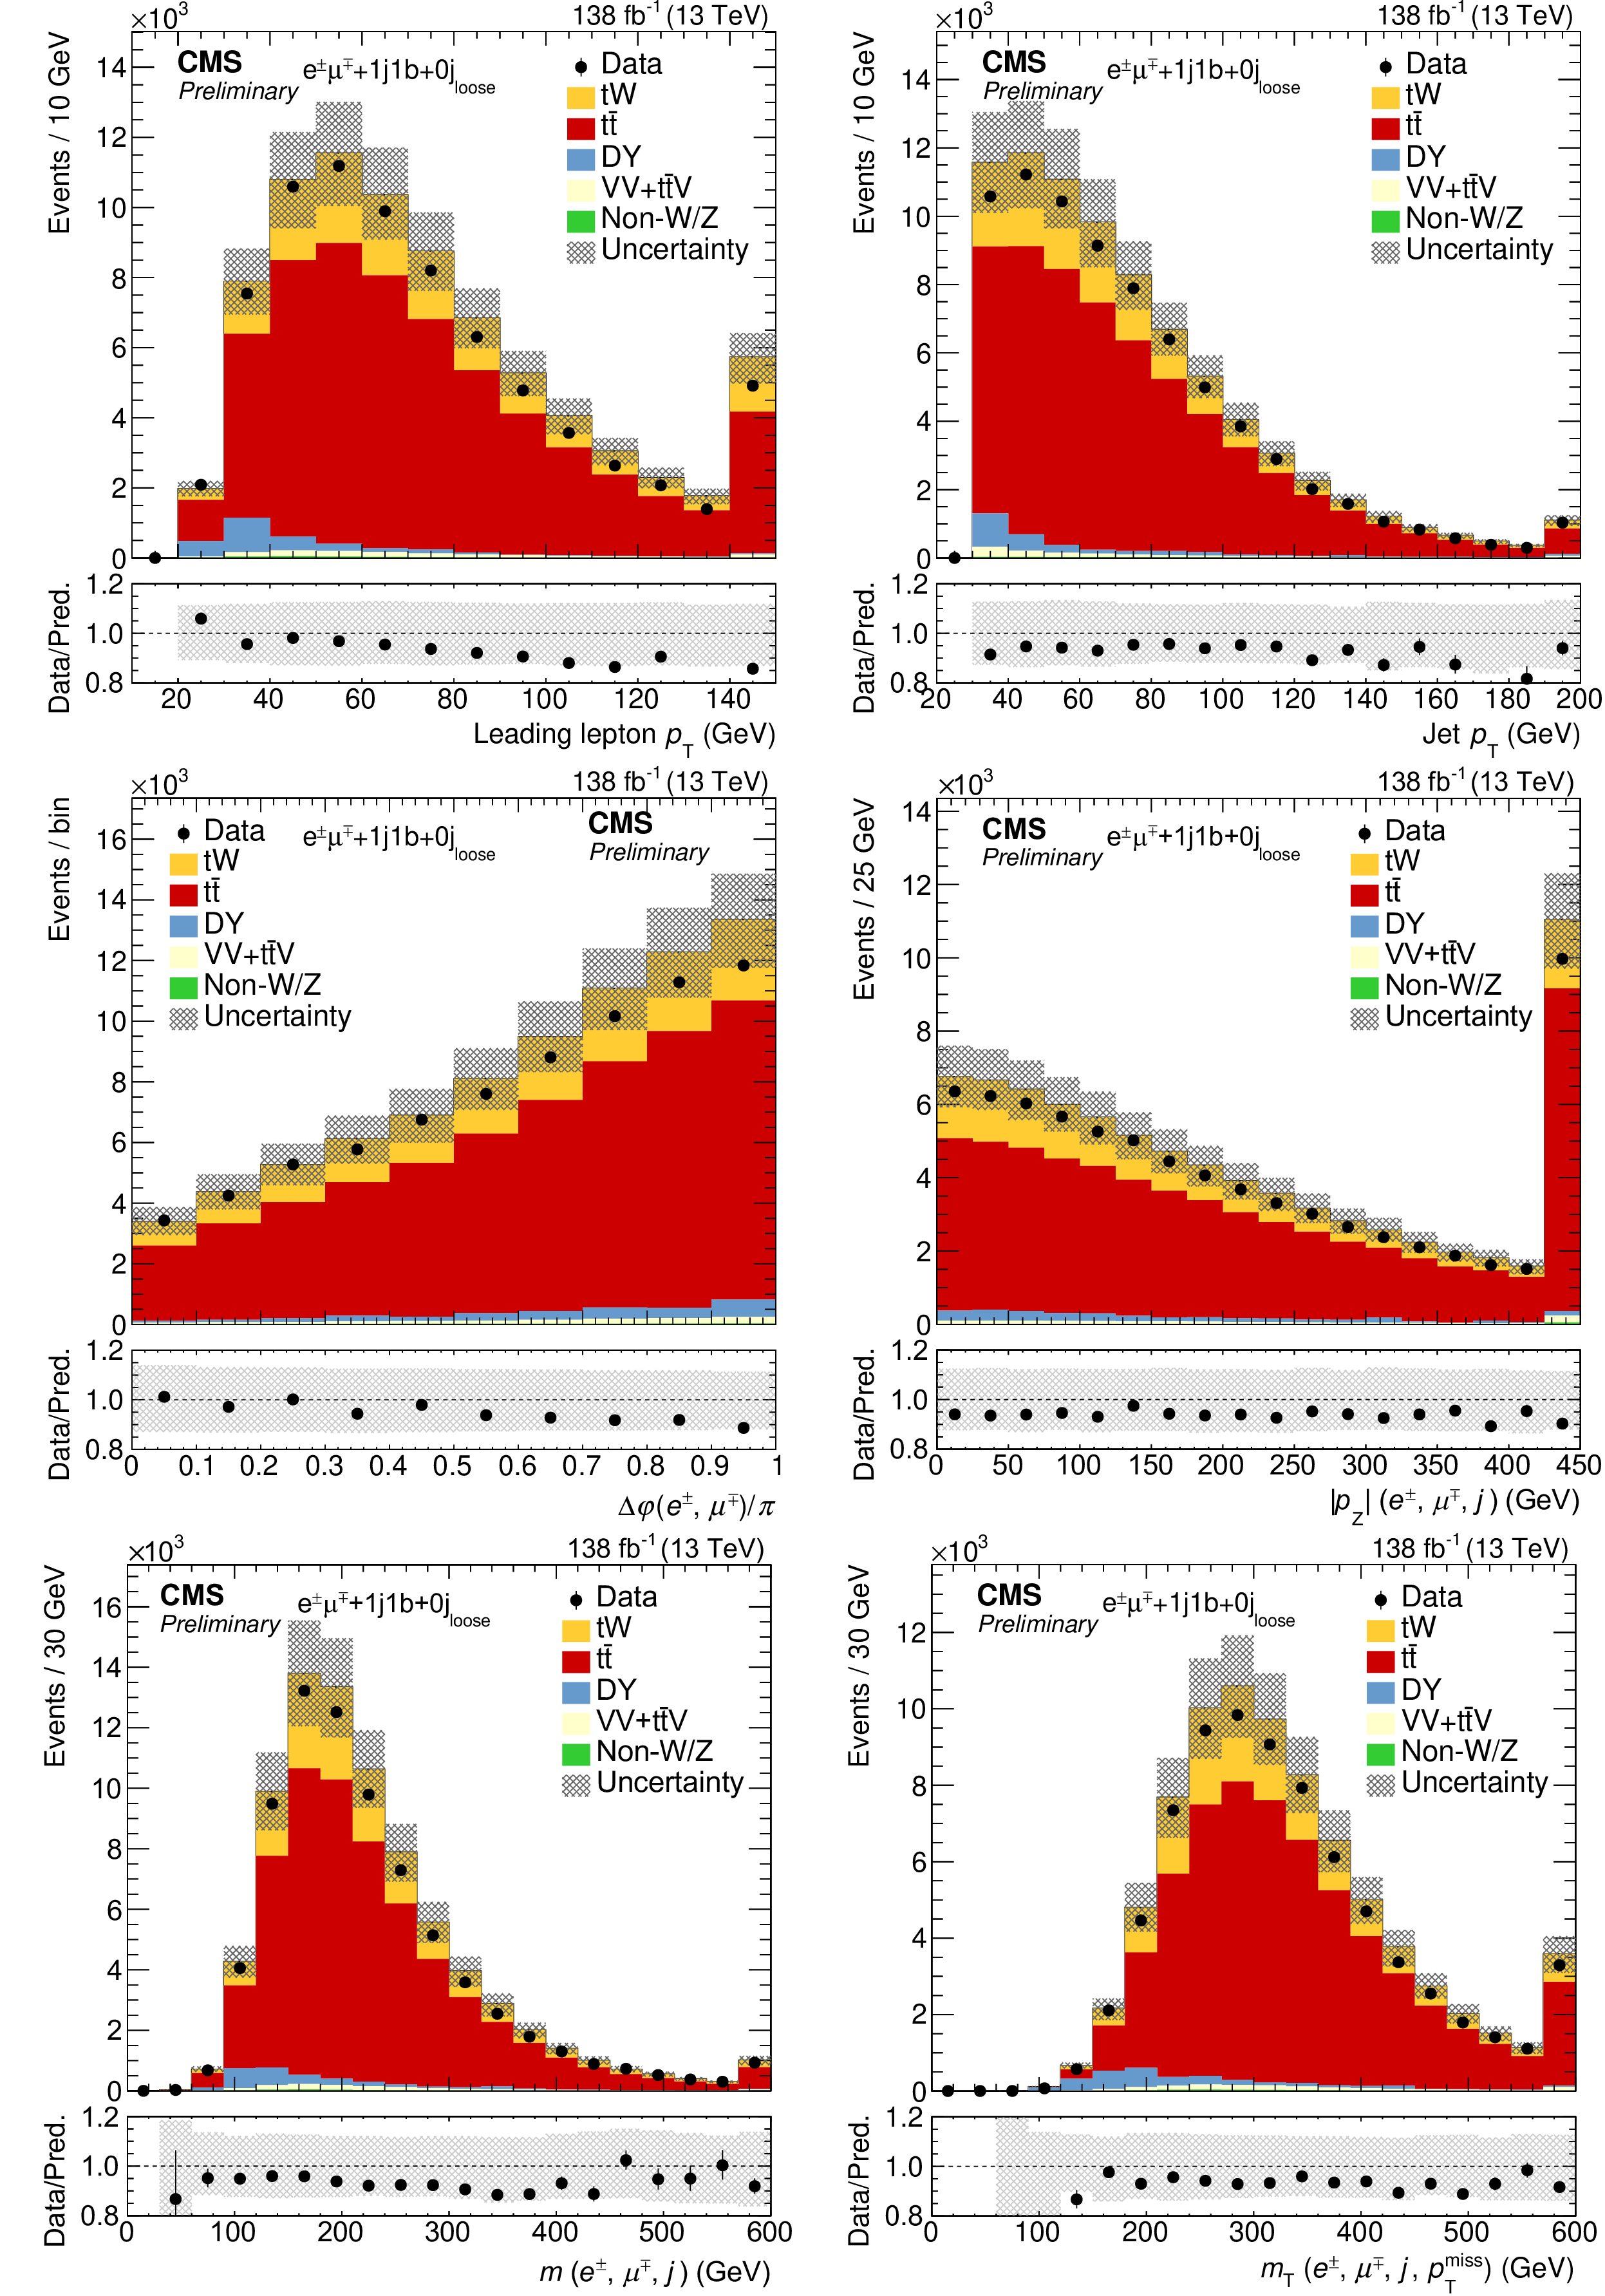
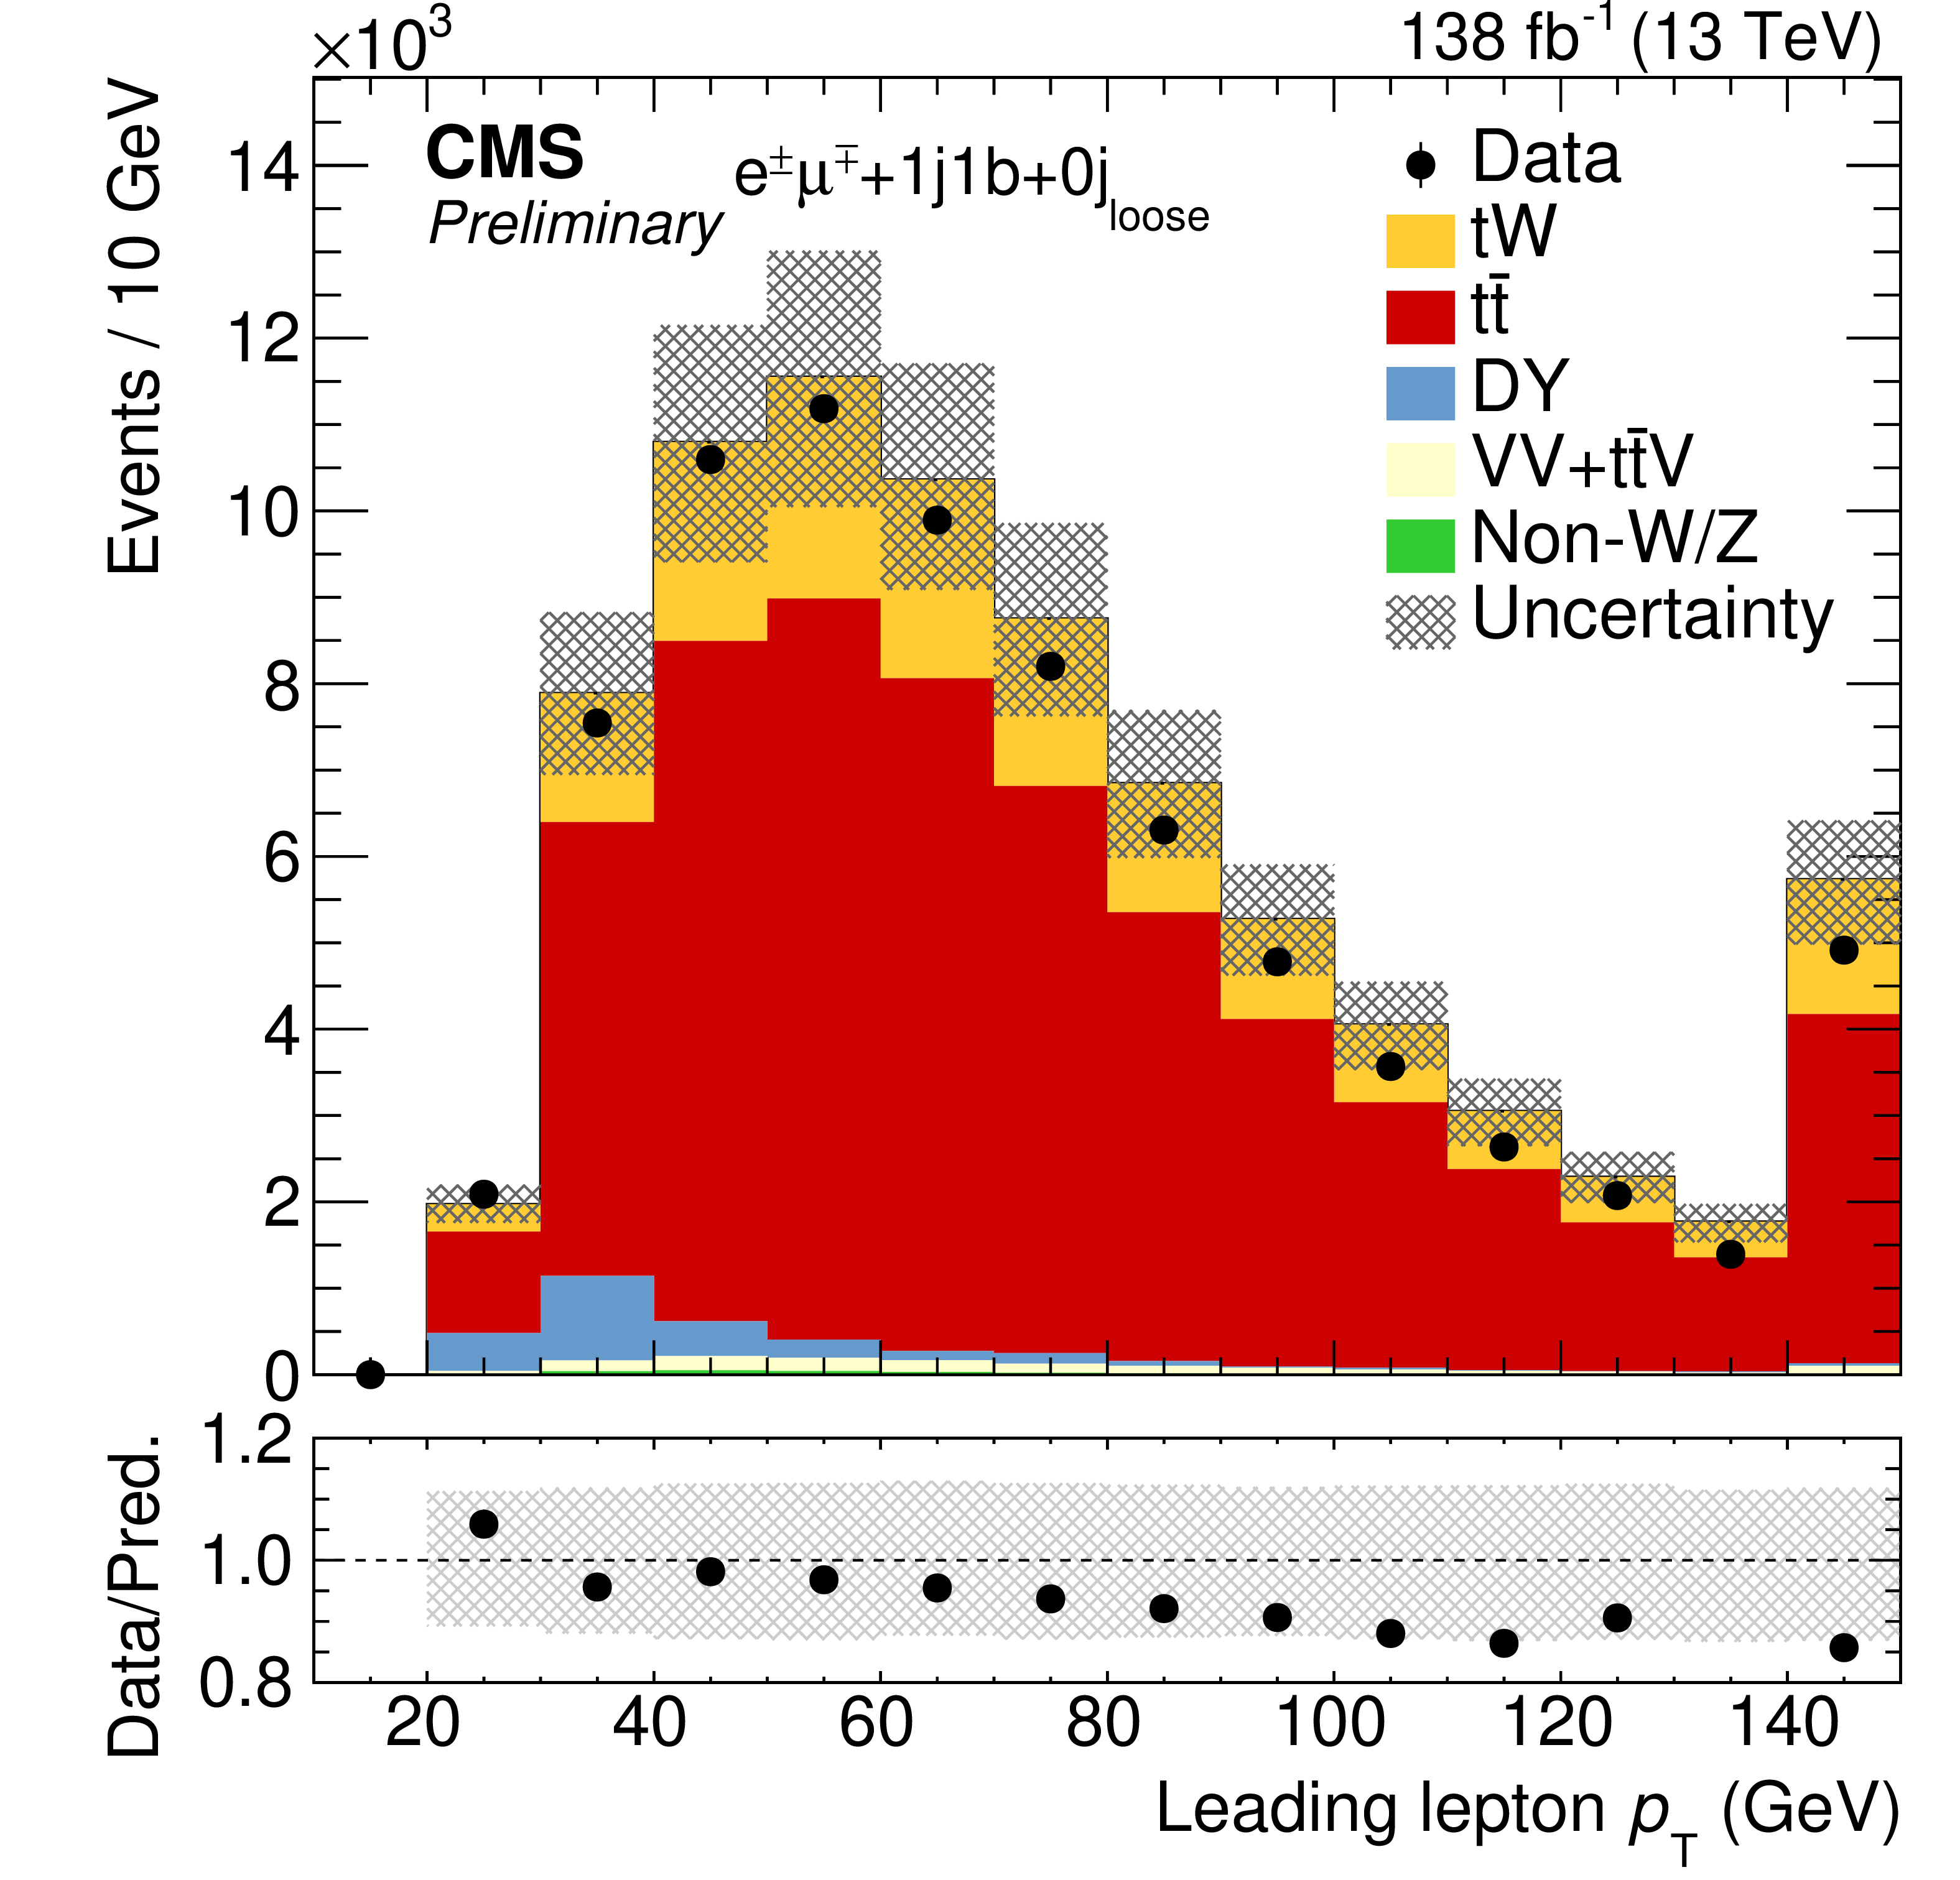
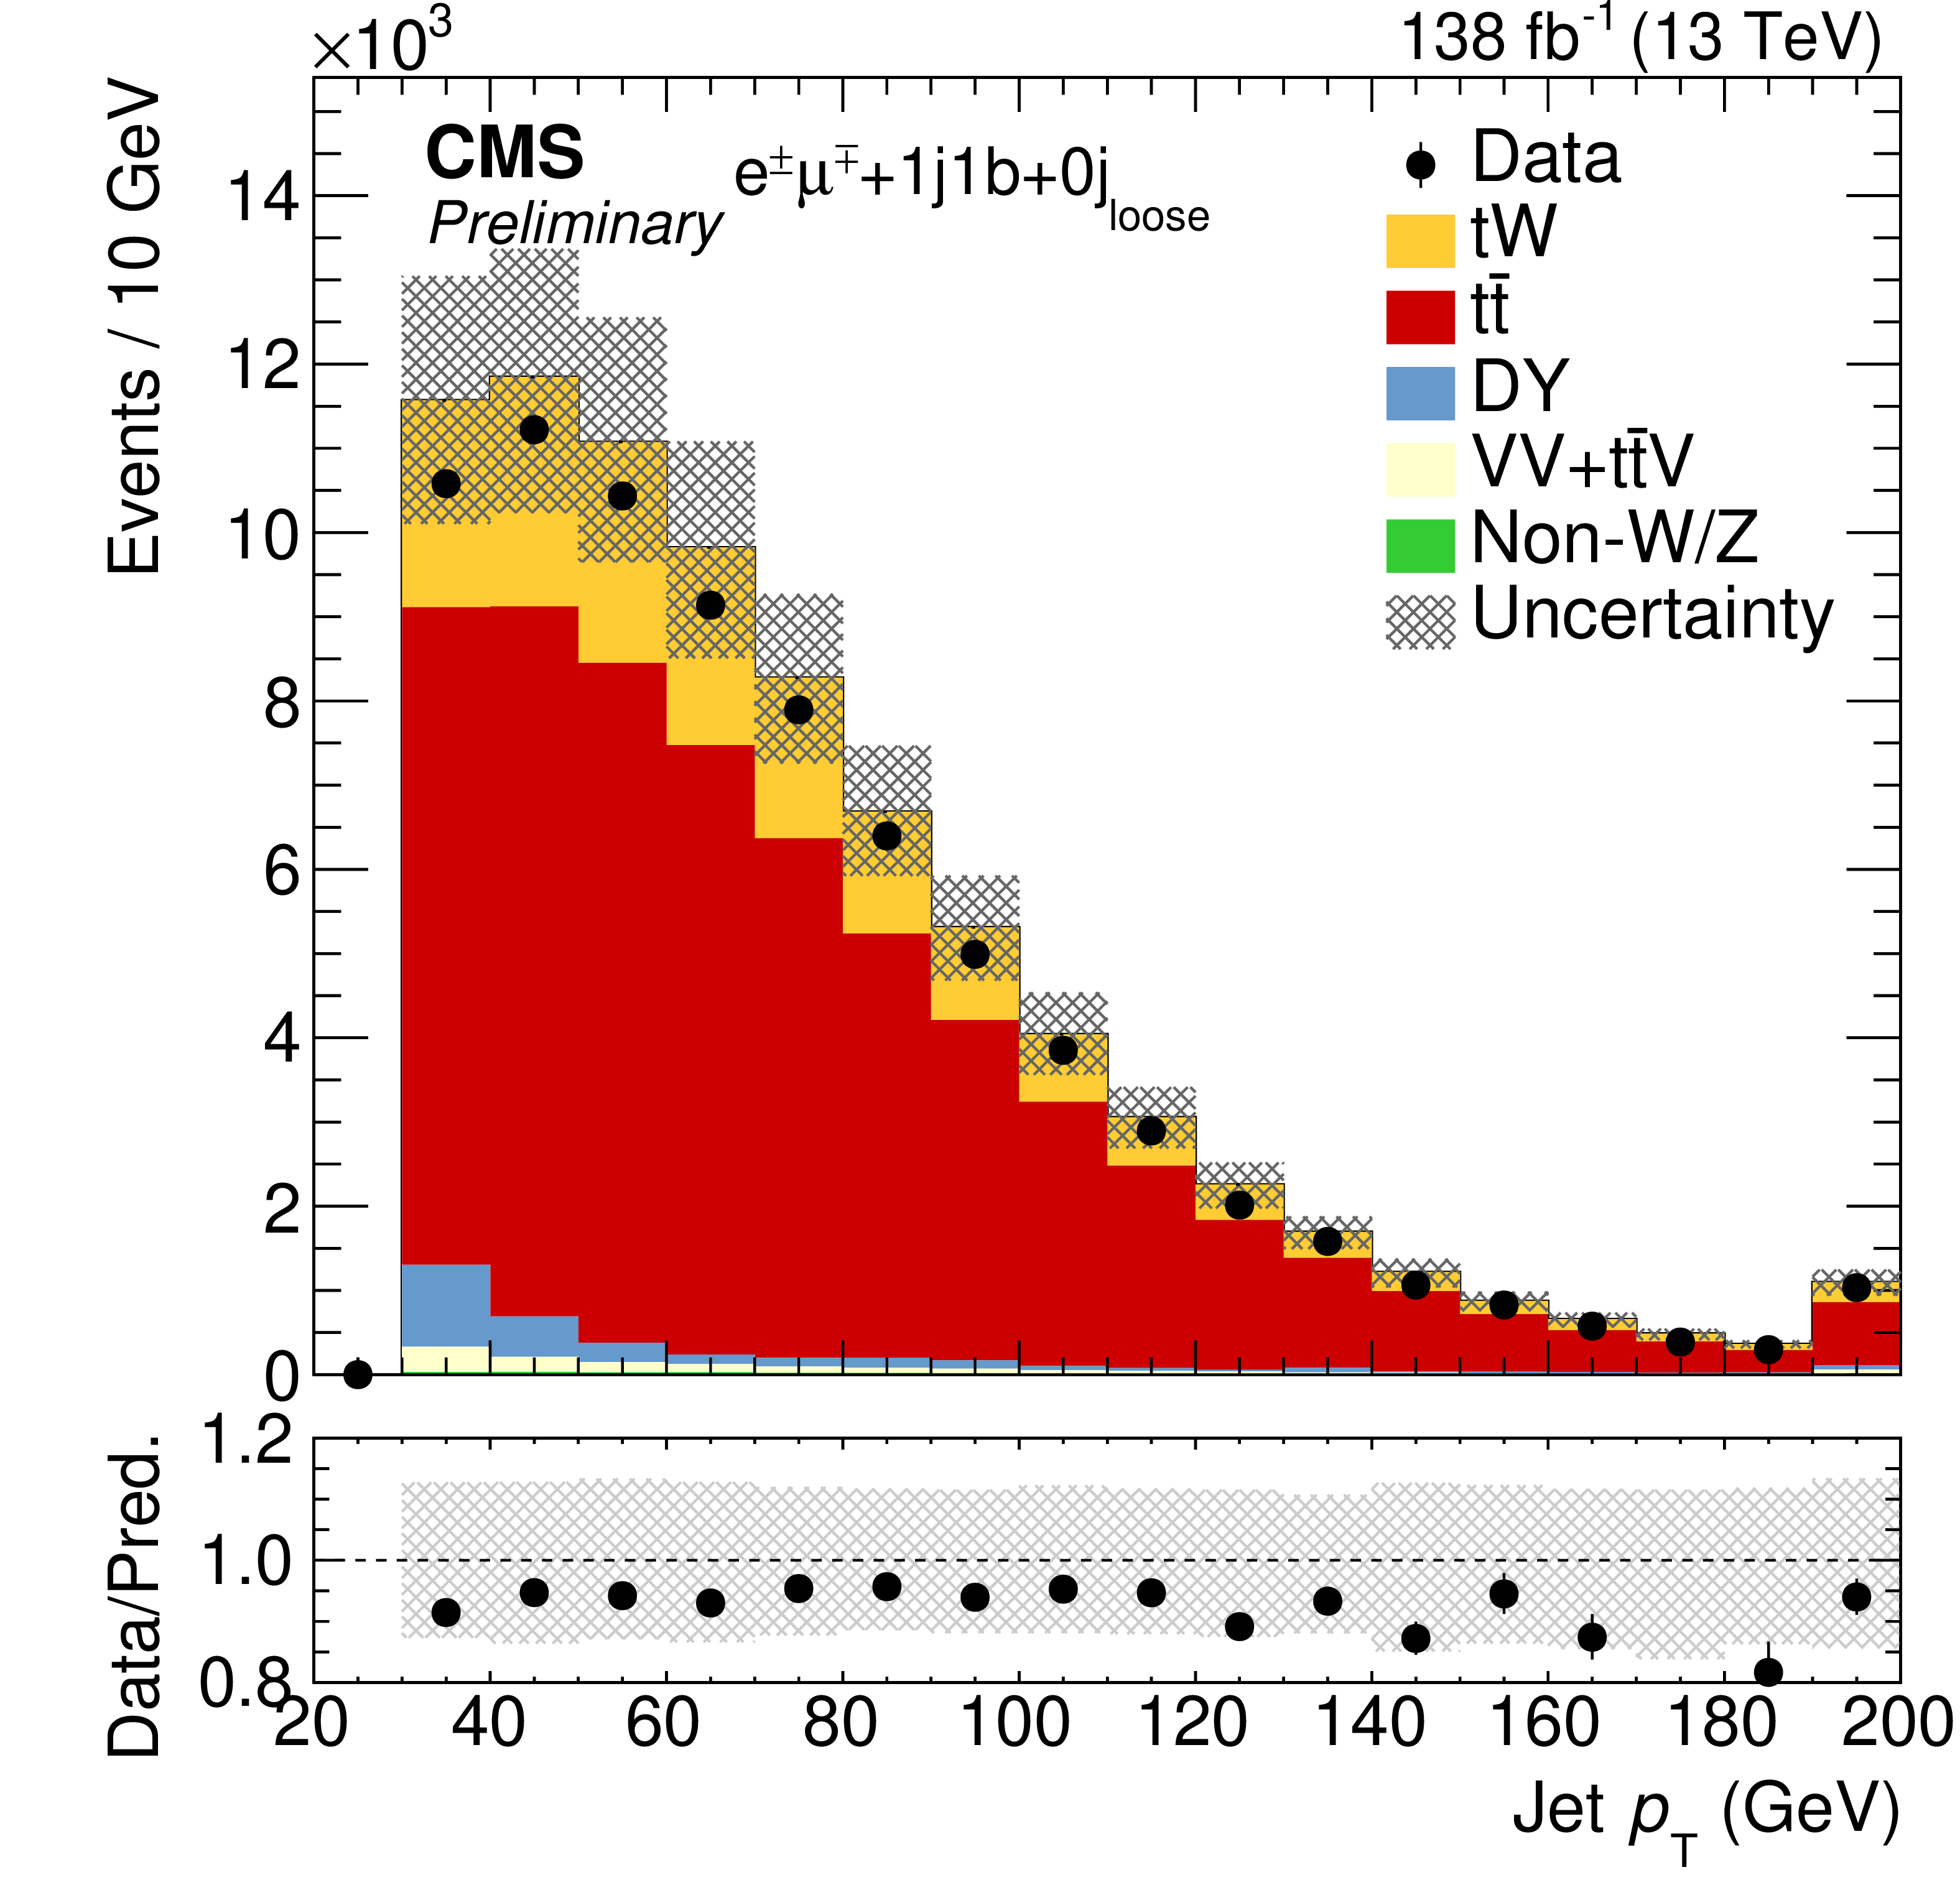
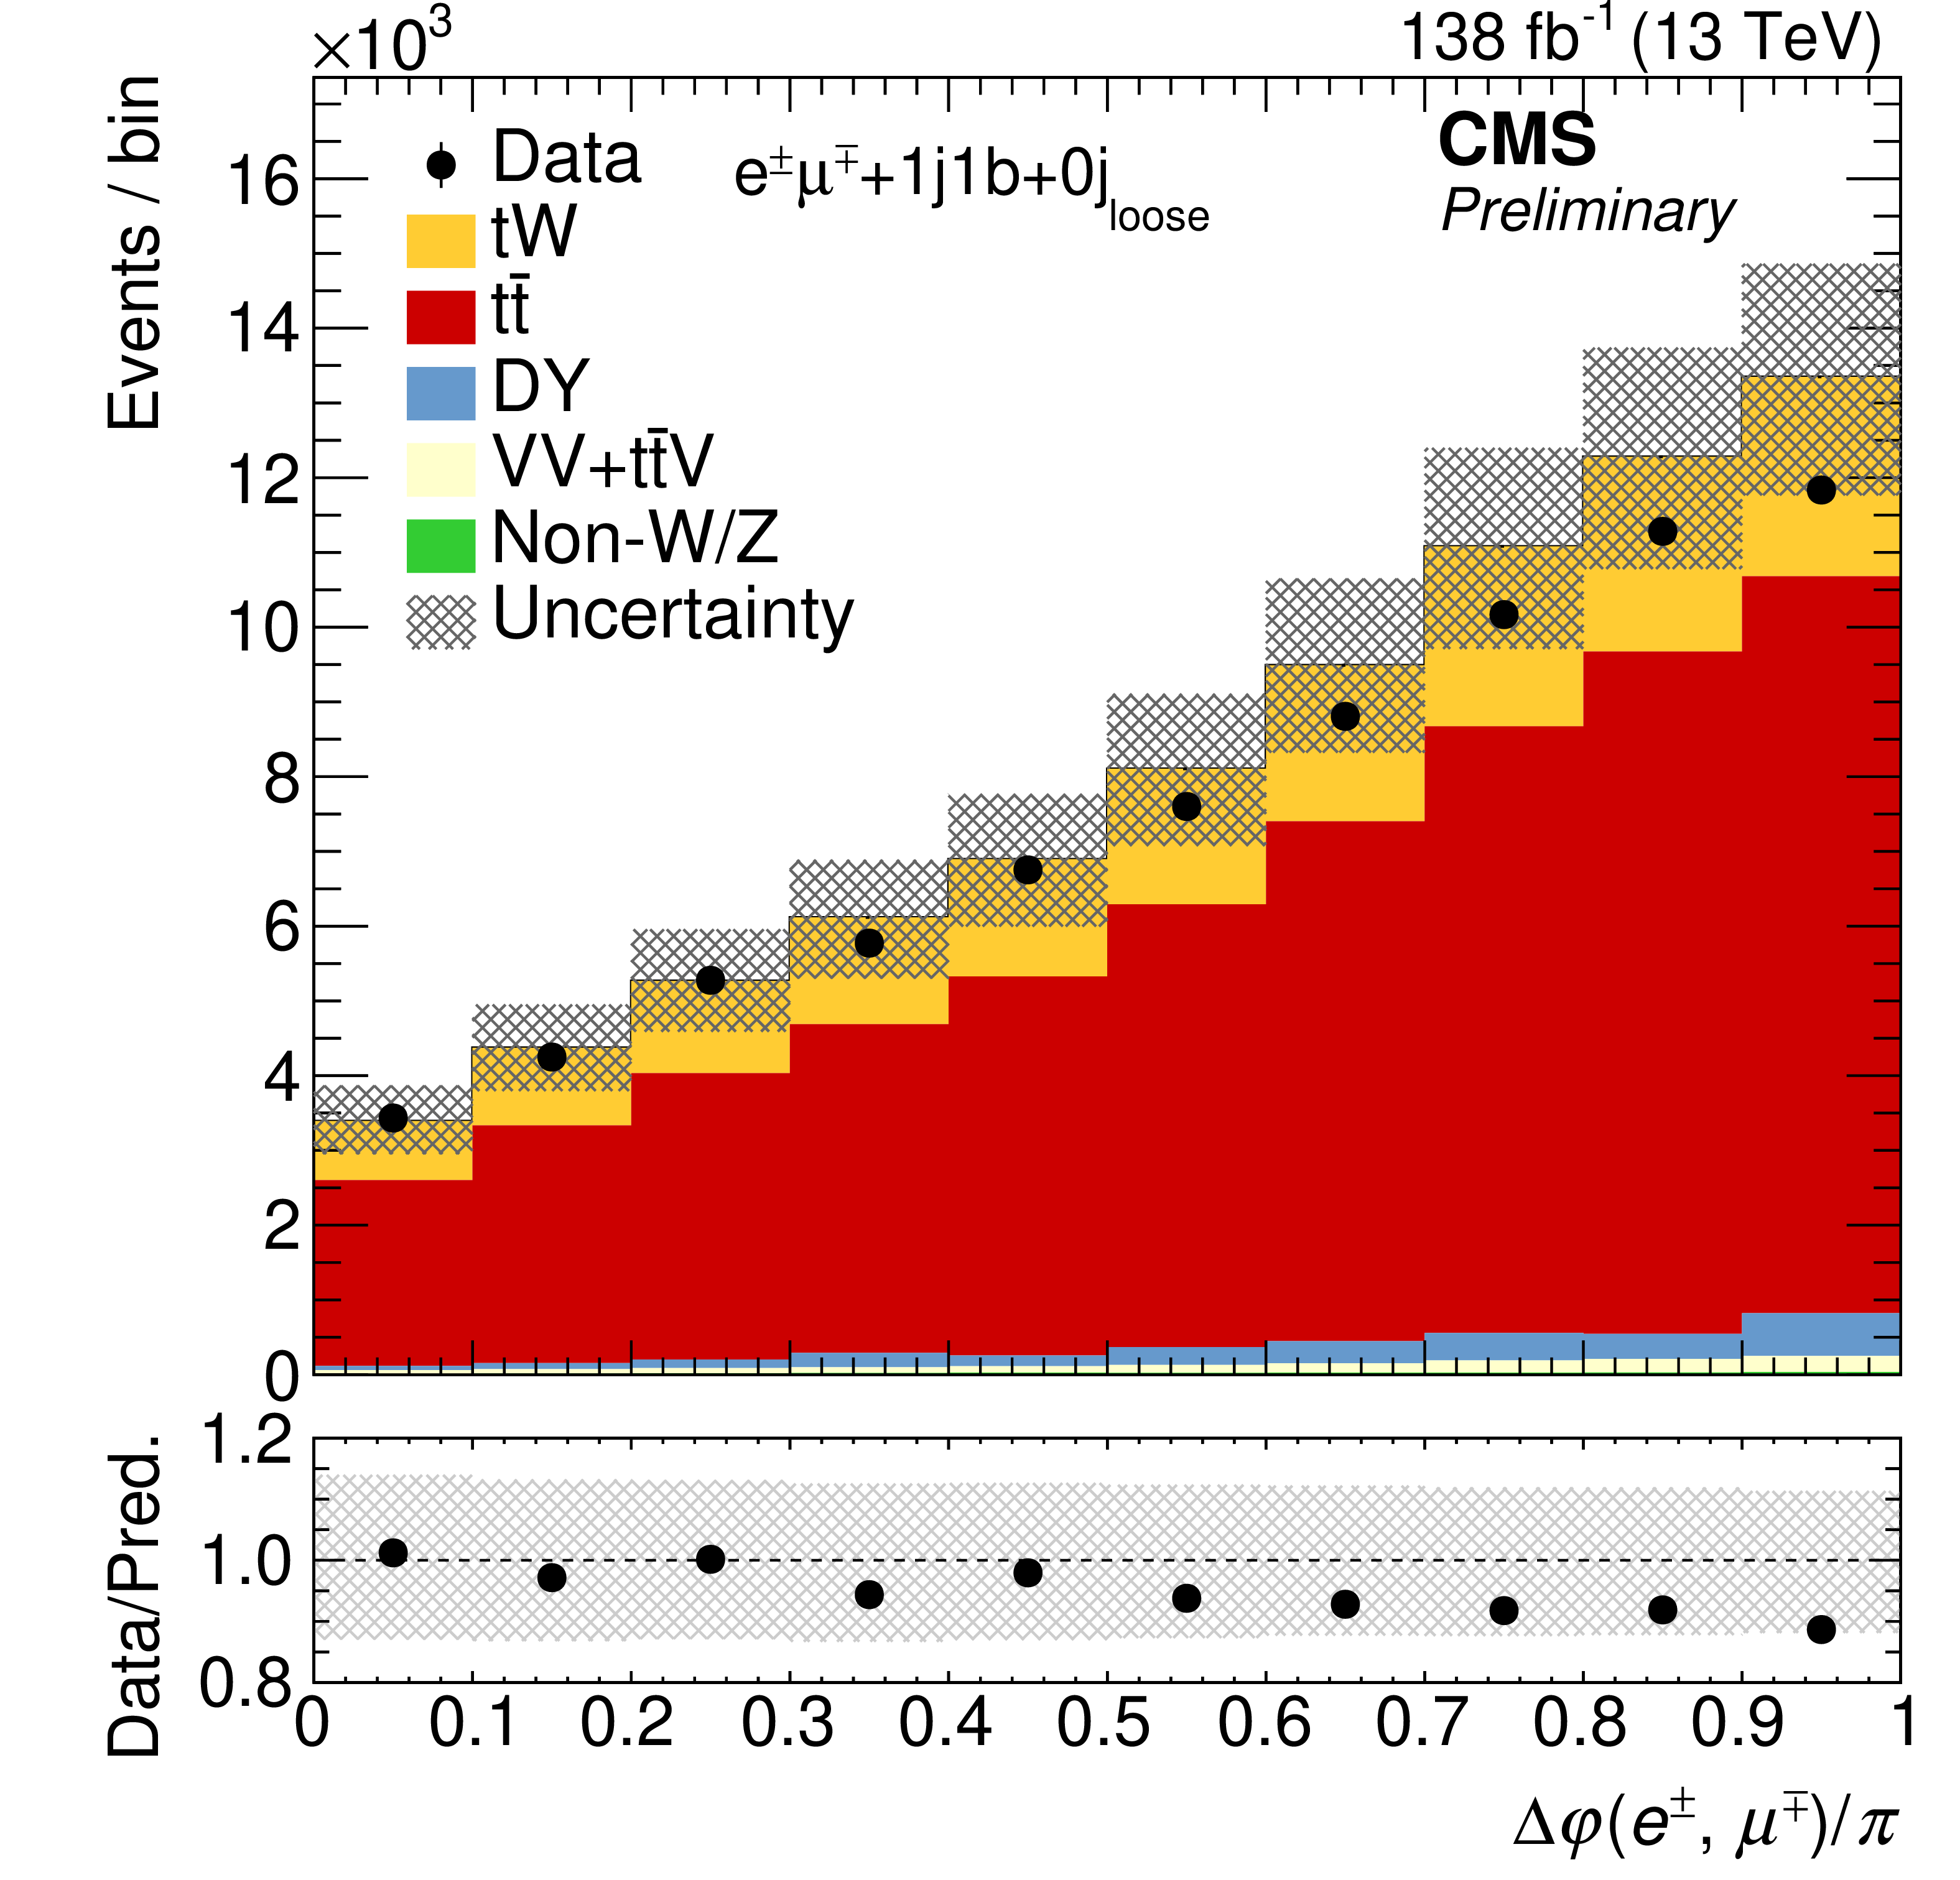
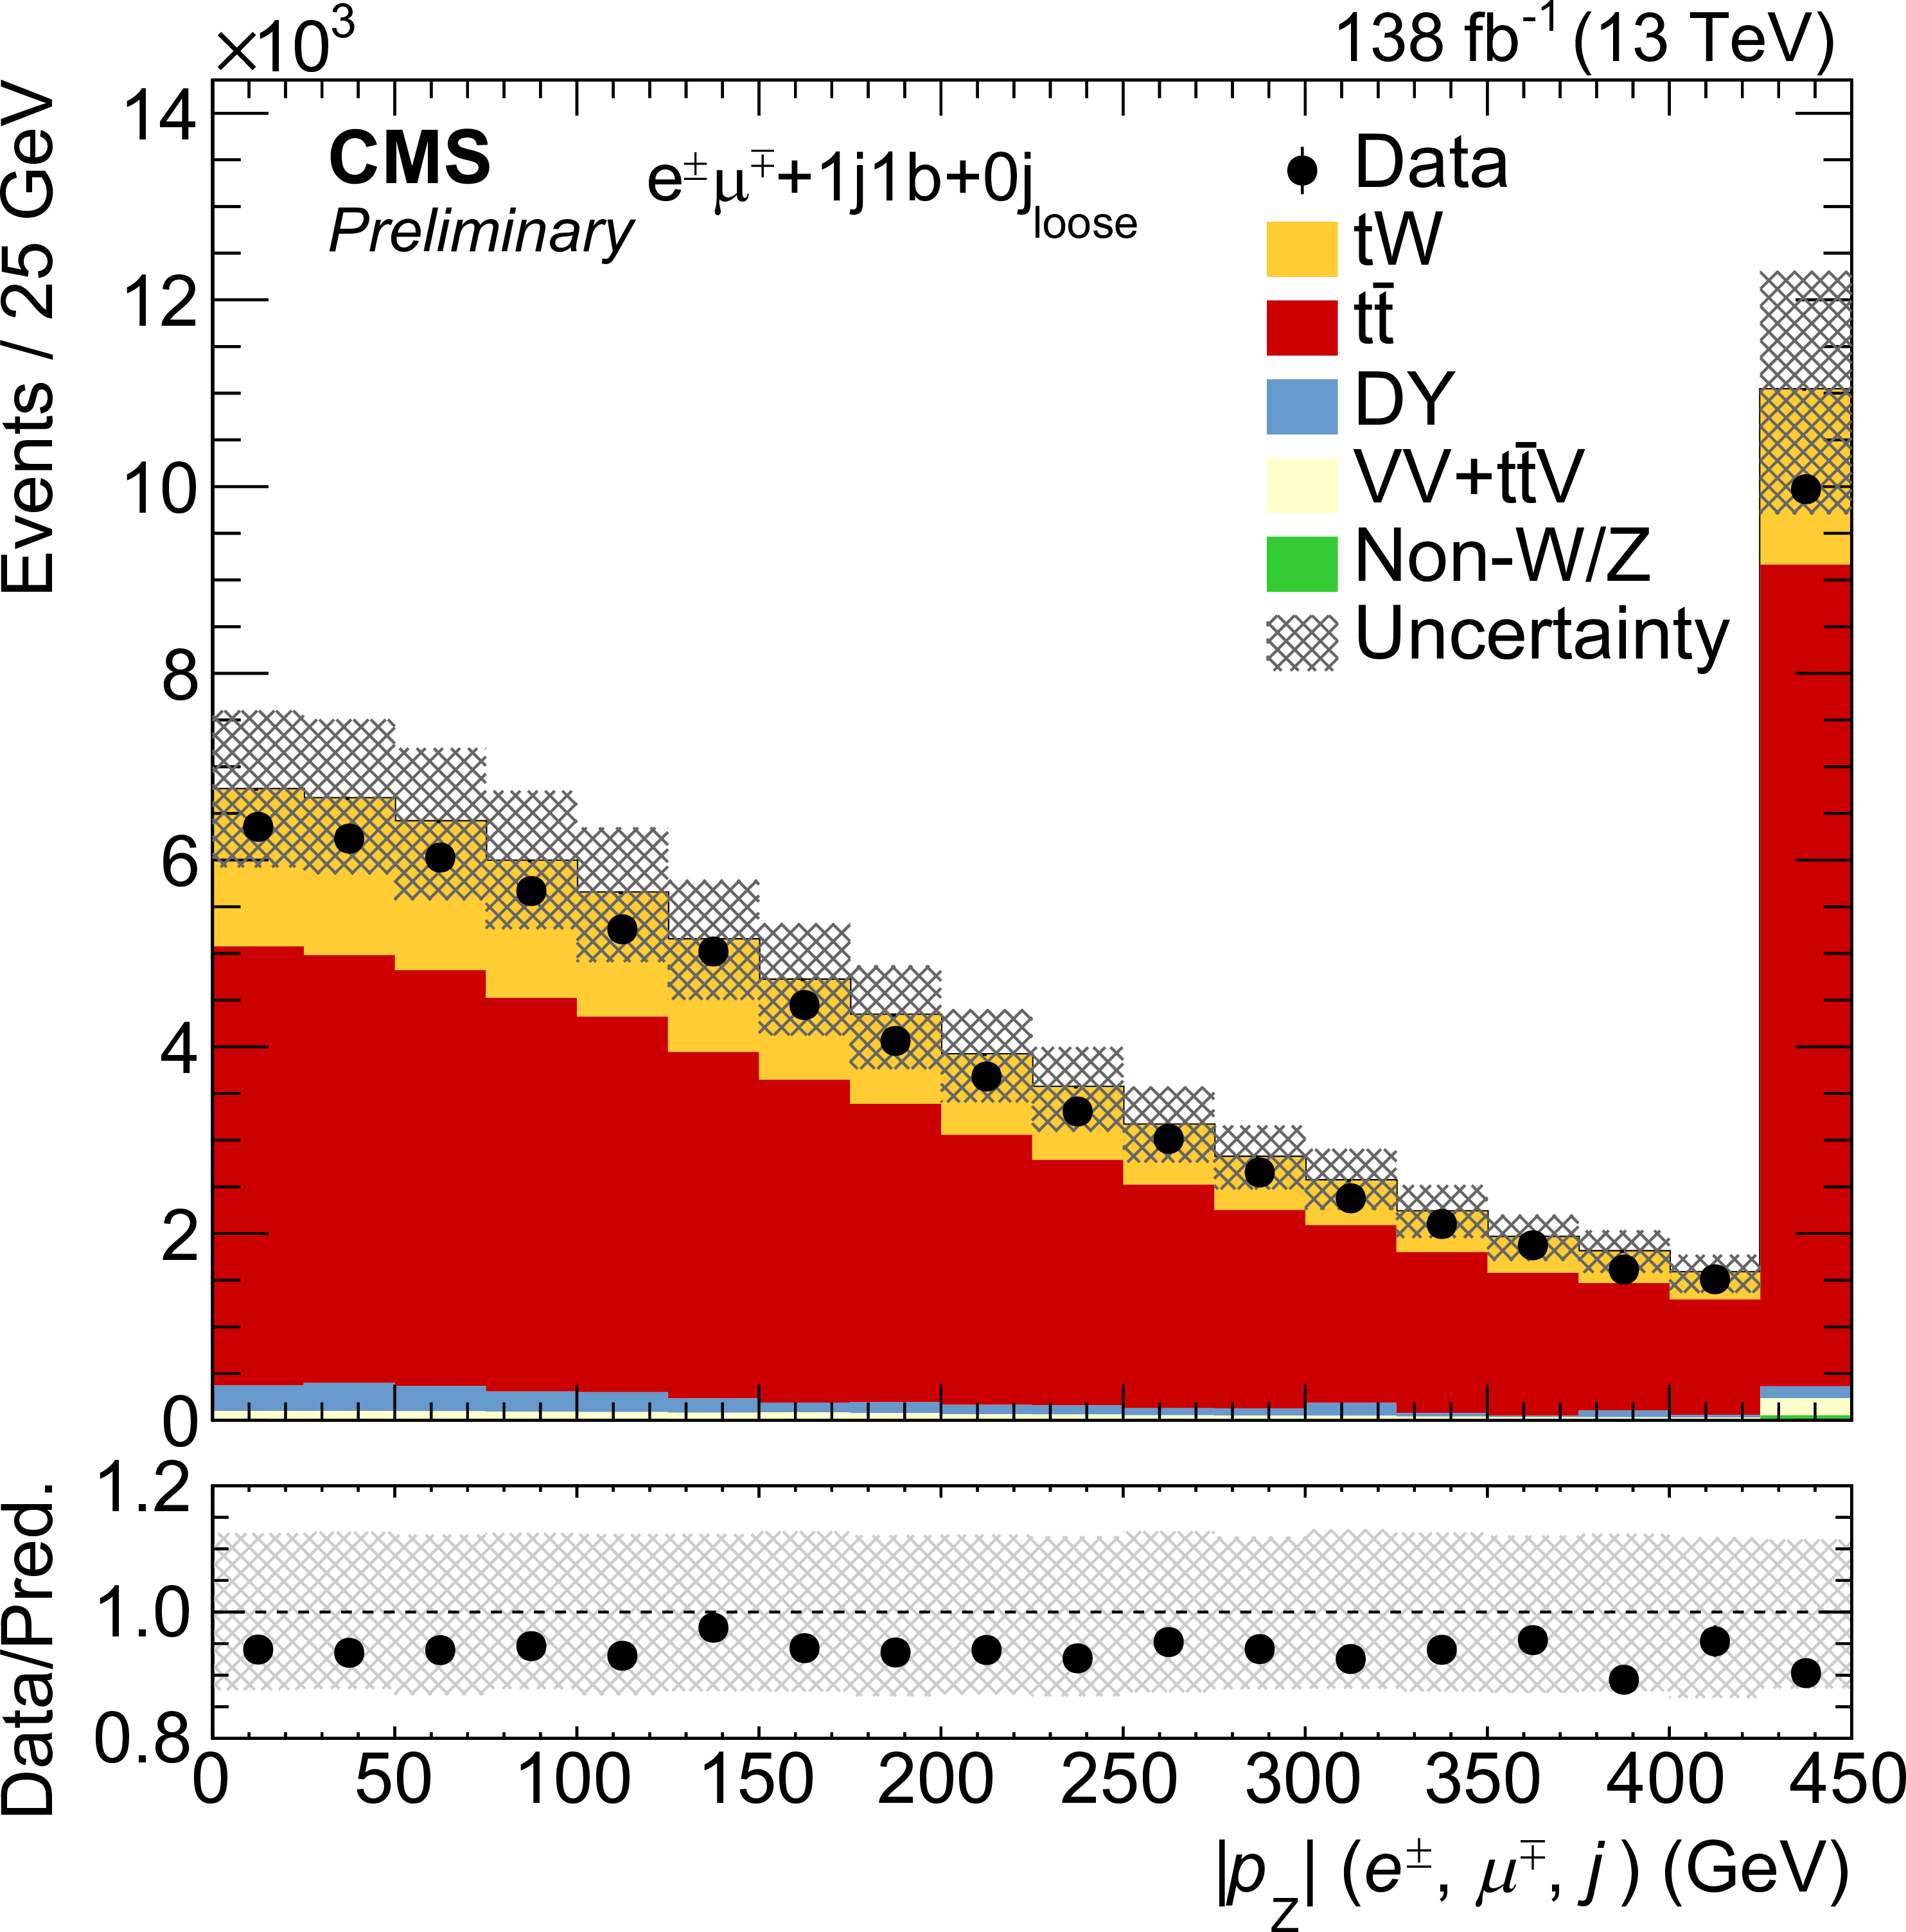
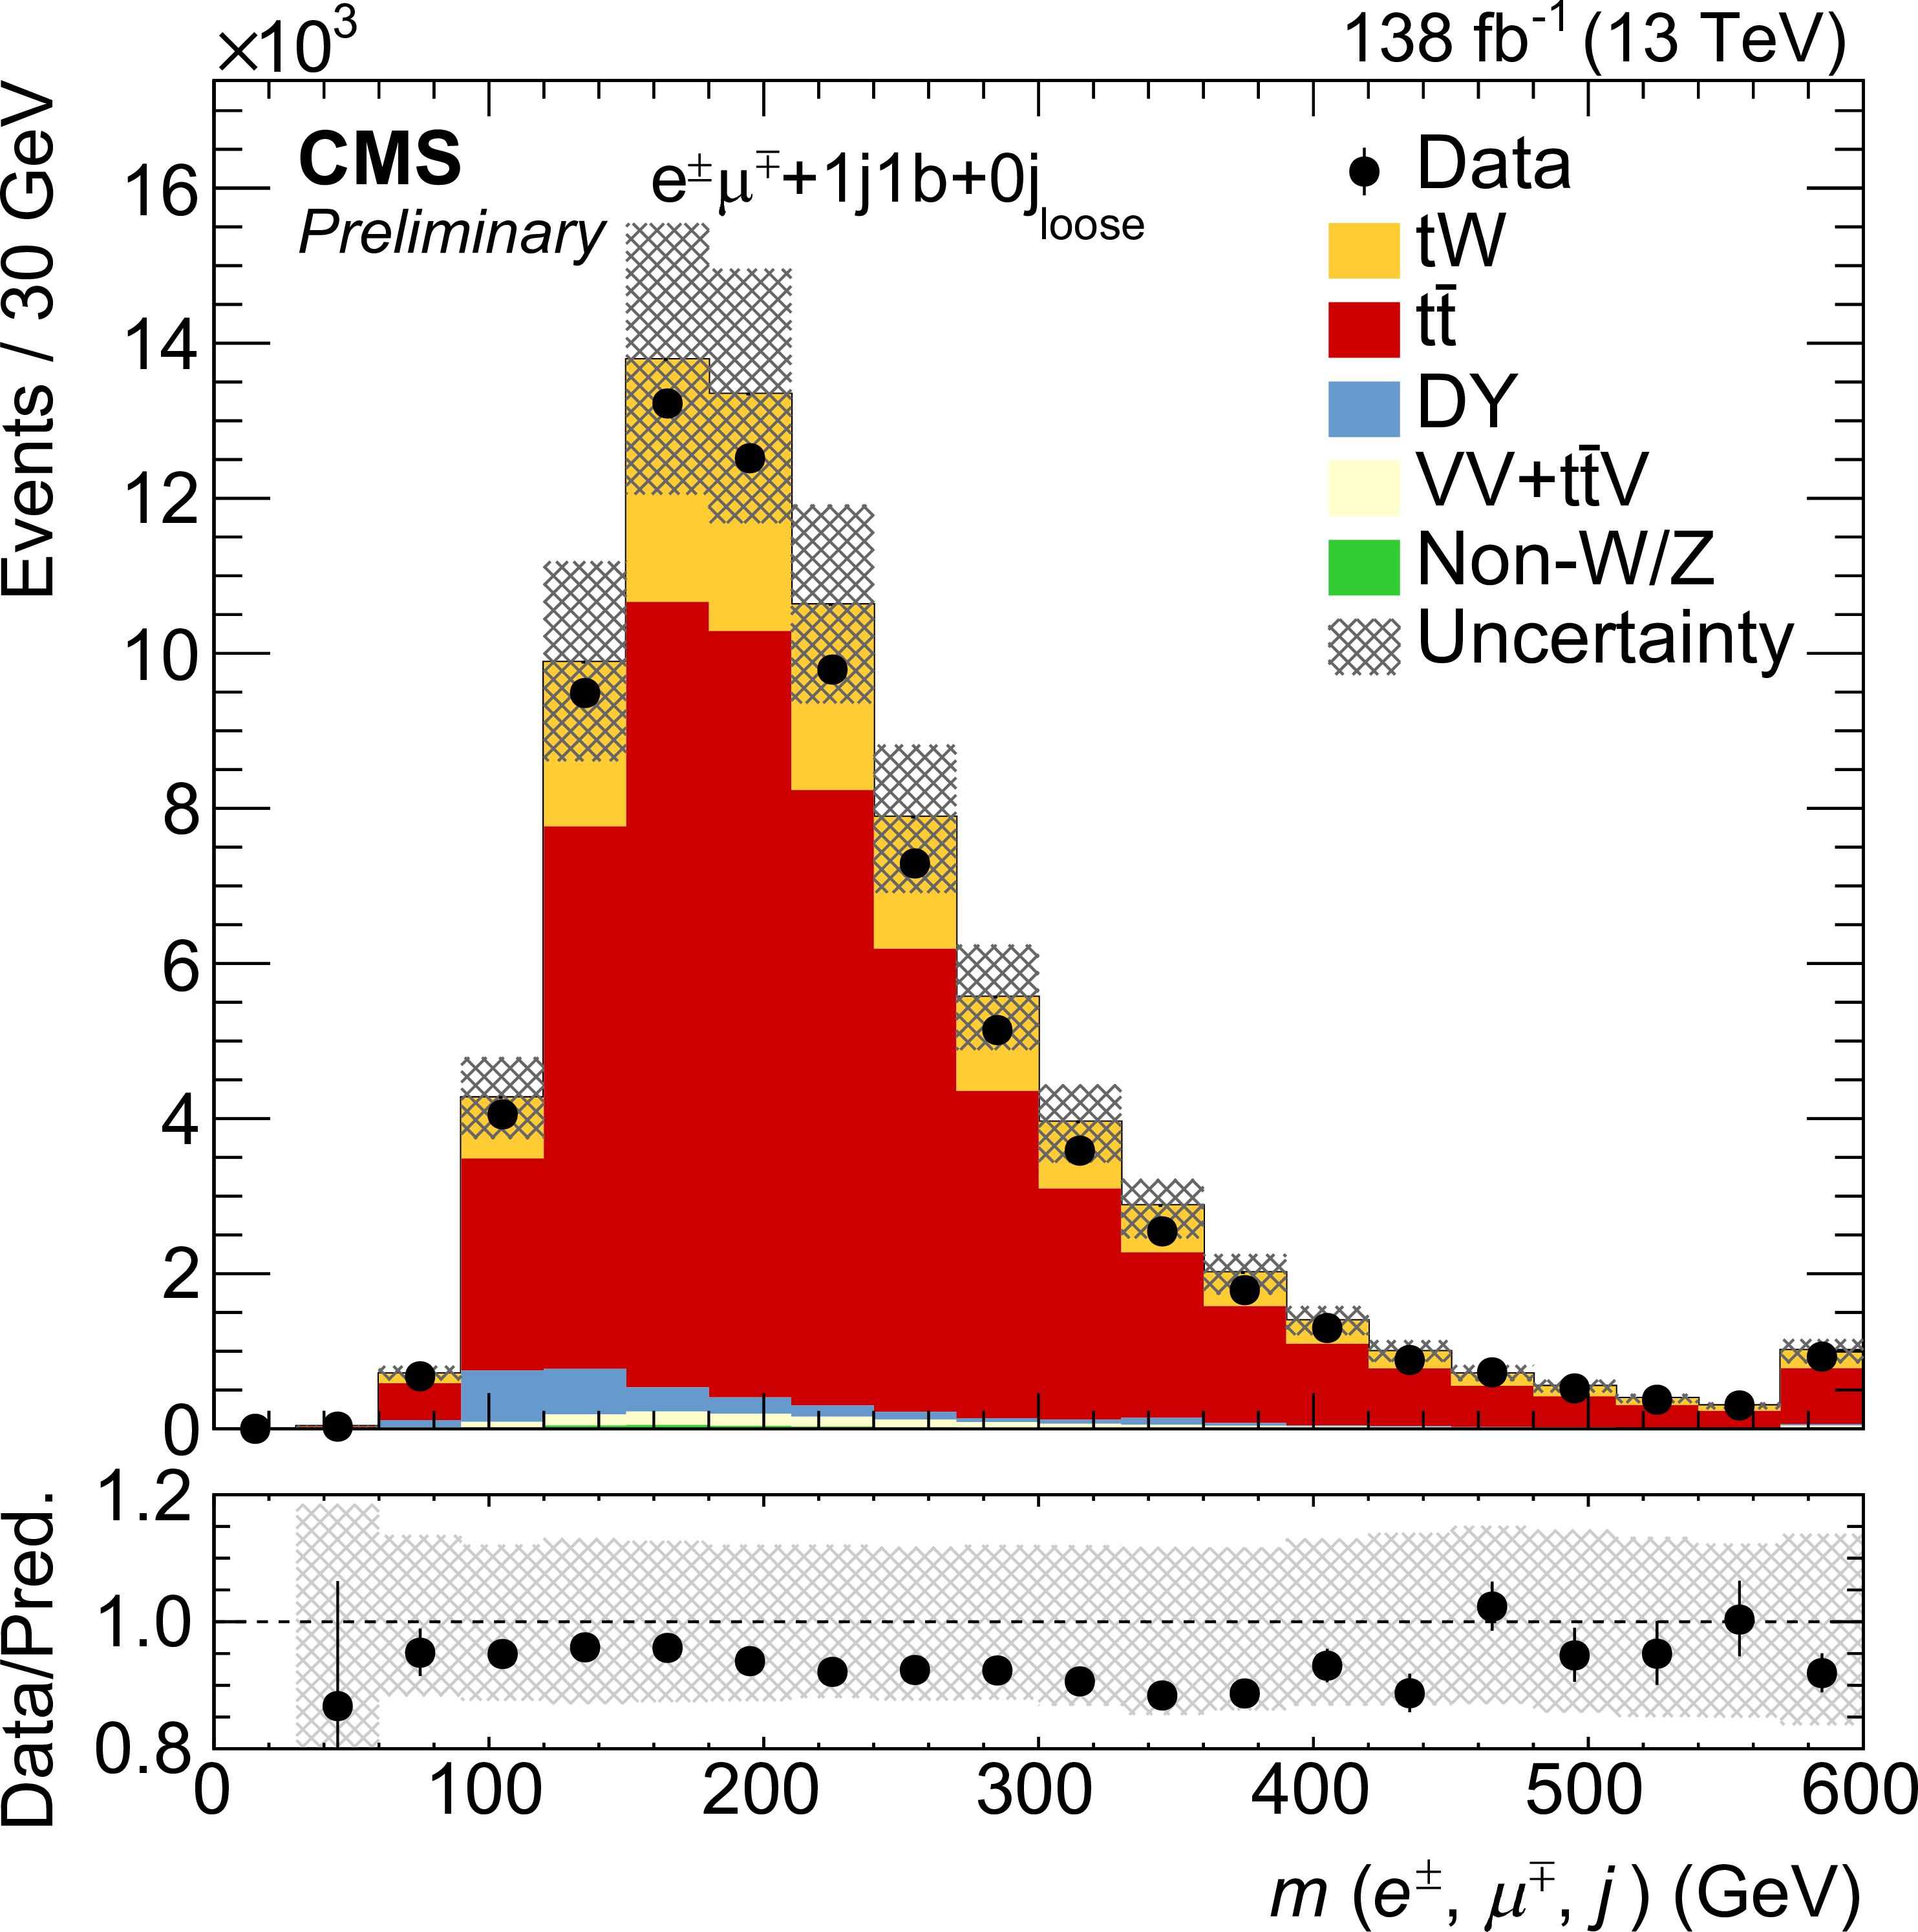
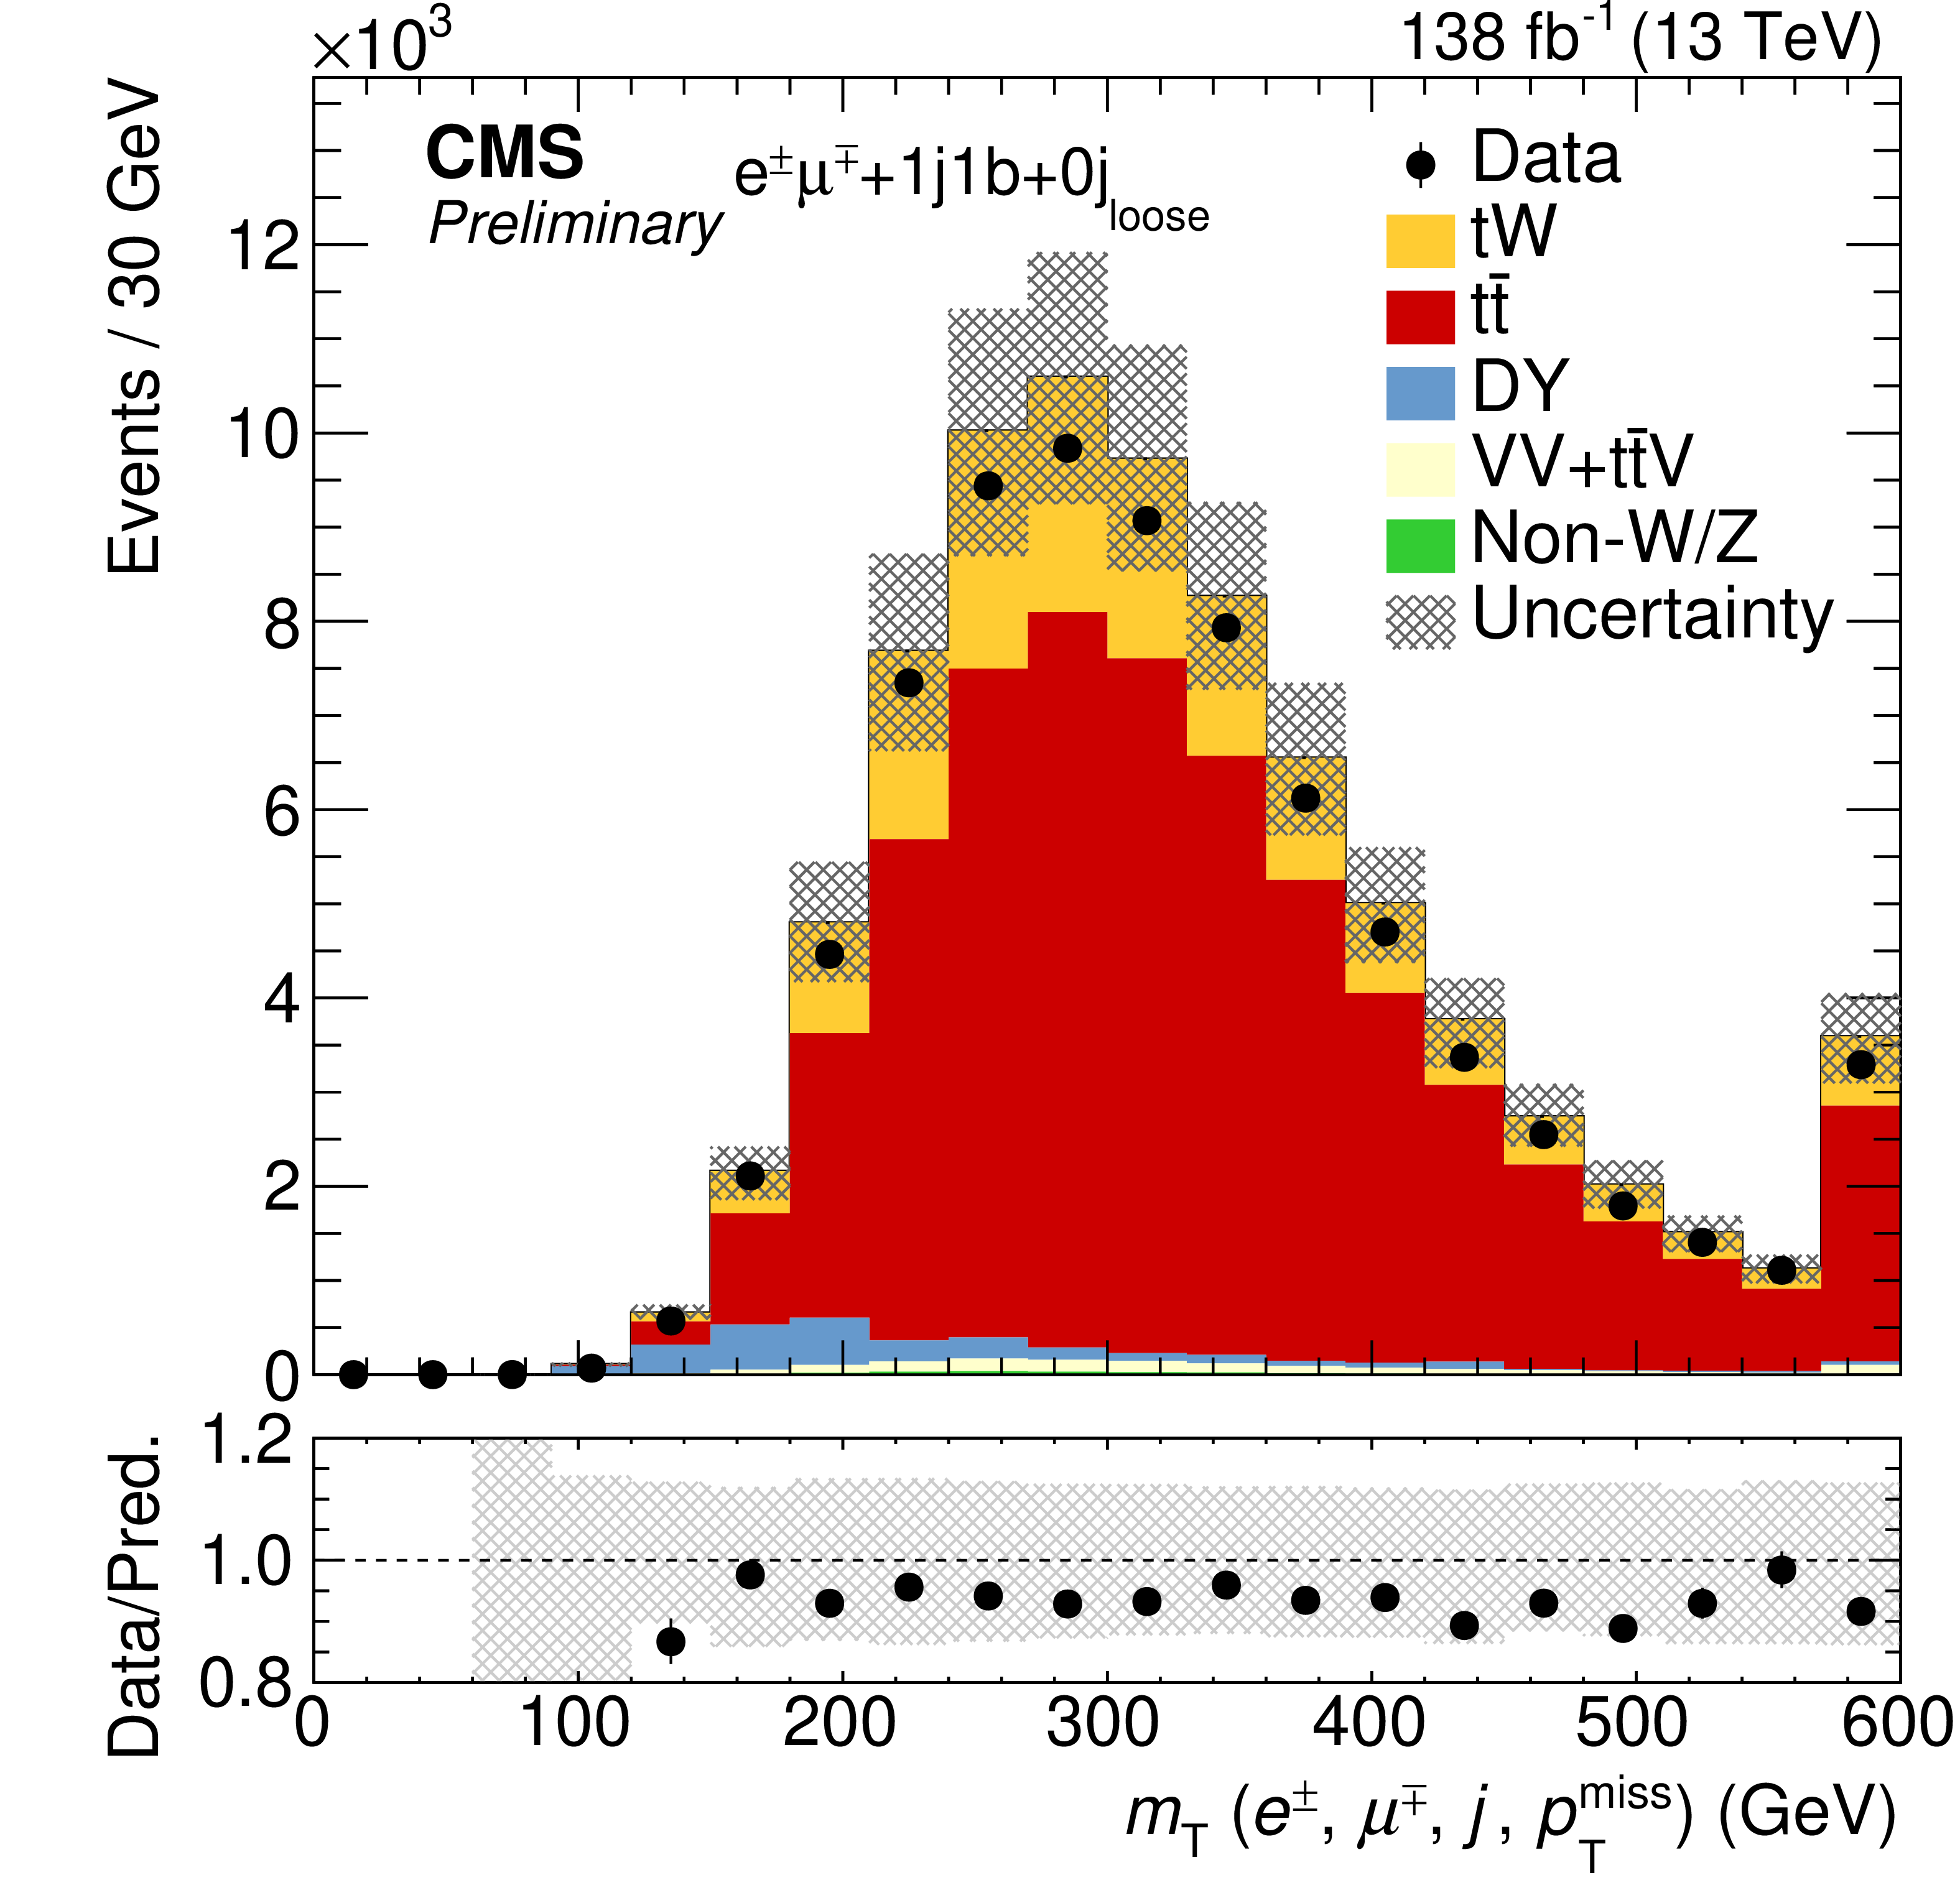
Figure 5:
Yields observed in data, compared with those expected from simulation, as a function of the six observables selected to measure the differential cross section for events in the signal region for the differential analysis (1j1b+0 loose jet). The hatched bands include the statistical and all systematic uncertainties. The last bin of each contribution contains overflow events. The bottom panel shows the ratios of data to the sum of the expected yields. |
png pdf |
Figure 5-a:
Yields observed in data, compared with those expected from simulation, as a function of the six observables selected to measure the differential cross section for events in the signal region for the differential analysis (1j1b+0 loose jet). The hatched bands include the statistical and all systematic uncertainties. The last bin of each contribution contains overflow events. The bottom panel shows the ratios of data to the sum of the expected yields. |
png pdf |
Figure 5-b:
Yields observed in data, compared with those expected from simulation, as a function of the six observables selected to measure the differential cross section for events in the signal region for the differential analysis (1j1b+0 loose jet). The hatched bands include the statistical and all systematic uncertainties. The last bin of each contribution contains overflow events. The bottom panel shows the ratios of data to the sum of the expected yields. |
png pdf |
Figure 5-c:
Yields observed in data, compared with those expected from simulation, as a function of the six observables selected to measure the differential cross section for events in the signal region for the differential analysis (1j1b+0 loose jet). The hatched bands include the statistical and all systematic uncertainties. The last bin of each contribution contains overflow events. The bottom panel shows the ratios of data to the sum of the expected yields. |
png pdf |
Figure 5-d:
Yields observed in data, compared with those expected from simulation, as a function of the six observables selected to measure the differential cross section for events in the signal region for the differential analysis (1j1b+0 loose jet). The hatched bands include the statistical and all systematic uncertainties. The last bin of each contribution contains overflow events. The bottom panel shows the ratios of data to the sum of the expected yields. |
png pdf |
Figure 5-e:
Yields observed in data, compared with those expected from simulation, as a function of the six observables selected to measure the differential cross section for events in the signal region for the differential analysis (1j1b+0 loose jet). The hatched bands include the statistical and all systematic uncertainties. The last bin of each contribution contains overflow events. The bottom panel shows the ratios of data to the sum of the expected yields. |
png pdf |
Figure 5-f:
Yields observed in data, compared with those expected from simulation, as a function of the six observables selected to measure the differential cross section for events in the signal region for the differential analysis (1j1b+0 loose jet). The hatched bands include the statistical and all systematic uncertainties. The last bin of each contribution contains overflow events. The bottom panel shows the ratios of data to the sum of the expected yields. |
png pdf |
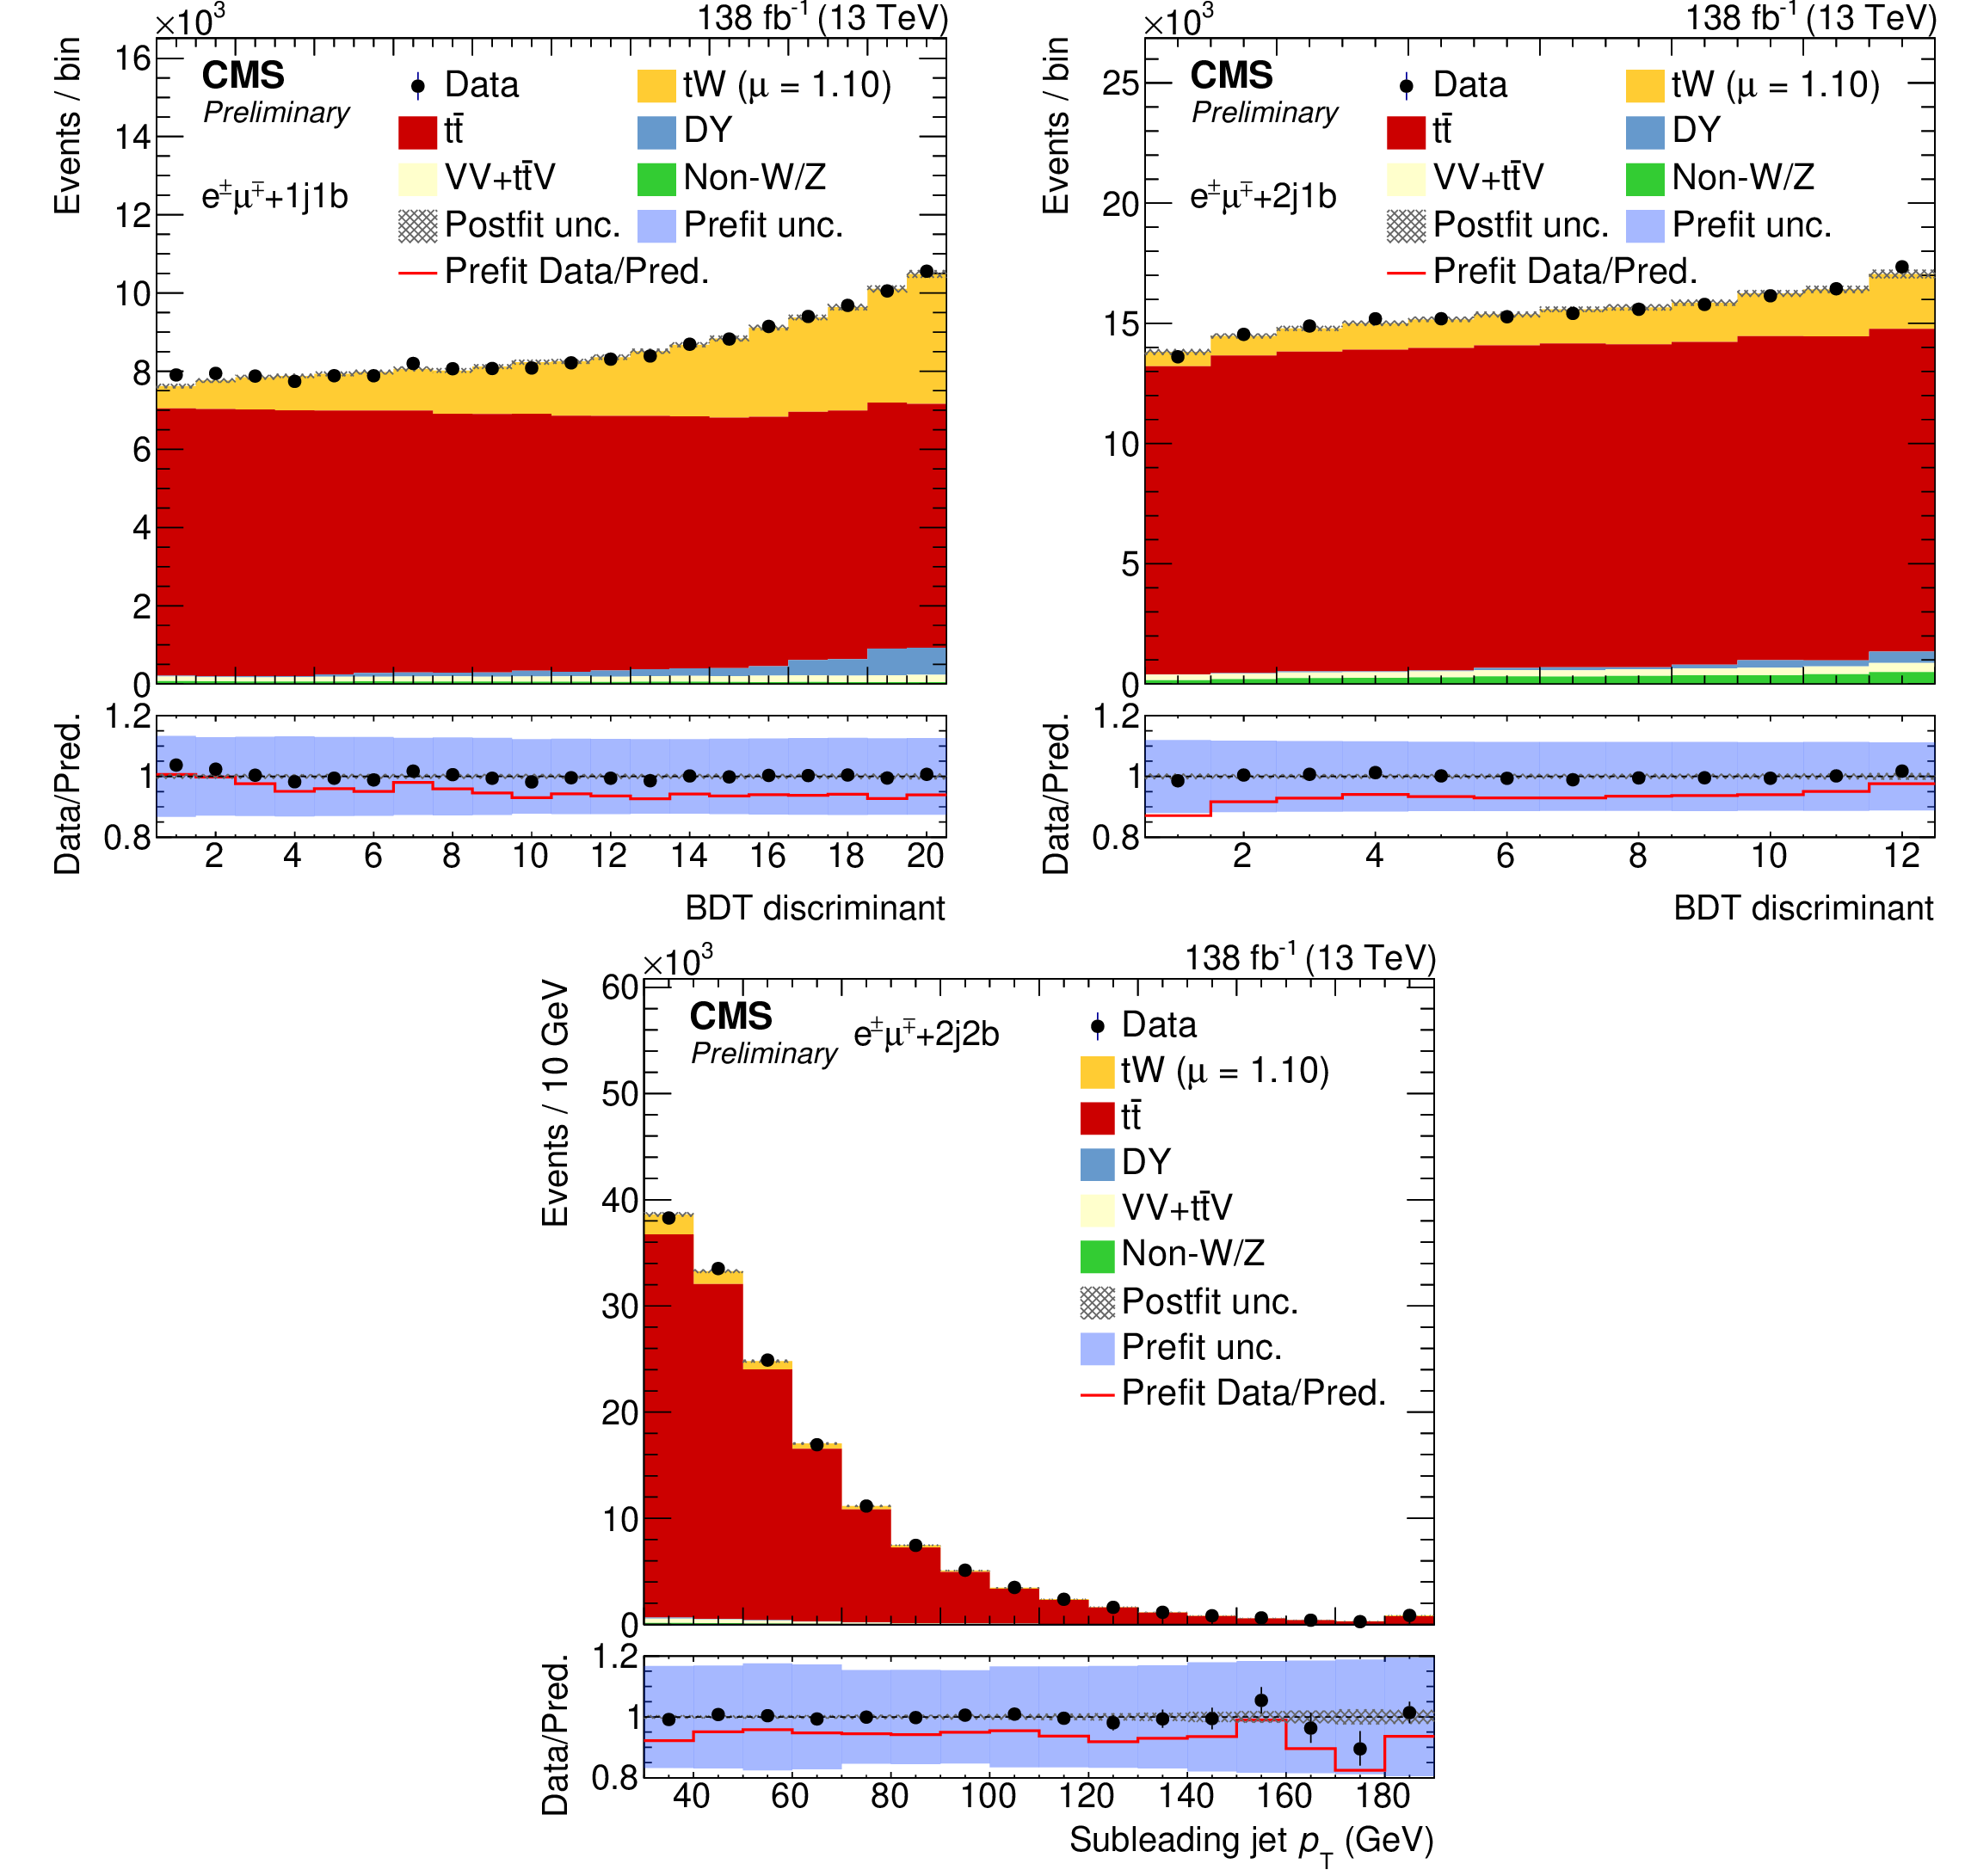
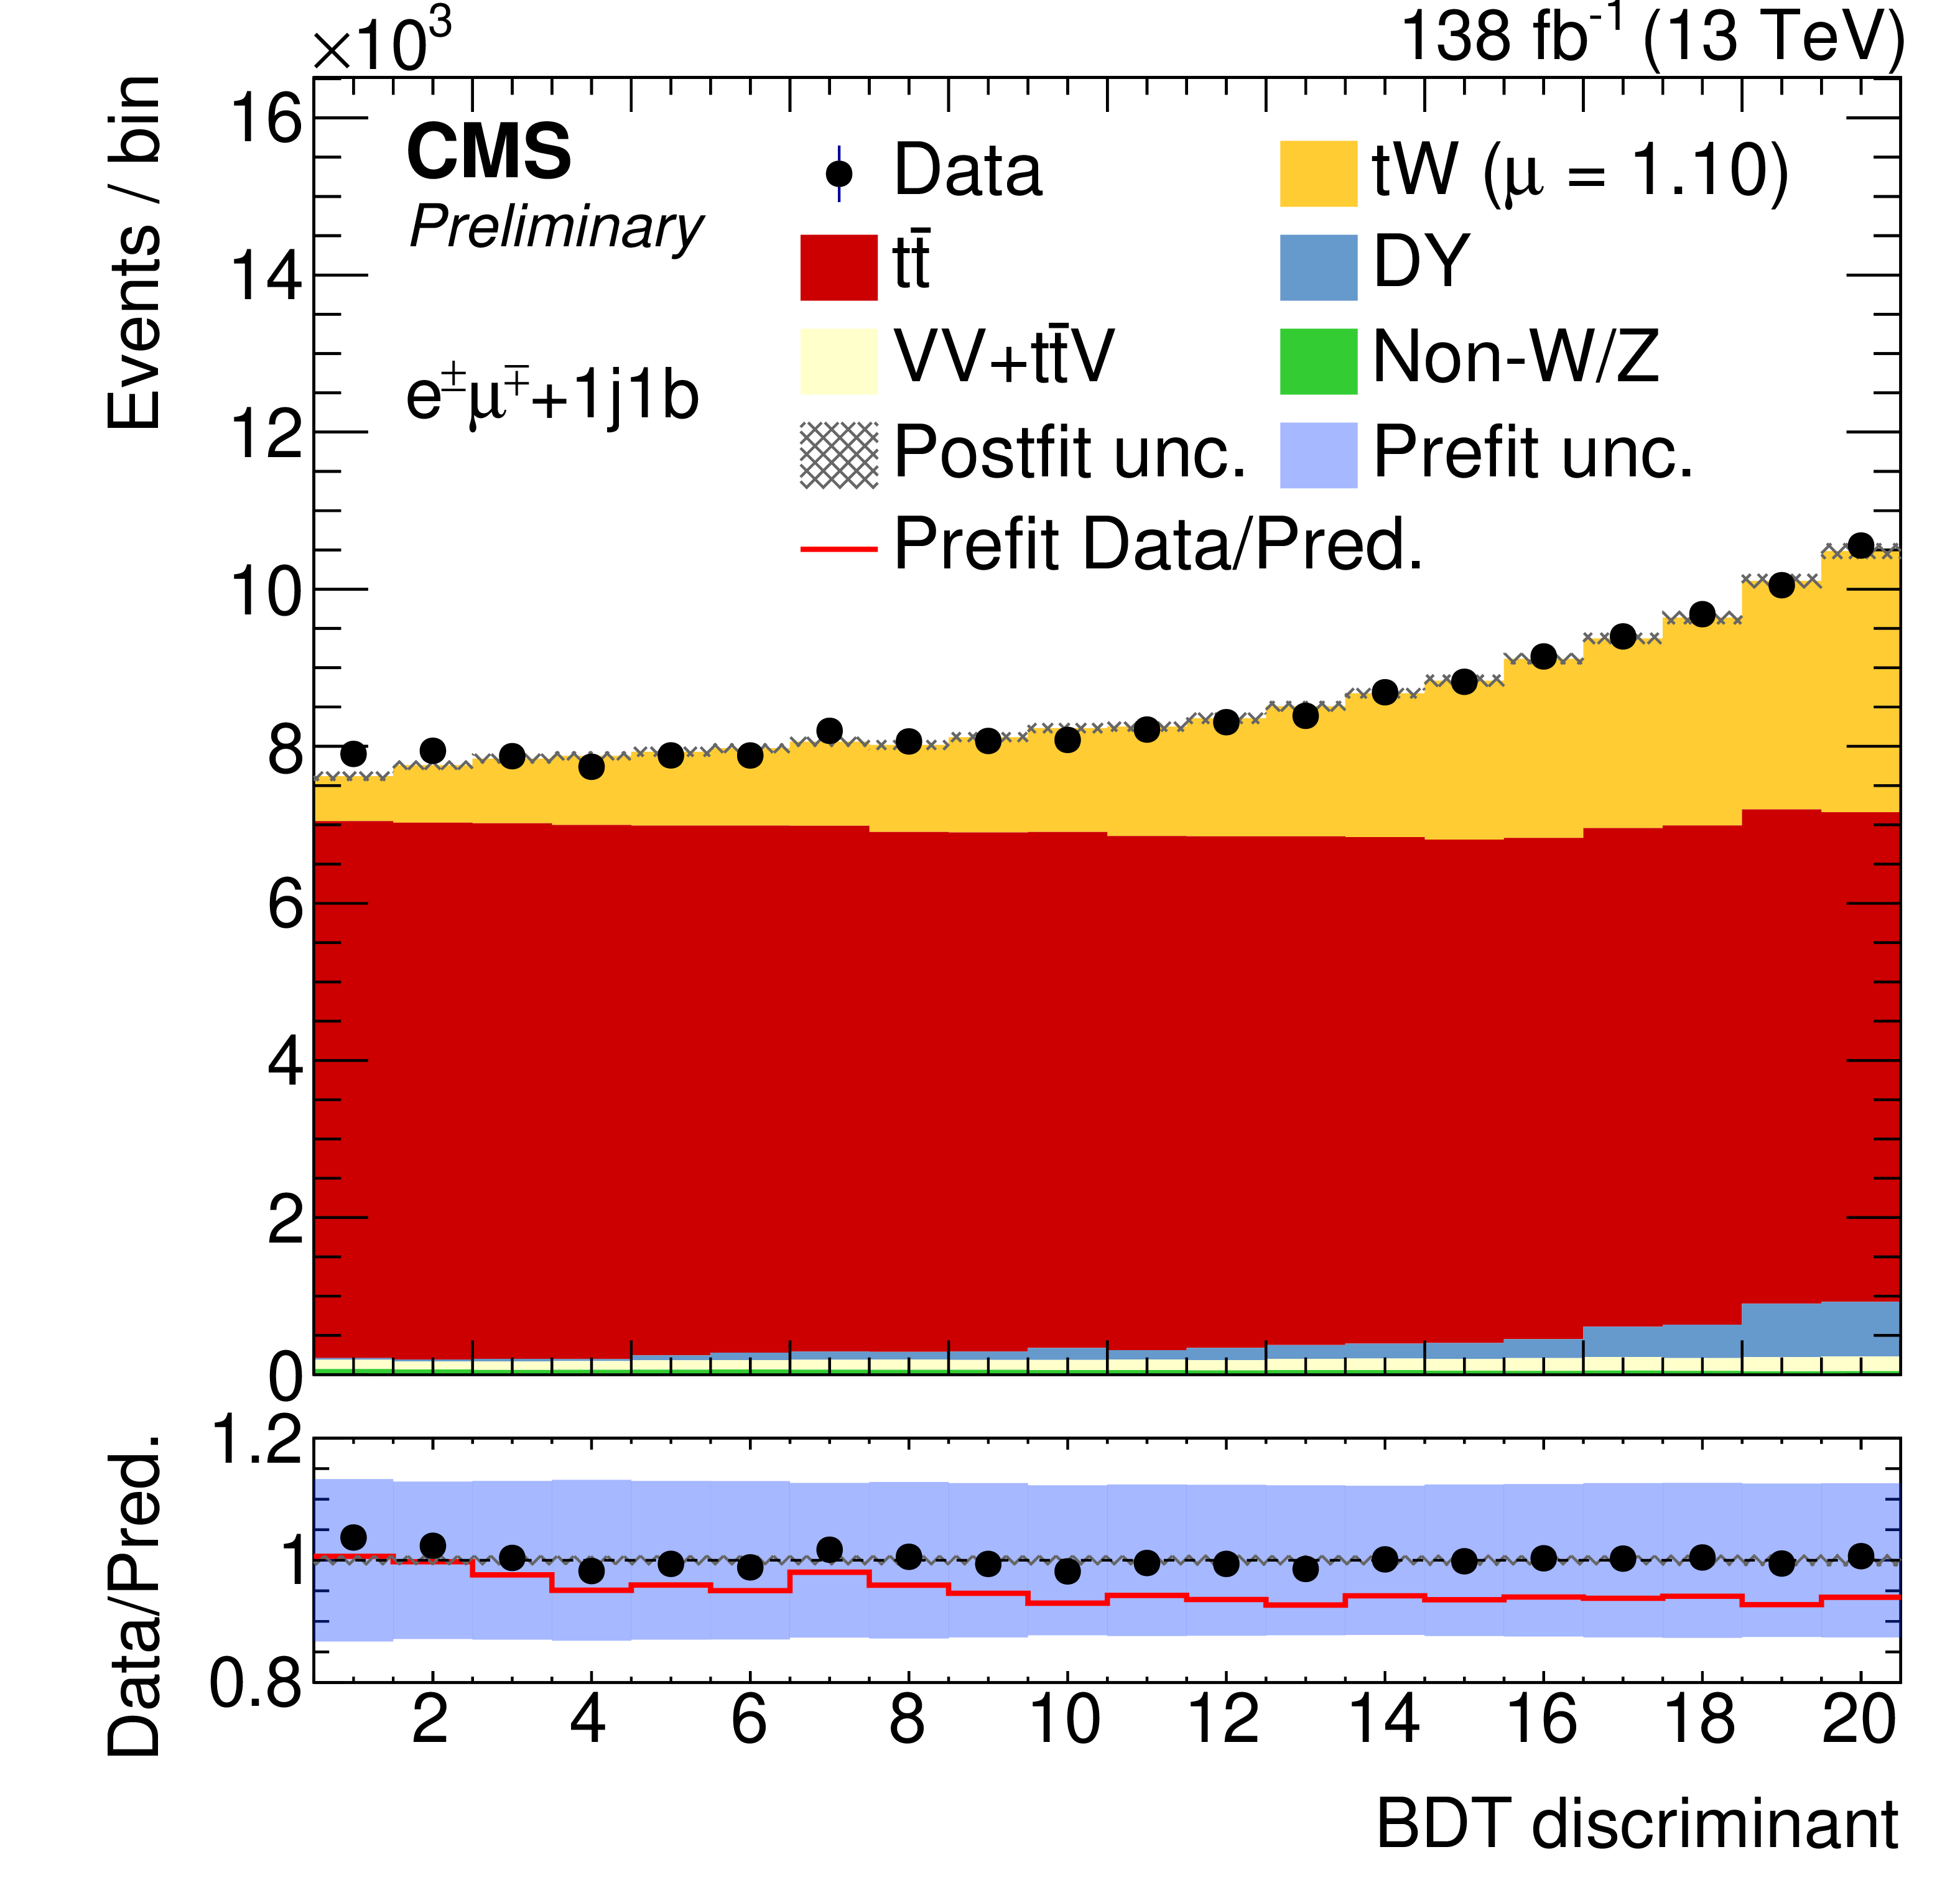
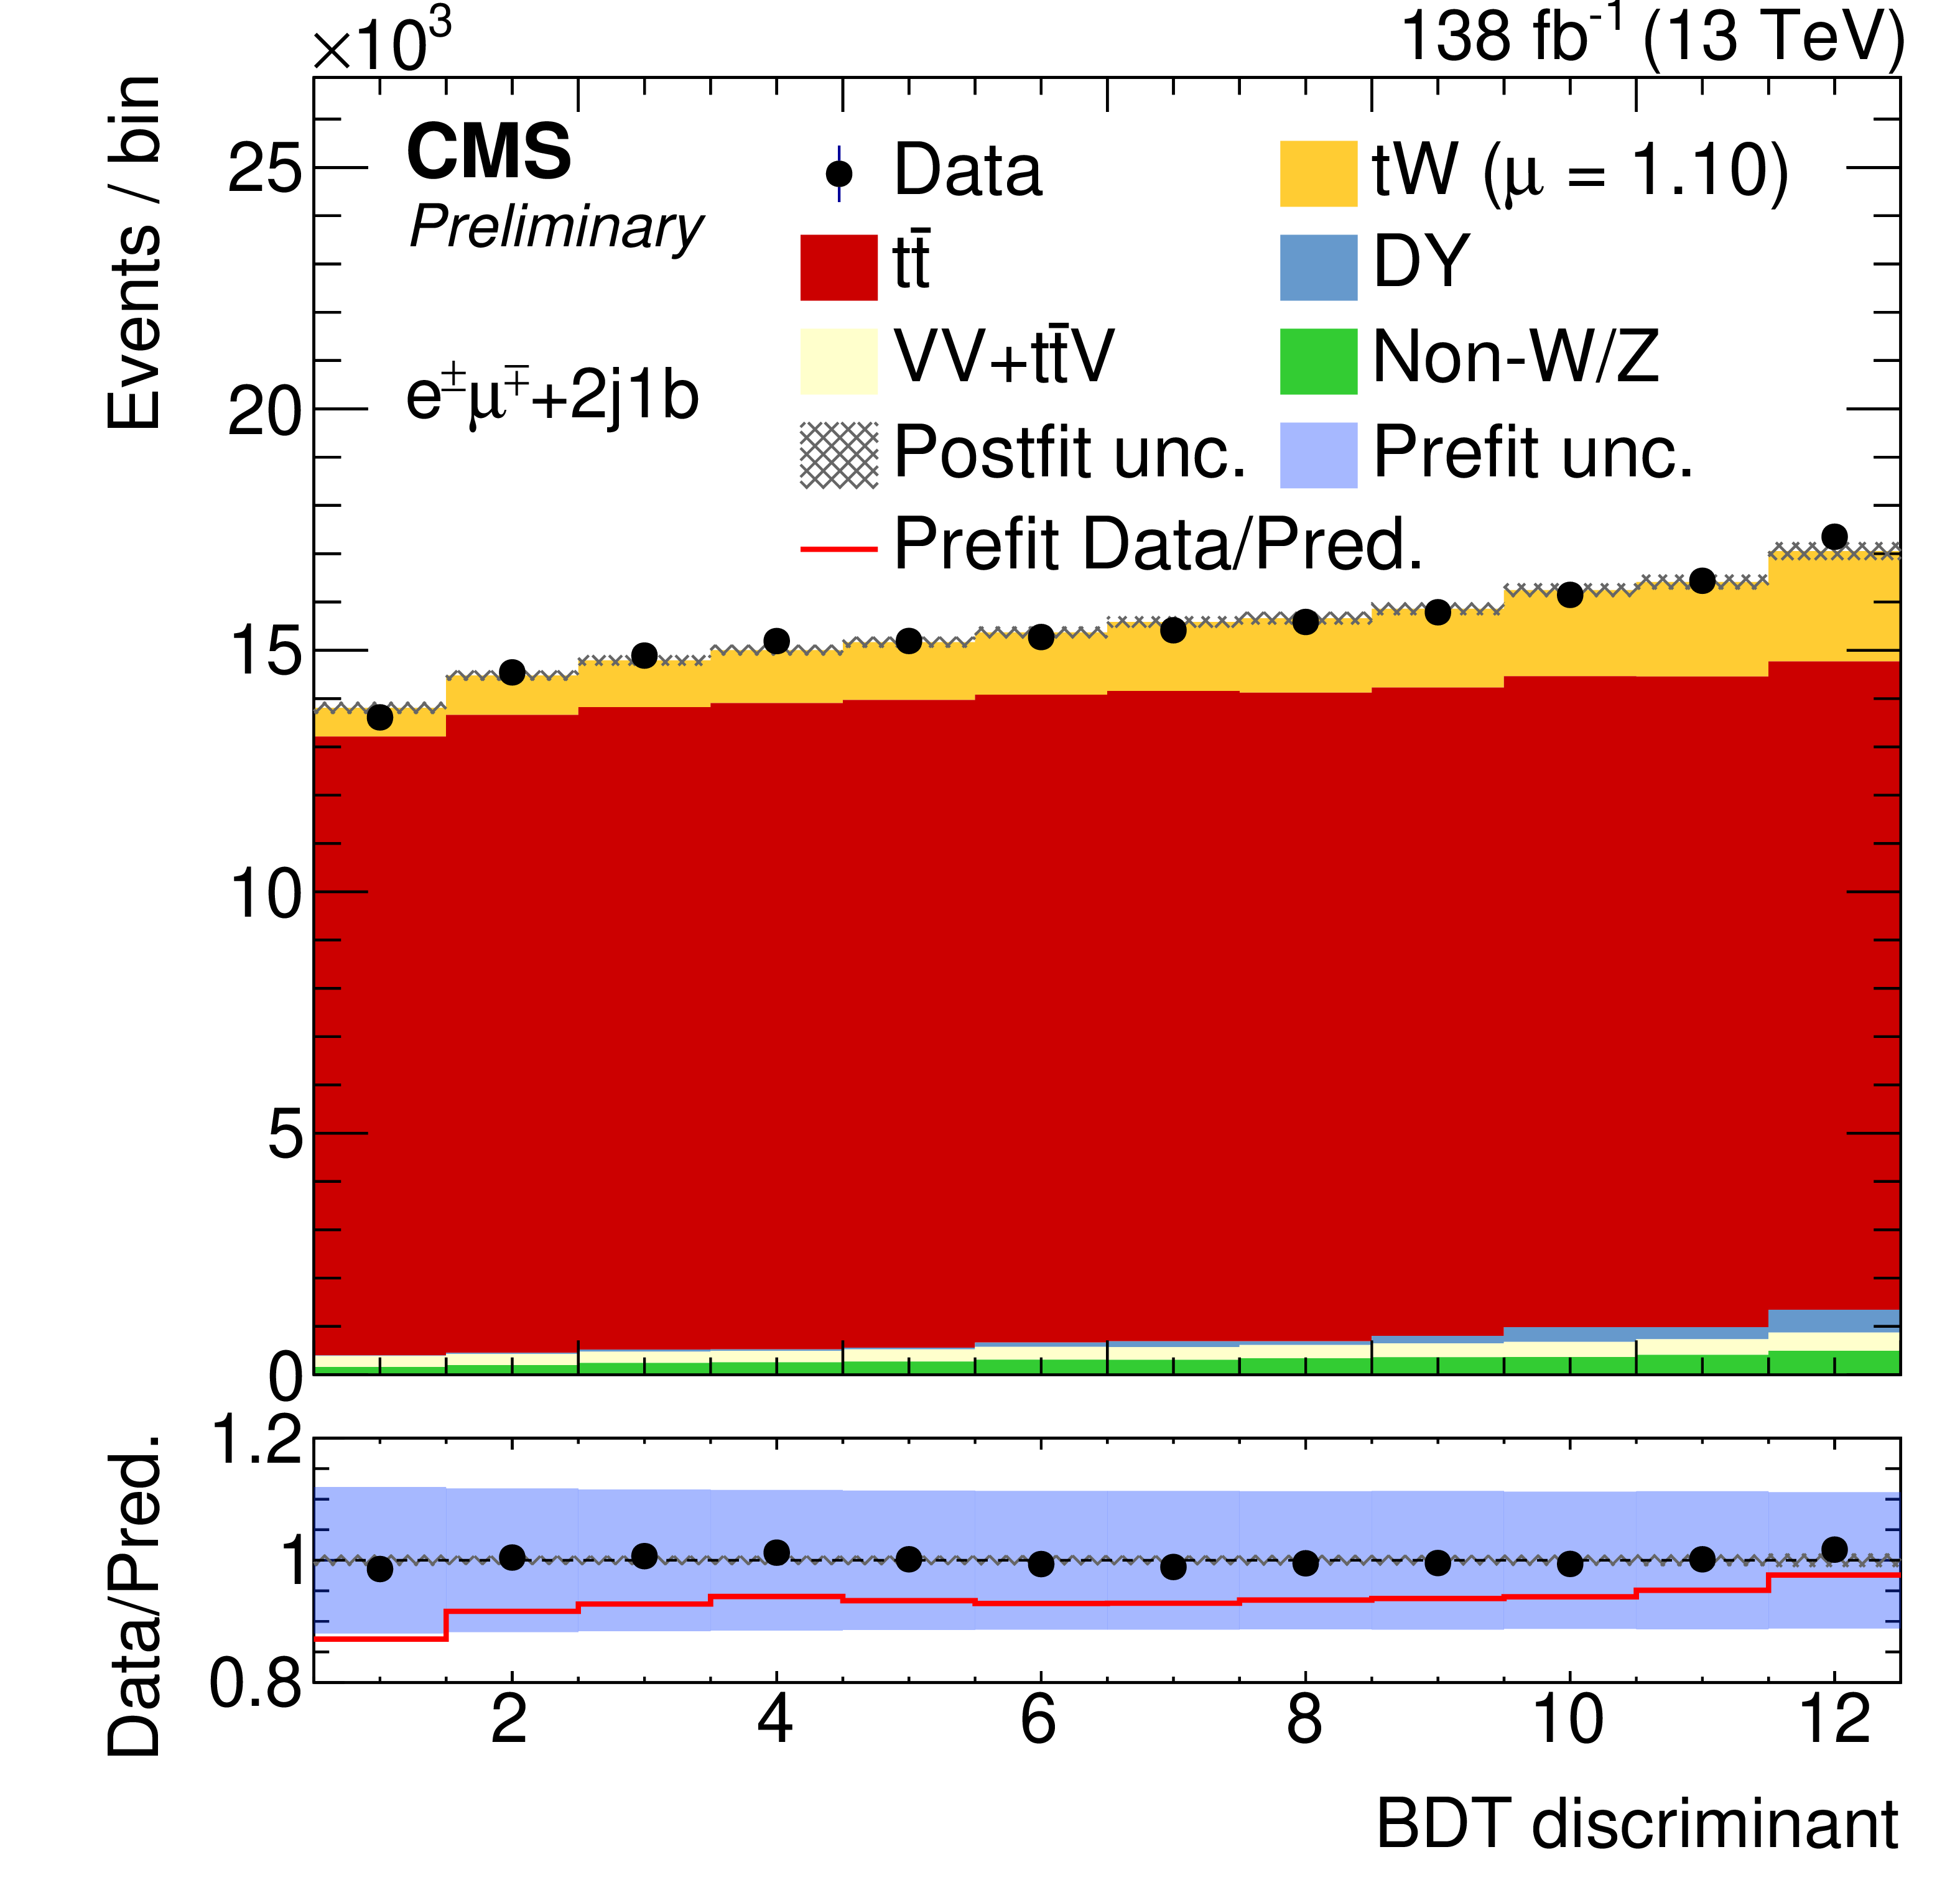
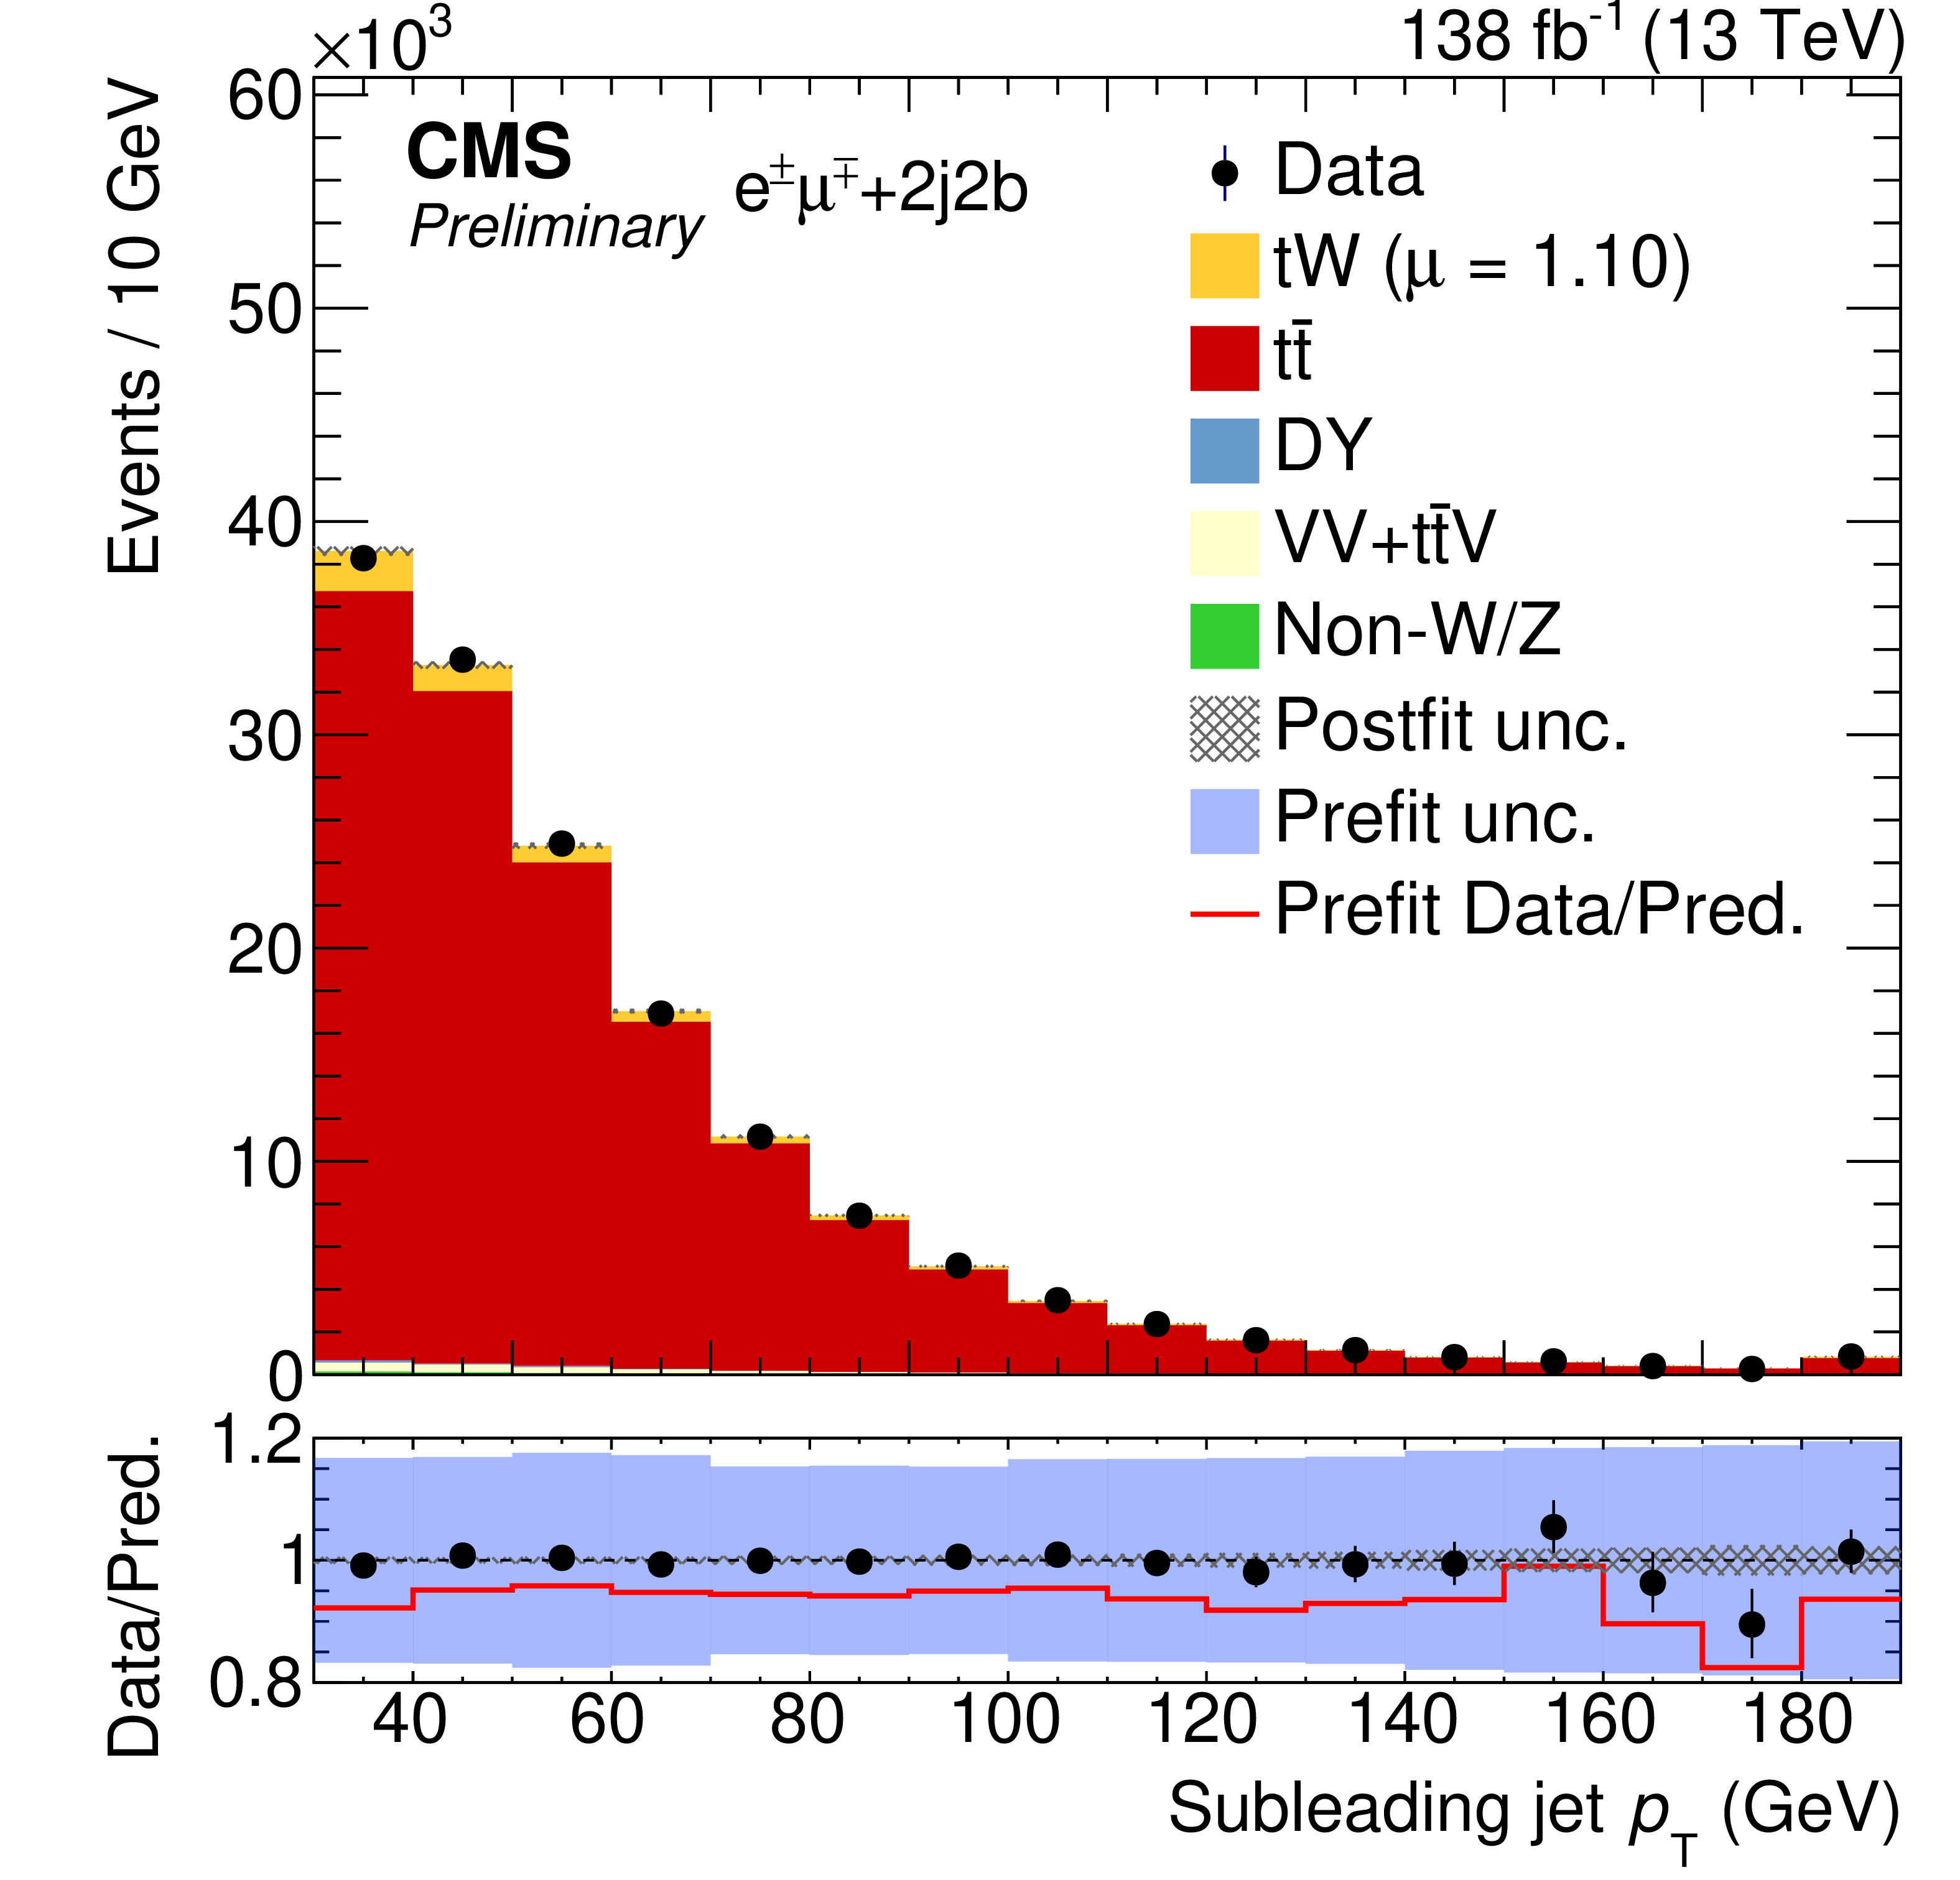
Figure 6:
Postfit distributions of the BDT output in the 1j1b (top left) and 2j1b (top right) regions and the data-MC comparison of the subleading jet ${p_{\mathrm {T}}}$ in the 2j2b region (bottom). The uncertainty band includes the statistical and systematic sources. The bottom of each panel shows the ratios of data to the prediction from simulations (red line) and from the fit (points), together with their corresponding uncertainties (solid and hatched band, respectively). |
png pdf |
Figure 6-a:
Postfit distributions of the BDT output in the 1j1b (top left) and 2j1b (top right) regions and the data-MC comparison of the subleading jet ${p_{\mathrm {T}}}$ in the 2j2b region (bottom). The uncertainty band includes the statistical and systematic sources. The bottom of each panel shows the ratios of data to the prediction from simulations (red line) and from the fit (points), together with their corresponding uncertainties (solid and hatched band, respectively). |
png pdf |
Figure 6-b:
Postfit distributions of the BDT output in the 1j1b (top left) and 2j1b (top right) regions and the data-MC comparison of the subleading jet ${p_{\mathrm {T}}}$ in the 2j2b region (bottom). The uncertainty band includes the statistical and systematic sources. The bottom of each panel shows the ratios of data to the prediction from simulations (red line) and from the fit (points), together with their corresponding uncertainties (solid and hatched band, respectively). |
png pdf |
Figure 6-c:
Postfit distributions of the BDT output in the 1j1b (top left) and 2j1b (top right) regions and the data-MC comparison of the subleading jet ${p_{\mathrm {T}}}$ in the 2j2b region (bottom). The uncertainty band includes the statistical and systematic sources. The bottom of each panel shows the ratios of data to the prediction from simulations (red line) and from the fit (points), together with their corresponding uncertainties (solid and hatched band, respectively). |
png pdf |
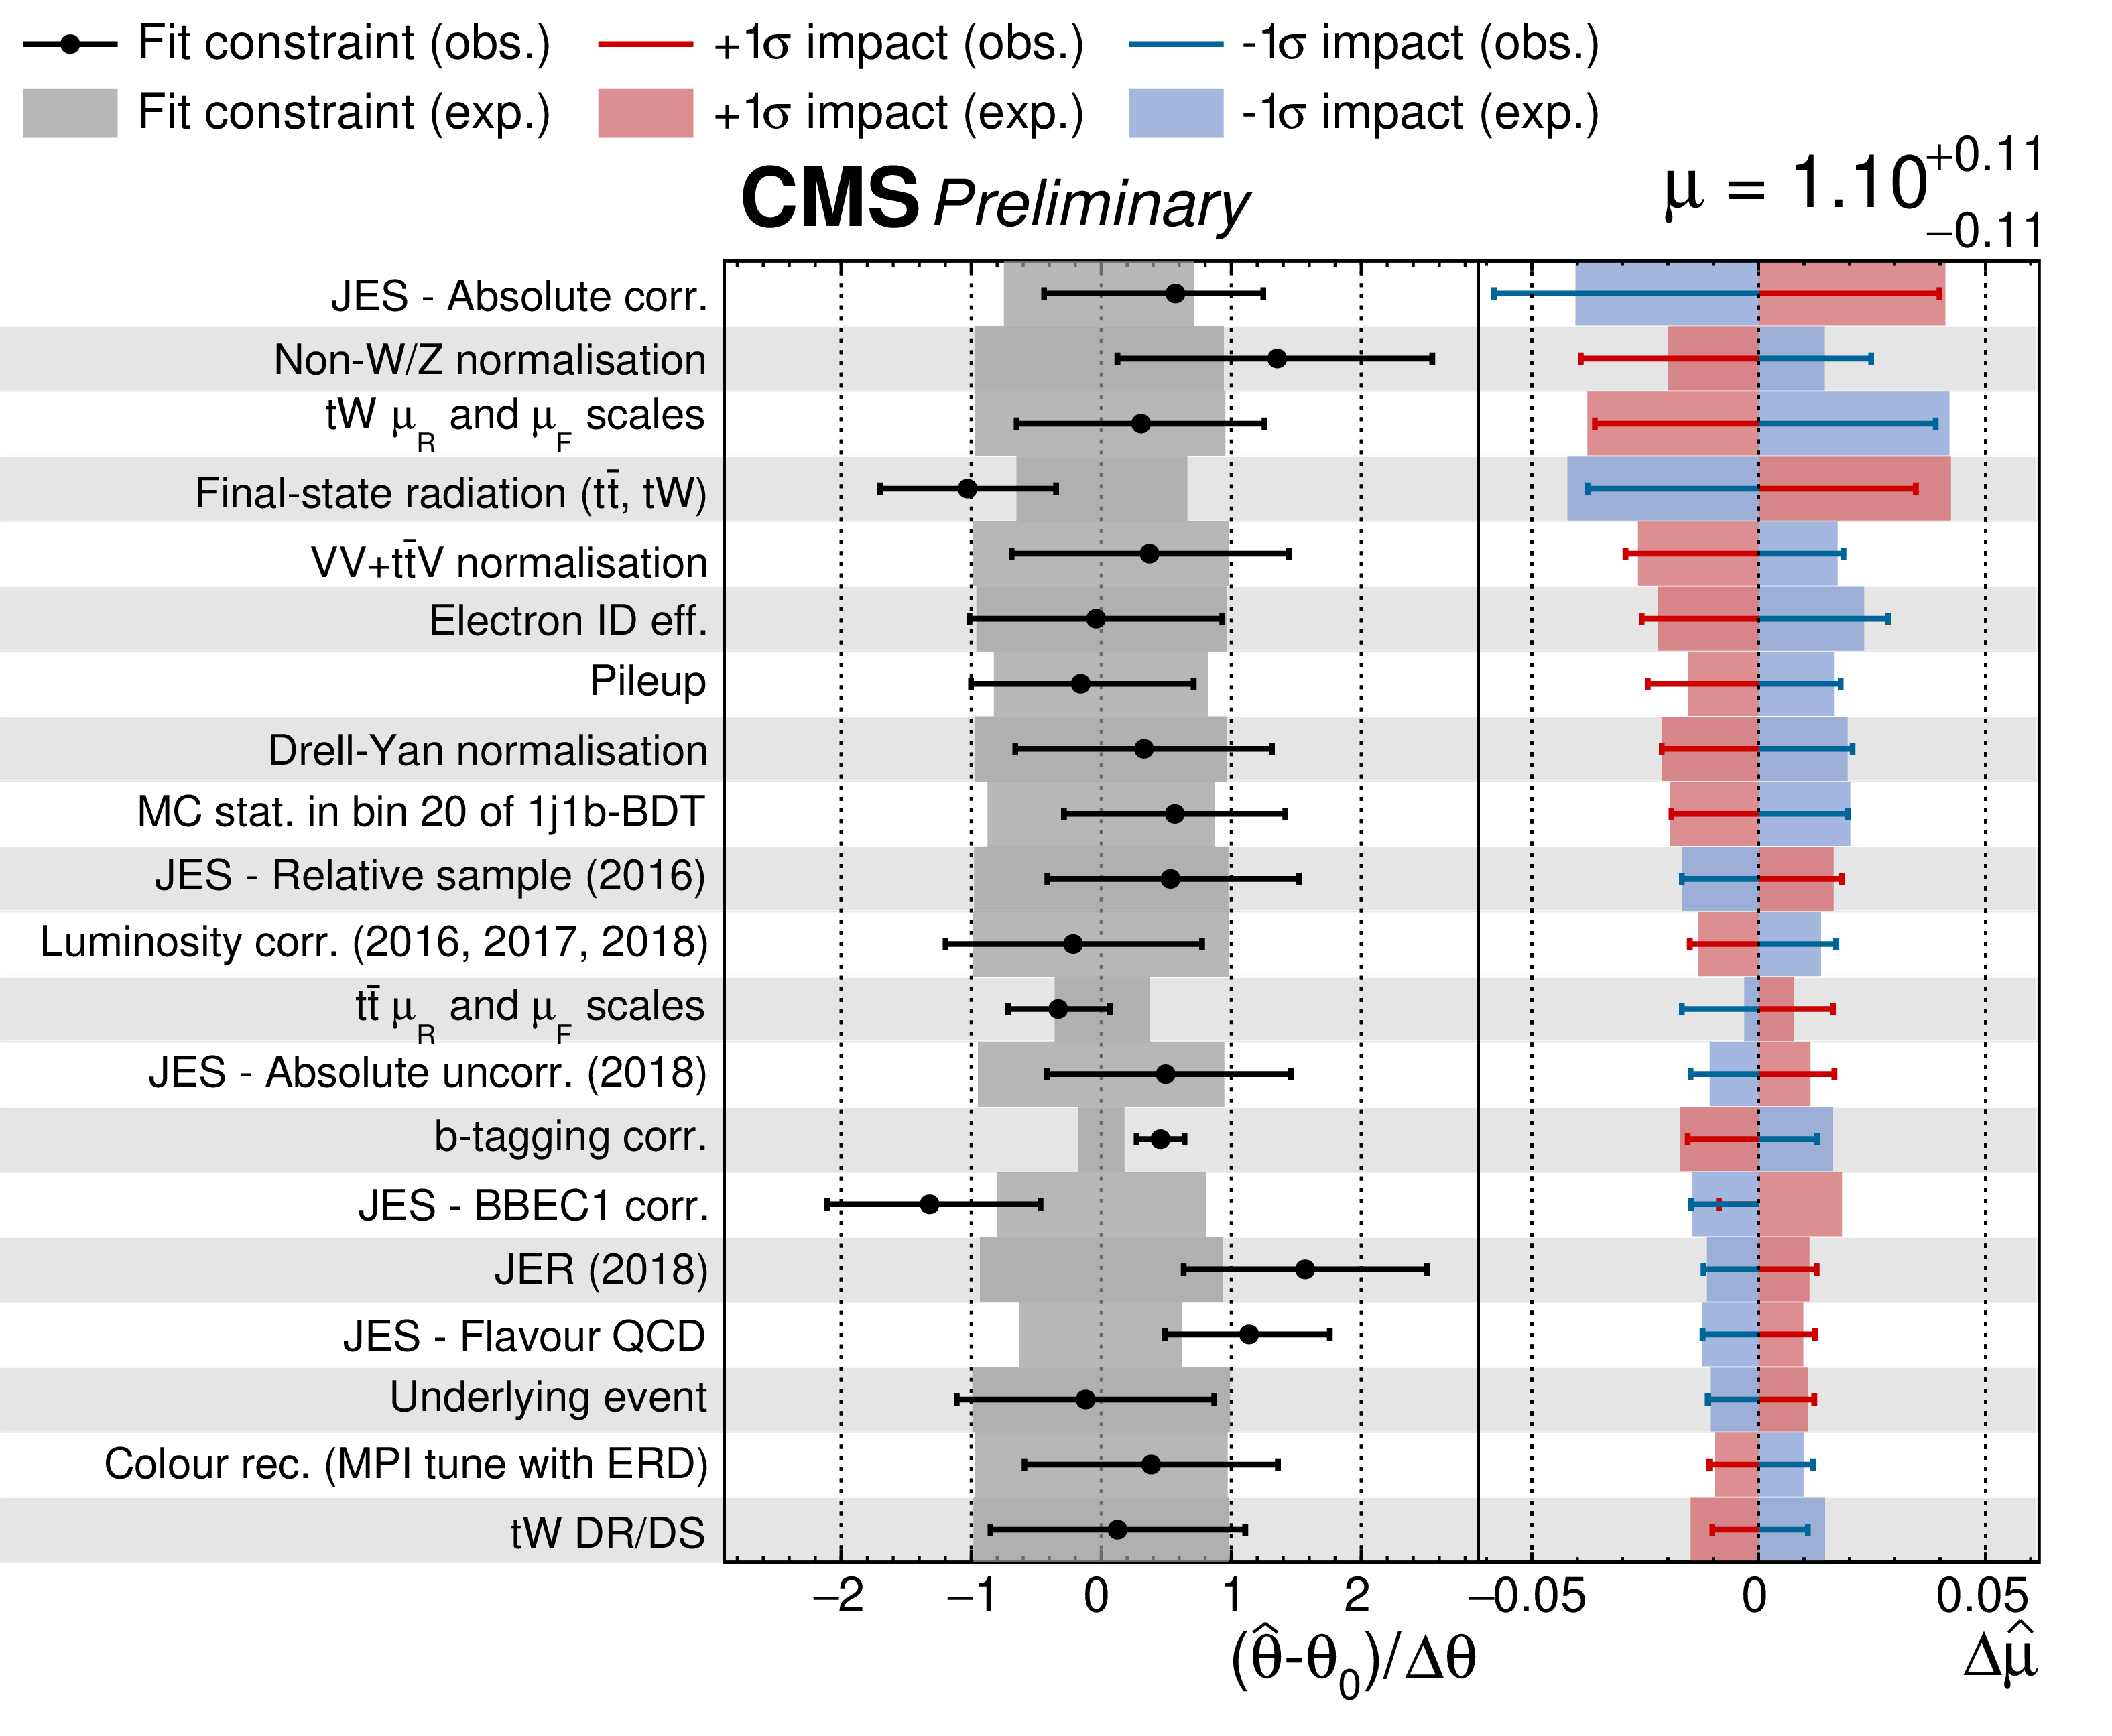
Figure 7:
Impact (right column) and pull (middle column) of the twenty dominating nuisance parameters (left column) in the ML fit used in the inclusive cross section measurement. The uncertainty bars of the pulls show the ratio between the postfit and prefit uncertainties giving effectively the constraint on the nuisance parameter. Corr. means the correlated component of the uncertainty over the three years and uncorr. the uncorrelated component for each year. The JES uncertainties are divided into several sources, where JES - Absolute groups contributions from scale corrections in the barrel, pileup corrections, and initial- (final-) state radiation corrections; JES - Relative sample encodes the uncertainty in the $\eta $ dependent calibration of the jets; JES - BBEC1 comes from the barrel (BB) and the first part of the endcaps (1.3 $ < |\eta | < $ 2.5; EC1) corrections from pileup removal and also a contribution from scale corrections in the barrel; and JES - Flavour QCD comes from the corrections applied to correct the different detector response to gluon and quark jets. |
png pdf |
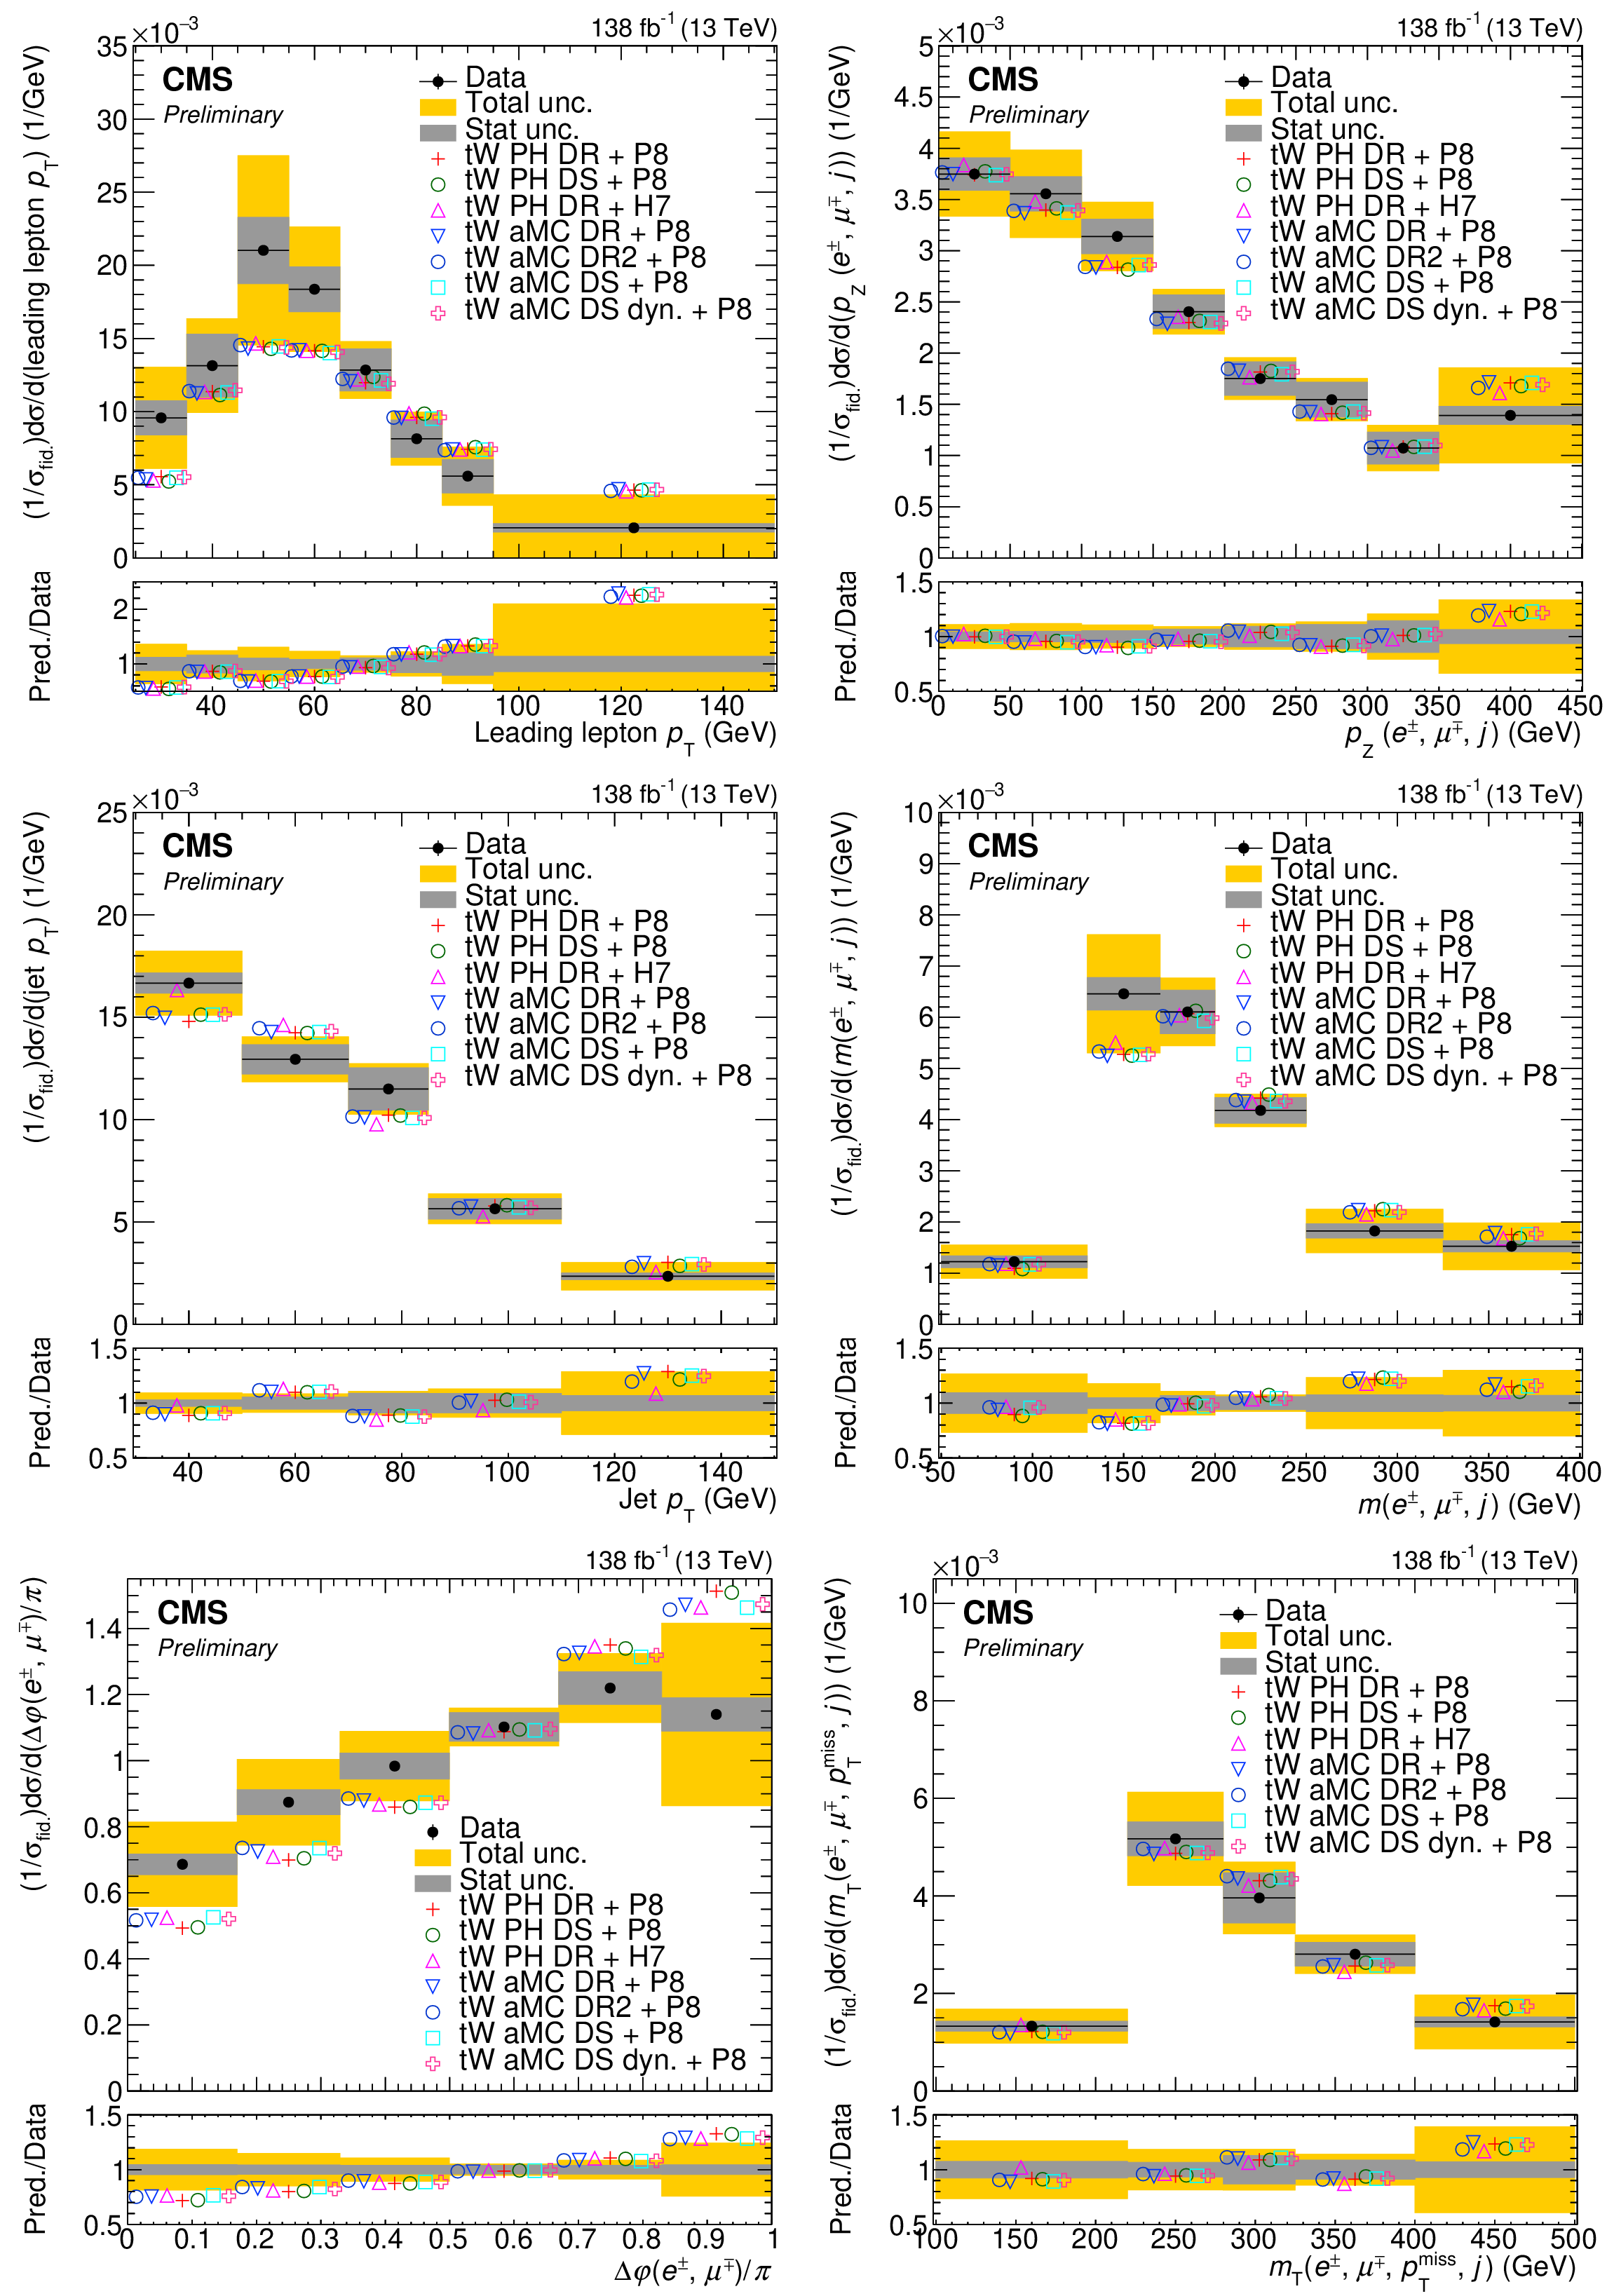
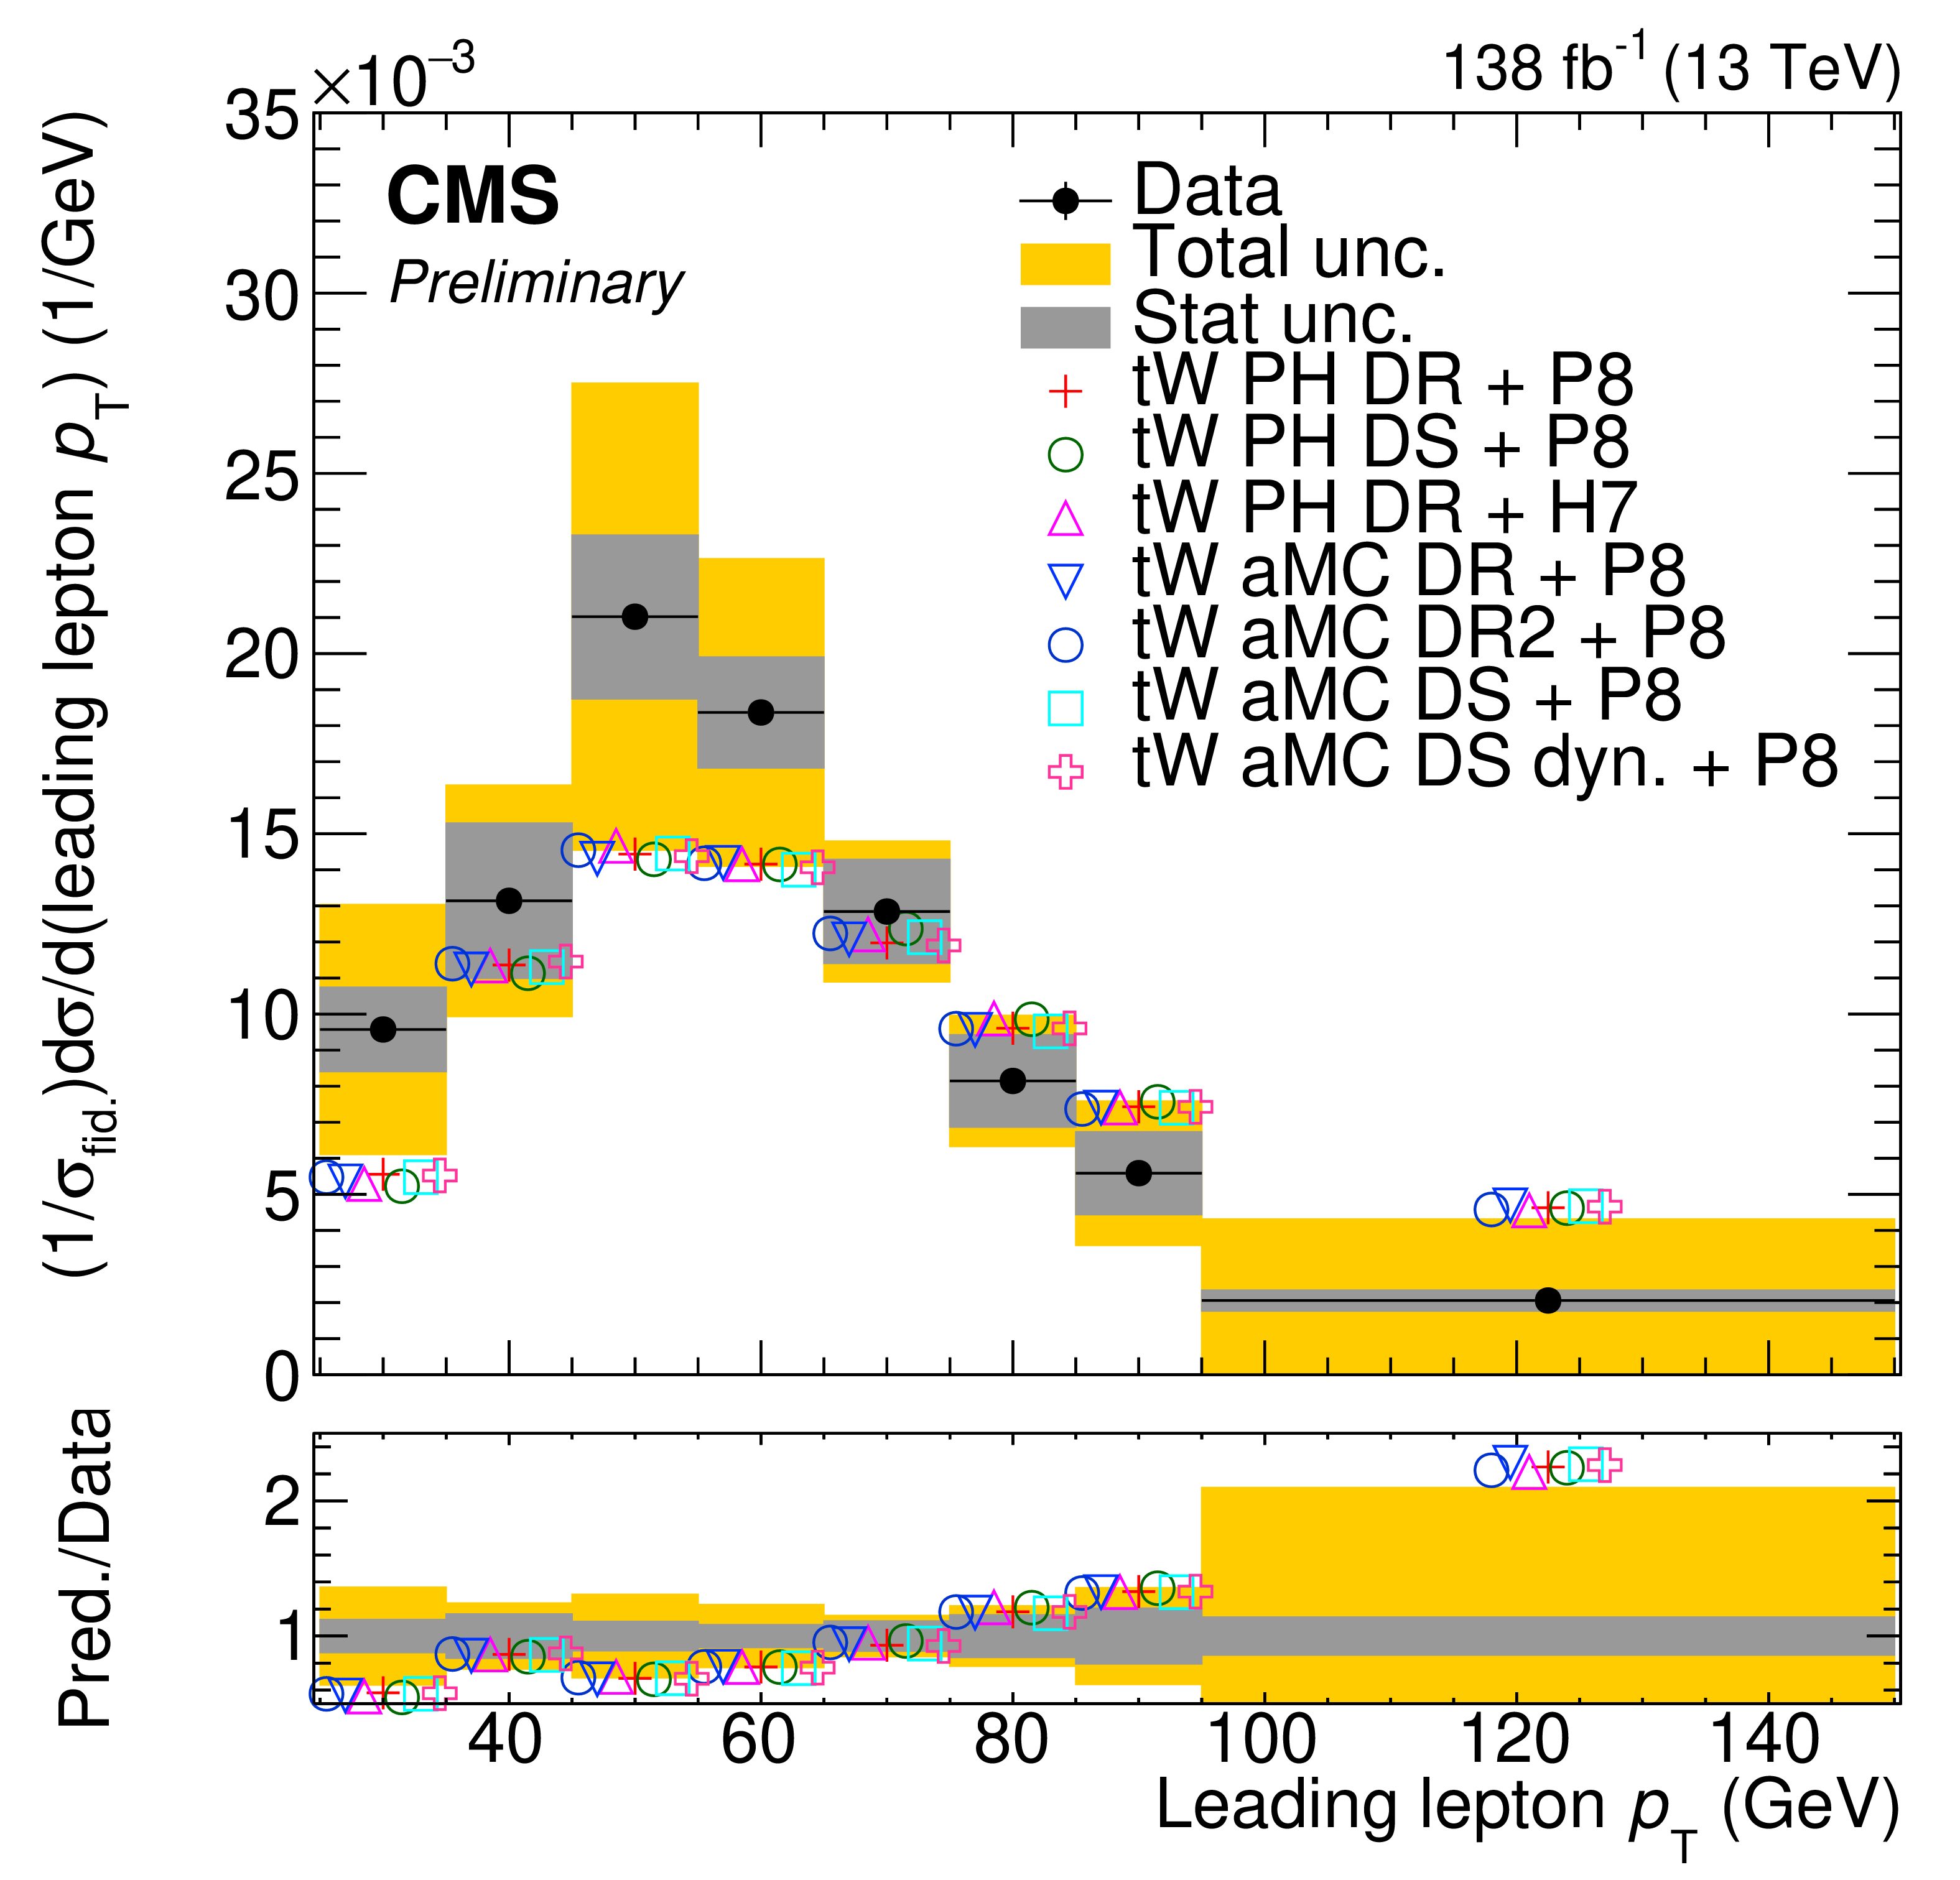
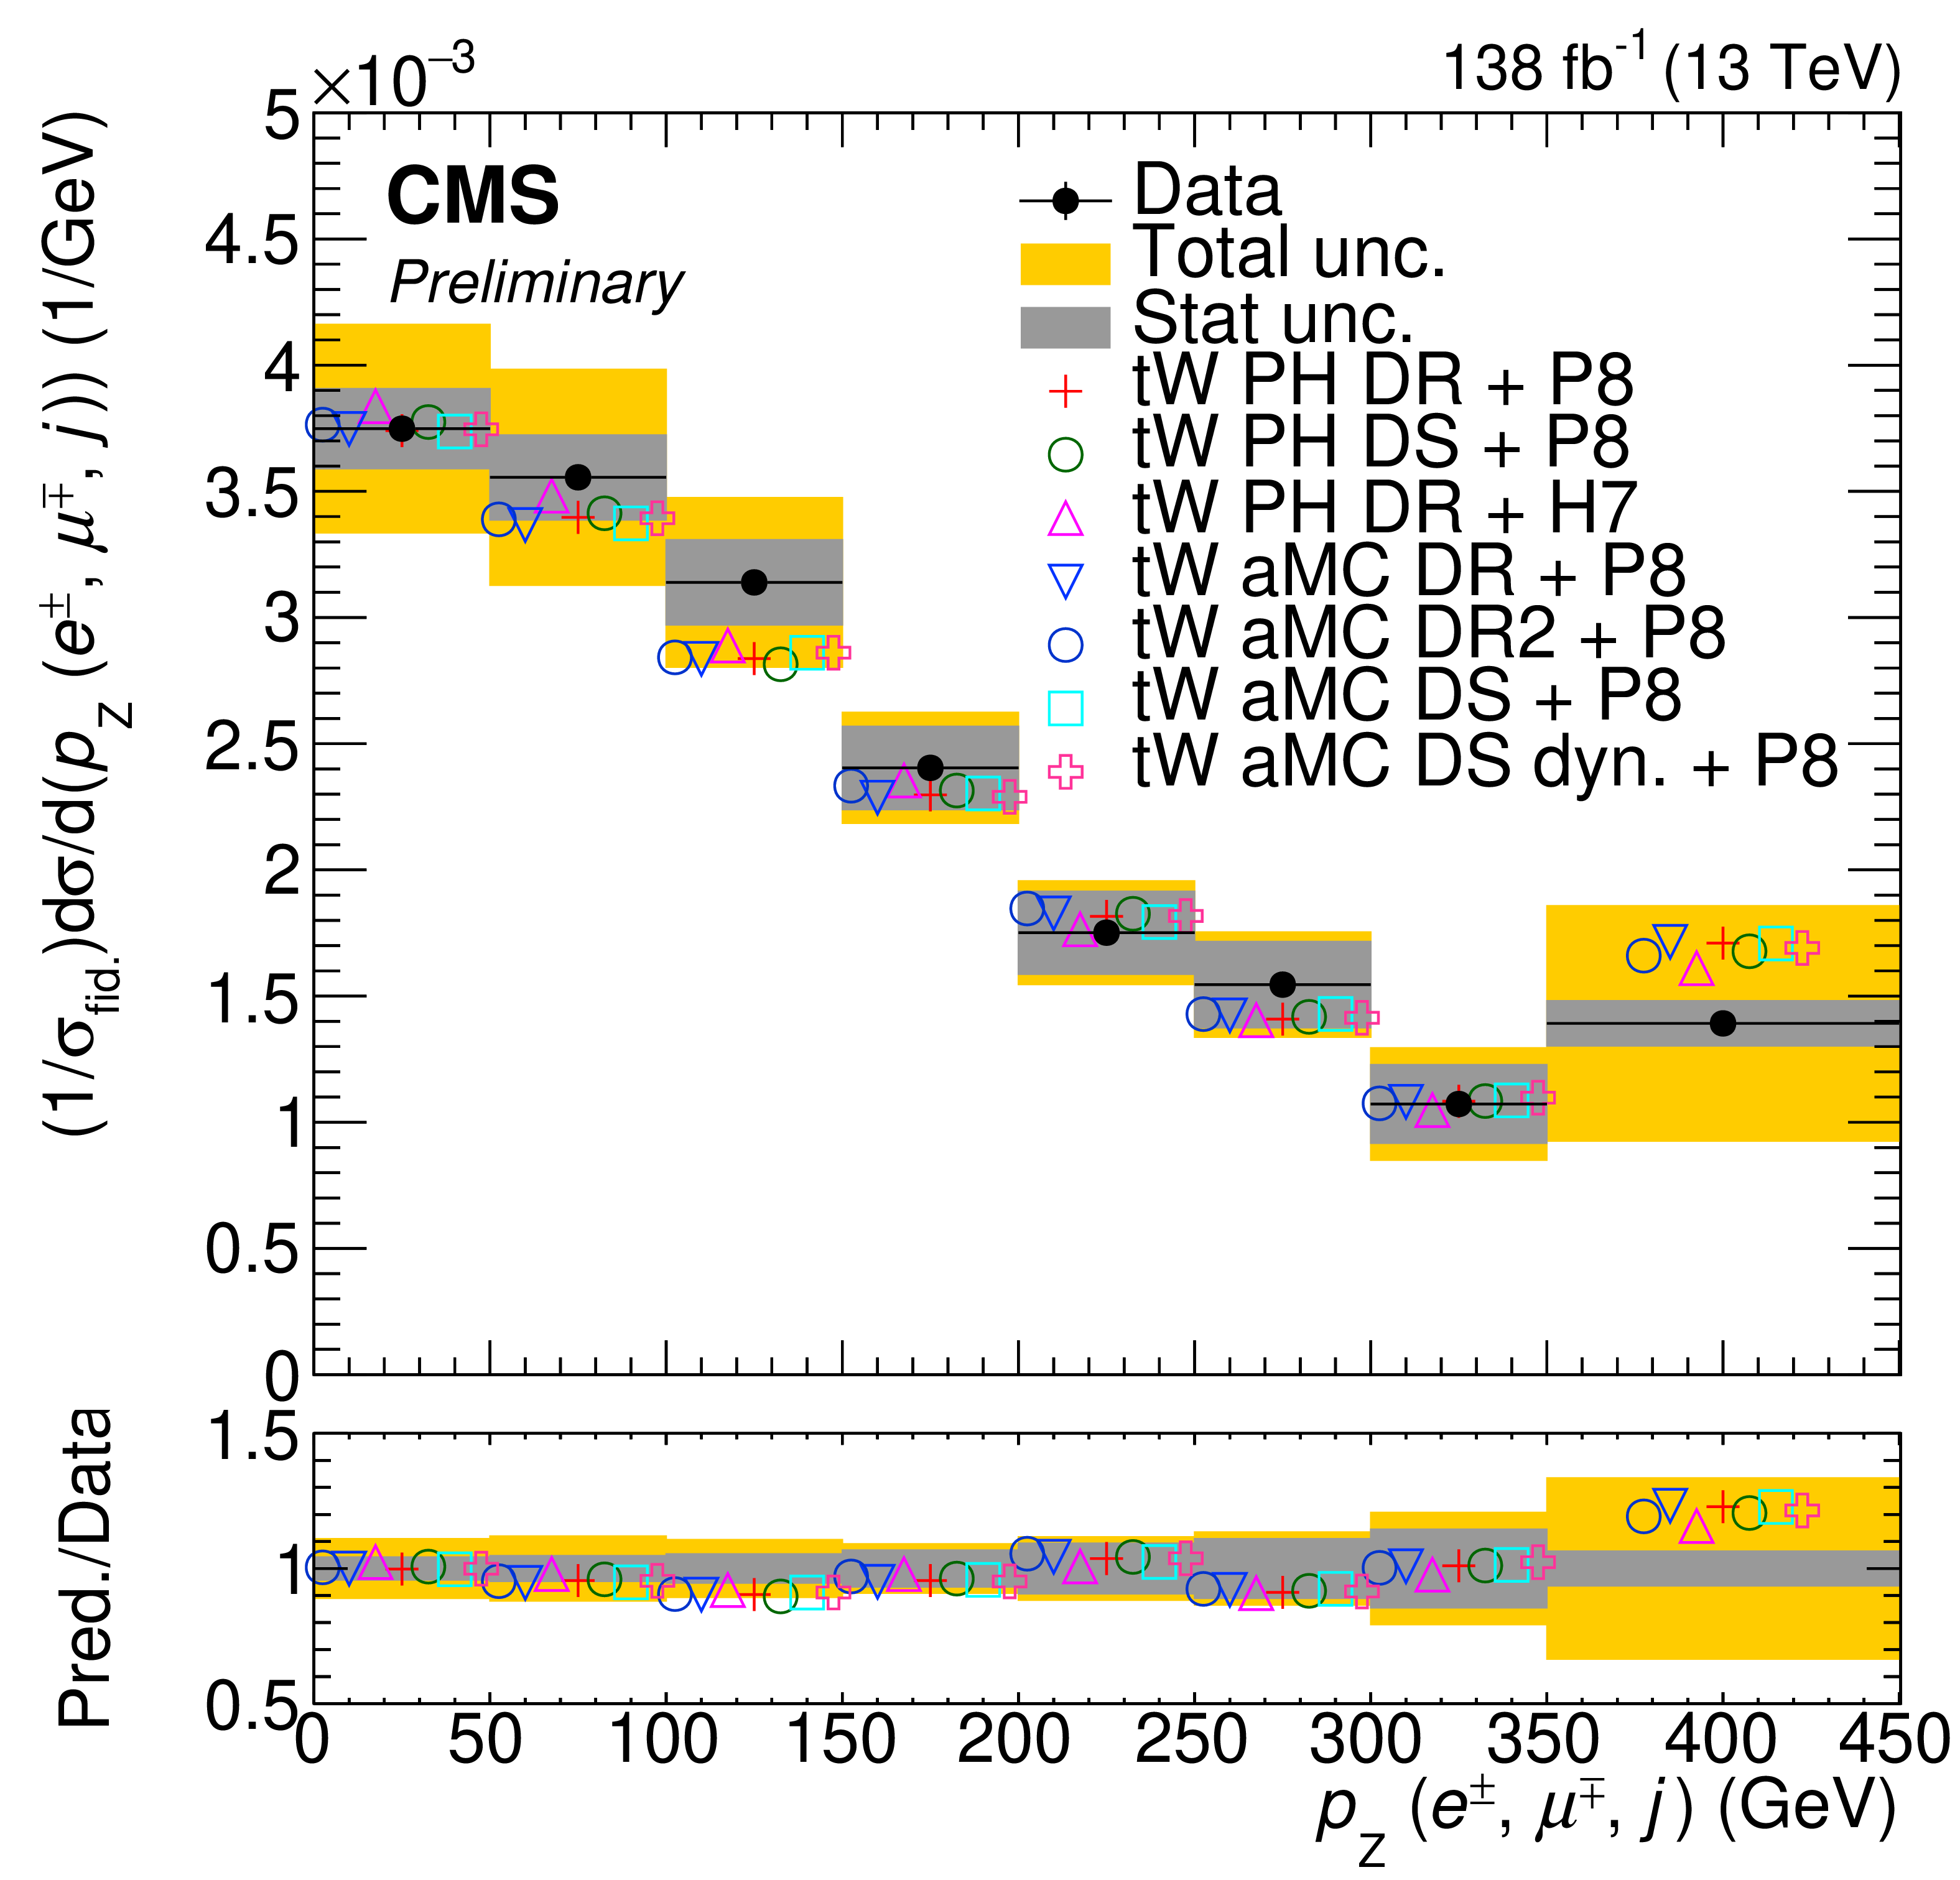
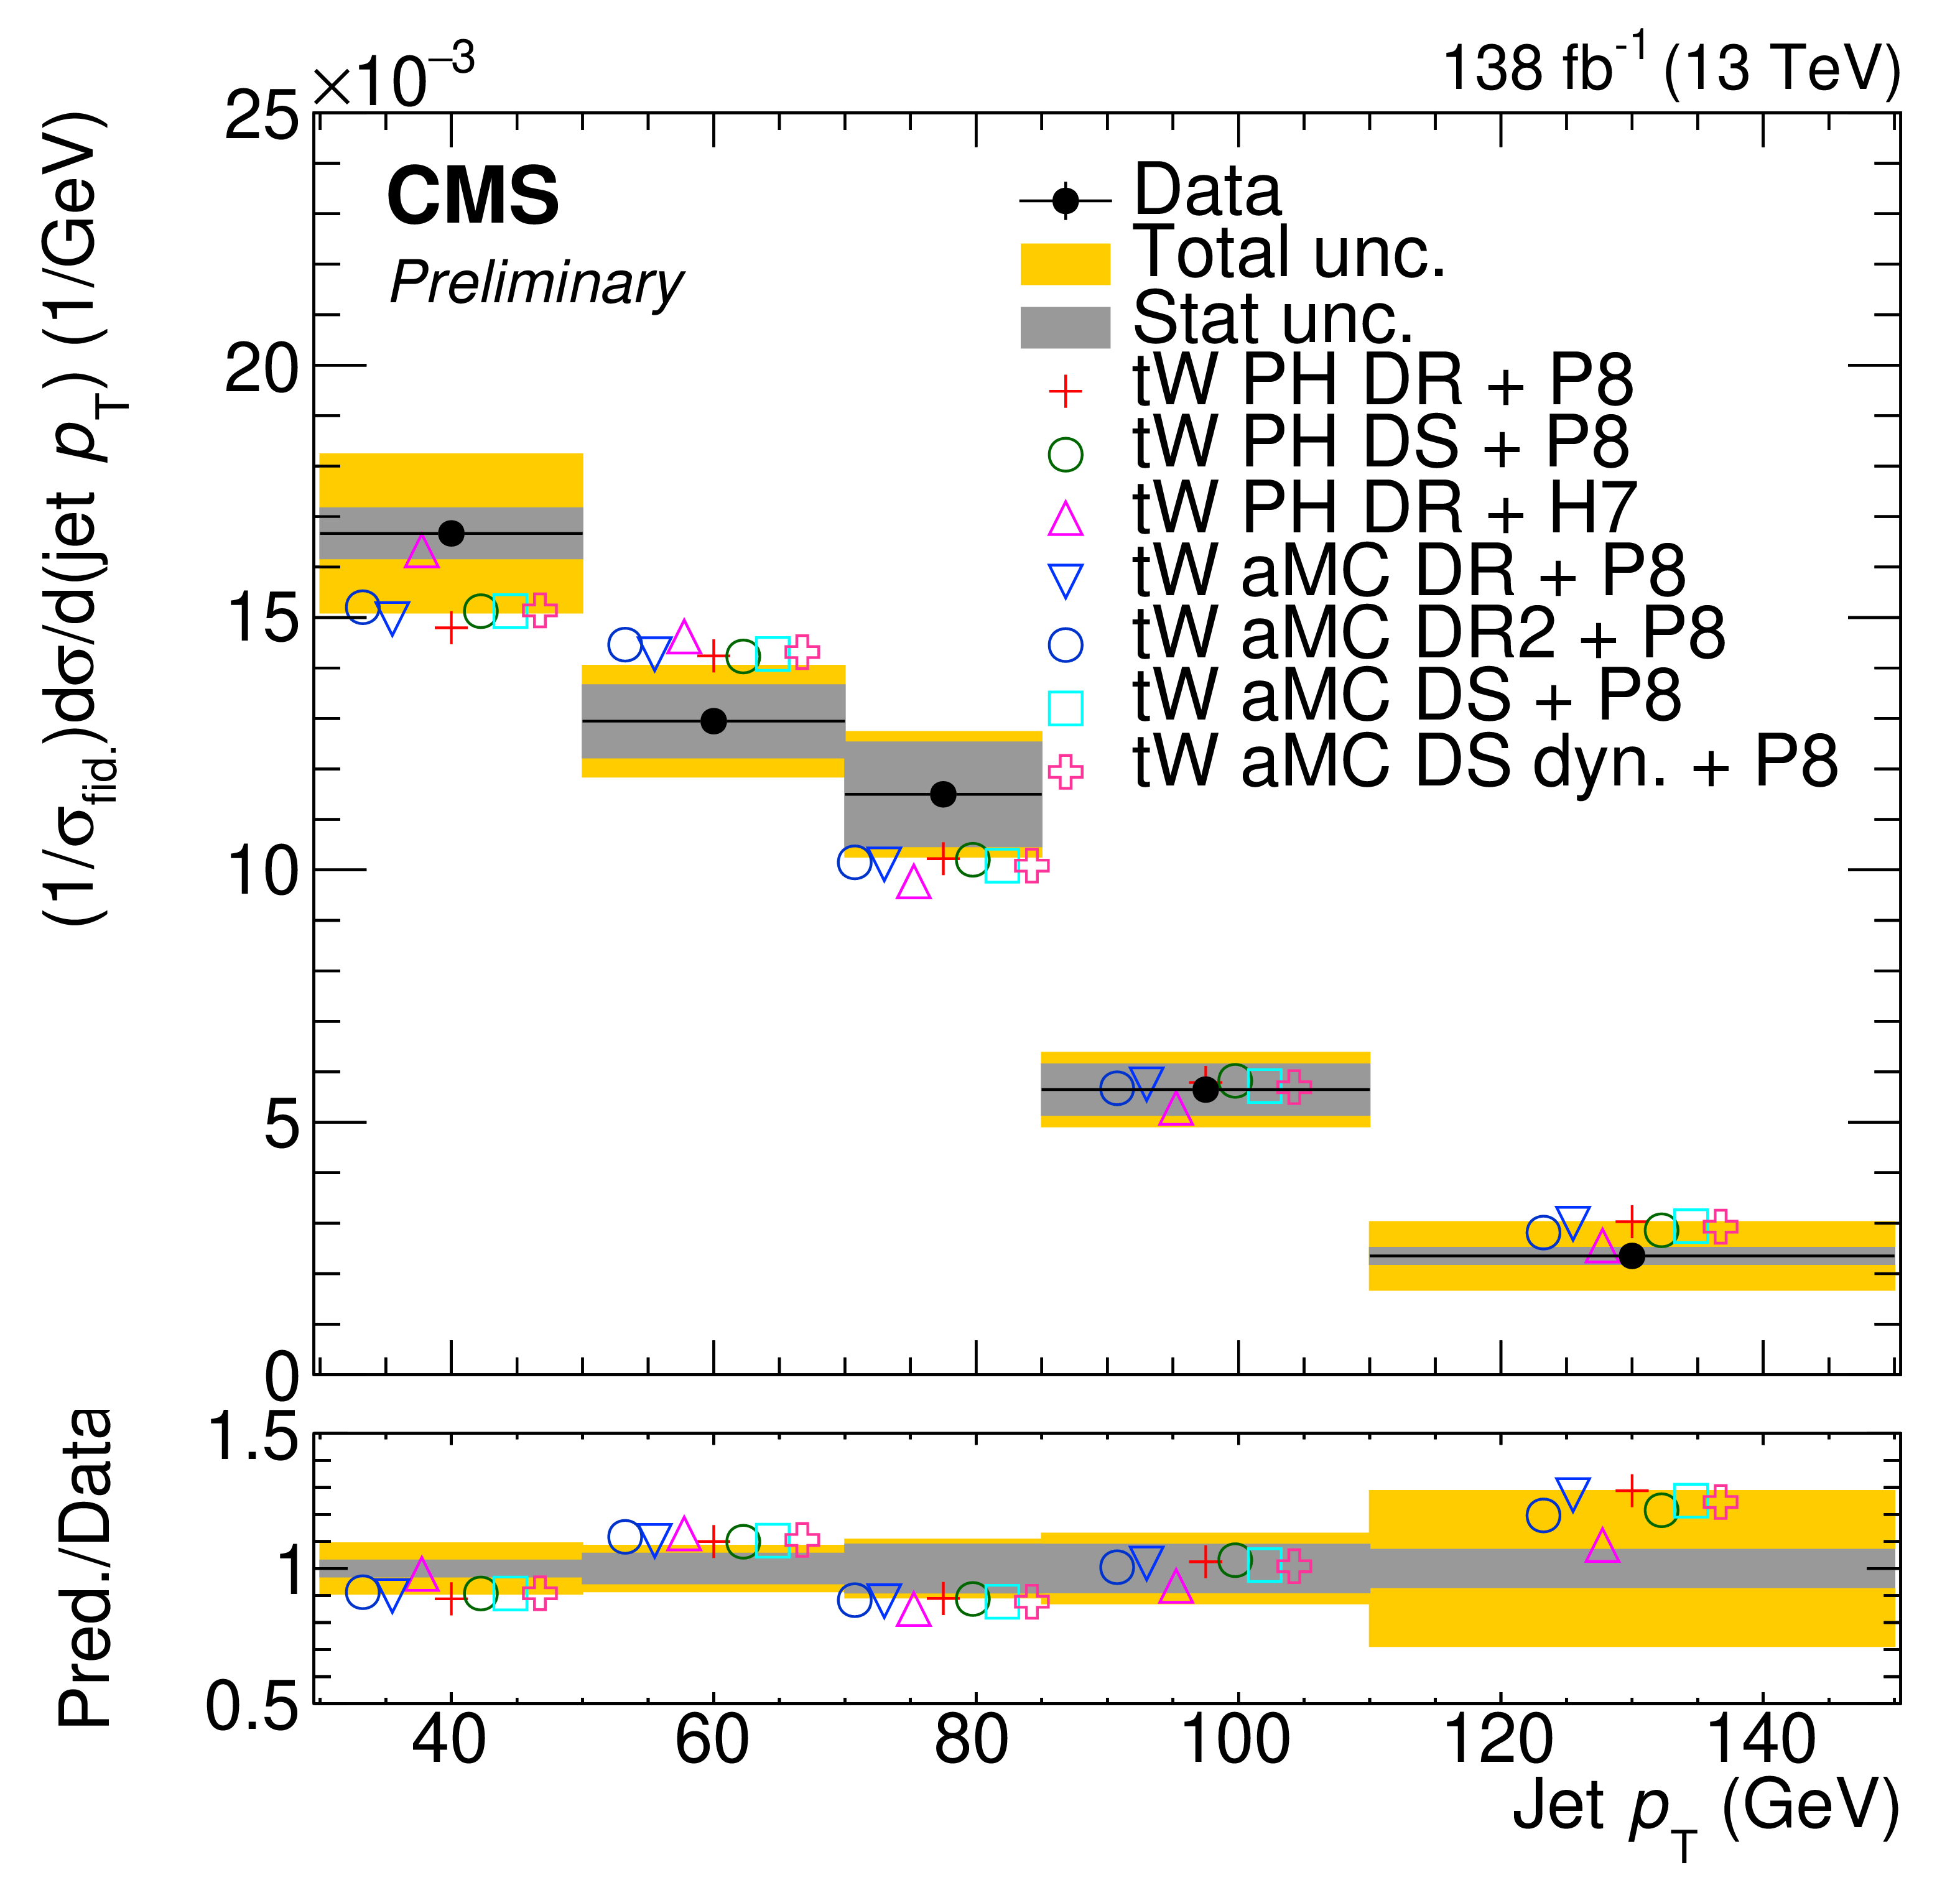
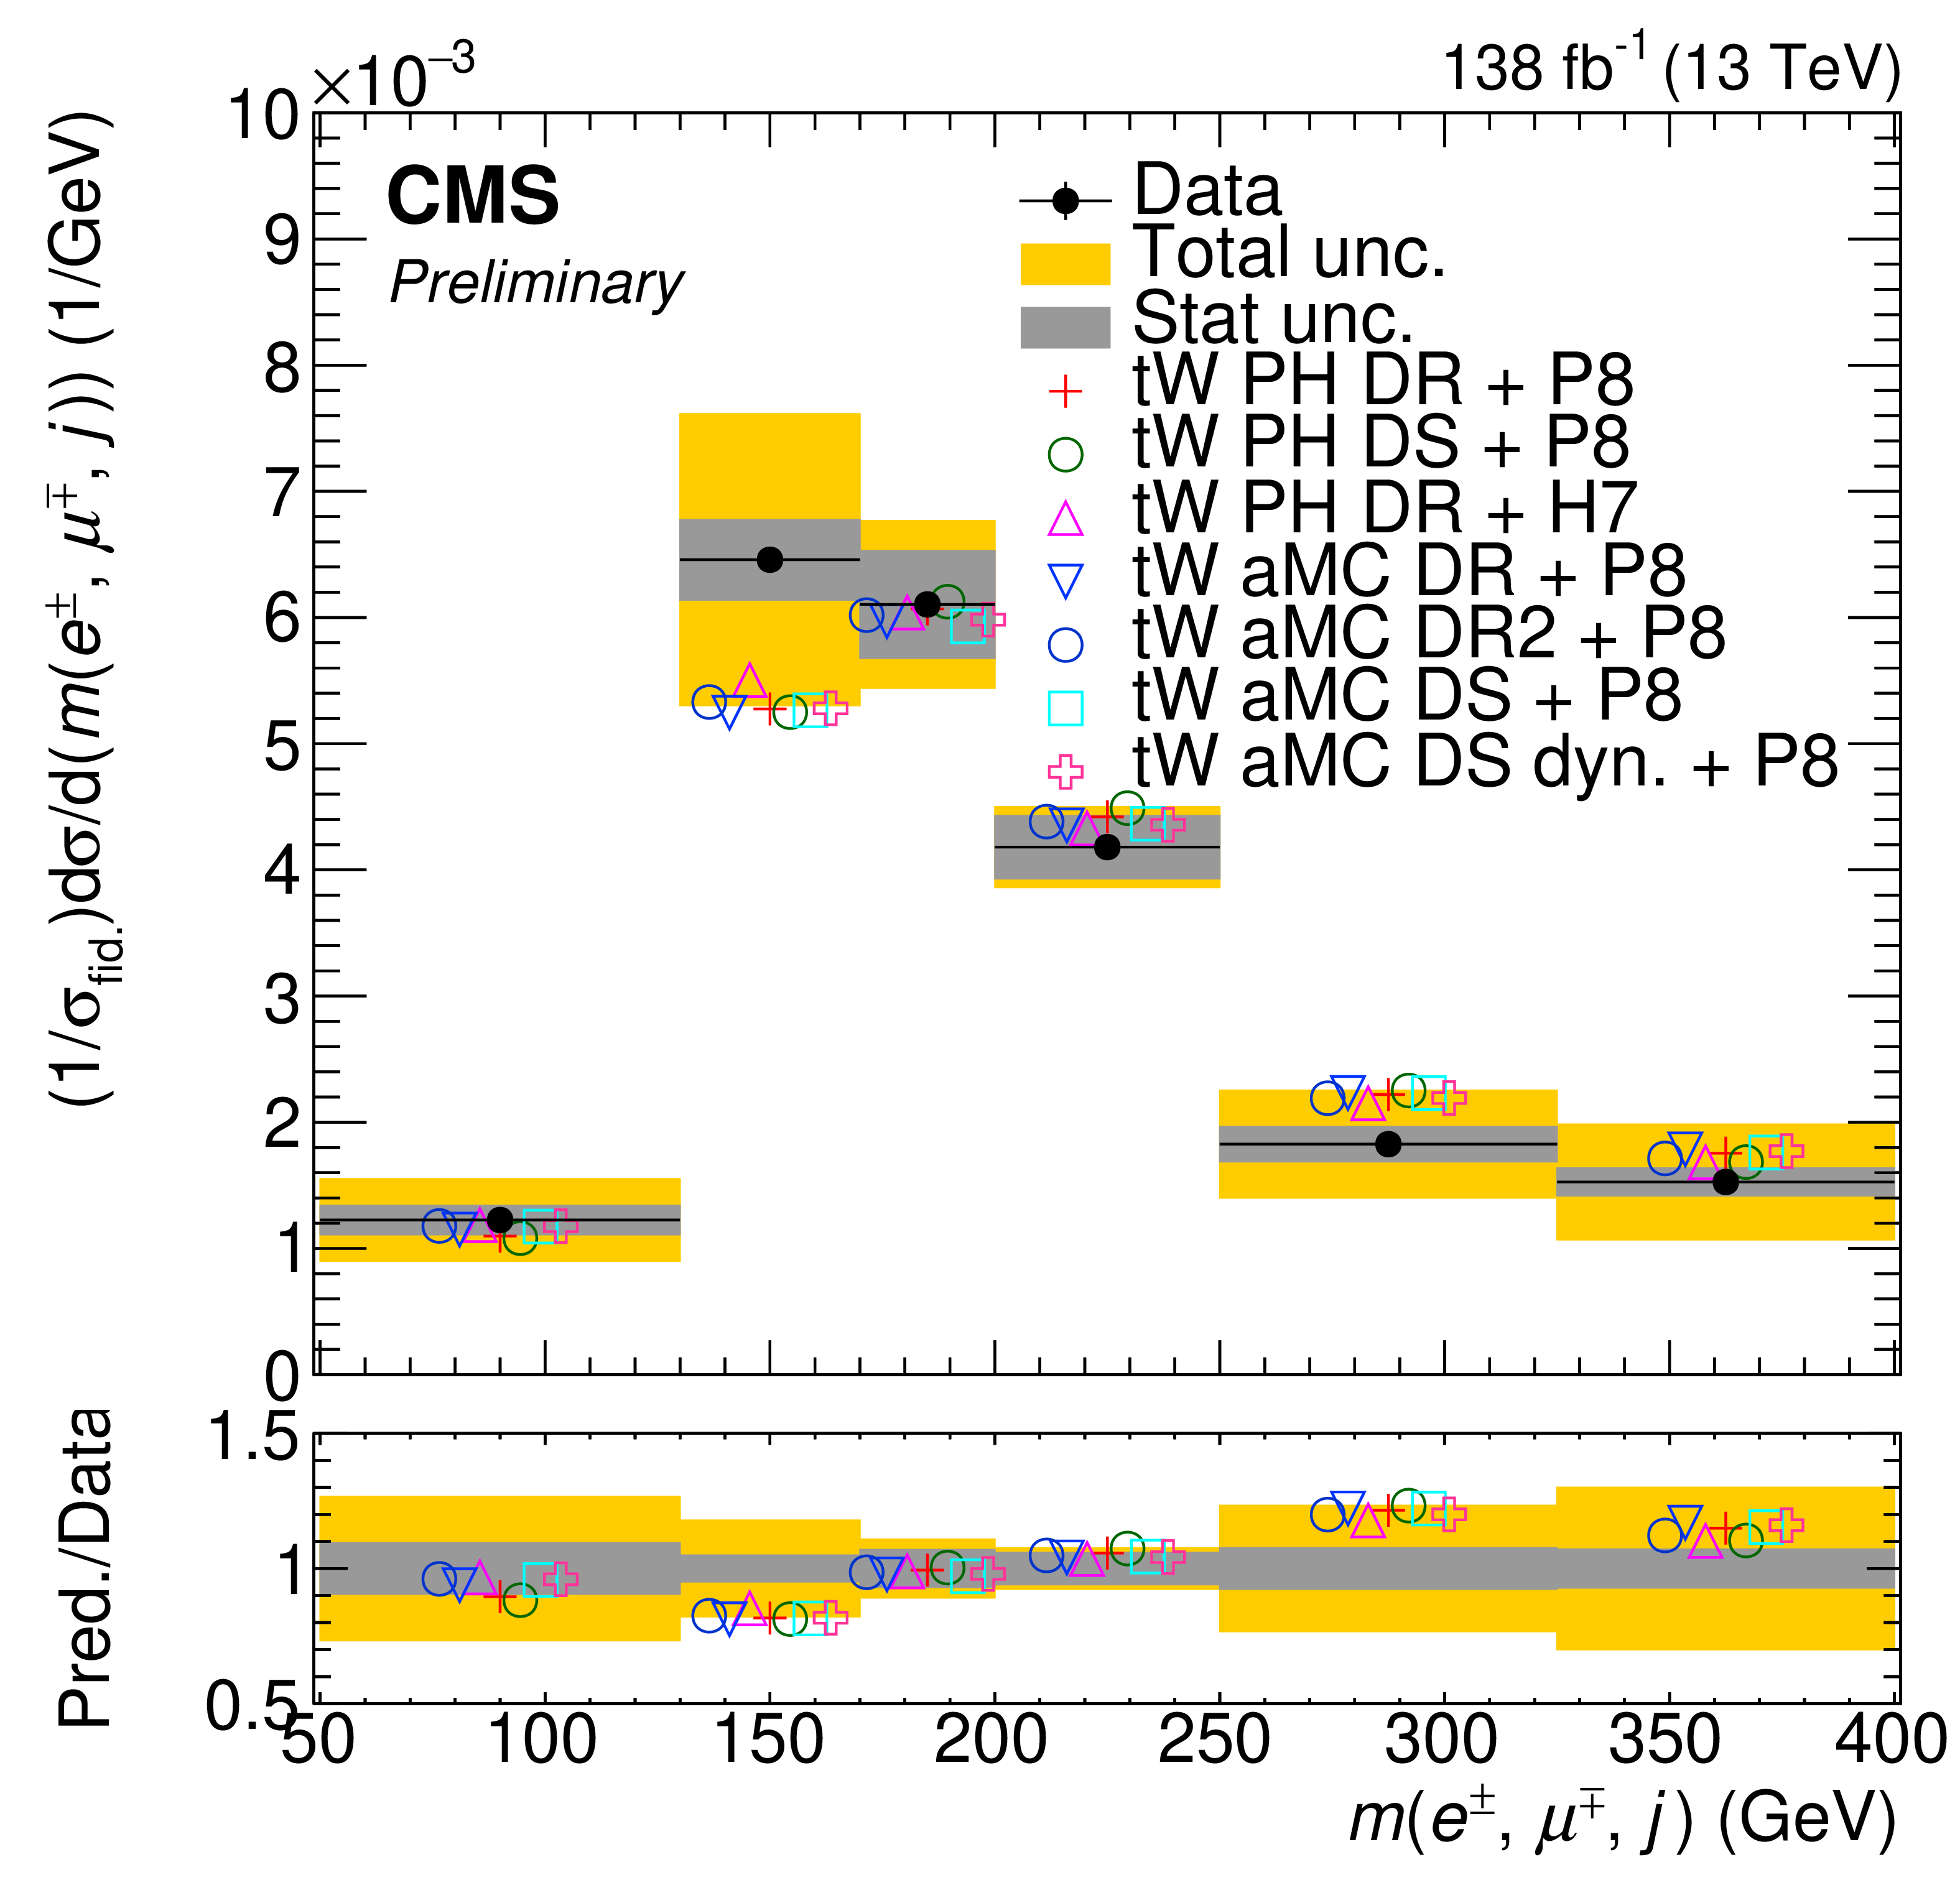
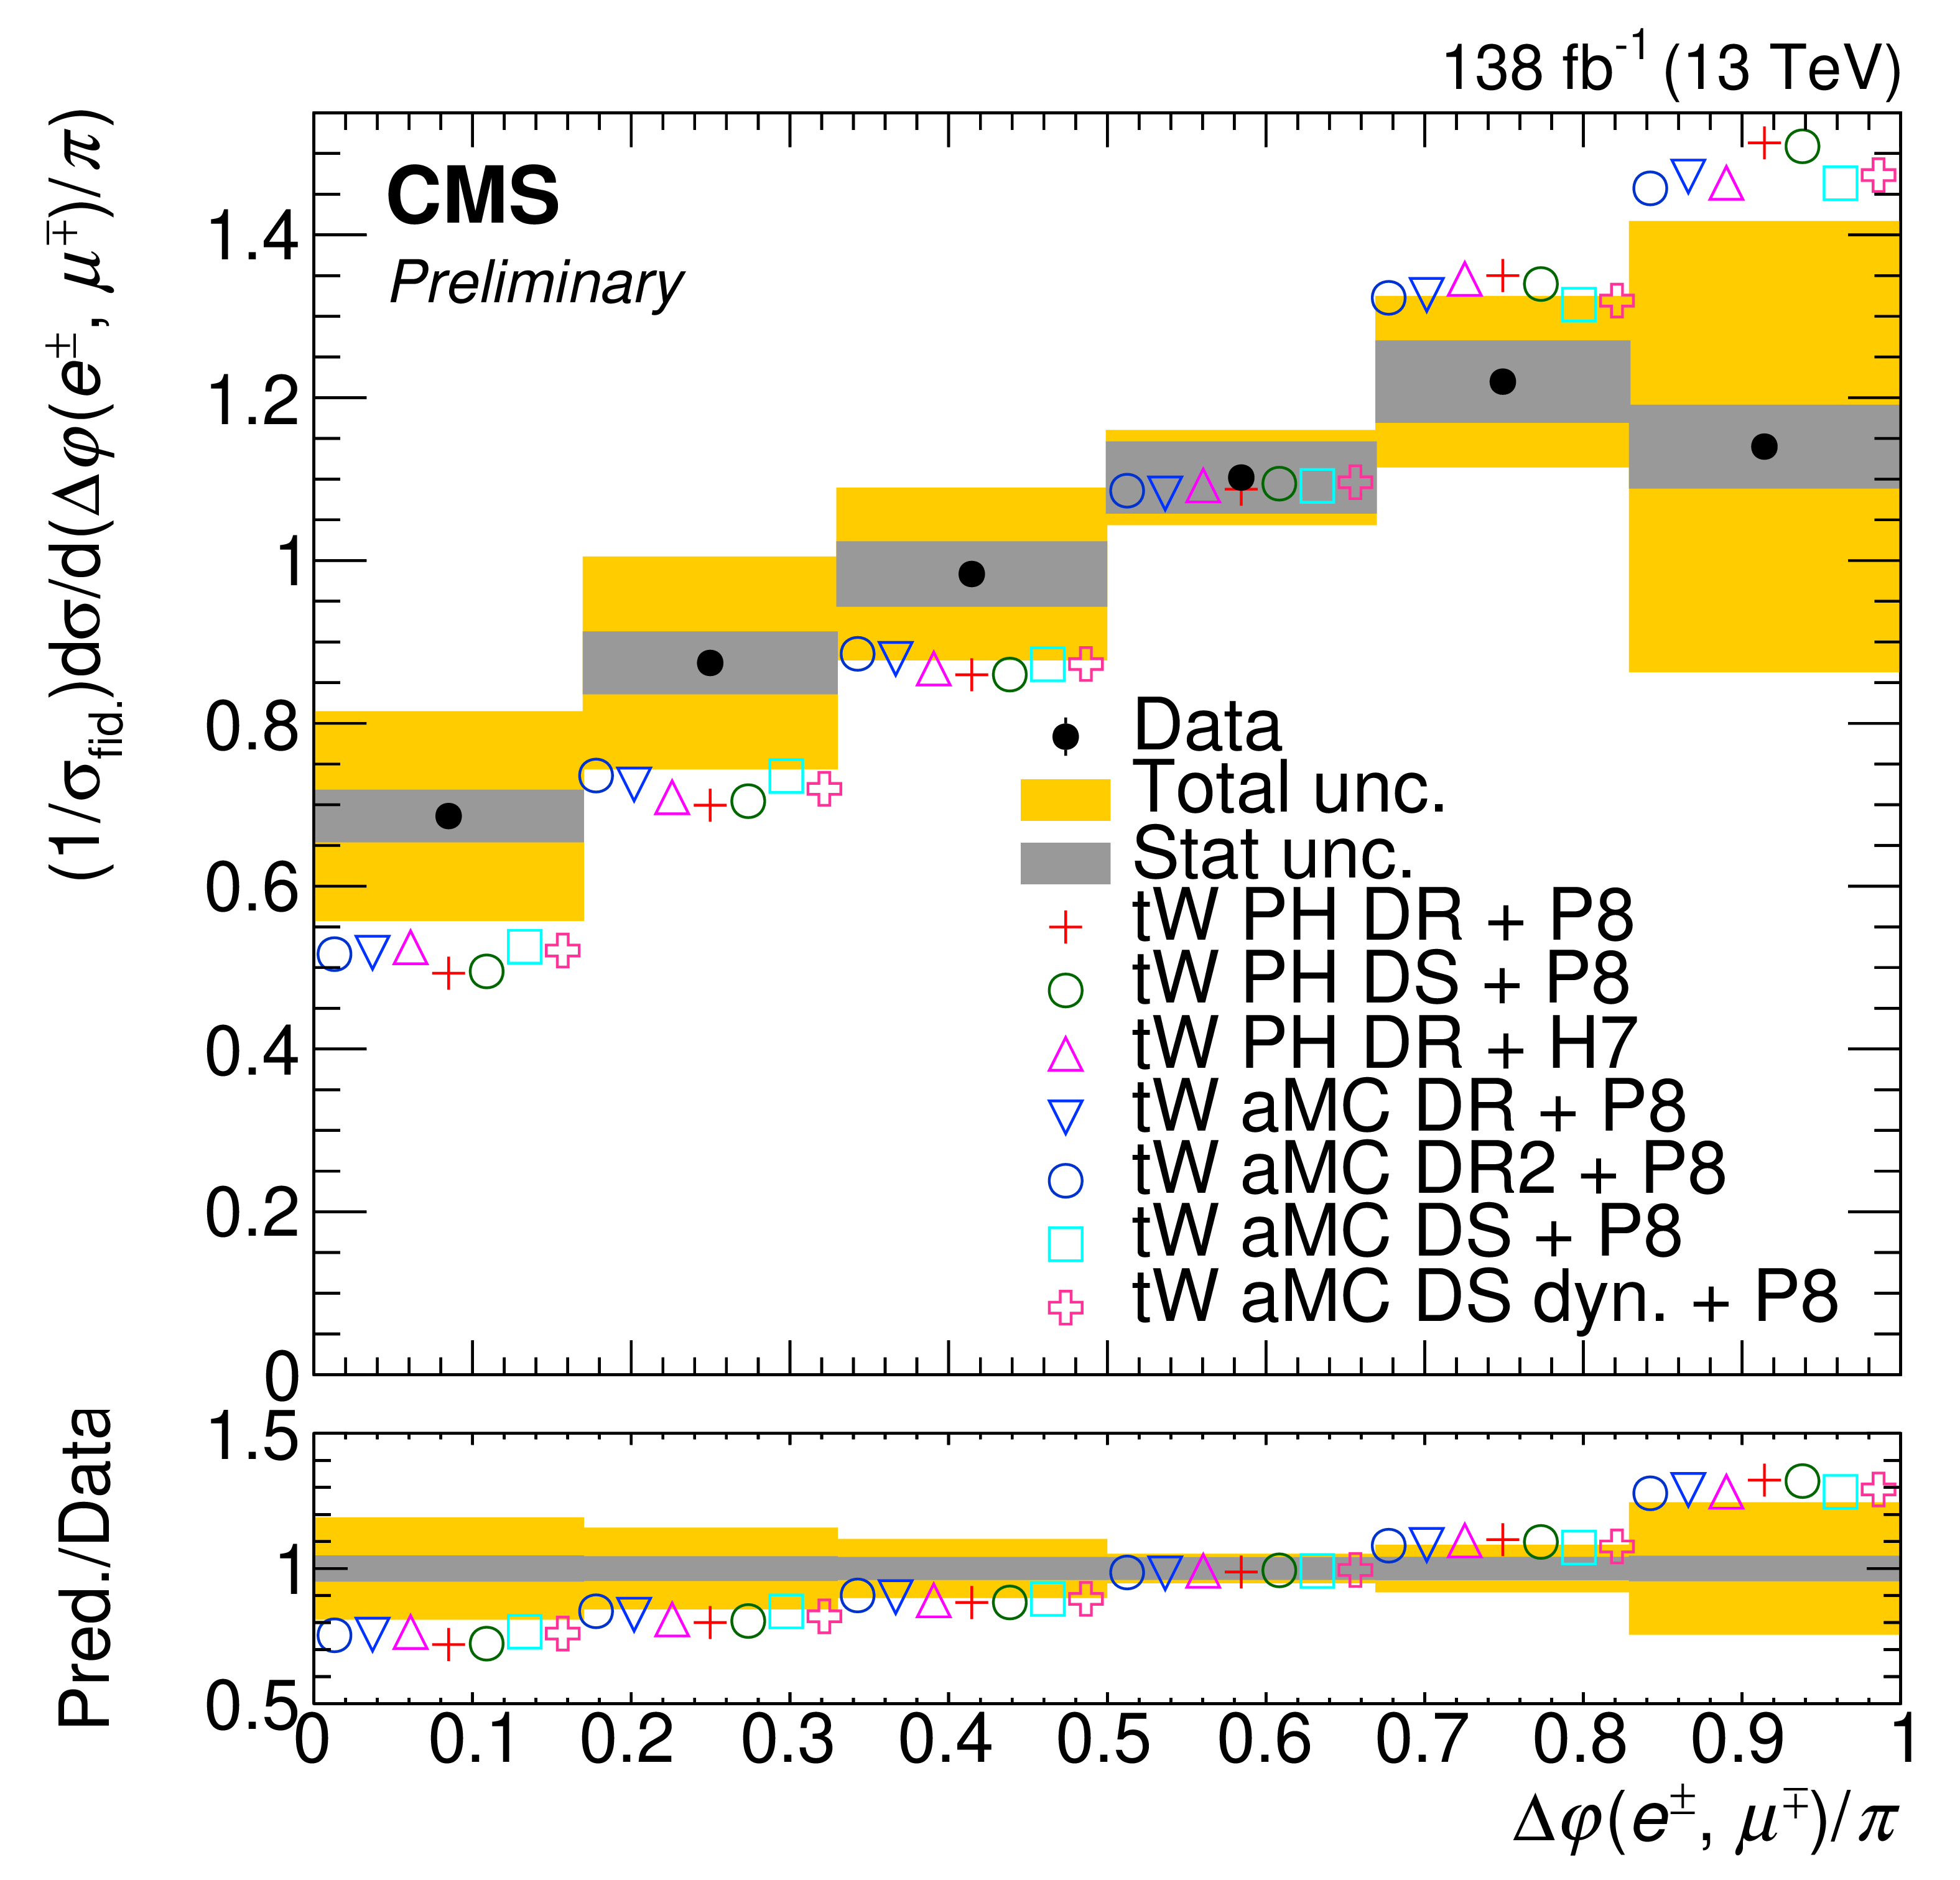
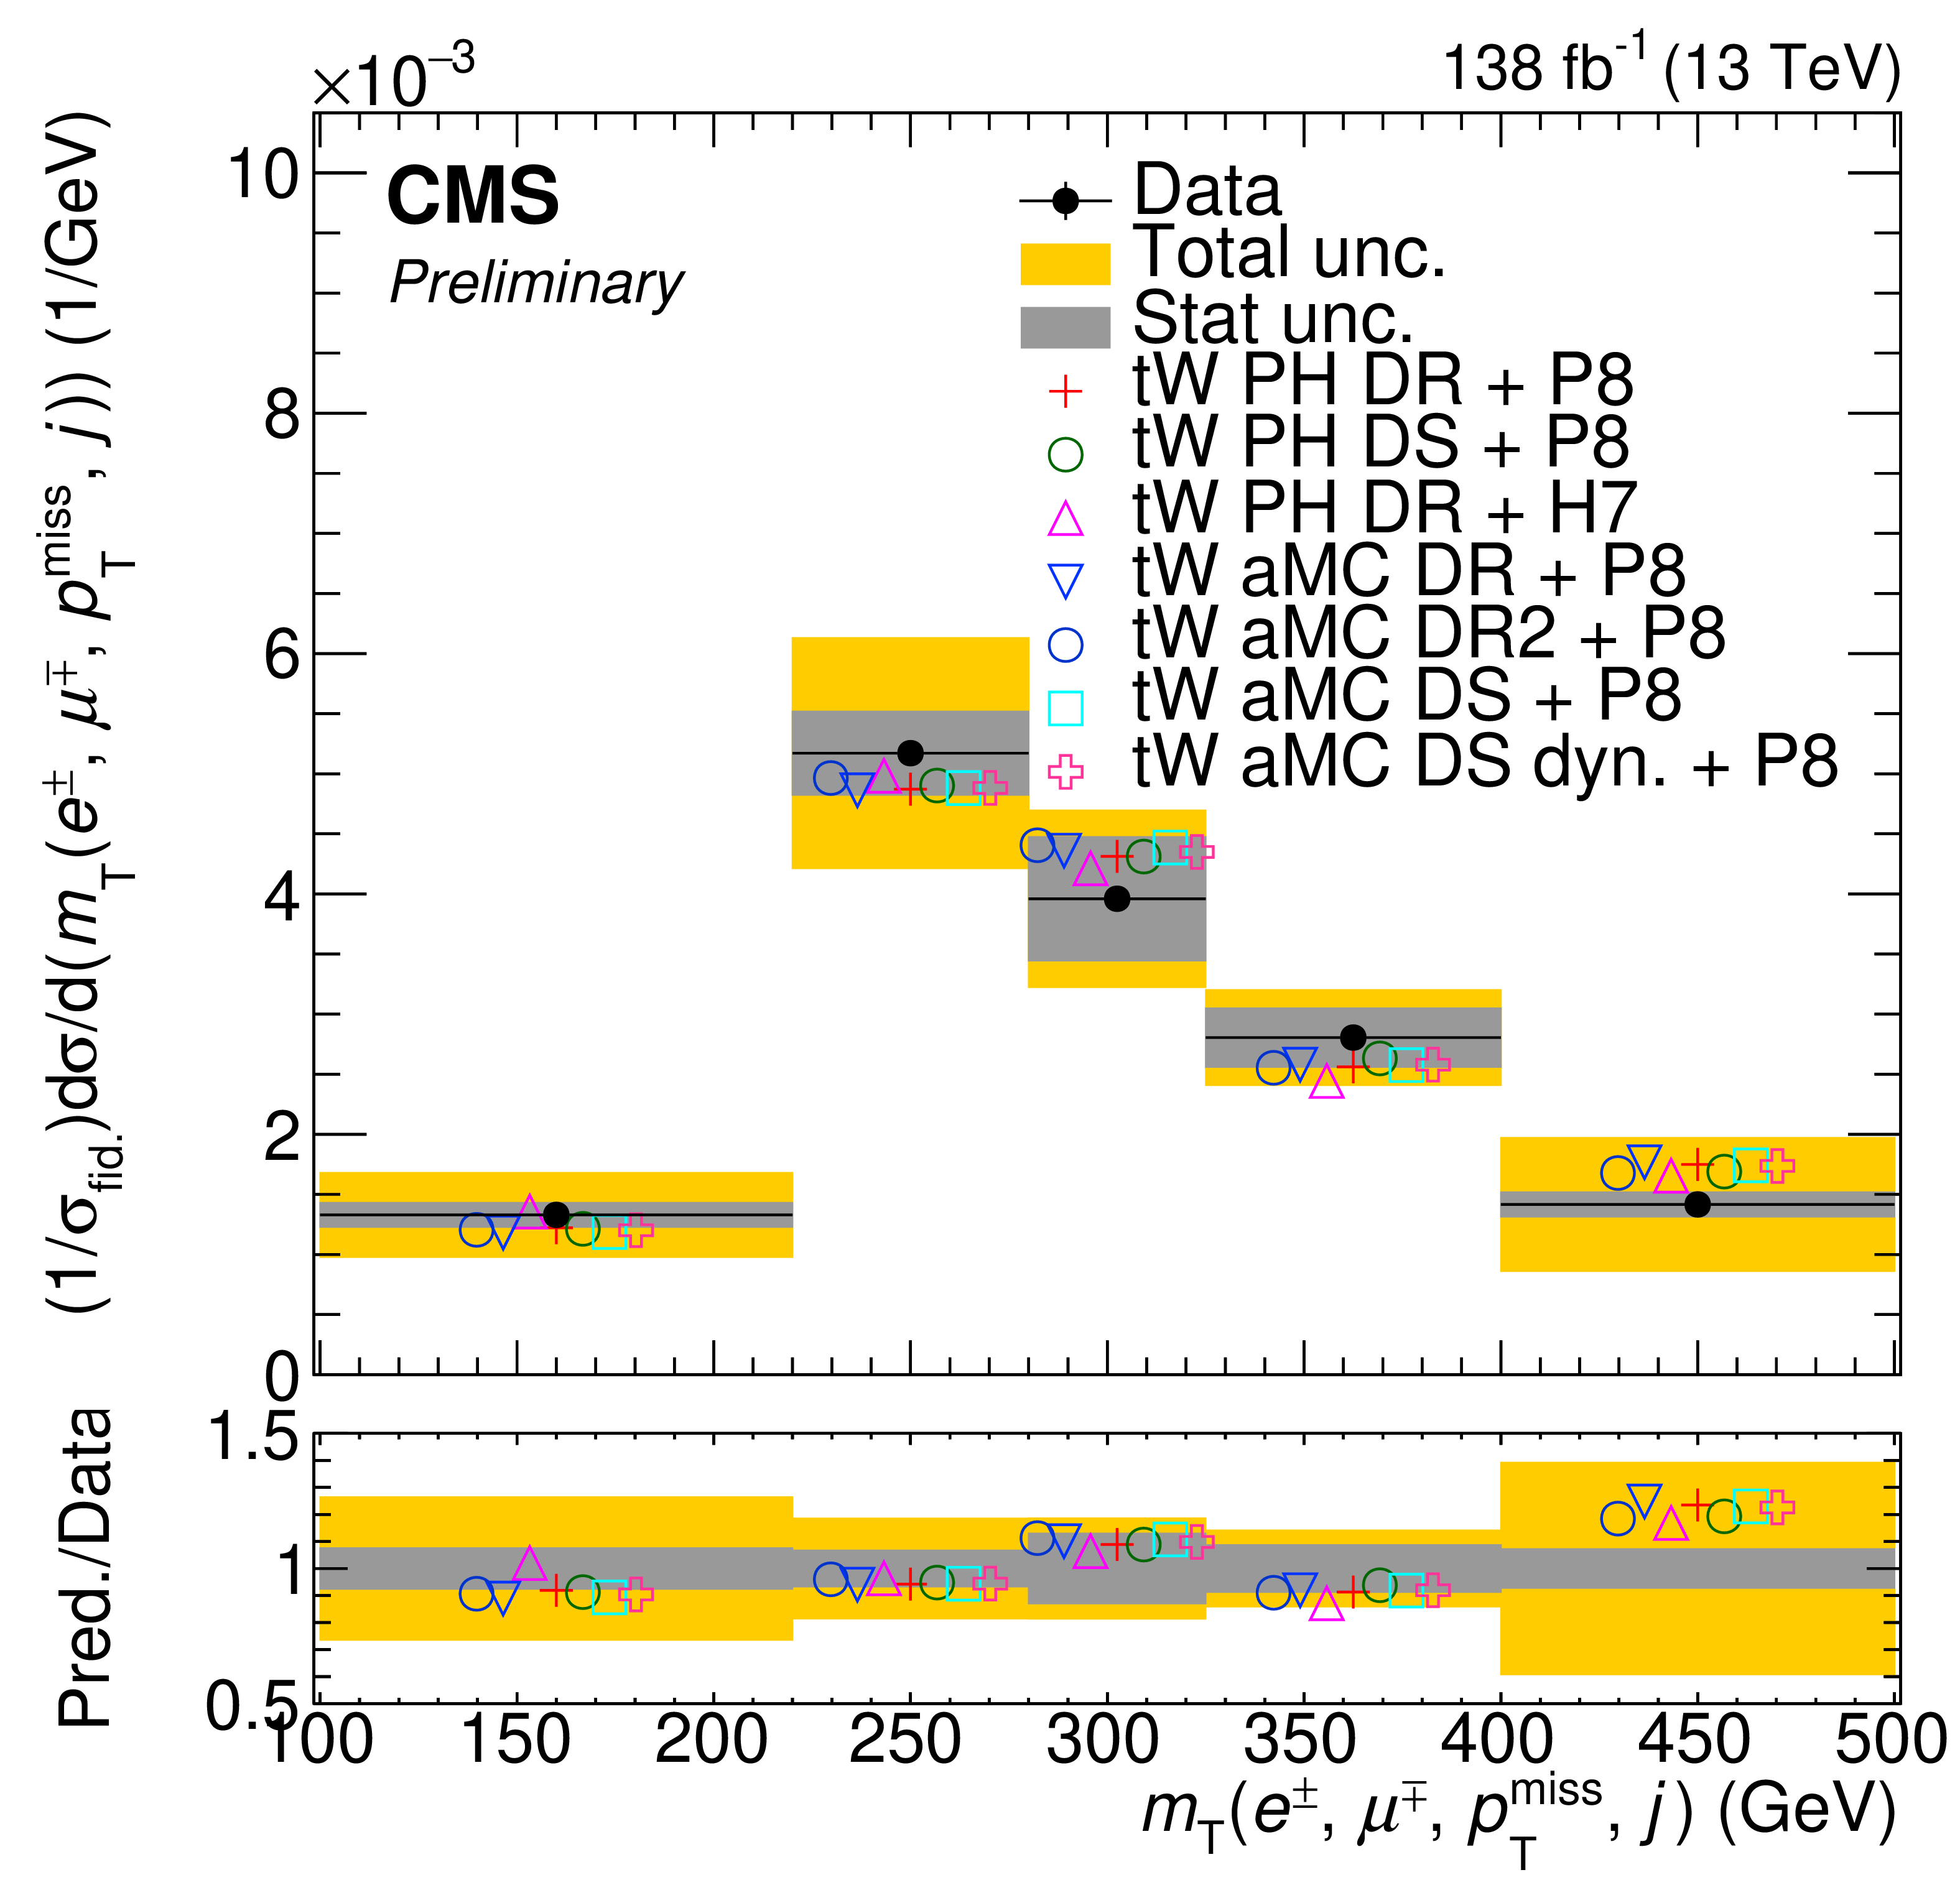
Figure 8:
Normalised differential tW production cross section as a function of the ${p_{\mathrm {T}}}$ of the leading lepton (top left), ${p_\text {Z}(\mathrm{e^{\pm}}, {\mu ^\mp}, j)}$ (top right), ${p_{\mathrm {T}}}$ of the jet (middle left), ${m(\mathrm{e^{\pm}}, {\mu ^\mp},j)}$ (middle right), ${\Delta \varphi (\mathrm{e^{\pm}}, {\mu ^\mp})}$ (bottom left), and ${m_{\text {T}}(\mathrm{e^{\pm}}, {\mu ^\mp},j, {{p_{\mathrm {T}}} ^\text {miss}})}$ (bottom right). Predictions from POWHEG (PH) + PYTHIA 8 (P8) DR and DS, POWHEG + HERWIG 7 (H7) DR, MadGraph 5_aMC@NLO (aMC) + PYTHIA 8 DR, DR2, DS and DS with a dynamic factor are also shown. The grey band shows the statistical uncertainty whereas the orange the total one. In the bottom panel, the ratio between predictions and data is shown. |
png pdf |
Figure 8-a:
Normalised differential tW production cross section as a function of the ${p_{\mathrm {T}}}$ of the leading lepton (top left), ${p_\text {Z}(\mathrm{e^{\pm}}, {\mu ^\mp}, j)}$ (top right), ${p_{\mathrm {T}}}$ of the jet (middle left), ${m(\mathrm{e^{\pm}}, {\mu ^\mp},j)}$ (middle right), ${\Delta \varphi (\mathrm{e^{\pm}}, {\mu ^\mp})}$ (bottom left), and ${m_{\text {T}}(\mathrm{e^{\pm}}, {\mu ^\mp},j, {{p_{\mathrm {T}}} ^\text {miss}})}$ (bottom right). Predictions from POWHEG (PH) + PYTHIA 8 (P8) DR and DS, POWHEG + HERWIG 7 (H7) DR, MadGraph 5_aMC@NLO (aMC) + PYTHIA 8 DR, DR2, DS and DS with a dynamic factor are also shown. The grey band shows the statistical uncertainty whereas the orange the total one. In the bottom panel, the ratio between predictions and data is shown. |
png pdf |
Figure 8-b:
Normalised differential tW production cross section as a function of the ${p_{\mathrm {T}}}$ of the leading lepton (top left), ${p_\text {Z}(\mathrm{e^{\pm}}, {\mu ^\mp}, j)}$ (top right), ${p_{\mathrm {T}}}$ of the jet (middle left), ${m(\mathrm{e^{\pm}}, {\mu ^\mp},j)}$ (middle right), ${\Delta \varphi (\mathrm{e^{\pm}}, {\mu ^\mp})}$ (bottom left), and ${m_{\text {T}}(\mathrm{e^{\pm}}, {\mu ^\mp},j, {{p_{\mathrm {T}}} ^\text {miss}})}$ (bottom right). Predictions from POWHEG (PH) + PYTHIA 8 (P8) DR and DS, POWHEG + HERWIG 7 (H7) DR, MadGraph 5_aMC@NLO (aMC) + PYTHIA 8 DR, DR2, DS and DS with a dynamic factor are also shown. The grey band shows the statistical uncertainty whereas the orange the total one. In the bottom panel, the ratio between predictions and data is shown. |
png pdf |
Figure 8-c:
Normalised differential tW production cross section as a function of the ${p_{\mathrm {T}}}$ of the leading lepton (top left), ${p_\text {Z}(\mathrm{e^{\pm}}, {\mu ^\mp}, j)}$ (top right), ${p_{\mathrm {T}}}$ of the jet (middle left), ${m(\mathrm{e^{\pm}}, {\mu ^\mp},j)}$ (middle right), ${\Delta \varphi (\mathrm{e^{\pm}}, {\mu ^\mp})}$ (bottom left), and ${m_{\text {T}}(\mathrm{e^{\pm}}, {\mu ^\mp},j, {{p_{\mathrm {T}}} ^\text {miss}})}$ (bottom right). Predictions from POWHEG (PH) + PYTHIA 8 (P8) DR and DS, POWHEG + HERWIG 7 (H7) DR, MadGraph 5_aMC@NLO (aMC) + PYTHIA 8 DR, DR2, DS and DS with a dynamic factor are also shown. The grey band shows the statistical uncertainty whereas the orange the total one. In the bottom panel, the ratio between predictions and data is shown. |
png pdf |
Figure 8-d:
Normalised differential tW production cross section as a function of the ${p_{\mathrm {T}}}$ of the leading lepton (top left), ${p_\text {Z}(\mathrm{e^{\pm}}, {\mu ^\mp}, j)}$ (top right), ${p_{\mathrm {T}}}$ of the jet (middle left), ${m(\mathrm{e^{\pm}}, {\mu ^\mp},j)}$ (middle right), ${\Delta \varphi (\mathrm{e^{\pm}}, {\mu ^\mp})}$ (bottom left), and ${m_{\text {T}}(\mathrm{e^{\pm}}, {\mu ^\mp},j, {{p_{\mathrm {T}}} ^\text {miss}})}$ (bottom right). Predictions from POWHEG (PH) + PYTHIA 8 (P8) DR and DS, POWHEG + HERWIG 7 (H7) DR, MadGraph 5_aMC@NLO (aMC) + PYTHIA 8 DR, DR2, DS and DS with a dynamic factor are also shown. The grey band shows the statistical uncertainty whereas the orange the total one. In the bottom panel, the ratio between predictions and data is shown. |
png pdf |
Figure 8-e:
Normalised differential tW production cross section as a function of the ${p_{\mathrm {T}}}$ of the leading lepton (top left), ${p_\text {Z}(\mathrm{e^{\pm}}, {\mu ^\mp}, j)}$ (top right), ${p_{\mathrm {T}}}$ of the jet (middle left), ${m(\mathrm{e^{\pm}}, {\mu ^\mp},j)}$ (middle right), ${\Delta \varphi (\mathrm{e^{\pm}}, {\mu ^\mp})}$ (bottom left), and ${m_{\text {T}}(\mathrm{e^{\pm}}, {\mu ^\mp},j, {{p_{\mathrm {T}}} ^\text {miss}})}$ (bottom right). Predictions from POWHEG (PH) + PYTHIA 8 (P8) DR and DS, POWHEG + HERWIG 7 (H7) DR, MadGraph 5_aMC@NLO (aMC) + PYTHIA 8 DR, DR2, DS and DS with a dynamic factor are also shown. The grey band shows the statistical uncertainty whereas the orange the total one. In the bottom panel, the ratio between predictions and data is shown. |
png pdf |
Figure 8-f:
Normalised differential tW production cross section as a function of the ${p_{\mathrm {T}}}$ of the leading lepton (top left), ${p_\text {Z}(\mathrm{e^{\pm}}, {\mu ^\mp}, j)}$ (top right), ${p_{\mathrm {T}}}$ of the jet (middle left), ${m(\mathrm{e^{\pm}}, {\mu ^\mp},j)}$ (middle right), ${\Delta \varphi (\mathrm{e^{\pm}}, {\mu ^\mp})}$ (bottom left), and ${m_{\text {T}}(\mathrm{e^{\pm}}, {\mu ^\mp},j, {{p_{\mathrm {T}}} ^\text {miss}})}$ (bottom right). Predictions from POWHEG (PH) + PYTHIA 8 (P8) DR and DS, POWHEG + HERWIG 7 (H7) DR, MadGraph 5_aMC@NLO (aMC) + PYTHIA 8 DR, DR2, DS and DS with a dynamic factor are also shown. The grey band shows the statistical uncertainty whereas the orange the total one. In the bottom panel, the ratio between predictions and data is shown. |
| Tables | |

png pdf |
Table 1:
Selection requirements of particle-level objects. |
png pdf |
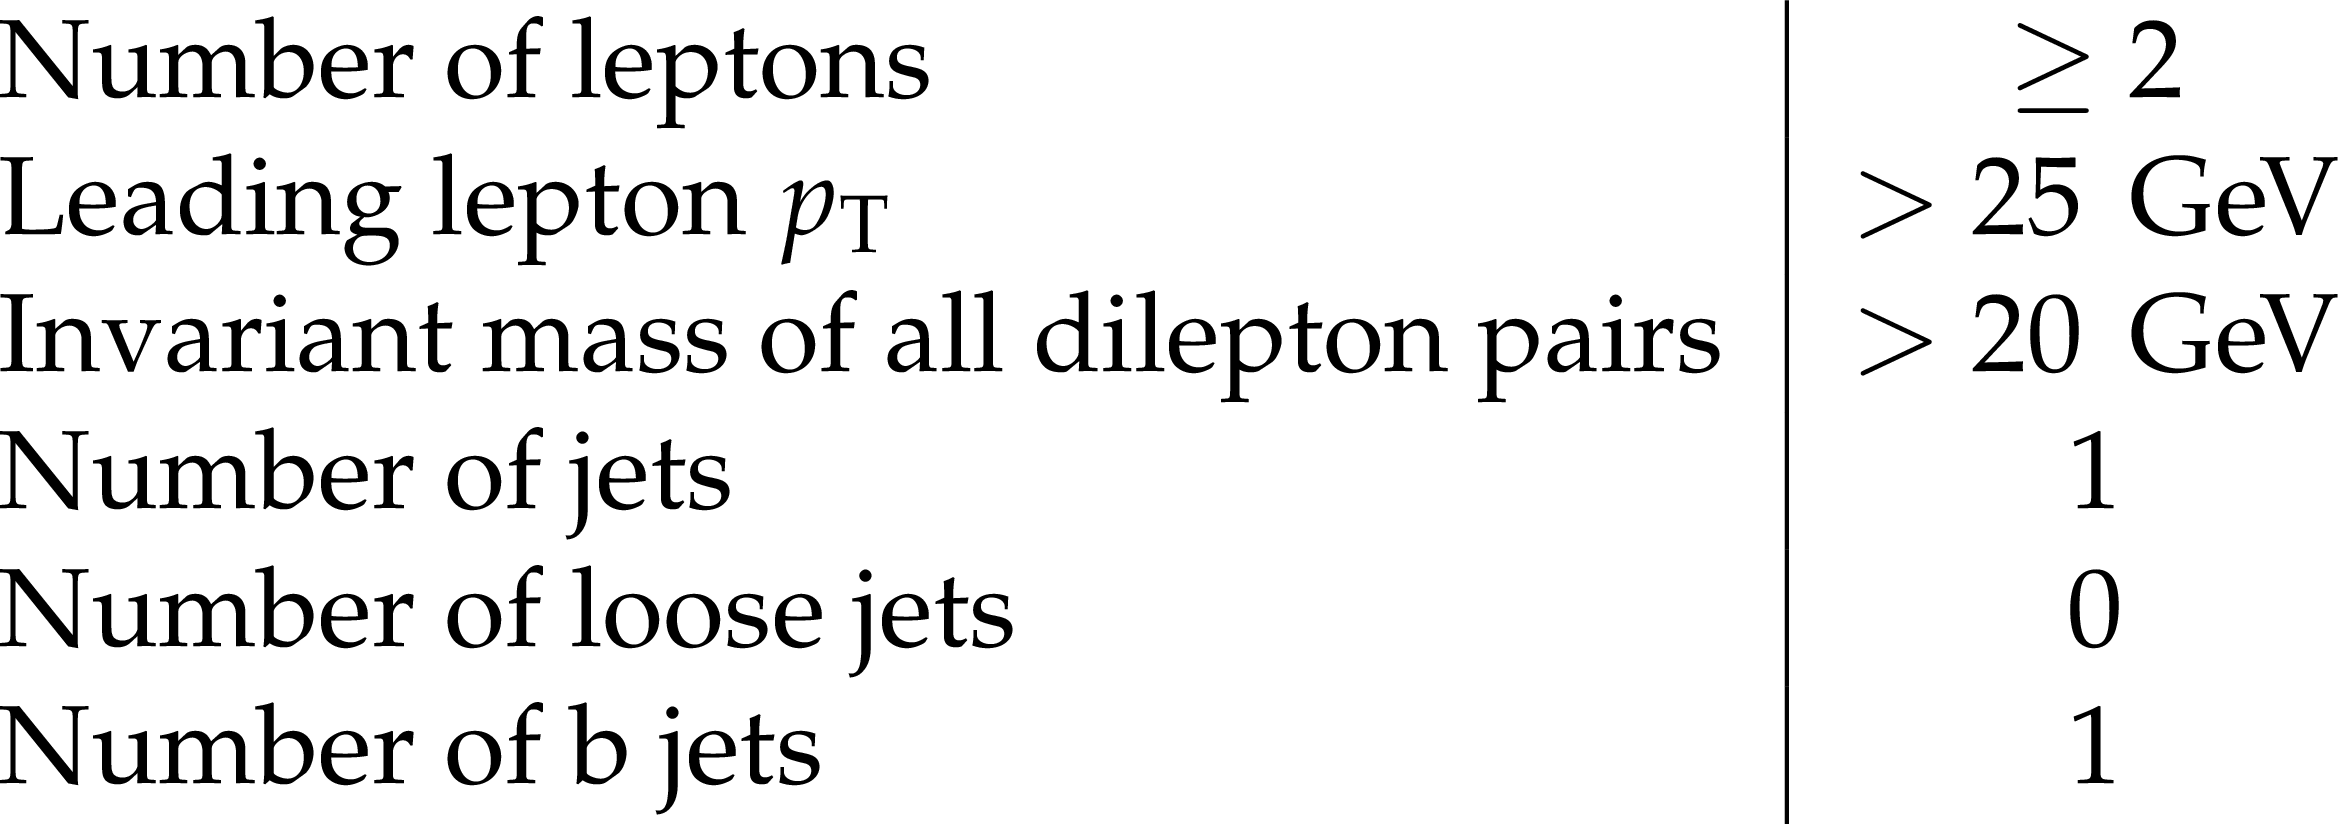
Table 2:
Definition of the fiducial region. |
| Summary |
|
The measurements of the inclusive and normalised differential cross sections of the production of a top quark in association with a W boson using 138 fb$^{-1}$ of data recorded by CMS has been presented for a final state containing an electron and a muon. For the inclusive measurement, the events have been classified depending on the number of jets and jets originating from bottom quarks. The signal is measured using a maximum likelihood fit to the distribution of boosted decision tree discriminants in two of the categories, and to the transverse momentum distribution of the second highest energetic jet in a third category. The measured cross section is 79.2 $\pm$ 0.8 (stat) $^{+7.0}_{-7.2}$ (syst) $\pm$ 1.1 (lumi) pb and has a total relative uncertainty of roughly 11%, clearly dominated by the systematic sources. The leading uncertainty sources are the jet energy scale, the matrix element scales for the tW process and the effect of the final-state radiation from $\mathrm{t\bar{t}}$ events. The differential cross section measurements are performed as a function of various properties of the event: the transverse momentum of the leading lepton, the transverse momentum of the jet; the difference in the $\varphi$ angle of the muon and the electron; the longitudinal momentum of the muon, the electron and the jet; the invariant mass of the muon, electron and the jet; and the transverse mass of the electron, the muon, the jet, and the missing transverse momentum. The results show uncertainties that vary depending on the chosen distribution, and range from $\sim$10% up to $\sim$40% (in relative terms) in the bulk of the distributions, reaching larger values in the tails. Agreement is overall good with respect to the expectations from the different generators. The different approaches to produce tW events show similar values in all distributions, pointing to small effects of the tW /$\mathrm{t\bar{t}}$ interference in the defined fiducial region and on these distributions. |
| References | ||||
| 1 | CDF Collaboration | First observation of electroweak single top quark production | PRL 103 (2009) 092002 | 0903.0885 |
| 2 | D0 Collaboration | Observation of single top quark production | PRL 103 (2009) 092001 | 0903.0850 |
| 3 | S. Frixione et al. | Single-top hadroproduction in association with a W boson | JHEP 07 (2008) 029 | 0805.3067 |
| 4 | A. S. Belyaev, E. E. Boos, and L. V. Dudko | Single top quark at future hadron colliders: Complete signal and background study | PRD 59 (1999) 075001 | hep-ph/9806332 |
| 5 | C. D. White, S. Frixione, E. Laenen, and F. Maltoni | Isolating Wt production at the LHC | JHEP 11 (2009) 074 | 0908.0631 |
| 6 | T. M. P. Tait and C. P. Yuan | Single top quark production as a window to physics beyond the standard model | PRD 63 (2000) 014018 | hep-ph/0007298 |
| 7 | Q.-H. Cao, J. Wudka, and C. P. Yuan | Search for new physics via single top production at the LHC | PLB 658 (2007) 50 | 0704.2809 |
| 8 | V. Barger, M. McCaskey, and G. Shaughnessy | Single top and Higgs associated production at the LHC | PRD 81 (2010) 034020 | 0911.1556 |
| 9 | N. Kidonakis | Theoretical results for electroweak-boson and single-top production | in Proceedings, 23rd International Workshop on Deep-Inelastic Scattering and Related Subjects (DIS 2015): Dallas, Texas, USA, April 27-May 01, 2015, volume DIS2015, p. 170 2015 | 1506.04072 |
| 10 | CMS Collaboration | Evidence for associated production of a single top quark and W boson in pp collisions at $ \sqrt{s} = $ 7 TeV | PRL 110 (2013) 022003 | CMS-TOP-11-022 1209.3489 |
| 11 | ATLAS Collaboration | Evidence for the associated production of a W boson and a top quark in ATLAS at $ \sqrt{s}= $ 7 TeV | PLB 716 (2012) 142 | 1205.5764 |
| 12 | CMS Collaboration | Observation of the associated production of a single top quark and a W boson in pp collisions at $ \sqrt s = $ 8 TeV | PRL 112 (2014) 231802 | CMS-TOP-12-040 1401.2942 |
| 13 | ATLAS Collaboration | Measurement of the production cross-section of a single top quark in association with a W boson at 8 TeV with the ATLAS experiment | JHEP 01 (2016) 064 | 1510.03752 |
| 14 | CMS Collaboration | Measurement of the production cross section for single top quarks in association with W bosons in proton-proton collisions at $ \sqrt{s}= $ 13 TeV | JHEP 10 (2018) 117 | CMS-TOP-17-018 1805.07399 |
| 15 | ATLAS Collaboration | Measurement of the cross-section for producing a W boson in association with a single top quark in pp collisions at $ \sqrt{s}= $ 13 TeV with ATLAS | JHEP 01 (2018) 063 | 1612.07231 |
| 16 | ATLAS Collaboration | Measurement of differential cross-sections of a single top quark produced in association with a W boson at $ \sqrt{s}= $ 13 TeV with ATLAS | EPJC 78 (2018) 186 | 1712.01602 |
| 17 | S. Alioli, P. Nason, C. Oleari, and E. Re | A general framework for implementing NLO calculations in shower Monte Carlo programs: the POWHEG BOX | JHEP 06 (2010) 043 | 1002.2581 |
| 18 | S. Frixione, P. Nason, and C. Oleari | Matching NLO QCD computations with Parton Shower simulations: the POWHEG method | JHEP 11 (2007) 070 | 0709.2092 |
| 19 | P. Nason | A new method for combining NLO QCD with shower Monte Carlo algorithms | JHEP 11 (2004) 040 | hep-ph/0409146 |
| 20 | T. M. P. Tait | The $ t W^{-} $ mode of single top production | PRD 61 (1999) 034001 | hep-ph/9909352 |
| 21 | J. Alwall et al. | The automated computation of tree-level and next-to-leading order differential cross sections, and their matching to parton shower simulations | JHEP 07 (2014) 079 | 1405.0301 |
| 22 | F. Demartin et al. | tWH associated production at the LHC | EPJC 77 (2017) 34 | 1607.05862 |
| 23 | NNPDF Collaboration | Parton distributions from high-precision collider data | EPJC 77 (2017) 663 | 1706.00428 |
| 24 | NNPDF Collaboration | Parton distributions for the LHC Run II | JHEP 04 (2015) 040 | 1410.8849 |
| 25 | T. Sjostrand et al. | An introduction to PYTHIA 8.2 | CPC 191 (2015) 159 | 1410.3012 |
| 26 | CMS Collaboration | Extraction and validation of a new set of CMS PYTHIA-8 tunes from underlying-event measurements | EPJC 80 (2020) 4 | CMS-GEN-17-001 1903.12179 |
| 27 | CMS Collaboration | Event generator tunes obtained from underlying event and multiparton scattering measurements | EPJC 76 (2016) 155 | CMS-GEN-14-001 1512.00815 |
| 28 | CMS Collaboration | Development and validation of HERWIG 7 tunes from CMS underlying-event measurements | EPJC 81 (2021) 312 | CMS-GEN-19-001 2011.03422 |
| 29 | M. Bahr et al. | Herwig++ Physics and Manual | EPJC 58 (2008) 639 | 0803.0883 |
| 30 | J. Bellm et al. | Herwig 7.0/Herwig++ 3.0 release note | EPJC 76 (2016) 196 | 1512.01178 |
| 31 | J. Bellm et al. | Herwig 7.1 Release Note | 1705.06919 | |
| 32 | J. Alwall et al. | Comparative study of various algorithms for the merging of parton showers and matrix elements in hadronic collisions | EPJC 53 (2008) 473 | 0706.2569 |
| 33 | R. Frederix and S. Frixione | Merging meets matching in MC@NLO | JHEP 12 (2012) 061 | 1209.6215 |
| 34 | GEANT4 Collaboration | GEANT4--a simulation toolkit | NIMA 506 (2003) 250 | |
| 35 | Y. Li and F. Petriello | Combining QCD and electroweak corrections to dilepton production in the framework of the FEWZ simulation code | PRD 86 (2012) 094034 | 1208.5967 |
| 36 | J. M. Campbell, R. K. Ellis, and C. Williams | Vector boson pair production at the LHC | JHEP 07 (2011) 018 | 1105.0020 |
| 37 | M. Czakon, P. Fiedler, and A. Mitov | Total top-quark pair-production cross section at hadron colliders through O($ \alpha_s^4 $) | PRL 110 (2013) 252004 | 1303.6254 |
| 38 | M. Czakon and A. Mitov | Top++: A program for the calculation of the top-pair cross-section at hadron colliders | CPC 185 (2014) 2930 | 1112.5675 |
| 39 | C. Seez | The cms trigger system | The European Physical Journal C - Particles and Fields 34 (Jul, 2004) 151 | |
| 40 | CMS Collaboration | Particle-flow reconstruction and global event description with the CMS detector | JINST 12 (2017) P10003 | CMS-PRF-14-001 1706.04965 |
| 41 | CMS Collaboration | Technical proposal for the Phase-II upgrade of the Compact Muon Solenoid | CMS-PAS-TDR-15-002 | CMS-PAS-TDR-15-002 |
| 42 | CMS Collaboration | Performance of electron reconstruction and selection with the CMS detector in proton-proton collisions at $ \sqrt{s} = $ 8 TeV | JINST 10 (2015) P06005 | CMS-EGM-13-001 1502.02701 |
| 43 | CMS Collaboration | Performance of the CMS muon detector and muon reconstruction with proton-proton collisions at $ \sqrt{s}= $ 13 TeV | JINST 13 (2018) P06015 | CMS-MUO-16-001 1804.04528 |
| 44 | M. Cacciari, G. P. Salam, and G. Soyez | The anti-$ {k_{\mathrm{T}}} $ jet clustering algorithm | JHEP 04 (2008) 063 | 0802.1189 |
| 45 | M. Cacciari, G. P. Salam, and G. Soyez | FastJet user manual | EPJC 72 (2012) 1896 | 1111.6097 |
| 46 | CMS Collaboration | Jet energy scale and resolution in the CMS experiment in pp collisions at 8 TeV | JINST 12 (2017) P02014 | CMS-JME-13-004 1607.03663 |
| 47 | CMS Collaboration | Performance of the DeepJet b tagging algorithm using 41.9 fb$^{-1}$ of data from proton-proton collisions at 13TeV with Phase 1 CMS detector | CDS | |
| 48 | E. Bols et al. | Jet flavour classification using DeepJet | JINST 15 (2020) P12012 | 2008.10519 |
| 49 | CMS Collaboration | Performance of missing transverse momentum reconstruction in proton-proton collisions at $ \sqrt{s} = $ 13 TeV using the CMS detector | JINST 14 (2019) P07004 | CMS-JME-17-001 1903.06078 |
| 50 | H. Voss, A. Hocker, J. Stelzer, and F. Tegenfeldt | TMVA, the toolkit for multivariate data analysis with ROOT | in XI International Workshop on Advanced Computing and Analysis Techniques in Physics Research, p. 040 SISSA, 2007 PoS(ACAT2007)040 | physics/0703039 |
| 51 | L. Breiman, J. Friedman, C. J. Stone, and R. A. Olshen | Chapman and Hall, 1984 ISBN 0-412-048141-8 | ||
| 52 | L. Moneta et al. | The RooStats Project | in 13th International Workshop on Advanced Computing and Analysis Techniques in Physics Research (ACAT2010) | 1009.1003 |
| 53 | R. J. Barlow and C. Beeston | Fitting using finite Monte Carlo samples | CPC 77 (1993) 219 | |
| 54 | J. S. Conway | Incorporating Nuisance Parameters in Likelihoods for Multisource Spectra | in PHYSTAT 2011 3 | 1103.0354 |
| 55 | ATLAS, CMS, LHC Higgs Combination Group Collaboration | Procedure for the LHC Higgs boson search combination in Summer 2011 | CMS-NOTE-2011-005 | |
| 56 | CMS Collaboration | Object definitions for top quark analyses at the particle level | CDS | |
| 57 | CMS Collaboration | Performance of Photon Reconstruction and Identification with the CMS Detector in Proton-Proton Collisions at $ \sqrt{s} = $ 8 TeV | JINST 10 (2015) P08010 | CMS-EGM-14-001 1502.02702 |
| 58 | CMS Collaboration | Description and performance of track and primary-vertex reconstruction with the CMS tracker | JINST 9 (2014) P10009 | CMS-TRK-11-001 1405.6569 |
| 59 | CMS Collaboration | Identification of heavy-flavour jets with the CMS detector in pp collisions at 13 TeV | JINST 13 (2018) P05011 | CMS-BTV-16-002 1712.07158 |
| 60 | ATLAS Collaboration | Measurement of the inelastic proton-proton cross section at $ \sqrt{s} = $ 13 TeV with the ATLAS detector at the LHC | PRL 117 (2016) 182002 | 1606.02625 |
| 61 | CMS Collaboration | Precision luminosity measurement in proton-proton collisions at $ \sqrt{s} = $ 13 TeV in 2015 and 2016 at CMS | EPJC 81 (2021) 800 | CMS-LUM-17-003 2104.01927 |
| 62 | CMS Collaboration | CMS luminosity measurement for the 2017 data-taking period at $ \sqrt{s}=$ 13 TeV | CMS-PAS-LUM-17-004 | CMS-PAS-LUM-17-004 |
| 63 | CMS Collaboration | CMS luminosity measurement for the 2018 data-taking period at $ \sqrt{s}=$ 13 TeV | CMS-PAS-LUM-18-002 | CMS-PAS-LUM-18-002 |
| 64 | P. Skands, S. Carrazza, and J. Rojo | Tuning PYTHIA 8.1: the Monash 2013 Tune | EPJC 74 (2014) 3024 | 1404.5630 |
| 65 | CMS Collaboration | Investigations of the impact of the parton shower tuning in Pythia 8 in the modelling of $\mathrm{t\bar{t}}$ at $ \sqrt{s}= $ 8 and 13 TeV | CMS-PAS-TOP-16-021 | CMS-PAS-TOP-16-021 |
| 66 | J. R. Christiansen and P. Z. Skands | String formation beyond leading colour | JHEP 08 (2015) 003 | 1505.01681 |
| 67 | S. Argyropoulos and T. Sjostrand | Effects of color reconnection on $\mathrm{t\bar{t}}$ final states at the LHC | JHEP 11 (2014) 043 | 1407.6653 |
| 68 | CMS Collaboration | Measurement of the top quark mass using proton-proton data at $ \sqrt{s} = $ 7 and 8 TeV | PRD 93 (2016) 072004 | CMS-TOP-14-022 1509.04044 |
| 69 | CMS Collaboration | Measurement of differential cross sections for top quark pair production using the lepton+jets final state in proton-proton collisions at 13 TeV | PRD 95 (2017) 092001 | CMS-TOP-16-008 1610.04191 |
| 70 | CMS Collaboration | Measurement of the differential cross section for top quark pair production in pp collisions at $ \sqrt{s} = $ 8 TeV | EPJC 75 (2015) 542 | CMS-TOP-12-028 1505.04480 |
| 71 | CMS Collaboration | Measurement of the $\mathrm{t\bar{t}}$ production cross section in the all-jets final state in pp collisions at $ \sqrt{s}= $ 8 TeV | EPJC 76 (2016) 128 | CMS-TOP-14-018 1509.06076 |
| 72 | CMS Collaboration | Measurement of the $\mathrm{t\bar{t}}$ production cross section, the top quark mass, and the strong coupling constant using dilepton events in pp collisions at $ \sqrt{s} = $ 13 TeV | EPJC 79 (2019) 368 | CMS-TOP-17-001 1812.10505 |
|
|
Compact Muon Solenoid LHC, CERN |
|

|

|

|

|

|