

Compact Muon Solenoid
LHC, CERN
| CMS-PAS-TOP-19-009 | ||
| Measurement of the top quark mass in events with a single reconstructed top quark at $\sqrt{s}=$ 13 TeV | ||
| CMS Collaboration | ||
| March 2021 | ||
| Abstract: A measurement of the top quark mass is performed in a sample enriched with single top quark events produced in the $t$ channel using 35.9 fb$^{-1}$ of proton-proton collision data recorded at $\sqrt{s} =$ 13 TeV by the CMS experiment in 2016. Candidate events are selected by requiring an isolated energetic lepton (muon or electron) and exactly two jets. One of the jets is identified to originate from a bottom quark, whereas the other stems from the hadronization of a light-flavor quark. Multivariate discriminators are designed to separate signal from backgrounds, and the thresholds on the discriminator outputs are optimized to ensure an event sample with high signal purity. The mass of the top quark is found to be 172.13$^{+0.76}_{-0.77}$ GeV, reaching a sub-GeV precision for the first time in this particular phase space. The masses of top quark and antiquark are also measured separately based on the charge of the lepton in the final state, from which the mass ratio and difference are determined to be 0.995$^{+0.005}_{-0.006}$ and 0.83$^{+0.77}_{-1.01}$ GeV, respectively. | ||
|
Links:
CDS record (PDF) ;
inSPIRE record ;
CADI line (restricted) ;
These preliminary results are superseded in this paper, Submitted to JHEP. The superseded preliminary plots can be found here. |
||
| Figures | |
png pdf |
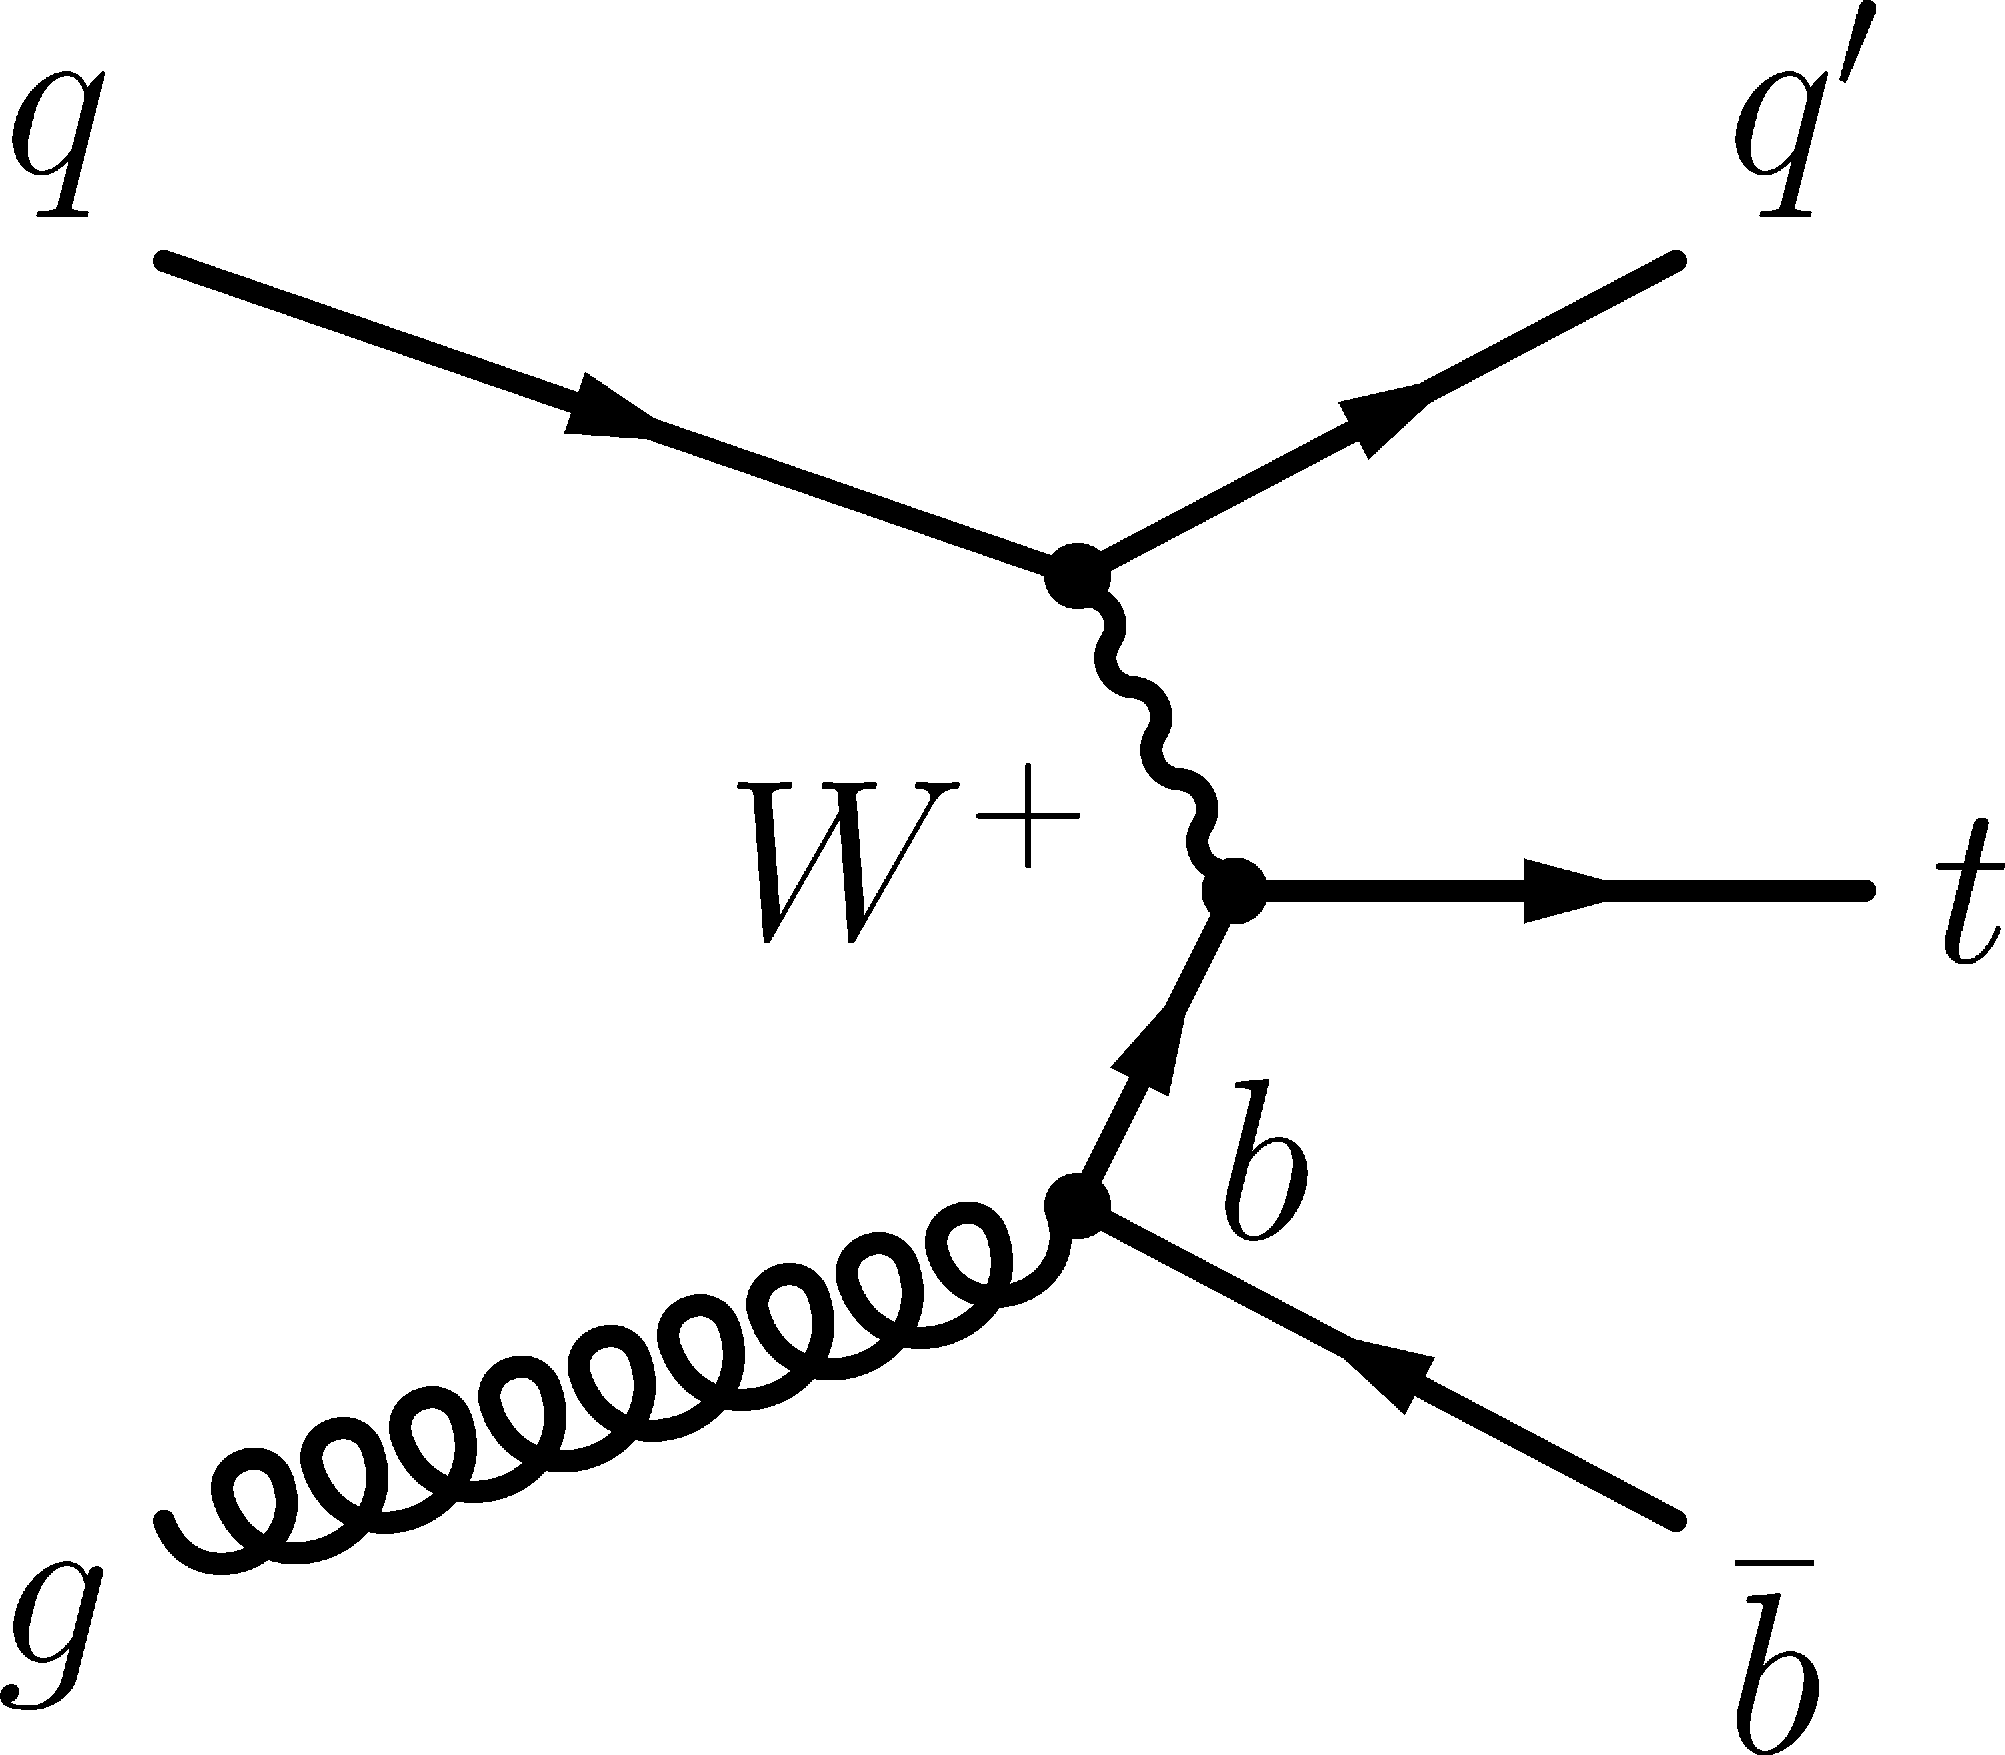
Figure 1-a:
Feynman diagrams of $t$-channel single top quark production at LO corresponding to four- (left) and five-flavor (right) schemes. |
png pdf |
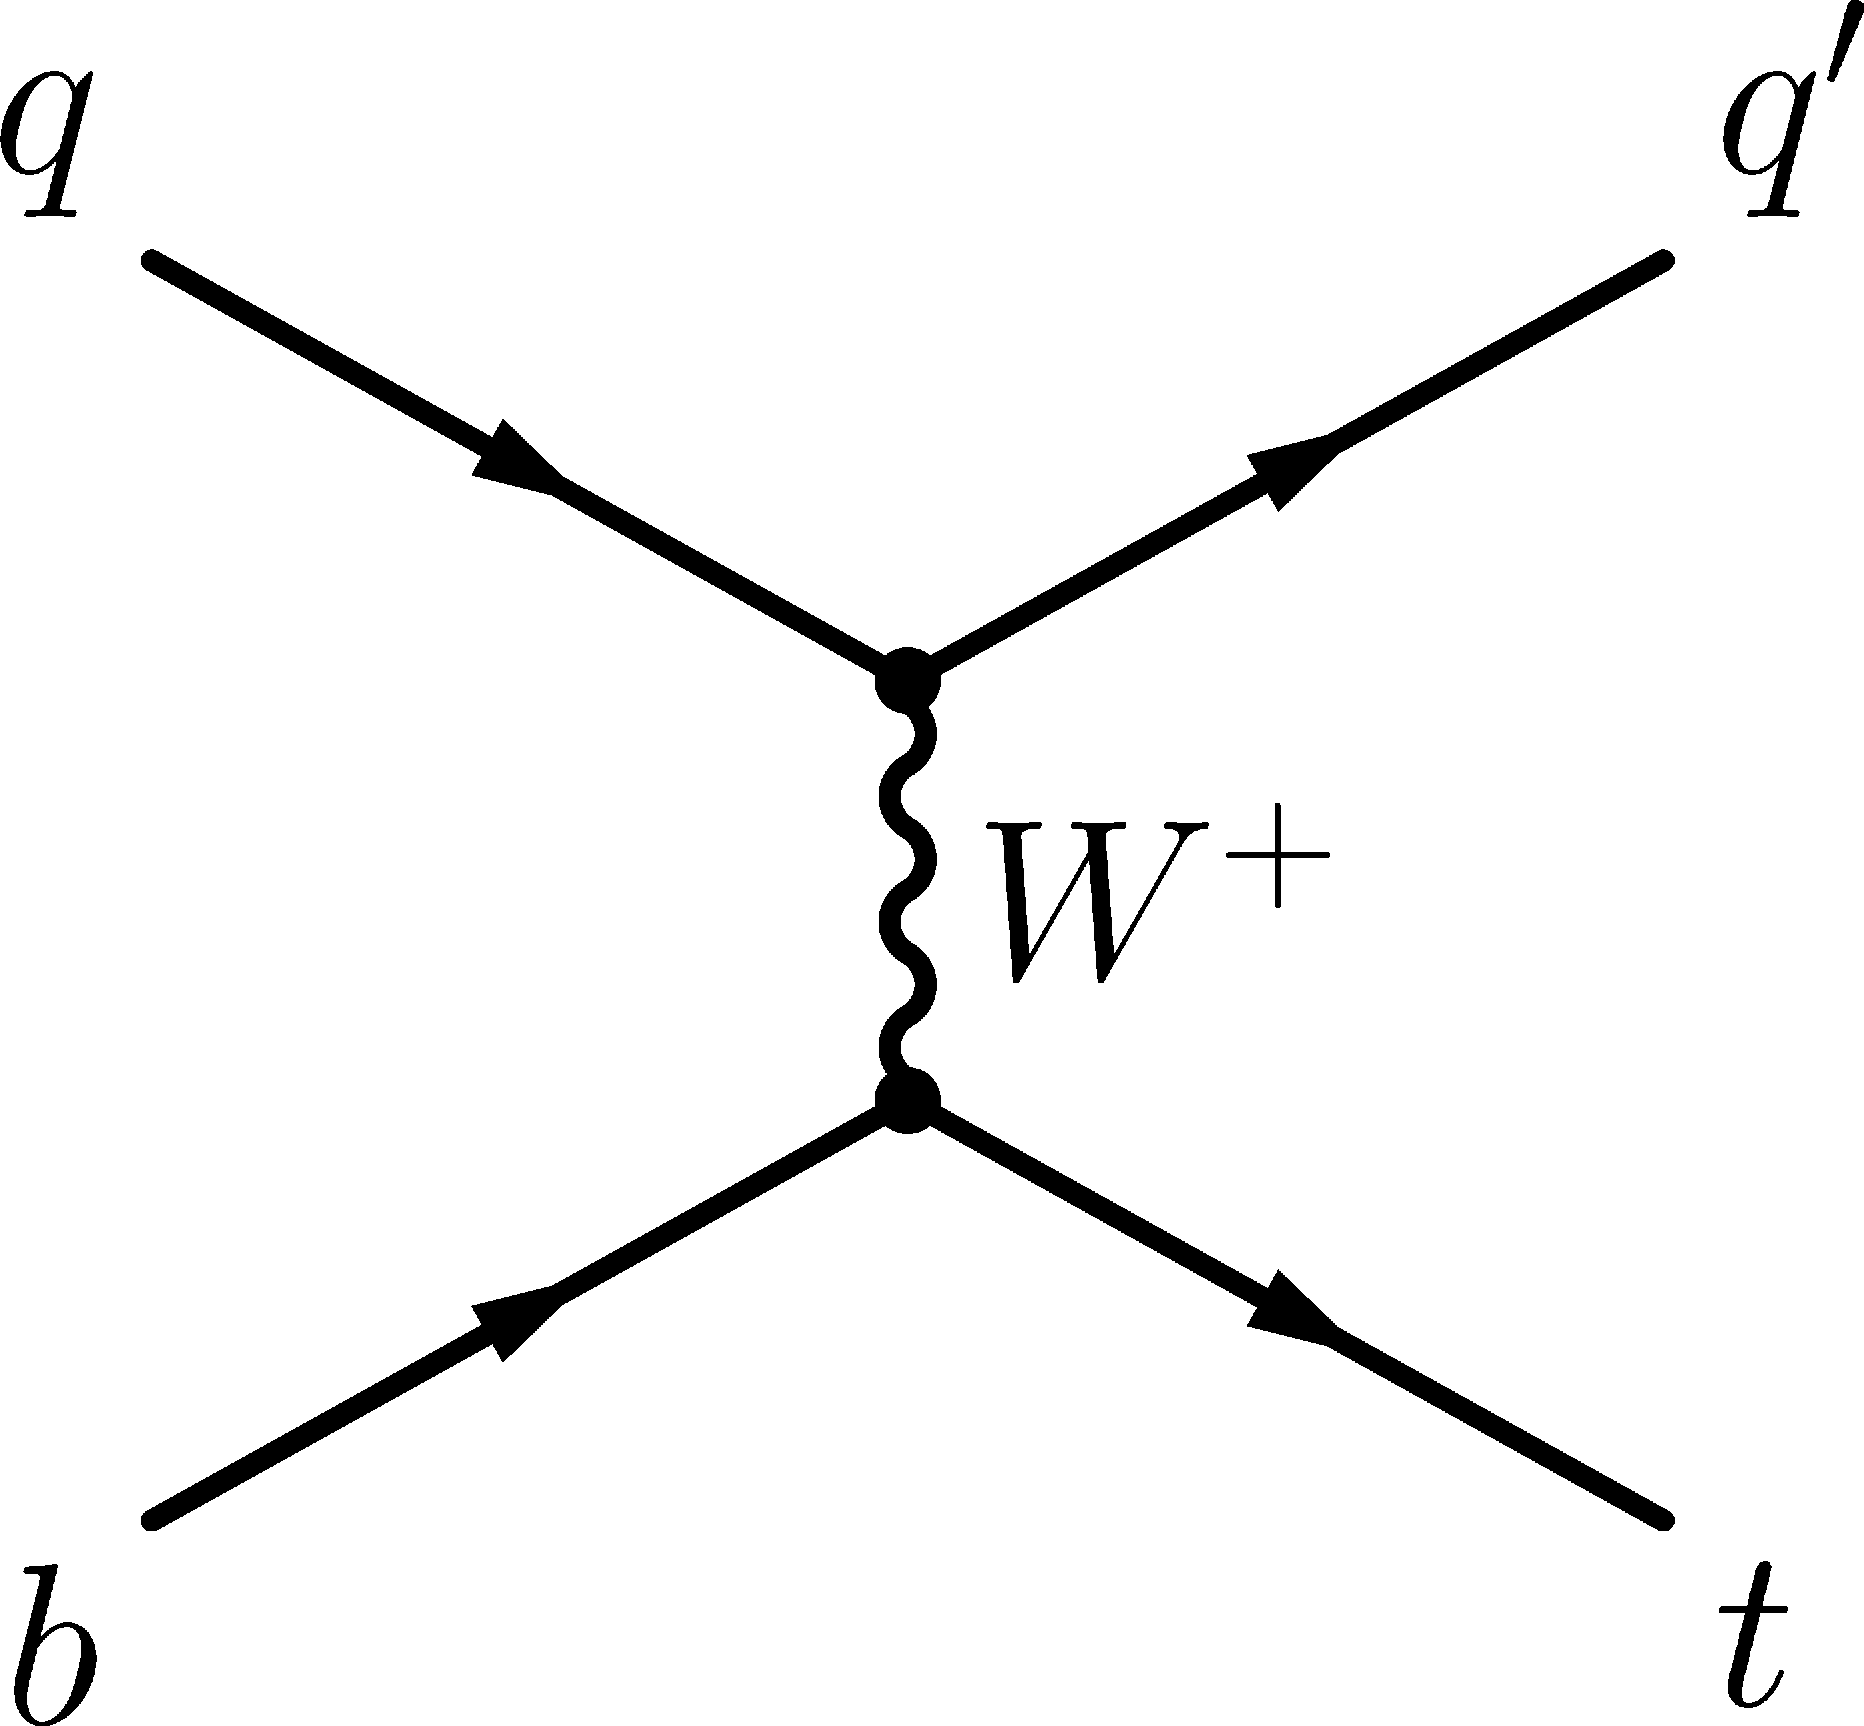
Figure 1-b:
Feynman diagrams of $t$-channel single top quark production at LO corresponding to four- (left) and five-flavor (right) schemes. |
png pdf |
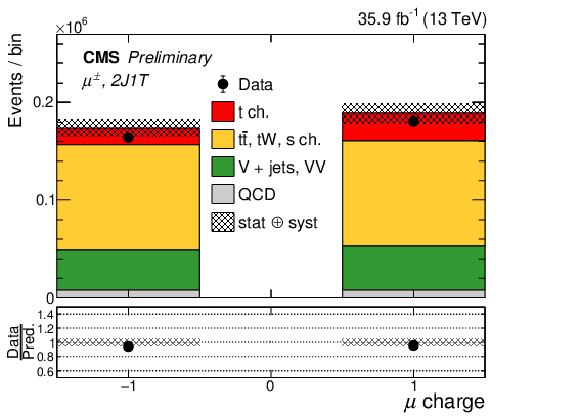
Figure 2-a:
Event yield corresponding to positively and negatively charged muons (left) and electrons (right) in the final states obtained from simulated signal and background processes as well as in data in the 2J1T event category. |
png pdf |
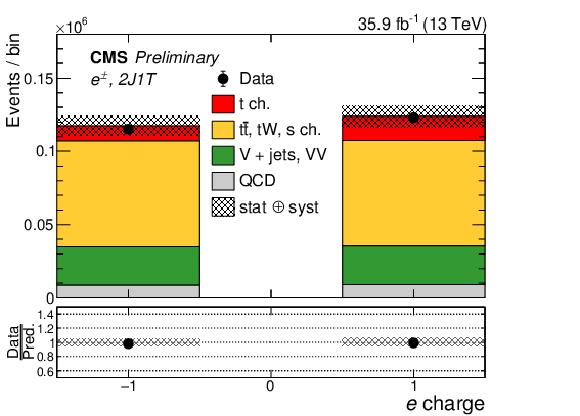
Figure 2-b:
Event yield corresponding to positively and negatively charged muons (left) and electrons (right) in the final states obtained from simulated signal and background processes as well as in data in the 2J1T event category. |
png pdf |
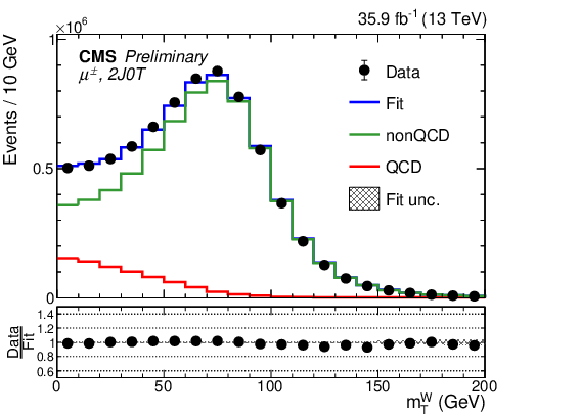
Figure 3-a:
Postfit distributions of ${m_{\mathrm {T}}^{\mathrm {W}}}$ for the muon (left) and electron (right) final state in the 2J0T (top) and 2J1T (bottom) event categories. The bands represent the postfit uncertainty on the ${m_{\mathrm {T}}^{\mathrm {W}}}$ distribution predicted by the fit. |
png pdf |
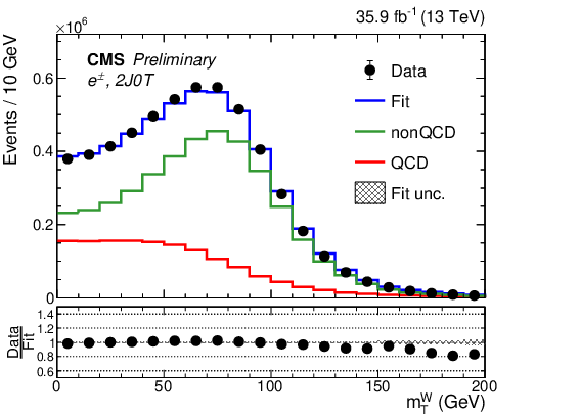
Figure 3-b:
Postfit distributions of ${m_{\mathrm {T}}^{\mathrm {W}}}$ for the muon (left) and electron (right) final state in the 2J0T (top) and 2J1T (bottom) event categories. The bands represent the postfit uncertainty on the ${m_{\mathrm {T}}^{\mathrm {W}}}$ distribution predicted by the fit. |
png pdf |
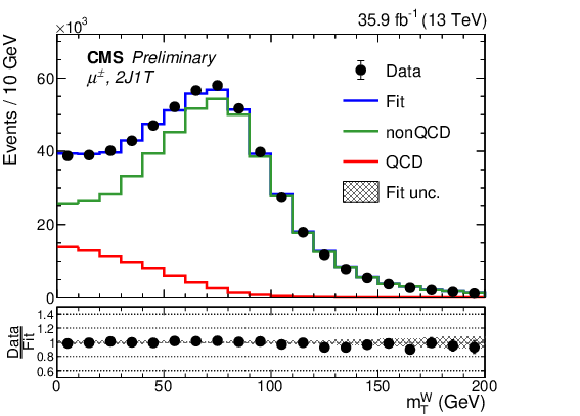
Figure 3-c:
Postfit distributions of ${m_{\mathrm {T}}^{\mathrm {W}}}$ for the muon (left) and electron (right) final state in the 2J0T (top) and 2J1T (bottom) event categories. The bands represent the postfit uncertainty on the ${m_{\mathrm {T}}^{\mathrm {W}}}$ distribution predicted by the fit. |
png pdf |
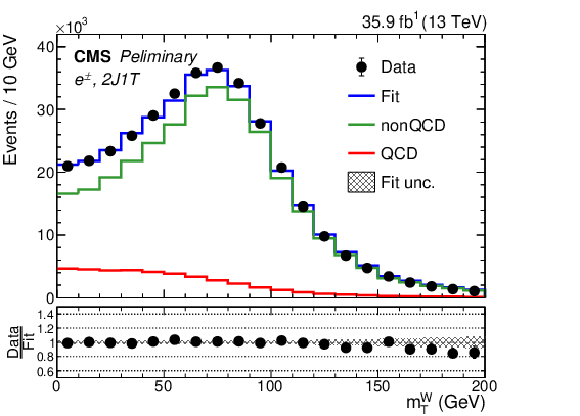
Figure 3-d:
Postfit distributions of ${m_{\mathrm {T}}^{\mathrm {W}}}$ for the muon (left) and electron (right) final state in the 2J0T (top) and 2J1T (bottom) event categories. The bands represent the postfit uncertainty on the ${m_{\mathrm {T}}^{\mathrm {W}}}$ distribution predicted by the fit. |
png pdf |
Figure 4-a:
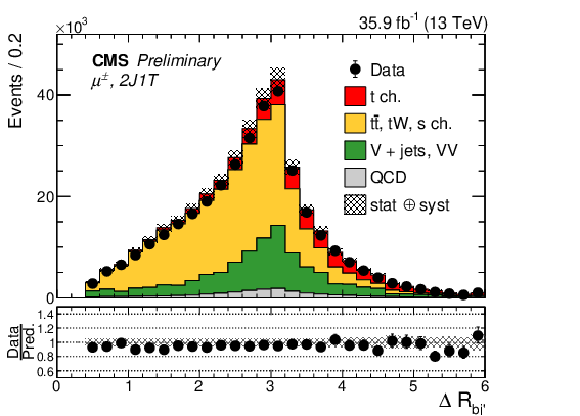
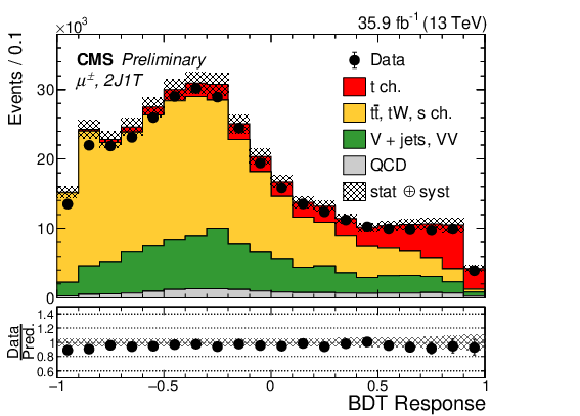
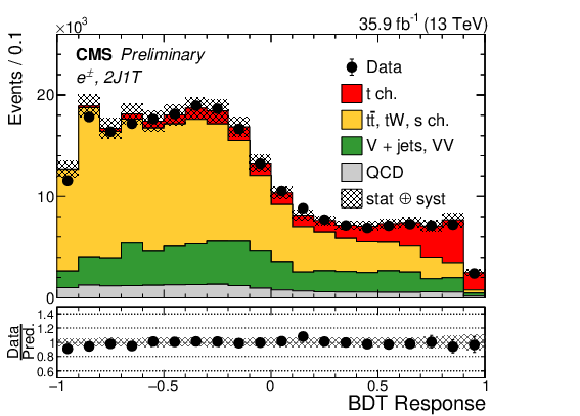
Data-MC comparisons of $\Delta \mathrm {R}_{bj^{\prime}}$ (top), light (untagged) jet $|\eta |$ (middle) and BDT response (bottom) in the 2J1T category for the muon (left) and electron (right) final state. The bands indicate the prefit statistical and systematic uncertainties added in quadrature. For the $\Delta \mathrm {R}_{bj^{\prime}}$ distributions in the top row, the last bins contain also entries with larger values. |
png pdf |
Figure 4-b:
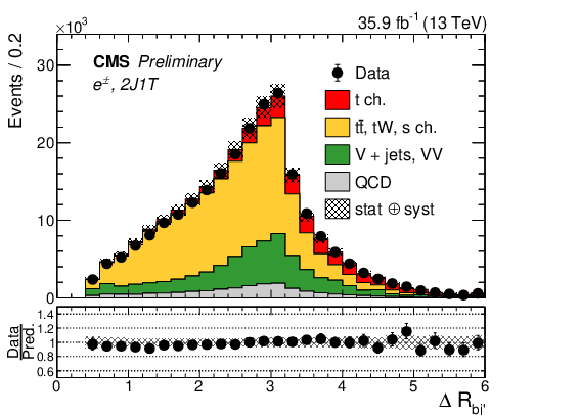
Data-MC comparisons of $\Delta \mathrm {R}_{bj^{\prime}}$ (top), light (untagged) jet $|\eta |$ (middle) and BDT response (bottom) in the 2J1T category for the muon (left) and electron (right) final state. The bands indicate the prefit statistical and systematic uncertainties added in quadrature. For the $\Delta \mathrm {R}_{bj^{\prime}}$ distributions in the top row, the last bins contain also entries with larger values. |
png pdf |
Figure 4-c:
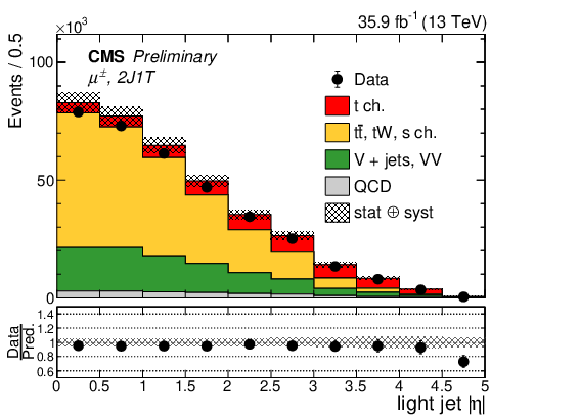
Data-MC comparisons of $\Delta \mathrm {R}_{bj^{\prime}}$ (top), light (untagged) jet $|\eta |$ (middle) and BDT response (bottom) in the 2J1T category for the muon (left) and electron (right) final state. The bands indicate the prefit statistical and systematic uncertainties added in quadrature. For the $\Delta \mathrm {R}_{bj^{\prime}}$ distributions in the top row, the last bins contain also entries with larger values. |
png pdf |
Figure 4-d:
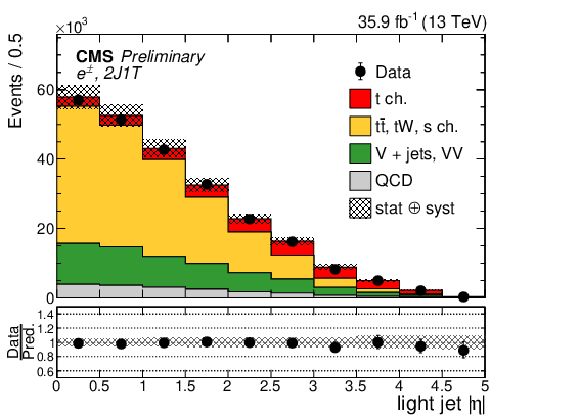
Data-MC comparisons of $\Delta \mathrm {R}_{bj^{\prime}}$ (top), light (untagged) jet $|\eta |$ (middle) and BDT response (bottom) in the 2J1T category for the muon (left) and electron (right) final state. The bands indicate the prefit statistical and systematic uncertainties added in quadrature. For the $\Delta \mathrm {R}_{bj^{\prime}}$ distributions in the top row, the last bins contain also entries with larger values. |
png pdf |
Figure 4-e:
Data-MC comparisons of $\Delta \mathrm {R}_{bj^{\prime}}$ (top), light (untagged) jet $|\eta |$ (middle) and BDT response (bottom) in the 2J1T category for the muon (left) and electron (right) final state. The bands indicate the prefit statistical and systematic uncertainties added in quadrature. For the $\Delta \mathrm {R}_{bj^{\prime}}$ distributions in the top row, the last bins contain also entries with larger values. |
png pdf |
Figure 4-f:
Data-MC comparisons of $\Delta \mathrm {R}_{bj^{\prime}}$ (top), light (untagged) jet $|\eta |$ (middle) and BDT response (bottom) in the 2J1T category for the muon (left) and electron (right) final state. The bands indicate the prefit statistical and systematic uncertainties added in quadrature. For the $\Delta \mathrm {R}_{bj^{\prime}}$ distributions in the top row, the last bins contain also entries with larger values. |
png pdf |
Figure 5-a:
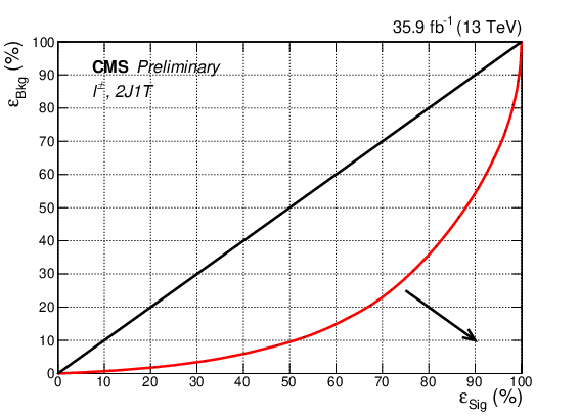
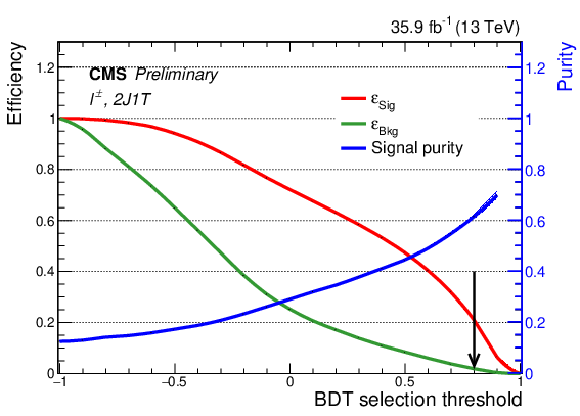
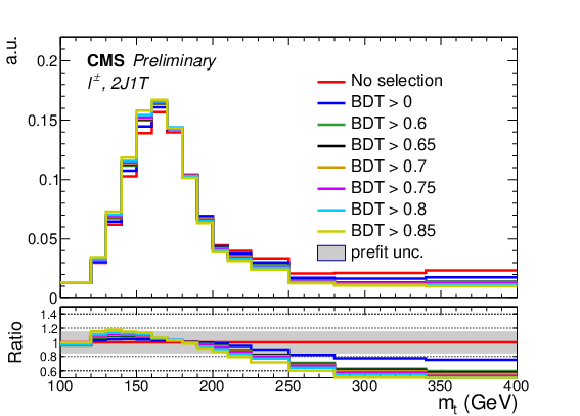
In the top row, the combined performance of the BDTs in the muon and electron final states is shown via the ROC curve (left) and a study of the signal and background efficiencies together with signal purity with different selection thresholds applied on the BDT responses (right). The arrows on the plots indicate the region of better separation (left) and final optimized selection criteria (right), respectively. The black line on the left plot corresponds to no separation between signal and background. The ROC integral is found to be about 16%. In the bottom row, a comparison of the reconstructed ${m_{\mathrm {t}}}$ templates from simulated signal events is shown on the left in the 2J1T category for different selection thresholds on the BDT responses along with their ratio relative to the case where no selection (red) is applied. The grey band represents the prefit rate uncertainty about the red curve. The optimization study is presented on the right where the combined uncertainty due to statistical and profiled systematic sources along with the uncertainty due to offset correction in the measured mass for the lepton charge inclusive case in the 2J1T category are evaluated with different selection thresholds on the BDT responses. These uncertainties are evaluated by means of a maximum likelihood fit discussed in Section 6 based on pseudoexperiments derived from simulated events. |
png pdf |
Figure 5-b:
In the top row, the combined performance of the BDTs in the muon and electron final states is shown via the ROC curve (left) and a study of the signal and background efficiencies together with signal purity with different selection thresholds applied on the BDT responses (right). The arrows on the plots indicate the region of better separation (left) and final optimized selection criteria (right), respectively. The black line on the left plot corresponds to no separation between signal and background. The ROC integral is found to be about 16%. In the bottom row, a comparison of the reconstructed ${m_{\mathrm {t}}}$ templates from simulated signal events is shown on the left in the 2J1T category for different selection thresholds on the BDT responses along with their ratio relative to the case where no selection (red) is applied. The grey band represents the prefit rate uncertainty about the red curve. The optimization study is presented on the right where the combined uncertainty due to statistical and profiled systematic sources along with the uncertainty due to offset correction in the measured mass for the lepton charge inclusive case in the 2J1T category are evaluated with different selection thresholds on the BDT responses. These uncertainties are evaluated by means of a maximum likelihood fit discussed in Section 6 based on pseudoexperiments derived from simulated events. |
png pdf |
Figure 5-c:
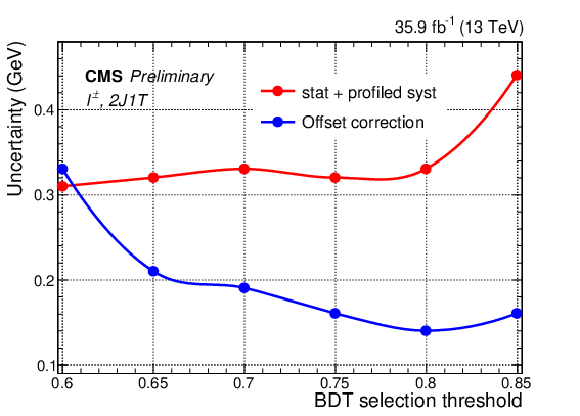
In the top row, the combined performance of the BDTs in the muon and electron final states is shown via the ROC curve (left) and a study of the signal and background efficiencies together with signal purity with different selection thresholds applied on the BDT responses (right). The arrows on the plots indicate the region of better separation (left) and final optimized selection criteria (right), respectively. The black line on the left plot corresponds to no separation between signal and background. The ROC integral is found to be about 16%. In the bottom row, a comparison of the reconstructed ${m_{\mathrm {t}}}$ templates from simulated signal events is shown on the left in the 2J1T category for different selection thresholds on the BDT responses along with their ratio relative to the case where no selection (red) is applied. The grey band represents the prefit rate uncertainty about the red curve. The optimization study is presented on the right where the combined uncertainty due to statistical and profiled systematic sources along with the uncertainty due to offset correction in the measured mass for the lepton charge inclusive case in the 2J1T category are evaluated with different selection thresholds on the BDT responses. These uncertainties are evaluated by means of a maximum likelihood fit discussed in Section 6 based on pseudoexperiments derived from simulated events. |
png pdf |
Figure 5-d:
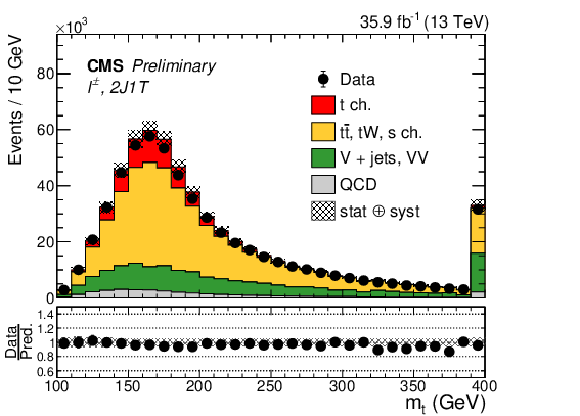
In the top row, the combined performance of the BDTs in the muon and electron final states is shown via the ROC curve (left) and a study of the signal and background efficiencies together with signal purity with different selection thresholds applied on the BDT responses (right). The arrows on the plots indicate the region of better separation (left) and final optimized selection criteria (right), respectively. The black line on the left plot corresponds to no separation between signal and background. The ROC integral is found to be about 16%. In the bottom row, a comparison of the reconstructed ${m_{\mathrm {t}}}$ templates from simulated signal events is shown on the left in the 2J1T category for different selection thresholds on the BDT responses along with their ratio relative to the case where no selection (red) is applied. The grey band represents the prefit rate uncertainty about the red curve. The optimization study is presented on the right where the combined uncertainty due to statistical and profiled systematic sources along with the uncertainty due to offset correction in the measured mass for the lepton charge inclusive case in the 2J1T category are evaluated with different selection thresholds on the BDT responses. These uncertainties are evaluated by means of a maximum likelihood fit discussed in Section 6 based on pseudoexperiments derived from simulated events. |
png pdf |
Figure 6-a:
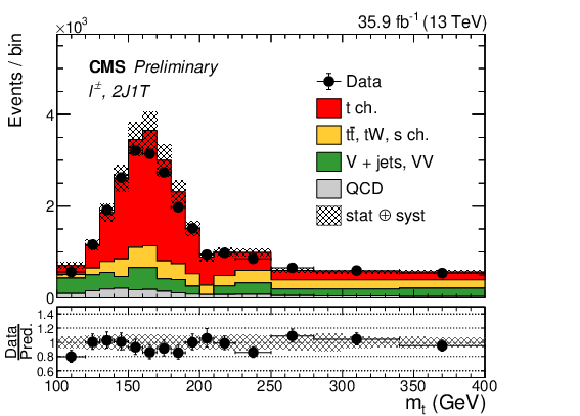
Data-MC comparison of the reconstructed ${m_{\mathrm {t}}}$ before (left) and after (right) applying optimized BDT selection criteria. The overflows are added to the last bin of each distribution. The bands represent prefit statistical and systematic uncertainties on the prediction added in quadrature. |
png pdf |
Figure 6-b:
Data-MC comparison of the reconstructed ${m_{\mathrm {t}}}$ before (left) and after (right) applying optimized BDT selection criteria. The overflows are added to the last bin of each distribution. The bands represent prefit statistical and systematic uncertainties on the prediction added in quadrature. |
png pdf |
Figure 7-a:
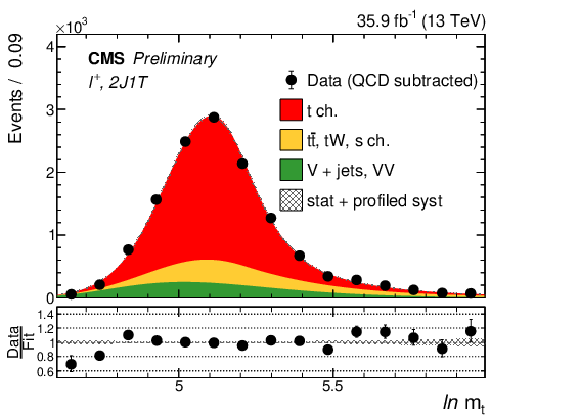
Postfit distribution of $y = \ln {m_{\mathrm {t}}} $ for the $\ell ^{+}$ (top), $\ell ^{-}$ (middle), and $\ell ^{\pm}$ (bottom) final states for signal and background processes compared to data in the 2J1T category. The bands represent the combined effect due to the statistical and profiled systematic uncertainty sources which is obtained from the fit. The fit is performed simultaneously in both lepton flavors by constructing a joint likelihood. The postfit signal ad background shapes for each lepton flavor are combined in this figure for comparison with data for the three different cases based on the lepton charge. |
png pdf |
Figure 7-b:
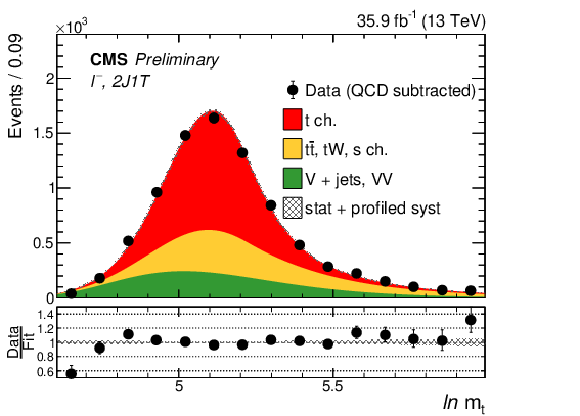
Postfit distribution of $y = \ln {m_{\mathrm {t}}} $ for the $\ell ^{+}$ (top), $\ell ^{-}$ (middle), and $\ell ^{\pm}$ (bottom) final states for signal and background processes compared to data in the 2J1T category. The bands represent the combined effect due to the statistical and profiled systematic uncertainty sources which is obtained from the fit. The fit is performed simultaneously in both lepton flavors by constructing a joint likelihood. The postfit signal ad background shapes for each lepton flavor are combined in this figure for comparison with data for the three different cases based on the lepton charge. |
png pdf |
Figure 7-c:
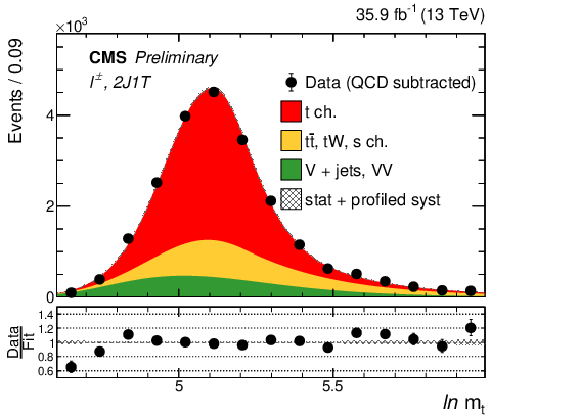
Postfit distribution of $y = \ln {m_{\mathrm {t}}} $ for the $\ell ^{+}$ (top), $\ell ^{-}$ (middle), and $\ell ^{\pm}$ (bottom) final states for signal and background processes compared to data in the 2J1T category. The bands represent the combined effect due to the statistical and profiled systematic uncertainty sources which is obtained from the fit. The fit is performed simultaneously in both lepton flavors by constructing a joint likelihood. The postfit signal ad background shapes for each lepton flavor are combined in this figure for comparison with data for the three different cases based on the lepton charge. |
png pdf |
Figure 8-a:
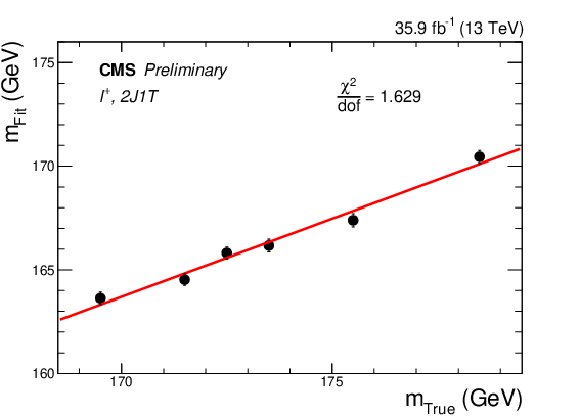
Test of the linearity of the fit output for different values of true ${m_{\mathrm {t}}}$ (left) and resulting offset correction derived as a function of the postfit mass (right) for events in the 2J1T category for the $\ell ^{+}$ (top), $\ell ^{-}$ (middle), and $\ell ^{\pm}$ (bottom) cases. The shaded regions indicate $\pm $1 standard deviations about the central values defined by the red line. |
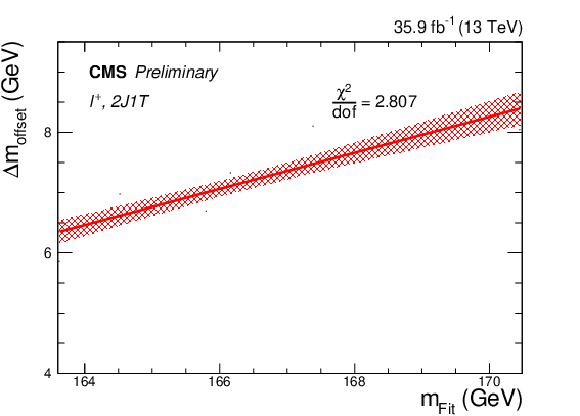
png pdf |
Figure 8-b:
Test of the linearity of the fit output for different values of true ${m_{\mathrm {t}}}$ (left) and resulting offset correction derived as a function of the postfit mass (right) for events in the 2J1T category for the $\ell ^{+}$ (top), $\ell ^{-}$ (middle), and $\ell ^{\pm}$ (bottom) cases. The shaded regions indicate $\pm $1 standard deviations about the central values defined by the red line. |
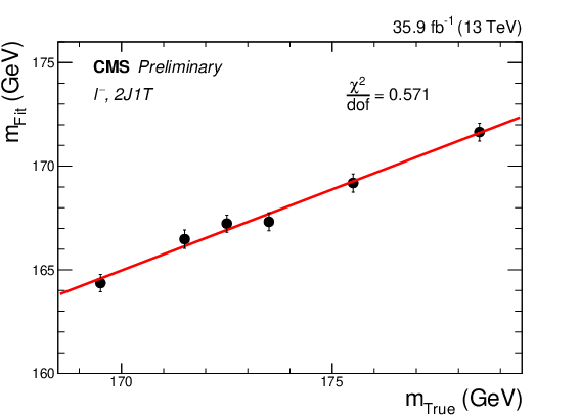
png pdf |
Figure 8-c:
Test of the linearity of the fit output for different values of true ${m_{\mathrm {t}}}$ (left) and resulting offset correction derived as a function of the postfit mass (right) for events in the 2J1T category for the $\ell ^{+}$ (top), $\ell ^{-}$ (middle), and $\ell ^{\pm}$ (bottom) cases. The shaded regions indicate $\pm $1 standard deviations about the central values defined by the red line. |
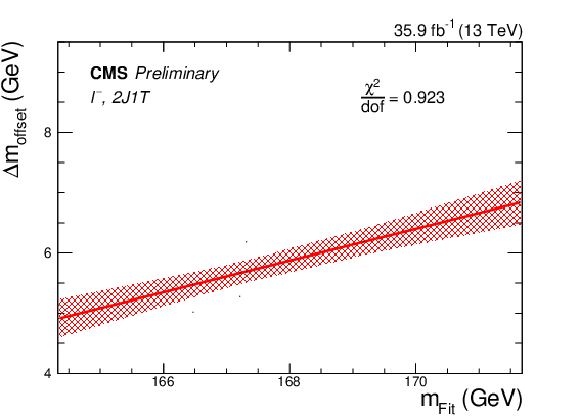
png pdf |
Figure 8-d:
Test of the linearity of the fit output for different values of true ${m_{\mathrm {t}}}$ (left) and resulting offset correction derived as a function of the postfit mass (right) for events in the 2J1T category for the $\ell ^{+}$ (top), $\ell ^{-}$ (middle), and $\ell ^{\pm}$ (bottom) cases. The shaded regions indicate $\pm $1 standard deviations about the central values defined by the red line. |
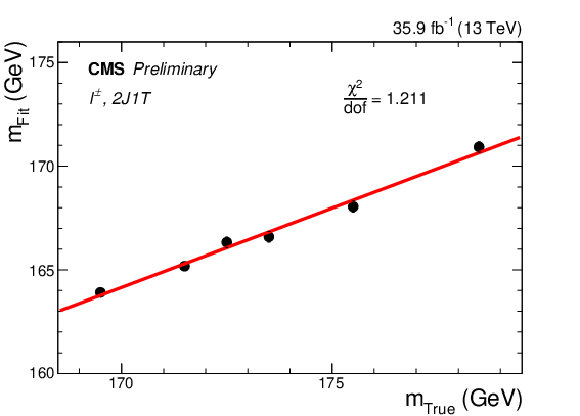
png pdf |
Figure 8-e:
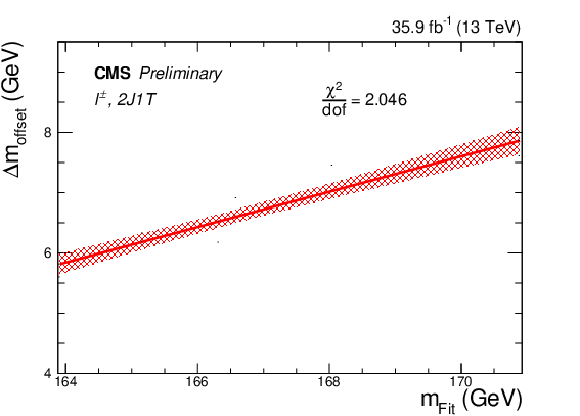
Test of the linearity of the fit output for different values of true ${m_{\mathrm {t}}}$ (left) and resulting offset correction derived as a function of the postfit mass (right) for events in the 2J1T category for the $\ell ^{+}$ (top), $\ell ^{-}$ (middle), and $\ell ^{\pm}$ (bottom) cases. The shaded regions indicate $\pm $1 standard deviations about the central values defined by the red line. |
png pdf |
Figure 8-f:
Test of the linearity of the fit output for different values of true ${m_{\mathrm {t}}}$ (left) and resulting offset correction derived as a function of the postfit mass (right) for events in the 2J1T category for the $\ell ^{+}$ (top), $\ell ^{-}$ (middle), and $\ell ^{\pm}$ (bottom) cases. The shaded regions indicate $\pm $1 standard deviations about the central values defined by the red line. |
png pdf |
Figure 9:
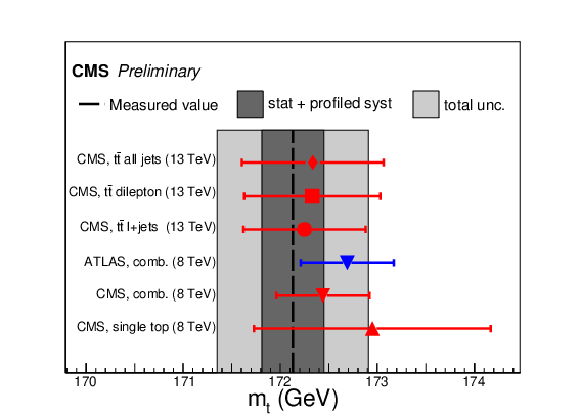
A comparison of the measured ${m_{\mathrm {t}}}$ is shown with previous ATLAS and CMS measurements, namely, measurements performed by the CMS Collaboration in ${\mathrm{t} {}\mathrm{\bar{t}}}$ events at 13 TeV in fully hadronic [8], dilepton [12], and semileptonic [7] final states, respectively; along with the combinations of measurements carried out at 8 TeV by the ATLAS [5] and CMS [6] Collaborations. The previous CMS measurement at 8 TeV in single top events [14] is also considered in this comparison. The dashed black line indicates the central value obtained from this measurement in the $\ell ^{\pm}$ final state. The darker band shows the combined effect of statistical and profiled systematic uncertainties, whereas the lighter band is the total uncertainty about the central value. |
png pdf |
Figure 10-a:
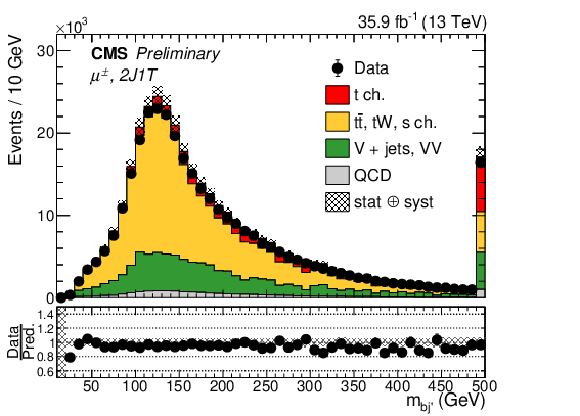
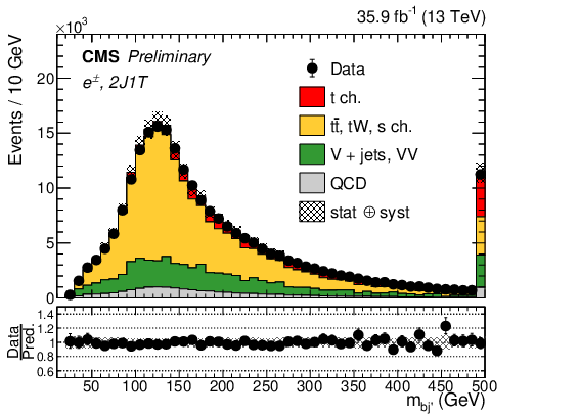
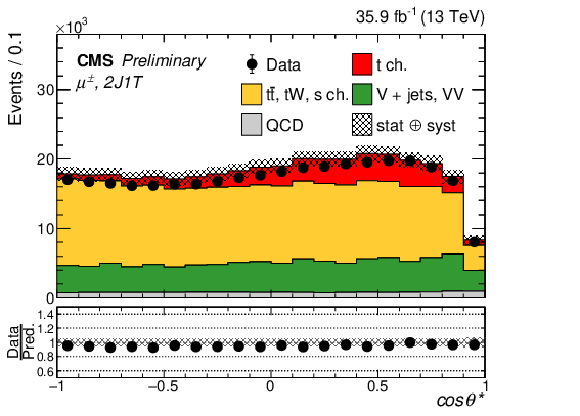
Data-MC comparison of $m_{\mathrm {bj^{\prime}}}$ (top), $\cos \theta ^{*}$ (middle) and ${m_{\mathrm {T}}^{\mathrm {W}}}$ (bottom) for the muon (left) and electron (right) final states in the 2J1T event category. The bands indicate the prefit statistical and systematic uncertainties added in quadrature. The overflow is added to the last bins of each plot. |
png pdf |
Figure 10-b:
Data-MC comparison of $m_{\mathrm {bj^{\prime}}}$ (top), $\cos \theta ^{*}$ (middle) and ${m_{\mathrm {T}}^{\mathrm {W}}}$ (bottom) for the muon (left) and electron (right) final states in the 2J1T event category. The bands indicate the prefit statistical and systematic uncertainties added in quadrature. The overflow is added to the last bins of each plot. |
png pdf |
Figure 10-c:
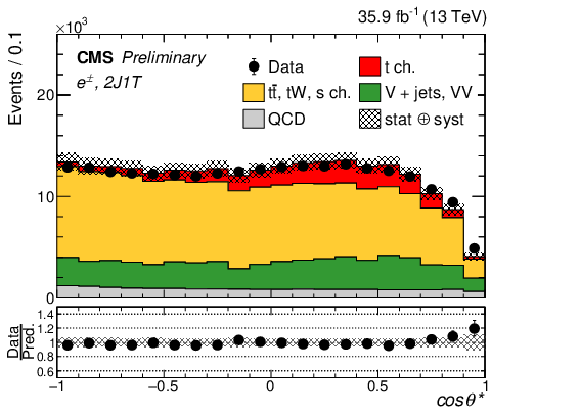
Data-MC comparison of $m_{\mathrm {bj^{\prime}}}$ (top), $\cos \theta ^{*}$ (middle) and ${m_{\mathrm {T}}^{\mathrm {W}}}$ (bottom) for the muon (left) and electron (right) final states in the 2J1T event category. The bands indicate the prefit statistical and systematic uncertainties added in quadrature. The overflow is added to the last bins of each plot. |
png pdf |
Figure 10-d:
Data-MC comparison of $m_{\mathrm {bj^{\prime}}}$ (top), $\cos \theta ^{*}$ (middle) and ${m_{\mathrm {T}}^{\mathrm {W}}}$ (bottom) for the muon (left) and electron (right) final states in the 2J1T event category. The bands indicate the prefit statistical and systematic uncertainties added in quadrature. The overflow is added to the last bins of each plot. |
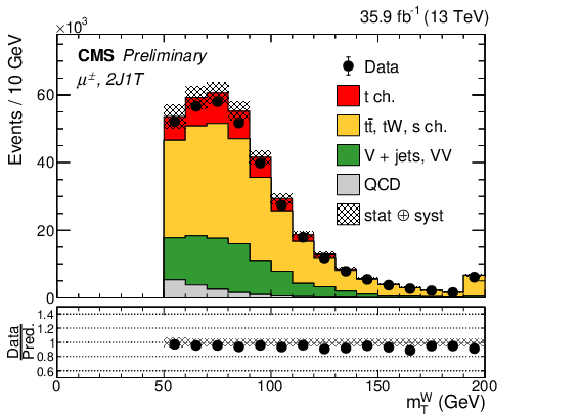
png pdf |
Figure 10-e:
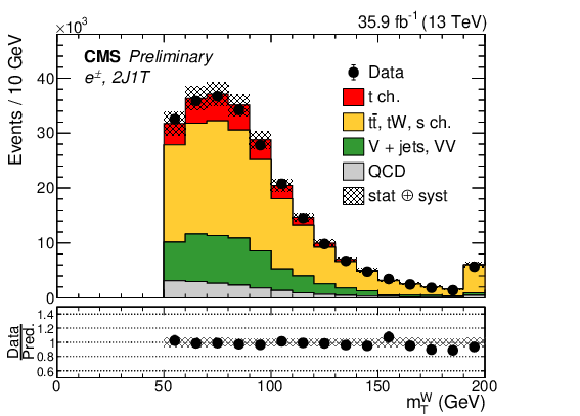
Data-MC comparison of $m_{\mathrm {bj^{\prime}}}$ (top), $\cos \theta ^{*}$ (middle) and ${m_{\mathrm {T}}^{\mathrm {W}}}$ (bottom) for the muon (left) and electron (right) final states in the 2J1T event category. The bands indicate the prefit statistical and systematic uncertainties added in quadrature. The overflow is added to the last bins of each plot. |
png pdf |
Figure 10-f:
Data-MC comparison of $m_{\mathrm {bj^{\prime}}}$ (top), $\cos \theta ^{*}$ (middle) and ${m_{\mathrm {T}}^{\mathrm {W}}}$ (bottom) for the muon (left) and electron (right) final states in the 2J1T event category. The bands indicate the prefit statistical and systematic uncertainties added in quadrature. The overflow is added to the last bins of each plot. |
png pdf |
Figure 11-a:
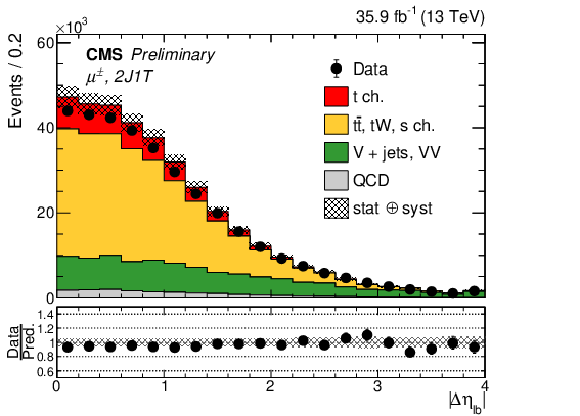
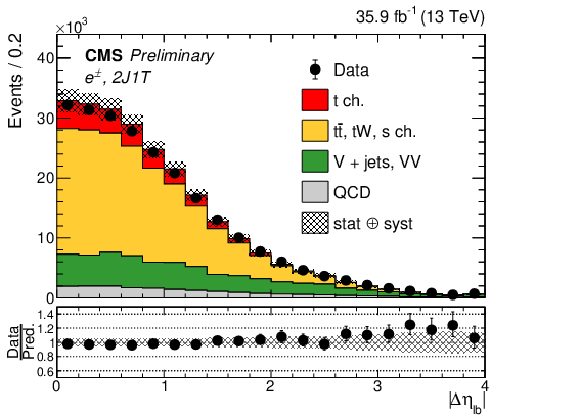
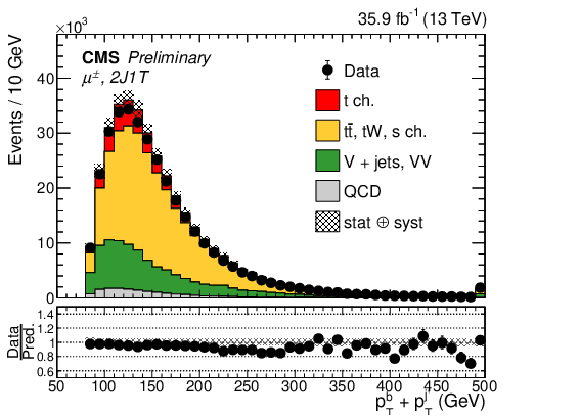
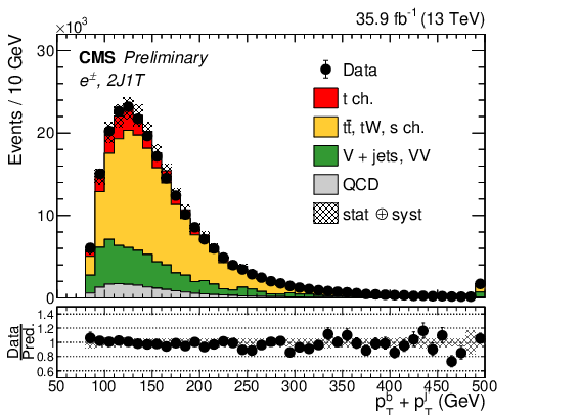
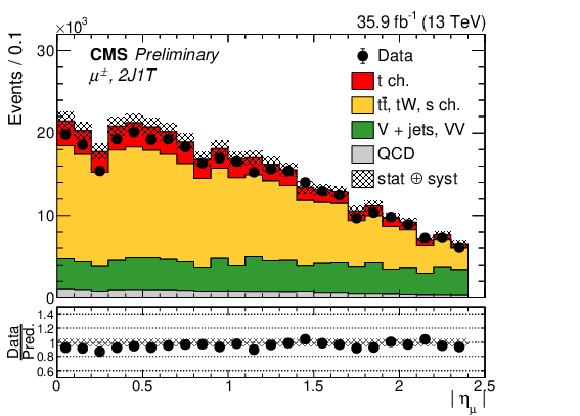
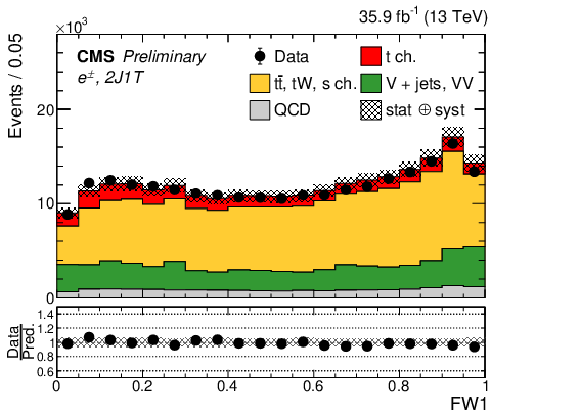
Data-MC comparisons of $| \Delta \eta _{\ell \mathrm {b}} | $ and $ {p_{\mathrm {T}}} ^{\mathrm {b}} + {p_{\mathrm {T}}} ^{\mathrm {j}^{\prime}}$ are presented in top and the middle row for muon (left) and electron (right) final states in the 2J1T event category. Th bottom row shows the data-MC comparisons of $| \eta _{\ell} | $ (left) and FW1 (right) for the muon (left) and electron (right) final states, respectively in the 2J1T event category. The bands indicate the prefit statistical and systematic uncertainties added in quadrature. The overflow is added to the last bins in the case of each plot except for the one in bottom-right. |
png pdf |
Figure 11-b:
Data-MC comparisons of $| \Delta \eta _{\ell \mathrm {b}} | $ and $ {p_{\mathrm {T}}} ^{\mathrm {b}} + {p_{\mathrm {T}}} ^{\mathrm {j}^{\prime}}$ are presented in top and the middle row for muon (left) and electron (right) final states in the 2J1T event category. Th bottom row shows the data-MC comparisons of $| \eta _{\ell} | $ (left) and FW1 (right) for the muon (left) and electron (right) final states, respectively in the 2J1T event category. The bands indicate the prefit statistical and systematic uncertainties added in quadrature. The overflow is added to the last bins in the case of each plot except for the one in bottom-right. |
png pdf |
Figure 11-c:
Data-MC comparisons of $| \Delta \eta _{\ell \mathrm {b}} | $ and $ {p_{\mathrm {T}}} ^{\mathrm {b}} + {p_{\mathrm {T}}} ^{\mathrm {j}^{\prime}}$ are presented in top and the middle row for muon (left) and electron (right) final states in the 2J1T event category. Th bottom row shows the data-MC comparisons of $| \eta _{\ell} | $ (left) and FW1 (right) for the muon (left) and electron (right) final states, respectively in the 2J1T event category. The bands indicate the prefit statistical and systematic uncertainties added in quadrature. The overflow is added to the last bins in the case of each plot except for the one in bottom-right. |
png pdf |
Figure 11-d:
Data-MC comparisons of $| \Delta \eta _{\ell \mathrm {b}} | $ and $ {p_{\mathrm {T}}} ^{\mathrm {b}} + {p_{\mathrm {T}}} ^{\mathrm {j}^{\prime}}$ are presented in top and the middle row for muon (left) and electron (right) final states in the 2J1T event category. Th bottom row shows the data-MC comparisons of $| \eta _{\ell} | $ (left) and FW1 (right) for the muon (left) and electron (right) final states, respectively in the 2J1T event category. The bands indicate the prefit statistical and systematic uncertainties added in quadrature. The overflow is added to the last bins in the case of each plot except for the one in bottom-right. |
png pdf |
Figure 11-e:
Data-MC comparisons of $| \Delta \eta _{\ell \mathrm {b}} | $ and $ {p_{\mathrm {T}}} ^{\mathrm {b}} + {p_{\mathrm {T}}} ^{\mathrm {j}^{\prime}}$ are presented in top and the middle row for muon (left) and electron (right) final states in the 2J1T event category. Th bottom row shows the data-MC comparisons of $| \eta _{\ell} | $ (left) and FW1 (right) for the muon (left) and electron (right) final states, respectively in the 2J1T event category. The bands indicate the prefit statistical and systematic uncertainties added in quadrature. The overflow is added to the last bins in the case of each plot except for the one in bottom-right. |
png pdf |
Figure 11-f:
Data-MC comparisons of $| \Delta \eta _{\ell \mathrm {b}} | $ and $ {p_{\mathrm {T}}} ^{\mathrm {b}} + {p_{\mathrm {T}}} ^{\mathrm {j}^{\prime}}$ are presented in top and the middle row for muon (left) and electron (right) final states in the 2J1T event category. Th bottom row shows the data-MC comparisons of $| \eta _{\ell} | $ (left) and FW1 (right) for the muon (left) and electron (right) final states, respectively in the 2J1T event category. The bands indicate the prefit statistical and systematic uncertainties added in quadrature. The overflow is added to the last bins in the case of each plot except for the one in bottom-right. |
png pdf |
Figure 12-a:
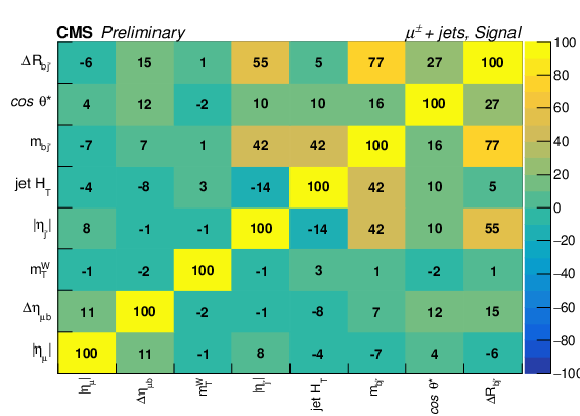
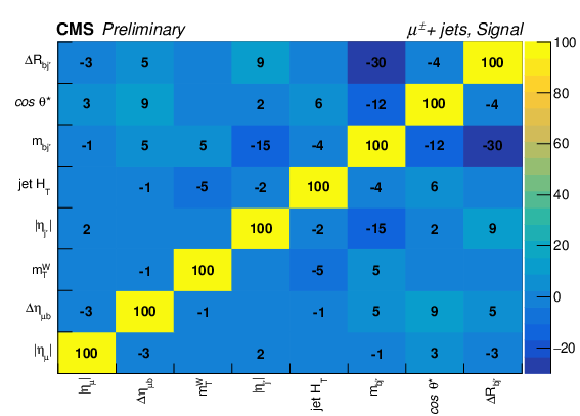
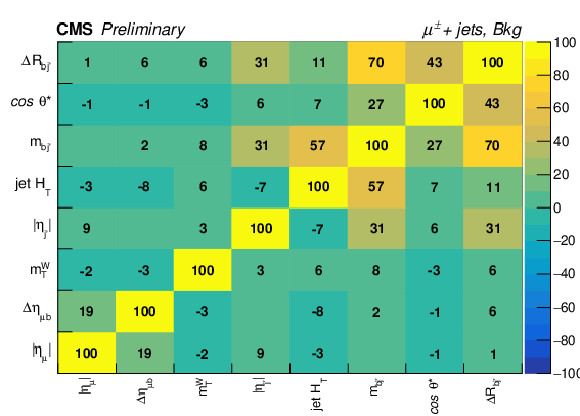
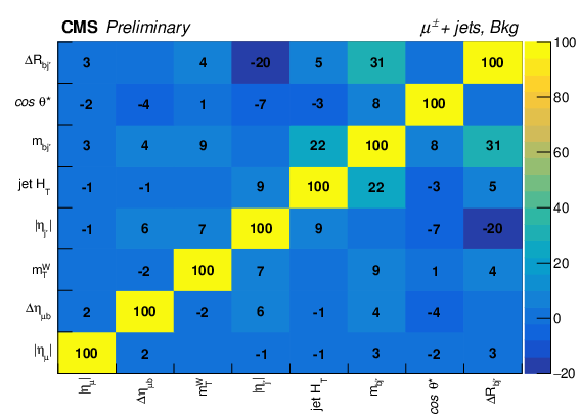
Correlations (in %) among for the input variables to the BDT designed for the muon final state in signal (top) and background (bottom) events in the 2J1T category before (left) and after (right) application of the decorrelation method available in TMVA. |
png pdf |
Figure 12-b:
Correlations (in %) among for the input variables to the BDT designed for the muon final state in signal (top) and background (bottom) events in the 2J1T category before (left) and after (right) application of the decorrelation method available in TMVA. |
png pdf |
Figure 12-c:
Correlations (in %) among for the input variables to the BDT designed for the muon final state in signal (top) and background (bottom) events in the 2J1T category before (left) and after (right) application of the decorrelation method available in TMVA. |
png pdf |
Figure 12-d:
Correlations (in %) among for the input variables to the BDT designed for the muon final state in signal (top) and background (bottom) events in the 2J1T category before (left) and after (right) application of the decorrelation method available in TMVA. |
png pdf |
Figure 13-a:
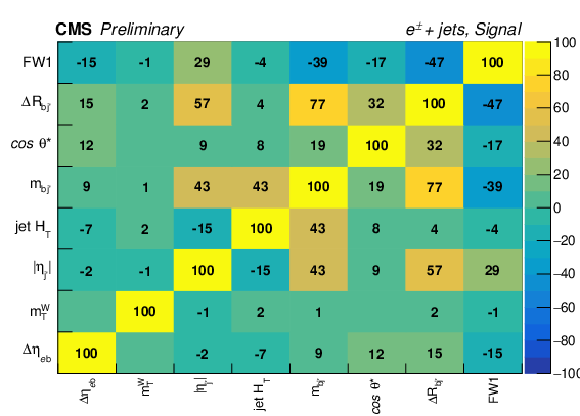
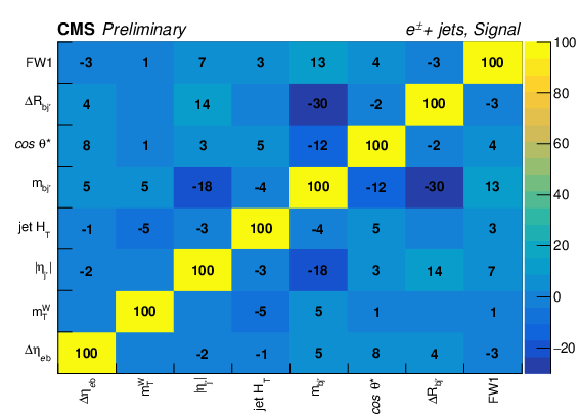
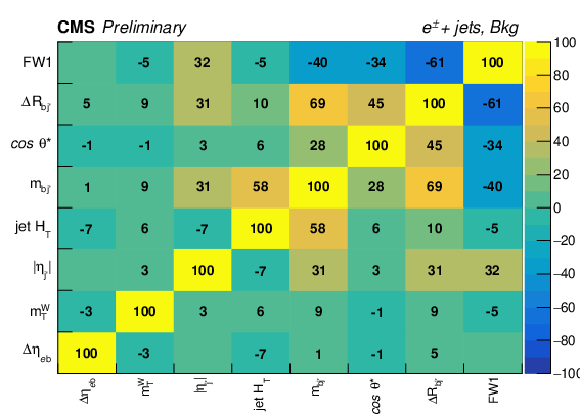
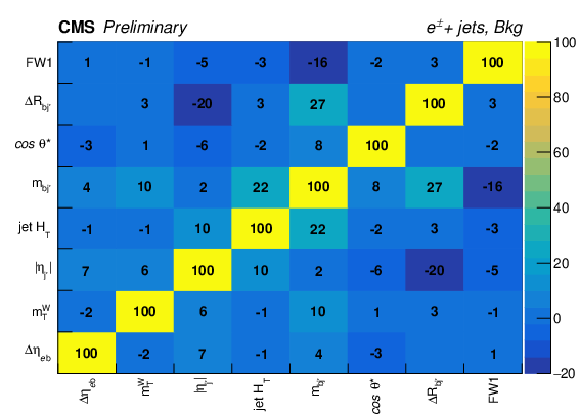
Correlations (in %) among for the input variables to the BDT designed for the electron final state in signal (top) and background (bottom) events in the 2J1T category before (left) and after (right) application of the decorrelation method available in TMVA. |
png pdf |
Figure 13-b:
Correlations (in %) among for the input variables to the BDT designed for the electron final state in signal (top) and background (bottom) events in the 2J1T category before (left) and after (right) application of the decorrelation method available in TMVA. |
png pdf |
Figure 13-c:
Correlations (in %) among for the input variables to the BDT designed for the electron final state in signal (top) and background (bottom) events in the 2J1T category before (left) and after (right) application of the decorrelation method available in TMVA. |
png pdf |
Figure 13-d:
Correlations (in %) among for the input variables to the BDT designed for the electron final state in signal (top) and background (bottom) events in the 2J1T category before (left) and after (right) application of the decorrelation method available in TMVA. |
png pdf |
Figure 14-a:
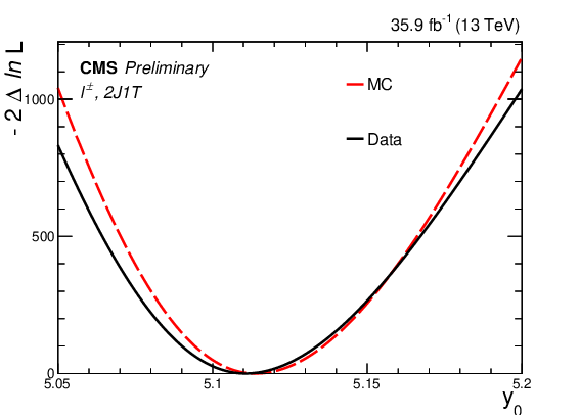
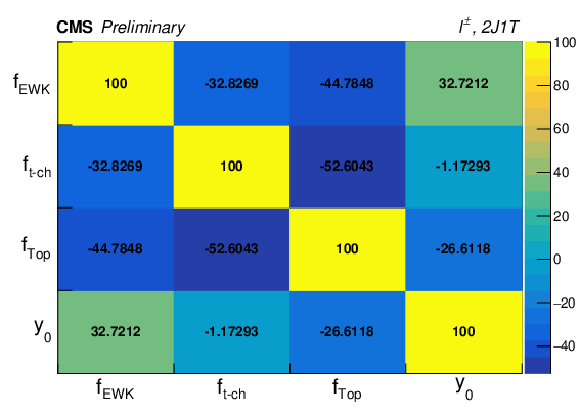
The scan of the profile likelihood ratios as a function of the POI in the parametric model are shown on the left for the fits corresponding to $\ell ^{\pm}$ final state in the 2J1T event category with simulated events and data. The correlation (in %) among the POI and nuisance parameters are shown on the right for the fit to data corresponding to $\ell ^{\pm}$ final state in the 2J1T event category. |
png pdf |
Figure 14-b:
The scan of the profile likelihood ratios as a function of the POI in the parametric model are shown on the left for the fits corresponding to $\ell ^{\pm}$ final state in the 2J1T event category with simulated events and data. The correlation (in %) among the POI and nuisance parameters are shown on the right for the fit to data corresponding to $\ell ^{\pm}$ final state in the 2J1T event category. |
| Summary |
| Events containing an isolated muon or electron and two jets, of which one is b-tagged, in the final state are used to measure the mass of top quarks and antiquarks, as well as their ratio and difference in the $t$ channel single top production. The top quark mass is measured to be 172.13$^{+0.76}_{-0.77}$ GeV from the inclusive measurement. For the very first time, a sub-GeV precision on the measured mass is achieved in this particular phase space. The masses of the top quark and antiquark are determined to be 172.62$^{+1.04}_{-0.75}$ GeV and 171.79$^{+1.44}_{-1.51}$ GeV, respectively. These quantities are used to determine the ratio of the masses of the top antiquarks to the quarks to be 0.995$^{+0.005}_{-0.006}$ along with the difference between top quark and antiquark masses to be 0.83$^{+0.77}_{-1.01}$ GeV, for the first time in events with single top quark production. The estimated mass ratio and difference agree with unity and zero, respectively, within uncertainties and are consistent with no violation of the charge conjugation-parity-time reversal invariance. The statistical uncertainty plays a minor role in the achieved precision of the measured masses, which are limited by the systematic uncertainties due to jet energy scale, color reconnection, and modeling of final state radiation in the signal process. A deeper understanding of these effects is therefore crucial not only to further improve the precisions of the measured masses; also for a deeper knowledge of their correlations in events with single top quark and antiquark production, in order to determine stringent limit for any violation of the charge conjugation-parity-time reversal invariance in this process in future. |
| References | ||||
| 1 | S. Alekhin, A. Djouadi, and S. Moch | The top quark and Higgs boson masses and the stability of the electroweak vacuum | PLB 716 (2012) 214 | 1207.0980 |
| 2 | G. Degrassi et al. | Higgs mass and vacuum stability in the Standard Model at NNLO | JHEP 08 (2012) 098 | 1205.6497 |
| 3 | M. Aliev et al. | HATHOR: HAdronic Top and Heavy quarks crOss section calculatoR | CPC 182 (2011) 1034 | 1007.1327 |
| 4 | P. Kant et al. | HatHor for single top-quark production: Updated predictions and uncertainty estimates for single top-quark production in hadronic collisions | CPC 191 (2015) 74 | 1406.4403 |
| 5 | ATLAS Collaboration | Measurement of the top quark mass in the $ \mathrm{t}\bar{\mathrm{t}}\rightarrow $ lepton+jets channel from $ \sqrt{s}= $ 8 TeV ATLAS data and combination with previous results | EPJC 79 (2019) 290 | 1810.01772 |
| 6 | CMS Collaboration | Measurement of the top quark mass using proton-proton data at $ \sqrt{s} = $ 7 and 8 TeV | PRD 93 (2016) 072004 | CMS-TOP-14-022 1509.04044 |
| 7 | CMS Collaboration | Measurement of the top quark mass with lepton+jets final states using pp collisions at $ \sqrt{s}= $ 13 TeV | EPJC 78 (2018) 891 | CMS-TOP-17-007 1805.01428 |
| 8 | CMS Collaboration | Measurement of the top quark mass in the all-jets final state at $ \sqrt{s} = $ 13 TeV and combination with the lepton+jets channel | EPJC 79 (2019) 313 | CMS-TOP-17-008 1812.10534 |
| 9 | CMS Collaboration | Measurement of the Jet Mass Distribution and Top Quark Mass in Hadronic Decays of Boosted Top Quarks in $ pp $ Collisions at $ \sqrt{s} = $ TeV | PRL 124 (2020) 202001 | CMS-TOP-19-005 1911.03800 |
| 10 | CMS Collaboration | Measurement of $ \mathrm{t\bar t} $ normalised multi-differential cross sections in pp collisions at $ \sqrt s= $ 13 TeV, and simultaneous determination of the strong coupling strength, top quark pole mass, and parton distribution functions | EPJC 80 (2020) 658 | CMS-TOP-18-004 1904.05237 |
| 11 | CMS Collaboration | Running of the top quark mass from proton-proton collisions at $ \sqrt{s} = $ 13TeV | PLB 803 (2020) 135263 | CMS-TOP-19-007 1909.09193 |
| 12 | CMS Collaboration | Measurement of the $ \mathrm{t}\overline{\mathrm{t}} $ production cross section, the top quark mass, and the strong coupling constant using dilepton events in pp collisions at $ \sqrt{s} = $ 13 TeV | EPJC 79 (2019) 368 | CMS-TOP-17-001 1812.10505 |
| 13 | S. Argyropoulos and T. Sjostrand | Effects of color reconnection on t$ \bar{\mathrm{t}} $ final states at the LHC | JHEP 11 (2014) 043 | 1407.6653 |
| 14 | CMS Collaboration | Measurement of the top quark mass using single top quark events in proton-proton collisions at $ \sqrt{s}= $ 8 TeV | EPJC 77 (2017) 354 | CMS-TOP-15-001 1703.02530 |
| 15 | P. Nason | A New method for combining NLO QCD with shower Monte Carlo algorithms | JHEP 11 (2004) 040 | hep-ph/0409146 |
| 16 | S. Frixione, P. Nason, and C. Oleari | Matching NLO QCD computations with Parton Shower simulations: the POWHEG method | JHEP 11 (2007) 070 | 0709.2092 |
| 17 | S. Alioli, P. Nason, C. Oleari, and E. Re | A general framework for implementing NLO calculations in shower Monte Carlo programs: the POWHEG BOX | JHEP 06 (2010) 043 | 1002.2581 |
| 18 | J. Alwall et al. | The automated computation of tree-level and next-to-leading order differential cross sections, and their matching to parton shower simulations | JHEP 07 (2014) 079 | 1405.0301 |
| 19 | S. Alioli, P. Nason, C. Oleari, and E. Re | NLO single-top production matched with shower in POWHEG: s- and t-channel contributions | JHEP 09 (2009) 111 | 0907.4076 |
| 20 | R. Frederix, E. Re, and P. Torrielli | Single-top $ t $-channel hadroproduction in the four-flavour scheme with POWHEG and aMC@NLO | JHEP 09 (2012) 130 | 1207.5391 |
| 21 | ATLAS Collaboration | Fiducial, total and differential cross-section measurements of $ t $-channel single top-quark production in pp collisions at 8 TeV using data collected by the ATLAS detector | EPJC 77 (2017) 531 | 1702.02859 |
| 22 | S. Alioli, S. O. Moch, and P. Uwer | Hadronic top-quark pair-production with one jet and parton showering | JHEP 01 (2012) 137 | 1110.5251 |
| 23 | E. Re | Single-top Wt-channel production matched with parton showers using the POWHEG method | EPJC 71 (2011) 1547 | 1009.2450 |
| 24 | R. Frederix and S. Frixione | Merging meets matching in MC@NLO | JHEP 12 (2012) 061 | 1209.6215 |
| 25 | T. Sjostrand et al. | An Introduction to PYTHIA 8.2 | CPC 191 (2015) 159 | 1410.3012 |
| 26 | CMS Collaboration | Event generator tunes obtained from underlying event and multiparton scattering measurements | EPJC 76 (2016) 155 | CMS-GEN-14-001 1512.00815 |
| 27 | CMS Collaboration | Investigations of the impact of the parton shower tuning in Pythia 8 in the modelling of $ \mathrm{t\overline{t}} $ at $ \sqrt{s}= $ 8 and 13 TeV | CMS-PAS-TOP-16-021 | CMS-PAS-TOP-16-021 |
| 28 | M. Botje et al. | The PDF4LHC Working Group Interim Recommendations | 1101.0538 | |
| 29 | GEANT4 Collaboration | GEANT4: A Simulation toolkit | NIMA 506 (2003) 250 | |
| 30 | M. Cacciari, G. P. Salam, and G. Soyez | The Anti-k(t) jet clustering algorithm | JHEP 04 (2008) 063 | 0802.1189 |
| 31 | M. Cacciari, G. P. Salam, and G. Soyez | FastJet user manual | EPJC C72 (2012) 1896 | 1111.6097 |
| 32 | CMS Collaboration | Particle-flow reconstruction and global event description with the CMS detector | JINST 12 (2017) P10003 | CMS-PRF-14-001 1706.04965 |
| 33 | W. Adam, R. Fruhwirth, A. Strandlie, and T. Todorov | Reconstruction of electrons with the Gaussian-sum filter in the CMS tracker at the LHC | JPG 31 (2005) 9 | physics/0306087 |
| 34 | CMS Collaboration | Performance of the CMS muon detector and muon reconstruction with proton-proton collisions at $ \sqrt{s} = $ 13 TeV | JINST 13 (2018) P06015 | CMS-MUO-16-001 1804.04528 |
| 35 | CMS Collaboration | Jet energy scale and resolution in the CMS experiment in pp collisions at 8 TeV | JINST 12 (2017) P02014 | CMS-JME-13-004 1607.03663 |
| 36 | CMS Collaboration | Identification of heavy-flavour jets with the CMS detector in pp collisions at 13 TeV | JINST 13 (2018) P05011 | CMS-BTV-16-002 1712.07158 |
| 37 | CMS Collaboration | Performance of missing transverse momentum reconstruction in proton-proton collisions at $ \sqrt{s} = $ 13 TeV using the CMS detector | JINST 14 (2019) P07004 | CMS-JME-17-001 1903.06078 |
| 38 | Particle Data Group, P. A. Zyla et al. | Review of particle physics | Prog. Theor. Exp. Phys. 2020 (2020) 083C01 | |
| 39 | CDF Collaboration | First Observation of Electroweak Single Top Quark Production | PRL 103 (2009) 092002 | 0903.0885 |
| 40 | D0 Collaboration | Observation of Single Top Quark Production | PRL 103 (2009) 092001 | 0903.0850 |
| 41 | A. Hoecker et al. | TMVA: Toolkit for Multivariate Data Analysis | PoS ACAT (2007) 040 | physics/0703039 |
| 42 | Y. Freund and R. E. Schapire | A Decision-Theoretic Generalization of On-Line Learning and an Application to Boosting | J. Comput. Syst. Sci. 55 (1997) 119 | |
| 43 | G. C. Fox and S. Wolfram | Event shapes in $ \mathrm{e}^{+}\mathrm{e}^{-} $ annihilation | Nuclear Physics B 157 (1979) 543 | |
| 44 | C. Bernaciak, M. S. A. Buschmann, A. Butter, and T. Plehn | Fox-Wolfram Moments in Higgs Physics | PRD 87 (2013) 073014 | 1212.4436 |
| 45 | Belle Collaboration | Evidence for the decay $ \mathrm{B}^{0}\to \mathrm{K}^{+} \mathrm{K}^{-} \pi^{0} $ | PRD 87 (2013) 091101 | 1304.5312 |
| 46 | H. Fanchiotti, C. A. Garcia Canal, and M. Marucho | The Landau distribution | Int. J. Mod. Phys. C 17 (2006) 1461 | hep-ph/0305310 |
| 47 | T. Skwarnicki | PhD thesis, Cracow, INP | ||
| 48 | Belle Collaboration | A detailed test of the CsI(Tl) calorimeter for BELLE with photon beams of energy between 20-MeV and 5.4-GeV | NIMA 441 (2000) 401 | |
| 49 | CMS Collaboration | Measurement of the single top quark and antiquark production cross sections in the $ t $ channel and their ratio in proton-proton collisions at $ \sqrt{s}= $ 13 TeV | PLB 800 (2020) 135042 | CMS-TOP-17-011 1812.10514 |
| 50 | M. Czakon, P. Fiedler, and A. Mitov | Total Top-Quark Pair-Production Cross Section at Hadron Colliders Through $ O(\alpha_{S}) $ | PRL 110 (2013) 252004 | 1303.6254 |
| 51 | CMS Collaboration | Measurement of differential cross sections for top quark pair production using the lepton+jets final state in proton-proton collisions at 13 TeV | PRD 95 (2017) 092001 | CMS-TOP-16-008 1610.04191 |
| 52 | CMS Collaboration | Measurement of the differential cross sections for the associated production of a W boson and jets in proton-proton collisions at $ \sqrt{s}= $ 13 TeV | PRD 96 (2017) 072005 | CMS-SMP-16-005 1707.05979 |
| 53 | CMS Collaboration | Measurement of differential cross sections for Z boson production in association with jets in proton-proton collisions at $ \sqrt{s} = $ 13 TeV | EPJC 78 (2018) 965 | CMS-SMP-16-015 1804.05252 |
| 54 | CMS Collaboration | Determination of Jet Energy Calibration and Transverse Momentum Resolution in CMS | JINST 6 (2011) P11002 | CMS-JME-10-011 1107.4277 |
| 55 | CMS Collaboration | Jet energy scale uncertainty correlations between ATLAS and CMS at 8 TeV | CMS-PAS-JME-15-001 | CMS-PAS-JME-15-001 |
| 56 | CMS Collaboration | Performance of the CMS missing transverse momentum reconstruction in pp data at $ \sqrt{s} = $ 8 TeV | JINST 10 (2015) P02006 | CMS-JME-13-003 1411.0511 |
| 57 | CMS Collaboration | Measurements of Inclusive W and Z Cross Sections in pp Collisions at $ \sqrt{s}= $ 7 TeV | JHEP 01 (2011) 080 | CMS-EWK-10-002 1012.2466 |
| 58 | CMS Collaboration | Measurement of the inelastic proton-proton cross section at $ \sqrt{s}= $ 13 TeV | JHEP 07 (2018) 161 | CMS-FSQ-15-005 1802.02613 |
| 59 | CMS Collaboration | CMS Luminosity Measurements for the 2016 Data Taking Period | CMS-PAS-LUM-17-001 | CMS-PAS-LUM-17-001 |
| 60 | J. R. Christiansen and P. Z. Skands | String Formation Beyond Leading Colour | JHEP 08 (2015) 003 | 1505.01681 |
| 61 | CMS Collaboration | Study of the underlying event in top quark pair production in $ \mathrm {p}\mathrm {p} $ collisions at 13 TeV | EPJC 79 (2019) 123 | CMS-TOP-17-015 1807.02810 |
| 62 | M. Bahr et al. | Herwig++ Physics and Manual | EPJC 58 (2008) 639 | 0803.0883 |
| 63 | ALEPH Collaboration | Study of the fragmentation of b quarks into B mesons at the Z peak | PLB 512 (2001) 30 | hep-ex/0106051 |
| 64 | DELPHI Collaboration | A study of the b-quark fragmentation function with the DELPHI detector at LEP I and an averaged distribution obtained at the Z Pole | EPJC 71 (2011) 1557 | 1102.4748 |
| 65 | M. G. Bowler | e$ ^{+} $ e$ ^{-} $ Production of Heavy Quarks in the String Model | Z. Phys. C 11 (1981) 169 | |
| 66 | C. Peterson, D. Schlatter, I. Schmitt, and P. M. Zerwas | Scaling Violations in Inclusive e$ ^{+} $ e$ ^{-} $ Annihilation Spectra | PRD 27 (1983) 105 | |
| 67 | A. Kalogeropoulos and J. Alwall | The SysCalc code: A tool to derive theoretical systematic uncertainties | 1801.08401 | |
| 68 | CMS Collaboration | Measurement of the differential cross section for top quark pair production in pp collisions at $ \sqrt{s} = $ 8 TeV | EPJC 75 (2015) 542 | CMS-TOP-12-028 1505.04480 |
| 69 | CMS Collaboration | Measurement of the mass difference between top quark and antiquark in pp collisions at $ \sqrt{s} = $ 8 TeV | PLB 770 (2017) 50 | CMS-TOP-12-031 1610.09551 |

|
Compact Muon Solenoid LHC, CERN |

|

|

|

|

|

|