

Compact Muon Solenoid
LHC, CERN
| CMS-PAS-TOP-19-005 | ||
| Measurement of the jet mass distribution in highly boosted top quark decays in pp collisions at $\sqrt{s}=$ 13 TeV | ||
| CMS Collaboration | ||
| July 2019 | ||
| Abstract: A measurement of the jet mass distribution in highly boosted hadronic top quark decays produced in $\text{t}\bar{\text{t}}$ events from pp collisions at $\sqrt{s}=$ 13 TeV is reported. The data were collected with the CMS detector at the LHC, and correspond to an integrated luminosity of 35.9 fb$^{-1}$. The measurement is performed in the $\ell$+jets channel where $\ell$ is an electron or muon. The products of the fully hadronic decay $\text{t} \rightarrow \text{b}\text{W}$ with $\text{W}\rightarrow\text{q}\bar{\text{q}}'$ are reconstructed with a single jet with transverse momentum $p_\text{T} > $ 400 GeV. The $\text{t}\bar{\text{t}}$ cross section as a function of the jet mass is unfolded at the particle level and is used to extract a value of the top quark mass of 172.56 $\pm$ 2.47 GeV. This is the first measurement of the top quark mass in the highly boosted regime with a total uncertainty comparable to those from measurements performed at threshold $\text{t}\bar{\text{t}}$ production. | ||
|
Links:
CDS record (PDF) ;
CADI line (restricted) ;
These preliminary results are superseded in this paper, PRL 124 (2020) 202001. The superseded preliminary plots can be found here. |
||
| Figures | Summary | Additional Figures & Tables | References | CMS Publications |
|---|
| Figures | |
png pdf |
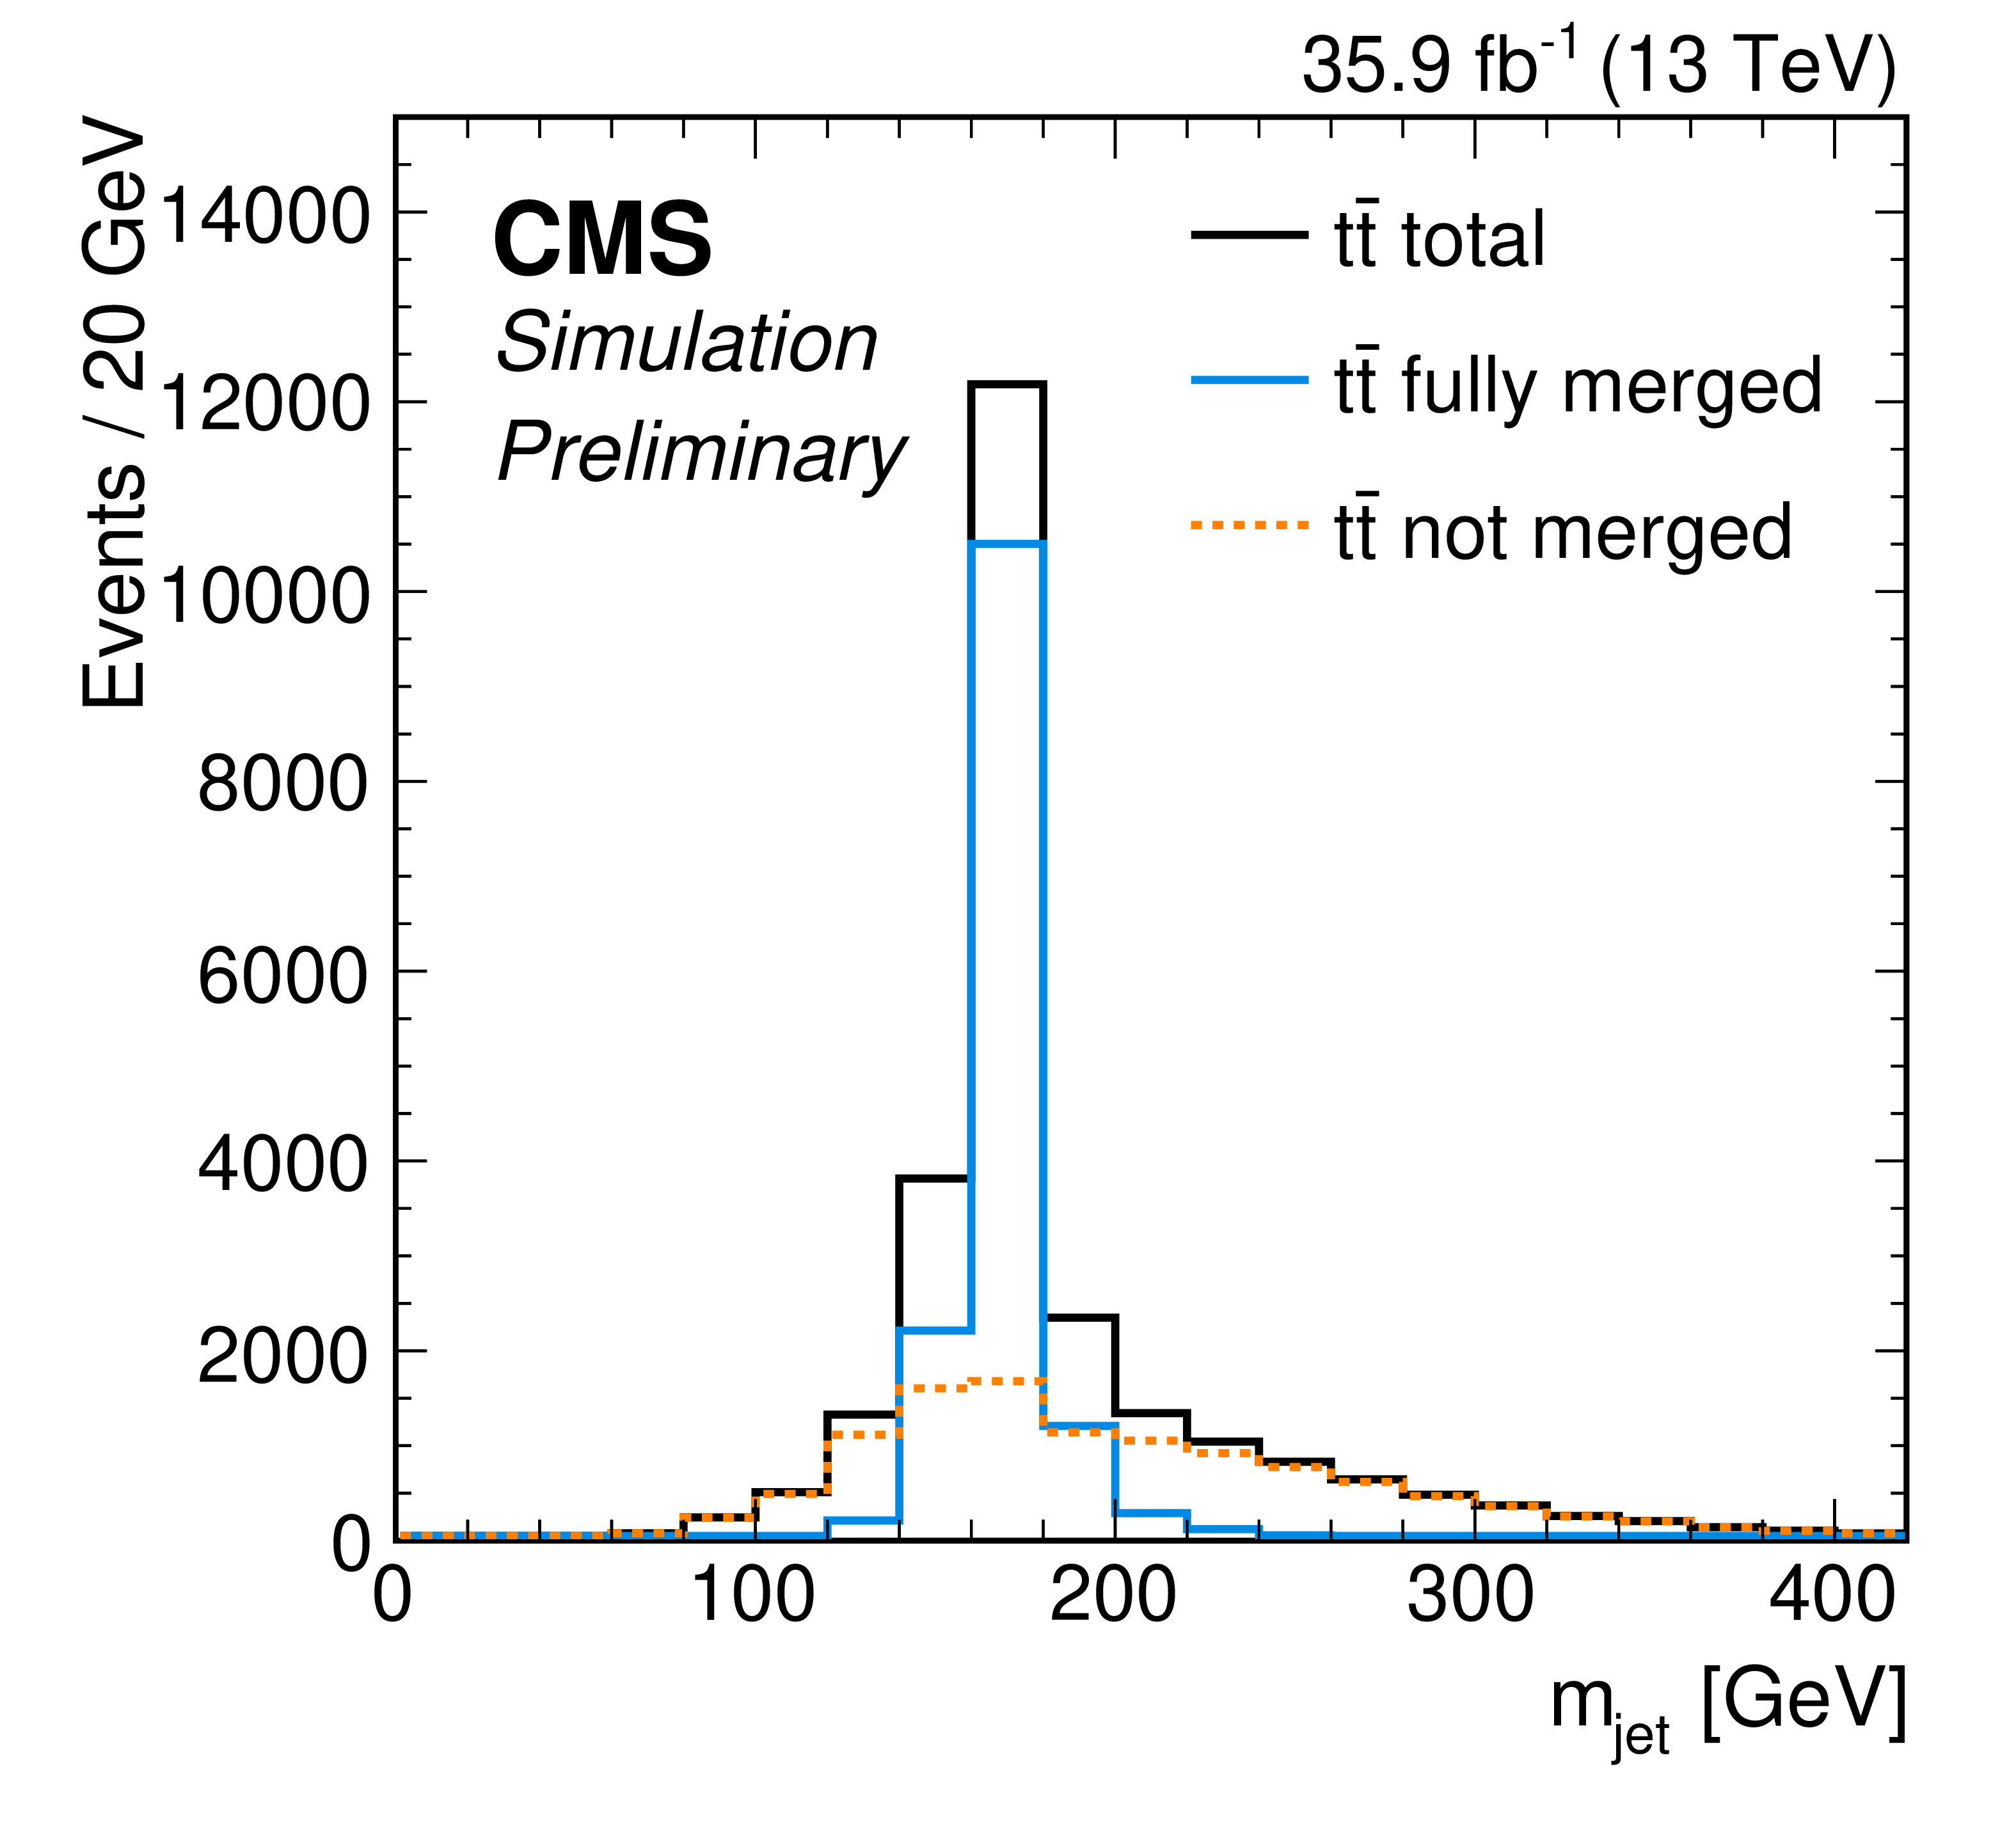
Figure 1:
Simulated distribution of ${m_\textrm {jet}}$ after the selection on particle level. The ${\mathrm{t} {}\mathrm{\bar{t}}}$ simulation (black, solid) is divided into fully merged (blue, solid) and not merged (orange, dashed) events. |

png pdf |
Figure 2:
Reconstructed distribution of ${m_\textrm {jet}}$ after the full event selection in the $\ell $+jets channel. The vertical bars on the points show the statistical uncertainty. The hatched region shows the total uncertainty in the simulation, including the statistical and experimental systematic uncertainties. The panel below shows the ratio of the data to the simulation. The uncertainty band includes the statistical and experimental systematic uncertainties, where the statistical (light grey) and total (dark grey) uncertainties are shown separately in the ratio. |
png pdf |
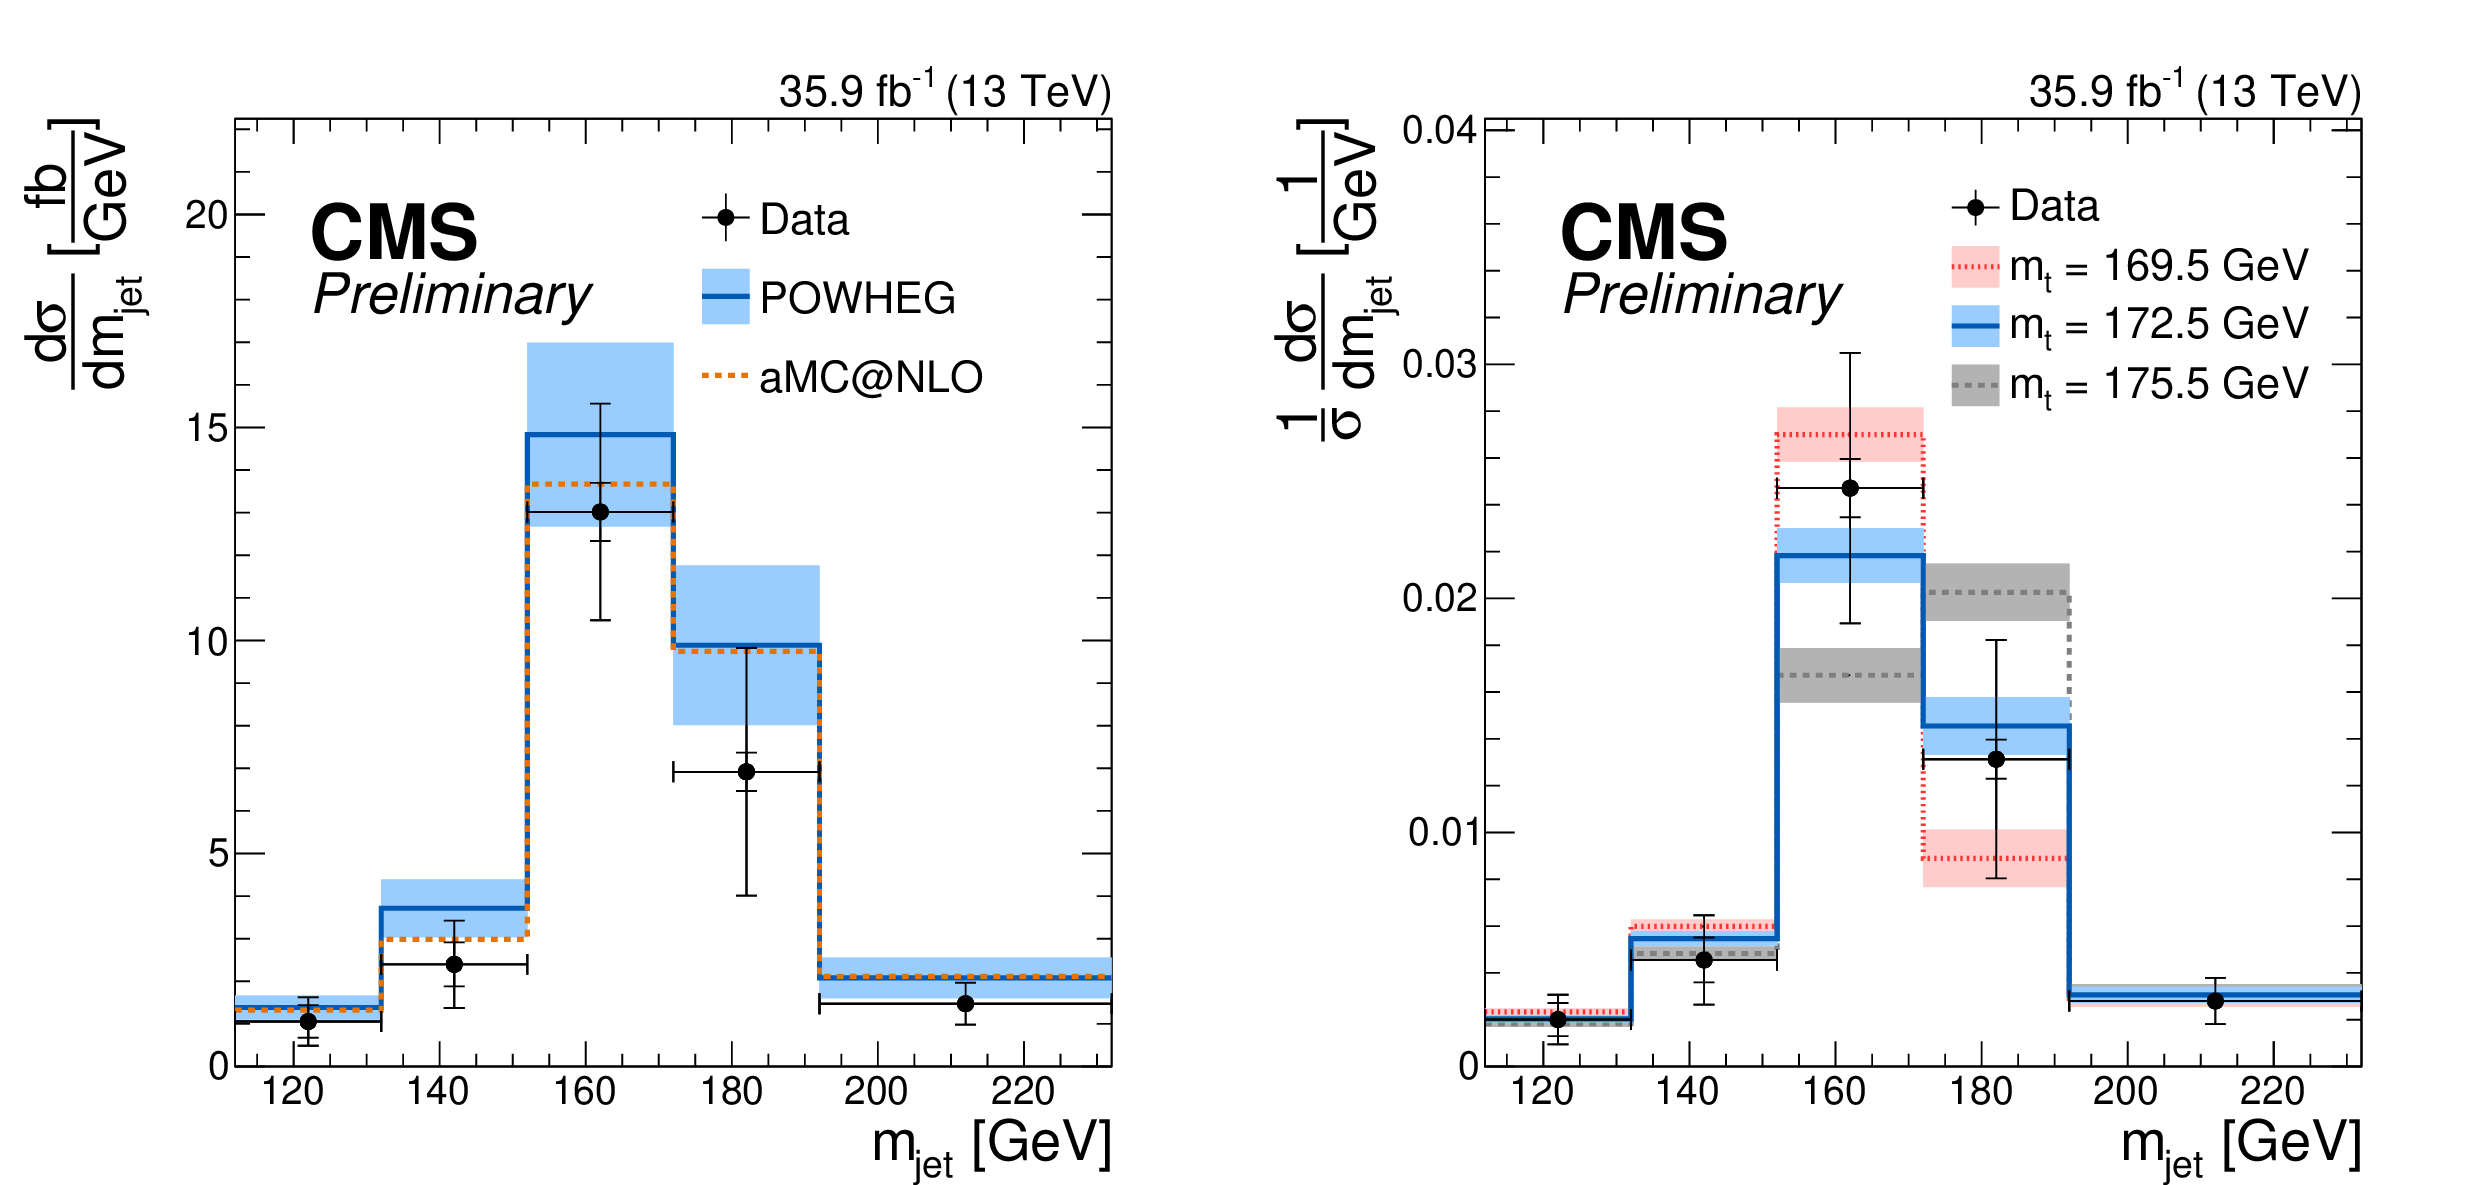
Figure 3:
The particle level ${\mathrm{t} {}\mathrm{\bar{t}}}$ differential cross section in the fiducial region as a function of the jet mass (left). The measurement is compared to predictions from POWHEG and MC@NLO. Theoretical uncertainties are shown as colored bands for the predictions from POWHEG. The normalized differential cross section (right) is compared to predictions from POWHEG with different values of $ {m_\mathrm{t}} $. The vertical bars represent the statistical (inner) and the total (outer) uncertainties. The horizontal bars show the bin width. |
png pdf |
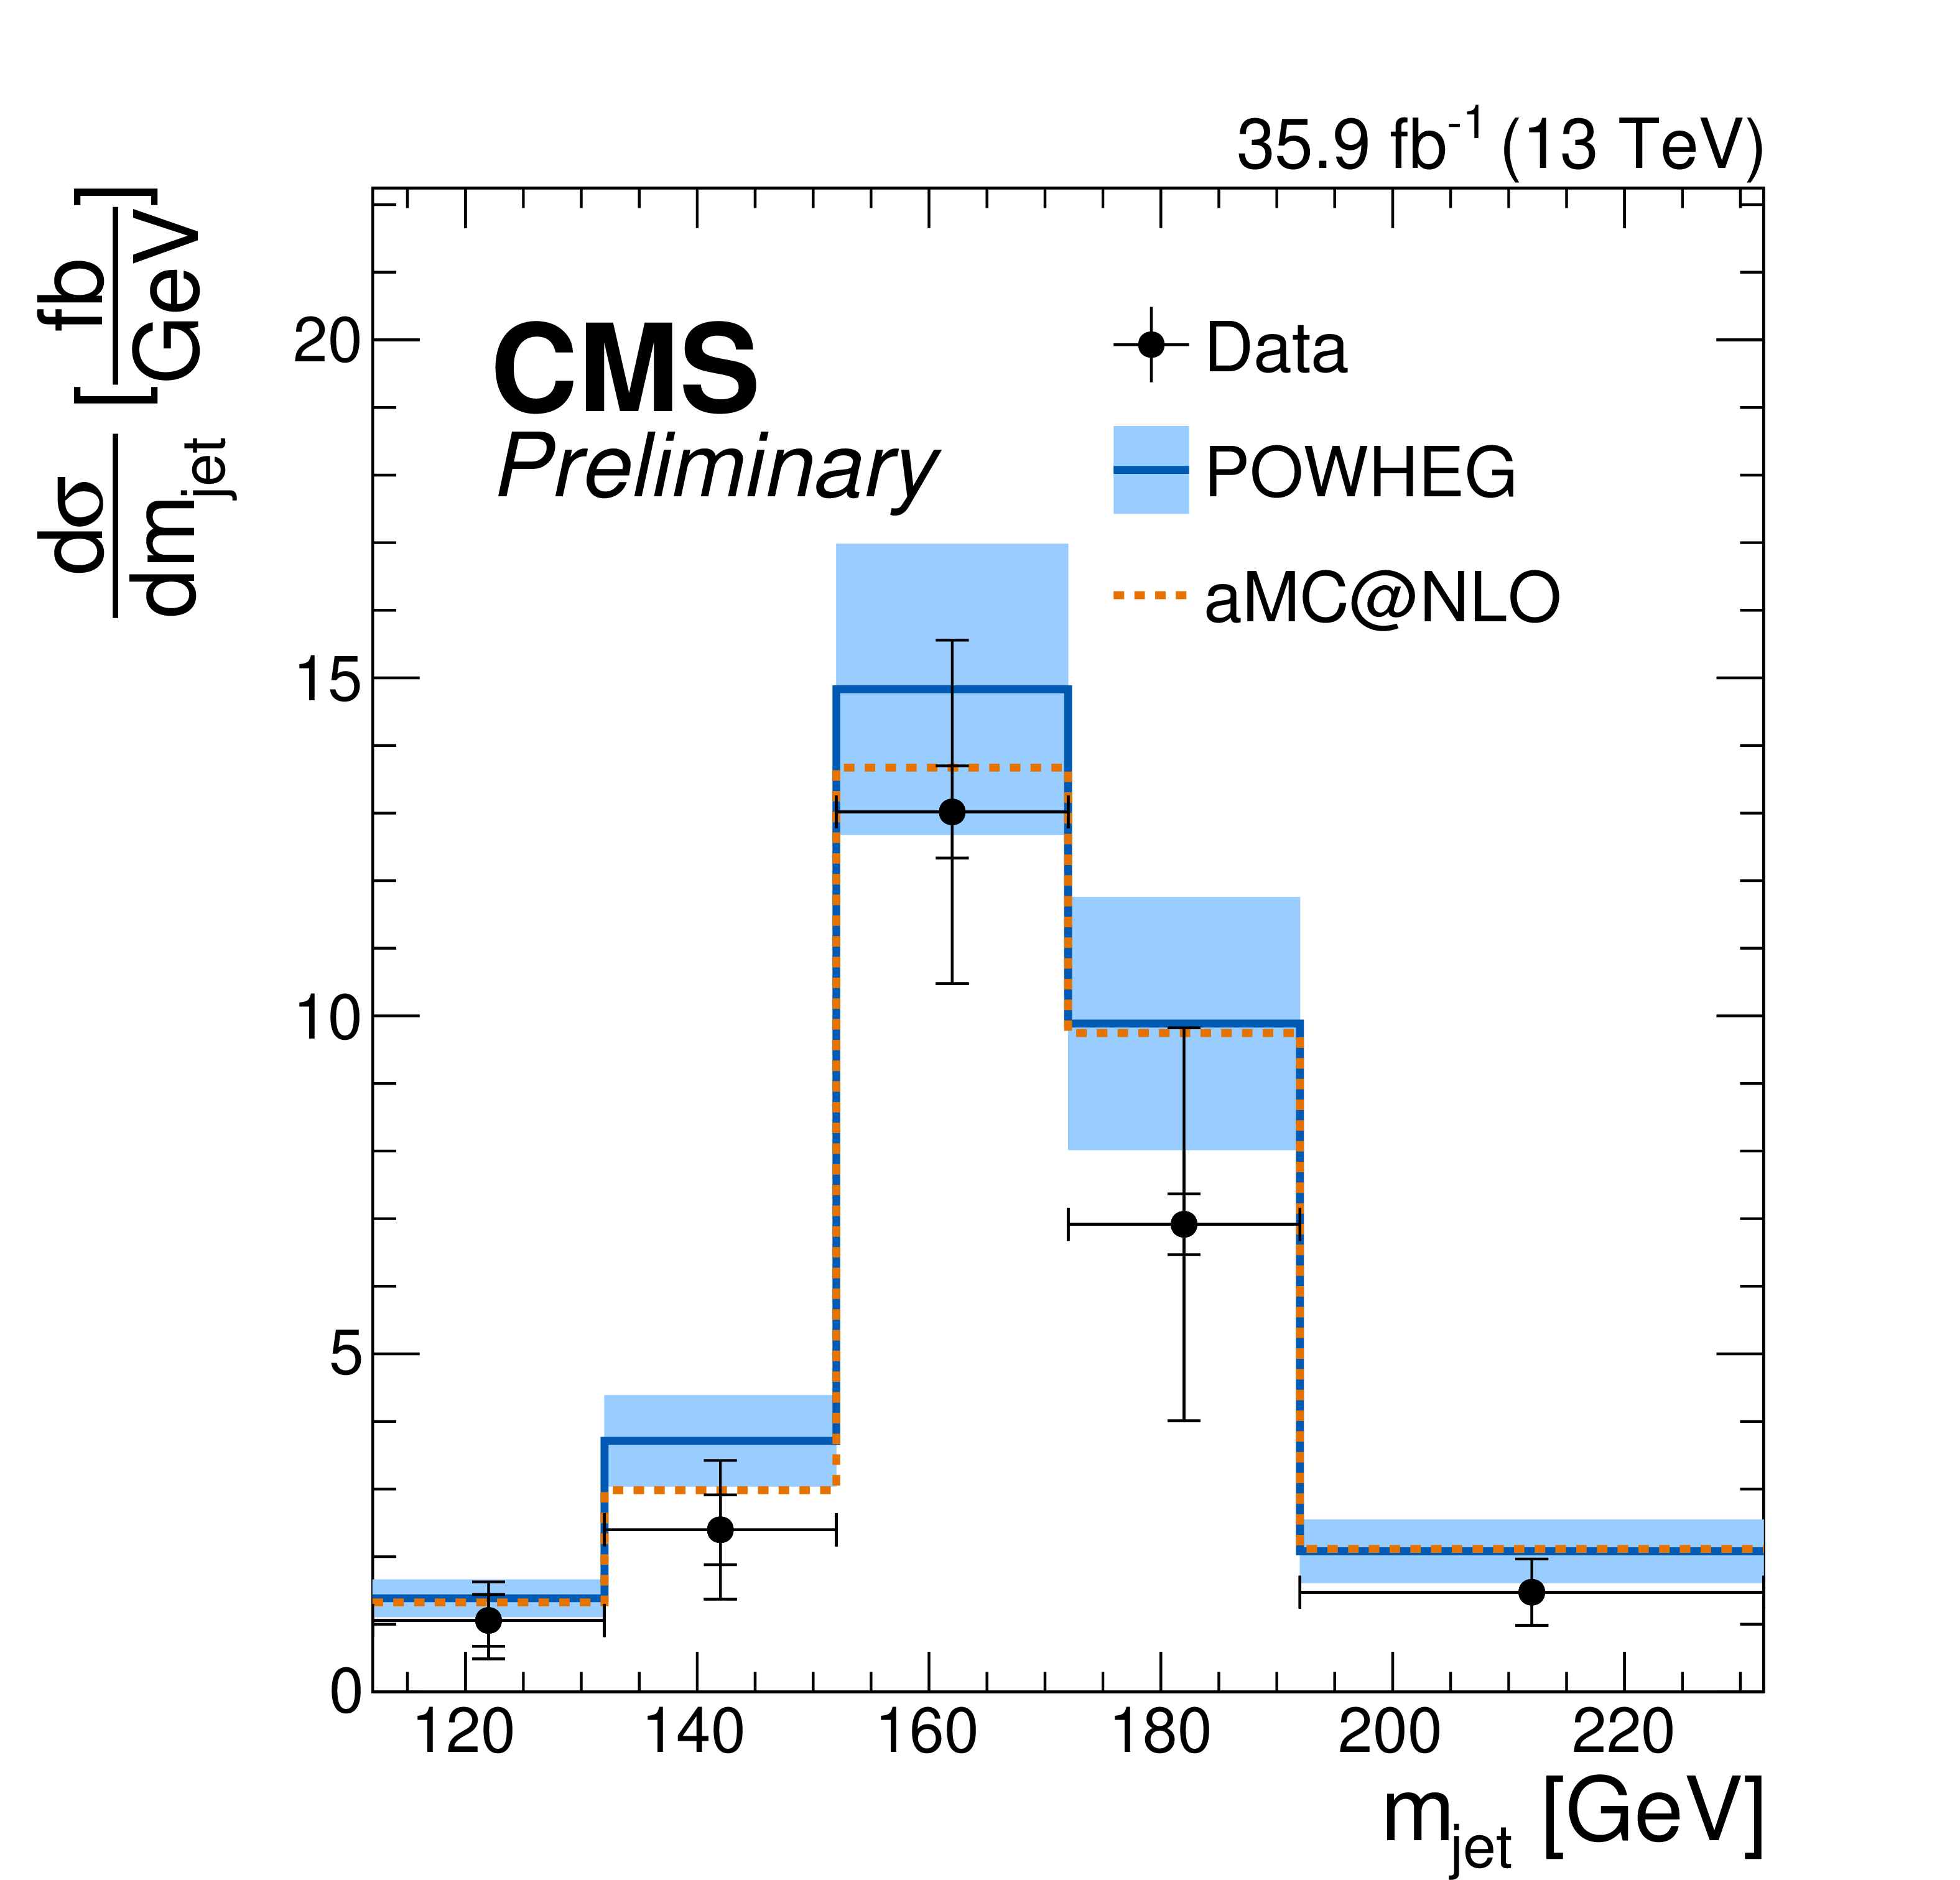
Figure 3-a:
The particle level ${\mathrm{t} {}\mathrm{\bar{t}}}$ differential cross section in the fiducial region as a function of the jet mass. The measurement is compared to predictions from POWHEG and MC@NLO. Theoretical uncertainties are shown as colored bands for the predictions from POWHEG. The horizontal bars show the bin width. |

png pdf |
Figure 3-b:
The normalized differential cross section is compared to predictions from POWHEG with different values of $ {m_\mathrm{t}} $. The vertical bars represent the statistical (inner) and the total (outer) uncertainties. The horizontal bars show the bin width. |
| Summary |
| In conclusion, we have presented a measurement of the differential cross section in highly boosted top quark decays as a function of the jet mass $ {m_\textrm{jet}} $. The measurement relies on a novel method to reconstruct highly-boosted top quark decays with the XCone jet algorithm, which results in a large improvement of the $ {m_\textrm{jet}} $ resolution and reduced systematic uncertainties. The shape of the unfolded distribution is well described by the simulation of $\mathrm{t\bar{t}}$ production and shows high sensitivity to the top quark mass $ {m_\mathrm{t}} $. A determination of $ {m_\mathrm{t}} $ from the normalized $ {m_\textrm{jet}} $ distribution results in a value of $ {m_\mathrm{t}} = $ 172.56 $\pm$ 2.47 GeV, which has an uncertainty similar to the ones from measurements at threshold production. This measurement can be compared directly to precise analytical calculations, feasible only in the highly-boosted regime. This result comprises an important step in understanding the ambiguities arising between the top quark pole mass and $ {m_\mathrm{t}} $ measurements at hadron colliders. |
| Additional Figures | |
png pdf |
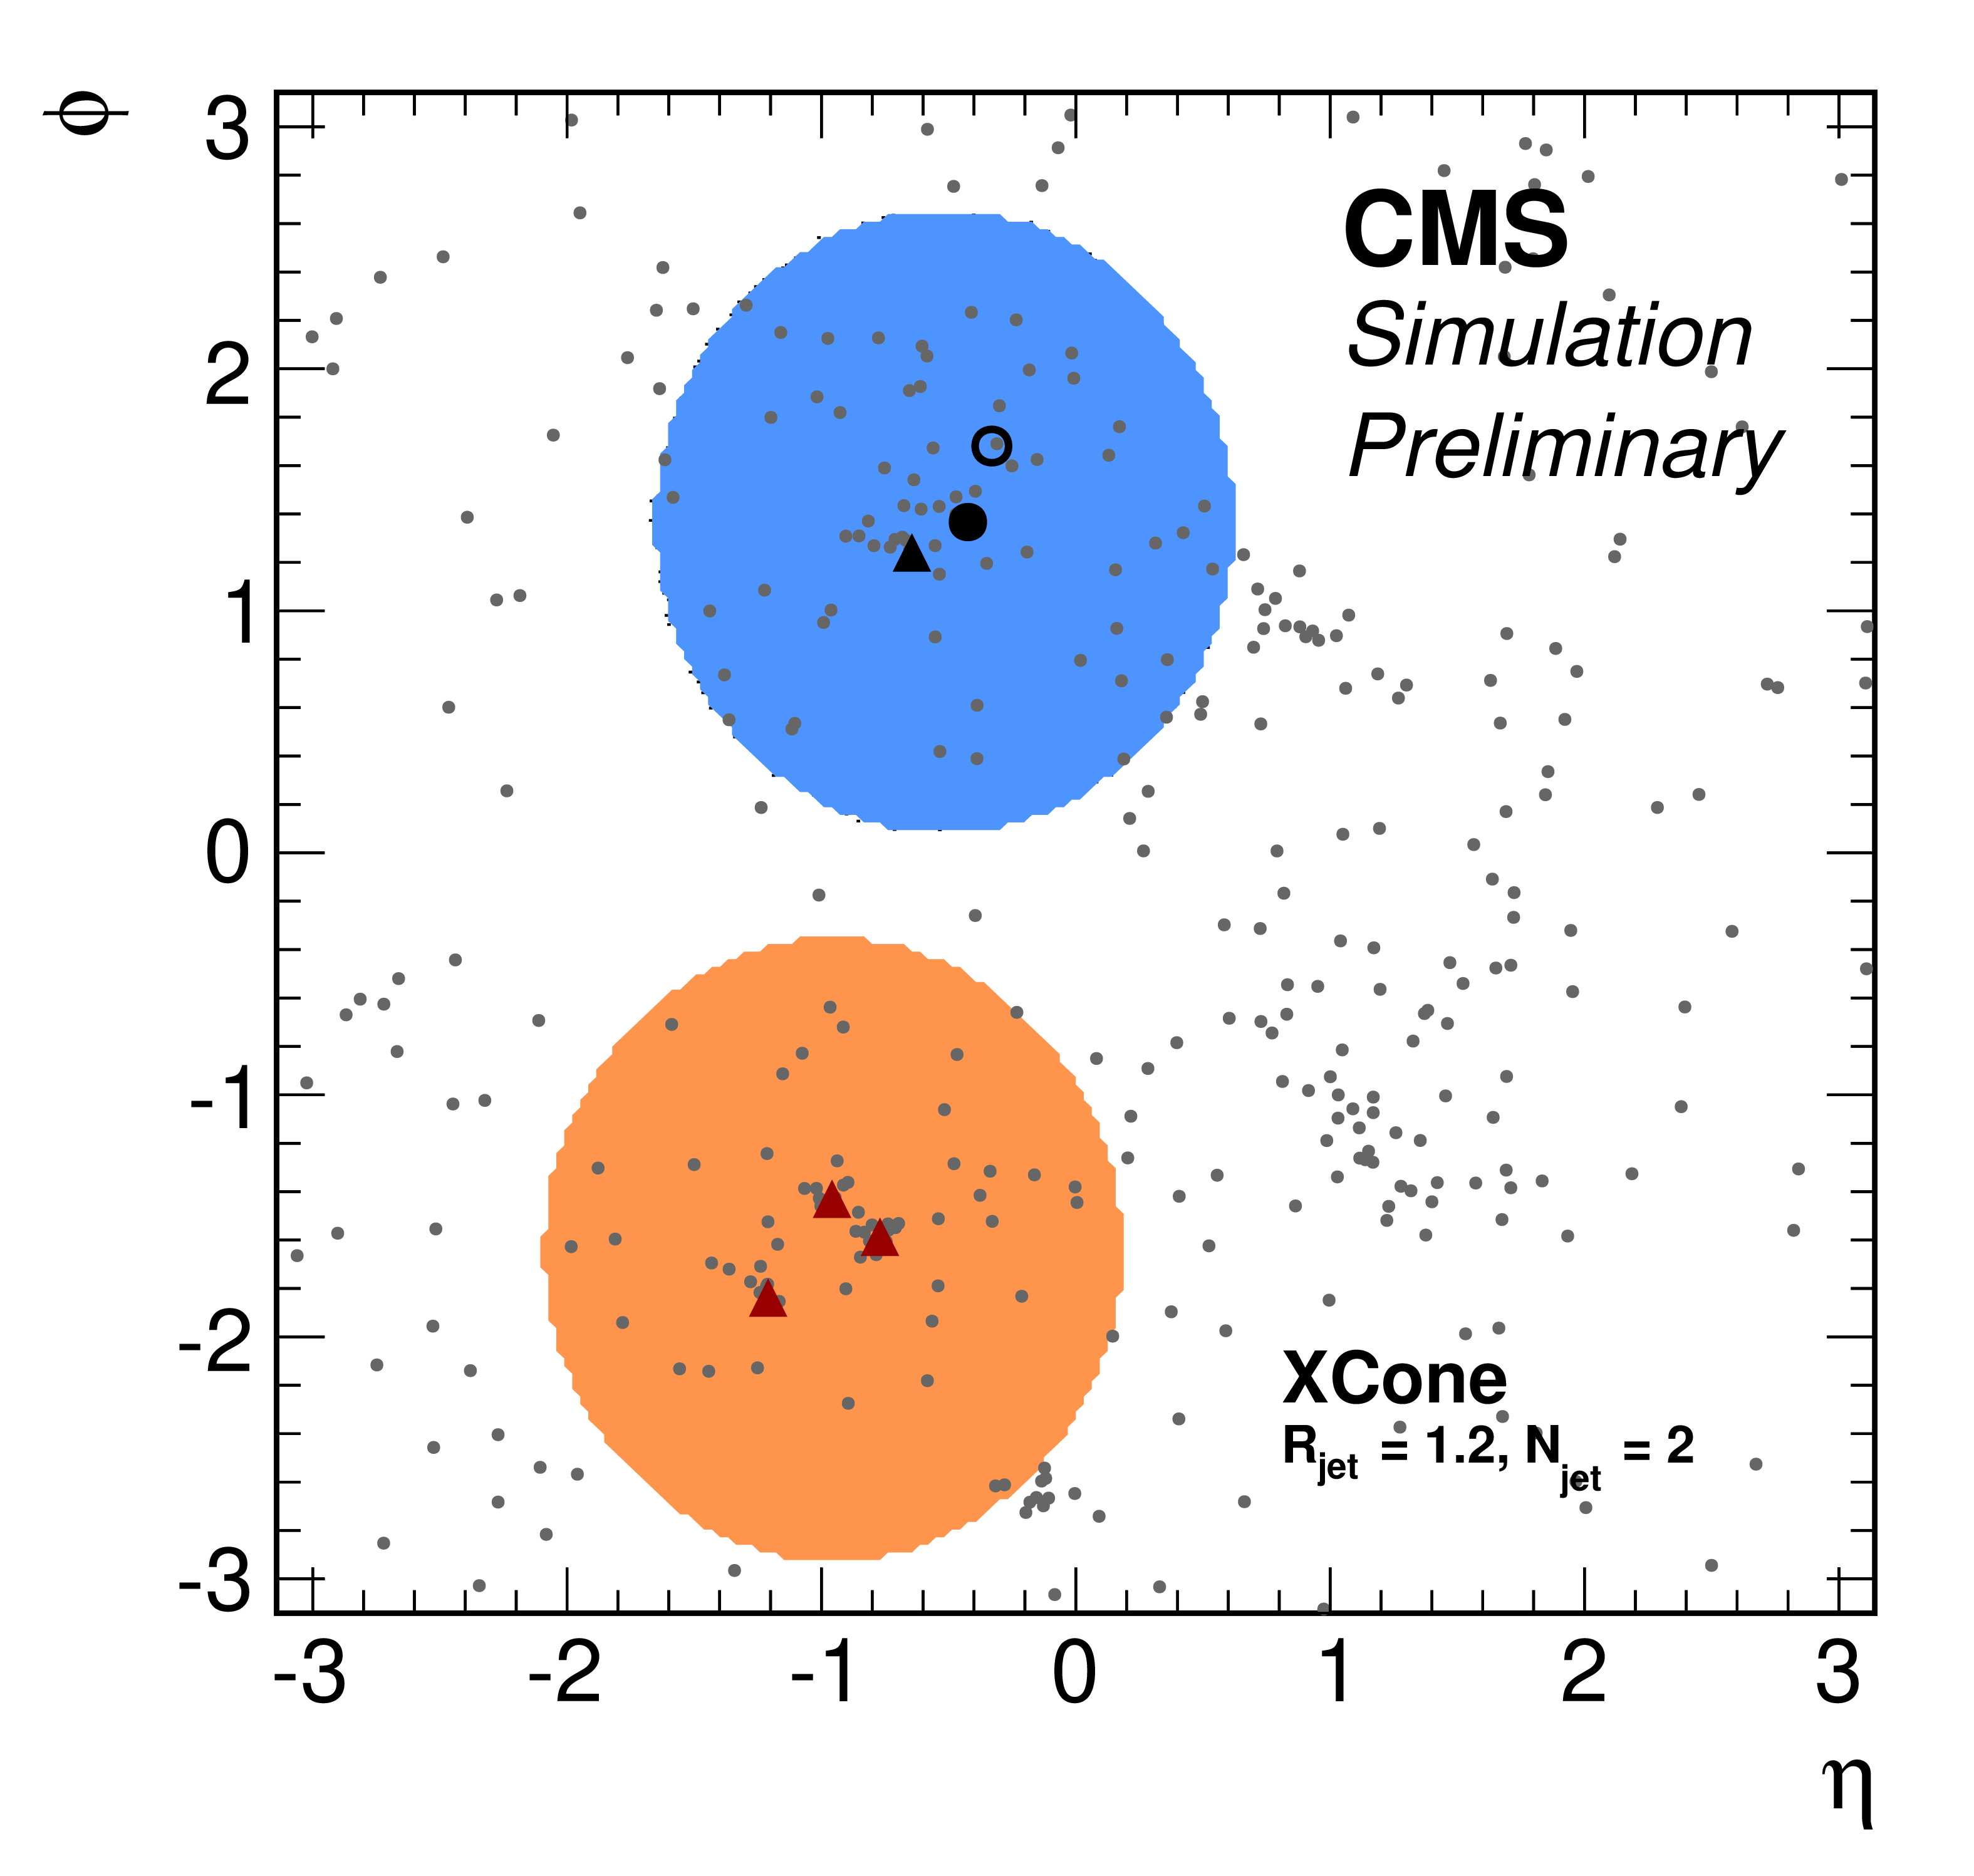
Additional Figure 1:
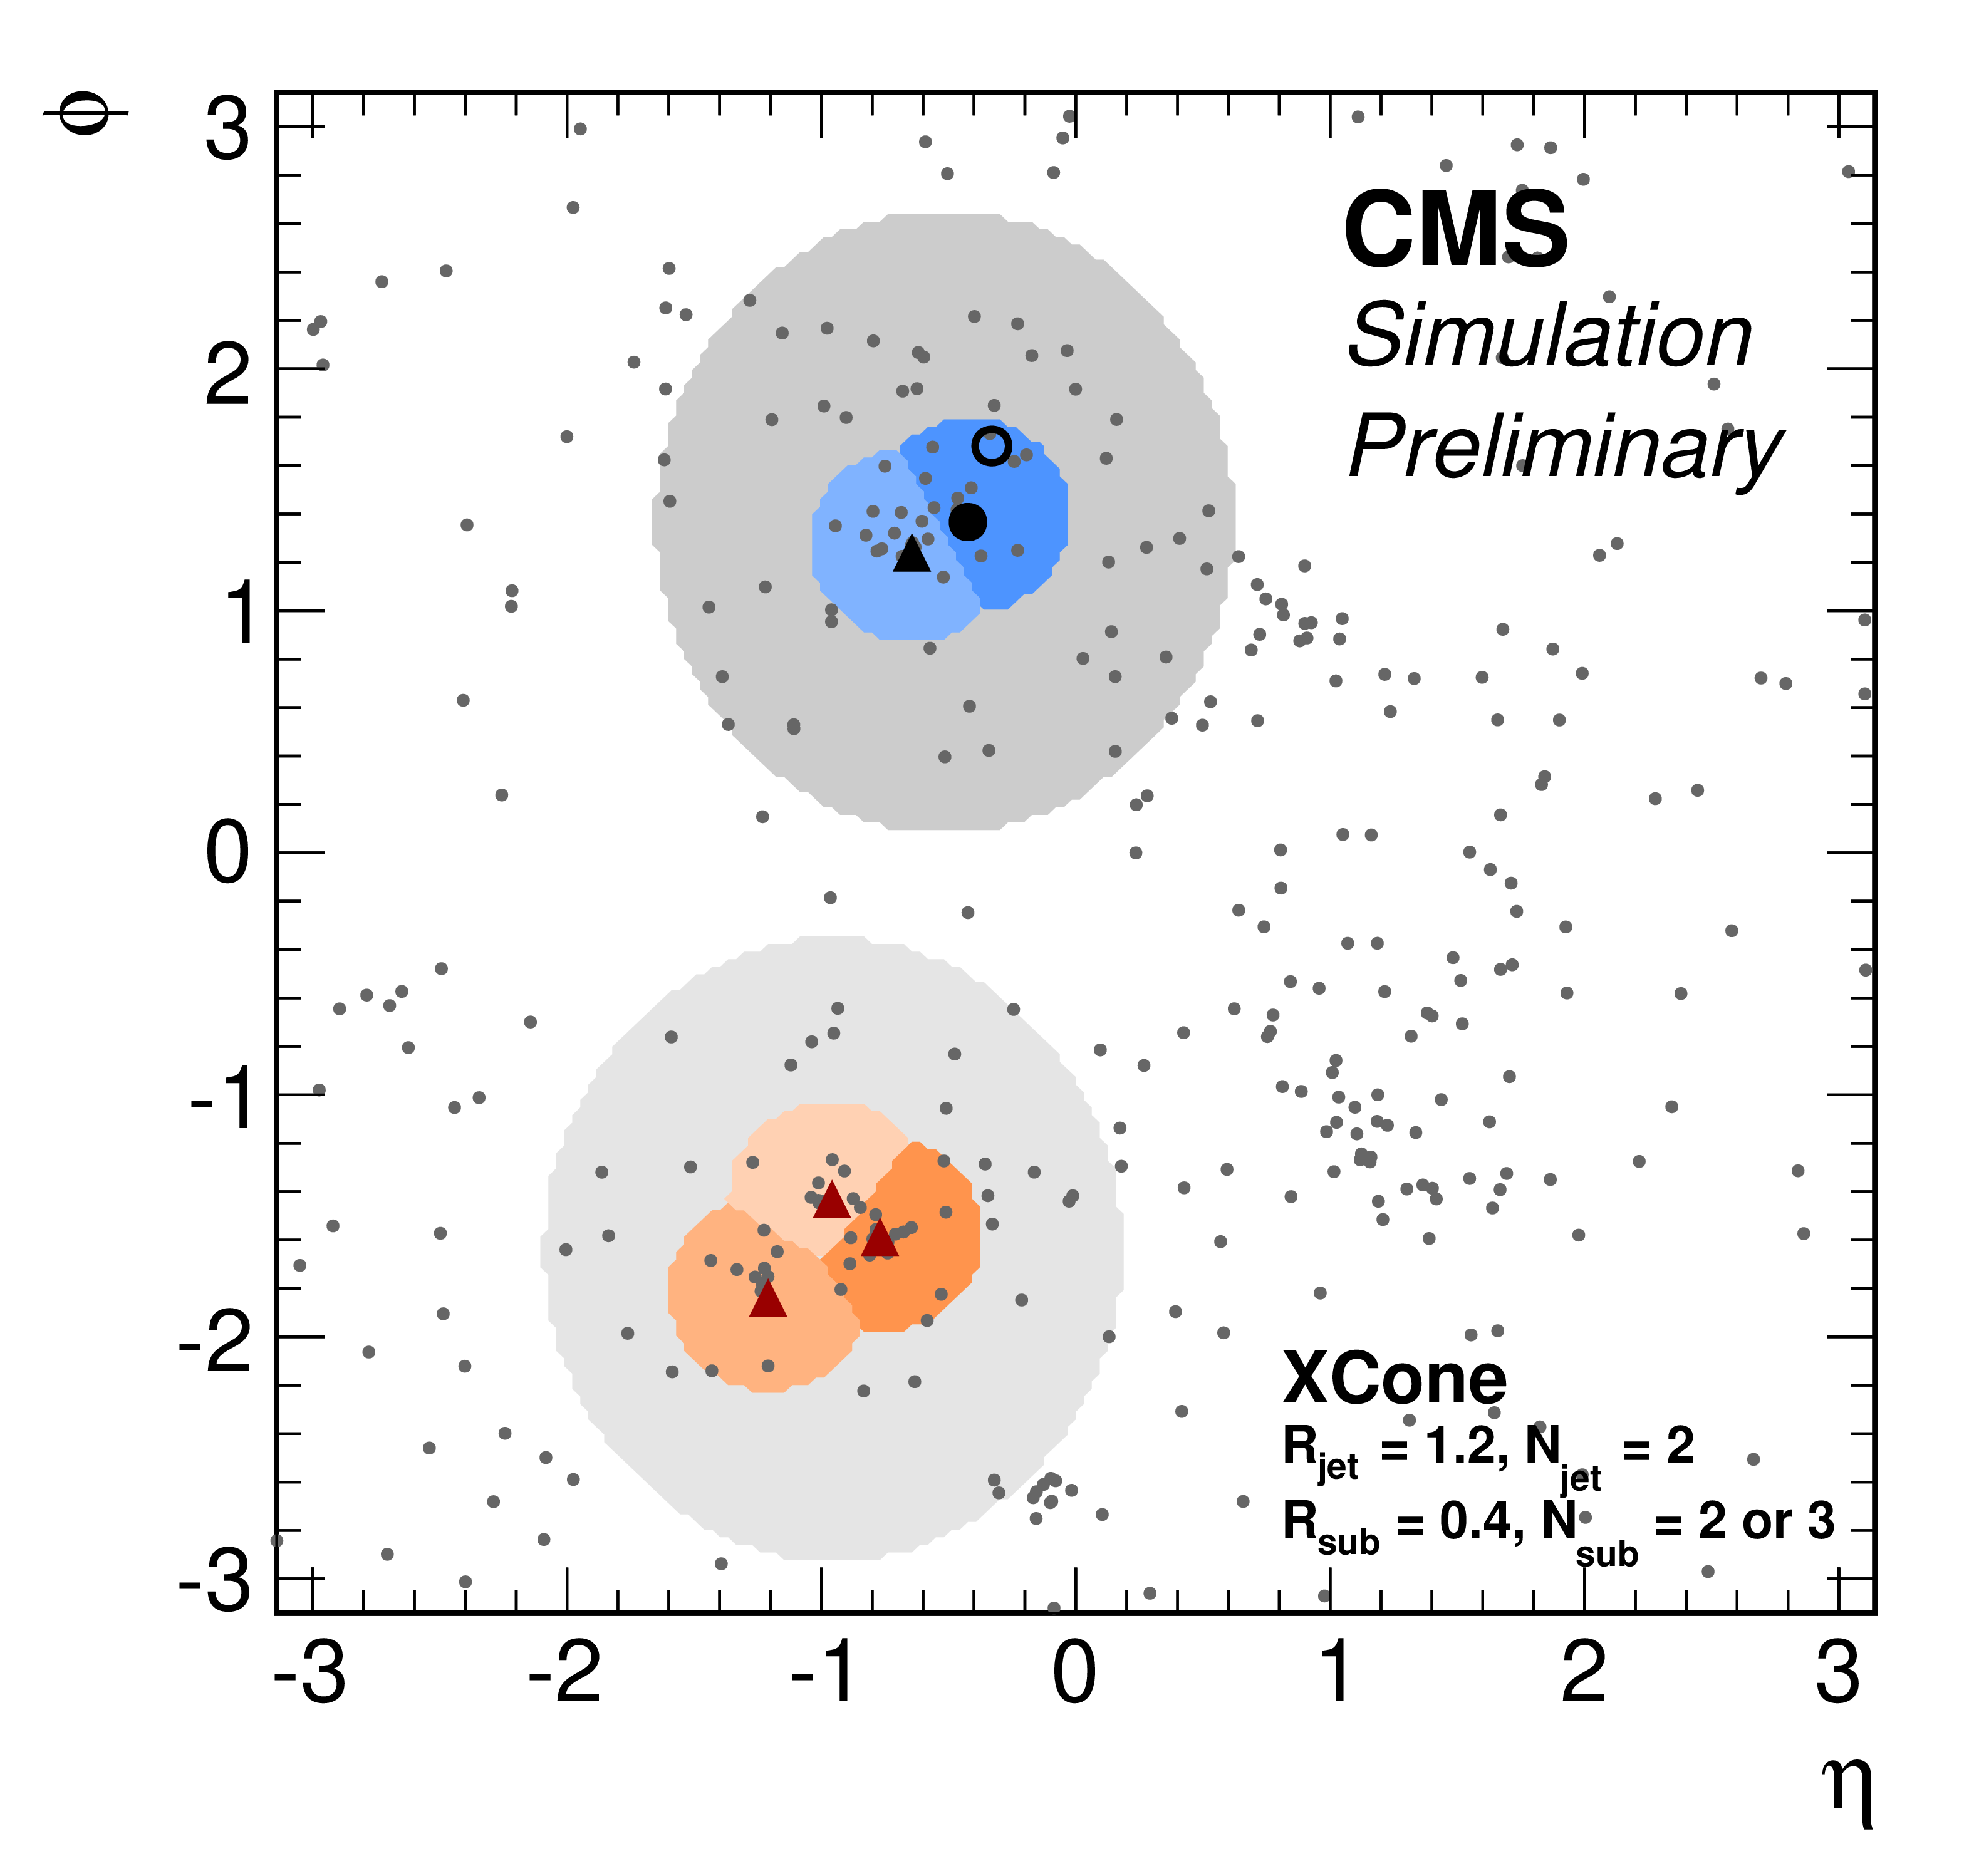
Display of a simulated ${{\mathrm {t}\overline {\mathrm {t}}}}$ event at the particle level in the $\eta $-$\phi $ plane clustered with the XCone algorithm with $R_\text {jet}=$ 1.2 and $N_\text {jet} = $ 2. The generated stable particles are shown by gray dots. The resulting XCone jets are represented by colored areas, where the jet including the lepton from the $ {{\mathrm {t}\overline {\mathrm {t}}}} \to \ell $+jets decay is shown in blue, and the jet reconstructing the fully-hadronic decay is shown in orange. For information, the decay products of the $ {{\mathrm {t}\overline {\mathrm {t}}}} $ decay are shown as well, where quarks are shown by triangles, the lepton is shown by a solid circle and the neutrino by an open circle. |
png pdf |
Additional Figure 2:
Display of the same simulated ${{\mathrm {t}\overline {\mathrm {t}}}}$ event at the particle level in the $\eta $-$\phi $ plane, where the constituents of the XCone jets are re-clustered with the XCone algorithm with $R_\text {sub}=$ 0.4, and $N_\text {sub} = $ 2 for the lepton jet and $N_\text {sub} = $ 3 for the other jet. The generated stable particles are shown by gray dots. The original XCone jets are represented by gray areas, the subjets are shown by colored areas. The hadronic jet has $ {p_{\mathrm {T}}} = $ 688 GeV and $m_\text {jet} = $ 191 GeV. For information, the decay products of the $ {{\mathrm {t}\overline {\mathrm {t}}}} $ decay are shown as well, where quarks are shown by triangles, the lepton is shown by a solid circle and the neutrino by an open circle. |

png pdf |
Additional Figure 3:
Jet energy scale for XCone subjets in simulated ttbar events. Shown is the relative difference between reconstructed and generated subjet ${p_{\mathrm {T}}}$ as a function of the generated subjet ${p_{\mathrm {T}}}$ for uncorrected subjets, subjets corrected with the anti-$ {k_{\mathrm {T}}}$ $R=$ 0.4 correction, and subjets with the anti-$ {k_{\mathrm {T}}}$ $R=$ 0.4 correction and the additional XCone correction. |
png pdf |
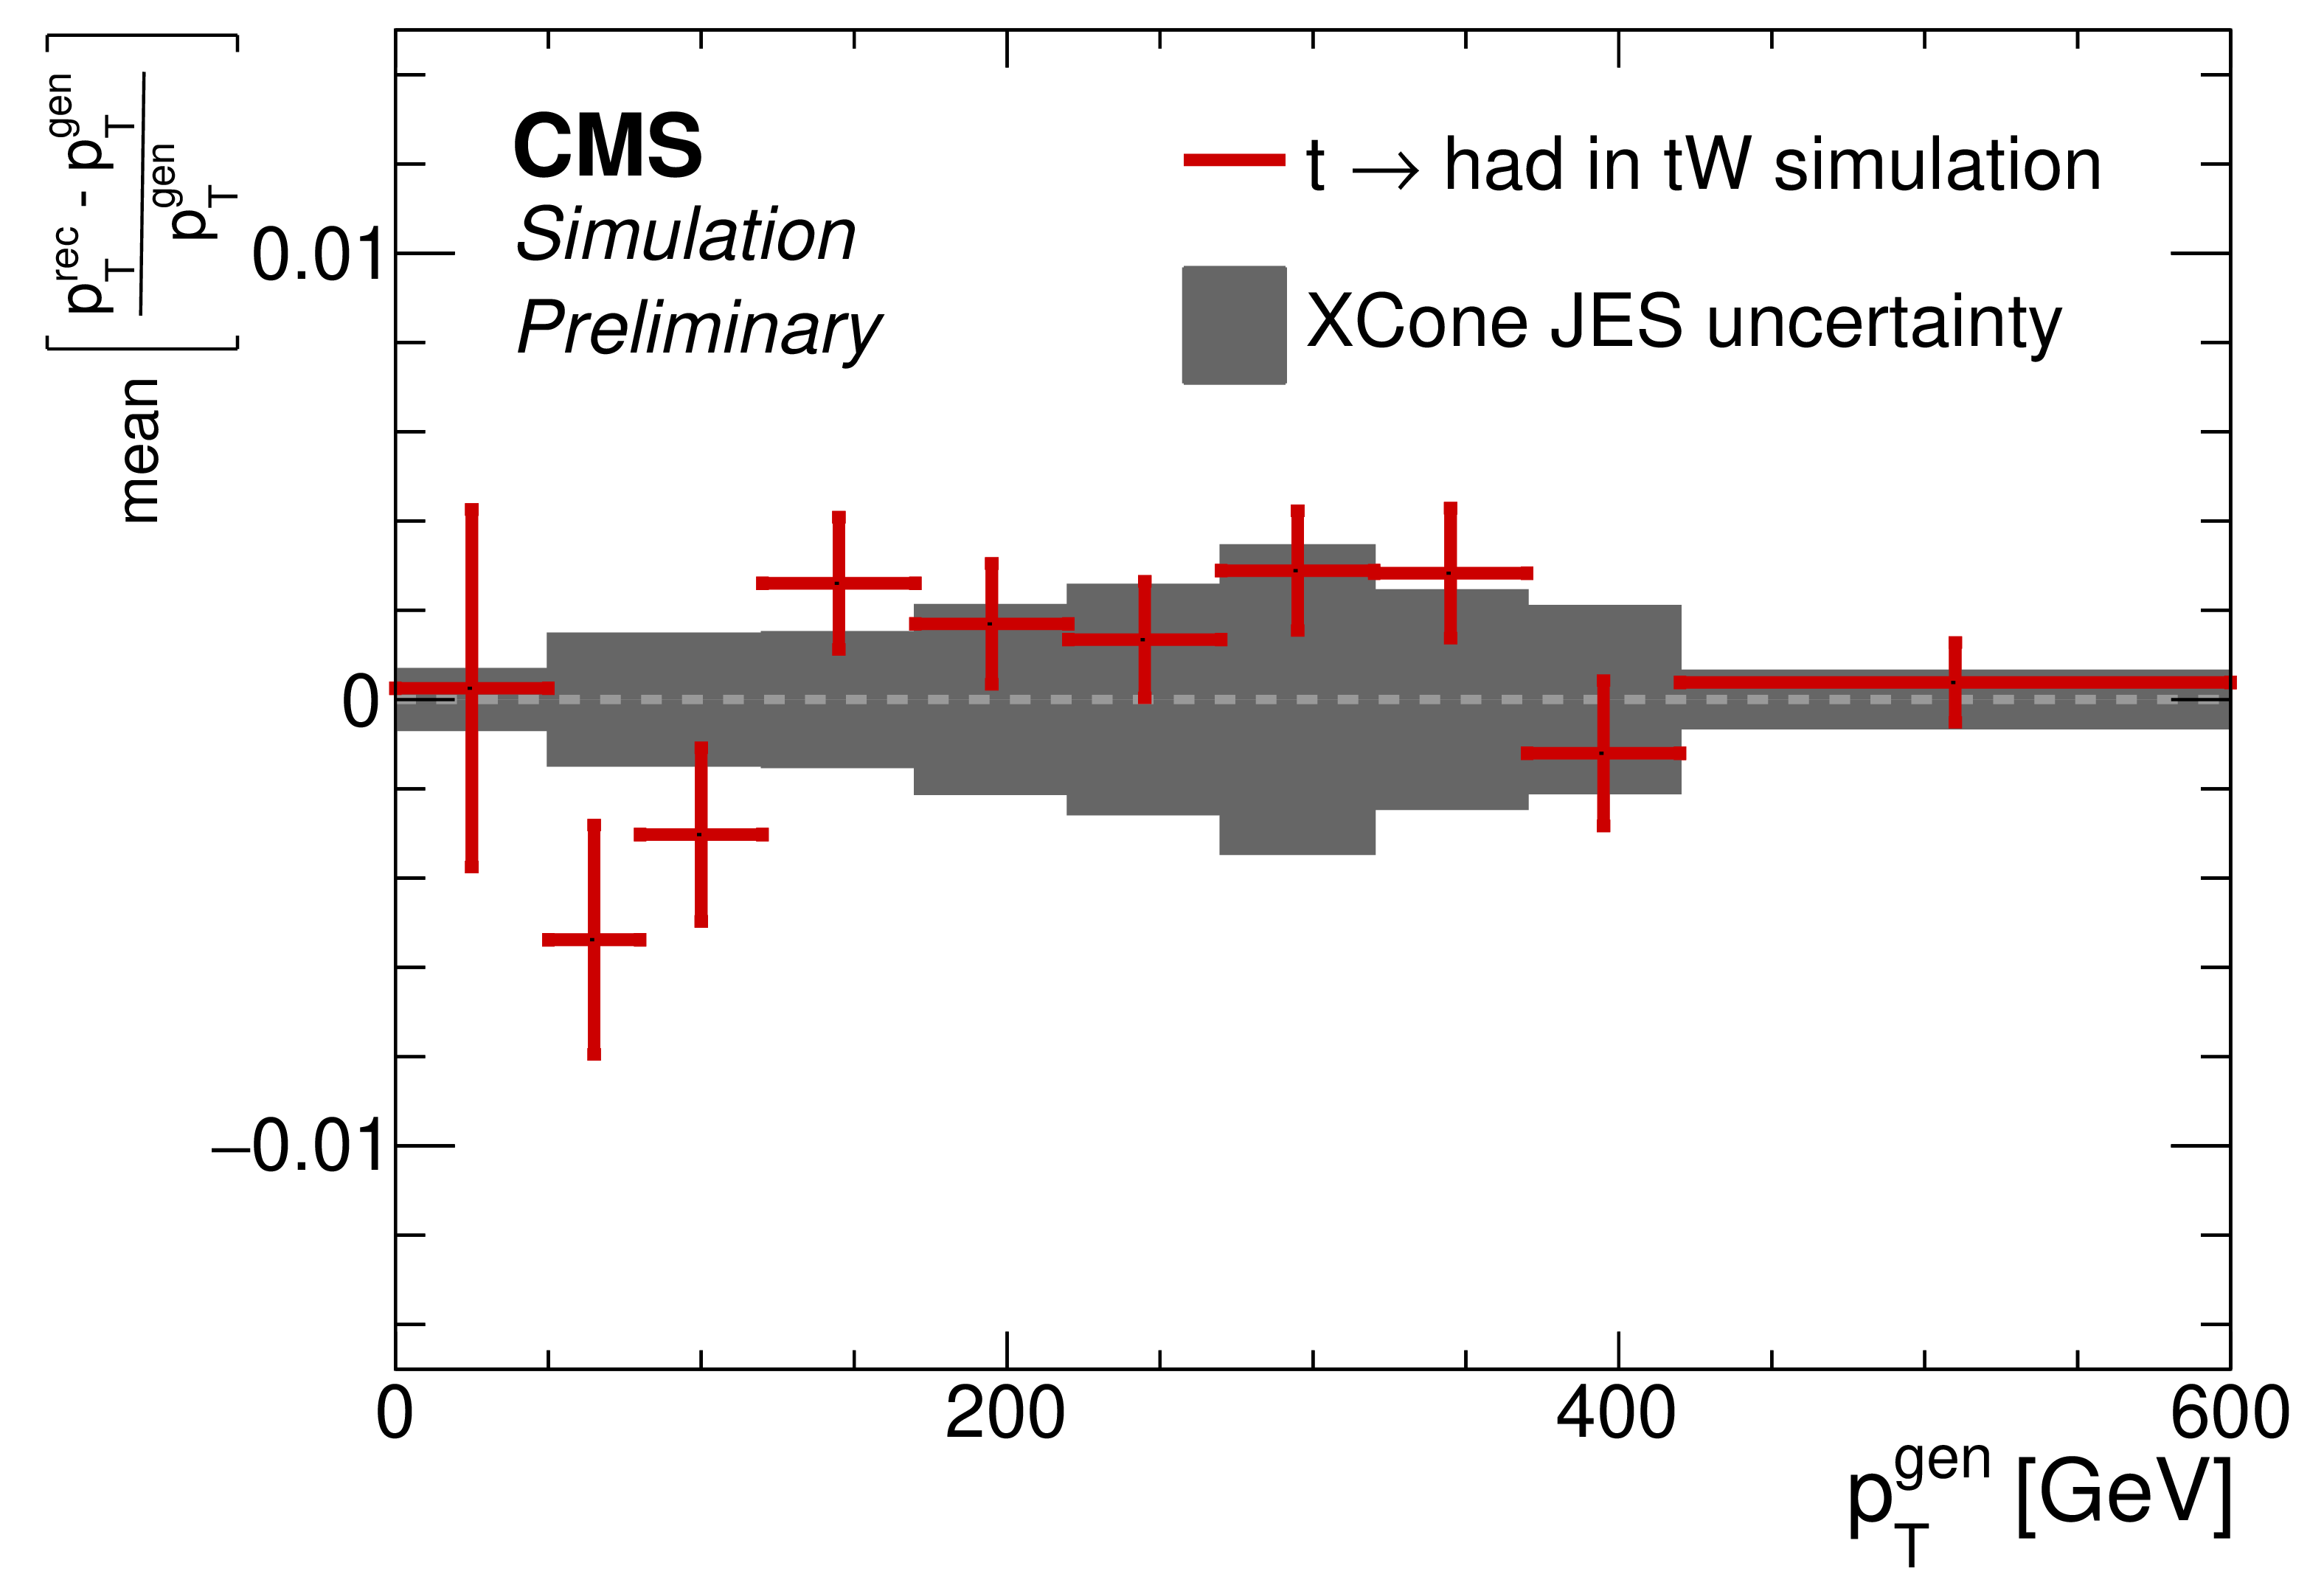
Additional Figure 4:
Test in simulated $ {\mathrm {t}} {\mathrm {W}}$ events of the additional correction applied to the XCone subjets. Shown is the relative difference between reconstructed and generated subjet ${p_{\mathrm {T}}}$ as a function of the generated subjet ${p_{\mathrm {T}}}$. The uncertainty in the XCone subjet correction derived in ${{\mathrm {t}\overline {\mathrm {t}}}}$ simulation is shown as gray area. |
png pdf |
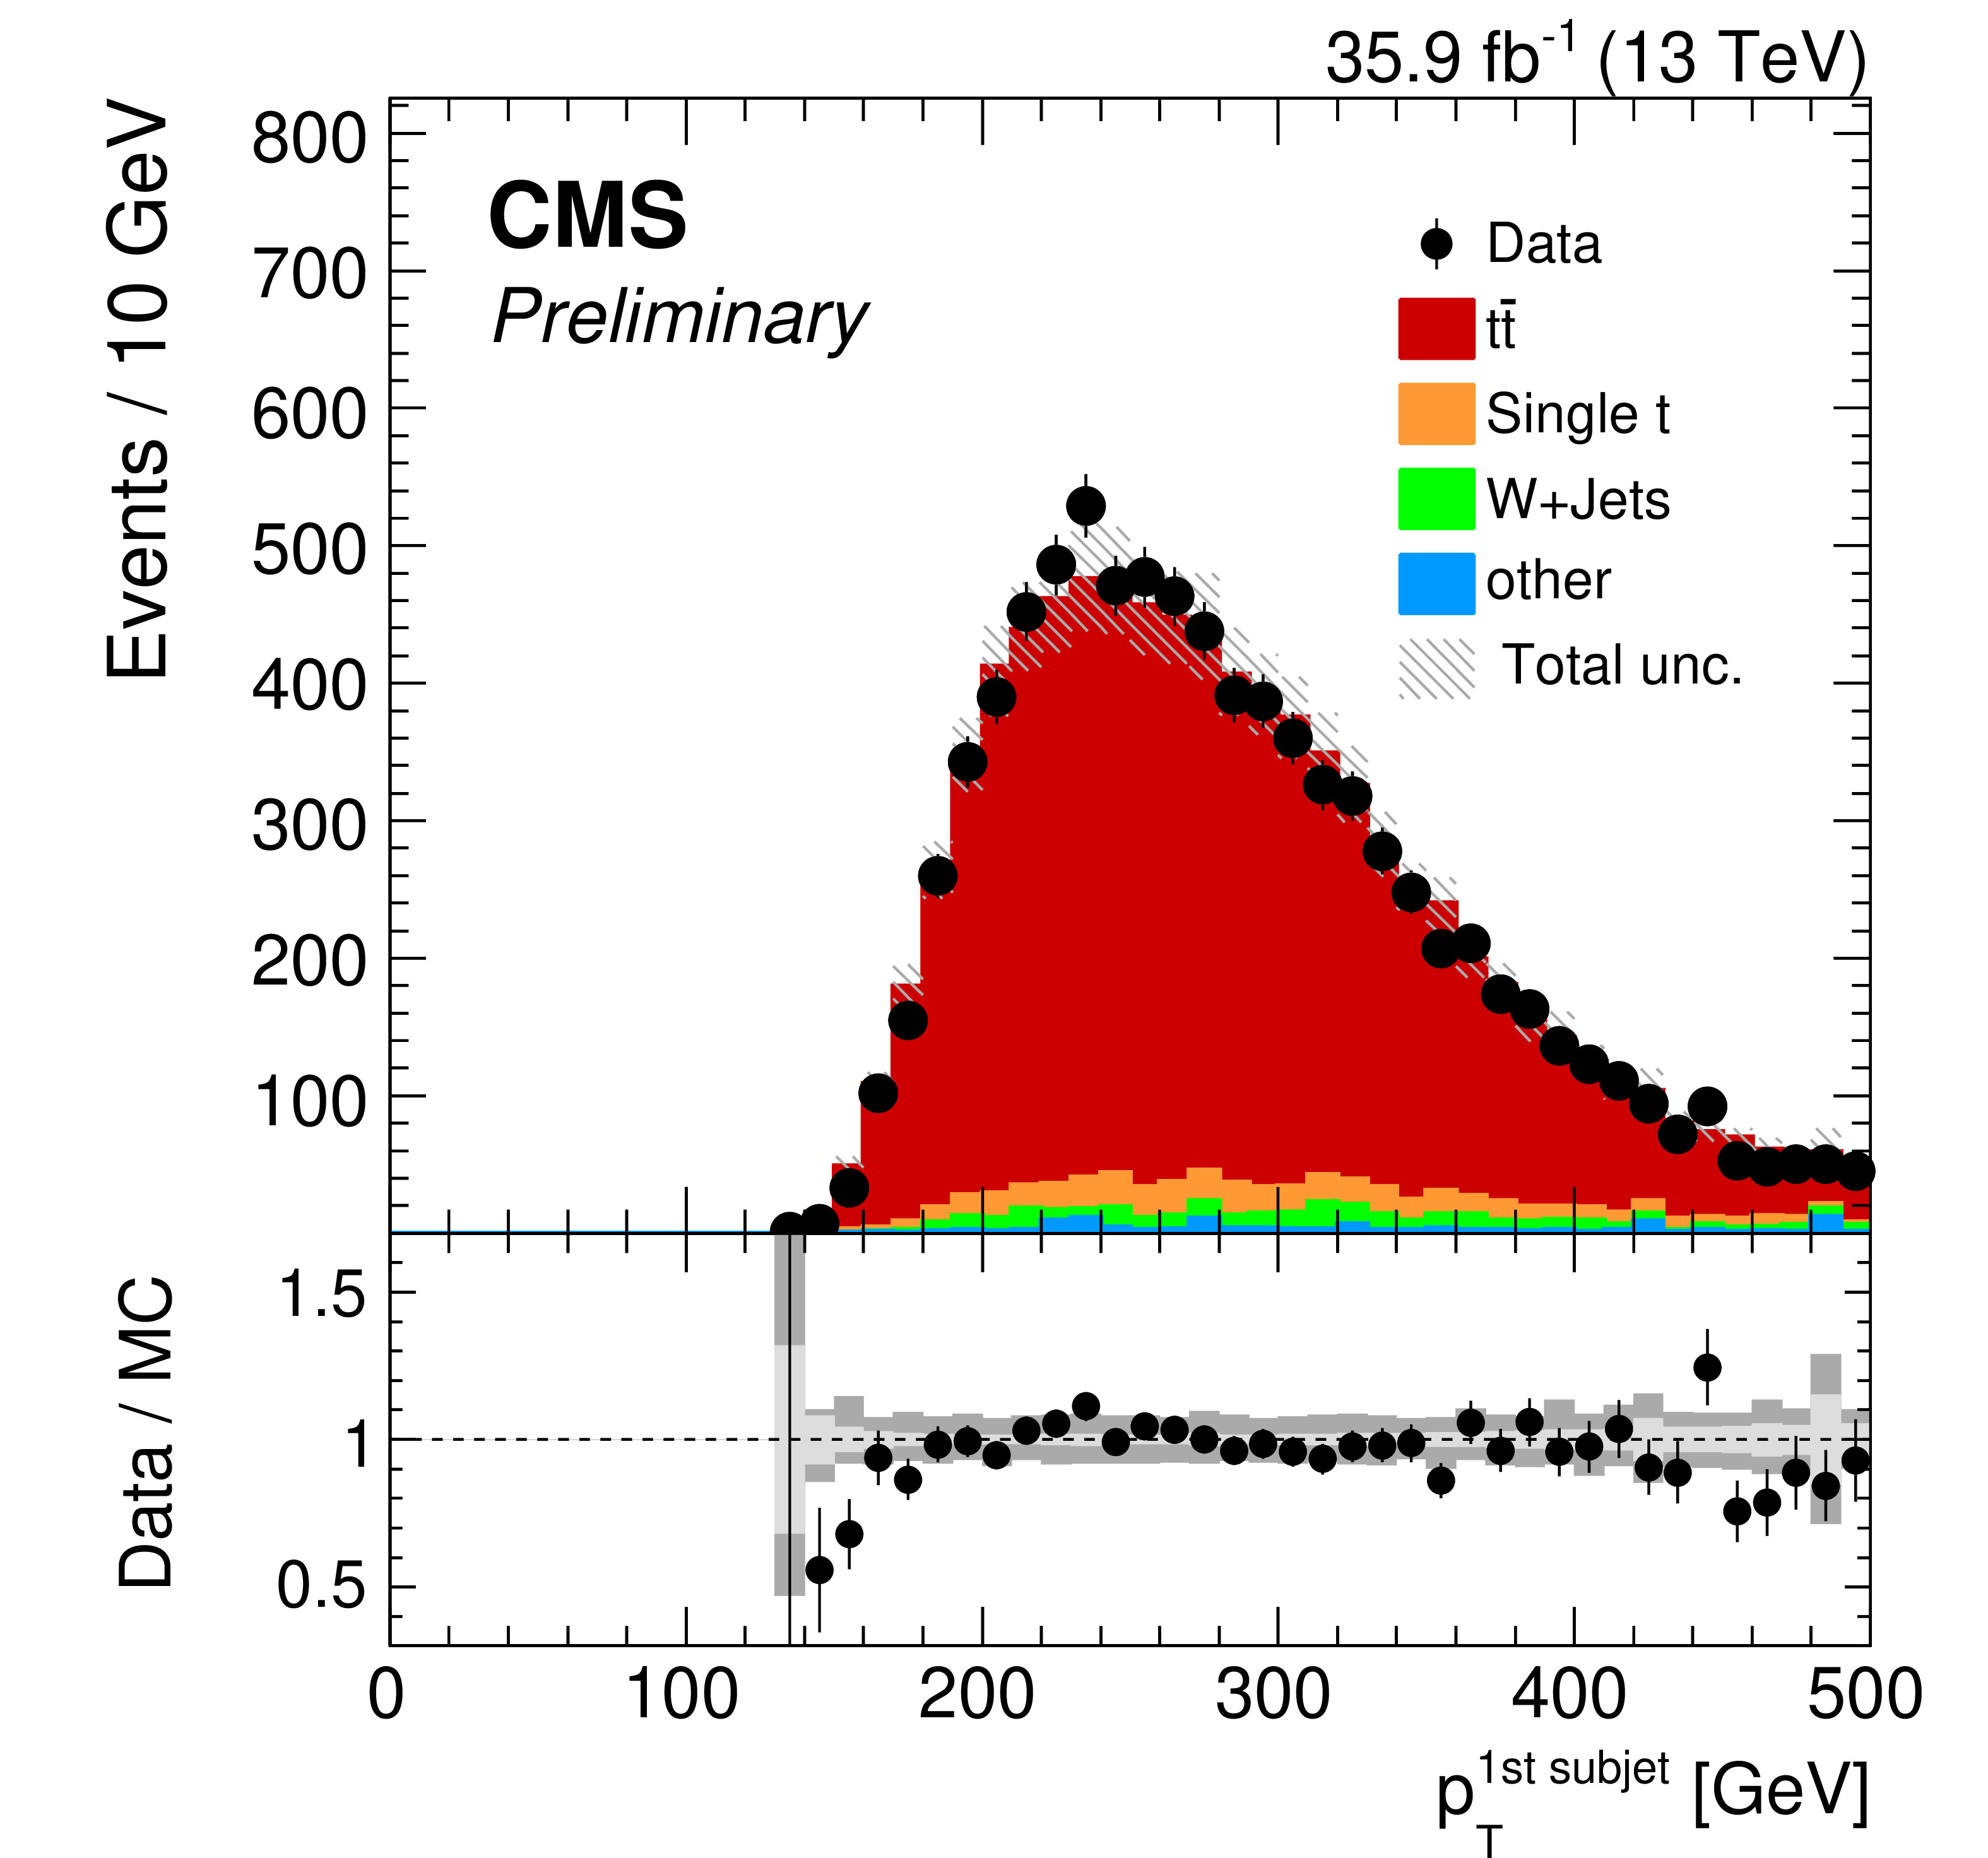
Additional Figure 5:
Reconstructed distribution of ${p_{\mathrm {T}}}$ of the ${p_{\mathrm {T}}} $-leading XCone subjet after the full event selection in the $\ell $+jets channel. The vertical bars on the points show the statistical uncertainty. The hatched region shows the total uncertainty in the simulation, including the statistical and experimental systematic uncertainties. The panel below shows the ratio of the data to the simulation. The uncertainty band includes the statistical and experimental systematic uncertainties, where the statistical (light grey) and total (dark grey) uncertainties are shown separately in the ratio. |
png pdf |
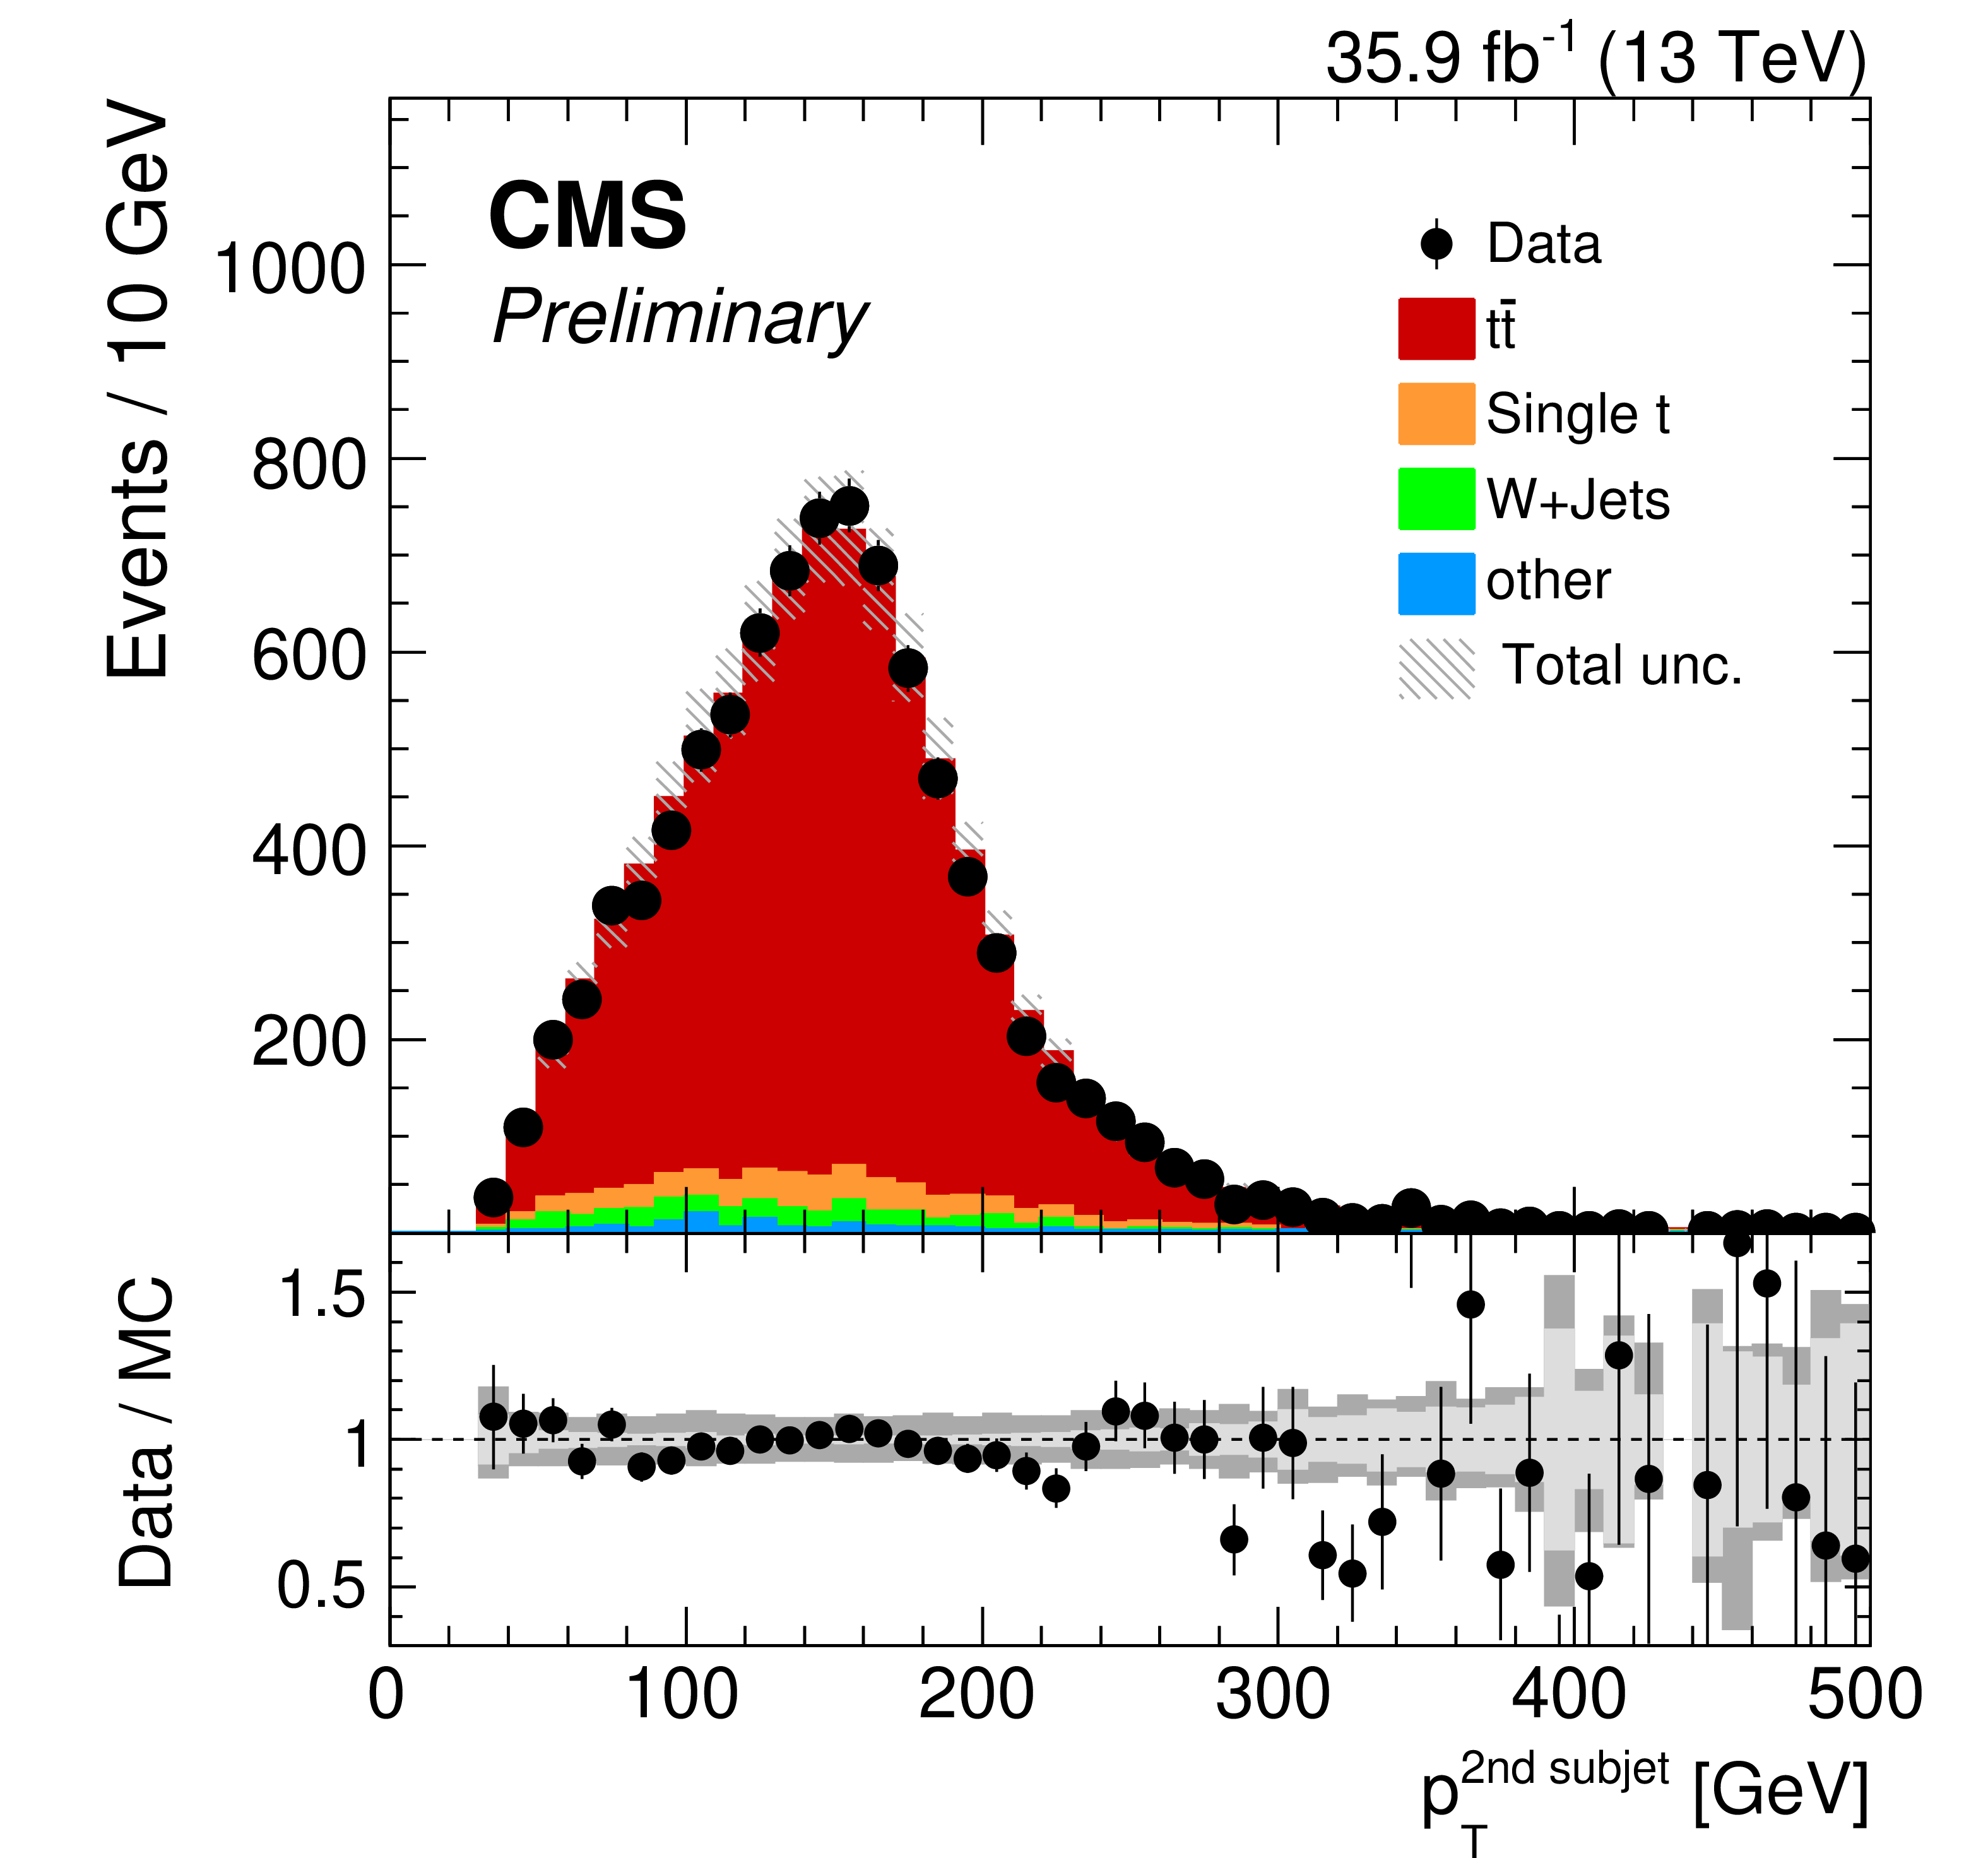
Additional Figure 6:
Reconstructed distribution of ${p_{\mathrm {T}}}$ of the second ${p_{\mathrm {T}}} $-leading XCone subjet after the full event selection in the $\ell $+jets channel. The vertical bars on the points show the statistical uncertainty. The hatched region shows the total uncertainty in the simulation, including the statistical and experimental systematic uncertainties. The panel below shows the ratio of the data to the simulation. The uncertainty band includes the statistical and experimental systematic uncertainties, where the statistical (light grey) and total (dark grey) uncertainties are shown separately in the ratio. |
png pdf |
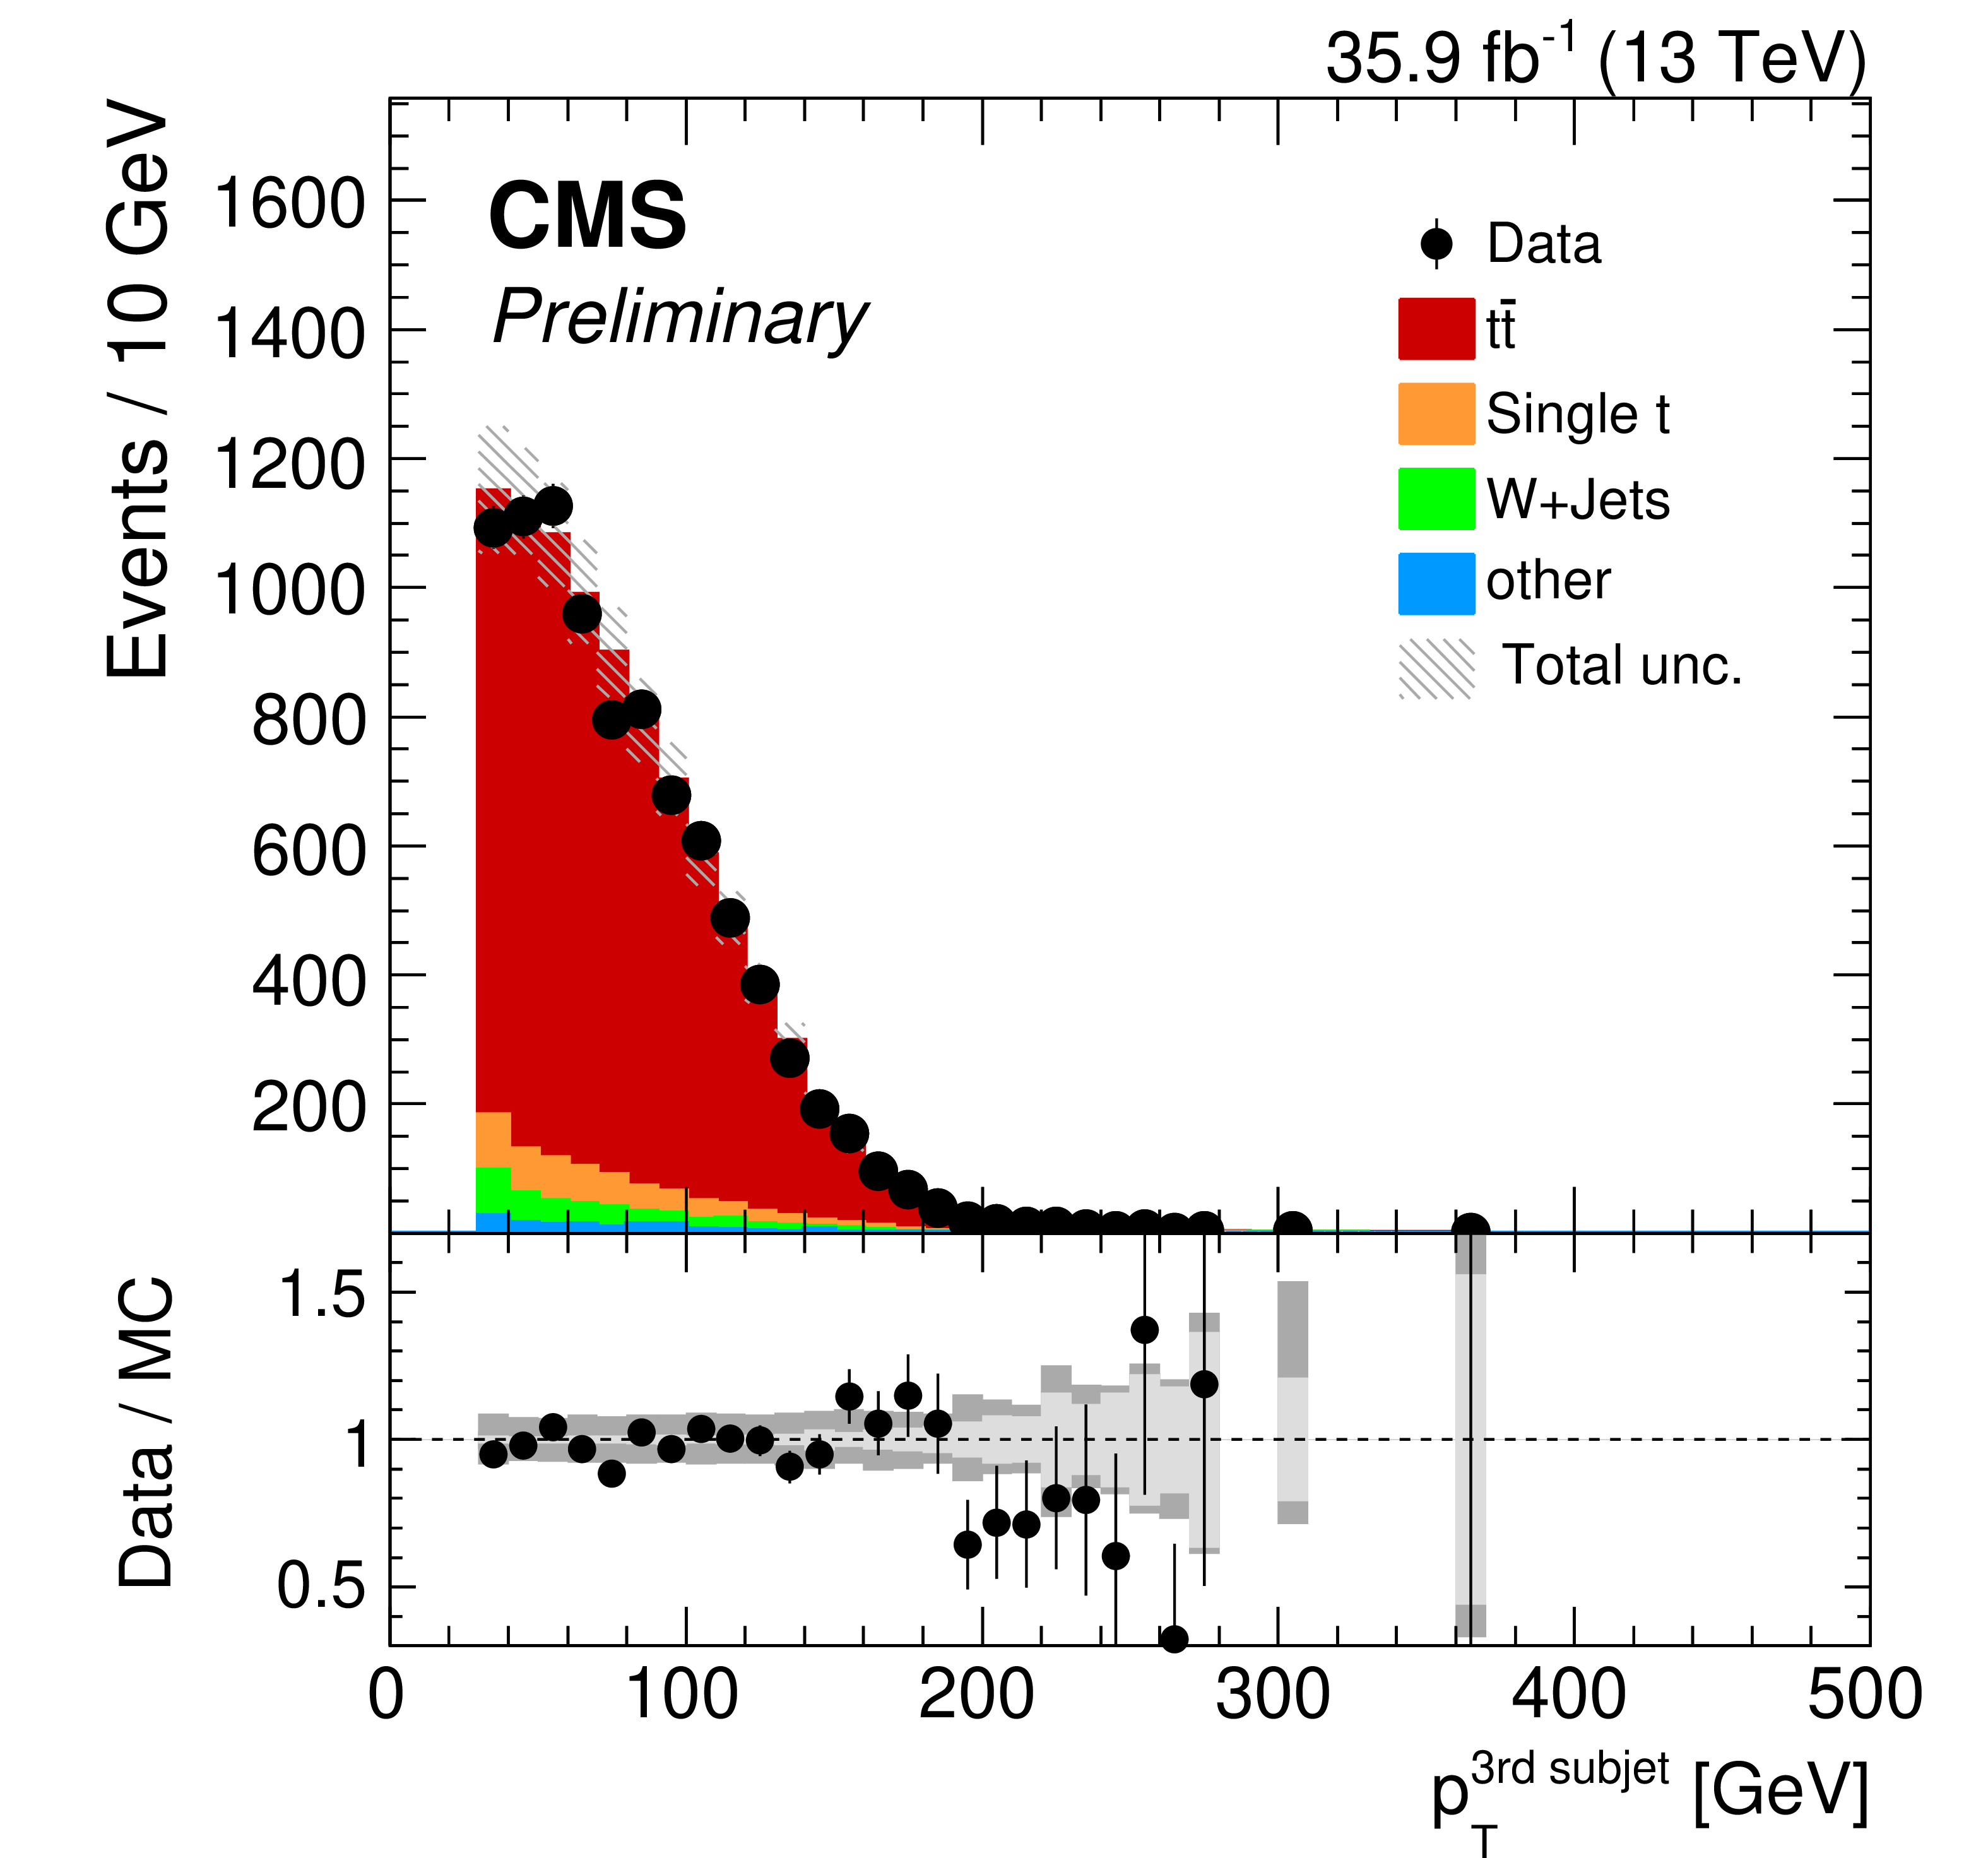
Additional Figure 7:
Reconstructed distribution of ${p_{\mathrm {T}}}$ of the third ${p_{\mathrm {T}}} $-leading XCone subjet after the full event selection in the $\ell $+jets channel. The vertical bars on the points show the statistical uncertainty. The hatched region shows the total uncertainty in the simulation, including the statistical and experimental systematic uncertainties. The panel below shows the ratio of the data to the simulation. The uncertainty band includes the statistical and experimental systematic uncertainties, where the statistical (light grey) and total (dark grey) uncertainties are shown separately in the ratio. |
png pdf |
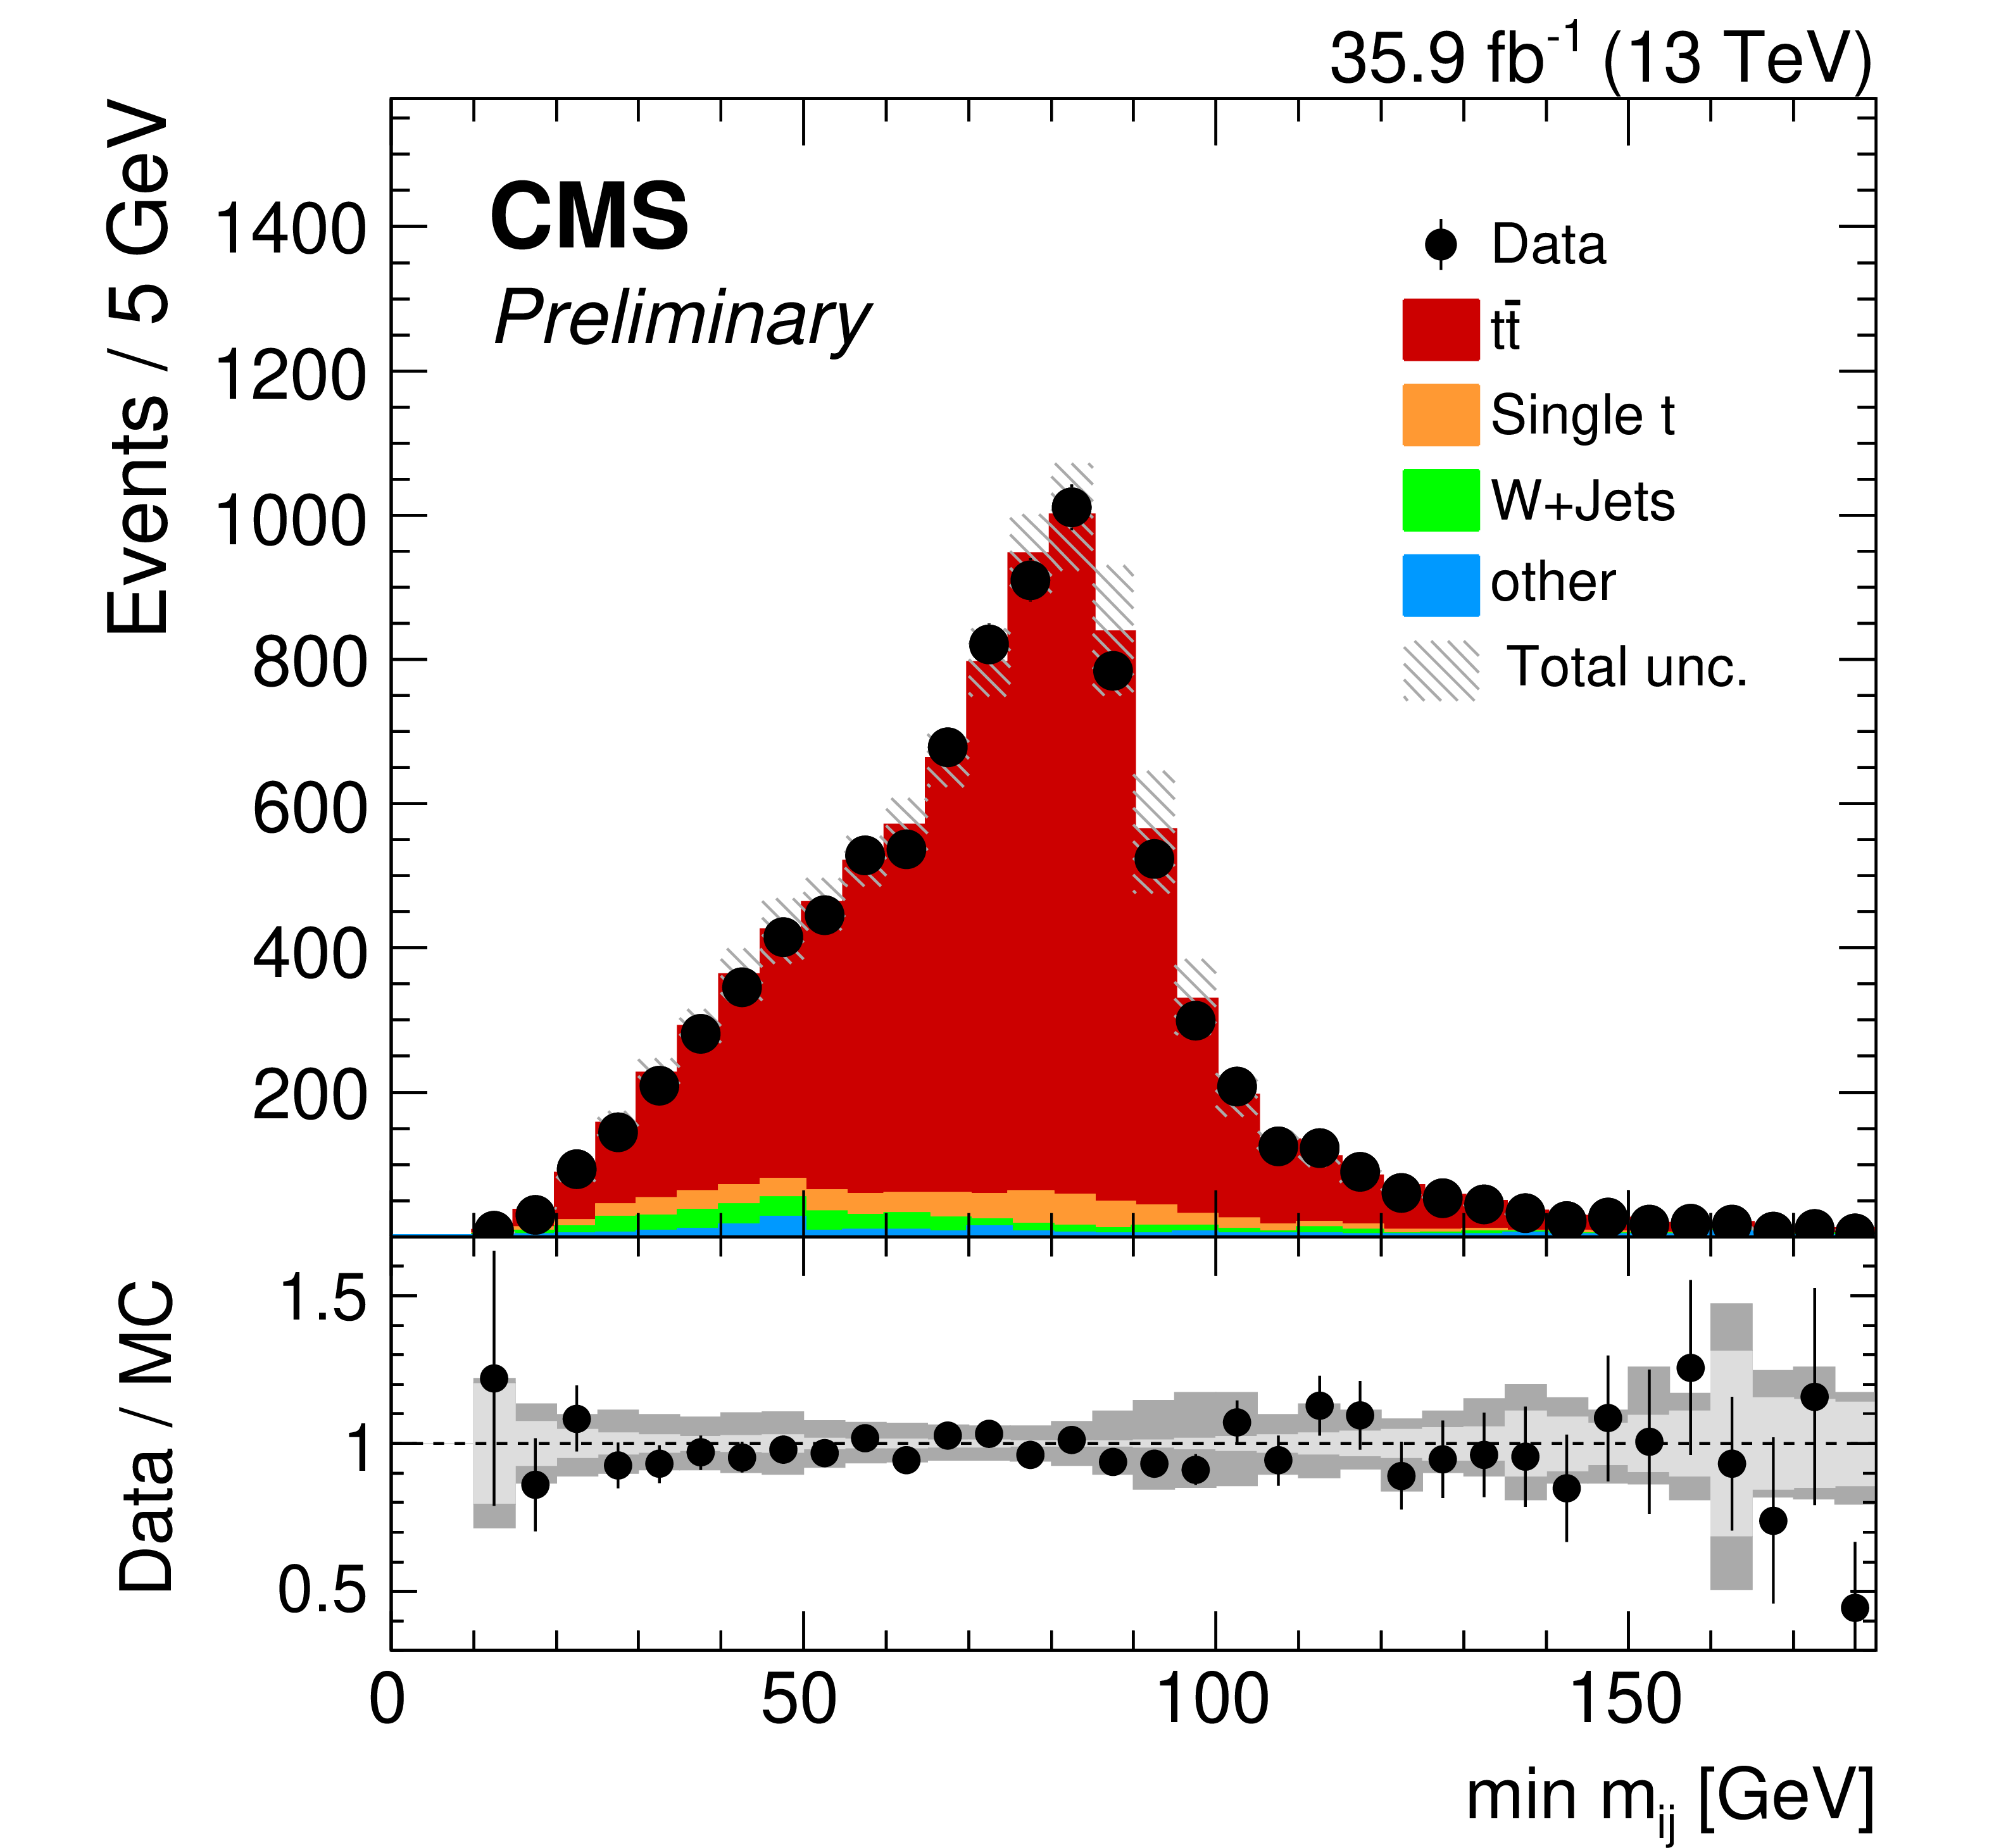
Additional Figure 8:
Reconstructed distribution of the minimum pairwise mass derived from the three XCone subjets after the full event selection in the $\ell $+jets channel. The vertical bars on the points show the statistical uncertainty. The hatched region shows the total uncertainty in the simulation, including the statistical and experimental systematic uncertainties. The panel below shows the ratio of the data to the simulation. The uncertainty band includes the statistical and experimental systematic uncertainties, where the statistical (light grey) and total (dark grey) uncertainties are shown separately in the ratio. |
png pdf |
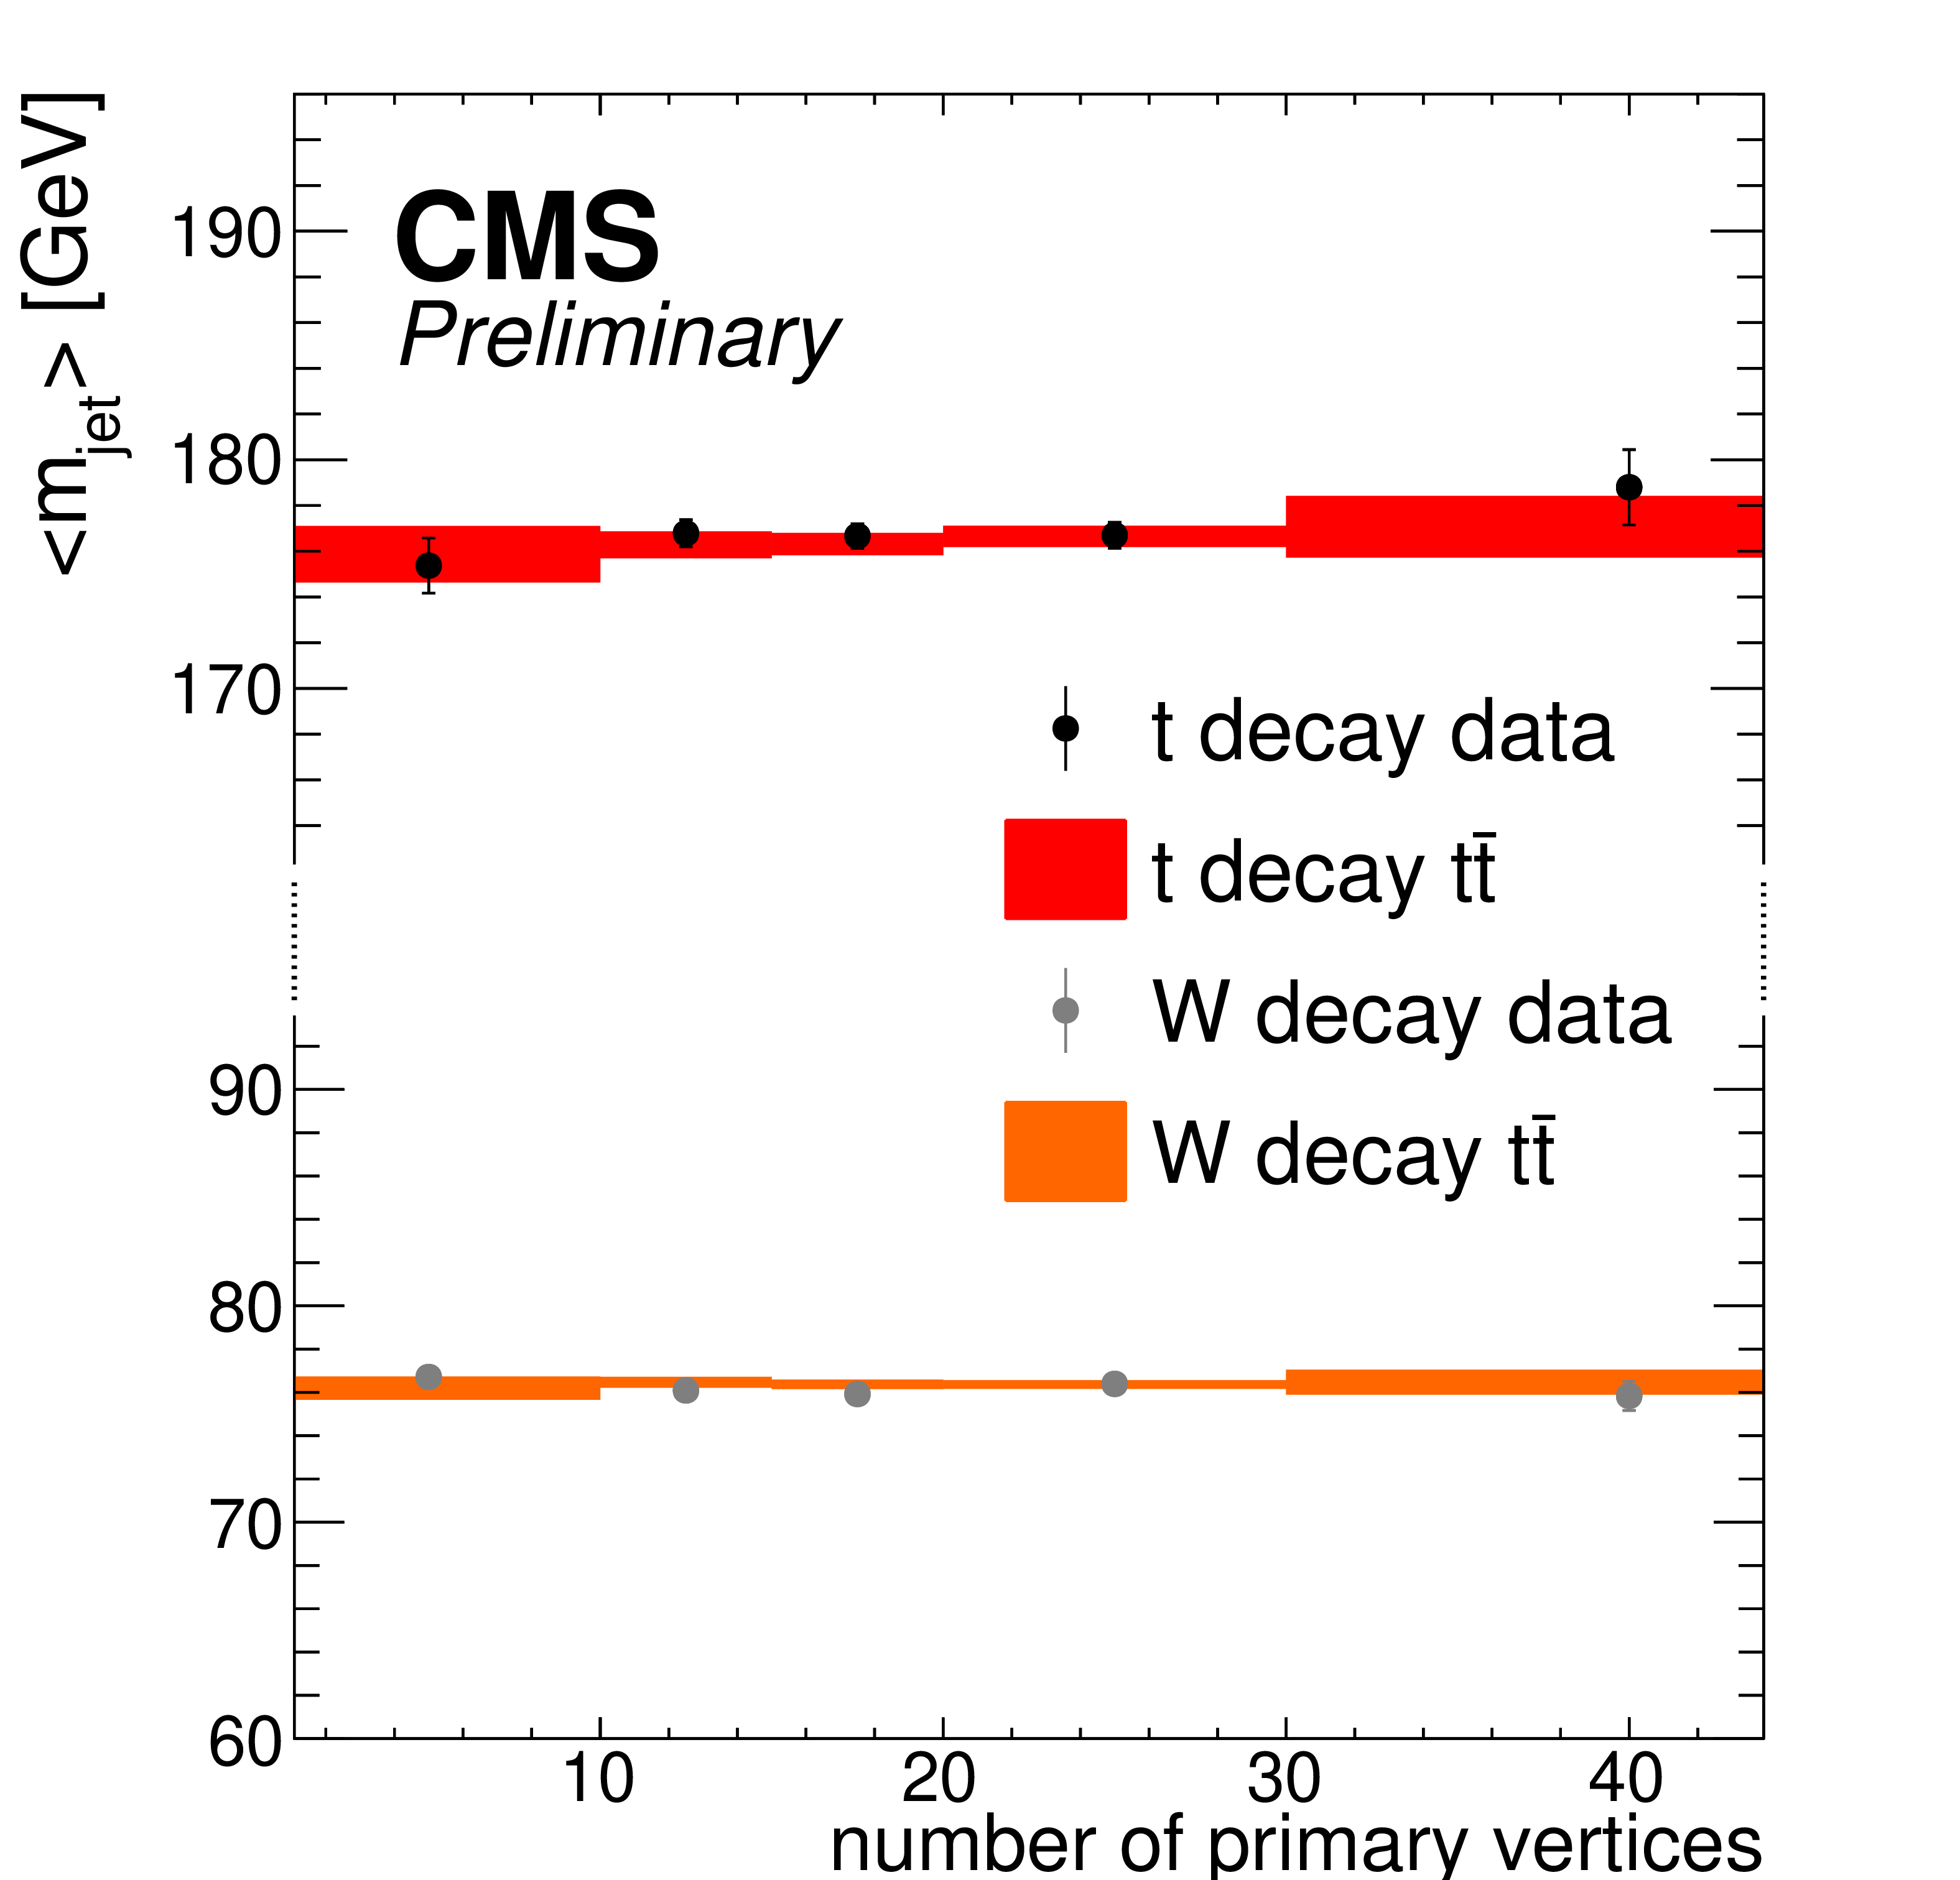
Additional Figure 9:
Mean values of the jet mass for XCone jets as function of the number of primary vertices. The jet mass from t decays is obtained from the four-vector sum of three XCone subjets, the jet mass from W decays is obtained from the two subjets with the smallest pairwise mass. The mean values are calculated in a jet mass range of 120-240 GeV for t decays and 65-95 GeV for W decays. |
png pdf |
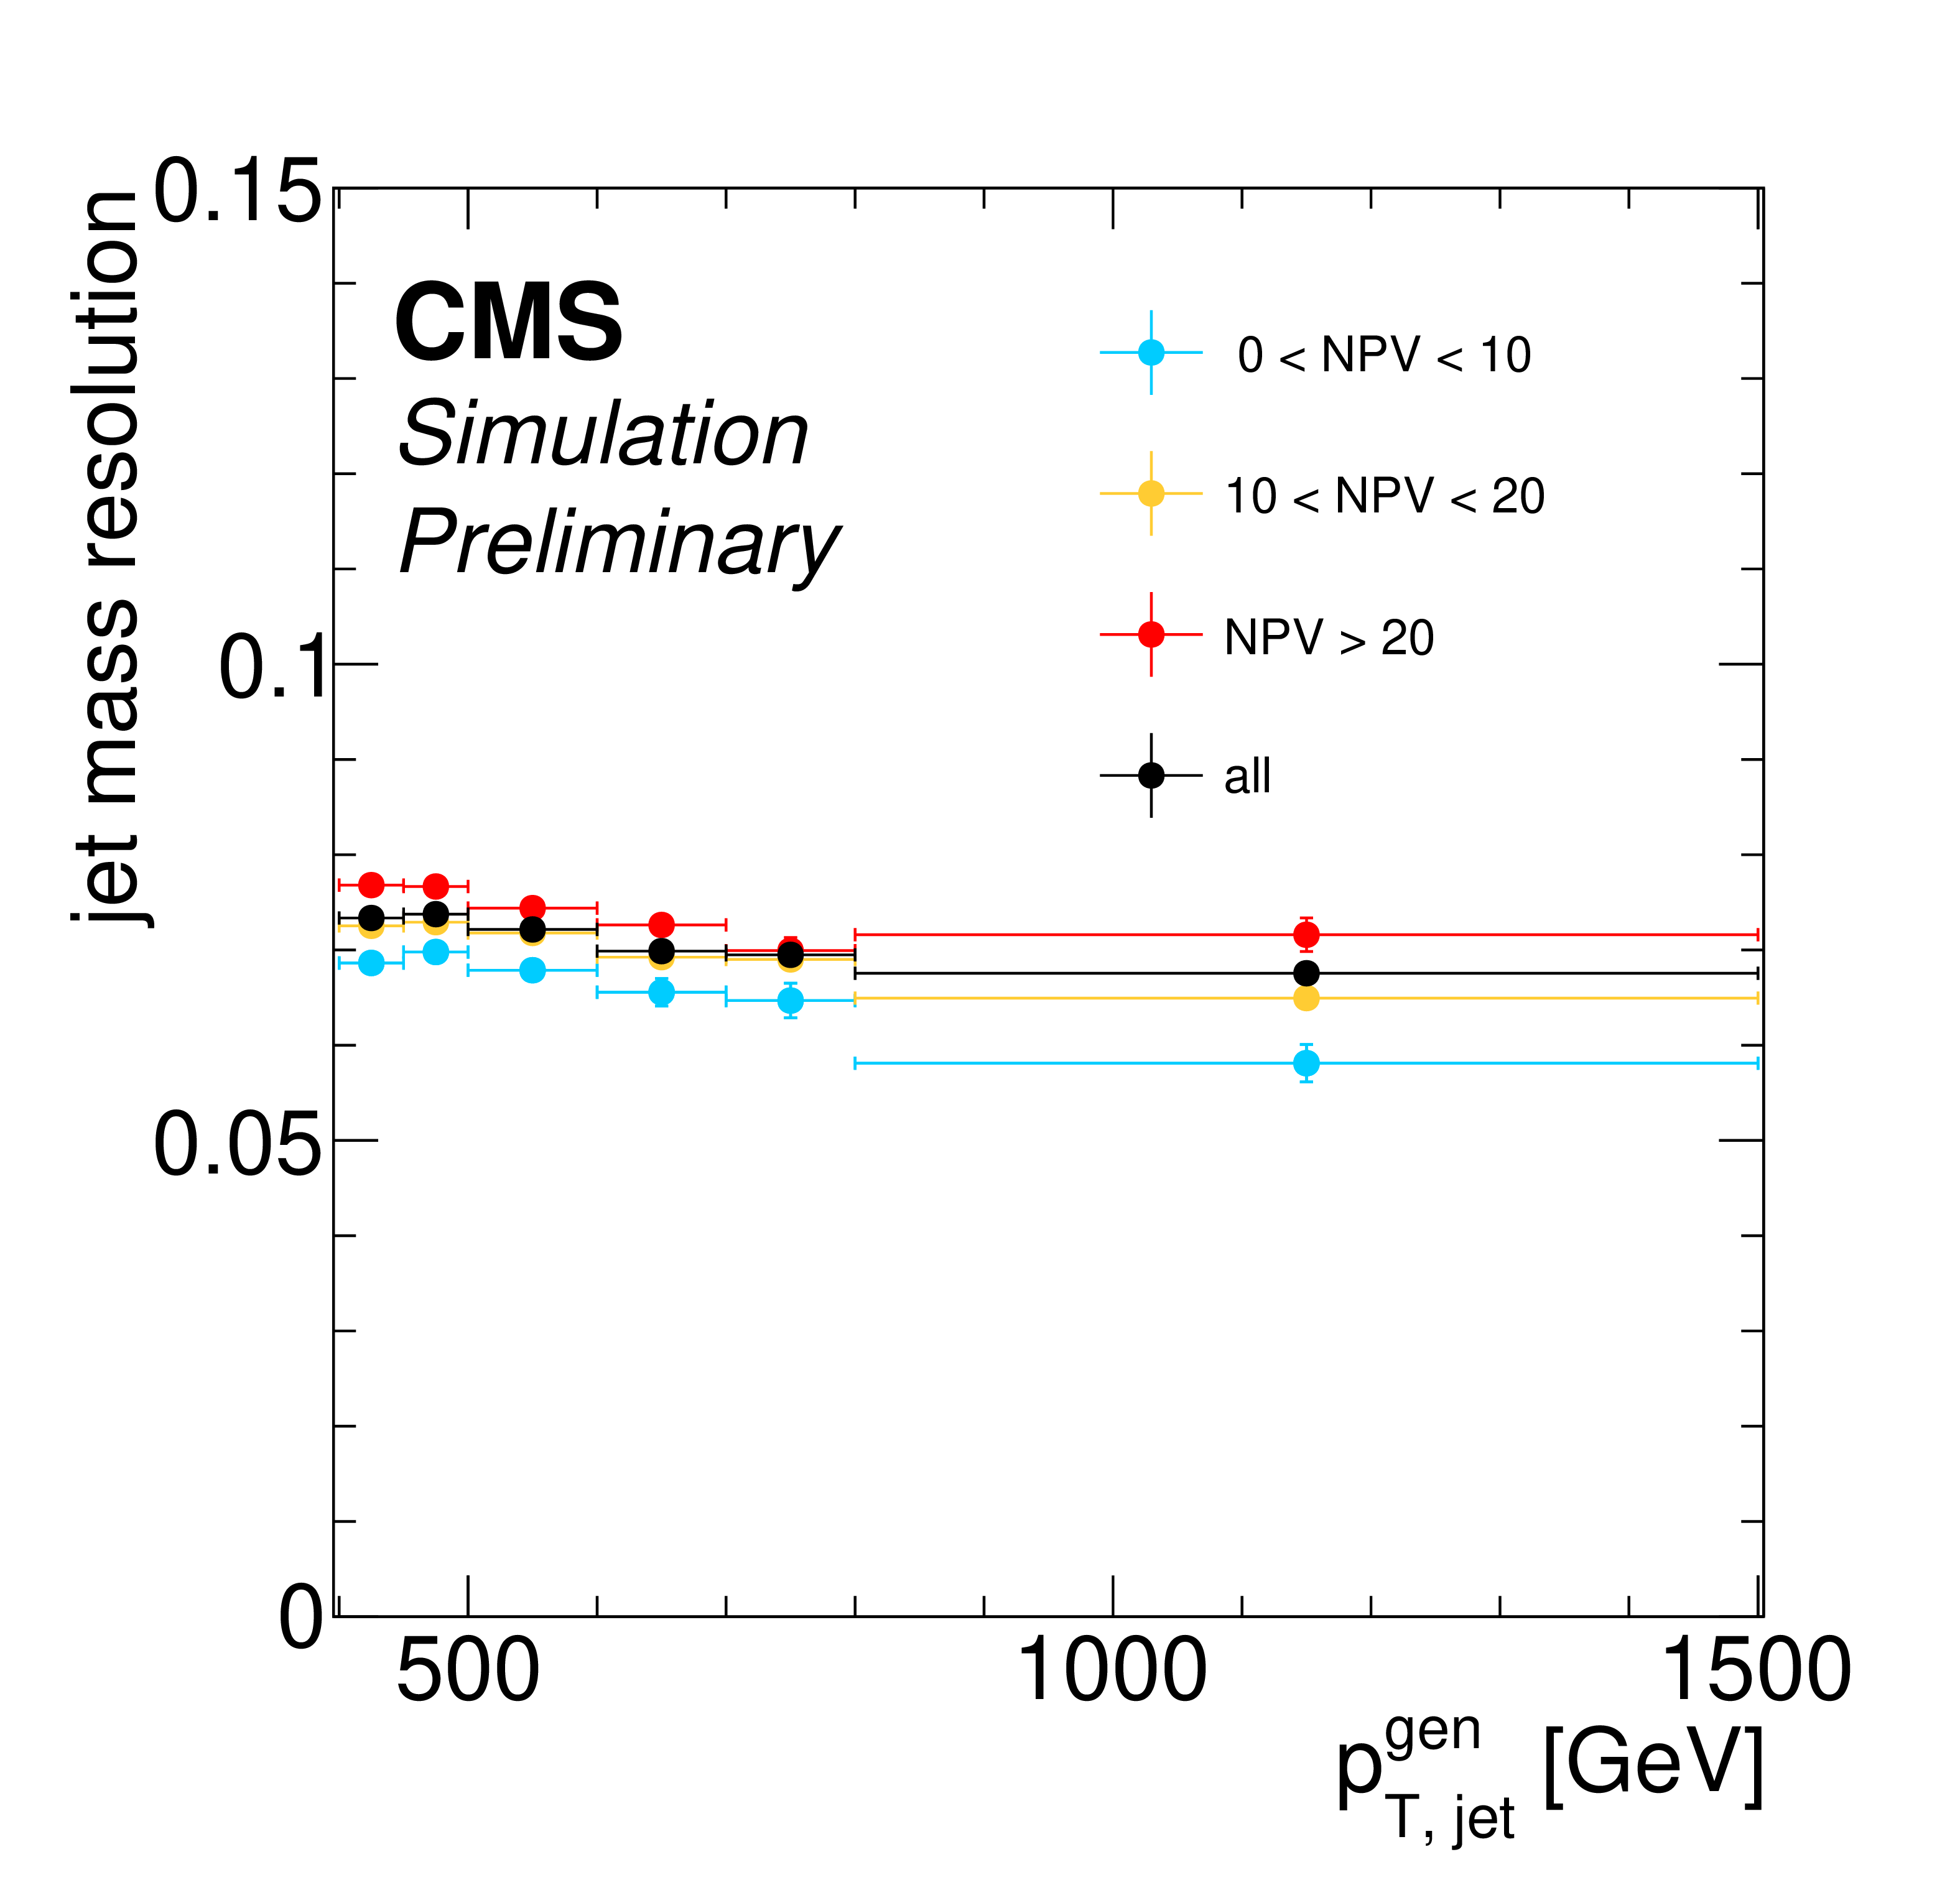
Additional Figure 10:
The XCone jet mass resolution as a function of the generated XCone jet ${p_{\mathrm {T}}}$. The resolution is obtained in simulated ${{\mathrm {t}\overline {\mathrm {t}}}}$ events after the selection of the fiducial measurement region. The resolution is shown for different selections on the number of primary vertices in the event, and for the inclusive sample. |
png pdf |
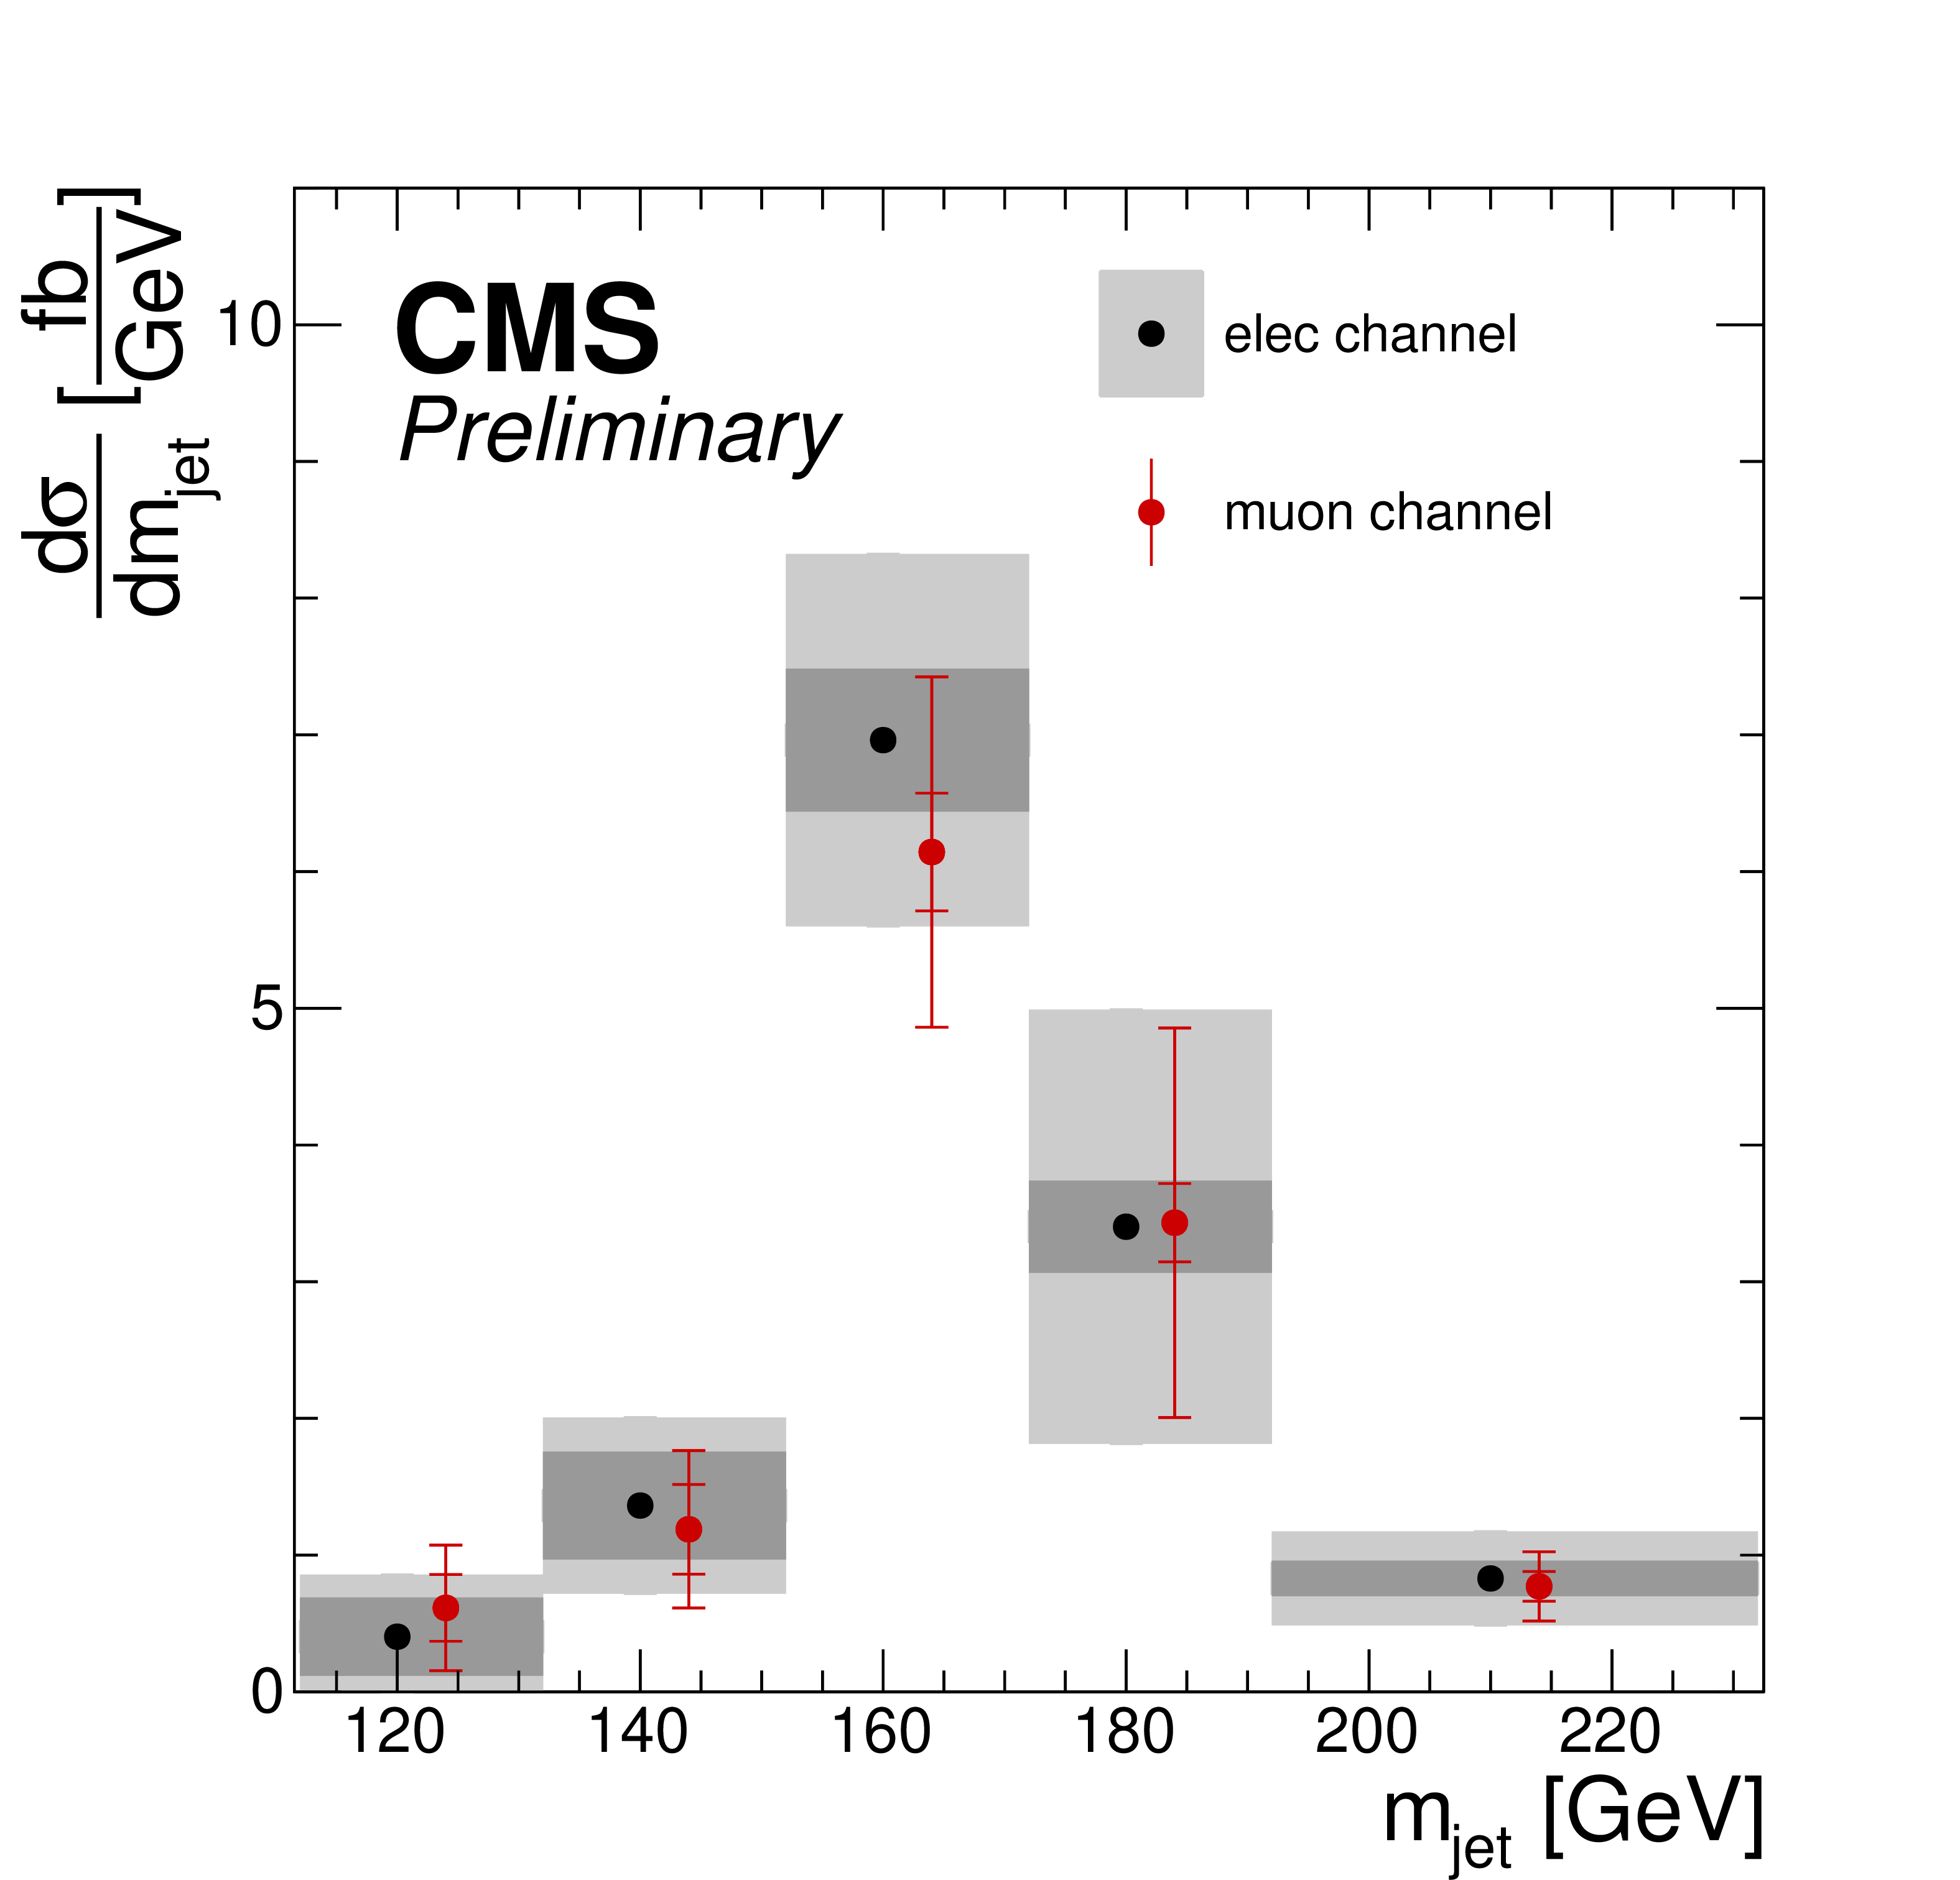
Additional Figure 11:
The particle level ${{\mathrm {t}\overline {\mathrm {t}}}}$ differential cross section in the fiducial region as a function of the jet mass, measured in the $ {\mathrm {e}}$+jets and $\mu $+jets channels. The inner vertical bars and dark gray areas represent the statistical uncertainties, the outer bars and light gray areas show the total uncertainties. |
png pdf |
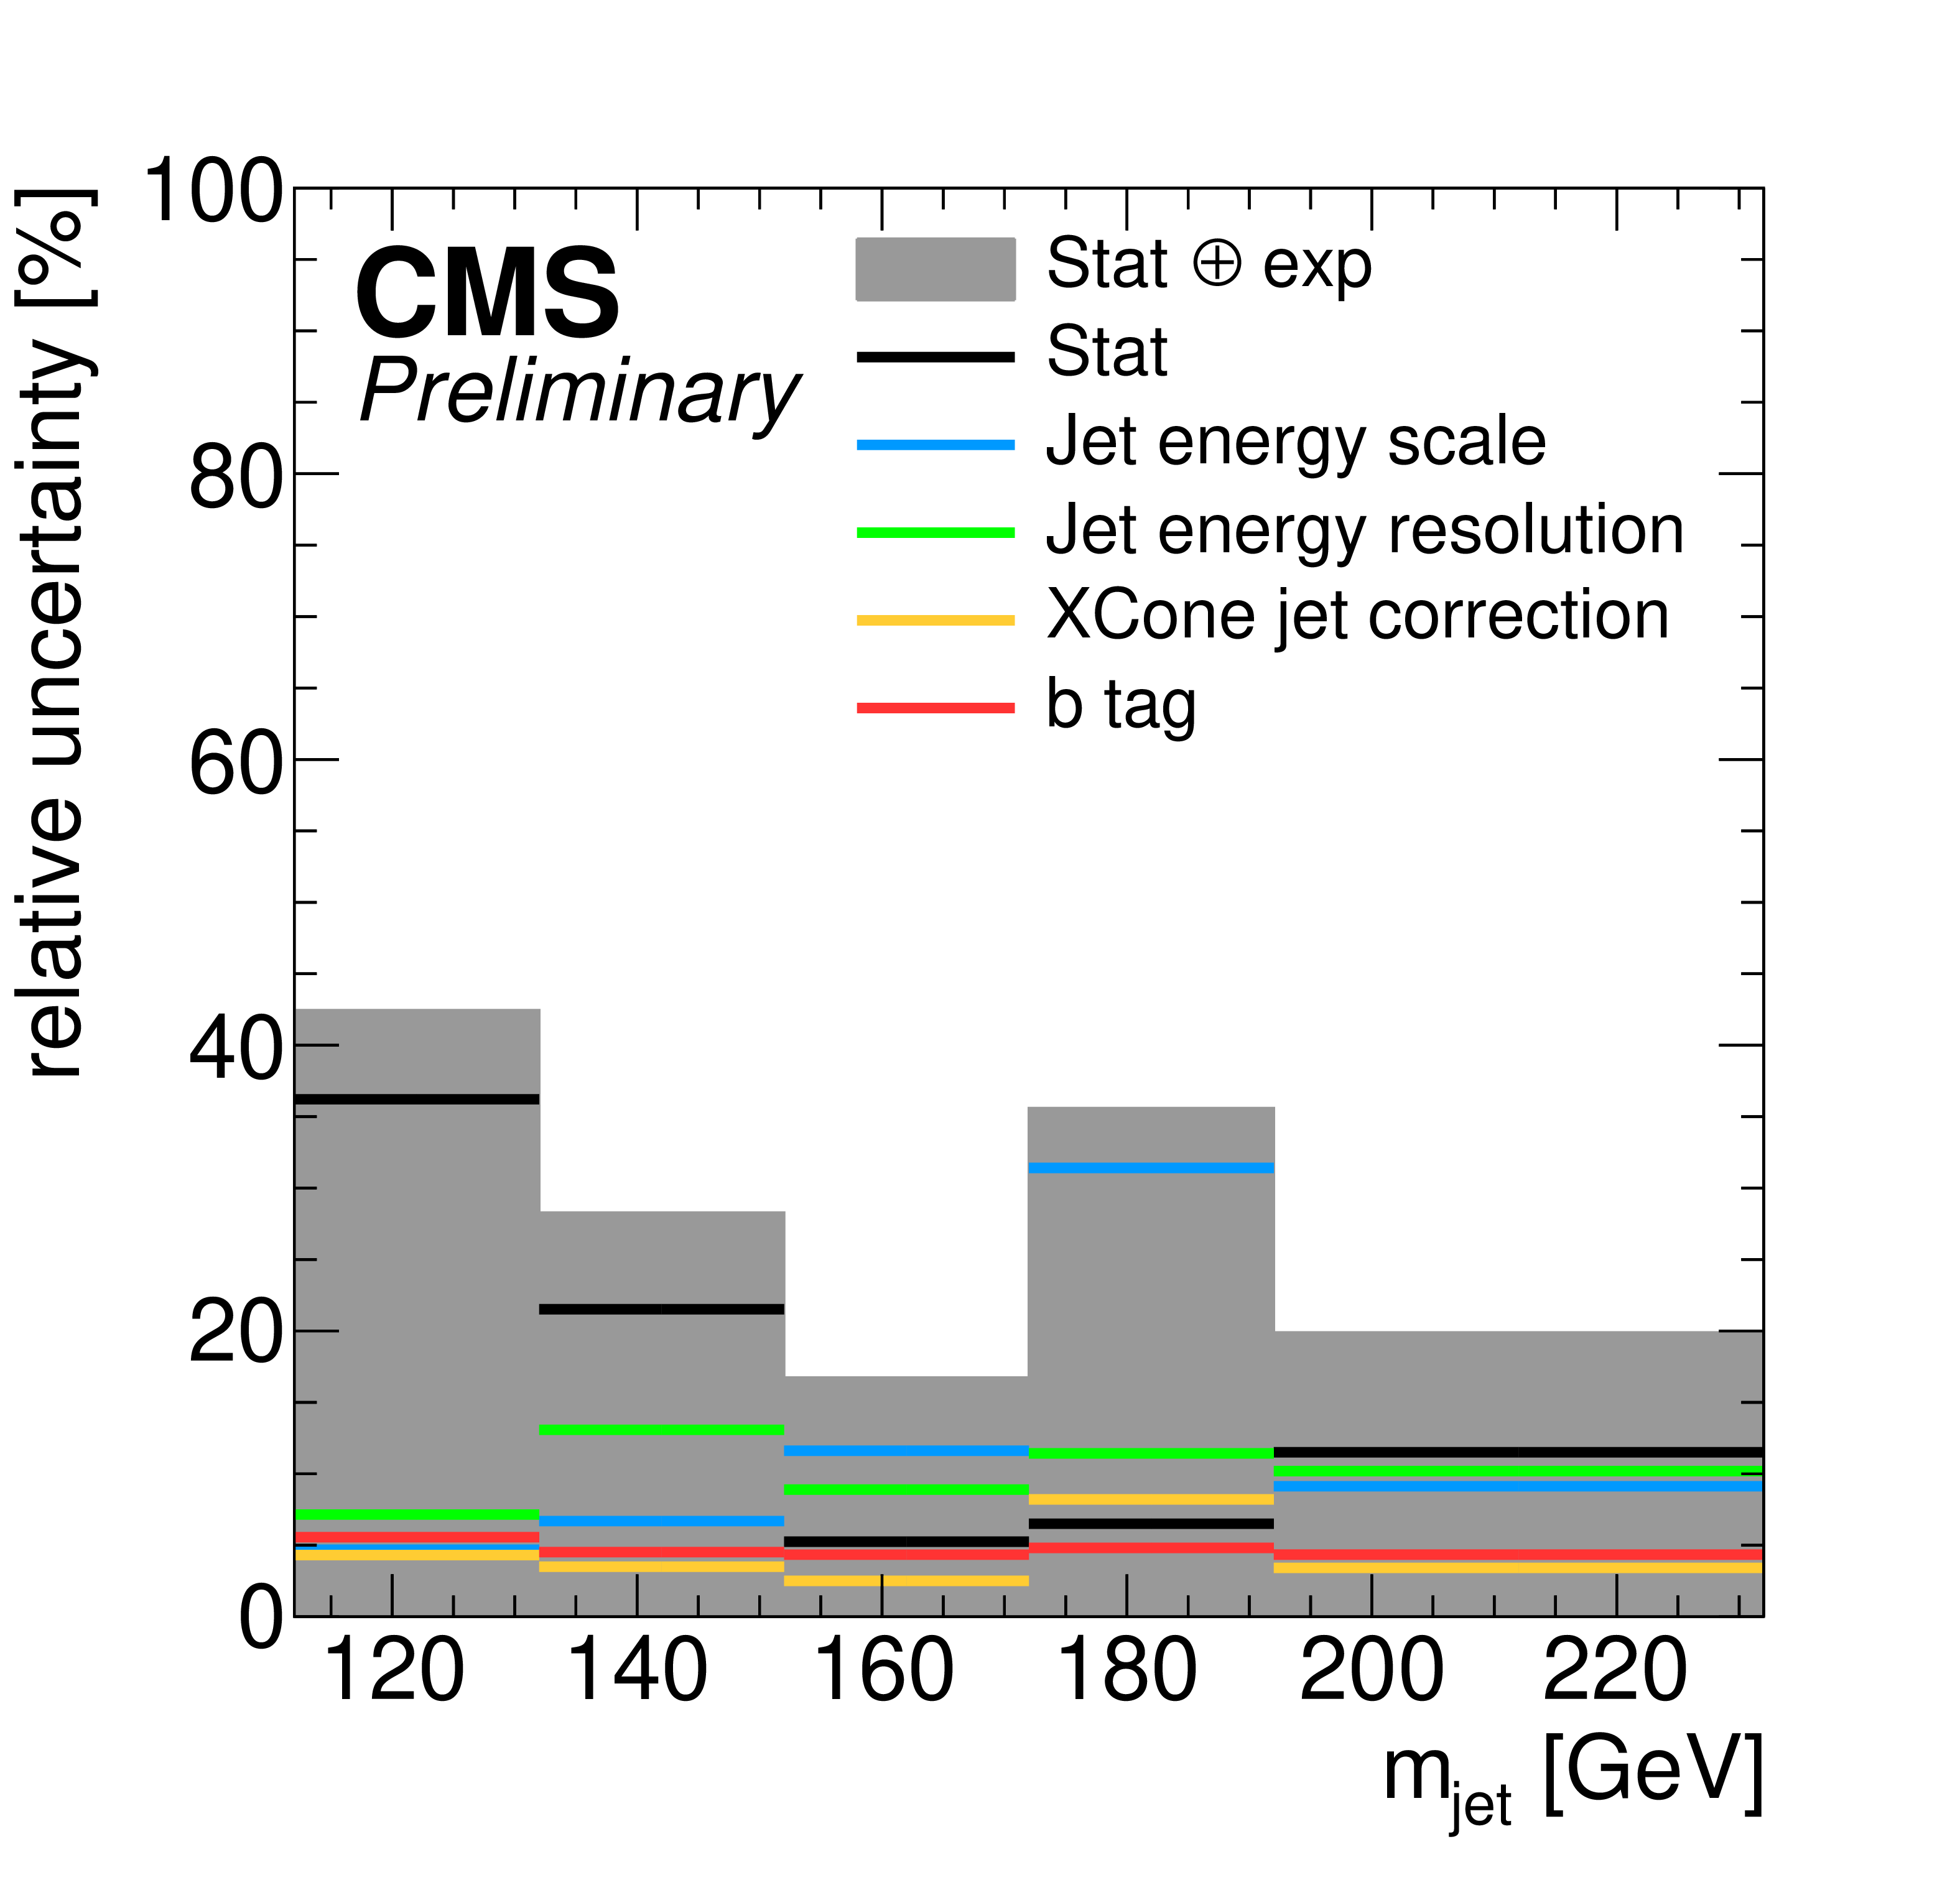
Additional Figure 12:
Statistical uncertainties compared to the individual experimental systematic uncertainties in the ${{\mathrm {t}\overline {\mathrm {t}}}}$ cross section measurement, as a function of the XCone jet mass. The sum of statistical and experimental systematic uncertainties is indicated by the gray region. |
png pdf |
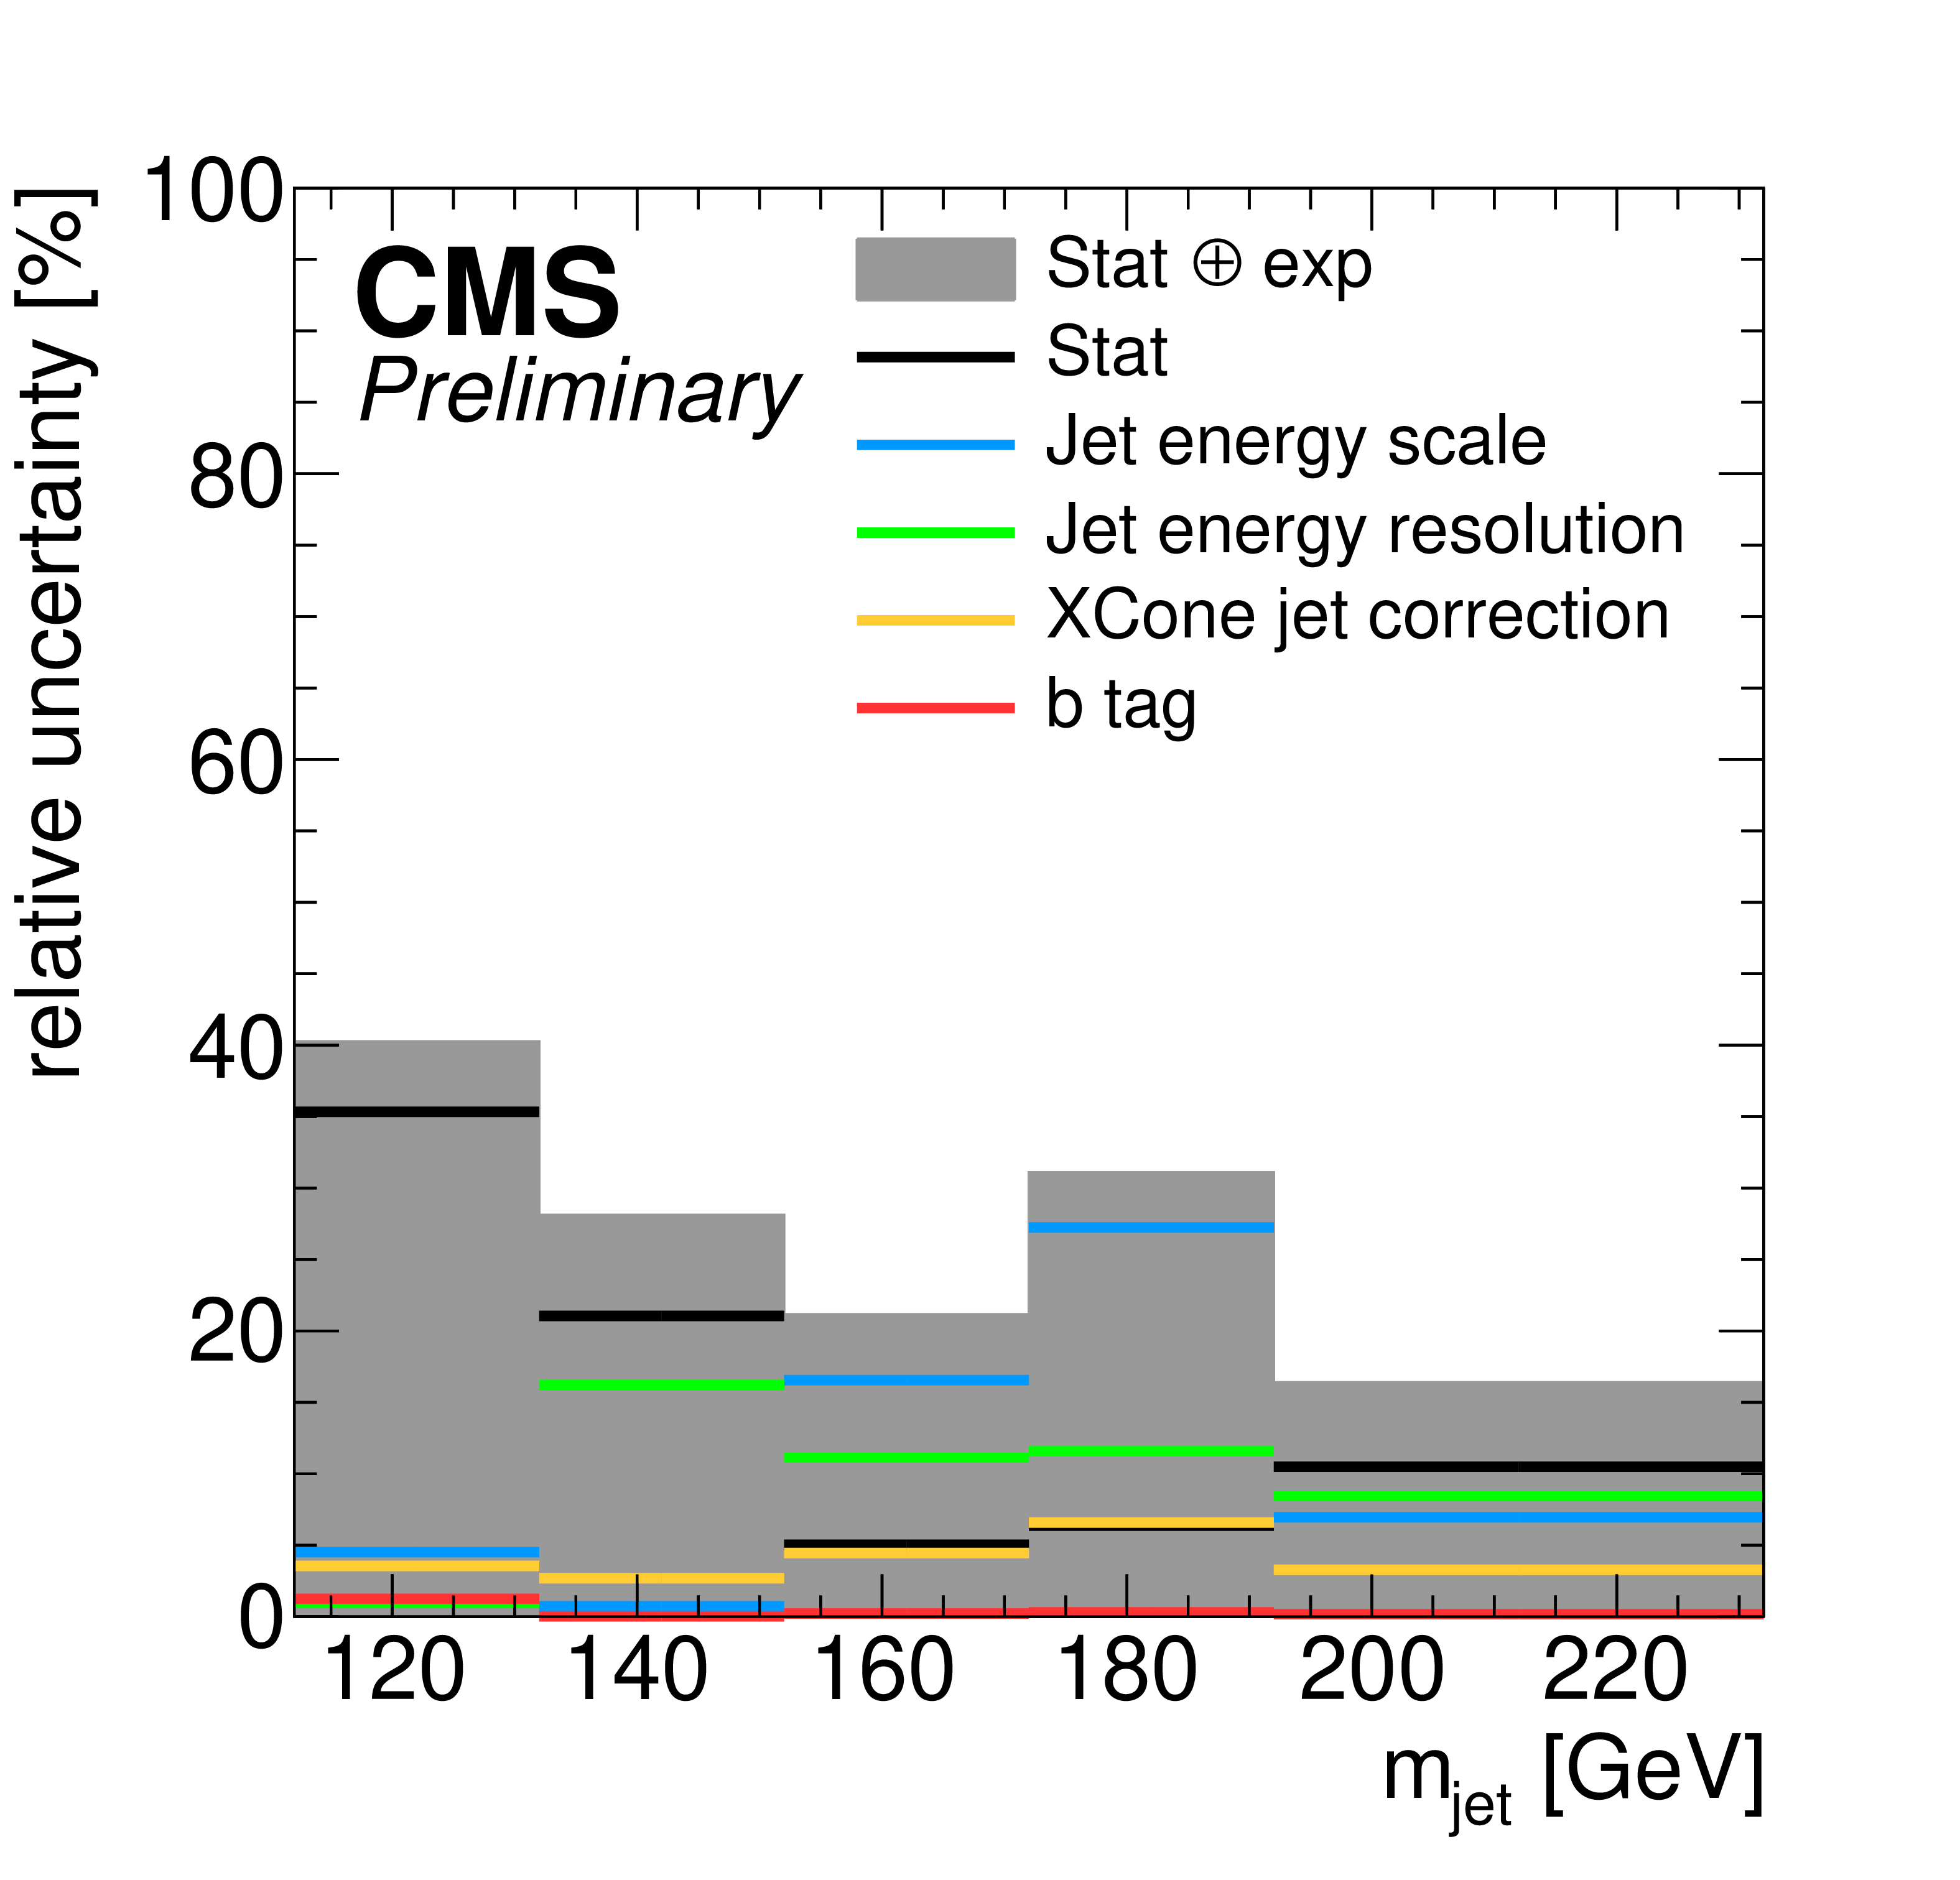
Additional Figure 13:
Statistical uncertainties compared to the individual experimental systematic uncertainties in the normalized ${{\mathrm {t}\overline {\mathrm {t}}}}$ cross section measurement, as a function of the XCone jet mass. The sum of statistical and experimental systematic uncertainties is indicated by the gray region. |
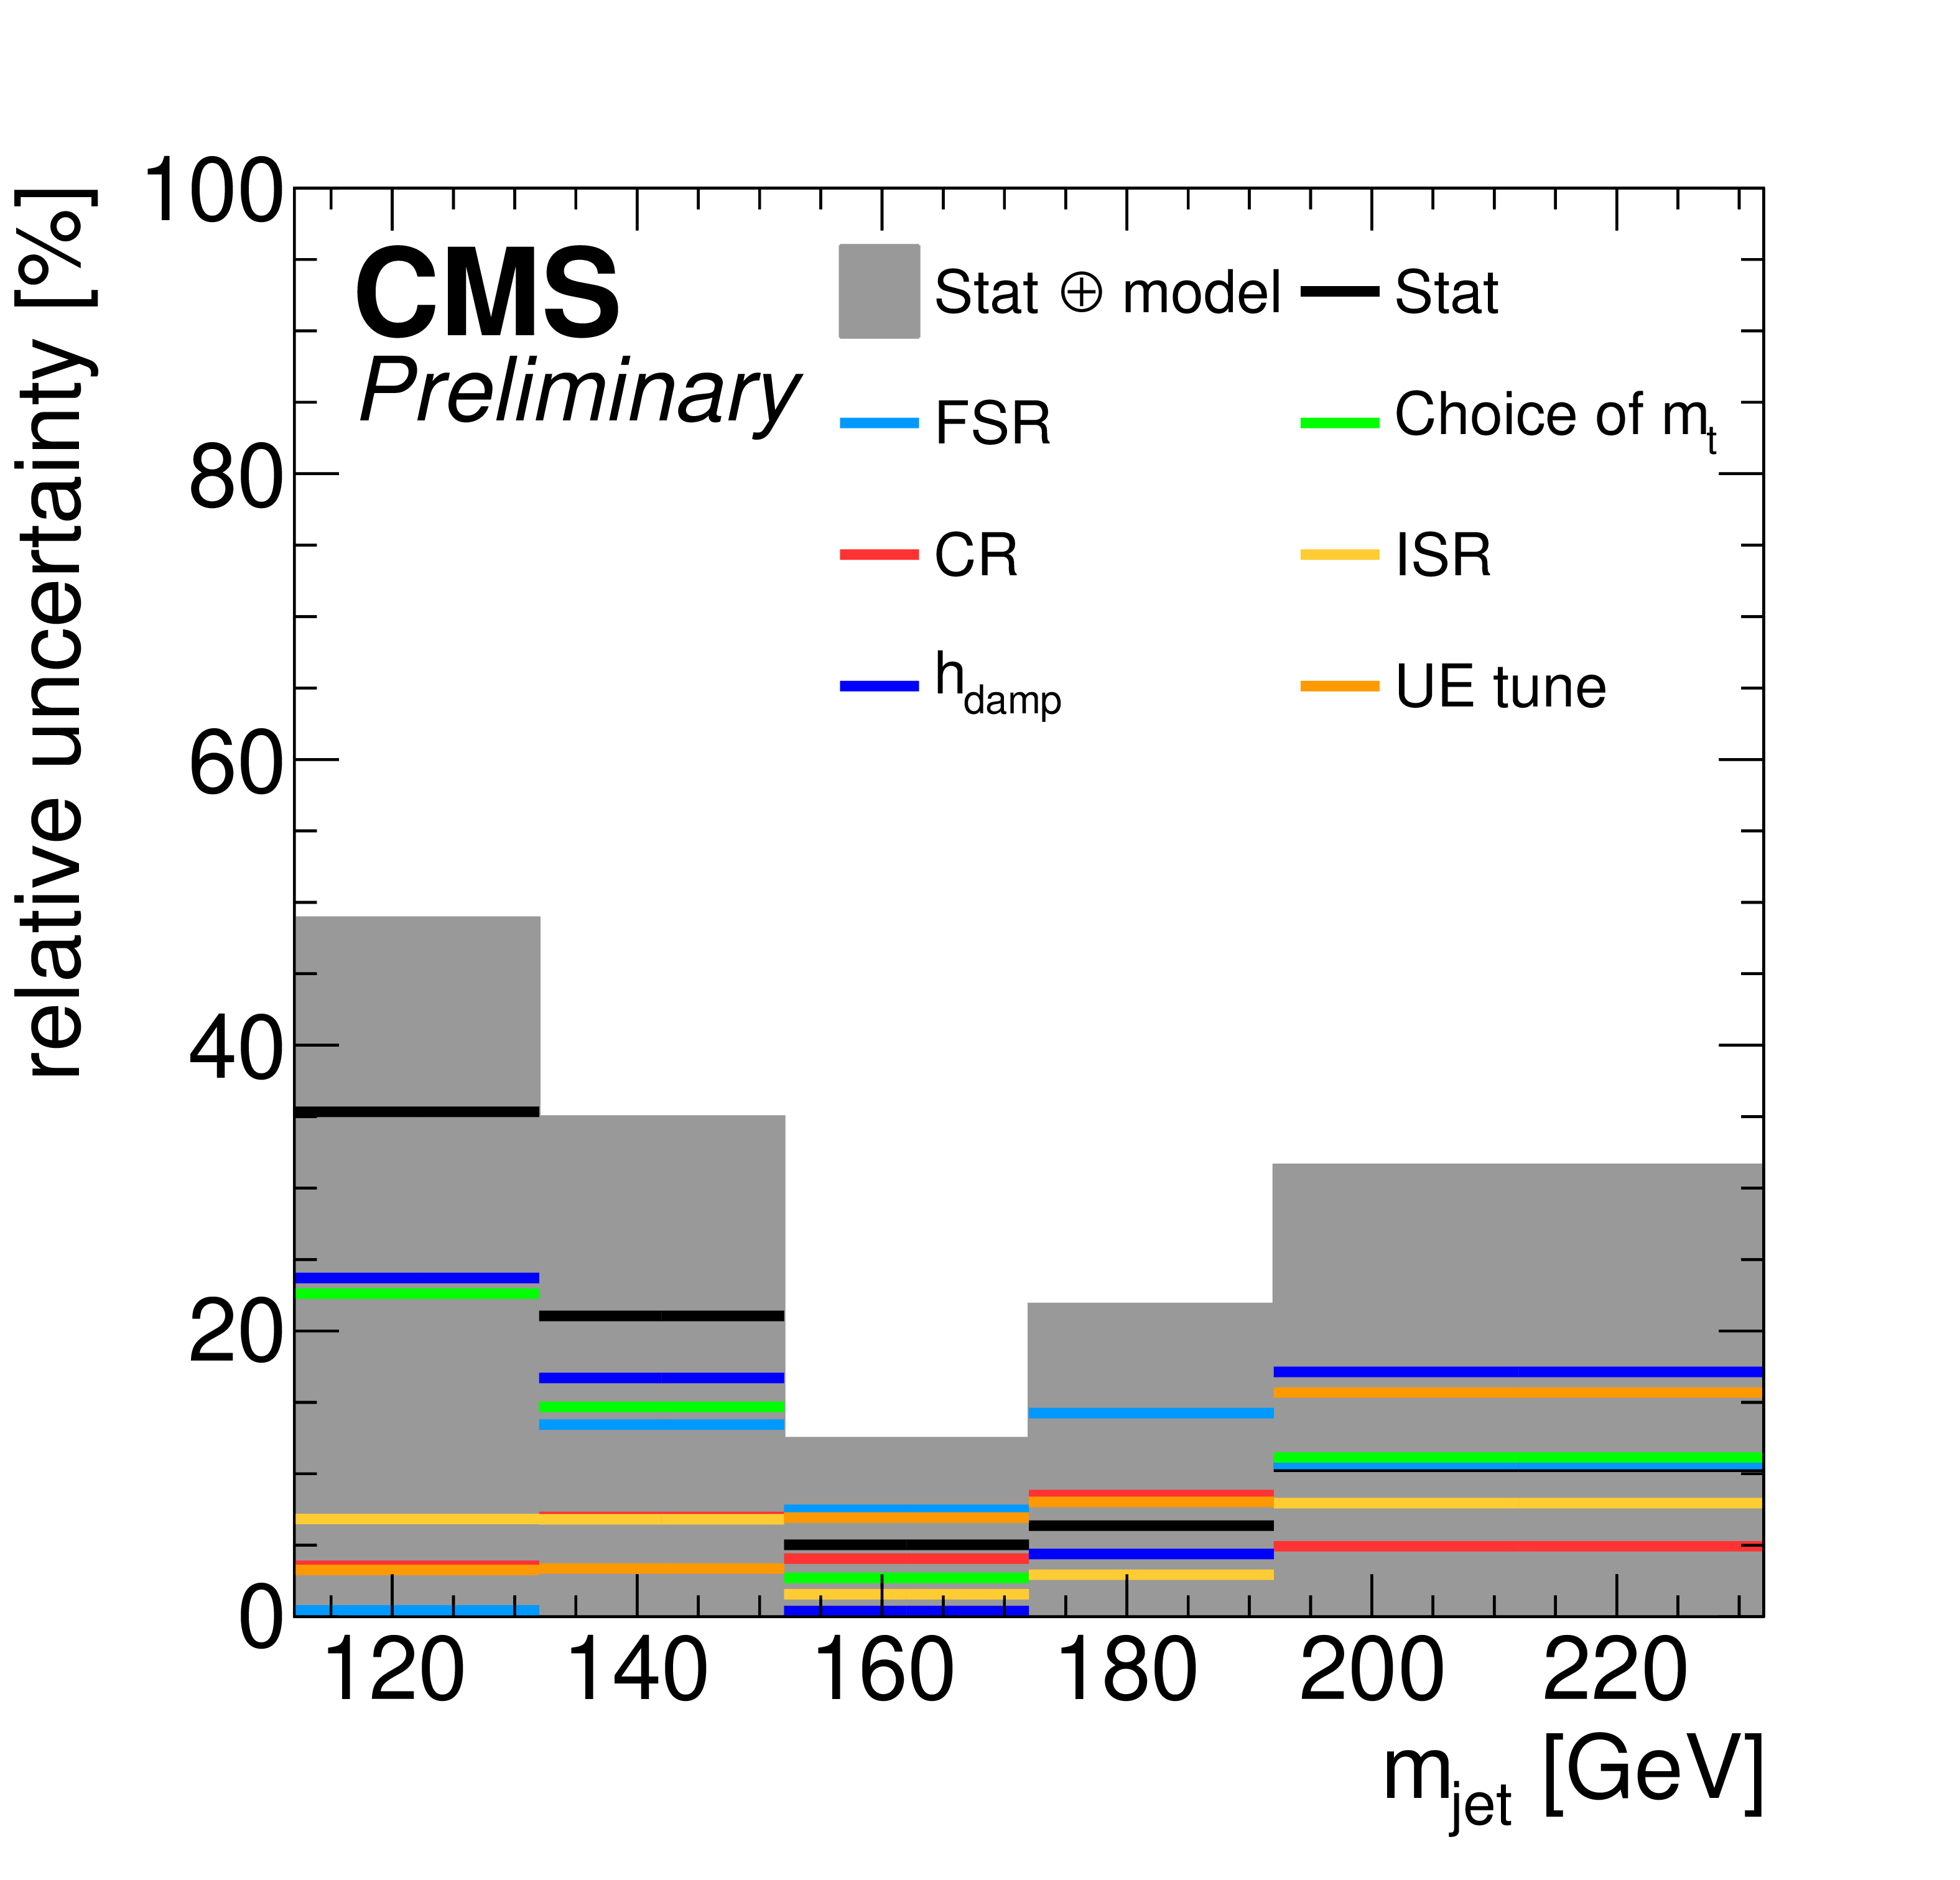
png pdf |
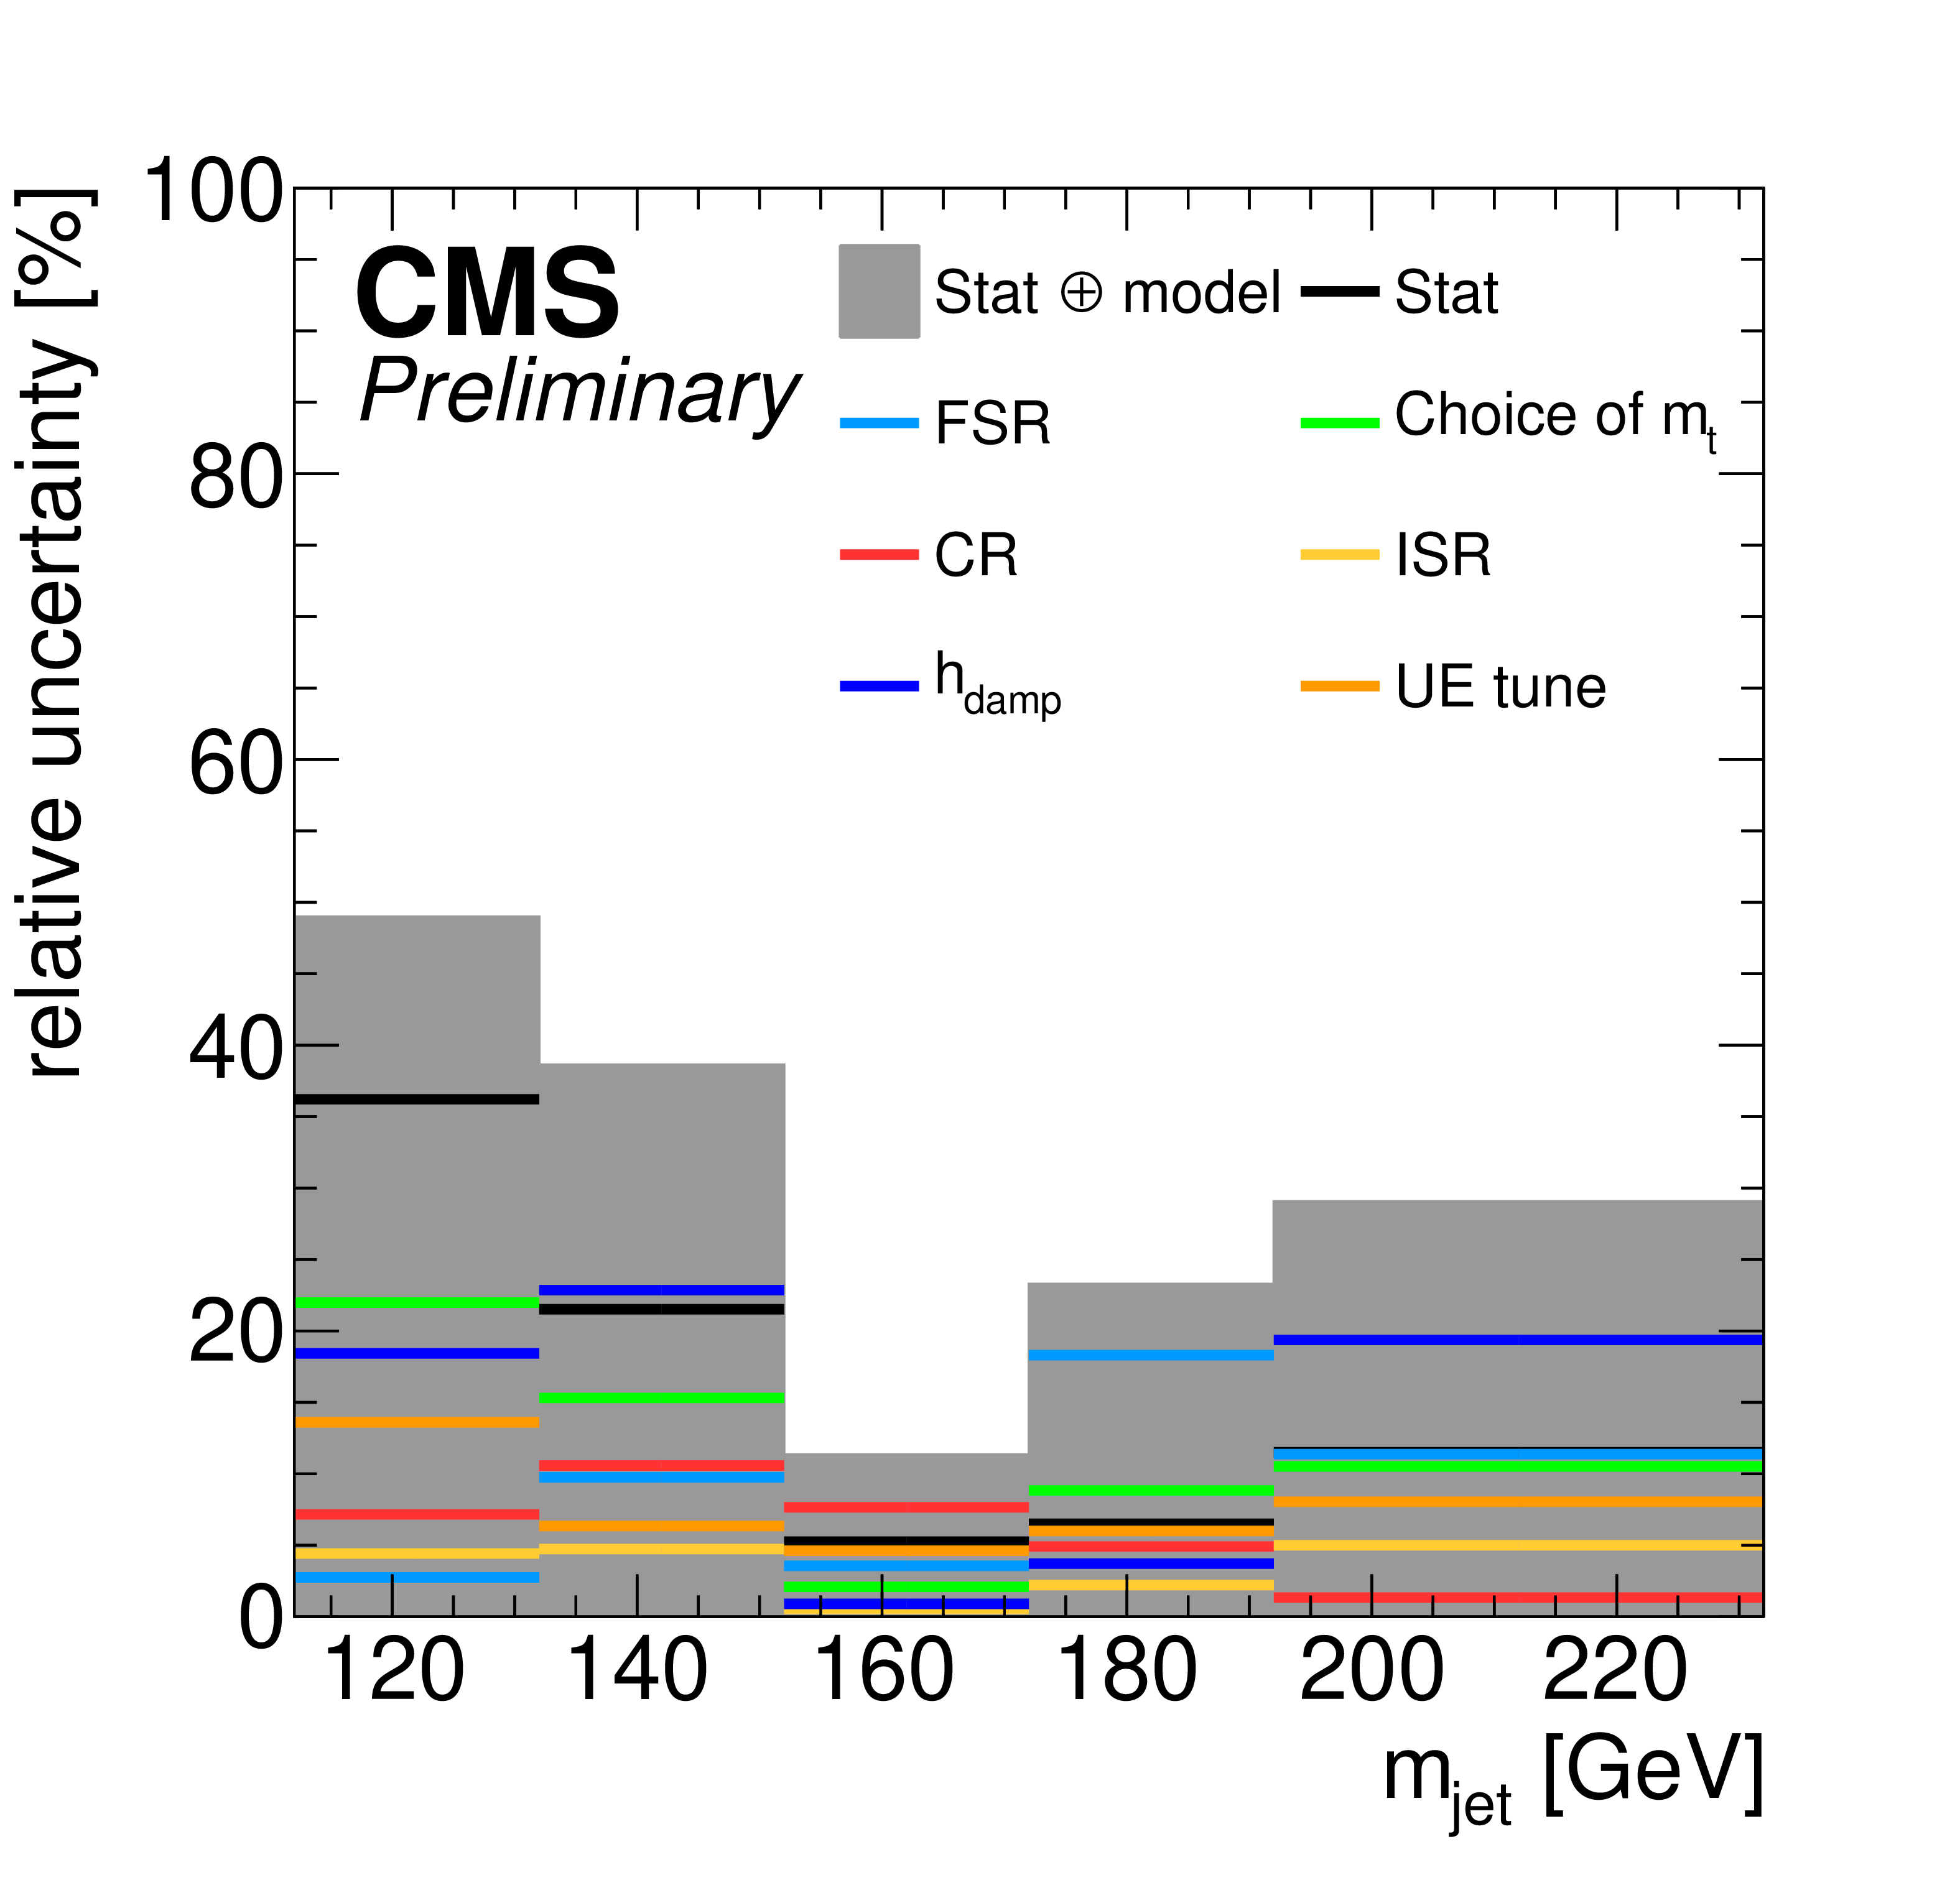
Additional Figure 14:
Statistical uncertainties compared to the individual modeling uncertainties in the unfolding of the ${{\mathrm {t}\overline {\mathrm {t}}}}$ cross section measurement, as a function of the XCone jet mass. The sum of statistical and modeling uncertainties is indicated by the gray region. |
png pdf |
Additional Figure 15:
Statistical uncertainties compared to the individual modeling uncertainties in the unfolding of the normalized ${{\mathrm {t}\overline {\mathrm {t}}}}$ cross section measurement, as a function of the XCone jet mass. The sum of statistical and modeling uncertainties is indicated by the gray region. |

png pdf |
Additional Figure 16:
Measured top quark mass versus its true value in ${{\mathrm {t}\overline {\mathrm {t}}}}$ simlation. The uncertainties include the statistical component and the uncertainty due to the choice of $m_t$ in the unfolding correction. |
| Additional Tables | |
png pdf |
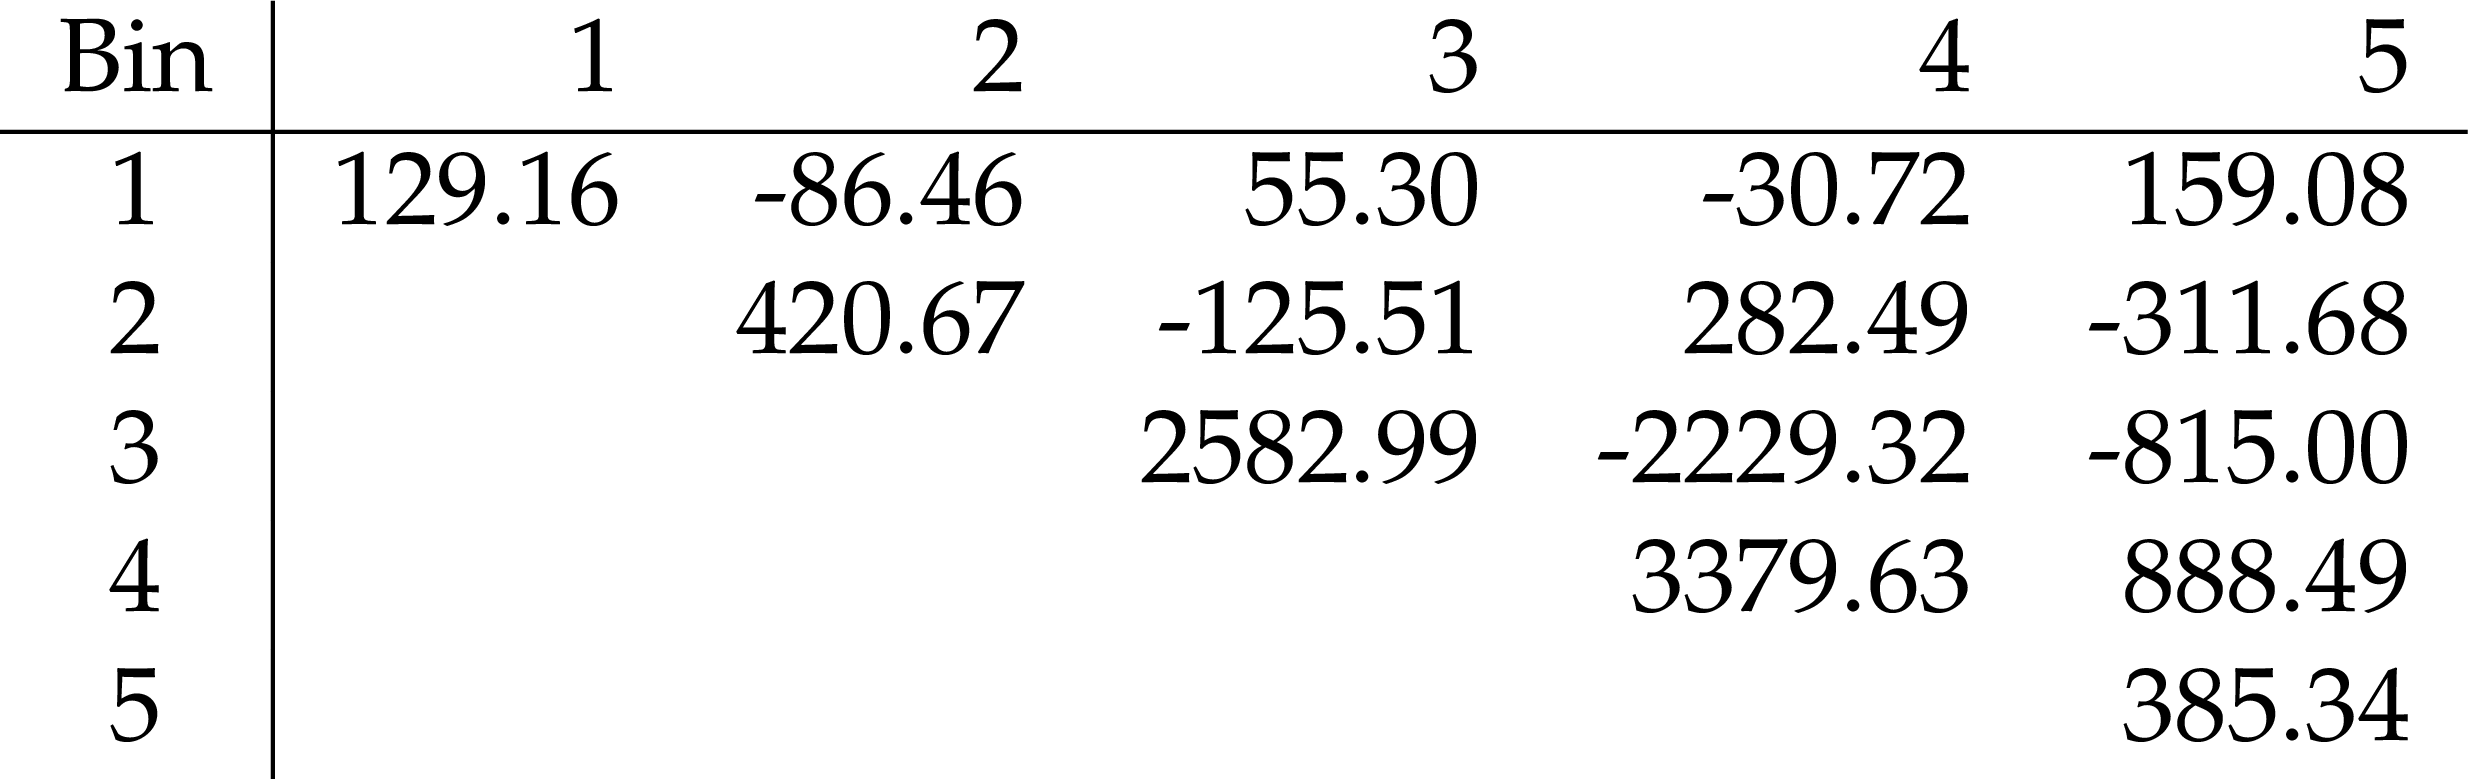
Additional Table 1:
Covariance matrix for the total uncertainties in the differential cross section. All entries are given in units of $\left [\text {fb}^2\right ]$. |
png pdf |
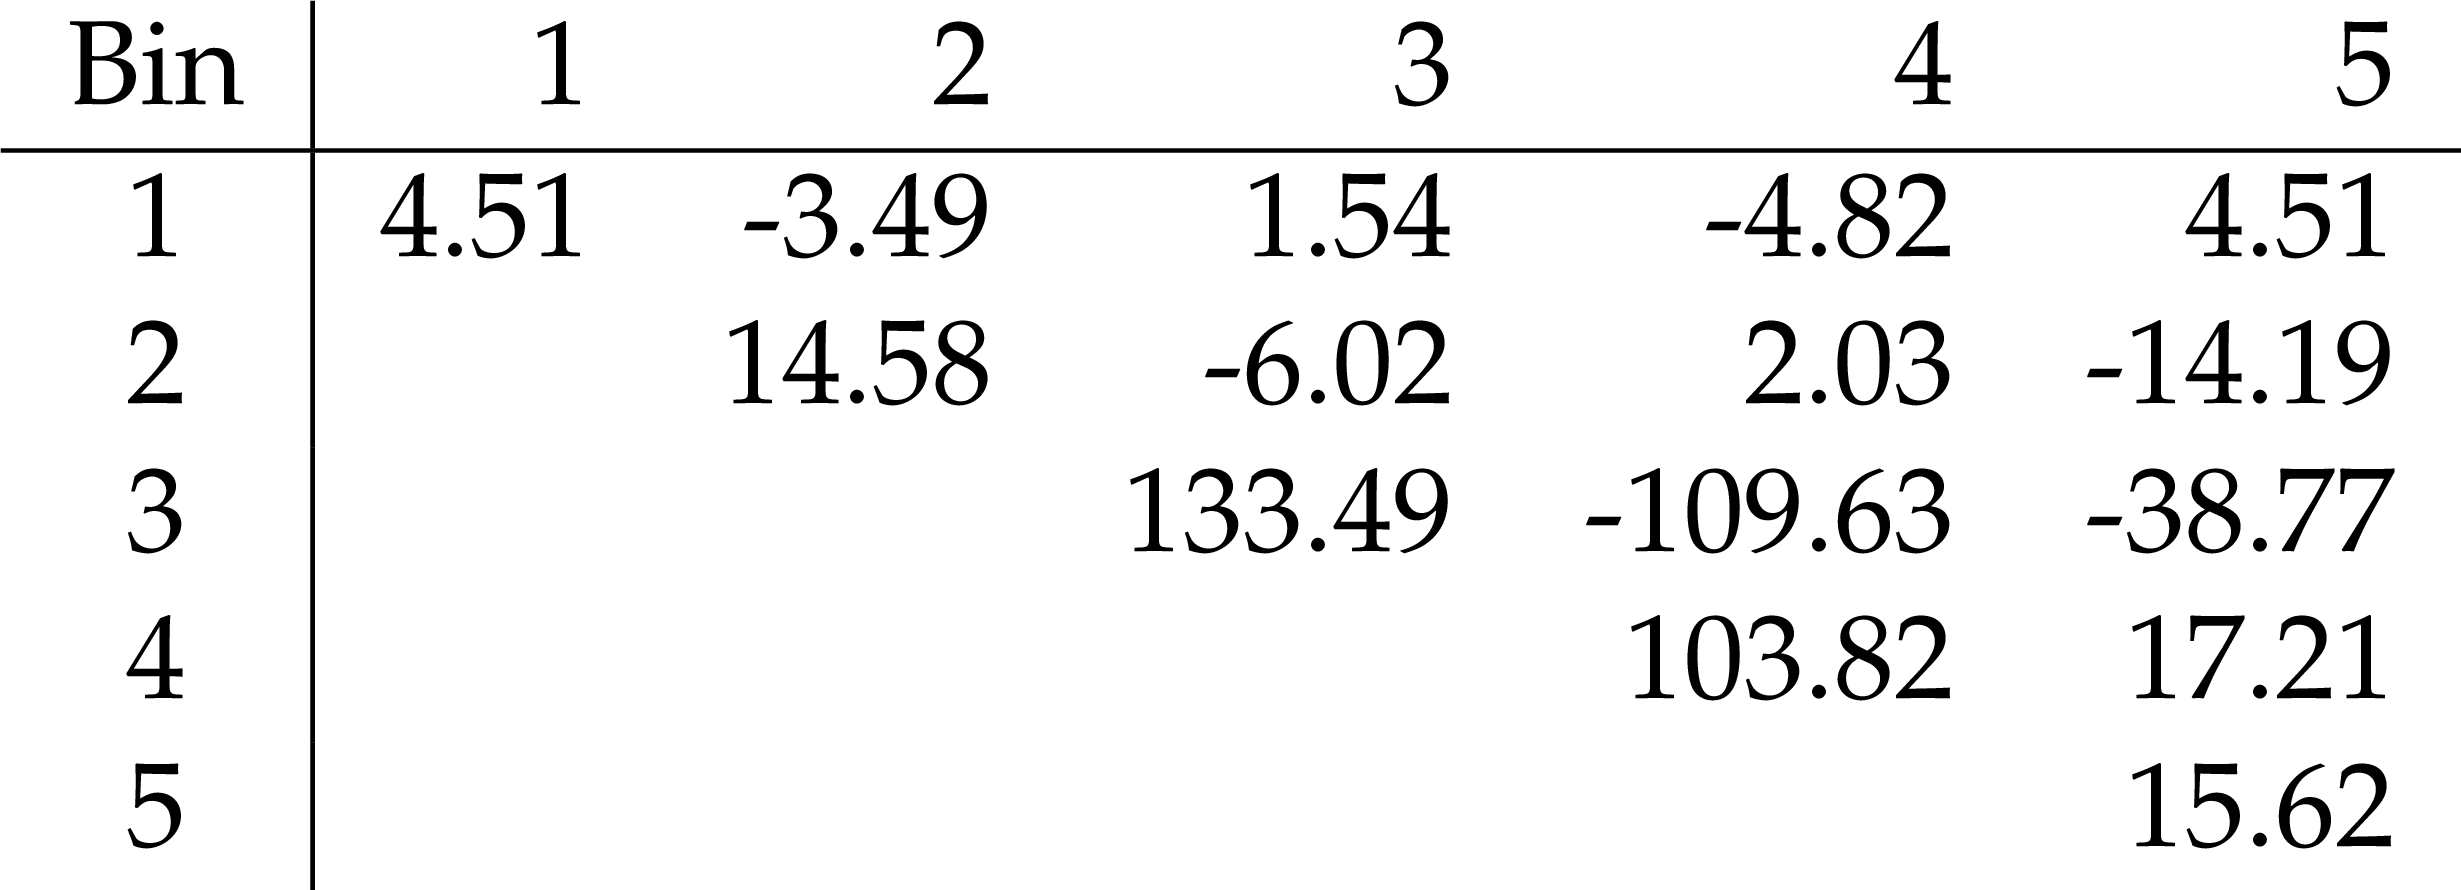
Additional Table 2:
Covariance matrix for the total uncertainties in the normalized differential cross section. All entries are given in units of $10^{-4}$. |
png pdf |
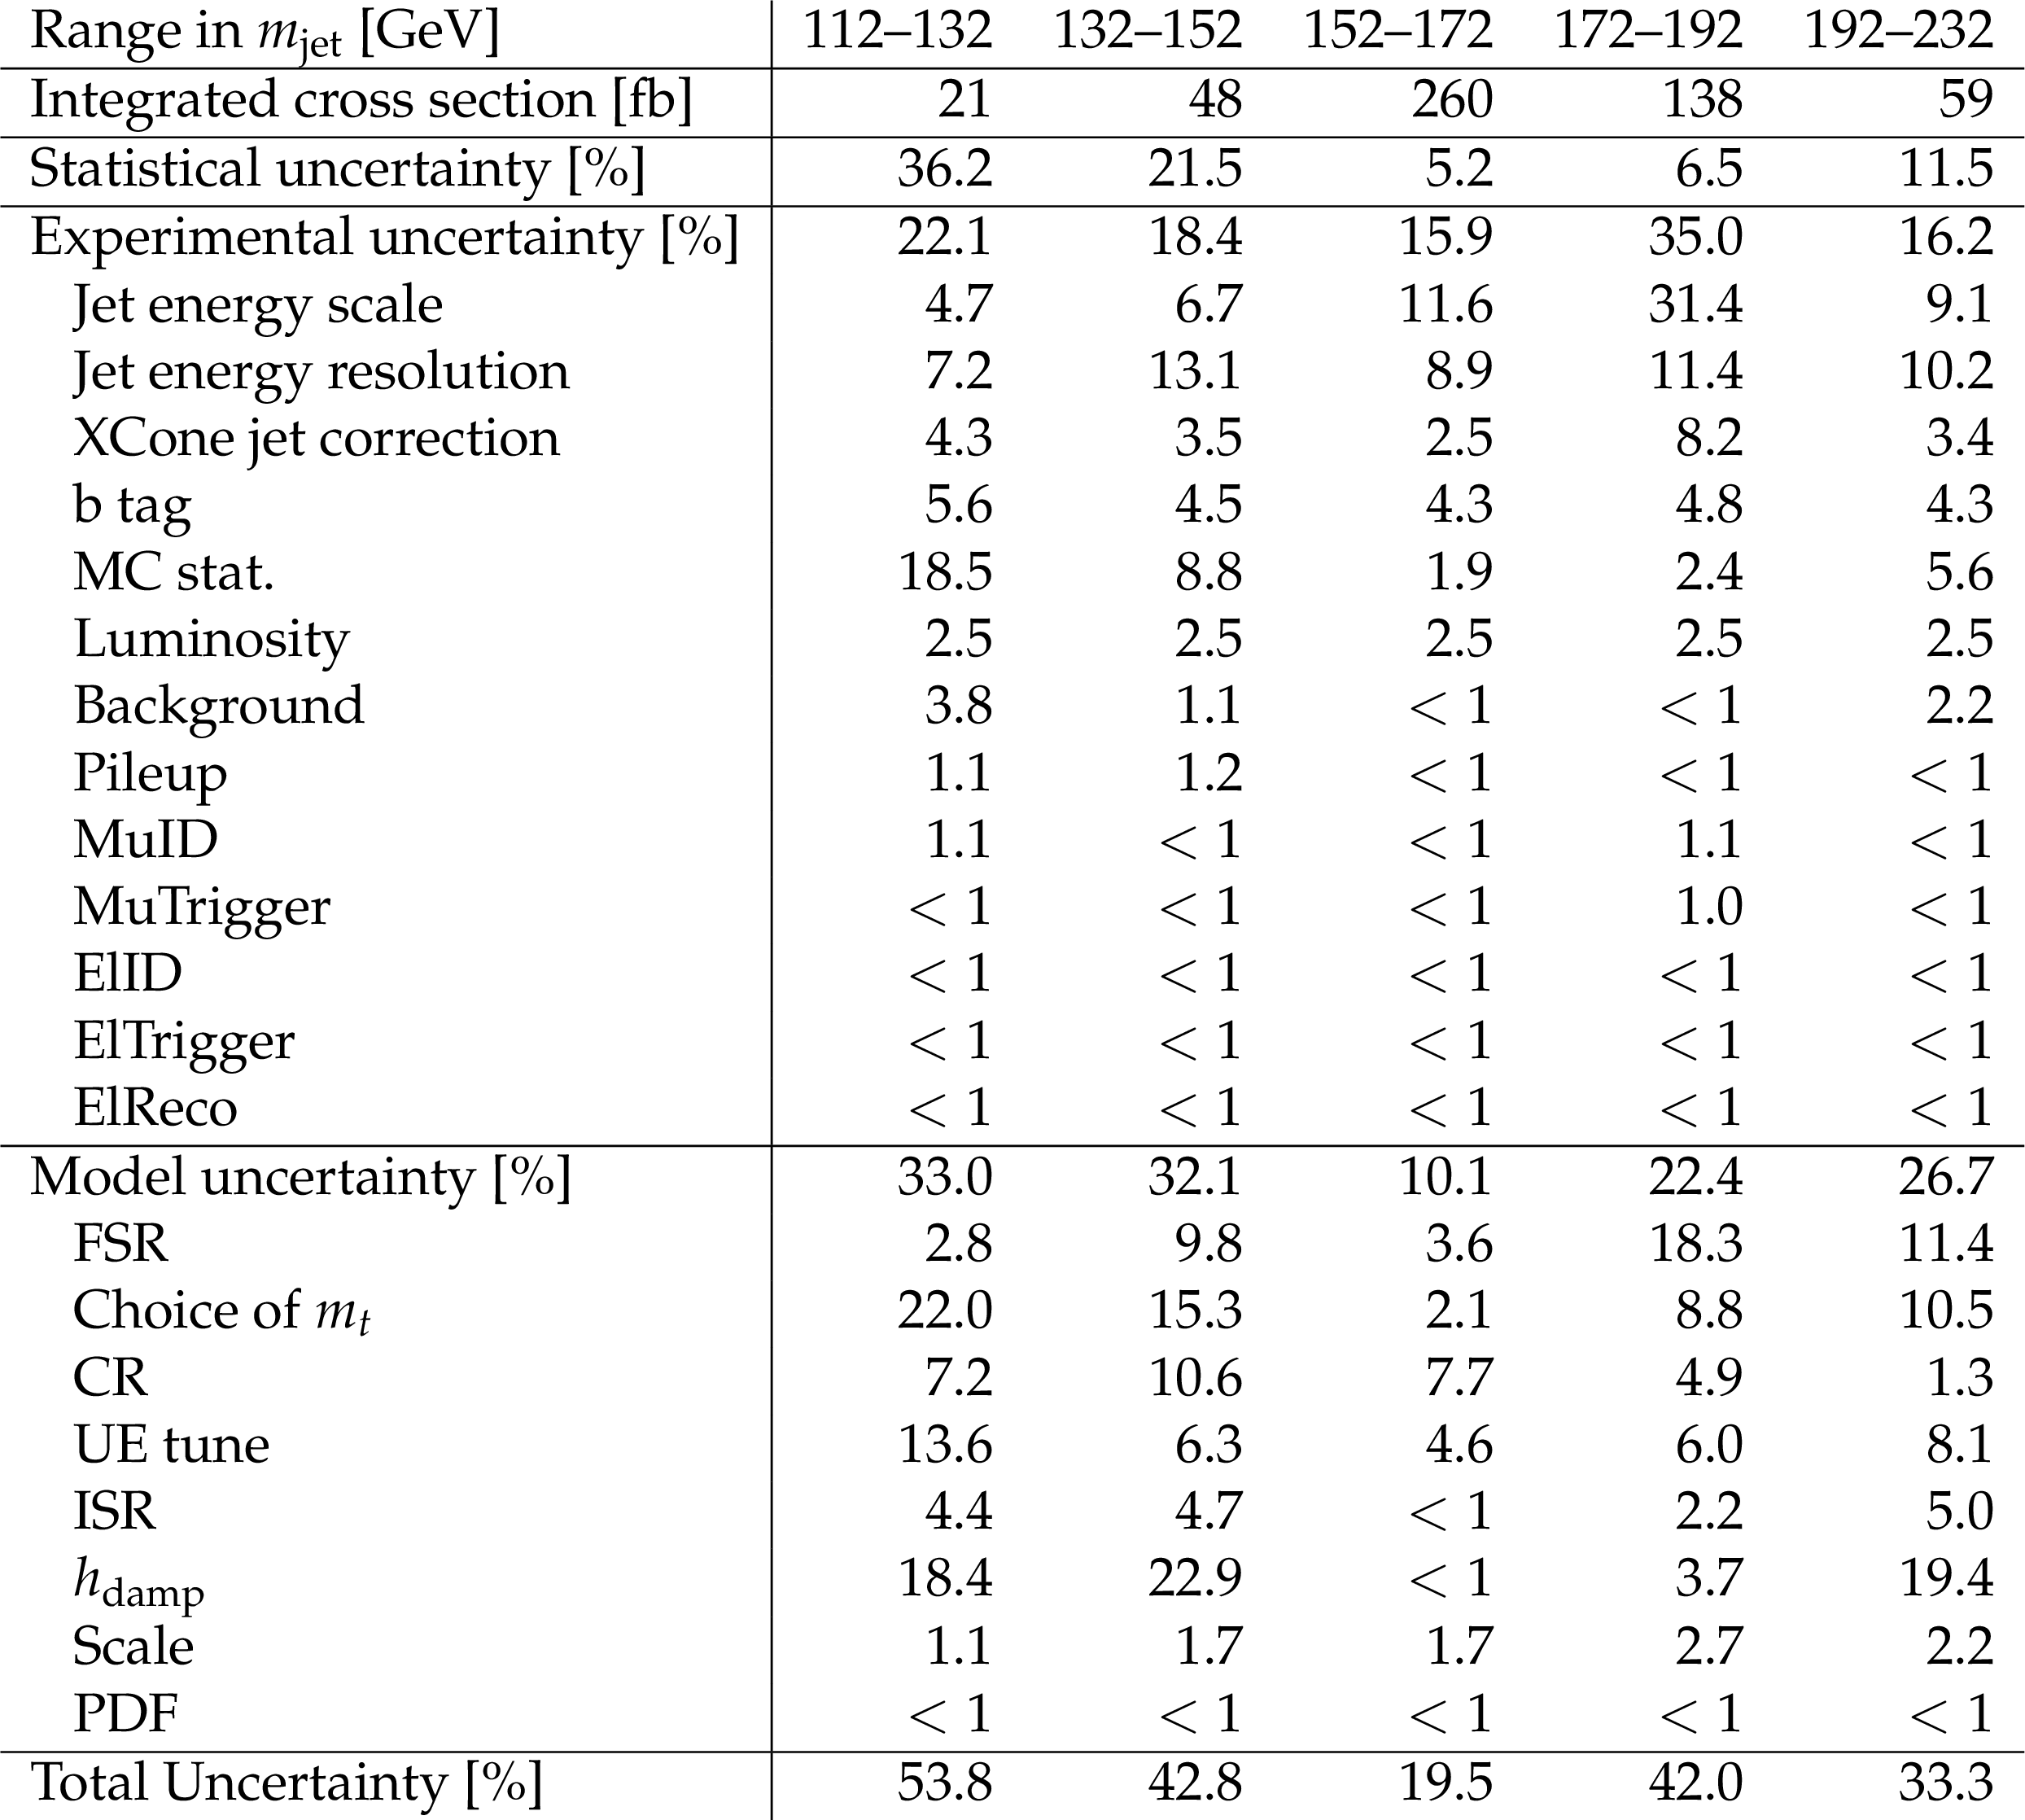
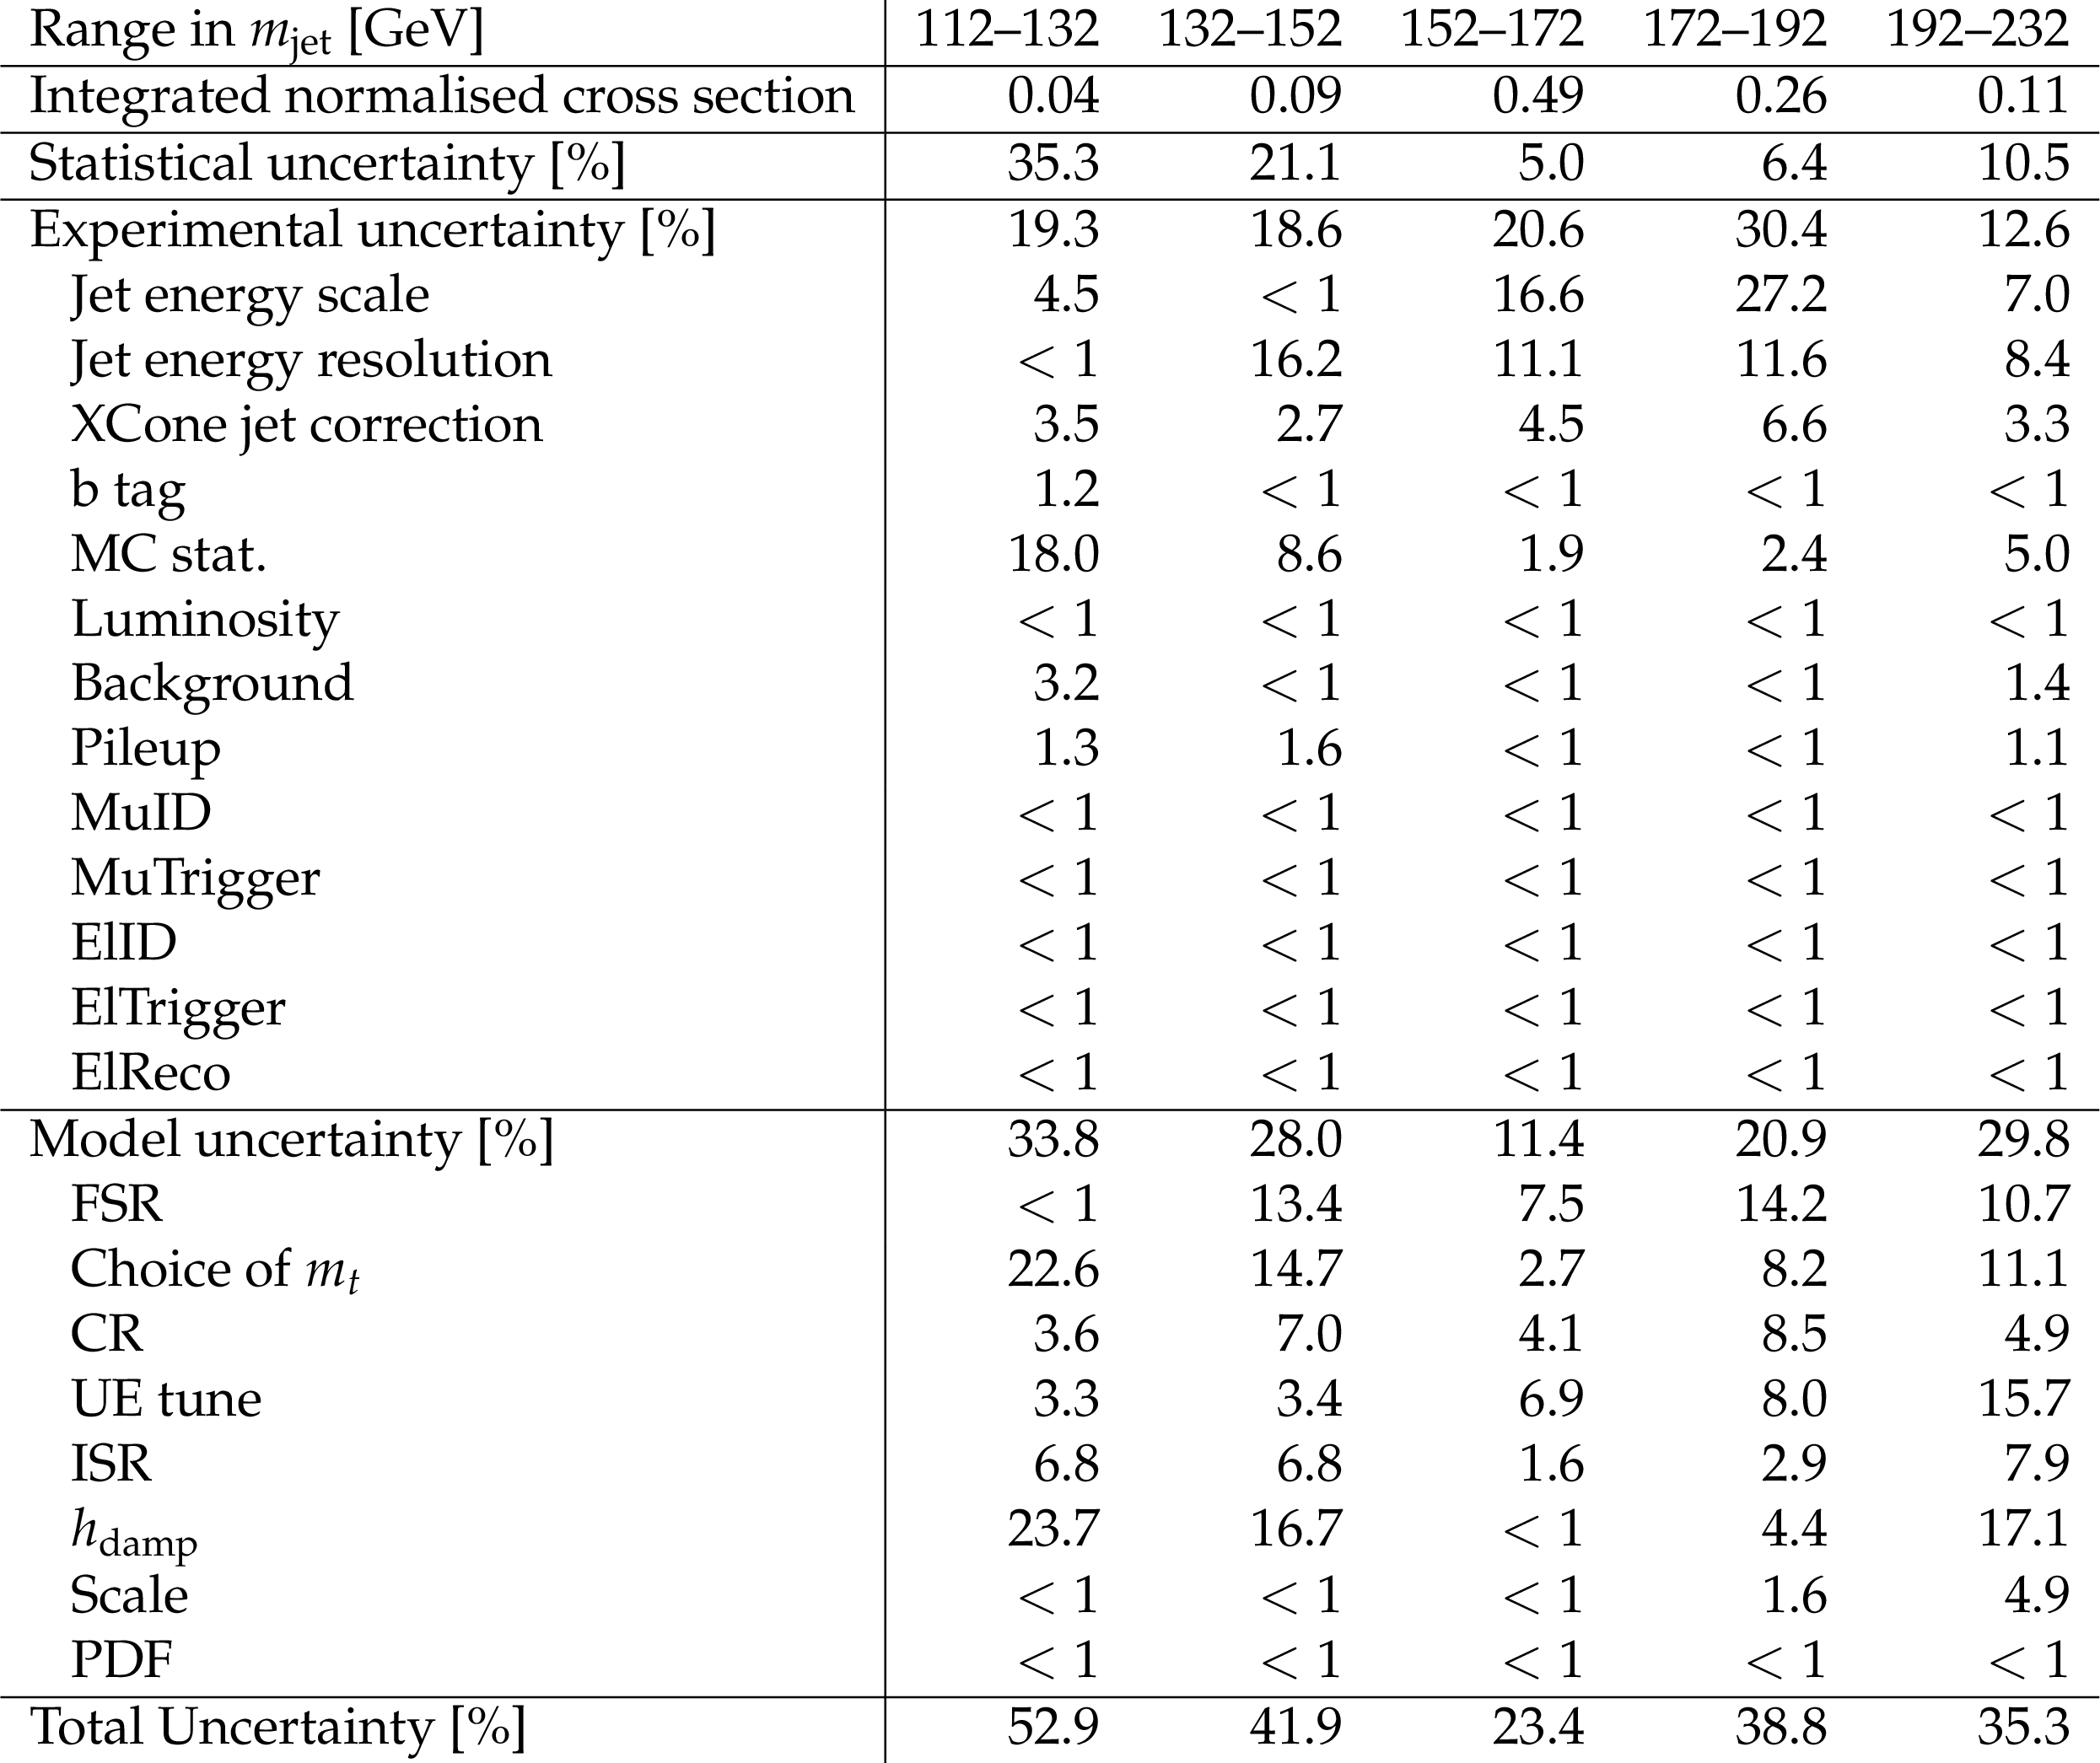
Additional Table 3:
Measured differential cross section in the fiducial region as a function of $m_\text {jet}$, with individual and total uncertainties in percent. For the experimental uncertainty and the uncertainty due to variations in the signal modeling at the unfolding, the individual components are listed separately. |
png pdf |
Additional Table 4:
Measured normalized differential cross section in the fiducial region as a function of $m_\text {jet}$, with individual and total uncertainties in percent. The two groups are experimental uncertainties, and uncertainties due to variations in the signal modeling at the unfolding. |
png pdf |
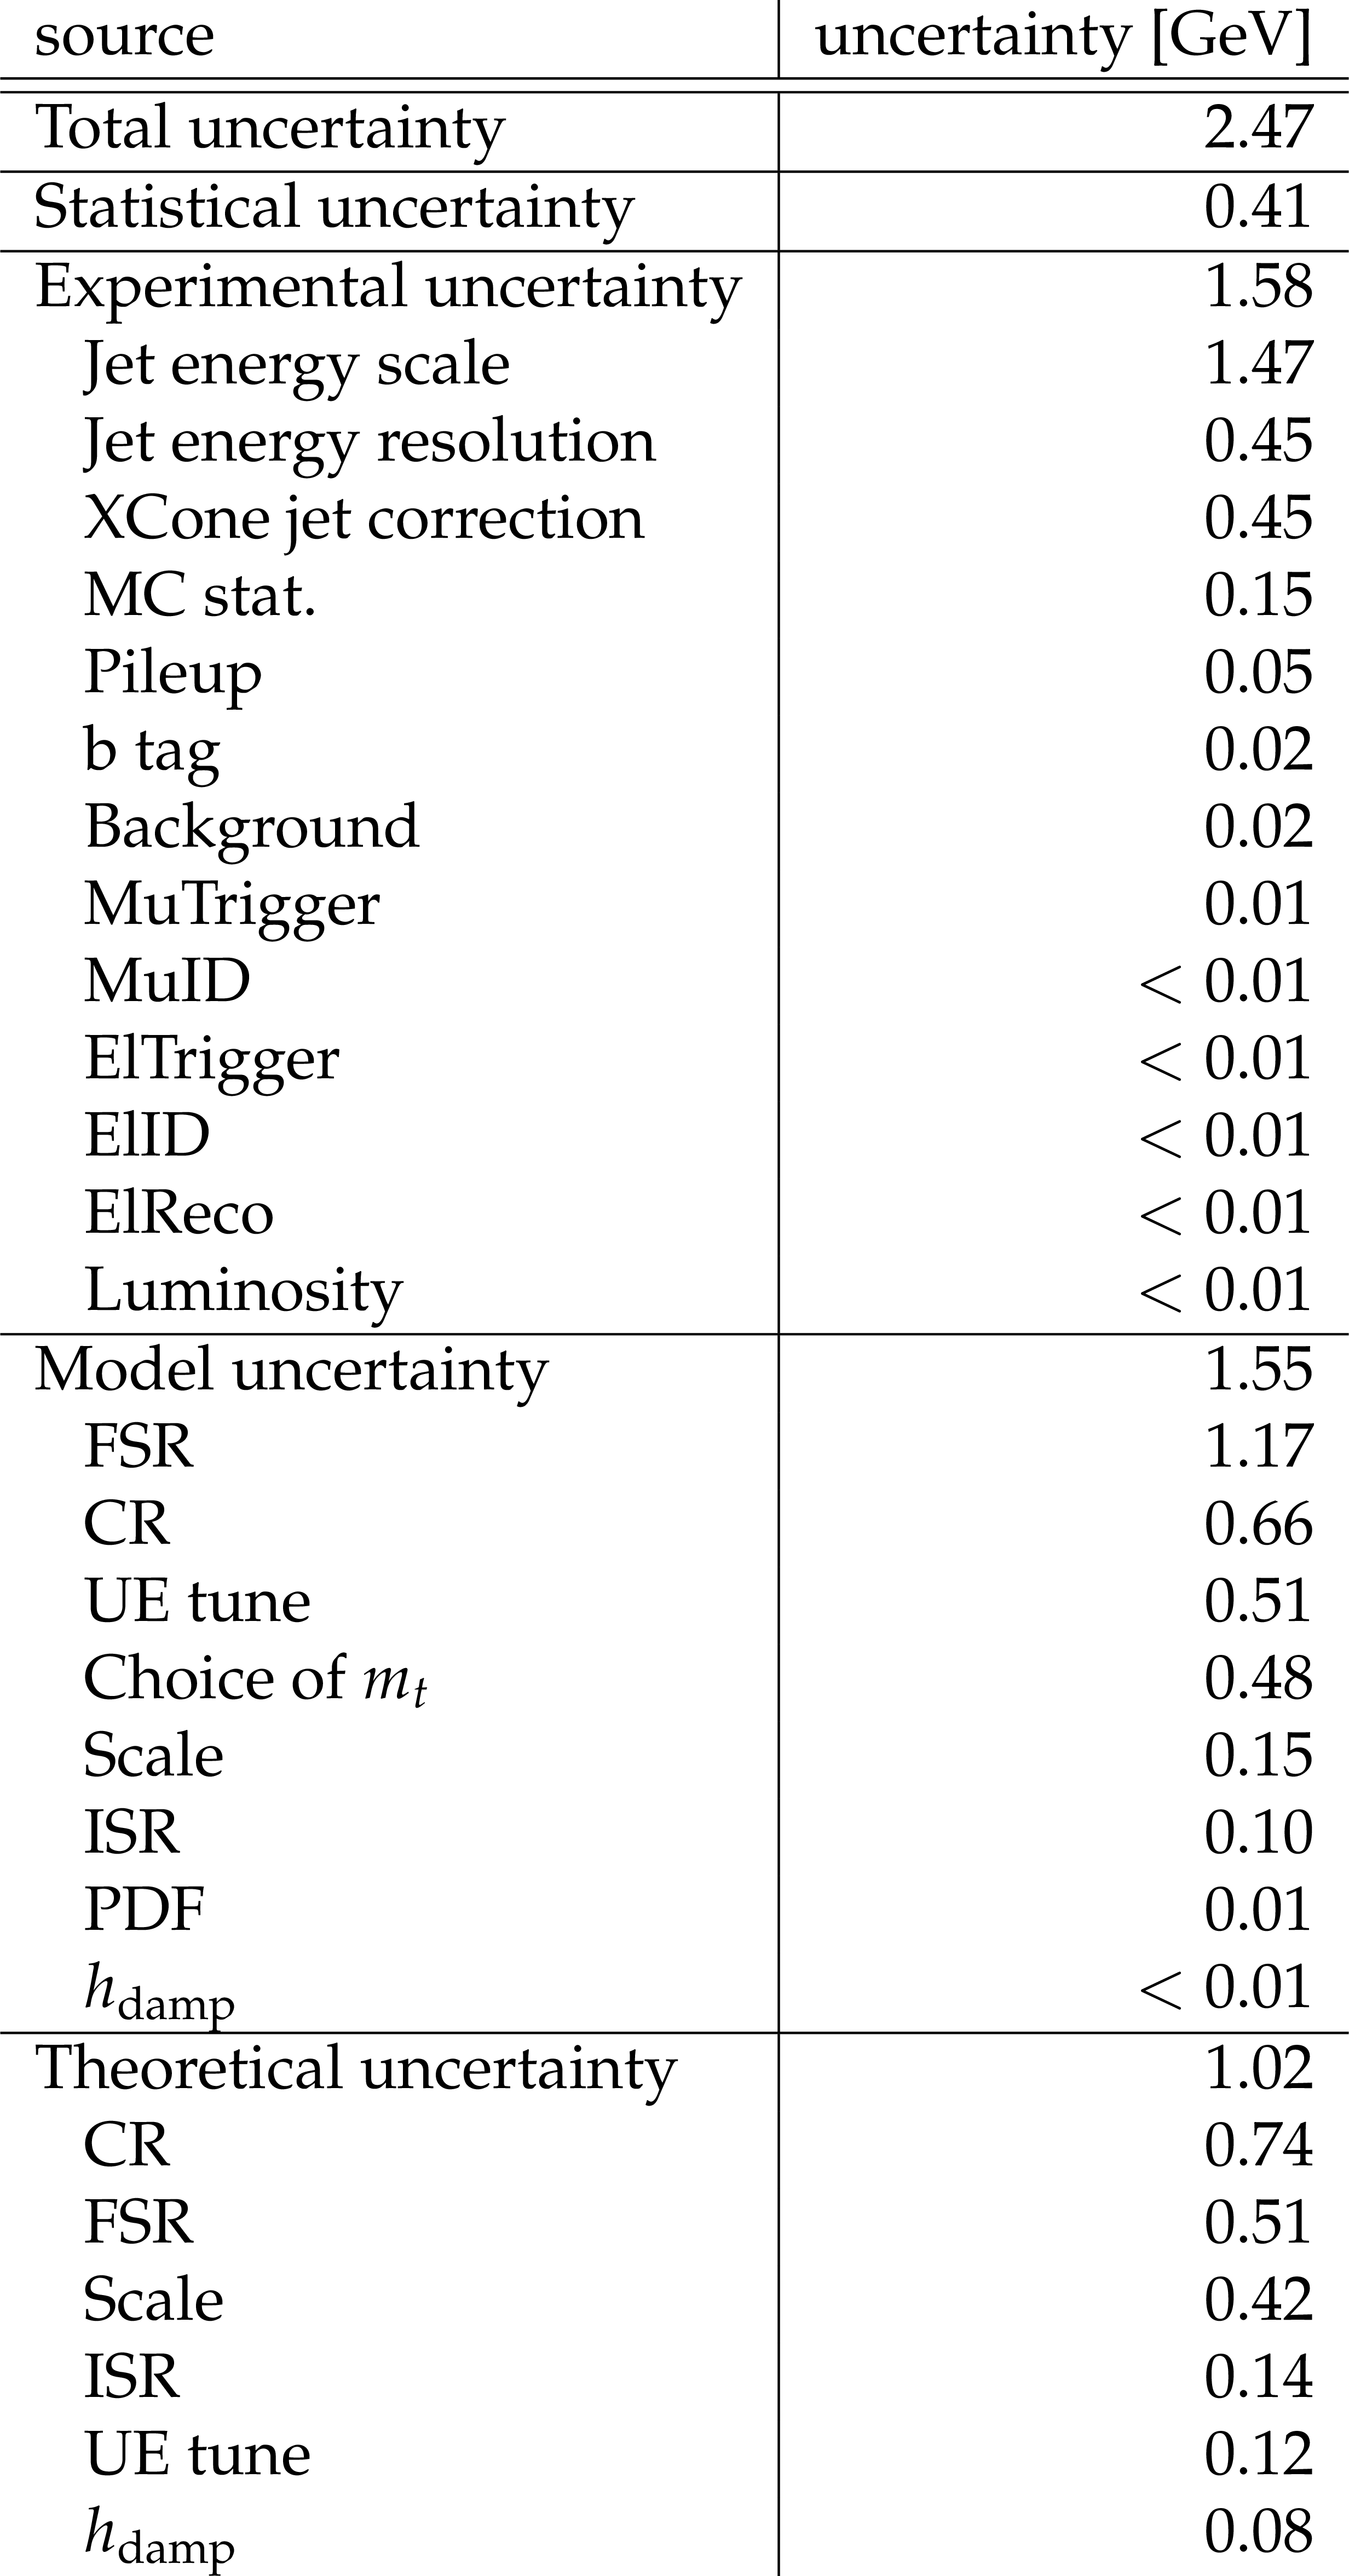
Additional Table 5:
Individual and total uncertainties in the determination of the top quark mass from the normalized differential cross section in GeV. The three groups are experimental uncertainties, uncertainties due to variations in the signal modeling at the unfolding, and theoretical uncertainties in the prediction of the normalized $m_\text {jet}$ distribution. |
| References | ||||
| 1 | J. Haller et al. | Update of the global electroweak fit and constraints on two-Higgs-doublet models | EPJC 78 (2018) 675 | 1803.01853 |
| 2 | Particle Data Group Collaboration | Review of particle physics | PRD 98 (2018) 030001 | |
| 3 | ATLAS Collaboration | Measurement of the top quark mass in the $ \mathrm{t\bar{t}}\rightarrow $ dilepton channel from $ \sqrt{s}= $ 8 TeV ATLAS data | PLB 761 (2016) 350 | 1606.02179 |
| 4 | ATLAS Collaboration | Top-quark mass measurement in the all-hadronic $ \mathrm{t\bar{t}} $ decay channel at $ \sqrt{s}= $ 8 TeV with the ATLAS detector | JHEP 09 (2017) 118 | 1702.07546 |
| 5 | ATLAS Collaboration | Measurement of the top quark mass in the $ \mathrm{t\bar{t}}\rightarrow $ lepton+jets channel from $ \sqrt{s}= $ 8 TeV ATLAS data and combination with previous results | EPJC 79 (2019) 290 | 1810.01772 |
| 6 | CMS Collaboration | Measurement of the top quark mass using proton-proton data at $ {\sqrt{s}} = $ 7 and 8 TeV | PRD 93 (2016) 072004 | CMS-TOP-14-022 1509.04044 |
| 7 | CMS Collaboration | Measurement of the top quark mass in the dileptonic $ \mathrm{t\bar{t}} $ decay channel using the mass observables $ {M}_{b\ell} $, $ {M}_{T2} $, and $ {M}_{b\ell\nu} $ in $ pp $ collisions at $ \sqrt{s}= $ 8 TeV | PRD 96 (2017) 032002 | CMS-TOP-15-008 1704.06142 |
| 8 | CMS Collaboration | Measurement of the top quark mass with lepton+jets final states using $ pp $ collisions at $ \sqrt{s}= $ 13 TeV | EPJC 78 (2018) 891 | CMS-TOP-17-007 1805.01428 |
| 9 | CMS Collaboration | Measurement of the top quark mass in the all-jets final state at $ \sqrt{s} = $ 13 TeV and combination with the lepton+jets channel | EPJC 79 (2019) 313 | CMS-TOP-17-008 1812.10534 |
| 10 | S. Ferrario Ravasio, T. Je\vzo, P. Nason, and C. Oleari | A theoretical study of top-mass measurements at the LHC using NLO+PS generators of increasing accuracy | EPJC 78 (2018) 458 | 1801.03944 |
| 11 | A. H. Hoang, S. Platzer, and D. Samitz | On the cutoff dependence of the quark mass parameter in angular ordered parton showers | JHEP 10 (2018) 200 | 1807.06617 |
| 12 | CMS Collaboration | Measurement of the $ \mathrm{t\bar{t}} $ production cross section in the e$ \mu $ channel in proton-proton collisions at $ \sqrt{s} = $ 7 and 8 TeV | JHEP 08 (2016) 029 | CMS-TOP-13-004 1603.02303 |
| 13 | CMS Collaboration | Measurement of the $ \mathrm{t\bar{t}} $ production cross section, the top quark mass, and the strong coupling constant using dilepton events in $ pp $ collisions at $ \sqrt{s} = $ 13 TeV | EPJC 79 (2019) 368 | CMS-TOP-17-001 1812.10505 |
| 14 | ATLAS Collaboration | Measurement of lepton differential distributions and the top quark mass in $ \mathrm{t\bar{t}} $ production in $ pp $ collisions at $ \sqrt{s}= $ 8 TeV with the ATLAS detector | EPJC 77 (2017) 804 | 1709.09407 |
| 15 | CMS Collaboration | Measurement of $ \mathrm{t\bar{t}} $ normalised multi-differential cross sections in $ pp $ collisions at $ \sqrt{s}= $ 13 TeV, and simultaneous determination of the strong coupling strength, top quark pole mass, and parton distribution functions | Submitted to: Eur. Phys. J | CMS-TOP-18-004 1904.05237 |
| 16 | N. Kidonakis | NNNLO soft-gluon corrections for the top-antitop pair production cross section | PRD 90 (2014) 014006 | 1405.7046 |
| 17 | M. Guzzi, K. Lipka, and S.-O. Moch | Top-quark pair production at hadron colliders: differential cross section and phenomenological applications with DiffTop | JHEP 01 (2015) 082 | 1406.0386 |
| 18 | C. Muselli et al. | Top quark pair production beyond NNLO | JHEP 08 (2015) 076 | 1505.02006 |
| 19 | S. Fleming, A. H. Hoang, S. Mantry, and I. W. Stewart | Jets from massive unstable particles: Top-mass determination | PRD 77 (2008) 074010 | hep-ph/0703207 |
| 20 | S. Fleming, A. H. Hoang, S. Mantry, and I. W. Stewart | Top jets in the peak region: Factorization analysis with next-to-leading-log resummation | PRD 77 (2008) 114003 | 0711.2079 |
| 21 | A. Jain, I. Scimemi, and I. W. Stewart | Two-loop jet-function and jet-mass for top quarks | PRD 77 (2008) 094008 | 0801.0743 |
| 22 | A. H. Hoang, A. Pathak, P. Pietrulewicz, and I. W. Stewart | Hard matching for boosted tops at two loops | JHEP 12 (2015) 059 | 1508.04137 |
| 23 | M. Butenschoen et al. | Top quark mass calibration for Monte Carlo event generators | PRL 117 (2016) 232001 | 1608.01318 |
| 24 | A. H. Hoang, S. Mantry, A. Pathak, and I. W. Stewart | Extracting a short distance top mass with light grooming | 1708.02586 | |
| 25 | A. H. Hoang, C. Lepenik, and M. Stahlhofen | Two-loop massive quark jet functions in SCET | 1904.12839 | |
| 26 | C. W. Bauer, S. Fleming, and M. E. Luke | Summing Sudakov logarithms in $ {B} \to {X}_s + \gamma $ in effective field theory | PRD 63 (2000) 014006 | hep-ph/0005275 |
| 27 | C. W. Bauer, S. Fleming, D. Pirjol, and I. W. Stewart | An effective field theory for collinear and soft gluons: Heavy to light decays | PRD 63 (2001) 114020 | hep-ph/0011336 |
| 28 | C. W. Bauer and I. W. Stewart | Invariant operators in collinear effective theory | PLB 516 (2001) 134 | hep-ph/0107001 |
| 29 | C. W. Bauer, D. Pirjol, and I. W. Stewart | Soft-collinear factorization in effective field theory | PRD 65 (2002) 054022 | hep-ph/0109045 |
| 30 | CMS Collaboration | Measurement of the jet mass in highly boosted $ \mathrm{t\bar{t}} $ events from $ pp $ collisions at $ \sqrt{s}= $ 8 TeV | EPJC 77 (2017) 467 | CMS-TOP-15-015 1703.06330 |
| 31 | I. W. Stewart et al. | XCone: N-jettiness as an exclusive cone jet algorithm | JHEP 11 (2015) 072 | 1508.01516 |
| 32 | CMS Collaboration | CMS luminosity measurements for the 2016 data taking period | CMS-PAS-LUM-17-001 | CMS-PAS-LUM-17-001 |
| 33 | CMS Collaboration | The CMS trigger system | JINST 12 (2017) P01020 | CMS-TRG-12-001 1609.02366 |
| 34 | P. Nason | A new method for combining NLO QCD with shower Monte Carlo algorithms | JHEP 11 (2004) 040 | hep-ph/0409146 |
| 35 | S. Frixione, P. Nason, and C. Oleari | Matching NLO QCD computations with parton shower simulations: the POWHEG method | JHEP 11 (2007) 070 | 0709.2092 |
| 36 | S. Alioli, P. Nason, C. Oleari, and E. Re | A general framework for implementing NLO calculations in shower Monte Carlo programs: the POWHEG BOX | JHEP 06 (2010) 043 | 1002.2581 |
| 37 | S. Frixione, P. Nason, and G. Ridolfi | A positive-weight next-to-leading-order Monte Carlo for heavy flavour hadroproduction | JHEP 09 (2007) 126 | 0707.3088 |
| 38 | S. Alioli, P. Nason, C. Oleari, and E. Re | NLO single-top production matched with shower in POWHEG: $ s $- and $ t $-channel contributions | JHEP 09 (2009) 111 | 0907.4076 |
| 39 | E. Re | Single-top Wt-channel production matched with parton showers using the POWHEG method | EPJC 71 (2011) 1547 | 1009.2450 |
| 40 | J. Alwall et al. | The automated computation of tree-level and next-to-leading order differential cross sections, and their matching to parton shower simulations | JHEP 07 (2014) 079 | 1405.0301 |
| 41 | S. Frixione and B. R. Webber | Matching NLO QCD computations and parton shower simulations | JHEP 06 (2002) 029 | hep-ph/0204244 |
| 42 | P. Artoisenet, R. Frederix, O. Mattelaer, and R. Rietkerk | Automatic spin-entangled decays of heavy resonances in Monte Carlo simulations | JHEP 03 (2013) 015 | 1212.3460 |
| 43 | T. Sj$\texto$strand et al. | An introduction to PYTHIA 8.2 | CPC 191 (2015) 159 | 1410.3012 |
| 44 | R. Frederix and S. Frixione | Merging meets matching in MC@NLO | JHEP 12 (2012) 061 | 1209.6215 |
| 45 | J. Alwall et al. | Comparative study of various algorithms for the merging of parton showers and matrix elements in hadronic collisions | EPJC 53 (2008) 473 | 0706.2569 |
| 46 | NNPDF Collaboration | Parton distributions for the LHC Run II | JHEP 04 (2015) 040 | 1410.8849 |
| 47 | CMS Collaboration | Investigations of the impact of the parton shower tuning in PYTHIA 8 in the modelling of $ \mathrm{t\overline{t}} $ at $ \sqrt{s}= $ 8 and 13 TeV | CMS-PAS-TOP-16-021 | CMS-PAS-TOP-16-021 |
| 48 | CMS Collaboration | Event generator tunes obtained from underlying event and multiparton scattering measurements | EPJC 76 (2016) 155 | CMS-GEN-14-001 1512.00815 |
| 49 | P. Skands, S. Carrazza, and J. Rojo | Tuning PYTHIA 8.1: the Monash 2013 Tune | EPJC 74 (2014) 3024 | 1404.5630 |
| 50 | GEANT4 Collaboration | GEANT4--a simulation toolkit | NIMA 506 (2003) 250 | |
| 51 | J. Allison et al. | GEANT4 developments and applications | IEEE Trans. Nucl. Sci. 53 (2006) 270 | |
| 52 | CMS Collaboration | Particle-flow reconstruction and global event description with the CMS detector | JINST 12 (2017) P10003 | CMS-PRF-14-001 1706.04965 |
| 53 | M. Cacciari, G. P. Salam, and G. Soyez | The anti-$ k_t $ jet clustering algorithm | JHEP 04 (2008) 063 | 0802.1189 |
| 54 | M. Cacciari, G. P. Salam, and G. Soyez | Fastjet user manual | EPJC72 (2012) 1896 | 1111.6097 |
| 55 | CMS Collaboration | Identification of heavy-flavour jets with the CMS detector in $ pp $ collisions at 13 TeV | JINST 13 (2018) P05011 | CMS-BTV-16-002 1712.07158 |
| 56 | J. Thaler and T. F. Wilkason | Resolving boosted jets with XCone | JHEP 12 (2015) 051 | 1508.01518 |
| 57 | CMS Collaboration | Performance of the CMS muon detector and muon reconstruction with proton-proton collisions at $ \sqrt{s}= $ 13 TeV | JINST 13 (2018) P06015 | CMS-MUO-16-001 1804.04528 |
| 58 | CMS Collaboration | Search for resonant $ \mathrm{t\bar{t}} $ production in proton-proton collisions at $ \sqrt{s}= $ 13 TeV | JHEP 04 (2019) 031 | CMS-B2G-17-017 1810.05905 |
| 59 | CMS Collaboration | Search for a heavy resonance decaying to a top quark and a vector-like top quark in the lepton+jets final state in $ pp $ collisions at $ \sqrt{s} = $ 13 TeV | EPJC 79 (2019) 208 | CMS-B2G-17-015 1812.06489 |
| 60 | CMS Collaboration | Jet energy scale and resolution in the CMS experiment in $ pp $ collisions at 8 TeV | JINST 12 (2017) P02014 | CMS-JME-13-004 1607.03663 |
| 61 | CMS Collaboration | Performance of missing transverse momentum reconstruction in proton-proton collisions at $ \sqrt{s} = $ 13 TeV using the CMS detector | Submitted to: JINST | CMS-JME-17-001 1903.06078 |
| 62 | S. Schmitt | TUnfold: An algorithm for correcting migration effects in high energy physics | JINST 7 (2012) T10003 | 1205.6201 |
| 63 | S. Schmitt | Data unfolding methods in high energy physics | in 12th Conference on Quark Confinement and the Hadron Spectrum (Confinement XII) Thessaloniki, Greece 2016 | 1611.01927 |
| 64 | CMS Collaboration | Measurement of the inelastic proton-proton cross section at $ \sqrt{s}= $ 13 TeV | JHEP 07 (2018) 161 | CMS-FSQ-15-005 1802.02613 |
| 65 | CMS Collaboration | Measurement of the $ \mathrm{t\bar{t}} $ production cross section using events in the $ \Pe \mu $ final state in $ pp $ collisions at $ \sqrt{s} = $ 13 TeV | EPJC 77 (2017) 172 | CMS-TOP-16-005 1611.04040 |
| 66 | CMS Collaboration | Measurement of inclusive $ \mathrm{W} $ and $ \mathrm{Z} $ boson production cross sections in $ pp $ collisions at $ \sqrt{s} = $ 8 TeV | PRL 112 (2014) 191802 | CMS-SMP-12-011 1402.0923 |
| 67 | CMS Collaboration | Cross section measurement of $ t $-channel single top quark production in $ pp $ collisions at $ \sqrt{s} = $ 13 TeV | PLB 772 (2017) 752 | CMS-TOP-16-003 1610.00678 |
| 68 | N. Kidonakis | NNLL threshold resummation for top-pair and single-top production | Phys. Part. Nucl. 45 (2014) 714 | 1210.7813 |
| 69 | T. Gehrmann et al. | $ {\mathrm{W}}^+{\mathrm{W}}^- $ production at hadron colliders in next-to-next-to-leading order QCD | PRL 113 (2014) 212001 | 1408.5243 |
| 70 | CMS Collaboration | Measurement of the $ \mathrm{W}\mathrm{Z} $ production cross section in $ pp $ collisions at $ \sqrt(s) = $ 13 TeV | PLB 766 (2017) 268 | CMS-SMP-16-002 1607.06943 |
| 71 | S. Argyropoulos and T. Sjostrand | Effects of color reconnection on $ \mathrm{t\bar{t}} $ final states at the LHC | JHEP 11 (2014) 043 | 1407.6653 |
| 72 | J. R. Christiansen and P. Z. Skands | String formation beyond leading colour | JHEP 08 (2015) 003 | 1505.01681 |
| 73 | ATLAS Collaboration | Measurement of the differential cross-section of highly boosted top quarks as a function of their transverse momentum in $ \sqrt{s} = $ 8 TeV proton-proton collisions using the ATLAS detector | PRD 93 (2016) 032009 | 1510.03818 |
| 74 | ATLAS Collaboration | Measurements of $ \mathrm{t\bar{t}} $ differential cross-sections of highly boosted top quarks decaying to all-hadronic final states in $ pp $ collisions at $ \sqrt{s}= $ 13 TeV using the ATLAS detector | PRD 98 (2018) 012003 | 1801.02052 |
| 75 | CMS Collaboration | Measurement of the integrated and differential $ \mathrm{t\bar{t}} $ production cross sections for high-$ p_\mathrm{T} $ top quarks in $ pp $ collisions at $ \sqrt{s}= $ 8 TeV | PRD 94 (2016) 072002 | CMS-TOP-14-012 1605.00116 |
| 76 | CMS Collaboration | Measurement of differential cross sections for the production of top quark pairs and of additional jets in lepton+jets events from $ pp $ collisions at $ \sqrt{s} = $ 13 TeV | PRD 97 (2018) 112003 | CMS-TOP-17-002 1803.08856 |
|
|
Compact Muon Solenoid LHC, CERN |
|

|

|

|

|

|