

Compact Muon Solenoid
LHC, CERN
| CMS-PAS-TOP-18-005 | ||
| Measurement of the top quark pair production cross section in the dilepton channel including a $\tau$ lepton in proton-proton collisions at $\sqrt{s}= $ 13 TeV | ||
| CMS Collaboration | ||
| August 2019 | ||
| Abstract: The cross section of the top quark pair production process $\mathrm{t\overline{t}}\rightarrow (\ell\nu_{\ell})(\tau_{\mathrm{h}}\nu_{\tau})\mathrm{b\overline{b}}$ is measured, where the $\tau_{\mathrm{h}}$ refers to the hadronic decays of the $\tau$ lepton, and $\ell=$ e, $\mu$. The data sample corresponds to an integrated luminosity of 35.9 fb$^{-1}$ and was collected in 2016 by the CMS detector in proton-proton collisions at $\sqrt{s}= $ 13 TeV. The measured cross section is $\sigma_{\mathrm{t\overline{t}}} = $ 781 $\pm$ 7 (stat) $\pm$ 62 (syst) $\pm$ 20 (lumi) pb. The ratio of the partial width $\Gamma(\mathrm{t}\rightarrow\tau\nu_{\tau}\mathrm{b})$ to the total width is measured to be 0.1050 $\pm$ 0.0009 (stat) $\pm$ 0.0071 (syst). | ||
|
Links:
CDS record (PDF) ;
CADI line (restricted) ;
These preliminary results are superseded in this paper, JHEP 02 (2020) 191. The superseded preliminary plots can be found here. |
||
| Figures | |
png pdf |
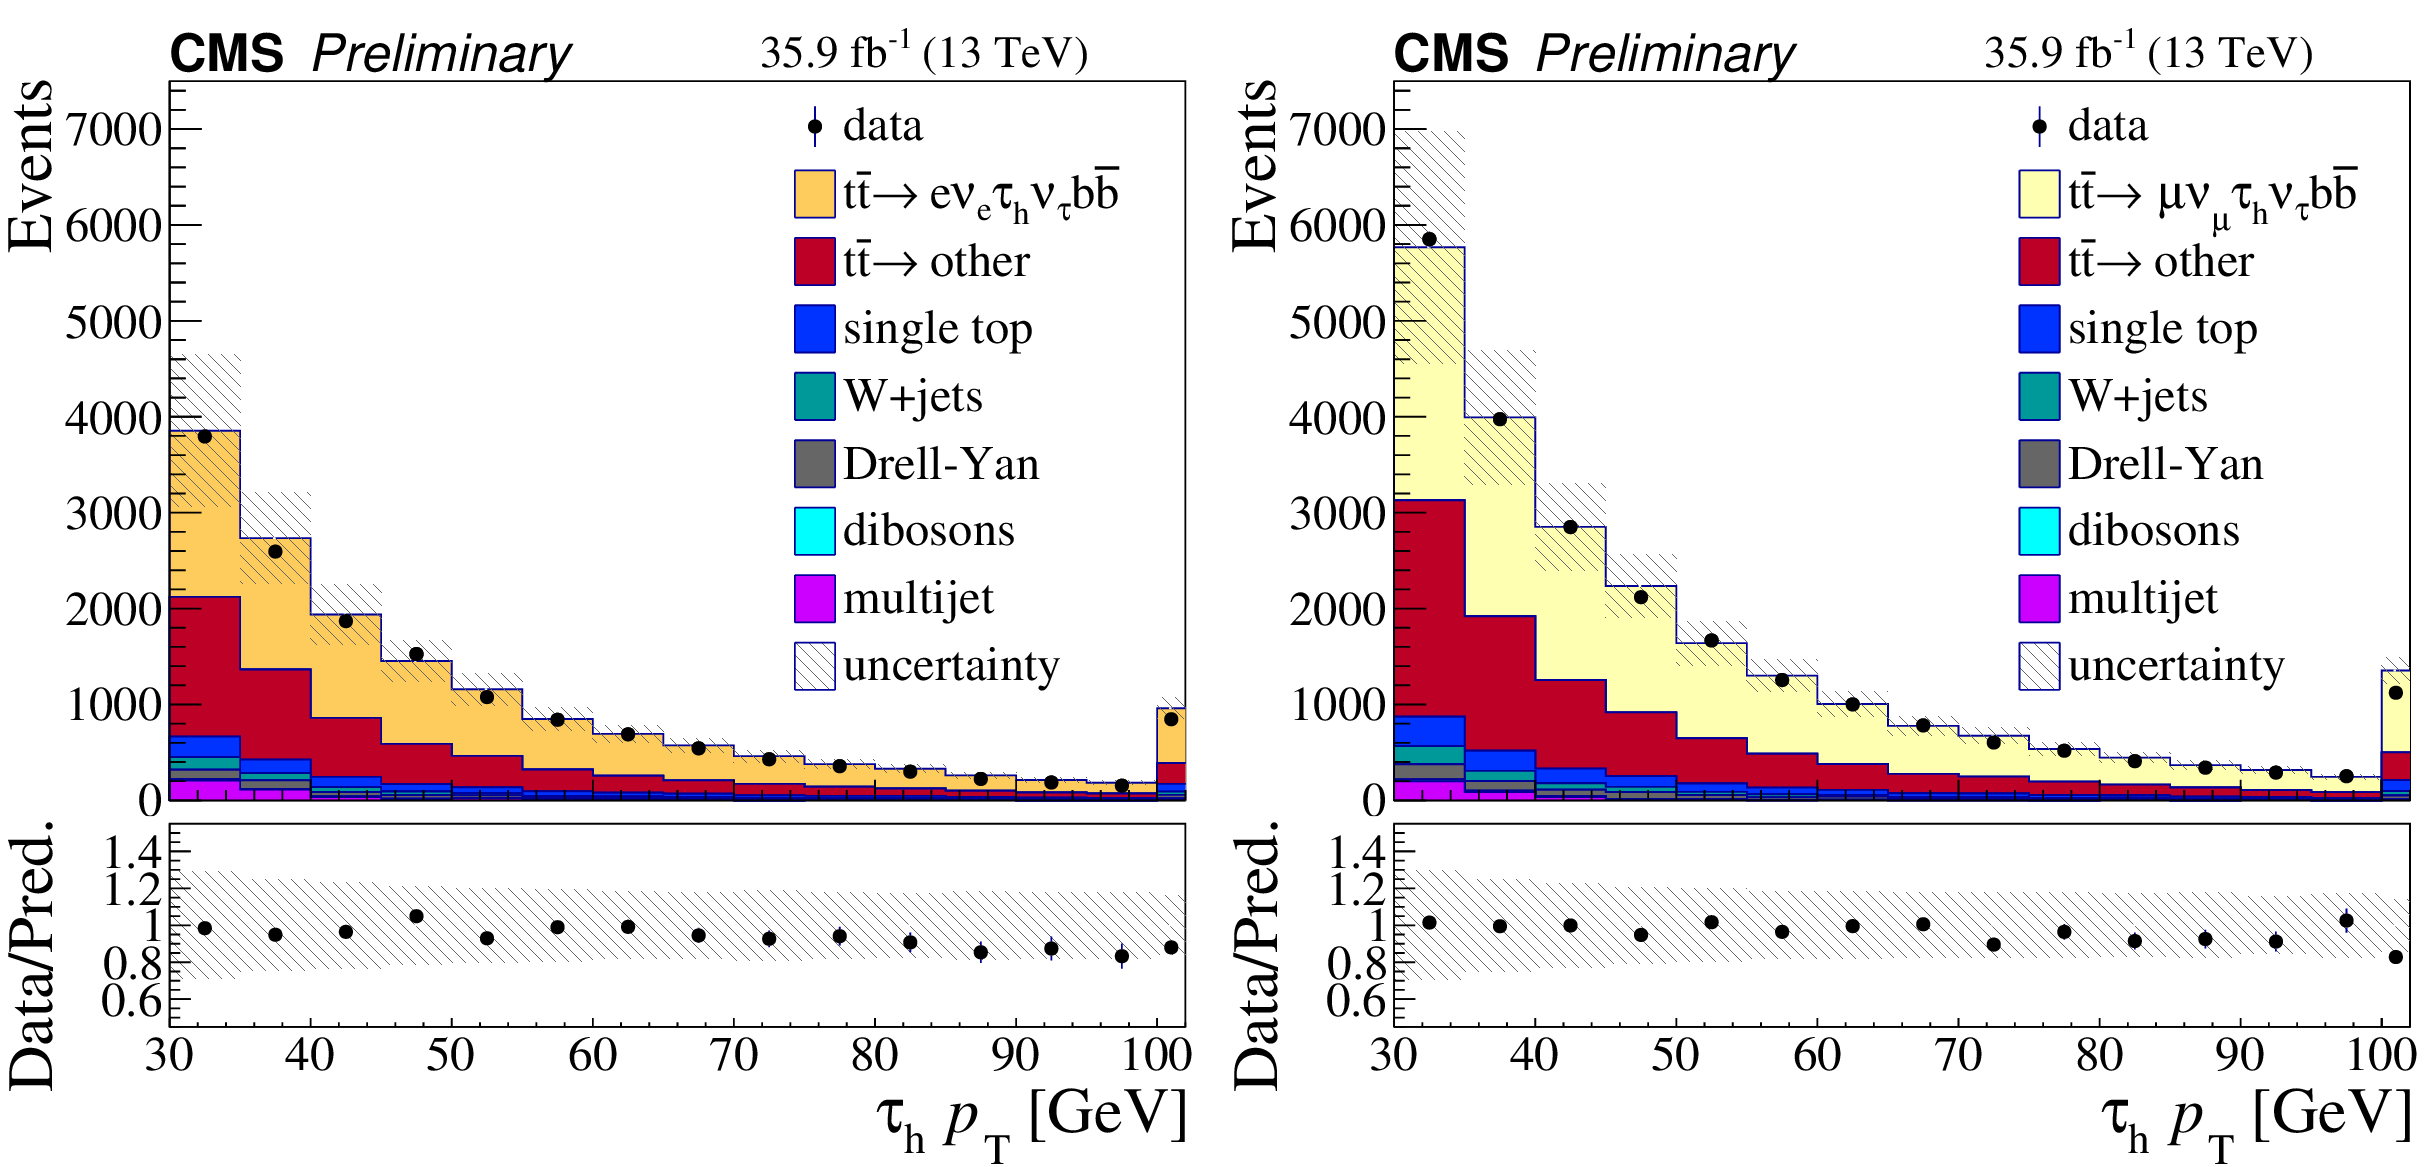
Figure 1:
The pre-fit $ {\tau _\mathrm {h}} $ ${p_{\mathrm {T}}}$ distributions for events of the $\mathrm{e} {\tau _\mathrm {h}} $ (left) and $\mu {\tau _\mathrm {h}} $ (right) final states. Distributions obtained from data (full circle) are compared with simulation (shaded area). The last bin includes the overflow of the $ {p_{\mathrm {T}}} $ distribution. The simulated contributions are normalized to the SM predicted values. The main processes are shown: the signal ($\mathrm{e} {\tau _\mathrm {h}} $ and $\mu {\tau _\mathrm {h}} $ final states), the other ${\mathrm{t} \mathrm{\bar{t}}}$ processes lumped together, single top quark (mainly $\mathrm{t} \mathrm{W} $), DY processes (mainly the $\tau _{\ell} {\tau _\mathrm {h}} $ decay), W+jets, dibosons and multijet. The ratio of the data to the total SM prediction is shown in the lower panel. The vertical bars on the data indicate the statistical uncertainties, the gray hatched band indicates the systematic uncertainties and the statistical uncertainties of all simulated samples. |
png pdf |
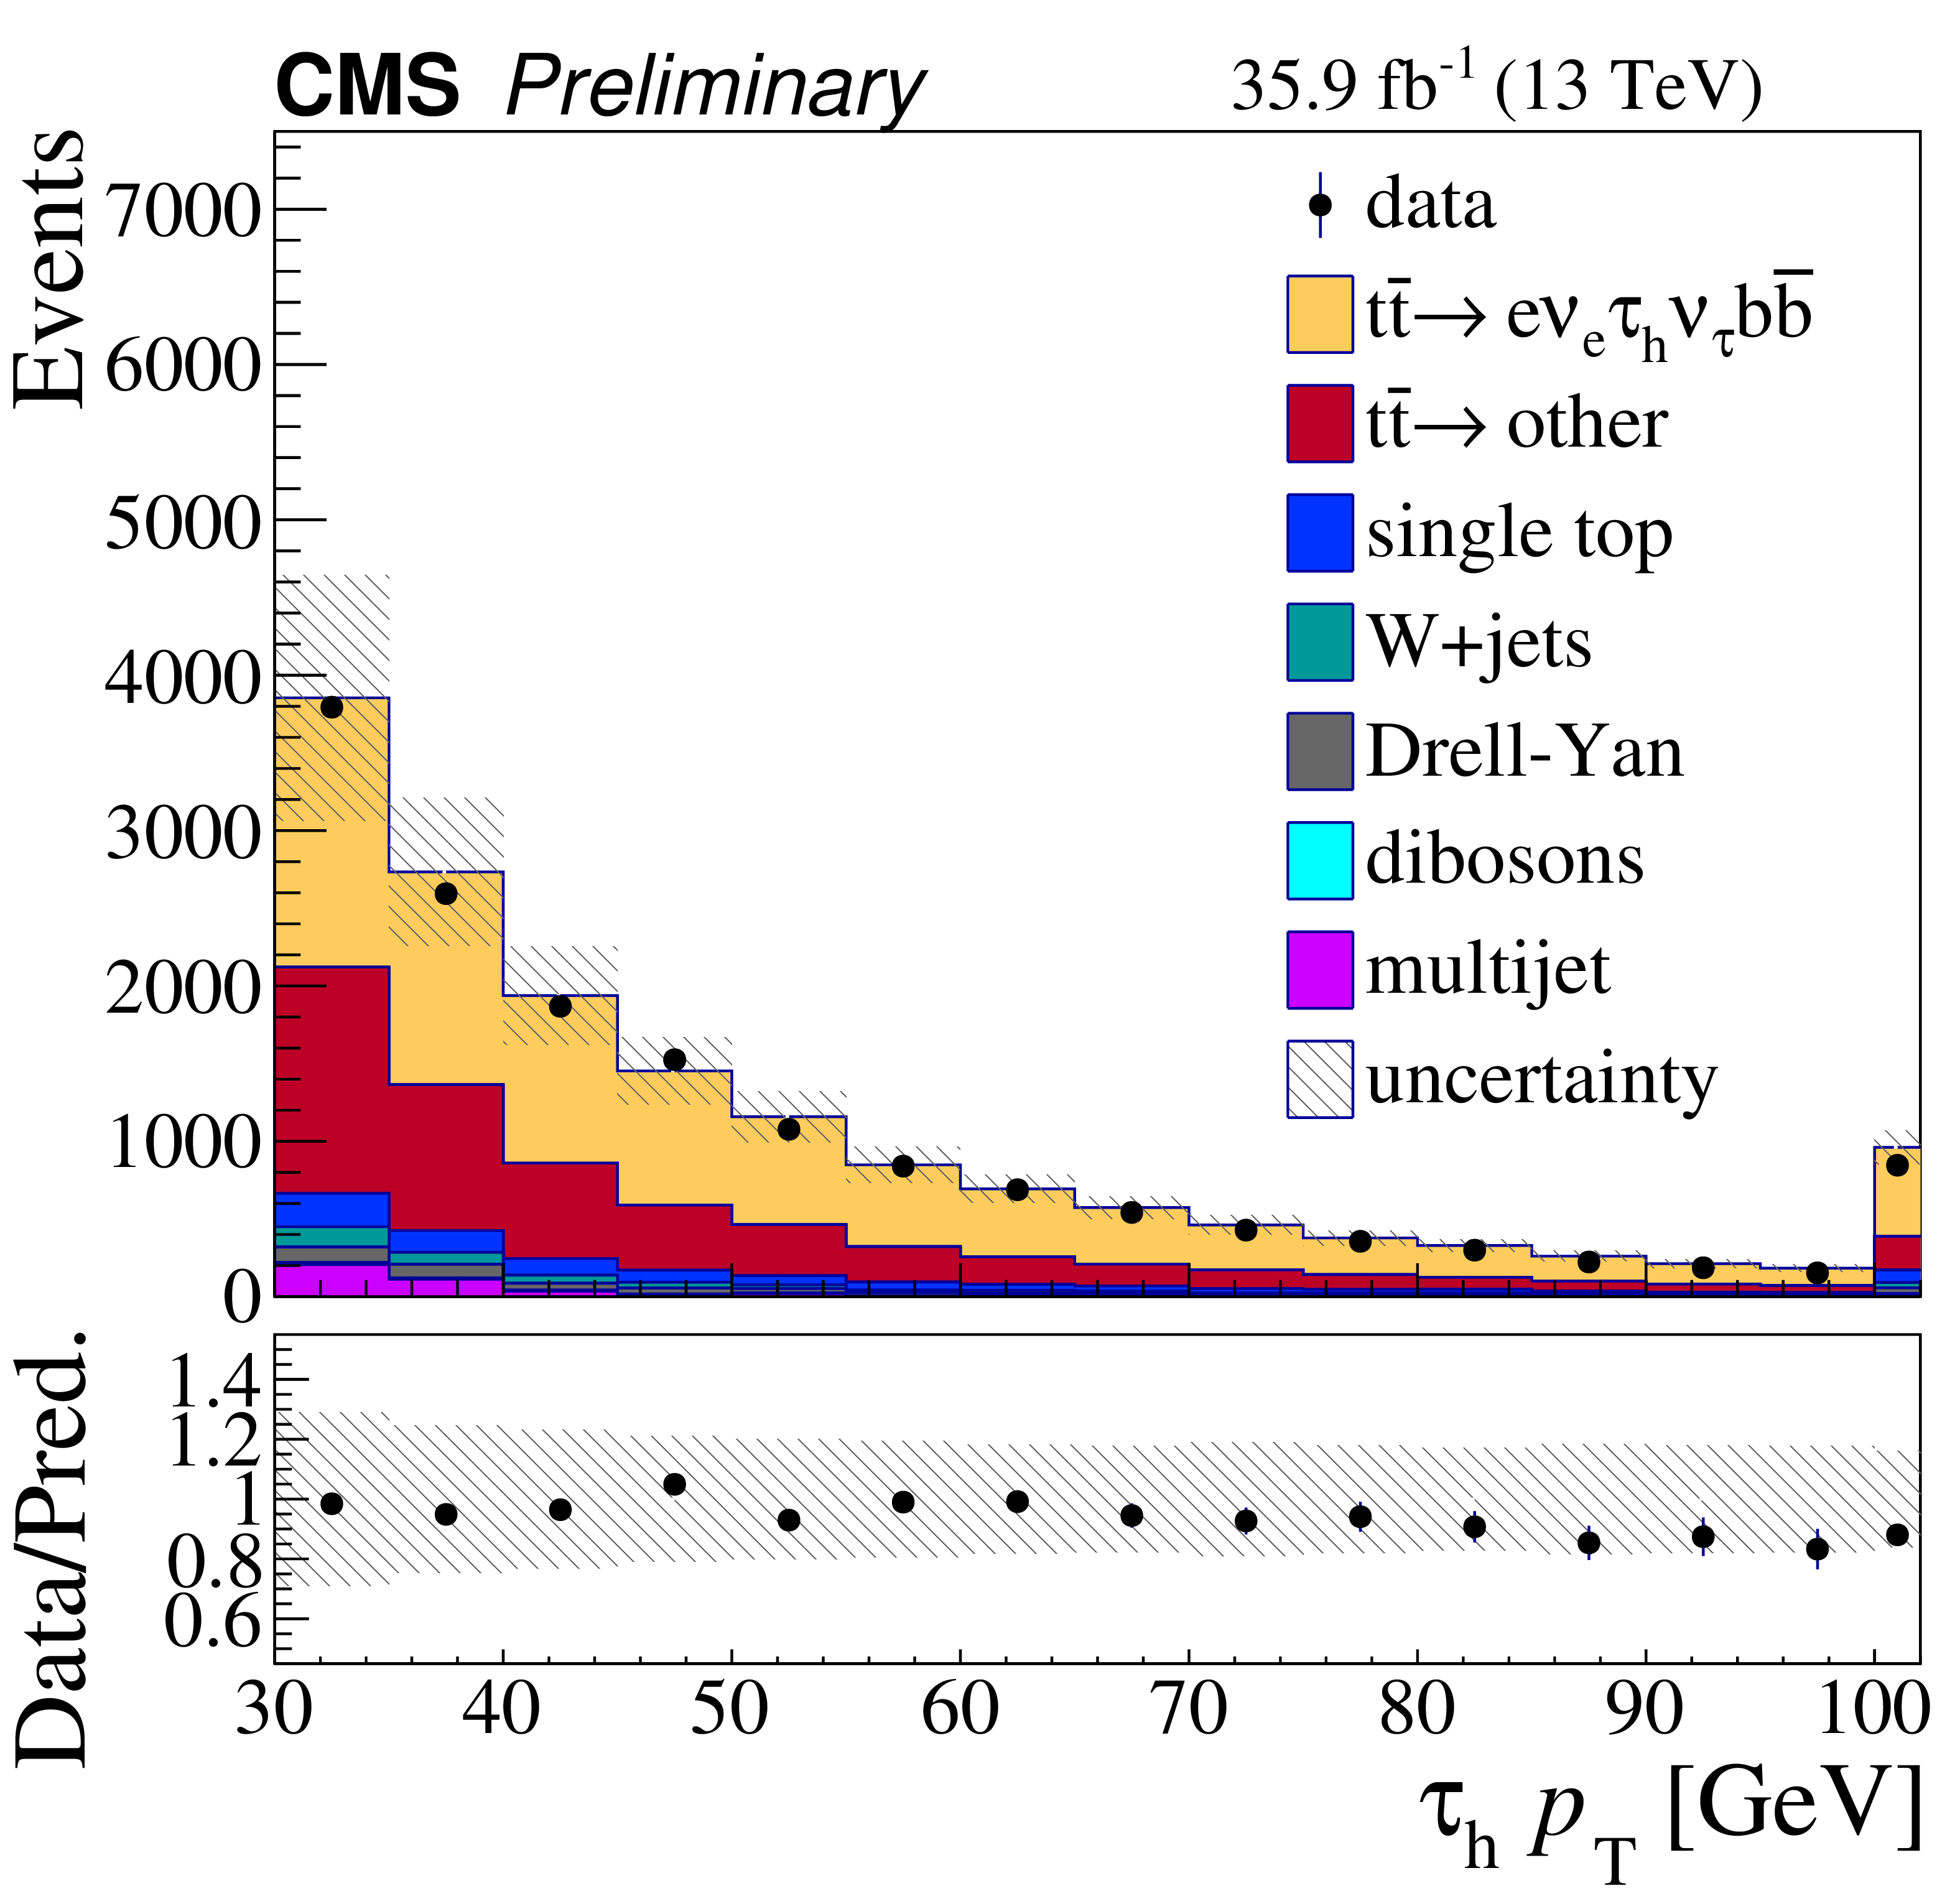
Figure 1-a:
The pre-fit $ {\tau _\mathrm {h}} $ ${p_{\mathrm {T}}}$ distributions for events of the $\mathrm{e} {\tau _\mathrm {h}} $ (left) and $\mu {\tau _\mathrm {h}} $ (right) final states. Distributions obtained from data (full circle) are compared with simulation (shaded area). The last bin includes the overflow of the $ {p_{\mathrm {T}}} $ distribution. The simulated contributions are normalized to the SM predicted values. The main processes are shown: the signal ($\mathrm{e} {\tau _\mathrm {h}} $ and $\mu {\tau _\mathrm {h}} $ final states), the other ${\mathrm{t} \mathrm{\bar{t}}}$ processes lumped together, single top quark (mainly $\mathrm{t} \mathrm{W} $), DY processes (mainly the $\tau _{\ell} {\tau _\mathrm {h}} $ decay), W+jets, dibosons and multijet. The ratio of the data to the total SM prediction is shown in the lower panel. The vertical bars on the data indicate the statistical uncertainties, the gray hatched band indicates the systematic uncertainties and the statistical uncertainties of all simulated samples. |
png pdf |
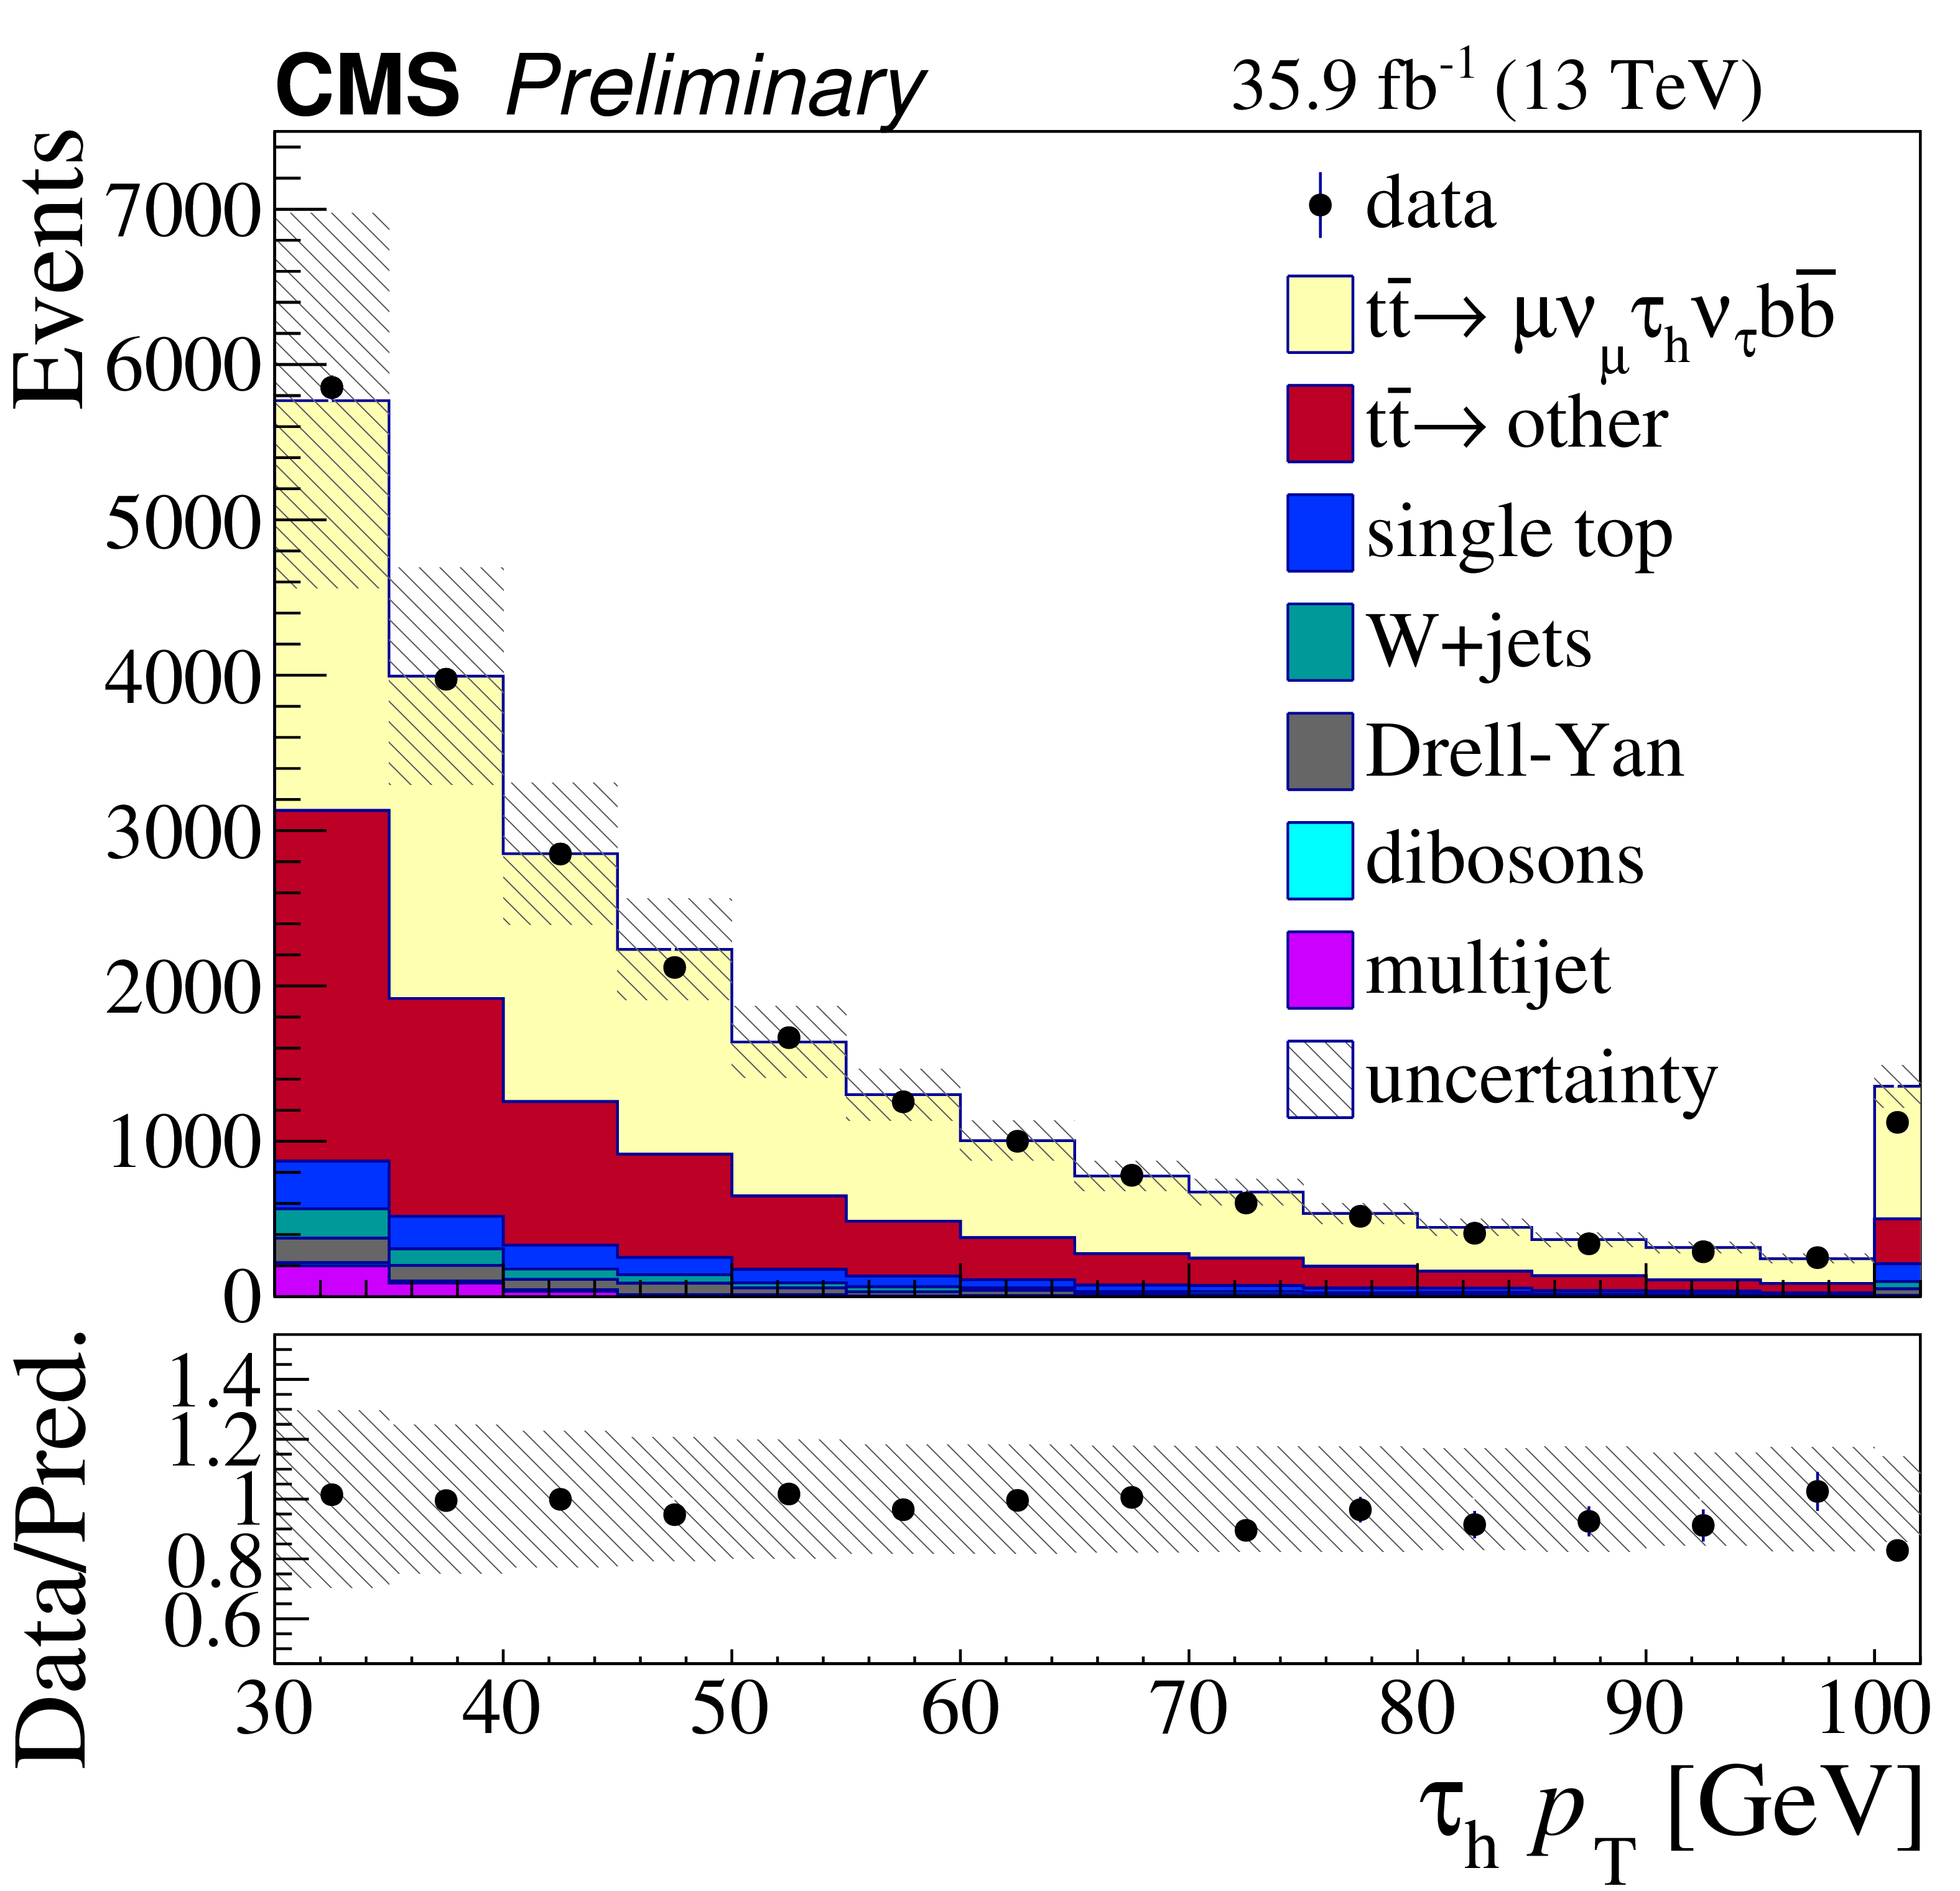
Figure 1-b:
The pre-fit $ {\tau _\mathrm {h}} $ ${p_{\mathrm {T}}}$ distributions for events of the $\mathrm{e} {\tau _\mathrm {h}} $ (left) and $\mu {\tau _\mathrm {h}} $ (right) final states. Distributions obtained from data (full circle) are compared with simulation (shaded area). The last bin includes the overflow of the $ {p_{\mathrm {T}}} $ distribution. The simulated contributions are normalized to the SM predicted values. The main processes are shown: the signal ($\mathrm{e} {\tau _\mathrm {h}} $ and $\mu {\tau _\mathrm {h}} $ final states), the other ${\mathrm{t} \mathrm{\bar{t}}}$ processes lumped together, single top quark (mainly $\mathrm{t} \mathrm{W} $), DY processes (mainly the $\tau _{\ell} {\tau _\mathrm {h}} $ decay), W+jets, dibosons and multijet. The ratio of the data to the total SM prediction is shown in the lower panel. The vertical bars on the data indicate the statistical uncertainties, the gray hatched band indicates the systematic uncertainties and the statistical uncertainties of all simulated samples. |
png pdf |
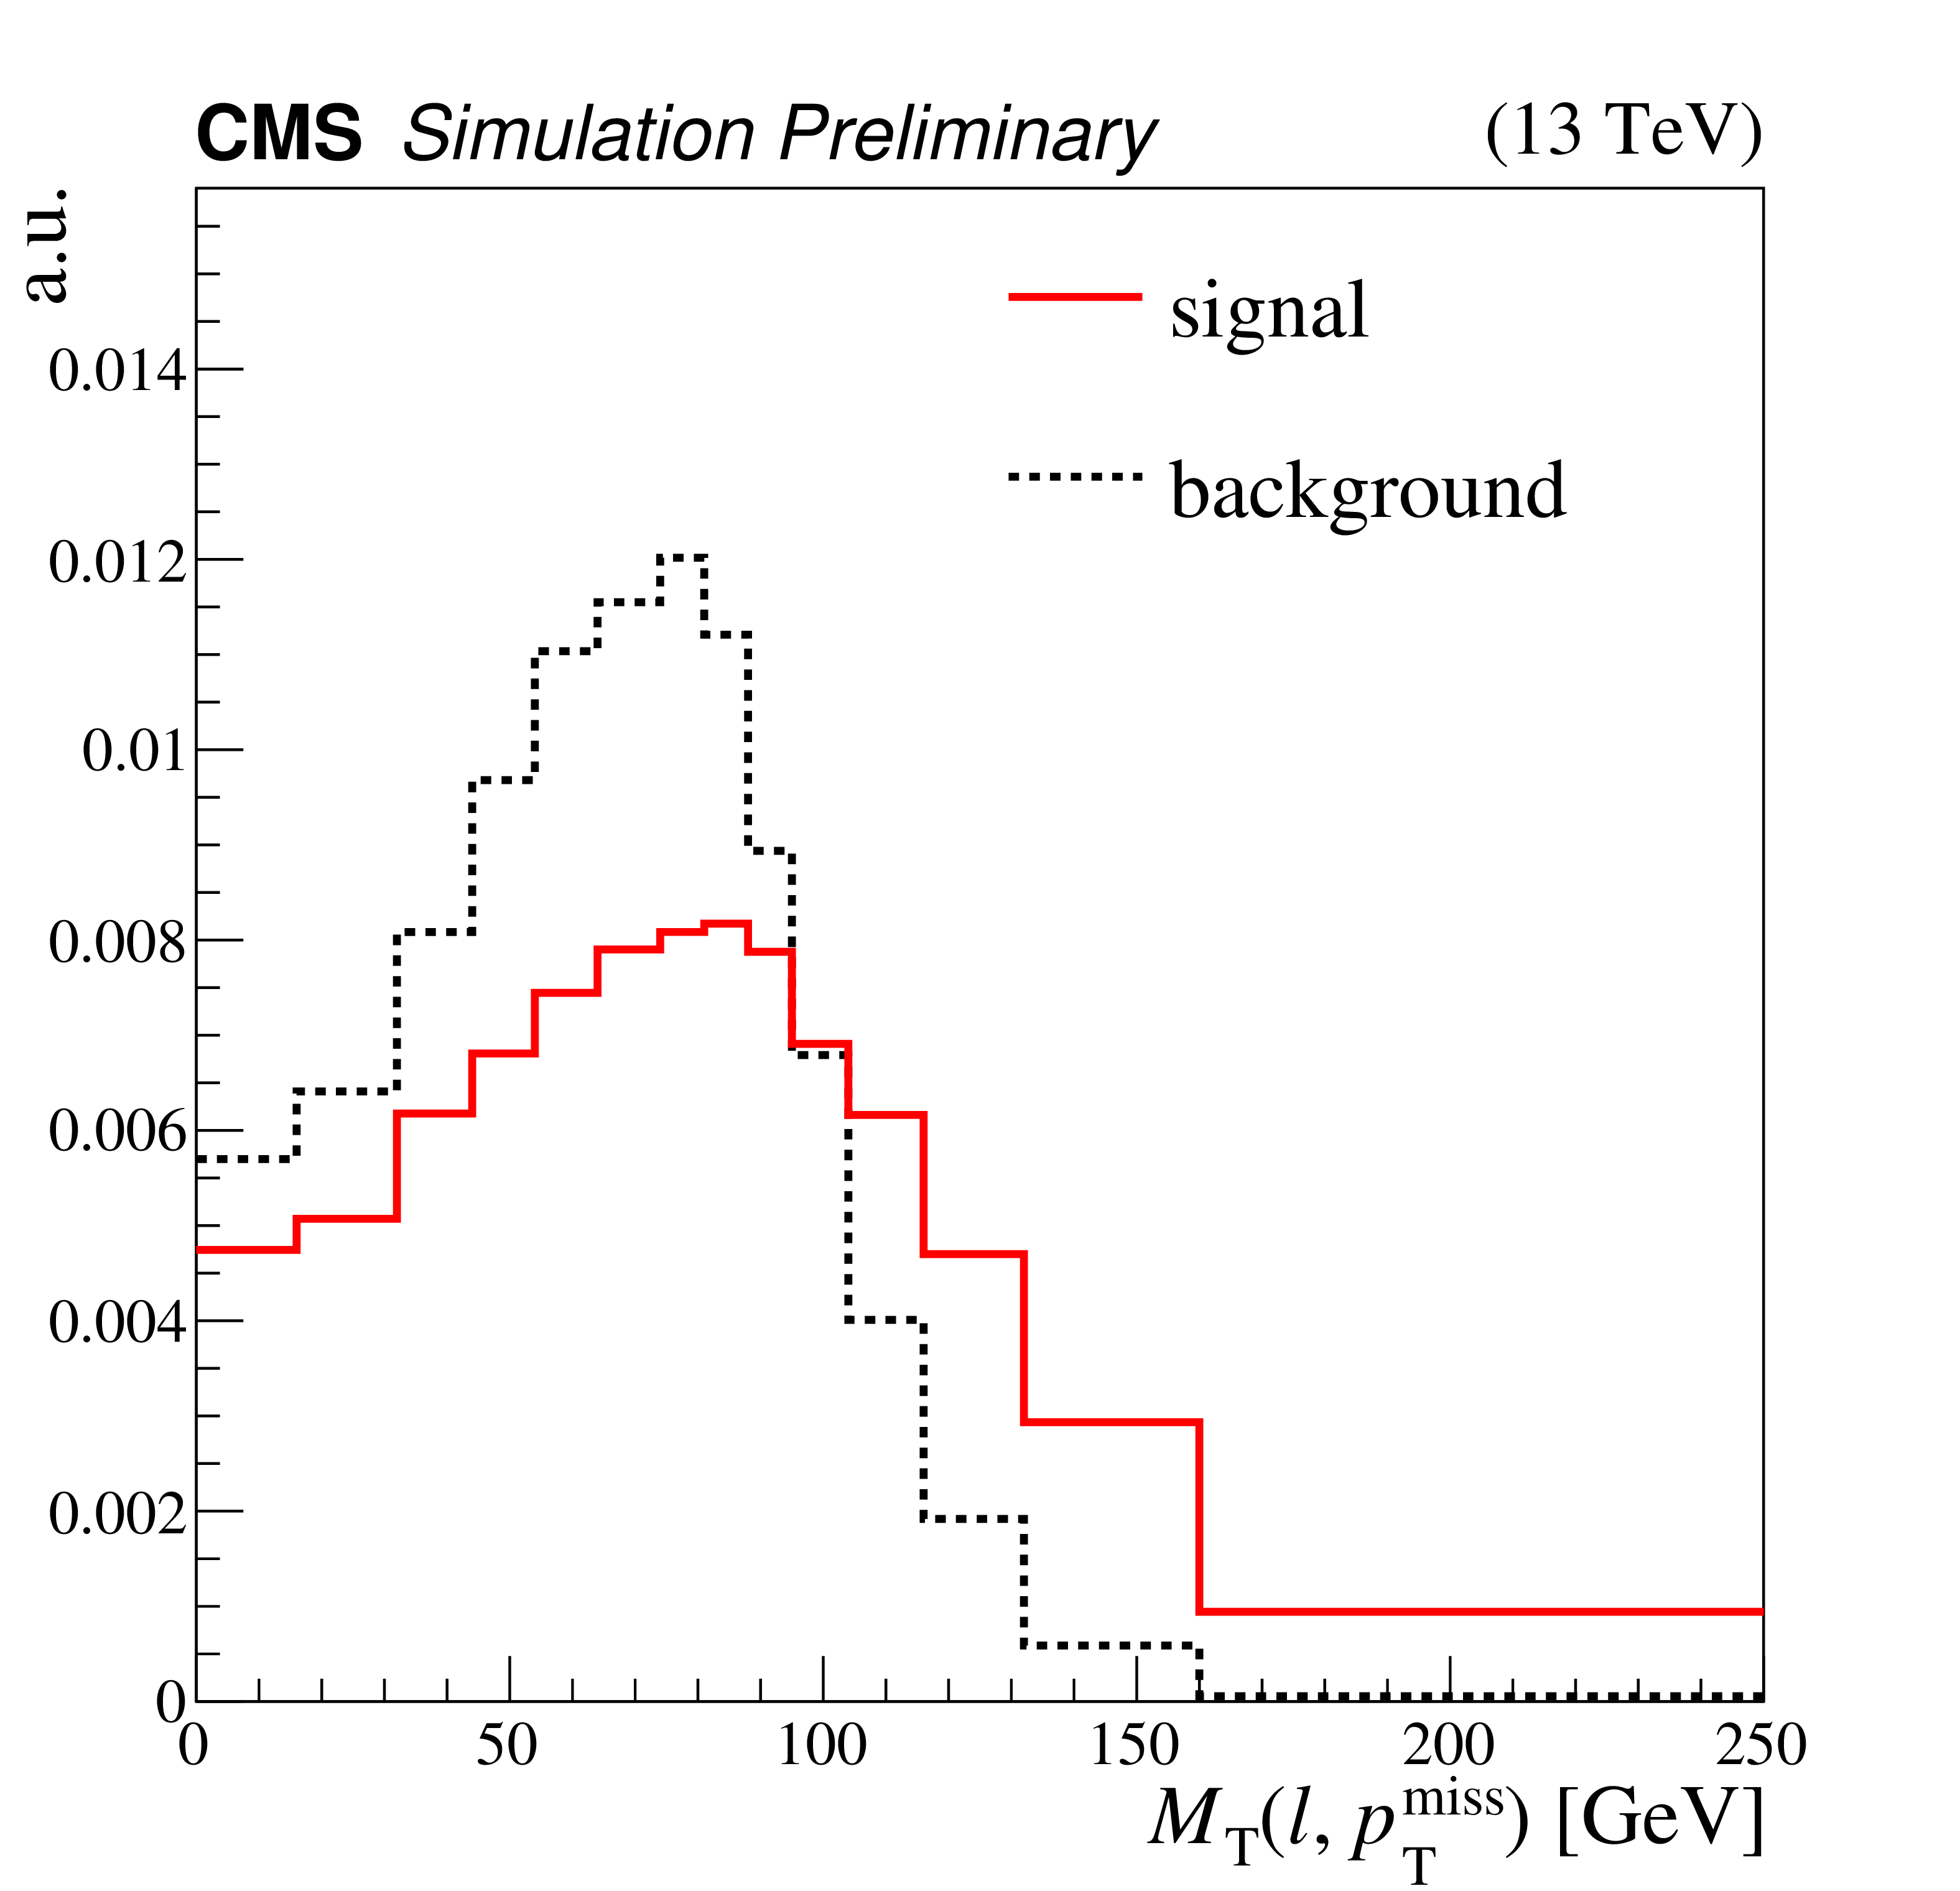
Figure 2:
Comparison of the shape of the distributions (normalized to unity) of the transverse mass between the lepton and ${{p_{\mathrm {T}}} ^\text {miss}}$, for the signal (${\mathrm{t} \mathrm{\bar{t}}} \rightarrow \ell \nu _{\ell} {\tau _\mathrm {h}} \nu _{\tau} \mathrm{b} \mathrm{\bar{b}} $) and the main background of misidentified $ {\tau _\mathrm {h}} $ (${\mathrm{t} \mathrm{\bar{t}}} \rightarrow \ell \nu _{\ell} \mathrm{q} \mathrm{\bar{q}} ' \mathrm{b} \mathrm{\bar{b}} $) in simulated ${\mathrm{t} \mathrm{\bar{t}}}$ events. |
png pdf |
Figure 3:
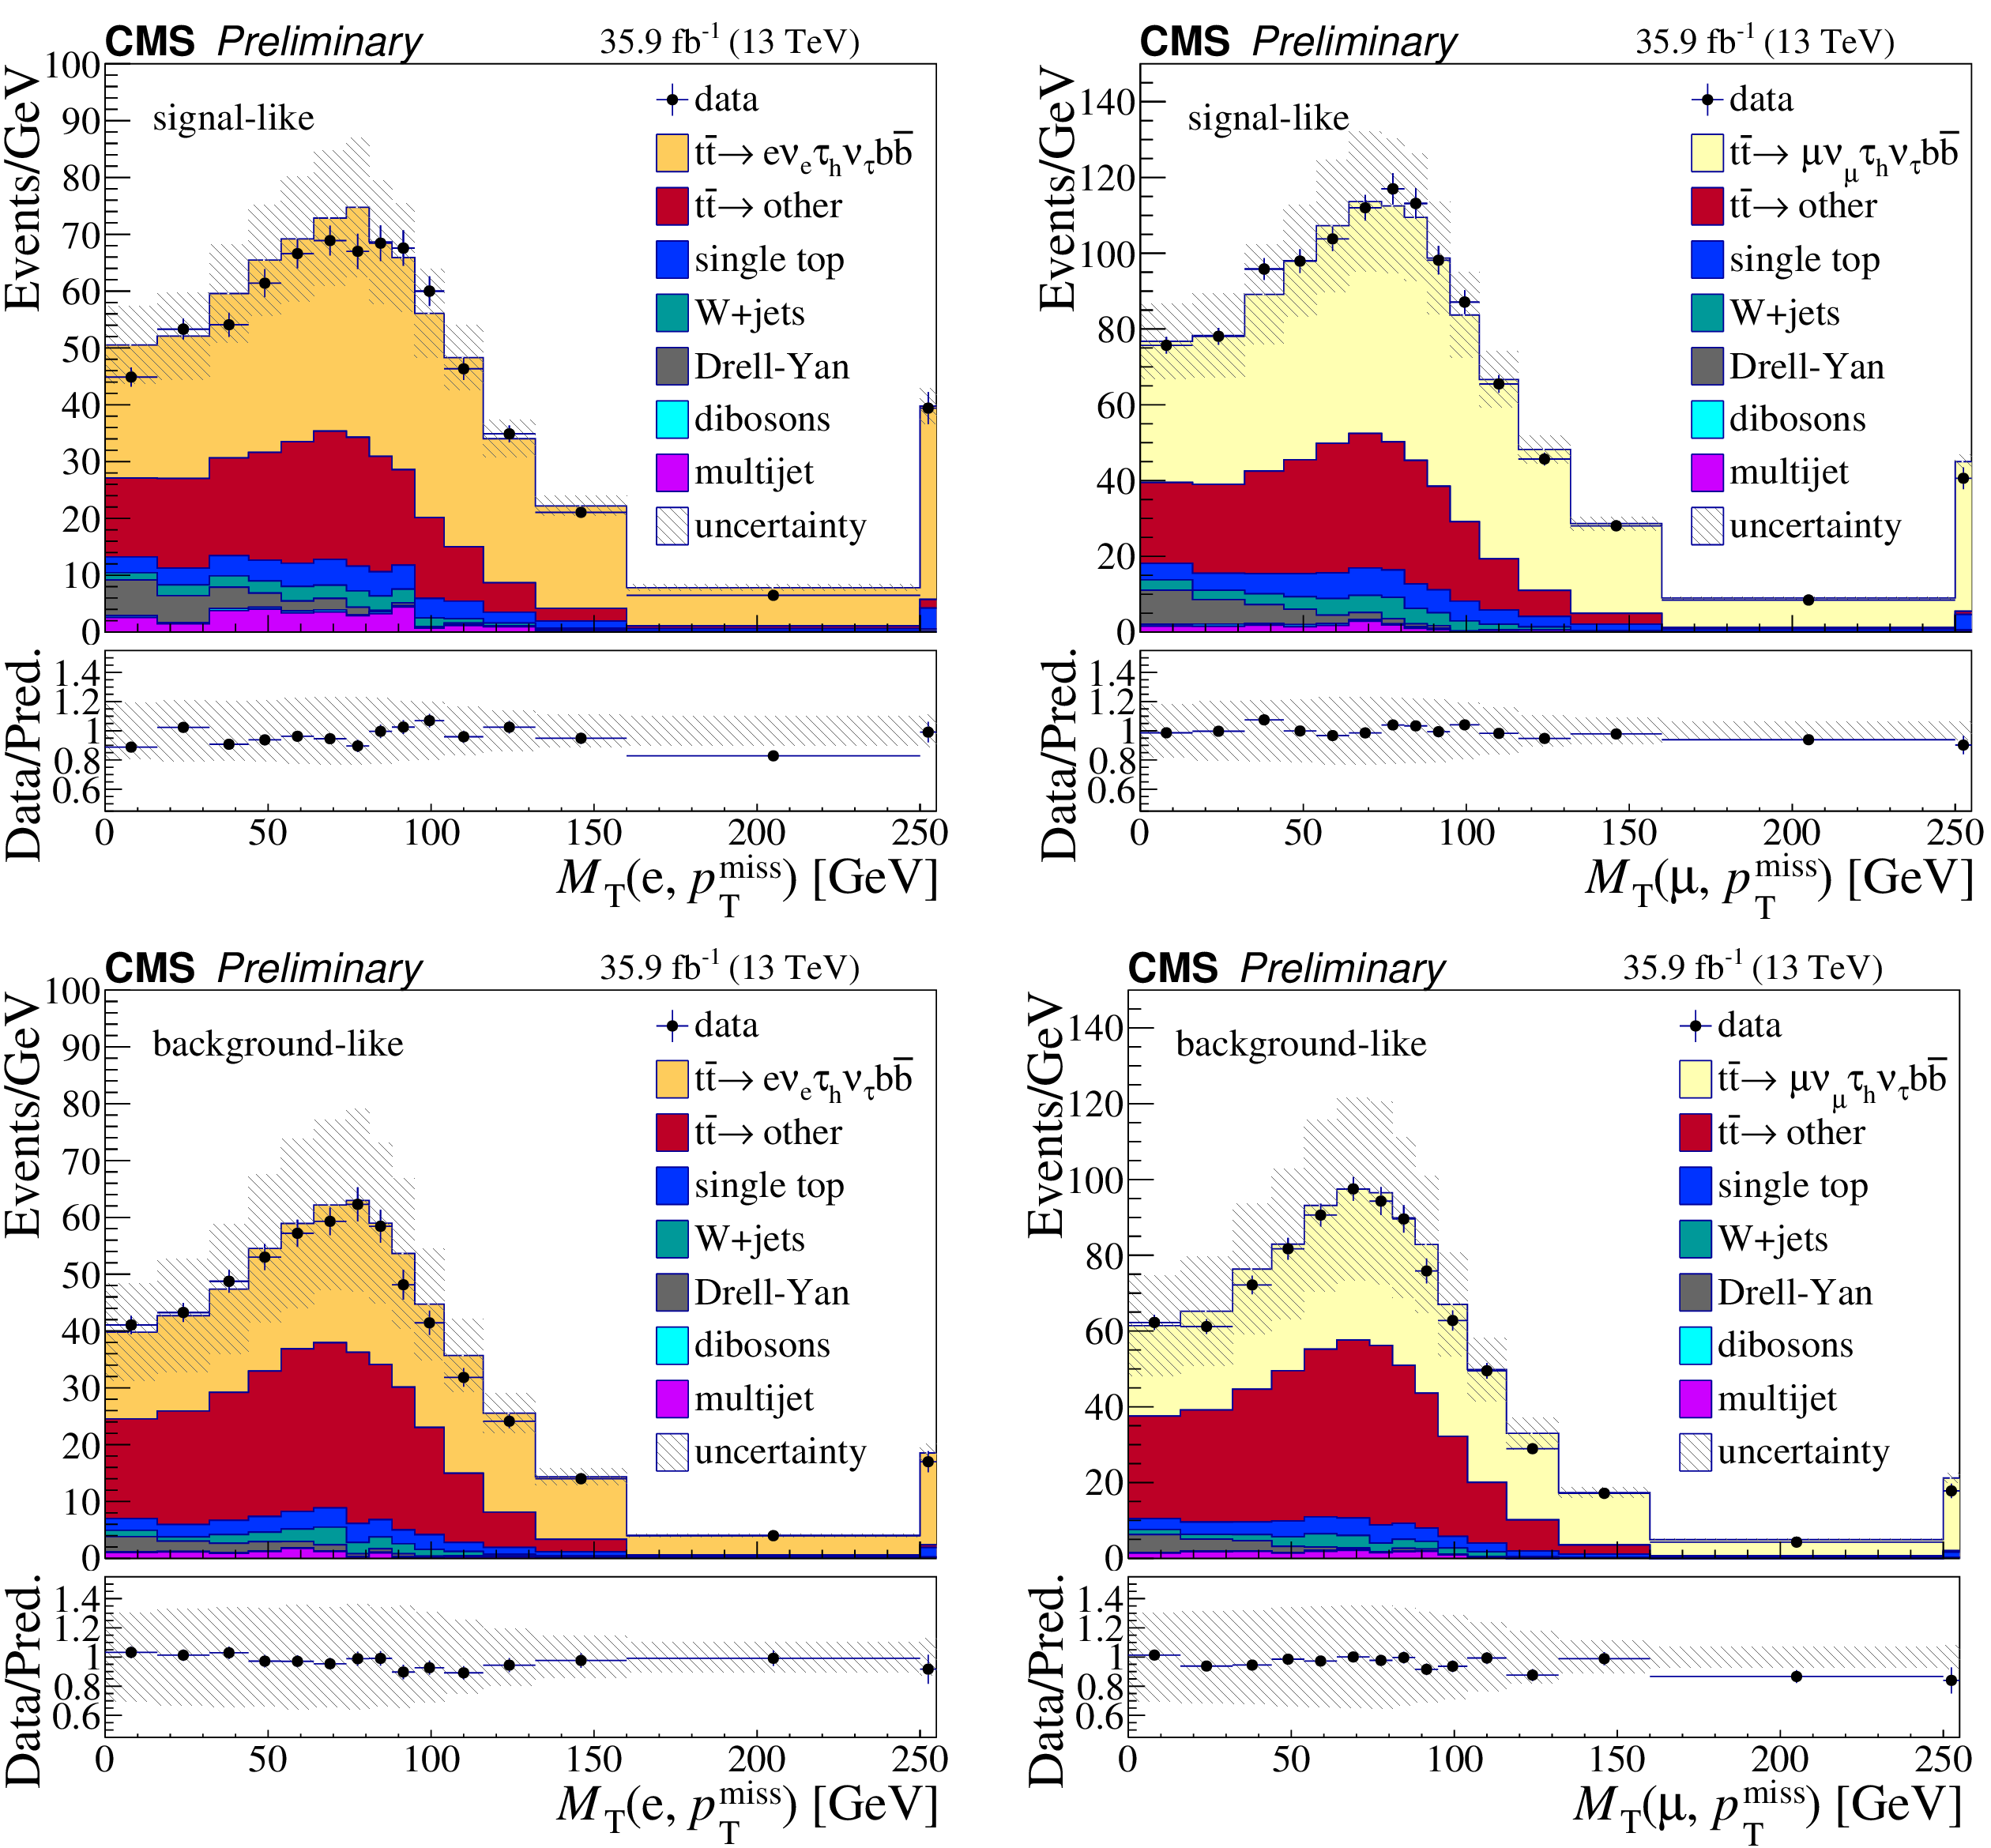
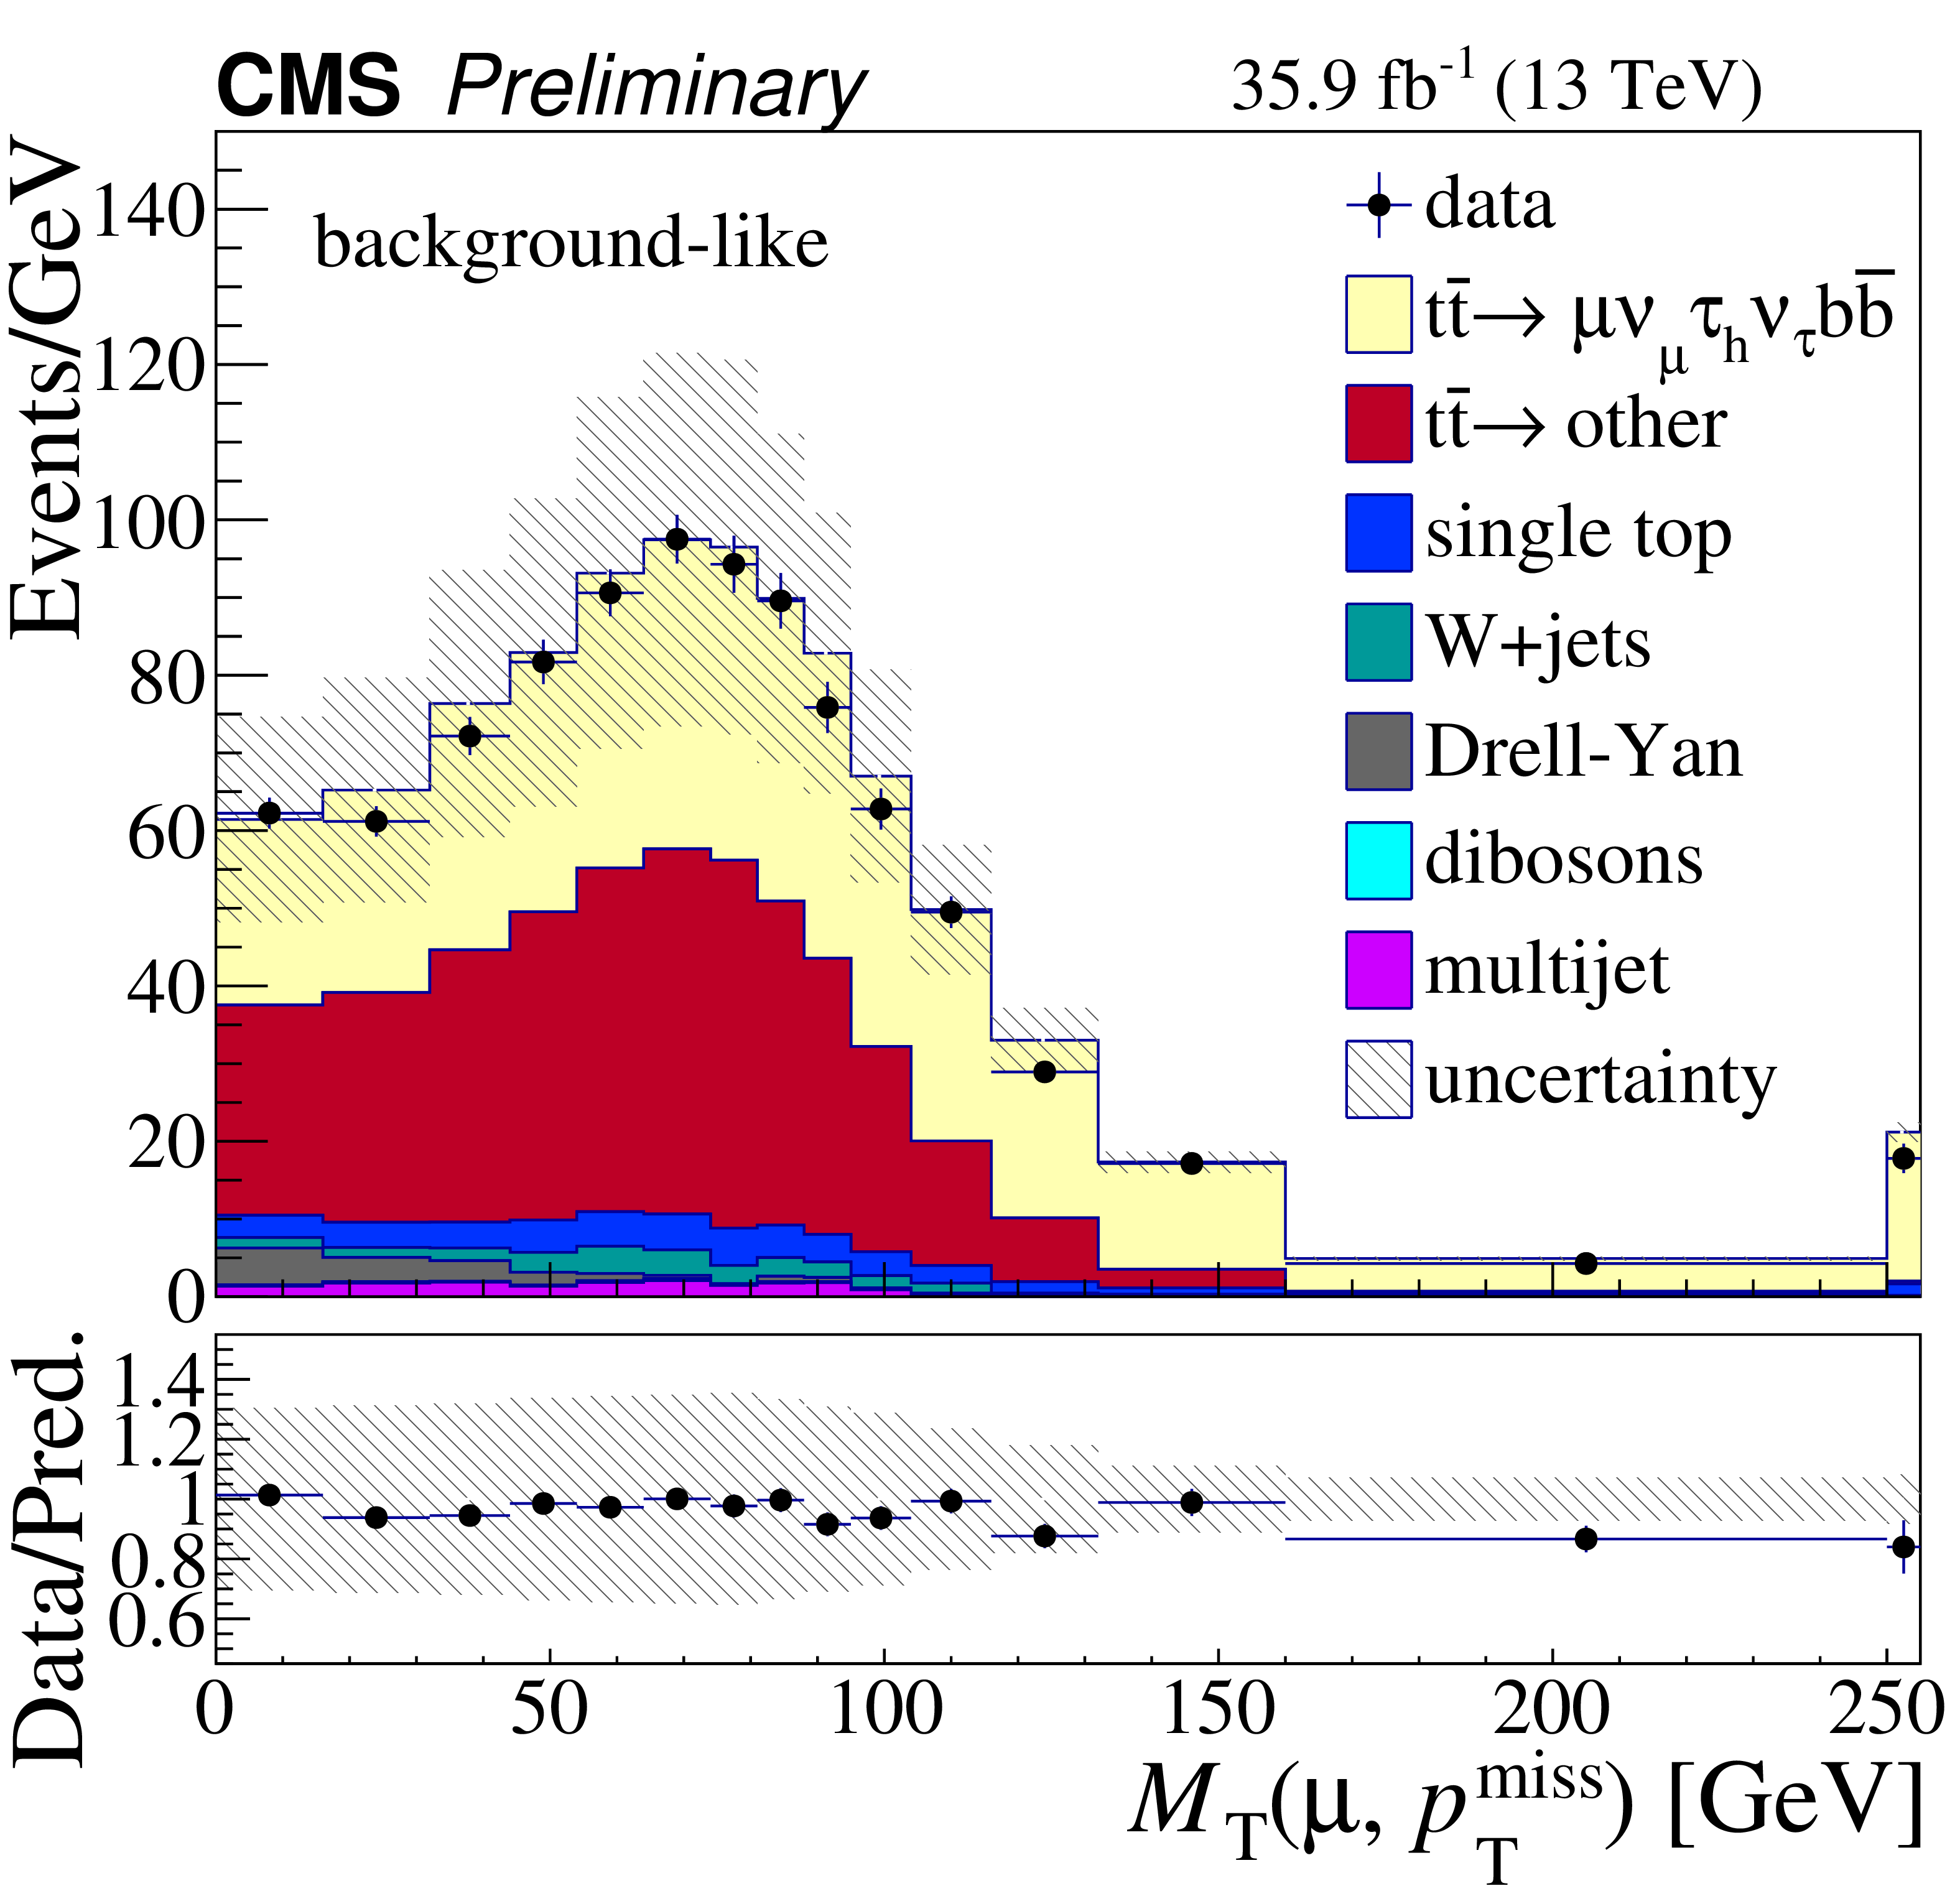
The pre-fit transverse mass distributions between lepton and ${{p_{\mathrm {T}}} ^\text {miss}}$, $M_{\mathrm {T}}$, in the signal-like (top) and background-like (bottom) event categories for the $\mathrm{e} {\tau _\mathrm {h}} $ (left) and $\mu {\tau _\mathrm {h}} $ (right) final states. Distributions obtained from data (full circle) are compared with simulation (shaded area). The last bin includes the overflow of the $M_{\mathrm {T}}$ distribution. The simulated contributions are normalized to the SM predicted values. The main processes are shown: the signal ($e {\tau _\mathrm {h}} $ and $\mu {\tau _\mathrm {h}} $ final states), the other ${\mathrm{t} \mathrm{\bar{t}}}$ processes lumped together, single top quark (mainly $\mathrm{t} \mathrm{W} $), DY processes (mainly the $\tau _{\ell} {\tau _\mathrm {h}} $ decay), W+jets, dibosons and multijet. The ratio of the data to the total SM prediction is shown in the lower panel. The vertical bars on the data indicate the statistical uncertainties, the hatched band indicates the systematic uncertainties and the statistical uncertainties of all simulated samples. |
png pdf |
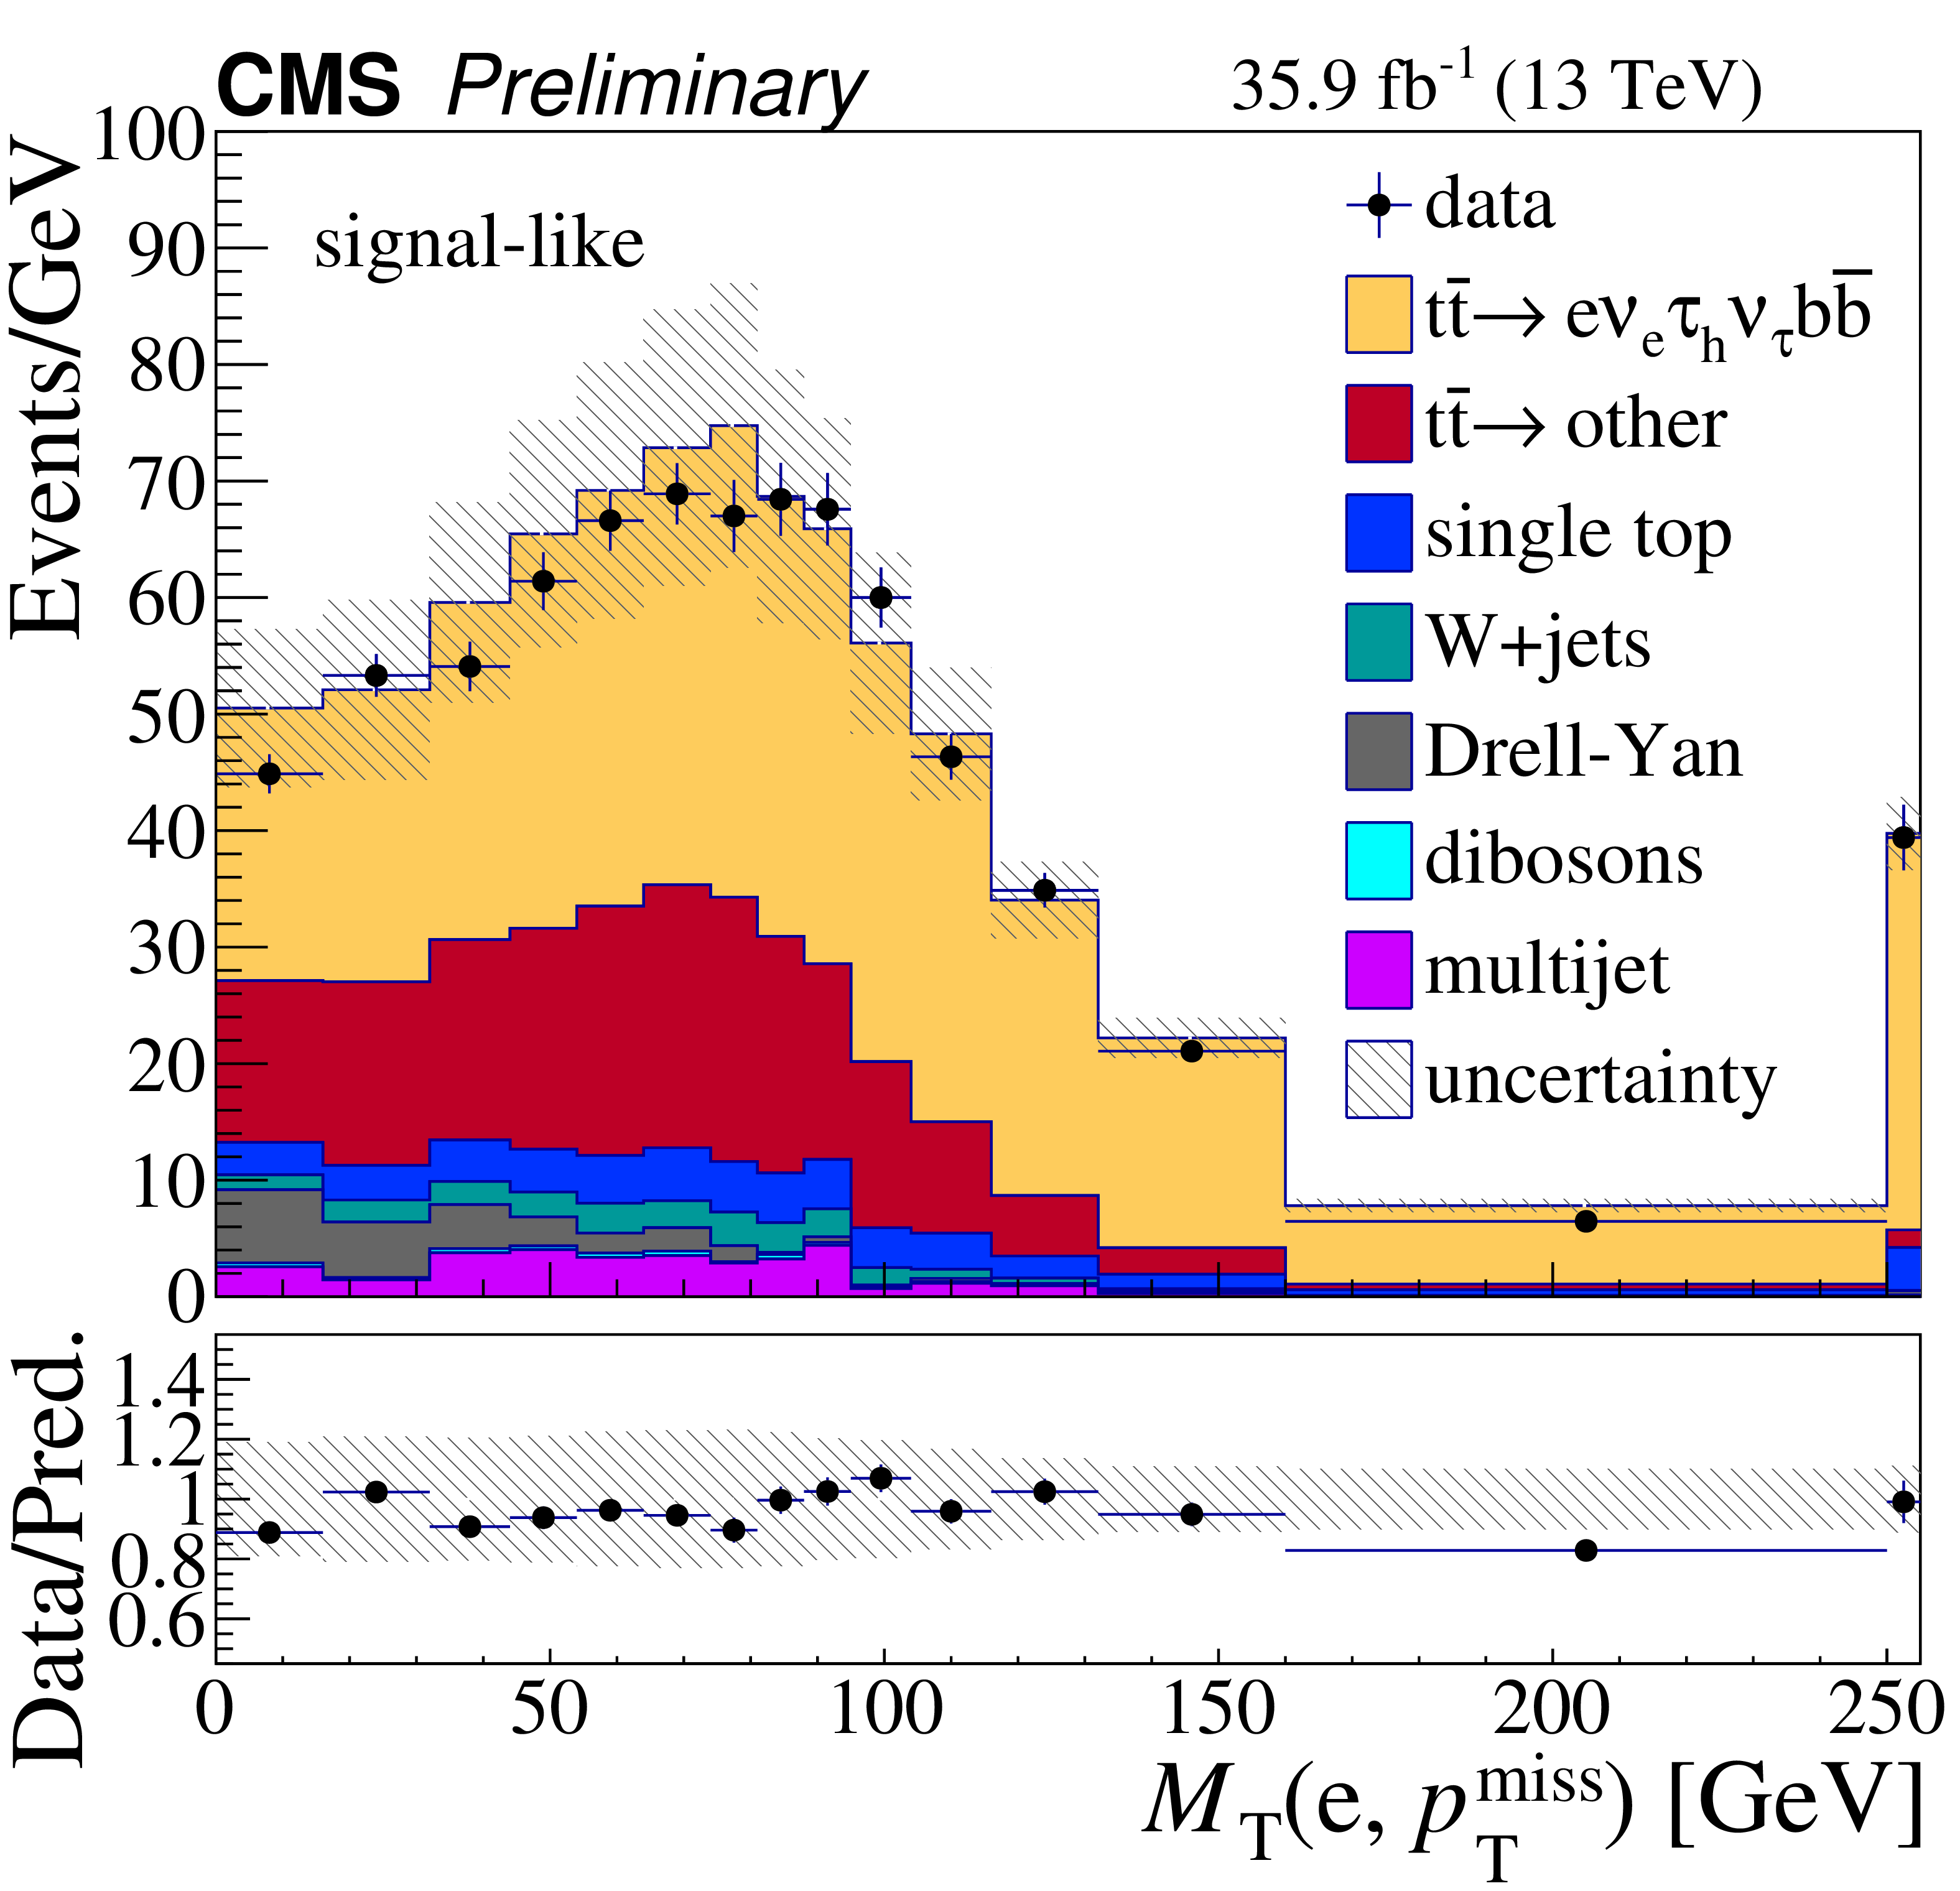
Figure 3-a:
The pre-fit transverse mass distributions between lepton and ${{p_{\mathrm {T}}} ^\text {miss}}$, $M_{\mathrm {T}}$, in the signal-like (top) and background-like (bottom) event categories for the $\mathrm{e} {\tau _\mathrm {h}} $ (left) and $\mu {\tau _\mathrm {h}} $ (right) final states. Distributions obtained from data (full circle) are compared with simulation (shaded area). The last bin includes the overflow of the $M_{\mathrm {T}}$ distribution. The simulated contributions are normalized to the SM predicted values. The main processes are shown: the signal ($e {\tau _\mathrm {h}} $ and $\mu {\tau _\mathrm {h}} $ final states), the other ${\mathrm{t} \mathrm{\bar{t}}}$ processes lumped together, single top quark (mainly $\mathrm{t} \mathrm{W} $), DY processes (mainly the $\tau _{\ell} {\tau _\mathrm {h}} $ decay), W+jets, dibosons and multijet. The ratio of the data to the total SM prediction is shown in the lower panel. The vertical bars on the data indicate the statistical uncertainties, the hatched band indicates the systematic uncertainties and the statistical uncertainties of all simulated samples. |
png pdf |
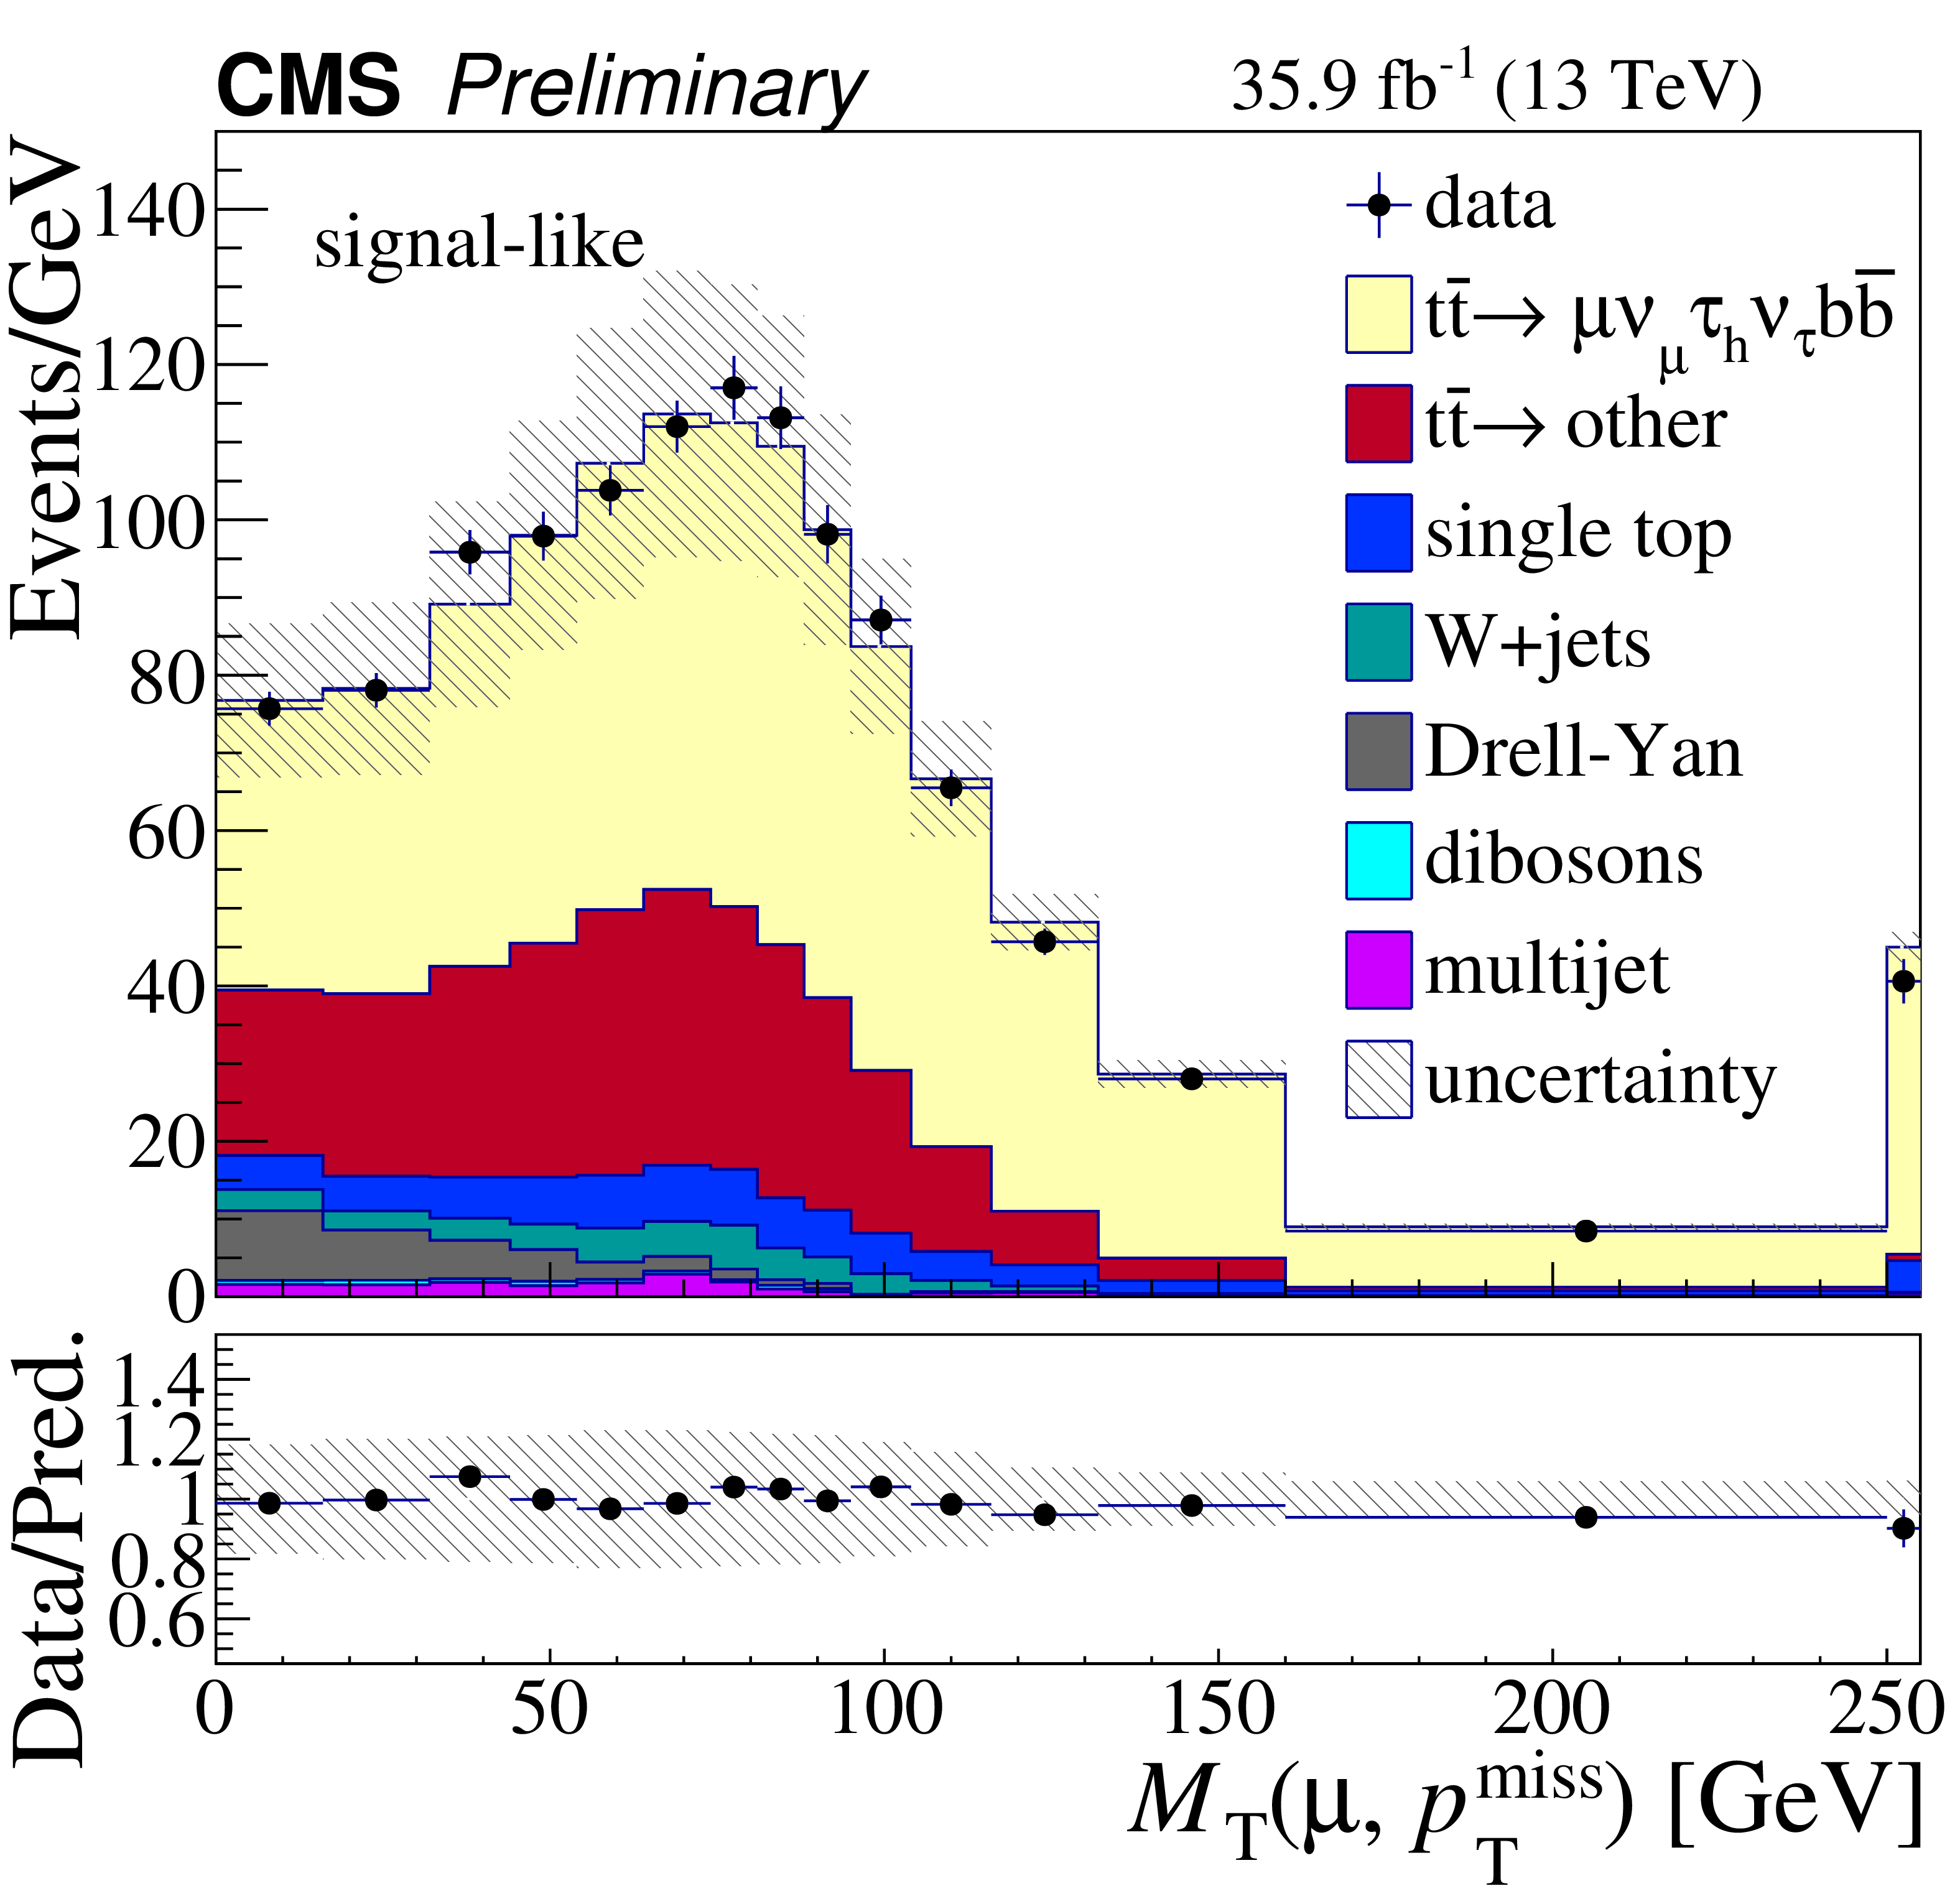
Figure 3-b:
The pre-fit transverse mass distributions between lepton and ${{p_{\mathrm {T}}} ^\text {miss}}$, $M_{\mathrm {T}}$, in the signal-like (top) and background-like (bottom) event categories for the $\mathrm{e} {\tau _\mathrm {h}} $ (left) and $\mu {\tau _\mathrm {h}} $ (right) final states. Distributions obtained from data (full circle) are compared with simulation (shaded area). The last bin includes the overflow of the $M_{\mathrm {T}}$ distribution. The simulated contributions are normalized to the SM predicted values. The main processes are shown: the signal ($e {\tau _\mathrm {h}} $ and $\mu {\tau _\mathrm {h}} $ final states), the other ${\mathrm{t} \mathrm{\bar{t}}}$ processes lumped together, single top quark (mainly $\mathrm{t} \mathrm{W} $), DY processes (mainly the $\tau _{\ell} {\tau _\mathrm {h}} $ decay), W+jets, dibosons and multijet. The ratio of the data to the total SM prediction is shown in the lower panel. The vertical bars on the data indicate the statistical uncertainties, the hatched band indicates the systematic uncertainties and the statistical uncertainties of all simulated samples. |
png pdf |
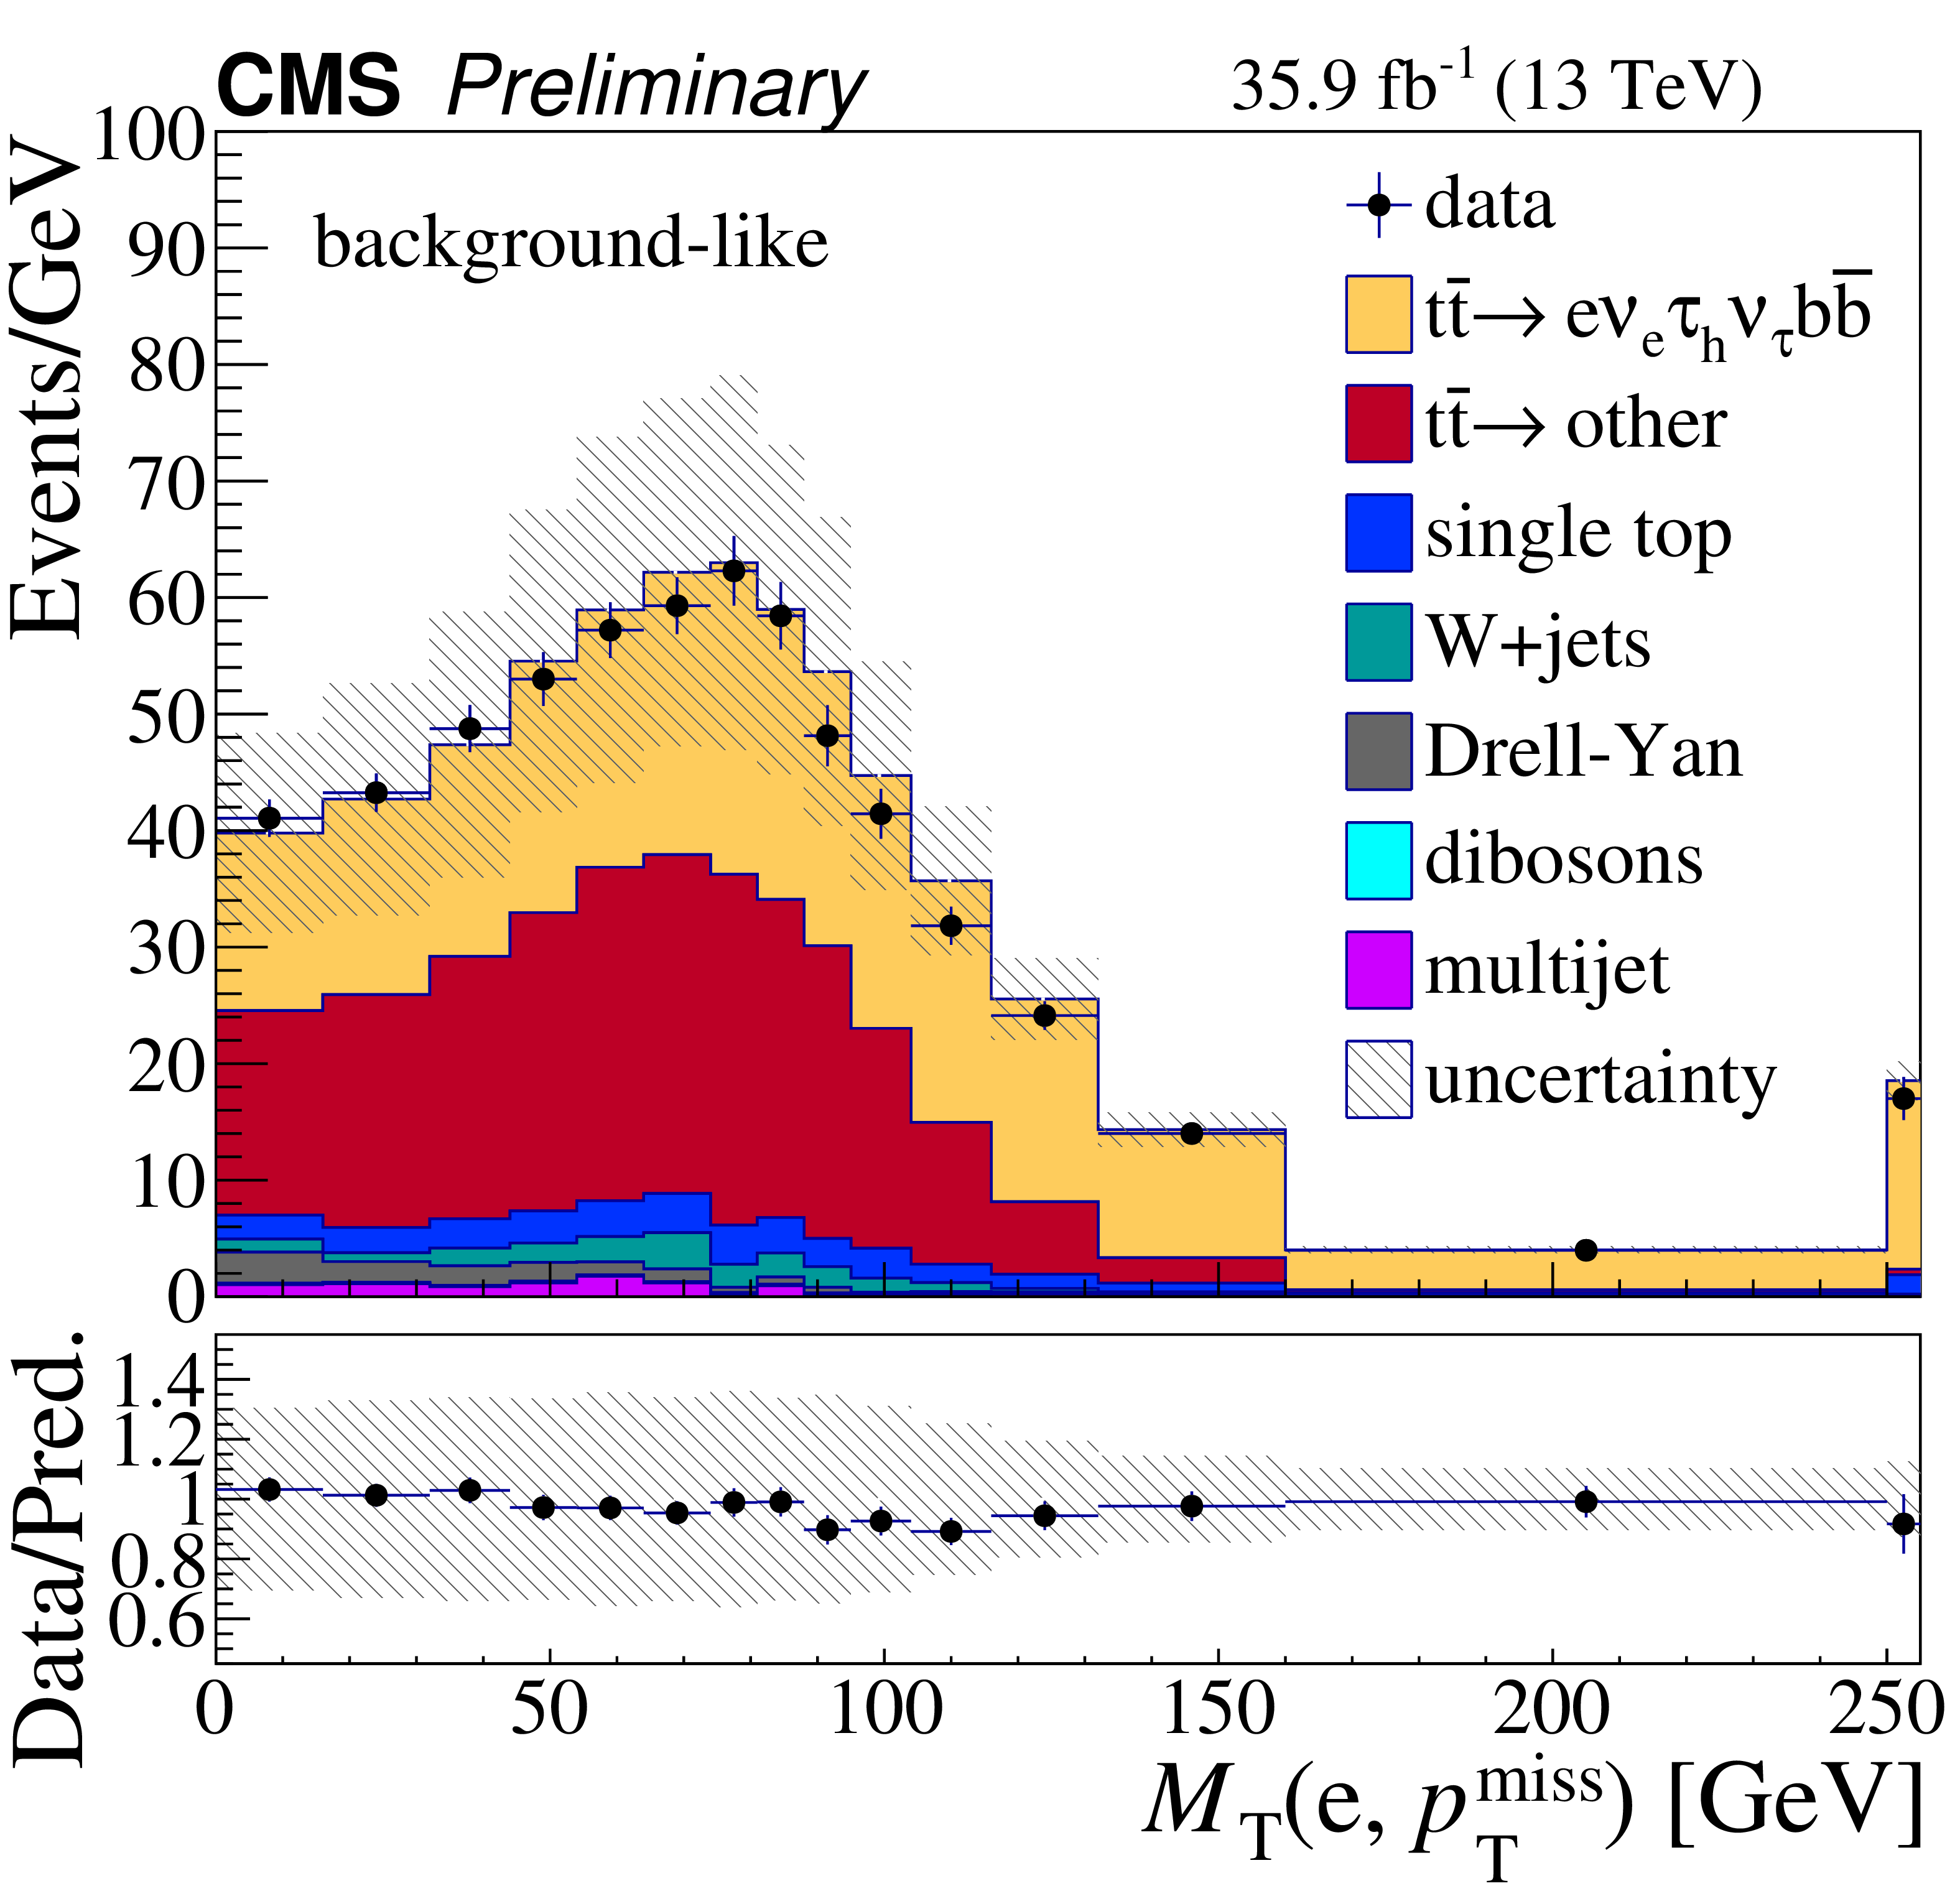
Figure 3-c:
The pre-fit transverse mass distributions between lepton and ${{p_{\mathrm {T}}} ^\text {miss}}$, $M_{\mathrm {T}}$, in the signal-like (top) and background-like (bottom) event categories for the $\mathrm{e} {\tau _\mathrm {h}} $ (left) and $\mu {\tau _\mathrm {h}} $ (right) final states. Distributions obtained from data (full circle) are compared with simulation (shaded area). The last bin includes the overflow of the $M_{\mathrm {T}}$ distribution. The simulated contributions are normalized to the SM predicted values. The main processes are shown: the signal ($e {\tau _\mathrm {h}} $ and $\mu {\tau _\mathrm {h}} $ final states), the other ${\mathrm{t} \mathrm{\bar{t}}}$ processes lumped together, single top quark (mainly $\mathrm{t} \mathrm{W} $), DY processes (mainly the $\tau _{\ell} {\tau _\mathrm {h}} $ decay), W+jets, dibosons and multijet. The ratio of the data to the total SM prediction is shown in the lower panel. The vertical bars on the data indicate the statistical uncertainties, the hatched band indicates the systematic uncertainties and the statistical uncertainties of all simulated samples. |
png pdf |
Figure 3-d:
The pre-fit transverse mass distributions between lepton and ${{p_{\mathrm {T}}} ^\text {miss}}$, $M_{\mathrm {T}}$, in the signal-like (top) and background-like (bottom) event categories for the $\mathrm{e} {\tau _\mathrm {h}} $ (left) and $\mu {\tau _\mathrm {h}} $ (right) final states. Distributions obtained from data (full circle) are compared with simulation (shaded area). The last bin includes the overflow of the $M_{\mathrm {T}}$ distribution. The simulated contributions are normalized to the SM predicted values. The main processes are shown: the signal ($e {\tau _\mathrm {h}} $ and $\mu {\tau _\mathrm {h}} $ final states), the other ${\mathrm{t} \mathrm{\bar{t}}}$ processes lumped together, single top quark (mainly $\mathrm{t} \mathrm{W} $), DY processes (mainly the $\tau _{\ell} {\tau _\mathrm {h}} $ decay), W+jets, dibosons and multijet. The ratio of the data to the total SM prediction is shown in the lower panel. The vertical bars on the data indicate the statistical uncertainties, the hatched band indicates the systematic uncertainties and the statistical uncertainties of all simulated samples. |
png pdf |
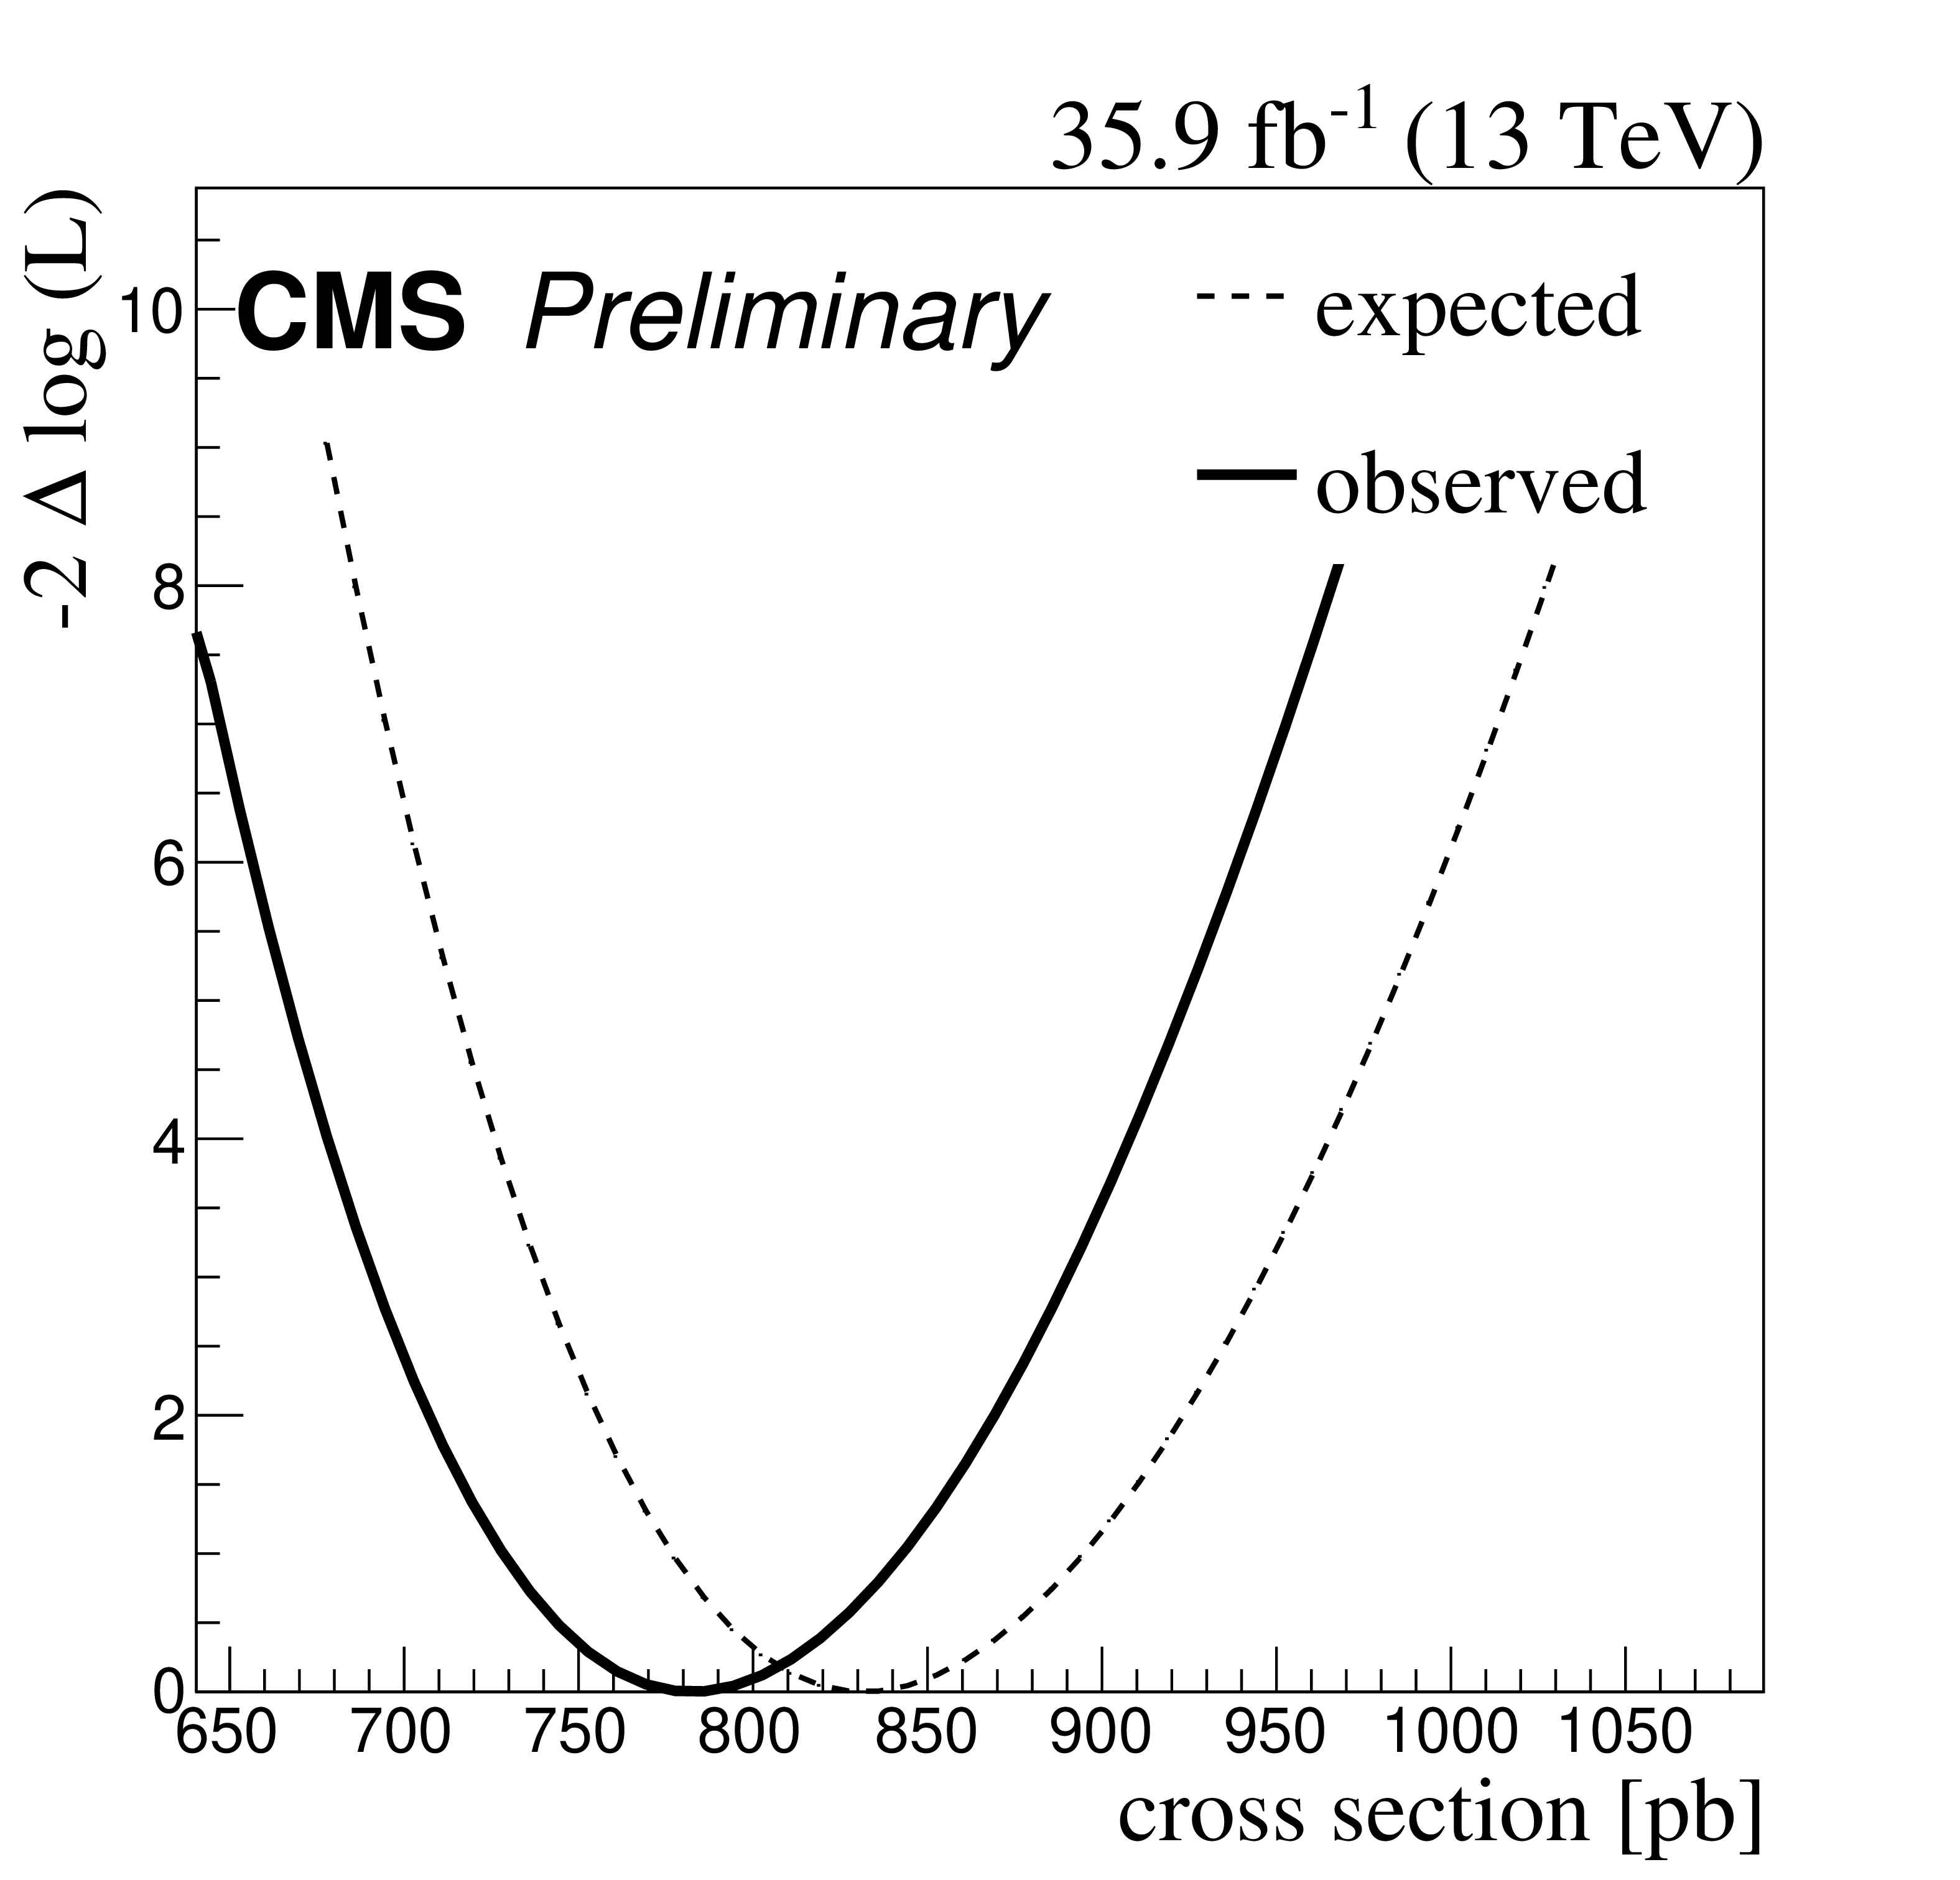
Figure 4:
The observed and expected variations of the likelihood as a function of the cross section $\sigma _{{\mathrm{t} \mathrm{\bar{t}}}}$. |
| Tables | |
png pdf |
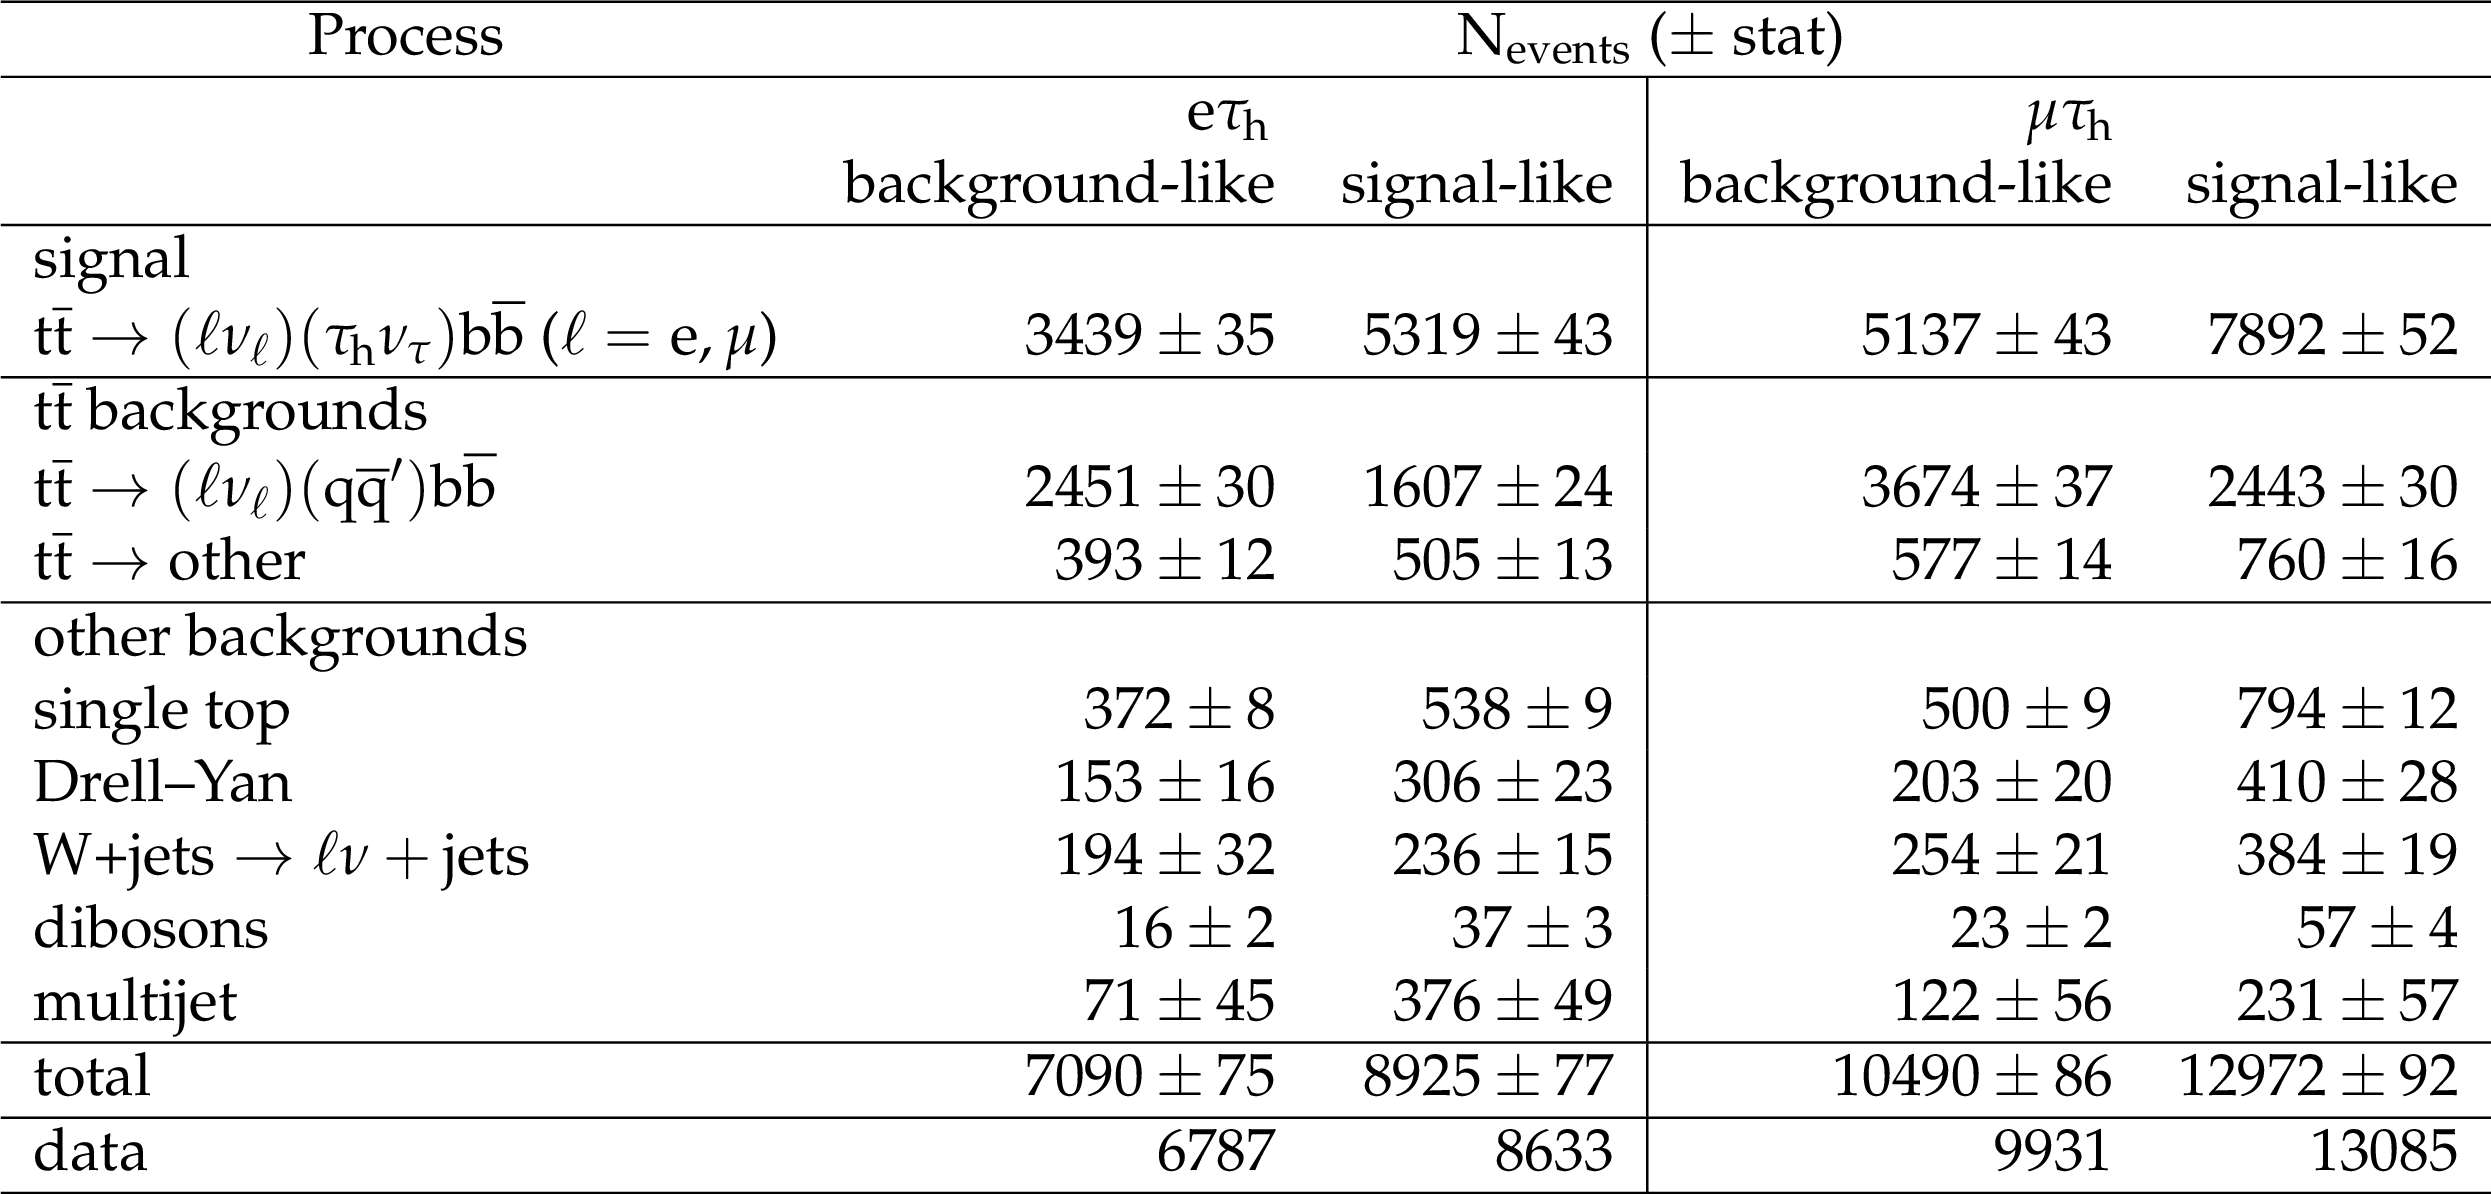
Table 1:
Expected event yields in the $\mathrm{e} {\tau _\mathrm {h}} $ and $\mu {\tau _\mathrm {h}} $ final states for signal and background processes for an integrated luminosity of 35.9 fb$^{-1}$. The expected pre-fit contributions of all processes are separated in the background-like and signal-like event categories. The statistical uncertainties of the modeling are shown for the processes estimated from the simulation. The uncertainty in the multijet contributions includes the statistical uncertainty of the data and the statistical uncertainty of the simulation of the other processes. |
png pdf |
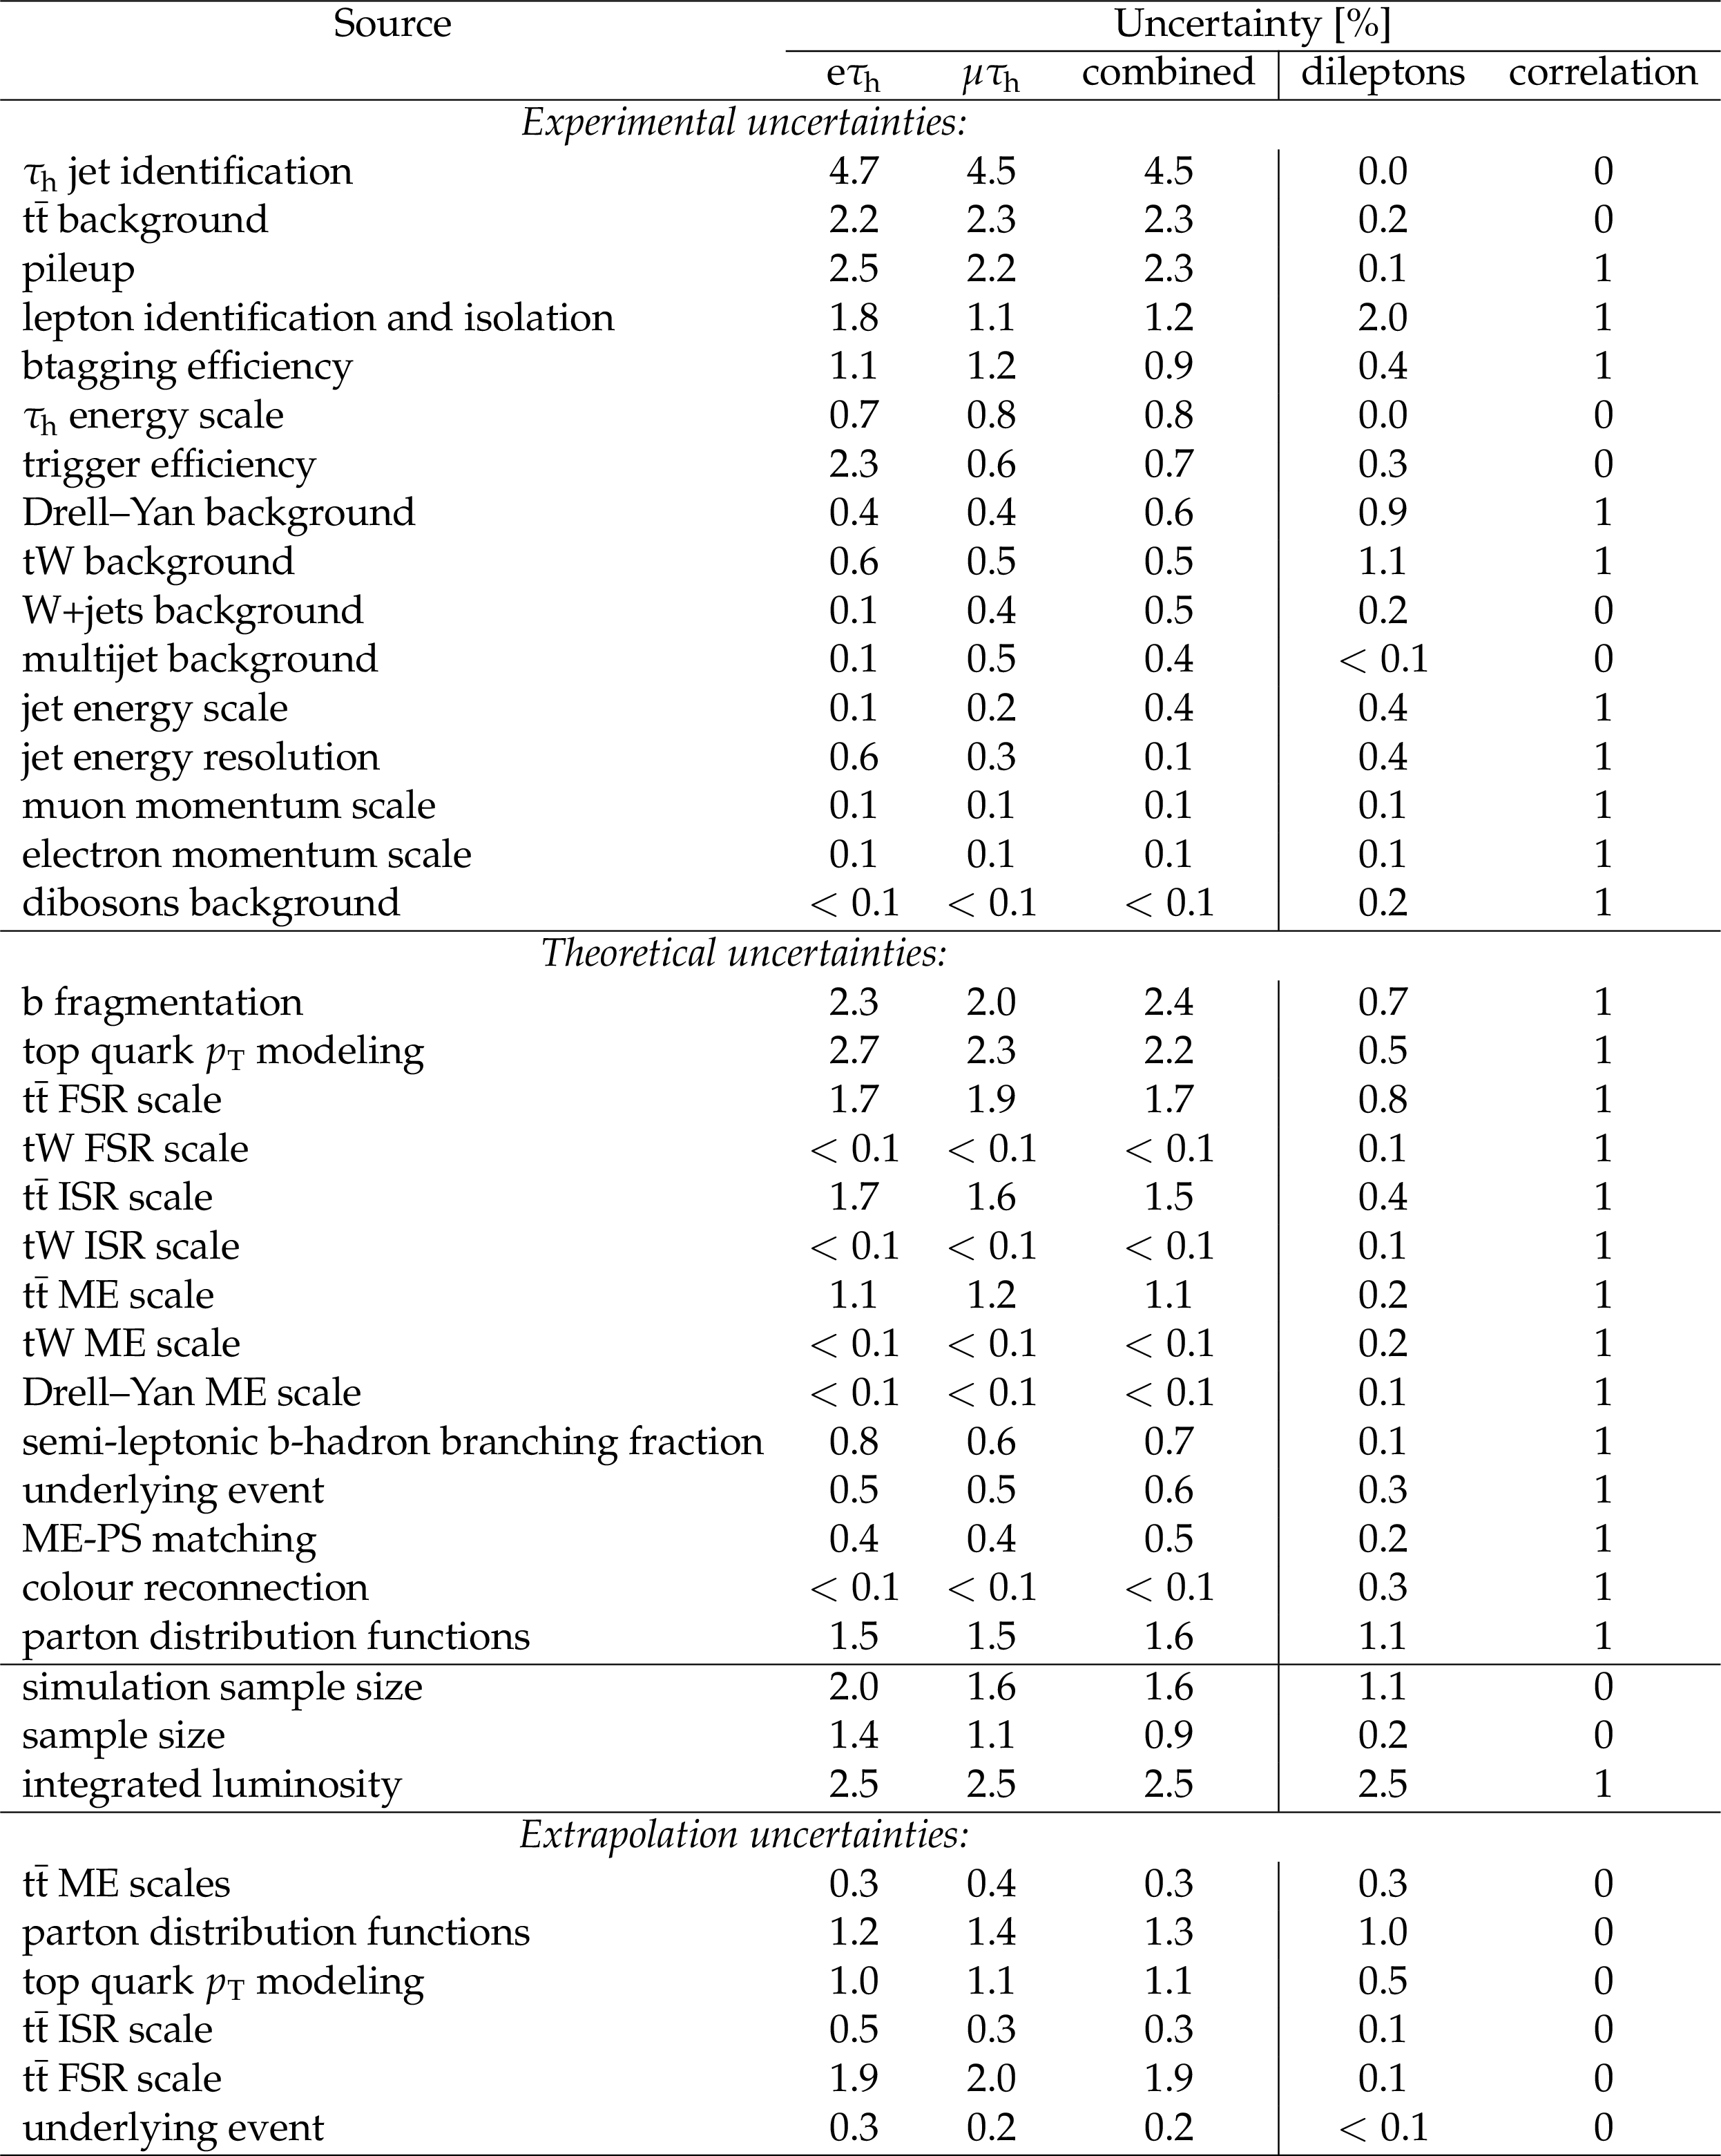
Table 2:
Systematic uncertainties determined from the fit to the observed data in the $\mathrm{e} {\tau _\mathrm {h}} $ and $\mu {\tau _\mathrm {h}} $ final states, and their combinations. Uncertainties are grouped by their origin: experimental, theoretical, and extrapolation. The uncertainties of the measurement in the dilepton final state [7] used in the partial width ratio estimate are also quoted (column "dileptons"), where the asymmetric extrapolation uncertainties are added in quadrature. Since both measurements are performed in the same data-taking period with the same reconstruction algorithms, some uncertainties are correlated as indicated in the rightmost column. |
| Summary |
| A measurement of the $\mathrm{t\bar{t}}$ production cross section in the $\tau$ dilepton channel $\mathrm{t\bar{t}}\rightarrow (\ell \nu_{\ell}) ({\tau_\mathrm{h}} \nu_{\tau}) \mathrm{b\bar{b}}$, ($\ell = $ e, $\mu$) is performed using a data sample with an integrated luminosity of 35.9 fb$^{-1}$ in proton-proton collisions at $\sqrt{s} = $ 13 TeV. Events are selected by requiring the presence of one electron or one muon, at least three jets, of which at least one is b-tagged and one is identified as a hadronically decaying $\tau$ lepton, ${\tau_\mathrm{h}}$. The largest background contribution comes from $\mathrm{t\bar{t}}$ lepton+jet events where one jet is misidentified as the ${\tau_\mathrm{h}}$. The background is constrained in a fit to the distribution of the transverse mass between lepton and missing transverse momentum, in two event categories, constructed according to the kinematic properties of the jets in the $\mathrm{t\bar{t}}$ lepton+jets final state. In the fit, the signal enters as a free parameter without constraining the kinematic properties of the $\tau$ lepton. This is the first measurement of the $\mathrm{t\bar{t}}$ production cross section in proton-proton collisions at $\sqrt{s} = $ 13 TeV that explicitly includes $\tau$ leptons, and it improves the relative precision with respect to the 7 and 8 TeV results [5,6]. The measured cross section is $\sigma_{\mathrm{t\bar{t}}}(\ell{\tau_\mathrm{h}}) = $ 781 $\pm$ 7 (stat) $\pm$ 62 (syst) $\pm$ 20 (lumi) pb for $m_{\mathrm{t}} = $ 172.5 GeV, in agreement with SM expectations. The measurement of the ratio of the cross sections in the $\ell\tau$ final state divided by the dilepton cross section yields a value $R_{\ell{\tau_\mathrm{h}}/\ell\ell}=$ 0.973 $\pm$ 0.009 (stat) $\pm$ 0.066 (syst), consistent with lepton universality. The ratio of the partial to the total width $\Gamma(\mathrm{t}\rightarrow\tau\nu_{\tau}\mathrm{b})/\Gamma_{\rm total}=$ 0.1050 $\pm$ 0.0009 (stat) $\pm$ 0.0071 (syst) is measured with respect to the $\mathrm{t\bar{t}}$ inclusive cross section in the dilepton final state [7]. |
| References | ||||
| 1 | LHCb Collaboration | Test of Lepton Flavor Universality by the measurement of the $ B^0 \to D^{*-} \tau^+ \nu_{\tau} $ branching fraction using three-prong $ \tau $ decays | PRD 97 (2018) 072013 | 1711.02505 |
| 2 | LHCb Collaboration | Search for lepton-universality violation in $ B^+\to K^+\ell^+\ell^- $ decays | PRL 122 (2019) 191801 | 1903.09252 |
| 3 | A. Djouadi | The Anatomy of electro-weak symmetry breaking. II. The Higgs bosons in the minimal supersymmetric model | PR 459 (2008) 1 | hep-ph/0503173 |
| 4 | G. C. Branco et al. | Theory and phenomenology of two-Higgs-doublet models | PR 516 (2012) 1 | 1106.0034 |
| 5 | CMS Collaboration | Measurement of the top quark pair production cross section in pp collisions at $ \sqrt{s} = $ 7 TeV in dilepton final states containing a $ \tau $ | PRD 85 (2012) 112007 | CMS-TOP-11-006 1203.6810 |
| 6 | CMS Collaboration | Measurement of the $ \mathrm{t\bar{t}} $ production cross section in pp collisions at $ \sqrt {s} = $ 8 ~TeV in dilepton final states containing one $ \tau $ lepton | PLB 739 (2014) 23 | CMS-TOP-12-026 1407.6643 |
| 7 | CMS Collaboration | Measurement of the $ \mathrm{t}\overline{\mathrm{t}} $ production cross section, the top quark mass, and the strong coupling constant using dilepton events in pp collisions at $ \sqrt{s} = $ 13 TeV | EPJC 79 (2019) 368 | CMS-TOP-17-001 1812.10505 |
| 8 | CDF Collaboration | Study of Top-Quark Production and Decays involving a Tau Lepton at CDF and Limits on a Charged-Higgs Boson Contribution | PRD 89 (2014) 091101 | 1402.6728 |
| 9 | ATLAS Collaboration | Measurements of the top quark branching ratios into channels with leptons and quarks with the ATLAS detector | PRD 92 (2015) 072005 | 1506.05074 |
| 10 | P. Nason | A new method for combining NLO QCD with shower Monte Carlo algorithms | JHEP 11 (2004) 040 | hep-ph/0409146 |
| 11 | S. Frixione, P. Nason, and C. Oleari | Matching NLO QCD computations with parton shower simulations: the POWHEG method | JHEP 11 (2007) 070 | 0709.2092 |
| 12 | S. Alioli, P. Nason, C. Oleari, and E. Re | A general framework for implementing NLO calculations in shower Monte Carlo programs: the POWHEG BOX | JHEP 06 (2010) 043 | 1002.2581 |
| 13 | J. M. Campbell, R. K. Ellis, P. Nason, and E. Re | Top-Pair Production and Decay at NLO Matched with Parton Showers | JHEP 04 (2015) 114 | 1412.1828 |
| 14 | J. Alwall et al. | The automated computation of tree-level and next-to-leading order differential cross sections, and their matching to parton shower simulations | JHEP 07 (2014) 079 | 1405.0301 |
| 15 | E. Re | Single-top Wt-channel production matched with parton showers using the POWHEG method | EPJC 71 (2011) 1547 | 1009.2450 |
| 16 | T. Sjostrand et al. | An Introduction to PYTHIA 8.2 | CPC 191 (2015) 159 | 1410.3012 |
| 17 | P. Skands, S. Carrazza, and J. Rojo | Tuning PYTHIA 8.1: the Monash 2013 tune | EPJC 74 (2014) 3024 | 1404.5630 |
| 18 | NNPDF Collaboration | Parton distributions for the LHC Run II | JHEP 04 (2015) 040 | 1410.8849 |
| 19 | GEANT4 Collaboration | GEANT4--a simulation toolkit | NIMA 506 (2003) 250 | |
| 20 | ATLAS Collaboration | Measurement of the inelastic proton-proton cross section at $ \sqrt{s} = $ 13 TeV with the ATLAS detector at the LHC | PRL 117 (2016) 182002 | 1606.02625 |
| 21 | M. Czakon and A. Mitov | Top++: A program for the calculation of the top-pair cross-section at hadron colliders | CPC 185 (2014) 2930 | 1112.5675 |
| 22 | S. Dulat et al. | New parton distribution functions from a global analysis of quantum chromodynamics | PRD 93 (2016) 033006 | 1506.07443 |
| 23 | Y. Li and F. Petriello | Combining QCD and electroweak corrections to dilepton production in FEWZ | PRD 86 (2012) 094034 | 1208.5967 |
| 24 | P. Kant et al. | HatHor for single top-quark production: Updated predictions and uncertainty estimates for single top-quark production in hadronic collisions | CPC 191 (2015) 74 | 1406.4403 |
| 25 | N. Kidonakis | NNLL threshold resummation for top-pair and single-top production | Phys. Part. Nucl. 45 (2014) 714 | 1210.7813 |
| 26 | J. M. Campbell and R. K. Ellis | MCFM for the Tevatron and the LHC | NPPS 205-206 (2010) 10 | 1007.3492 |
| 27 | J. M. Campbell, R. K. Ellis, and C. Williams | Vector boson pair production at the LHC | JHEP 07 (2011) 018 | 1105.0020 |
| 28 | CMS Collaboration | Particle-flow reconstruction and global event description with the CMS detector | JINST 12 (2017) P10003 | CMS-PRF-14-001 1706.04965 |
| 29 | M. Cacciari, G. P. Salam, and G. Soyez | The anti-$ k_\mathrm{t} $ jet clustering algorithm | JHEP 04 (2008) 063 | 0802.1189 |
| 30 | CMS Collaboration | Electron and photon performance in CMS with the full 2016 data sample. | CDS | |
| 31 | CMS Collaboration | Performance of the CMS muon detector and muon reconstruction with proton-proton collisions at $ \sqrt{s}= $ 13 TeV | JINST 13 (2018) P06015 | CMS-MUO-16-001 1804.04528 |
| 32 | CMS Collaboration | Performance of reconstruction and identification of $ \tau $ leptons decaying to hadrons and $ \nu_\tau $ in pp collisions at $ \sqrt{s}= $ 13 TeV | JINST 13 (2018) P10005 | CMS-TAU-16-003 1809.02816 |
| 33 | CMS Collaboration | Identification of heavy-flavour jets with the CMS detector in pp collisions at 13 TeV | JINST 13 (2018) P05011 | CMS-BTV-16-002 1712.07158 |
| 34 | G. Cowan, K. Cranmer, E. Gross, and O. Vitells | Asymptotic formulae for likelihood-based tests of new physics | EPJC 71 (2011) 1554 | |
| 35 | CMS Collaboration | Performance of CMS muon reconstruction in pp collision events at $ \sqrt{s} = $ 7 TeV | JINST 7 (2012) P10002 | CMS-MUO-10-004 1206.4071 |
| 36 | CMS Collaboration | Performance of electron reconstruction and selection with the CMS detector in proton-proton collisions at $ \sqrt{s} = $ 8 TeV | JINST 10 (2015) P06005 | CMS-EGM-13-001 1502.02701 |
| 37 | CMS Collaboration | Identification of b-quark jets with the CMS experiment | JINST 8 (2013) P04013 | CMS-BTV-12-001 1211.4462 |
| 38 | CMS Collaboration | Jet energy scale and resolution in the CMS experiment in pp collisions at 8 TeV | JINST 12 (2017) P02014 | CMS-JME-13-004 1607.03663 |
| 39 | CMS Collaboration | CMS Luminosity Measurements for the 2016 Data Taking Period | CMS-PAS-LUM-17-001 | CMS-PAS-LUM-17-001 |
| 40 | OPAL Collaboration | Inclusive analysis of the b quark fragmentation function in Z decays at LEP | EPJC 29 (2003) 463 | hep-ex/0210031 |
| 41 | ALEPH Collaboration | Study of the fragmentation of b quarks into B mesons at the Z peak | PLB 512 (2001) 30 | hep-ex/0106051 |
| 42 | SLD Collaboration | Measurement of the b quark fragmentation function in $ \rm{Z^{0}} $ decays | PRD 65 (2002) 092006 | hep-ex/0202031 |
| 43 | DELPHI Collaboration | A study of the b-quark fragmentation function with the DELPHI detector at LEP I and an averaged distribution obtained at the Z Pole | EPJC 71 (2011) 1557 | |
| 44 | M. G. Bowler | $ \mathrm{e}^{+}\mathrm{e}^{{-}} $ production of heavy quarks in the string model | Z. Phys. C 11 (1981) 169 | |
| 45 | C. Peterson, D. Schlatter, I. Schmitt, and P. M. Zerwas | Scaling violations in inclusive $ \mathrm{e}^{+}\mathrm{e}^{{-}} $ annihilation spectra | PRD 27 (1983) 105 | |
| 46 | Particle Data Group, M. Tanabashi et al. | Review of particle physics | PRD 98 (2018) 030001 | |
| 47 | CMS Collaboration | Measurement of normalized differential $ \mathrm{t}\overline{\mathrm{t}} $ cross sections in the dilepton channel from pp collisions at $ \sqrt{s}= $ 13 TeV | JHEP 04 (2018) 060 | CMS-TOP-16-007 1708.07638 |
| 48 | CMS Collaboration | Measurement of differential cross sections for top quark pair production using the lepton+jets final state in proton-proton collisions at 13 TeV | PRD 95 (2017) 092001 | CMS-TOP-16-008 1610.04191 |
| 49 | CMS Collaboration | Investigations of the impact of the parton shower tuning in Pythia 8 in the modelling of $ \mathrm{t\overline{t}} $ at $ \sqrt{s}= $ 8 and 13 TeV | CMS-PAS-TOP-16-021 | CMS-PAS-TOP-16-021 |
|
|
Compact Muon Solenoid LHC, CERN |
|

|

|

|

|

|