

Compact Muon Solenoid
LHC, CERN
| CMS-PAS-SMP-21-005 | ||
| Measurement of the production cross section of a W boson in association with a charm quark in proton-proton collisions at $\sqrt{s}= $ 13 TeV | ||
| CMS Collaboration | ||
| July 2022 | ||
| Abstract: The strange quark content of the proton is probed through the measurement of the production cross section of a W boson and a charm (c) quark in proton-proton collisions at a centre-of-mass energy of 13 TeV. The analysis uses a data sample corresponding to a total integrated luminosity of 138 fb$^{-1}$ collected by the CMS detector at the LHC. W bosons are identified through their leptonic decays to an electron or a muon, and a neutrino. Charm jets are tagged by the presence of a muon or a secondary vertex inside the jet. The W+c production cross section and the cross section ratio $ \sigma({\rm W^+\! {+}\bar{c}}) / \sigma({\rm W^-\! {+}c})$ are measured inclusively and differentially as functions of the transverse momentum and the pseudorapidity of the lepton from the W boson decay. The measurements, with improved precision from previous CMS studies, are compared with theoretical predictions. | ||
|
Links:
CDS record (PDF) ;
CADI line (restricted) ;
These preliminary results are superseded in this paper, Submitted to EPJC. The superseded preliminary plots can be found here. |
||
| Figures | |

png pdf |
Figure 1:
Leading order diagrams for the associated production of a W boson and a charm quark. The electric charges of the W boson and the c quark have opposite sign. |
png pdf |
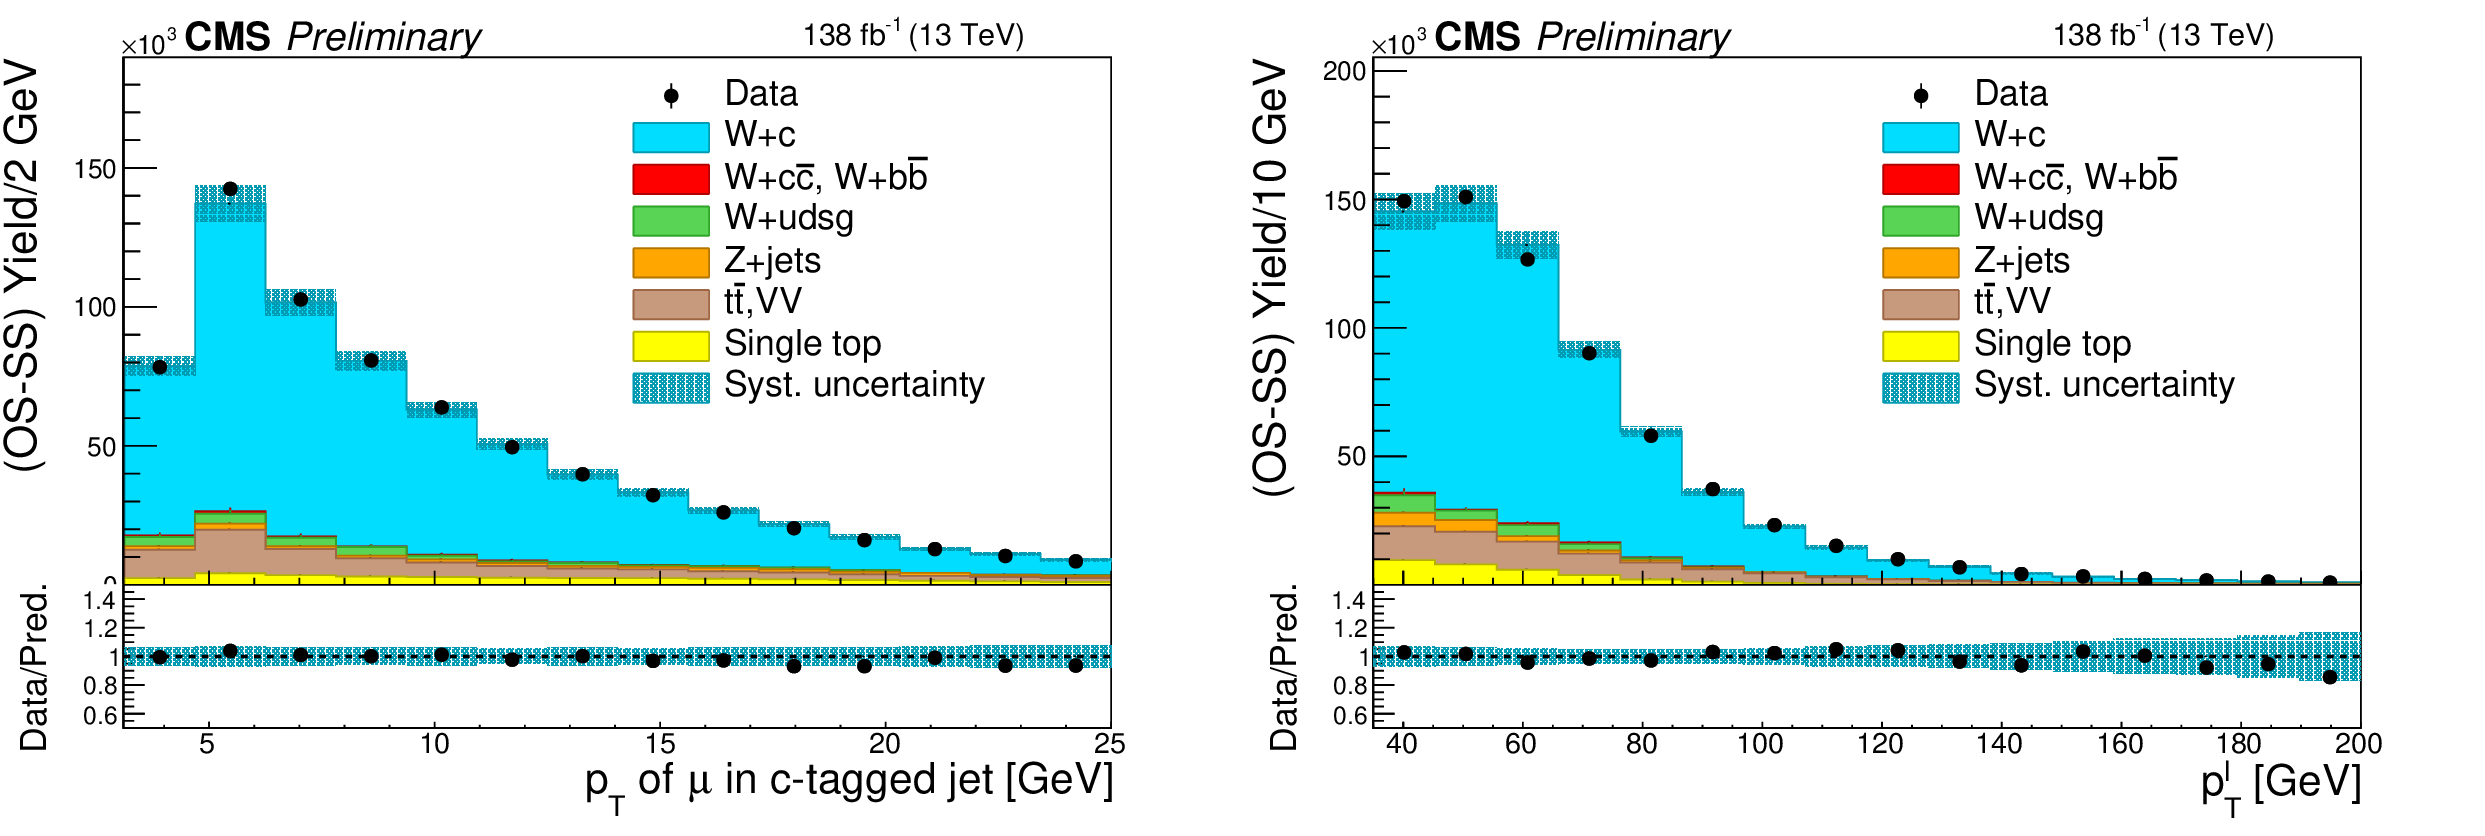
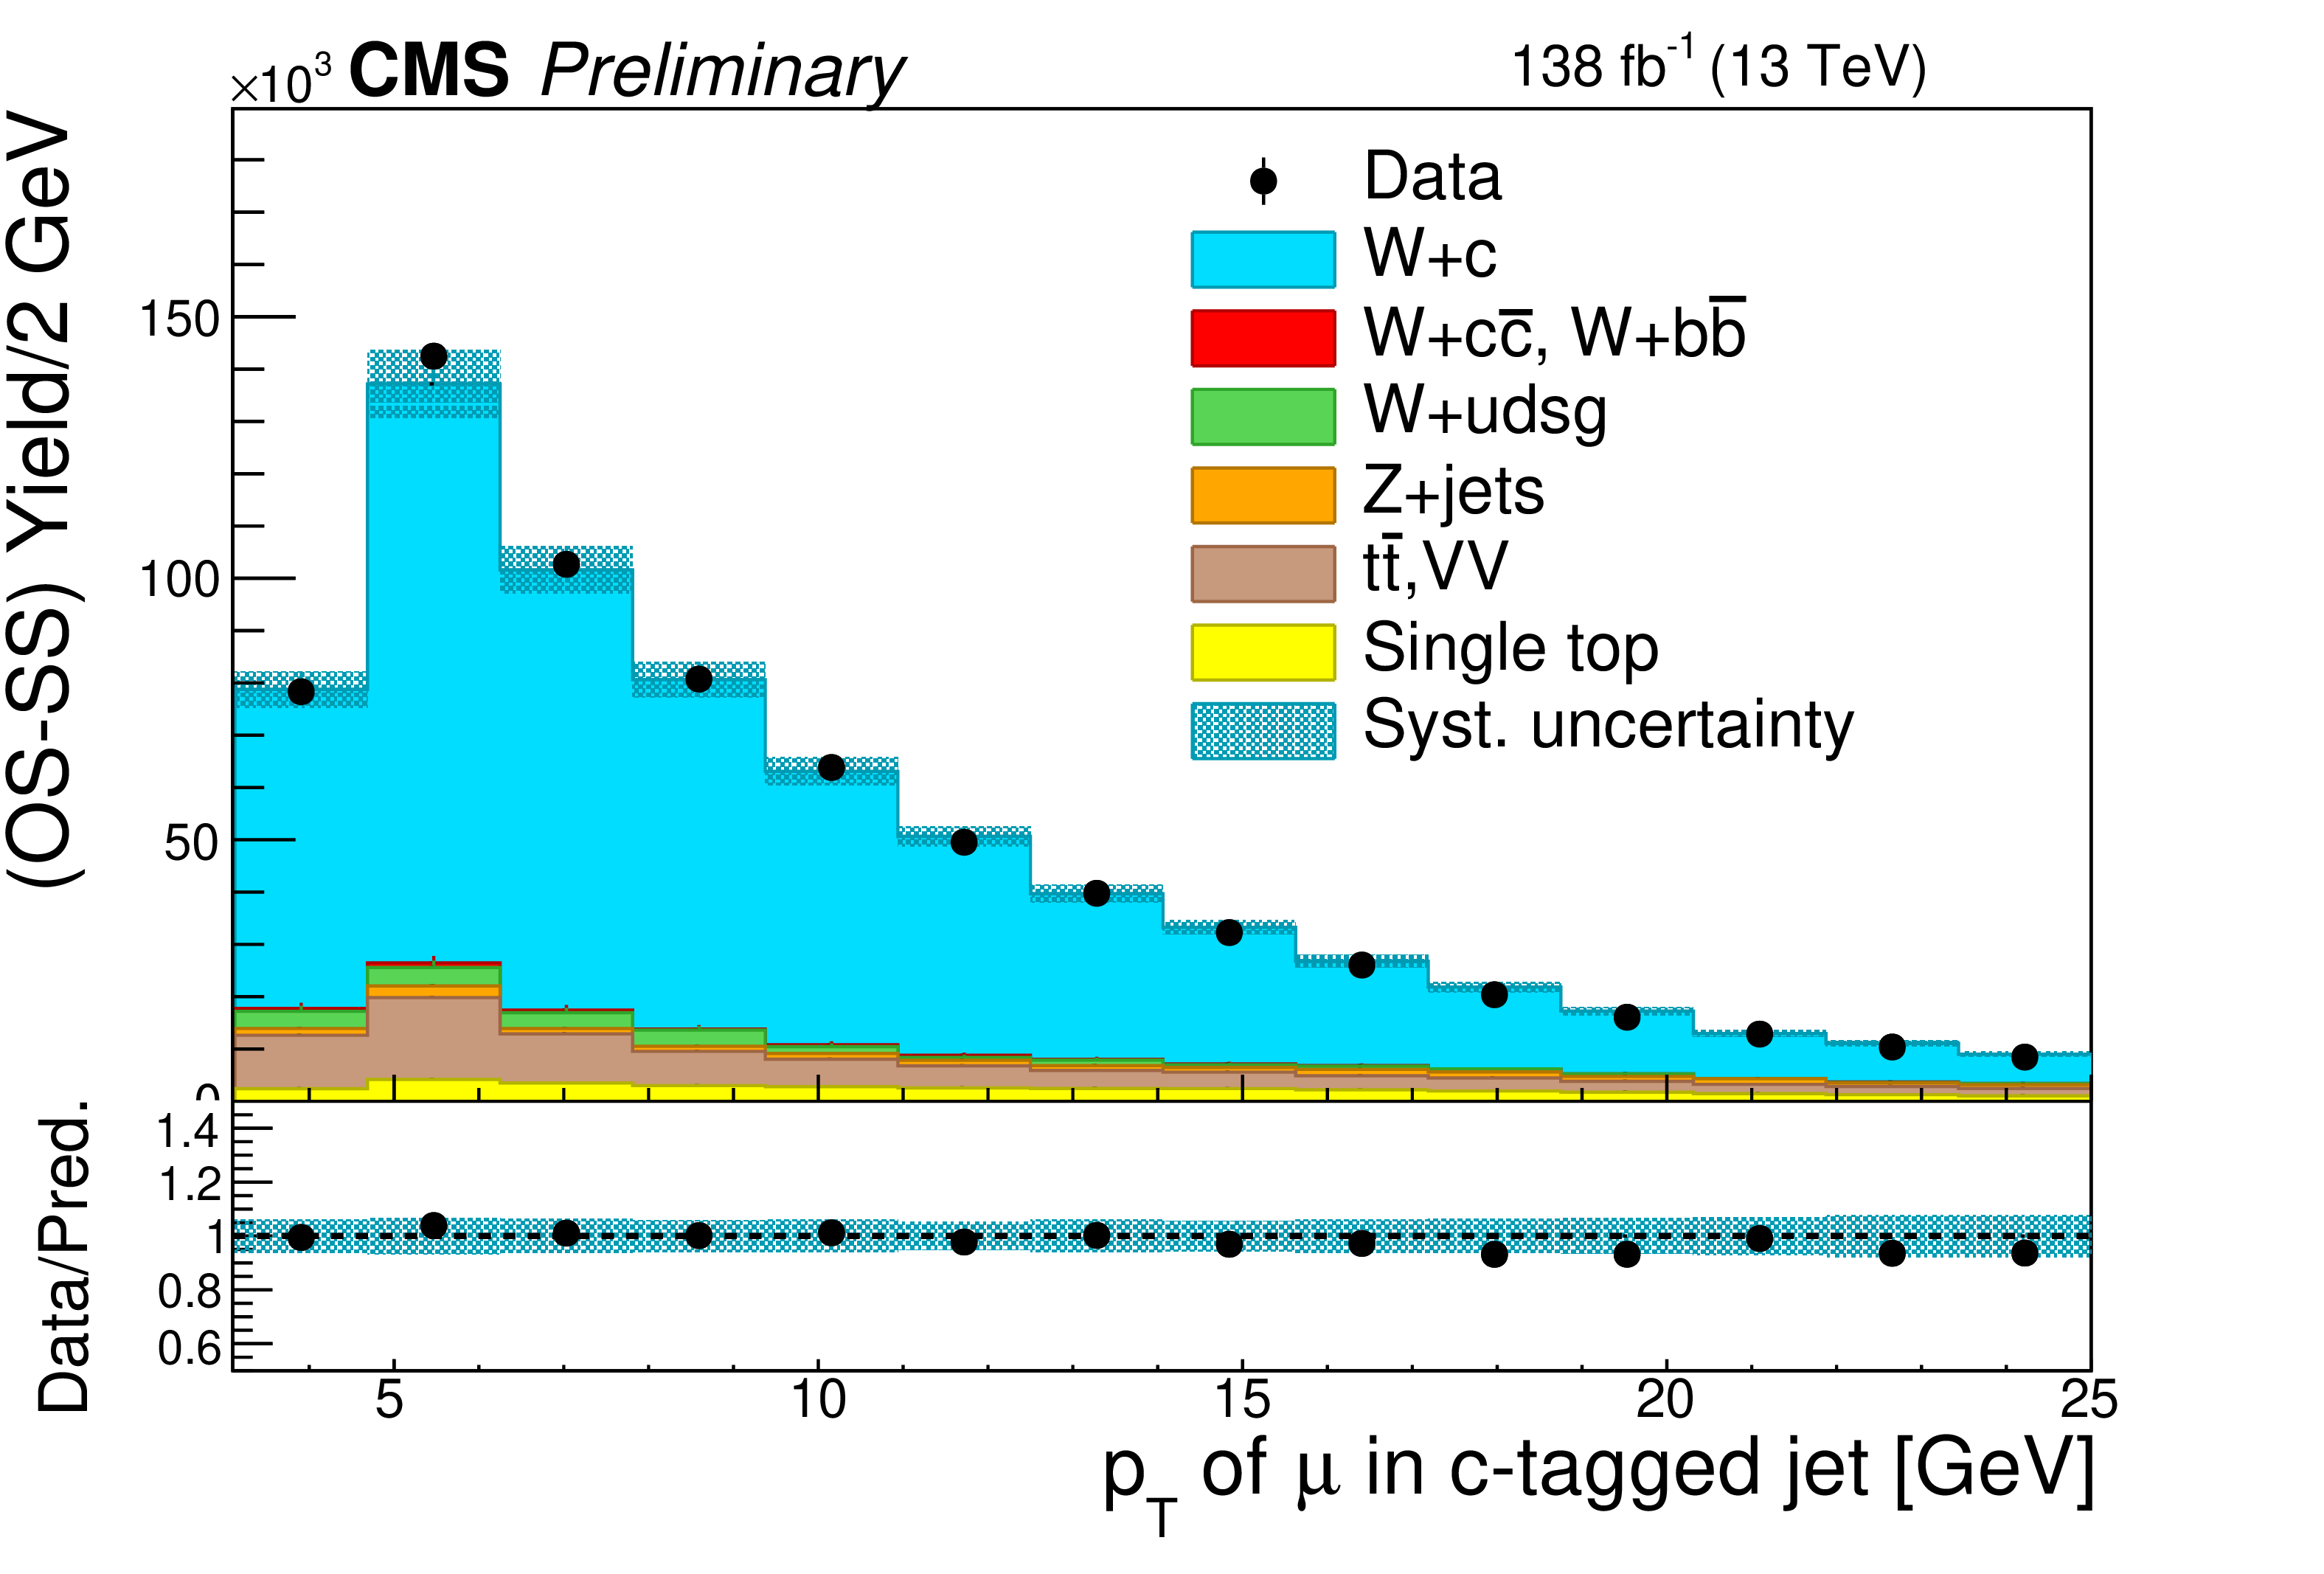
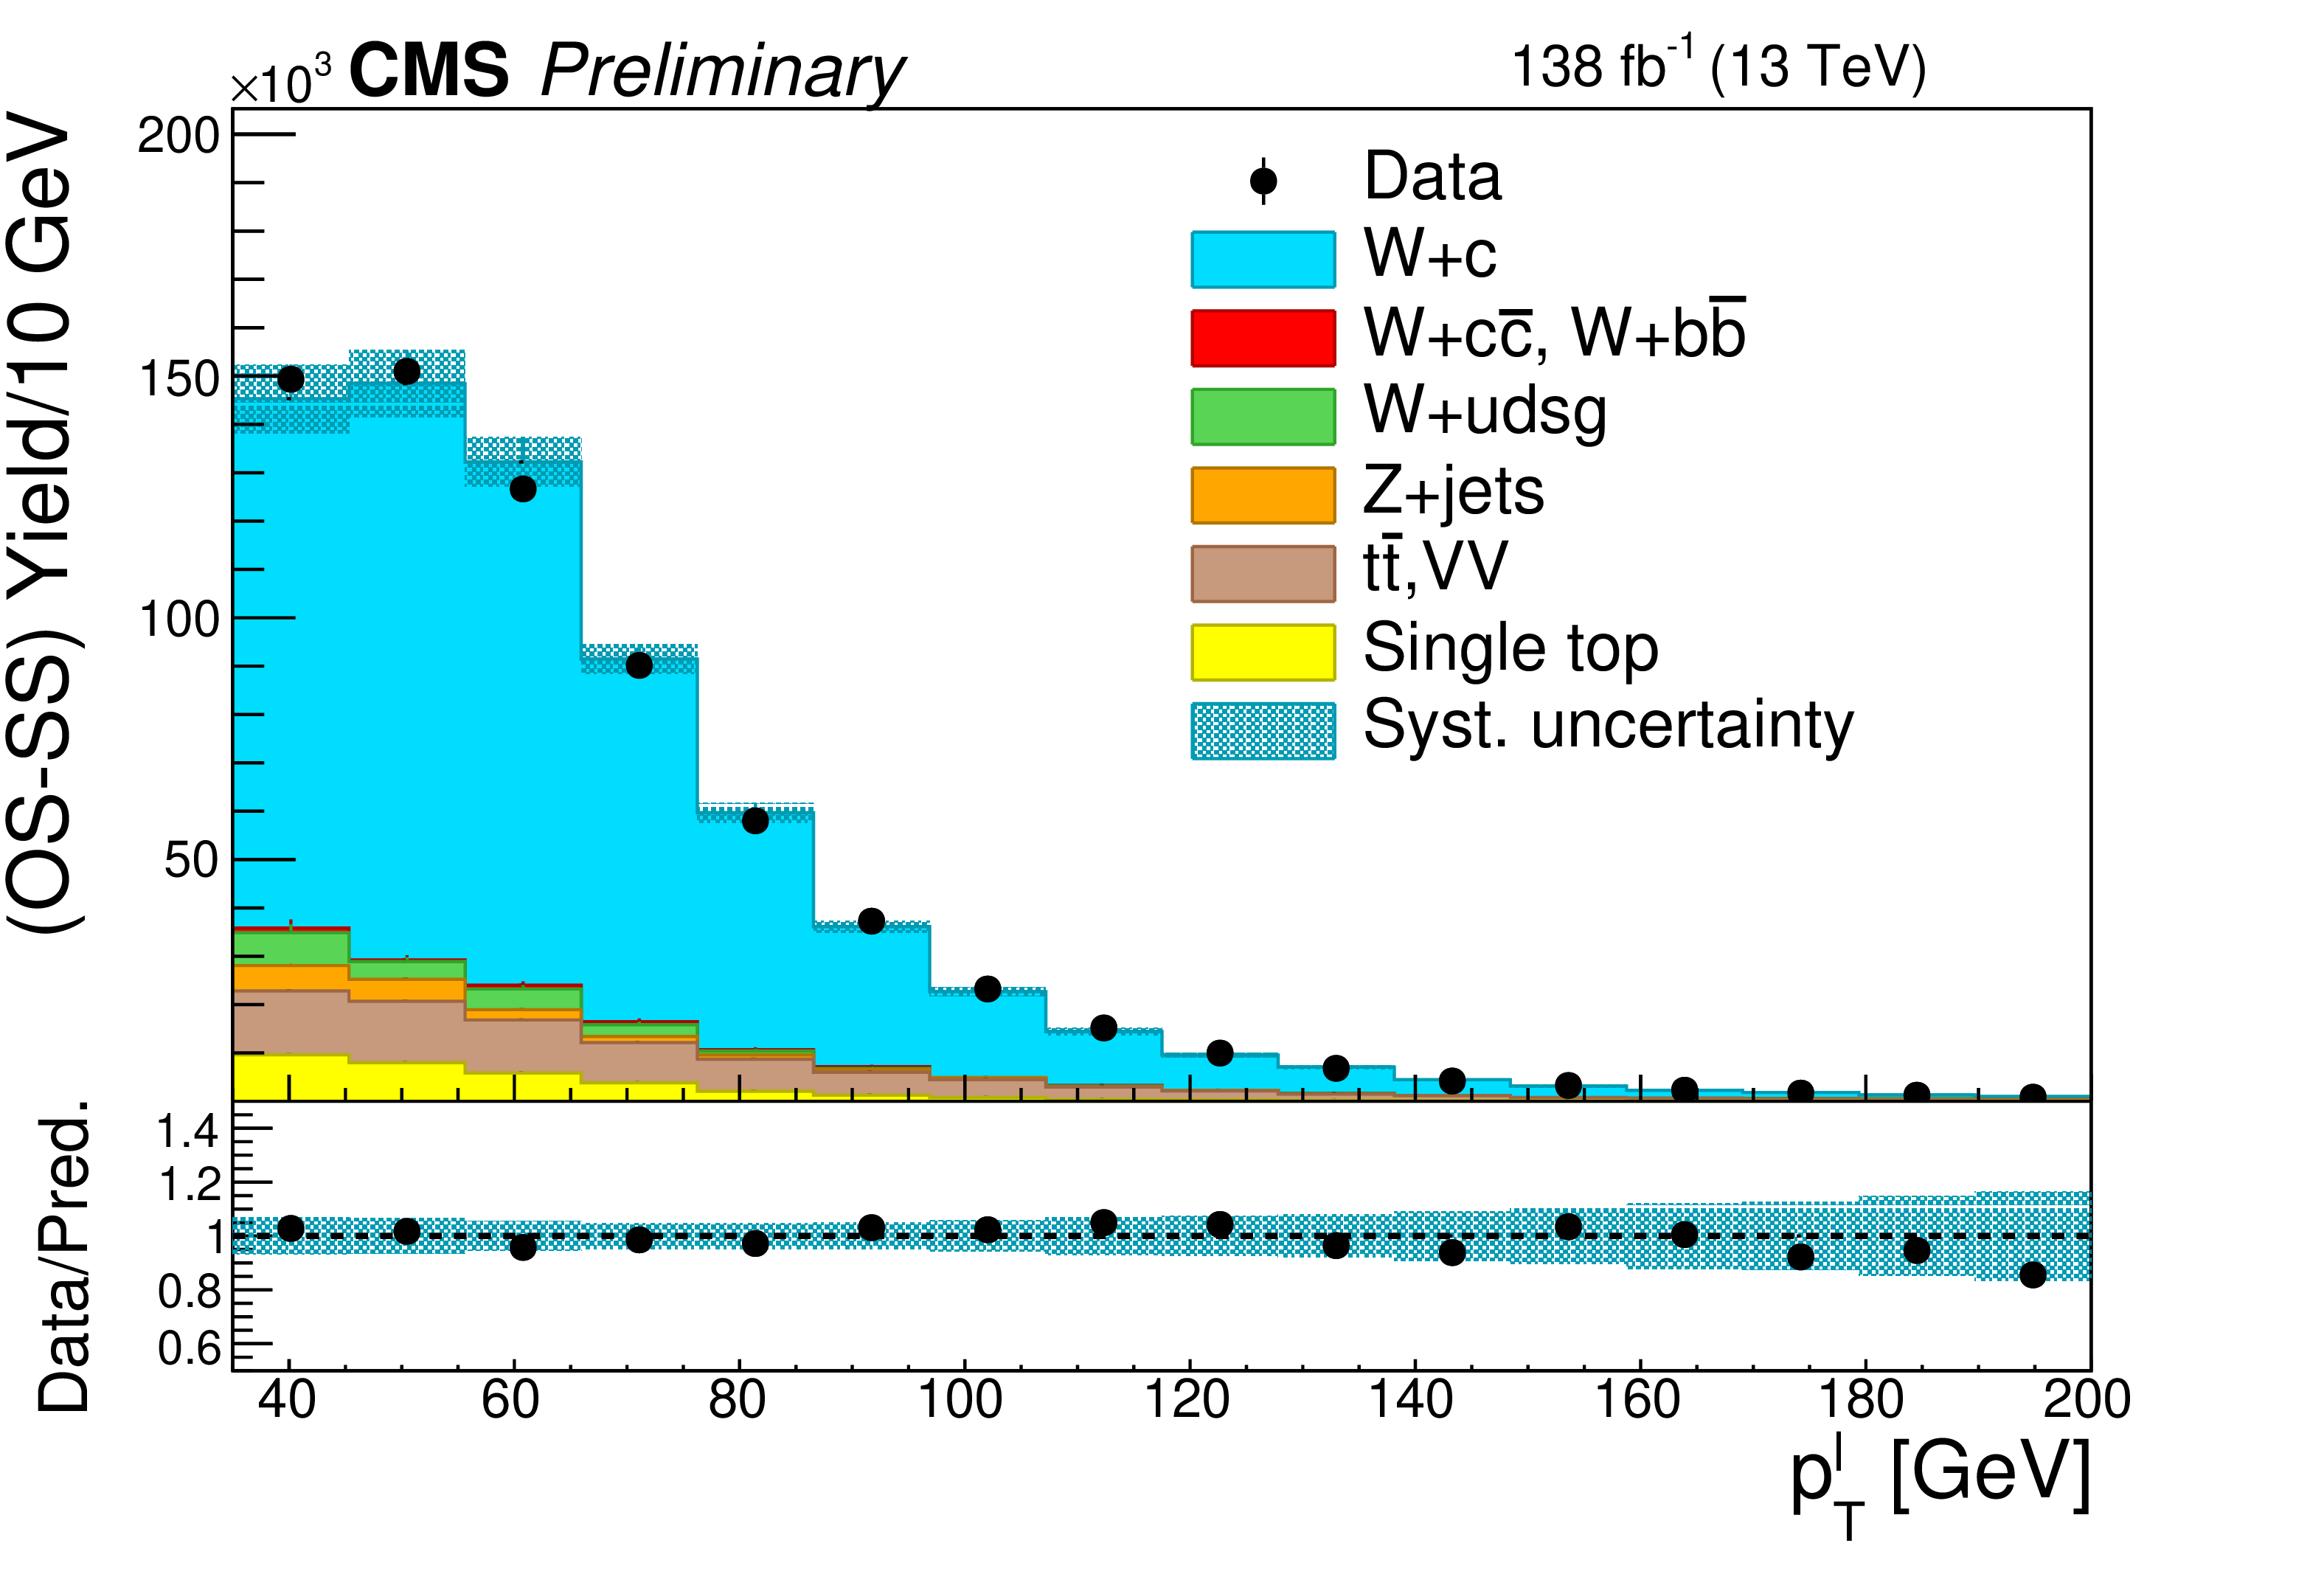
Figure 2:
Distributions after OS-SS subtraction of the $ {p_{\mathrm {T}}} $ of the muon inside the c jet (left) and the $ {p_{\mathrm {T}}} $ of the lepton from the W decay (right) for events in the SL sample, summing up the contributions of the two W boson decay channels. The contributions of the various processes are estimated with the simulated samples. The statistical uncertainty in the data is smaller than the size of the data dots. The hatched areas represent the sum in quadrature of statistical and systematic uncertainties in the MC simulation. The ratio of data to simulation is shown in the lower panels. The uncertainty band in the ratio includes the statistical uncertainty in the data, and the statistical and systematic uncertainties in the MC simulation. |
png pdf |
Figure 2-a:
Distributions after OS-SS subtraction of the $ {p_{\mathrm {T}}} $ of the muon inside the c jet (left) and the $ {p_{\mathrm {T}}} $ of the lepton from the W decay (right) for events in the SL sample, summing up the contributions of the two W boson decay channels. The contributions of the various processes are estimated with the simulated samples. The statistical uncertainty in the data is smaller than the size of the data dots. The hatched areas represent the sum in quadrature of statistical and systematic uncertainties in the MC simulation. The ratio of data to simulation is shown in the lower panels. The uncertainty band in the ratio includes the statistical uncertainty in the data, and the statistical and systematic uncertainties in the MC simulation. |
png pdf |
Figure 2-b:
Distributions after OS-SS subtraction of the $ {p_{\mathrm {T}}} $ of the muon inside the c jet (left) and the $ {p_{\mathrm {T}}} $ of the lepton from the W decay (right) for events in the SL sample, summing up the contributions of the two W boson decay channels. The contributions of the various processes are estimated with the simulated samples. The statistical uncertainty in the data is smaller than the size of the data dots. The hatched areas represent the sum in quadrature of statistical and systematic uncertainties in the MC simulation. The ratio of data to simulation is shown in the lower panels. The uncertainty band in the ratio includes the statistical uncertainty in the data, and the statistical and systematic uncertainties in the MC simulation. |
png pdf |
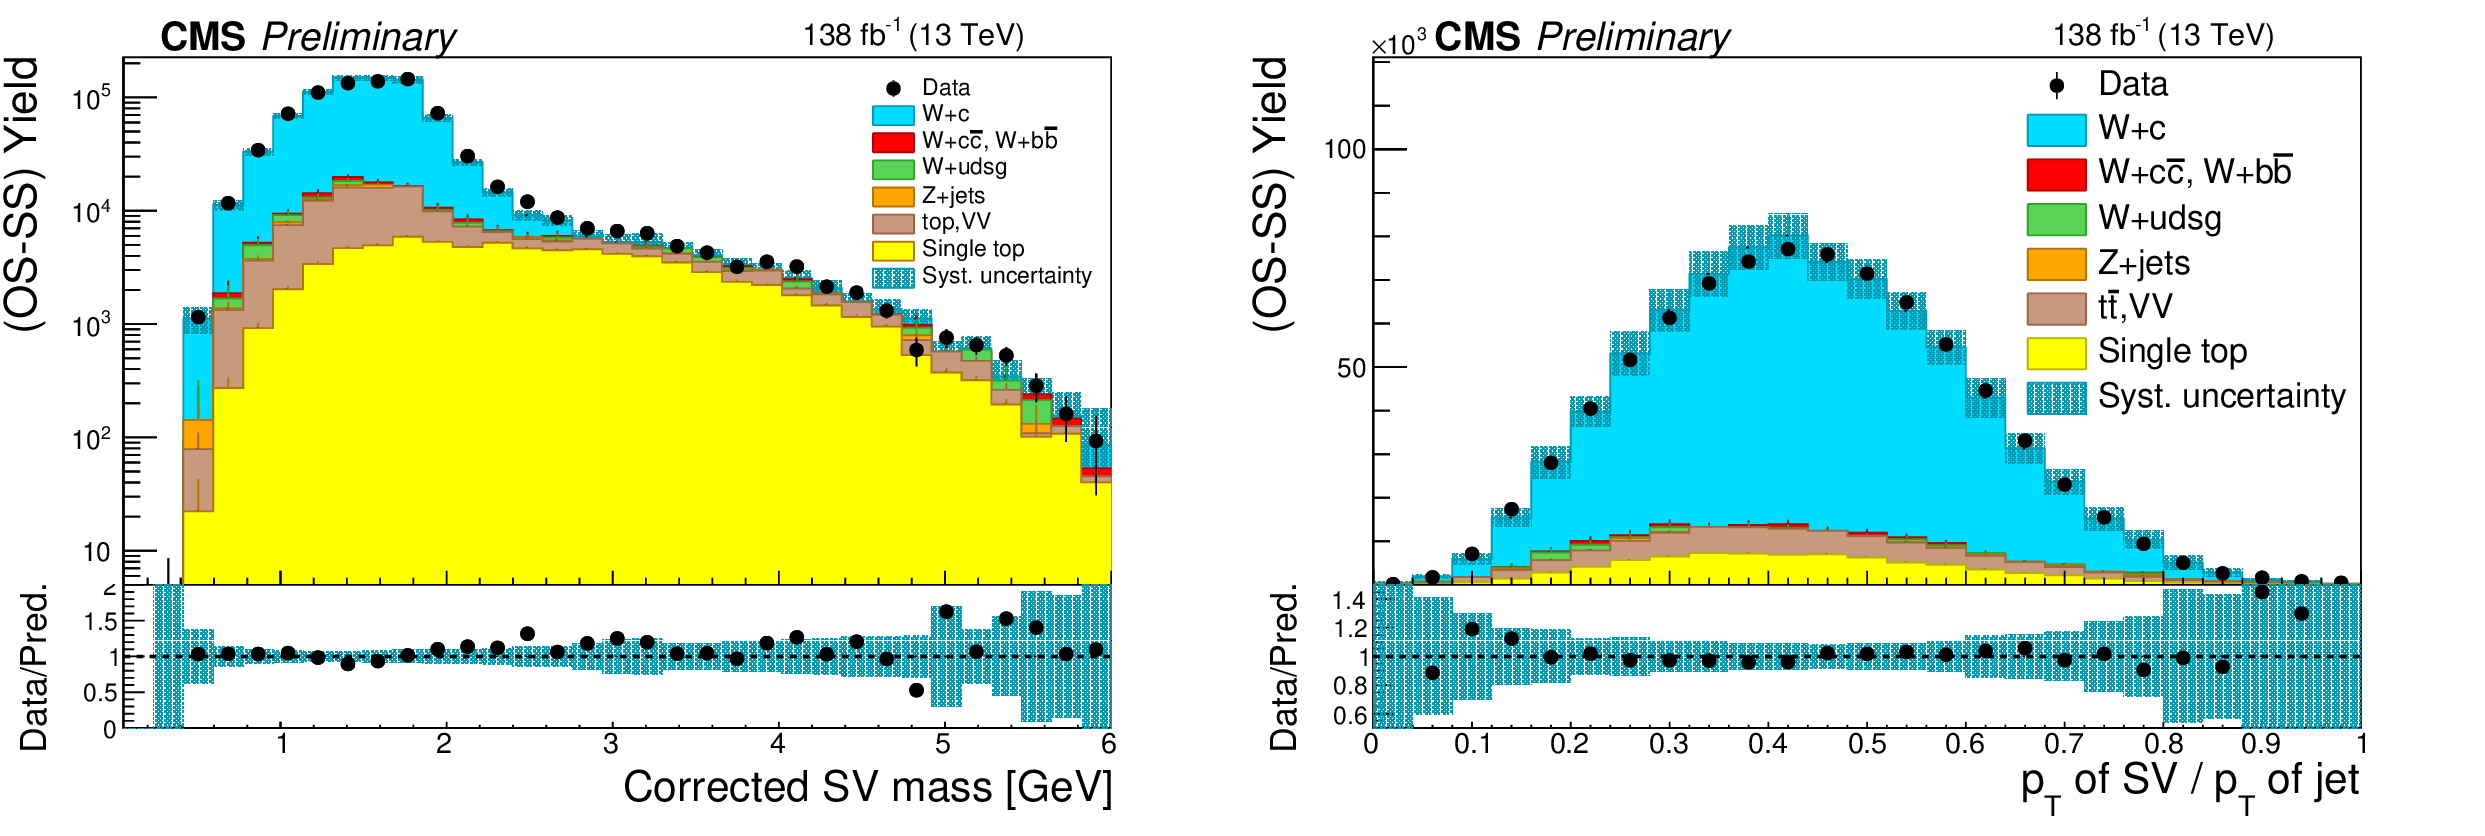
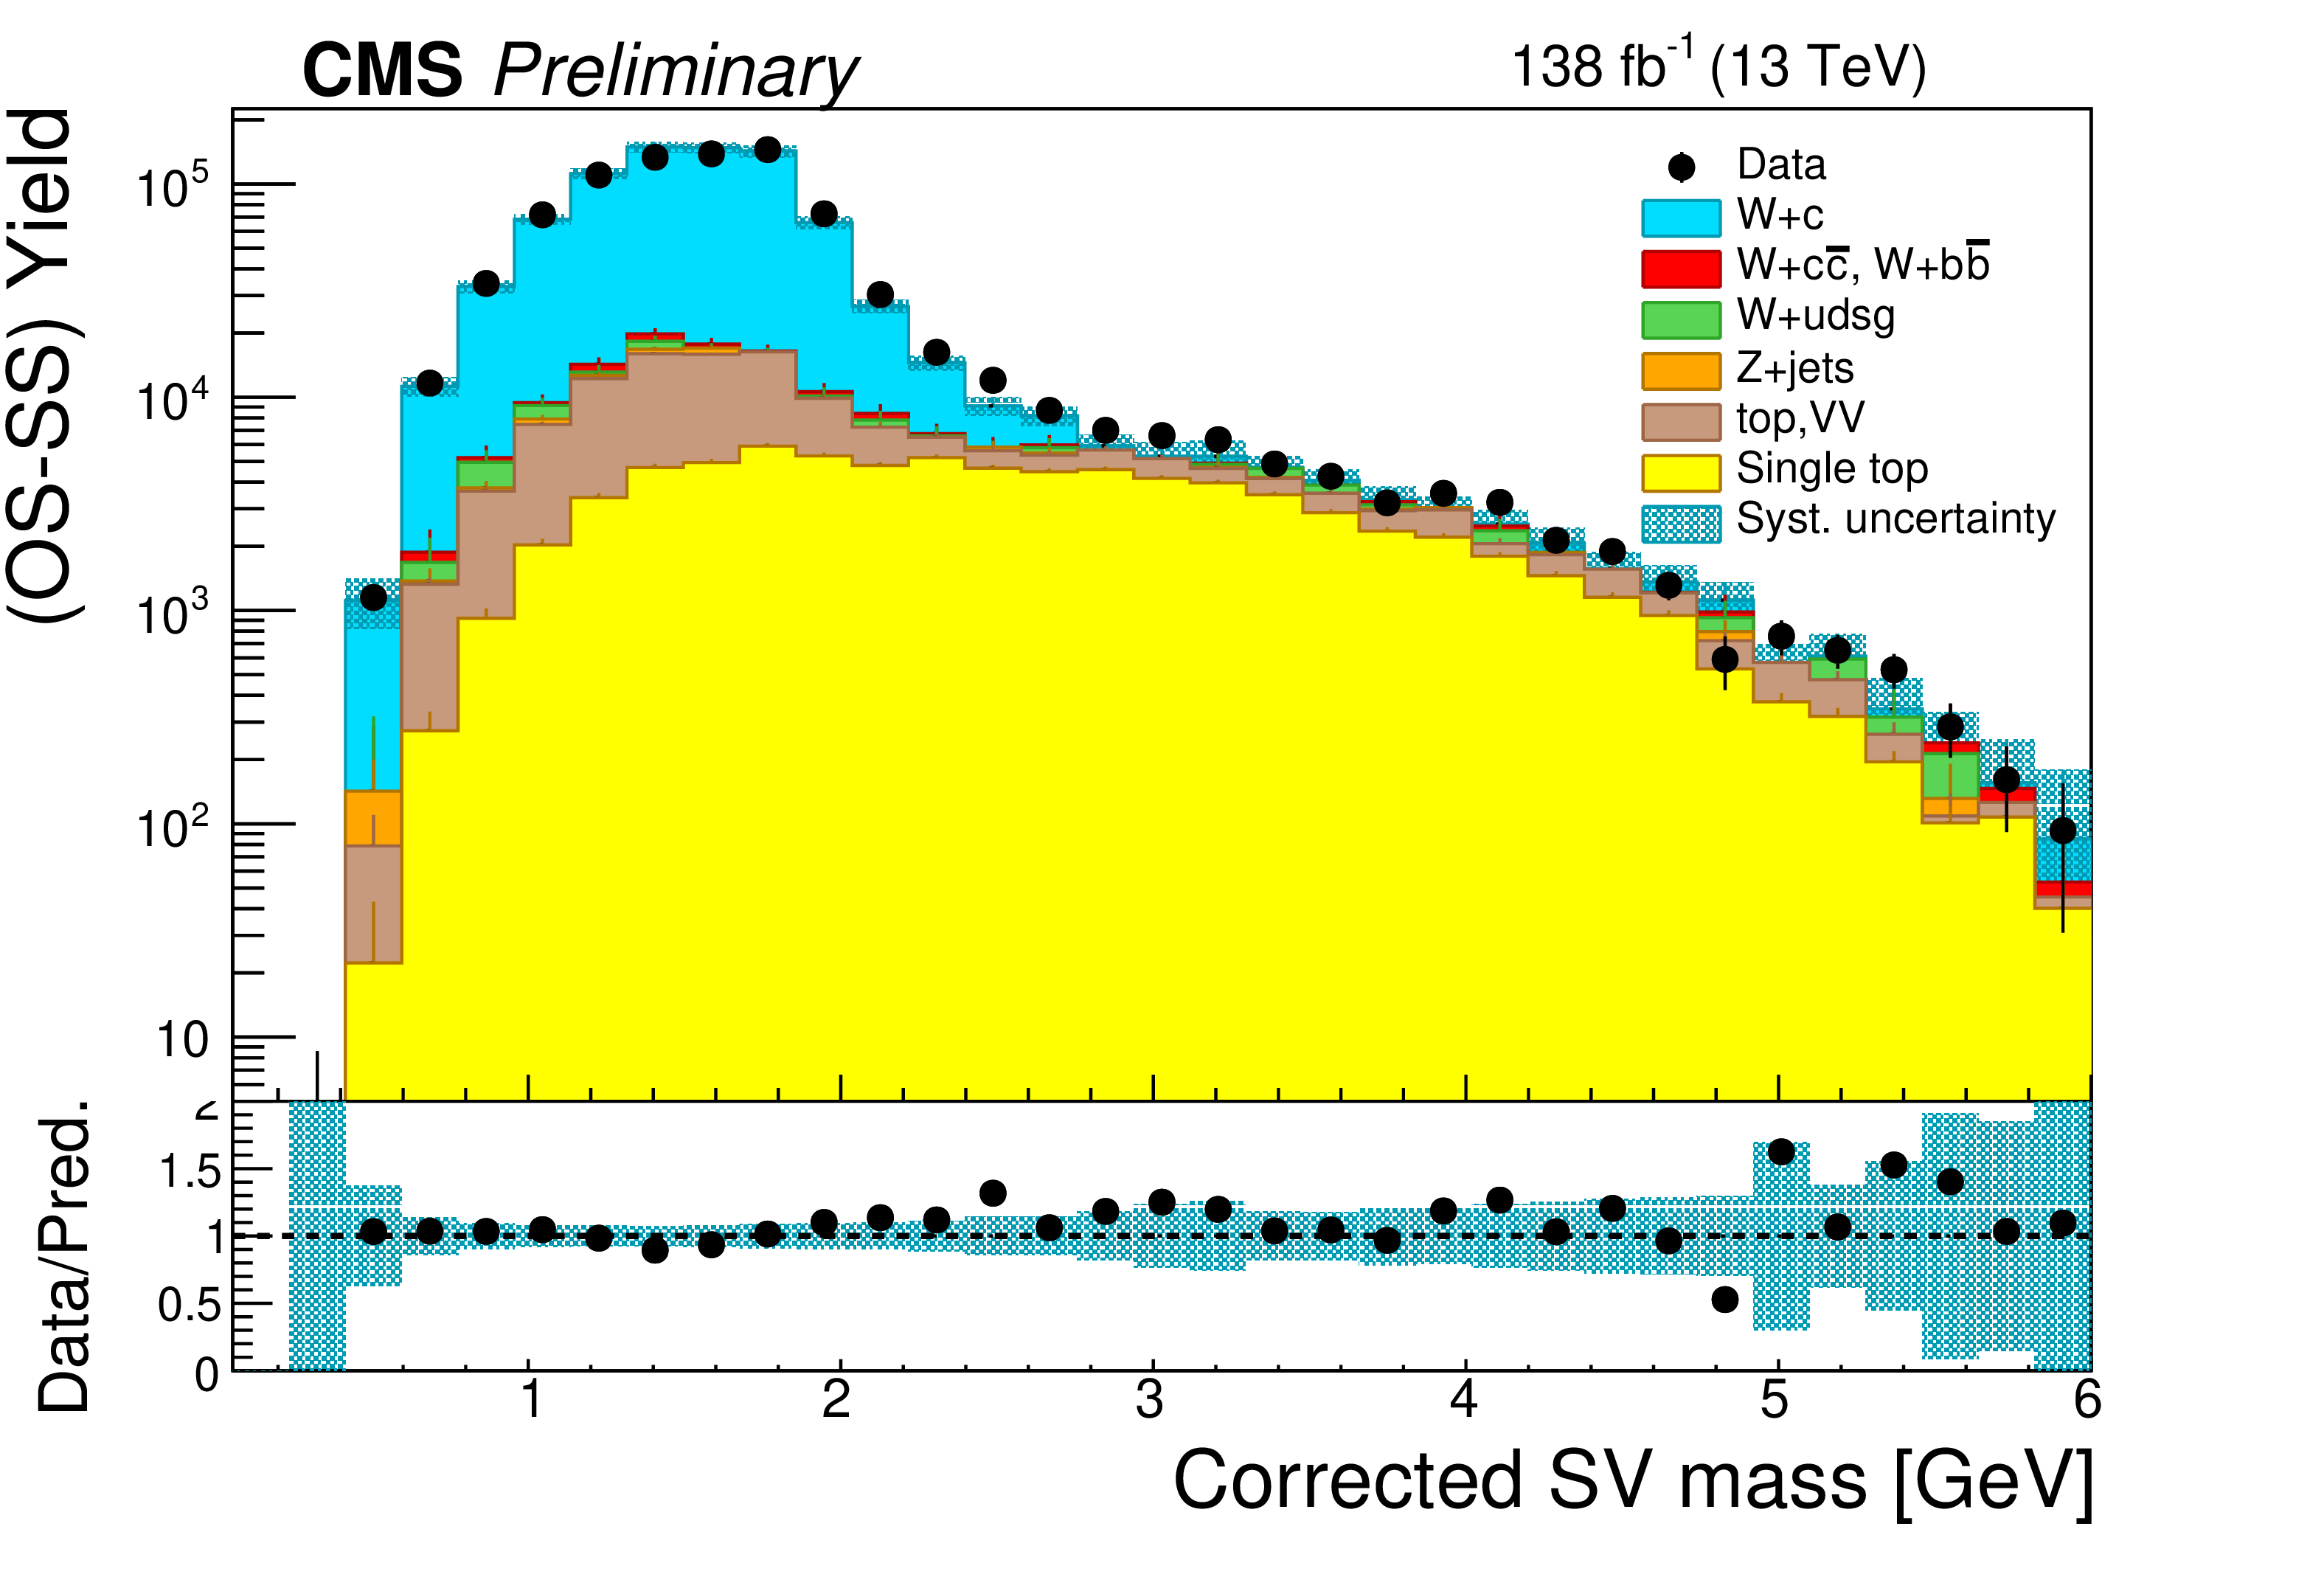
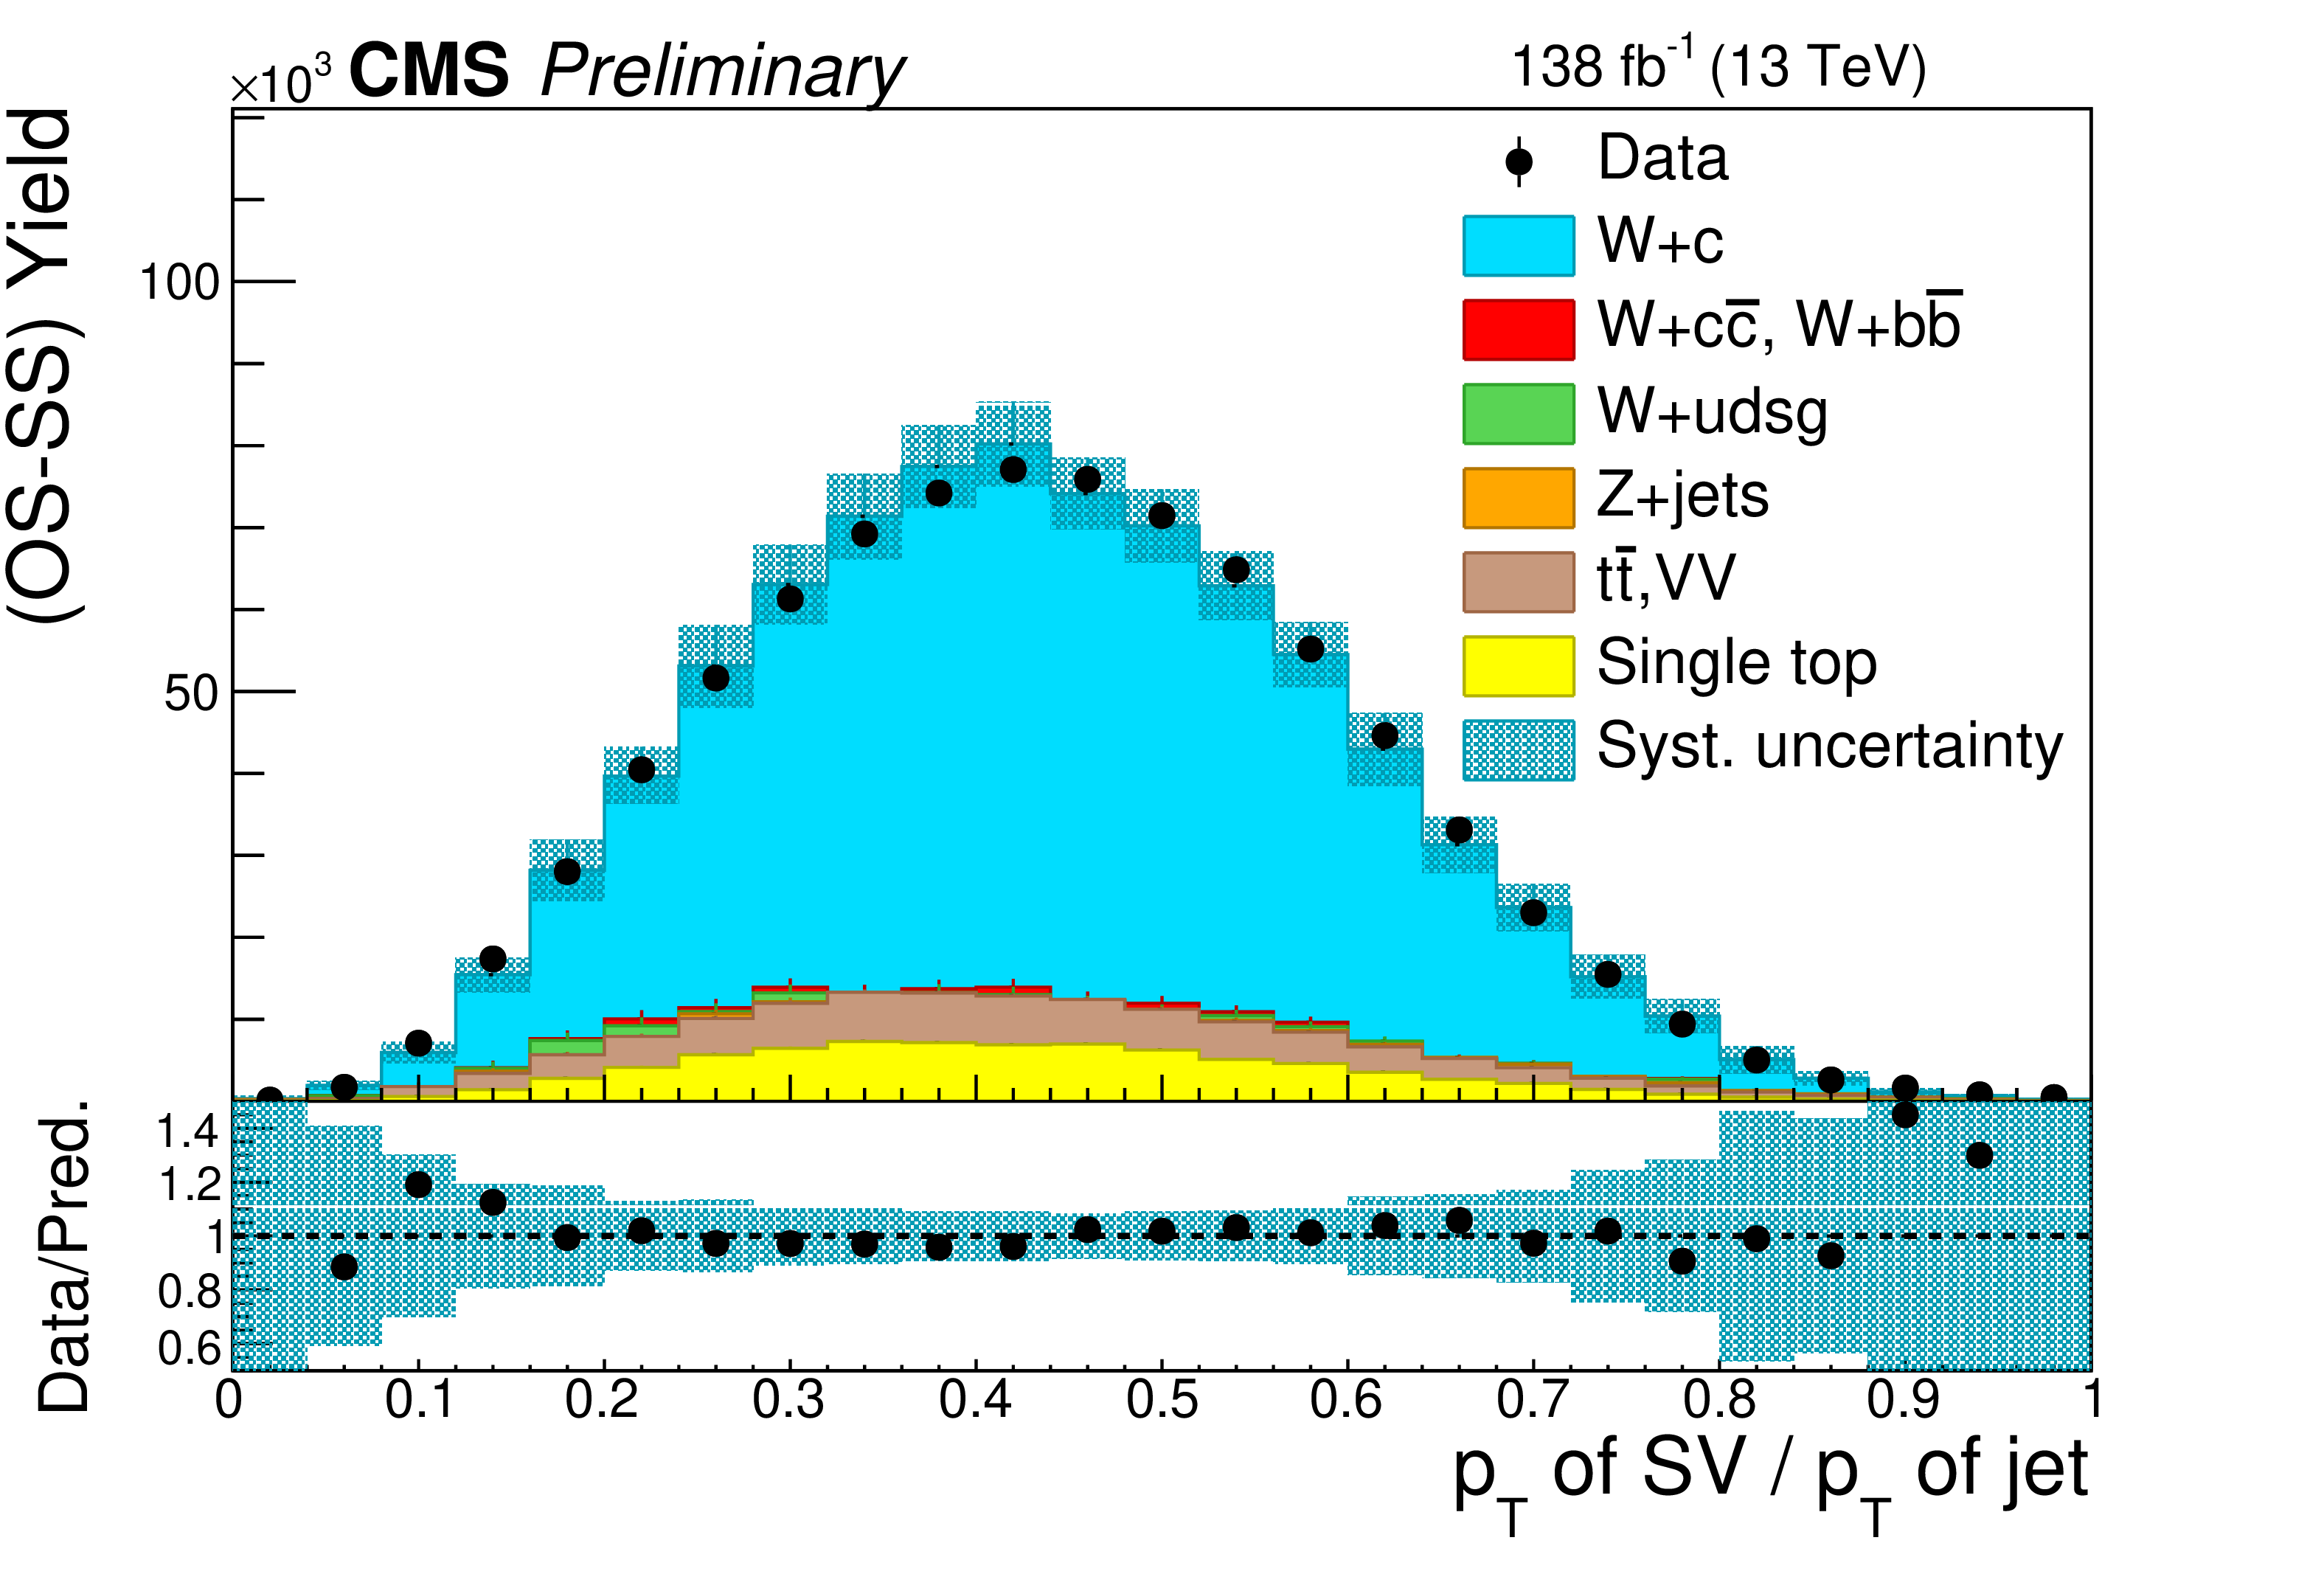
Figure 3:
Distributions after OS-SS subtraction of the corrected SV mass (left) and SV transverse momentum divided by the jet transverse momentum (right) for events in the SV sample, summing up the contributions of the two W boson decay channels. The contributions from all processes are estimated with the simulated samples. The statistical uncertainty in the data is smaller than the size of the data dots. The hatched areas represent the sum in quadrature of statistical and systematic uncertainties in the MC simulation. The ratio of data to simulation is shown in the lower panels. The uncertainty band in the ratio includes the statistical uncertainty in the data, and the statistical and systematic uncertainties in the MC simulation. |
png pdf |
Figure 3-a:
Distributions after OS-SS subtraction of the corrected SV mass (left) and SV transverse momentum divided by the jet transverse momentum (right) for events in the SV sample, summing up the contributions of the two W boson decay channels. The contributions from all processes are estimated with the simulated samples. The statistical uncertainty in the data is smaller than the size of the data dots. The hatched areas represent the sum in quadrature of statistical and systematic uncertainties in the MC simulation. The ratio of data to simulation is shown in the lower panels. The uncertainty band in the ratio includes the statistical uncertainty in the data, and the statistical and systematic uncertainties in the MC simulation. |
png pdf |
Figure 3-b:
Distributions after OS-SS subtraction of the corrected SV mass (left) and SV transverse momentum divided by the jet transverse momentum (right) for events in the SV sample, summing up the contributions of the two W boson decay channels. The contributions from all processes are estimated with the simulated samples. The statistical uncertainty in the data is smaller than the size of the data dots. The hatched areas represent the sum in quadrature of statistical and systematic uncertainties in the MC simulation. The ratio of data to simulation is shown in the lower panels. The uncertainty band in the ratio includes the statistical uncertainty in the data, and the statistical and systematic uncertainties in the MC simulation. |

png pdf |
Figure 4:
Comparison of the measured fiducial $ {\sigma ({\mathrm{W} \,\mathrm{c}})}$ cross section unfolded to the particle level with the predictions from the MadGraph5_aMC@NLO simulation using two different PDF sets (NNPDF3.0 and NNPDF3.1). Two different tunes (CUETP8M1 and CP5) for the parton showering, hadronization and underlying event modelling in PYTHIA 8 are also used. |
png pdf |
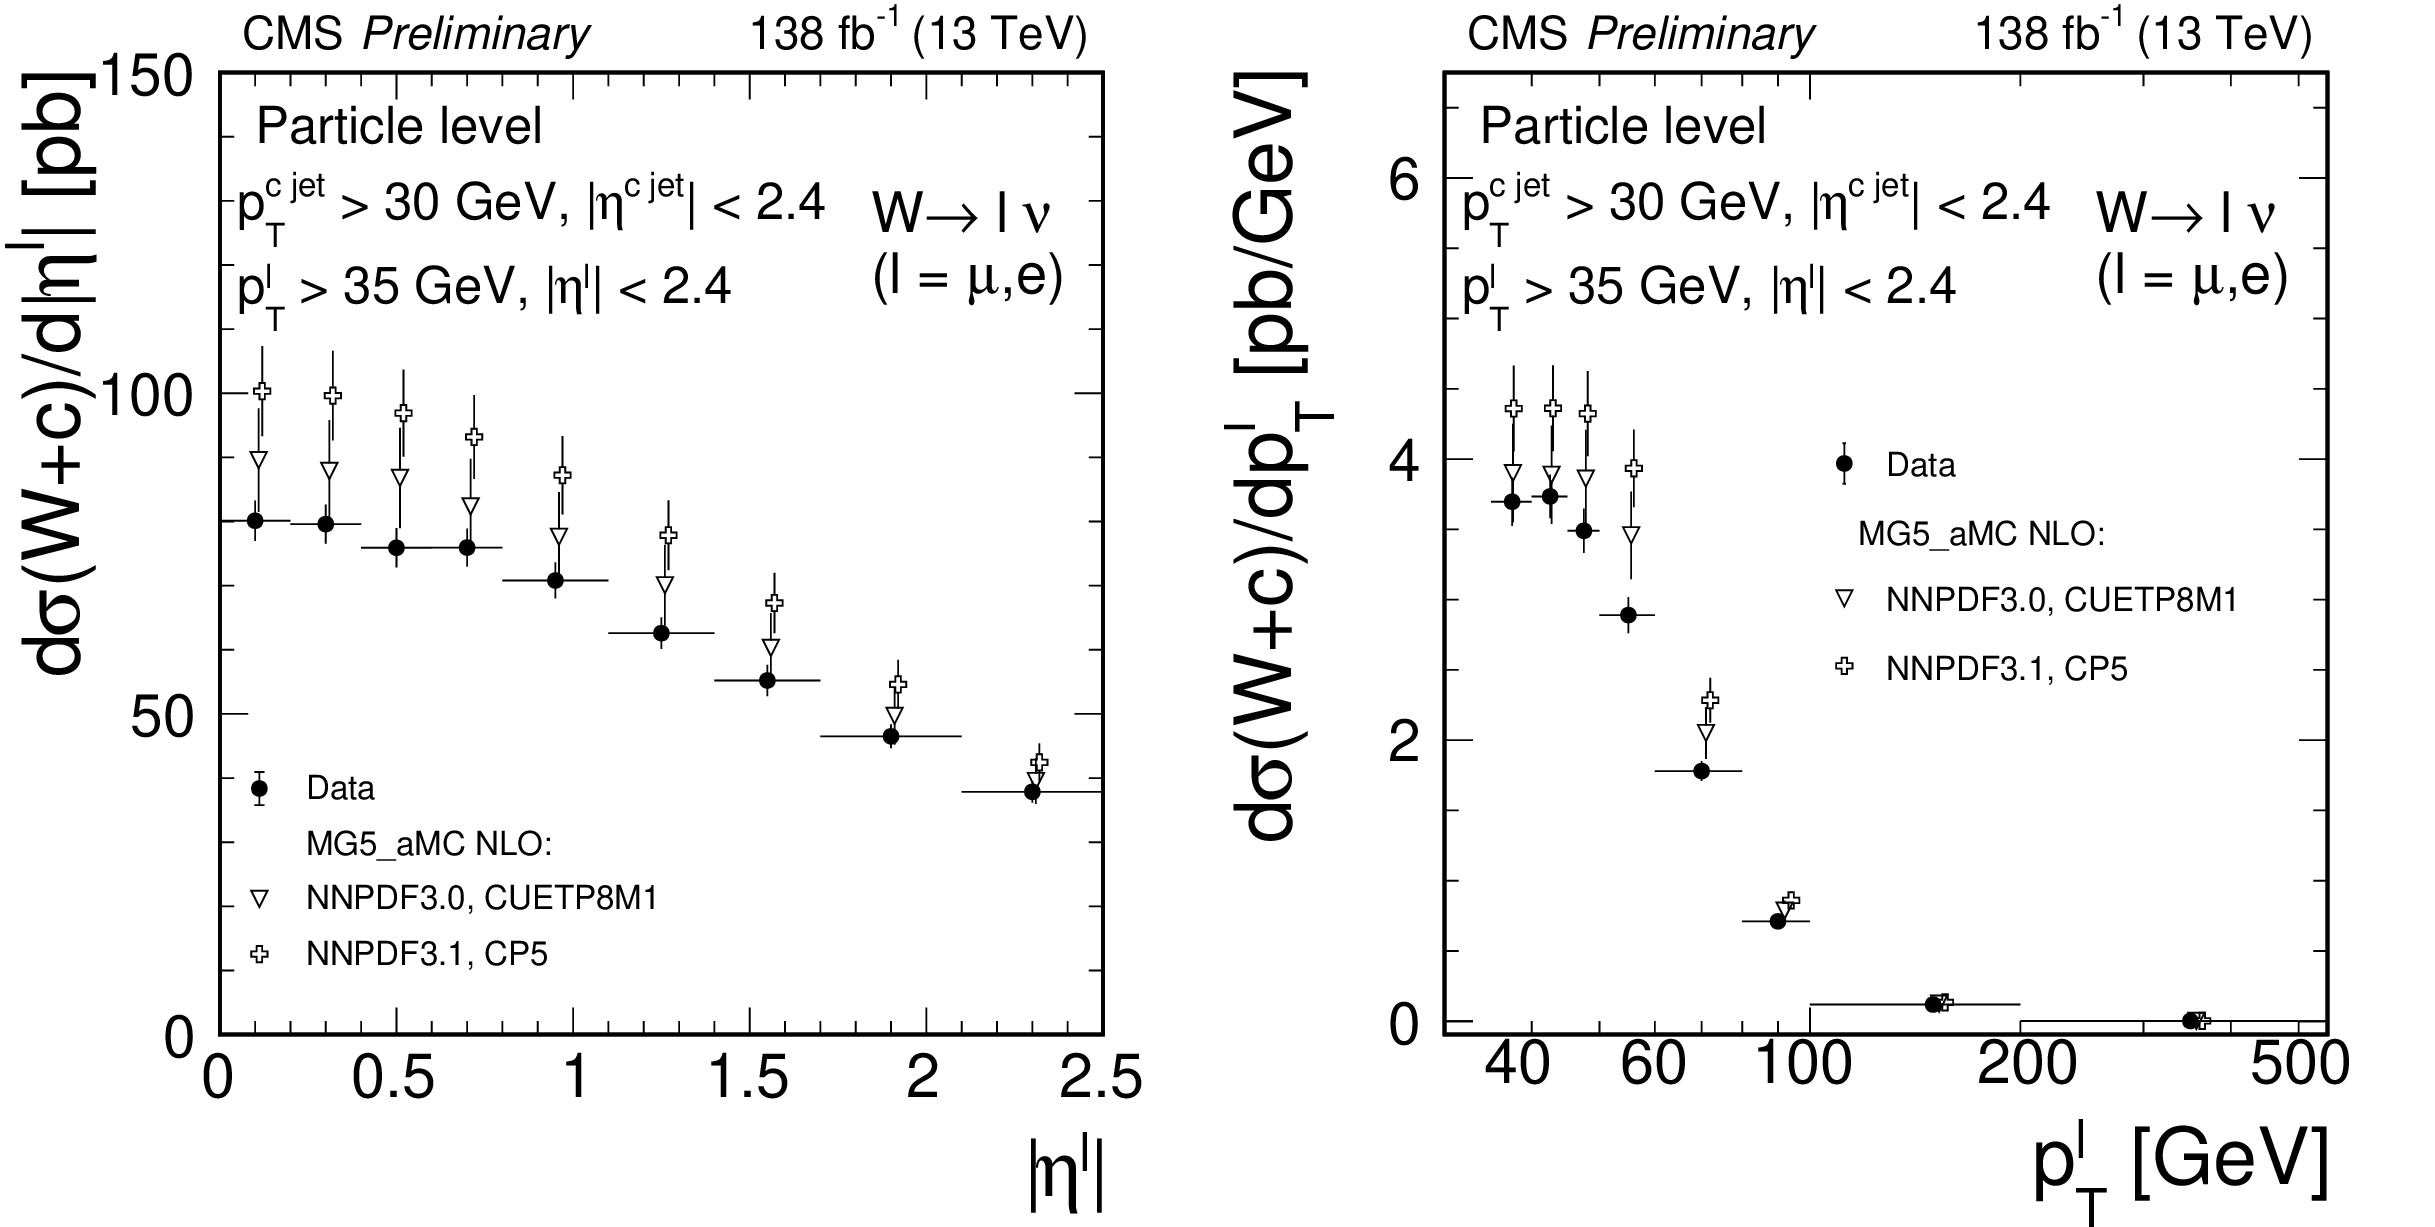
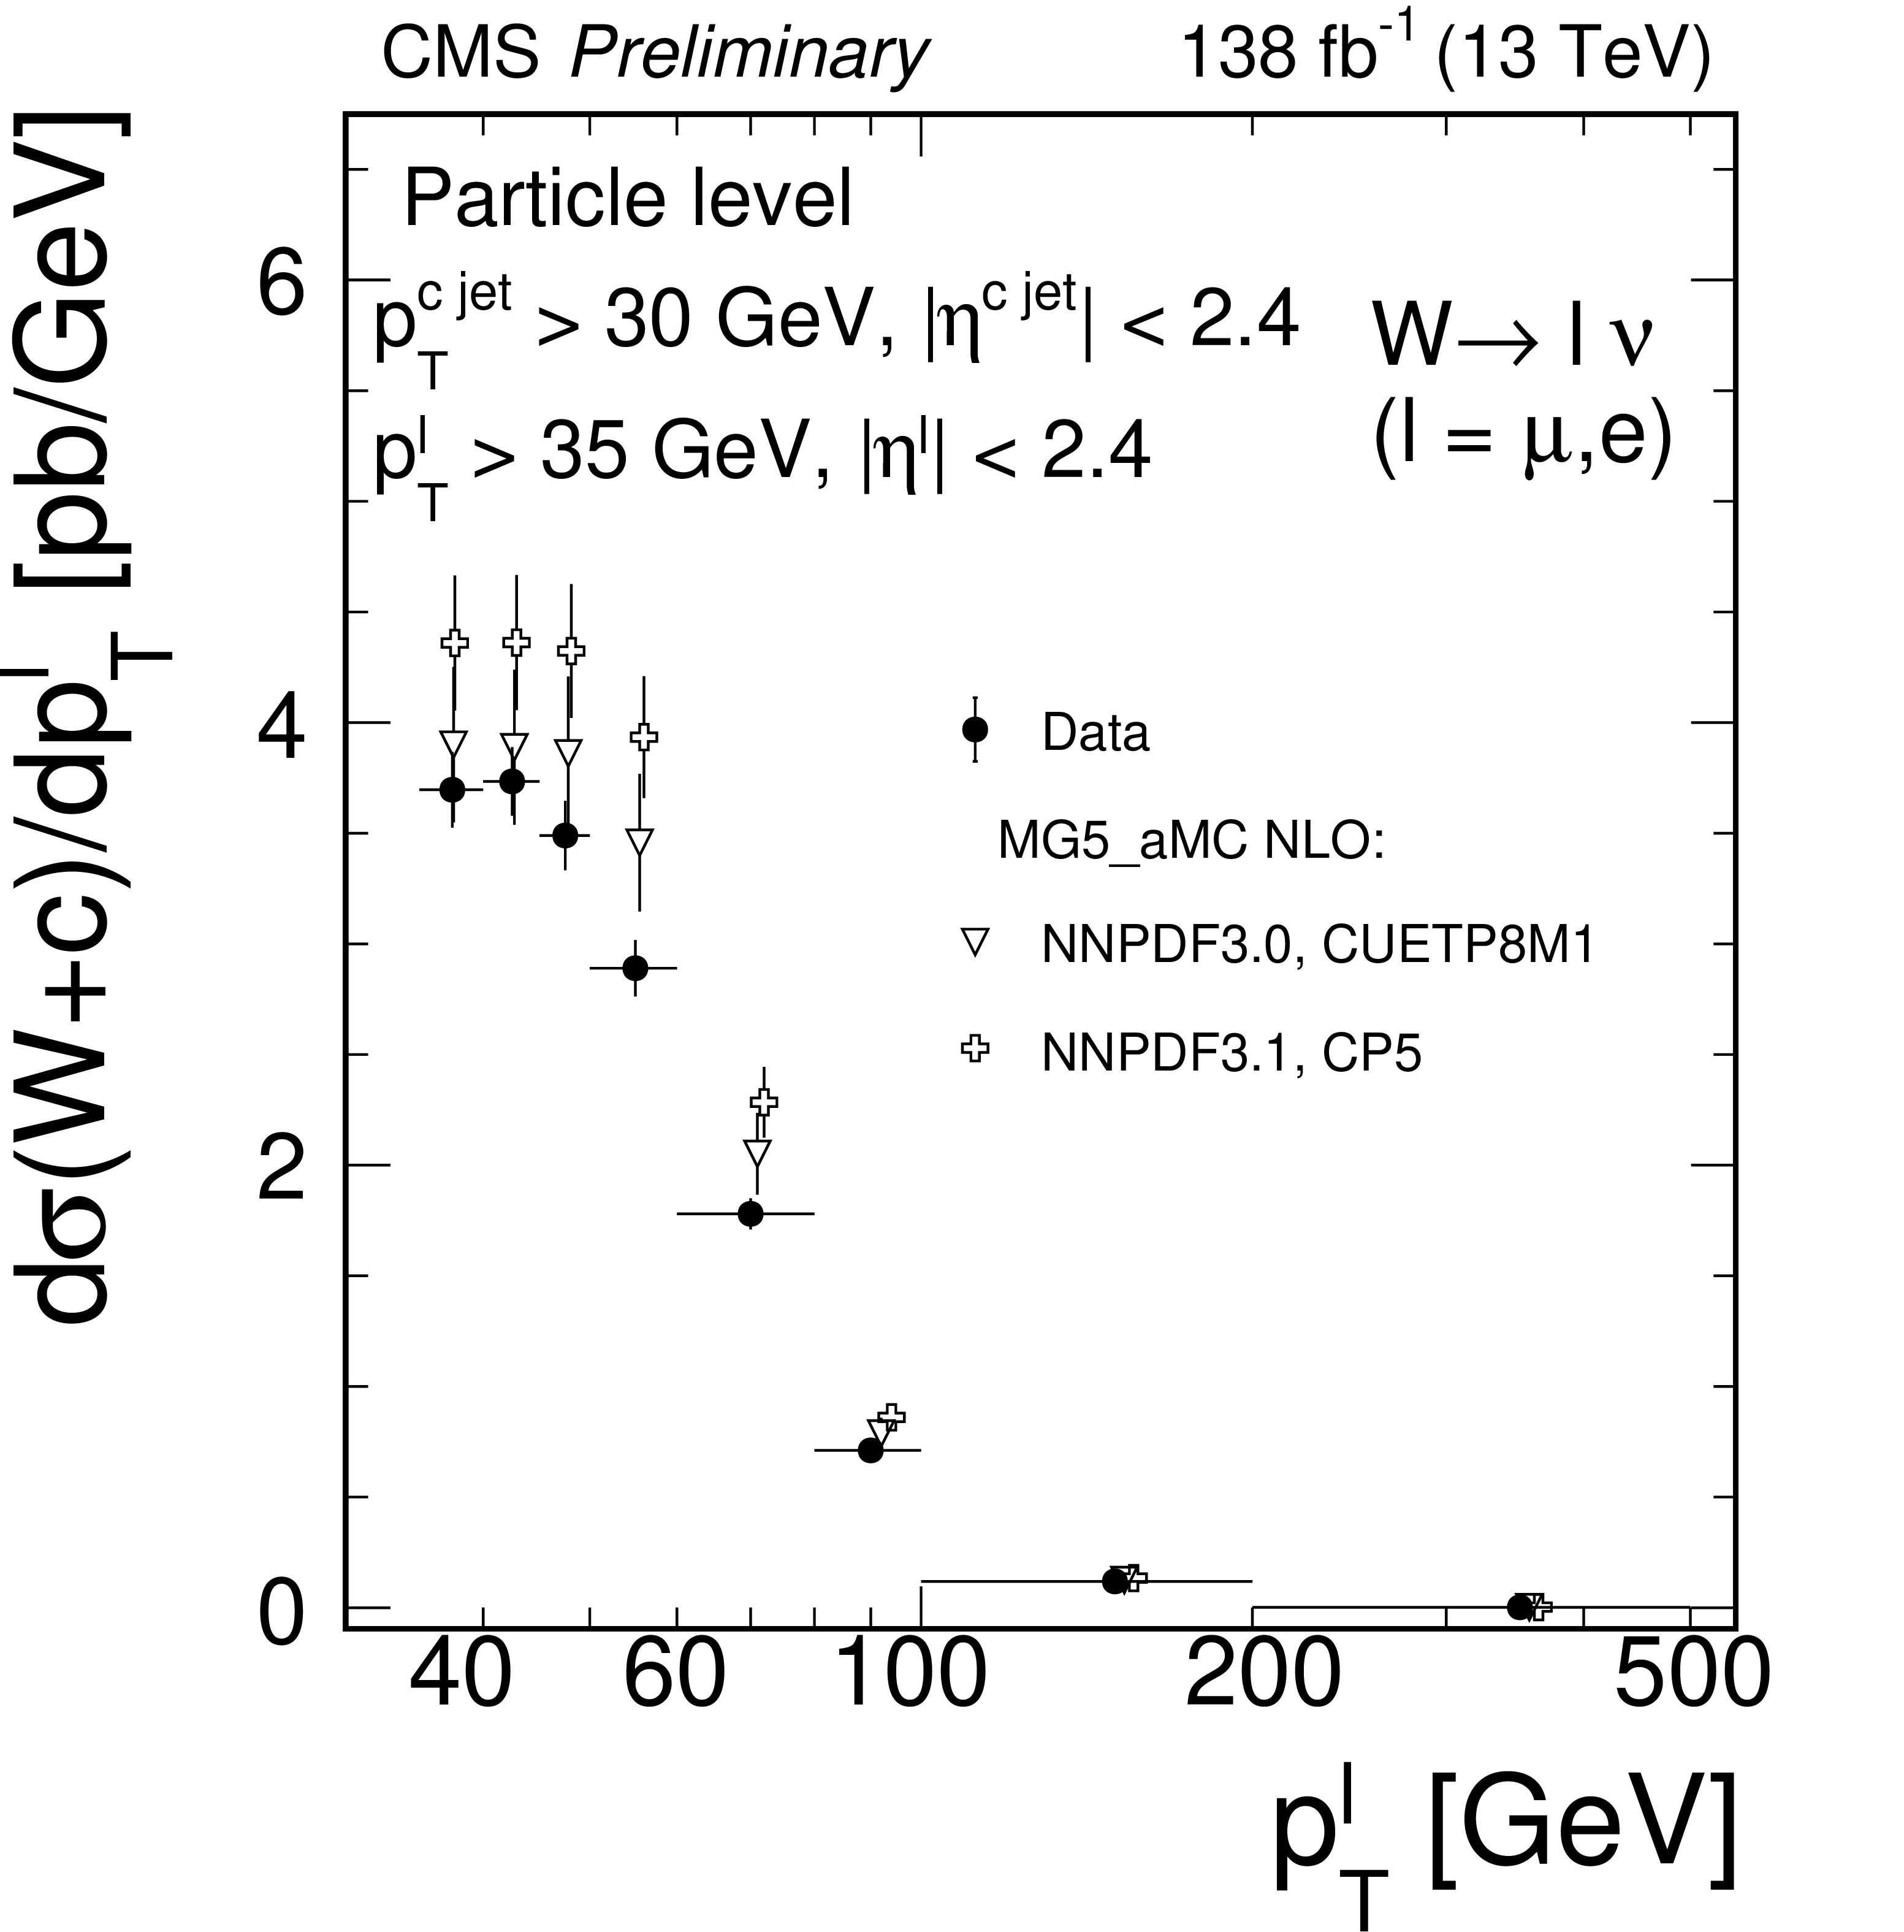
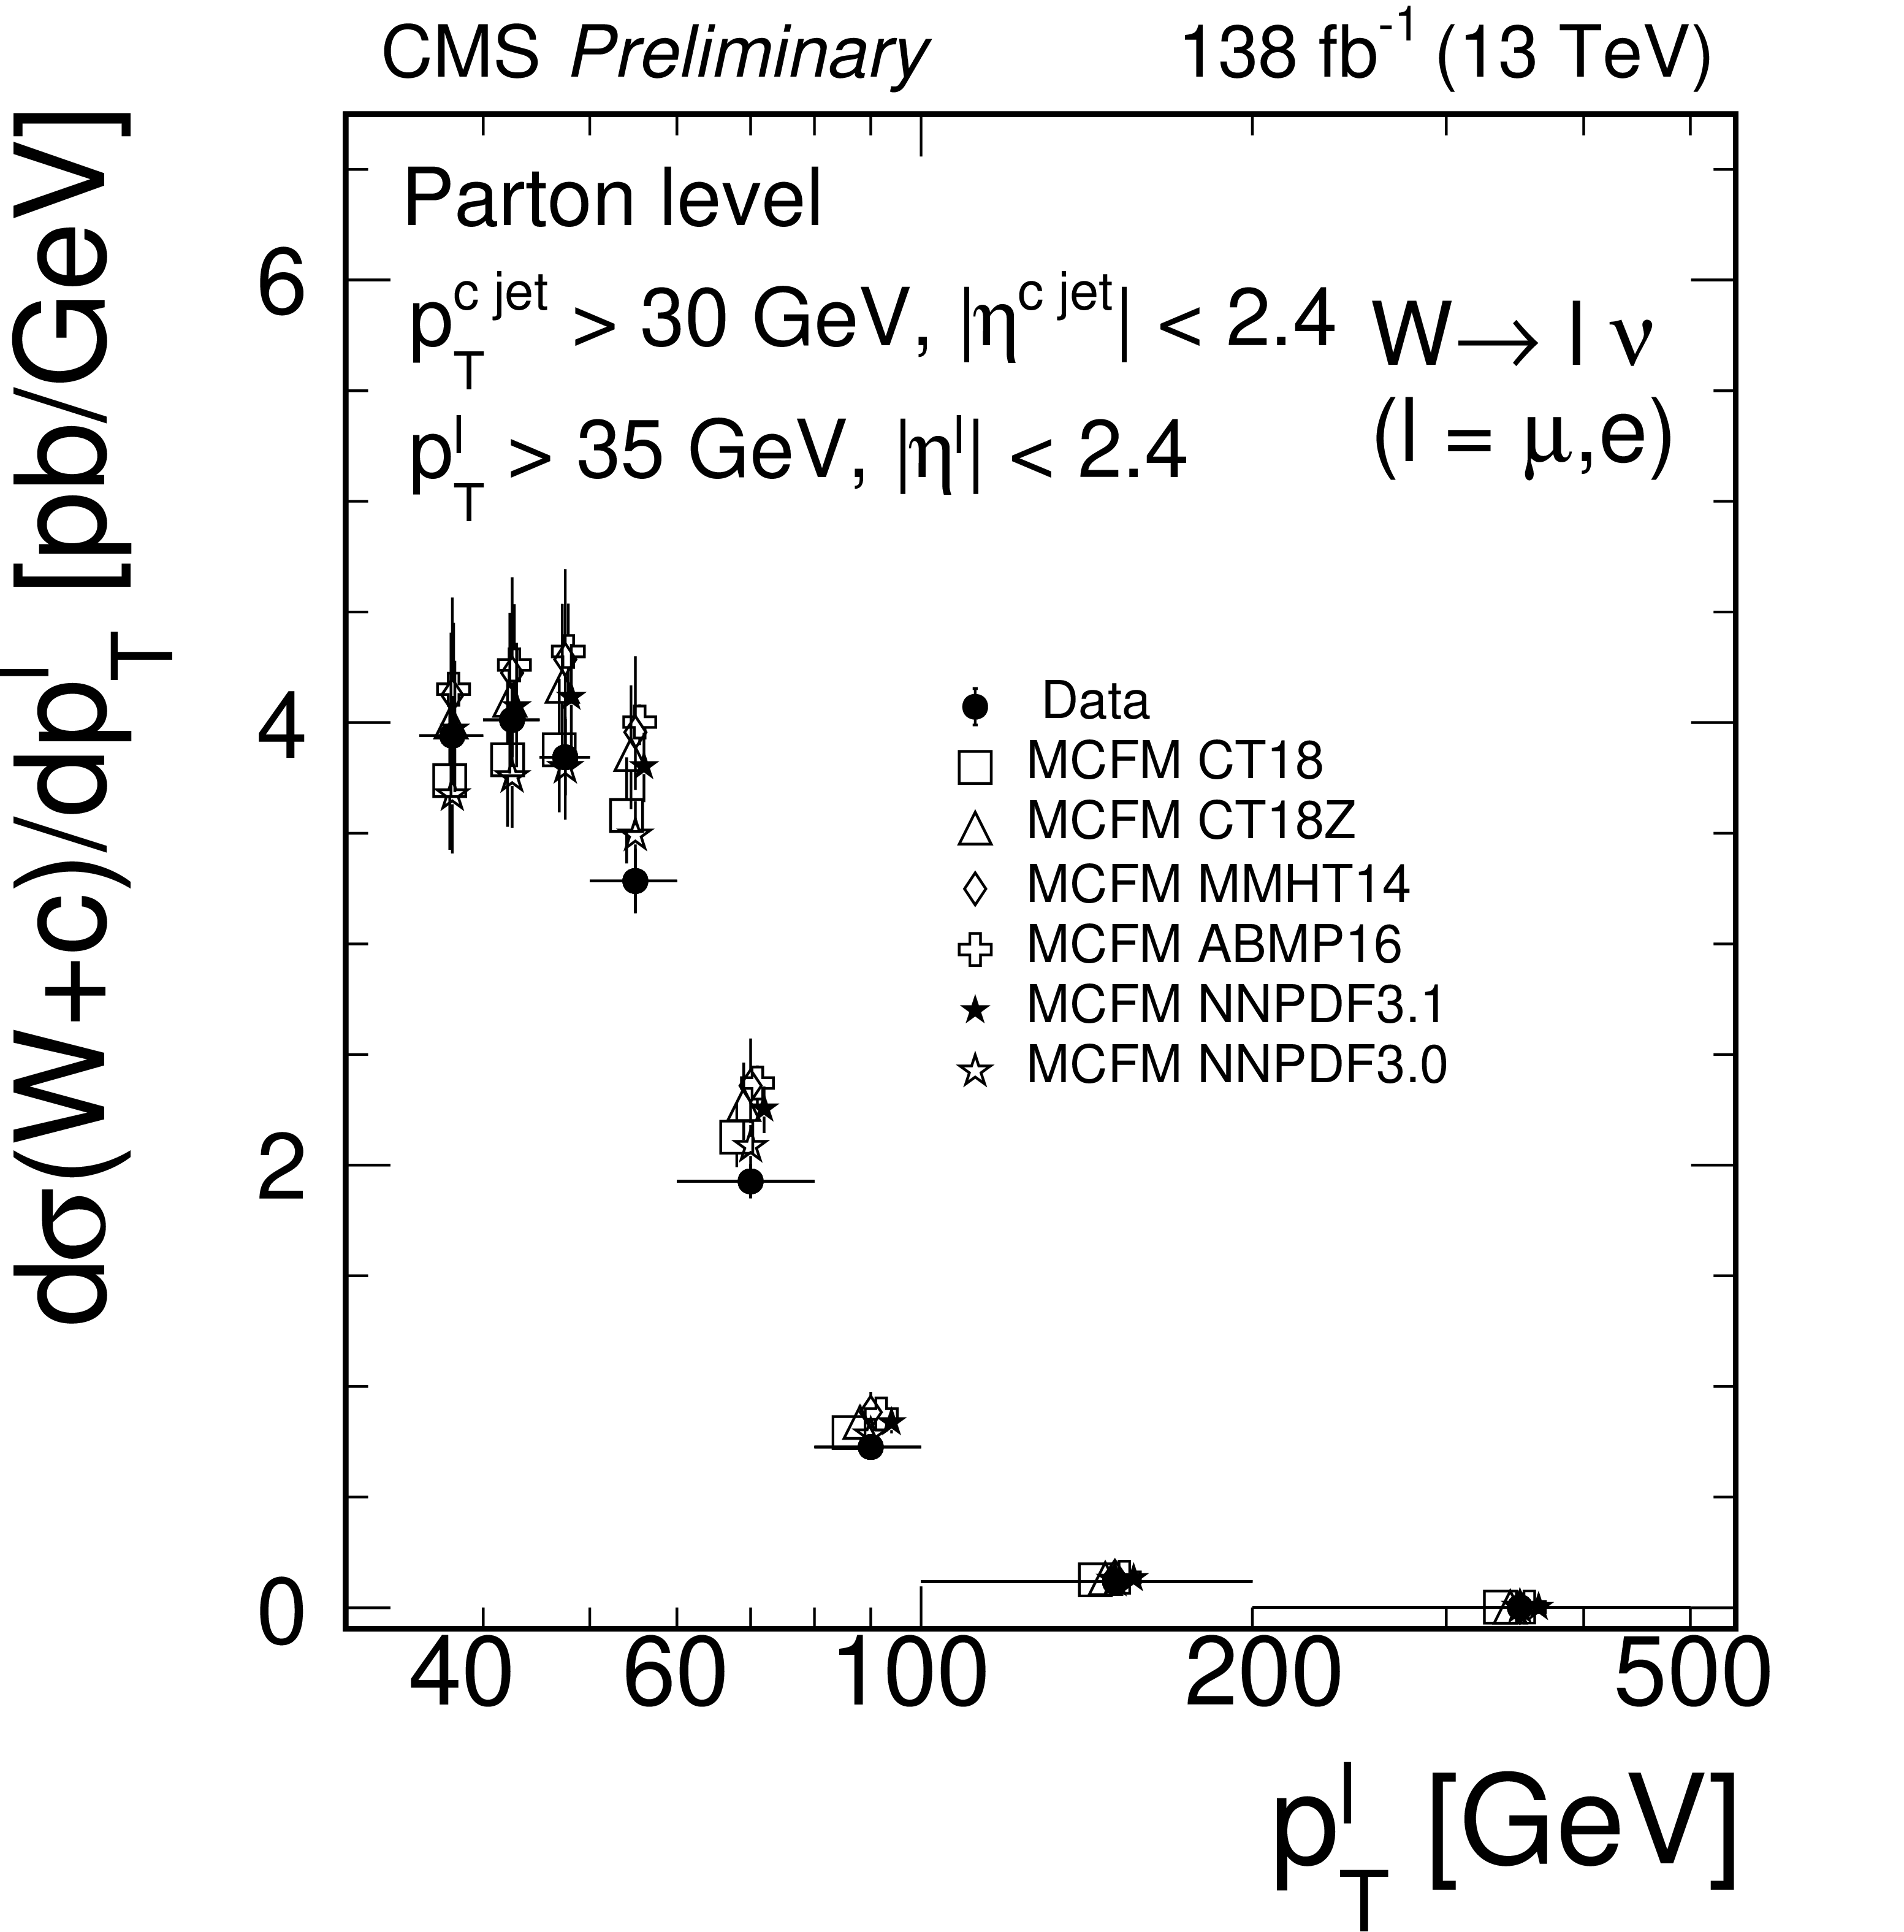
Figure 5:
Measured differential cross sections $ {{\mathrm {d}}\sigma ({\mathrm{W} \,\mathrm{c}})/ {\mathrm {d}} {| \eta ^\ell |}}$ (left) and $ {{\mathrm {d}}\sigma ({\mathrm{W} \,\mathrm{c}})/ {\mathrm {d}}{{p_{\mathrm {T}}} ^\ell}}$ (right) unfolded to the particle level, compared with the predictions of the MadGraph5_aMC@NLO simulation. |

png pdf |
Figure 5-a:
Measured differential cross sections $ {{\mathrm {d}}\sigma ({\mathrm{W} \,\mathrm{c}})/ {\mathrm {d}} {| \eta ^\ell |}}$ (left) and $ {{\mathrm {d}}\sigma ({\mathrm{W} \,\mathrm{c}})/ {\mathrm {d}}{{p_{\mathrm {T}}} ^\ell}}$ (right) unfolded to the particle level, compared with the predictions of the MadGraph5_aMC@NLO simulation. |
png pdf |
Figure 5-b:
Measured differential cross sections $ {{\mathrm {d}}\sigma ({\mathrm{W} \,\mathrm{c}})/ {\mathrm {d}} {| \eta ^\ell |}}$ (left) and $ {{\mathrm {d}}\sigma ({\mathrm{W} \,\mathrm{c}})/ {\mathrm {d}}{{p_{\mathrm {T}}} ^\ell}}$ (right) unfolded to the particle level, compared with the predictions of the MadGraph5_aMC@NLO simulation. |
png pdf |
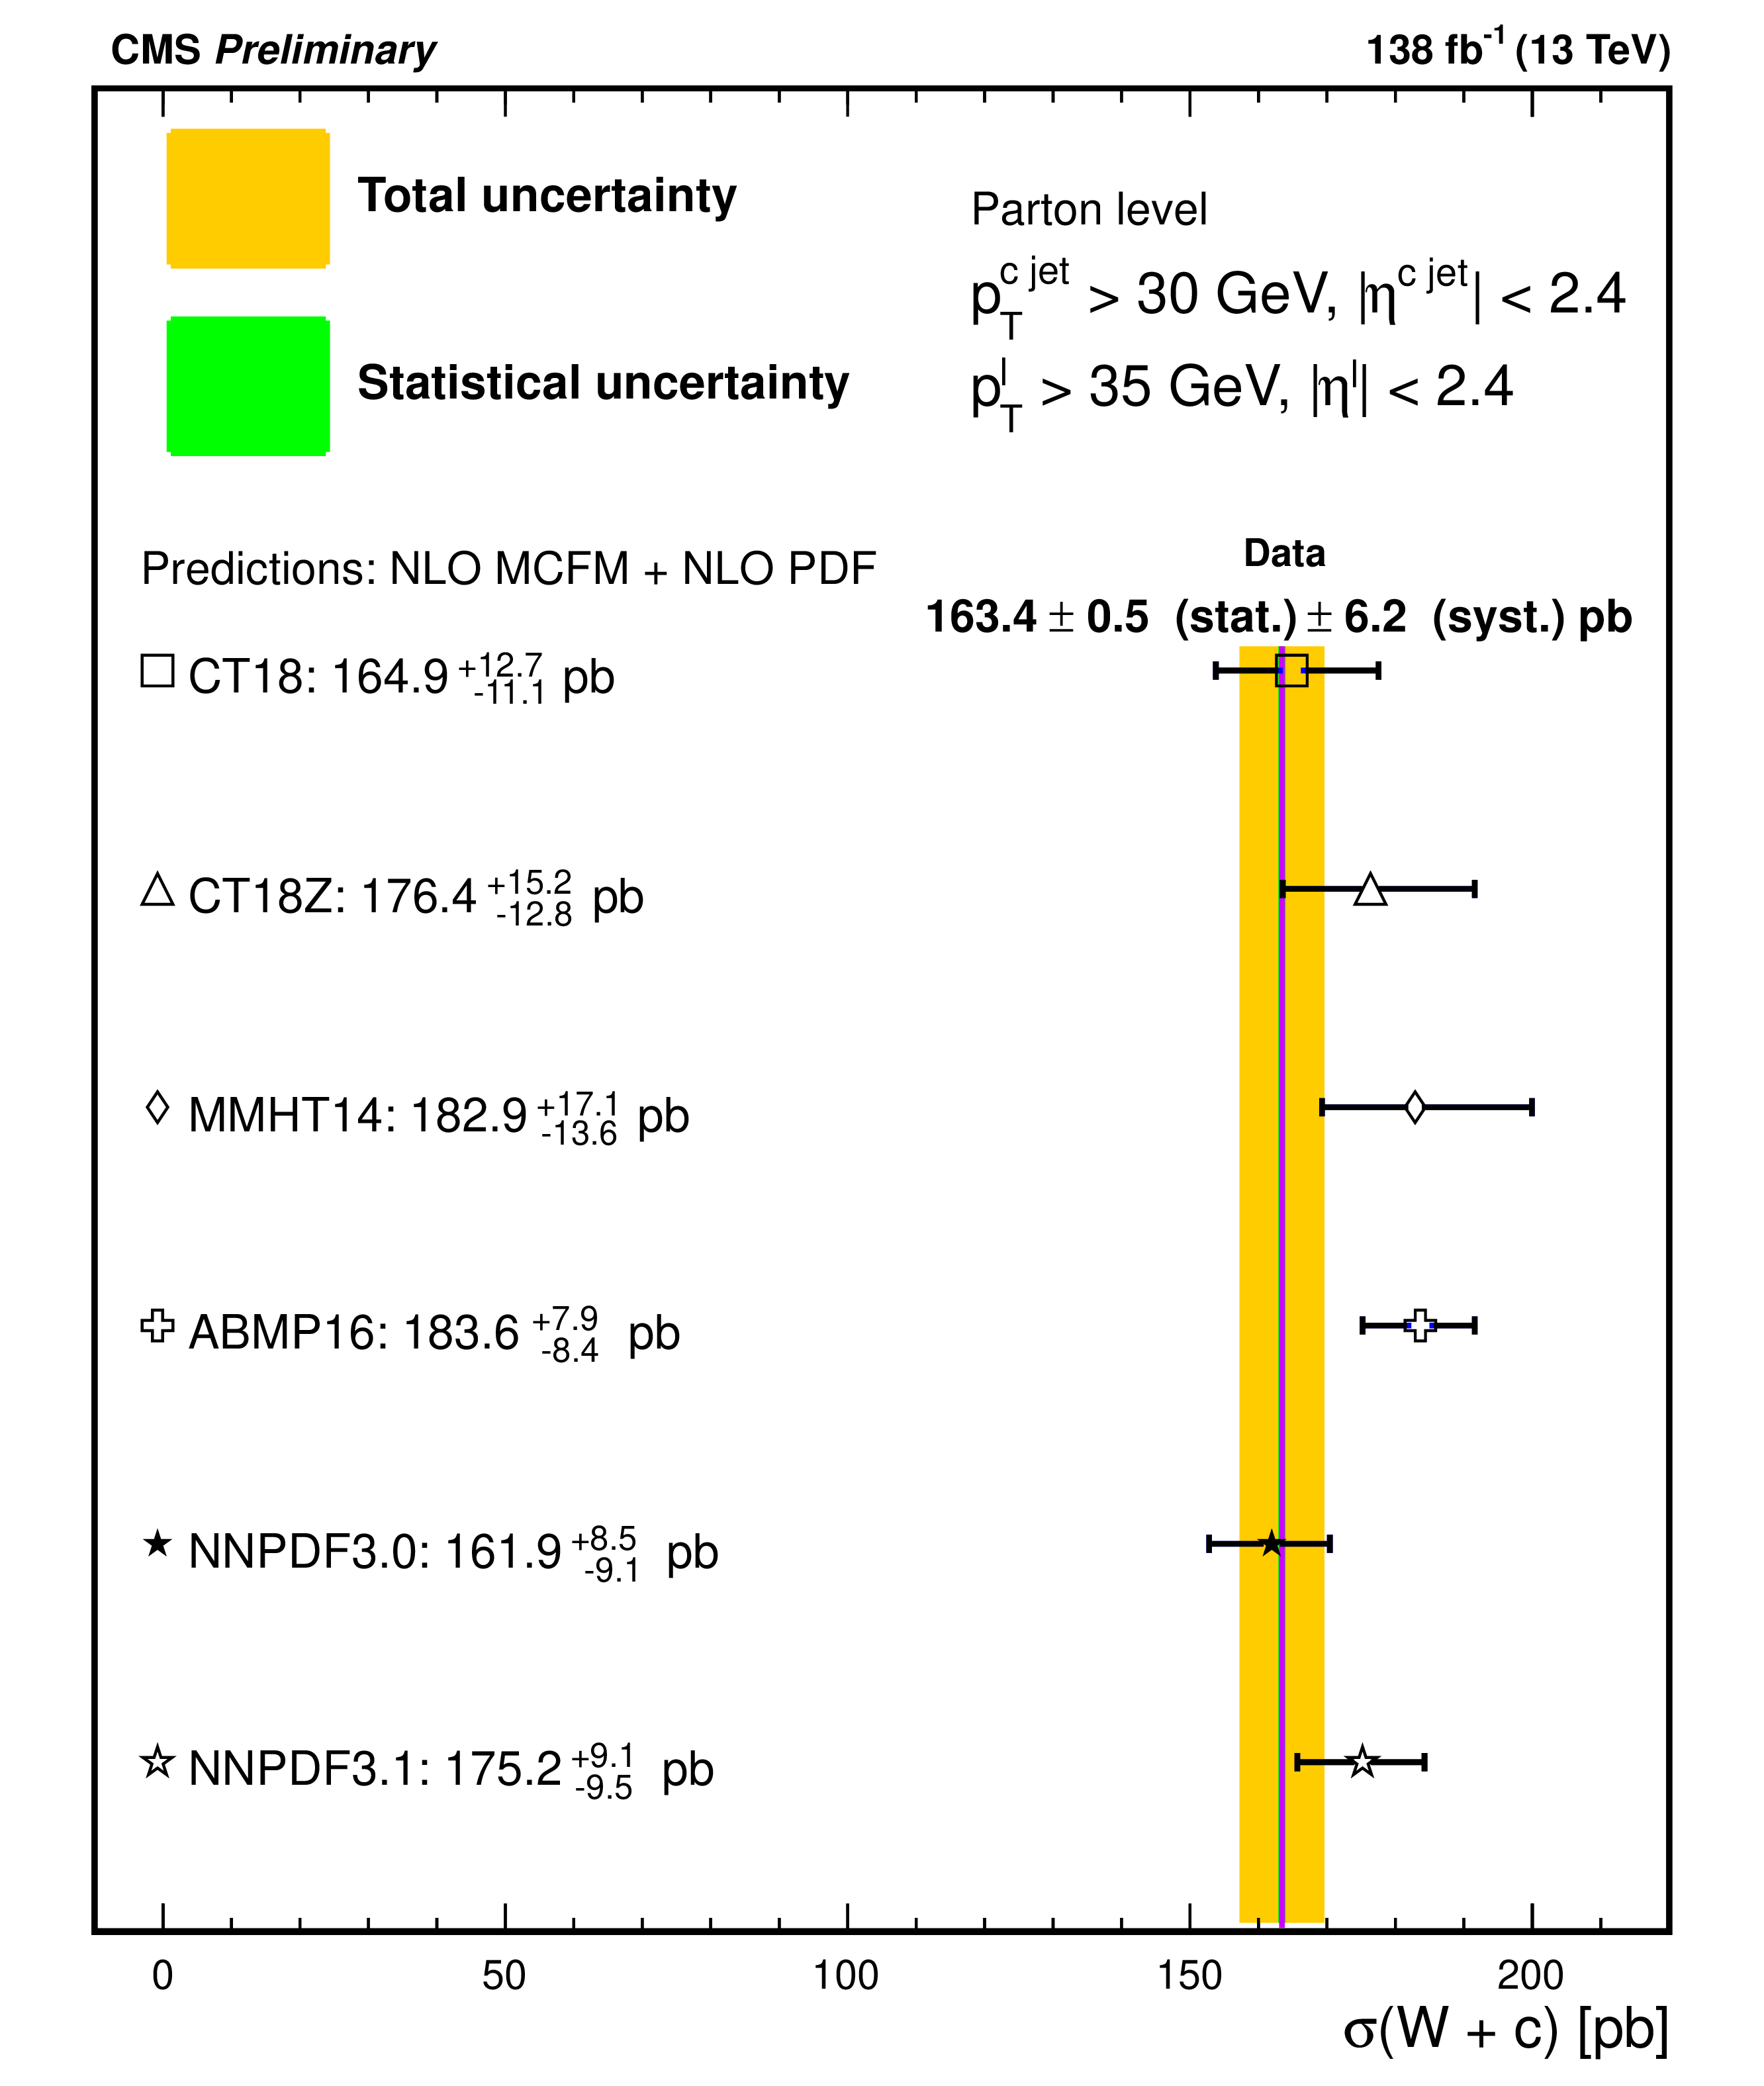
Figure 6:
Comparison of the experimental measurement of $ {\sigma ({\mathrm{W} \,\mathrm{c}})}$, unfolded to the parton level, with the predictions from the MCFM NLO calculations using different PDF sets. |

png pdf |
Figure 7:
Measured differential cross sections $ {{\mathrm {d}}\sigma ({\mathrm{W} \,\mathrm{c}})/ {\mathrm {d}} {| \eta ^\ell |}}$ (left) and $ {{\mathrm {d}}\sigma ({\mathrm{W} \,\mathrm{c}})/ {\mathrm {d}}{{p_{\mathrm {T}}} ^\ell}}$ (right) unfolded to the parton level, compared with the predictions from the MCFM NLO calculations using different PDF sets. |
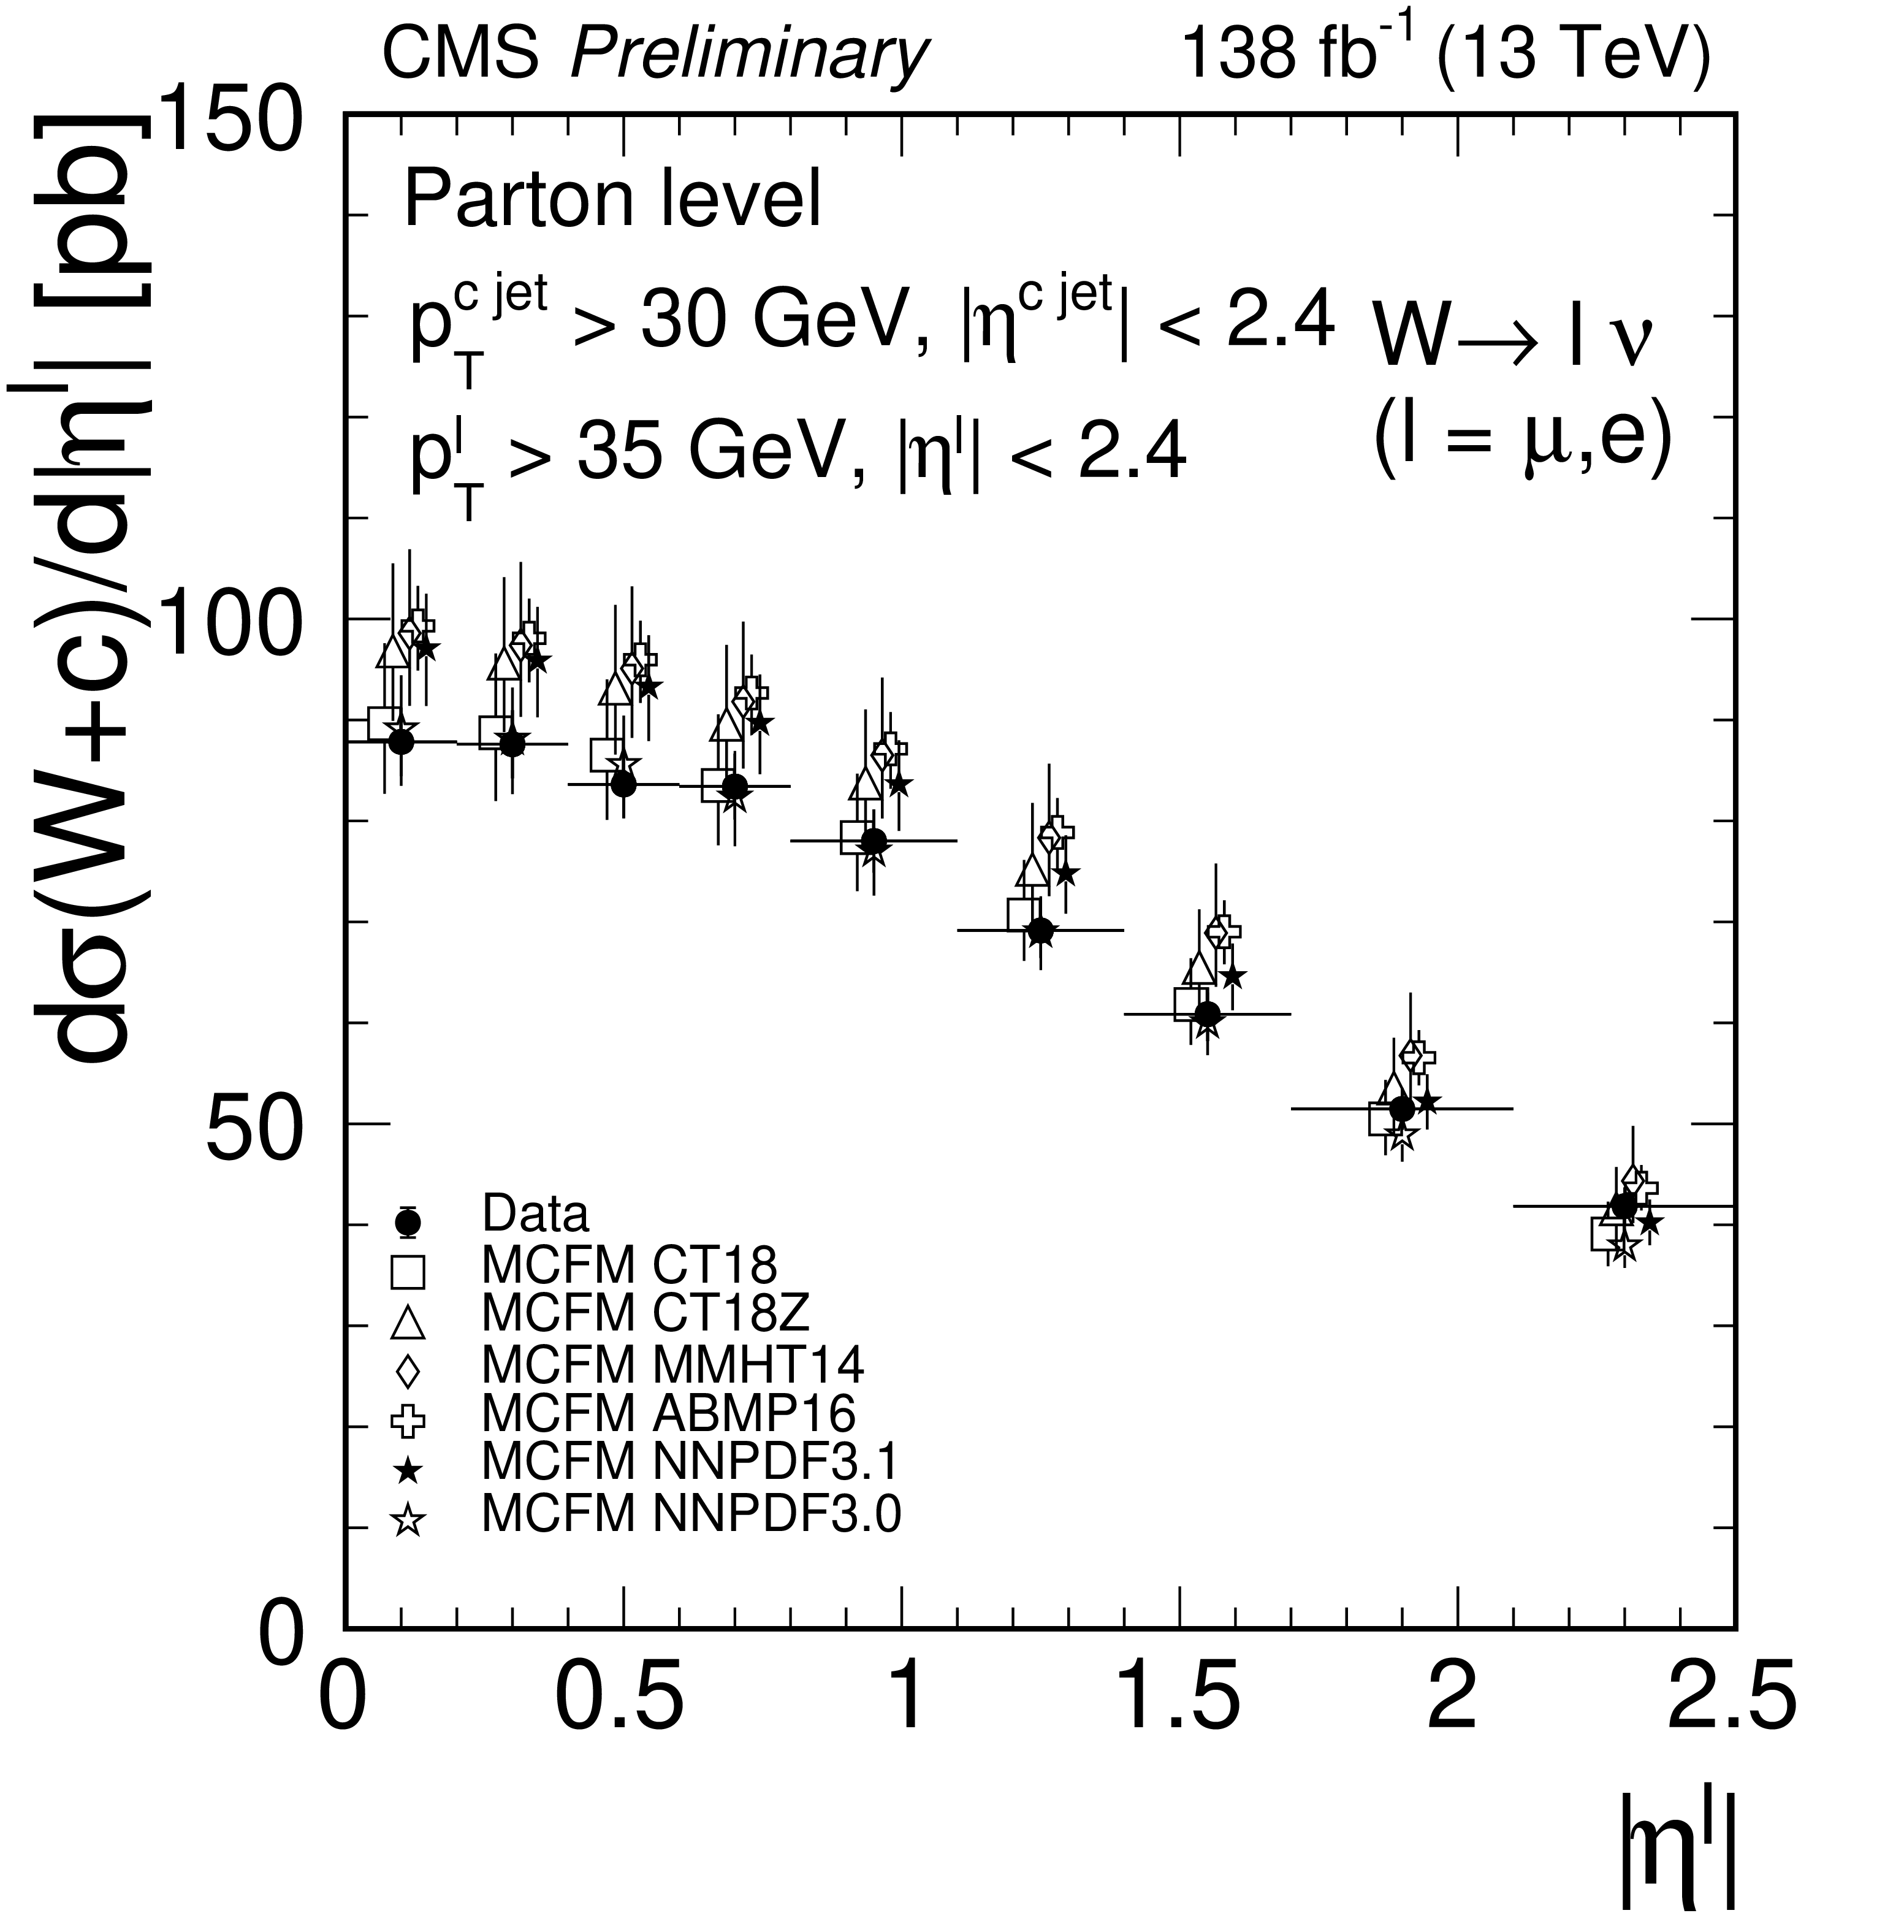
png pdf |
Figure 7-a:
Measured differential cross sections $ {{\mathrm {d}}\sigma ({\mathrm{W} \,\mathrm{c}})/ {\mathrm {d}} {| \eta ^\ell |}}$ (left) and $ {{\mathrm {d}}\sigma ({\mathrm{W} \,\mathrm{c}})/ {\mathrm {d}}{{p_{\mathrm {T}}} ^\ell}}$ (right) unfolded to the parton level, compared with the predictions from the MCFM NLO calculations using different PDF sets. |
png pdf |
Figure 7-b:
Measured differential cross sections $ {{\mathrm {d}}\sigma ({\mathrm{W} \,\mathrm{c}})/ {\mathrm {d}} {| \eta ^\ell |}}$ (left) and $ {{\mathrm {d}}\sigma ({\mathrm{W} \,\mathrm{c}})/ {\mathrm {d}}{{p_{\mathrm {T}}} ^\ell}}$ (right) unfolded to the parton level, compared with the predictions from the MCFM NLO calculations using different PDF sets. |
png pdf |
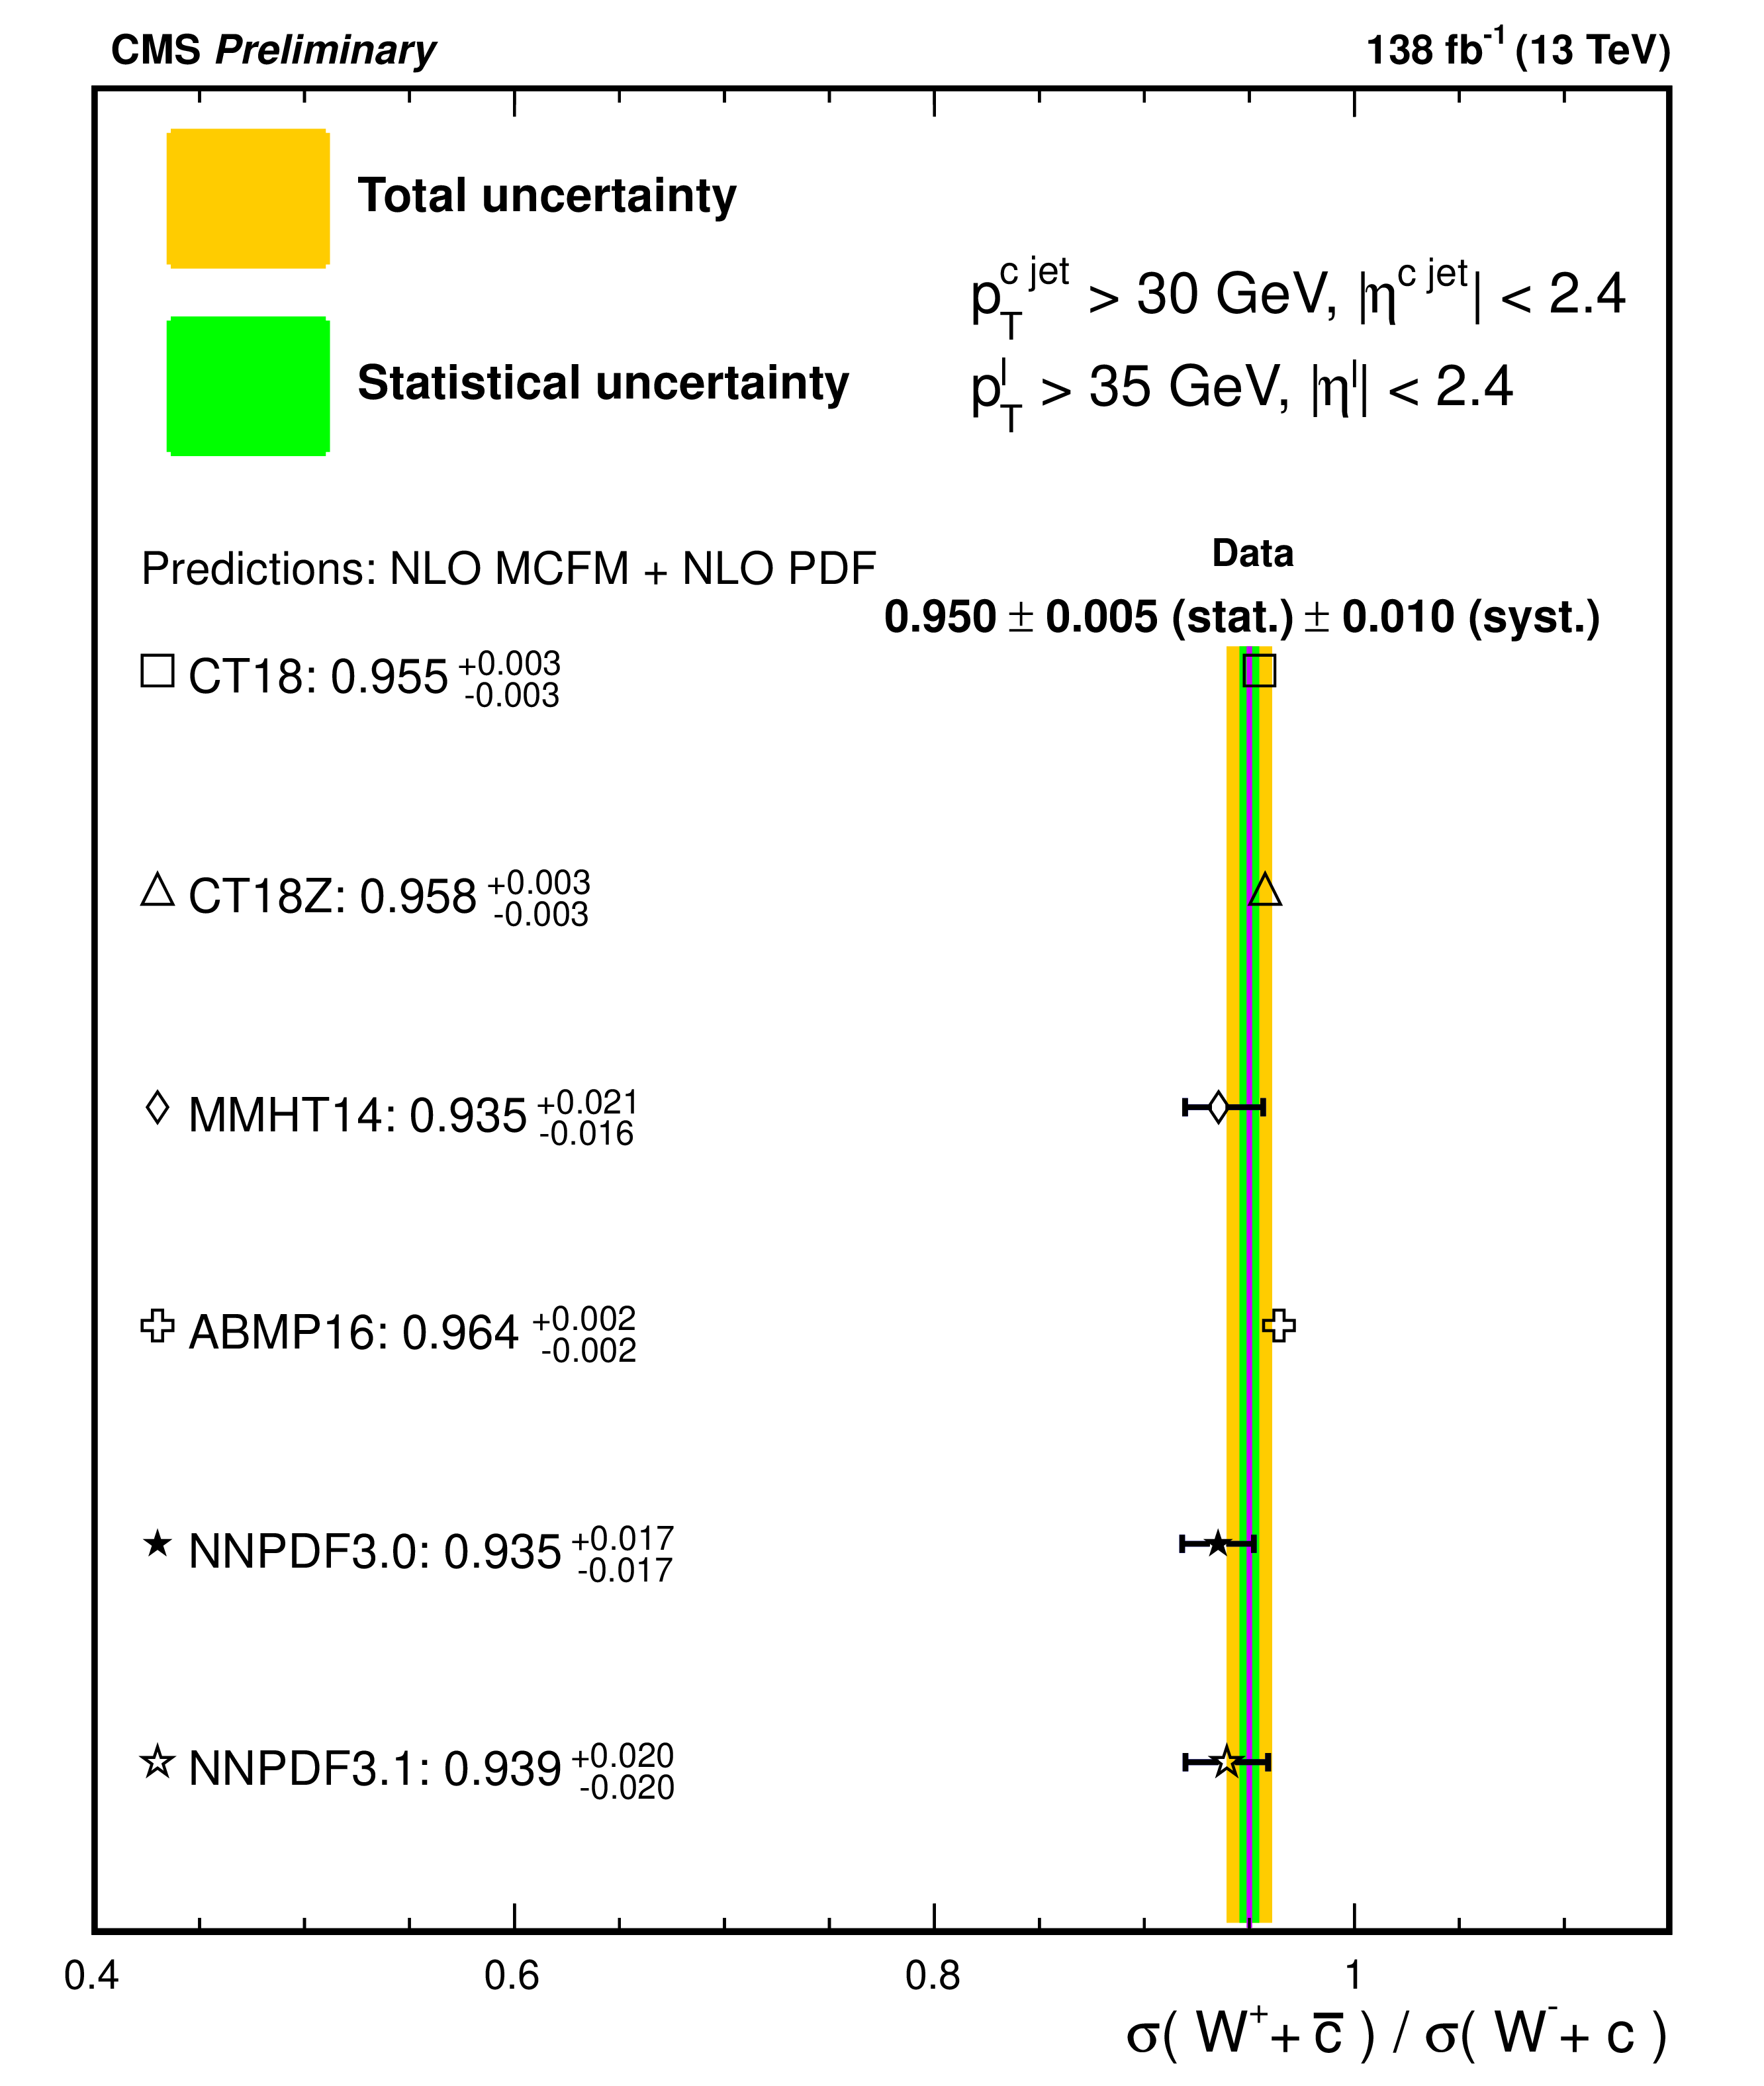
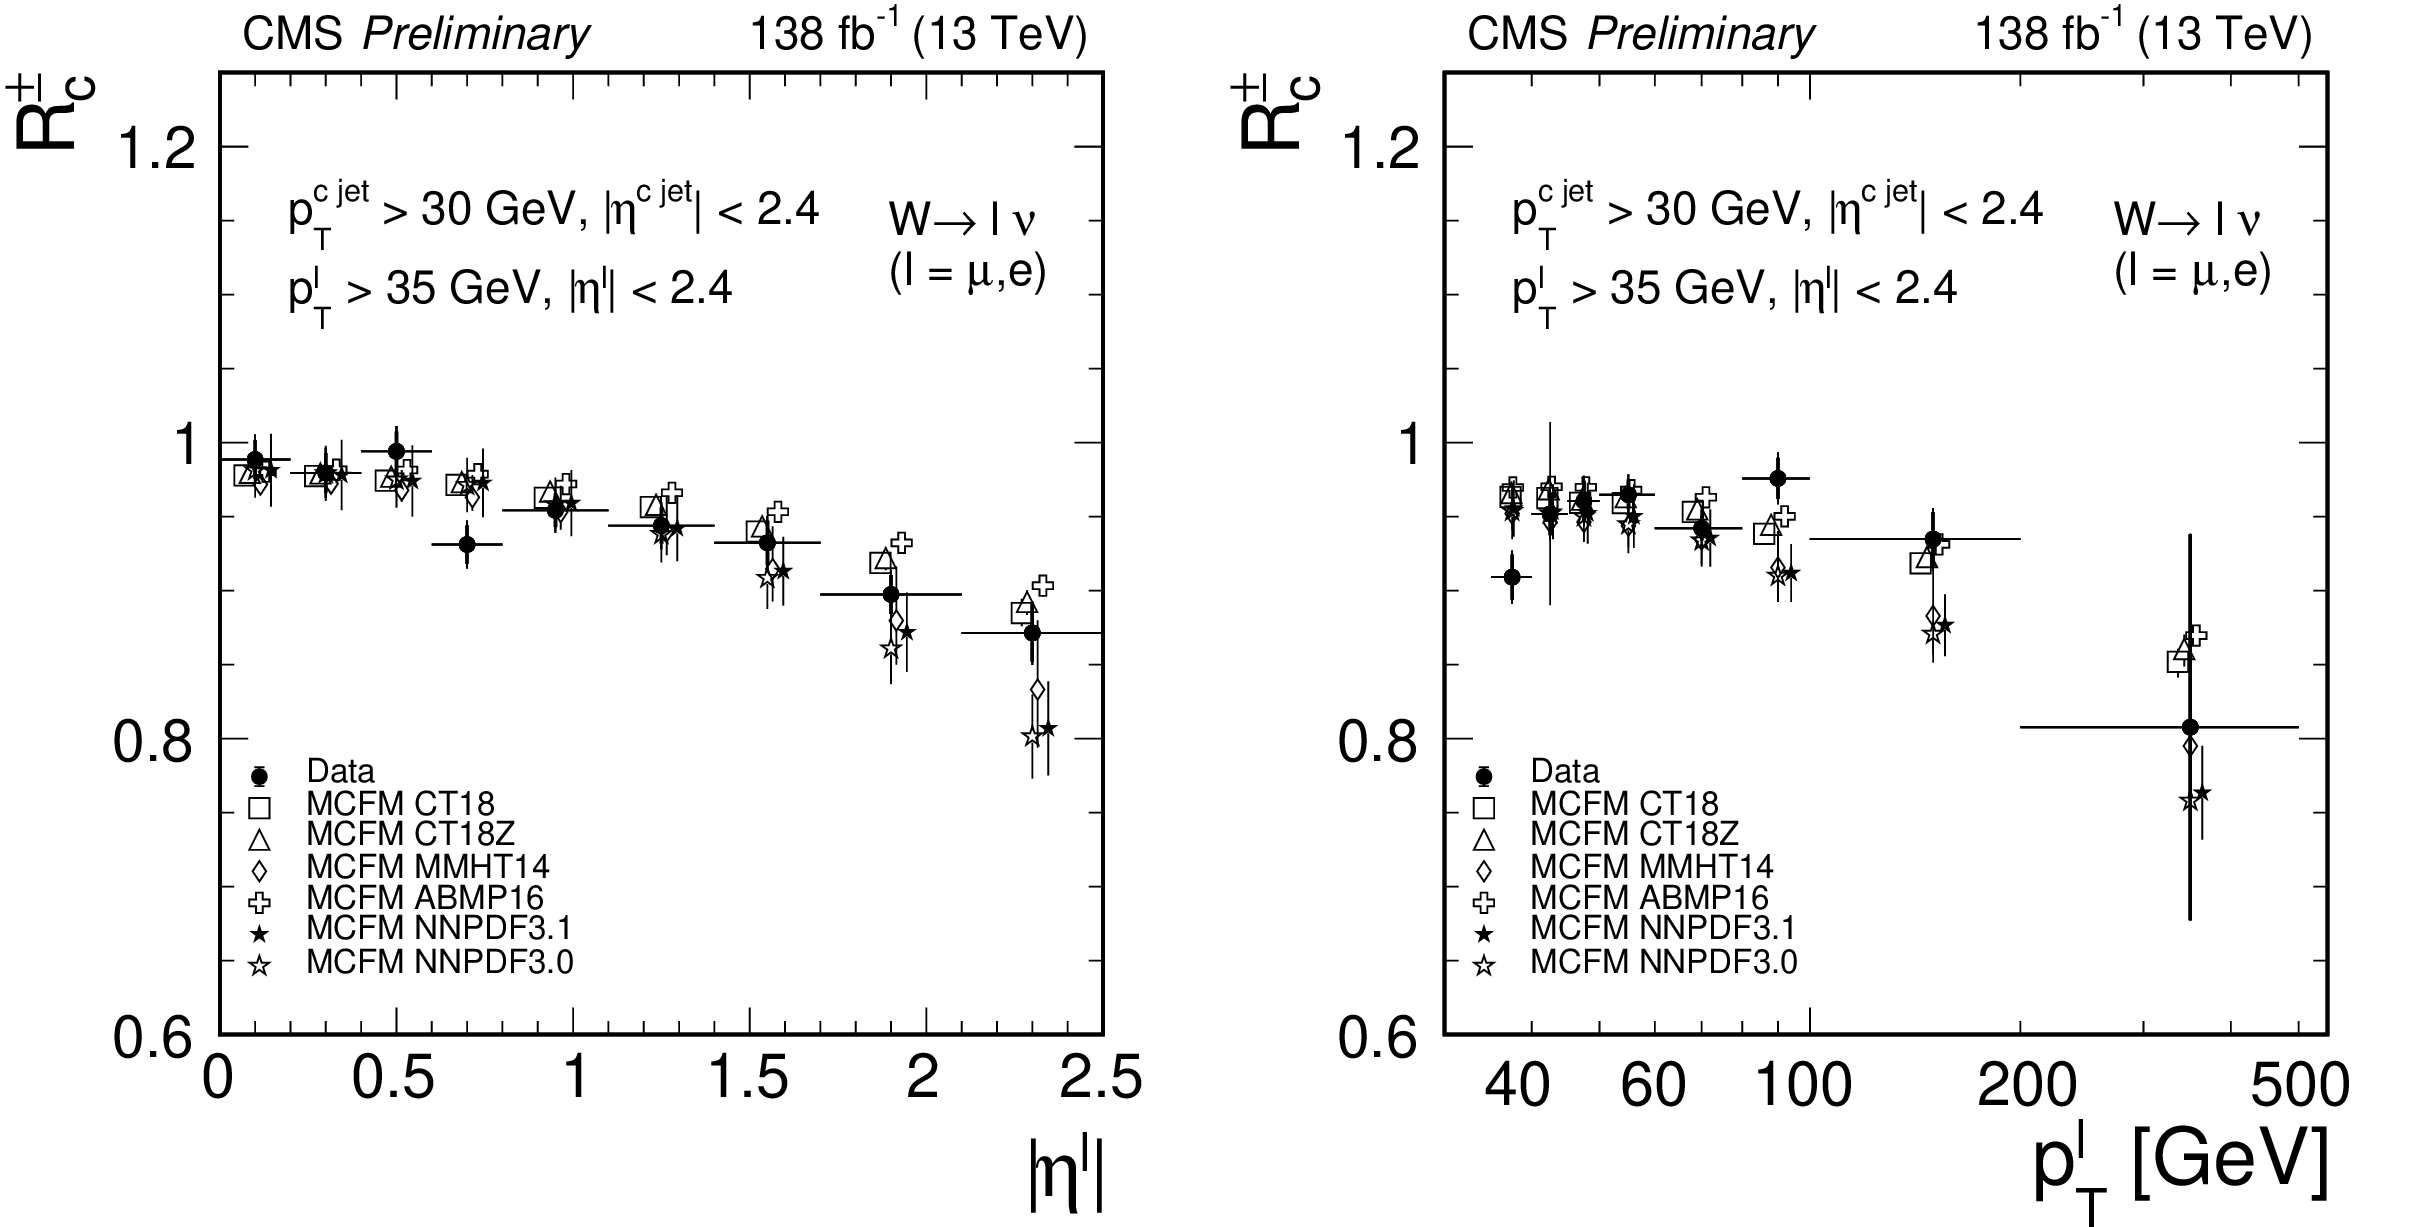
Figure 8:
Comparison of the experimental measurement of $ {R_c^{\pm}}$ with the MCFM NLO calculations using different PDF sets. |
png pdf |
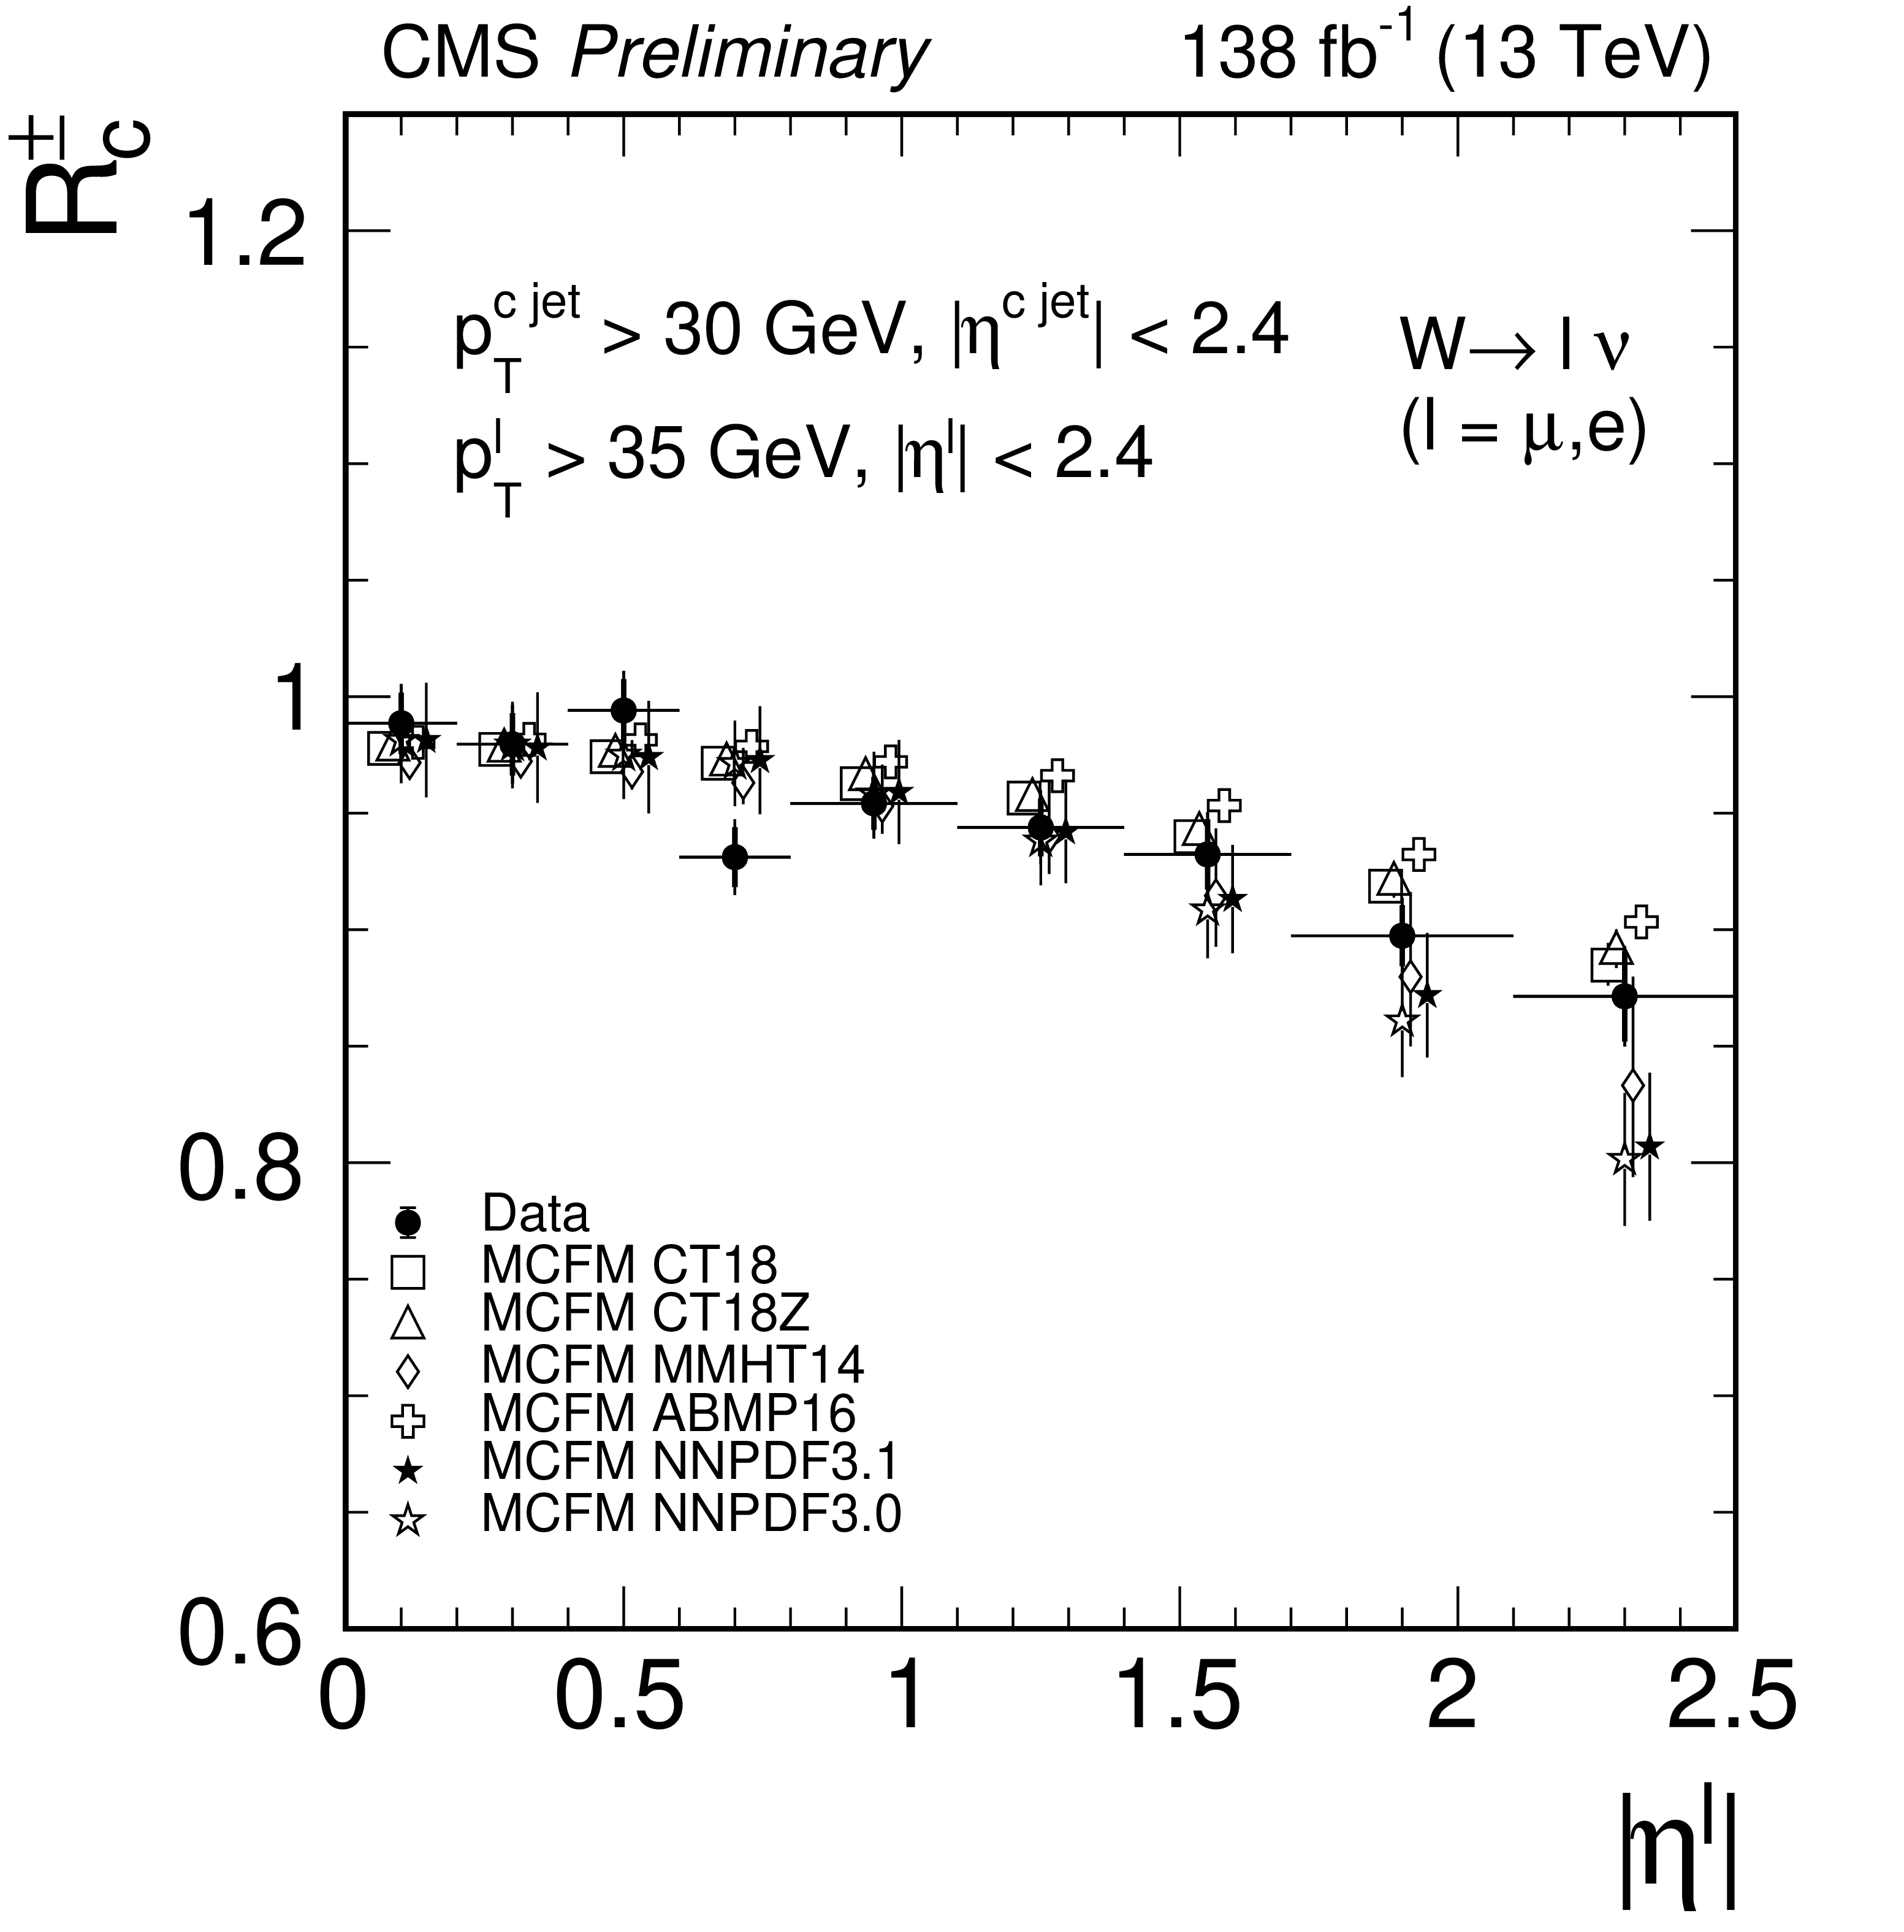
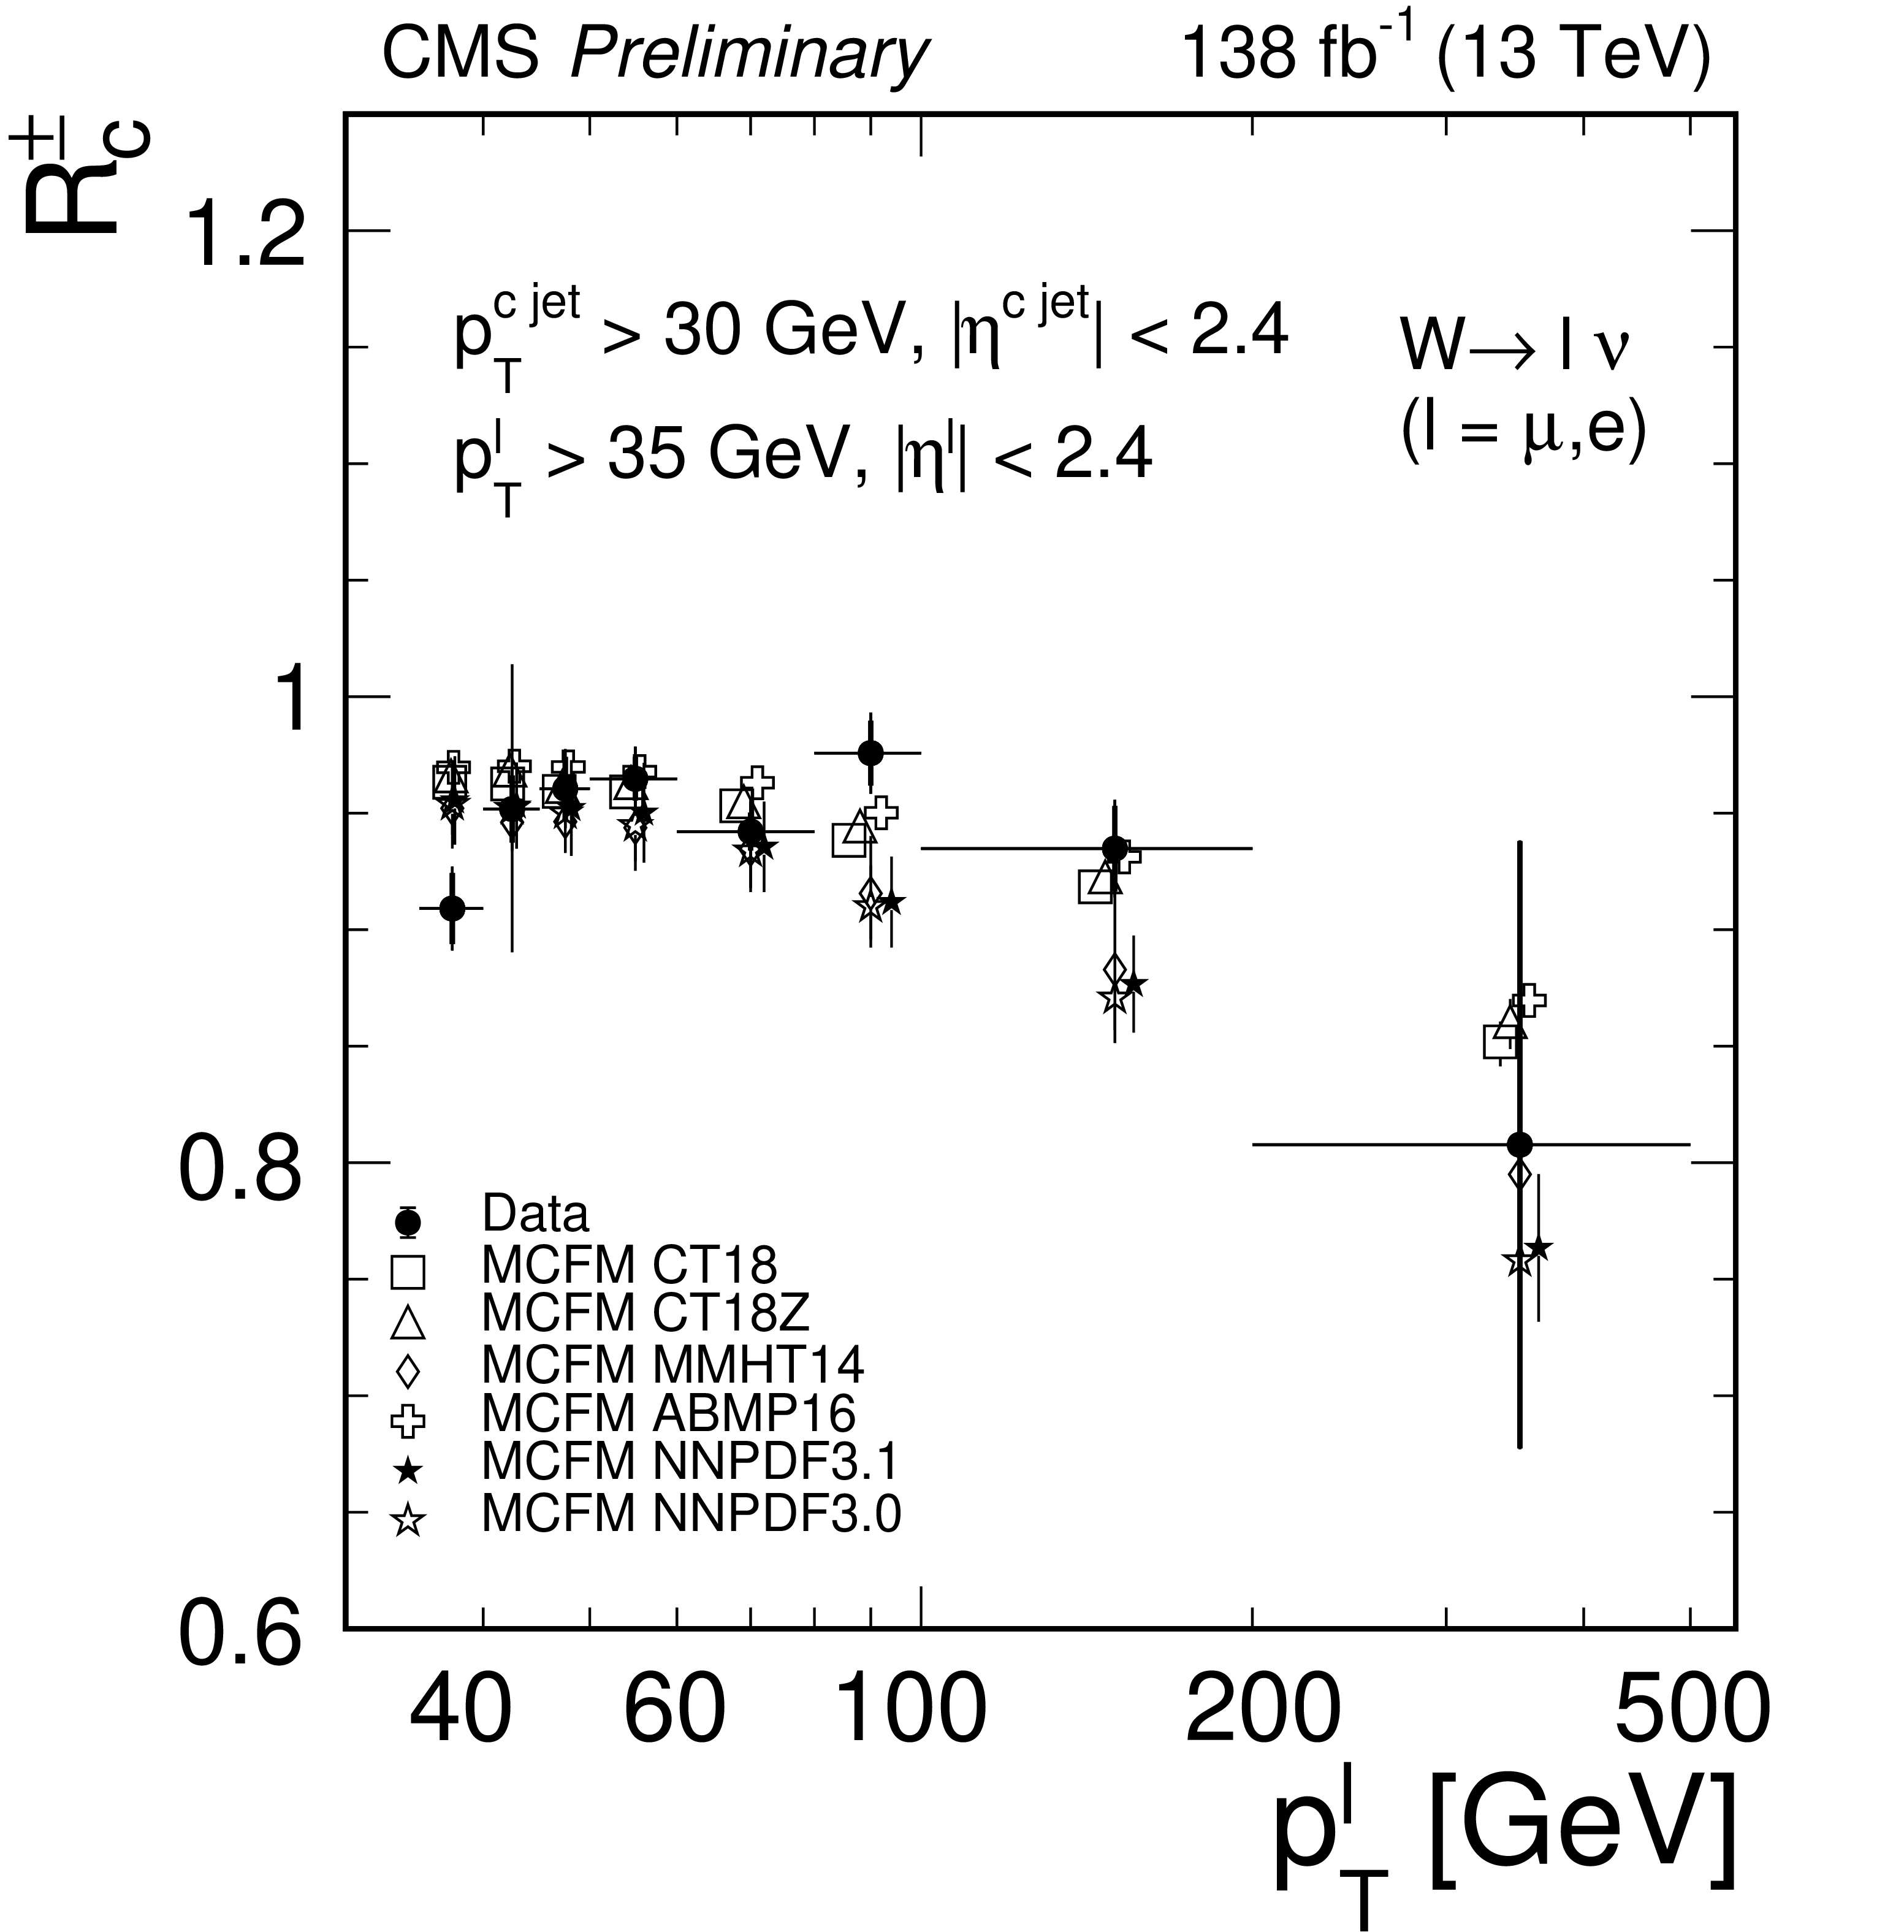
Figure 9:
Measured cross section ratio $ {R_c^{\pm}}$ as a function of the absolute value of $\eta ^\ell $ (left) and $ {p_{\mathrm {T}}} ^\ell $ (right), compared with the MCFM NLO calculations using different PDF sets. |
png pdf |
Figure 9-a:
Measured cross section ratio $ {R_c^{\pm}}$ as a function of the absolute value of $\eta ^\ell $ (left) and $ {p_{\mathrm {T}}} ^\ell $ (right), compared with the MCFM NLO calculations using different PDF sets. |
png pdf |
Figure 9-b:
Measured cross section ratio $ {R_c^{\pm}}$ as a function of the absolute value of $\eta ^\ell $ (left) and $ {p_{\mathrm {T}}} ^\ell $ (right), compared with the MCFM NLO calculations using different PDF sets. |
| Tables | |

png pdf |
Table 1:
Simulated flavour composition (in percentage) of the SL sample after selection and OS-SS subtraction. $ {\mathrm{W} + \mathrm{ Q \bar{Q} }}$ stands for the sum of the contributions of ${\mathrm{W} +\mathrm{ c \bar{c} }}$ and ${\mathrm{W} + \mathrm{ b \bar{b} }}$. |

png pdf |
Table 2:
Simulated flavour composition (in percentage) of the SV sample after selection and OS-SS subtraction. $ {\mathrm{W} + \mathrm{ Q \bar{Q} }}$ stands for the sum of the contributions of ${\mathrm{W} +\mathrm{ c \bar{c} }}$ and ${\mathrm{W} + \mathrm{ b \bar{b} }}$. |

png pdf |
Table 3:
Summary of the selection requirements for the four selection channels of the analysis. |
png pdf |
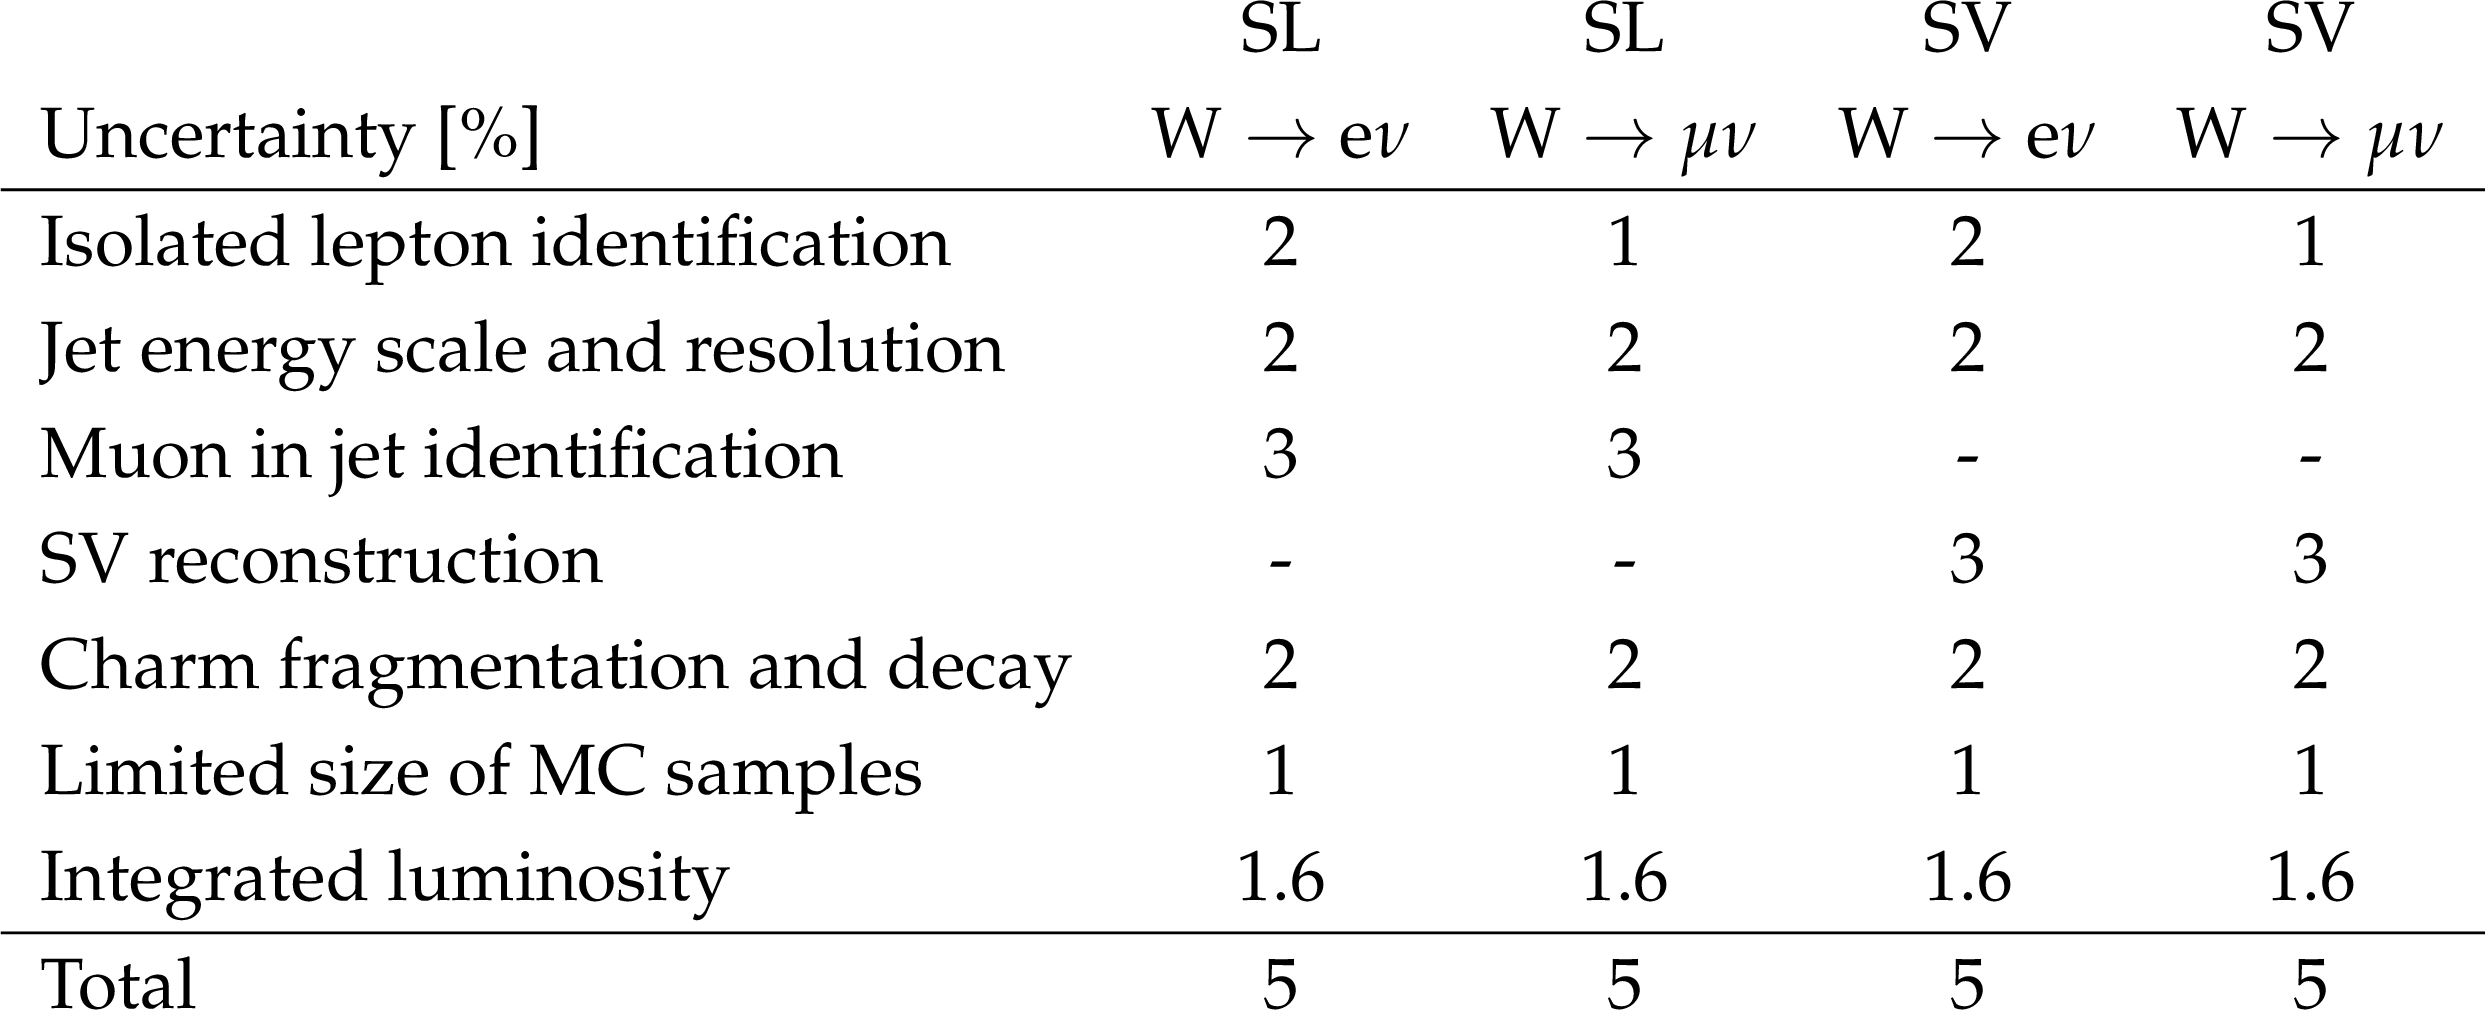
Table 4:
Summary of the main systematic uncertainties, in percentage of the measured fiducial cross section, for the four selection channels of the analysis. |

png pdf |
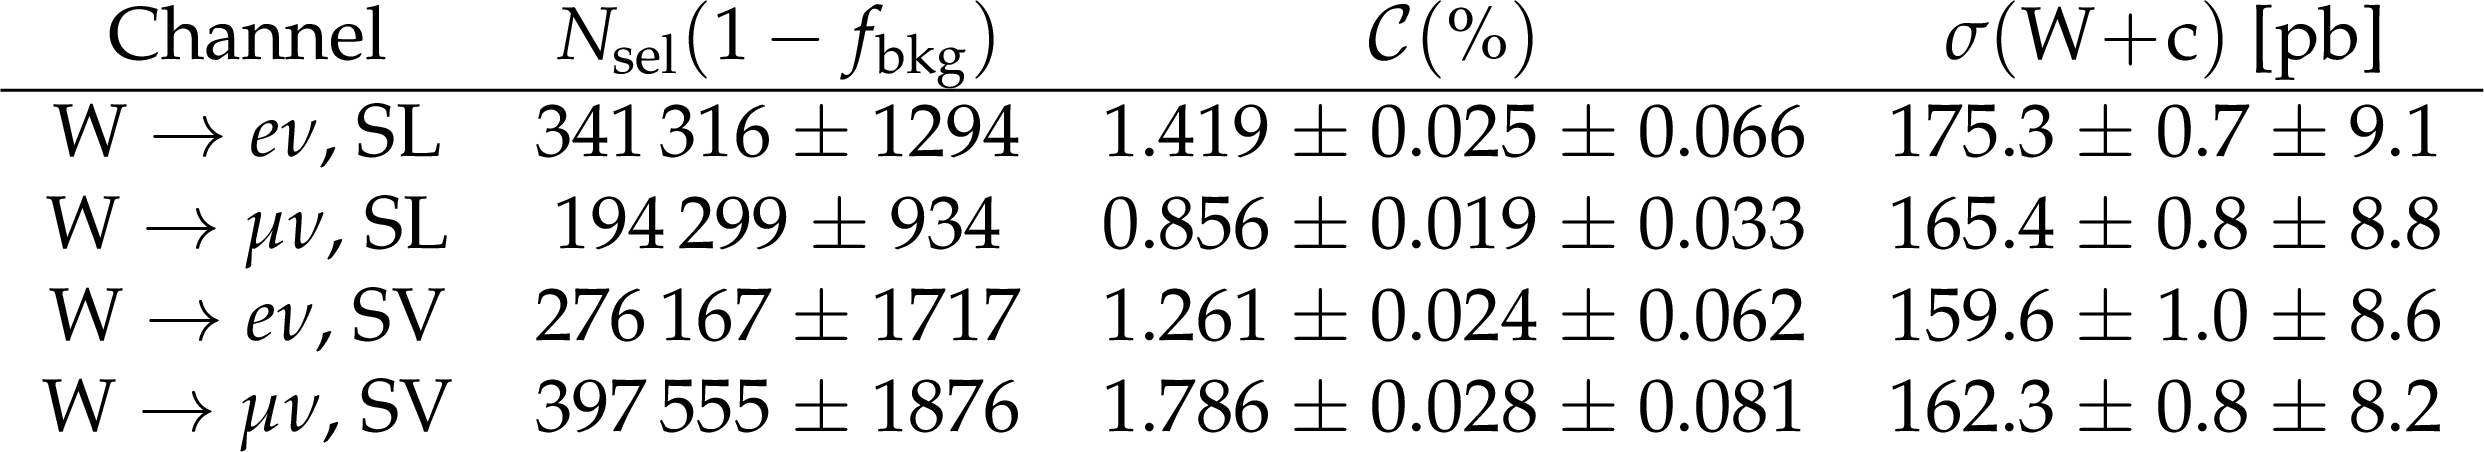
Table 5:
Measured production cross sections $ {\sigma ({\mathrm{W} \,\mathrm{c}})}$ unfolded to the particle level in the four channels (electron and muon W decay modes, SL and SV charm tagging modes) together with statistical (first) and systematic (second) uncertainties. Event yields (with statistical uncertainties) after OS-SS and remaining background subtraction, and acceptance times efficiency values ($\mathcal {C}$) are also given. |
png pdf |
Table 6:
Measured production cross sections $ {\sigma ({\mathrm{W} \,\mathrm{c}})}$ unfolded to the parton level in the four channels (electron and muon W decay modes, SL and SV charm tagging modes) together with statistical (first) and systematic (second) uncertainties. Event yields (with statistical uncertainties) after OS-SS and remaining background subtraction, and acceptance times efficiency values (${\cal C}$) are also given. |

png pdf |
Table 7:
Predictions for $ {\sigma ({\mathrm{W} \,\mathrm{c}})}$ production from MCFM at NLO for the phase space of the analysis. For every PDF set, the central value of the prediction is given, together with the uncertainty as prescribed from the PDF set, and the uncertainties associated with the scale variations and with the value of $\alpha _{\rm {s}}$. The total uncertainty is given in the last column. The last row in the table gives the experimental results presented in this document. |
png pdf |
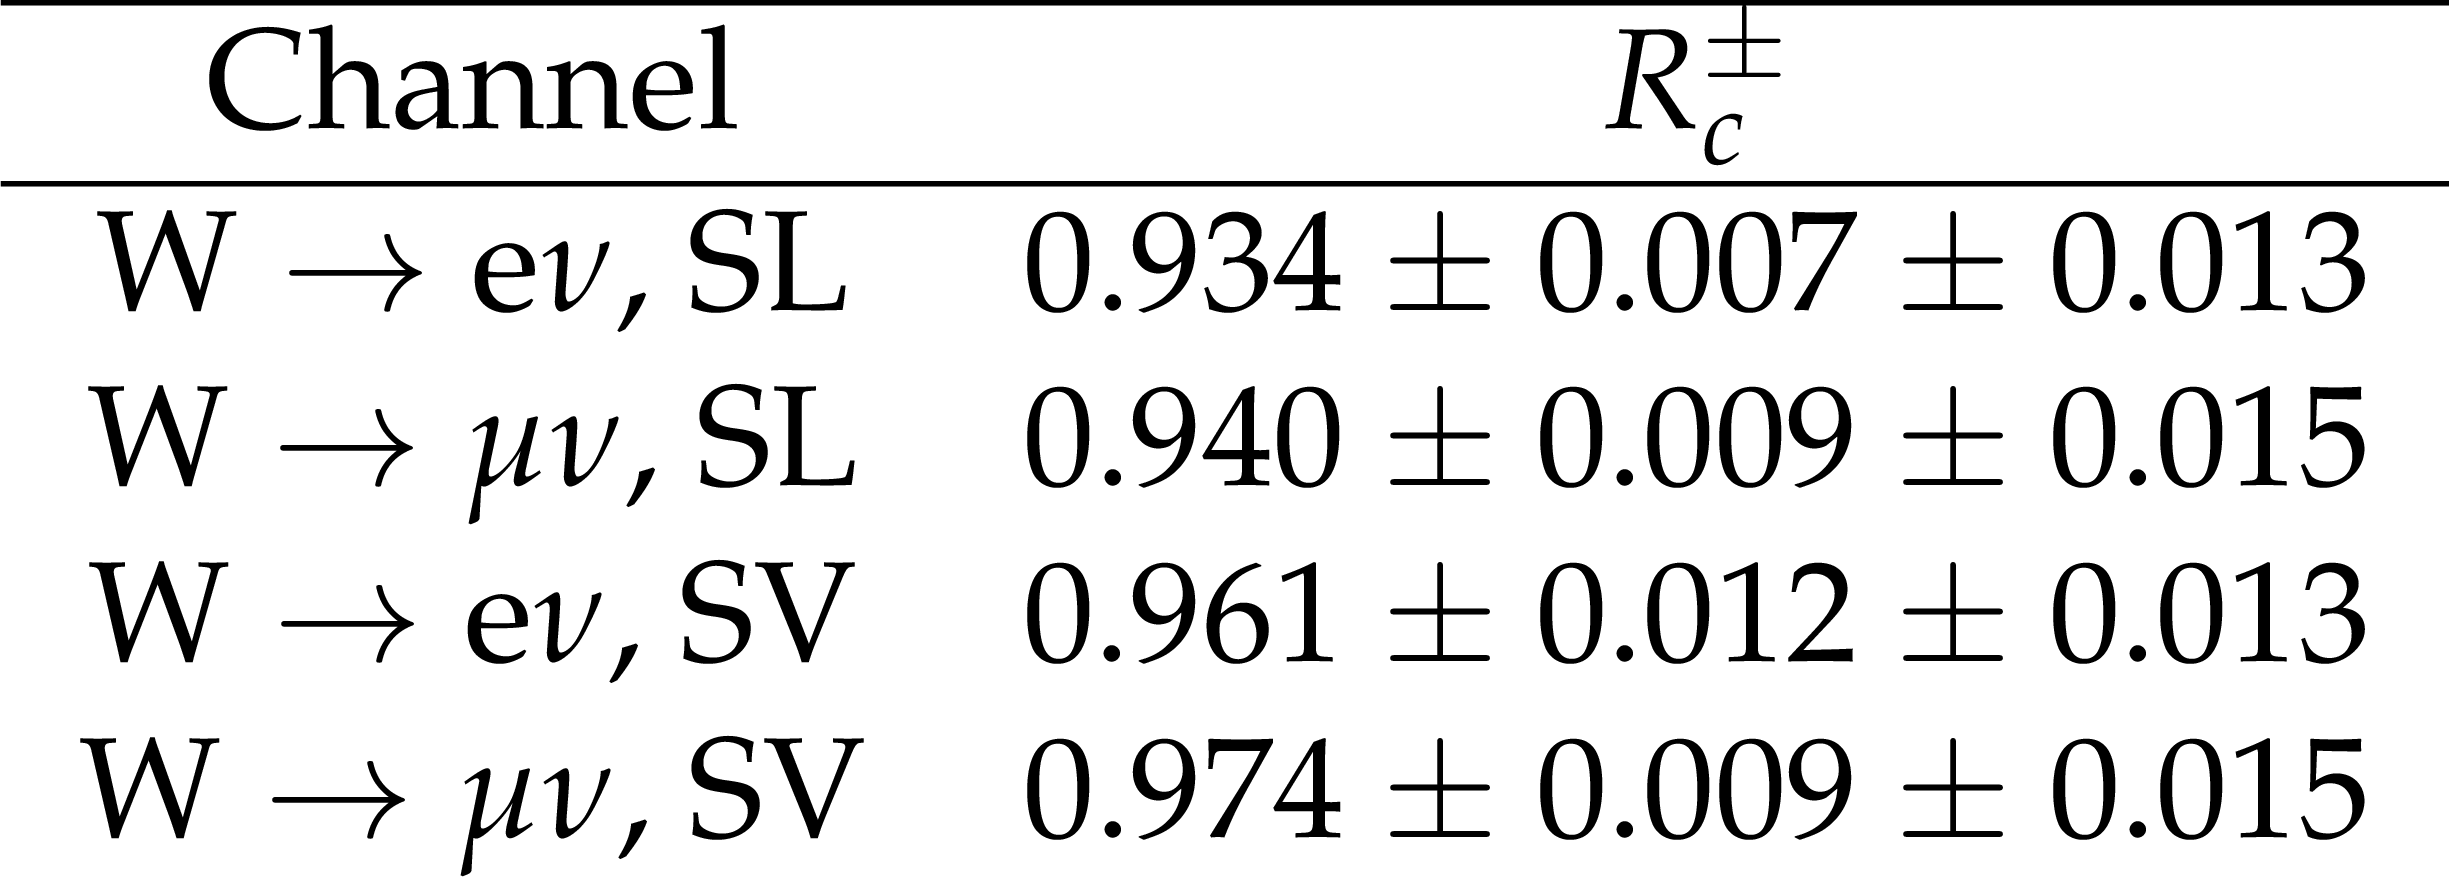
Table 8:
Measured production cross section ratio $ {R_c^{\pm}}$ in the four channels (electron and muon W decay modes, SL and SV charm tagging modes). Statistical (first) and systematic (second) uncertainties are also given. |
png pdf |
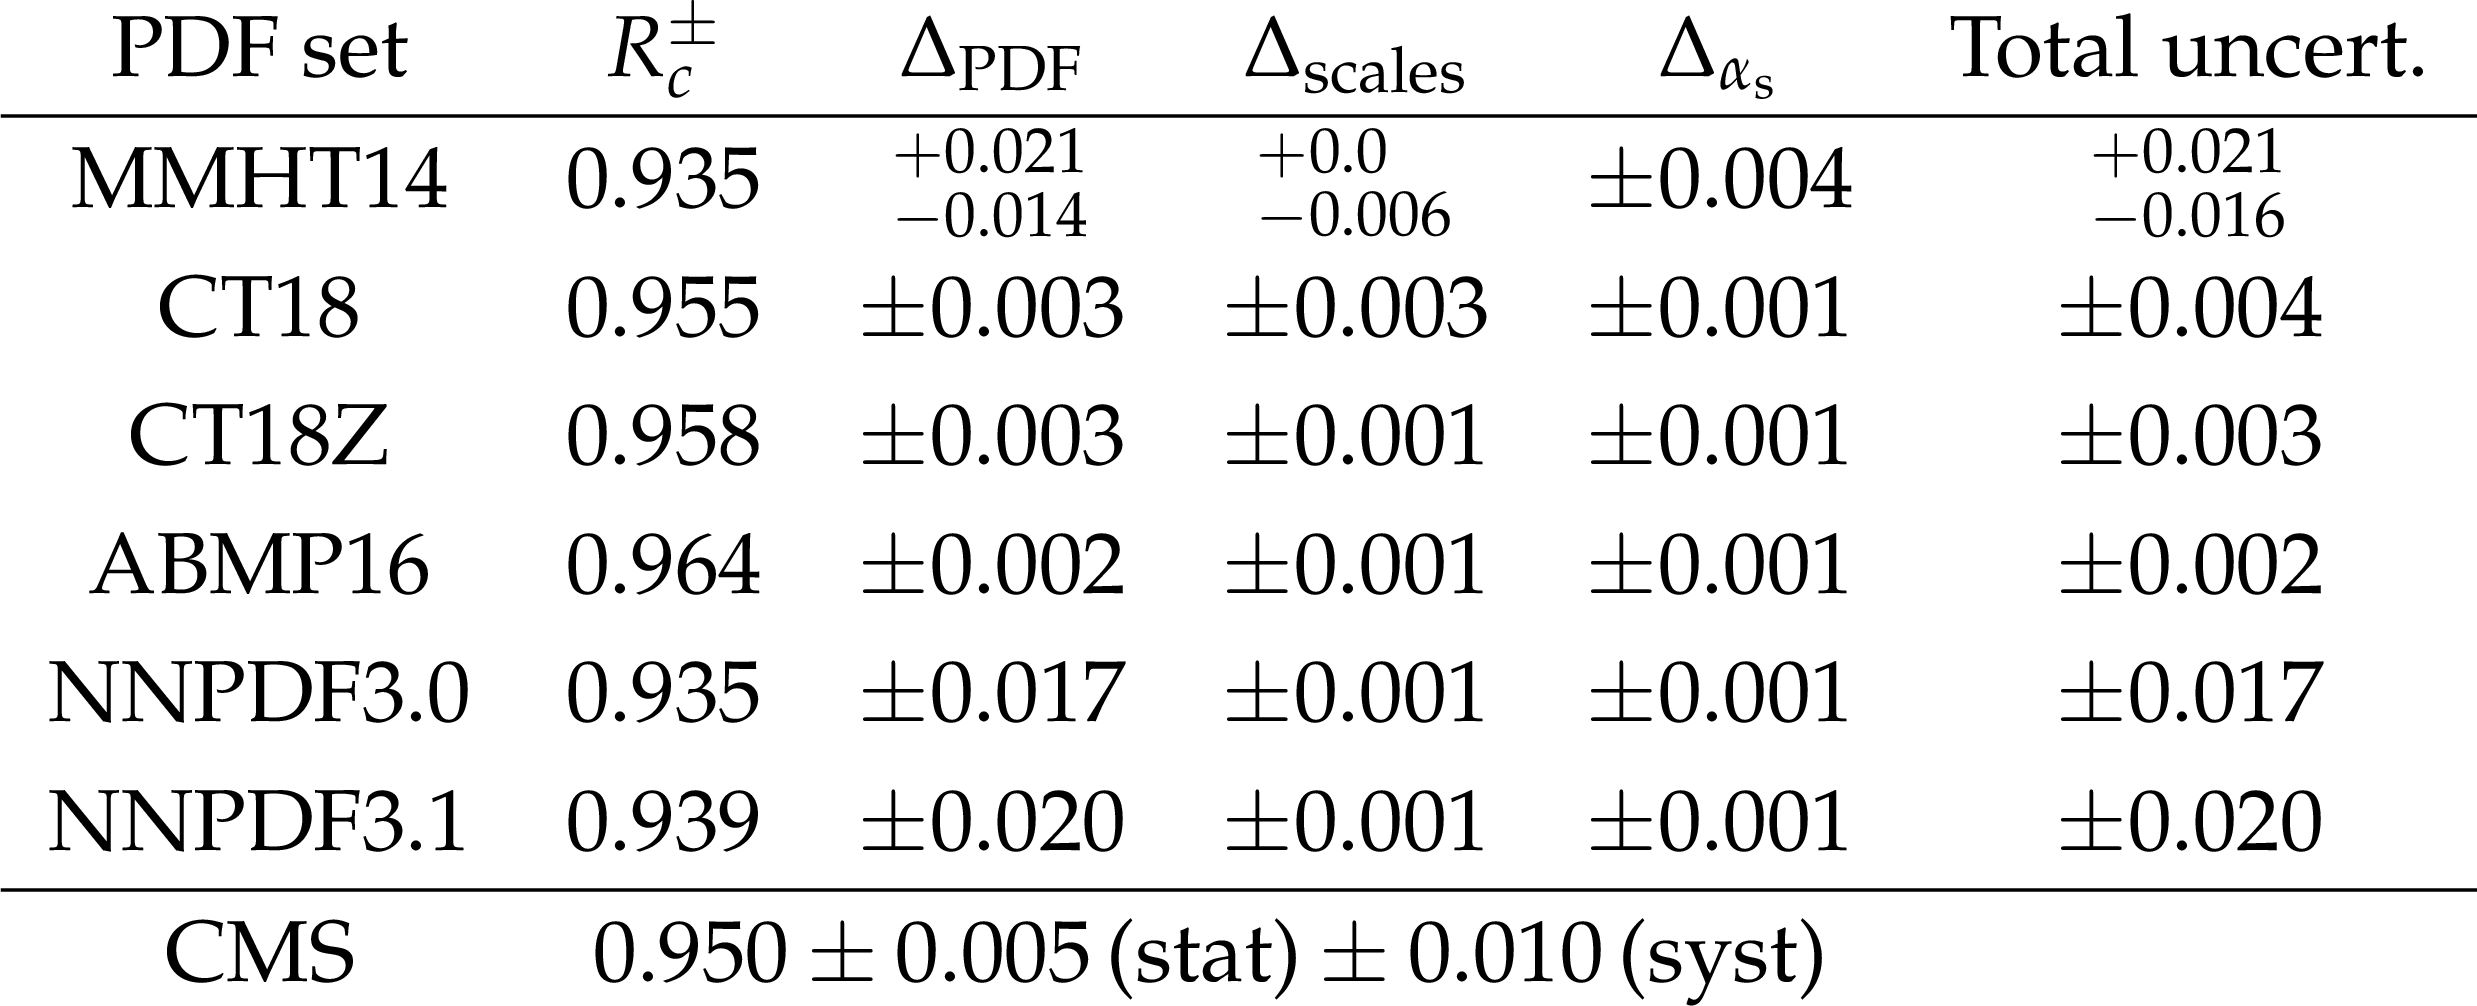
Table 9:
Theoretical predictions for $ {R_c^{\pm}}$ calculated with MCFM at NLO. The kinematic selection follows the experimental requirements. For every PDF set, the central value of the prediction is given, together with the uncertainty as prescribed from the PDF set, and the uncertainties associated with the scale variations and with the value of $\alpha _{\rm {s}}$. The total uncertainty is given in the last column. The last row in the table gives the experimental results presented in this note. |
| Summary |
|
The associated production of a W boson with a charm quark (Wc) in proton-proton (pp) collisions at a center-of-mass energy of 13 TeV is studied with a data sample collected by the CMS experiment corresponding to an integrated luminosity of 138 fb$^{-1}$ . The W+c process is selected based on the presence of a high transverse momentum lepton (electron or muon), coming from a W boson decay, and a jet with the signature of a charm hadron decay. Charm hadron decays are identified either by the presence of a muon inside a jet or by reconstructing a secondary decay vertex within the jet. Measurements are combined from the four different channels (electron and muon W boson decay channels, muon and secondary vertex charm identification channels). Cross section measurements, within a fiducial region defined by the kinematics of the lepton from the W boson decay and the jet originated by the charm quark (${p_{\mathrm{T}}}^{\ell} > $ 35 GeV, $|\eta^{\ell}| < $ 2.4, ${p_{\mathrm{T}}}^{\,\mathrm{c}\,\text{jet}} > $ 30 GeV, $|\eta^{\,\mathrm{c}\,\text{jet}}| < $ 2.4), are unfolded to the particle and parton levels. Cross sections are also measured differentially as a function of $|{\eta^\ell}|$ and ${p_{\mathrm{T}}}^\ell$. The cross section ratio for the processes $\mathrm{W^{+}}{+}\bar{c}$ and $\mathrm{W^{-}}{+}c$ is measured as well. The measured fiducial $\sigma(\mathrm{W{+}c})$ production cross section unfolded to the particle level is: The cross section measurement unfolded to the parton level yields: The measured $\sigma(\mathrm{W^{+}{+}\bar{c}})/{\sigma(\mathrm{W^{-}{+}c})}$ cross section ratio is: The measurements are compared with theoretical predictions. The particle level measurements are compared with the predictions of the MadGraph5_aMC@NLO MC generator. The parton level measurements and the cross section ratio measurement are compared with analytical calculations from the MCFM program using different NLO PDF sets. The predicted fiducial cross section is generally higher (up to around 10%) than the measured $\sigma(\mathrm{W{+}c})$, and modest deviations are observed in the shapes of the differential cross sections. Inclusion of these measurements in future PDF fits should improve the modeling of the strange quark parton distribution function. |
| References | ||||
| 1 | U. Baur et al. | The charm content of W + 1 jet events as a probe of the strange quark distribution function | PLB 318 (1993) 544 | hep-ph/9308370 |
| 2 | F. Faura et al. | The Strangest Proton? | EPJC 80 (2020), no. 12 | 2009.00014 |
| 3 | ATLAS Collaboration | Search for the decay of the higgs boson to charm quarks with the ATLAS experiment | Physical Review Letters 120 (05, 2018) | 1802.04329 |
| 4 | CMS Collaboration | A search for the standard model higgs boson decaying to charm quarks | Journal of High Energy Physics 2020 (03, 2020) | CMS-HIG-18-031 1912.01662 |
| 5 | CMS Collaboration | Measurement of associated W+charm production in pp collisions at $ \sqrt{s} = $ 7 TeV | JHEP 02 (2014) 013 | CMS-SMP-12-002 1310.1138 |
| 6 | CMS Collaboration | Measurements of the production of a W boson in association with a charm quark in proton-proton collisions at $ \sqrt{s}= $ 8 TeV | Submitted to EPJC | CMS-SMP-18-013 2112.00895 |
| 7 | CMS Collaboration | Measurement of associated production of a W boson and a charm quark in proton-proton collisions at $ \sqrt{s} = $ 13 TeV | EPJC 79 (2019) 269 | CMS-SMP-17-014 1811.10021 |
| 8 | ATLAS Collaboration | Measurement of the production of a W boson in association with a charm quark in pp collisions at $ \sqrt{s}= $ 7 TeV with the ATLAS detector | JHEP 05 (2014) 068 | 1402.6263 |
| 9 | LHCb Collaboration | Study of W boson production in association with beauty and charm | Physical Review D 92 (05, 2015) 052001 | 1505.04051 |
| 10 | CMS Collaboration | Track impact parameter resolution in the 2017 dataset with the CMS phase-1 pixel detector | CDS | |
| 11 | CMS Collaboration | The CMS experiment at the CERN LHC | JINST 3 (2008) S08004 | CMS-00-001 |
| 12 | CMS Collaboration | Performance of the CMS Level-1 trigger in proton-proton collisions at $ \sqrt{s} = $ 13 TeV | JINST 15 (2020) P10017 | CMS-TRG-17-001 2006.10165 |
| 13 | CMS Collaboration | The CMS trigger system | JINST 12 (2017) P01020 | CMS-TRG-12-001 1609.02366 |
| 14 | W. Adam et al. | The CMS phase-1 pixel detector upgrade | Journal of Instrumentation 16 (2021), no. 02 | 2012.14304 |
| 15 | CMS Collaboration | Performance of b tagging algorithms in proton-proton collisions at 13 TeV with phase 1 CMS detector | CDS | |
| 16 | S. Alioli, P. Nason, C. Oleari, and E. Re | A general framework for implementing NLO calculations in shower Monte Carlo programs: the POWHEG BOX | JHEP 06 (2010) 043 | 1002.2581 |
| 17 | T. Sjostrand, S. Mrenna, and P. Z. Skands | A brief introduction to PYTHIA 8.1 | CPC 178 (2008) 852 | 0710.3820 |
| 18 | J. Alwall et al. | The automated computation of tree-level and next-to-leading order differential cross sections, and their matching to parton shower simulations | JHEP 07 (2014) 079 | 1405.0301 |
| 19 | NNPDF Collaboration | Parton distributions for the LHC Run II | JHEP 04 (2015) 040 | 1410.8849 |
| 20 | NNPDF Collaboration | Parton distributions from high-precision collider data | EPJC 77 (2017) 663 | 1706.00428 |
| 21 | T. Sj$\ddot\rm o$strand et al. | An introduction to PYTHIA 8.2 | CPC 191 (2015) 159 | 1410.3012 |
| 22 | P. Skands, S. Carrazza, and J. Rojo | Tuning PYTHIA 8.1: the Monash 2013 Tune | EPJC 74 (2014), no. 8 | 1404.5630 |
| 23 | CMS Collaboration | Event generator tunes obtained from underlying event and multiparton scattering measurements | EPJC 76 (2016) 155 | CMS-GEN-14-001 1512.00815 |
| 24 | CMS Collaboration | Extraction and validation of a new set of CMS PYTHIA8 tunes from underlying-event measurements | EPJC 80 (2020), no. 1, 4 | CMS-GEN-17-001 1903.12179 |
| 25 | CMS Collaboration | Underlying event tunes and double parton scattering | CDS | |
| 26 | J. Alwall et al. | Comparative study of various algorithms for the merging of parton showers and matrix elements in hadronic collisions | EPJC 53 (2008) 473 | 0706.2569 |
| 27 | R. Frederix and S. Frixione | Merging meets matching in MC@NLO | JHEP 12 (2012) 061 | 1209.6215 |
| 28 | M. Lisovyi, A. Verbytskyi, and O. Zenaiev | Combined analysis of charm-quark fragmentation-fraction measurements | EPJC 76 (2016) 397 | 1509.01061 |
| 29 | Particle Data Group Collaboration | Review of Particle Physics | PTEP 2020 (2020), no. 8, 083C01 | |
| 30 | \GEANTfour Collaboration | GEANT4 --- a simulation toolkit | NIMA 506 (2003) 250 | |
| 31 | CMS Collaboration | Particle-flow reconstruction and global event description with the CMS detector | JINST 12 (2017) P10003 | CMS-PRF-14-001 1706.04965 |
| 32 | CMS Collaboration | Technical proposal for the Phase-II upgrade of the Compact Muon Solenoid | CMS-PAS-TDR-15-002 | CMS-PAS-TDR-15-002 |
| 33 | CMS Collaboration | Electron and photon reconstruction and identification with the CMS experiment at the CERN LHC | JINST 16 (2021) P05014 | CMS-EGM-17-001 2012.06888 |
| 34 | CMS Collaboration | ECAL 2016 refined calibration and Run2 summary plots | CDS | |
| 35 | A. M. Sirunyan et al. | Performance of the CMS muon trigger system in proton-proton collisions at $ \sqrt{s} = $ 13 TeV | Journal of Instrumentation 16 (jul, 2021) 07001 | 2102.04790 |
| 36 | CMS Collaboration | Performance of the CMS muon detector and muon reconstruction with proton-proton collisions at $ \sqrt{s}= $ 13 TeV | JINST 13 (2018) | CMS-MUO-16-001 1804.04528 |
| 37 | M. Cacciari, G. P. Salam, and G. Soyez | The anti-$ k_t $ jet clustering algorithm | JHEP 04 (2008) 063 | 0802.1189 |
| 38 | M. Cacciari, G. P. Salam, and G. Soyez | FastJet user manual | EPJC 72 (2012) 1896 | 1111.6097 |
| 39 | CMS Collaboration | Jet energy scale and resolution in the CMS experiment in pp collisions at 8 TeV | JINST 12 (2017) P02014 | CMS-JME-13-004 1607.03663 |
| 40 | CMS Collaboration | Performance of missing transverse momentum reconstruction in proton-proton collisions at $ \sqrt{s} = $ 13 TeV using the CMS detector | JINST 14 (2019) P07004 | CMS-JME-17-001 1903.06078 |
| 41 | CMS Collaboration | Measurement of the inclusive W and Z production cross sections in pp collisions at $ \sqrt{s}= $ 7 TeV with the CMS experiment | JHEP 10 (2011) 132 | CMS-EWK-10-005 1107.4789 |
| 42 | M. Cacciari and G. P. Salam | Pileup subtraction using jet areas | PLB 659 (2008) 119 | 0707.1378 |
| 43 | CMS Collaboration | Identification of heavy-flavour jets with the CMS detector in pp collisions at 13 TeV | JINST 13 (2018) P05011 | CMS-BTV-16-002 1712.07158 |
| 44 | CMS Collaboration | Identification of b-quark jets with the CMS experiment | JINST 8 (2013) P04013 | CMS-BTV-12-001 1211.4462 |
| 45 | CMS Collaboration | Measurement of $ {\mathrm b}\bar{\mathrm b} $ angular correlations based on secondary vertex reconstruction at $ \sqrt{s}= $ 7 TeV | JHEP 03 (2011) 136 | CMS-BPH-10-010 1102.3194 |
| 46 | CMS Collaboration | Measurement of the cross section and angular correlations for associated production of a Z boson with b hadrons in pp collisions at $ \sqrt{s}= $ 7 TeV | JHEP 12 (2013) 039 | CMS-EWK-11-015 1310.1349 |
| 47 | W. Waltenberger, R. Fruhwirth, and P. Vanlaer | Adaptive vertex fitting | JPG 34 (2007) N343 | |
| 48 | A. Ali and F. Barreiro | The Final States $ \ell^\mp K^\pm K^\pm $ X in Jets as Signatures of $ B(s $)0 $ \bar{B}(s $)0 Mixings | Z. Phys. C 30 (1986) 635 | |
| 49 | M. Gronau, A. Nippe, and J. L. Rosner | Method for flavor tagging in neutral B meson decays | PRD 47 (1993) 1988 | hep-ph/9211311 |
| 50 | LHCb Collaboration | Identification of beauty and charm quark jets at LHCb | JINST 10 (2015) P06013 | 1504.07670 |
| 51 | CMS Collaboration | Measurement of associated Z + charm production in proton-proton collisions at $ \sqrt{s} = $ 8 TeV | EPJC 78 (2018) 287 | CMS-SMP-15-009 1711.02143 |
| 52 | CMS Collaboration | Precision luminosity measurement in proton-proton collisions at $ \sqrt{s} = $ 13 TeV in 2015 and 2016 at CMS | EPJC 81 (2021) 800 | CMS-LUM-17-003 2104.01927 |
| 53 | CMS Collaboration | CMS luminosity measurement for the 2017 data-taking period at $ \sqrt{s} = $ 13 TeV | CMS-PAS-LUM-17-004 | CMS-PAS-LUM-17-004 |
| 54 | CMS Collaboration | CMS luminosity measurement for the 2018 data-taking period at $ \sqrt{s} = $ 13 TeV | CMS-PAS-LUM-18-002 | CMS-PAS-LUM-18-002 |
| 55 | J. Butterworth et al. | PDF4LHC recommendations for LHC Run II | Journal of Physics G: Nuclear and Particle Physics 43 (01, 2016) 023001 | 1510.03865 |
| 56 | J. Campbell and T. Neumann | Precision Phenomenology with MCFM | JHEP 12 (2019) 034 | 1909.09117 |
| 57 | L. A. Harland-Lang, A. D. Martin, P. Motylinski, and R. S. Thorne | Parton distributions in the LHC era: MMHT 2014 PDFs | EPJC 75 (2015) 204 | 1412.3989 |
| 58 | T.-J. Hou et al. | New CTEQ global analysis of quantum chromodynamics with high-precision data from the LHC | PRD 103 (Jan, 2021) 014013 | 1912.10053 |
| 59 | S. Alekhin, J. Blumlein, and S. Moch | NLO PDFs from the ABMP16 fit | EPJC 78 (2018) 477 | 1803.07537 |
| 60 | A. Buckley et al. | LHAPDF6: parton density access in the LHC precision era | EPJC 75 (2015) 132 | 1412.7420 |
|
|
Compact Muon Solenoid LHC, CERN |
|

|

|

|

|

|