

Compact Muon Solenoid
LHC, CERN
| CMS-PAS-SMP-21-001 | ||
| First observation of the electroweak production of a leptonically decaying W$^{+}$W$^{-}$ pair in association with two jets in $\sqrt{s} = $ 13 TeV pp collisions. | ||
| CMS Collaboration | ||
| November 2021 | ||
| Abstract: The first observation of the electroweak production of a W$^{+}$W$^{-}$ pair in association with two jets, with both W bosons decaying leptonically, is reported. The data sample corresponds to 138 fb$^{-1}$ of proton-proton collisions at 13 TeV. Events are selected by requiring two leptons (electrons or muons) and two jets with large pseudorapidity separation and high invariant mass. Events are categorized based on the flavour of final state leptons. A signal is observed with a significance of 5.6 standard deviations and the measured fiducial cross section is 10.2 $\pm$ 2.0 fb. The fiducial volume is required to have two oppositely-charged leptons in the $ | \eta | < $ 2.5 region with $p_{\mathrm{T}} > $ 25 GeV and $p_{\mathrm{T}} > $ 13 GeV respectively, having an invariant mass greater than 50 GeV; additionaly, at least two jets in the $ | \eta | < $ 4.7 region with a cone size $\Delta R = $ 0.4 and $p_{\mathrm{T}} > $ 30 GeV are selected, having a pseudorapidity gap larger than 2.5 and an invariant mass greater than 300 GeV. | ||
|
Links:
CDS record (PDF) ;
CADI line (restricted) ;
These preliminary results are superseded in this paper, Submitted to PLB. The superseded preliminary plots can be found here. |
||
| Figures | |
png pdf |
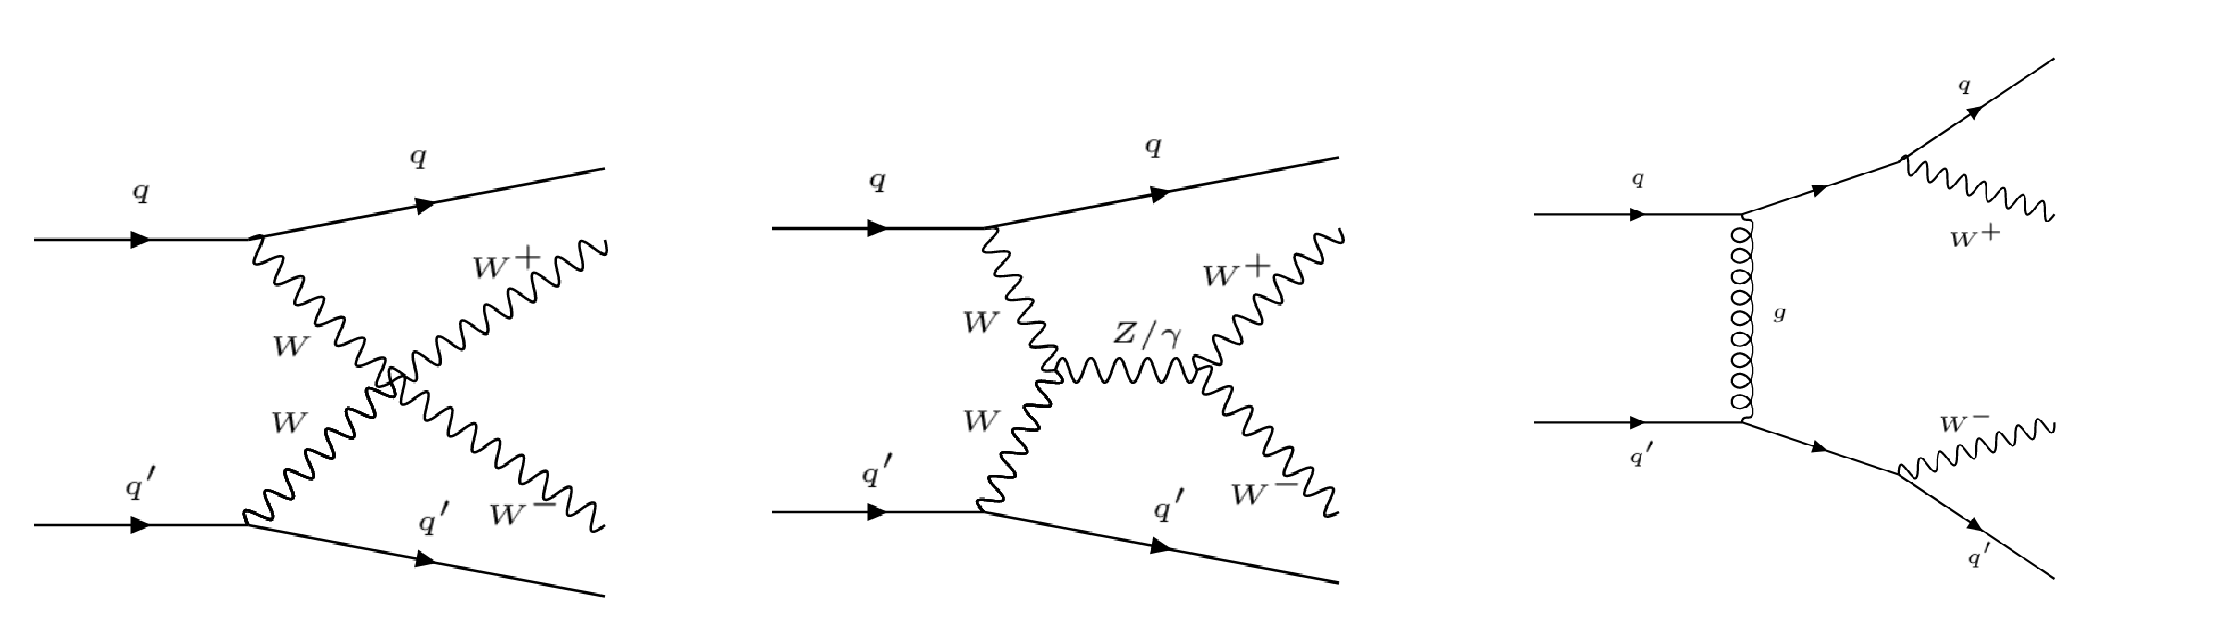
Figure 1:
Examples of Feynman diagrams for the EW (left, middle) and QCD (right) production of W$^{+}$W$^{-}$. |
png |
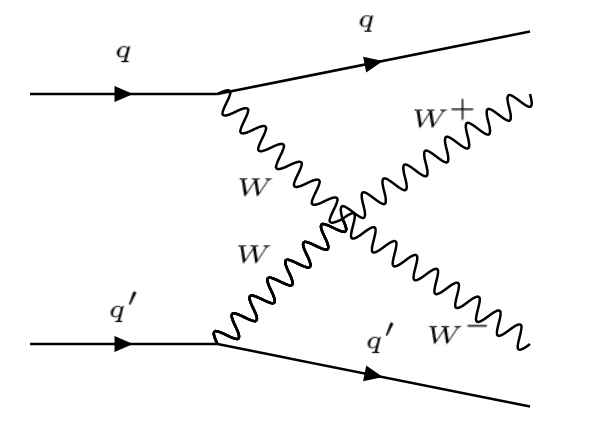
Figure 1-a:
Examples of Feynman diagrams for the EW (left, middle) and QCD (right) production of W$^{+}$W$^{-}$. |
png |
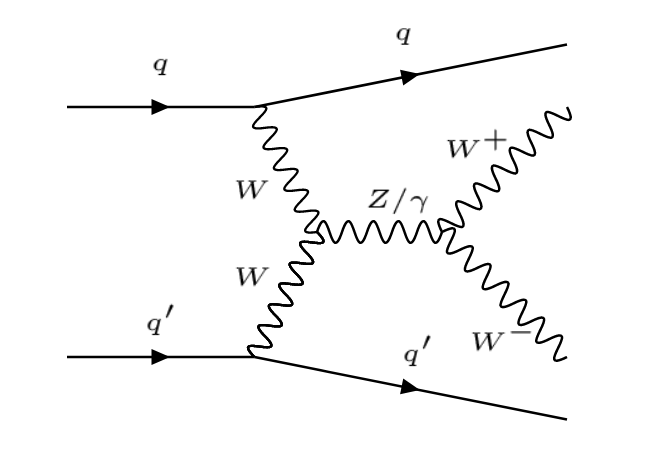
Figure 1-b:
Examples of Feynman diagrams for the EW (left, middle) and QCD (right) production of W$^{+}$W$^{-}$. |
png |
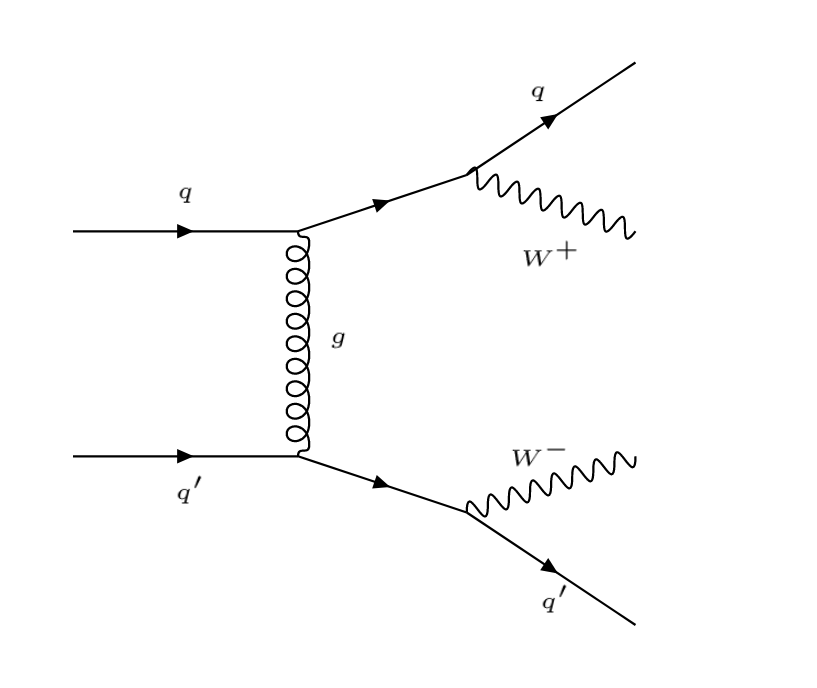
Figure 1-c:
Examples of Feynman diagrams for the EW (left, middle) and QCD (right) production of W$^{+}$W$^{-}$. |

png pdf |
Figure 2:
Post-fit DNN output distributions in the e$\mu $ signal region for $ {Z_{\ell \ell}} < $ 1 (left) and $ {Z_{\ell \ell}} \geq $ 1 (right). |

png pdf |
Figure 2-a:
Post-fit DNN output distributions in the e$\mu $ signal region for $ {Z_{\ell \ell}} < $ 1 (left) and $ {Z_{\ell \ell}} \geq $ 1 (right). |

png pdf |
Figure 2-b:
Post-fit DNN output distributions in the e$\mu $ signal region for $ {Z_{\ell \ell}} < $ 1 (left) and $ {Z_{\ell \ell}} \geq $ 1 (right). |

png pdf |
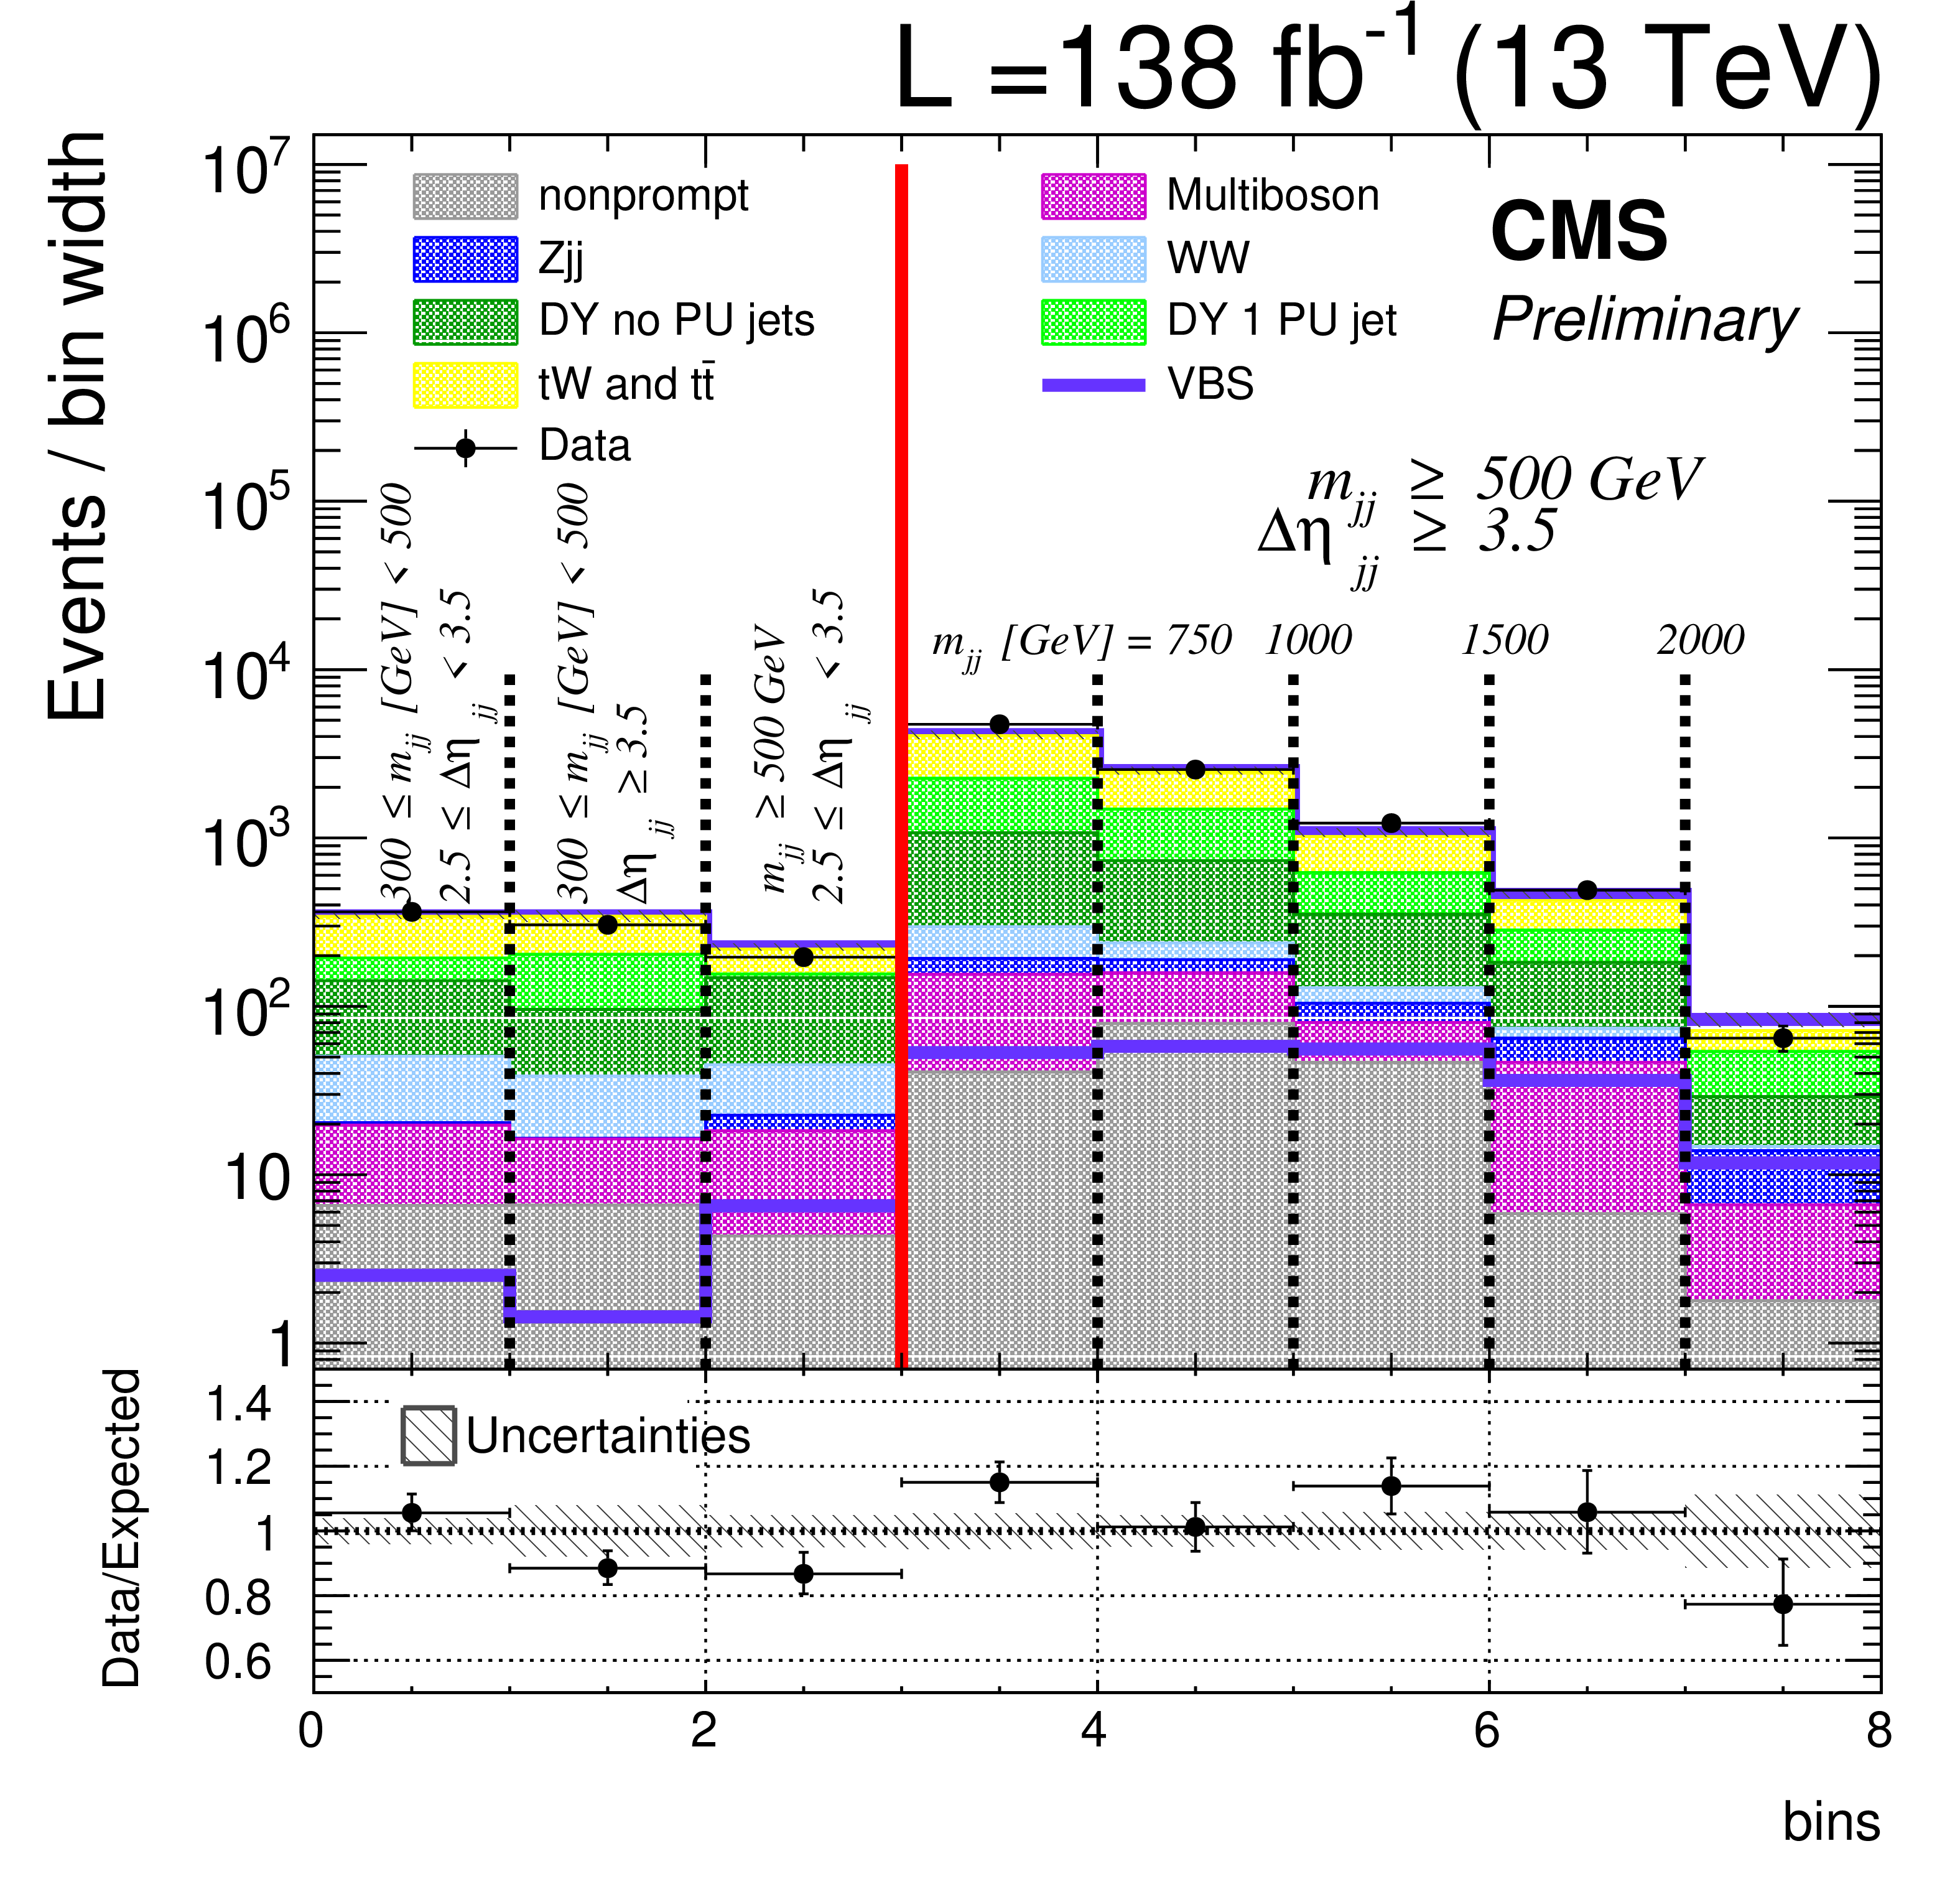
Figure 3:
Post-fit ${m_{\mathrm {jj}}}$ distribution for the signal regions in same-flavour categories (ee and $\mu \mu $ combined) for $ {Z_{\ell \ell}} < $ 1 (left) and $ {Z_{\ell \ell}} \geq $ 1 (right). For each plot, the first bin contains the number of events in the 300 $ < {m_{\mathrm {jj}}} [ GeV ] < $ 500 and 2.5 $ < {\Delta \eta _{\mathrm {jj}}} < $ 3.5 category, the second bin those in the 300 $ < {m_{\mathrm {jj}}} [ GeV ] < $ 500 and $ {\Delta \eta _{\mathrm {jj}}} > $ 3.5 category, and the third bin those in the $ {m_{\mathrm {jj}}} > $ 500 GeV and 2.5 $ < {\Delta \eta _{\mathrm {jj}}} < $ 3.5 category. The last five bins represent the ${m_{\mathrm {jj}}}$ distribution in the $ {m_{\mathrm {jj}}} > $ 500 GeV and $ {\Delta \eta _{\mathrm {jj}}} > $ 3.5 category normalized to the width of the bins. |

png pdf |
Figure 3-a:
Post-fit ${m_{\mathrm {jj}}}$ distribution for the signal regions in same-flavour categories (ee and $\mu \mu $ combined) for $ {Z_{\ell \ell}} < $ 1 (left) and $ {Z_{\ell \ell}} \geq $ 1 (right). For each plot, the first bin contains the number of events in the 300 $ < {m_{\mathrm {jj}}} [ GeV ] < $ 500 and 2.5 $ < {\Delta \eta _{\mathrm {jj}}} < $ 3.5 category, the second bin those in the 300 $ < {m_{\mathrm {jj}}} [ GeV ] < $ 500 and $ {\Delta \eta _{\mathrm {jj}}} > $ 3.5 category, and the third bin those in the $ {m_{\mathrm {jj}}} > $ 500 GeV and 2.5 $ < {\Delta \eta _{\mathrm {jj}}} < $ 3.5 category. The last five bins represent the ${m_{\mathrm {jj}}}$ distribution in the $ {m_{\mathrm {jj}}} > $ 500 GeV and $ {\Delta \eta _{\mathrm {jj}}} > $ 3.5 category normalized to the width of the bins. |
png pdf |
Figure 3-b:
Post-fit ${m_{\mathrm {jj}}}$ distribution for the signal regions in same-flavour categories (ee and $\mu \mu $ combined) for $ {Z_{\ell \ell}} < $ 1 (left) and $ {Z_{\ell \ell}} \geq $ 1 (right). For each plot, the first bin contains the number of events in the 300 $ < {m_{\mathrm {jj}}} [ GeV ] < $ 500 and 2.5 $ < {\Delta \eta _{\mathrm {jj}}} < $ 3.5 category, the second bin those in the 300 $ < {m_{\mathrm {jj}}} [ GeV ] < $ 500 and $ {\Delta \eta _{\mathrm {jj}}} > $ 3.5 category, and the third bin those in the $ {m_{\mathrm {jj}}} > $ 500 GeV and 2.5 $ < {\Delta \eta _{\mathrm {jj}}} < $ 3.5 category. The last five bins represent the ${m_{\mathrm {jj}}}$ distribution in the $ {m_{\mathrm {jj}}} > $ 500 GeV and $ {\Delta \eta _{\mathrm {jj}}} > $ 3.5 category normalized to the width of the bins. |
png pdf |
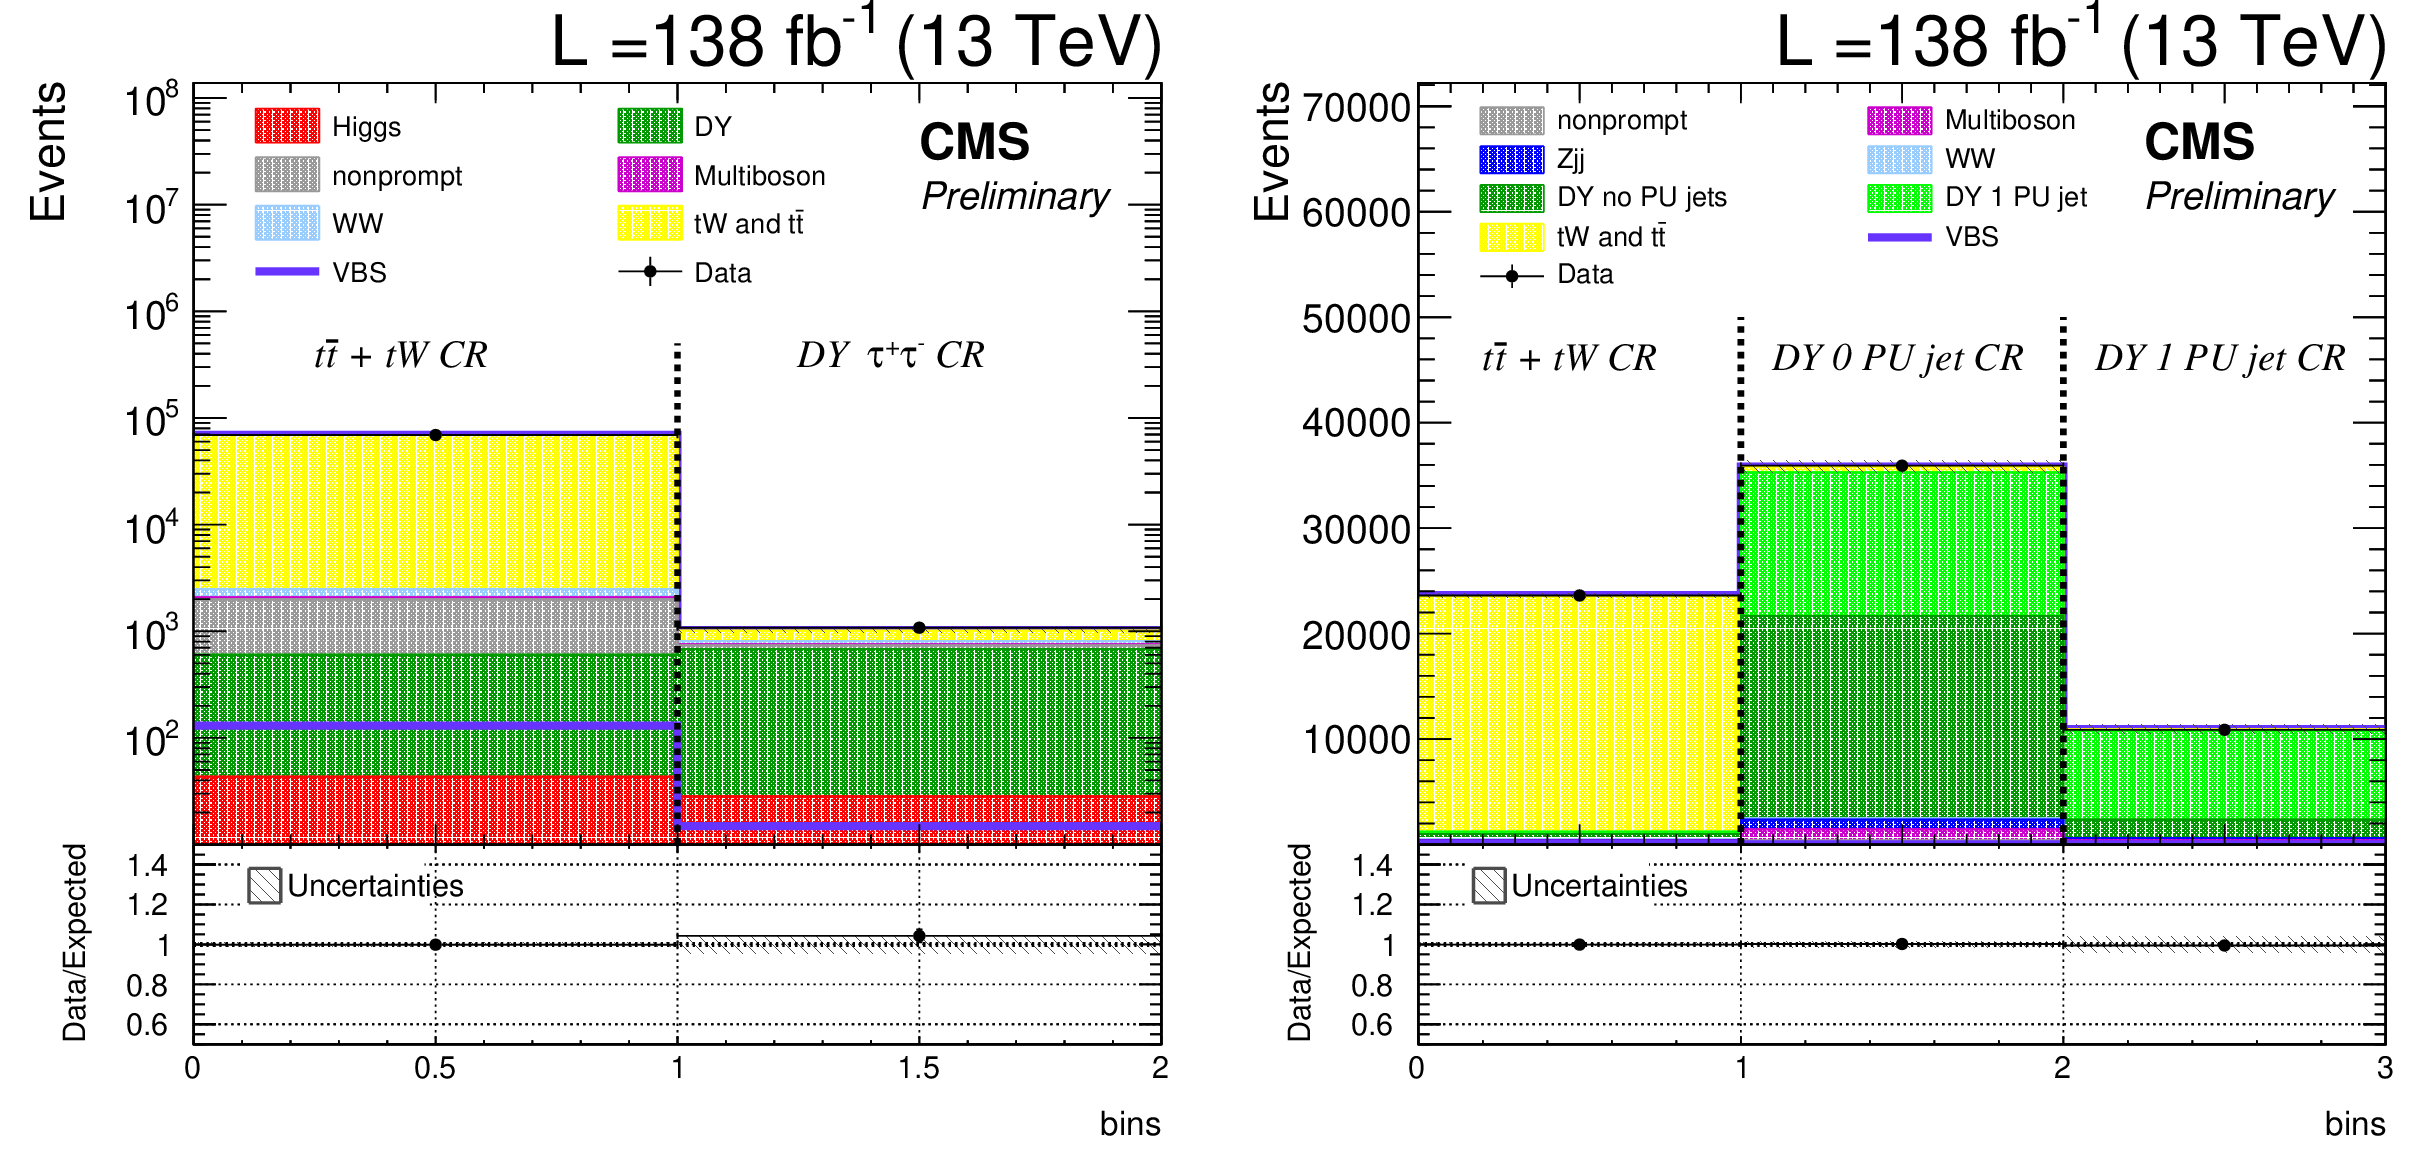
Figure 4:
Post-fit number of events in the control regions for different-flavour (left) and same-flavour (right, with ee and $\mu \mu $ combined) categories. In the left-hand plot, the first bin contains the number of events in the ${\mathrm{t} {}\mathrm{\bar{t}}}$ + $\mathrm{t} \mathrm{W} $ different-flavour control region and the second bin those in the DY $\tau \tau $ control region. In the right-hand plot, the first bin contains the number of events in the ${\mathrm{t} {}\mathrm{\bar{t}}}$ + $\mathrm{t} \mathrm{W} $ same-flavour control region, the second bin those in the $ {\Delta \eta _{\mathrm {jj}}} < $ 5 DY control region, and the third bin those in the $ {\Delta \eta _{\mathrm {jj}}} > $ 5 DY control region. |

png pdf |
Figure 4-a:
Post-fit number of events in the control regions for different-flavour (left) and same-flavour (right, with ee and $\mu \mu $ combined) categories. In the left-hand plot, the first bin contains the number of events in the ${\mathrm{t} {}\mathrm{\bar{t}}}$ + $\mathrm{t} \mathrm{W} $ different-flavour control region and the second bin those in the DY $\tau \tau $ control region. In the right-hand plot, the first bin contains the number of events in the ${\mathrm{t} {}\mathrm{\bar{t}}}$ + $\mathrm{t} \mathrm{W} $ same-flavour control region, the second bin those in the $ {\Delta \eta _{\mathrm {jj}}} < $ 5 DY control region, and the third bin those in the $ {\Delta \eta _{\mathrm {jj}}} > $ 5 DY control region. |
png pdf |
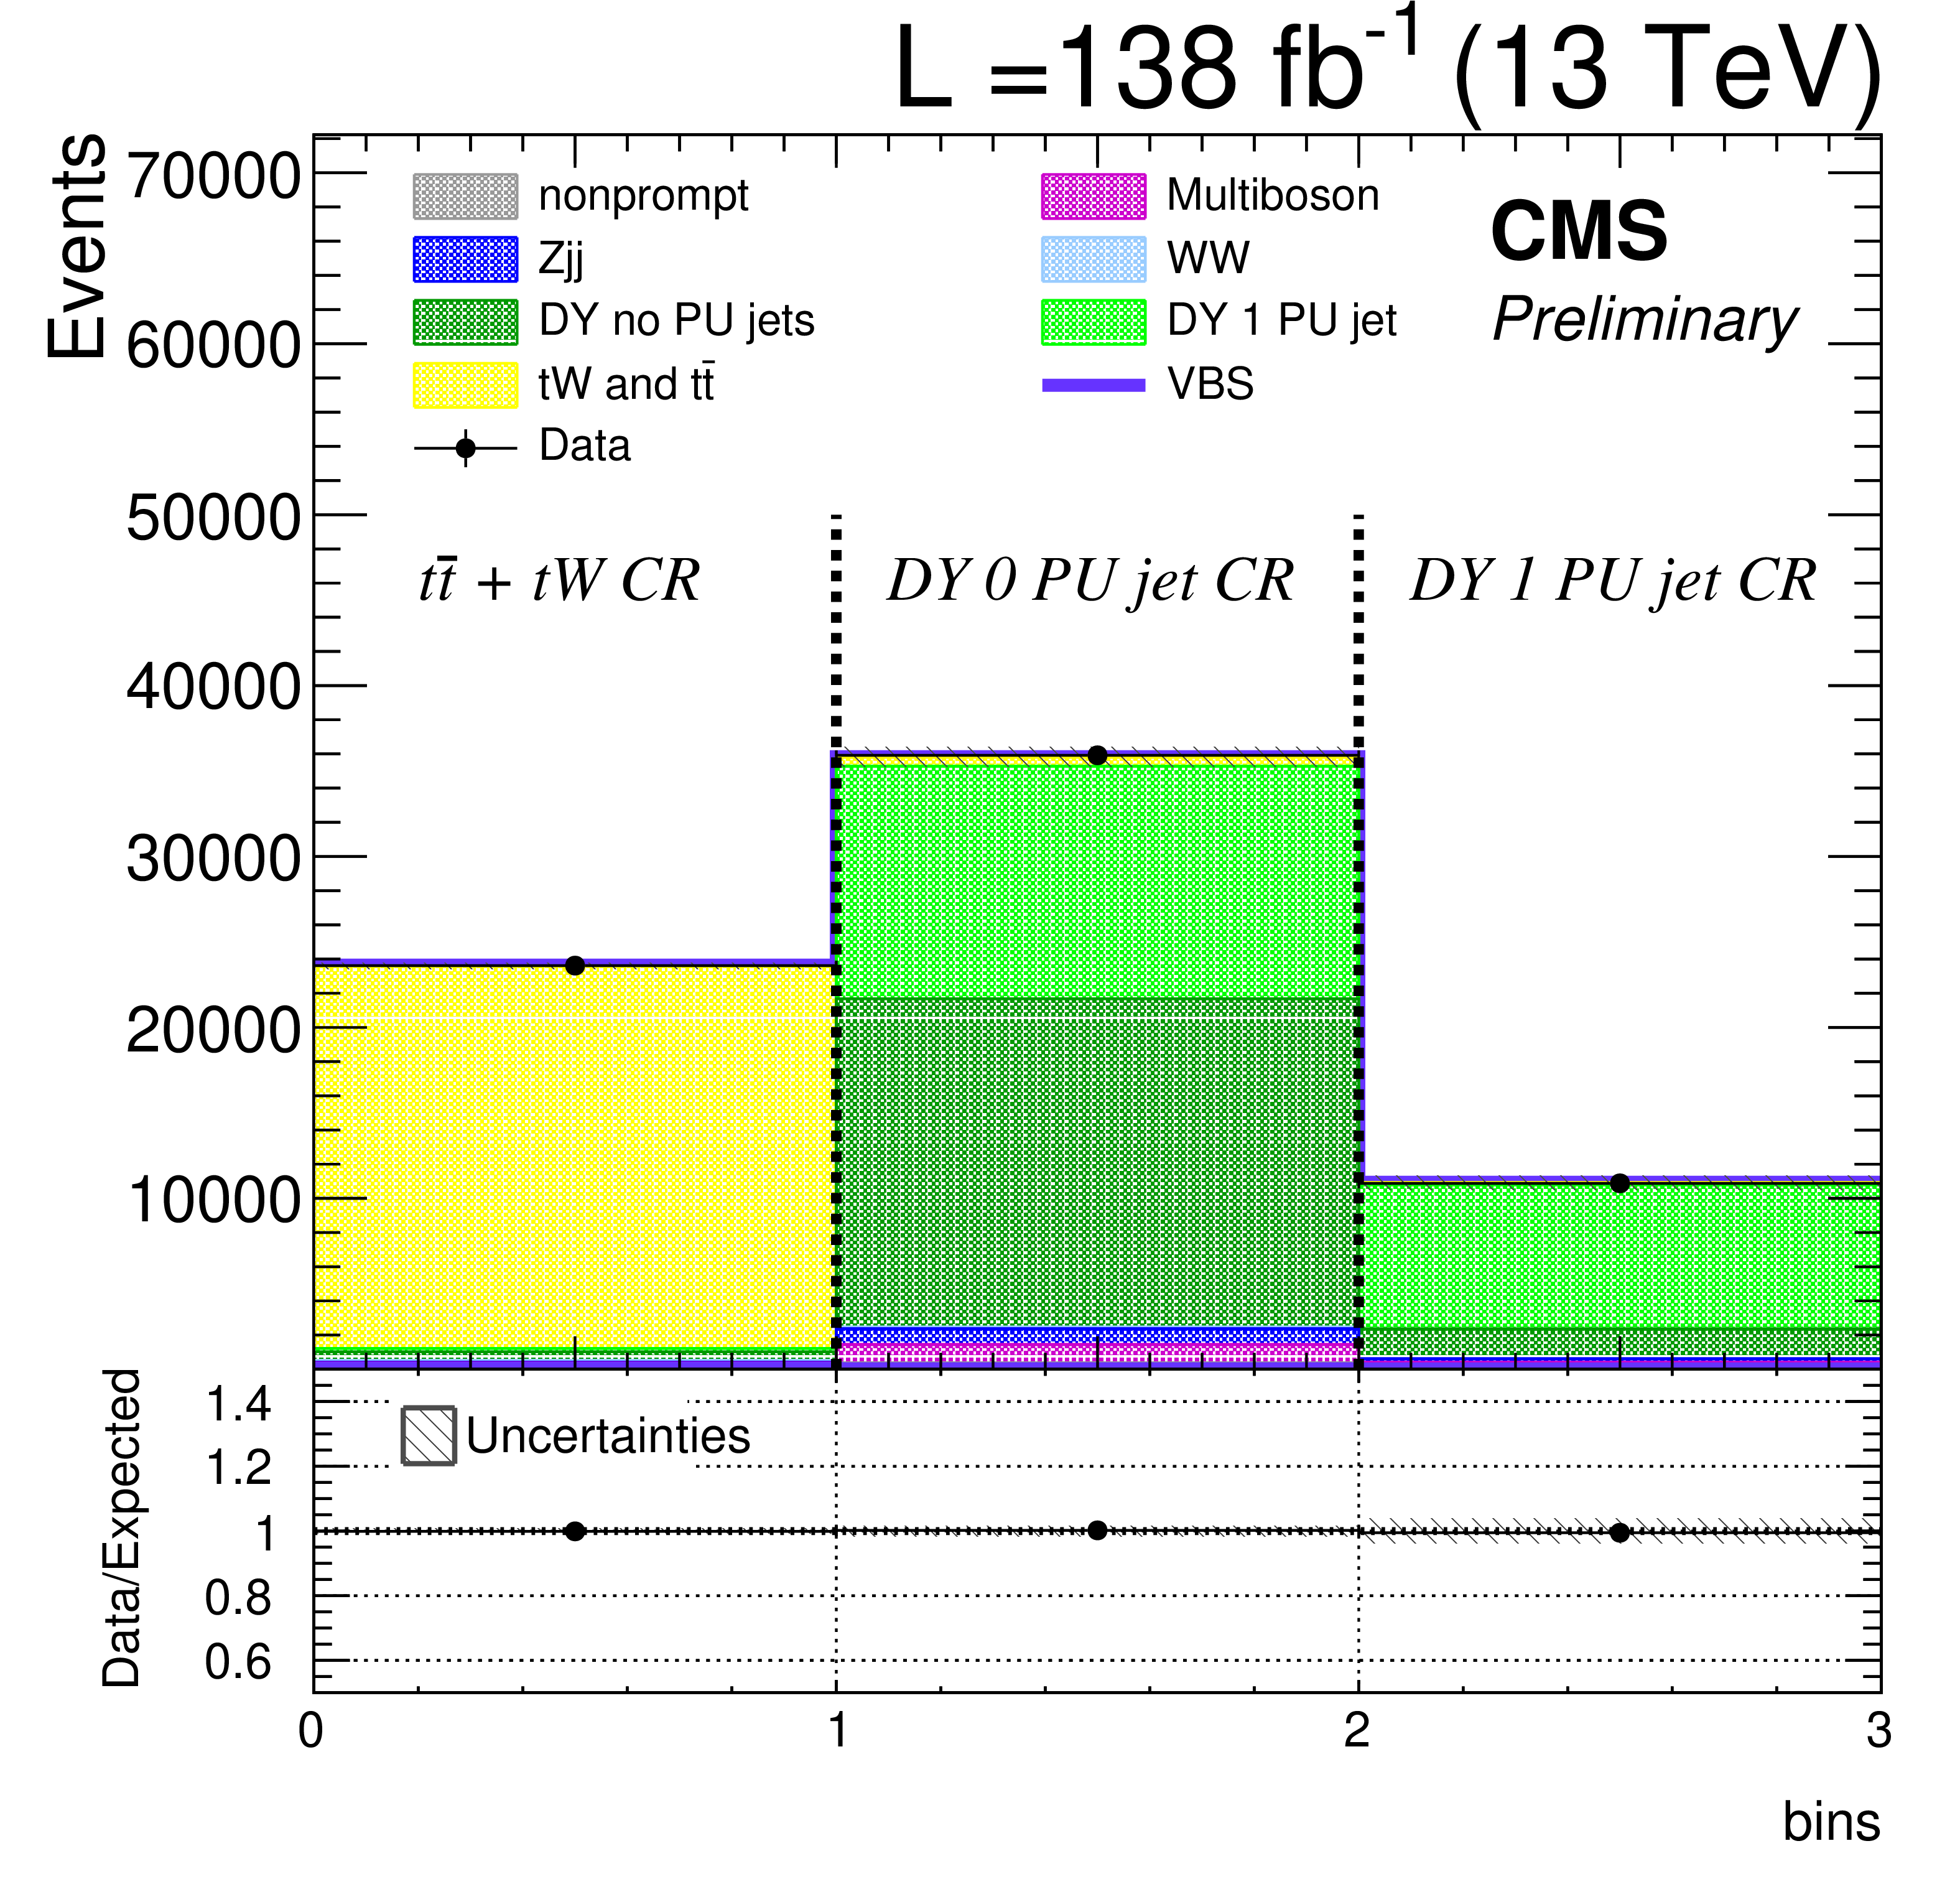
Figure 4-b:
Post-fit number of events in the control regions for different-flavour (left) and same-flavour (right, with ee and $\mu \mu $ combined) categories. In the left-hand plot, the first bin contains the number of events in the ${\mathrm{t} {}\mathrm{\bar{t}}}$ + $\mathrm{t} \mathrm{W} $ different-flavour control region and the second bin those in the DY $\tau \tau $ control region. In the right-hand plot, the first bin contains the number of events in the ${\mathrm{t} {}\mathrm{\bar{t}}}$ + $\mathrm{t} \mathrm{W} $ same-flavour control region, the second bin those in the $ {\Delta \eta _{\mathrm {jj}}} < $ 5 DY control region, and the third bin those in the $ {\Delta \eta _{\mathrm {jj}}} > $ 5 DY control region. |
| Tables | |

png pdf |
Table 1:
Set of variables used as inputs to the DNN for both ${Z_{\ell \ell}} < $ 1 and ${Z_{\ell \ell}} \geq $ 1 models. The order of the table does not correspond to variable importance. |
png pdf |
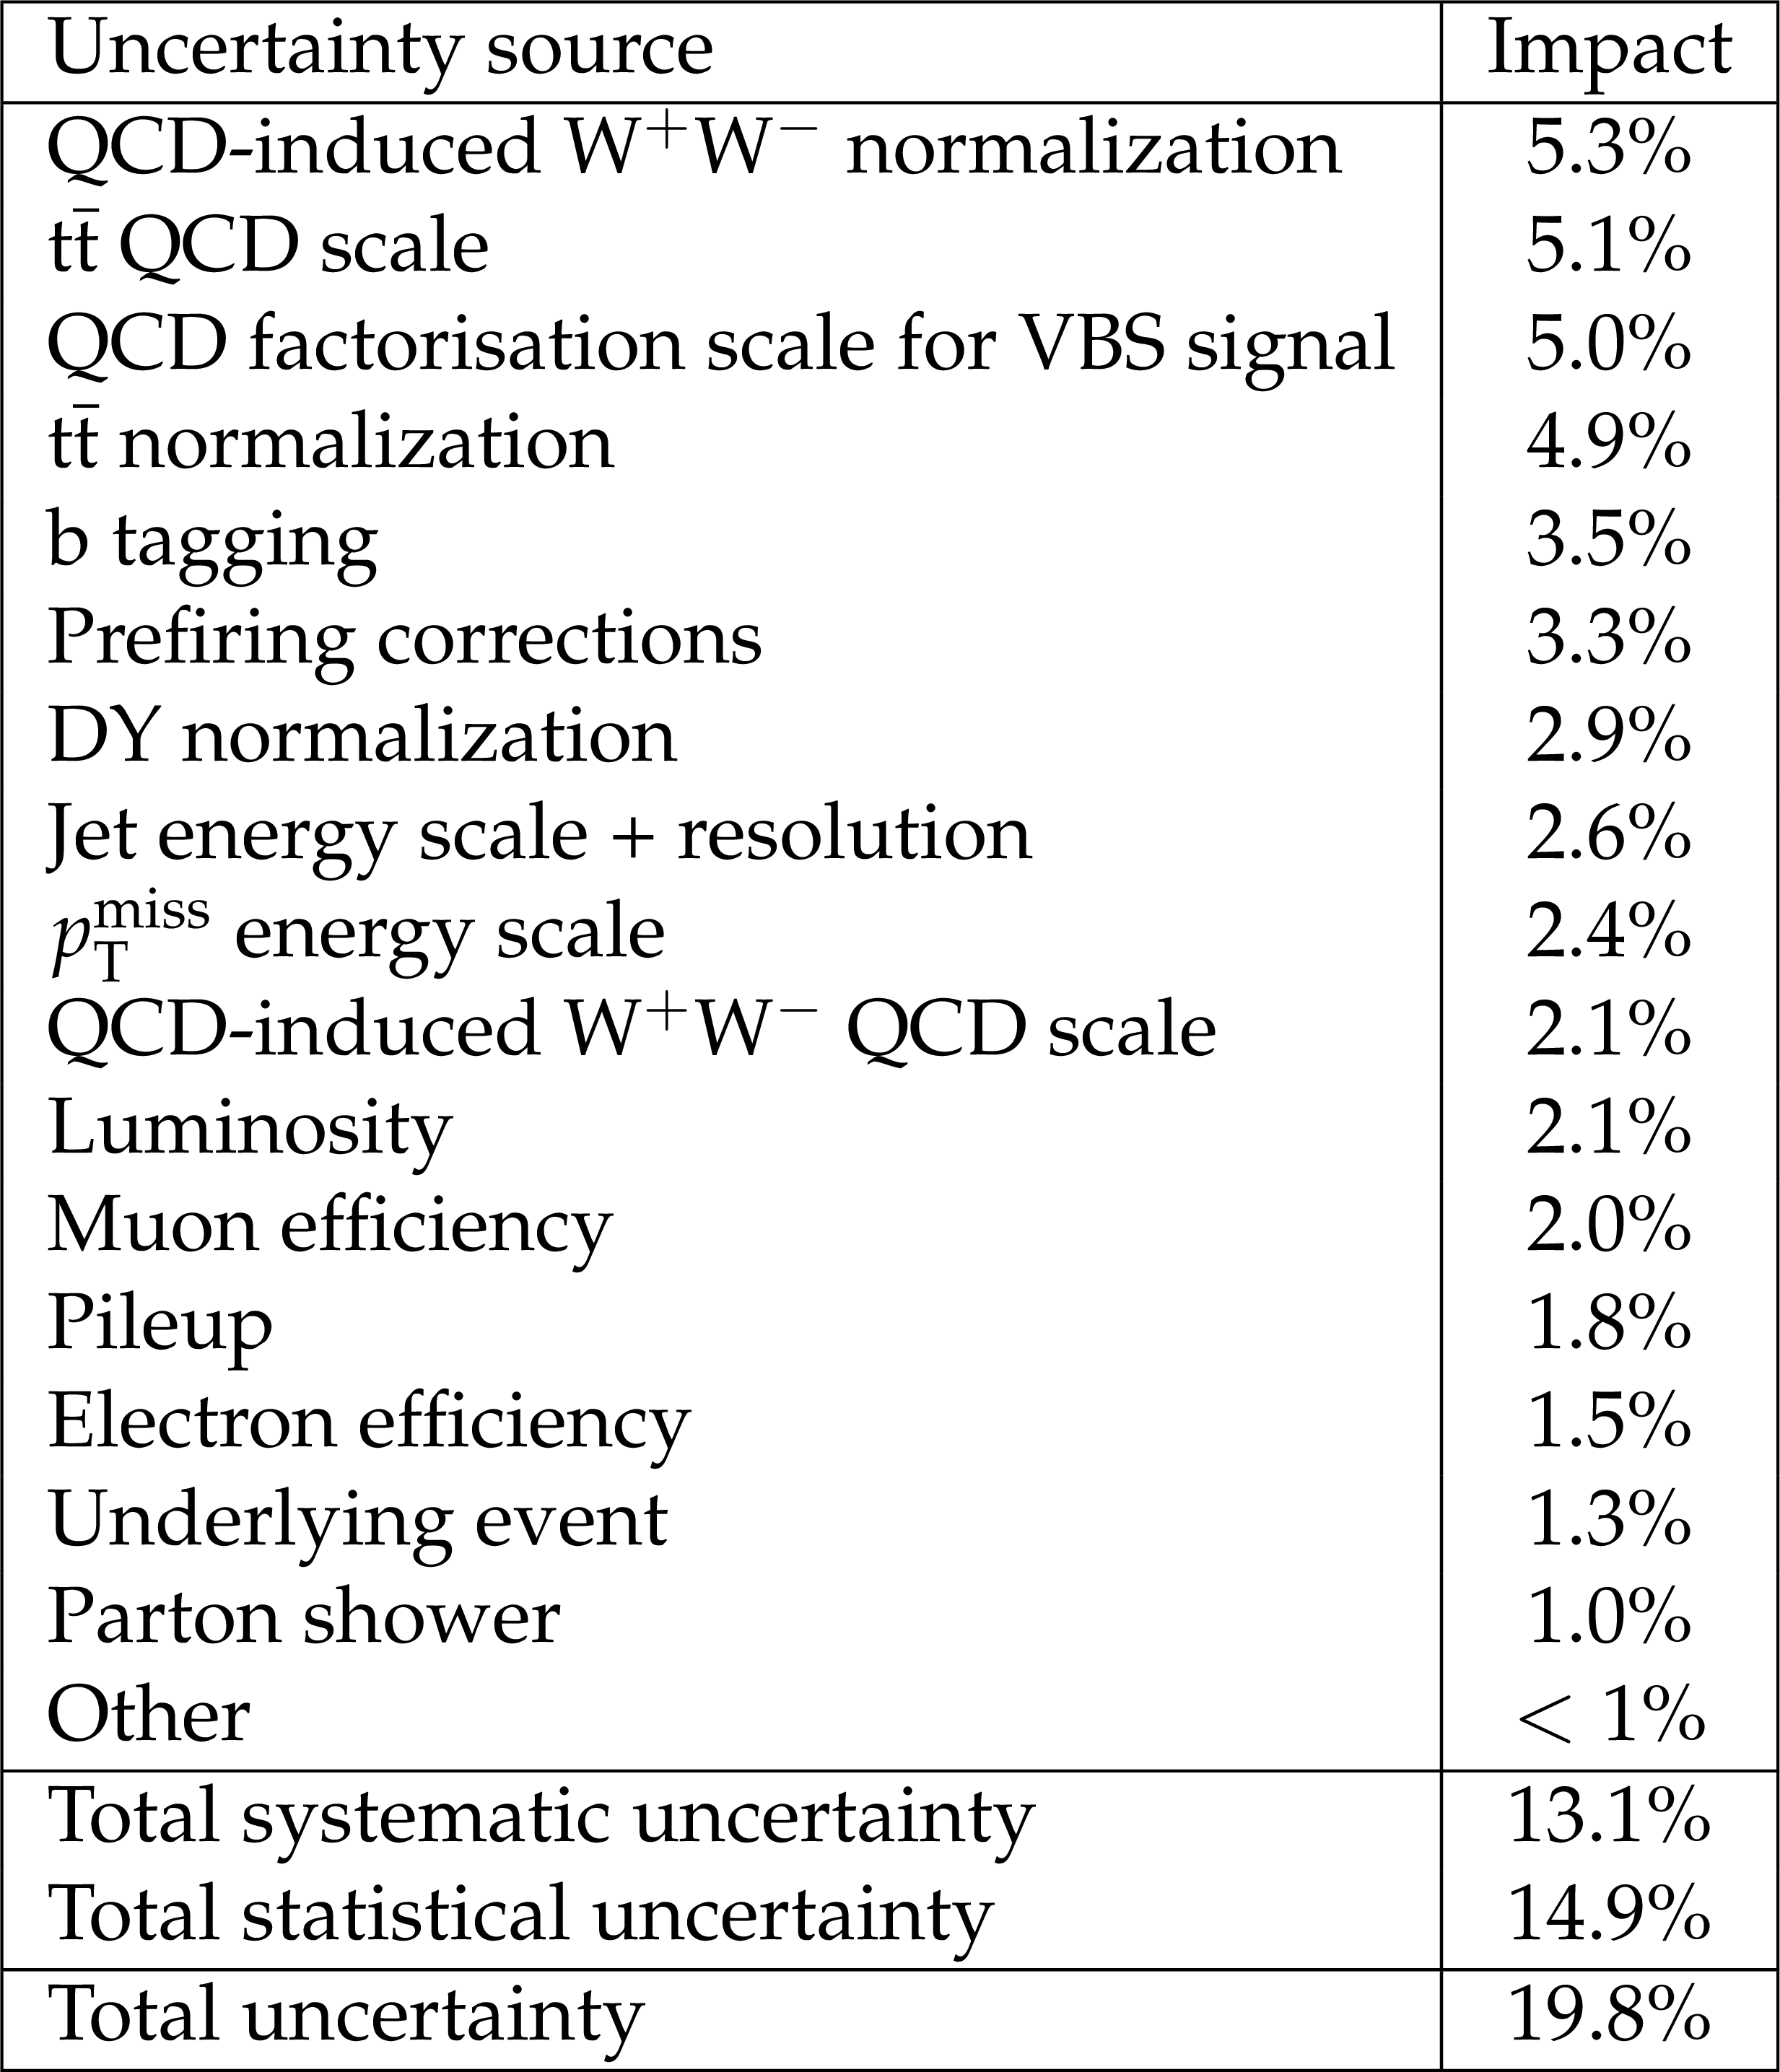
Table 2:
Sources of systematic uncertainty affecting the signal yield by more than 1%. The total uncertainty is also reported, as well as the total systematic and statistical contributions. |

png pdf |
Table 3:
Definition of the fiducial volume close to the reconstructed signal region. |
| Summary |
|
The first observation of the electroweak production of a pair of opposite-sign W bosons in association with two jets is reported. Selected events contain two opposite sign leptons (electrons or muons), missing transverse energy and two jets with high invariant mass and large separation in pseudorapidity. A data set corresponding to an integrated luminosity of 138 fb$^{-1}$ has been analyzed, collected by the CMS detector at the LHC during proton-proton collisions at a center-of-mass energy of 13 TeV. Machine learning techniques have been employed to deal with the irreducible background from the QCD-induced production of W bosons and the dominant background from the production of top quark pairs. The electroweak W$^{+}$W$^{-}$ production cross section has been measured in two fiducial volumes; in the more inclusive one the cross section is 99 $\pm$ 20 fb (89 $\pm$ 5 fb expected), whereas in the one closer to the reconstructed signal region, the measured cross section is 10.2 $\pm$ 2.0 fb (9.1 $\pm$ 0.6 fb expected). The measured signal corresponds to an observed (expected) significance of 5.6 (5.2) standard deviations with respect to the only-background hypothesis. |
| References | ||||
| 1 | A. Ballestrero et al. | Vector boson scattering: Recent experimental and theory developments | Rev. Phys. 3 (2018) 44 | 1801.04203 |
| 2 | CMS Collaboration | Observation of electroweak production of same-sign W boson pairs in the two jet and two same-sign lepton final state in proton-proton collisions at $ \sqrt{s} = $ ~13~TeV | PRL 120 (2018) 081801 | CMS-SMP-17-004 1709.05822 |
| 3 | CMS Collaboration | Measurements of production cross sections of WZ and same-sign WW boson pairs in association with two jets in proton-proton collisions at $ \sqrt{s} = $ 13 TeV | Physics Letters B 809 (2020) 135710 | CMS-SMP-19-012 2005.01173 |
| 4 | CMS Collaboration | The CMS experiment at the CERN LHC | Journal of Instrumentation 3 (2008) S08004 | |
| 5 | CMS Collaboration | Precision luminosity measurement in proton-proton collisions at $ \sqrt{s} = $ 13 TeV in 2015 and 2016 at CMS | EPJC 81 (2021) 800 | CMS-LUM-17-003 2104.01927 |
| 6 | CMS Collaboration | CMS luminosity measurement for the 2017 data-taking period at $ \sqrt{s} = $ 13 TeV | CMS-PAS-LUM-17-004 | CMS-PAS-LUM-17-004 |
| 7 | CMS Collaboration | CMS luminosity measurement for the 2018 data-taking period at $ \sqrt{s} = $ 13 TeV | CMS-PAS-LUM-18-002 | CMS-PAS-LUM-18-002 |
| 8 | CMS Collaboration | Measurements of properties of the Higgs boson decaying to a W boson pair in pp collisions at $ \sqrt{s}= $ 13~TeV | PLB 791 (2019) 96 | CMS-HIG-16-042 1806.05246 |
| 9 | J. Alwall et al. | The automated computation of tree-level and next-to-leading order differential cross sections, and their matching to parton shower simulations | JHEP 07 (2014) 079 | 1405.0301 |
| 10 | T. Sjostrand et al. | An Introduction to PYTHIA 8.2 | CPC 191 (2015) 159 | 1410.3012 |
| 11 | S. Alioli, P. Nason, C. Oleari, and E. Re | A general framework for implementing NLO calculations in shower Monte Carlo programs: the POWHEG BOX | JHEP 06 (2010) 043 | 1002.2581 |
| 12 | E. Re, M. Wiesemann, and G. Zanderighi | NNLOPS accurate predictions for $ W^+W^- $ production | Journal of High Energy Physics 2018 (2018) | 1805.09857 |
| 13 | K. Hamilton, P. Nason, and G. Zanderighi | Finite quark-mass effects in the NNLOPS POWHEG+MiNLO Higgs generator | JHEP 05 (2015) 140 | 1501.04637 |
| 14 | J. M. Campbell and R. K. Ellis | An update on vector boson pair production at hadron colliders | PRD 60 (1999) 113006 | hep-ph/9905386 |
| 15 | J. M. Campbell, R. K. Ellis, and C. Williams | Vector boson pair production at the LHC | Journal of High Energy Physics 2011 (2011) | 1105.0020 |
| 16 | J. M. Campbell, R. K. Ellis, and W. T. Giele | A Multi-Threaded Version of MCFM | EPJC 75 (2015) 246 | 1503.06182 |
| 17 | NNPDF Collaboration | Parton distributions with QED corrections | NPB 877 (2013) 290 | 1308.0598 |
| 18 | NNPDF Collaboration | Unbiased global determination of parton distributions and their uncertainties at NNLO and at LO | NPB 855 (2012) 153 | 1107.2652 |
| 19 | NNPDF Collaboration | Parton distributions from high-precision collider data | EPJC 77 (2017) 663 | 1706.00428 |
| 20 | CMS Collaboration | Event generator tunes obtained from underlying event and multiparton scattering measurements | EPJC 76 (2016) 155 | CMS-GEN-14-001 1512.00815 |
| 21 | CMS Collaboration | Extraction and validation of a new set of CMS PYTHIA8 tunes from underlying-event measurements | EPJC 80 (2020) 4 | CMS-GEN-17-001 1903.12179 |
| 22 | CMS Collaboration | Electron and photon reconstruction and identification with the cms experiment at the cern lhc | Journal of Instrumentation 16 (2021) P05014 | 2012.06888v2 |
| 23 | CMS Collaboration | Performance of the CMS muon detector and muon reconstruction with proton-proton collisions at $ \sqrt{s}= $ 13~TeV | JINST 13 (2018) P06015 | CMS-MUO-16-001 1804.04528 |
| 24 | E. Bols et al. | Jet flavour classification using DeepJet | Journal of Instrumentation 15 (2020) P12012 | 2008.10519v2 |
| 25 | D. P. Kingma and J. Ba | Adam: a method for stochastic optimization | technical report | 1412.6980 |
| 26 | G. Cowan, K. Cranmer, E. Gross, and O. Vitells | Asymptotic formulae for likelihood-based tests of new physics | EPJC 71 (2011) 1554 | 1007.1727 |
|
|
Compact Muon Solenoid LHC, CERN |
|

|

|

|

|

|