

Compact Muon Solenoid
LHC, CERN
| CMS-PAS-SMP-16-002 | ||
| Measurement of the WZ production cross section in pp collisions at $\sqrt{s} = $ 13 TeV | ||
| CMS Collaboration | ||
| April 2016 | ||
| Abstract: The WZ production cross section in proton-proton collisions is measured with the CMS experiment at the LHC at $\sqrt{s} = $ 13 TeV using a data sample corresponding to an integrated luminosity of 2.3 fb$^{-1}$. The measurement is performed in the leptonic decay modes WZ $\rightarrow \ell\nu\ell'\ell'$, where $\ell$, $\ell' = \mathrm{e}$, $\mu$. The measured cross section $\sigma(\mathrm{pp} \rightarrow \mathrm{WZ}) =$ 40.9 $\pm$ 3.4 (stat) $^{ +3.1}_{-3.3 }$ (syst) $\pm$ 0.4 (theo) $\pm$ 1.3 (lumi) pb, for Z bosons produced in the mass region 60 $< m_{\mathrm{Z}} <$ 120 GeV, is consistent with the standard model prediction. | ||
|
Links:
CDS record (PDF) ;
CADI line (restricted) ;
These preliminary results are superseded in this paper, PLB 766 (2017) 268. The superseded preliminary plots can be found here. |
||
| Figures | |
png pdf |
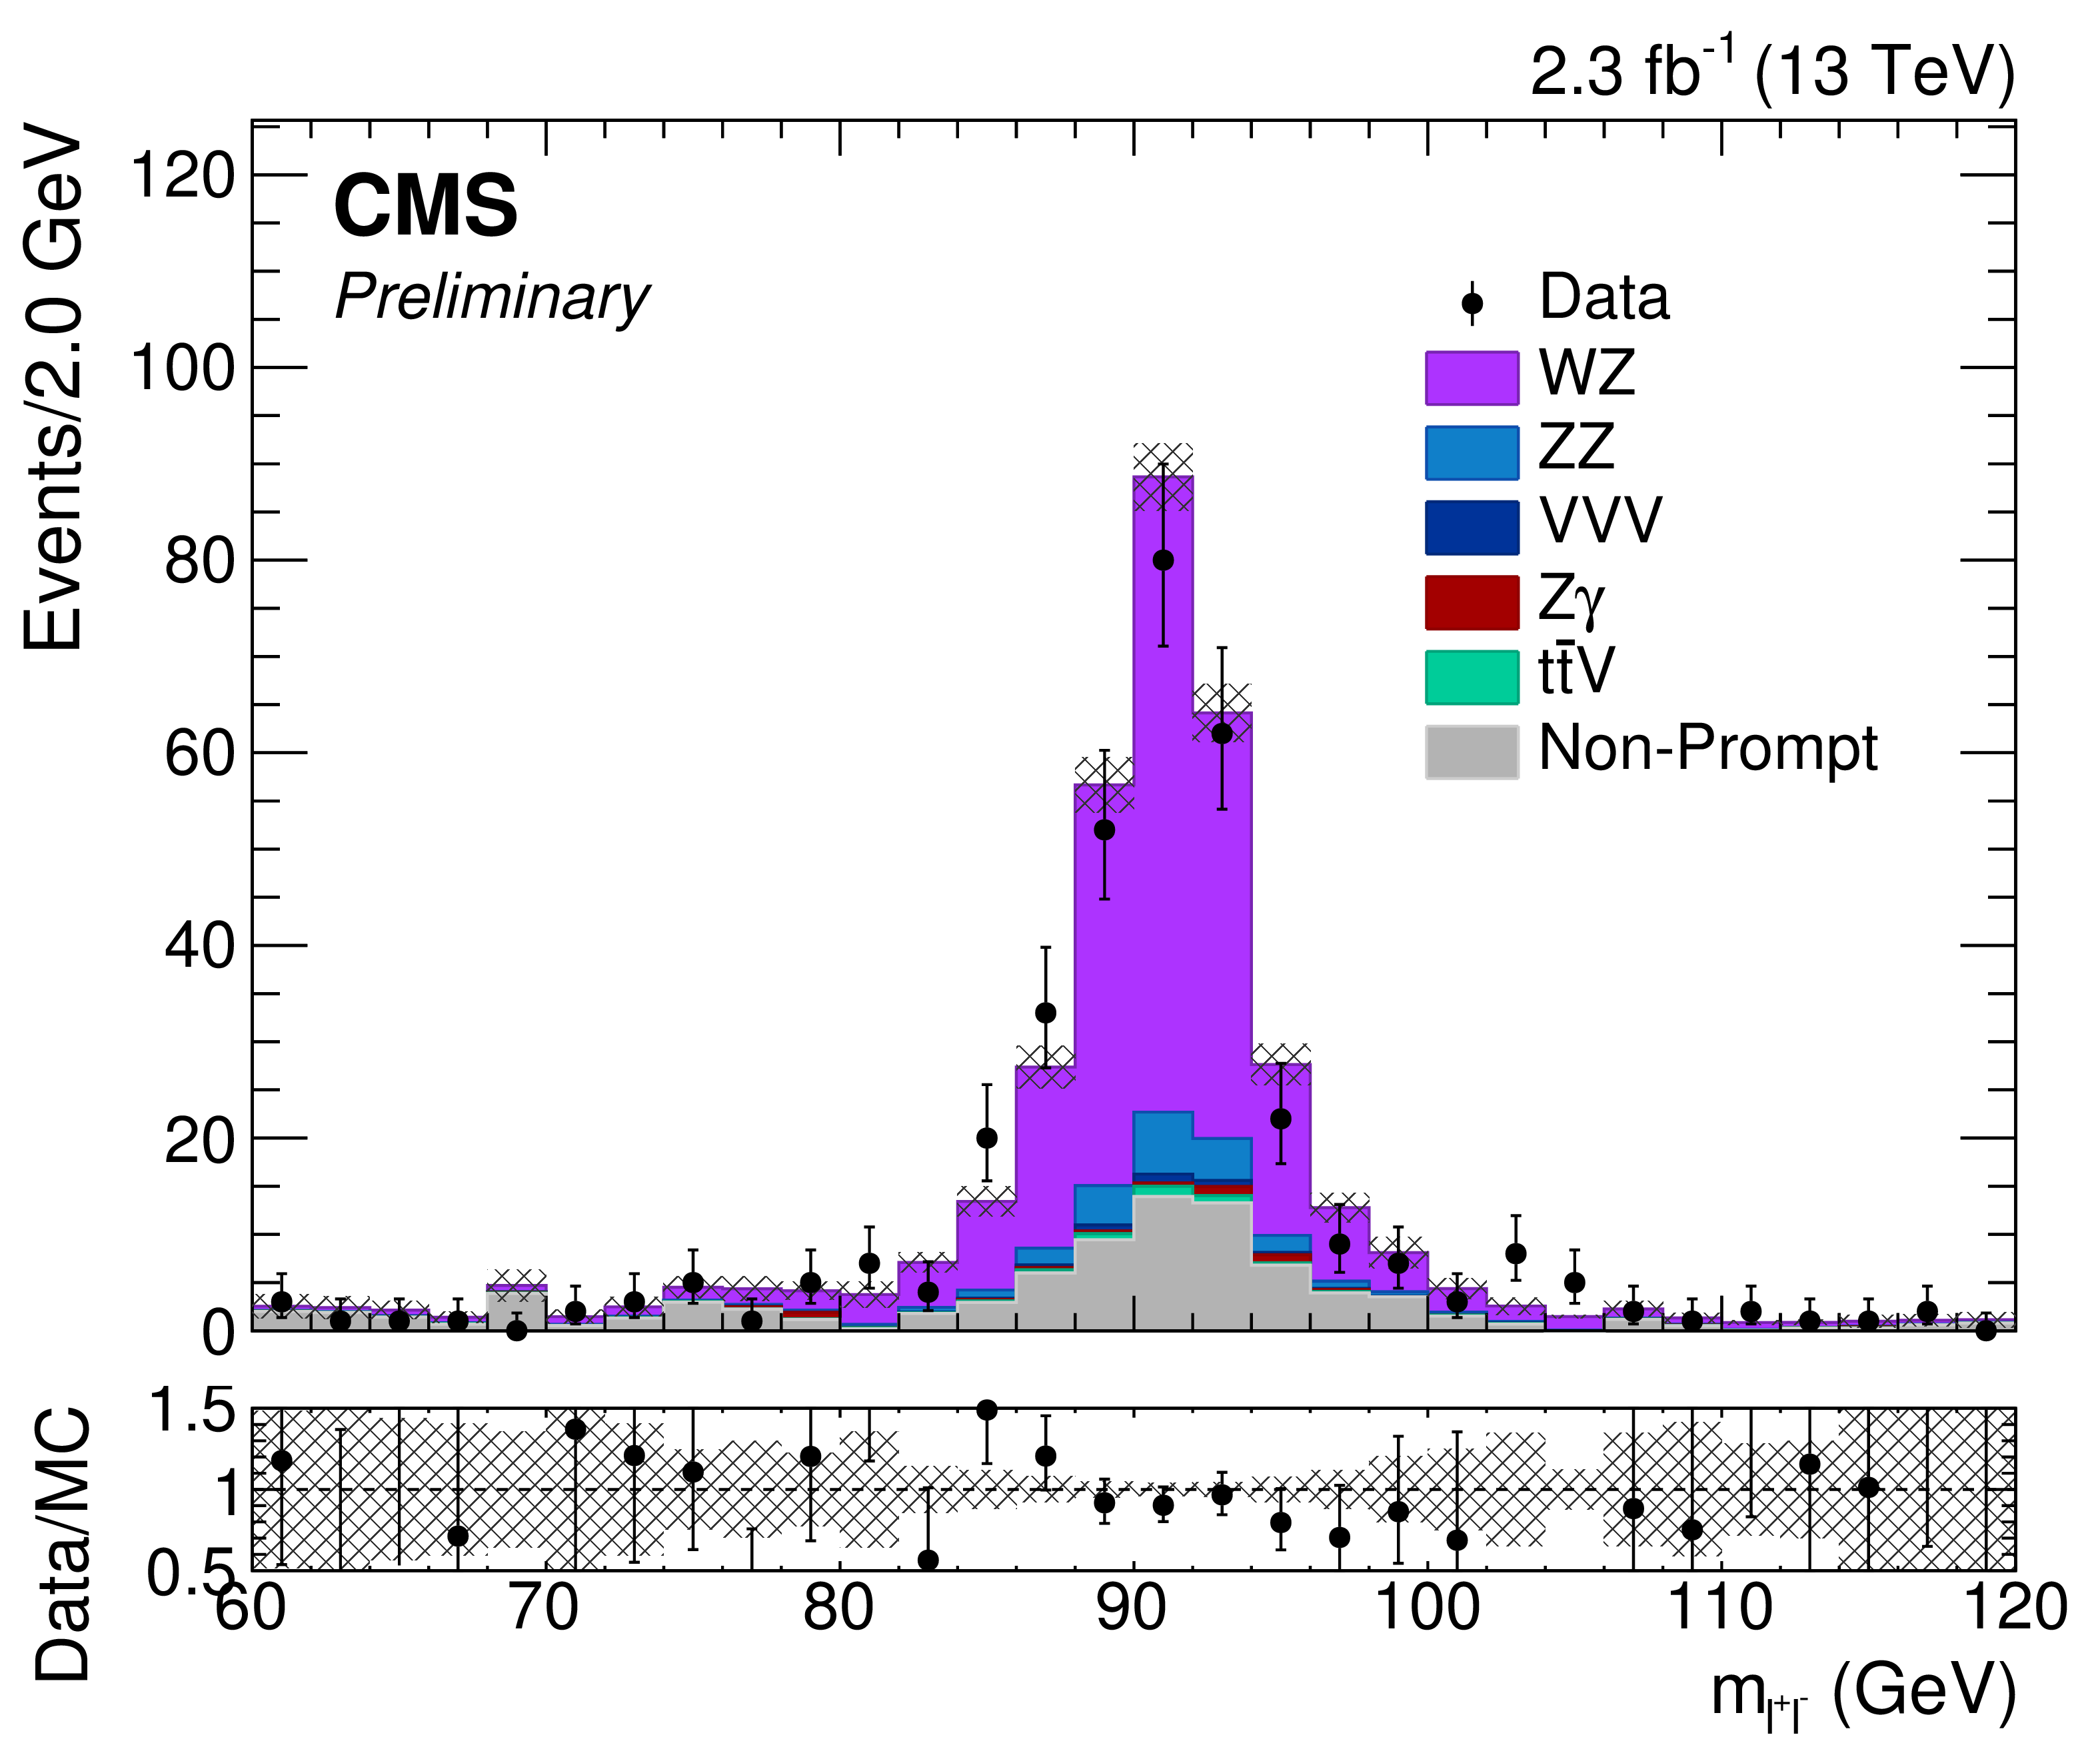
Figure 1-a:
Distribution of the Z reconstructed mass summed for all decay channels with the $m_{\mathrm{ Z } }$ selection extended to 60-120 GeV. The results correspond to an integrated luminosity of 2.3 fb$^{-1}$. Solid symbols represent the data with statistical uncertainty, shaded histograms represent the expected WZ signal and backgrounds. Uncertainties in signal and backgrounds include experimental systematic, theoretical, and luminosity uncertainties in addition to statistical uncertainty. The background shapes are taken from simulation or data, as described in the text. |

png pdf |
Figure 1-b:
Distribution of the $\ell \ell '\ell '$ reconstructed mass summed for all decay channels with the $m_{3\ell } > $ 100 GeV selection requirement removed. The results correspond to an integrated luminosity of 2.3 fb$^{-1}$. Solid symbols represent the data with statistical uncertainty, shaded histograms represent the expected WZ signal and backgrounds. Uncertainties in signal and backgrounds include experimental systematic, theoretical, and luminosity uncertainties in addition to statistical uncertainty. The background shapes are taken from simulation or data, as described in the text. |
png pdf |
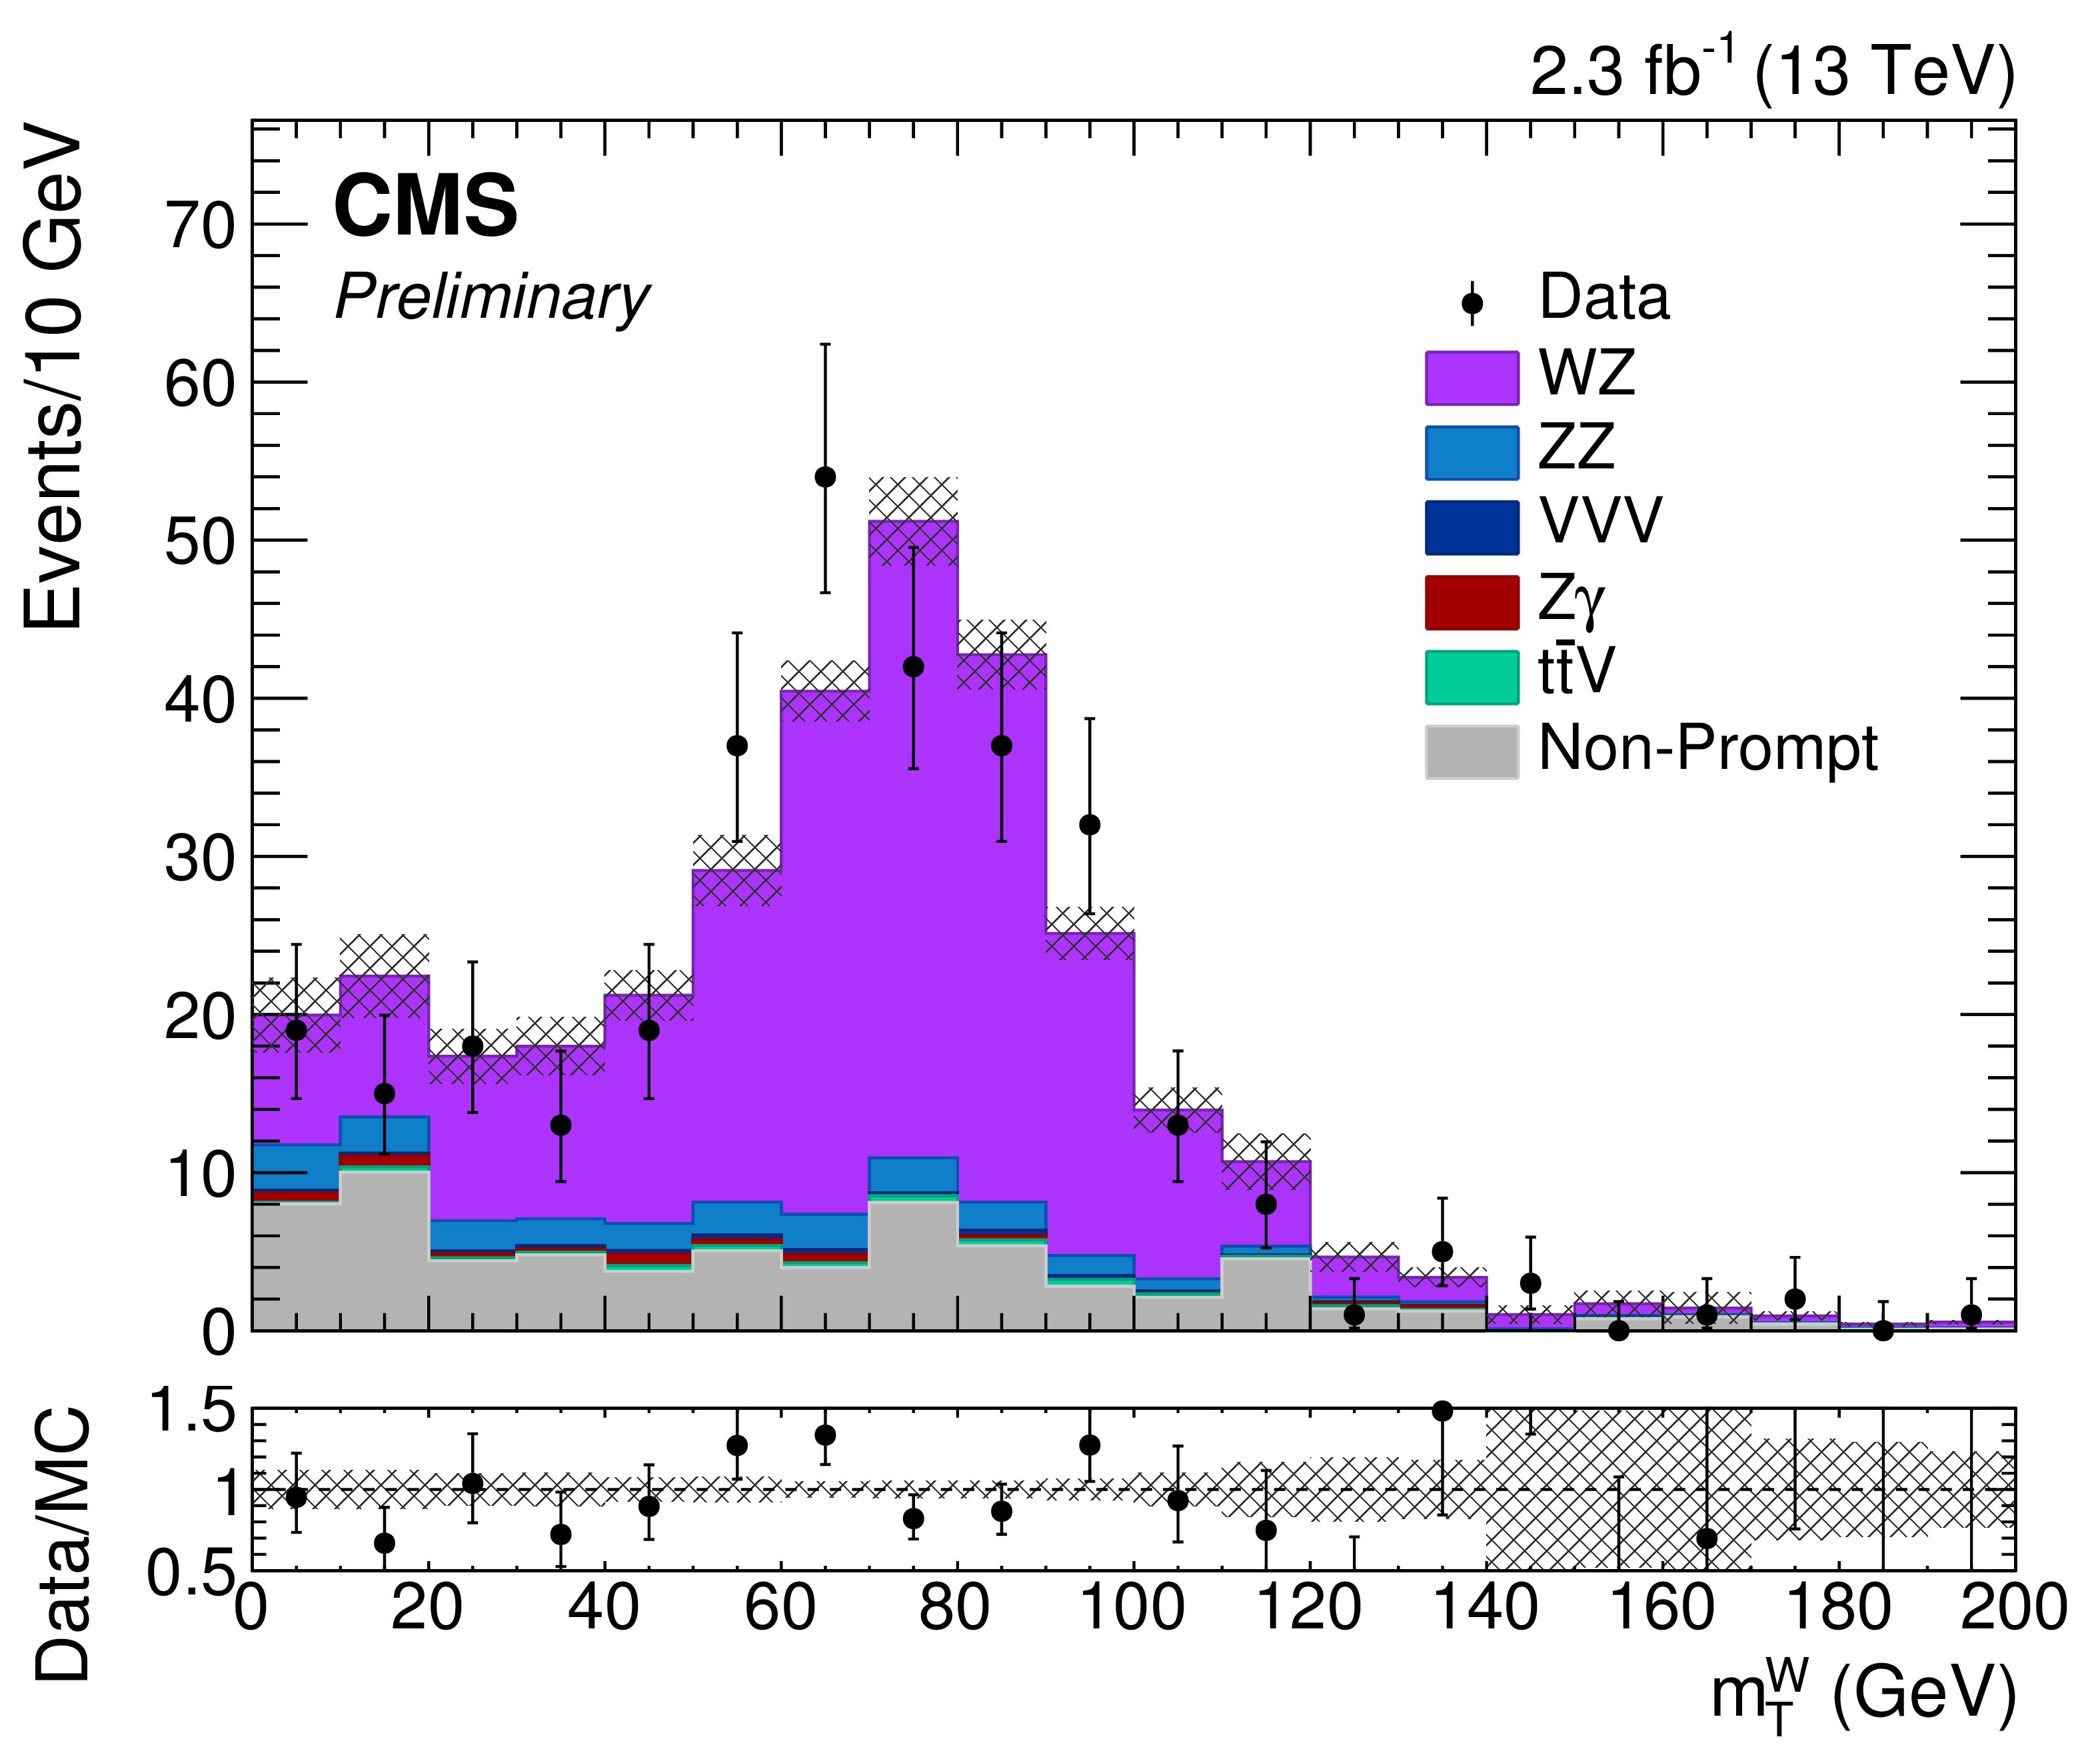
Figure 1-c:
The transverse mass of the lepton from W and $ {E_\mathrm {T}^\mathrm {miss}}$ system. The results correspond to an integrated luminosity of 2.3 fb$^{-1}$. Solid symbols represent the data with statistical uncertainty, shaded histograms represent the expected WZ signal and backgrounds. Uncertainties in signal and backgrounds include experimental systematic, theoretical, and luminosity uncertainties in addition to statistical uncertainty. The background shapes are taken from simulation or data, as described in the text. |
png pdf |
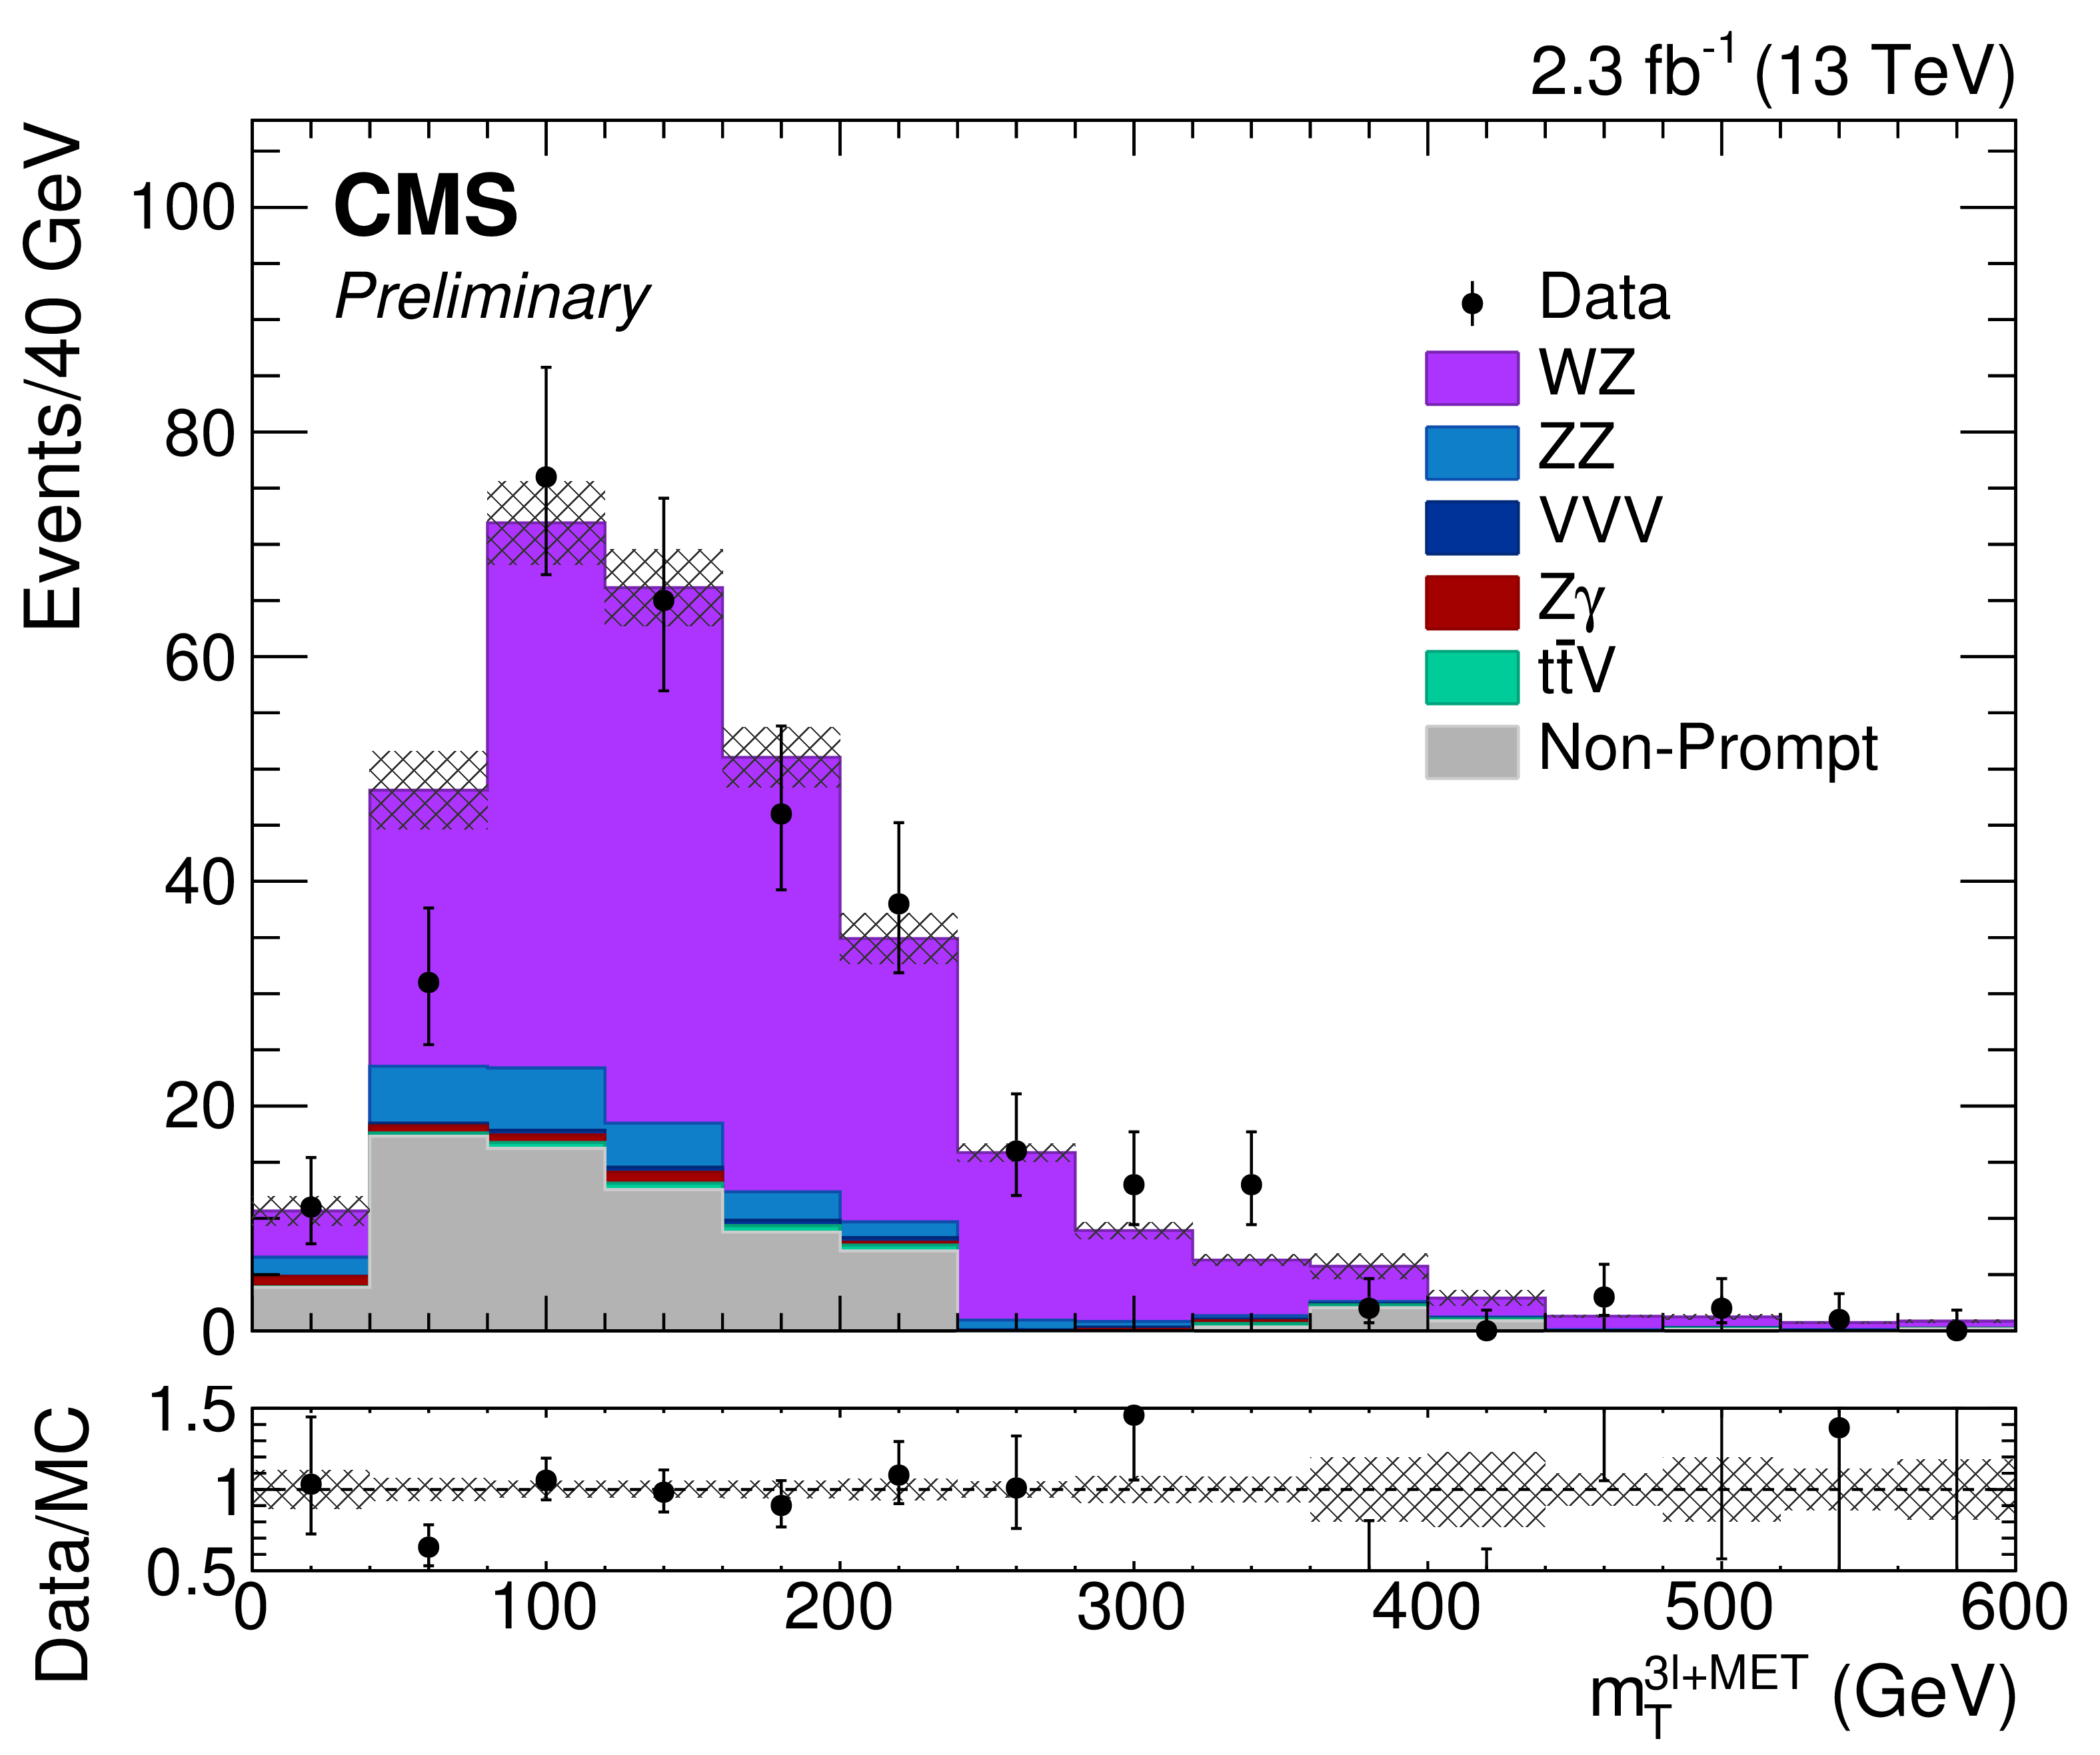
Figure 1-d:
The transverse mass of the three leptons and $ {E_\mathrm {T}^\mathrm {miss}}$ system. The results correspond to an integrated luminosity of 2.3 fb$^{-1}$. Solid symbols represent the data with statistical uncertainty, shaded histograms represent the expected WZ signal and backgrounds. Uncertainties in signal and backgrounds include experimental systematic, theoretical, and luminosity uncertainties in addition to statistical uncertainty. The background shapes are taken from simulation or data, as described in the text. |

png pdf |
Figure 2-a:
Distribution of the number of jets with $ {p_{\mathrm {T}}} >$ 30 GeV in the event. The results correspond to an integrated luminosity of 2.3 fb$^{-1}$. Solid symbols represent the data with statistical uncertainty, shaded histograms represent the expected WZ signal and backgrounds. Uncertainties in signal and backgrounds include experimental systematic, theoretical, and luminosity uncertainties in addition to statistical uncertainty. The background shapes are taken from simulation or data, as described in the text. |
png pdf |
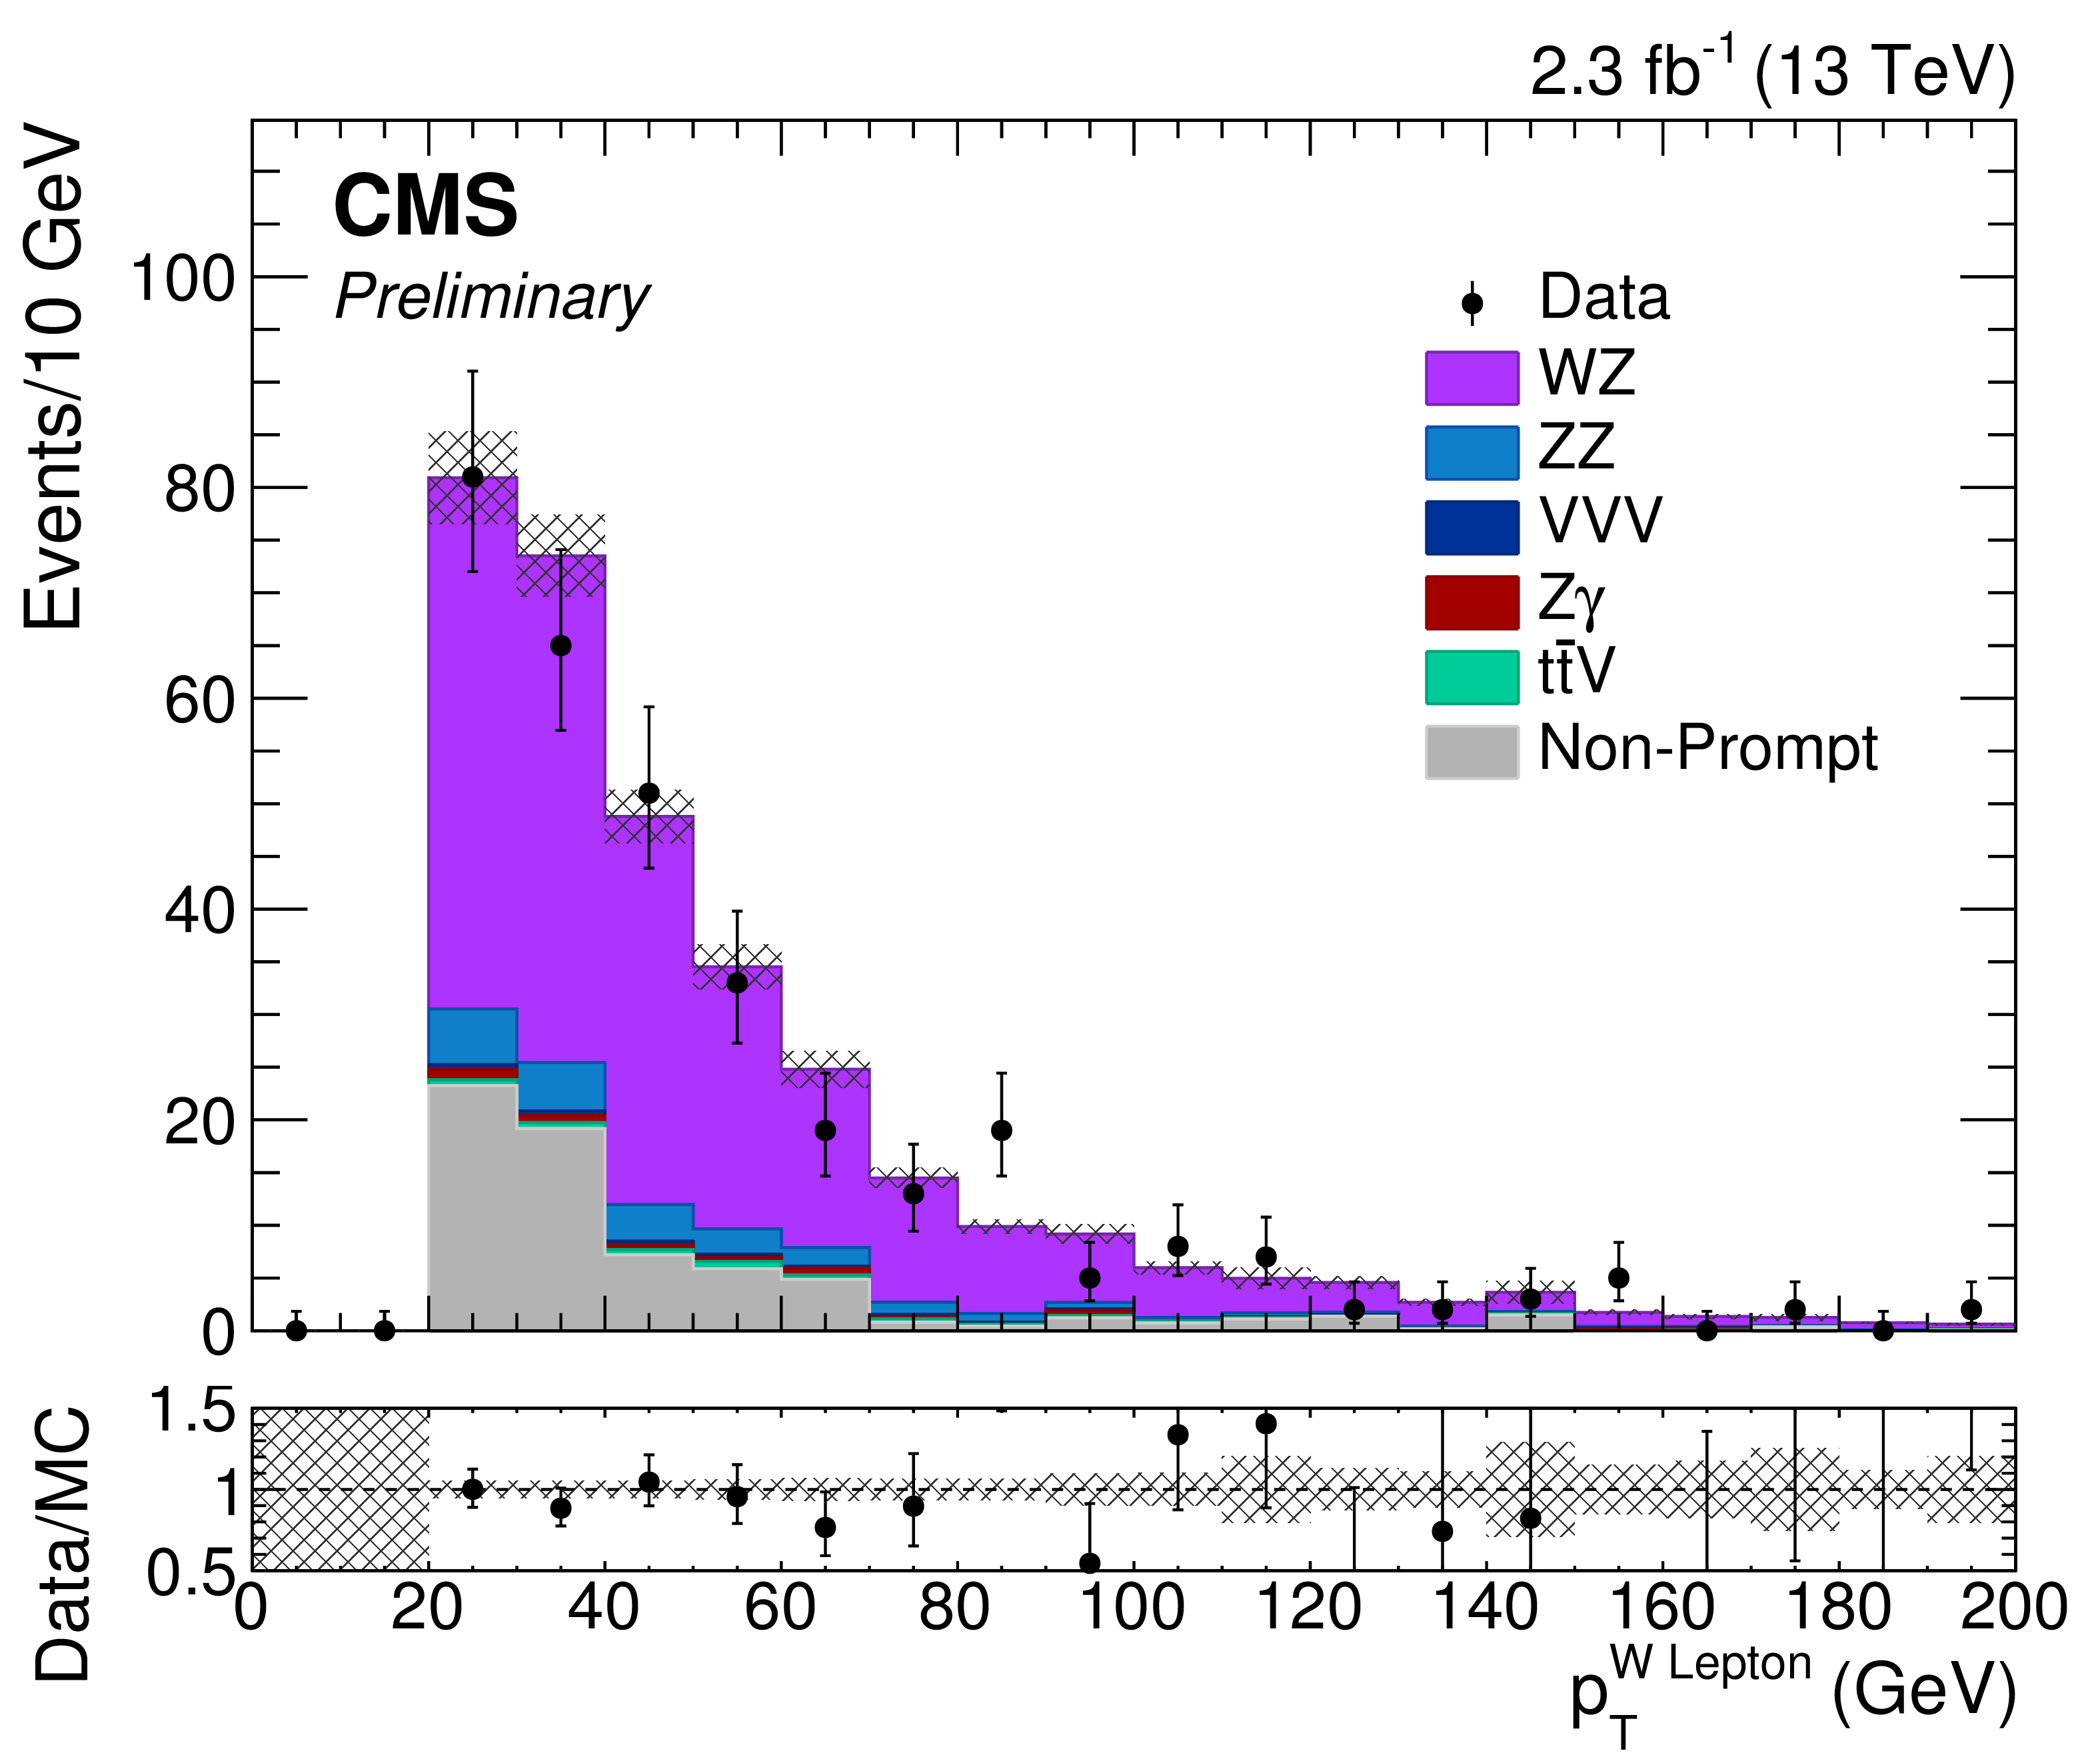
Figure 2-b:
Transverse momentum of the lepton associated with W. The results correspond to an integrated luminosity of 2.3 fb$^{-1}$. Solid symbols represent the data with statistical uncertainty, shaded histograms represent the expected WZ signal and backgrounds. Uncertainties in signal and backgrounds include experimental systematic, theoretical, and luminosity uncertainties in addition to statistical uncertainty. The background shapes are taken from simulation or data, as described in the text. |
png pdf |
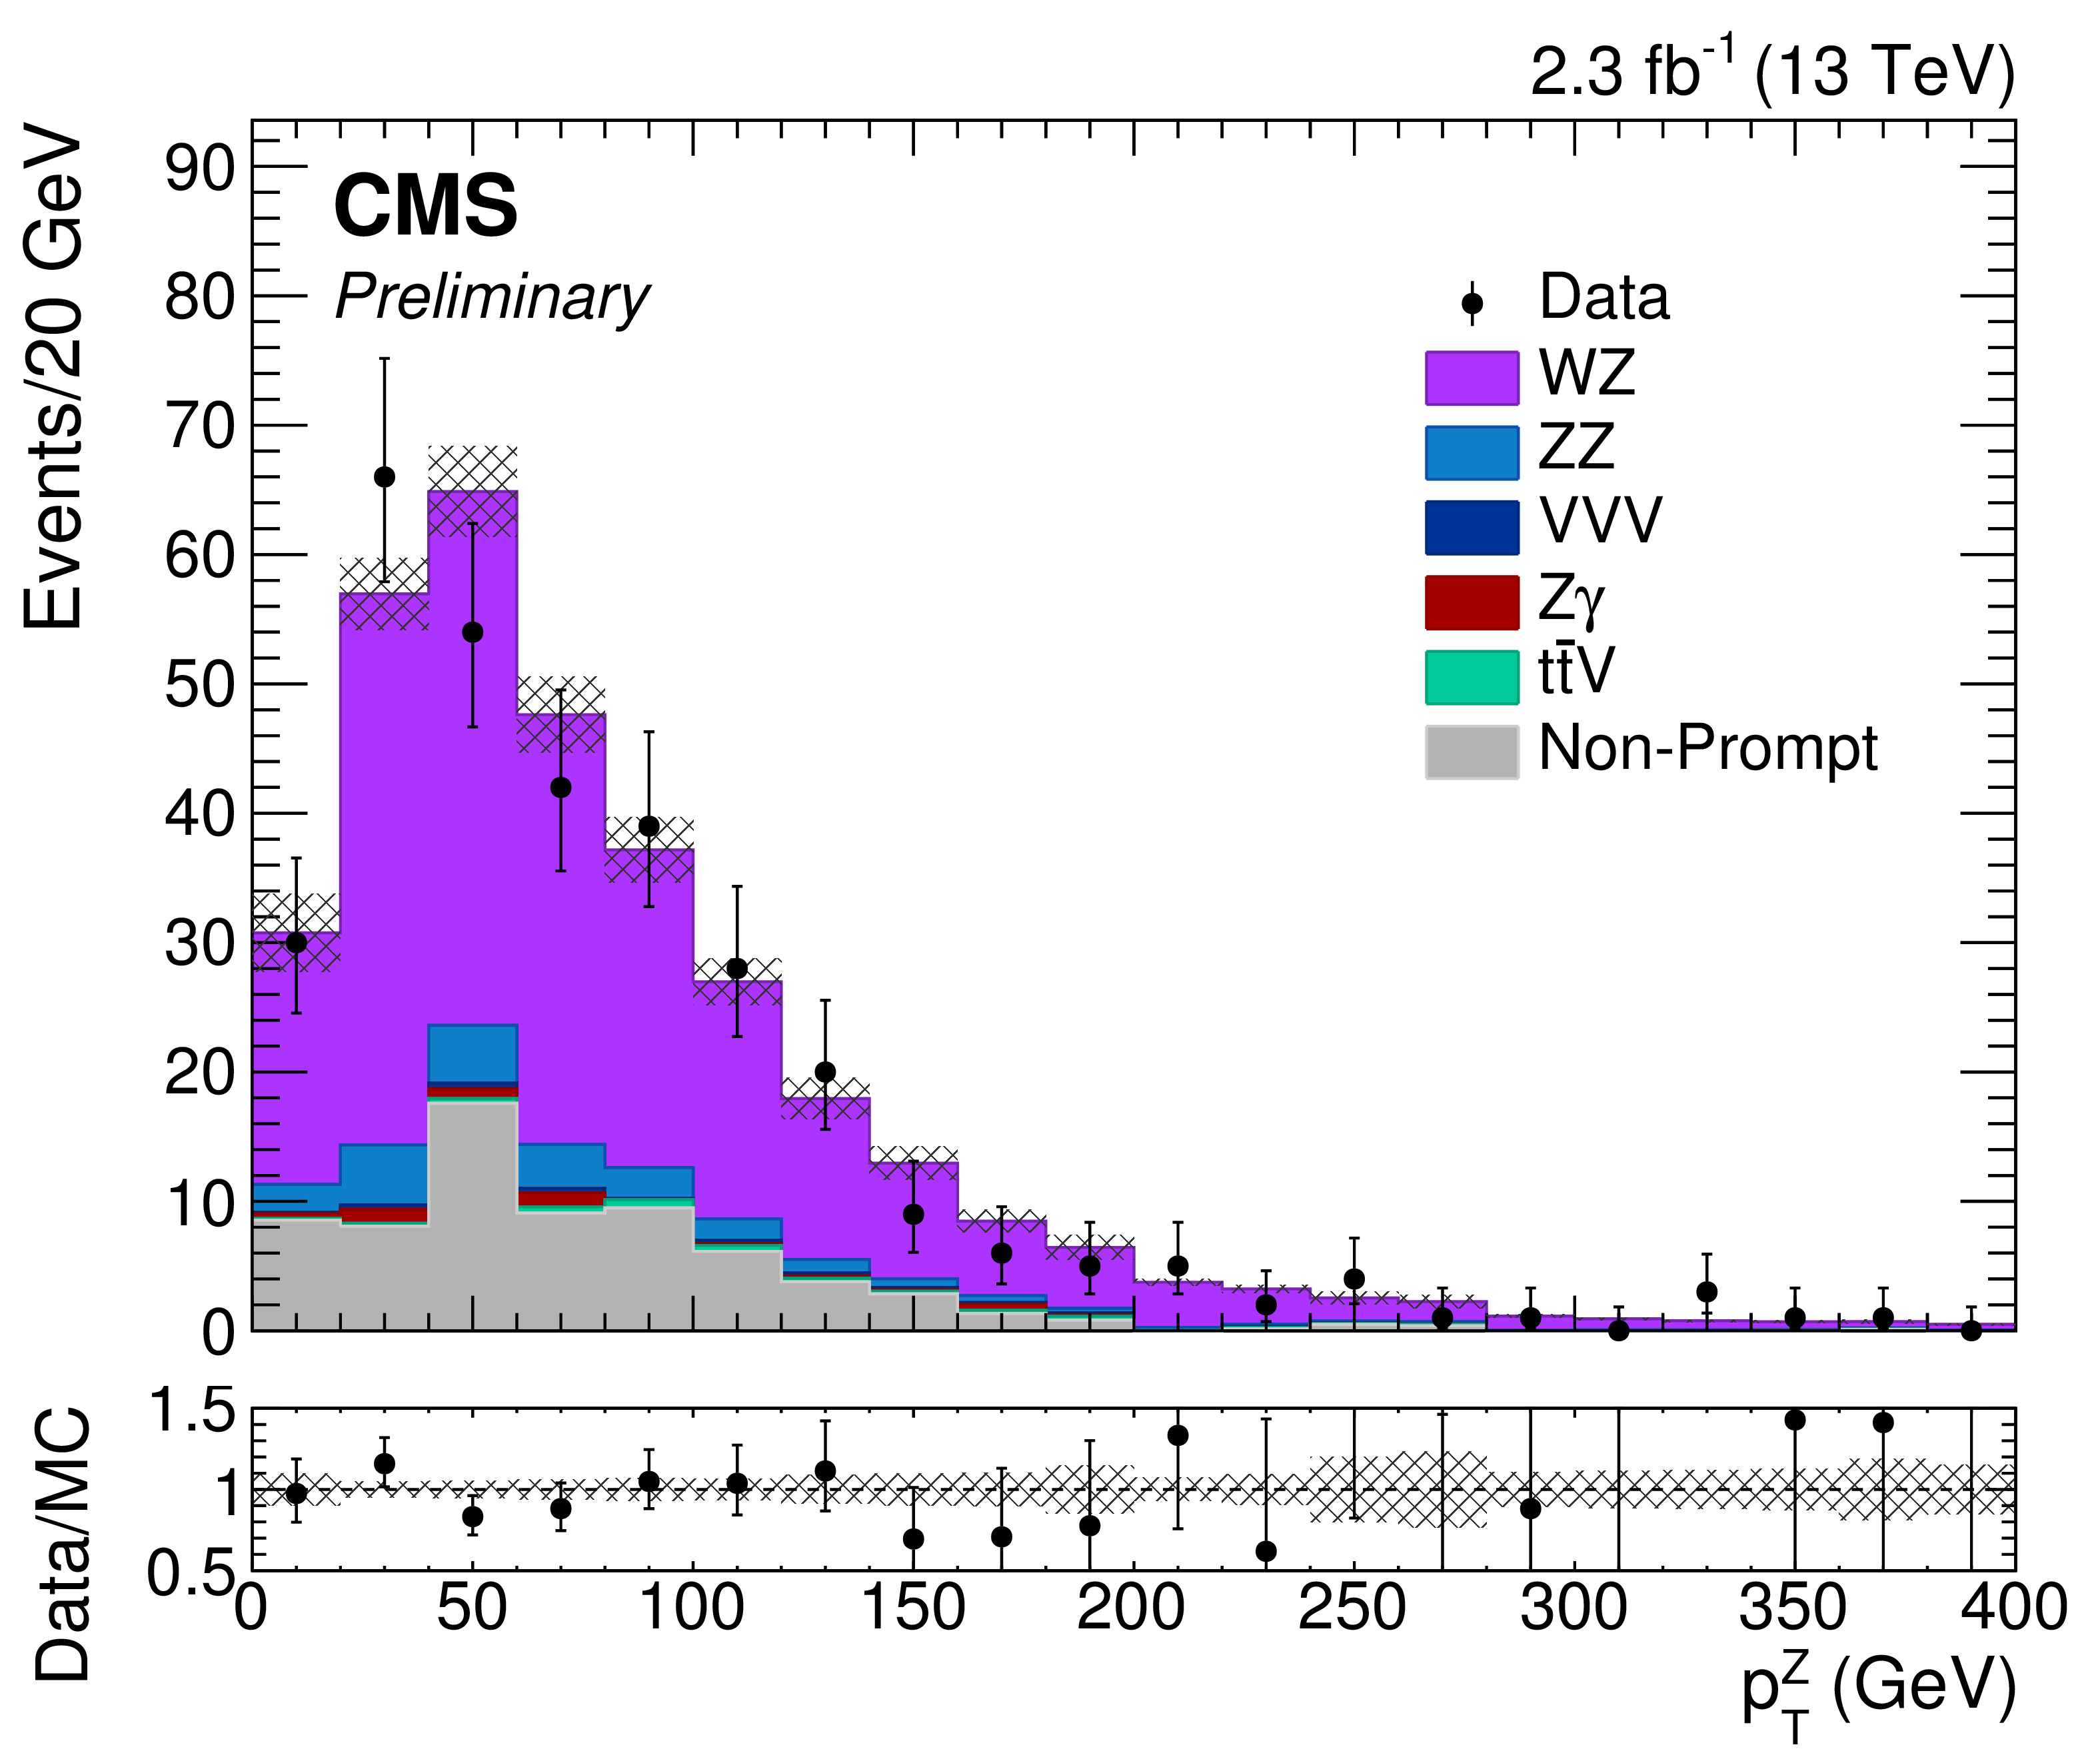
Figure 2-c:
Transverse momentum of selected Z candidates. The results correspond to an integrated luminosity of 2.3 fb$^{-1}$. Solid symbols represent the data with statistical uncertainty, shaded histograms represent the expected WZ signal and backgrounds. Uncertainties in signal and backgrounds include experimental systematic, theoretical, and luminosity uncertainties in addition to statistical uncertainty. The background shapes are taken from simulation or data, as described in the text. |

png pdf |
Figure 2-d:
Transverse momentum of selected W candidates. The results correspond to an integrated luminosity of 2.3 fb$^{-1}$. Solid symbols represent the data with statistical uncertainty, shaded histograms represent the expected WZ signal and backgrounds. Uncertainties in signal and backgrounds include experimental systematic, theoretical, and luminosity uncertainties in addition to statistical uncertainty. The background shapes are taken from simulation or data, as described in the text. |
| Tables | |
png pdf |
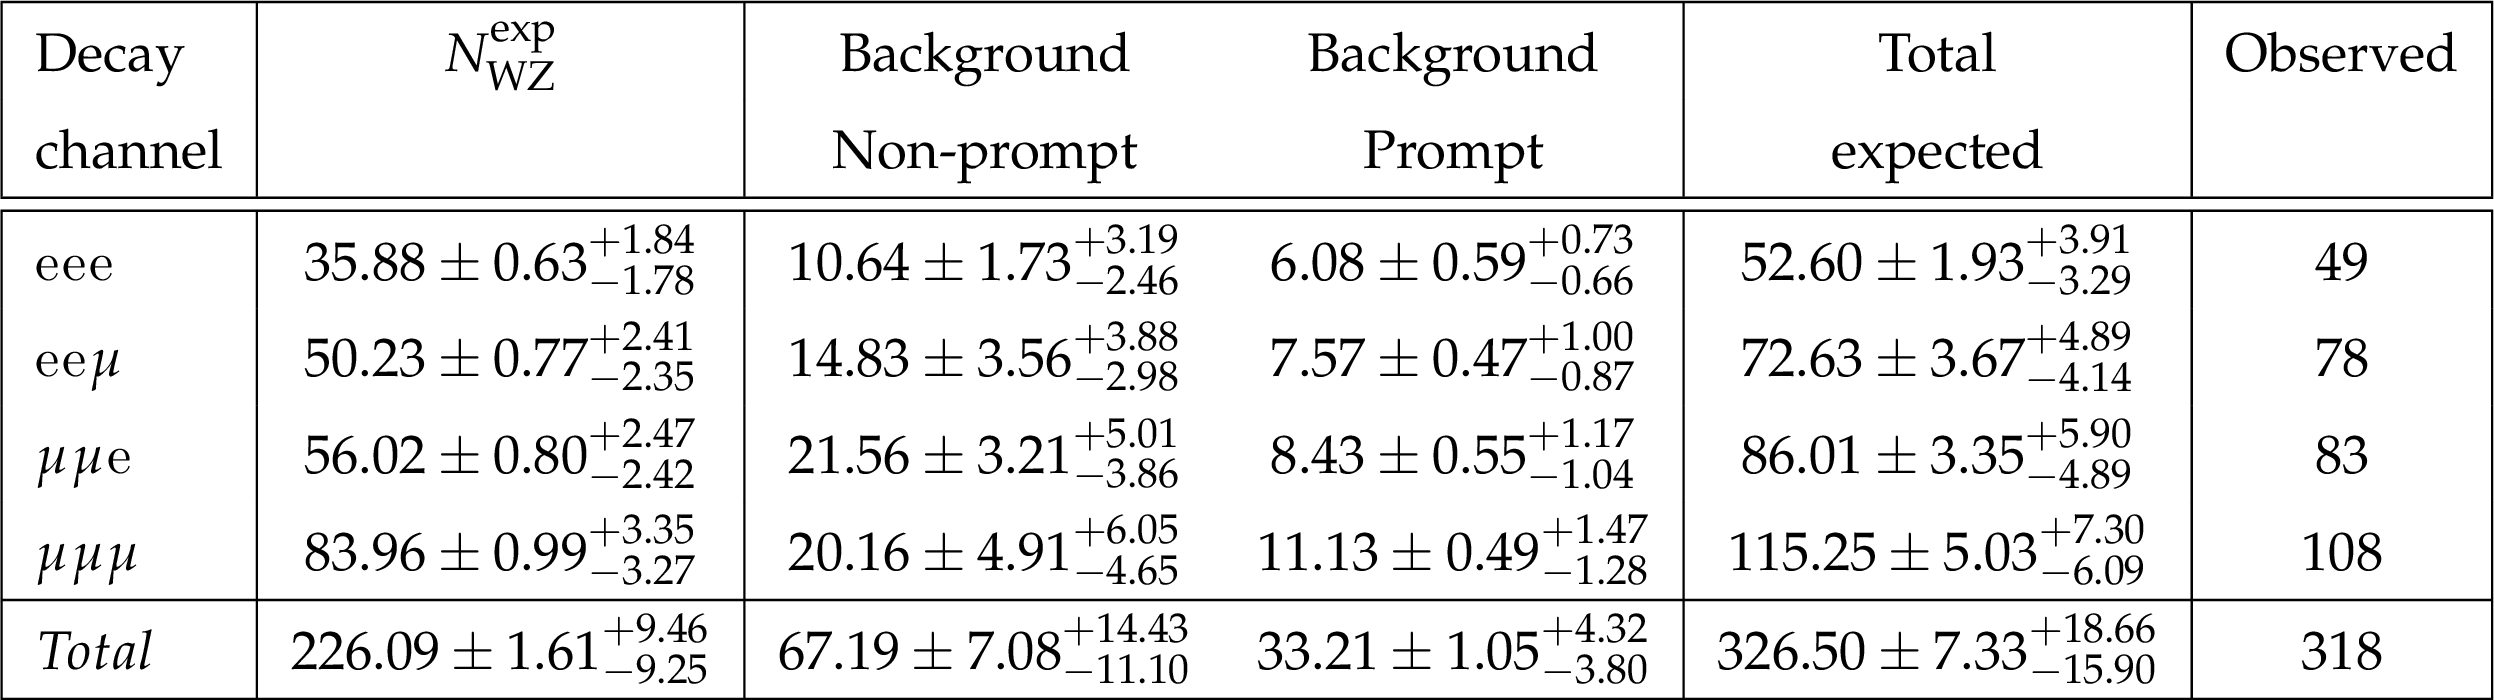
Table 1:
The observed and expected yields of WZ events, and estimated yield of background events obtained from data driven method as explained in the text shown for each decay channel together with the prompt leptons background, estimated from simulation. |
| Summary |
| The WZ production cross section is measured in proton-proton collisions at $\sqrt{s} =$ 13 TeV with the CMS experiment at the LHC using a data sample corresponding to an integrated luminosity of 2.3 fb$^{-1}$. The measurement is performed in the leptonic decay modes $\mathrm{ WZ } \rightarrow \ell\nu\ell'\ell'$, where $\ell$, $\ell' = \mathrm{ e }$, $\mu$. The measured cross section $\sigma(\mathrm{ p }\mathrm{ p } \to \mathrm{ W }\mathrm{ Z }) =$ 40.9 $\pm$ 3.4 (stat) $^{+3.1}_{-3.3}$ (syst) $\pm$ 0.4 (theo) $\pm$ 1.3 (lumi) pb, for Z bosons produced in the mass region 60 $< m_{\mathrm{Z}} <$ 120 GeV, is consistent with with the NLO expectation of 42.6 $^{+1.6}_{-0.8}$ pb. |
| Additional Figures | |
png pdf |
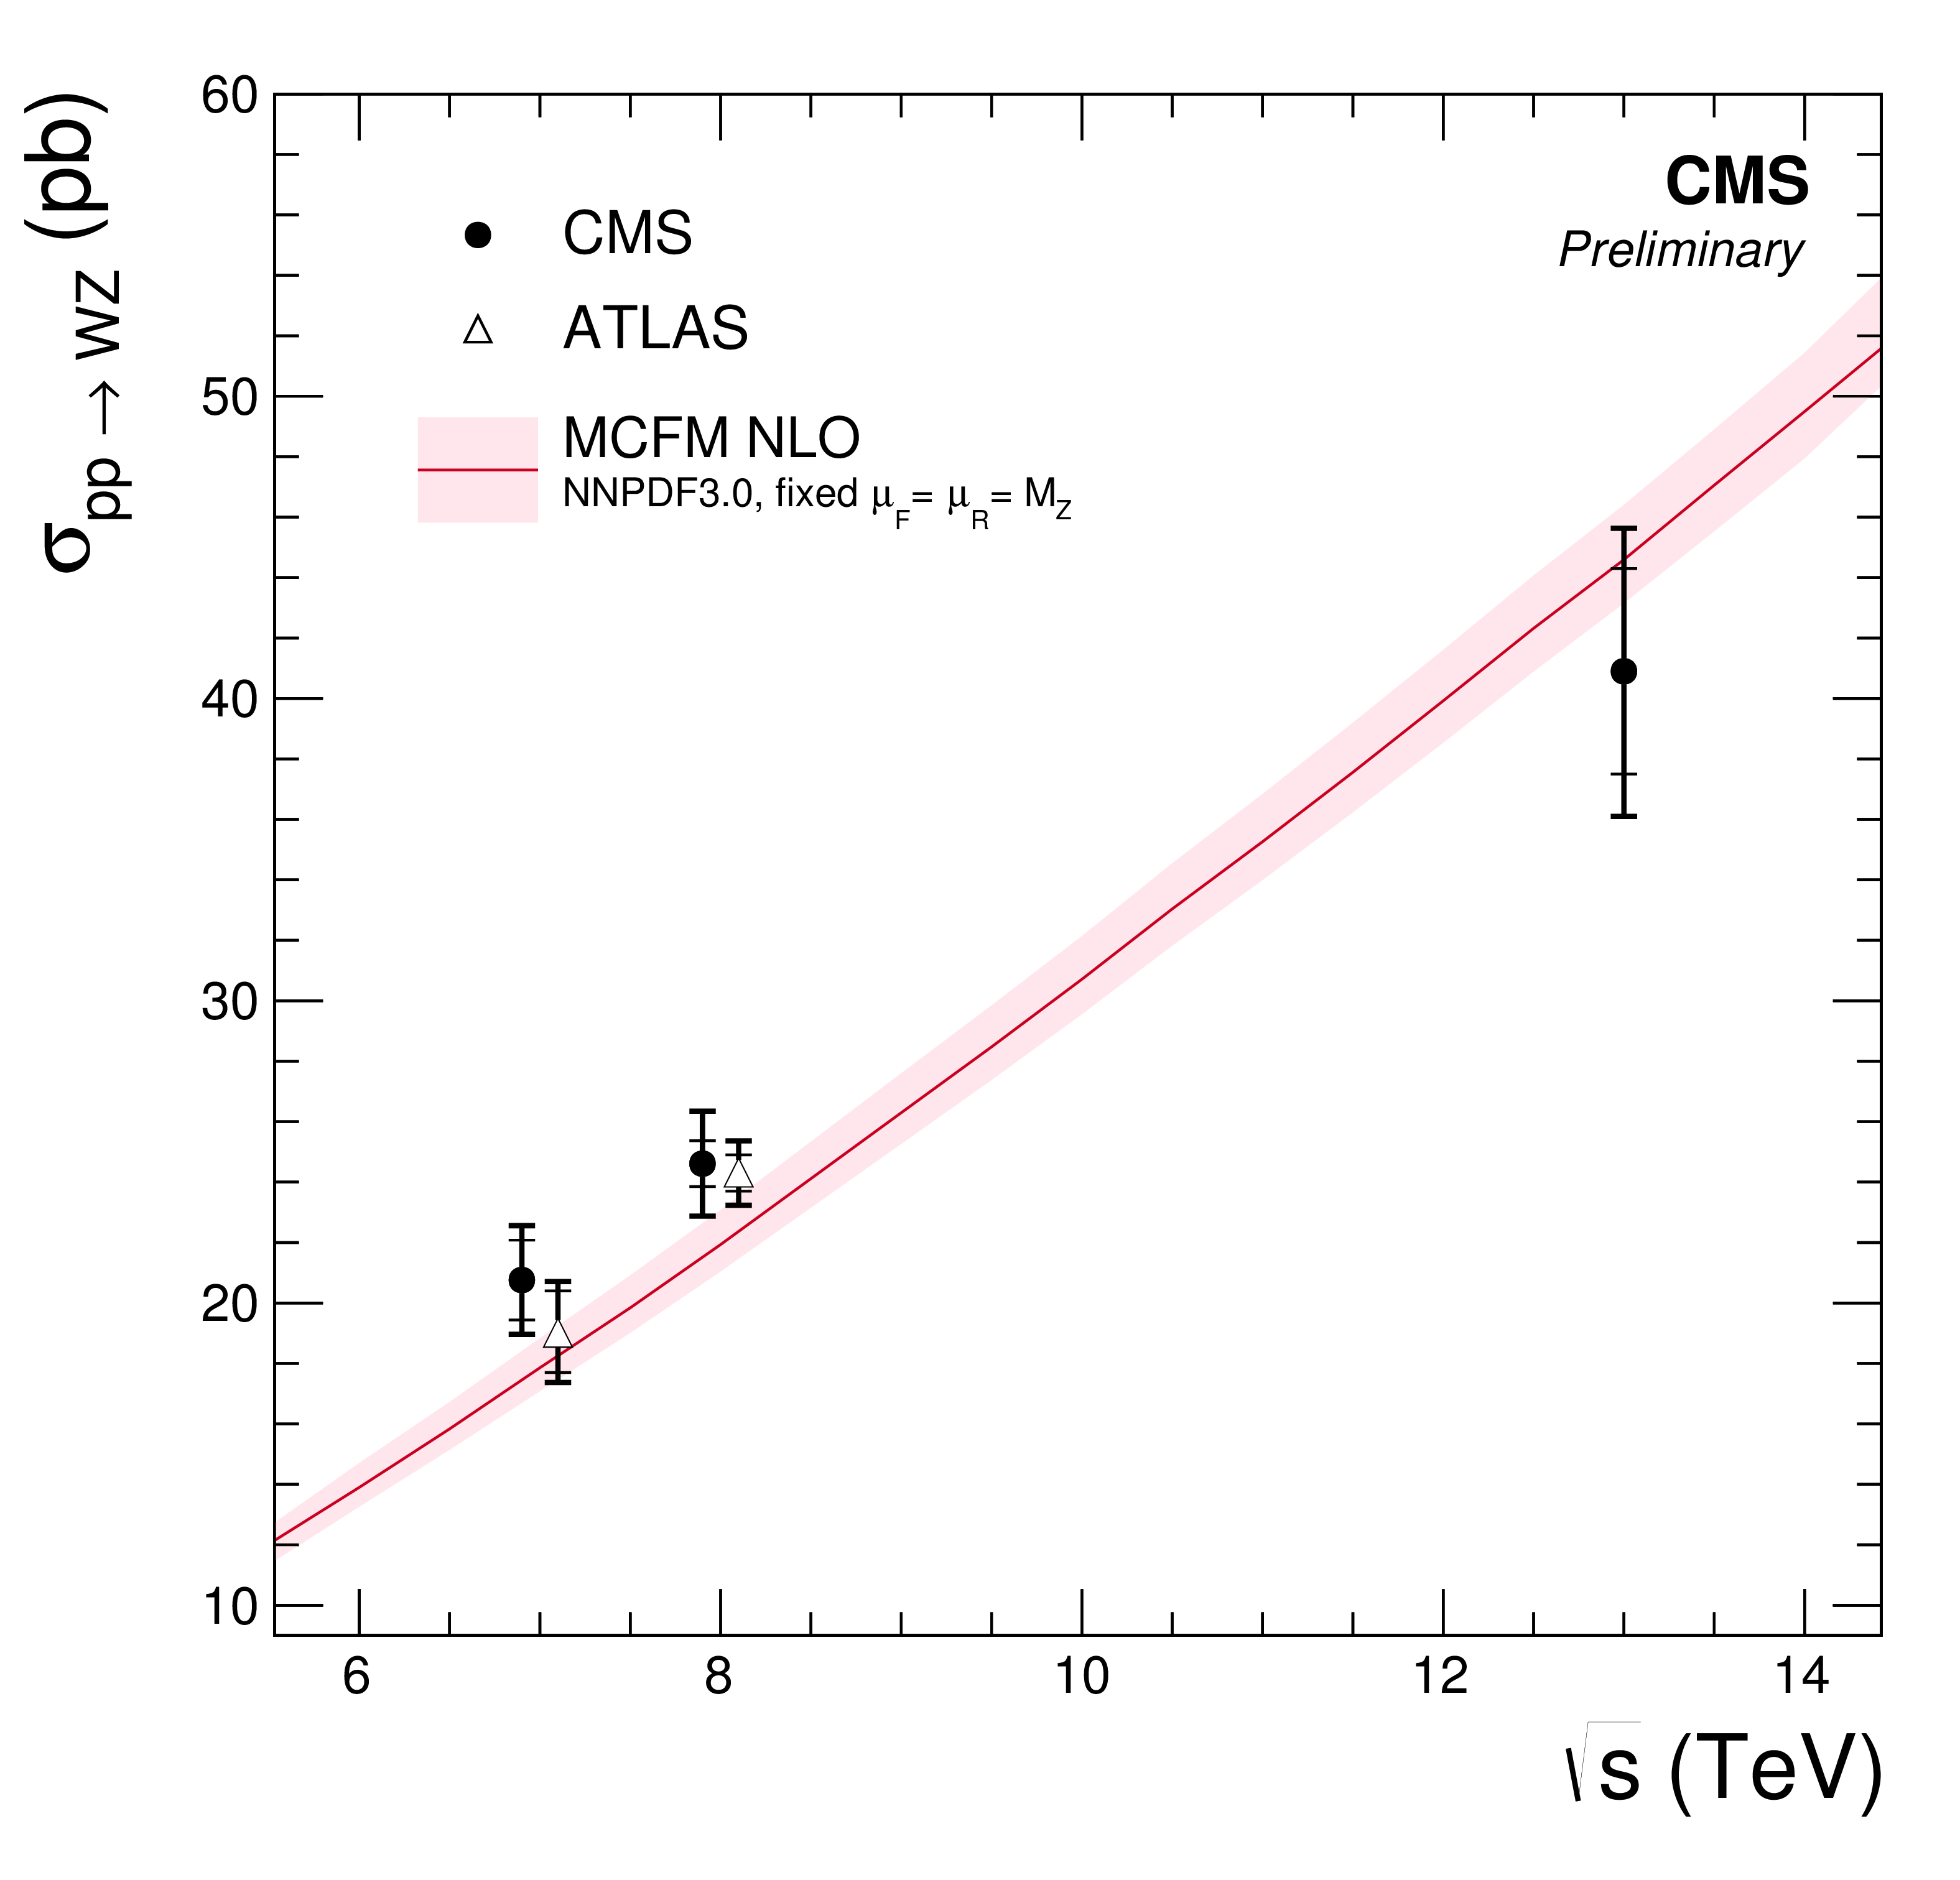
Additional Figure 1:
The WZ total cross section as a function of the proton-proton center-of-mass energy. Results from CMS and ATLAS experiments are compared to predictions of MCFM with NNPDF3.0 PDF and fixed renormalization and factorization scales set to the mass of the Z boson. The uncertainties on the data are statistical (inner bars) and statistical and systematic squared (outer bars). The band around the theoretical predictions reflects uncertainties from the scales variation up and down by factor of two and (PDF+$\alpha_s$) uncertainty of NNPDF3.0. The theoretical predictions and CMS 13 TeV cross section are calculated for the Z boson mass window 60-120 GeV. All ATLAS measurements are performed with the Z boson mass window 66-116 GeV (estimated correction factor 1%) and 7 and 8 TeV CMS measurements with window 71-111 GeV (estimated correction factor 2%). |
|
|
Compact Muon Solenoid LHC, CERN |
|

|

|

|

|

|