

Compact Muon Solenoid
LHC, CERN
| CMS-PAS-HIN-20-004 | ||
| Observation of the ${\rm B_c^+}$ meson in PbPb and pp collisions at ${\sqrt {\smash [b]{s_{_{\mathrm {NN}}}}}} = $ 5.02 TeV | ||
| CMS Collaboration | ||
| May 2021 | ||
| Abstract: The ${\rm B_c^+}$ meson is observed with the CMS detector in proton-proton and lead-lead collisions at a center-of-mass energy per nucleon pair of ${\sqrt {\smash [b]{s_{_{\mathrm {NN}}}}}} = $ 5.02 TeV, via the ${\rm B_c^+} \rightarrow ({\rm J}/\psi \rightarrow \mu^+ \mu^-) \mu^+ \nu_\mu$ decay. Its cross section and nuclear modification factor are measured in two bins of the trimuon transverse momentum, and in two ranges of collision centrality. As the ${\rm B_c^+}$ is the only meson containing two different flavored heavy quarks, it provides a unique bridge between charmonia, bottomonia, and open heavy mesons. The insights gained from these results will further the understanding of the interplay of suppression and enhancement mechanisms in the production of heavy mesons in the hot and dense matter created in heavy ion collisions. | ||
|
Links:
CDS record (PDF) ;
inSPIRE record ;
CADI line (restricted) ;
These preliminary results are superseded in this paper, Submitted to PRL. The superseded preliminary plots can be found here. |
||
| Figures | Summary | Additional Figures | References | CMS Publications |
|---|
| Figures | |
png pdf |
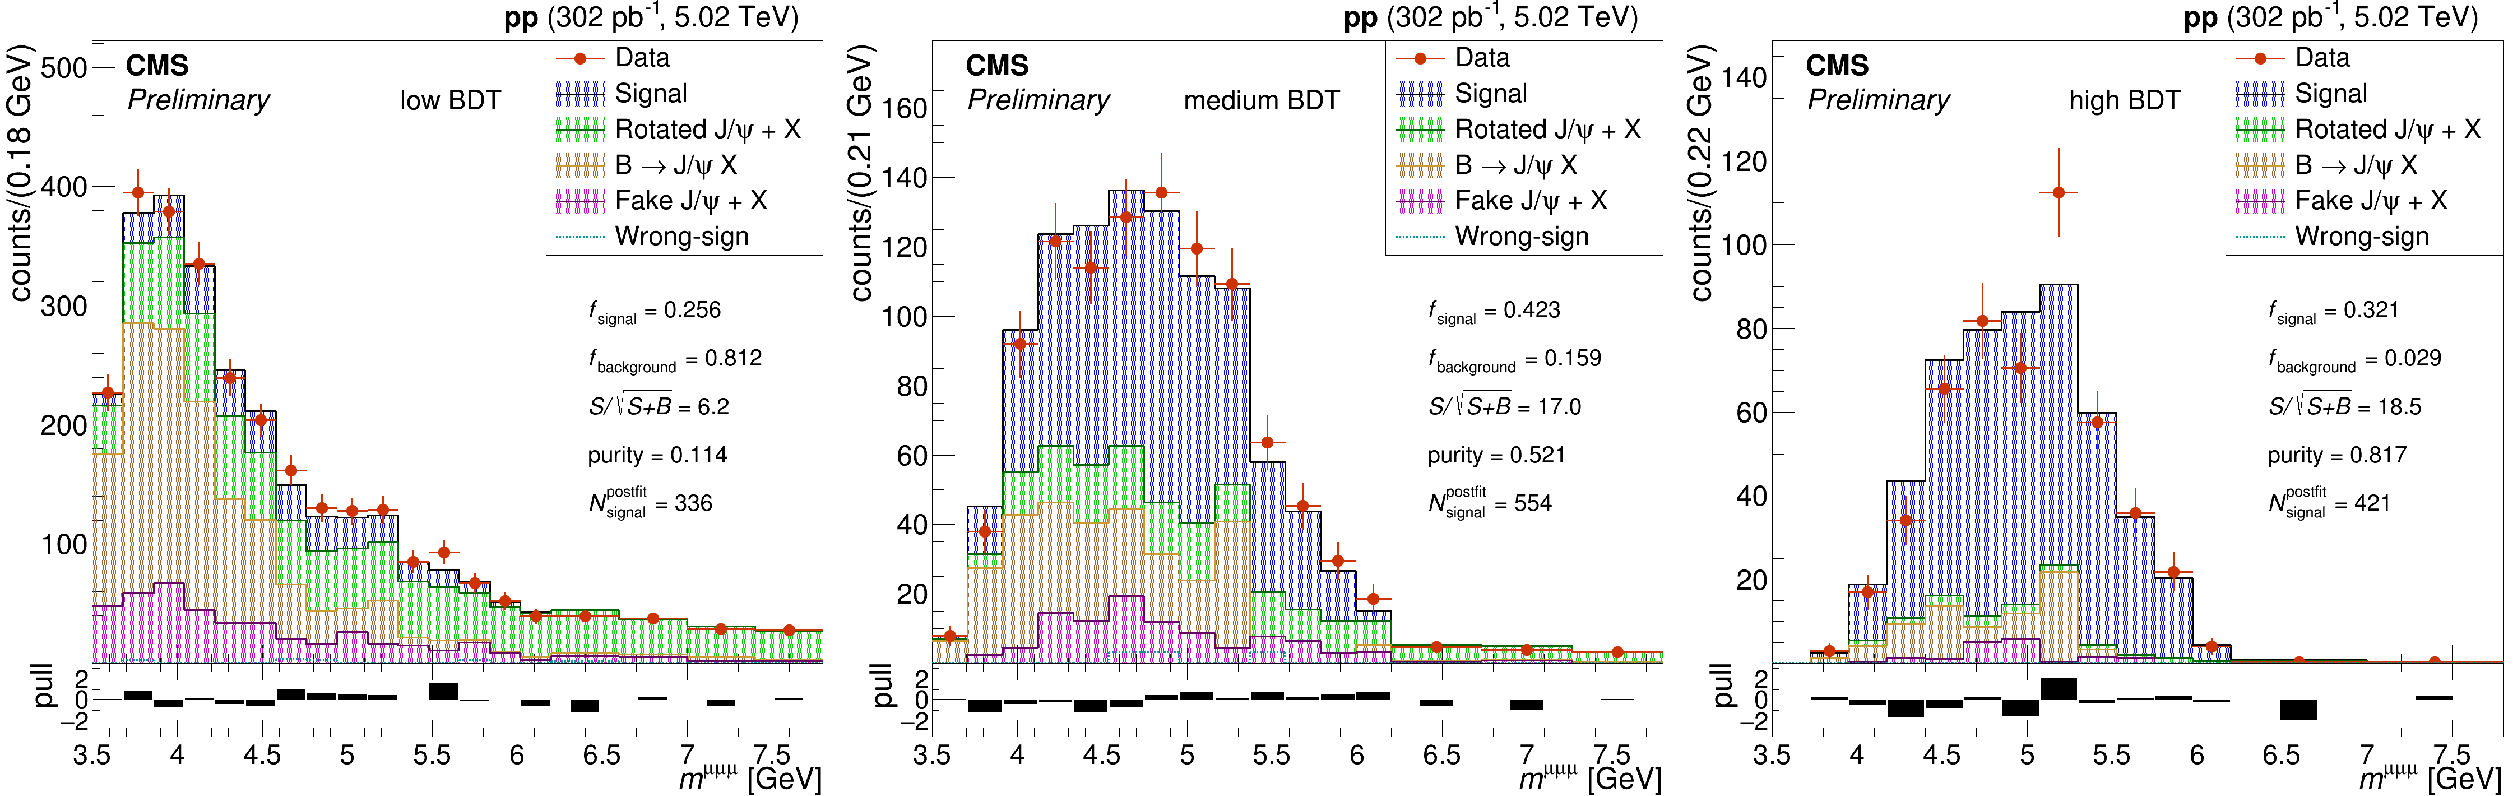
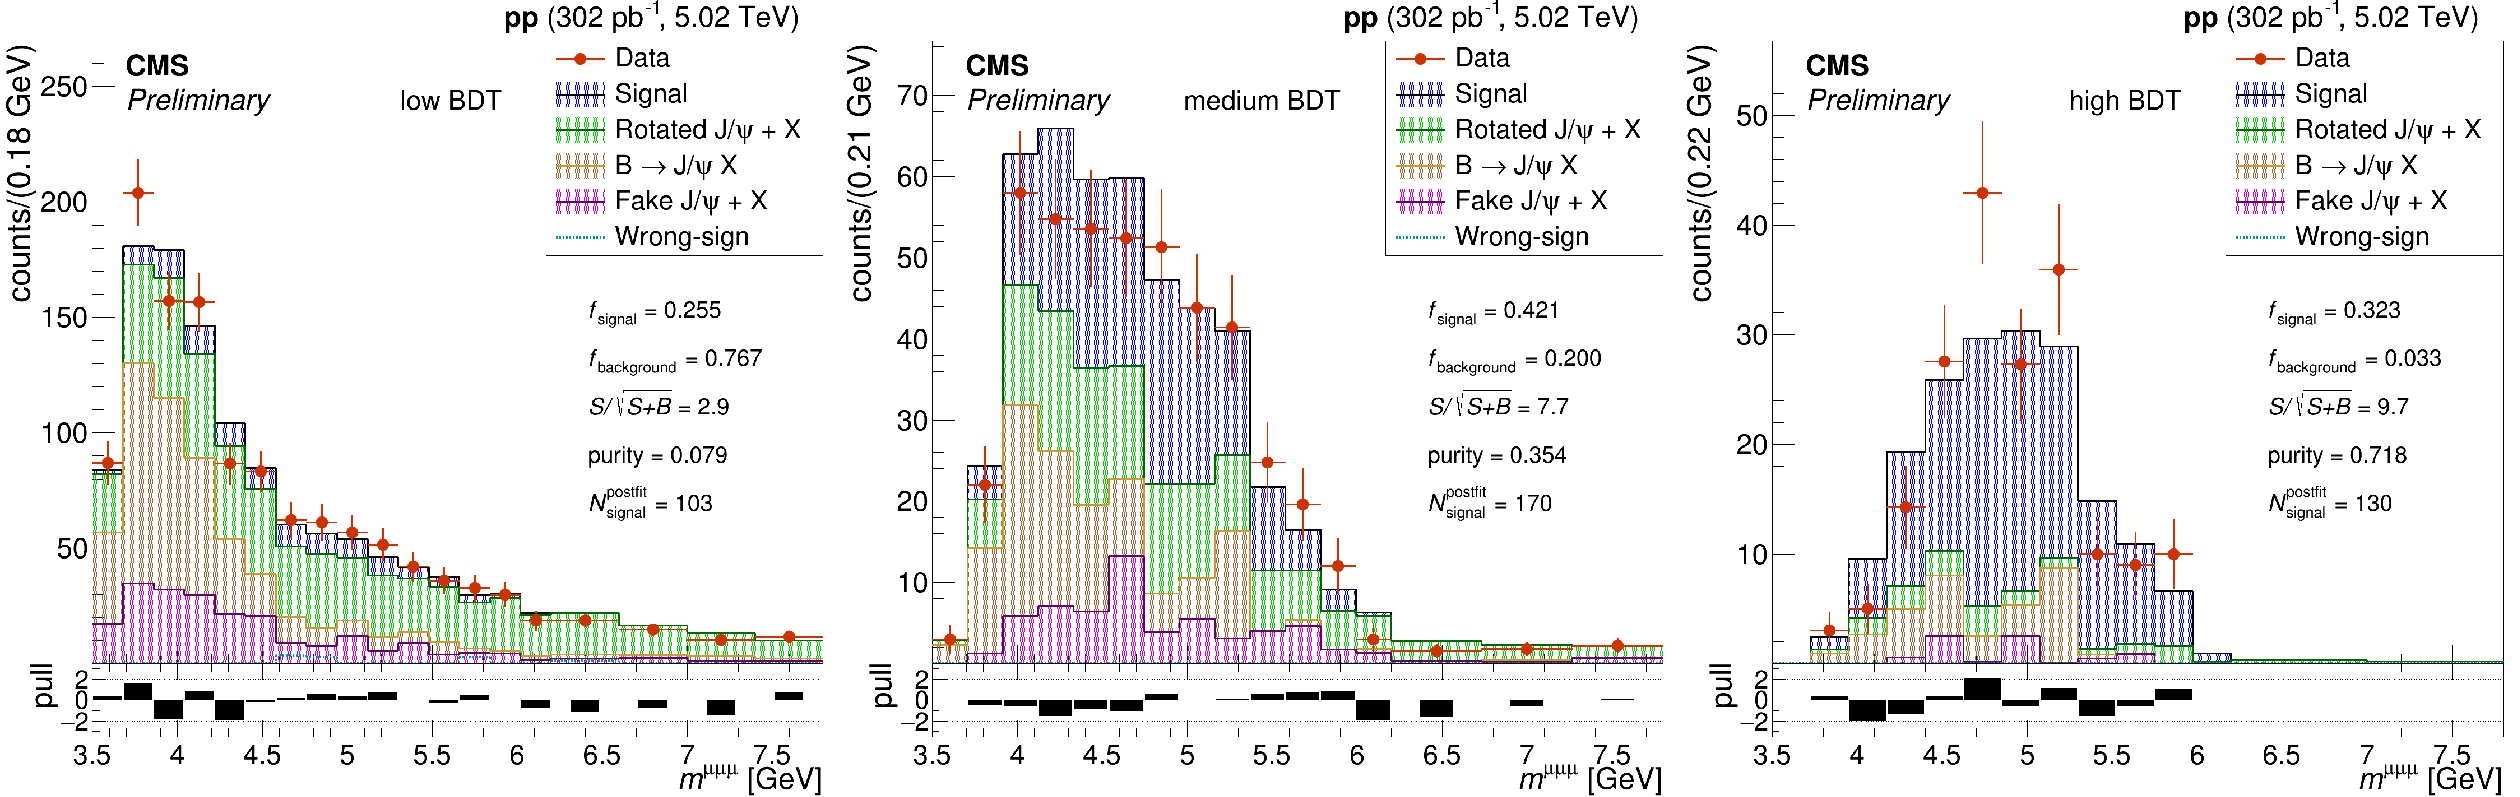
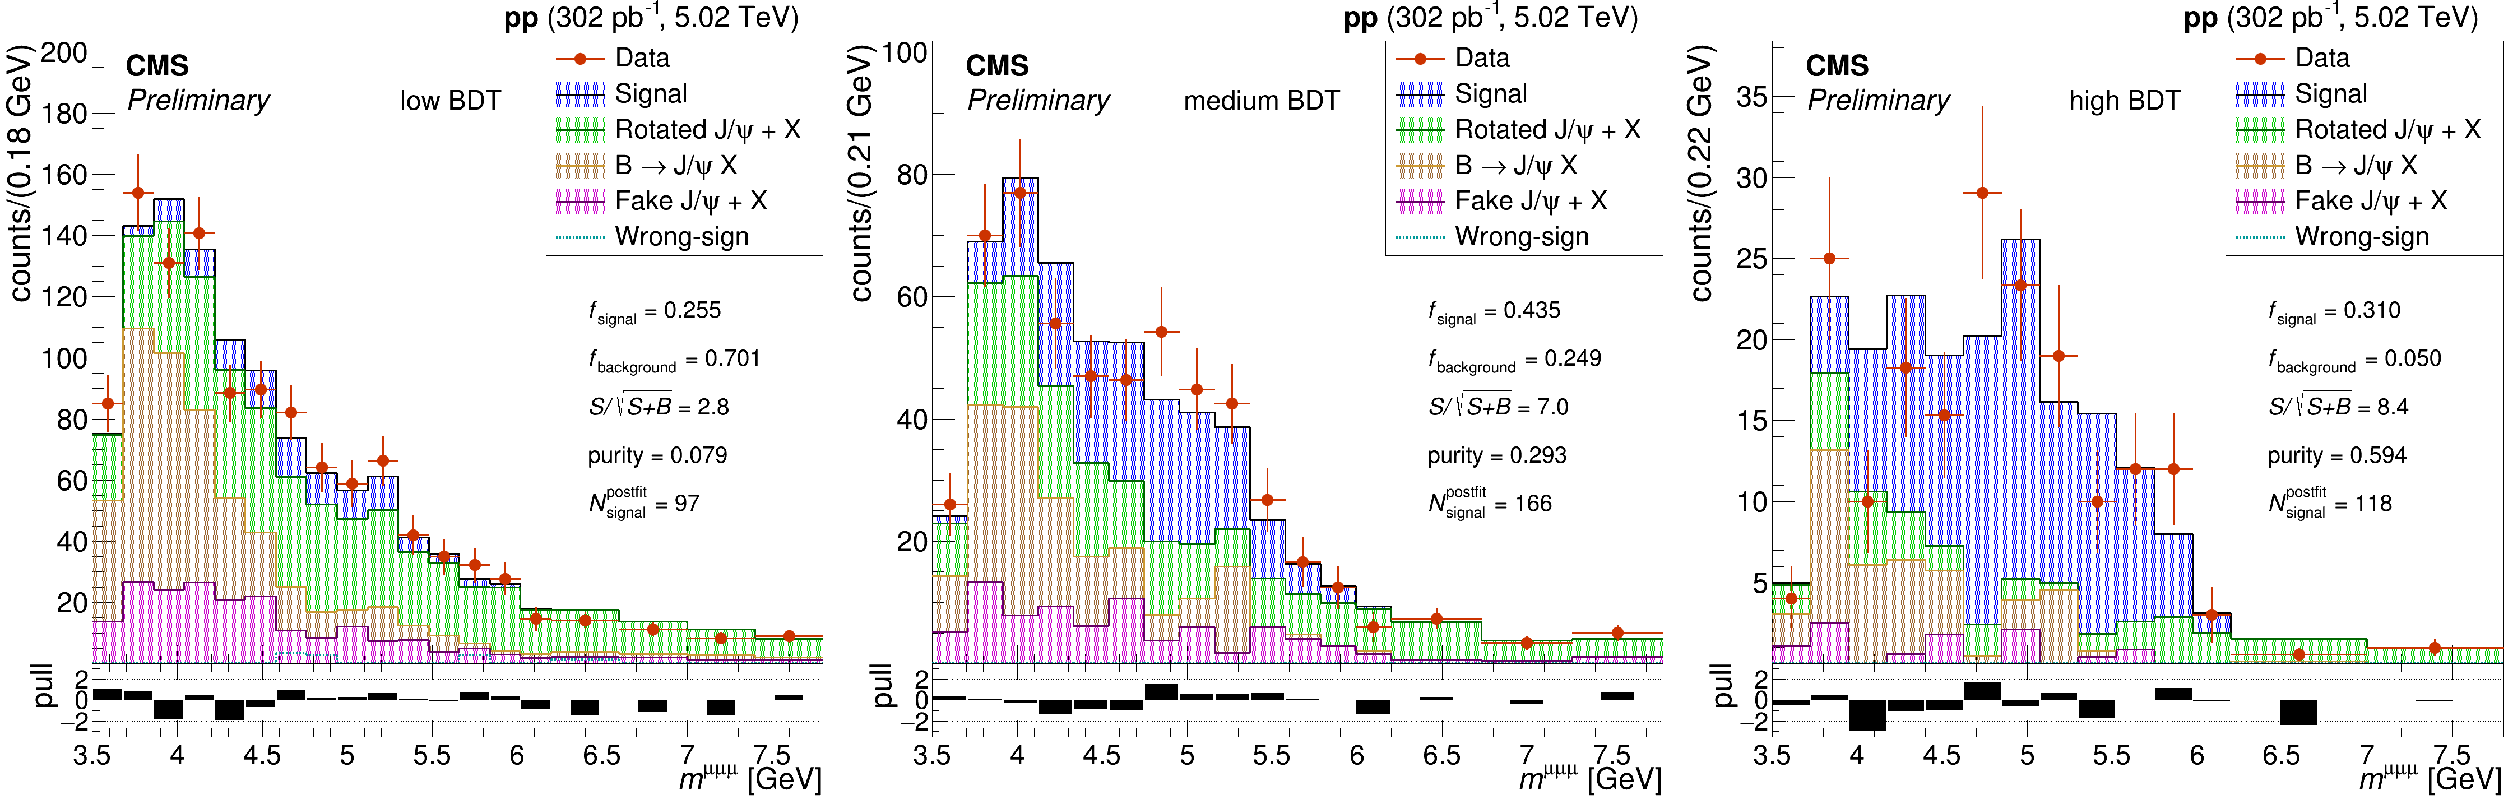
Figure 1:
Template fit of the trimuon mass distributions in the three BDT bins, for the pp data sample integrated over the two studied kinematic regions. The lower panels show the pull between data and the fitted distributions. |

png pdf |
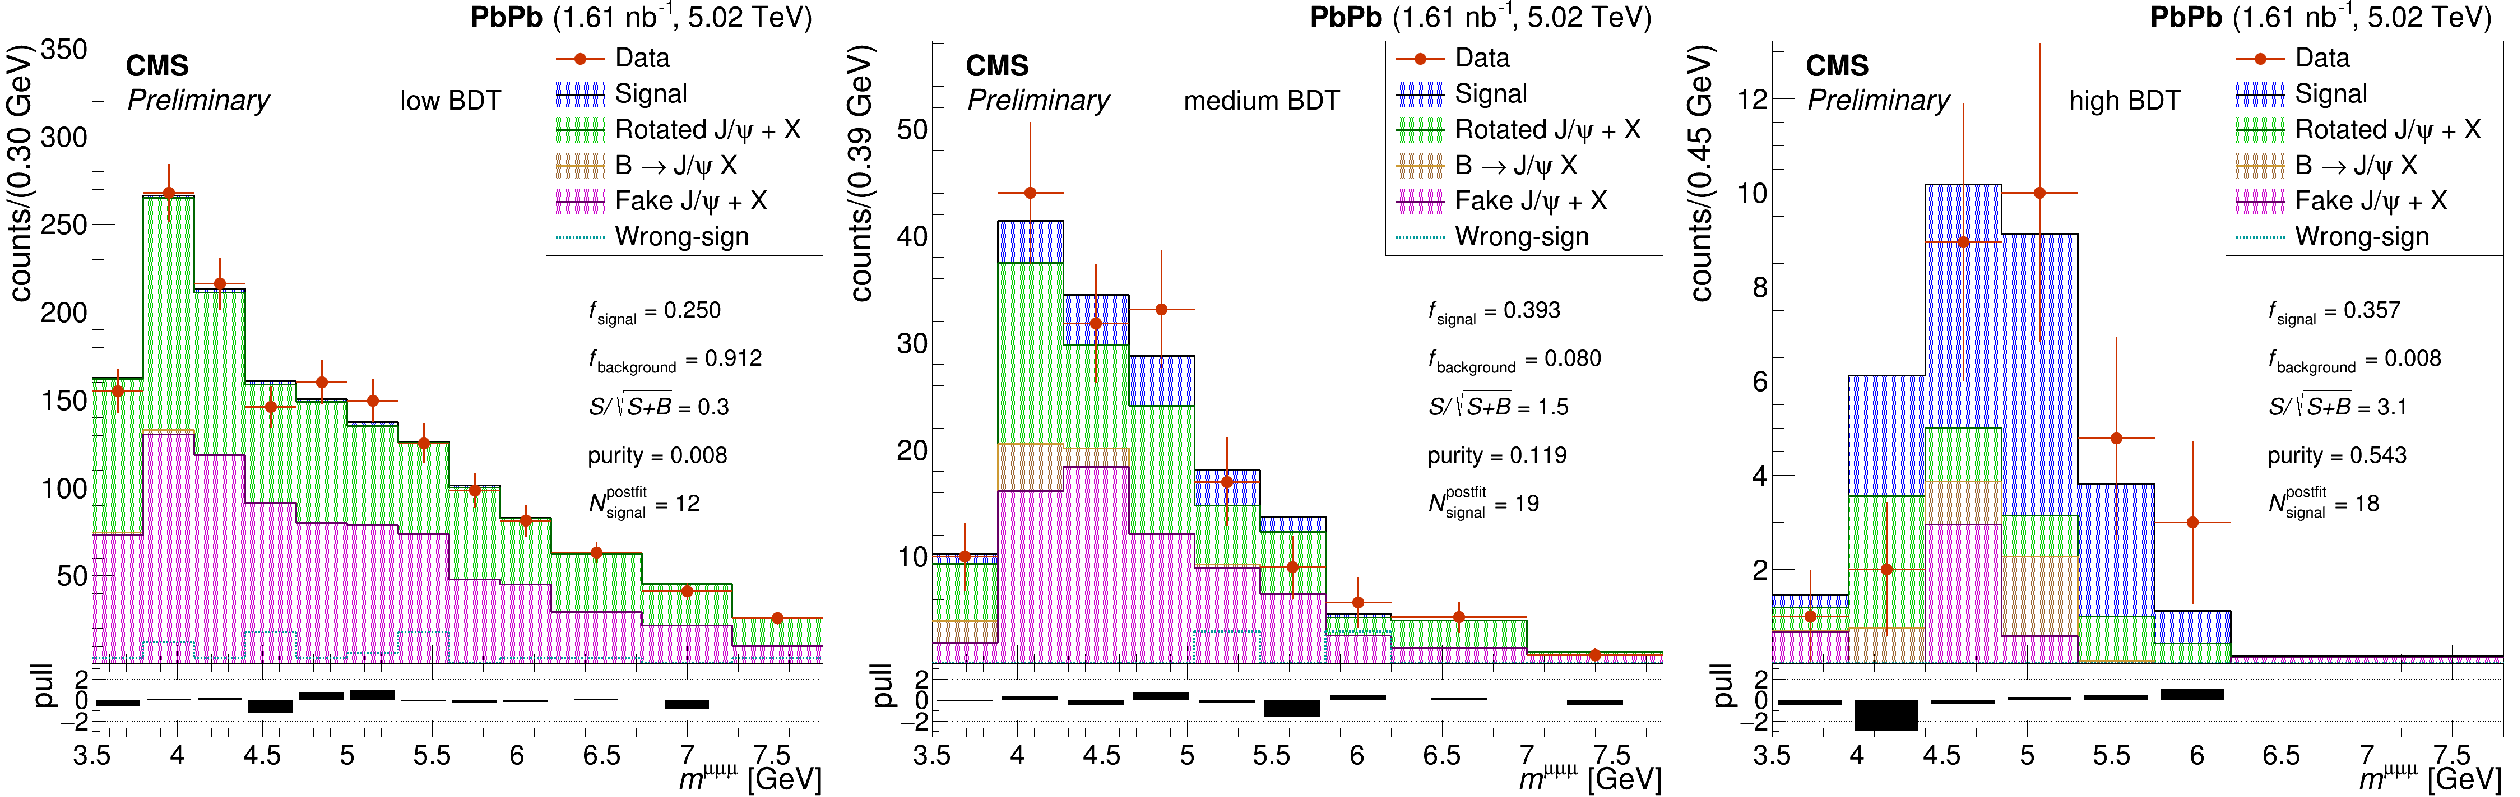
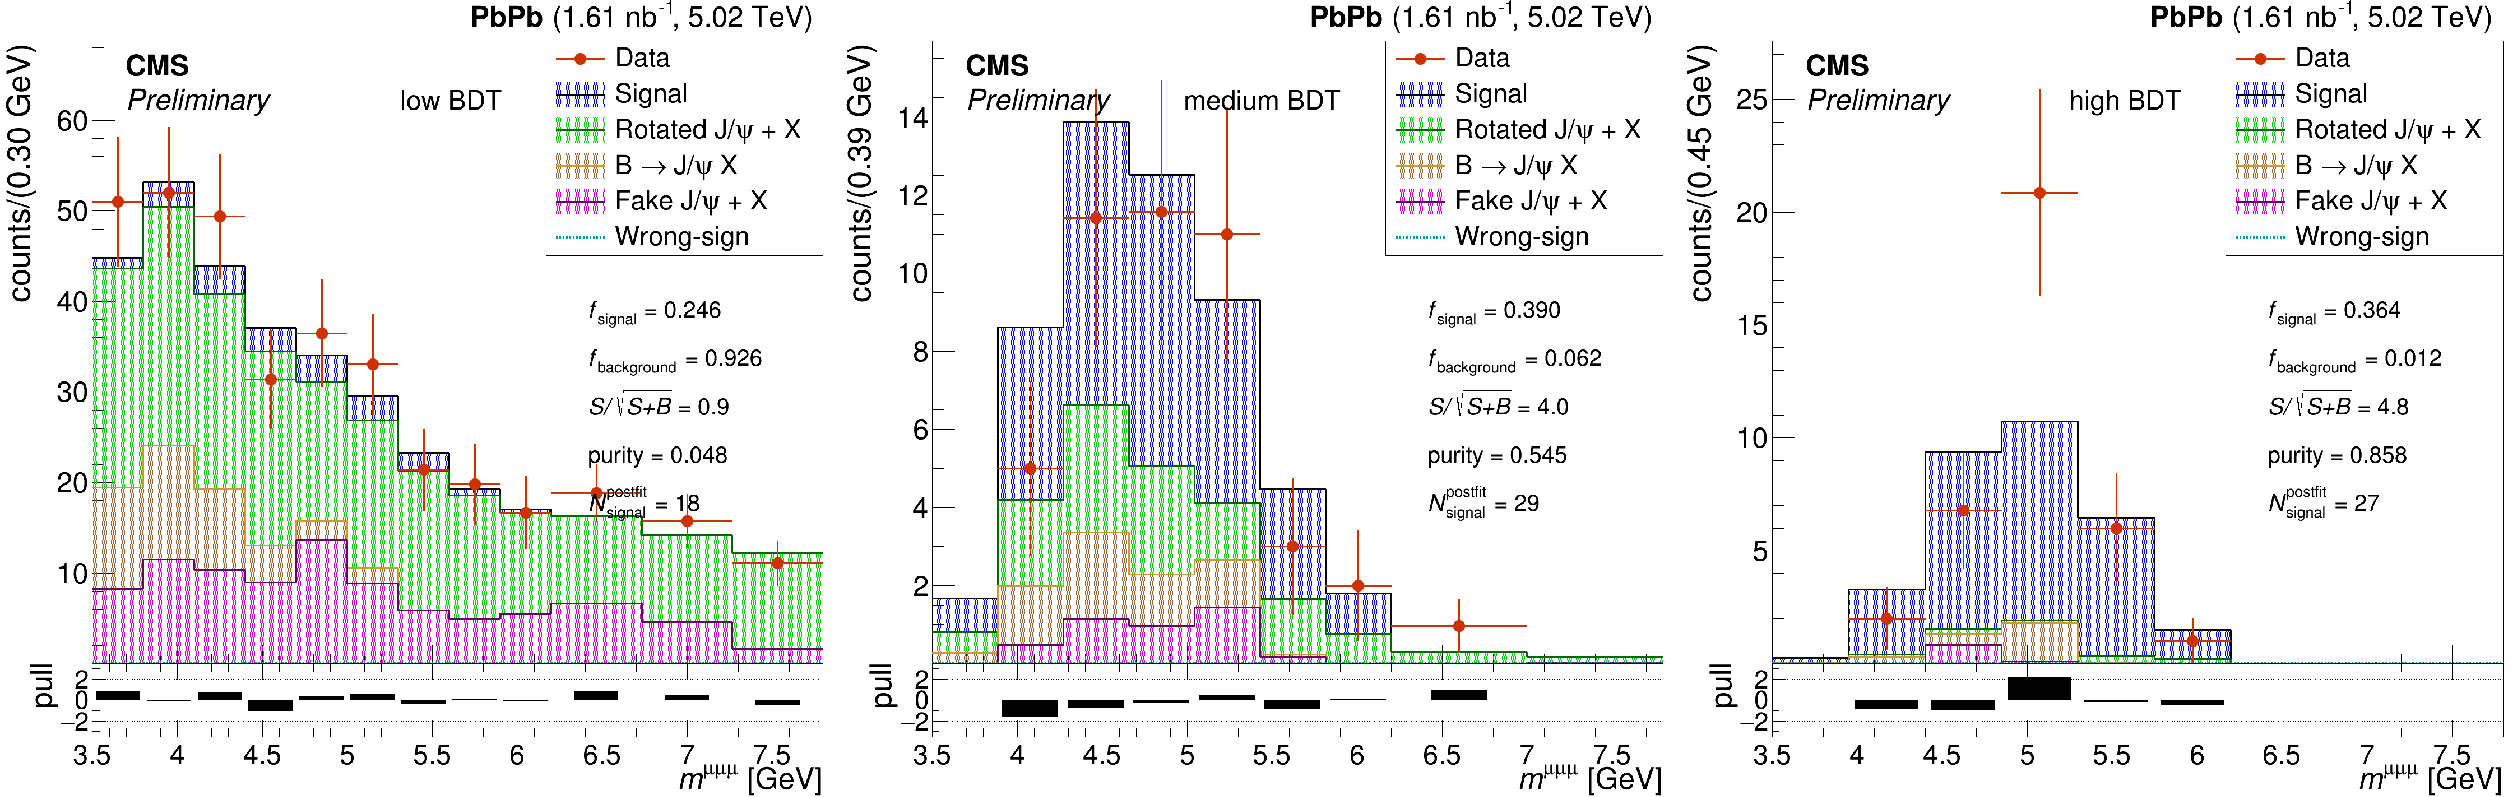
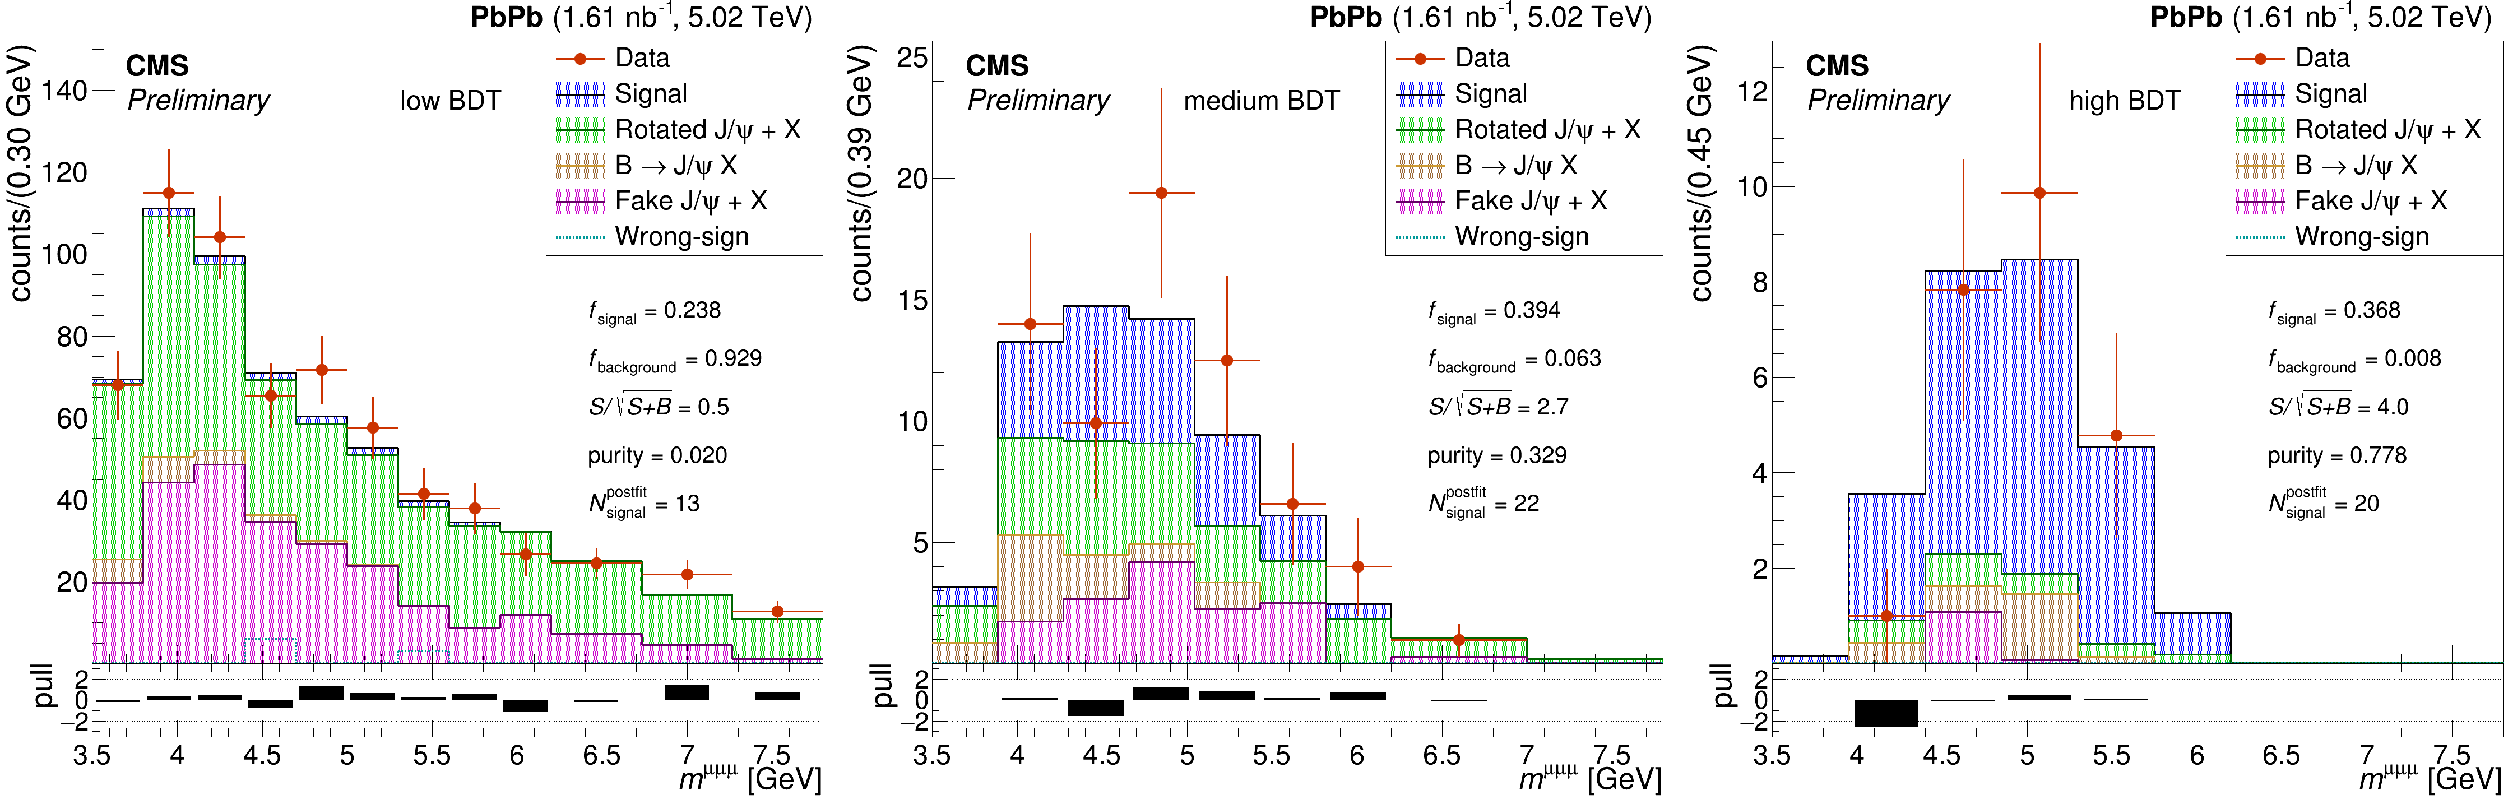
Figure 2:
Template fit of the trimuon mass distributions in the three BDT bins, for the PbPb data sample integrated over the two studied kinematic regions. The lower panels show the pull between data and the fitted distributions. |
png pdf |
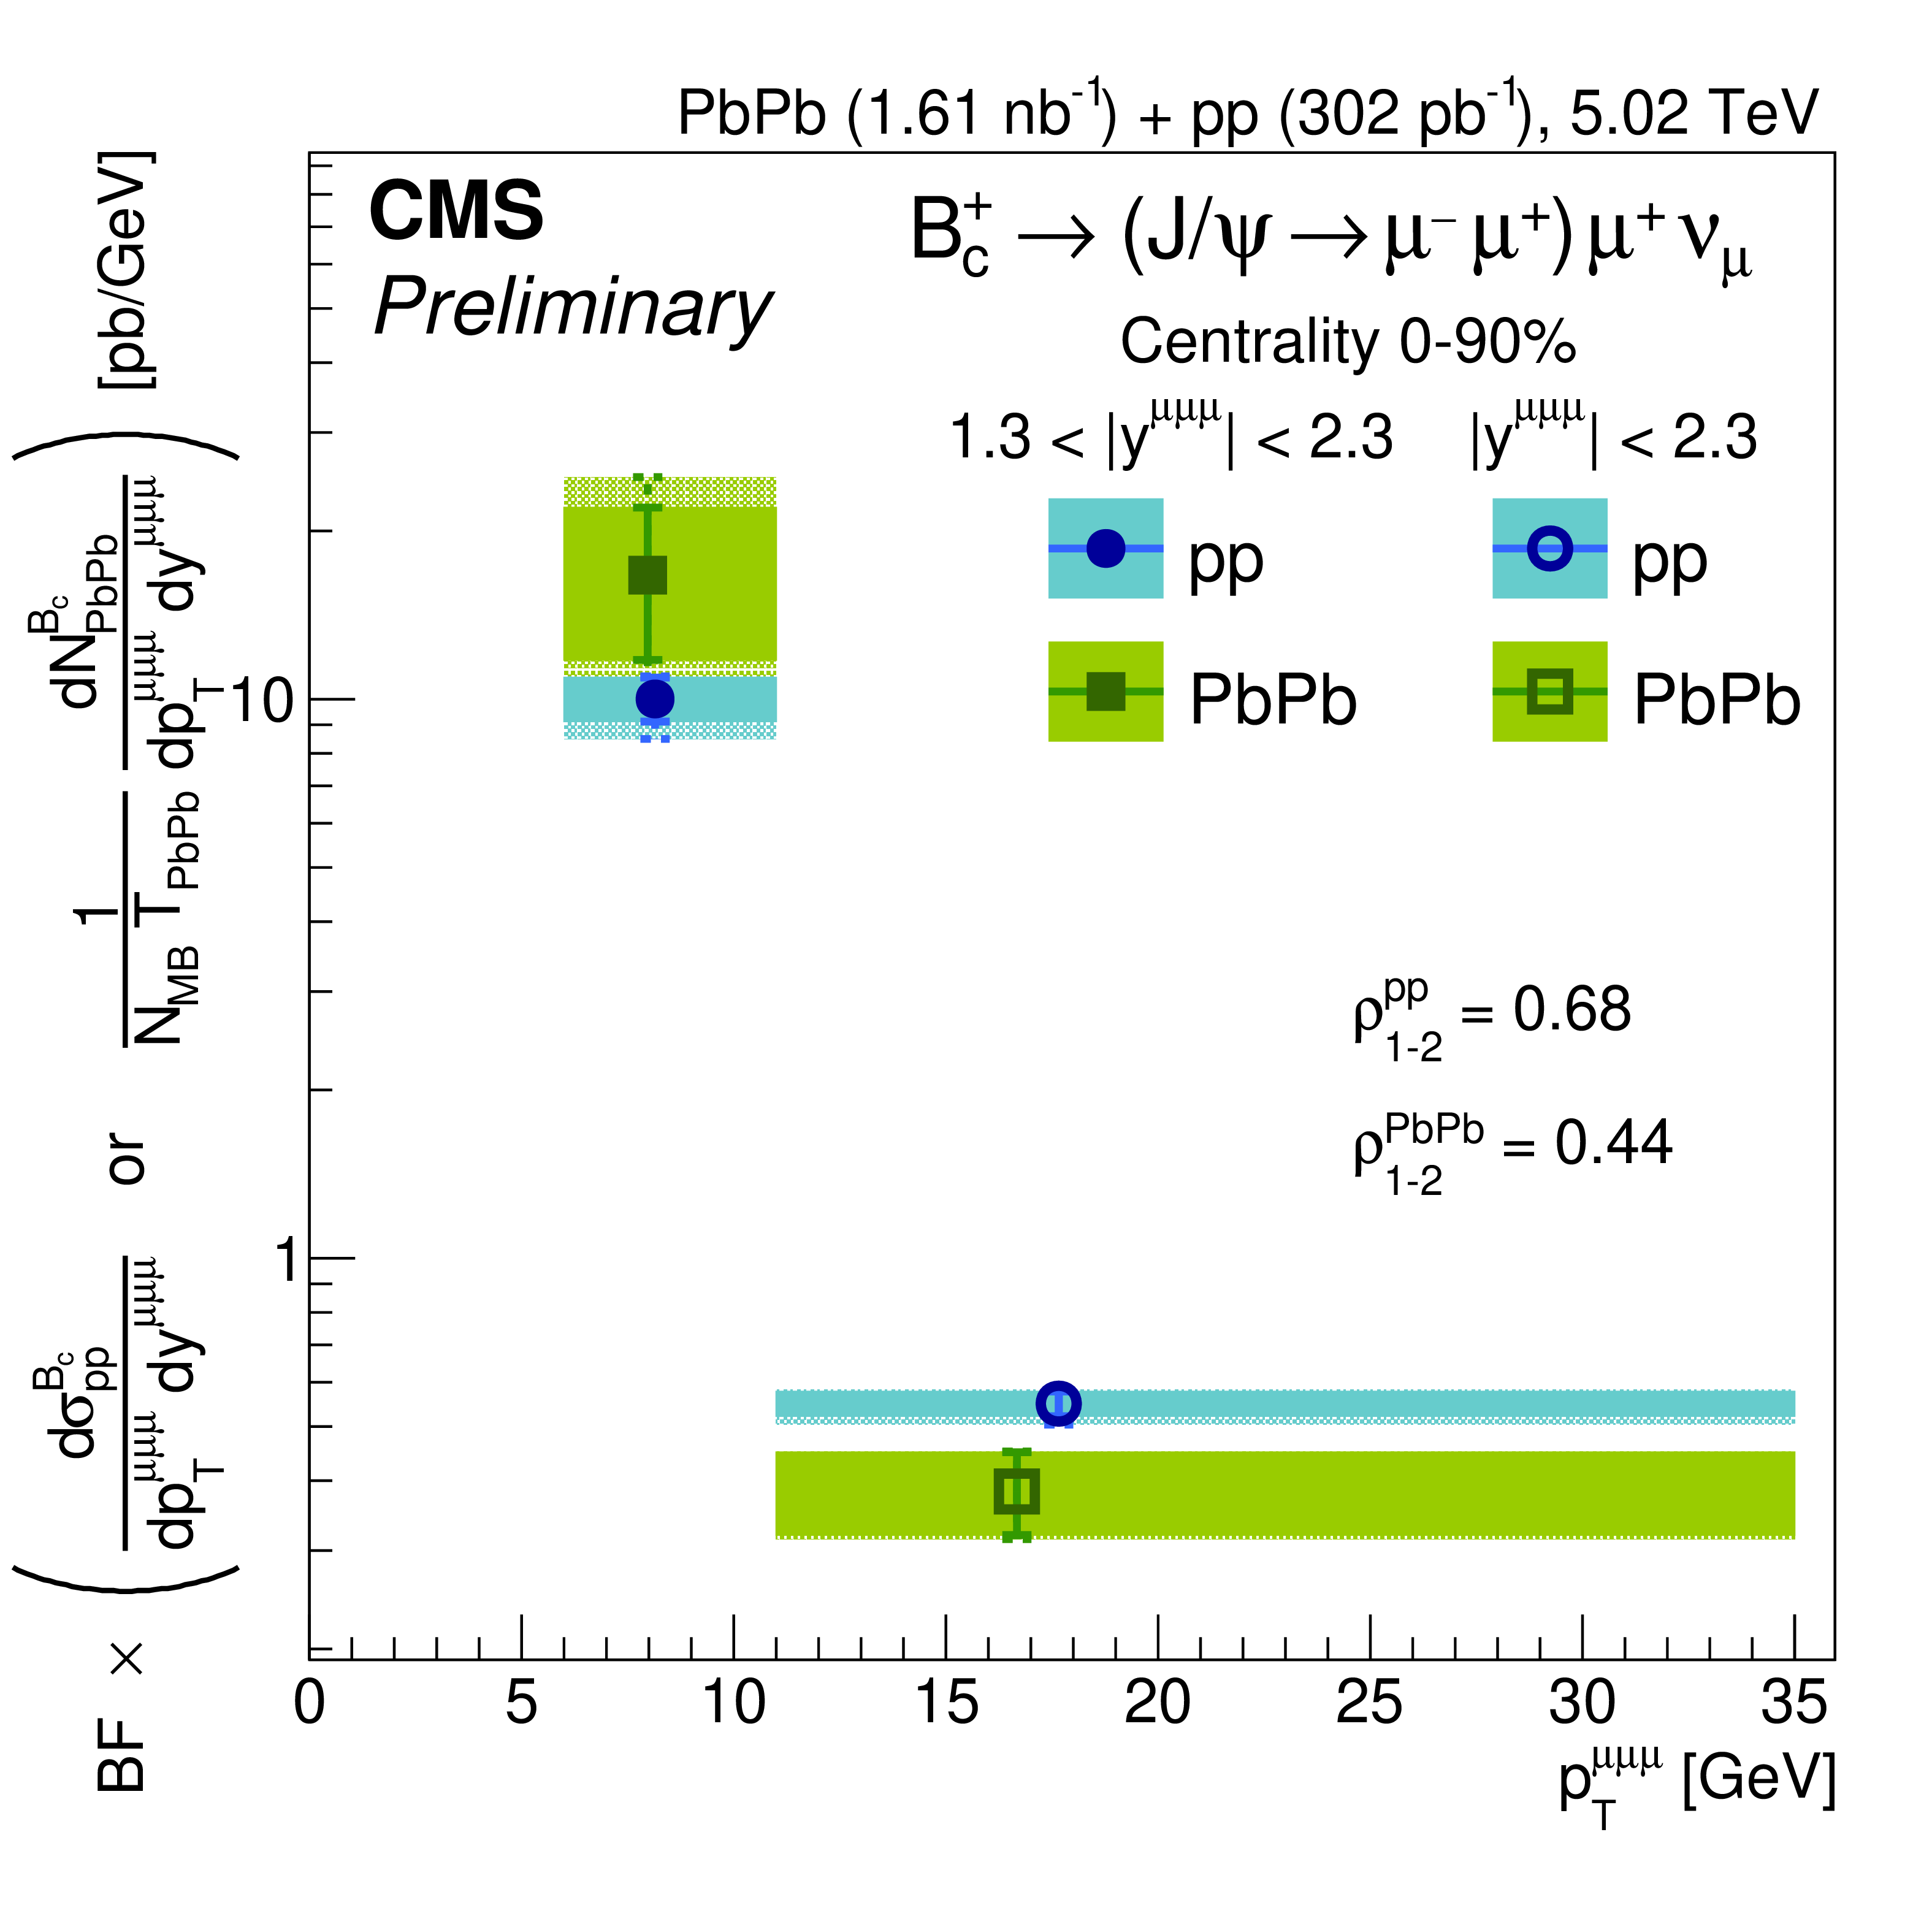
Figure 3:
$\mathrm{B^{+}_{c}}$ meson production pp -equivalent cross-section times branching fraction of the studied decay in pp and PbPb collisions. Two bins of the trimuon ${p_{\mathrm {T}}}$ are shown, which also correspond to different rapidity ranges. The solid and lighter rectangles show the fit uncertainty and the total uncertainty, respectively. The bin-to-bin correlation factor $\rho _{1\textrm {-}2}$ is also displayed. The markers of the ${p_\text {T}^{\mu \mu \mu}}$ bins are placed according to the Lafferty-Wyatt prescription [39]. |
png pdf |
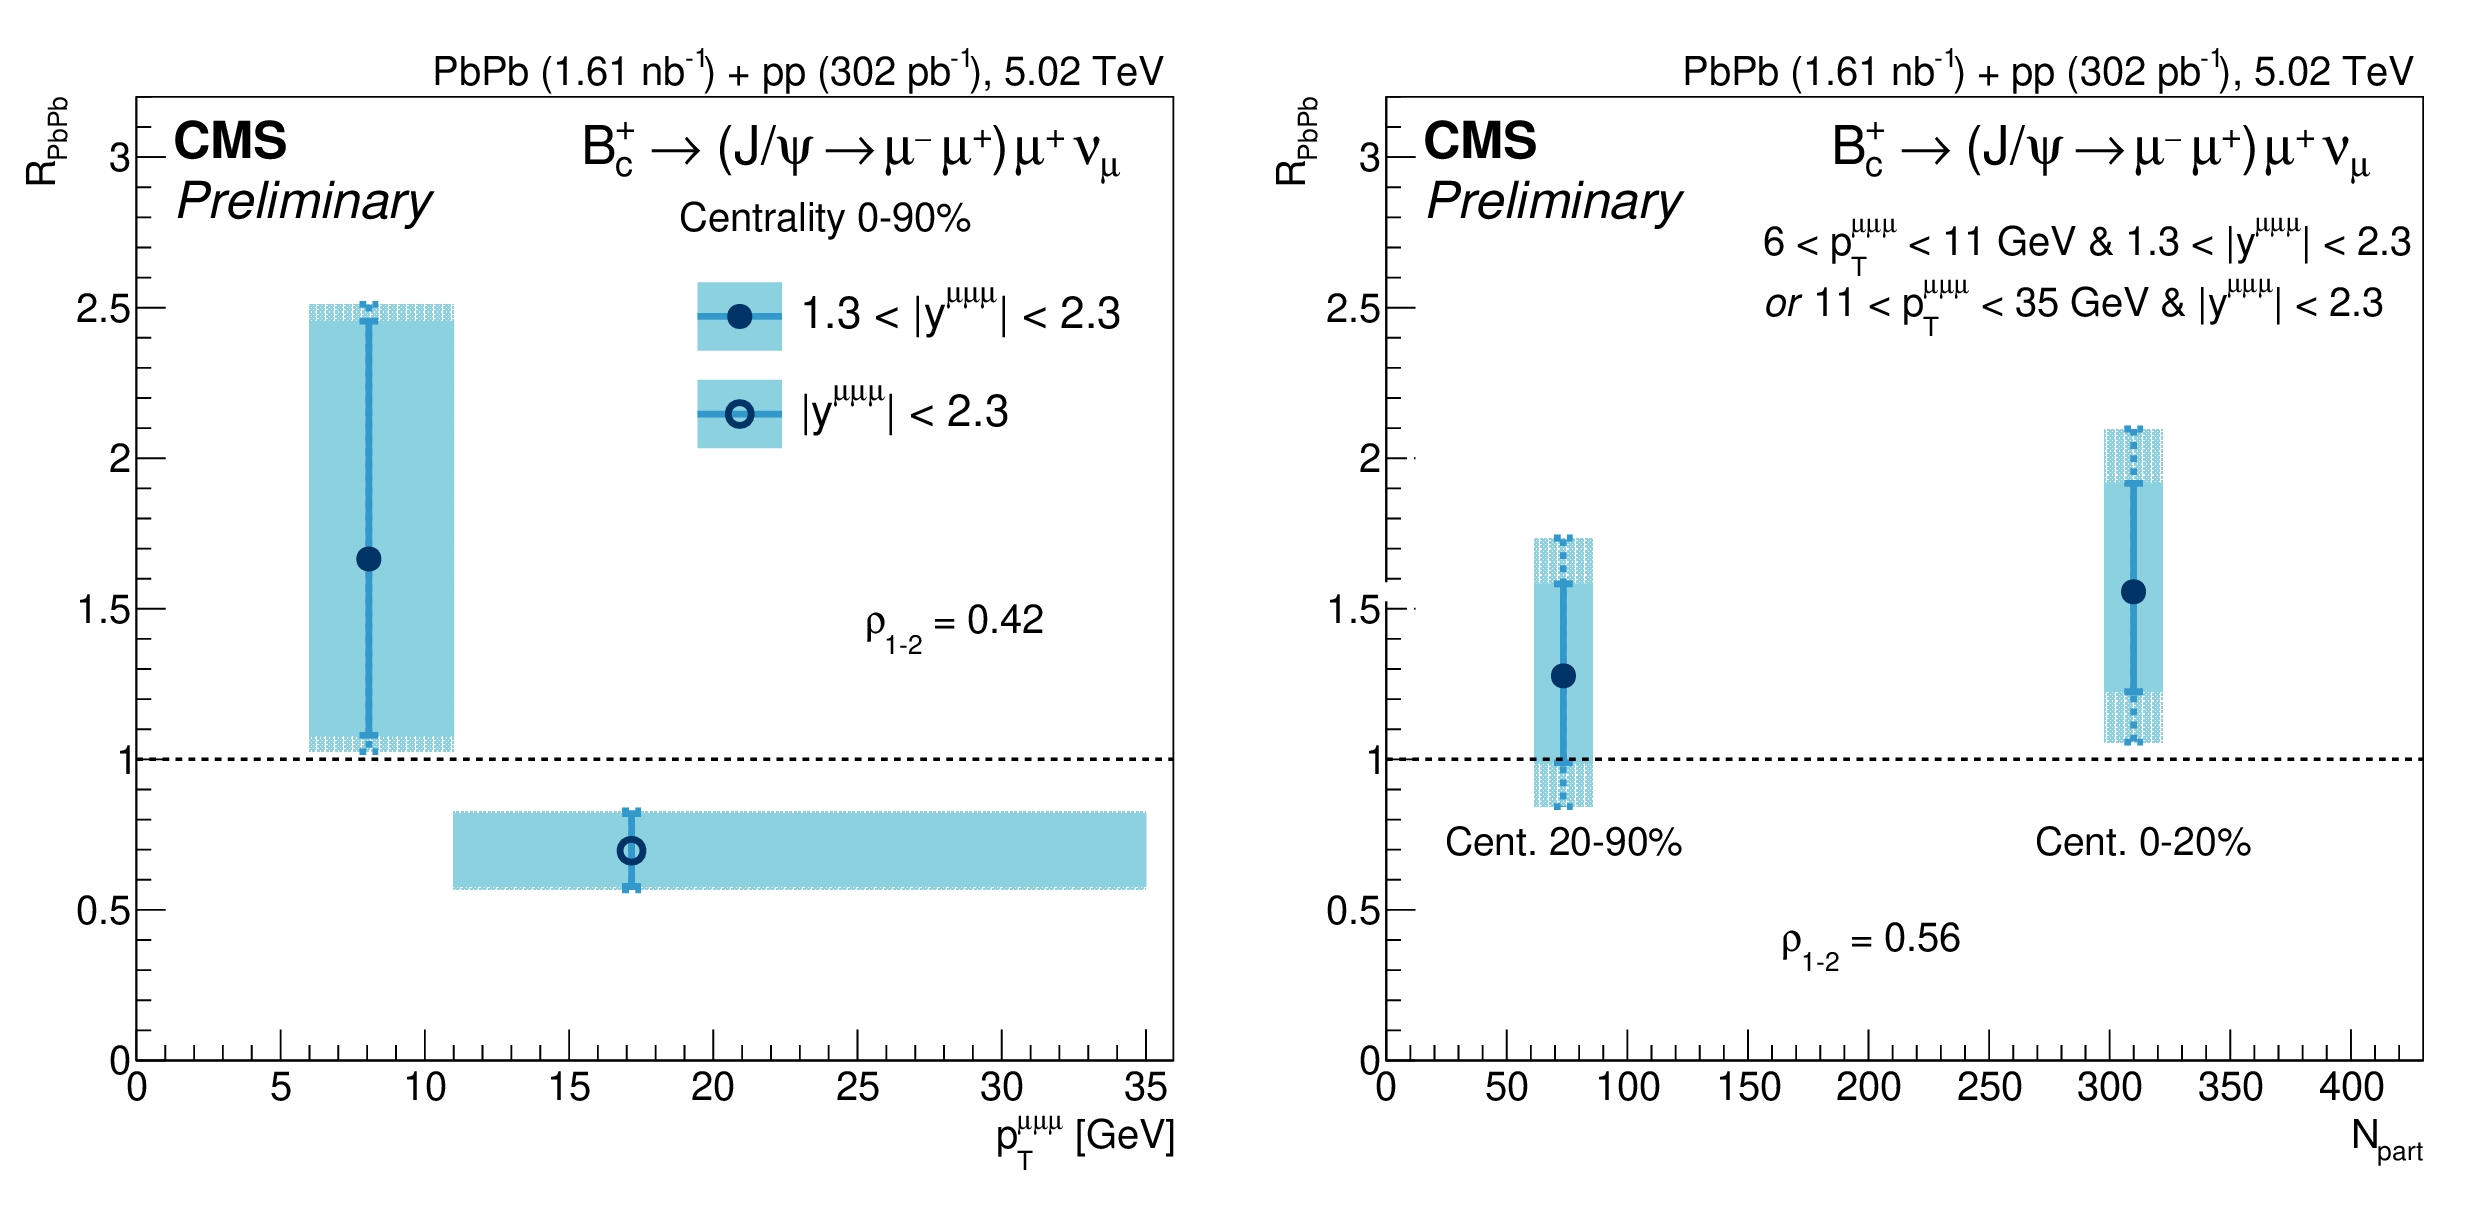
Figure 4:
$\mathrm{B^{+}_{c}}$ meson nuclear modification factor in ${p_\text {T}^{\mu \mu \mu}}$ bins corresponding to different rapidity ranges (left), and in centrality bins integrated over the studied kinematic range (right). The solid and lighter rectangles, respectively, show the bin-to-bin-uncorrelated uncertainty and the total uncertainty, such that the uncertainty on the difference of the two bins is the quadratic sum of uncorrelated uncertainties. The bin-to-bin correlation factor $\rho _{1\textrm {-}2}$ is also displayed. The markers of the ${p_\text {T}^{\mu \mu \mu}}$ bins are placed as the average of the Lafferty-Wyatt prescription [39] applied on the pp and PbPb spectra. The centrality bin markers are placed at the minimum-bias average number of participants $N_{\textrm {part}}$. |

png pdf |
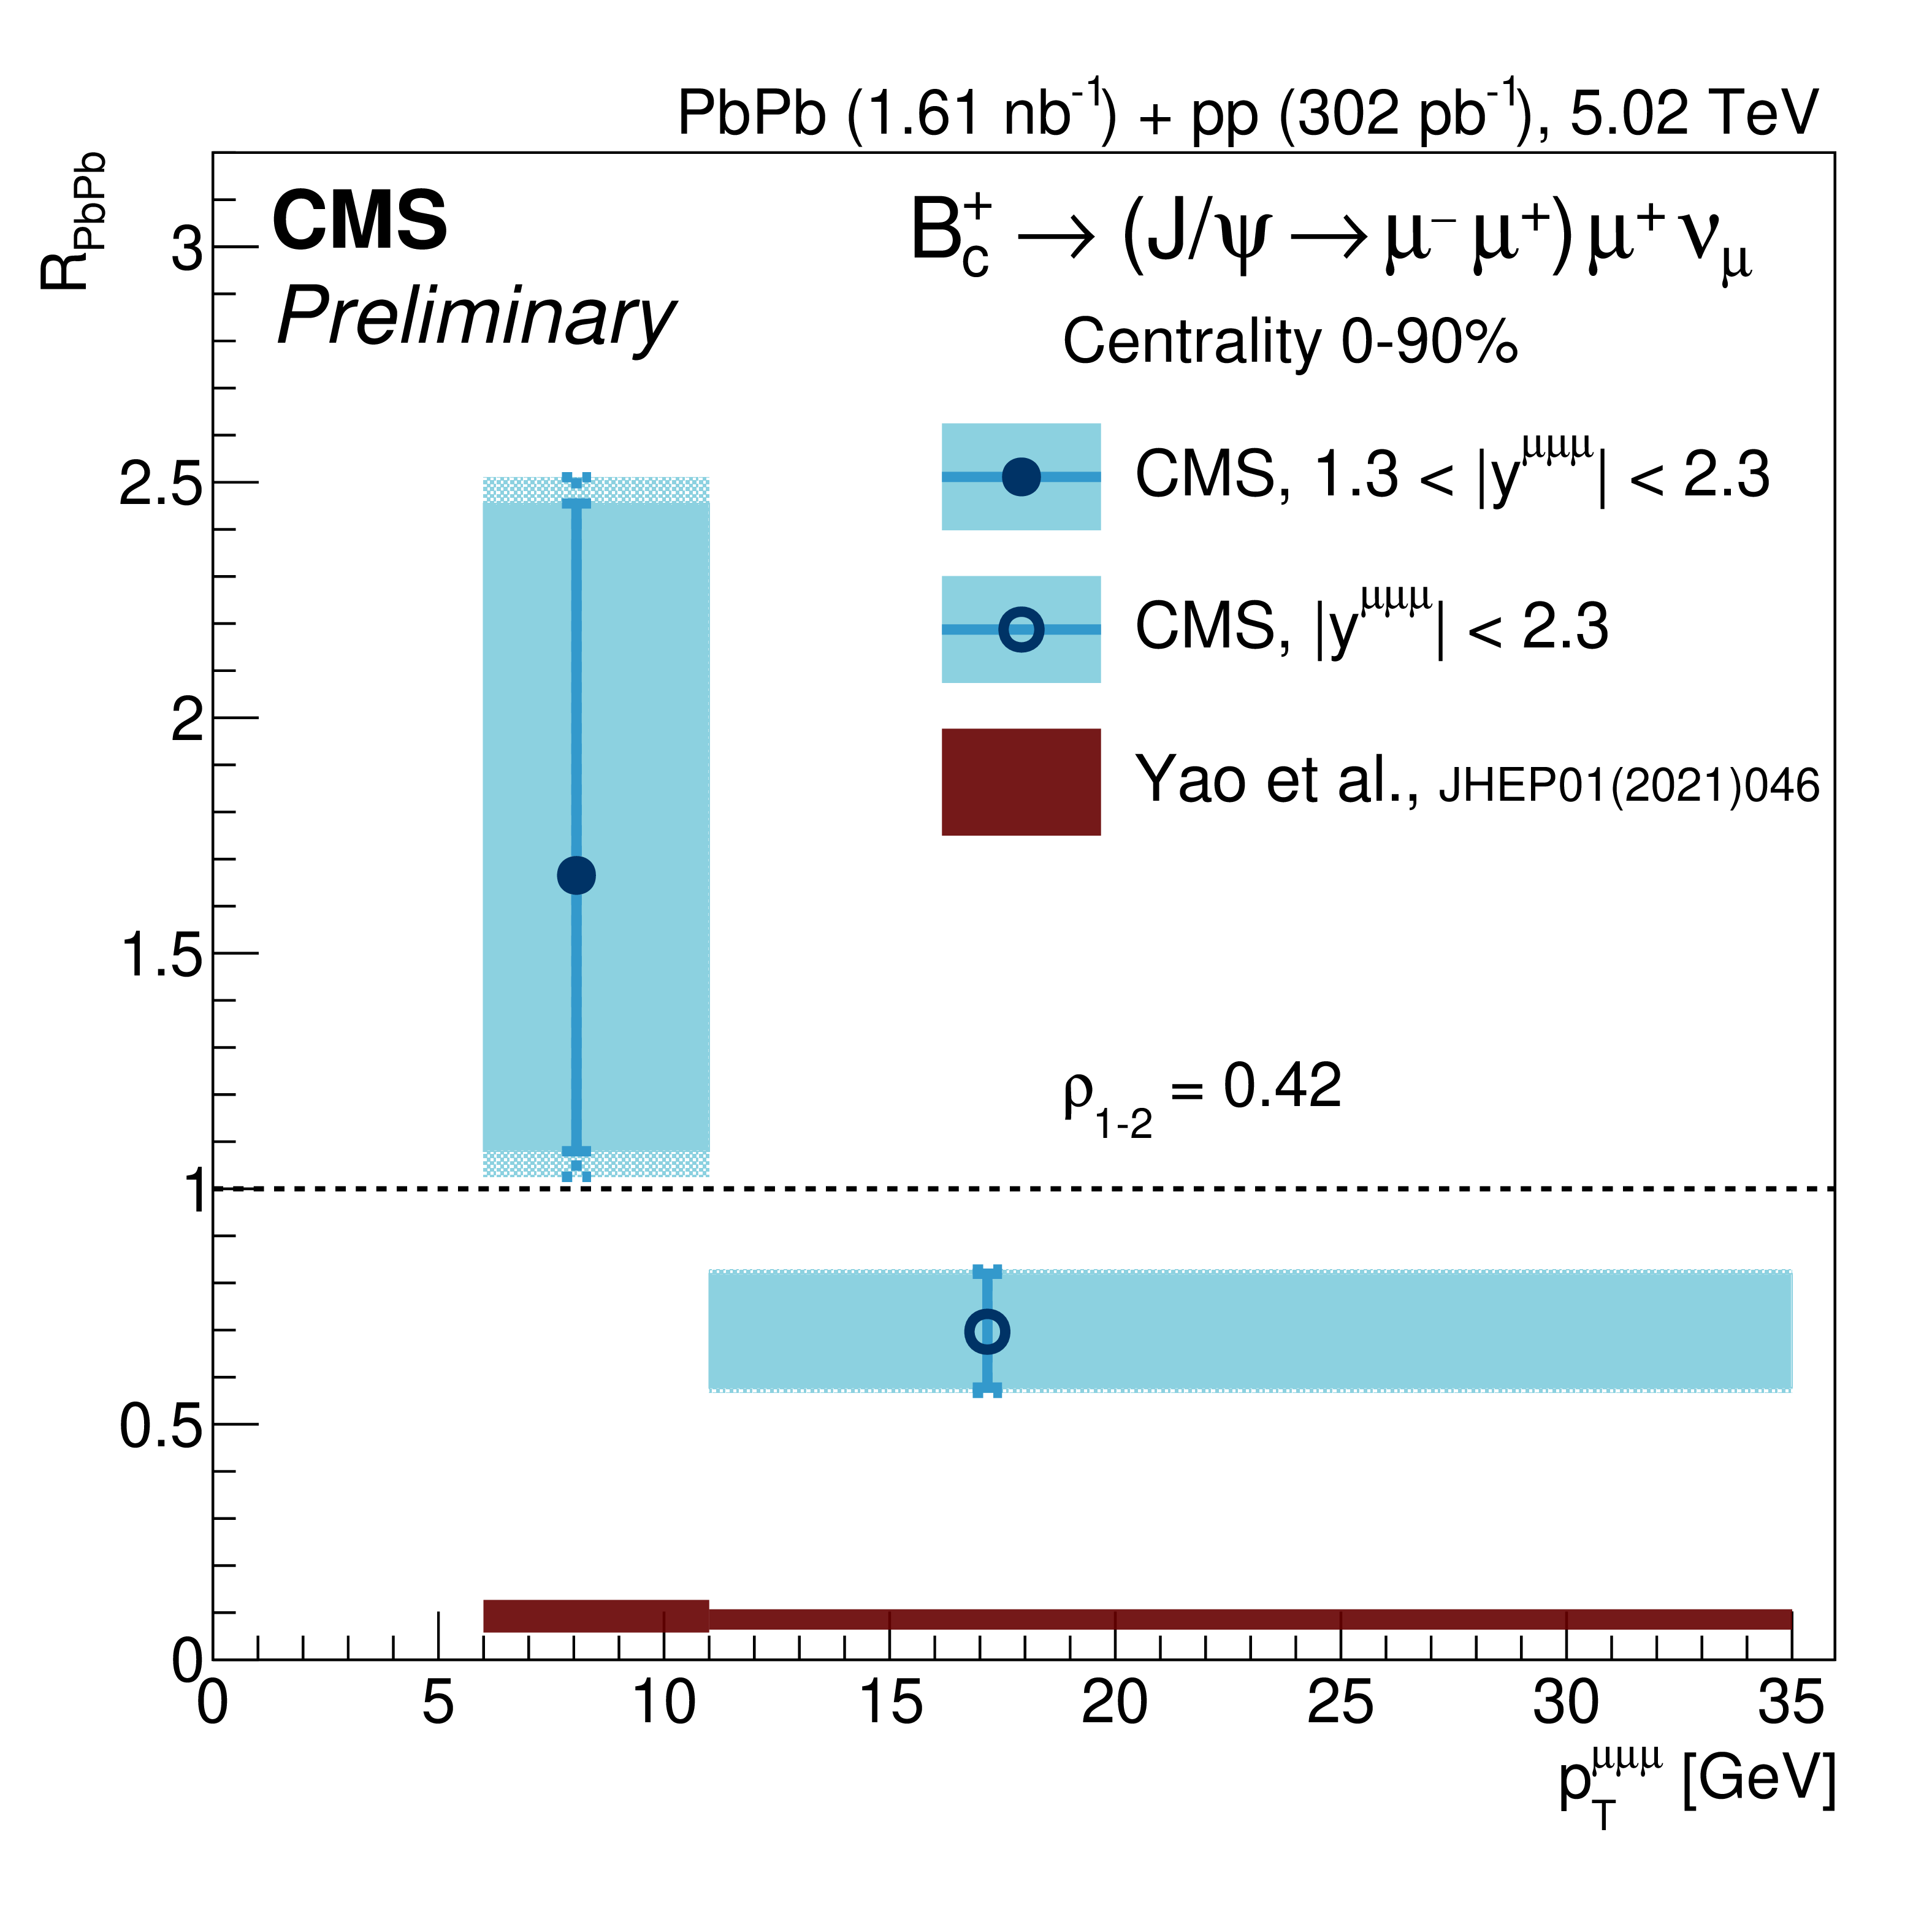
Figure 4-a:
$\mathrm{B^{+}_{c}}$ meson nuclear modification factor in ${p_\text {T}^{\mu \mu \mu}}$ bins corresponding to different rapidity ranges. The solid and lighter rectangles, respectively, show the bin-to-bin-uncorrelated uncertainty and the total uncertainty, such that the uncertainty on the difference of the two bins is the quadratic sum of uncorrelated uncertainties. The bin-to-bin correlation factor $\rho _{1\textrm {-}2}$ is also displayed. The markers of the ${p_\text {T}^{\mu \mu \mu}}$ bins are placed as the average of the Lafferty-Wyatt prescription [39] applied on the pp and PbPb spectra. |

png pdf |
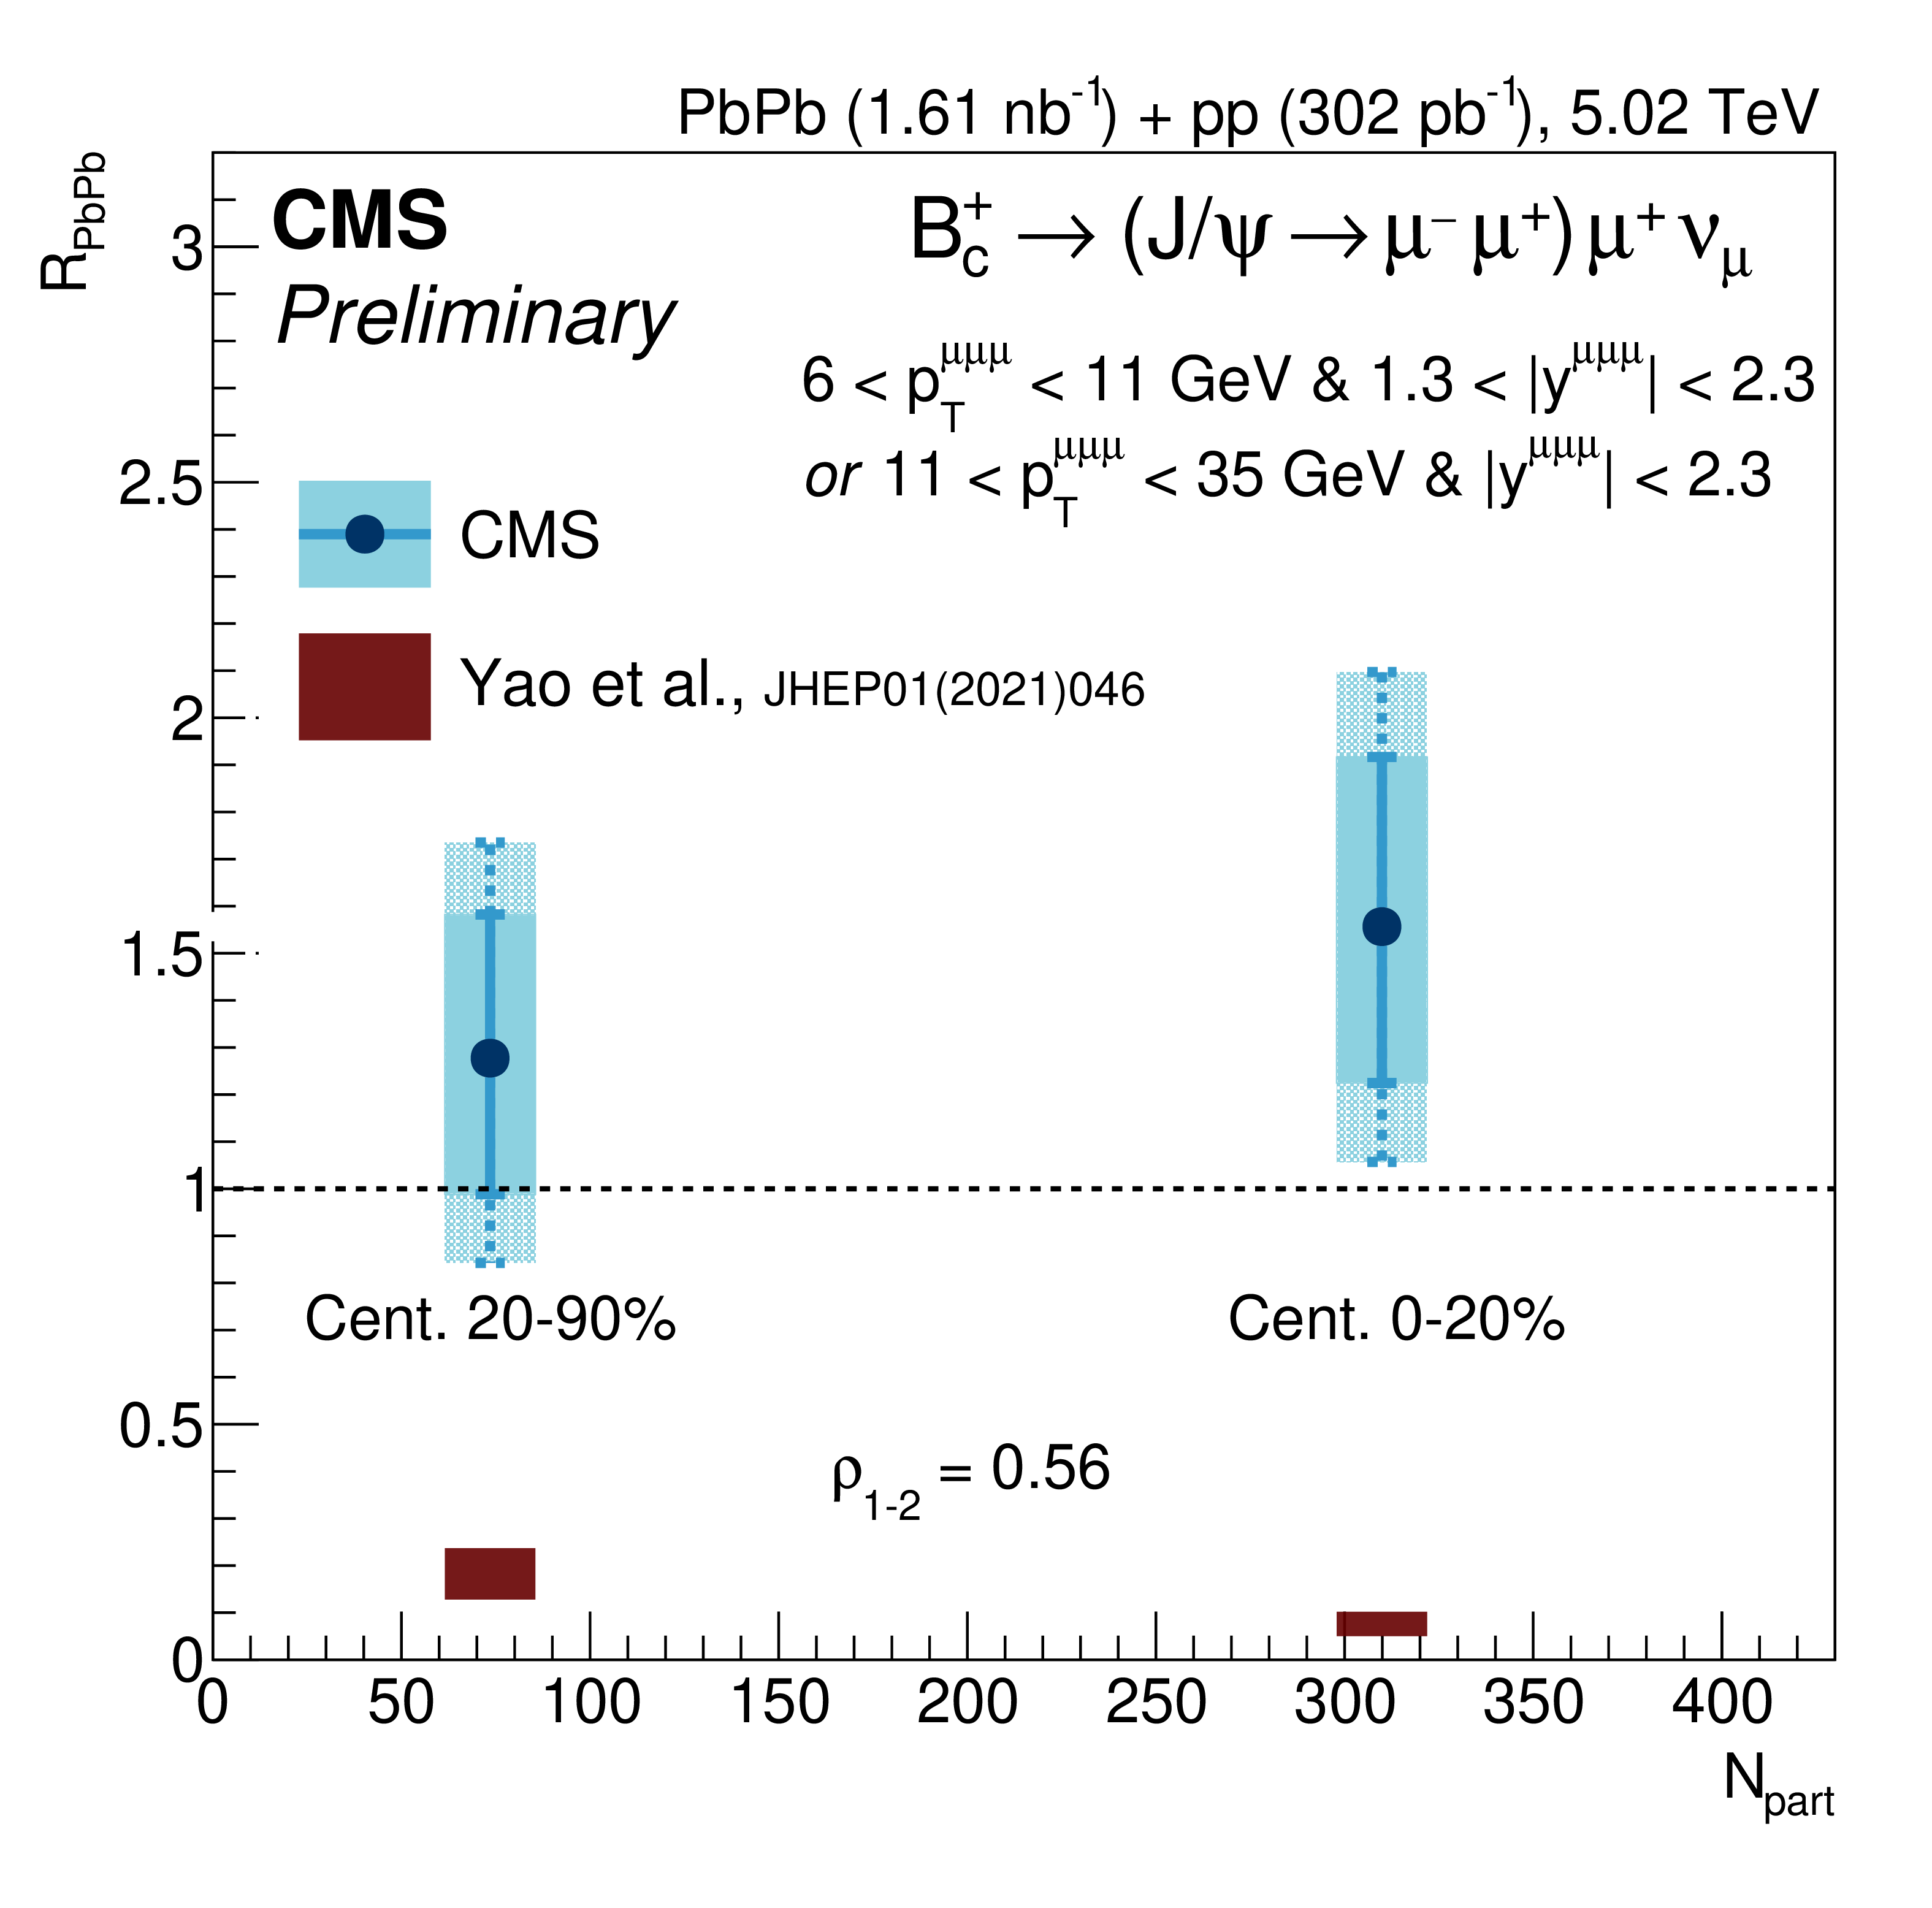
Figure 4-b:
$\mathrm{B^{+}_{c}}$ meson nuclear modification factor in centrality bins integrated over the studied kinematic range. The solid and lighter rectangles, respectively, show the bin-to-bin-uncorrelated uncertainty and the total uncertainty, such that the uncertainty on the difference of the two bins is the quadratic sum of uncorrelated uncertainties. The bin-to-bin correlation factor $\rho _{1\textrm {-}2}$ is also displayed. The centrality bin markers are placed at the minimum-bias average number of participants $N_{\textrm {part}}$. |
| Summary |
| In summary, the first observation of the ${\rm B_c^+}$ meson in heavy ion collisions is presented. The production cross sections in PbPb and pp collisions, along with their ratios, are measured in two bins of ${p_{\mathrm {T}}}$ and two bins of centrality. This unique meson, a hybrid beauty-charm state as well as the heaviest ground-state B meson, helps disentangle the enhancement and suppression mechanisms at play in the evolution of heavy quarks through the QGP. |
| Additional Figures | |
png pdf |
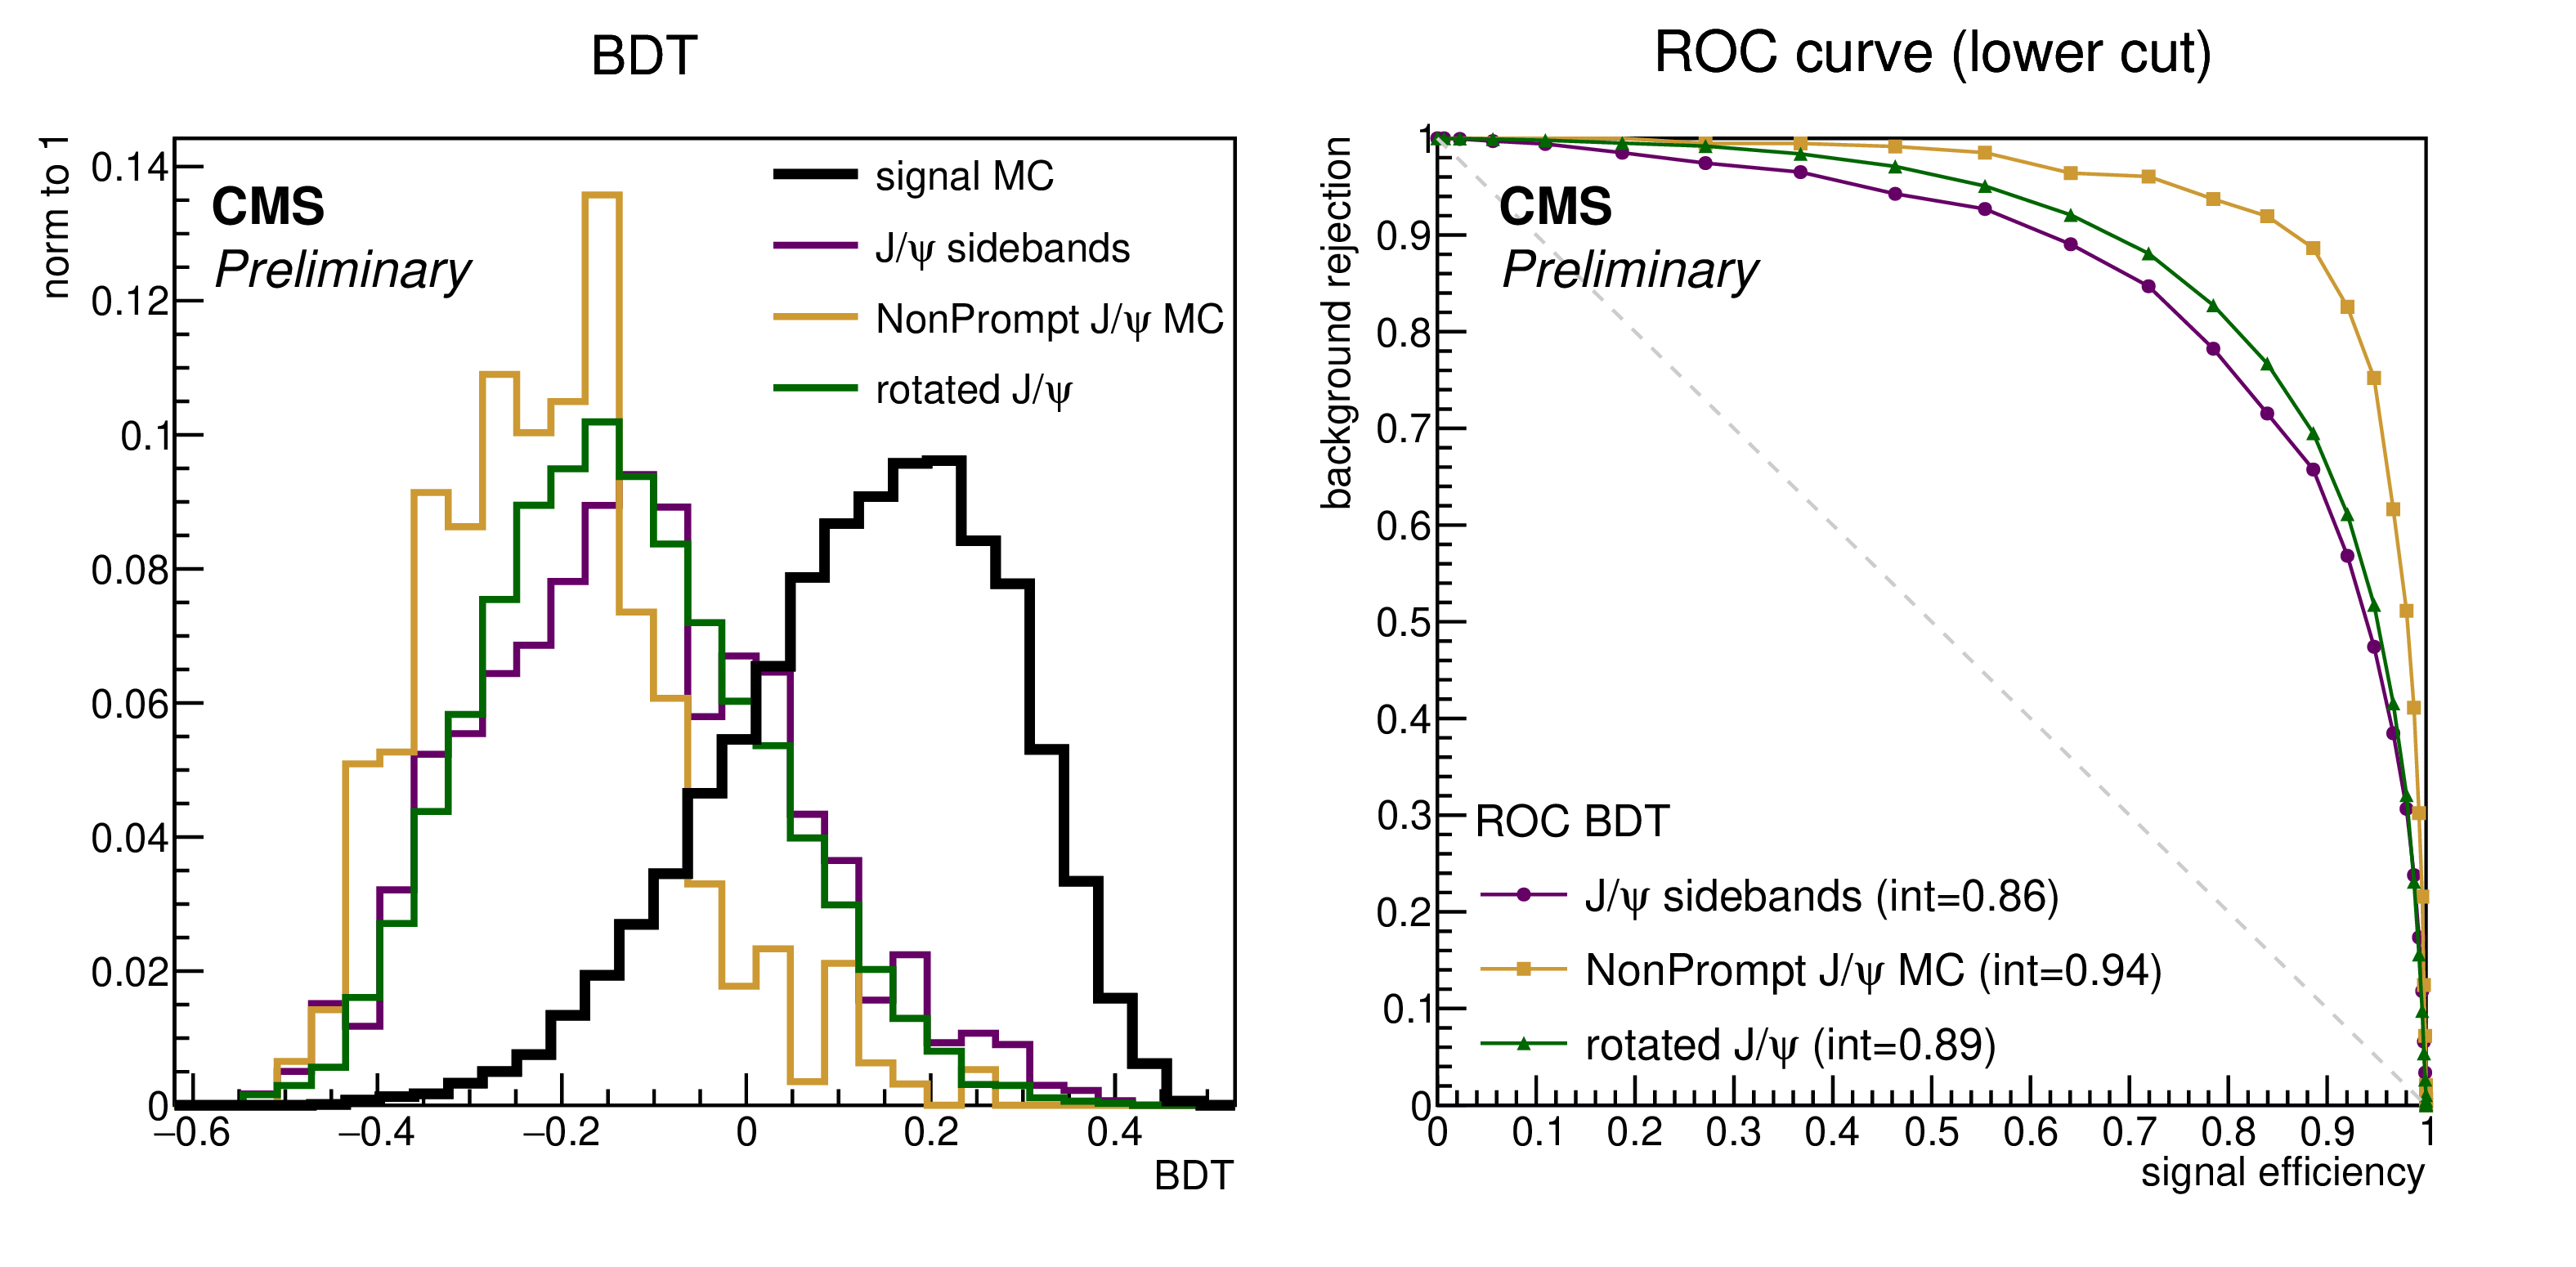
Additional Figure 1:
Distribution of the BDT variable for the pp samples. The ROC curve showing the discriminative power is also shown on the right. |

png pdf |
Additional Figure 2:
Distribution of the BDT variable for the PbPb samples. The ROC curve showing the discriminative power is also shown on the right. |
png pdf |
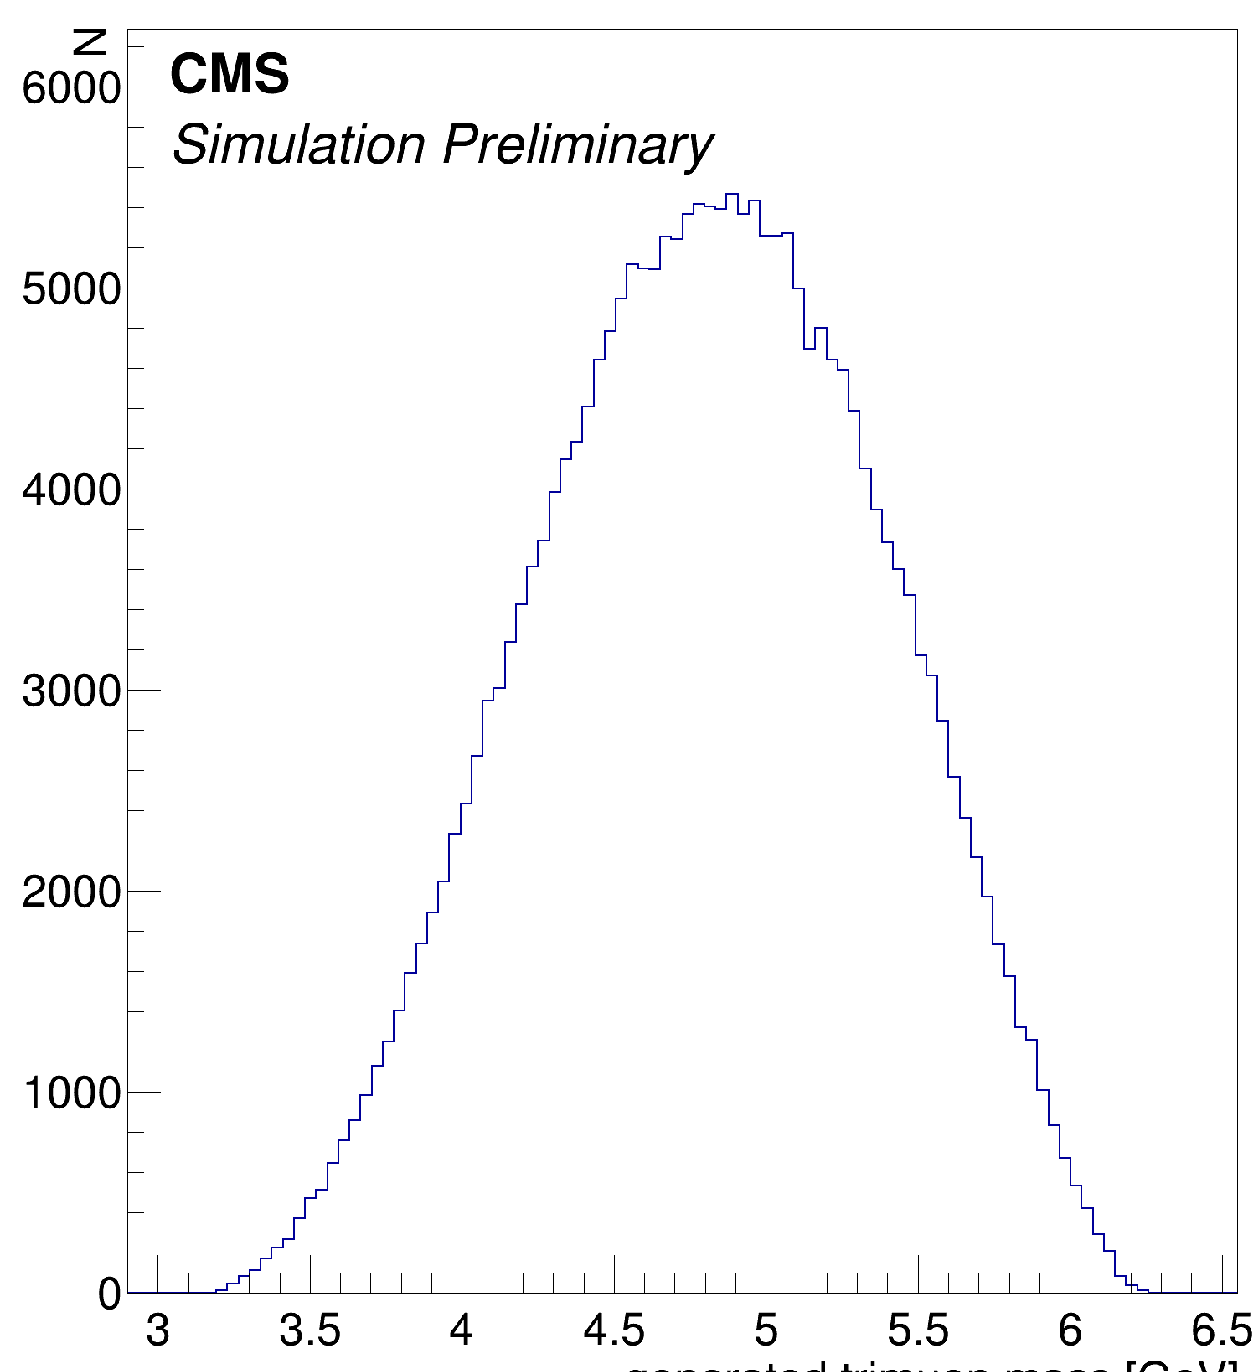
Additional Figure 3:
Trimuon mass distribution for simulated decays in the studied kinematic region, without any other selection. |

png pdf |
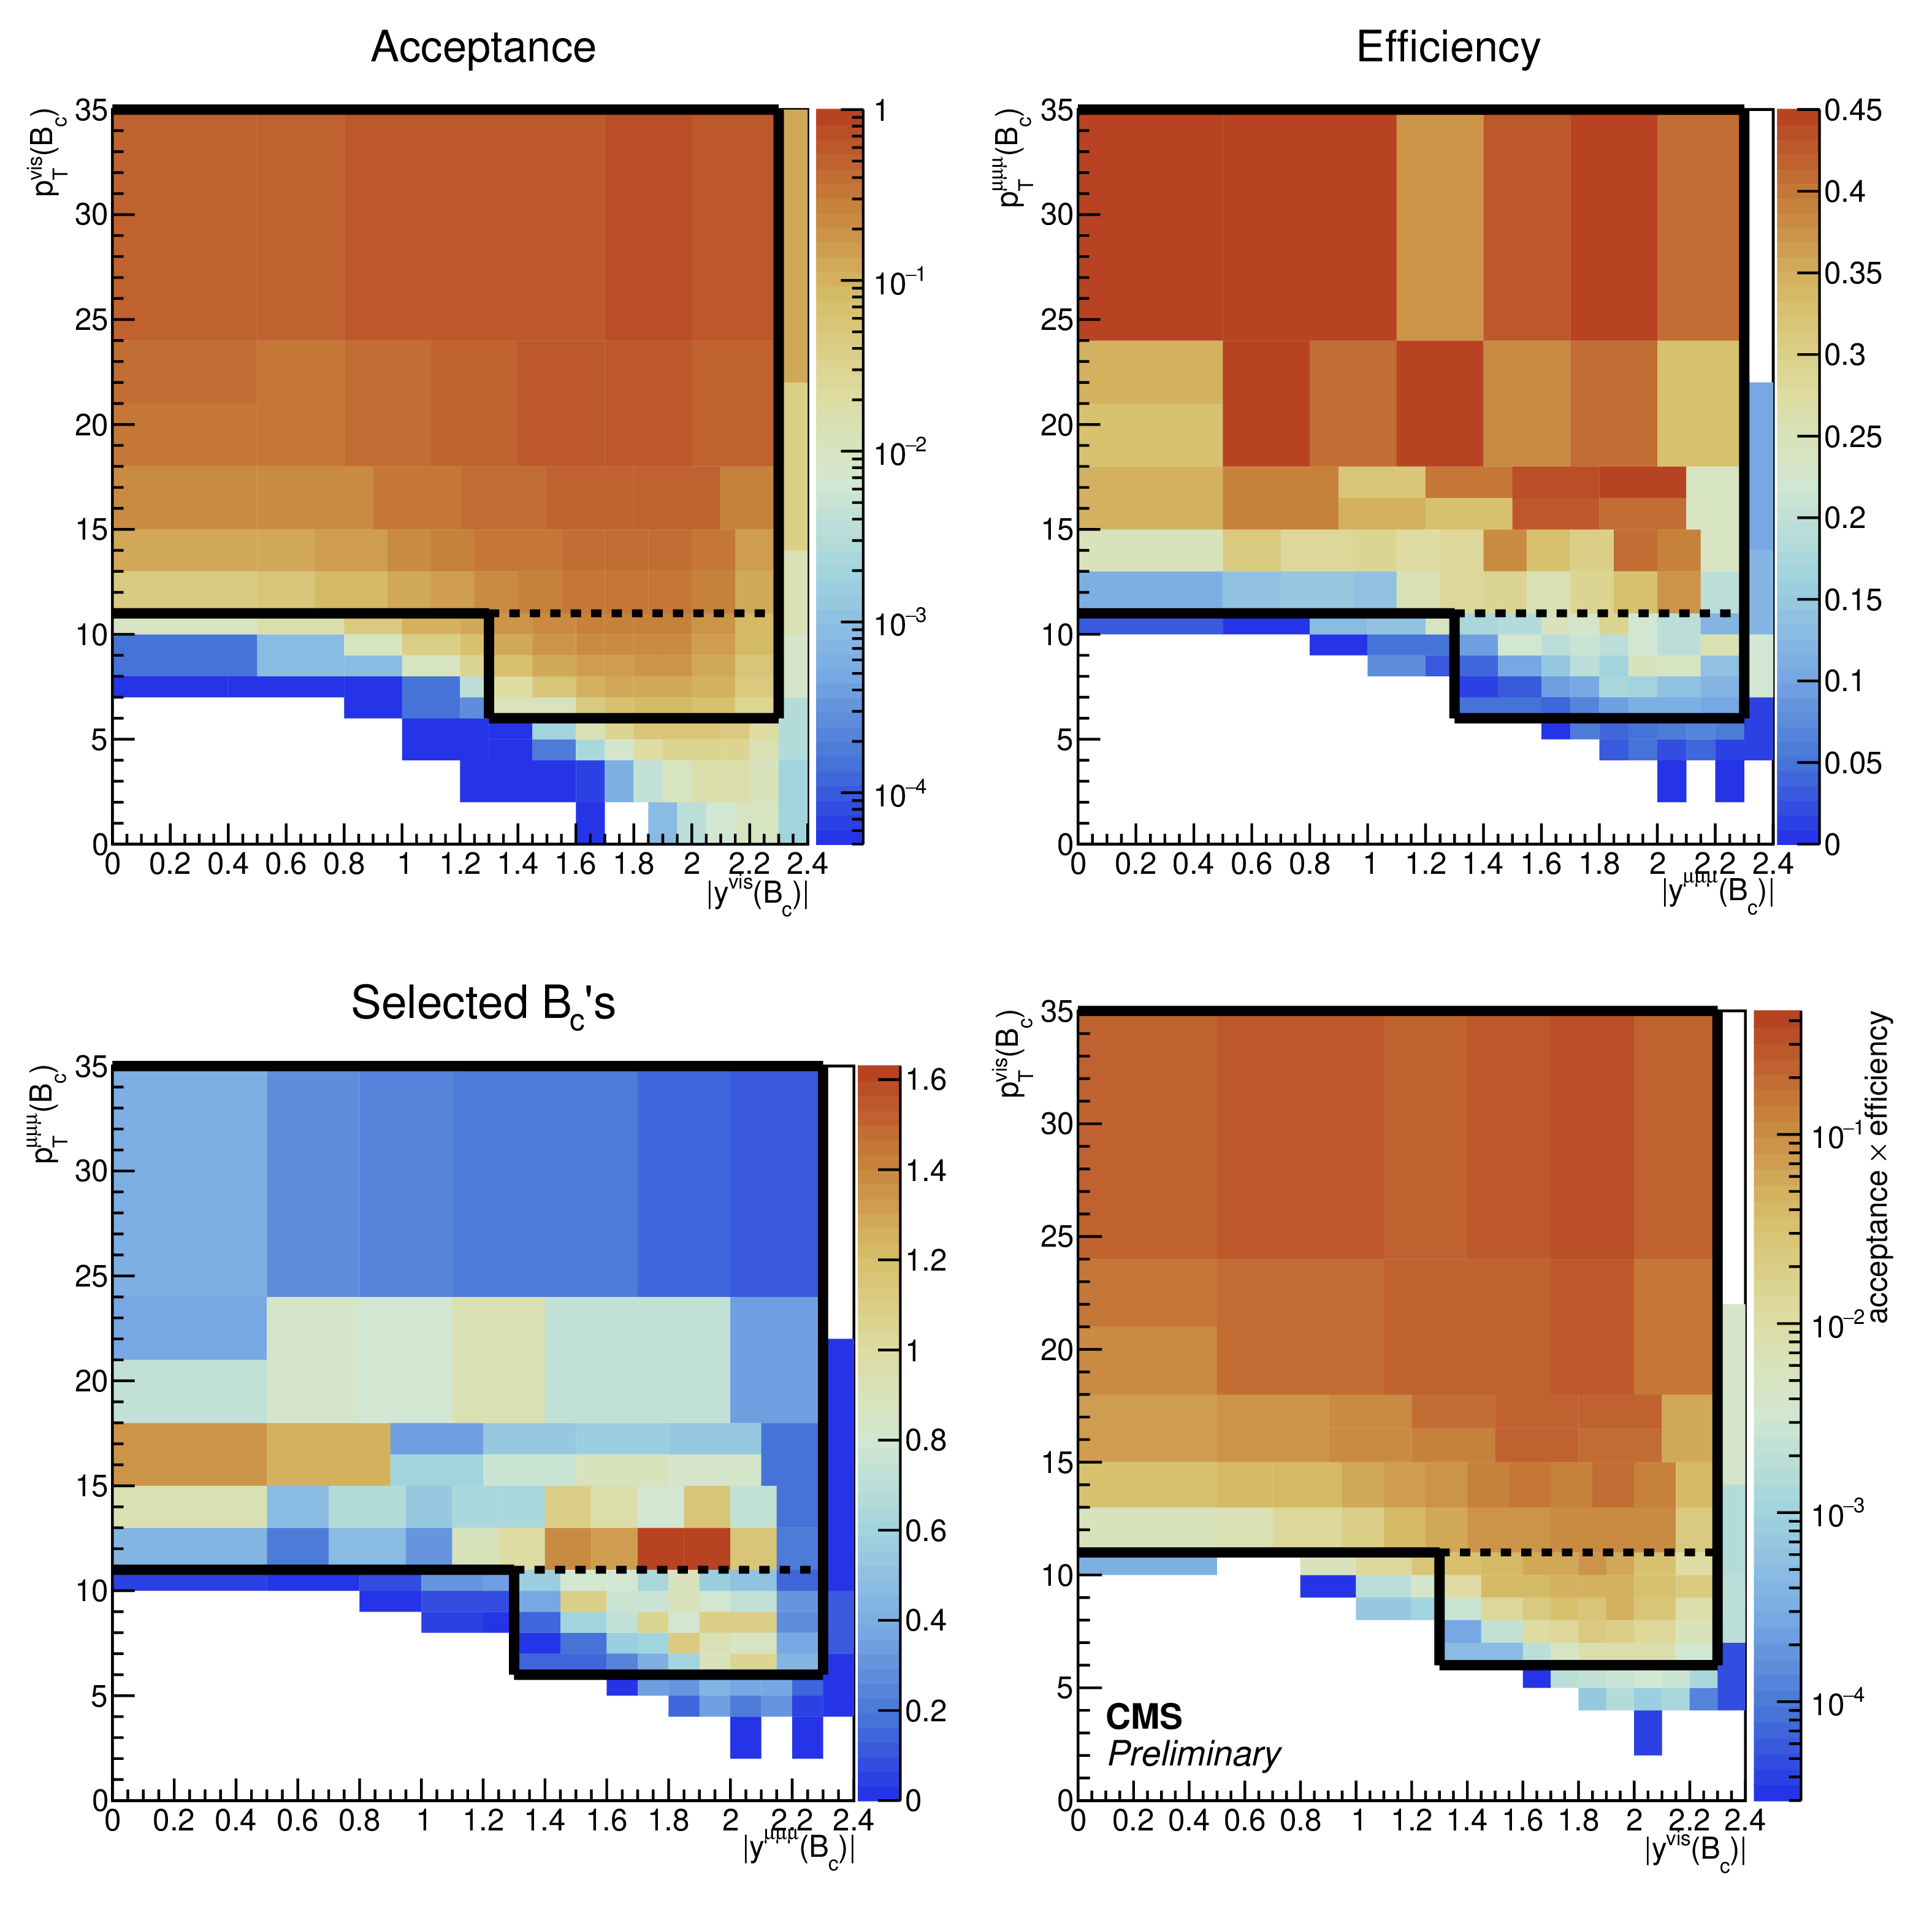
Additional Figure 4:
Acceptance times efficiency of the trigger, reconstruction and selection of the signal, as a function of the trimuon ${p_{\mathrm {T}}}$ and absolute rapidity, in pp collision. It is estimated from the simulated signal sample corrected with the final measured ${p_\text {T}^{\mu \mu \mu}}$ distribution. The black lines show the regions chosen as the two kinematic bins. |
png pdf |
Additional Figure 5:
Acceptance times efficiency of the trigger, reconstruction and selection of the signal, as a function of the trimuon ${p_{\mathrm {T}}}$ and absolute rapidity, in PbPb collision. It is estimated from the simulated signal sample corrected with the final measured ${p_\text {T}^{\mu \mu \mu}}$ distribution. The black lines show the regions chosen as the two kinematic bins. |
png pdf |
Additional Figure 6:
Template fit in pp for candidates with 6 $ < {p_\text {T}^{\mu \mu \mu}} < $ 11 GeV and 1.3 $ < | {y^{\mu \mu \mu}} | < $ 2.3. The trimuon mass distributions of data and of the fitted signal and background sources are shown in the three BDT bins. The lower panels show the pull between data and the fitted distributions. |

png pdf |
Additional Figure 7:
Template fit in pp for candidates with 11 $ < {p_\text {T}^{\mu \mu \mu}} < $ 35 GeV and $| {y^{\mu \mu \mu}} | < $ 2.3. The trimuon mass distributions of data and of the fitted signal and background sources are shown in the three BDT bins. The lower panels show the pull between data and the fitted distributions. |
png pdf |
Additional Figure 8:
Template fit in PbPb for candidates with 6 $ < {p_\text {T}^{\mu \mu \mu}} < $ 11 GeV and 1.3 $ < | {y^{\mu \mu \mu}} | < $ 2.3. The trimuon mass distributions of data and of the fitted signal and background sources are shown in the three BDT bins. The lower panels show the pull between data and the fitted distributions. |
png pdf |
Additional Figure 9:
Template fit in PbPb for candidates with 11 $ < {p_\text {T}^{\mu \mu \mu}} < $ 35 GeV and $| {y^{\mu \mu \mu}} | < $ 2.3. The trimuon mass distributions of data and of the fitted signal and background sources are shown in the three BDT bins. The lower panels show the pull between data and the fitted distributions. |

png pdf |
Additional Figure 10:
Template fit in PbPb for candidates in the 0-20% centrality range, integrated over the two studied kinematic regions. The trimuon mass distributions of data and of the fitted signal and background sources are shown in the three BDT bins. The lower panels show the pull between data and the fitted distributions. |
png pdf |
Additional Figure 11:
Template fit in PbPb for candidates in the 20-90% centrality range, integrated over the two studied kinematic regions. The trimuon mass distributions of data and of the fitted signal and background sources are shown in the three BDT bins. The lower panels show the pull between data and the fitted distributions. |
png pdf |
Additional Figure 12:
Template fit in pp for candidates with 6 $ < {p_\text {T}^{\mu \mu \mu}} < $ 11 GeV and 1.3 $ < | {y^{\mu \mu \mu}} | < $ 2.3, with a BDT variable decorrelated from the trimuon mass. The trimuon mass distributions of data and of the fitted signal and background sources are shown in the three BDT bins. The lower panels show the pull between data and the fitted distributions. |

png pdf |
Additional Figure 13:
Template fit in PbPb for candidates with 6 $ < {p_\text {T}^{\mu \mu \mu}} < $ 11 GeV and 1.3 $ < | {y^{\mu \mu \mu}} | < $ 2.3, with a BDT variable decorrelated from the trimuon mass. The trimuon mass distributions of data and of the fitted signal and background sources are shown in the three BDT bins. The lower panels show the pull between data and the fitted distributions. |

png pdf |
Additional Figure 14:
Post-fit yield and its uncertainty, divided by the nominal post-fit yield, for all fit method variations. The pp and PbPb yields as well as the ratio PbPb /pp are shown for both ${p_{\mathrm {T}}}$ bins. For each bin, a vertical dotted line at 1 indicates the position of the nominal value. The horizontal dotted lines indicate groups of similar variations. The names of all variations are mentioned in the left column. The variations included in the calculation of the uncertainty are in orange; the others, only used as checks, are in violet. |

png pdf |
Additional Figure 15:
$-2\Delta \ln\mathcal {L}$ versus the parameters of interest $r_1$ and $r_2$ that multiply the signal normalisation in the low-${p_{\mathrm {T}}}$ and high-${p_{\mathrm {T}}}$ bin, respectively. Only the regions with $-2\Delta \ln\mathcal {L} < 25$ are coloured, which approximately corresponds to a 5$\sigma $ contour. The first (blue) colour level corresponds to a 1$\sigma $ contour. |
png pdf |
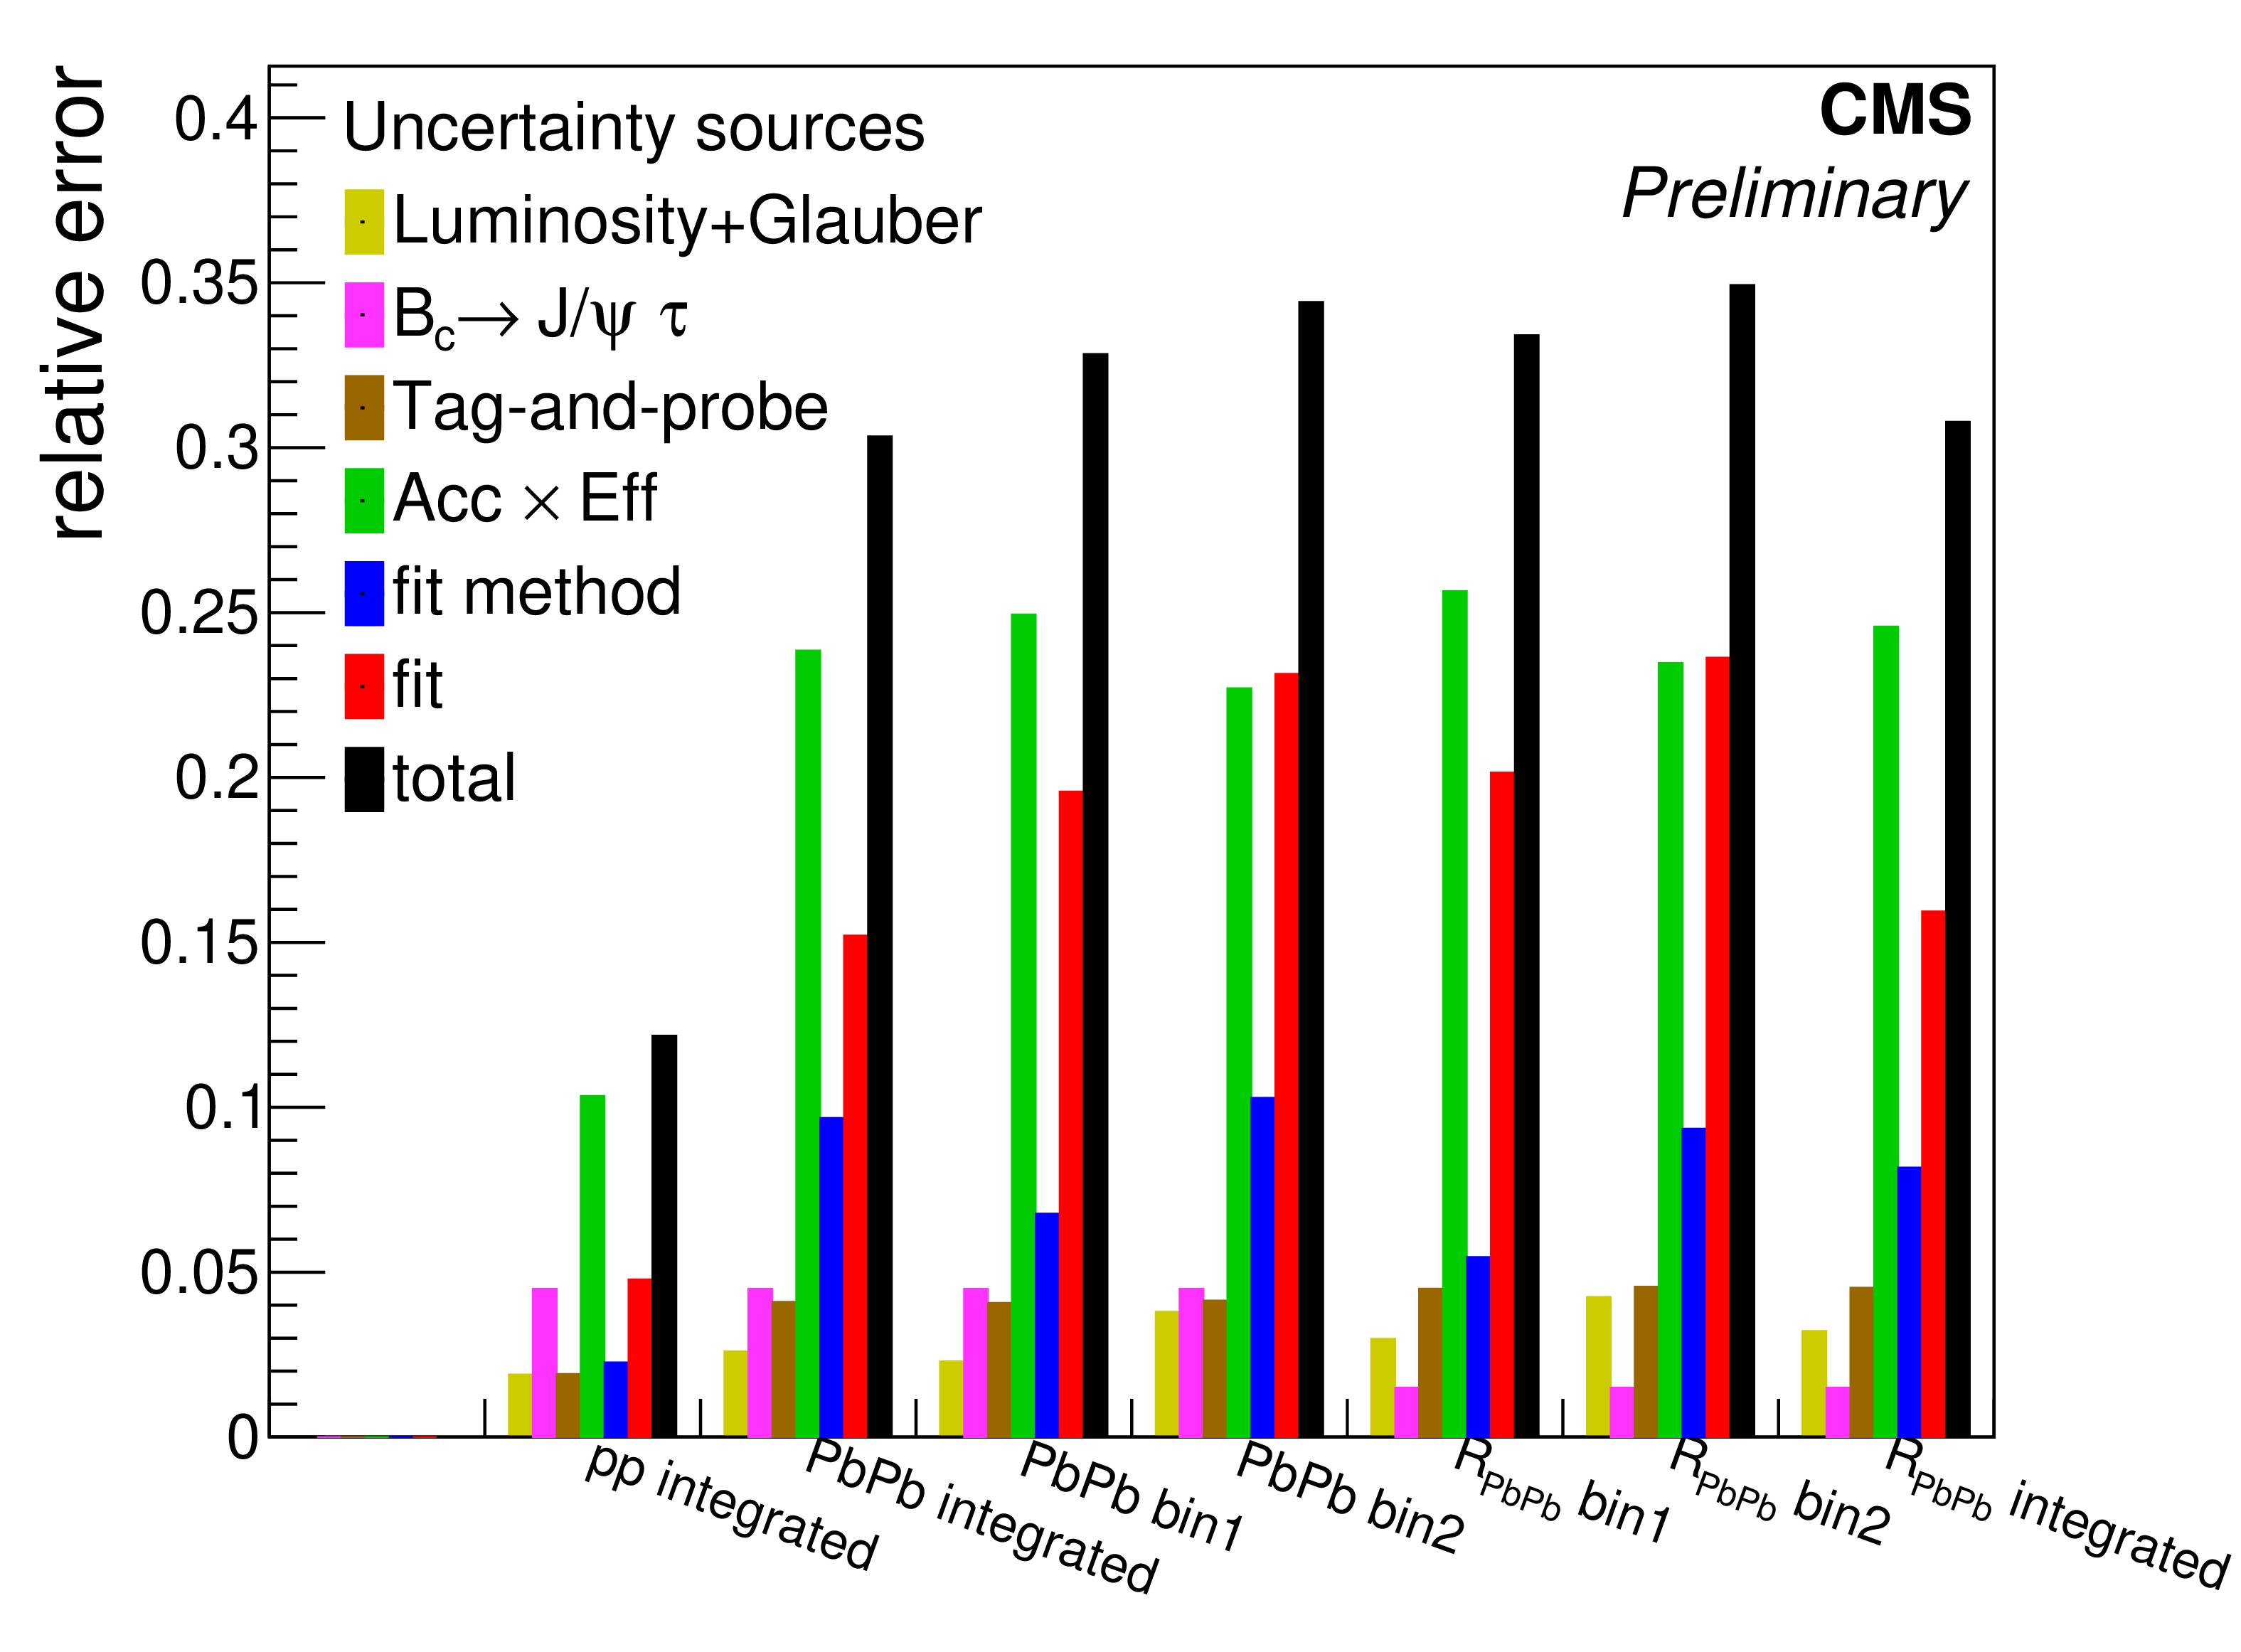
Additional Figure 16:
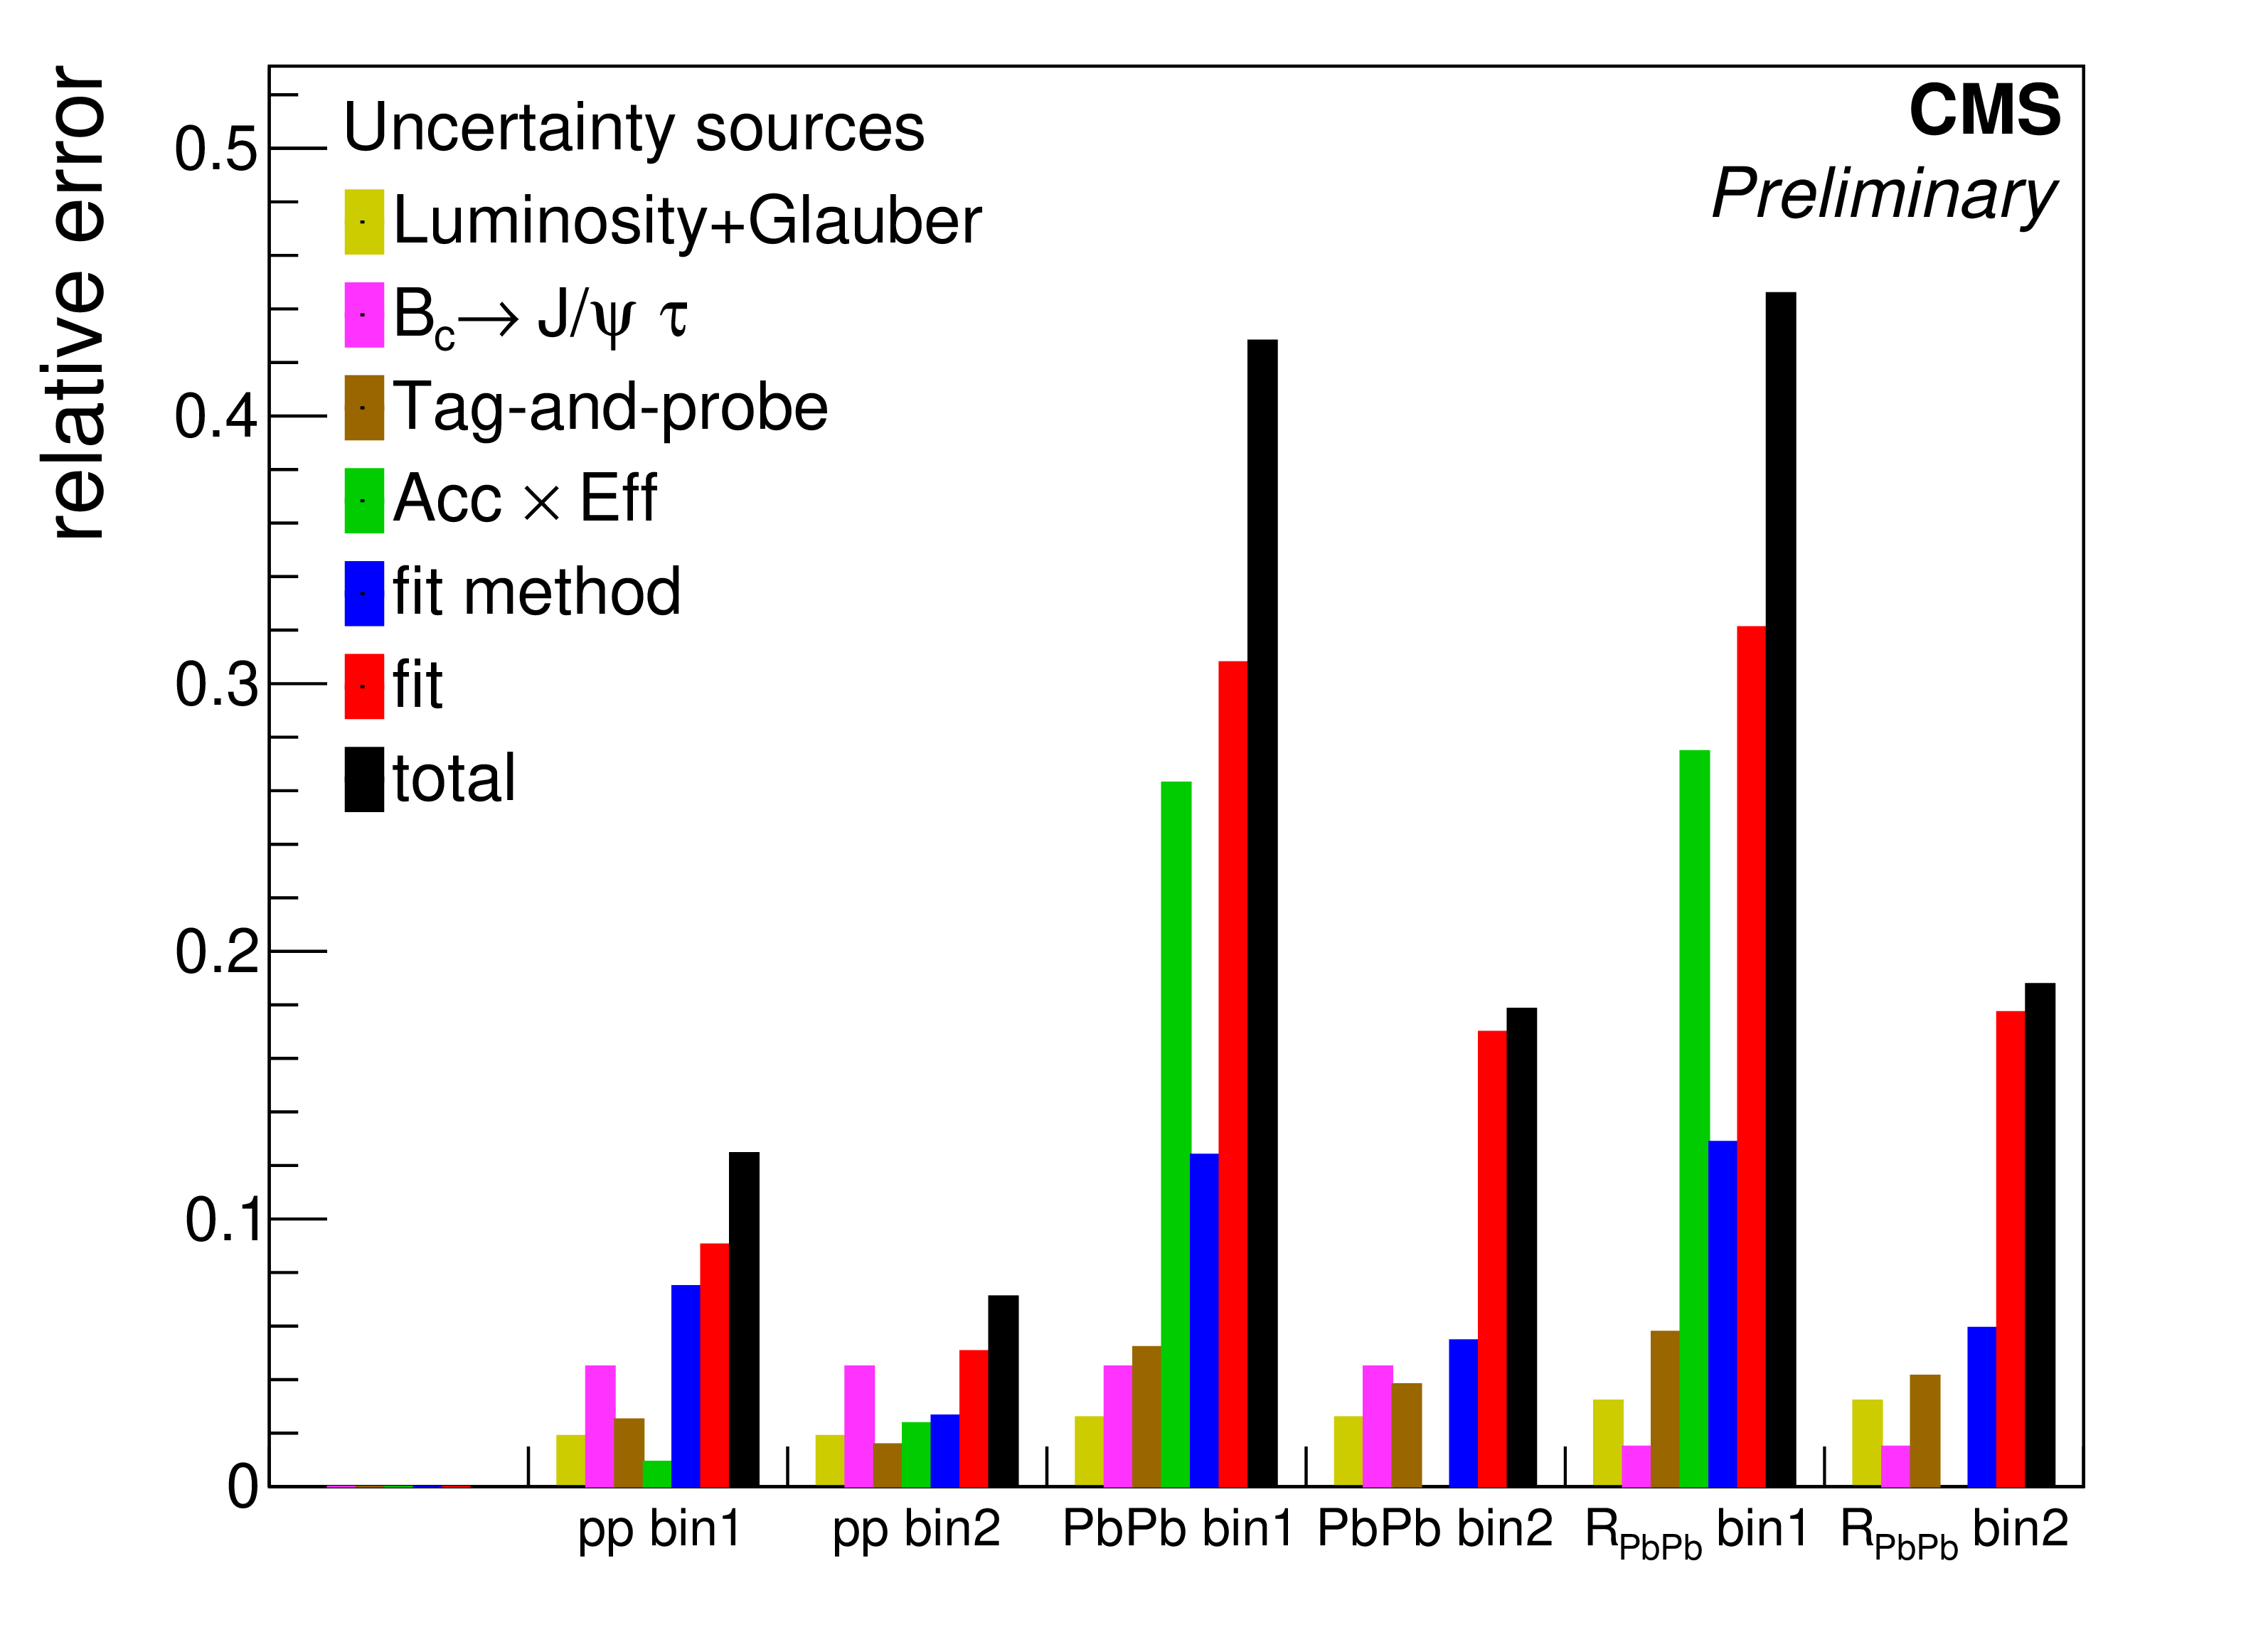
Contribution of the various sources to the relative uncertainties in the cross sections and in the ${R_{\textrm {PbPb}}}$, compared to the total uncertainty, for the ${p_{\mathrm {T}}}$ dependence. Bin1 is at low-${p_{\mathrm {T}}}$ and bin2 is at high-${p_{\mathrm {T}}}$. The average of the lower and higher uncertainty is shown, except for the uncertainties from other decays where, for the cross sections, only the lower (non-zero) uncertainty is shown. |
png pdf |
Additional Figure 17:
Contribution of the various sources to the relative uncertainties in the cross sections and in the ${R_{\textrm {PbPb}}}$, compared to the total uncertainty, for the centrality dependence. Bin1 is at low-${p_{\mathrm {T}}}$ and bin2 is at high-${p_{\mathrm {T}}}$. The average of the lower and higher uncertainty is shown, except for the uncertainties from other decays where, for the cross sections, only the lower (non-zero) uncertainty is shown. |
png pdf |
Additional Figure 18:
Comparison of theoretical predictions of the nuclear modification factor of in the two ${p_{\mathrm {T}}}$ bins. The kinematics of the prediction are the ones of the full, whereas the trimuon kinematics are used for our measurement. |
png pdf |
Additional Figure 19:
Comparison of theoretical predictions of the nuclear modification factor of in the two centrality bins. The kinematics of the prediction are the ones of the full, whereas the trimuon kinematics are used for our measurement. |
png pdf |
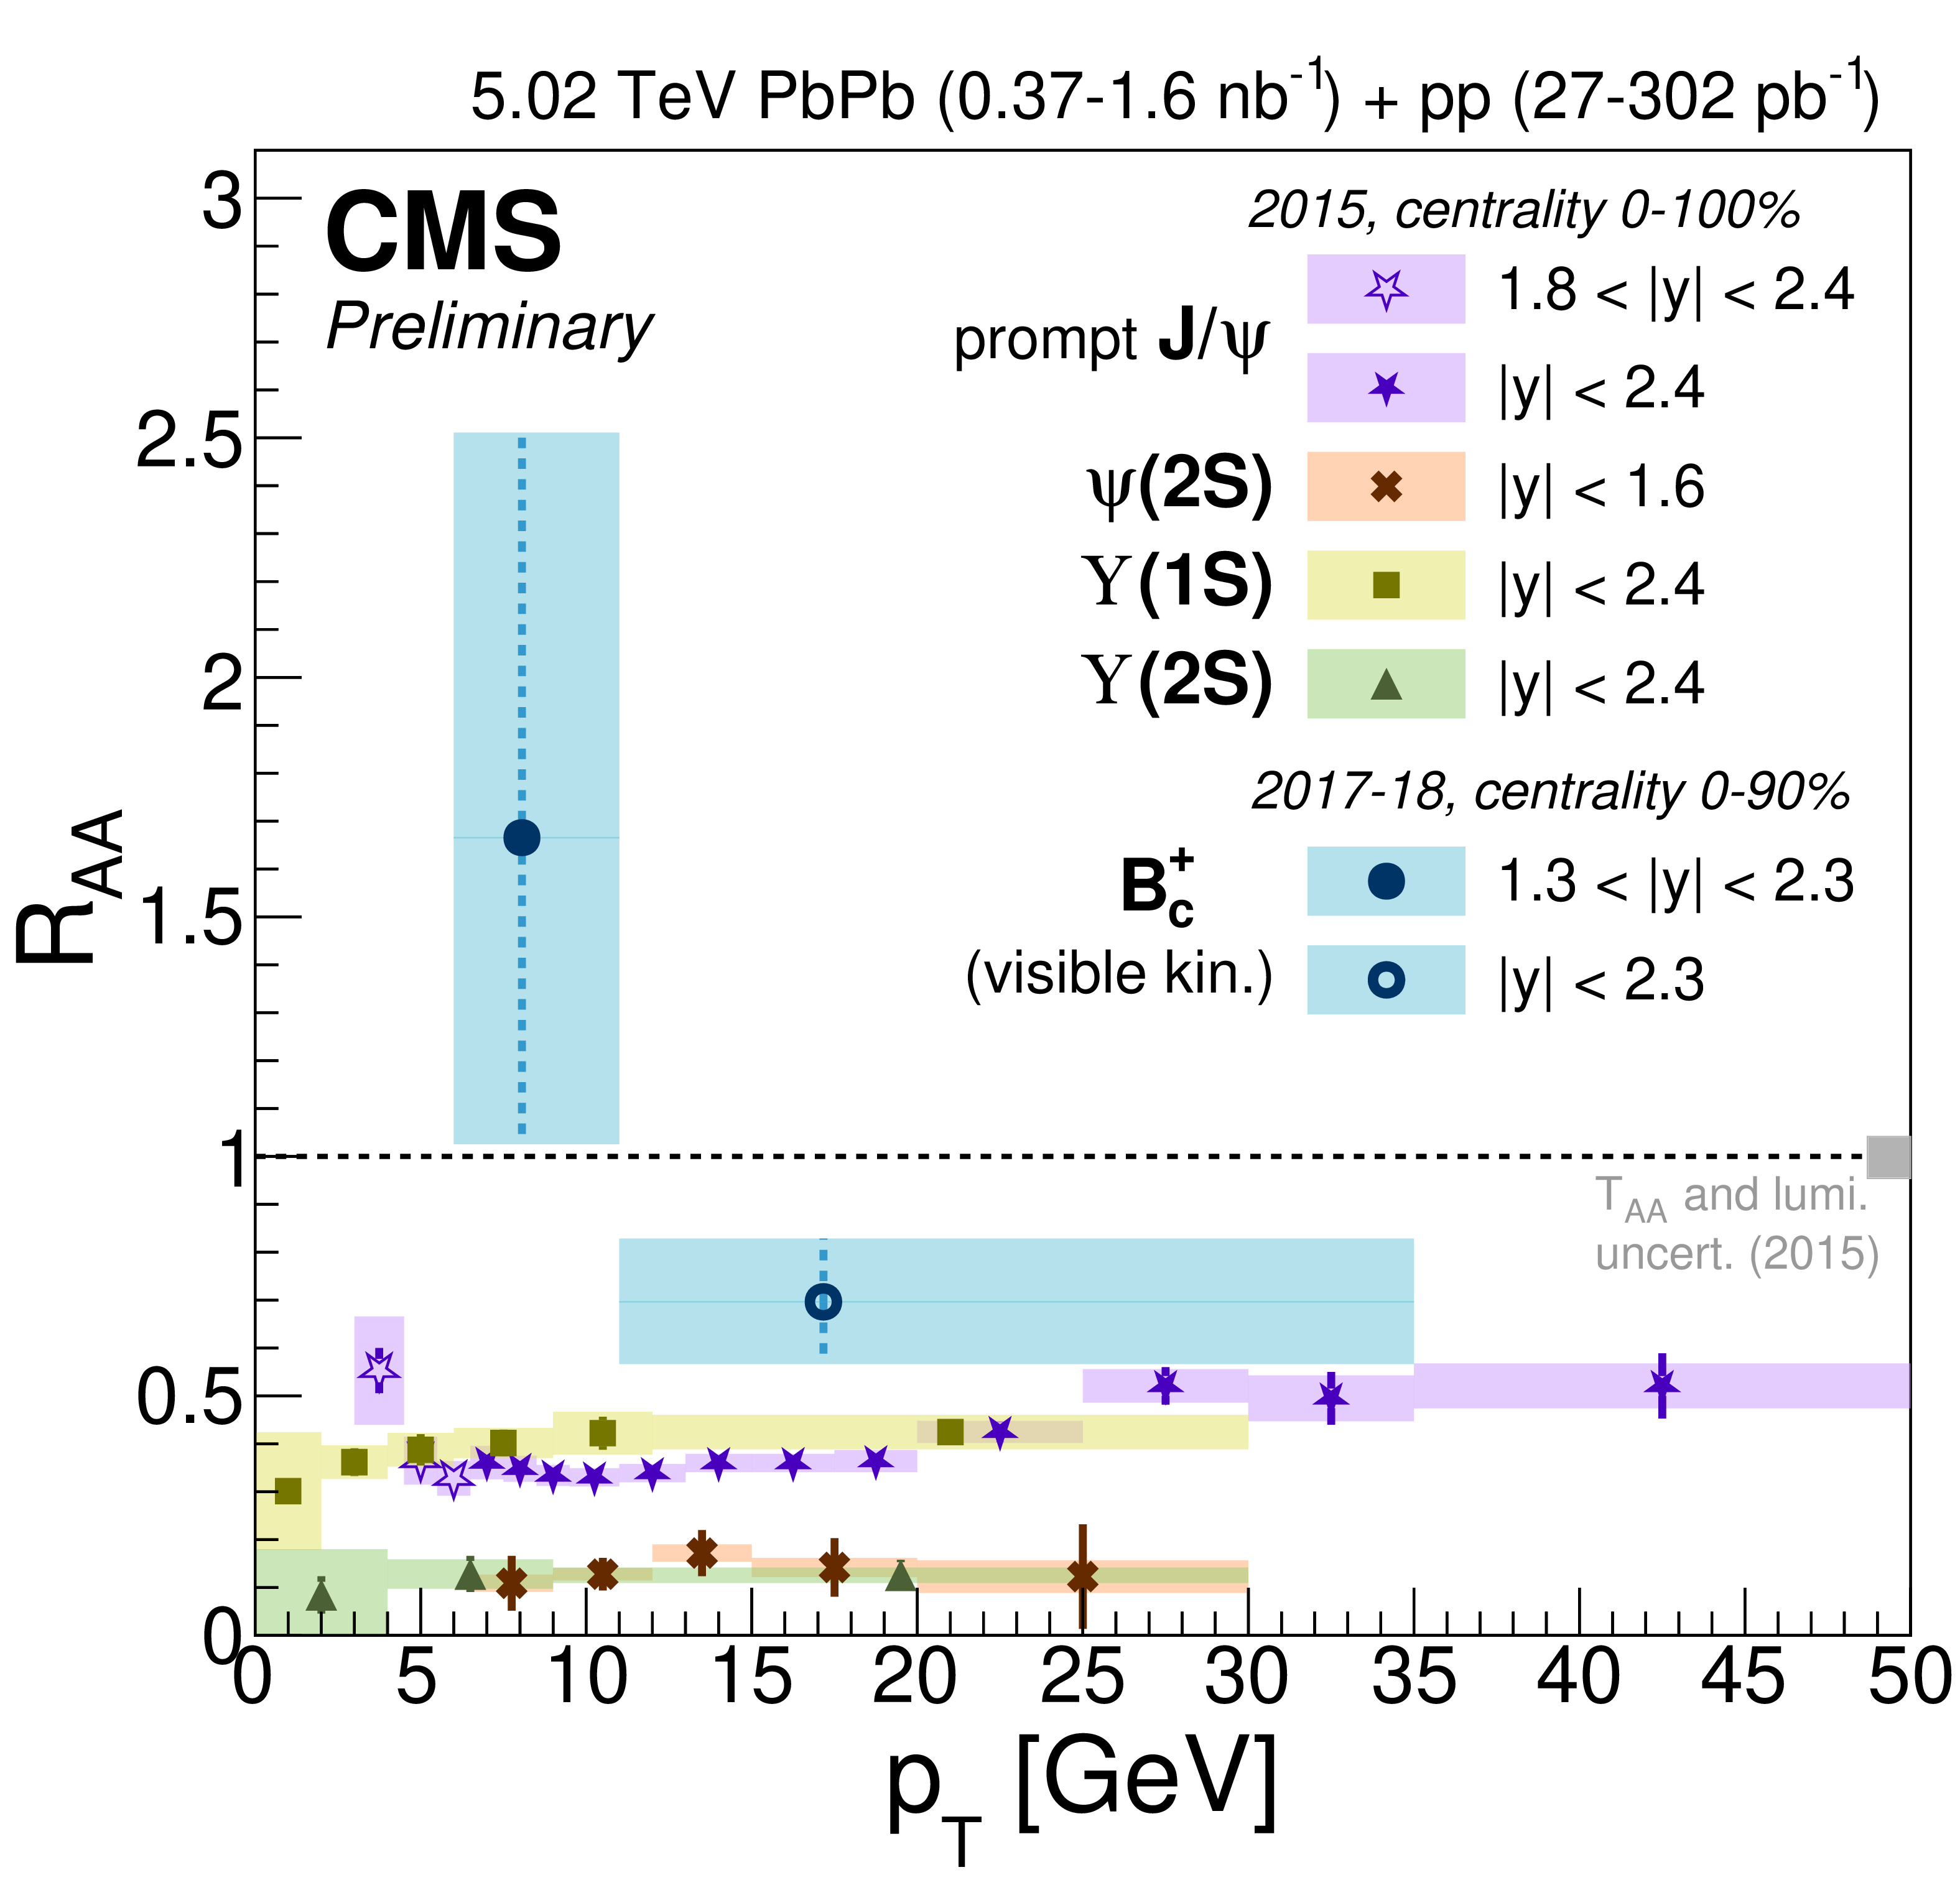
Additional Figure 20:
Comparison of the modification to the nuclear modification factors measured with CMS for heavy quarkonia ground and excited states. Only the total uncertainty is shown for the, whereas all other results show the statistical uncertainties as bars and the systematic uncertainties as shaded boxes. The modification is binned in the trimuon ${p_{\mathrm {T}}}$. |
png pdf |
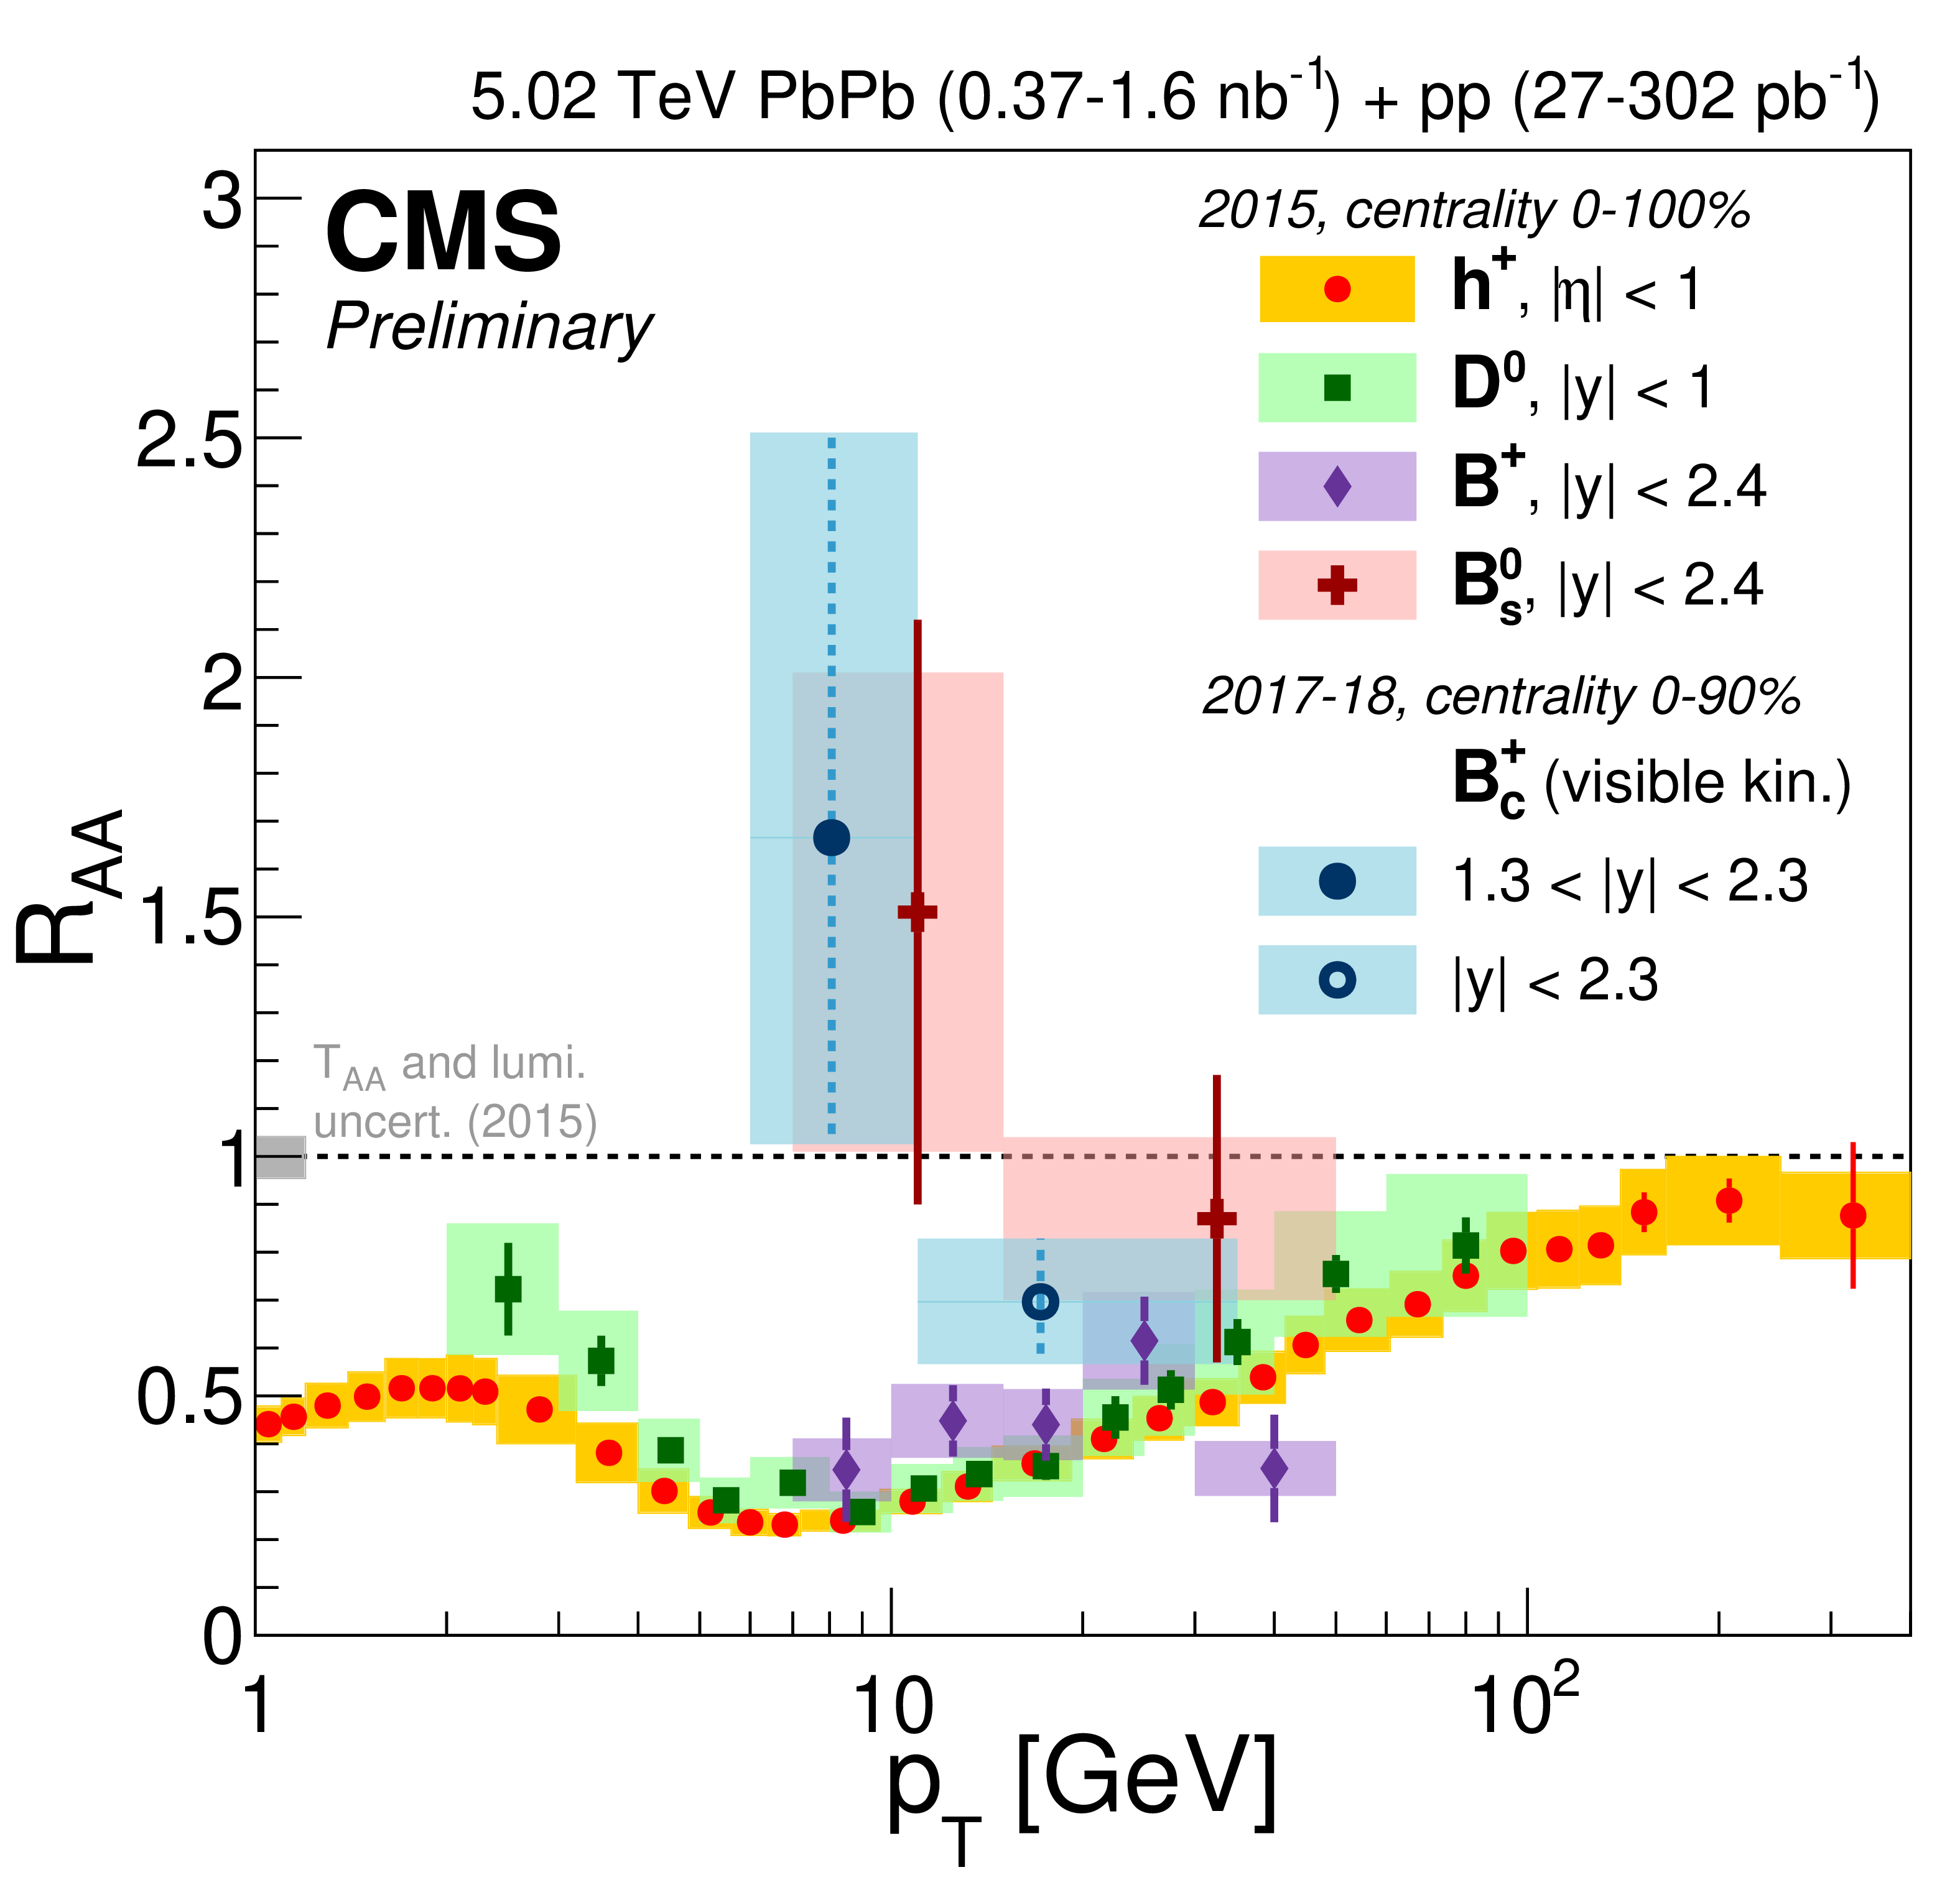
Additional Figure 21:
Comparison of the modification to the nuclear modification factors measured with CMS for various open heavy flavour mesons and for light hadrons. Only the total uncertainty is shown for the, whereas all other results show the statistical uncertainties as bars and the systematic uncertainties as shaded boxes. The modification is binned in the trimuon ${p_{\mathrm {T}}}$. |
png pdf |
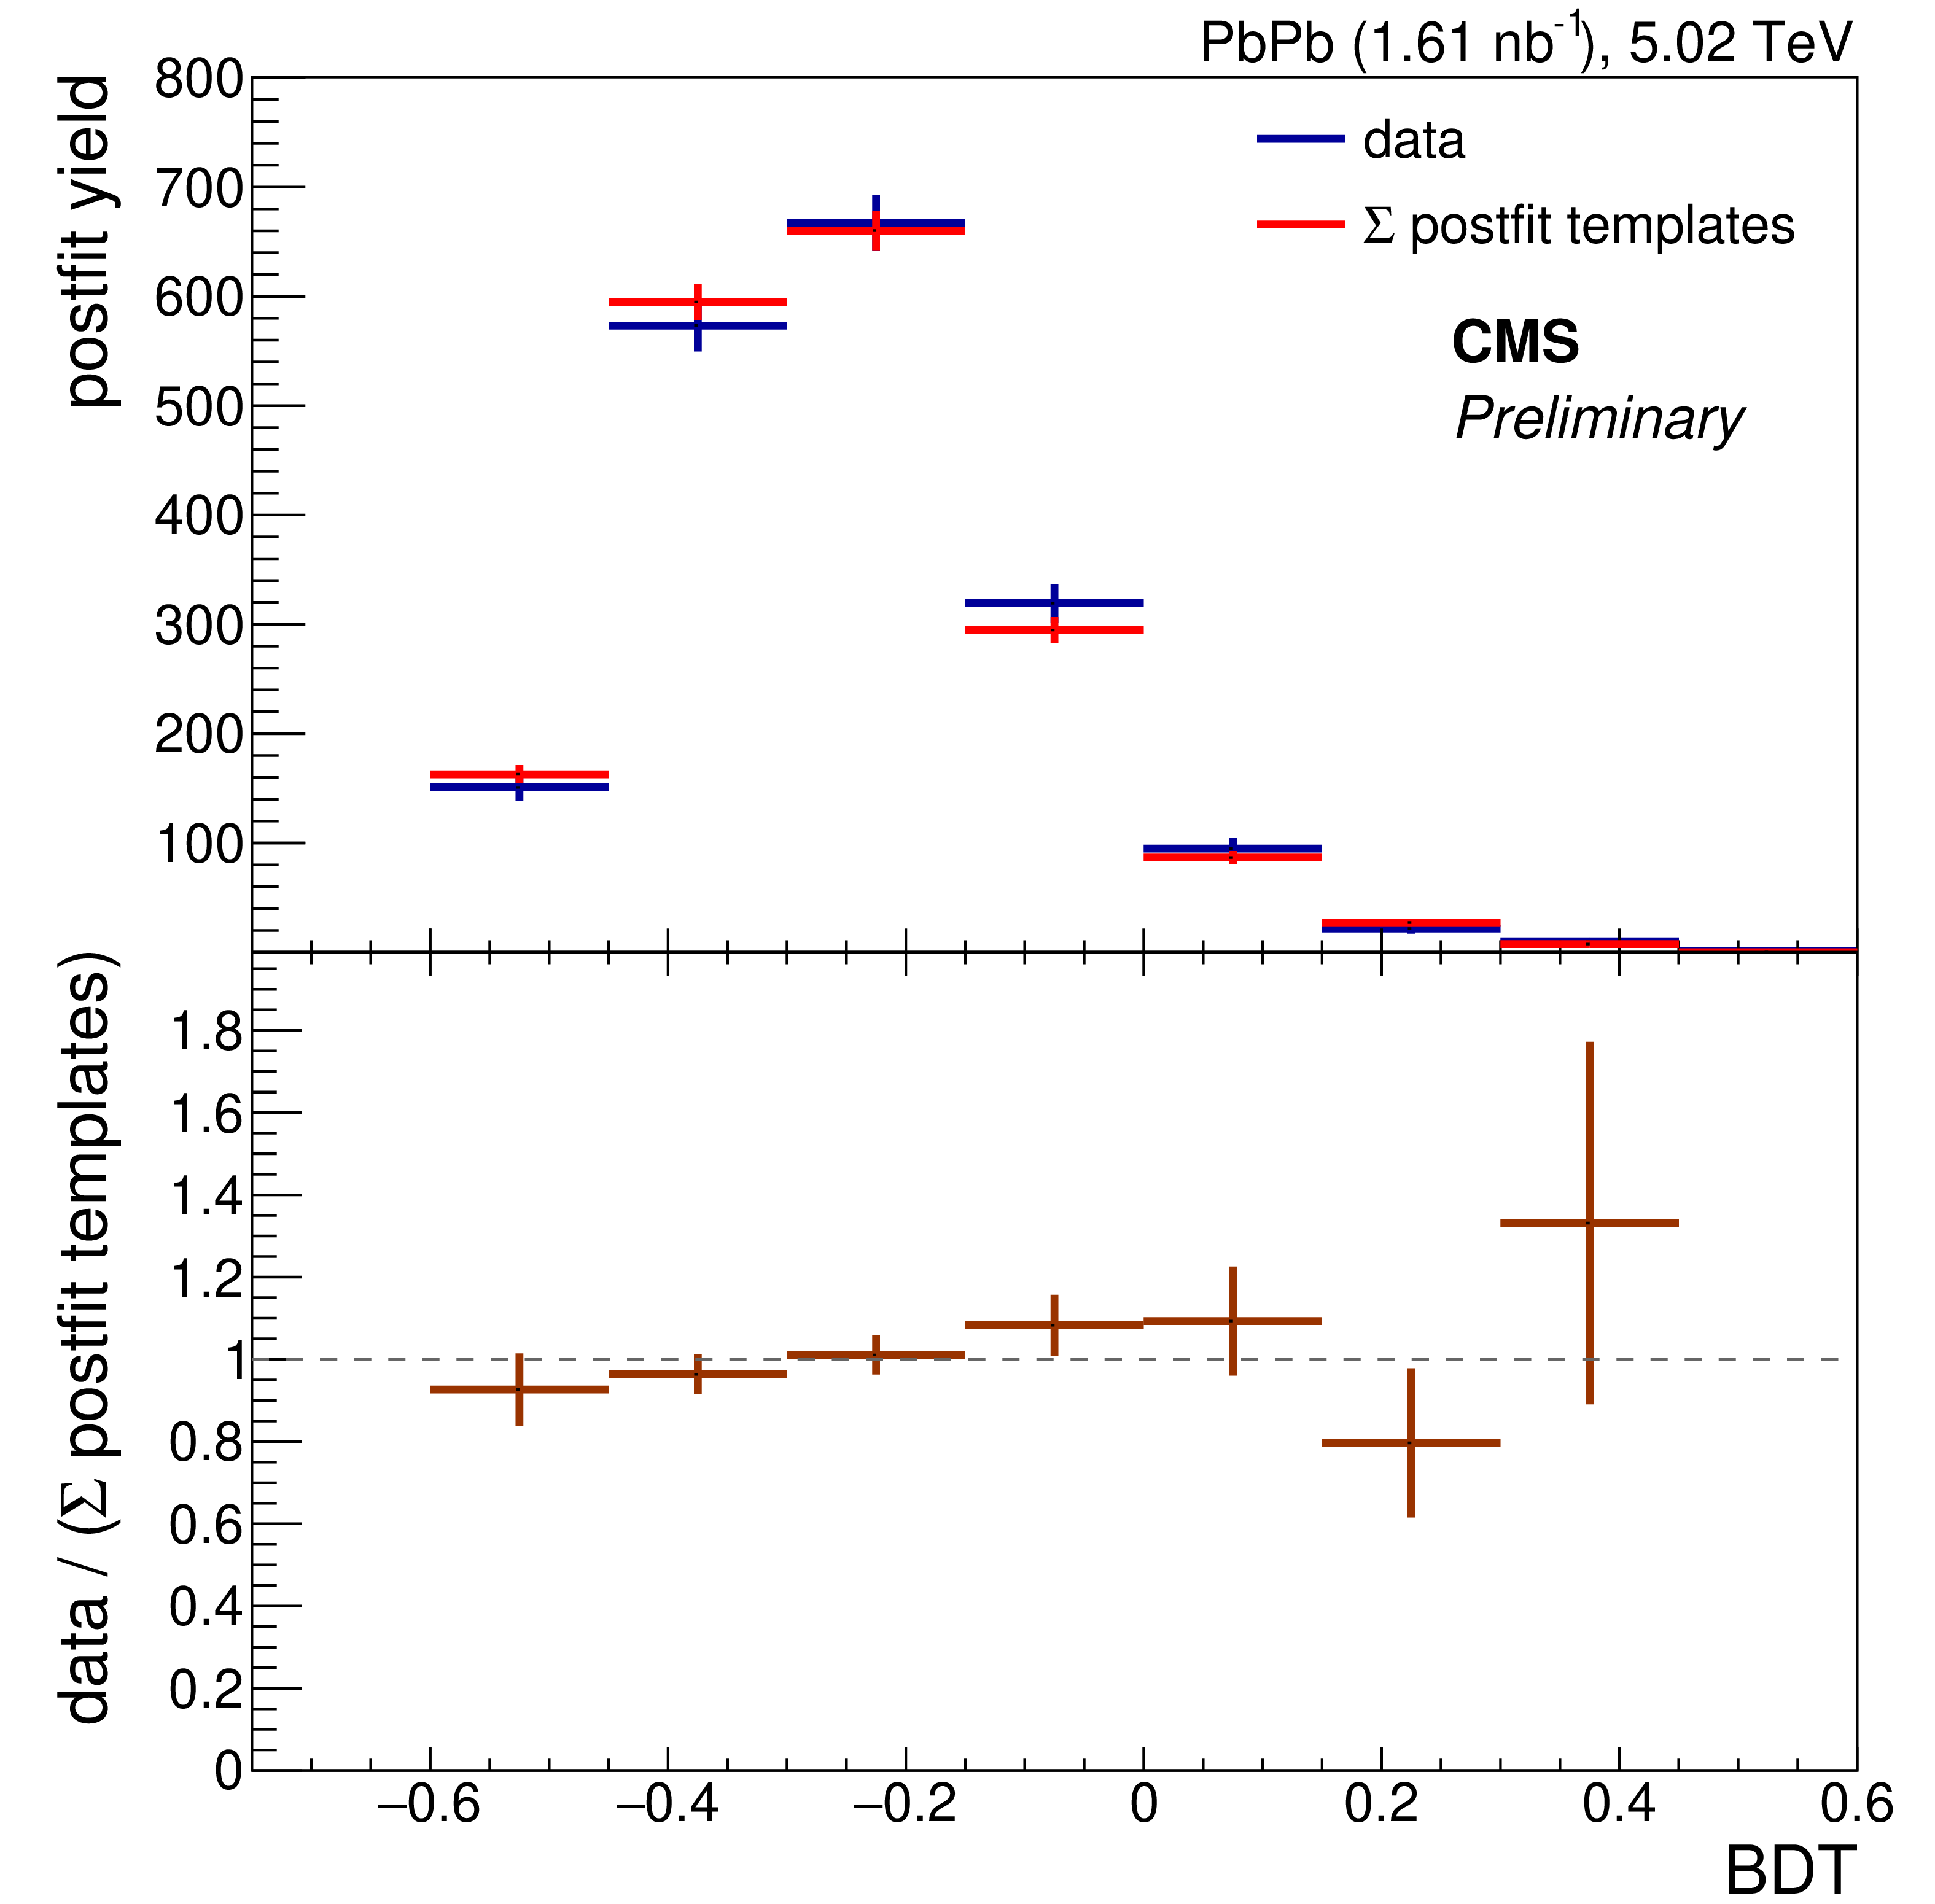
Additional Figure 22:
Comparison and ratio of the BDT distributions of data and of the sum of all post-fit templates (signal MC plus the three backgrounds) for the first $p_{\mathrm{T}}$ bin in PbPb. The templates result from the final fit, after the second $p_{\mathrm{T}}$ spectrum correction of the signal MC. The displayed uncertainties are purely statistical. |
png pdf |
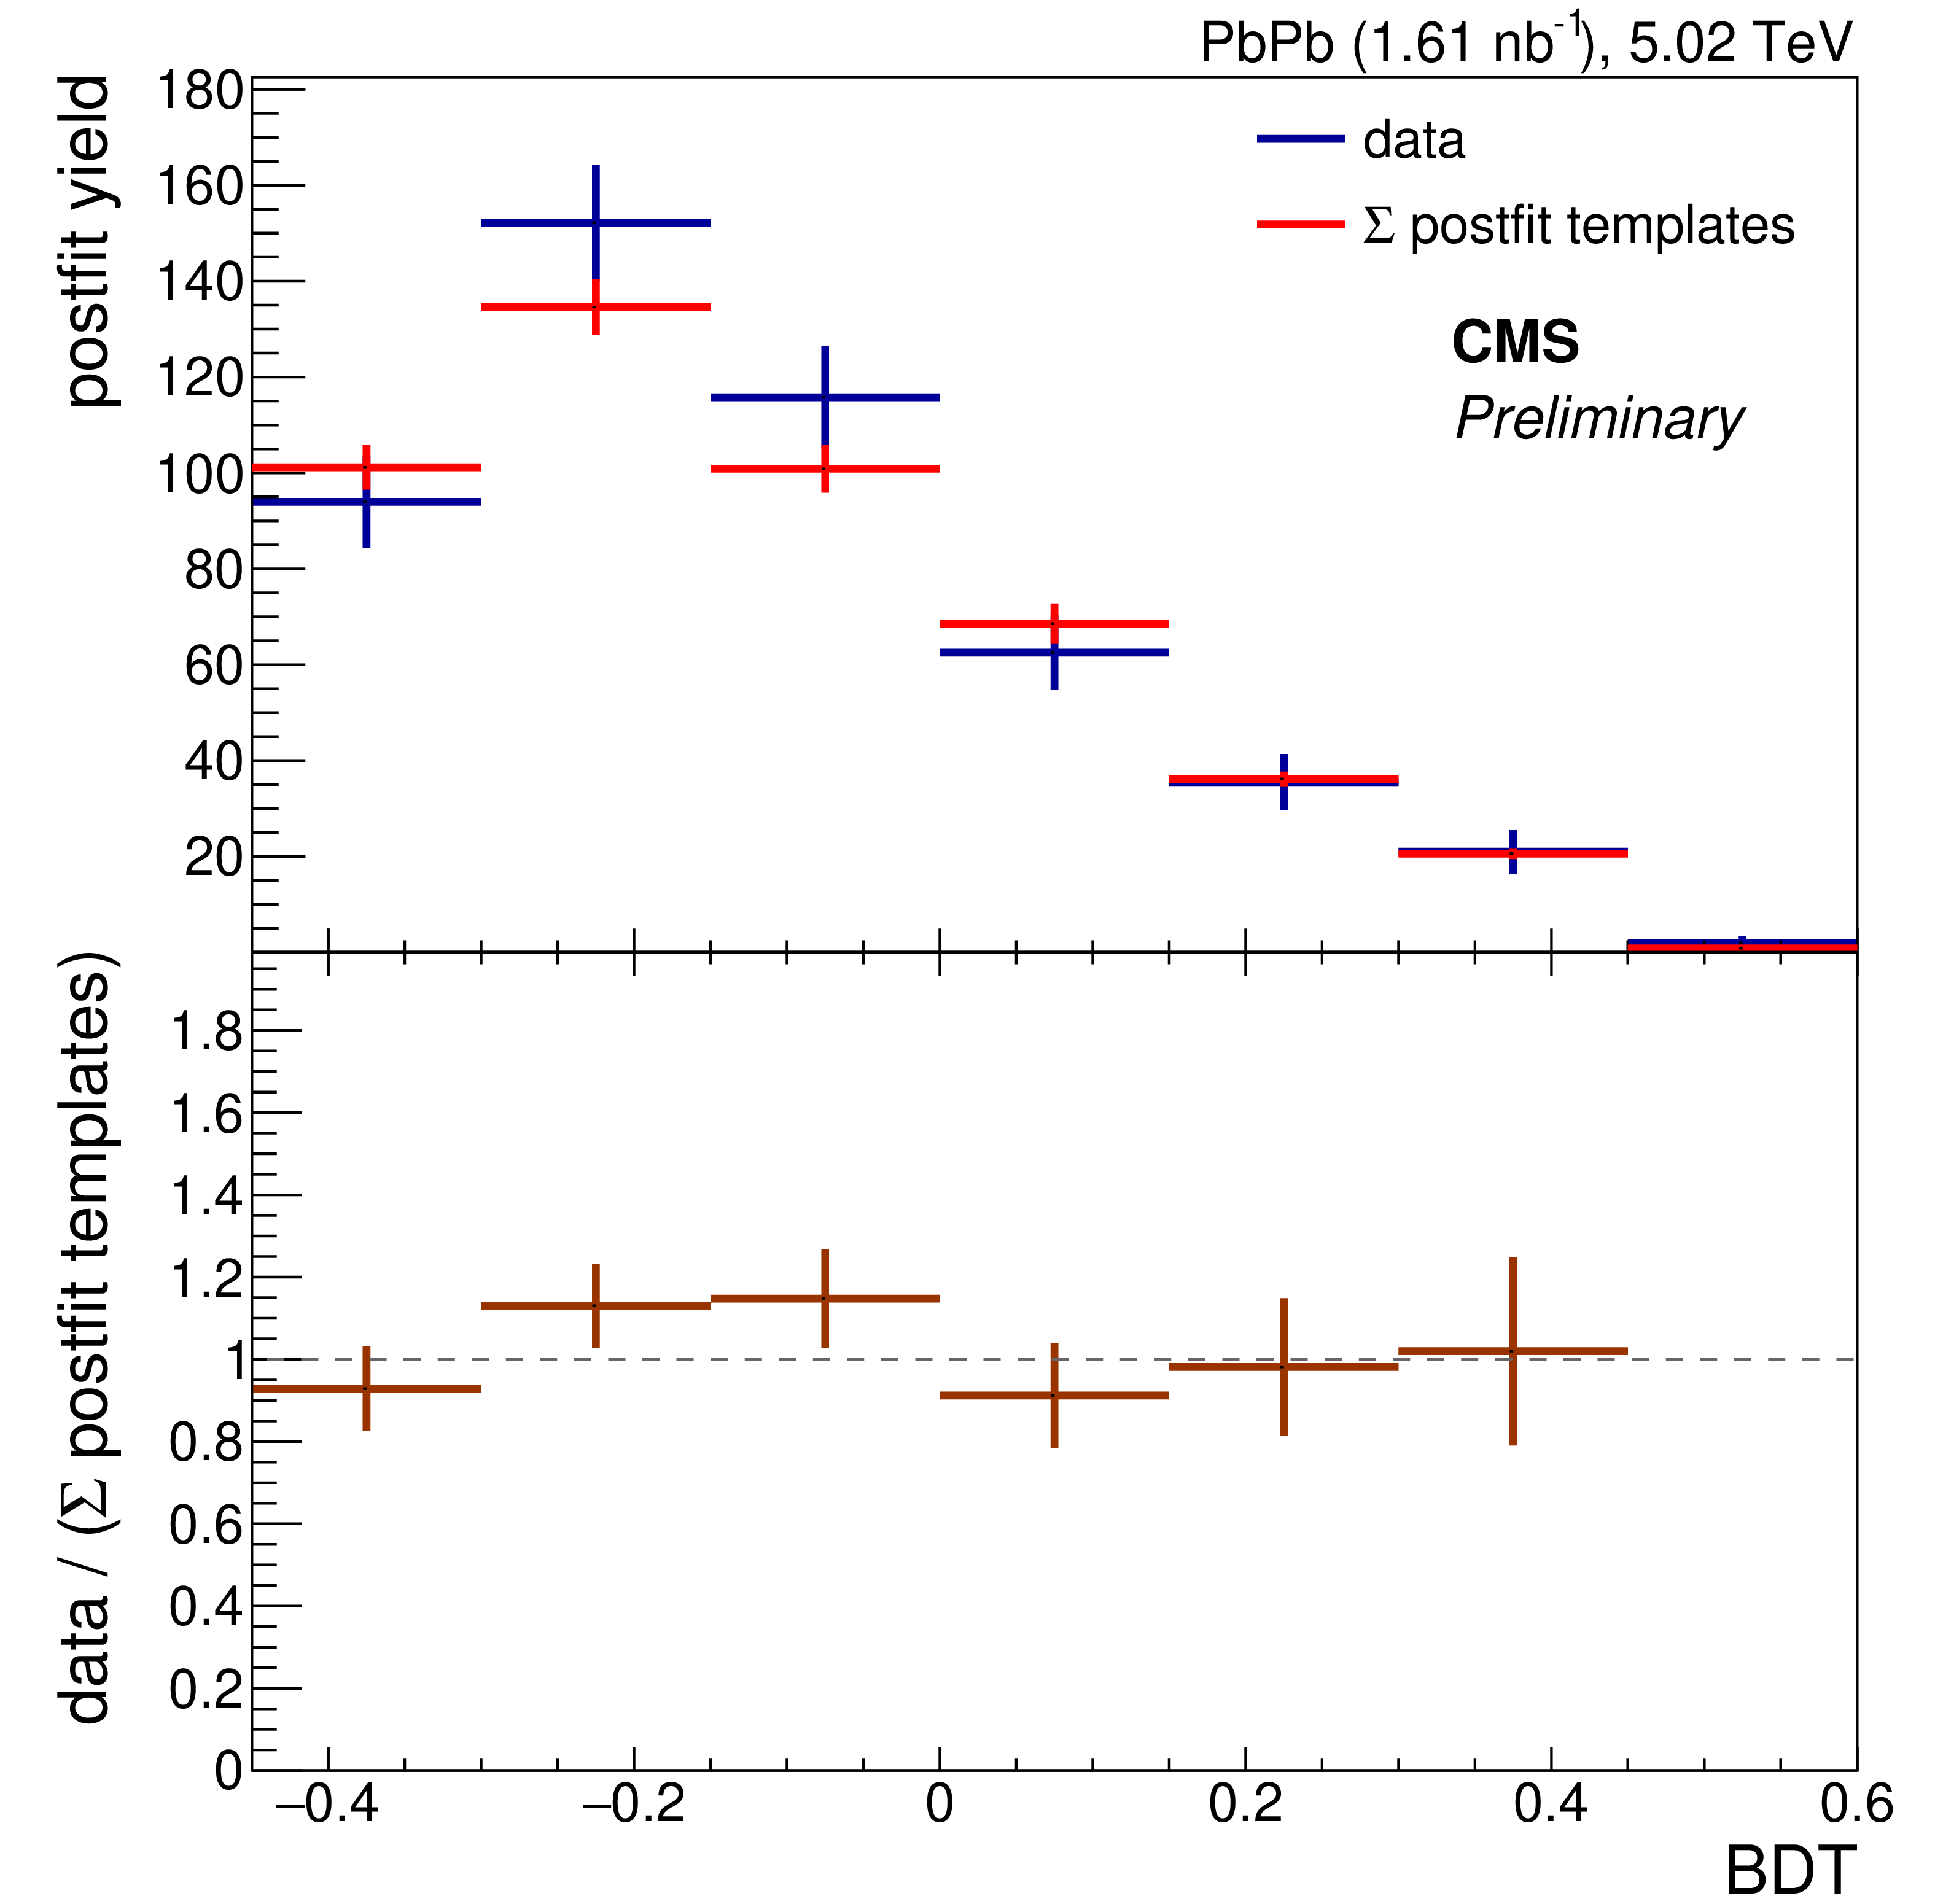
Additional Figure 23:
Comparison and ratio of the BDT distributions of data and of the sum of all post-fit templates (signal MC plus the three backgrounds) for the second $p_{\mathrm{T}}$ bin in PbPb. The templates result from the final fit, after the second $p_{\mathrm{T}}$ spectrum correction of the signal MC. The displayed uncertainties are purely statistical. |
png pdf |
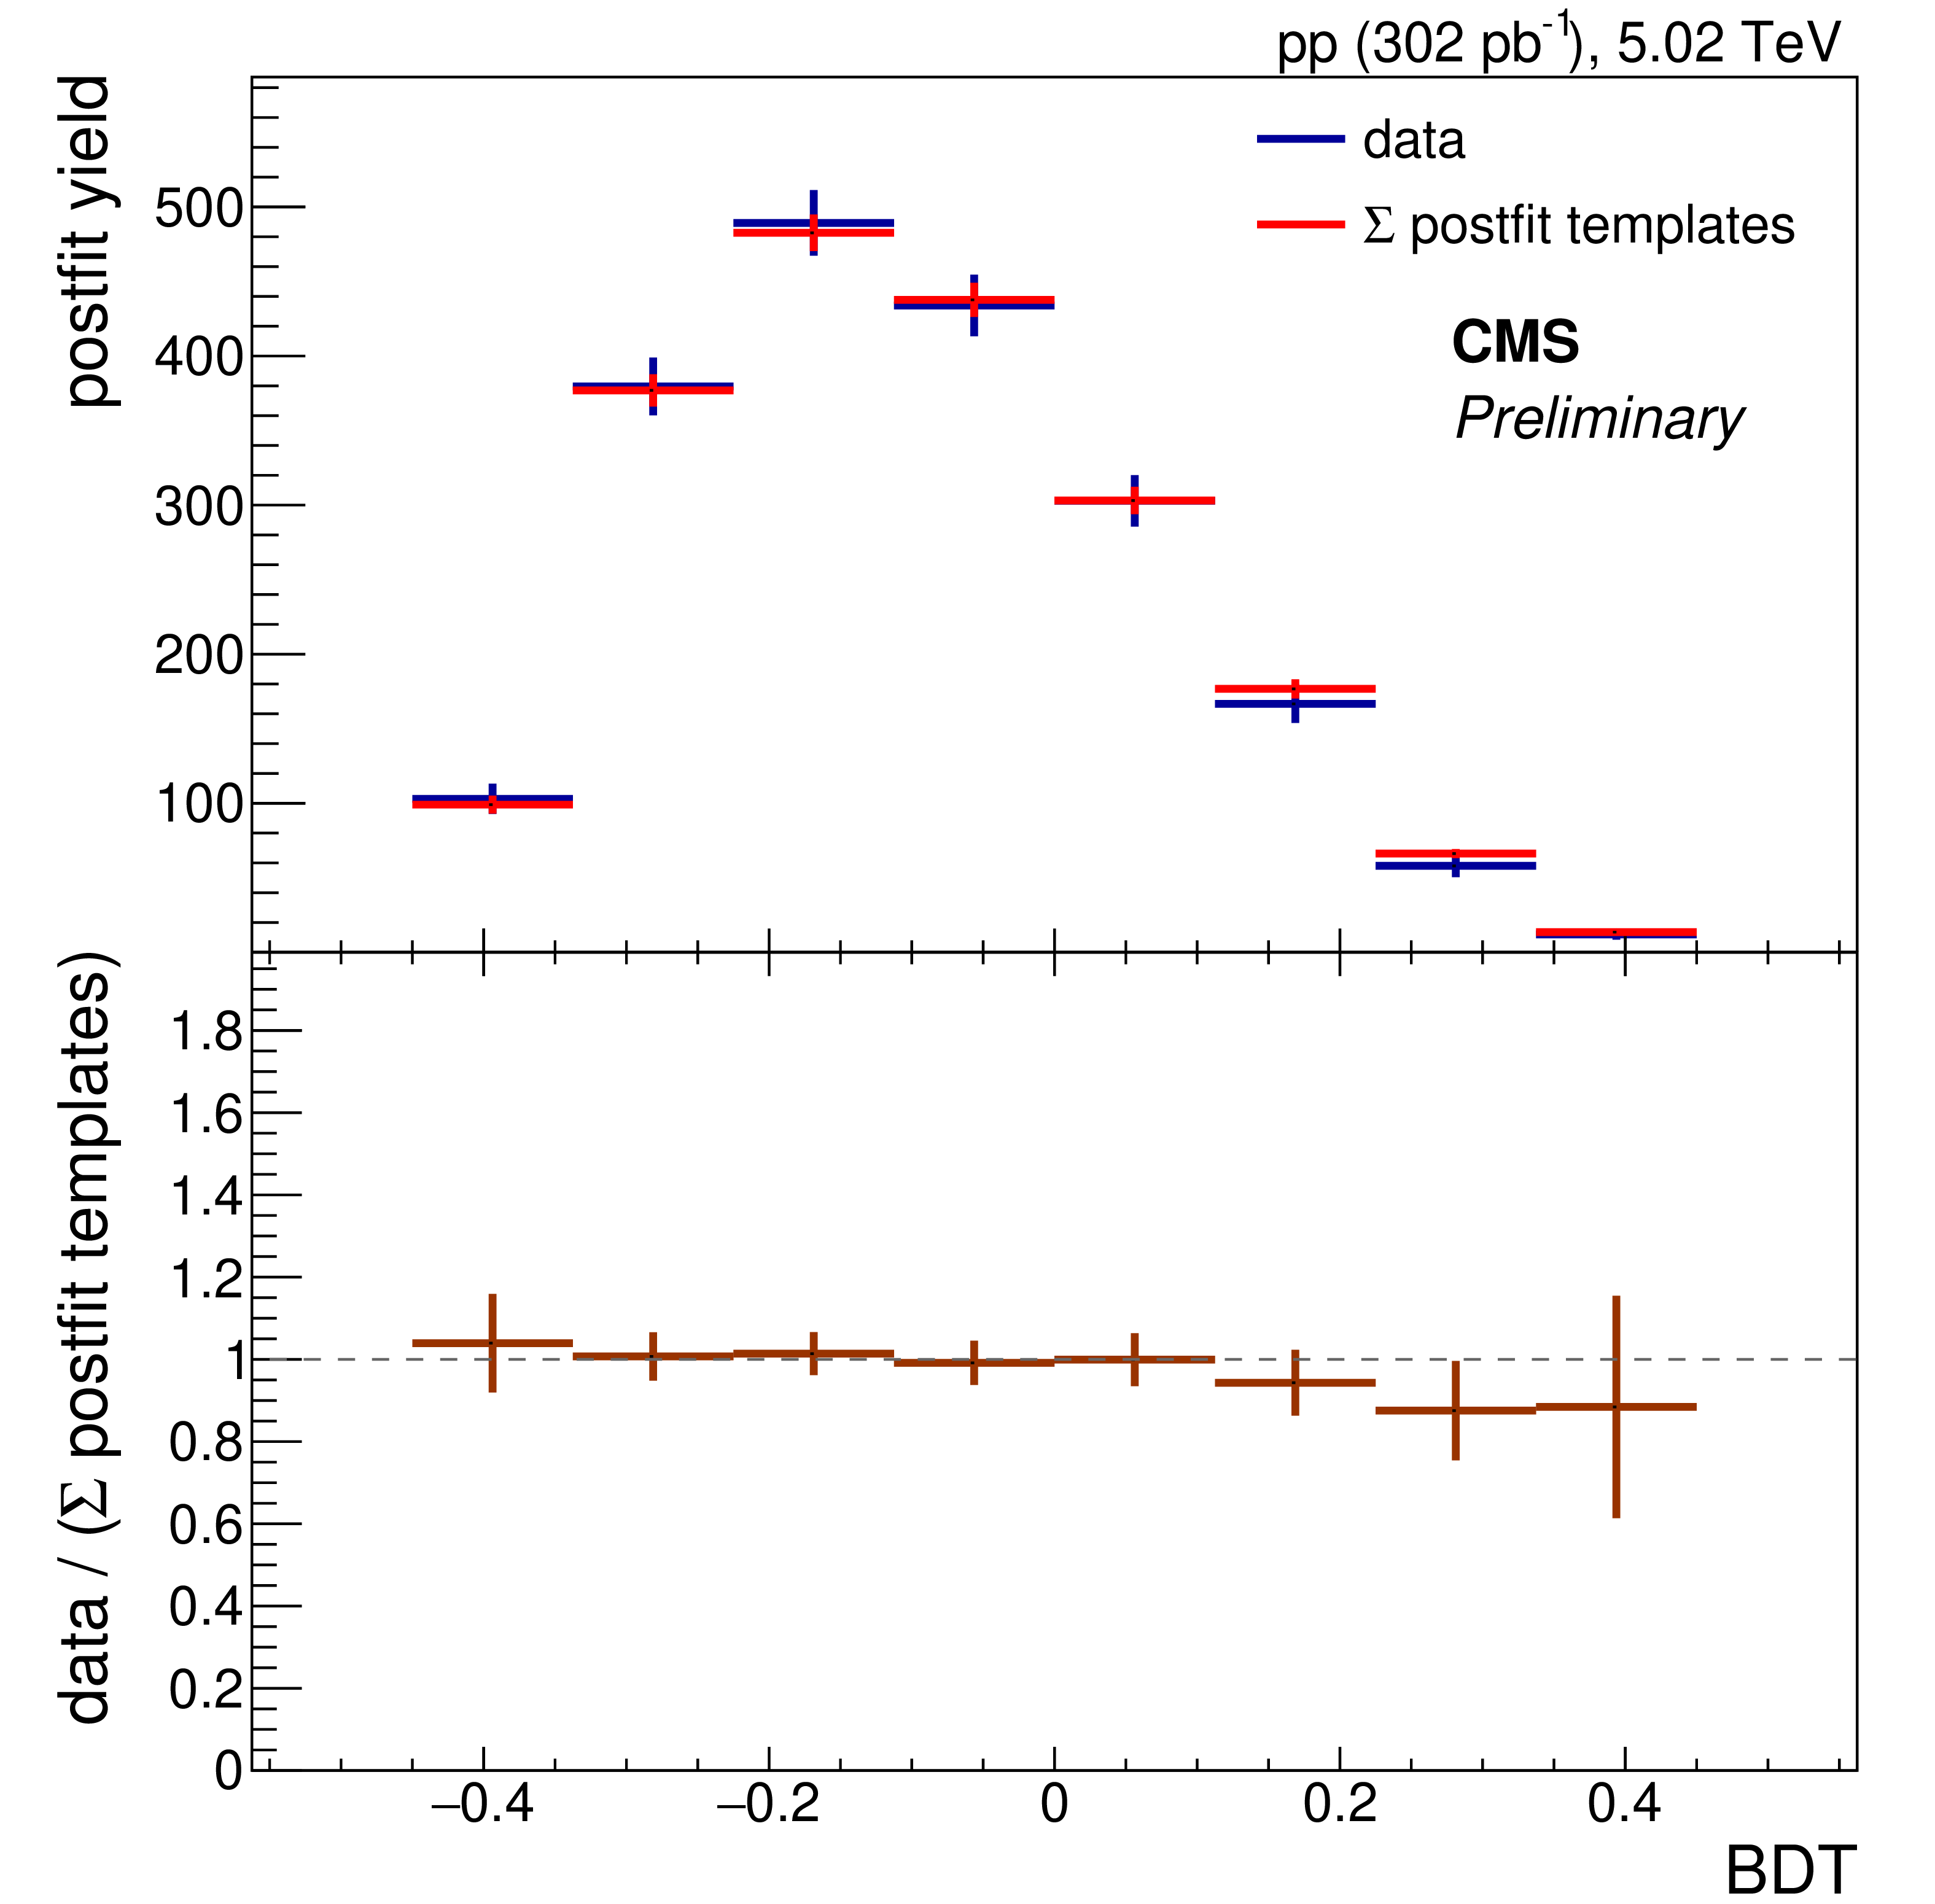
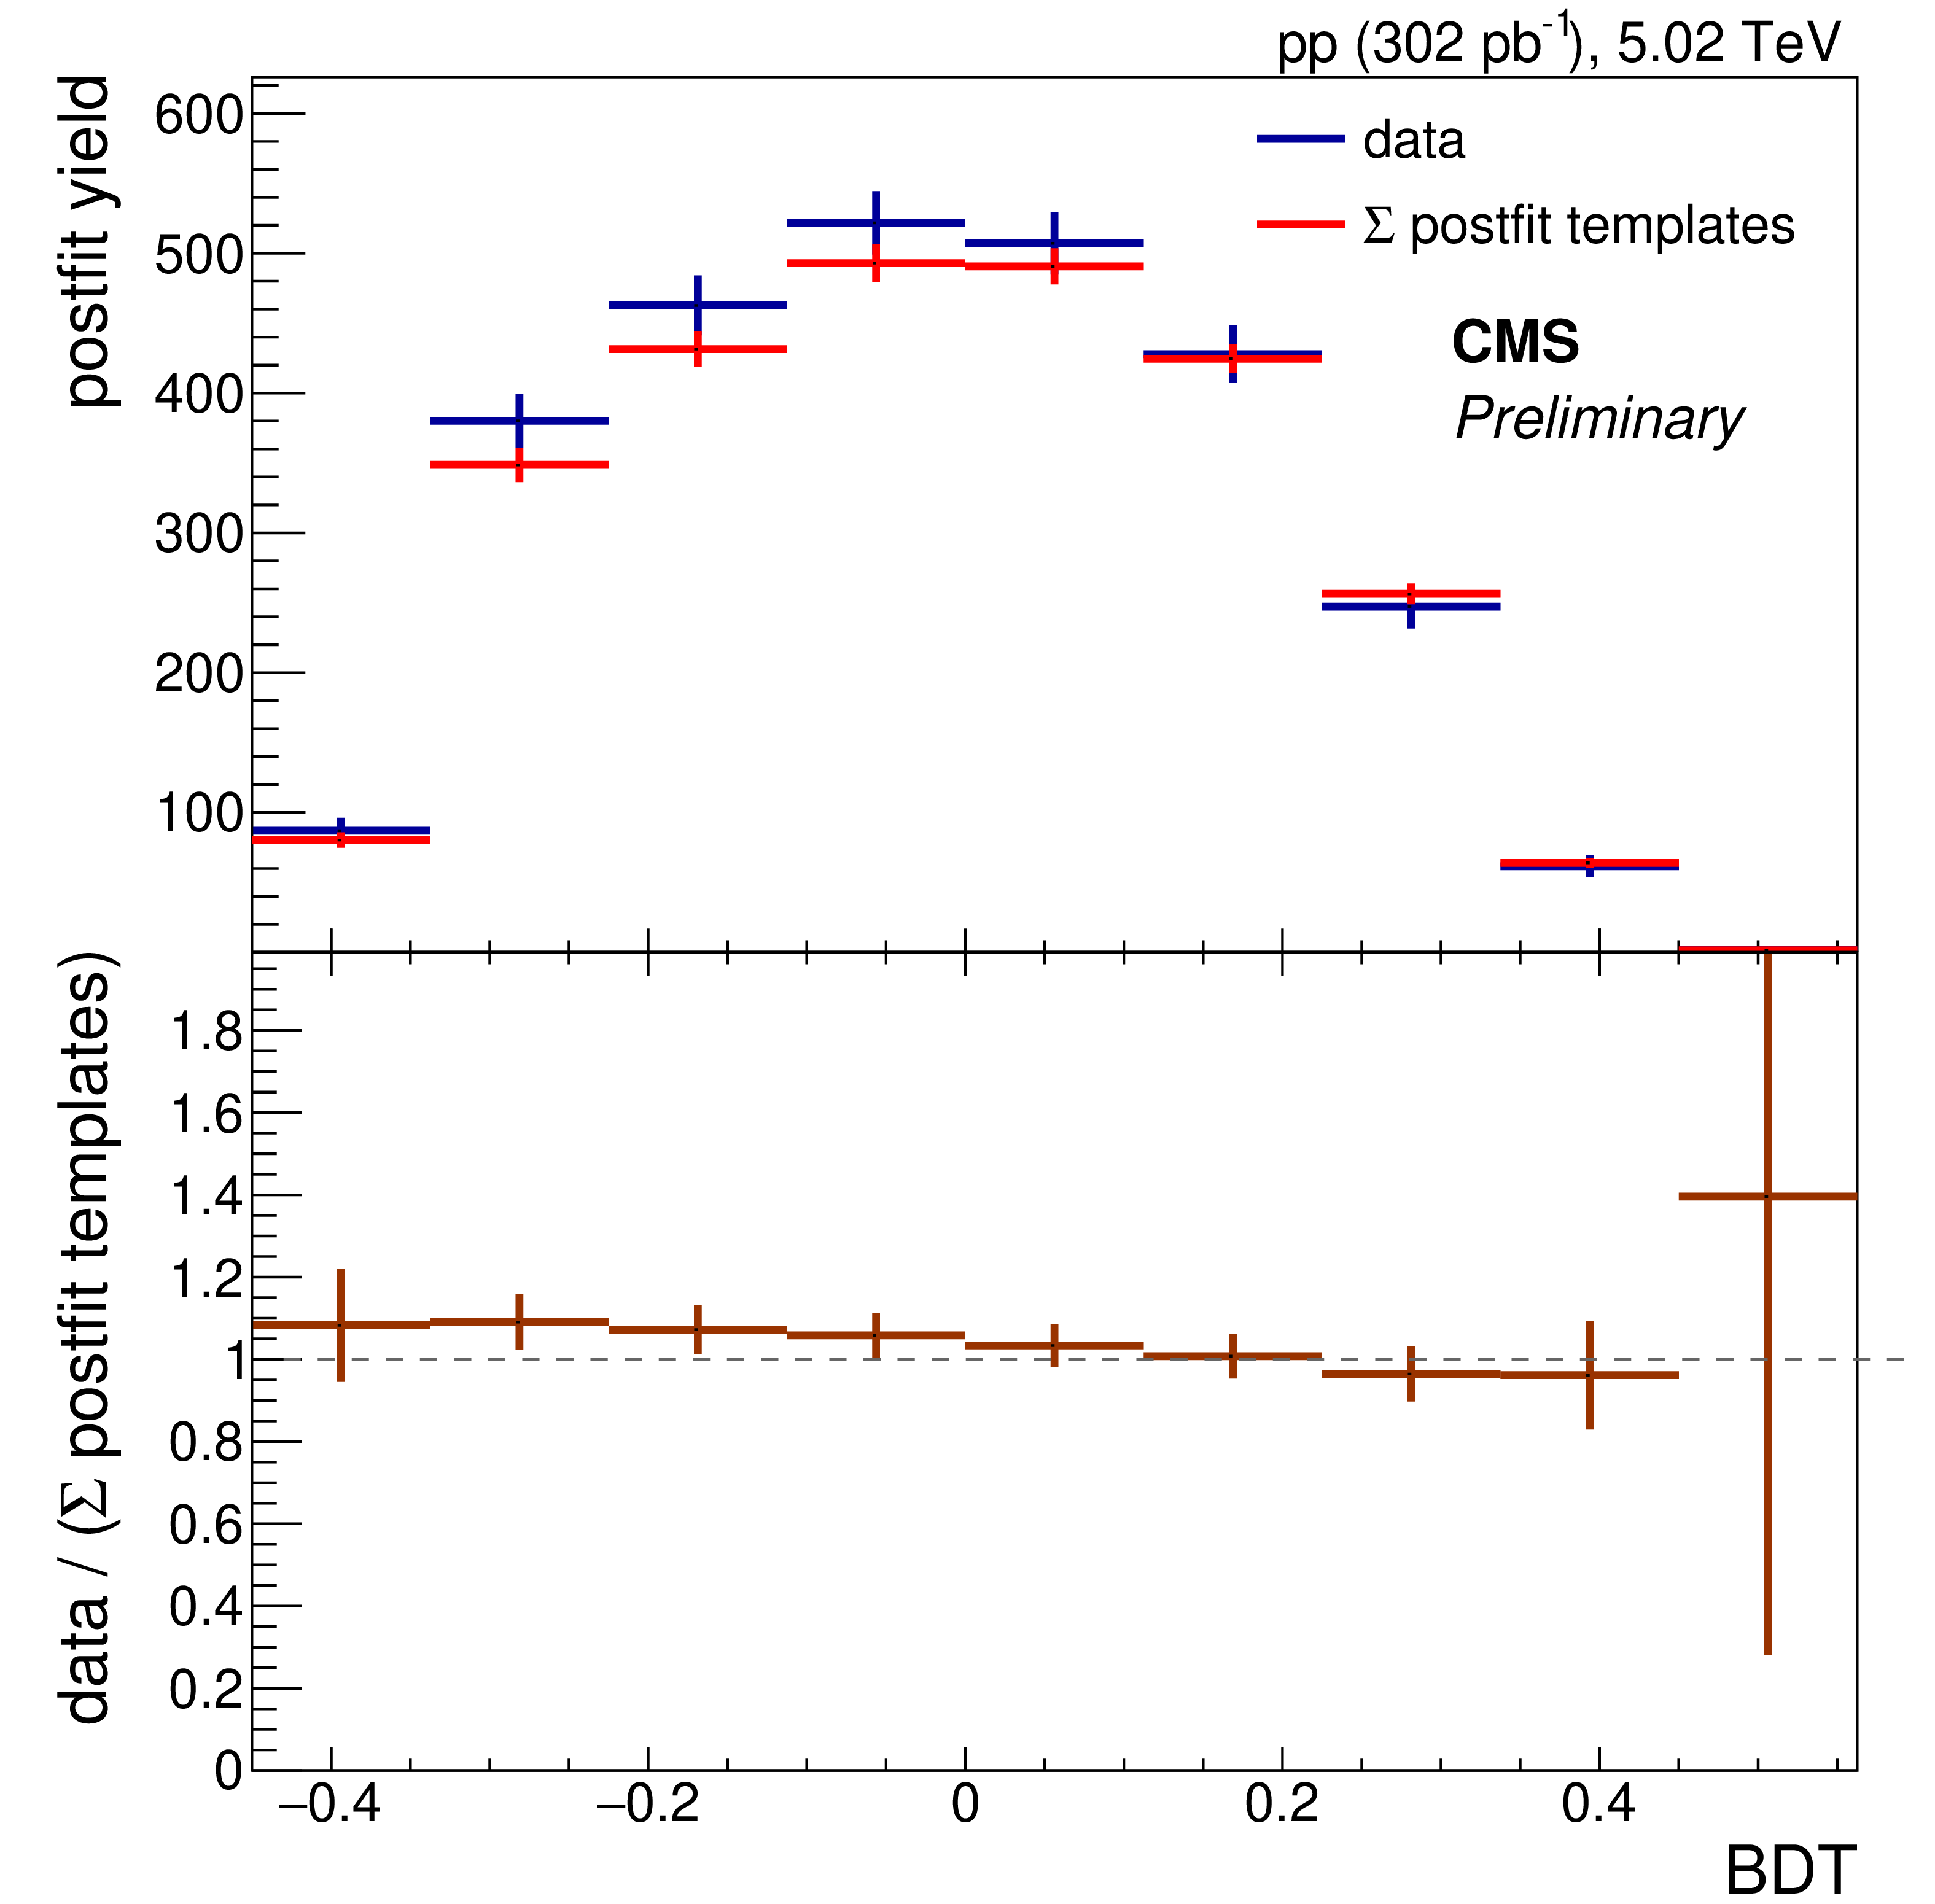
Additional Figure 24:
Comparison and ratio of the BDT distributions of data and of the sum of all post-fit templates (signal MC plus the three backgrounds) for the first $p_{\mathrm{T}}$ bin in pp. The templates result from the final fit, after the BDT distribution correction and the second $p_{\mathrm{T}}$ spectrum correction of the signal MC. The displayed uncertainties are purely statistical. |
png pdf |
Additional Figure 25:
Comparison and ratio of the BDT distributions of data and of the sum of all post-fit templates (signal MC plus the three backgrounds) for the second $p_{\mathrm{T}}$ bin in pp. The templates result from the final fit, after the BDT distribution correction and the second $p_{\mathrm{T}}$ spectrum correction of the signal MC. The displayed uncertainties are purely statistical. |
| References | ||||
| 1 | T. Matsui and H. Satz | $ J/\psi $ suppression by quark-gluon plasma formation | PLB 178 (1986) 416 | |
| 2 | NA50 Collaboration | Evidence for deconfinement of quarks and gluons from the $ J/\psi $ suppression pattern measured in Pb + Pb collisions at the CERN SPS | PLB 477 (2000) 28 | |
| 3 | PHENIX Collaboration | $ J/\psi $ Production vs Centrality, Transverse Momentum, and Rapidity in Au+Au Collisions at $ {\sqrt {\smash [b]{s_{_{\mathrm {NN}}}}}} = $ 200 GeV | PRL 98 (2007) 232301 | nucl-ex/0611020 |
| 4 | ALICE Collaboration | Centrality, rapidity and transverse momentum dependence of $ J/\psi $ suppression in Pb-Pb collisions at $ {\sqrt {\smash [b]{s_{_{\mathrm {NN}}}}}} = $ 2.76 TeV | PLB 734 (2014) 314 | 1311.0214 |
| 5 | P. Braun-Munzinger and J. Stachel | (Non)thermal aspects of charmonium production and a new look at $ J/\psi $ suppression | PLB 490 (2000) 196 | nucl-th/0007059 |
| 6 | R. L. Thews, M. Schroedter, and J. Rafelski | Enhanced $ J/\psi $ production in deconfined quark matter | PRC 63 (2001) 054905 | hep-ph/0007323 |
| 7 | CMS Collaboration | Observation of sequential Upsilon suppression in PbPb collisions | PRL 109 (2012) 222301 | CMS-HIN-11-011 1208.2826 |
| 8 | Y. Liu, C. Greiner, and A. Kostyuk | $ B_c $ meson enhancement and the momentum dependence in Pb + Pb collisions at energies available at the CERN Large Hadron Collider | PRC 87 (2013) 014910 | 1207.2366 |
| 9 | M. Schroedter, R. L. Thews, and J. Rafelski | $ B_c $ meson production in nuclear collisions at RHIC | PRC 62 (2000) 024905 | hep-ph/0004041 |
| 10 | CMS Collaboration | Measurement of the $ {B}^{\pm} $ Meson Nuclear Modification Factor in Pb-Pb Collisions at $ {\sqrt {\smash [b]{s_{_{\mathrm {NN}}}}}} = $ 5.02 TeV | PRL 119 (2017) 152301 | CMS-HIN-16-011 1705.04727 |
| 11 | CMS Collaboration | Measurement of B$ ^0_\mathrm{s} $ meson production in pp and PbPb collisions at $ {\sqrt {\smash [b]{s_{_{\mathrm {NN}}}}}} = $ 5.02 TeV | PLB 796 (2019) 168 | CMS-HIN-17-008 1810.03022 |
| 12 | CMS Collaboration | Measurement of prompt and nonprompt charmonium suppression in $ \text {PbPb} $ collisions at 5.02 TeV | EPJC 78 (2018) 509 | CMS-HIN-16-025 1712.08959 |
| 13 | CMS Collaboration | Nuclear modification factor of D$ ^0 $ mesons in PbPb collisions at $ {\sqrt {\smash [b]{s_{_{\mathrm {NN}}}}}} = $ 5.02 TeV | PLB 782 (2018) 474 | CMS-HIN-16-001 1708.04962 |
| 14 | ALICE Collaboration | Measurement of D$ ^{0} $, D$ ^{+} $, D$ ^{*+} $ and D$ _{s}^{+} $ production in Pb-Pb collisions at $ \sqrt{{\mathrm{s}}_{\mathrm{NN}}}= $ 5.02 TeV | JHEP 10 (2018) 174 | 1804.09083 |
| 15 | ATLAS Collaboration | Prompt and non-prompt $ J/\psi $ and $ \psi (2\mathrm {S}) $ suppression at high transverse momentum in 5.02 TeV Pb+Pb collisions with the ATLAS experiment | EPJC 78 (2018) 762 | 1805.04077 |
| 16 | F. Arleo | Quenching of hadron spectra in heavy ion collisions at the LHC | PRL 119 (2017) 062302 | 1703.10852 |
| 17 | Y. L. Dokshitzer and D. E. Kharzeev | Heavy-quark colorimetry of QCD matter | PLB 519 (2001) 199 | hep-ph/0106202 |
| 18 | CDF Collaboration | Observation of the $ B_c $ meson in $ p\bar{p} $ collisions at $ \sqrt{s} = $ 1.8 TeV | PRL 81 (1998) 2432 | hep-ex/9805034 |
| 19 | ATLAS Collaboration | Observation of an Excited $ B_c^\pm $ Meson State with the ATLAS Detector | PRL 113 (2014) 212004 | 1407.1032 |
| 20 | LHCb Collaboration | Observation of an excited $ B_c^+ $ state | PRL 122 (2019) 232001 | 1904.00081 |
| 21 | CMS Collaboration | Observation of Two Excited B$ ^+_\mathrm{c} $ States and Measurement of the B$ ^+_\mathrm{c} $(2S) Mass in pp Collisions at $ \sqrt{s} = $ 13 TeV | PRL 122 (2019) 132001 | CMS-BPH-18-007 1902.00571 |
| 22 | LHCb Collaboration | Measurement of the ratio of $ B_c^+ $ branching fractions to $ J/\psi\pi^+ $ and $ J/\psi\mu^+\nu_\mu $ | PRD 90 (2014) 032009 | 1407.2126 |
| 23 | CMS Collaboration | The CMS experiment at the CERN LHC | JINST 3 (2008) S08004 | CMS-00-001 |
| 24 | CMS Collaboration | Performance of the CMS muon detector and muon reconstruction with proton-proton collisions at $ \sqrt{s}= $ 13 TeV | JINST 13 (2018) P06015 | CMS-MUO-16-001 1804.04528 |
| 25 | CMS Collaboration | Description and performance of track and primary-vertex reconstruction with the CMS tracker | JINST 9 (2014) P10009 | CMS-TRK-11-001 1405.6569 |
| 26 | CMS Collaboration | The CMS trigger system | JINST 12 (2017) P01020 | CMS-TRG-12-001 1609.02366 |
| 27 | C.-H. Chang, J.-X. Wang, and X.-G. Wu | BCVEGPY2.0: An upgrade version of the generator BCVEGPY with the addition of hadroproduction of the $ P $-wave $ B_c $ states | CPC 174 (2006) 241 | hep-ph/0504017 |
| 28 | D. J. Lange | The EvtGen particle decay simulation package | NIMA 462 (2001) 152 | |
| 29 | T. Sjostrand et al. | An introduction to PYTHIA 8.2 | CPC 191 (2015) 159 | 1410.3012 |
| 30 | CMS Collaboration | Extraction and validation of a new set of CMS PYTHIA8 tunes from underlying-event measurements | EPJC 80 (2020) 4 | CMS-GEN-17-001 1903.12179 |
| 31 | I. P. Lokhtin and A. M. Snigirev | A model of jet quenching in ultrarelativistic heavy ion collisions and high-pt hadron spectra at RHIC | EPJC 45 (2006) 211 | hep-ph/0506189 |
| 32 | GEANT4 Collaboration | GEANT4--a simulation toolkit | NIMA 506 (2003) 250 | |
| 33 | CMS Collaboration | Fragmentation of jets containing a $ {\mathrm{J}/\psi} $ meson in PbPb and pp collisions at 5 TeV | CMS-PAS-HIN-19-007 | CMS-PAS-HIN-19-007 |
| 34 | CMS Collaboration | Measurement of the azimuthal anisotropy of $ \Upsilon $(1S) and $ \Upsilon $(2S) mesons in PbPb collisions at $ {\sqrt {\smash [b]{s_{_{\mathrm {NN}}}}}} = $ 5.02 TeV | Submitted to PLB | CMS-HIN-19-002 2006.07707 |
| 35 | H. Voss, A. Hoecker, J. Stelzer, and F. Tegenfeldt | TMVA, the Toolkit for Multivariate Data Analysis with ROOT | PoS ACAT (2007) 040 | |
| 36 | W. Verkerke and D. P. Kirkby | The roofit toolkit for data modeling | eConf C0303241 (2003) MOLT007 | physics/0306116 |
| 37 | CMS Collaboration | Luminosity measurement in proton-proton collisions at 5.02 TeV in 2017 at CMS | CMS-PAS-LUM-19-001 | CMS-PAS-LUM-19-001 |
| 38 | C. Loizides, J. Kamin, and D. d'Enterria | Improved Monte Carlo Glauber predictions at present and future nuclear colliders | PRC 97 (2018) 054910 | 1710.07098 |
| 39 | G. D. Lafferty and T. R. Wyatt | Where to stick your data points: The treatment of measurements within wide bins | NIMA 355 (1995) 541 | |
|
|
Compact Muon Solenoid LHC, CERN |
|

|

|

|

|

|