

Compact Muon Solenoid
LHC, CERN
| CMS-PAS-EXO-20-012 | ||
| Search for resonance production in events with a photon and jet with the CMS experiment | ||
| CMS Collaboration | ||
| 20 September 2022 | ||
| Abstract: A search for resonance production in the $ \gamma+ $jet final state has been performed using proton-proton collision data collected at $ \sqrt{s}= $ 13 TeV by the CMS experiment at the LHC. The total data analyzed correspond to an integrated luminosity of 138 fb$ ^{-1} $. Models of excited quarks, excited heavy quark flavors, and quantum black holes are considered. The invariant mass spectrum of the $ \gamma+ $jet system is searched for resonances over the standard model continuum background. In the absence of any observed deviation from expected standard model backgrounds, exclusion limits on mass of resonance and other parameters are set. Excited quarks are excluded up to a mass of 6.0 TeV and excited heavy flavor quarks up to 2.2 TeV. Quantum black hole signal production is excluded up to 7.5 TeV and 5.2 TeV for the Arkani-Hamed-Dimopoulos-Dvali and Randall-Sundrum models. | ||
|
Links:
CDS record (PDF) ;
CADI line (restricted) ;
These preliminary results are superseded in this paper, Submitted to JHEP. The superseded preliminary plots can be found here. |
||
| Figures | |
png pdf |
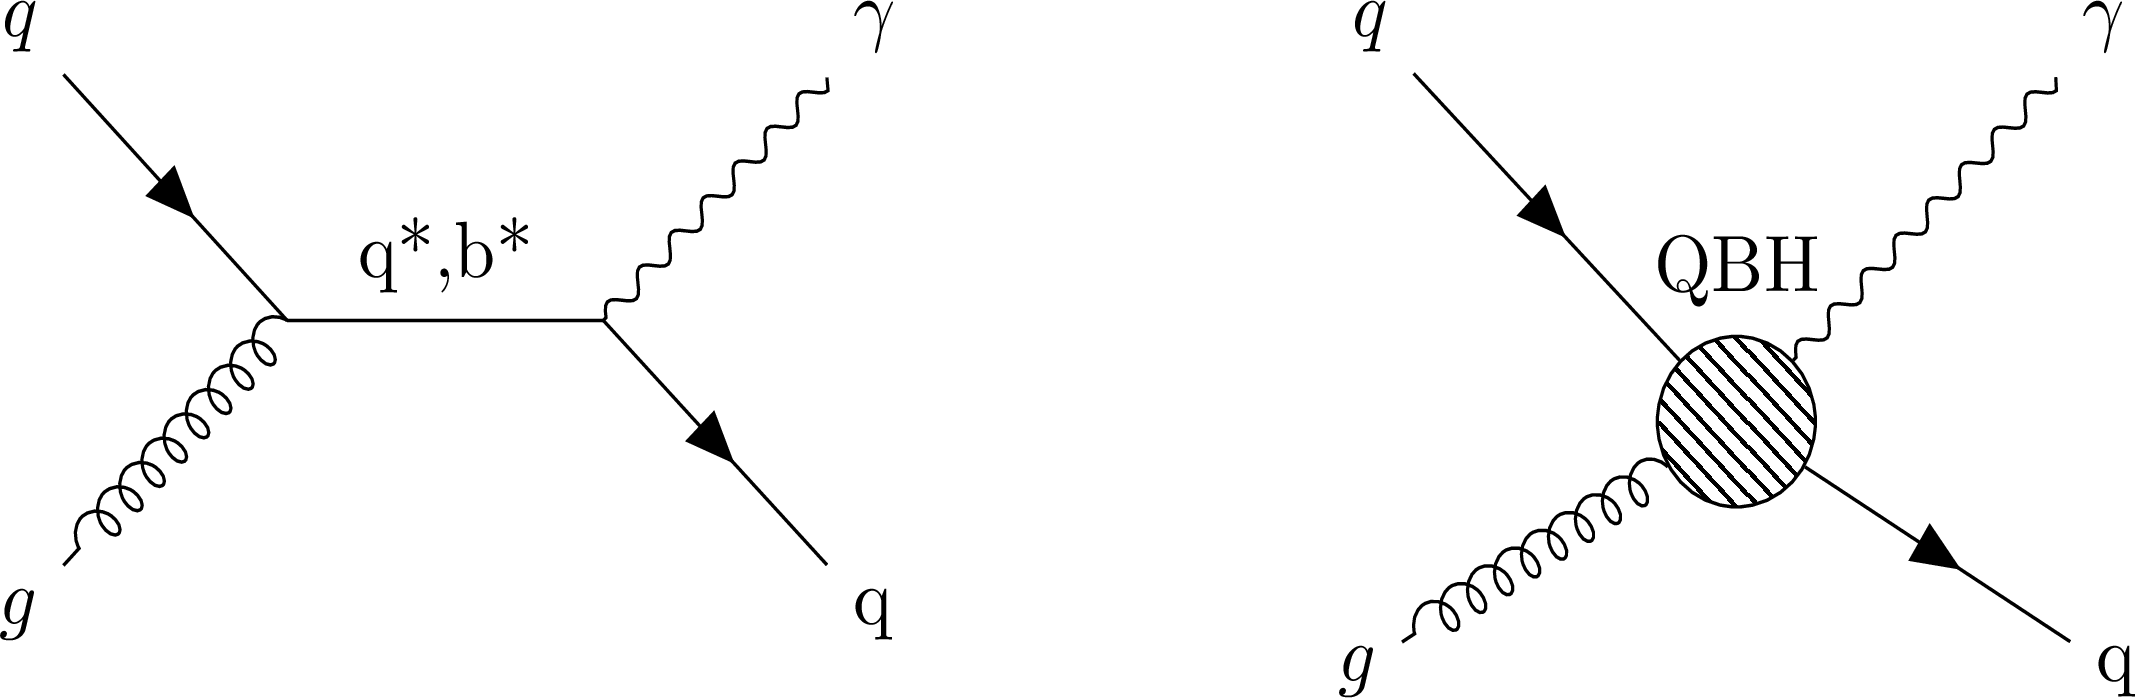
Figure 1:
Illustrative diagrams for $ \gamma $+jet resonance signal models of $ {\mathrm{q}^\star} $, $ {\mathrm{b}^\star} $ (left), and QBH production (right). |
png pdf |
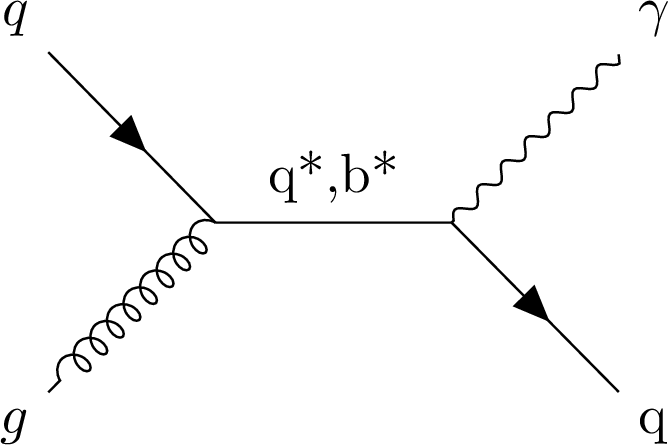
Figure 1-a:
Illustrative diagrams for $ \gamma $+jet resonance signal models of $ {\mathrm{q}^\star} $, $ {\mathrm{b}^\star} $ (left), and QBH production (right). |
png pdf |
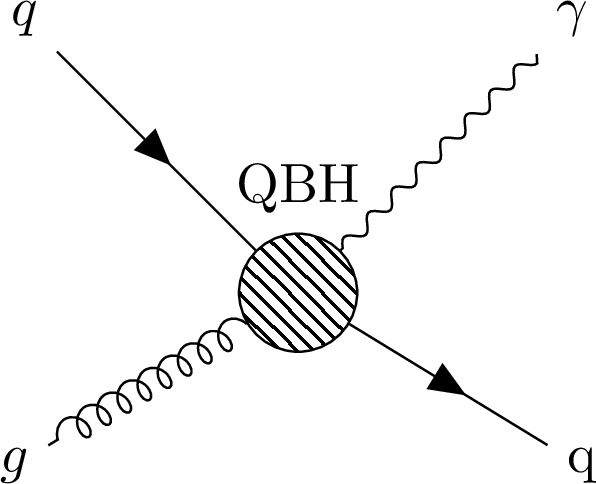
Figure 1-b:
Illustrative diagrams for $ \gamma $+jet resonance signal models of $ {\mathrm{q}^\star} $, $ {\mathrm{b}^\star} $ (left), and QBH production (right). |
png pdf |
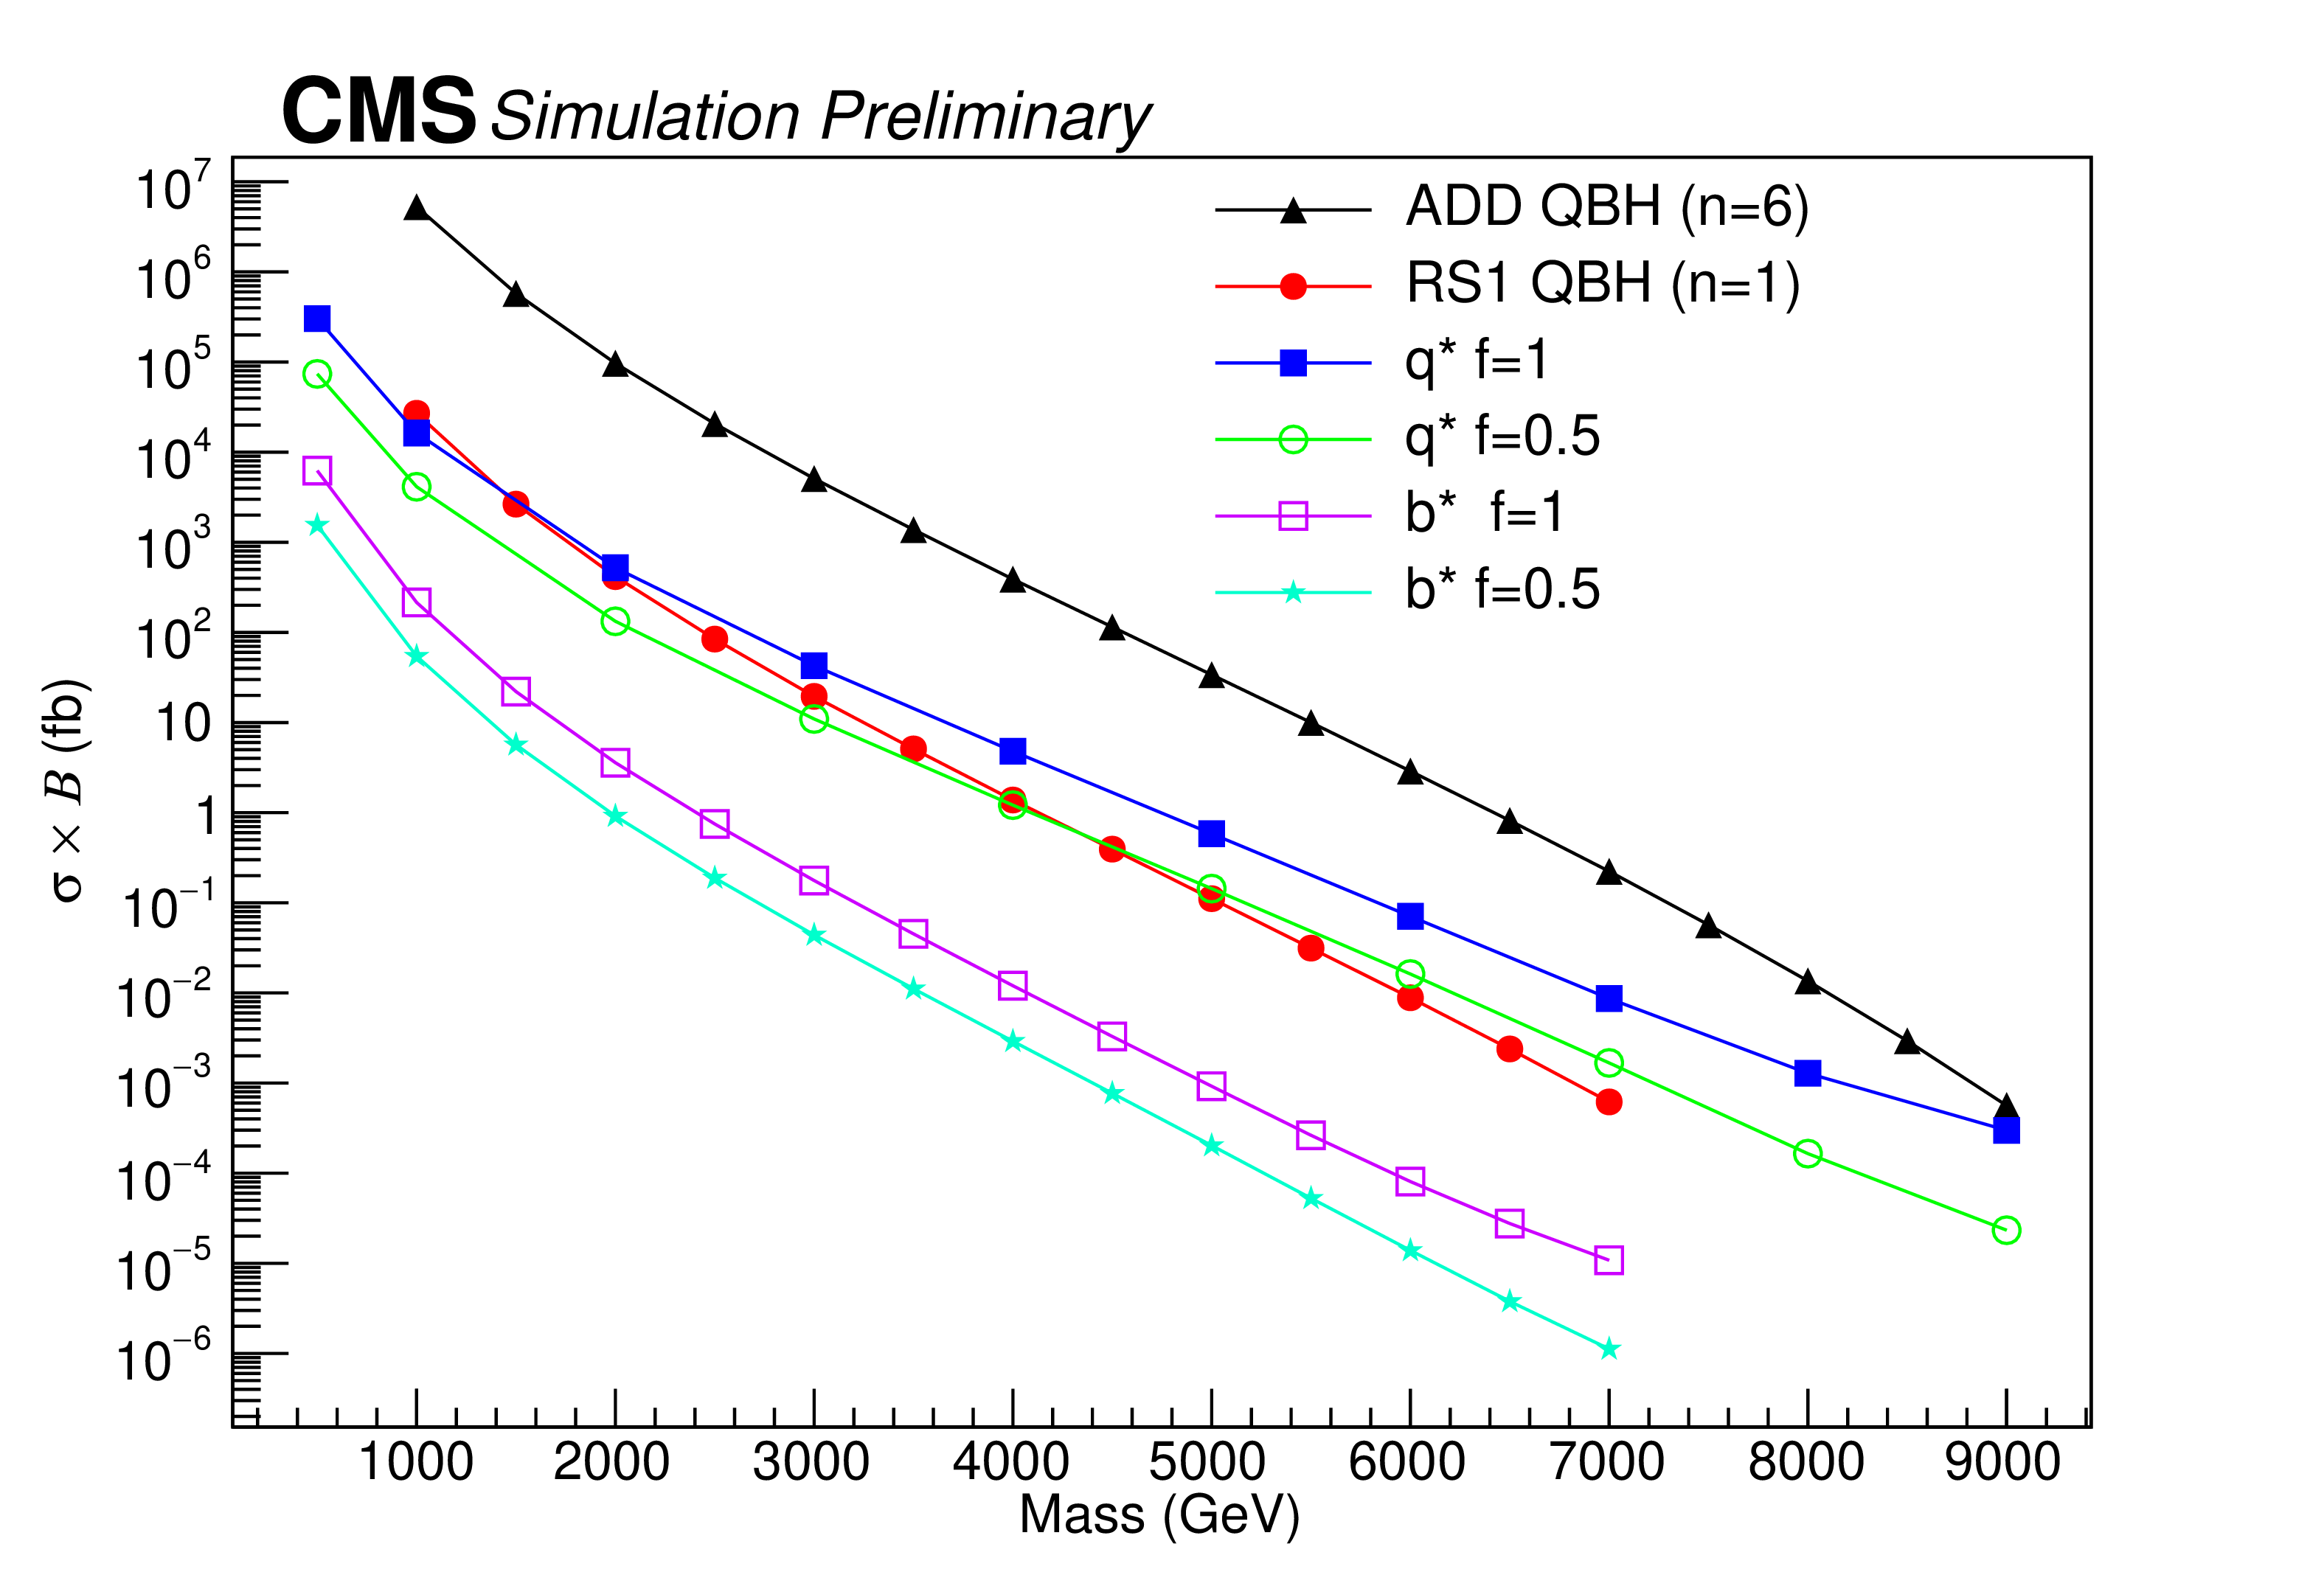
Figure 2:
The product of the cross section and branching fraction for mass of $ {\mathrm{q}^\star} $, $ {\mathrm{b}^\star} $ signals ($ M_{{\mathrm{q}^\star}/{\mathrm{b}^\star}} $) and QBH signal models ($ M_{th} $) considered in this analysis. |
png pdf |
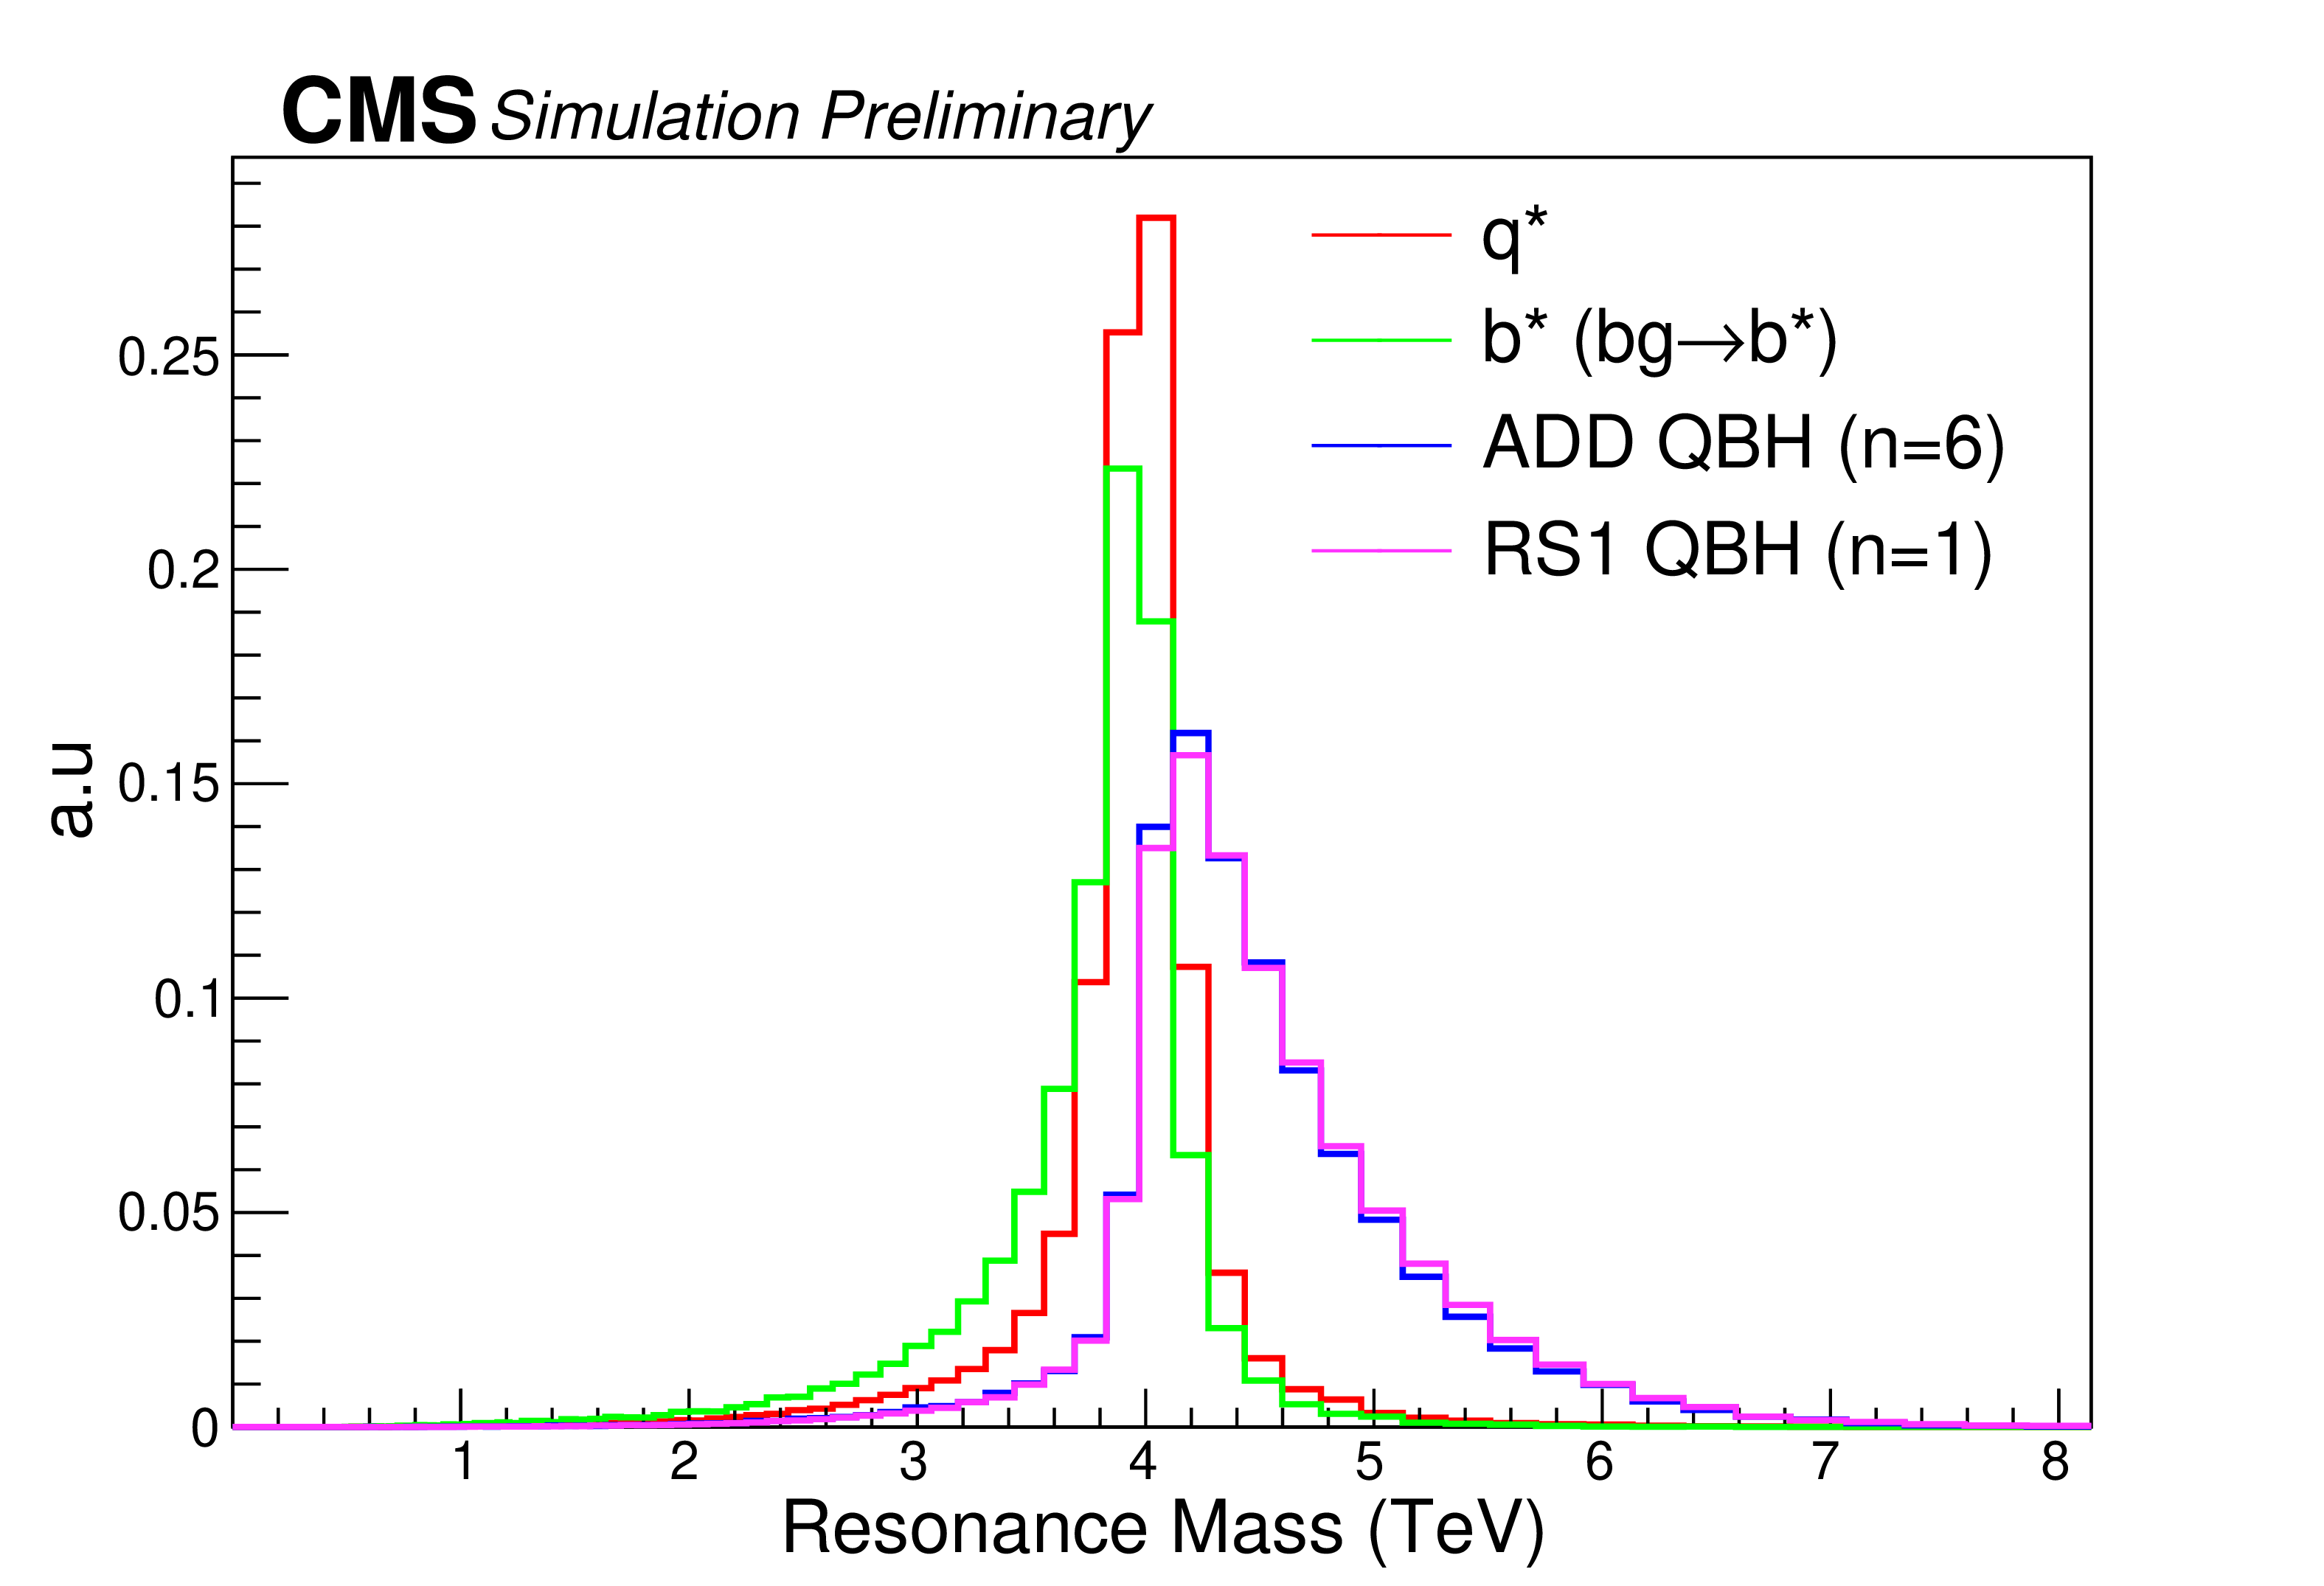
Figure 3:
Distributions of $ \gamma $+jet invariant mass generated from various signal samples. |
png pdf |
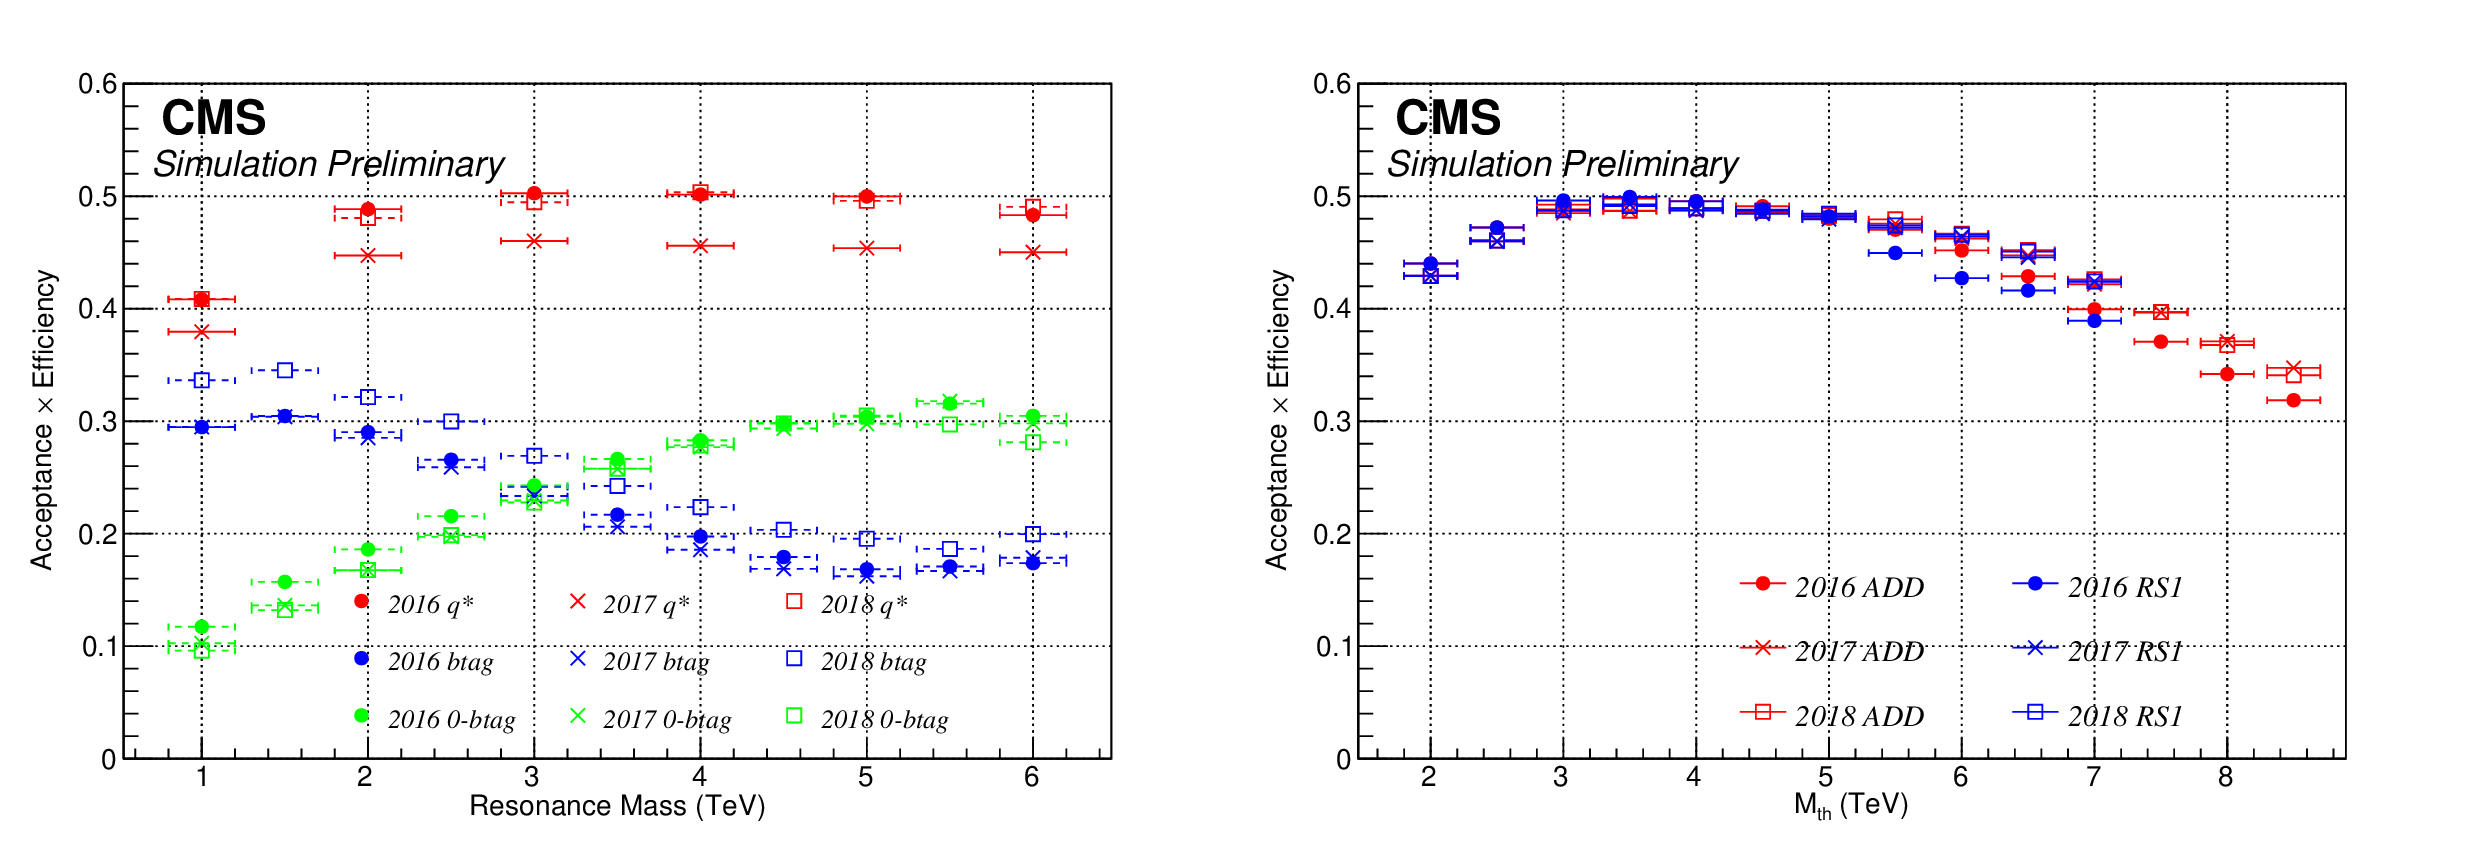
Figure 4:
The product of acceptance and efficiency for the signals $ {\mathrm{q}^\star} $ in the inclusive category and $ {\mathrm{b}^\star} $ in b tag and 0-b tag category for SM coupling $ f = $ 1.0 (left), and QBH (ADD/RS1) model in the inclusive category for different mass values (right) of the years 2016, 2017, and 2018. |
png pdf |
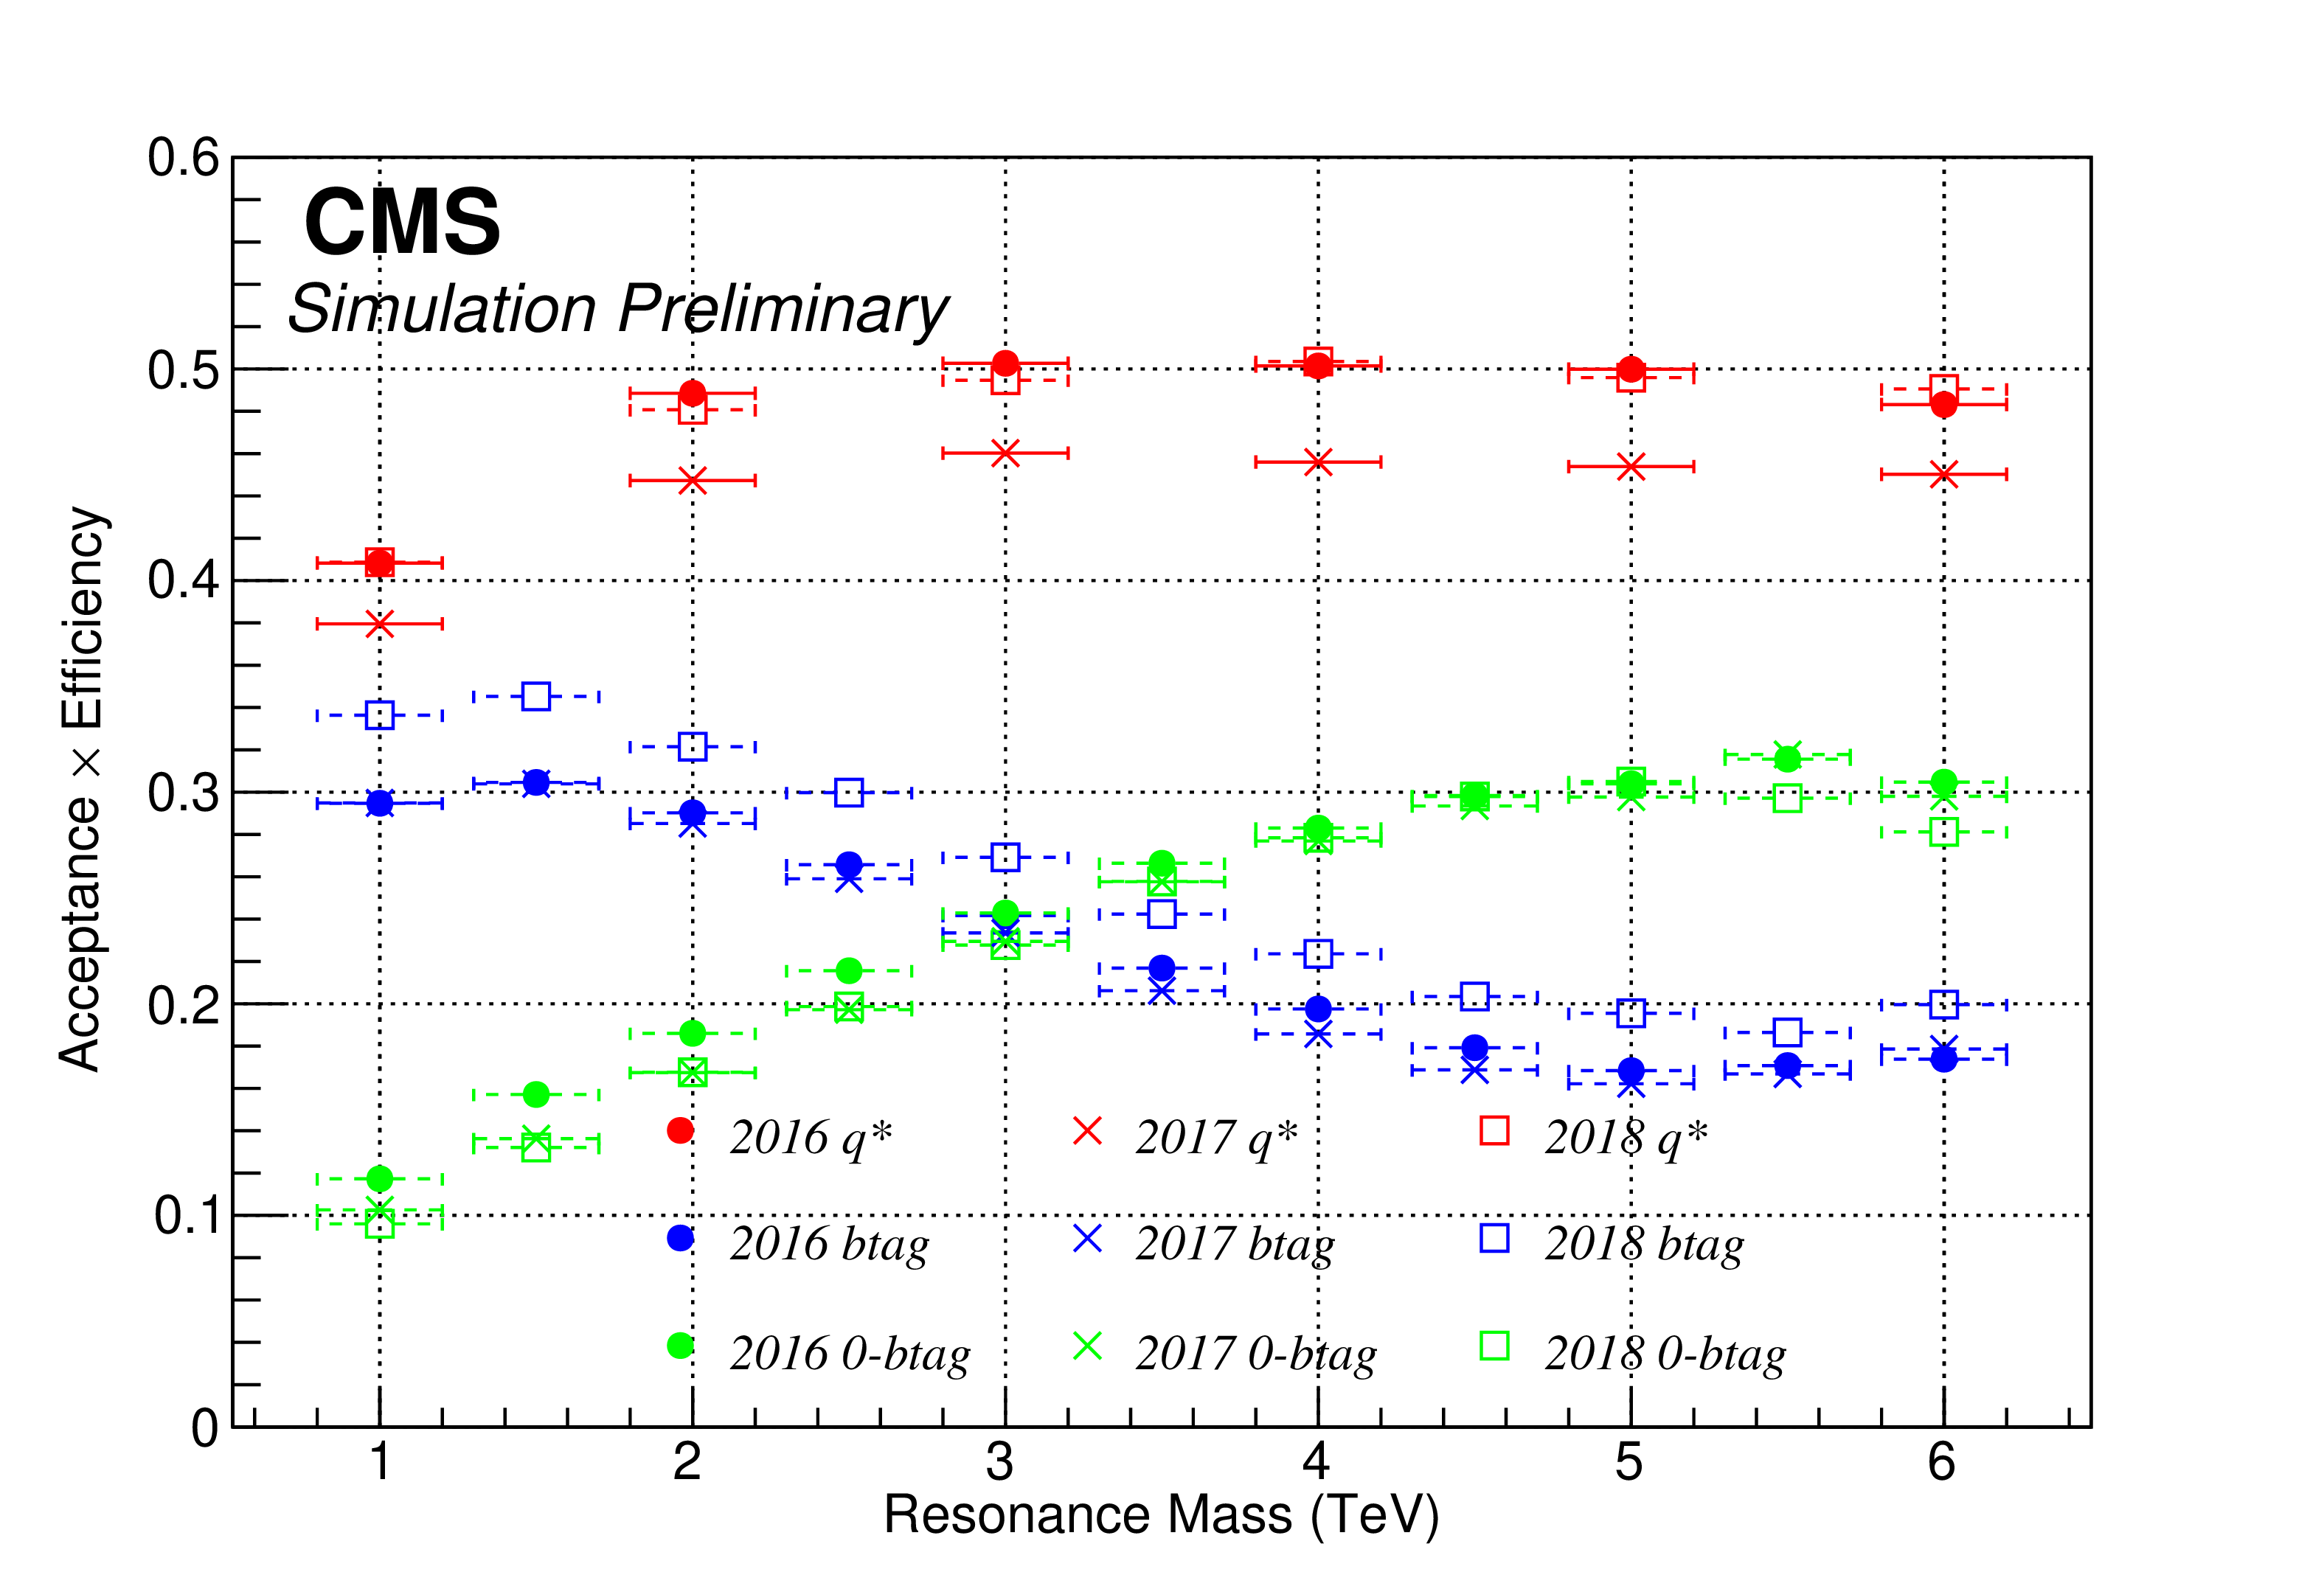
Figure 4-a:
The product of acceptance and efficiency for the signals $ {\mathrm{q}^\star} $ in the inclusive category and $ {\mathrm{b}^\star} $ in b tag and 0-b tag category for SM coupling $ f = $ 1.0 (left), and QBH (ADD/RS1) model in the inclusive category for different mass values (right) of the years 2016, 2017, and 2018. |
png pdf |
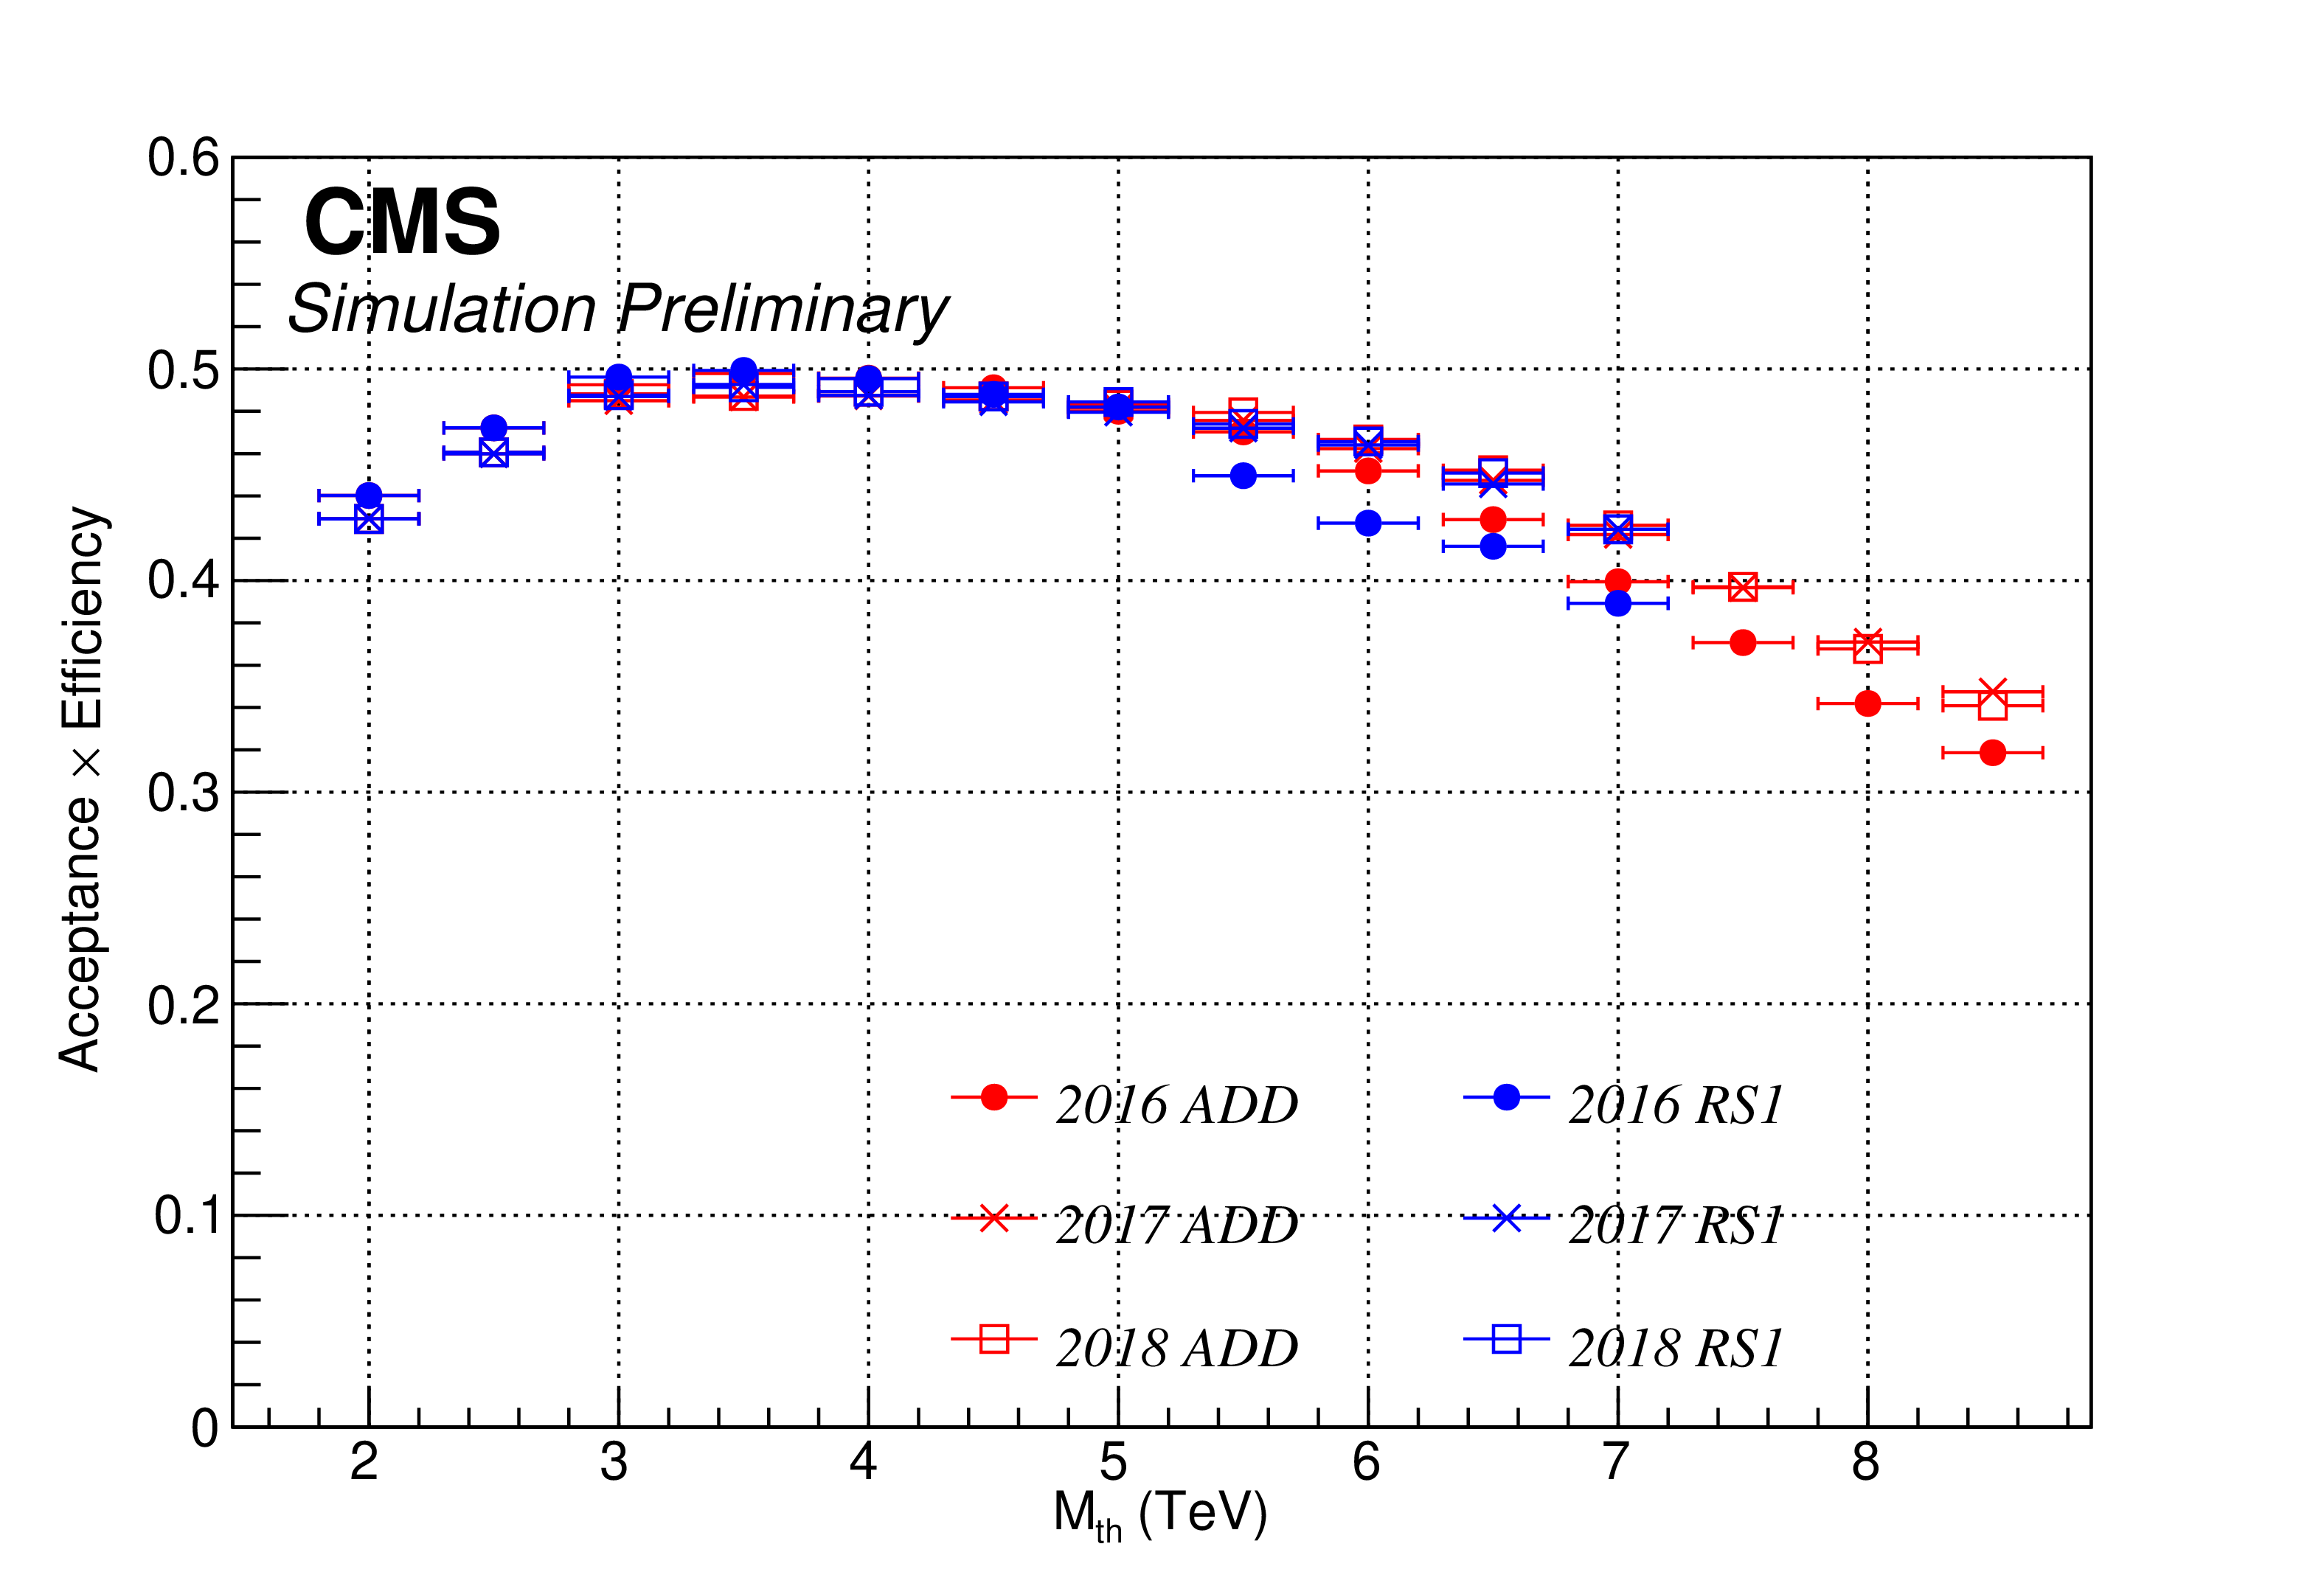
Figure 4-b:
The product of acceptance and efficiency for the signals $ {\mathrm{q}^\star} $ in the inclusive category and $ {\mathrm{b}^\star} $ in b tag and 0-b tag category for SM coupling $ f = $ 1.0 (left), and QBH (ADD/RS1) model in the inclusive category for different mass values (right) of the years 2016, 2017, and 2018. |
png pdf |
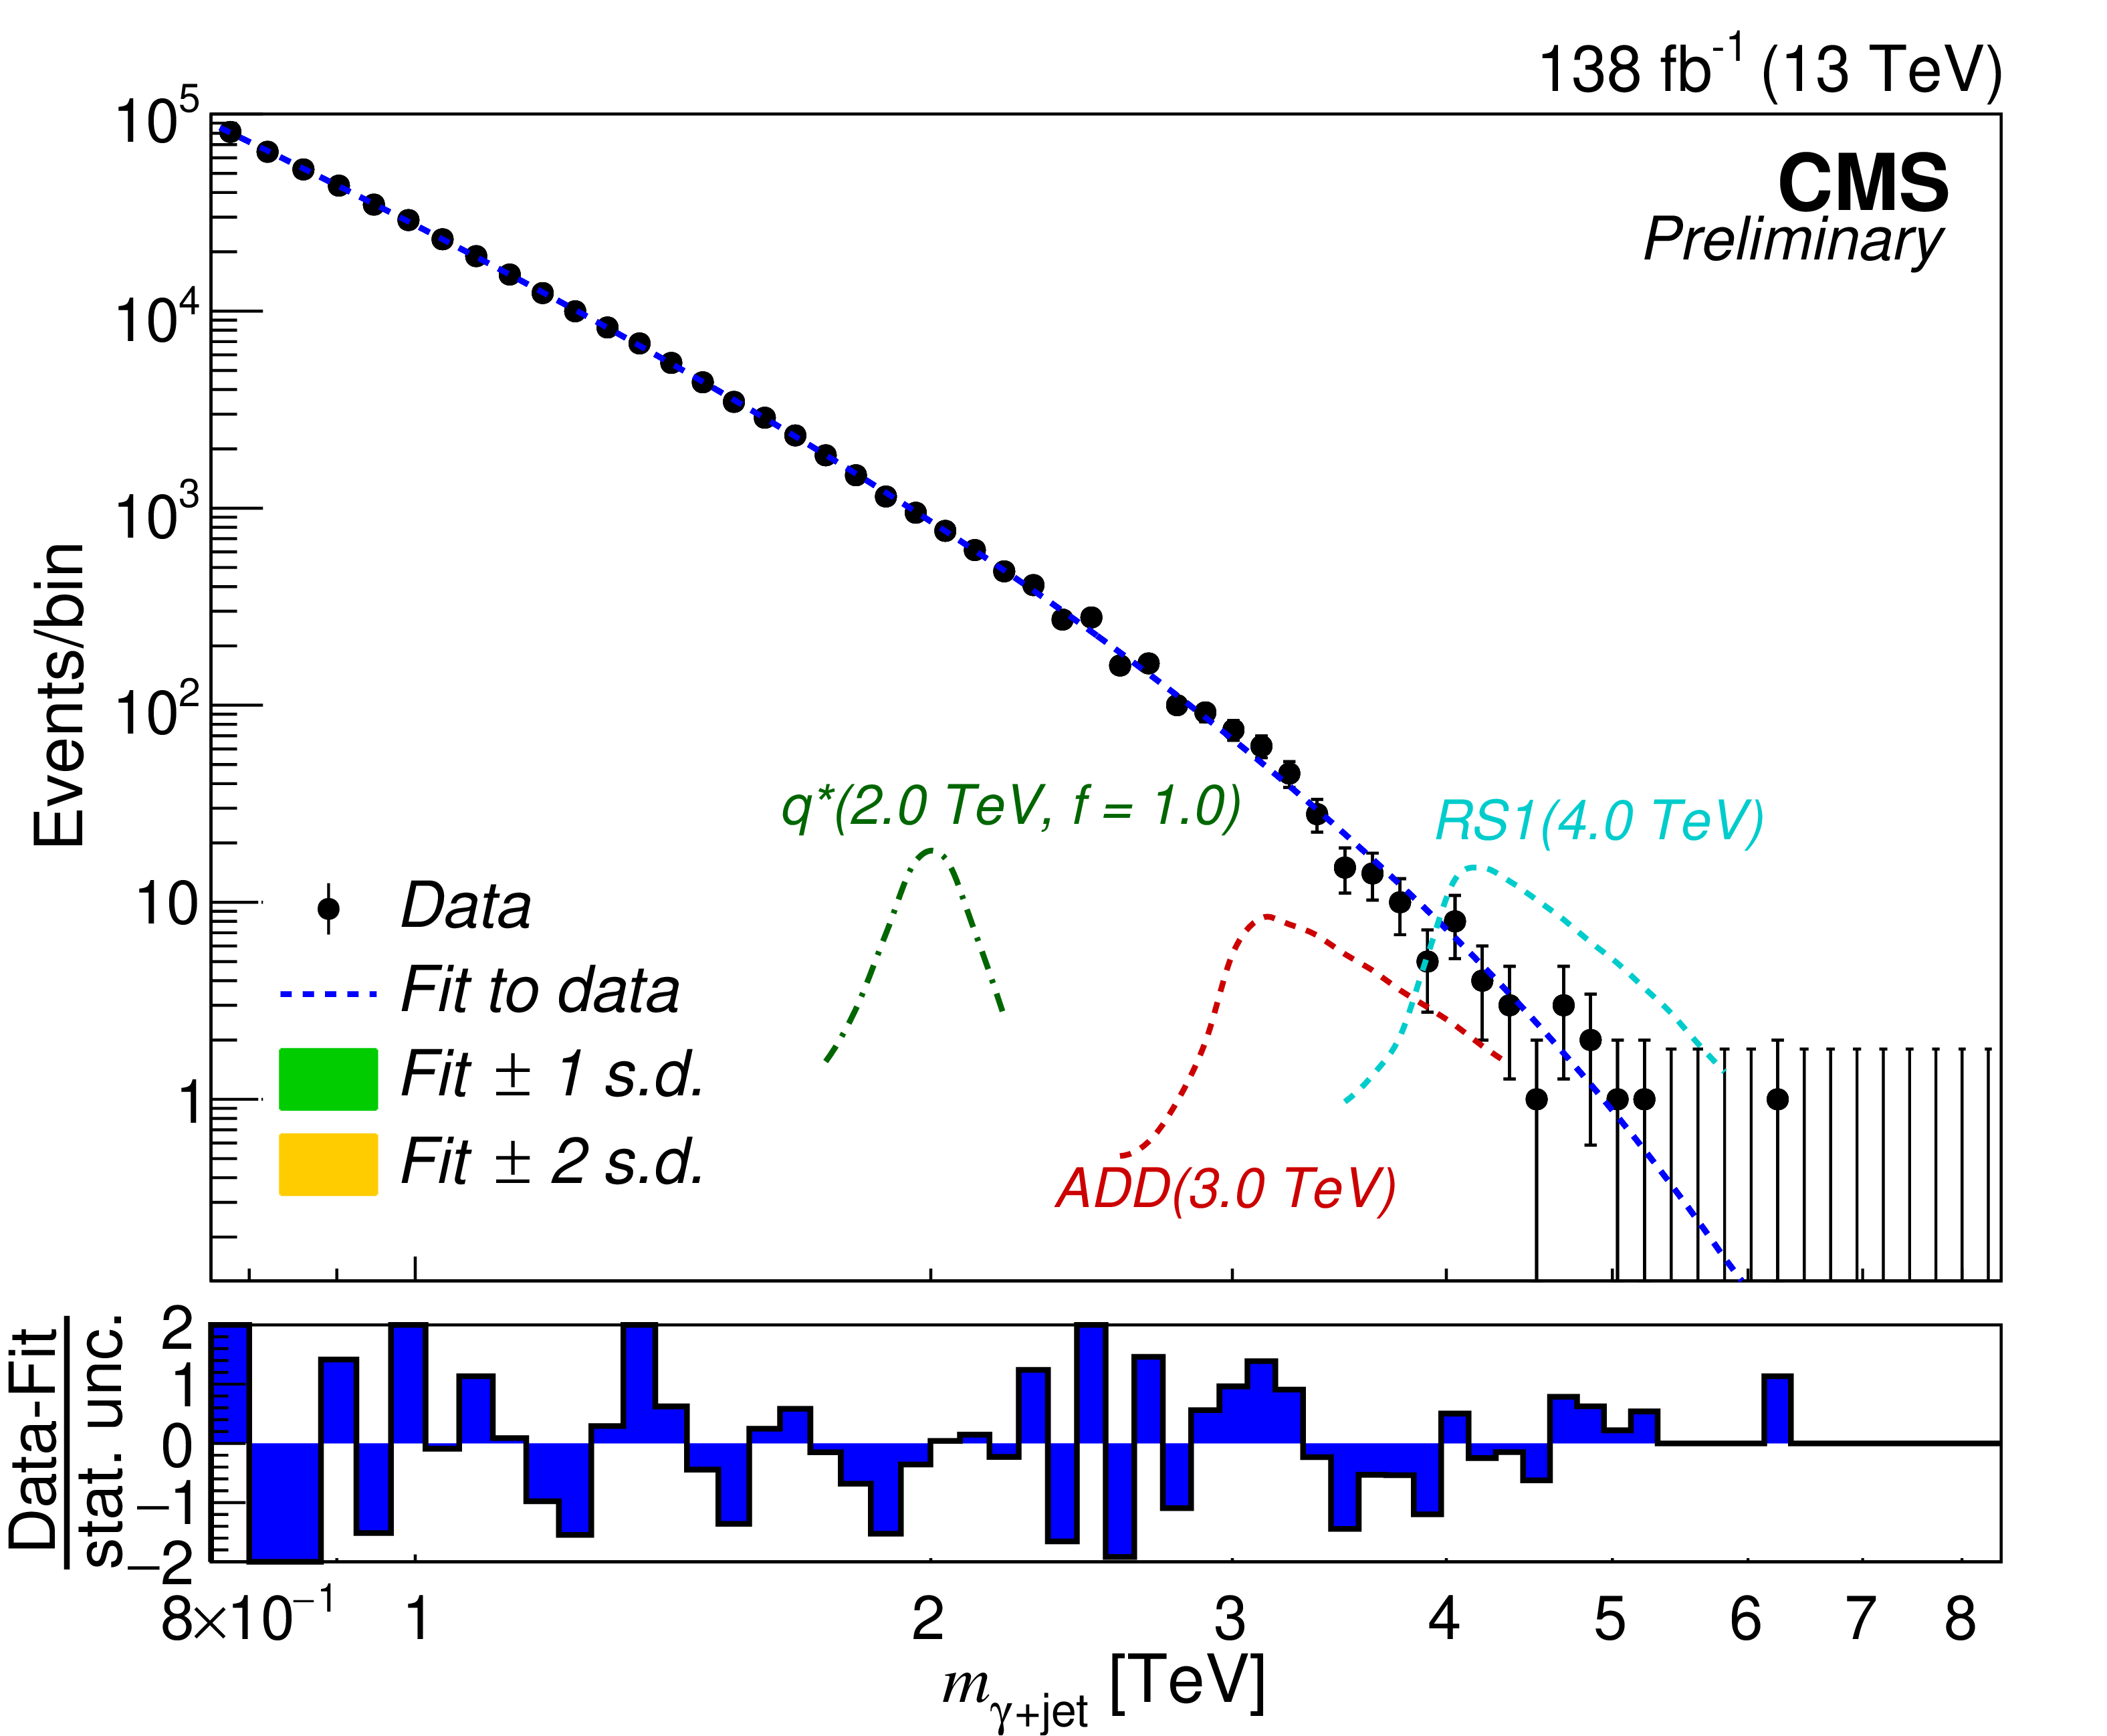
Figure 5:
Fit to the $ \gamma $+jet invariant mass distribution in data with Eq. 2 for the "inclusive" category of $ {\mathrm{q}^\star} $ and QBH with final selection is shown. Simulations of the $ {\mathrm{q}^\star} $ signal with 2 TeV mass and coupling $ f = $ 1.0, QBH ADD model with $ M_\text{th}= $ 3 TeV, and RS1 model with $ M_\text{th}= $ 4 TeV are also shown. The bottom panel shows the difference between the data yield and background prediction divided by data statistical uncertainty. The green and yellow bands, respectively, represent the 68 and 95% CL statistical uncertainties of the fit. |
png pdf |
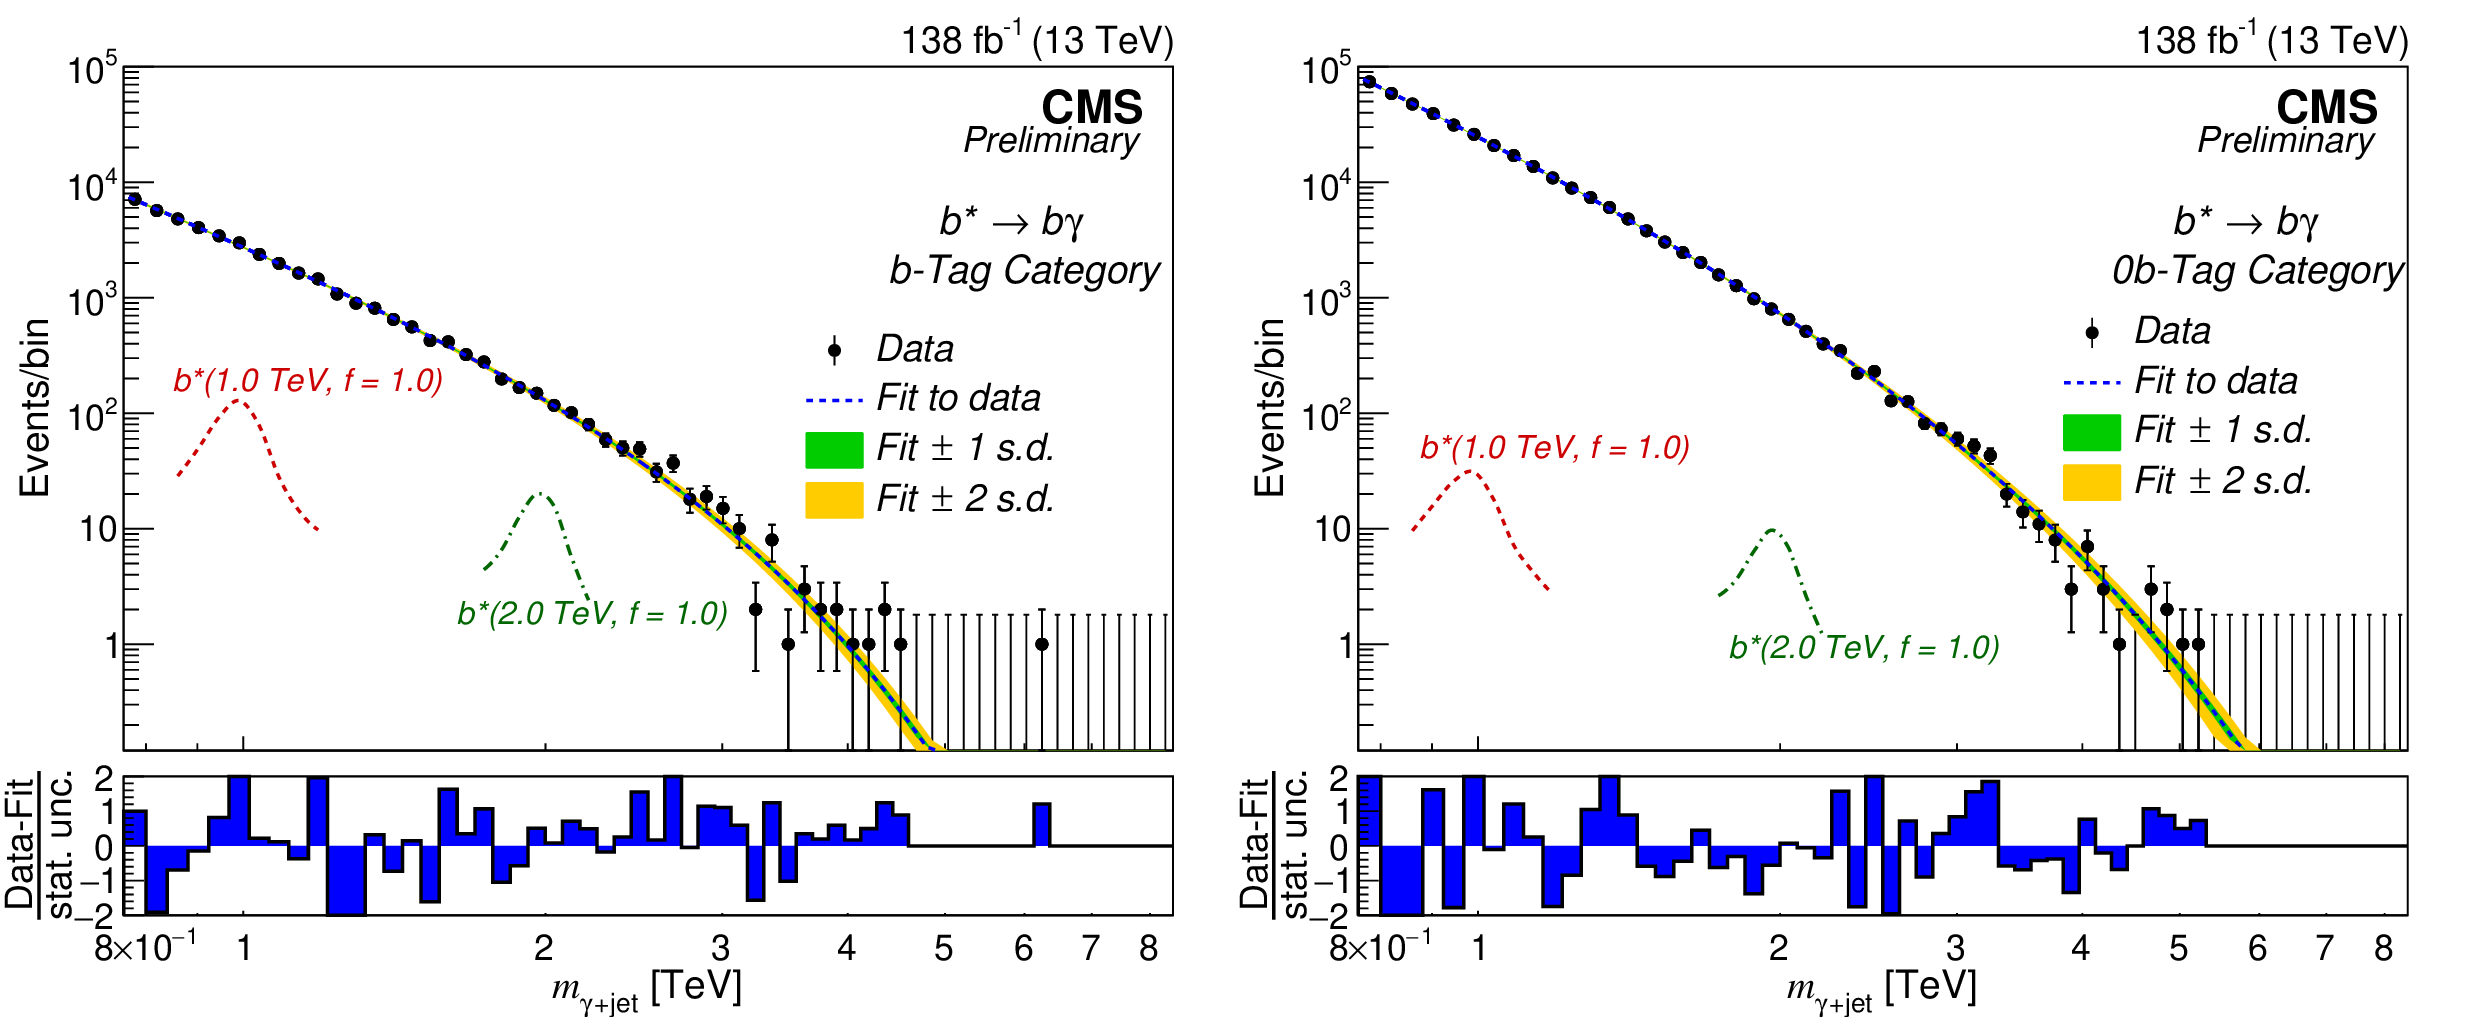
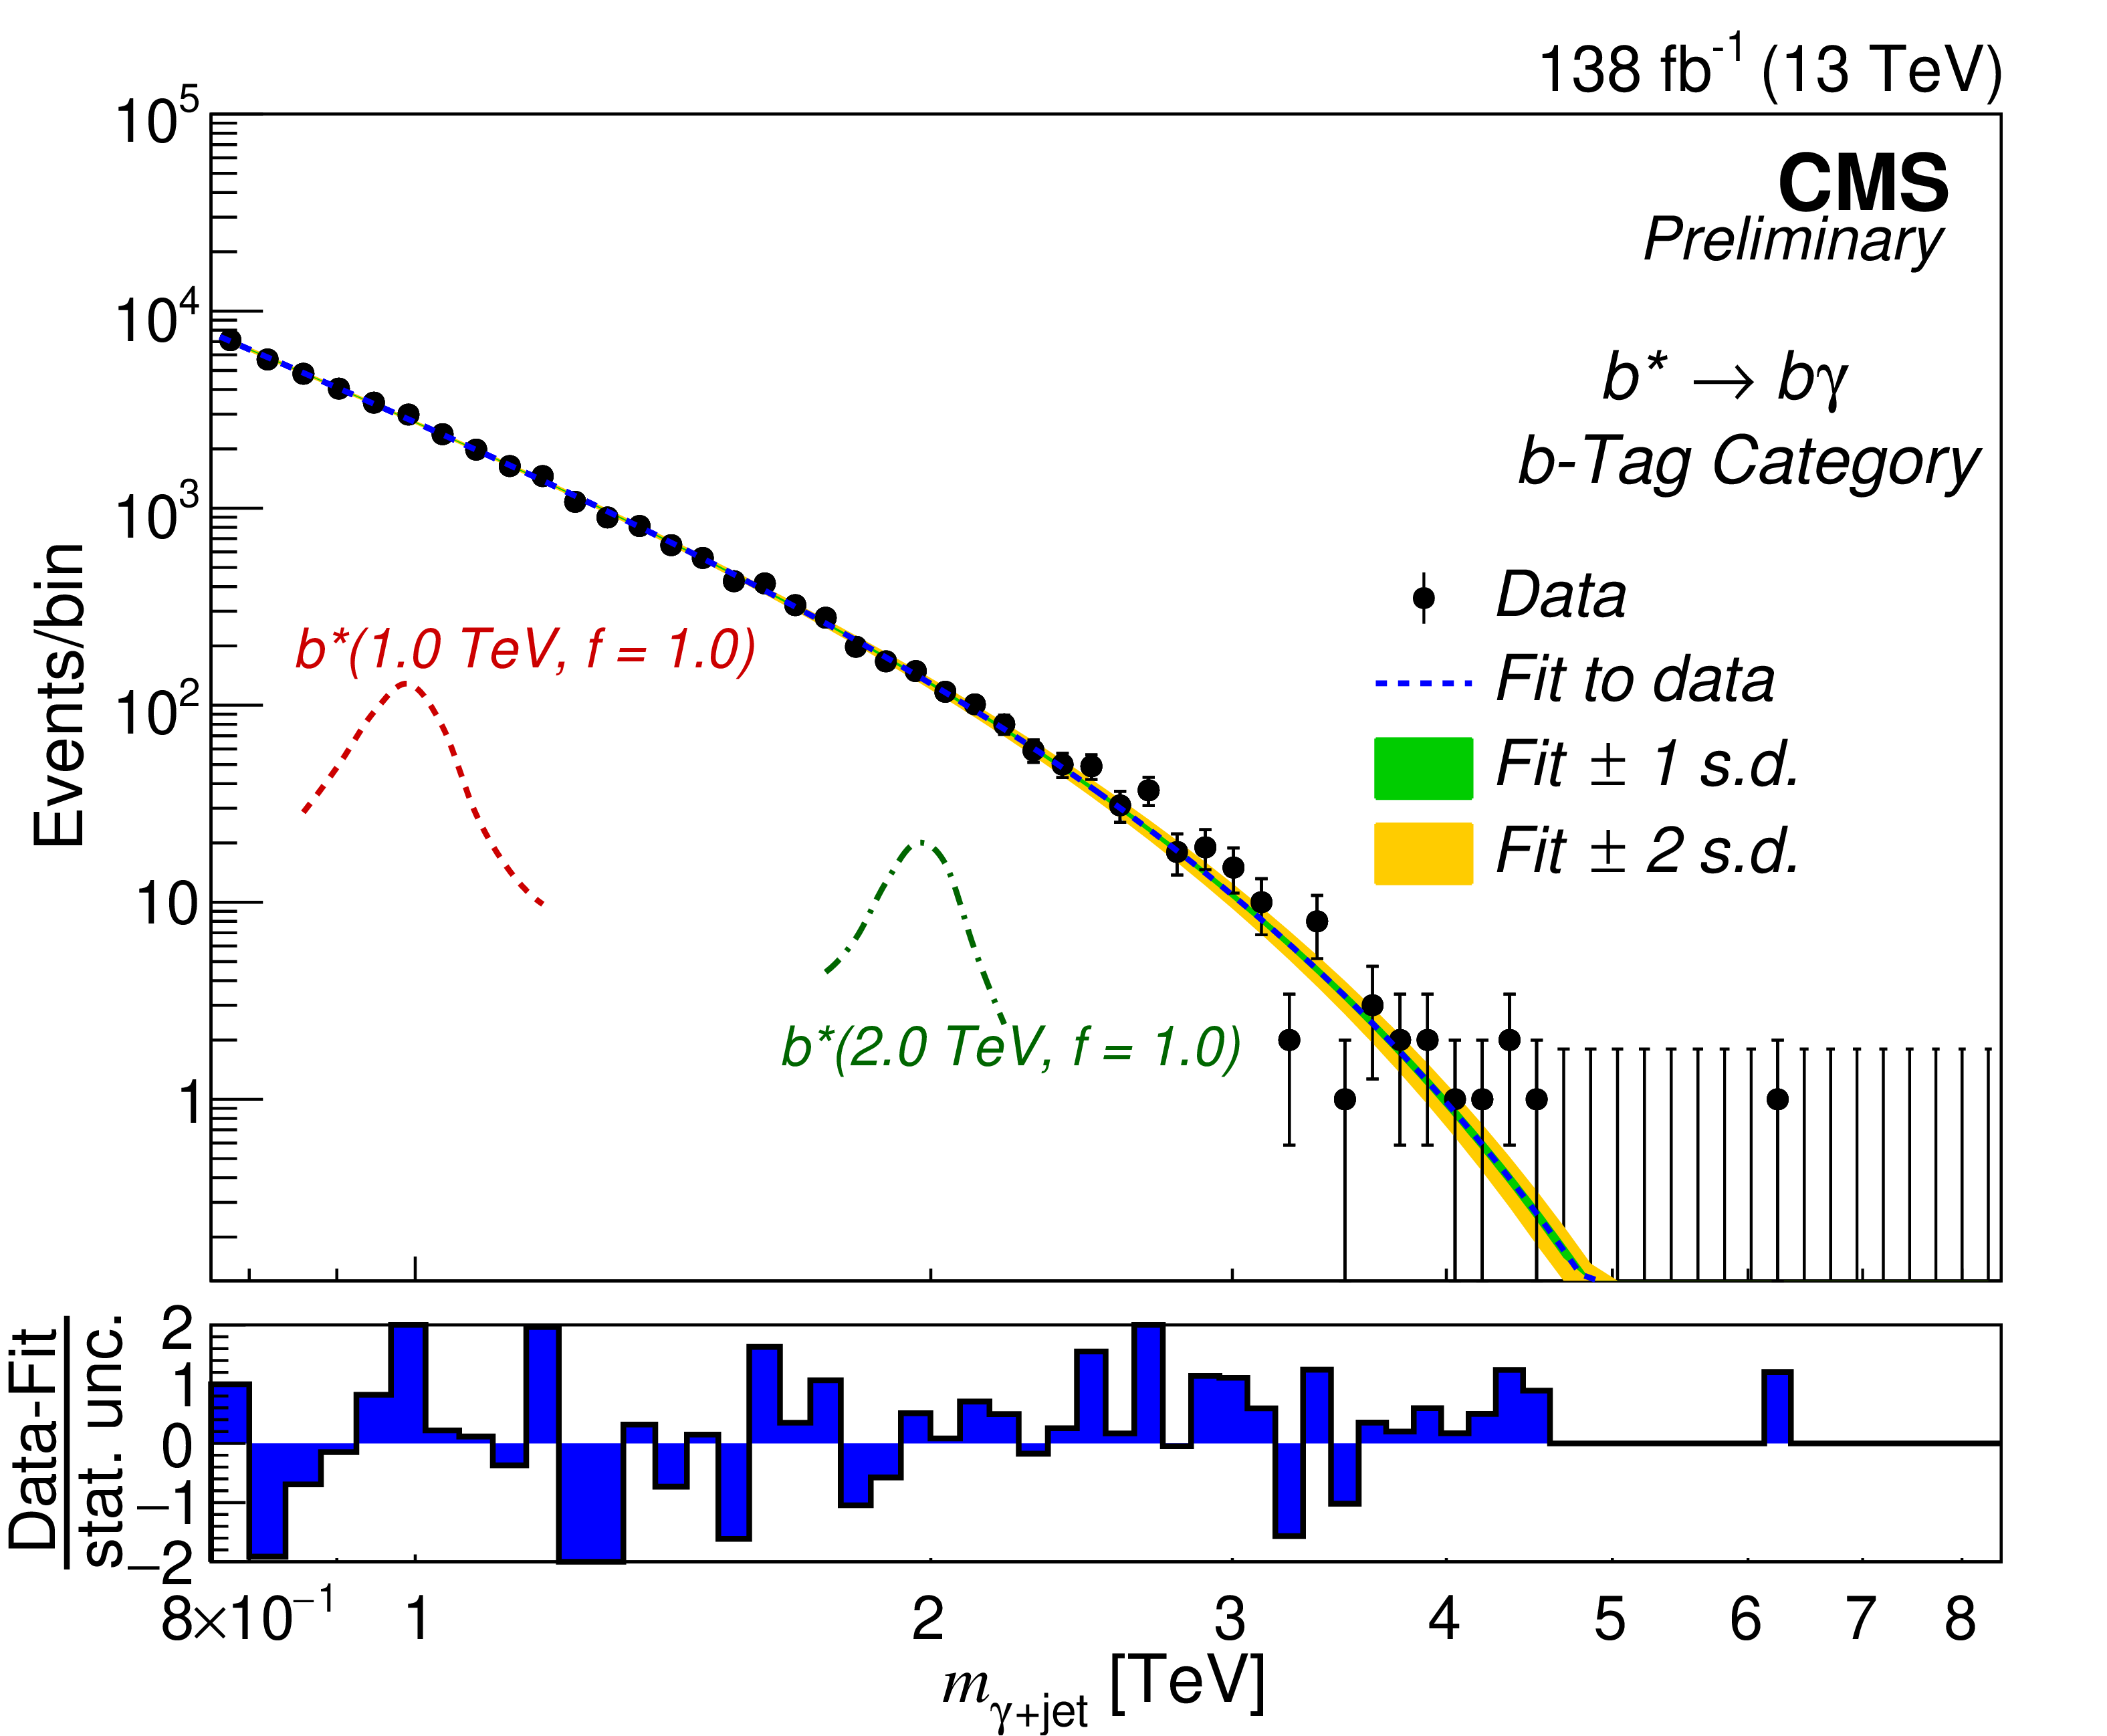
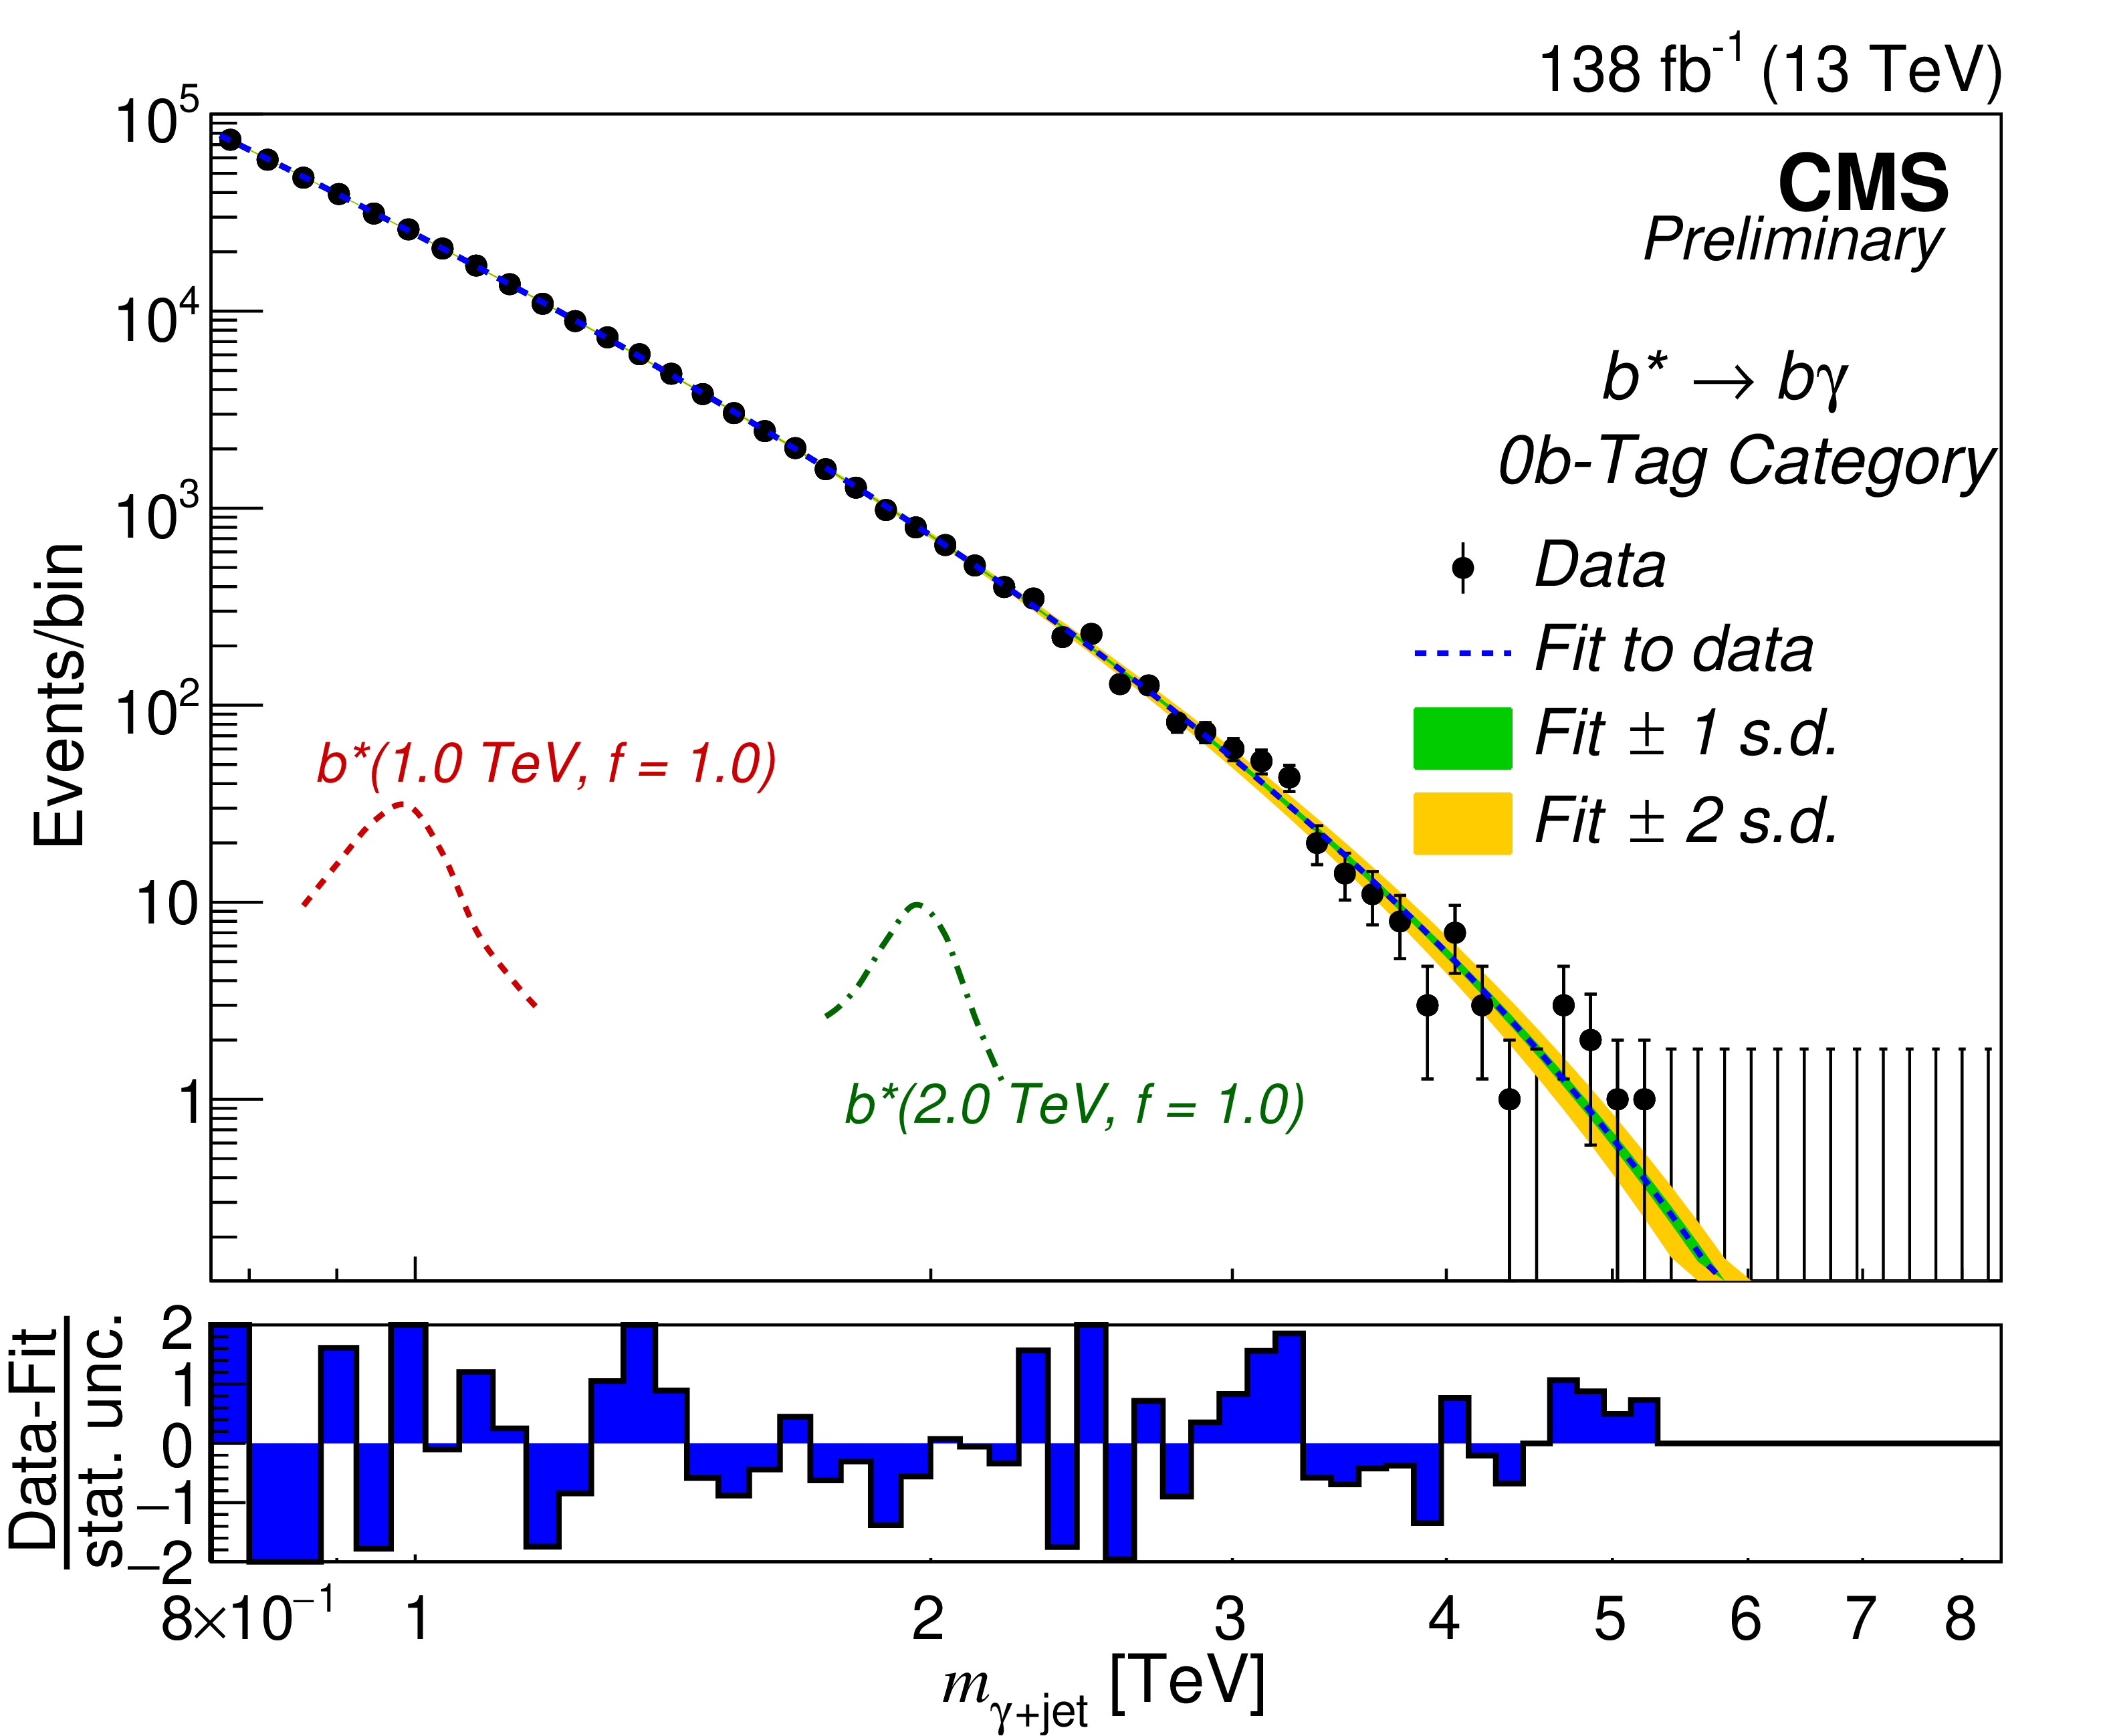
Figure 6:
Fits to the $ \gamma $+jet invariant mass distributions in data with Eq. 2 for the $ {\mathrm{b}^\star} $ selection for the b tag category (left) and 0-b tag category (right) are shown. Simulations of $ {\mathrm{b}^\star} $ signals are shown for the mass values of 1.0 and 2.0 TeV and $ f = $ 1.0. The bottom panel shows the difference between the data yield and background prediction divided by data statistical uncertainty. The green and yellow bands, respectively, represent the 68 and 95% CL statistical uncertainties of the fits. |
png pdf |
Figure 6-a:
Fits to the $ \gamma $+jet invariant mass distributions in data with Eq. 2 for the $ {\mathrm{b}^\star} $ selection for the b tag category (left) and 0-b tag category (right) are shown. Simulations of $ {\mathrm{b}^\star} $ signals are shown for the mass values of 1.0 and 2.0 TeV and $ f = $ 1.0. The bottom panel shows the difference between the data yield and background prediction divided by data statistical uncertainty. The green and yellow bands, respectively, represent the 68 and 95% CL statistical uncertainties of the fits. |
png pdf |
Figure 6-b:
Fits to the $ \gamma $+jet invariant mass distributions in data with Eq. 2 for the $ {\mathrm{b}^\star} $ selection for the b tag category (left) and 0-b tag category (right) are shown. Simulations of $ {\mathrm{b}^\star} $ signals are shown for the mass values of 1.0 and 2.0 TeV and $ f = $ 1.0. The bottom panel shows the difference between the data yield and background prediction divided by data statistical uncertainty. The green and yellow bands, respectively, represent the 68 and 95% CL statistical uncertainties of the fits. |
png pdf |
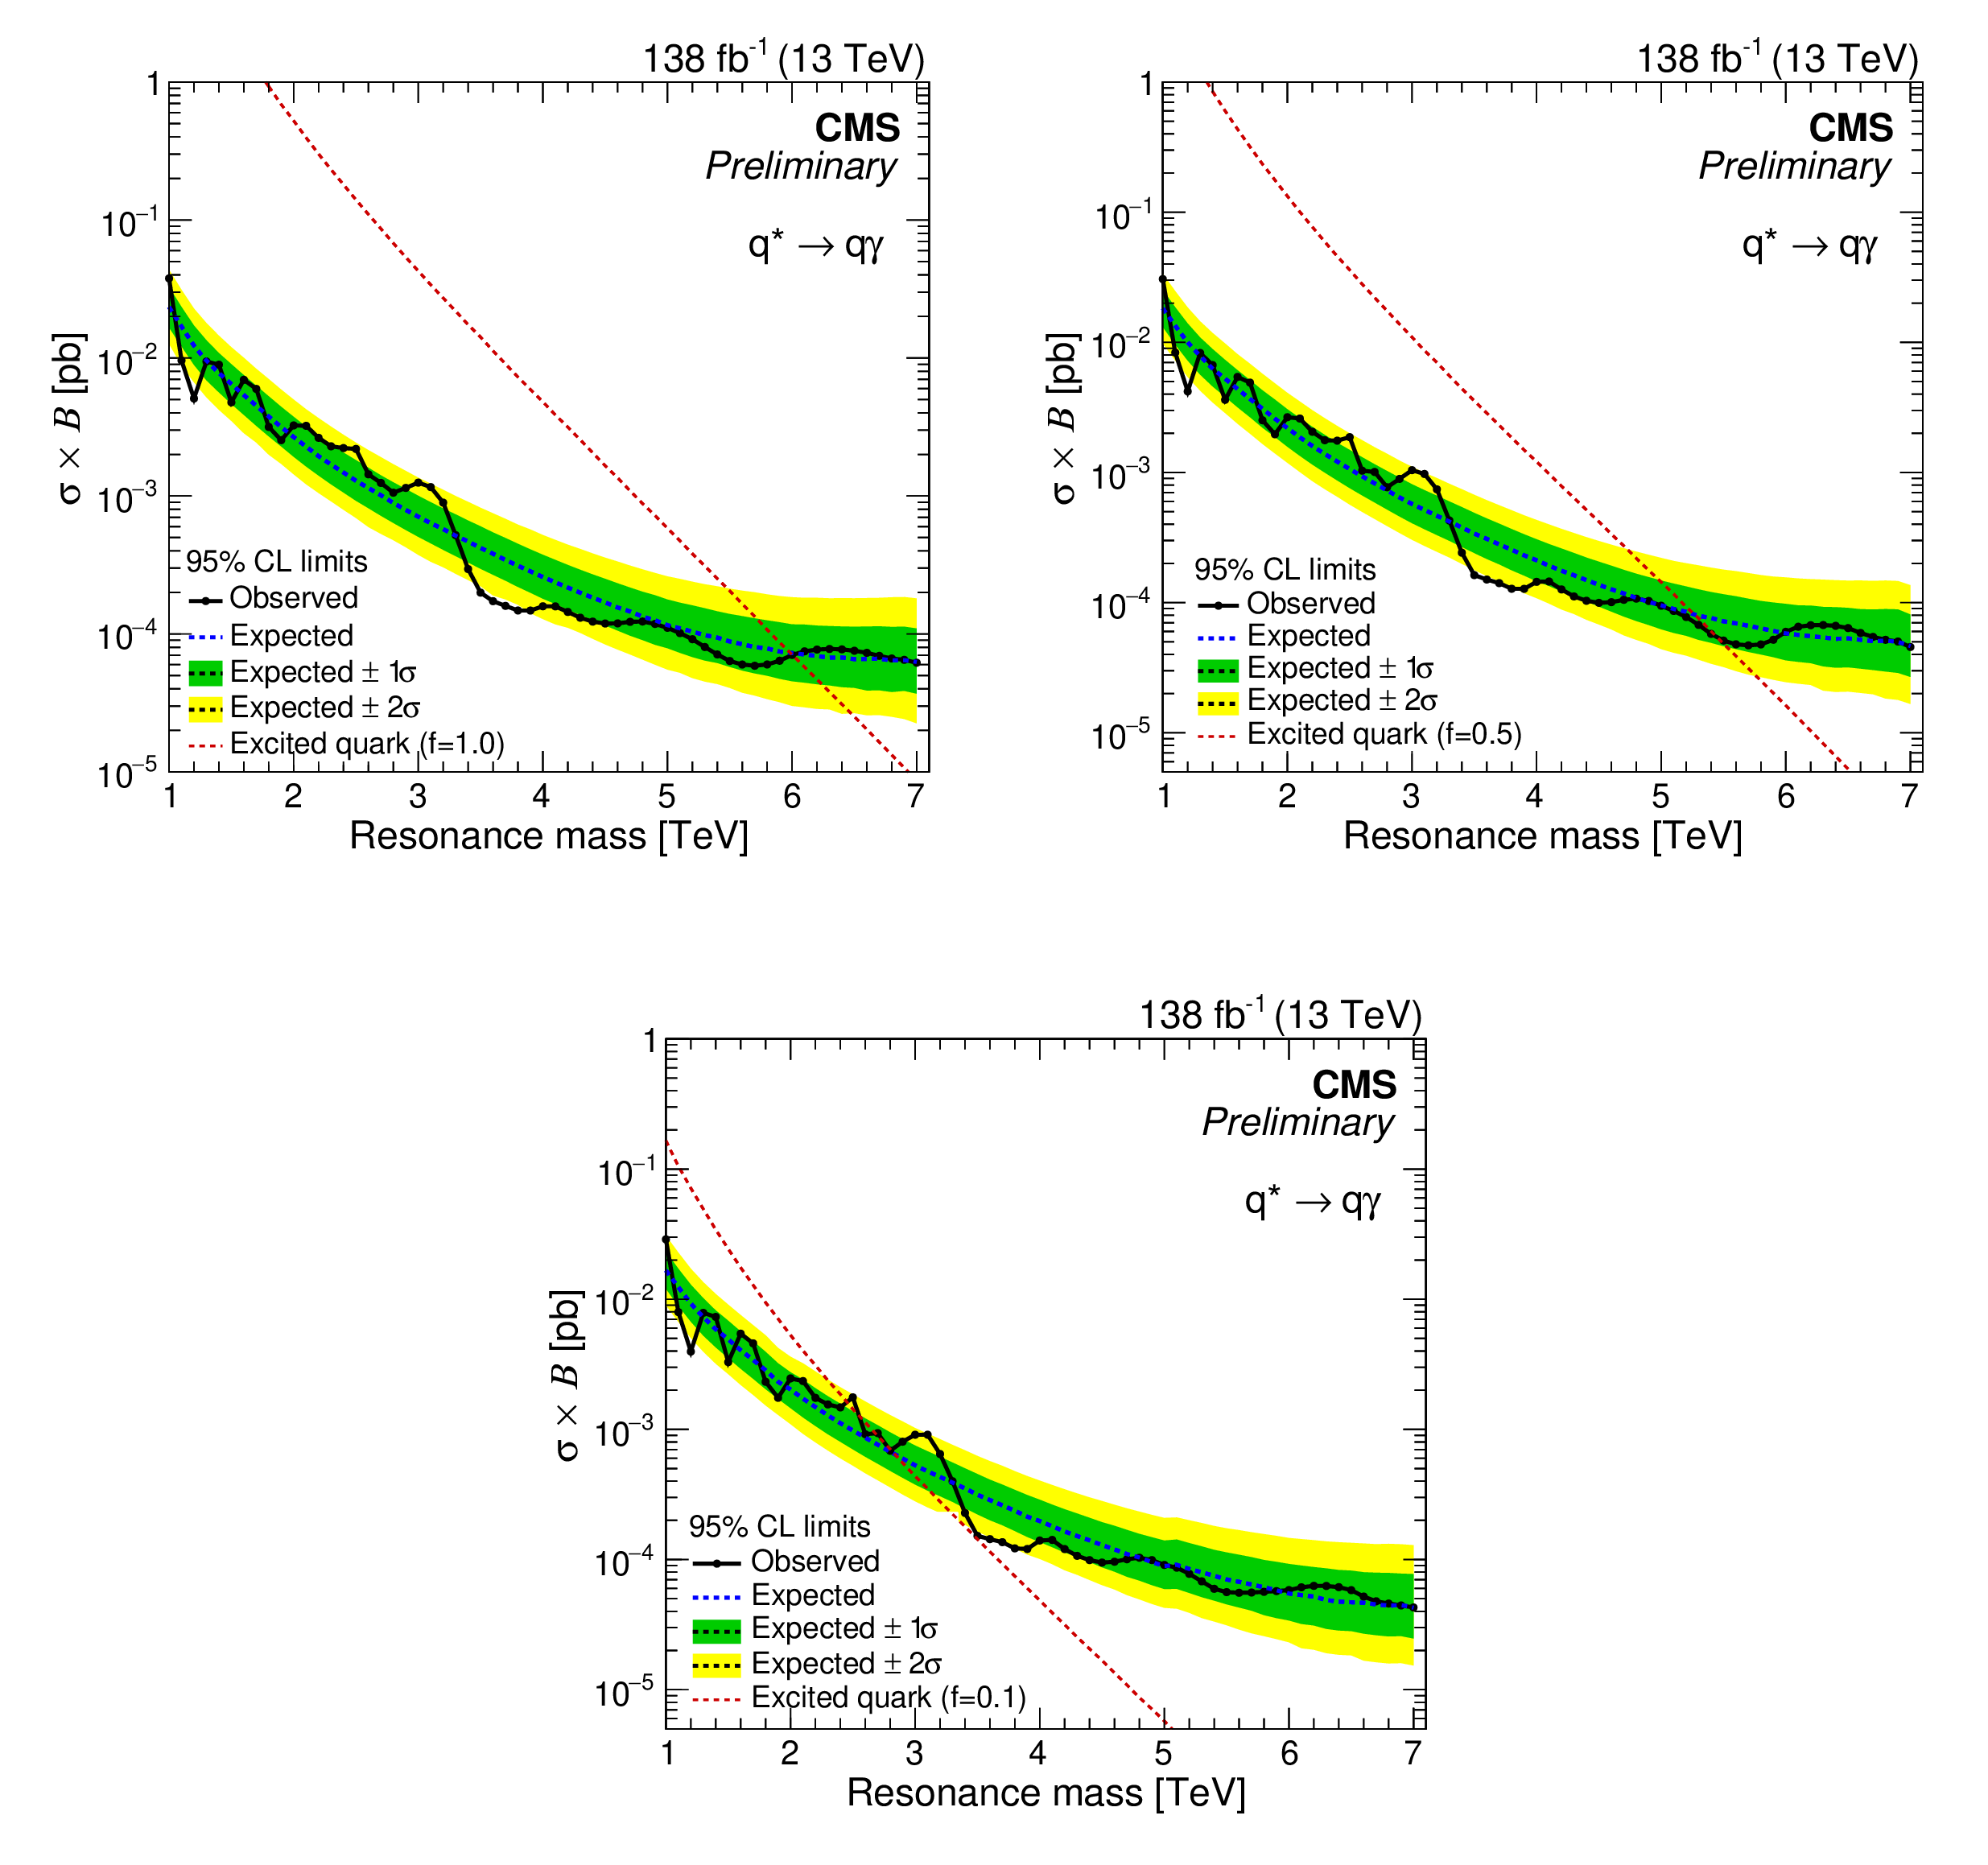
Figure 7:
The expected (dashed) and observed (solid) 95% CL upper limits on $ \sigma\mathcal{B} $ as a function of the $ {\mathrm{q}^\star} $ signal mass for coupling strength $ f= $ 1.0 (upper left), and $ f= $ 0.5 (upper right), and $ f= $ 0.1 (lower). The green (inner) and yellow bands (outer) corresponds to 1 and 2 standard deviation uncertainties in the expected limit. The limits are compared with theoretical predictions for $ {\mathrm{q}^\star} $ production for the corresponding coupling strengths. |
png pdf |
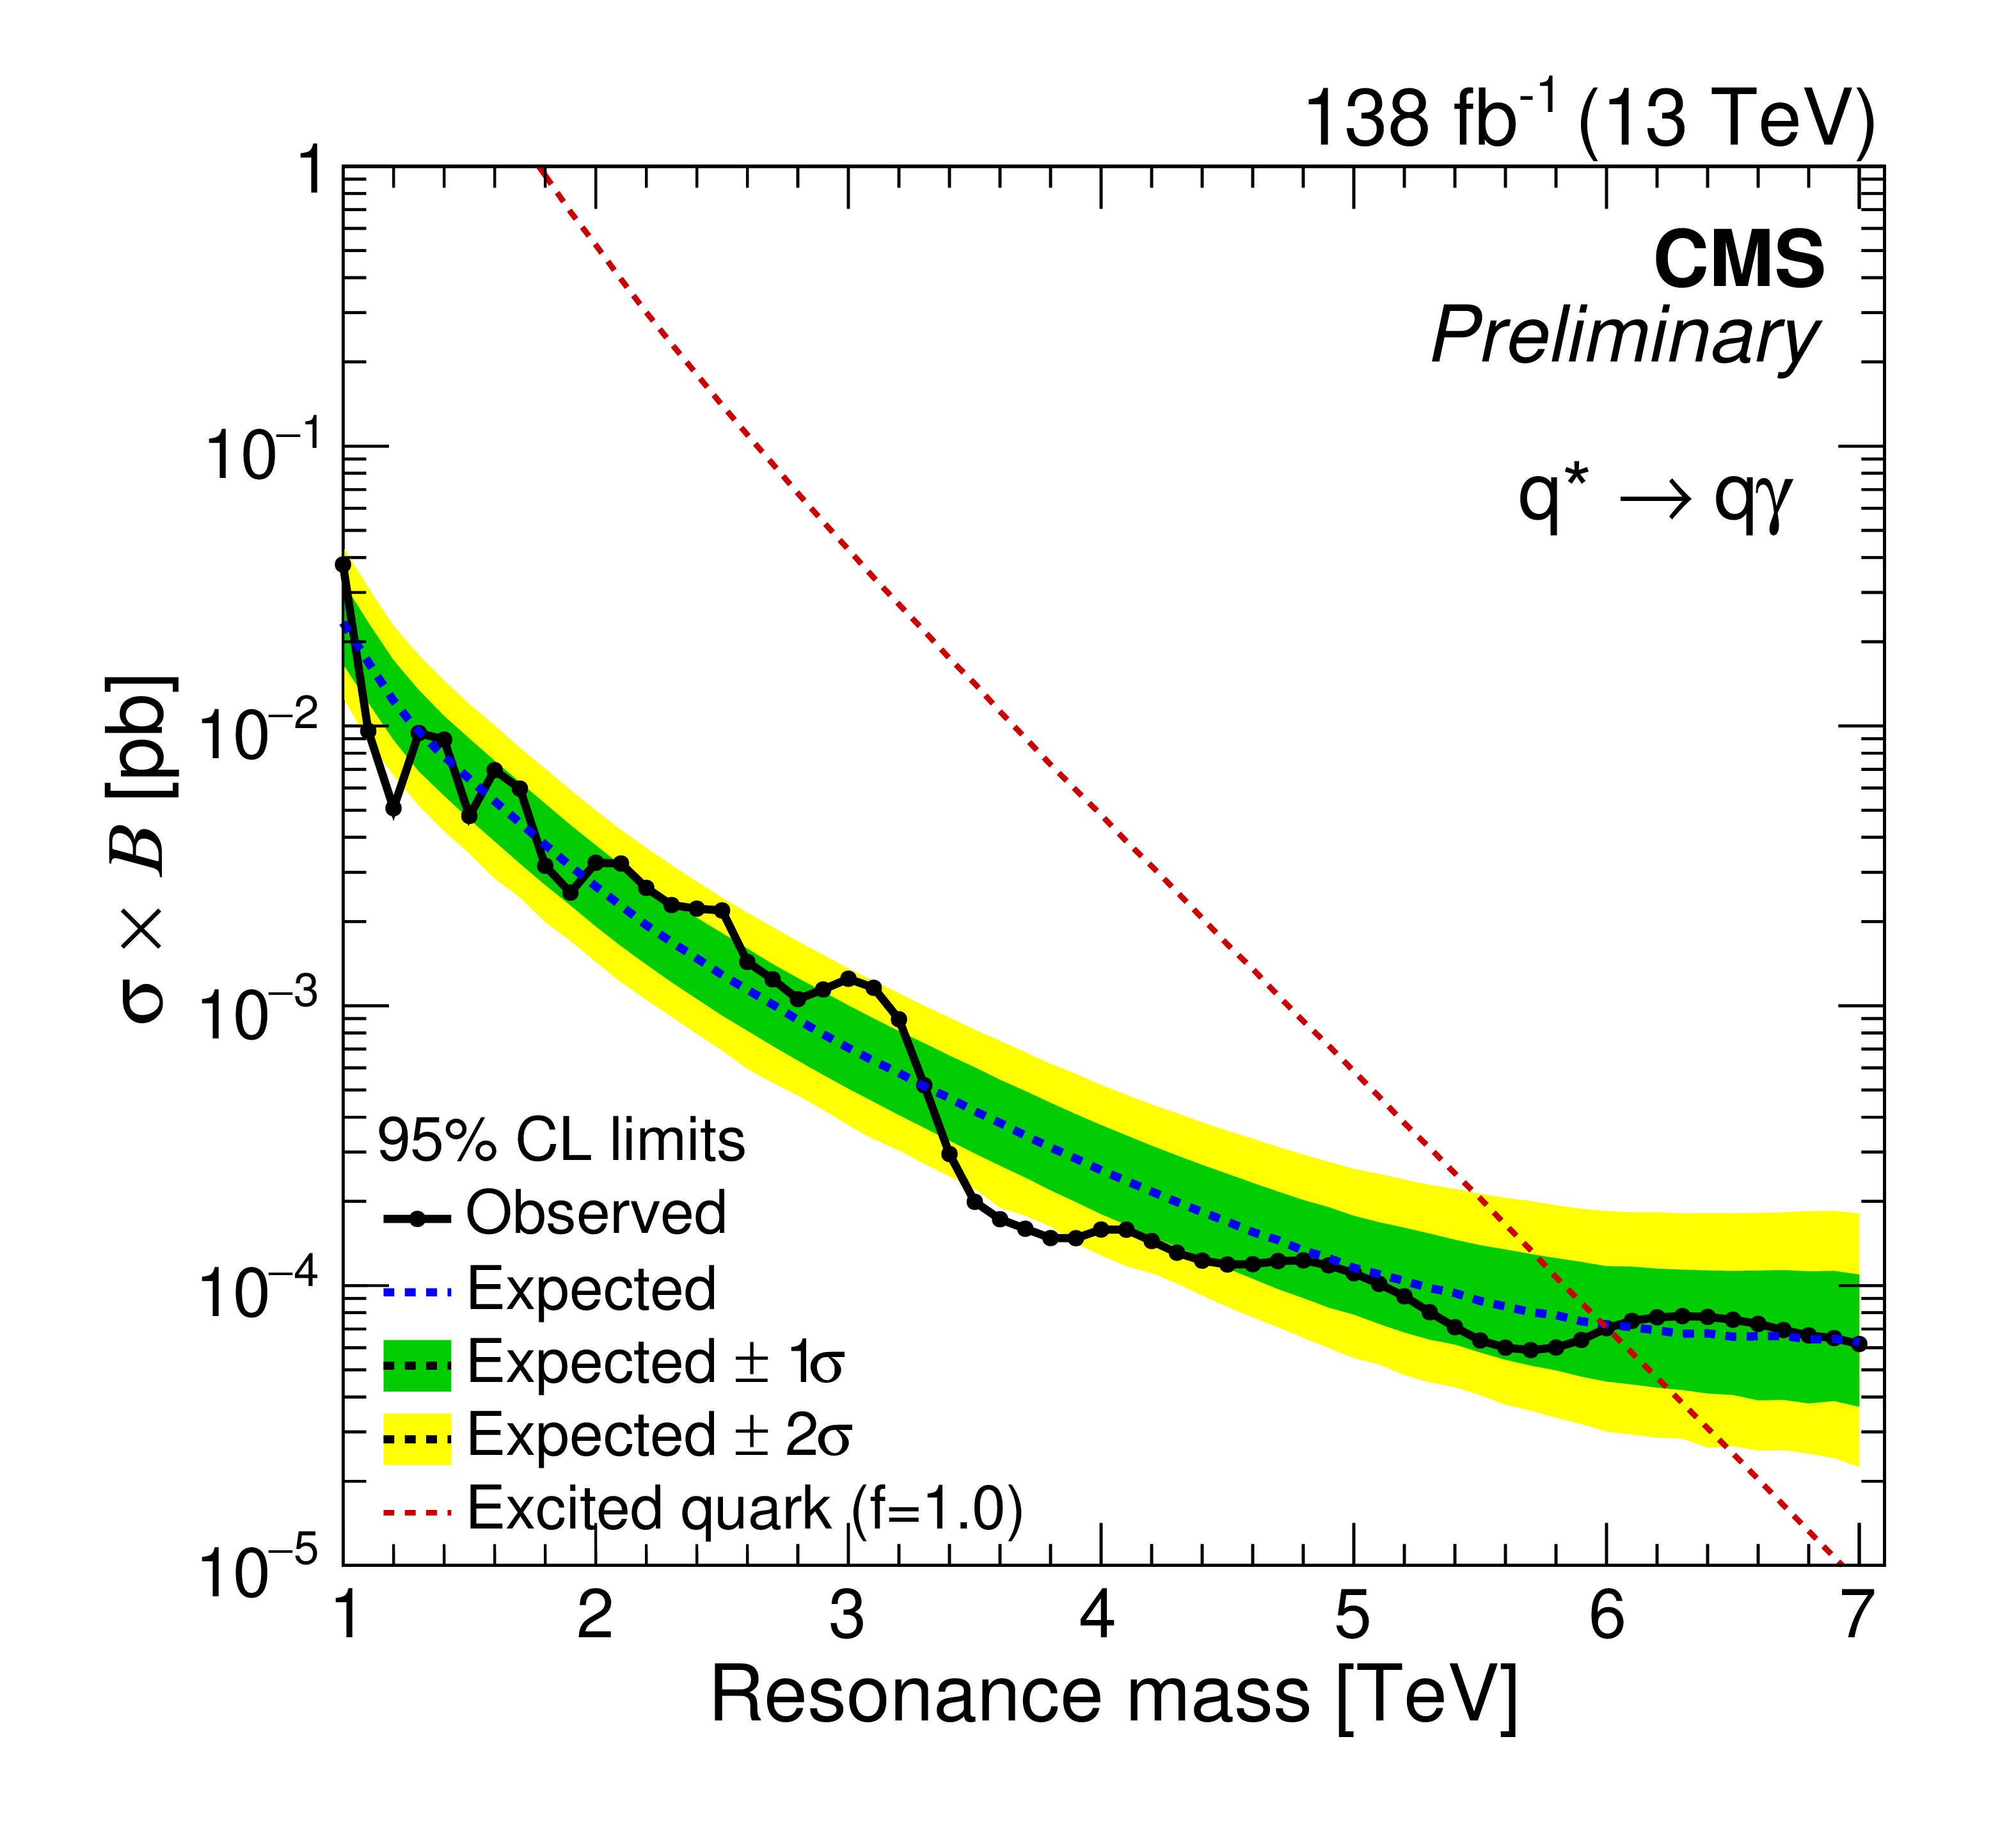
Figure 7-a:
The expected (dashed) and observed (solid) 95% CL upper limits on $ \sigma\mathcal{B} $ as a function of the $ {\mathrm{q}^\star} $ signal mass for coupling strength $ f= $ 1.0 (upper left), and $ f= $ 0.5 (upper right), and $ f= $ 0.1 (lower). The green (inner) and yellow bands (outer) corresponds to 1 and 2 standard deviation uncertainties in the expected limit. The limits are compared with theoretical predictions for $ {\mathrm{q}^\star} $ production for the corresponding coupling strengths. |
png pdf |
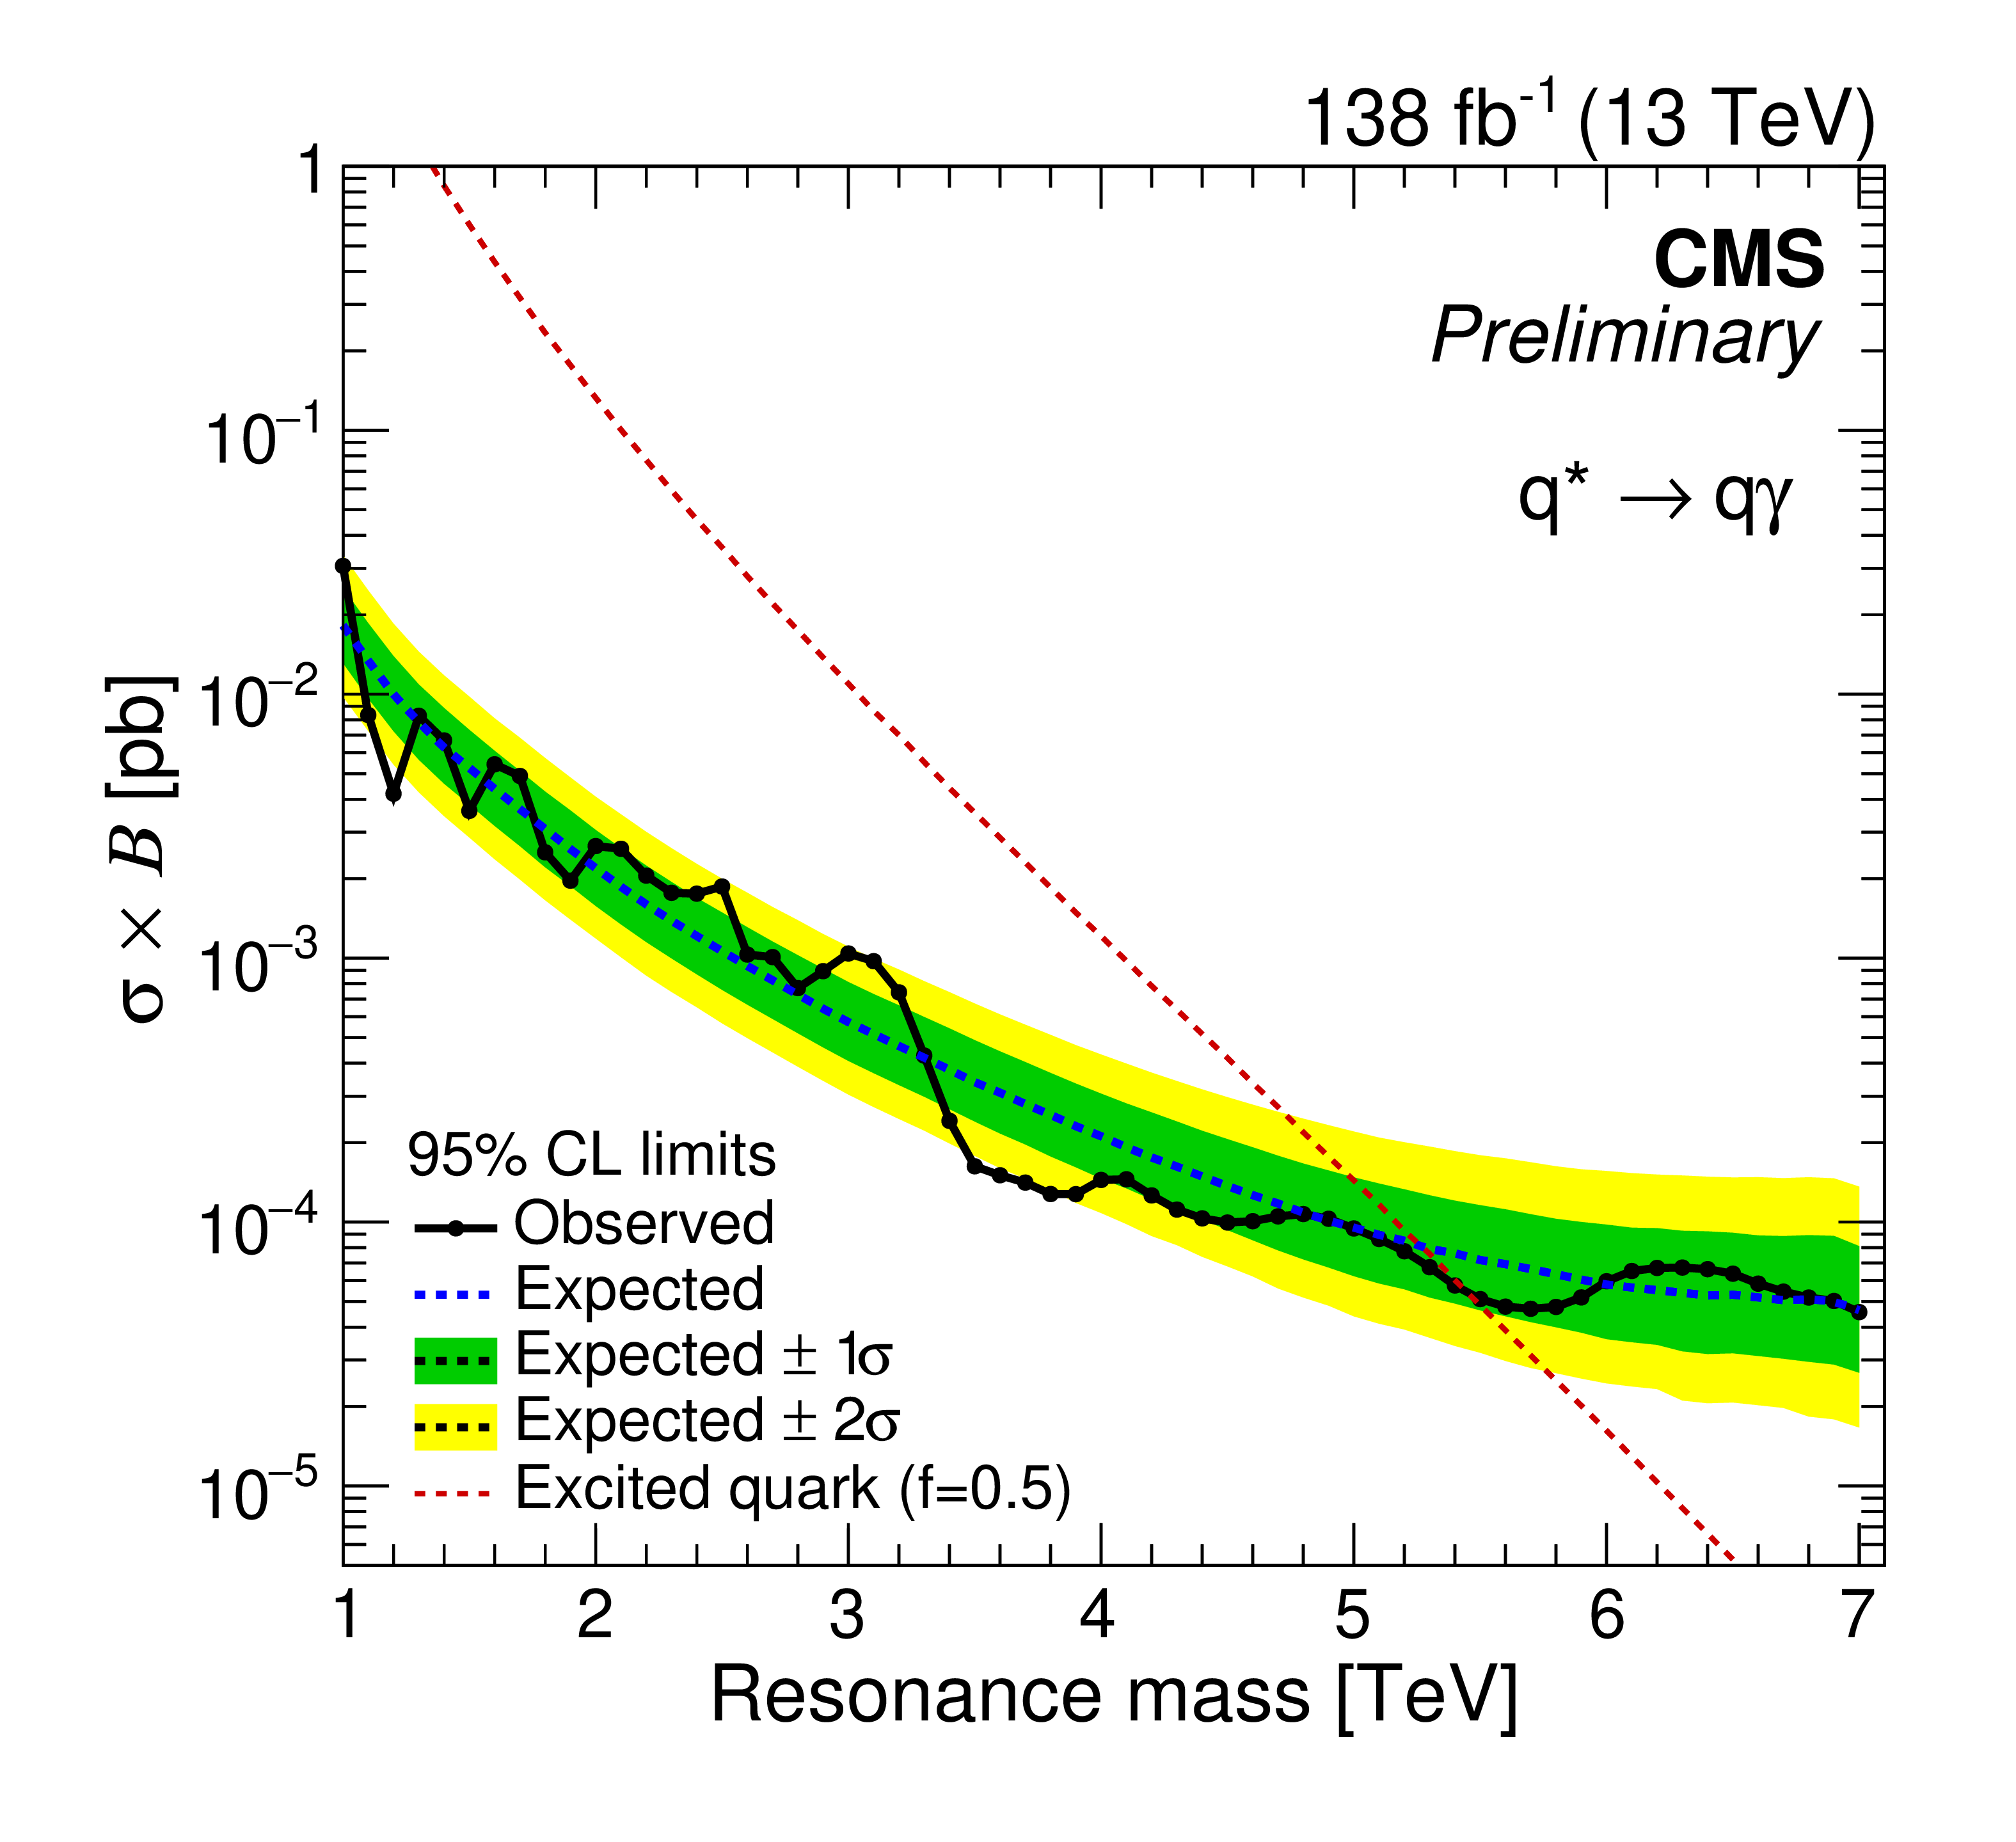
Figure 7-b:
The expected (dashed) and observed (solid) 95% CL upper limits on $ \sigma\mathcal{B} $ as a function of the $ {\mathrm{q}^\star} $ signal mass for coupling strength $ f= $ 1.0 (upper left), and $ f= $ 0.5 (upper right), and $ f= $ 0.1 (lower). The green (inner) and yellow bands (outer) corresponds to 1 and 2 standard deviation uncertainties in the expected limit. The limits are compared with theoretical predictions for $ {\mathrm{q}^\star} $ production for the corresponding coupling strengths. |

png pdf |
Figure 7-c:
The expected (dashed) and observed (solid) 95% CL upper limits on $ \sigma\mathcal{B} $ as a function of the $ {\mathrm{q}^\star} $ signal mass for coupling strength $ f= $ 1.0 (upper left), and $ f= $ 0.5 (upper right), and $ f= $ 0.1 (lower). The green (inner) and yellow bands (outer) corresponds to 1 and 2 standard deviation uncertainties in the expected limit. The limits are compared with theoretical predictions for $ {\mathrm{q}^\star} $ production for the corresponding coupling strengths. |
png pdf |
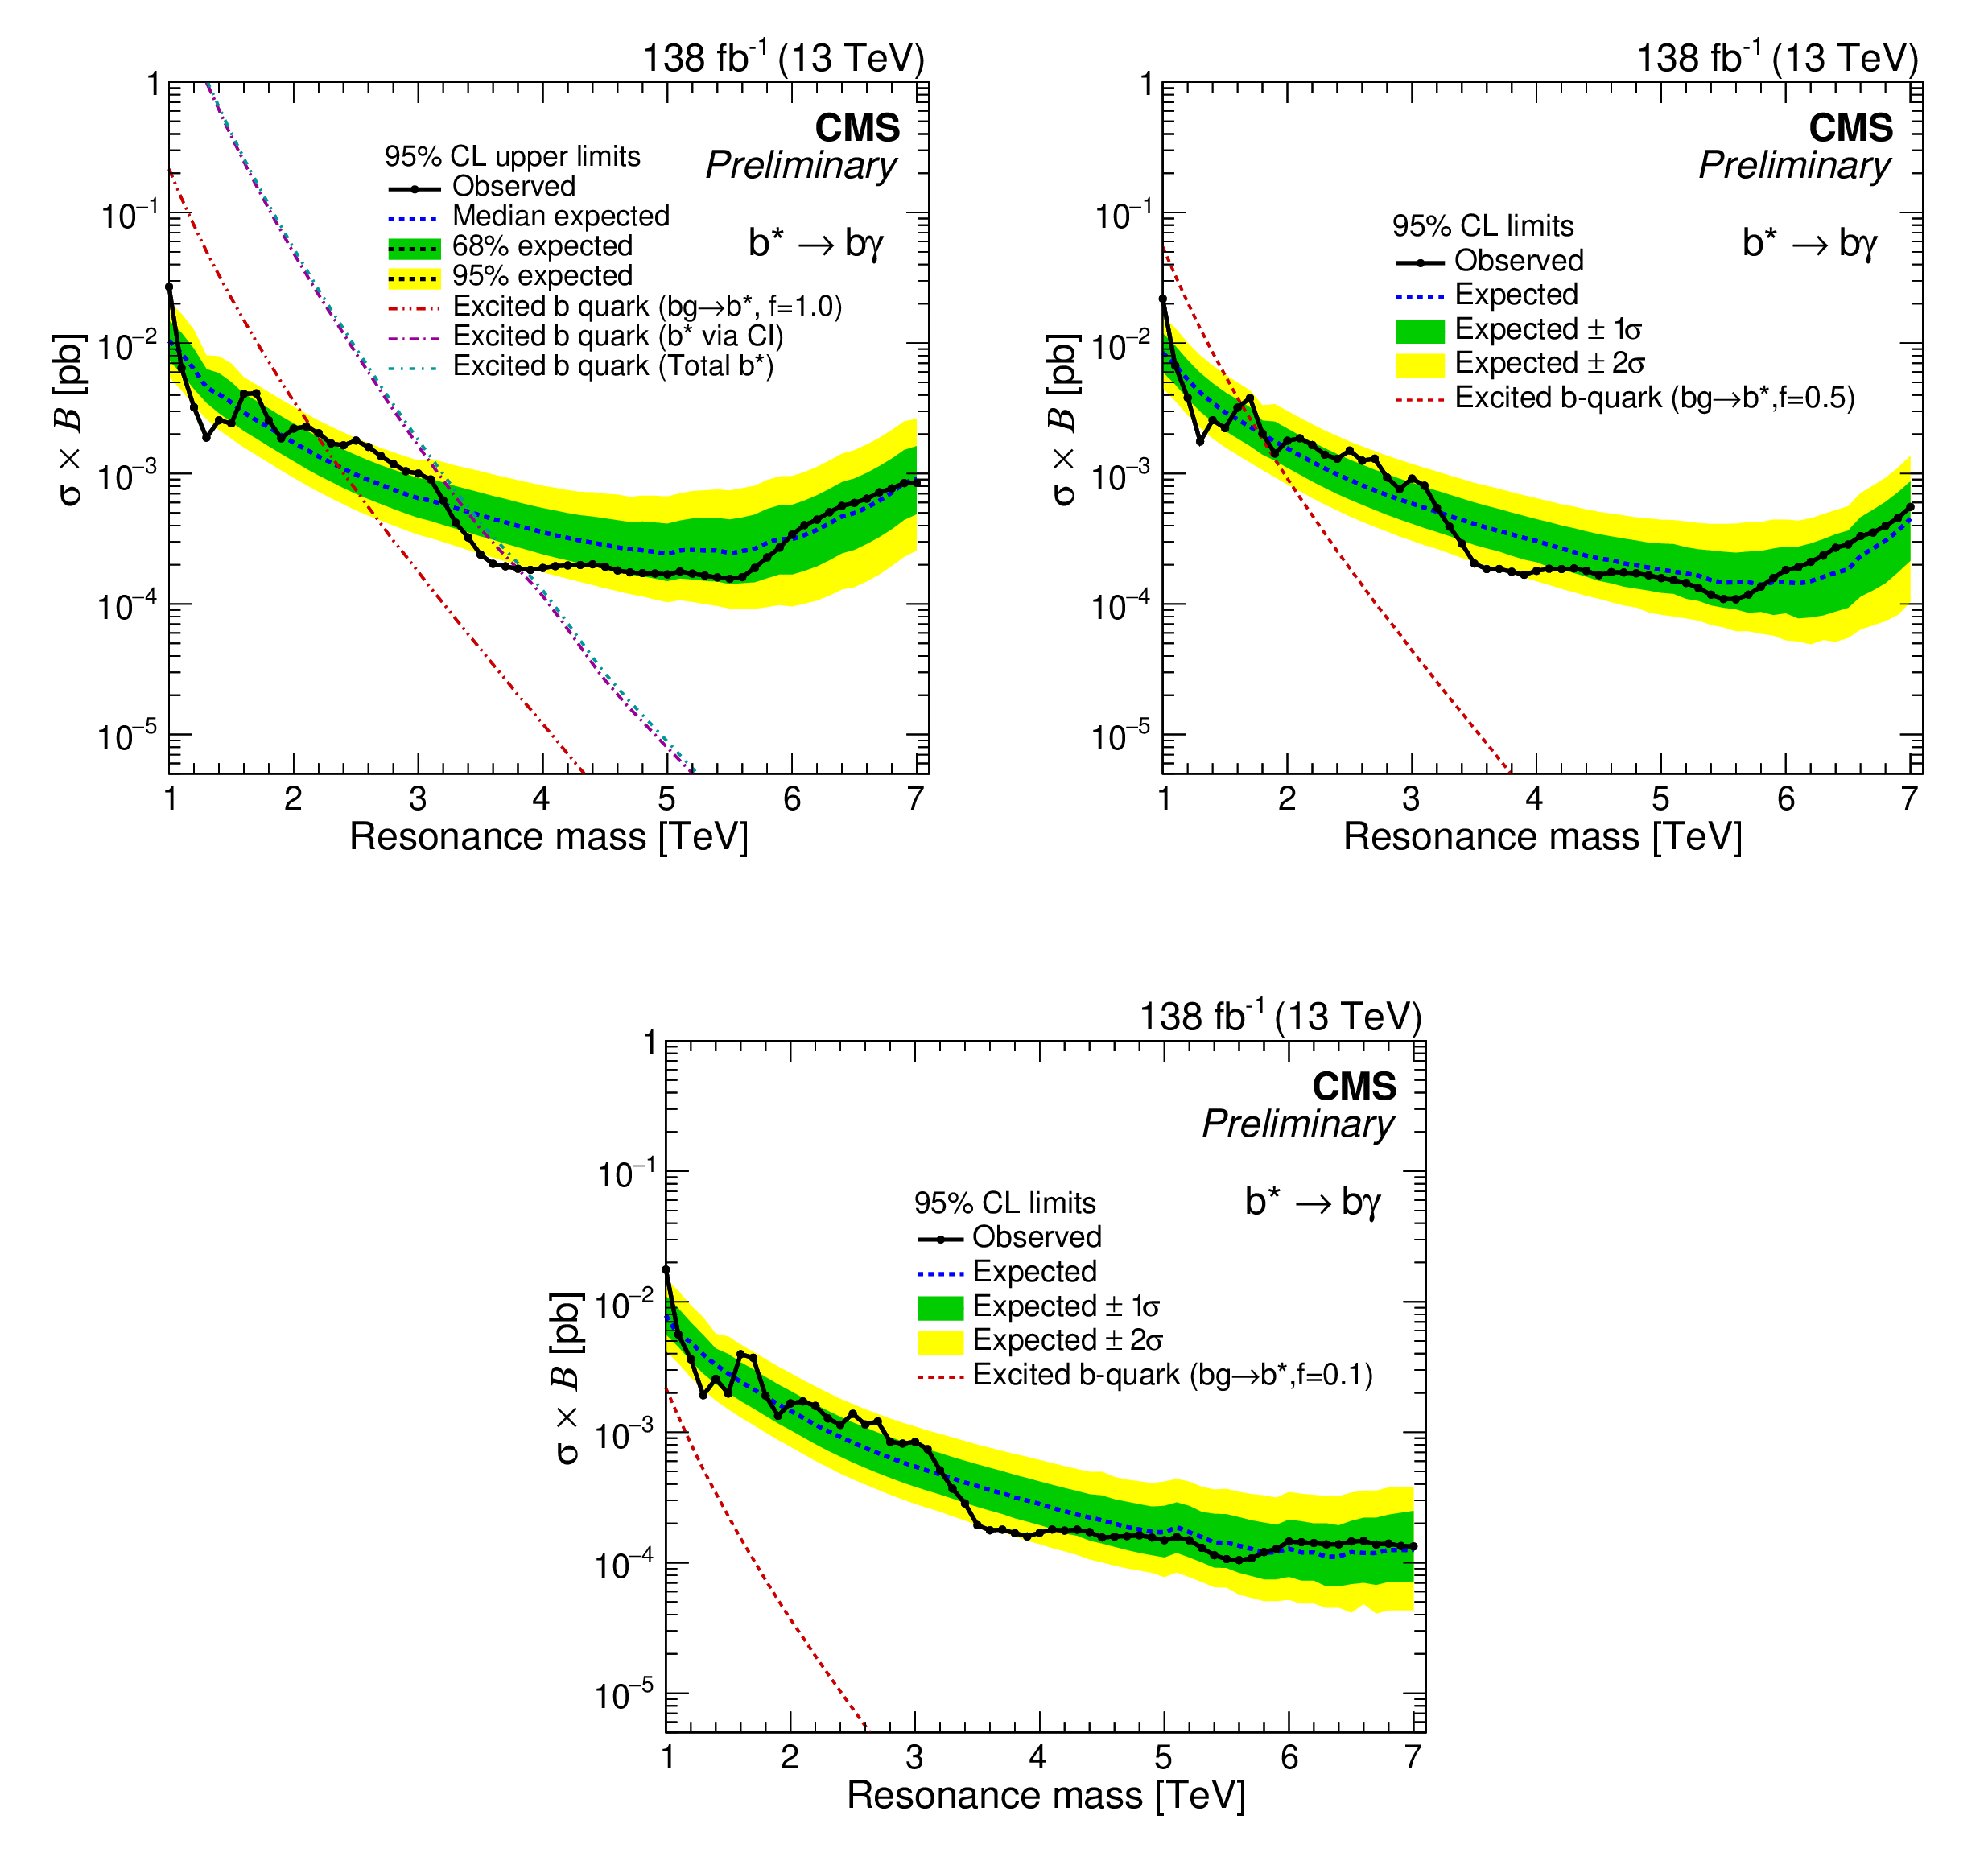
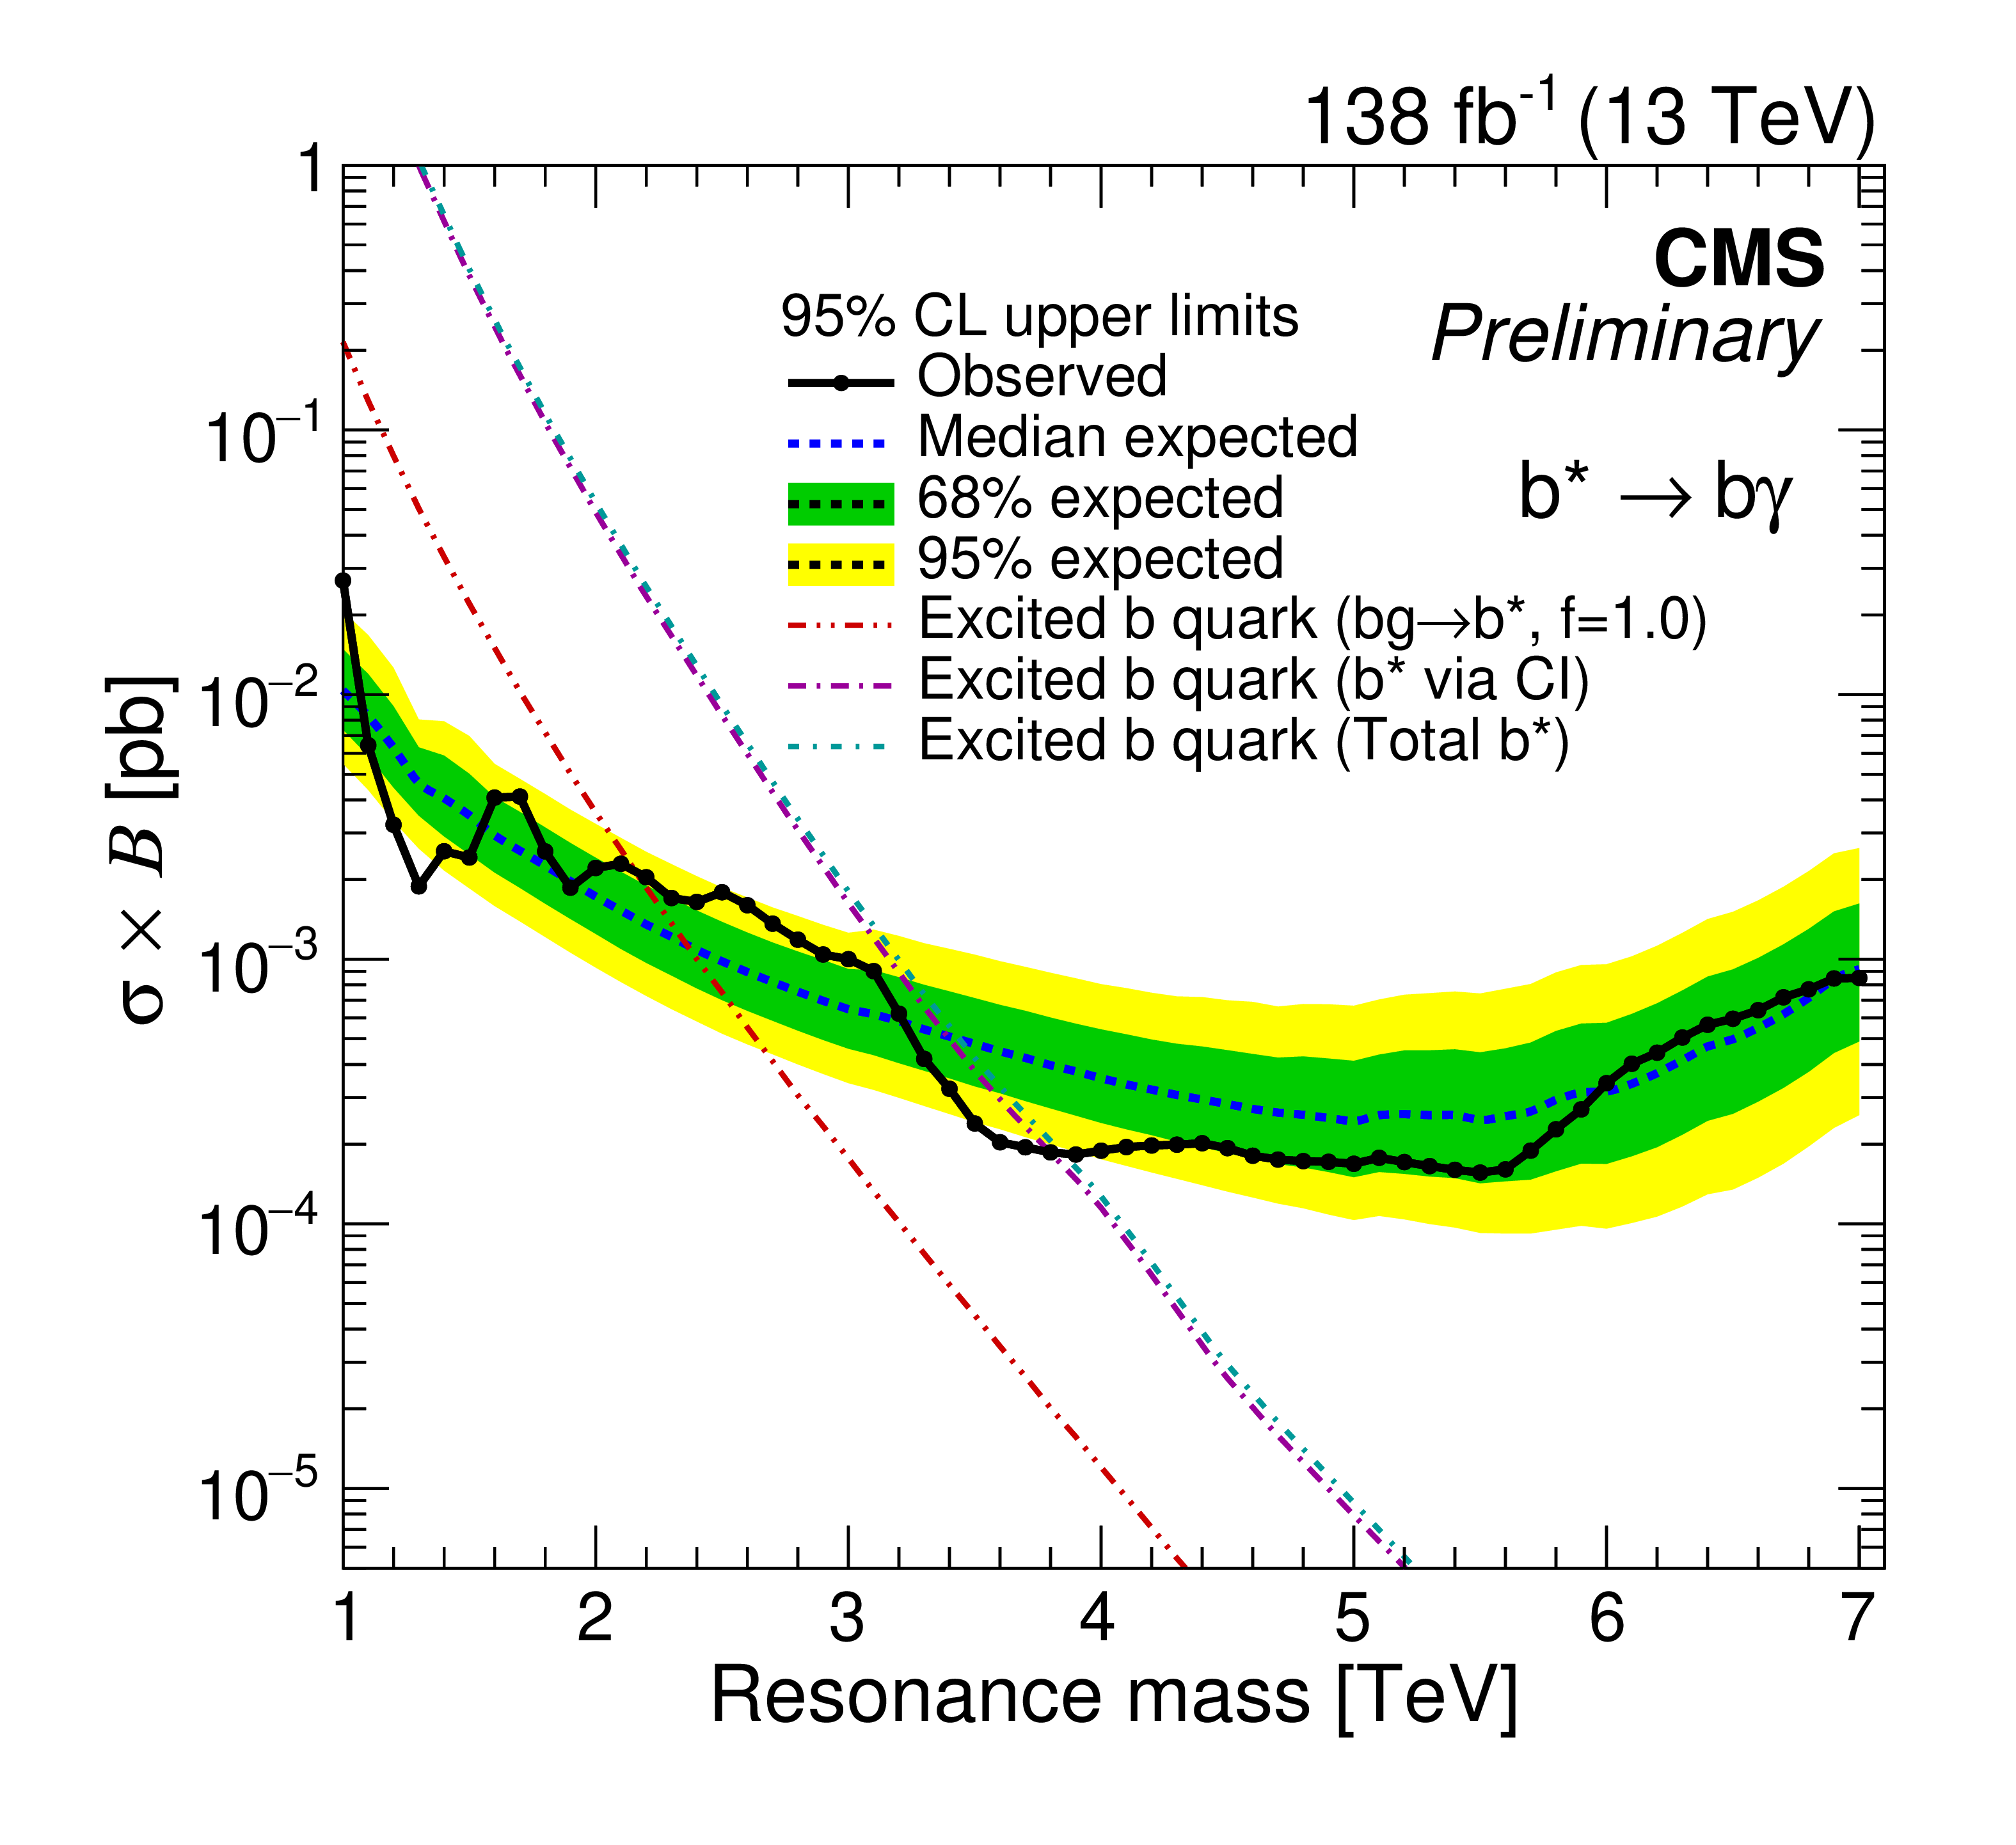
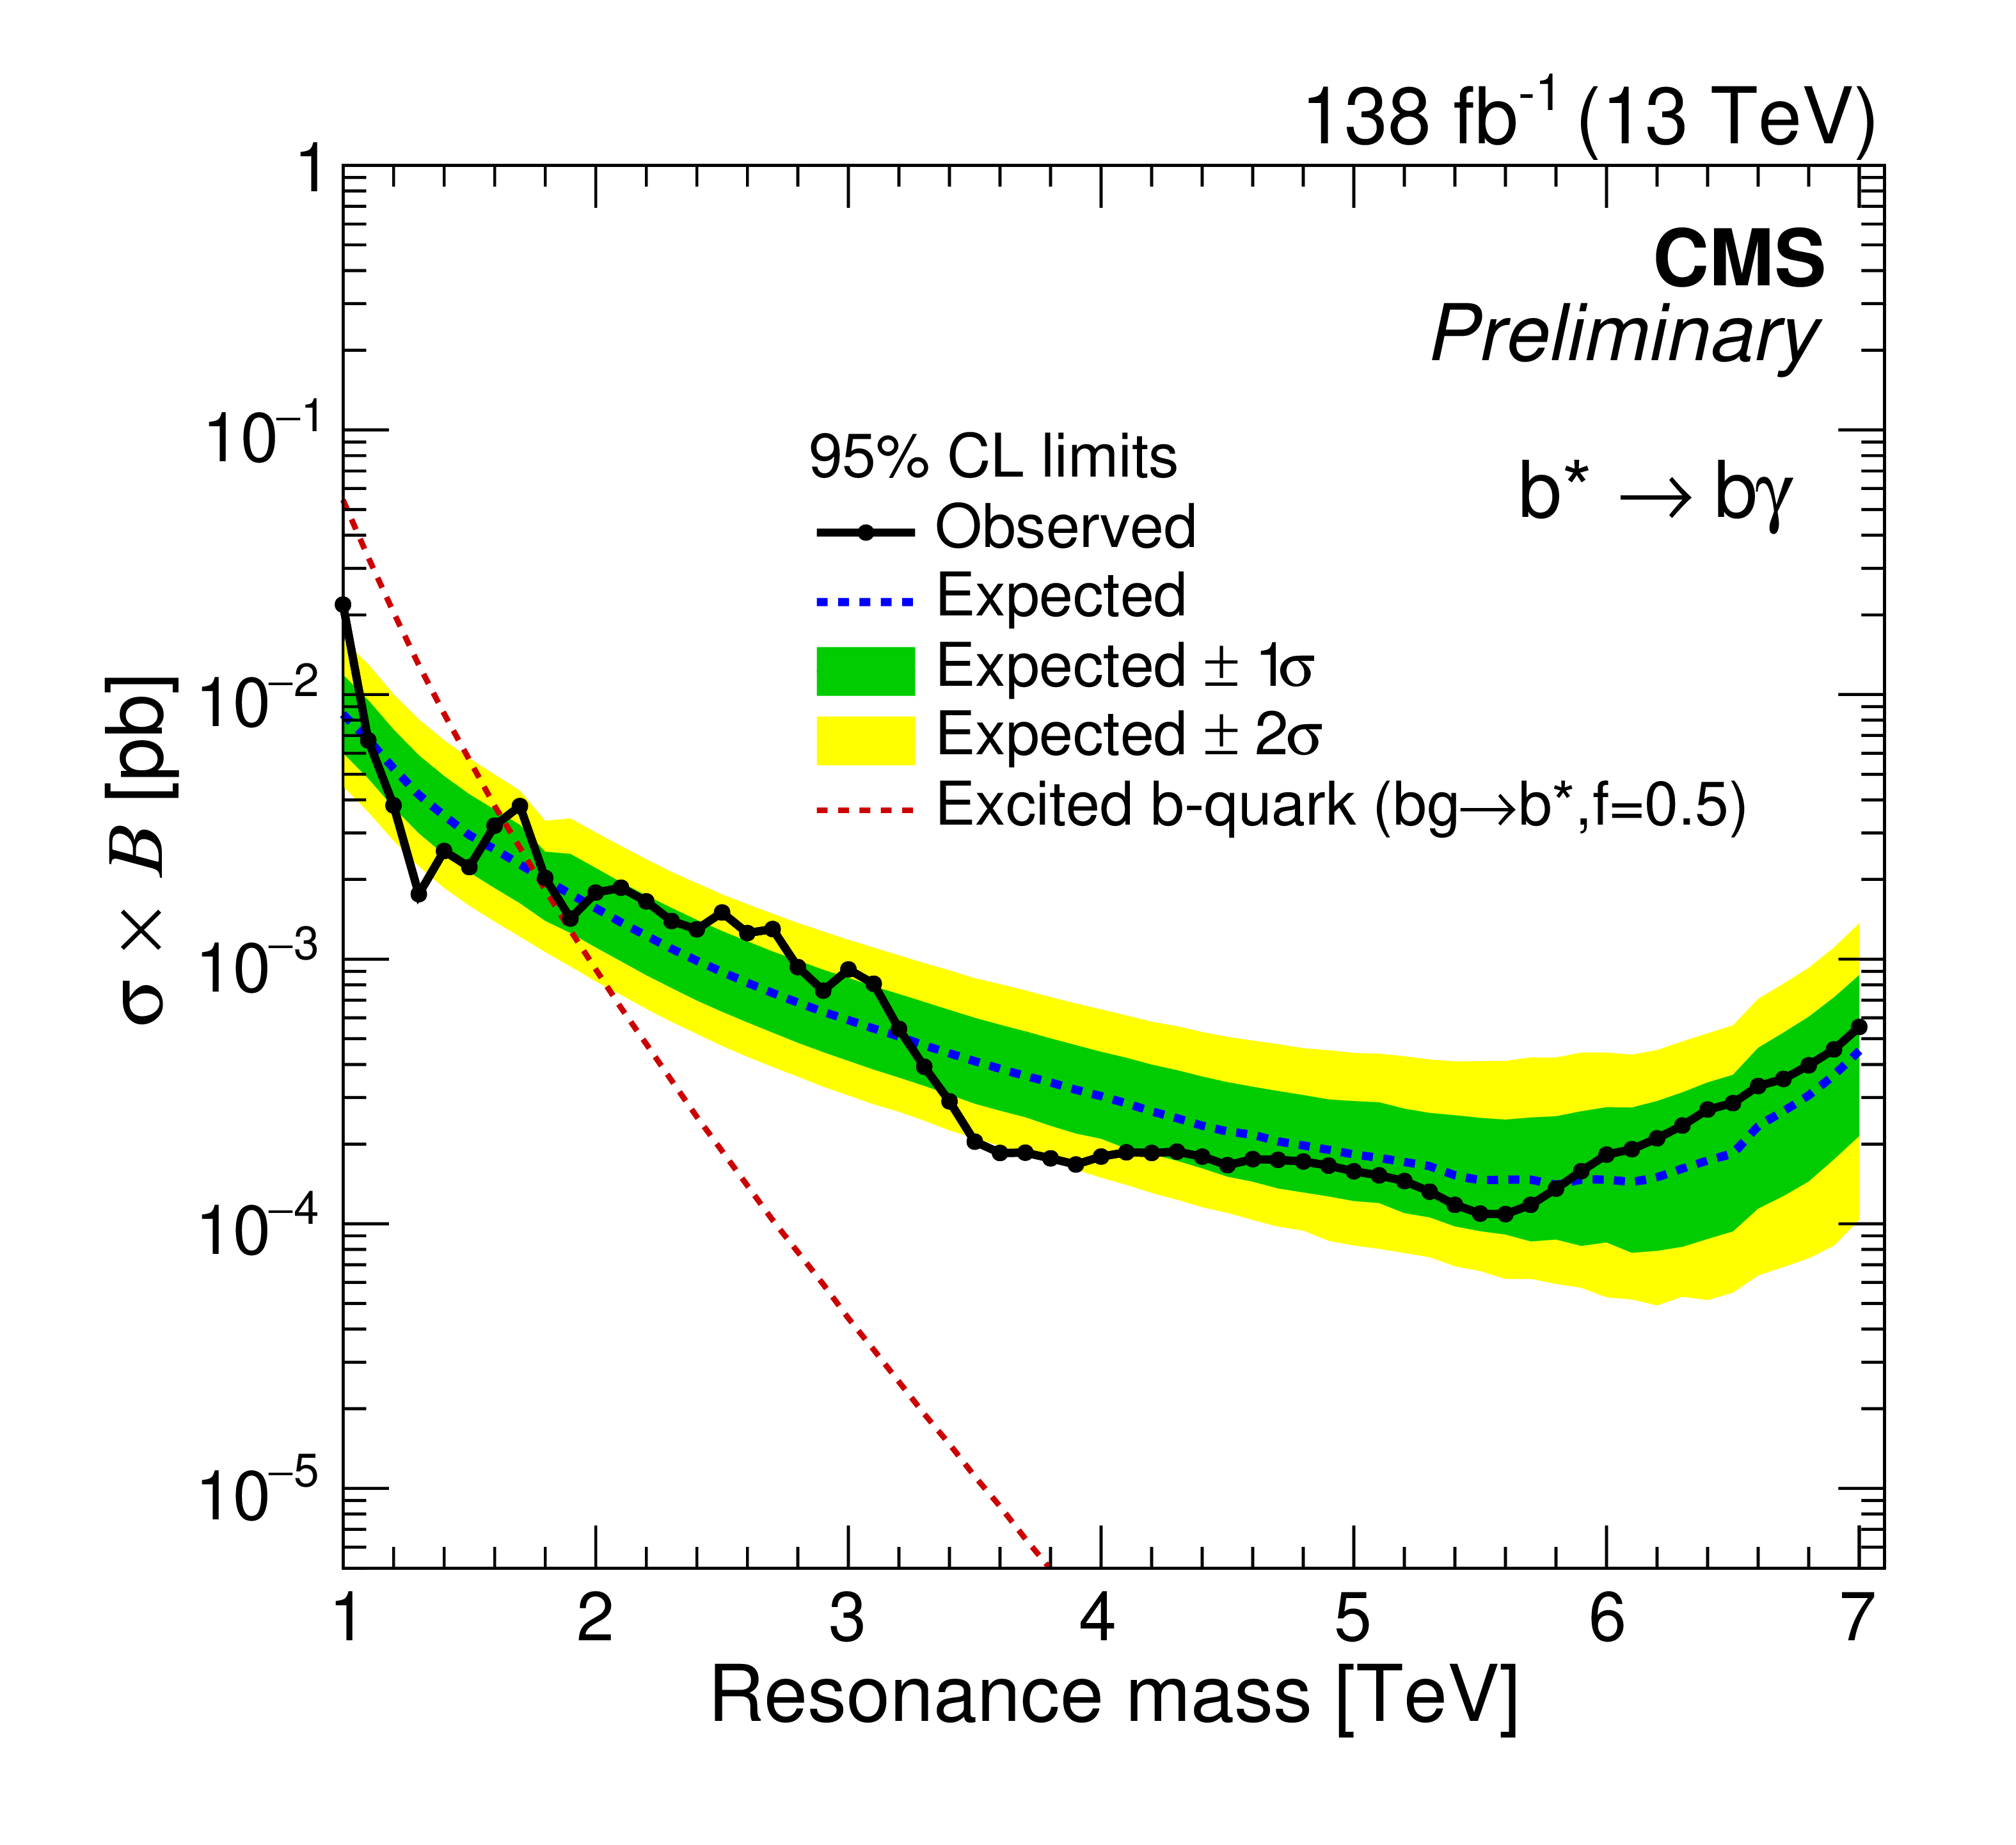
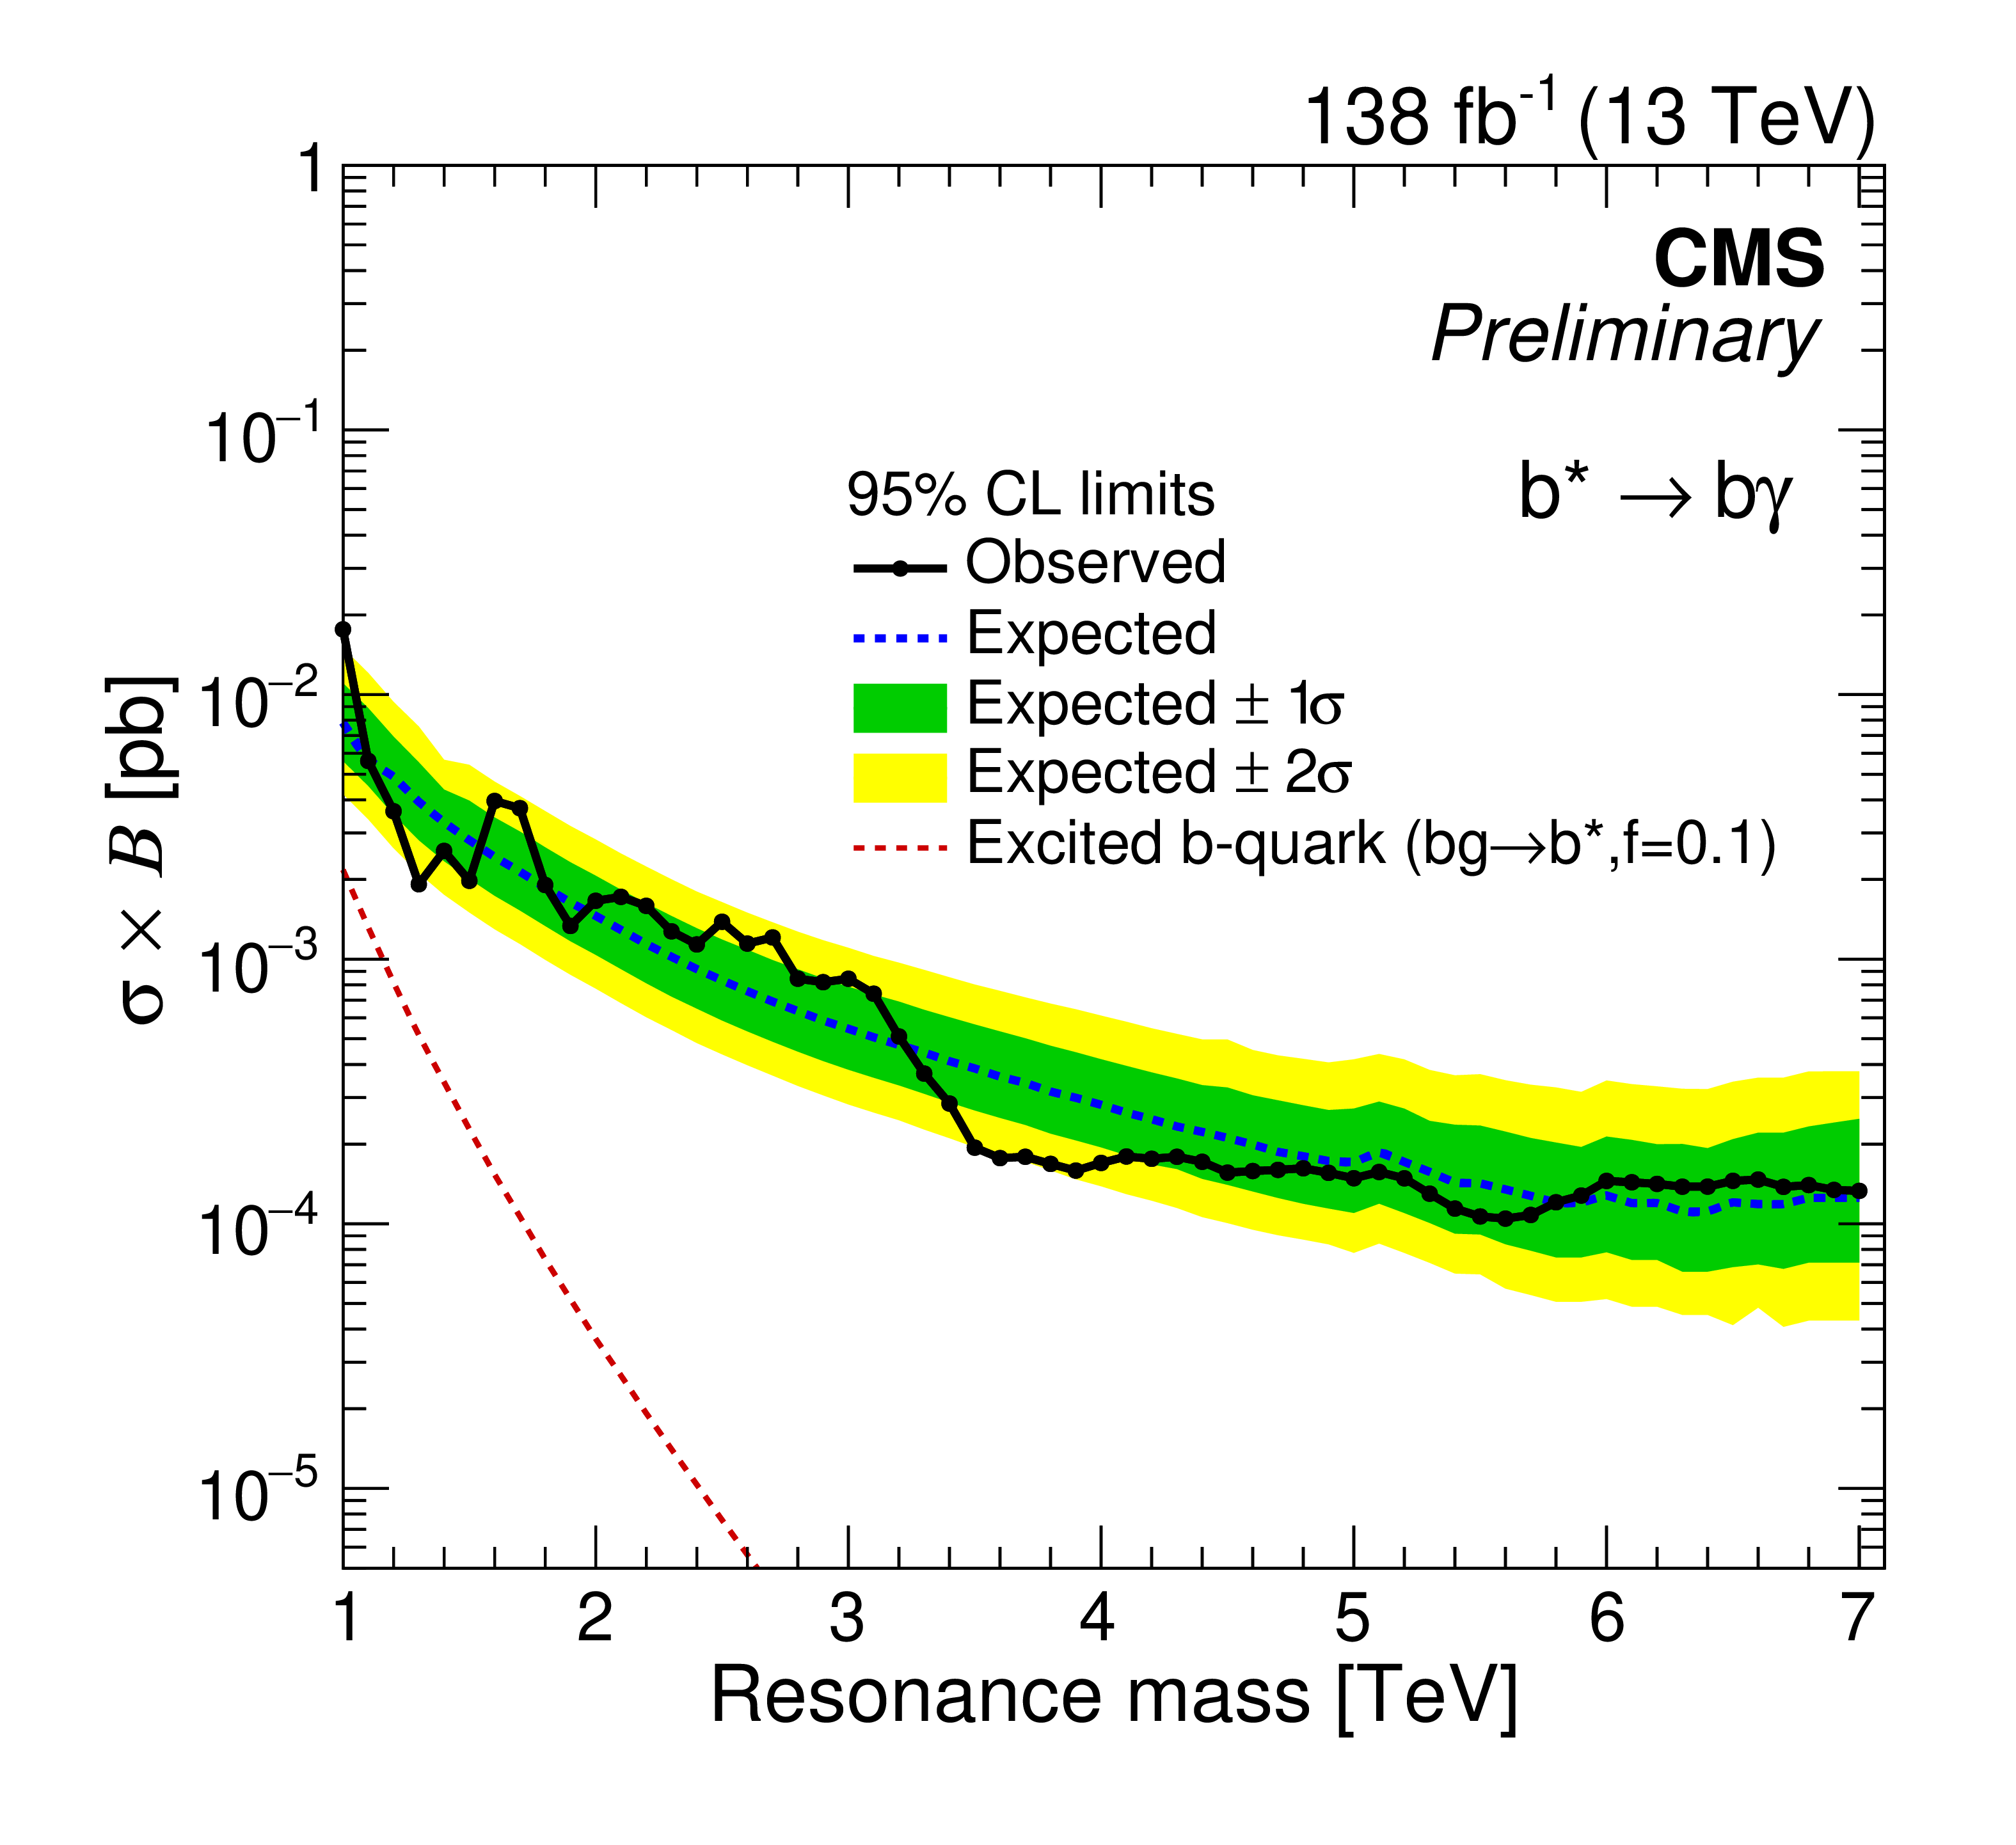
Figure 8:
The expected (dashed) and observed (solid) 95% CL upper limits on $ \sigma\mathcal{B} $ as a function of the $ {\mathrm{b}^\star} $ signal mass for coupling strength $ f= $ 1.0 (upper left), and $ f= $ 0.5 (upper right), and $ f= $ 0.1 (lower). The green (inner) and yellow bands (outer) corresponds to 1 and 2 standard deviation uncertainties in the expected limit. The limits are compared with theoretical predictions for $ {\mathrm{b}^\star} $ production for the corresponding coupling strengths. For coupling $ f= $ 1.0, the limits are compared for $ {\mathrm{b}^\star} $ production by gauge interactions (red), contact interactions (violet) and total $ {\mathrm{b}^\star} $ signal by the addition of these two production modes. |
png pdf |
Figure 8-a:
The expected (dashed) and observed (solid) 95% CL upper limits on $ \sigma\mathcal{B} $ as a function of the $ {\mathrm{b}^\star} $ signal mass for coupling strength $ f= $ 1.0 (upper left), and $ f= $ 0.5 (upper right), and $ f= $ 0.1 (lower). The green (inner) and yellow bands (outer) corresponds to 1 and 2 standard deviation uncertainties in the expected limit. The limits are compared with theoretical predictions for $ {\mathrm{b}^\star} $ production for the corresponding coupling strengths. For coupling $ f= $ 1.0, the limits are compared for $ {\mathrm{b}^\star} $ production by gauge interactions (red), contact interactions (violet) and total $ {\mathrm{b}^\star} $ signal by the addition of these two production modes. |
png pdf |
Figure 8-b:
The expected (dashed) and observed (solid) 95% CL upper limits on $ \sigma\mathcal{B} $ as a function of the $ {\mathrm{b}^\star} $ signal mass for coupling strength $ f= $ 1.0 (upper left), and $ f= $ 0.5 (upper right), and $ f= $ 0.1 (lower). The green (inner) and yellow bands (outer) corresponds to 1 and 2 standard deviation uncertainties in the expected limit. The limits are compared with theoretical predictions for $ {\mathrm{b}^\star} $ production for the corresponding coupling strengths. For coupling $ f= $ 1.0, the limits are compared for $ {\mathrm{b}^\star} $ production by gauge interactions (red), contact interactions (violet) and total $ {\mathrm{b}^\star} $ signal by the addition of these two production modes. |
png pdf |
Figure 8-c:
The expected (dashed) and observed (solid) 95% CL upper limits on $ \sigma\mathcal{B} $ as a function of the $ {\mathrm{b}^\star} $ signal mass for coupling strength $ f= $ 1.0 (upper left), and $ f= $ 0.5 (upper right), and $ f= $ 0.1 (lower). The green (inner) and yellow bands (outer) corresponds to 1 and 2 standard deviation uncertainties in the expected limit. The limits are compared with theoretical predictions for $ {\mathrm{b}^\star} $ production for the corresponding coupling strengths. For coupling $ f= $ 1.0, the limits are compared for $ {\mathrm{b}^\star} $ production by gauge interactions (red), contact interactions (violet) and total $ {\mathrm{b}^\star} $ signal by the addition of these two production modes. |
png pdf |
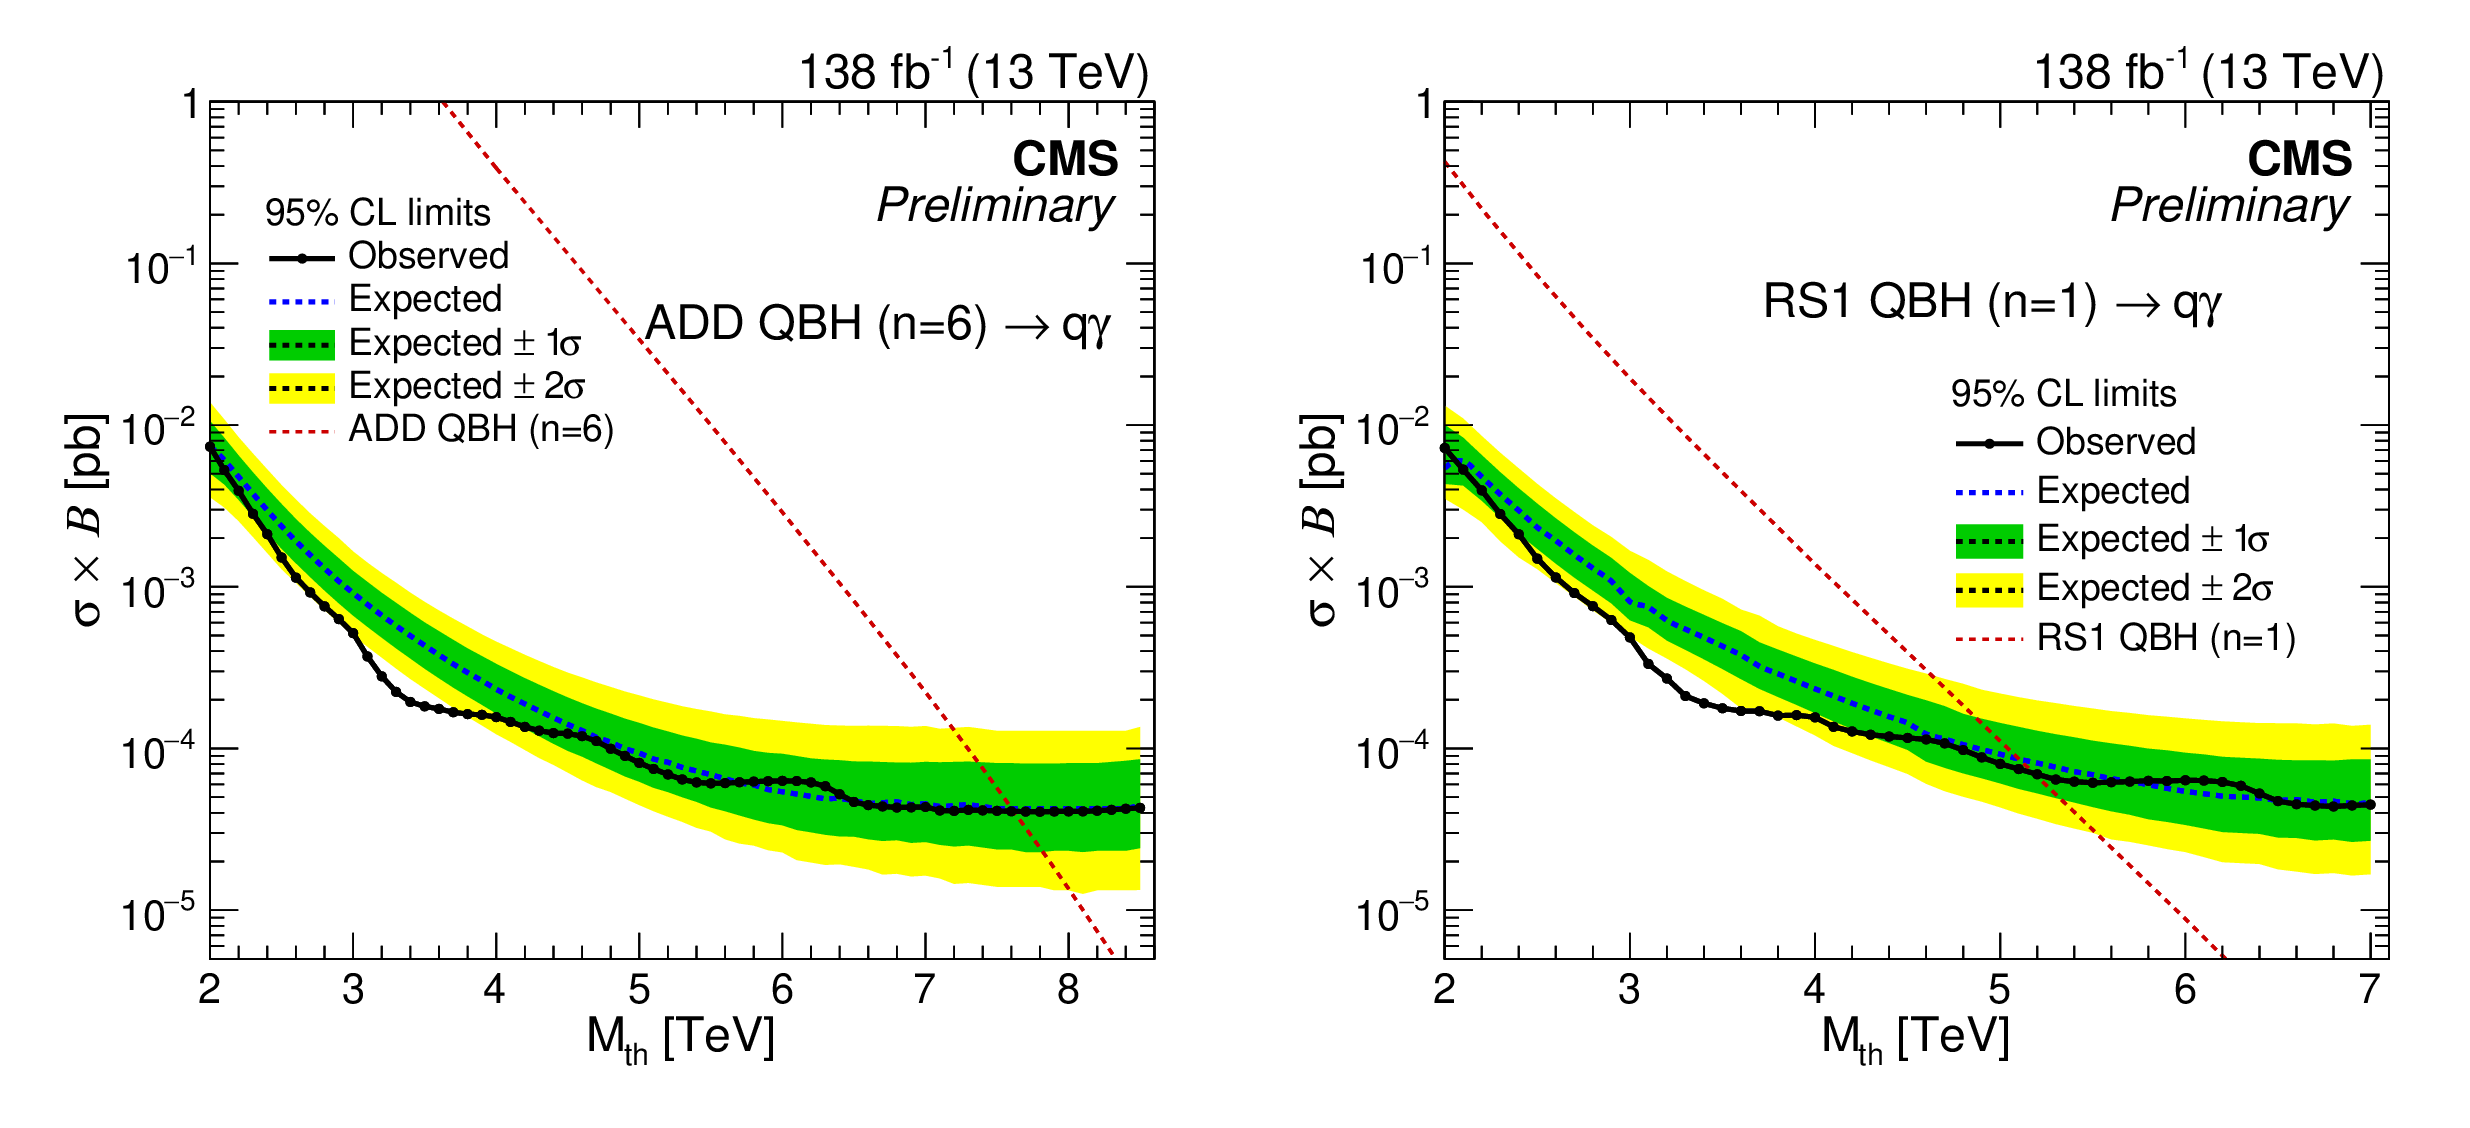
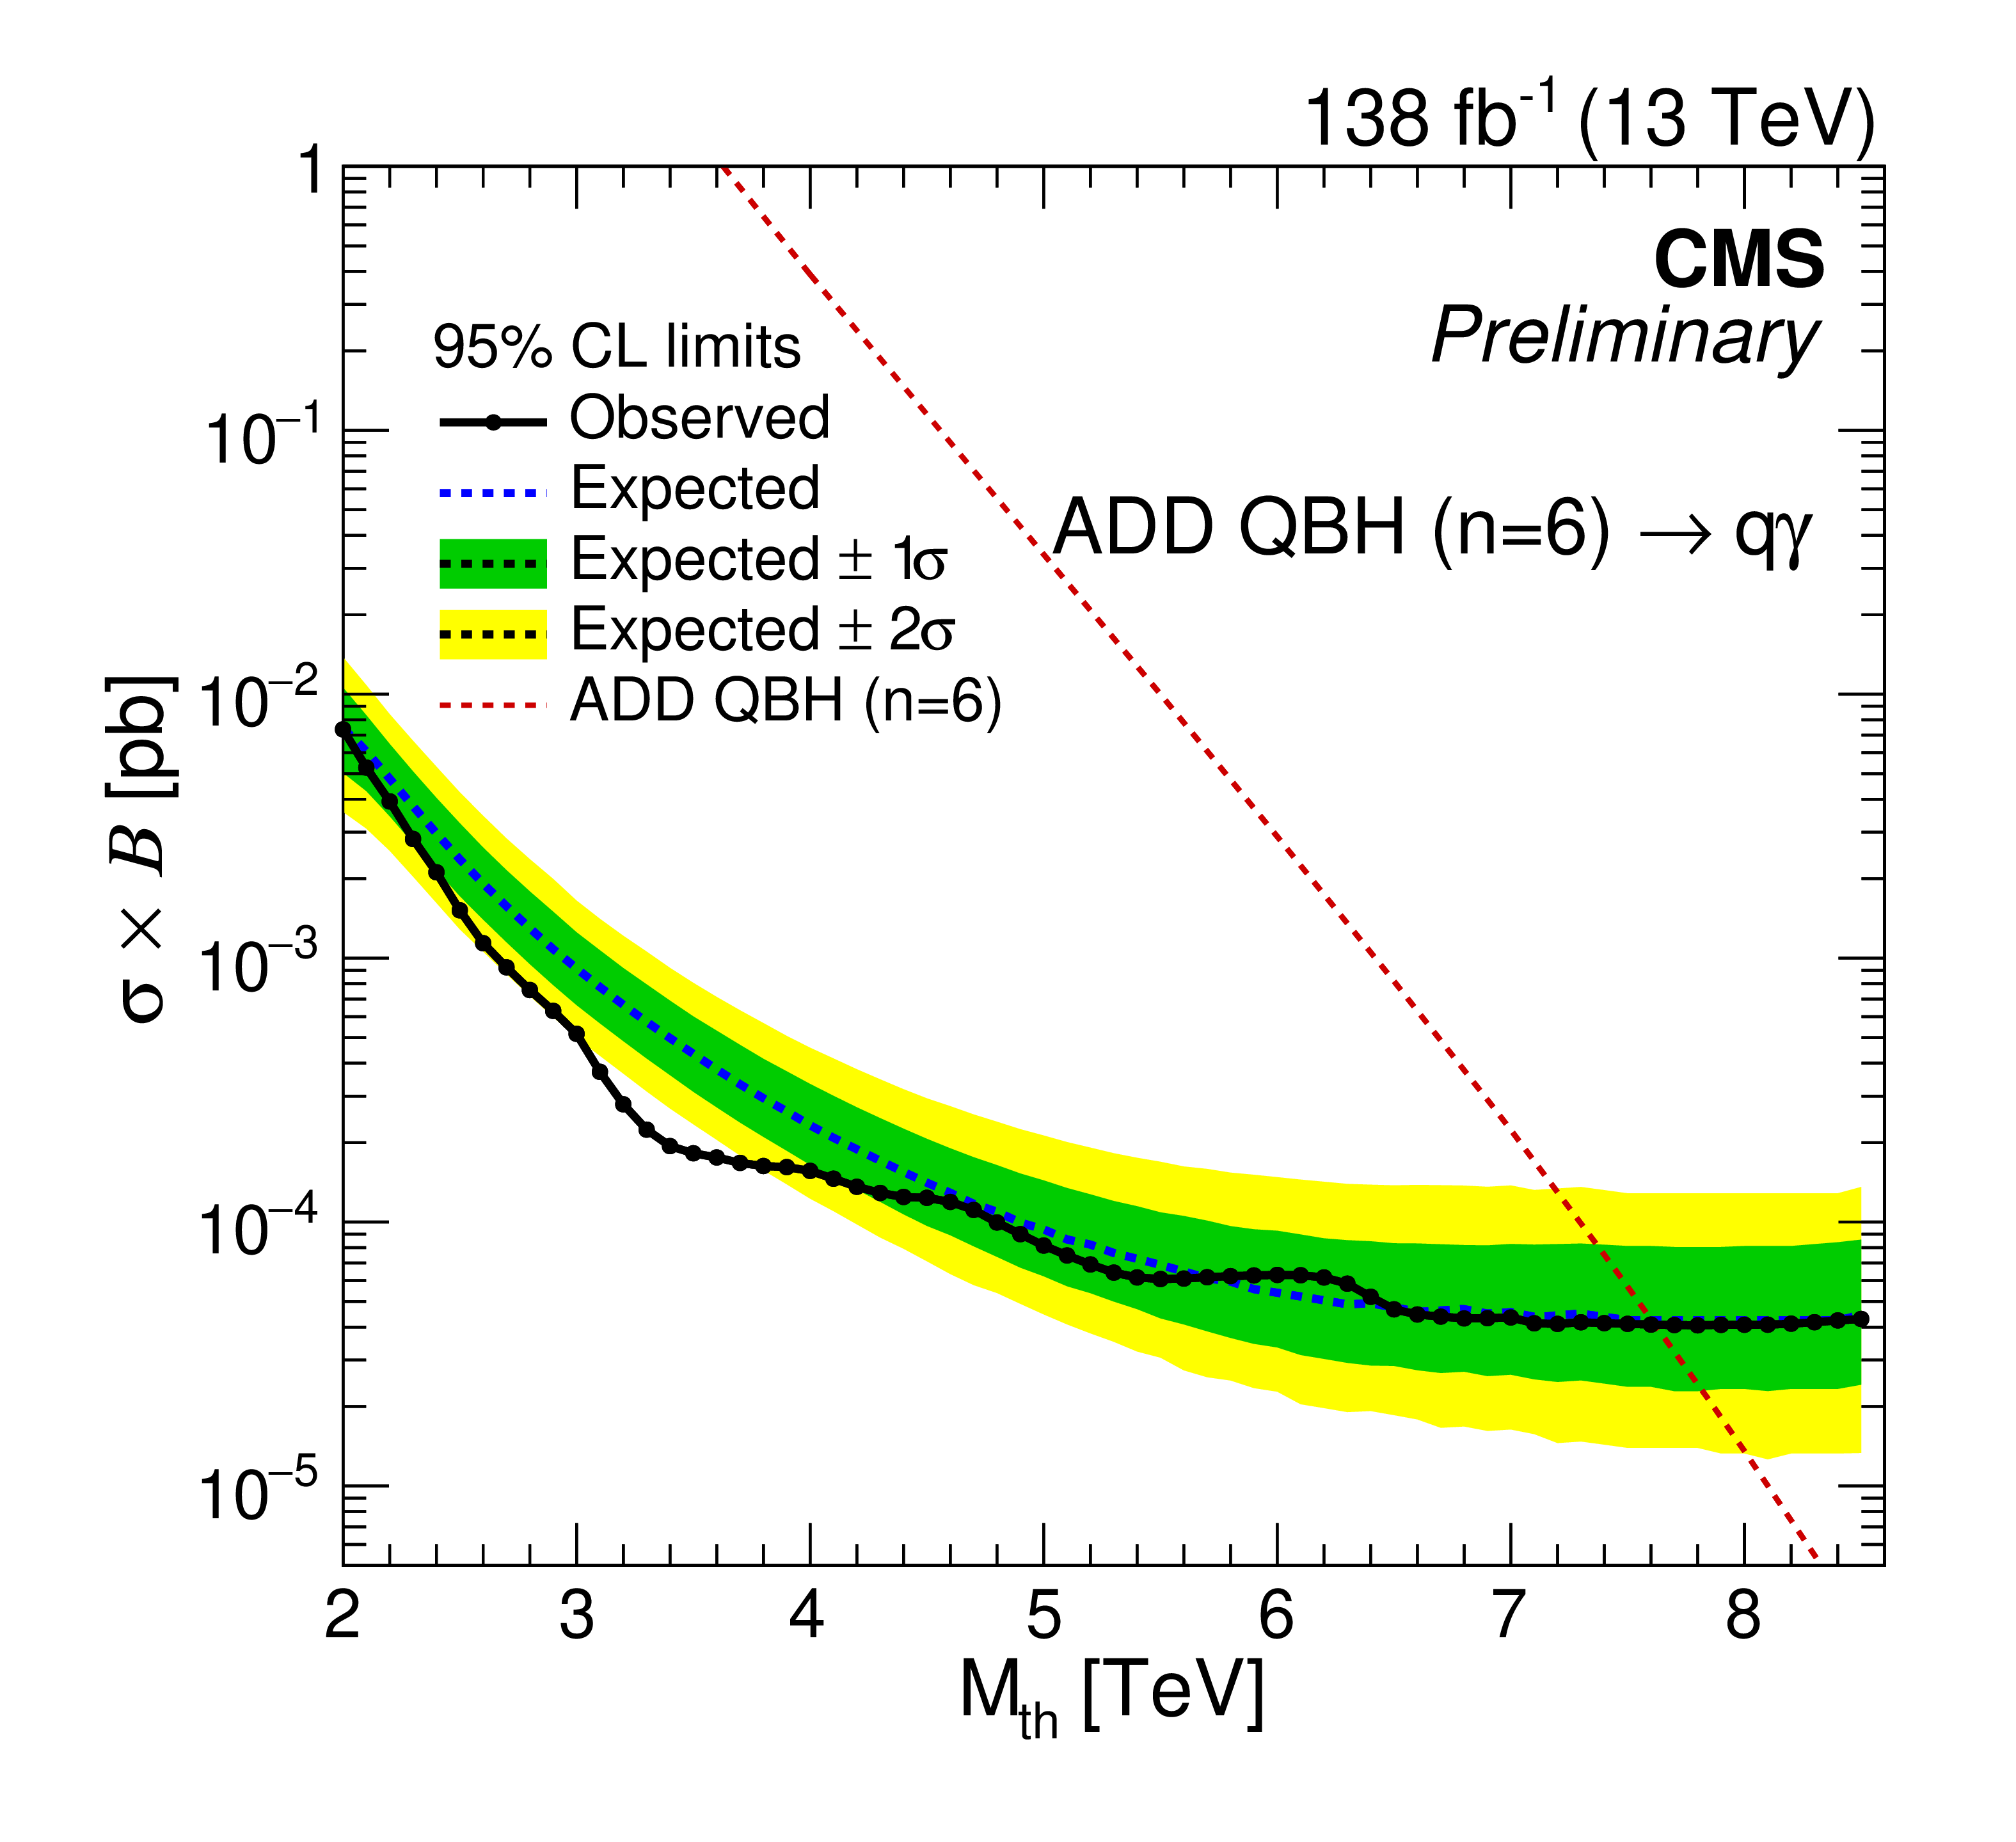
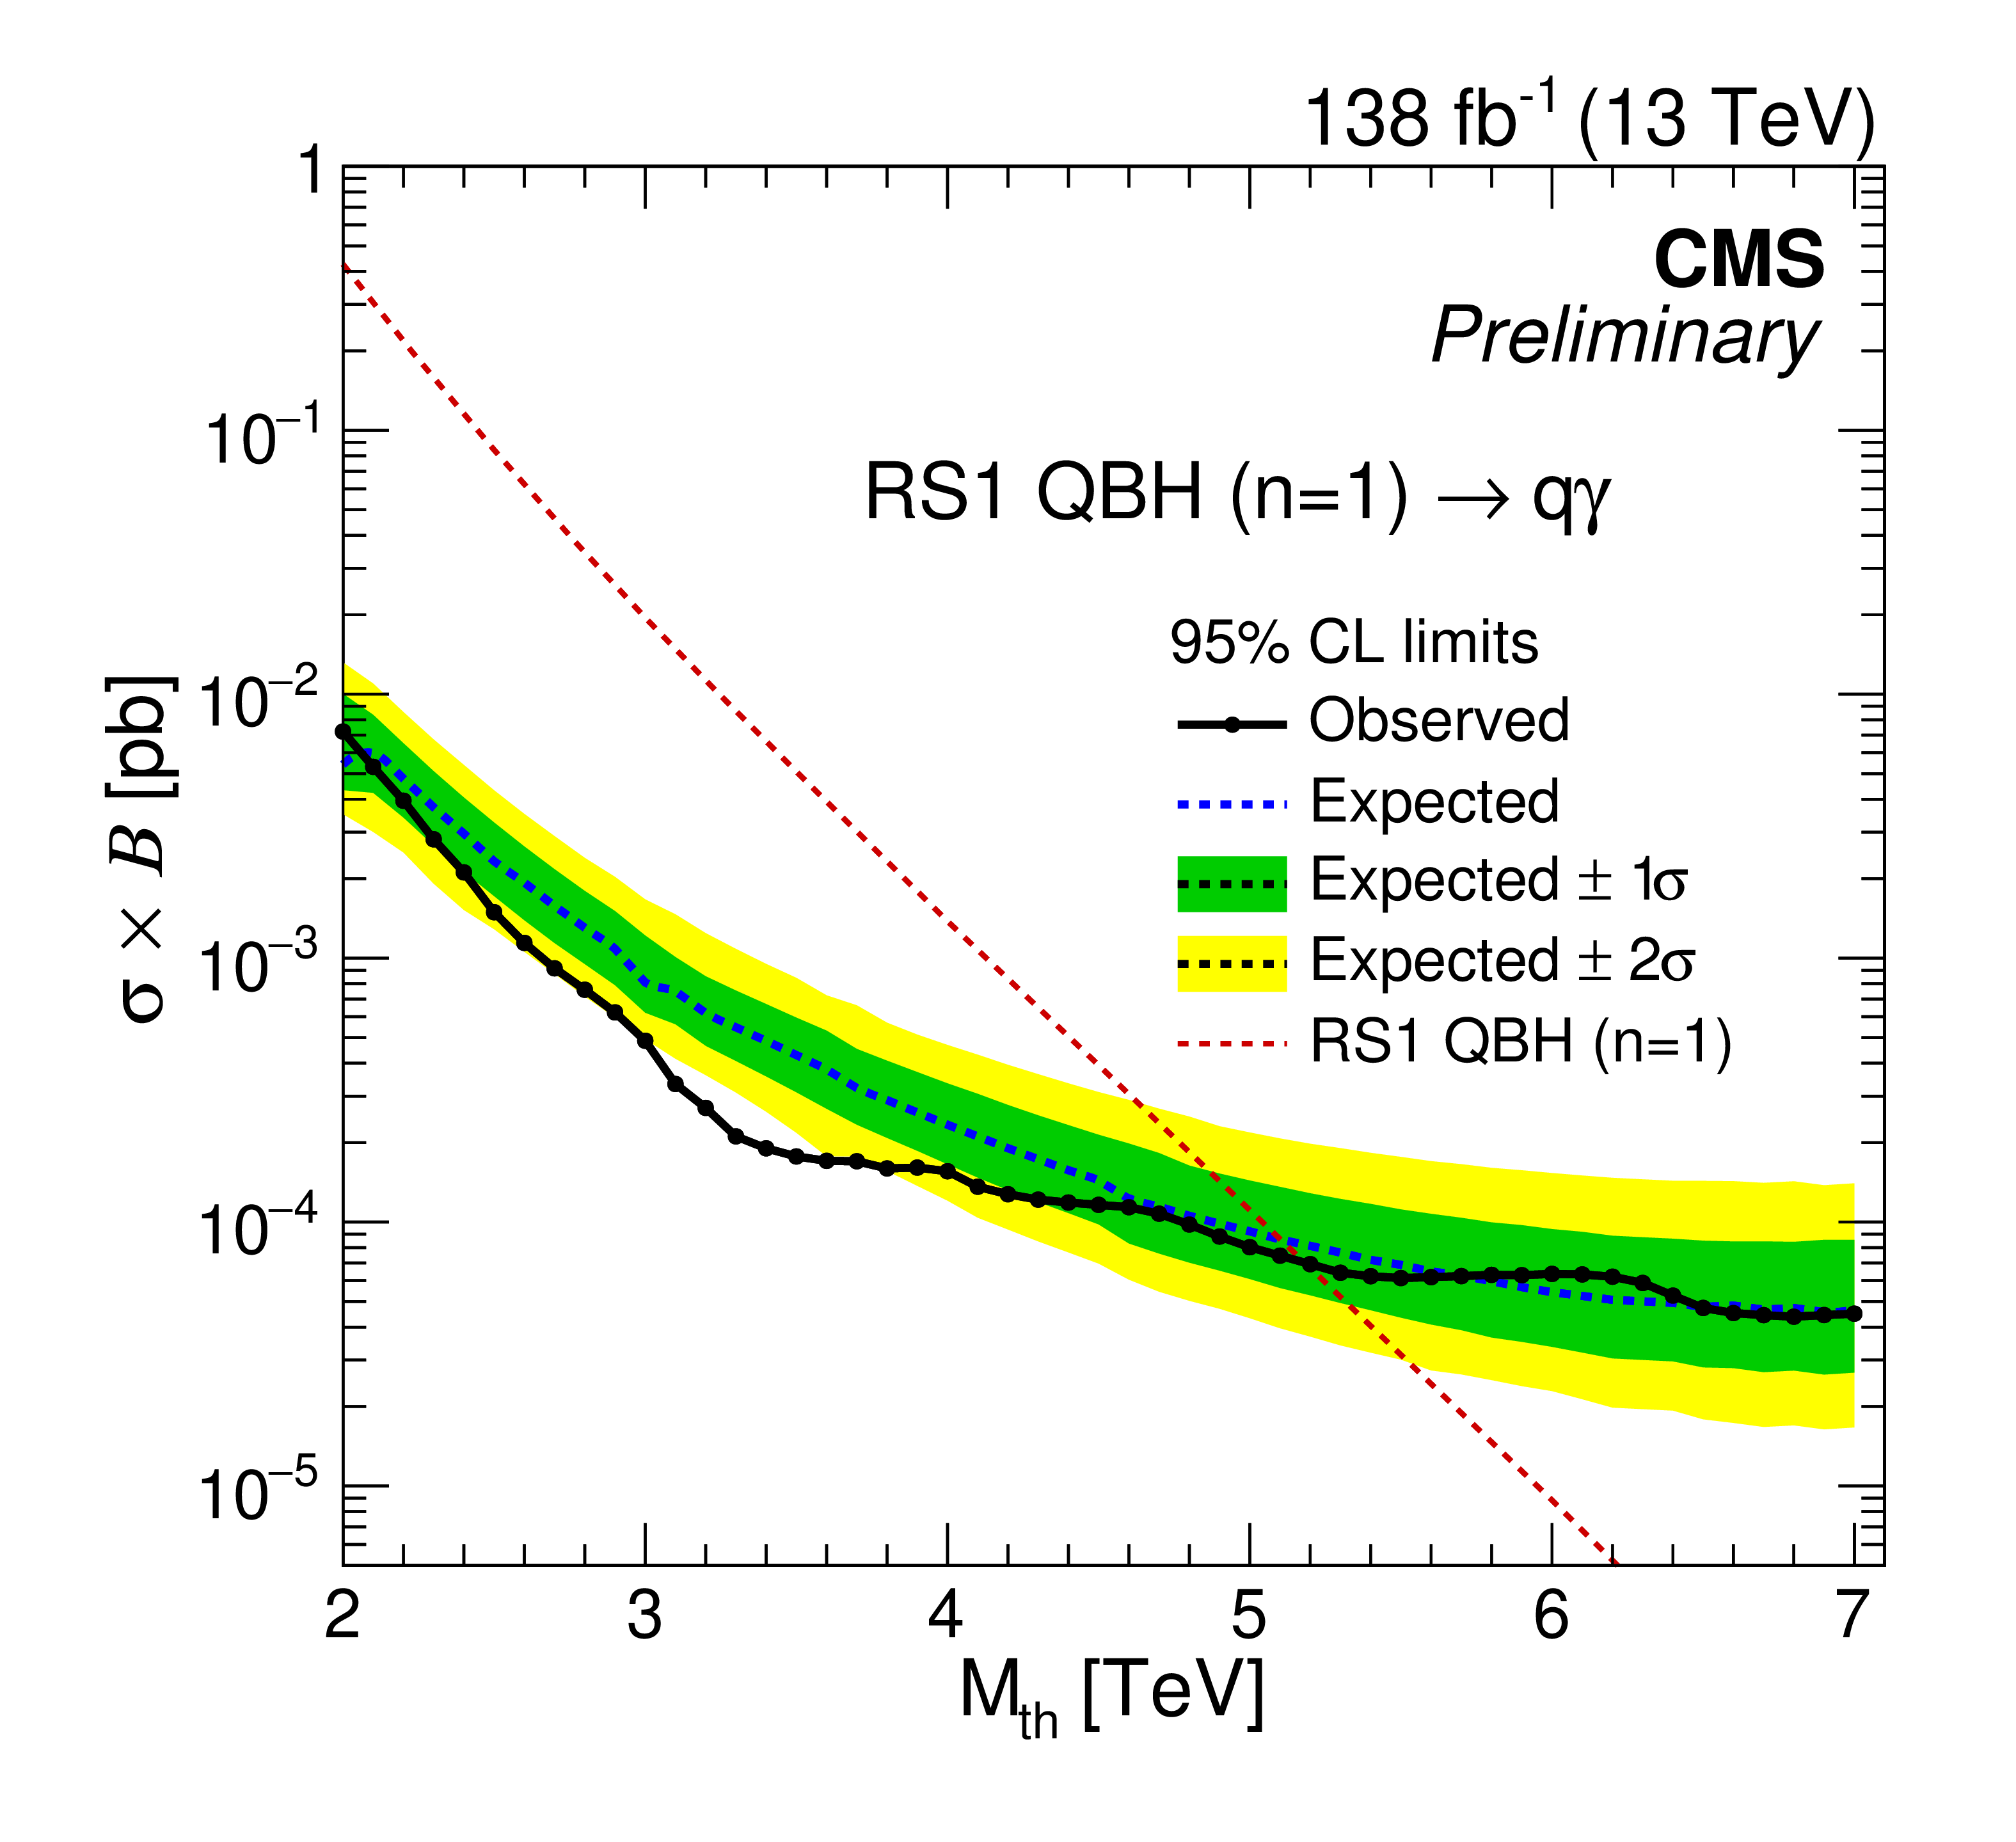
Figure 9:
The expected (dashed) and observed (solid) 95% CL upper limit on $ \sigma\mathcal{B} $ as a function of the ADD ($ n= $ 6) and RS1 ($ n= $ 1) models signal mass on left and right respectively. The green (inner) and yellow bands (outer) corresponds to 1 and 2 standard deviation uncertainties in the expected limit. The limits are compared with theoretical predictions for QBH production for ADD ($ n= $ 6) and RS1 ($ n= $ 1) models. |
png pdf |
Figure 9-a:
The expected (dashed) and observed (solid) 95% CL upper limit on $ \sigma\mathcal{B} $ as a function of the ADD ($ n= $ 6) and RS1 ($ n= $ 1) models signal mass on left and right respectively. The green (inner) and yellow bands (outer) corresponds to 1 and 2 standard deviation uncertainties in the expected limit. The limits are compared with theoretical predictions for QBH production for ADD ($ n= $ 6) and RS1 ($ n= $ 1) models. |
png pdf |
Figure 9-b:
The expected (dashed) and observed (solid) 95% CL upper limit on $ \sigma\mathcal{B} $ as a function of the ADD ($ n= $ 6) and RS1 ($ n= $ 1) models signal mass on left and right respectively. The green (inner) and yellow bands (outer) corresponds to 1 and 2 standard deviation uncertainties in the expected limit. The limits are compared with theoretical predictions for QBH production for ADD ($ n= $ 6) and RS1 ($ n= $ 1) models. |
png pdf |
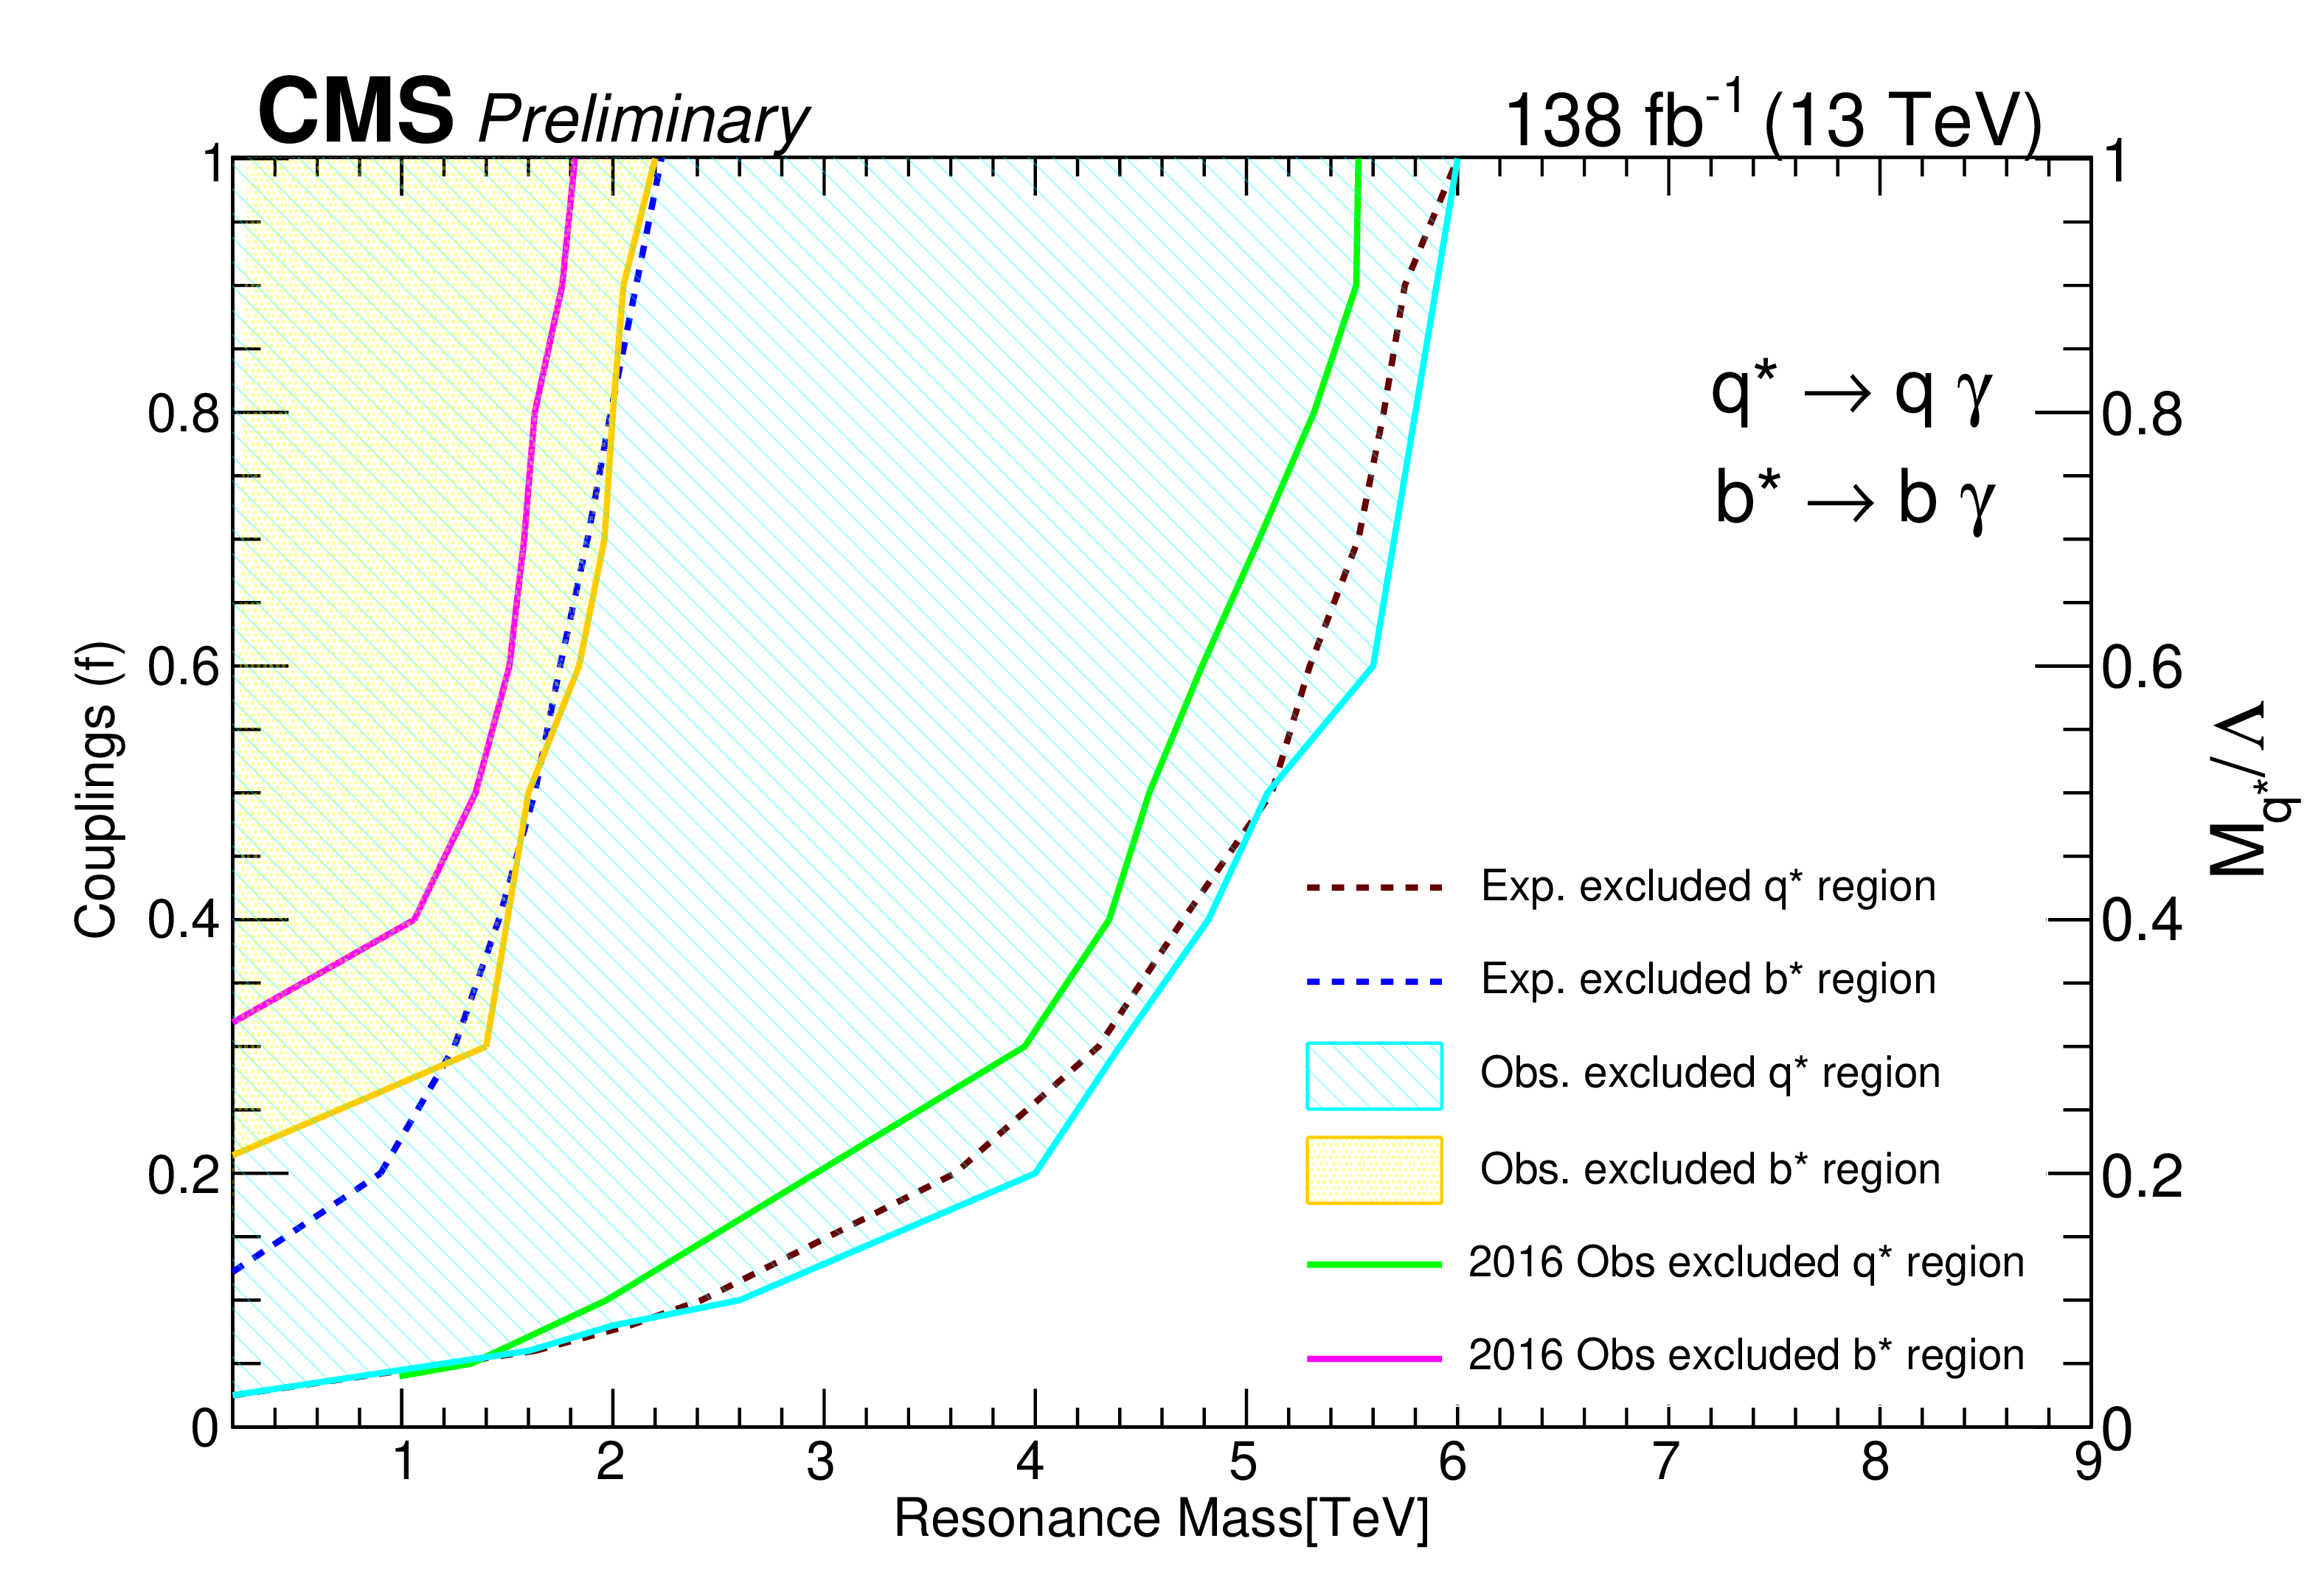
Figure 10:
The expected and observed 95% CL exclusion mass limits variation with the SM coupling for the excited $ {\mathrm{q}^\star} $ and $ {\mathrm{b}^\star} $ signal models. The previous published mass exclusion limits by the CMS experiment with 2016 data set [13] in the same decay channel is also shown. |
| Tables | |
png pdf |
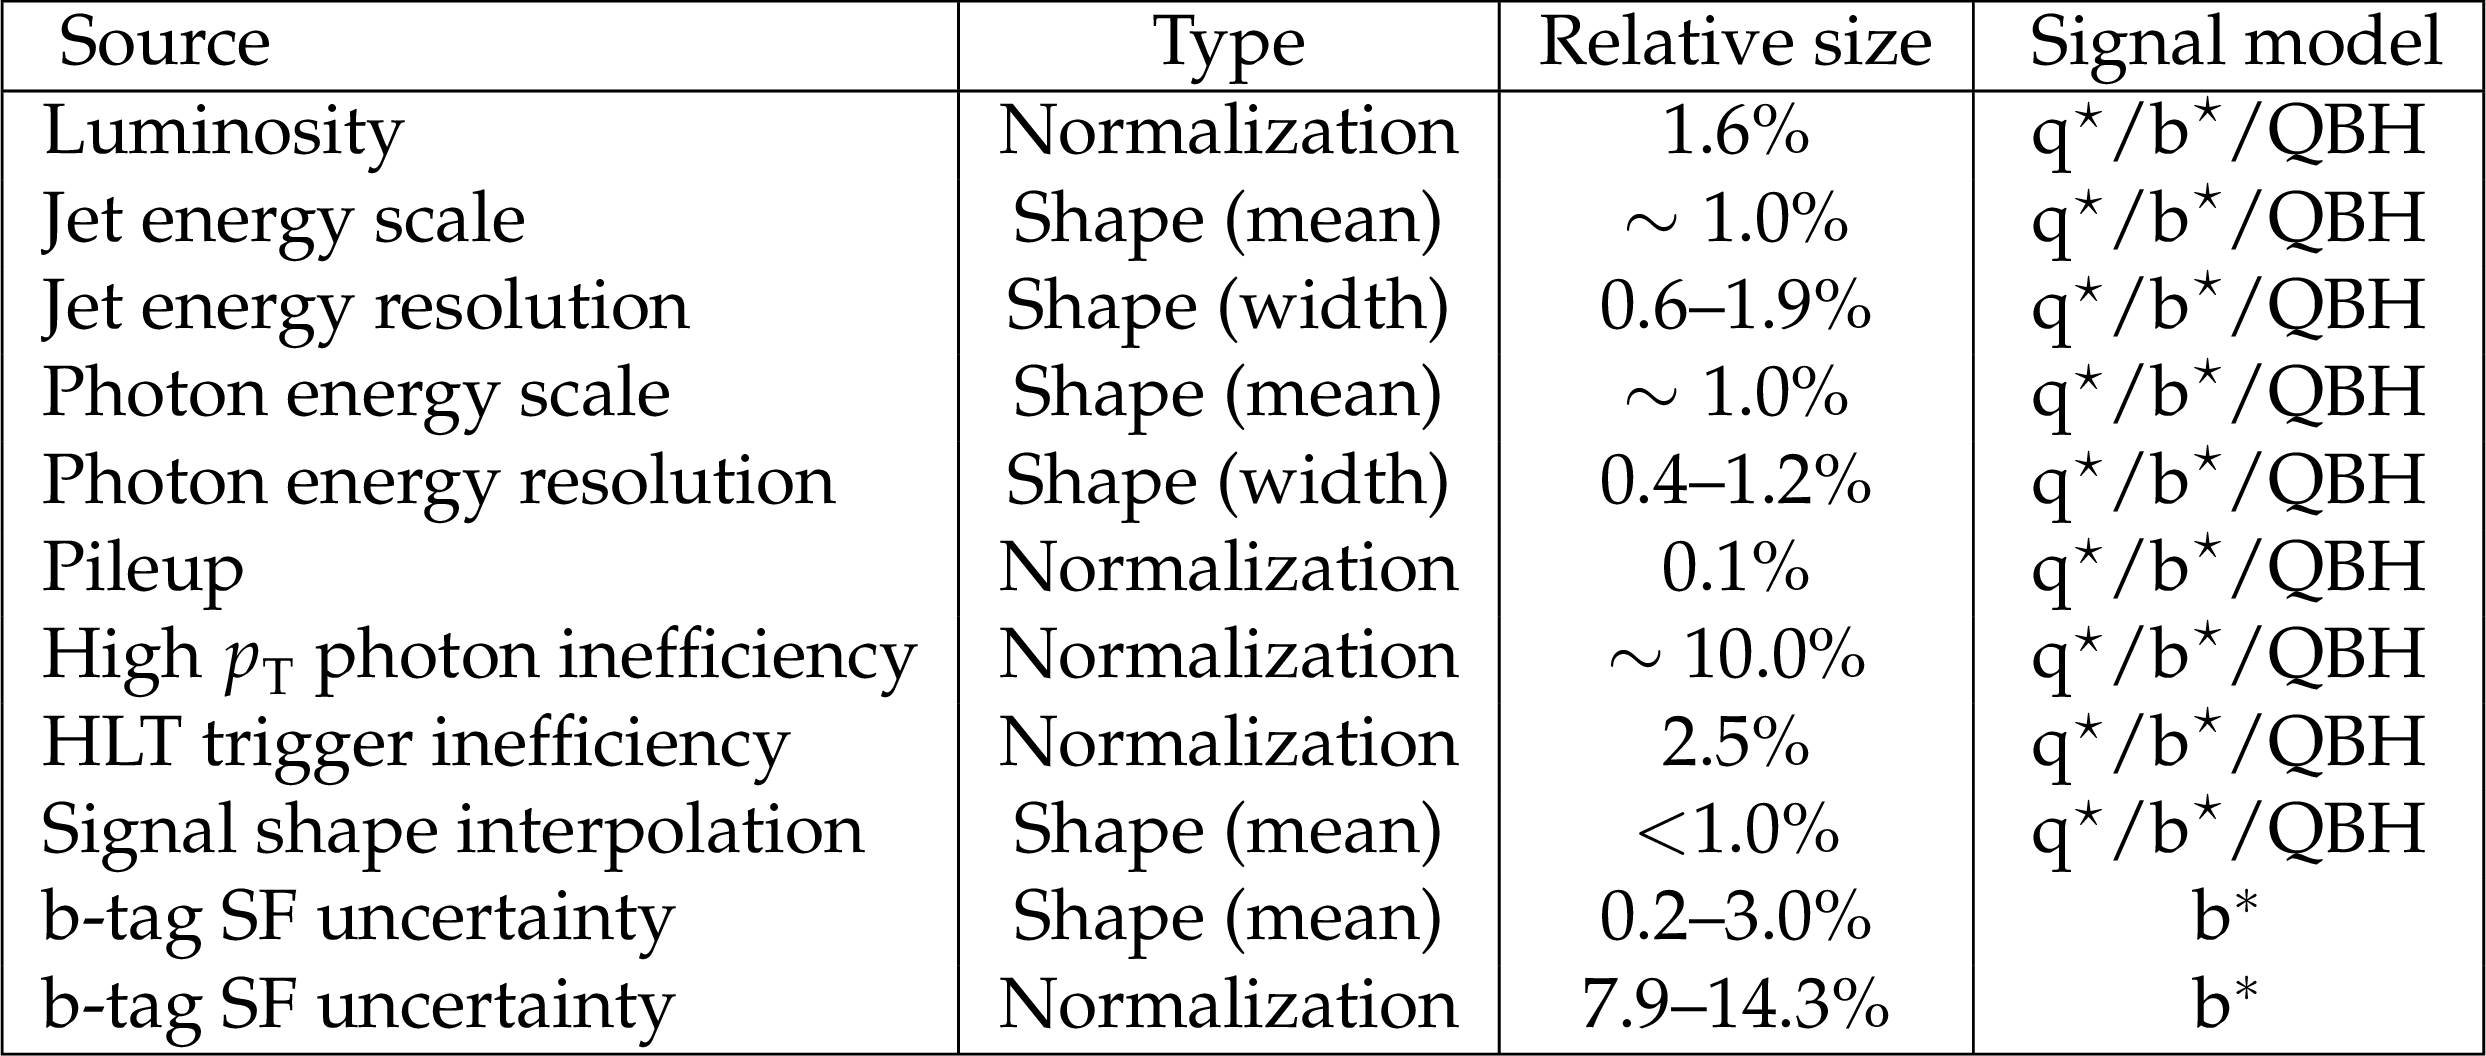
Table 1:
Effect of various systematic uncertainties on $ \gamma+ $jet resonance signal distributions. |
| Summary |
| A search for a resonance in the $ \gamma $+jet final state is performed using the CMS proton-proton collision data at $ \sqrt{s}= $ 13 TeV corresponding to an integrated luminosity of 138 fb$ ^{-1} $. Models considered for the search are excited quarks, excited b quarks, and quantum black holes. For coupling multiplier $ f = $ 1.0, the observed (expected) lower mass bounds on excited quark and excited $ {\mathrm{b}^\star} $ are estimated to be 6.0 (6.0) TeV and 2.2 (2.3) TeV respectively. For quantum black hole production, observed exclusion limits of 7.5 TeV and 5.2 TeV are set on the Arkani-Hamed-Dimopoulos-Dvali model and the Randall-Sundrum model with $ n= $ 6 and 1 extra dimensions, respectively. These lower mass bounds are the most stringent to date among those obtained in the $ \gamma $+jet final state. |
| References | ||||
| 1 | M. E. Peskin | Beyond the standard model | hep-ph/9705479 | |
| 2 | M. Shaposhnikov and A. Shkerin | Gravity, scale invariance and the hierarchy problem | JHEP 10 (2018) 024 | 1804.06376 |
| 3 | W. Buchmuller | Composite quarks and leptons | Acta Phys. Austriaca Suppl. 27 (1985) 517 | |
| 4 | U. Baur, I. Hinchliffe, and D. Zeppenfeld | Excited quark production at hadron colliders | Int. J. Mod. Phys. A 2 (1987) 1285 | |
| 5 | U. Baur, M. Spira, and P. M. Zerwas | Excited quark and lepton production at hadron colliders | PRD 42 (1990) 815 | |
| 6 | S. Dimopoulos and G. L. Landsberg | Black holes at the LHC | PRL 87 (2001) 161602 | hep-ph/0106295 |
| 7 | I. A. D'Souza and C. S. Kalman | Preons: Models of Leptons, Quarks and Gauge Bosons as Composite Objects | WORLD SCIENTIFIC, 1992 link |
|
| 8 | S. Bhattacharya, S. S. Chauhan, B. C. Choudhary, and D. Choudhury | Quark excitations through the prism of direct photon plus jet at the LHC | PRD 80 (2009) 015014 | 0901.3927 |
| 9 | CMS Collaboration | Search for excited quarks in the $ \gamma + $jet final state in proton-proton collisions at $ \sqrt{s}= $ 8 TeV | PLB 738 (2014) 274 | CMS-EXO-13-003 1406.5171 |
| 10 | CMS Collaboration | Search for resonances and quantum black holes using dijet mass spectra in proton-proton collisions at $ \sqrt{s} = $ 8 TeV | PRD 91 (2015) 052009 | CMS-EXO-12-059 1501.04198 |
| 11 | CMS Collaboration | Search for narrow resonances decaying to dijets in proton-proton collisions at $ \sqrt{s} = $ 13 TeV | PRL 116 (2016) 071801 | CMS-EXO-15-001 1512.01224 |
| 12 | CMS Collaboration | Search for high mass dijet resonances with a new background prediction method in proton-proton collisions at $ \sqrt{s}= $ 13 TeV | JHEP 05 (2020) 033 | CMS-EXO-19-012 1911.03947 |
| 13 | CMS Collaboration | Search for excited quarks of light and heavy flavor in $ \gamma + $ jet final states in proton--proton collisions at $ \sqrt{s} = $ 13TeV | PLB 781 (2018) 390 | CMS-EXO-17-002 1711.04652 |
| 14 | ATLAS Collaboration | Search for new phenomena with photon+jet events in proton-proton collisions at $ \sqrt{s}= $ 13 TeV with the ATLAS detector | JHEP 03 (2016) 041 | 1512.05910 |
| 15 | ATLAS Collaboration | Search for new phenomena in high-mass final states with a photon and a jet from $ pp $ collisions at $ \sqrt{s} $ = 13 TeV with the ATLAS detector | EPJC 78 (2018) 102 | 1709.10440 |
| 16 | ATLAS Collaboration | Search for resonances in the mass distribution of jet pairs with one or two jets identified as $ b $-jets in proton-proton collisions at $ \sqrt{s}= $ 13 TeV with the ATLAS detector | PRD 98 (2018) 032016 | 1805.09299 |
| 17 | ATLAS Collaboration | Search for new resonances in mass distributions of jet pairs using 139 fb$ ^{-1} $ of $ pp $ collisions at $ \sqrt{s}= $ 13 TeV with the ATLAS detector | JHEP 03 (2020) 145 | 1910.08447 |
| 18 | CDF Collaboration | Search for excited quarks in $ \text{p}\bar{\text{p}} $ collisions at $ \sqrt{s} = $ 1.8 TeV | PRL 72 (1994) 3004 | |
| 19 | CDF Collaboration | Search for new particles decaying to dijets at CDF | PRD 55 (1997) 5263 | hep-ex/9702004 |
| 20 | CDF Collaboration | Search for new particles decaying into dijets in proton-antiproton collisions at $ \sqrt{s} $ = 1.96 TeV | PRD 79 (2009) 112002 | 0812.4036 |
| 21 | N. Arkani-Hamed, S. Dimopoulos, and G. R. Dvali | The hierarchy problem and new dimensions at a millimeter | PLB 429 (1998) 263 | hep-ph/9803315 |
| 22 | L. Randall and R. Sundrum | A large mass hierarchy from a small extra dimension | PRL 83 (1999) 3370 | hep-ph/9905221 |
| 23 | X. Calmet, W. Gong, and S. D. H. Hsu | Colorful quantum black holes at the LHC | PLB 668 (2008) 20 | 0806.4605 |
| 24 | P. Meade and L. Randall | Black holes and quantum gravity at the LHC | JHEP 05 (2008) 003 | 0708.3017 |
| 25 | CMS Collaboration | Search for black holes in high-multiplicity final states in proton-proton collisions at $ \sqrt{s}= $ 13 TeV | PLB 774 (2017) 279 | CMS-EXO-15-007 1705.01403 |
| 26 | CMS Collaboration | Performance of photon reconstruction and identification with the CMS detector in proton-proton collisions at $ \sqrt{s} = $ 8 TeV | JINST 10 (2015) P08010 | CMS-EGM-14-001 1502.02702 |
| 27 | CMS Collaboration | Jet energy scale and resolution in the CMS experiment in pp collisions at 8 TeV | JINST 12 (2017) P02014 | CMS-JME-13-004 1607.03663 |
| 28 | CMS Collaboration | The CMS experiment at the CERN LHC | JINST 3 (2008) S08004 | |
| 29 | CMS Collaboration | Performance of the CMS Level-1 trigger in proton-proton collisions at $ \sqrt{s} = $ 13 TeV | JINST 15 (2020) P10017 | CMS-TRG-17-001 2006.10165 |
| 30 | CMS Collaboration | The CMS trigger system | JINST 12 (2017) P01020 | CMS-TRG-12-001 1609.02366 |
| 31 | T. Sjöstrand et al. | An introduction to PYTHIA 8.2 | Comput. Phys. Commun. 191 (2015) 159 | 1410.3012 |
| 32 | GEANT4 Collaboration | GEANT4 --- a simulation toolkit | NIM A 506 (2003) 250 | |
| 33 | CMS Collaboration | Event generator tunes obtained from underlying event and multiparton scattering measurements | EPJC 76 (2016) 155 | CMS-GEN-14-001 1512.00815 |
| 34 | CMS Collaboration | Extraction and validation of a new set of CMS PYTHIA8 tunes from underlying-event measurements | EPJC 80 (2020) 4 | CMS-GEN-17-001 1903.12179 |
| 35 | NNPDF Collaboration | Parton distributions from high-precision collider data | EPJC 77 (2017) 663 | 1706.00428 |
| 36 | NNPDF Collaboration | Parton distributions with LHC data | NPB 867 (2013) 244 | 1207.1303 |
| 37 | D. M. Gingrich | Quantum black holes with charge, colour, and spin at the LHC | JPG 37 (2010) 105008 | 0912.0826 |
| 38 | J. Pumplin et al. | New generation of parton distributions with uncertainties from global QCD analysis | JHEP 07 (2002) 012 | hep-ph/0201195 |
| 39 | J. Alwall et al. | The automated computation of tree-level and next-to-leading order differential cross sections, and their matching to parton shower simulations | JHEP 07 (2014) 079 | 1405.0301 |
| 40 | J. Alwall et al. | Comparative study of various algorithms for the merging of parton showers and matrix elements in hadronic collisions | EPJC 53 (2008) 473 | 0706.2569 |
| 41 | CMS Collaboration | Particle-flow reconstruction and global event description with the cms detector | JINST 12 (2017) P10003 | CMS-PRF-14-001 1706.04965 |
| 42 | CMS Collaboration | Electron and photon reconstruction and identification with the CMS experiment at the CERN LHC | JINST 16 (2021) P05014 | CMS-EGM-17-001 2012.06888 |
| 43 | M. Cacciari, G. P. Salam, and G. Soyez | The anti-$k_{\mathrm{T}}$ jet clustering algorithm | JHEP 04 (2008) 063 | 0802.1189 |
| 44 | M. Cacciari, G. P. Salam, and G. Soyez | FastJet user manual | EPJC 72 (2012) 1896 | 1111.6097 |
| 45 | CMS Collaboration | Jet algorithms performance in 13 TeV data | CMS Physics Analysis Summary, 2017 CMS-PAS-JME-16-003 |
CMS-PAS-JME-16-003 |
| 46 | CMS Collaboration | Identification of heavy-flavour jets with the CMS detector in pp collisions at 13 TeV | JINST 13 (2018) P05011 | CMS-BTV-16-002 1712.07158 |
| 47 | E. Bols et al. | Jet flavour classification using DeepJet | JINST 15 (2020) P12012 link |
2008.10519 |
| 48 | R. A. Fisher | On the interpretation of $ \chi^{2} $ from contingency tables, and the calculation of p | J. Roy. Stat. Soc. 85 (1922) 87 | |
| 49 | CMS Collaboration | Identification of double-b quark jets in boosted event topologies | CMS Physics Analysis Summary , CERN, 2016 CMS-PAS-BTV-15-002 |
CMS-PAS-BTV-15-002 |
| 50 | CMS Collaboration | Precision luminosity measurement in proton-proton collisions at $ \sqrt{s} = $ 13 TeV in 2015 and 2016 at CMS | EPJC 81 (2021) 800 | CMS-LUM-17-003 2104.01927 |
| 51 | CMS Collaboration | CMS luminosity measurement for the 2017 data taking period | CMS Physics Analysis Summary , CERN, 2018 link |
CMS-PAS-LUM-17-004 |
| 52 | CMS Collaboration | CMS luminosity measurement for the 2018 data taking period | CMS Physics Analysis Summary , CERN, 2019 link |
CMS-PAS-LUM-18-002 |
| 53 | CMS Collaboration | Measurement of the inelastic proton-proton cross section at $ \sqrt{s}= $ 13 TeV | JHEP 07 (2018) 161 | CMS-FSQ-15-005 1802.02613 |
| 54 | T. Junk | Confidence level computation for combining searches with small statistics | NIM A 434 (1999) 435 | hep-ex/9902006 |
| 55 | A. L. Read | Presentation of search results: the $ CL_s $ technique | JPG 28 (2002) 2693 | |
| 56 | LHC Higgs Combination Group | Procedure for the LHC Higgs boson search combination in Summer 2011 | Technical Report CMS-NOTE-2011-005, ATL-PHYS-PUB-2011-11, CERN, Geneva, 2011 | |
| 57 | G. Cowan, K. Cranmer, E. Gross, and O. Vitells | Asymptotic formulae for likelihood-based tests of new physics | EPJC 71 (2011) 1554 | 1007.1727 |
|
|
Compact Muon Solenoid LHC, CERN |
|

|

|

|

|

|