

Compact Muon Solenoid
LHC, CERN
| CMS-PAS-BTV-15-002 | ||
| Identification of double-b quark jets in boosted event topologies | ||
| CMS Collaboration | ||
| July 2016 | ||
| Abstract: Searches for new physics at the LHC necessitate to distinguish the merged decay products of resonances produced with high transverse momentum, from jets that originate from single partons. We present an algorithm that aims to reconstruct the $\mathrm{b\bar{b}}$ decay mode of such resonances. The algorithm is applicable to any resonance with the mass close to the W/Z/H boson mass and with high enough energy for its decay products to be clustered in a single jet within a cone of size $R= $ 0.8 . An example is the 125 GeV Higgs boson which is the focus of this document. The efficiency and the mistag rate from top quark jets have been measured using the 2.6 fb$^{-1}$ dataset collected with the CMS experiment at 13 TeV in 2015. | ||
| Links: CDS record (PDF) ; inSPIRE record ; CADI line (restricted) ; | ||
| Figures | |
png pdf |
Figure 1:
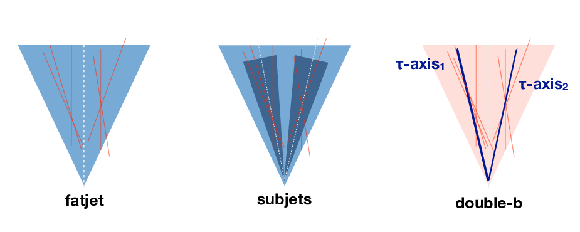
Schematic comparison of the fat jet and subjet b tagging approaches and the presented double-b tagger. |

png pdf |
Figure 2-a:
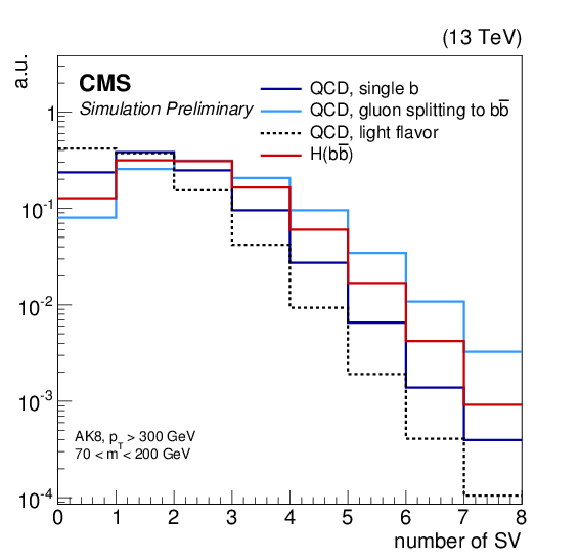
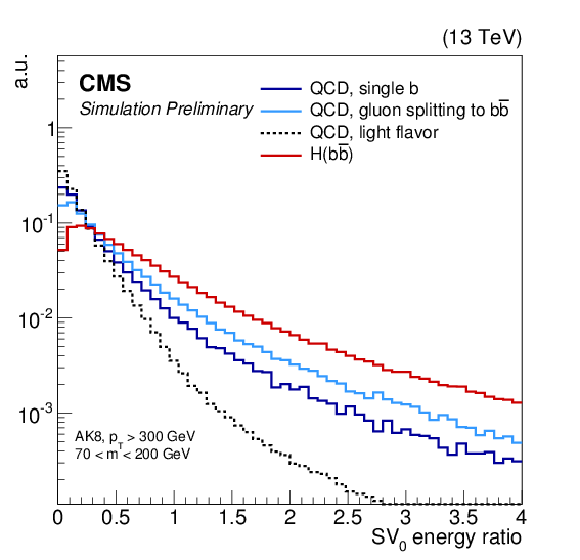
Distributions of 2D IP significance for the most displaced track raising the SV invariant mass above the bottom quark threshold, number of secondary vertices associated to the AK8 jet, the vertex energy ratio for SV$_0$, and the $z$ variable. Comparison between H$\rightarrow \mathrm {b\bar {b}}$ jets from simulated samples of KK-Graviton decaying to HH and QCD jets containing zero, one or two b quarks are used. AK8 jets are selected with $ {p_{\mathrm {T}}} > $ 300 GeV and pruned jet mass 70 $ < m < $ 200 GeV. The distributions are normalized to unit area. |
png pdf |
Figure 2-b:
Distributions of 2D IP significance for the most displaced track raising the SV invariant mass above the bottom quark threshold, number of secondary vertices associated to the AK8 jet, the vertex energy ratio for SV$_0$, and the $z$ variable. Comparison between H$\rightarrow \mathrm {b\bar {b}}$ jets from simulated samples of KK-Graviton decaying to HH and QCD jets containing zero, one or two b quarks are used. AK8 jets are selected with $ {p_{\mathrm {T}}} > $ 300 GeV and pruned jet mass 70 $ < m < $ 200 GeV. The distributions are normalized to unit area. |
png pdf |
Figure 2-c:
Distributions of 2D IP significance for the most displaced track raising the SV invariant mass above the bottom quark threshold, number of secondary vertices associated to the AK8 jet, the vertex energy ratio for SV$_0$, and the $z$ variable. Comparison between H$\rightarrow \mathrm {b\bar {b}}$ jets from simulated samples of KK-Graviton decaying to HH and QCD jets containing zero, one or two b quarks are used. AK8 jets are selected with $ {p_{\mathrm {T}}} > $ 300 GeV and pruned jet mass 70 $ < m < $ 200 GeV. The distributions are normalized to unit area. |

png pdf |
Figure 2-d:
Distributions of 2D IP significance for the most displaced track raising the SV invariant mass above the bottom quark threshold, number of secondary vertices associated to the AK8 jet, the vertex energy ratio for SV$_0$, and the $z$ variable. Comparison between H$\rightarrow \mathrm {b\bar {b}}$ jets from simulated samples of KK-Graviton decaying to HH and QCD jets containing zero, one or two b quarks are used. AK8 jets are selected with $ {p_{\mathrm {T}}} > $ 300 GeV and pruned jet mass 70 $ < m < $ 200 GeV. The distributions are normalized to unit area. |
png pdf |
Figure 3-a:
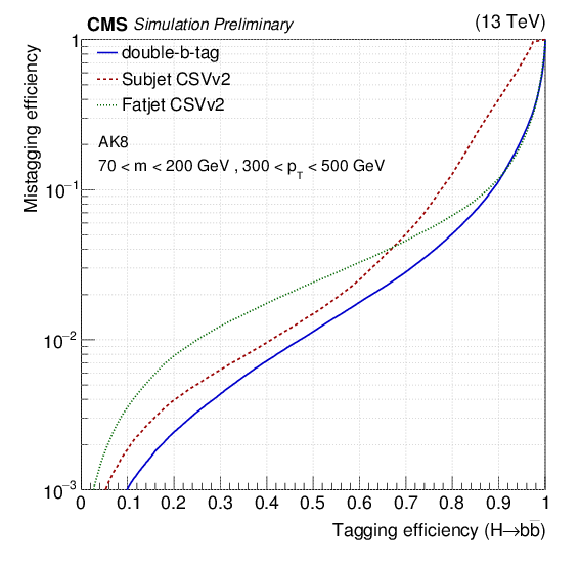
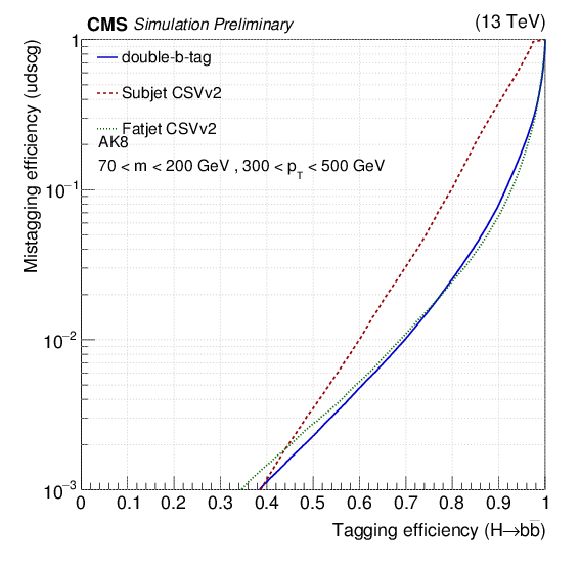
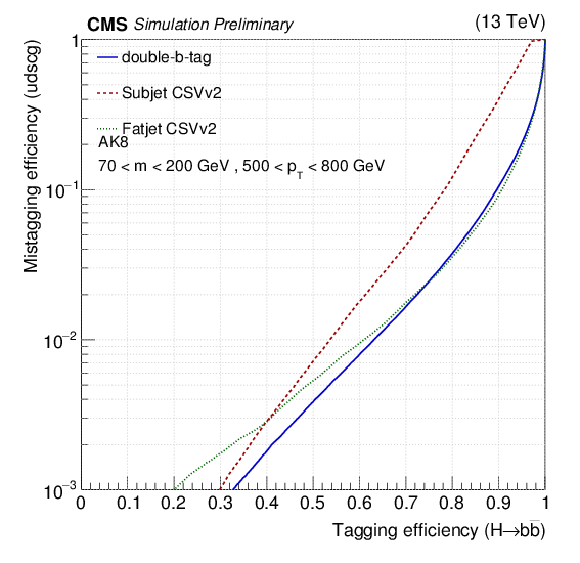
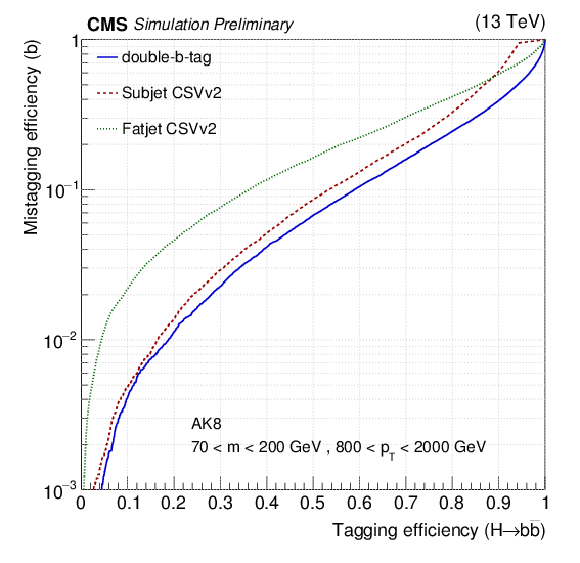
Comparison of the performance of the double-b tagger, the minimum CSVv2 value among the two subjets b tag scores, and fat jet b tag which exploits CSVv2 algorithm. The tagging efficiency for signal is evaluated using boosted H$\rightarrow {\mathrm{ b \bar{b} } } $ jets from simulation. The mistag rate is evaluated for simulated QCD jets containing zero, one or two b quarks. \textbf {a} for all jets with 300 $< {p_{\mathrm {T}}} <$ 500 GeV, \textbf {b} for 500 $< {p_{\mathrm {T}}} <$ 800 GeV, \textbf {c} for ${p_{\mathrm {T}}} >$ 800 GeV. \textbf {d} shows for ${p_{\mathrm {T}}} >$ 800 GeV the mistag rate evaluated for $g\rightarrow {\mathrm{ b \bar{b} } } $. |
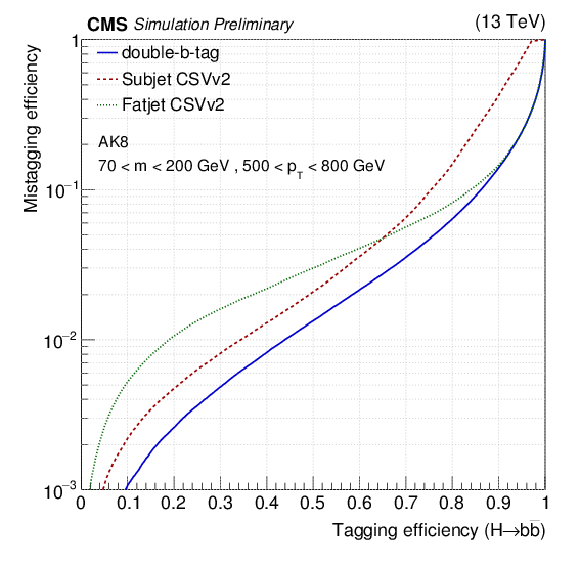
png pdf |
Figure 3-b:
Comparison of the performance of the double-b tagger, the minimum CSVv2 value among the two subjets b tag scores, and fat jet b tag which exploits CSVv2 algorithm. The tagging efficiency for signal is evaluated using boosted H$\rightarrow {\mathrm{ b \bar{b} } } $ jets from simulation. The mistag rate is evaluated for simulated QCD jets containing zero, one or two b quarks. \textbf {a} for all jets with 300 $< {p_{\mathrm {T}}} <$ 500 GeV, \textbf {b} for 500 $< {p_{\mathrm {T}}} <$ 800 GeV, \textbf {c} for ${p_{\mathrm {T}}} >$ 800 GeV. \textbf {d} shows for ${p_{\mathrm {T}}} >$ 800 GeV the mistag rate evaluated for $g\rightarrow {\mathrm{ b \bar{b} } } $. |

png pdf |
Figure 3-c:
Comparison of the performance of the double-b tagger, the minimum CSVv2 value among the two subjets b tag scores, and fat jet b tag which exploits CSVv2 algorithm. The tagging efficiency for signal is evaluated using boosted H$\rightarrow {\mathrm{ b \bar{b} } } $ jets from simulation. The mistag rate is evaluated for simulated QCD jets containing zero, one or two b quarks. \textbf {a} for all jets with 300 $< {p_{\mathrm {T}}} <$ 500 GeV, \textbf {b} for 500 $< {p_{\mathrm {T}}} <$ 800 GeV, \textbf {c} for ${p_{\mathrm {T}}} >$ 800 GeV. \textbf {d} shows for ${p_{\mathrm {T}}} >$ 800 GeV the mistag rate evaluated for $g\rightarrow {\mathrm{ b \bar{b} } } $. |
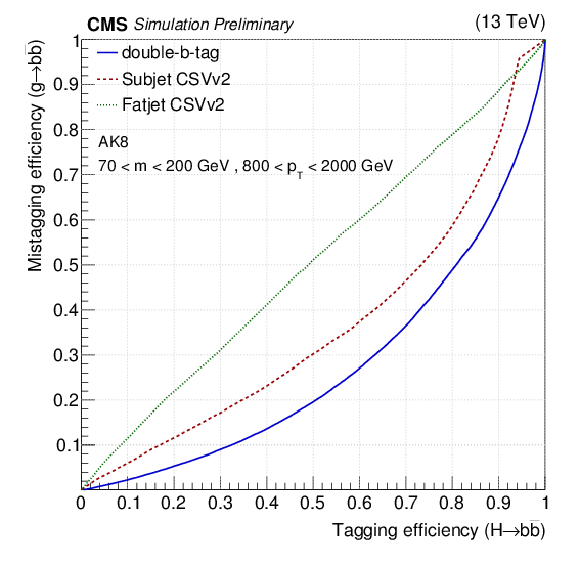
png pdf |
Figure 3-d:
Comparison of the performance of the double-b tagger, the minimum CSVv2 value among the two subjets b tag scores, and fat jet b tag which exploits CSVv2 algorithm. The tagging efficiency for signal is evaluated using boosted H$\rightarrow {\mathrm{ b \bar{b} } } $ jets from simulation. The mistag rate is evaluated for simulated QCD jets containing zero, one or two b quarks. \textbf {a} for all jets with 300 $< {p_{\mathrm {T}}} <$ 500 GeV, \textbf {b} for 500 $< {p_{\mathrm {T}}} <$ 800 GeV, \textbf {c} for ${p_{\mathrm {T}}} >$ 800 GeV. \textbf {d} shows for ${p_{\mathrm {T}}} >$ 800 GeV the mistag rate evaluated for $g\rightarrow {\mathrm{ b \bar{b} } } $. |
png pdf |
Figure 4-a:
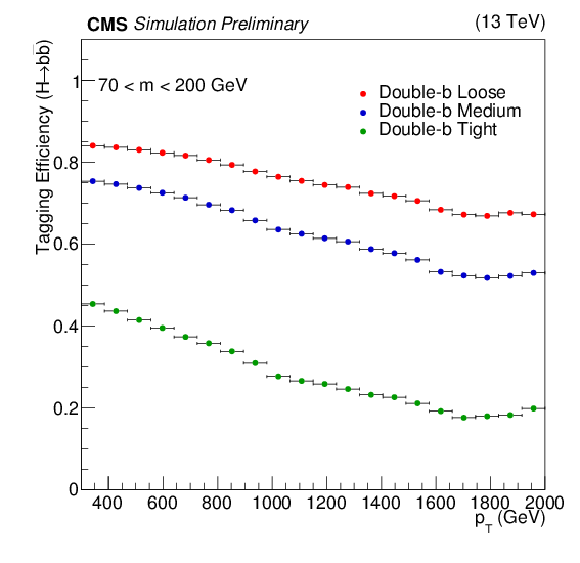
Signal efficiency (a) and mistag rate (b) distribution with respect to jet ${p_{\mathrm {T}}}$ after a selection on the double-b tagger for Loose, Medium and Tight operating points. Simulated H$\rightarrow {\mathrm{ b \bar{b} } } $ jets from KK-Graviton decaying to HH (a) and QCD jets containing zero, one or two b quarks (b) are used. AK8 jets are selected with $ {p_{\mathrm {T}}} > $ 300 GeV and pruned jet mass 70 $ < m < $ 200 GeV. |
png pdf |
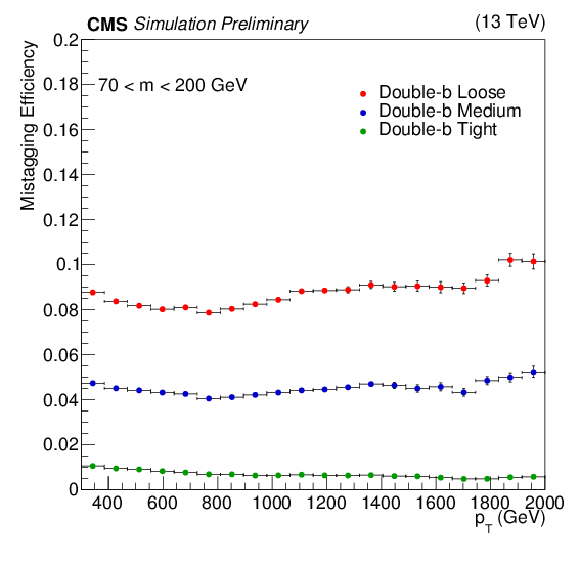
Figure 4-b:
Signal efficiency (a) and mistag rate (b) distribution with respect to jet ${p_{\mathrm {T}}}$ after a selection on the double-b tagger for Loose, Medium and Tight operating points. Simulated H$\rightarrow {\mathrm{ b \bar{b} } } $ jets from KK-Graviton decaying to HH (a) and QCD jets containing zero, one or two b quarks (b) are used. AK8 jets are selected with $ {p_{\mathrm {T}}} > $ 300 GeV and pruned jet mass 70 $ < m < $ 200 GeV. |
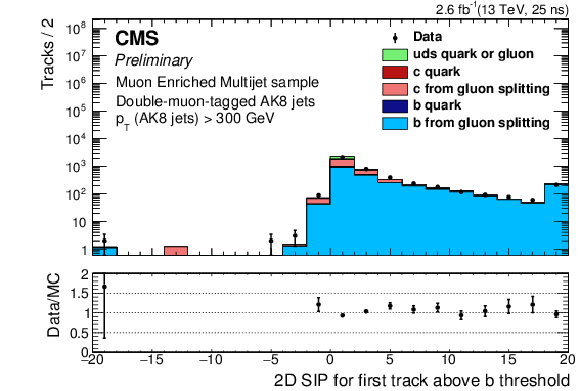
png pdf |
Figure 5-a:
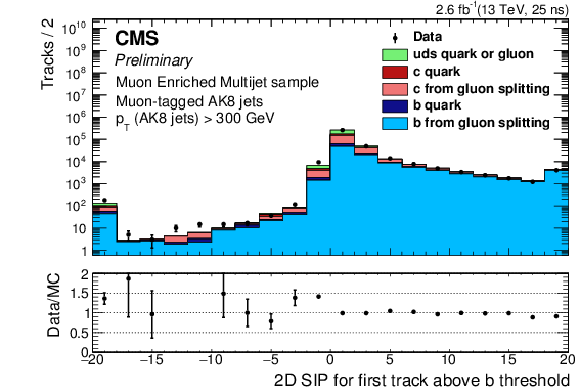
Distributions of 2D IP significance for the most displaced track raising the SV invariant mass above the b quark threshold, number of secondary vertices associated to the AK8 jet, the vertex energy ratio for SV$_0$, and the $z$ variable. Data and simulated events are shown for the double-muon tagged jets selection. Simulated events are normalized to the yield observed in data, the overflow is in last bin. The bottom panel in each figure shows the ratio of the number of events observed in data to that of the MC prediction. |
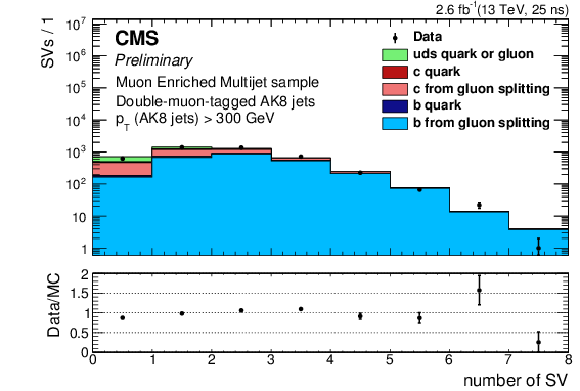
png pdf |
Figure 5-b:
Distributions of 2D IP significance for the most displaced track raising the SV invariant mass above the b quark threshold, number of secondary vertices associated to the AK8 jet, the vertex energy ratio for SV$_0$, and the $z$ variable. Data and simulated events are shown for the double-muon tagged jets selection. Simulated events are normalized to the yield observed in data, the overflow is in last bin. The bottom panel in each figure shows the ratio of the number of events observed in data to that of the MC prediction. |
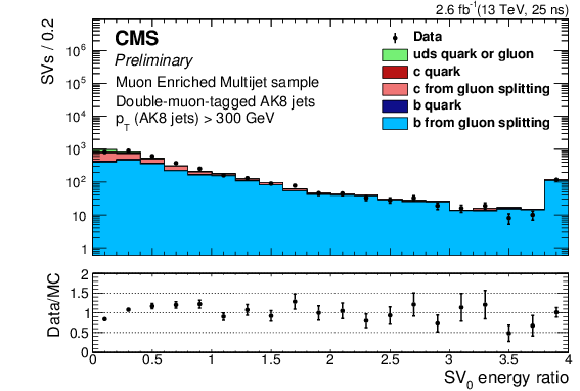
png pdf |
Figure 5-c:
Distributions of 2D IP significance for the most displaced track raising the SV invariant mass above the b quark threshold, number of secondary vertices associated to the AK8 jet, the vertex energy ratio for SV$_0$, and the $z$ variable. Data and simulated events are shown for the double-muon tagged jets selection. Simulated events are normalized to the yield observed in data, the overflow is in last bin. The bottom panel in each figure shows the ratio of the number of events observed in data to that of the MC prediction. |
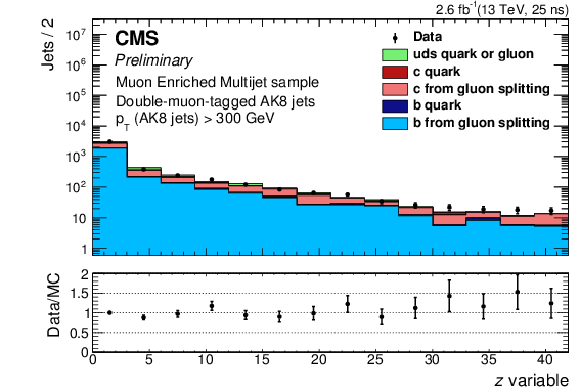
png pdf |
Figure 5-d:
Distributions of 2D IP significance for the most displaced track raising the SV invariant mass above the b quark threshold, number of secondary vertices associated to the AK8 jet, the vertex energy ratio for SV$_0$, and the $z$ variable. Data and simulated events are shown for the double-muon tagged jets selection. Simulated events are normalized to the yield observed in data, the overflow is in last bin. The bottom panel in each figure shows the ratio of the number of events observed in data to that of the MC prediction. |
png pdf |
Figure 6:
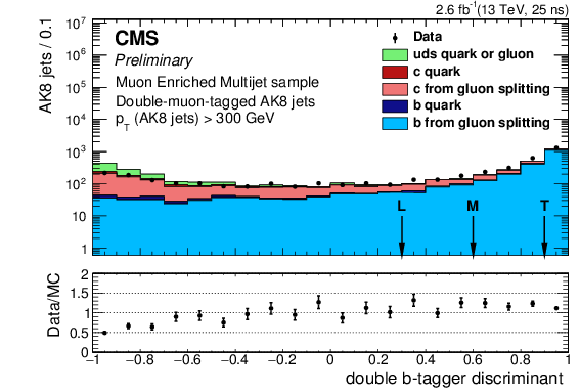
Double-b tagger discriminant distribution in data and simulated samples for the double-muon tagged jets selection. Simulated events are normalized to the yield observed in data. The loose, medium and tight operating points are also reported. The bottom panel shows the ratio of the number of events observed in data to that of the MC prediction. |
png pdf |
Figure 7-a:
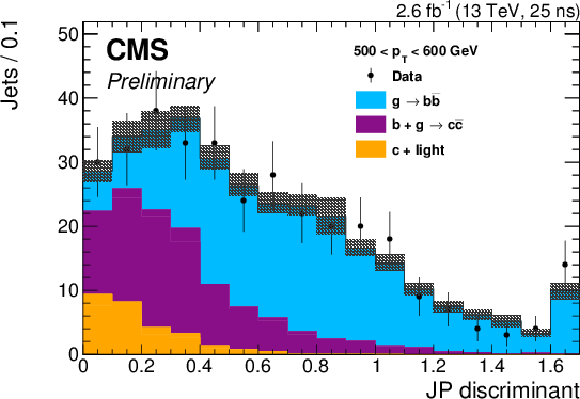
Comparison of the JP discriminant distribution for the data and the sum of the fitted templates for all selected jets (a) and those jets passing the loose double-b tagger requirement (b) with ${p_{\mathrm {T}}}$ between 500 and 600 GeV. The shaded area represents the statistical and systematic (refer to the text for details) uncertainties on MC templates. Double-muon tagged AK8 jets are used for this measurement. The overflow is included in the last bin. |

png pdf |
Figure 7-b:
Comparison of the JP discriminant distribution for the data and the sum of the fitted templates for all selected jets (a) and those jets passing the loose double-b tagger requirement (b) with ${p_{\mathrm {T}}}$ between 500 and 600 GeV. The shaded area represents the statistical and systematic (refer to the text for details) uncertainties on MC templates. Double-muon tagged AK8 jets are used for this measurement. The overflow is included in the last bin. |
png pdf |
Figure 8-a:
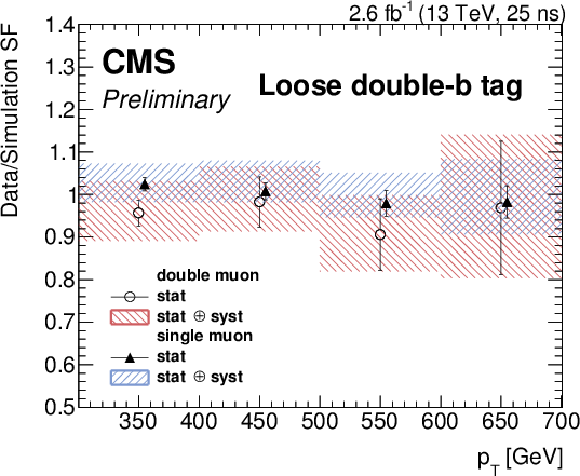
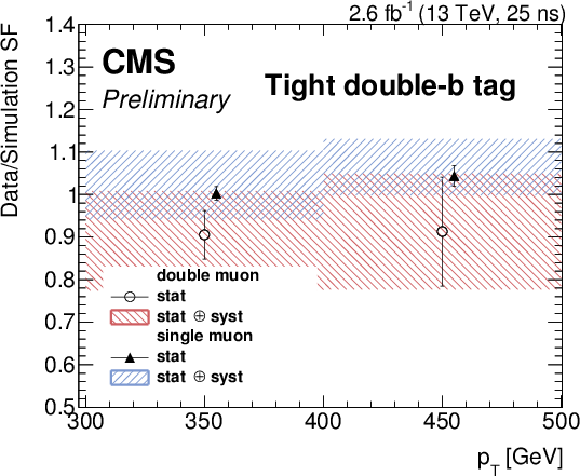
Data/MC efficiency ratio (SF) for loose, medium and tight double-b tagger requirement obtained with single and double-muon tagged selections. Central values of scale factors are artificially shifted along the x-axis for better visibility. |
png pdf |
Figure 8-b:
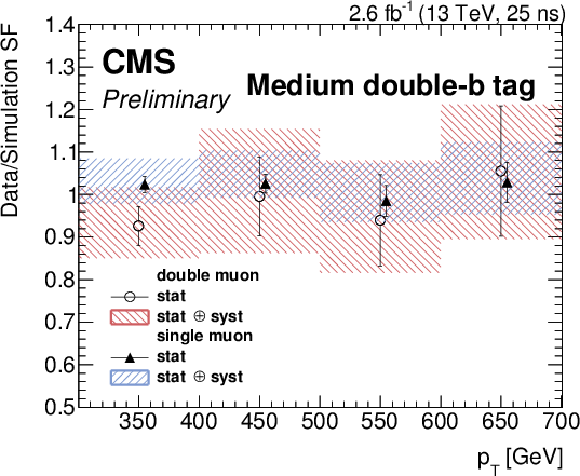
Data/MC efficiency ratio (SF) for loose, medium and tight double-b tagger requirement obtained with single and double-muon tagged selections. Central values of scale factors are artificially shifted along the x-axis for better visibility. |
png pdf |
Figure 8-c:
Data/MC efficiency ratio (SF) for loose, medium and tight double-b tagger requirement obtained with single and double-muon tagged selections. Central values of scale factors are artificially shifted along the x-axis for better visibility. |
png pdf |
Figure 9:
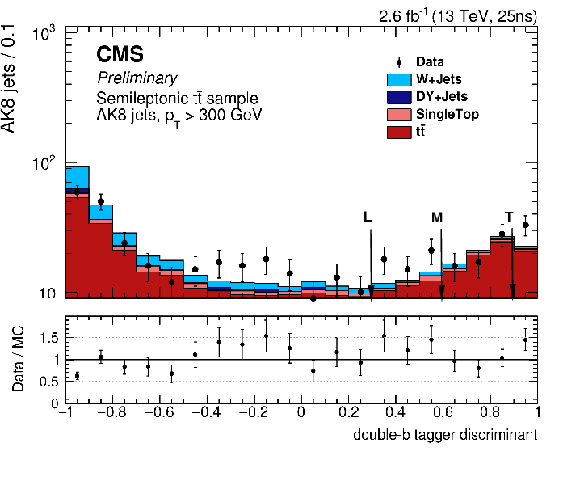
Double-b tagger discriminant distribution for the jet associated to the boosted top quark hadronic decay in selected semi-leptonic $ {\mathrm{ t \bar{t} } } $ events. Simulated events are normalized to the yield observed in data. The bottom panel shows the ratio of the number of events observed in data to that of the MC prediction. |
png pdf |
Figure 10-a:
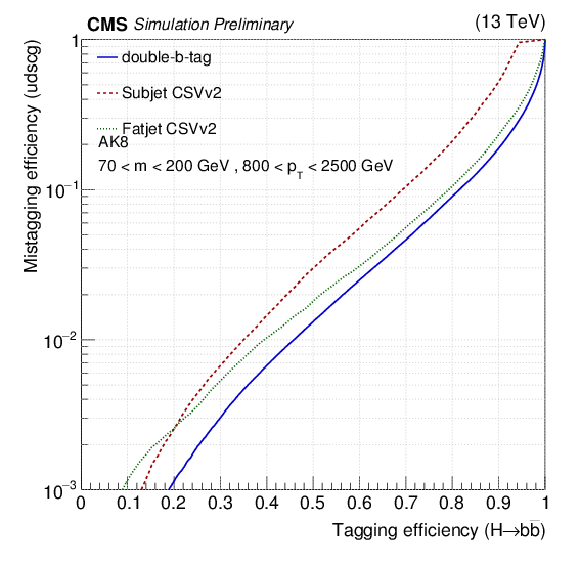
Comparison of the performance of the double-b tagger, the minimum CSVv2 value among the two subjets b tag scores, and fat jet b tag which exploits CSVv2 algorithm. The tagging efficiency for signal is evaluated using boosted H$\rightarrow {\mathrm{ b \bar{b} } } $ jets from simulation. The mistag rate is evaluated for simulated QCD jets containing zero b quark. \textbf {a} for all jets with 300 $< {p_{\mathrm {T}}} <$ 500 GeV, \textbf {b} for 500 $< {p_{\mathrm {T}}} <$ 800 GeV, \textbf {c} for ${p_{\mathrm {T}}} >$ 800 GeV. |
png pdf |
Figure 10-b:
Comparison of the performance of the double-b tagger, the minimum CSVv2 value among the two subjets b tag scores, and fat jet b tag which exploits CSVv2 algorithm. The tagging efficiency for signal is evaluated using boosted H$\rightarrow {\mathrm{ b \bar{b} } } $ jets from simulation. The mistag rate is evaluated for simulated QCD jets containing zero b quark. \textbf {a} for all jets with 300 $< {p_{\mathrm {T}}} <$ 500 GeV, \textbf {b} for 500 $< {p_{\mathrm {T}}} <$ 800 GeV, \textbf {c} for ${p_{\mathrm {T}}} >$ 800 GeV. |
png pdf |
Figure 10-c:
Comparison of the performance of the double-b tagger, the minimum CSVv2 value among the two subjets b tag scores, and fat jet b tag which exploits CSVv2 algorithm. The tagging efficiency for signal is evaluated using boosted H$\rightarrow {\mathrm{ b \bar{b} } } $ jets from simulation. The mistag rate is evaluated for simulated QCD jets containing zero b quark. \textbf {a} for all jets with 300 $< {p_{\mathrm {T}}} <$ 500 GeV, \textbf {b} for 500 $< {p_{\mathrm {T}}} <$ 800 GeV, \textbf {c} for ${p_{\mathrm {T}}} >$ 800 GeV. |
png pdf |
Figure 11-a:
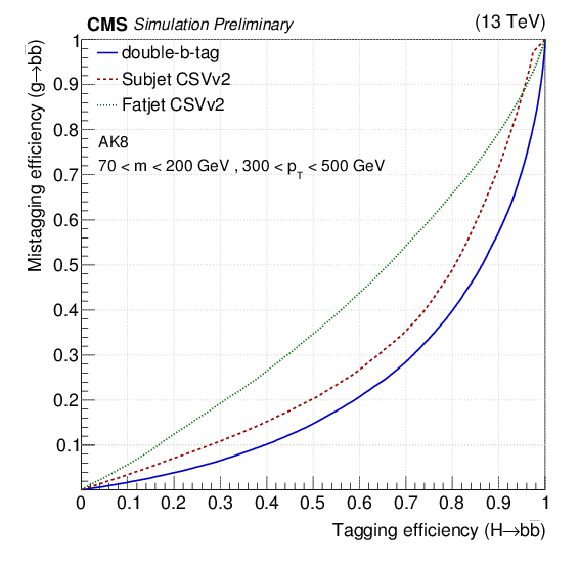
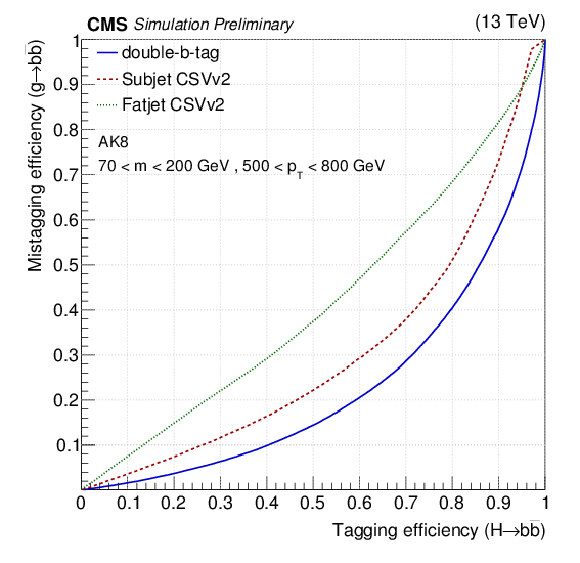
Comparison of the performance of the double-b tagger, the minimum CSVv2 value among the two subjets b tag scores, and fat jet b tag which exploits CSVv2 algorithm. The tagging efficiency for signal is evaluated using boosted H$\rightarrow {\mathrm{ b \bar{b} } } $ jets from simulation. The mistag rate is evaluated for simulated QCD jets containing two b quarks. \textbf {a} for all jets with 300 $< {p_{\mathrm {T}}} <$ 500 GeV, \textbf {b} for 500 $< {p_{\mathrm {T}}} <$ 800 GeV. |
png pdf |
Figure 11-b:
Comparison of the performance of the double-b tagger, the minimum CSVv2 value among the two subjets b tag scores, and fat jet b tag which exploits CSVv2 algorithm. The tagging efficiency for signal is evaluated using boosted H$\rightarrow {\mathrm{ b \bar{b} } } $ jets from simulation. The mistag rate is evaluated for simulated QCD jets containing two b quarks. \textbf {a} for all jets with 300 $< {p_{\mathrm {T}}} <$ 500 GeV, \textbf {b} for 500 $< {p_{\mathrm {T}}} <$ 800 GeV. |
png pdf |
Figure 12-a:
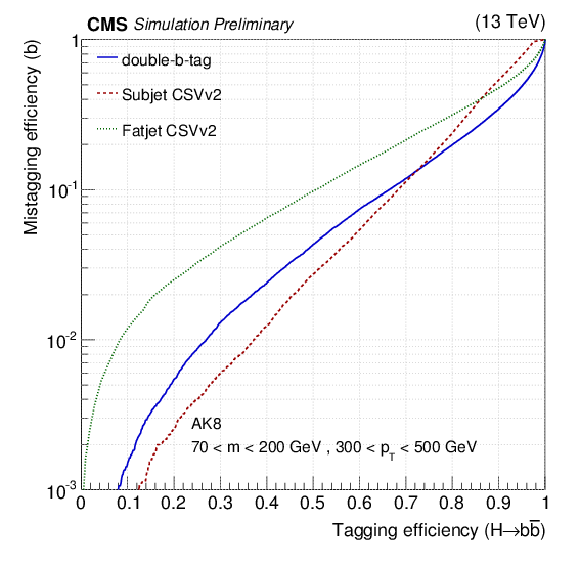
Comparison of the performance of the double-b tagger, the minimum CSVv2 value among the two subjets b tag scores, and fat jet b tag which exploits CSVv2 algorithm. The tagging efficiency for signal is evaluated using boosted H$\rightarrow {\mathrm{ b \bar{b} } } $ jets from simulation. The mistag rate is evaluated for simulated QCD jets containing one b quark. \textbf {a} for all jets with 300 $< {p_{\mathrm {T}}} <$ 500 GeV, \textbf {b} for 500 $< {p_{\mathrm {T}}} <$ 800 GeV, \textbf {c} for ${p_{\mathrm {T}}} >$ 800 GeV. |

png pdf |
Figure 12-b:
Comparison of the performance of the double-b tagger, the minimum CSVv2 value among the two subjets b tag scores, and fat jet b tag which exploits CSVv2 algorithm. The tagging efficiency for signal is evaluated using boosted H$\rightarrow {\mathrm{ b \bar{b} } } $ jets from simulation. The mistag rate is evaluated for simulated QCD jets containing one b quark. \textbf {a} for all jets with 300 $< {p_{\mathrm {T}}} <$ 500 GeV, \textbf {b} for 500 $< {p_{\mathrm {T}}} <$ 800 GeV, \textbf {c} for ${p_{\mathrm {T}}} >$ 800 GeV. |
png pdf |
Figure 12-c:
Comparison of the performance of the double-b tagger, the minimum CSVv2 value among the two subjets b tag scores, and fat jet b tag which exploits CSVv2 algorithm. The tagging efficiency for signal is evaluated using boosted H$\rightarrow {\mathrm{ b \bar{b} } } $ jets from simulation. The mistag rate is evaluated for simulated QCD jets containing one b quark. \textbf {a} for all jets with 300 $< {p_{\mathrm {T}}} <$ 500 GeV, \textbf {b} for 500 $< {p_{\mathrm {T}}} <$ 800 GeV, \textbf {c} for ${p_{\mathrm {T}}} >$ 800 GeV. |
png pdf |
Figure 13-a:
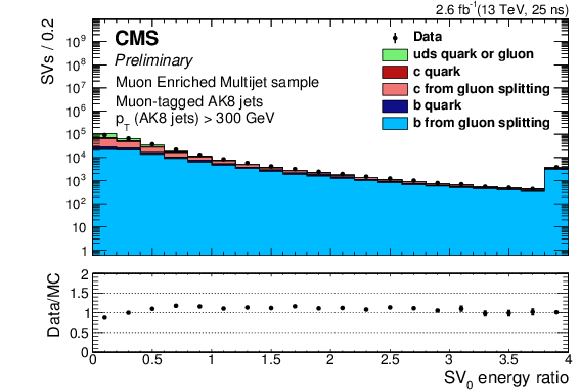
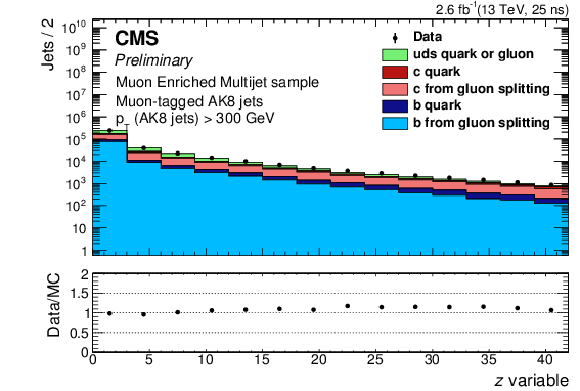
Distributions of 2D IP significance for the most displaced track raising the SV invariant mass above the b quark threshold, number of secondary vertices associated to the AK8 jet, the vertex energy ratio for SV$_0$, and the $z$ variable. Data and simulated events are shown for the single-muon tagged jets selection. Simulated events are normalized to the yield observed in data, the overflow is in last bin. The bottom panel in each figure shows the ratio of the number of events observed in data to that of the MC prediction. |

png pdf |
Figure 13-b:
Distributions of 2D IP significance for the most displaced track raising the SV invariant mass above the b quark threshold, number of secondary vertices associated to the AK8 jet, the vertex energy ratio for SV$_0$, and the $z$ variable. Data and simulated events are shown for the single-muon tagged jets selection. Simulated events are normalized to the yield observed in data, the overflow is in last bin. The bottom panel in each figure shows the ratio of the number of events observed in data to that of the MC prediction. |
png pdf |
Figure 13-c:
Distributions of 2D IP significance for the most displaced track raising the SV invariant mass above the b quark threshold, number of secondary vertices associated to the AK8 jet, the vertex energy ratio for SV$_0$, and the $z$ variable. Data and simulated events are shown for the single-muon tagged jets selection. Simulated events are normalized to the yield observed in data, the overflow is in last bin. The bottom panel in each figure shows the ratio of the number of events observed in data to that of the MC prediction. |
png pdf |
Figure 13-d:
Distributions of 2D IP significance for the most displaced track raising the SV invariant mass above the b quark threshold, number of secondary vertices associated to the AK8 jet, the vertex energy ratio for SV$_0$, and the $z$ variable. Data and simulated events are shown for the single-muon tagged jets selection. Simulated events are normalized to the yield observed in data, the overflow is in last bin. The bottom panel in each figure shows the ratio of the number of events observed in data to that of the MC prediction. |

png pdf |
Figure 14:
Double-b tagger discriminant distribution in data and simulated samples for the single-muon tagged jets selection. Simulated events are normalized to the yield observed in data. The loose, medium and tight operating points are also reported. The bottom panel shows the ratio of the number of events observed in data to that of the MC prediction. |
| Tables | |

png pdf |
Table 1:
Loose double-b tag efficiency ($\epsilon $) and Data/MC efficiency ratio (SF). Uncertainties are both statistical and systematic for the SF and data efficiency, while for the MC efficiency only the statistical uncertainty is reported. Jets with ${p_{\mathrm {T}}} >$700 GeV are included in the last bin. |

png pdf |
Table 2:
Medium double-b tag efficiency ($\epsilon $) and Data/MC efficiency ratio (SF). Uncertainties are both statistical and systematic for the SF and data efficiency, while for the MC efficiency only the statistical uncertainty is reported. Jets with ${p_{\mathrm {T}}} >$ 700 GeV are included in the last bin. |

png pdf |
Table 3:
Tight double-b tag efficiency ($\epsilon $) and Data/MC efficiency ratio (SF). Uncertainties are both statistical and systematic for the SF and data efficiency, while for the MC efficiency only the statistical uncertainty is reported. Jets with ${p_{\mathrm {T}}} >$500 GeV are included in the last bin. |

png pdf |
Table 4:
Mistag scale factors from top quark jets for the three operating points of the double-b tagger and for different ${p_{\mathrm {T}}}$ ranges. The reported uncertainties are statistical only. For the ${p_{\mathrm {T}}} $-inclusive scale factor ($ {p_{\mathrm {T}}} >$ 300 GeV) both statistical and systematic uncertainties are reported. Jets with ${p_{\mathrm {T}}} >$ 700 (500) GeV are included in the last bin. |
| Summary |
| We have presented the ``double-b tagging" algorithm aiming at identifying the $\mathrm{b\bar{b}}$ decay mode of resonances produced with high transverse momentum and detected as single fat jets, and to distinguish them from jets initiated by single partons. An example is the Higgs boson which is the focus of this document but with general applicability to any resonance with the mass close to the W/Z/H mass and $p_\mathrm{T}$ above 300 GeV. We show that this new tagger outperforms the previous techniques to distinguish H jets from the QCD background. At the same signal efficiency, the mistag rate is lower by a factor of 2 compared to, for example, the subjet b tagging approach [4,DP-2014/031]. Given the different kinematic properties expected for a $\mathrm{ b \bar{b} }$ pair originating from the decay of a massive resonance compared to gluon splitting, the mistag rate for the gluon splitting background reduces from 60% to 50% for the loose operating point and from 20% to 10% for the tight operating point compared to the subjet approach. The efficiency and mistag rate from top quark jets have been measured in data and correction factors for simulated jets have been derived for three different operating points for jets with $p_\mathrm{T}$ between 300 and 700 GeV (500 GeV for the tight working point). The uncertainty on the scale factor measurements will be improved with the increased integrated luminosity in 2016, as well as a higher $p_\mathrm{T}$ range will be covered. |
| References | ||||
| 1 | CMS Collaboration | Observation of a new boson at a mass of 125 GeV with the CMS experiment at the LHC | PLB 716 (2012) 30--61 | CMS-HIG-12-028 1207.7235 |
| 2 | ATLAS Collaboration | Observation of a new particle in the search for the Standard Model Higgs boson with the ATLAS detector at the LHC | PLB 716 (2012) 1--29 | 1207.7214 |
| 3 | J. M. Butterworth, A. R. Davison, M. Rubin, and G. P. Salam | Jet substructure as a new Higgs search channel at the LHC | Phys.Rev.Lett. 100 (2008) 242001 | 0802.2470 |
| 4 | CMS Collaboration | Performance of b tagging at $ \sqrt{s} $=8 TeV in multijet, ttbar and boosted topology events | CMS-PAS-BTV-13-001 | CMS-PAS-BTV-13-001 |
| 5 | CMS Collaboration | Performance of b tagging in boosted topology events | CMS-DP-2014-031 | |
| 6 | CMS Collaboration | Search for vector-like T quarks decaying to top quarks and Higgs bosons in the all-hadronic channel using jet substructure | JHEP 06 (2015) 080 | CMS-B2G-14-002 1503.01952 |
| 7 | CMS Collaboration | Search for pair-produced vector-like B quarks in proton-proton collisions at $ \sqrt{s} $ = 8 TeV | Submitted to PRD | CMS-B2G-13-006 1507.07129 |
| 8 | CMS Collaboration | Search for heavy resonances decaying to two Higgs bosons in final states containing four b quarks | Submitted to EPJC | CMS-EXO-12-053 1602.08762 |
| 9 | A. Hoecker et al. | TMVA: Toolkit for Multivariate Data Analysis | PoS ACAT (2007) 040 | physics/0703039 |
| 10 | CMS Collaboration | Measurement of $ B\bar{B} $ Angular Correlations based on Secondary Vertex Reconstruction at $ \sqrt{s}=7 $ TeV | JHEP 03 (2011) 136 | CMS-BPH-10-010 1102.3194 |
| 11 | LHC Higgs Cross Section Working Group Collaboration | Handbook of LHC Higgs Cross Sections: 3. Higgs Properties | 1307.1347 | |
| 12 | CMS Collaboration | The CMS experiment at the CERN LHC | JINST 3 (2008) S08004 | CMS-00-001 |
| 13 | L. Randall and R. Sundrum | A Large mass hierarchy from a small extra dimension | PRL 83 (1999) 3370--3373 | hep-ph/9905221 |
| 14 | T. Sj\"ostrand et al. | An Introduction to PYTHIA 8.2 | CPC 191 (2015) 159--177 | 1410.3012 |
| 15 | P. Nason | A New method for combining NLO QCD with shower Monte Carlo algorithms | JHEP 11 (2004) 040 | hep-ph/0409146 |
| 16 | S. Frixione, P. Nason, and C. Oleari | Matching NLO QCD computations with Parton Shower simulations: the POWHEG method | JHEP 11 (2007) 070 | 0709.2092 |
| 17 | S. Alioli, P. Nason, C. Oleari, and E. Re | A general framework for implementing NLO calculations in shower Monte Carlo programs: the POWHEG BOX | JHEP 06 (2010) 043 | 1002.2581 |
| 18 | S. Frixione, P. Nason, and G. Ridolfi | A Positive-weight next-to-leading-order Monte Carlo for heavy flavour hadroproduction | JHEP 09 (2007) 126 | 0707.3088 |
| 19 | E. Re | Single-top Wt-channel production matched with parton showers using the POWHEG method | EPJC 71 (2011) 1547 | 1009.2450 |
| 20 | J. Alwall et al. | The automated computation of tree-level and next-to-leading order differential cross sections, and their matching to parton shower simulations | JHEP 07 (2014) 079 | 1405.0301 |
| 21 | J. Alwall et al. | MadGraph 5 : Going Beyond | JHEP 06 (2011) 128 | 1106.0522 |
| 22 | M. L. Mangano, M. Moretti, F. Piccinini, and M. Treccani | Matching Matrix Elements and Shower Evolution for Top-Quark Production in Hadronic Collisions | JHEP 01 (2007) 013 | hep-ph/0611129 |
| 23 | NNPDF Collaboration | Parton distributions for the LHC Run II | JHEP 04 (2015) 040 | 1410.8849 |
| 24 | CMS Collaboration | Event generator tunes obtained from underlying event and multiparton scattering measurements | EPJC 76 (2016), no. 3, 155 | CMS-GEN-14-001 1512.00815 |
| 25 | CMS Collaboration | Particle-Flow Event Reconstruction in CMS and Performance for Jets, Taus, and MET | CDS | |
| 26 | CMS Collaboration | Commissioning of the Particle-Flow reconstruction in Minimum-Bias and Jet Events from pp Collisions at 7 TeV | CDS | |
| 27 | CMS Collaboration | Performance of CMS muon reconstruction in $ pp $ collision events at $ \sqrt{s}=7 $ TeV | JINST 7 (2012) P10002 | CMS-MUO-10-004 1206.4071 |
| 28 | M. Cacciari, G. P. Salam, and G. Soyez | The Anti-k(t) jet clustering algorithm | JHEP 04 (2008) 063 | 0802.1189 |
| 29 | M. Cacciari, G. P. Salam, and G. Soyez | FastJet User Manual | EPJC 72 (2012) 1896 | 1111.6097 |
| 30 | M. Cacciari and G. P. Salam | Dispelling the $ N^{3} $ myth for the $ k_t $ jet-finder | PLB 641 (2006) 57--61 | hep-ph/0512210 |
| 31 | CMS Collaboration | Determination of jet energy calibration and transverse momentum resolution in CMS | JINST 6 (November, 2011) 11002 | CMS-JME-10-011 1107.4277 |
| 32 | CMS Collaboration | Pileup Jet Identification | ||
| 33 | D. Krohn, J. Thaler, and L.-T. Wang | Jet Trimming | JHEP 02 (2010) 084 | 0912.1342 |
| 34 | S. D. Ellis, C. K. Vermilion, and J. R. Walsh | Recombination Algorithms and Jet Substructure: Pruning as a Tool for Heavy Particle Searches | Phys.Rev. D 81 (2010) 094023 | 0912.0033 |
| 35 | J. Thaler and K. Van Tilburg | Identifying Boosted Objects with N-subjettiness | JHEP 03 (2011) 015 | 1011.2268 |
| 36 | CMS Collaboration | Identification of b quark jets at the CMS Experiment in the LHC Run 2 | ||
| 37 | CMS Collaboration | Identification of b-quark jets with the CMS experiment | JINST 8 (2013) P04013 | CMS-BTV-12-001 1211.4462 |
| 38 | CMS Collaboration | Measurement of the differential cross section for top quark pair production in pp collisions at $ \sqrt{s} = 8\,\text {TeV} $ | EPJC75 (2015), no. 11, 542 | CMS-TOP-12-028 1505.04480 |

|
Compact Muon Solenoid LHC, CERN |

|

|

|

|

|

|