

Compact Muon Solenoid
LHC, CERN
| CMS-PAS-EXO-18-002 | ||
| Search for heavy long-lived charged particles with large ionization energy loss in proton-proton collisions at $ \sqrt{s} = $ 13 TeV | ||
| CMS Collaboration | ||
| 27 March 2024 | ||
| Abstract: A search for heavy, long-lived, charged particles depositing large ionization within the silicon tracker is presented. This analysis uses proton-proton collision data with center of mass energy at $ \sqrt{s} = $ 13 TeV, collected in 2017 and 2018 by the CMS experiment at the CERN LHC, corresponding to an integrated luminosity of 101 fb$^{-1}$. Two different approaches for the search are taken. One new method exploits the independence of the silicon pixel and silicon strips measurements, and an improved version of the mass method used in previous iterations of the analysis is further employed. No significant excess of events is observed. The results are interpreted in the context of pair production of supersymmetric particles, namely gluinos, top squarks and tau sleptons, or for Drell-Yan pair production of fourth generation ($ \tau' $) leptons with an electric charge equal to or twice the electron charge ($ e $). This search presents also for the first time an interpretation of a Z' boson decaying to two $ \tau' $ leptons having an electric charge equal to 2$ e $. The 95% confidence upper limits on the production cross section are extracted for each of these hypothetical particles. | ||
|
Links:
CDS record (PDF) ;
CADI line (restricted) ;
These preliminary results are superseded in this paper, Submitted to JHEP. The superseded preliminary plots can be found here. |
||
| Figures | |

png pdf |
Figure 1:
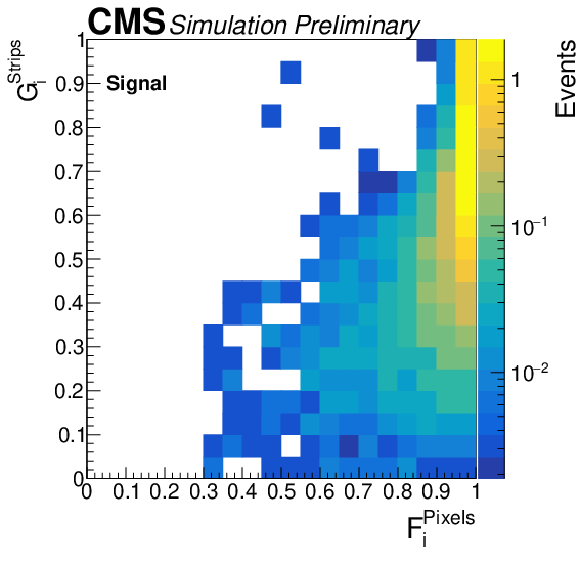
The $ F_{\text{i}}^{\text{Pixels}} $ vs $ G_{\text{i}}^{\text{Strips}} $ distribution for the SM MC (left), and the 1800 GeV mass $ \mathrm{\widetilde{g}} $ R-hadron (right), after passing the selection criteria listed in Table 2. |

png pdf |
Figure 1-a:
The $ F_{\text{i}}^{\text{Pixels}} $ vs $ G_{\text{i}}^{\text{Strips}} $ distribution for the SM MC (left), and the 1800 GeV mass $ \mathrm{\widetilde{g}} $ R-hadron (right), after passing the selection criteria listed in Table 2. |
png pdf |
Figure 1-b:
The $ F_{\text{i}}^{\text{Pixels}} $ vs $ G_{\text{i}}^{\text{Strips}} $ distribution for the SM MC (left), and the 1800 GeV mass $ \mathrm{\widetilde{g}} $ R-hadron (right), after passing the selection criteria listed in Table 2. |

png pdf |
Figure 2:
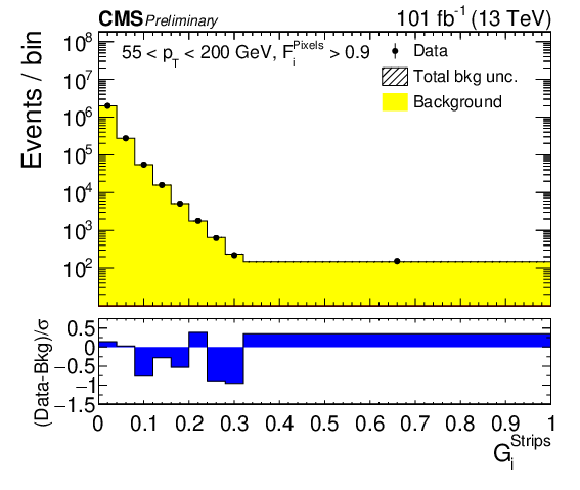
The $ G_{\text{i}}^{\text{Strips}} $ distribution in the FAIL (left) and PASS (right) regions for events passing the event selection and with 55 $ < p_{\mathrm{T}} < $ 200 GeV. The data recorded in 2017 and 2018 are represented by black markers. The background predicted by the ionization method is shown in yellow, with the shaded area indicating the background uncertainty. The histograms associated to the 557 GeV $ \widetilde{\tau} $ and 1800 GeV $ \mathrm{\widetilde{g}} $ signals are not visible on the plots, their contribution being negligible in this region. The lower panel displays the pulls, defined as the difference between the observed (Data) and predicted (Bkg) yields divided by the associated uncertainty ($ \sigma $). |

png pdf |
Figure 2-a:
The $ G_{\text{i}}^{\text{Strips}} $ distribution in the FAIL (left) and PASS (right) regions for events passing the event selection and with 55 $ < p_{\mathrm{T}} < $ 200 GeV. The data recorded in 2017 and 2018 are represented by black markers. The background predicted by the ionization method is shown in yellow, with the shaded area indicating the background uncertainty. The histograms associated to the 557 GeV $ \widetilde{\tau} $ and 1800 GeV $ \mathrm{\widetilde{g}} $ signals are not visible on the plots, their contribution being negligible in this region. The lower panel displays the pulls, defined as the difference between the observed (Data) and predicted (Bkg) yields divided by the associated uncertainty ($ \sigma $). |
png pdf |
Figure 2-b:
The $ G_{\text{i}}^{\text{Strips}} $ distribution in the FAIL (left) and PASS (right) regions for events passing the event selection and with 55 $ < p_{\mathrm{T}} < $ 200 GeV. The data recorded in 2017 and 2018 are represented by black markers. The background predicted by the ionization method is shown in yellow, with the shaded area indicating the background uncertainty. The histograms associated to the 557 GeV $ \widetilde{\tau} $ and 1800 GeV $ \mathrm{\widetilde{g}} $ signals are not visible on the plots, their contribution being negligible in this region. The lower panel displays the pulls, defined as the difference between the observed (Data) and predicted (Bkg) yields divided by the associated uncertainty ($ \sigma $). |

png pdf |
Figure 3:
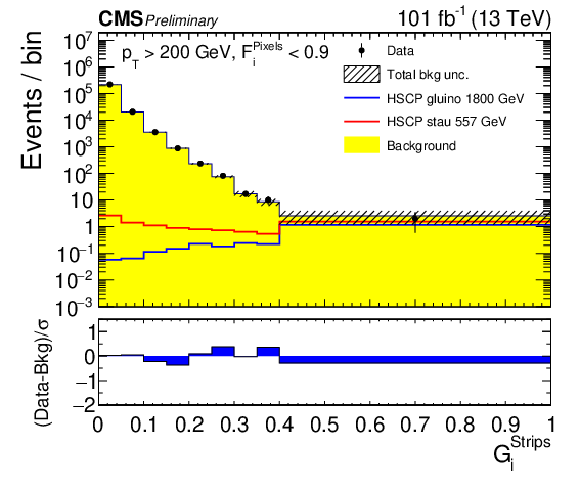
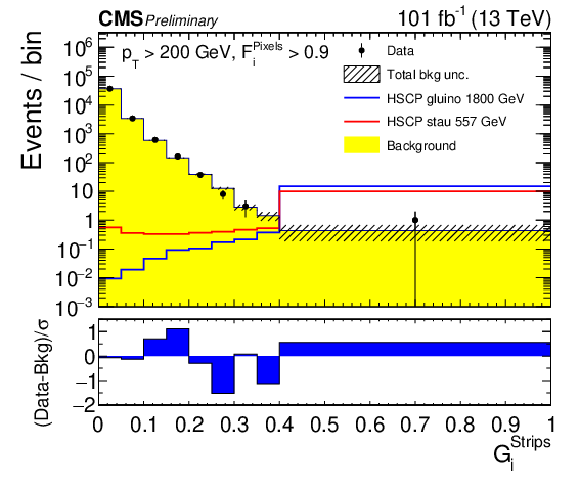
The $ G_{\text{i}}^{\text{Strips}} $ distribution in the FAIL (left) and PASS (right) regions for events passing the the event selection and with $ p_{\mathrm{T}} > $ 200 GeV. The data recorded in 2017 and 2018 are represented by black dots. The background predicted by the ionization method is shown in yellow, with the hatched area indicating the background uncertainty. As an example, the blue line shows the 1800 GeV $ \mathrm{\widetilde{g}} $ signal distribution and the red line shows the 557 GeV $ \widetilde{\tau} $ signal distribution. The lower panel displays the pulls, defined as the difference between the observed (Data) and predicted (Bkg) yields divided by the associated uncertainty ($ \sigma $). |
png pdf |
Figure 3-a:
The $ G_{\text{i}}^{\text{Strips}} $ distribution in the FAIL (left) and PASS (right) regions for events passing the the event selection and with $ p_{\mathrm{T}} > $ 200 GeV. The data recorded in 2017 and 2018 are represented by black dots. The background predicted by the ionization method is shown in yellow, with the hatched area indicating the background uncertainty. As an example, the blue line shows the 1800 GeV $ \mathrm{\widetilde{g}} $ signal distribution and the red line shows the 557 GeV $ \widetilde{\tau} $ signal distribution. The lower panel displays the pulls, defined as the difference between the observed (Data) and predicted (Bkg) yields divided by the associated uncertainty ($ \sigma $). |
png pdf |
Figure 3-b:
The $ G_{\text{i}}^{\text{Strips}} $ distribution in the FAIL (left) and PASS (right) regions for events passing the the event selection and with $ p_{\mathrm{T}} > $ 200 GeV. The data recorded in 2017 and 2018 are represented by black dots. The background predicted by the ionization method is shown in yellow, with the hatched area indicating the background uncertainty. As an example, the blue line shows the 1800 GeV $ \mathrm{\widetilde{g}} $ signal distribution and the red line shows the 557 GeV $ \widetilde{\tau} $ signal distribution. The lower panel displays the pulls, defined as the difference between the observed (Data) and predicted (Bkg) yields divided by the associated uncertainty ($ \sigma $). |
png pdf |
Figure 4:
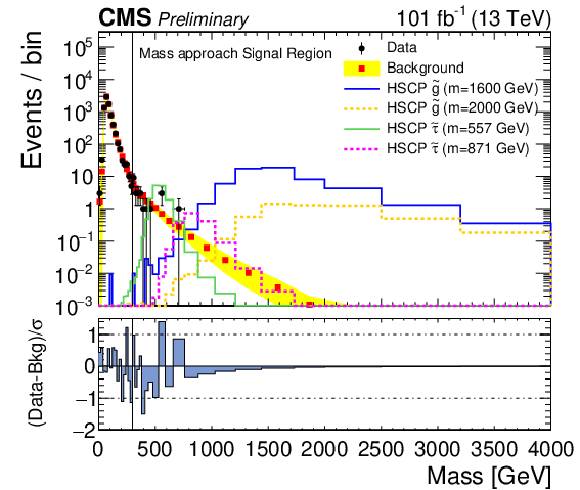
Mass prediction in the signal region defined by $ G_{\text{i}}^{\text{Strips}} > $ 0.22 and $ p_{\mathrm{T}} > $ 70 GeV. The data recorded in 2017 and 2018 are represented by black dots. The data driven background estimate is displayed as red markers with the yellow envelope representing the quadratic sum of the statistical uncertainty and the systematic uncertainty. Several signal scenarios are also displayed. The last bin includes the overflow. The lower panel shows the ratio of the observed yields (Data) to those predicted (Bkg). The lower panel shows the pulls, defined as the difference between the observed (Data) and predicted (Bkg) yields divided by the associated uncertainty ($ \sigma $). |

png pdf |
Figure 5:
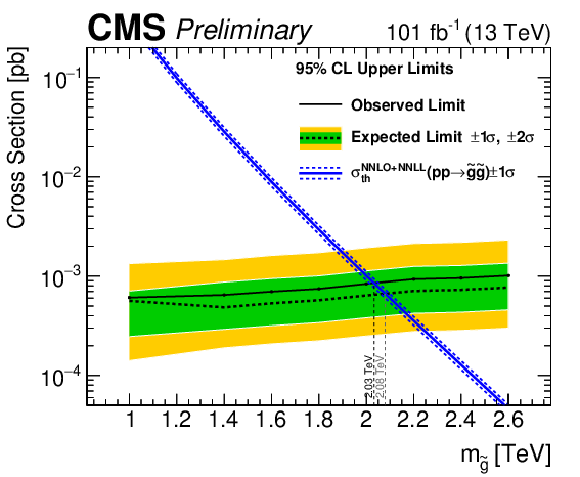
Cross section limits for $ \mathrm{\widetilde{g}} $ R-hadrons obtained with the ionization method on the left and with the mass method on the right. The numerical values corresponding to the expected and observed mass limits are written vertically on the plot in light and dark grey, respectively. |
png pdf |
Figure 5-a:
Cross section limits for $ \mathrm{\widetilde{g}} $ R-hadrons obtained with the ionization method on the left and with the mass method on the right. The numerical values corresponding to the expected and observed mass limits are written vertically on the plot in light and dark grey, respectively. |

png pdf |
Figure 5-b:
Cross section limits for $ \mathrm{\widetilde{g}} $ R-hadrons obtained with the ionization method on the left and with the mass method on the right. The numerical values corresponding to the expected and observed mass limits are written vertically on the plot in light and dark grey, respectively. |
png pdf |
Figure 6:
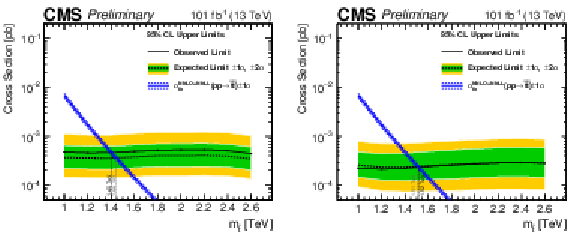
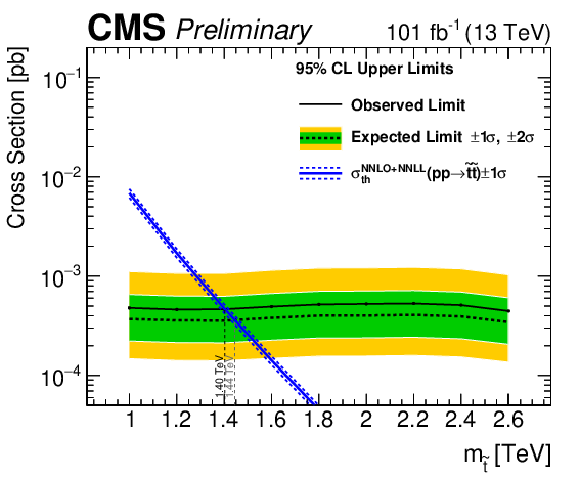
Cross section limits for $ \widetilde{t} $ R-hadrons obtained with the ionization method on the left and with the mass method on the right. |
png pdf |
Figure 6-a:
Cross section limits for $ \widetilde{t} $ R-hadrons obtained with the ionization method on the left and with the mass method on the right. |

png pdf |
Figure 6-b:
Cross section limits for $ \widetilde{t} $ R-hadrons obtained with the ionization method on the left and with the mass method on the right. |

png pdf |
Figure 7:
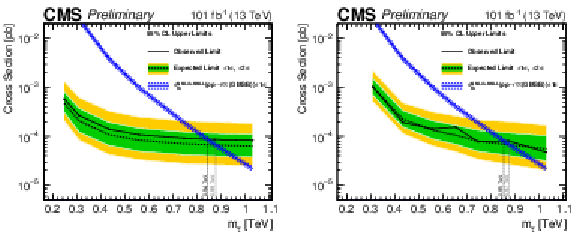
Cross section limits for the direct pair-production of $ \widetilde{\tau} $, considering both handednesses, obtained with the ionization method (left) and the mass method (right). |

png pdf |
Figure 7-a:
Cross section limits for the direct pair-production of $ \widetilde{\tau} $, considering both handednesses, obtained with the ionization method (left) and the mass method (right). |
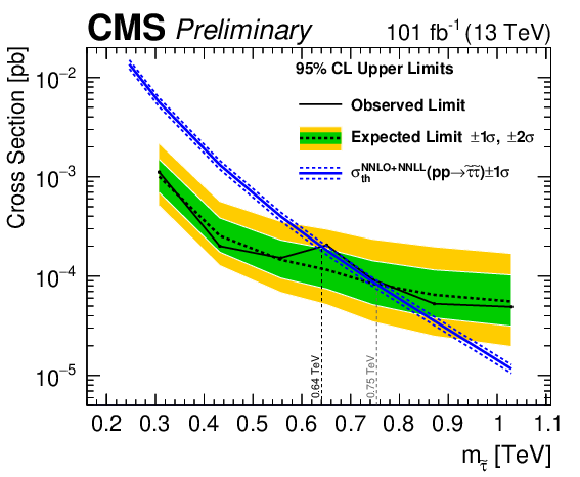
png pdf |
Figure 7-b:
Cross section limits for the direct pair-production of $ \widetilde{\tau} $, considering both handednesses, obtained with the ionization method (left) and the mass method (right). |
png pdf |
Figure 8:
Cross section limits for the $ \widetilde{\tau} $ production within the GMSB model, obtained with the ionization method (left) and the mass method (right). |
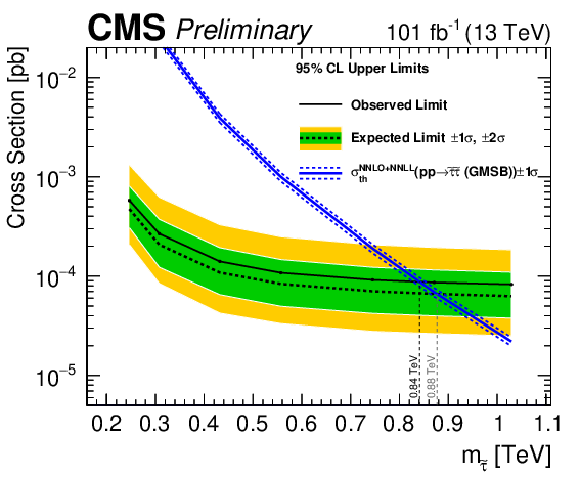
png pdf |
Figure 8-a:
Cross section limits for the $ \widetilde{\tau} $ production within the GMSB model, obtained with the ionization method (left) and the mass method (right). |

png pdf |
Figure 8-b:
Cross section limits for the $ \widetilde{\tau} $ production within the GMSB model, obtained with the ionization method (left) and the mass method (right). |

png pdf |
Figure 9:
Cross section limits for the DY-produced $ \tau^\prime $ fermions with $ |Q| = $ 1$e $ for the ionization method (left) and the mass method (right). |

png pdf |
Figure 9-a:
Cross section limits for the DY-produced $ \tau^\prime $ fermions with $ |Q| = $ 1$e $ for the ionization method (left) and the mass method (right). |

png pdf |
Figure 9-b:
Cross section limits for the DY-produced $ \tau^\prime $ fermions with $ |Q| = $ 1$e $ for the ionization method (left) and the mass method (right). |

png pdf |
Figure 10:
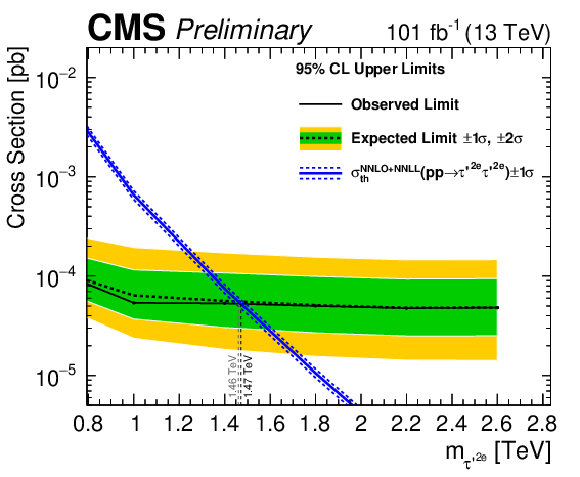
Cross section limits for the DY-produced $ \tau^\prime $ fermions with $ |Q| = $ 2$e $ for the ionization method (left) and the mass method (right). |

png pdf |
Figure 10-a:
Cross section limits for the DY-produced $ \tau^\prime $ fermions with $ |Q| = $ 2$e $ for the ionization method (left) and the mass method (right). |
png pdf |
Figure 10-b:
Cross section limits for the DY-produced $ \tau^\prime $ fermions with $ |Q| = $ 2$e $ for the ionization method (left) and the mass method (right). |

png pdf |
Figure 11:
2D exclusion showing the observed cross section limit as a function of the masses of the $ \tau^\prime $ (on the $ x $-axis) and of the Z' boson (on the $ y $-axis), for the ionization method on the left and for the mass method on the right. The black shaded region corresponds to the area that is compatible with the ATLAS excess from Ref. [35] and the black star corresponds to the best fit of the ATLAS excess with this model. |
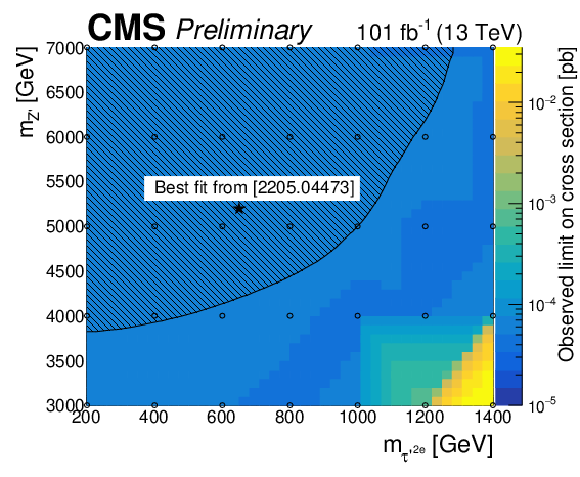
png pdf |
Figure 11-a:
2D exclusion showing the observed cross section limit as a function of the masses of the $ \tau^\prime $ (on the $ x $-axis) and of the Z' boson (on the $ y $-axis), for the ionization method on the left and for the mass method on the right. The black shaded region corresponds to the area that is compatible with the ATLAS excess from Ref. [35] and the black star corresponds to the best fit of the ATLAS excess with this model. |

png pdf |
Figure 11-b:
2D exclusion showing the observed cross section limit as a function of the masses of the $ \tau^\prime $ (on the $ x $-axis) and of the Z' boson (on the $ y $-axis), for the ionization method on the left and for the mass method on the right. The black shaded region corresponds to the area that is compatible with the ATLAS excess from Ref. [35] and the black star corresponds to the best fit of the ATLAS excess with this model. |
png pdf |
Figure 12:
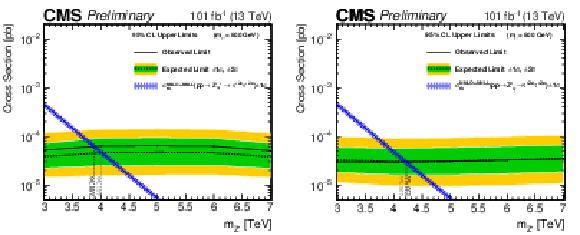
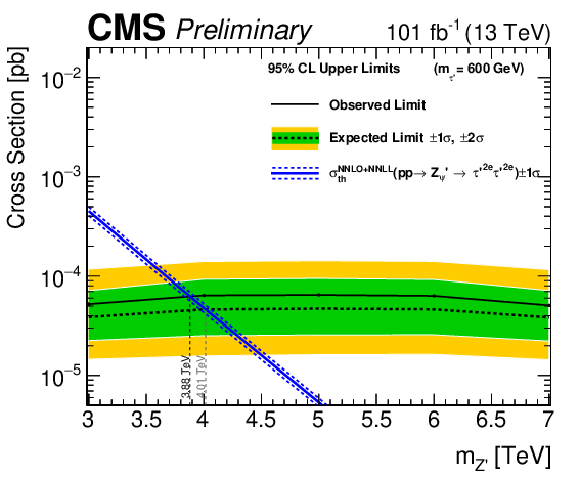
Cross section limits for the Z'$_\psi$ model with a fixed $ \tau^\prime $ mass of 600 GeV, for the ionization method (left) and the mass method (right). |
png pdf |
Figure 12-a:
Cross section limits for the Z'$_\psi$ model with a fixed $ \tau^\prime $ mass of 600 GeV, for the ionization method (left) and the mass method (right). |
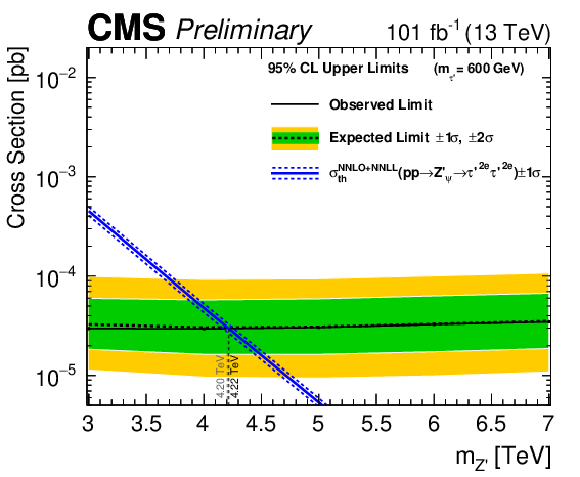
png pdf |
Figure 12-b:
Cross section limits for the Z'$_\psi$ model with a fixed $ \tau^\prime $ mass of 600 GeV, for the ionization method (left) and the mass method (right). |

png pdf |
Figure 13:
Cross section limits for the Z'$_{\text{SSM}} $ model with a fixed $ \tau^\prime $ mass of 600 GeV, for the ionization method (left) and the mass method (right). |

png pdf |
Figure 13-a:
Cross section limits for the Z'$_{\text{SSM}} $ model with a fixed $ \tau^\prime $ mass of 600 GeV, for the ionization method (left) and the mass method (right). |

png pdf |
Figure 13-b:
Cross section limits for the Z'$_{\text{SSM}} $ model with a fixed $ \tau^\prime $ mass of 600 GeV, for the ionization method (left) and the mass method (right). |
| Tables | |

png pdf |
Table 1:
Summary of K and C values for 2017 and 2018 data and Monte Carlo. |

png pdf |
Table 2:
Cumulative selection efficiency for the data and for two signal hypotheses. |
png pdf |
Table 3:
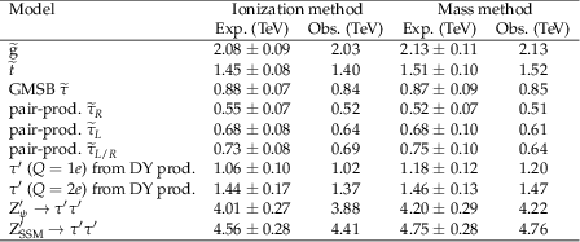
Expected and observed mass limits obtained using 2017-2018 data for various HSCP candidate models, for the two background estimate methods. |
| Summary |
| A dedicated search for heavy long-lived charged particles produced in proton-proton collisions at $ \sqrt{s} = $ 13 TeV using the CMS detector was presented. Since the experimental signature is a highly ionizing isolated track of high $ p_{\mathrm{T}} $, the analysis is based on anomalous $ \text{d}E/\text{d}x $ deposits in the silicon tracker. The data, corresponding to an integrated luminosity of 101 fb$ ^{-1} $, are compatible with the background expectations, performed by two different estimation methods. The ionization method is based on the newly introduced ionization variable $ F_{\text{i}}^{\text{Pixels}} $ using only the pixel information and on the $ G_{\text{i}}^{\text{Strips}} $ discriminant using the charges collected in the silicon strip detector. The mass method is based on the reconstruction of mass using the ionization variable $ I_{\text{h}} $, providing an estimate of the most probable value of $ \text{d}E/\text{d}x $ of the track, and the momentum of the candidate. The two methods lead to similar sensitivity. This note presents cross section limits interpreted in the context of several models predicting the pair production of gluinos, top squark R-Hadrons, tau sleptons, and $ \tau^\prime $ leptons with an electric charge equal to 1$ e $ or 2$ e $. Gluino R-hadrons are excluded at 95% CL with a mass up to 2.13 TeV, top squarks R-hadrons up to 1.52 TeV, pair produced $ \widetilde{\tau}_{L/R} $ up to 0.69 TeV, and $ \tau^\prime $ fermions with an electric charge equal to 1$ e $ (2$ e $) up to 1.20 TeV (1.47 TeV). The model predicting a pair of doubly-charged $ \tau^\prime $ fermions from the Z' boson decay motivated by an excess reported by the ATLAS Collaboration [34] is directly explored, and no significant deviation from the SM is observed. Cross section limits are extracted as a function of the Z' and $ \tau^\prime $ masses. For a $ \tau^\prime $ mass of 600 GeV, Z'$_\psi$ (Z'$_{\text{SSM}} $) bosons are excluded at 95% CL with a mass up to 4.22 TeV (4.76 TeV). |
| References | ||||
| 1 | M. Drees and X. Tata | Signals for heavy exotics at hadron colliders and supercolliders | PLB 252 (1990) 695 | |
| 2 | M. Fairbairn et al. | Stable massive particles at colliders | Phys. Rept. 438 (2007) 1 | hep-ph/0611040 |
| 3 | C. W. Bauer et al. | Supermodels for early LHC | PLB 690 (2010) 280 | 0909.5213 |
| 4 | A. Kusenko and M. E. Shaposhnikov | Supersymmetric Q-balls as dark matter | PLB 418 (1998) 46 | hep-ph/9709492 |
| 5 | B. Koch, M. Bleicher, and H. Stoecker | Black holes at LHC? | JPG 34 (2007) S535 | hep-ph/0702187 |
| 6 | J. S. Schwinger | Magnetic charge and quantum field theory | PR 144 (1966) 1087 | |
| 7 | D. Fargion, M. Khlopov, and C. A. Stephan | Cold dark matter by heavy double charged leptons? | Class. Quant. Grav. 23 (2006) 7305 | astro-ph/0511789 |
| 8 | J. Alimena et al. | Searching for long-lived particles beyond the standard model at the Large Hadron Collider | JPG 47 (2020) 090501 | 1903.04497 |
| 9 | L. Lee, C. Ohm, A. Soffer, and T.-T. Yu | Collider searches for long-lived particles beyond the standard model | [Erratum: Prog.Part.Nucl.Phys. 122, 12 ()], 2019 Prog. Part. Nucl. Phys. 106 (2019) 210 |
1810.12602 |
| 10 | Particle Data Group Collaboration | Review of particle physics | PTEP 2022 (2022) 083C01 | |
| 11 | ALEPH Collaboration | Search for pair production of longlived heavy charged particles in $ \rm{e}^+ \rm{e}^- $ annihilation | PLB 405 (1997) 379 | hep-ex/9706013 |
| 12 | DELPHI Collaboration | Search for heavy stable and longlived particles in $ \rm{e}^+ \rm{e}^- $ collisions at $ \sqrt{s} = $ 189 GeV | PLB 478 (2000) 65 | hep-ex/0103038 |
| 13 | L3 Collaboration | Search for heavy neutral and charged leptons in $ \rm{e}^{+} \rm{e}^{-} $ annihilation at LEP | PLB 517 (2001) 75 | hep-ex/0107015 |
| 14 | OPAL Collaboration | Search for stable and longlived massive charged particles in $ \rm{e}^+ \rm{e}^- $ collisions at $ \sqrt{s} = $ 130 GeV to 209 GeV | PLB 572 (2003) 8 | hep-ex/0305031 |
| 15 | H1 Collaboration | Measurement of anti-deuteron photoproduction and a search for heavy stable charged particles at HERA | EPJC 36 (2004) 413 | hep-ex/0403056 |
| 16 | CDF Collaboration | Search for long-lived massive charged particles in 1.96 TeV $ \rm{\bar{p}p} $ collisions | PRL 103 (2009) 021802 | 0902.1266 |
| 17 | D0 Collaboration | Search for long-lived charged massive particles with the D0 detector | PRL 102 (2009) 161802 | 0809.4472 |
| 18 | D0 Collaboration | A search for charged massive long-lived particles | PRL 108 (2012) 121802 | 1110.3302 |
| 19 | D0 Collaboration | Search for charged massive long-lived particles at $ \sqrt{s} = $ 1.96 TeV | PRD 87 (2013) 052011 | 1211.2466 |
| 20 | ATLAS Collaboration | Search for heavy long-lived charged particles with the ATLAS detector in pp collisions at $ \sqrt{s} = $ 7 TeV | PLB 703 (2011) 428 | 1106.4495 |
| 21 | ATLAS Collaboration | Search for stable hadronising squarks and gluinos with the ATLAS experiment at the LHC | PLB 701 (2011) 1 | 1103.1984 |
| 22 | ATLAS Collaboration | Search for massive long-lived highly ionising particles with the ATLAS detector at the LHC | PLB 698 (2011) 353 | 1102.0459 |
| 23 | ATLAS Collaboration | Searches for heavy long-lived sleptons and R-hadrons with the ATLAS detector in pp collisions at $ \sqrt{s}= $ 7 TeV | PLB 720 (2013) 277 | 1211.1597 |
| 24 | ATLAS Collaboration | Search for long-lived, multi-charged particles in pp collisions at $ \sqrt{s}= $ 7 TeV using the ATLAS detector | PLB 722 (2013) 305 | 1301.5272 |
| 25 | ATLAS Collaboration | Searches for heavy long-lived charged particles with the ATLAS detector in proton-proton collisions at $ \sqrt{s}= $ 8 TeV | JHEP 01 (2015) 068 | 1411.6795 |
| 26 | ATLAS Collaboration | Search for heavy long-lived multi-charged particles in pp collisions at $ \sqrt{s}= $ 8 TeV using the ATLAS detector | EPJC 75 (2015) 362 | 1504.04188 |
| 27 | ATLAS Collaboration | Search for metastable heavy charged particles with large ionisation energy loss in pp collisions at $ \sqrt{s} = $ 8 TeV using the ATLAS experiment | EPJC 75 (2015) 407 | 1506.05332 |
| 28 | ATLAS Collaboration | Search for metastable heavy charged particles with large ionization energy loss in pp collisions at $ \sqrt{s} = $ 13 TeV using the ATLAS experiment | PRD 93 (2016) 112015 | 1604.04520 |
| 29 | ATLAS Collaboration | Search for heavy long-lived charged $ r $-hadrons with the ATLAS detector in 3.2 fb$ ^{-1} $ of proton--proton collision data at $ \sqrt{s} = $ 13 TeV | PLB 760 (2016) 647 | 1606.05129 |
| 30 | CMS Collaboration | Search for heavy stable charged particles in pp collisions at $ \sqrt{s}= $ 7 TeV | JHEP 03 (2011) 024 | CMS-EXO-10-011 1101.1645 |
| 31 | CMS Collaboration | Search for fractionally charged particles in pp collisions at $ \sqrt{s}= $ 7 TeV | PRD 87 (2013) 092008 | CMS-EXO-11-074 1210.2311 |
| 32 | CMS Collaboration | Search for heavy long-lived charged particles in pp collisions at $ \sqrt{s}= $ 7 TeV | PLB 713 (2012) 408 | CMS-EXO-11-022 1205.0272 |
| 33 | CMS Collaboration | Search for long-lived charged particles in proton-proton collisions at $ \sqrt s= $ 13 TeV | PRD 94 (2016) 112004 | CMS-EXO-15-010 1609.08382 |
| 34 | ATLAS Collaboration | Search for heavy, long-lived, charged particles with large ionisation energy loss in p p collisions at $ \sqrt{s} = $ 13 TeV using the ATLAS experiment and the full run 2 dataset | JHEP 06 (2023) 158 | 2205.06013 |
| 35 | G. F. Giudice, M. McCullough, and D. Teresi | dE/dx from boosted long-lived particles | JHEP 08 (2022) 012 | |
| 36 | T. Sjöstrand et al. | An introduction to PYTHIA 8.2 | Comput. Phys. Commun. 191 (2015) 159 | 1410.3012 |
| 37 | CMS Collaboration | Extraction and validation of a new set of CMS PYTHIA8 tunes from underlying-event measurements | EPJC 80 (2020) 4 | CMS-GEN-17-001 1903.12179 |
| 38 | NNPDF Collaboration | Parton distributions from high-precision collider data | EPJC 77 (2017) 663 | 1706.00428 |
| 39 | G. F. Giudice and A. Romanino | Split supersymmetry | NPB 699 (2004) 65 | hep-ph/0406088 |
| 40 | N. Arkani-Hamed, S. Dimopoulos, G. F. Giudice, and A. Romanino | Aspects of split supersymmetry | NPB 709 (2005) 3 | |
| 41 | J. L. Hewett, B. Lillie, M. Masip, and T. G. Rizzo | Signatures of long-lived gluinos in split supersymmetry | JHEP 09 (2004) 070 | |
| 42 | W. Kilian, T. Plehn, P. Richardson, and E. Schmidt | Split supersymmetry at colliders | EPJC 39 (2005) 229 | |
| 43 | A. C. Kraan | Interactions of heavy stable hadronizing particles | EPJC 37 (2004) 91 | hep-ex/0404001 |
| 44 | R. Mackeprang and A. Rizzi | Interactions of coloured heavy stable particles in matter | EPJC 50 (2007) 353 | hep-ph/0612161 |
| 45 | G. F. Giudice and R. Rattazzi | Theories with gauge mediated supersymmetry breaking | Phys. Rept. 322 (1999) 419 | hep-ph/9801271 |
| 46 | P. Meade, N. Seiberg, and D. Shih | General gauge mediation | Progress of Theoretical Physics Supplement 177 (2009) 143 | |
| 47 | B. C. Allanach et al. | The Snowmass points and slopes: Benchmarks for SUSY searches | EPJC 25 (2002) 113 | hep-ph/0202233 |
| 48 | H. Baer, F. E. Paige, S. D. Protopescu, and X. Tata | ISAJET 7.69: A Monte Carlo event generator for pp, anti-p p, and $ \rm{e}^{+} \rm{e}^{-} $ reactions | technical report, 2003 link |
hep-ph/0312045 |
| 49 | Geant4 Collaboration | Geant4: A simulation toolkit | NIM A 506 (2003) 250 | |
| 50 | D. J. Lange et al. | Upgrades for the CMS simulation | J. Phys. Conf. Ser. 608 (2015) 012056 | |
| 51 | CMS Collaboration | The CMS experiment at the CERN LHC | JINST 3 (2008) S08004 | |
| 52 | CMS Tracker Group Collaboration | The CMS phase-1 pixel detector upgrade | JINST 16 (2021) P02027 | 2012.14304 |
| 53 | CMS Collaboration | Description and performance of track and primary-vertex reconstruction with the CMS tracker | JINST 9 (2014) P10009 | CMS-TRK-11-001 1405.6569 |
| 54 | CMS Collaboration | Technical proposal for the Phase-II upgrade of the Compact Muon Solenoid | CMS Technical Proposal CERN-LHCC-2015-010, CMS-TDR-15-02, CMS, 2015 CDS |
|
| 55 | CMS Collaboration | Performance of the CMS level-1 trigger in proton-proton collisions at $ \sqrt{s} = $ 13 TeV | JINST 15 (2020) P10017 | CMS-TRG-17-001 2006.10165 |
| 56 | CMS Collaboration | The CMS trigger system | JINST 12 (2017) P01020 | CMS-TRG-12-001 1609.02366 |
| 57 | CMS Collaboration | Particle-flow reconstruction and global event description with the CMS detector | JINST 12 (2017) P10003 | CMS-PRF-14-001 1706.04965 |
| 58 | CMS Collaboration | Searches for long-lived charged particles in pp collisions at $ \sqrt{s} = $ 7 and 8 TeV | JHEP 07 (2013) 122 | CMS-EXO-12-026 1305.0491 |
| 59 | V. Chiochia et al. | Simulation of the CMS prototype silicon pixel sensors and comparison with test beam measurements | IEEE Trans. Nucl. Sci. 52 (2005) 1067 | physics/0411143 |
| 60 | ISE Integrated Systems Engineering AG | ISE TCAD Release 9.0 | Zürich, Switzerland, 2003 | |
| 61 | CMS Collaboration | Performance of the CMS muon detector and muon reconstruction with proton-proton collisions at $ \sqrt{s}= $ 13 TeV | JINST 13 (2018) P06015 | CMS-MUO-16-001 1804.04528 |
| 62 | K. Rehermann and B. T. Tweedie | Efficient identification of boosted semileptonic top quarks at the LHC | JHEP 03 (2011) 59 | |
| 63 | R. A. Fisher | On the interpretation of $ \chi^2 $ from contingency tables, and the calculation of p | Journal of the Royal Statistical Society 85 (1922) 87 | |
| 64 | S. Baker and R. D. Cousins | Clarification of the use of chi-square and likelihood functions in fits to histograms | NIM 221 (1984) 437 | |
| 65 | CMS Collaboration | Precision luminosity measurement in proton-proton collisions at $ \sqrt{s} = $ 13 TeV in 2015 and 2016 at CMS | EPJC 81 (2021) 800 | CMS-LUM-17-003 2104.01927 |
| 66 | CMS Collaboration | CMS luminosity measurement for the 2017 data-taking period at $ \sqrt{s} = $ 13 TeV | CMS Physics Analysis Summary , CMS, 2018 link |
CMS-PAS-LUM-17-004 |
| 67 | CMS Collaboration | CMS luminosity measurement for the 2018 data-taking period at $ \sqrt{s} = $ 13 TeV | CMS Physics Analysis Summary , CMS, 2019 link |
CMS-PAS-LUM-18-002 |
| 68 | T. Junk | Confidence level computation for combining searches with small statistics | NIM A 434 (1999) 435 | hep-ex/9902006 |
| 69 | A. L. Read | Presentation of search results: the $ CL_s $ technique | JPG 28 (2002) 2693 | |
| 70 | G. Cowan, K. Cranmer, E. Gross, and O. Vitells | Asymptotic formulae for likelihood-based tests of new physics | EPJC 71 (2011) 1554 | 1007.1727 |
| 71 | C. Borschensky et al. | Squark and gluino production cross sections in pp collisions at $ \sqrt{s} = $ 13, 14, 33 and 100 TeV | EPJC 74 (2014) 3174 | |
| 72 | E. Accomando et al. | Z' physics with early LHC data | PRD 83 (2011) 075012 | 1010.6058 |
| 73 | J. L. Hewett and T. G. Rizzo | Low-energy phenomenology of superstring-inspired E6 models | Physics Reports 183 (1989) 193 | |
| 74 | CMS Collaboration | HEPData record corresponding to JHEP 2306 (2023) 158 | link | |

|
Compact Muon Solenoid LHC, CERN |

|

|

|

|

|

|