

Compact Muon Solenoid
LHC, CERN
| CMS-PAS-BPH-22-012 | ||
| Test of lepton flavor universality violation in semileptonic $ \mathrm{B}_{\mathrm{c}}^+ $ meson decays at CMS | ||
| CMS Collaboration | ||
| 31 August 2023 | ||
| Abstract: A measurement of the ratio of branching fractions $ \mathrm{R}(\mathrm{J}/\psi) = \mathcal{B}(\mathrm{B}_{\mathrm{c}}^+\rightarrow\mathrm{J}/\psi\tau^+\nu_{\tau}) / \mathcal{B}(\mathrm{B}_{\mathrm{c}}^+\rightarrow\mathrm{J}/\psi\mu^+\nu_{\mu}) $ in the $ \mathrm{J}/\psi\rightarrow\mu^+\mu^- $, $ \tau^+\rightarrow\mu^+\nu_{\mu}\nu_{\bar{\tau}} $ decay channel is presented. This measurement uses a sample of proton-proton collision data at a center of mass energy of 13 TeV collected by the CMS experiment in 2018 and corresponding to 59.7 fb$ ^{-1} $ of integrated luminosity. The measured ratio $ \mathrm{R}(\mathrm{J}/\psi) = $ 0.17 $ ^{+ 0.18}_{- 0.17} $ (stat) $^{+ 0.21}_{- 0.22} $ (syst) $^{+ 0.19}_{- 0.18} $ (theo) $ = $ 0.17 $ \pm $ 0.33 agrees within 0.3 standard deviations with the value predicted by the standard model of particle physics. | ||
|
Links:
CDS record (PDF) ;
Physics Briefing ;
CADI line (restricted) ;
These preliminary results are superseded in this paper, PRD 111 (2025) L051102. The superseded preliminary plots can be found here. |
||
| Figures & Tables | Summary | Additional Figures | References | CMS Publications |
|---|
| Figures | |
png pdf |
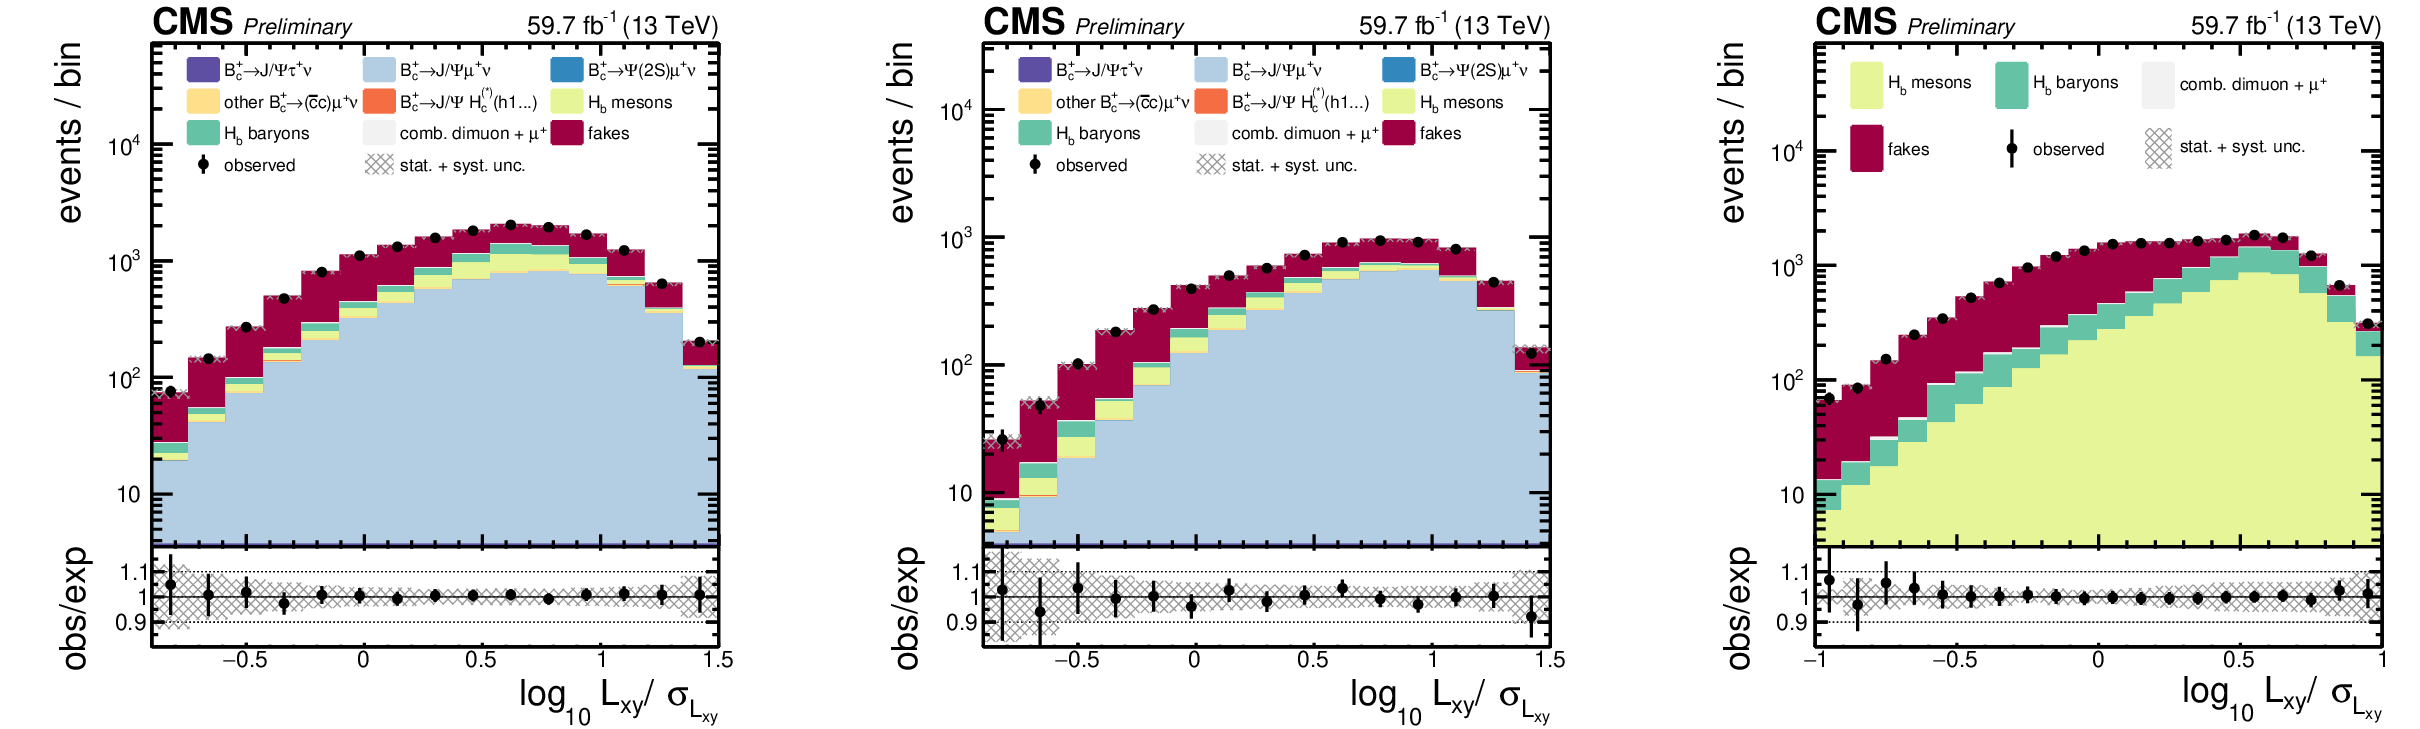
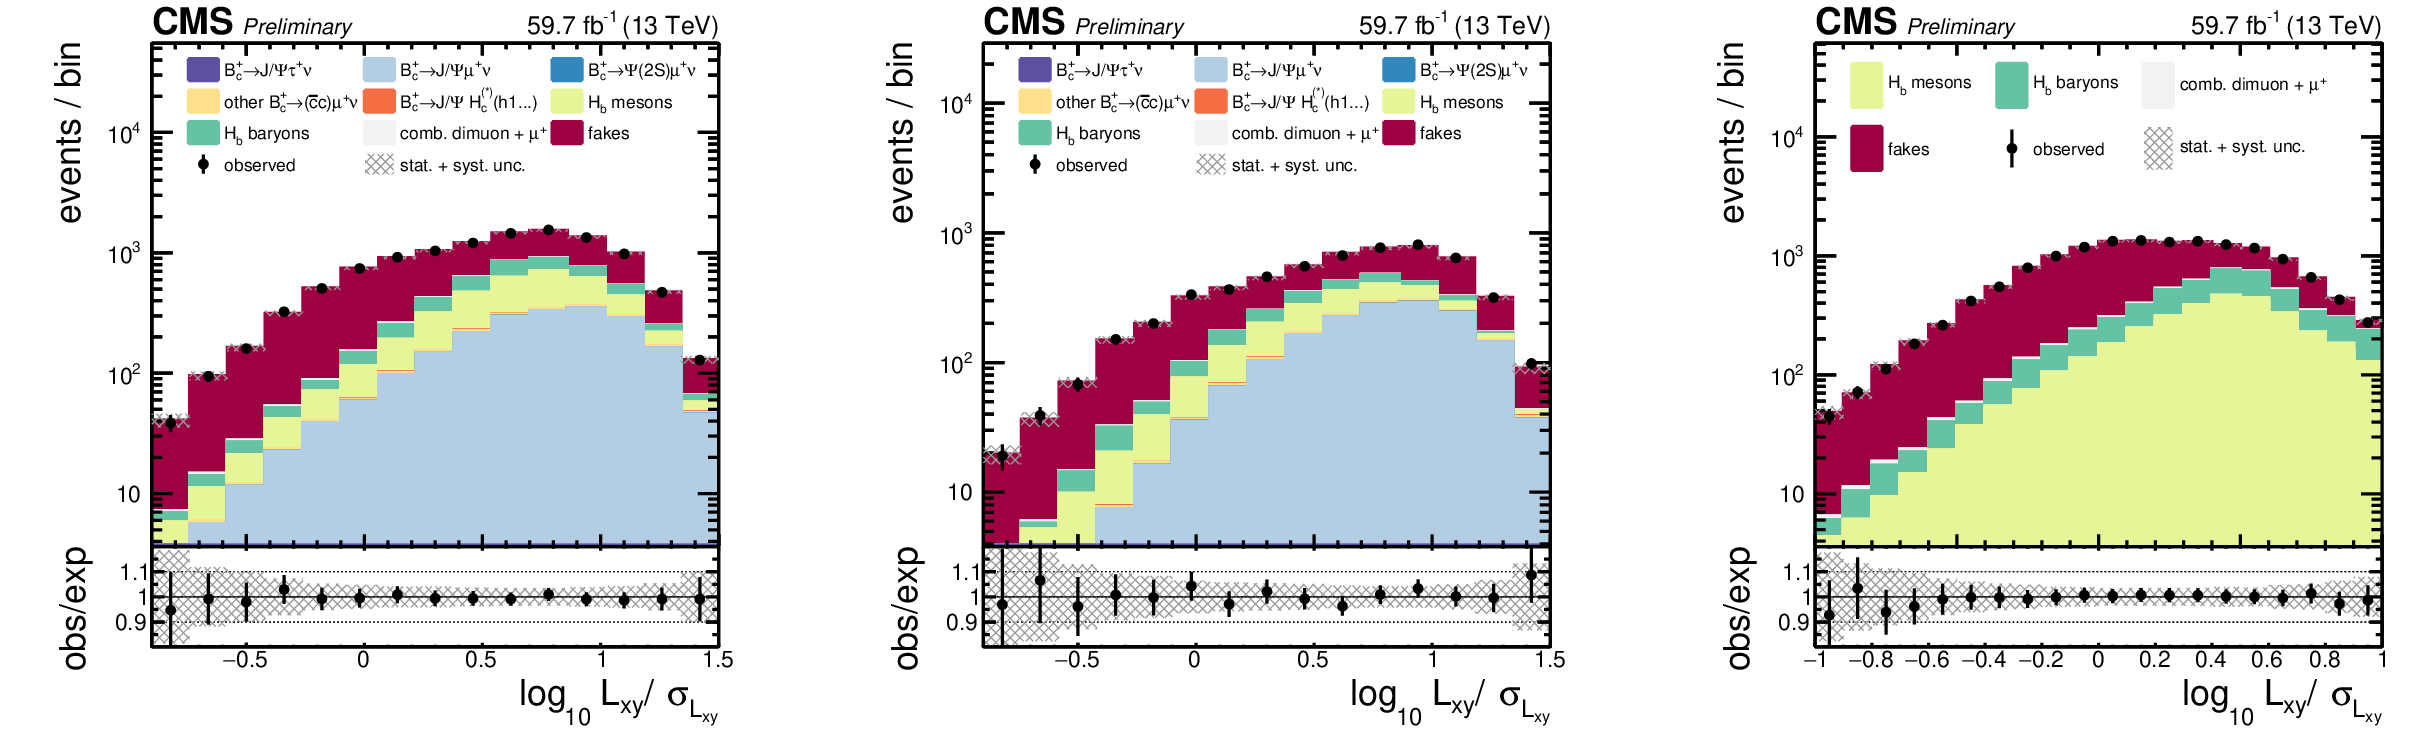
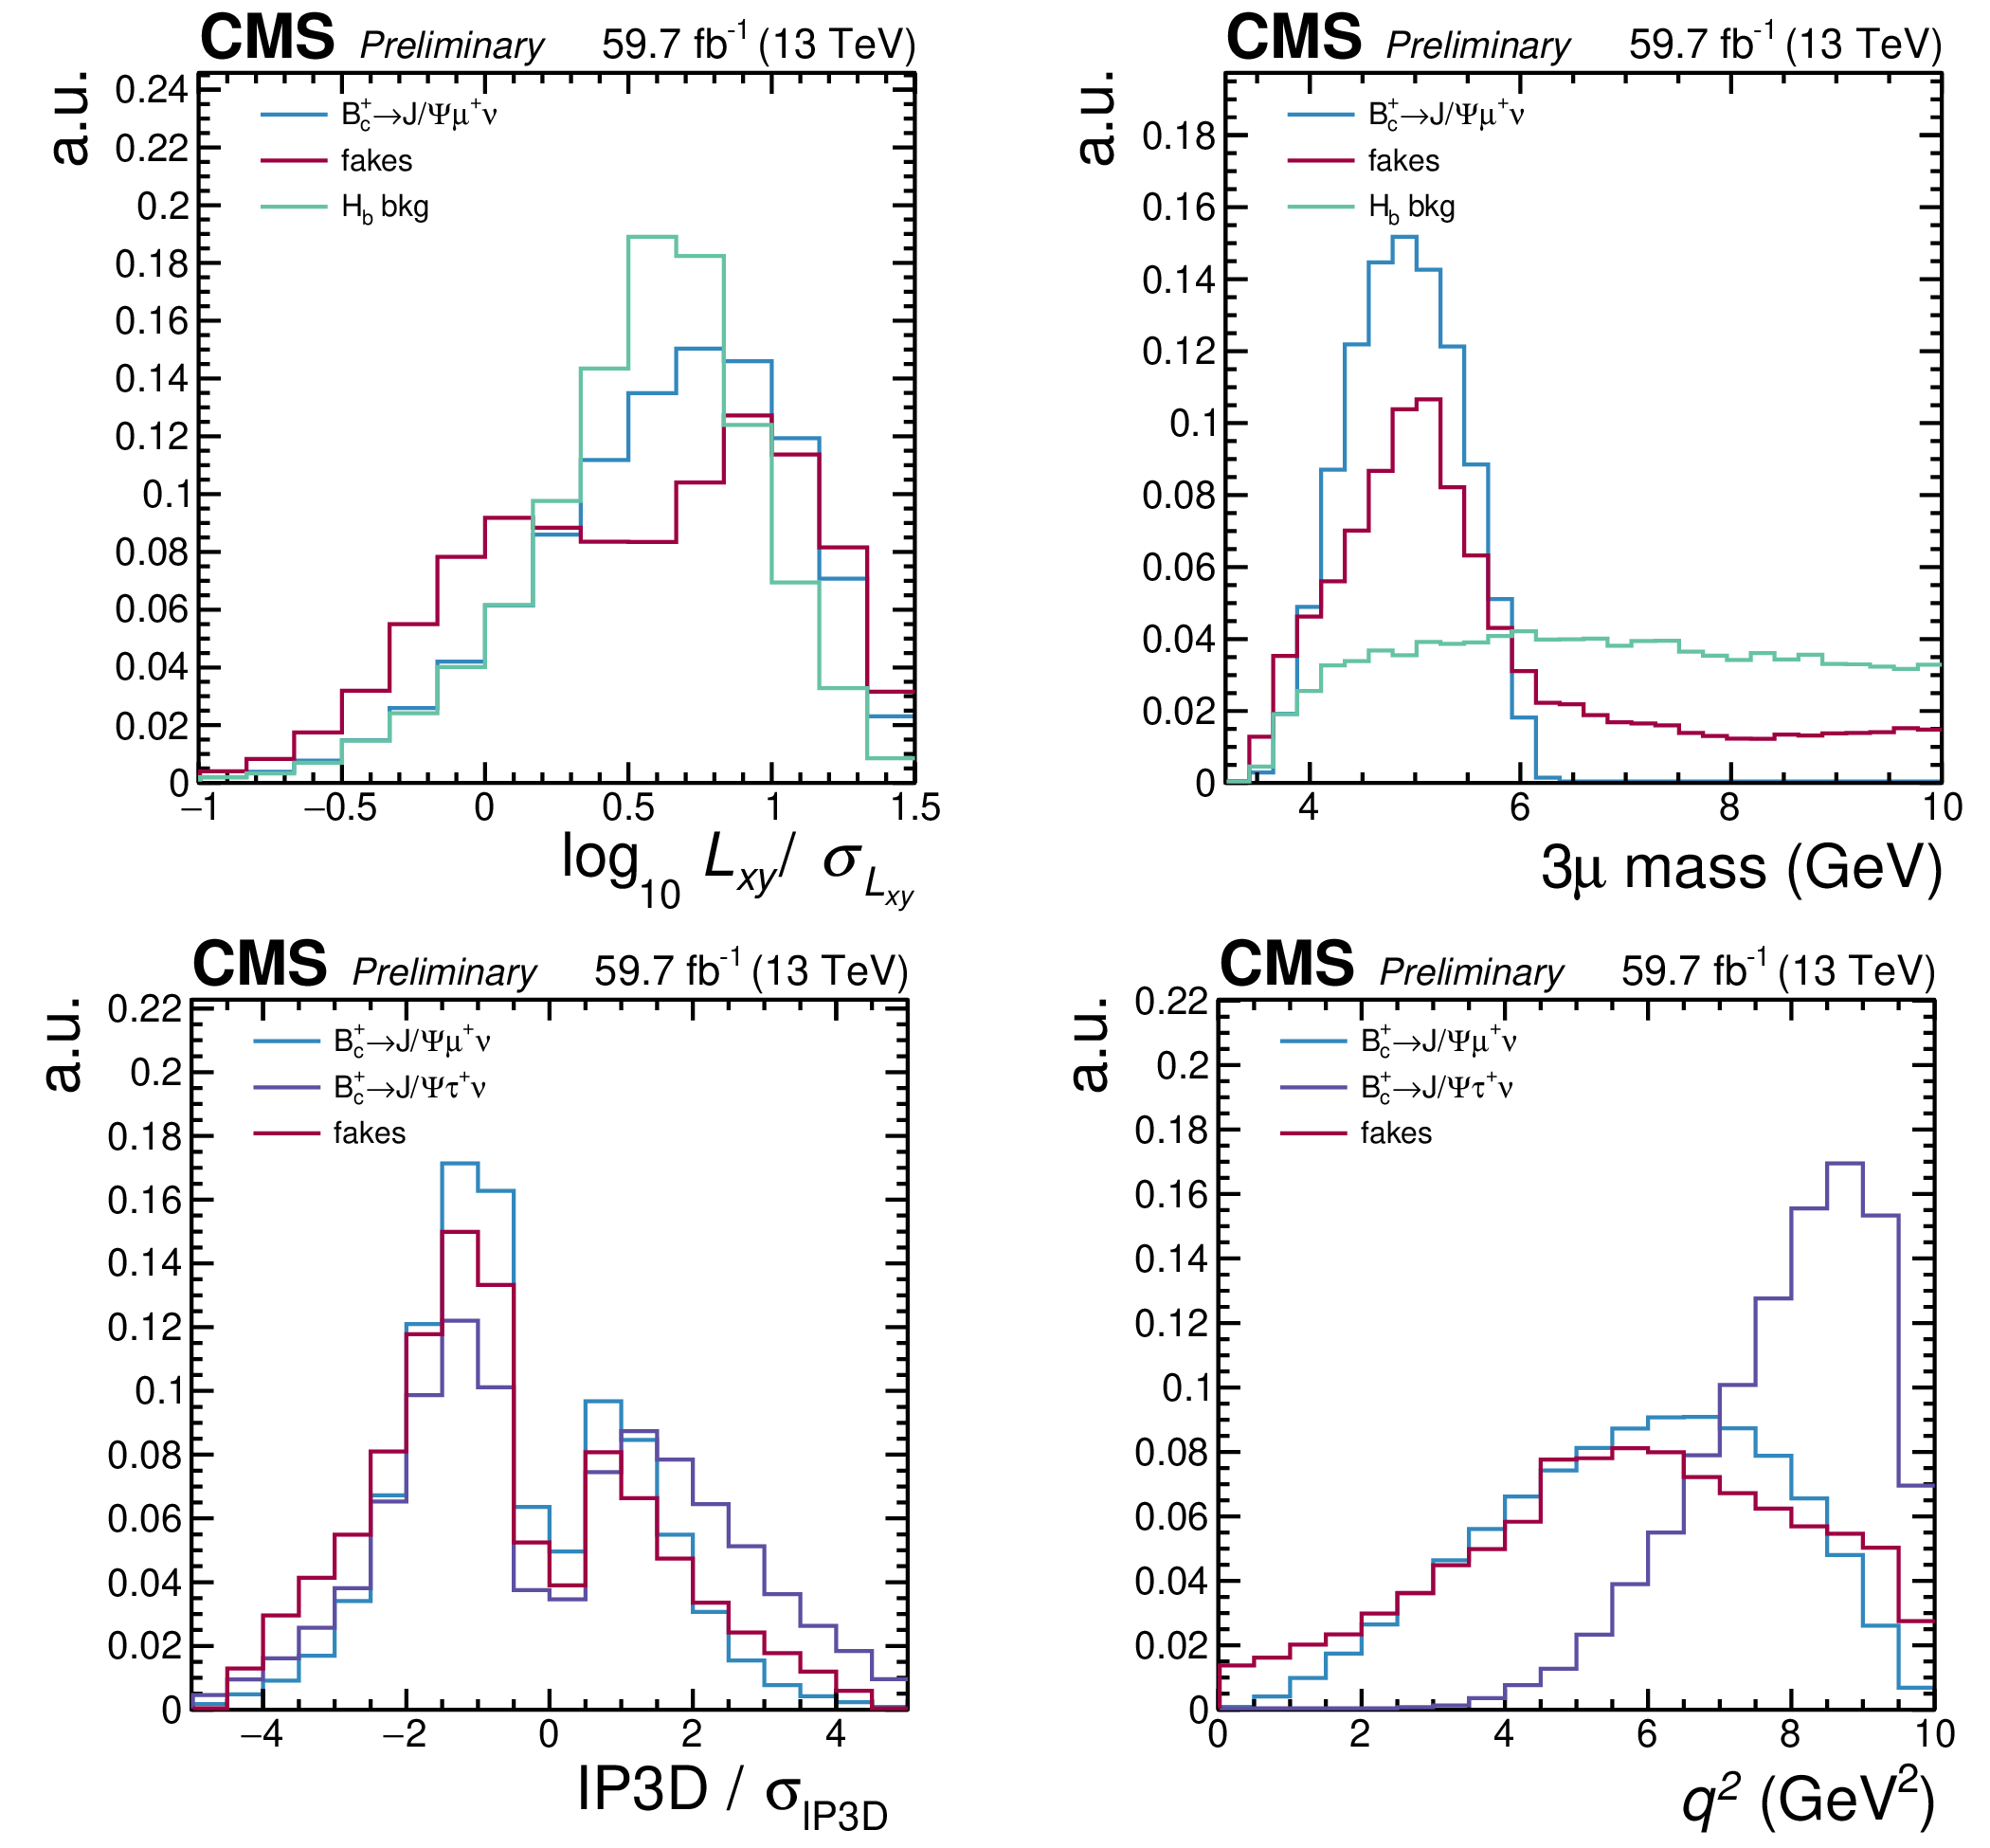
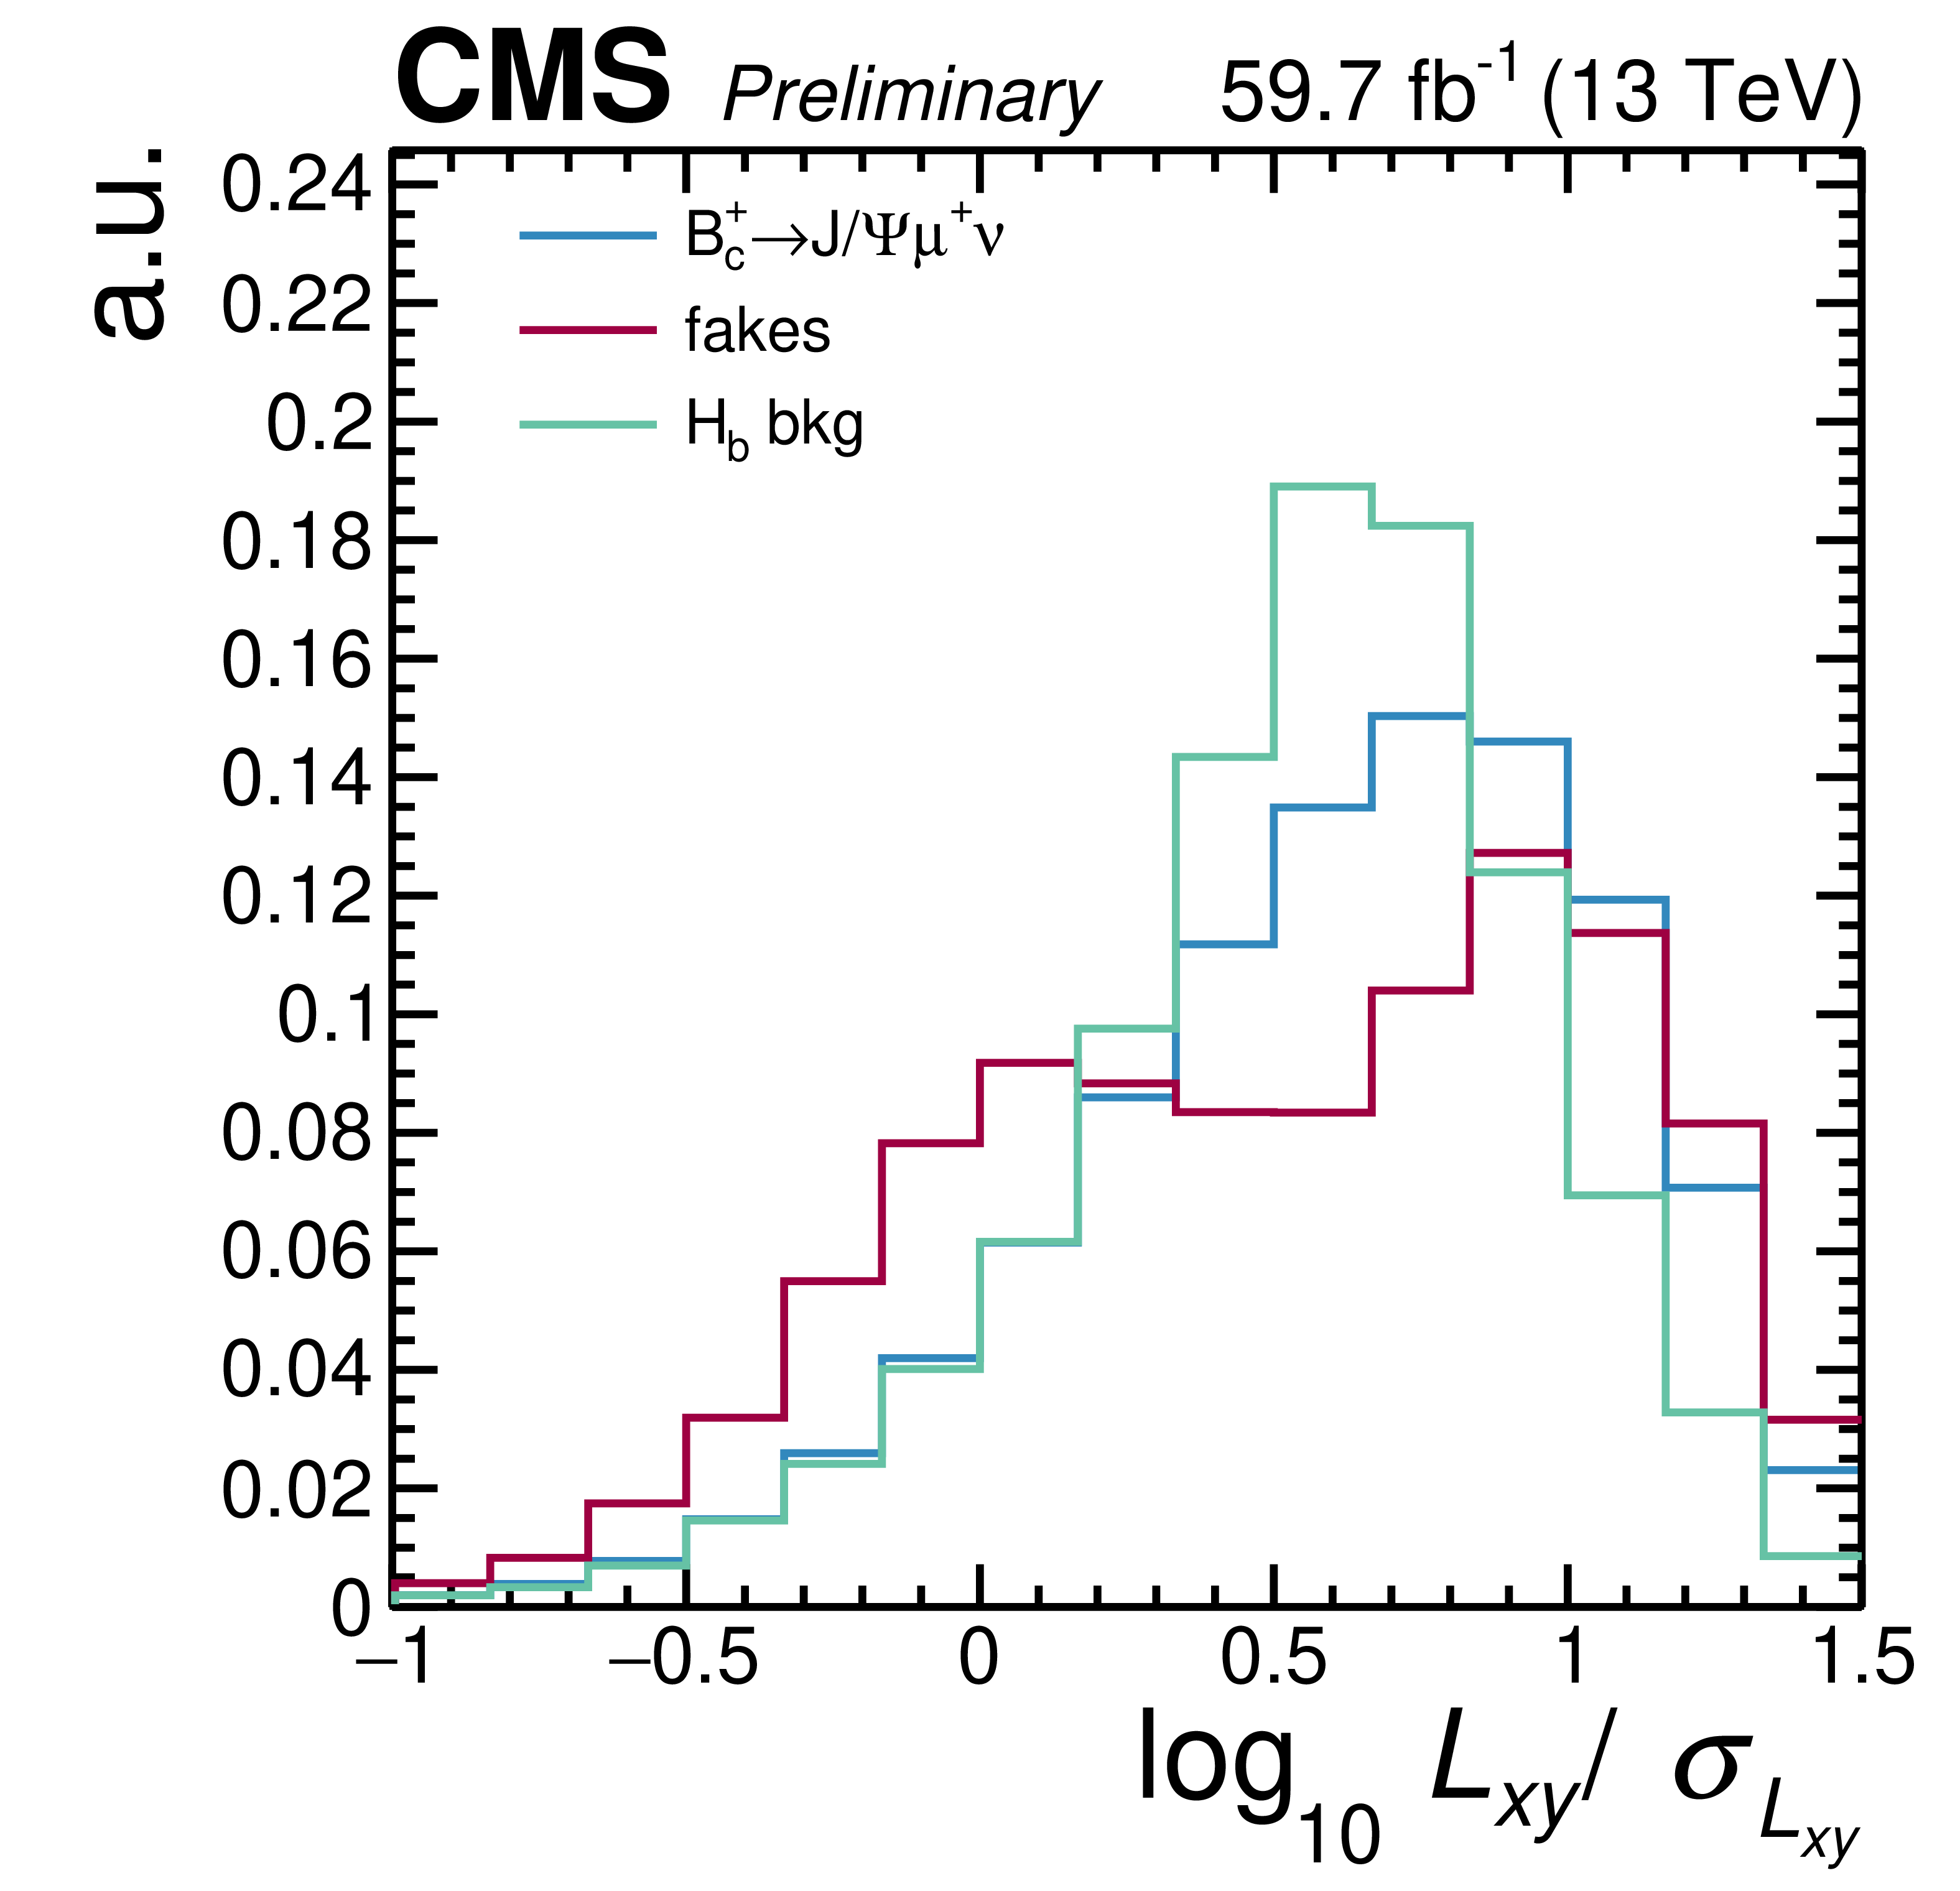
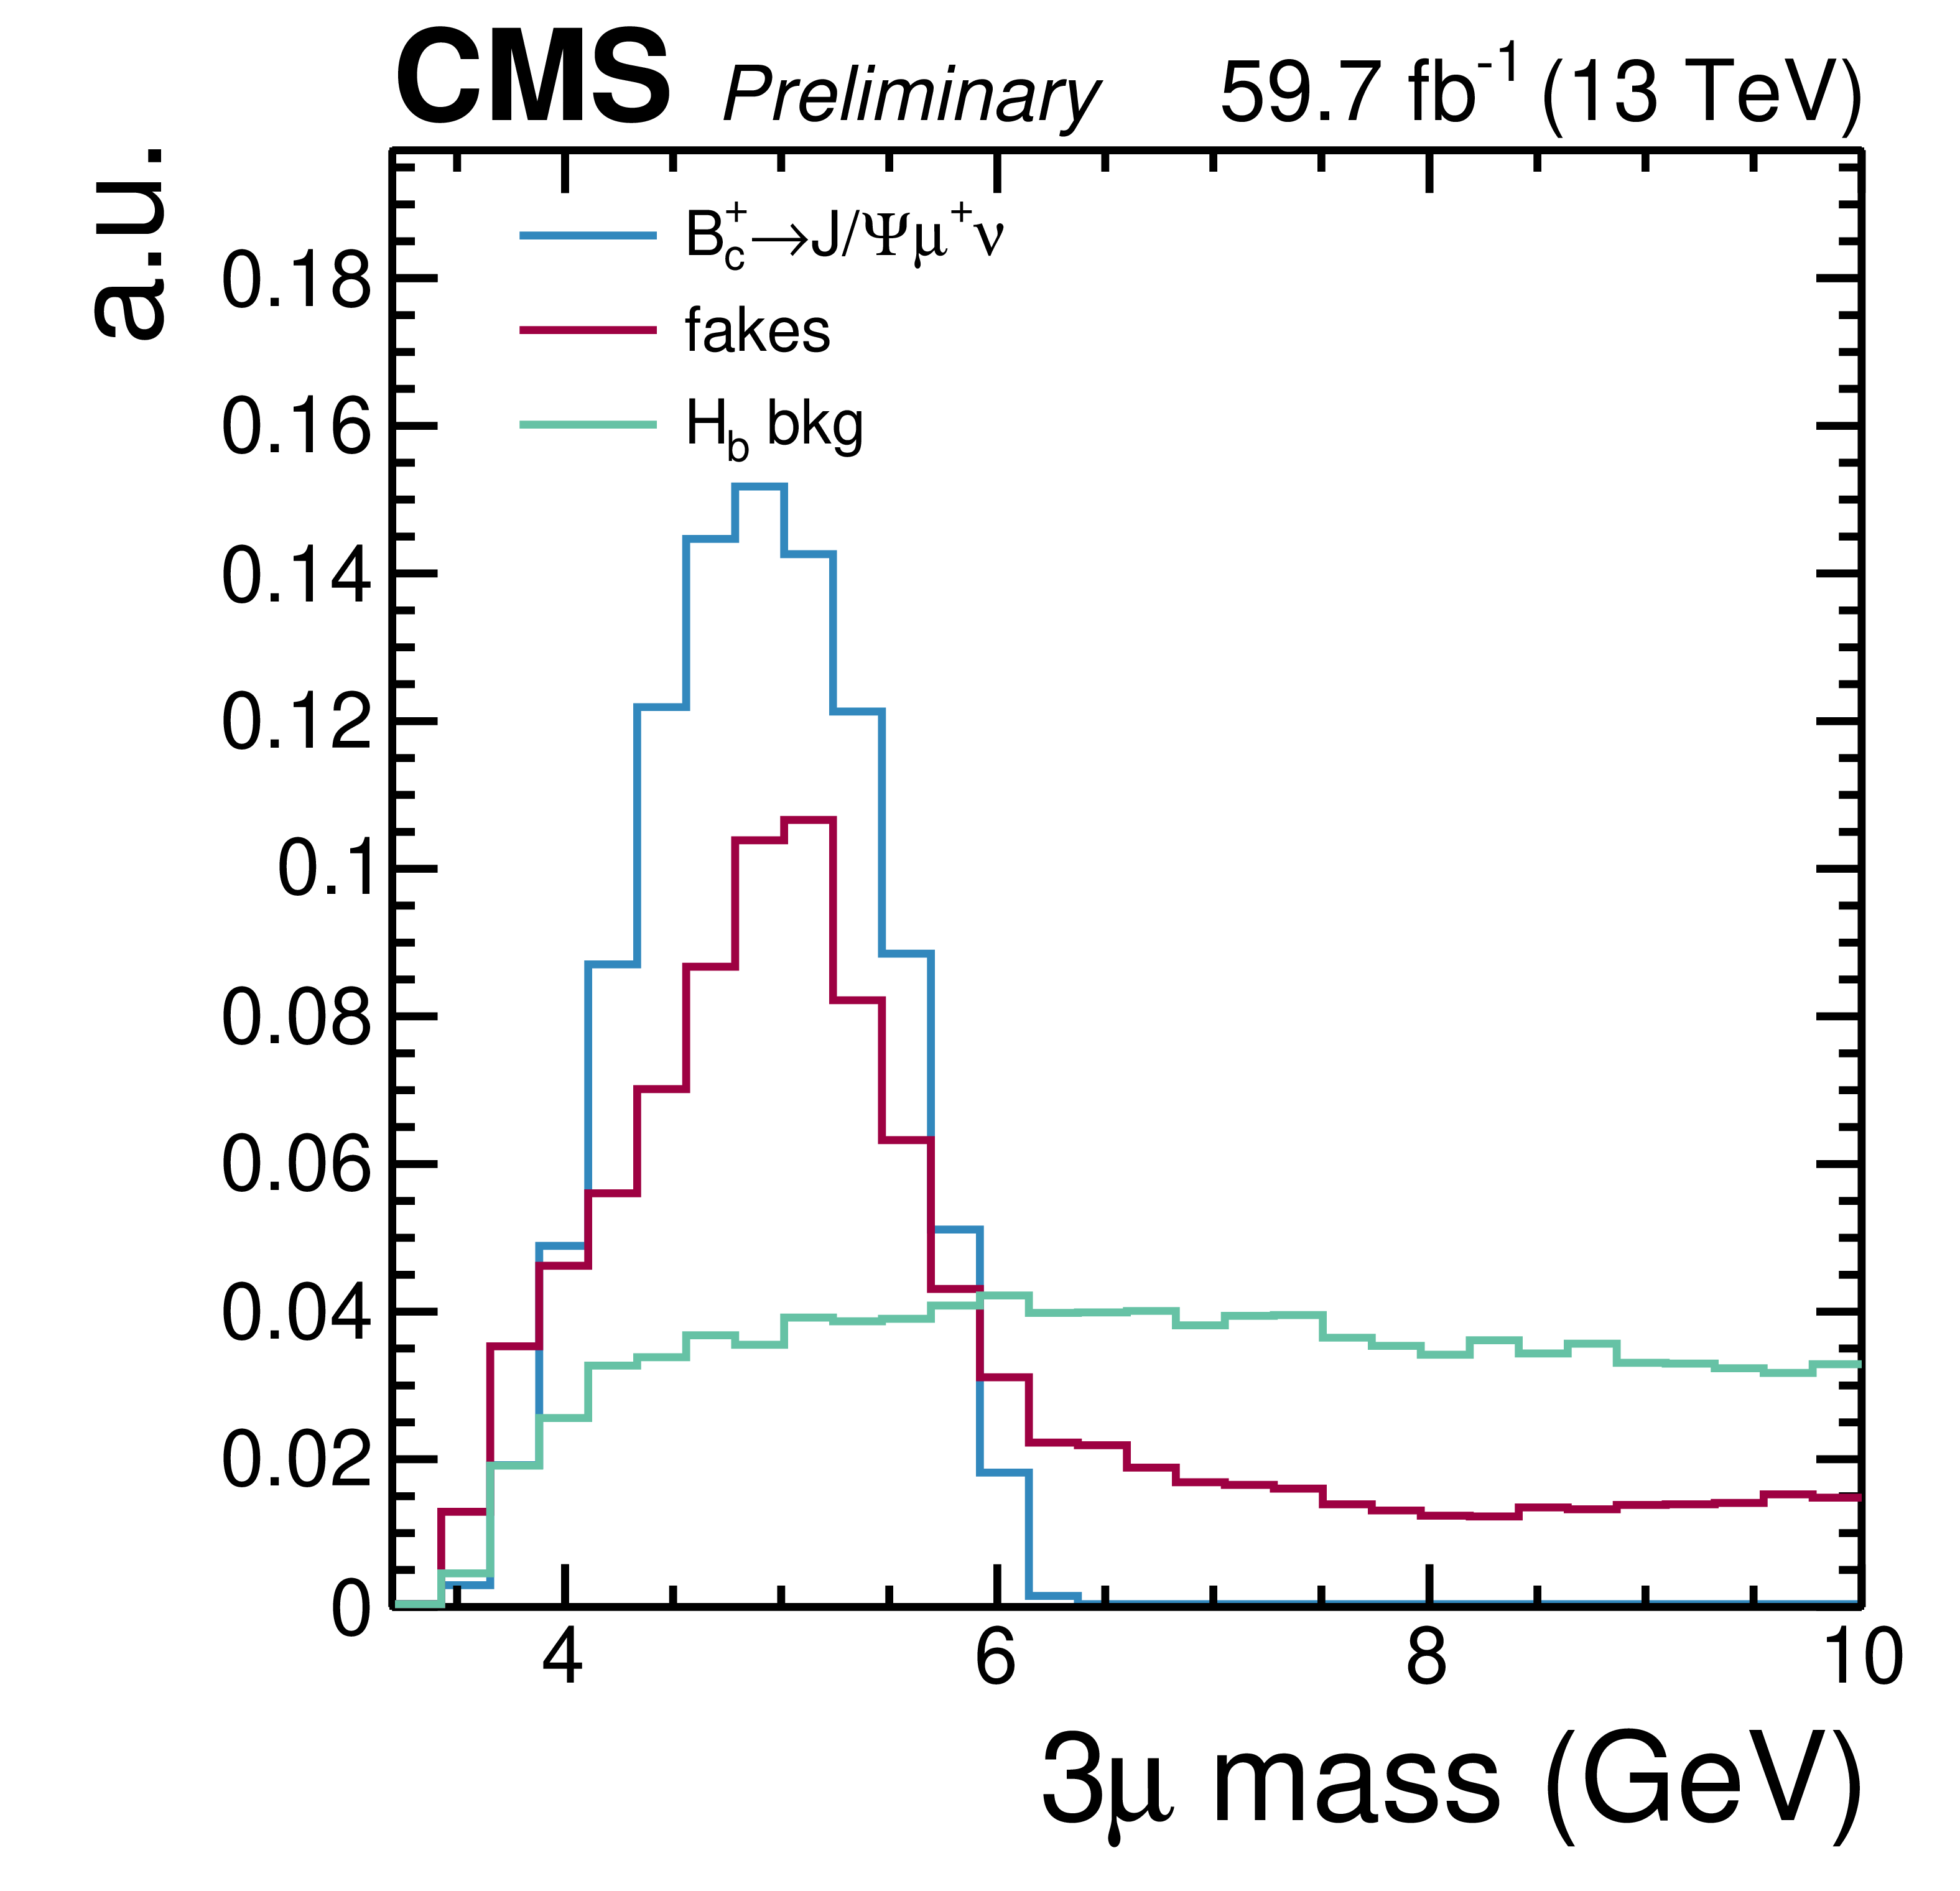
Figure 1:
Distributions of the $ L_{xy}/\sigma_{L_{xy}} $ (left) observable for the $ \mathrm{B}_{c}^{+} \to \mathrm{J}/\psi\, \mu^+\nu_{ \mu} $ (blue) signal channel, the fakes background (red) and the $ H_\mathrm{b} $ background (green); distributions of the $ \mathrm{IP3D}/\sigma_{\mathrm{IP3D}} $ (center) and $ q^2 $ (right) observables for the $ \mathrm{B}_{c}^{+} \to \mathrm{J}/\psi\, \mu^+\nu_{ \mu} $ (blue) and $ \mathrm{B}_{c}^{+} \to \mathrm{J}/\psi\, \tau^+\nu_{ \tau} $ (purple) signal channels and the fakes background (red). In all plots, events are selected in the region defined by $ m(3\mu) < m_{\mathrm{B}_{c}^{+}} $. |

png pdf |
Figure 1-a:
Distributions of the $ L_{xy}/\sigma_{L_{xy}} $ (left) observable for the $ \mathrm{B}_{c}^{+} \to \mathrm{J}/\psi\, \mu^+\nu_{ \mu} $ (blue) signal channel, the fakes background (red) and the $ H_\mathrm{b} $ background (green); distributions of the $ \mathrm{IP3D}/\sigma_{\mathrm{IP3D}} $ (center) and $ q^2 $ (right) observables for the $ \mathrm{B}_{c}^{+} \to \mathrm{J}/\psi\, \mu^+\nu_{ \mu} $ (blue) and $ \mathrm{B}_{c}^{+} \to \mathrm{J}/\psi\, \tau^+\nu_{ \tau} $ (purple) signal channels and the fakes background (red). In all plots, events are selected in the region defined by $ m(3\mu) < m_{\mathrm{B}_{c}^{+}} $. |
png pdf |
Figure 1-b:
Distributions of the $ L_{xy}/\sigma_{L_{xy}} $ (left) observable for the $ \mathrm{B}_{c}^{+} \to \mathrm{J}/\psi\, \mu^+\nu_{ \mu} $ (blue) signal channel, the fakes background (red) and the $ H_\mathrm{b} $ background (green); distributions of the $ \mathrm{IP3D}/\sigma_{\mathrm{IP3D}} $ (center) and $ q^2 $ (right) observables for the $ \mathrm{B}_{c}^{+} \to \mathrm{J}/\psi\, \mu^+\nu_{ \mu} $ (blue) and $ \mathrm{B}_{c}^{+} \to \mathrm{J}/\psi\, \tau^+\nu_{ \tau} $ (purple) signal channels and the fakes background (red). In all plots, events are selected in the region defined by $ m(3\mu) < m_{\mathrm{B}_{c}^{+}} $. |
png pdf |
Figure 1-c:
Distributions of the $ L_{xy}/\sigma_{L_{xy}} $ (left) observable for the $ \mathrm{B}_{c}^{+} \to \mathrm{J}/\psi\, \mu^+\nu_{ \mu} $ (blue) signal channel, the fakes background (red) and the $ H_\mathrm{b} $ background (green); distributions of the $ \mathrm{IP3D}/\sigma_{\mathrm{IP3D}} $ (center) and $ q^2 $ (right) observables for the $ \mathrm{B}_{c}^{+} \to \mathrm{J}/\psi\, \mu^+\nu_{ \mu} $ (blue) and $ \mathrm{B}_{c}^{+} \to \mathrm{J}/\psi\, \tau^+\nu_{ \tau} $ (purple) signal channels and the fakes background (red). In all plots, events are selected in the region defined by $ m(3\mu) < m_{\mathrm{B}_{c}^{+}} $. |
png pdf |
Figure 2:
Likelihood scan of the $ \mathrm{R}(\mathrm{J}/\psi) $ measurement. The blue dashed line includes only statistical uncertainty, whereas the red dashed line includes also theoretical systematic uncertainties and the solid black line includes all uncertainties. |
png pdf |
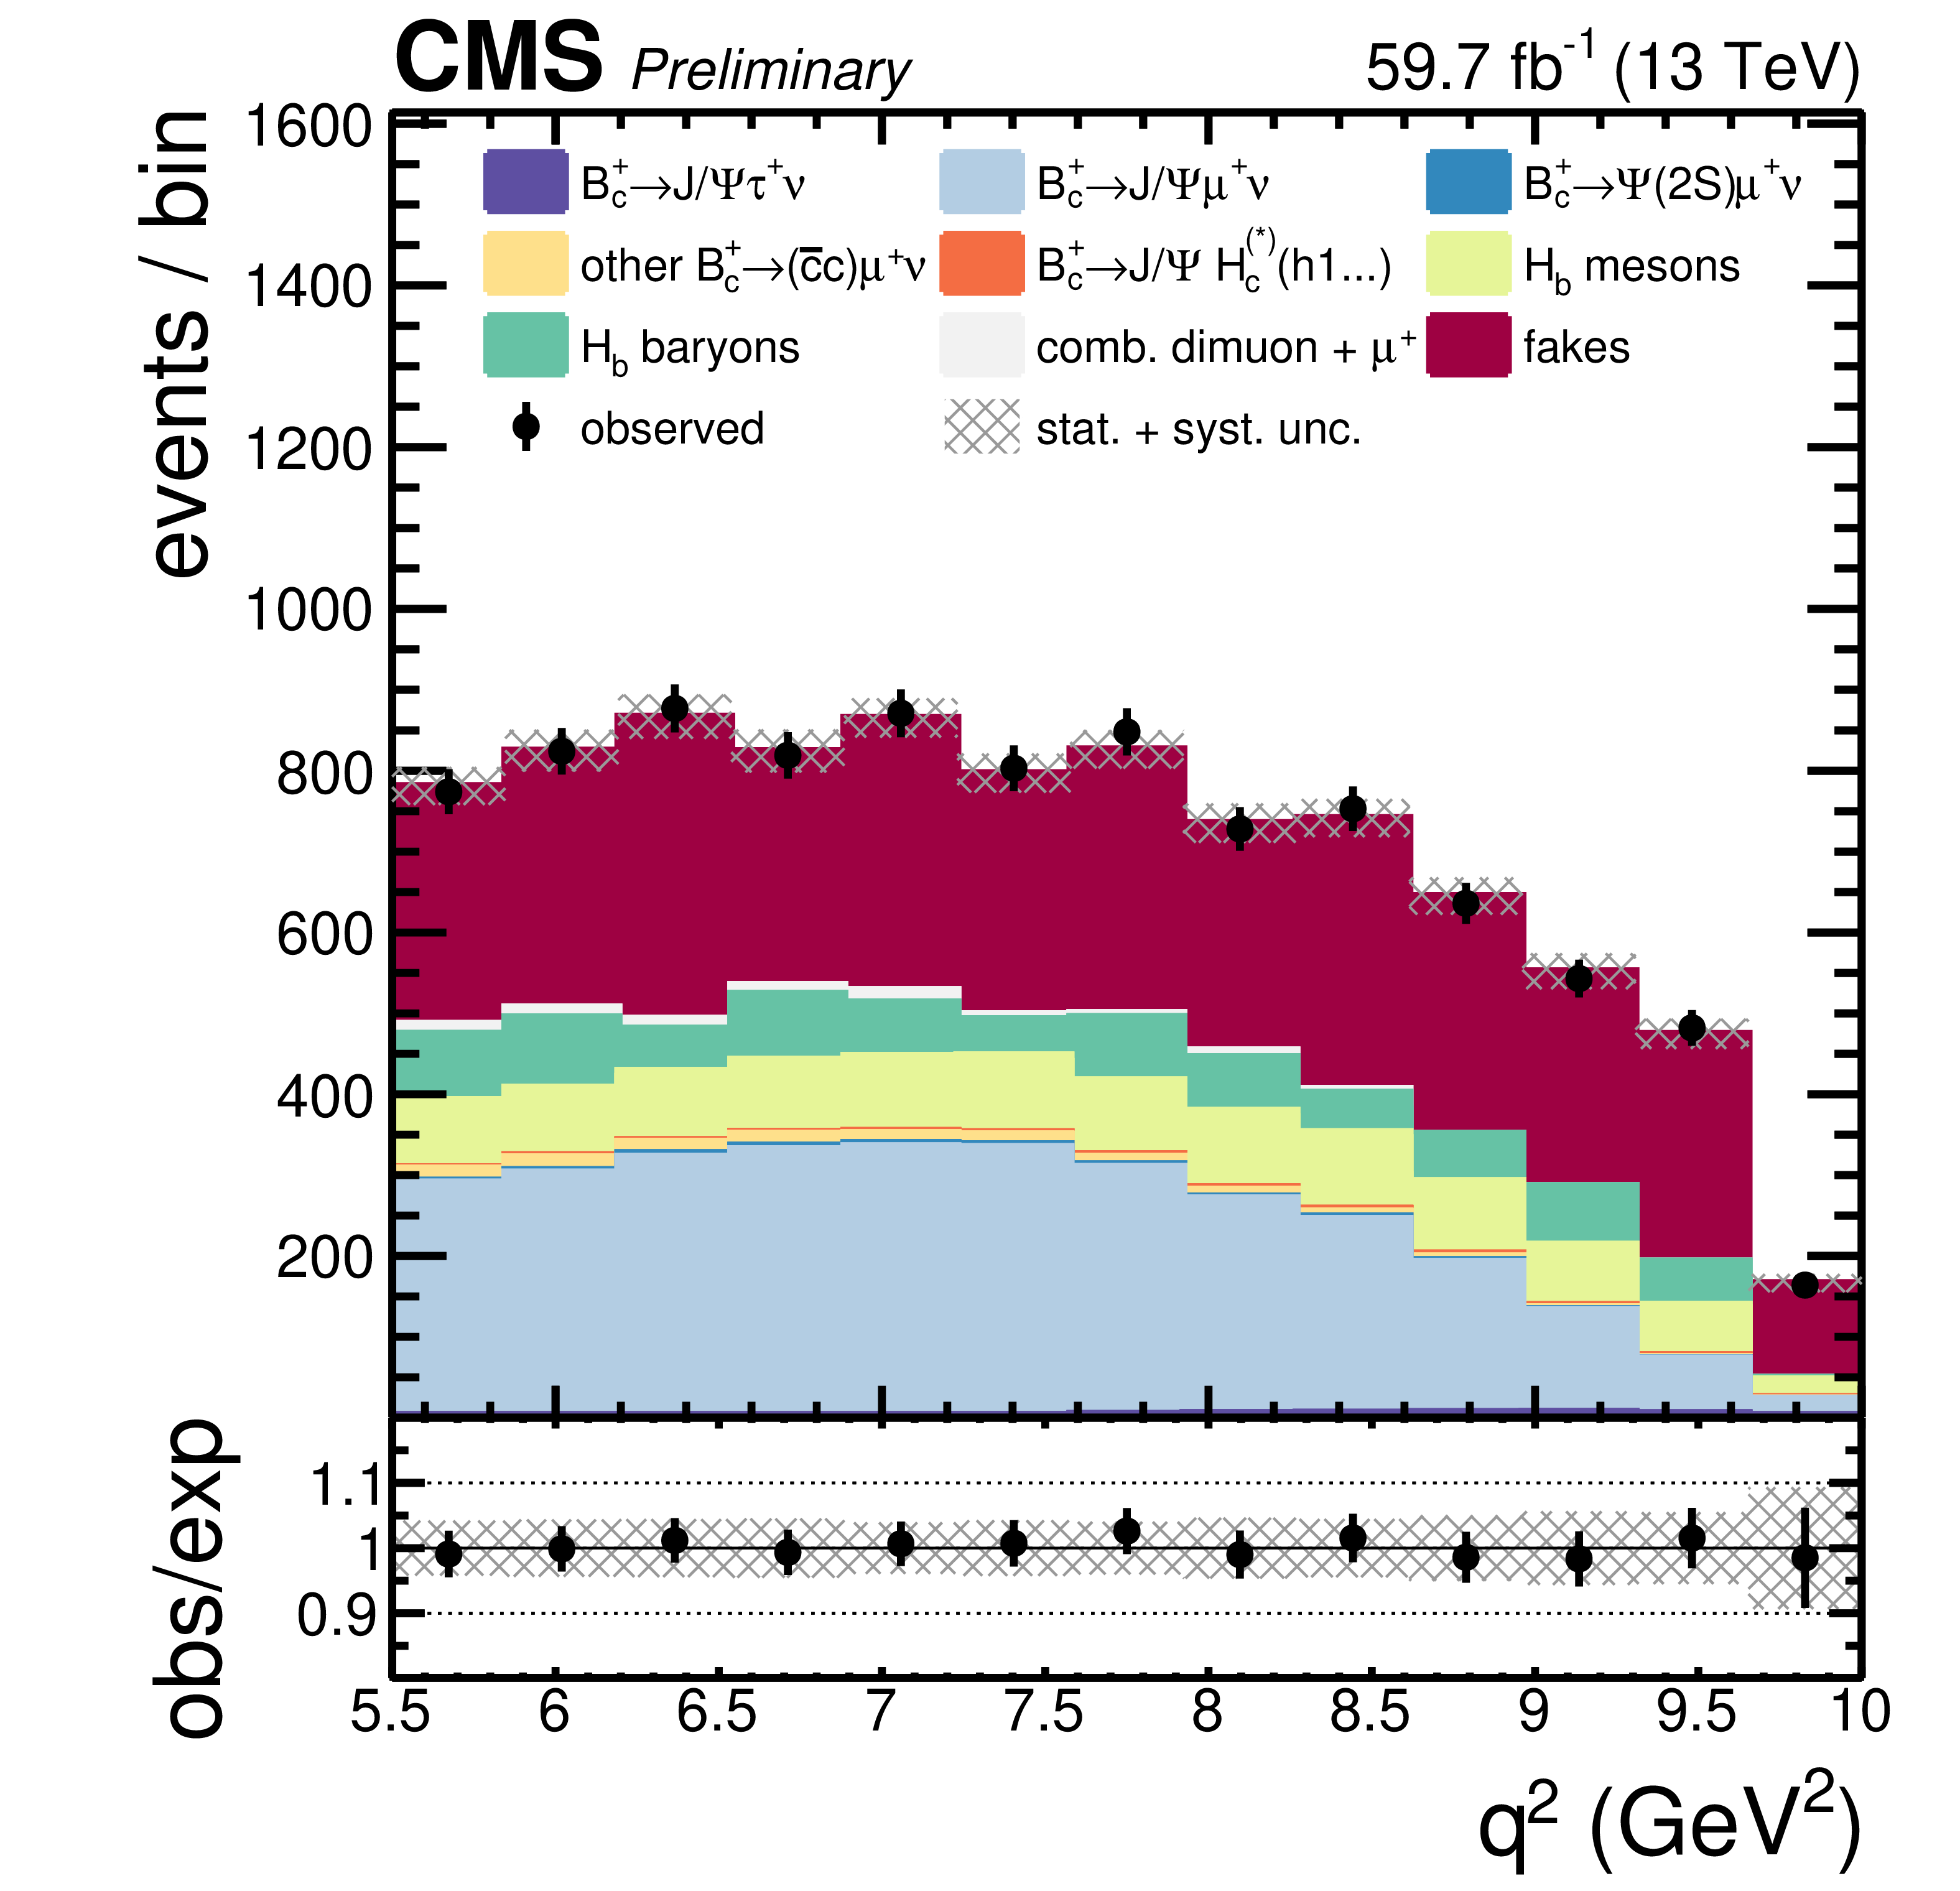
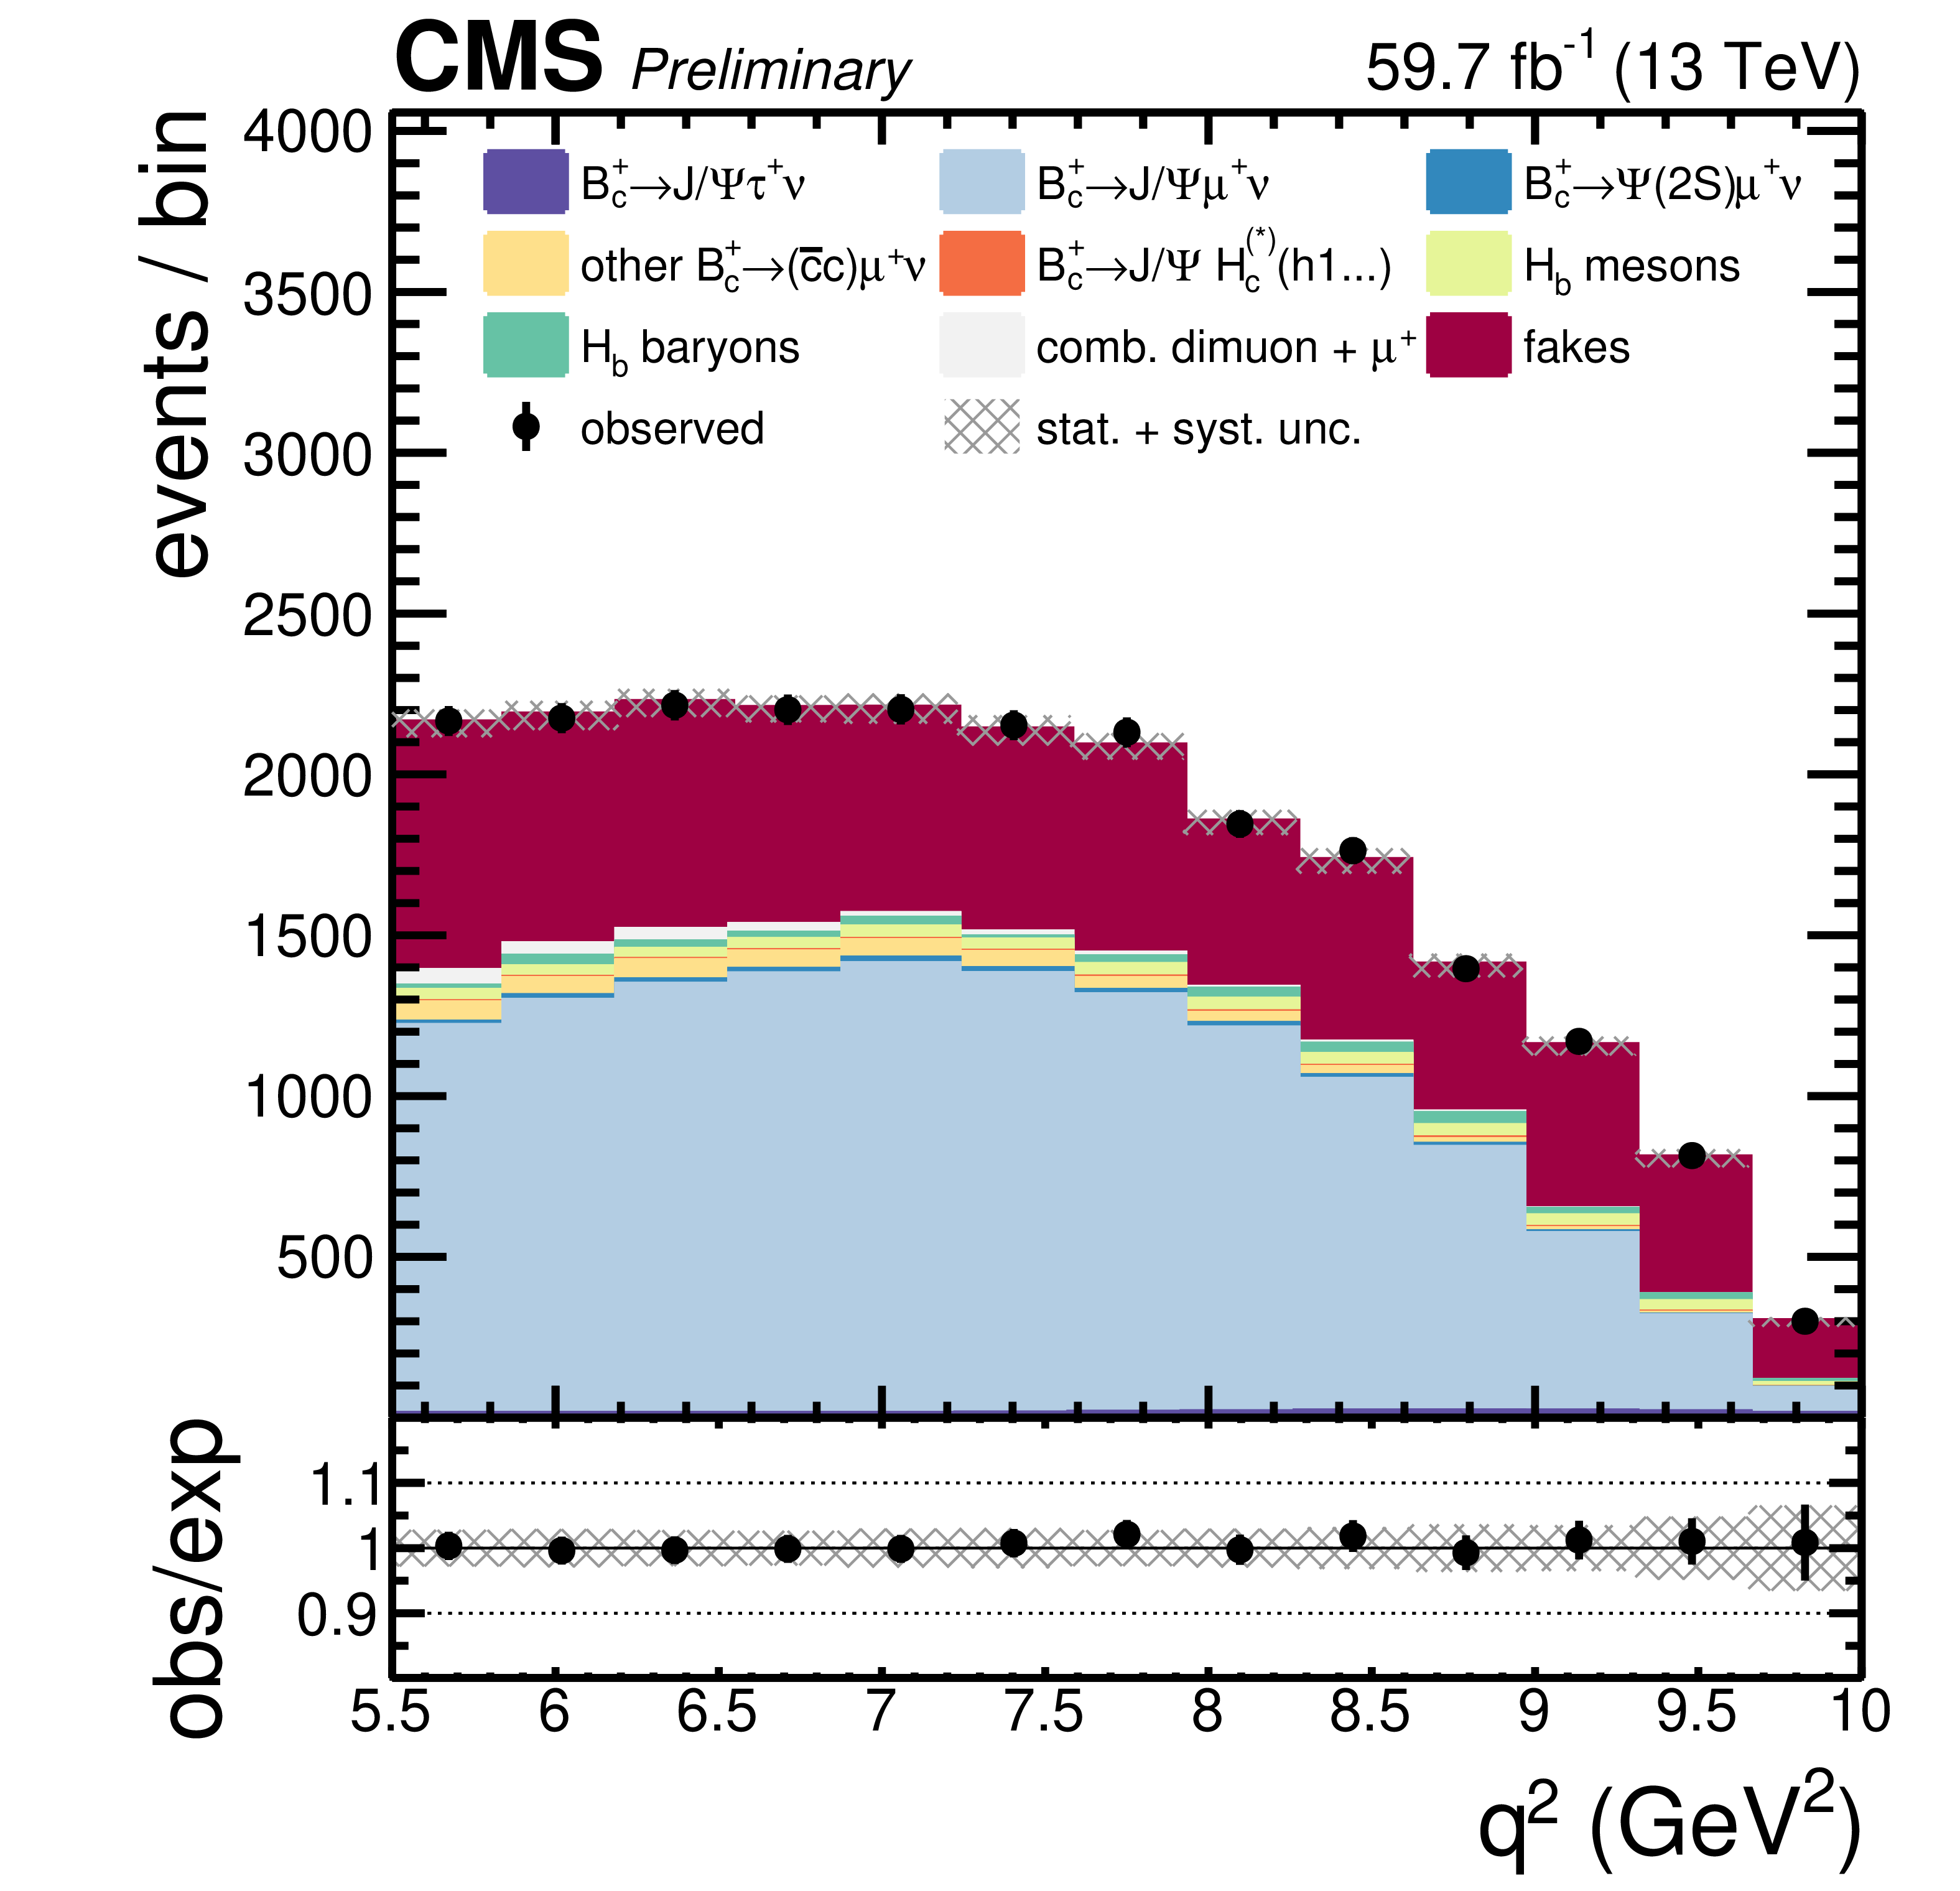
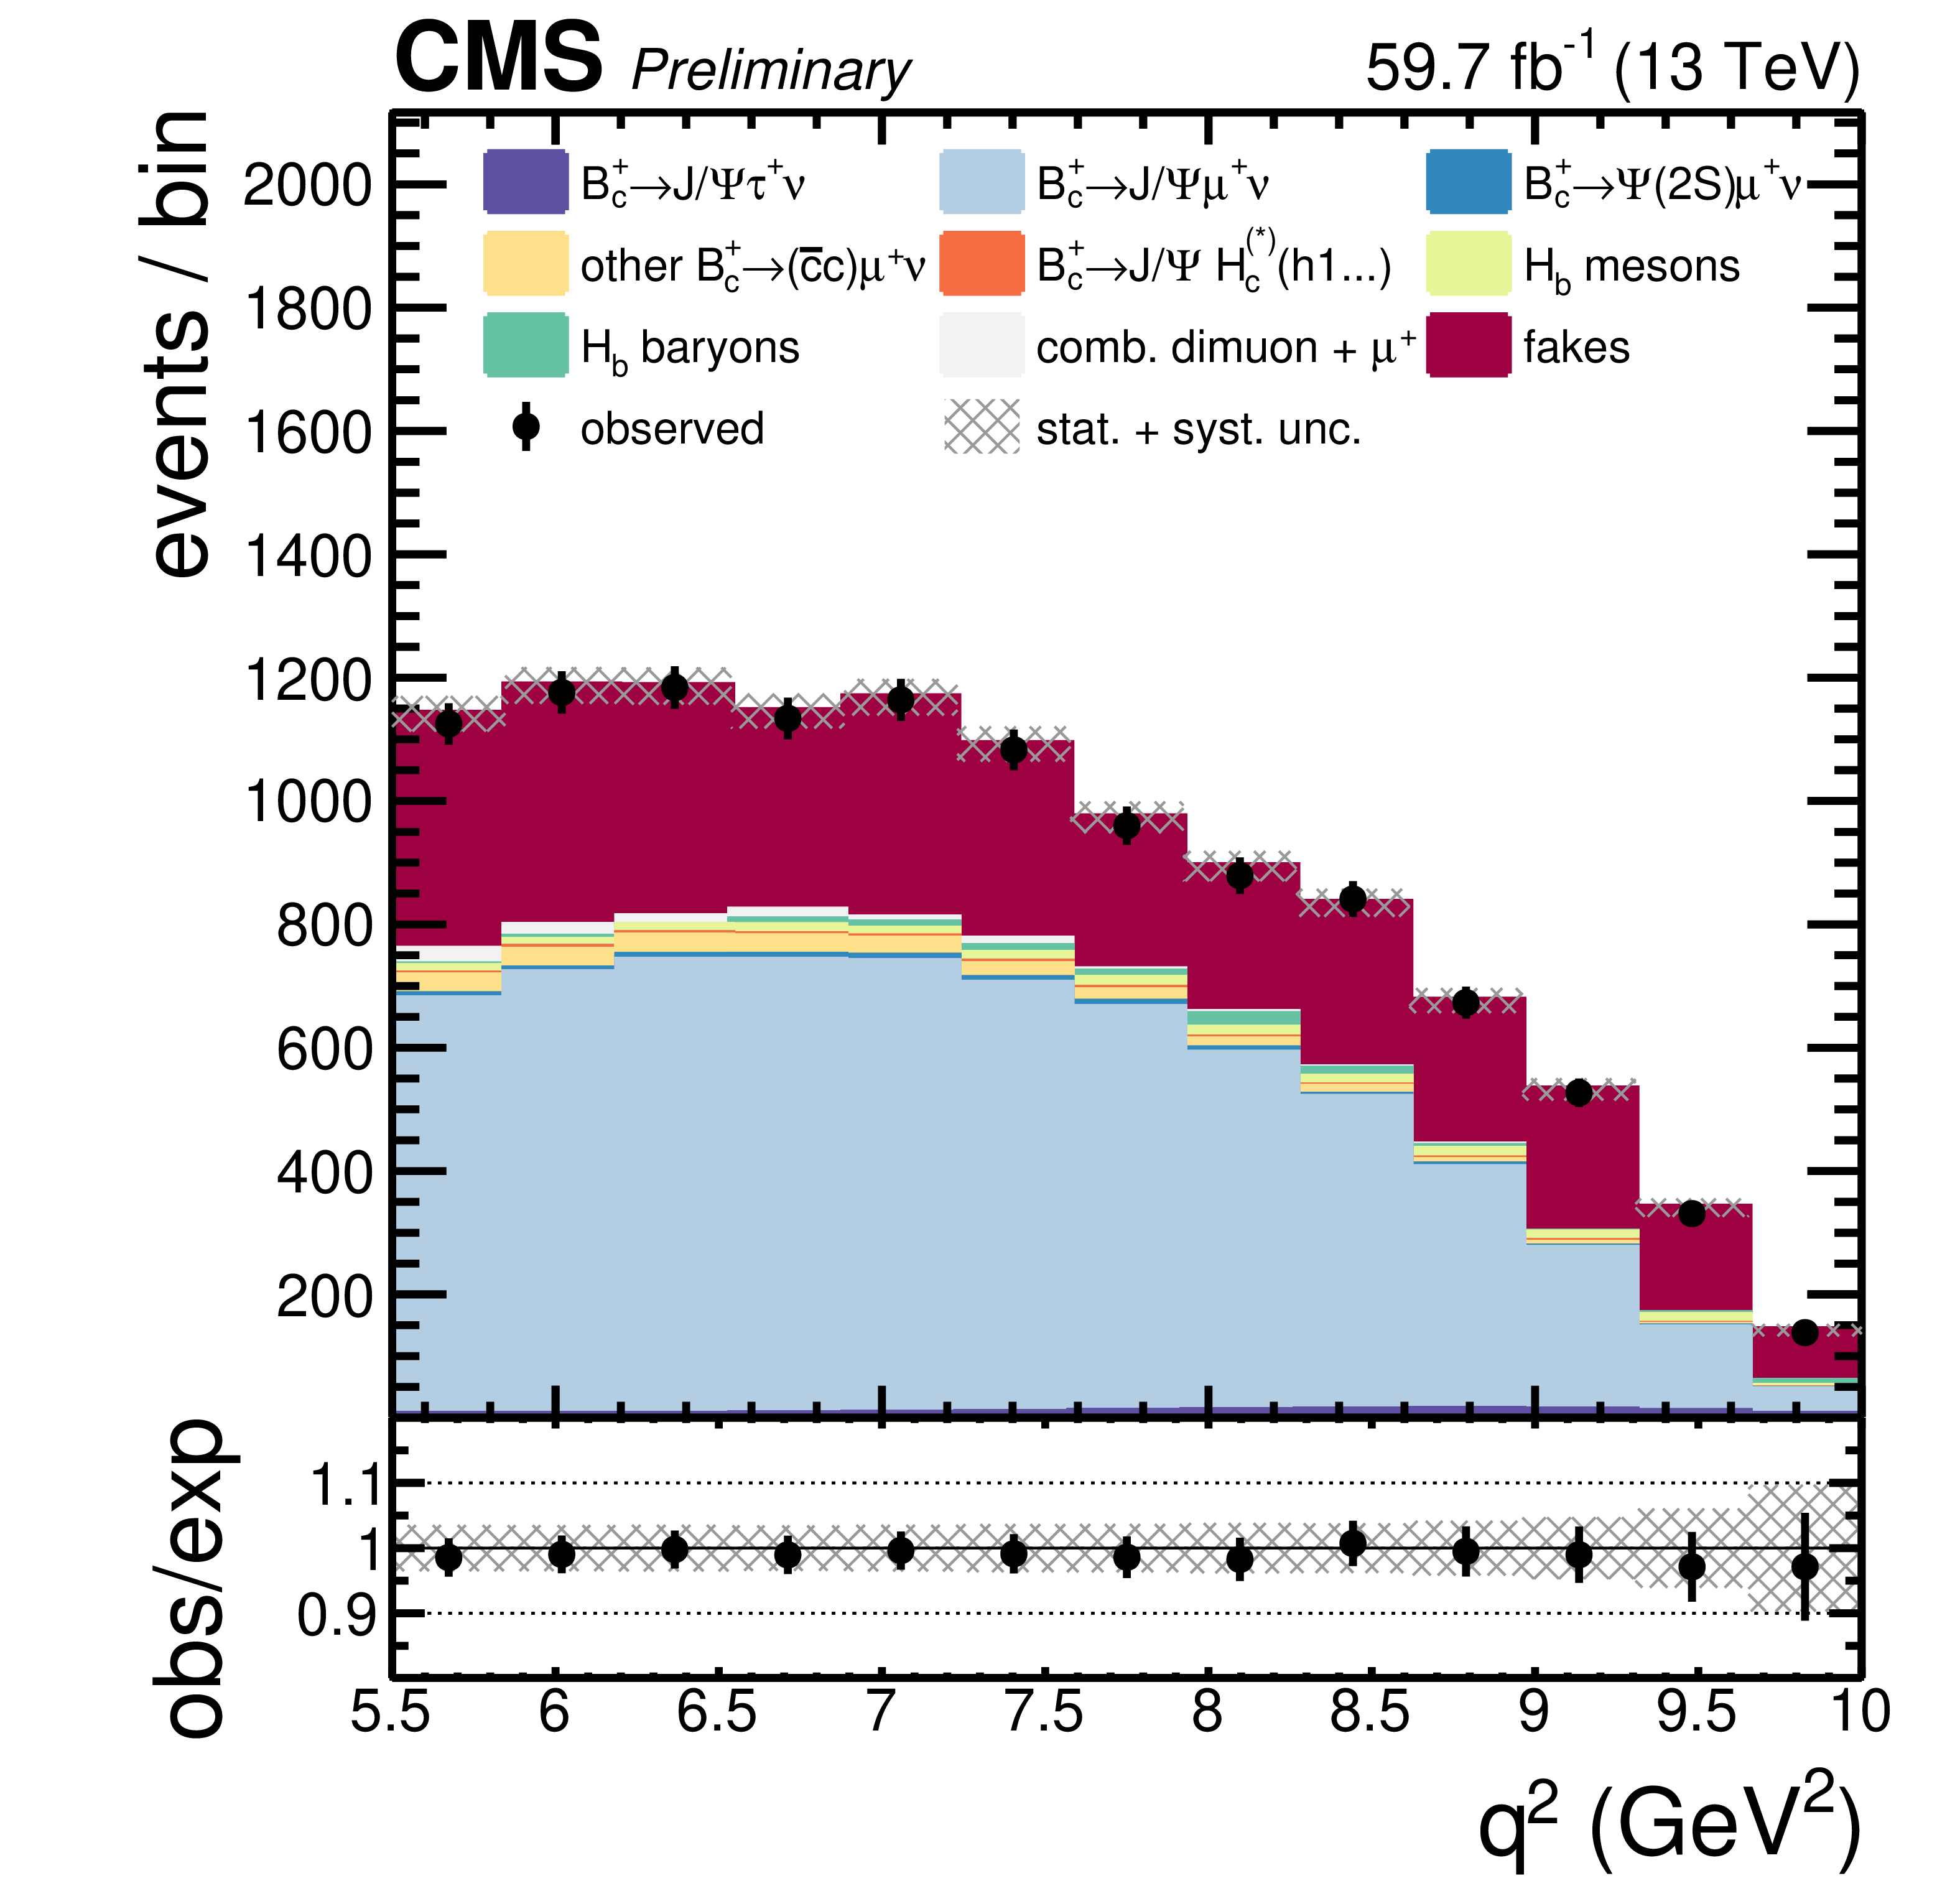
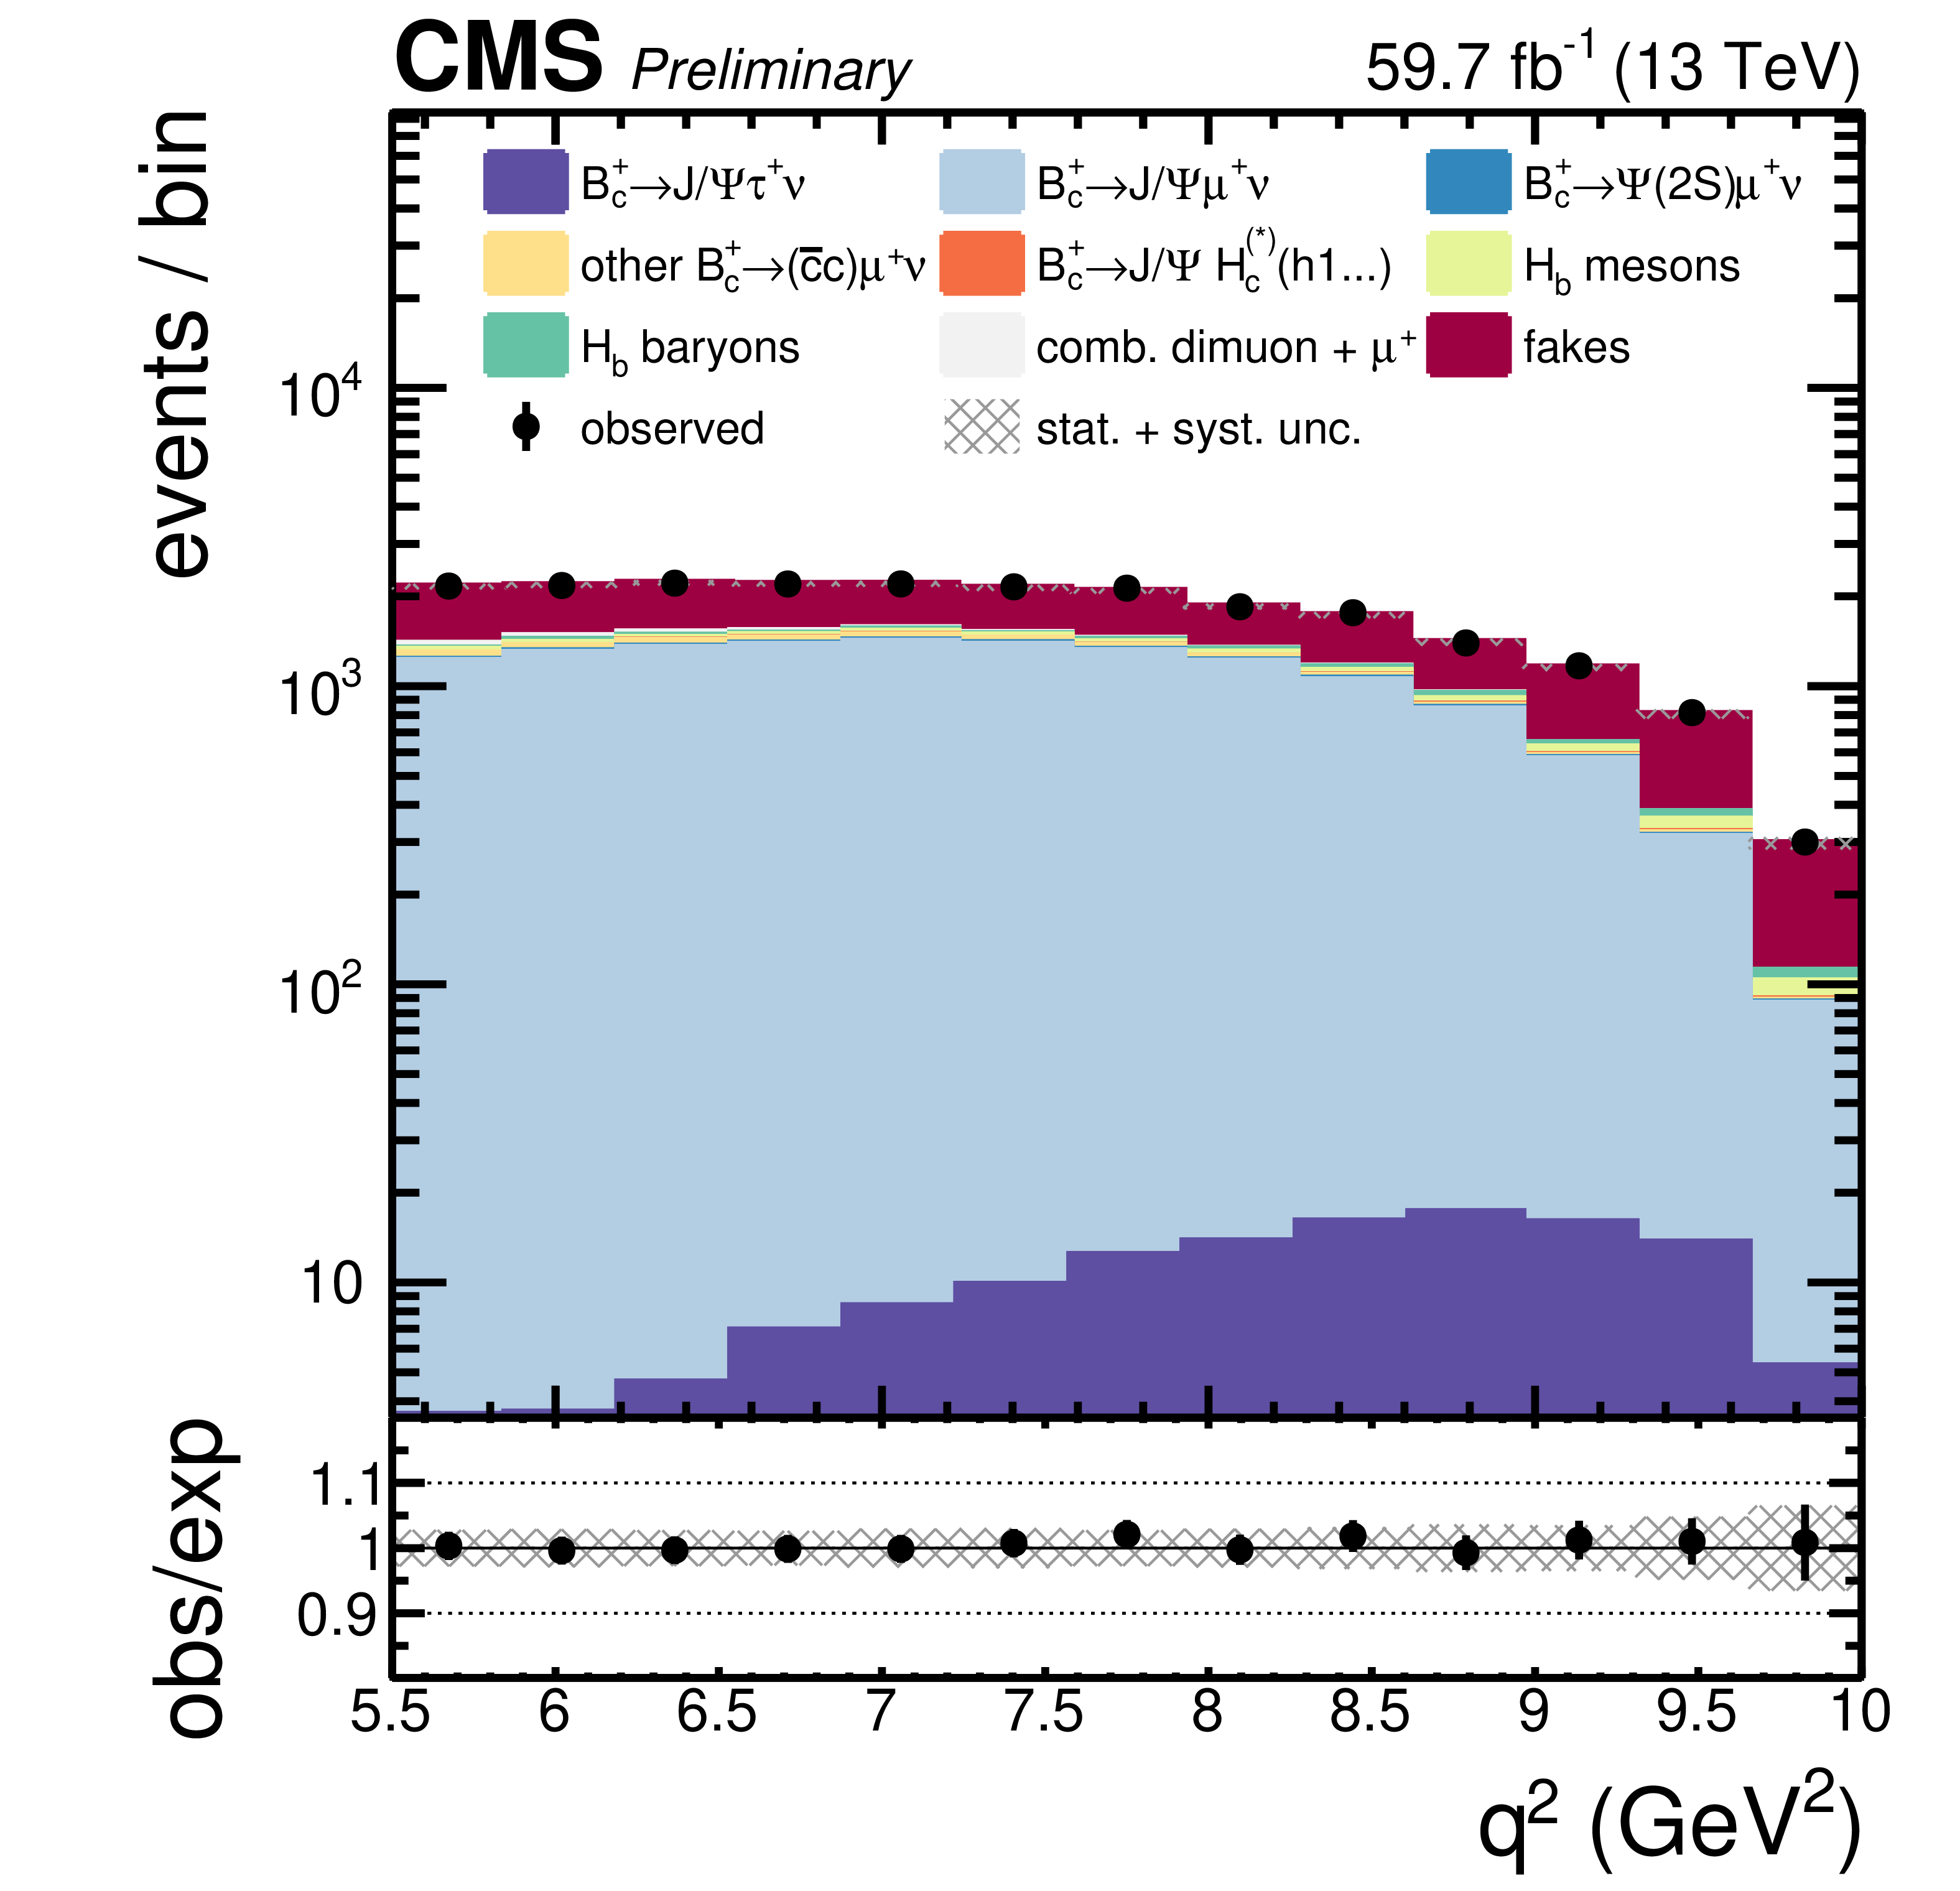
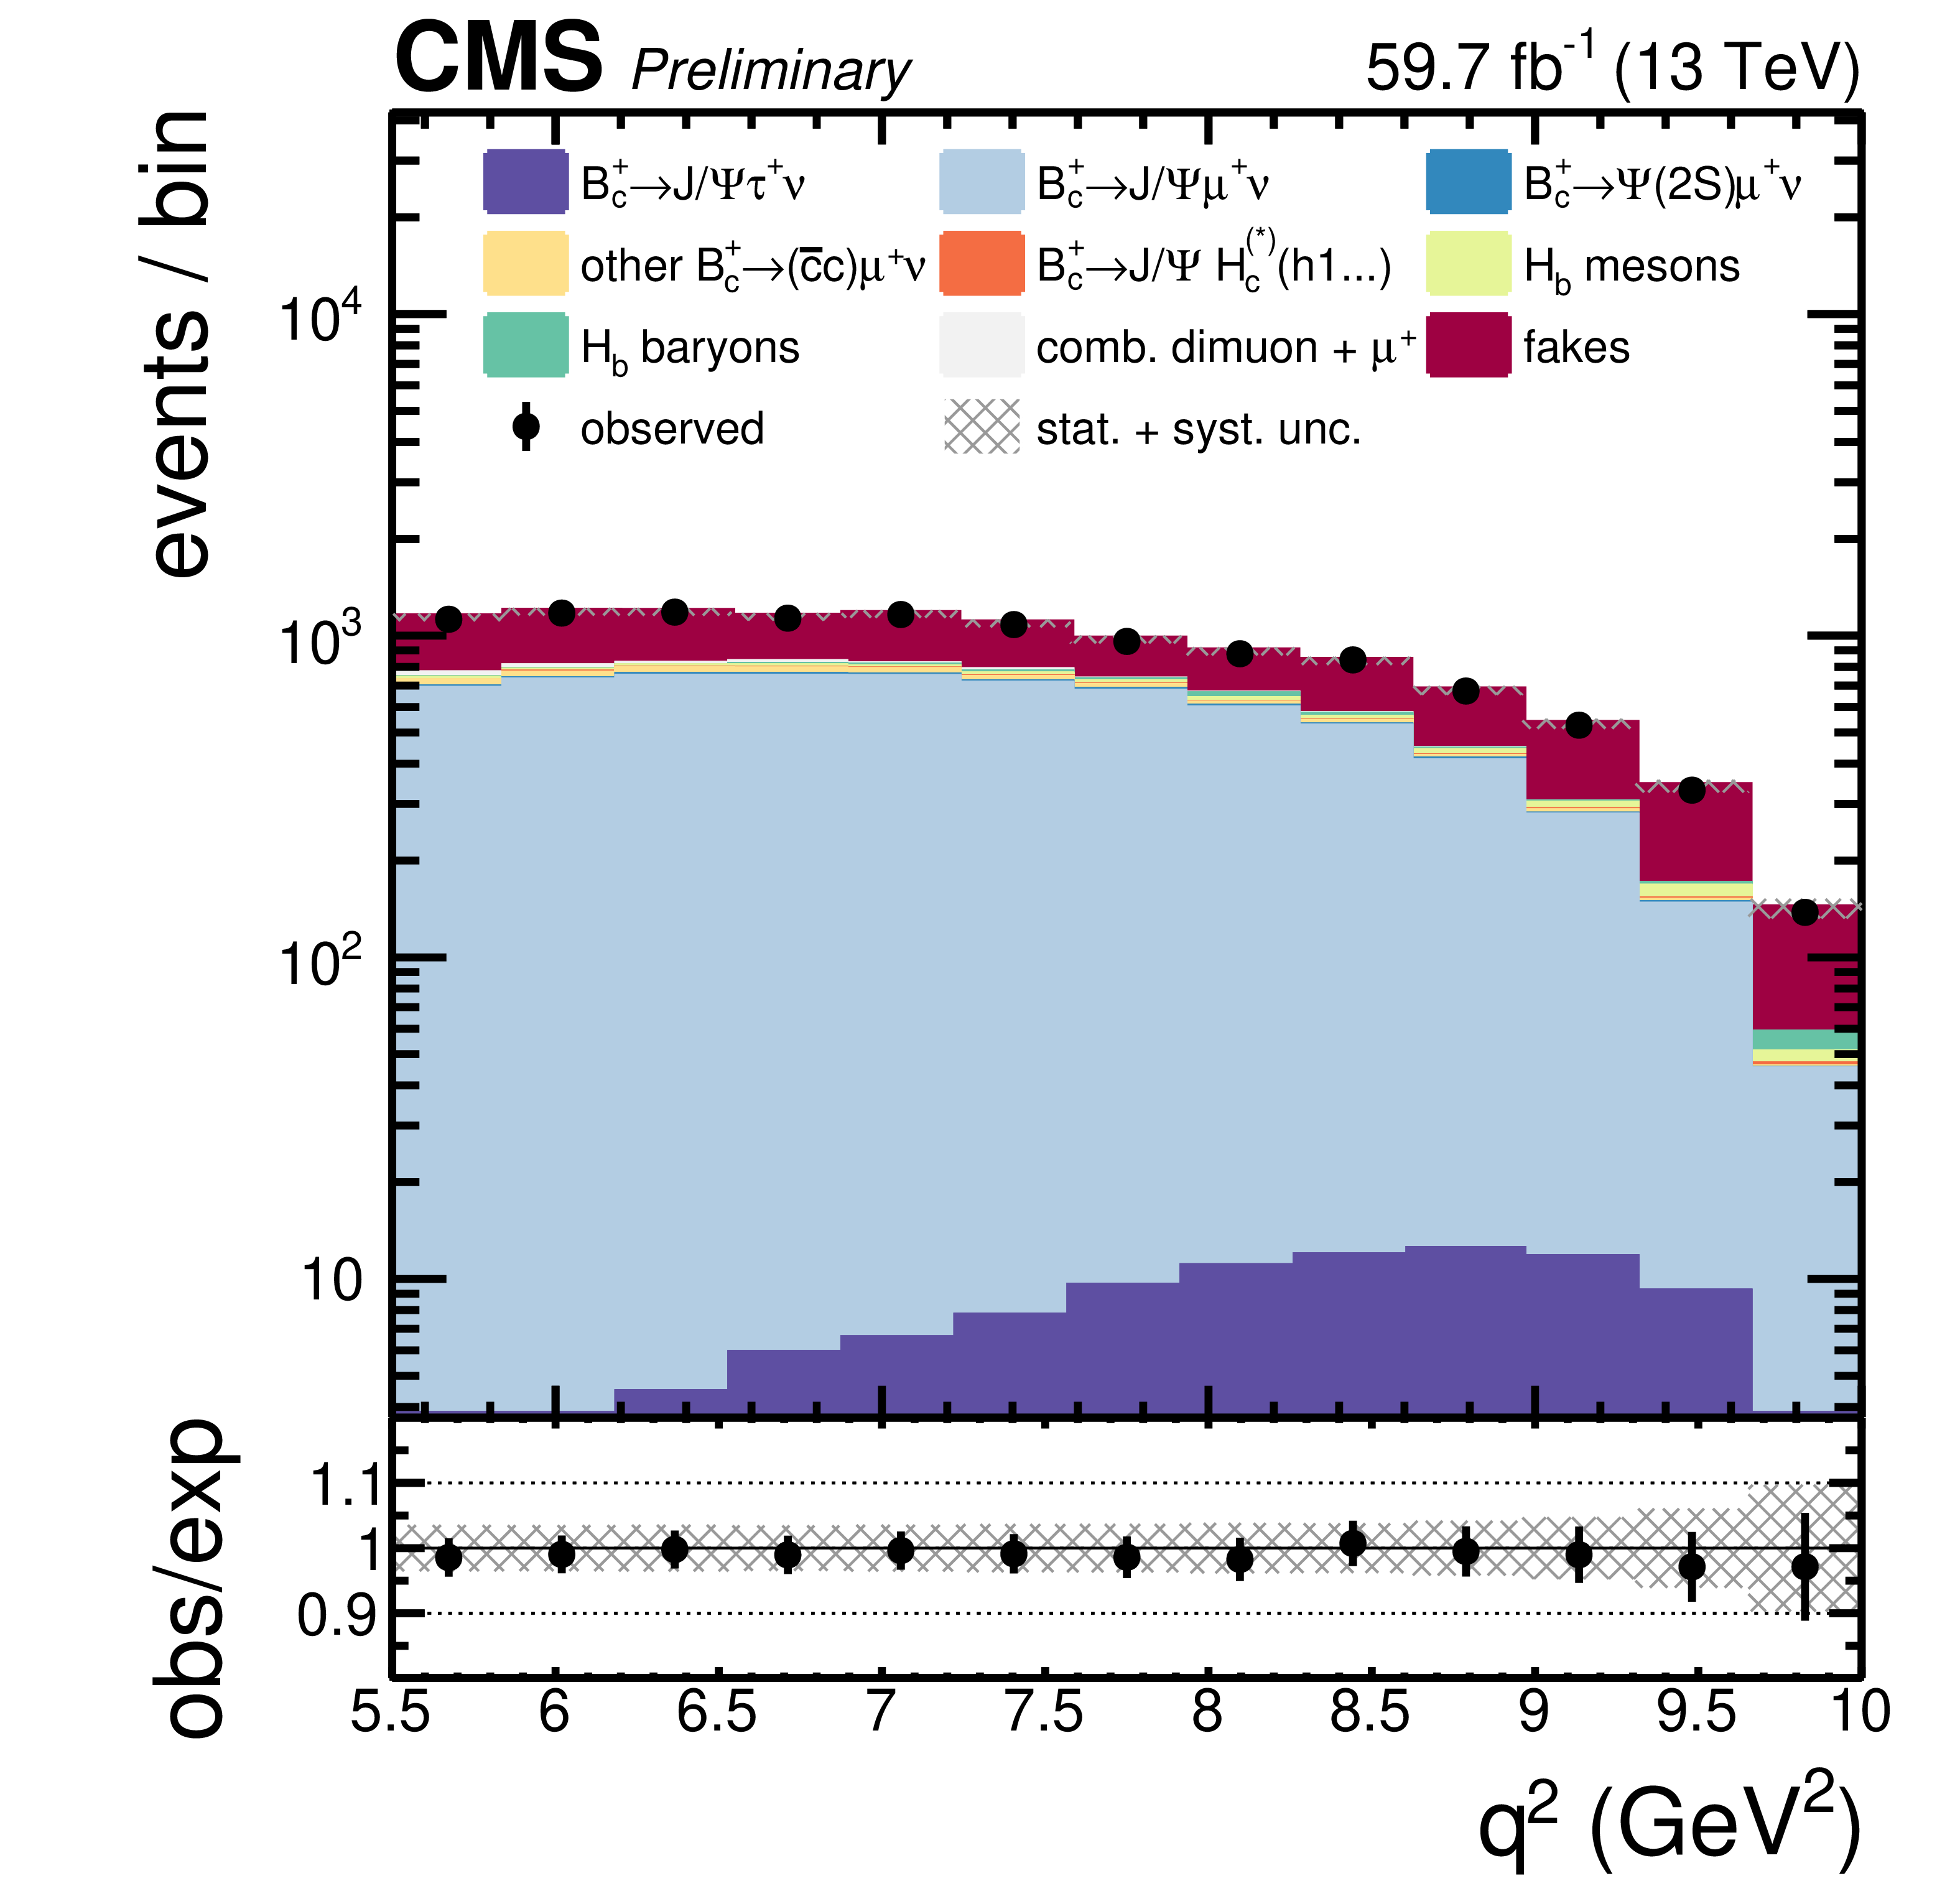
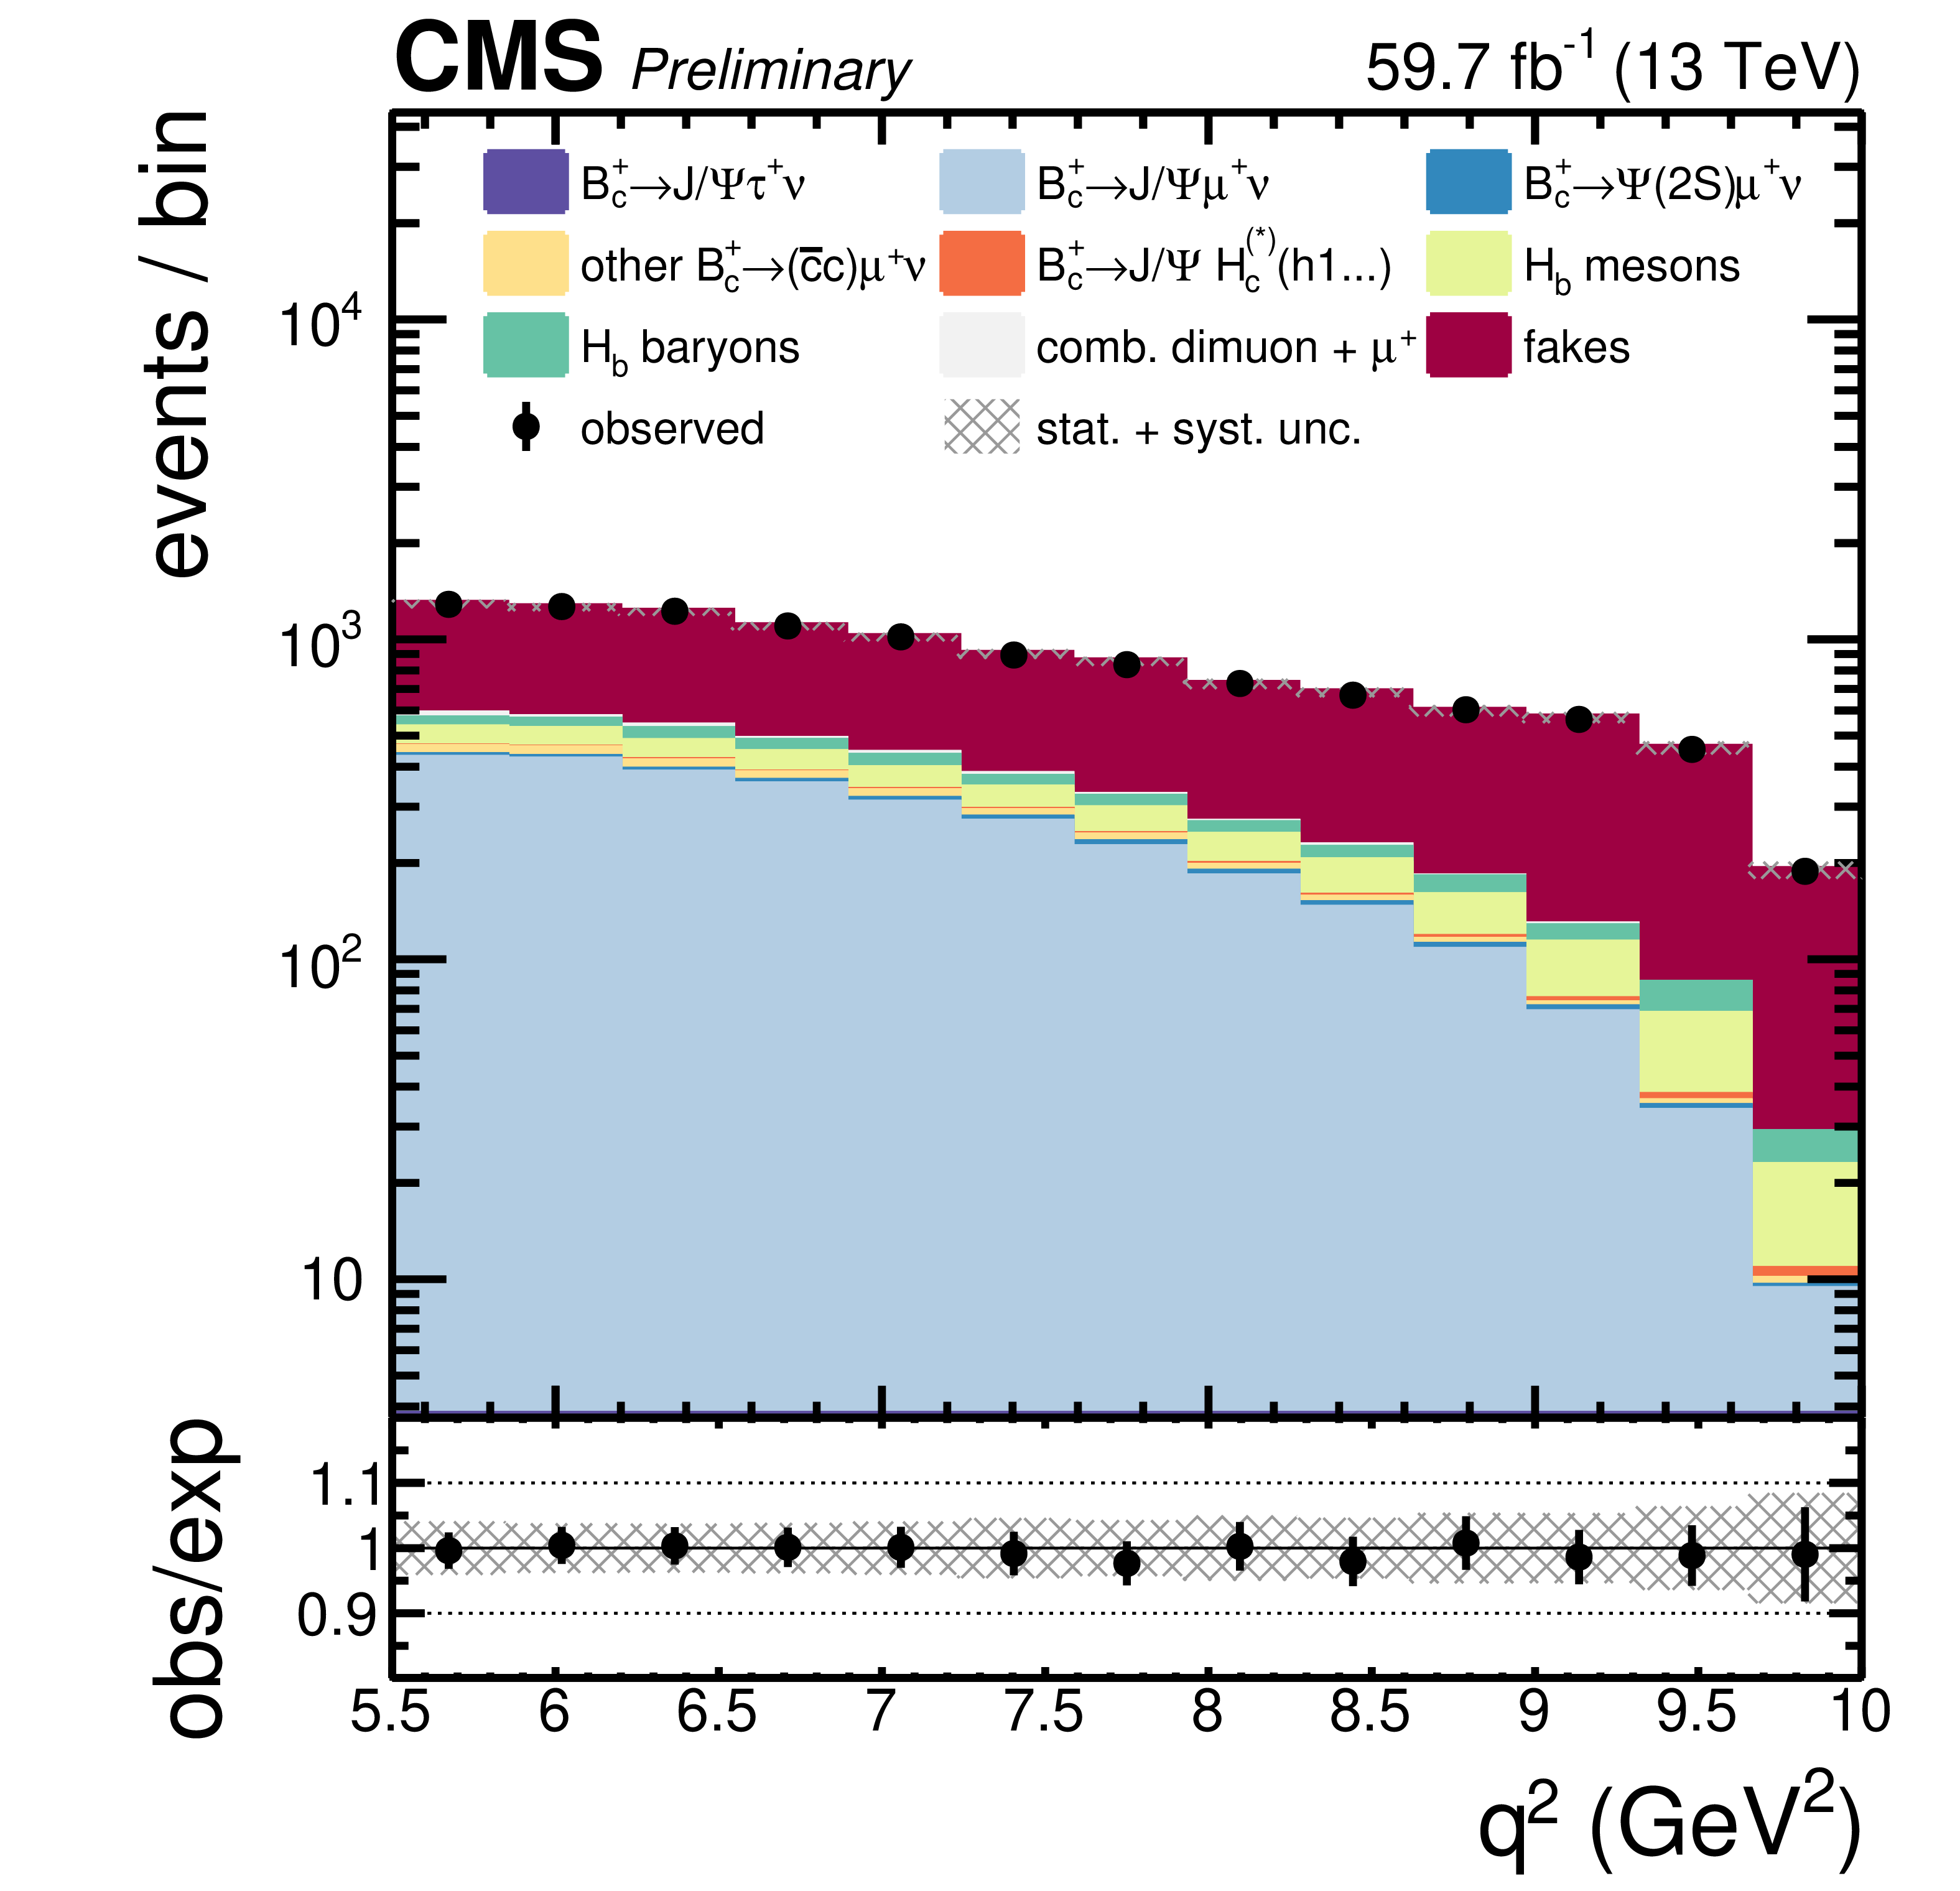
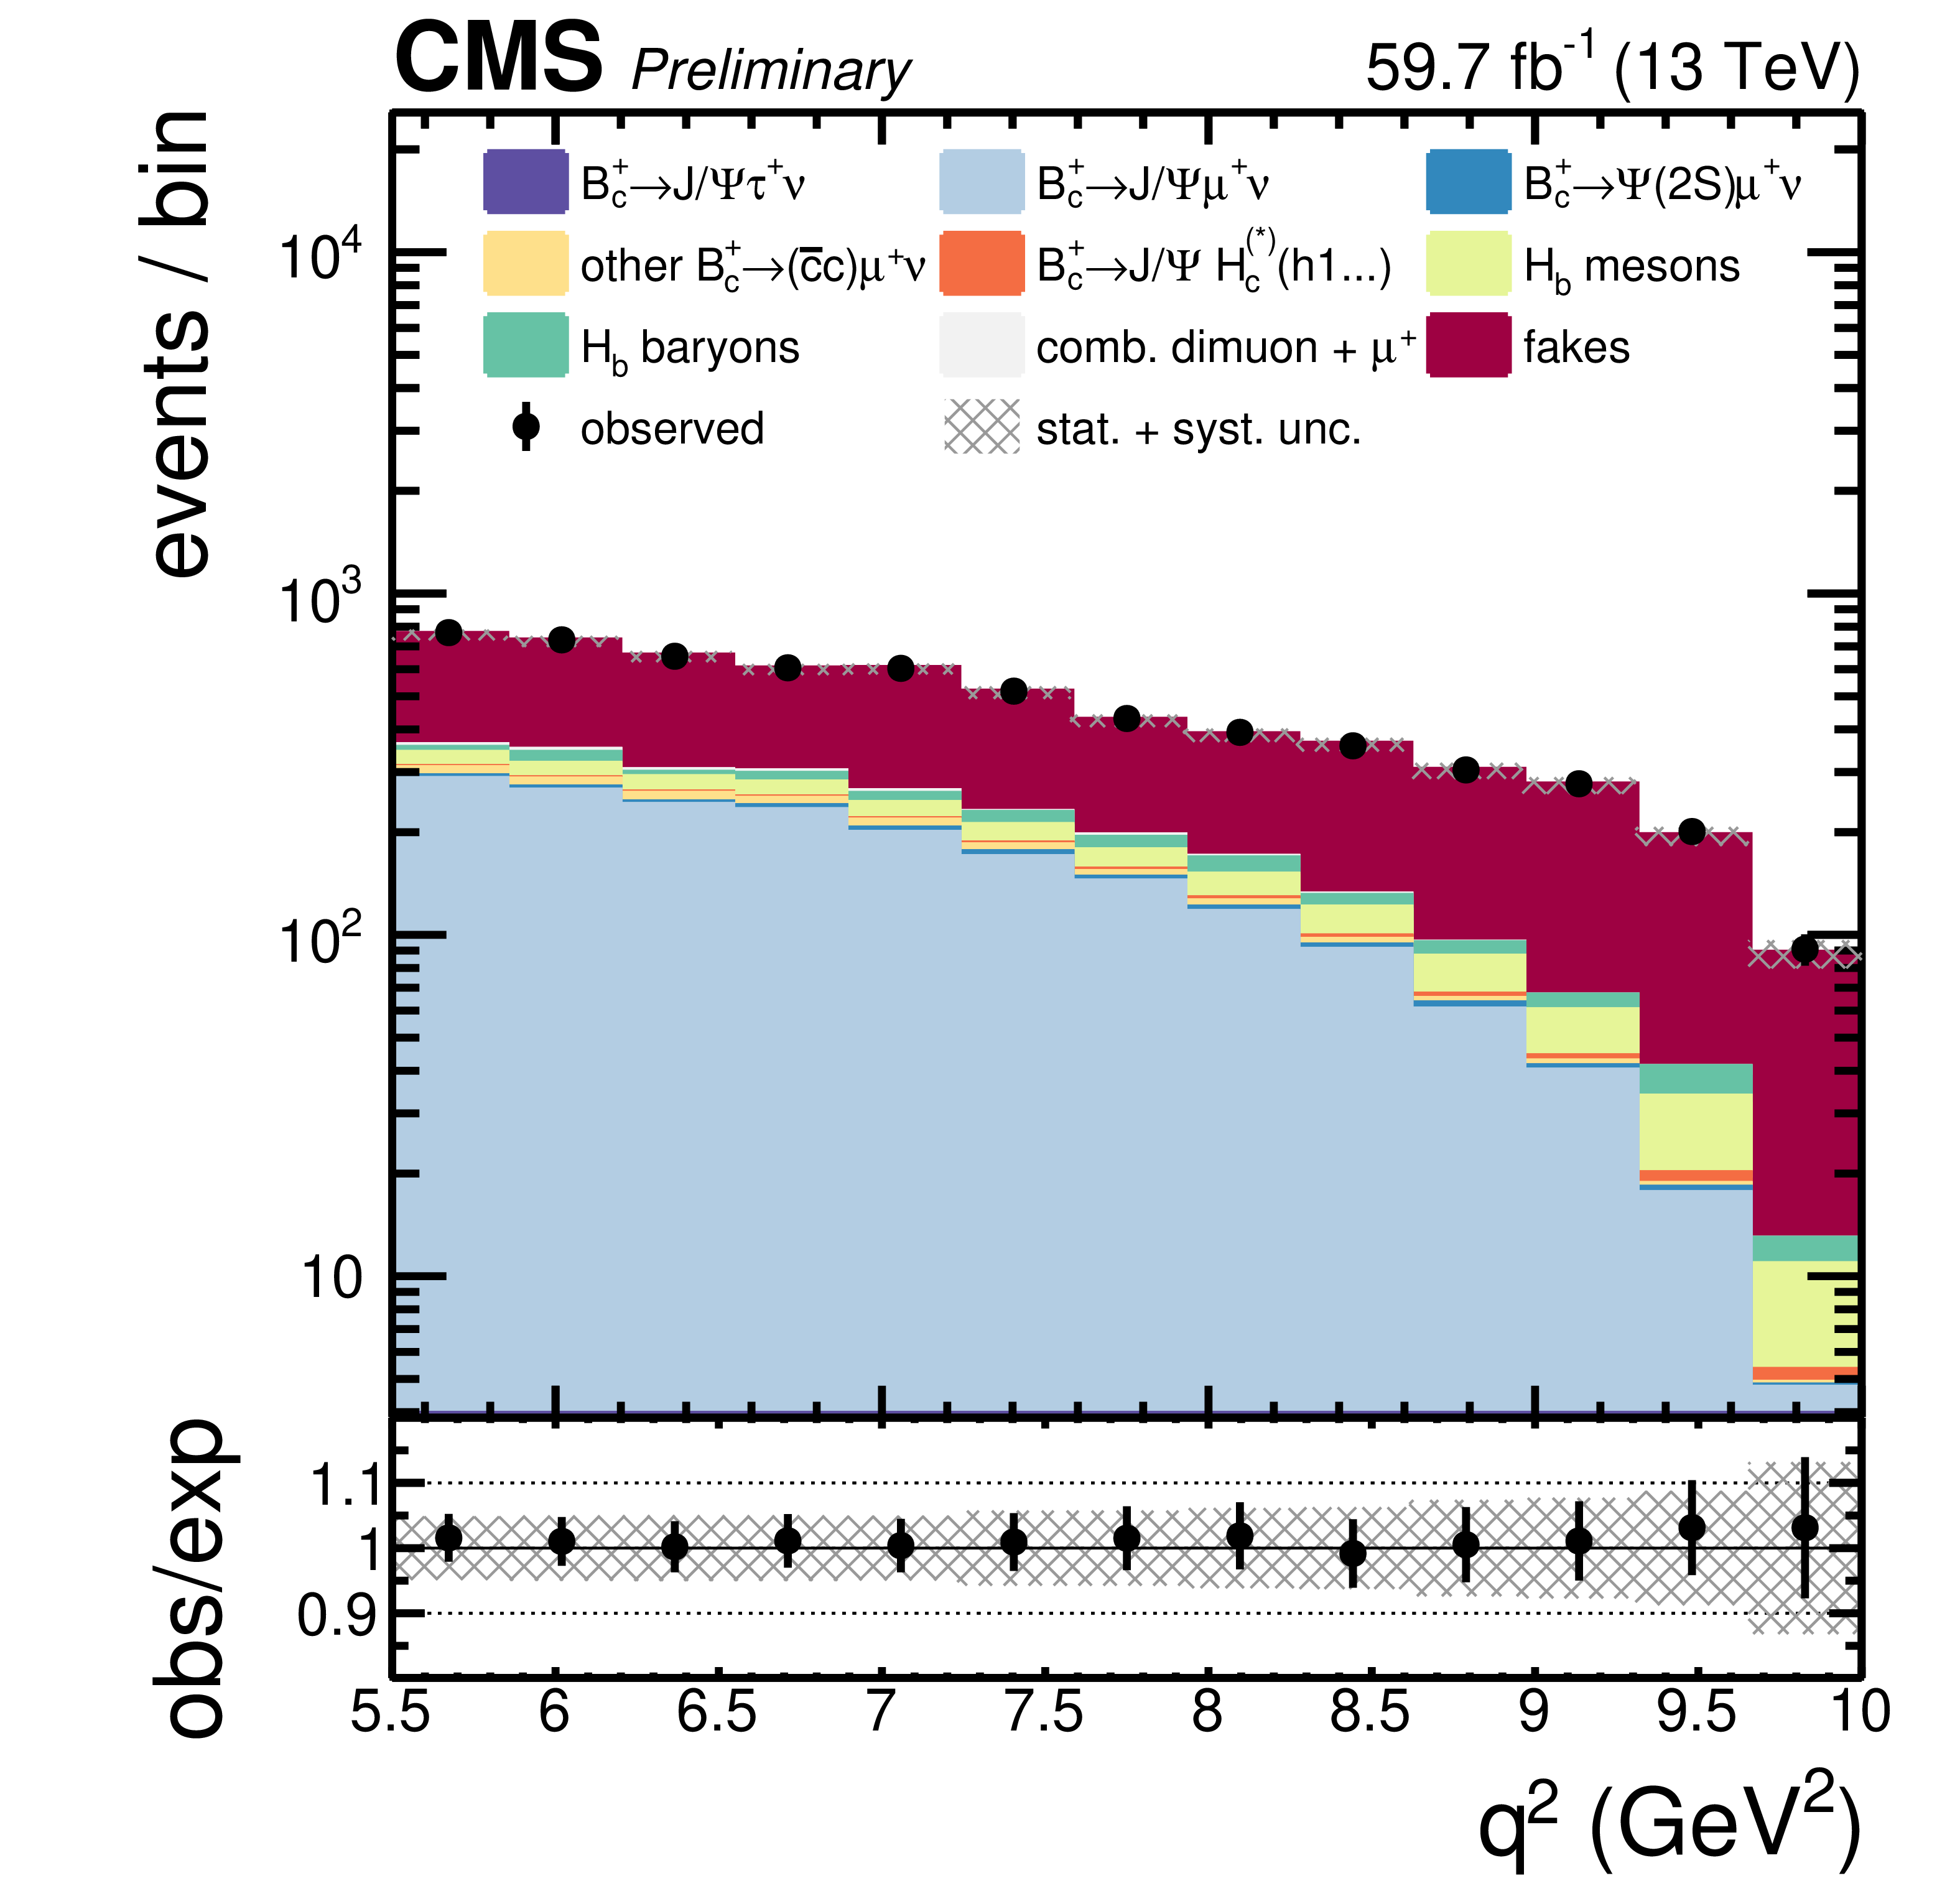
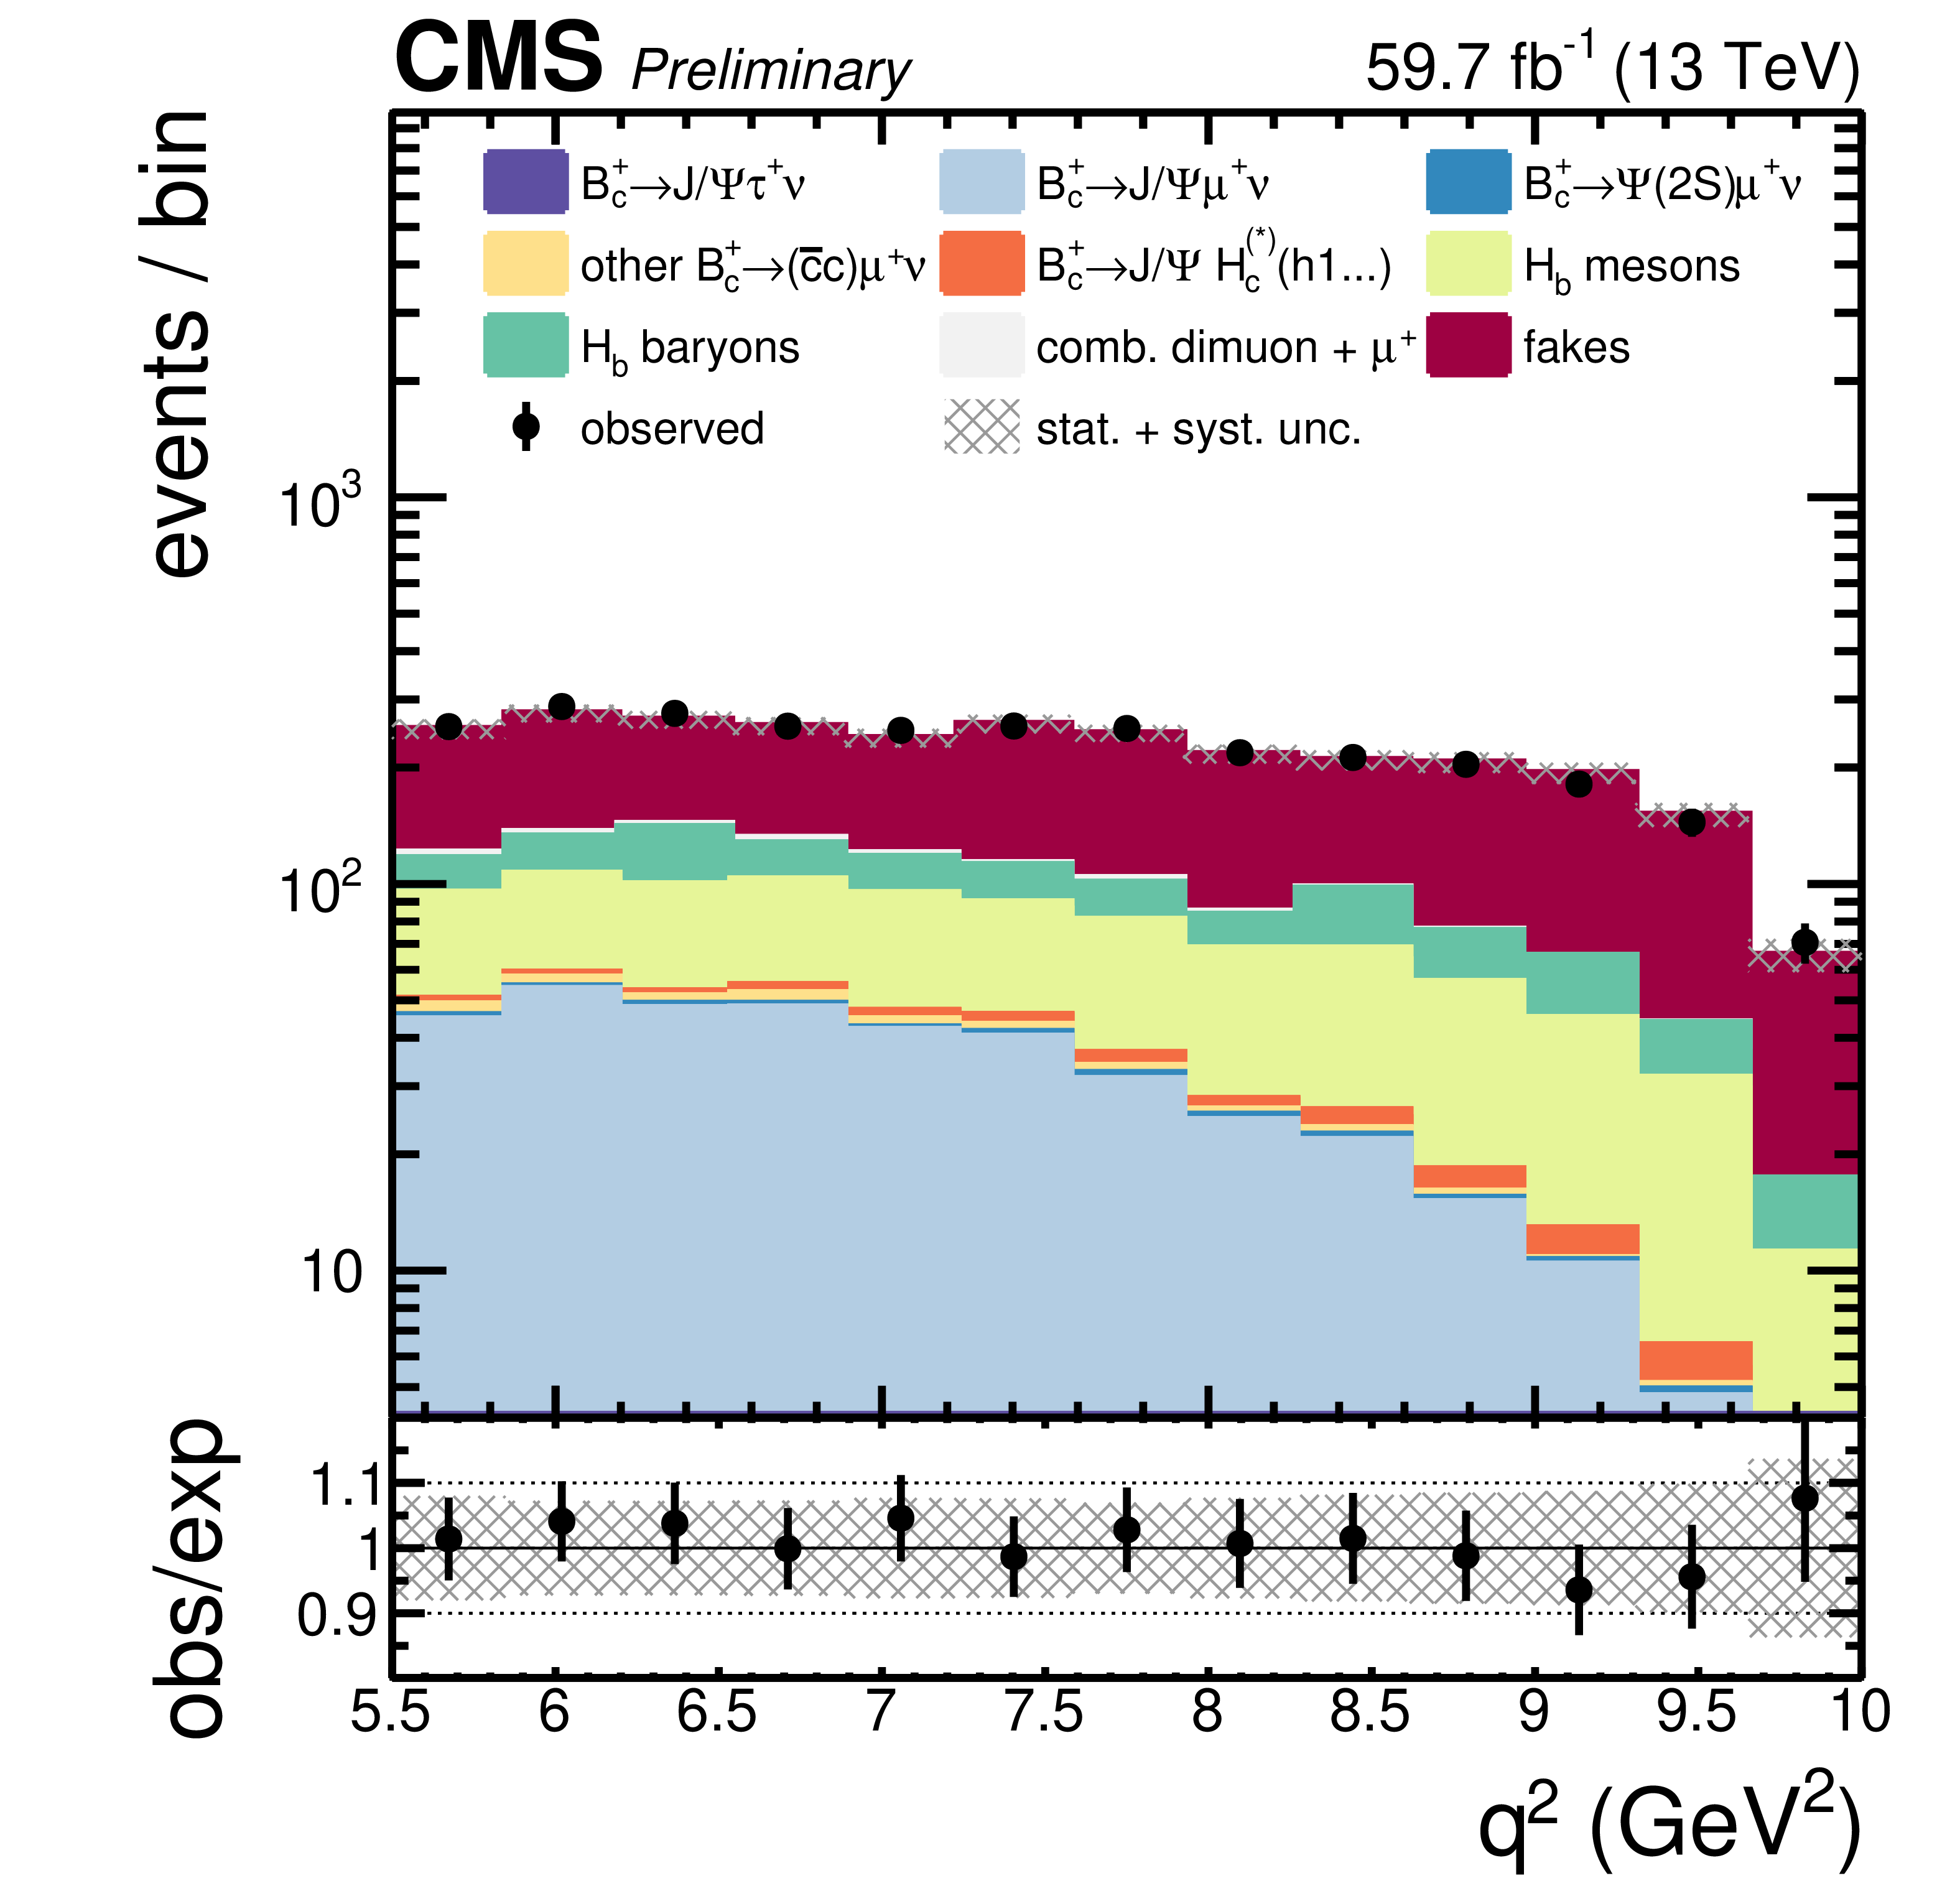
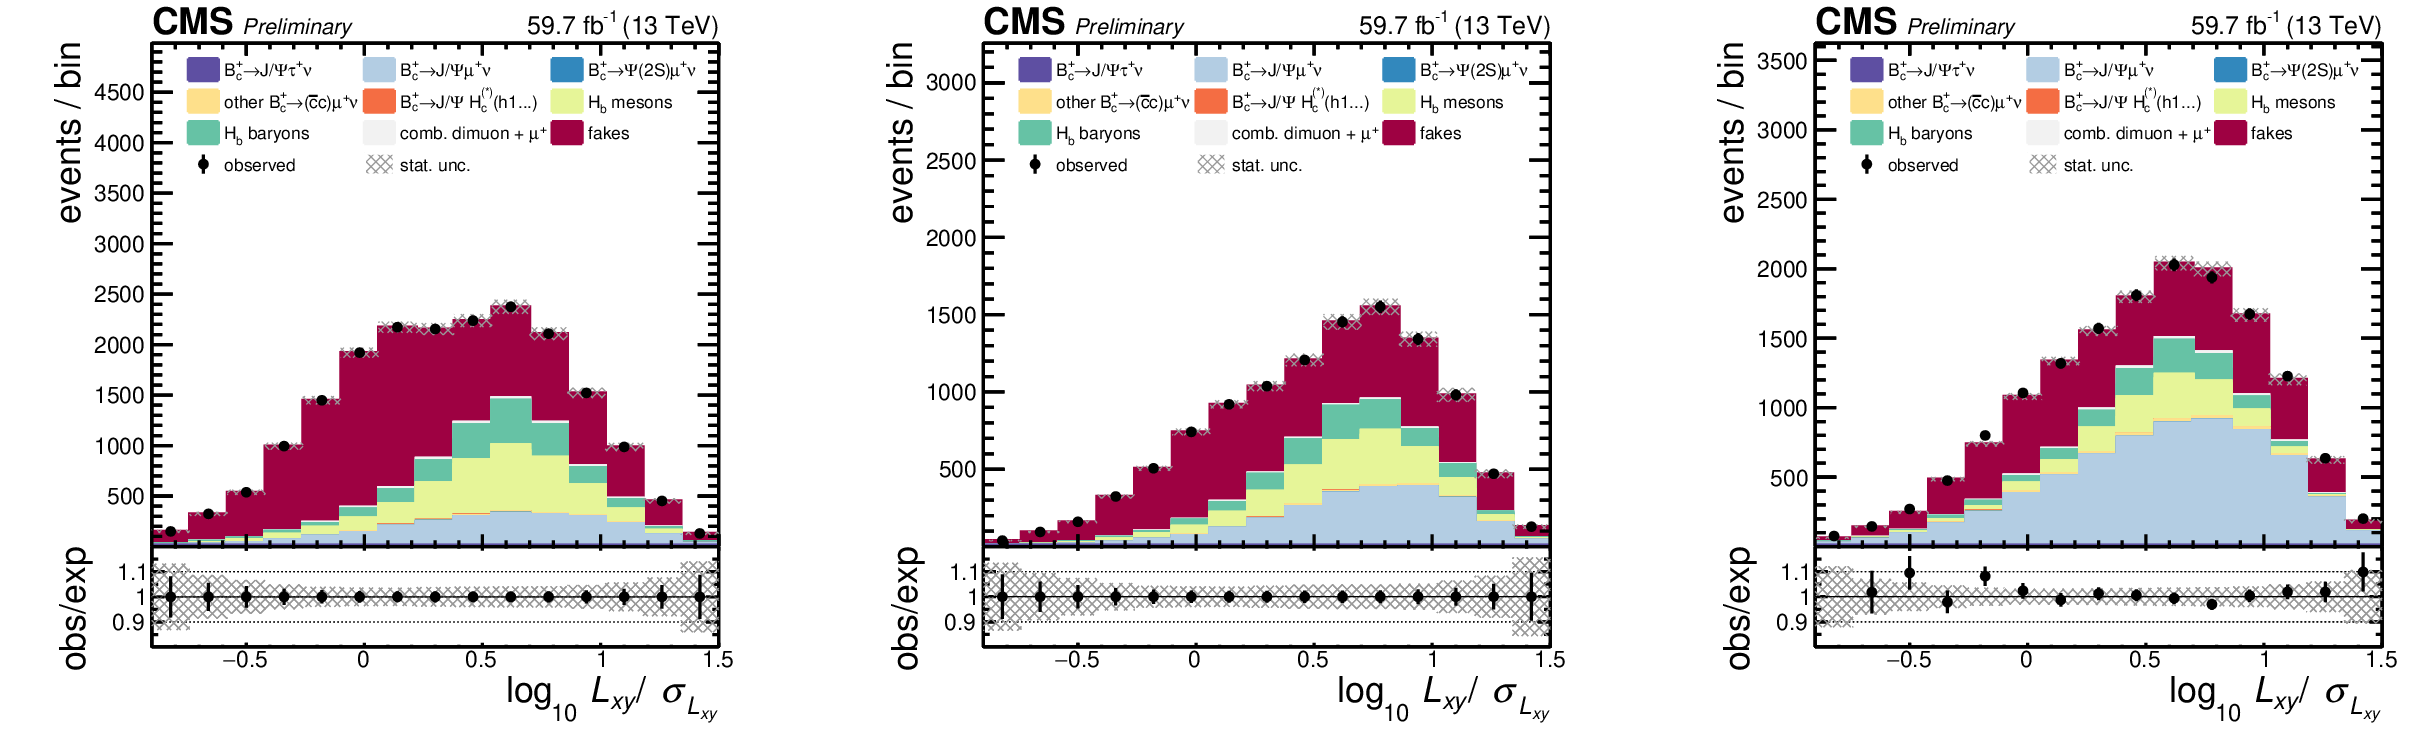
Figure 3:
Distributions of the $ q^2 $ observable in the signal-enriched data region, defined by $ m(3\mu) < m_{\mathrm{B}_{c}^{+}} $ in the bin of $ q^2 > $ 5.5 GeV$^2$ and $ \mathrm{IP3D}/\sigma_{\mathrm{IP3D}} > $ 2 (left); of the $ L_{xy}/\sigma_{L_{xy}} $ observable in the data region defined by $ m(3\mu) < m_{\mathrm{B}_{c}^{+}} $ in the bin of $ q^2 < $ 4.5 GeV$^2$ and $ \mathrm{IP3D}/\sigma_{\mathrm{IP3D}} > $ 0 (center) and in the data region defined by $ m(3\mu) > m_{\mathrm{B}_{c}^{+}} $(right). In each figure, data are compared to the expectation, with the normalization, shape parameters for the different contributions as well as $ \mathrm{R}(\mathrm{J}/\psi) $ shown at their best-fit values. The ratio between the data and the expected stack of signal and background contributions is shown in the lower panel. The post-fit total uncertainty of the expectation is represented by the hashed band. |
png pdf |
Figure 3-a:
Distributions of the $ q^2 $ observable in the signal-enriched data region, defined by $ m(3\mu) < m_{\mathrm{B}_{c}^{+}} $ in the bin of $ q^2 > $ 5.5 GeV$^2$ and $ \mathrm{IP3D}/\sigma_{\mathrm{IP3D}} > $ 2 (left); of the $ L_{xy}/\sigma_{L_{xy}} $ observable in the data region defined by $ m(3\mu) < m_{\mathrm{B}_{c}^{+}} $ in the bin of $ q^2 < $ 4.5 GeV$^2$ and $ \mathrm{IP3D}/\sigma_{\mathrm{IP3D}} > $ 0 (center) and in the data region defined by $ m(3\mu) > m_{\mathrm{B}_{c}^{+}} $(right). In each figure, data are compared to the expectation, with the normalization, shape parameters for the different contributions as well as $ \mathrm{R}(\mathrm{J}/\psi) $ shown at their best-fit values. The ratio between the data and the expected stack of signal and background contributions is shown in the lower panel. The post-fit total uncertainty of the expectation is represented by the hashed band. |
png pdf |
Figure 3-b:
Distributions of the $ q^2 $ observable in the signal-enriched data region, defined by $ m(3\mu) < m_{\mathrm{B}_{c}^{+}} $ in the bin of $ q^2 > $ 5.5 GeV$^2$ and $ \mathrm{IP3D}/\sigma_{\mathrm{IP3D}} > $ 2 (left); of the $ L_{xy}/\sigma_{L_{xy}} $ observable in the data region defined by $ m(3\mu) < m_{\mathrm{B}_{c}^{+}} $ in the bin of $ q^2 < $ 4.5 GeV$^2$ and $ \mathrm{IP3D}/\sigma_{\mathrm{IP3D}} > $ 0 (center) and in the data region defined by $ m(3\mu) > m_{\mathrm{B}_{c}^{+}} $(right). In each figure, data are compared to the expectation, with the normalization, shape parameters for the different contributions as well as $ \mathrm{R}(\mathrm{J}/\psi) $ shown at their best-fit values. The ratio between the data and the expected stack of signal and background contributions is shown in the lower panel. The post-fit total uncertainty of the expectation is represented by the hashed band. |
png pdf |
Figure 3-c:
Distributions of the $ q^2 $ observable in the signal-enriched data region, defined by $ m(3\mu) < m_{\mathrm{B}_{c}^{+}} $ in the bin of $ q^2 > $ 5.5 GeV$^2$ and $ \mathrm{IP3D}/\sigma_{\mathrm{IP3D}} > $ 2 (left); of the $ L_{xy}/\sigma_{L_{xy}} $ observable in the data region defined by $ m(3\mu) < m_{\mathrm{B}_{c}^{+}} $ in the bin of $ q^2 < $ 4.5 GeV$^2$ and $ \mathrm{IP3D}/\sigma_{\mathrm{IP3D}} > $ 0 (center) and in the data region defined by $ m(3\mu) > m_{\mathrm{B}_{c}^{+}} $(right). In each figure, data are compared to the expectation, with the normalization, shape parameters for the different contributions as well as $ \mathrm{R}(\mathrm{J}/\psi) $ shown at their best-fit values. The ratio between the data and the expected stack of signal and background contributions is shown in the lower panel. The post-fit total uncertainty of the expectation is represented by the hashed band. |
| Tables | |
png pdf |
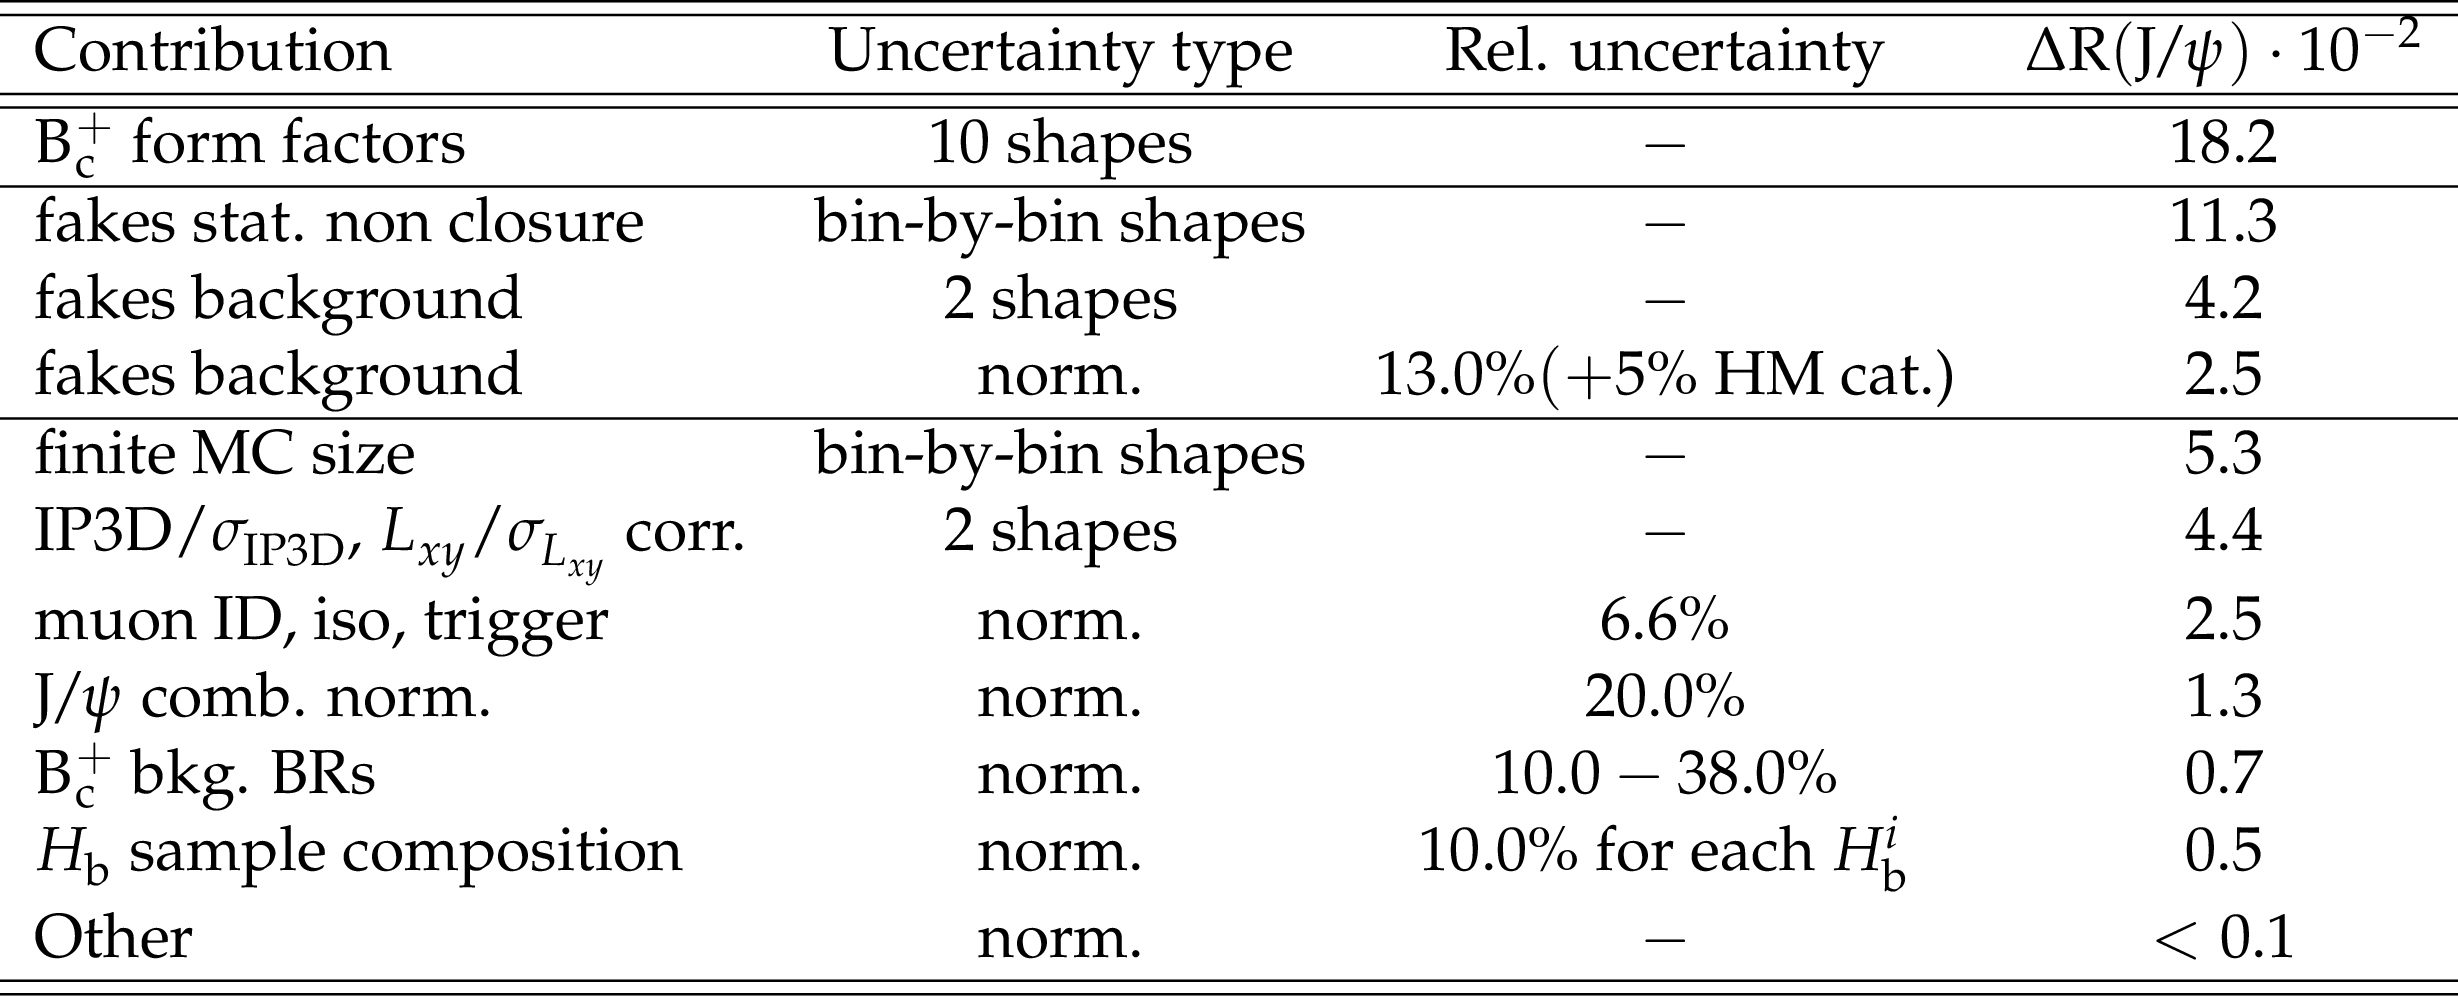
Table 1:
Leading systematic uncertainties for the measurement of $ \mathrm{R}(\mathrm{J}/\psi) $. The second column reports the uncertainty type: shape or normalization. For shape uncertainties we also include the number of shapes considered (except for bin-by-bin), while for normalization uncertainties the relative contribution (%) is reported in the third column. The last column shows the resulting uncertainty on the $ \mathrm{R}(\mathrm{J}/\psi) $ measurement ($ \Delta\mathrm{R}(\mathrm{J}/\psi) $). |
| Summary |
|
In summary, using data collected by the CMS experiment in 2018 at a center of mass energy of 13 TeV and corresponding to 59.7 fb$ ^{-1} $ of integrated luminosity, the measurement of the ratio of branching fractions gives: |
| Additional Figures | |

png pdf |
Additional Figure 1:
Postfit distributions of the $ q^2 $ observable in the signal-enriched data regions, defined by $ m(3\mu) < m_{\mathrm{B}_{c}} $ with the third muon passing the isolation criteria, and $ \mathrm{IP3D}/\sigma_{\mathrm{IP3D}} < - 2$ (top-left), $ -2 < \mathrm{IP3D}/\sigma_{\mathrm{IP3D}} < $ 0 (top-right), 0 $ < \mathrm{IP3D}/\sigma_{\mathrm{IP3D}} < $ 2 (bottom-left) and $ \mathrm{IP3D}/\sigma_{\mathrm{IP3D}} > $ 2 (bottom-right). |
png pdf |
Additional Figure 1-a:
Postfit distributions of the $ q^2 $ observable in the signal-enriched data regions, defined by $ m(3\mu) < m_{\mathrm{B}_{c}} $ with the third muon passing the isolation criteria, and $ \mathrm{IP3D}/\sigma_{\mathrm{IP3D}} < - 2$ (top-left), $ -2 < \mathrm{IP3D}/\sigma_{\mathrm{IP3D}} < $ 0 (top-right), 0 $ < \mathrm{IP3D}/\sigma_{\mathrm{IP3D}} < $ 2 (bottom-left) and $ \mathrm{IP3D}/\sigma_{\mathrm{IP3D}} > $ 2 (bottom-right). |
png pdf |
Additional Figure 1-b:
Postfit distributions of the $ q^2 $ observable in the signal-enriched data regions, defined by $ m(3\mu) < m_{\mathrm{B}_{c}} $ with the third muon passing the isolation criteria, and $ \mathrm{IP3D}/\sigma_{\mathrm{IP3D}} < - 2$ (top-left), $ -2 < \mathrm{IP3D}/\sigma_{\mathrm{IP3D}} < $ 0 (top-right), 0 $ < \mathrm{IP3D}/\sigma_{\mathrm{IP3D}} < $ 2 (bottom-left) and $ \mathrm{IP3D}/\sigma_{\mathrm{IP3D}} > $ 2 (bottom-right). |
png pdf |
Additional Figure 1-c:
Postfit distributions of the $ q^2 $ observable in the signal-enriched data regions, defined by $ m(3\mu) < m_{\mathrm{B}_{c}} $ with the third muon passing the isolation criteria, and $ \mathrm{IP3D}/\sigma_{\mathrm{IP3D}} < - 2$ (top-left), $ -2 < \mathrm{IP3D}/\sigma_{\mathrm{IP3D}} < $ 0 (top-right), 0 $ < \mathrm{IP3D}/\sigma_{\mathrm{IP3D}} < $ 2 (bottom-left) and $ \mathrm{IP3D}/\sigma_{\mathrm{IP3D}} > $ 2 (bottom-right). |
png pdf |
Additional Figure 1-d:
Postfit distributions of the $ q^2 $ observable in the signal-enriched data regions, defined by $ m(3\mu) < m_{\mathrm{B}_{c}} $ with the third muon passing the isolation criteria, and $ \mathrm{IP3D}/\sigma_{\mathrm{IP3D}} < - 2$ (top-left), $ -2 < \mathrm{IP3D}/\sigma_{\mathrm{IP3D}} < $ 0 (top-right), 0 $ < \mathrm{IP3D}/\sigma_{\mathrm{IP3D}} < $ 2 (bottom-left) and $ \mathrm{IP3D}/\sigma_{\mathrm{IP3D}} > $ 2 (bottom-right). |
png pdf |
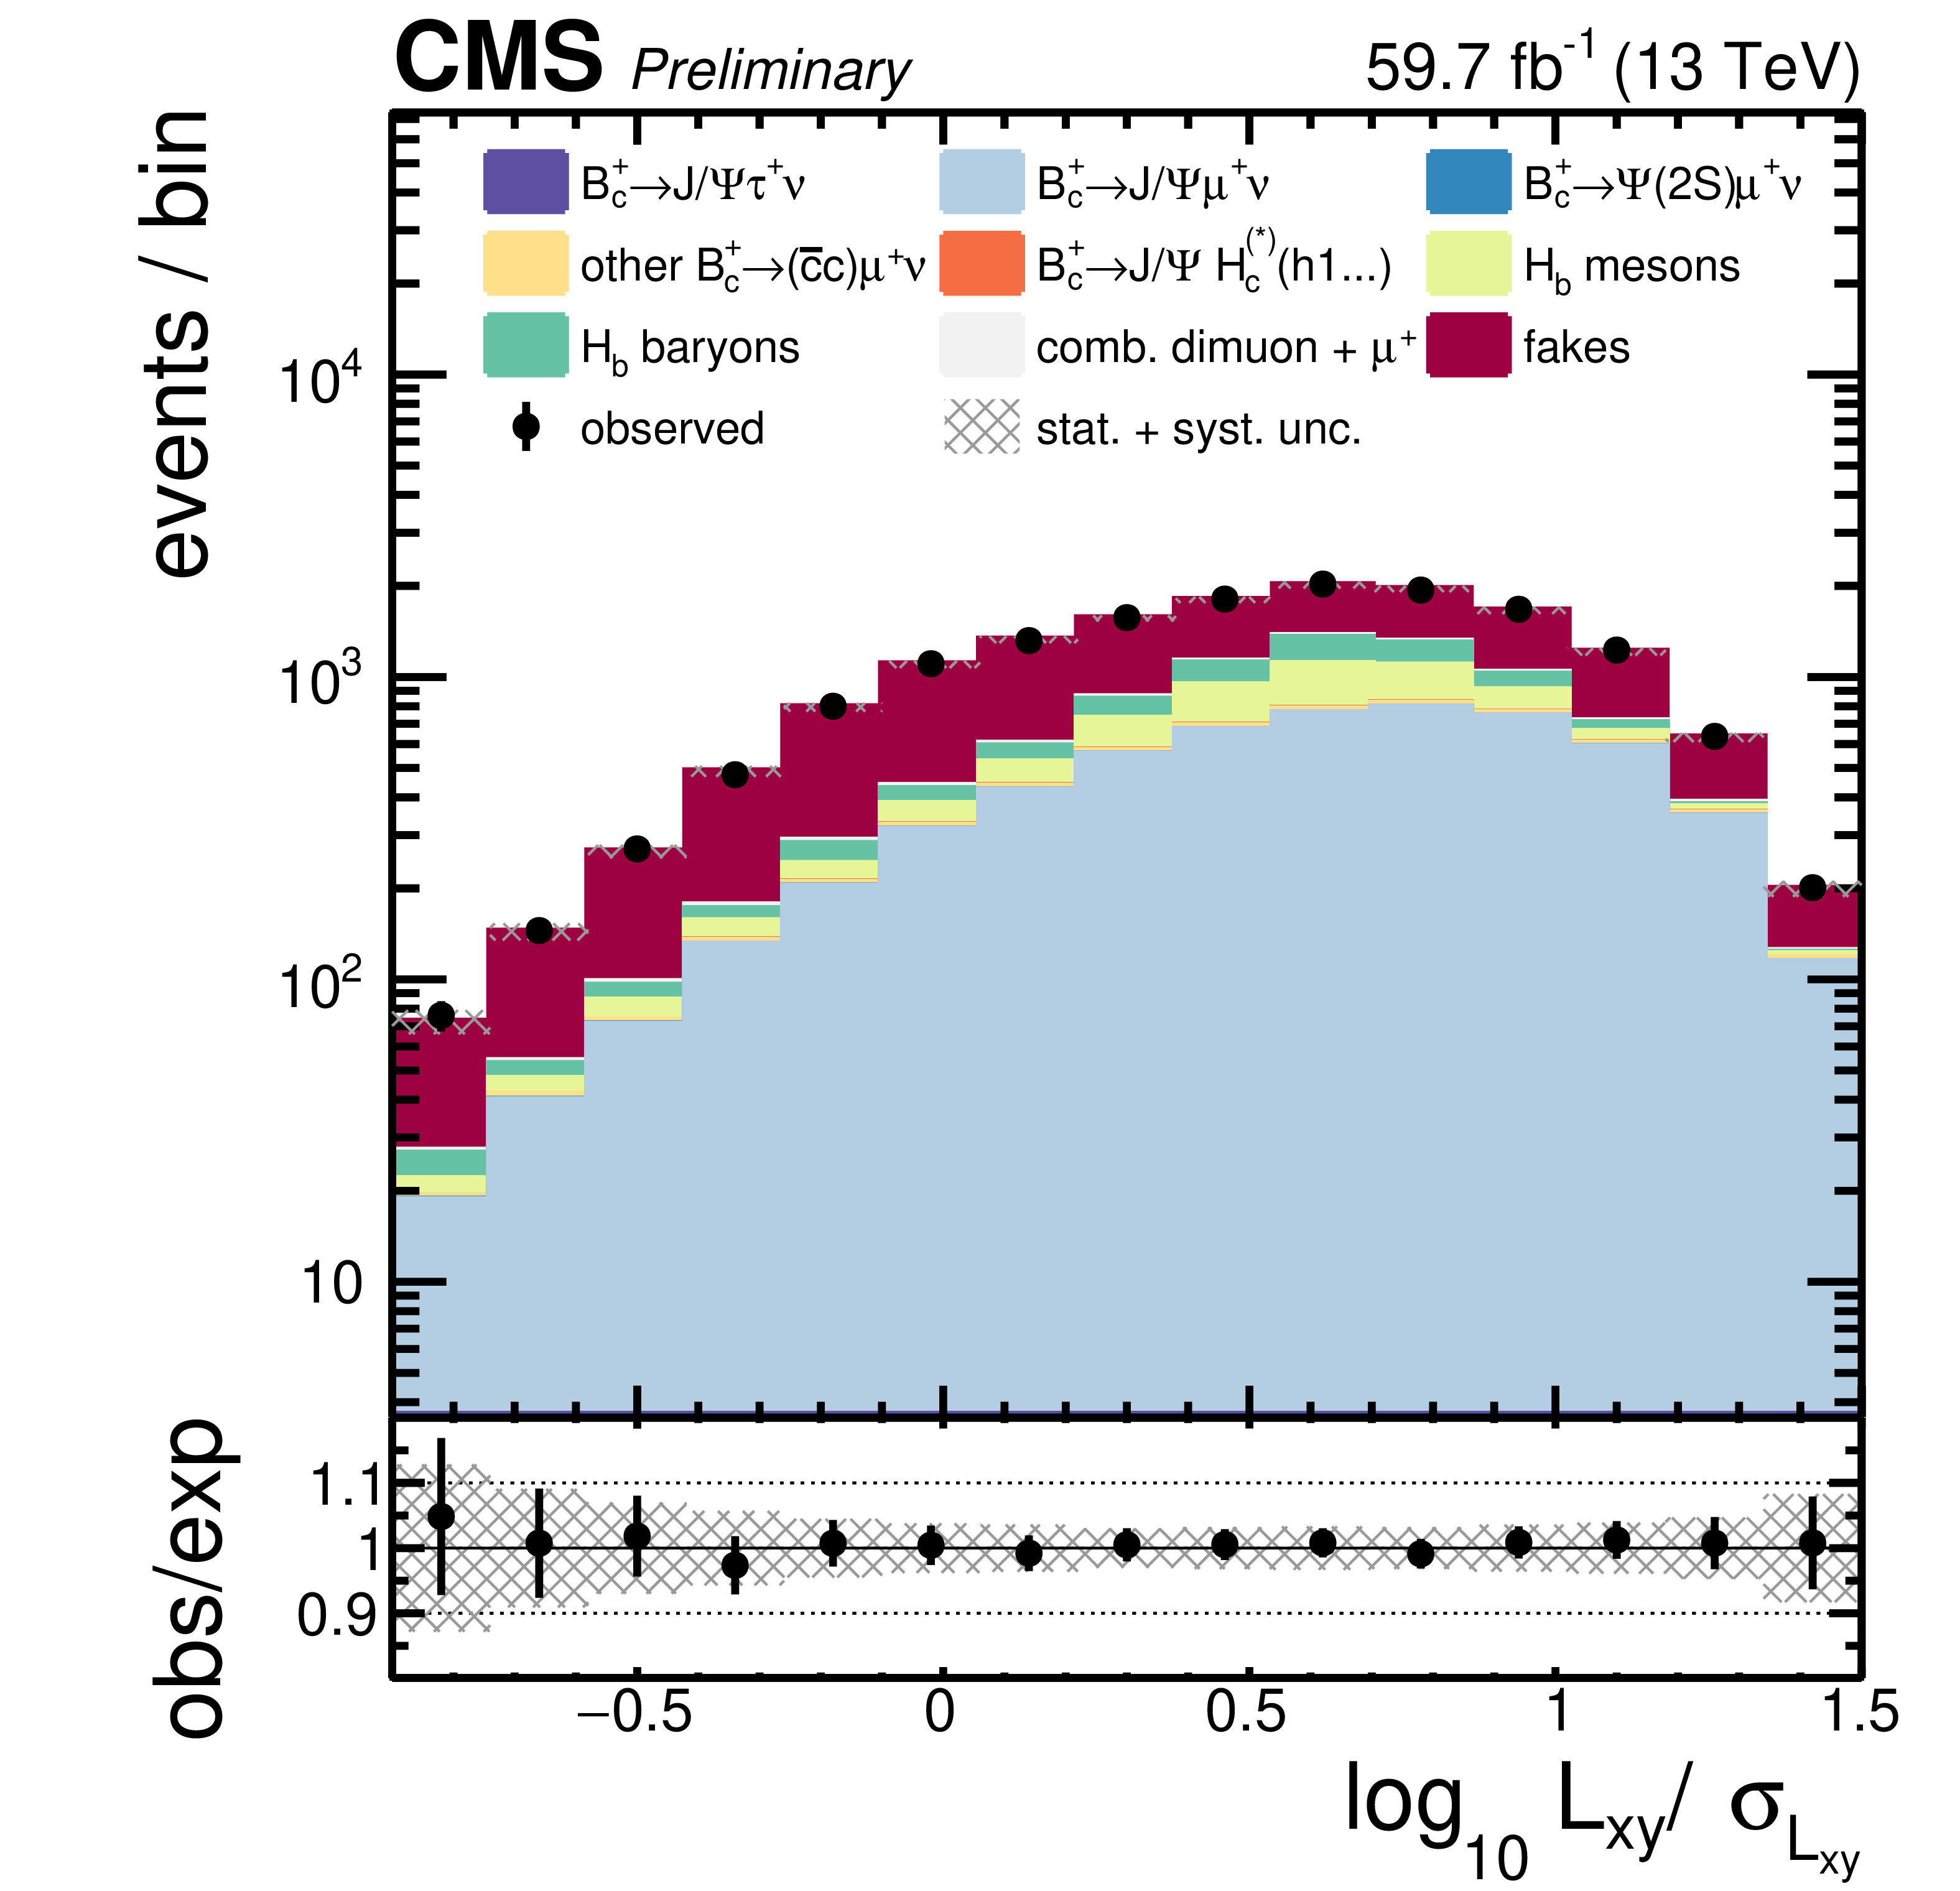
Additional Figure 2:
Postfit distributions of the $ L_{xy}/\sigma_{L_{xy}} $ observable in the background-enriched data regions, defined by $ m(3\mu) < m_{\mathrm{B}_{c}} $ and $ q^2 < $ 4.5 GeV, with the third muon passing the isolation criteria and $ \mathrm{IP3D}/\sigma_{\mathrm{IP3D}} < $ 0 (left), $ \mathrm{IP3D}/\sigma_{\mathrm{IP3D}} > $ 0 (center) and in the background-enriched data region defined by $ m(3\mu) > m_{\mathrm{B}_{c}} $ with the third muon passing the isolation criteria (right). |
png pdf |
Additional Figure 2-a:
Postfit distributions of the $ L_{xy}/\sigma_{L_{xy}} $ observable in the background-enriched data regions, defined by $ m(3\mu) < m_{\mathrm{B}_{c}} $ and $ q^2 < $ 4.5 GeV, with the third muon passing the isolation criteria and $ \mathrm{IP3D}/\sigma_{\mathrm{IP3D}} < $ 0 (left), $ \mathrm{IP3D}/\sigma_{\mathrm{IP3D}} > $ 0 (center) and in the background-enriched data region defined by $ m(3\mu) > m_{\mathrm{B}_{c}} $ with the third muon passing the isolation criteria (right). |

png pdf |
Additional Figure 2-b:
Postfit distributions of the $ L_{xy}/\sigma_{L_{xy}} $ observable in the background-enriched data regions, defined by $ m(3\mu) < m_{\mathrm{B}_{c}} $ and $ q^2 < $ 4.5 GeV, with the third muon passing the isolation criteria and $ \mathrm{IP3D}/\sigma_{\mathrm{IP3D}} < $ 0 (left), $ \mathrm{IP3D}/\sigma_{\mathrm{IP3D}} > $ 0 (center) and in the background-enriched data region defined by $ m(3\mu) > m_{\mathrm{B}_{c}} $ with the third muon passing the isolation criteria (right). |

png pdf |
Additional Figure 2-c:
Postfit distributions of the $ L_{xy}/\sigma_{L_{xy}} $ observable in the background-enriched data regions, defined by $ m(3\mu) < m_{\mathrm{B}_{c}} $ and $ q^2 < $ 4.5 GeV, with the third muon passing the isolation criteria and $ \mathrm{IP3D}/\sigma_{\mathrm{IP3D}} < $ 0 (left), $ \mathrm{IP3D}/\sigma_{\mathrm{IP3D}} > $ 0 (center) and in the background-enriched data region defined by $ m(3\mu) > m_{\mathrm{B}_{c}} $ with the third muon passing the isolation criteria (right). |
png pdf |
Additional Figure 3:
Postfit distributions of the $ q^2 $ observable in the signal-enriched data regions, defined by $ m(3\mu) < m_{\mathrm{B}_{c}} $ with the third muon failing the isolation criteria, and $ \mathrm{IP3D}/\sigma_{\mathrm{IP3D}} < - 2$ (top-left), $ -2 < \mathrm{IP3D}/\sigma_{\mathrm{IP3D}} < $ 0 (top-right), 0 $ < \mathrm{IP3D}/\sigma_{\mathrm{IP3D}} < $ 2 (bottom-left) and $ \mathrm{IP3D}/\sigma_{\mathrm{IP3D}} > $ 2 (bottom-right). |
png pdf |
Additional Figure 3-a:
Postfit distributions of the $ q^2 $ observable in the signal-enriched data regions, defined by $ m(3\mu) < m_{\mathrm{B}_{c}} $ with the third muon failing the isolation criteria, and $ \mathrm{IP3D}/\sigma_{\mathrm{IP3D}} < - 2$ (top-left), $ -2 < \mathrm{IP3D}/\sigma_{\mathrm{IP3D}} < $ 0 (top-right), 0 $ < \mathrm{IP3D}/\sigma_{\mathrm{IP3D}} < $ 2 (bottom-left) and $ \mathrm{IP3D}/\sigma_{\mathrm{IP3D}} > $ 2 (bottom-right). |

png pdf |
Additional Figure 3-b:
Postfit distributions of the $ q^2 $ observable in the signal-enriched data regions, defined by $ m(3\mu) < m_{\mathrm{B}_{c}} $ with the third muon failing the isolation criteria, and $ \mathrm{IP3D}/\sigma_{\mathrm{IP3D}} < - 2$ (top-left), $ -2 < \mathrm{IP3D}/\sigma_{\mathrm{IP3D}} < $ 0 (top-right), 0 $ < \mathrm{IP3D}/\sigma_{\mathrm{IP3D}} < $ 2 (bottom-left) and $ \mathrm{IP3D}/\sigma_{\mathrm{IP3D}} > $ 2 (bottom-right). |
png pdf |
Additional Figure 3-c:
Postfit distributions of the $ q^2 $ observable in the signal-enriched data regions, defined by $ m(3\mu) < m_{\mathrm{B}_{c}} $ with the third muon failing the isolation criteria, and $ \mathrm{IP3D}/\sigma_{\mathrm{IP3D}} < - 2$ (top-left), $ -2 < \mathrm{IP3D}/\sigma_{\mathrm{IP3D}} < $ 0 (top-right), 0 $ < \mathrm{IP3D}/\sigma_{\mathrm{IP3D}} < $ 2 (bottom-left) and $ \mathrm{IP3D}/\sigma_{\mathrm{IP3D}} > $ 2 (bottom-right). |

png pdf |
Additional Figure 3-d:
Postfit distributions of the $ q^2 $ observable in the signal-enriched data regions, defined by $ m(3\mu) < m_{\mathrm{B}_{c}} $ with the third muon failing the isolation criteria, and $ \mathrm{IP3D}/\sigma_{\mathrm{IP3D}} < - 2$ (top-left), $ -2 < \mathrm{IP3D}/\sigma_{\mathrm{IP3D}} < $ 0 (top-right), 0 $ < \mathrm{IP3D}/\sigma_{\mathrm{IP3D}} < $ 2 (bottom-left) and $ \mathrm{IP3D}/\sigma_{\mathrm{IP3D}} > $ 2 (bottom-right). |
png pdf |
Additional Figure 4:
Postfit distributions of the $ L_{xy}/\sigma_{L_{xy}} $ observable in the background-enriched data regions, defined by $ m(3\mu) < m_{\mathrm{B}_{c}} $ and $ q^2 < $ 4.5 GeV, with the third muon failing the isolation criteria and $ \mathrm{IP3D}/\sigma_{\mathrm{IP3D}} < $ 0 (left), $ \mathrm{IP3D}/\sigma_{\mathrm{IP3D}} > $ 0 (center) and in the background-enriched data region defined by $ m(3\mu) > m_{\mathrm{B}_{c}} $ with the third muon failing the isolation criteria (right). |
png pdf |
Additional Figure 4-a:
Postfit distributions of the $ L_{xy}/\sigma_{L_{xy}} $ observable in the background-enriched data regions, defined by $ m(3\mu) < m_{\mathrm{B}_{c}} $ and $ q^2 < $ 4.5 GeV, with the third muon failing the isolation criteria and $ \mathrm{IP3D}/\sigma_{\mathrm{IP3D}} < $ 0 (left), $ \mathrm{IP3D}/\sigma_{\mathrm{IP3D}} > $ 0 (center) and in the background-enriched data region defined by $ m(3\mu) > m_{\mathrm{B}_{c}} $ with the third muon failing the isolation criteria (right). |
png pdf |
Additional Figure 4-b:
Postfit distributions of the $ L_{xy}/\sigma_{L_{xy}} $ observable in the background-enriched data regions, defined by $ m(3\mu) < m_{\mathrm{B}_{c}} $ and $ q^2 < $ 4.5 GeV, with the third muon failing the isolation criteria and $ \mathrm{IP3D}/\sigma_{\mathrm{IP3D}} < $ 0 (left), $ \mathrm{IP3D}/\sigma_{\mathrm{IP3D}} > $ 0 (center) and in the background-enriched data region defined by $ m(3\mu) > m_{\mathrm{B}_{c}} $ with the third muon failing the isolation criteria (right). |
png pdf |
Additional Figure 4-c:
Postfit distributions of the $ L_{xy}/\sigma_{L_{xy}} $ observable in the background-enriched data regions, defined by $ m(3\mu) < m_{\mathrm{B}_{c}} $ and $ q^2 < $ 4.5 GeV, with the third muon failing the isolation criteria and $ \mathrm{IP3D}/\sigma_{\mathrm{IP3D}} < $ 0 (left), $ \mathrm{IP3D}/\sigma_{\mathrm{IP3D}} > $ 0 (center) and in the background-enriched data region defined by $ m(3\mu) > m_{\mathrm{B}_{c}} $ with the third muon failing the isolation criteria (right). |
png pdf |
Additional Figure 5:
Postfit distributions of the $ q^2 $ observable (in log scale) in the signal-enriched data regions, defined by $ m(3\mu) < m_{\mathrm{B}_{c}} $ with the third muon passing the isolation criteria, and $ \mathrm{IP3D}/\sigma_{\mathrm{IP3D}} < - 2$ (top-left), $ -2 < \mathrm{IP3D}/\sigma_{\mathrm{IP3D}} < $ 0 (top-right), 0 $ < \mathrm{IP3D}/\sigma_{\mathrm{IP3D}} < $ 2 (bottom-left) and $ \mathrm{IP3D}/\sigma_{\mathrm{IP3D}} > $ 2 (bottom-right). |
png pdf |
Additional Figure 5-a:
Postfit distributions of the $ q^2 $ observable (in log scale) in the signal-enriched data regions, defined by $ m(3\mu) < m_{\mathrm{B}_{c}} $ with the third muon passing the isolation criteria, and $ \mathrm{IP3D}/\sigma_{\mathrm{IP3D}} < - 2$ (top-left), $ -2 < \mathrm{IP3D}/\sigma_{\mathrm{IP3D}} < $ 0 (top-right), 0 $ < \mathrm{IP3D}/\sigma_{\mathrm{IP3D}} < $ 2 (bottom-left) and $ \mathrm{IP3D}/\sigma_{\mathrm{IP3D}} > $ 2 (bottom-right). |
png pdf |
Additional Figure 5-b:
Postfit distributions of the $ q^2 $ observable (in log scale) in the signal-enriched data regions, defined by $ m(3\mu) < m_{\mathrm{B}_{c}} $ with the third muon passing the isolation criteria, and $ \mathrm{IP3D}/\sigma_{\mathrm{IP3D}} < - 2$ (top-left), $ -2 < \mathrm{IP3D}/\sigma_{\mathrm{IP3D}} < $ 0 (top-right), 0 $ < \mathrm{IP3D}/\sigma_{\mathrm{IP3D}} < $ 2 (bottom-left) and $ \mathrm{IP3D}/\sigma_{\mathrm{IP3D}} > $ 2 (bottom-right). |
png pdf |
Additional Figure 5-c:
Postfit distributions of the $ q^2 $ observable (in log scale) in the signal-enriched data regions, defined by $ m(3\mu) < m_{\mathrm{B}_{c}} $ with the third muon passing the isolation criteria, and $ \mathrm{IP3D}/\sigma_{\mathrm{IP3D}} < - 2$ (top-left), $ -2 < \mathrm{IP3D}/\sigma_{\mathrm{IP3D}} < $ 0 (top-right), 0 $ < \mathrm{IP3D}/\sigma_{\mathrm{IP3D}} < $ 2 (bottom-left) and $ \mathrm{IP3D}/\sigma_{\mathrm{IP3D}} > $ 2 (bottom-right). |

png pdf |
Additional Figure 5-d:
Postfit distributions of the $ q^2 $ observable (in log scale) in the signal-enriched data regions, defined by $ m(3\mu) < m_{\mathrm{B}_{c}} $ with the third muon passing the isolation criteria, and $ \mathrm{IP3D}/\sigma_{\mathrm{IP3D}} < - 2$ (top-left), $ -2 < \mathrm{IP3D}/\sigma_{\mathrm{IP3D}} < $ 0 (top-right), 0 $ < \mathrm{IP3D}/\sigma_{\mathrm{IP3D}} < $ 2 (bottom-left) and $ \mathrm{IP3D}/\sigma_{\mathrm{IP3D}} > $ 2 (bottom-right). |
png pdf |
Additional Figure 6:
Postfit distributions of the $ L_{xy}/\sigma_{L_{xy}} $ observable (in log scale) in the background-enriched data regions, defined by $ m(3\mu) < m_{\mathrm{B}_{c}} $ and $ q^2 < $ 4.5 GeV, with the third muon passing the isolation criteria and $ \mathrm{IP3D}/\sigma_{\mathrm{IP3D}} < $ 0 (left), $ \mathrm{IP3D}/\sigma_{\mathrm{IP3D}} > $ 0 (center) and in the background-enriched data region defined by $ m(3\mu) > m_{\mathrm{B}_{c}} $ with the third muon passing the isolation criteria (right). |
png pdf |
Additional Figure 6-a:
Postfit distributions of the $ L_{xy}/\sigma_{L_{xy}} $ observable (in log scale) in the background-enriched data regions, defined by $ m(3\mu) < m_{\mathrm{B}_{c}} $ and $ q^2 < $ 4.5 GeV, with the third muon passing the isolation criteria and $ \mathrm{IP3D}/\sigma_{\mathrm{IP3D}} < $ 0 (left), $ \mathrm{IP3D}/\sigma_{\mathrm{IP3D}} > $ 0 (center) and in the background-enriched data region defined by $ m(3\mu) > m_{\mathrm{B}_{c}} $ with the third muon passing the isolation criteria (right). |
png pdf |
Additional Figure 6-b:
Postfit distributions of the $ L_{xy}/\sigma_{L_{xy}} $ observable (in log scale) in the background-enriched data regions, defined by $ m(3\mu) < m_{\mathrm{B}_{c}} $ and $ q^2 < $ 4.5 GeV, with the third muon passing the isolation criteria and $ \mathrm{IP3D}/\sigma_{\mathrm{IP3D}} < $ 0 (left), $ \mathrm{IP3D}/\sigma_{\mathrm{IP3D}} > $ 0 (center) and in the background-enriched data region defined by $ m(3\mu) > m_{\mathrm{B}_{c}} $ with the third muon passing the isolation criteria (right). |
png pdf |
Additional Figure 6-c:
Postfit distributions of the $ L_{xy}/\sigma_{L_{xy}} $ observable (in log scale) in the background-enriched data regions, defined by $ m(3\mu) < m_{\mathrm{B}_{c}} $ and $ q^2 < $ 4.5 GeV, with the third muon passing the isolation criteria and $ \mathrm{IP3D}/\sigma_{\mathrm{IP3D}} < $ 0 (left), $ \mathrm{IP3D}/\sigma_{\mathrm{IP3D}} > $ 0 (center) and in the background-enriched data region defined by $ m(3\mu) > m_{\mathrm{B}_{c}} $ with the third muon passing the isolation criteria (right). |
png pdf |
Additional Figure 7:
Postfit distributions of the $ q^2 $ observable (in log scale) in the signal-enriched data regions, defined by $ m(3\mu) < m_{\mathrm{B}_{c}} $ with the third muon failing the isolation criteria, and $ \mathrm{IP3D}/\sigma_{\mathrm{IP3D}} < - 2$ (top-left), $ -2 < \mathrm{IP3D}/\sigma_{\mathrm{IP3D}} < $ 0 (top-right), 0 $ < \mathrm{IP3D}/\sigma_{\mathrm{IP3D}} < $ 2 (bottom-left) and $ \mathrm{IP3D}/\sigma_{\mathrm{IP3D}} > $ 2 (bottom-right). |
png pdf |
Additional Figure 7-a:
Postfit distributions of the $ q^2 $ observable (in log scale) in the signal-enriched data regions, defined by $ m(3\mu) < m_{\mathrm{B}_{c}} $ with the third muon failing the isolation criteria, and $ \mathrm{IP3D}/\sigma_{\mathrm{IP3D}} < - 2$ (top-left), $ -2 < \mathrm{IP3D}/\sigma_{\mathrm{IP3D}} < $ 0 (top-right), 0 $ < \mathrm{IP3D}/\sigma_{\mathrm{IP3D}} < $ 2 (bottom-left) and $ \mathrm{IP3D}/\sigma_{\mathrm{IP3D}} > $ 2 (bottom-right). |
png pdf |
Additional Figure 7-b:
Postfit distributions of the $ q^2 $ observable (in log scale) in the signal-enriched data regions, defined by $ m(3\mu) < m_{\mathrm{B}_{c}} $ with the third muon failing the isolation criteria, and $ \mathrm{IP3D}/\sigma_{\mathrm{IP3D}} < - 2$ (top-left), $ -2 < \mathrm{IP3D}/\sigma_{\mathrm{IP3D}} < $ 0 (top-right), 0 $ < \mathrm{IP3D}/\sigma_{\mathrm{IP3D}} < $ 2 (bottom-left) and $ \mathrm{IP3D}/\sigma_{\mathrm{IP3D}} > $ 2 (bottom-right). |
png pdf |
Additional Figure 7-c:
Postfit distributions of the $ q^2 $ observable (in log scale) in the signal-enriched data regions, defined by $ m(3\mu) < m_{\mathrm{B}_{c}} $ with the third muon failing the isolation criteria, and $ \mathrm{IP3D}/\sigma_{\mathrm{IP3D}} < - 2$ (top-left), $ -2 < \mathrm{IP3D}/\sigma_{\mathrm{IP3D}} < $ 0 (top-right), 0 $ < \mathrm{IP3D}/\sigma_{\mathrm{IP3D}} < $ 2 (bottom-left) and $ \mathrm{IP3D}/\sigma_{\mathrm{IP3D}} > $ 2 (bottom-right). |
png pdf |
Additional Figure 7-d:
Postfit distributions of the $ q^2 $ observable (in log scale) in the signal-enriched data regions, defined by $ m(3\mu) < m_{\mathrm{B}_{c}} $ with the third muon failing the isolation criteria, and $ \mathrm{IP3D}/\sigma_{\mathrm{IP3D}} < - 2$ (top-left), $ -2 < \mathrm{IP3D}/\sigma_{\mathrm{IP3D}} < $ 0 (top-right), 0 $ < \mathrm{IP3D}/\sigma_{\mathrm{IP3D}} < $ 2 (bottom-left) and $ \mathrm{IP3D}/\sigma_{\mathrm{IP3D}} > $ 2 (bottom-right). |
png pdf |
Additional Figure 8:
Postfit distributions of the $ L_{xy}/\sigma_{L_{xy}} $ observable (in log scale) in the background-enriched data regions, defined by $ m(3\mu) < m_{\mathrm{B}_{c}} $ and $ q^2 < $ 4.5 GeV, with the third muon failing the isolation criteria and $ \mathrm{IP3D}/\sigma_{\mathrm{IP3D}} < $ 0 (left), $ \mathrm{IP3D}/\sigma_{\mathrm{IP3D}} > $ 0 (center) and in the background-enriched data region defined by $ m(3\mu) > m_{\mathrm{B}_{c}} $ with the third muon failing the isolation criteria (right). |
png pdf |
Additional Figure 8-a:
Postfit distributions of the $ L_{xy}/\sigma_{L_{xy}} $ observable (in log scale) in the background-enriched data regions, defined by $ m(3\mu) < m_{\mathrm{B}_{c}} $ and $ q^2 < $ 4.5 GeV, with the third muon failing the isolation criteria and $ \mathrm{IP3D}/\sigma_{\mathrm{IP3D}} < $ 0 (left), $ \mathrm{IP3D}/\sigma_{\mathrm{IP3D}} > $ 0 (center) and in the background-enriched data region defined by $ m(3\mu) > m_{\mathrm{B}_{c}} $ with the third muon failing the isolation criteria (right). |

png pdf |
Additional Figure 8-b:
Postfit distributions of the $ L_{xy}/\sigma_{L_{xy}} $ observable (in log scale) in the background-enriched data regions, defined by $ m(3\mu) < m_{\mathrm{B}_{c}} $ and $ q^2 < $ 4.5 GeV, with the third muon failing the isolation criteria and $ \mathrm{IP3D}/\sigma_{\mathrm{IP3D}} < $ 0 (left), $ \mathrm{IP3D}/\sigma_{\mathrm{IP3D}} > $ 0 (center) and in the background-enriched data region defined by $ m(3\mu) > m_{\mathrm{B}_{c}} $ with the third muon failing the isolation criteria (right). |
png pdf |
Additional Figure 8-c:
Postfit distributions of the $ L_{xy}/\sigma_{L_{xy}} $ observable (in log scale) in the background-enriched data regions, defined by $ m(3\mu) < m_{\mathrm{B}_{c}} $ and $ q^2 < $ 4.5 GeV, with the third muon failing the isolation criteria and $ \mathrm{IP3D}/\sigma_{\mathrm{IP3D}} < $ 0 (left), $ \mathrm{IP3D}/\sigma_{\mathrm{IP3D}} > $ 0 (center) and in the background-enriched data region defined by $ m(3\mu) > m_{\mathrm{B}_{c}} $ with the third muon failing the isolation criteria (right). |
png pdf |
Additional Figure 9:
Validation of the method to derive the fakes background in the fakes-enriched data control region. |
png pdf |
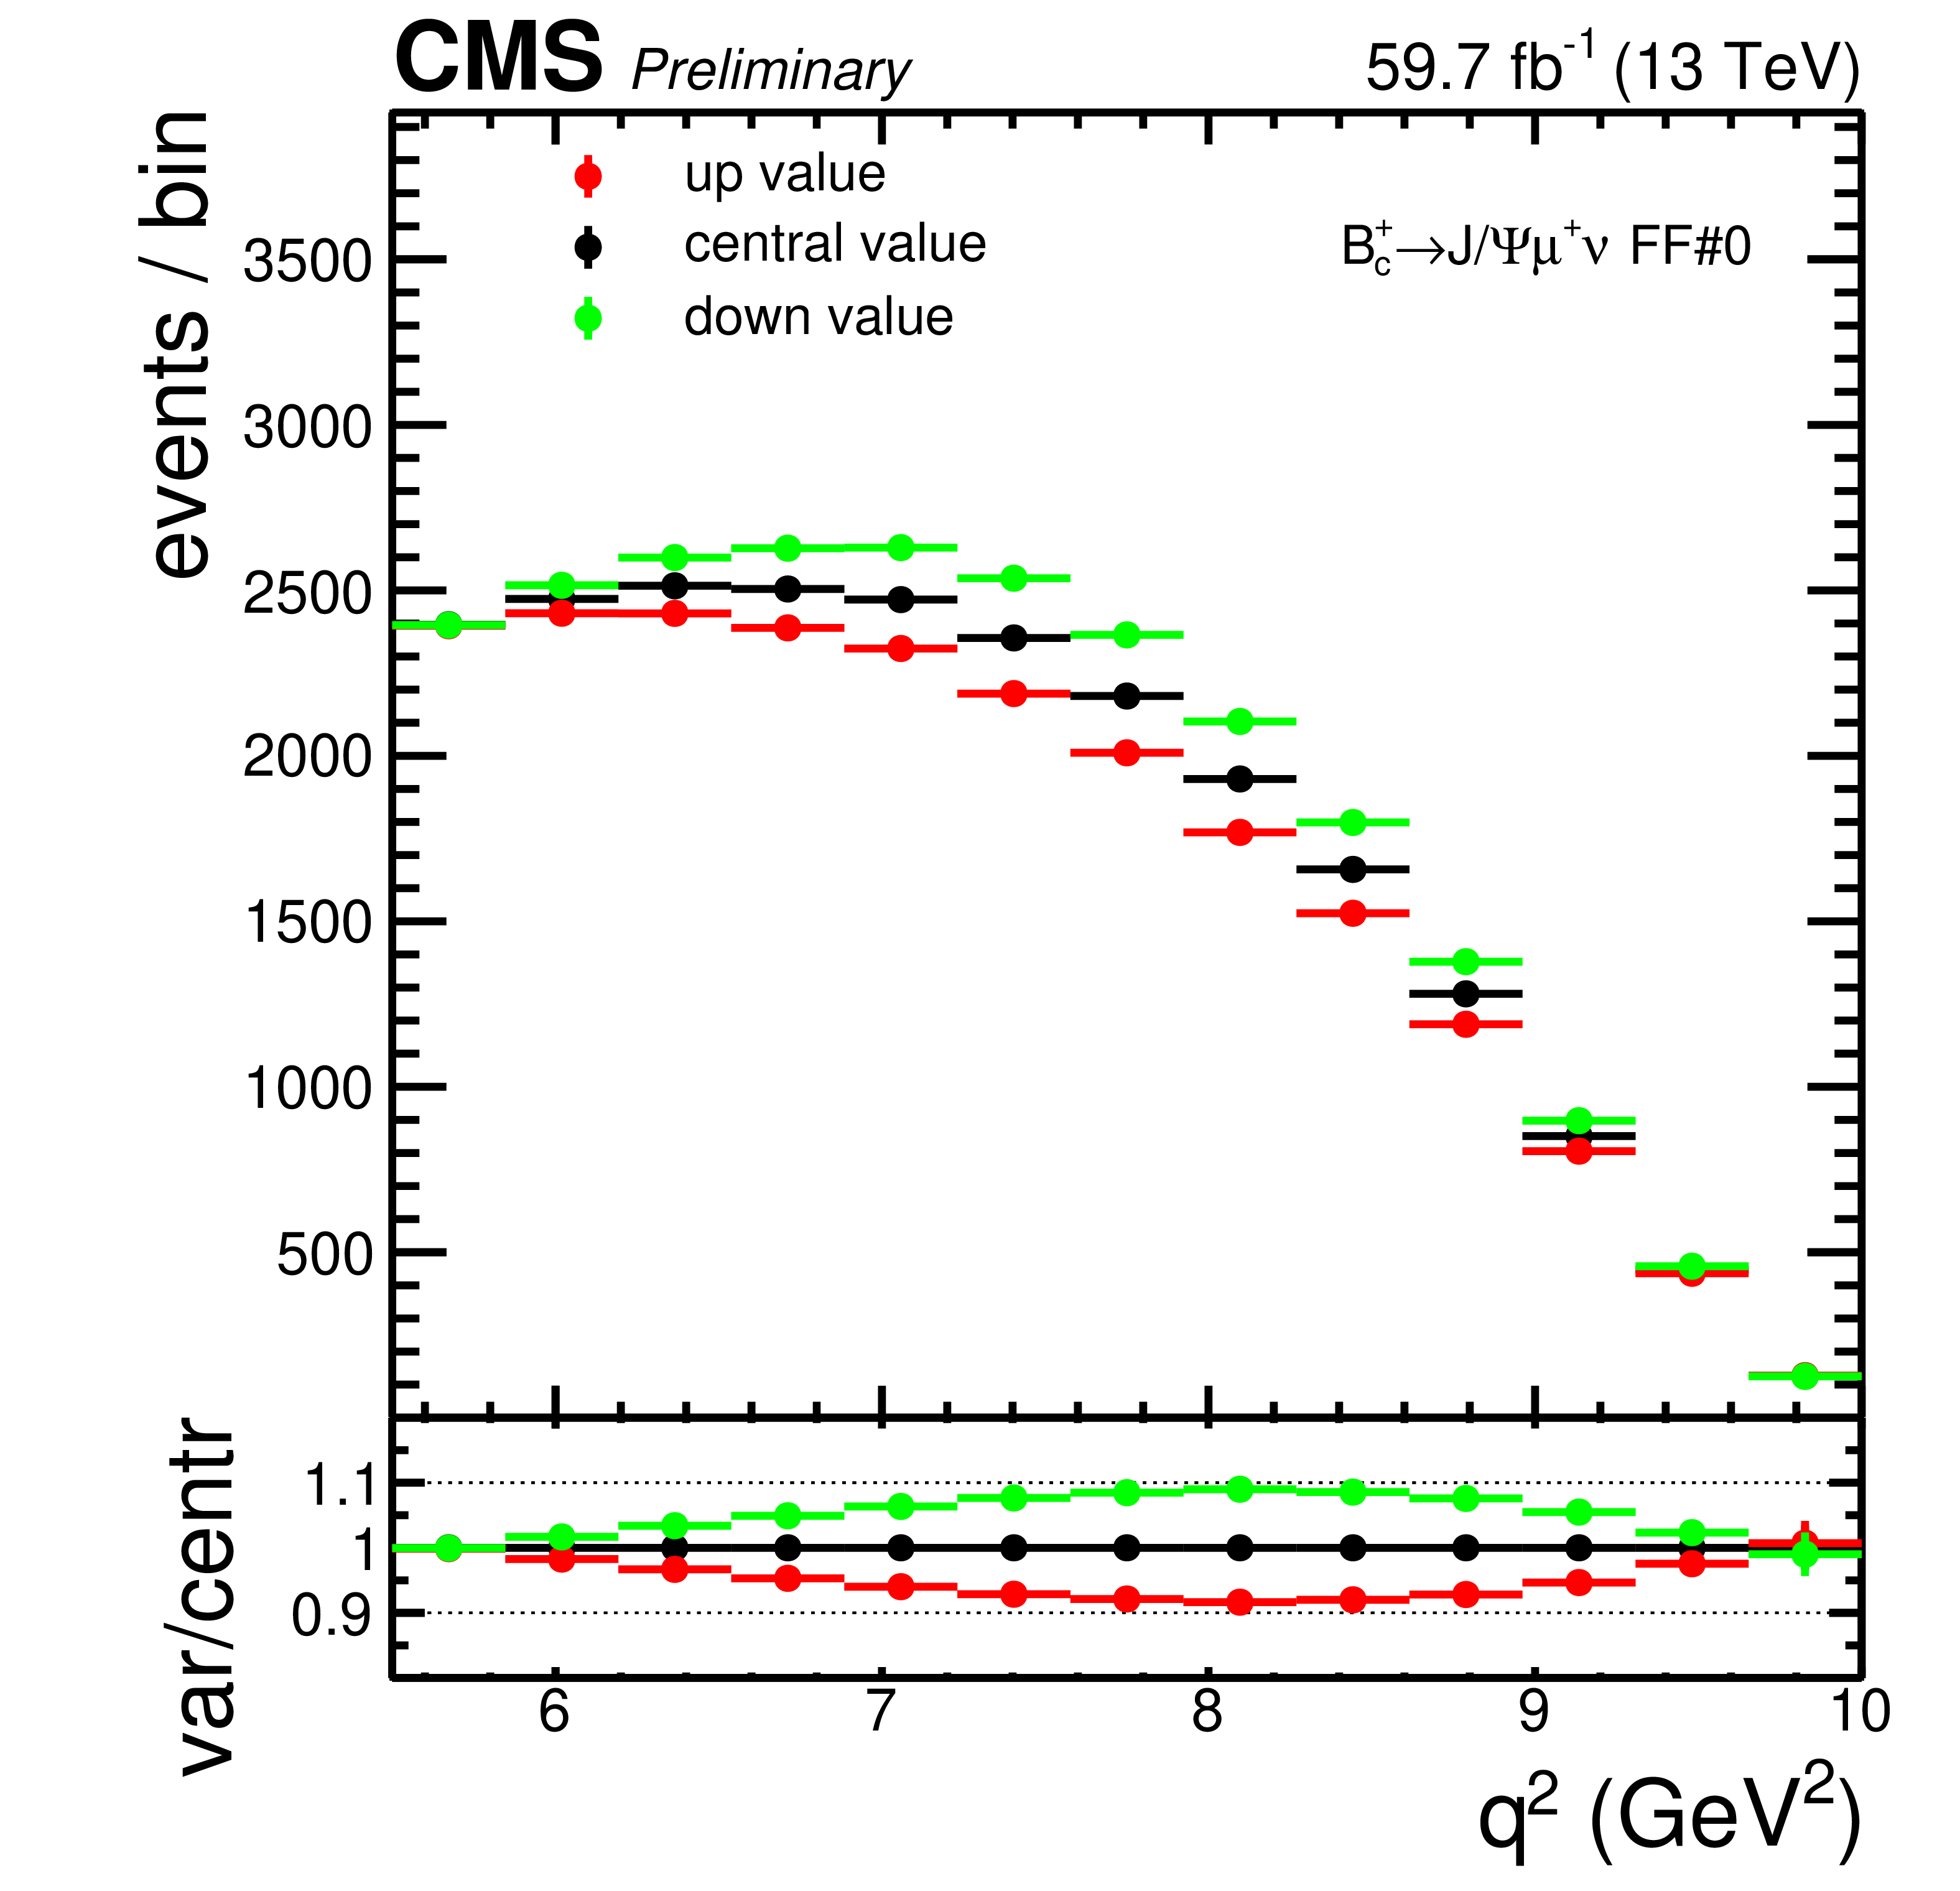
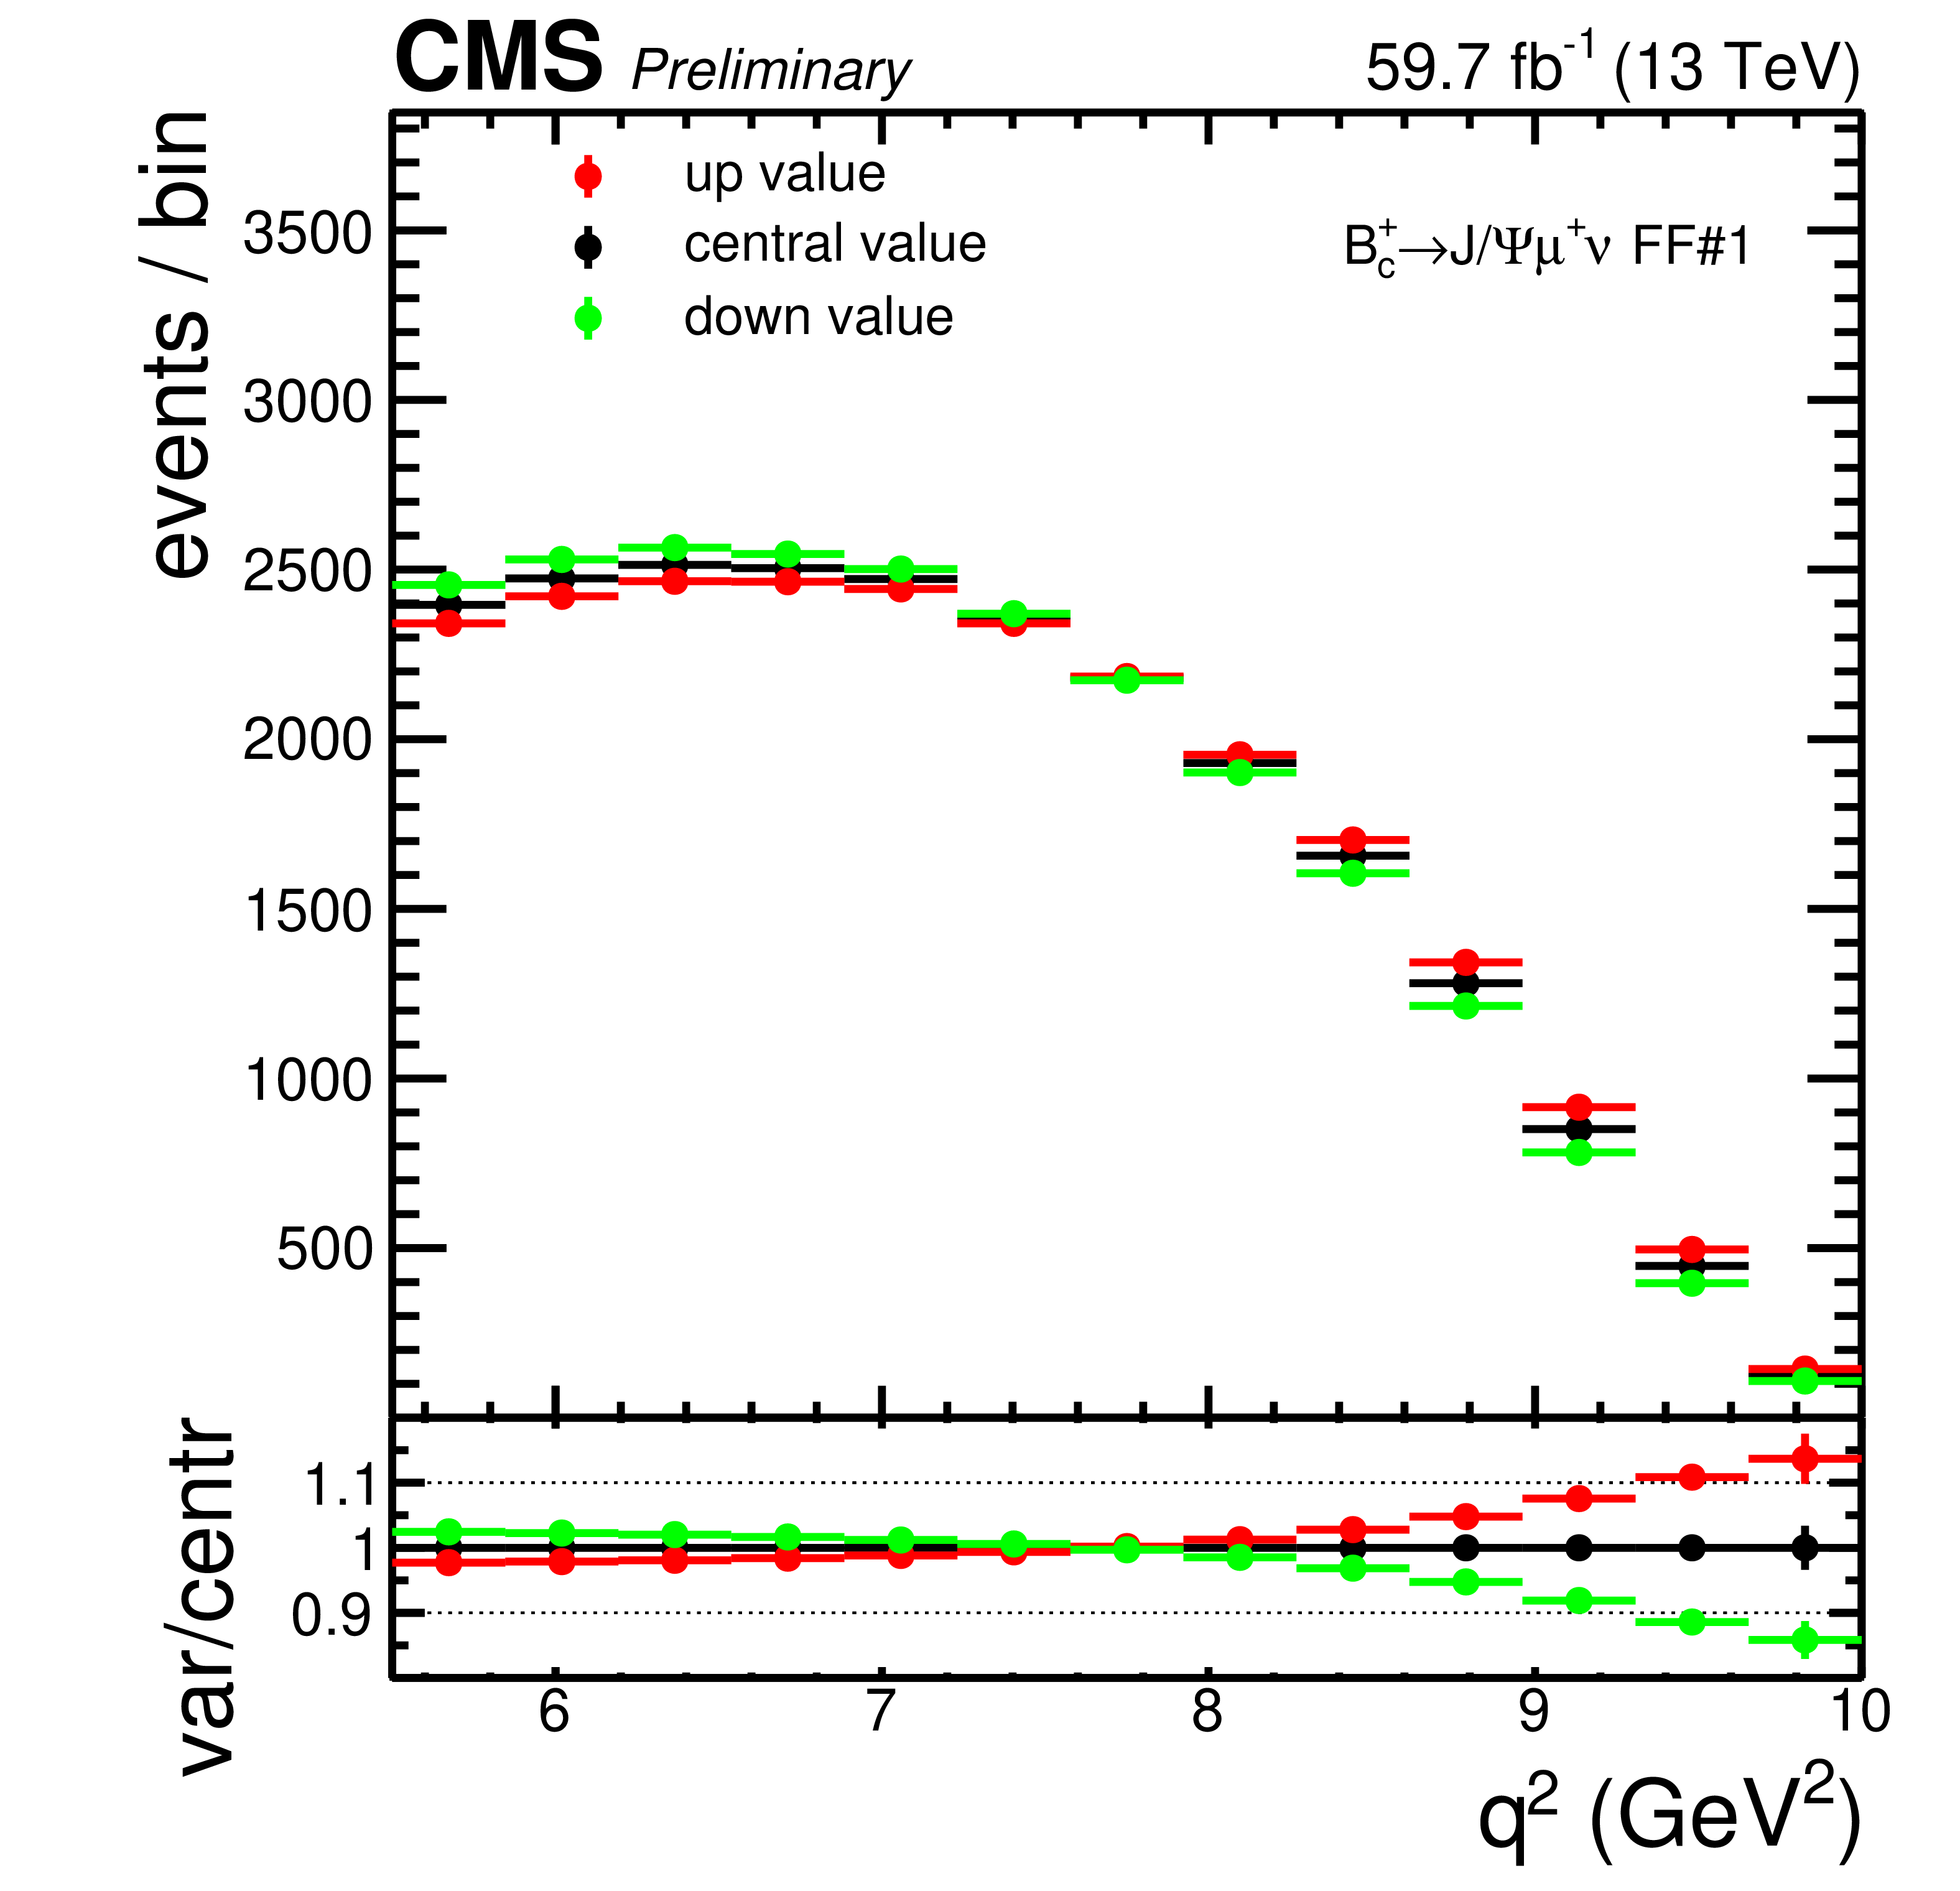
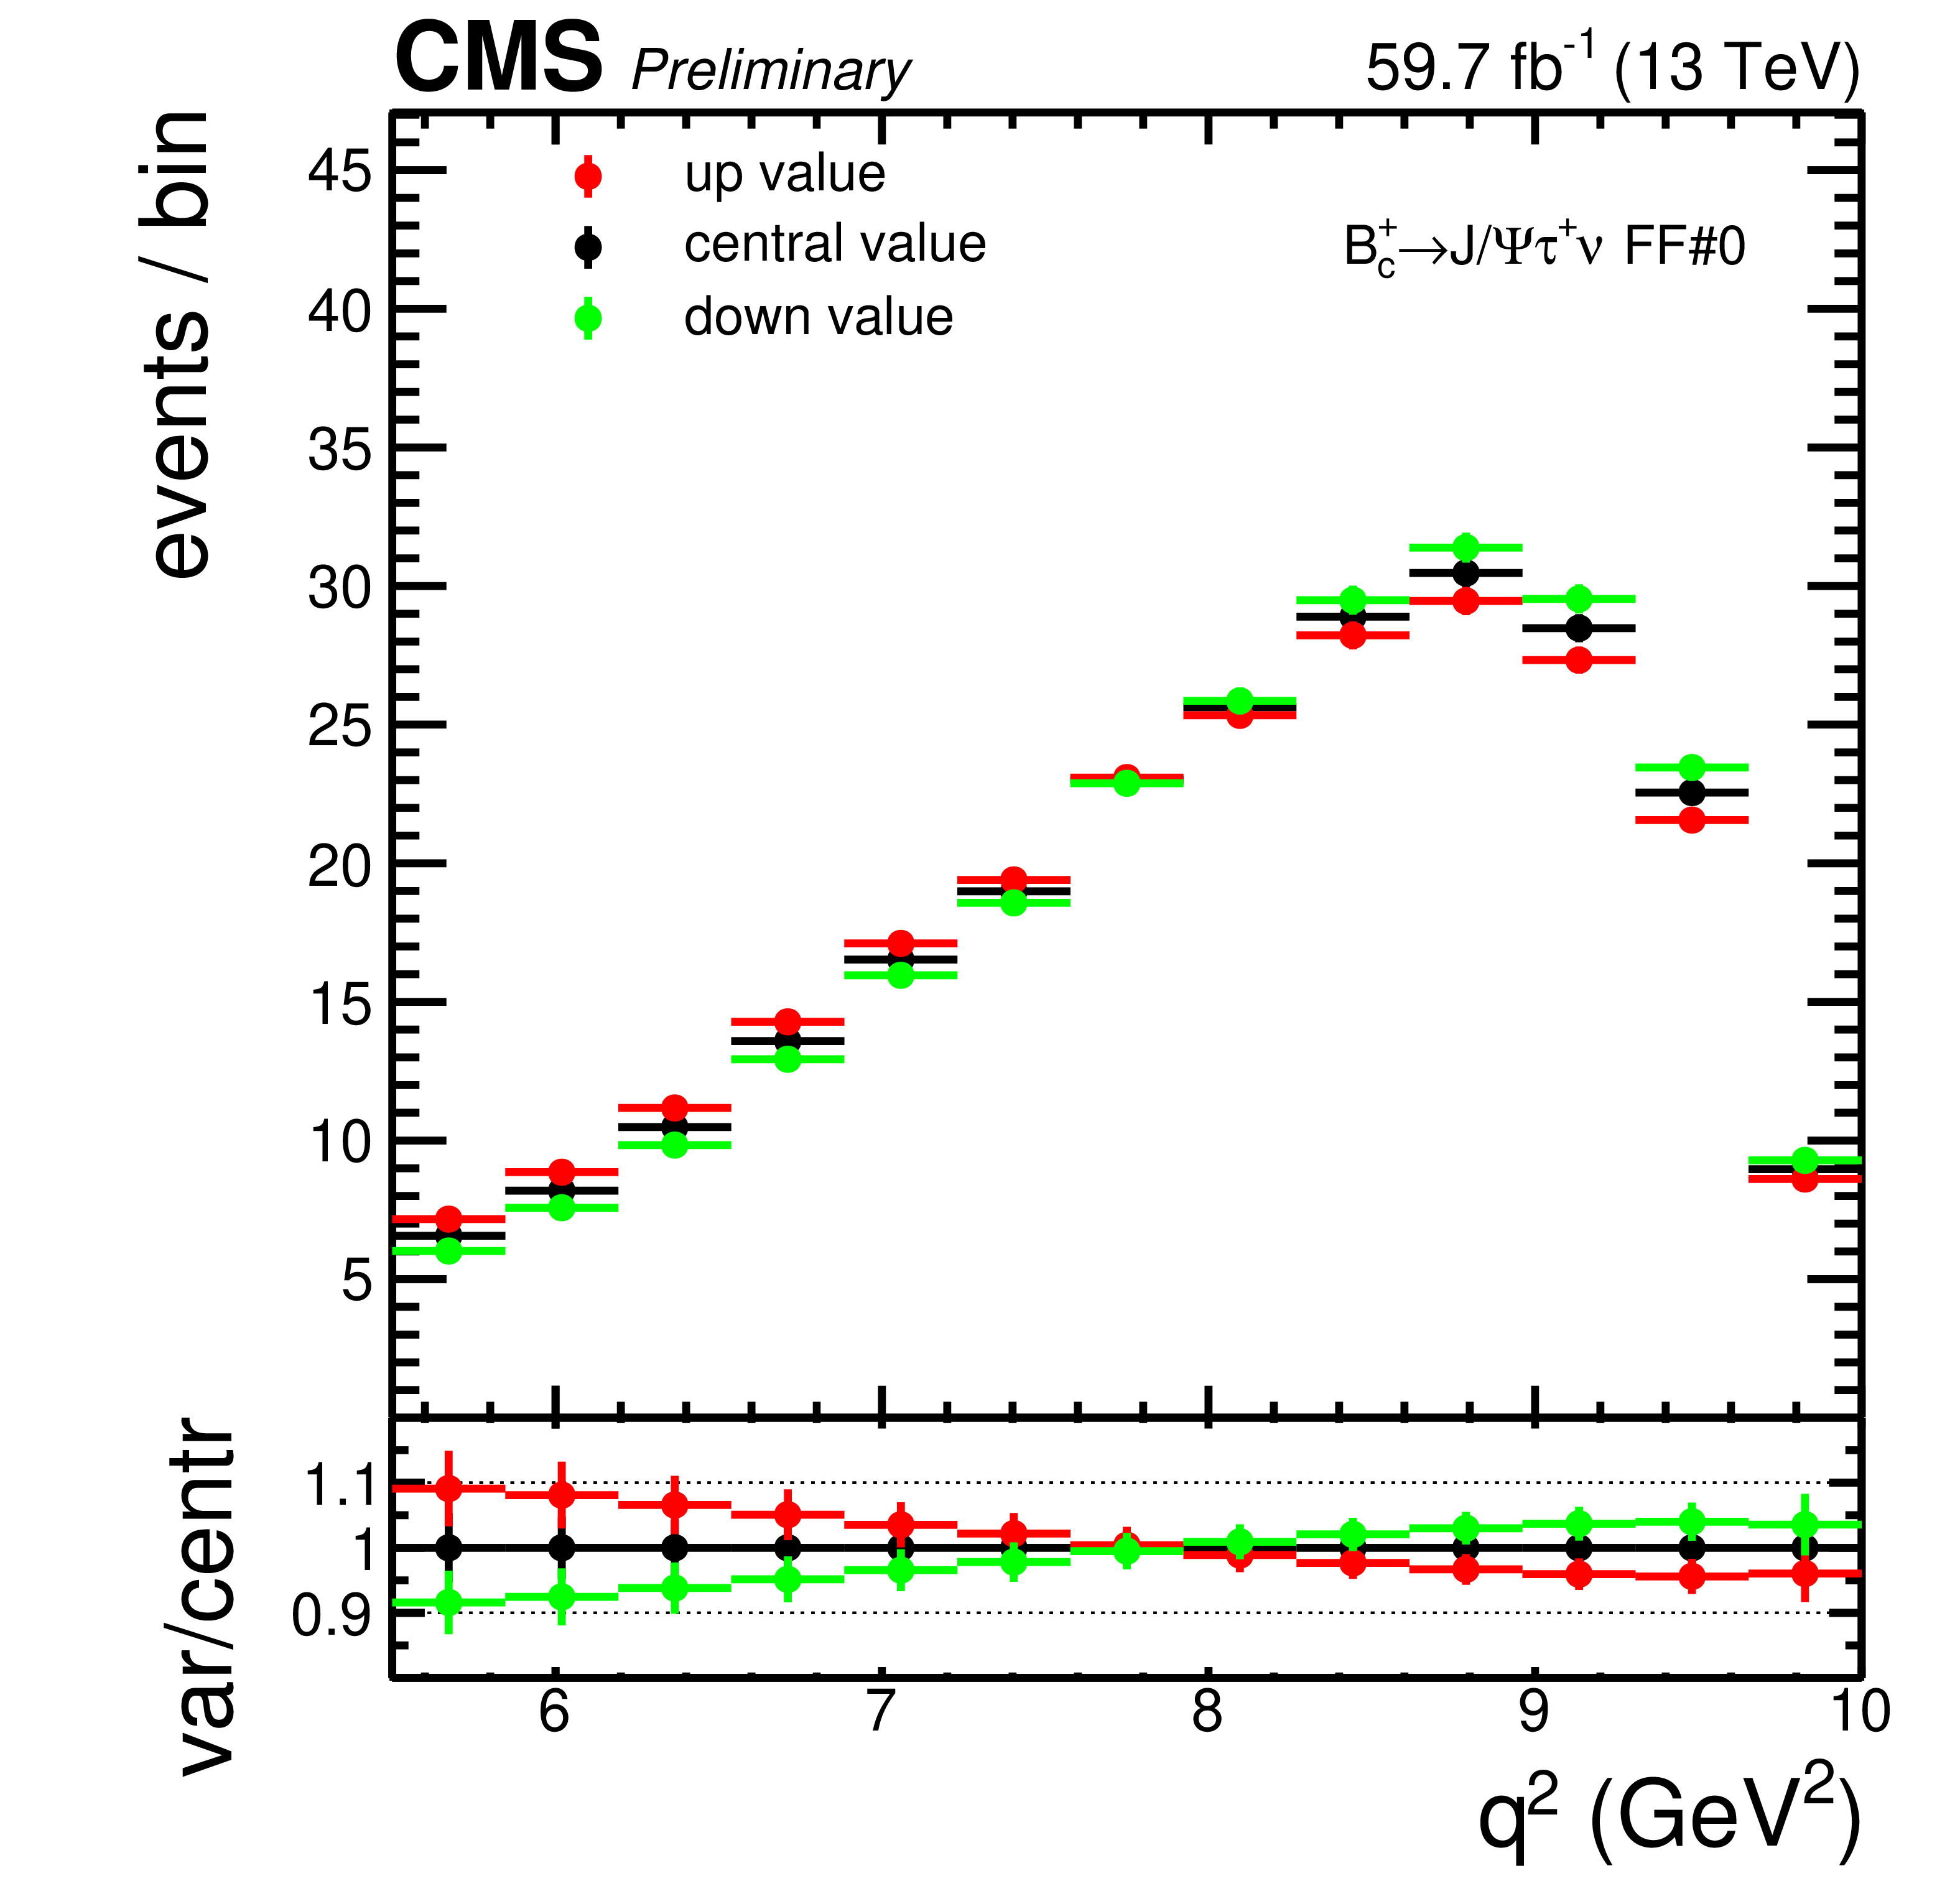
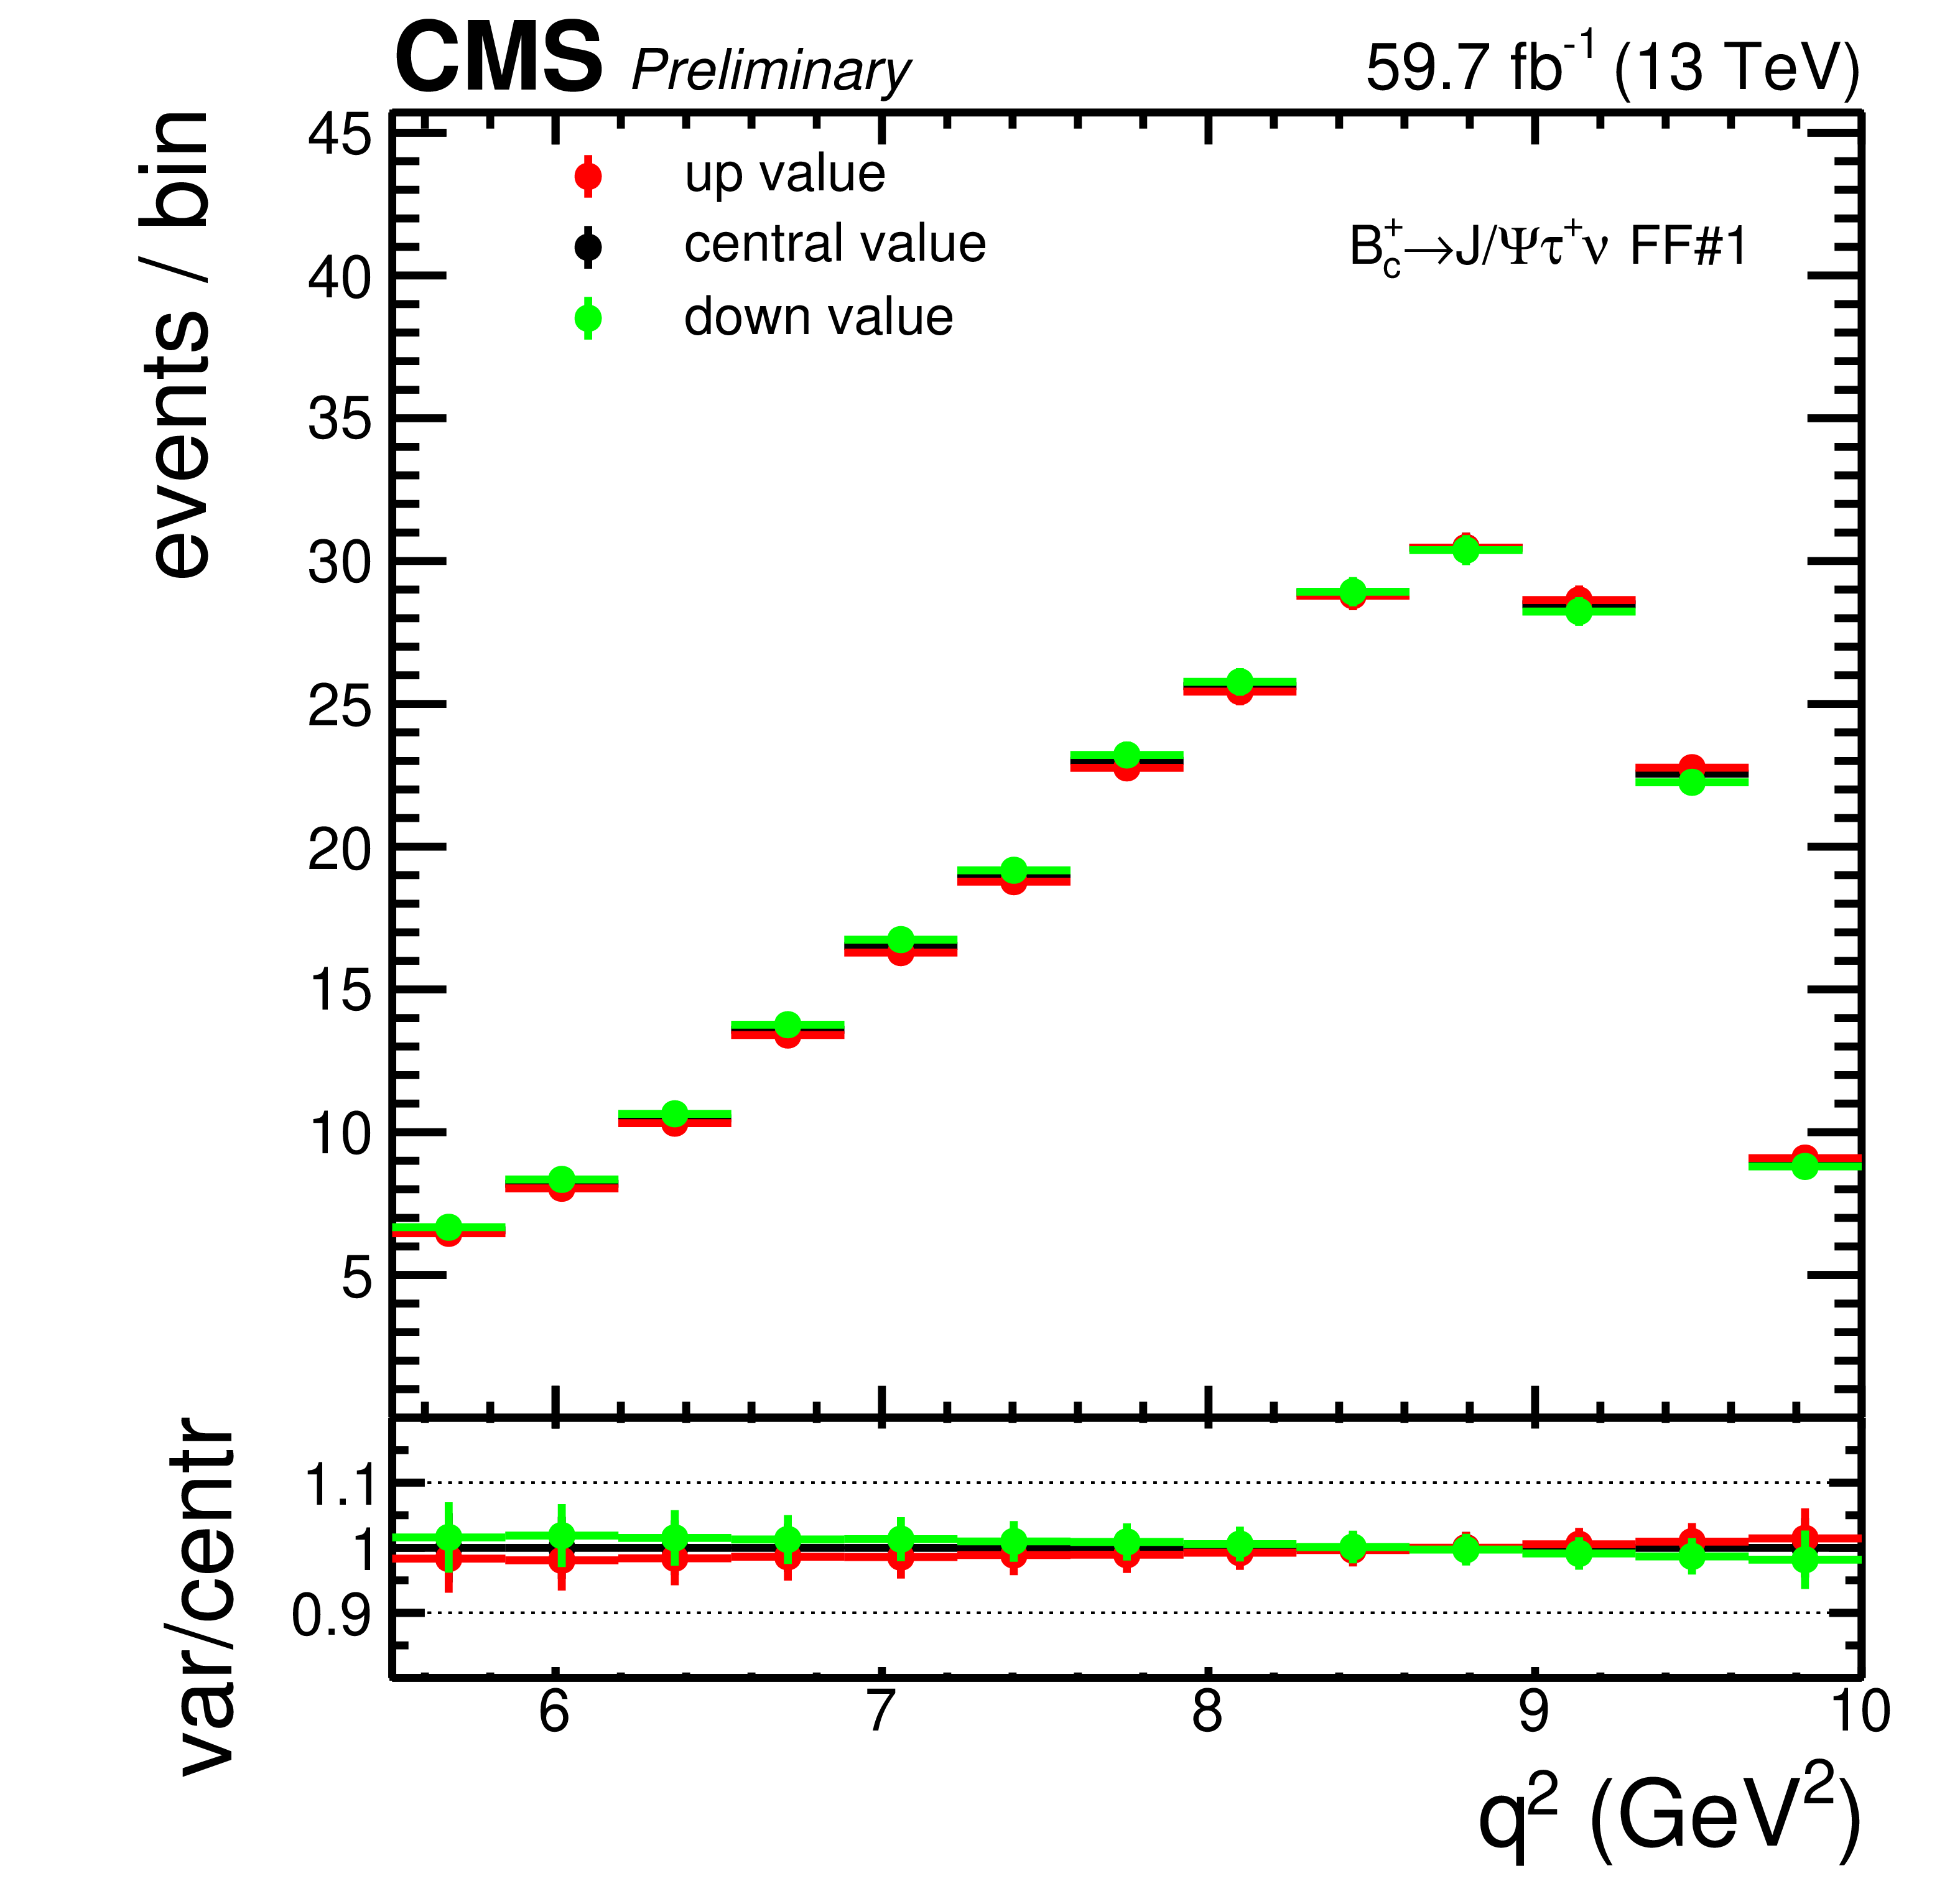
Additional Figure 10:
Comparison of the $ \pm $1$\sigma $ shape variations of the $ \mathrm{B}_{c}^{+}\! \to \! \mathrm{J}/\psi\, \mu^+\nu_{\!\mu} $ (top) and $ \mathrm{B}_{c}^{+}\! \to \! \mathrm{J}/\psi\, \tau^+\nu_{\!\tau} $ (bottom) samples for the form factor related uncertainties with the larger impacts on $ \mathrm{R}(\mathrm{J}/\psi) $, named FF0 (left) FF1 (right). |
png pdf |
Additional Figure 10-a:
Comparison of the $ \pm $1$\sigma $ shape variations of the $ \mathrm{B}_{c}^{+}\! \to \! \mathrm{J}/\psi\, \mu^+\nu_{\!\mu} $ (top) and $ \mathrm{B}_{c}^{+}\! \to \! \mathrm{J}/\psi\, \tau^+\nu_{\!\tau} $ (bottom) samples for the form factor related uncertainties with the larger impacts on $ \mathrm{R}(\mathrm{J}/\psi) $, named FF0 (left) FF1 (right). |
png pdf |
Additional Figure 10-b:
Comparison of the $ \pm $1$\sigma $ shape variations of the $ \mathrm{B}_{c}^{+}\! \to \! \mathrm{J}/\psi\, \mu^+\nu_{\!\mu} $ (top) and $ \mathrm{B}_{c}^{+}\! \to \! \mathrm{J}/\psi\, \tau^+\nu_{\!\tau} $ (bottom) samples for the form factor related uncertainties with the larger impacts on $ \mathrm{R}(\mathrm{J}/\psi) $, named FF0 (left) FF1 (right). |
png pdf |
Additional Figure 10-c:
Comparison of the $ \pm $1$\sigma $ shape variations of the $ \mathrm{B}_{c}^{+}\! \to \! \mathrm{J}/\psi\, \mu^+\nu_{\!\mu} $ (top) and $ \mathrm{B}_{c}^{+}\! \to \! \mathrm{J}/\psi\, \tau^+\nu_{\!\tau} $ (bottom) samples for the form factor related uncertainties with the larger impacts on $ \mathrm{R}(\mathrm{J}/\psi) $, named FF0 (left) FF1 (right). |
png pdf |
Additional Figure 10-d:
Comparison of the $ \pm $1$\sigma $ shape variations of the $ \mathrm{B}_{c}^{+}\! \to \! \mathrm{J}/\psi\, \mu^+\nu_{\!\mu} $ (top) and $ \mathrm{B}_{c}^{+}\! \to \! \mathrm{J}/\psi\, \tau^+\nu_{\!\tau} $ (bottom) samples for the form factor related uncertainties with the larger impacts on $ \mathrm{R}(\mathrm{J}/\psi) $, named FF0 (left) FF1 (right). |
png pdf |
Additional Figure 11:
Distributions of the $ L_{xy}/\sigma_{L_{xy}} $ (top left) and three-muon candidate invariant mass $ m(3\mu) $ (top right) observables for the $ \mathrm{B}_{c}^{+}\! \to \! \mathrm{J}/\psi\, \mu^+\nu_{\!\mu} $ (blue) signal channel, the fakes background (red) and the $ H_\mathrm{b} $ background (green); distributions of the $ \mathrm{IP3D}/\sigma_{\mathrm{IP3D}} $ (bottom left) and $ q^2 $ (bottom right) observables for the $ \mathrm{B}_{c}^{+}\! \to \! \mathrm{J}/\psi\, \mu^+\nu_{\!\mu} $ (blue) and $ \mathrm{B}_{c}^{+}\! \to \! \mathrm{J}/\psi\, \tau^+\nu_{\!\tau} $ (purple) signal channels and the fakes background (red). These distributions are obtained at preselection level and except top right plot, events are selected in the region defined by $ m(3\mu) < m_{\mathrm{B}_{c}} $. |
png pdf |
Additional Figure 11-a:
Distributions of the $ L_{xy}/\sigma_{L_{xy}} $ (top left) and three-muon candidate invariant mass $ m(3\mu) $ (top right) observables for the $ \mathrm{B}_{c}^{+}\! \to \! \mathrm{J}/\psi\, \mu^+\nu_{\!\mu} $ (blue) signal channel, the fakes background (red) and the $ H_\mathrm{b} $ background (green); distributions of the $ \mathrm{IP3D}/\sigma_{\mathrm{IP3D}} $ (bottom left) and $ q^2 $ (bottom right) observables for the $ \mathrm{B}_{c}^{+}\! \to \! \mathrm{J}/\psi\, \mu^+\nu_{\!\mu} $ (blue) and $ \mathrm{B}_{c}^{+}\! \to \! \mathrm{J}/\psi\, \tau^+\nu_{\!\tau} $ (purple) signal channels and the fakes background (red). These distributions are obtained at preselection level and except top right plot, events are selected in the region defined by $ m(3\mu) < m_{\mathrm{B}_{c}} $. |
png pdf |
Additional Figure 11-b:
Distributions of the $ L_{xy}/\sigma_{L_{xy}} $ (top left) and three-muon candidate invariant mass $ m(3\mu) $ (top right) observables for the $ \mathrm{B}_{c}^{+}\! \to \! \mathrm{J}/\psi\, \mu^+\nu_{\!\mu} $ (blue) signal channel, the fakes background (red) and the $ H_\mathrm{b} $ background (green); distributions of the $ \mathrm{IP3D}/\sigma_{\mathrm{IP3D}} $ (bottom left) and $ q^2 $ (bottom right) observables for the $ \mathrm{B}_{c}^{+}\! \to \! \mathrm{J}/\psi\, \mu^+\nu_{\!\mu} $ (blue) and $ \mathrm{B}_{c}^{+}\! \to \! \mathrm{J}/\psi\, \tau^+\nu_{\!\tau} $ (purple) signal channels and the fakes background (red). These distributions are obtained at preselection level and except top right plot, events are selected in the region defined by $ m(3\mu) < m_{\mathrm{B}_{c}} $. |

png pdf |
Additional Figure 11-c:
Distributions of the $ L_{xy}/\sigma_{L_{xy}} $ (top left) and three-muon candidate invariant mass $ m(3\mu) $ (top right) observables for the $ \mathrm{B}_{c}^{+}\! \to \! \mathrm{J}/\psi\, \mu^+\nu_{\!\mu} $ (blue) signal channel, the fakes background (red) and the $ H_\mathrm{b} $ background (green); distributions of the $ \mathrm{IP3D}/\sigma_{\mathrm{IP3D}} $ (bottom left) and $ q^2 $ (bottom right) observables for the $ \mathrm{B}_{c}^{+}\! \to \! \mathrm{J}/\psi\, \mu^+\nu_{\!\mu} $ (blue) and $ \mathrm{B}_{c}^{+}\! \to \! \mathrm{J}/\psi\, \tau^+\nu_{\!\tau} $ (purple) signal channels and the fakes background (red). These distributions are obtained at preselection level and except top right plot, events are selected in the region defined by $ m(3\mu) < m_{\mathrm{B}_{c}} $. |

png pdf |
Additional Figure 11-d:
Distributions of the $ L_{xy}/\sigma_{L_{xy}} $ (top left) and three-muon candidate invariant mass $ m(3\mu) $ (top right) observables for the $ \mathrm{B}_{c}^{+}\! \to \! \mathrm{J}/\psi\, \mu^+\nu_{\!\mu} $ (blue) signal channel, the fakes background (red) and the $ H_\mathrm{b} $ background (green); distributions of the $ \mathrm{IP3D}/\sigma_{\mathrm{IP3D}} $ (bottom left) and $ q^2 $ (bottom right) observables for the $ \mathrm{B}_{c}^{+}\! \to \! \mathrm{J}/\psi\, \mu^+\nu_{\!\mu} $ (blue) and $ \mathrm{B}_{c}^{+}\! \to \! \mathrm{J}/\psi\, \tau^+\nu_{\!\tau} $ (purple) signal channels and the fakes background (red). These distributions are obtained at preselection level and except top right plot, events are selected in the region defined by $ m(3\mu) < m_{\mathrm{B}_{c}} $. |
png pdf |
Additional Figure 12:
This figure illustrates the estimate of the fakes background contribution, from left to right. Prefit distributions in the background-enriched region defined by $ m(3\mu) < m_{\mathrm{B}_{c}} $, $ q^2 < $ 4.5 GeV, and $ \mathrm{IP3D}/\sigma_{\mathrm{IP3D}} < $ 0 are shown as an example, although the same method applies to all regions. The third muon is required to pass the softMVA identification criteria. Data are overlaid to the expectation. In the leftmost plot, the third muon fails the isolation condition $ I^{\mathrm{rel}} < $ 0.2. This corresponds to the \it application region. The plot in the middle is obtained by applying fake rate probability weights to events in the previous one. The template of fakes background expected in the region $ I^{\mathrm{rel}} < $ 0.2 (visually corresponding to the the fakes background component in the rightmost plot) is obtained at this stage by subtracting all MC as well as the dimuon combinatorial contribution from the data distribution. In the ratio panels in the left and center plot, data points are fixed at one by construction at prefit level. The subtraction is incorporated in the fit. |
png pdf |
Additional Figure 12-a:
This figure illustrates the estimate of the fakes background contribution, from left to right. Prefit distributions in the background-enriched region defined by $ m(3\mu) < m_{\mathrm{B}_{c}} $, $ q^2 < $ 4.5 GeV, and $ \mathrm{IP3D}/\sigma_{\mathrm{IP3D}} < $ 0 are shown as an example, although the same method applies to all regions. The third muon is required to pass the softMVA identification criteria. Data are overlaid to the expectation. In the leftmost plot, the third muon fails the isolation condition $ I^{\mathrm{rel}} < $ 0.2. This corresponds to the \it application region. The plot in the middle is obtained by applying fake rate probability weights to events in the previous one. The template of fakes background expected in the region $ I^{\mathrm{rel}} < $ 0.2 (visually corresponding to the the fakes background component in the rightmost plot) is obtained at this stage by subtracting all MC as well as the dimuon combinatorial contribution from the data distribution. In the ratio panels in the left and center plot, data points are fixed at one by construction at prefit level. The subtraction is incorporated in the fit. |
png pdf |
Additional Figure 12-b:
This figure illustrates the estimate of the fakes background contribution, from left to right. Prefit distributions in the background-enriched region defined by $ m(3\mu) < m_{\mathrm{B}_{c}} $, $ q^2 < $ 4.5 GeV, and $ \mathrm{IP3D}/\sigma_{\mathrm{IP3D}} < $ 0 are shown as an example, although the same method applies to all regions. The third muon is required to pass the softMVA identification criteria. Data are overlaid to the expectation. In the leftmost plot, the third muon fails the isolation condition $ I^{\mathrm{rel}} < $ 0.2. This corresponds to the \it application region. The plot in the middle is obtained by applying fake rate probability weights to events in the previous one. The template of fakes background expected in the region $ I^{\mathrm{rel}} < $ 0.2 (visually corresponding to the the fakes background component in the rightmost plot) is obtained at this stage by subtracting all MC as well as the dimuon combinatorial contribution from the data distribution. In the ratio panels in the left and center plot, data points are fixed at one by construction at prefit level. The subtraction is incorporated in the fit. |
png pdf |
Additional Figure 12-c:
This figure illustrates the estimate of the fakes background contribution, from left to right. Prefit distributions in the background-enriched region defined by $ m(3\mu) < m_{\mathrm{B}_{c}} $, $ q^2 < $ 4.5 GeV, and $ \mathrm{IP3D}/\sigma_{\mathrm{IP3D}} < $ 0 are shown as an example, although the same method applies to all regions. The third muon is required to pass the softMVA identification criteria. Data are overlaid to the expectation. In the leftmost plot, the third muon fails the isolation condition $ I^{\mathrm{rel}} < $ 0.2. This corresponds to the \it application region. The plot in the middle is obtained by applying fake rate probability weights to events in the previous one. The template of fakes background expected in the region $ I^{\mathrm{rel}} < $ 0.2 (visually corresponding to the the fakes background component in the rightmost plot) is obtained at this stage by subtracting all MC as well as the dimuon combinatorial contribution from the data distribution. In the ratio panels in the left and center plot, data points are fixed at one by construction at prefit level. The subtraction is incorporated in the fit. |
| References | ||||
| 1 | UA1 Collaboration | Studies of Intermediate Vector Boson Production and Decay in UA1 at the CERN Proton - Antiproton Collider | Z. Phys. C 44 (1989) 15 | |
| 2 | ALEPH, DELPHI, L3, OPAL, SLD, LEP Electroweak Working Group, SLD Electroweak Group, SLD Heavy Flavour Group Collaboration | Precision electroweak measurements on the $ Z $ resonance | Phys. Rept. 427 (2006) 257 | hep-ex/0509008 |
| 3 | ATLAS Collaboration | Precision measurement and interpretation of inclusive $ W^+ $, $ W^- $ and $ Z/\gamma ^* $ production cross sections with the ATLAS detector | EPJC 77 (2017) 367 | 1612.03016 |
| 4 | M. Tanaka | Charged Higgs effects on exclusive semitauonic $ B $ decays | Z. Phys. C 67 (1995) 321 | hep-ph/9411405 |
| 5 | A. Crivellin, C. Greub, and A. Kokulu | Explaining $ B\to D\tau\nu $, $ B\to D^*\tau\nu $ and $ B\to \tau\nu $ in a 2HDM of type III | PRD 86 (2012) 054014 | 1206.2634 |
| 6 | M. Freytsis, Z. Ligeti, and J. T. Ruderman | Flavor models for $ \bar{B} \to D^{(*)} \tau \bar{\nu} $ | PRD 92 (2015) 054018 | 1506.08896 |
| 7 | A. Crivellin, G. D'Ambrosio, and J. Heeck | Addressing the LHC flavor anomalies with horizontal gauge symmetries | PRD 91 (2015) 075006 | 1503.03477 |
| 8 | ATLAS Collaboration | Search for new phenomena in $ pp $ collisions in final states with tau leptons, b-jets, and missing transverse momentum with the ATLAS detector | PRD 104 (2021) 112005 | 2108.07665 |
| 9 | CMS Collaboration | Search for new particles in events with energetic jets and large missing transverse momentum in proton-proton collisions at $ \sqrt{s} $ = 13 TeV | JHEP 11 (2021) 153 | CMS-EXO-20-004 2107.13021 |
| 10 | CMS Collaboration | Search for heavy resonances and quantum black holes in e\ensuremath\mu, e\ensuremath\tau, and \ensuremath\mu\ensuremath\tau final states in proton-proton collisions at $ \sqrt{s} $ = 13 TeV | JHEP 05 (2023) 227 | CMS-EXO-19-014 2205.06709 |
| 11 | CMS Collaboration | Search for a high-mass dimuon resonance produced in association with b quark jets at $ \sqrt{s} $=13 TeV | CMS-EXO-22-016 2307.08708 |
|
| 12 | BaBar Collaboration | Measurement of an Excess of $ \bar{B} \to D^{(*)}\tau^- \bar{\nu}_\tau $ Decays and Implications for Charged Higgs Bosons | PRD 88 (2013) 072012 | 1303.0571 |
| 13 | Belle Collaboration | Measurement of the branching ratio of $ \bar{B} \to D^{(\ast)} \tau^- \bar{\nu}_\tau $ relative to $ \bar{B} \to D^{(\ast)} \ell^- \bar{\nu}_\ell $ decays with hadronic tagging at Belle | PRD 92 (2015) 072014 | 1507.03233 |
| 14 | Belle Collaboration | Measurement of the branching ratio of $ \bar{B}^0 \rightarrow D^{*+} \tau^- \bar{\nu}_{\tau} $ relative to $ \bar{B}^0 \rightarrow D^{*+} \ell^- \bar{\nu}_{\ell} $ decays with a semileptonic tagging method | PRD 94 (2016) 072007 | 1607.07923 |
| 15 | Belle Collaboration | Recent Belle II results on semileptonic B decays and tests of lepton-flavor universality | Talk given at 31st International Symposium on Lepton Photon Interactions at High Energies, July 2023 link |
|
| 16 | LHCb Collaboration | Measurement of the ratio of branching fractions $ \mathcal{B}(\bar{B}^0 \to D^{*+}\tau^{-}\bar{\nu}_{\tau})/\mathcal{B}(\bar{B}^0 \to D^{*+}\mu^{-}\bar{\nu}_{\mu}) $ | PRL 115 (2015) 111803 | 1506.08614 |
| 17 | LHCb Collaboration | Measurement of the ratio of the $ B^0 \to D^{*-} \tau^+ \nu_{\tau} $ and $ B^0 \to D^{*-} \mu^+ \nu_{\mu} $ branching fractions using three-prong $ \tau $-lepton decays | PRL 120 (2018) 171802 | 1708.08856 |
| 18 | LHCb Collaboration | Measurement of the ratios of branching fractions $ \mathcal{R}(D^{*}) $ and $ \mathcal{R}(D^{0}) $ | 2302.02886 | |
| 19 | Y. Amhis et al. | Averages of $ b $-hadron, $ c $-hadron, and $ \tau $-lepton properties as of 2021 | PRD 107 (2023) 052008 | 2206.07501 |
| 20 | LATTICE-HPQCD Collaboration | $ R(J/\psi) $ and $ B_c^- \rightarrow J/\psi \ell^-\bar{\nu}_\ell $ Lepton Flavor Universality Violating Observables from Lattice QCD | PRL 125 (2020) 222003 | 2007.06956 |
| 21 | A. Y. Anisimov, I. M. Narodetsky, C. Semay, and B. Silvestre-Brac | The $ B_c $ meson lifetime in the light front constituent quark model | PLB 452 (1999) 129 | hep-ph/9812514 |
| 22 | V. V. Kiselev | Exclusive decays and lifetime of $ B_c $ meson in QCD sum rules | hep-ph/0211021 | |
| 23 | M. A. Ivanov, J. G. Korner, and P. Santorelli | Exclusive semileptonic and nonleptonic decays of the $ B_c $ meson | PRD 73 (2006) 054024 | hep-ph/0602050 |
| 24 | E. Hernandez, J. Nieves, and J. M. Verde-Velasco | Study of exclusive semileptonic and non-leptonic decays of $ B_c $ - in a nonrelativistic quark model | PRD 74 (2006) 074008 | hep-ph/0607150 |
| 25 | LHCb Collaboration | Measurement of the ratio of branching fractions $ \mathcal{B}(B_c^+\,\to\,J/\psi\tau^+\nu_\tau) $/$ \mathcal{B}(B_c^+\,\to\,J/\psi\mu^+\nu_\mu) $ | PRL 120 (2018) 121801 | 1711.05623 |
| 26 | CMS Collaboration | The CMS Experiment at the CERN LHC | JINST 3 (2008) S08004 | |
| 27 | CMS Collaboration | Performance of the CMS Level-1 trigger in proton-proton collisions at $ \sqrt{s} = $ 13 TeV | JINST 15 (2020) P10017 | CMS-TRG-17-001 2006.10165 |
| 28 | CMS Collaboration | The CMS trigger system | JINST 12 (2017) P01020 | CMS-TRG-12-001 1609.02366 |
| 29 | CMS Collaboration | Electron and photon reconstruction and identification with the CMS experiment at the CERN LHC | JINST 16 (2021) P05014 | CMS-EGM-17-001 2012.06888 |
| 30 | CMS Collaboration | Performance of the CMS muon detector and muon reconstruction with proton-proton collisions at $ \sqrt{s}= $ 13 TeV | JINST 13 (2018) P06015 | CMS-MUO-16-001 1804.04528 |
| 31 | CMS Collaboration | Description and performance of track and primary-vertex reconstruction with the CMS tracker | JINST 9 (2014) P10009 | CMS-TRK-11-001 1405.6569 |
| 32 | CMS Collaboration | Particle-flow reconstruction and global event description with the CMS detector | JINST 12 (2017) P10003 | CMS-PRF-14-001 1706.04965 |
| 33 | CMS Collaboration | Performance of reconstruction and identification of $ \tau $ leptons decaying to hadrons and $ \nu_\tau $ in pp collisions at $ \sqrt{s}= $ 13 TeV | JINST 13 (2018) P10005 | CMS-TAU-16-003 1809.02816 |
| 34 | CMS Collaboration | Identification of hadronic tau lepton decays using a deep neural network | JINST 17 (2022) P07023 | CMS-TAU-20-001 2201.08458 |
| 35 | CMS Collaboration | Jet energy scale and resolution in the CMS experiment in pp collisions at 8 TeV | JINST 12 (2017) P02014 | CMS-JME-13-004 1607.03663 |
| 36 | CMS Collaboration | Performance of missing transverse momentum reconstruction in proton-proton collisions at $ \sqrt{s} = $ 13 TeV using the CMS detector | JINST 14 (2019) P07004 | CMS-JME-17-001 1903.06078 |
| 37 | LHCb Collaboration | Precision measurement of the $ B_{c}^{+} $ meson mass | JHEP 07 (2020) 123 | 2004.08163 |
| 38 | C.-H. Chang, X.-Y. Wang, and X.-G. Wu | BCVEGPY2.2: a newly upgraded version for hadronic production of the meson $ \rm B_c $ and its excited states | Comput. Phys. Commun. 197 (2015) 335 | 1507.05176 |
| 39 | D. J. Lange | The EvtGen particle decay simulation package | NIM A 462 (2001) 152 | |
| 40 | S. Frixione, E. Laenen, P. Motylinski, and B. R. Webber | Single-top production in MC@NLO | JHEP 03 (2006) 092 | hep-ph/0512250 |
| 41 | T. Sjostrand, S. Mrenna, and P. Z. Skands | A Brief Introduction to PYTHIA 8.1 | Comput. Phys. Commun. 178 (2008) 852 | 0710.3820 |
| 42 | Particle Data Group Collaboration | Review of particle physics | Prog. Theor. Exp. Phys. 2022 (2022) 083C01 | |
| 43 | LHCb Collaboration | Measurement of the $ B_c^- $ meson production fraction and asymmetry in 7 and 13 TeV $ pp $ collisions | PRD 100 (2019) 112006 | 1910.13404 |
| 44 | LHCb Collaboration | Observation of $ B^+_c \rightarrow J/\psi D_s^+ $ and $ B^+_c \rightarrow J/\psi D_s^{*+} $ decays | PRD 87 (2013) 112012 | 1304.4530 |
| 45 | ATLAS Collaboration | Study of the $ B_c^+ \rightarrow J/\psi D_s^+ $ and $ B_c^+ \rightarrow J/\psi D_s^{*+} $ decays with the ATLAS detector | EPJC 76 (2016) 1 | 1507.07099 |
| 46 | LHCb Collaboration | Observation of $ B_{c}^{+} \to J/\psi D^{(*)} K^{(*)} $ decays | PRD 95 (2017) 032005 | 1612.07421 |
| 47 | V. Kiselev, A. Likhoded, and A. Onishchenko | Semileptonic bc-meson decays in sum rules of qcd and nrqcd | Nuclear Physics B 569 (2000) 473 | |
| 48 | F. U. Bernlochner et al. | Das ist der HAMMER: Consistent new physics interpretations of semileptonic decays | EPJC 80 (2020) 883 | 2002.00020 |
| 49 | T. D. Cohen, H. Lamm, and R. F. Lebed | Precision model-independent bounds from a global analysis of $ b \rightarrow c\ell\nu $ form factors | PRD 10 (2019) 094503 | |
| 50 | CMS Collaboration | Measurement of the total and differential inclusive $ B^+ $ hadron cross sections in pp collisions at $ \sqrt{s} $ = 13 TeV | PLB 771 (2017) 435 | CMS-BPH-15-004 1609.00873 |
| 51 | Z. Was, P. Golonka, and G. Nanava | PHOTOS Monte Carlo and its theoretical accuracy | Nucl. Phys. B Proc. Suppl. 18 (2008) 1 | 0807.2762 |
| 52 | J. Allison et al. | Geant4 developments and applications | IEEE Trans. Nucl. Sci. 53 (2006) 270 | |
| 53 | CMS Collaboration | Measurement of the B$ ^0_\mathrm{S} \to \mu^+\mu^- $ decay properties and search for the B$ ^0 \to \mu^+\mu^- $ decay in proton-proton collisions at $ \sqrt{s} $ = 13 TeV | PLB 842 (2023) 137955 | CMS-BPH-21-006 2212.10311 |
| 54 | M. J. Oreglia | A study of the reactions $ \psi^\prime \to \gamma \gamma \psi $ | PhD thesis, Stanford University, SLAC Report SLAC-R-236, 1980 link |
|
| 55 | S. Algeri, J. Aalbers, K. Dundas Mor\r a , and J. Conrad | Searching for new phenomena with profile likelihood ratio tests | Nature Rev. Phys. 2 (2020) 245 | 1911.10237 |
|
|
Compact Muon Solenoid LHC, CERN |
|

|

|

|

|

|