

Compact Muon Solenoid
LHC, CERN
| CMS-PAS-BPH-21-006 | ||
| Measurement of ${\mathrm B^0_s}\to\mu^+\mu^-$ decay properties and search for the ${\mathrm B}^0\to\mu\mu$ decay in proton-proton collisions at $\sqrt{s}=$ 13 TeV | ||
| CMS Collaboration | ||
| July 2022 | ||
| Abstract: We report a measurement of the ${\mathrm B^0_s}\to\mu^+\mu^-$ branching fraction and its effective lifetime, as well as results of a search for the ${\mathrm B}^0\to\mu^+\mu^-$ decay in proton-proton collisions at $\sqrt{s}=$ 13 TeV at the LHC. The analysis is based on data collected with the CMS detector in 2016-2018 corresponding to an integrated luminosity of 140 fb$^{-1}$. The measured branching fraction of the ${\mathrm B^0_s}\to\mu^+\mu^-$ decay and the effective ${\mathrm B^0_s}$ lifetime are the most precise measurements to date. No evidence for the ${\mathrm B}^0\to\mu^+\mu^-$ decay has been found. All results are found to be consistent with the standard model predictions. | ||
|
Links:
CDS record (PDF) ;
Physics Briefing ;
CADI line (restricted) ;
These preliminary results are superseded in this paper, PLB 842 (2023) 137955. The superseded preliminary plots can be found here. |
||
| Figures | |
png pdf |
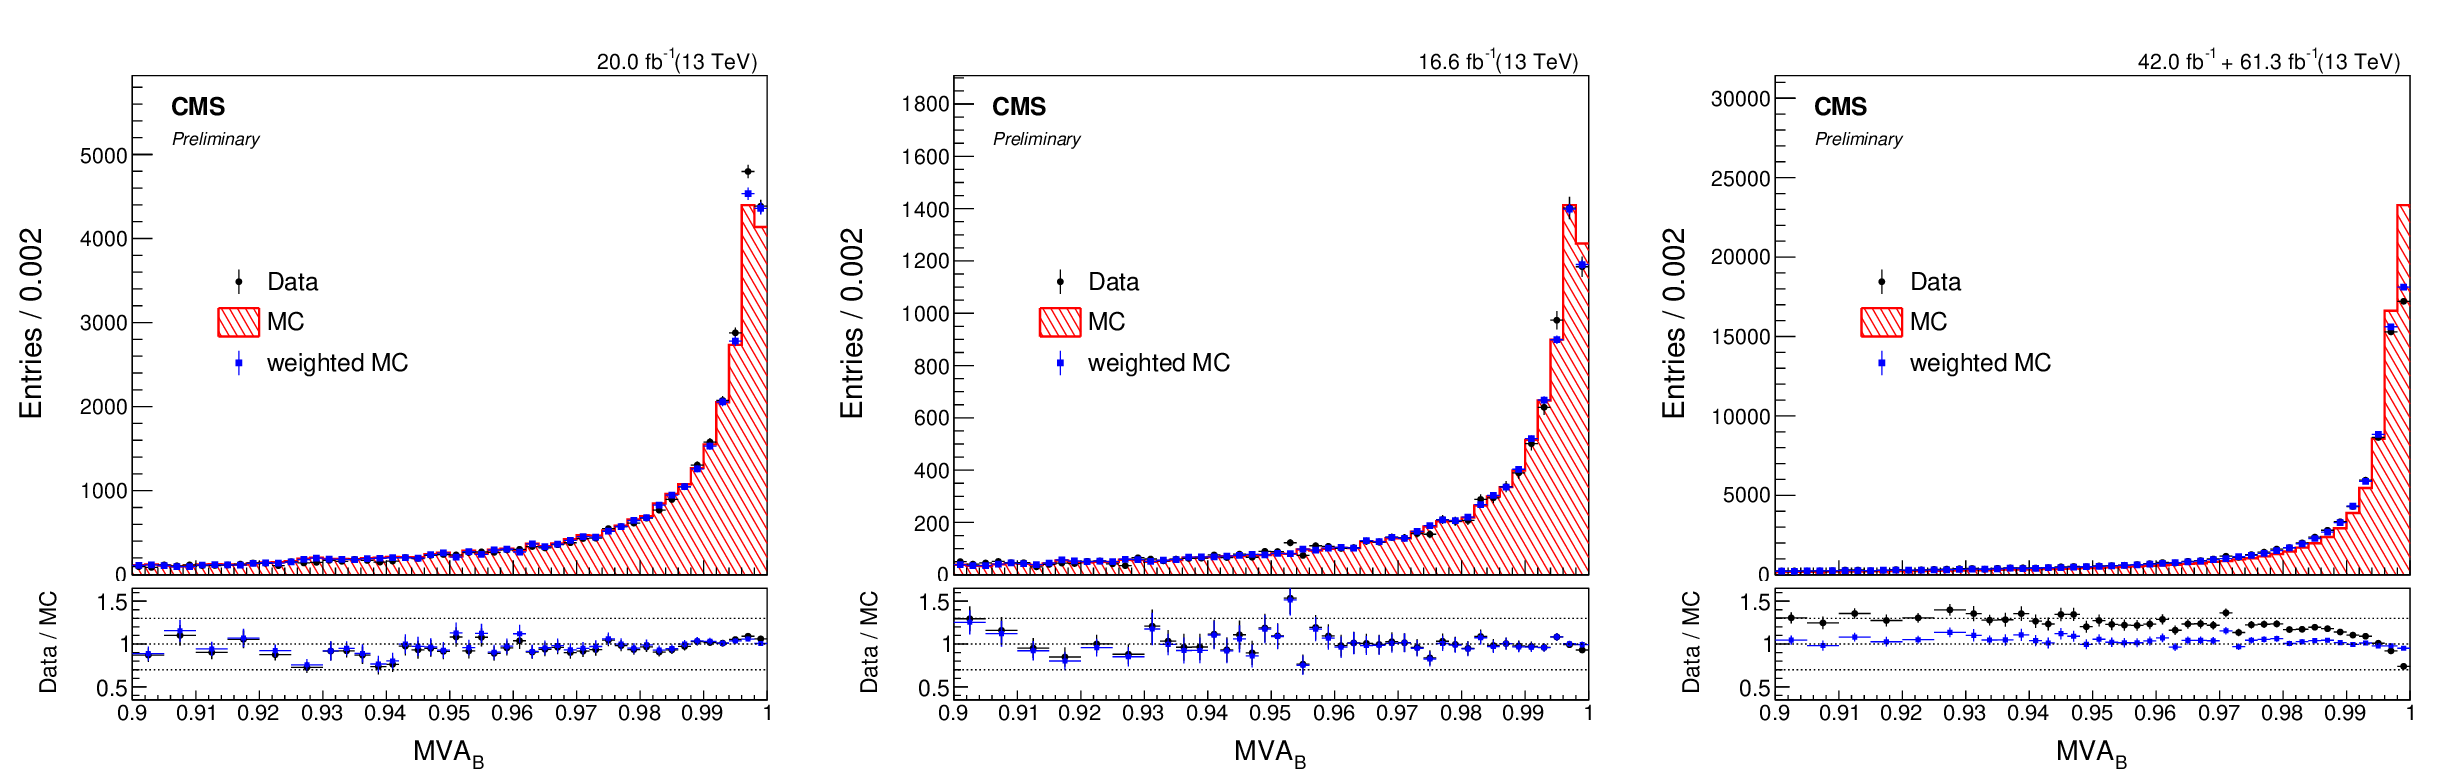
Figure 1:
Distributions of the MVA$_{\text{B}}$ output for 2016a (left), 2016b (center), and 2017-2018 (right) data and the corresponding simulations. The blue histograms represent reweighted MC simulations using the XGBoost reweighting method. The MC distributions are normalized to the data integral. |
png pdf |
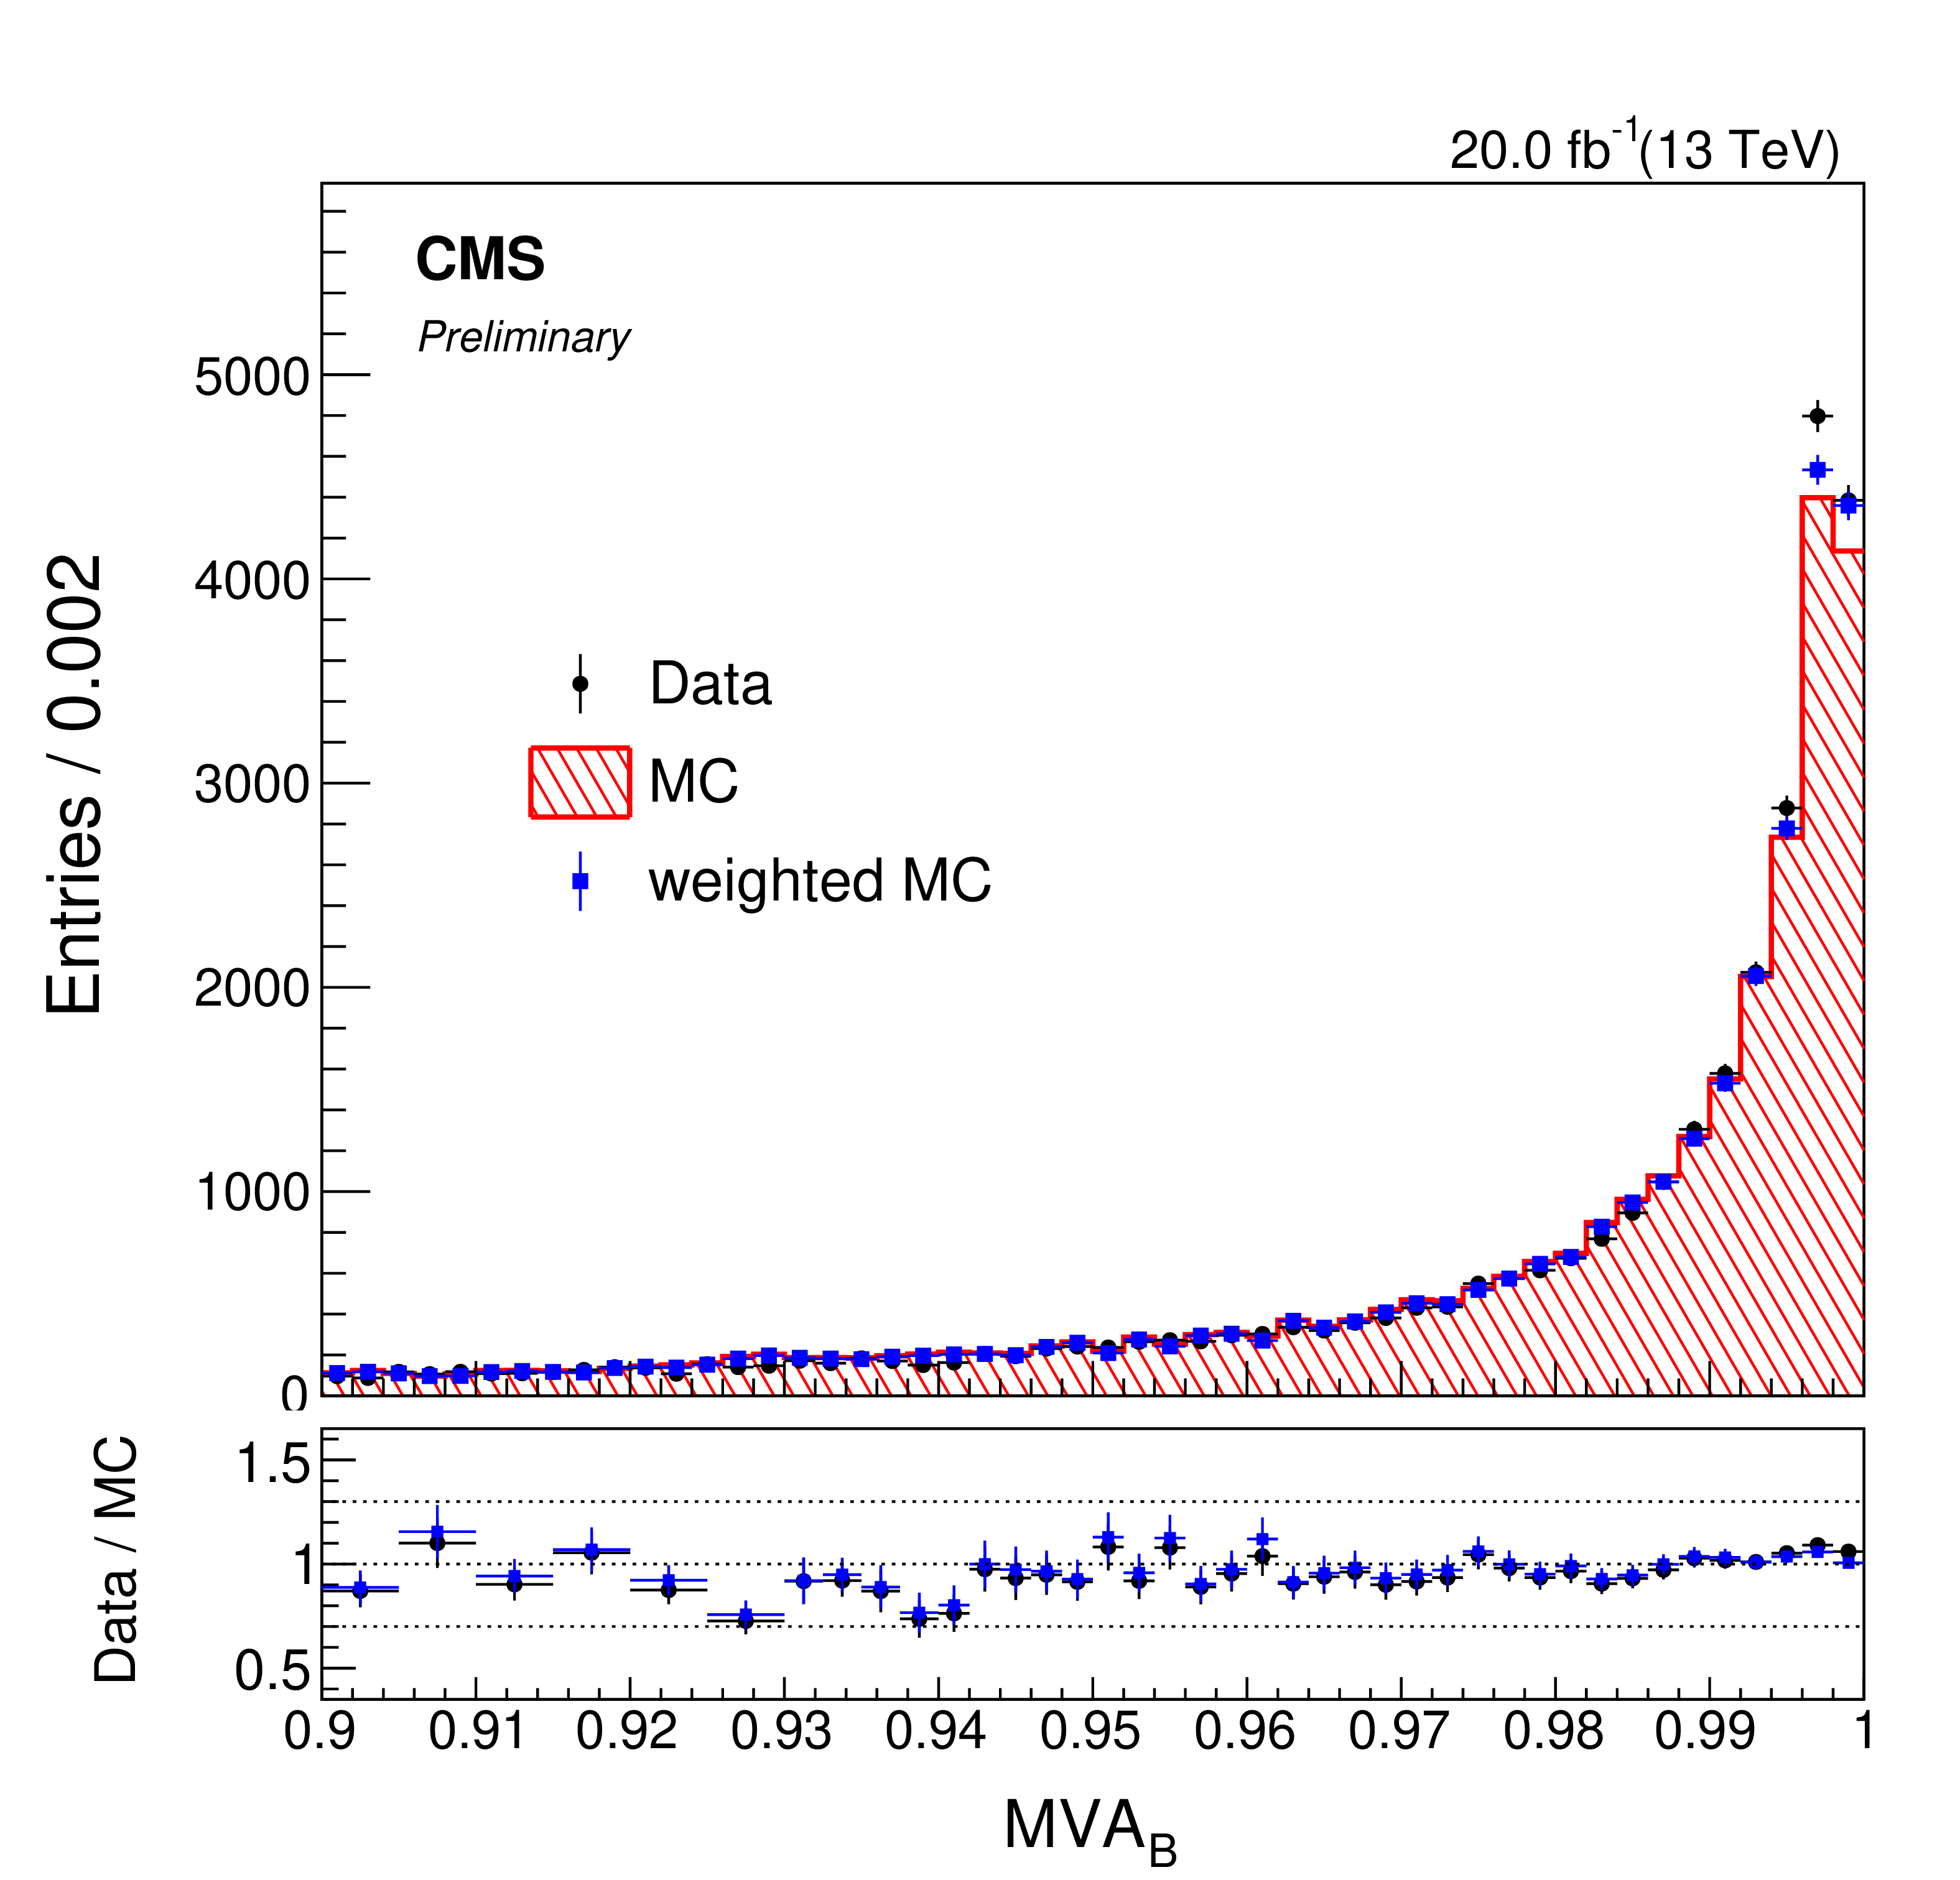
Figure 1-a:
Distribution of the MVA$_{\text{B}}$ output for 2016a data and the corresponding simulations. The blue histogram represents the reweighted MC simulations using the XGBoost reweighting method. The MC distribution is normalized to the data integral. |
png pdf |
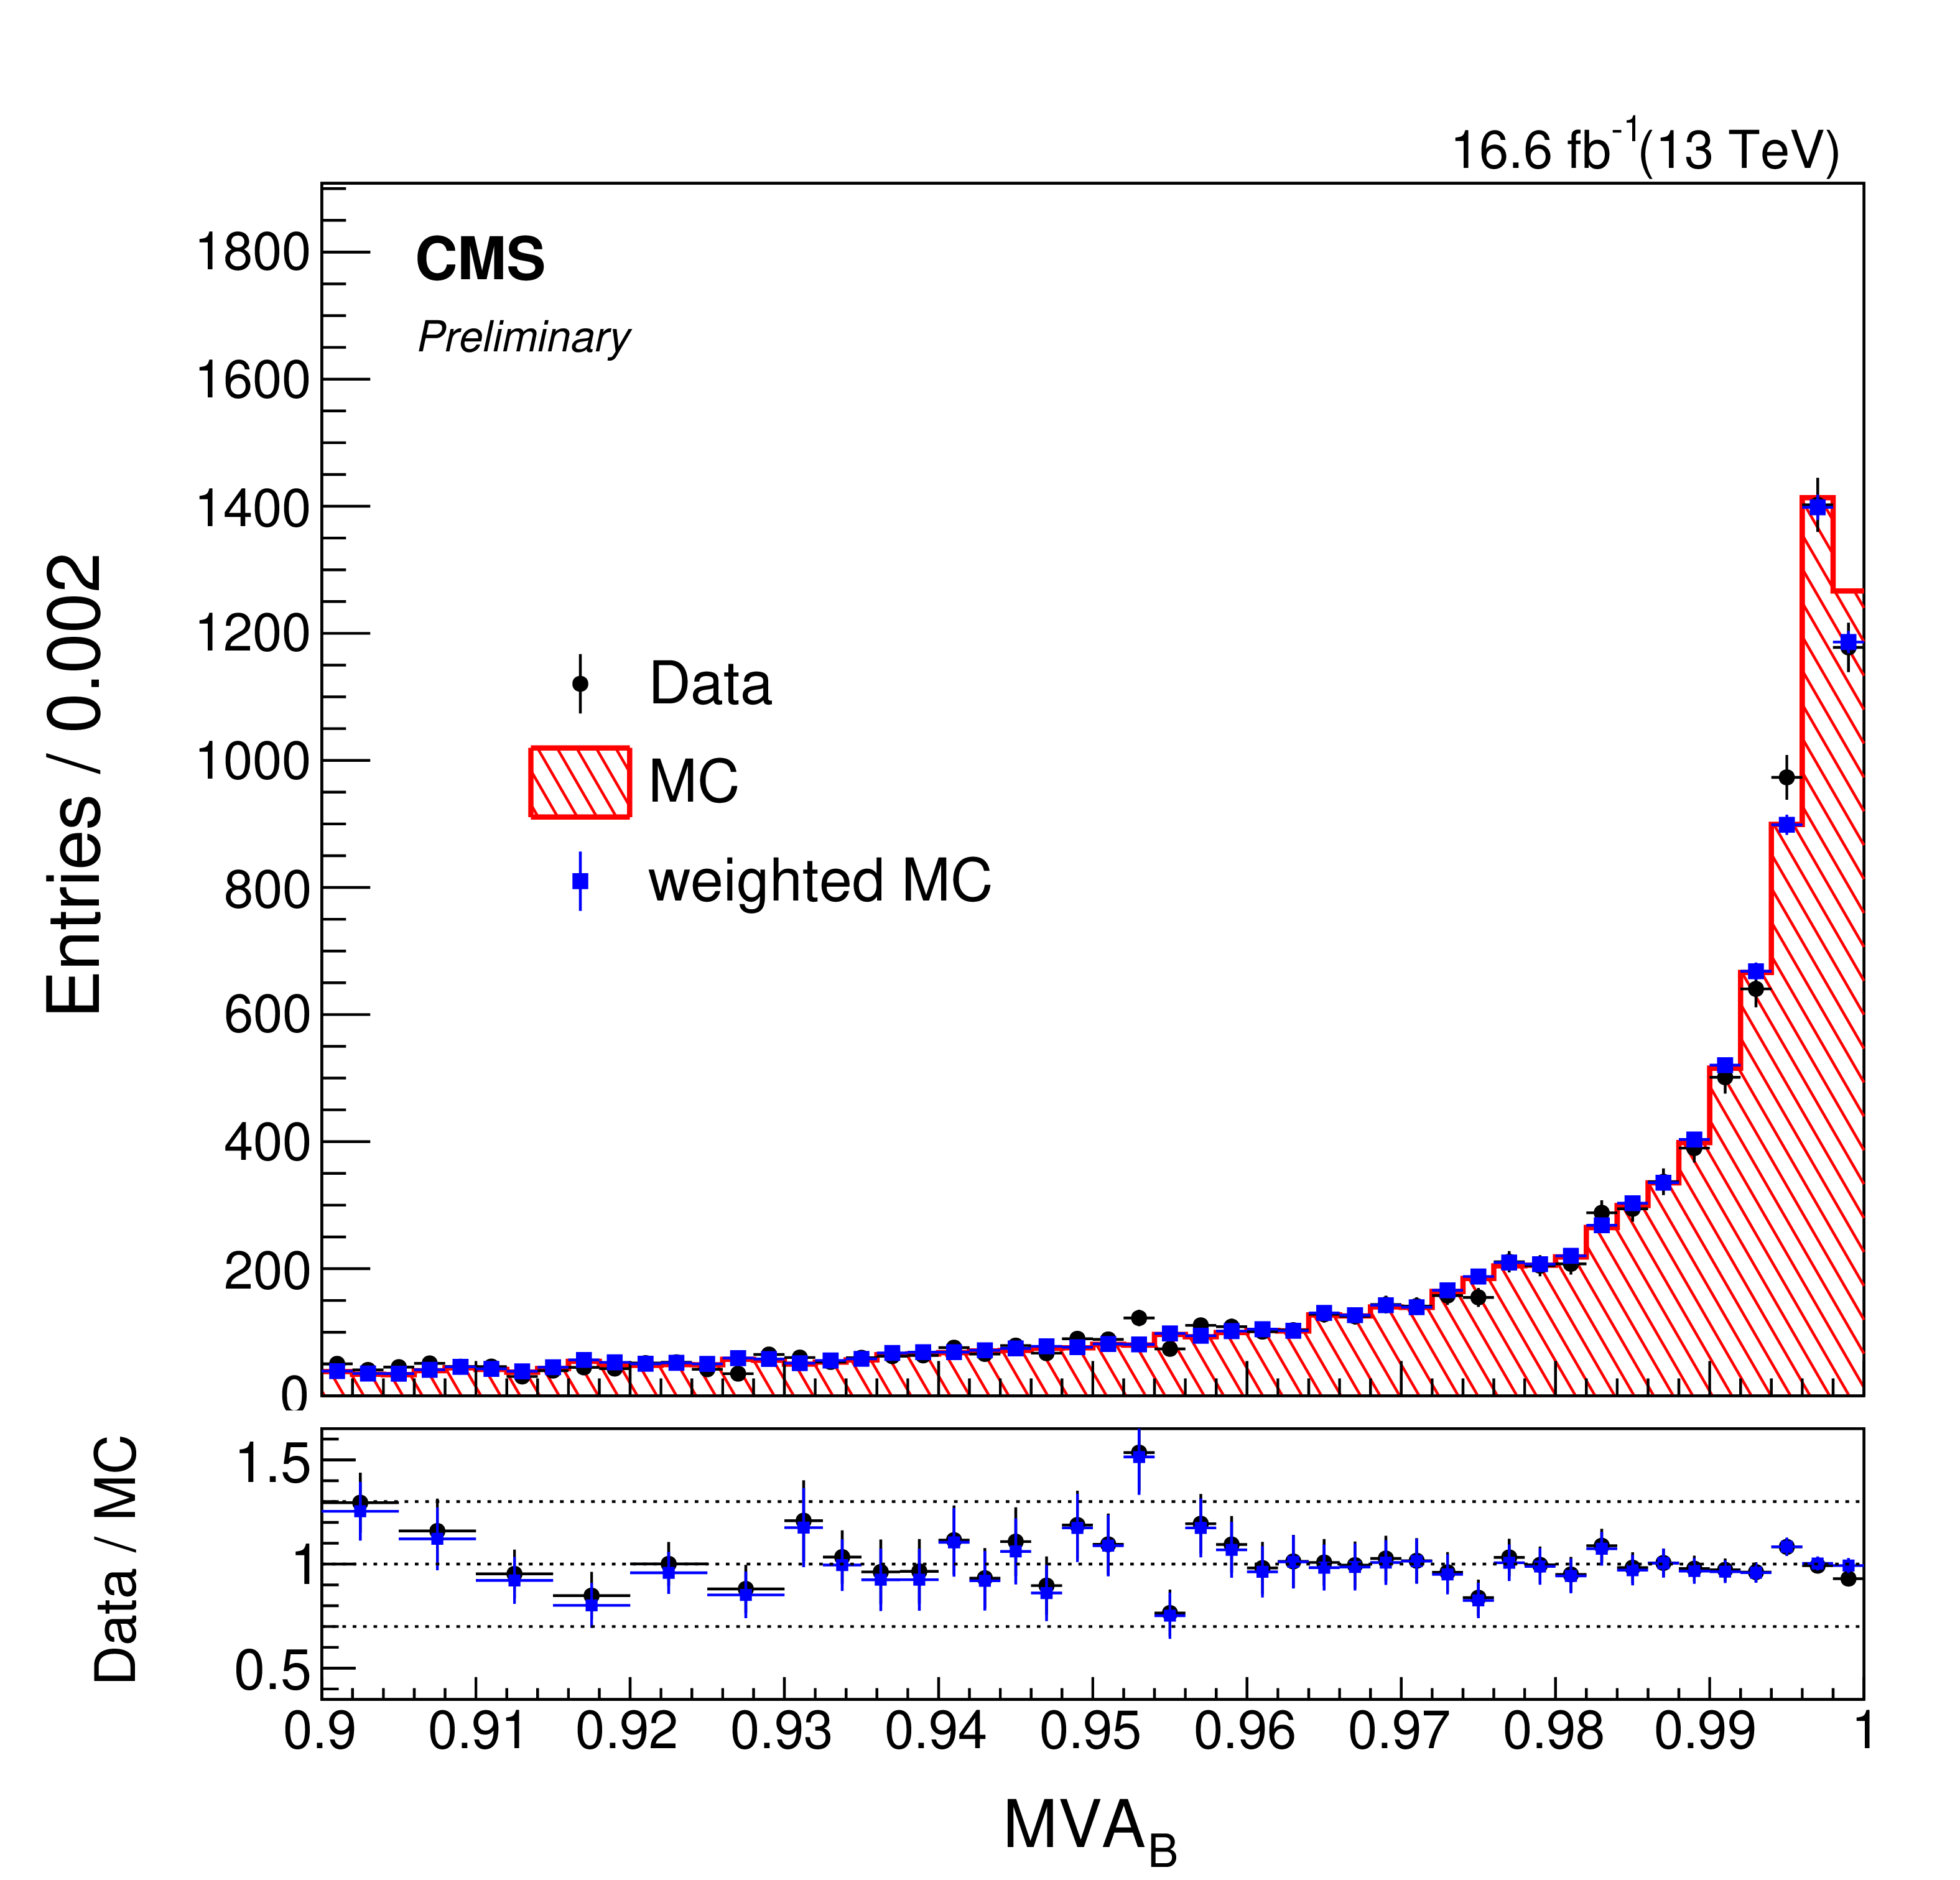
Figure 1-b:
Distribution of the MVA$_{\text{B}}$ output for 2016b data and the corresponding simulations. The blue histogram represents the reweighted MC simulations using the XGBoost reweighting method. The MC distribution is normalized to the data integral. |
png pdf |
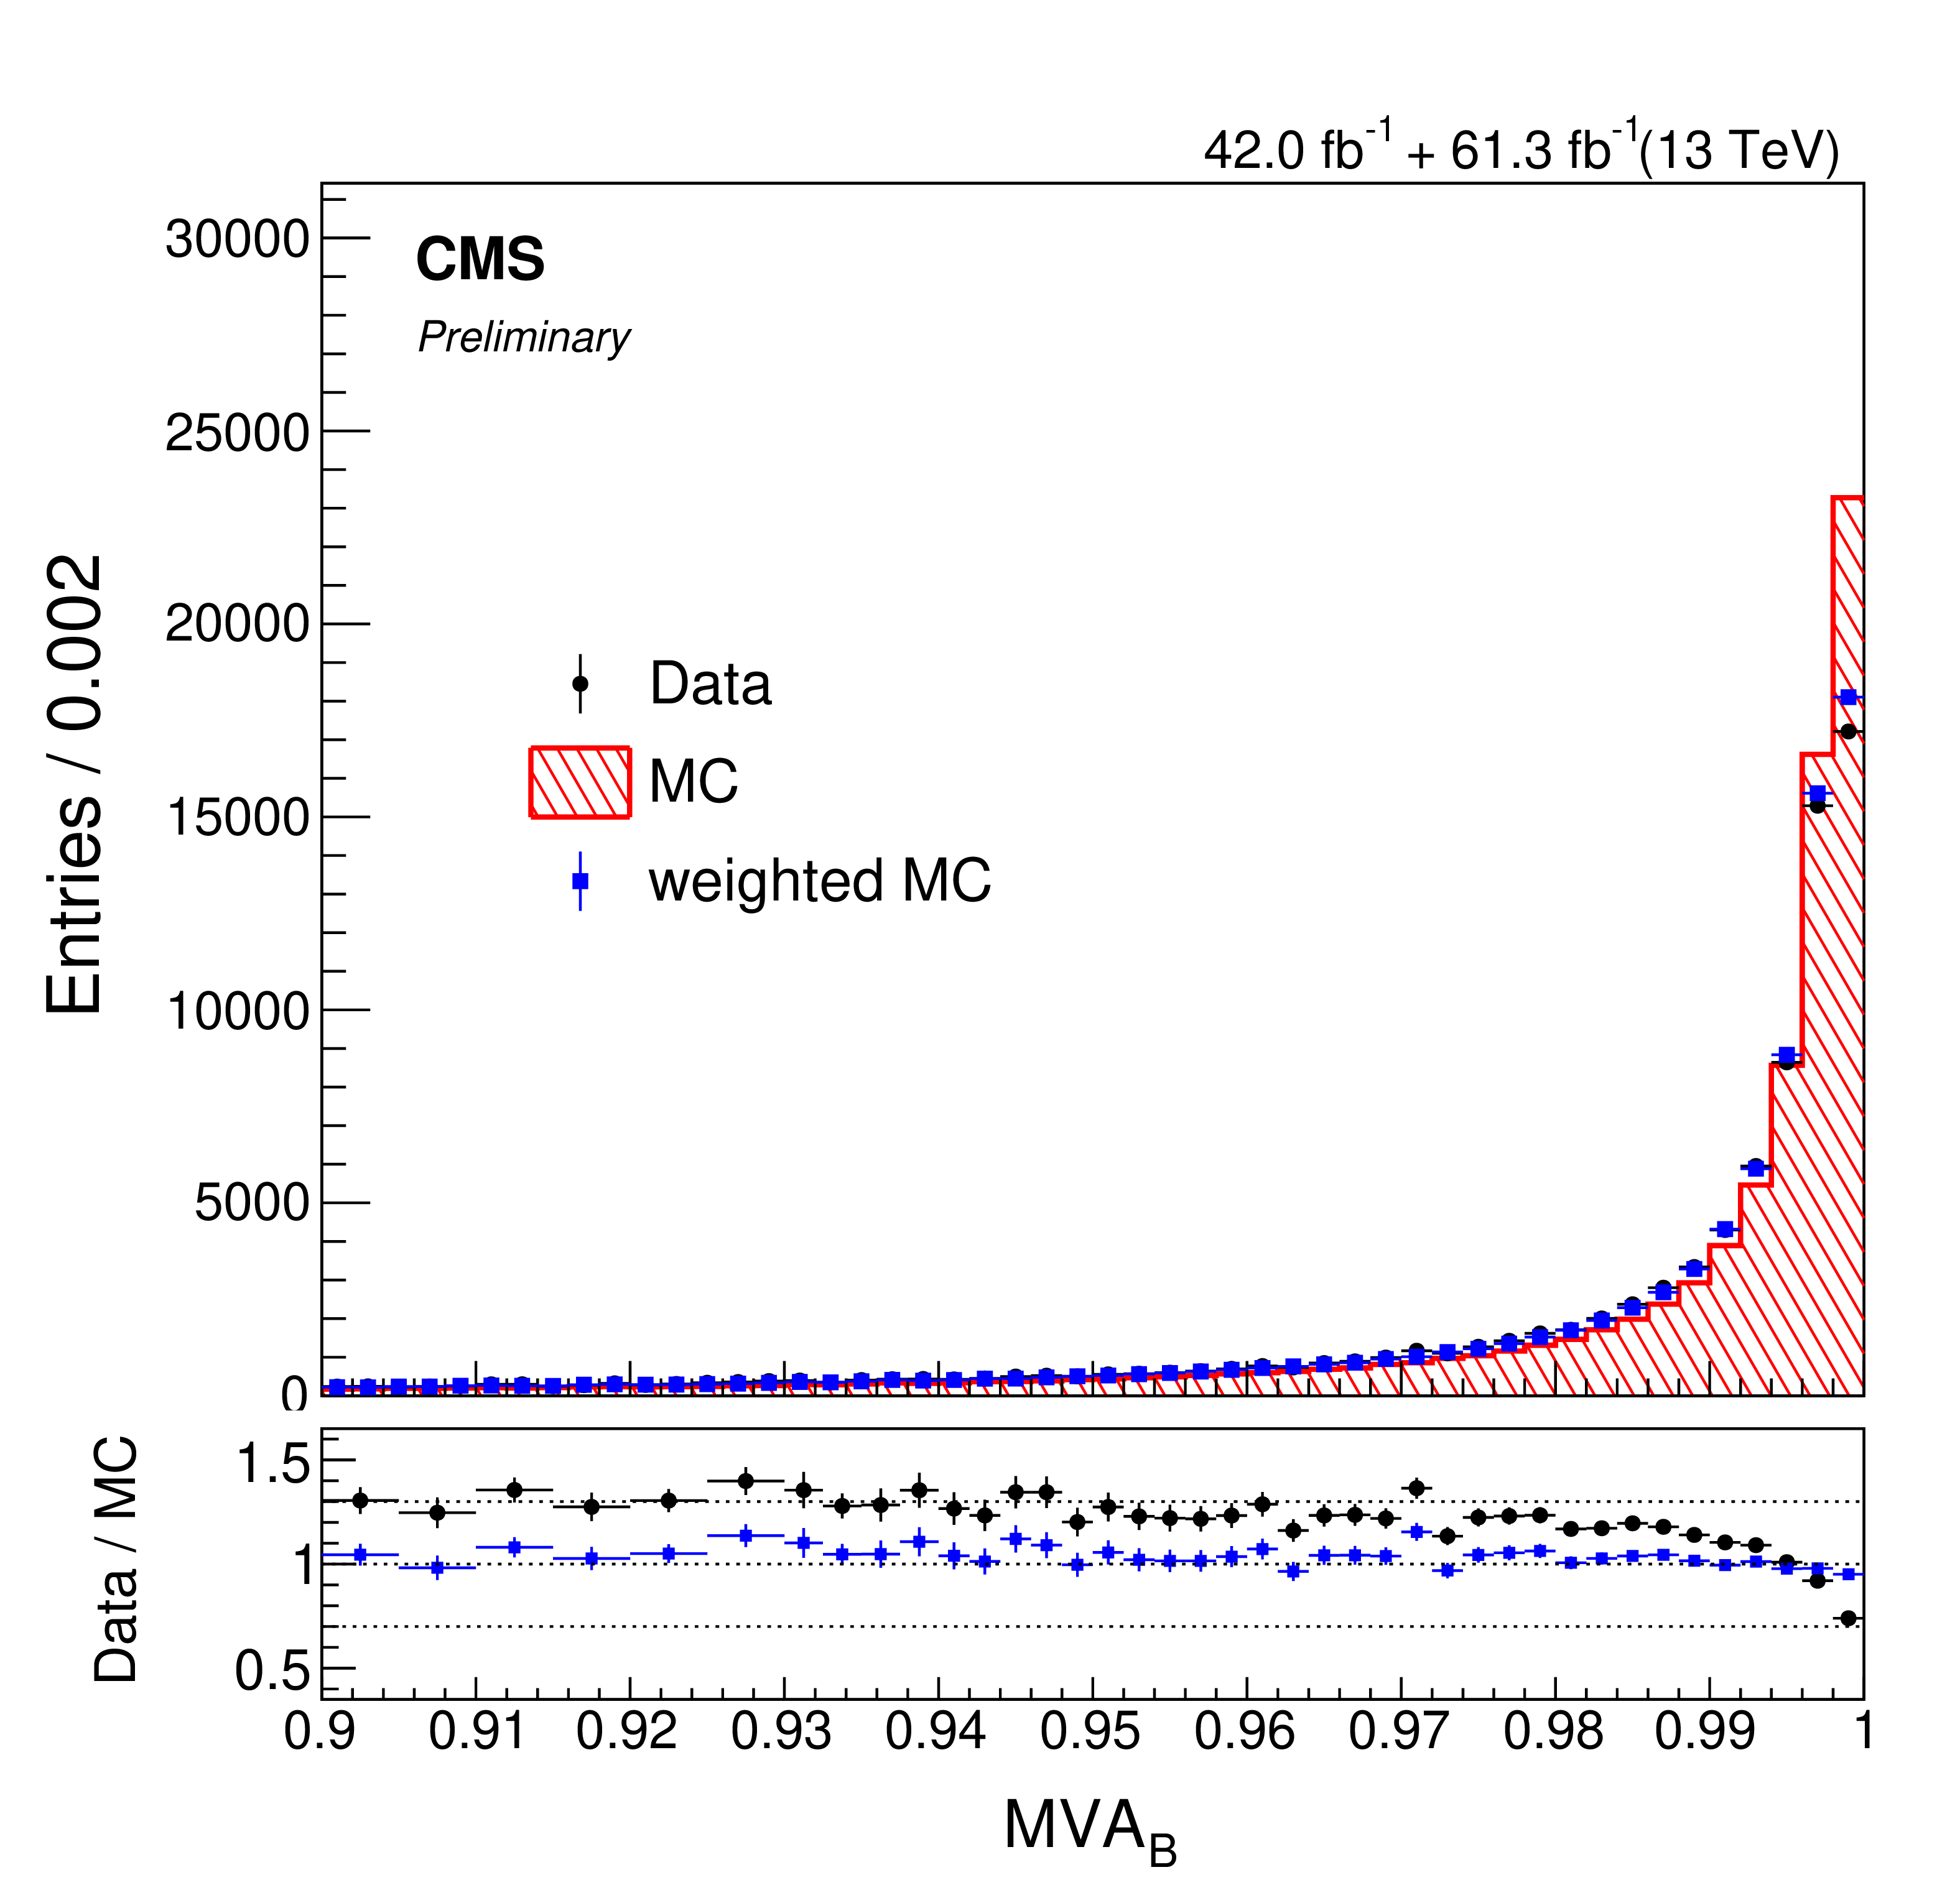
Figure 1-c:
Distribution of the MVA$_{\text{B}}$ output for 2017-2018 data and the corresponding simulations. The blue histogram represents the reweighted MC simulations using the XGBoost reweighting method. The MC distribution is normalized to the data integral. |
png pdf |
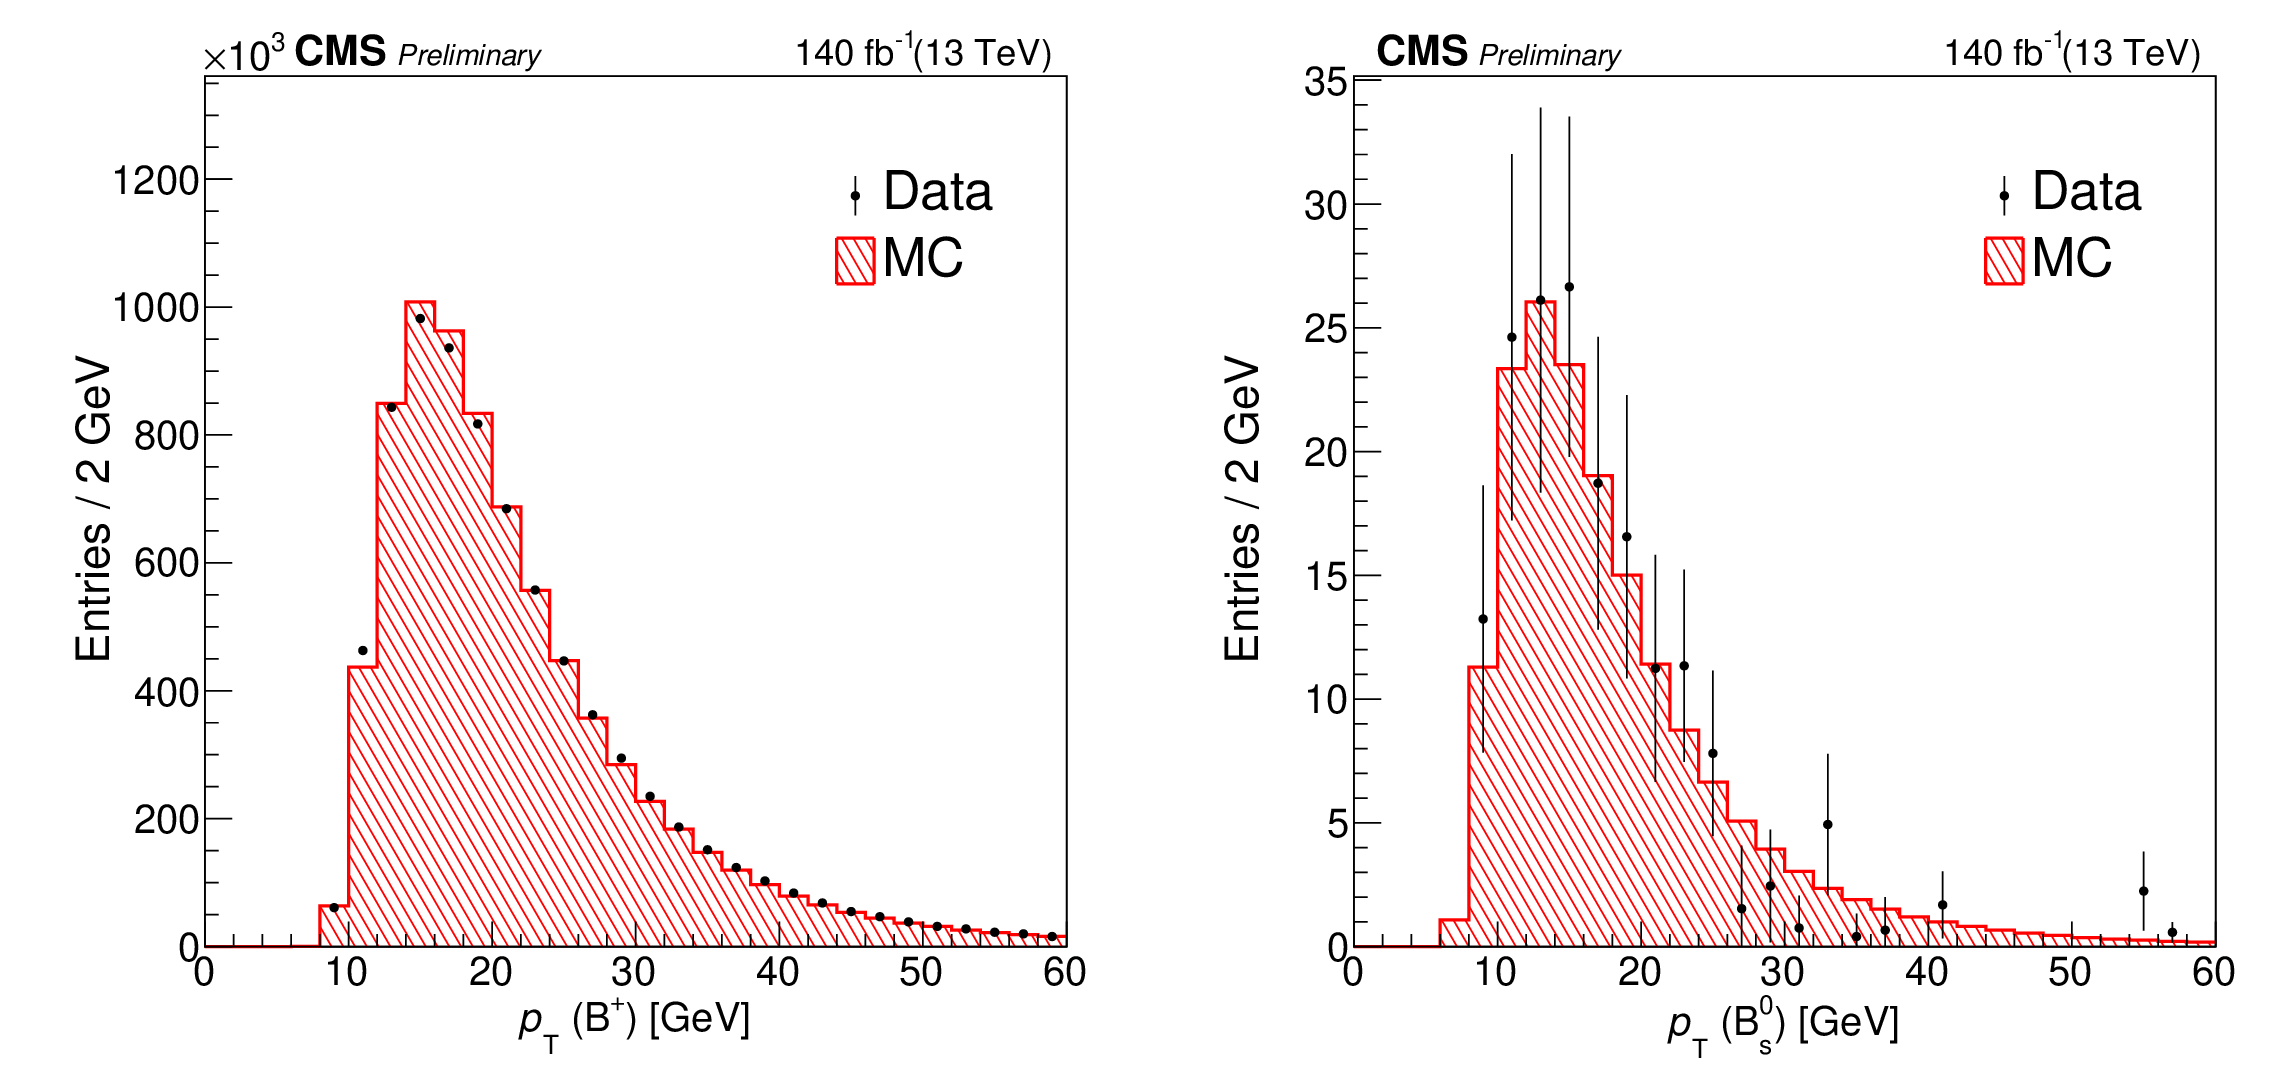
Figure 2:
The distribution of the B meson $p_{\mathrm {T}}$ after the sPlot background subtraction in data (points with the error bars) and simulation (hatched histogram) for $ {\mathrm{B^{+}} \to \mathrm{J}/\psi \mathrm{K^{+}}} $ (left) and $ {\mathrm{B_s}^{0}\to \mu^{+} \mu^{-}} $ (right) events. The MC distributions are normalized to the data integral. |
png pdf |
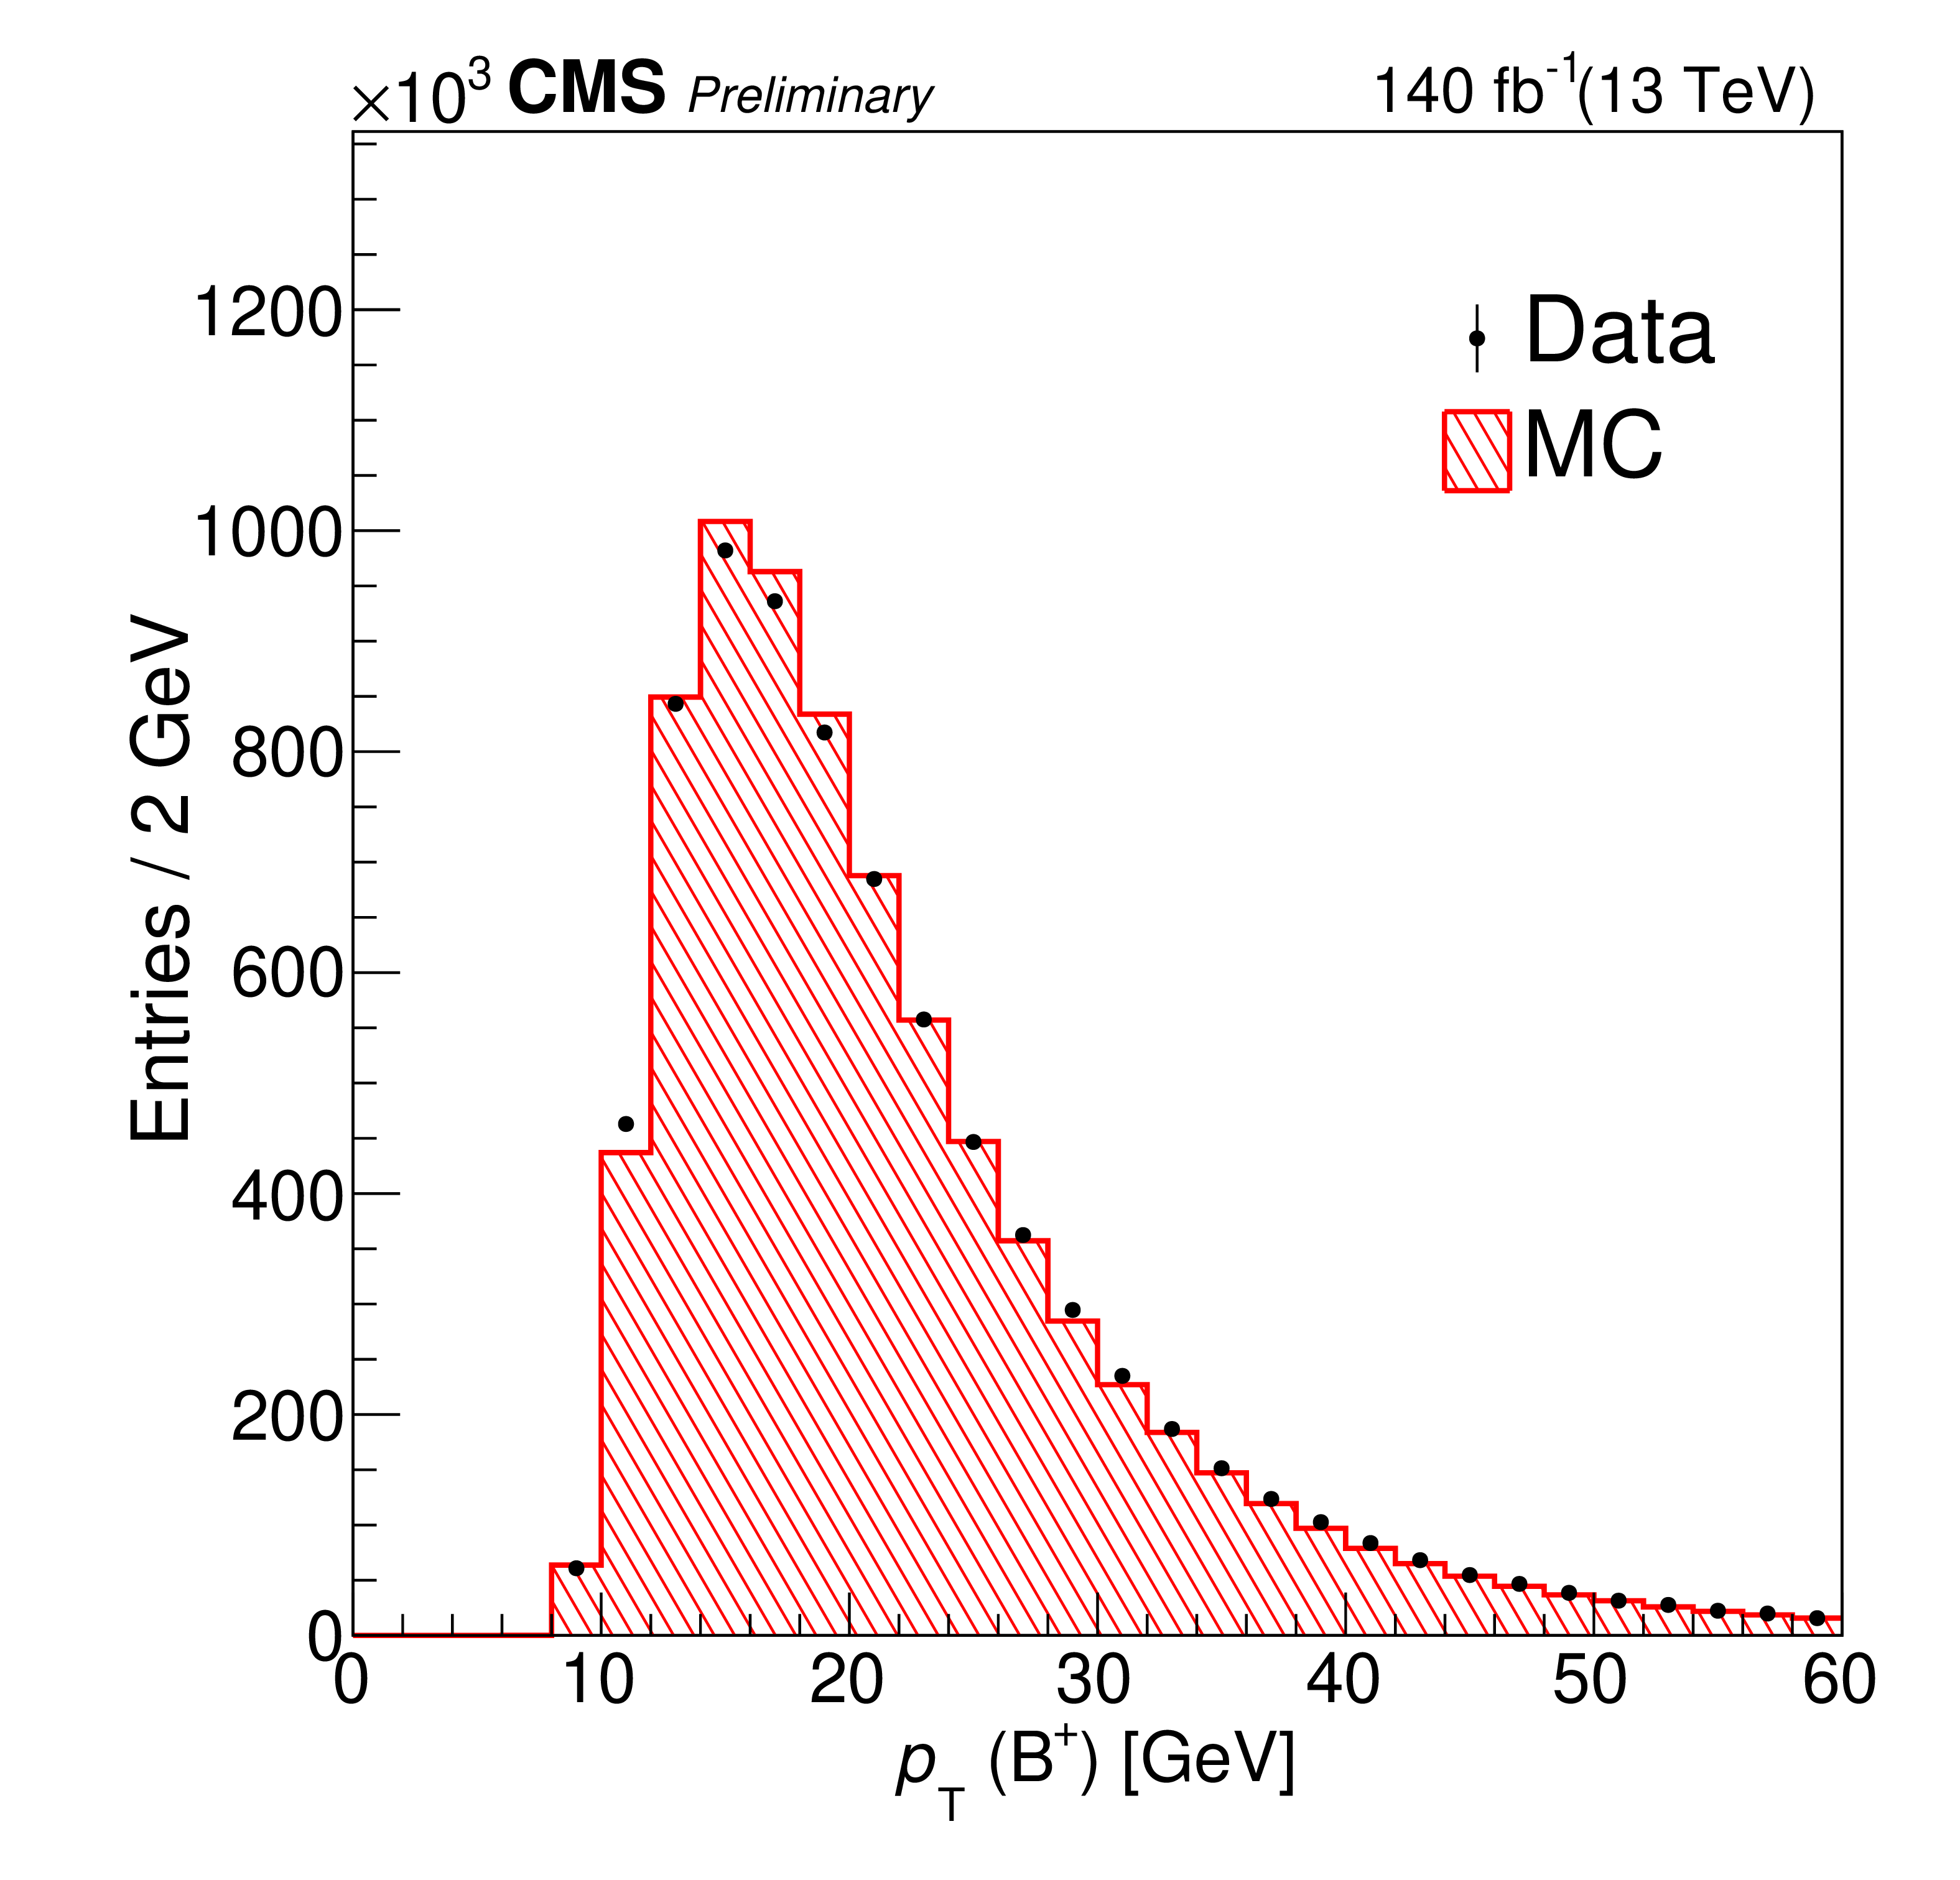
Figure 2-a:
The distribution of the B meson $p_{\mathrm {T}}$ after the sPlot background subtraction in data (points with the error bars) and simulation (hatched histogram) for $ {\mathrm{B^{+}} \to \mathrm{J}/\psi \mathrm{K^{+}}} $ events. The MC distribution is normalized to the data integral. |
png pdf |
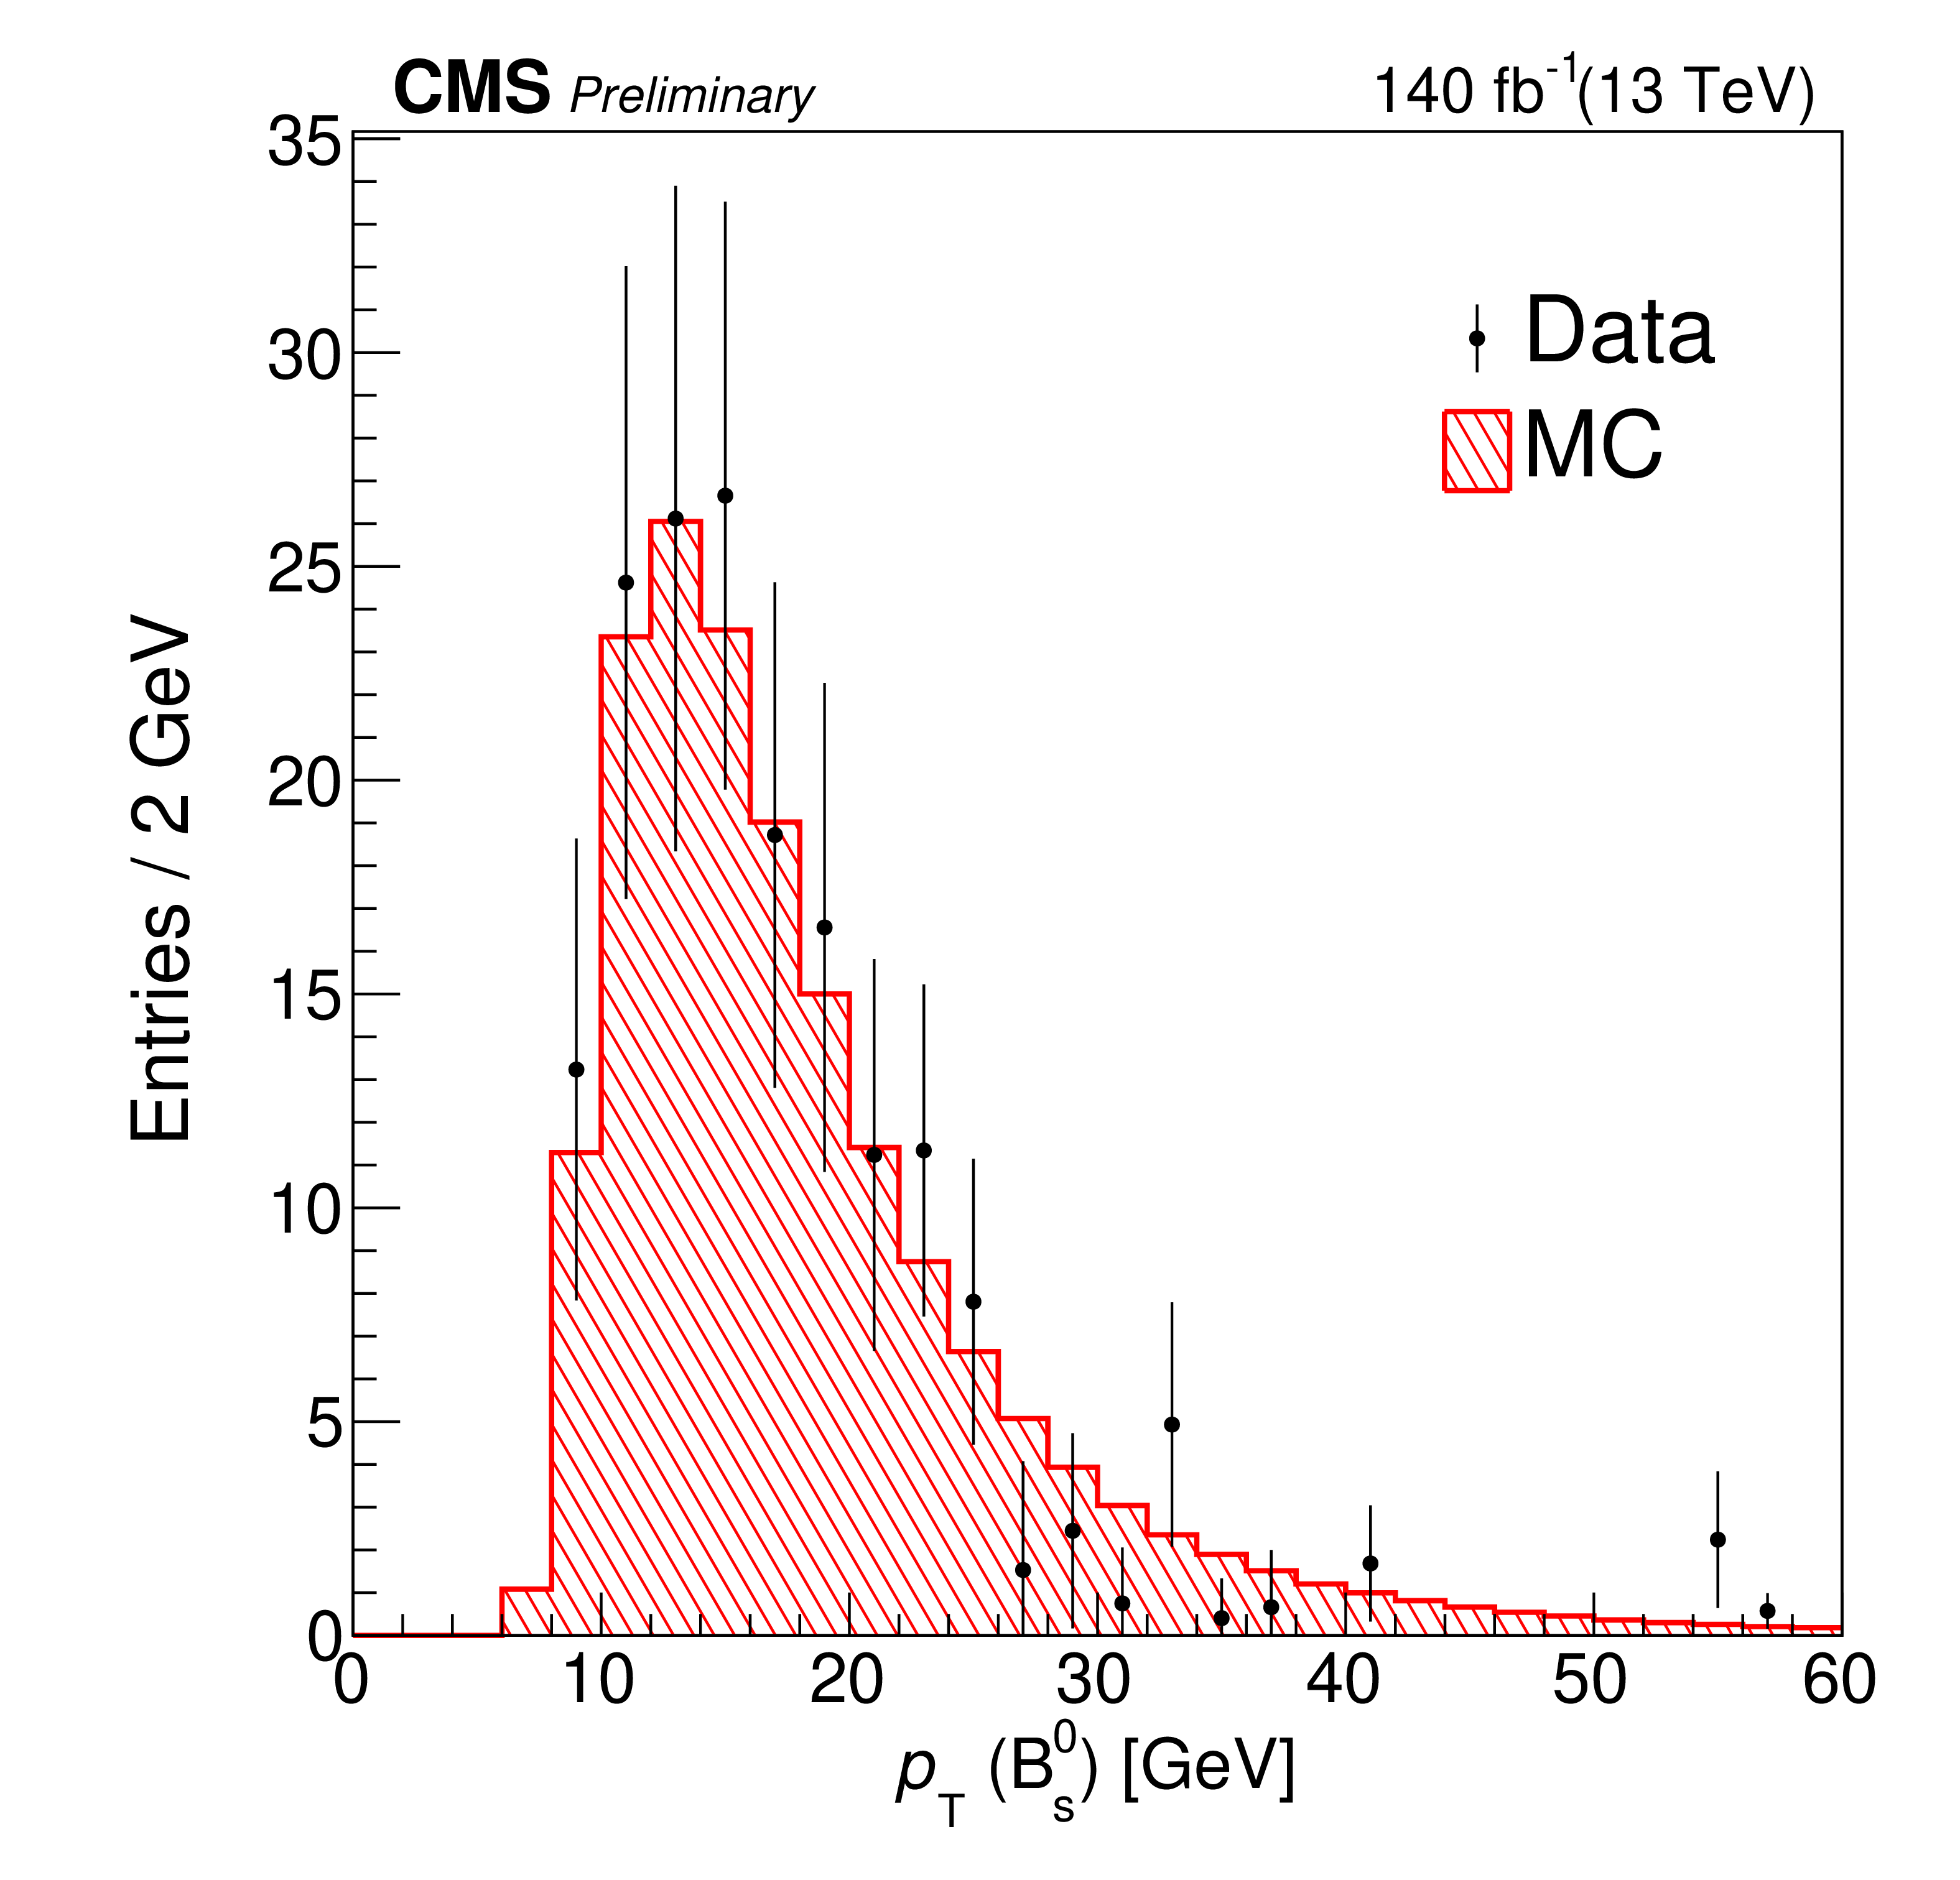
Figure 2-b:
The distribution of the B meson $p_{\mathrm {T}}$ after the sPlot background subtraction in data (points with the error bars) and simulation (hatched histogram) for $ {\mathrm{B_s}^{0}\to \mu^{+} \mu^{-}} $ events. The MC distribution is normalized to the data integral. |
png pdf |
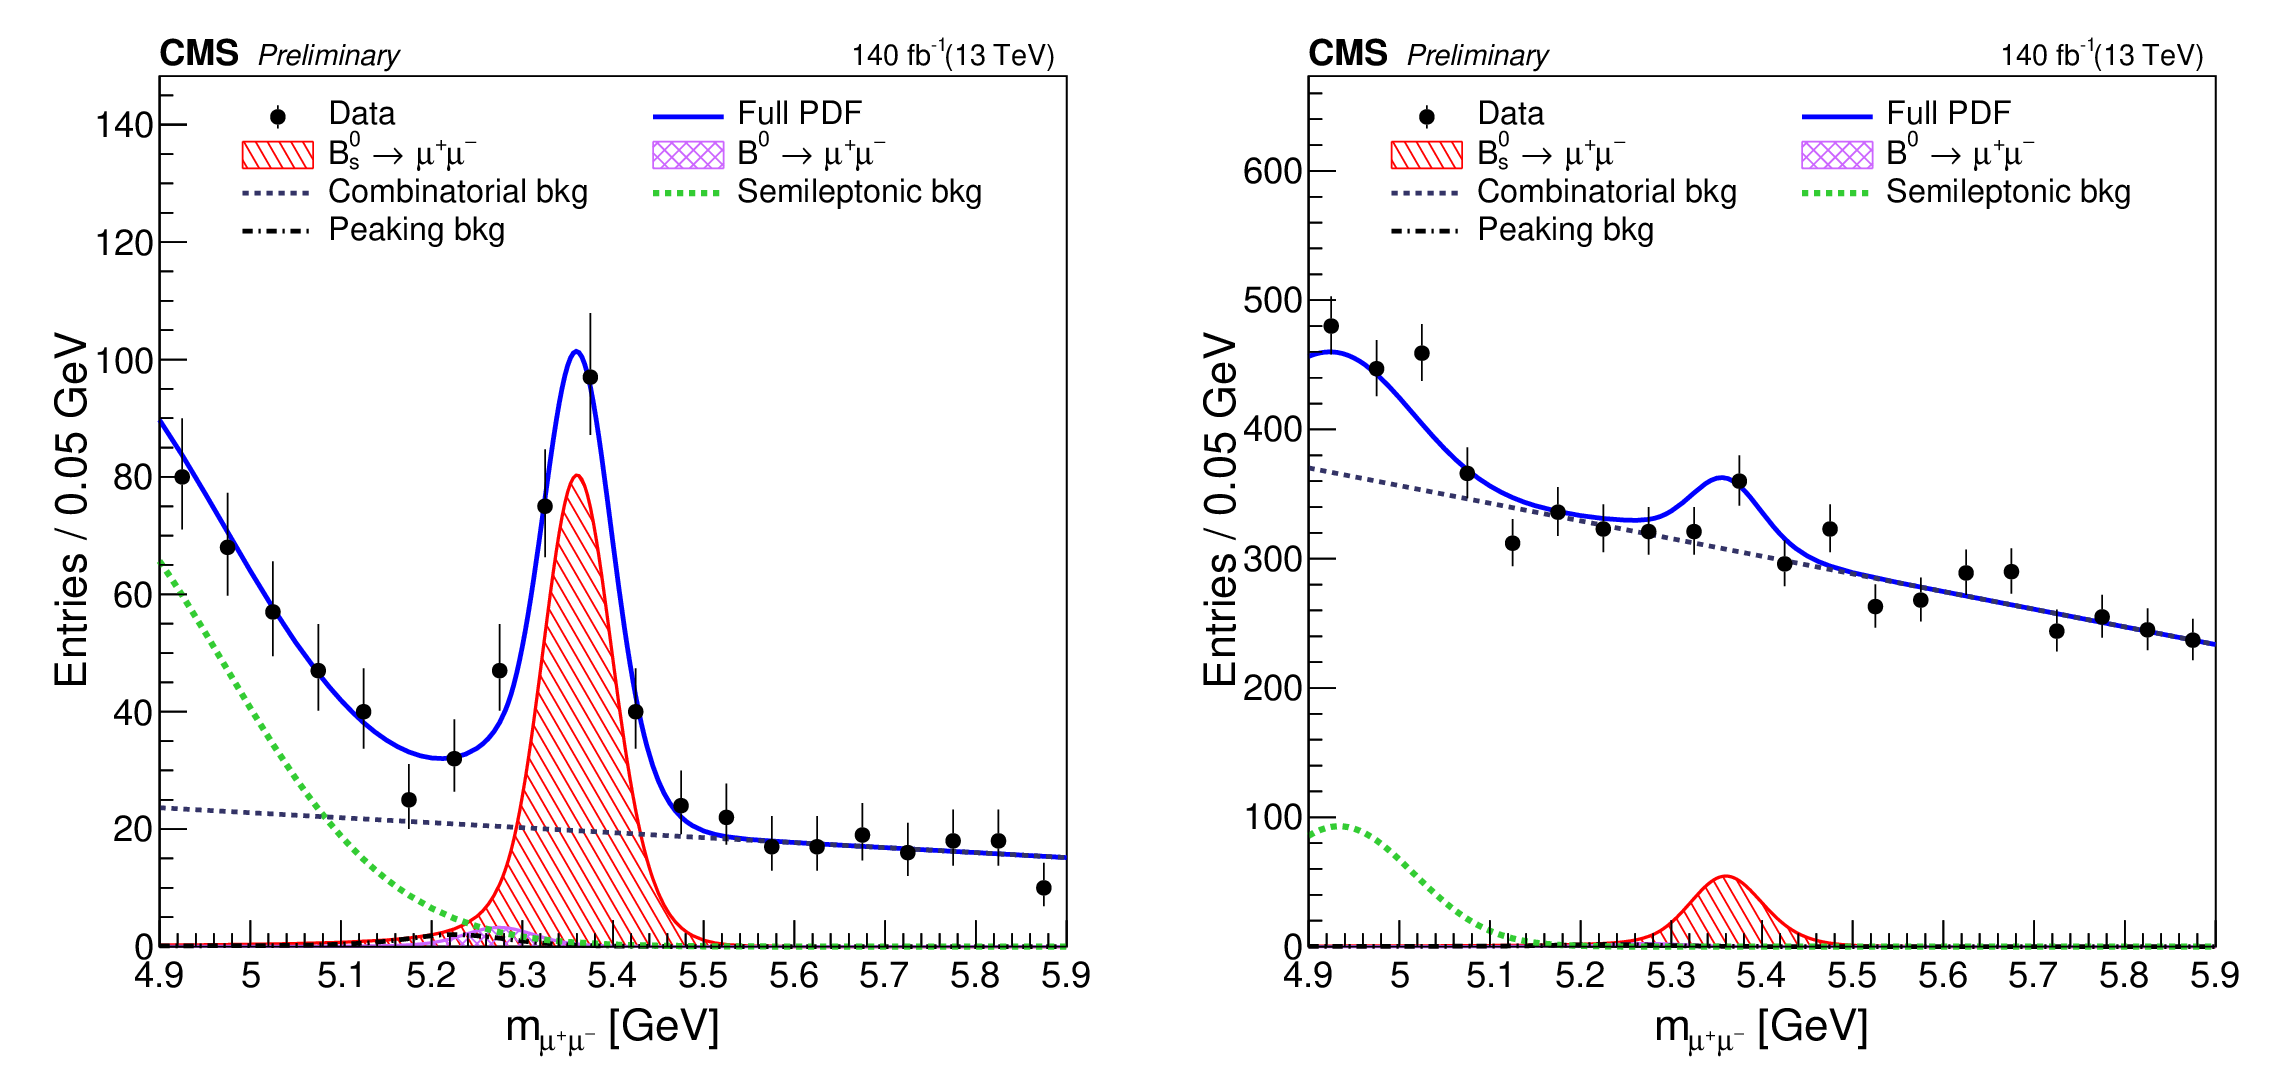
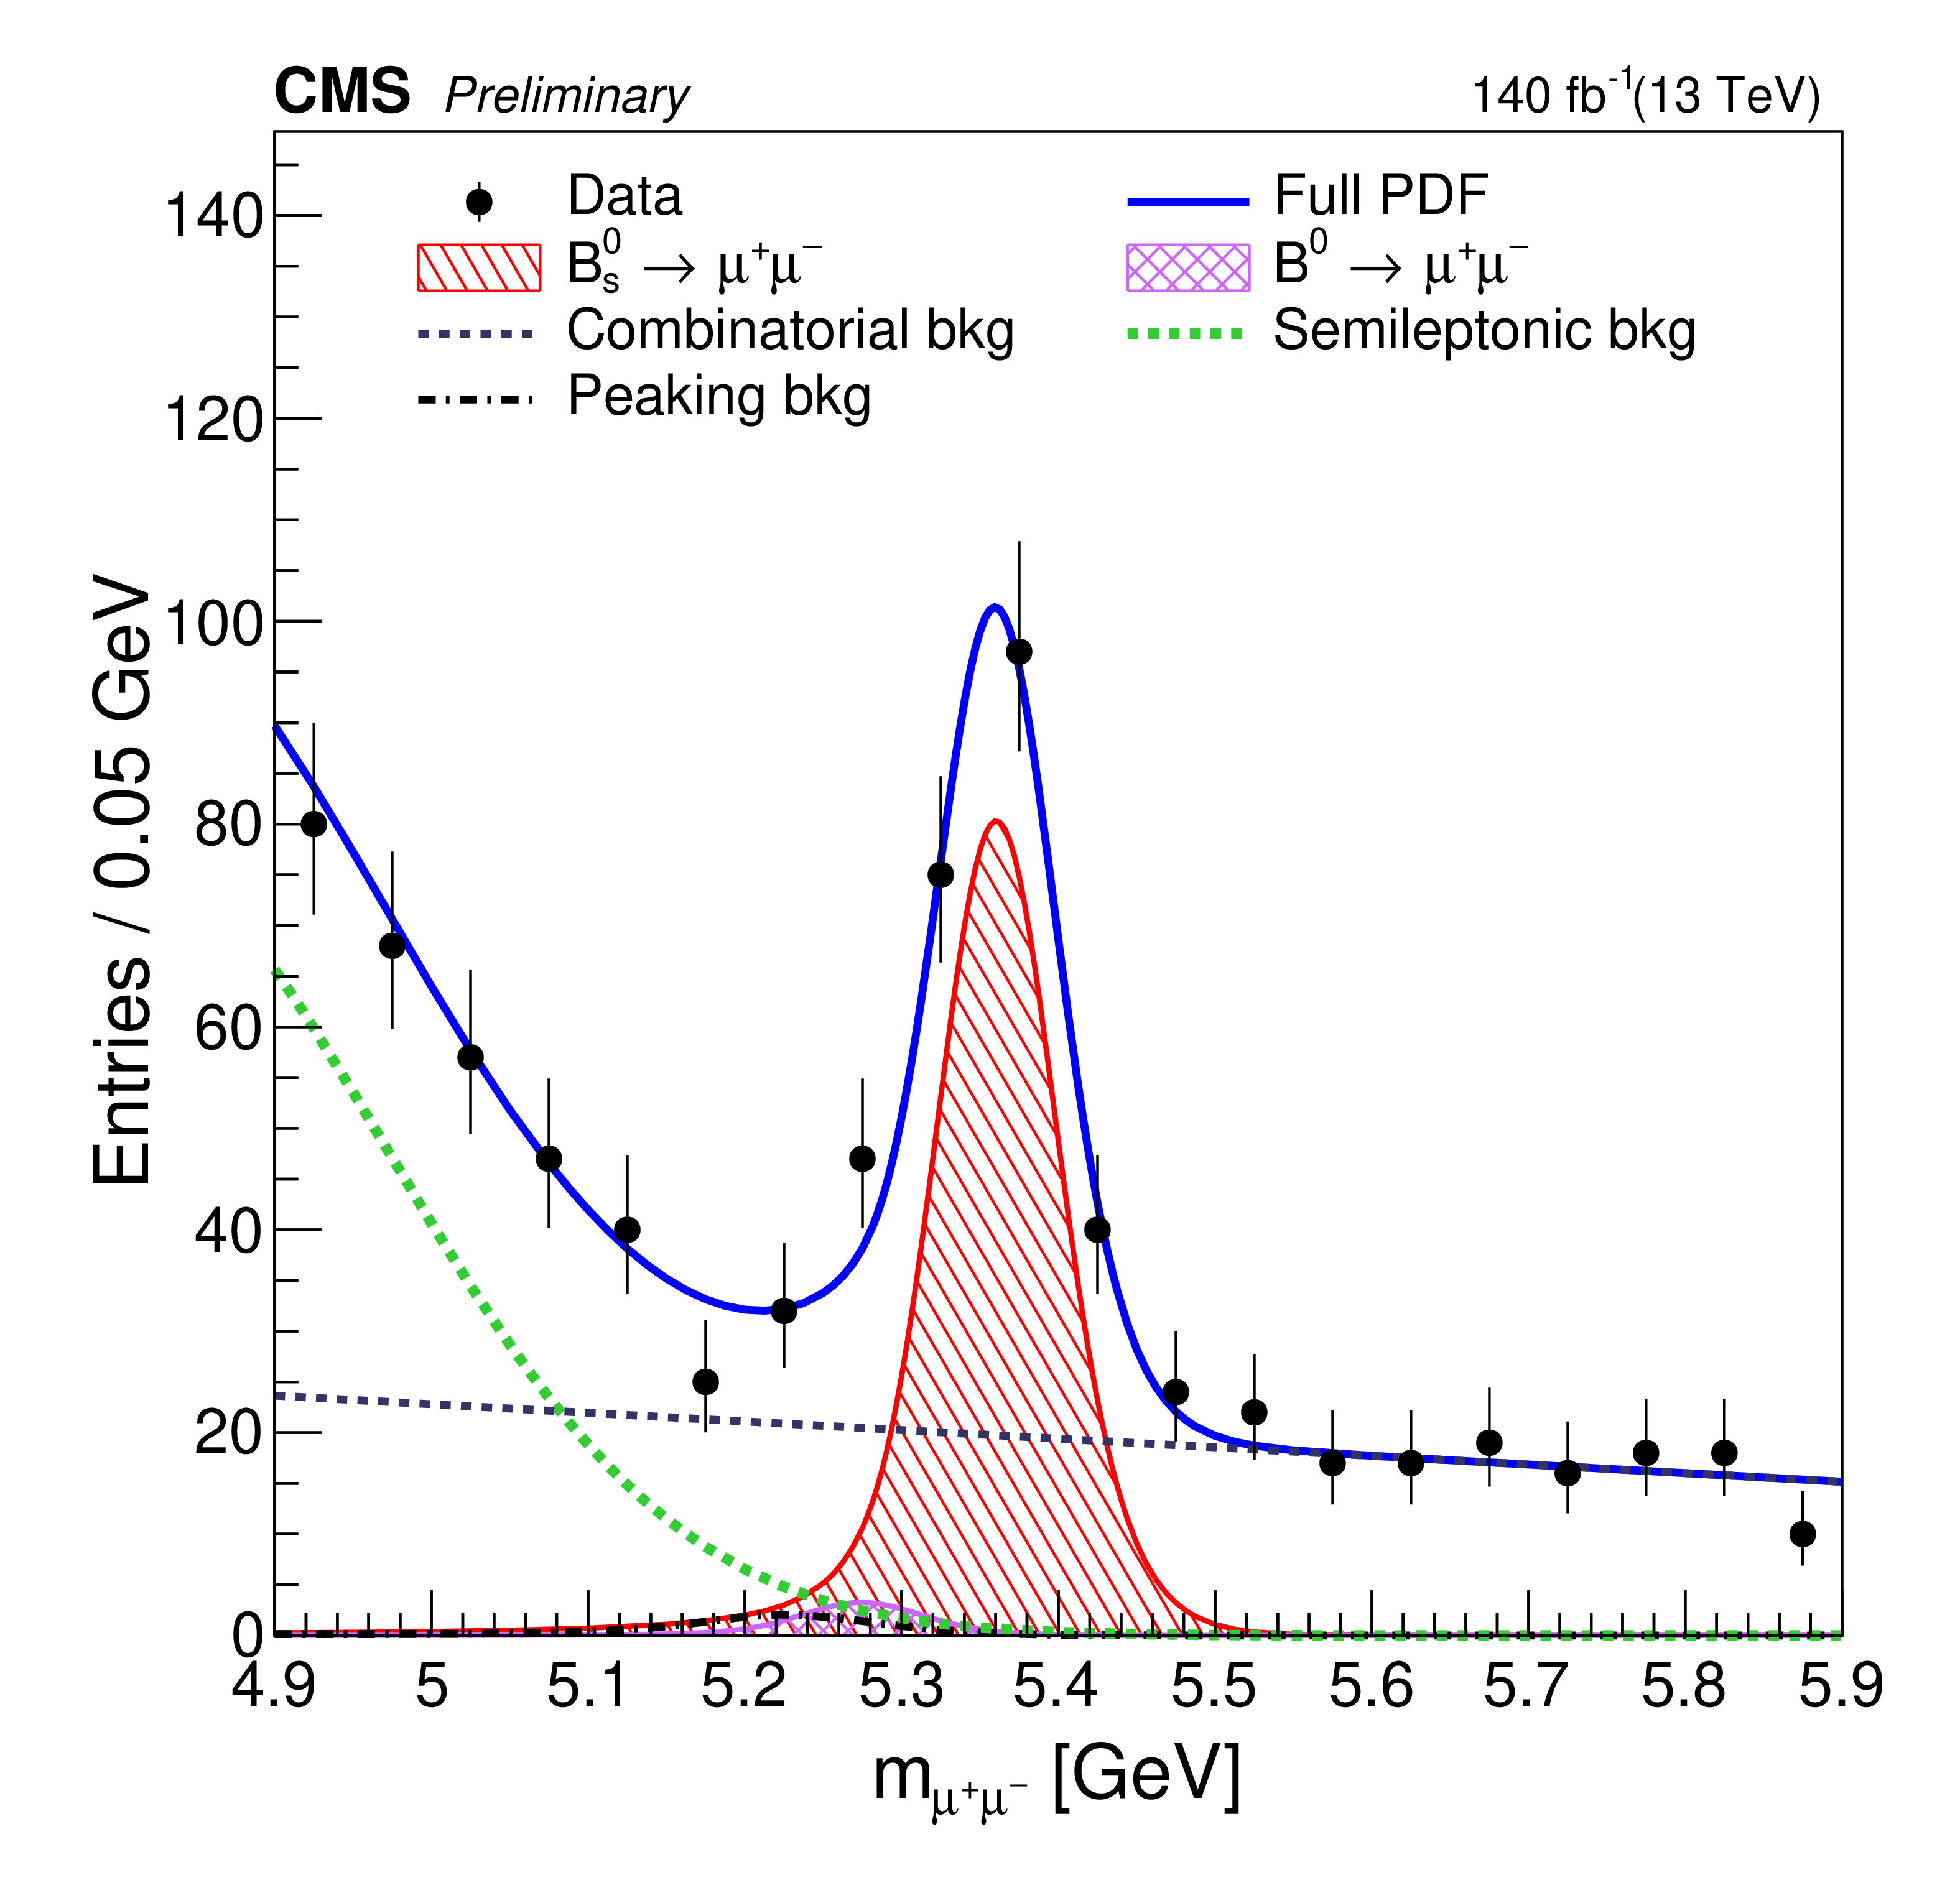
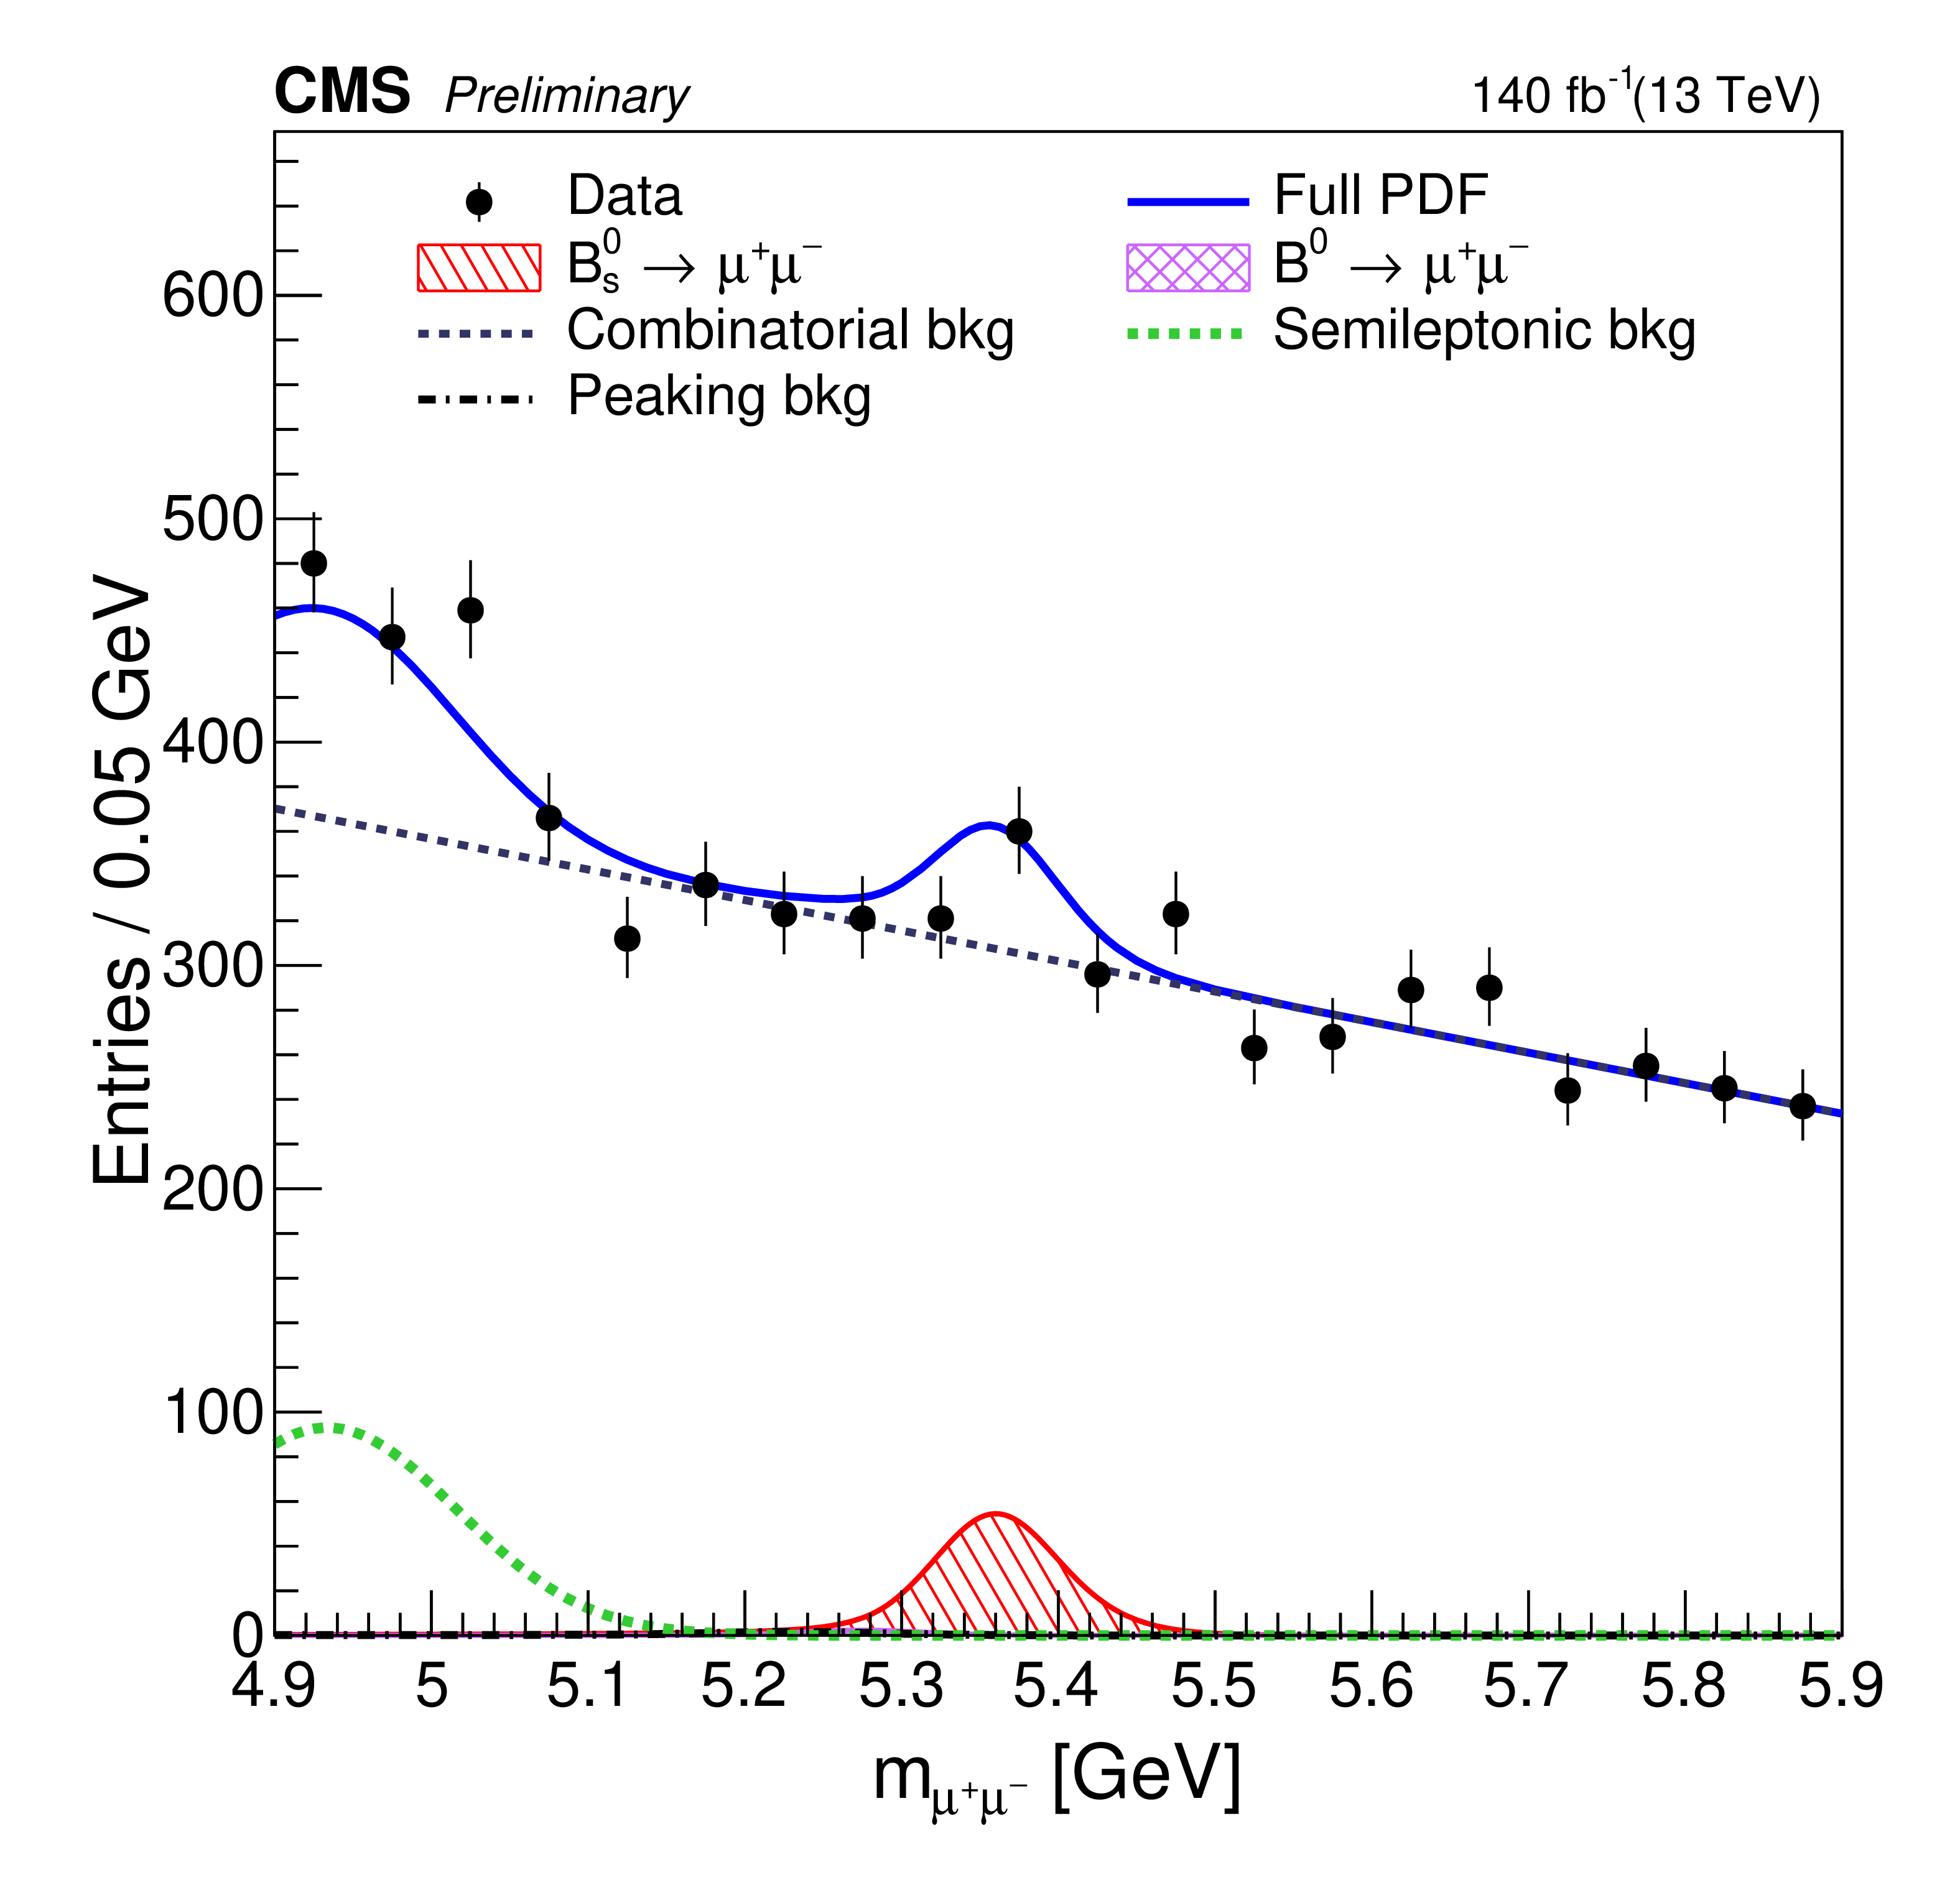
Figure 3:
The projections on the dimuon mass axis for the branching fraction fit for the MVA$_{\text{B}} > $ 0.99 category (left) and 0.99 $ > $ MVA$_{\text{B}} > $ 0.90 category (right). The blue curves represent the corresponding projections of the final fit model. |
png pdf |
Figure 3-a:
The projection on the dimuon mass axis for the branching fraction fit for the MVA$_{\text{B}} > $ 0.99 category. The blue curve represents the corresponding projection of the final fit model. |
png pdf |
Figure 3-b:
The projection on the dimuon mass axis for the branching fraction fit for the 0.99 $ > $ MVA$_{\text{B}} > $ 0.90 category. The blue curve represents the corresponding projection of the final fit model. |
png pdf |
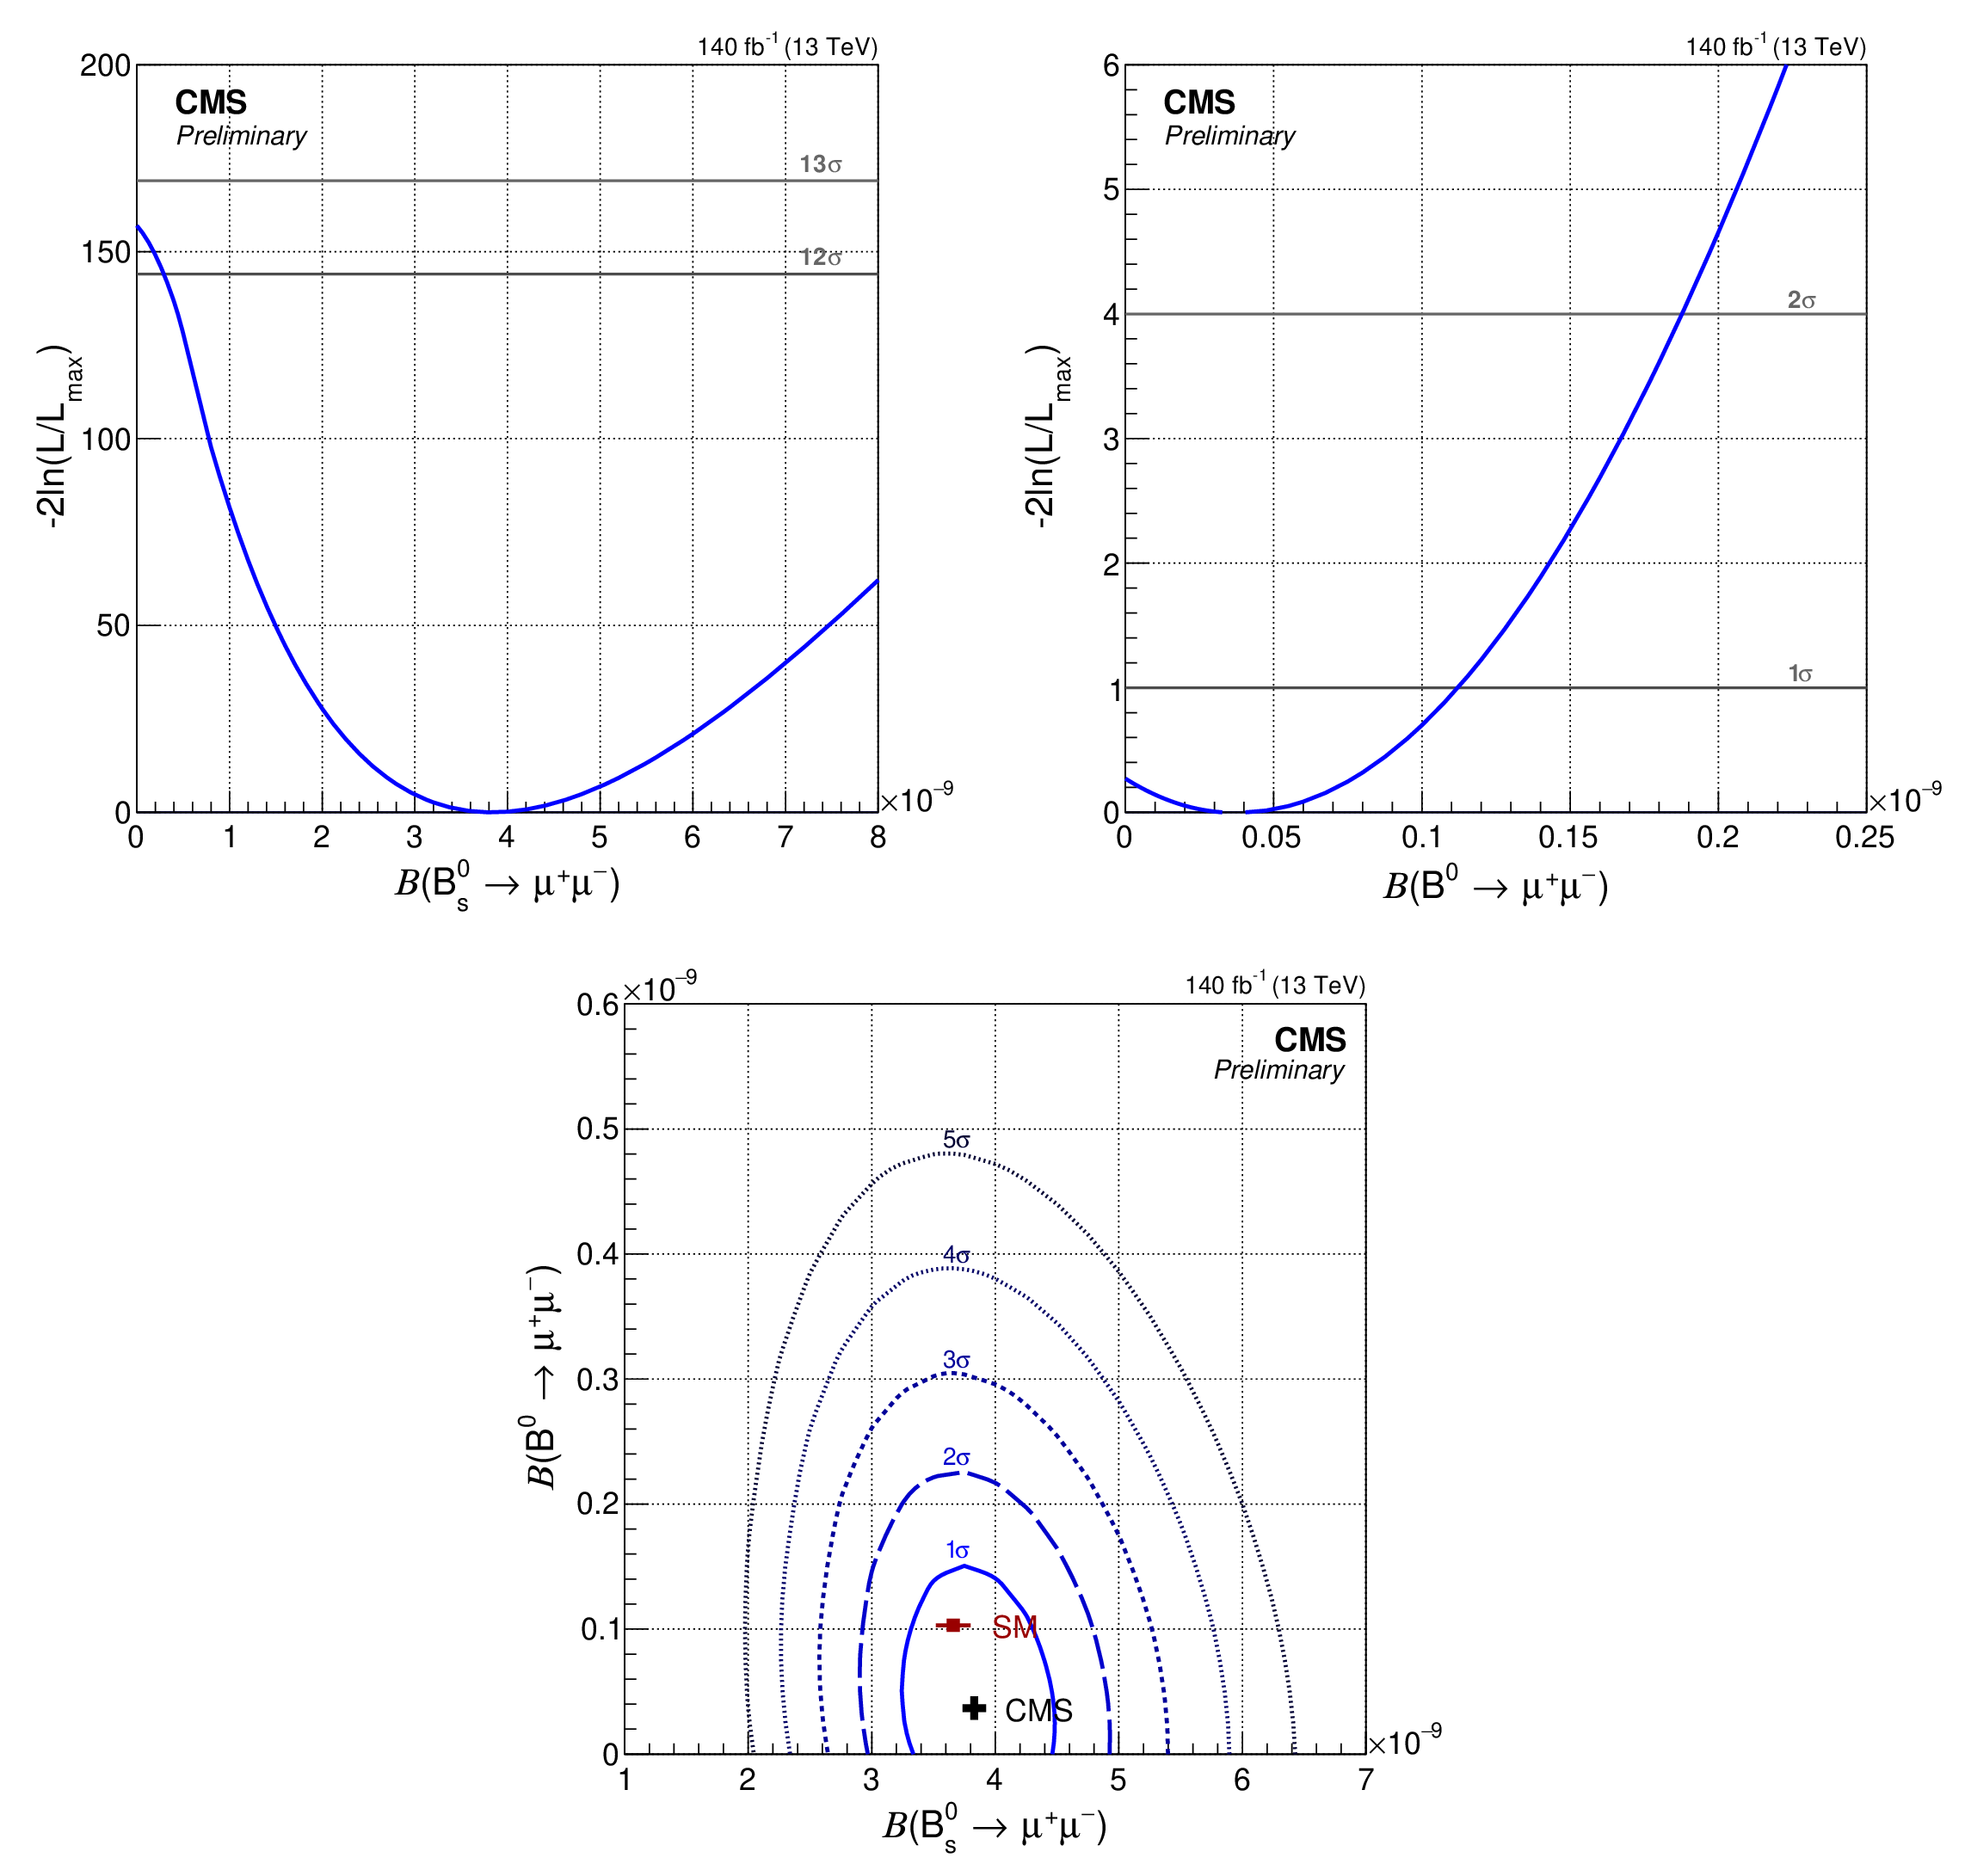
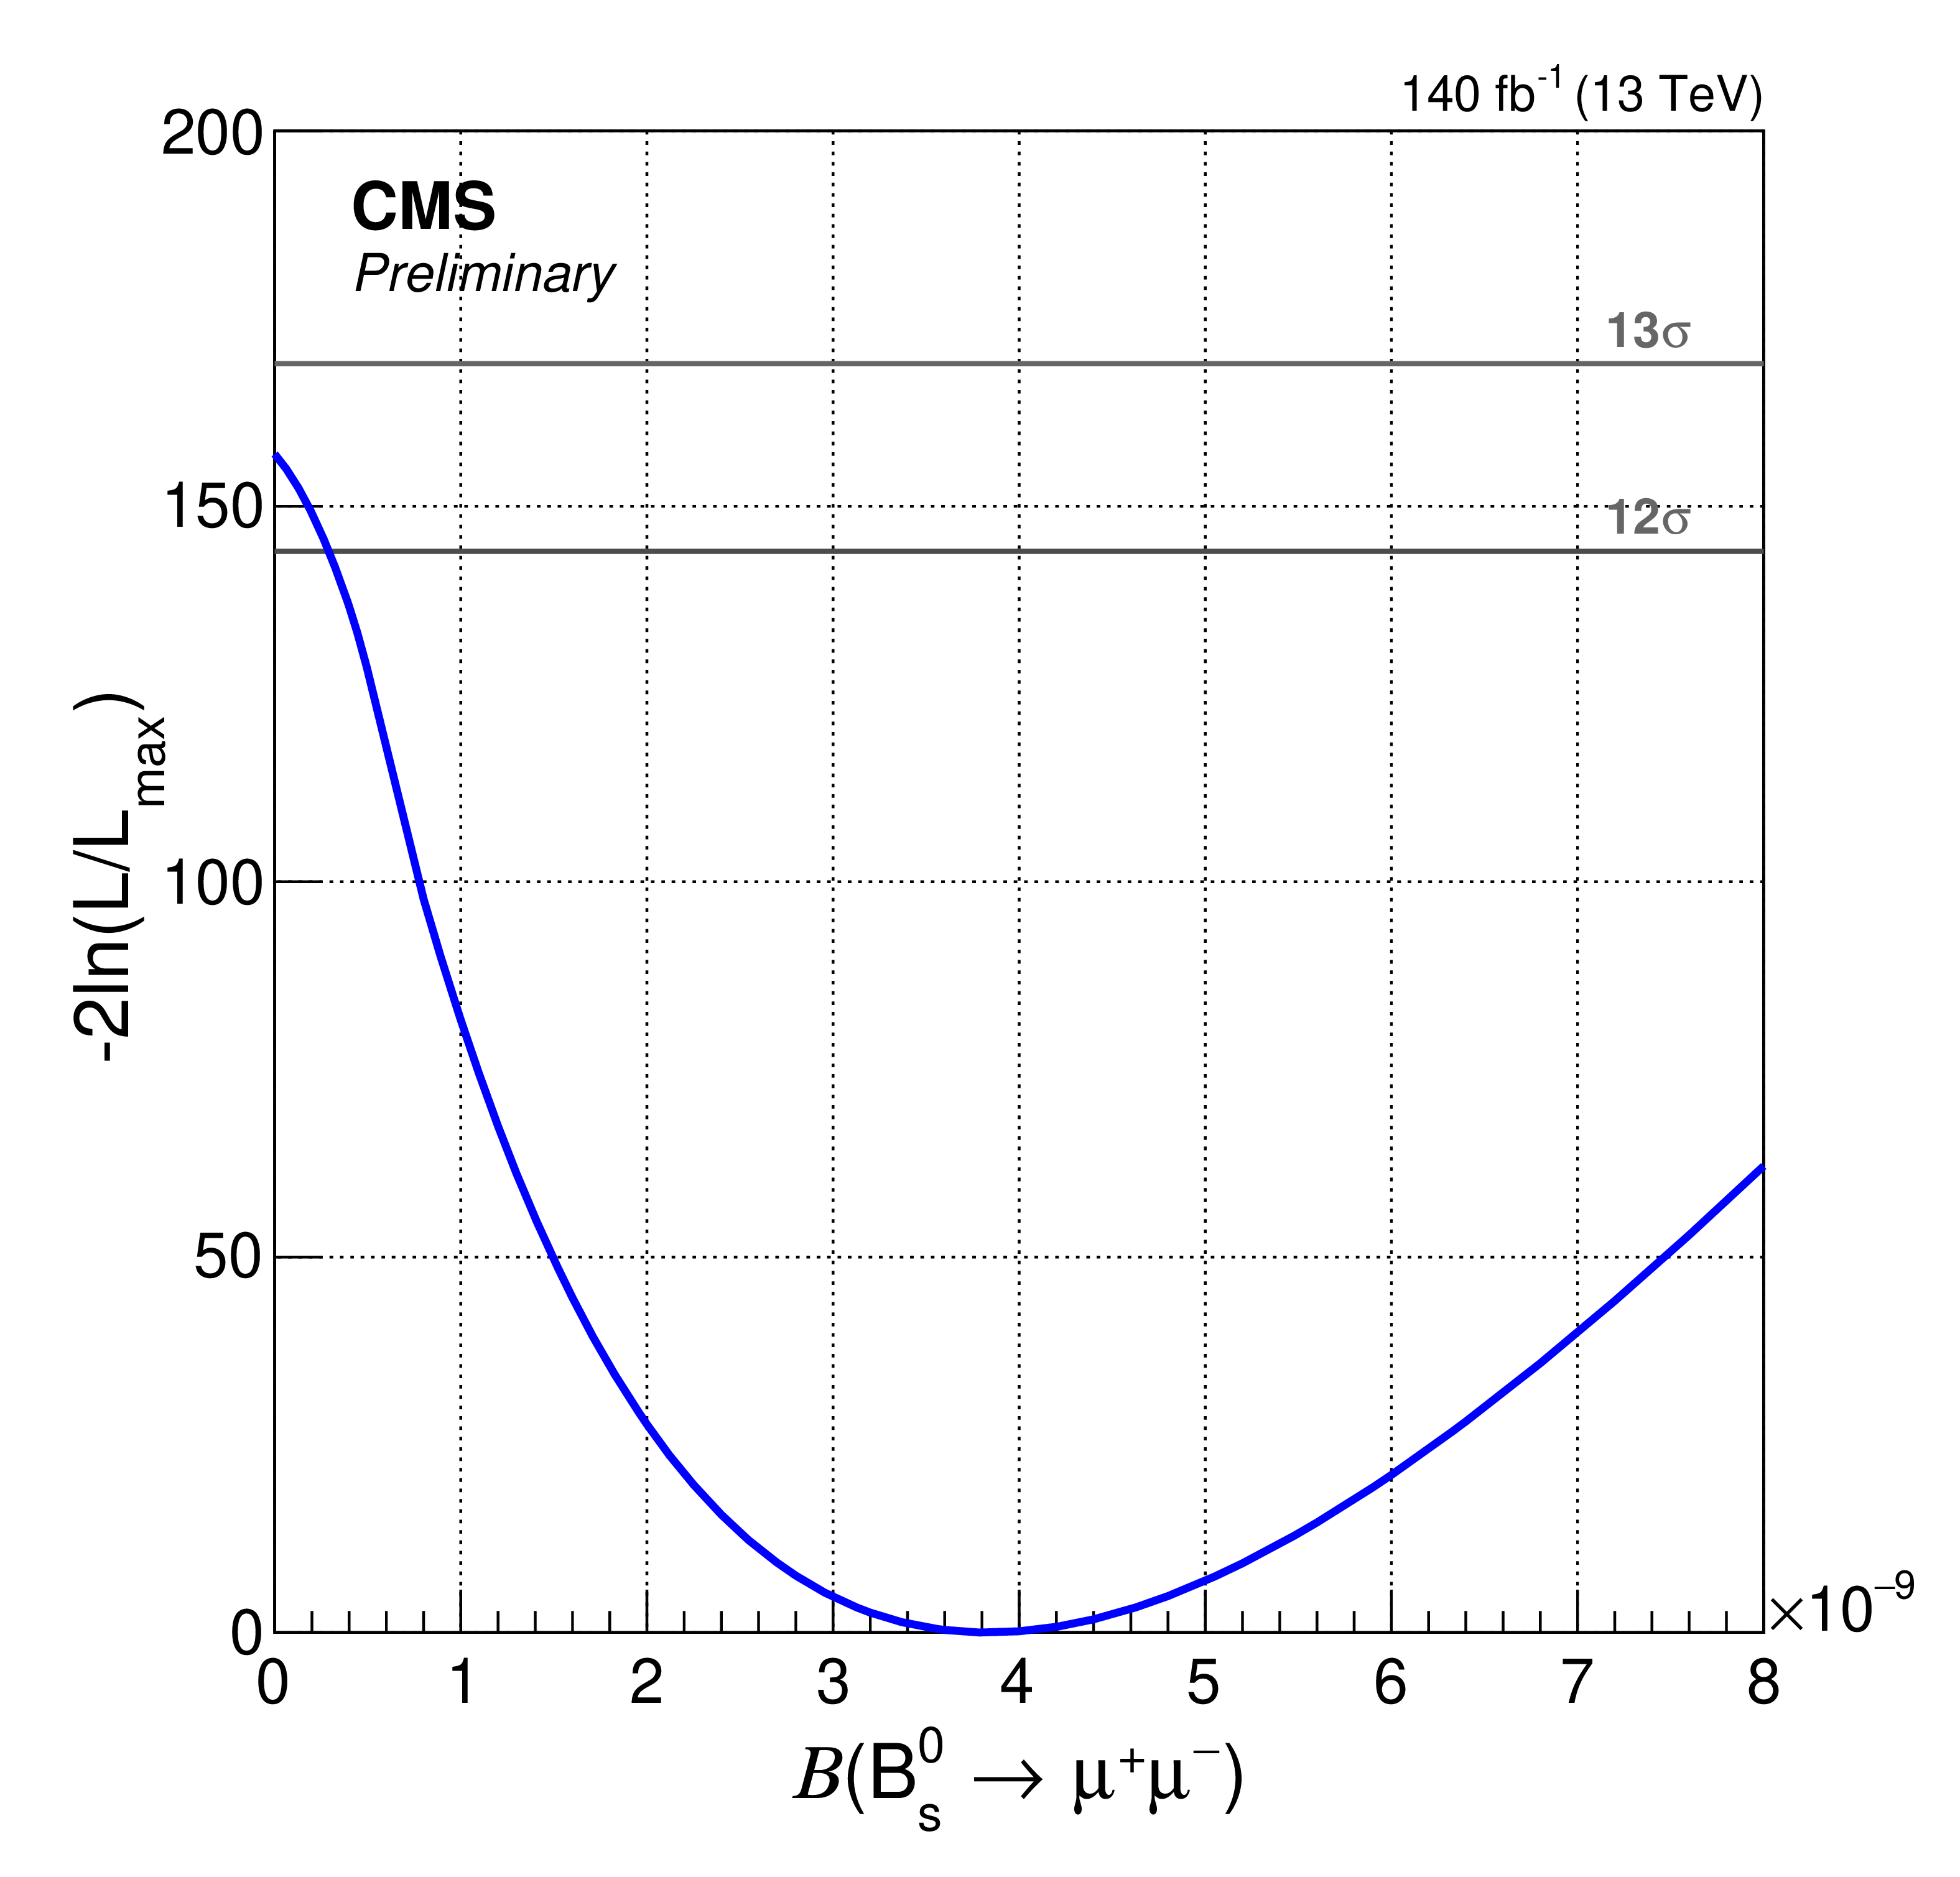
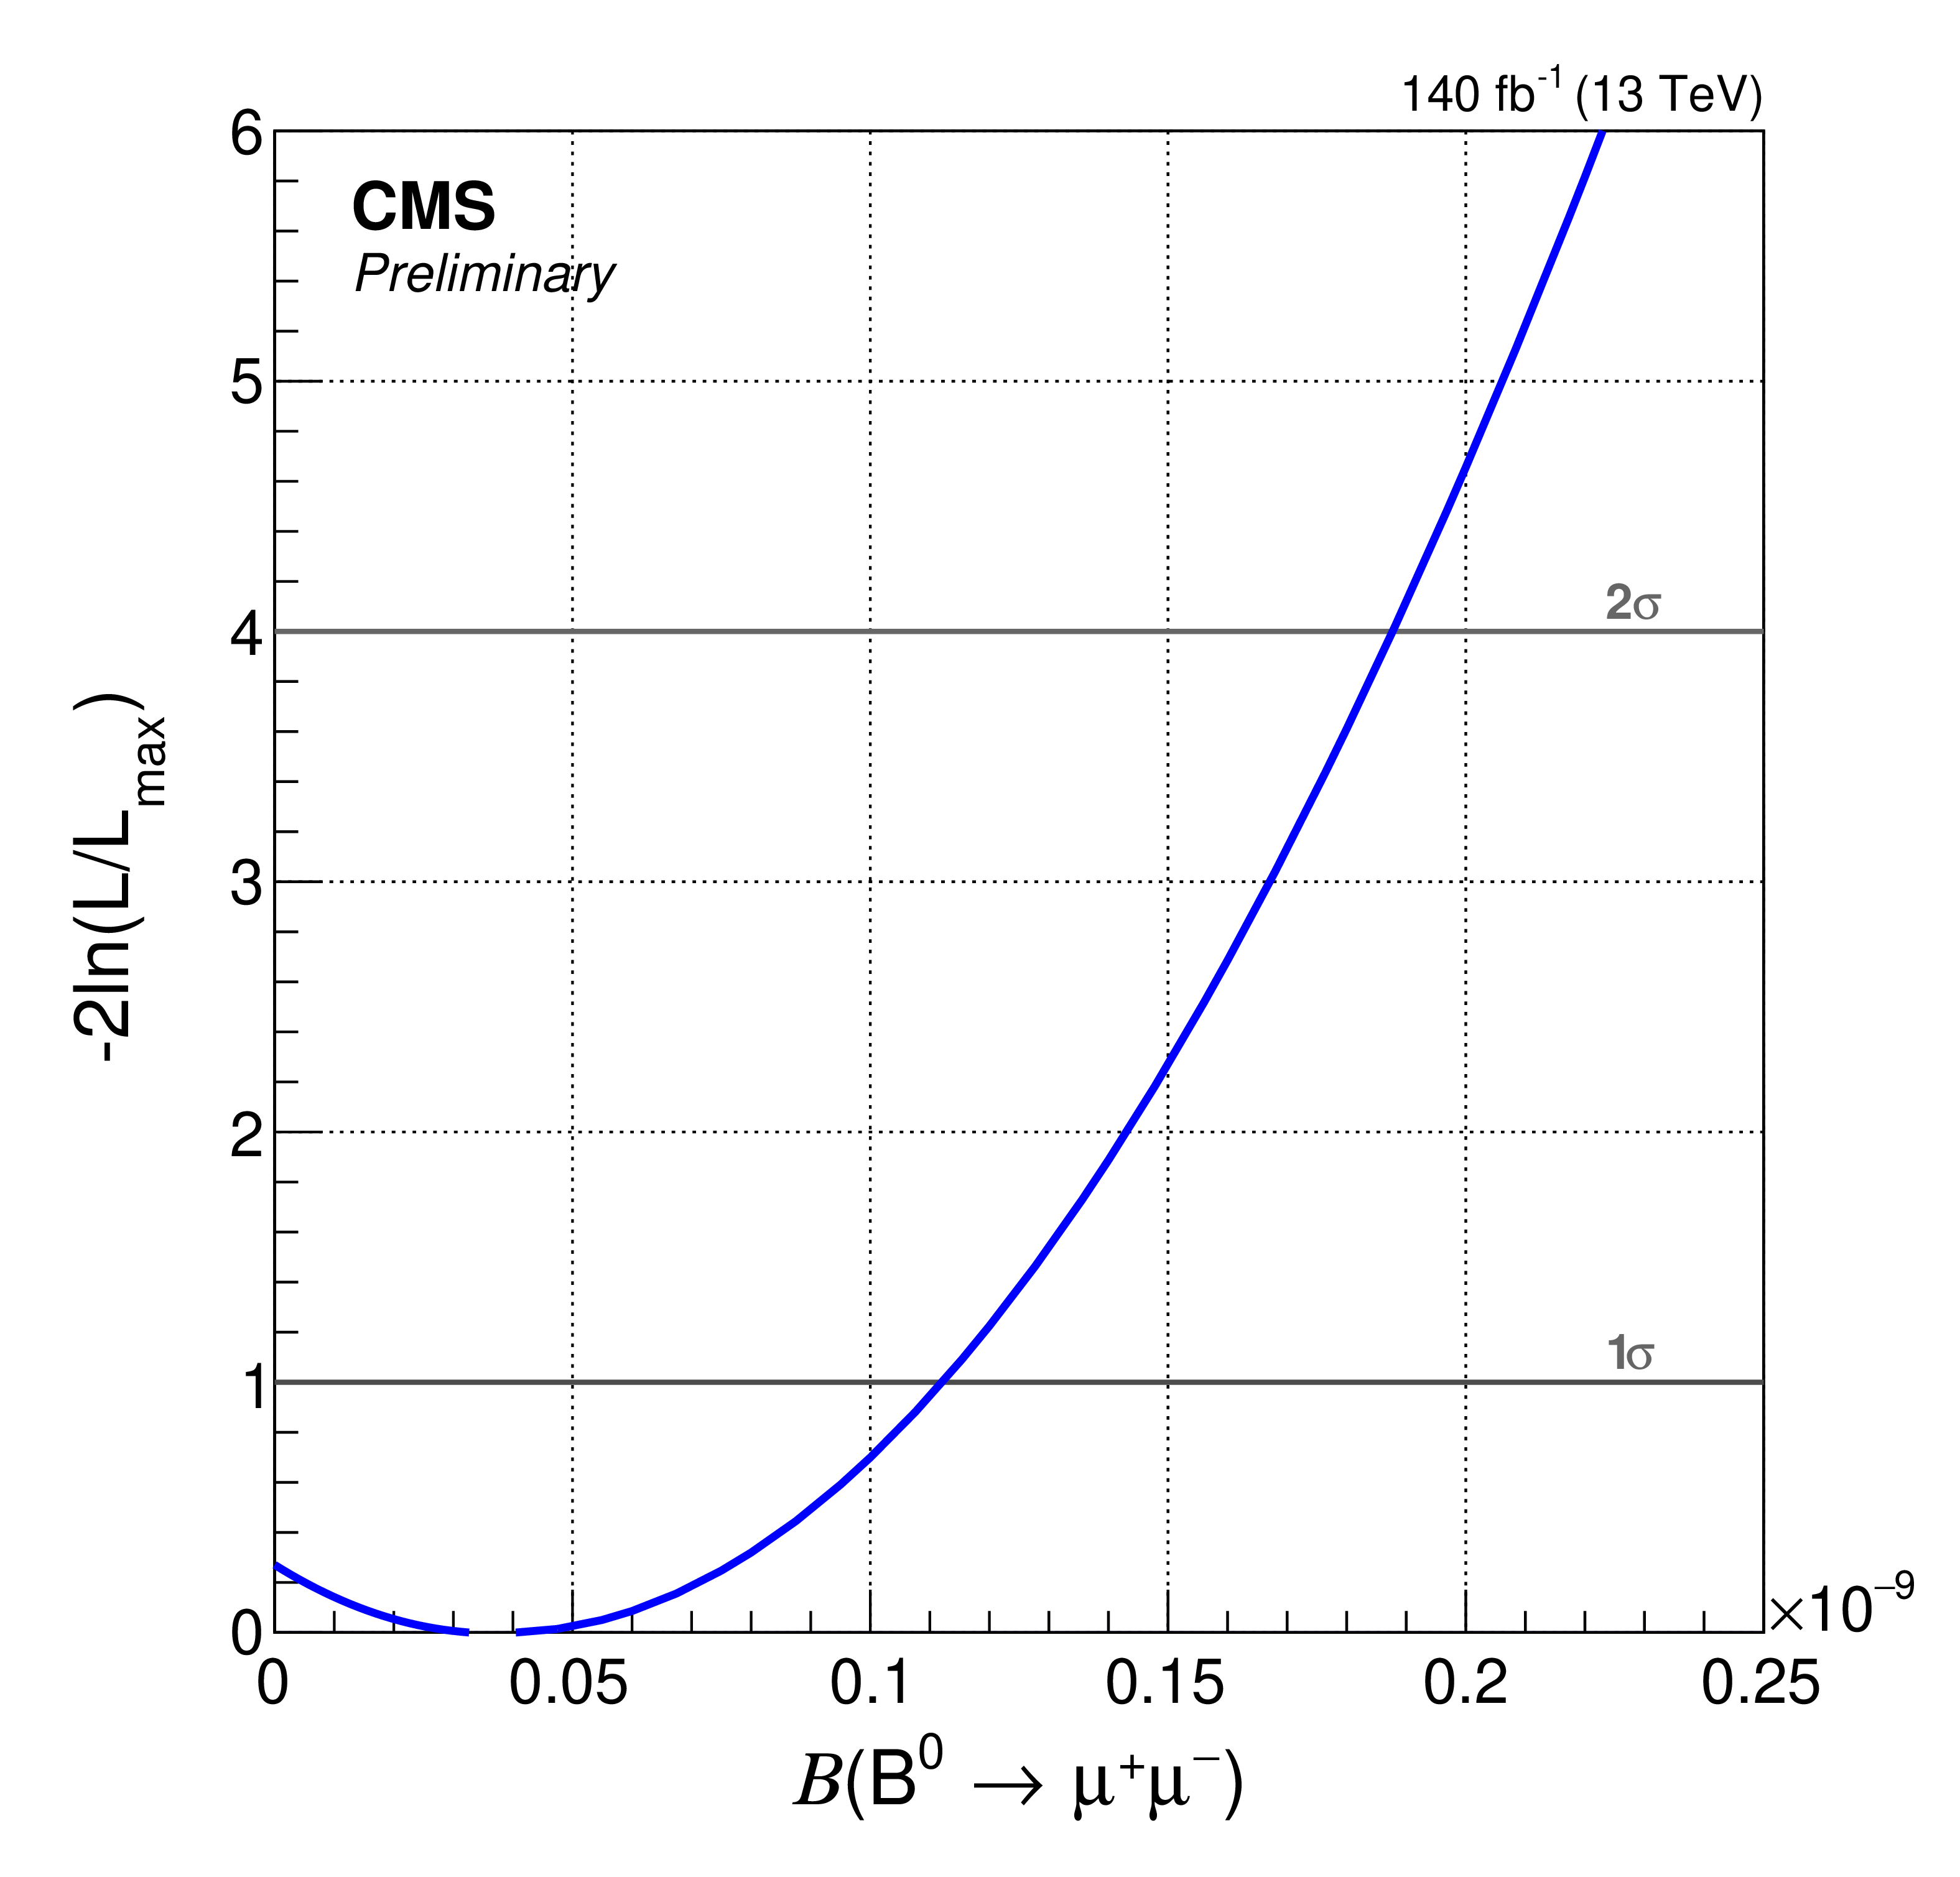
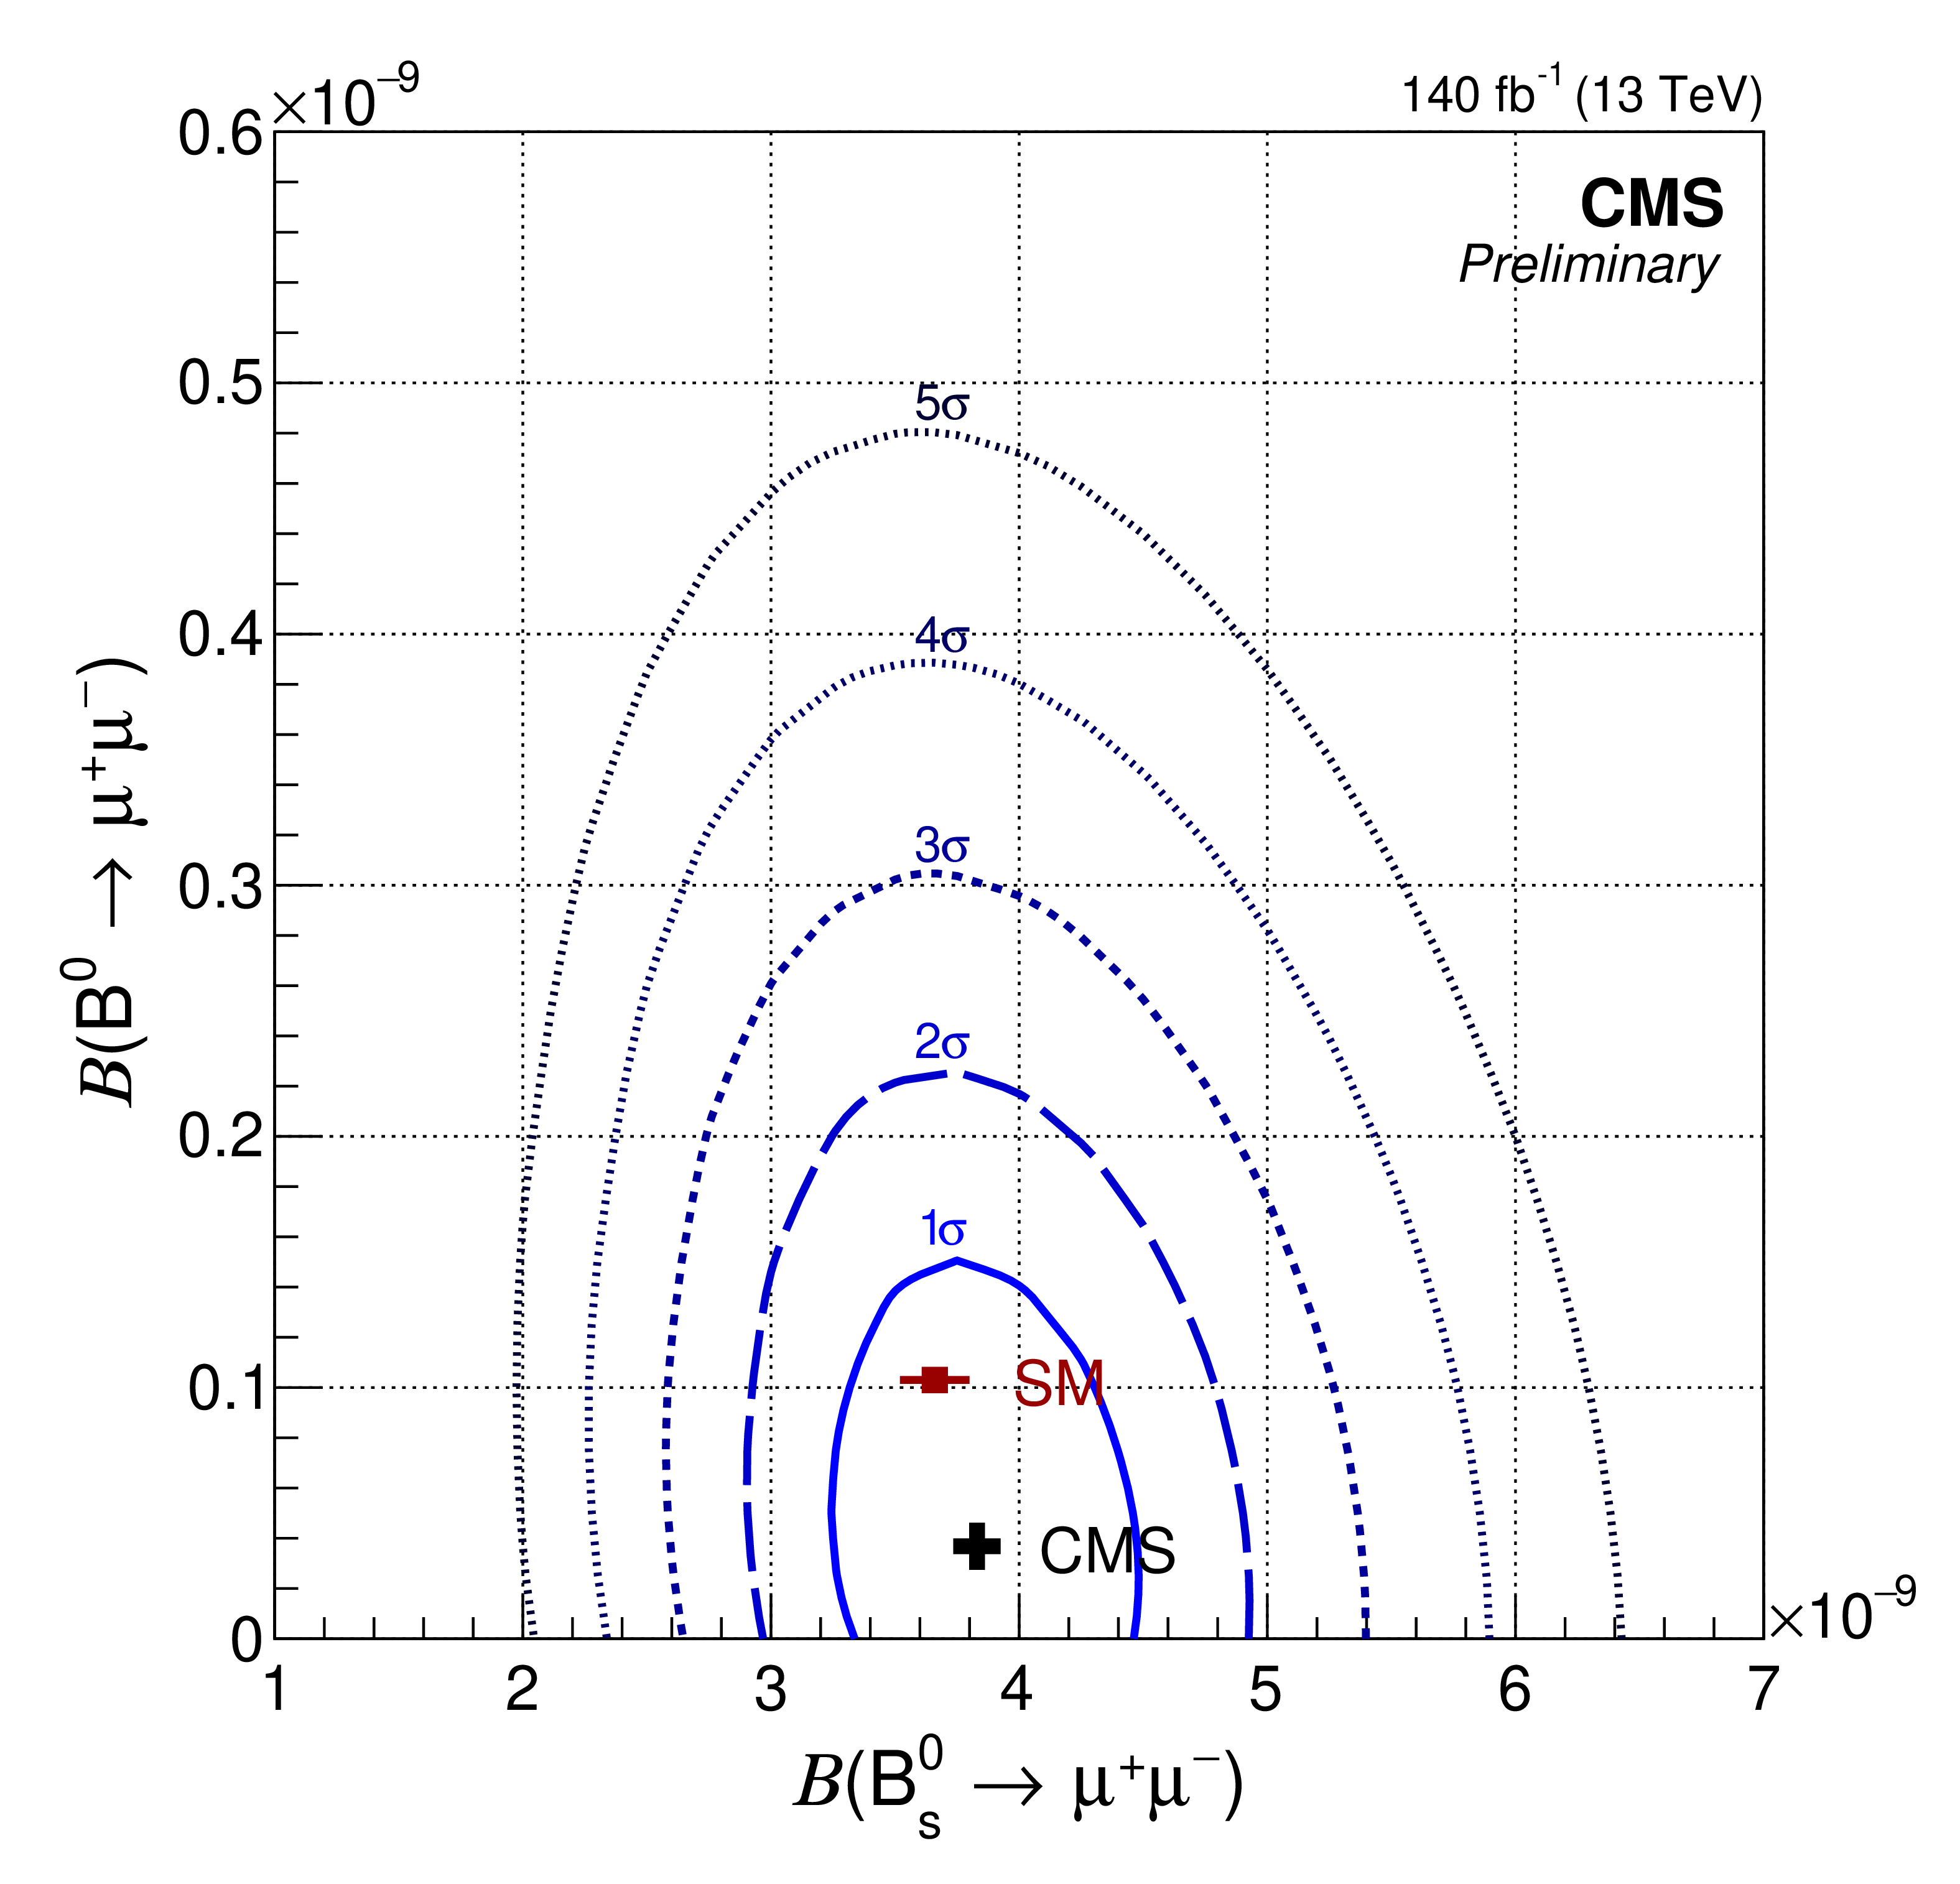
Figure 4:
The profile likelihood scan as a function of ${\mathrm{B_s}^{0}\to \mu^{+} \mu^{-}}$ (left) and ${\mathrm{B}^{0} \to \mu^{+} \mu^{-}}$ (right) decay branching fractions in 1D (upper plots) and in 2D (lower plot). The contours in 2D enclose the regions with 1-5 standard deviation coverage, where 1$\sigma $, 2$\sigma $ and 3$\sigma $ regions correspond to 68.3%, 95.4%, and 99.7% confidence level, respectively. |
png pdf |
Figure 4-a:
The profile likelihood scan as a function of the ${\mathrm{B_s}^{0}\to \mu^{+} \mu^{-}}$ decay branching fraction in 1D. |
png pdf |
Figure 4-b:
The profile likelihood scan as a function of the ${\mathrm{B}^{0} \to \mu^{+} \mu^{-}}$ decay branching fraction in 1D. |
png pdf |
Figure 4-c:
The profile likelihood scan as a function of ${\mathrm{B_s}^{0}\to \mu^{+} \mu^{-}}$ and ${\mathrm{B}^{0} \to \mu^{+} \mu^{-}}$ decay branching fractions in 2D. The contours enclose the regions with 1-5 standard deviation coverage, where 1$\sigma $, 2$\sigma $ and 3$\sigma $ regions correspond to 68.3%, 95.4%, and 99.7% confidence level, respectively. |
png pdf |
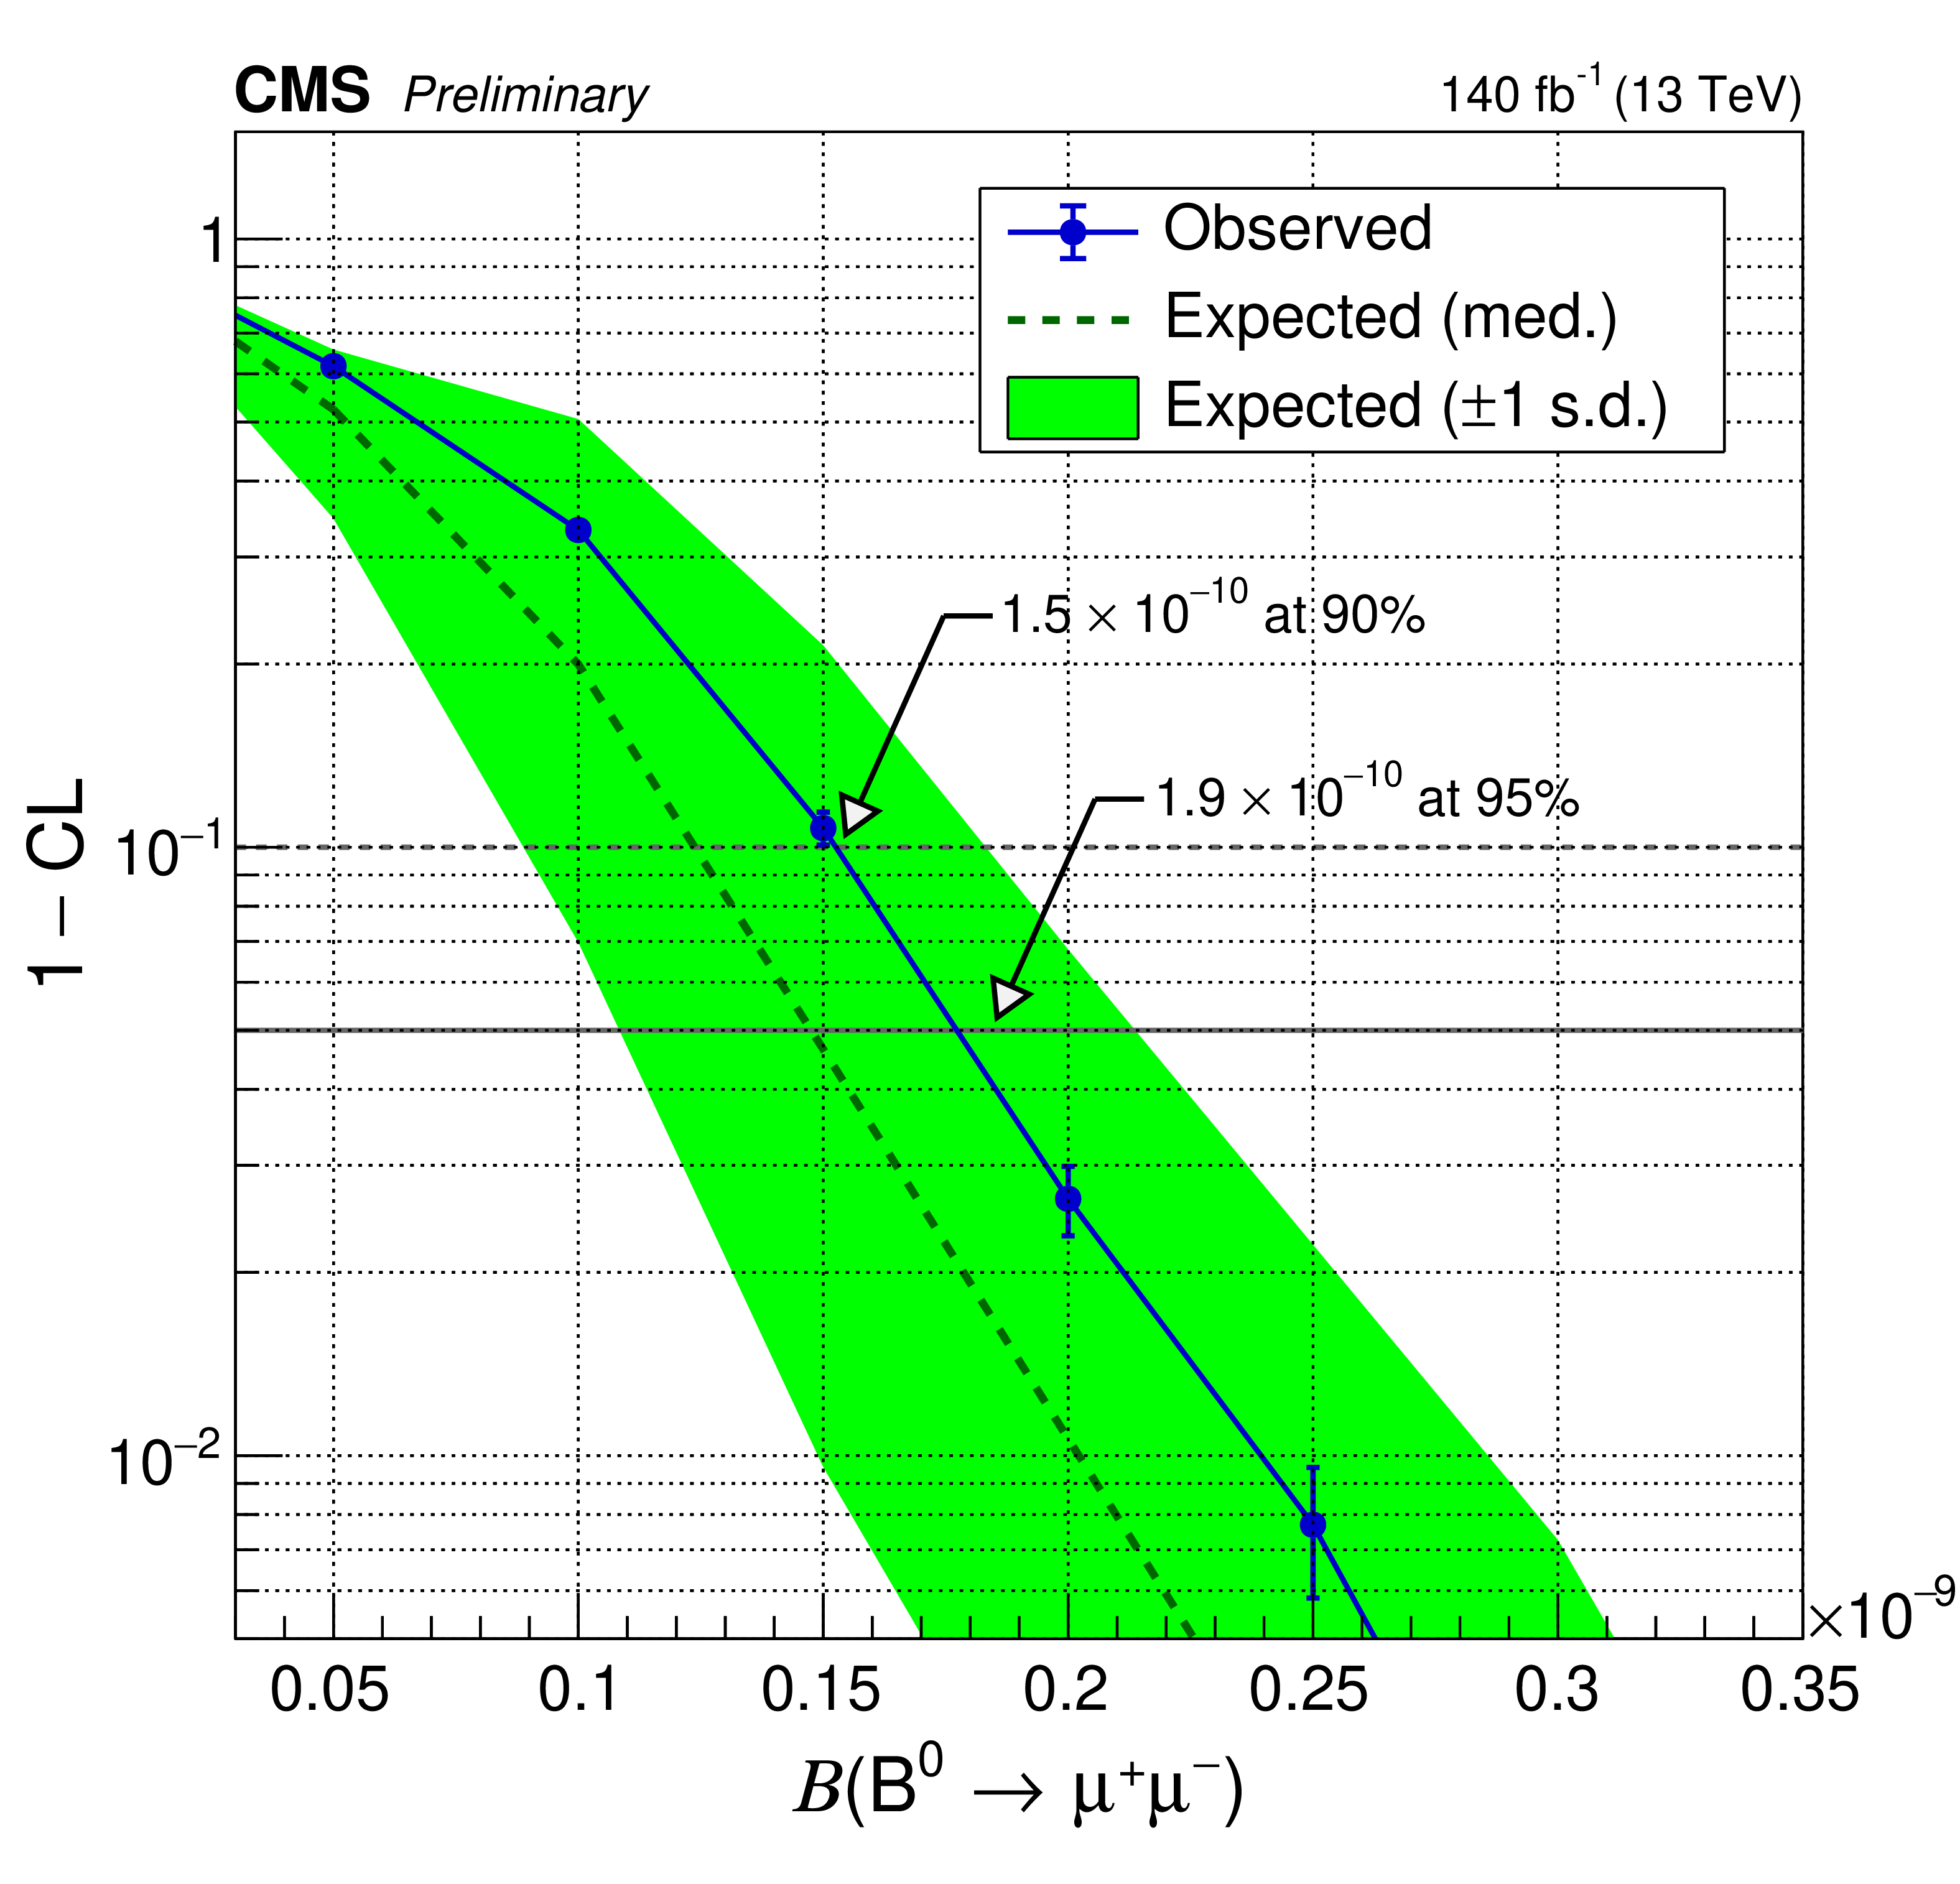
Figure 5:
The upper limits on the ${\mathrm{B}^{0} \to \mu^{+} \mu^{-}}$ decay branching fraction using the CL$_\text {s}$ method. |
png pdf |
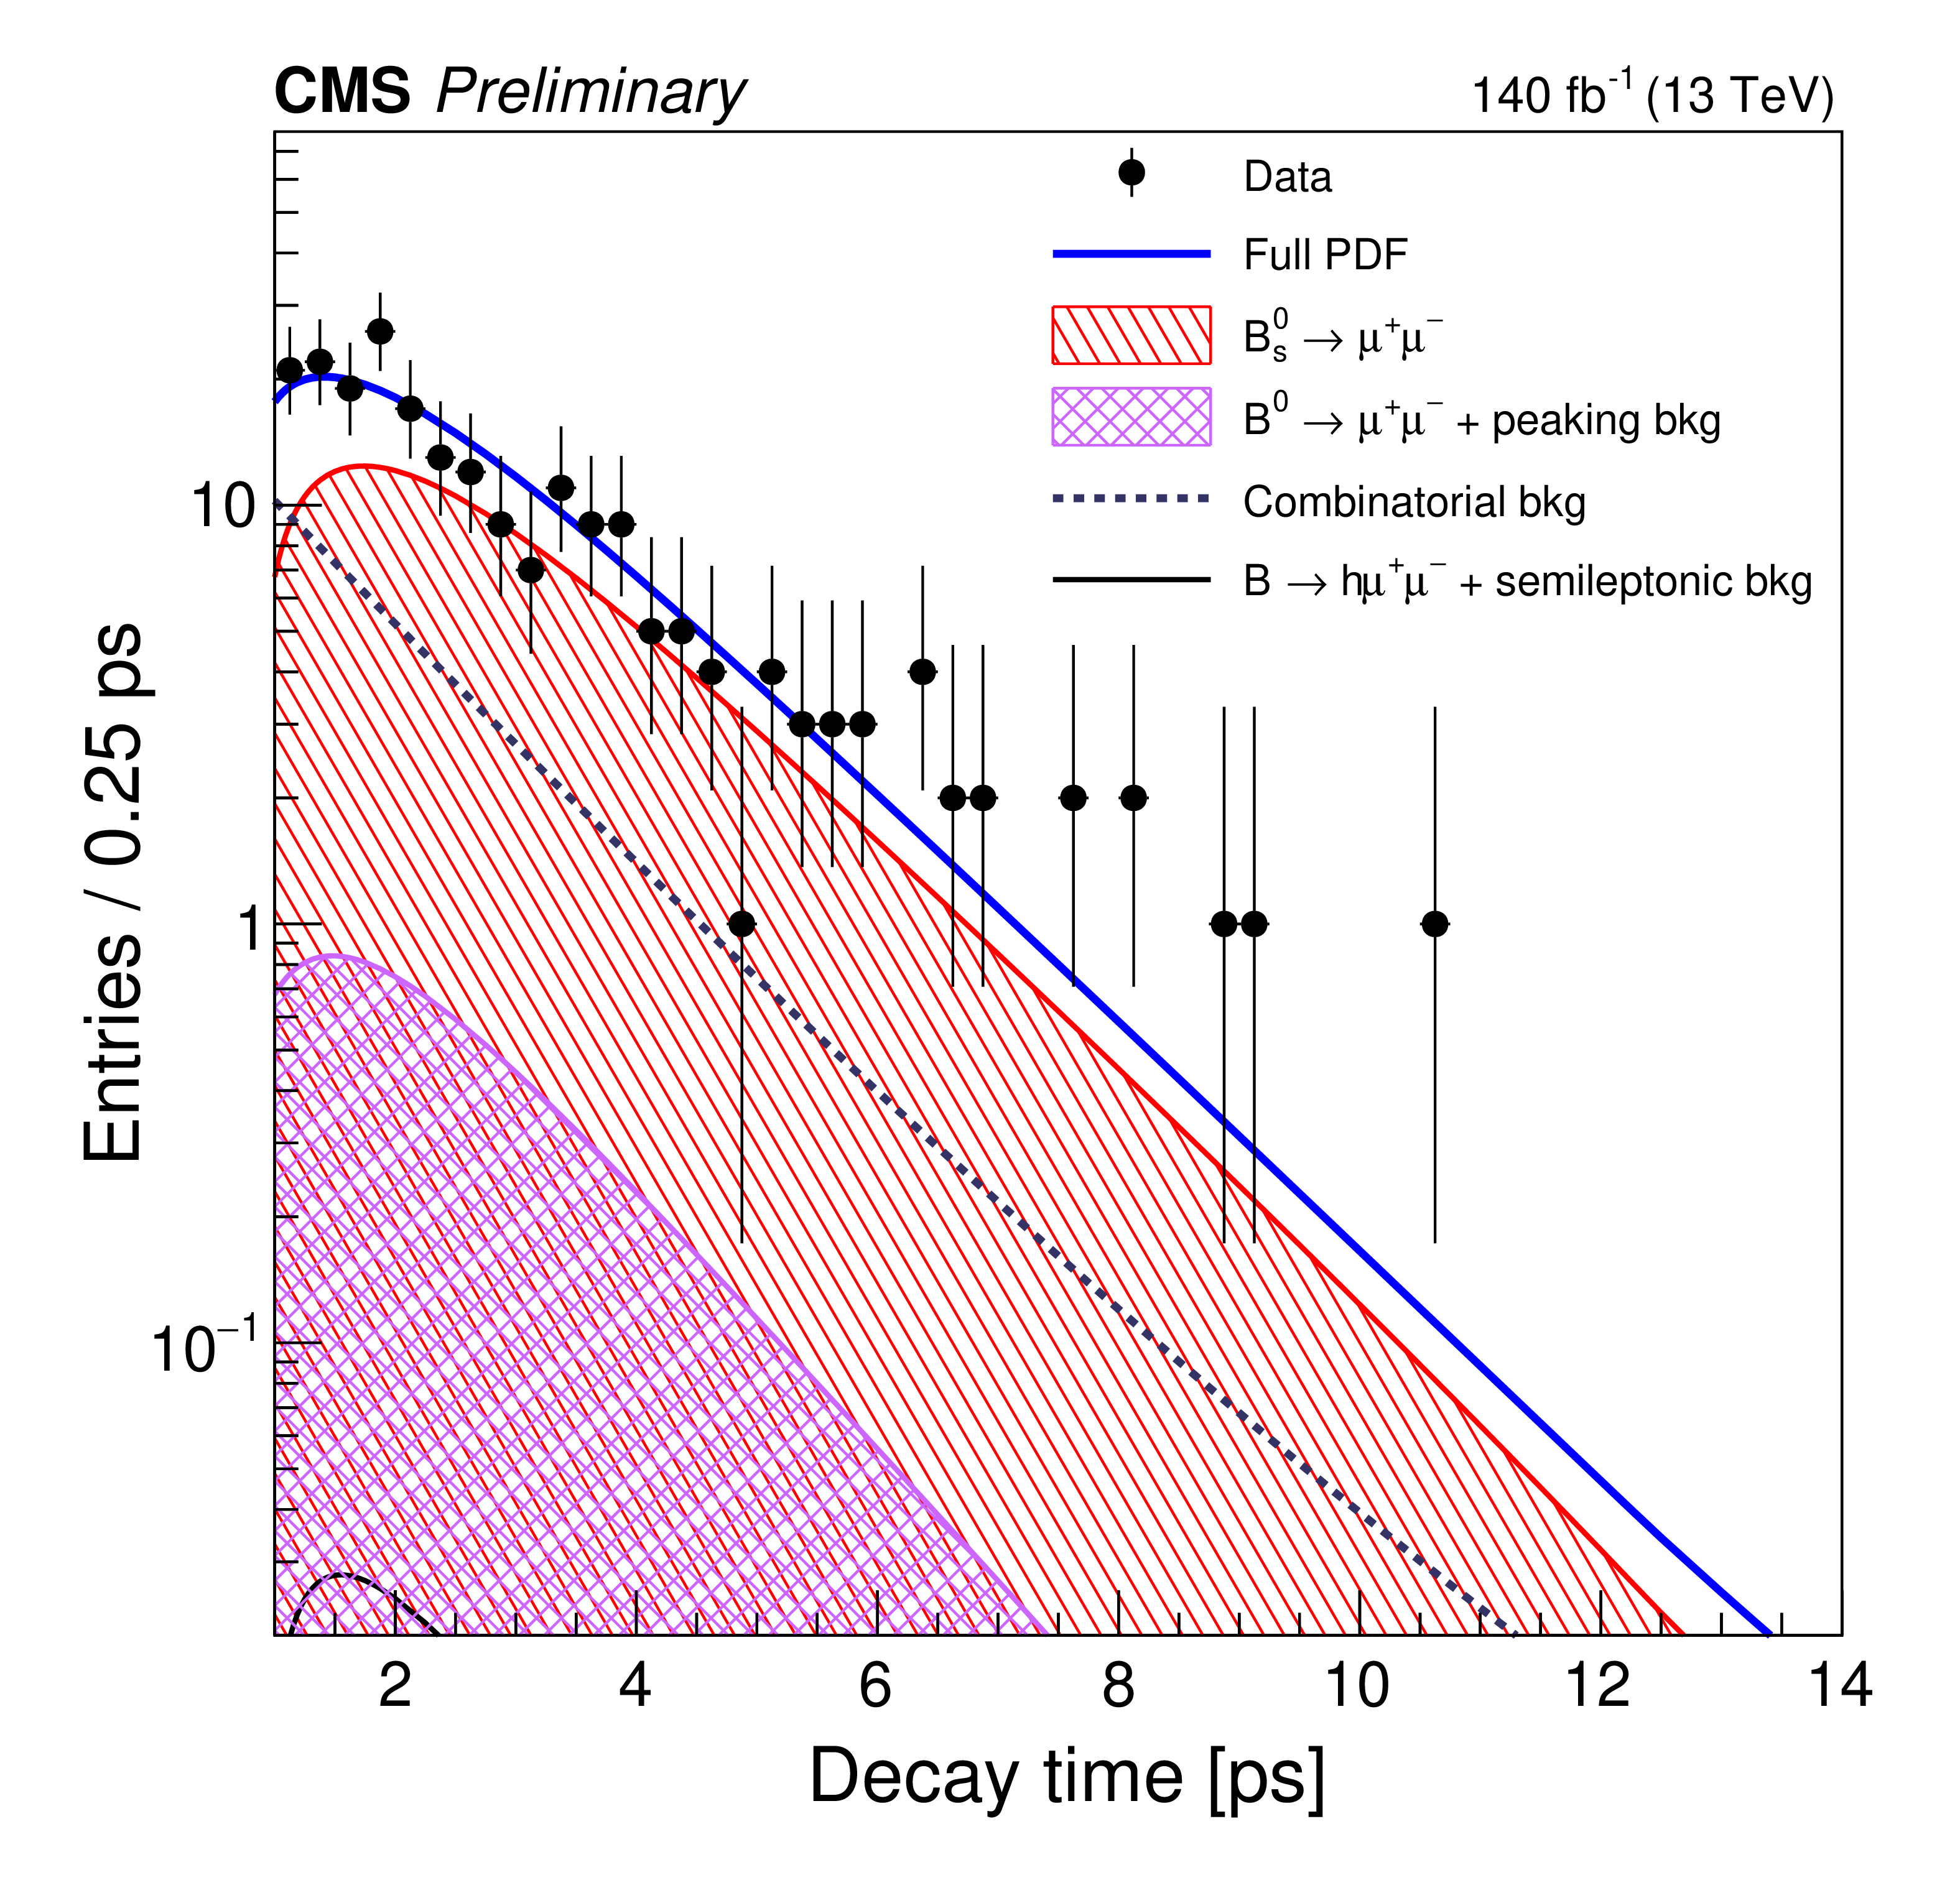
Figure 6:
The UML fit projection on the decay time axis for the signal region 5.28 $ < m_{{\mu \mu}} < $ 5.48 GeV. |
| Tables | |
png pdf |
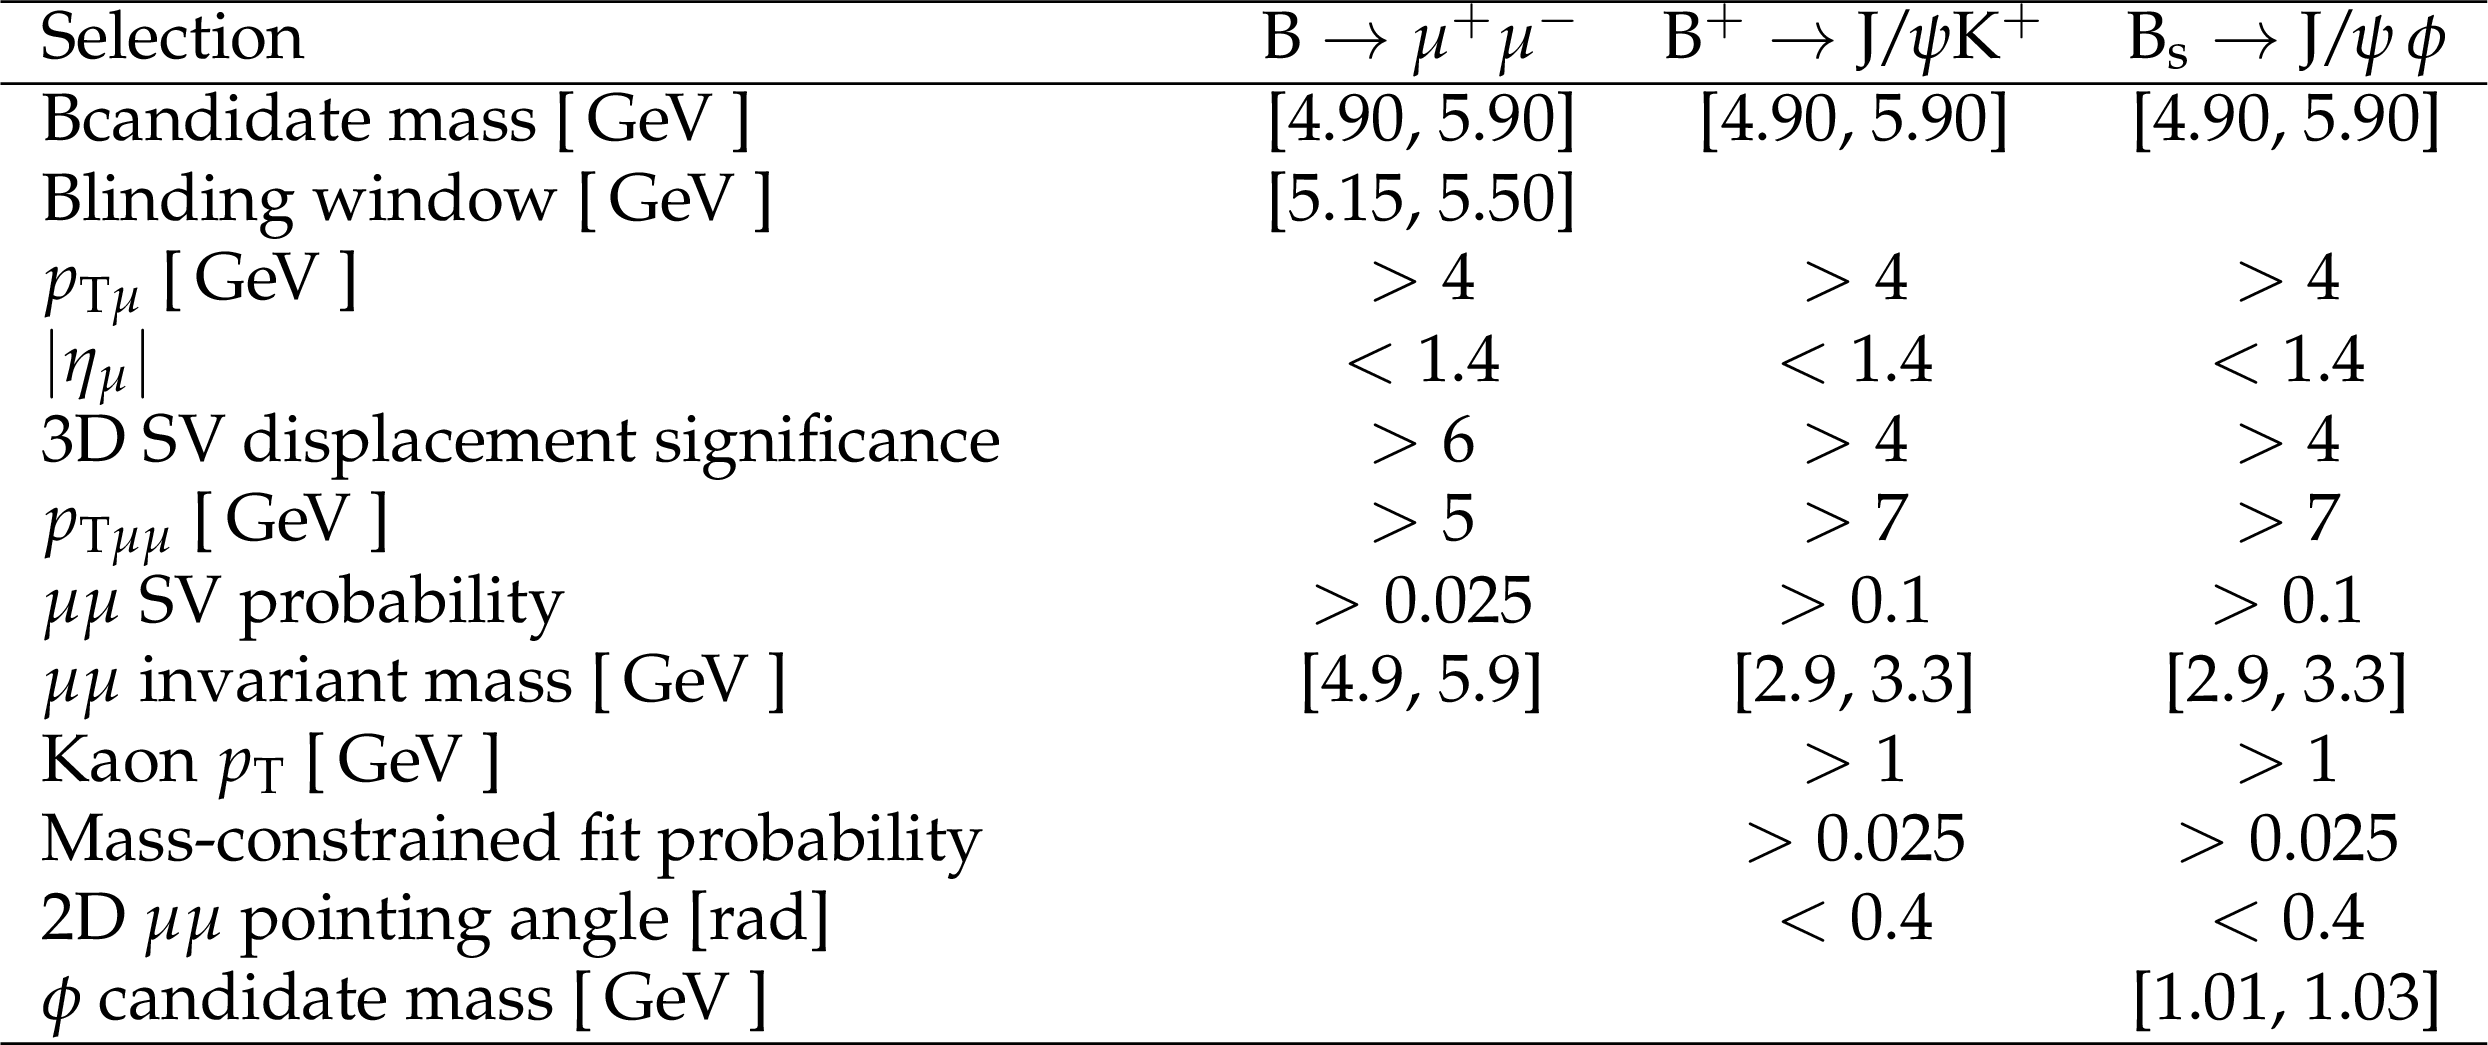
Table 1:
Selection summary before the analysis MVA$_{\text{B}}$. |
png pdf |
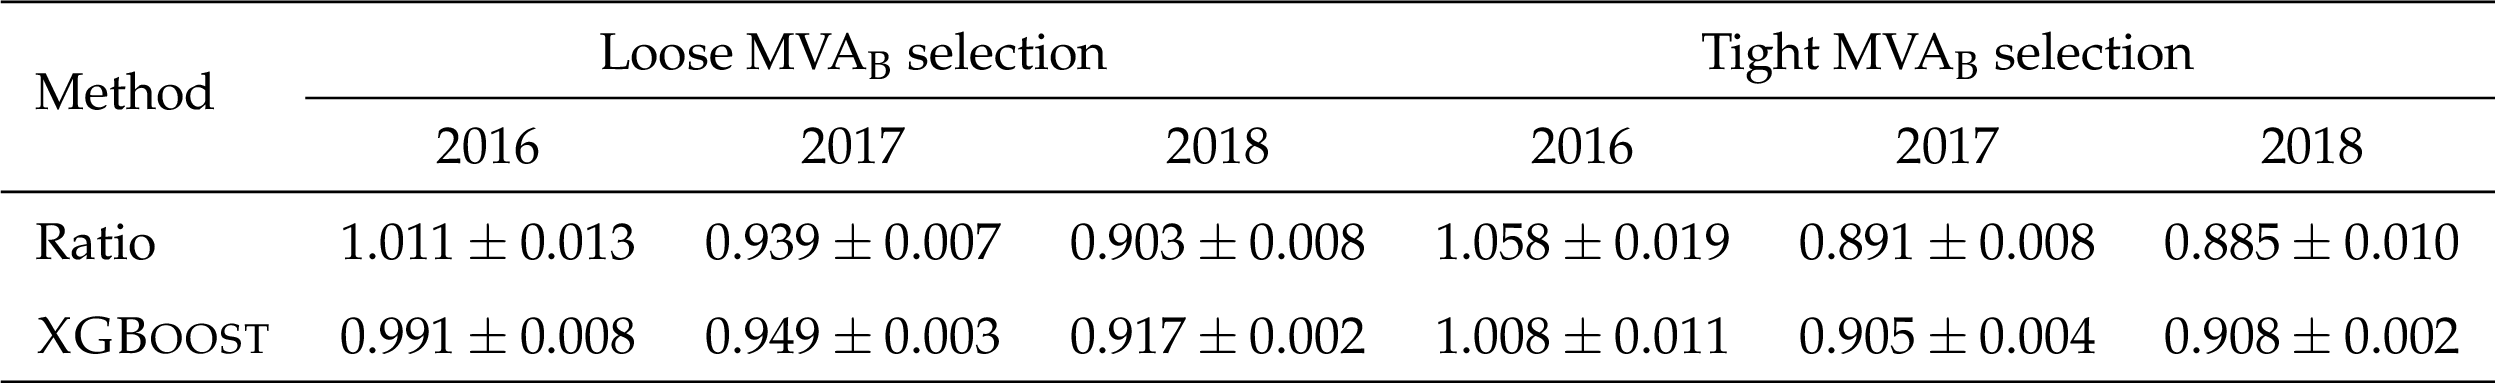
Table 2:
Efficiency corrections for the ${\mathrm{B_s}^{0}\to \mu^{+} \mu^{-}}$ decays derived using two different methods: the efficiency ratio between data and simulation and XGBoost reweighting in ${\mathrm{B^{+}} \to \mathrm{J}/\psi \mathrm{K^{+}}}$ events. The loose region is defined as MVA$_{\text{B}} > $ 0.9 and the tight one as MVA$_{\text{B}} > $ 0.99. |
png pdf |
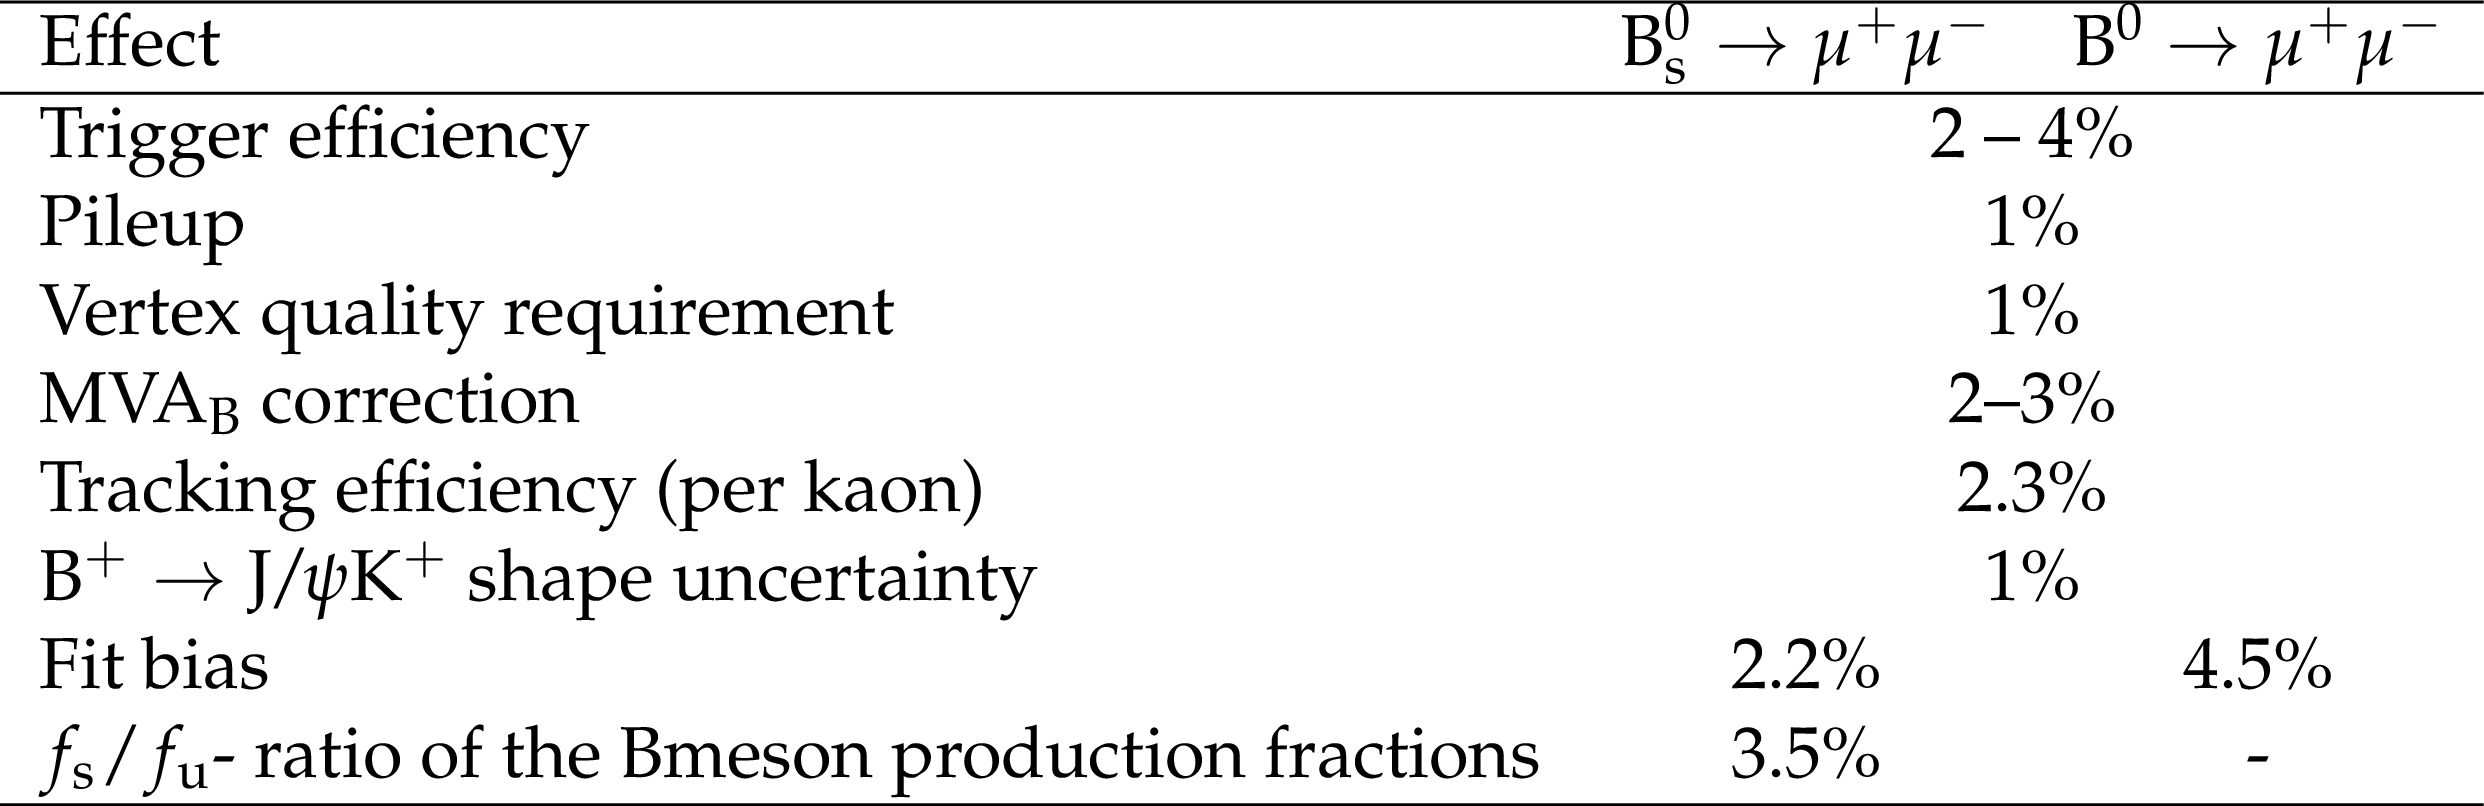
Table 3:
Summary of the systematic uncertainties for the ${\mathrm{B_s}^{0}\to \mu^{+} \mu^{-}}$ and ${\mathrm{B}^{0} \to \mu^{+} \mu^{-}}$ branching fraction measurements. |
png pdf |
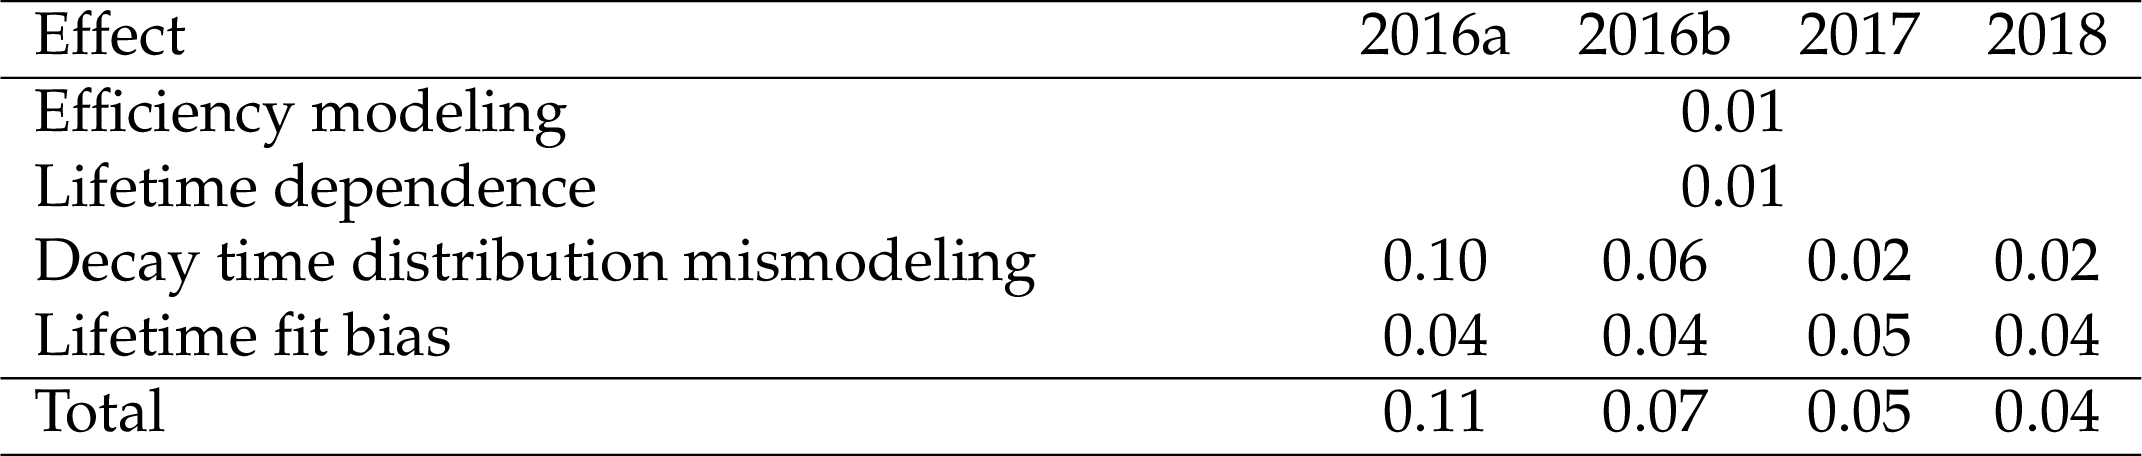
Table 4:
Summary of the systematic uncertainties in the ${\mathrm{B_s}^{0}\to \mu^{+} \mu^{-}}$ effective lifetime measurement (ps). |
png pdf |
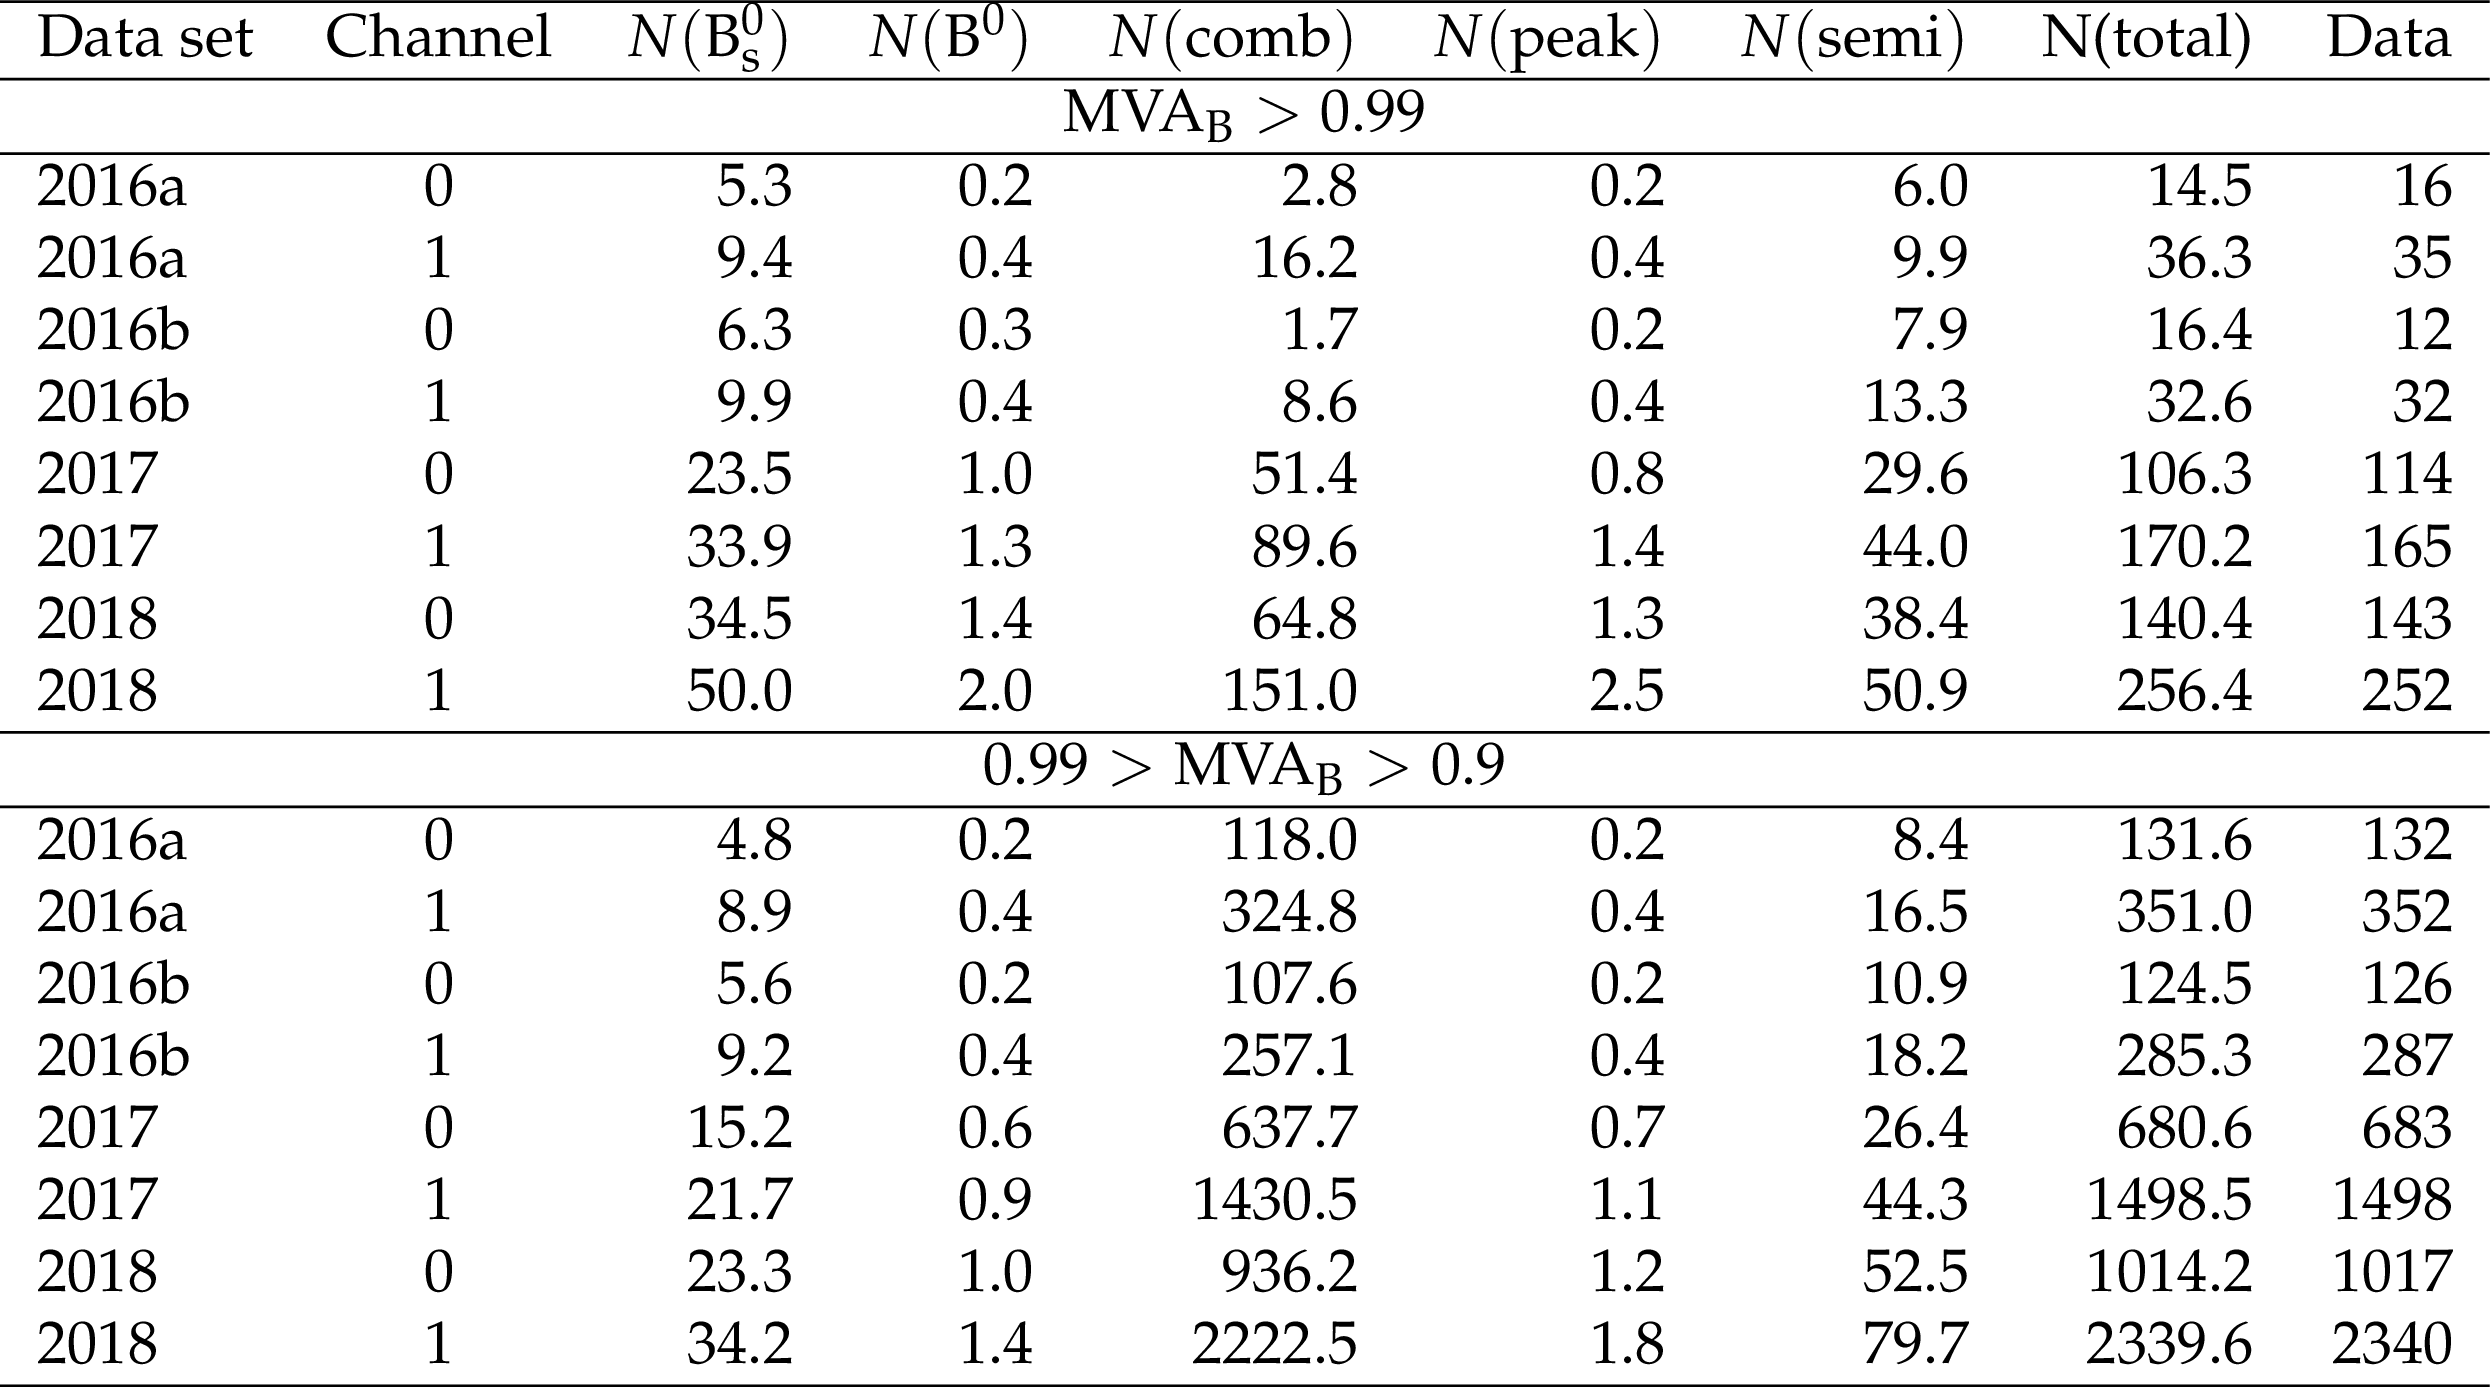
Table 5:
Expected and observed event yields for each category (postfit). Channel 0 and 1 refer to the $ {| {\eta _{\text {F}}} |}$ ranges of [0.0,0.7] and [0.7,1.4], respectively. |
| Summary |
|
A measurement of the branching fraction of the $\mathrm{B_s}^{0} \to \mu^{+}\mu^{-}$ decay based on the data set of proton-proton collisions at $\sqrt{s} = $ 13 TeV corresponding to an integrated luminosity of 140 fb$^{-1}$ has been presented and is found consistent with the standard model (SM) predictions within one standard deviation. The relative combined uncertainty is reduced from 23 to 11% compared with the previous CMS measurement [4] based on the partial 13 TeV data set, while the central value is found to be somewhat higher. The new analysis applied to the data used in Ref. [4] yields a result similar to the original measurement, indicating that the shift in the central value is driven mostly by the new data. The search for the $\mathrm{B_d}^{0} \to \mu^{+}\mu^{-}$ decay has not revealed a significant event excess with respect to the dominant combinatorial background prediction. More data will be required to establish its existence and compare the result with the SM predictions. Compared with the latest LHCb measurement of $\mathcal{B}(\mathrm{B_s}^{0} \to \mu^{+}\mu^{-}) = $ (3.09$^{+0.46}_{-0.43}$$^{+0.15}_{-0.11}$) $\times$ 10$^{-9}$ [6], our result is about 1.2 standard deviations higher, which is going to shift the world average from its current value $\mathcal{B}(\mathrm{B_s}^{0} \to \mu^{+}\mu^{-}) = $ (2.69$^{+0.37}_{-0.35}$) $\times$ 10$^{-9}$ [7] to a larger value, more consistent with the SM prediction, thus reducing the overall tension. This implies that the potential beyond-the-SM physics contribution preferred by the global fits to the rare ${\mathrm{b} \to \mathrm{s}\ell^+\ell^-} $ decay data [20] is most likely constrained to a single semileptonic operator $O_9$. The uncertainties in the branching fraction and effective lifetime measurements are dominated by the statistical component, which allows us to expect significant improvements in the precision of the future measurements with the LHC Run 3 data. The effective lifetime measurement of the $\mathrm{B_s}^{0} \to \mu^{+}\mu^{-}$ decay is also consistent with the SM predictions and has achieved the level of uncertainty comparable with the lifetime difference between the heavy and light $\mathrm{B_s}^{0}$ meson mass eigenstates, thus offering sensitivity to potential beyond-the-SM physics effects in the effective lifetime. |
| References | ||||
| 1 | M. Beneke, C. Bobeth, and R. Szafron | Power-enhanced leading-logarithmic QED corrections to $ B_q \to \mu^+\mu^- $ | JHEP 10 (2019) 232 | 1908.07011 |
| 2 | CMS, LHCb Collaboration | Observation of the rare $ B^0_s\to\mu^+\mu^- $ decay from the combined analysis of CMS and LHCb data | Nature 522 (2015) 68 | 1411.4413 |
| 3 | ATLAS Collaboration | Study of the rare decays of $ B^0_s $ and $ B^0 $ mesons into muon pairs using data collected during 2015 and 2016 with the ATLAS detector | JHEP 04 (2019) 098 | 1812.03017 |
| 4 | CMS Collaboration | Measurement of properties of B$ ^0_\mathrm{s}\to\mu^+\mu^- $ decays and search for B$ ^0\to\mu^+\mu^- $ with the CMS experiment | JHEP 04 (2020) 188 | CMS-BPH-16-004 1910.12127 |
| 5 | LHCb Collaboration | Measurement of the $ B^0_s\to\mu^+\mu^- $ branching fraction and effective lifetime and search for $ B^0\to\mu^+\mu^- $ decays | PRL 118 (2017), no. 19, 191801 | 1703.05747 |
| 6 | LHCb Collaboration | Measurement of the $ B^0_s\to\mu^+\mu^- $ decay properties and search for the $ B^0\to\mu^+\mu^- $ and $ B^0_s\to\mu^+\mu^-\gamma $ decays | PRD 105 (2022) 012010 | 2108.09283 |
| 7 | CMS Collaboration | Combination of the ATLAS, CMS and LHCb results on the $ B^0_{(s)} \to \mu^+\mu^- $ decays | CMS-PAS-BPH-20-003, LHCb-CONF-2020-002 | |
| 8 | LHCb Collaboration | Differential branching fractions and isospin asymmetries of $ B \to K^{(*)} \mu^+ \mu^- $ decays | JHEP 06 (2014) 133 | 1403.8044 |
| 9 | LHCb Collaboration | Angular analysis and differential branching fraction of the decay $ B^0_s\to\phi\mu^+\mu^- $ | JHEP 09 (2015) 179 | 1506.08777 |
| 10 | LHCb Collaboration | Measurements of the S-wave fraction in $ B^{0}\rightarrow K^{+}\pi^{-}\mu^{+}\mu^{-} $ decays and the $ B^{0}\rightarrow K^{\ast}(892)^{0}\mu^{+}\mu^{-} $ differential branching fraction | JHEP 11 (2016) 047 | 1606.04731 |
| 11 | LHCb Collaboration | Branching Fraction Measurements of the Rare $ B^0_s\rightarrow\phi\mu^+\mu^- $ and $ B^0_s\rightarrow f_2^\prime(1525)\mu^+\mu^- $- Decays | PRL 127 (2021) 151801 | 2105.14007 |
| 12 | LHCb Collaboration | Measurement of $ CP $-Averaged Observables in the $ B^{0}\rightarrow K^{*0}\mu^{+}\mu^{-} $ Decay | PRL 125 (2020) 011802 | 2003.04831 |
| 13 | LHCb Collaboration | Angular Analysis of the $ B^{+}\rightarrow K^{\ast+}\mu^{+}\mu^{-} $ Decay | PRL 126 (2021) 161802 | 2012.13241 |
| 14 | LHCb Collaboration | Test of lepton universality with $ B^{0} \rightarrow K^{*0}\ell^{+}\ell^{-} $ decays | JHEP 08 (2017) 055 | 1705.05802 |
| 15 | LHCb Collaboration | Test of lepton universality in beauty-quark decays | NP 18 (2022) 277 | 2103.11769 |
| 16 | Belle Collaboration | Test of Lepton-Flavor Universality in $ {B\to K^\ast\ell^+\ell^-} $ Decays at Belle | PRL 126 (2021) 161801 | 1904.02440 |
| 17 | BELLE Collaboration | Test of lepton flavor universality and search for lepton flavor violation in $ B \rightarrow K\ell \ell $ decays | JHEP 03 (2021) 105 | 1908.01848 |
| 18 | CMS Collaboration | Angular analysis of the decay $ B^0 \to K^{*0} \mu^+ \mu^- $ from pp collisions at $ \sqrt s = $ 8 TeV | PLB 753 (2016) 424--448 | CMS-BPH-13-010 1507.08126 |
| 19 | CMS Collaboration | Measurement of angular parameters from the decay $ \mathrm{B}^0 \to \mathrm{K}^{*0} \mu^+ \mu^- $ in proton-proton collisions at $ \sqrt{s} = $ 8 TeV | PLB 781 (2018) 517--541 | CMS-BPH-15-008 1710.02846 |
| 20 | W. Altmannshofer and P. Stangl | New physics in rare B decays after Moriond 2021 | EPJC 81 (2021), no. 10, 952 | 2103.13370 |
| 21 | HFLAV Collaboration | Averages of $ b $-hadron, $ c $-hadron, and $ \tau $-lepton properties as of summer 2016 | EPJC77 (2017) 895 | 1612.07233 |
| 22 | CMS Collaboration | The CMS experiment at the CERN LHC | JINST 3 (2008) S08004 | CMS-00-001 |
| 23 | CMS Collaboration | Description and performance of track and primary-vertex reconstruction with the CMS tracker | JINST 9 (2014) P10009 | CMS-TRK-11-001 1405.6569 |
| 24 | CMS Tracker Group Collaboration | The CMS phase-1 pixel detector upgrade | JINST 16 (2021) P02027 | 2012.14304 |
| 25 | CMS Collaboration | Track impact parameter resolution for the full pseudo rapidity coverage in the 2017 dataset with the CMS phase-1 pixel detector | CDS | |
| 26 | CMS Collaboration | Performance of the CMS muon detector and muon reconstruction with proton-proton collisions at $ \sqrt{s}= $ 13 TeV | JINST 13 (2018) P06015 | CMS-MUO-16-001 1804.04528 |
| 27 | CMS Collaboration | Performance of the CMS Level-1 trigger in proton-proton collisions at $ \sqrt{s} = $ 13 TeV | JINST 15 (2020) P10017 | CMS-TRG-17-001 2006.10165 |
| 28 | CMS Collaboration | The CMS trigger system | JINST 12 (2017) P01020 | CMS-TRG-12-001 1609.02366 |
| 29 | CMS Collaboration | Precision luminosity measurement in proton-proton collisions at $ \sqrt{s} = $ 13 TeV in 2015 and 2016 at CMS | EPJC 81 (2021) 800 | CMS-LUM-17-003 2104.01927 |
| 30 | CMS Collaboration | CMS luminosity measurements for the 2017 data-taking period at $ \sqrt{s} = $ 13 TeV | CMS-PAS-LUM-17-004 | CMS-PAS-LUM-17-004 |
| 31 | CMS Collaboration | CMS luminosity measurements for the 2018 data-taking period at $ \sqrt{s} = $ 13 TeV | CMS-PAS-LUM-18-002 | CMS-PAS-LUM-18-002 |
| 32 | T. Sjostrand et al. | An introduction to PYTHIA 8.2 | CPC 191 (2015) 159 | 1410.3012 |
| 33 | CMS Collaboration | Extraction and validation of a new set of CMS PYTHIA8 tunes from underlying-event measurements | EPJC 80 (2020) 4 | CMS-GEN-17-001 1903.12179 |
| 34 | GEANT4 Collaboration | GEANT4--a simulation toolkit | NIMA 506 (2003) 250 | |
| 35 | D. J. Lange | The EvtGen particle decay simulation package | NIMA 462 (2001) 152 | |
| 36 | N. Davidson, T. Przedzinski, and Z. Was | PHOTOS interface in C++: technical and physics documentation | CPC 199 (2016) 86 | 1011.0937 |
| 37 | K. Prokofiev and T. Speer | A kinematic and a decay chain reconstruction library | Prepared for Computing in High-Energy Physics (CHEP '04), Interlaken, Switzerland, 27 Sep - 1 Oct 2004 | |
| 38 | T. Chen and C. Guestrin | XGBoost: A scalable tree boosting system | in Proceedings of the 22nd ACM SIGKDD International Conference on Knowledge Discovery and Data Mining, KDD '16, pp. 785--794 ACM, New York, NY, USA | |
| 39 | M. Pivk and F. R. Le Diberder | SPlot: A Statistical tool to unfold data distributions | NIMA555 (2005) 356 | physics/0402083 |
| 40 | CMS Collaboration | Tracking performances for charged pions with run2 legacy data | CDS | |
| 41 | Particle Data Group Collaboration | Review of Particle Physics | PTEP 2020 (2020), no. 8, 083C01 | |
| 42 | LHCb Collaboration | Precise measurement of the~$ f_s/f_d $ ratio of fragmentation fractions and of $ B^0_s $ decay branching fractions | PRD 104 (2021) 032005 | 2103.06810 |
| 43 | Belle Collaboration | Measurement of the decays $ B^0_s \to J/\psi\phi(1020), B^0_s \to J/\psi f_2'(1525) $ and $ B^0_s \to J/\psi K^+K^- $ at Belle | PRD 88 (2013), no. 11, 114006 | 1309.0704 |
| 44 | T. Junk | Confidence level computation for combining searches with small statistics | NIMA 434 (1999) 435 | hep-ex/9902006 |
| 45 | A. L. Read | Presentation of search results: The CL$ _{\text{s}} $ technique | JPG 28 (2002) 2693 | |
|
|
Compact Muon Solenoid LHC, CERN |
|

|

|

|

|

|