

Compact Muon Solenoid
LHC, CERN
| CMS-TOP-23-008 ; CERN-EP-2024-184 | ||
| Measurement of inclusive and differential cross sections of single top quark production in association with a W boson in proton-proton collisions at $ \sqrt{s}= $ 13.6 TeV | ||
| CMS Collaboration | ||
| 10 September 2024 | ||
| JHEP 01 (2025) 107 | ||
| Abstract: The first measurement of the inclusive and normalised differential cross sections of single top quark production in association with a W boson in proton-proton collisions at a centre-of-mass energy of 13.6 TeV is presented. The data were recorded with the CMS detector at the LHC in 2022, and correspond to an integrated luminosity of 34.7 fb$^{-1}$. The analysed events contain one muon and one electron in the final state. For the inclusive measurement, multivariate discriminants exploiting the kinematic properties of the events are used to separate the signal from the dominant top quark-antiquark production background. A cross section of 82.3 $ \pm $ 2.1 (stat) $ \,^{+9.9}_{-9.7} $ (syst) $ \pm $ 3.3 (lumi) pb is obtained, consistent with the predictions of the standard model. A fiducial region is defined according to the detector acceptance to perform the differential measurements. The resulting differential distributions are unfolded to particle level and show good agreement with the predictions at next-to-leading order in perturbative quantum chromodynamics. | ||
| Links: e-print arXiv:2409.06444 [hep-ex] (PDF) ; CDS record ; inSPIRE record ; HepData record ; Physics Briefing ; CADI line (restricted) ; | ||
| Figures & Tables | Summary | Additional Figures | References | CMS Publications |
|---|
| Figures | |

png pdf |
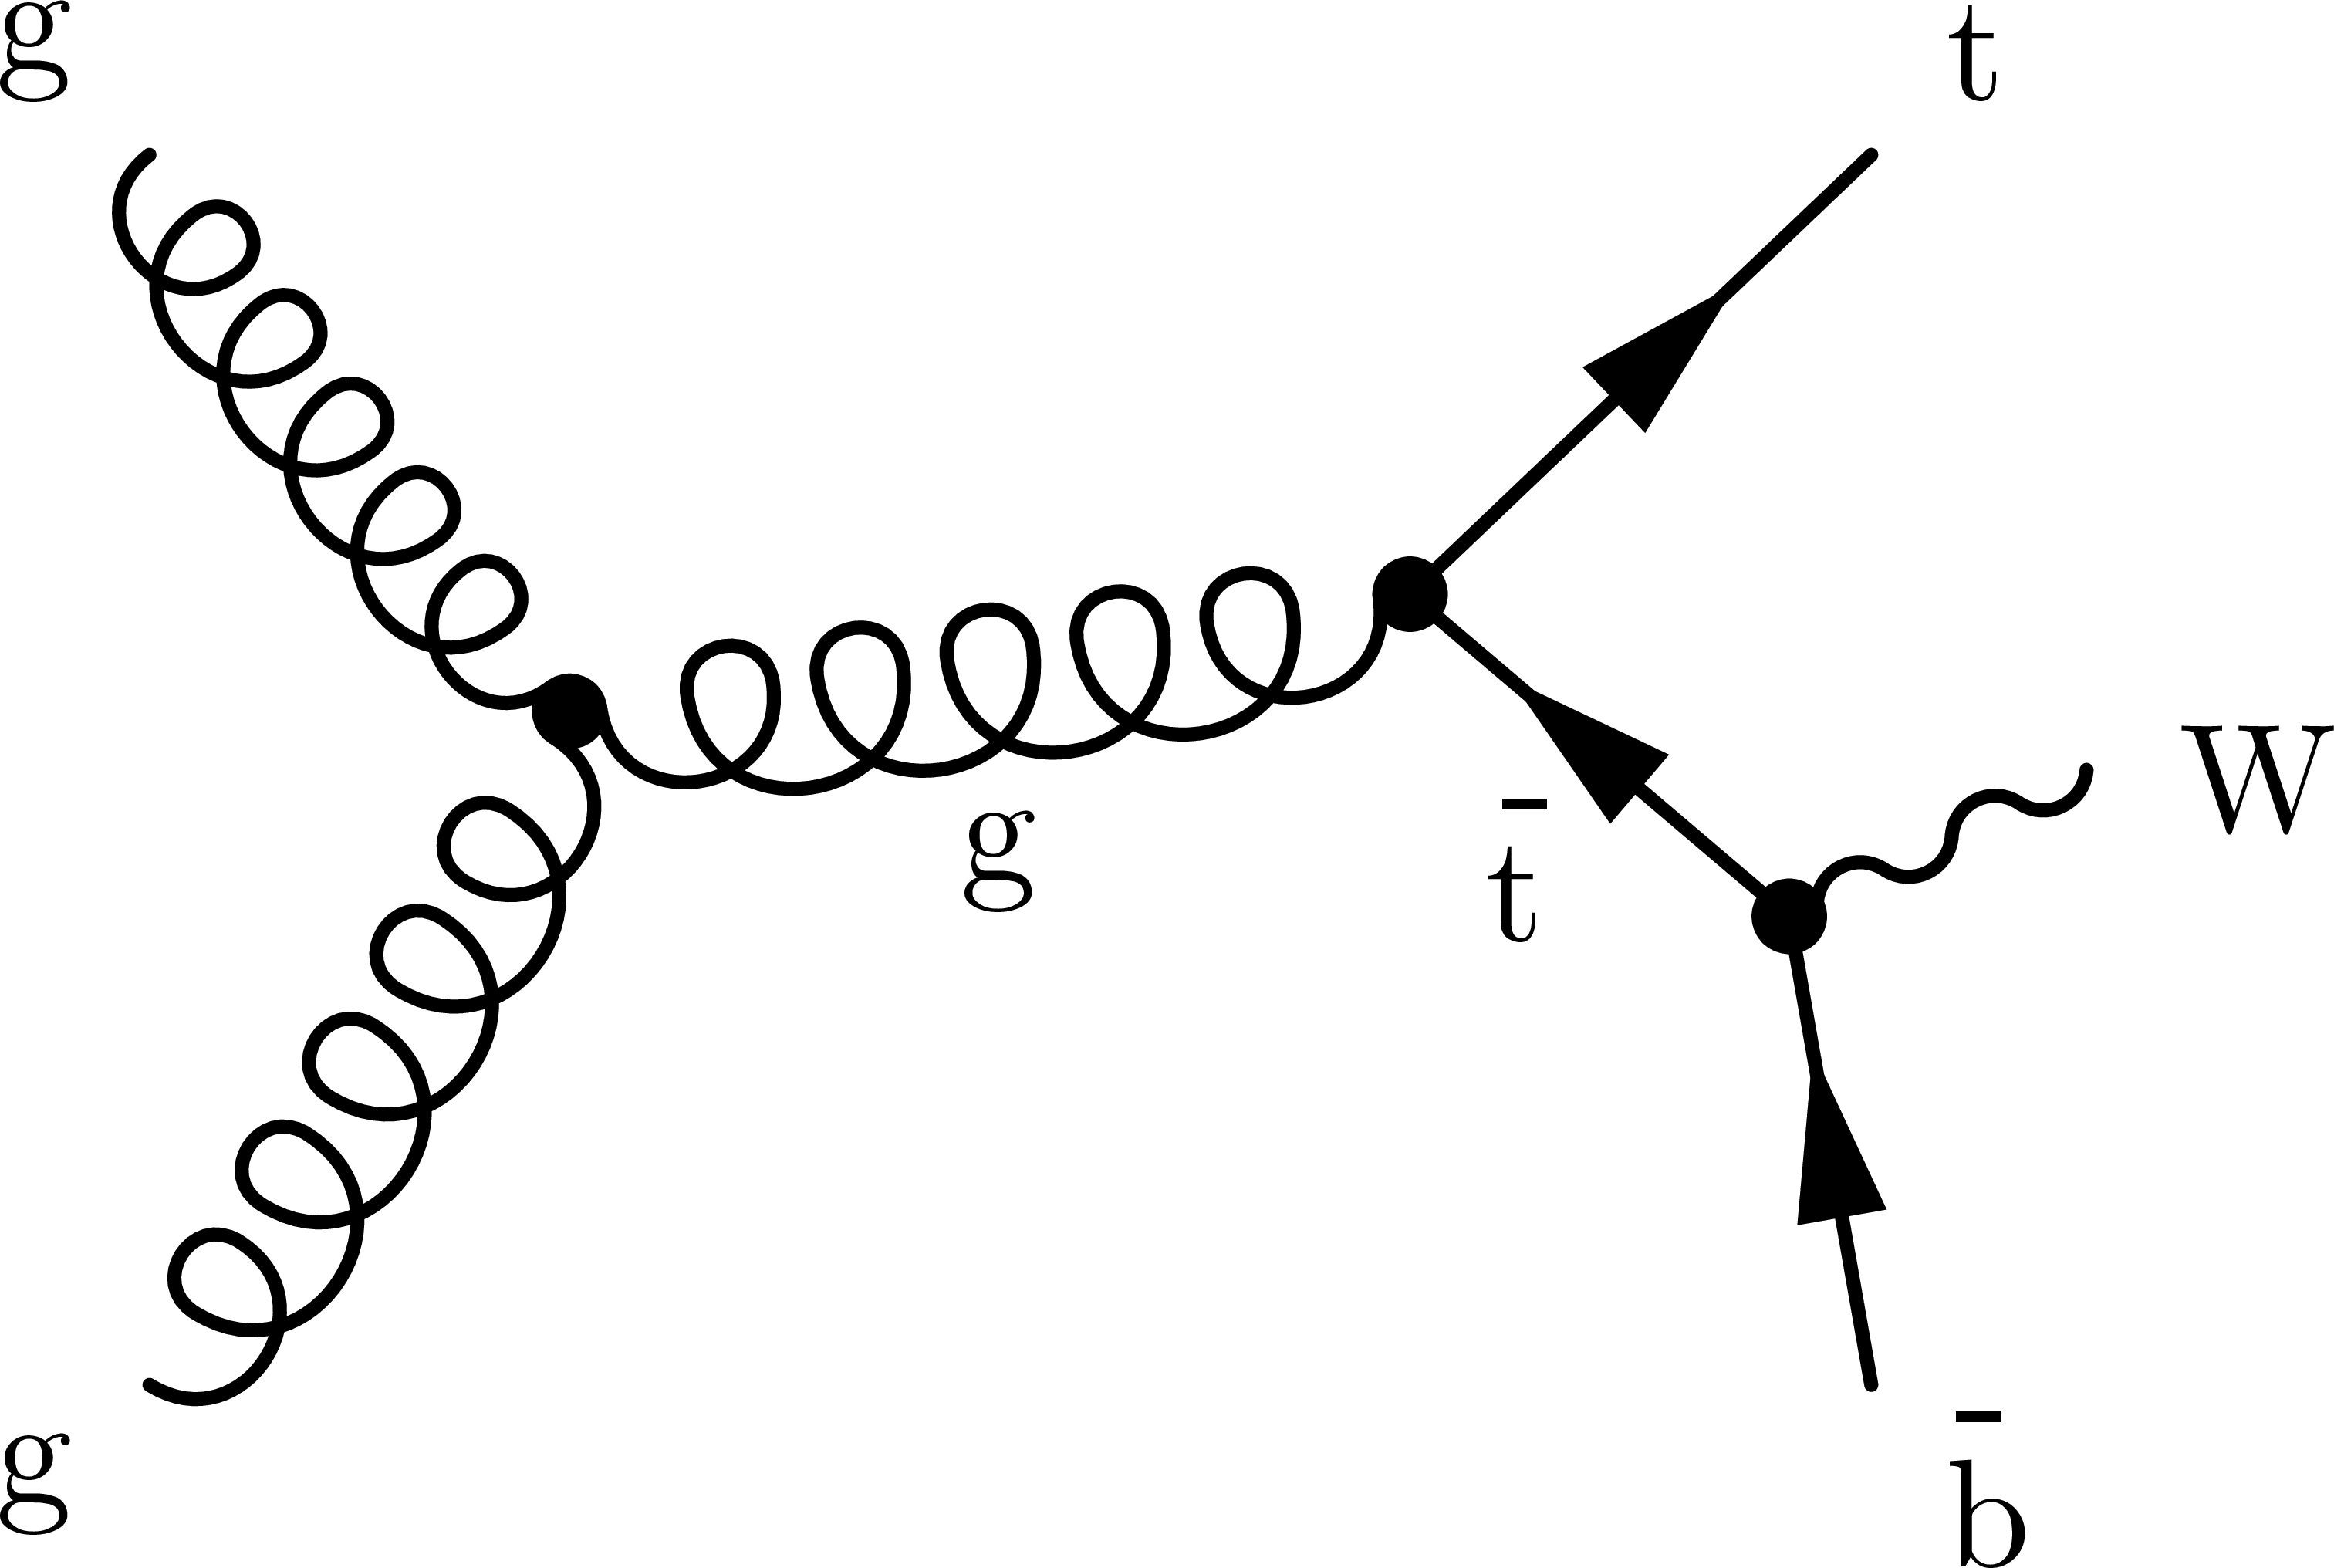
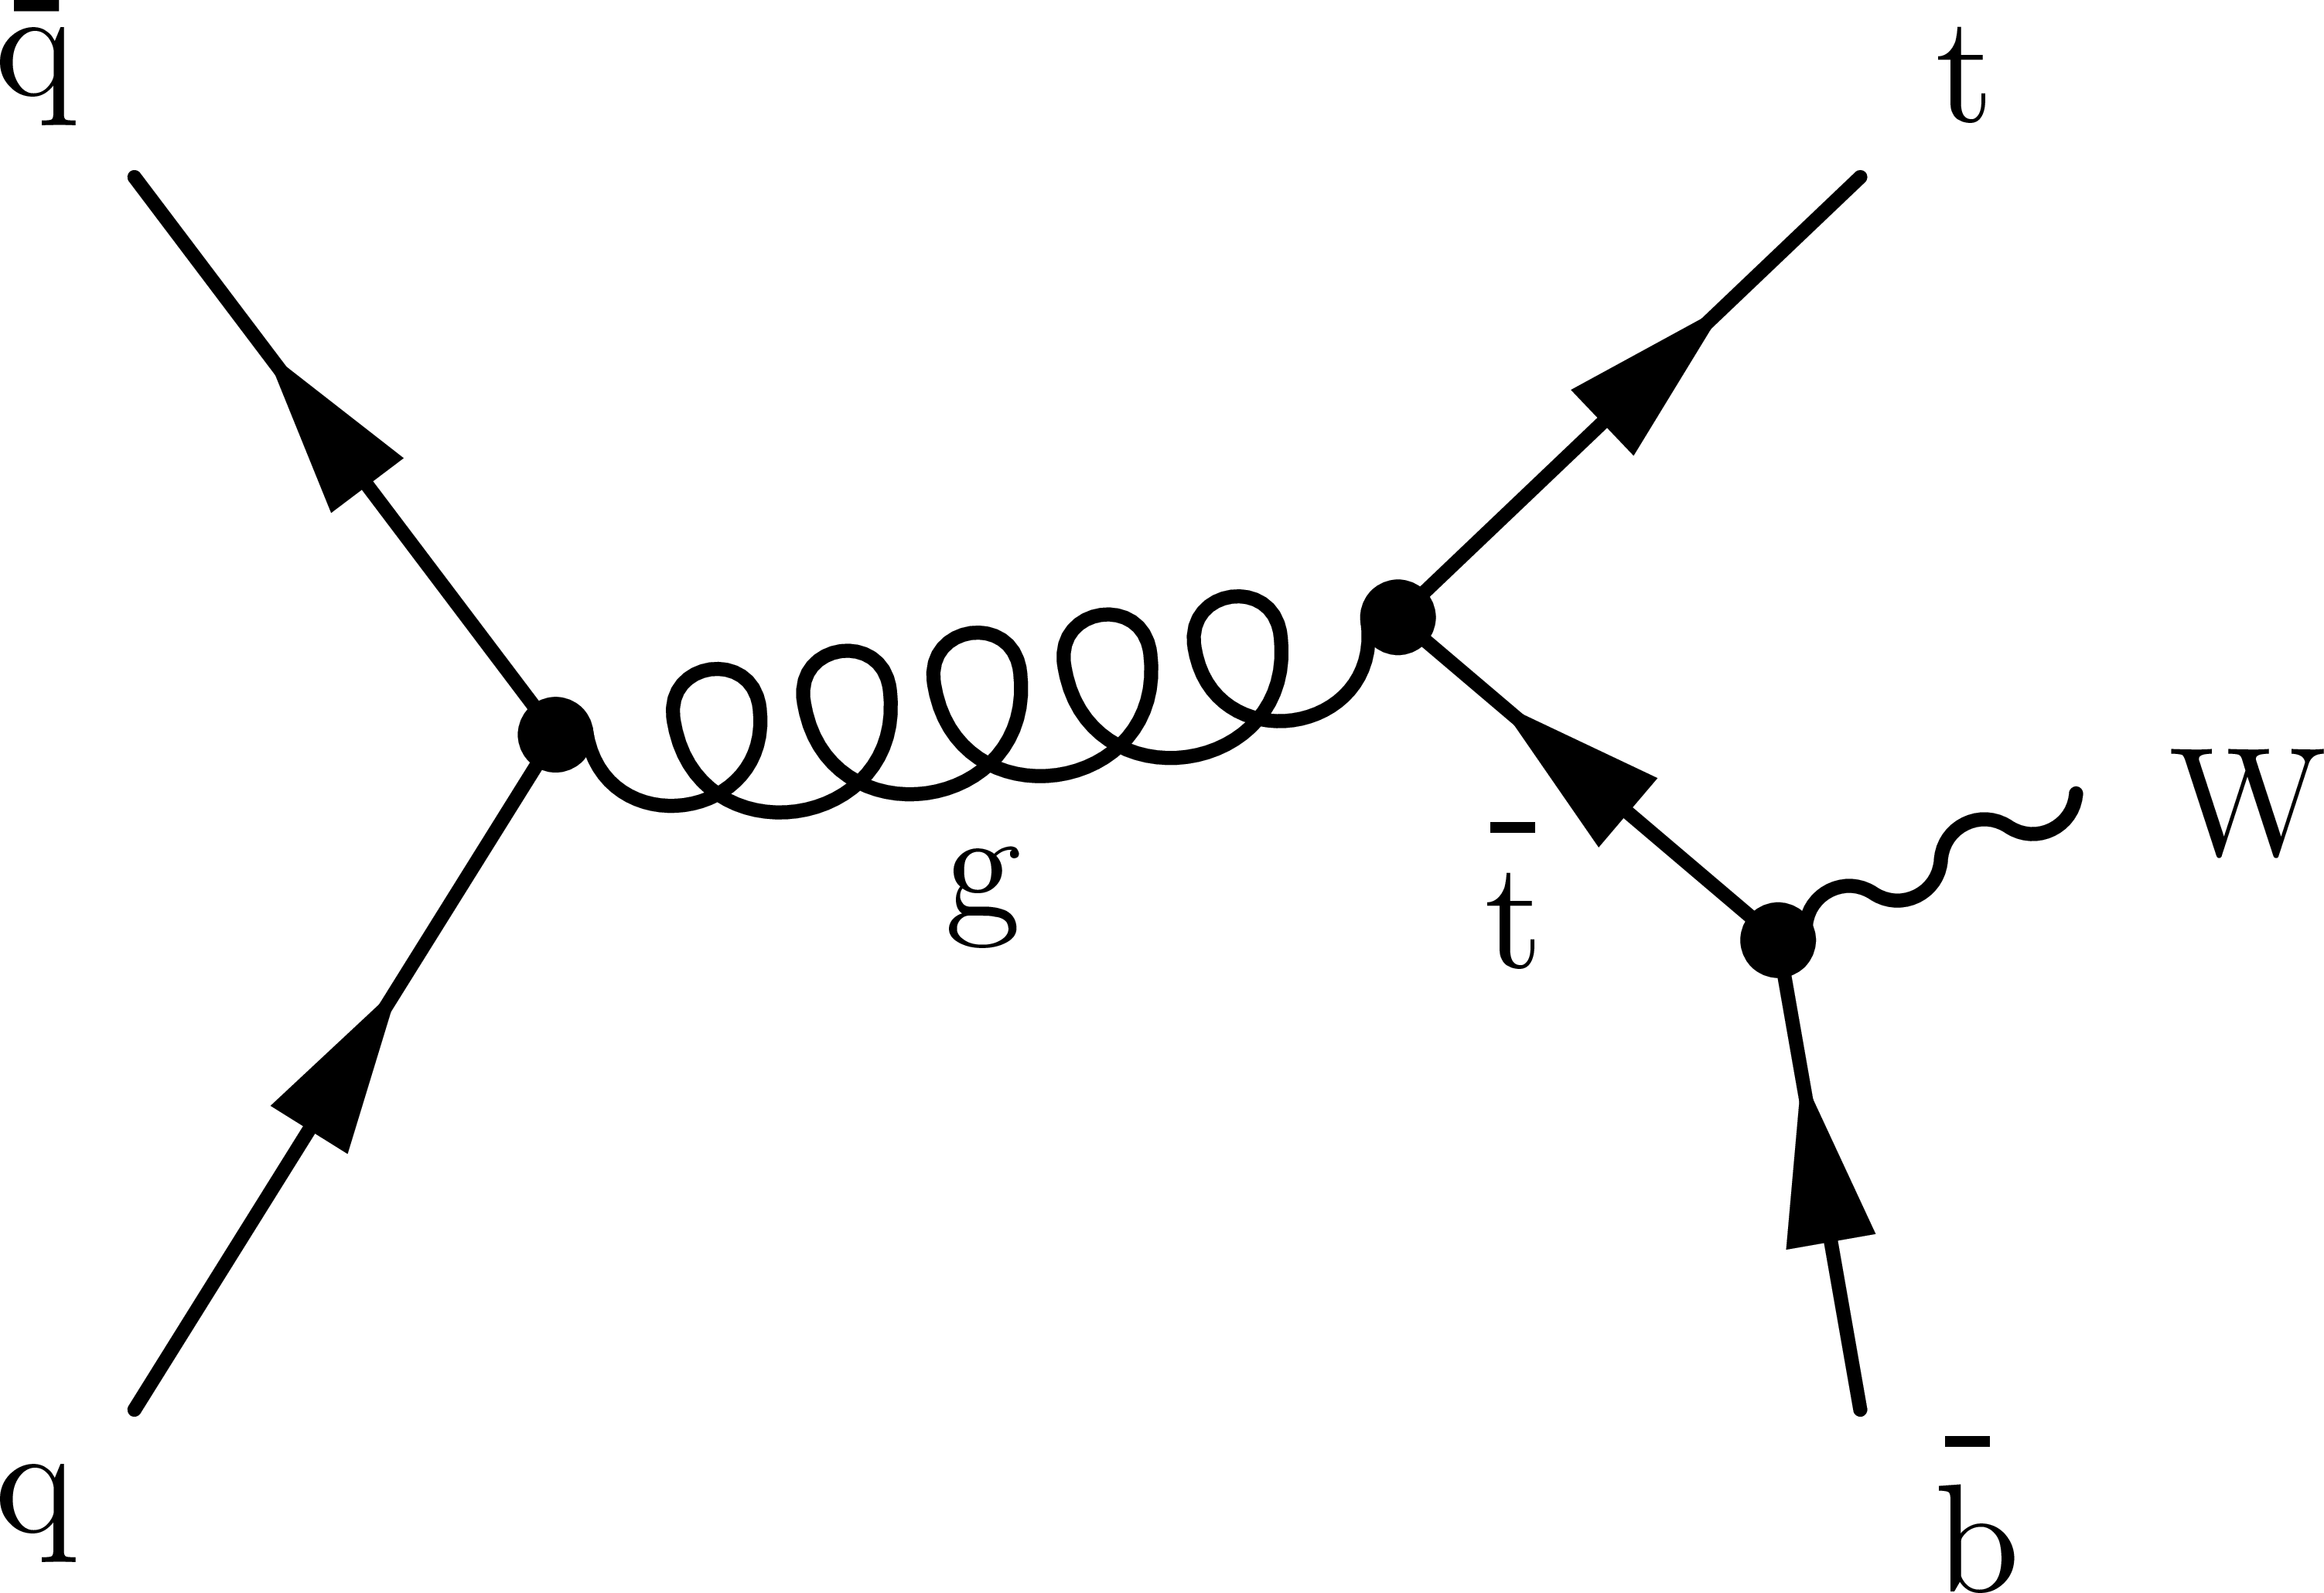
Figure 1:
Leading-order Feynman diagrams of single top quark production in the $ \mathrm{t}\mathrm{W} $ mode. The charge-conjugate modes are implicitly included. |

png pdf |
Figure 1-a:
Leading-order Feynman diagrams of single top quark production in the $ \mathrm{t}\mathrm{W} $ mode. The charge-conjugate modes are implicitly included. |

png pdf |
Figure 1-b:
Leading-order Feynman diagrams of single top quark production in the $ \mathrm{t}\mathrm{W} $ mode. The charge-conjugate modes are implicitly included. |

png pdf |
Figure 2:
Representative Feynman diagrams for $ \mathrm{t}\mathrm{W} $ single top quark production at NLO that are removed from the signal definition in the DR scheme. The charge-conjugate modes are implicitly included. |

png pdf |
Figure 2-a:
Representative Feynman diagrams for $ \mathrm{t}\mathrm{W} $ single top quark production at NLO that are removed from the signal definition in the DR scheme. The charge-conjugate modes are implicitly included. |
png pdf |
Figure 2-b:
Representative Feynman diagrams for $ \mathrm{t}\mathrm{W} $ single top quark production at NLO that are removed from the signal definition in the DR scheme. The charge-conjugate modes are implicitly included. |
png pdf |
Figure 2-c:
Representative Feynman diagrams for $ \mathrm{t}\mathrm{W} $ single top quark production at NLO that are removed from the signal definition in the DR scheme. The charge-conjugate modes are implicitly included. |
png pdf |
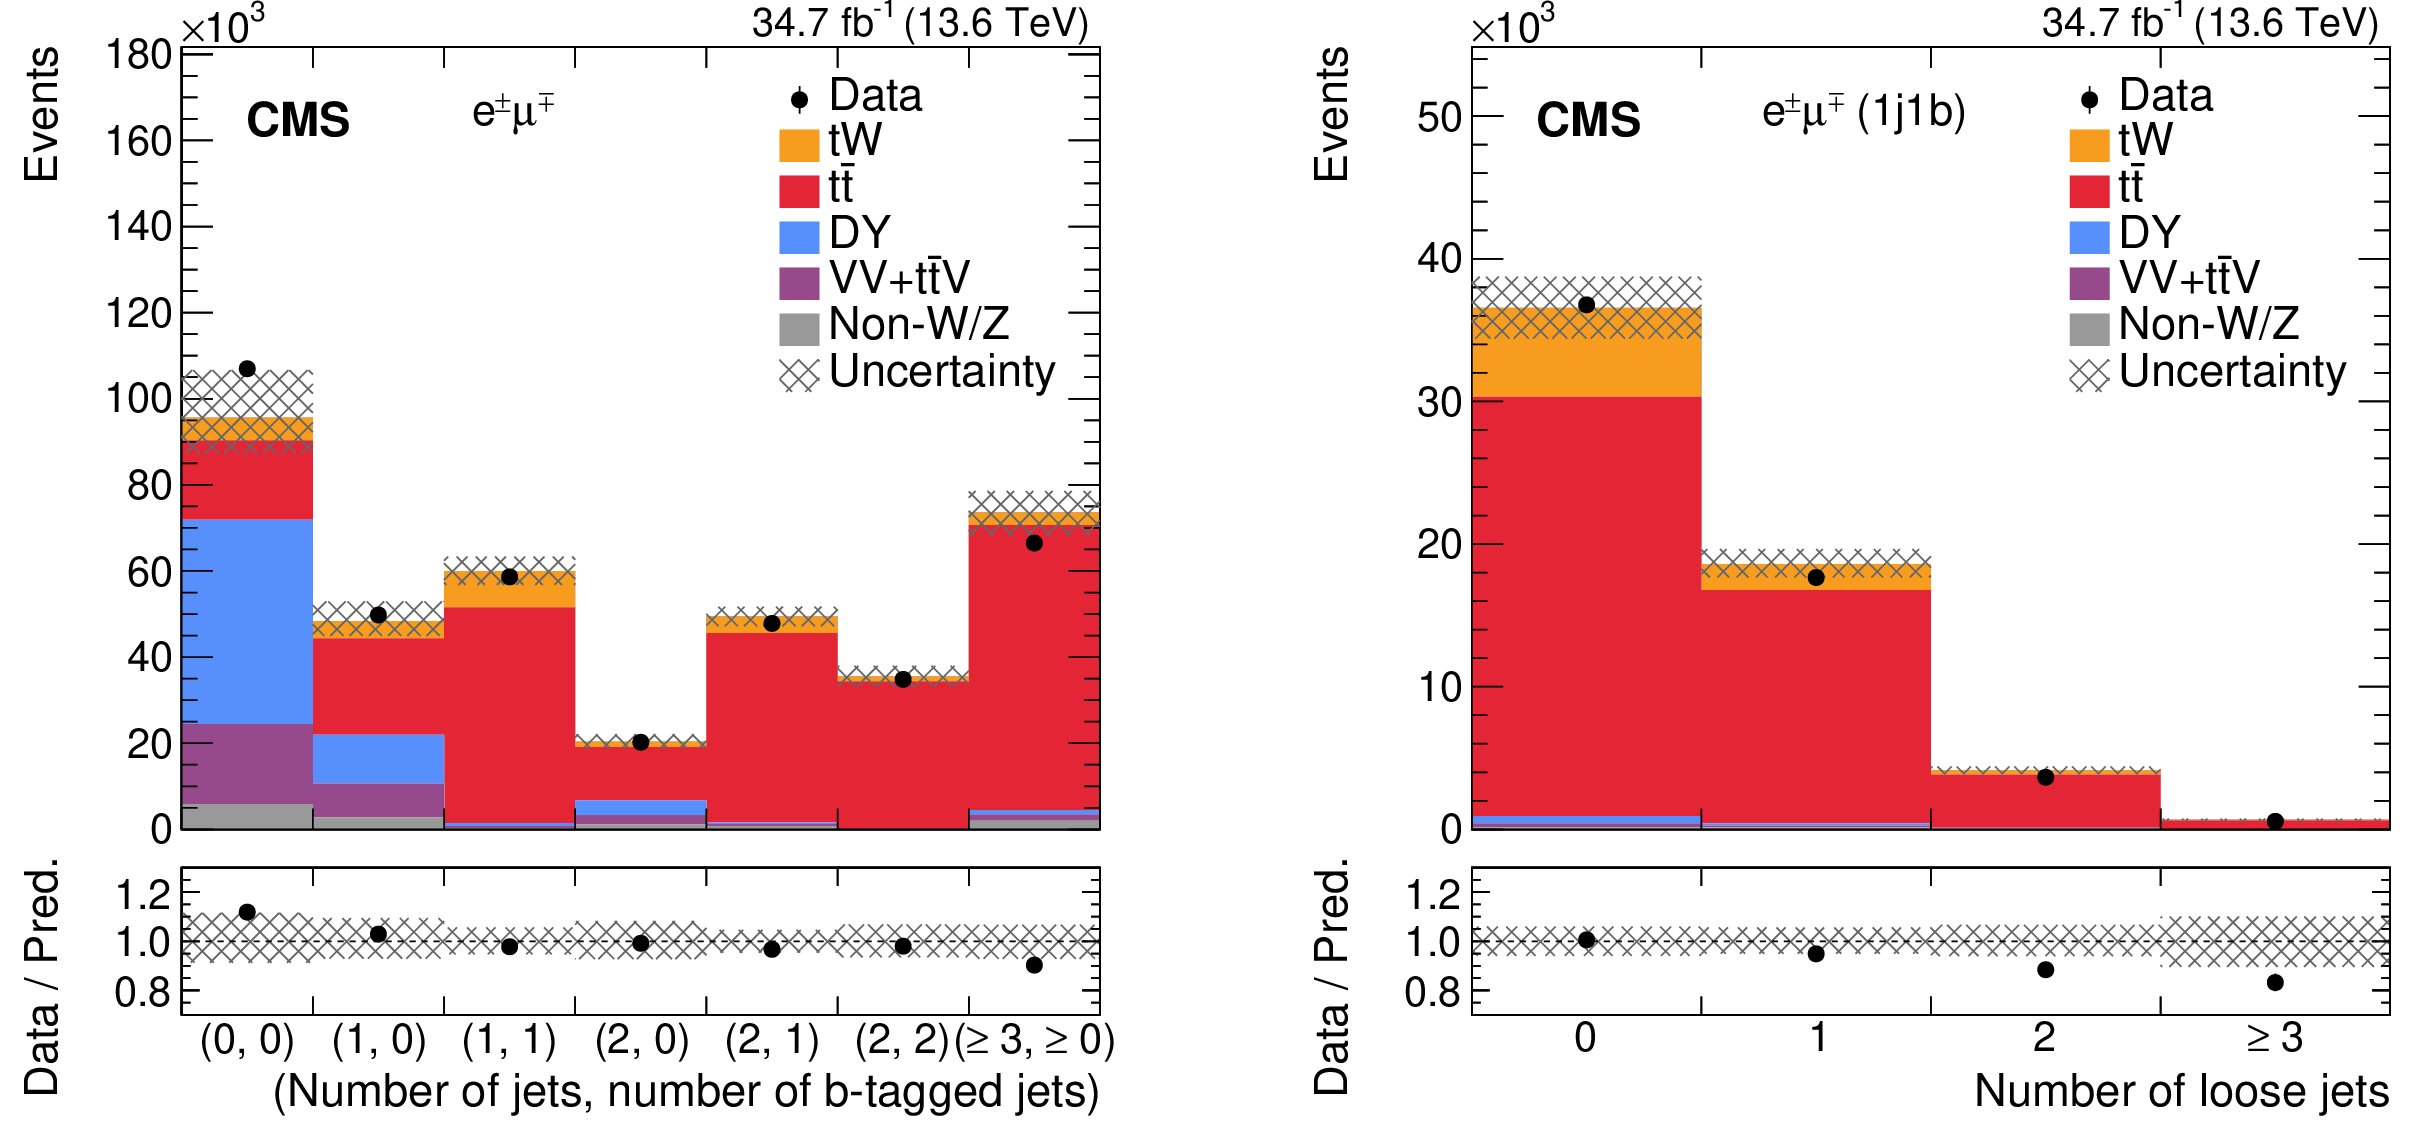
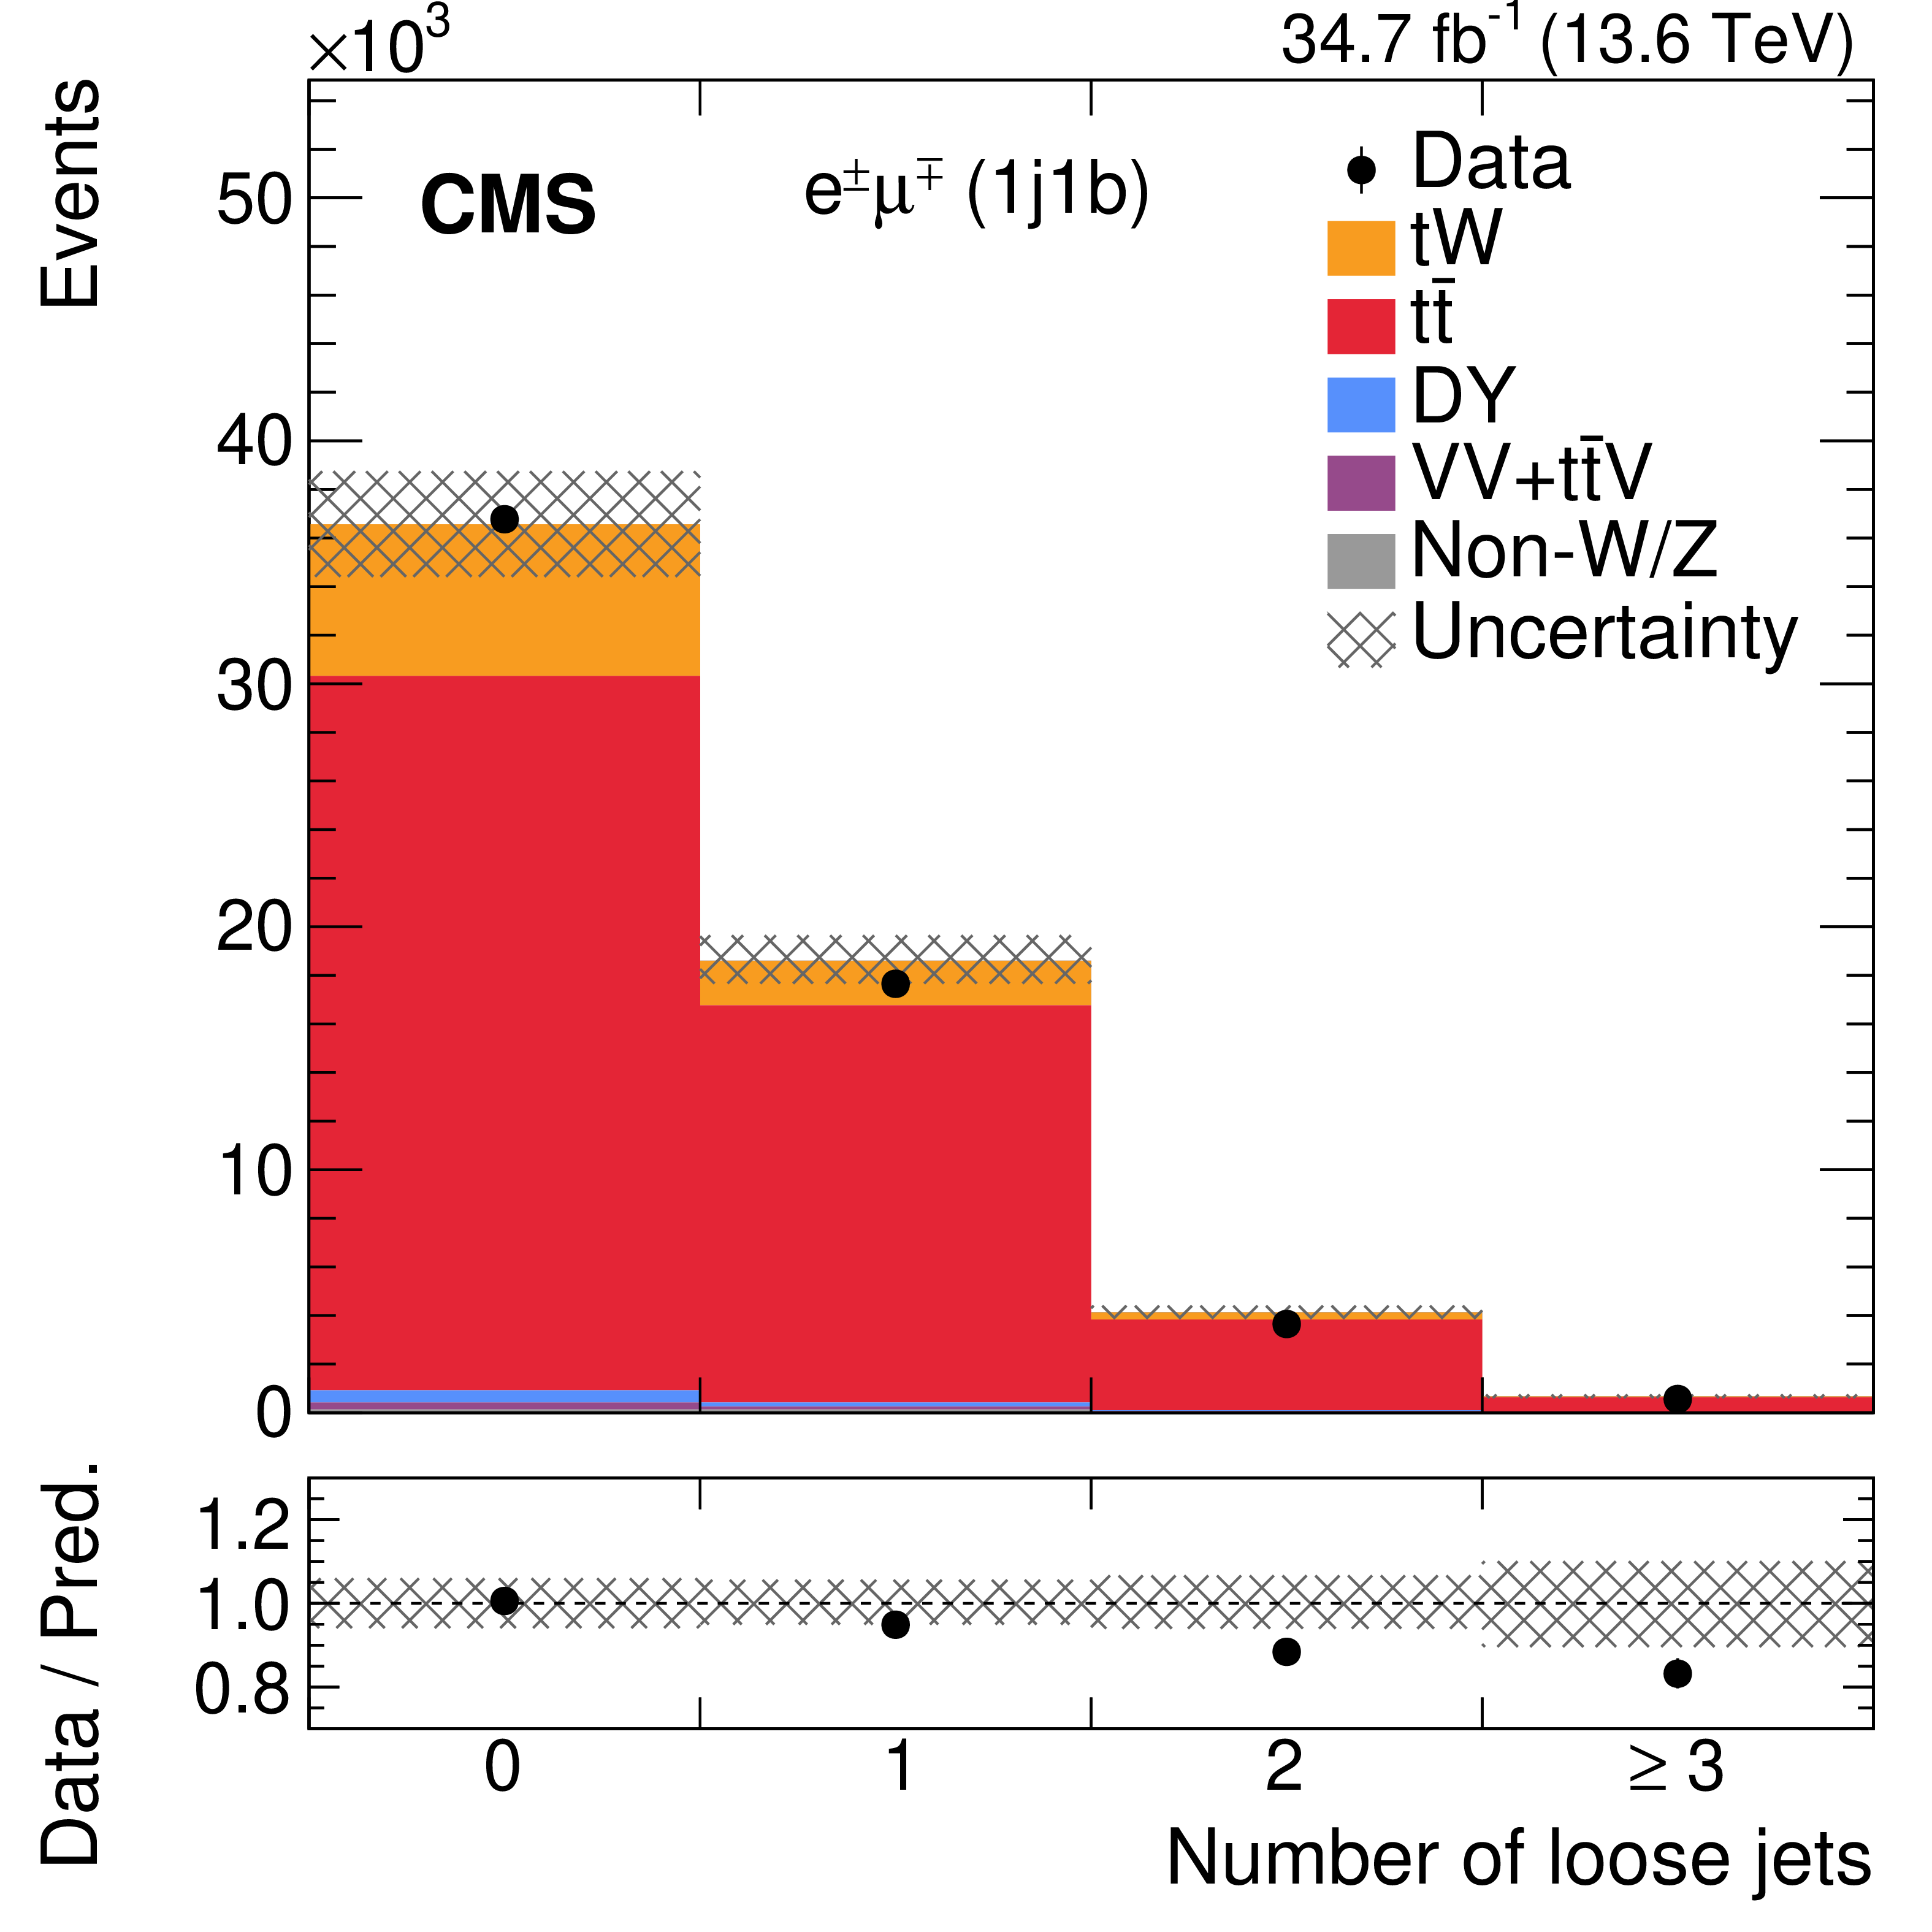
Figure 3:
Left: the number of events observed in data (points) and predicted from simulation (filled histograms) in the $ \mathrm{e}^\pm\mu^\mp $ final state as a function of the number of jets and b-tagged jets before the maximum likelihood fit. Right: the number of loose jets per event in the $ \mathrm{e}^\pm\mu^\mp $ final state from the 1j1b region before the maximum likelihood fit. The vertical bars on the points show the statistical uncertainties in the data. The hatched band represents the sum of the statistical and systematic uncertainties in the MC predictions. The lower panels show the ratio of data to the sum of the expected yields. |

png pdf |
Figure 3-a:
Left: the number of events observed in data (points) and predicted from simulation (filled histograms) in the $ \mathrm{e}^\pm\mu^\mp $ final state as a function of the number of jets and b-tagged jets before the maximum likelihood fit. Right: the number of loose jets per event in the $ \mathrm{e}^\pm\mu^\mp $ final state from the 1j1b region before the maximum likelihood fit. The vertical bars on the points show the statistical uncertainties in the data. The hatched band represents the sum of the statistical and systematic uncertainties in the MC predictions. The lower panels show the ratio of data to the sum of the expected yields. |
png pdf |
Figure 3-b:
Left: the number of events observed in data (points) and predicted from simulation (filled histograms) in the $ \mathrm{e}^\pm\mu^\mp $ final state as a function of the number of jets and b-tagged jets before the maximum likelihood fit. Right: the number of loose jets per event in the $ \mathrm{e}^\pm\mu^\mp $ final state from the 1j1b region before the maximum likelihood fit. The vertical bars on the points show the statistical uncertainties in the data. The hatched band represents the sum of the statistical and systematic uncertainties in the MC predictions. The lower panels show the ratio of data to the sum of the expected yields. |

png pdf |
Figure 4:
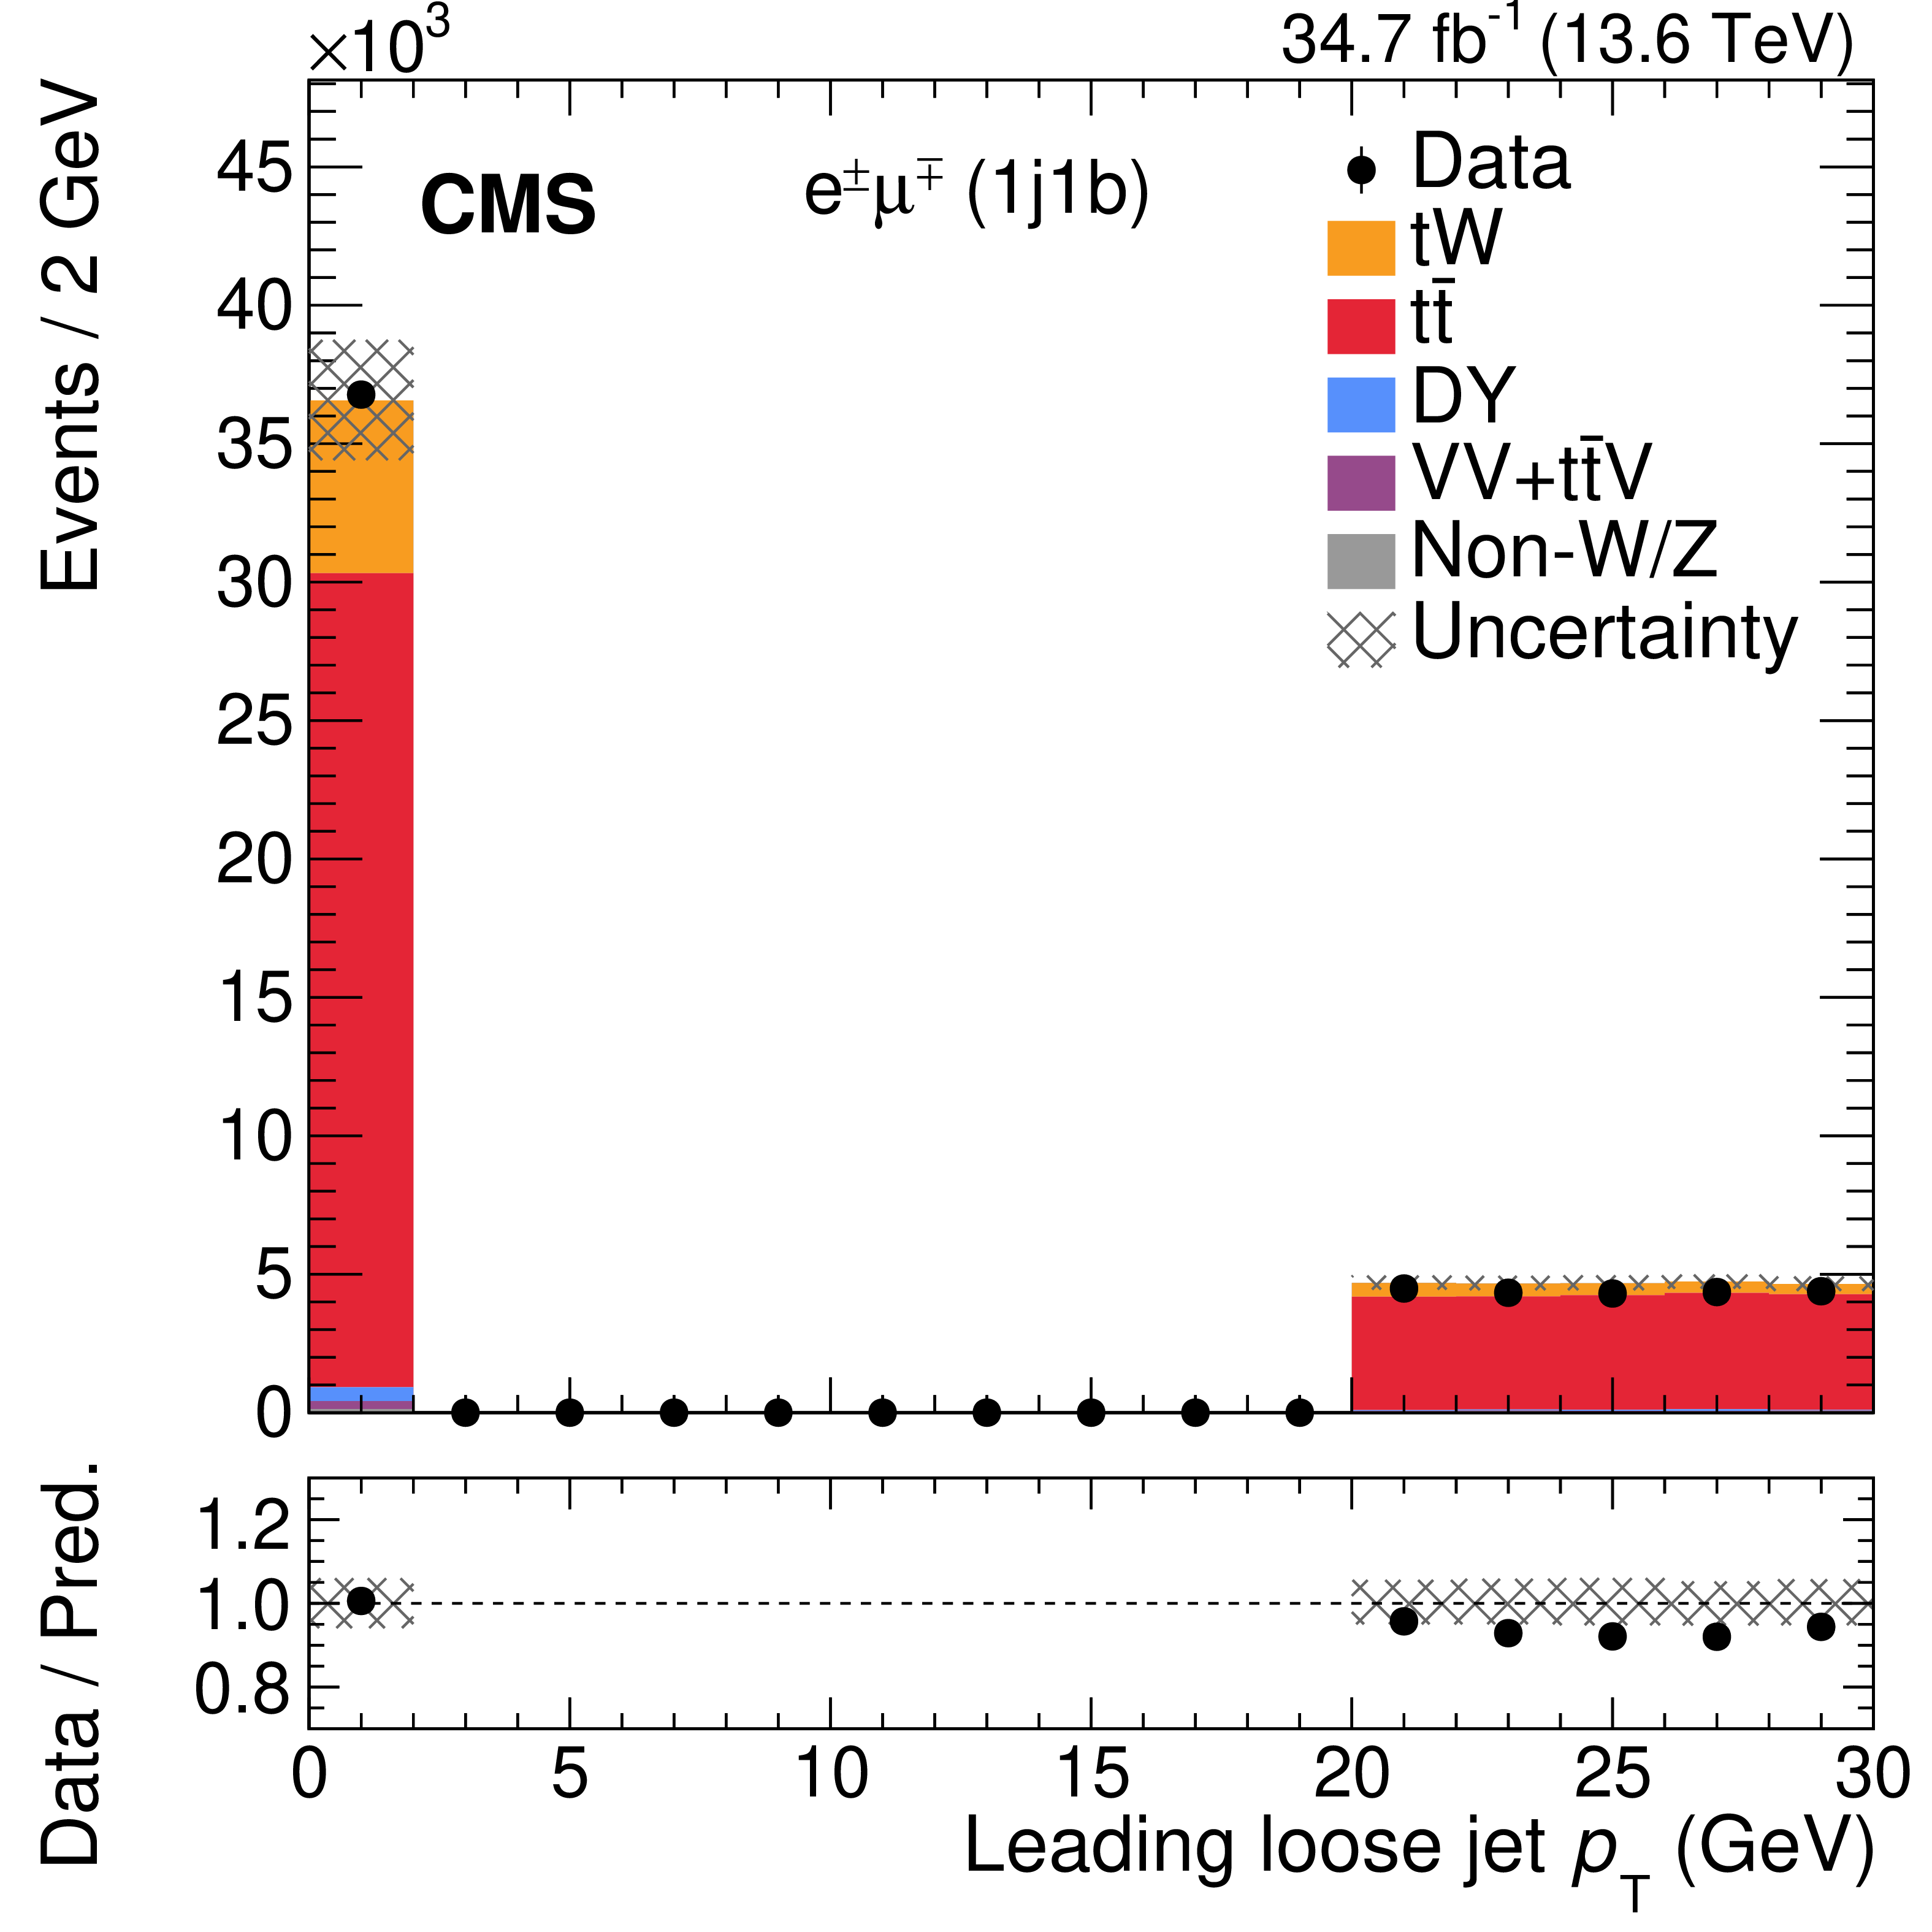
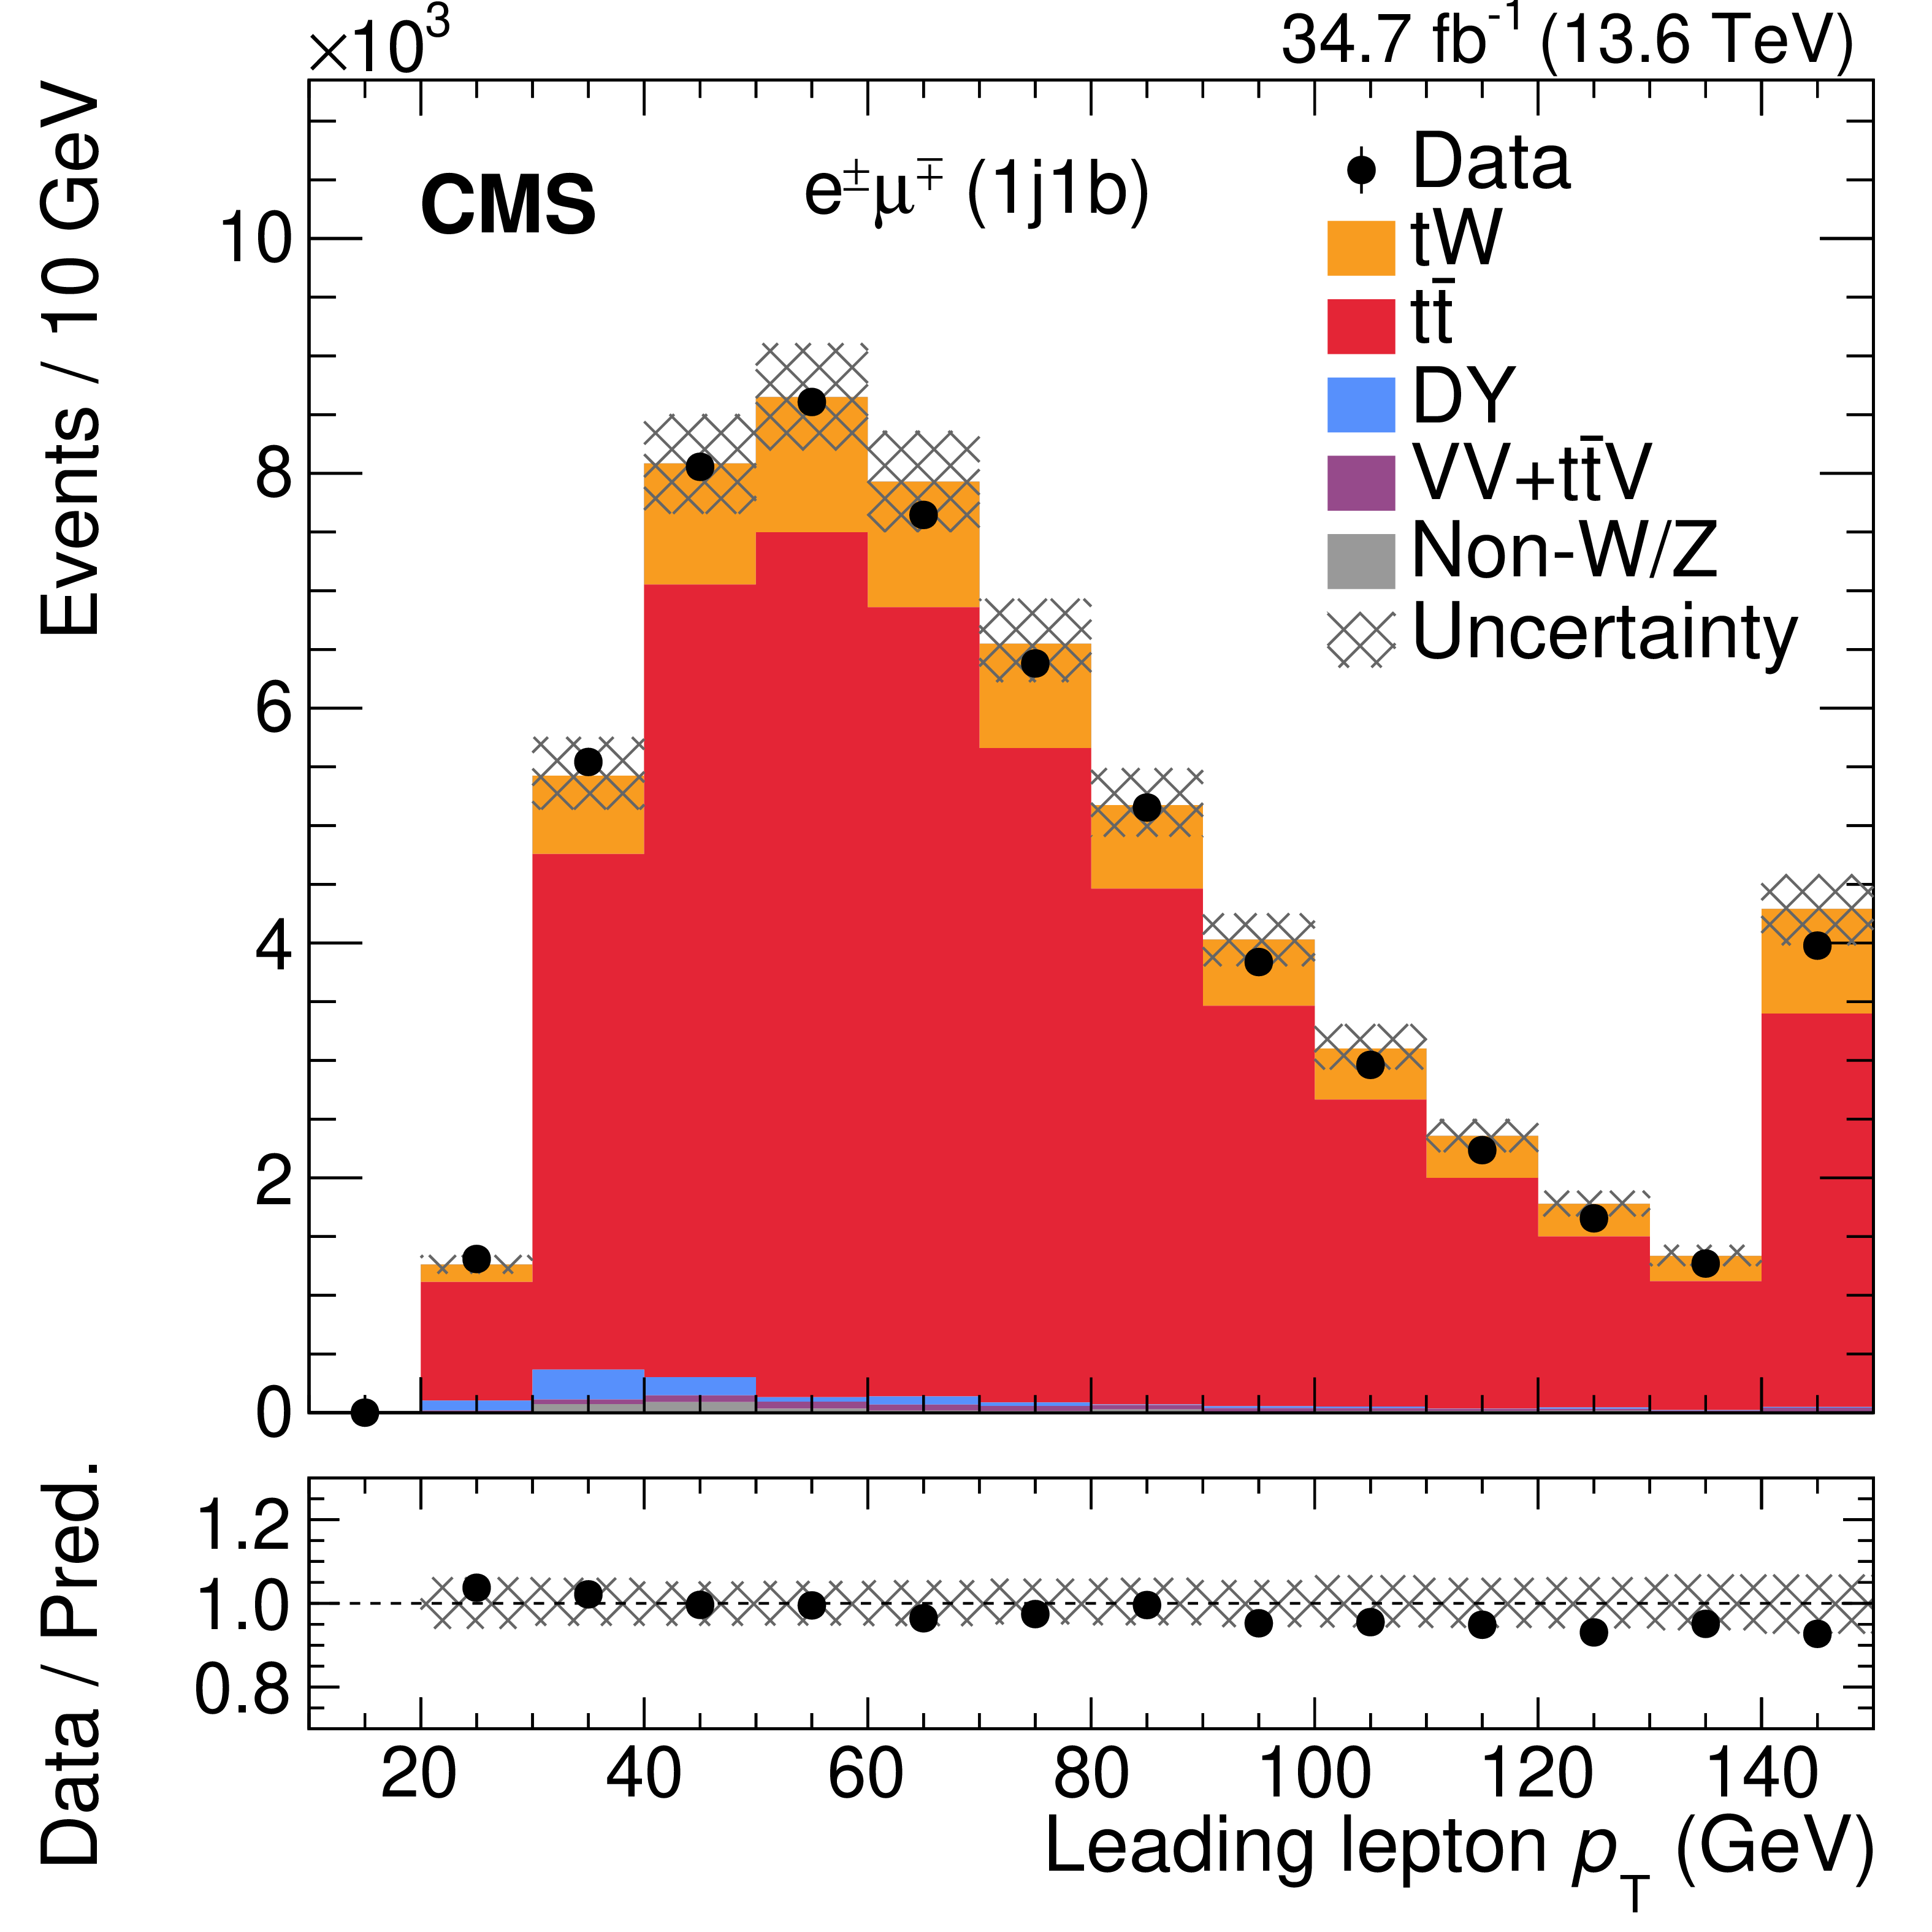
Distributions from data (points) and MC simulations (filled histograms) before the maximum likelihood fit of the four most discriminating variables used for the RF training of the 1j1b region: (upper left) the $ p_{\mathrm{T}} $ of the leading loose jet; (upper right) the $ p_{\mathrm{T}} $ of the leading lepton; (lower left) the magnitude of the transverse momentum of the dilepton+jet system; and (lower right) the invariant mass of the dilepton system. The last bin of each distribution includes the overflow events, except for the leading loose jet $ p_{\mathrm{T}} $ distribution, which is only defined up to 30 GeV. The first bin in the upper left plot contains events with no loose jets. The vertical bars on the points give the statistical uncertainty in the data, and the hatched band represents the sum of the statistical and systematic uncertainties in the MC predictions. The lower panels show the ratio of the data to the sum of the MC predictions. |
png pdf |
Figure 4-a:
Distributions from data (points) and MC simulations (filled histograms) before the maximum likelihood fit of the four most discriminating variables used for the RF training of the 1j1b region: (upper left) the $ p_{\mathrm{T}} $ of the leading loose jet; (upper right) the $ p_{\mathrm{T}} $ of the leading lepton; (lower left) the magnitude of the transverse momentum of the dilepton+jet system; and (lower right) the invariant mass of the dilepton system. The last bin of each distribution includes the overflow events, except for the leading loose jet $ p_{\mathrm{T}} $ distribution, which is only defined up to 30 GeV. The first bin in the upper left plot contains events with no loose jets. The vertical bars on the points give the statistical uncertainty in the data, and the hatched band represents the sum of the statistical and systematic uncertainties in the MC predictions. The lower panels show the ratio of the data to the sum of the MC predictions. |
png pdf |
Figure 4-b:
Distributions from data (points) and MC simulations (filled histograms) before the maximum likelihood fit of the four most discriminating variables used for the RF training of the 1j1b region: (upper left) the $ p_{\mathrm{T}} $ of the leading loose jet; (upper right) the $ p_{\mathrm{T}} $ of the leading lepton; (lower left) the magnitude of the transverse momentum of the dilepton+jet system; and (lower right) the invariant mass of the dilepton system. The last bin of each distribution includes the overflow events, except for the leading loose jet $ p_{\mathrm{T}} $ distribution, which is only defined up to 30 GeV. The first bin in the upper left plot contains events with no loose jets. The vertical bars on the points give the statistical uncertainty in the data, and the hatched band represents the sum of the statistical and systematic uncertainties in the MC predictions. The lower panels show the ratio of the data to the sum of the MC predictions. |

png pdf |
Figure 4-c:
Distributions from data (points) and MC simulations (filled histograms) before the maximum likelihood fit of the four most discriminating variables used for the RF training of the 1j1b region: (upper left) the $ p_{\mathrm{T}} $ of the leading loose jet; (upper right) the $ p_{\mathrm{T}} $ of the leading lepton; (lower left) the magnitude of the transverse momentum of the dilepton+jet system; and (lower right) the invariant mass of the dilepton system. The last bin of each distribution includes the overflow events, except for the leading loose jet $ p_{\mathrm{T}} $ distribution, which is only defined up to 30 GeV. The first bin in the upper left plot contains events with no loose jets. The vertical bars on the points give the statistical uncertainty in the data, and the hatched band represents the sum of the statistical and systematic uncertainties in the MC predictions. The lower panels show the ratio of the data to the sum of the MC predictions. |

png pdf |
Figure 4-d:
Distributions from data (points) and MC simulations (filled histograms) before the maximum likelihood fit of the four most discriminating variables used for the RF training of the 1j1b region: (upper left) the $ p_{\mathrm{T}} $ of the leading loose jet; (upper right) the $ p_{\mathrm{T}} $ of the leading lepton; (lower left) the magnitude of the transverse momentum of the dilepton+jet system; and (lower right) the invariant mass of the dilepton system. The last bin of each distribution includes the overflow events, except for the leading loose jet $ p_{\mathrm{T}} $ distribution, which is only defined up to 30 GeV. The first bin in the upper left plot contains events with no loose jets. The vertical bars on the points give the statistical uncertainty in the data, and the hatched band represents the sum of the statistical and systematic uncertainties in the MC predictions. The lower panels show the ratio of the data to the sum of the MC predictions. |
png pdf |
Figure 5:
The distributions of the RF outputs for events in the 1j1b (upper left) and 2j1b (upper right) regions, and the subleading jet $ p_{\mathrm{T}} $ for the 2j2b region (lower). The number of observed events (points) and estimated signal and background events (filled histograms) before the maximum likelihood fit are shown. The last bin of the subleading jet $ p_{\mathrm{T}} $ distribution includes the overflow events. The vertical bars on the points represent the statistical uncertainty in the data, and the hatched band the total uncertainty in the estimated events before the fit. The lower panels display the ratio of the data to the sum of the estimated events (points) before the fit, with the bands giving the corresponding uncertainties. |

png pdf |
Figure 5-a:
The distributions of the RF outputs for events in the 1j1b (upper left) and 2j1b (upper right) regions, and the subleading jet $ p_{\mathrm{T}} $ for the 2j2b region (lower). The number of observed events (points) and estimated signal and background events (filled histograms) before the maximum likelihood fit are shown. The last bin of the subleading jet $ p_{\mathrm{T}} $ distribution includes the overflow events. The vertical bars on the points represent the statistical uncertainty in the data, and the hatched band the total uncertainty in the estimated events before the fit. The lower panels display the ratio of the data to the sum of the estimated events (points) before the fit, with the bands giving the corresponding uncertainties. |

png pdf |
Figure 5-b:
The distributions of the RF outputs for events in the 1j1b (upper left) and 2j1b (upper right) regions, and the subleading jet $ p_{\mathrm{T}} $ for the 2j2b region (lower). The number of observed events (points) and estimated signal and background events (filled histograms) before the maximum likelihood fit are shown. The last bin of the subleading jet $ p_{\mathrm{T}} $ distribution includes the overflow events. The vertical bars on the points represent the statistical uncertainty in the data, and the hatched band the total uncertainty in the estimated events before the fit. The lower panels display the ratio of the data to the sum of the estimated events (points) before the fit, with the bands giving the corresponding uncertainties. |

png pdf |
Figure 5-c:
The distributions of the RF outputs for events in the 1j1b (upper left) and 2j1b (upper right) regions, and the subleading jet $ p_{\mathrm{T}} $ for the 2j2b region (lower). The number of observed events (points) and estimated signal and background events (filled histograms) before the maximum likelihood fit are shown. The last bin of the subleading jet $ p_{\mathrm{T}} $ distribution includes the overflow events. The vertical bars on the points represent the statistical uncertainty in the data, and the hatched band the total uncertainty in the estimated events before the fit. The lower panels display the ratio of the data to the sum of the estimated events (points) before the fit, with the bands giving the corresponding uncertainties. |
png pdf |
Figure 5-d:
The distributions of the RF outputs for events in the 1j1b (upper left) and 2j1b (upper right) regions, and the subleading jet $ p_{\mathrm{T}} $ for the 2j2b region (lower). The number of observed events (points) and estimated signal and background events (filled histograms) before the maximum likelihood fit are shown. The last bin of the subleading jet $ p_{\mathrm{T}} $ distribution includes the overflow events. The vertical bars on the points represent the statistical uncertainty in the data, and the hatched band the total uncertainty in the estimated events before the fit. The lower panels display the ratio of the data to the sum of the estimated events (points) before the fit, with the bands giving the corresponding uncertainties. |
png pdf |
Figure 5-e:
The distributions of the RF outputs for events in the 1j1b (upper left) and 2j1b (upper right) regions, and the subleading jet $ p_{\mathrm{T}} $ for the 2j2b region (lower). The number of observed events (points) and estimated signal and background events (filled histograms) before the maximum likelihood fit are shown. The last bin of the subleading jet $ p_{\mathrm{T}} $ distribution includes the overflow events. The vertical bars on the points represent the statistical uncertainty in the data, and the hatched band the total uncertainty in the estimated events before the fit. The lower panels display the ratio of the data to the sum of the estimated events (points) before the fit, with the bands giving the corresponding uncertainties. |
png pdf |
Figure 5-f:
The distributions of the RF outputs for events in the 1j1b (upper left) and 2j1b (upper right) regions, and the subleading jet $ p_{\mathrm{T}} $ for the 2j2b region (lower). The number of observed events (points) and estimated signal and background events (filled histograms) before the maximum likelihood fit are shown. The last bin of the subleading jet $ p_{\mathrm{T}} $ distribution includes the overflow events. The vertical bars on the points represent the statistical uncertainty in the data, and the hatched band the total uncertainty in the estimated events before the fit. The lower panels display the ratio of the data to the sum of the estimated events (points) before the fit, with the bands giving the corresponding uncertainties. |
png pdf |
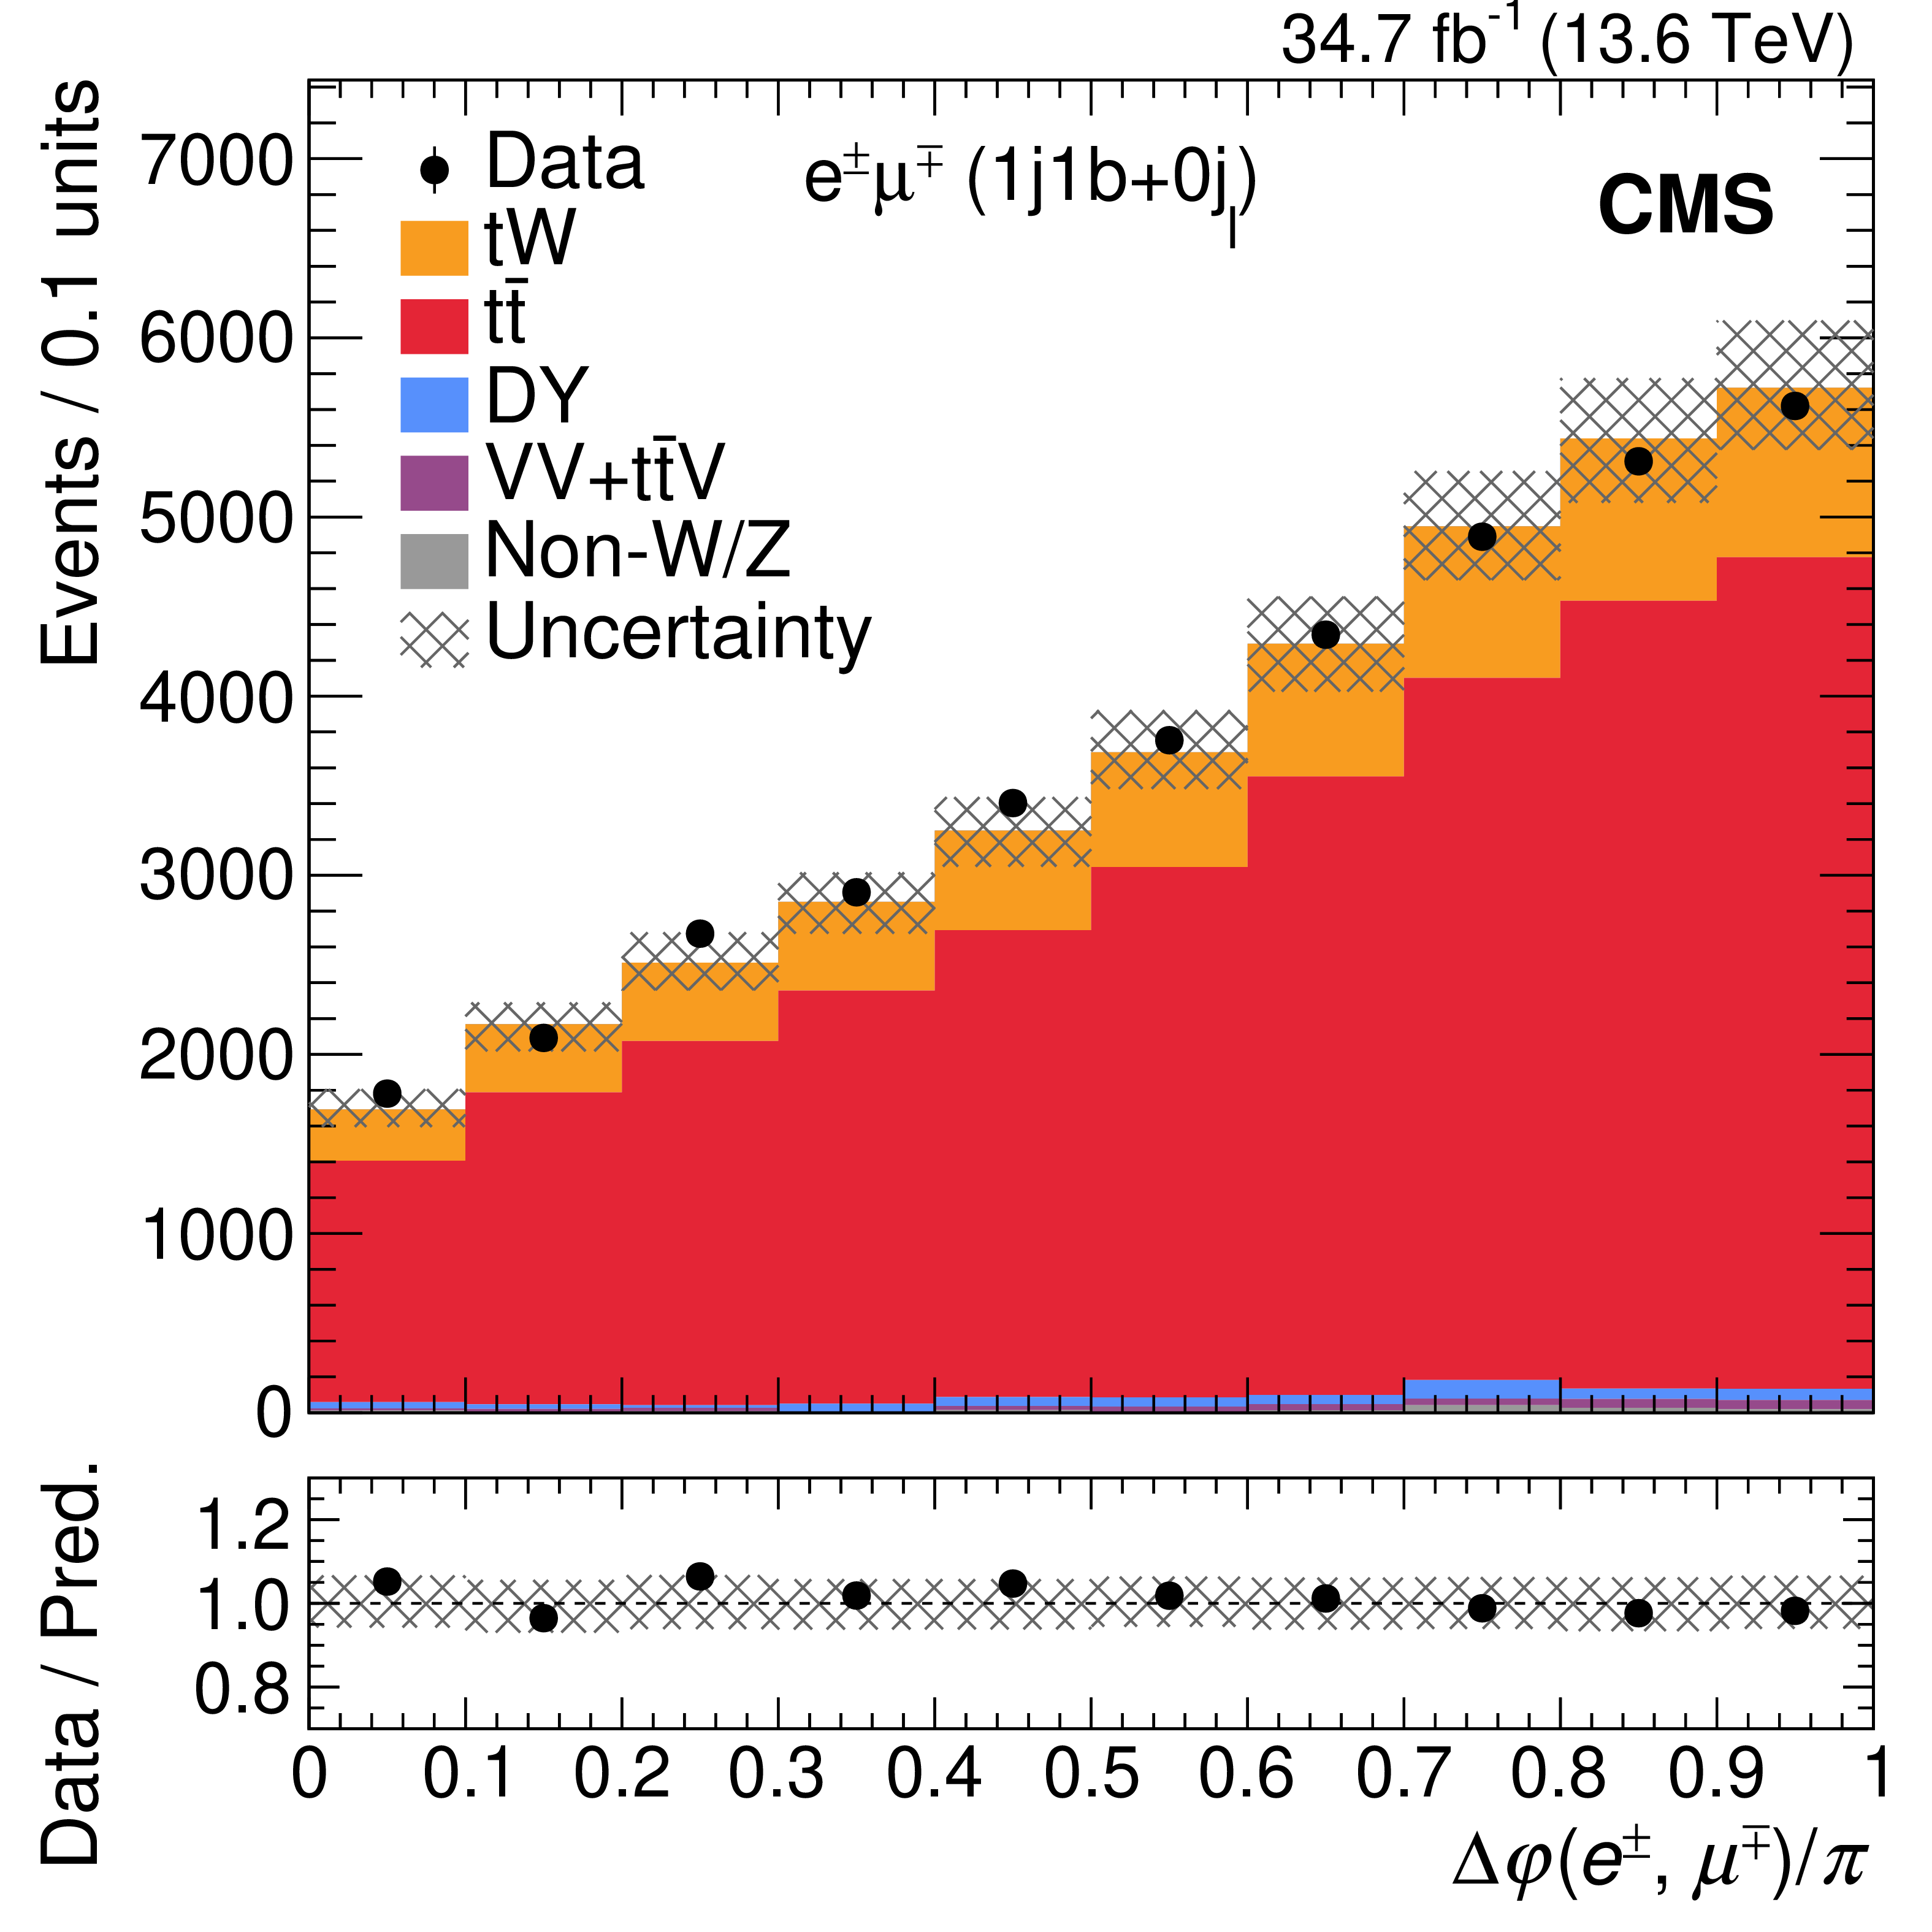
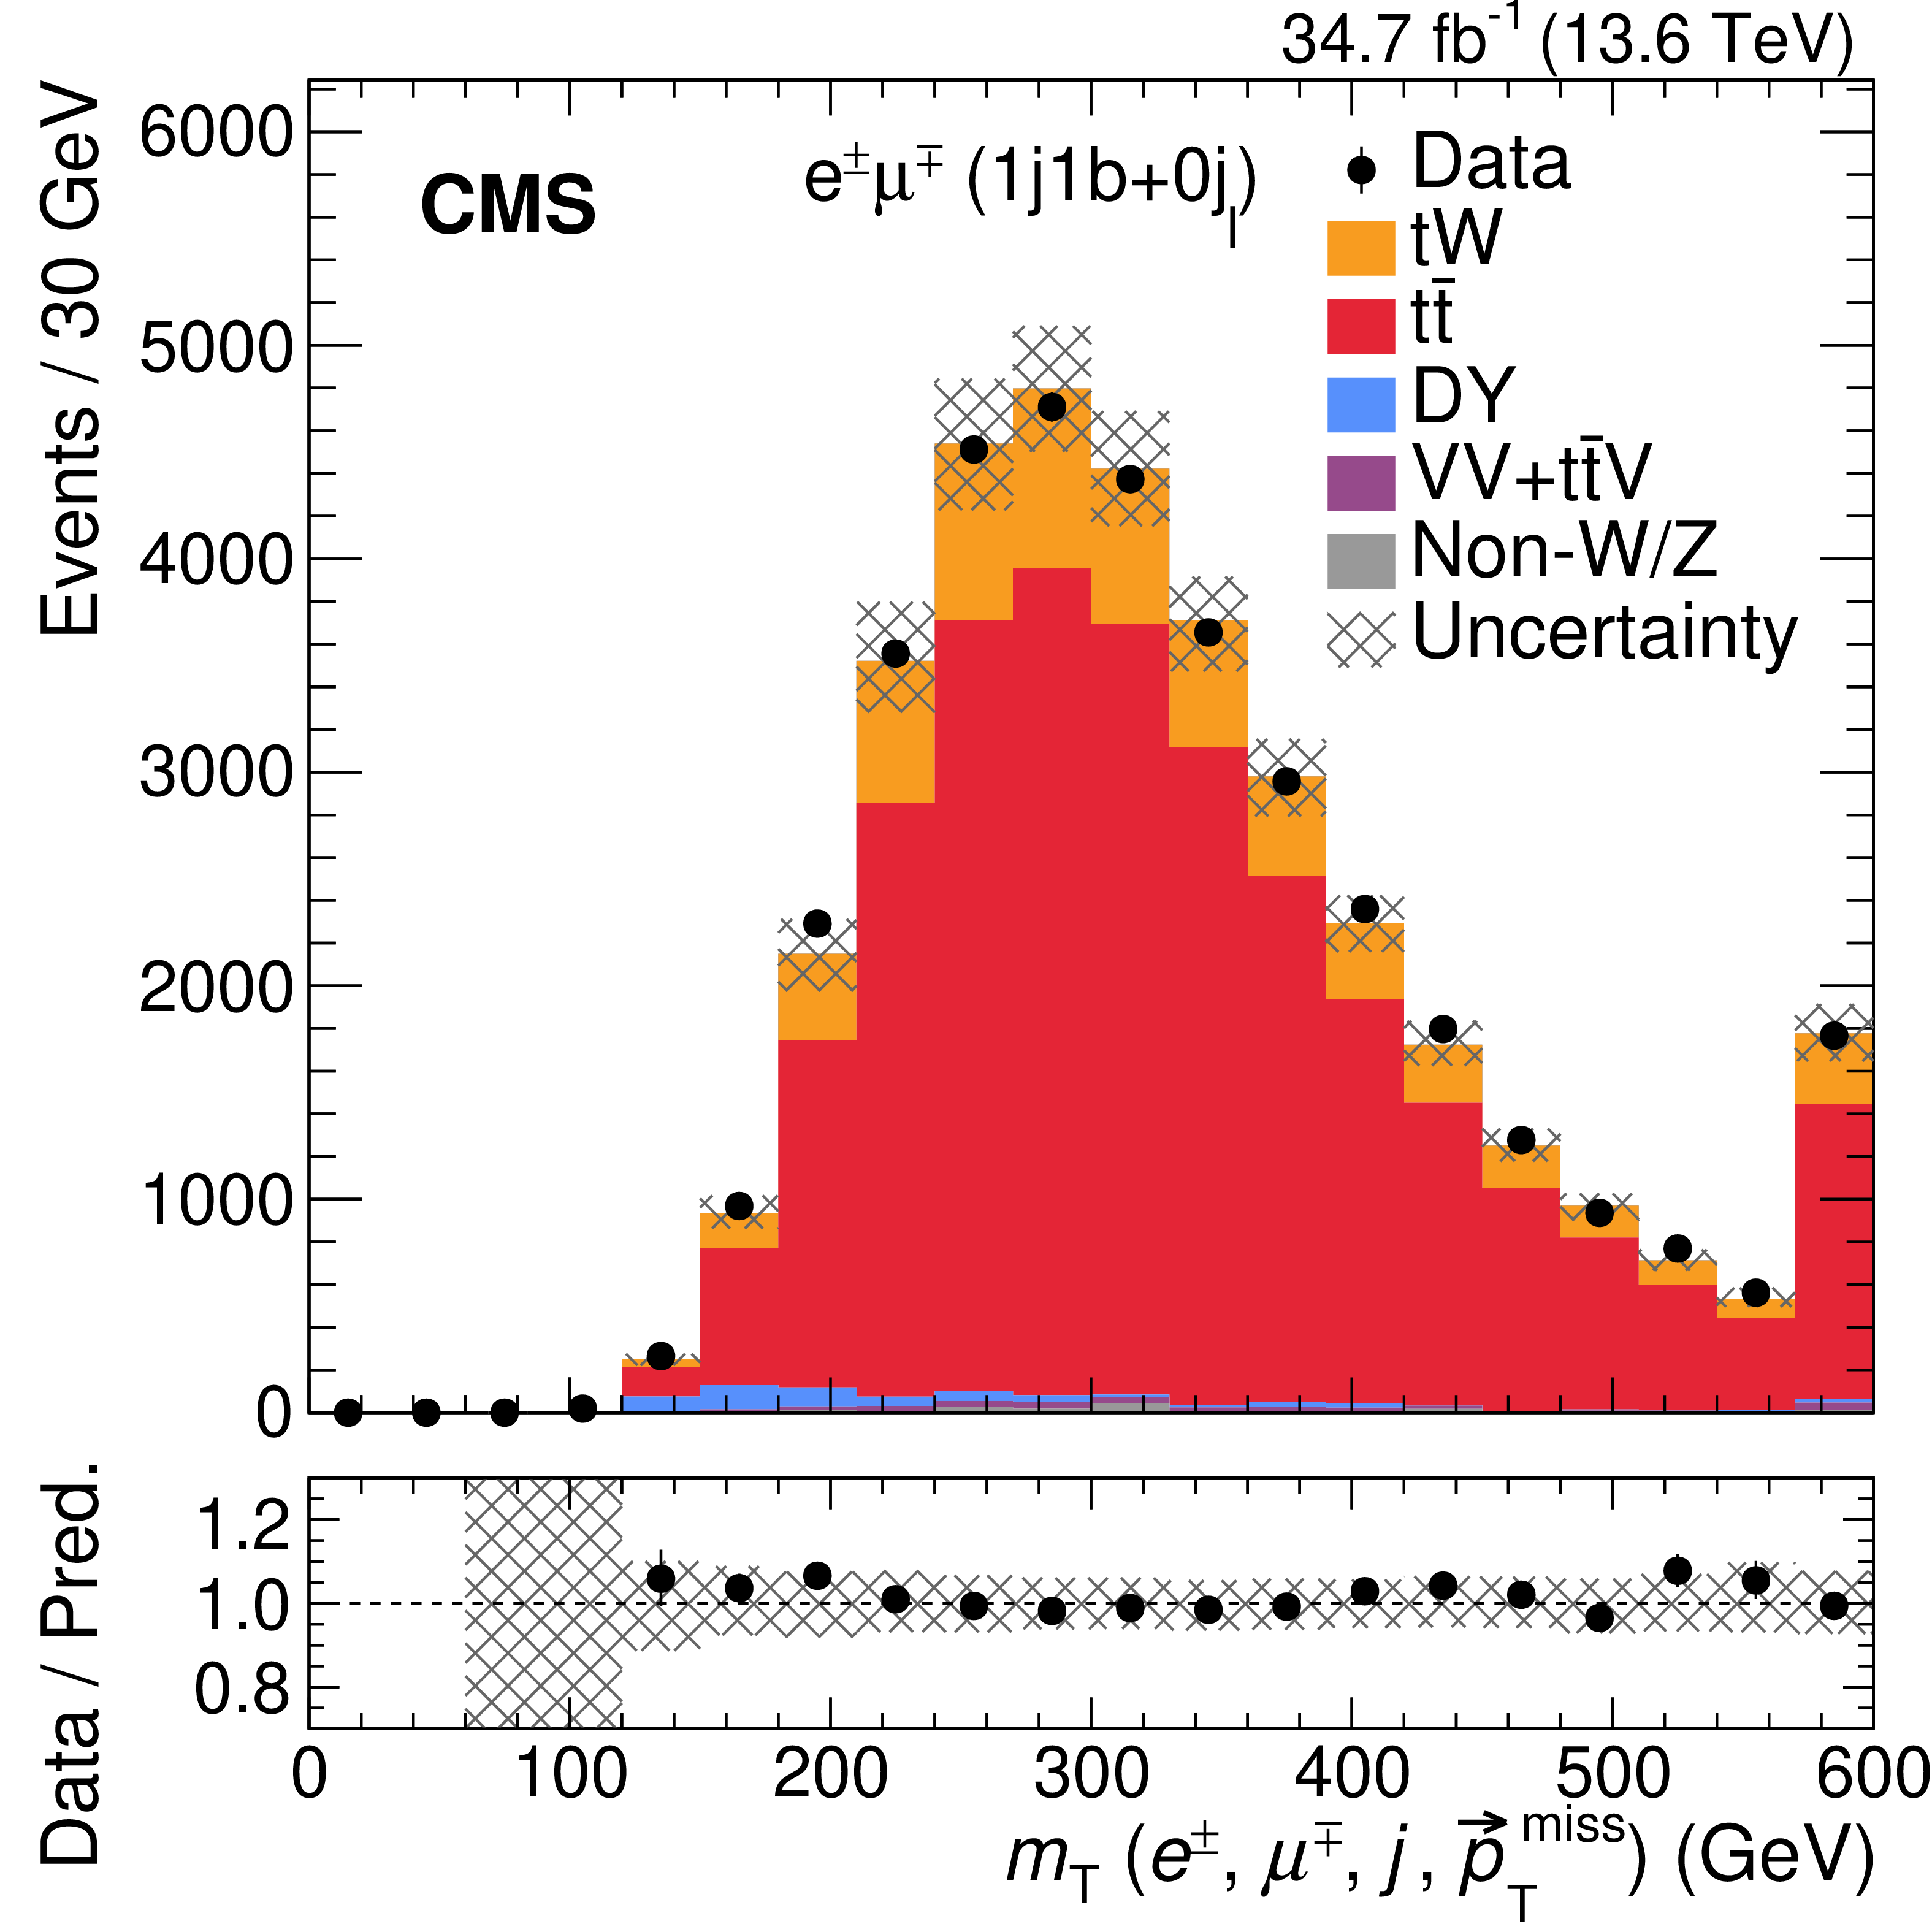
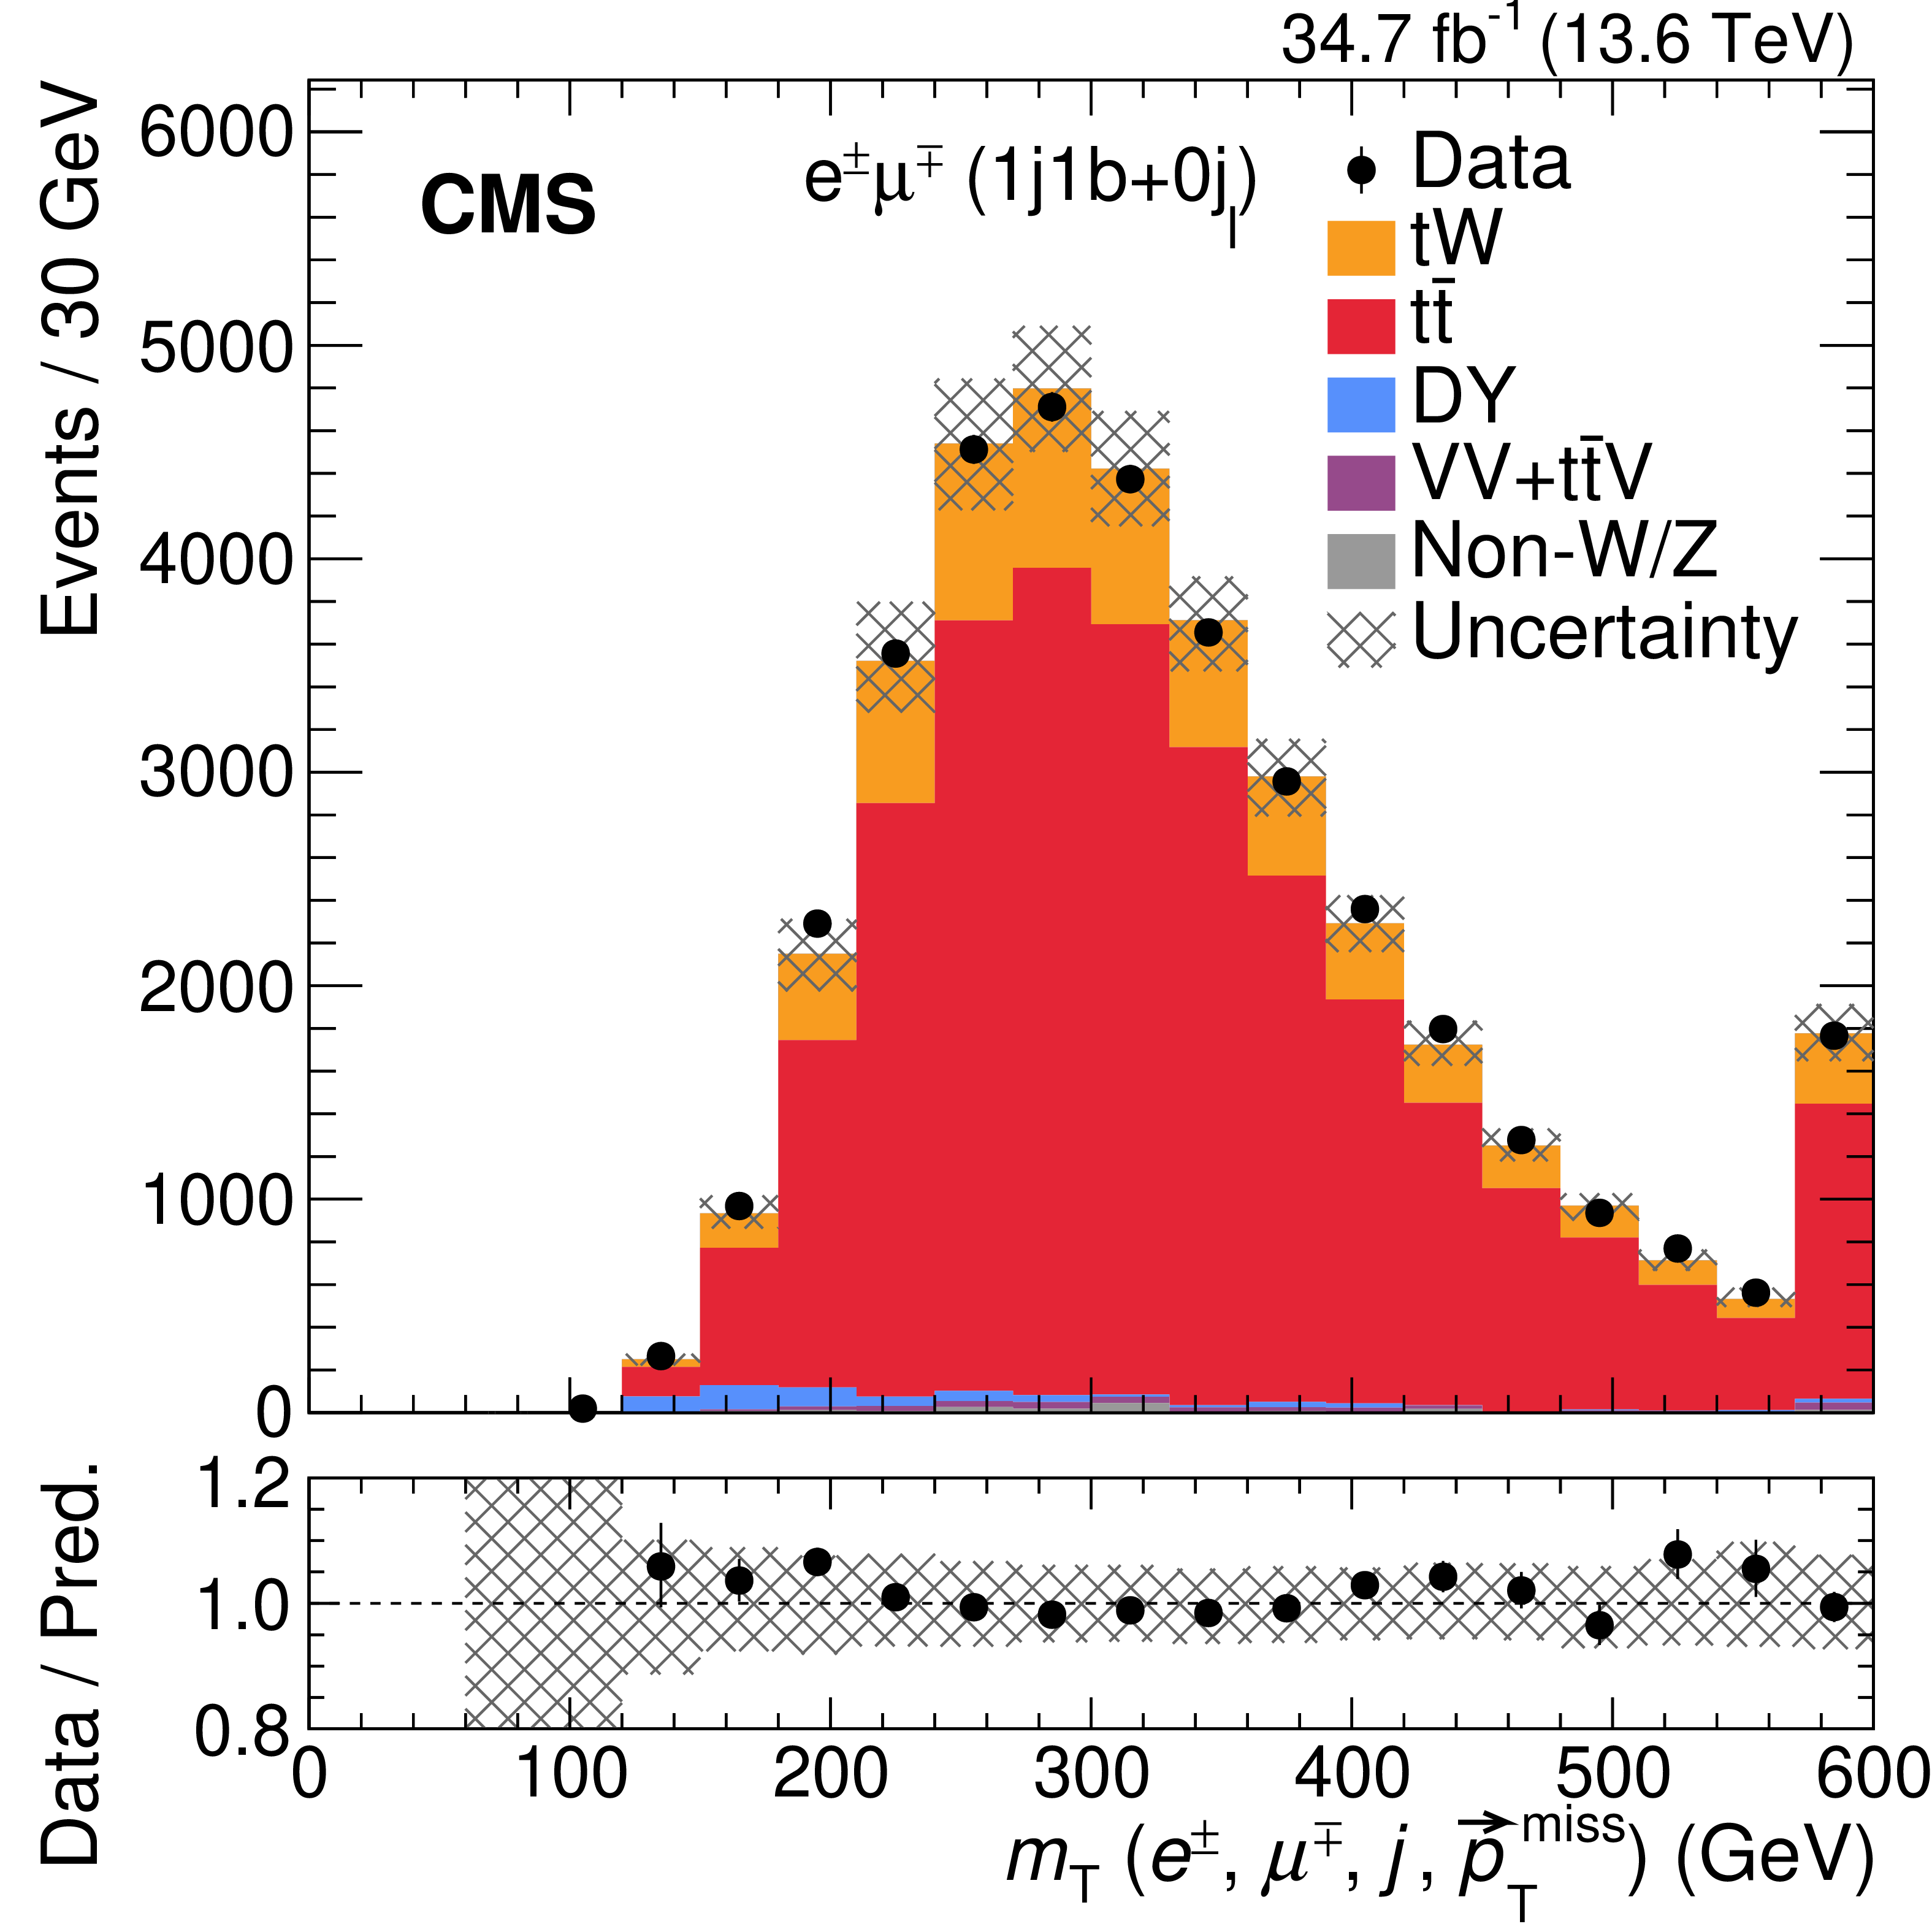
Figure 6:
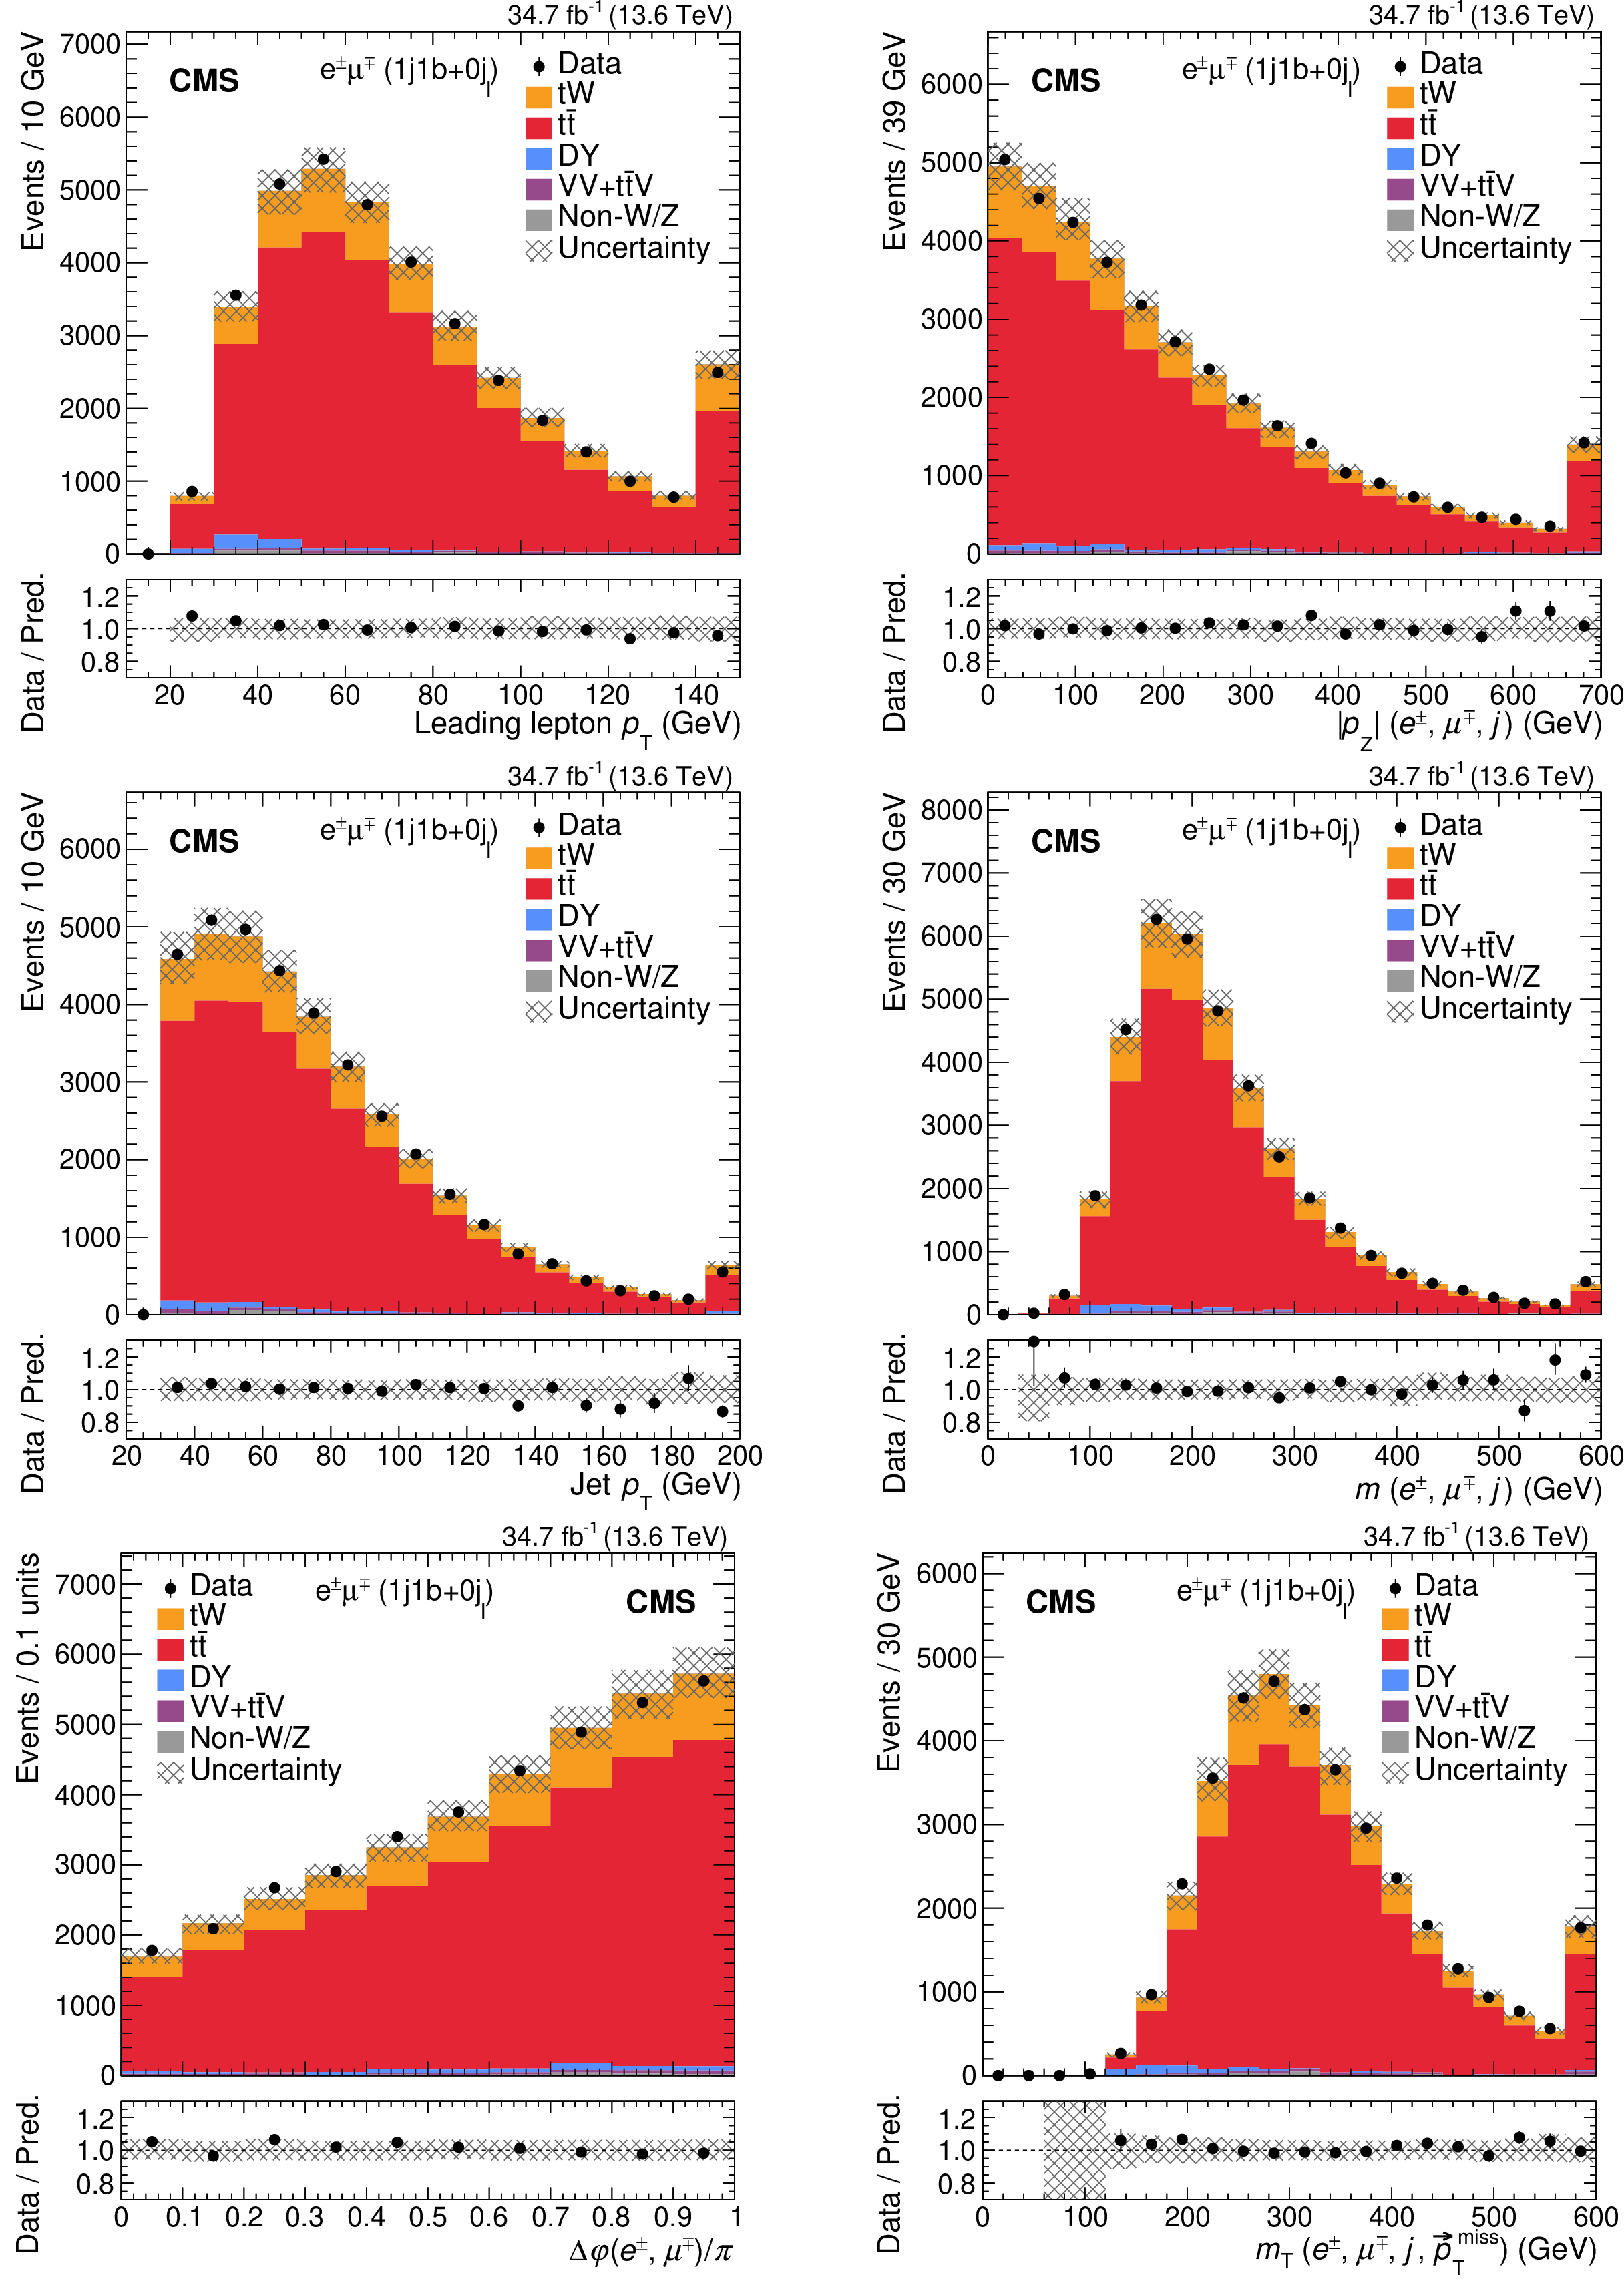
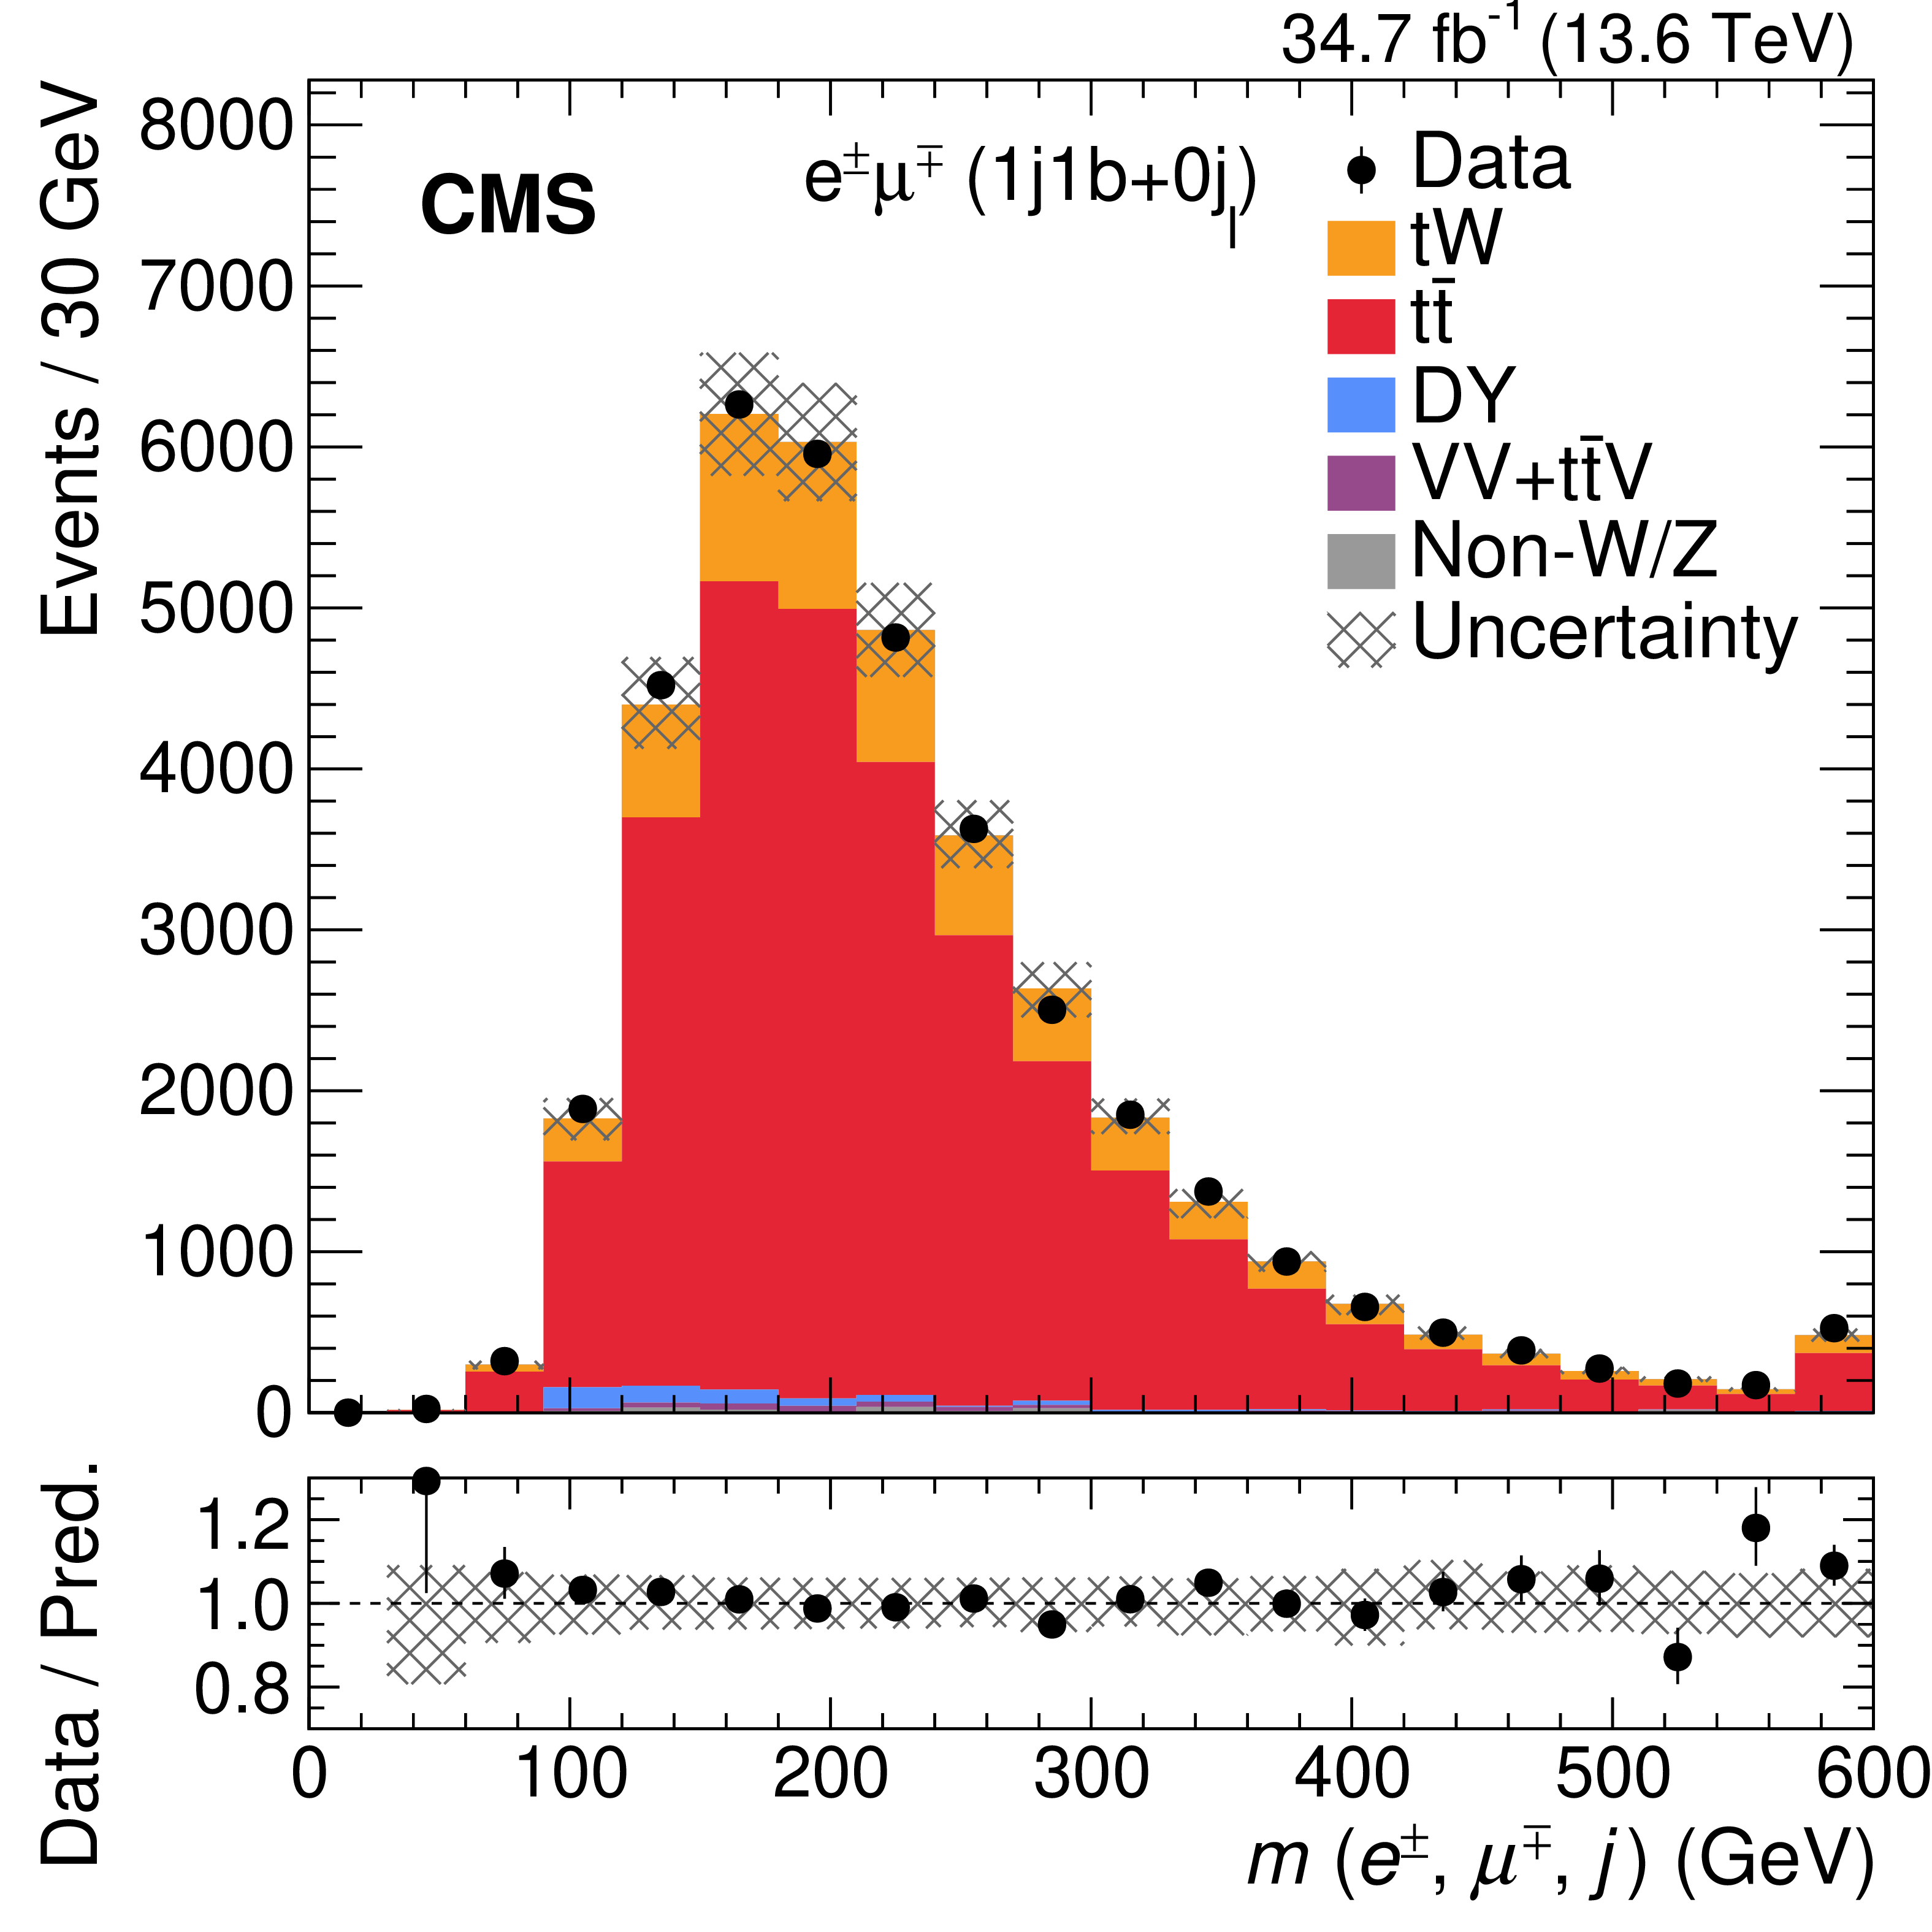
The measured distributions from data (points) and MC simulations (filled histograms) before the maximum likelihood fit of the six observables used to measure the $ \mathrm{t}\mathrm{W} $ differential cross sections. Signal events in the 1j1b region with 0 loose jets (0 $ \mathrm{j}_{\text{l}} $) are selected. The last bin of each distribution contains the overflow events. The vertical bars on the data show the statistical uncertainty. The hatched band displays the sum of the statistical and systematic uncertainties in the MC predictions. The lower panels show the ratio of the data to the sum of the MC expectations. |

png pdf |
Figure 6-a:
The measured distributions from data (points) and MC simulations (filled histograms) before the maximum likelihood fit of the six observables used to measure the $ \mathrm{t}\mathrm{W} $ differential cross sections. Signal events in the 1j1b region with 0 loose jets (0 $ \mathrm{j}_{\text{l}} $) are selected. The last bin of each distribution contains the overflow events. The vertical bars on the data show the statistical uncertainty. The hatched band displays the sum of the statistical and systematic uncertainties in the MC predictions. The lower panels show the ratio of the data to the sum of the MC expectations. |
png pdf |
Figure 6-b:
The measured distributions from data (points) and MC simulations (filled histograms) before the maximum likelihood fit of the six observables used to measure the $ \mathrm{t}\mathrm{W} $ differential cross sections. Signal events in the 1j1b region with 0 loose jets (0 $ \mathrm{j}_{\text{l}} $) are selected. The last bin of each distribution contains the overflow events. The vertical bars on the data show the statistical uncertainty. The hatched band displays the sum of the statistical and systematic uncertainties in the MC predictions. The lower panels show the ratio of the data to the sum of the MC expectations. |

png pdf |
Figure 6-c:
The measured distributions from data (points) and MC simulations (filled histograms) before the maximum likelihood fit of the six observables used to measure the $ \mathrm{t}\mathrm{W} $ differential cross sections. Signal events in the 1j1b region with 0 loose jets (0 $ \mathrm{j}_{\text{l}} $) are selected. The last bin of each distribution contains the overflow events. The vertical bars on the data show the statistical uncertainty. The hatched band displays the sum of the statistical and systematic uncertainties in the MC predictions. The lower panels show the ratio of the data to the sum of the MC expectations. |

png pdf |
Figure 6-d:
The measured distributions from data (points) and MC simulations (filled histograms) before the maximum likelihood fit of the six observables used to measure the $ \mathrm{t}\mathrm{W} $ differential cross sections. Signal events in the 1j1b region with 0 loose jets (0 $ \mathrm{j}_{\text{l}} $) are selected. The last bin of each distribution contains the overflow events. The vertical bars on the data show the statistical uncertainty. The hatched band displays the sum of the statistical and systematic uncertainties in the MC predictions. The lower panels show the ratio of the data to the sum of the MC expectations. |

png pdf |
Figure 6-e:
The measured distributions from data (points) and MC simulations (filled histograms) before the maximum likelihood fit of the six observables used to measure the $ \mathrm{t}\mathrm{W} $ differential cross sections. Signal events in the 1j1b region with 0 loose jets (0 $ \mathrm{j}_{\text{l}} $) are selected. The last bin of each distribution contains the overflow events. The vertical bars on the data show the statistical uncertainty. The hatched band displays the sum of the statistical and systematic uncertainties in the MC predictions. The lower panels show the ratio of the data to the sum of the MC expectations. |
png pdf |
Figure 6-f:
The measured distributions from data (points) and MC simulations (filled histograms) before the maximum likelihood fit of the six observables used to measure the $ \mathrm{t}\mathrm{W} $ differential cross sections. Signal events in the 1j1b region with 0 loose jets (0 $ \mathrm{j}_{\text{l}} $) are selected. The last bin of each distribution contains the overflow events. The vertical bars on the data show the statistical uncertainty. The hatched band displays the sum of the statistical and systematic uncertainties in the MC predictions. The lower panels show the ratio of the data to the sum of the MC expectations. |
png pdf |
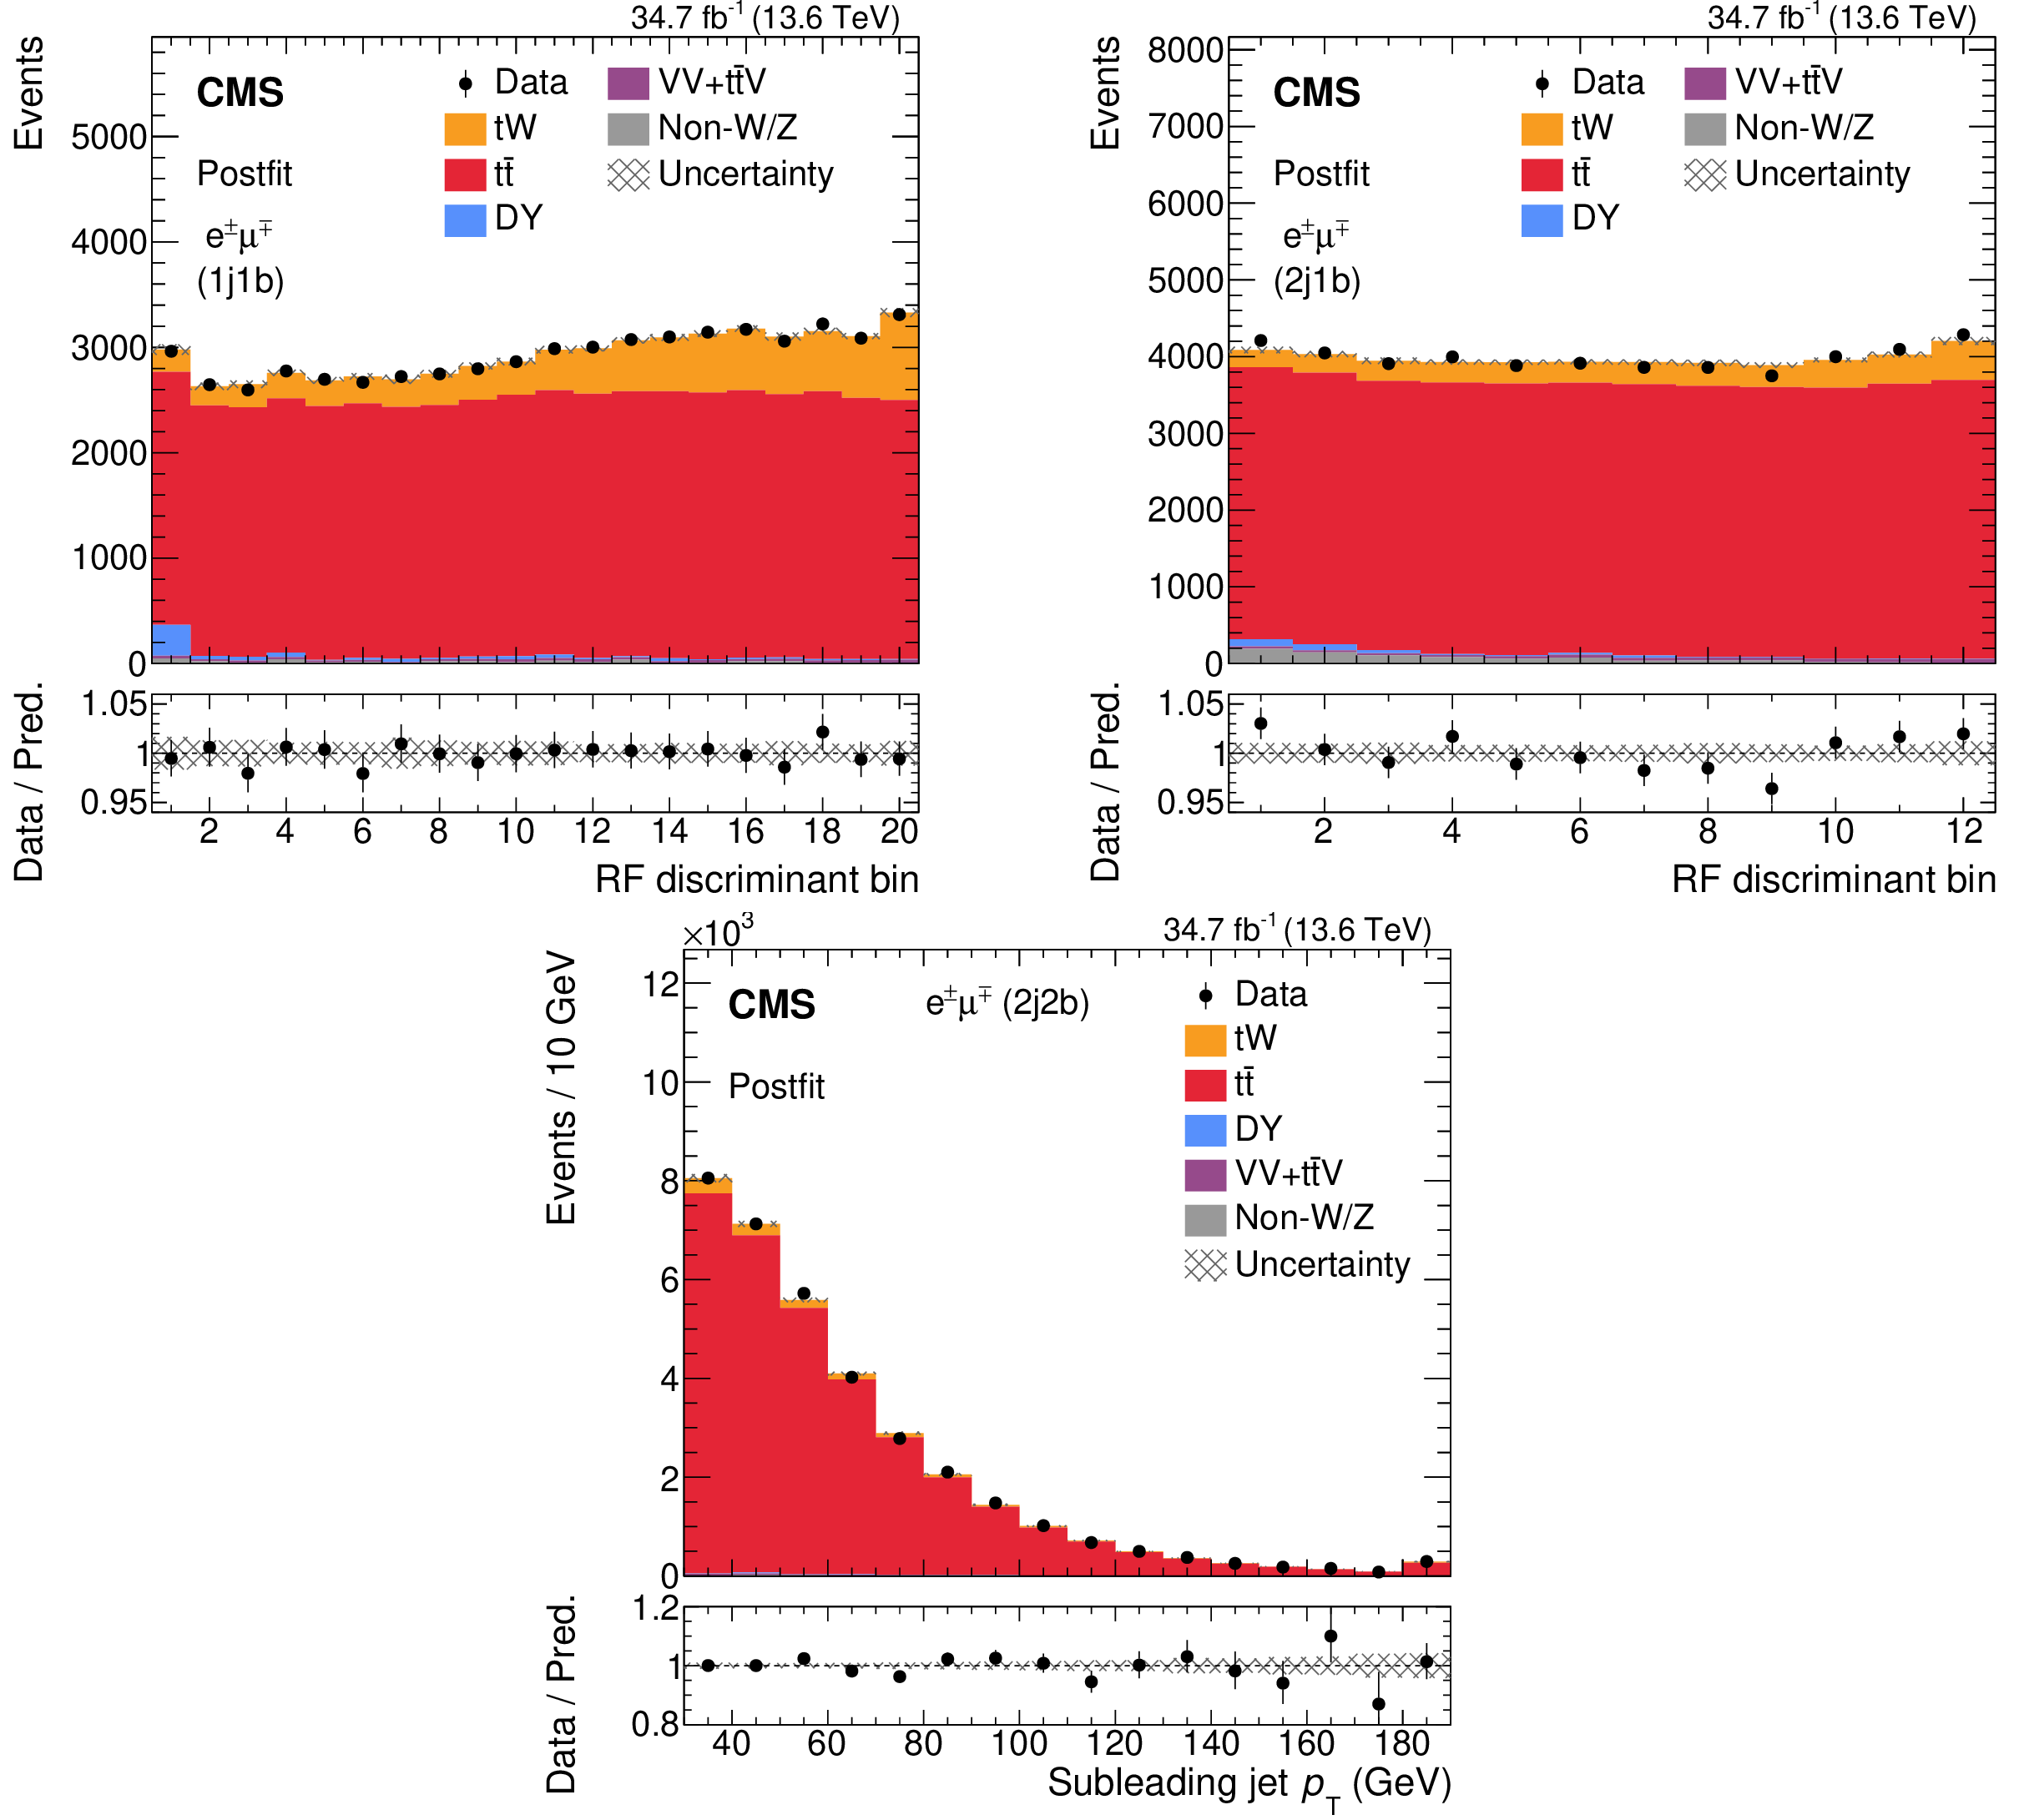
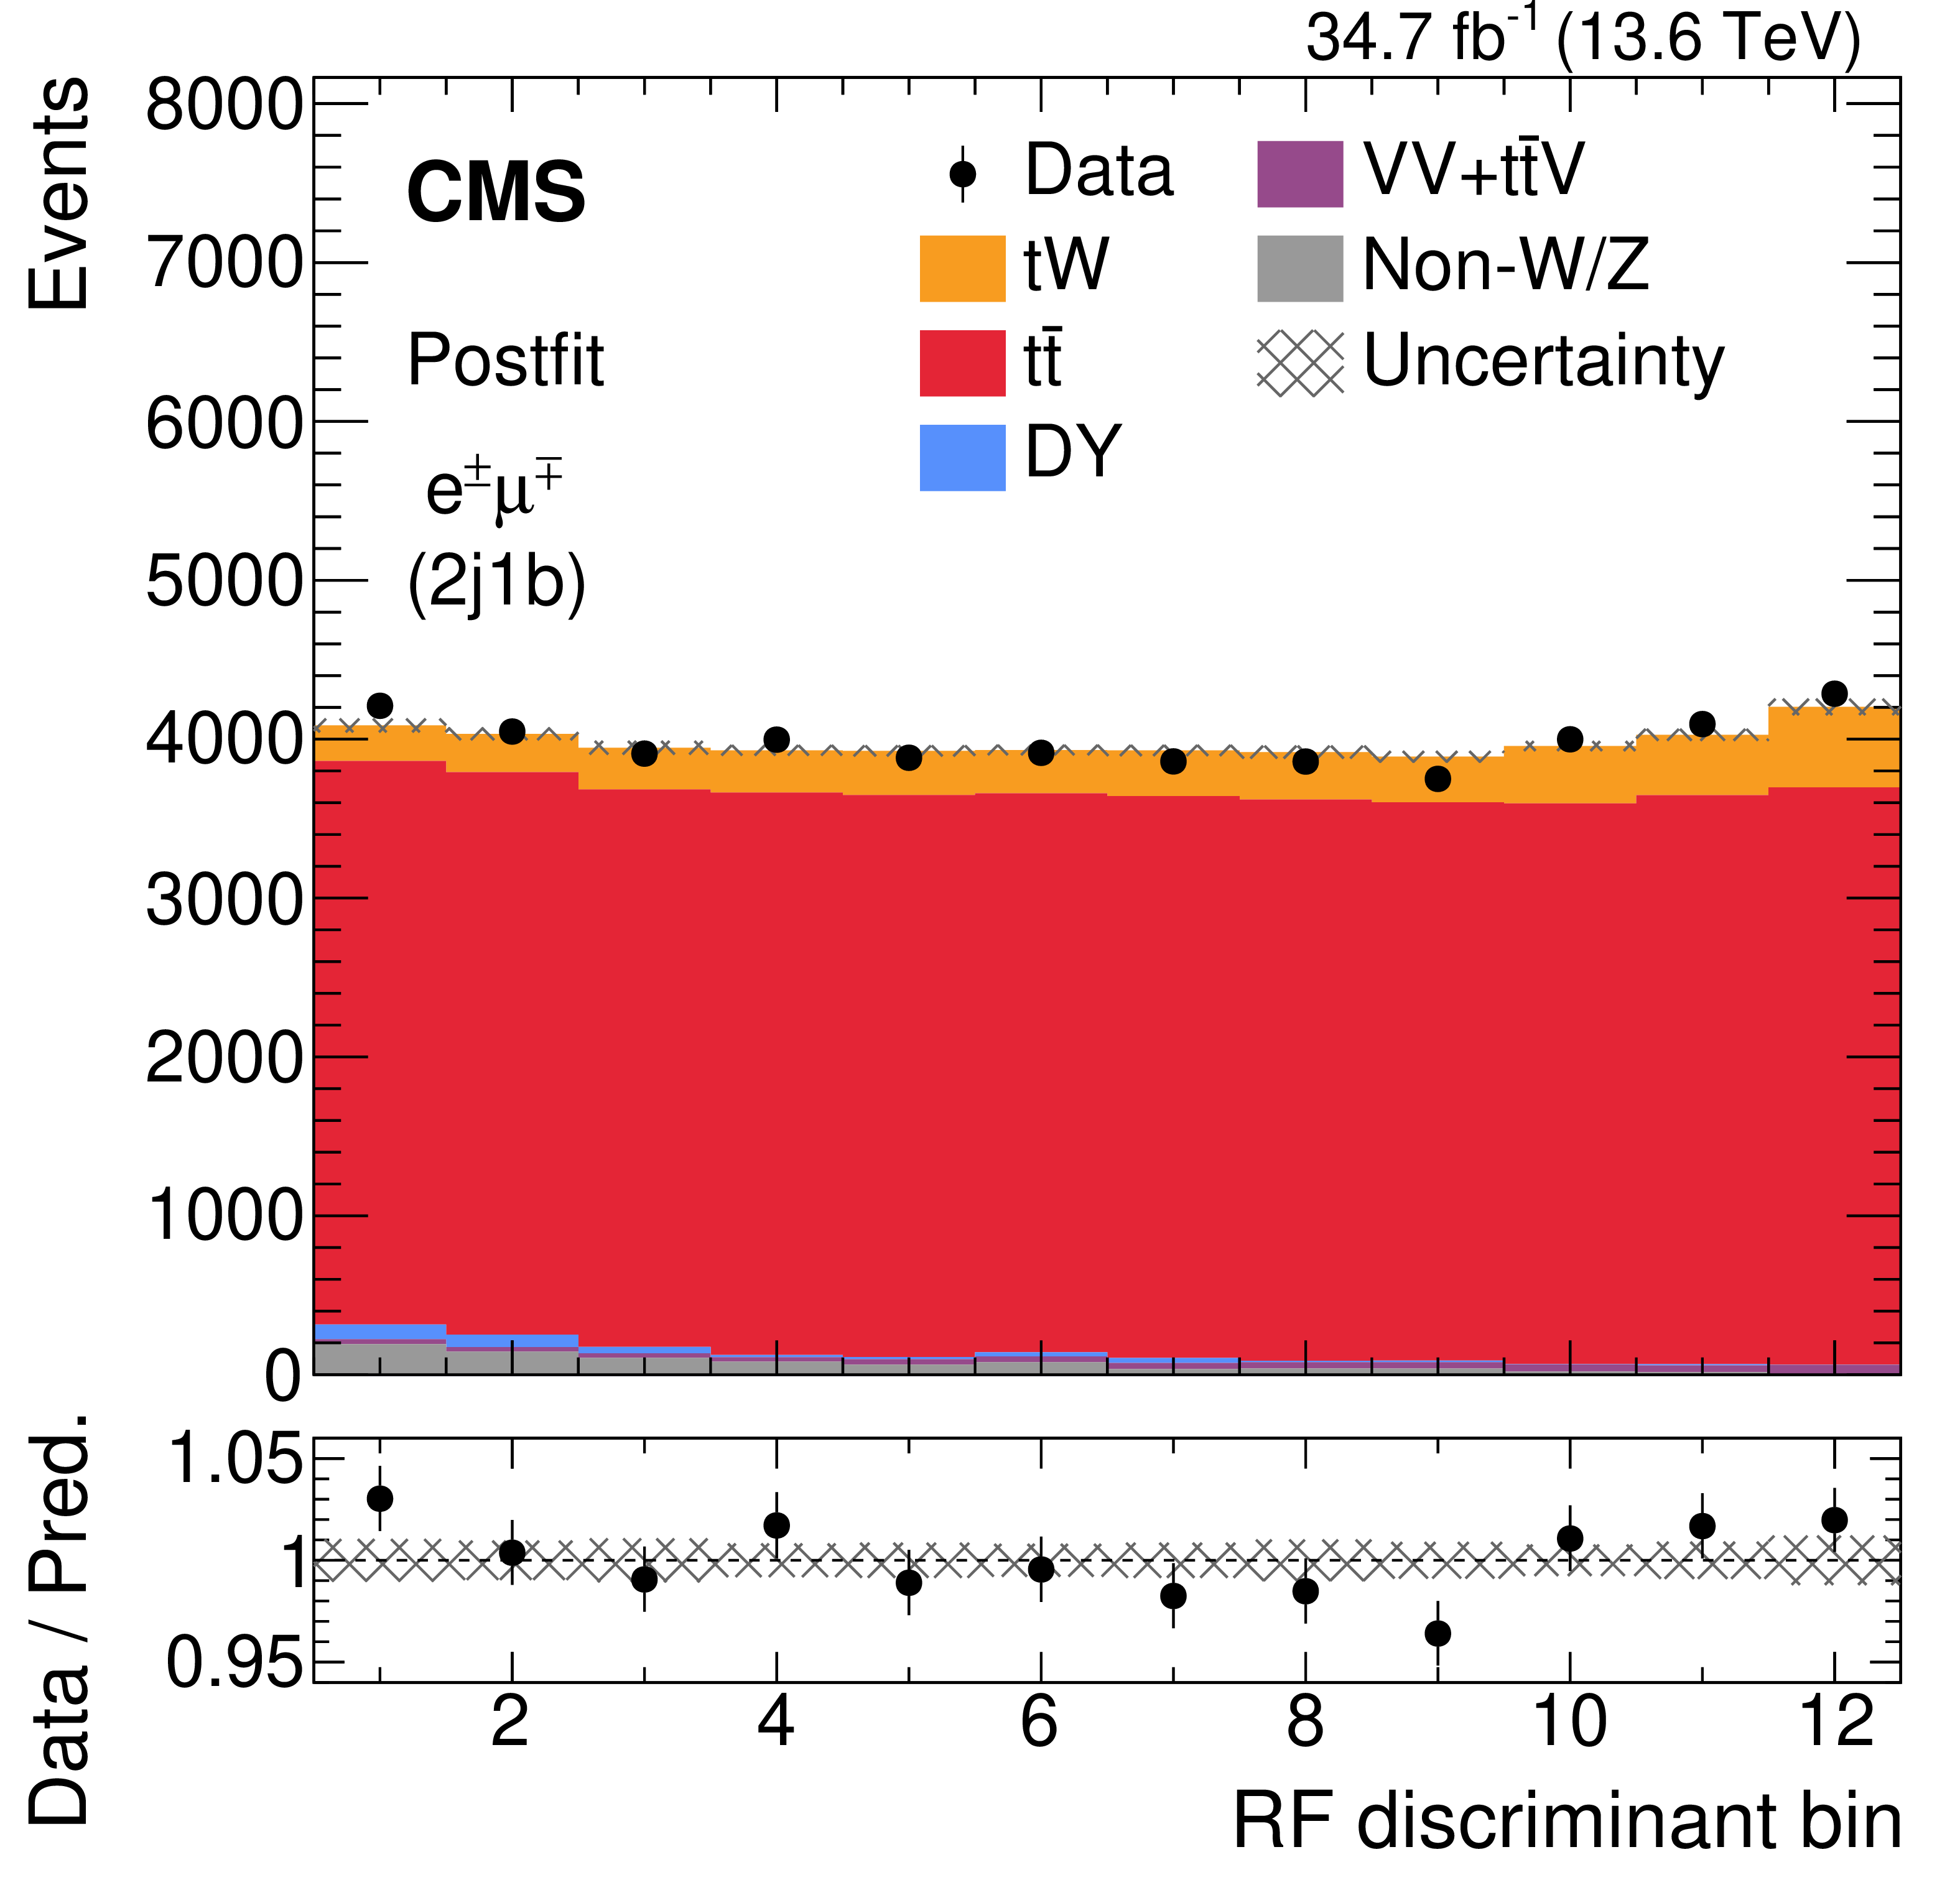
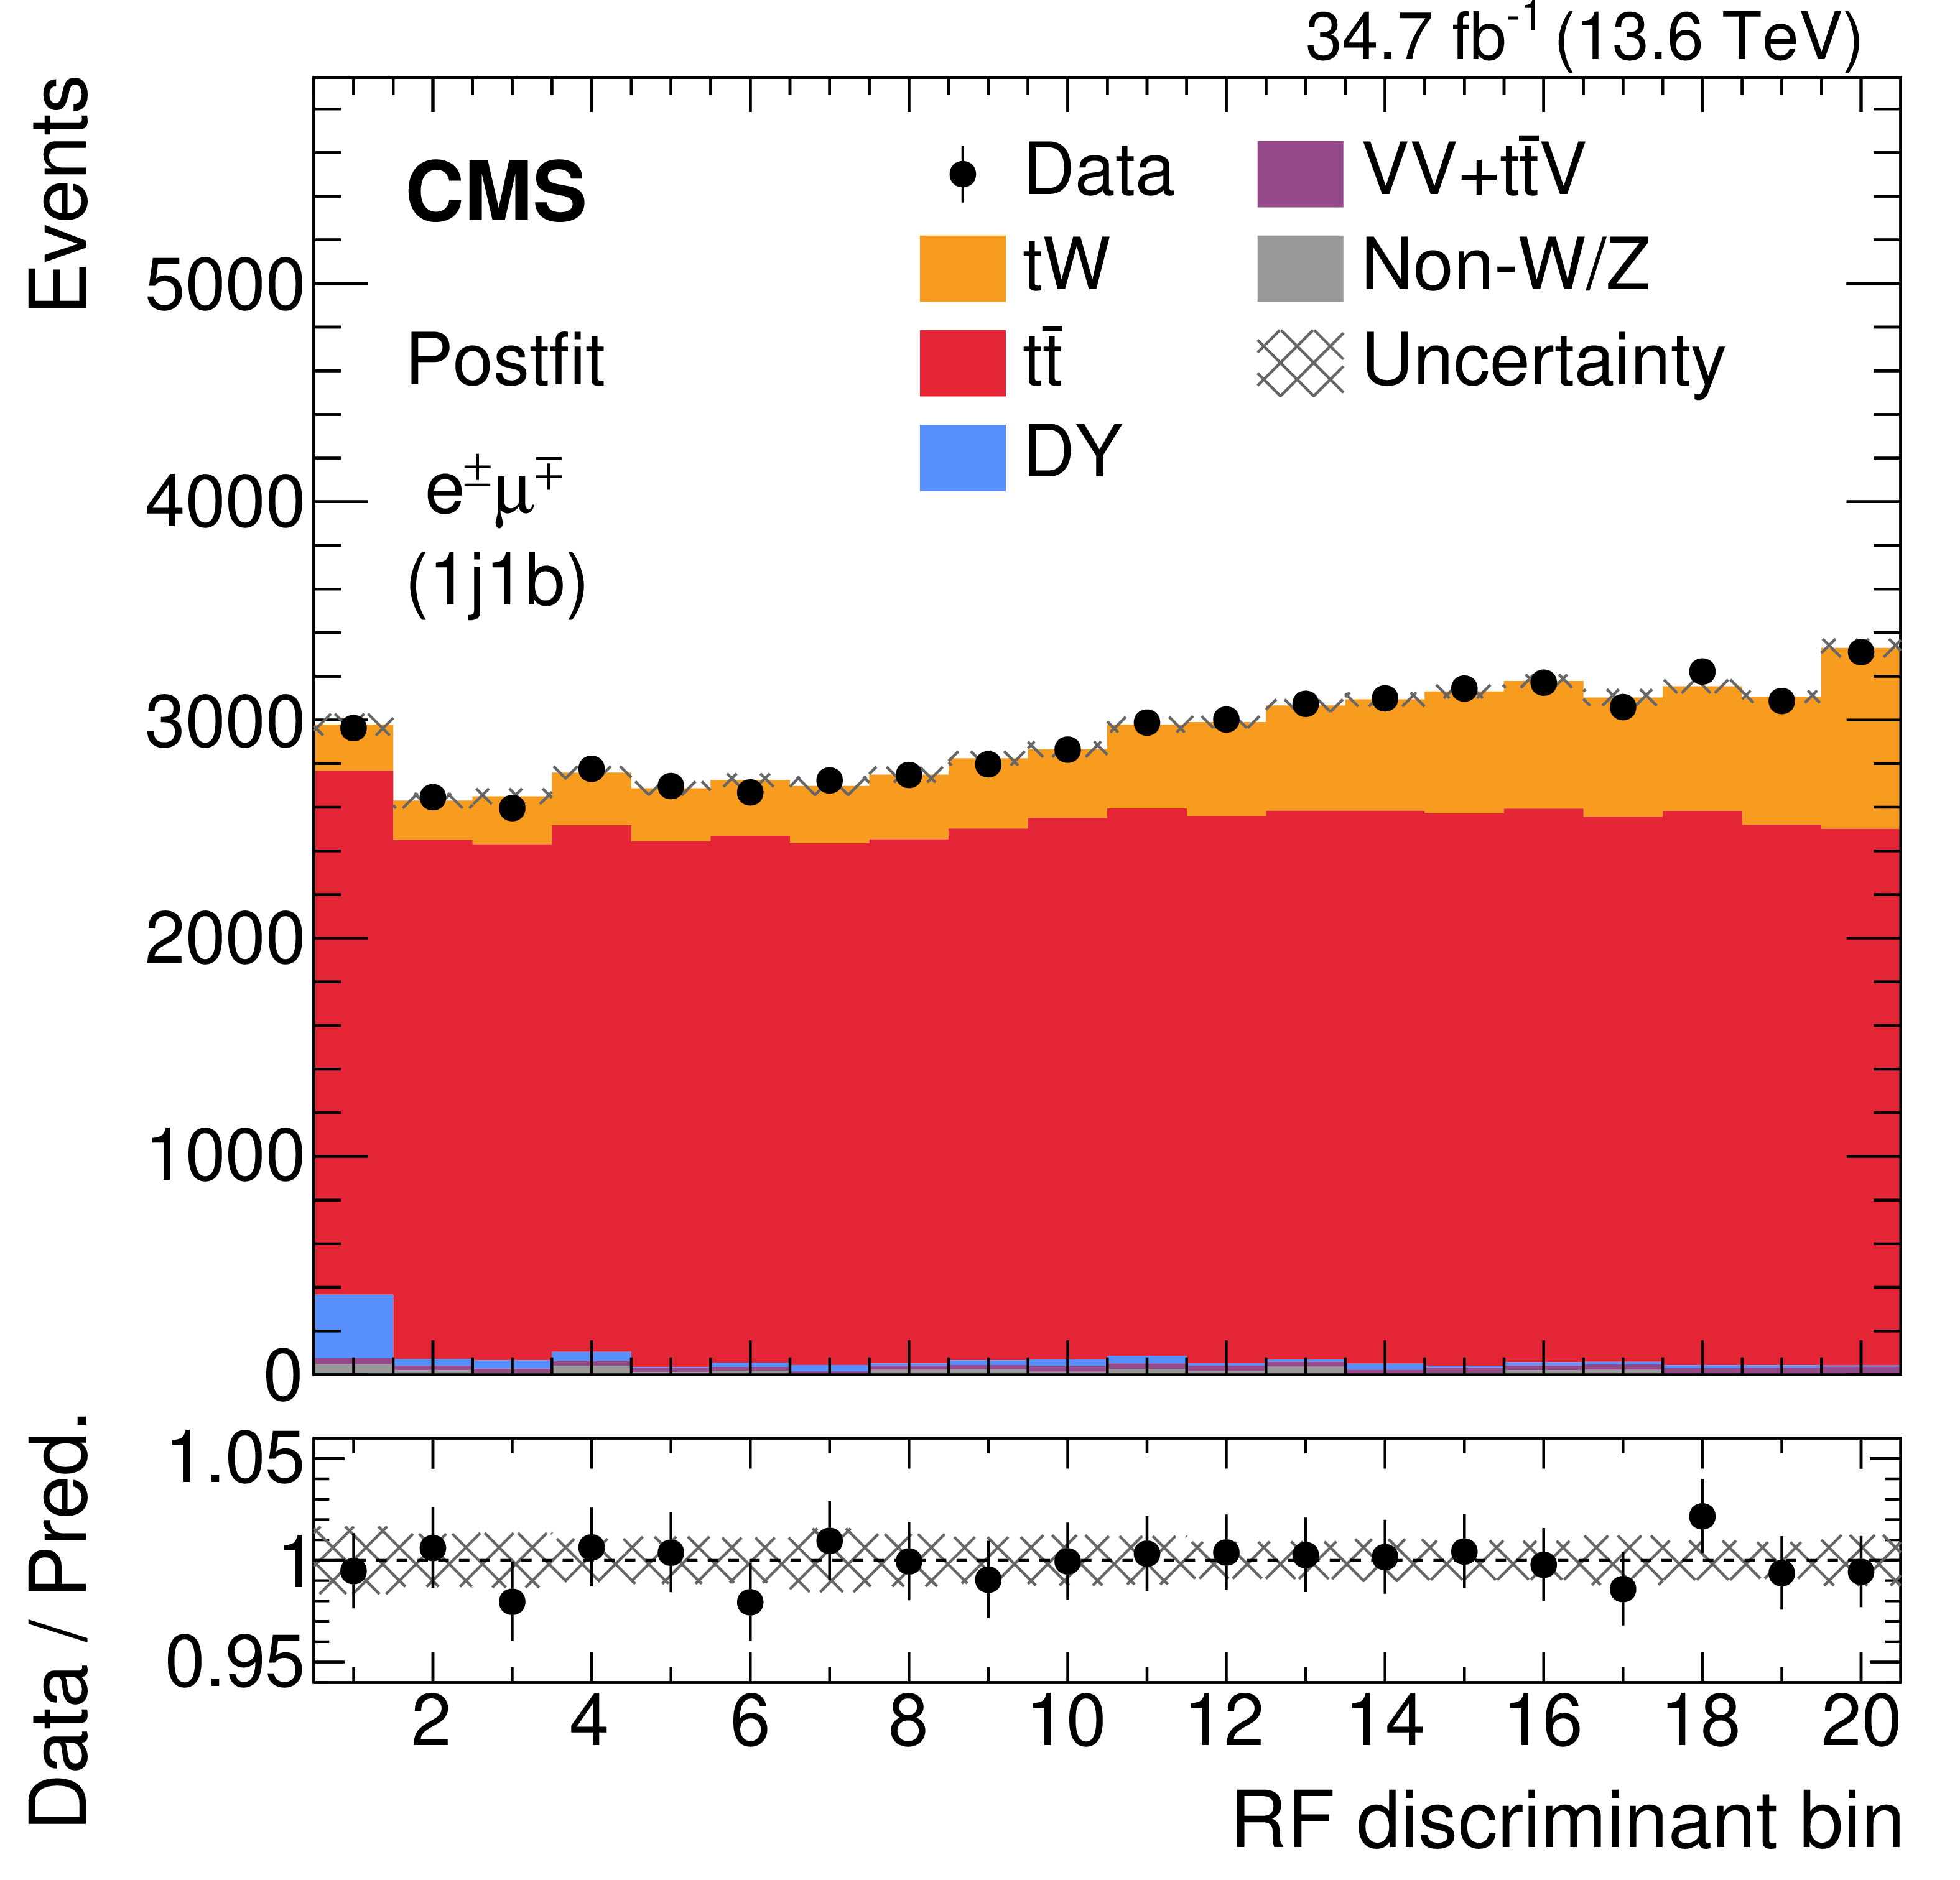
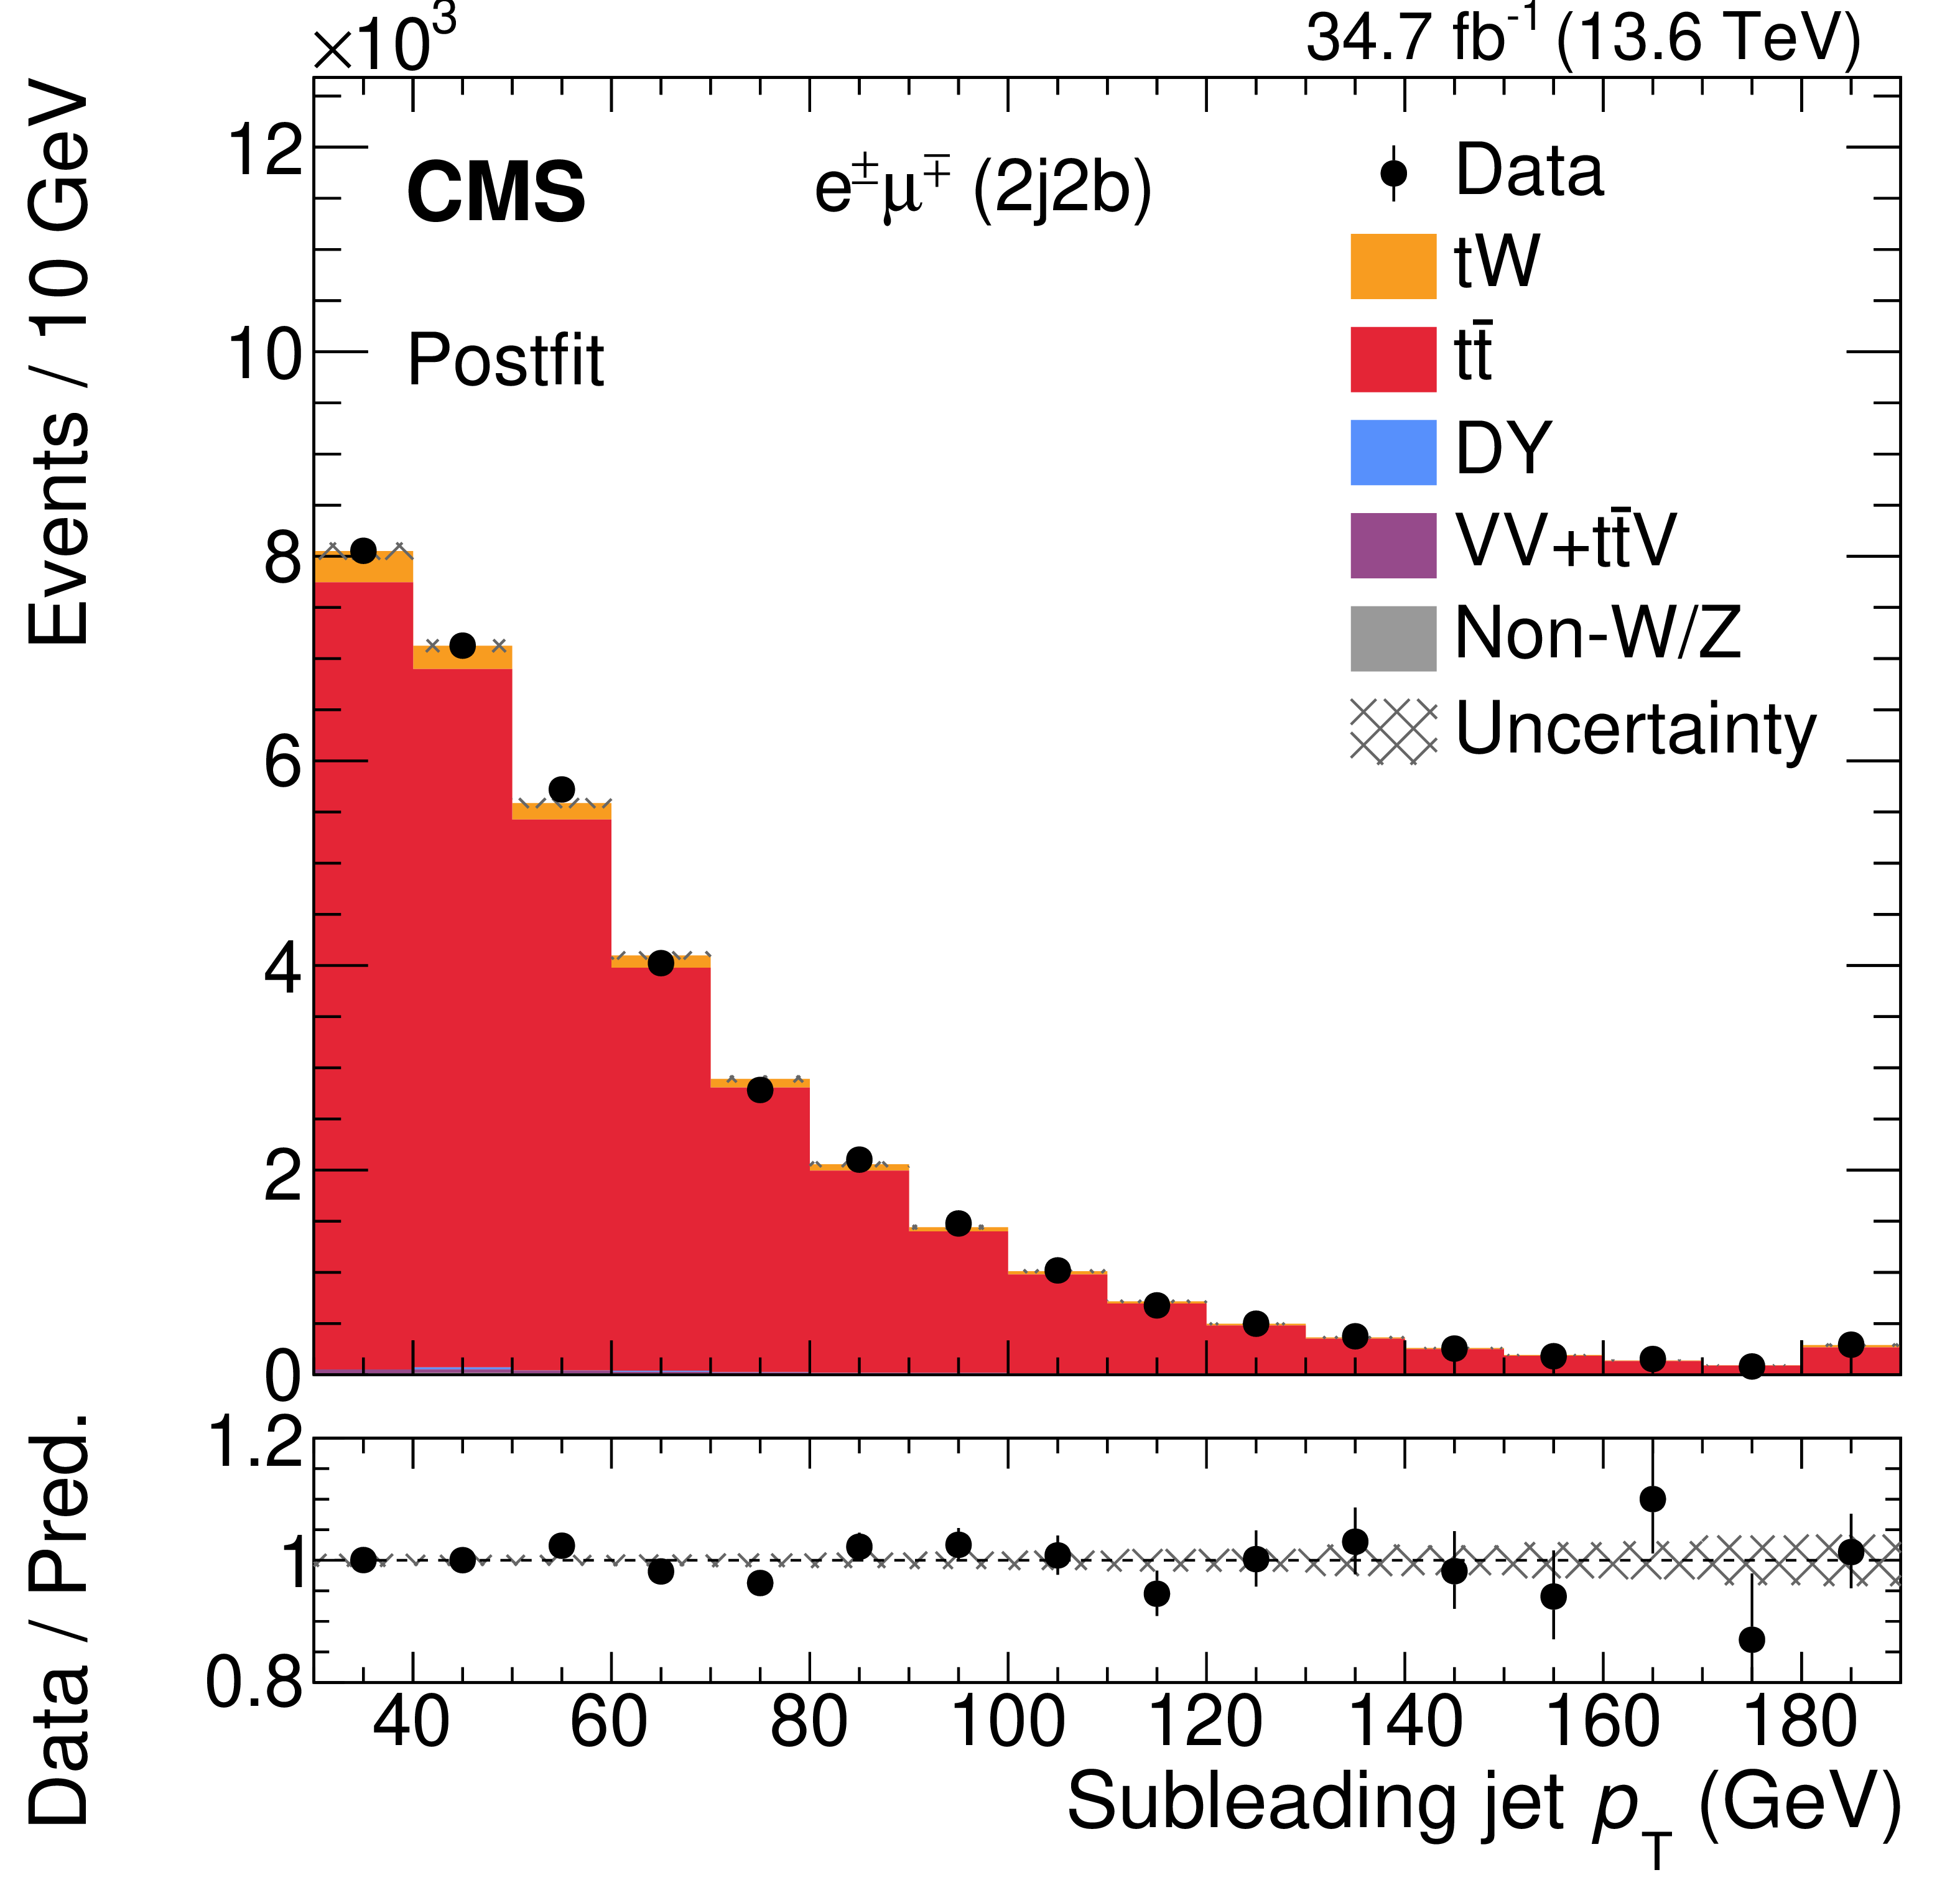
Figure 7:
The distributions of the RF outputs for events in the 1j1b (upper left) and 2j1b (upper right) regions, and the subleading jet $ p_{\mathrm{T}} $ for the 2j2b region (lower). The number of observed events (points) and estimated signal and background events (filled histograms) from the maximum likelihood fit are shown. The last bin of the subleading jet $ p_{\mathrm{T}} $ distribution includes the overflow events. The vertical bars on the points represent the statistical uncertainty in the data, and the hatched band the total uncertainty in the estimated events after the fit. The lower panels display the ratio of the data to the sum of the estimated events (points) after the fit, with the bands giving the corresponding uncertainties. |
png pdf |
Figure 7-a:
The distributions of the RF outputs for events in the 1j1b (upper left) and 2j1b (upper right) regions, and the subleading jet $ p_{\mathrm{T}} $ for the 2j2b region (lower). The number of observed events (points) and estimated signal and background events (filled histograms) from the maximum likelihood fit are shown. The last bin of the subleading jet $ p_{\mathrm{T}} $ distribution includes the overflow events. The vertical bars on the points represent the statistical uncertainty in the data, and the hatched band the total uncertainty in the estimated events after the fit. The lower panels display the ratio of the data to the sum of the estimated events (points) after the fit, with the bands giving the corresponding uncertainties. |

png pdf |
Figure 7-b:
The distributions of the RF outputs for events in the 1j1b (upper left) and 2j1b (upper right) regions, and the subleading jet $ p_{\mathrm{T}} $ for the 2j2b region (lower). The number of observed events (points) and estimated signal and background events (filled histograms) from the maximum likelihood fit are shown. The last bin of the subleading jet $ p_{\mathrm{T}} $ distribution includes the overflow events. The vertical bars on the points represent the statistical uncertainty in the data, and the hatched band the total uncertainty in the estimated events after the fit. The lower panels display the ratio of the data to the sum of the estimated events (points) after the fit, with the bands giving the corresponding uncertainties. |
png pdf |
Figure 7-c:
The distributions of the RF outputs for events in the 1j1b (upper left) and 2j1b (upper right) regions, and the subleading jet $ p_{\mathrm{T}} $ for the 2j2b region (lower). The number of observed events (points) and estimated signal and background events (filled histograms) from the maximum likelihood fit are shown. The last bin of the subleading jet $ p_{\mathrm{T}} $ distribution includes the overflow events. The vertical bars on the points represent the statistical uncertainty in the data, and the hatched band the total uncertainty in the estimated events after the fit. The lower panels display the ratio of the data to the sum of the estimated events (points) after the fit, with the bands giving the corresponding uncertainties. |

png pdf |
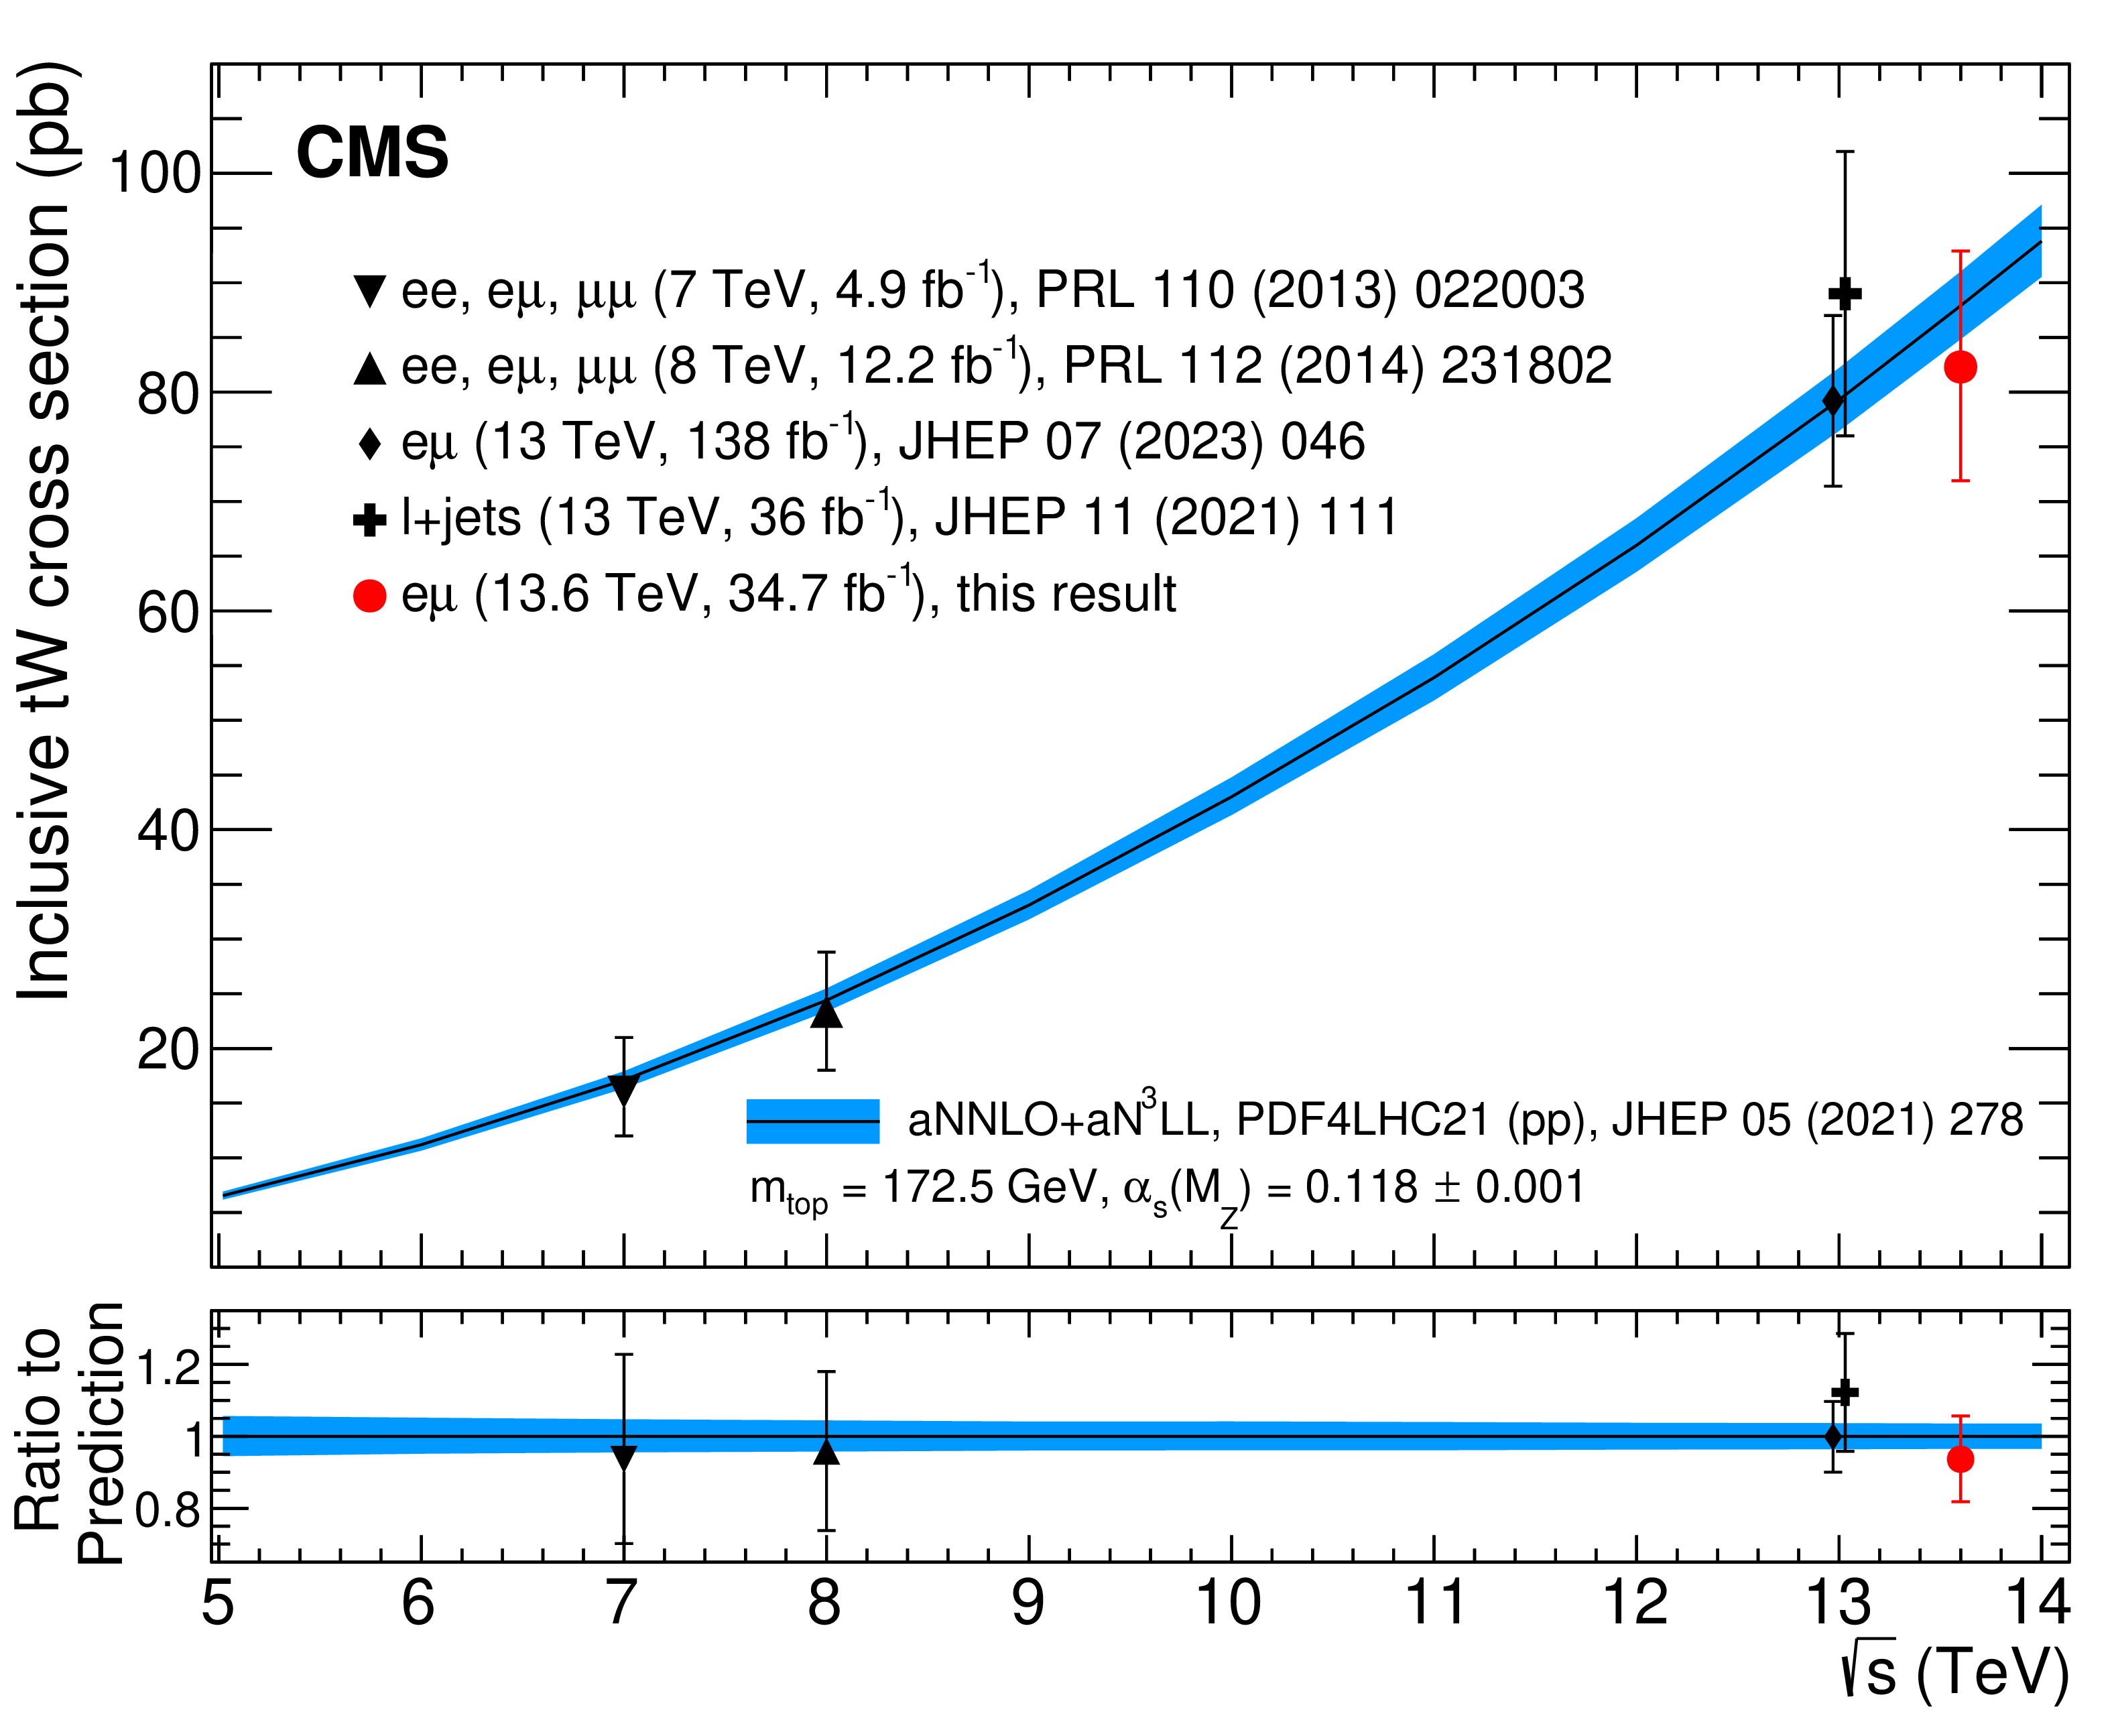
Figure 8:
The $ \mathrm{t}\mathrm{W} $ cross section as a function of $ \sqrt{s} $, as obtained in this analysis (red filled circle) and in previous measurements by the CMS experiment [22,4,27,30] (black markers), with vertical bars on the markers indicating the total uncertainty in the measurements. Points corresponding to measurements at the same $ \sqrt{s} $ are horizontally shifted for better visibility. The SM prediction [15,17,16] is shown with a black line and blue uncertainty bands. |

png pdf |
Figure 9:
The twenty largest impacts $ \Delta\hat{\mu} $ (right column) and fit constraints $ (\hat{\theta}-\theta_0)/\Delta\theta $ (middle column) of the nuisance parameters listed in the left column from the maximum likelihood fit used to determine the inclusive $ \mathrm{t}\mathrm{W} $ cross section. The horizontal bars on the fit constraints show the ratio of the uncertainties of the fit result to the previous ones, effectively giving the constraint on the nuisance parameter. If the period is specified alongside the uncertainty name, it indicates that this is the component of the uncertainty uncorrelated by periods. There are two possible periods, before (2022PreEE) and after (2022PostEE) ECAL water leak. The JES uncertainties are divided into several sources, where ``JES - absolute'' groups contributions from scale corrections in the barrel, pileup corrections, and initial- and final-state radiation corrections; ``JES - relative sample'' encodes the uncertainty in the $ \eta $-dependent calibration of the jets; ``JES - relativeBal'' accounts for the full difference between log-linear fits of MPF (Missing transverse energy Projection Fraction) and $ p_{\mathrm{T}} $ balance methods [114]; and ``JES - quark/gluon'' comes from the corrections applied to correct the different detector response to gluon and quark jets. This last uncertainty is split in three components. These components are: light for the gluon and up, down, and strange quark jets, charm for the c jets, and bottom for the b jets. |

png pdf |
Figure 9-a:
The twenty largest impacts $ \Delta\hat{\mu} $ (right column) and fit constraints $ (\hat{\theta}-\theta_0)/\Delta\theta $ (middle column) of the nuisance parameters listed in the left column from the maximum likelihood fit used to determine the inclusive $ \mathrm{t}\mathrm{W} $ cross section. The horizontal bars on the fit constraints show the ratio of the uncertainties of the fit result to the previous ones, effectively giving the constraint on the nuisance parameter. If the period is specified alongside the uncertainty name, it indicates that this is the component of the uncertainty uncorrelated by periods. There are two possible periods, before (2022PreEE) and after (2022PostEE) ECAL water leak. The JES uncertainties are divided into several sources, where ``JES - absolute'' groups contributions from scale corrections in the barrel, pileup corrections, and initial- and final-state radiation corrections; ``JES - relative sample'' encodes the uncertainty in the $ \eta $-dependent calibration of the jets; ``JES - relativeBal'' accounts for the full difference between log-linear fits of MPF (Missing transverse energy Projection Fraction) and $ p_{\mathrm{T}} $ balance methods [114]; and ``JES - quark/gluon'' comes from the corrections applied to correct the different detector response to gluon and quark jets. This last uncertainty is split in three components. These components are: light for the gluon and up, down, and strange quark jets, charm for the c jets, and bottom for the b jets. |

png pdf |
Figure 9-b:
The twenty largest impacts $ \Delta\hat{\mu} $ (right column) and fit constraints $ (\hat{\theta}-\theta_0)/\Delta\theta $ (middle column) of the nuisance parameters listed in the left column from the maximum likelihood fit used to determine the inclusive $ \mathrm{t}\mathrm{W} $ cross section. The horizontal bars on the fit constraints show the ratio of the uncertainties of the fit result to the previous ones, effectively giving the constraint on the nuisance parameter. If the period is specified alongside the uncertainty name, it indicates that this is the component of the uncertainty uncorrelated by periods. There are two possible periods, before (2022PreEE) and after (2022PostEE) ECAL water leak. The JES uncertainties are divided into several sources, where ``JES - absolute'' groups contributions from scale corrections in the barrel, pileup corrections, and initial- and final-state radiation corrections; ``JES - relative sample'' encodes the uncertainty in the $ \eta $-dependent calibration of the jets; ``JES - relativeBal'' accounts for the full difference between log-linear fits of MPF (Missing transverse energy Projection Fraction) and $ p_{\mathrm{T}} $ balance methods [114]; and ``JES - quark/gluon'' comes from the corrections applied to correct the different detector response to gluon and quark jets. This last uncertainty is split in three components. These components are: light for the gluon and up, down, and strange quark jets, charm for the c jets, and bottom for the b jets. |
png pdf |
Figure 9-c:
The twenty largest impacts $ \Delta\hat{\mu} $ (right column) and fit constraints $ (\hat{\theta}-\theta_0)/\Delta\theta $ (middle column) of the nuisance parameters listed in the left column from the maximum likelihood fit used to determine the inclusive $ \mathrm{t}\mathrm{W} $ cross section. The horizontal bars on the fit constraints show the ratio of the uncertainties of the fit result to the previous ones, effectively giving the constraint on the nuisance parameter. If the period is specified alongside the uncertainty name, it indicates that this is the component of the uncertainty uncorrelated by periods. There are two possible periods, before (2022PreEE) and after (2022PostEE) ECAL water leak. The JES uncertainties are divided into several sources, where ``JES - absolute'' groups contributions from scale corrections in the barrel, pileup corrections, and initial- and final-state radiation corrections; ``JES - relative sample'' encodes the uncertainty in the $ \eta $-dependent calibration of the jets; ``JES - relativeBal'' accounts for the full difference between log-linear fits of MPF (Missing transverse energy Projection Fraction) and $ p_{\mathrm{T}} $ balance methods [114]; and ``JES - quark/gluon'' comes from the corrections applied to correct the different detector response to gluon and quark jets. This last uncertainty is split in three components. These components are: light for the gluon and up, down, and strange quark jets, charm for the c jets, and bottom for the b jets. |
png pdf |
Figure 9-d:
The twenty largest impacts $ \Delta\hat{\mu} $ (right column) and fit constraints $ (\hat{\theta}-\theta_0)/\Delta\theta $ (middle column) of the nuisance parameters listed in the left column from the maximum likelihood fit used to determine the inclusive $ \mathrm{t}\mathrm{W} $ cross section. The horizontal bars on the fit constraints show the ratio of the uncertainties of the fit result to the previous ones, effectively giving the constraint on the nuisance parameter. If the period is specified alongside the uncertainty name, it indicates that this is the component of the uncertainty uncorrelated by periods. There are two possible periods, before (2022PreEE) and after (2022PostEE) ECAL water leak. The JES uncertainties are divided into several sources, where ``JES - absolute'' groups contributions from scale corrections in the barrel, pileup corrections, and initial- and final-state radiation corrections; ``JES - relative sample'' encodes the uncertainty in the $ \eta $-dependent calibration of the jets; ``JES - relativeBal'' accounts for the full difference between log-linear fits of MPF (Missing transverse energy Projection Fraction) and $ p_{\mathrm{T}} $ balance methods [114]; and ``JES - quark/gluon'' comes from the corrections applied to correct the different detector response to gluon and quark jets. This last uncertainty is split in three components. These components are: light for the gluon and up, down, and strange quark jets, charm for the c jets, and bottom for the b jets. |

png pdf |
Figure 9-e:
The twenty largest impacts $ \Delta\hat{\mu} $ (right column) and fit constraints $ (\hat{\theta}-\theta_0)/\Delta\theta $ (middle column) of the nuisance parameters listed in the left column from the maximum likelihood fit used to determine the inclusive $ \mathrm{t}\mathrm{W} $ cross section. The horizontal bars on the fit constraints show the ratio of the uncertainties of the fit result to the previous ones, effectively giving the constraint on the nuisance parameter. If the period is specified alongside the uncertainty name, it indicates that this is the component of the uncertainty uncorrelated by periods. There are two possible periods, before (2022PreEE) and after (2022PostEE) ECAL water leak. The JES uncertainties are divided into several sources, where ``JES - absolute'' groups contributions from scale corrections in the barrel, pileup corrections, and initial- and final-state radiation corrections; ``JES - relative sample'' encodes the uncertainty in the $ \eta $-dependent calibration of the jets; ``JES - relativeBal'' accounts for the full difference between log-linear fits of MPF (Missing transverse energy Projection Fraction) and $ p_{\mathrm{T}} $ balance methods [114]; and ``JES - quark/gluon'' comes from the corrections applied to correct the different detector response to gluon and quark jets. This last uncertainty is split in three components. These components are: light for the gluon and up, down, and strange quark jets, charm for the c jets, and bottom for the b jets. |

png pdf |
Figure 9-f:
The twenty largest impacts $ \Delta\hat{\mu} $ (right column) and fit constraints $ (\hat{\theta}-\theta_0)/\Delta\theta $ (middle column) of the nuisance parameters listed in the left column from the maximum likelihood fit used to determine the inclusive $ \mathrm{t}\mathrm{W} $ cross section. The horizontal bars on the fit constraints show the ratio of the uncertainties of the fit result to the previous ones, effectively giving the constraint on the nuisance parameter. If the period is specified alongside the uncertainty name, it indicates that this is the component of the uncertainty uncorrelated by periods. There are two possible periods, before (2022PreEE) and after (2022PostEE) ECAL water leak. The JES uncertainties are divided into several sources, where ``JES - absolute'' groups contributions from scale corrections in the barrel, pileup corrections, and initial- and final-state radiation corrections; ``JES - relative sample'' encodes the uncertainty in the $ \eta $-dependent calibration of the jets; ``JES - relativeBal'' accounts for the full difference between log-linear fits of MPF (Missing transverse energy Projection Fraction) and $ p_{\mathrm{T}} $ balance methods [114]; and ``JES - quark/gluon'' comes from the corrections applied to correct the different detector response to gluon and quark jets. This last uncertainty is split in three components. These components are: light for the gluon and up, down, and strange quark jets, charm for the c jets, and bottom for the b jets. |
png pdf |
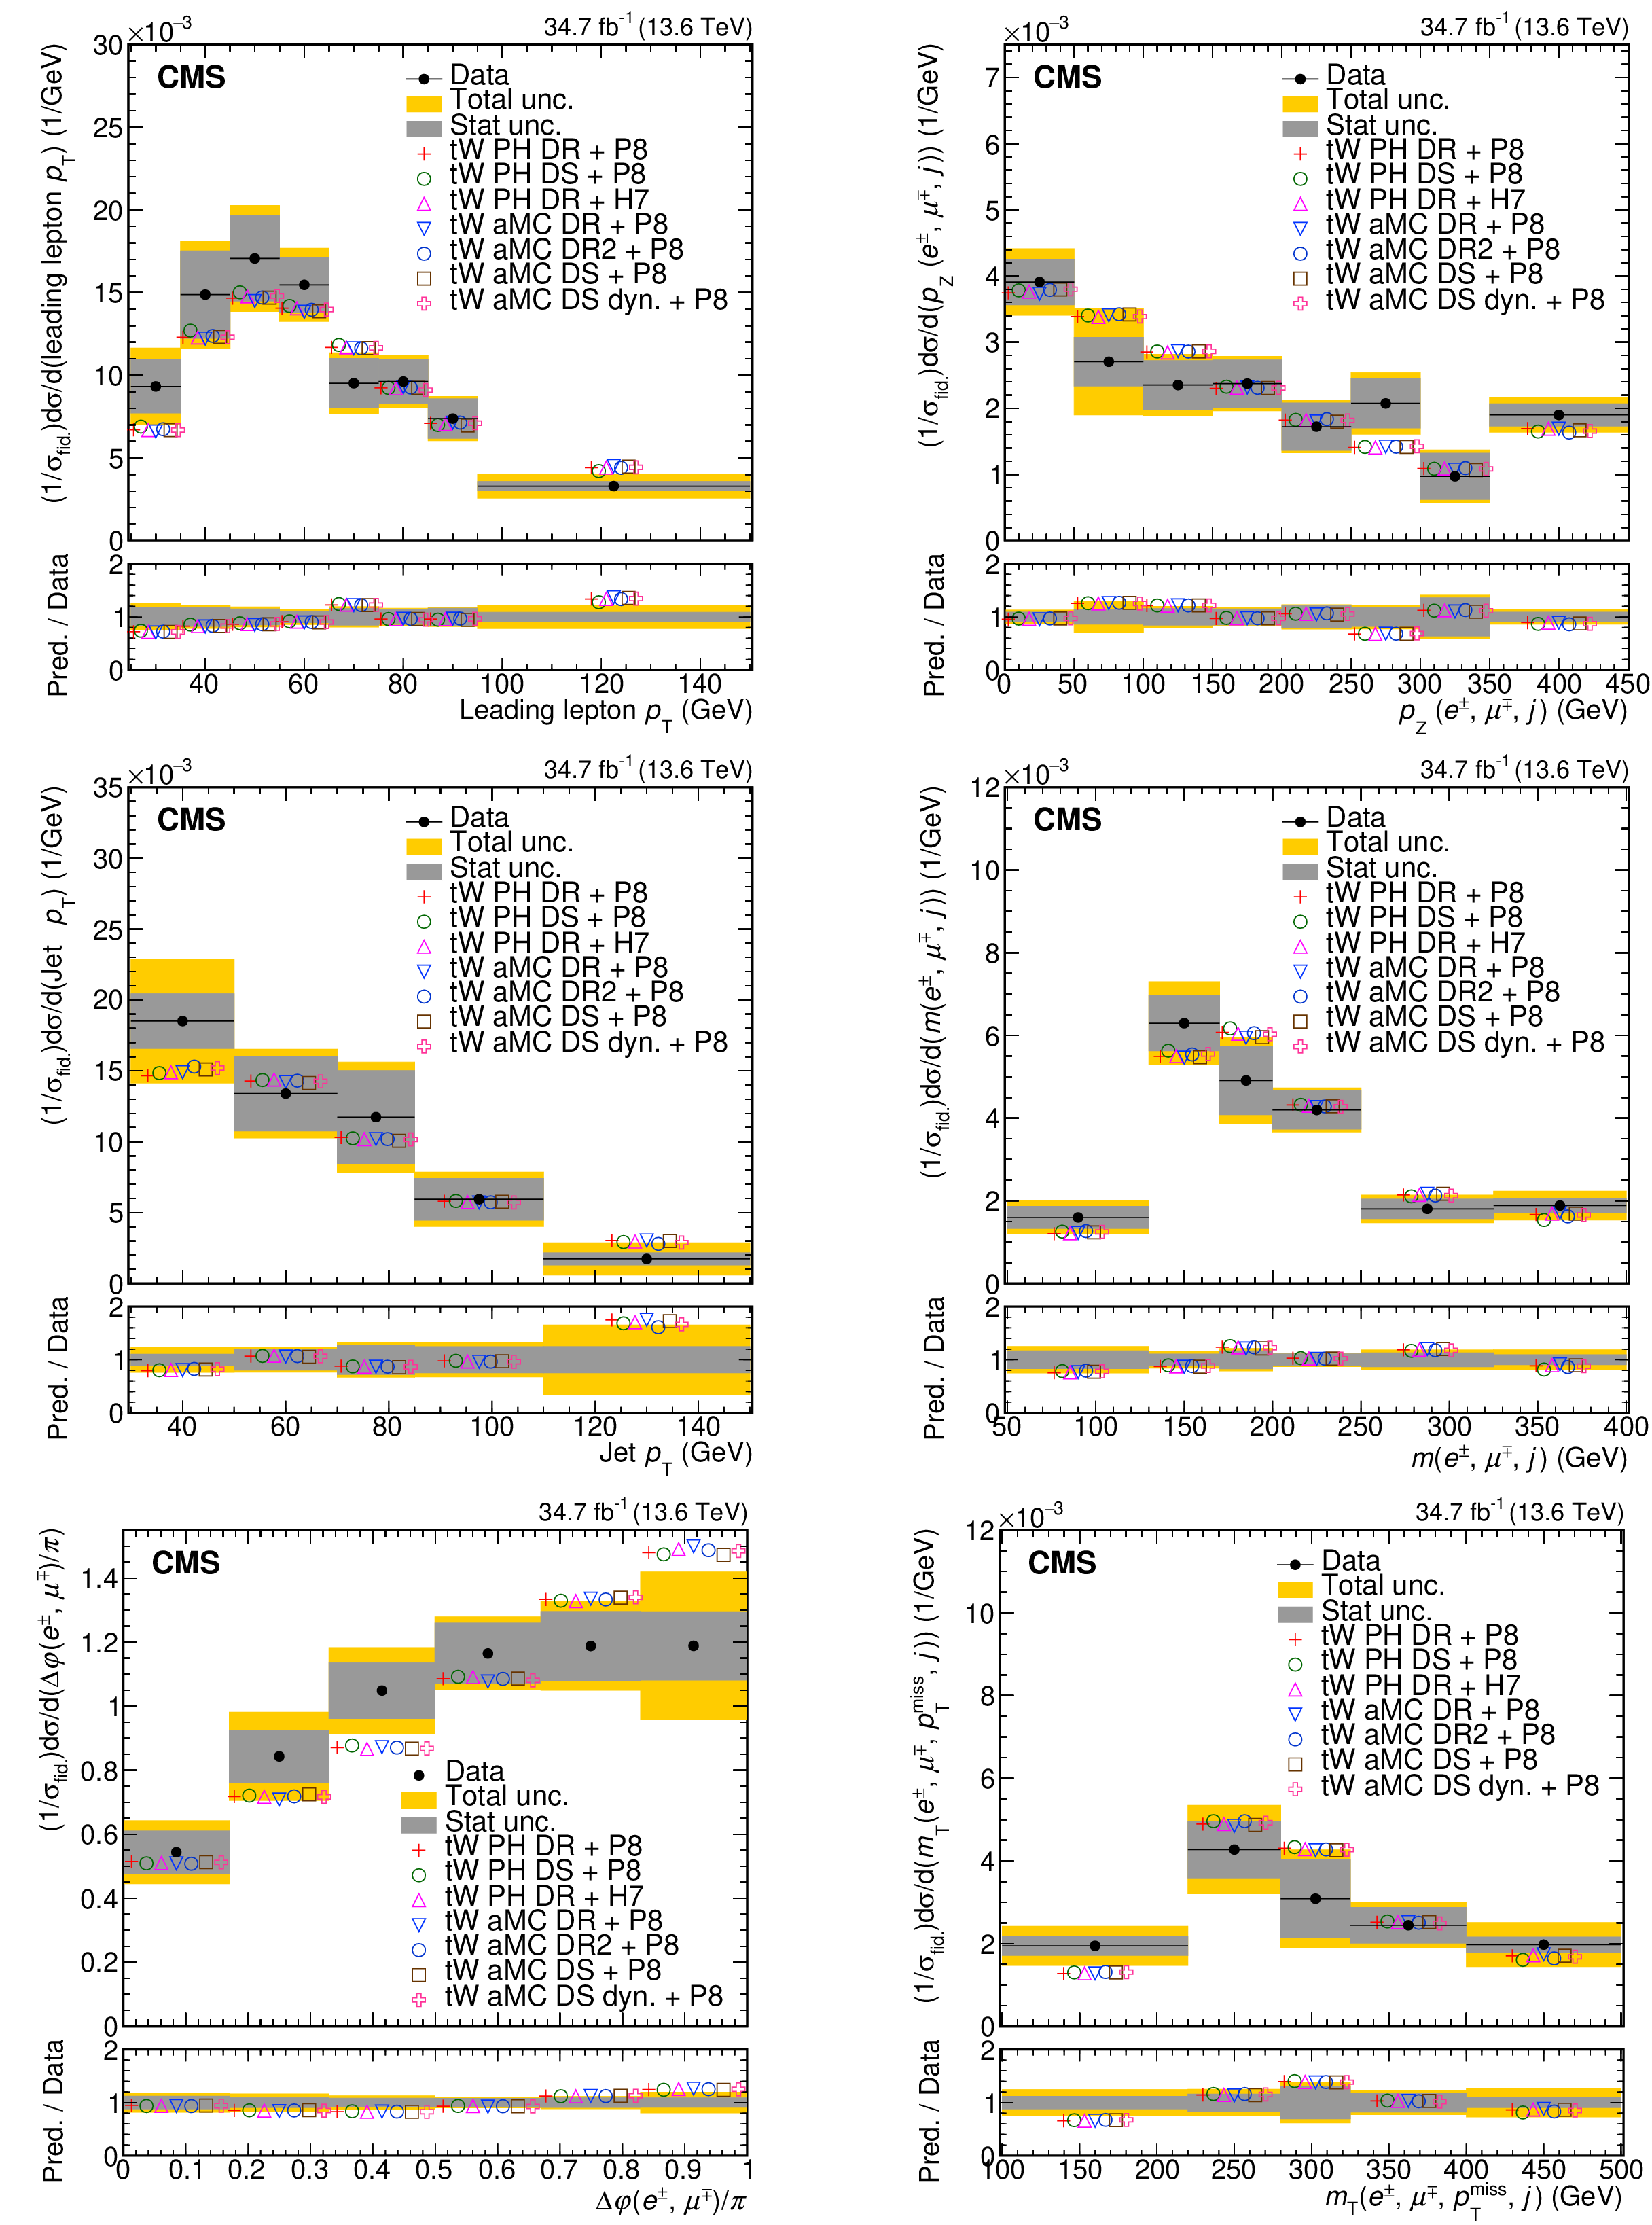
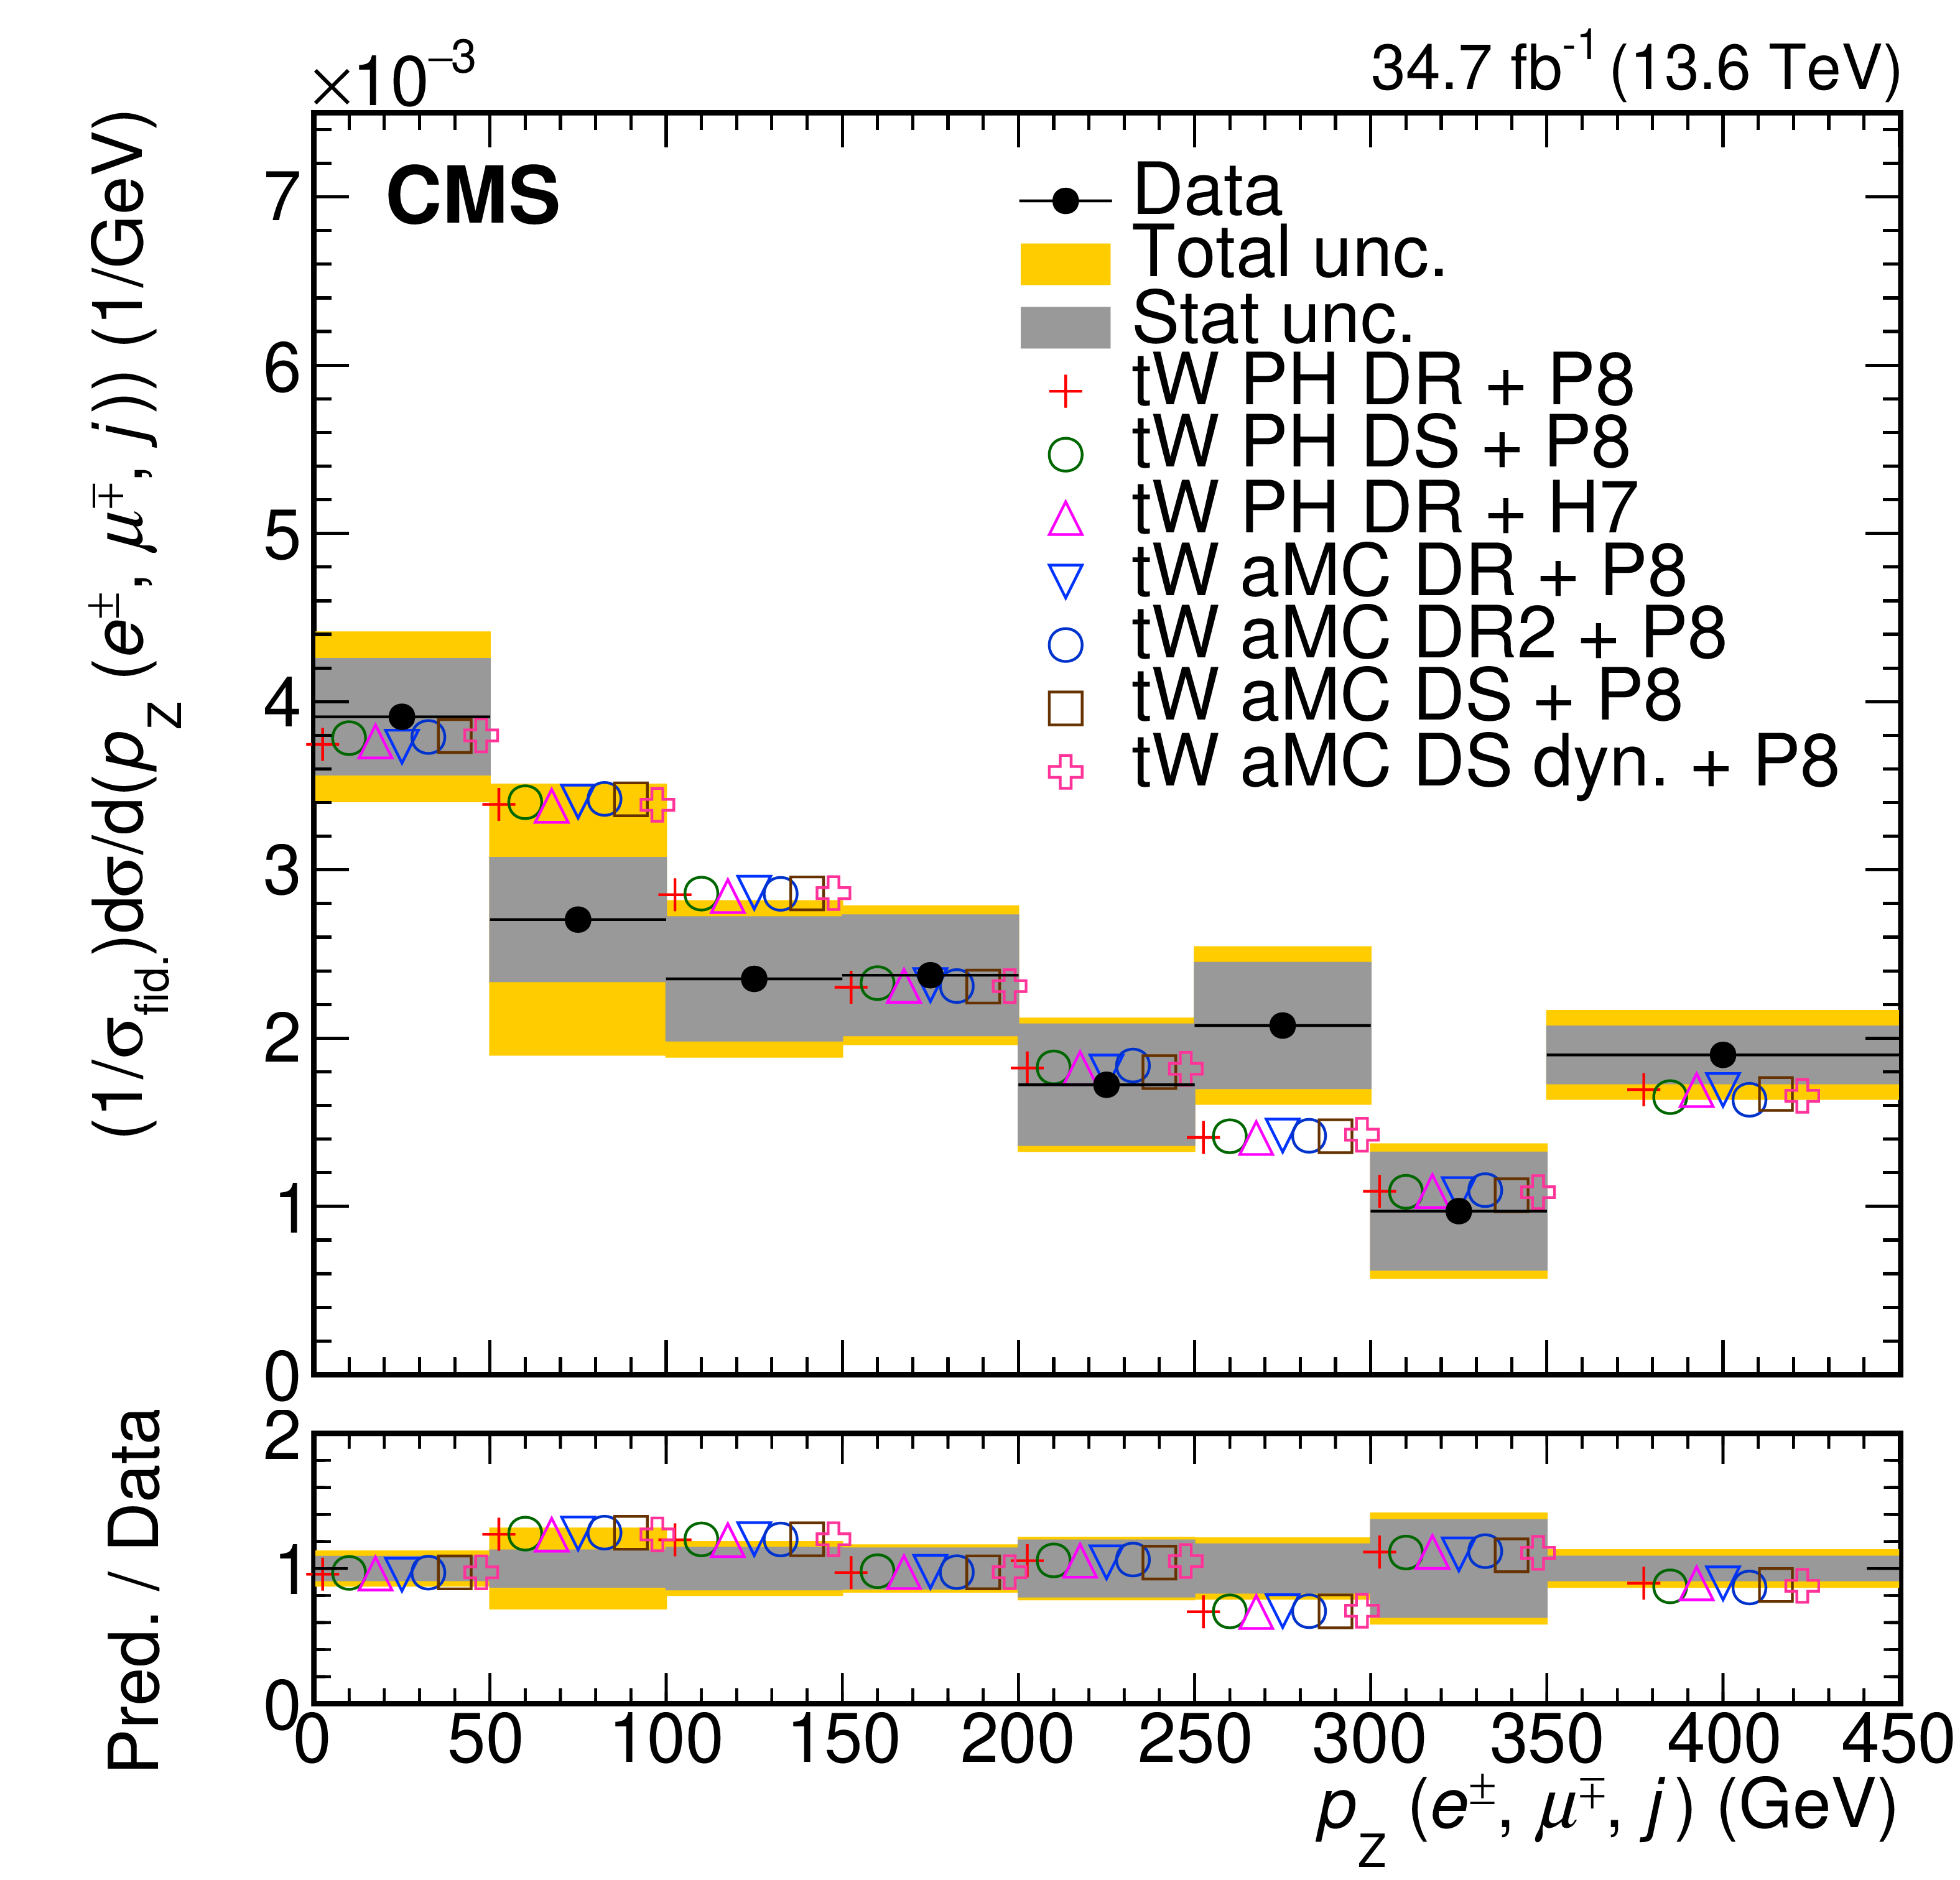
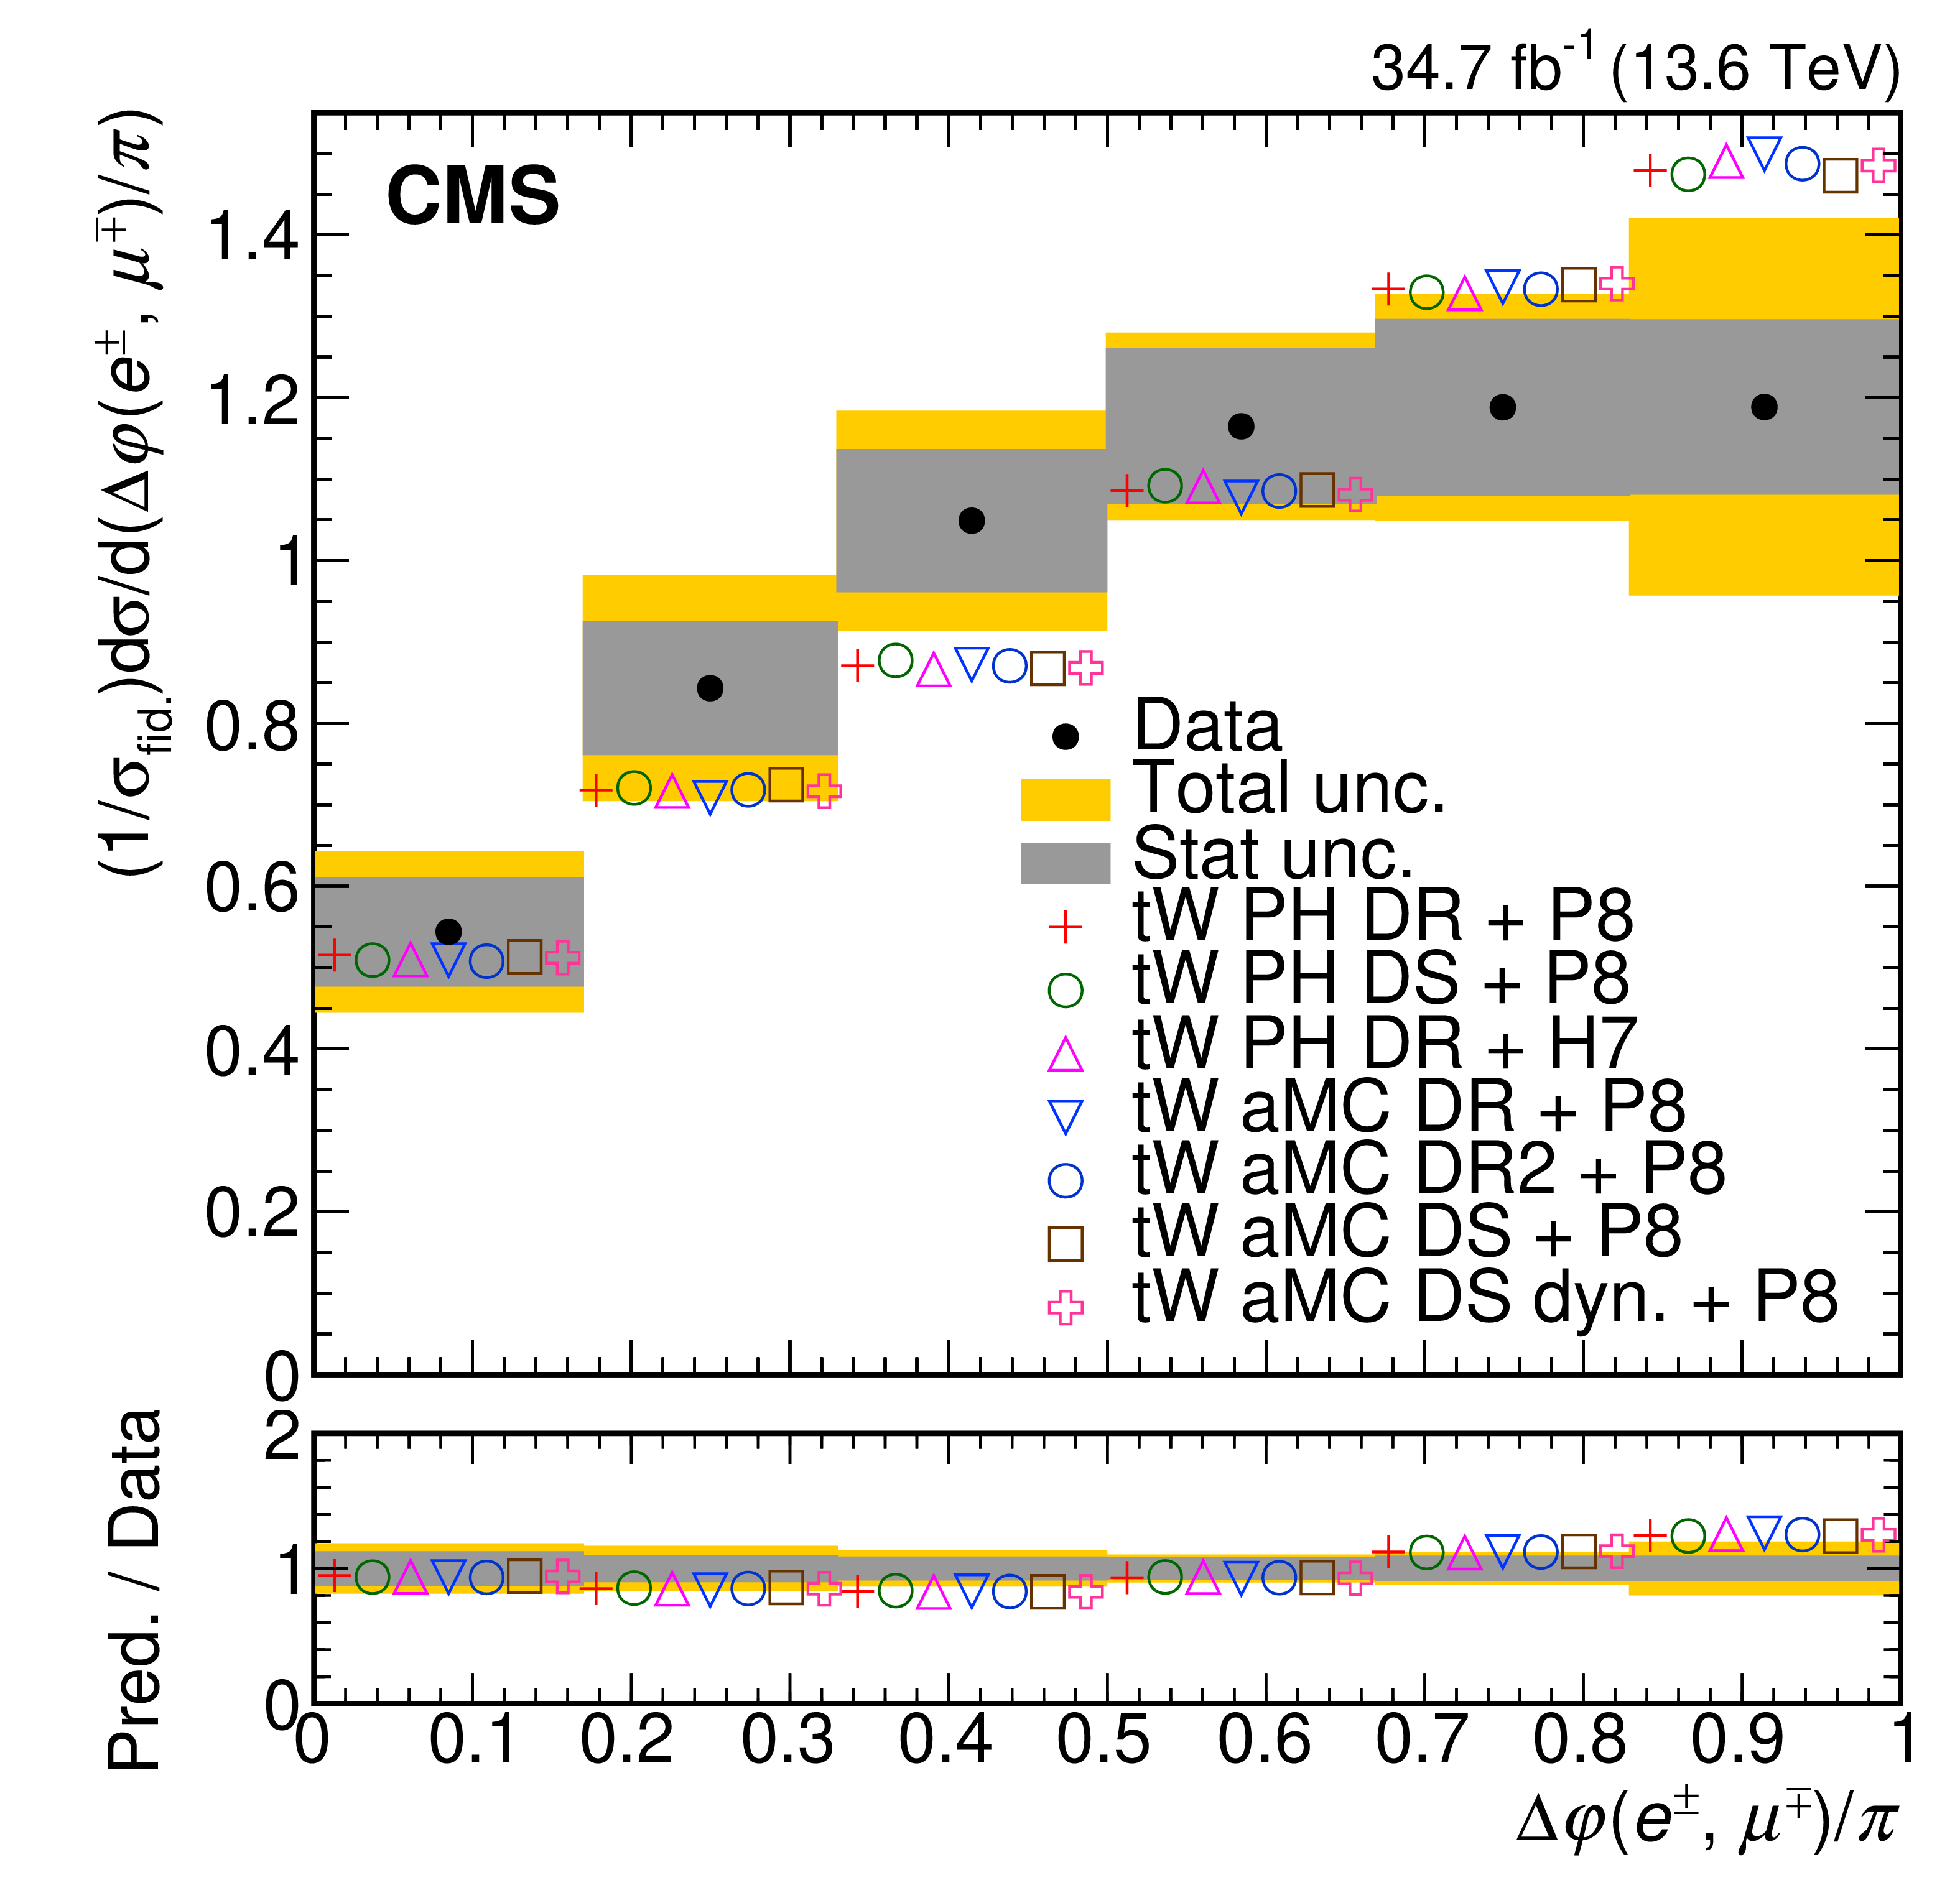
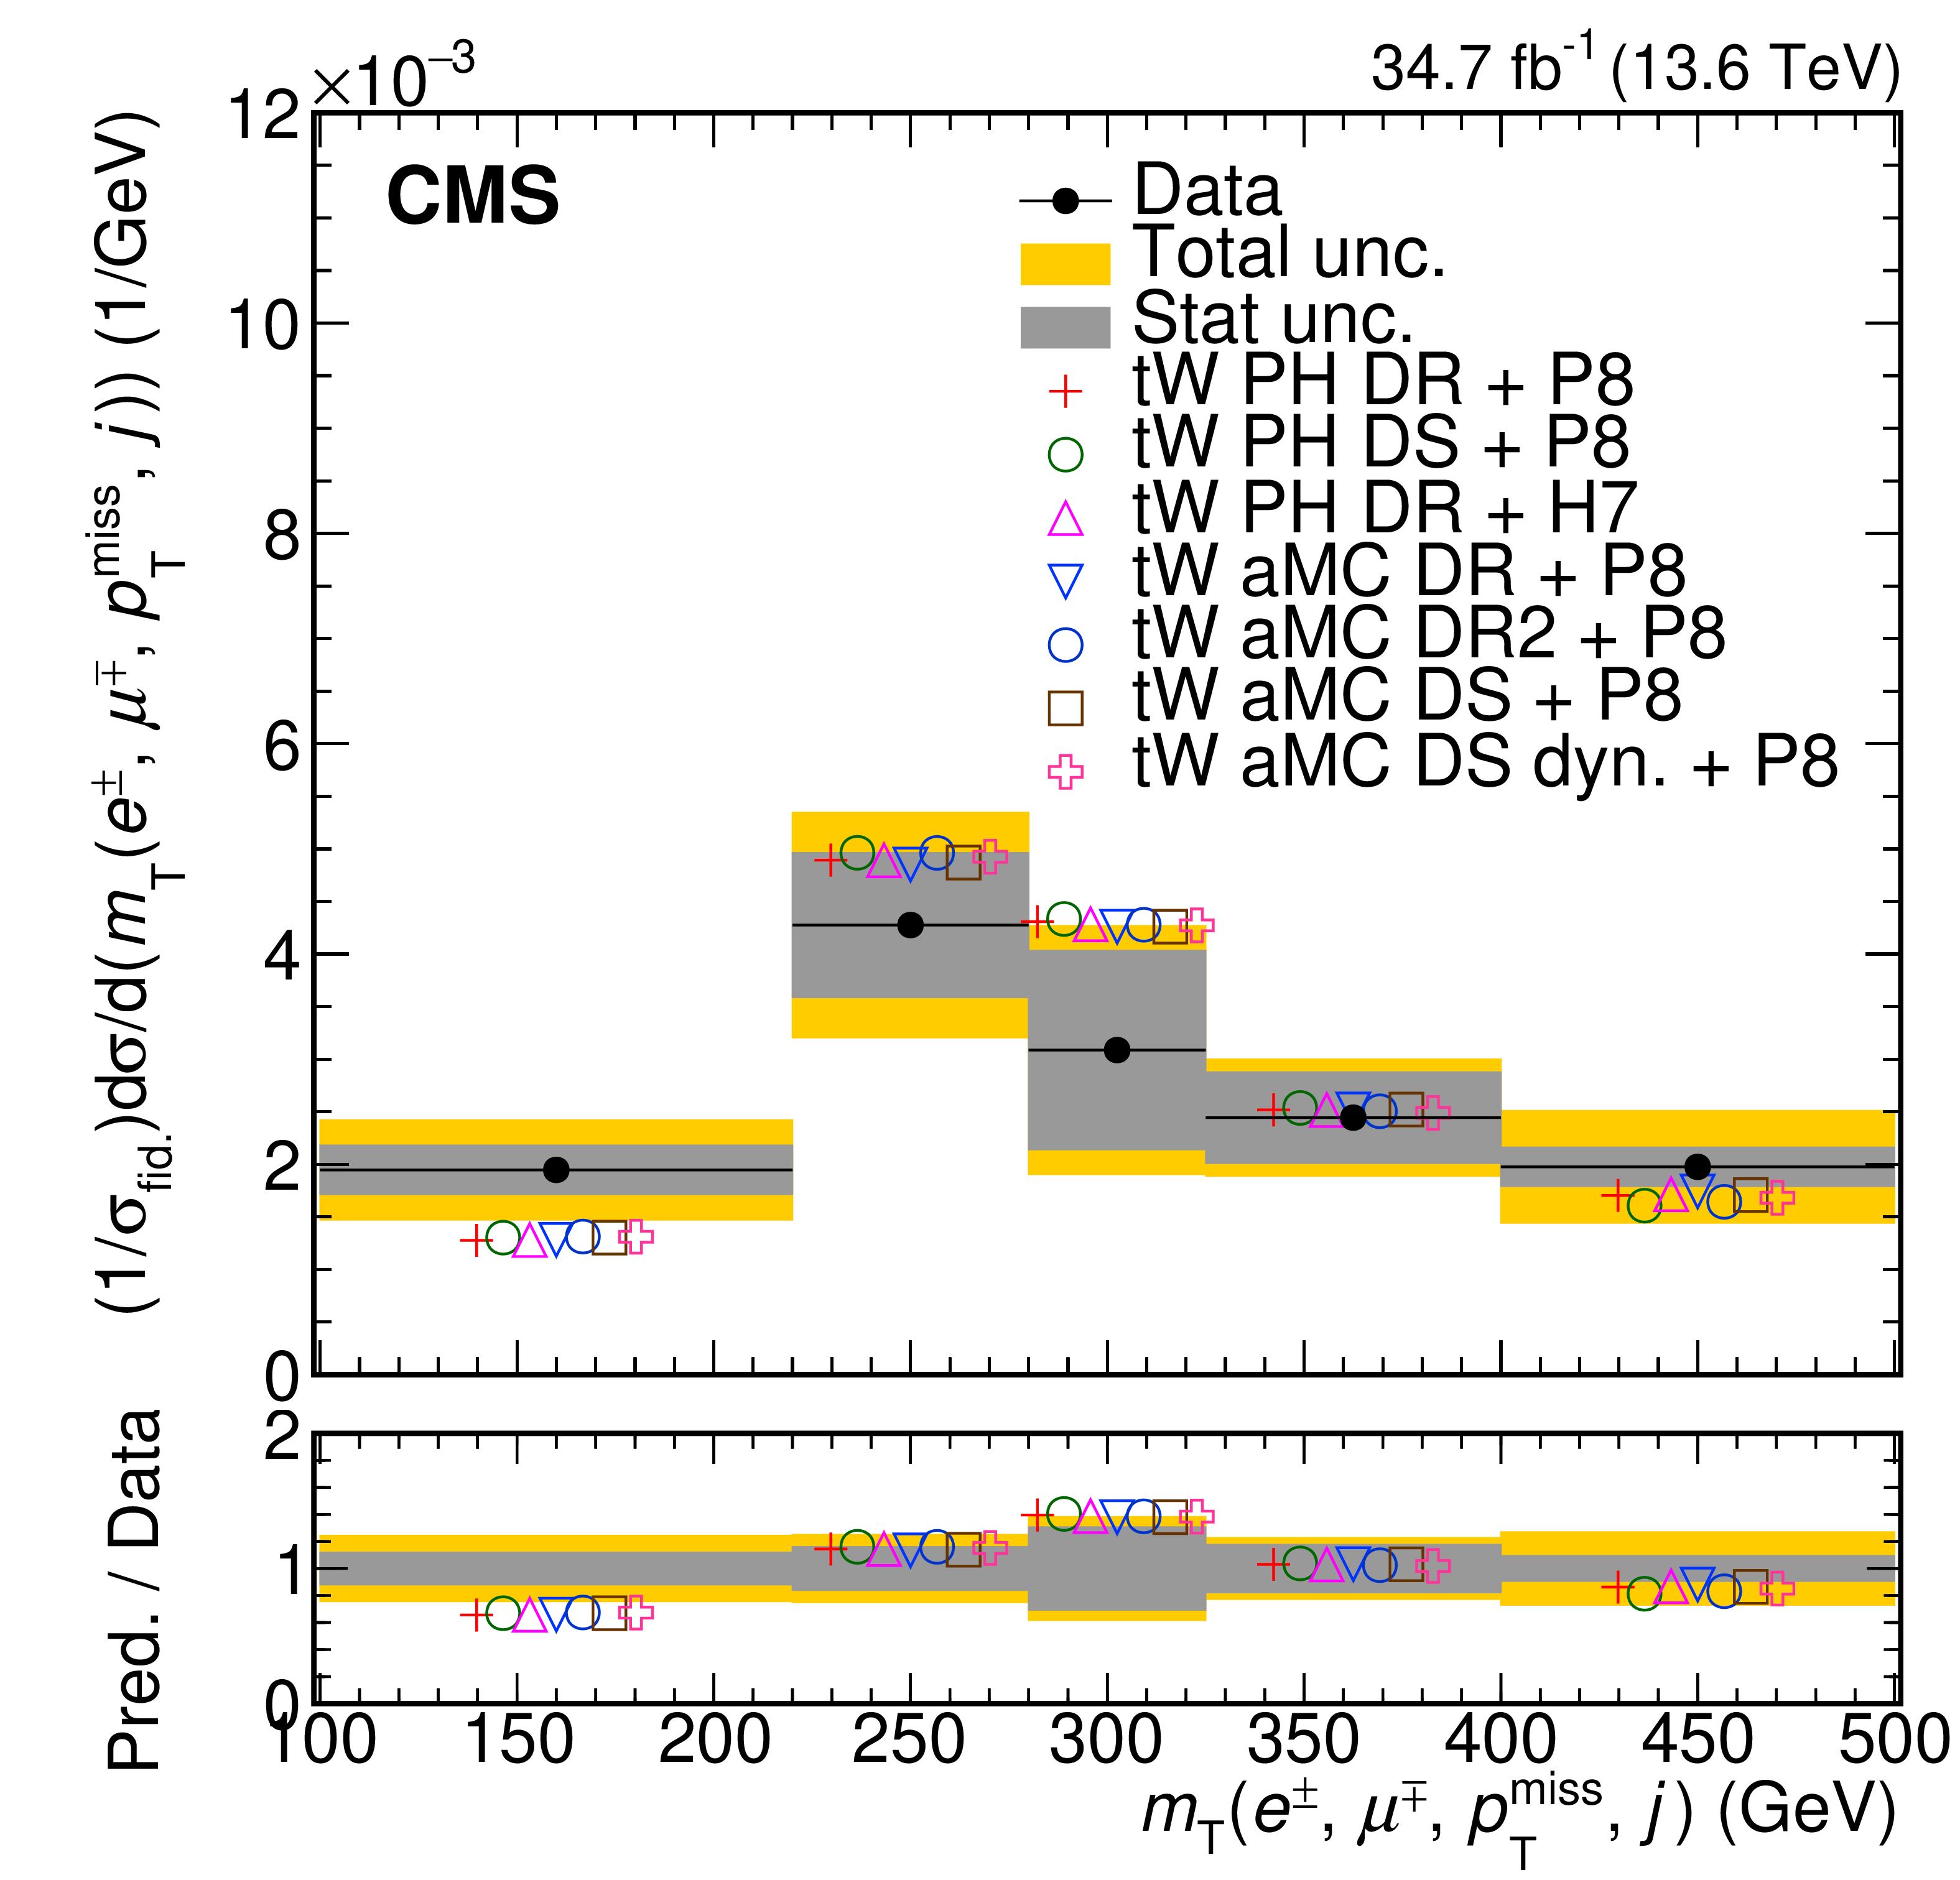
Figure 10:
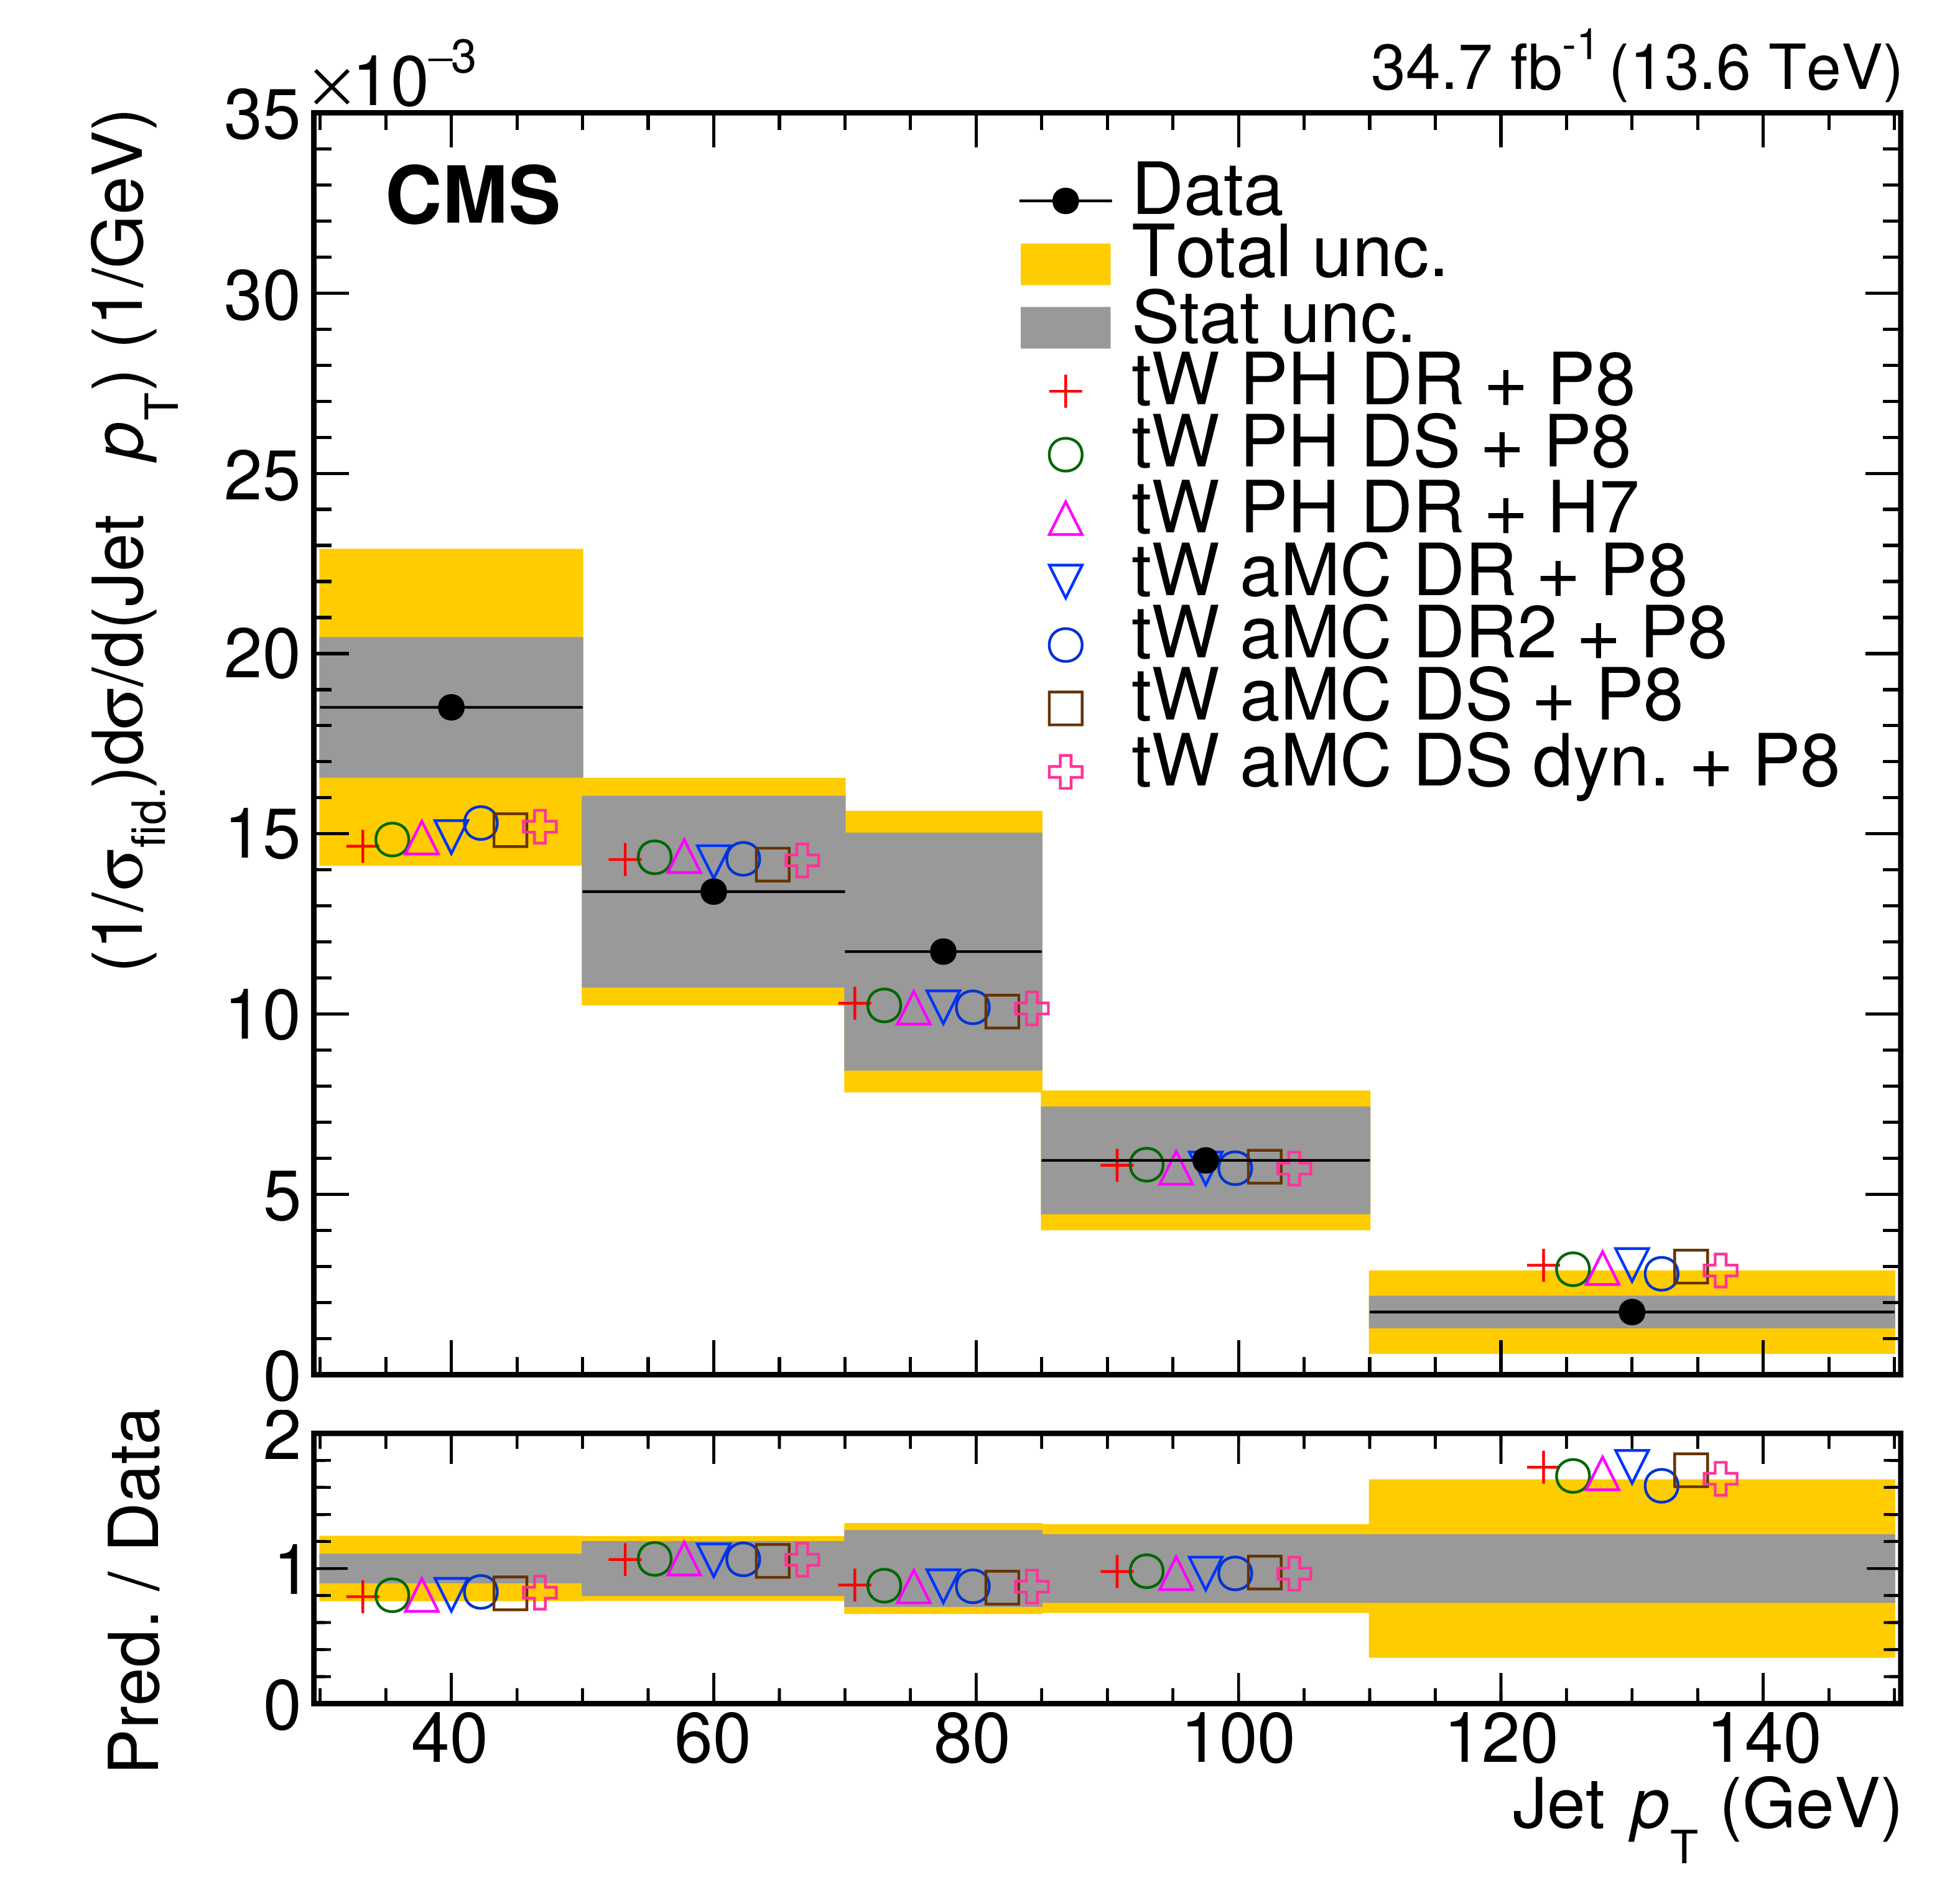
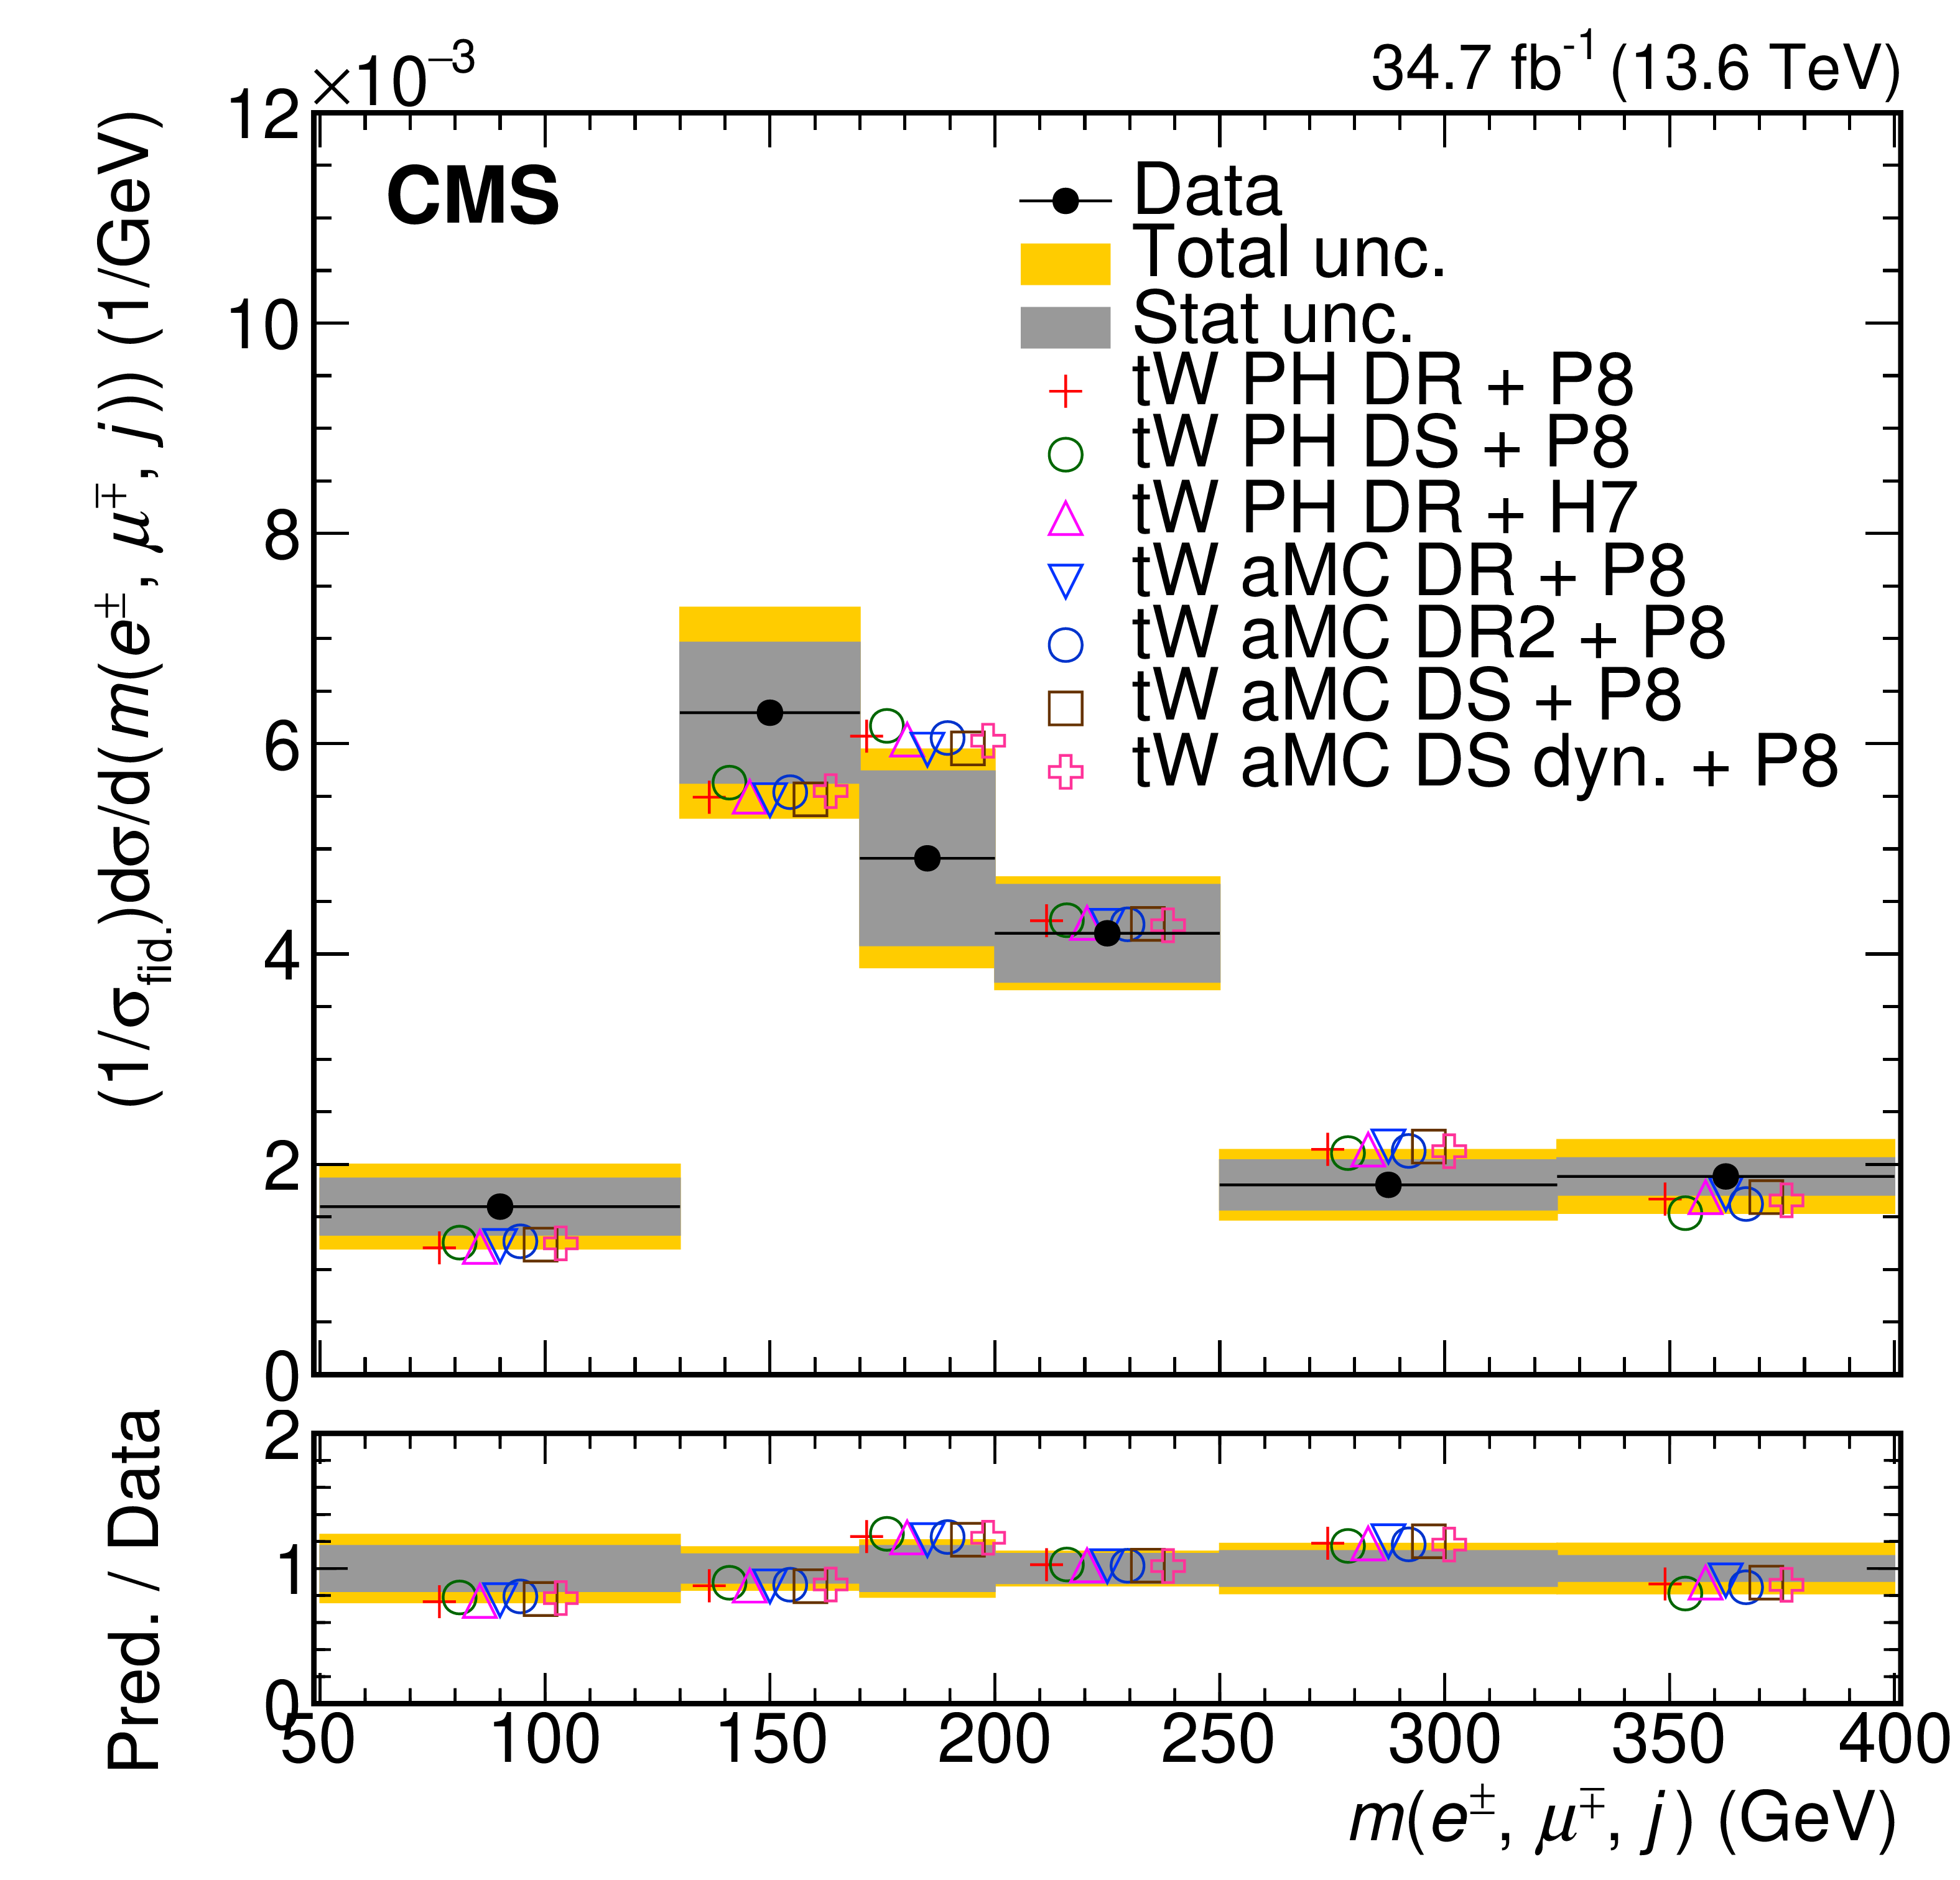
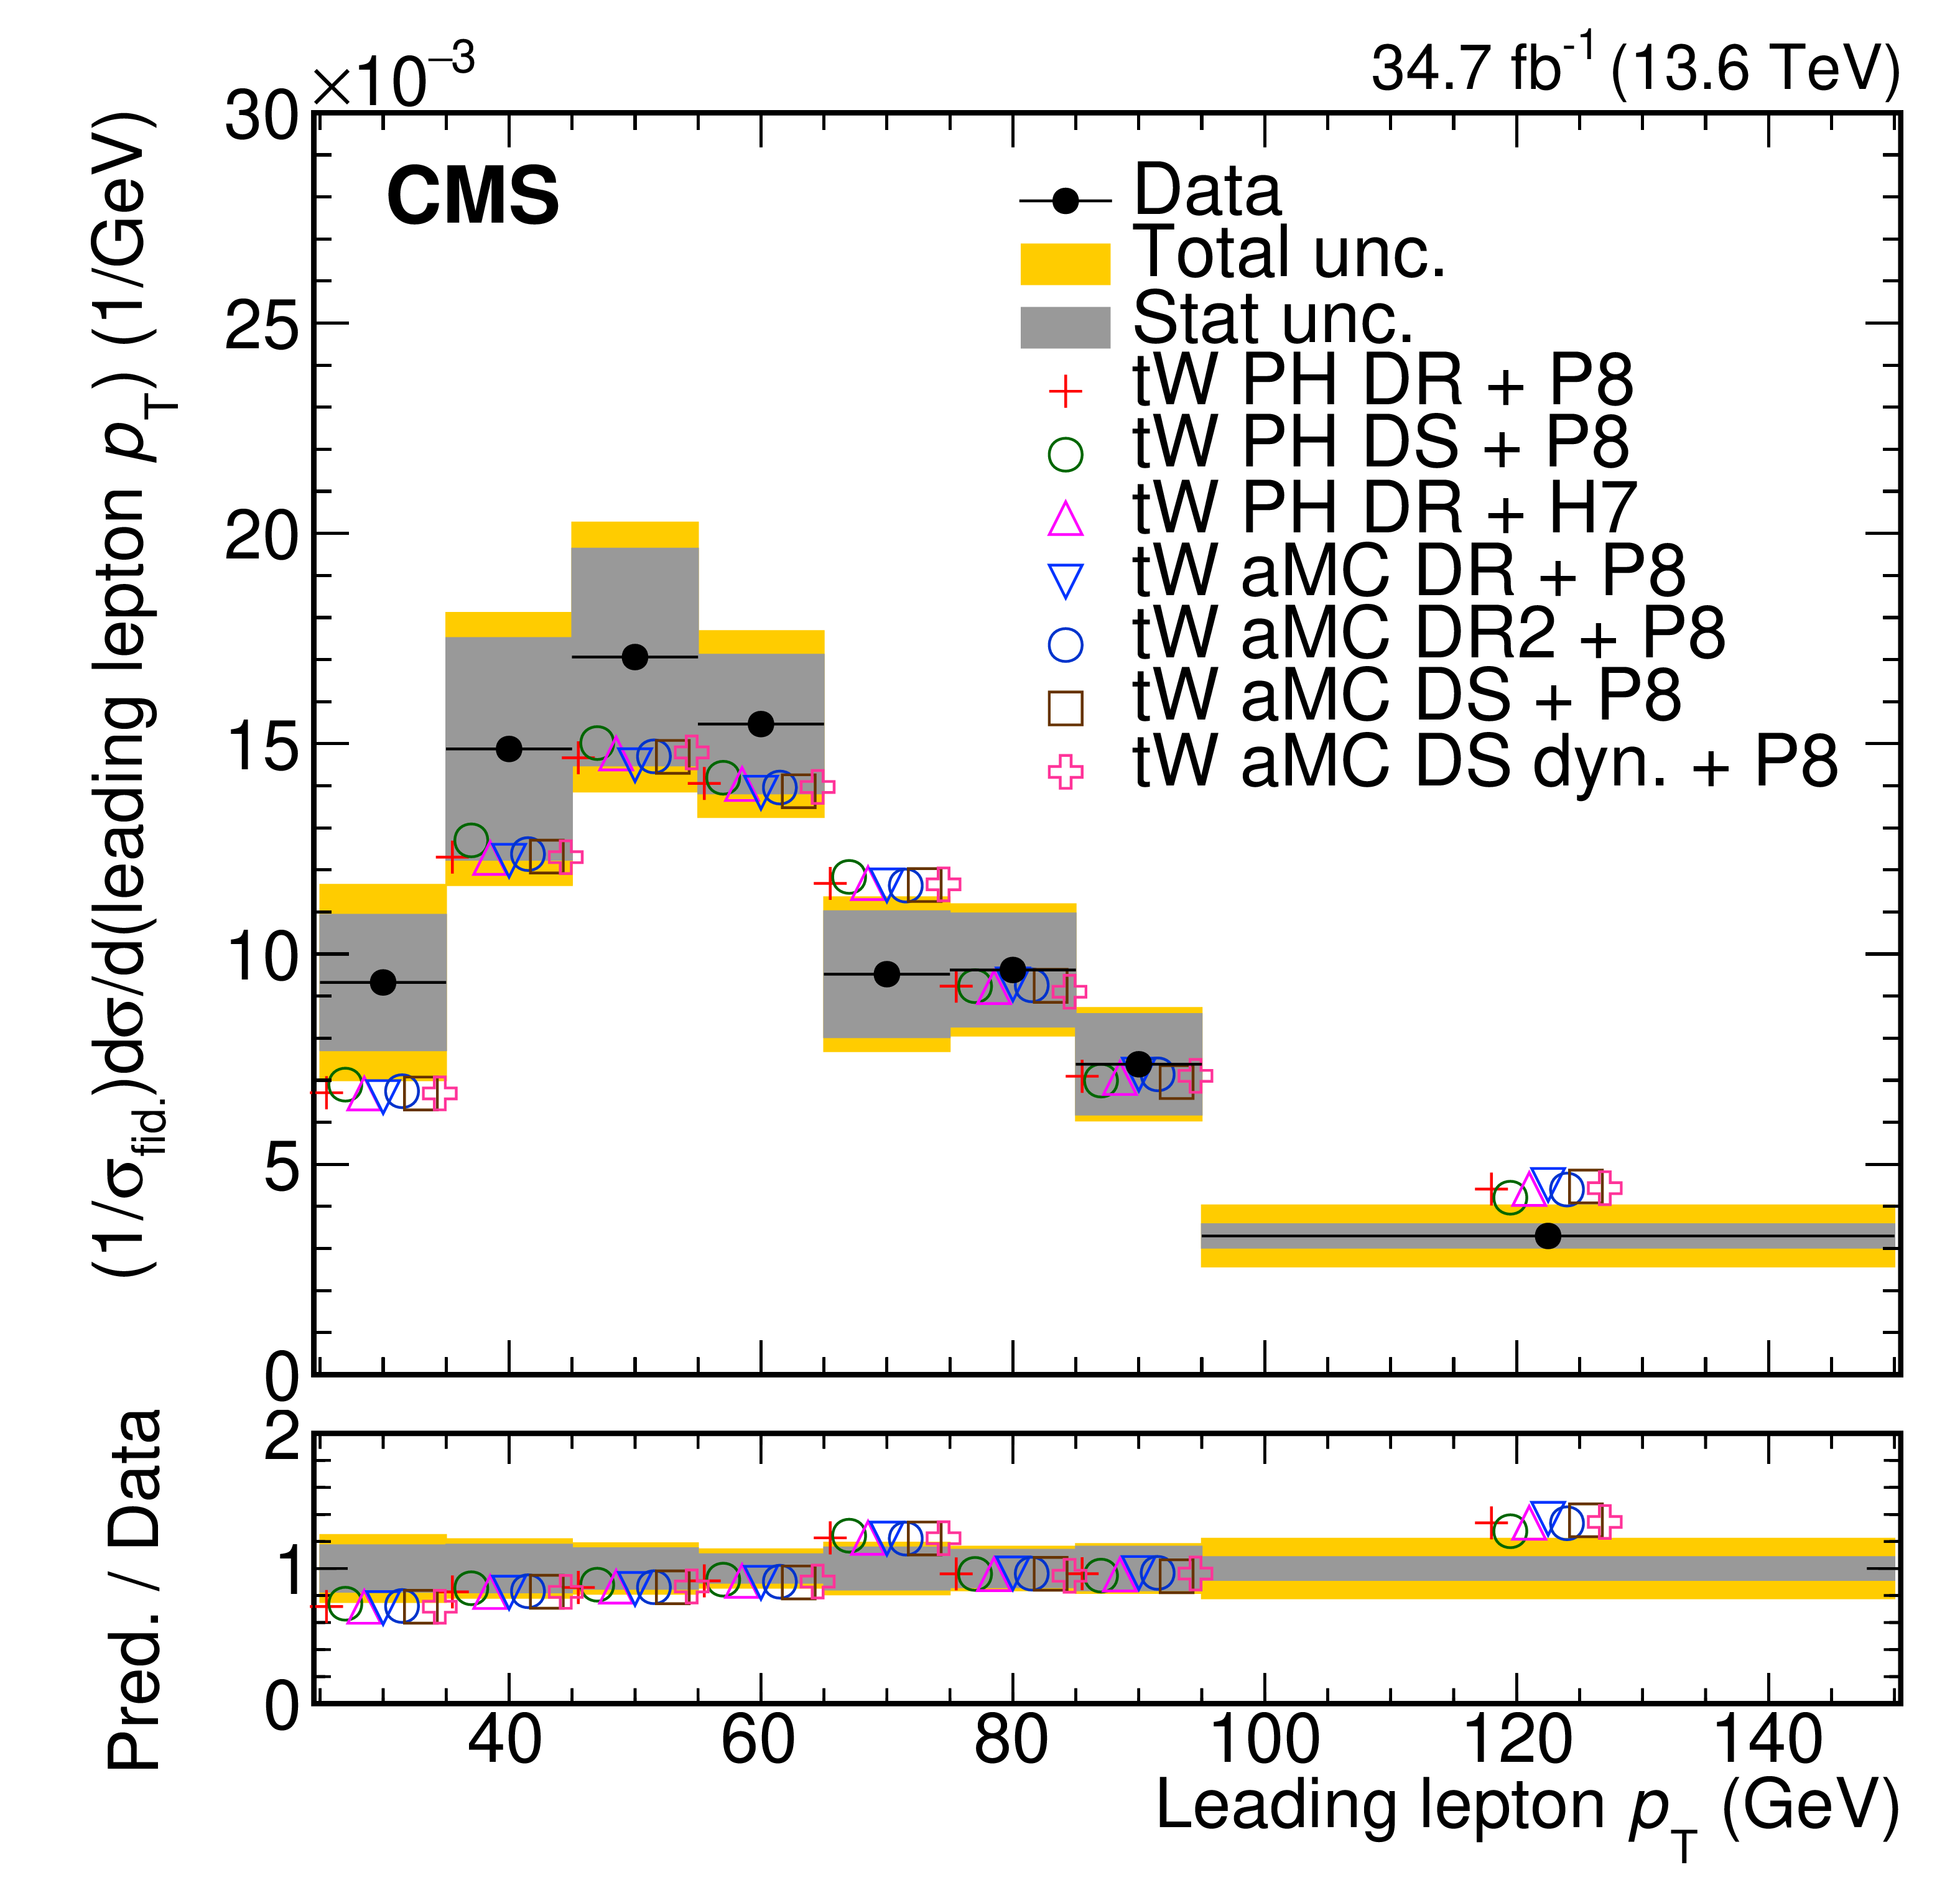
Normalised fiducial differential $ \mathrm{t}\mathrm{W} $ production cross sections as functions of the $ p_{\mathrm{T}} $ of the leading lepton (upper left), $ p_z(\mathrm{e}^\pm,\mu^\mp,\mathrm{j}) $ (upper right), $ p_{\mathrm{T}} $ of the jet (middle left), $ m(\mathrm{e}^\pm,\mu^\mp,\mathrm{j}) $ (middle right), $ \Delta\varphi(\mathrm{e}^\pm,\mu^\mp) $ (lower left), and $ m_{\mathrm{T}}(\mathrm{e}^\pm,\mu^\mp,\mathrm{j},{\vec p}_{\mathrm{T}}^{\,\text{miss}}) $ (lower right). The horizontal bars on the points show the bin width. Predictions from POWHEG BOX (PH) DR and DS + PYTHIA8 (P8), POWHEG BOX DR + HERWIG 7 (H7), MadGraph-5_aMC@NLO (aMC) DR, DR2, DS, and DS with a dynamic factor + PYTHIA8 are also shown. The grey band represents the statistical uncertainty and the yellow band the total uncertainty. In the lower panels, the ratio of the predictions to the data is shown. |
png pdf |
Figure 10-a:
Normalised fiducial differential $ \mathrm{t}\mathrm{W} $ production cross sections as functions of the $ p_{\mathrm{T}} $ of the leading lepton (upper left), $ p_z(\mathrm{e}^\pm,\mu^\mp,\mathrm{j}) $ (upper right), $ p_{\mathrm{T}} $ of the jet (middle left), $ m(\mathrm{e}^\pm,\mu^\mp,\mathrm{j}) $ (middle right), $ \Delta\varphi(\mathrm{e}^\pm,\mu^\mp) $ (lower left), and $ m_{\mathrm{T}}(\mathrm{e}^\pm,\mu^\mp,\mathrm{j},{\vec p}_{\mathrm{T}}^{\,\text{miss}}) $ (lower right). The horizontal bars on the points show the bin width. Predictions from POWHEG BOX (PH) DR and DS + PYTHIA8 (P8), POWHEG BOX DR + HERWIG 7 (H7), MadGraph-5_aMC@NLO (aMC) DR, DR2, DS, and DS with a dynamic factor + PYTHIA8 are also shown. The grey band represents the statistical uncertainty and the yellow band the total uncertainty. In the lower panels, the ratio of the predictions to the data is shown. |
png pdf |
Figure 10-b:
Normalised fiducial differential $ \mathrm{t}\mathrm{W} $ production cross sections as functions of the $ p_{\mathrm{T}} $ of the leading lepton (upper left), $ p_z(\mathrm{e}^\pm,\mu^\mp,\mathrm{j}) $ (upper right), $ p_{\mathrm{T}} $ of the jet (middle left), $ m(\mathrm{e}^\pm,\mu^\mp,\mathrm{j}) $ (middle right), $ \Delta\varphi(\mathrm{e}^\pm,\mu^\mp) $ (lower left), and $ m_{\mathrm{T}}(\mathrm{e}^\pm,\mu^\mp,\mathrm{j},{\vec p}_{\mathrm{T}}^{\,\text{miss}}) $ (lower right). The horizontal bars on the points show the bin width. Predictions from POWHEG BOX (PH) DR and DS + PYTHIA8 (P8), POWHEG BOX DR + HERWIG 7 (H7), MadGraph-5_aMC@NLO (aMC) DR, DR2, DS, and DS with a dynamic factor + PYTHIA8 are also shown. The grey band represents the statistical uncertainty and the yellow band the total uncertainty. In the lower panels, the ratio of the predictions to the data is shown. |

png pdf |
Figure 10-c:
Normalised fiducial differential $ \mathrm{t}\mathrm{W} $ production cross sections as functions of the $ p_{\mathrm{T}} $ of the leading lepton (upper left), $ p_z(\mathrm{e}^\pm,\mu^\mp,\mathrm{j}) $ (upper right), $ p_{\mathrm{T}} $ of the jet (middle left), $ m(\mathrm{e}^\pm,\mu^\mp,\mathrm{j}) $ (middle right), $ \Delta\varphi(\mathrm{e}^\pm,\mu^\mp) $ (lower left), and $ m_{\mathrm{T}}(\mathrm{e}^\pm,\mu^\mp,\mathrm{j},{\vec p}_{\mathrm{T}}^{\,\text{miss}}) $ (lower right). The horizontal bars on the points show the bin width. Predictions from POWHEG BOX (PH) DR and DS + PYTHIA8 (P8), POWHEG BOX DR + HERWIG 7 (H7), MadGraph-5_aMC@NLO (aMC) DR, DR2, DS, and DS with a dynamic factor + PYTHIA8 are also shown. The grey band represents the statistical uncertainty and the yellow band the total uncertainty. In the lower panels, the ratio of the predictions to the data is shown. |

png pdf |
Figure 10-d:
Normalised fiducial differential $ \mathrm{t}\mathrm{W} $ production cross sections as functions of the $ p_{\mathrm{T}} $ of the leading lepton (upper left), $ p_z(\mathrm{e}^\pm,\mu^\mp,\mathrm{j}) $ (upper right), $ p_{\mathrm{T}} $ of the jet (middle left), $ m(\mathrm{e}^\pm,\mu^\mp,\mathrm{j}) $ (middle right), $ \Delta\varphi(\mathrm{e}^\pm,\mu^\mp) $ (lower left), and $ m_{\mathrm{T}}(\mathrm{e}^\pm,\mu^\mp,\mathrm{j},{\vec p}_{\mathrm{T}}^{\,\text{miss}}) $ (lower right). The horizontal bars on the points show the bin width. Predictions from POWHEG BOX (PH) DR and DS + PYTHIA8 (P8), POWHEG BOX DR + HERWIG 7 (H7), MadGraph-5_aMC@NLO (aMC) DR, DR2, DS, and DS with a dynamic factor + PYTHIA8 are also shown. The grey band represents the statistical uncertainty and the yellow band the total uncertainty. In the lower panels, the ratio of the predictions to the data is shown. |
png pdf |
Figure 10-e:
Normalised fiducial differential $ \mathrm{t}\mathrm{W} $ production cross sections as functions of the $ p_{\mathrm{T}} $ of the leading lepton (upper left), $ p_z(\mathrm{e}^\pm,\mu^\mp,\mathrm{j}) $ (upper right), $ p_{\mathrm{T}} $ of the jet (middle left), $ m(\mathrm{e}^\pm,\mu^\mp,\mathrm{j}) $ (middle right), $ \Delta\varphi(\mathrm{e}^\pm,\mu^\mp) $ (lower left), and $ m_{\mathrm{T}}(\mathrm{e}^\pm,\mu^\mp,\mathrm{j},{\vec p}_{\mathrm{T}}^{\,\text{miss}}) $ (lower right). The horizontal bars on the points show the bin width. Predictions from POWHEG BOX (PH) DR and DS + PYTHIA8 (P8), POWHEG BOX DR + HERWIG 7 (H7), MadGraph-5_aMC@NLO (aMC) DR, DR2, DS, and DS with a dynamic factor + PYTHIA8 are also shown. The grey band represents the statistical uncertainty and the yellow band the total uncertainty. In the lower panels, the ratio of the predictions to the data is shown. |
png pdf |
Figure 10-f:
Normalised fiducial differential $ \mathrm{t}\mathrm{W} $ production cross sections as functions of the $ p_{\mathrm{T}} $ of the leading lepton (upper left), $ p_z(\mathrm{e}^\pm,\mu^\mp,\mathrm{j}) $ (upper right), $ p_{\mathrm{T}} $ of the jet (middle left), $ m(\mathrm{e}^\pm,\mu^\mp,\mathrm{j}) $ (middle right), $ \Delta\varphi(\mathrm{e}^\pm,\mu^\mp) $ (lower left), and $ m_{\mathrm{T}}(\mathrm{e}^\pm,\mu^\mp,\mathrm{j},{\vec p}_{\mathrm{T}}^{\,\text{miss}}) $ (lower right). The horizontal bars on the points show the bin width. Predictions from POWHEG BOX (PH) DR and DS + PYTHIA8 (P8), POWHEG BOX DR + HERWIG 7 (H7), MadGraph-5_aMC@NLO (aMC) DR, DR2, DS, and DS with a dynamic factor + PYTHIA8 are also shown. The grey band represents the statistical uncertainty and the yellow band the total uncertainty. In the lower panels, the ratio of the predictions to the data is shown. |
| Tables | |
png pdf |
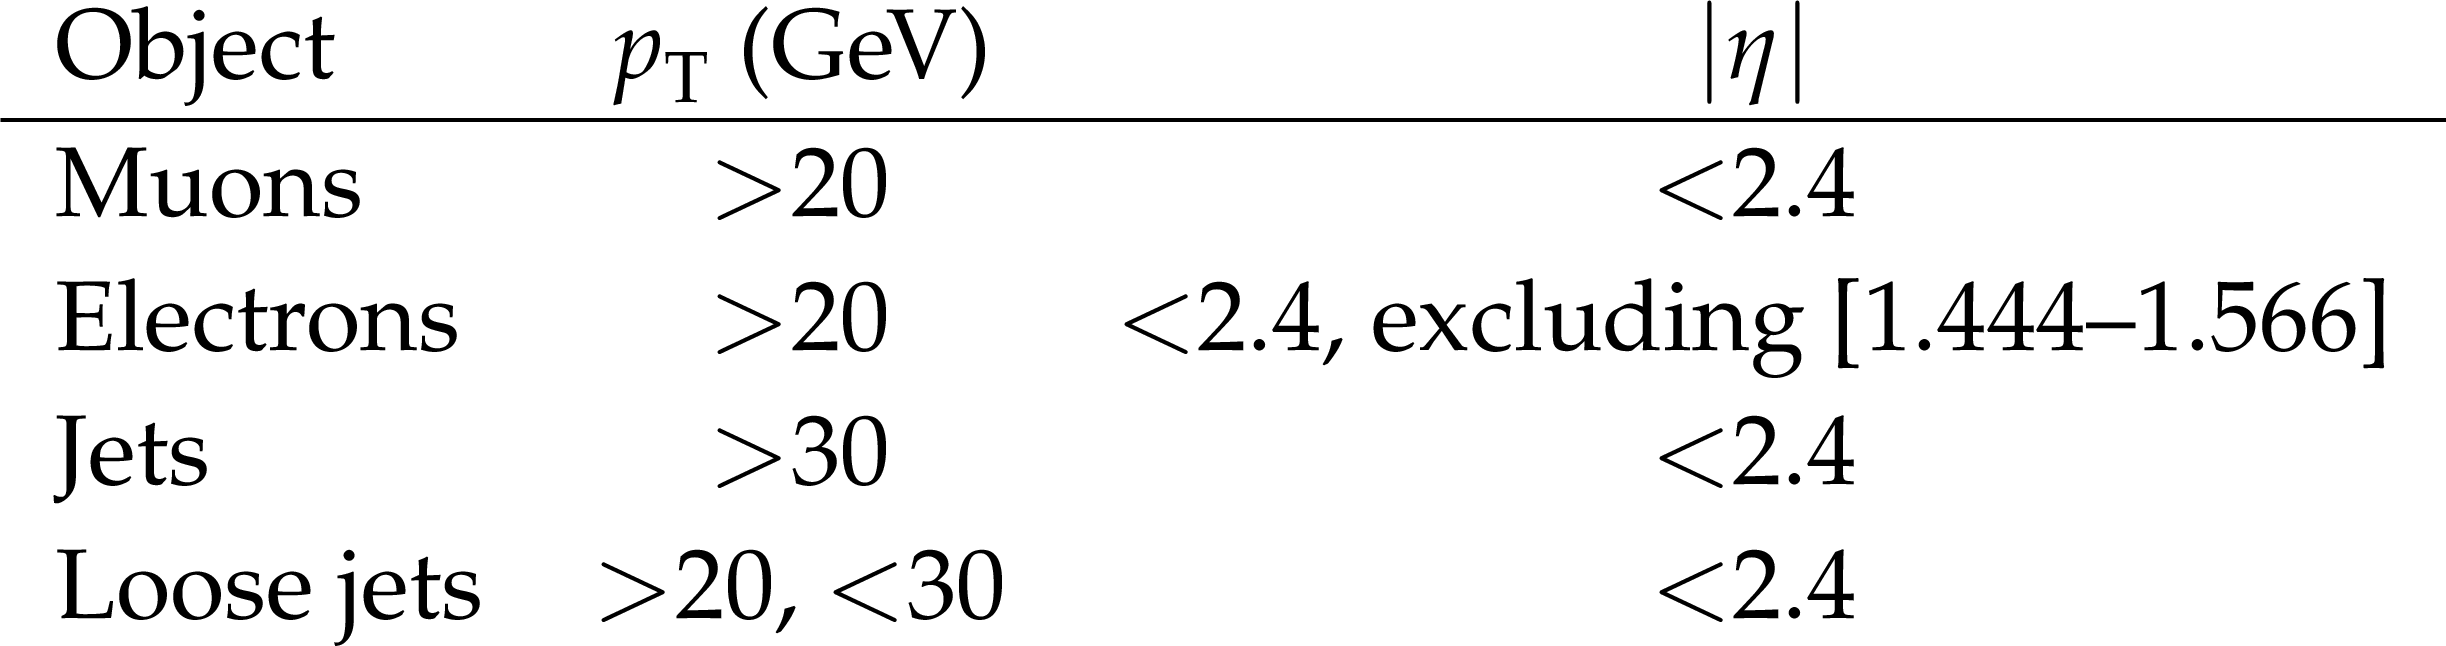
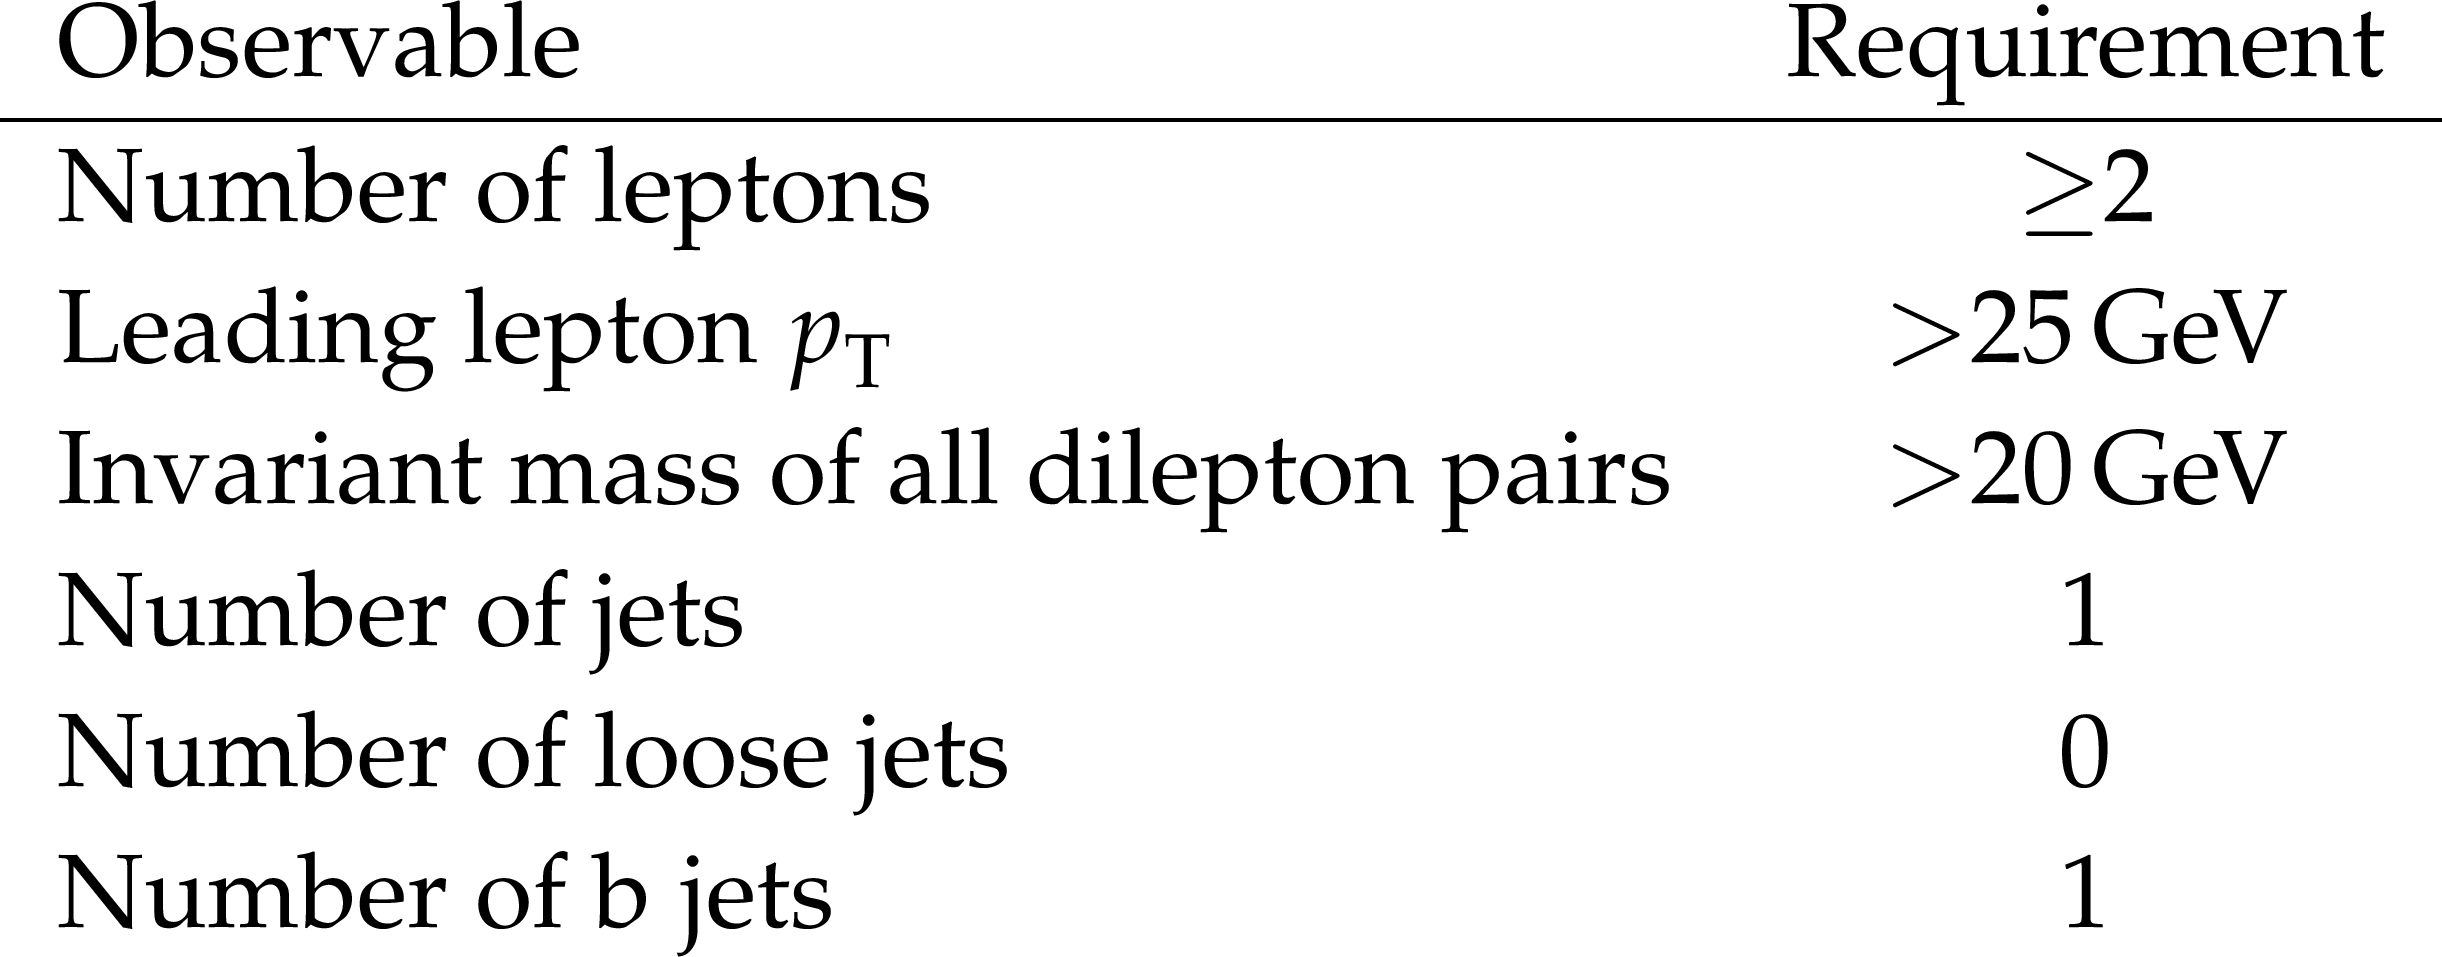
Table 1:
Selection requirements for particle-level objects. |
png pdf |
Table 2:
Definition of the fiducial region. |
png pdf |
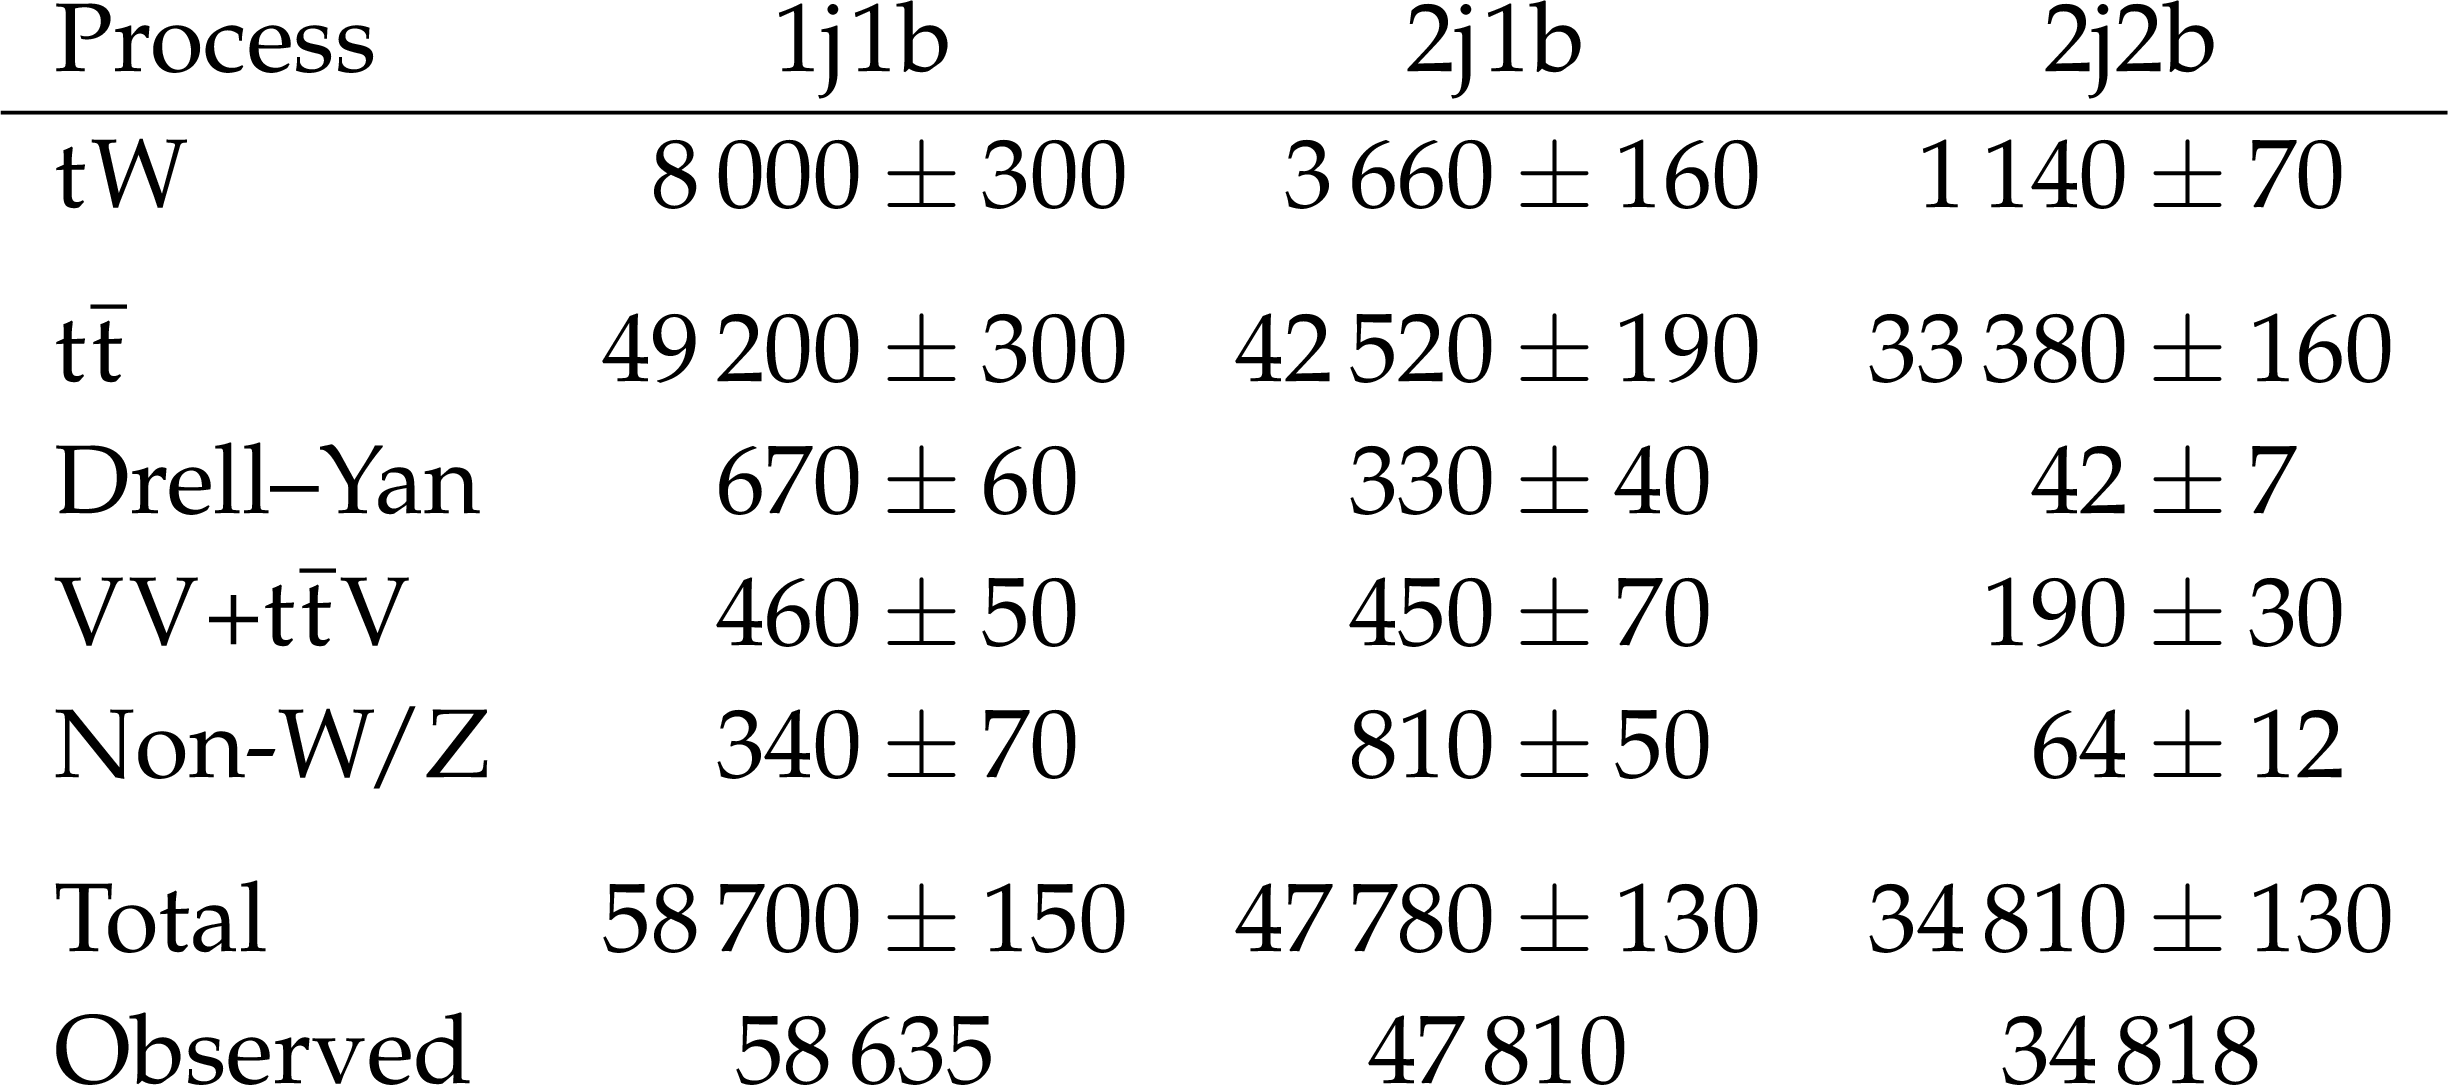
Table 3:
The number of estimated signal and background events after the fit in the 1j1b, 2j1b, and 2j2b regions compared to the observed number of events. The total uncertainties in the estimated events after the fit are given. |
png pdf |
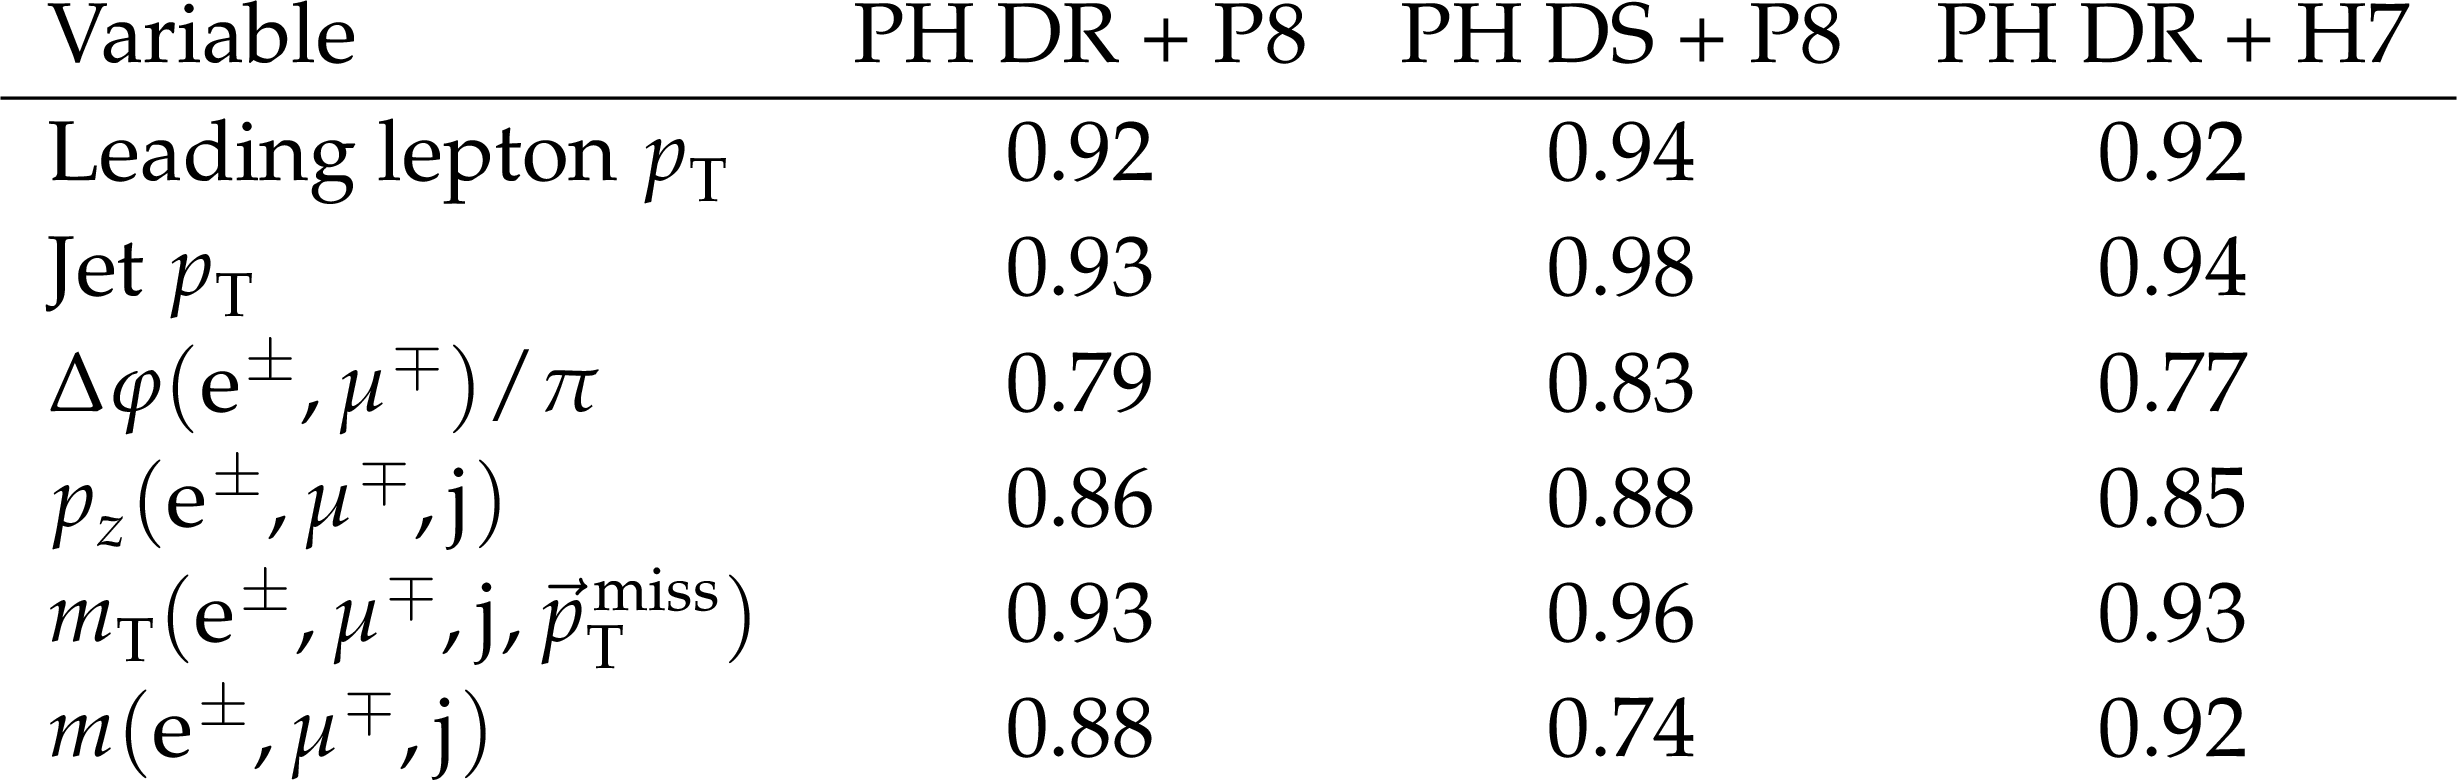
Table 4:
The $ p $-values from the $ \chi^2 $ goodness-of-fit tests comparing the six differential cross section measurements with the predictions from POWHEG BOX (PH) DR and DS + PYTHIA8 (P8) and POWHEG BOX DR + HERWIG 7 (H7). The complete covariance matrix from the results and the statistical uncertainties in the predictions are taken into account. |

png pdf |
Table 5:
The $ p $-values from the $ \chi^2 $ goodness-of-fit tests comparing the six differential cross section measurements with the predictions from MadGraph-5_aMC@NLO (aMC) DR, DR2, DS, and DS with a dynamic factor + PYTHIA8. The complete covariance matrix from the results and the statistical uncertainties in the predictions are taken into account. |
| Summary |
| Inclusive and normalised differential cross sections of top quark production in association with a W boson are measured in proton-proton collision data at $ \sqrt{s}= $ 13.6 TeV. The selected data, corresponding to an integrated luminosity of 34.7 fb$^{-1}$, contain events with an electron and a muon of opposite charge. For the inclusive measurement, the events have been categorised depending on the number of jets and jets originating from the fragmentation of bottom quarks. The signal is measured using a maximum likelihood fit to the distribution of random forest discriminants in the regions with one or two jets where one of them is identified as originating from the fragmentation of a bottom quark (b jet), and to the transverse momentum ($ p_{\mathrm{T}} $) distribution of the second-highest $ p_{\mathrm{T}} $ jet in a third category with two jets, both of which are b jets. The measured inclusive cross section is 82.3 $ \pm $ 2.1 (stat) $ \,^{+9.9}_{-9.7} $ (syst) $ \pm $ 3.3 (lumi) pb, with a total relative uncertainty of about 13%. This measurement is in agreement with the latest theoretical prediction at approximate next-to-next-to-next-to-leading order accuracy in perturbative quantum chromodynamics and with other measurements. The differential cross section measurements are performed as functions of six kinematic observables of the events in the fiducial phase space corresponding to the selection criteria. The results have relative uncertainties in the range of 20-40%, depending on the measured observable. The uncertainties are mainly statistical. There is good agreement between the measurements and the predictions from the different event generators. The different approaches used to simulate $ \mathrm{t}\mathrm{W} $ events give similar values in all distributions, which points to small effects related to the $ \mathrm{t}\mathrm{W} $/ $ \mathrm{t} \overline{\mathrm{t}} $ interference on these distributions in the defined fiducial region. |
| Additional Figures | |
png pdf |
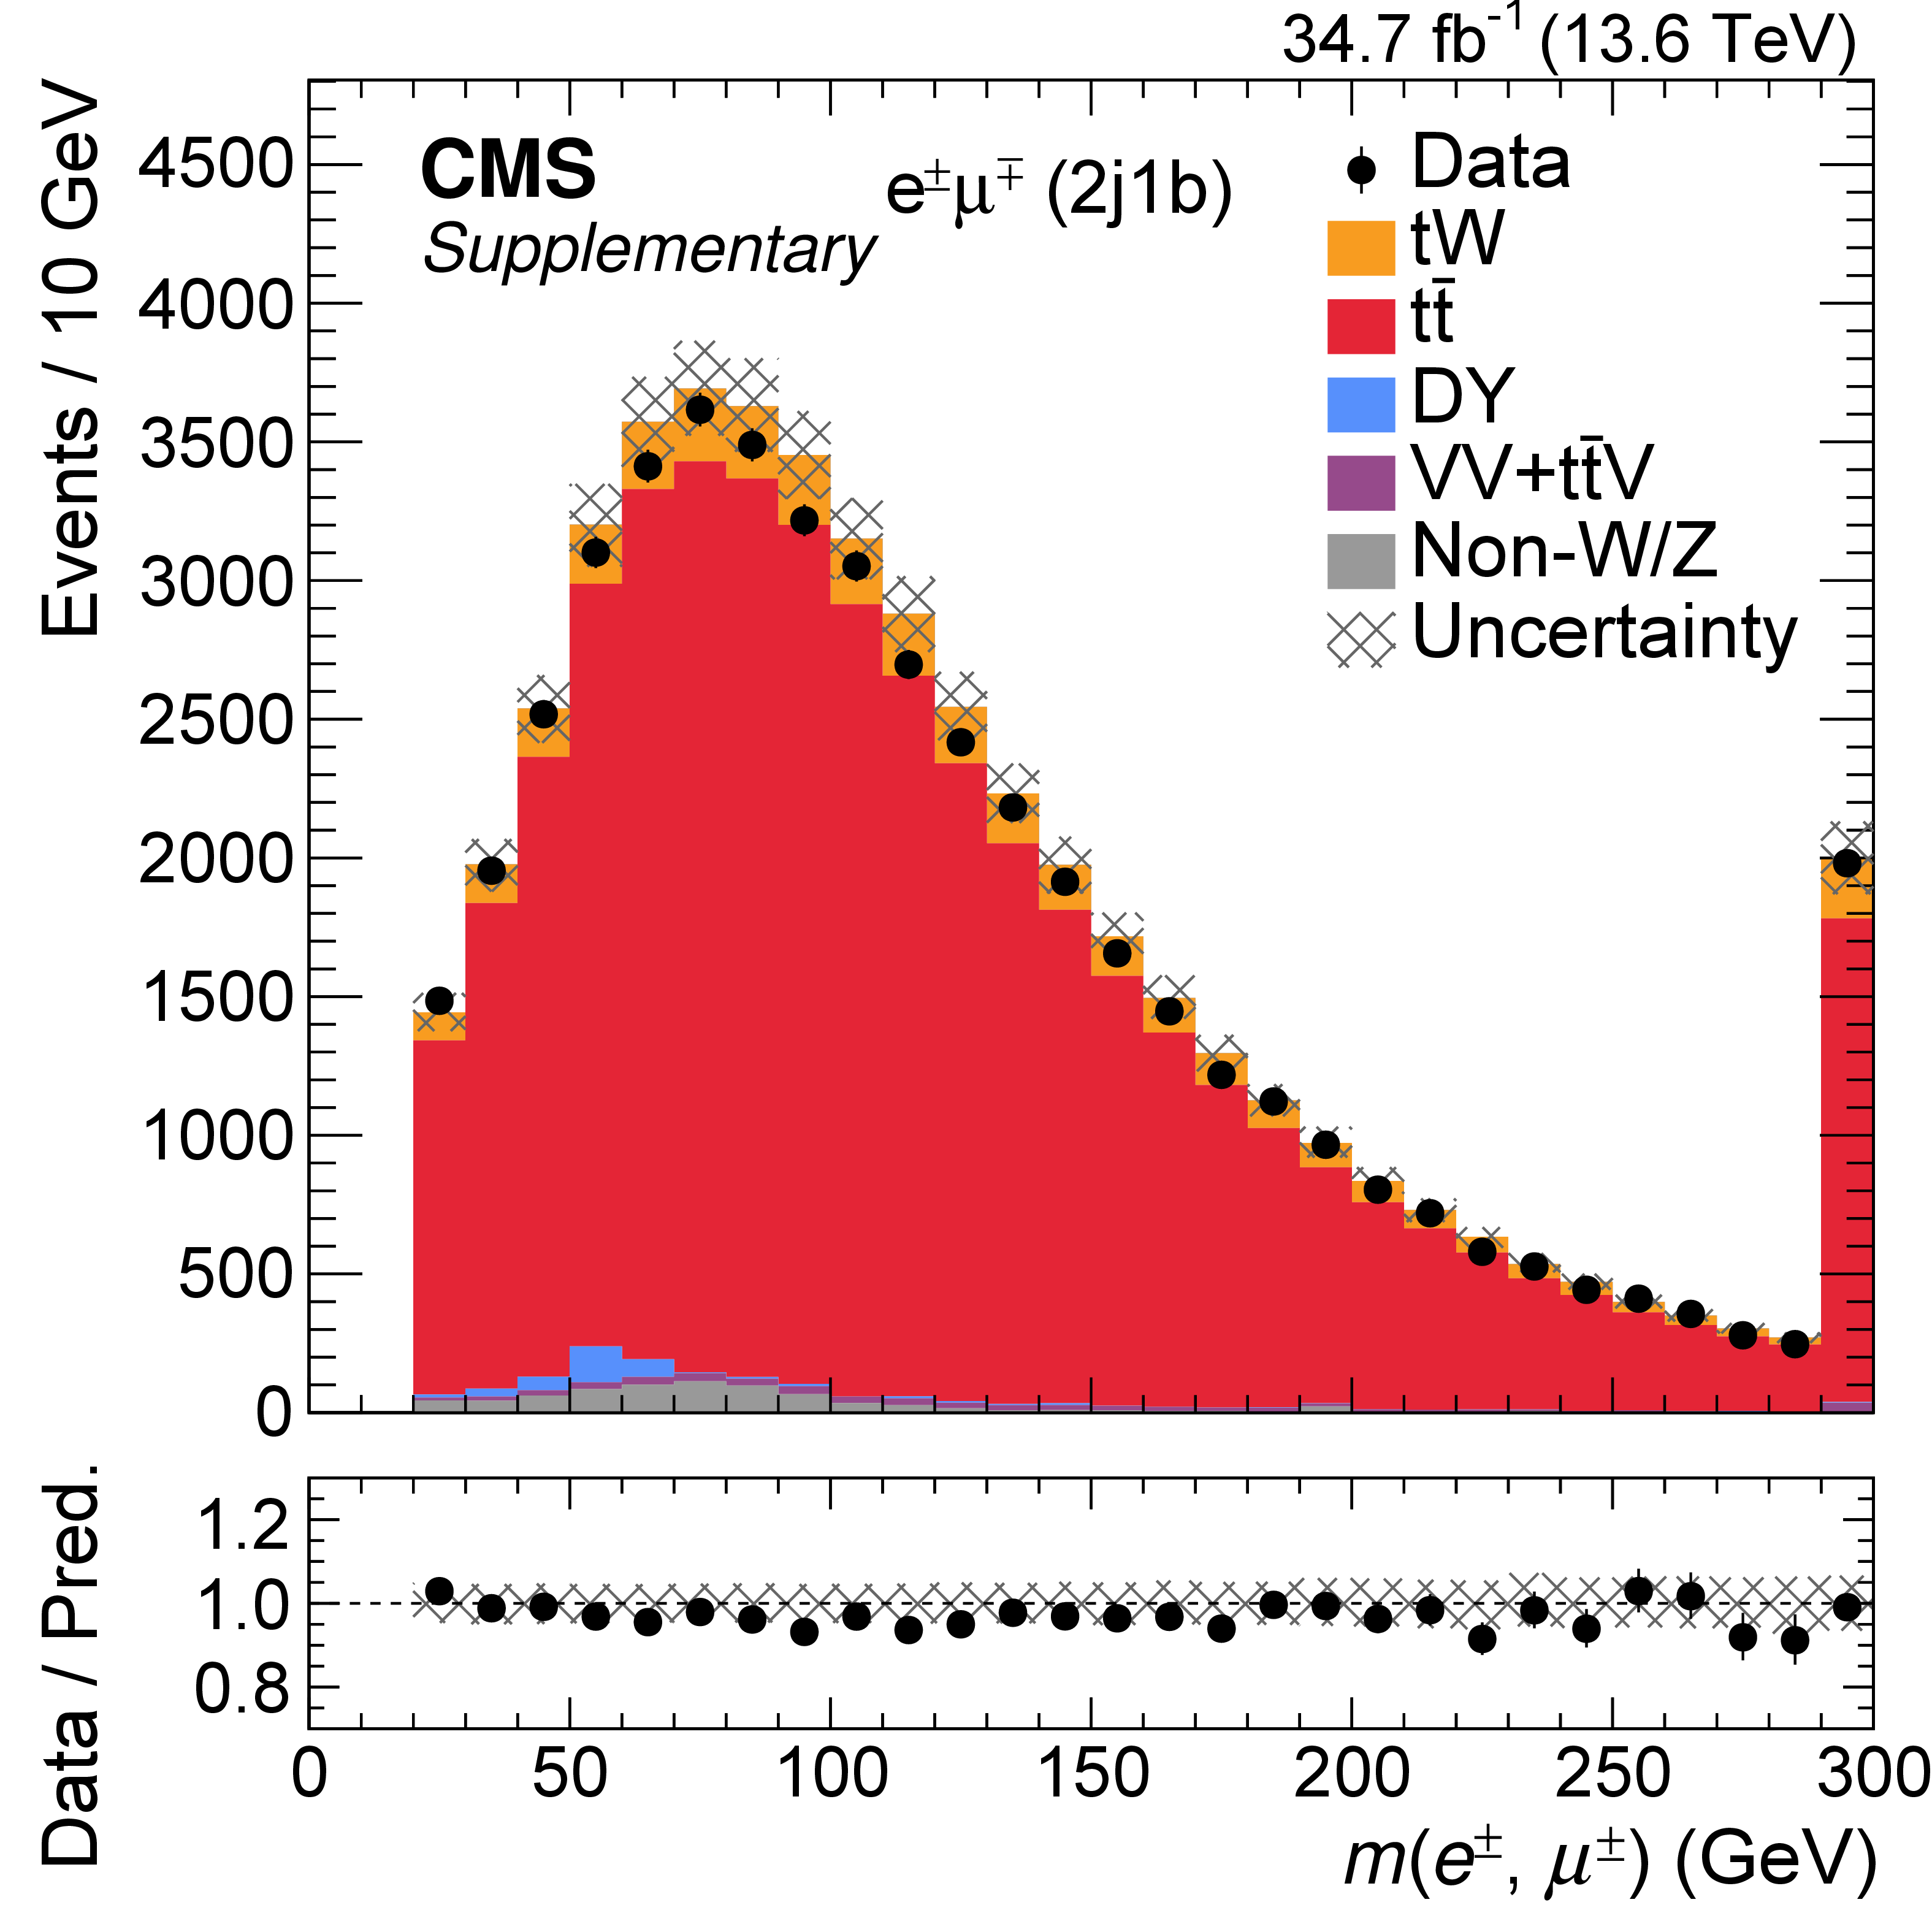
Additional Figure 1:
Distribution from data (points) and MC simulations (filled histograms) before the maximum likelihood fit of the first most discriminating variable used for the RF training of the 2j1b region: the invariant mass of the dilepton system. The last bin of the distribution includes the overflow events. The vertical bars on the points give the statistical uncertainty in the data, and the hatched band represents the sum of the statistical and systematic uncertainties in the MC predictions. The lower panels show the ratio of the data to the sum of the MC predictions. |
png pdf |
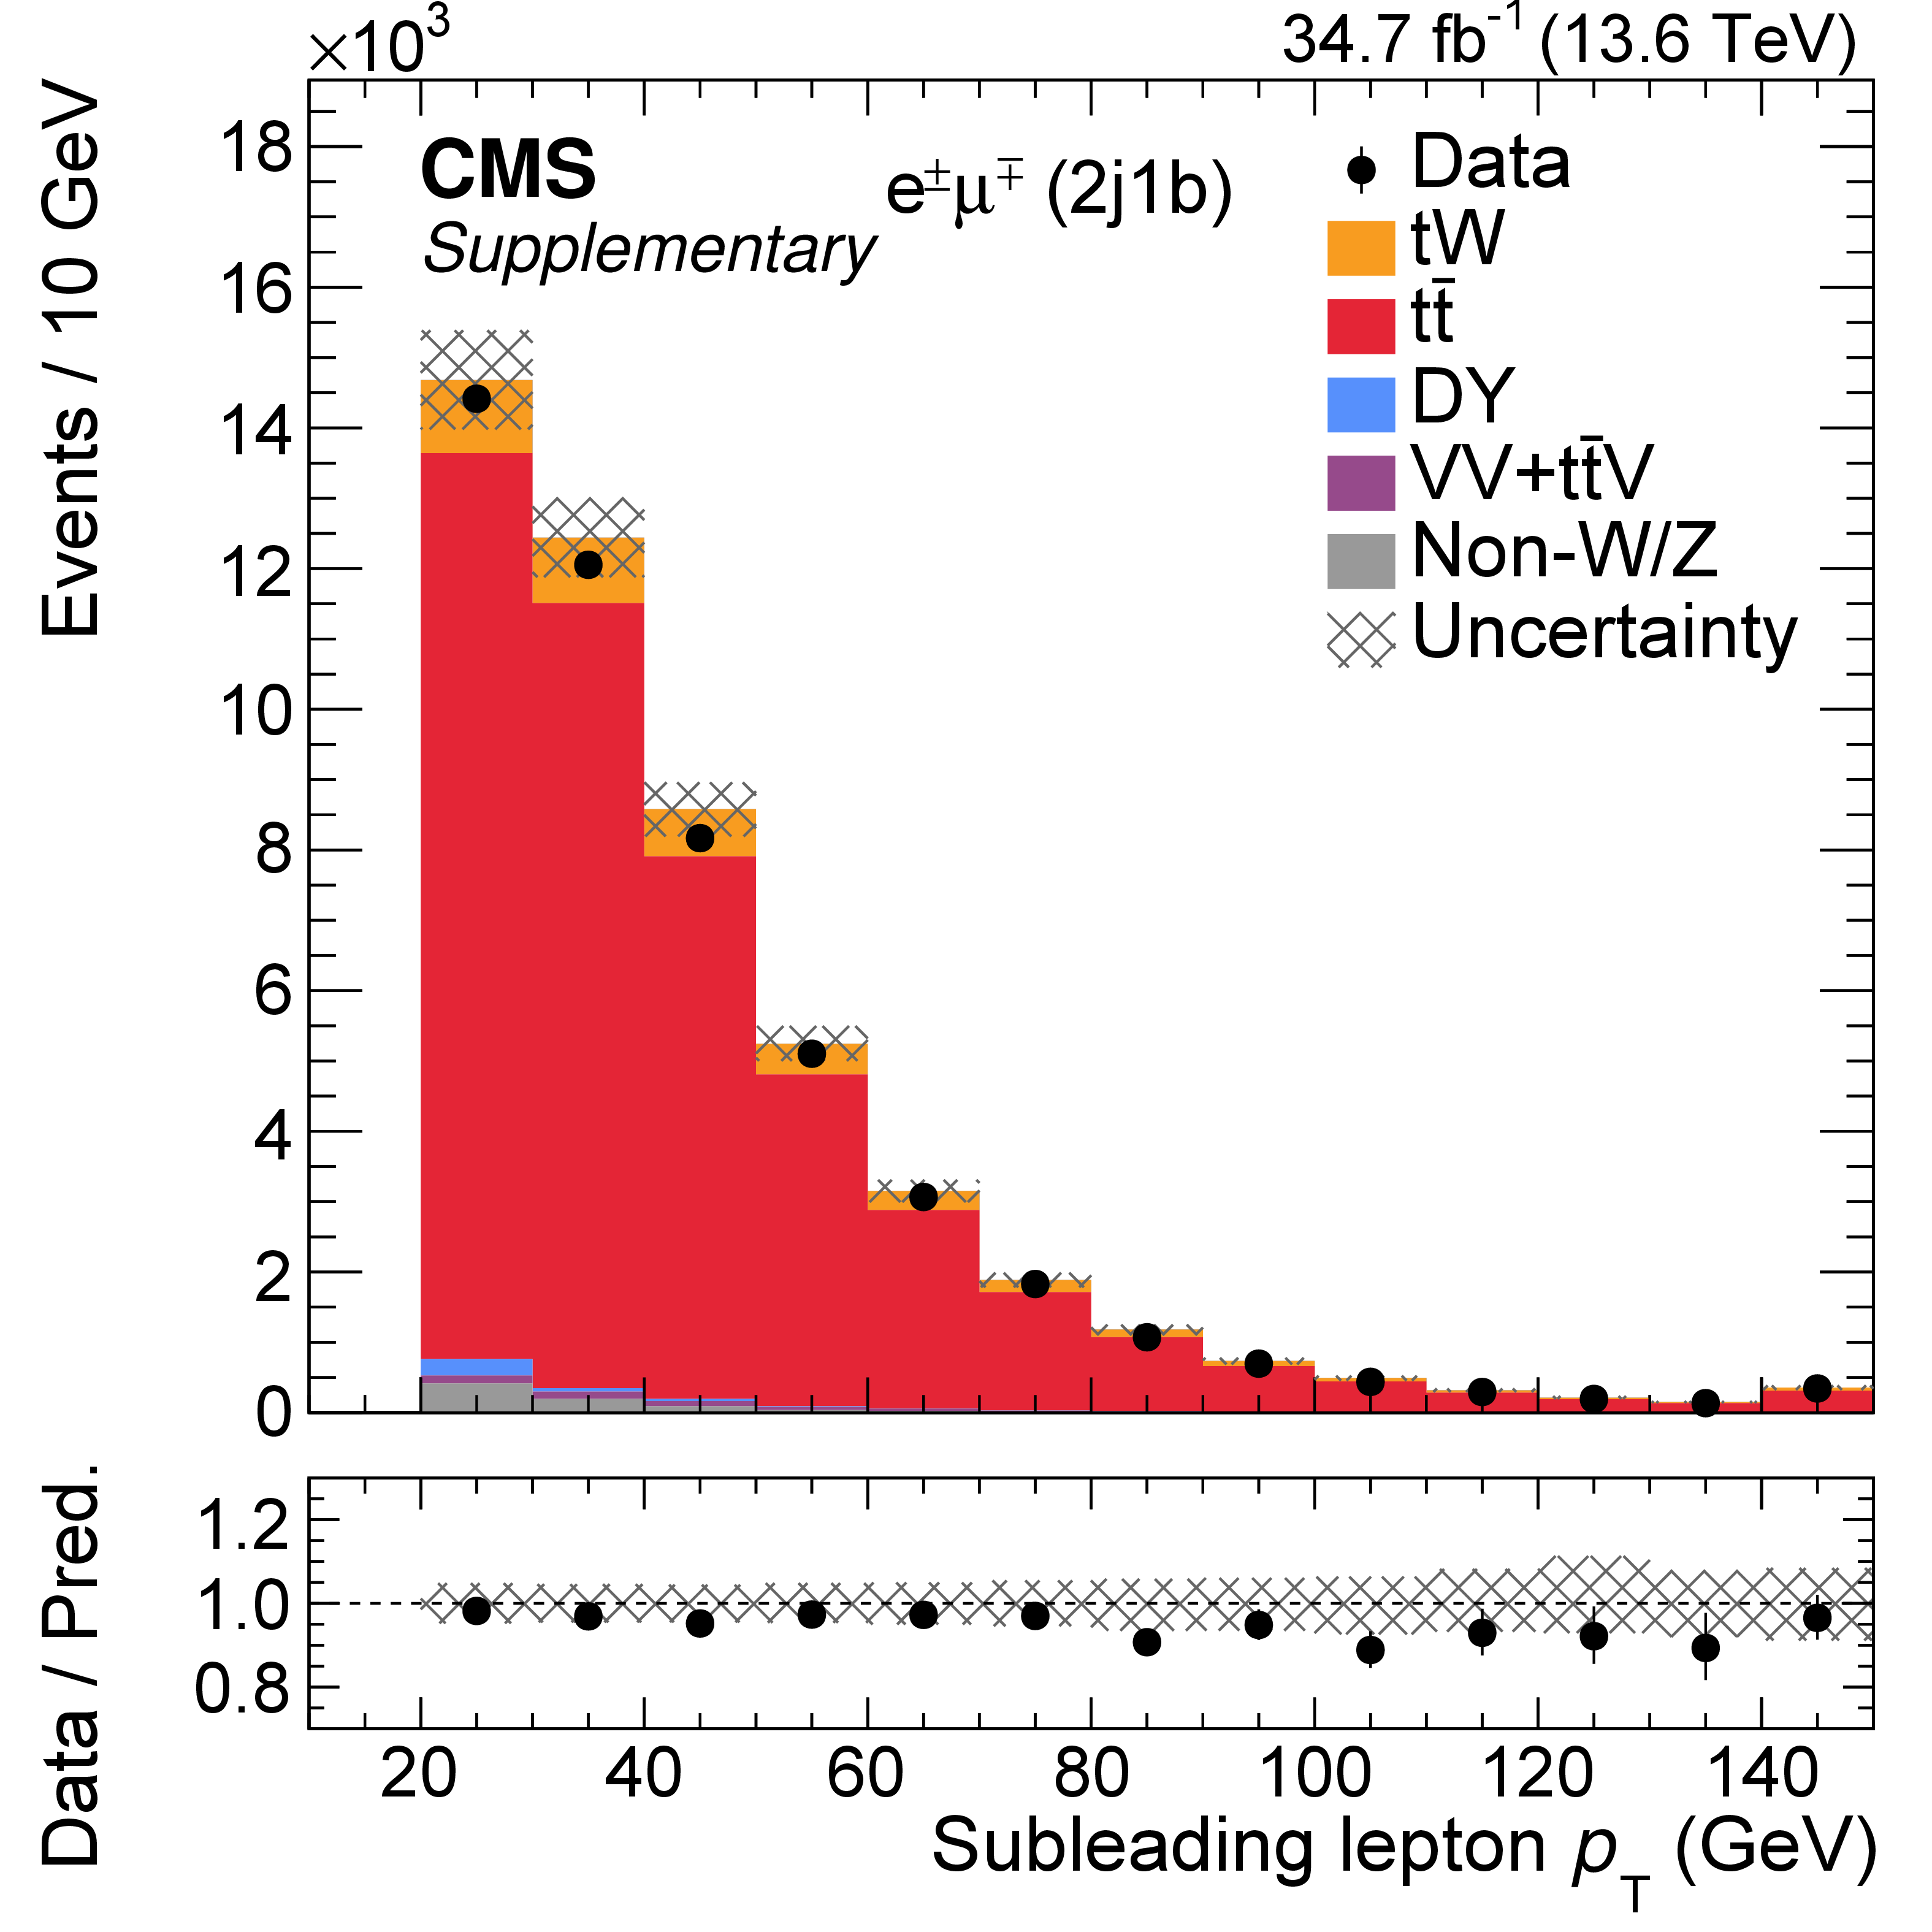
Additional Figure 2:
Distribution from data (points) and MC simulations (filled histograms) before the maximum likelihood fit of the second most discriminating variable used for the RF training of the 2j1b region: the transverse momentum of the subleading lepton. The last bin of the distribution includes the overflow events. The vertical bars on the points give the statistical uncertainty in the data, and the hatched band represents the sum of the statistical and systematic uncertainties in the MC predictions. The lower panels show the ratio of the data to the sum of the MC predictions. |
png pdf |
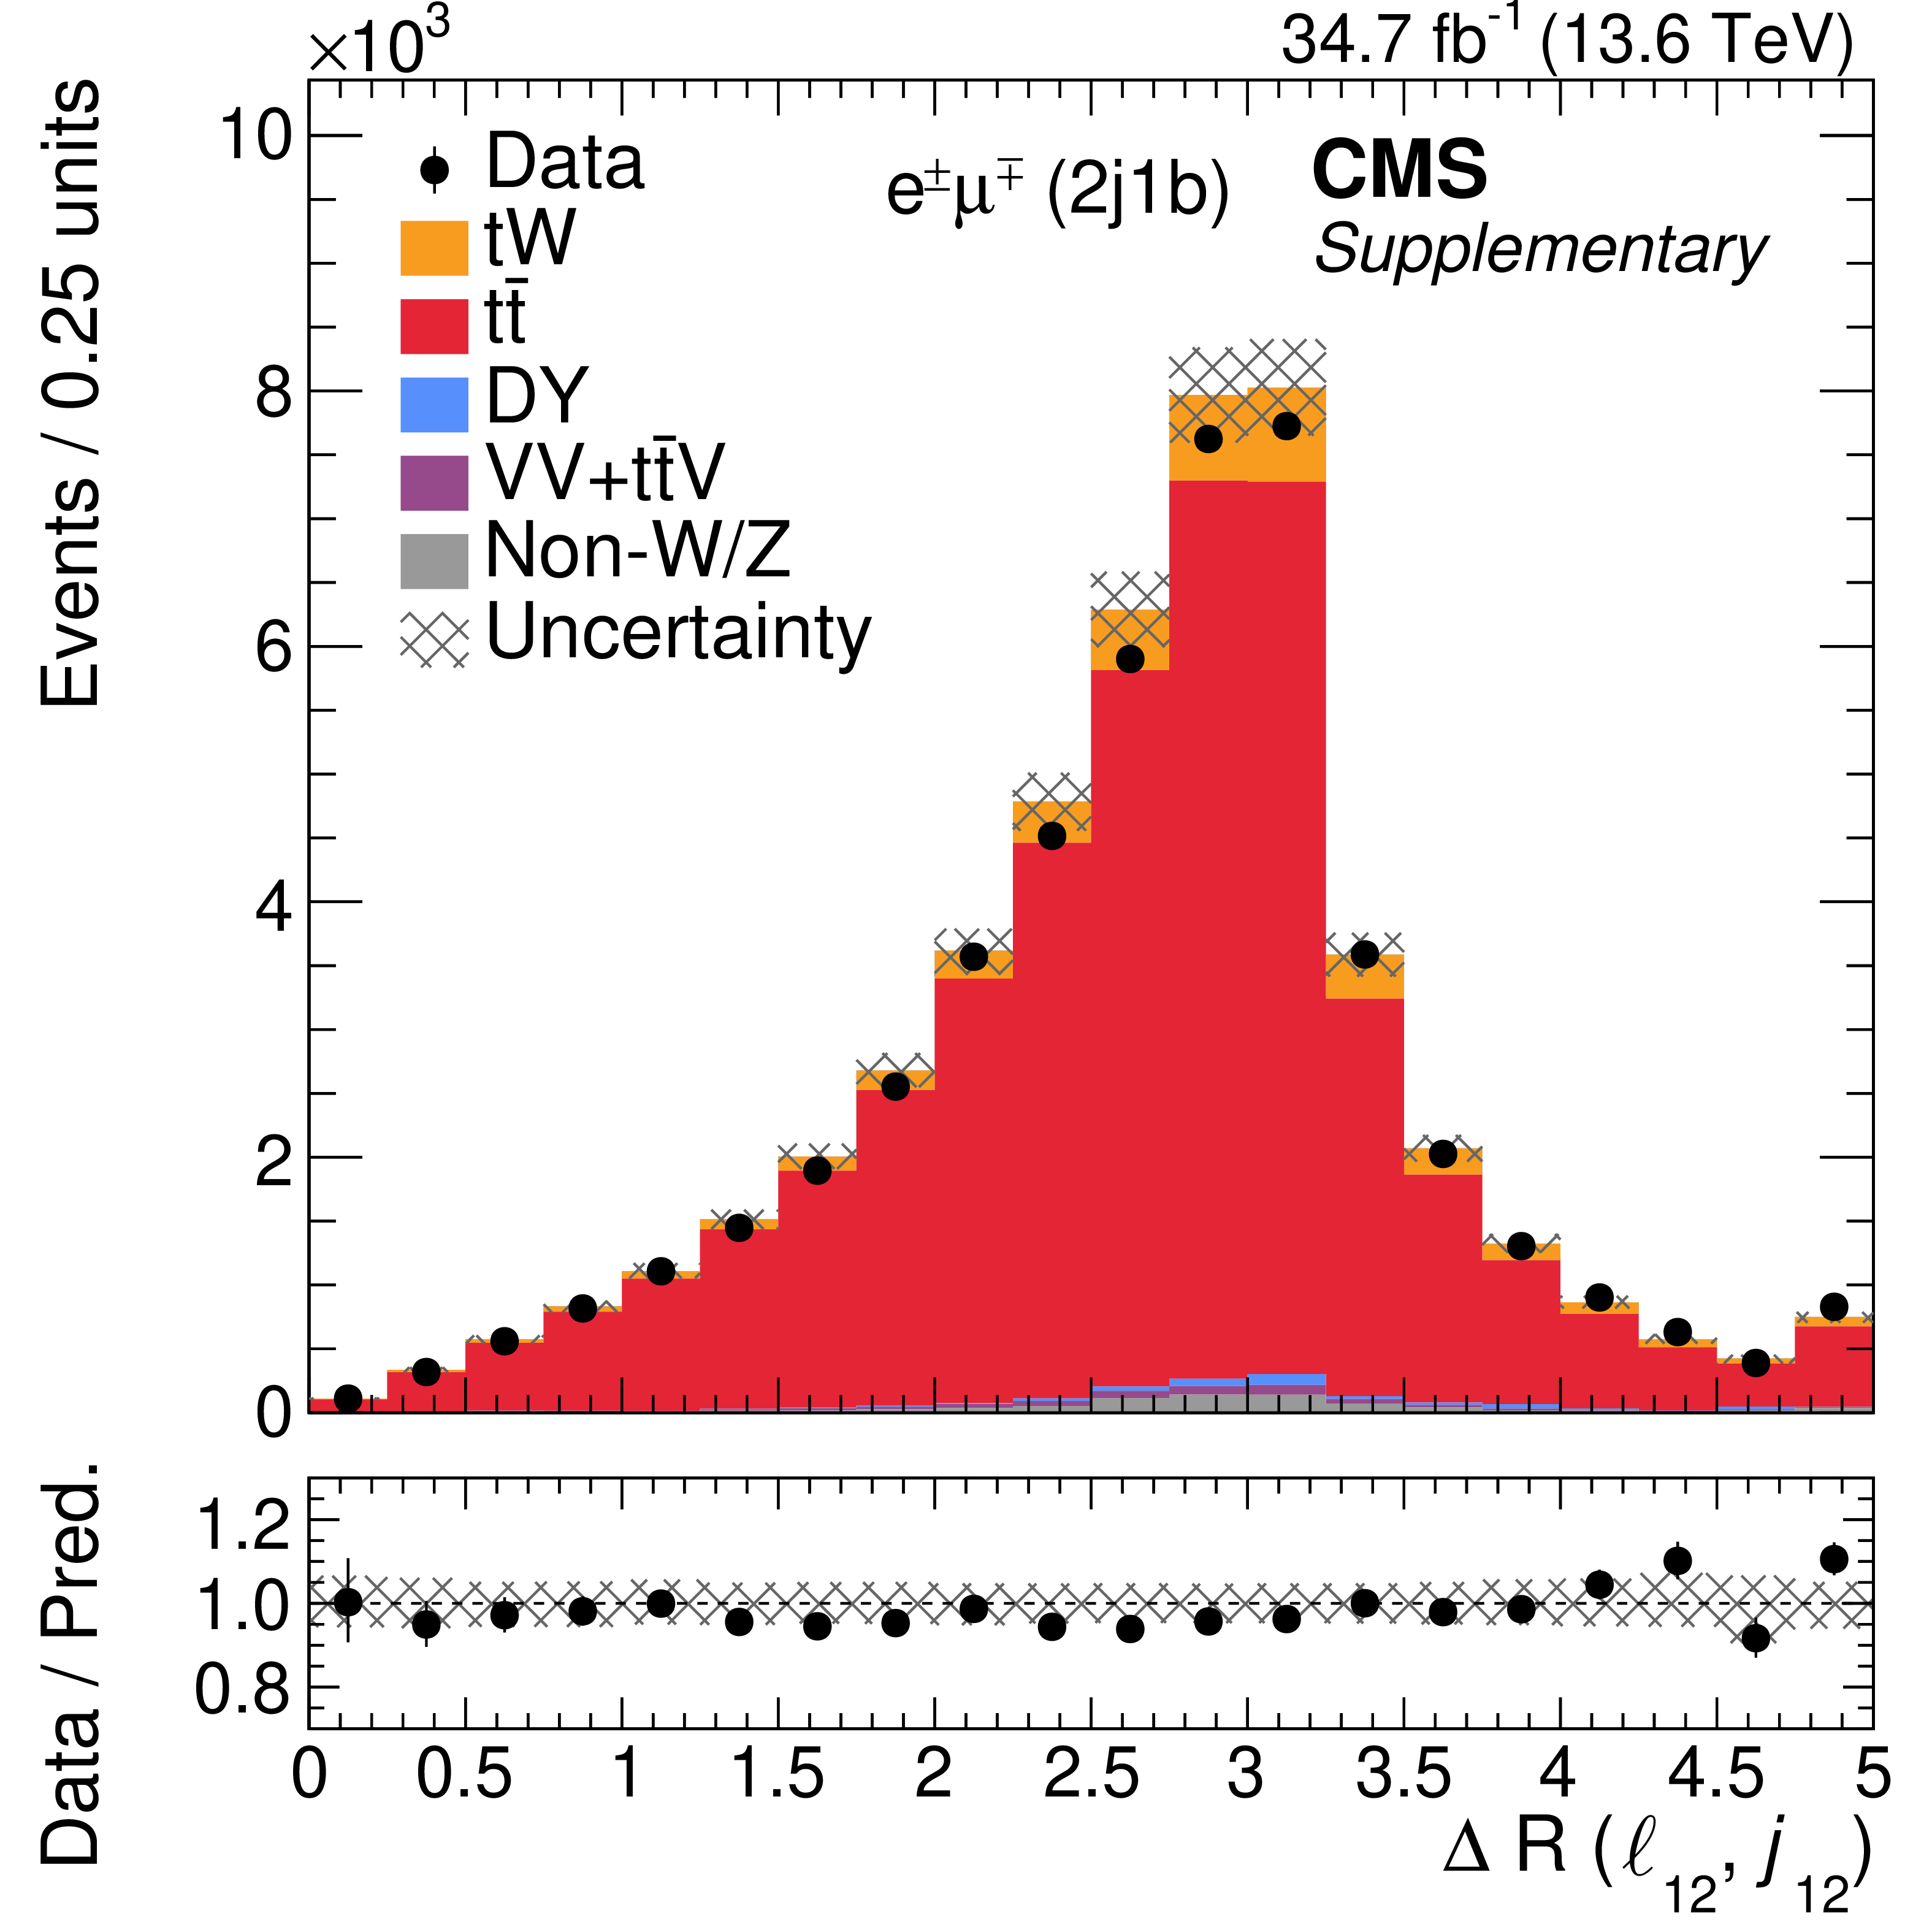
Additional Figure 3:
Distribution from data (points) and MC simulations (filled histograms) before the maximum likelihood fit of the third most discriminating variable used for the RF training of the 2j1b region: the separation in $ \eta\text{-}\varphi $ space between the dilepton and dijet systems. The last bin of the distribution includes the overflow events. The vertical bars on the points give the statistical uncertainty in the data, and the hatched band represents the sum of the statistical and systematic uncertainties in the MC predictions. The lower panels show the ratio of the data to the sum of the MC predictions. |

png pdf |
Additional Figure 4:
Distribution from data (points) and MC simulations (filled histograms) before the maximum likelihood fit of the fourth most discriminating variable used for the RF training of the 2j1b region: the transverse momentum of the dilepton and jet system. The last bin of the distribution includes the overflow events. The vertical bars on the points give the statistical uncertainty in the data, and the hatched band represents the sum of the statistical and systematic uncertainties in the MC predictions. The lower panels show the ratio of the data to the sum of the MC predictions. |
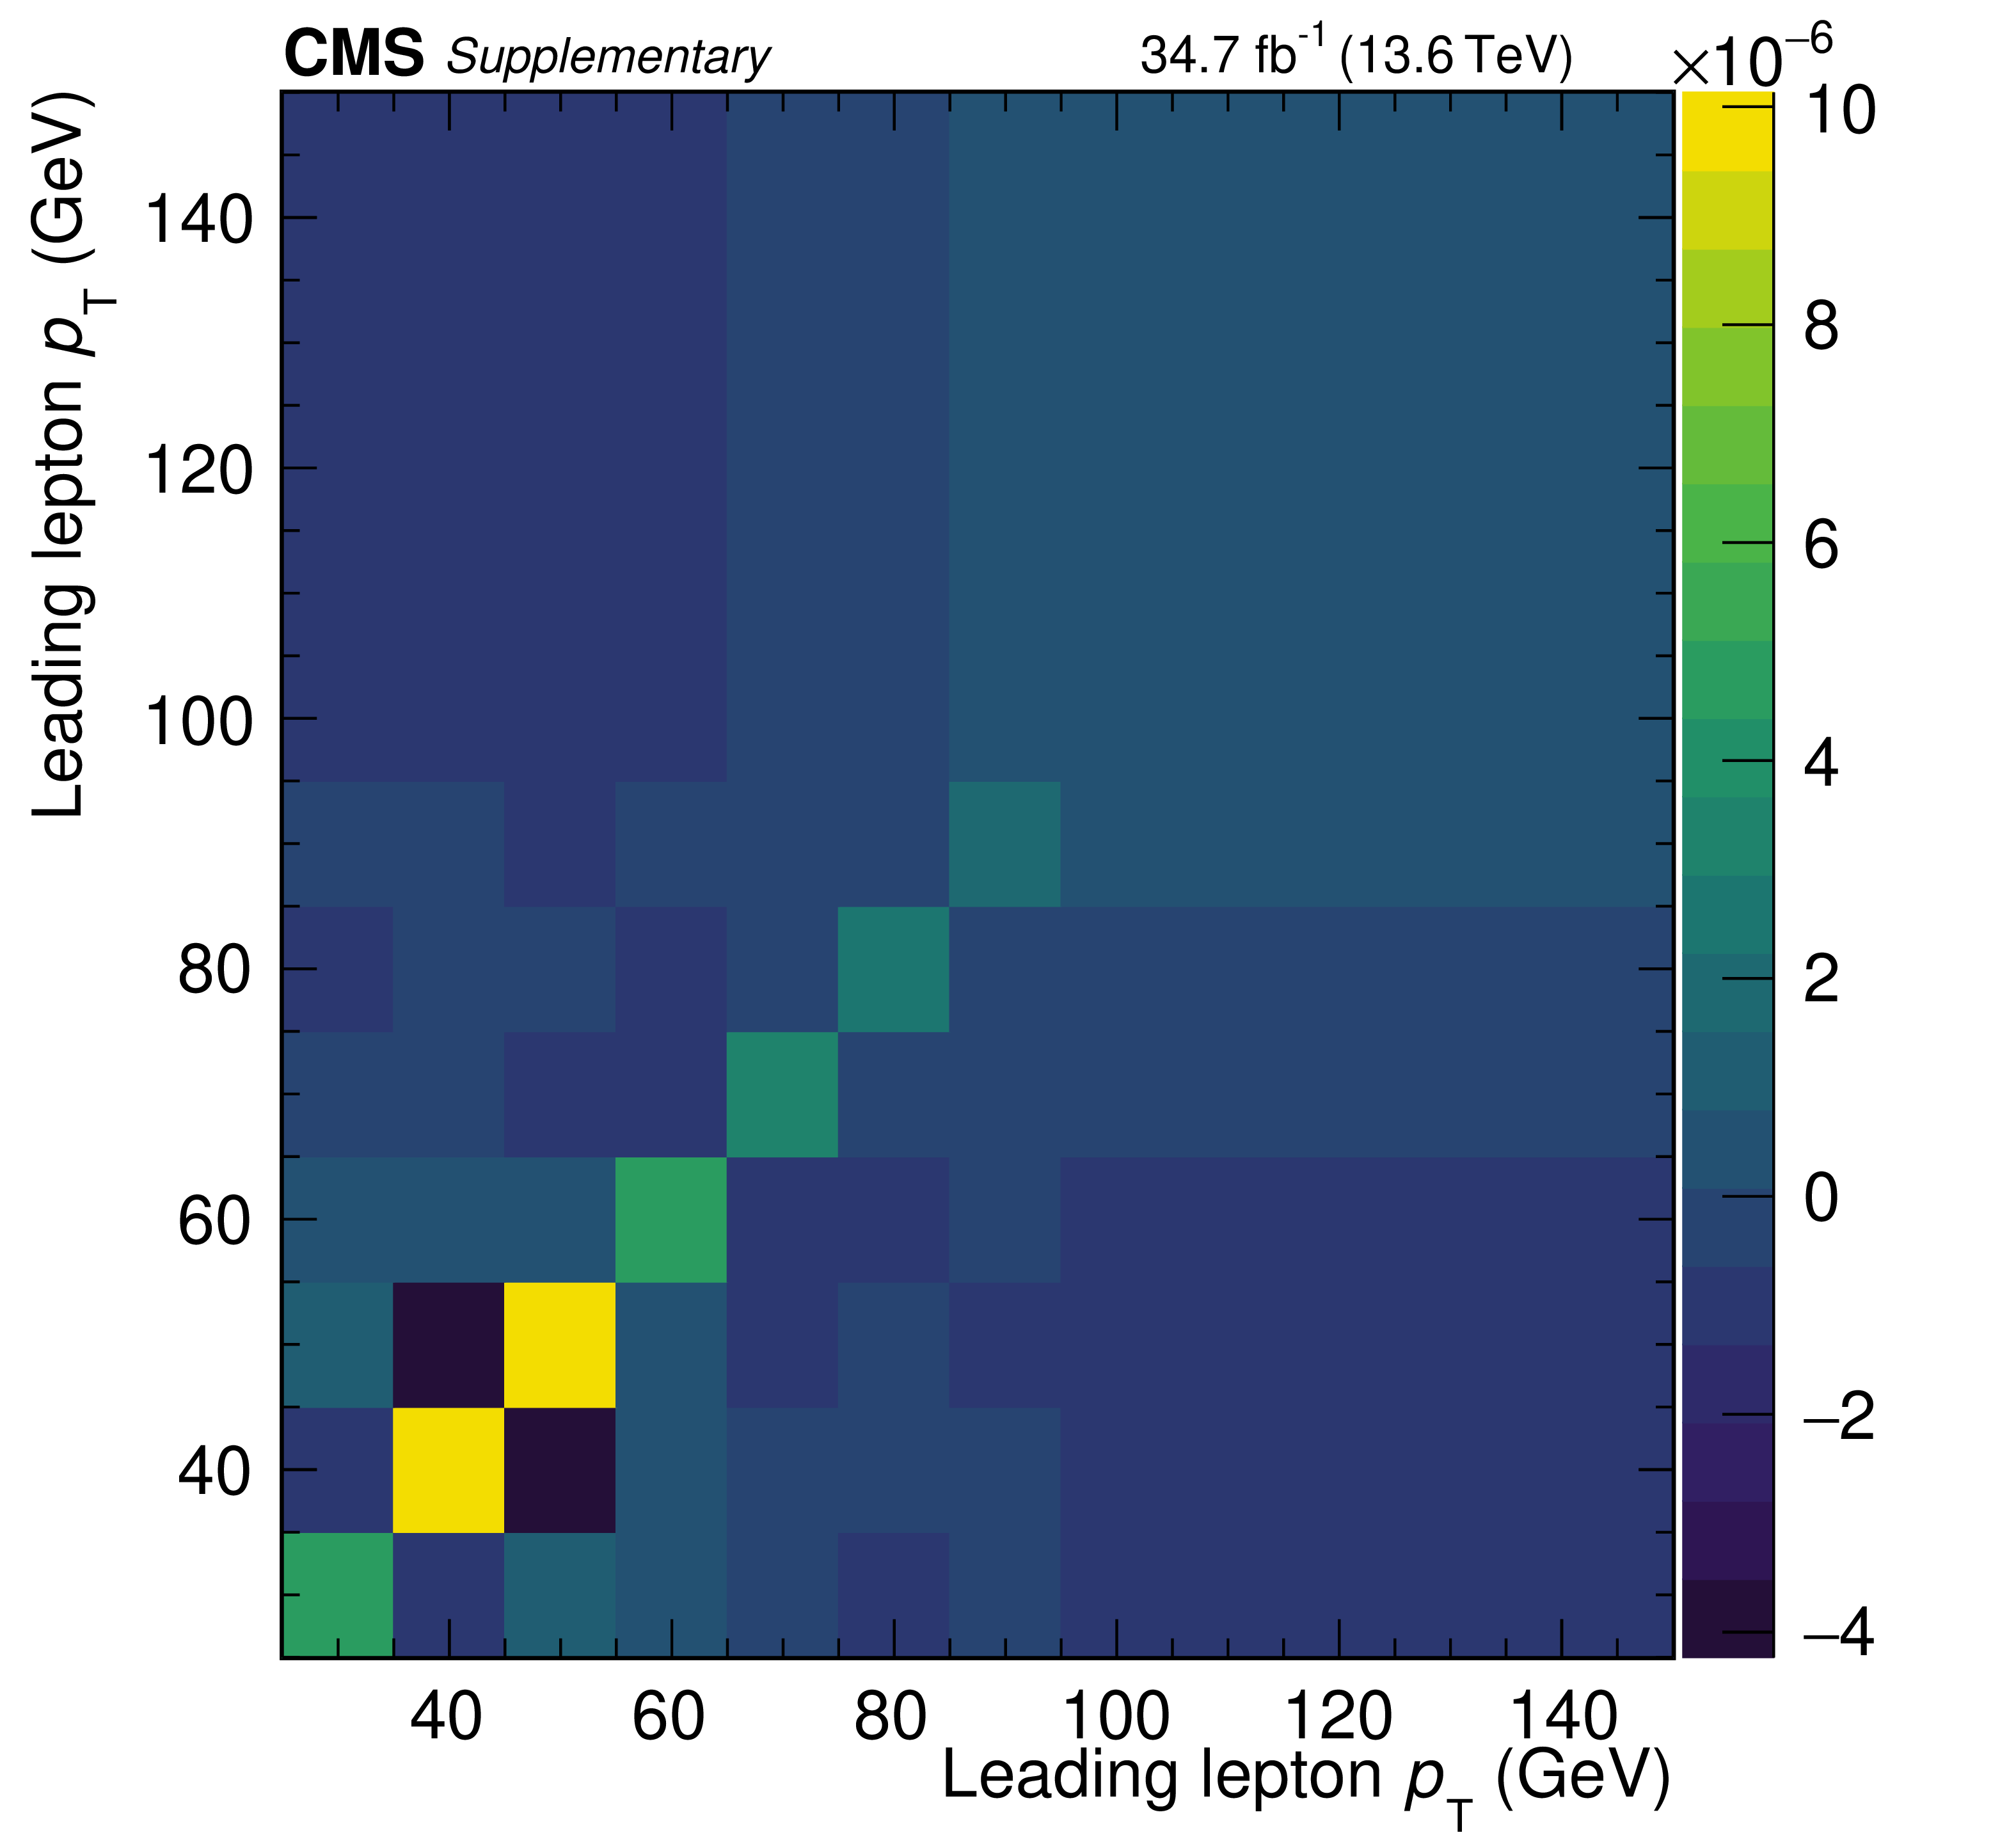
png pdf |
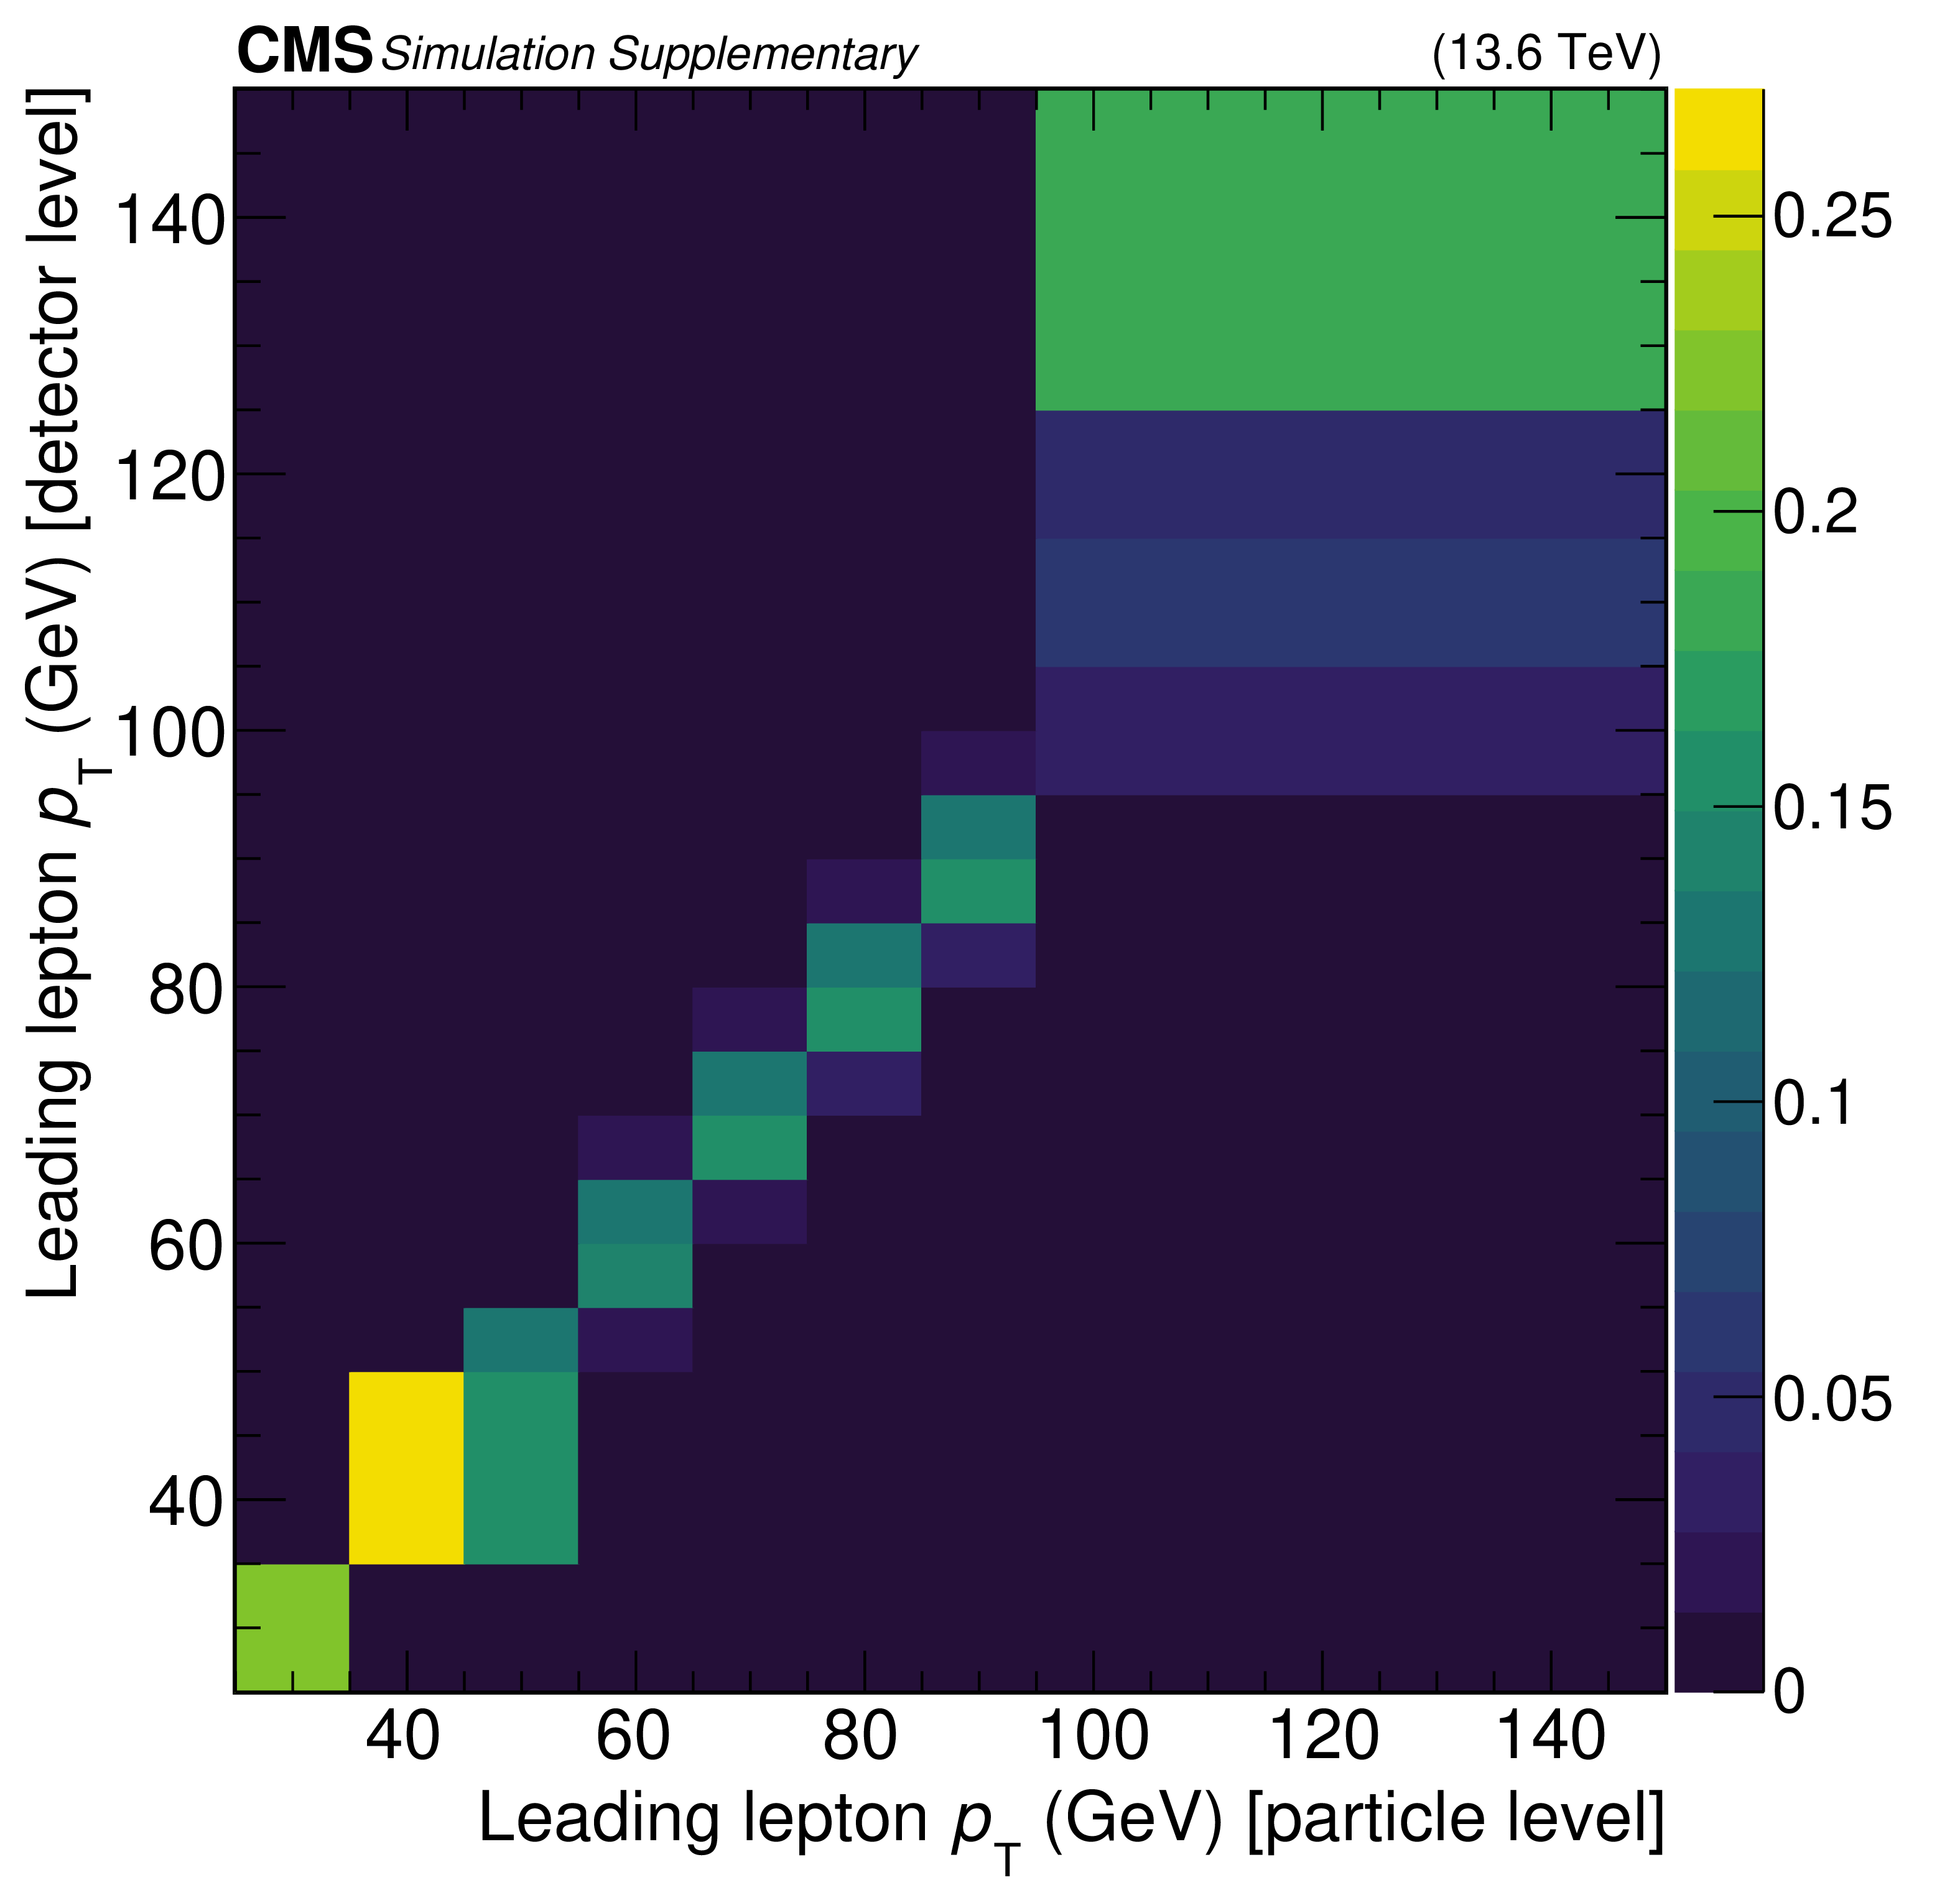
Additional Figure 5:
Response matrix between detector and particle level for $ p_{\mathrm{T}} $ of the leading lepton. |
png pdf |
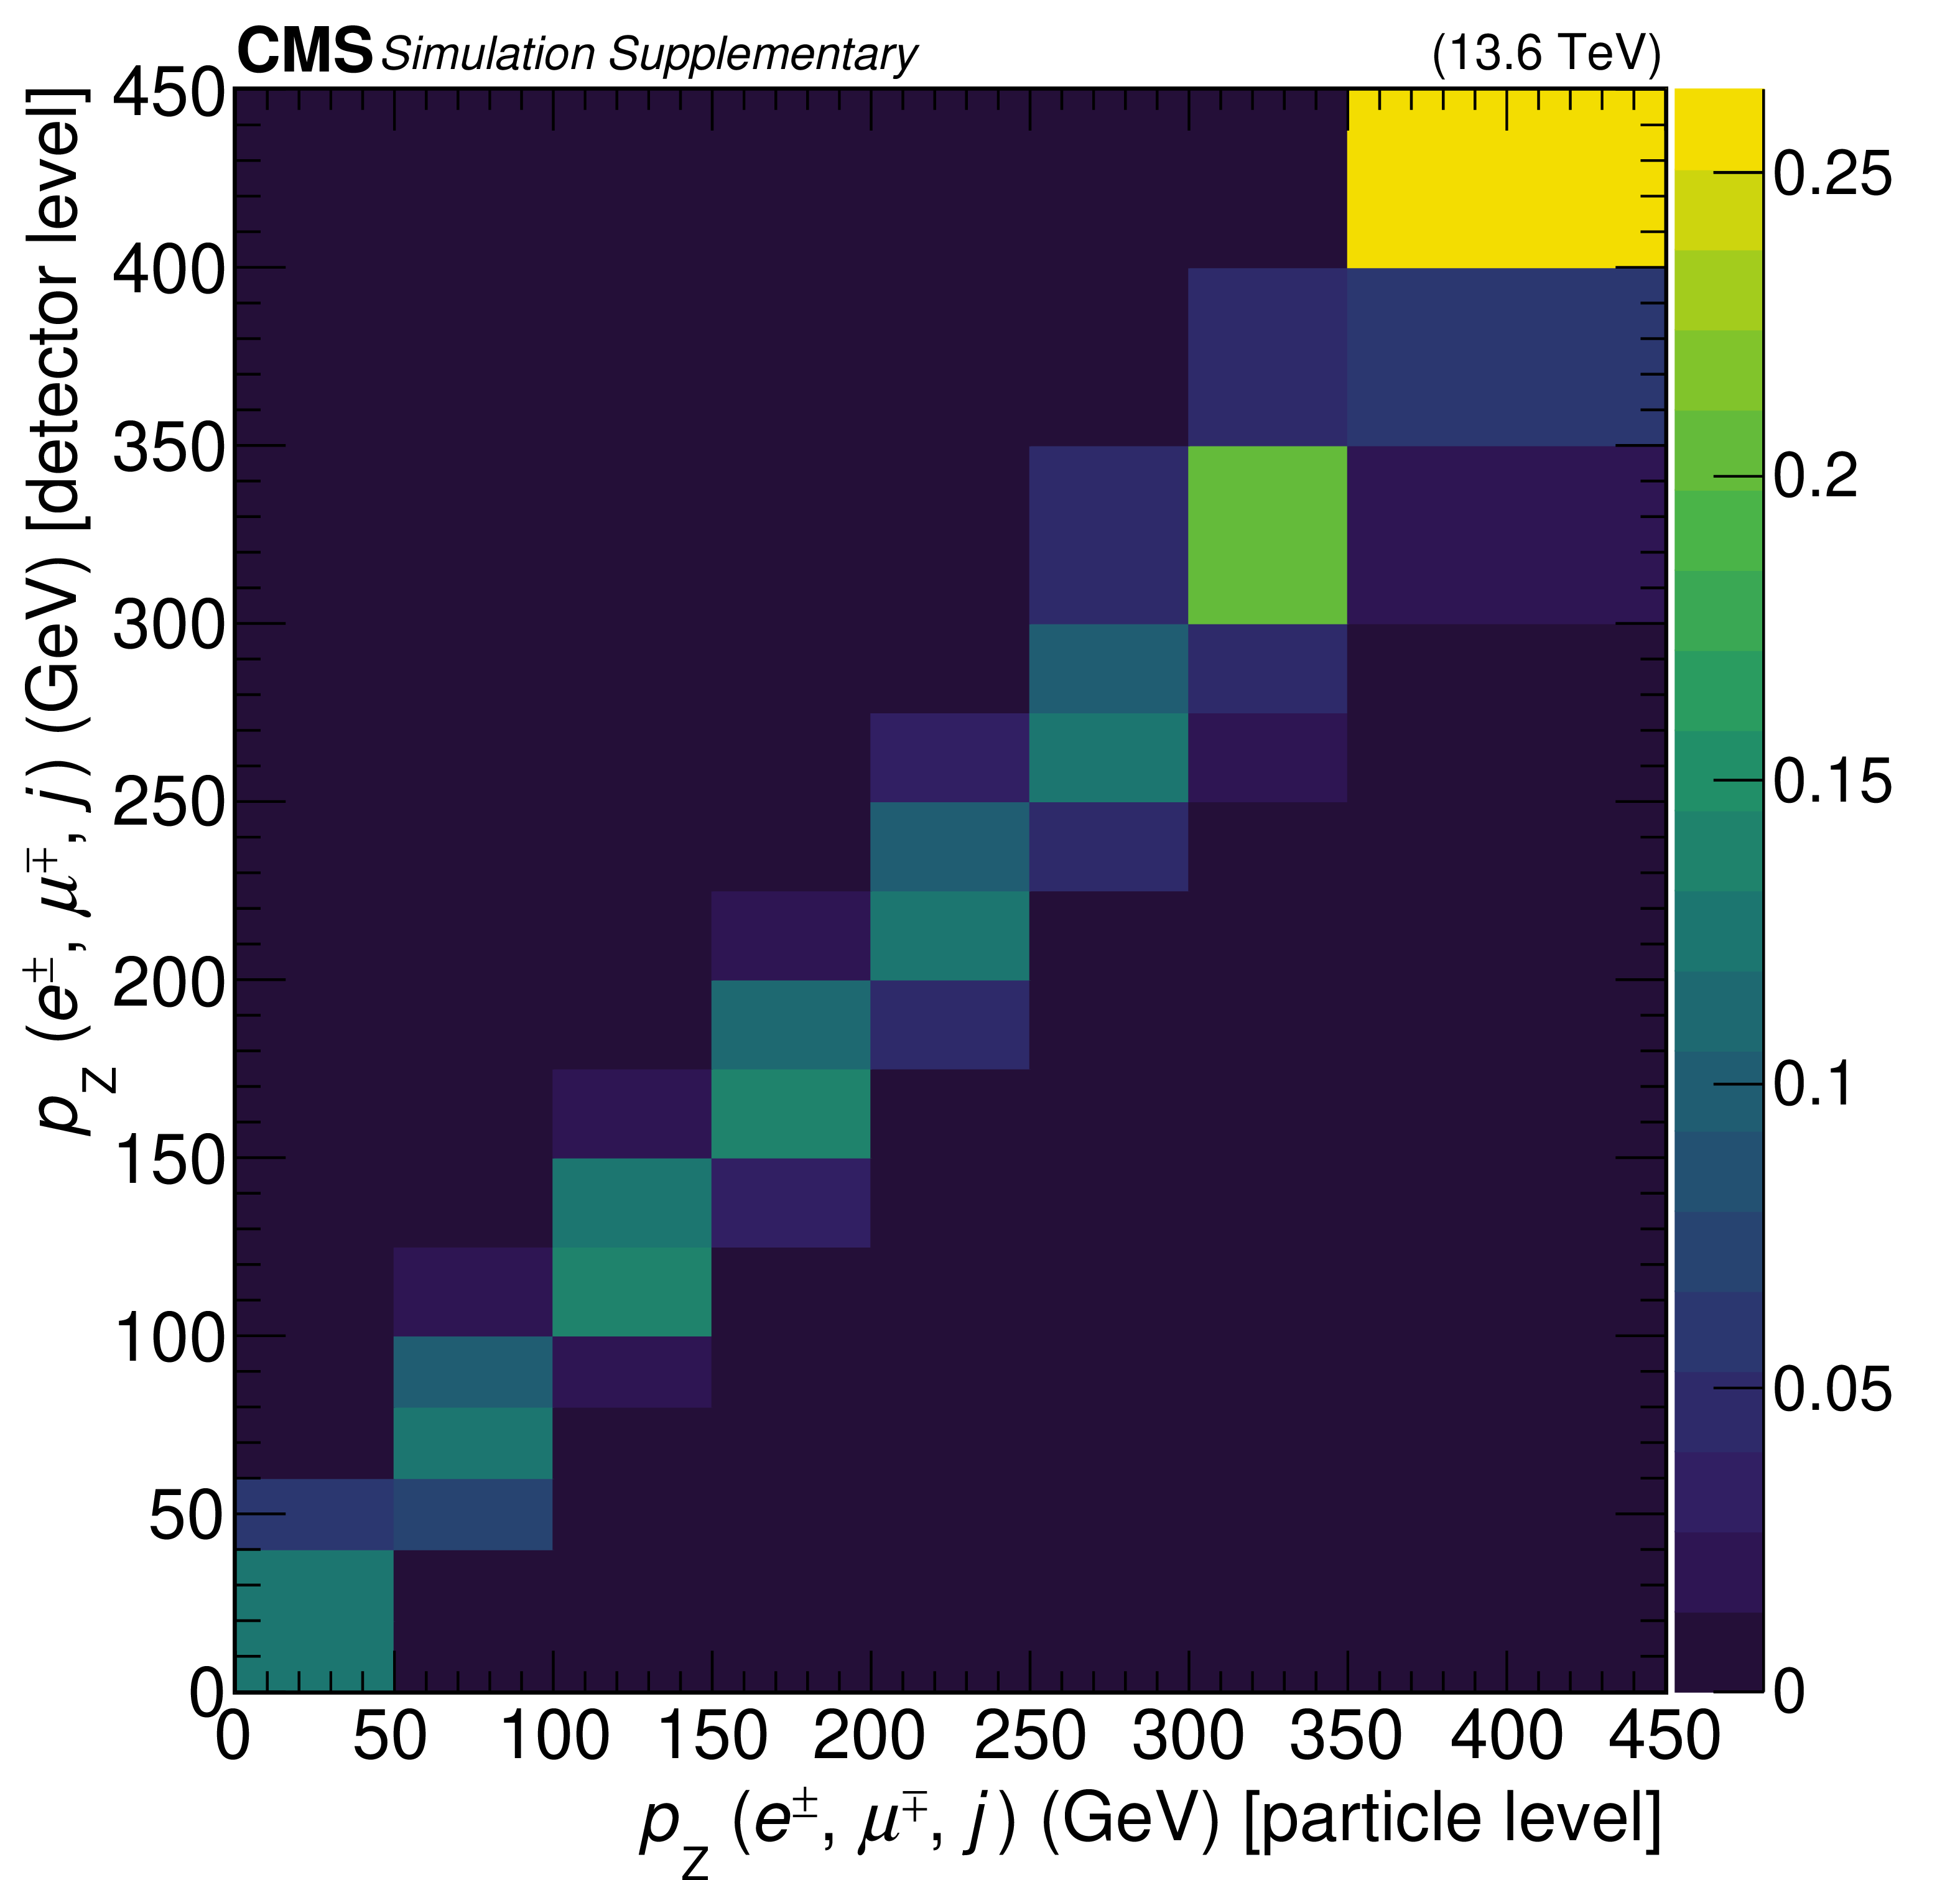
Additional Figure 6:
Response matrix between detector and particle level for $ p_\text{Z}(\mathrm{e}^\pm, \mu^\mp, j) $. |
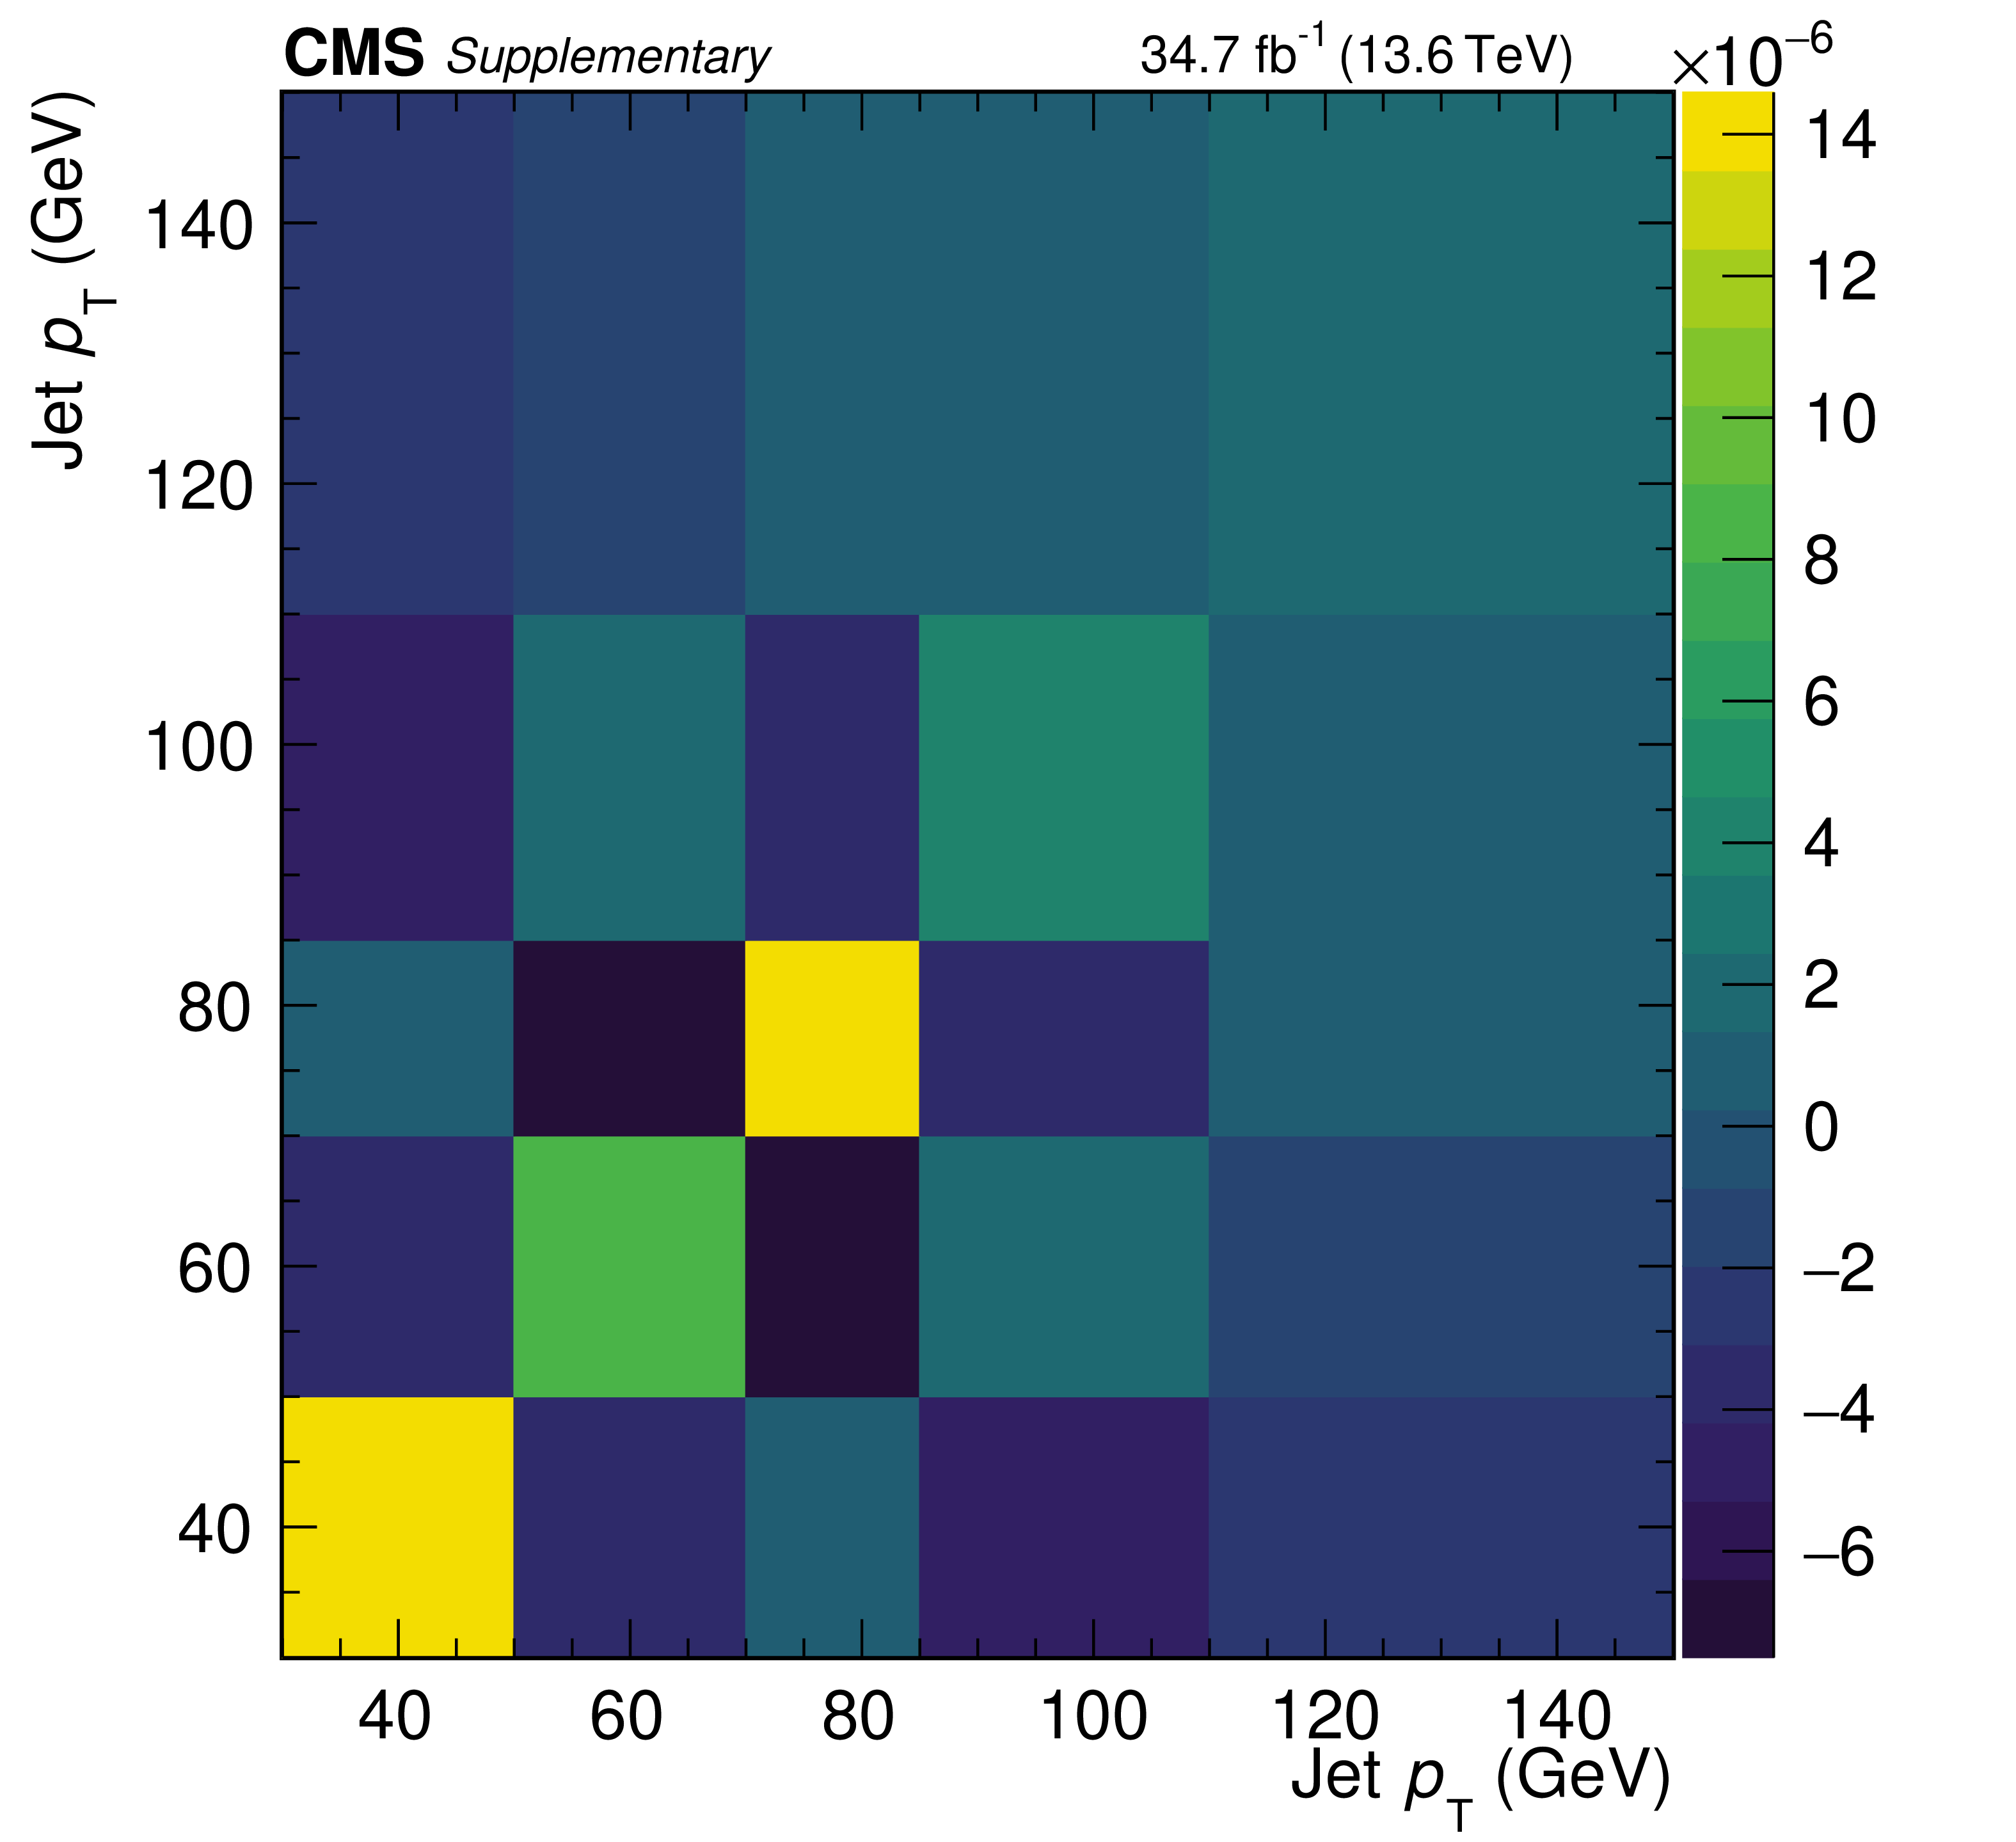
png pdf |
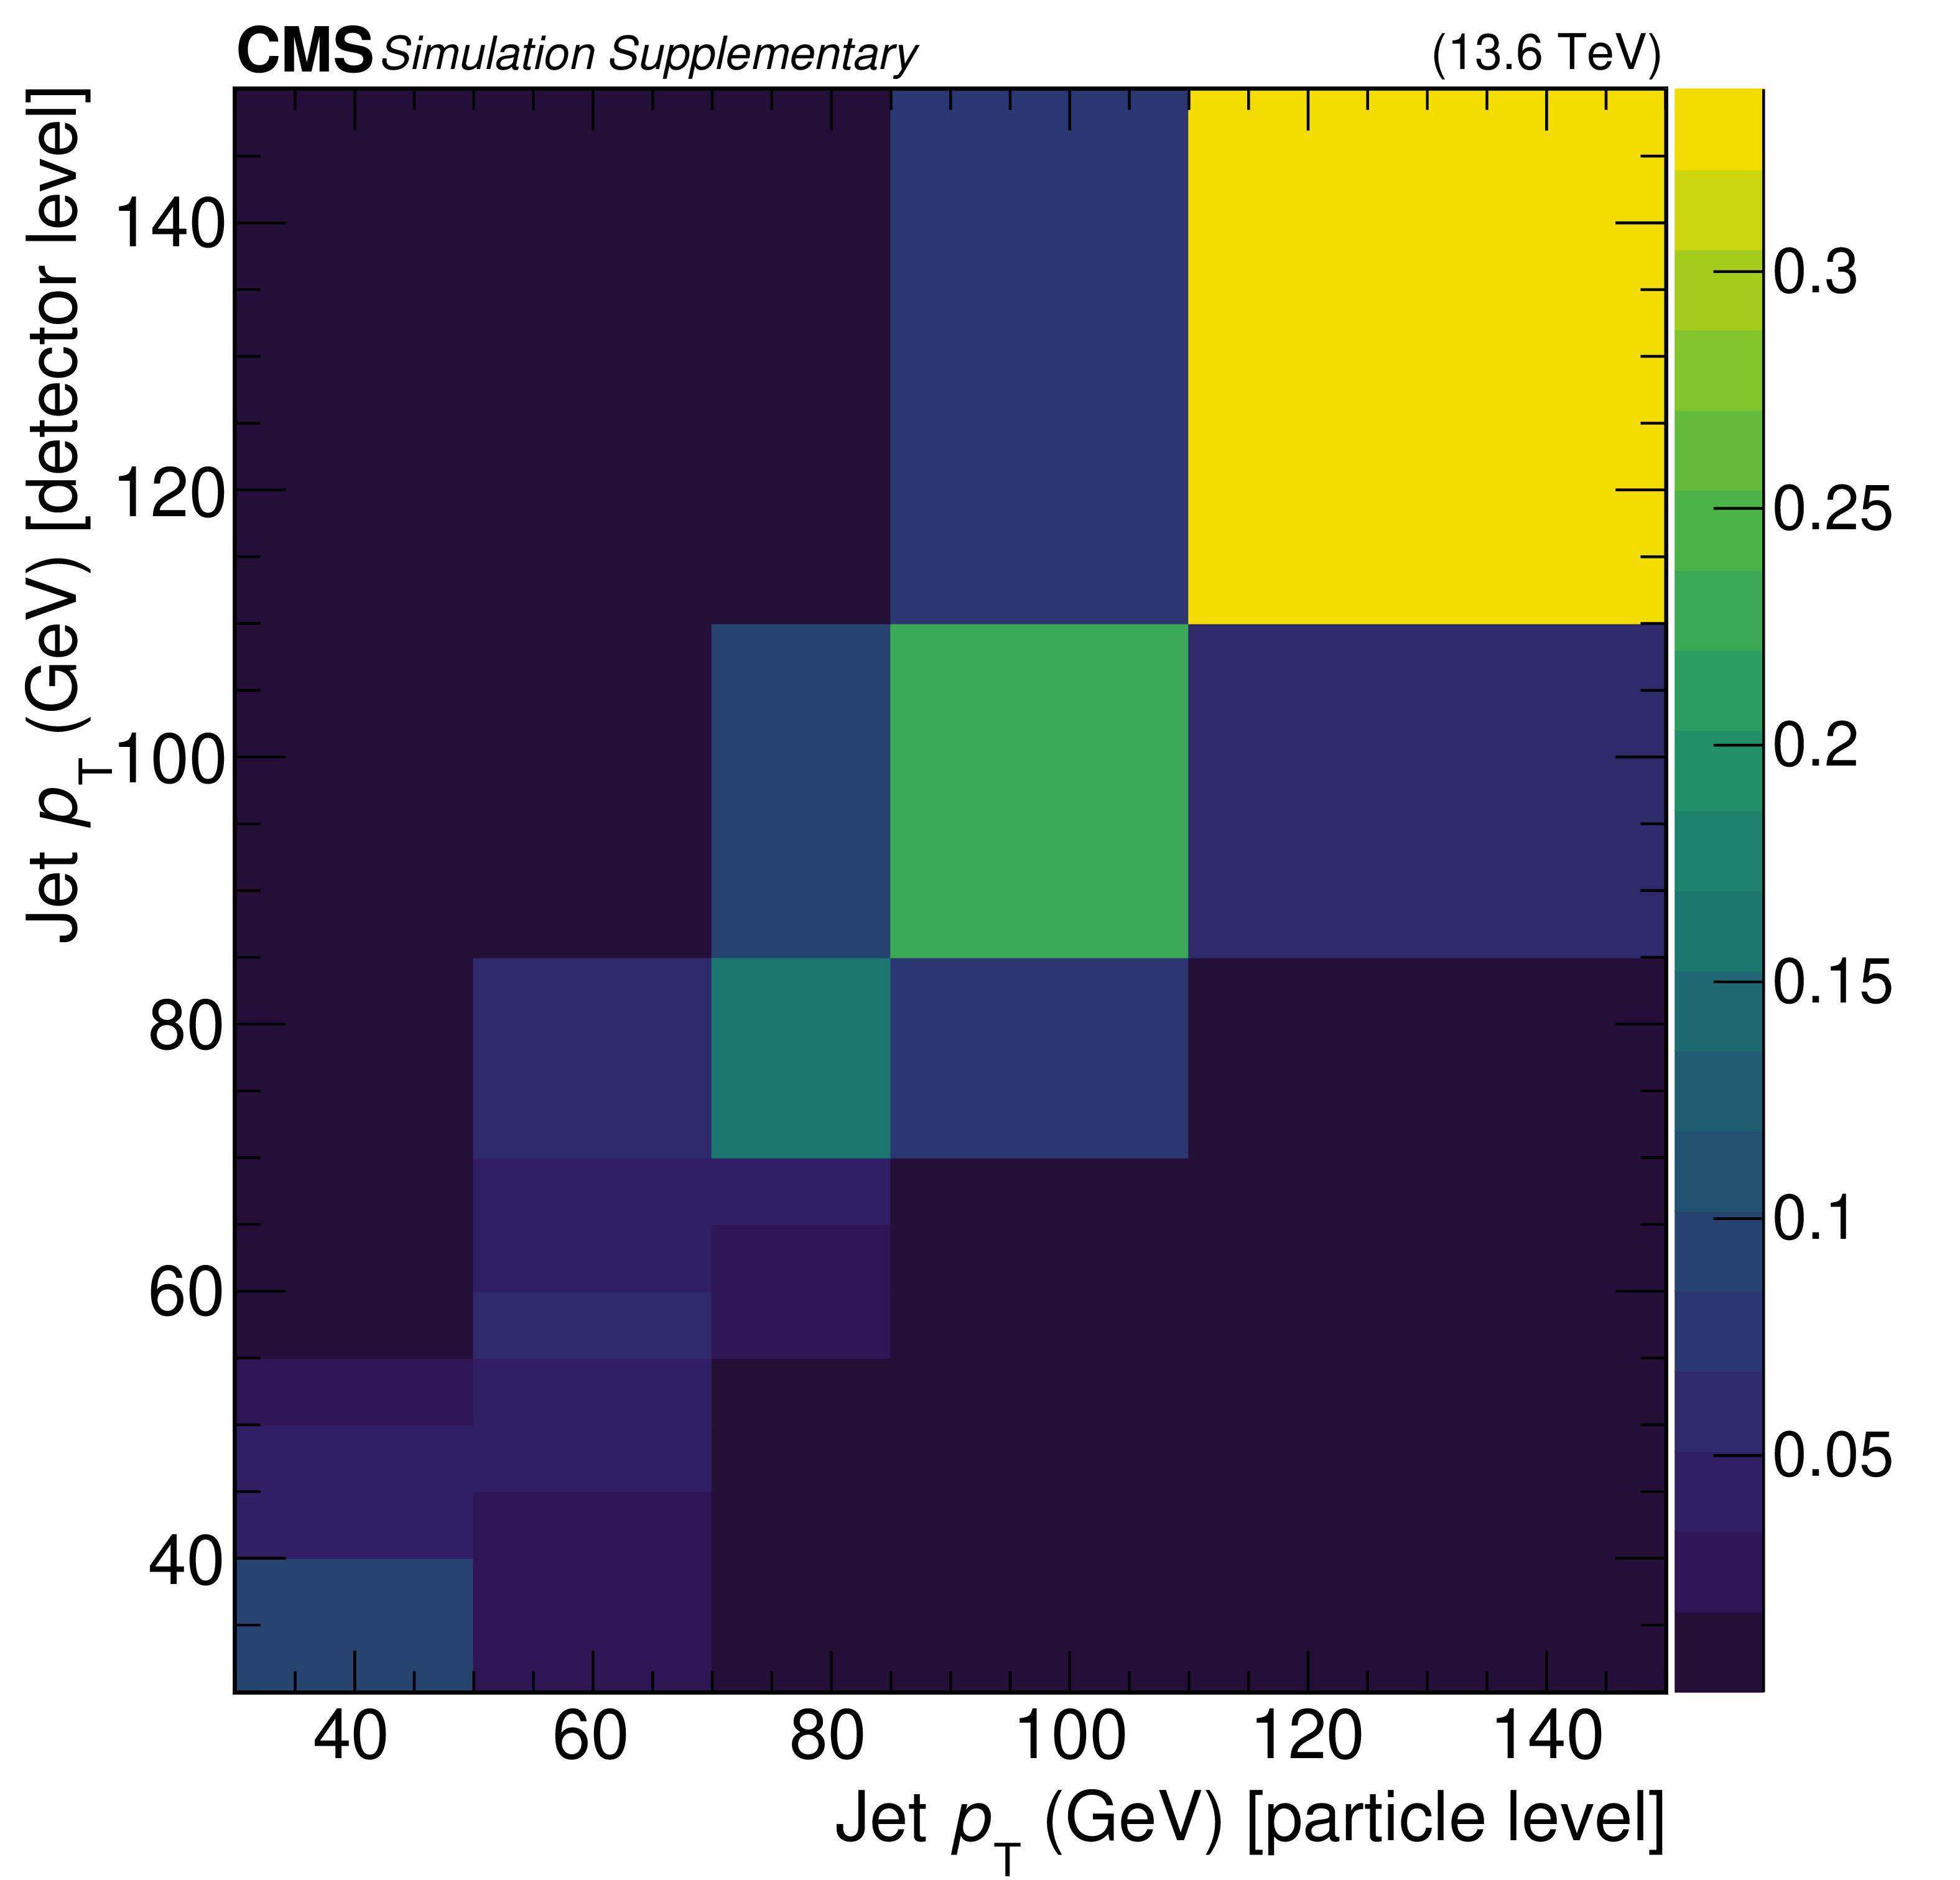
Additional Figure 7:
Response matrix between detector and particle level for $ p_{\mathrm{T}} $ of the jet. |
png pdf |
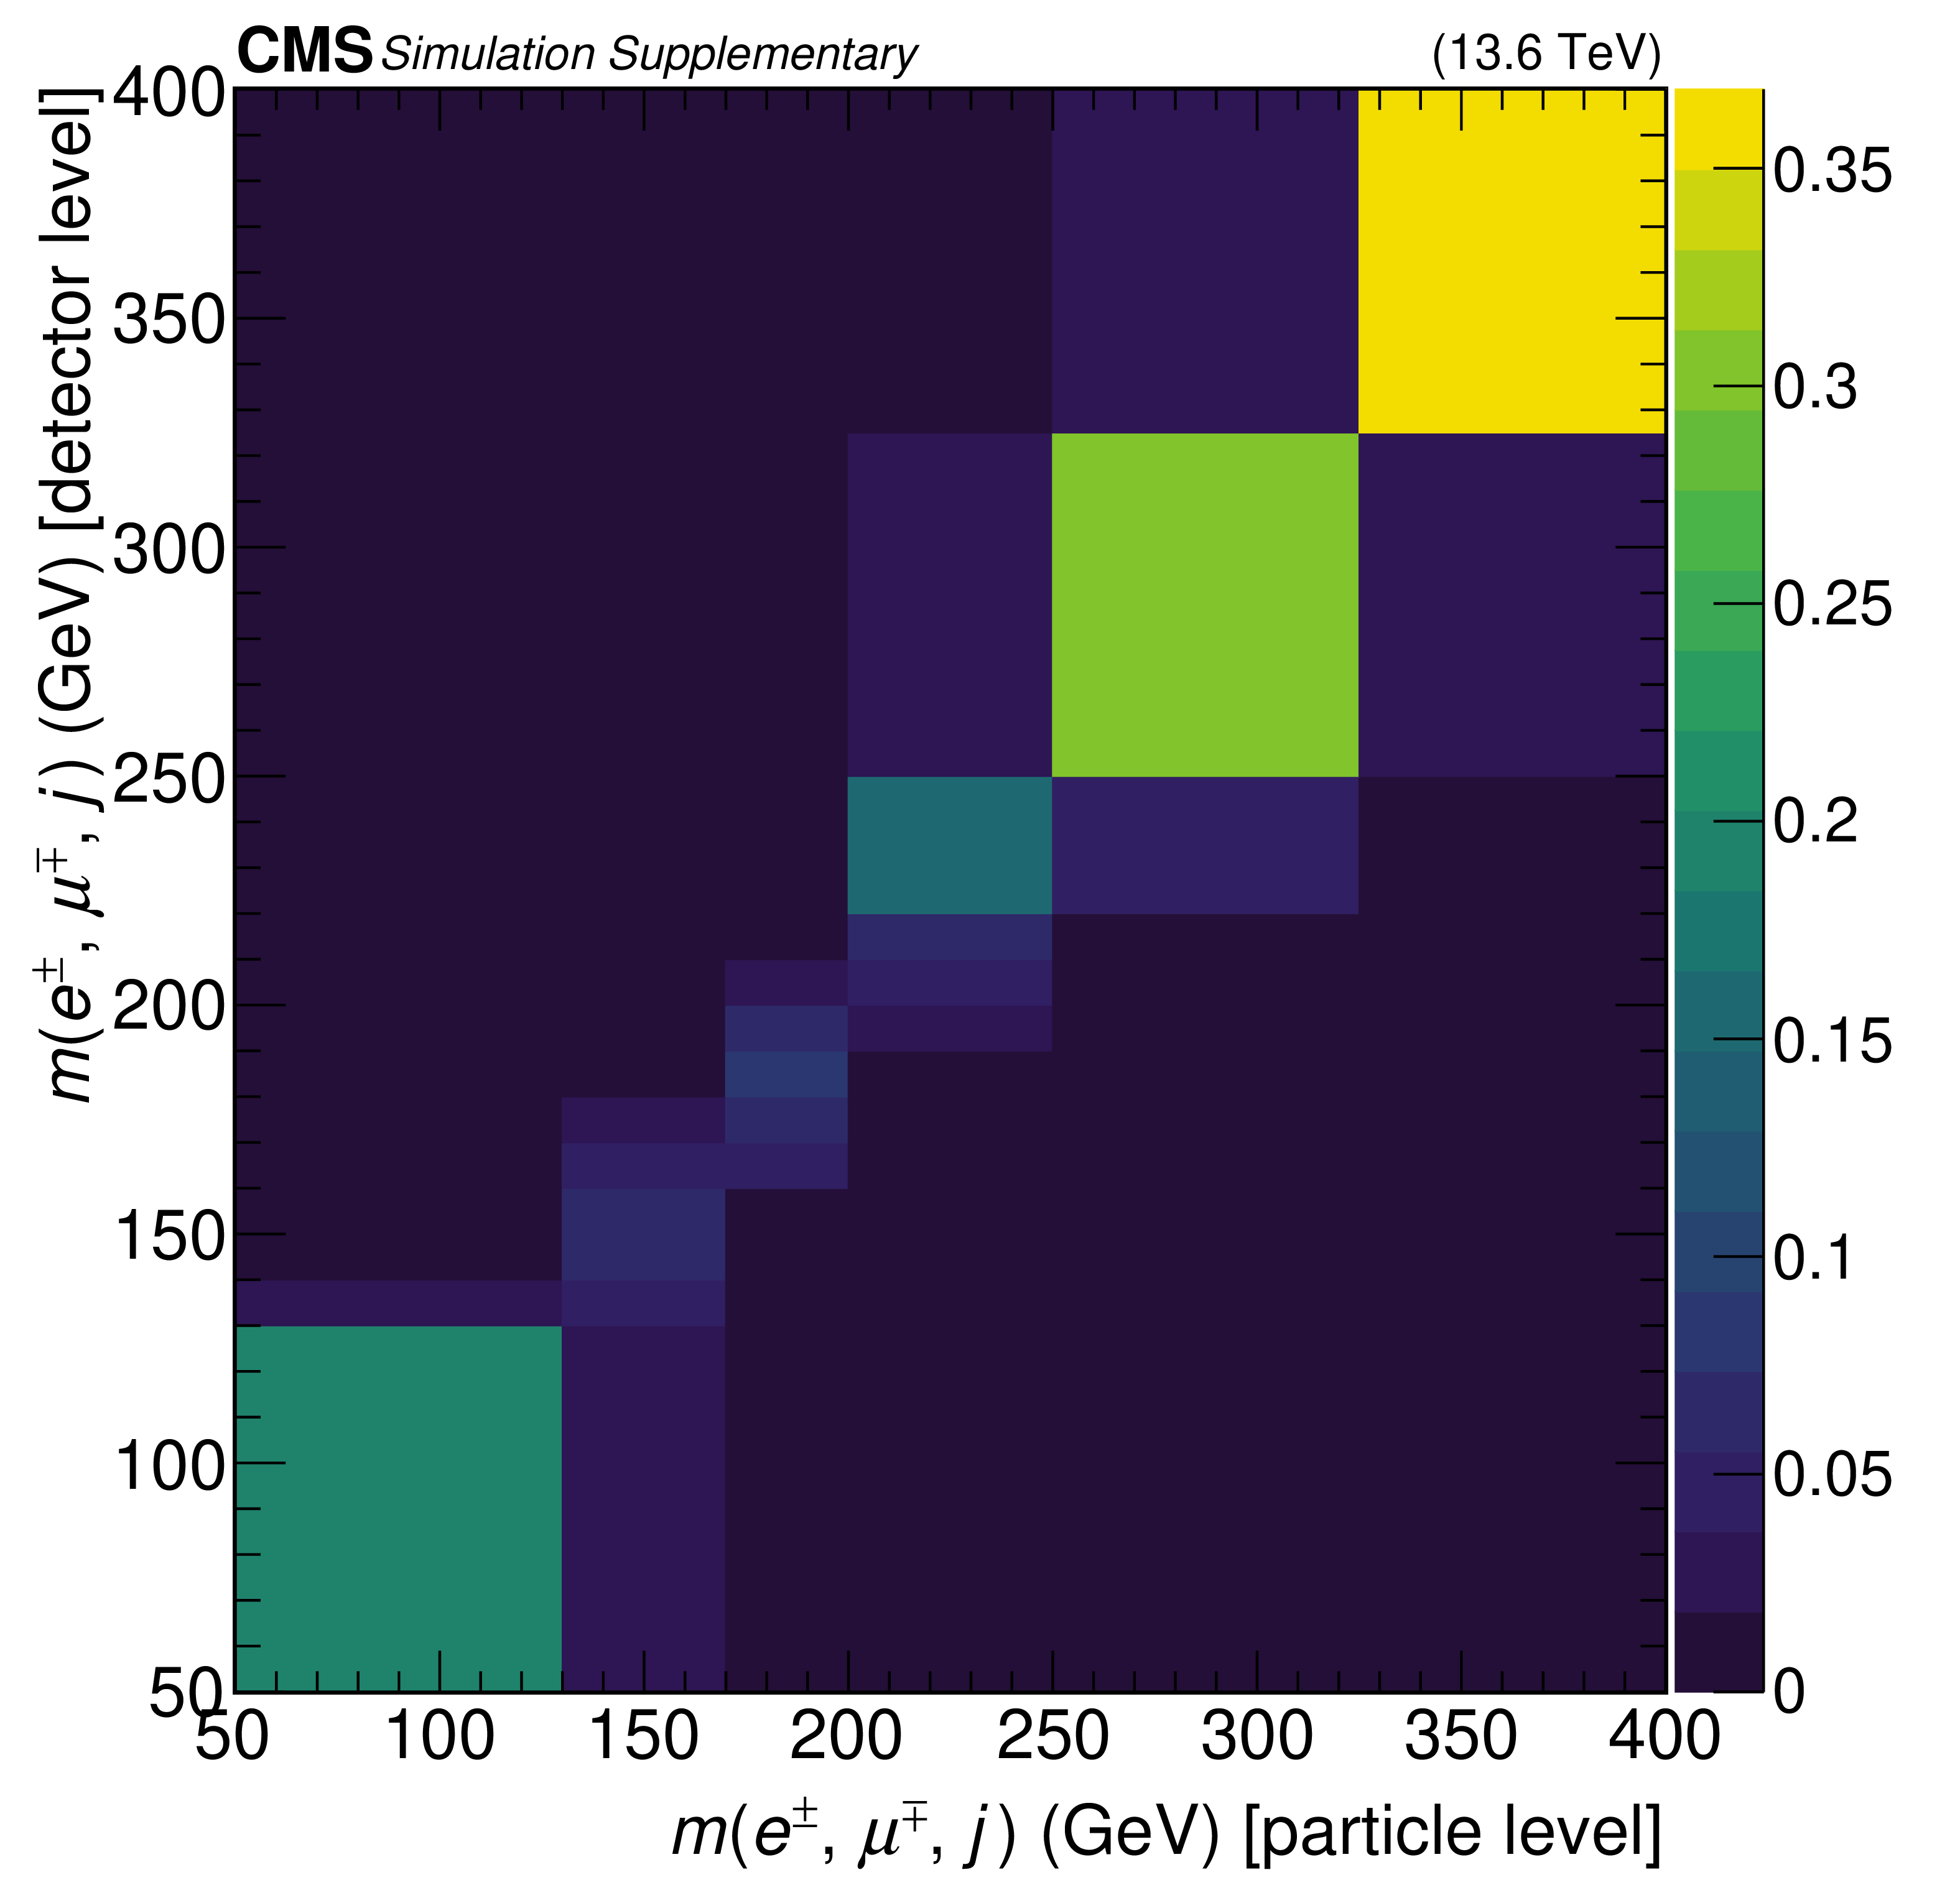
Additional Figure 8:
Response matrix between detector and particle level for $ m(\mathrm{e}^\pm, \mu^\mp,j) $. |
png pdf |
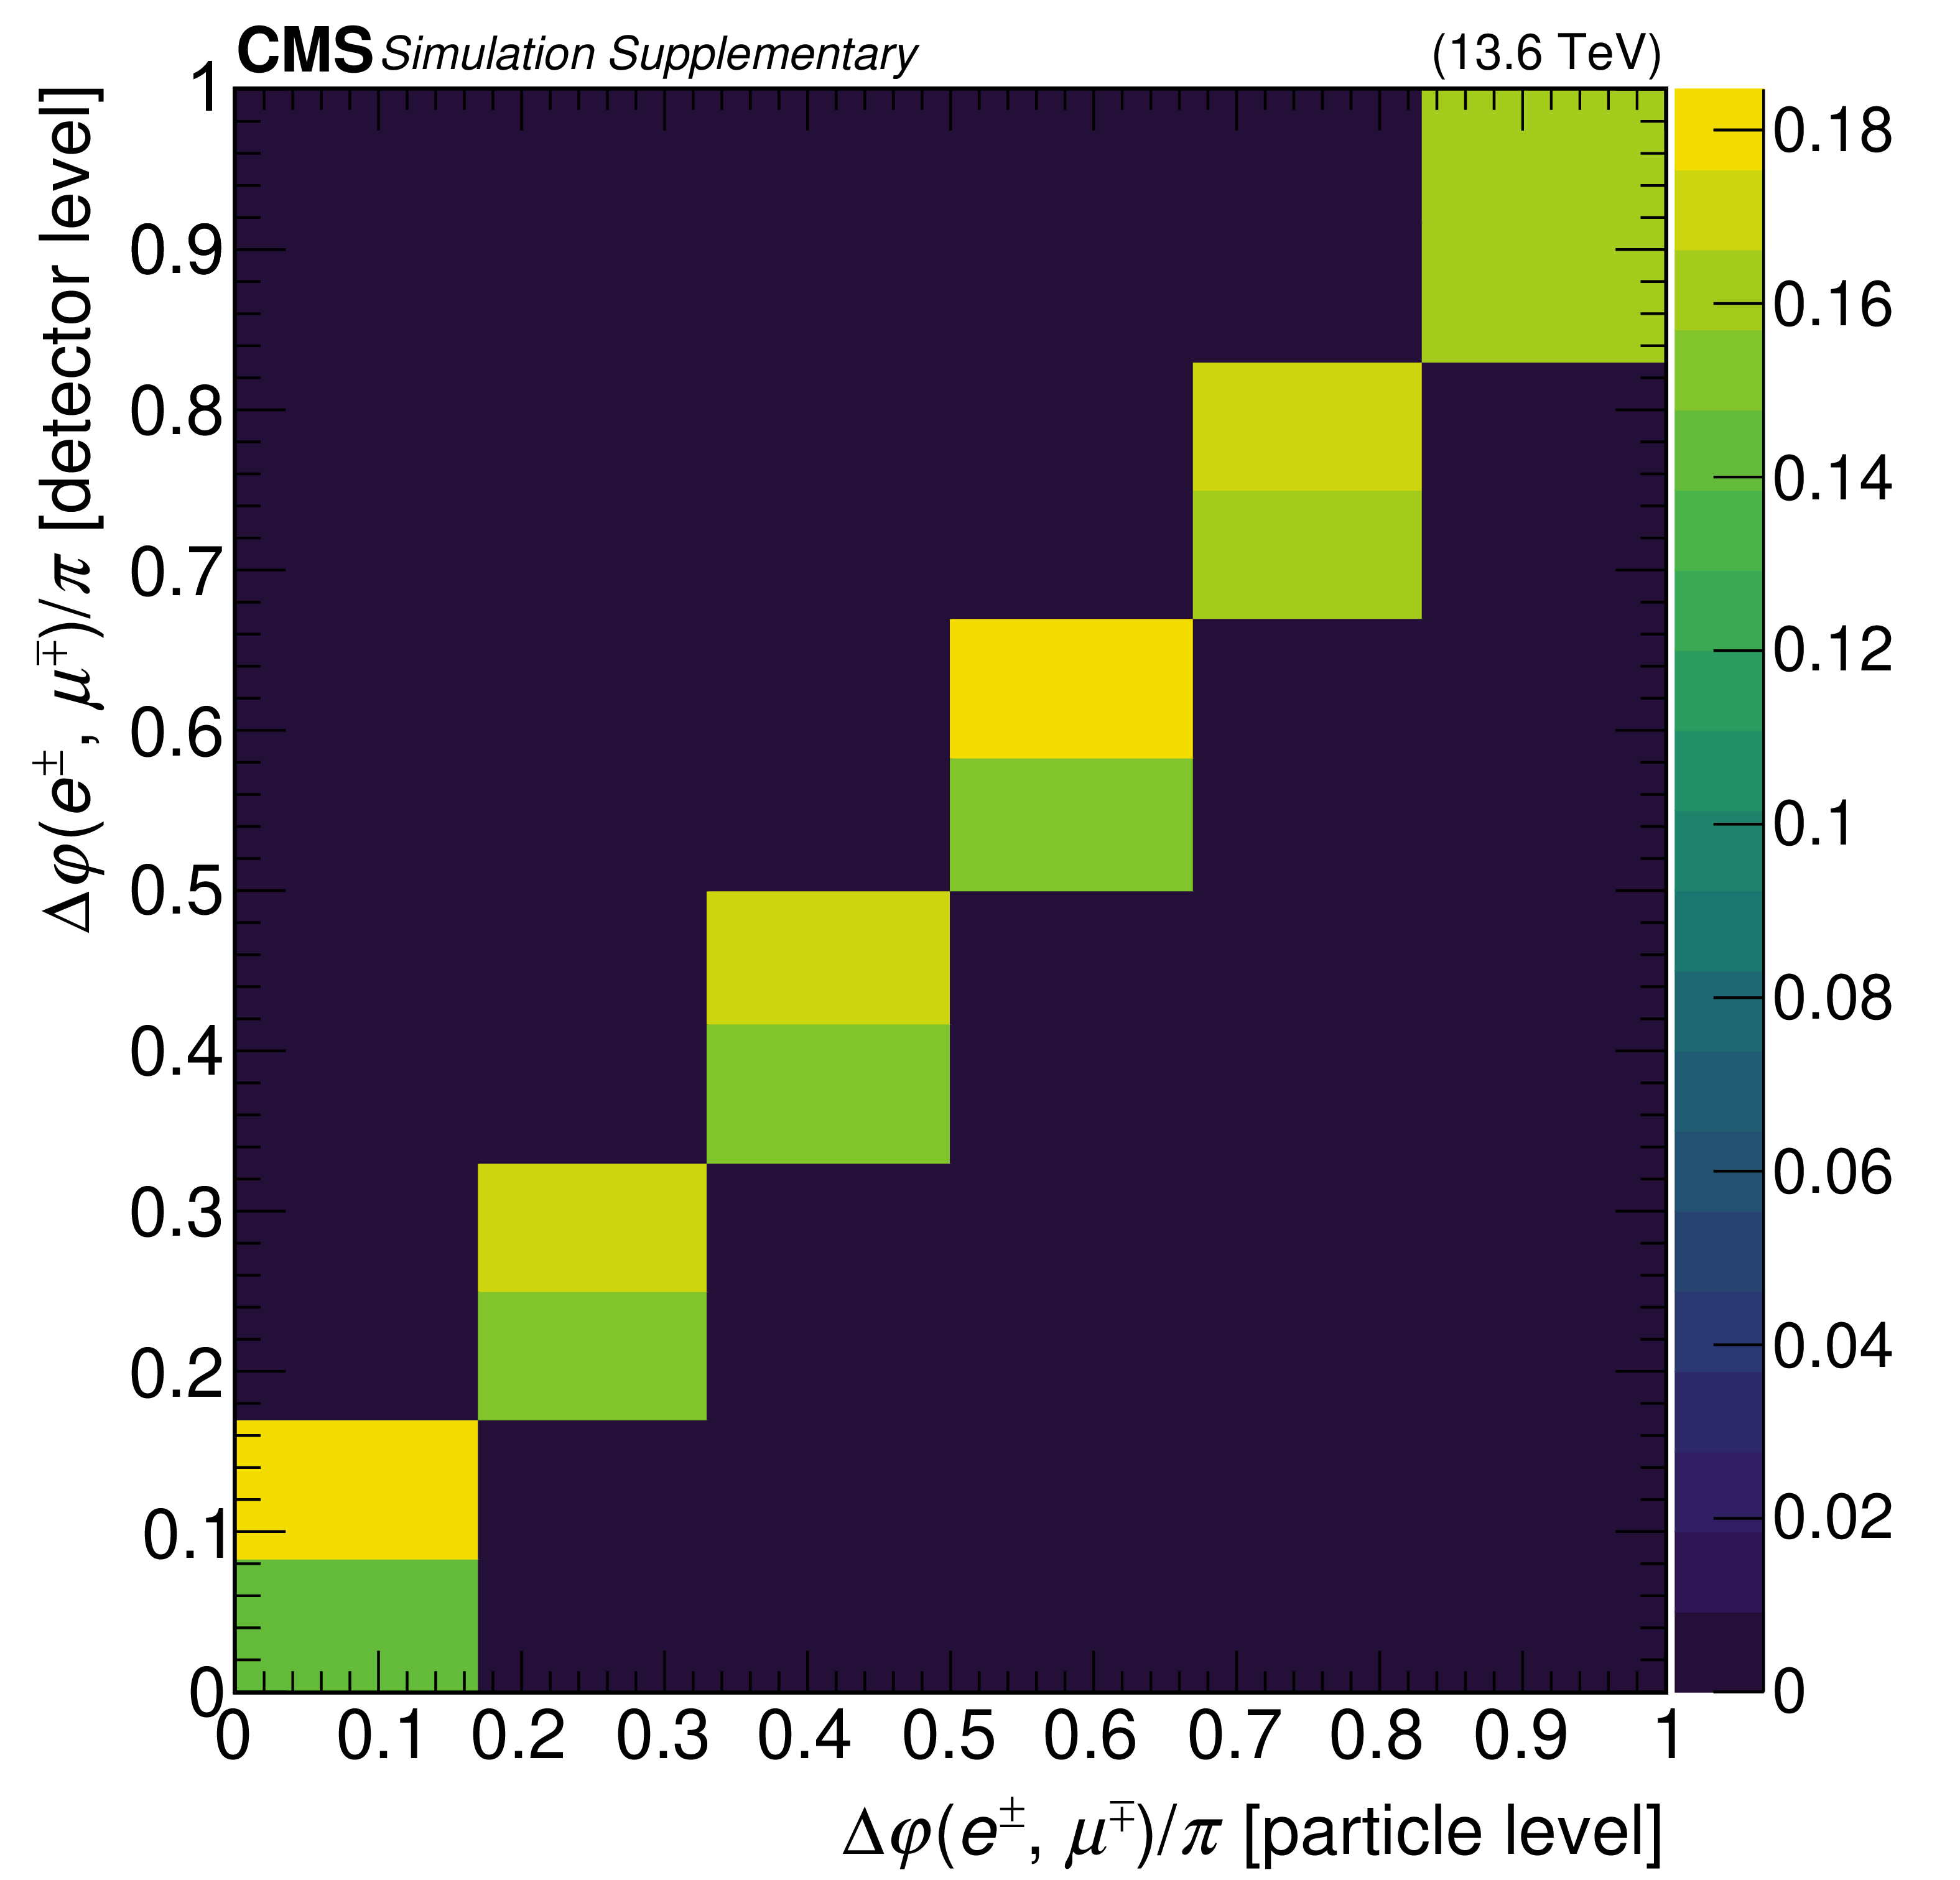
Additional Figure 9:
Response matricx between detector and particle level for $ \Delta\varphi(\mathrm{e}^\pm, \mu^\mp) $. |
png pdf |
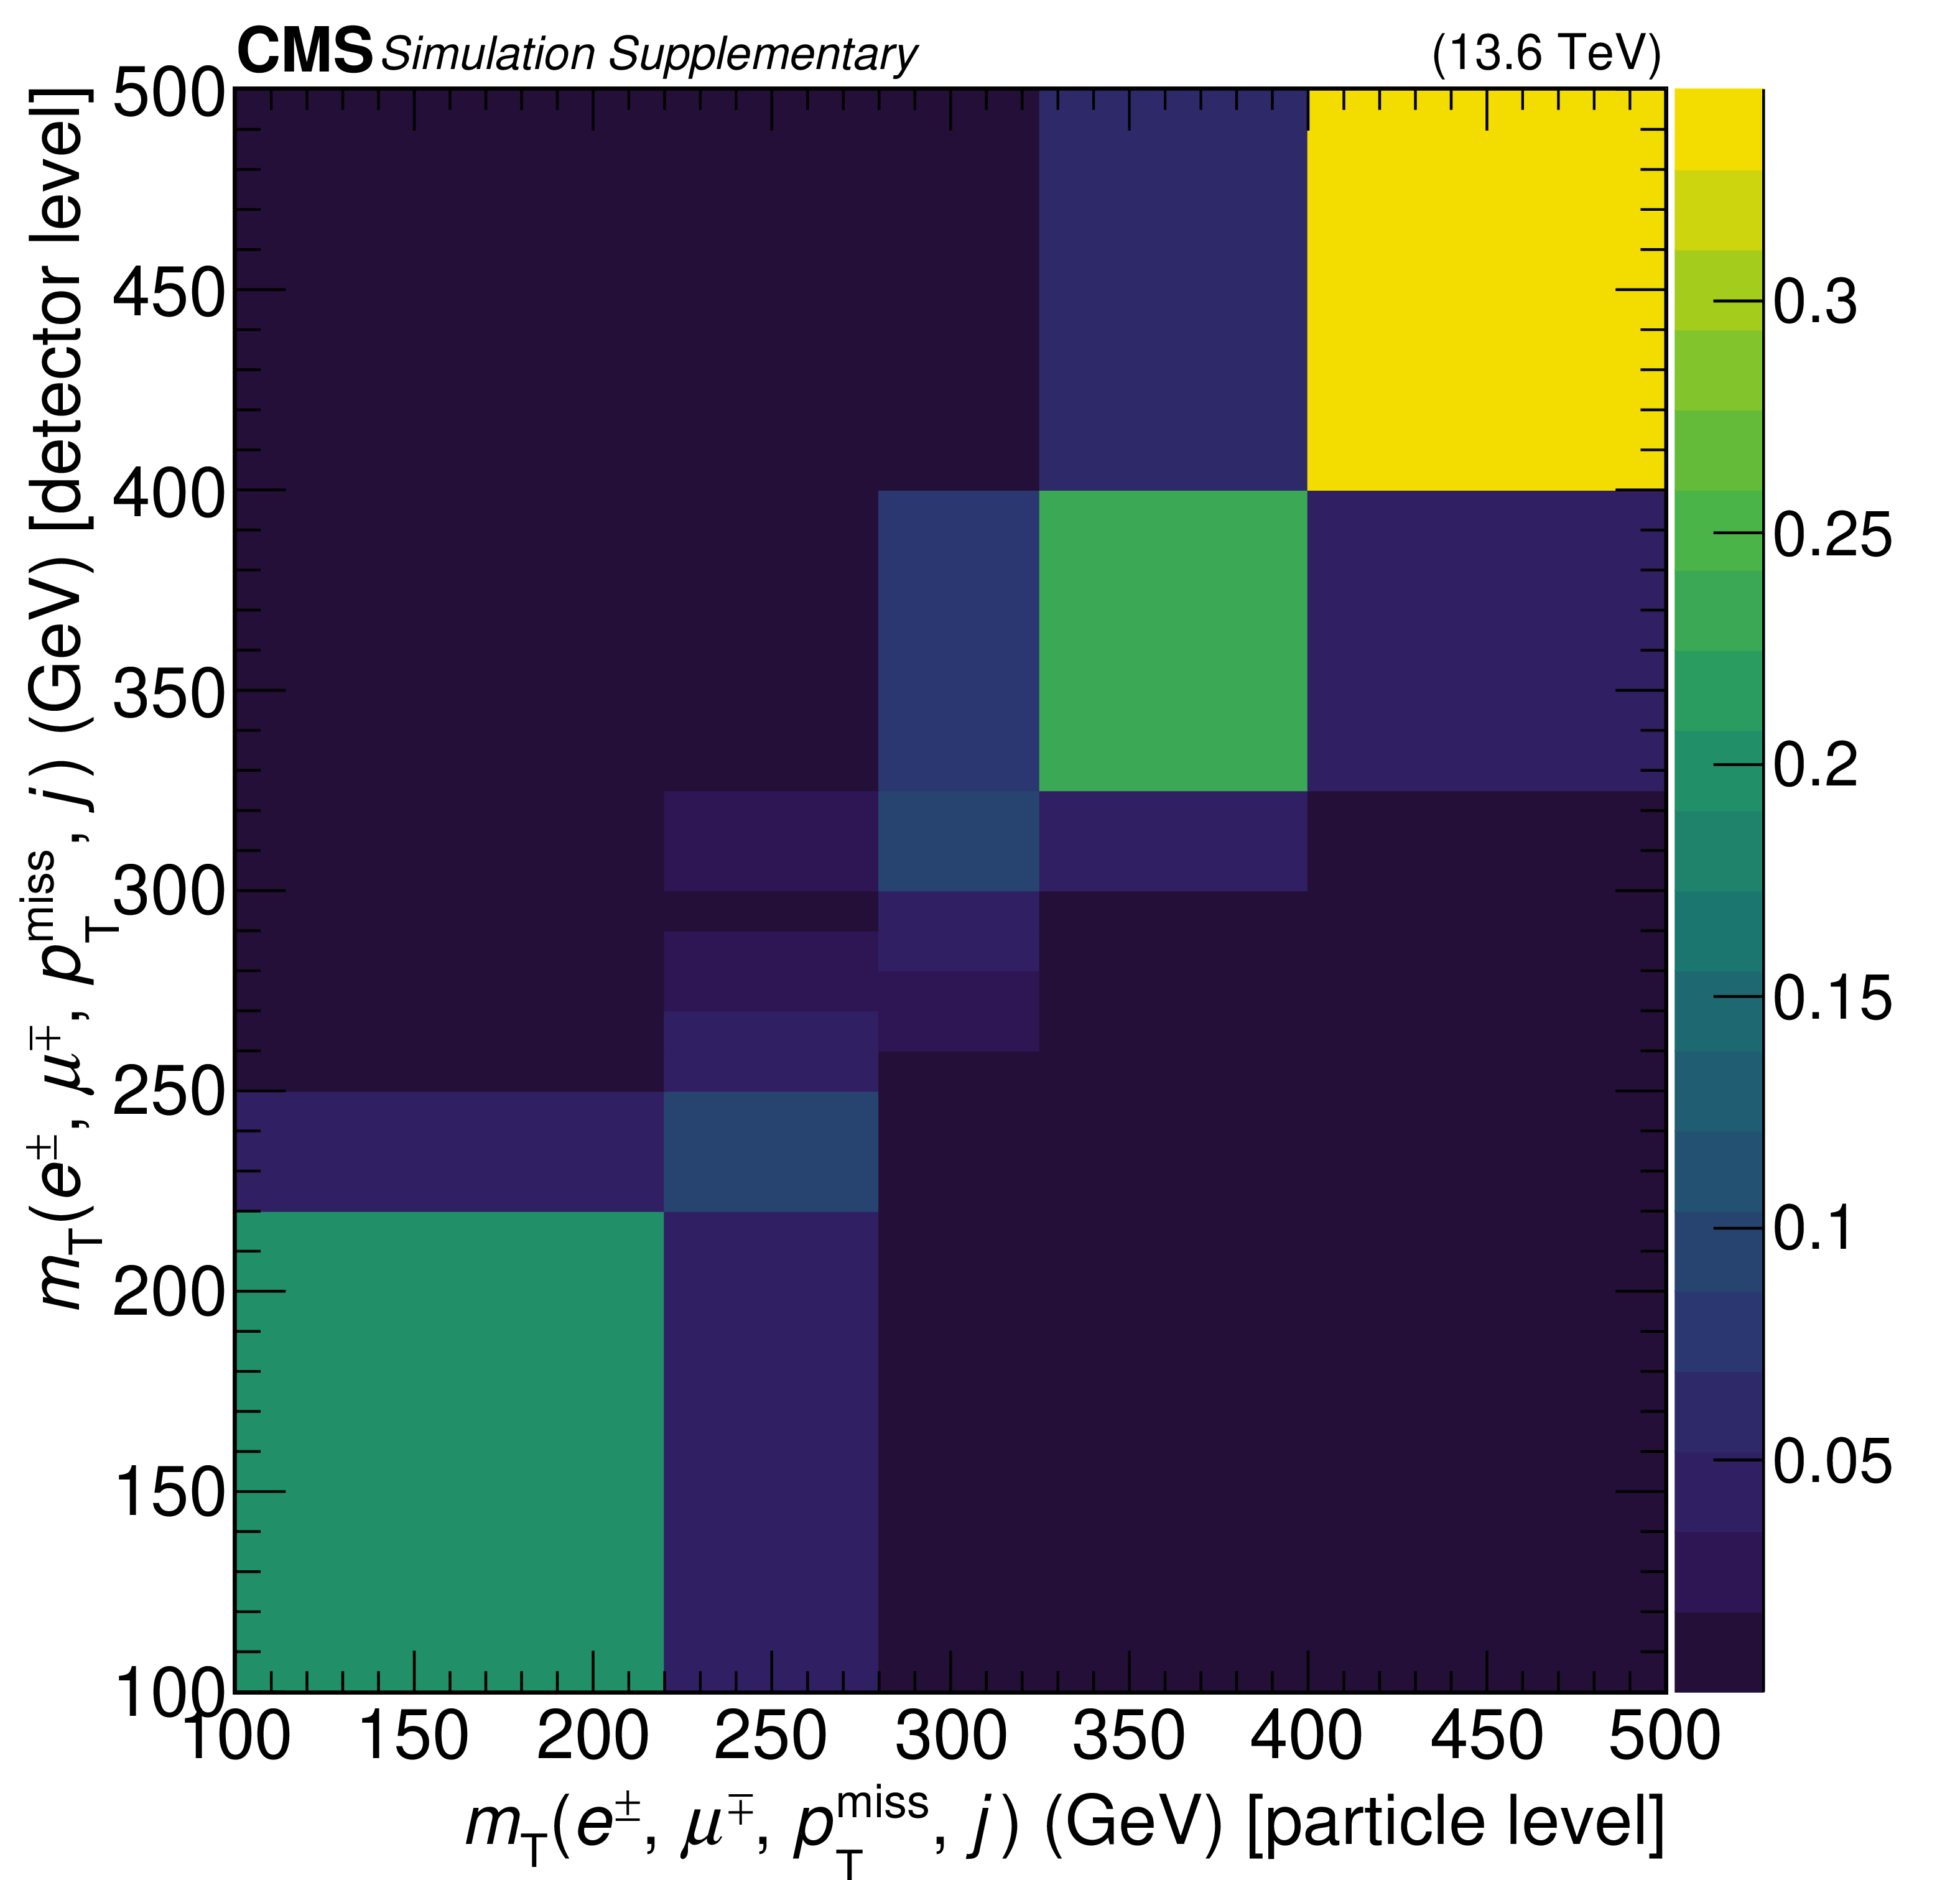
Additional Figure 10:
Response matrix between detector and particle level for $ m_{\text{T}}(\mathrm{e}^\pm, \mu^\mp, j, p_{\mathrm{T}}^\text{miss}) $. |
png pdf |
Additional Figure 11:
Covariance matrix including all uncertainties of the differential result for $ p_{\mathrm{T}} $ of the leading lepton. |
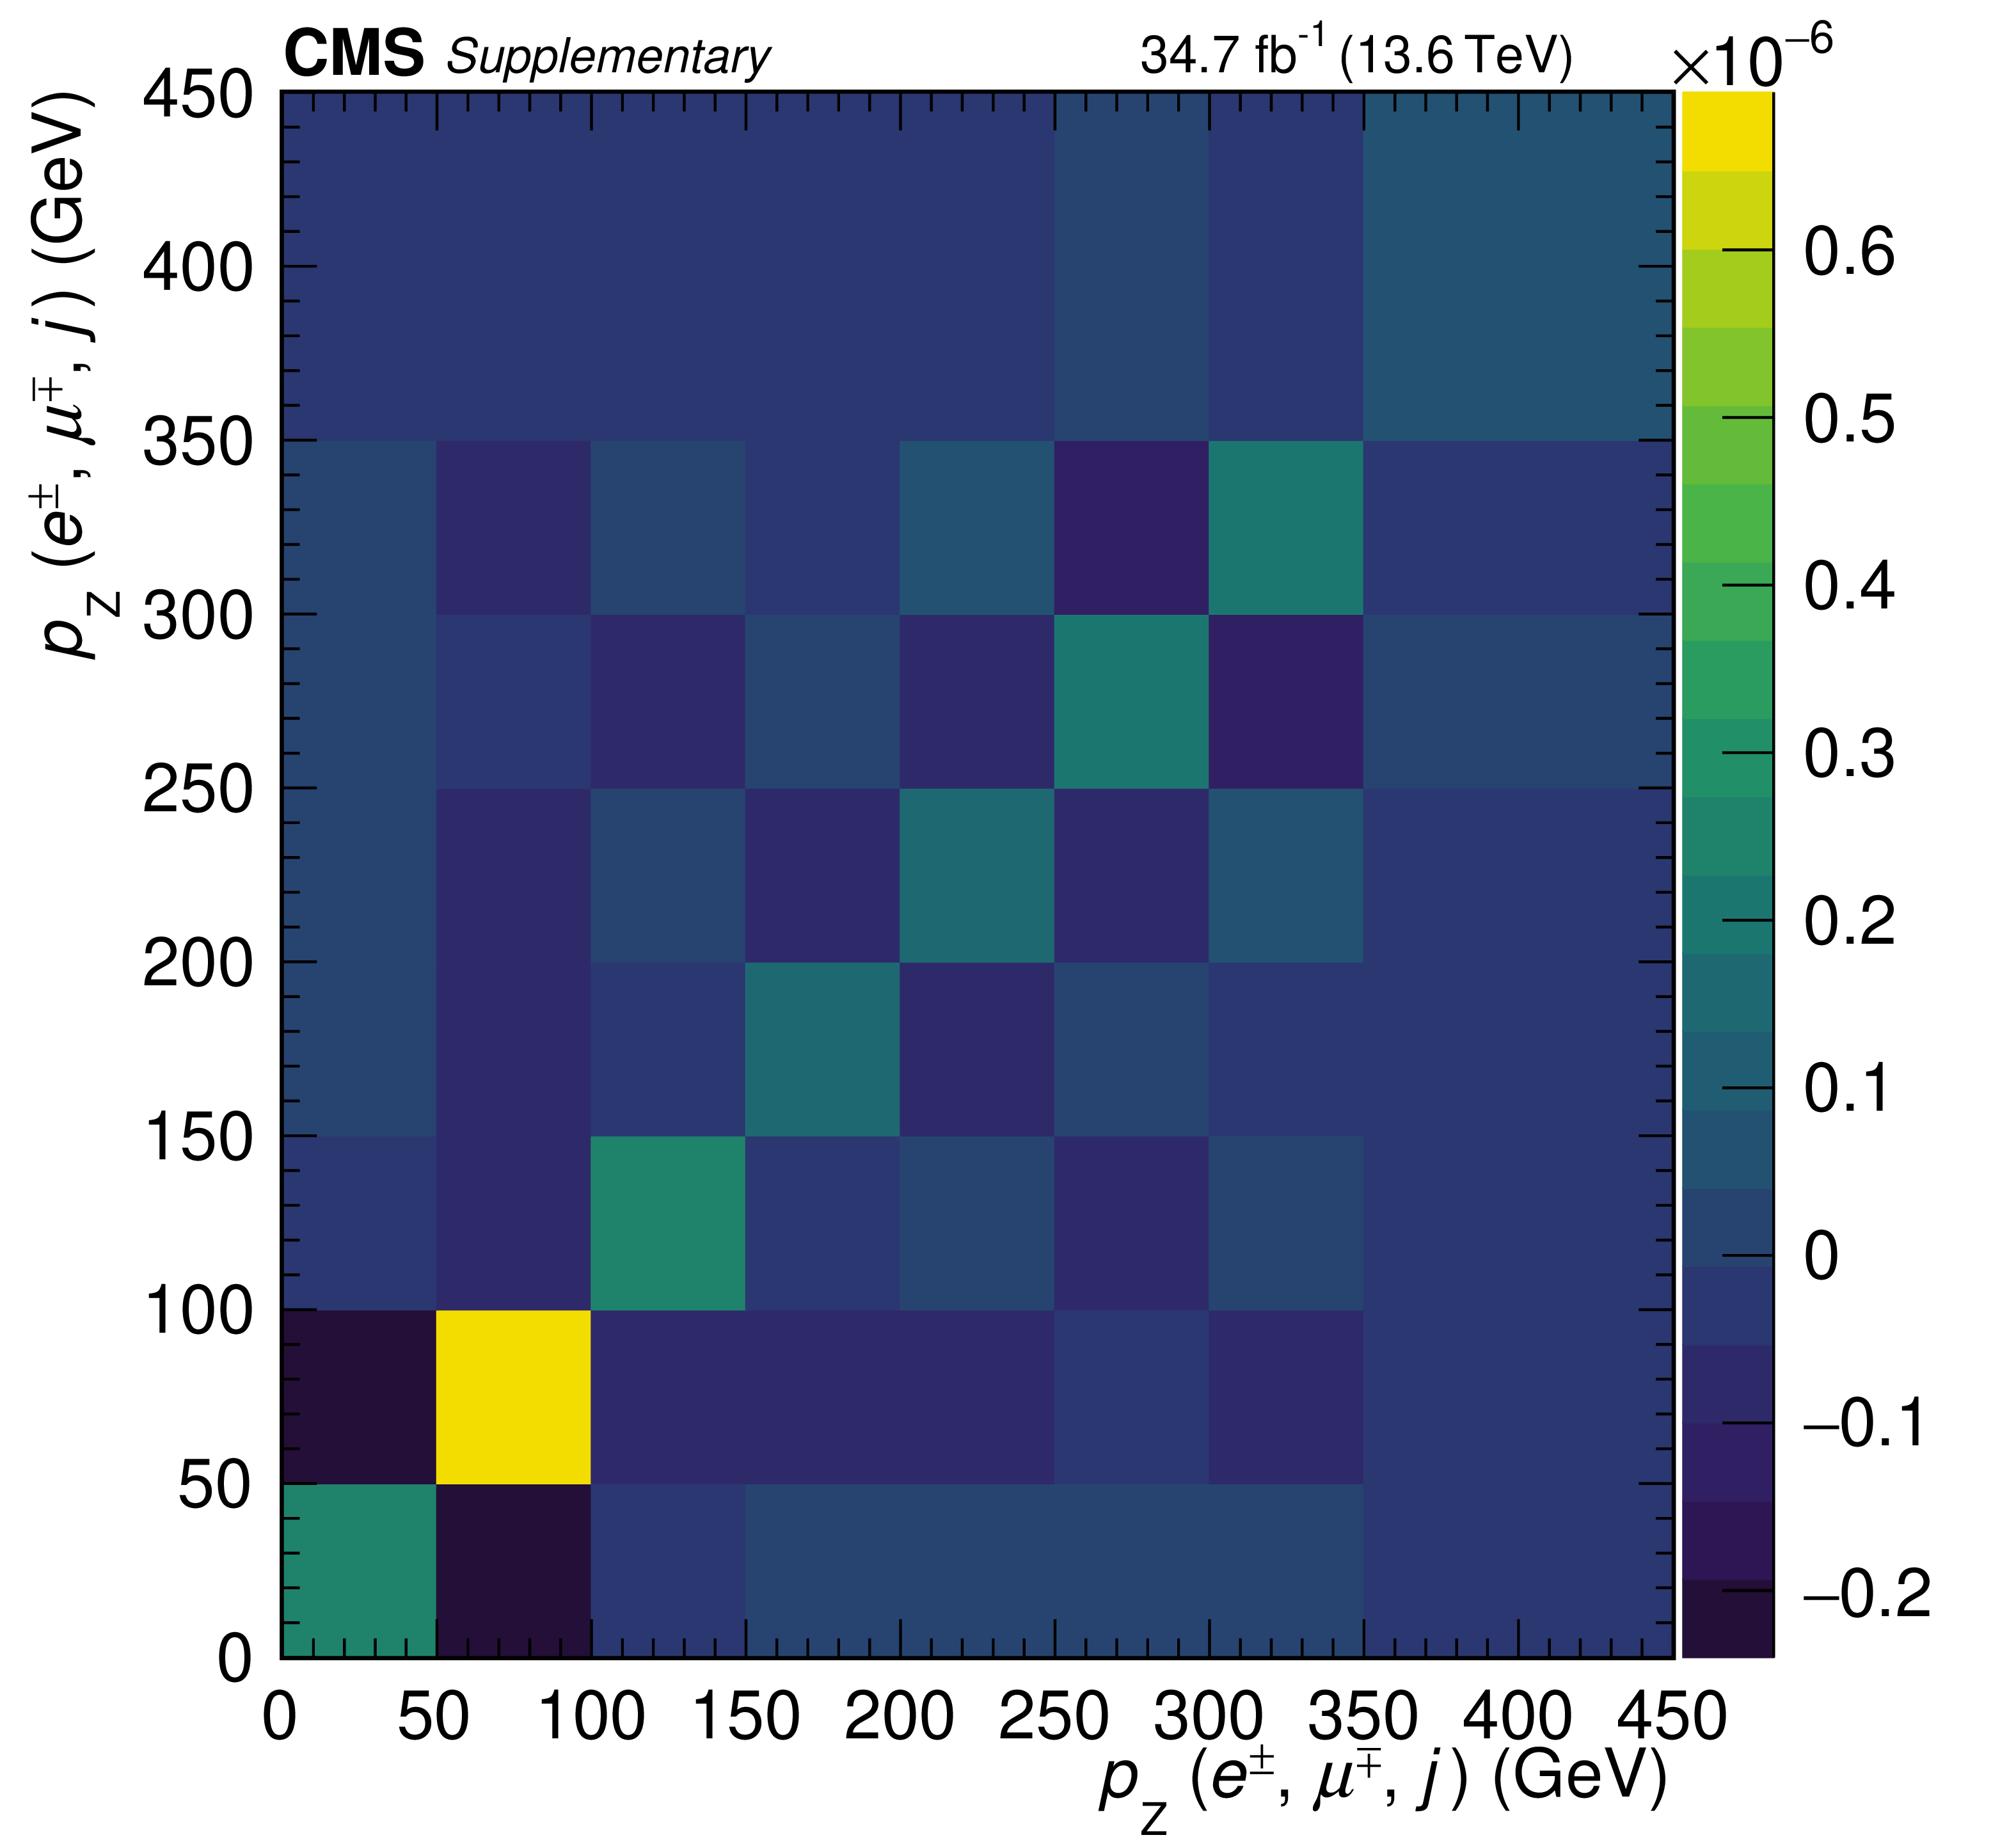
png pdf |
Additional Figure 12:
Covariance matrix including all uncertainties of the differential result for $ p_\text{Z}(\mathrm{e}^\pm, \mu^\mp, j) $. |
png pdf |
Additional Figure 13:
Covariance matrix including all uncertainties of the differential result for $ p_{\mathrm{T}} $ of the jet. |
png pdf |
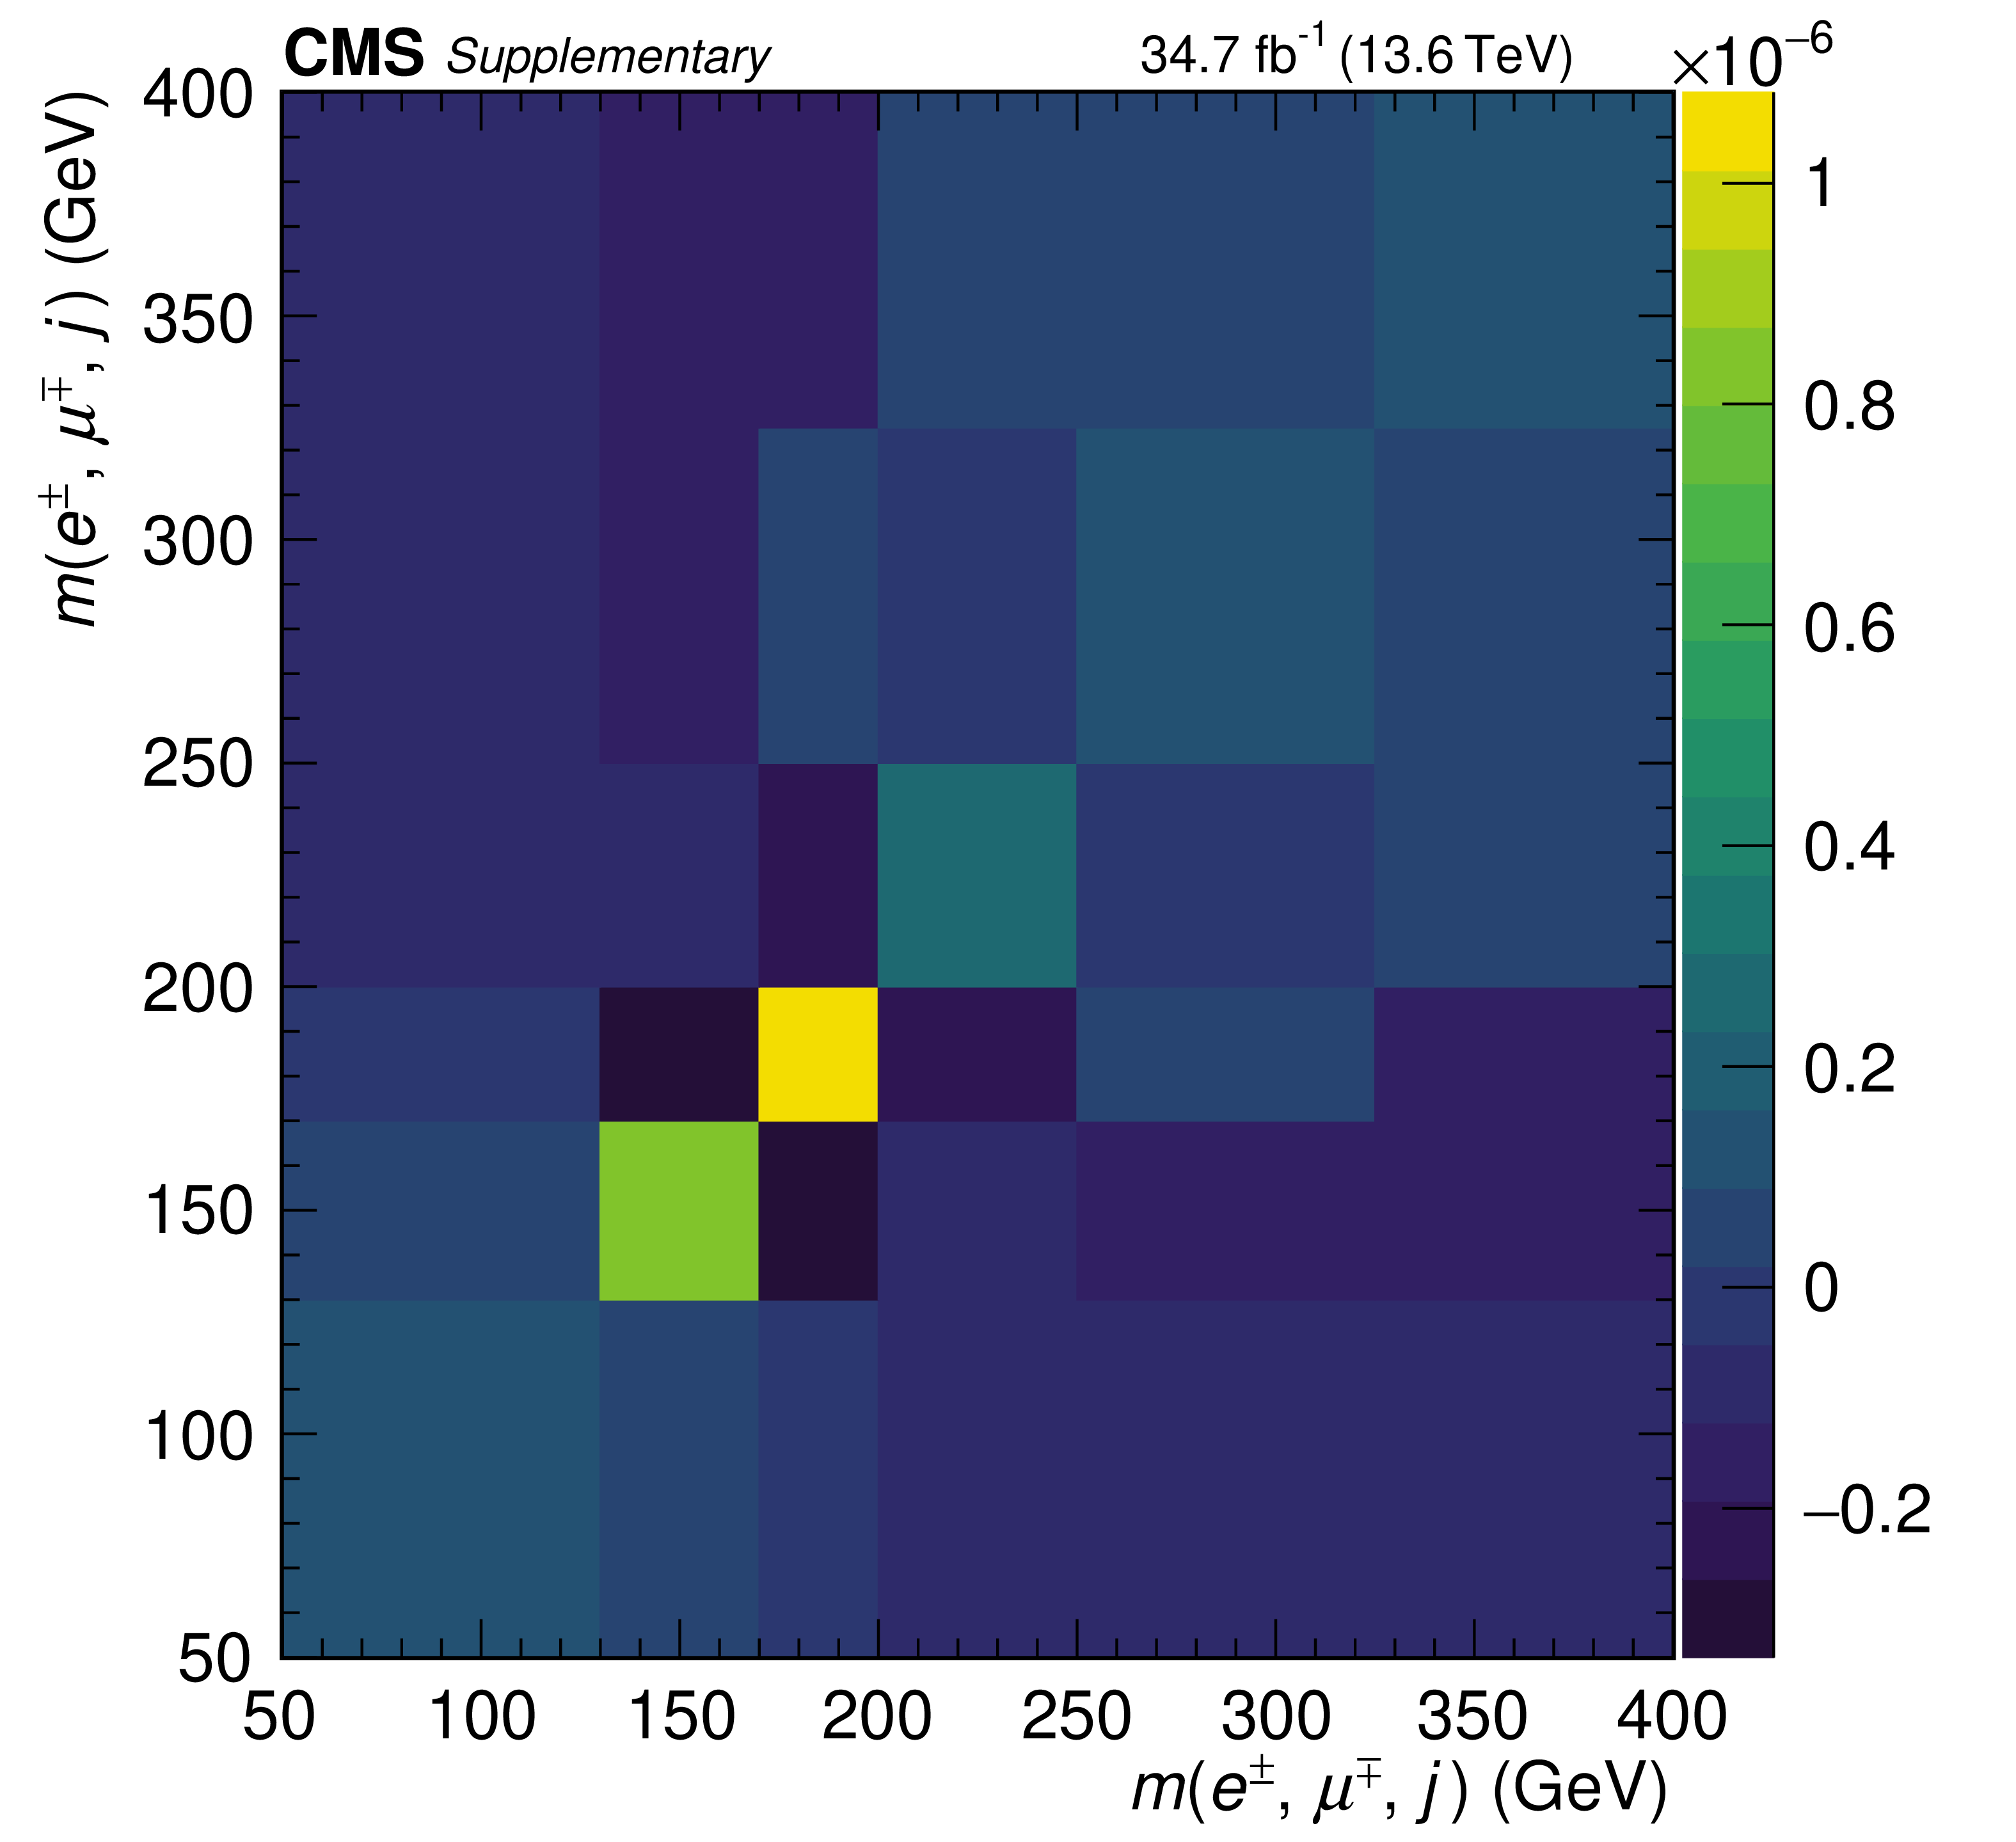
Additional Figure 14:
Covariance matrix including all uncertainties of the differential result for $ m(\mathrm{e}^\pm, \mu^\mp, j) $. |
png pdf |
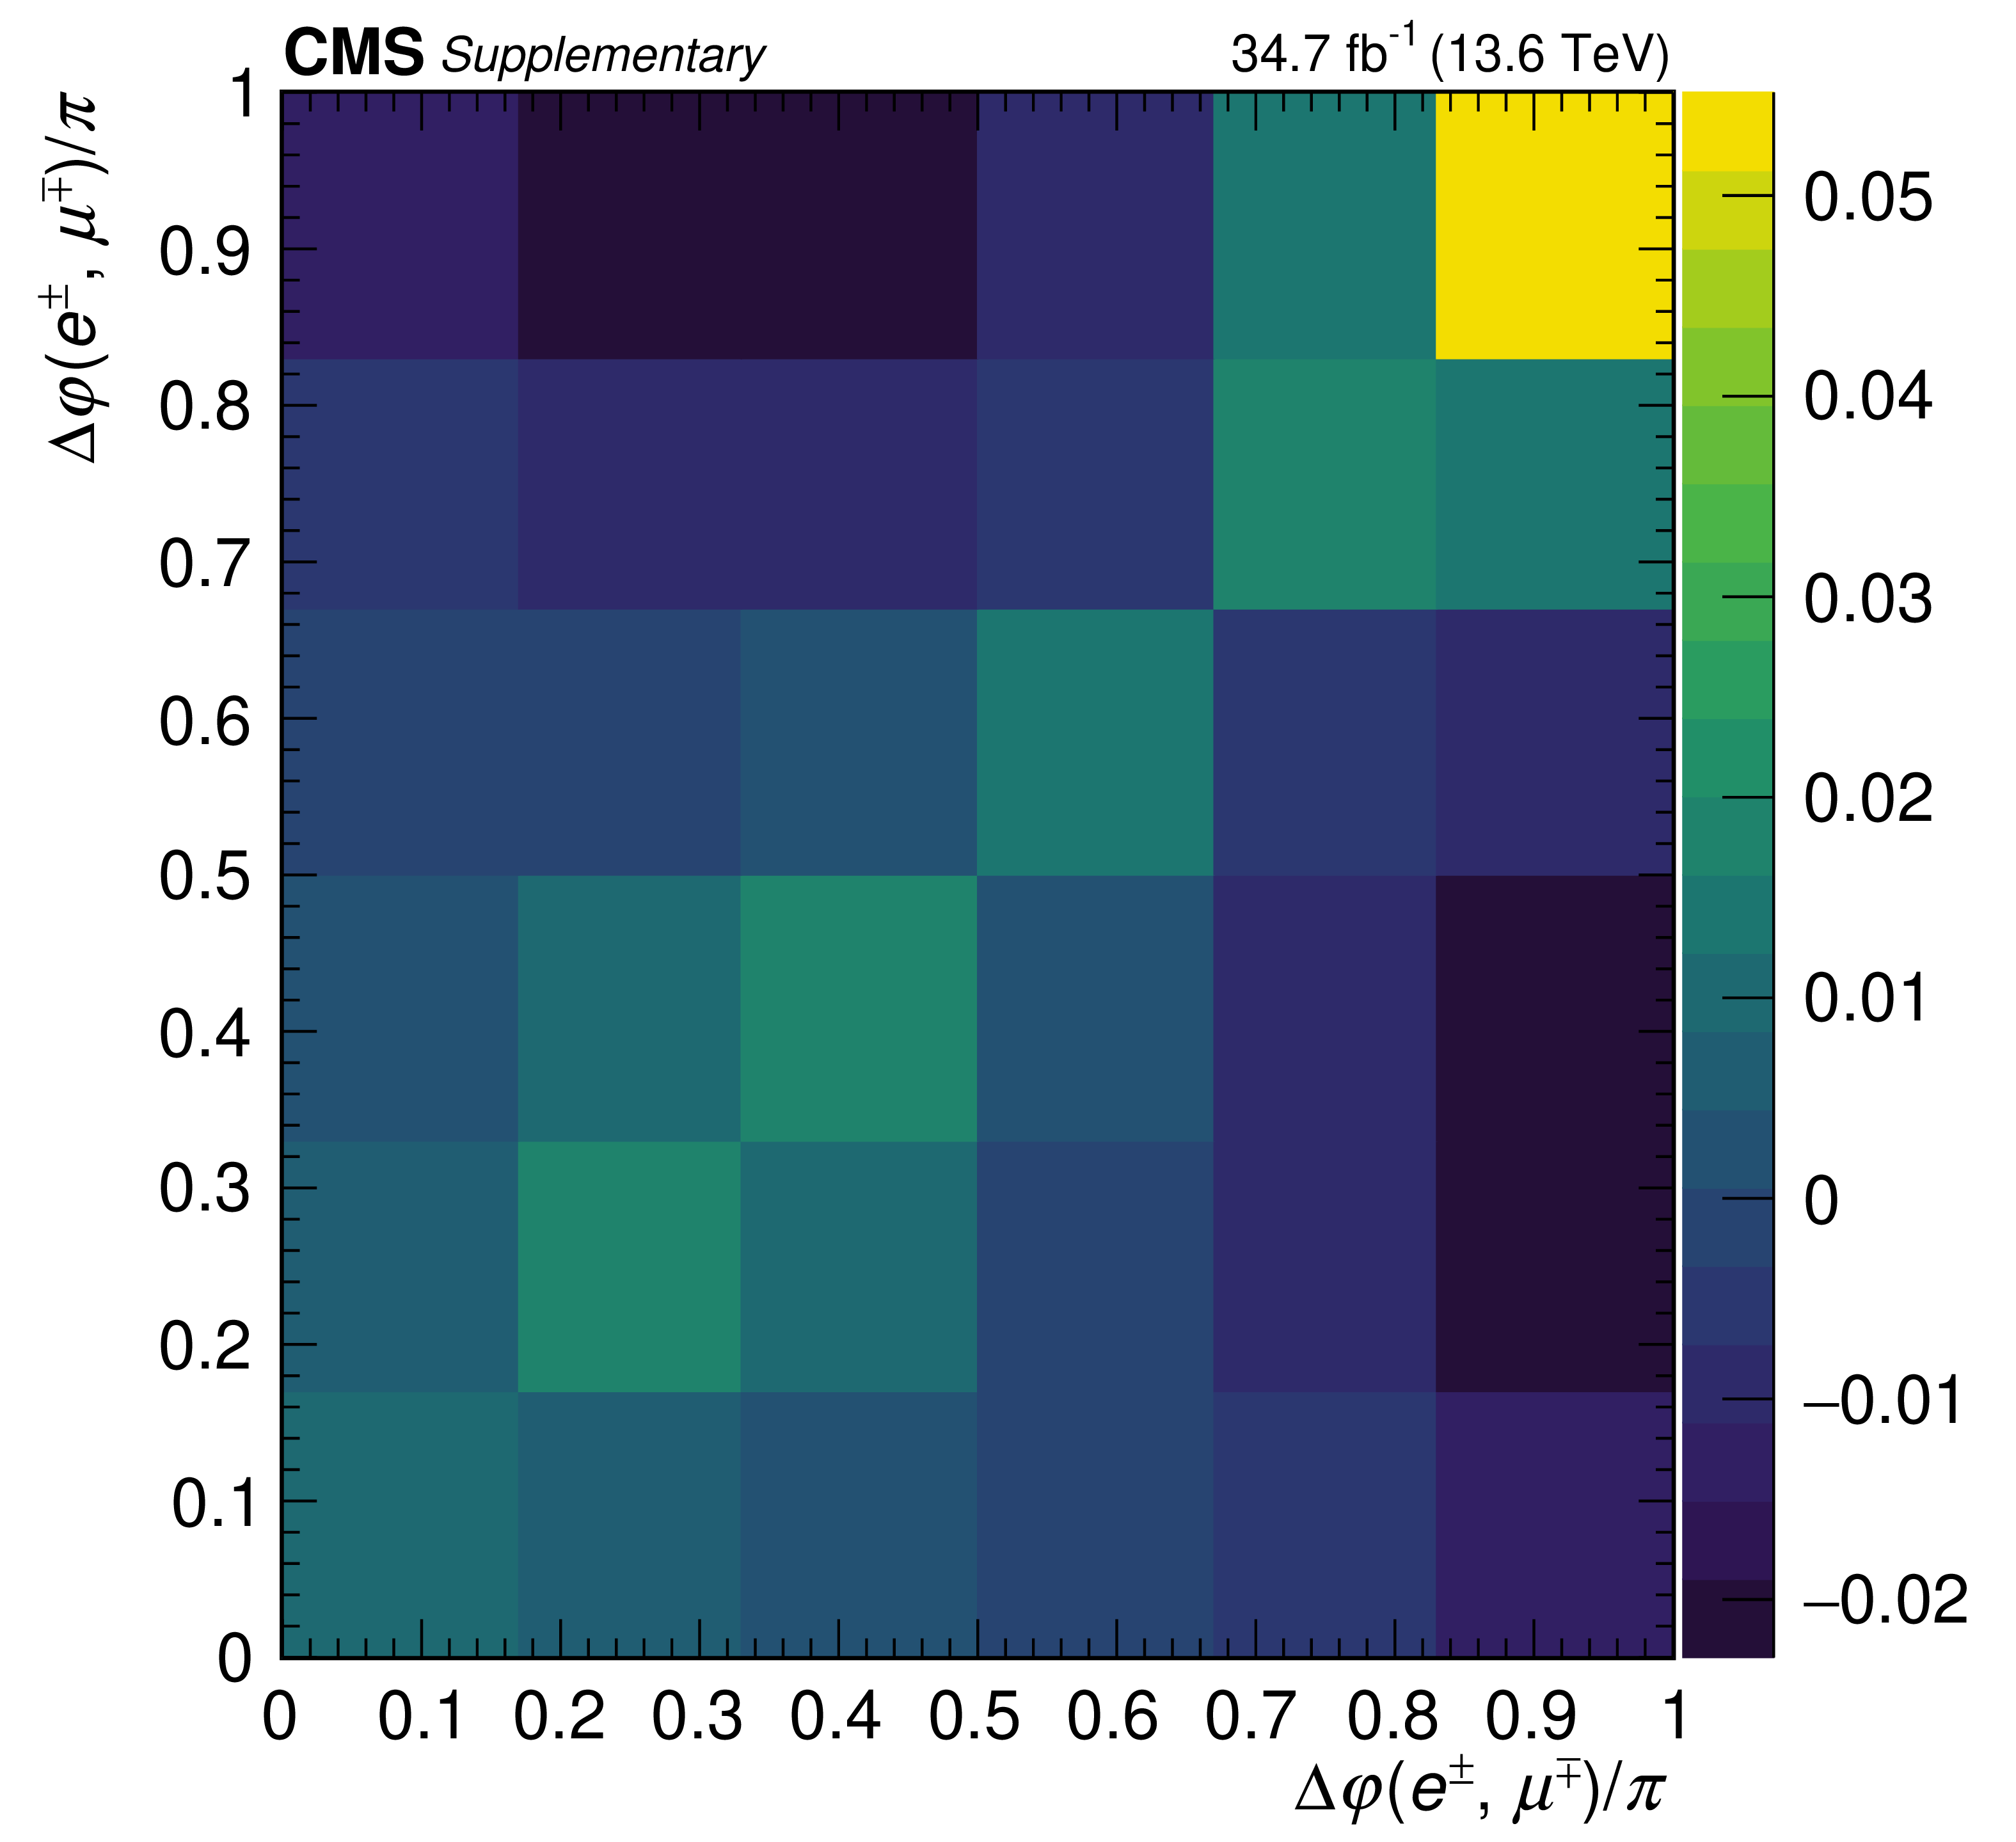
Additional Figure 15:
Covariance matrix including all uncertainties of the differential result for $ \Delta\varphi(\mathrm{e}^\pm, \mu^\mp) $. |

png pdf |
Additional Figure 16:
Covariance matrix including all uncertainties of the differential result for $ m_{\text{T}}(\mathrm{e}^\pm, \mu^\mp, j, p_{\mathrm{T}}^\text{miss}) $. |
| References | ||||
| 1 | A. S. Belyaev, E. E. Boos, and L. V. Dudko | Single top quark at future hadron colliders: Complete signal and background study | PRD 59 (1999) 075001 | hep-ph/9806332 |
| 2 | S. Frixione et al. | Single-top hadroproduction in association with a W boson | JHEP 07 (2008) 029 | 0805.3067 |
| 3 | C. D. White, S. Frixione, E. Laenen, and F. Maltoni | Isolating $ {\mathrm{W}\mathrm{t}} $ production at the LHC | JHEP 11 (2009) 074 | 0908.0631 |
| 4 | CMS Collaboration | Observation of the associated production of a single top quark and a W boson in $ {\mathrm{p}\mathrm{p}} $ collisions at $ \sqrt{s}= $ 8 TeV | PRL 112 (2014) 231802 | CMS-TOP-12-040 1401.2942 |
| 5 | W. Fang, B. Clerbaux, A. Giammanco, and R. Goldouzian | Model-independent constraints on the CKM matrix elements $ |V_{\mathrm{t}\mathrm{b}}| $, $ |V_{\mathrm{t}\mathrm{s}}| $ and $ |V_{\mathrm{t}\mathrm{d}}| $ | JHEP 03 (2019) 022 | 1807.07319 |
| 6 | R. Rahaman and A. Subba | Probing top quark anomalous moments in W boson associated single top quark production at the LHC using polarization and spin correlation | PRD 108 (2023) 055027 | 2306.06889 |
| 7 | T. M. P. Tait and C.-P. Yuan | Single top quark production as a window to physics beyond the standard model | PRD 63 (2000) 014018 | hep-ph/0007298 |
| 8 | Q.-H. Cao, J. Wudka, and C.-P. Yuan | Search for new physics via single-top production at the LHC | PLB 658 (2007) 50 | 0704.2809 |
| 9 | V. Barger, M. McCaskey, and G. Shaughnessy | Single top and Higgs associated production at the LHC | PRD 81 (2010) 034020 | 0911.1556 |
| 10 | D. Pinna, A. Zucchetta, M. R. Buckley, and F. Canelli | Single top quarks and dark matter | PRD 96 (2017) 035031 | 1701.05195 |
| 11 | CMS Collaboration | Search for dark matter produced in association with a single top quark or a top quark pair in proton-proton collisions at $ \sqrt{s}= $ 13 TeV | JHEP 03 (2019) 141 | CMS-EXO-18-010 1901.01553 |
| 12 | ATLAS Collaboration | Search for dark matter produced in association with bottom or top quarks in $ \sqrt{s}= $ 13 TeV $ {\mathrm{p}\mathrm{p}} $ collisions with the ATLAS detector | EPJC 78 (2018) 18 | 1710.11412 |
| 13 | CMS Collaboration | First measurement of the top quark pair production cross section in proton-proton collisions at $ \sqrt{s}= $ 13.6 TeV | JHEP 08 (2023) 204 | CMS-TOP-22-012 2303.10680 |
| 14 | ATLAS Collaboration | Inclusive and differential cross-sections for dilepton $ \mathrm{t} \overline{\mathrm{t}} $ production measured in $ \sqrt{s}= $ 13 TeV $ {\mathrm{p}\mathrm{p}} $ collisions with the ATLAS detector | JHEP 07 (2023) 141 | 2303.15340 |
| 15 | N. Kidonakis and N. Yamanaka | Higher-order corrections for $ {\mathrm{t}\mathrm{W}} $ production at high-energy hadron colliders | JHEP 05 (2021) 278 | 2102.11300 |
| 16 | N. Kidonakis | Two-loop soft anomalous dimensions for single top quark associated production with a $ \mathrm{W^-} $ or $ \mathrm{H}^{-} $ | PRD 82 (2010) 054018 | 1005.4451 |
| 17 | N. Kidonakis | Soft-gluon corrections for $ {\mathrm{t}\mathrm{W}} $ production at N\textsuperscript3LO | PRD 96 (2017) 034014 | 1612.06426 |
| 18 | PDF4LHC Working Group , R. D. Ball et al. | The PDF4LHC21 combination of global PDF fits for the LHC Run 3 | JPG 49 (2022) 080501 | 2203.05506 |
| 19 | D0 Collaboration | Observation of single top-quark production | PRL 103 (2009) 092001 | 0903.0850 |
| 20 | CDF Collaboration | Observation of electroweak single top-quark production | PRL 103 (2009) 092002 | 0903.0885 |
| 21 | ATLAS Collaboration | Evidence for the associated production of a W boson and a top quark in ATLAS at $ \sqrt{s}= $ 7 TeV | PLB 716 (2012) 142 | 1205.5764 |
| 22 | CMS Collaboration | Evidence for associated production of a single top quark and W boson in $ {\mathrm{p}\mathrm{p}} $ collisions at $ \sqrt{s}= $ 7 TeV | PRL 110 (2013) 022003 | CMS-TOP-11-022 1209.3489 |
| 23 | ATLAS Collaboration | Measurement of the production cross-section of a single top quark in association with a W boson at 8 TeV with the ATLAS experiment | JHEP 01 (2016) 064 | 1510.03752 |
| 24 | ATLAS Collaboration | Measurement of the cross-section for producing a W boson in association with a single top quark in $ {\mathrm{p}\mathrm{p}} $ collisions at $ \sqrt{s}= $ 13 TeV with ATLAS | JHEP 01 (2018) 063 | 1612.07231 |
| 25 | CMS Collaboration | Measurement of the production cross section for single top quarks in association with W bosons in proton-proton collisions at $ \sqrt{s}= $ 13 TeV | JHEP 10 (2018) 117 | CMS-TOP-17-018 1805.07399 |
| 26 | ATLAS Collaboration | Measurement of single top-quark production in association with a W boson in $ {\mathrm{p}\mathrm{p}} $ collisions at $ \sqrt{s}= $ 13 TeV with the ATLAS detector | Submitted to Phys. Rev. D, 2024 | 2407.15594 |
| 27 | CMS Collaboration | Measurement of inclusive and differential cross sections for single top quark production in association with a W boson in proton-proton collisions at $ \sqrt{s}= $ 13 TeV | JHEP 07 (2023) 046 | CMS-TOP-21-010 2208.00924 |
| 28 | ATLAS Collaboration | Measurement of differential cross-sections of a single top quark produced in association with a W boson at $ \sqrt{s}= $ 13 TeV with ATLAS | EPJC 78 (2018) 186 | 1712.01602 |
| 29 | ATLAS Collaboration | Probing the quantum interference between singly and doubly resonant top-quark production in $ {\mathrm{p}\mathrm{p}} $ collisions at $ \sqrt{s}= $ 13 TeV with the ATLAS detector | PRL 121 (2018) 152002 | 1806.04667 |
| 30 | CMS Collaboration | Observation of $ {\mathrm{t}\mathrm{W}} $ production in the single-lepton channel in $ {\mathrm{p}\mathrm{p}} $ collisions at $ \sqrt{s}= $ 13 TeV | JHEP 11 (2021) 111 | CMS-TOP-20-002 2109.01706 |
| 31 | ATLAS Collaboration | Measurement of single top-quark production in association with a W boson in the single-lepton channel at $ \sqrt{s}= $ 8 TeV with the ATLAS detector | EPJC 81 (2021) 720 | 2007.01554 |
| 32 | CMS Collaboration | HEPData record for this analysis | link | |
| 33 | CMS Collaboration | The CMS experiment at the CERN LHC | JINST 3 (2008) S08004 | |
| 34 | CMS Collaboration | Development of the CMS detector for the CERN LHC Run 3 | JINST 19 (2024) P05064 | CMS-PRF-21-001 2309.05466 |
| 35 | CMS Collaboration | Performance of the CMS Level-1 trigger in proton-proton collisions at $ \sqrt{s}= $ 13 TeV | JINST 15 (2020) P10017 | CMS-TRG-17-001 2006.10165 |
| 36 | CMS Collaboration | The CMS trigger system | JINST 12 (2017) P01020 | CMS-TRG-12-001 1609.02366 |
| 37 | CMS Collaboration | Measurement of inclusive and differential cross sections for $ {\mathrm{W^+}\mathrm{W^-}} $ production in proton-proton collisions at $ \sqrt{s}= $ 13.6 TeV | Submitted to Phys. Lett. B, 2024 | CMS-SMP-24-001 2406.05101 |
| 38 | CMS Collaboration | CMS technical design report for the Phase 1 upgrade of the hadron calorimeter | CMS Technical Proposal CERN-LHCC-2012-015, CMS-TDR-010, 2012 CDS |
|
| 39 | CMS Collaboration | Performance of the CMS phase-1 pixel detector with Run 3 data | CMS Detector Performance Note CMS-DP-2022-047, 2022 CDS |
|
| 40 | CMS Collaboration | Commissioning CMS online reconstruction with GPUs | CMS Detector Performance Note CMS-DP-2023-004, 2023 CDS |
|
| 41 | N. Karunarathna | Run 3 luminosity measurements with the Pixel Luminosity Telescope | CMS Collaboration, in Proc. 41st International Conference on High Energy Physics (ICHEP ): Bologna, Italy, 2022 [PoS (ICHEP) 936] |
|
| 42 | J. Wańczyk | Upgraded CMS Fast Beam Condition Monitor for LHC Run 3 online luminosity and beam-induced background measurements | CMS Collaboration, in Proc. 11th International Beam Instrumentation Conference (IBIC ): Krakow, Poland, 2022 [JACoW (IBIC) 540] |
|
| 43 | CMS BRIL Collaboration | The Pixel Luminosity Telescope: a detector for luminosity measurement at CMS using silicon pixel sensors | EPJC 83 (2023) 673 | 2206.08870 |
| 44 | CMS Collaboration | Particle-flow reconstruction and global event description with the CMS detector | JINST 12 (2017) P10003 | CMS-PRF-14-001 1706.04965 |
| 45 | CMS Collaboration | Technical proposal for the Phase-II upgrade of the Compact Muon Solenoid | CMS Technical Proposal CERN-LHCC-2015-010, CMS-TDR-15-02, 2015 link |
|
| 46 | M. Cacciari, G. P. Salam, and G. Soyez | The anti-$ k_{\mathrm{T}} $ jet clustering algorithm | JHEP 04 (2008) 063 | 0802.1189 |
| 47 | M. Cacciari, G. P. Salam, and G. Soyez | FASTJET user manual | EPJC 72 (2012) 1896 | 1111.6097 |
| 48 | D. Bertolini, P. Harris, M. Low, and N. Tran | Pileup per particle identification | JHEP 10 (2014) 059 | 1407.6013 |
| 49 | CMS Collaboration | Pileup mitigation at CMS in 13 TeV data | JINST 15 (2020) P09018 | CMS-JME-18-001 2003.00503 |
| 50 | CMS Collaboration | Jet energy scale and resolution in the CMS experiment in $ {\mathrm{p}\mathrm{p}} $ collisions at 8 TeV | JINST 12 (2017) P02014 | CMS-JME-13-004 1607.03663 |
| 51 | CMS Collaboration | Jet algorithms performance in 13 TeV data | CMS Physics Analysis Summary, 2017 CMS-PAS-JME-16-003 |
CMS-PAS-JME-16-003 |
| 52 | CMS Collaboration | Jet energy scale and resolution measurements using prompt Run 3 data collected by CMS in the first months of 2022 at 13.6 TeV | CMS Detector Performance Note CMS-DP-2022-054, 2022 CDS |
|
| 53 | S. Alioli, P. Nason, C. Oleari, and E. Re | A general framework for implementing NLO calculations in shower Monte Carlo programs: the POWHEG box | JHEP 06 (2010) 043 | 1002.2581 |
| 54 | S. Frixione, P. Nason, and C. Oleari | Matching NLO QCD computations with parton shower simulations: the POWHEG method | JHEP 11 (2007) 070 | 0709.2092 |
| 55 | P. Nason | A new method for combining NLO QCD with shower Monte Carlo algorithms | JHEP 11 (2004) 040 | hep-ph/0409146 |
| 56 | ATLAS and CMS Collaborations | Improved common $ \mathrm{t} \overline{\mathrm{t}} $ Monte Carlo settings for ATLAS and CMS | Technical Report CMS-NOTE-2023-004, ATL-PHYS-PUB-2023-016, 2023 | |
| 57 | T. M. P. Tait | $ {\mathrm{t}\mathrm{W^-}} $ mode of single top quark production | PRD 61 (1999) 034001 | hep-ph/9909352 |
| 58 | J. Alwall et al. | The automated computation of tree-level and next-to-leading order differential cross sections, and their matching to parton shower simulations | JHEP 07 (2014) 079 | 1405.0301 |
| 59 | F. Demartin et al. | $ {\mathrm{t}\mathrm{W}\mathrm{H}} $ associated production at the LHC | EPJC 77 (2017) 34 | 1607.05862 |
| 60 | S. Frixione, G. Ridolfi, and P. Nason | A positive-weight next-to-leading-order Monte Carlo for heavy flavour hadroproduction | JHEP 09 (2007) 126 | 0707.3088 |
| 61 | NNPDF Collaboration | Parton distributions from high-precision collider data | EPJC 77 (2017) 663 | 1706.00428 |
| 62 | C. Bierlich et al. | A comprehensive guide to the physics and usage of PYTHIA8.3 | SciPost Phys. Codeb. 8 (2022) | 2203.11601 |
| 63 | CMS Collaboration | Extraction and validation of a new set of CMS PYTHIA8 tunes from underlying-event measurements | EPJC 80 (2020) 4 | CMS-GEN-17-001 1903.12179 |
| 64 | M. Bähr et al. | HERWIG++ physics and manual | EPJC 58 (2008) 639 | 0803.0883 |
| 65 | J. Bellm et al. | HERWIG 7.0/ HERWIG++ 3.0 release note | EPJC 76 (2016) 196 | 1512.01178 |
| 66 | J. Bellm et al. | HERWIG 7.1 release note | 1705.06919 | |
| 67 | CMS Collaboration | Development and validation of HERWIG 7 tunes from CMS underlying-event measurements | EPJC 81 (2021) 312 | CMS-GEN-19-001 2011.03422 |
| 68 | R. Frederix and S. Frixione | Merging meets matching in MC@NLO | JHEP 12 (2012) 061 | 1209.6215 |
| 69 | GEANT4 Collaboration | GEANT 4---a simulation toolkit | NIM A 506 (2003) 250 | |
| 70 | Y. Li and F. Petriello | Combining QCD and electroweak corrections to dilepton production in FEWZ | PRD 86 (2012) 094034 | 1208.5967 |
| 71 | J. M. Campbell, R. K. Ellis, and C. Williams | Vector boson pair production at the LHC | JHEP 07 (2011) 018 | 1105.0020 |
| 72 | M. Czakon, P. Fiedler, and A. Mitov | Total top-quark pair-production cross section at hadron colliders through $ \mathcal{O}({\alpha_\mathrm{S}}^4) $ | PRL 110 (2013) 252004 | 1303.6254 |
| 73 | M. Czakon and A. Mitov | top++: a program for the calculation of the top-pair cross-section at hadron colliders | Comput. Phys. Commun. 185 (2014) 2930 | 1112.5675 |
| 74 | CMS Collaboration | Electron and photon reconstruction and identification with the CMS experiment at the CERN LHC | JINST 16 (2021) P05014 | CMS-EGM-17-001 2012.06888 |
| 75 | CMS Collaboration | Performance of the CMS muon detector and muon reconstruction with proton-proton collisions at $ \sqrt{s}= $ 13 TeV | JINST 13 (2018) P06015 | CMS-MUO-16-001 1804.04528 |
| 76 | H. Qu, C. Li, and S. Qian | Particle transformer for jet tagging | in Proc. 39th International Conference on Machine Learning (ICML ): Baltimore MD, USA, 2022 PMLR 162 (2022) 18281 |
2202.03772 |
| 77 | CMS Collaboration | Adversarial training for b-tagging algorithms in CMS | CMS Detector Performance Note CMS-DP-2022-049, 2022 CDS |
|
| 78 | CMS Collaboration | Transformer models for heavy flavor jet identification | CMS Detector Performance Note CMS-DP-2022-050, 2022 CDS |
|
| 79 | CMS Collaboration | Run 3 commissioning results of heavy-flavor jet tagging at $ \sqrt{s}= $ 13.6 TeV with CMS data using a modern framework for data processing | CMS Detector Performance Note CMS-DP-2022-024, 2024 CDS |
|
| 80 | CMS Collaboration | Performance summary of AK4 jet b tagging with data from 2022 proton-proton collisions at 13.6 TeV with the CMS detector | CMS Detector Performance Note CMS-DP-2022-025, 2024 CDS |
|
| 81 | CMS Collaboration | Identification of heavy-flavour jets with the CMS detector in $ {\mathrm{p}\mathrm{p}} $ collisions at 13 TeV | JINST 13 (2018) P05011 | CMS-BTV-16-002 1712.07158 |
| 82 | E. Bols et al. | Jet flavour classification using DeepJet | JINST 15 (2020) P12012 | 2008.10519 |
| 83 | A. Prinzie and D. Van den Poel | Random multiclass classification: Generalizing random forests to random MNL and random NB | in Proc. 18th International Conference on Database and Expert Systems Applications (DEXA ): Regensburg, Germany, 2007 link |
|
| 84 | F. Pedregosa et al. | scikit-learn: Machine learning in Python | J. Mach. Learn. Res. 12 (2011) 2825 | |
| 85 | L. Breiman, J. Friedman, R. A. Olshen, and C. J. Stone | Classification and regression trees | Chapman & Hall/CRC, Boca Raton FL, USA, 1984 link |
|
| 86 | R. Cousins | Generalization of chisquare goodness-of-fit test for binned data using saturated models, with application to histograms | link | |
| 87 | E. Gross and O. Vitells | Trial factors for the look elsewhere effect in high energy physics | EPJC 70 (2010) 525 | 1005.1891 |
| 88 | R. Barlow and C. Beeston | Fitting using finite Monte Carlo samples | Comput. Phys. Commun. 77 (1993) 219 | |
| 89 | J. S. Conway | Incorporating nuisance parameters in likelihoods for multisource spectra | in Proc. 2011 Workshop on Statistical Issues Related to Discovery Claims in Search Experiments and Unfolding (PHYSTAT): Geneva, Switzerland, 2011 link |
1103.0354 |
| 90 | CMS Collaboration | The CMS statistical analysis and combination tool: combine | Comput. Softw. Big Sci. 8 (2024) 19 | CMS-CAT-23-001 2404.06614 |
| 91 | W. Verkerke and D. Kirkby | The RooFit toolkit for data modeling | in Proc. 13th International Conference on Computing in High Energy and Nuclear Physics (CHEP), La Jolla CA, United States, 2003 [eConf C0303241 MOLT007] |
physics/0306116 |
| 92 | L. Moneta et al. | The RooStats project | in Proc. 13th International Workshop on Advanced Computing and Analysis Techniques in Physics Research (ACAT): Jaipur, India, 2010 [PoS (ACAT) 057] |
1009.1003 |
| 93 | CMS Collaboration | Object definitions for top quark analyses at the particle level | CMS Note 2017-004 CDS |
|
| 94 | M. Cacciari, G. P. Salam, and G. Soyez | The catchment area of jets | JHEP 04 (2008) 005 | 0802.1188 |
| 95 | G. Cowan | Statistical data analysis | Clarendon Press, Oxford, UK, 1998 | |
| 96 | S. Schmitt | TUnfold, an algorithm for correcting migration effects in high energy physics | JINST 7 (2012) T10003 | 1205.6201 |
| 97 | G. Cowan, K. Cranmer, E. Gross, and O. Vitells | Asymptotic formulae for likelihood-based tests of new physics | EPJC 71 (2011) 1554 | 1007.1727 |
| 98 | W. S. Cleveland | Robust locally weighted regression and smoothing scatterplots | J. Am. Stat. Assoc. 74 (1979) 829 | |
| 99 | CMS Collaboration | Performance of photon reconstruction and identification with the CMS detector in proton-proton collisions at $ \sqrt{s}= $ 8 TeV | JINST 10 (2015) P08010 | CMS-EGM-14-001 1502.02702 |
| 100 | CMS Collaboration | Description and performance of track and primary-vertex reconstruction with the CMS tracker | JINST 9 (2014) P10009 | CMS-TRK-11-001 1405.6569 |
| 101 | CMS Collaboration | Measurements of inclusive W and Z cross sections in $ {\mathrm{p}\mathrm{p}} $ collisions at $ \sqrt{s}= $ 7 TeV | JHEP 01 (2011) 080 | CMS-EWK-10-002 1012.2466 |
| 102 | CMS Collaboration | Measurement of the inelastic proton-proton cross section at $ \sqrt{s}= $ 13 TeV | JHEP 07 (2018) 161 | CMS-FSQ-15-005 1802.02613 |
| 103 | CMS Collaboration | Luminosity measurement in proton-proton collisions at 13.6 TeV in 2022 at CMS | CMS Physics Analysis Summary, 2024 CMS-PAS-LUM-22-001 |
CMS-PAS-LUM-22-001 |
| 104 | CMS Collaboration | Precision luminosity measurement in proton-proton collisions at $ \sqrt{s}= $ 13 TeV in 2015 and 2016 at CMS | EPJC 81 (2021) 800 | CMS-LUM-17-003 2104.01927 |
| 105 | P. Skands, S. Carrazza, and J. Rojo | Tuning PYTHIA8.1: the Monash 2013 tune | EPJC 74 (2014) 3024 | 1404.5630 |
| 106 | S. Argyropoulos and T. Sjöstrand | Effects of color reconnection on $ \mathrm{t} \overline{\mathrm{t}} $ final states at the LHC | JHEP 11 (2014) 043 | 1407.6653 |
| 107 | CMS Collaboration | CMS PYTHIA8 colour reconnection tunes based on underlying-event data | EPJC 83 (2023) 587 | CMS-GEN-17-002 2205.02905 |
| 108 | CMS Collaboration | Investigations of the impact of the parton shower tuning in PYTHIA8 in the modelling of $ \mathrm{t} \overline{\mathrm{t}} $ at $ \sqrt{s}= $ 8 and 13 TeV | CMS Physics Analysis Summary, 2016 CMS-PAS-TOP-16-021 |
CMS-PAS-TOP-16-021 |
| 109 | ATLAS and CMS Collaborations | Combination of measurements of the top quark mass from data collected by the ATLAS and CMS experiments at $ \sqrt{s}= $ 7 and 8 TeV | PRL 132 (2024) 261902 | 2402.08713 |
| 110 | CMS Collaboration | Measurement of differential cross sections for top quark pair production using the lepton+jets final state in proton-proton collisions at 13 TeV | PRD 95 (2017) 092001 | CMS-TOP-16-008 1610.04191 |
| 111 | CMS Collaboration | Measurement of the differential cross section for top quark pair production in $ {\mathrm{p}\mathrm{p}} $ collisions at $ \sqrt{s} = $ 8 TeV | EPJC 75 (2015) 542 | CMS-TOP-12-028 1505.04480 |
| 112 | CMS Collaboration | Measurement of the $ \mathrm{t} \overline{\mathrm{t}} $ production cross section in the all-jets final state in $ {\mathrm{p}\mathrm{p}} $ collisions at $ \sqrt{s}= $ 8 TeV | EPJC 76 (2016) 128 | CMS-TOP-14-018 1509.06076 |
| 113 | M. Czakon et al. | Top-pair production at the LHC through NNLO QCD and NLO EW | JHEP 10 (2017) 186 | 1705.04105 |
| 114 | CMS Collaboration | Determination of jet energy calibration and transverse momentum resolution in CMS | JINST 6 (2011) P11002 | CMS-JME-10-011 1107.4277 |
| 115 | CMS Collaboration | Measurement of the top quark polarization and $ \mathrm{t} \overline{\mathrm{t}} $ spin correlations using dilepton final states in proton-proton collisions at $ \sqrt{s}= $ 13 TeV | PRD 100 (2019) 072002 | CMS-TOP-18-006 1907.03729 |
|
|
Compact Muon Solenoid LHC, CERN |
|

|

|

|

|

|